Embed Size (px)
Citation preview

This article appeared in a journal published by Elsevier. The attachedcopy is furnished to the author for internal non-commercial researchand education use, including for instruction at the authors institution
and sharing with colleagues.
Other uses, including reproduction and distribution, or selling orlicensing copies, or posting to personal, institutional or third party
websites are prohibited.
In most cases authors are permitted to post their version of thearticle (e.g. in Word or Tex form) to their personal website orinstitutional repository. Authors requiring further information
regarding Elsevier’s archiving and manuscript policies areencouraged to visit:
http://www.elsevier.com/authorsrights

Author's personal copy
A comparison study of Portland cement hydration kinetics as measuredby chemical shrinkage and isothermal calorimetry
Xueyu Pang a,⇑, Dale P. Bentz b, Christian Meyer c, Gary P. Funkhouser a, Robert Darbe a
a Halliburton, 3000 N Sam Houston Pkwy E, Houston, TX 77032, USAb Engineering Laboratory, National Institute of Standards and Technology, USAc Department of Civil Engineering and Engineering Mechanics, Columbia University, USA
a r t i c l e i n f o
Article history:Received 29 November 2012Received in revised form 7 February 2013Accepted 20 March 2013Available online 28 March 2013
Keywords:Cement hydrationKineticsChemical shrinkageHeat of hydrationIsothermal calorimetryOilwell cement
a b s t r a c t
Two different methods of evaluating cement hydration kinetics, namely chemical shrinkage and isother-mal calorimetry tests, are used to investigate the early stage hydration of different classes of oilwellcement at various temperatures. For a given cement paste, the hydration kinetics curves measured bythe two methods are proportional to each other at the same curing temperature. The ratio of heat ofhydration to chemical shrinkage for different cements used in this study ranges from 7500 J/mL to8000 J/mL at 25 �C and increases almost linearly with increasing curing temperature at a rate that variesonly slightly with cement composition (approximately 58 J/mL per �C). A previously proposed scale factormodel for simulating the effect of curing temperature and pressure on cement hydration kinetics is fur-ther validated in this study for its temperature aspect. The model is shown to be particularly helpful incorrecting for slight temperature errors in the experiments.
� 2013 Elsevier Ltd. All rights reserved.
1. Introduction
The hydration of Portland cement is a complex process. Despitedecades of research, many detailed features are still not clearlyunderstood today, primarily because of the complicating influ-ences of different clinker phases, impurities, and their interactions.Nevertheless, the general hydration kinetics of cement is often rep-resented by the rate of change of the overall degree of hydration a,which is defined as the total weight fraction of cement reacted. Asa composite material consisting mainly of four compounds, or clin-ker phases (C3S, C2S, C3A and C4AF1), the overall degree of hydrationof cement is typically written as [1]:
aðtÞ ¼ pC3SaC3SðtÞ þ pC2SaC2SðtÞ þ pC3AaC3AðtÞ þ pC4AFaC4AFðtÞ ð1Þ
where pi is the original weight fraction of Phase i in the anhydrouscement and ai(t) is the degree of hydration of Phase i at time t. Di-rect determination of ai(t) can be made by quantitative X-ray dif-fraction analysis (QXDA) [1,2], though it is difficult to obtainaccurate results. Some properties of a hydrating cement paste, suchas the non-evaporable water content, the cumulative heat evolutionand the total chemical shrinkage have been shown to have approx-imately linear relationships with the overall degree of hydration
[1,3–5]. As a matter of fact, a is more easily and commonly deter-mined indirectly by tracking the time dependence of one or moreof these properties. For the purposes of this paper, the semi-contin-uous measure of the progress of the degree of hydration with time(a(t)) and its derivative (da(t)/dt) are both referred to as the hydra-tion kinetics curves.
Among the different methods of approximating cement hydra-tion progress, heat of hydration tests used to be the only one thatprovided continuous data suitable for evaluating hydration mech-anisms. Automated chemical shrinkage test methods have beendeveloped in recent years [6–9] and are now also frequently usedto study cement hydration mechanisms [9–12]. Therefore, it isimportant to investigate the differences and similarities betweenthese two different methods, which may also help us gain furtherinsights about the cement hydration process. In this study, boththe traditional isothermal calorimetry and one of the newly devel-oped chemical shrinkage test methods were employed to measurethe hydration kinetics of cement at similar curing conditions and adetailed comparison of the two sets of test results was performed.
The experimental test methods and detailed test plan of thisstudy are described Section 2. The theoretical analysis regardingthe correlation between heat of hydration and chemical shrinkageis presented in Section 3. Because temperature control of thechemical shrinkage tests performed in this study was not veryaccurate, a method of correcting the temperature differences be-tween isothermal calorimetry tests and chemical shrinkage tests
0958-9465/$ - see front matter � 2013 Elsevier Ltd. All rights reserved.http://dx.doi.org/10.1016/j.cemconcomp.2013.03.007
⇑ Corresponding author.E-mail address: [email protected] (X. Pang).
1 Cement chemistry notation: C = CaO, S = SiO2, H = H2O, A = Al2O3, F = Fe2O3.
Cement & Concrete Composites 39 (2013) 23–32
Contents lists available at SciVerse ScienceDirect
Cement & Concrete Composites
journal homepage: www.elsevier .com/locate /cemconcomp

Author's personal copy
is also proposed in Section 3 based on a scale factor model devel-oped earlier. The scale factor model was developed to simulatethe effect of curing temperature and pressure on cement hydrationkinetics and has been preliminarily validated using chemicalshrinkage test data [12]. When the hydration kinetics curve of areference curing temperature is known for a given cement paste,the scale factor model can be used to estimate the hydration kinet-ics curve for a given temperature or the temperature of a givenhydration kinetics curve. In Section 4.1, the model is further vali-dated with isothermal calorimetry test data from this study. Sincethe rate of hydration is measured directly in these tests, the accu-racy and limitations of the scale factor model can be observed anddiscussed in greater detail. In Section 4.2, it is shown that thehydration kinetics measured by chemical shrinkage can be corre-lated excellently with those measured by isothermal calorimetryby applying the proposed model in this study.
2. Materials and methods
2.1. Materials
Oilwell cements are based upon Portland cement, but manufac-tured to a higher level of consistency from one production batch toanother. There are no substantial differences between oilwell ce-ments and ordinary Portland cements, except for the fact that someClass H (API Specification 10A [13]) cement may have near zeroC3A content. API Classes A, B, and C cements are similar to ASTMTypes I, II, and III cements, respectively. The hydration kinetics offour different classes of oilwell cements, namely Classes A, C, G,and H, were investigated at different curing temperatures in thisstudy. All slurries (cement pastes) were prepared with de-aeratedwater and cement only, with no additives. As will be shown in Sec-tion 2.2, standard water-to-cement (w/c) mass ratios for each classof cement were used, as defined in API Specification 10A [13]. Themain compound compositions of the different types of cements de-rived from the oxide analysis test results using the Bogue calcula-tion method [14] are presented in Table 1. As shown in the table,two different types of Class H cements were used: a premium ClassH (H-P) and a standard Class H. Some minor composition variationswere observed between different batches of standard Class H ce-ment (H-I and H-II) produced from the same plant.
The particle size distributions of the cements were measured bythe laser scattering technique with dry dispersion methods (atleast 10 measurements were performed on each type of cement).The average test results are presented in Fig. 1 (Class H-I cementwas not measured as it should be similar to Class H-II cement).The median particle sizes for Classes A, C, G, H-P, and H-II cementswere 38 lm, 15 lm, 34 lm, 30 lm, and 23 lm, respectively, whiletheir specific surface areas calculated from the PSD data (assumingspherical particles and a cement density of 3150 kg/m3) were356 m2/kg, 565 m2/kg, 327 m2/kg, 394 m2/kg, and 323 m2/kg,respectively. Apparently, the median particle size does not neces-sarily correlates with the specific surface area since the latter isprimarily dominated by the relative proportion of the fine parti-cles. The particle size distribution curves for the Class A, G, and
H-P cements are very similar, suggesting that similar grinding pro-cedures may have been adopted in manufacturing these cements.Class C cement is ground much finer than the other classes toachieve a higher specific surface area and enhance early-agereactivity.
2.2. Chemical shrinkage test
The total absolute volume of cement hydration product is smal-ler than the combined initial volume of the anhydrous cement andwater. This reduction in volume during hydration is known aschemical shrinkage. Despite the apparently simple principle ofchemical shrinkage measurement, there are experimental difficul-ties that can yield spurious results. For example, the traditionalchemical shrinkage test (ASTM C1608 [15]) involves adding a sig-nificant amount of water on top of a thin specimen (<10 mm) tokeep it saturated. A recent study showed that the quantity andthe composition of the surface water have a significant impact ontest results [16]. Increasing the amount of surface water was foundto increase the chemical shrinkage rate before the end of the induc-tion period and to reduce the peak chemical shrinkage rate duringlater periods. The initial increase is probably due to the accelerateddissolution as a result of more Ca2+ leaching out of the paste sam-ple (and into the surface water solution), while the reduced peakrate might be related to a dilution effect. Massive precipitates ofportlandite were observed on the surface of specimens of alite(the main composition of Portland cement) used for chemicalshrinkage measurement [17]. Additionally, when the same mea-suring device was used, increasing sample thickness was consis-tently found to cause a reduction in chemical shrinkage at laterages (>15 h) [6,16,17]. This thickness effect may be explained bytwo hypotheses: (1) the reduction in the permeability of the sam-ple might prevent surface water from filling all the pores in thethicker samples (depercolation); (2) a larger fraction of the thinnersample is diluted by the surface water, resulting in a fasterhydration rate at later ages. Costoya [17] found that using a smalldiameter device with less surface water (cylindrical flask) system-atically gave a higher chemical shrinkage of a given mass of alitepaste than when the same mass of paste was used in a large diam-eter device with more surface water (Erlenmeyer flask), eventhough the former generated a much thicker sample. The authoralso found that chemical shrinkage measured with the former de-vice was the same as that measured with a set ground paste sam-ple for a period exceeding 250 h. Therefore, for cement pastes withrelatively high w/c ratios, surface water probably has a muchstronger effect on the test result than the thickness of the sampleand the latter is probably not a limiting factor.
Table 1Estimated main compound compositions (by mass percentage) of the differentcements.
Cement C3S C2S C3A C4AF C2F CaSO4 Free lime
A 61.7 12.0 8.4 9.4 0 4.7 1.4C 72.2 5.2 2.2 11.8 0 4.7 0.2G 62.6 15.9 4.8 10.9 0 3.8 0.2H-P 47.9 27.5 0 16.2 2.0 4.2 0.3H-I 66.5 11.7 0.3 13.4 0 4.5 0.3H-II 70.3 8.5 0 12.8 0.0 4.8 0.3
Fig. 1. Particle size distributions of different classes of cements.
24 X. Pang et al. / Cement & Concrete Composites 39 (2013) 23–32

Author's personal copy
In this study, chemical shrinkage was measured by a recentlydeveloped test apparatus [18] originally designed to obtain in situtensile strength of oilwell cements at different curing pressures.The apparatus allows automatic collection of chemical shrinkagedata from samples cured at different temperatures and pressures.In addition, by using a large volume of cement paste (four51 mm by 170 mm cylinders), the effect of surface water on test re-sults is expected to be minimal. When a hydrostatic curing pres-sure of 0.69 MPa was applied, tests performed using hollowcylinders (whose entire annular surfaces were covered by filter pa-per for water saturation) with a wall thickness of approximately10 mm were found to generate the same results as solid cylinders[18], suggesting sample thickness is not a limiting factor of test re-sults for this type of test under the conditions being employed. Thetest design of the chemical shrinkage test series is shown in Table 2.The main shortcoming of this new test apparatus is the lack of pre-cise temperature control. Fortunately, as will be discussed later,any slight temperature errors can be accounted for with a scale fac-tor when the test results are correlated with those of the isother-mal calorimetry tests. Test data oscillation also seems to bedramatically increased when heating devices are employed forhigh temperature tests, and such oscillations make it difficult tocalculate reliable derivative curves directly from cumulative exper-imental data. Uncertainties in test results caused by factors otherthan temperature fluctuations are estimated to be less than 3% atthe end of 3 d. More detailed uncertainty analysis of this experi-mental technique is given in [18].
2.3. Isothermal calorimetry test
Compared to chemical shrinkage, isothermal calorimetry is amore established test method of measuring overall cement hydra-tion progress. In the second test series, hydration of the differenttypes of cements is tracked with an isothermal calorimeter accord-ing to standard test procedures [19]. Tests were conducted atatmospheric pressure and three different curing temperatures.Table 3 shows the test design for this test series. The temperaturesof isothermal calorimetry tests can be controlled more preciselydue to the small sample size (4–5 g). For this technique, the aver-age absolute difference between replicate specimens of cementpaste is 2.4 � 10�5 W/g (cement), with a maximum absolute differ-ence of 0.00011 W/g (cement), for measurements conducted be-
tween 1 h and 7 d after mixing [20]. It should be mentioned thatthe samples used in the isothermal calorimetry tests were curedunder sealed condition, which is different from the saturated cur-ing condition for the chemical shrinkage tests. Although it is diffi-cult to accurately evaluate the effect of saturation condition on theisothermal calorimetry test results due to various experimentaldifficulties, a previous study [5] suggests that saturation has a neg-ligible effect on tests with relatively high w/c ratios (the small dif-ferences in tests results were probably caused by the surface watereffect discussed in Section 2.2).
3. Theoretical background and analysis
3.1. Indirect methods of measuring cement hydration
When the indirect methods are employed to measure cementhydration progress, the relationships between experimental re-sults and the overall degree of hydration can be expressed as[9,21–25]:
aðtÞ ¼ wnðtÞw0
n¼ HðtÞ
H0 ¼CSðtÞCS0 ð2Þ
where wn(t) and w0n are the non-evaporable water content at time t
and at complete hydration, respectively (typically in g/g cement);H(t) and H0 are the cumulative heat evolution at time t and at com-plete hydration, respectively (typically in J/g cement); and CS(t) andCS0 are the total chemical shrinkage at time t and at completehydration, respectively (typically in mL/g cement). w0
n depends onthe molar masses of the hydration products, while H0 depends onthe enthalpy changes of the chemical reactions, both of which areexpected to remain constant as long as the chemical formulae ofthe hydration products do not change. However, CS0 depends onthe molar volumes of water and the hydration products and hencevaries with both temperature and pressure. According to Eq. (2),since w0
n and H0 remain invariant (at least within the temperatureand pressure range used in this study), the dependency of CS0 ontemperature and pressure can be approximately evaluated bystudying the correlations between wn(t), H(t), and CS(t) at variouscuring conditions. Studies have shown that the ratio of CS(t) town(t), evaluated at discrete data points, decreases with increasingtemperature [6,10], suggesting that CS0 decreases with increasingtemperature. The focus of this study is the correlation betweenCS(t) and H(t), both of which have been measured continuously.
It should be pointed out that the indirect methods only give agross approximation to the hydration rate of cement becausehydration of the different phases also progresses at different rates.If we ignore the interactions between different clinker phases andthe phase changes of different hydration products during hydra-tion, then the total heat of hydration and chemical shrinkagemay be correlated with the degree of hydration of each individualclinker phase as follows,
HðtÞ ¼ aC3SpC3SaC3SðtÞ þ aC2SpC2SaC2SðtÞ þ aC3ApC3AaC3AðtÞþ aC4AFpC4AFaC4AFðtÞ ð3Þ
CSðtÞ ¼ bC3SpC3SaC3SðtÞ þ bC2SpC2SaC2SðtÞ þ bC3ApC3AaC3AðtÞþ bC4AFpC4AFaC4AFðtÞ ð4Þ
where ai, and bi are the cumulative heat evolution and the totalchemical shrinkage, respectively, associated with the completehydration of 1 g of clinker phase i. Eqs. (3) and (4) can be used toestimate the parameters associated with the complete hydrationcondition in Eq. (2), using the sums
H0 ¼X
aipi;CS0 ¼X
bipi ð5Þ
Table 2Chemical shrinkage tests (test series I, test duration = 72 h).
Curing temperature (�C) Ambienta 40.6b 60b
Cement w/c – – –A 0.46 CS-A-1 CS-A-2 CS-A-3C 0.56 CS-C-1 CS-C-2 CS-C-3G 0.44 CS-G-1 CS-G-2 CS-G-3H-P 0.38 CS-HP-1 CS-HP-2 CS-HP-3H-I 0.38 CS-H-1 CS-H-2
a Lab temperature (�24 ± 2.8 �C).b Estimated specimen temperature (will be corrected later based on test results).
Table 3Isothermal calorimetry tests (test series II, test duration = 168 h).
Curing temperature (�C) 25 40 60
Cement w/c – – –A 0.46 IC-A-1 IC-A-2 IC-A-3C 0.56 IC-C-1 IC-C-2 IC-C-3G 0.44 IC-G-1 IC-G-2 IC-G-3H-P 0.38 IC-HP-1 IC-HP-2 IC-HP-3H-I 0.38 IC-H-1 IC-H-2 IC-H-3
X. Pang et al. / Cement & Concrete Composites 39 (2013) 23–32 25

Author's personal copy
Eq. (2) is only exact either when all the different clinker phaseshydrate at the same rate or when the coefficients (i.e. ai’s and bi’s)associated with different phases are the same, neither of which istrue [26,27]. Nevertheless, Eq. (2) is still widely used as acceptableapproximations [9,21–25]. In addition, if the ratios of the coeffi-cients associated with different clinker phases are constant, that is,
aC3S
bC3S¼ aC2S
bC2S¼ aC3A
bC3A¼ aC4AF
bC4AFð6Þ
then the following part of Eq. (2) will still be exact,
HðtÞH0 ¼
CSðtÞCS0 ð7Þ
Accurate determination of the coefficients (i.e. ai, and bi) foreach individual phase is challenging because complete hydrationof all clinker phases is difficult to achieve and estimation of thephase compositions (i.e., pi) are usually not accurate. Recent esti-mates (Table 4) suggest that Eq. (6) is approximately true for threeout of four main clinker phases (C3S, C3A, C4AF). Therefore, Eq. (7)should provide a reasonable approximation, especially for earlyage hydration, which is typically dominated by C3S and C3A.
3.2. A scale factor model for the effect of curing conditions on cementhydration
When the time dependence of the degree of hydration of ce-ment is represented by an unknown function, the effect of curingtemperature and pressure can be modeled by incorporating a scalefactor C into that function [12]. For example, if hydration at the ref-erence temperature Tr and pressure Pr is represented by the follow-ing functions,
Integral curve : a ¼ aTr ;Pr ðtÞ; Derivative curve : da=dt
¼ a0Tr ;PrðtÞ ð8Þ
then the transformed functions at temperature T and pressure P are
Integral curve : a ¼ aT;PðtÞ ¼ aTr ;Pr ðCtÞ;Derivative curve : da=dt ¼ a0T;PðtÞ ¼ C � a0Tr ;Pr
ðCtÞ ð9Þ
The scale factor is similar to the coefficient used to compute theequivalent age of a specified curing condition when applying thematurity method to estimate concrete strength (ASTM C1074[30]). It is important to note that both the scale factor model andthe equivalent age method assume the hydration mechanism donot change over the ranges of temperature and pressure studied.The dependence of the scale factor on curing temperature can bemodeled by the following equation [12],
CTr�T;Pr�P ¼ expEa
R1Tr� 1
T
� �þ DV z
RPr
T� P
T
� � !ð10Þ
where Ea is the apparent activation energy (J/mol); DV� is the appar-ent activation volume (m3/mol); R is the universal gas constant(8.314 J/(mol K)); T and P are the temperature (K) and pressure(Pa) of an arbitrary curing condition, while Tr and Pr are the temper-ature (K) and pressure (Pa) of the reference curing condition; C is
the scale factor associated with temperature change from Tr to Tand pressure change from Pr to P.
One of the most important advantages of the scale factor modelis that it is very straightforward and easy to use. The physicalmeaning of the model is that the hydration rate at any curing con-dition is increased or decreased by a factor of C compared with thatat the reference curing condition at the same degree of hydration.Probably due to the different mechanism of hydration during thevery early period (before the end of the induction period), it issometimes necessary to offset the predicted hydration kineticscurve using the scale factor model to generate a better agreementwith the experimental curve, especially when their curing temper-atures are different. The offset is not necessary for tests performedat different curing pressures in the range from 0.7 MPa to 51.7 MPa[12]. Therefore, a more accurate representation of the relationshipbetween the hydration kinetics curves at temperatures T and Tr (forthe same curing pressure) is,
Integral Curves : aTðtÞ ¼ aTr CTr�T � ðt � t0Þð ÞDerivative Curves : a0TðtÞ ¼ CTr�T � a0Tr
CTr�T � ðt � t0Þð Þ ð11Þ
where aT and aTr are the functions representing the time depen-dence of the degree of hydration at temperatures T and Tr, respec-tively; t0 is the offset time, which appears to increase withincreasing differences between Tr and T; CTr�T is the scale factor re-lated to the temperature differences, which is the same as definedin Eq. (10) at constant pressure,
CTr�T ¼ expEa
R1Tr� 1
T
� �� �ð12Þ
3.3. Correlation between heat of hydration and chemical shrinkage
If we consider an isothermal calorimetry test performed at tem-perature TIC and a chemical shrinkage test performed at tempera-ture TCS, the degree of hydration measured by the former can beexpressed as,
aTIC ðtÞ ¼HTIC ðtÞ
H0 ð13Þ
while that measured by the latter can be expressed as,
aTCS ðtÞ ¼CSTCS ðtÞCS0ðTCSÞ
ð14Þ
Note that, as already discussed, CS0 is a function of temperature.Employing the scale factor model, one can obtain,
aTIC ðtÞ ¼ aTCS CTCS�TIC ðt � t0Þ� �
ð15Þ
where the scale factor is related to the temperature difference be-tween the two types of tests by the following equation,
CTCS�TIC ¼ expEa
R1
TCS� 1
TIC
� �� �ð16Þ
By combining Eqs. (13)–(15), the cumulative heat evolution H(t)can be related to the total chemical shrinkage CS(t) by the follow-ing equation,
HTIC ðtÞ ¼H0
CS0ðTCSÞCSTCS CTCS�TIC ðt � t0Þ
� �ð17Þ
4. Test results and discussion
4.1. Validation of the scale factor model
One of the most important assumptions of the scale factor mod-el is that the normalized rate of hydration vs. degree of hydration
Table 4Coefficients for estimating the parameters at the complete hydration condition.
Phase C3S C2S C3A C4AF Reference
ai (J/g)a 510 247 1356 427 [28]bi (mL/g at 25 �C) 0.0596 0.0503 0.13 0.0469 [9]ai/bi 8557 4911 10,431 9104
a Obtained by multi-linear regression analysis from experimental data of 21different cements, slightly different from theoretical values calculated from stan-dard enthalpy of formation [28,29], which depend on the chemical formulae ofhydration products.
26 X. Pang et al. / Cement & Concrete Composites 39 (2013) 23–32

Author's personal copy
curve of a given cement paste is invariant with curing condition(for isothermal and isobaric tests). The assumption has been veri-fied for different types of cement in the pressure range from 0.7to 51.7 MPa using chemical shrinkage test data [12]. Oscillationsof chemical shrinkage test results at high temperatures made it dif-ficult to derive the rate of hydration accurately. Therefore, furthervalidation of this assumption is desirable for different curing tem-peratures with the heat evolution data. Based on the values listedin Table 4 and assuming C2F generates the same amount of heat asC4AF on the same mass basis, the cumulative heat generated atcomplete hydration (H0) was estimated to be 497.7 J/g (cement),461.1 J/g, 470.1 J/g, 429.2 J/g, and 385.9 J/g, for Classes A, C, G, H-I, and H-P cements, respectively. The hydration progress of thesedifferent types of cement can be obtained by normalizing the heatevolution data by their respective H0 values.
It should be pointed out that the scale factor model was devel-oped for a single reaction process assuming that the curing condi-tion only changes the rate of the reaction, but not its nature. Inreality, Portland cement hydration is a much more complex pro-cess with all the different clinker phases having different reaction
rates as well as different sensitivities to curing temperaturechanges (i.e., activation energies). The composition of the hydra-tion products may also change if curing temperature changes sig-nificantly. Therefore, the model can be applied onlyapproximately to analyze Portland cement hydration. Fig. 2 showsthe rate of hydration vs. degree of hydration derived from the heatevolution data of Class H-I cement before and after normalization.While the normalized data at different curing temperatures coin-cide relatively well during early and late periods, slight deviationsare observed during the middle period, (i.e., for degrees of hydra-tion approximately ranging from 0.2 to 0.5). Fig. 3 shows the nor-malized rate of hydration vs. degree of hydration of the four othertypes of cement obtained at different curing temperatures. Similarconvergence behaviors were observed except for the Class A andClass C cements at 60 �C, both of which diverge significantly fromtheir behavior at 25 �C and 40 �C. For all the different types of ce-ment, the divergences of the normalized kinetics curves becomesmore significant as the temperature difference increases, due tothe different temperature sensitivities of different phases. The nor-malized hydration data at 25 �C and 40 �C appear to show better
0 0.2 0.4 0.6 0.80
0.02
0.04
0.06
0.08
0.1
0.12
0.14
Degree of hydration
Rat
e of
hyd
ratio
n (/h
)
0 0.2 0.4 0.6 0.80
0.2
0.4
0.6
0.8
1
Degree of hydration
Nor
mal
ized
rate
of h
ydra
tion 25°C
40°C60°C
25°C40°C60°C
Fig. 2. Effect of curing temperature on hydration rate as a function of degree of hydration (Class H-I cement, w/c = 0.38).
0 0.2 0.4 0.6 0.80
0.2
0.4
0.6
0.8
1
Nor
mal
ized
rate
of h
ydra
tion
0 0.2 0.4 0.6 0.80
0.2
0.4
0.6
0.8
1
0 0.2 0.4 0.6 0.80
0.2
0.4
0.6
0.8
1
Degree of hydration
Nor
mal
ized
rate
of h
ydra
tion
0 0.2 0.4 0.6 0.80
0.2
0.4
0.6
0.8
1
Degree of hydration
25°C40°C60°C
25°C40°C60°C
25°C40°C60°C
25°C40°C60°C
Class CClass A
Class G Class H-P
Fig. 3. Normalized rate of hydration vs. degree of hydration of different cements.
X. Pang et al. / Cement & Concrete Composites 39 (2013) 23–32 27
Author's personal copy
compliance with the model, indicating that the scale factor modelis more accurate for relatively small temperature changes.
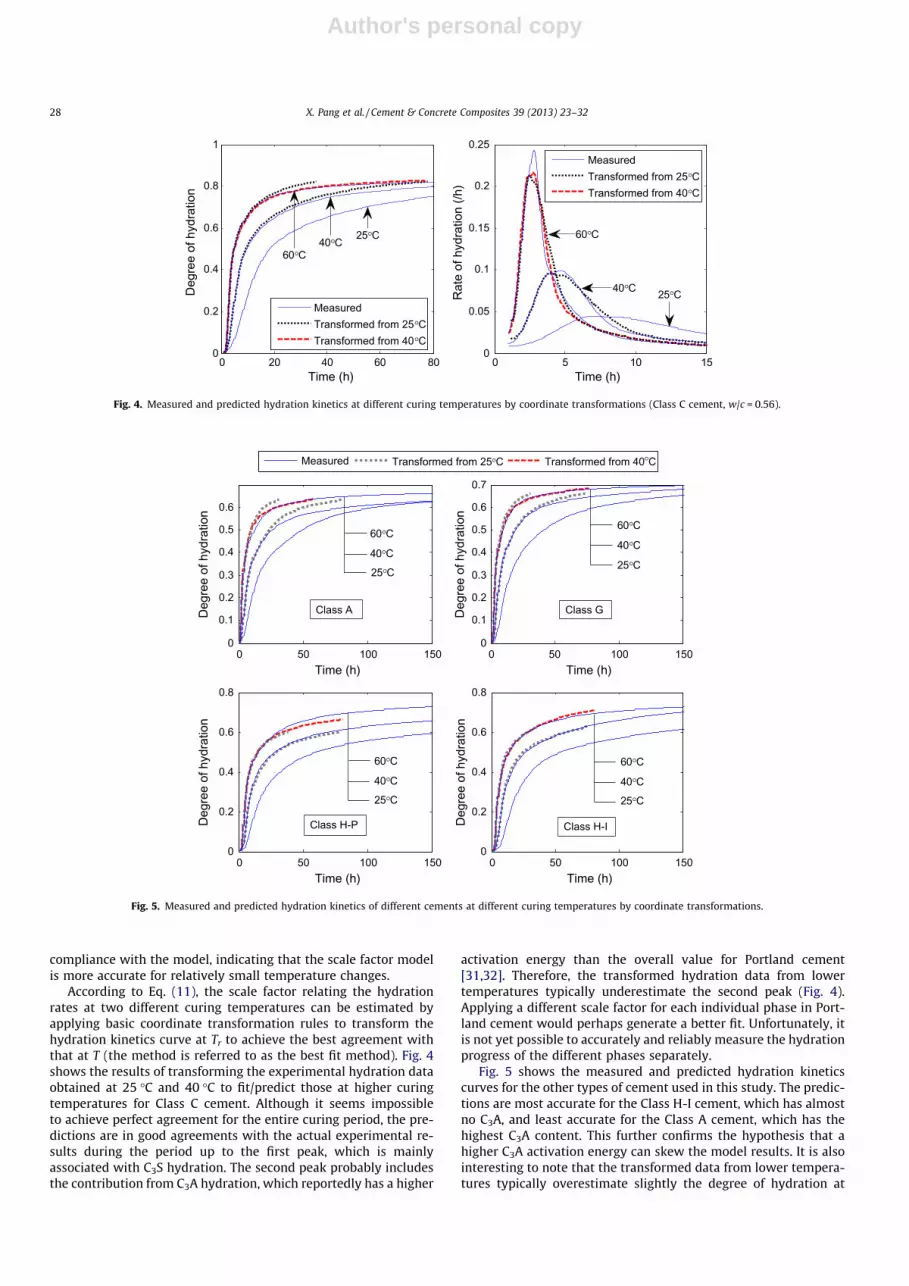
According to Eq. (11), the scale factor relating the hydrationrates at two different curing temperatures can be estimated byapplying basic coordinate transformation rules to transform thehydration kinetics curve at Tr to achieve the best agreement withthat at T (the method is referred to as the best fit method). Fig. 4shows the results of transforming the experimental hydration dataobtained at 25 �C and 40 �C to fit/predict those at higher curingtemperatures for Class C cement. Although it seems impossibleto achieve perfect agreement for the entire curing period, the pre-dictions are in good agreements with the actual experimental re-sults during the period up to the first peak, which is mainlyassociated with C3S hydration. The second peak probably includesthe contribution from C3A hydration, which reportedly has a higher
activation energy than the overall value for Portland cement[31,32]. Therefore, the transformed hydration data from lowertemperatures typically underestimate the second peak (Fig. 4).Applying a different scale factor for each individual phase in Port-land cement would perhaps generate a better fit. Unfortunately, itis not yet possible to accurately and reliably measure the hydrationprogress of the different phases separately.
Fig. 5 shows the measured and predicted hydration kineticscurves for the other types of cement used in this study. The predic-tions are most accurate for the Class H-I cement, which has almostno C3A, and least accurate for the Class A cement, which has thehighest C3A content. This further confirms the hypothesis that ahigher C3A activation energy can skew the model results. It is alsointeresting to note that the transformed data from lower tempera-tures typically overestimate slightly the degree of hydration at
0 20 40 60 800
0.2
0.4
0.6
0.8
1
Deg
ree
of h
ydra
tion
0 5 10 150
0.05
0.1
0.15
0.2
0.25
Rat
e of
hyd
ratio
n (/h
)
MeasuredTransformed from 25°CTransformed from 40°C
MeasuredTransformed from 25°CTransformed from 40°C
25°C40°C
25°C40°C60°C
60°C
Time (h) Time (h)
Fig. 4. Measured and predicted hydration kinetics at different curing temperatures by coordinate transformations (Class C cement, w/c = 0.56).
0 50 100 1500
0.1
0.2
0.3
0.4
0.5
0.6
Time (h)
Deg
ree
of h
ydra
tion
0 50 100 1500
0.1
0.2
0.3
0.4
0.5
0.6
0.7
Time (h)
Deg
ree
of h
ydra
tion
0 50 100 1500
0.2
0.4
0.6
0.8
Time (h)
Deg
ree
of h
ydra
tion
0 50 100 1500
0.2
0.4
0.6
0.8
Time (h)
Deg
ree
of h
ydra
tion
Measured Transformed from 25°C Transformed from 40°C
40°C
60°C
60°C
40°C
60°C
40°C
25°C25°C
25°C
60°C
40°C
Class H-P Class H-I
Class GClass A
25°C
Fig. 5. Measured and predicted hydration kinetics of different cements at different curing temperatures by coordinate transformations.
28 X. Pang et al. / Cement & Concrete Composites 39 (2013) 23–32
Author's personal copy
later ages, with the exception of Class H-P cement, for which theopposite is true. Table 5 lists the offset time and scale factor, aswell as the apparent activation energy (calculated from the scalefactor using Eq. (12)) associated with each temperature change.The constants are obtained by trial and error to provide the bestagreements as shown in Figs. 4 and 5. For comparison purposes,Table 5 also lists the scale factors and apparent activation energiescalculated with the peak hydration rate method as proposed in aprevious study [12]. The constants obtained by the two differentmethods generally agree well with each other for relatively smalltemperature changes (from 25 �C to 40 �C and from 40 �C to60 �C) but may differ quite noticeably for the larger temperaturechange (from 25 �C to 60 �C). The apparent activation energies ob-tained in different temperature ranges appear to decrease withincreasing temperature except for Class A cement, for which theopposite is true. The apparent activation energies obtained in thisstudy are also found to be much lower than those calculated fromchemical shrinkage test data [12]. The latter are probably less accu-rate due to the inadequate temperature control of the tests and er-rors associated with estimating CS0 at different temperatures (H0 isassumed to be independent of temperature).
4.2. Correlations between chemical shrinkage and heat of hydration ofcement
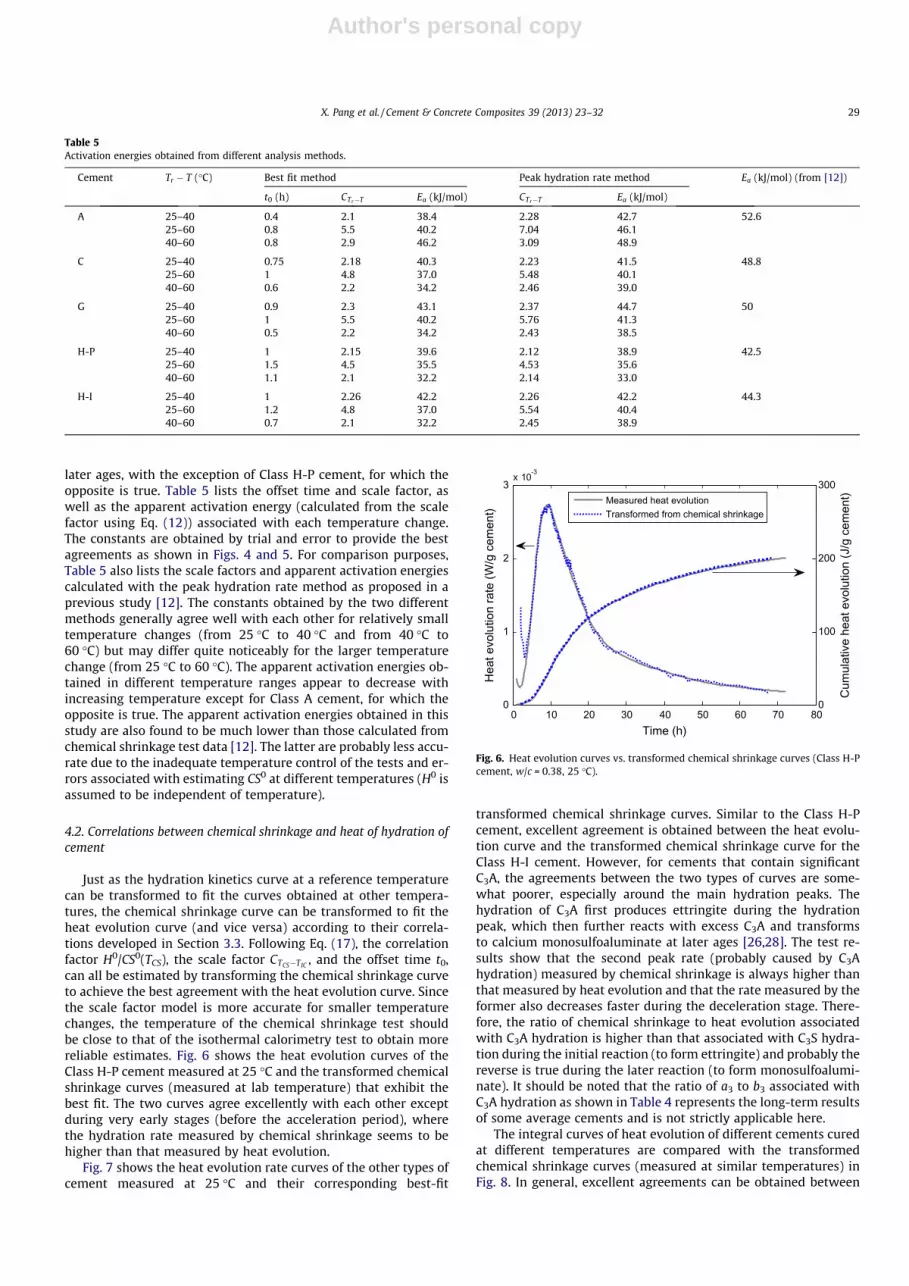
Just as the hydration kinetics curve at a reference temperaturecan be transformed to fit the curves obtained at other tempera-tures, the chemical shrinkage curve can be transformed to fit theheat evolution curve (and vice versa) according to their correla-tions developed in Section 3.3. Following Eq. (17), the correlationfactor H0/CS0(TCS), the scale factor CTCS�TIC , and the offset time t0,can all be estimated by transforming the chemical shrinkage curveto achieve the best agreement with the heat evolution curve. Sincethe scale factor model is more accurate for smaller temperaturechanges, the temperature of the chemical shrinkage test shouldbe close to that of the isothermal calorimetry test to obtain morereliable estimates. Fig. 6 shows the heat evolution curves of theClass H-P cement measured at 25 �C and the transformed chemicalshrinkage curves (measured at lab temperature) that exhibit thebest fit. The two curves agree excellently with each other exceptduring very early stages (before the acceleration period), wherethe hydration rate measured by chemical shrinkage seems to behigher than that measured by heat evolution.
Fig. 7 shows the heat evolution rate curves of the other types ofcement measured at 25 �C and their corresponding best-fit
transformed chemical shrinkage curves. Similar to the Class H-Pcement, excellent agreement is obtained between the heat evolu-tion curve and the transformed chemical shrinkage curve for theClass H-I cement. However, for cements that contain significantC3A, the agreements between the two types of curves are some-what poorer, especially around the main hydration peaks. Thehydration of C3A first produces ettringite during the hydrationpeak, which then further reacts with excess C3A and transformsto calcium monosulfoaluminate at later ages [26,28]. The test re-sults show that the second peak rate (probably caused by C3Ahydration) measured by chemical shrinkage is always higher thanthat measured by heat evolution and that the rate measured by theformer also decreases faster during the deceleration stage. There-fore, the ratio of chemical shrinkage to heat evolution associatedwith C3A hydration is higher than that associated with C3S hydra-tion during the initial reaction (to form ettringite) and probably thereverse is true during the later reaction (to form monosulfoalumi-nate). It should be noted that the ratio of a3 to b3 associated withC3A hydration as shown in Table 4 represents the long-term resultsof some average cements and is not strictly applicable here.
The integral curves of heat evolution of different cements curedat different temperatures are compared with the transformedchemical shrinkage curves (measured at similar temperatures) inFig. 8. In general, excellent agreements can be obtained between
Table 5Activation energies obtained from different analysis methods.
Cement Tr � T (�C) Best fit method Peak hydration rate method Ea (kJ/mol) (from [12])
t0 (h) CTr�T Ea (kJ/mol) CTr�T Ea (kJ/mol)
A 25–40 0.4 2.1 38.4 2.28 42.7 52.625–60 0.8 5.5 40.2 7.04 46.140–60 0.8 2.9 46.2 3.09 48.9
C 25–40 0.75 2.18 40.3 2.23 41.5 48.825–60 1 4.8 37.0 5.48 40.140–60 0.6 2.2 34.2 2.46 39.0
G 25–40 0.9 2.3 43.1 2.37 44.7 5025–60 1 5.5 40.2 5.76 41.340–60 0.5 2.2 34.2 2.43 38.5
H-P 25–40 1 2.15 39.6 2.12 38.9 42.525–60 1.5 4.5 35.5 4.53 35.640–60 1.1 2.1 32.2 2.14 33.0
H-I 25–40 1 2.26 42.2 2.26 42.2 44.325–60 1.2 4.8 37.0 5.54 40.440–60 0.7 2.1 32.2 2.45 38.9
500
1
2
3x 10⁻³
Time (h)
Hea
t evo
lutio
n ra
te (W
/g c
emen
t)
0 10 20 30 40 60 70 800
100
200
300
Cum
ulat
ive
heat
evo
lutio
n (J
/g c
emen
t)Measured heat evolutionTransformed from chemical shrinkage
Fig. 6. Heat evolution curves vs. transformed chemical shrinkage curves (Class H-Pcement, w/c = 0.38, 25 �C).
X. Pang et al. / Cement & Concrete Composites 39 (2013) 23–32 29

Author's personal copy
the integral hydration kinetics curves obtained from the two differ-ent methods. The constants used to transform the chemical shrink-
age curves to fit the heat evolution curves, including thecorrelation factor, the scale factor, and the offset time, are listed
0 20 40 600
1
2
3
4
5x 10⁻³
Time (h)
Hea
t evo
lutio
n ra
te (W
/g c
emen
t)
0 20 40 600
1
2
3
4
5
6x 10⁻³
Time (h)
Hea
t evo
lutio
n ra
te (W
/g c
emen
t)
0 20 40 600
1
2
3
4
5x 10⁻³
Time (h)
Hea
t evo
lutio
n ra
te (W
/g c
emen
t)
0 20 40 600
1
2
3x 10⁻³
Time (h)
Hea
t evo
lutio
n ra
te (W
/g c
emen
t)
Measured heat evolution Transformed from chemical shrinkage
Class CClass A
Class G Class H-I
Fig. 7. Heat evolution vs. transformed chemical shrinkage for the different types of cement (derivative curves).
0 20 40 60 800
50
100
150
200
250
300
350
Time (h)
Cum
ulat
ive
heat
evo
lutio
n (J
/g c
emen
t)
0 20 40 60 800
100
200
300
400
Time (h)
Cum
ulat
ive
heat
evo
lutio
n (J
/g c
emen
t)
0 20 40 60 800
50
100
150
200
250
300
350
Time (h)
Cum
ulat
ive
heat
evo
lutio
n (J
/g c
emen
t)
0 20 40 60 800
50
100
150
200
250
300
Time (h)
Cum
ulat
ive
heat
evo
lutio
n (J
/g c
emen
t)
Measured heat evolution Transformed from chemical shrinkage
60°C
40°C
25°C
60°C
40°C
25°C
60°C
40°C
25°C
60°C
40°C
25°C
Class A Class C
Class G Class H-P
Fig. 8. Heat evolution curves vs. transformed chemical shrinkage curves for different types of cement at different curing temperatures (integral curves).
30 X. Pang et al. / Cement & Concrete Composites 39 (2013) 23–32

Author's personal copy
in Table 6. The cause of the offset time (primarily observed forambient temperature tests) is not yet clear. It may be associatedwith variations of the duration of the induction periods, whichtend to be affected by many different factors that are difficult tocontrol. Following Eq. (16), the temperature of the chemicalshrinkage test (TCS) can be estimated from the more-precisely-measured temperature of the isothermal calorimetry test (TIC) byusing the scale factor and the previously obtained activation ener-gies in the 25 �C to 60 �C temperature range (Table 5). As shown inTable 6, the calculated sample temperatures of the chemicalshrinkage tests are slightly higher than the previously estimatedvalues (Table 3). To further demonstrate that the scale factors areindeed associated with the slight temperature differences betweenchemical shrinkage tests and isothermal calorimetry tests, one ofthe chemical shrinkage tests (test CS-H-2) was performed byreducing the target temperature (set with the temperature control-lers) by 2.8 �C (5 �F). The obtained chemical shrinkage curve of thisparticular test is found to be directly proportional to the heat evo-lution curve (i.e., C = 1).
At lab temperature (approximately 25 �C), the correlation factorbetween heat evolution and chemical shrinkage (H0/CS0) for thedifferent cements is found to range from 7500 J/mL to 8000 J/mL,well within the previously reported range of 6500–8500 J/mL[33,34]. The correlation factor increases with increasing curingtemperature. Since H0 is independent of curing temperature, theresults suggest that CS0 decreases with increasing temperature,consistent with previous studies [6,10]. In the relatively small tem-perature range investigated (25–60 �C), the variations of CS0/H0
and H0/CS0 with temperature can both be approximated by linearmodels. Fig. 9 shows the dependence of CS0/H0 on curing temper-ature for different types of cement. The least square fits of all datapoints indicate the average rate of change to be �0.00076 mL/kJper �C for CS0/H0 and +58 J/mL per �C for H0/CS0. When normalizedto the values at 25 �C, the linear reduction rate of CS0 with increas-ing temperature is determined to be 0.57%, 0.65%, 0.58%, 0.66%, and0.57% per �C for Class A, C, G, H-P, and H-I cements, respectively,suggesting an average reduction rate of 0.60% (with a standarddeviation of 0.046%) per �C. For comparison, a reduction rate of0.78% per �C may be obtained from test data of Zhang et al. [10]in the same temperature range, where the correlations betweenw0
n and CS0 of Class H cement were investigated.
5. Conclusions
The hydration kinetics of different types of cement cured at dif-ferent temperatures has been evaluated by both the traditionalisothermal calorimetry test method and a newly developed chem-ical shrinkage test method. A scale factor model that can be used to
predict the effect of curing temperature on cement hydrationkinetics, previously validated with chemical shrinkage test data,is further discussed and validated with the heat evolution test data.Due to the fact that the different compounds in cement hydrate atdifferent rates and have different temperature sensitivities, themodel is found to be more accurate for cement with simpler com-positions (e.g., no or very low C3A content) and/or for smaller tem-perature changes (e.g. 615 �C). The scale factor model alsointroduces a new method of estimating the apparent activationenergies of Portland cement (i.e. the best-fit method). The apparentactivation energies of Classes A, C, G, H-P and H-I cements deter-mined using the heat of hydration data in the temperature rangeof 25–60 �C are 40.2 kJ/mol, 37 kJ/mol, 40.2 kJ/mol, 35.5 kJ/mol,and 37 kJ/mol, respectively.
A correlation study of chemical shrinkage and isothermal calo-rimetry test data indicate that total chemical shrinkage is propor-tional to cumulative heat evolution if the two tests are conductedon the same cement paste at the same curing temperature, inagreement with previous research. The scale factor model dis-cussed in this study can be used to account for any unmeasuredsmall temperature differences. The proportionality constant,namely the ratio of total chemical shrinkage to total heat releaseat complete hydration (CS0/H0), varies slightly with cement compo-sition and decreases with increasing curing temperature. If H0 isassumed to be independent of curing temperature, then CS0 de-creases approximately linearly with increasing temperature at arate of 0.600 ± 0.046% per �C from the reference values at 25 �Cfor the different cements used in this study. Compared to C3Shydration, early C3A hydration (typically at the main hydrationpeak) seems to create a higher ratio of chemical shrinkage to heatevolution, while later C3A hydration (typically during the deceler-ation period) appears to create a lower ratio. As a result, the rate ofchemical shrinkage curve typically has a slightly different shapethan the heat flow curve for cements that contain significant C3A.
Acknowledgements
The continuous support of this study from Dr. Lewis Normanand Dr. Ron Morgan of Halliburton is cordially appreciated. Wethank Mr. David Meadows of Halliburton for his help in developingthe chemical shrinkage test apparatus and Ms. Donna Chen ofColumbia University for her help in performing part of theexperimental work. The critical review of this work by Dr. JeffreyBullard of NIST is also greatly acknowledged.
Table 6Best-fit constants for correlating chemical shrinkage and heat evolution test resultsand the respective temperatures of different tests (refer to Eq. (17)).
Test no. t0 (h) CTCS�TIC H0/CS0 (TCS)(J/mL)
TIC (�C) TCS (�C)
CS-A-1 IC-A-1 1 1.09 7600 25 23.4CS-C-1 IC-C-1 0.4 0.85 7800 25 28.3CS-G-1 IC-G-1 0.7 0.95 7700 25 25.9CS-HP-1 IC-HP-1 1.2 1.07 7500 25 23.6CS-H-1 IC-H-1 1 1.11 8000 25 22.9CS-A-2 IC-A-2 0 0.84 8400 40 43.6CS-C-2 IC-C-2 0 0.9 8350 40 42.3CS-G-2 IC-G-2 0 0.86 8850 40 43.1CS-HP-2 IC-HP-2 0.6 0.9 8700 40 42.4CS-H-2 IC-H-2 0 1 8850 40 40.0CS-A-3 IC-A-3 0 0.9 9750 60 62.4CS-C-3 IC-C-3 0 0.9 10,100 60 62.7CS-G-3 IC-G-3 0 0.91 9750 60 62.2CS-HP-3 IC-HP-3 0 0.85 10,200 60 64.3
20 30 40 50 60 700.09
0.1
0.11
0.12
0.13
0.14
Curing temperature (°C)
CS0 /H
0 (mL/
kJ)
Class AClass CClass GClass H-PClass H-I
Fig. 9. Dependence of correlation factor (CS0/H0) on curing temperature.
X. Pang et al. / Cement & Concrete Composites 39 (2013) 23–32 31

Author's personal copy
References
[1] Parrott LJ, Geiker M, Gutteridge WA, Killoh D. Monitoring Portland cementhydration: comparison of methods. Cem Concr Res 1990;20:919–26.
[2] Gutteridge WA, Dalziel JA. Filler cement: the effect of the secondarycomponent on the hydration of portland cement: Part I. A fine non-hydraulicfiller. Cem Concr Res 1990;20:778–82.
[3] Bentz DP. A three-dimensional cement hydration and microstructure program:I. Hydration rate, heat of hydration, and chemical shrinkage, NISTIR 5756. USDepartment of Commerce, Washington DC; 1995.
[4] Escalante-Garcia JI. Nonevaporable water from neat OPC and replacementmaterials in composite cements hydrated at different temperatures. CemConcr Res 2003;33(11):1883–8.
[5] Lura P, Winnefeld F, Klemm S. Simultaneous measurements of heat ofhydration and chemical shrinkage on hardening cement pastes. J Therm AnalCalorim 2010;101(3):925–32.
[6] Geiker M. Studies of Portland cement hydration: measurements of chemicalshrinkage and a systematic evaluation of hydration curves by means of thedispersion model. PhD thesis, Technical University of Denmark; 1983.
[7] Mounanga P, Baroghel-Bouny V, Loukili A, Khelidj A. Autogenous deformationsof cement pastes: Part I. Temperature effects at early age and micro–macrocorrelations. Cem Concr Res 2006;36:110–22.
[8] Peethamparan S, Weissinger E, Vocaturo J, Zhang J, Scherer G. Monitoringchemical shrinkage using pressure sensors. Adv Mater Sci Concr ACI SP-2702010;7:77–88.
[9] Pang X, Meyer C. Cement chemical shrinkage as measure of hydration kineticsand its relationship with nonevaporable water. ACI Mater J2012;109(3):341–52.
[10] Zhang J, Weissinger EA, Peethamparan S, Scherer GW. Early hydration andsetting of oil well cement. Cem Concr Res 2010;40:1023–33.
[11] Scherer GW, Zhang J, Thomas JJ. Nucleation and growth models for hydrationof cement. Cem Concr Res 2012;42:982–93.
[12] Pang X, Meyer C, Darbe R, Funkhouser GP. Modeling the effect of curingtemperature and pressure on cement hydration kinetics. ACI Mater J2013;110(2):137–48.
[13] API Specification 10A. Specification for cements and materials for wellcementing, American Petroleum Institute; 2010. p. 38.
[14] ASTM C150/C150M – 09. Standard specification for Portland cement. ASTMInternational, West Conshohocken, PA; 2009. p. 10.
[15] ASTM C1608. Standard test method for chemical shrinkage of hydrauliccement paste. ASTM International, West Conshohocken, PA; 2007. p. 4.
[16] Sant G, Lura P, Weiss J. Measurement of volume change in cementitiousmaterials at early ages: review of testing protocols and interpretation ofresults. J Trans Res Rec 2006;1979:21–9.
[17] Costoya M. Kinetics and microstructural investigation on the hydration oftricalcium silicate. Doctoral thesis, École Polytechnique Fédérale de Lausanne,Switzerland; 2008.
[18] Pang X. Effects of curing temperature and pressure on the chemical, physical,and mechanical properties of Portland cement. PhD dissertation, ColumbiaUniversity, New York; 2011.
[19] ASTM C1679. Standard practice for measuring hydration kinetics of hydrauliccementitious mixtures using isothermal calorimetry. West Conshohocken,PA: ASTM International; 2009.
[20] Bentz DP, Ferraris CF. Rheology and setting of high volume fly ash mixtures.Cem Concr Compos 2010;32(4):265–70.
[21] Mills RH. Factors influencing cessation of hydration in water cured cementpastes, special report no. 90. In: Proceedings of the symposium on thestructure of Portland cement paste and concrete. Highway Research Board,Washington DC; 1966. p. 406–24.
[22] Mounanga P, Khelidj A, Loukili A, Baroghel-Bouny V. Predicting Ca(OH)2
content and chemical shrinkage of hydrating cement pastes using analyticalapproach. Cem Concr Res 2004;34:255–65.
[23] Swaddiwudhipong S, Chen D, Zhang MH. Simulation of the exothermichydration process of Portland cement. Adv Cem Res 2002;14(2):61–9.
[24] Schindler AK, Folliard KJ. Heat of hydration models for cementitious materials.ACI Mater J 2005;102(1):24–33.
[25] Poole JL, Riding KA, Folliard KJ, Juenger MCG, Schindler AK. Methods forcalculating activation energy for Portland cement. ACI Mater J2007;104(1):303–11.
[26] Hewlett PC. Lea’s chemistry of cement and concrete. 4th ed. Oxford,England: Butterworth-Heinemann; 1998.
[27] Escalante-Garcia JI, Sharp JH. Effect of temperature on the hydration of themain clinker phases in Portland cements: Part I, neat cements. Cem Concr Res1998;28(9):1245–57.
[28] Taylor HFW. Cement chemistry. 2nd ed. London, UK: Thomas Telford; 1997.[29] Bentz DP, Barret T, de la Varga I, Weiss J. Relating compressive strength to heat
release in mortars. Adv Civ Eng Mater, in press[30] ASTM C1074. Standard practice for estimating concrete strength by the
maturity method. West Conshohocken, PA: ASTM International; 2010. p. 10.[31] Bushnell-Watson SM. The effect of temperature upon the setting behaviour of
refractory CAC. PhD thesis, University of Sheffield; 1987.[32] Banfill PFG. Superplasticizers for Ciment Fondu Part 2: effect of temperature
on the hydration reaction. Adv Cem Res 1995;7:151–7.[33] Bentz D, Sant G, Weiss J. Early-age properties of cement-based
materials: I. Influence of cement fineness. ASCE J Mater Civ Eng2008;20(7):502–8.
[34] Bentz DP. Blending different fineness cements to engineer the properties ofcement-based materials. Mag Concr Res 2010;62(5):327–38.
32 X. Pang et al. / Cement & Concrete Composites 39 (2013) 23–32