Embed Size (px)
Citation preview
Citation: Cherdantseva, Y.;
Burnap, P.; Nadjm-Tehrani, S.;
Jones, K. A Configurable
Dependency Model of a SCADA
System for Goal-Oriented Risk
Assessment. Appl. Sci. 2022, 12, 4880.
https://doi.org/10.3390/
app12104880
Academic Editor: Luis
Hernández-Callejo
Received: 28 March 2022
Accepted: 22 April 2022
Published: 11 May 2022
Publisher’s Note: MDPI stays neutral
with regard to jurisdictional claims in
published maps and institutional affil-
iations.
Copyright: © 2022 by the authors.
Licensee MDPI, Basel, Switzerland.
This article is an open access article
distributed under the terms and
conditions of the Creative Commons
Attribution (CC BY) license (https://
creativecommons.org/licenses/by/
4.0/).
applied sciences
Article
A Configurable Dependency Model of a SCADA System forGoal-Oriented Risk AssessmentYulia Cherdantseva 1,* , Pete Burnap 1, Simin Nadjm-Tehrani 2 and Kevin Jones 3
1 School of Computer Science and Informatics, Cardiff University, Cardiff CF10 3AT, UK; [email protected] Department of Computer and Information Science, Linköping University, 581 83 Linköping, Sweden;
[email protected] Airbus Group, Duffryn, Newport NP10 8FZ, UK; [email protected]* Correspondence: [email protected]
Abstract: A key purpose of a Supervisory Control and Data Acquisition (SCADA) system is to enableeither an on-site or remote supervisory control and monitoring of physical processes of variousnatures. In order for a SCADA system to operate safely and securely, a wide range of experts withdiverse backgrounds must work in close rapport. It is critical to have an overall view of an entiresystem at a high level of abstraction which is accessible to all experts involved, and which assistswith gauging and assessing risks to the system. Furthermore, a SCADA system is composed of alarge number of interconnected technical and non-technical sub-elements, and it is crucial to capturethe dependencies between these sub-elements for a comprehensive and rigorous risk assessment. Inthis paper, we present a generic configurable dependency model of a SCADA system which capturescomplex dependencies within a system and facilitates goal-oriented risk assessment. The modelwas developed by collecting and analysing the understanding of the dependencies within a SCADAsystem from 36 domain experts. We describe a methodology followed for developing the dependencymodel, present an illustrative example where the generic dependency model is configured for aSCADA system controlling water distribution, and outline an exemplary risk assessment processbased on it.
Dataset License: CC-BY-NC
Keywords: cyber security; risk assessment; risk analysis; dependency model; SCADA; ICS
1. Introduction
The main purpose of a Supervisory Control and Data Acquisition (SCADA) systemis to enable on-site or remote supervisory control and monitoring of physical processesof various nature: manufacturing processes, water distribution, transportation, gas andoil, etc.). It does so by collecting, analysing and visualising data from field devices, and bychanging the state of field devices in response to any disruptive change.
SCADA systems control physical processes in many sectors including those whichform a Critical National Infrastructure (CNI): Chemicals, Civil Nuclear, Energy, Food, Water,Space, and Transport. Therefore, the cyber security and safety of a CNI as well as of manyother industrial processes heavily relies on the secure and safe operation of supportingSCADA systems. A compromised SCADA system may have a detrimental impact on theavailability and integrity of critical services, and it could lead to the loss of life, casualties,and significant environmental, economic and social impacts.
SCADA systems provide direct links from a digital world into physical processesthat may drastically affect physical resources, environment and even human health andlives. In 2000, the unauthorised tampering with a SCADA system in the Maroochy WaterSystem by a former system engineer led to sewage overflow and resulted in the damageto the surrounding environment [1]. In 2010, the Stuxnet computer worm was used in an
Appl. Sci. 2022, 12, 4880. https://doi.org/10.3390/app12104880 https://www.mdpi.com/journal/applsci
Appl. Sci. 2022, 12, 4880 2 of 29
attack on the Iranian nuclear facility, leading to the failure of one-fifth of all centrifuges [2].The Stuxnet attack vividly illustrated the possible severe consequences of a cyber attack onCNI. In 2020, Honda factories had to freeze global production after a ransomware attack,which intended to disrupt ICSs. The overview of 43 historical attacks on Industrial ControlSystems (ICS) [1]—a SCADA system is a type of ICS—highlights the critical role that aSCADA system may play in a cyber attack. The cyber attacks on SCADA systems areconsidered to be one of the popular vectors of attacks on CNI [3].
Since SCADA systems underpin many industrial and critical processes, it is of pivotalimportance to manage efficiently risks within SCADA systems [4]. In SCADA and other ICSsystems, achieving a safe and secure operation of a system depends on a large number ofdiverse factors of different nature, including but not limited to administrational, regulatory,human-oriented, technical and environmental factors. These factors must be capturedand analysed.
For an efficient risk assessment and management to be in place, a wide range ofexperts including network and hardware engineers, software developers, system operators,Human Resources (HR) administrators, and floor managers (non-exhaustive list of rolesinvolved) with diverse backgrounds must communicate and work in rapport. Any riskdecision related to the safe and secure operation of a complex multi-variable system such asa SCADA system requires a rigorous justification built upon a well-documented evidencebase. In this scenario, it is critical to have an overall view of the entire system accessibleto all experts. This “helicopter” view of a SCADA system will help to gauge risks to thesystem and its components.
A SCADA system is a complex system composed of a large number of interconnectedand mutually influencing technical and non-technical components. It is crucial for riskassessment methodology applied in the context of a SCADA system to account for thedependencies between the components within the system as well as for the dependencieson external systems, upon which the system under analysis has no control.
In this paper, we present a method of assessing cyber security risk in the context of aSCADA system which is based on dependency modelling. Dependency modelling is anobjective-driven, dynamic, dependency-defining approach, which is standardised by theOpen Group [5]. We explain the dependency modelling method in detail in Section 2. Thedependency modelling approach in the context of a SCADA system aims to answer thefollowing questions:
• What is required for achieving the safe and secure operation of a SCADA system (the coregoal)? What does the success of this core goal depend upon?
• What is the likelihood of achieving the core goal?• What can be done to maximise the likelihood of achieving the core goal?
The key contribution of this paper is a SCADA Dependency Model (SCADA DM)—awidely applicable industry-agnostic multi-faceted dependency model of a SCADA systemwhich comprises 452 SCADA system dependencies. Our SCADA DM offers a holistic viewof a system that is an integration of sub-models developed by stakeholders responsible forthe different aspects of a SCADA system and for the systems reliant on it. The SCADA DMwe present in this paper was co-designed with domain experts with varying backgroundsfollowing a rigorous knowledge capture methodology and validated by practitioners andacademics via focus groups. By following the rigorous well-documented model develop-ment process with the involvement of domain experts, we produced a comprehensive,justified and validated model of a SCADA system, which is capable of supporting riskassessment process.
The presented SCADA DM facilitates understanding of complex interactions and inter-dependencies within a SCADA system. The adopted dependency modelling approachoffers the ability to predict the impact of failure of any dependency on other parts ofthe system and on the system as a whole. A SCADA DM assists with managing thedependencies within the system and well as accounting for external factors that are outsideof the system control (e.g., geo-environmental factors and espionage).
Appl. Sci. 2022, 12, 4880 3 of 29
The secondary contribution of the paper is the illustrative example of applying thedependency modelling approach to risk assessment, underpinned by the SCADA DM,in the context of SCADA systems. We focus on a water distribution process. To the bestof our knowledge, it is the first application of dependency modelling to assessing cybersecurity risks within a SCADA system in a CNI sector. The illustrative example showshow the presented generic SCADA DM could be configured for a specific SCADA systemand how it could facilitate risk assessment process.
The remainder of the paper is organised as follows. In Sections 2 and 3, we provide anoverview of dependency modelling and of the related literature, respectively. In Section 4,we discuss the research methodology for the development and validation of the SCADADM. In Section 5, we present the SCADA DM, focusing on its six key areas. An illustrativeexample of conducting a risk assessment for a SCADA system controlling water distributionis outlined in Section 6. Finally, conclusions are drawn, and future work is discussed inSection 7.
2. Background: Dependency Modelling
Dependency modelling is a goal-oriented risk assessment method, which is basedon the assumption that all risks come through interdependencies, and that in order to beresilient, a system needs to recognise and manage all dependencies (both external andinternal). It is a positivist, top–down approach of elaborating dependencies from the coresystem goal.
The major distinctive feature of this method is that it focuses on the desired outcomeof a system (the core goal) and on the supporting sub-goals that should be achieved forthe overall success of the core goal. This feature distinguishes dependency modellingfrom failure-oriented risk assessment methods [4], which attempt to enumerate threats to asystem and list “all the things that could go wrong” with a system [5] (p. 10).
The Open Group’s Dependency Modelling standard [5] provides guidance on howto construct a Dependency Model (DM)—a graph model of a system that consists of acollection of nodes (systems dependencies) arranged in a tree-like hierarchy [5]. Theseentities in a DM are referred to as paragons or goals, and they are depicted as rectangles.A paragon represents a desired state of a system or of an element of a system.
A DM has only one root node, which represents the core goal of a system, and multipleleaf nodes representing sub-goals upon which the core goal depends. Each leaf node hasonly one parent node, but it can have zero-to-many child nodes. The leaf nodes that donot have child nodes do not have dependencies within the scope of the model and arecalled uncontrollables, highlighting the fact that the system itself has no control over thestate of these paragons. A DM is composed of smaller building blocks that are meaningfullow-level DMs.
One of the key concepts in dependency modelling is the probability of success/failureof each node. This is because dependency modelling builds on the notion of conditionalprobability, which is the probability of an event occurring given that another event has takenplace. In a DM, every childless leaf node is assigned a probability of being in a desired stateor being successful. The probability is assigned based either on expert opinion (subjective)or based on historical data, when available (objective) [4]. The conditional probability ofa parent node being successful is calculated based on the success probabilities of childnodes. Dependency modelling is a quantitative risk assessment method that facilitates risksensitivity analysis that shows which system dependencies present the highest risk to thesuccess of the core goal.
In a DM, there are two types of relationships between child nodes of one parent node:and and or. An and relationship means that all child nodes should be successful for thesuccess of a parent node. An or relationship indicates that at least one child node should besuccessful for the success of a parent node. An or relationship reduces overall risk, while anand relationship increases it. An OR relationship may be used to introduce a cyber securitycountermeasure which mitigates a risk posed to a system by a certain dependency.
Appl. Sci. 2022, 12, 4880 4 of 29
The probability of a parent paragon with an AND relationship between independentchild paragons is calculated as follows:
P(A) =N
∏i=1
P(Bi)
where A is the parent paragon, B is a child paragon, P(X) is the probability of the paragonX, and N is the number of child paragons.
The equation for the probability of a parent paragon with an OR relationship betweenindependent child paragons is shown below:
P(A) = 1−N
∏i=1
(1− P(Bi))
A DM facilitates the communication between system stakeholders by providing a com-mon ground for the discussion about system’s core goal, sub-goals, risks and dependencies.It helps to avoid misunderstandings and omissions in risk assessment by providing a clearvisual representation of dependencies within a complex system. It is a flexible methodwhich is applicable to a system of any size or nature, as well as to an organisation or aproject [5].
3. Related Literature
In 2016, Cherdantseva et al. [4] presented an extensive literature review examin-ing the risk assessment methods used in the context of SCADA systems and ICS. Thissection contains a brief summary of that review and the discussion of the most recentrelated publications.
Tree-based risk assessment methods as well as other risk assessment methods basedon directed graphs fall under the category of Probabilistic Risk Assessment (PRA) methods.Tree-based methods are similar to each other in their logic and aim to define the probabilityof a top event or its reliability [6]. What constitutes the major difference between varioustree-based methods is a top event: a threat, a fault, an attack or an incident. The vastmajority of tree-based risk assessment methods are failure-oriented. They start with anattack, threat or negative consequences and work out a model based on it. Some of themadopt an attacker’s perspective and, accounting for the vulnerabilities of an infrastructure,model the steps to be performed by an attacker to gain unauthorised access to a system [7].
Dependency modelling also belongs to the group of quantitative, tree-based PRAmethods. A DM is a form of a directed graph. As other graph-based risk assessmentmethods, dependency modelling strives to calculate the probability of a top event in agraph. However, while in failure-oriented methods such as fault tree, attack trees, eventtrees, and vulnerability trees a top event represents an undesired event, in dependencymodelling, a top event always represents a desired outcome (a core goal).
Among probabilistic tree-based methods for SCADA systems, inductive and deductivemethods are distinguished [8,9]. Inductive methods (e.g., event tree) trace from possiblecauses to undesired events as opposed to deductive methods (e.g., fault and attack trees),which trace from undesired events to possible causes [9]. Inductive methods are alsoreferred to as forward search techniques, while deductive methods are referred to asbackward search techniques [10]. Dependency modelling is a deductive method in terms ofhow each dependency model is created, because it is necessary to start with a top desiredevent (a core goal) in order to identify all underlying dependencies.
One of the limitations of failure-oriented methods, which dependency modellingovercomes with the use of an OR relationship (Section 2), is that, in its basic form, attackand fault trees do not facilitate the modelling of security countermeasures or defencemechanisms [7]. However, more elaborated versions of attack graphs exist that allowmodelling countermeasures, e.g., [11].
Appl. Sci. 2022, 12, 4880 5 of 29
Failure-oriented PRA methods have another limitation [12]: one of the fundamentalissues is that the estimation of risk is never complete because it is not possible to identifya full list of all undesired events/threats. Dependency modelling avoids this pitfall byfocusing on the “known” side of a system. In the majority of cases, it is possible to identifyall dependencies within a system and all elements upon which a core goal and each ofits child nodes depend. As any comprehensive and thorough risk assessment method,dependency modelling requires time and effort to be invested in developing a completemodel of a system. Any DM will require continuous revision to ensure that it is up to dateat a given stage.
In [13], a multi-model incident prediction and risk assessment approach based onBayesian Networks and designed for ICS is described. This method also belongs to thegroup of failure-oriented methods, but non-traditionally for failure-oriented methods, thisproposal claims to assess the risk caused by unknown attacks. In [7], a risk assessmentmethod is suggested based on Decision Networks that extend Bayesian Networks. It is de-signed for the analysis of attack/defence scenarios in CNI. This method, while belonging tothe group of failure-oriented graph-based PRA models, allows modelling countermeasuresand accounting for their costs, thus facilitating the determination of the most cost-effectiveset of countermeasures.
Many failure-oriented tree-based methods either enrich an attack tree with additionaldata or combine it with the models of other types, including goal-oriented models. For ex-ample, [14] exploits a dual approach: while an infrastructure hyper-graph is a goal-orientedmodel, an evolution graph is an attack-oriented model. The Dynamic Risk ManagementResponse System (DRMRS) [15]—a framework consisting of three main components suchas attack modelling, risk modelling and response modelling—uses attack graphs, which areaccompanied by a mission graph presenting a business model of an organisation, businessfunctions, and assets required. A mission graph contains information only about technicaldevices within a SCADA system. The dependency model of SCADA presented in thispaper adopts a much broader view and encapsulates diverse technical and non-technicalaspects pertaining to a SCADA environment.
Addressing the earlier call for a comprehensive risk management method for SCADAsystems [4], an integrated cyber security risk management framework for cyber-physicalsystems is presented in [16]. The framework is illustrated using the scenario of a powergrid system. This approach is conceptually similar to the risk assessment approach adoptedin our research in the following ways: (1) it adopts a holistic perspective and a multi-stakeholder view on a system, (2) it covers both technical and non-technical risks, and (3) itaddresses the effect from interdependent system components. However, as opposed to ourapproach, the framework in [16] (1) does not focus on systematically identifying all systemdependencies, and it only lists high-level classes of interdependencies (physical, cyber,logical and geographical interdependencies); and (2) adopts a failure-oriented approach bygenerating cyber-security attack scenarios to support risk assessment.
In Section 6, we consider an illustrative example of a water distribution system; hence,it is important to consider publications related to cyber-security risk assessment in thissector. Cyber-physical attacks on water distribution systems are examined in [17], where anattack model and a MATLAB toolbox are presented which support the identification of theinfrastructure components and the specification of attacks. As opposed to our approach,this work, in line with the publications considered above, also adopts an attack-orientedapproach, and it only focuses on the technical components of a SCADA system. The focuson the technical components (networks and hardware devices) persists in water distributionrisk assessment—according to the recent review of modelling methodologies for managingwater distribution security [18], all reviewed approaches focus on the network componentof a system only, failing to address in detail a wider view on cyber security and the role ofnon-technical factors in a cyber attack.
The analysis in [4] indicates that quantitative PRA methods in general do not concen-trate on the context establishment stage. The context establishment phase, if addressed
Appl. Sci. 2022, 12, 4880 6 of 29
by a method, is typically limited to the understanding of a network configuration. Conse-quently, only risks associated with the ICT components of a SCADA system are taken intoaccount by a risk assessment method while overlooking a large number of risks arisingfrom non-technical aspects.
Among the related publications, only [19] is exclusively dedicated to the context estab-lishment and the understanding of a SCADA system. It is one of a very few publicationsadopting a goal-oriented approach. The Hierarchical Holographic Model (HHM), whichunderpins risk assessment in [19], is the methodology for “capturing and representing theessence of the inherent diverse characteristics and attributes of a system” [20]. Three sub-modelsare distinguished in the HHM of a SCADA system: (1) hardware and software, (2) humansupervisory and (3) environment. Each of these sub-models is decomposed into elementsand each element is decomposed into sub-topics. The HHM model of SCADA in [19]includes 263 elements. In comparison with the model in [19], our SCADA DM provides amore detailed view of a SCADA system comprising six key areas and 452 system dependen-cies. We expanded the key area System Architecture to include the Hardware, Software andNetworks elements. The sub-topic Human Supervisory from the SCADA HHM is includedin the SCADA DM under the key area Employees, which has a broader nature. In additionto the three key areas addressed by the HHM model, we also identified and included thethree new key areas: System Life Cycle, Data (Information) and Management.
4. Research Methodology
The research methodology we followed in this research project is summarised in thefollowing steps:
1. Elicit relevant knowledge from experts using the mind mapping knowledge capturetechnique;
2. Analyse the collected individual mind maps and develop a unified mind map of aSCADA system;
3. Translate the unified mind map into a dependency model—the SCADA DM;4. Validate the SCADA DM with experts;5. Demonstrate how the SCADA DM facilities risk assessment and supports decision-
making (an illustrative example is presented in Section 6).
4.1. Why Mind Maps?
Expert knowledge could be captured using a variety of techniques ranging frominterviews and surveys to concept maps and mind maps. In this research, we chose mindmapping guided by the reasons explained below.
Mind mapping is based on the natural structure of a human mind [21]. A mind map isa radial diagram that represents semantic or other connections between portions of learnedmaterial hierarchically [22]. Mind mapping finds its application in learning, research andbusiness where it may be used for knowledge capture and sharing, brainstorming andproblem solving. It is a convenient tool for the quick capture of opinion and summary ofknowledge. Mind maps accelerate the accumulation of information, its structuring andsystematisation. They assist reflective thinking and enable a user to link the knowledgeabout a topic to the broader body of knowledge [23].
Mind mapping was preferred to other knowledge capture techniques because
• It is easy to learn and use so that all experts were able to produce detailed mind mapsduring a one-hour workshop. Previous work reports the results of a comparativeanalysis of four knowledge sharing techniques (mind maps, concept maps, conceptualdiagrams and visual metaphors). The comparison indicates that mind mapping is theeasiest technique to use and learn in comparison to other methods [22].
• It offers a more time-efficient data collection for the researchers. In particular, usingthis method, we were able to elicit opinions from a group of experts at the same time.It would not be possible with interviews, for example.
Appl. Sci. 2022, 12, 4880 7 of 29
• It allows optimising the data analysis by requesting the participants to produce mindmaps themselves rather than the researchers producing a mind map based on theanalysis of in-depth interviews or observations. According to [24], “mind mapping canallow researchers to make rapid and valid transcriptions of qualitative interviews without theneed for interviews to be transcribed verbatim. It may also aid the researcher in the analysisof qualitative data by helping her or him to ‘bracket’ their own preconceptions, which isfundamental in phenomenological research”.
• The similarity of a tree-like structure between a mind map and a dependency modelguarantees that the raw data are already well structured and easier to analyse andtranslate into a dependency model (than for example data from in-depth interviews). Inaddition, mind maps are association maps [23]—mind maps allow making meaningfulconnections and associations between various concepts and between different parts ofrelated knowledge—and as such, they could efficiently depict dependency associations.
4.2. Data Collection—The Mind Mapping Workshops
In order to capture expert knowledge, a mind mapping exercise was conducted witha group of ICS/SCADA experts during the 3rd UK Workshop on Cyber Security of ICSand SCADA systems. The SCADA mind mapping workshops were also run in Swedenwith selected industrial collaborators of the Swedish Centre for Resilient Information andControl Systems (RICS) www.rics.se (accessed on 27 March 2022). We also employedSCADA experts online via professional networking sites. Overall, 36 domain expertsparticipated in the mind mapping exercise. Twenty-one responses were captured duringthe workshop with the UK-based experts in cyber security of ICS and SCADA. Twelvemind maps were collected at the RICS centre. Three SCADA experts were employed viaLinkedIn. All participants irrespective of the mode of participation followed the sameprocedure. The exercise took approximately one hour.
During the mind mapping workshops, the participants were invited to produce mindmaps of a SCADA system. We aimed to establish how domain experts conceptualiseand mentally represent the dependencies within a SCADA system. Prior to the exercise,the rules of mind mapping were explained to the participants, and they were presentedwith several mind map examples.
The following instructions were given to all participants for the mind mapping exercise:
• Place in the centre the name of the main topic—“SCADA” (use blue/black ink);• Identify the major elements/components of a SCADA system, place them around the
main topic and link them to the main topic with lines indicating dependencies withinthe system;
• For each new element of your mind map, identify sub-elements and connect themusing lines to the element;
• Continue identifying sub-elements for each new element of your mind map until youreach the point where no more sub-elements may be specified;
• Use different colours to indicate the criticality of the elements within every node:
– The most critical elements of a node—circle with red;– The elements of medium criticality—circle with green; and– The least critical elements of the node—do not circle.
These instructions simplify the mind mapping guidelines provided in [21]. In ourexperiment, we did not ask the participant to draw any images or symbols to accompanythe nodes of a mind map because the aim of the experiment was to elicit the hierarchy ofdependencies rather than to produce a cognitively effective mind map. Typically, in mindmaps, the links between nodes indicate unspecified connections among the element of themap. To avoid misinterpretations, the participants were instructed to use links only toindicate dependencies within a SCADA system. While working on their individual mindmaps, the participants were instructed to answer the questions outlined below:
Appl. Sci. 2022, 12, 4880 8 of 29
• What is required for successful operation of a SCADA system?• What does a system depend upon?• What does each element of a system depend upon?• How critical is each element (colour-coded answer)?
The participants were requested to work individually, and no discussions were allowedduring the mind mapping exercise. This was done deliberately in order to prevent crossinfluences between the participants and to enable the independence of responses. However,after the mind maps were finished, the participants were invited to observe mind mapsof their colleagues and exchange opinions, and to add additional elements to their mindmaps if they felt any were missing.
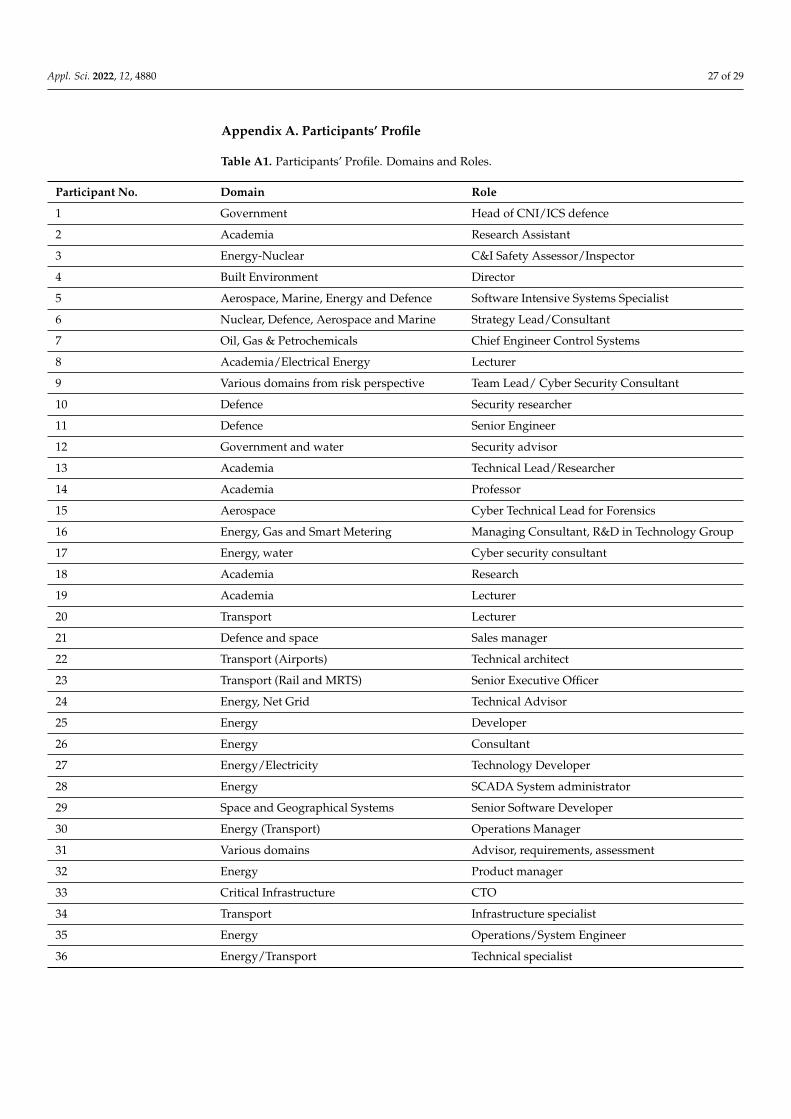
4.3. Participants’ Profile
The profiles of 36 participants are presented in Appendix A in Tables A1 and A2.Among the participants, the experience in SCADA systems has a mean of 10.8 years withstandard deviation of 11.8 and ranges from 1 to 40 years. Experts of a broad spectrumof different roles participated in the exercise: academics and practitioners, engineersand consultants, technical and non-technical specialists. Experts came predominantlyfrom industry with only six participants from academia. The participants came fromdifferent domains including government and defence, energy, aerospace and marine, oil,gas and petrochemicals, water, smart metering and transport. The aspects of SCADAsystems that the participants specialised in were also diverse and included management,risk assessment, cyber security, certification, procurement, networks, modelling, design,and implementation.
Among the participants, 6 did not have experience in cyber security. The numberof years of experience in security among the 29 experts with expertise varied from 2 to37 years with the average of 11 years. The overall average for all participants is 9 years,with the standard deviation of 9.
The set of mind maps was collected from the independent individuals, which wereexperienced in the relevant subject areas. The broad range of domains and roles of theparticipants makes the group representative of the SCADA stakeholders in general. Hence,the collected mind maps present snapshots of a SCADA system from various perspectivesconditioned by the background of the participants. The diversity of the participants enablesthe generalisation of the exercise results to the entire SCADA community and justifies theassumption about the acceptable levels of completeness of the knowledge captured.
4.4. Data Analysis and Development of a Unified Mind Map
After the data collection stage, the 36 individual mind maps of a SCADA system wereanalysed. In this process, we followed the 5 stages of qualitative data analysis [25]:
• Familiarization—Immersion in the raw data (mind maps) when the researchers ob-served all mind maps to estimate the richness of the material;
• Identifying themes—Key areas derivation from the raw data;• Indexing—Linking key areas and other elements throughout all participants’ mind maps;• Charting—Rearranging the data from individual mind maps into a unified mind map
containing the data, first, from some and, then, all respondents;• Mapping—In its general sense, this stage does not refer to mind mapping specifi-
cally, but to any form of creating a mental model or a framework of a phenomenonunder investigation. In our case, we used mind mapping at this stage to define thephenomenon and find associations.
The template analysis method [26] was used in this project as a suitable and well-established method for analysing interpretative phenomenological data collected in theform of mind maps. Each unique element identified in a mind map became a code.The codes were grouped into themes representing the key areas and arranged within ahierarchy. An initial template of key areas and high-level sub-elements was created basedon the analysis of 5 randomly selected mind maps. We then worked through all remaining
Appl. Sci. 2022, 12, 4880 9 of 29
mind maps—element by element—looking for new elements that could be related topreviously identified themes or added as or under new themes.
All unique elements identified as a result of the analysis of the collected mind mapswere captured. Reasonable adjustments were made regarding the naming of the elements.If the analysis showed that the participants referred to the same concept using differ-ent names, these similar elements were merged together. For example, analysis of childelements confirmed that the participants referred to the same concept as Networks, Com-munications, or Interconnections. These elements were united under the term Networks.We also united close terms such as TCP/IP, IP and IP-based networks in one element.The elements Remotely Controlled Devices and Field Devices were merged as well as suchelements as Operator Terminal and Human–Machine Interface (HMI). The elements such asbusiness system link, enterprise interface and corporate access were also grouped togetherunder the term Corporate Access.
It was imperative to capture the complex hierarchical nature of a SCADA system,and mind maps as a tool served in this goal well. The collected elements were analysed,then grouped and categorised according to their nature to produce a unified mind map.The process required an in-depth knowledge of SCADA systems. In many cases, we had torefer to the SCADA literature to clarify the meaning of concepts and relationships betweenthem. Some elements were grouped together as they referred to closely related concepts;for other elements, we had to add new node layers.
Each of the 36 mind maps contained between 14 and 107 elements with the averagenumber of elements per model of 42.25 ± 19.10. Overall, 1521 elements were identified outof which 610 were unique. The maximum number of hierarchical levels of the mind maps(max depth) varied in the range between 2 and 8 with the average of 3.89 ± 1.17. Eachmind map had between 1 and 15 key elements, i.e., the elements whose parent element isthe core element of a SCADA system. The average number of key elements was 6.89 ± 3.79.
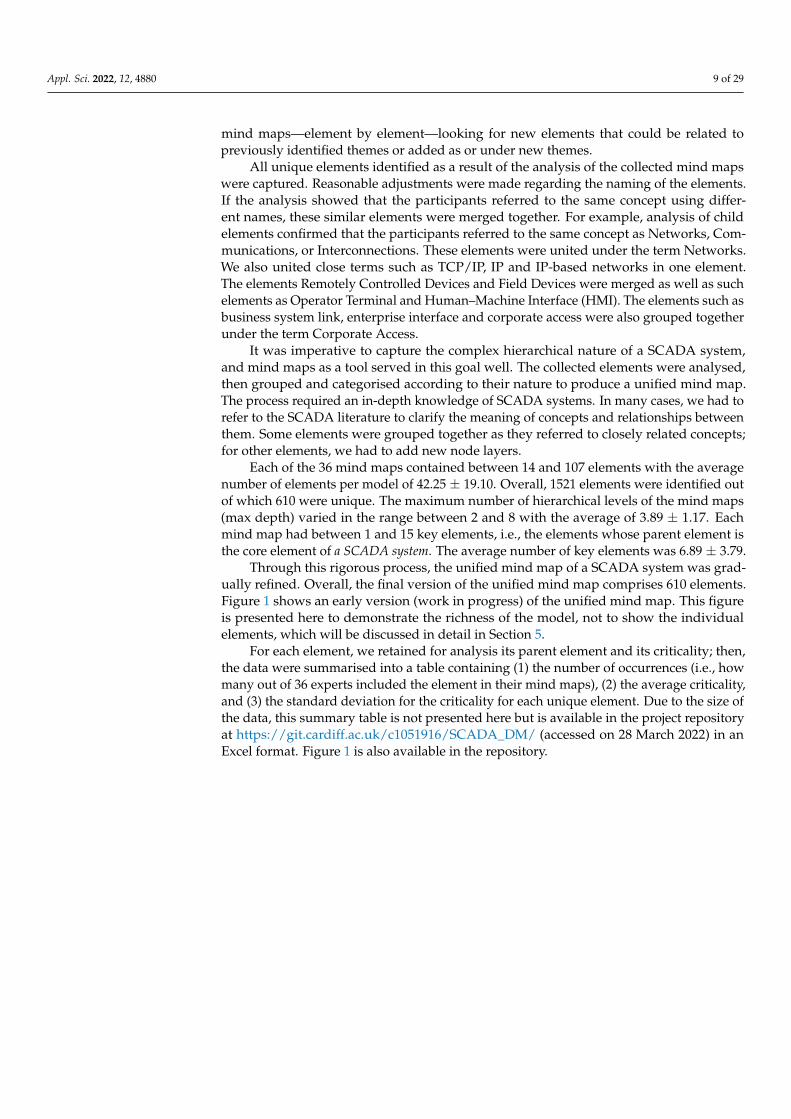
Through this rigorous process, the unified mind map of a SCADA system was grad-ually refined. Overall, the final version of the unified mind map comprises 610 elements.Figure 1 shows an early version (work in progress) of the unified mind map. This figureis presented here to demonstrate the richness of the model, not to show the individualelements, which will be discussed in detail in Section 5.
For each element, we retained for analysis its parent element and its criticality; then,the data were summarised into a table containing (1) the number of occurrences (i.e., howmany out of 36 experts included the element in their mind maps), (2) the average criticality,and (3) the standard deviation for the criticality for each unique element. Due to the size ofthe data, this summary table is not presented here but is available in the project repositoryat https://git.cardiff.ac.uk/c1051916/SCADA_DM/ (accessed on 28 March 2022) in anExcel format. Figure 1 is also available in the repository.
Appl. Sci. 2022, 12, 4880 10 of 29
Figure 1. An Early Version of the Unified SCADA Mind Map.
Appl. Sci. 2022, 12, 4880 11 of 29
4.5. From the Unified Mind Map to a Dependency Model
The unified mind map went through a rigorous transformation process to be convertedto a dependency model and to ensure that all rules of dependency modelling are obeyed.
At the very core of our dependency model is the safe and secure operation of a SCADAsystem. Setting this as the major objective reflects the fact that safety and security, as well asrisks, are the properties of the overall system rather than of any sub-component on its own.While in the unified mind map, there were 610 elements, in the process of transformation,the number of elements was reduced to 452 elements due to the following reasons:
• Elements from the unified mind map were combined together to form one paragonwhen an entry in a mind map referred to the characteristics of another entity, e.g., aparticipant had drawn an element such as “Operating System” and then child elementsdepicting its characteristics such as “Secure” and “Up-To-Date”.
• The entities which outlined various concrete implementations of higher-level enti-ties were not included; e.g., we only kept a paragon for an Operating System (OS),but we did not include all the different types of OSs listed by the participants (e.g.,Linux, Windows, MAC OS), similarly for communication protocols. As the modelis configurable, it is expected that a user will enrich the model with the paragonsfor every operating system that is in use by the organisation and paragons for everycommunication protocol that is relevant to the system being modelled.
• A small number of elements did not find a place in the final model as the elementseither were not fit with the main structure of the model or were specific to a particularsub-domain rather than being relevant to SCADA systems in general.
• In a small number of cases, it was not possible to establish the meaning of the entitybased on the information provided by the participants. This is one of the limitationsof the chosen approach to data collection where we did not have an opportunity toclarify information provided during the workshops at a later stage.
The names of the paragons have been formulated generically to ensure that whenconfigured, they could be replaced with characteristics relevant to the scenario. For example,we named one of the paragons “Software is Ok”. This may have different interpretationsfor different organisations; some may interpret it to mean that “Software is effective infulfilling its purpose”, others as “Software is protected from external attacks”, or bothof the above. While identifying the important dependencies, we do not prescribe thecharacteristics and exact interpretations of paragons, leaving the exact wording to the endusers of the configurable SCADA model to be defined to suit each particular context.
4.6. Validation by Experts
We ran three workshops with 9 cyber security and ICS experts (5 academics and4 industry practitioners). The participants of these validation workshops were not involvedin the mind mapping exercise at the initial stage of the project. The experts were presentedwith a printed version of the unified SCADA mind map (Figure 1) and asked to answer thefollowing questions:
1. Does the top-level mind map reflect your vision of a SCADA system?2. Are there any irrelevant elements?3. Are there any elements missing (completeness and coverage)?4. Is the suggested hierarchy of elements consistent with your understanding of depen-
dencies within a SCADA system?
There were no new elements suggested during the workshops, and the expert grouppositively commented on the completeness of the unified mind map. There were sugges-tions made about the restructuring of elements under the key area “External Dependencies”.All comments from the first workshop were addressed, and the final version of the mindmap was presented at the second workshop when the expert group agreed on the structure.No further suggestions for change were received during the second workshop.
Appl. Sci. 2022, 12, 4880 12 of 29
During the validation workshops, the following comments were received from theindustry participants commenting on the usefulness of the SCADA DM:
• An ISC manager at a manufacturing plant: “It is useful to have an extensive model onits own to look at. It is very difficult to sit down in a traditional workshop and cover everyscenario: you always forget something, you always miss something. Getting the right peopleround the table, being able to manage those people to go though all the scenarios is very timeconsuming and expensive. Most people do not want to be there it becomes boring after a whilefor them. Certainly, if there is a predefined model that covers the majority of the scenarios, youmiss less. To have a model which captures that wider experience saves us money, saves us time.Certainly, it is a useful tool”.
• An ICT manager at a manufacturing plant: “There is not really anything we use in termsof modelling that helps us accurately look at probabilities. That is why a dependency modelmay be quite useful, because you do not want to spend a huge amount of money if there is avery low probability and because for everything we do we have to justify costs against benefits.Without understanding probabilities it is very difficult to do that”.
• A SCADA specialist: “Never I could come up with over 400 elements in a model, I wouldhave struggled. It is certainly useful as it is all about knowledge sharing”.
5. The SCADA Dependency Model5.1. Top Level of the SCADA DM
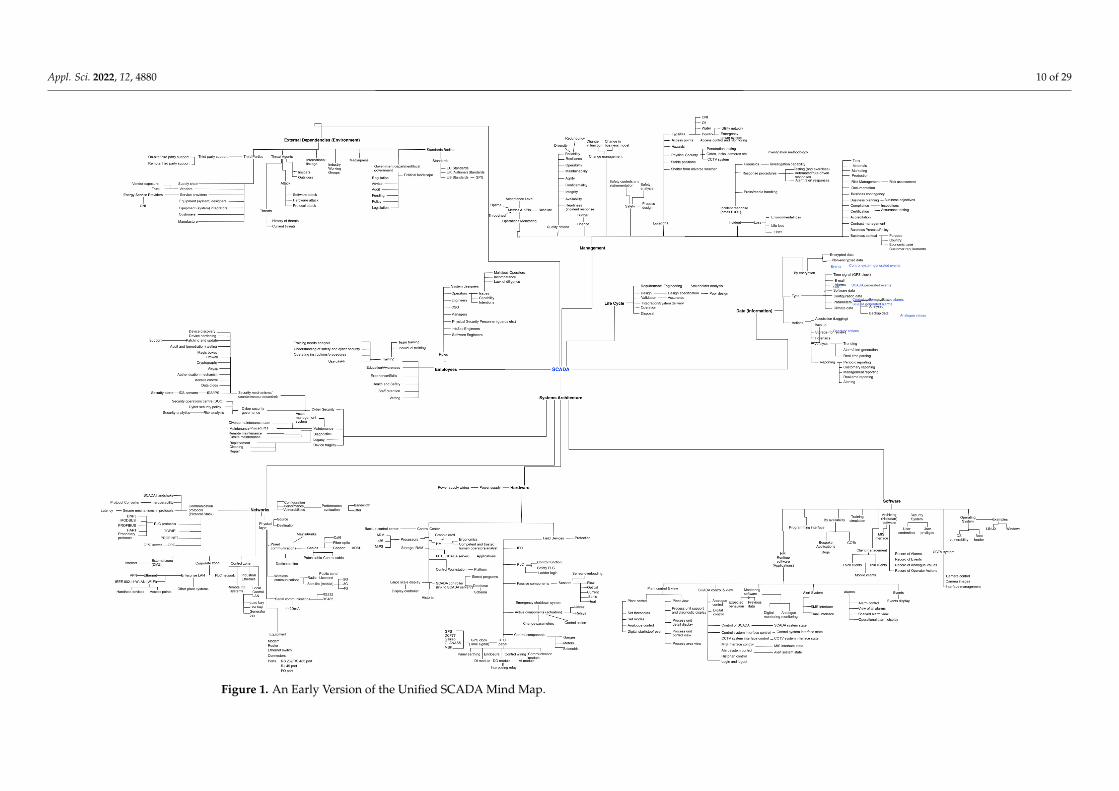
Figure 2 shows the top-level elements of the unified mind map. The template analysisof the individual mind maps enabled us to identify the top six key areas of a SCADA system:
1. Management;2. System Architecture;3. Employees;4. External Dependencies (Environment);5. Data (Information); and6. System Life Cycle.
The System Architecture element is decomposed into the following three elements:Networks, Hardware and Software.
Figure 2. Top-Level Entities of the Unified Mind Map of a SCADA System.
The top level of the unified mind map was directly translated into the dependencymodel of the safe and secure operation of a SCADA system. The top level of the SCADA DMis presented in Figure 3. We used iDepend https://idependeu.herokuapp.com (accessed on28 March 2022) as the tool for deploying our SCADA DM and conducting risk assessmentin Section 6. A plus sign at the top right corner of a paragon indicates the presence ofchild paragons. Overall, the model includes 452 elements covering the six key areas of a
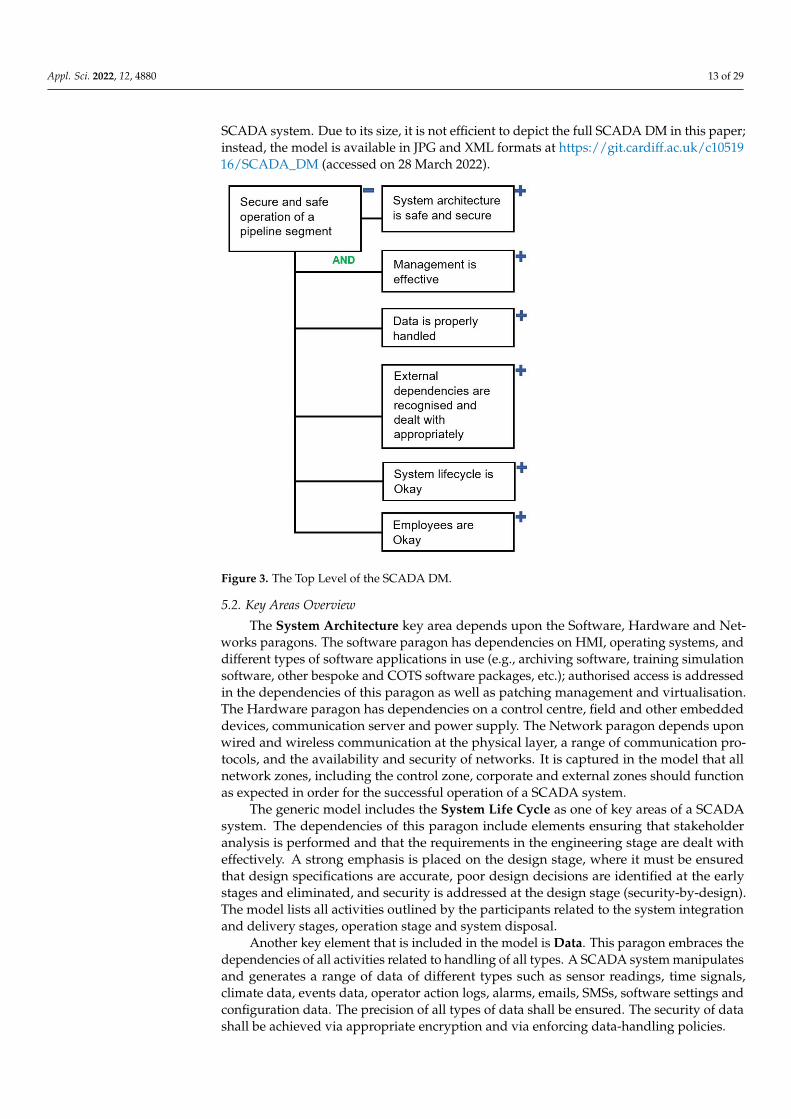
Appl. Sci. 2022, 12, 4880 13 of 29
SCADA system. Due to its size, it is not efficient to depict the full SCADA DM in this paper;instead, the model is available in JPG and XML formats at https://git.cardiff.ac.uk/c1051916/SCADA_DM (accessed on 28 March 2022).
Figure 3. The Top Level of the SCADA DM.
5.2. Key Areas Overview
The System Architecture key area depends upon the Software, Hardware and Net-works paragons. The software paragon has dependencies on HMI, operating systems, anddifferent types of software applications in use (e.g., archiving software, training simulationsoftware, other bespoke and COTS software packages, etc.); authorised access is addressedin the dependencies of this paragon as well as patching management and virtualisation.The Hardware paragon has dependencies on a control centre, field and other embeddeddevices, communication server and power supply. The Network paragon depends uponwired and wireless communication at the physical layer, a range of communication pro-tocols, and the availability and security of networks. It is captured in the model that allnetwork zones, including the control zone, corporate and external zones should functionas expected in order for the successful operation of a SCADA system.
The generic model includes the System Life Cycle as one of key areas of a SCADAsystem. The dependencies of this paragon include elements ensuring that stakeholderanalysis is performed and that the requirements in the engineering stage are dealt witheffectively. A strong emphasis is placed on the design stage, where it must be ensuredthat design specifications are accurate, poor design decisions are identified at the earlystages and eliminated, and security is addressed at the design stage (security-by-design).The model lists all activities outlined by the participants related to the system integrationand delivery stages, operation stage and system disposal.
Another key element that is included in the model is Data. This paragon embraces thedependencies of all activities related to handling of all types. A SCADA system manipulatesand generates a range of data of different types such as sensor readings, time signals,climate data, events data, operator action logs, alarms, emails, SMSs, software settings andconfiguration data. The precision of all types of data shall be ensured. The security of datashall be achieved via appropriate encryption and via enforcing data-handling policies.
Appl. Sci. 2022, 12, 4880 14 of 29
Given the nature of SCADA systems, it was anticipated that the generic model willpredominantly focus on the technical infrastructure. However, the Management of SCADAsystems was denoted as one of the key areas. Other non-technical aspects received sig-nificant attention in the generic model. For example, the participants outlined a range ofquality criteria including
1. Availability;2. Integrity;3. Confidentiality;4. Agility;5. Sustainability;6. Maintainability;7. Operability;8. Resilience;9. Reliability; and10. Incident response readiness.
In addition, through such activities as operations monitoring, change, contract andrisk management, logistics, marketing and certification, the participants have indicated theneed for understanding of a problem at the decision level, and the need for appreciating thebusiness context in which a system operates. We have included safety and cyber securityinto the model under the key area Management.
Despite the known criticality of safety consideration in SCADA systems, safety didnot receive a lot of attention in the mind maps collected. Only four out of 36 participantsincluded safety in their mind maps. More emphasis was placed by the participants oncyber security. Twenty-five participants included cyber security or entities related to itinto their mind maps. Cyber security governance is included into the generic dependencymodel under the key area Management, while the technical aspects of security are listedunder the key area System Architecture. Among the entities upon which effective cybersecurity governance depends, the participants named cyber security policies, compliancewith cyber security regulations, organisational security culture, anticipation of unknownvulnerabilities, understanding of known vulnerabilities, and security data analytics.
The important role of human factors in SCADA systems is extensively discussed inthe literature [19]. Errors made by human operators, who remotely control and monitorSCADA systems, or engineers, who design and configure SCADA systems, may and inmany cases have led to undesirable or even disastrous consequences [4]. A significantnumber of paragons in the generic dependency model are dependencies of the key areathat we named Employees. The model indicates a need for ensuring that all roles andexperts, who are involved in the design, development, operation and monitoring of aSCADA system (including but not limited to software and system engineers, informationsecurity engineers, managers, physical security personnel and operators), should receivethe required training and satisfy a number of requirements discussed below. Operatorsmust be competent and diligent, and they should be able to undertake manual supervisionof a system when required. All intentions shall be monitored and observed, which shallhelp to identify malicious operators.
The SCADA operators, who are located remotely and do not have an opportunityto observe the processes in real time, judge the state of physical processes only basedon the reports from the SCADA system via HMI. Hence, not only the correctness andprecision of the information is important but also the effectiveness of the informationrepresentation. The importance of the interactions between human operators and machinesshould be recognised in every SCADA system, and adverse effects of poor interactionsshould be minimised.
Appl. Sci. 2022, 12, 4880 15 of 29
Training provided to the operators shall start with the analysis of training needs; bothindividual and team training sessions are required. Use case scenarios shall be examinedduring training sessions. Given the level of responsibility of the operators of the SCADAsystem, a background check shall take place as a part of the procedures for new personnel.Procedures for leaving personnel shall also be in place. Staff retention programs shall be inplace. The model also includes such elements as health and safety, required knowledge andexpertise, appropriate level of awareness, and effective administration of human resources.
Human resources management is also accounted for in the generic dependency model.SCADA systems that use advanced technology require highly-skilled personnel, who willkeep their knowledge up-to-date through continuous training.
External dependencies also play an important role for the success of safe and secureoperations within a SCADA system. All external factors outlined by the participantsare captured under the key area External Dependencies (Environment). As one of theexternal dependencies, third parties upon which SCADA processes rely were identified.The third party list includes vendors, service providers, equipment and system design-ers, equipment and system integrators (when these activities are outsourced), customers,manufacturers and all stakeholders of a supply chain. Other dependencies of this paragoninclude threat agents, industry working groups, press and media, and government andstandardisation bodies.
5.3. Configurability of the Model
The SCADA DM presented in Sections 5.1 and 5.2 is a configurable template. Whenused in a particular scenario, the elements of the SCADA DM must be adjusted to reflect thespecifics of a particular system. The irrelevant or out of scope elements must be removed,and system-specific elements and clarifying elements may be added. The model may alsobe configured to address only certain aspects of a system (aspect view).
For example, if the analysis only requires risk assessment of the key area SystemArchitecture, then other key areas of the model may be omitted. In this instance, the paragonrepresenting the key areas of interest becomes the root paragon of a new aspect-specificmodel. Thus, for example, if a risk assessment is conducted from the point of viewof a human resources department, then the consideration is only given to the key areaEmployees and its dependencies.
Additional configuration should be done by creating definitions for paragon statesdeclared in a DM. For example, for a paragon “All hardware components are operational”,the developers and users of a configured model should define what “operational” meansin each particular context.
An important question with regard to the population of the SCADA DM is about theprobabilities of leaf paragons on the far right—uncontrollables (see Section 2). The analysisof risk assessment methods conducted in the frame of this research project [4] shows thatthe probabilistic data for the calculations of risk or impact in Probabilistic Risk Assessment(PRA) methods are typically derived based on (1) historical data (e.g., incident logs asin [27]), (2) expert judgment or (3) a combination of both. The correctness of the resultsrendered by any PRA method (including dependency modelling) strongly depends on thequality of estimated probabilities, which ideally should originate from objective empiricaldata. Objective data in this instance are data received from statistical sampling, historicalrecords or experimentation [10].
Appl. Sci. 2022, 12, 4880 16 of 29
However, historical data are not always available due to various reasons includinghardware and software specifics, legacy and confidentiality around safety- and security-critical systems [4]. Hence, in many risk assessment methods, including dependencymodelling, it is necessary to rely on expert opinion. Since the correctness of risk estimationis founded in the precision of the probabilities involved in the calculation, it is importantto ensure that the expert opinion is accurately captured and documented along withall the evidence upon which the estimation of probability was made whenever possible.For example, for the paragon Analogue Monitoring is Okay, the probability of this paragonbeing in a successful state may be calculated based on the number of incidents withanalogue monitoring in the previous period.
Compiling national statistics, or reported compliance data, e.g., in the context of Euro-pean regulations, may also be a means to ground the individual estimates on collectivelyavailable knowledge.
6. Illustrative Example: Water Distribution System
In this section, we consider a cyber-physical system which controls water distributionalong a segment of a pipeline.
6.1. Scenario Description
The pipeline is equipped at intervals along its length with pressure transducers (sen-sors), pumps and valves. The valves can be placed every 5 to 20 miles along the pipeline.A Remote Terminal Unit (RTU) periodically collects data from the pressure sensors, whichare scattered over the pipeline, and sends commands to valves and pumps.
We examine the section of the pipeline where RTU 1 collects the pressure readingsfrom Sensor 1 and controls the safety shut-off valve, and where its neighbouring RTU2 collects the pressure readings from Sensor 2 and controls the pump. Both RTUs arecommonly used data logging components CR1000 Measurement and Control Systems [28].
The business process diagram expressed in Business Process Model and Notation(BPMN) [29] in Figure 4 shows the process of communication between the control centre,RTU 1, RTU 2 and other field equipment. On the initiation of the control process RTU 1requests a pressure value from Sensor 1 (P1) and verifies whether the pressure exceedsa threshold value (Pmax). If P1 is greater than Pmax, then control actions are taken toadjust the flow rate and pressure in the pipeline. We indicate this in the diagram with anintermediate throwing Link Event “Pressure Correction”. The actions required to correctthe pressure may be depicted in a separate diagram, but in this example, we do not focuson this scenario. If P1 does not exceed Pmax, RTU 1 requests the pressure reading from RTU2, which it receives from Sensor 2 (P2). RTU 1 calculates the pressure difference between itsown sensor and the sensor of RTU 2 (∆P = |P1− P2|). The threshold (∆Pmax) is typicallyexceeded by ∆P when the pipeline is broken. If ∆P does not exceed its threshold, then RTU1 repeats the request to its sensor after a scan interval. A scan interval is set for each CR1000and may vary between 1 s and 1 h. If ∆P exceeds the threshold, then RTU 1 sends an alarmsignal to the control centre. The control centre answers with an emergency control order toRTU 1 to shut down the valve and to RTU 2 to stop the pump. The CR1000 has 8 DigitalI/O ports selectable under program control as binary inputs or control outputs. One ofthese ports is used as output to switch power to the pump via a solid state relay. The ordersfrom the control centre allow shutting down the portion of the pipeline in the event of anaccident or for other safety reasons.
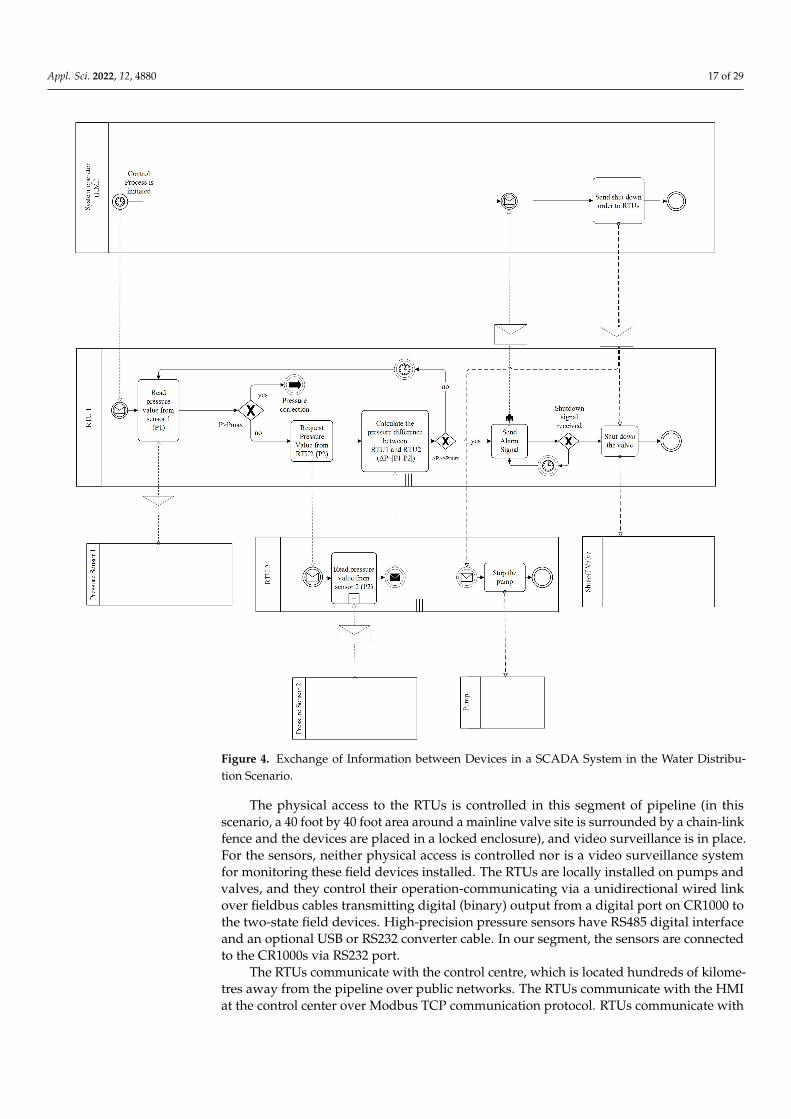
Appl. Sci. 2022, 12, 4880 17 of 29
Figure 4. Exchange of Information between Devices in a SCADA System in the Water Distribu-tion Scenario.
The physical access to the RTUs is controlled in this segment of pipeline (in thisscenario, a 40 foot by 40 foot area around a mainline valve site is surrounded by a chain-linkfence and the devices are placed in a locked enclosure), and video surveillance is in place.For the sensors, neither physical access is controlled nor is a video surveillance systemfor monitoring these field devices installed. The RTUs are locally installed on pumps andvalves, and they control their operation-communicating via a unidirectional wired linkover fieldbus cables transmitting digital (binary) output from a digital port on CR1000 tothe two-state field devices. High-precision pressure sensors have RS485 digital interfaceand an optional USB or RS232 converter cable. In our segment, the sensors are connectedto the CR1000s via RS232 port.
The RTUs communicate with the control centre, which is located hundreds of kilome-tres away from the pipeline over public networks. The RTUs communicate with the HMIat the control center over Modbus TCP communication protocol. RTUs communicate with
Appl. Sci. 2022, 12, 4880 18 of 29
each other to exchange pressure readings over a bidirectional wireless link using ModbusRTU protocol.
6.2. Configuring SCADA DM for the Scenario
The generic SCADA DM presented in Section 5 is used as the baseline template. In or-der to produce a dependency model for this specific water distribution system, controllingwater distribution, we first create a new model based on the generic template and thenrefine it for the specific context.
In order to keep this example at a manageable scope, we focus on two out of thesix key areas: System Architecture, where we predominantly concentrate on the hardwarecomponents, and Employees, since a human operator plays a crucial role in this process.
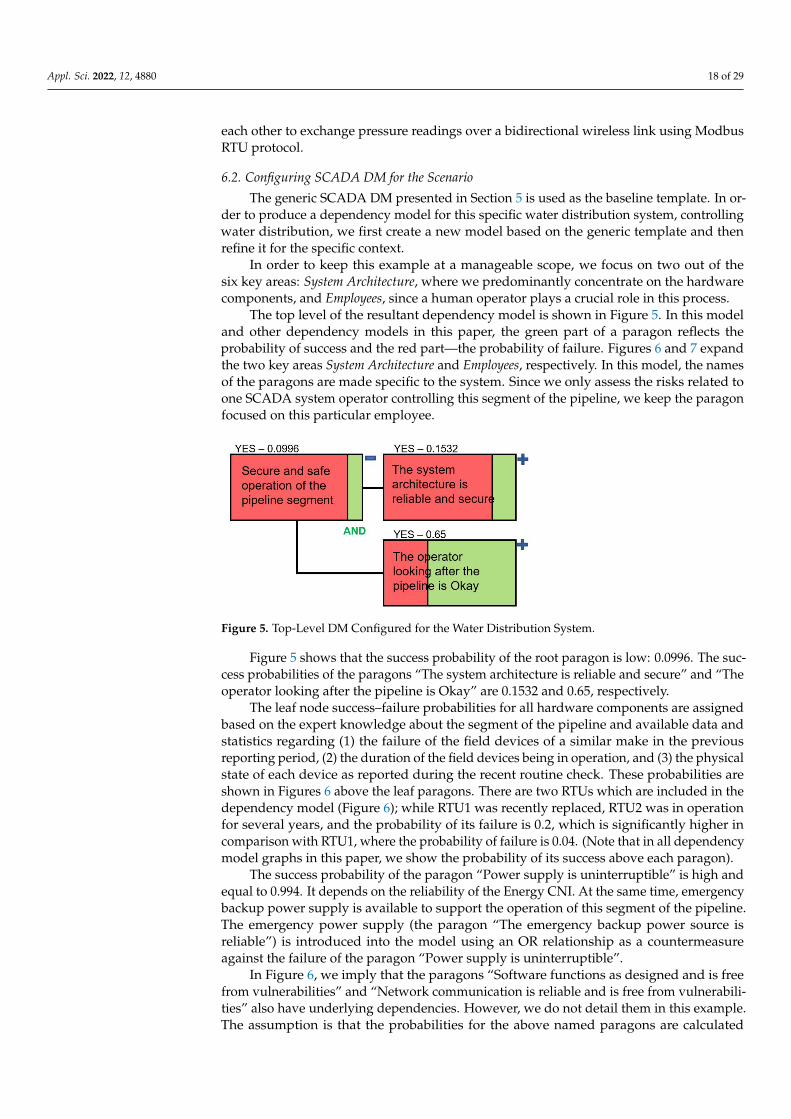
The top level of the resultant dependency model is shown in Figure 5. In this modeland other dependency models in this paper, the green part of a paragon reflects theprobability of success and the red part—the probability of failure. Figures 6 and 7 expandthe two key areas System Architecture and Employees, respectively. In this model, the namesof the paragons are made specific to the system. Since we only assess the risks related toone SCADA system operator controlling this segment of the pipeline, we keep the paragonfocused on this particular employee.
Figure 5. Top-Level DM Configured for the Water Distribution System.
Figure 5 shows that the success probability of the root paragon is low: 0.0996. The suc-cess probabilities of the paragons “The system architecture is reliable and secure” and “Theoperator looking after the pipeline is Okay” are 0.1532 and 0.65, respectively.
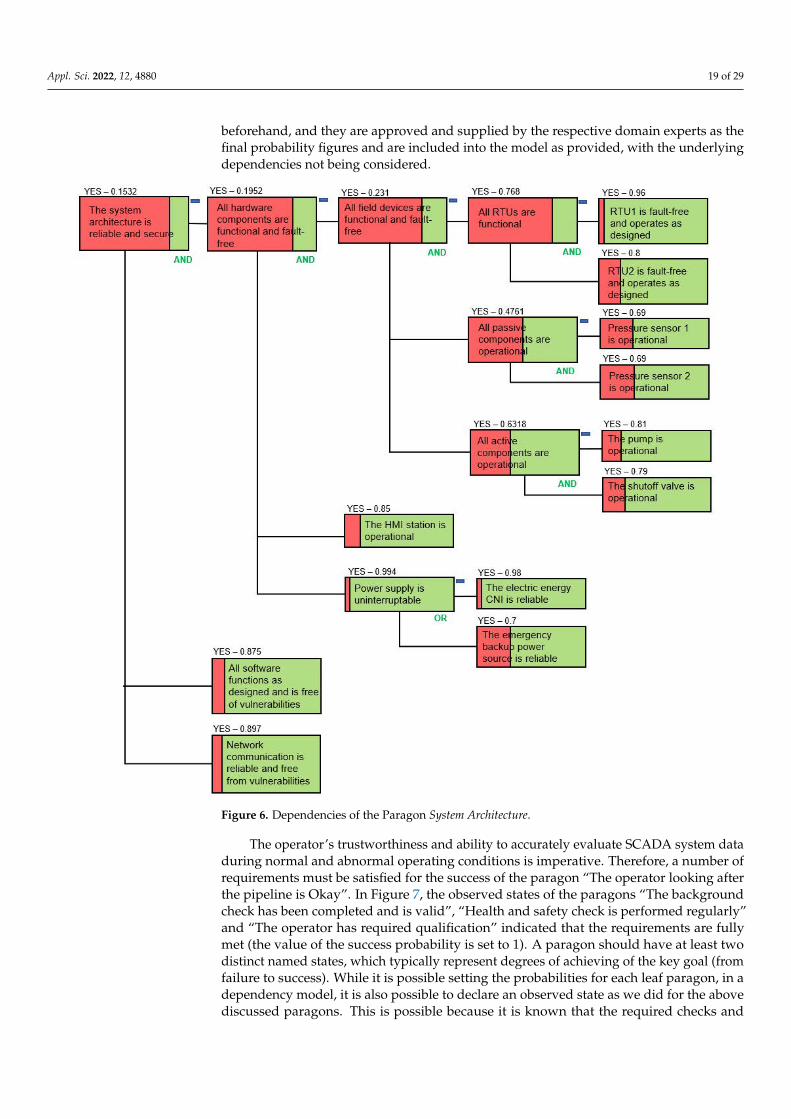
The leaf node success–failure probabilities for all hardware components are assignedbased on the expert knowledge about the segment of the pipeline and available data andstatistics regarding (1) the failure of the field devices of a similar make in the previousreporting period, (2) the duration of the field devices being in operation, and (3) the physicalstate of each device as reported during the recent routine check. These probabilities areshown in Figures 6 above the leaf paragons. There are two RTUs which are included in thedependency model (Figure 6); while RTU1 was recently replaced, RTU2 was in operationfor several years, and the probability of its failure is 0.2, which is significantly higher incomparison with RTU1, where the probability of failure is 0.04. (Note that in all dependencymodel graphs in this paper, we show the probability of its success above each paragon).
The success probability of the paragon “Power supply is uninterruptible” is high andequal to 0.994. It depends on the reliability of the Energy CNI. At the same time, emergencybackup power supply is available to support the operation of this segment of the pipeline.The emergency power supply (the paragon “The emergency backup power source isreliable”) is introduced into the model using an OR relationship as a countermeasureagainst the failure of the paragon “Power supply is uninterruptible”.
In Figure 6, we imply that the paragons “Software functions as designed and is freefrom vulnerabilities” and “Network communication is reliable and is free from vulnerabili-ties” also have underlying dependencies. However, we do not detail them in this example.The assumption is that the probabilities for the above named paragons are calculated
Appl. Sci. 2022, 12, 4880 19 of 29
beforehand, and they are approved and supplied by the respective domain experts as thefinal probability figures and are included into the model as provided, with the underlyingdependencies not being considered.
Figure 6. Dependencies of the Paragon System Architecture.
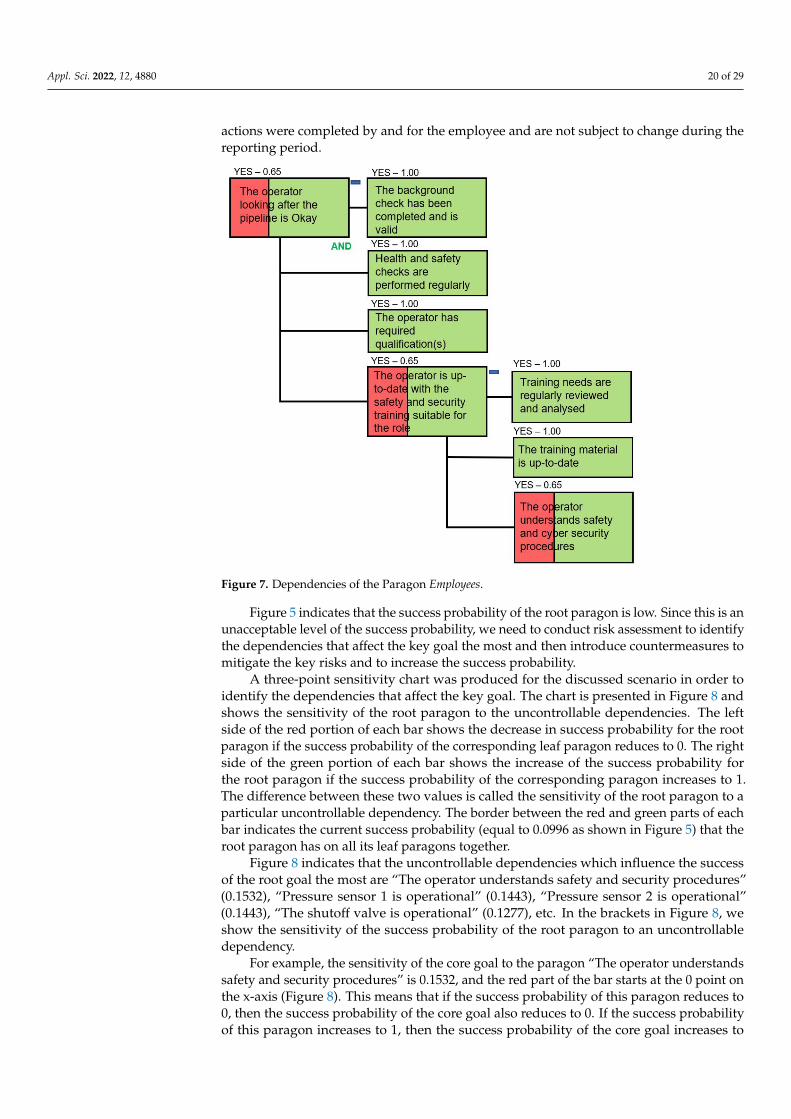
The operator’s trustworthiness and ability to accurately evaluate SCADA system dataduring normal and abnormal operating conditions is imperative. Therefore, a number ofrequirements must be satisfied for the success of the paragon “The operator looking afterthe pipeline is Okay”. In Figure 7, the observed states of the paragons “The backgroundcheck has been completed and is valid”, “Health and safety check is performed regularly”and “The operator has required qualification” indicated that the requirements are fullymet (the value of the success probability is set to 1). A paragon should have at least twodistinct named states, which typically represent degrees of achieving of the key goal (fromfailure to success). While it is possible setting the probabilities for each leaf paragon, in adependency model, it is also possible to declare an observed state as we did for the abovediscussed paragons. This is possible because it is known that the required checks and
Appl. Sci. 2022, 12, 4880 20 of 29
actions were completed by and for the employee and are not subject to change during thereporting period.
Figure 7. Dependencies of the Paragon Employees.
Figure 5 indicates that the success probability of the root paragon is low. Since this is anunacceptable level of the success probability, we need to conduct risk assessment to identifythe dependencies that affect the key goal the most and then introduce countermeasures tomitigate the key risks and to increase the success probability.
A three-point sensitivity chart was produced for the discussed scenario in order toidentify the dependencies that affect the key goal. The chart is presented in Figure 8 andshows the sensitivity of the root paragon to the uncontrollable dependencies. The leftside of the red portion of each bar shows the decrease in success probability for the rootparagon if the success probability of the corresponding leaf paragon reduces to 0. The rightside of the green portion of each bar shows the increase of the success probability forthe root paragon if the success probability of the corresponding paragon increases to 1.The difference between these two values is called the sensitivity of the root paragon to aparticular uncontrollable dependency. The border between the red and green parts of eachbar indicates the current success probability (equal to 0.0996 as shown in Figure 5) that theroot paragon has on all its leaf paragons together.
Figure 8 indicates that the uncontrollable dependencies which influence the successof the root goal the most are “The operator understands safety and security procedures”(0.1532), “Pressure sensor 1 is operational” (0.1443), “Pressure sensor 2 is operational”(0.1443), “The shutoff valve is operational” (0.1277), etc. In the brackets in Figure 8, weshow the sensitivity of the success probability of the root paragon to an uncontrollabledependency.
For example, the sensitivity of the core goal to the paragon “The operator understandssafety and security procedures” is 0.1532, and the red part of the bar starts at the 0 point onthe x-axis (Figure 8). This means that if the success probability of this paragon reduces to0, then the success probability of the core goal also reduces to 0. If the success probabilityof this paragon increases to 1, then the success probability of the core goal increases to
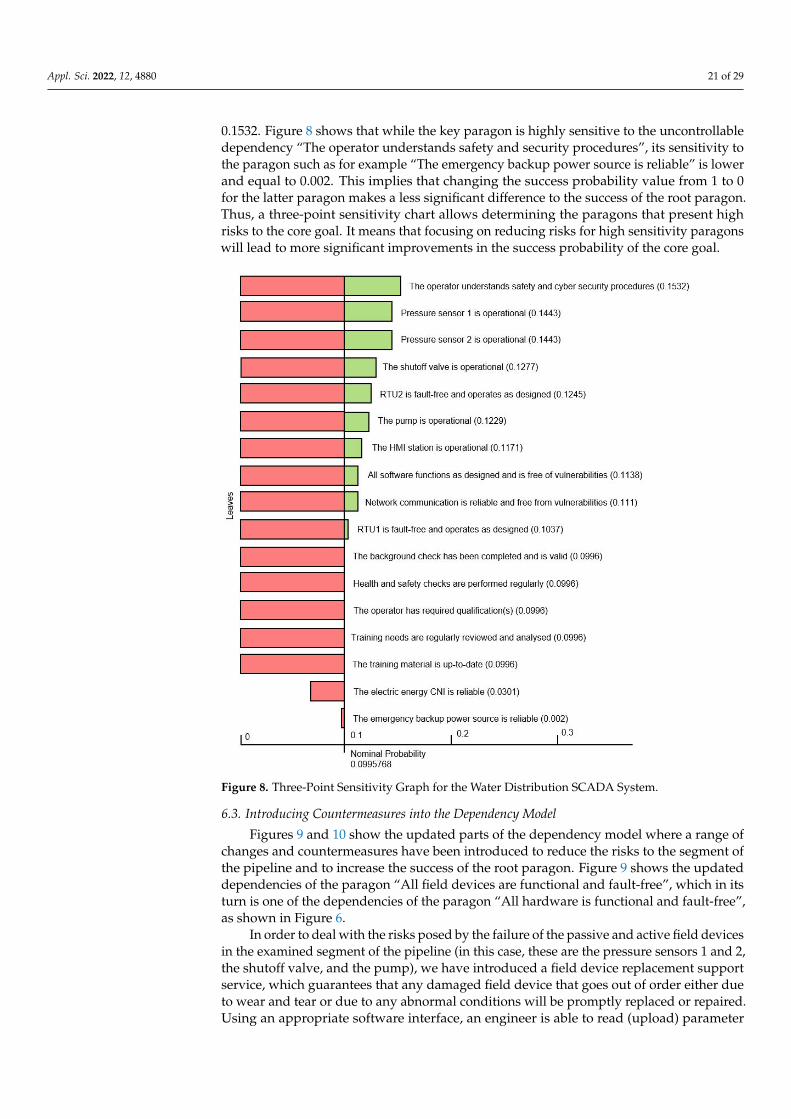
Appl. Sci. 2022, 12, 4880 21 of 29
0.1532. Figure 8 shows that while the key paragon is highly sensitive to the uncontrollabledependency “The operator understands safety and security procedures”, its sensitivity tothe paragon such as for example “The emergency backup power source is reliable” is lowerand equal to 0.002. This implies that changing the success probability value from 1 to 0for the latter paragon makes a less significant difference to the success of the root paragon.Thus, a three-point sensitivity chart allows determining the paragons that present highrisks to the core goal. It means that focusing on reducing risks for high sensitivity paragonswill lead to more significant improvements in the success probability of the core goal.
Figure 8. Three-Point Sensitivity Graph for the Water Distribution SCADA System.
6.3. Introducing Countermeasures into the Dependency Model
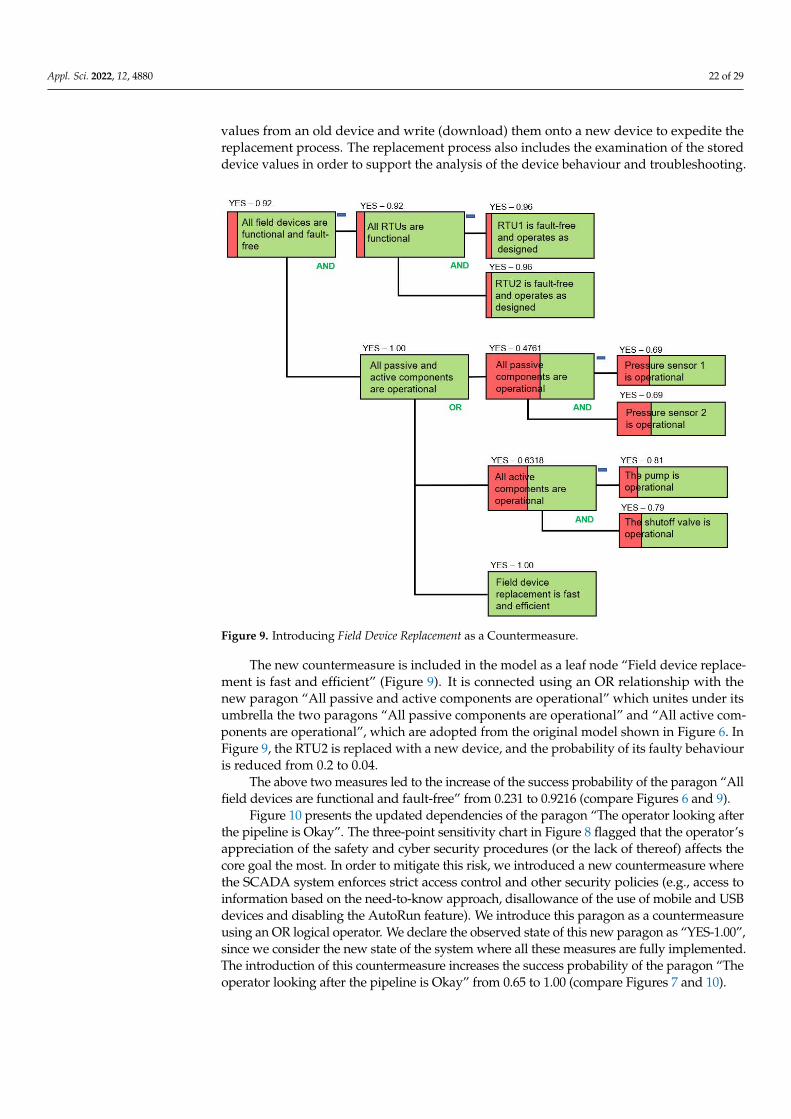
Figures 9 and 10 show the updated parts of the dependency model where a range ofchanges and countermeasures have been introduced to reduce the risks to the segment ofthe pipeline and to increase the success of the root paragon. Figure 9 shows the updateddependencies of the paragon “All field devices are functional and fault-free”, which in itsturn is one of the dependencies of the paragon “All hardware is functional and fault-free”,as shown in Figure 6.
In order to deal with the risks posed by the failure of the passive and active field devicesin the examined segment of the pipeline (in this case, these are the pressure sensors 1 and 2,the shutoff valve, and the pump), we have introduced a field device replacement supportservice, which guarantees that any damaged field device that goes out of order either dueto wear and tear or due to any abnormal conditions will be promptly replaced or repaired.Using an appropriate software interface, an engineer is able to read (upload) parameter
Appl. Sci. 2022, 12, 4880 22 of 29
values from an old device and write (download) them onto a new device to expedite thereplacement process. The replacement process also includes the examination of the storeddevice values in order to support the analysis of the device behaviour and troubleshooting.
Figure 9. Introducing Field Device Replacement as a Countermeasure.
The new countermeasure is included in the model as a leaf node “Field device replace-ment is fast and efficient” (Figure 9). It is connected using an OR relationship with thenew paragon “All passive and active components are operational” which unites under itsumbrella the two paragons “All passive components are operational” and “All active com-ponents are operational”, which are adopted from the original model shown in Figure 6. InFigure 9, the RTU2 is replaced with a new device, and the probability of its faulty behaviouris reduced from 0.2 to 0.04.
The above two measures led to the increase of the success probability of the paragon “Allfield devices are functional and fault-free” from 0.231 to 0.9216 (compare Figures 6 and 9).
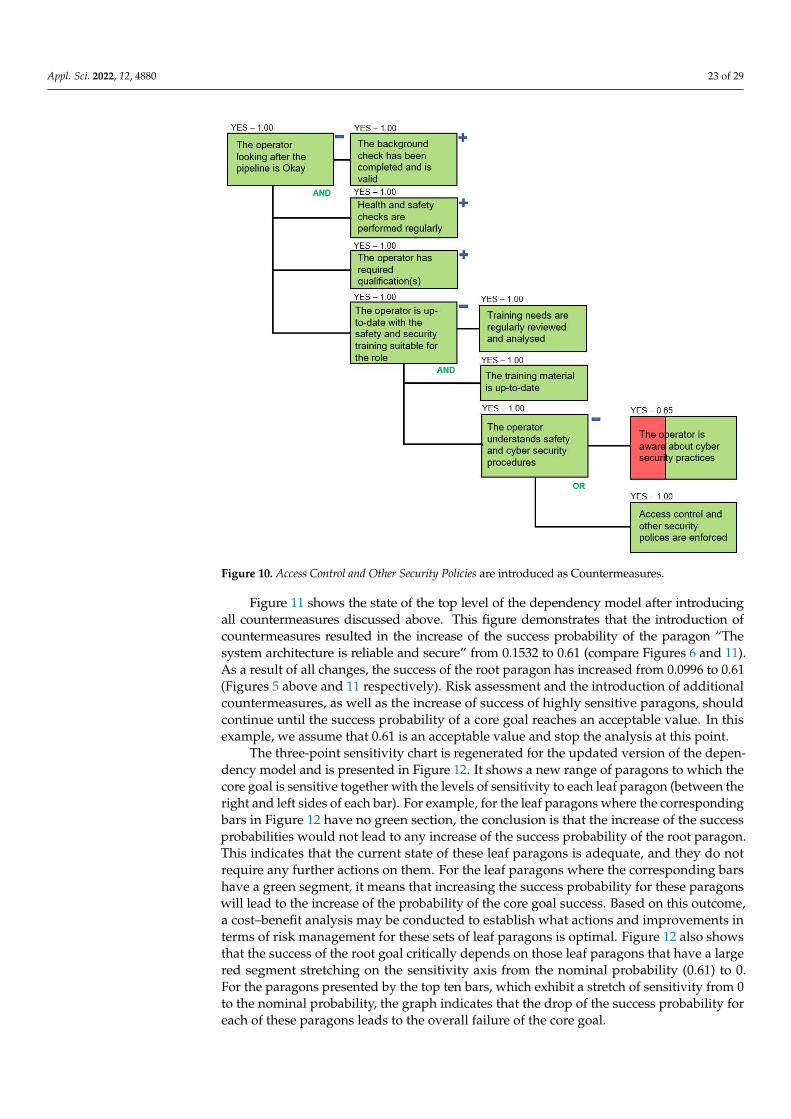
Figure 10 presents the updated dependencies of the paragon “The operator looking afterthe pipeline is Okay”. The three-point sensitivity chart in Figure 8 flagged that the operator’sappreciation of the safety and cyber security procedures (or the lack of thereof) affects thecore goal the most. In order to mitigate this risk, we introduced a new countermeasure wherethe SCADA system enforces strict access control and other security policies (e.g., access toinformation based on the need-to-know approach, disallowance of the use of mobile and USBdevices and disabling the AutoRun feature). We introduce this paragon as a countermeasureusing an OR logical operator. We declare the observed state of this new paragon as “YES-1.00”,since we consider the new state of the system where all these measures are fully implemented.The introduction of this countermeasure increases the success probability of the paragon “Theoperator looking after the pipeline is Okay” from 0.65 to 1.00 (compare Figures 7 and 10).
Appl. Sci. 2022, 12, 4880 23 of 29
Figure 10. Access Control and Other Security Policies are introduced as Countermeasures.
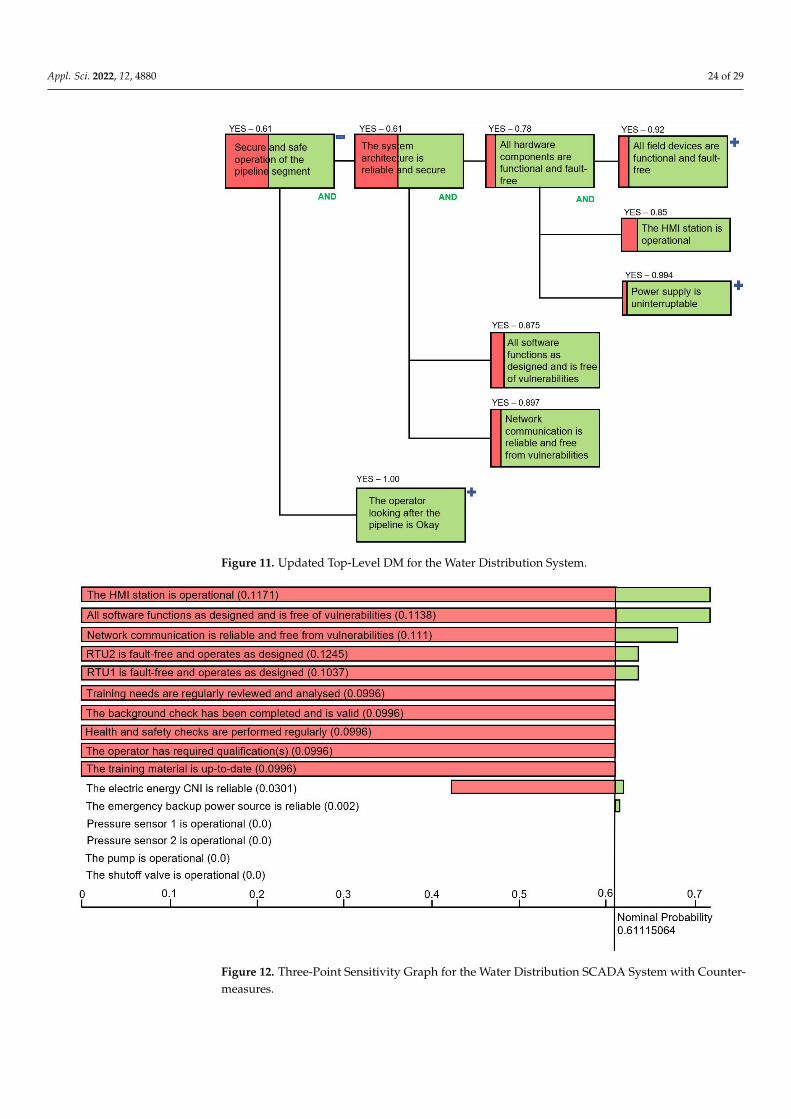
Figure 11 shows the state of the top level of the dependency model after introducingall countermeasures discussed above. This figure demonstrates that the introduction ofcountermeasures resulted in the increase of the success probability of the paragon “Thesystem architecture is reliable and secure” from 0.1532 to 0.61 (compare Figures 6 and 11).As a result of all changes, the success of the root paragon has increased from 0.0996 to 0.61(Figures 5 above and 11 respectively). Risk assessment and the introduction of additionalcountermeasures, as well as the increase of success of highly sensitive paragons, shouldcontinue until the success probability of a core goal reaches an acceptable value. In thisexample, we assume that 0.61 is an acceptable value and stop the analysis at this point.
The three-point sensitivity chart is regenerated for the updated version of the depen-dency model and is presented in Figure 12. It shows a new range of paragons to which thecore goal is sensitive together with the levels of sensitivity to each leaf paragon (between theright and left sides of each bar). For example, for the leaf paragons where the correspondingbars in Figure 12 have no green section, the conclusion is that the increase of the successprobabilities would not lead to any increase of the success probability of the root paragon.This indicates that the current state of these leaf paragons is adequate, and they do notrequire any further actions on them. For the leaf paragons where the corresponding barshave a green segment, it means that increasing the success probability for these paragonswill lead to the increase of the probability of the core goal success. Based on this outcome,a cost–benefit analysis may be conducted to establish what actions and improvements interms of risk management for these sets of leaf paragons is optimal. Figure 12 also showsthat the success of the root goal critically depends on those leaf paragons that have a largered segment stretching on the sensitivity axis from the nominal probability (0.61) to 0.For the paragons presented by the top ten bars, which exhibit a stretch of sensitivity from 0to the nominal probability, the graph indicates that the drop of the success probability foreach of these paragons leads to the overall failure of the core goal.
Appl. Sci. 2022, 12, 4880 24 of 29
Figure 11. Updated Top-Level DM for the Water Distribution System.
Figure 12. Three-Point Sensitivity Graph for the Water Distribution SCADA System with Counter-measures.
Appl. Sci. 2022, 12, 4880 25 of 29
Above, we presented some exemplary conclusions that may be derived from a three-point sensitivity chart. A sensitivity chart forms a basis for a systematic and more detailedrisk assessment for each dependency in a model.
7. Conclusions and Future Work
In this project, we collected and analysed the understanding of the dependencieswithin a SCADA system from 36 domain experts. As the key contribution, we haveproduced and presented a configurable dependency model of a SCADA system containing452 dependencies. The model addresses all identifiable areas of a SCADA system and servesas a template that may be configured to fit the specifics and needs of a particular SCADAsystem. It is time- and resource-consuming for any organisation to undertake the typeof activity we undertook in this project in order to build an extensive multi-dimensionalmodel of a SCADA system. Using our configurable model will help organisations savetime and resources dedicated to risk assessment, and it will allow them to benefit frommuch broader domain expertise than they generally have access to.
The proposed model has a broad scope, as it identifies and incorporates the elementsthat are pertinent to a diverse range of roles involved in the design, development, operationand maintenance of a SCADA system. It is virtually impossible from the perspective of anoperator, for example, to identify the issues that are managed at a higher or different level,e.g., communication with media in case of an incident or customer service, etc. At the sametime, from the perspective of a hardware engineer, it is hardly feasible to anticipate issueswith the cognitive effectiveness of data visualisation and timely training of operators onupdated security procedures. The SCADA DM presented in this paper brought together thedifferent perspectives onto a SCADA system and organised them in a hierarchical structureof a dependency model which could facilitate risk assessment.
We demonstrated how dependency modelling could be utilised for risk assessmentusing a case study of a water distribution SCADA system. The risk sensitivity of everydependency was quantified, and the dependencies that pose the highest or significant riskto the success of the core goal were flagged.
The presented configurable, customisable dependency model of a SCADA systemprovides the academic and industry community with a toolkit for better understating ofa SCADA system and for risk assessment. The SCADA DM may support the justifiableevidence-based decision making with regard to the choice of effective risk-mitigatingcountermeasures based on probabilistic inferences. It is a template for predictive analysisthat could support those who deal with a myriad of issues in ICS systems and cybersecurity investments.
The validation of the presented model is rooted (1) in the fact that the initial datawere collected from the domain experts, (2) in a rigorously documented and transparentprocess of mind maps analysis and the subsequent process of transforming the unifiedmind map into the dependency model, and (3) in the confirmation of the completeness andappropriateness of the SCADA DM by experts during the validation workshops.
We recognise the limitations of the PRA method used in the following: dependencymodelling does not allow specifying the weighted importance of dependencies. This will bea subject of our future work. The tool also inherits the weaknesses of a classic quantitativerisk-based analysis that is subjective and at the same time hard to justify with high confi-dence for all paragons. A version of the approach could be developed allowing probabilityintervals rather than fixed values reflecting the best–worst-case scenarios. Furthermore,the SCADA DM will benefit from additional iterations of stakeholders’ reviews and mod-ifications. Additional workshops with domain experts will help to fine-tune the model.In the future, we plan to conduct a detailed comparison of the SCADA DM with otheremerging goal-oriented models of a SCADA system, and this may lead to the enriching ofthe SCADA DM with new elements.
Appl. Sci. 2022, 12, 4880 26 of 29
In this paper, we focused on the use of the SCADA DM for risk assessment. However,the model may have implications that go beyond this. The SCADA DM may supportin-work training and awareness programs. A newcomer to the SCADA domain or even anexpert willing to expand their knowledge may rely on the model to gain faster appreciationof the complexity and diversity of a SCADA system. We believe that the SCADA DMwill be of value for the SCADA/ICS community and thereby provide it as a blueprint forfuture instantiation.
Author Contributions: Conceptualization, Y.C., P.B. and K.J.; Data curation, Y.C. and S.N.-T.; Fund-ing acquisition, P.B. and K.J.; Methodology, Y.C.; Visualization, Y.C.; Writing—original draft, Y.C.;Writing—review and editing, Y.C. and S.N.-T. All authors have read and agreed to the publishedversion of the manuscript.
Funding: This work was funded by the Airbus Group Endeavr Wales scheme under the SCADACyber Security Life-cycle (SCADA-CSL) programme. The third author is supported by the nationalproject RICS (Resilient Information and Control Systems) financed by the Swedish Civil ContingenciesAgency (MSB).
Institutional Review Board Statement: The data collection was conducted in 2015–2016. Accordingto the Ethics Committee procedure that was in place in 2015, data collection activities that did notinvolve personally identifiable information were not subject for approval.
Informed Consent Statement: Informed consent was obtained from all subjects involved in the study.
Data Availability Statement: The SCADA Dependency model is available in a graphical form (jpg)and as an XML at https://git.cardiff.ac.uk/c1051916/SCADA_DM (accessed on 27 March 2022).
Acknowledgments: The authors would like to thank all experts who participated in the SCADAmind mapping exercise and in the validation workshops.
Conflicts of Interest: The funders had no role in the design of the study; in the collection, analyses,or interpretation of data; in the writing of the manuscript, or in the decision to publish the results.
AbbreviationsThe following abbreviations are used in this manuscript:
BPMN Business Process Model and NotationCNI Critical National InfrastructureDM Dependency ModelHMI Human–Machine InterfaceICS Industrial Control SystemsOS Operating SystemPRA Probabilistic Risk AssessmentSCADA Supervisory Control and Data AcquisitionRTU Remote Terminal Unit
Appl. Sci. 2022, 12, 4880 27 of 29
Appendix A. Participants’ Profile
Table A1. Participants’ Profile. Domains and Roles.
Participant No. Domain Role
1 Government Head of CNI/ICS defence
2 Academia Research Assistant
3 Energy-Nuclear C&I Safety Assessor/Inspector
4 Built Environment Director
5 Aerospace, Marine, Energy and Defence Software Intensive Systems Specialist
6 Nuclear, Defence, Aerospace and Marine Strategy Lead/Consultant
7 Oil, Gas & Petrochemicals Chief Engineer Control Systems
8 Academia/Electrical Energy Lecturer
9 Various domains from risk perspective Team Lead/ Cyber Security Consultant
10 Defence Security researcher
11 Defence Senior Engineer
12 Government and water Security advisor
13 Academia Technical Lead/Researcher
14 Academia Professor
15 Aerospace Cyber Technical Lead for Forensics
16 Energy, Gas and Smart Metering Managing Consultant, R&D in Technology Group
17 Energy, water Cyber security consultant
18 Academia Research
19 Academia Lecturer
20 Transport Lecturer
21 Defence and space Sales manager
22 Transport (Airports) Technical architect
23 Transport (Rail and MRTS) Senior Executive Officer
24 Energy, Net Grid Technical Advisor
25 Energy Developer
26 Energy Consultant
27 Energy/Electricity Technology Developer
28 Energy SCADA System administrator
29 Space and Geographical Systems Senior Software Developer
30 Energy (Transport) Operations Manager
31 Various domains Advisor, requirements, assessment
32 Energy Product manager
33 Critical Infrastructure CTO
34 Transport Infrastructure specialist
35 Energy Operations/System Engineer
36 Energy/Transport Technical specialist
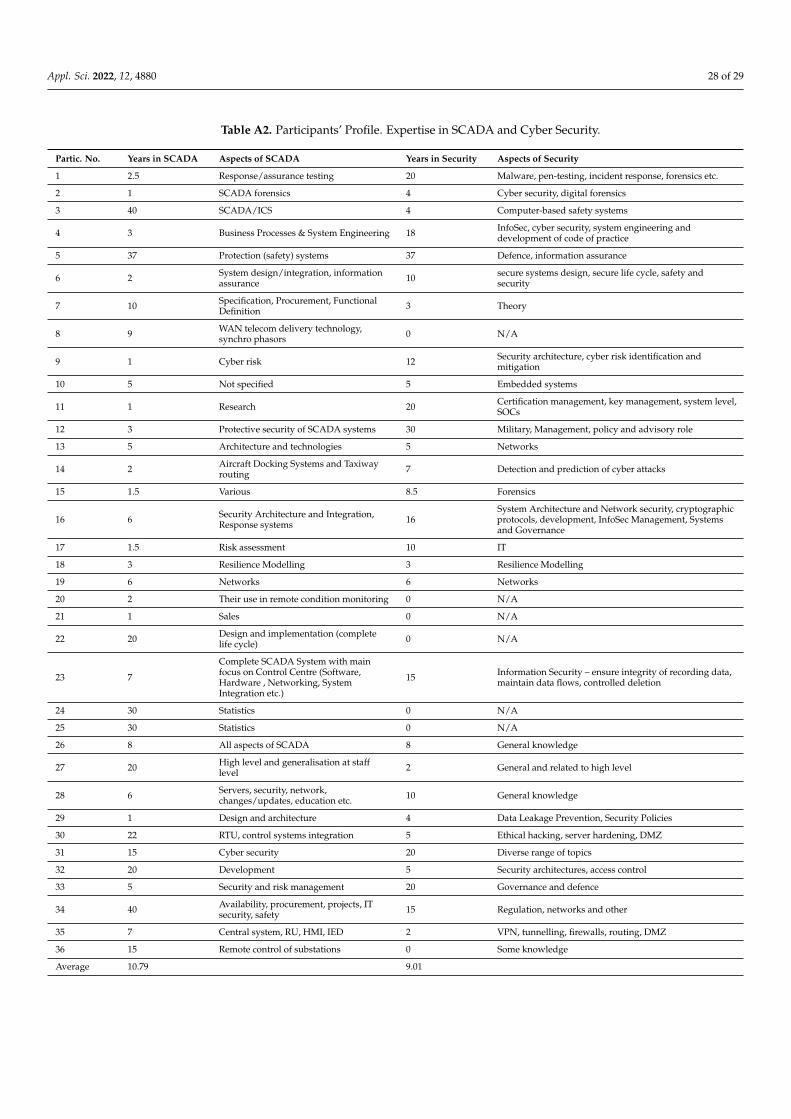
Appl. Sci. 2022, 12, 4880 28 of 29
Table A2. Participants’ Profile. Expertise in SCADA and Cyber Security.
Partic. No. Years in SCADA Aspects of SCADA Years in Security Aspects of Security
1 2.5 Response/assurance testing 20 Malware, pen-testing, incident response, forensics etc.
2 1 SCADA forensics 4 Cyber security, digital forensics
3 40 SCADA/ICS 4 Computer-based safety systems
4 3 Business Processes & System Engineering 18 InfoSec, cyber security, system engineering anddevelopment of code of practice
5 37 Protection (safety) systems 37 Defence, information assurance
6 2 System design/integration, informationassurance 10 secure systems design, secure life cycle, safety and
security
7 10 Specification, Procurement, FunctionalDefinition 3 Theory
8 9 WAN telecom delivery technology,synchro phasors 0 N/A
9 1 Cyber risk 12 Security architecture, cyber risk identification andmitigation
10 5 Not specified 5 Embedded systems
11 1 Research 20 Certification management, key management, system level,SOCs
12 3 Protective security of SCADA systems 30 Military, Management, policy and advisory role
13 5 Architecture and technologies 5 Networks
14 2 Aircraft Docking Systems and Taxiwayrouting 7 Detection and prediction of cyber attacks
15 1.5 Various 8.5 Forensics
16 6 Security Architecture and Integration,Response systems 16
System Architecture and Network security, cryptographicprotocols, development, InfoSec Management, Systemsand Governance
17 1.5 Risk assessment 10 IT
18 3 Resilience Modelling 3 Resilience Modelling
19 6 Networks 6 Networks
20 2 Their use in remote condition monitoring 0 N/A
21 1 Sales 0 N/A
22 20 Design and implementation (completelife cycle) 0 N/A
23 7
Complete SCADA System with mainfocus on Control Centre (Software,Hardware , Networking, SystemIntegration etc.)
15 Information Security – ensure integrity of recording data,maintain data flows, controlled deletion
24 30 Statistics 0 N/A
25 30 Statistics 0 N/A
26 8 All aspects of SCADA 8 General knowledge
27 20 High level and generalisation at stafflevel 2 General and related to high level
28 6 Servers, security, network,changes/updates, education etc. 10 General knowledge
29 1 Design and architecture 4 Data Leakage Prevention, Security Policies
30 22 RTU, control systems integration 5 Ethical hacking, server hardening, DMZ
31 15 Cyber security 20 Diverse range of topics
32 20 Development 5 Security architectures, access control
33 5 Security and risk management 20 Governance and defence
34 40 Availability, procurement, projects, ITsecurity, safety 15 Regulation, networks and other
35 7 Central system, RU, HMI, IED 2 VPN, tunnelling, firewalls, routing, DMZ
36 15 Remote control of substations 0 Some knowledge
Average 10.79 9.01
Appl. Sci. 2022, 12, 4880 29 of 29
References1. Miller, T.; Staves, A.; Maesschalck, S.; Sturdee, M.; Green, B. Looking back to look forward: Lessons learnt from cyber-attacks on
Industrial Control Systems. Int. J. Crit. Infrastruct. Prot. 2021, 35, 100464. [CrossRef]2. Miller, B.; Rowe, D. A survey SCADA of and critical infrastructure incidents. In Proceedings of the 1st Annual Conference on
Research in Information Technology, Calgary, AL, Canada, 11–13 October 2012.3. Maglaras, L.; Ferrag, M.A.; Derhab, A.; Mukherjee, M.; Janicke, H.; Rallis, S. Threats, protection and attribution of cyber attacks
on critical infrastructures. arXiv 2019, arXiv:1901.03899.4. Cherdantseva, Y.; Burnap, P.; Blyth, A.; Eden, P.; Jones, K.; Soulsby, H.; Stoddart, K. A Review of cyber security risk assessment
methods for SCADA systems. Comput. Secur. 2016, 56, 1–27. [CrossRef]5. The Open Group. Dependency Modeling (O-DM). Constructing a Data Model to Manage Risk and Build Trust between Inter-Dependent
Enterprises; Open Group: San Francisco, CA, USA, 2012.6. Patel, S.; Graham, J.; Ralston, P. Quantitatively assessing the vulnerability of critical information systems: A new method for
evaluating security enhancements. Int. J. Inf. Manag. 2008, 28, 483–491. [CrossRef]7. Codetta-Raiteri, D.; Portinale, L. Decision Networks for Security Risk Assessment of Critical Infrastructures. ACM Trans. Internet
Technol. (TOIT) 2018, 18, 29. [CrossRef]8. Cheminod, M.; Durante, L.; Valenzano, A. Review of Security Issues in Industrial Networks. IEEE Trans. Ind. Inform. 2013, 9,
277–293. [CrossRef]9. Ralston, P.; Graham, J.; Hieb J. Cyber security risk assessment for SCADA and DCS networks. ISA Trans. 2007, 46, 583–594.
[CrossRef] [PubMed]10. Taylor, C.; Krings, A.; Alves-Foss, J. Risk analysis and probabilistic survivability assessment (RAPSA): An assessment approach
for power substation hardening. In Proceedings of the ACM Workshop on Scientific Aspects of Cyber Terrorism, (SACT),Washington, DC, USA, 21 November 2002; p. 64.
11. Roy, A.; Kim, D.; Trivedi, K.S. Cyber security analysis using attack countermeasure trees. In Proceedings of the Sixth AnnualWorkshop on Cyber Security and Information Intelligence Research, Oak Ridge, TN, USA, 21–23 April 2010; p. 28.
12. Guan, J.; Graham J.; Hieb, J. A digraph model for risk identification and management in SCADA systems. In Proceedings of theIEEE International Conference on Intelligence and Security Informatics (ISI), Beijing, China, 10–12 July 2011; pp. 150–155.
13. Zhang, Q.; Zhou, C.; Xiong, N.; Qin, Y.; Li, X.; Huang, S. Multimodel-based incident prediction and risk assessment in dynamiccybersecurity protection for industrial control systems. IEEE Trans. Syst. Man Cybern. Syst. 2016, 46, 1429–1444. [CrossRef]
14. Baiardi, F.; Telmon, C.; Sgandurra, D. Hierarchical, model-based risk management of critical infrastructures. Reliab. Eng. Syst.2009, 94, 1403–1415. [CrossRef]
15. Gonzalez-Granadillo, G.; Dubus, S.; Motzek, A.; Garcia-Alfaro, J.; Alvarez, E.; Merialdo, M.; Debar, H. Dynamic risk managementresponse system to handle cyber threats. Future Gener. Comput. Syst. 2018, 83, 535–552. [CrossRef]
16. Kure, H.I.; Islam, S.; Razzaque, M.A. An integrated cyber security risk management approach for a cyber-physical system. Appl.Sci. 2018, 8, 898. [CrossRef]
17. Taormina, R.; Galelli, S.; Tippenhauer, N.O.; Salomons, E.; Ostfeld, A. Characterizing cyber-physical attacks on water distributionsystems. J. Water Resour. Plan. Manag. 2017, 143, 04017009. [CrossRef]
18. Berglund, E.Z.; Pesantez, J.E.; Rasekh, A.; Shafiee, M.E.; Sela, L.; Haxton, T. Review of modeling methodologies for managingwater distribution security. J. Water Resour. Plan. Manag. 2020, 146, 03120001. [CrossRef]
19. Chittester, C.; Haimes, Y.Y. Risks of terrorism to information technology and to critical interdependent infrastructures. J. Homel.Secur. Emerg. Manag. 2004, 1, 402. [CrossRef]
20. Haimes, Y.V. Hierarchical holographic modeling. IEEE Trans. Syst. Man Cybern. 1981, 11, 606–617. [CrossRef]21. Buzan, T. The Mind Map Book; Penguin: New York, NY, USA, 1991.22. Eppler, M.J. A comparison between concept maps, mind maps, conceptual diagrams, and visual metaphors as complementary
tools for knowledge construction and sharing. Inf. Vis. 2006, 5, 202–210. [CrossRef]23. Dixon, R.A.; Lammi, M. Cognitive Mapping Techniques: Implications for Research in Engineering and Technology Education. J.
Technol. Educ. 2014, 25, 2–17. [CrossRef]24. Tattersall, C.; Powell, J.; Stroud, J.; Pringle, J. Mind mapping in qualitative research. Nurs. Times 2011, 107, 20–22. [PubMed]25. Ritchie, J.; Spencer, L. Qualitative data analysis for applied policy research. Qual. Res. Companion 2002, 573, 305–329.26. King, N. Using templates in the thematic analysis of text. In Essential Guide to Qualitative Methods in Organizational Research;
Cassell, C., Symon, G., Eds.; Sage: Newcastle upon Tyne, UK, 2004.27. Gertman, D.; Folkers, R.; Roberts, J. Scenario-based approach to risk analysis in support of cyber security. In Proceedings of
the 5th International Topical Meeting on Nuclear Plant Instrumentation Controls, and Human Machine Interface Technology,Albuquerque, NM, USA, 12–16 November 2006.
28. Campbell Scientific. CR1000 Measurement and Control System; Revision: 7/08; Campbell Scientific: Logan, UT, USA, 2008.29. ISO/IEC 19510:2013(E); Information Technology-Object Management Group Business Process Model and Notation. ISO: Geneva,
Switzerland, 2013.


