Embed Size (px)
Citation preview
Environmental Impact Assessment Review 38 (2013) 73–87
Contents lists available at SciVerse ScienceDirect
Environmental Impact Assessment Review
j ourna l homepage: www.e lsev ie r .com/ locate /e ia r
A critical review of seven selected neighborhood sustainability assessment tools
Ayyoob Sharifi ⁎, Akito MurayamaDepartment of Environmental Engineering and Architecture, Graduate School of Environmental Studies, Nagoya University, Nagoya, Aichi Prefecture 464‐8601, Japan
Abbreviations: SA, Sustainability Assessment; NSA, Nsessment; EIA, Environmental Impact Assessment; NEPAicy Act; SEA, Strategic Environmental Assessment; PPPsBREEAM, Building Research Establishment EnvironLEED-ND, Leadership in Energy and Environmental Desiment; AHURI, Australian Housing and Urban Research Inmunity Rating; HQE2R, Haute Qualité EnvironnementaleHigh Quality Environment and Economy in RegenerationAssessment System for Building Environmental EfficieECC, EarthCraft Communities; USGBC, U.S. Green Buildithe New Urbanism; NRDC, Natural Resources Defense CBuilding Consortium; CSTB, Centre Scientifique et TechnSustainability Assessment System; AHP, Analytic Hierarof Housing and Urban Development.⁎ Corresponding author at: Department of Environme
ture, Graduate School of Environmental Studies, NFuro-cho, Chikusa-ku, Nagoya, Aichi Prefecture 464‐86778, +81 90 6614 2920 (mobile); fax: +81 52 789 37
E-mail addresses: [email protected]@gmail.com (A. Sharifi), murayama@cor(A. Murayama).
0195-9255/$ – see front matter © 2012 Elsevier Inc. Alldoi:10.1016/j.eiar.2012.06.006
a b s t r a c t
a r t i c l e i n f oArticle history:Received 20 December 2011Received in revised form 5 June 2012Accepted 9 June 2012Available online 20 July 2012
Keywords:Neighborhood sustainability assessmentSustainability coverageSubjectivityAdaptabilityApplicability
Neighborhood sustainability assessment tools have become widespread since the turn of 21st century andmany communities, mainly in the developed world, are utilizing these tools to measure their success inapproaching sustainable development goals. In this study, seven tools from Australia, Europe, Japan, andthe United States are selected and analyzed with the aim of providing insights into the current situations;highlighting the strengths, weaknesses, successes, and failures; and making recommendations for future im-provements. Using a content analysis, the issues of sustainability coverage, pre-requisites, local adaptability,scoring and weighting, participation, reporting, and applicability are discussed in this paper. The results ofthis study indicate that most of the tools are not doing well regarding the coverage of social, economic,and institutional aspects of sustainability; there are ambiguities and shortcomings in the weighting, scoring,and rating; in most cases, there is no mechanism for local adaptability and participation; and, only those toolswhich are embedded within the broader planning framework are doing well with regard to applicability.
© 2012 Elsevier Inc. All rights reserved.
1. Introduction
Since ancient times, cities around the world have been spatiallydivided into districts or neighborhoods (Rohe, 2009). Neighborhoodsare building blocks of our cities (Searfoss, 2011), and, from the earlyyears of twentieth century, planners have experimented with pro-grams for improving the quality of life in urban neighborhoods(Rohe and Gates, 1985). Although neighborhood planning has a rela-tively long history, it was not until the beginning years of the 21stcentury that planners and environmentalists began to design toolsfor Sustainability Assessment (SA) in the neighborhood scale.
eighborhood Sustainability As-, National Environmental Pol-
, Policies, Plans, and Programs;mental Assessment Method;gn for Neighborhood Develop-stitute; SCR, Sustainable Com-et Economique Réhabilitation/; CASBEE-UD, Comprehensivency for Urban Development;ng Council; CNU, Congress forouncil; JSBC, Japan Sustainableique du bâtiment; QSAS, Qatarchy Process; HUD, Department
ntal Engineering and Architec-agoya University, D2-1(510)601, Japan. Tel.: +81 52 74753.c.jp,ot.nuac.nagoya-u.ac.jp
rights reserved.
The Neighborhood Sustainability Assessment (NSA) tools can berecognized as the latest generation of impact assessment tools. Pro-ject scale Environmental Impact Assessment (EIA) tools were thefirst generation which began in the United States with the passageof the National Environmental Policy Act (NEPA) in 1969 (Shepard,2005; Turner, 1998). EIA was developed to address the increasingpressure on human environment, following the economic and socialtransformation of the twentieth century, which was accelerated inscope, scale, and intensity after World War II (Costanza et al., 2007;Gibson et al., 2005), and resulted in public environmental concerns(Gibson et al., 2005). Later, the other generations such as StrategicEnvironmental Assessment (SEA) for assessment of Policies, Plans,and Programs (PPPs) (Therivel, 2004) and Sustainability Assessment(SA) for assessment of PPPs and projects (Bond and Morrison-Saunders,2011; Pope and Clayton, 2011) were also introduced in late 1980s(Therivel, 2004) and 1990s (Gibson et al., 2005) respectively.
Also, there are several building environmental assessment toolswhich have matured remarkably since the introduction of the UKBuilding Research Establishment Environmental Assessment Method(BREEAM) in 1990 (Retzlaff, 2009, and Sev, 2011).
The above examples indicate that there are many assessment toolsfocusing on the urban and regional level, as well as the level of thesingle building, while there is a lack of attention and experience onthe intermediate level of urban neighborhoods (Blum, 2007; Hurleyand Horne, 2006). Choguill (2008) argues that, “no single city cancontribute to overall sustainability if its own component parts arefound not to be sustainable”. In the recent years, acknowledgingthis and the fact that neighborhood is the scale at which land devel-opment takes place and new buildings and facilities are proposed, de-bated, and constructed (Benfield, 2010), the focus is turned to
74 A. Sharifi, A. Murayama / Environmental Impact Assessment Review 38 (2013) 73–87
developing assessment frameworks and tools for urban neighbor-hoods (Haapio, 2012; Retzlaff, 2009). This can be regarded as anotherstep towards fulfillment of Local Agenda 21's objective of pursuingsustainable development at the local level (United Nations, 1993).
1.1. Previous researches on the NSA tools
Notwithstanding the fact that more than one decade has passedsince the introduction of NSA tools, there is a scant amount of researchevaluating their performance and effectivity. Hurley and Horne (2006)made a comparison between Vicurban Sustainability Charter, Leader-ship in Energy and Environmental Design for Neighborhood Develop-ment (LEED-ND), and the Australian Housing and Urban ResearchInstitute (AHURI) indicators. Their analysis is mainly focused on differ-ences and similarities among the tools, and themes and criteria used intheir assessment system. In another study, (Hurley, 2009) investigatedthe main focus of Sustainable Community Rating (SCR) tool. There arealso studies by Blum (2007) and Coplak and Raksanyi (2003) that re-spectively introduce Haute Qualité Environnementale et EconomiqueRéhabilitation/HighQuality Environment and Economy in Regeneration(HQE2R) and Ecocity assessment processes without evaluating theirperformance. Garde (2009) surveyed some LEED-ND pilot projects toreveal which criteria are used most and least, and emphasizes on theimportance of adaptation to locality, and setting pre-requisites in therevised version. In a recent study by Haapio (2012), she provides a gen-eral account of the current situations of three third-party assessmenttools (LEED-ND, BREEAM Communities, and Comprehensive Assess-ment System for Building Environmental Efficiency for Urban Develop-ment (CASBEE-UD)). Emphasizing on the importance of applyingassessment tools for achieving sustainable communities, she warnsabout the problems associated with the selection of criteria and trans-ferability of NSA tools to other contexts.
These studies are mainly focused on one, or a limited number, ofthe existing tools, and are primarily aiming at providing a general in-troduction of the tools. In some cases they have mentioned associatedproblems concerning weighting, criteria selection, and lack of a sys-tems approach; however, there is still a lack of in-depth critical eval-uation of the NSA tools.
Analyzing multiple cases is necessary to increase the breadth ofanalysis, verify the findings, and produce findings that are not merelythe result of idiosyncrasies of the research setting and are transferableto other cases or generalizable to theory (Cavaye, 1996; Hurley,2011).
1.2. Aims of the study
The main purpose of this study is to critically review sevenwell-known NSA tools. The specific objectives are: (a) to fill the gapin literature regarding research on evaluation of NSA tools;(b) to in-troduce a framework for evaluating the effectiveness of NSA tools;(c) to evaluate to which degree are NSA tools able to incorporatethe different dimensions of sustainability; (d) to identify the differ-ences, commonalities, strengths, weaknesses, successes, and failuresof NSA tools through cross-comparison of them; (e) to understandvarious problems and challenges the NSA tools are grappling with;and (f) to discuss some solutions to these problems and challenges,and refinements needed to enhance the efficiency of NSA tools.
Tools and initiatives from different countries are analyzed and dis-cussed, using the designed framework presented in Section 3, to shedlight on the issue of SA in the neighborhood level; to discuss the dif-ferences, similarities, successes, and failures; and to touch on theprospect of the SA of urban neighborhoods. By criticizing these toolswe want to evaluate to which degree they are able to incorporatethe different dimensions of sustainability and go towards bringingabout sustainable neighborhoods, and furthermore, to highlight the
areas where the tools are lagging behind and come up with ideasfor their improvement.
1.3. Contents of the study
This paper begins with an introduction about the background ofassessment practices, the significance of conducting assessment inthe neighborhood scale, previous researches on SA tools for neighbor-hoods, and aims of the study. Section 2 provides an overview of exis-ting NSA tools, and selected tools for further analyses are brieflyintroduced. Section 3 presents the criteria used for analyses andframework designed for this research. In Section 4, tools are analyzedagainst the framework designed in the previous section. Eachsub-section of this part of the paper deals with one of the sevencriteria identified in Section 3. In each sub-section, first the justifica-tion for choosing the criterion, its importance, and its optimal stateare described. Following this, selected tools are tested against the cri-terion and the similarities, differences, strengths, weaknesses, suc-cesses, and failures of the tools are highlighted. Section 5 discussesthe findings of this study and makes some suggestions for consider-ation in the future refinements.
2. Overview of NSA tools
A neighborhood is a fundamental building block of a city, and agood starting point to create a truly sustainable community. Recog-nizing the importance of neighborhoods as the frontlines in the battlefor sustainability (Choguill, 2008), in some countries around theworld, initiatives have been taken to pave the way for making sus-tainable neighborhoods, and several tools have been developed to as-sess the sustainability performance of plans and their success in theway towards achieving sustainability.
NSA tool (also sometimes referred to as: district sustainability as-sessment tool, neighborhood sustainability rating tool, sustainablecommunity rating tool) is a tool that evaluates and rates the perfor-mance of a given neighborhood against a set of criteria and themes, toassess the neighborhoods' position on the way towards sustainabilityand specify the extent of neighborhoods' success in approaching sus-tainability goals.
There are currently several NSA toolsworldwidewhich can be divid-ed into two main categories. The first category consists of third-partyassessment tools which are spin-offs of building assessment tools andassess the sustainability beyond a single building. The second one in-cludes tools which are embedded into neighborhood-scale plans andsustainability initiatives to assess their sustainability performance. Inthis paper, wherever the term “spin-off tools” is used, it refers to the for-mer category, and wherever the term “plan-embedded tools” is men-tioned, reference is made to the latter category.
Table 1 classifies some of the most well-known NSA tools intothese two categories.
For the purpose of this study, first a broad range of tools wereidentified through a literature review from a wide array of sources.The aim was to cover the tools that most frequently appear in the lit-erature; and, as far as possible, cover the variety of the broad fieldthat can be viewed as SA. Many tools were identified which were rel-evant to SA at the neighborhood scale. However, due to the limitedscope of this study, it was decided to only focus on the tools whichare fully developed, consider all three pillars of sustainability, theirmanuals are accessible (publicly available), and include scoring aspart of the process. It was also decided to, as far as possible, havetools from different parts of the world.
The following seven major NSA tools are selected for furtheranalysis:
– LEED-ND– EarthCraft Communities (ECC)
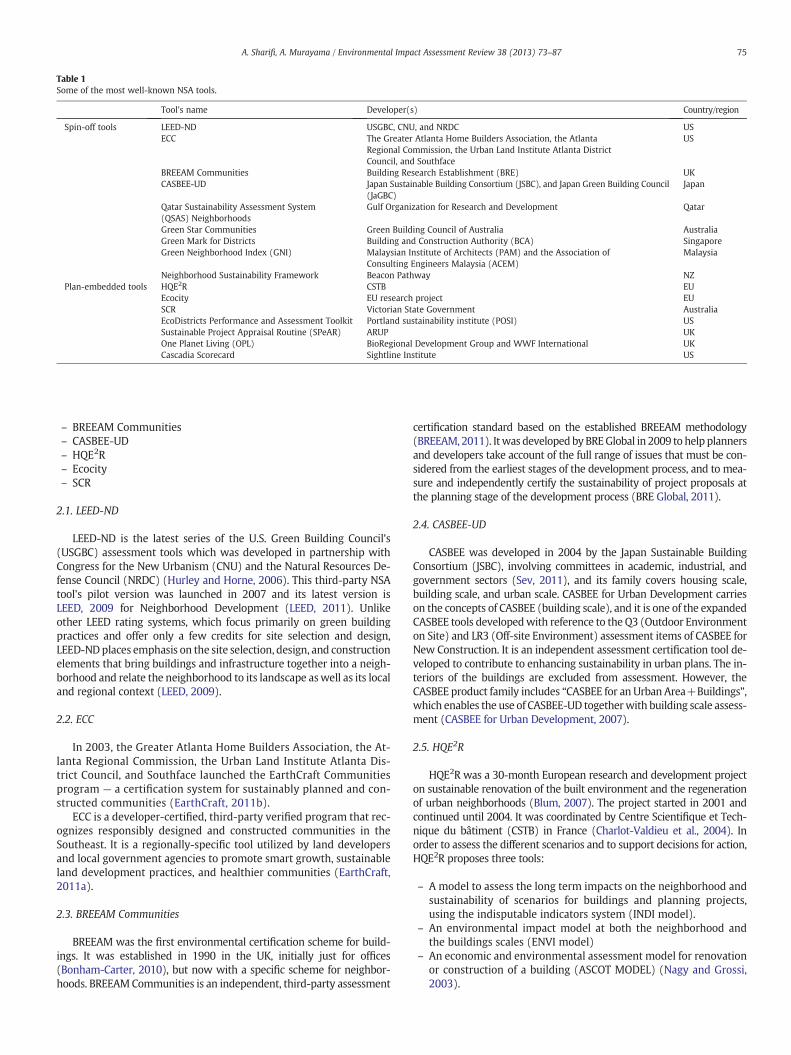
Table 1Some of the most well-known NSA tools.
Tool's name Developer(s) Country/region
Spin-off tools LEED-ND USGBC, CNU, and NRDC USECC The Greater Atlanta Home Builders Association, the Atlanta
Regional Commission, the Urban Land Institute Atlanta DistrictCouncil, and Southface
US
BREEAM Communities Building Research Establishment (BRE) UKCASBEE-UD Japan Sustainable Building Consortium (JSBC), and Japan Green Building Council
(JaGBC)Japan
Qatar Sustainability Assessment System(QSAS) Neighborhoods
Gulf Organization for Research and Development Qatar
Green Star Communities Green Building Council of Australia AustraliaGreen Mark for Districts Building and Construction Authority (BCA) SingaporeGreen Neighborhood Index (GNI) Malaysian Institute of Architects (PAM) and the Association of
Consulting Engineers Malaysia (ACEM)Malaysia
Neighborhood Sustainability Framework Beacon Pathway NZPlan-embedded tools HQE2R CSTB EU
Ecocity EU research project EUSCR Victorian State Government AustraliaEcoDistricts Performance and Assessment Toolkit Portland sustainability institute (POSI) USSustainable Project Appraisal Routine (SPeAR) ARUP UKOne Planet Living (OPL) BioRegional Development Group and WWF International UKCascadia Scorecard Sightline Institute US
75A. Sharifi, A. Murayama / Environmental Impact Assessment Review 38 (2013) 73–87
– BREEAM Communities– CASBEE-UD– HQE2R– Ecocity– SCR
2.1. LEED-ND
LEED-ND is the latest series of the U.S. Green Building Council's(USGBC) assessment tools which was developed in partnership withCongress for the New Urbanism (CNU) and the Natural Resources De-fense Council (NRDC) (Hurley and Horne, 2006). This third-party NSAtool's pilot version was launched in 2007 and its latest version isLEED, 2009 for Neighborhood Development (LEED, 2011). Unlikeother LEED rating systems, which focus primarily on green buildingpractices and offer only a few credits for site selection and design,LEED-NDplaces emphasis on the site selection, design, and constructionelements that bring buildings and infrastructure together into a neigh-borhood and relate the neighborhood to its landscape aswell as its localand regional context (LEED, 2009).
2.2. ECC
In 2003, the Greater Atlanta Home Builders Association, the At-lanta Regional Commission, the Urban Land Institute Atlanta Dis-trict Council, and Southface launched the EarthCraft Communitiesprogram — a certification system for sustainably planned and con-structed communities (EarthCraft, 2011b).
ECC is a developer-certified, third-party verified program that rec-ognizes responsibly designed and constructed communities in theSoutheast. It is a regionally-specific tool utilized by land developersand local government agencies to promote smart growth, sustainableland development practices, and healthier communities (EarthCraft,2011a).
2.3. BREEAM Communities
BREEAM was the first environmental certification scheme for build-ings. It was established in 1990 in the UK, initially just for offices(Bonham-Carter, 2010), but now with a specific scheme for neighbor-hoods. BREEAMCommunities is an independent, third-party assessment
certification standard based on the established BREEAM methodology(BREEAM, 2011). Itwas developedbyBREGlobal in 2009 to help plannersand developers take account of the full range of issues that must be con-sidered from the earliest stages of the development process, and to mea-sure and independently certify the sustainability of project proposals atthe planning stage of the development process (BRE Global, 2011).
2.4. CASBEE‐UD
CASBEE was developed in 2004 by the Japan Sustainable BuildingConsortium (JSBC), involving committees in academic, industrial, andgovernment sectors (Sev, 2011), and its family covers housing scale,building scale, and urban scale. CASBEE for Urban Development carrieson the concepts of CASBEE (building scale), and it is one of the expandedCASBEE tools developedwith reference to the Q3 (Outdoor Environmenton Site) and LR3 (Off-site Environment) assessment items of CASBEE forNew Construction. It is an independent assessment certification tool de-veloped to contribute to enhancing sustainability in urban plans. The in-teriors of the buildings are excluded from assessment. However, theCASBEE product family includes “CASBEE for an Urban Area+Buildings”,which enables the use of CASBEE-UD togetherwith building scale assess-ment (CASBEE for Urban Development, 2007).
2.5. HQE2R
HQE2R was a 30-month European research and development projecton sustainable renovation of the built environment and the regenerationof urban neighborhoods (Blum, 2007). The project started in 2001 andcontinued until 2004. It was coordinated by Centre Scientifique et Tech-nique du bâtiment (CSTB) in France (Charlot-Valdieu et al., 2004). Inorder to assess the different scenarios and to support decisions for action,HQE2R proposes three tools:
– A model to assess the long term impacts on the neighborhood andsustainability of scenarios for buildings and planning projects,using the indisputable indicators system (INDI model).
– An environmental impact model at both the neighborhood andthe buildings scales (ENVI model)
– An economic and environmental assessment model for renovationor construction of a building (ASCOT MODEL) (Nagy and Grossi,2003).
76 A. Sharifi, A. Murayama / Environmental Impact Assessment Review 38 (2013) 73–87
2.6. Ecocity
Ecocity is an international research project supported by the Euro-pean Commission within the 5th framework program. The approachof Ecocity is to develop a common concept and design model settle-ments in seven participating countries with different socio-cultural,legislative, economic and climatic conditions (Coplak and Raksanyi,2003).
Ecocity was practiced from 2002 to 2005 (Gaffron et al., 2005). Ithas a self-assessment list with focus on the evaluation of urban struc-ture and transport, and several indicators and benchmarks have beendeveloped for the purpose of assessment. The relative evaluation isconducted by comparing the value of an indicator to a given bench-mark value (Gaffron et al., 2008).
2.7. SCR
SCR has been developed by VicUrban, the Victorian Government'sland development agency. It was developed to ensure that VicUrban in-corporated “measurable principles of economic, environmental and so-cial sustainability” into its projects (Hurley, 2009).
SCR has developed three assessment tools to measure planned per-formance for different types of residential communities: Master PlannedCommunity, Urban Renewal Community, and Provincial Community. Inthis study, the 2007 version of master planned community has beenused for analysis (SCR, 2011).
Table 2Characteristics of NSA tools.
NSA tool LEED-ND ECC BREEAMCommunities
CASBEE-U
Developmentdate
2009 (pilot2007)
2003 2009 2006 (reviedition)
Country/region
USA, Canada,and China
USA UK Japan
Ratings Certified 40–49
Minimally acceptablegreen development:100 points plus thepre-requisites
Unclassified b25 Poor (C)
Silver 50–59
Pass ≥25 Fairlypoor(B−)
Good ≥40 Good(B+)
Gold 60–79
Very good ≥55 Verygood (A)
Platinum80–100
Excellent ≥70 Excellent(S)Outstanding ≥85
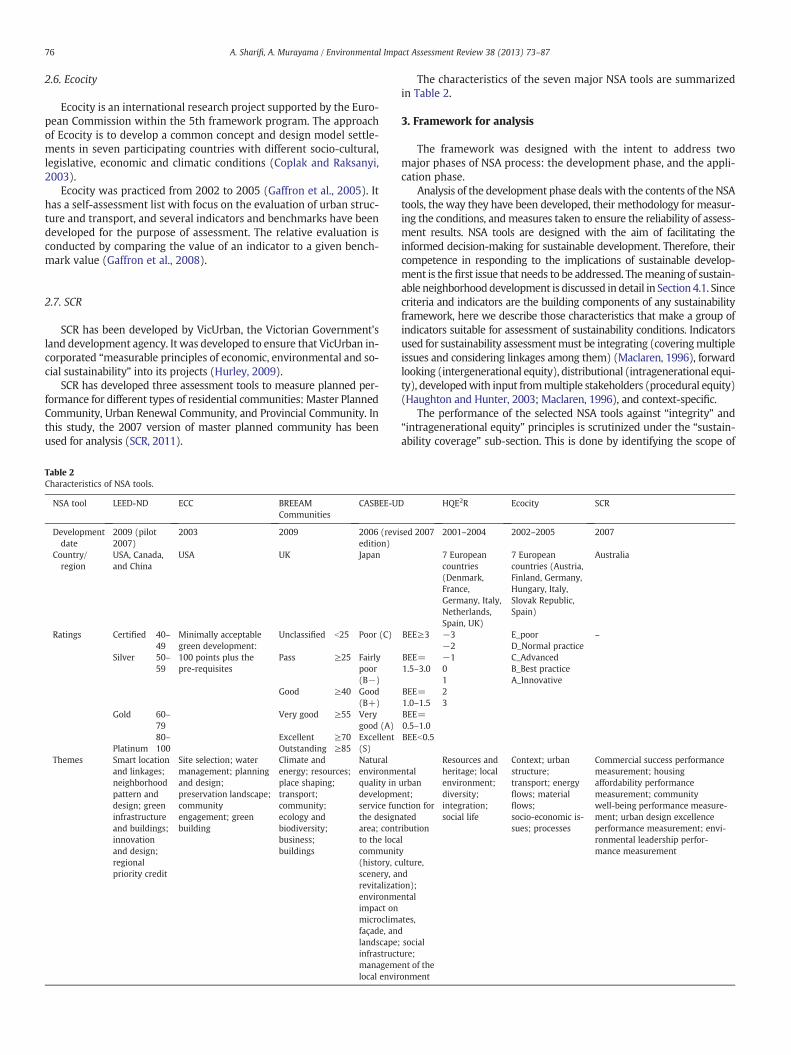
Themes Smart locationand linkages;neighborhoodpattern anddesign; greeninfrastructureand buildings;innovationand design;regionalpriority credit
Site selection; watermanagement; planningand design;preservation landscape;communityengagement; greenbuilding
Climate andenergy; resources;place shaping;transport;community;ecology andbiodiversity;business;buildings
Naturalenvironmequality indevelopmeservice funthe designarea; contto the locacommunit(history, cscenery, anrevitalizatenvironmeimpact onmicroclimfaçade, anlandscape;infrastructmanagemelocal envir
The characteristics of the seven major NSA tools are summarizedin Table 2.
3. Framework for analysis
The framework was designed with the intent to address twomajor phases of NSA process: the development phase, and the appli-cation phase.
Analysis of the development phase deals with the contents of the NSAtools, the way they have been developed, their methodology for measur-ing the conditions, andmeasures taken to ensure the reliability of assess-ment results. NSA tools are designed with the aim of facilitating theinformed decision-making for sustainable development. Therefore, theircompetence in responding to the implications of sustainable develop-ment is the first issue that needs to be addressed. Themeaning of sustain-able neighborhooddevelopment is discussed in detail in Section 4.1. Sincecriteria and indicators are the building components of any sustainabilityframework, here we describe those characteristics that make a group ofindicators suitable for assessment of sustainability conditions. Indicatorsused for sustainability assessmentmust be integrating (coveringmultipleissues and considering linkages among them) (Maclaren, 1996), forwardlooking (intergenerational equity), distributional (intragenerational equi-ty), developedwith input frommultiple stakeholders (procedural equity)(Haughton and Hunter, 2003; Maclaren, 1996), and context-specific.
The performance of the selected NSA tools against “integrity” and“intragenerational equity” principles is scrutinized under the “sustain-ability coverage” sub-section. This is done by identifying the scope of
D HQE2R Ecocity SCR
sed 2007 2001–2004 2002–2005 2007
7 Europeancountries(Denmark,France,Germany, Italy,Netherlands,Spain, UK)
7 Europeancountries (Austria,Finland, Germany,Hungary, Italy,Slovak Republic,Spain)
Australia
BEE≥3 −3−2−10123
E_poorD_Normal practiceC_AdvancedB_Best practiceA_Innovative
–
BEE=1.5–3.0
BEE=1.0–1.5BEE=0.5–1.0BEEb0.5
ntalurbannt;ction foratedributionlyulture,d
ion);ntal
ates,dsocialure;nt of theonment
Resources andheritage; localenvironment;diversity;integration;social life
Context; urbanstructure;transport; energyflows; materialflows;socio-economic is-sues; processes
Commercial success performancemeasurement; housingaffordability performancemeasurement; communitywell-being performance measure-ment; urban design excellenceperformance measurement; envi-ronmental leadership perfor-mance measurement
77A. Sharifi, A. Murayama / Environmental Impact Assessment Review 38 (2013) 73–87
selected tools and analyzing their success in providing a holistic accountof the situations. Considering that the mere inclusion of differentcriteria does not assure their uptake, “Inclusion of pre-requisites” as awarrant for achieving a certain level of performance is also investigated.Context-specificity of the selected tools is examined in the “Adaptationto locality” sub-section. The rigor and reliability of assessmentmethod-ology, measures taken to mitigate the subjectivity, and considerationsto fulfill the principle of “intergenerational equity” through usingmean-ingful set of reference points that can best proximate the conditions andrequirements in the future time horizons are criticized in the “Scoringand weighting” sub-section. Compliance with the “procedural equity”principle as an important element in the process of sustainability assess-ment is investigated in the “Participation” sub-section. Considering theimportance of proper reporting of the assessment results in helpingthe NSA tools to achieve their main aimwhich is to function as decisionsupport systems, “Presentation of results” is explored in a separatesub-section.
For NSA tools to realize their aim of contributing to sustainable de-velopment, a comprehensive and reliable NSA tool alone is not suffi-cient. Application, as the second major phase of assessment process,needs to be also considered. Accordingly, in this paper the applicabil-ity of the selected NSA tools is also analyzed.
Based on what was discussed above, the following framework isdesigned to be used in the analysis:
– Sustainability coverage: What are the major themes included in theNSA tools and how successful are they in assessing neighbor-hoods' performance in a comprehensive and integrated way?
– Inclusion of pre-requisites: Whether there are strategies to assurethe achievement of a certain level of performance.
– Adaptation to locality: Whether the NSA tools have considered thecontext-specific needs and priorities in their assessments.
– Scoring and weighting: What methods are used by NSA tools toscore and weigh different criteria and how rigorous is thisprocess?
– Participation: What mechanisms are utilized by the NSA tools toinvolve different stakeholders during the development and opera-tional stages?
– Presentation of results: How do NSA tools report the results of as-sessment and to what extent are they useful as decision supportsystems?
– Applicability: How practical are the NSA tools and what strategiescan be taken to increase their applicability?
Each of the elements of this framework is further explained underthe respective sub-section. It should not be forgotten however, thatthey are all interconnected and must be regarded as complementaryelements which should not be used in isolation.
Content analysis of relevant documents such as guidelines, policypapers, andmanuals of each of the sevenNSA tools,was themainmeth-od used for analyzing the tools using this framework.Moreover, in caseswhere further information was required, interviews (CASBEE-UD) andpersonal communications (LEED-ND, BREEAM Communities, and SCR)with tools' developers and experts were conducted to acquire the infor-mation necessary for analysis.
4. Analysis using the framework
4.1. Sustainability coverage
To investigate the tools' potential for sustainability coverage, it isnecessary to first clarify what we mean here by the term sustainability.Since the publication of Bruntland report (WCED, World Commissionon Environment and Development, 1987), numerous definitions ofwhat sustainable development entails have been made (Boyoko et al.,2006; Langeweg, 1998). Oftenused interchangeablywith the term “sus-tainability”, there is still no consensus on how to define sustainable
development. However, despite all these varieties in interpretations,central to most of them is the integration of social, economic, and envi-ronmental dimensions, often mentioned as the three pillars of sustain-ability (Boyoko et al., 2006).
In addition, some authors like Valentin and Spangenberg (2000),Parris and Kates (2003), and Wijngaarden (2001); also, emphasizeon the importance of integrating the institutional dimension.
In the urban and neighborhood contexts, where various forces andentities influence the decision-making process, it is crucial to add theinstitutional dimension to the three pillars of sustainability. What wemean here as institutional is not only interactions between the gov-ernmental and non-governmental organizations involved in the deci-sion making, but also a set of norms, laws, and regulations governingthese interactions. As Spangenberg (2002) contends, institutional di-mension also has the ability to facilitate the linkages between otherdimensions and complement them. Accordingly, in this study we con-sider sustainability as having four pillars.
Although approaching sustainability is the common objective of thetools studied here, there are differences in the way they pursue it. There-fore, despite having similarities, the themes, criteria, and indicators usedfor assessment are not common within urban assessment tools. It is nec-essary to briefly describe what is meant here by the terms “theme”, “cri-terion”, and “indicator”. Themes are the broad topics of concern tosustainability. Each theme has one or more criteria which, as defined byMunier (2004), are “parameters used to evaluate the contribution of aproject to meet the required objective”. Each criterion has, in turn, oneor more indicators which are variables that provide specific measure-ments. This can be better explained through an example: “resourcesand environment” is one of the main themes which includes “energy”as a criterion that can be measured by indicators such as “the amount ofneighborhood's annual heating/or cooling consumption provided by theneighborhood plant” and “the ratio of solar oriented buildings”.
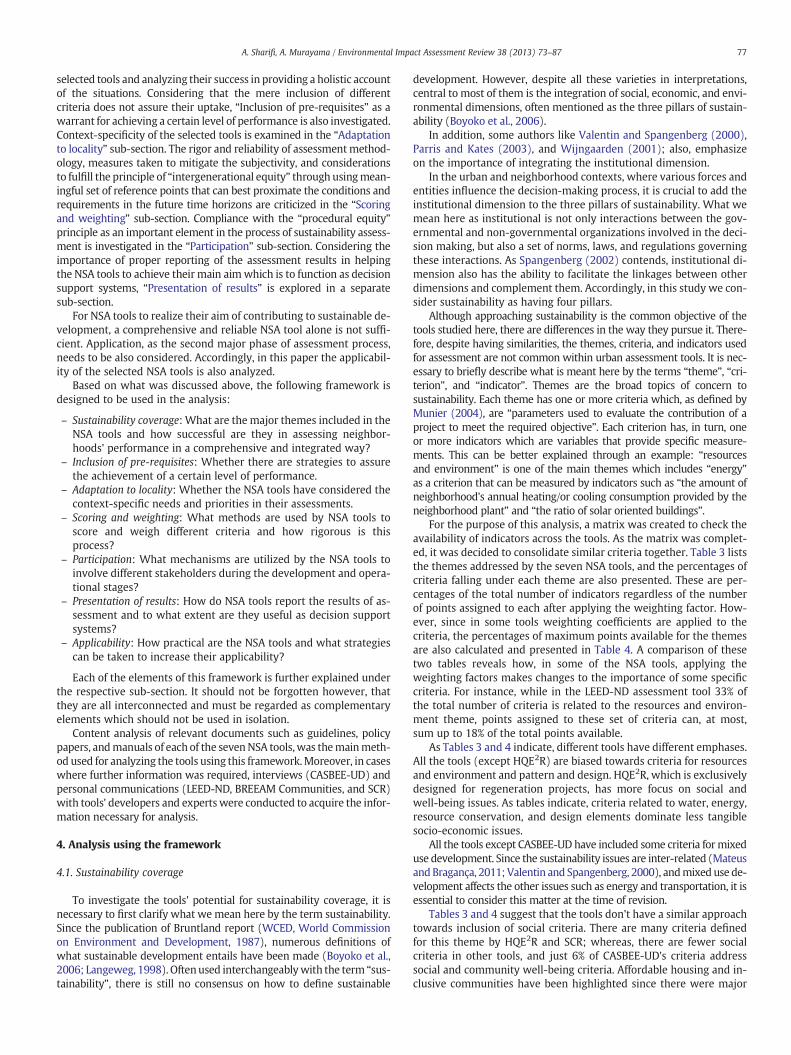
For the purpose of this analysis, a matrix was created to check theavailability of indicators across the tools. As the matrix was complet-ed, it was decided to consolidate similar criteria together. Table 3 liststhe themes addressed by the seven NSA tools, and the percentages ofcriteria falling under each theme are also presented. These are per-centages of the total number of indicators regardless of the numberof points assigned to each after applying the weighting factor. How-ever, since in some tools weighting coefficients are applied to thecriteria, the percentages of maximum points available for the themesare also calculated and presented in Table 4. A comparison of thesetwo tables reveals how, in some of the NSA tools, applying theweighting factors makes changes to the importance of some specificcriteria. For instance, while in the LEED-ND assessment tool 33% ofthe total number of criteria is related to the resources and environ-ment theme, points assigned to these set of criteria can, at most,sum up to 18% of the total points available.
As Tables 3 and 4 indicate, different tools have different emphases.All the tools (except HQE2R) are biased towards criteria for resourcesand environment and pattern and design. HQE2R, which is exclusivelydesigned for regeneration projects, has more focus on social andwell-being issues. As tables indicate, criteria related to water, energy,resource conservation, and design elements dominate less tangiblesocio-economic issues.
All the tools except CASBEE-UD have included some criteria formixeduse development. Since the sustainability issues are inter-related (Mateusand Bragança, 2011; Valentin and Spangenberg, 2000), andmixed use de-velopment affects the other issues such as energy and transportation, it isessential to consider this matter at the time of revision.
Tables 3 and 4 suggest that the tools don't have a similar approachtowards inclusion of social criteria. There are many criteria definedfor this theme by HQE2R and SCR; whereas, there are fewer socialcriteria in other tools, and just 6% of CASBEE-UD's criteria addresssocial and community well-being criteria. Affordable housing and in-clusive communities have been highlighted since there were major
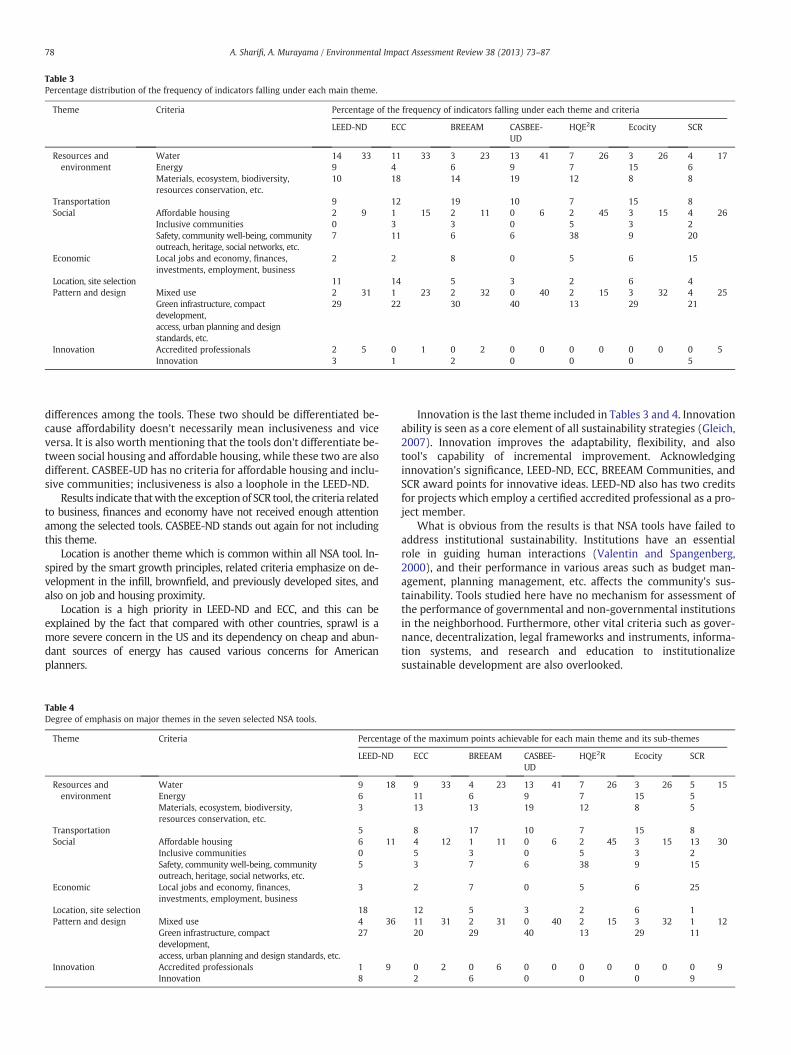
Table 3Percentage distribution of the frequency of indicators falling under each main theme.
Theme Criteria Percentage of the frequency of indicators falling under each theme and criteria
LEED-ND ECC BREEAM CASBEE-UD
HQE2R Ecocity SCR
Resources andenvironment
Water 14 33 11 33 3 23 13 41 7 26 3 26 4 17Energy 9 4 6 9 7 15 6Materials, ecosystem, biodiversity,resources conservation, etc.
10 18 14 19 12 8 8
Transportation 9 12 19 10 7 15 8Social Affordable housing 2 9 1 15 2 11 0 6 2 45 3 15 4 26
Inclusive communities 0 3 3 0 5 3 2Safety, community well-being, communityoutreach, heritage, social networks, etc.
7 11 6 6 38 9 20
Economic Local jobs and economy, finances,investments, employment, business
2 2 8 0 5 6 15
Location, site selection 11 14 5 3 2 6 4Pattern and design Mixed use 2 31 1 23 2 32 0 40 2 15 3 32 4 25
Green infrastructure, compactdevelopment,access, urban planning and designstandards, etc.
29 22 30 40 13 29 21
Innovation Accredited professionals 2 5 0 1 0 2 0 0 0 0 0 0 0 5Innovation 3 1 2 0 0 0 5
78 A. Sharifi, A. Murayama / Environmental Impact Assessment Review 38 (2013) 73–87
differences among the tools. These two should be differentiated be-cause affordability doesn't necessarily mean inclusiveness and viceversa. It is also worth mentioning that the tools don't differentiate be-tween social housing and affordable housing, while these two are alsodifferent. CASBEE-UD has no criteria for affordable housing and inclu-sive communities; inclusiveness is also a loophole in the LEED-ND.
Results indicate thatwith the exception of SCR tool, the criteria relatedto business, finances and economy have not received enough attentionamong the selected tools. CASBEE-ND stands out again for not includingthis theme.
Location is another theme which is common within all NSA tool. In-spired by the smart growth principles, related criteria emphasize on de-velopment in the infill, brownfield, and previously developed sites, andalso on job and housing proximity.
Location is a high priority in LEED-ND and ECC, and this can beexplained by the fact that compared with other countries, sprawl is amore severe concern in the US and its dependency on cheap and abun-dant sources of energy has caused various concerns for Americanplanners.
Table 4Degree of emphasis on major themes in the seven selected NSA tools.
Theme Criteria Percentage
LEED-ND
Resources andenvironment
Water 9 18Energy 6Materials, ecosystem, biodiversity,resources conservation, etc.
3
Transportation 5Social Affordable housing 6 11
Inclusive communities 0Safety, community well-being, communityoutreach, heritage, social networks, etc.
5
Economic Local jobs and economy, finances,investments, employment, business
3
Location, site selection 18Pattern and design Mixed use 4 36
Green infrastructure, compactdevelopment,access, urban planning and design standards, etc.
27
Innovation Accredited professionals 1 9Innovation 8
Innovation is the last theme included in Tables 3 and 4. Innovationability is seen as a core element of all sustainability strategies (Gleich,2007). Innovation improves the adaptability, flexibility, and alsotool's capability of incremental improvement. Acknowledginginnovation's significance, LEED-ND, ECC, BREEAM Communities, andSCR award points for innovative ideas. LEED-ND also has two creditsfor projects which employ a certified accredited professional as a pro-ject member.
What is obvious from the results is that NSA tools have failed toaddress institutional sustainability. Institutions have an essentialrole in guiding human interactions (Valentin and Spangenberg,2000), and their performance in various areas such as budget man-agement, planning management, etc. affects the community's sus-tainability. Tools studied here have no mechanism for assessment ofthe performance of governmental and non-governmental institutionsin the neighborhood. Furthermore, other vital criteria such as gover-nance, decentralization, legal frameworks and instruments, informa-tion systems, and research and education to institutionalizesustainable development are also overlooked.
of the maximum points achievable for each main theme and its sub-themes
ECC BREEAM CASBEE-UD
HQE2R Ecocity SCR
9 33 4 23 13 41 7 26 3 26 5 1511 6 9 7 15 513 13 19 12 8 5
8 17 10 7 15 84 12 1 11 0 6 2 45 3 15 13 305 3 0 5 3 23 7 6 38 9 15
2 7 0 5 6 25
12 5 3 2 6 111 31 2 31 0 40 2 15 3 32 1 1220 29 40 13 29 11
0 2 0 6 0 0 0 0 0 0 0 92 6 0 0 0 9
79A. Sharifi, A. Murayama / Environmental Impact Assessment Review 38 (2013) 73–87
As the NSA tools evolve, institutional sustainability criteria areexpected to be included in the sustainability checklists to addressthe issue of governance and need for more efficient administrativeprocedures. QSAS and Green Star Communities can be regarded asharbingers of this evolution, as they have respectively included man-agement and urban governance in their themes.
Results of this section are in agreement with those reported byMurgante et al. (2011) suggesting that there is a lack of balance be-tween different sustainability dimensions. This section's analyses in-dicate that the issue of integrated sustainability which has beenemphasized in many studies (e.g., Conroy and Berke, 2004; Dahl,2007; Hacking and Guthrie, 2008; Roseland, 2000) is not yet welladdressed within the framework of NSA tools; and, by and large, en-vironmental dimension dominates other less tangible dimensions.While environmental aspects are essential for achieving the inter-generational equity, other aspects and their essential role in fulfill-ment of intragenerational equity should not be overlooked. Thisneeds to be considered at the time of refinement.
Developing a set of horizontal standardized methods, similar toCEN/TC 350 standards developed by the European Committee forStandardization, which provides a core set of criteria for assessmentin a region is a good way to achieve an integrated and holistic frame-work that avoids gaps and overlapping. However, since neighbor-hoods have different meanings in different contexts, this should bein tandem with mechanisms for adaptations which are discussed inSections 4.3 and 4.4.
It should be mentioned however, that inclusion of a specific crite-rion in the assessment system doesn't guarantee its implementation,and there should be other mechanisms for enforcement. Section 4.2brings up the importance of having pre-requisites in the assessmentframework.
4.2. Inclusion of pre-requisites
In the previous section it was warned that inclusion of criteria perse doesn't necessarily mean that the development will comply withthem. Some measures need to be taken to ensure that the minimumsustainability requirements are met.
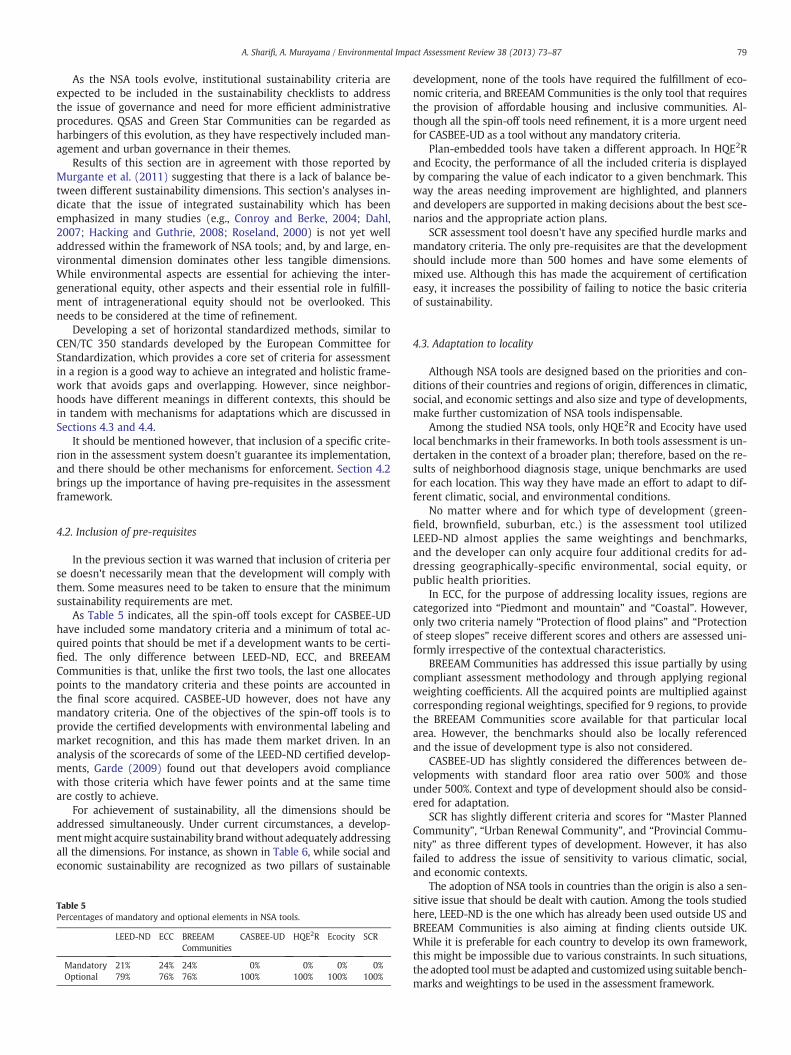
As Table 5 indicates, all the spin-off tools except for CASBEE-UDhave included some mandatory criteria and a minimum of total ac-quired points that should be met if a development wants to be certi-fied. The only difference between LEED-ND, ECC, and BREEAMCommunities is that, unlike the first two tools, the last one allocatespoints to the mandatory criteria and these points are accounted inthe final score acquired. CASBEE-UD however, does not have anymandatory criteria. One of the objectives of the spin-off tools is toprovide the certified developments with environmental labeling andmarket recognition, and this has made them market driven. In ananalysis of the scorecards of some of the LEED-ND certified develop-ments, Garde (2009) found out that developers avoid compliancewith those criteria which have fewer points and at the same timeare costly to achieve.
For achievement of sustainability, all the dimensions should beaddressed simultaneously. Under current circumstances, a develop-mentmight acquire sustainability brandwithout adequately addressingall the dimensions. For instance, as shown in Table 6, while social andeconomic sustainability are recognized as two pillars of sustainable
Table 5Percentages of mandatory and optional elements in NSA tools.
LEED-ND ECC BREEAMCommunities
CASBEE‐UD HQE2R Ecocity SCR
Mandatory 21% 24% 24% 0% 0% 0% 0%Optional 79% 76% 76% 100% 100% 100% 100%
development, none of the tools have required the fulfillment of eco-nomic criteria, and BREEAM Communities is the only tool that requiresthe provision of affordable housing and inclusive communities. Al-though all the spin-off tools need refinement, it is a more urgent needfor CASBEE-UD as a tool without any mandatory criteria.
Plan-embedded tools have taken a different approach. In HQE2Rand Ecocity, the performance of all the included criteria is displayedby comparing the value of each indicator to a given benchmark. Thisway the areas needing improvement are highlighted, and plannersand developers are supported in making decisions about the best sce-narios and the appropriate action plans.
SCR assessment tool doesn't have any specified hurdle marks andmandatory criteria. The only pre-requisites are that the developmentshould include more than 500 homes and have some elements ofmixed use. Although this has made the acquirement of certificationeasy, it increases the possibility of failing to notice the basic criteriaof sustainability.
4.3. Adaptation to locality
Although NSA tools are designed based on the priorities and con-ditions of their countries and regions of origin, differences in climatic,social, and economic settings and also size and type of developments,make further customization of NSA tools indispensable.
Among the studied NSA tools, only HQE2R and Ecocity have usedlocal benchmarks in their frameworks. In both tools assessment is un-dertaken in the context of a broader plan; therefore, based on the re-sults of neighborhood diagnosis stage, unique benchmarks are usedfor each location. This way they have made an effort to adapt to dif-ferent climatic, social, and environmental conditions.
No matter where and for which type of development (green-field, brownfield, suburban, etc.) is the assessment tool utilizedLEED-ND almost applies the same weightings and benchmarks,and the developer can only acquire four additional credits for ad-dressing geographically-specific environmental, social equity, orpublic health priorities.
In ECC, for the purpose of addressing locality issues, regions arecategorized into “Piedmont and mountain” and “Coastal”. However,only two criteria namely “Protection of flood plains” and “Protectionof steep slopes” receive different scores and others are assessed uni-formly irrespective of the contextual characteristics.
BREEAM Communities has addressed this issue partially by usingcompliant assessment methodology and through applying regionalweighting coefficients. All the acquired points are multiplied againstcorresponding regional weightings, specified for 9 regions, to providethe BREEAM Communities score available for that particular localarea. However, the benchmarks should also be locally referencedand the issue of development type is also not considered.
CASBEE-UD has slightly considered the differences between de-velopments with standard floor area ratio over 500% and thoseunder 500%. Context and type of development should also be consid-ered for adaptation.
SCR has slightly different criteria and scores for “Master PlannedCommunity”, “Urban Renewal Community”, and “Provincial Commu-nity” as three different types of development. However, it has alsofailed to address the issue of sensitivity to various climatic, social,and economic contexts.
The adoption of NSA tools in countries than the origin is also a sen-sitive issue that should be dealt with caution. Among the tools studiedhere, LEED-ND is the one which has already been used outside US andBREEAM Communities is also aiming at finding clients outside UK.While it is preferable for each country to develop its own framework,this might be impossible due to various constraints. In such situations,the adopted toolmust be adapted and customized using suitable bench-marks and weightings to be used in the assessment framework.
Table 6Distribution of mandatory elements across those tools which have required mandatory criteria.
Theme Criteria LEED-ND ECC BREEAM
F % F % F %
Resources and environment Water 2 17 5 20 1 6Energy 1 8 0 0 2 13Other resources (materials, ecosystem, biodiversity, resources conservation) 3 25 5 20 3 19
Transportation 0 0 1 4 2 13Social Affordable housing 0 0 0 0 1 6
Inclusive communities 0 0 1 4 1 6Safety, community outreach, health and wellbeing, education, cultural, heritage, social networks, … 0 0 5 20 1 6
Economic Local Jobs and economy, finances, investments, employment 0 0 0 0 0 0Location, site selection 2 17 1 4 1 6Pattern and design Mixed use 0 0 0 0 0 0
Green infrastructure, compact development, access, urban planning and design standards 4 33 7 28 4 25Total 12 100 25 100 16 100
80 A. Sharifi, A. Murayama / Environmental Impact Assessment Review 38 (2013) 73–87
Because of significant variations in scope, planners should be awarethat one size doesn't fit all and a customized and adapted tool with sup-plementary information is needed for each development. Therefore,context-specific criteria should be included and weightings should beassigned according to values of relevant specific communities (Gibsonet al., 2005). This might impose additional economic burden on the de-veloper, but it is the onlyway they can assure the viability and reliabilityof assessment results and providing the decision-makerswith a realisticaccount of the situations. Section 4.4 explores the weighting and its rolein taking account of context-specific issues.
4.4. Scoring and weighting
Other important aspects of NSA tools are scoring and weightingwhich, as Retzlaff (2008) contends, are related to local adaptabilitythat was discussed in the previous section. Similar to comparative as-sessments involving many relevant factors (Gibson et al., 2005), NSAtools weigh criteria by assigning a score value for each element.
Weighting is one of the most theoretically controversial aspectswithin the SA systems (Alwaer et al., 2008; Retzlaff, 2009). It impliesthe significance and importance of different criteria, although it is ex-tremely difficult to compare and rank different elements (Retzlaff,2009).
The often subjective nature of scoring and weighting differentcriteria (Garde, 2009; Retzlaff, 2009; Vakili-Ardebili and Boussabaine,2007), has made this practice vulnerable to ambiguity (Kajikawa etal., 2011).
Weighting procedures were scrutinized to find the basis forweighting across the tools. Each tool has its own unique way ofweighting the criteria; however, tools can be classified into four cate-gories based on the similarities among them.
LEED-ND, ECC, and SCR constitute the first category. There aresome differences between the criteria used in their lists, but even inthe cases where identical criteria are used sometimes different pointsare awarded. For instance they have respectively allocated 4, 35, and8 points to the mixed-use criterion. Notwithstanding these differ-ences, these tools have undertaken similar ways to weight elements.None of them use fractions or negative values. Despite using a mix-ture of quantitative and qualitative measures, it has been tried to, asmuch as possible, verify the scores objectively; this is a good effortto reduce the subjectivity of scoring. They have developed target per-formances or benchmarks for each criterion, and points are awardedbased on how much the performance is above the target or bench-mark. The potential impacts of each criterion are considered when al-locating points. As such those with higher potential of causingimpacts would be weighedmore heavily. As a basis for relative alloca-tion of points, experts use the impact categories and standards set bydifferent institutes and organizations, and the practice of assigning
relative importance to the criteria is the time when the problem ofsubjectivity raises.
Because of its distinctive characteristics, “BREEAM communities”is the single tool of second category. Allocating not more than 3 pointsto each individual criterion and applying regional weightings are fea-tures that distinguish its weighting system from those of the tools inthe previous category.
Minimum acceptable performance levels and benchmarks are setwhich should be satisfied for a criterion to acquire one point as the“minimum”. Two points are awarded when a higher performancelevel, labeled as “good”, is acquired, and there are three points avail-able for the “best” performance. Likewise the tools in the former cat-egory, technical standards and scientific evidence are used to makethe tools more objective and credible. However, there are several oc-casions where the weighting system is ambiguous and prone to sub-jectivity. This issue can better be understood in the light of anexample: The criteria for “Land reuse” states that to attain the mini-mum point the developer should demonstrate that 50–74% of the de-velopment site that was built on previously developed/brownfieldland will be brought back into use, and if it can be demonstratedthat 75–99% and 100% of the site meet the criteria, two and threepoints can be awarded, respectively. The problem is that there is noscientific justification for setting 50% as the minimum and awardingthe same points for two different projects that their correspondingpercentages are in the same range, but with significant difference.For instance, the project which 50% of it is built on brownfield landacquires as many points as the one with 74% built on brownfields.
Moreover, in some cases, assessor's discretion might be decisive inpoint allocation. This is a more serious issue when dealing with social is-sues. The practice of setting regionalweightings too, involves subjectivity.
Likewise the second category, the third one includes just one toolnamely CASBEE-UD. Scoring and weighting is done using a mixture ofqualitative and quantitative measures.
Each criterion has 5 score levels from 1 to 5. However, this doesn'tmean that levels 1 and 5 are always designated as respectively thelowest and highest levels of performance. In many cases, one ormore levels are designated as inapplicable without giving a specificreason. For instance, in the case of assessing the performance againstthe criterion for “Reduction of ground subsidence” levels 4 and 5 aredefined as inapplicable and level 3 is the highest level of performance.
Unlike tools in the previous categories, weights are not allocatedby comparing the performance level against a target level of perfor-mance. Level 3 which is an indicator of the normal situation (acceptedlevel of performance in Japan, e.g. for classification, treatment, anddisposal of waste, sorting waste into five types is considered as a nor-mal practice and is used for defining level 3), is used as a referencelevel, and scores from 1 to 5 are assigned according to the perfor-mance level (below, equal, or above the reference level). Althoughin some cases the standards set by other departments are utilized
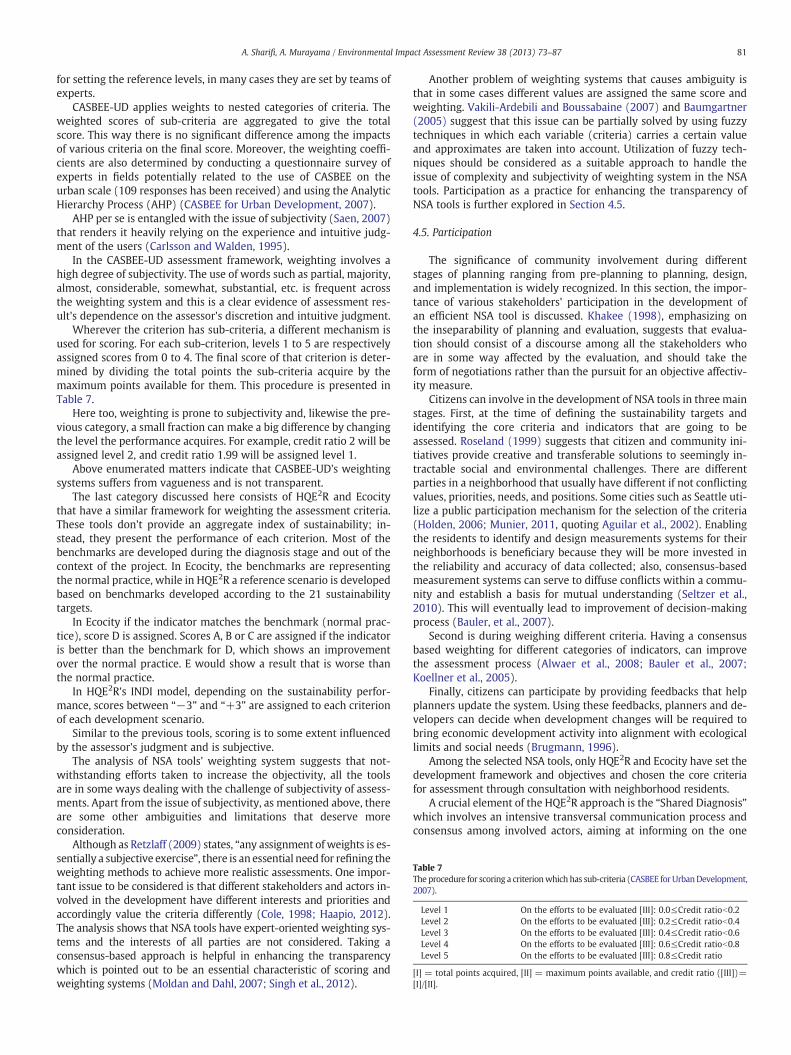
Table 7The procedure for scoring a criterionwhich has sub-criteria (CASBEE forUrbanDevelopment,2007).
Level 1 On the efforts to be evaluated [III]: 0.0≤Credit ratiob0.2Level 2 On the efforts to be evaluated [III]: 0.2≤Credit ratiob0.4Level 3 On the efforts to be evaluated [III]: 0.4≤Credit ratiob0.6Level 4 On the efforts to be evaluated [III]: 0.6≤Credit ratiob0.8Level 5 On the efforts to be evaluated [III]: 0.8≤Credit ratio
[I] = total points acquired, [II] = maximum points available, and credit ratio ([III])=[I]/[II].
81A. Sharifi, A. Murayama / Environmental Impact Assessment Review 38 (2013) 73–87
for setting the reference levels, in many cases they are set by teams ofexperts.
CASBEE-UD applies weights to nested categories of criteria. Theweighted scores of sub-criteria are aggregated to give the totalscore. This way there is no significant difference among the impactsof various criteria on the final score. Moreover, the weighting coeffi-cients are also determined by conducting a questionnaire survey ofexperts in fields potentially related to the use of CASBEE on theurban scale (109 responses has been received) and using the AnalyticHierarchy Process (AHP) (CASBEE for Urban Development, 2007).
AHP per se is entangled with the issue of subjectivity (Saen, 2007)that renders it heavily relying on the experience and intuitive judg-ment of the users (Carlsson and Walden, 1995).
In the CASBEE-UD assessment framework, weighting involves ahigh degree of subjectivity. The use of words such as partial, majority,almost, considerable, somewhat, substantial, etc. is frequent acrossthe weighting system and this is a clear evidence of assessment res-ult's dependence on the assessor's discretion and intuitive judgment.
Wherever the criterion has sub-criteria, a different mechanism isused for scoring. For each sub-criterion, levels 1 to 5 are respectivelyassigned scores from 0 to 4. The final score of that criterion is deter-mined by dividing the total points the sub-criteria acquire by themaximum points available for them. This procedure is presented inTable 7.
Here too, weighting is prone to subjectivity and, likewise the pre-vious category, a small fraction can make a big difference by changingthe level the performance acquires. For example, credit ratio 2 will beassigned level 2, and credit ratio 1.99 will be assigned level 1.
Above enumerated matters indicate that CASBEE-UD's weightingsystems suffers from vagueness and is not transparent.
The last category discussed here consists of HQE2R and Ecocitythat have a similar framework for weighting the assessment criteria.These tools don't provide an aggregate index of sustainability; in-stead, they present the performance of each criterion. Most of thebenchmarks are developed during the diagnosis stage and out of thecontext of the project. In Ecocity, the benchmarks are representingthe normal practice, while in HQE2R a reference scenario is developedbased on benchmarks developed according to the 21 sustainabilitytargets.
In Ecocity if the indicator matches the benchmark (normal prac-tice), score D is assigned. Scores A, B or C are assigned if the indicatoris better than the benchmark for D, which shows an improvementover the normal practice. E would show a result that is worse thanthe normal practice.
In HQE2R's INDI model, depending on the sustainability perfor-mance, scores between “−3” and “+3” are assigned to each criterionof each development scenario.
Similar to the previous tools, scoring is to some extent influencedby the assessor's judgment and is subjective.
The analysis of NSA tools' weighting system suggests that not-withstanding efforts taken to increase the objectivity, all the toolsare in some ways dealing with the challenge of subjectivity of assess-ments. Apart from the issue of subjectivity, as mentioned above, thereare some other ambiguities and limitations that deserve moreconsideration.
Although as Retzlaff (2009) states, “any assignment of weights is es-sentially a subjective exercise”, there is an essential need for refining theweighting methods to achieve more realistic assessments. One impor-tant issue to be considered is that different stakeholders and actors in-volved in the development have different interests and priorities andaccordingly value the criteria differently (Cole, 1998; Haapio, 2012).The analysis shows that NSA tools have expert-oriented weighting sys-tems and the interests of all parties are not considered. Taking aconsensus-based approach is helpful in enhancing the transparencywhich is pointed out to be an essential characteristic of scoring andweighting systems (Moldan and Dahl, 2007; Singh et al., 2012).
Another problem of weighting systems that causes ambiguity isthat in some cases different values are assigned the same score andweighting. Vakili-Ardebili and Boussabaine (2007) and Baumgartner(2005) suggest that this issue can be partially solved by using fuzzytechniques in which each variable (criteria) carries a certain valueand approximates are taken into account. Utilization of fuzzy tech-niques should be considered as a suitable approach to handle theissue of complexity and subjectivity of weighting system in the NSAtools. Participation as a practice for enhancing the transparency ofNSA tools is further explored in Section 4.5.
4.5. Participation
The significance of community involvement during differentstages of planning ranging from pre-planning to planning, design,and implementation is widely recognized. In this section, the impor-tance of various stakeholders' participation in the development ofan efficient NSA tool is discussed. Khakee (1998), emphasizing onthe inseparability of planning and evaluation, suggests that evalua-tion should consist of a discourse among all the stakeholders whoare in some way affected by the evaluation, and should take theform of negotiations rather than the pursuit for an objective affectiv-ity measure.
Citizens can involve in the development of NSA tools in three mainstages. First, at the time of defining the sustainability targets andidentifying the core criteria and indicators that are going to beassessed. Roseland (1999) suggests that citizen and community ini-tiatives provide creative and transferable solutions to seemingly in-tractable social and environmental challenges. There are differentparties in a neighborhood that usually have different if not conflictingvalues, priorities, needs, and positions. Some cities such as Seattle uti-lize a public participation mechanism for the selection of the criteria(Holden, 2006; Munier, 2011, quoting Aguilar et al., 2002). Enablingthe residents to identify and design measurements systems for theirneighborhoods is beneficiary because they will be more invested inthe reliability and accuracy of data collected; also, consensus-basedmeasurement systems can serve to diffuse conflicts within a commu-nity and establish a basis for mutual understanding (Seltzer et al.,2010). This will eventually lead to improvement of decision-makingprocess (Bauler, et al., 2007).
Second is during weighing different criteria. Having a consensusbased weighting for different categories of indicators, can improvethe assessment process (Alwaer et al., 2008; Bauler et al., 2007;Koellner et al., 2005).
Finally, citizens can participate by providing feedbacks that helpplanners update the system. Using these feedbacks, planners and de-velopers can decide when development changes will be required tobring economic development activity into alignment with ecologicallimits and social needs (Brugmann, 1996).
Among the selected NSA tools, only HQE2R and Ecocity have set thedevelopment framework and objectives and chosen the core criteriafor assessment through consultation with neighborhood residents.
A crucial element of the HQE2R approach is the “Shared Diagnosis”which involves an intensive transversal communication process andconsensus among involved actors, aiming at informing on the one
82 A. Sharifi, A. Murayama / Environmental Impact Assessment Review 38 (2013) 73–87
hand and knowing the needs, wishes and priorities of residents andusers on the other hand.
In Ecocity, community input is acquired through iterative hearingsand workshops, and exchanges between developers and stakeholders.
CASBEE-UD has taken a step towards adopting a consensus-basedapproach; however, it has reduced the stakeholders to industry, gov-ernment, and academia.
In the other tools participation in the process of developing objec-tives and criteria for assessment is mainly restricted to group(s) ofexperts working with developer (s).
Regarding the involvement of residents in the weighting and feed-back processes, none of the tools have yet provided an arena for in-volvement of the residents in the practice.
4.6. Presentation of results
The next important issue to be discussed here is the presentationof assessment results. Although it is difficult, if not impossible, to pre-cisely define the degree of sustainability (Bell and Morse, 2008;Haberl et al., 2004), a sustainability report should provide a balancedand reasonable representation of the sustainability, including bothpositive and negative contributions (Sustainability, 2011).
The assessment results can potentially be used by different stake-holders including planners, developers, local authorities, real estatemarket, and residents. Notwithstanding the fact that end users' pur-poses of using the assessment results might differ from one another,as Coplak and Raksanyi (2003) suggest, the core aim of most of as-sessment tools is to play the role of a decision aid tool. The final re-sults must provide an adequate and reliable snapshot of thesituations on the ground, have the potential to guide planning deci-sions, evaluate actions and the degree of progress towards sustain-able development, and raise the awareness of residents.
Due to the significance of the assessment results in thedecision-making process, they should be straightforward and trans-parent to avoid green washing and ill-based decisions.
The ability to track temporal changes is another issue that needs tobe considered and is of high usage for the monitoring purposes.Below, the selected tools' approaches to presentation of results areanalyzed to evaluate their ability to address the above mentionedcharacteristics.
LEED-ND and BREEAM communities have a similar way of pre-senting the final results. The only difference between these two isthat in BREEAM Communities those projects which fail to acquirethreshold points are also labeled. As shown in Table 2, in most ofthe cases, certified projects are assigned a label based on the scoresthey've achieved. Despite simplicity of presentation, it cannot be reg-arded as a transparent representation of sustainability. As Koellner etal. (2005) point out, “still, the fundamental objective of both privateand institutional investors is to maximize the expected rate of returnon their investment”. This market driven nature of the majority of de-velopments, increases the risk of just focusing on some specific highlyvisible aspects or aspects that have a quick return on investment. Anexample of such aspects has been demonstrated in a study of some ofthe LEED-ND pilot projects in the United States (Garde, 2009). Al-though in practice compromises and trade-offs will be unavoidablein most policy, program, plan and project decisions (Gibson, 2006),the final presentation should identify the strengths and weaknessesof the project in order to inform end users of the situations. This ob-jective can to some extent be achieved by breaking down the resultsin terms of different aspects (such as economic, social, environmental,institutional). This way, those areas which are lagging behind can bespotted and accordingly proper actions can be taken to improve theirperformance level.
ECC and SCR have no rating categories and the user must gothrough all the criteria and their performance, which is not feasiblefor all users.
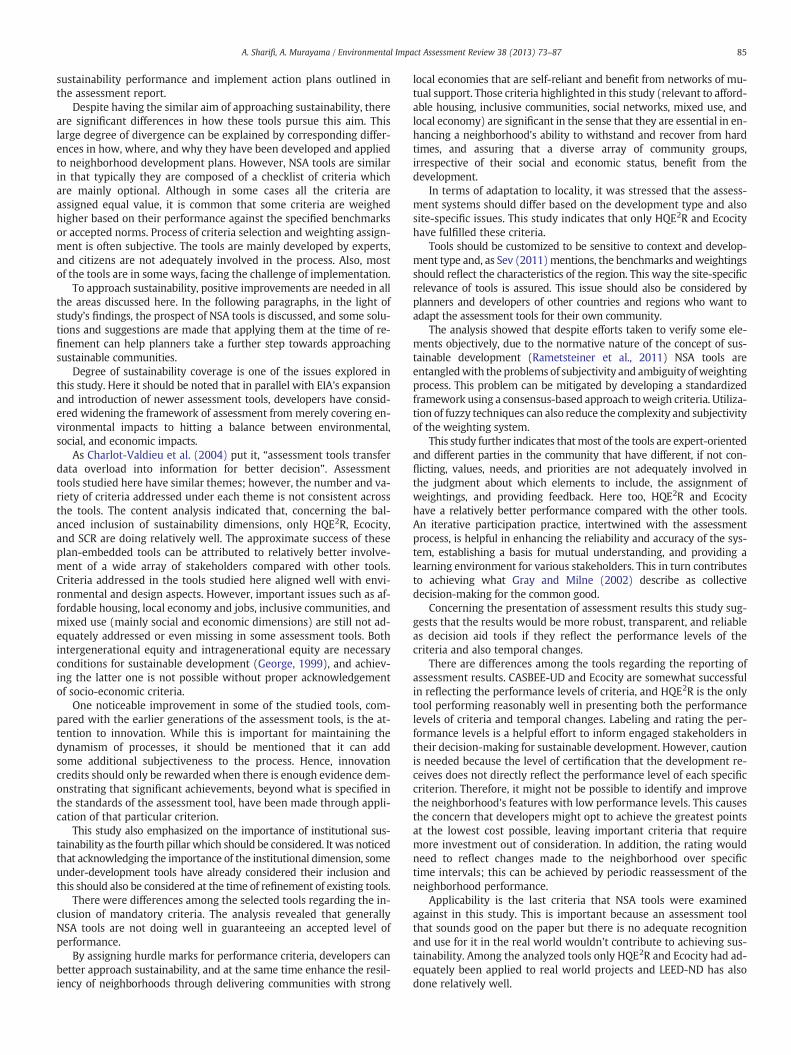
CASBEE-UD has to some extent addressed the aforementionedshortcomings by presenting the results of each theme. Moreover,there are two ratings (fairly poor and poor) for performances belowthe normal performance that highlight the areas needing improve-ment. The assessment results are displayed in three different formats.First, a graph of BEEUD (Building Environmental Efficiency of UrbanDevelopment) with “Environmental Quality in Urban Development”on the vertical axis and “Environmental Load in Urban Development”on the horizontal axis. The steeper the gradient, the more sustainableis the project. Second is a radar chart that is simply indicating the per-formance of each main theme. Third, six bar charts presenting theperformance of the main sub-themes of each of the six major themes.This helps the end user to get a better knowledge of those areas doingwell and those needing improvement. Moreover, presenting the datain three formats with increasing details makes it possible for the con-sumer of the tool to utilize the tool that meets her/his purpose. Fig. 1shows the CASBEE-UD's results for a given project.
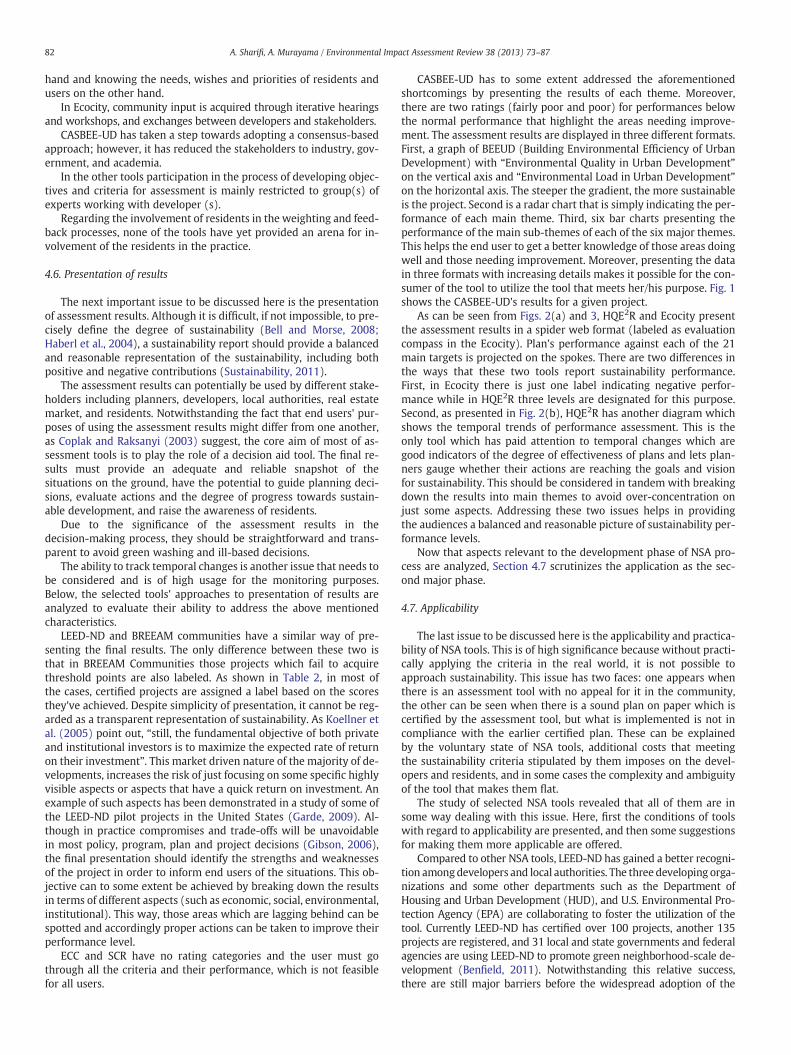
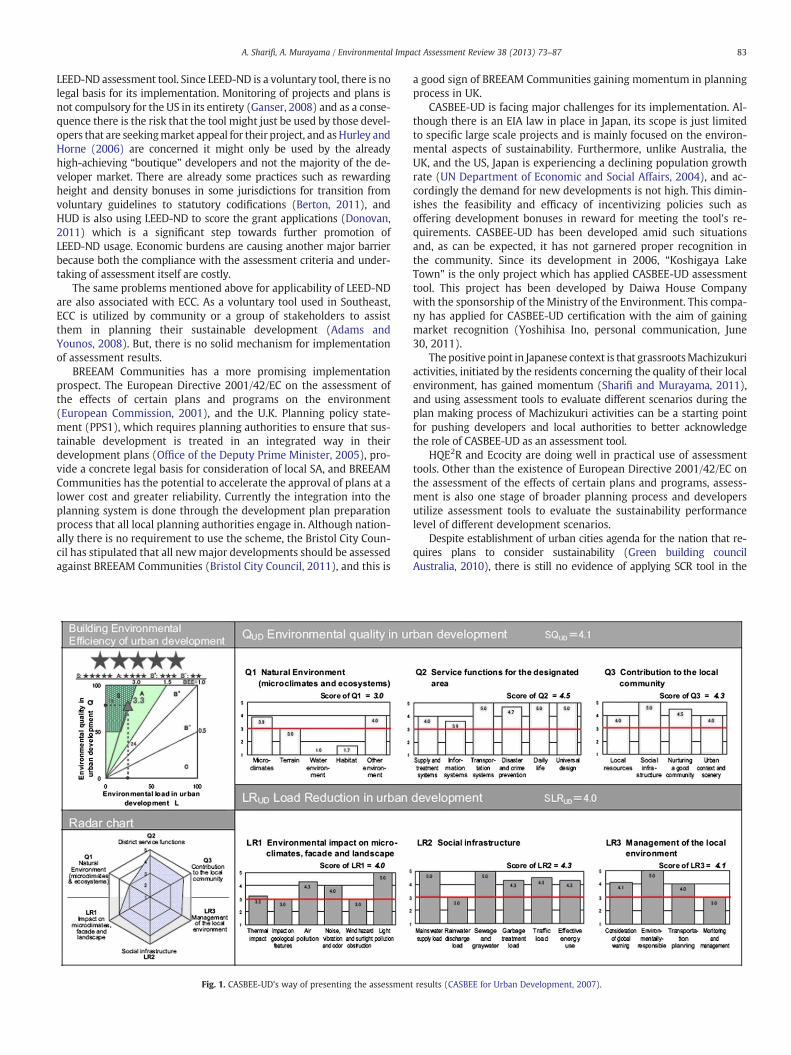
As can be seen from Figs. 2(a) and 3, HQE2R and Ecocity presentthe assessment results in a spider web format (labeled as evaluationcompass in the Ecocity). Plan's performance against each of the 21main targets is projected on the spokes. There are two differences inthe ways that these two tools report sustainability performance.First, in Ecocity there is just one label indicating negative perfor-mance while in HQE2R three levels are designated for this purpose.Second, as presented in Fig. 2(b), HQE2R has another diagram whichshows the temporal trends of performance assessment. This is theonly tool which has paid attention to temporal changes which aregood indicators of the degree of effectiveness of plans and lets plan-ners gauge whether their actions are reaching the goals and visionfor sustainability. This should be considered in tandem with breakingdown the results into main themes to avoid over-concentration onjust some aspects. Addressing these two issues helps in providingthe audiences a balanced and reasonable picture of sustainability per-formance levels.
Now that aspects relevant to the development phase of NSA pro-cess are analyzed, Section 4.7 scrutinizes the application as the sec-ond major phase.
4.7. Applicability
The last issue to be discussed here is the applicability and practica-bility of NSA tools. This is of high significance because without practi-cally applying the criteria in the real world, it is not possible toapproach sustainability. This issue has two faces: one appears whenthere is an assessment tool with no appeal for it in the community,the other can be seen when there is a sound plan on paper which iscertified by the assessment tool, but what is implemented is not incompliance with the earlier certified plan. These can be explainedby the voluntary state of NSA tools, additional costs that meetingthe sustainability criteria stipulated by them imposes on the devel-opers and residents, and in some cases the complexity and ambiguityof the tool that makes them flat.
The study of selected NSA tools revealed that all of them are insome way dealing with this issue. Here, first the conditions of toolswith regard to applicability are presented, and then some suggestionsfor making them more applicable are offered.
Compared to other NSA tools, LEED-ND has gained a better recogni-tion amongdevelopers and local authorities. The three developing orga-nizations and some other departments such as the Department ofHousing and Urban Development (HUD), and U.S. Environmental Pro-tection Agency (EPA) are collaborating to foster the utilization of thetool. Currently LEED-ND has certified over 100 projects, another 135projects are registered, and 31 local and state governments and federalagencies are using LEED-ND to promote green neighborhood-scale de-velopment (Benfield, 2011). Notwithstanding this relative success,there are still major barriers before the widespread adoption of the
83A. Sharifi, A. Murayama / Environmental Impact Assessment Review 38 (2013) 73–87
LEED-ND assessment tool. Since LEED-ND is a voluntary tool, there is nolegal basis for its implementation. Monitoring of projects and plans isnot compulsory for the US in its entirety (Ganser, 2008) and as a conse-quence there is the risk that the tool might just be used by those devel-opers that are seekingmarket appeal for their project, and asHurley andHorne (2006) are concerned it might only be used by the alreadyhigh-achieving “boutique” developers and not the majority of the de-veloper market. There are already some practices such as rewardingheight and density bonuses in some jurisdictions for transition fromvoluntary guidelines to statutory codifications (Berton, 2011), andHUD is also using LEED-ND to score the grant applications (Donovan,2011) which is a significant step towards further promotion ofLEED-ND usage. Economic burdens are causing another major barrierbecause both the compliance with the assessment criteria and under-taking of assessment itself are costly.
The same problems mentioned above for applicability of LEED-NDare also associated with ECC. As a voluntary tool used in Southeast,ECC is utilized by community or a group of stakeholders to assistthem in planning their sustainable development (Adams andYounos, 2008). But, there is no solid mechanism for implementationof assessment results.
BREEAM Communities has a more promising implementationprospect. The European Directive 2001/42/EC on the assessment ofthe effects of certain plans and programs on the environment(European Commission, 2001), and the U.K. Planning policy state-ment (PPS1), which requires planning authorities to ensure that sus-tainable development is treated in an integrated way in theirdevelopment plans (Office of the Deputy Prime Minister, 2005), pro-vide a concrete legal basis for consideration of local SA, and BREEAMCommunities has the potential to accelerate the approval of plans at alower cost and greater reliability. Currently the integration into theplanning system is done through the development plan preparationprocess that all local planning authorities engage in. Although nation-ally there is no requirement to use the scheme, the Bristol City Coun-cil has stipulated that all newmajor developments should be assessedagainst BREEAM Communities (Bristol City Council, 2011), and this is
Fig. 1. CASBEE-UD's way of presenting the assessmen
a good sign of BREEAM Communities gaining momentum in planningprocess in UK.
CASBEE-UD is facing major challenges for its implementation. Al-though there is an EIA law in place in Japan, its scope is just limitedto specific large scale projects and is mainly focused on the environ-mental aspects of sustainability. Furthermore, unlike Australia, theUK, and the US, Japan is experiencing a declining population growthrate (UN Department of Economic and Social Affairs, 2004), and ac-cordingly the demand for new developments is not high. This dimin-ishes the feasibility and efficacy of incentivizing policies such asoffering development bonuses in reward for meeting the tool's re-quirements. CASBEE-UD has been developed amid such situationsand, as can be expected, it has not garnered proper recognition inthe community. Since its development in 2006, “Koshigaya LakeTown” is the only project which has applied CASBEE-UD assessmenttool. This project has been developed by Daiwa House Companywith the sponsorship of the Ministry of the Environment. This compa-ny has applied for CASBEE-UD certification with the aim of gainingmarket recognition (Yoshihisa Ino, personal communication, June30, 2011).
The positive point in Japanese context is that grassrootsMachizukuriactivities, initiated by the residents concerning the quality of their localenvironment, has gained momentum (Sharifi and Murayama, 2011),and using assessment tools to evaluate different scenarios during theplan making process of Machizukuri activities can be a starting pointfor pushing developers and local authorities to better acknowledgethe role of CASBEE-UD as an assessment tool.
HQE2R and Ecocity are doing well in practical use of assessmenttools. Other than the existence of European Directive 2001/42/EC onthe assessment of the effects of certain plans and programs, assess-ment is also one stage of broader planning process and developersutilize assessment tools to evaluate the sustainability performancelevel of different development scenarios.
Despite establishment of urban cities agenda for the nation that re-quires plans to consider sustainability (Green building councilAustralia, 2010), there is still no evidence of applying SCR tool in the
t results (CASBEE for Urban Development, 2007).
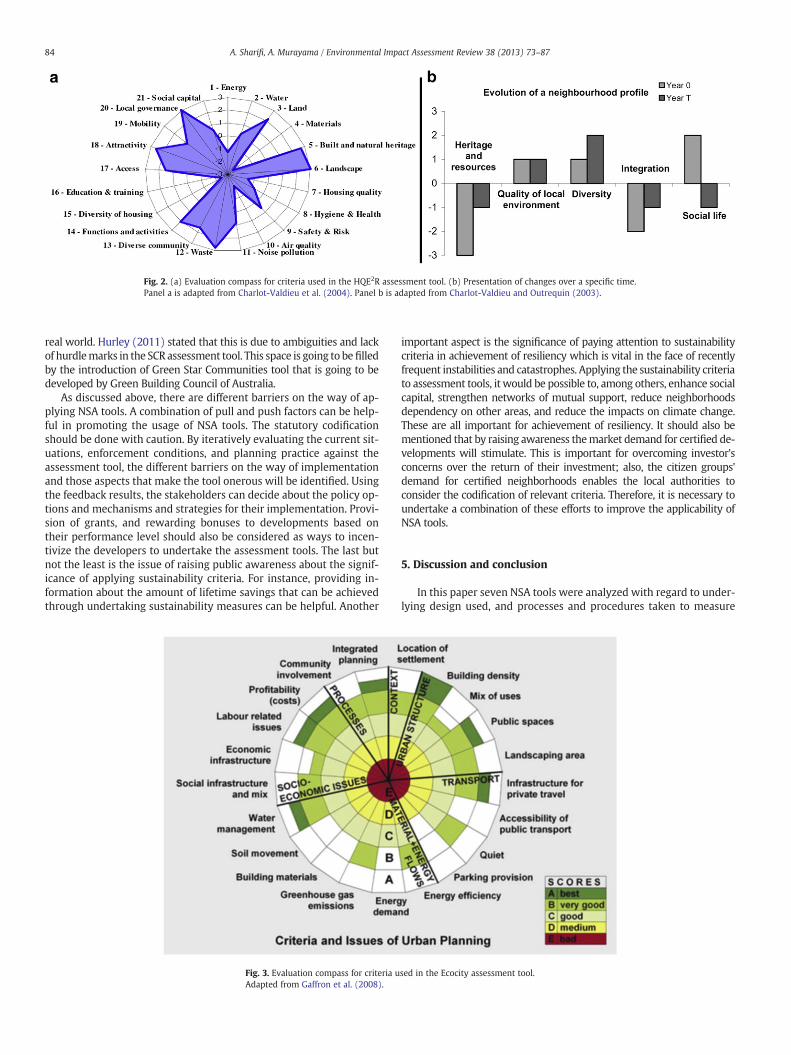
Fig. 2. (a) Evaluation compass for criteria used in the HQE2R assessment tool. (b) Presentation of changes over a specific time.Panel a is adapted from Charlot-Valdieu et al. (2004). Panel b is adapted from Charlot-Valdieu and Outrequin (2003).
84 A. Sharifi, A. Murayama / Environmental Impact Assessment Review 38 (2013) 73–87
real world. Hurley (2011) stated that this is due to ambiguities and lackof hurdlemarks in the SCR assessment tool. This space is going to befilledby the introduction of Green Star Communities tool that is going to bedeveloped by Green Building Council of Australia.
As discussed above, there are different barriers on the way of ap-plying NSA tools. A combination of pull and push factors can be help-ful in promoting the usage of NSA tools. The statutory codificationshould be done with caution. By iteratively evaluating the current sit-uations, enforcement conditions, and planning practice against theassessment tool, the different barriers on the way of implementationand those aspects that make the tool onerous will be identified. Usingthe feedback results, the stakeholders can decide about the policy op-tions and mechanisms and strategies for their implementation. Provi-sion of grants, and rewarding bonuses to developments based ontheir performance level should also be considered as ways to incen-tivize the developers to undertake the assessment tools. The last butnot the least is the issue of raising public awareness about the signif-icance of applying sustainability criteria. For instance, providing in-formation about the amount of lifetime savings that can be achievedthrough undertaking sustainability measures can be helpful. Another
Fig. 3. Evaluation compass for criteria uAdapted from Gaffron et al. (2008).
important aspect is the significance of paying attention to sustainabilitycriteria in achievement of resiliency which is vital in the face of recentlyfrequent instabilities and catastrophes. Applying the sustainability criteriato assessment tools, it would be possible to, among others, enhance socialcapital, strengthen networks of mutual support, reduce neighborhoodsdependency on other areas, and reduce the impacts on climate change.These are all important for achievement of resiliency. It should also bementioned that by raising awareness themarket demand for certified de-velopments will stimulate. This is important for overcoming investor'sconcerns over the return of their investment; also, the citizen groups'demand for certified neighborhoods enables the local authorities toconsider the codification of relevant criteria. Therefore, it is necessary toundertake a combination of these efforts to improve the applicability ofNSA tools.
5. Discussion and conclusion
In this paper seven NSA tools were analyzed with regard to under-lying design used, and processes and procedures taken to measure
sed in the Ecocity assessment tool.
85A. Sharifi, A. Murayama / Environmental Impact Assessment Review 38 (2013) 73–87
sustainability performance and implement action plans outlined inthe assessment report.
Despite having the similar aim of approaching sustainability, thereare significant differences in how these tools pursue this aim. Thislarge degree of divergence can be explained by corresponding differ-ences in how, where, and why they have been developed and appliedto neighborhood development plans. However, NSA tools are similarin that typically they are composed of a checklist of criteria whichare mainly optional. Although in some cases all the criteria areassigned equal value, it is common that some criteria are weighedhigher based on their performance against the specified benchmarksor accepted norms. Process of criteria selection and weighting assign-ment is often subjective. The tools are mainly developed by experts,and citizens are not adequately involved in the process. Also, mostof the tools are in some ways, facing the challenge of implementation.
To approach sustainability, positive improvements are needed in allthe areas discussed here. In the following paragraphs, in the light ofstudy's findings, the prospect of NSA tools is discussed, and some solu-tions and suggestions are made that applying them at the time of re-finement can help planners take a further step towards approachingsustainable communities.
Degree of sustainability coverage is one of the issues explored inthis study. Here it should be noted that in parallel with EIA's expansionand introduction of newer assessment tools, developers have consid-ered widening the framework of assessment from merely covering en-vironmental impacts to hitting a balance between environmental,social, and economic impacts.
As Charlot-Valdieu et al. (2004) put it, “assessment tools transferdata overload into information for better decision”. Assessmenttools studied here have similar themes; however, the number and va-riety of criteria addressed under each theme is not consistent acrossthe tools. The content analysis indicated that, concerning the bal-anced inclusion of sustainability dimensions, only HQE2R, Ecocity,and SCR are doing relatively well. The approximate success of theseplan-embedded tools can be attributed to relatively better involve-ment of a wide array of stakeholders compared with other tools.Criteria addressed in the tools studied here aligned well with envi-ronmental and design aspects. However, important issues such as af-fordable housing, local economy and jobs, inclusive communities, andmixed use (mainly social and economic dimensions) are still not ad-equately addressed or even missing in some assessment tools. Bothintergenerational equity and intragenerational equity are necessaryconditions for sustainable development (George, 1999), and achiev-ing the latter one is not possible without proper acknowledgementof socio-economic criteria.
One noticeable improvement in some of the studied tools, com-pared with the earlier generations of the assessment tools, is the at-tention to innovation. While this is important for maintaining thedynamism of processes, it should be mentioned that it can addsome additional subjectiveness to the process. Hence, innovationcredits should only be rewarded when there is enough evidence dem-onstrating that significant achievements, beyond what is specified inthe standards of the assessment tool, have been made through appli-cation of that particular criterion.
This study also emphasized on the importance of institutional sus-tainability as the fourth pillar which should be considered. It was noticedthat acknowledging the importance of the institutional dimension, someunder-development tools have already considered their inclusion andthis should also be considered at the time of refinement of existing tools.
There were differences among the selected tools regarding the in-clusion of mandatory criteria. The analysis revealed that generallyNSA tools are not doing well in guaranteeing an accepted level ofperformance.
By assigning hurdle marks for performance criteria, developers canbetter approach sustainability, and at the same time enhance the resil-iency of neighborhoods through delivering communities with strong
local economies that are self-reliant and benefit from networks of mu-tual support. Those criteria highlighted in this study (relevant to afford-able housing, inclusive communities, social networks, mixed use, andlocal economy) are significant in the sense that they are essential in en-hancing a neighborhood's ability to withstand and recover from hardtimes, and assuring that a diverse array of community groups,irrespective of their social and economic status, benefit from thedevelopment.
In terms of adaptation to locality, it was stressed that the assess-ment systems should differ based on the development type and alsosite-specific issues. This study indicates that only HQE2R and Ecocityhave fulfilled these criteria.
Tools should be customized to be sensitive to context and develop-ment type and, as Sev (2011)mentions, the benchmarks andweightingsshould reflect the characteristics of the region. This way the site-specificrelevance of tools is assured. This issue should also be considered byplanners and developers of other countries and regions who want toadapt the assessment tools for their own community.
The analysis showed that despite efforts taken to verify some ele-ments objectively, due to the normative nature of the concept of sus-tainable development (Rametsteiner et al., 2011) NSA tools areentangledwith the problems of subjectivity and ambiguity ofweightingprocess. This problem can be mitigated by developing a standardizedframework using a consensus-based approach toweigh criteria. Utiliza-tion of fuzzy techniques can also reduce the complexity and subjectivityof the weighting system.
This study further indicates thatmost of the tools are expert-orientedand different parties in the community that have different, if not con-flicting, values, needs, and priorities are not adequately involved inthe judgment about which elements to include, the assignment ofweightings, and providing feedback. Here too, HQE2R and Ecocityhave a relatively better performance compared with the other tools.An iterative participation practice, intertwined with the assessmentprocess, is helpful in enhancing the reliability and accuracy of the sys-tem, establishing a basis for mutual understanding, and providing alearning environment for various stakeholders. This in turn contributesto achieving what Gray and Milne (2002) describe as collectivedecision-making for the common good.
Concerning the presentation of assessment results this study sug-gests that the results would be more robust, transparent, and reliableas decision aid tools if they reflect the performance levels of thecriteria and also temporal changes.
There are differences among the tools regarding the reporting ofassessment results. CASBEE-UD and Ecocity are somewhat successfulin reflecting the performance levels of criteria, and HQE2R is the onlytool performing reasonably well in presenting both the performancelevels of criteria and temporal changes. Labeling and rating the per-formance levels is a helpful effort to inform engaged stakeholders intheir decision-making for sustainable development. However, cautionis needed because the level of certification that the development re-ceives does not directly reflect the performance level of each specificcriterion. Therefore, it might not be possible to identify and improvethe neighborhood's features with low performance levels. This causesthe concern that developers might opt to achieve the greatest pointsat the lowest cost possible, leaving important criteria that requiremore investment out of consideration. In addition, the rating wouldneed to reflect changes made to the neighborhood over specifictime intervals; this can be achieved by periodic reassessment of theneighborhood performance.
Applicability is the last criteria that NSA tools were examinedagainst in this study. This is important because an assessment toolthat sounds good on the paper but there is no adequate recognitionand use for it in the real world wouldn't contribute to achieving sus-tainability. Among the analyzed tools only HQE2R and Ecocity had ad-equately been applied to real world projects and LEED-ND has alsodone relatively well.
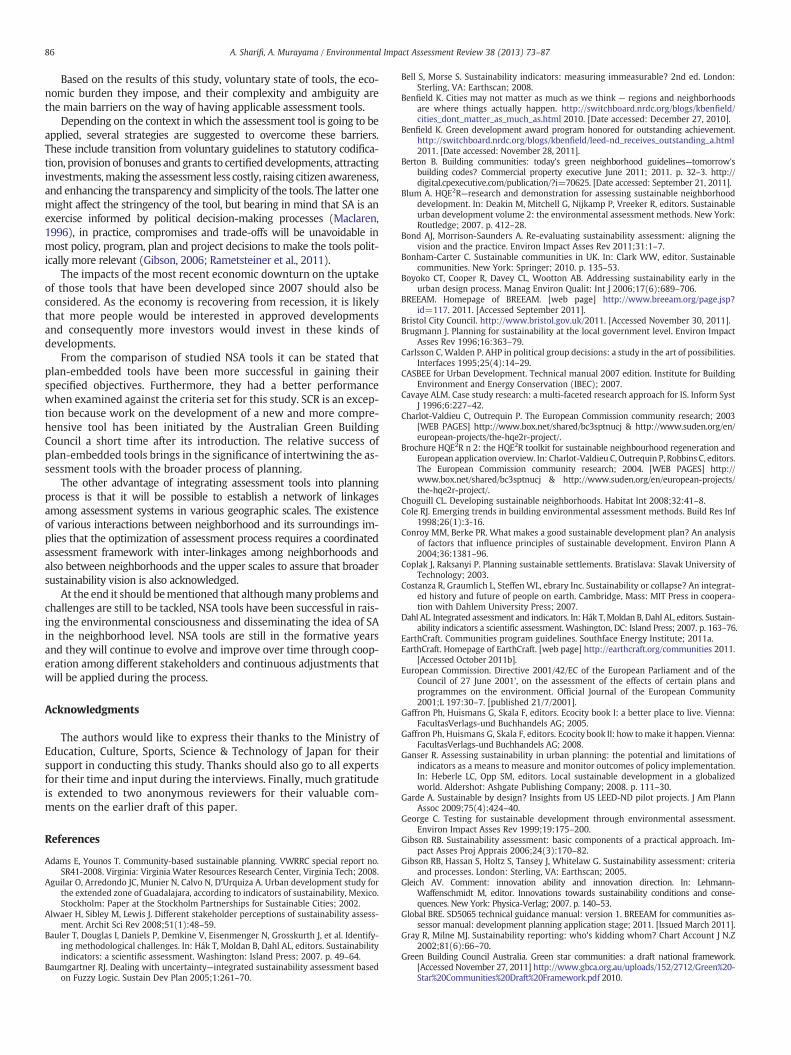
86 A. Sharifi, A. Murayama / Environmental Impact Assessment Review 38 (2013) 73–87
Based on the results of this study, voluntary state of tools, the eco-nomic burden they impose, and their complexity and ambiguity arethe main barriers on the way of having applicable assessment tools.
Depending on the context in which the assessment tool is going to beapplied, several strategies are suggested to overcome these barriers.These include transition from voluntary guidelines to statutory codifica-tion, provision of bonuses and grants to certified developments, attractinginvestments,making the assessment less costly, raising citizen awareness,and enhancing the transparency and simplicity of the tools. The latter onemight affect the stringency of the tool, but bearing in mind that SA is anexercise informed by political decision-making processes (Maclaren,1996), in practice, compromises and trade-offs will be unavoidable inmost policy, program, plan and project decisions to make the tools polit-ically more relevant (Gibson, 2006; Rametsteiner et al., 2011).
The impacts of the most recent economic downturn on the uptakeof those tools that have been developed since 2007 should also beconsidered. As the economy is recovering from recession, it is likelythat more people would be interested in approved developmentsand consequently more investors would invest in these kinds ofdevelopments.
From the comparison of studied NSA tools it can be stated thatplan-embedded tools have been more successful in gaining theirspecified objectives. Furthermore, they had a better performancewhen examined against the criteria set for this study. SCR is an excep-tion because work on the development of a new and more compre-hensive tool has been initiated by the Australian Green BuildingCouncil a short time after its introduction. The relative success ofplan-embedded tools brings in the significance of intertwining the as-sessment tools with the broader process of planning.
The other advantage of integrating assessment tools into planningprocess is that it will be possible to establish a network of linkagesamong assessment systems in various geographic scales. The existenceof various interactions between neighborhood and its surroundings im-plies that the optimization of assessment process requires a coordinatedassessment framework with inter-linkages among neighborhoods andalso between neighborhoods and the upper scales to assure that broadersustainability vision is also acknowledged.
At the end it should bementioned that althoughmanyproblems andchallenges are still to be tackled, NSA tools have been successful in rais-ing the environmental consciousness and disseminating the idea of SAin the neighborhood level. NSA tools are still in the formative yearsand they will continue to evolve and improve over time through coop-eration among different stakeholders and continuous adjustments thatwill be applied during the process.
Acknowledgments
The authors would like to express their thanks to the Ministry ofEducation, Culture, Sports, Science & Technology of Japan for theirsupport in conducting this study. Thanks should also go to all expertsfor their time and input during the interviews. Finally, much gratitudeis extended to two anonymous reviewers for their valuable com-ments on the earlier draft of this paper.
References
Adams E, Younos T. Community-based sustainable planning. VWRRC special report no.SR41-2008. Virginia: Virginia Water Resources Research Center, Virginia Tech; 2008.
Aguilar O, Arredondo JC, Munier N, Calvo N, D’Urquiza A. Urban development study forthe extended zone of Guadalajara, according to indicators of sustainability, Mexico.Stockholm: Paper at the Stockholm Partnerships for Sustainable Cities; 2002.
Alwaer H, Sibley M, Lewis J. Different stakeholder perceptions of sustainability assess-ment. Archit Sci Rev 2008;51(1):48–59.
Bauler T, Douglas I, Daniels P, Demkine V, Eisenmenger N, Grosskurth J, et al. Identify-ing methodological challenges. In: Hák T, Moldan B, Dahl AL, editors. Sustainabilityindicators: a scientific assessment. Washington: Island Press; 2007. p. 49–64.
Baumgartner RJ. Dealing with uncertainty—integrated sustainability assessment basedon Fuzzy Logic. Sustain Dev Plan 2005;1:261–70.
Bell S, Morse S. Sustainability indicators: measuring immeasurable? 2nd ed. London:Sterling, VA: Earthscan; 2008.
Benfield K. Cities may not matter as much as we think — regions and neighborhoodsare where things actually happen. http://switchboard.nrdc.org/blogs/kbenfield/cities_dont_matter_as_much_as.html 2010. [Date accessed: December 27, 2010].
Benfield K. Green development award program honored for outstanding achievement.http://switchboard.nrdc.org/blogs/kbenfield/leed-nd_receives_outstanding_a.html2011. [Date accessed: November 28, 2011].
Berton B. Building communities: today's green neighborhood guidelines—tomorrow'sbuilding codes? Commercial property executive June 2011; 2011. p. 32–3. http://digital.cpexecutive.com/publication/?i=70625. [Date accessed: September 21, 2011].
Blum A. HQE2R—research and demonstration for assessing sustainable neighborhooddevelopment. In: Deakin M, Mitchell G, Nijkamp P, Vreeker R, editors. Sustainableurban development volume 2: the environmental assessment methods. New York:Routledge; 2007. p. 412–28.
Bond AJ, Morrison-Saunders A. Re-evaluating sustainability assessment: aligning thevision and the practice. Environ Impact Asses Rev 2011;31:1–7.
Bonham-Carter C. Sustainable communities in UK. In: Clark WW, editor. Sustainablecommunities. New York: Springer; 2010. p. 135–53.
Boyoko CT, Cooper R, Davey CL, Wootton AB. Addressing sustainability early in theurban design process. Manag Environ Qualit: Int J 2006;17(6):689–706.
BREEAM. Homepage of BREEAM. [web page] http://www.breeam.org/page.jsp?id=117. 2011. [Accessed September 2011].
Bristol City Council. http://www.bristol.gov.uk/2011. [Accessed November 30, 2011].Brugmann J. Planning for sustainability at the local government level. Environ Impact
Asses Rev 1996;16:363–79.Carlsson C, Walden P. AHP in political group decisions: a study in the art of possibilities.
Interfaces 1995;25(4):14–29.CASBEE for Urban Development. Technical manual 2007 edition. Institute for Building
Environment and Energy Conservation (IBEC); 2007.Cavaye ALM. Case study research: a multi-faceted research approach for IS. Inform Syst
J 1996;6:227–42.Charlot-Valdieu C, Outrequin P. The European Commission community research; 2003
[WEB PAGES] http://www.box.net/shared/bc3sptnucj & http://www.suden.org/en/european-projects/the-hqe2r-project/.
Brochure HQE2R n 2: the HQE2R toolkit for sustainable neighbourhood regeneration andEuropean application overview. In: Charlot-Valdieu C, Outrequin P, Robbins C, editors.The European Commission community research; 2004. [WEB PAGES] http://www.box.net/shared/bc3sptnucj & http://www.suden.org/en/european-projects/the-hqe2r-project/.
Choguill CL. Developing sustainable neighborhoods. Habitat Int 2008;32:41–8.Cole RJ. Emerging trends in building environmental assessment methods. Build Res Inf
1998;26(1):3-16.Conroy MM, Berke PR. What makes a good sustainable development plan? An analysis
of factors that influence principles of sustainable development. Environ Plann A2004;36:1381–96.
Coplak J, Raksanyi P. Planning sustainable settlements. Bratislava: Slavak University ofTechnology; 2003.
Costanza R, Graumlich L, Steffen WL, ebrary Inc. Sustainability or collapse? An integrat-ed history and future of people on earth. Cambridge, Mass: MIT Press in coopera-tion with Dahlem University Press; 2007.
Dahl AL. Integrated assessment and indicators. In: Hák T,Moldan B, Dahl AL, editors. Sustain-ability indicators a scientific assessment. Washington, DC: Island Press; 2007. p. 163–76.
EarthCraft. Communities program guidelines. Southface Energy Institute; 2011a.EarthCraft. Homepage of EarthCraft. [web page] http://earthcraft.org/communities 2011.
[Accessed October 2011b].European Commission. Directive 2001/42/EC of the European Parliament and of the
Council of 27 June 2001’, on the assessment of the effects of certain plans andprogrammes on the environment. Official Journal of the European Community2001;L 197:30–7. [published 21/7/2001].
Gaffron Ph, Huismans G, Skala F, editors. Ecocity book I: a better place to live. Vienna:FacultasVerlags-und Buchhandels AG; 2005.
Gaffron Ph, Huismans G, Skala F, editors. Ecocity book II: how tomake it happen. Vienna:FacultasVerlags-und Buchhandels AG; 2008.
Ganser R. Assessing sustainability in urban planning: the potential and limitations ofindicators as a means to measure and monitor outcomes of policy implementation.In: Heberle LC, Opp SM, editors. Local sustainable development in a globalizedworld. Aldershot: Ashgate Publishing Company; 2008. p. 111–30.
Garde A. Sustainable by design? Insights from US LEED-ND pilot projects. J Am PlannAssoc 2009;75(4):424–40.
George C. Testing for sustainable development through environmental assessment.Environ Impact Asses Rev 1999;19:175–200.
Gibson RB. Sustainability assessment: basic components of a practical approach. Im-pact Asses Proj Apprais 2006;24(3):170–82.
Gibson RB, Hassan S, Holtz S, Tansey J, Whitelaw G. Sustainability assessment: criteriaand processes. London: Sterling, VA: Earthscan; 2005.
Gleich AV. Comment: innovation ability and innovation direction. In: Lehmann-Waffenschmidt M, editor. Innovations towards sustainability conditions and conse-quences. New York: Physica-Verlag; 2007. p. 140–53.
Global BRE. SD5065 technical guidance manual: version 1. BREEAM for communities as-sessor manual: development planning application stage; 2011. [Issued March 2011].
Gray R, Milne MJ. Sustainability reporting: who's kidding whom? Chart Account J N.Z2002;81(6):66–70.
Green Building Council Australia. Green star communities: a draft national framework.[Accessed November 27, 2011] http://www.gbca.org.au/uploads/152/2712/Green%20-Star%20Communities%20Draft%20Framework.pdf 2010.
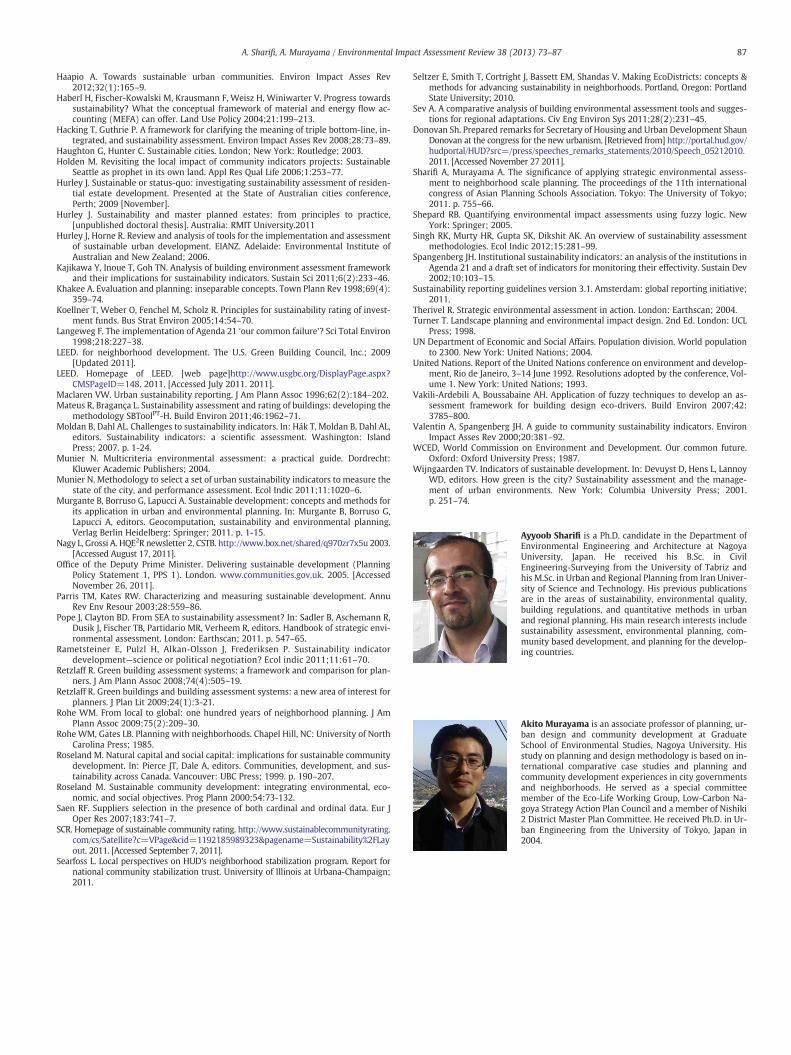
87A. Sharifi, A. Murayama / Environmental Impact Assessment Review 38 (2013) 73–87
Haapio A. Towards sustainable urban communities. Environ Impact Asses Rev2012;32(1):165–9.
Haberl H, Fischer-Kowalski M, Krausmann F, Weisz H, Winiwarter V. Progress towardssustainability? What the conceptual framework of material and energy flow ac-counting (MEFA) can offer. Land Use Policy 2004;21:199–213.
Hacking T, Guthrie P. A framework for clarifying the meaning of triple bottom-line, in-tegrated, and sustainability assessment. Environ Impact Asses Rev 2008;28:73–89.
Haughton G, Hunter C. Sustainable cities. London; New York: Routledge; 2003.Holden M. Revisiting the local impact of community indicators projects: Sustainable
Seattle as prophet in its own land. Appl Res Qual Life 2006;1:253–77.Hurley J. Sustainable or status-quo: investigating sustainability assessment of residen-
tial estate development. Presented at the State of Australian cities conference,Perth; 2009 [November].
Hurley J. Sustainability and master planned estates: from principles to practice,[unpublished doctoral thesis]. Australia: RMIT University.2011
Hurley J, Horne R. Review and analysis of tools for the implementation and assessmentof sustainable urban development. EIANZ. Adelaide: Environmental Institute ofAustralian and New Zealand; 2006.
Kajikawa Y, Inoue T, Goh TN. Analysis of building environment assessment frameworkand their implications for sustainability indicators. Sustain Sci 2011;6(2):233–46.
Khakee A. Evaluation and planning: inseparable concepts. Town Plann Rev 1998;69(4):359–74.
Koellner T, Weber O, Fenchel M, Scholz R. Principles for sustainability rating of invest-ment funds. Bus Strat Environ 2005;14:54–70.
Langeweg F. The implementation of Agenda 21 ‘our common failure’? Sci Total Environ1998;218:227–38.
LEED. for neighborhood development. The U.S. Green Building Council, Inc.; 2009[Updated 2011].
LEED. Homepage of LEED. [web page]http://www.usgbc.org/DisplayPage.aspx?CMSPageID=148. 2011. [Accessed July 2011. 2011].
Maclaren VW. Urban sustainability reporting. J Am Plann Assoc 1996;62(2):184–202.Mateus R, Bragança L. Sustainability assessment and rating of buildings: developing the
methodology SBToolPT-H. Build Environ 2011;46:1962–71.Moldan B, Dahl AL. Challenges to sustainability indicators. In: Hák T, Moldan B, Dahl AL,
editors. Sustainability indicators: a scientific assessment. Washington: IslandPress; 2007. p. 1-24.
Munier N. Multicriteria environmental assessment: a practical guide. Dordrecht:Kluwer Academic Publishers; 2004.
Munier N. Methodology to select a set of urban sustainability indicators to measure thestate of the city, and performance assessment. Ecol Indic 2011;11:1020–6.
Murgante B, Borruso G, Lapucci A. Sustainable development: concepts and methods forits application in urban and environmental planning. In: Murgante B, Borruso G,Lapucci A, editors. Geocomputation, sustainability and environmental planning.Verlag Berlin Heidelberg: Springer; 2011. p. 1-15.
Nagy L, Grossi A. HQE2R newsletter 2, CSTB. http://www.box.net/shared/q970zr7x5u 2003.[Accessed August 17, 2011].
Office of the Deputy Prime Minister. Delivering sustainable development (PlanningPolicy Statement 1, PPS 1). London. www.communities.gov.uk. 2005. [AccessedNovember 26, 2011].
Parris TM, Kates RW. Characterizing and measuring sustainable development. AnnuRev Env Resour 2003;28:559–86.
Pope J, Clayton BD. From SEA to sustainability assessment? In: Sadler B, Aschemann R,Dusik J, Fischer TB, Partidario MR, Verheem R, editors. Handbook of strategic envi-ronmental assessment. London: Earthscan; 2011. p. 547–65.
Rametsteiner E, Pulzl H, Alkan-Olsson J, Frederiksen P. Sustainability indicatordevelopment—science or political negotiation? Ecol indic 2011;11:61–70.
Retzlaff R. Green building assessment systems: a framework and comparison for plan-ners. J Am Plann Assoc 2008;74(4):505–19.
Retzlaff R. Green buildings and building assessment systems: a new area of interest forplanners. J Plan Lit 2009;24(1):3-21.
Rohe WM. From local to global: one hundred years of neighborhood planning. J AmPlann Assoc 2009;75(2):209–30.
Rohe WM, Gates LB. Planning with neighborhoods. Chapel Hill, NC: University of NorthCarolina Press; 1985.
Roseland M. Natural capital and social capital: implications for sustainable communitydevelopment. In: Pierce JT, Dale A, editors. Communities, development, and sus-tainability across Canada. Vancouver: UBC Press; 1999. p. 190–207.
Roseland M. Sustainable community development: integrating environmental, eco-nomic, and social objectives. Prog Plann 2000;54:73-132.
Saen RF. Suppliers selection in the presence of both cardinal and ordinal data. Eur JOper Res 2007;183:741–7.
SCR. Homepage of sustainable community rating. http://www.sustainablecommunityrating.com/cs/Satellite?c=VPage&cid=1192185989323&pagename=Sustainability%2FLayout. 2011. [Accessed September 7, 2011].
Searfoss L. Local perspectives on HUD's neighborhood stabilization program. Report fornational community stabilization trust. University of Illinois at Urbana-Champaign;2011.
Seltzer E, Smith T, Cortright J, Bassett EM, Shandas V. Making EcoDistricts: concepts &methods for advancing sustainability in neighborhoods. Portland, Oregon: PortlandState University; 2010.
Sev A. A comparative analysis of building environmental assessment tools and sugges-tions for regional adaptations. Civ Eng Environ Sys 2011;28(2):231–45.
Donovan Sh. Prepared remarks for Secretary of Housing and Urban Development ShaunDonovan at the congress for the new urbanism. [Retrieved from] http://portal.hud.gov/hudportal/HUD?src=/press/speeches_remarks_statements/2010/Speech_05212010.2011. [Accessed November 27 2011].
Sharifi A, Murayama A. The significance of applying strategic environmental assess-ment to neighborhood scale planning. The proceedings of the 11th internationalcongress of Asian Planning Schools Association. Tokyo: The University of Tokyo;2011. p. 755–66.
Shepard RB. Quantifying environmental impact assessments using fuzzy logic. NewYork: Springer; 2005.
Singh RK, Murty HR, Gupta SK, Dikshit AK. An overview of sustainability assessmentmethodologies. Ecol Indic 2012;15:281–99.
Spangenberg JH. Institutional sustainability indicators: an analysis of the institutions inAgenda 21 and a draft set of indicators for monitoring their effectivity. Sustain Dev2002;10:103–15.
Sustainability reporting guidelines version 3.1. Amsterdam: global reporting initiative;2011.
Therivel R. Strategic environmental assessment in action. London: Earthscan; 2004.Turner T. Landscape planning and environmental impact design. 2nd Ed. London: UCL
Press; 1998.UN Department of Economic and Social Affairs. Population division. World population
to 2300. New York: United Nations; 2004.United Nations. Report of the United Nations conference on environment and develop-
ment, Rio de Janeiro, 3–14 June 1992. Resolutions adopted by the conference, Vol-ume 1. New York: United Nations; 1993.
Vakili-Ardebili A, Boussabaine AH. Application of fuzzy techniques to develop an as-sessment framework for building design eco-drivers. Build Environ 2007;42:3785–800.
Valentin A, Spangenberg JH. A guide to community sustainability indicators. EnvironImpact Asses Rev 2000;20:381–92.
WCED, World Commission on Environment and Development. Our common future.Oxford: Oxford University Press; 1987.
Wijngaarden TV. Indicators of sustainable development. In: Devuyst D, Hens L, LannoyWD, editors. How green is the city? Sustainability assessment and the manage-ment of urban environments. New York: Columbia University Press; 2001.p. 251–74.
Ayyoob Sharifi is a Ph.D. candidate in the Department ofEnvironmental Engineering and Architecture at NagoyaUniversity, Japan. He received his B.Sc. in CivilEngineering-Surveying from the University of Tabriz andhis M.Sc. in Urban and Regional Planning from Iran Univer-sity of Science and Technology. His previous publicationsare in the areas of sustainability, environmental quality,building regulations, and quantitative methods in urbanand regional planning. His main research interests includesustainability assessment, environmental planning, com-munity based development, and planning for the develop-ing countries.
Akito Murayama is an associate professor of planning, ur-ban design and community development at GraduateSchool of Environmental Studies, Nagoya University. Hisstudy on planning and design methodology is based on in-ternational comparative case studies and planning andcommunity development experiences in city governmentsand neighborhoods. He served as a special committeemember of the Eco-Life Working Group, Low-Carbon Na-goya Strategy Action Plan Council and a member of Nishiki2 District Master Plan Committee. He received Ph.D. in Ur-ban Engineering from the University of Tokyo, Japan in2004.


![New Seven Tools[1]](https://img.pdfslide.net/doc/110x75/6319f7e820bd5bb1740c12e2/new-seven-tools1.jpg)


