Embed Size (px)
Citation preview
HAL Id: hal-03209546https://hal-amu.archives-ouvertes.fr/hal-03209546
Submitted on 27 Apr 2021
HAL is a multi-disciplinary open accessarchive for the deposit and dissemination of sci-entific research documents, whether they are pub-lished or not. The documents may come fromteaching and research institutions in France orabroad, or from public or private research centers.
L’archive ouverte pluridisciplinaire HAL, estdestinée au dépôt et à la diffusion de documentsscientifiques de niveau recherche, publiés ou non,émanant des établissements d’enseignement et derecherche français ou étrangers, des laboratoirespublics ou privés.
Distributed under a Creative Commons Attribution| 4.0 International License
Climate change: A driver of future conflicts in thePersian Gulf Region?
Abdolmajid Naderi Beni, Nick Marriner, Arash Sharifi, Jafar Azizpour,Keivan Kabiri, Morteza Djamali, Alan Kirman
To cite this version:Abdolmajid Naderi Beni, Nick Marriner, Arash Sharifi, Jafar Azizpour, Keivan Kabiri, et al.. Climatechange: A driver of future conflicts in the Persian Gulf Region?. Heliyon, Elsevier 2021, 7 (2),pp.e06288. �10.1016/j.heliyon.2021.e06288�. �hal-03209546�
Research article
Climate change: A driver of future conflicts in the Persian Gulf Region?
Abdolmajid Naderi Beni a,*, Nick Marriner b, Arash Sharifi c, Jafar Azizpour a, Keivan Kabiri a,Morteza Djamali d, Alan Kirman e
a Iranian National Institute for Oceanography and Atmospheric Science (INIOAS), No. 3, Etmadzadeh Street, West Fatemi Avenue, Tehran, Iranb CNRS, Th�eMA UMR 6049, Universit�e de Bourgogne Franche-Comt�e, 32 Rue M�egevand, Besançon Cedex, 25030, Francec BETA Analytic-Isobar Science, Research and Development Department, Miami, USAd Institut M�editerran�een de Biodiversit�e et d’�Ecologie Marine et Continentale (IMBE), IMBE - UMR Aix Marseille Universit�e, CNRS, IRD, Avignon Universit�e, Francee CAMS, Ecole des Hautes Etudes en Sciences Sociales, France
A R T I C L E I N F O
Keywords:Persian GulfClimate changeEconomyEnvironmentWater scarcity
* Corresponding author.E-mail address: [email protected] (A. Naderi
https://doi.org/10.1016/j.heliyon.2021.e06288
A B S T R A C T
Ongoing global change and its direct environmental impacts, in addition to securing economic transition to the post-oil era, could trigger complex socio-economic and political crises in oil-dependent economies of the Persian Gulf Region (PGR). To evaluate the role of climate change and related policies in degrading the environment and its socio-economic impacts in the PGR, we have used a variety of available global datasets and published data. The results show that the countries of the PGR pursue some types of socio-economic reforms to alleviate the impacts of climate change. However, it seems that these attempts are not compatible with the environment's capacity. The main problem stems from the fact that political differences between the PGR nations prevent them from managing the Persian Gulf environment as an integrated natural system and consequently they have to limit their efforts within their borders, regardless of what happens in other parts of the system. The shift to alternative revenue sources by the countries needs socioeconomic preparedness while there are environmental obstacles, political tensions and geopolitical rivalries. Unless there is a cooperative approach to mitigate the effects of climate change, accompanied by a reorientation of PGR economies, the situation is likely to worsen rather than improve. To address the challenges of climate change, integrated regional collaborations are needed. Collective action, such as more investment in regional research and development and education, is required if the PGR is to successfully transition from a commodity-based to a knowledge-based economy.
1. Introduction
A plethora of historical, archaeological and geological evidenceevokes synchroneity between major palaeoclimatic changes and socio-economic/political crises in West Asia (Kaniewski et al. 2012, 2018,2019; Sharifi et al., 2015). The timing of these events cannot be dis-missed as simply pure coincidence and, regarding their geographicalextent, the factors driving these changes were undoubtedly large scale(Kennett and Kennett 2007; Caspers 1971; Hole 1994; Gurjazkaite et al.,2018). The role of environmental shifts in shaping past societal changesmay be explained by the vulnerability of some societies to extreme cli-matic conditions such as droughts and floods, with consequent impactson food production (Kaniewski et al., 2015; Weiss 1997).
Climatic variability and its effects on human environments led ourancestors to consider different adaptation strategies, depending on theirtechnical capabilities and the severity of the changes. In some cases, they
Beni).
migrated (Gupta et al., 2006) leading to de-urbanization and a shift fromsedentary to nomadic lifestyles (Djamali et al., 2009; Kaniewski et al.,2012; Wright et al., 2003). In other cases, they innovated techniques tosurvive under new environmental conditions e.g. the invention of hy-draulic structures (Madani et al., 2016) and transitioned to new agri-cultural products/methods (Djamali et al., 2016). Whatever theadaptation approach was, the new socio-economic conditions led to thelegislation of new rules and new governing systems (DeMenocal 2001)that in turn created fresh sources of conflict or communication betweenthe societies.
Given West Asia's long and complex environmental and social his-tories, it is not surprising that current climate change has also beenadvanced as a potential trigger for socio-economic and political problems(Scheffran and Battaglini 2011; Scheffran et al., 2012; Sowers et al.,2011). Unlike ancient societies, we know that the cause of presentclimate change is human-induced CO2 emissions linked to the
2. Environmental framework
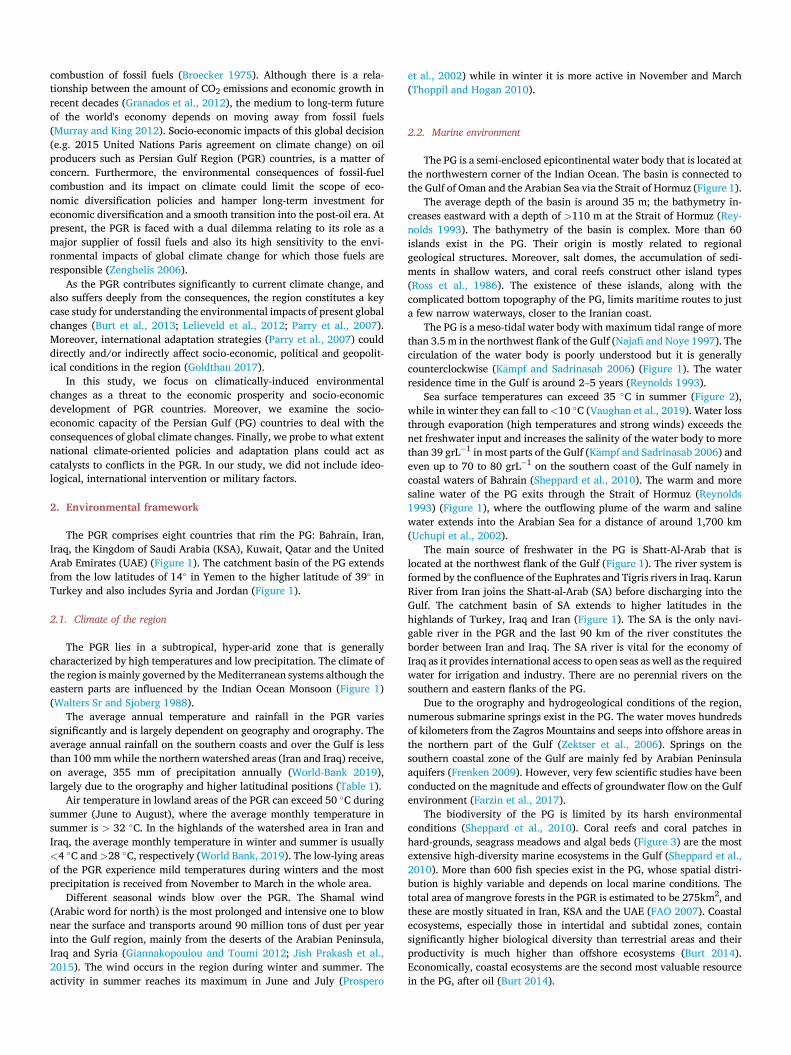
The PGR comprises eight countries that rim the PG: Bahrain, Iran,Iraq, the Kingdom of Saudi Arabia (KSA), Kuwait, Qatar and the UnitedArab Emirates (UAE) (Figure 1). The catchment basin of the PG extendsfrom the low latitudes of 14� in Yemen to the higher latitude of 39� inTurkey and also includes Syria and Jordan (Figure 1).
2.1. Climate of the region
The PGR lies in a subtropical, hyper-arid zone that is generallycharacterized by high temperatures and low precipitation. The climate ofthe region is mainly governed by theMediterranean systems although theeastern parts are influenced by the Indian Ocean Monsoon (Figure 1)(Walters Sr and Sjoberg 1988).
The average annual temperature and rainfall in the PGR variessignificantly and is largely dependent on geography and orography. Theaverage annual rainfall on the southern coasts and over the Gulf is lessthan 100 mmwhile the northern watershed areas (Iran and Iraq) receive,on average, 355 mm of precipitation annually (World-Bank 2019),largely due to the orography and higher latitudinal positions (Table 1).
Air temperature in lowland areas of the PGR can exceed 50 �C duringsummer (June to August), where the average monthly temperature insummer is > 32 �C. In the highlands of the watershed area in Iran andIraq, the average monthly temperature in winter and summer is usually<4 �C and >28 �C, respectively (World Bank, 2019). The low-lying areasof the PGR experience mild temperatures during winters and the mostprecipitation is received from November to March in the whole area.
Different seasonal winds blow over the PGR. The Shamal wind(Arabic word for north) is the most prolonged and intensive one to blownear the surface and transports around 90 million tons of dust per yearinto the Gulf region, mainly from the deserts of the Arabian Peninsula,Iraq and Syria (Giannakopoulou and Toumi 2012; Jish Prakash et al.,2015). The wind occurs in the region during winter and summer. Theactivity in summer reaches its maximum in June and July (Prospero
combustion of fossil fuels (Broecker 1975). Although there is a rela-tionship between the amount of CO2 emissions and economic growth in recent decades (Granados et al., 2012), the medium to long-term future of the world's economy depends on moving away from fossil fuels (Murray and King 2012). Socio-economic impacts of this global decision (e.g. 2015 United Nations Paris agreement on climate change) on oil producers such as Persian Gulf Region (PGR) countries, is a matter of concern. Furthermore, the environmental consequences of fossil-fuel combustion and its impact on climate could limit the scope of eco-nomic diversification policies and hamper long-term investment for economic diversification and a smooth transition into the post-oil era. At present, the PGR is faced with a dual dilemma relating to its role as a major supplier of fossil fuels and also its high sensitivity to the envi-ronmental impacts of global climate change for which those fuels are responsible (Zenghelis 2006).
As the PGR contributes significantly to current climate change, and also suffers deeply from the consequences, the region constitutes a key case study for understanding the environmental impacts of present global changes (Burt et al., 2013; Lelieveld et al., 2012; Parry et al., 2007). Moreover, international adaptation strategies (Parry et al., 2007) could directly and/or indirectly affect socio-economic, political and geopolit-ical conditions in the region (Goldthau 2017).
In this study, we focus on climatically-induced environmental changes as a threat to the economic prosperity and socio-economic development of PGR countries. Moreover, we examine the socio-economic capacity of the Persian Gulf (PG) countries to deal with the consequences of global climate changes. Finally, we probe to what extent national climate-oriented policies and adaptation plans could act as catalysts to conflicts in the PGR. In our study, we did not include ideo-logical, international intervention or military factors.
et al., 2002) while in winter it is more active in November and March(Thoppil and Hogan 2010).
2.2. Marine environment
The PG is a semi-enclosed epicontinental water body that is located atthe northwestern corner of the Indian Ocean. The basin is connected tothe Gulf of Oman and the Arabian Sea via the Strait of Hormuz (Figure 1).
The average depth of the basin is around 35 m; the bathymetry in-creases eastward with a depth of >110 m at the Strait of Hormuz (Rey-nolds 1993). The bathymetry of the basin is complex. More than 60islands exist in the PG. Their origin is mostly related to regionalgeological structures. Moreover, salt domes, the accumulation of sedi-ments in shallow waters, and coral reefs construct other island types(Ross et al., 1986). The existence of these islands, along with thecomplicated bottom topography of the PG, limits maritime routes to justa few narrow waterways, closer to the Iranian coast.
The PG is a meso-tidal water body with maximum tidal range of morethan 3.5 m in the northwest flank of the Gulf (Najafi and Noye 1997). Thecirculation of the water body is poorly understood but it is generallycounterclockwise (K€ampf and Sadrinasab 2006) (Figure 1). The waterresidence time in the Gulf is around 2–5 years (Reynolds 1993).
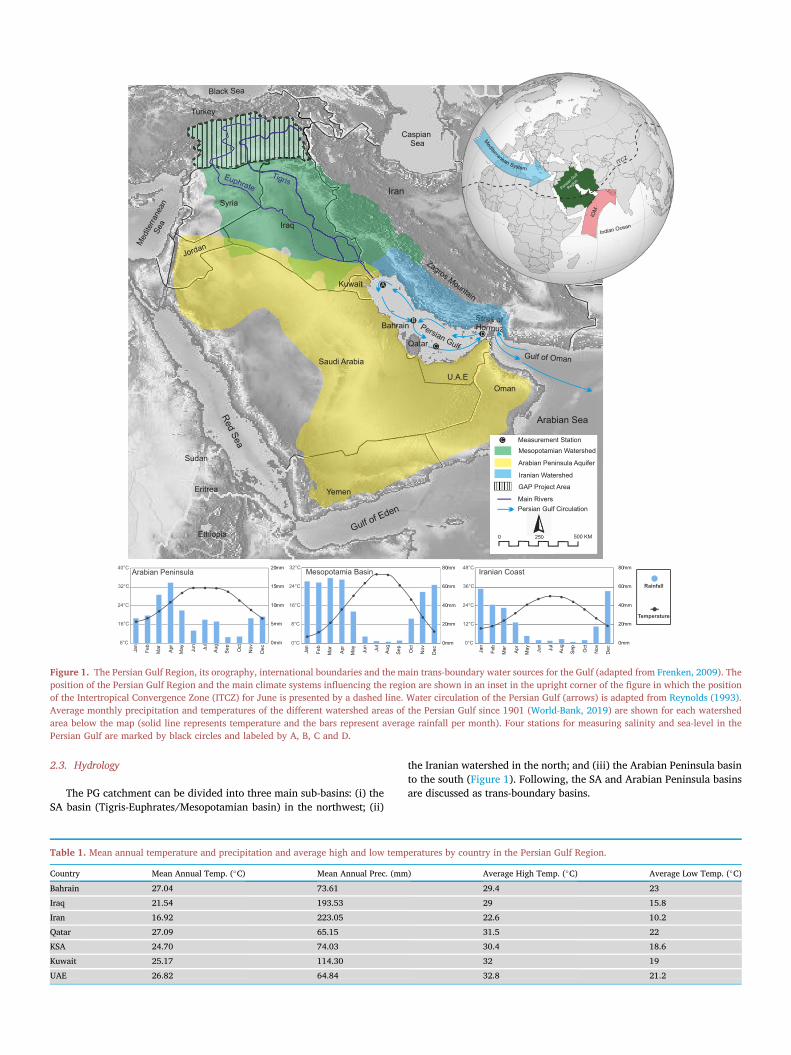
Sea surface temperatures can exceed 35 �C in summer (Figure 2),while in winter they can fall to<10 �C (Vaughan et al., 2019). Water lossthrough evaporation (high temperatures and strong winds) exceeds thenet freshwater input and increases the salinity of the water body to morethan 39 grL�1 in most parts of the Gulf (K€ampf and Sadrinasab 2006) andeven up to 70 to 80 grL�1 on the southern coast of the Gulf namely incoastal waters of Bahrain (Sheppard et al., 2010). The warm and moresaline water of the PG exits through the Strait of Hormuz (Reynolds1993) (Figure 1), where the outflowing plume of the warm and salinewater extends into the Arabian Sea for a distance of around 1,700 km(Uchupi et al., 2002).
The main source of freshwater in the PG is Shatt-Al-Arab that islocated at the northwest flank of the Gulf (Figure 1). The river system isformed by the confluence of the Euphrates and Tigris rivers in Iraq. KarunRiver from Iran joins the Shatt-al-Arab (SA) before discharging into theGulf. The catchment basin of SA extends to higher latitudes in thehighlands of Turkey, Iraq and Iran (Figure 1). The SA is the only navi-gable river in the PGR and the last 90 km of the river constitutes theborder between Iran and Iraq. The SA river is vital for the economy ofIraq as it provides international access to open seas as well as the requiredwater for irrigation and industry. There are no perennial rivers on thesouthern and eastern flanks of the PG.
Due to the orography and hydrogeological conditions of the region,numerous submarine springs exist in the PG. The water moves hundredsof kilometers from the Zagros Mountains and seeps into offshore areas inthe northern part of the Gulf (Zektser et al., 2006). Springs on thesouthern coastal zone of the Gulf are mainly fed by Arabian Peninsulaaquifers (Frenken 2009). However, very few scientific studies have beenconducted on the magnitude and effects of groundwater flow on the Gulfenvironment (Farzin et al., 2017).
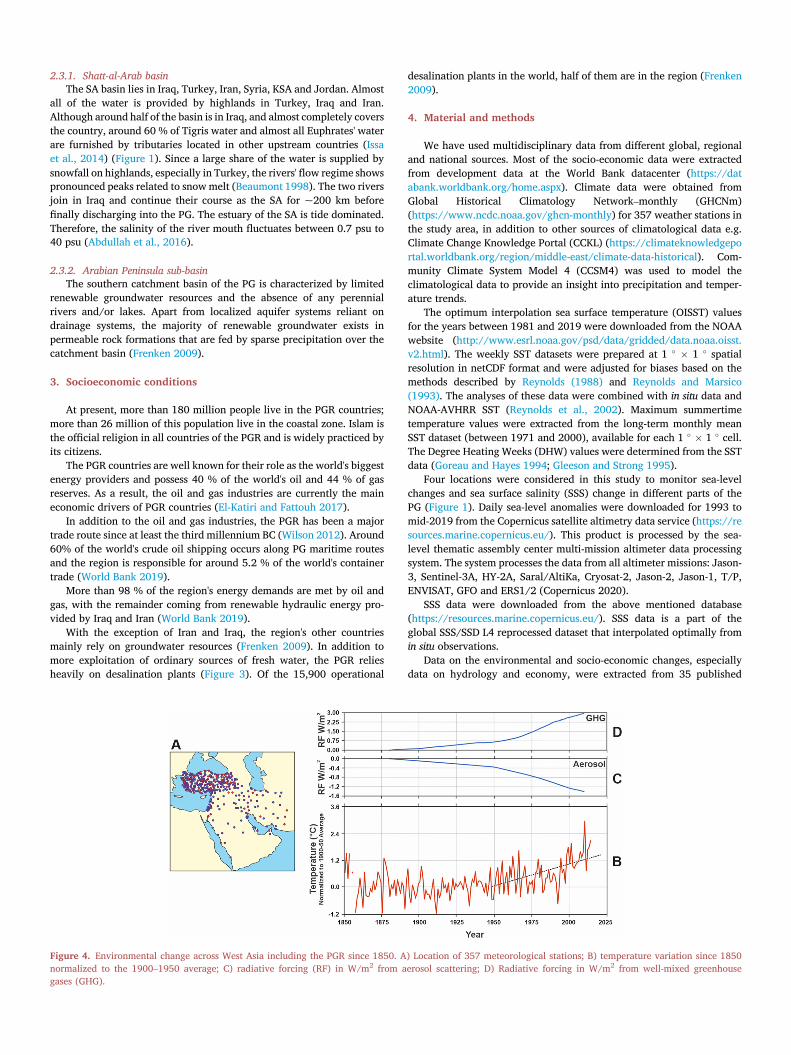
The biodiversity of the PG is limited by its harsh environmentalconditions (Sheppard et al., 2010). Coral reefs and coral patches inhard-grounds, seagrass meadows and algal beds (Figure 3) are the mostextensive high-diversity marine ecosystems in the Gulf (Sheppard et al.,2010). More than 600 fish species exist in the PG, whose spatial distri-bution is highly variable and depends on local marine conditions. Thetotal area of mangrove forests in the PGR is estimated to be 275km2, andthese are mostly situated in Iran, KSA and the UAE (FAO 2007). Coastalecosystems, especially those in intertidal and subtidal zones, containsignificantly higher biological diversity than terrestrial areas and theirproductivity is much higher than offshore ecosystems (Burt 2014).Economically, coastal ecosystems are the second most valuable resourcein the PG, after oil (Burt 2014).
Zagros Mountain
Strait of Hormuz
Med
iterra
nean
Sea
TigrisEuphrate
Mesopotamian Watershed
Arabian Peninsula Aquifer
Iranian Watershed
Main Rivers
GAP Project Area
Iran
Iraq
Saudi Arabia
Oman
Yemen
U.A.E
Qatar
Bahrain
Kuwait
Jordan
Sudan
Eritrea
Ethiopia
Red Sea
Arabian Sea
Gulf of Eden
Gulf of Oman
Persian Gulf
Black Sea
Caspian Sea
Syria
Turkey
0 250 500 KM250250
Persian Gulf Circulation
Persian
Gulf
Region
ITCZ
IOM
Strait ofHormuz
Rainfall
Temperature
Jan
Feb
Mar Ap
r
May Ju
n
Jul
Aug
Sep
Oct
Nov
Dec
8°C
16°C
24°C
32°C
40°C
0 mm
5 mm
10 mm
15 mm
20 mmArabian Peninsula
0°C
8°C
16°C
24°C
32°C
0 mm
20 mm
40 mm
60 mm
80 mmMesopotamia Basin
Jan
Feb
Mar Ap
r
May Ju
n
Jul
Aug
Sep
Oct
Nov
Dec
Iranian Coast
0°C
12°C
24°C
36°C
48°C
0 mm
20 mm
40 mm
60 mm
80 mm
Jan
Feb
Mar Ap
r
May Ju
n
Jul
Aug
Sep
Oct
Nov
Dec
Indian Ocean
A
B
C
D
C Measurement Station
Figure 1. The Persian Gulf Region, its orography, international boundaries and the main trans-boundary water sources for the Gulf (adapted from Frenken, 2009). Theposition of the Persian Gulf Region and the main climate systems influencing the region are shown in an inset in the upright corner of the figure in which the positionof the Intertropical Convergence Zone (ITCZ) for June is presented by a dashed line. Water circulation of the Persian Gulf (arrows) is adapted from Reynolds (1993).Average monthly precipitation and temperatures of the different watershed areas of the Persian Gulf since 1901 (World-Bank, 2019) are shown for each watershedarea below the map (solid line represents temperature and the bars represent average rainfall per month). Four stations for measuring salinity and sea-level in thePersian Gulf are marked by black circles and labeled by A, B, C and D.
2.3. Hydrology
The PG catchment can be divided into three main sub-basins: (i) theSA basin (Tigris-Euphrates/Mesopotamian basin) in the northwest; (ii)
Table 1. Mean annual temperature and precipitation and average high and low temp
Country Mean Annual Temp. (�C) Mean Annual Prec. (mm
Bahrain 27.04 73.61
Iraq 21.54 193.53
Iran 16.92 223.05
Qatar 27.09 65.15
KSA 24.70 74.03
Kuwait 25.17 114.30
UAE 26.82 64.84
the Iranian watershed in the north; and (iii) the Arabian Peninsula basinto the south (Figure 1). Following, the SA and Arabian Peninsula basinsare discussed as trans-boundary basins.
eratures by country in the Persian Gulf Region.
) Average High Temp. (�C) Average Low Temp. (�C)
29.4 23
29 15.8
22.6 10.2
31.5 22
30.4 18.6
32 19
32.8 21.2
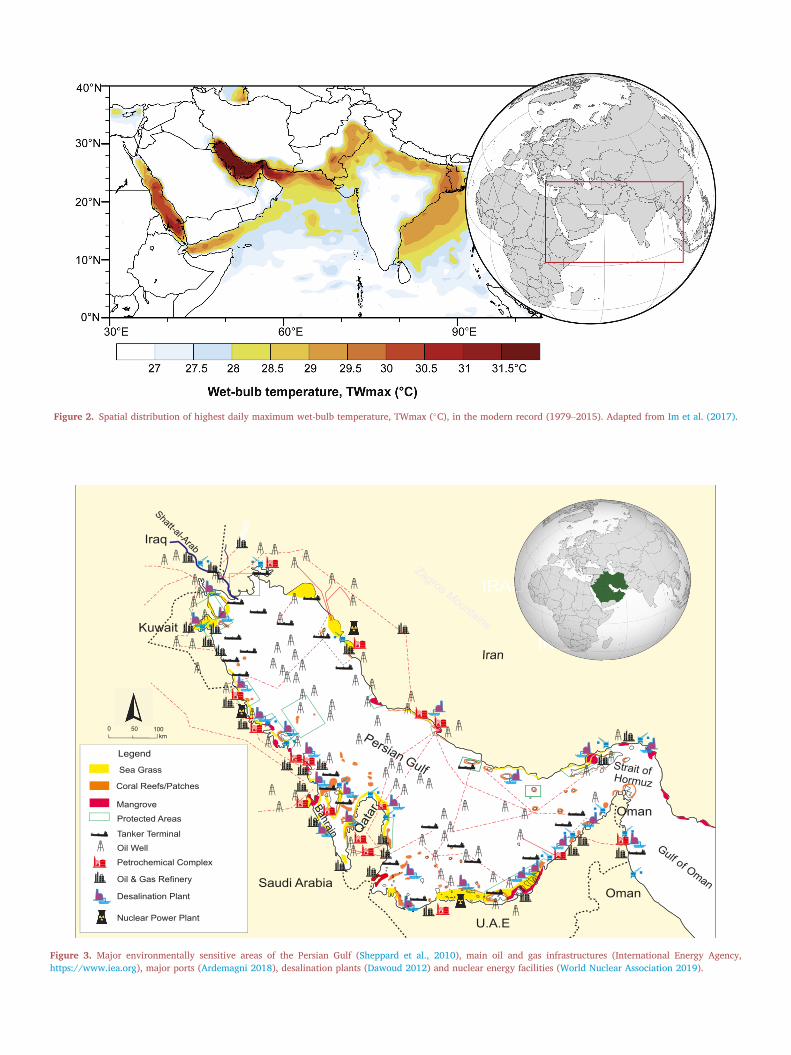
Figure 2. Spatial distribution of highest daily maximum wet-bulb temperature, TWmax (�C), in the modern record (1979–2015). Adapted from Im et al. (2017).
IRAN
Iraq
Saudi Arabia
U.A.E
Persian Gulf
Shatt-al-Arab Karu
n
Iran
Sea Grass
Coral Reefs/Patches
Legend
MangroveProtected Areas
Tanker TerminalOil WellPetrochemical Complex
Oil & Gas Refinery
Desalination Plant
Nuclear Power Plant
IRAN
Karu
n
Zagros Mountains
IRRRRRRRRRRRRRRRRRRRRRRRRRRRRRRRRRRRRRRRRRRRRRRRRRRRRRRRRRRRRRRRRRRRRAAAAAAAAAAAAAAAAAAAAAAAAAAAAAAAAAAAAAAAAAAAAAAAAAAAAAAAAAAAAAAANNNNNNN
NNNNNNNNNNNNNN
0 50 100 km
Kuwait
Oman
Oman
Qatar
Bahrain
Strait of Hormuz
Gulf of Oman
Figure 3. Major environmentally sensitive areas of the Persian Gulf (Sheppard et al., 2010), main oil and gas infrastructures (International Energy Agency,https://www.iea.org), major ports (Ardemagni 2018), desalination plants (Dawoud 2012) and nuclear energy facilities (World Nuclear Association 2019).
3. Socioeconomic conditions
At present, more than 180 million people live in the PGR countries;more than 26 million of this population live in the coastal zone. Islam isthe official religion in all countries of the PGR and is widely practiced byits citizens.
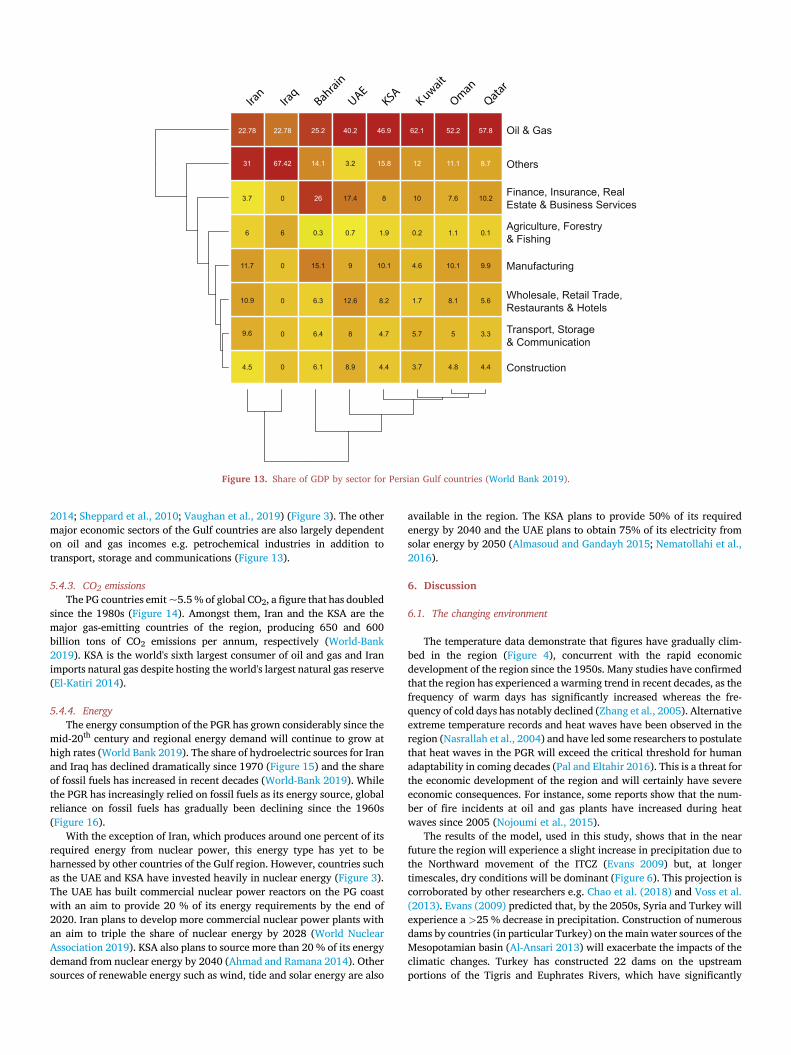
The PGR countries are well known for their role as the world's biggestenergy providers and possess 40 % of the world's oil and 44 % of gasreserves. As a result, the oil and gas industries are currently the maineconomic drivers of PGR countries (El-Katiri and Fattouh 2017).
In addition to the oil and gas industries, the PGR has been a majortrade route since at least the third millennium BC (Wilson 2012). Around60% of the world's crude oil shipping occurs along PG maritime routesand the region is responsible for around 5.2 % of the world's containertrade (World Bank 2019).
More than 98 % of the region's energy demands are met by oil andgas, with the remainder coming from renewable hydraulic energy pro-vided by Iraq and Iran (World Bank 2019).
With the exception of Iran and Iraq, the region's other countriesmainly rely on groundwater resources (Frenken 2009). In addition tomore exploitation of ordinary sources of fresh water, the PGR reliesheavily on desalination plants (Figure 3). Of the 15,900 operational
2.3.1. Shatt-al-Arab basinThe SA basin lies in Iraq, Turkey, Iran, Syria, KSA and Jordan. Almost
all of the water is provided by highlands in Turkey, Iraq and Iran. Although around half of the basin is in Iraq, and almost completely covers the country, around 60 % of Tigris water and almost all Euphrates' water are furnished by tributaries located in other upstream countries (Issa et al., 2014) (Figure 1). Since a large share of the water is supplied by snowfall on highlands, especially in Turkey, the rivers' flow regime shows pronounced peaks related to snow melt (Beaumont 1998). The two rivers join in Iraq and continue their course as the SA for ~200 km before finally discharging into the PG. The estuary of the SA is tide dominated. Therefore, the salinity of the river mouth fluctuates between 0.7 psu to 40 psu (Abdullah et al., 2016).
2.3.2. Arabian Peninsula sub-basinThe southern catchment basin of the PG is characterized by limited
renewable groundwater resources and the absence of any perennial rivers and/or lakes. Apart from localized aquifer systems reliant on drainage systems, the majority of renewable groundwater exists in permeable rock formations that are fed by sparse precipitation over the catchment basin (Frenken 2009).
Figure 4. Environmental change across West Asia including the PGR since 1850. Anormalized to the 1900–1950 average; C) radiative forcing (RF) in W/m2 from agases (GHG).
desalination plants in the world, half of them are in the region (Frenken2009).
4. Material and methods
We have used multidisciplinary data from different global, regionaland national sources. Most of the socio-economic data were extractedfrom development data at the World Bank datacenter (https://databank.worldbank.org/home.aspx). Climate data were obtained fromGlobal Historical Climatology Network–monthly (GHCNm)(https://www.ncdc.noaa.gov/ghcn-monthly) for 357 weather stations inthe study area, in addition to other sources of climatological data e.g.Climate Change Knowledge Portal (CCKL) (https://climateknowledgeportal.worldbank.org/region/middle-east/climate-data-historical). Com-munity Climate System Model 4 (CCSM4) was used to model theclimatological data to provide an insight into precipitation and temper-ature trends.
The optimum interpolation sea surface temperature (OISST) valuesfor the years between 1981 and 2019 were downloaded from the NOAAwebsite (http://www.esrl.noaa.gov/psd/data/gridded/data.noaa.oisst.v2.html). The weekly SST datasets were prepared at 1 � � 1 � spatialresolution in netCDF format and were adjusted for biases based on themethods described by Reynolds (1988) and Reynolds and Marsico(1993). The analyses of these data were combined with in situ data andNOAA-AVHRR SST (Reynolds et al., 2002). Maximum summertimetemperature values were extracted from the long-term monthly meanSST dataset (between 1971 and 2000), available for each 1 � � 1 � cell.The Degree Heating Weeks (DHW) values were determined from the SSTdata (Goreau and Hayes 1994; Gleeson and Strong 1995).
Four locations were considered in this study to monitor sea-levelchanges and sea surface salinity (SSS) change in different parts of thePG (Figure 1). Daily sea-level anomalies were downloaded for 1993 tomid-2019 from the Copernicus satellite altimetry data service (https://resources.marine.copernicus.eu/). This product is processed by the sea-level thematic assembly center multi-mission altimeter data processingsystem. The system processes the data from all altimeter missions: Jason-3, Sentinel-3A, HY-2A, Saral/AltiKa, Cryosat-2, Jason-2, Jason-1, T/P,ENVISAT, GFO and ERS1/2 (Copernicus 2020).
SSS data were downloaded from the above mentioned database(https://resources.marine.copernicus.eu/). SSS data is a part of theglobal SSS/SSD L4 reprocessed dataset that interpolated optimally fromin situ observations.
Data on the environmental and socio-economic changes, especiallydata on hydrology and economy, were extracted from 35 published
) Location of 357 meteorological stations; B) temperature variation since 1850erosol scattering; D) Radiative forcing in W/m2 from well-mixed greenhouse
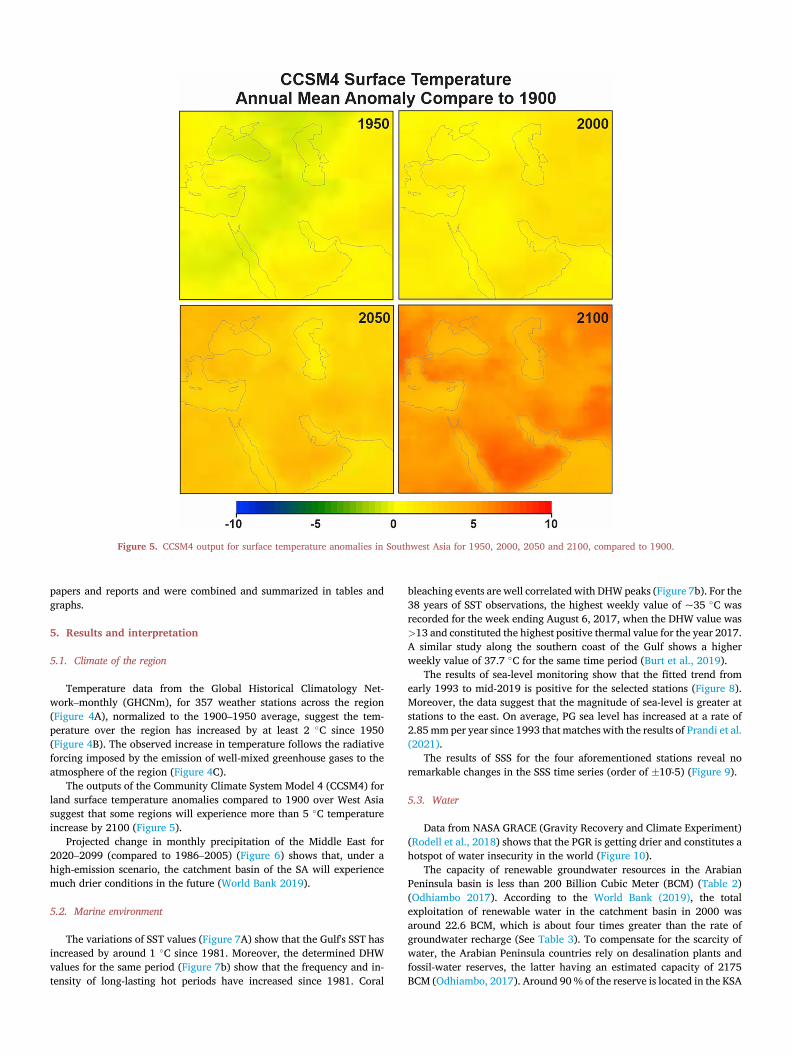
Figure 5. CCSM4 output for surface temperature anomalies in Southwest Asia for 1950, 2000, 2050 and 2100, compared to 1900.
papers and reports and were combined and summarized in tables andgraphs.
5. Results and interpretation
5.1. Climate of the region
Temperature data from the Global Historical Climatology Net-work–monthly (GHCNm), for 357 weather stations across the region(Figure 4A), normalized to the 1900–1950 average, suggest the tem-perature over the region has increased by at least 2 �C since 1950(Figure 4B). The observed increase in temperature follows the radiativeforcing imposed by the emission of well-mixed greenhouse gases to theatmosphere of the region (Figure 4C).
The outputs of the Community Climate System Model 4 (CCSM4) forland surface temperature anomalies compared to 1900 over West Asiasuggest that some regions will experience more than 5 �C temperatureincrease by 2100 (Figure 5).
Projected change in monthly precipitation of the Middle East for2020–2099 (compared to 1986–2005) (Figure 6) shows that, under ahigh-emission scenario, the catchment basin of the SA will experiencemuch drier conditions in the future (World Bank 2019).
5.2. Marine environment
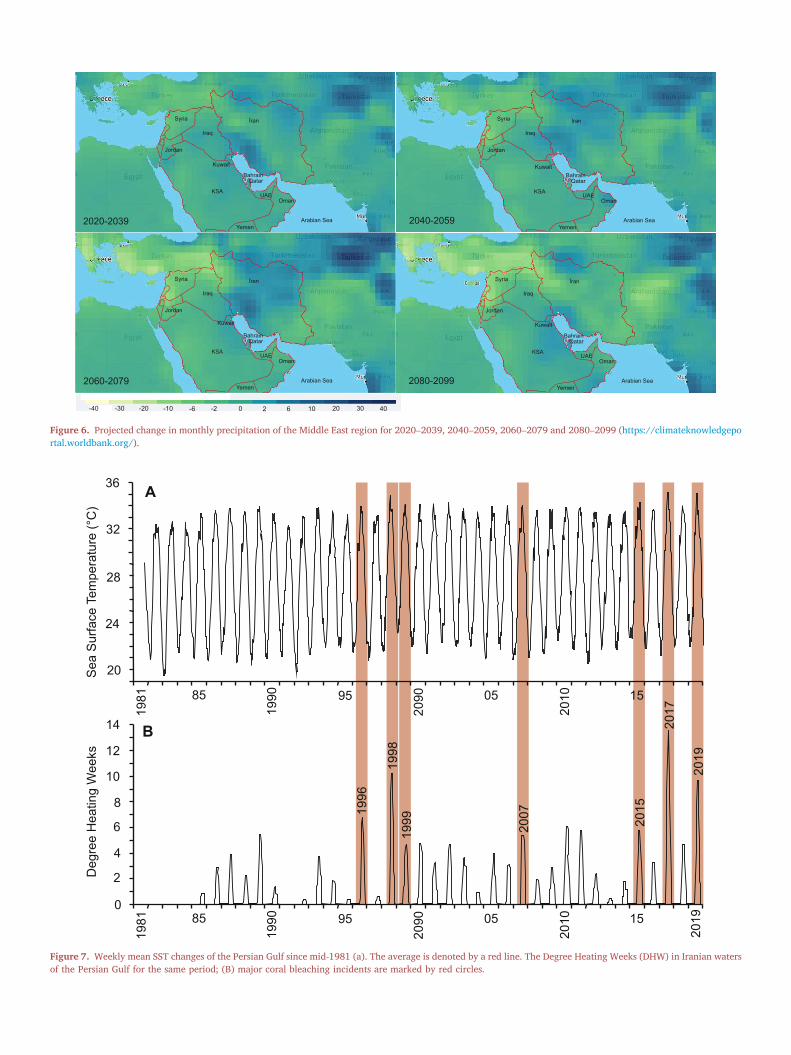
The variations of SST values (Figure 7A) show that the Gulf's SST hasincreased by around 1 �C since 1981. Moreover, the determined DHWvalues for the same period (Figure 7b) show that the frequency and in-tensity of long-lasting hot periods have increased since 1981. Coral
bleaching events are well correlated with DHWpeaks (Figure 7b). For the38 years of SST observations, the highest weekly value of ~35 �C wasrecorded for the week ending August 6, 2017, when the DHW value was>13 and constituted the highest positive thermal value for the year 2017.A similar study along the southern coast of the Gulf shows a higherweekly value of 37.7 �C for the same time period (Burt et al., 2019).
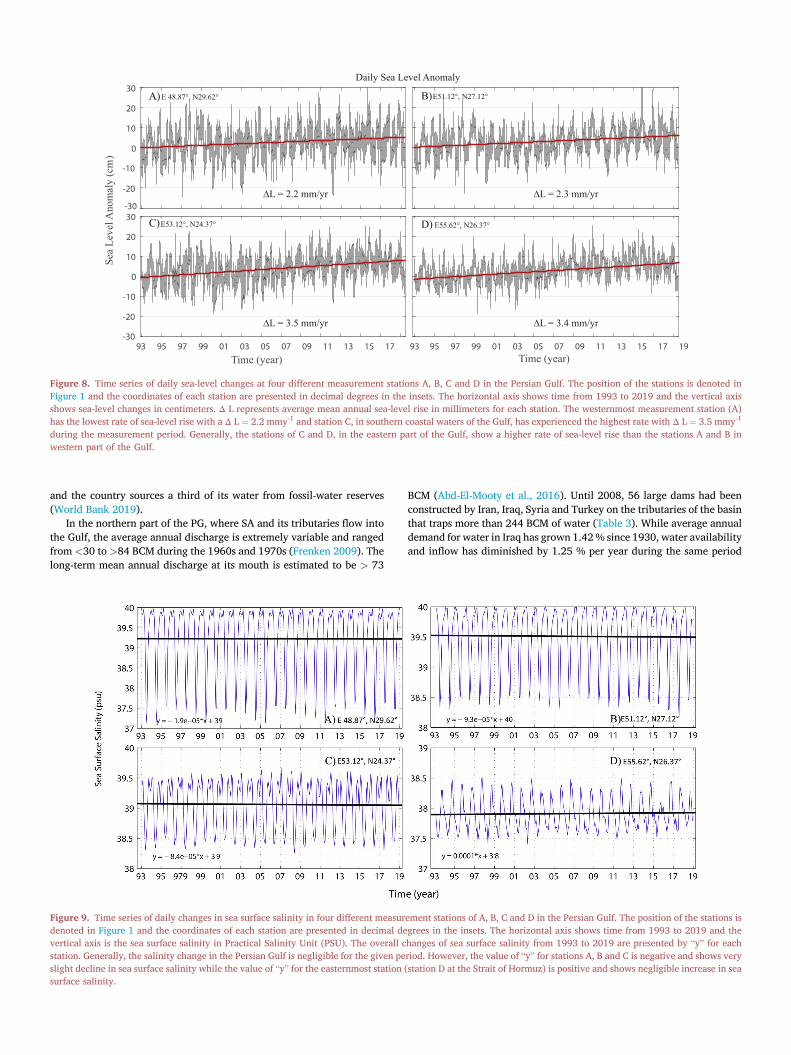
The results of sea-level monitoring show that the fitted trend fromearly 1993 to mid-2019 is positive for the selected stations (Figure 8).Moreover, the data suggest that the magnitude of sea-level is greater atstations to the east. On average, PG sea level has increased at a rate of2.85 mm per year since 1993 that matches with the results of Prandi et al.(2021).
The results of SSS for the four aforementioned stations reveal noremarkable changes in the SSS time series (order of �10̂-5) (Figure 9).
5.3. Water
Data from NASA GRACE (Gravity Recovery and Climate Experiment)(Rodell et al., 2018) shows that the PGR is getting drier and constitutes ahotspot of water insecurity in the world (Figure 10).
The capacity of renewable groundwater resources in the ArabianPeninsula basin is less than 200 Billion Cubic Meter (BCM) (Table 2)(Odhiambo 2017). According to the World Bank (2019), the totalexploitation of renewable water in the catchment basin in 2000 wasaround 22.6 BCM, which is about four times greater than the rate ofgroundwater recharge (See Table 3). To compensate for the scarcity ofwater, the Arabian Peninsula countries rely on desalination plants andfossil-water reserves, the latter having an estimated capacity of 2175BCM (Odhiambo, 2017). Around 90% of the reserve is located in the KSA
Iran
Iraq
Kuwait
QatarBahrain
KSAUAE
Oman
Syria
Jordan
YemenArabian Sea
Iran
Iraq
Kuwait
QatarBahrain
KSAUAE
Oman
Syria
Jordan
YemenArabian Sea
Iran
Iraq
Kuwait
QatarBahrain
KSAUAE
Oman
Syria
Jordan
YemenArabian Sea
Iran
Iraq
Kuwait
QatarBahrain
KSAUAE
Oman
Syria
Jordan
YemenArabian Sea
2020-2039 2040-2059
2060-2079 2080-2099
-40 -30 -20 -10 -6 -2 0 2 6 10 3020 40
Figure 6. Projected change in monthly precipitation of the Middle East region for 2020–2039, 2040–2059, 2060–2079 and 2080–2099 (https://climateknowledgeportal.worldbank.org/).
1981
1990
2090
201085 95 05 15
1981
1990
2090
2010
201985 95 05 15
1996
1998
1999 2007 2015
2017
2019
Deg
ree
Hea
ting
Wee
ksSe
a Su
rface
Tem
pera
ture
(°C
)
0
2
4
8
6
10
12
14 B
20
24
28
32
36 A
Figure 7. Weekly mean SST changes of the Persian Gulf since mid-1981 (a). The average is denoted by a red line. The Degree Heating Weeks (DHW) in Iranian watersof the Persian Gulf for the same period; (B) major coral bleaching incidents are marked by red circles.
-20
-10
0
10
20
30Daily Sea Level Anomaly
93 95 97 99 01 03 05 07 09 11 13 15 17-30
-20
-10
0
10
20
30
Sea
Leve
l Ano
mal
y (c
m)
93 95 97 99 01 03 05 07 09 11 13 15 17 19Time (year)
∆L = 2.2 mm/yr ∆L = 2.3 mm/yr
∆L = 3.4 mm/yr∆L = 3.5 mm/yr
A) B)
C) D)
-30
E 48.87°, N29.62° E51.12°, N27.12°
E53.12°, N24.37° E55.62°, N26.37°
Time (year)
Figure 8. Time series of daily sea-level changes at four different measurement stations A, B, C and D in the Persian Gulf. The position of the stations is denoted inFigure 1 and the coordinates of each station are presented in decimal degrees in the insets. The horizontal axis shows time from 1993 to 2019 and the vertical axisshows sea-level changes in centimeters. Δ L represents average mean annual sea-level rise in millimeters for each station. The westernmost measurement station (A)has the lowest rate of sea-level rise with a Δ L ¼ 2.2 mmy-1 and station C, in southern coastal waters of the Gulf, has experienced the highest rate with Δ L ¼ 3.5 mmy-1
during the measurement period. Generally, the stations of C and D, in the eastern part of the Gulf, show a higher rate of sea-level rise than the stations A and B inwestern part of the Gulf.
and the country sources a third of its water from fossil-water reserves(World Bank 2019).
In the northern part of the PG, where SA and its tributaries flow intothe Gulf, the average annual discharge is extremely variable and rangedfrom <30 to >84 BCM during the 1960s and 1970s (Frenken 2009). Thelong-term mean annual discharge at its mouth is estimated to be > 73
Figure 9. Time series of daily changes in sea surface salinity in four different measurdenoted in Figure 1 and the coordinates of each station are presented in decimal devertical axis is the sea surface salinity in Practical Salinity Unit (PSU). The overall cstation. Generally, the salinity change in the Persian Gulf is negligible for the given peslight decline in sea surface salinity while the value of “y” for the easternmost station (surface salinity.
BCM (Abd-El-Mooty et al., 2016). Until 2008, 56 large dams had beenconstructed by Iran, Iraq, Syria and Turkey on the tributaries of the basinthat traps more than 244 BCM of water (Table 3). While average annualdemand for water in Iraq has grown 1.42% since 1930, water availabilityand inflow has diminished by 1.25 % per year during the same period
ement stations of A, B, C and D in the Persian Gulf. The position of the stations isgrees in the insets. The horizontal axis shows time from 1993 to 2019 and thehanges of sea surface salinity from 1993 to 2019 are presented by “y” for eachriod. However, the value of “y” for stations A, B and C is negative and shows verystation D at the Strait of Hormuz) is positive and shows negligible increase in sea
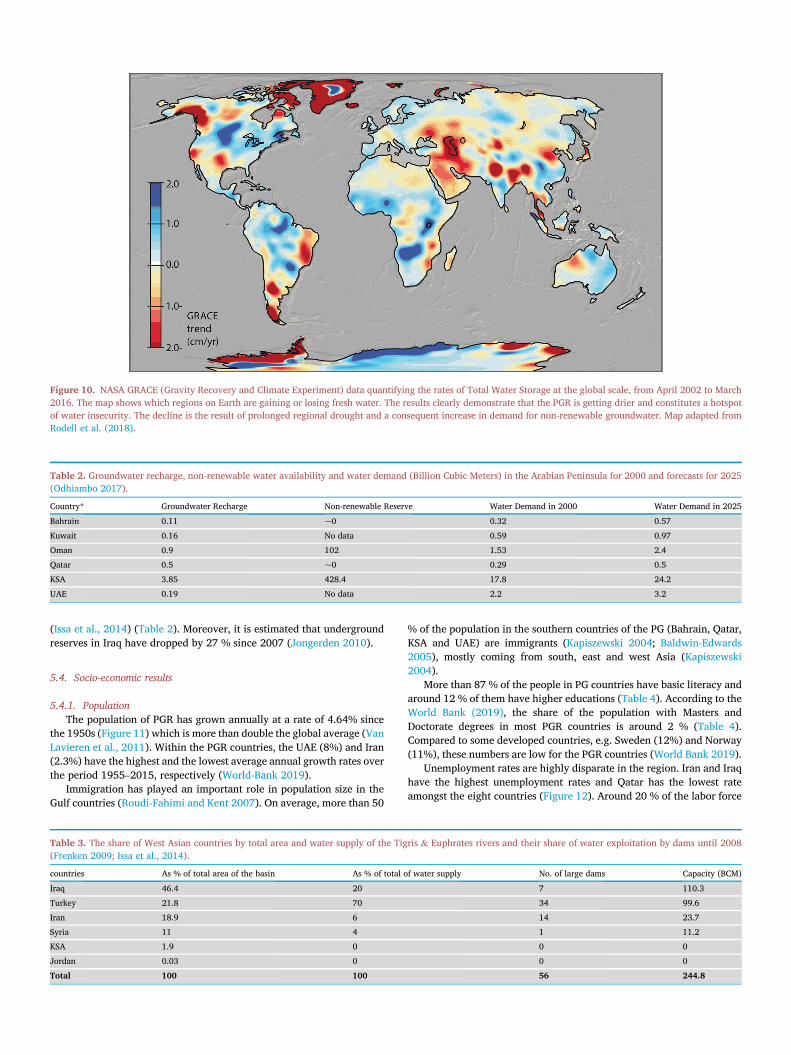
Figure 10. NASA GRACE (Gravity Recovery and Climate Experiment) data quantifying the rates of Total Water Storage at the global scale, from April 2002 to March2016. The map shows which regions on Earth are gaining or losing fresh water. The results clearly demonstrate that the PGR is getting drier and constitutes a hotspotof water insecurity. The decline is the result of prolonged regional drought and a consequent increase in demand for non-renewable groundwater. Map adapted fromRodell et al. (2018).
Table 2. Groundwater recharge, non-renewable water availability and water demand (Billion Cubic Meters) in the Arabian Peninsula for 2000 and forecasts for 2025(Odhiambo 2017).
Country* Groundwater Recharge Non-renewable Reserve Water Demand in 2000 Water Demand in 2025
Bahrain 0.11 ~0 0.32 0.57
Kuwait 0.16 No data 0.59 0.97
Oman 0.9 102 1.53 2.4
Qatar 0.5 ~0 0.29 0.5
KSA 3.85 428.4 17.8 24.2
UAE 0.19 No data 2.2 3.2
(Issa et al., 2014) (Table 2). Moreover, it is estimated that undergroundreserves in Iraq have dropped by 27 % since 2007 (Jongerden 2010).
5.4. Socio-economic results
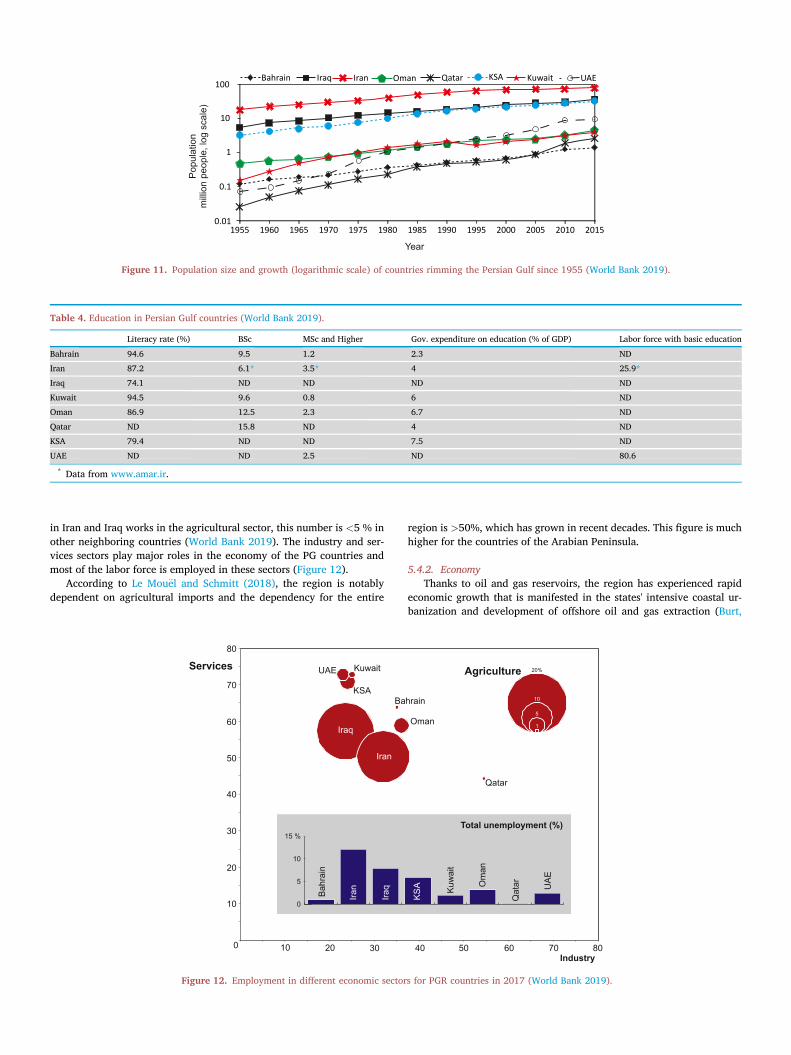
5.4.1. PopulationThe population of PGR has grown annually at a rate of 4.64% since
the 1950s (Figure 11) which is more than double the global average (VanLavieren et al., 2011). Within the PGR countries, the UAE (8%) and Iran(2.3%) have the highest and the lowest average annual growth rates overthe period 1955–2015, respectively (World-Bank 2019).
Immigration has played an important role in population size in theGulf countries (Roudi-Fahimi and Kent 2007). On average, more than 50
Table 3. The share of West Asian countries by total area and water supply of the Tig(Frenken 2009; Issa et al., 2014).
countries As % of total area of the basin As % of total o
Iraq 46.4 20
Turkey 21.8 70
Iran 18.9 6
Syria 11 4
KSA 1.9 0
Jordan 0.03 0
Total 100 100
% of the population in the southern countries of the PG (Bahrain, Qatar,KSA and UAE) are immigrants (Kapiszewski 2004; Baldwin-Edwards2005), mostly coming from south, east and west Asia (Kapiszewski2004).
More than 87 % of the people in PG countries have basic literacy andaround 12 % of them have higher educations (Table 4). According to theWorld Bank (2019), the share of the population with Masters andDoctorate degrees in most PGR countries is around 2 % (Table 4).Compared to some developed countries, e.g. Sweden (12%) and Norway(11%), these numbers are low for the PGR countries (World Bank 2019).
Unemployment rates are highly disparate in the region. Iran and Iraqhave the highest unemployment rates and Qatar has the lowest rateamongst the eight countries (Figure 12). Around 20 % of the labor force
ris & Euphrates rivers and their share of water exploitation by dams until 2008
f water supply No. of large dams Capacity (BCM)
7 110.3
34 99.6
14 23.7
1 11.2
0 0
0 0
56 244.8
1
1955 1960 1965 1970 1975 1980 1985 1990 1995 2000 2005 2010 20150.01
0.1
100
10
Bahrain Qatar UAEKuwaitOman KSAIranIraq
Year
Popu
latio
n m
illion
peo
ple,
log
scal
e)
Figure 11. Population size and growth (logarithmic scale) of countries rimming the Persian Gulf since 1955 (World Bank 2019).
Table 4. Education in Persian Gulf countries (World Bank 2019).
Literacy rate (%) BSc MSc and Higher Gov. expenditure on education (% of GDP) Labor force with basic education
Bahrain 94.6 9.5 1.2 2.3 ND
Iran 87.2 6.1* 3.5* 4 25.9*
Iraq 74.1 ND ND ND ND
Kuwait 94.5 9.6 0.8 6 ND
Oman 86.9 12.5 2.3 6.7 ND
Qatar ND 15.8 ND 4 ND
KSA 79.4 ND ND 7.5 ND
UAE ND ND 2.5 ND 80.6
* Data from www.amar.ir.
in Iran and Iraq works in the agricultural sector, this number is <5 % inother neighboring countries (World Bank 2019). The industry and ser-vices sectors play major roles in the economy of the PG countries andmost of the labor force is employed in these sectors (Figure 12).
According to Le Mou€el and Schmitt (2018), the region is notablydependent on agricultural imports and the dependency for the entire
Iran
Ba
Bahr
ain
Kuwait
KSA
UAE
Iraq
80
70
60
50
40
30
20
20 30
10
Services
100
0
5
10
15 %
Iran
Iraq
Figure 12. Employment in different economic sector
10
region is >50%, which has grown in recent decades. This figure is muchhigher for the countries of the Arabian Peninsula.
5.4.2. EconomyThanks to oil and gas reservoirs, the region has experienced rapid
economic growth that is manifested in the states' intensive coastal ur-banization and development of offshore oil and gas extraction (Burt,
Qatar
hrain
Oman
40 50 60 70 80
Agriculture
Industry
Total unemployment (%)
KSA Ku
wai
t
Om
an
Qat
ar UAE
1
5
10
20%
s for PGR countries in 2017 (World Bank 2019).
Iran
Iraq
Bahrain
UAE
KSA
Kuwait
Oman
Qatar
Construction
Transport, Storage& Communication
Wholesale, Retail Trade,Restaurants & Hotels
Manufacturing
Agriculture, Forestry& Fishing
Finance, Insurance, RealEstate & Business Services
Others
Oil & Gas22.78 22.78
31 67.42
3.7
6 6
0
0
0
0
0
40.2
3.2
0.7
17.4
9
12.6
8
8.9
46.9
15.8
1.9
8
10.1
8.2
4.7
4.4
62.1
12
0.2
10
4.6
1.7
5.7
3.7
52.2
11.1
1.1
7.6
10.1
8.1
5
4.8
57.8
8.7
0.1
10.2
9.9
5.6
3.3
4.4
25.2
14.1
0.3
26
15.1
6.3
6.4
6.1
11.7
10.9
9.6
4.5
Figure 13. Share of GDP by sector for Persian Gulf countries (World Bank 2019).
2014; Sheppard et al., 2010; Vaughan et al., 2019) (Figure 3). The othermajor economic sectors of the Gulf countries are also largely dependenton oil and gas incomes e.g. petrochemical industries in addition totransport, storage and communications (Figure 13).
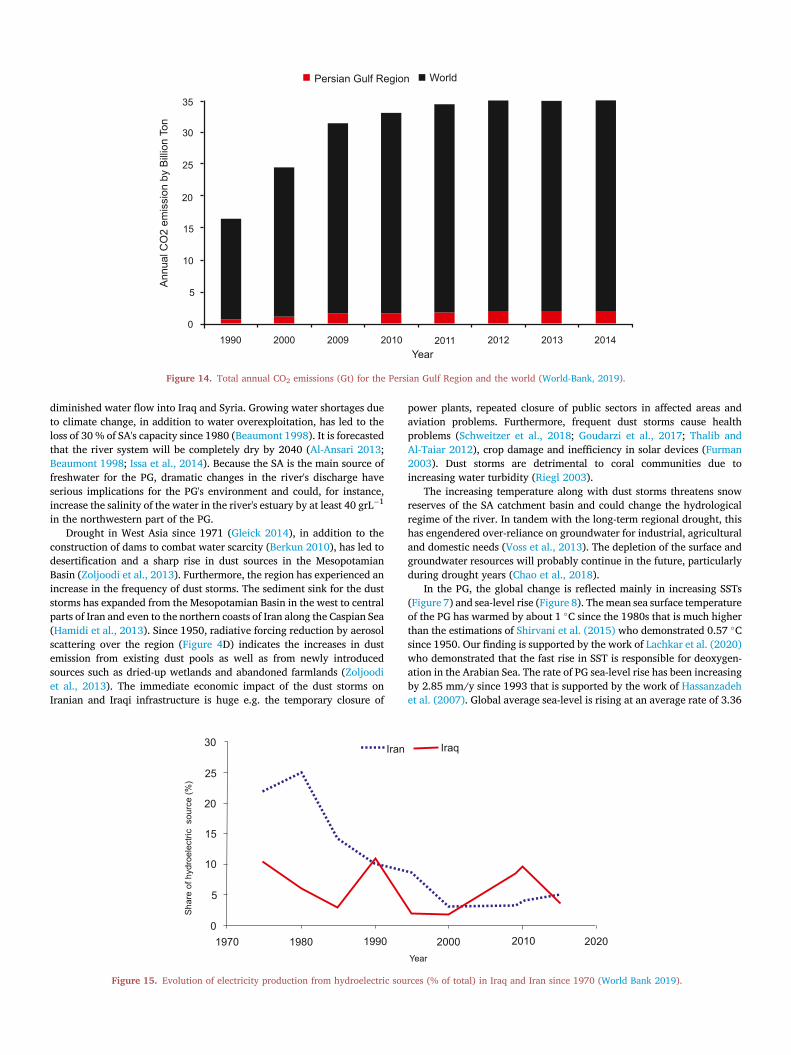
5.4.3. CO2 emissionsThe PG countries emit ~5.5% of global CO2, a figure that has doubled
since the 1980s (Figure 14). Amongst them, Iran and the KSA are themajor gas-emitting countries of the region, producing 650 and 600billion tons of CO2 emissions per annum, respectively (World-Bank2019). KSA is the world's sixth largest consumer of oil and gas and Iranimports natural gas despite hosting the world's largest natural gas reserve(El-Katiri 2014).
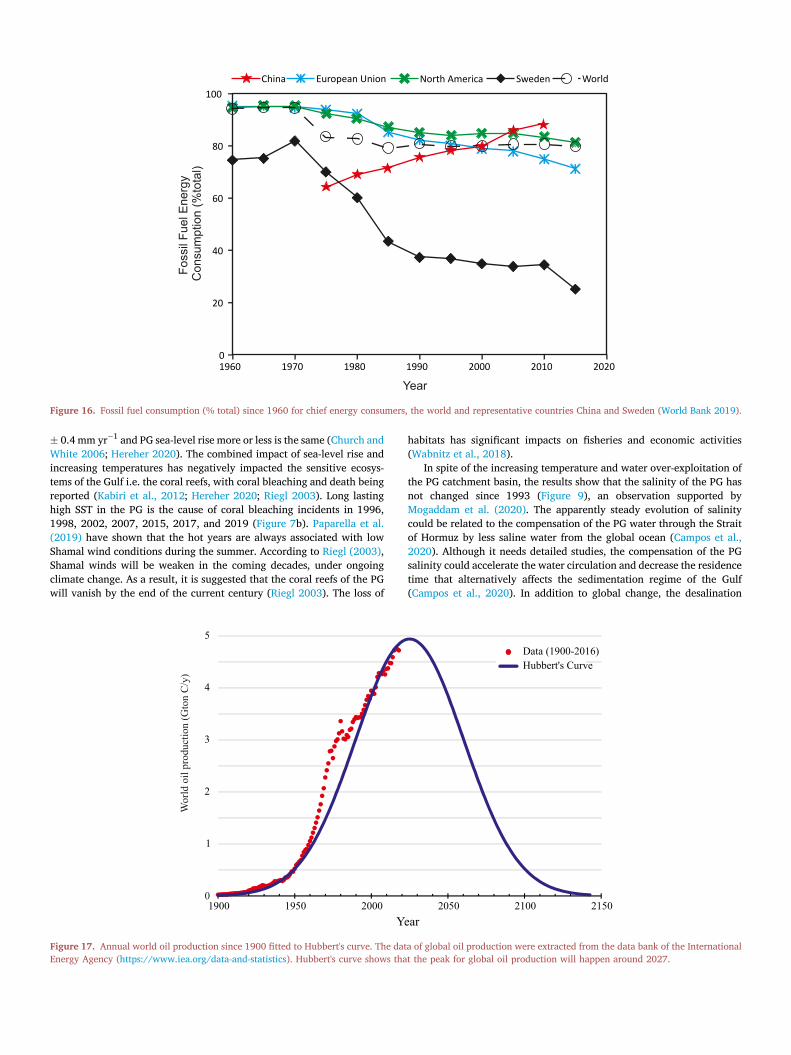
5.4.4. EnergyThe energy consumption of the PGR has grown considerably since the
mid-20th century and regional energy demand will continue to grow athigh rates (World Bank 2019). The share of hydroelectric sources for Iranand Iraq has declined dramatically since 1970 (Figure 15) and the shareof fossil fuels has increased in recent decades (World-Bank 2019). Whilethe PGR has increasingly relied on fossil fuels as its energy source, globalreliance on fossil fuels has gradually been declining since the 1960s(Figure 16).
With the exception of Iran, which produces around one percent of itsrequired energy from nuclear power, this energy type has yet to beharnessed by other countries of the Gulf region. However, countries suchas the UAE and KSA have invested heavily in nuclear energy (Figure 3).The UAE has built commercial nuclear power reactors on the PG coastwith an aim to provide 20 % of its energy requirements by the end of2020. Iran plans to develop more commercial nuclear power plants withan aim to triple the share of nuclear energy by 2028 (World NuclearAssociation 2019). KSA also plans to source more than 20 % of its energydemand from nuclear energy by 2040 (Ahmad and Ramana 2014). Othersources of renewable energy such as wind, tide and solar energy are also
available in the region. The KSA plans to provide 50% of its requiredenergy by 2040 and the UAE plans to obtain 75% of its electricity fromsolar energy by 2050 (Almasoud and Gandayh 2015; Nematollahi et al.,2016).
6. Discussion
6.1. The changing environment
The temperature data demonstrate that figures have gradually clim-bed in the region (Figure 4), concurrent with the rapid economicdevelopment of the region since the 1950s. Many studies have confirmedthat the region has experienced a warming trend in recent decades, as thefrequency of warm days has significantly increased whereas the fre-quency of cold days has notably declined (Zhang et al., 2005). Alternativeextreme temperature records and heat waves have been observed in theregion (Nasrallah et al., 2004) and have led some researchers to postulatethat heat waves in the PGR will exceed the critical threshold for humanadaptability in coming decades (Pal and Eltahir 2016). This is a threat forthe economic development of the region and will certainly have severeeconomic consequences. For instance, some reports show that the num-ber of fire incidents at oil and gas plants have increased during heatwaves since 2005 (Nojoumi et al., 2015).
The results of the model, used in this study, shows that in the nearfuture the region will experience a slight increase in precipitation due tothe Northward movement of the ITCZ (Evans 2009) but, at longertimescales, dry conditions will be dominant (Figure 6). This projection iscorroborated by other researchers e.g. Chao et al. (2018) and Voss et al.(2013). Evans (2009) predicted that, by the 2050s, Syria and Turkey willexperience a >25 % decrease in precipitation. Construction of numerousdams by countries (in particular Turkey) on the main water sources of theMesopotamian basin (Al-Ansari 2013) will exacerbate the impacts of theclimatic changes. Turkey has constructed 22 dams on the upstreamportions of the Tigris and Euphrates Rivers, which have significantly
0
5
10
15
20
25
30
35
Annu
al C
O2
emis
sion
by
Billio
n To
n
Year1990 2000 2009 2010 2011 2012 2013 2014
Persian Gulf Region World
Figure 14. Total annual CO2 emissions (Gt) for the Persian Gulf Region and the world (World-Bank, 2019).
diminished water flow into Iraq and Syria. Growing water shortages dueto climate change, in addition to water overexploitation, has led to theloss of 30 % of SA's capacity since 1980 (Beaumont 1998). It is forecastedthat the river system will be completely dry by 2040 (Al-Ansari 2013;Beaumont 1998; Issa et al., 2014). Because the SA is the main source offreshwater for the PG, dramatic changes in the river's discharge haveserious implications for the PG's environment and could, for instance,increase the salinity of the water in the river's estuary by at least 40 grL�1
in the northwestern part of the PG.Drought in West Asia since 1971 (Gleick 2014), in addition to the
construction of dams to combat water scarcity (Berkun 2010), has led todesertification and a sharp rise in dust sources in the MesopotamianBasin (Zoljoodi et al., 2013). Furthermore, the region has experienced anincrease in the frequency of dust storms. The sediment sink for the duststorms has expanded from the Mesopotamian Basin in the west to centralparts of Iran and even to the northern coasts of Iran along the Caspian Sea(Hamidi et al., 2013). Since 1950, radiative forcing reduction by aerosolscattering over the region (Figure 4D) indicates the increases in dustemission from existing dust pools as well as from newly introducedsources such as dried-up wetlands and abandoned farmlands (Zoljoodiet al., 2013). The immediate economic impact of the dust storms onIranian and Iraqi infrastructure is huge e.g. the temporary closure of
1970 1980 1990
Iran
0
5
10
15
20
25
30
Shar
e of
hyd
roel
ectri
c s
ourc
e (%
)
Figure 15. Evolution of electricity production from hydroelectric sou
12
power plants, repeated closure of public sectors in affected areas andaviation problems. Furthermore, frequent dust storms cause healthproblems (Schweitzer et al., 2018; Goudarzi et al., 2017; Thalib andAl-Taiar 2012), crop damage and inefficiency in solar devices (Furman2003). Dust storms are detrimental to coral communities due toincreasing water turbidity (Riegl 2003).
The increasing temperature along with dust storms threatens snowreserves of the SA catchment basin and could change the hydrologicalregime of the river. In tandem with the long-term regional drought, thishas engendered over-reliance on groundwater for industrial, agriculturaland domestic needs (Voss et al., 2013). The depletion of the surface andgroundwater resources will probably continue in the future, particularlyduring drought years (Chao et al., 2018).
In the PG, the global change is reflected mainly in increasing SSTs(Figure 7) and sea-level rise (Figure 8). Themean sea surface temperatureof the PG has warmed by about 1 �C since the 1980s that is much higherthan the estimations of Shirvani et al. (2015) who demonstrated 0.57 �Csince 1950. Our finding is supported by the work of Lachkar et al. (2020)who demonstrated that the fast rise in SST is responsible for deoxygen-ation in the Arabian Sea. The rate of PG sea-level rise has been increasingby 2.85 mm/y since 1993 that is supported by the work of Hassanzadehet al. (2007). Global average sea-level is rising at an average rate of 3.36
2000 2010 2020
Iraq
Year
rces (% of total) in Iraq and Iran since 1970 (World Bank 2019).
0
20
40
60
80
100
1960 1970 1980 1990 2000 2010 2020
WorldChina European Union North America Sweden
Foss
il Fu
el E
nerg
y C
onsu
mpt
ion
(%to
tal)
Year
Figure 16. Fossil fuel consumption (% total) since 1960 for chief energy consumers, the world and representative countries China and Sweden (World Bank 2019).
� 0.4 mm yr�1 and PG sea-level rise more or less is the same (Church andWhite 2006; Hereher 2020). The combined impact of sea-level rise andincreasing temperatures has negatively impacted the sensitive ecosys-tems of the Gulf i.e. the coral reefs, with coral bleaching and death beingreported (Kabiri et al., 2012; Hereher 2020; Riegl 2003). Long lastinghigh SST in the PG is the cause of coral bleaching incidents in 1996,1998, 2002, 2007, 2015, 2017, and 2019 (Figure 7b). Paparella et al.(2019) have shown that the hot years are always associated with lowShamal wind conditions during the summer. According to Riegl (2003),Shamal winds will be weaken in the coming decades, under ongoingclimate change. As a result, it is suggested that the coral reefs of the PGwill vanish by the end of the current century (Riegl 2003). The loss of
1
2
3
4
5
1900 1950 2000
Ye
0
Worl
d o
il p
roduct
ion (
Gto
n C
/y)
Figure 17. Annual world oil production since 1900 fitted to Hubbert's curve. The datEnergy Agency (https://www.iea.org/data-and-statistics). Hubbert's curve shows tha
habitats has significant impacts on fisheries and economic activities(Wabnitz et al., 2018).
In spite of the increasing temperature and water over-exploitation ofthe PG catchment basin, the results show that the salinity of the PG hasnot changed since 1993 (Figure 9), an observation supported byMogaddam et al. (2020). The apparently steady evolution of salinitycould be related to the compensation of the PG water through the Straitof Hormuz by less saline water from the global ocean (Campos et al.,2020). Although it needs detailed studies, the compensation of the PGsalinity could accelerate the water circulation and decrease the residencetime that alternatively affects the sedimentation regime of the Gulf(Campos et al., 2020). In addition to global change, the desalination
2050 2100 2150
ar
Data (1900-2016)
Hubbert's Curve
a of global oil production were extracted from the data bank of the Internationalt the peak for global oil production will happen around 2027.
wthorGnoitalupoP
htworE Gc cionom
OIL
Climate Change
Dust
Water
Shortage
Sea LevelRise
Tem
pera
ture
Incr
ease
MigrationExtreme
EventsNationalInterests
Dam
Cons
truct
ion
Non-renewable
WaterExploitation
Disalination
Plants
Ports
Deve
lopm
ent
Geopolitical
Non-OILEconomy
Toursim
Transportation
Ener
gy
Financial
Centers
Services
Conflict
Conflict
Interests
CoastalUrbanism
Conflict
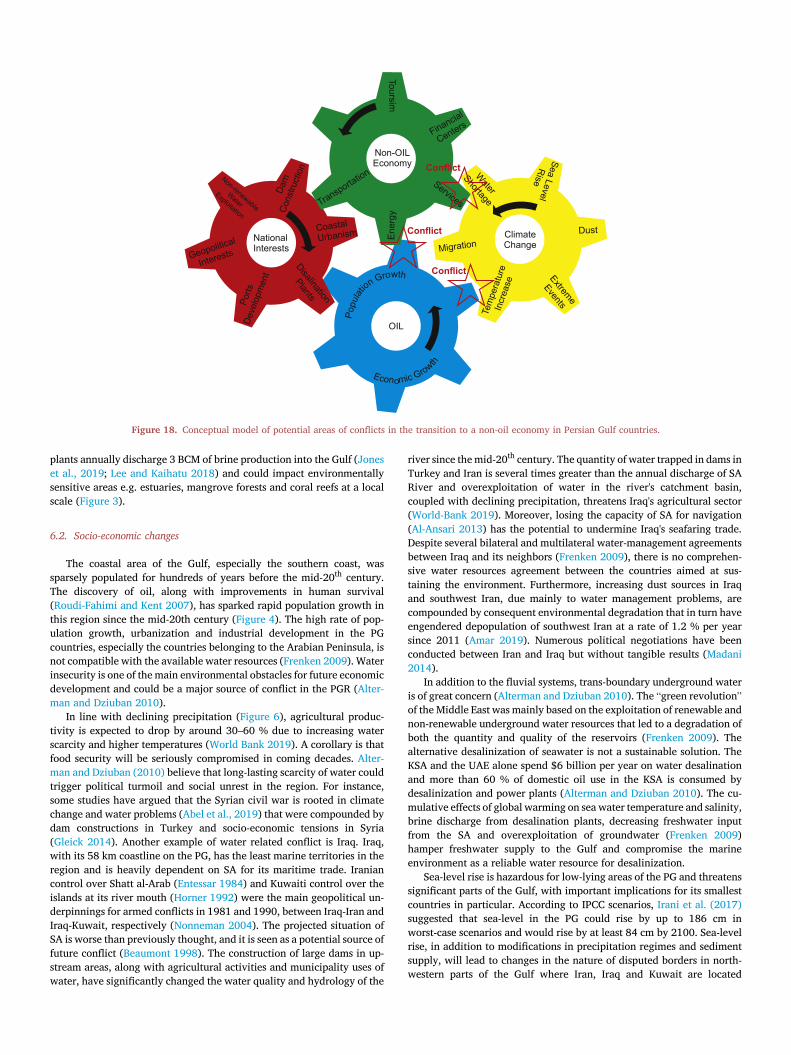
Figure 18. Conceptual model of potential areas of conflicts in the transition to a non-oil economy in Persian Gulf countries.
plants annually discharge 3 BCM of brine production into the Gulf (Joneset al., 2019; Lee and Kaihatu 2018) and could impact environmentallysensitive areas e.g. estuaries, mangrove forests and coral reefs at a localscale (Figure 3).
6.2. Socio-economic changes
The coastal area of the Gulf, especially the southern coast, wassparsely populated for hundreds of years before the mid-20th century.The discovery of oil, along with improvements in human survival(Roudi-Fahimi and Kent 2007), has sparked rapid population growth inthis region since the mid-20th century (Figure 4). The high rate of pop-ulation growth, urbanization and industrial development in the PGcountries, especially the countries belonging to the Arabian Peninsula, isnot compatible with the available water resources (Frenken 2009). Waterinsecurity is one of the main environmental obstacles for future economicdevelopment and could be a major source of conflict in the PGR (Alter-man and Dziuban 2010).
In line with declining precipitation (Figure 6), agricultural produc-tivity is expected to drop by around 30–60 % due to increasing waterscarcity and higher temperatures (World Bank 2019). A corollary is thatfood security will be seriously compromised in coming decades. Alter-man and Dziuban (2010) believe that long-lasting scarcity of water couldtrigger political turmoil and social unrest in the region. For instance,some studies have argued that the Syrian civil war is rooted in climatechange and water problems (Abel et al., 2019) that were compounded bydam constructions in Turkey and socio-economic tensions in Syria(Gleick 2014). Another example of water related conflict is Iraq. Iraq,with its 58 km coastline on the PG, has the least marine territories in theregion and is heavily dependent on SA for its maritime trade. Iraniancontrol over Shatt al-Arab (Entessar 1984) and Kuwaiti control over theislands at its river mouth (Horner 1992) were the main geopolitical un-derpinnings for armed conflicts in 1981 and 1990, between Iraq-Iran andIraq-Kuwait, respectively (Nonneman 2004). The projected situation ofSA is worse than previously thought, and it is seen as a potential source offuture conflict (Beaumont 1998). The construction of large dams in up-stream areas, along with agricultural activities and municipality uses ofwater, have significantly changed the water quality and hydrology of the
river since themid-20th century. The quantity of water trapped in dams inTurkey and Iran is several times greater than the annual discharge of SARiver and overexploitation of water in the river's catchment basin,coupled with declining precipitation, threatens Iraq's agricultural sector(World-Bank 2019). Moreover, losing the capacity of SA for navigation(Al-Ansari 2013) has the potential to undermine Iraq's seafaring trade.Despite several bilateral and multilateral water-management agreementsbetween Iraq and its neighbors (Frenken 2009), there is no comprehen-sive water resources agreement between the countries aimed at sus-taining the environment. Furthermore, increasing dust sources in Iraqand southwest Iran, due mainly to water management problems, arecompounded by consequent environmental degradation that in turn haveengendered depopulation of southwest Iran at a rate of 1.2 % per yearsince 2011 (Amar 2019). Numerous political negotiations have beenconducted between Iran and Iraq but without tangible results (Madani2014).
In addition to the fluvial systems, trans-boundary underground wateris of great concern (Alterman and Dziuban 2010). The “green revolution”of the Middle East was mainly based on the exploitation of renewable andnon-renewable underground water resources that led to a degradation ofboth the quantity and quality of the reservoirs (Frenken 2009). Thealternative desalinization of seawater is not a sustainable solution. TheKSA and the UAE alone spend $6 billion per year on water desalinationand more than 60 % of domestic oil use in the KSA is consumed bydesalinization and power plants (Alterman and Dziuban 2010). The cu-mulative effects of global warming on sea water temperature and salinity,brine discharge from desalination plants, decreasing freshwater inputfrom the SA and overexploitation of groundwater (Frenken 2009)hamper freshwater supply to the Gulf and compromise the marineenvironment as a reliable water resource for desalinization.
Sea-level rise is hazardous for low-lying areas of the PG and threatenssignificant parts of the Gulf, with important implications for its smallestcountries in particular. According to IPCC scenarios, Irani et al. (2017)suggested that sea-level in the PG could rise by up to 186 cm inworst-case scenarios and would rise by at least 84 cm by 2100. Sea-levelrise, in addition to modifications in precipitation regimes and sedimentsupply, will lead to changes in the nature of disputed borders in north-western parts of the Gulf where Iran, Iraq and Kuwait are located
(Schofield 2018). In addition to the impacts on sedimentary islands of the Gulf, changes in sea-level, along with changes in sedimentation regime due to general circulation changes, have the potential to affect heavy investments in coastal urbanization and industrialization (Donchyts et al., 2016).
6.3. Adaptation plans
Due to the strategic position of West Asia, including the PGR, in global trading routes, PG countries have invested heavily in maritime infra-structure and ports with an eye to economic diversification for the post-oil era and as a reliable path for economic development (Ardemagni 2018). For instance, the PGR has a central role in the Chinese “One Belt One Road” project in international trade and economy (Lin 2011). The rapid development of ports along the PG coast shows that PG countries have invested heavily in this economic sector. The rivalry to control the region's main ports and trading routes has acted as a source of conflict between the northern and southern countries of the PG (Ardemagni 2018). The economic shifts forecasted under climate change could intensify competition. At present, rivalry is compounded by geopolitical instability in Bab-el-Mandeb Strait and the Strait of Hormuz (Ardemagni 2018) (Figure 1).
The tourism industry, which is also an alternative source of revenue to oil, faces significant cultural barriers in the PGR. The contribution of travel and tourism to the economy of PG countries averages <5 % of their GDP (Henderson 2006). In fact, the region constitutes one of the least developed tourism regions in the world (Sharpley 2002). In spite of this, revenues from travel and tourism have increased dramatically from around 2 billion dollars in 1995 to around 59 billion dollars in 2017 and these are predicted to swell to >190 billion dollars by 2026 (World Bank 2019). Despite disparities between Islamic traditions and tourism, some of the countries in the region are changing their regulations so as to be compatible with international tourism, in addition to developing tourist infrastructure (Henderson 2006). However, climate change (e.g. extreme temperatures and dust storms), along with environmental degradation, especially in attractive areas (e.g. coral reefs), could seriously affect the future of tourism in the region.
More investment in hydropower energy by Iran and Iraq is risky, based on future climate scenarios (Jamali et al., 2013), although they are concerned about the impacts of eventual flash floods e.g. the March 2019 flood that affected two thirds of Iran. However, the PGR has considerable potential for other types of renewable energies (Nematollahi et al., 2016). For example, wind energy could be harnessed in countries such as Iran and Oman (Nematollahi et al., 2016). Exploitation of tidal energy is possible for countries in the northwest and southeast of the Gulf. Solar energy could be exploited throughout the region (Almasoud and Gan-dayh 2015), although the increasing frequency of dust storms and high temperatures could hamper this.
Although nuclear energy could play an important role in meeting the world's energy demands, especially in developing countries where future energy demands will be high (Vaillancourt et al., 2008), it is the most controversial source of alternative energy sources. Iran's nuclear pro-gram, for instance, has triggered a series of international crises since 2002 (€Ozcan and €Ozdamar 2009). Furthermore, in addition to the po-litical obstacles in using nuclear energy, the environmental impacts of the power plants on the PG's environment are considerable. In fact, the warm water outflow from planned nuclear reactors, in addition to PG desali-nation plants, will further accentuate thermal anomalies in the Gulf, at least at local scales, and intensify negative impacts on the sensitive environments.
According to the Paris Agreement on climate action, countries are committed to keeping global temperature increases less than 2 �C above pre-industrial levels, by the end of the 21st century (United Nations 2015). This temperature threshold has already been broken in the PGR. G20 countries, as the main greenhouse gas emitters and the chief cus-tomers of PG oil, have to cut their greenhouse gas emissions notably by
2050 (Goldthau 2017). In the short to medium term, PG countries have tocombat the direct impacts of global warming, but theymust also continueto supply oil and gas to the global economy. At longer timescales, how-ever, they have to accept the reality of replacing fossil fuels with cleanerenergies (Covert et al., 2016). Clean energy sources require heavy capitalinvestment and technological capabilities that are mostly hosted indeveloped countries. The commodity-based economies of the PG coun-tries have to reduce their dependency on fossil fuels and find new reve-nue sources (Goldthau 2017) as global oil production may have reachedits peak (Figure 17).
While climate is changing fast, and the environment is beingdegraded, options for economic diversification remain limited for PGcountries. A transition from commodity-dependent economies to a sus-tainable knowledge-based economy is difficult due to low numbers ofeducated/qualified people, compounded by the “brain drain” that alsoaffects the region (€Ozden 2006). Of course, it is possible for PG countriesto transition to a technology-based economy, in collaboration withdeveloped countries, but more industrialization of the region will in-crease the present anthropogenic pressures on the environment withwider societal consequences (Sale et al., 2011). Moreover, political ten-sions and cultural barriers in the region threaten long-term foreign in-vestment (Burt and Bartholomew, 2019).
Notwithstanding the fact that oil has been the main economic drivingforce in the PGR since mid-20th century, climate change impacts andinternational mitigation/adaptation policies have reduced the impor-tance of oil for the long-term development of the countries (Figure 18).The countries have to be more dependent on oil to provide financialresources to transition to a non-oil economy but, by contrast, the envi-ronmental impacts of climate change make it difficult to transition to anon-oil economy. In the current situation, PGR countries must avoidregional rivalries and conflicts and invest more to educate the people tocombat the effects of climate change. Moreover, these countries mustwork together to find regional solutions to save the environment as themain reliable source of sustainable development (Figure 18) while localtechnical capacity has been identified as a major obstacle for improvedenvironmental regulation and management (Sale et al., 2011; van Lav-ieren et al., 2011).
7. Conclusion
The PGR faces two major problems regarding global climate change:(i) direct impacts of climate change and environmental degradation; and(ii) securing the economic transition/diversification to the post-oil era.While rapid environmental changes have attracted less attention fromgovernment authorities in littoral countries of the PG, they will none-theless be important in economic diversification (e.g. focusing on mari-time development) and controlling water resources. In this regard, itseems that both extremities of the PG, the Strait of Hormuz and the Shatt-al-Arab, constitute hotspots for regional rivalries. While national rivalriescontinue to dominate the region's geopolitical context, the environmentis being rapidly degraded and endangering sustainable development ofthe region. Although the economic activities of the littoral countries arerestricted to national boundaries, the environmental impacts of theseactivities are felt in all coastal countries, even 1700 km away in theArabian Sea. Environmental degradation will limit the scope of economicdiversification policies and hinder long-term investment e.g. for thetourism and travel industries. Countries should learn that they havelimited time to educate their societies to tackle the direct and indirectimpacts of climate change and to increase technological and scientificcapabilities to change their economic paths. For instance, investing inrenewable energy sources and developing new revenue streams requiresreducing political tensions, developing regional cooperation, andadopting integrated environmental policies by all regional countries.These attempts should be integrated, planned regionally and undertakencollaboratively. Although cooperation and partnerships between PGRcountries is urgently needed, the outlook is not promising. In this regard,
The authors declare no conflict of interest.
Additional information
Supplementary content related to this article has been publishedonline at https://doi.org/10.1016/j.heliyon.2021.e06288.
Acknowledgements
This study has been conducted in the framework of the INIOAS pro-gram on “Study and Monitoring of Global Change and It's Impacts”,project No. 06-012-393. The sea-level and salinity changes were cali-brated by measurements during the PGGOOS project of the INIOAS (02-021-91). Economic work was done in the context of the OECD's NewApproaches to Economic Challenges initiative. The authors appreciatethe thoughtful comments of the reviewers and editors that helped us toimprove the work. The authors also appreciate Dr. Behrouz Abtahi, thedirector of the INIOAS, for his supports.
References
Abd-El-Mooty, M., Kansoh, R., Abdulhadi, A., 2016. Challenges of water resources in Iraq.Hydrol. Curr. Res. 7 (4), 1–8.
Abdullah, A.D., Gisen, J.I., Zaag, P.v. d., Savenije, H.H., Karim, U.F., Masih, I., et al.,2016. Predicting the salt water intrusion in the Shatt al-Arab estuary using ananalytical approach. Hydrol. Earth Syst. Sci. 20 (10), 4031–4042.
Abel, G.J., Brottrager, M., Cuaresma, J.C., Muttarak, R., 2019. Climate, conflict and forcedmigration. Global Environ. Change 54, 239–249.
Ahmad, A., Ramana, M., 2014. Too costly to matter: economics of nuclear power forSaudi Arabia. Energy 69, 682–694.
the role of scientific communities and international bodies is important to focus the attention of political leaders on the impacts of climate change for regional stability and long-term prosperity.
Declarations
Author contribution statement
Abdolmajid Naderi Beni: Analyzed and interpreted the data; Wrote the paper.
Nick Marriner and Morteza Djamali: Contributed reagents, materials, analysis tools or data.
Arsah Sharifi: Analyzed and interpreted the data; Contributed re-agents, materials, analysis tools or data.
Alan Kirman, Jafar Azizpour and Keivan Kabiri: Analyzed and inter-preted the data.
Funding statement
This work was supported by the Iranian National Science Foundation Grant (INSF-98000990).
Data availability statement
Data associated with this study has been deposited at the below re-positories: 1- Development data at the World -Bank datacenter: https://databank.worldbank.org/home.aspx. 2- Global Historical Climatology Network–monthly (GHCNm): https://www.ncdc.noaa.gov/ghcn-month ly. 3- Climate Change Knowledge Portal (CCKL): (https://climatekno wledgeportal.worldbank.org/region/middle-east/climate-data-historica l. 4- The optimum interpolation sea surface temperature (OISST): http ://www.esrl.noaa.gov/psd/data/gridded/data.noaa.oisst.v2.html. 5-Daily sea-level anomaly: https://resources.marine.copernicus.eu/. 6-Daily Sea Surface Salinity: https://resources.marine.copernicus.eu/.
Declaration of interests statement
Al-Ansari, N., 2013. Management of water resources in Iraq: perspectives and prognoses.Engineering 5 (6), 667–684.
Almasoud, A., Gandayh, H.M., 2015. Future of solar energy in Saudi Arabia. J. King SaudUniv.-Eng. Sci. 27 (2), 153–157.
Alterman, J.B., Dziuban, M., 2010. Clear Gold: Water as a Strategic Resource in the MiddleEast: a Report of the CSIS Middle East Program: Center for Strategic and InternationalStudies.
Amar, 2019. Statistic Center of Iran. https://www.amar.org.ir.Ardemagni, E., 2018. Gulf Powers: Maritime Rivalry in the Western Indian Ocean.Baldwin-Edwards, M., 2005. Migration in the Middle East and Mediterranean: A Regional
Study Prepared for the Global Commission on International Migration.Beaumont, P., 1998. Restructuring of water usage in the Tigris-Euphrates basin: the
impact of modern water management policies. In: Coppock, J., Miller (Eds.), JATransformation of Middle Eastern Natural Environments: Legacies and Lessons,pp. 168–186.
Berkun, M., 2010. Hydroelectric potential and environmental effects of multidamhydropower projects in Turkey. Energy Sustain. Dev. 14 (4), 320–329.
Broecker, W.S., 1975. Climatic change: are we on the brink of a pronounced globalwarming? Science 189 (4201), 460–463.
Burt, J.A., 2014. The environmental costs of coastal urbanization in the Arabian Gulf.City, 18, 760–770.
Burt, J.A., Bartholomew, A., 2019. Towards more sustainable coastal development in theArabian Gulf: opportunities for ecological engineering in an urbanized seascape. Mar.Pollut. Bull. 142, 93–102.
Burt, J.A., Feary, D.A., Van Lavieren, H., 2013. Persian Gulf reefs: an important asset forclimate science in urgent need of protection. Ocean Chall. 20, 49–56.
Burt, J.A., Paparella, F., Al-Mansoori, N., Al-Mansoori, A., Al-Jailani, H., 2019. Causes andconsequences of the 2017 coral bleaching event in the southern Persian/ArabianGulf. Coral Reefs 38, 567–589.
Campos, E.J., Gordon, A.L., Kjerfve, B., Vieira, F., Cavalcante, G., 2020. Freshwaterbudget in the Persian (Arabian) Gulf and exchanges at the Strait of Hormuz. PloS One15, e0233090.
Caspers, E.C.D., 1971. New archaeological evidence for maritime trade in the Persian Gulfduring the Late Protoliterate period. East W. 21 (1/2), 21–44.
Chao, N., Luo, Z., Wang, Z., Jin, T., 2018. Retrieving groundwater depletion and droughtin the tigris-euphrates basin between 2003 and 2015. Groundwater 56 (5), 770–782.
Church, J.A., White, N.J., 2006. A 20th century acceleration in global sea-level rise.Geophys. Res. Lett. 33.
Covert, T., Greenstone, M., Knittel, C.R., 2016. Will we ever stop using fossil fuels?J. Econ. Perspect. 30 (1), 117–138.
Dawoud, M.A., 2012. Environmental impacts of seawater desalination: Arabian Gulf casestudy. Int. J. Environ. Sustain. 1 (3).
DeMenocal, P.B., 2001. Cultural responses to climate change during the late Holocene.Science 667–673.
Djamali, M., de Beaulieu, J.-L., Andrieu-Ponel, V., Berberian, M., Miller, N.F.,Gandouin, E., et al., 2009. A late Holocene pollen record from Lake Almalou in NWIran: evidence for changing land-use in relation to some historical events during thelast 3700 years. J. Archaeol. Sci. 36 (7), 1364–1375.
Djamali, M., Jones, M.D., Migliore, J., Balatti, S., Fader, M., Contreras, D., et al., 2016.Olive cultivation in the heart of the Persian Achaemenid Empire: new insights intoagricultural practices and environmental changes reflected in a late Holocene pollenrecord from Lake Parishan, SW Iran. Veg. Hist. Archaeobotany 25 (3), 255–269.
Donchyts, G., Baart, F., Winsemius, H., Gorelick, N., Kwadijk, J., Van De Giesen, N., 2016.Earth's surface water change over the past 30 years. Nat. Clim. Change 6 (9), 810.
El-Katiri, L., 2014. A Roadmap for Renewable Energy in the Middle East and North Africa.Oxford institute for energy studies.
El-Katiri, L., Fattouh, B., 2017. A brief political economy of energy subsidies in the MiddleEast and North Africa. In: Combining Economic and Political Development. BrillNijhoff, pp. 58–87.
Entessar, N., 1984. External involvement in the Persian Gulf conflict. J. Conflict Stud. 4(4).
Evans, J.P., 2009. 21st century climate change in the Middle East. Climatic Change 92 (3-4), 417–432.
FAO, 2007. The World's Mangroves 1980-2005. FAO Forestry Paper 153.Farzin, M., Nazari, S., Amani, A., Feiznia, S., Kazemi Azemi, G.-A., 2017. Determination of
Submarine Groundwater Discharge Probable Areas into the Persian Gulf onCoastlines of Bushehr Province Using Standard thermal Anomaly Map.
Frenken, K., 2009. Irrigation in the Middle East region in figures AQUASTAT Survey-2008. Water Rep. (34).
Furman, H.K.H., 2003. Dust storms in the Middle East: sources of origin and theirtemporal characteristics. Indoor Built Environ. 12 (6), 419–426.
Giannakopoulou, E., Toumi, R., 2012. The Persian Gulf summertime low-level jet oversloping terrain. Q. J. R. Meteorol. Soc. 138 (662), 145–157.
Gleeson, M., Strong, A., 1995. Applying MCSST to coral reef bleaching. Adv. Space Res.16 (10), 151–154.
Gleick, P.H., 2014. Water, drought, climate change, and conflict in Syria. Weather Clim.Soc. 6 (3), 331–340.
Goldthau, A., 2017. The G20 must govern the shift to low-carbon energy. Nature News546 (7657), 203.
Goreau, T.J., Hayes, R.L., 1994. Coral bleaching and ocean" hot spots. Ambio-J. Hum.Environ. Res. Manag. 23 (3), 176–180.
Goudarzi, G., Daryanoosh, S., Godini, H., Hopke, P., Sicard, P., De Marco, A., et al., 2017.Health risk assessment of exposure to the Middle-Eastern Dust storms in the Iranianmegacity of Kermanshah. Publ. Health 148, 109–116.
Granados, J.A.T., Ionides, E.L., Carpintero, �O., 2012. Climate change and the worldeconomy: short-run determinants of atmospheric CO2. Environ. Sci. Pol. 21, 50–62.
Gupta, A.K., Anderson, D.M., Pandey, D.N., Singhvi, A.K., 2006. Adaptation and humanmigration, and evidence of agriculture coincident with changes in the Indian summermonsoon during the Holocene. Current Sci.-Banglore 90 (8), 1082.
Gurjazkaite, K., Routh, J., Djamali, M., Vaezi, A., Poher, Y., Beni, A.N., et al., 2018.Vegetation history and human-environment interactions through the late Holocene inKonar Sandal, SE Iran. Quat. Sci. Rev. 194, 143–155.
Hamidi, M., Kavianpour, M.R., Shao, Y., 2013. Synoptic analysis of dust storms in theMiddle East. Asia-Pac. J. Atmos. Sci. 49 (3), 279–286.
Hassanzadeh, S., Kiasatpour, A., Hosseinibalam, F., 2007. Sea-level response toatmospheric forcing along the north coast of Persian Gulf. Meteorol. Atmos. Phys. 95(3-4), 223–237.
Henderson, J.C., 2006. Tourism in Dubai: overcoming barriers to destinationdevelopment. Int. J. Tourism Res. 8 (2), 87–99.
Hereher, M.E., 2020. Assessment of climate change impacts on sea surface temperaturesand sea level rise—the Arabian Gulf. Climate 8, 50.
Hole, F., 1994. Environmental instabilities and urban origins. In: Chiefdoms and EarlyStates in the Near East: The Organizational Dynamics of Complexity, 18, p. 121.
Horner, J., 1992. The Iraq-Kuwait Border dispute. J. Borderl. Stud. 7 (1), 1–18.Im, E.-S., Pal, J.S., Eltahir, E.A., 2017. Deadly heat waves projected in the densely
populated agricultural regions of South Asia. Sci. Adv. 3 (8), e1603322.Irani, M., Massah Bavani, A., Bohluli, A., Lahijani, H.A.K., 2017. sea level rise in Persian
Gulf and Oman sea due to climate change in the future periods. Phys. Geogr. Res. Q. 4(4), 603–614.
Issa, I.E., Al-Ansari, N., Sherwany, G., Knutsson, S., 2014. Expected future of waterresources within Tigris–Euphrates rivers basin, Iraq. J. Water Resour. Protect. 6 (5),421–432.
Jamali, S., Abrishamchi, A., Madani, K., 2013. Climate change and hydropower planningin the Middle East: implications for Iran’s Karkheh hydropower systems. J. EnergyEng. 139 (3), 153–160.
Jish Prakash, P., Stenchikov, G.L., Kalenderski, S., Osipov, S., Bangalath, H.K., 2015. Theimpact of dust storms on the Arabian Peninsula and the red sea. Atmos. Chem. Phys.
Jones, E., Qadir, M., van Vliet, M.T., Smakhtin, V., Kang, S.-m., 2019. The state ofdesalination and brine production: a global outlook. Sci. Total Environ. 657,1343–1356.
Jongerden, J., 2010. Dams and politics in Turkey: utilizing water, developing conflict.Middle East Pol. 17 (1), 137–143.
Kabiri, K., Pradhan, B., Rezai, H., Ghobadi, Y., Moradi, M., 2012. Fluctuation of seasurface temperature in the Persian Gulf and its impact on coral reef communitiesaround Kish Island. In: 2012 IEEE Colloquium on Humanities, Science andEngineering (CHUSER). IEEE, pp. 164–167.
K€ampf, J., Sadrinasab, M., 2006. The circulation of the Persian Gulf: a numerical study.Ocean Sci. 2 (1), 27–41.
Kaniewski, D., Guiot, J., Van Campo, E., 2015. Drought and societal collapse 3200 yearsago in the Eastern Mediterranean: a review. Wiley Interdiscipl. Rev.: Clim. Change 6(4), 369–382.
Kaniewski, D., Marriner, N., Cheddadi, R., Guiot, J., Van Campo, E., 2018. The 4.2 kaBPevent in the Levant. Clim. Past 14 (10).
Kaniewski, D., Marriner, N., Cheddadi, R., Morhange, C., Bretschneider, J., Jans, G., et al.,2019. Cold and dry outbreaks in the eastern Mediterranean 3200 years ago. Geology47 (10), 933–937.
Kaniewski, D., Van Campo, E., Weiss, H., 2012. Drought is a recurring challenge in theMiddle East. Proc. Natl. Acad. Sci. Unit. States Am. 109 (10), 3862–3867.
Kapiszewski, A., 2004. Arab Labour Migration to the GCC States. In: Arab Migration in aGlobalized World. International Organization for Migration, Geneva, pp. 115–133.
Kennett, D.J., Kennett, J.P., 2007. Influence of Holocene marine transgression and climatechange on cultural evolution in southern Mesopotamia. In: Climate Change andCultural Dynamics. Elsevier, pp. 229–264.
Lachkar, Z., Mehari, M., Al Azhar, M., Levy, M., Smith, S., 2020. Fast local warming ofsea-surface is the main factor of recent deoxygenation in the Arabian Sea. Biogeosci.Discuss. 1–27.
Le Mou€el, C., Schmitt, B., 2018. Food Dependency in the Middle East and North AfricaRegion: Retrospective Analysis and Projections to 2050. Springer.
Lee, W., Kaihatu, J.M., 2018. Effects of desalination on hydrodynamic process in PersianGulf. Coastal Eng. Proc. (36), 3.
Lelieveld, J., Hadjinicolaou, P., Kostopoulou, E., Chenoweth, J., El Maayar, M.,Giannakopoulos, C., et al., 2012. Climate change and impacts in the easternmediterranean and the Middle East. Climatic Change 114 (3-4), 667–687.
Lin, C., 2011. China’s new silk road to the Mediterranean: the Eurasian land bridge andreturn of Admiral Zheng He. ISPSW Strategy Ser.: Focus Defense Int. Sec. 165, 1–23.
Madani, K., 2014. Water management in Iran: what is causing the looming crisis?J. Environ. Soc. Sci. 4 (4), 315–328.
Madani, K., AghaKouchak, A., Mirchi, A., 2016. Iran’s socio-economic drought:challenges of a water-bankrupt nation. Iran. Stud. 49 (6), 997–1016.
Mogaddam, S.F., Bidokhti, A., Givi, F.A., Ezam, M., 2020. Evaluation of physical changes(temperature and salinity) in the Persian Gulf waters due to climate change usingfield data and numerical modeling. Int. J. Environ. Sci. Technol. 17 (4), 2141–2152.
Murray, J., King, D., 2012. Climate policy: oil's tipping point has passed. Nature 481(7382), 433.
Najafi, H.S., Noye, B.J., 1997. Modelling Tides in the Persian Gulf Using DynamicNesting.
Nasrallah, H.A., Nieplova, E., Ramadan, E., 2004. Warm season extreme temperatureevents in Kuwait. J. Arid Environ. 56 (2), 357–371.
Nematollahi, O., Hoghooghi, H., Rasti, M., Sedaghat, A., 2016. Energy demands andrenewable energy resources in the Middle East. Renew. Sustain. Energy Rev. 54,1172–1181.
Nojoumi, A., Nikdel, S., Haidaripour, S.M., 2015. A review of the oil, gas andpetrochemistry fire incidents during the last two years. In: Process EngineeringConference, Iran.
Nonneman, G., 2004. The Gulf states and the Iran-Iraq war: pattern shifts andcontinuities. In: Iran, Iraq, and the Legacies of War. Springer, pp. 167–192.
Odhiambo, G.O., 2017. Water scarcity in the Arabian Peninsula and socio-economicimplications. Appl. Water Sci. 7 (5), 2479–2492.
€Ozcan, N.A., €Ozdamar, €O., 2009. Iran's nuclear program and the future of US-Iranianrelations. Middle East Pol. 16 (1), 121–133.
€Ozden, Ç., 2006. Brain drain in Middle East and North Africa: the Patterns under theSurface. United Nations Population, EGM/2006/10, New York, NY.
Pal, J.S., Eltahir, E.A., 2016. Future temperature in southwest Asia projected to exceed athreshold for human adaptability. Nat. Clim. Change 6 (2), 197.
Paparella, F., Xu, C., Vaughan, G.O., Burt, J.A., 2019. Coral bleaching in the Persian/Arabian Gulf is modulated by summer winds. Front. Mar. Sci. 6, 205.
Parry, M., Parry, M.L., Canziani, O., Palutikof, J., Van der Linden, P., Hanson, C., 2007.Climate Change 2007-impacts, Adaptation and Vulnerability: Working group IIContribution to the Fourth Assessment Report of the IPCC, 4. Cambridge UniversityPress.
Prandi, P., Meyssignac, B., Ablain, M., Spada, G., Ribes, A., Benveniste, J., 2021. Local sealevel trends, accelerations and uncertainties over 1993–2019. Sci. Data 8, 1–12.
Prospero, J.M., Ginoux, P., Torres, O., Nicholson, S.E., Gill, T.E., 2002. Environmentalcharacterization of global sources of atmospheric soil dust identified with the Nimbus7 Total Ozone Mapping Spectrometer (TOMS) absorbing aerosol product. Rev.Geophys. 40 (1), 2-1–2-31.
Reynolds, R.M., 1993. Physical oceanography of the Gulf, Strait of Hormuz, and the Gulfof Oman—results from the Mt mitchell expedition. Mar. Pollut. Bull. 27, 35–59.
Reynolds, R.W., 1988. A real-time global sea surface temperature analysis. J. Clim. 1 (1),75–87.
Reynolds, R.W., Marsico, D.C., 1993. An improved real-time global sea surfacetemperature analysis. J. Clim. 6 (1), 114–119.
Reynolds, R.W., Rayner, N.A., Smith, T.M., Stokes, D.C., Wang, W., 2002. An improved insitu and satellite SST analysis for climate. J. Clim. 15 (13), 1609–1625.
Riegl, B., 2003. Climate change and coral reefs: different effects in two high-latitude areas(Arabian Gulf, South Africa). Coral Reefs 22 (4), 433–446.
Rodell, M., Famiglietti, J., Wiese, D., Reager, J., Beaudoing, H., Landerer, F.W., et al.,2018. Emerging trends in global freshwater availability. Nature 557 (7707), 651.
Ross, D.A., Uchupi, E., White, R.S., 1986. The geology of the Persian Gulf-Gulf of Omanregion: a synthesis. Rev. Geophys. 24 (3), 537–556.
Roudi-Fahimi, F., Kent, M.M., 2007. Challenges and opportunities: the population of theMiddle East and north Africa. Popul. Bull. 62 (2), 24.
Sale, P.F., Feary, D.A., Burt, J.A., Bauman, A.G., Cavalcante, G.H., Drouillard, K.G.,Kjerfve, B., Marquis, E., Trick, C.G., Usseglio, P., 2011. The growing need forsustainable ecological management of marine communities of the Persian Gulf.Ambio 40, 4–17.
Scheffran, J., Battaglini, A., 2011. Climate and conflicts: the security risks of globalwarming. Reg. Environ. Change 11 (1), 27–39.
Scheffran, J., Brzoska, M., Brauch, H.G., Link, P.M., Schilling, J., 2012. Climate Change,Human Security and Violent Conflict: Challenges for Societal Stability, 8. SpringerScience & Business Media.
Schofield, R., 2018. International boundaries and borderlands in the Middle East:balancing context, exceptionalism and representation. Geopolitics 23 (3), 608–631.
Schweitzer, M.D., Calzadilla, A.S., Salamo, O., Sharifi, A., Kumar, N., Holt, G., et al., 2018.Lung health in era of climate change and dust storms. Environ. Res. 163, 36–42.
Sharifi, A., Pourmand, A., Canuel, E.A., Ferer-Tyler, E., Peterson, L.C., Aichner, B., et al.,2015. Abrupt climate variability since the last deglaciation based on a high-resolution, multi-proxy peat record from NW Iran: the hand that rocked the Cradle ofCivilization? Quat. Sci. Rev. 123, 215–230.
Sharpley, R., 2002. The challenges of economic diversification through tourism: the caseof Abu Dhabi. Int. J. Tourism Res. 4 (3), 221–235.
Sheppard, C., Al-Husiani, M., Al-Jamali, F., Al-Yamani, F., Baldwin, R., Bishop, J., et al.,2010. The Gulf: a young sea in decline. Mar. Pollut. Bull. 60 (1), 13–38.
Shirvani, A., Nazemosadat, S., Kahya, E., 2015. Analyses of the Persian Gulf sea surfacetemperature: prediction and detection of climate change signals. Arabian J. Geosci. 8(4), 2121–2130.
Sowers, J., Vengosh, A., Weinthal, E., 2011. Climate change, water resources, and thepolitics of adaptation in the Middle East and North Africa. Climatic Change 104 (3-4),599–627.
Thalib, L., Al-Taiar, A., 2012. Dust storms and the risk of asthma admissions to hospitalsin Kuwait. Sci. Total Environ. 433, 347–351.
Thoppil, P.G., Hogan, P.J., 2010. Persian Gulf response to a wintertime shamal windevent. Deep Sea Res. Oceanogr. Res. Pap. 57, 946–955.
Uchupi, E., Swift, S., Ross, D., 2002. Morphology and late quaternary sedimentation in theGulf of Oman Basin. Mar. Geophys. Res. 23 (2), 185–208.
United-Nations, 2015. Paris Agreement. In: https://unfccc.int/process-and-meetings/the-paris-agreement/the-paris-agreement.
Vaillancourt, K., Labriet, M., Loulou, R., Waaub, J.-P., 2008. The role of nuclear energy inlong-term climate scenarios: an analysis with the World-TIMES model. Energy Pol. 36(7), 2296–2307.
Van Lavieren, H., Burt, J., Feary, D.A., Cavalcante, G., Marquis, E., Benedetti, L., Trick, C.,Kjerfve, B., Sale, P.F., 2011. Managing the Growing Impacts of Development onFragile Coastal and marine Ecosystems: Lessons from the Gulf. A Policy Report. UNU-INWEH, Hamilton, ON, Canada.
Voss, K.A., Famiglietti, J.S., Lo, M., De Linage, C., Rodell, M., Swenson, S.C., 2013.Groundwater depletion in the Middle East from GRACE with implications for

World Seas: an Environmental Evaluation, second ed. Elsevier Science, Amsterdam,NL, pp. pp1–23.
Wabnitz, C.C., Lam, V.W., Reygondeau, G., Teh, L.C., Al-Abdulrazzak, D., Khalfallah, M.,Pauly, D., Palomares, M.L.D., Zeller, D., Cheung, W.W., 2018. Climate change impactson marine biodiversity, fisheries and society in the Arabian Gulf. PloS One 13,e0194537.
Walters Sr, K., Sjoberg, W., 1988. The Persian Gulf region: a climatological study. In:USAF Environmental Technical Applications Center, Scott Air Force Base, Illinois,pp. 62225–65438. USA. Technical report No. USAFETAC/TN–88/002 (AD–A222654).
Weiss, H., 1997. Late third millennium abrupt climate change and social collapse in WestAsia and Egypt. In: Third Millennium BC Climate Change and Old World Collapse.Springer, pp. 711–723.
transboundary water management in the Tigris-Euphrates-Western Iran region.Water Resour. Res. 49 (2), 904–914.
Vaughan, G.O., Al-Mansoori, N., Burt, J., 2019. The Arabian Gulf. In: Sheppard, C. (Ed.),
Wilson, A., 2012. The Persian Gulf (RLE Iran A). Routledge.World Bank, 2019. Development Data. World Bank. https://databank.worldbank.org/h
ome.aspx.World-Nuclear-Association, 2019. Nuclear Power in Iran. http://www.world-nuclear.o
rg/information-library/country-profiles/countries-g-n/iran.aspx.Wright, H., Thorpe, J.L., Mackay, A., Battarbee, R., Birks, J., Oldfield, F., 2003. Climatic
change and the origin of agriculture in the Near East. Glob. Change Holocene 49–62.Zektser, I.S., Everett, L.G., Dzhamalov, R.G., 2006. Submarine Groundwater. CRC Press.Zenghelis, D., 2006. Stern Review: the Economics of Climate Change. HM Treasury,
London, England.Zhang, X., Aguilar, E., Sensoy, S., Melkonyan, H., Tagiyeva, U., Ahmed, N., et al., 2005.
Trends in Middle East climate extreme indices from 1950 to 2003. J. Geophys. Res.:Atmosphere 110 (D22).
Zoljoodi, M., Didevarasl, A., Saadatabadi, A.R., 2013. Dust events in the western parts ofIran and the relationship with drought expansion over the dust-source areas in Iraqand Syria. Atmos. Clim. Sci. 3 (3), 321–336.


