Embed Size (px)
Citation preview

Aquaculture, 64 (1987) 305-323 Elsevier Science Publishers B.V., Amsterdam - Printed in The Netherlands
305
A Dynamic Simulation Model for Growth of the African Catfish, Clarias gariepinus (Burchell 1822) IV. The Effect of Feed Formulation on Growth and Feed IJtilization
M.A.M. MACHIELS
Department of Fish Culture and Fisheries, Agricultural University, P.O. Box 338, 6700 AH Wageninge n (The Netherlands)
(Accepted 25 March 1987)
ABSTRAC’T
Machiels, M.A.M., 1987. A dynamic simulation model for growth of the African catfish, Clark gariepinus (Burchell 1822). IV. The effect of feed formulation on growth and feed utilization. Aquacultwe, 64: 305323.
A dynamic simulation model is used to calculate growth of Clarias gariepinus (Burchell) fed with differently formulated diets. To verify the calculations, the results of the simulation are compared with experimental data. The experiments were carried out to determine the growth performance of C. gariepinus, fed with diets containing different protein sources. A fish meal diet was fed at four feeding levels in a respiration experiment. The alternative sources (blood meal, casein, groundnut, cottonseed, rapeseed and soybean) were tested at various inclusion rates with fish meal in aquarium experiments at one feeding level. Both experiments lasted two periods of 4 weeks each.
The output of the simulation model, being fresh weight gain, protein gain, fat gain, oxygen consumption and ammonia production, agreed well with results from the respiration experiment, except for fat gain at the highest feeding levels and ammonia production in the second experi- mental period. It was shown that C. gariepinus is able to convert feed nutrients very efficiently into fish biomass. A protein conversion efficiency of nearly 60% was found.
In the aquarium experiments the fresh weight gain decreased when an increasing part of the fish meal was replaced by alternative protein sources. The output of the simulation model (fresh weight gain) in comparison with the experimental results showed that it is possible to calculate the weight conversions of differently formulated diets, when there is a reliable estimation of the amino acid composition of the protein sources used.
INTRODUCTION
Due to the intensification of culture methods, it is essential to develop com- plete diets for Clurias guriepinus (Burchelll822 ) . Complete diets in intensive fish culture are used for the provision of all essential nutrients to the fish. In
0044-8486/87/$03.50 0 1987 Elsevier Science Publishers B.V.

306
order to develop such diets it is not only necessary to know the specific nutrient requirements of the animal, but also to optimize feed formulation in order to obtain fast growth of high quality fish at low costs (Moore, 1985).
Effects of feed composition on feed utilization and growth of C. gariepinus were investigated for the macro-nutrients protein, fat and carbohydrates (Machiels and Henken, 1985; Henken et al., 1986; Machiels and Van Dam, 1987). Results of these experiments were used to calibrate and validate an explanatory model, which was developed to simulate growth and growth com- position of C. gariepinus for different feeding levels and feed compositions (Machiels and Henken, 1986,1987).
Fish diets have a high protein content compared with diets for homeotherms. Traditionally the feed is composed to a large extent of fish meal, because its protein content (60-70% ) and its biological value are high. As fish meal is both expensive and difficult to obtain in many areas, there is a growing demand for alternative protein sources. For economical and practical reasons the pro- tein in diets used in fish culture should be composed from locally available and “payable” protein sources.
The suitability of a protein source in fish diets depends on its protein content and amino acid composition. The protein content should be high enough to formulate the minimum required dietary protein level in a complete diet. The amino acid composition of the protein determines the conversion efficiency. The actual part of the protein which is used for biosynthesis of fish protein depends on the diet composition, i.e. the protein to fat ratio (Machiels and Henken, 1987). Research on the amino acid requirement of C. guriepinus is lacking, but it seems possible to calculate theoretically the weight conversions in the intermediate metabolism. From these conversions the relation between diet quality, diet quantity and growth can be calculated. In this way, feed for- mulation can be related to production parameters. To verify this hypothesis, results of the calculations should be compared with independent experimental data. Such (unpublished) data are available from several experiments, which were carried out to determine the growth performance of C. gariepinus fed with different protein sources of plant and animal origin. The experimental results as well as the comparison of the model output with these experimental results will be discussed in this paper.
MATERIALS AND METHODS
The experimental protein sources were fish meal, blood meal, casein, groundnut, cottonseed, rapeseed and soybean. Since fish meal was a major ingredient of most diets, this was tested in a separate respiration experiment at four feeding levels. The other protein sources were tested at various inclu- sion rates with fish meal in aquarium experiments at one feeding level only. In these experiments a 100% fish meal diet was used as a control to allow com-

307
parisons between different experiments. The diet codes and diet formulations are presented in Table 1.
Simulation
To simulate growth of C. guriepinus an explanatory model developed earlier (Machiels and Henken, 1986, 1987) was used. The model was extended in accordance with experimental results from the third publication of this series (Machiels and Van Dam, 1987). The model calculates biosynthesis and other metabolic processes using feed intake and digestion as starting points. Biosyn- thesis of Iprotein and fat is calculated from general biochemical reaction equa- tions. Thie weight conversions for the different protein sources were determined according to their amino acid composition as given by Janssen et al. (1979). These biochemical weight conversion reactions are summarized in Table 2.
Under the assumption that the fat in both feed and fish consists of tri-oleyl- glycerol ( TOG), the conversion reaction for biosynthesis of body fat is:
0.96 g olein + 0.10 g glycerol + 0.014 mole ATP+ 1 g TOG + 0.06 g H2 0
The amount of glucose, obtained from carbohydrate, was calculated by multi- plying the amount of digestible carbohydrate by 1.11 to account for hydration. The reaction equation for biosynthesis of body fat from glucose is as follows:
1 g glucose + 0.22 g 0, -+0.29 g TOG + 0.63 g CO, + 0.30 g H2 0
Energy for respiration is formed by breakdown of the body substances protein and fat. The net result of biosynthesis and breakdown for respiration is protein and fat gain. Fresh weight gain is calculated from the protein gain. The fat gain is thought to affect only the body composition (Machiels and Henken, 1986).
At highL feed rations the fish does not eat all the feed offered. The feed intake regulation in the model is controlled by fish weight, temperature, biomass com- position and carbohydrate content of the diet (Machiels and Henken, 1987; Machiels and Van Dam, 1987). Mean fish weight per tank and the fat content of the fish at the beginning of an experiment were the initial values for the model calculations.
Experiments
Feed and fish Commercially available samples of fish meal, casein, blood meal, soybean,
groundnut, cottonseed and rapeseed were obtained from various sources. The formulation and proximate analysis of the 33 diets is given in Table 1. The crude protein content of the test diets was 38.5 ( + 1.9) % of the dry matter. Total dietary protein was supplied by fish meal in the control diets. The test diets contained graded levels of fish meal supplemented with one of the alter-

308
TABLE 1
Chemical analysis and composition of the experimental diets
Diet Chemical Composition code analysis
(in D.M.)
Prot. Fat Fat Dex- CMC Vit. mix trin min.
(1) (2) (3) (W) (%) (X) (%) (%) (%)
Cellu- Amino lose acid
suppl. (4)
(%)
Protein source
Fish Alternative meal
(%) (%)
l-l 41.1 18.0 12.0 10.0 5.0
2-1 39.1 16.6 13.6 10.0 5.0 2-2 37.9 17.6 13.6 10.0 5.0 2-3 40.1 19.1 16.0 10.0 5.0 2-4 38.3 21.3 16.0 10.0 5.0 2-5 40.0 20.4 16.0 10.0 5.0 2-6 39.4 24.1 16.0 10.0 5.0 2-7 40.5 28.0 16.0 10.0 5.0 2-8 38.0 17.6 16.0 10.0 5.0 2-9 38.9 22.1 16.0 10.0 5.0 2-10 38.9 21.8 16.0 10.0 5.0 2-11 41.3 26.3 16.0 10.0 5.0 2-12 41.3 22.4 16.0 10.0 5.0
6.0 14.0
6.0 0 6.0 0 6.0 0.8 6.0 0.8 6.0 4.2 6.0 4.2 6.0 10.8 6.0 21.8 6.0 16.9 6.0 12.7 6.0 11.7 6.0 11.4
3-l 35.3 21.4 13.6 9.9 3.0 3.0 0 3-2 36.6 17.6 13.8 10.0 3.0 3.0 0 3-3 40.4 15.4 10.9 9.9 3.0 3.0 8.4 3-4 39.8 15.6 11.0 10.0 3.0 3.0 8.5 3-5 37.6 16.8 10.3 9.9 3.0 3.0 25.1 3-6 38.4 14.2 10.4 10.0 3.0 3.0 25.2 3-7 39.0 15.7 10.8 9.9 3.0 3.0 0 3-8 38.7 16.0 11.0 10.0 3.0 3.0 0 3-9 39.3 16.0 10.7 9.9 3.0 3.0 11.3 3-10 38.1 15.0 10.9 10.0 3.0 3.0 11.5
4-l 39.8 12.1 8.3 11.2 3.7 4.5 3.3 4-2 40.6 12.0 8.3 11.2 3.7 4.5 3.3 4-3 38.2 14.1 8.3 11.2 3.7 4.5 9.5 4-4 39.9 14.1 8.3 11.2 3.7 4.5 9.5 4-5 36.7 15.4 8.3 11.2 3.7 4.5 15.6 4-6 37.0 15.4 8.3 11.3 3.7 4.5 15.6 4-7 36.4 18.8 8.3 11.2 3.7 4.5 27.9 4-8 40.7 13.8 11.1 15.0 5.0 6.0 23.5 4-9 33.7 14.2 8.3 11.2 3.7 4.5 35.3 4-10 34.5 15.5 8.3 11.2 3.7 4.5 31.6
-
+ - + - + - - - - - - -
+
+ - + - + - + -
+ - + - +
- - -
52.0 0 (Control diet)
0 65.4 (Groundnut) 0 65.4 (Groundnut)
13.1 49.1 (Groundnut) 13.1 49.1 (Groundnut) 26.1 32.7 (Groundnut) 26.1 32.7 (Groundnut) 52.2 0 (Control diet 0 41.2 (Casein)
26.1 20.6 (Casein) 26.1 24.2 (Blood meal) 39.2 12.1 (Blood meal)
)
44.4 7.2 (Blood meal)
19.8 49.6 (Cottonseed) 20.1 50.2 (Cottonseed) 35.9 27.9 (Cottonseed) 36.3 28.1 (Cottonseed) 48.1 0 (Control diet) 48.4 0 (Control diet) 23.6 48.1 (Rapeseed) 24.0 48.9 (Rapeseed) 35.8 25.0 (Bapeseed) 36.3 25.4 (Rapeseed)
0 69.0 (Soybean) 0 69.0 (Soybean )
11.1 51.7 (Soybean) 11.1 51.7 (Soybean) 22.2 34.5 (Soybean) 22.2 34.5 (Soybean) 44.4 0 (Control diet ) 0 39.4 (Casein)
22.3 14.8 (Casein) 33.3 7.4 (Casein)
(1) The fat mix was based on fish oil. (2 ) Carboxyl methyl cellulose. (3) Vitamin & mineral mix. Trouw & Co., Putten, The Netherlands. (4) - , No amino acid supplementation.

309
TABLE 2
Parameter values for the weight conversion in biosynthesis of fish protein from different protein diets used in the experiments
02 ATP Protein CO, Glucose Hz0 NH,
(a) (b) (c) (d) (e) (f) (g)
Diet Limiting code amino acid
- 0.051
0.25 -- 0.026 0.21 --0.018 0.18 -- 0.003 0.16 -- 0.003 0.12 0.012 0.10 0.012 - 0.051 0.20 --0.011 0.10 0.015 0.24 --0.019 0.12 0.016 0.07 0.028
0.08 0.023 0.07 0.023 0.03 0.037 0.03 0.037 - 0.051 - 0.051 0.05 0.035 0.06 0.035 0.03 0.039 0.03 0.038
0.15 0.001 0.19 --0.011 0.12 0.014 0.14 0.002 0.08 0.026 0.09 0.024 - 0.051 0.20 -.O.Oll 0.10 0.015 0.05 0.037
0.85 - -
0.41 0.41 0.52 0.52 0.63 0.63 0.85 0.52 0.68 0.53 0.69 0.75
0.26 0.25 0.26 0.22 0.19 0.19 0.19 0.17 0.14 0.12 0.13 0.11 - -
0.14 0.19 0.07 0.09 0.19 0.22 0.09 0.11 0.06 0.07
0.67 0.66 0.76 0.75 0.85 0.85 0.73 0.72 0.79 0.78
0.08 0.08 0.08 0.08 0.04 0.03 0.04 0.03 - - - -
0.06 0.05 0.07 0.06 0.03 0.03 0.03 0.03
0.58 0.52 0.65 0.60 0.72 0.68 0.85 0.52 0.68 0.76
0.14 0.16 0.19 0.19 0.11 0.12 0.14 0.14 0.08 0.08 0.09 0.09 -
0.14 0.07 0.03
-
0.19 0.09 0.05
0.15
0.33 0.32 0.28 0.28 0.24 0.24 0.15 0.36 0.26 0.30 0.23 0.19
0.25 0.25 0.19 0.20 0.15 0.15 0.21 0.21 0.19 0.19
0.26 0.30 0.24 0.25 0.20 0.23 0.15 0.36 0.26 0.20
-
0.09
0.09 0.08 0.07 0.05 0.04 -
0.04 0.03 0.07 0.03 0.02
0.03 0.03 0.02 0.02 - -
0.02 0.02 0.01 0.01
0.05 0.07 0.03 0.05 0.03 0.03 -
0.04 0.03 0.01
l-l
2-l 2-2 2-3 2-4 2-5 2-6 2-7 2-8 2-9 2-10 2-11 2-12
3-l 3-2 3-3 3-4 3-5 3-6 3-7 3-8 3-9 3-10
4-1 4-2 4-3 4-4 4-5 4-6 4-7 4-8 4-9 4-10
proline methionine proline methioline proline methionine
tryptophan tryptophan isoleucine isoleucine isoleucine
tryptophan lysine tryptophan lysine
histidine lysine histidine lysine
histidine methionine histidine methionine histidine methionine
tryptophan tryptophan tryptophan
The hydration of the protein was accounted for by multiplying the amount of feed protein by 1.18. Biosynthesis of fish protein is presented according to the following reaction equation: 1 g amino acid+ (a) g O,+ (b) mole ATP-+ (c) g protein+(d) g CO,+(e) g glucose+ (f) g
H,O+k) e;NH,

310
native protein sources. Where possible the alternative sources supplied from 0 to 100% of the total protein in the diets.
Each diet contained 8-10% fat mix, 3-6% vitamin/mineral mix (Trouw & Co, Putten, The Netherlands), 35% carboxyl methyl cellulose as binder, lo-15% dextrin and O-35% cellulose, depending on the protein content of the protein source. The calculated metabolizable energy (ME) content of the diets was 12.6 ( 5 1.2) kJ/g, using ME values of 16.7 kJ/g for protein and dextrin and 37.7 kJ/g for fat mix.
The soybean, groundnut, cottonseed and rapeseed diets were formulated in duplicate. One of each pair was supplemented with synthetic amino acids (arginine, lysine, methionine and cysteine) up to the levels recommended for channel catfish (NRC, 1977). The amino acid composition of the protein in the diets was calculated from Janssen et al. (1979) and NRC (1977). The content of lysine and methionine in fish meal can vary to a great extent depending on the origin of the fish meal (NRC, 1977) ; therefore, one control diet in experiment 3 was supplemented with 4.5 g lysine and 1.5 g methionine per kg. After mixing, the diets were stored at 4°C in air-tight buckets until used. Before feeding, water was added to the mixtures, so that the diets were fed in a semi-moist form.
The experimental design, mean initial weight, stocking density, feeding level and water temperature for each of the different experiments is given in Table
Experiment 1 took place in 175-1 balance respirometers (Hogendoorn et al., 1981)) while experiments 2,3 and 4 were done in 150-l glass aquariums. Both respirometers and aquariums are part of recirculation systems including sedi- mentation tanks and biological filters ( Hogendoorn et al., 1983 ) . The experi- ments in the aquaria were run in duplicate.
C. gariepinus were obtained using the methods described earlier (Hogen- doorn, 1979,198O; Hogendoorn and Vismans, 1980). The fish, full sibs in each experiment, were reared up to the required weight according to the recommen- dations (Hogendoorn et al., 1983) and fed with a commercial trout diet (Trouw & Co, Putten, The Netherlands).
Experimental procedure At the beginning of the experiments the fish were hand-graded and assigned
to the experimental tanks, while a sample was taken for body composition analysis. The feeding was based on the dry matter content of the diets and the fresh body weight of the fish. The feed ration was adjusted daily, assuming an overall feed conversion ( 0.9-1.4)) depending on the fish weight and the feeding level (Hogendoorn et al., 1983). The feed was provided during the night using ‘Scharflinger’ conveyor belt feeders. Feed intake was not monitored and pos- sibly part of the feed was not eaten in some experiments.
After 4 weeks the fish in each tank were sampled for analysis of body com-

311
TABLE 3
Experimental design: initial weight (g) , density (number of fish/tank), feeding level (percentage of fresh body weight/day) and temperature ( “C) in two experimental periods of 4 weeks each
Experiment number
System
Temperature
Protein source
1st period Initial wt. Density Feeding level
2nd period Initial wt. Density Feeding levlsl
1
Repirometer
25
Fish meal
9.9( kO.4) 100
2.0-6.0
56.9 ( + 3.9) 25
1.3-3.9
2
Aquarium
25
Blood meal Casein Groundnut
10.8( k 1.1) 55
3.5
44.1( 26.6) 25
1.5
3 4
Aquarium Aquarium
27 25
Cottonseed Soybean Rapeseed Casein
8.6( kO.5) 133.4( & 12.6) 50 30
6.7 2.0
52.5( k4.3) 205.8( & 18.9) 25 20
4.8 2.0
position. In experiments 3 and 4 the remaining fish were weighed and used again in lthe second experimental period of 4 weeks. In experiments 1 and 2 newly reared fish, weighed and sampled for body composition analysis, were used in the second experimental period. After the second period all fish in each tank were weighed and taken as sample. The sampled fish were kept at - 18” C until anal.ysis of body composition was performed. Fish samples as well as sam- ples of the diets were analysed in duplicate for dry matter, crude protein (N- Kjeldahl x 6.25) and crude fat ( hexane extraction).
On the first day and once a week thereafter the oxygen consumption of the fish was measured during 24 h in experiment 1. During the 24-h monitoring period the water in the sedimentation funnels of the system was also sampled continuously for analysis of ammonia according to NEN (1981) .
RESULTS
The average weight of the fish at the start and at the end of each period, the amount of feed given and the body composition are presented in Tables 4,5,6 and 7 for experiments 1,2,3 and 4 respectively.
Fish meal: experiment 1
The results of simulation and experiment obtained in the two periods for fresh weight gain, protein gain and fat gain in relation to the feed ration are summarized in Figs. 1, 2 and 3.
312
TABLE 4
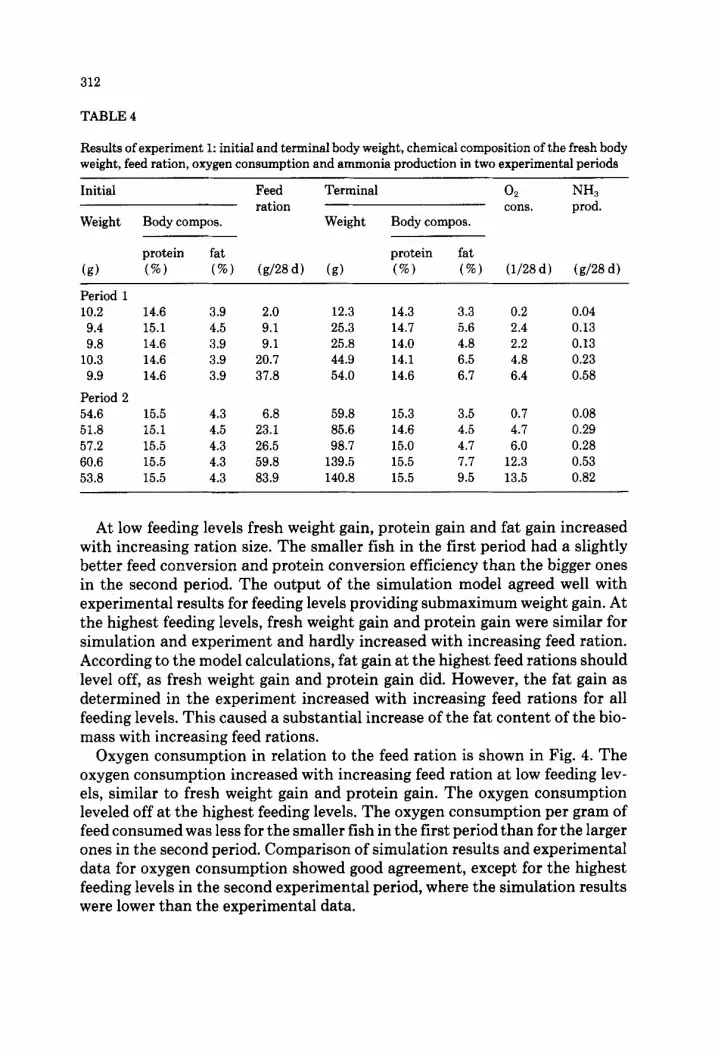
Results of experiment 1: initial and terminal body weight, chemical composition of the fresh body weight, feed ration, oxygen consumption and ammonia production in two experimental periods
Initial Feed Terminal 02 NI-L ration cons. prod.
Weight Body compos. Weight Body compos.
protein fat protein fat
(9) (%J (%) (g/28d) (8) (W) (%I t1/28d) (g/28d)
Period 1 10.2 14.6 3.9 2.0 12.3 14.3 3.3 0.2 0.04 9.4 15.1 4.5 9.1 25.3 14.7 5.6 2.4 0.13 9.8 14.6 3.9 9.1 25.8 14.0 4.8 2.2 0.13
10.3 14.6 3.9 20.7 44.9 14.1 6.5 4.8 0.23 9.9 14.6 3.9 37.8 54.0 14.6 6.7 6.4 0.58
Period 2 54.6 15.5 4.3 6.8 59.8 15.3 3.5 0.7 0.08 51.8 15.1 4.5 23.1 85.6 14.6 4.5 4.7 0.29 57.2 15.5 4.3 26.5 98.7 15.0 4.7 6.0 0.28 60.6 15.5 4.3 59.8 139.5 15.5 7.7 12.3 0.53 53.8 15.5 4.3 83.9 140.8 15.5 9.5 13.5 0.82
At low feeding levels fresh weight gain, protein gain and fat gain increased with increasing ration size. The smaller fish in the first period had a slightly better feed conversion and protein conversion efficiency than the bigger ones in the second period. The output of the simulation model agreed well with experimental results for feeding levels providing submaximum weight gain. At the highest feeding levels, fresh weight gain and protein gain were similar for simulation and experiment and hardly increased with increasing feed ration. According to the model calculations, fat gain at the highest feed rations should level off, as fresh weight gain and protein gain did. However, the fat gain as determined in the experiment increased with increasing feed rations for all feeding levels. This caused a substantial increase of the fat content of the bio- mass with increasing feed rations.
Oxygen consumption in relation to the feed ration is shown in Fig. 4. The oxygen consumption increased with increasing feed ration at low feeding lev- els, similar to fresh weight gain and protein gain. The oxygen consumption leveled off at the highest feeding levels. The oxygen consumption per gram of feed consumed was less for the smaller fish in the first period than for the larger ones in the second period. Comparison of simulation results and experimental data for oxygen consumption showed good agreement, except for the highest feeding levels in the second experimental period, where the simulation results were lower than the experimental data.

313
Feed ration
O Protein gain J -r
Feed ration
Q
I I, I I .o lS,O
I I 30.0 4s.o 60.0 7S.0
J 90.0
Feed ration
Figs. l-3. Fresh weight gain, protein gain and fat gain (g/fish per 28 days) in relation to the feed ration (g/fish per 28 days) in two periods of experiment 1 and the comparable output of the simulation model (drawn lines). 0, first period: + , second period.

314
0 Oxygen consumption 6
+ +
+
:I//-
+ 0
+
I I I I I I .O IS.0 JO.0 4s.o 60.0 IS.0 90.0
Feed ration
m Ammonia production
.kY+ , I I I I .o IS.0 30.0 45.0 60.0 75.0
1 90.0
Feed ration Figs. 4 and 5. Oxygen consumption (l/fish per 28 days) and ammonia production (g/fish per 28 days) in relation to the feed ration (g/fish per 28 days) in two periods of experiment 1 and the comparable output of the simulation model (drawn lines). Symbols as in Figs. l-3.
Ammonia production in relation to the amount of feed given is shown in Fig. 5. With increasing feed rations the ammonia production increased. A consid- erable difference between the simulation results and the experimental data was found when the amount of ammonia production per gram feed intake was com- pared for both periods. In the simulation, ammonia production depends on both the fish weight and the feed ration, and consequently is higher for the larger fish and for the high feed rations. The experimental results suggest that ammonia production depends on the feed ration only.
Alternative protein sources, experiments 2,3 and 4
The results of the calculations with the simulation model, as well as the experimental results, for fresh weight gain in relation to the different mixtures

315
TABLE 5
Results of experiment 2: initial and terminal body weight, chemical composition of initial and terminal samples, feed ration, feed conversion and protein productive value for the two experi- mental periods. Mean and standard deviation (in parentheses) of the replicates per treatment
Initial weight
(g)
Feed Terminal ration weight
(g/28 d) (g)
Body composition
protein fat (%) (%)
Feed PPV (1) Diet conversion code
(-) (-)
Period 1
10.7 (0.5) 16/5 (0.8) 27.6 (5.3) 11.1 (0.3) 15.1 (0.4) 18.1 (1.0) 8.7 (1.6) 14.6 (2.8) 22.4 (3.8)
10.6 (0.9) 16.0 (1.6) 24.3 (5.4) 9.9 (0.3) 16.7 (0.5) 29.9 (2.7)
10.2 (0.4) 17.5 (0.8) 30.1 (0.5) 12.0 (0.5) 22.5 (0.7) 42.6 (4.0) 9.2 (2.0) 15.3 (3.4) 23.6 (4.6) 9.1 (1.8) 16.2 (3.8) 30.3 (5.4)
11.8 (0.1) 18.9 (0.3) 30.4 (2.1) 12.0 (0.0) 20.4 (0.2) 36.1 (0.3) 12.1 (0.4) 21.2 (0.8) 41.3 (5.0)
Period 2
54.1 (1.4) 50.8 (1.1) 54.7 (3.3) 54.2 (2.0) 48.1 (3.1) 50.6 (1.2) 56.2 (4.2) 47.7 (0.1) 52.9 (1.9) 61.1 (2.0) 57.2 (8.2) 55.2 (3.0)
29.5 (0.6) 28.0 (0.9) 31.1 (1.7) 31.0 (1.3) 27.0 (2.2) 29.0 (1.7) 33.8 (3.3) 26.5 (0.3) 28.6 (2.3) 34.4 (1.3) 31.9 (4.0) 30.9 (1.3)
89.4 (0.5) 76.4 (3.6) 99.7 (7.3) 96.3 (7.9) 89.2 (8.5) 94.9 (4.0)
104.7 (6.4) 84.6 (1.0) 97.0 (3.9)
105.8 (5.4) 106.4 (18.4) 103.1 (6.9)
(initial sample) 13.3 4.0 (terminal samples) 14.2 (0.49) 8.6 (2.33) 14.7 (0.28) 5.4 (0.24) 14.1 (0.81) 5.6 (1.48) 14.0 (0.73) 6.6 (0.32) 14.5 (0.51) 7.6 (0.02) 15.1 (0.35) 7.1 (0.47) 14.8 (0.34) 8.2 (0.33) 14.3 (0.41) 5.4 (1.24) 15.2 (0.18) 7.0 (0.56) 14.9 (0.47) 9.0 (0.87) 14.7 (0.16) 7.7 (0.64) 14.4 (0.61) 7.8 (0.01)
(initial sample) 16.2 6.7 (terminal samples) 15.3 (0.04) 7.1 (0.39) 15.2 (0.28) 6.7 (0.06) 15.4 (0.11) 8.0 (0.98) 14.5 (0.52) 7.6 (0.11) 15.1 (0.08) 6.9 (0.22) 15.2 (0.10) 6.8 (1.27) 15.5 (0.33) 7.4 (0.40) 15.6 (0.37) 6.1 (0.46) 15.6 (0.31) 6.5 (0.11) 15.6 (0.21) 6.6 (0.76) 15.5 (0.32) 8.0 (1.38) 15.5 (0.09) 7.3 (0.19)
0.98 (0.39) 2.14 (0.57) 1.06 (0.03) 1.18 (0.50) 0.84 (0.09) 0.88 (0.09) 0.74 (0.07) 1.06 (0.04) 0.76 (0.04) 1.01 (0.15) 0.85 (0.02) 0.73 (0.11)
0.83 (0.04) 1.09 (0.08) 0.69 (0.03) 0.74 (0.09) 0.66 (0.03) 0.66 (0.00) 0.70 (0.04) 0.72 (0.03) 0.65 (0.02) 0.77 (0.03) 0.65 (0.08) 0.65 (0.03)
0.39 (0.11) 2-1 0.21 (0.03) 2-2 0.34 (0.02) 2-3 0.33 (0.06) 2-4 0.47 (6.02) 2-5 0.47 (0.02) 2-6 0.53 (0.03) 2-7 0.42 (0.00) 2-8 0.53 (0.02) 2-9 0.40 (0.03) 2-10 0.44 (0.02) 2-11 0.50 (0.04) 2-12
0.42 (0.02) 2-1 0.32 (0.05) 2-2 0.53 (0.03) 2-3 0.43 (0.01) 2-4 0.52 (0.03) 2-5 0.53 (0.01) 2-6 0.51 (0.06) 2-7 0.54 (0.05) 2-8 0.60 (0.01) 2-9 0.50 (0.04) 2-10 0.54 (0.03) 2-11 0.54 (0.03) 2-12
(1) PPV: productive protein value = protein gain/protein intake.
of protein sources are presented in Fig. 6. The effect of amino acid supplemen- tation was positive both in the experiments and in the simulation. The positive effect was small except for the experimental results of two groundnut diets (100% and 50% ) . Therefore, only the results of the treatments without amino

316
TABLE 6
Results of experiment 3: initial and terminal body weight, chemical composition of initial and terminal samples, feed ration, feed conversion and protein productive value for the two experi- mental periods. The chemical composition of the terminal sample of the first period is identical to the chemical body composition of the initial sample of the second period. Mean and standard deviation (in parentheses) of the replicates per treatment
Initial weight
k)
Feed Terminal ration weight
(g/28 d) (9)
Period 1
9.0 (0.1) 8.1 (0.8) 9.3 (0.6) 7.9 (0.6) 8.2 (0.1) 8.7 (0.0) 8.2 (0.0) 9.2 (1.5) 8.9 (0.1) 8.9 (0.4)
Period 2 37.0 (3.0) 32.4 (5.3) 44.6 (5.0) 46.0 (1.4) 57.5 (1.0) 48.6 (2.5) 39.4 (1.5) 38.4 (1.5) 44.5 (1.2) 42.0 (0.4)
41.6 (-) 34.3 (2.6) 41.6 (-) 28.5 (6.6) 41.6 (-) 43.3 (5.8) 41.6 (-) 42.7 (3.4) 41.6 (-) 53.1 (0.6) 41.6 (-) 50.9 (2.5) 41.6 (-) 35.7 (0.8) 41.6 (-) 35.5 (0.5) 41.6 (-) 46.3 (2.2) 41.6 (-) 42.5 (3.8)
83.4 (- ) 89.5 (4.1) 83.4 ( - ) 82.2 (3.1) 83.4 (-) 128.1 (7.7) 83.4 ( - ) 129.0 (17.8) 83.4 ( - ) 144.8 (17.0) 83.4 (-) 131.4 (7.8) 83.4 ( - ) 98.6 (20.4) 83.4 (-) 81.4 (3.6) 83.4 (- ) 121.4 (11.5) 83.4 (-) 110.8 (4.0)
Body composition Feed conversion
protein fat (%) (W) (-)
(initial sample) 14.2 2.6 (terminal samples) 15.3 (0.56) 6.0 (0.21) 1.64 (0.15) 15.2 (0.30) 6.6 (0.23) 2.04 (0.42) 15.7 (0.51) 6.1 (0.23) 1.23 (0.18) 15.1 (0.21) 6.0 (0.00) 1.20 (0.09) 15.2 (0.17) 6.7 (0.28) 0.93 (0.01) 14.7 (1.42) 6.8 (0.08) 0.99 (0.05) 15.0 (0.34) 6.1 (0.41) 1.51 (0.05) 15.3 (0.23) 5.8 (0.08) 1.58 (0.06) 14.9 (0.09) 6.9 (0.91) 1.11 (0.07) 15.0 (0.00) 6.8 (0.53) 1.24 (0.14)
15.8 (0.42) 7.7 (0.91) 1.59 (0.26) 15.5 (0.46) 8.4 (0.26) 1.68 (0.37) 16.0 (0.31) 8.0 (0.31) 1.00 (0.19) 15.4 (0.78) 7.9 (0.37) 1.00 (0.35) 15.6 (0.57) 8.7 (0.30) 0.96 (0.24) 16.0 (0.19) 8.6 (0.13) 1.01 (0.15) 15.8 (0.15) 7.7 (1.19) 1.41 (0.82) 15.9 (0.25) 7.4 (0.16) 1.94 (0.27) 15.8 (0.40) 8.4 (0.68) 1.08 (0.18) 16.0 (0.11) 8.6 (0.04) 1.21 (0.09)
PPV (1)
Diet code
(-)
0.27 (0.01) 3-l 0.21 (0.05) 3-2 0.32 (0.04) 3-3 0.32 (0.02) 3-4 0.44 (0.00) 3-5 0.39 (0.03) 3-6 0.26 (0.00) 3-7 0.26 (0.00) 3-8 0.34 (0.02) 3-9 0.32 (0.03) 3-10
0.29 (0.02) 3-l 0.26 (0.03) 3-2 0.40 (0.04) 3-3 0.39 (0.06) 3-4 0.44 (0.05) 3-5 0.43 (0.02) 3-6 0.30 (0.09) 3-7 0.22 (0.02) 3-8 0.38 (0.04) 3-9 0.36 (0.03) 3-10
(1) PPV: productive protein value = protein gain/protein intake.
acid supplementation are presented in this figure. The results of a treatment will be discussed in relation to the result of the 100% fish meal control diet in the same experiment, because initial body weight, body composition, feeding level and temperature differed for each experiment.
A comparison of simulated and experimental results for the 100% fish meal control diets shows an overestimation of the results in the simulation for experiment 2 and the first period of experiment 4, while the results were under- estimated for experiment 3 and the second period of experiment 4.
In general fresh weight gain decreased at decreasing fish meal/alternative

317
TABLE 7
Results of experiment 4: initial and terminal body weight, chemical composition of initial and terminal samples, feed ration, feed conversion and protein productive value for the two experi- mental periods. The chemical composition of the terminal sample of the first period is identical to the chemical body composition of the initial sample of the second period. Mean and standard deviation (in parentheses) of the replicates per treatment
Initial weight
(9)
Feed ration
(g/28 d)
Terminal weight
(g)
Body composition Feed PPV Diet conversion (1) code
protein fat
(%) (%) (-) (-)
Period 1
137.9 (2.0) 85.6 (1.6) 202.0 (3.4) 143.3 (13.8) 90.1 (7.2) 216.3 (17.5) 147.0 (10.0) 89.3 (2.5) 218.9 (6.3) 143.7 (27.9) 91.1 (16.8) 222.5 (38.5) 142.1 (24.8) 90.0 (14.6) 220.7 (33.9) 147.7 (16.1) 91.9 (8.8) 223.4 (12.8) 140.3 (12.7) 89.7 (7.6) 216.8 (19.3) 142.3 (8.6) 65.3 (3.0) 201.9 (5.4) 135.5 (11.1) 85.0 (4.8) 205.6 (14.6) 149.7 (5.7) 96.3 (2.2) 235.1 (5.4)
Period 2 205.6 (9.8) 209.0 (9.5 I 201.6 (5.9) 217.7 (29.4) 229.4 (34.4 1 250.7 (27.4 1 218.2 (23.0) 200.4 (8.1) 214.2 (20.4), 235.3 (13.2)
138.2 (7.8) 280.9 (16.3) 133.9 (5.0) 257.8 (5.3) 134.9 (6.5) 309.5 (10.4) 138.7 (11.7) 311.5 (30.9) 160.1 (24.0) 369.4 (46.4) 172.5 (18.9) 392.9 (38.2) 150.2 (16.3) 340.9 (37.4) 102.0 (0.8) 285.4 (14.7) 144.8 (12.5) 331.3 (28.6) 163.7 (11.5) 382.1 (30.8)
(initial sample) 16.0 4.9 (terminal samples) 17.8 (1.3) 5.3 (0.2) 1.34 (0.00) 17.0 (0.5) 4.7 (0.1) 1.23 (0.04) 16.6 (0.3) 4.7 (0.7) 1.24 (0.09) 16.4 (0.2) 5.7 (0.2) 1.16 (0.07) 16.6 (0.3) 5.5 (0.4) 1.15 (0.06) 15.0 (0.7) 4.6 (0.7) 1.21 (0.16) 15.4 (0.6) 5.1 (0.5) 1.17 (0.00) 16.1 (0.4) 6.3 (0.4) 1.10 (0.10) 15.8 (0.0) 5.3 (0.2) 1.21 (0.01) 15.5 (0.5) 6.1 (0.1) 1.13 (0.03)
17.9 (0.4) 6.5 (0.5) 1.84 (0.06) 17.6 (0.1) 7.0 (0.6) 2.74 (0.30) 17.7 (0.2) 7.4 (0.9) 1.25 (0.01) 17.5 (0.1) 6.8 (0.2) 1.48 (0.10) 17.8 (0.4) 8.0 (1.7) 1.14 (0.08) 17.0 (0.5) 8.1 (0.6) 1.21 (0.05) 16.5 (0.2) 7.0 (0.1) 1.22 (0.01) 17.5 (0.3) 7.6 (0.1) 1.20 (0.11) 16.8 (0.2) 6.4 (0.3) 1.24 (0.02) 16.7 (0.5) 7.5 (0.1) 1.12 (0.07)
0.42 (0.08) 4-l 0.38 (0.03) 4-2 0.38 (0.00) 4-3 0.38 (0.00) 4-4 0.43 (0.03) 4-5 0.30 (0.10) 4-6 0.34 (0.03) 4-7 0.37 (0.06) 4-8 0.38 (0.01) 4-9 0.38 (0.04) 4-10
0.24 (0.06) 4-l 0.18 (0.04) 4-2 0.41 (0.00) 4-3 0.34 (0.02) 4-4 0.47 (0.00) 4-5 0.46 (0.05) 4-6 0.41 (0.04) 4-7 0.43 (0.03) 4-8 0.45 (0.02) 4-9 0.48 (0.01) 4-10
(1) PPV: productive protein value = protein gain/protein intake.
protein source ratios. For the simulation, the ranking order of this decrease was soybean and rapeseed, casein, cottonseed, groundnut and blood meal. In the experiments this decrease was smallest for the soybean and casein diets, and greatest for the cottonseed and rapeseed diets, while the decrease for the blood meal diets was similar to that for the cottonseed diet in the first period and nearly constant at all replacement levels in the second period. Fish fed with a 75% soybean diet in the first period, a 50% soybean diet and a 25% casein diet in both periods and a 50% blood meal diet in the second period

- --
9
P
-
experiment 4
FRESH WEIGHT GAIN
2
experiment 3
I-
!_
experiment 2

319
showed a higher fresh weight gain than those fed the 100% fish meal control diets.
In the model no difference was found between the 100% fish meal diets with and without amino acid supplementation. In the experiments a minimal posi- tive effect of amino acid supplementation was found for these diets. In exper- iment 3 the fresh weight gain was 2.9 and 0.6% higher in the first and second experimental periods, respectively, with amino acid supplementation.
Feed conversion and protein conversion efficiency were better in the second period of ‘experiments 2 and 3 and in the first period of experiment 4. These differences were relatively smaller for the simulation than for the experimental results.
The results for protein gain were similar to those for fresh weight gain. The similarity was less for fat gain. In the model, fat gain depends on the feed composition (fat/protein ratio) and feeding level, which were almost the same per experiment, and is practically independent of the protein source used. However, in the experiments an increase of fat gain was found with increasing fish meal levels.
The greatest discrepancy between model calculations and experiments was found for the second period, especially for the high feeding levels (experiment 4), the simulated results being lower than the experimental ones. This dis- crepancy may be due to different parameter values for the regulation of the feed intake for these diets, because simulation and experiment in the second period coincide reasonably well if the maximum feed intake is increased by 25%.
DISCUSSION AND CONCLUSION
The first experiment in this study indicated that C. guriepinus is able to convert feed nutrients very efficiently into fish biomass. A protein conversion efficiency of 60% can only be reached in cases where the feed protein has a high biological value and digestibility. Moreover, the feed must contain suffi- cient fat and/or carbohydrates to minimize gluconeogenesis of amino acids. However the fat and/or carbohydrate content in the feed influences the bio- mass composition, which in turn affects regulation of the feed intake (Machiels and Van Darn, 1987). In time, the high fat content of the diet will decrease the maximum feed intake of the fish. The initial fat content of the fish was too low and the experimental period was too short, to verify the reduction of the max- imum feed intake in this experiment.
While fresh weight gain and protein gain were constant at the highest feed- ing levels in experiment 1, the fat gain still increased at the highest feed intake levels. In experiments 3 and 4 high feeding levels were used and the fat gain, calculated with the model, was an overestimation of the experimental results. This indicates that at these feeding levels the fish still eats extra amounts of
feed but utilizes only the fat or the protein in the feed for fat synthesis via lipogenesis. The effect of these processes will be the same. Both will cause an increase in oxygen consumption at the highest feeding levels, which was found in the respiration experiment. If body composition is a major production goal, this could be important in practical fish culture. However, if the fresh weight gain is the only production goal, such feeding levels are too high to be economical.
Clay (1981) determined soluble nitrogen excretion for individually housed C. gariepinus. For fasting fish the excretion amounted to 0.0055 mg N gg’ h-‘. This means that the ammonia production will vary according to the fish weight. The model used here also predicts a difference in ammonia production for the two weight classes in the respective experimental periods, but the measured ammonia production suggests a strong dependency on the feed ration only. It may be concluded that the experimental procedure measuring the ammonia production was incorrect. The faeces and the feed remnants were not separated from the tanks immediately. In the sedimentation funnels of the tanks ammonification and nitrification can take place, thereby changing the amount of ammonia in the water, which interferes with the measurement of the ammo- nia production of the fish.
The decrease in fresh weight gain with increasing amounts of fish meal being replaced by an alternative protein source can be caused by a number of factors. One reason for the reduced performance of the diets with increasing levels of the alternative protein sources may have been a lower digestibility of these sources. Research by Wilson et al. (1981) showed that the variability of diges- tibilities for different alternative protein sources (83.3 & 6.6) was as great as the variability of two types of fish meal (79.3 k9.6). An alternative protein source can have a completely different amino acid profile compared to fish meal. When fish meal is replaced by such a protein source, an essential amino acids deficiency is possible. In such a case the fresh weight gain will decrease because the biological value of the dietary protein and thereby the protein con- version efficiency is decreasing. The effect of supplementation of amino acids was not high enough to get results equal to those of the control diets. It seems that protein requirements of C. guriepinus are met if the amino acid profile of the feed protein agrees with the amino acid composition of fish meal protein. For some other fish species this was also noticed (Tacon and Cowey, 1985).
The possibilities of a fish adapting to a change of the protein source in the diet are not clear (Cowey and Sargent, 1979). For carp it was shown that the activities of enzymes concerned in the degradation of the essential amino acid histidine depend on the histine concentration in the diet. If this phenomenon also holds for C. guriepinus and for other essential amino acids, the rate of amino acid degradation of the labile protein can be controlled by a sudden change in amino acid composition of the protein in the diet. If the fish is able to conserve an essential amino acid, the protein efficiency of an amino acid-

321
deficient diet would be temporarily better than expected from the amino acid profile of that diet. A higher protein turnover in small fish will shorten the duration of this temporary effect. When different fish were used in the two experimental periods, the protein efficiency was better in the second period compared to the first period in which smaller fish were used. If the same fish were used in both periods the results of the first period were better. This indi- cates that a feeding period for testing protein in fish diets should last at least 2 months, depending on the initial fish weight. The hypothesis stated above can explain part of the discrepancy between calculated and experimental results. The model calculations are based on a static approach to biosynthesis of body protein from feed protein, both with a constant amino acid composition. How- ever, protein conversion seems to be subject to dynamic metabolic changes,
The reduced weight gain, found for the higher inclusion levels of the alter- native protein sources, could be caused by toxic components, like an anti-tryp- sin factor in soybean, or by a lower appetite for diets with alternative protein sources. Growth will be reduced when the concentration of toxic components exceeds a! certain limit. In that case, inclusion level of the protein source with the toxic component and feeding level determine whether the limit is exceeded. Palatability of the diet plays an important role if high feeding levels are used. No clear #statement can be made as to which factor probably caused the growth reduction in this experiment, since only one feeding level was offered to the fish. Therefore, diet ingredients should be tested at a range of feed rations in order to discriminate between the possible factors causing reduced weight gain at high inclusion levels of the alternative protein sources.
Soybean and casein seem to be good alternatives as basic sources of protein in the fish diet. Although in fish nutrition research, casein is often used as a protein source because of its purity and constant quality, its use is considered less suitable because of its high price. In addition, the experiments described here indicate that growth results for casein diets are inferior to fish meal diets. Extrapolation of results of nutrition research based on casein diets to practical conditions, where mostly diets based on other ingredients (e.g. fish meal) are used, needs a correction, which depends on the feed ingredients used. Other alternative protein sources can be considered for supplementation in smaller quantities. Addition of ingredients containing a surplus of a specific amino acid can increase the biological value of the total protein if that amino acid is lim- iting in tlne other ingredients.
A diet is correctly formulated if it supplies the animal with those quantities of nutrients which are required for optimal production (Van Es, 1976). Opti- mal production can be defined from a biological or an economic viewpoint. A biological optimum may be achieved if the diet is formulated in such a way that the lowest allowable levels for protein (amino acids), fat (fatty acids), car- bohydrates and micro-nutrients ensuring the animal’s well-being are included. If the intake of nutrient guaranties the fish farmers maximal profit, then an

322
economic optimum is reached. The feed formulation for both optima will sel- dom be the same. Calculations with a model as presented in this series can help to develop the biologically optimal feed formulation for different nutrient sources available and for different environmental circumstances. The ultimate choice of the feed depends on the intensity of the culture process and its eco- nomics. For the latter purposes the model output can be used in combination with linear programming techniques. The simulation model is suitable for pre- dicting the influence of fat, protein and carbohydrate supply on the perform- ance of C. guriepinus, based on the chemical composition of the feed and the fish biomass. For feed formulation purposes it seems possible to calculate a ranking order of ingredients to be included in the diet, based on the chemical composition of the ingredients. A precise estimate of the amino acid compo- sition of the protein sources and of the fatty acid composition of the fat is needed for accurate predictions.
ACKNOWLEDGEMENTS
Part of the experimental work reported in this paper was carried out as stu- dent projects at the Department of Fish Culture and Fisheries for which the author is very grateful to Ir. O.L.M. Haenen, Ir. M. van der Schaft, B. Schui- lenburg and Ir. M.M.J. Speekenbrink. Thanks are also due to Prof. Dr. E.A. Huisman, Dr. F.W.T. Penning de Vries, Prof. Dr. Ir. R. Rabbinge and Dr. Ir. A.M. Henken for their interest in the research project, useful advice, organi- zational support and encouragement. The financial support of the LEB Fund, Wageningen, The Netherlands, for the completion of the project is also grate- fully acknowledged.
REFERENCES
Clay, D., 1981. Utilization of plant materials by juvenile African catfish (Clarias gariepinus) and its importance in fish culture. J. Limnol. Sot. S. Afr., 7: 47-56.
Cowey, C.B. and Sargent, J.R., 1979. Nutrition. In: W.S. Hoar, D.J. Randall and J.T. Brett (Edi- tars) , Fish Physiology, Vol. VIII. Bioenergetics and Growth. Academic Press, New York, NY, pp. l-70.
Henken, A.M., Machiels, M.A.M., Dekker, W. and Hogendoorn, H., 1986. The effect of dietary protein and energy content on growth rate and feed utilization of the African catfish Clark gariepinus (Burchelll822). Aquaculture, 58: 55-74.
Hogendoorn, H., 1979. Controlled propagation of the African catfish, Clarias lazera (C. & V.) . I. Reproductive biology and field experiments. Aquaculture, 17: 323-333.
Hogendoorn, H., 1980. Controlled propagation of the African catfish, Claris luzeru (C. & V.) . III. Feeding and growth of fry. Aquaculture, 21: 233-241.
Hogendoorn, H. and Vismans, M.M., 1980. Controlled propagation of the African catfish, Clark- lazera (C. & V.) . II. Artificial reproduction. Aquaculture, 21: 39-53.
Hogendoorn, H., Van Korlaar, F. and Bosch, H., 1981. An open circuit balance respirometer for bioenergetic studies of fish growth. Aquaculture, 26: 183-187.

323
Hogendoorn, H., Jansen, J.A.J., Koops, W.J., Machiels, M.A.M., Van Ewijk, P.H. and Van Hees, J.P., 1983. Growth and production of the African catfish, Clarias lazera (C. & V.) . II. Effects of body weight, temperature and feeding level in intensive tank culture. Aquaculture, 34: 265-285.
Janssen, W.M.M., Terpstra, K., Beeking, F.F.E. and Bisalsky, A.J.N., 1979. Feeding values for poultry. Spelderholt Mededelingen 303. Spelderholt Institute for Poultry Research, Beekber- gen, The Netherlands, 59 pp.
Machiels, M.A.M. and Henken, A.M., 1985. Growth rate, feed utilization and energy metabolism of the African catfish, Clarias gariepinus (Burchell 1822) as affected by dietary protein and energy content. Aquaculture, 44: 271-284.
Machiels, M.A.M. and Henken, A.M., 1986. A dynamic simulation model for growth of the African catfish, (Clarias gariepinus (Burchell 1822). I. Effect of feeding level on growth and energy metabohsm. Aquaculture, 56: 29-35.
Machiels, M.A.M. and Henken, A.M., 1987. A dynamic simulation model for growth of the African catfish, Clark gariepinus (Burchelll822). II. Effect of feed composition on growth and energy metabohsm. Aquaculture, 60: 33-54.
Machiels, M.A.M. and Van Dam, A., 1987. A dynamic simulation model for growth of the African catfish, Clarias gariepinus (Burchell 1822). III. Effect of body composition on growth and feed utibzation. Aquaculture, 60: 55-71.
Moore, L.B., 1985. The role of feeds and feeding in aquatic animal production. GeoJournal, 10.3: 245-251.
NEN, 1981. Water - Photometric determination of ammonium content. Nederlands Normalis- atie Instituut NEN 6472, Rijswijk, The Netherlands, 4 pp.
NRC, 1977. Nutrient requirements of warmwater fishes. National Research Council - National Academy of Science, Washington, DC, 78 pp.
Tacon, A.G.J. and Cowey, C.B., 1985. Protein and amino acid requirements. In: P. Tytler and P. Calow (IEditors), Fish Energetics: New Perspectives. Croom Helm, London and Sydney, pp. 155-184.
Van Es, A.J.H., 1976. Unique problems in diet formulation. In: P.V. Fonnesbeck, L.E. Harris and L.C. Kearl (Editors), Proceedings of the First International Symposium on Feed Composi- tion, Animal Nutrient Requirement and Computerization of Diets. Utah Agric. Exp. Stn., Utah State University, Logan, UT, pp. 15-21.
Wilson, R.F’., Robinson, E.H. and Poe, W.E., 1981. Apparent and true availability of amino acids from common feed ingredients for channel catfish. J. Nutr., 111: 923-929.


