Embed Size (px)
Citation preview
The impact of elevated water nitrite concentration on
physiology, growth and feed intake of African catfish
Clarias gariepinus (Burchell 1822)
Jonathan A C Roques1,2,*, Edward Schram2,*, Tom Spanings1, Tirsa van Schaik1, Wout Abbink2,
Jeroen Boerrigter1, Pepijn de Vries2, Hans van de Vis2 & Gert Flik1
1Department of Animal Physiology, Institute for Water and Wetland Research, Faculty of Science, Radboud University
Nijmegen, Nijmegen, The Netherlands2IMARES, Wageningen Aquaculture, Wageningen UR, Wageningen, The Netherlands
Correspondence: J A C Roques, Department of Animal Physiology, Institute for Water and Wetland Research, Faculty of Science,
Radboud University Nijmegen, Heyendaalseweg 135, AJ Nijmegen 6525, The Netherlands. E-mail: [email protected]
*Contributed equally to this study.
Wageningen Aquaculture is a consortium of IMARES (Institute for Marine Resources & Ecosystem Studies) and AFI (Aquaculture
and Fisheries Group, Wageningen University), both part of Wageningen University & Research Centre (WUR).
Abstract
The nitrite threshold concentration in rearing
water of African catfish (Clarias gariepinus) was
assessed. African catfish with an initial mean (SD)
weight of 219.7 (57.8) g were exposed to an
increasing range of water nitrite from 6 (Control)
to 928 lM nitrite for 28 days. Mean (SD) plasma
nitrite concentrations increased from 5.0 (3.6) to
32.5 (12.6) lM at 928 lM ambient nitrite. The
increase in nitrite was accompanied by gradual
increase in plasma nitrate from 41.6 (28.4) lM to
420.2 (106.4) lM. Haematocrit, haemoglobin,
methemoglobin, plasma concentrations of cortisol,
glucose, lactate, osmolality, gill morphology and
branchial Na+/K+-ATPase activity were not
affected. Feed intake, final weight, SGR, FCR and
mortality were not affected. We advise not to
exceed a water nitrite concentration of 43 lM(0.6 mg L�1 NO2
�-N) to prevent the risk of
reduced growth and feed intake in African catfish
aquaculture.
Keywords: African catfish, nitrite, growth,
stress physiology, methemoglobin, recirculating
aquaculture systems
Introduction
The aquaculture industry has been expanding
rapidly over the past four decades (FAO 2012). In
(intensive) recirculation systems (RAS), water is
treated to allow the reuse of over 90% of the rear-
ing water (Bovendeur, Eding & Henken 1987;
Eding, Kamstra, Verreth, Huisman & Klapwijk
2006). In RAS, fish risk exposure to toxic levels of
nitrite. Nitrogenous wastes in RAS are managed
by nitrification (biological oxidation of ammonia to
nitrate) and denitrification (biological reduction in
nitrate to nitrogen gas) (Bovendeur et al. 1987;
Eding et al. 2006; Van Rijn 2010). Both processes
can cause nitrite accumulation in the rearing
water (Van Rijn & Rivera 1990).
Nitrite is very toxic to organisms, as it converts
haemoglobin (Hb) into methemoglobin (MethHb)
that does not carry oxygen (Kiese 1974). At high
external nitrite levels, fish reduce their overall
activity to reduce their oxygen requirement; this
goes, however, with the cost of impaired growth
and a series of vital functions (reviewed by Lewis &
Morris 1986). In freshwater, nitrite enters the
organism primarily via the chloride cells in the gills
(Bath & Eddy 1980). Nitrite has an affinity for this
branchial Cl�/HCO3� exchanger and therefore can
compete with the normal Cl� uptake mechanism.
This can lead to (partial) shift from Cl� uptake to
NO2� uptake when nitrite is present at high con-
centrations in the environment (Jensen 2003).
Therefore, fish with high branchial chloride uptake
rates are more sensitive to nitrite toxicity than
those with low uptake rates (Williams & Eddy
1986). This pertains in particular to freshwater
© 2013 John Wiley & Sons Ltd 1
Aquaculture Research, 2013, 1–12 doi:10.1111/are.12292
species, where active branchial uptake is the main
route of entry of anions (Jensen 2003). Elevated
chloride levels in the water are known to alleviate
nitrite toxicity, due to competitive effects on bran-
chial nitrite uptake (Crawford & Allen 1977). This
protective effect is not uniform between species
(reviewed by Lewis & Morris 1986).
African catfish (Clarias gariepinus) is commer-
cially farmed in intensive RAS in the Netherlands
(Van Duijn, Schneider, Poelman, Van der Veen &
Beukers 2010). The global aquaculture production
of African catfish has been increasing rapidly since
2000. In 2011, 194 000 tonnes were farmed
globally (FAO 2011). The effects of chronic nitrite
exposure on African catfish physiology and food
intake are not known. Most of the studies on
nitrite toxicity determined the median lethal dose,
LD50, for several fish species with exposure times
up to 120 h. Chronic exposure studies are scarce
and mostly limited to purely toxicological effects,
with no attention to effects on growth parameters,
of interest to farmers (reviewed by Lewis & Morris
1986; Kroupova, Machova & Svobodova 2005).
Hilmy et al. (Hilmy, El-Domiaty & Wershana
1987) exposed African catfish for 6 months to
228 lM of nitrite (1/10th of their 96 median tol-
erance limit). They observed a decrease in erythro-
cytes counts, haemoglobin content and production
of methemoglobin. In our experimental design, we
exposed African catfish to a range of nitrite
concentrations that allowed us to see subtle yet
important effect on parameters of interest for fish
farmers, without causing mortalities or serious
toxic effect.
For channel catfish, Ictalurus punctatus, the
lowest concentration nitrite leading to growth
suppression after 31 days was 115 lM (44% of
the minimum concentration to induce mortality)
(Colt, Ludwig, Tchobanoglous & Cech 1981). The
minimum concentration causing mortality for this
species is about half of the 96-h LC50 (Bowser,
Falls, Van Zandt, Collier & Phillips 1983). There-
fore, the minimum ambient concentration of
nitrite leading to detectable growth was set up at
about one-fifth of the 96-h LC50 (Lewis & Morris
1986). This information was taken into account
when designing the experimental concentrations
range. We exposed African catfish to increasing
water nitrite concentrations [6 (Control), 111,
280, 459 and 928 lM] for 28 days to assess the
nitrite threshold concentration for physiology,
growth and food intake. In addition, we exposed
two aquaria to high ambient nitrite concentrations
(921 lM) in the addition on sodium chloride
(350 mg L�1; 6 mM) to investigate the potential
attenuating effect of chloride on nitrite toxicity.
Materials and methods
Experimental conditions
African catfish (C. gariepinus) were obtained from
Fleuren-Nooijen BV, Someren, The Netherlands.
The treatment of the fish in the laboratory was in
accordance with Dutch law concerning animal
welfare, as tested and approved by the ethical
committee for animal experimentation of Wagen-
ingen UR Livestock Research.
Fish (n = 192) were randomly divided over
sixteen 30-L rectangular glass (12 fish per tank),
dark covered tanks and acclimatized to the experi-
mental tanks for 15 days. During this acclimatiza-
tion period, some fish with skin damage (due to
aggressive behaviour; n = 6) were removed, result-
ing in some variation in number of fish per tank
(10–12). After this period of 15 days, the behaviour
of the fish had stabilized, and nitrite exposure com-
menced. At the start of the 28 days experiment, the
overall initial mean (SD) weight was 219.7 (57.8)
g. The mean stocking density was 84.7 kg m�3, a
value below densities practised at commercial
farms for this size class (100–300 kg m�3, Van de
Nieuwegiessen, Olwo, Khong, Verreth & Schrama
2009).
The experiment consisted of eight treatments, in
duplicate. Treatments were assigned randomly to
the 16 tanks. Treatment 1 was included to collect
blood at the start of the experiment (t = 0). Fish in
treatments 3–7 were exposed to one of five differ-
ent nitrite concentrations in the water: 6, 111,
280, 459 and 928 lM. Fish in treatment 2 (pair-
fed) were kept at control nitrite levels and pair-fed
to the fish kept at 928 lM nitrite (treatment 7) to
discriminate between effects caused by low feed
intake due to high nitrite in the water. Fish in
treatment 8 (chloride) were exposed to high nitrite
(921 lM) in the presence of sodium chloride
(350 mg L�1; 6 mM) to evaluate a potential atten-
uating effect of chloride (and sodium) on nitrite
toxicity (Eddy, Kunzlik & Bath 1983; Stormer,
Jensen & Rankin 1996; reviewed by Lewis &
Morris 1986 and Kroupova et al. 2005). During
acclimatization and experimental periods, all tanks
were supplied with local tap water via a header
© 2013 John Wiley & Sons Ltd, Aquaculture Research, 1–122
Impact of water nitrite on C. Gariepinus J A C Roques et al. Aquaculture Research, 2013, 1–12
tank at a flow of 185 L day�1 (chloride concentra-
tions range: 0.4–0.7 lM, Vitens Watertechnologie,
The Netherlands). Experimental nitrite concentra-
tions were realized by infusion of NaNO2 (Merk,
Hohenbrunn, Germany) stock solutions prepared
in tap water (Table 1), which were pumped into
the tanks using a peristaltic pump (Watson Mar-
low 505 S; Rotterdam, The Netherlands) at a flow
of 4.75 L day�1 per tank; each tank was equipped
with an air stone positioned at the point of sodium
nitrite inflow to guaranty good mixing of the
infused stock solution with the tank water. Flow
rates were monitored daily and adjusted when
necessary to reach the desired nitrite concentra-
tions. Nitrite concentrations were gradually
increased to the desired concentrations during the
first 4 days of the experimental period. Fresh stock
solutions (Table 1) were prepared daily during the
first 11 days of the experimental period and in this
period nitrite (NO2�-N), nitrate (NO3
�-N) and total
ammonia (NH4+-N plus NH3-N) concentrations
were monitored daily (NitriVer 3 TNT Reagent Set,
NitraVer X Nitrogen-Nitrate Reagent Set, Nitro-
gen-Ammonia TNT, AmVer Reagent Set, tests for
NO3�, NO2
� and NH4+, Hach Lange, D€usseldorf,
Germany, in a Hach DR/890 colorimeter, Hach
Lange). During the remainder of the experimental
period fresh stock solutions were prepared weekly
and nitrite, nitrate and total ammonia concentra-
tions were monitored twice per week. Water tem-
perature, pH and dissolved oxygen concentrations
were monitored daily prior to feeding in all tanks
(Hach Lange HQ 40 multimeter) throughout the
entire experiment. Mean (SD) water temperature
was 25.7 (0.5) °C throughout the experimental
period. Conductivity was measured with a WTW
Cond 315i (WTW GmbH, Weilheim in Oberbay-
ern, Germany), and presented in Table 1.
Blood sampling
On the day nitrite exposure started (day 0), fish in
treatment 1 (t = 0) were sampled. After 28 days of
exposure to nitrite, the fish from the seven remain-
ing treatments were sampled (10–12 fish per tank).
Fish were rapidly netted and anaesthetized in 0.1%
(v/v) 2-phenoxyethanol (Sigma, St. Louis, MO,
USA). Within 2 min, blood (2 9 1.0 mL) was
taken by puncture of the caudal vessels with a
tuberculin syringe fitted with a 25-gauge needle;
Na2EDTA was used as anticoagulant. One 150
microtiter aliquot was immediately used for the
haematocrit determination and haemoglobin/
methemoglobin measurement. The remainder of
blood was immediately centrifuged for 10 min
(14 000 g, 4°C) and the plasma so obtained was
stored at �20°C until further analyses.
Blood haematocrit, haemoglobin and
methemoglobin levels
Immediately after blood puncture, subsamples
were drawn into (heparinized) glass capillaries and
centrifuged (13 600 g; 2 min) to measure haemat-
ocrit values. Results were rounded to the closest
0.5%. Blood haemoglobin and methemoglobin
were measured with commercially available kits
(Instruchemie, Delfzijl, The Netherlands; FAR
diagnostics, Verona, Italy).
Plasma concentrations of nitrate, nitrite, cortisol,
glucose, lactate, chloride, plasma osmolality and
branchial Na+/K+-ATPase activity
Plasma concentration of cortisol was determined
using radioimmunoassay as described in detail by
Gorissen et al. (Gorissen, Bernier, Manuel, de Gelder,
Metz, Huising & Flik 2012). Plasma osmolality was
measured using a cryoscopic osmometer (Osmomat
030, Gonotec, Germany). Plasma concentrations of
glucose, lactate, chloride, nitrate and nitrite were
measured with commercially available enzymatic
kits adapted to 96-well plates as described recently
(Schram, Roques, Abbink, Spanings, De Vries, Bier-
man, Van de Vis & Flik 2010; Schram, Roques, Abb-
ink, Yokohama, Spanings, De Vries, Bierman, Van
de Vis & Flik 2012). Branchial Na+/K+-ATPase
activity was measured as described by Metz et al.
(Metz, Van den Burg, Wendelaar Bonga & Flik
2003).
Gill morphology
From each fish a second gill arch was removed
immediately after blood sampling and placed over-
night in Bouin’s fixative (75 volumes saturated
picric acid, 25 volumes saturated formaldehyde
and 5 volumes acetic acid) and then embedded in
paraffin. Gill sections were made to include the
trailing edge of the filament where in this species
the chloride cells reside. Gill sections were immune
stained according to Dang et al. (Dang, Lock, Flik
& Wendelaar Bonga 2000) as described in detail
for African catfish (Schram et al. 2010, 2012).
© 2013 John Wiley & Sons Ltd, Aquaculture Research, 1–12 3
Aquaculture Research, 2013, 1–12 Impact of water nitrite on C. Gariepinus J A C Roques et al.
Specific growth rate, feed intake and feed
conversion rate
On day 0 and day 28, the fish in each tank were
individually weighed (Mettler PM 34 Delta range)
to the nearest 1 g, to calculate the specific growth
rate (SGR) as follows:
SGR ¼ ðlnðWtÞ � lnðW0ÞÞ � 100
t;
where SGR = specific growth rate (% day�1), Wt =mean weight at day 28 (g), W0 = mean weight at
day 0 (g) and t = number of days.
Floating feed (Catfish type Me-3; Skretting,
Boxmeer, The Netherlands) with 49% crude pro-
tein and 11% crude lipids was given twice daily
at 09:00 and 15:00 hours until apparent satia-
tion (no more feed was taken for at least 5 min
following administration of the feed). Feed loads
per tank were recorded daily. All uneaten pellets
were collected from each tank 1 h after each of
the two daily feeding sessions. Feed loss per tank
was calculated as the total number of uneaten
feed pellets multiplied by 0.0966 g per pellet, the
average weight of a pellet, determined by weigh-
ing 100 feed pellets. Daily feed intake per tank
resulted from the difference between daily feed
load and daily feed loss. Daily feed intake per
tank was divided by the number of fish in the
tank to calculate the daily feed intake per fish in
each tank (to account for different numbers of
fish per tank). For each tank the total feed
intake per fish (TFI) was determined by summa-
tion of daily feed intake per fish in each tank.
Total feed intake per fish and biomass increase
per fish were used to calculate feed conversion
rate (FCR) as follows:
FCR ¼ TFI
ðWt �W0Þ
where FCR = feed conversion rate (g/g), TFI =total feed intake (g per fish), Wt = mean individual
weight at day 28 (g) and W0 = mean individual
weight at day 0 (g).
Statistics
Physiological parameters
Physiological parameters are expressed as mean
(SD) of the individual measurements per treat-
ment. For each tanks, 10–12 fish had been
sampled; in some instances not all samples were
analysed because of insufficient volume or fish
mortality. Data were log transformed (if required)
to obtain residuals that were normally distributed
and to obtain homogeneity of variance of residu-
als across treatment levels. Mean values for physi-
ological parameters were tested for differences
among the treatments using linear mixed models
(REML) with treatments as fixed effects and tank
as a random effect (F-tests with Kenward–Roger
approximation to the residual degrees of freedom;
Kenward & Roger 1997). Statistical analyses were
performed in SAS 9.2 (SAS Institute Inc., Cary,
NC, USA). Only when significant treatment effects
were detected, a least significance difference (LSD)
post hoc analysis was used to estimate the level
of significance between mean values. For both
REML and LSD analysis the fiducial limit was set
at 5%.
Table 1 Composition of the treatment-specific stock solutions, the predicted* nitrite and sodium concentrations, the
predicted salinity in all treatments and the measured values per treatment for nitrite concentration, conductivity and
the pH range
NO2� Treatment
Predicted* water quality Measured water quality
Stock solutions
[NaNO2] (g L�1)
[NO2�]
(lM)
[Na+]
(lM)
[Cl�](lM)
[NO2�-N]
(mg L�1)
[NO2�]
(lM)
Conductivity
(mS cm�1) pH range
2 – Pair-fed control 0 0 0 0 0.93 66 448.4 (9.9) 7.27–7.80
3 – Control 0 0 0 0 0.10 6 488.0 (23.2) 7.06–7.73
4 – NO2� 2.58 89 89.3 0 1.55 111 492.5 (21.5) 7.01–7.80
5 – NO2� 5.15 179 178.6 0 3.92 280 484.5 (23.1) 7.28–7.79
6 – NO2� 10.30 357 357.1 0 6.43 459 514.4 (30.1) 7.40–7.87
7 – NO2� 20.60 715 714.3 0 13.0 928 545.8 (14.4) 7.28–7.80
8 – NO2� + NaCl 20.60 715 6361.1 5646.8 12.9 921 1300.3 (78.3) 7.01–7.88
*Based on equal flow rates per tank of 5 L day�1 for the stock solutions and 500 L day�1 for the tap water flow.
© 2013 John Wiley & Sons Ltd, Aquaculture Research, 1–124
Impact of water nitrite on C. Gariepinus J A C Roques et al. Aquaculture Research, 2013, 1–12
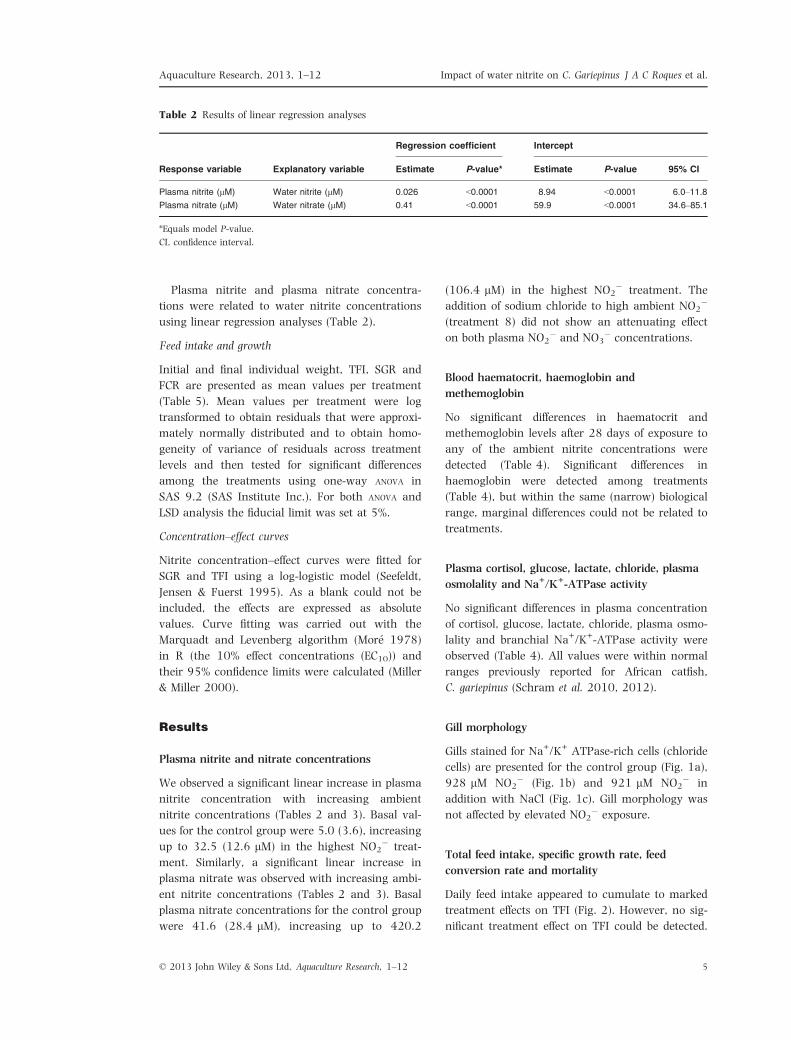
Plasma nitrite and plasma nitrate concentra-
tions were related to water nitrite concentrations
using linear regression analyses (Table 2).
Feed intake and growth
Initial and final individual weight, TFI, SGR and
FCR are presented as mean values per treatment
(Table 5). Mean values per treatment were log
transformed to obtain residuals that were approxi-
mately normally distributed and to obtain homo-
geneity of variance of residuals across treatment
levels and then tested for significant differences
among the treatments using one-way ANOVA in
SAS 9.2 (SAS Institute Inc.). For both ANOVA and
LSD analysis the fiducial limit was set at 5%.
Concentration–effect curves
Nitrite concentration–effect curves were fitted for
SGR and TFI using a log-logistic model (Seefeldt,
Jensen & Fuerst 1995). As a blank could not be
included, the effects are expressed as absolute
values. Curve fitting was carried out with the
Marquadt and Levenberg algorithm (Mor�e 1978)
in R (the 10% effect concentrations (EC10)) and
their 95% confidence limits were calculated (Miller
& Miller 2000).
Results
Plasma nitrite and nitrate concentrations
We observed a significant linear increase in plasma
nitrite concentration with increasing ambient
nitrite concentrations (Tables 2 and 3). Basal val-
ues for the control group were 5.0 (3.6), increasing
up to 32.5 (12.6 lM) in the highest NO2� treat-
ment. Similarly, a significant linear increase in
plasma nitrate was observed with increasing ambi-
ent nitrite concentrations (Tables 2 and 3). Basal
plasma nitrate concentrations for the control group
were 41.6 (28.4 lM), increasing up to 420.2
(106.4 lM) in the highest NO2� treatment. The
addition of sodium chloride to high ambient NO2�
(treatment 8) did not show an attenuating effect
on both plasma NO2� and NO3
� concentrations.
Blood haematocrit, haemoglobin and
methemoglobin
No significant differences in haematocrit and
methemoglobin levels after 28 days of exposure to
any of the ambient nitrite concentrations were
detected (Table 4). Significant differences in
haemoglobin were detected among treatments
(Table 4), but within the same (narrow) biological
range, marginal differences could not be related to
treatments.
Plasma cortisol, glucose, lactate, chloride, plasma
osmolality and Na+/K+-ATPase activity
No significant differences in plasma concentration
of cortisol, glucose, lactate, chloride, plasma osmo-
lality and branchial Na+/K+-ATPase activity were
observed (Table 4). All values were within normal
ranges previously reported for African catfish,
C. gariepinus (Schram et al. 2010, 2012).
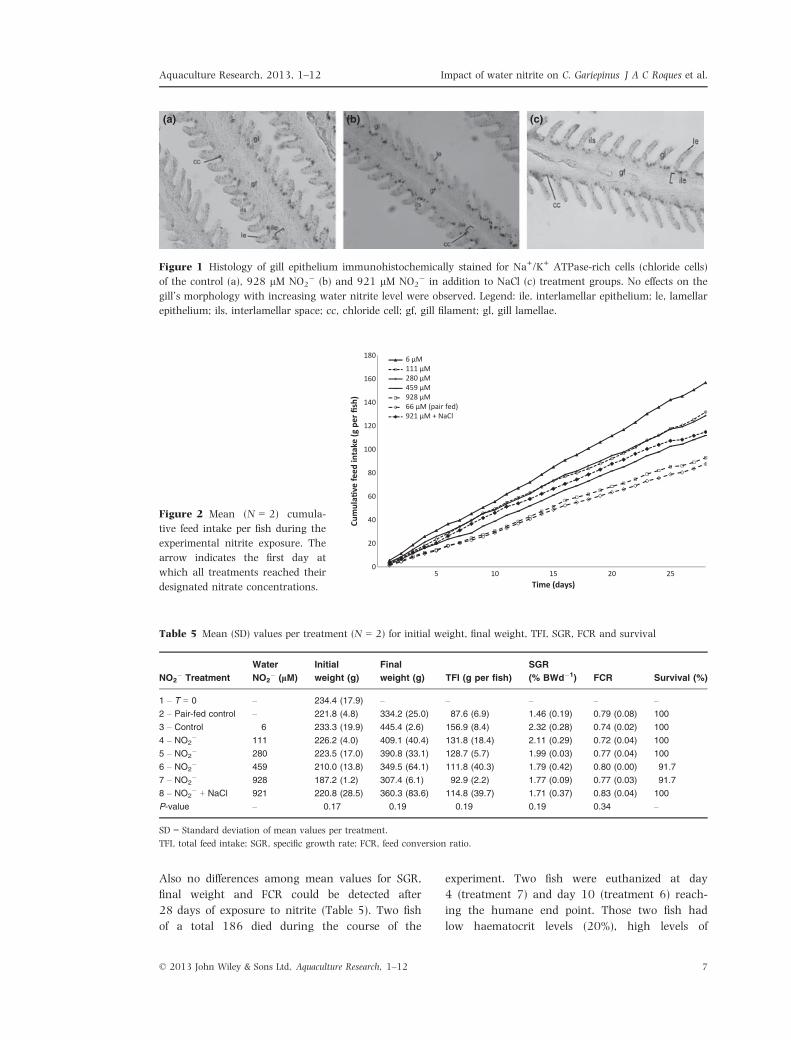
Gill morphology
Gills stained for Na+/K+ ATPase-rich cells (chloride
cells) are presented for the control group (Fig. 1a),
928 lM NO2� (Fig. 1b) and 921 lM NO2
� in
addition with NaCl (Fig. 1c). Gill morphology was
not affected by elevated NO2� exposure.
Total feed intake, specific growth rate, feed
conversion rate and mortality
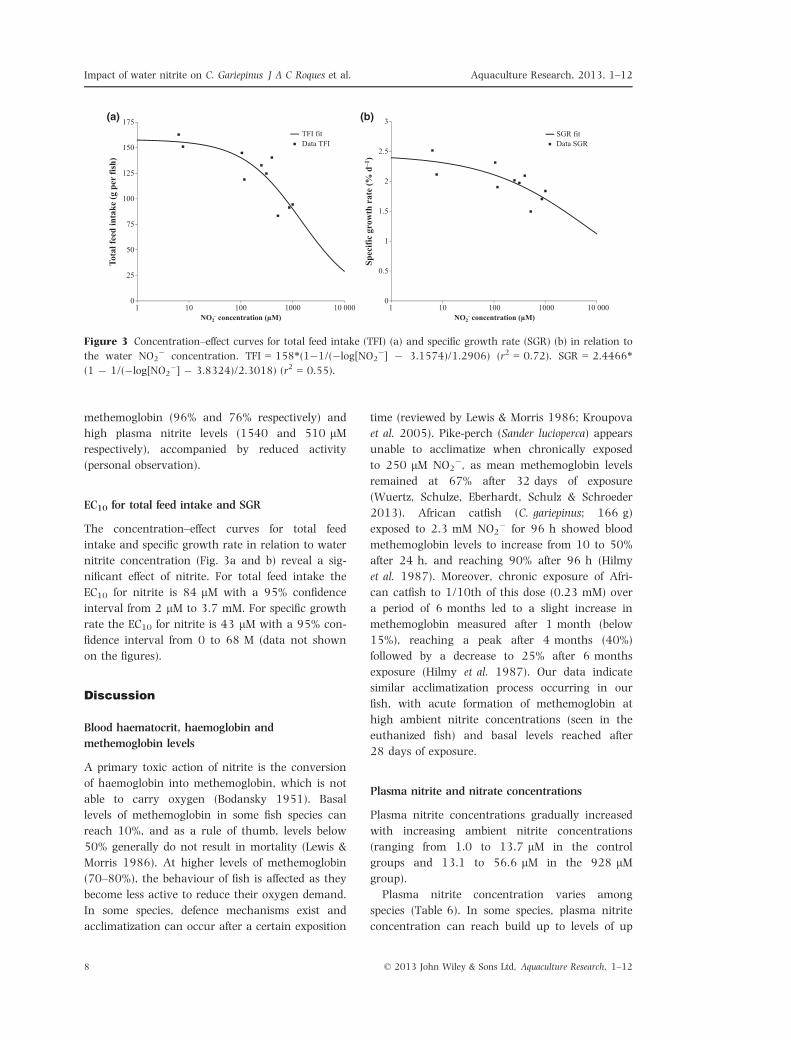
Daily feed intake appeared to cumulate to marked
treatment effects on TFI (Fig. 2). However, no sig-
nificant treatment effect on TFI could be detected.
Table 2 Results of linear regression analyses
Response variable Explanatory variable
Regression coefficient Intercept
Estimate P-value* Estimate P-value 95% CI
Plasma nitrite (lM) Water nitrite (lM) 0.026 <0.0001 8.94 <0.0001 6.0–11.8
Plasma nitrate (lM) Water nitrate (lM) 0.41 <0.0001 59.9 <0.0001 34.6–85.1
*Equals model P-value.
CI, confidence interval.
© 2013 John Wiley & Sons Ltd, Aquaculture Research, 1–12 5
Aquaculture Research, 2013, 1–12 Impact of water nitrite on C. Gariepinus J A C Roques et al.
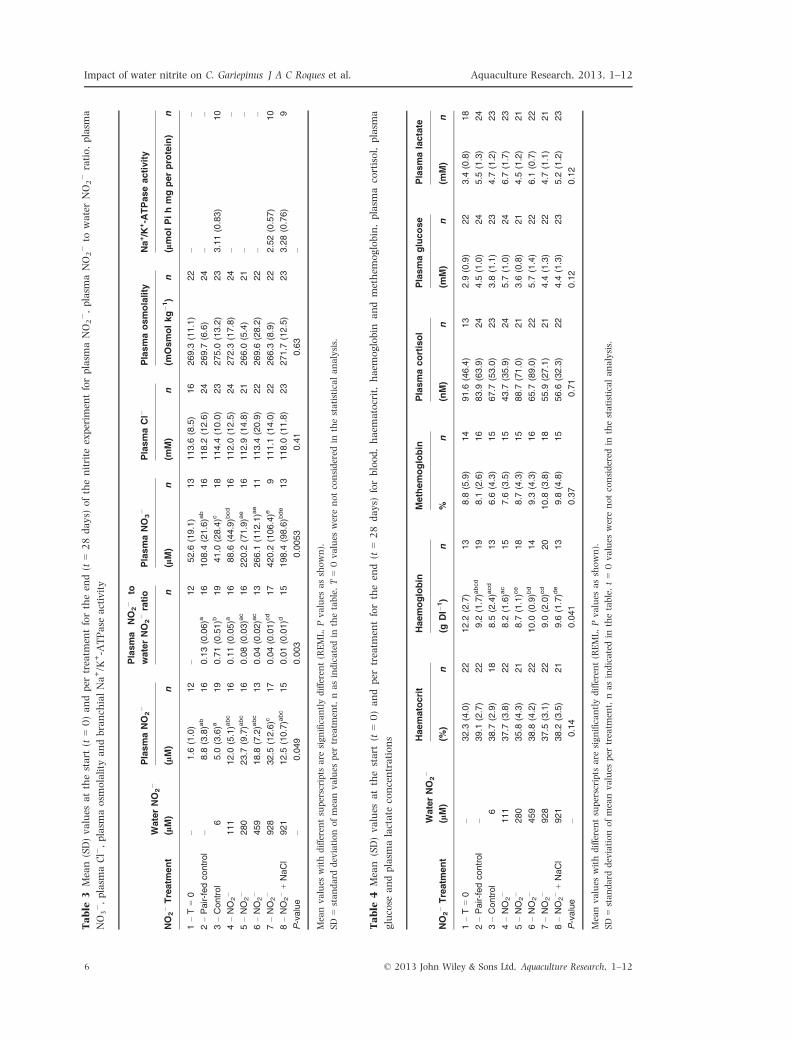
Table
3Mean(SD)values
atthestart
(t=0)andper
treatm
entfortheen
d(t
=28days)
ofthenitrite
experim
entforplasm
aNO2�,plasm
aNO2�to
waterNO2�ratio,plasm
a
NO3�,plasm
aCl�,plasm
aosm
olality
andbranch
ialNa+/K
+-A
TPase
activity
NO
2�Treatm
ent
WaterNO
2�
PlasmaNO
2�
Plasma
NO
2�
to
waterNO
2�ratio
PlasmaNO
3�
PlasmaCl�
Plasmaosmolality
Na+/K
+-A
TPaseactivity
(lM)
(lM)
nn
(lM)
n(m
M)
n(m
Osmolkg�1)
n(lmolPihmgperprotein)
n
1–T=0
–1.6
(1.0)
12
–12
52.6
(19.1)
13
113.6
(8.5)
16
269.3
(11.1)
22
––
2–Pair-fedcontrol
–8.8
(3.8)a
b16
0.13(0.06)a
16
108.4
(21.6)a
b16
118.2
(12.6)
24
269.7
(6.6)
24
––
3–Control
65.0
(3.6)a
19
0.71(0.51)b
19
41.0
(28.4)c
18
114.4
(10.0)
23
275.0
(13.2)
23
3.11(0.83)
10
4–NO
2�
111
12.0
(5.1)a
bc
16
0.11(0.05)a
16
88.6
(44.9)b
cd
16
112.0
(12.5)
24
272.3
(17.8)
24
––
5–NO
2�
280
23.7
(9.7)a
bc
16
0.08(0.03)a
c16
220.2
(71.9)a
e16
112.9
(14.8)
21
266.0
(5.4)
21
––
6–NO
2�
459
18.8
(7.2)a
bc
13
0.04(0.02)a
c13
266.1
(112.1)a
e11
113.4
(20.9)
22
269.6
(28.2)
22
––
7–NO
2�
928
32.5
(12.6)c
17
0.04(0.01)cd
17
420.2
(106.4)e
9111.1
(14.0)
22
266.3
(8.9)
22
2.52(0.57)
10
8–NO
2�+NaCl
921
12.5
(10.7)abc
15
0.01(0.01)d
15
198.4
(98.6)b
de
13
118.0
(11.8)
23
271.7
(12.5)
23
3.28(0.76)
9
P-value
–0.049
0.003
0.0053
0.41
0.63
–
Meanvalues
withdifferentsuperscripts
are
significantlydifferent(REML,Pvalues
asshown).
SD
=standard
deviationofmeanvalues
per
treatm
ent,nasindicatedin
thetable.T=0values
werenotconsidered
inthestatisticalanalysis.
Table
4Mean
(SD)values
atthestart
(t=0)andper
treatm
entfortheen
d(t
=28
days)
forblood,haem
atocrit,haem
oglobin
andmethem
oglobin,plasm
acortisol,plasm
a
glucose
andplasm
alactate
concentrations
NO
2�Treatm
ent
WaterNO
2�
Haematocrit
Haemoglobin
Methemoglobin
Plasmacortisol
Plasmaglucose
Plasmalactate
(lM)
(%)
n(g
Dl�
1)
n%
n(nM)
n(m
M)
n(m
M)
n
1–T=0
–32.3
(4.0)
22
12.2
(2.7)
13
8.8
(5.9)
14
91.6
(46.4)
13
2.9
(0.9)
22
3.4
(0.8)
18
2–Pair-fedcontrol
–39.1
(2.7)
22
9.2
(1.7)a
bcd
19
8.1
(2.6)
16
83.9
(63.9)
24
4.5
(1.0)
24
5.5
(1.3)
24
3–Control
638.7
(2.9)
18
8.5
(2.4)a
cd
13
6.6
(4.3)
15
67.7
(53.0)
23
3.8
(1.1)
23
4.7
(1.2)
23
4–NO
2�
111
37.7
(3.8)
22
8.2
(1.6)a
c15
7.6
(3.5)
15
43.7
(35.9)
24
5.7
(1.0)
24
6.7
(1.7)
23
5–NO
2�
280
35.8
(4.3)
21
8.7
(1.1)ce
18
8.7
(4.3)
15
88.7
(71.0)
21
3.6
(0.8)
21
4.5
(1.2)
21
6–NO
2�
459
38.8
(4.2)
22
10.0
(0.9)b
d14
9.3
(4.3)
16
65.7
(89.0)
22
5.7
(1.4)
22
6.1
(0.7)
22
7–NO
2�
928
37.5
(3.1)
22
9.0
(2.0)cd
20
10.8
(3.8)
18
55.9
(27.1)
21
4.4
(1.3)
22
4.7
(1.1)
21
8–NO
2�+NaCl
921
38.2
(3.5)
21
9.6
(1.7)d
e13
9.8
(4.8)
15
56.6
(32.3)
22
4.4
(1.3)
23
5.2
(1.2)
23
P-value
–0.14
0.041
0.37
0.71
0.12
0.12
Meanvalues
withdifferentsuperscripts
are
significantlydifferent(REML,Pvalues
asshown).
SD=standard
deviationofmeanvalues
per
treatm
ent,nasindicatedin
thetable.t=0values
werenotconsidered
inthestatisticalanalysis.
© 2013 John Wiley & Sons Ltd, Aquaculture Research, 1–126
Impact of water nitrite on C. Gariepinus J A C Roques et al. Aquaculture Research, 2013, 1–12
Also no differences among mean values for SGR,
final weight and FCR could be detected after
28 days of exposure to nitrite (Table 5). Two fish
of a total 186 died during the course of the
experiment. Two fish were euthanized at day
4 (treatment 7) and day 10 (treatment 6) reach-
ing the humane end point. Those two fish had
low haematocrit levels (20%), high levels of
(a) (b) (c)
Figure 1 Histology of gill epithelium immunohistochemically stained for Na+/K+ ATPase-rich cells (chloride cells)
of the control (a), 928 lM NO2� (b) and 921 lM NO2
� in addition to NaCl (c) treatment groups. No effects on the
gill’s morphology with increasing water nitrite level were observed. Legend: ile, interlamellar epithelium; le, lamellar
epithelium; ils, interlamellar space; cc, chloride cell; gf, gill filament; gl, gill lamellae.
0
20
40
60
80
100
120
140
160
180
252015105
Cum
ula
ve fe
ed in
take
(g p
er fi
sh)
Time (days)
6 µM111 µM280 µM459 µM928 µM66 µM (pair fed)921 µM + NaCl
Figure 2 Mean (N = 2) cumula-
tive feed intake per fish during the
experimental nitrite exposure. The
arrow indicates the first day at
which all treatments reached their
designated nitrate concentrations.
Table 5 Mean (SD) values per treatment (N = 2) for initial weight, final weight, TFI, SGR, FCR and survival
NO2� Treatment
Water
NO2� (lM)
Initial
weight (g)
Final
weight (g) TFI (g per fish)
SGR
(% BWd�1) FCR Survival (%)
1 – T = 0 – 234.4 (17.9) – – – – –
2 – Pair-fed control – 221.8 (4.8) 334.2 (25.0) 87.6 (6.9) 1.46 (0.19) 0.79 (0.08) 100
3 – Control 6 233.3 (19.9) 445.4 (2.6) 156.9 (8.4) 2.32 (0.28) 0.74 (0.02) 100
4 – NO2� 111 226.2 (4.0) 409.1 (40.4) 131.8 (18.4) 2.11 (0.29) 0.72 (0.04) 100
5 – NO2� 280 223.5 (17.0) 390.8 (33.1) 128.7 (5.7) 1.99 (0.03) 0.77 (0.04) 100
6 – NO2� 459 210.0 (13.8) 349.5 (64.1) 111.8 (40.3) 1.79 (0.42) 0.80 (0.00) 91.7
7 – NO2� 928 187.2 (1.2) 307.4 (6.1) 92.9 (2.2) 1.77 (0.09) 0.77 (0.03) 91.7
8 – NO2� + NaCl 921 220.8 (28.5) 360.3 (83.6) 114.8 (39.7) 1.71 (0.37) 0.83 (0.04) 100
P-value – 0.17 0.19 0.19 0.19 0.34 –
SD = Standard deviation of mean values per treatment.
TFI, total feed intake; SGR, specific growth rate; FCR, feed conversion ratio.
© 2013 John Wiley & Sons Ltd, Aquaculture Research, 1–12 7
Aquaculture Research, 2013, 1–12 Impact of water nitrite on C. Gariepinus J A C Roques et al.
methemoglobin (96% and 76% respectively) and
high plasma nitrite levels (1540 and 510 lMrespectively), accompanied by reduced activity
(personal observation).
EC10 for total feed intake and SGR
The concentration–effect curves for total feed
intake and specific growth rate in relation to water
nitrite concentration (Fig. 3a and b) reveal a sig-
nificant effect of nitrite. For total feed intake the
EC10 for nitrite is 84 lM with a 95% confidence
interval from 2 lM to 3.7 mM. For specific growth
rate the EC10 for nitrite is 43 lM with a 95% con-
fidence interval from 0 to 68 M (data not shown
on the figures).
Discussion
Blood haematocrit, haemoglobin and
methemoglobin levels
A primary toxic action of nitrite is the conversion
of haemoglobin into methemoglobin, which is not
able to carry oxygen (Bodansky 1951). Basal
levels of methemoglobin in some fish species can
reach 10%, and as a rule of thumb, levels below
50% generally do not result in mortality (Lewis &
Morris 1986). At higher levels of methemoglobin
(70–80%), the behaviour of fish is affected as they
become less active to reduce their oxygen demand.
In some species, defence mechanisms exist and
acclimatization can occur after a certain exposition
time (reviewed by Lewis & Morris 1986; Kroupova
et al. 2005). Pike-perch (Sander lucioperca) appears
unable to acclimatize when chronically exposed
to 250 lM NO2�, as mean methemoglobin levels
remained at 67% after 32 days of exposure
(Wuertz, Schulze, Eberhardt, Schulz & Schroeder
2013). African catfish (C. gariepinus; 166 g)
exposed to 2.3 mM NO2� for 96 h showed blood
methemoglobin levels to increase from 10 to 50%
after 24 h, and reaching 90% after 96 h (Hilmy
et al. 1987). Moreover, chronic exposure of Afri-
can catfish to 1/10th of this dose (0.23 mM) over
a period of 6 months led to a slight increase in
methemoglobin measured after 1 month (below
15%), reaching a peak after 4 months (40%)
followed by a decrease to 25% after 6 months
exposure (Hilmy et al. 1987). Our data indicate
similar acclimatization process occurring in our
fish, with acute formation of methemoglobin at
high ambient nitrite concentrations (seen in the
euthanized fish) and basal levels reached after
28 days of exposure.
Plasma nitrite and nitrate concentrations
Plasma nitrite concentrations gradually increased
with increasing ambient nitrite concentrations
(ranging from 1.0 to 13.7 lM in the control
groups and 13.1 to 56.6 lM in the 928 lMgroup).
Plasma nitrite concentration varies among
species (Table 6). In some species, plasma nitrite
concentration can reach build up to levels of up
0
25
50
75
100
125
150
175
1 10 100 1000 10 000
Tota
l fee
d in
take
(g p
er fi
sh)
NO2– concentration (μM)
1 10 100 1000 10 000NO2
– concentration (μM)
TFI fitData TFI
0
0.5
1
1.5
2
2.5
3
Spec
ific
grow
th r
ate
(% d
–1)
SGR fitData SGR
(a) (b)
Figure 3 Concentration–effect curves for total feed intake (TFI) (a) and specific growth rate (SGR) (b) in relation to
the water NO2� concentration. TFI = 158*(1�1/(�log[NO2
�] � 3.1574)/1.2906) (r2 = 0.72). SGR = 2.4466*(1 � 1/(�log[NO2
�] � 3.8324)/2.3018) (r2 = 0.55).
© 2013 John Wiley & Sons Ltd, Aquaculture Research, 1–128
Impact of water nitrite on C. Gariepinus J A C Roques et al. Aquaculture Research, 2013, 1–12
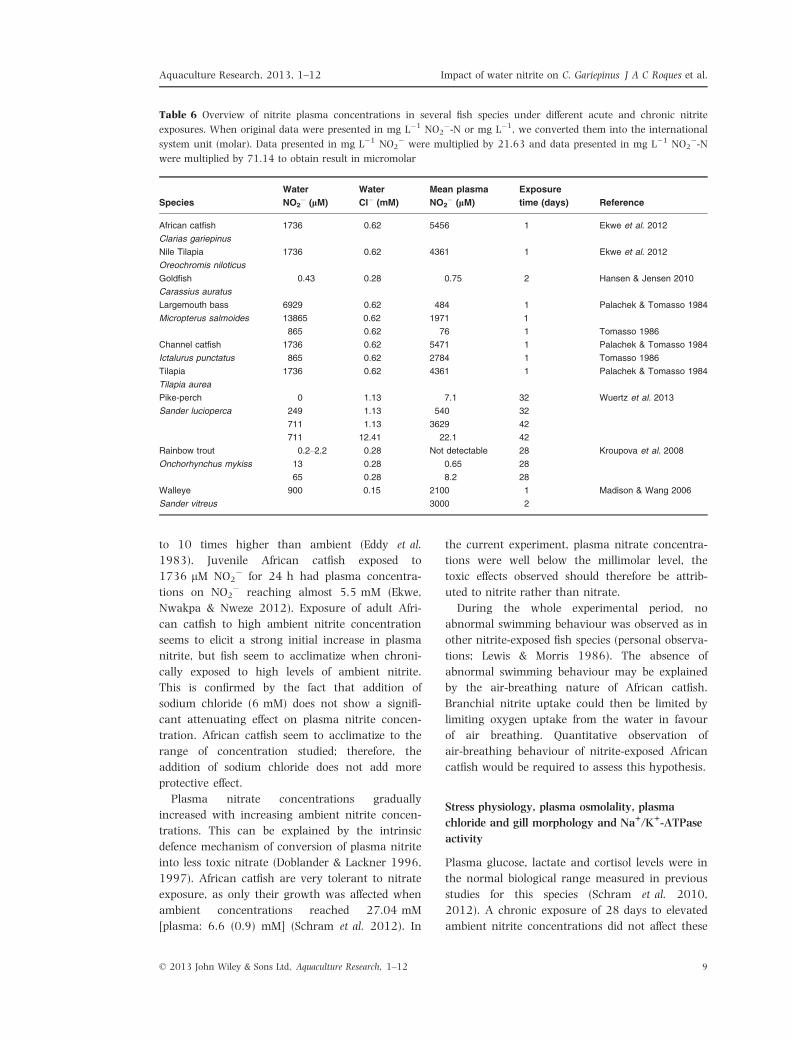
to 10 times higher than ambient (Eddy et al.
1983). Juvenile African catfish exposed to
1736 lM NO2� for 24 h had plasma concentra-
tions on NO2� reaching almost 5.5 mM (Ekwe,
Nwakpa & Nweze 2012). Exposure of adult Afri-
can catfish to high ambient nitrite concentration
seems to elicit a strong initial increase in plasma
nitrite, but fish seem to acclimatize when chroni-
cally exposed to high levels of ambient nitrite.
This is confirmed by the fact that addition of
sodium chloride (6 mM) does not show a signifi-
cant attenuating effect on plasma nitrite concen-
tration. African catfish seem to acclimatize to the
range of concentration studied; therefore, the
addition of sodium chloride does not add more
protective effect.
Plasma nitrate concentrations gradually
increased with increasing ambient nitrite concen-
trations. This can be explained by the intrinsic
defence mechanism of conversion of plasma nitrite
into less toxic nitrate (Doblander & Lackner 1996,
1997). African catfish are very tolerant to nitrate
exposure, as only their growth was affected when
ambient concentrations reached 27.04 mM
[plasma: 6.6 (0.9) mM] (Schram et al. 2012). In
the current experiment, plasma nitrate concentra-
tions were well below the millimolar level, the
toxic effects observed should therefore be attrib-
uted to nitrite rather than nitrate.
During the whole experimental period, no
abnormal swimming behaviour was observed as in
other nitrite-exposed fish species (personal observa-
tions; Lewis & Morris 1986). The absence of
abnormal swimming behaviour may be explained
by the air-breathing nature of African catfish.
Branchial nitrite uptake could then be limited by
limiting oxygen uptake from the water in favour
of air breathing. Quantitative observation of
air-breathing behaviour of nitrite-exposed African
catfish would be required to assess this hypothesis.
Stress physiology, plasma osmolality, plasma
chloride and gill morphology and Na+/K+-ATPase
activity
Plasma glucose, lactate and cortisol levels were in
the normal biological range measured in previous
studies for this species (Schram et al. 2010,
2012). A chronic exposure of 28 days to elevated
ambient nitrite concentrations did not affect these
Table 6 Overview of nitrite plasma concentrations in several fish species under different acute and chronic nitrite
exposures. When original data were presented in mg L�1 NO2�-N or mg L�1, we converted them into the international
system unit (molar). Data presented in mg L�1 NO2� were multiplied by 21.63 and data presented in mg L�1 NO2
�-Nwere multiplied by 71.14 to obtain result in micromolar
Species
Water
NO2� (lM)
Water
Cl� (mM)
Mean plasma
NO2� (lM)
Exposure
time (days) Reference
African catfish
Clarias gariepinus
1736 0.62 5456 1 Ekwe et al. 2012
Nile Tilapia
Oreochromis niloticus
1736 0.62 4361 1 Ekwe et al. 2012
Goldfish
Carassius auratus
0.43 0.28 0.75 2 Hansen & Jensen 2010
Largemouth bass
Micropterus salmoides
6929
13865
0.62
0.62
484
1971
1
1
Palachek & Tomasso 1984
865 0.62 76 1 Tomasso 1986
Channel catfish
Ictalurus punctatus
1736 0.62 5471 1 Palachek & Tomasso 1984
865 0.62 2784 1 Tomasso 1986
Tilapia
Tilapia aurea
1736 0.62 4361 1 Palachek & Tomasso 1984
Pike-perch
Sander lucioperca
0 1.13 7.1 32 Wuertz et al. 2013
249 1.13 540 32
711 1.13 3629 42
711 12.41 22.1 42
Rainbow trout
Onchorhynchus mykiss
0.2–2.2 0.28 Not detectable 28 Kroupova et al. 2008
13 0.28 0.65 28
65 0.28 8.2 28
Walleye
Sander vitreus
900 0.15 2100 1 Madison & Wang 2006
3000 2
© 2013 John Wiley & Sons Ltd, Aquaculture Research, 1–12 9
Aquaculture Research, 2013, 1–12 Impact of water nitrite on C. Gariepinus J A C Roques et al.
parameters, underpinning once again the toler-
ance of the African catfish towards high nitroge-
nous waste compounds. Plasma osmolality and
plasma chloride, a major determinant of plasma
osmolality, were not affected by high nitrite
concentrations. The Na+/K+-ATPase activity was
in the range previously observed for this species
exposed to ammonia (Schram et al. 2010). The
Na/K-ATPase activity was assessed only in the
control group (treatment 3), high nitrite (treat-
ment 7) and high nitrite in presence of sodium
chloride (treatment 8). As no differences between
those extreme groups were observed, the interme-
diate groups were not measured. This enzyme does
not play a role in the nitrite uptake or removal of
nitrite as it was observed for ammonia (Schram
et al. 2010). The branchial Cl�/HCO3� exchanger
which normally is involved in chloride uptake and
may be disrupted when ambient nitrite concentra-
tions are high, causing a (partial) shift to NO2�
uptake (Jensen 2003), was not investigated in this
study.
In rainbow trout exposed to several
increasing nitrite concentrations for 28 days,
severe morphological alterations of the gills were
observed already from the lowest 0.22 lM NO2�,
culminating in the highest concentration (65.2 lMNO2
�) (Kroupova, Machova, Piackova, Blahova,
Dobsikova, Novotny & Svobodova 2008). Over
32 days of exposure to different nitrite
concentrations (0–250 lM NO2�), 40–60% of the
gills of juvenile pike-perch showed abnormalities.
Nevertheless, no changes could be related to treat-
ment effects (Wuertz et al. 2013). Toxic effect of gill
morphology thus depends on the species.
Feed intake
During the first 4 days of the experiment, when
nitrite concentrations were building up, feed intake
was similar among all treatments. However, when
the desired concentrations of nitrite had been
reached (day 5), different pattern in feed intake
showed up almost instantly (Fig. 2), with interme-
diate patterns related to the different concentra-
tions, the minimum feed intake being reached in
the highest nitrite concentration group and a
potential attenuating effect of the addition of
sodium chloride. Feed intake and SGR and final
weight patterns seem to be gradually affected by
raising ambient nitrite concentrations (Table 5;
Fig. 2). However, differences are not significant.
A pair-fed group was introduced to discriminate
effects of high nitrite exposure from potential
effects of reduced feed intake. No significant differ-
ences were observed in physiological parameters
for any treatment.
Nitrite toxicity
The main mechanism of nitrite toxicity is well doc-
umented with the conversion of haemoglobin into
methemoglobin that is incapable of carrying
oxygen (Bodansky 1951). The comparable methe-
moglobin levels among treatments after 28 days of
nitrite exposure show that African catfish is able
to acclimatize to relatively high ambient nitrite
concentrations. Similar methemoglobin concentra-
tions were observed in this species exposed to
1/10th of the 96 median tolerance limit (228 lMNO2
�; Hilmy et al. 1987). Plasma nitrite concen-
trations gradually increased with increasing ambi-
ent nitrite concentrations. The increase in plasma
nitrate with increasing water nitrite concentra-
tions indicates that African catfish successfully
detoxify internally nitrite to less toxic nitrate as
described earlier in trout hepatocytes (Doblander &
Lackner 1996). The addition of sodium chloride
(6 mM) does not show a further attenuating effect
both regarding plasma nitrite concentration and
growth parameters; African catfish appears to
acclimatize to chronic nitrite exposure already
without sodium chloride; the addition of this com-
pound has no real beneficial effect in the concen-
tration range studied.
The nitrite concentration range was designed
based on actual nitrite exposure in commercial
African catfish aquaculture combined with values
from the literature, and the aim of this experiment
was to measure subtle changes that could impair
the fish welfare. In our opinion, the set of data
obtained allows to draw conclusions regarding the
nitrite toxicity to African catfish and the threshold
concentrations for safe aquaculture production.
Previous studies on nitrite toxicity mainly focused
on acute LC50 up to 96 h (reviewed by Kroupova
et al. 2005). The parameters traditionally mea-
sured are mainly related to the nitrite effect on
blood haemoglobin and methemoglobin formation.
In this study, we investigated, in addition to those
parameters, the effect of chronic nitrite exposure
on stress physiology and growth, parameters of
interest from the welfare and commercial aquacul-
ture points of view.
© 2013 John Wiley & Sons Ltd, Aquaculture Research, 1–1210
Impact of water nitrite on C. Gariepinus J A C Roques et al. Aquaculture Research, 2013, 1–12
Nitrite threshold concentrations
African catfish chronically exposed to 1 mM ambi-
ent nitrite appears capable of mitigating the
adverse effects of nitrite. The concentration effect
curves revealed a significant effect of nitrite expo-
sure on total feed intake and specific growth rate.
The concentration–effect curves do not provide a
clear-cut nitrite threshold concentration for Afri-
can catfish as the calculated EC10 values for nitrite
of 84 for feed intake and 43 lM for growth both
have very large 95% confidence intervals. There-
fore, the reported EC10 values should be treated as
indicative. All observations jointly taken we advise
for African catfish not to exceed a nitrite
concentration of 43 lM. As stated earlier, several
studies investigated the acute lethal concentration
of nitrite for numerous species, but data regarding
nitrite toxicity for chronic exposure, combining
physiology and growth are scare. As an example,
the NOEC and LOEC for juvenile rainbow
trout after 28 days of nitrite exposure were esti-
mated at 0.22 lM NO2� (0.01 mg L�1 NO2
�) and4.34 lM NO2
� (0.2 mg L�1 NO2�) respectively
(Kroupova et al. 2008); which indicates that this
species is more sensitive to nitrite than African
catfish.
Conclusions
This study demonstrates that African catfish,
C. gariepinus, is tolerant to high ambient nitrite
concentrations over a period of 28 days. Nitrite
accumulates mildly in the plasma with increasing
ambient nitrite concentrations. The greater
increase in plasma nitrate with increasing ambient
nitrite concentrations provides a good indirect
evidence for internal nitrite detoxification into less
toxic nitrate. Stress physiology and ionic balance
are not affected by high ambient nitrite concentra-
tions. Growth and feed intake show a differential
pattern from the first day of exposure, but differ-
ences are not significant.
We advise for African catfish not to exceed a
water nitrite concentration of 43 lM (0.6 mg L�1
NO2�-N). Below this nitrite concentration physio-
logical and growth disturbances are avoided.
Acknowledgments
The authors would like to express their gratitude
to Kim Roelofs, Corrina Hinrichs, Mark Westerink,
Sven W€urtz and Lauriane Michel for their help
and technical assistance. This study was funded by
the Dutch Ministry of Economic Affairs, Agricul-
ture and Innovation. The authors declare that
there is no conflict of interest in this study.
References
Bath N. & Eddy F.B. (1980) Transport of nitrite across fish
gills. Journal of Experimental Zoology 214, 119–121.
Bodansky O. (1951) Methemoglobinemia and methemo-
globin-producing compounds. Pharmacological Reviews
3, 144–196.
Bovendeur J., Eding E.H. & Henken A.M. (1987)
Design and performance of a water recirculation sys-
tem for high-density culture of the African catfish,
Clarias gariepinus (Burchell 1822). Aquaculture 63,
329–353.
Bowser P.R., Falls W.W., Van Zandt J., Collier N. &
Phillips J.D. (1983) Methemoglobinaemia in chanel
catfish: methods of prevention. Progressive Fish-
Culturist 45, 154–158.
Colt J., Ludwig R., Tchobanoglous G. & Cech J.J. Jr
(1981) The effects of nitrite on the short-term growth
and survival of channel catfish, Ictalurus punctatus.
Aquaculture 24, 111–122.
Crawford R.E. & Allen G.H. (1977) Seawater inhibition of
nitrite toxicity to Chinook salmon. Transactions of the
American Fisheries Society 106, 105–109.
Dang Z.C., Lock R.A.C., Flik G. & Wendelaar Bonga S.E.
(2000) Na+/K+-ATPase immunoreactivity in branchial
chloride cells of Oreochromis mossambicus exposed to
copper. Journal of Experimental Biology 203, 379–387.
Doblander C. & Lackner R. (1996) Metabolism and
detoxification of nitrite by trout hepatocytes. Biochimica
et Biophysica Acta 1289, 270–274.
Doblander C. & Lackner R. (1997) Oxidation of nitrite to
nitrate in isolated erythrocytes: a possible mechanism
for adaptation to environmental nitrite. Canadian Jour-
nal of Fisheries and Aquatic Sciences 57, 157–161.
Eddy F.B., Kunzlik P.A. & Bath R.N. (1983) Uptake and
loss of nitrite from the blood of rainbow trout, Salmo
gairdneri Richardson, and Atlantic salmon, Salmo salar
L. in fresh water and in dilute sea water. Journal of
Fish Biology 23, 105–116.
Eding E.H., Kamstra A., Verreth J.A.J., Huisman E.A. &
Klapwijk A. (2006) Design and operation of nitrifying
trickling filters in recirculating aquaculture: a review.
Aquacultural Engineering 34, 234–260.
Ekwe O.O., Nwakpa J.N. & Nweze B.O. (2012) Biochemi-
cal effects of nitrite on methemoglobin and plasma
nitrite concentration in three tropical freshwater fishes.
Ozean Journal of Applied Sciences 5, 25–31.
FAO (2011) Available at: http://www.fao.org/fishery/
culturedspecies/Clarias_gariepinus/en (accessed 6 Sep-
tember 2013).
© 2013 John Wiley & Sons Ltd, Aquaculture Research, 1–12 11
Aquaculture Research, 2013, 1–12 Impact of water nitrite on C. Gariepinus J A C Roques et al.
FAO (2012) The State of World Fisheries and Aquaculture.
FAO Fisheries and Aquaculture Department Communi-
cation Division, FAO United Nations, Rome, 209pp.
Gorissen M., Bernier N.J., Manuel R., de Gelder S., Metz
J.R., Huising M.O. & Flik G. (2012) Recombinant
human Leptin Attenuates Stress Axis Activity in Com-
mon carp (Cyprinus carpio L.). General and Comparative
Endocrinology 178, 75–81.
Hansen M.N. & Jensen F.B. (2010) Nitric oxide metabo-
lites in goldfish under normoxic and hypoxic
conditions. Journal of Experimental Biology 213,
3593–3602.
Hilmy A.M., El-Domiaty N.A. & Wershana K. (1987)
Acute and chronic toxicity of nitrite to Clarias lazera.
Comparative Biochemistry and Physiology Part C: Com-
parative Pharmacology 86, 247–253.
Jensen F.B. (2003) Nitrite disrupts multiple physiological
functions in aquatic animals. Comparative Biochemistry
and Physiology-Part A: Molecular & Integrative Physiol-
ogy 135, 9–24.
Kenward M.G. & Roger J.H. (1997) Small sample infer-
ence for fixed effects from restricted maximum likeli-
hood. Biometrics 53, 983–987.
Kiese M. (1974) Methaemoglobinaemia: A Comprehensive
Treatise. pp. 55–125. CRC Press, Cleveland, OH.
Kroupova H., Machova J. & Svobodova Z. (2005) Nitrite
influence on fish: a review. Veterinarni Medicina-Praha-
50, 461–471.
Kroupova H., Machova J., Piackova V., Blahova J.,
Dobsikova R., Novotny L. & Svobodova Z. (2008)
Effects of subchronic nitrite exposure on rainbow trout
(Onchorhynus mykiss). Ecotoxicology and Environmental
Safety 71, 813–820.
Lewis W.M. & Morris D.P. (1986) Toxicity of nitrite to
fish: a review. Transactions of the American Fisheries
Society 115, 183–195.
Madison B.N. & Wang Y.S. (2006) Haematological
responses of acute nitrite exposure in walleye (Sander
vitreus). Aquatic Toxicology 79, 16–23.
Metz J.R., Van den Burg E.H., Wendelaar Bonga S.E. &
Flik G. (2003) Regulation of Branchial Na+/K+-ATPase
in common carp Cyprinus carpio acclimated to different
temperatures. Journal of Experimental Biology 206,
2273–2280.
Miller J.N. & Miller J.C. (2000) Statistics and Chemometrics
for Analytical Chemistry. Prentice Hall, Harlow, UK.
Mor�e J. (1978) The Levenberg-Marquardt algorithm:
implementation and theory. In: Numerical Analysis (ed.
by G.E. Watson), pp. 105–116. Springer-Verlag,
Berlin-Heidelberg-New York.
Palachek R.M. & Tomasso J.R. (1984) Toxicity of nitrite to
channel catfish (Ictalurus punctatus), Tilapia (Tilapia au-
rea), and largemouth bass (Micropterus salmoides): evi-
dence for a nitrite exclusion mechanism. Canadian
Journal of Fisheries and Aquatic Sciences 41, 1739–1744.
Schram E., Roques J.A.C., Abbink W., Spanings T., De
Vries P., Bierman S., Van de Vis J.W. & Flik G. (2010)
The impact of elevated water ammonia concentration
on physiology, growth and feed intake of African
catfish (Clarias gariepinus). Aquaculture 306, 108–115.
Schram E., Roques J.A.C., Abbink W., Yokohama Y.,
Spanings T., De Vries P., Bierman S., Van de Vis H. &
Flik G. (2012) The impact of elevated water nitrate
concentration on physiology, growth and feed intake
of African catfish Clarias gariepinus (Burchell 1822).
Aquaculture Research. doi:10.1111/are.12098. in press.
Seefeldt S.S., Jensen J.E. & Fuerst E.P. (1995) Log-logistic
analysis of herbicide dose response relationships. Weed
Technology 9, 218–227.
Stormer J., Jensen F.B. & Rankin J.C. (1996) Uptake of
nitrite, nitrate, and bromide in rainbow trout,
Oncorhynchus mykiss: effects on ionic balance. Canadian
Journal of Fisheries and Aquatic Sciences 53, 1943–1950.
Tomasso J.R. (1986) Comparative toxicity of nitrite to
freshwater fishes. Aquatic Toxicology 8, 129–137.
Van de Nieuwegiessen P.G., Olwo J., Khong S., Verreth
J.A.J. & Schrama J.W. (2009) Effects of age and stock-
ing density on the welfare of African catfish, Clarias
gariepinus Burchell. Aquaculture 288, 69–75.
Van Duijn A.P., Schneider O., Poelman M., Van der Veen
H. & Beukers R. (2010) Visteelt in Nederland. Analyse
en aanzet tot actie. LEI rapport 2010 025, Wagenin-
gen UR, Den Haag, 56pp. In Dutch.
Van Rijn J. (2010) Chapter 9 denitrification. In: Recircu-
lating Aquaculture (2nd edn) (ed. by M.B. Timmons &
J.M. Ebeling), pp. 387–424. Cayuga Aqua Ventures,
New York, USA.
Van Rijn J. & Rivera G. (1990) Aerobic and anaerobic
biofiltration in an aquaculture unit-Nitrite accumula-
tion as a result of nitrification and denitrification.
Aquacultural Engineering 9, 217–234.
Williams E.M. & Eddy F.B. (1986) Chloride uptake in
freshwater teleosts and its relationship to nitrite uptake
and toxicity. Journal of Comparative Physiology B 156,
867–872.
Wuertz S., Schulze S.G.E., Eberhardt U., Schulz C. &
Schroeder J.P. (2013) Acute and chronic nitrite toxicity
in juvenile pike-perch (Sander lucioperca) and its compen-
sation by chloride. Comparative Biochemistry and Physiol-
ogy Part C: Comparative Pharmacology 157, 352–360.
© 2013 John Wiley & Sons Ltd, Aquaculture Research, 1–1212
Impact of water nitrite on C. Gariepinus J A C Roques et al. Aquaculture Research, 2013, 1–12


