Embed Size (px)
Citation preview

Computers & Operations Research 33 (2006) 1081–1101www.elsevier.com/locate/cor
A generic multi-attribute analysis systemAntonio Jiménez∗, Sixto Ríos-Insua, Alfonso Mateos
Department of Artificial Intelligence, School of Computer Science, Madrid Technical University, Campus de Montegancedo s/n,28660 Boadilla del Monte, Madrid, Spain
Available online 5 November 2004
Abstract
This paper describes a generic decision support system based on an additive multiattribute utility model that isintended to allay many of the operational difficulties involved in the multicriteria decision-making process. Thesystem accounts for uncertainty about the alternative consequences and admits incomplete information about thedecision-makers’ preferences, which leads to classes of utility functions and weight intervals. The additive modelis used to assess, on the one hand, average overall utilities, on which the ranking of alternatives is based and, onthe other, minimum and maximum overall utilities, which give further insight into the robustness of this ranking.When the information obtained is not meaningful enough so as to definitively recommend an alternative, an iterationprocess can be carried out by tightening the imprecise parameters and assessing the non-dominated and potentiallyoptimal alternatives or using Monte Carlo simulation techniques to determine useful information about dominanceamong the alternatives.� 2004 Elsevier Ltd. All rights reserved.
Keywords:Decision support system; Additive multiattribute utility function; Incomplete information; Monte Carlo simulationtechniques
1. Introduction
The generic multi-attribute analysis (GMAA) system1 is a PC-based decision support system (DSS)based on an additive multi-attribute utility model that is intended to allay many of the operational dif-ficulties involved in the decision analysis (DA) cycle[1–4]. This cycle can be divided into four steps:
∗ Corresponding author.E-mail address:[email protected](A. Jiménez).1 http://www.dia.fi.upm.es/∼ajimenez/GMAA.
0305-0548/$ - see front matter� 2004 Elsevier Ltd. All rights reserved.doi:10.1016/j.cor.2004.09.003

1082 A. Jiménez et al. / Computers & Operations Research 33 (2006) 1081–1101
structuring the problem (which includes specifying objectives, building a value hierarchy and establishingattributes for the lowest-level objectives); identifying the feasible alternatives, their impact anduncertainty(if necessary); quantifying preferences (which includes the assessment of the component attribute utilitiesas well as the value trade-offs); evaluating alternatives and performing sensitivity analysis (SA).The system that we shall describe is an extension of the evaluation module developed for the European
projects MOIRA (model-based computerized system for management support to identify optimal strate-gies for restoring radionuclidecontaminatedaquatic ecosystemsanddrainageareas)[5,6], andCOMETES(implementing computerized methodologies to evaluate the effectiveness of countermeasures for restor-ing radionuclide contaminated fresh water ecosystems)[7]. It has been tested and validated in severalreal scenarios, like Lake]vre Heimdalsvatn[8,9] or Lake Kozhanovskoe[10,11].However, the GMAA systemwas not developed and implemented ad hoc for the above aquatic ecosys-
tem restoration problem, it was designed to aid the DM in a range of complex decision-making problemswhere DA can be specially useful[12,13] like military systems acquisition processes[14], the analysisof alternatives for the disposition of surplus weapons-grade plutonium[15,16], etc.In this sense, the DM can interactively build an objectives hierarchy that should include all the relevant
aspects related to the complex decision-making problem under consideration.The GMAA system accounts for uncertainty about the alternative consequences, as discussed in[17],
which can be defined in terms of continuous uniformly distributed intervals instead of single valuesfor each attribute. The system also admits incomplete information about the DM’s preferences throughvalue intervals as responses to the probability questions the DM is asked, which leads to classes of utilityfunctions andweight intervals. This is less demanding for a single DMand alsomakes the system suitablefor group decision support, where individual conflicting views in a group of DMs can be captured throughimprecise answers.The different alternatives under consideration can be evaluated by means of an additive multiattribute
utility function. The additive model is used to assess, on the one hand, average overall utilities, on whichthe ranking of alternatives is based and, on the other, minimum and maximum overall utilities, whichgive further insight into the robustness of this ranking. Different displays of ranking results are provided,and it is also possible to select another objective to rank by.Finally, the GMAA system provides several types of SA, like classical SA, which involves changing
the parameters and observing their impact on the ranking of alternatives, or the assessment of weightstability intervals, in which an objective weight can vary maintaining a constant ratio among the otherweights without affecting the overall alternative ranking.Other types of SA are the determination of non-dominated and potentially optimal alternatives, which
reduces the number of interesting alternatives for the DM[18–20], and the application of Monte Carlosimulation techniques, which allows simultaneous changes to the weights and generates results that canbe easily analyzed statistically to provide more insights into the multiattribute model recommendations[21,22]. Both SAs take advantage of the useful imprecise information collected during the assignment ofthe component utilities and weights and the uncertain alternative consequences entered. In some cases,the information obtained from the alternatives evaluation is not meaningful enough so as to definitivelyrecommend an alternative, i.e., we get very overlapped imprecise overall utilities. In these cases, theabove techniques play a very important role. They may provide more meaningful information, and aninteractive process can be carried out by tightening the respective imprecise alternative consequences,component utilities and weights and reassessing the non-dominated and potentially optimal alternativesor performing Monte Carlo simulation techniques again.
A. Jiménez et al. / Computers & Operations Research 33 (2006) 1081–1101 1083
Throughout the paper we use an example of an application to illustrate the usefulness of the GMAAsystem. The example refers to the selection of a technology for the disposition of surplus weapons-grade plutonium by the Department of Energy in the USA. A major objective of this decision was tofurther US efforts to prevent the proliferation of nuclear weapons, but other concerns that were addressedinclude economic, technical, institutional, schedule, environmental, and health and safety issues. Thisproblem has been studied in depth, see[15,16,23]. We have used the data reported in these papers,including, however, uncertainty about the alternative consequences and imprecision concerning the DM’spreferences (5% deviation in both cases). As a consequence, average overall utilities and the consequentranking of alternativeswill match up, butmoremeaningful informationwill be output by taking advantageof the imprecision concerning the input parameters through the different SAs provided by the GMAAsystem.We have divided the paper, according to DA stages, into the following five sections where we describe
the steps mentioned above and their application to the above complex decision-making problem and,finally, provide some conclusions.
2. Structuring the problem
There are several benefits to be gained from using a hierarchy to model complex decision-makingproblems with multiple objectives. For instance, it helps to ensure that there will be no big gaps (missingobjectives) at lower levels, situations where redundancy or double-counting could easily occur can beidentified and it provides a basis upon which to develop and appraise screening criteria[24].Theobjectives hierarchymust includeall the relevant aspects related to the problemunder consideration
and should be structured in such a way that the objectives of similar importance are at the same level ofthe tree, improving the DMs’ understanding of the decision.In the GMAA system the user can interactively create or delete nodes and branches to build or modify
the objectives hierarchy by means of a floating menu, which is displayed when the DM left-clicks a nodeof the tree. A name, label and description must be entered for each objective, as should the respectiveattribute units and ranges for the lowest-level objectives. Note that attributes are used to indicate to whatextent the considered alternatives achieve the lowest-level objectives. For some basic properties relatedto the set of attributes see[1]. The system also accounts for attributes with a subjective scale and withdiscrete values.The objectives hierarchy in the selection of a technology for the disposition of surplus weapons-grade
plutonium is shown inFig. 1. There are three main objectives at the highest level:non-proliferation(Non-Prolifer), environmental, safety and health(ES&H), andoperational effectiveness(Op. Effectiv).Non-proliferationis made up oftheft, diversion, irreversibility (Irreversibil), international cooperation(Int’l Cooper) and timeless; ES&H of human health and safety(Human H&S), socio-economic(SocioEconom) andnatural environment(Nat Environ); andcost for operational effectiveness. Each of themis split into other sub-objectives and so on. Finally, 37 lowest level objectives are identified. A completedescription of the objectives and attributes is given in[16].Fig. 2shows the objective, and its associated attribute information, forH&S risk transportation(Transp
Death).The lowest level objectives can have associated attributes with a continuous scale, likeH&S risk
transportation(Transp Death), discrete attribute value, likeIAEA attractiveness(IAEA Attract), or a

1084 A. Jiménez et al. / Computers & Operations Research 33 (2006) 1081–1101
Fig. 1. Objectives hierarchy.
constructed scale, likeRussian cooperation(Russian Coop). In this case, the DM directly enters valuebetween 0 and 1 just by thinking about how good or bad the alternative is with respect to the attribute inquestion, where 0 is the worst and 1 is the best.
3. Identifying feasible alternatives
Next, feasible alternativesmust be identified, as well as should their consequences in terms of attributesassociated with the lowest-level objectives and uncertainty (if necessary). As we have pointed out, the

A. Jiménez et al. / Computers & Operations Research 33 (2006) 1081–1101 1085
Fig. 2. Information aboutH&S risk transportation.
GMAA accounts for uncertainty about the consequences or outcomes of the alternatives under consider-ation in such a way that they can be provided by means of uniformly distributed ranges instead of singlevalues as an approach under certainty would demand. Thus, given an objectives hierarchy with attributesXi, i = 1, . . . , n, the consequences of a decision alternativeSj , j = 1, . . . , m, can be described underuncertainty by a vector of ranges[xjL , xjU] = ([xjL
1 , xjU1 ], . . . , [xjL
n , xjUn ]), wherexjL
i andxjUi are the
lower (L) and upper (U) level of attributeXi for Sj , and both end-points being equal, i.e.,xjLi = x
jUi ,
would be equivalent to the case under certainty, where the policy effects for an alternativeSj in attributeXi are precisely known.Moreover, alternatives with missing consequences, that is, alternatives that do not provide values or
consequences for some attributes in the hierarchy, could be represented by the respective attribute ranges,[xjL
i , xjUi ] = [rmini , rmaxi ], wherermini andrmaxi are the bounds of theith attribute range. This means that
all the respective attribute values are possible and with the same probability.In the complex decision-making problem in question, 13 technologies for the disposition of surplus
weapons-grade plutonium were considered, seeTable 1. Briefly, reactor alternativeswould use surplusplutonium to fabricate mixed oxide fuel for nuclear reactors that generate electric power; whileimmo-bilitation alternativeswould immobilitate surplus plutonium by mixing it with different substances, likenon-radioactive and radioactive glass, or ceramic, and pouring it in recipients, like cans, canisters; anddirect disposal alternativeswould place it in a borehole.The technology consequences were entered in the GMAA system and some uncertainty about them
was added. For instance, an original value equal toa in the ith attribute was translated into the valueinterval[a − 0.05(rmaxi − rmini ), a + 0.05(rmaxi − rmini )], wherermini andrmini are the bounds of theithattribute range, i.e., an attribute deviation of 5% was used. Note that out-of-range consequences are notallowed, andrmin or rmax are used as the respective bounds of the consequence interval.Fig. 3shows thewindow displayed by the system where the technology consequences can be viewed.

1086 A. Jiménez et al. / Computers & Operations Research 33 (2006) 1081–1101
Table 1Technologies to be evaluated
Reactor alternativesExisting light water reactors, existing facilitiesExisting light water reactors, greenfield facilitiesPartially completed light water reactorsEvolutionary light water reactorsCANDU reactors
Direct disposal alternativesDeep borehole (immobilitation)Deep borehole (direct emplacement)
Immobilitation alternativesVitrification greenfieldVitrification can-in-canisterVitrification adjunt melterCeramic greenfieldCeramic can-in-canisterElectrometallurgical treatment
Fig. 3. Viewing technology consequences.
The DM can use the “minimum” and “maximum” radio buttons to view the lower and upper bounds ofthe consequence intervals, respectively. Note that new alternatives can be added, an existing alternativecan be deleted/discarded or its consequences can be modified.

A. Jiménez et al. / Computers & Operations Research 33 (2006) 1081–1101 1087
Fig. 4. Class of utility functions forType of nuclear accounting system.
4. Quantifying preferences
Quantifying preferences involves assessing theDM’s single attribute utilities,which represent theDM’spreferences concerning the possible alternative consequences, and weights, which represent the relativeimportance of criteria in the objectives hierarchy. Both will be used later to evaluate the alternativesthrough a multi-attribute utility function.In both cases, the system admits incomplete information through value intervals as responses to the
probability questions the DM is asked, which leads to classes of utility functions and weight intervals,respectively. This is less stressful on experts, see[25–27]. Moreover, it makes the system suitable forgroup decision support, because individual conflicting views or judgements in a group of stakeholderscan be captured through imprecise responses.Component utility functions and attribute weights can be used to identify efficient candidate solutions
or to stimulate negotiation strategies, see, e.g.,[28–32].
4.1. Assessment of component utility functions
Component utilities can be assigned using four procedures depending on the level of knowledge andfeatures of the attribute under consideration.When there is in-depth and precise knowledge about the attribute, the DM can directly construct a
piecewise linear utility function by providing the best and the worst attribute values and up to threeintermediate values with their respective imprecise utilities.The class of utility functions will be constructed in this case by joining up to four linear segments
between the best and the worst values for upper and lower values of the assignments. So, the user is askedto provide intermediate intervals (up to three). If no intermediate points are specified, then the result willbe a single linear function.Fig. 4 shows the entered values and the respective class of utility functionsfor type of nuclear accounting system(Type of NAS).This measure is included in boththeft(Theft) anddiversion(Diversion). The scale is defined over the
percentage of time that item accounting can be used for a kilogram of plutonium at the facility, rangingfrom 0 to 100% item accounting. The shape of the utility function can also be changed bymouse draggingthe intermediate points.

1088 A. Jiménez et al. / Computers & Operations Research 33 (2006) 1081–1101
Fig. 5. Constructing an imprecise utility function with the gamble-based method.
The second procedure is used when the DM has little knowledge about or experience with the topic.This assessment approach involves the DM answering indifference conditions between lotteries and sureamounts, and does not require theDM to indicate the form of the imprecise piecewise utility function. Theprocedure is based on the combination of two slightlymodified standard procedures for utility assessment:thefractile method[33–36]and theextreme gambles method[37,38].In the fractile method, the DM is asked to provide attribute value intervals that he/she considers
equivalent to different gambles, whose results are the most and least preferred attribute values withcertain probabilities and their complementaries, respectively. The extreme gambles method, on the otherhand, demands imprecise probabilities for the lottery[9].The system includes a routine implementing a wheel of fortune to output these probability intervals,
see[39], which displays the probabilistic questions and provides guidance to the expert until an intervalof indifference probabilities is obtained. A number of additional questions are included as consistencychecks.If the intersection of the classes of utility functions output by the above methods were to be empty
for some attribute values, the DM would have provided inconsistent responses and he/she should re-assess his/her preferences. Otherwise, the intersection will be the range for the DM’s utility functions,seeFig. 5.The third procedure is usedwhen different discrete attribute values have been identified for the attribute
instead of a continuous scale. The DM is asked to provide the possible discrete attribute values (up toeight), their description and the respective imprecise utilities.Fig. 6shows imprecise utilities for discreteattribute values forIAEA attractiveness(IAEA Attract). If a technology scores well on this attribute, theInternational Atomic Energy Agency(IAEA) will be less concerned about the threat of diversion by thehost nation, because the material in process is difficult to reuse in a weapons program.The discrete attribute values correspond to direct-use unirradiated, direct-use irradiated, indirect-use
and eligible for termination, respectively.Finally, the fourth procedure applies when the DM decides to use a subjective scale without defining a
utility function, because it is difficult to ascertain what the value of each alternative is for the respectivesubjective attribute. This procedure is implemented in the system by means of a thermometer scale[40].

A. Jiménez et al. / Computers & Operations Research 33 (2006) 1081–1101 1089
Fig. 6. Imprecise utilities for discrete attribute values.
Fig. 7. Subjective values forRussian cooperation.
The DM will enter utility intervals by hand using scrollbars, as shown inFig. 7 for Russian cooperation(Russian Coop).
4.2. Weight elicitation
Quantifying preferences also involves assessing weights, which represent the relative importance ofcriteria in the objectives hierarchy. The attribute weights, used in the alternative evaluation, reflect therelative importance of the change in the attribute from the worst attribute level to the best attributelevel. Attribute weights are hierarchically assessed, i.e., the objective weights are elicited by weighting

1090 A. Jiménez et al. / Computers & Operations Research 33 (2006) 1081–1101
Fig. 8. First probability question for weight elicitation based on tradeoffs forirreversibility.
attributes andobjectives alongonebranchat a timeandmultiplying the localweights through the objectivehierarchy.Note that when the system is opened, the starting point is equally weighted objectives. If the DM
disagrees with the objective weights, they can be modified by using one of the two weight elicitationmethods provided by the GMAA system: weight elicitation based on trade-offs and direct assignment.Note that imprecision concerning the DM’s responses is allowed in both methods by means of rangesof responses to the probability question that the DM is asked. A normalization process is automaticallyperformed from the DM’s responses, leading to an average normalized weight and a normalized weightinterval for each sub-objective under consideration.Weight elicitationbeginswith theattributesand thencontinues in ascendingorder through thehierarchy.
The first method, perhaps more suitable for the low-level objectives in the hierarchy because it involves amore specific area of knowledge, is based on trade-offs among the respective attributes of the lowest-levelobjectives stemming from the same objective[1]. The DM is asked to give an interval of probabilitiessuch that he/she is indifferent with respect to a gamble and sure consequences.Figs. 8and9 show an example for the objectiveirreversibility (Irreversibil).In both probability questions, the DM faces a lottery, whose outputs are the best values for the attributes
stemming fromirreversibility (Irreversibil) with the demanded probability and the worst values for thesame attributes with the complementary probability, and some given sure attribute values. But, the mid-value of the attribute range and the worst attribute value formaterial form(Mater. Form) andmateriallocation (Location), are the given sure amounts, respectively, in the first question while, in the second,they are the worst attribute value and the mid-value of the attribute range, respectively.On the other hand, direct assignment is perhapsmore suitable for the possiblymore political upper level
objectives. The DM has to directly provide a weight interval for each sub-objective under consideration.Once the relative importance of the objective and attributes has been rated along the branches of
the hierarchy, the attribute weight can be assessed by multiplying the respective average weights andnormalized weight interval bounds of the objectives in the path from the root (global objective) to eachleaf (attribute), seeFig. 10.

A. Jiménez et al. / Computers & Operations Research 33 (2006) 1081–1101 1091
Fig. 9. Second probability question for weight elicitation based on tradeoffs forirreversibility.
Fig. 10. Some attribute weights.
5. Evaluating alternatives
Once the DM’s preferences have been quantified, the different alternatives under consideration can beevaluated by means of an additive multiattribute utility function, whose appearance is
u(Sj ) =n∑
i=1wiui(x
ji ), (1)

1092 A. Jiménez et al. / Computers & Operations Research 33 (2006) 1081–1101
Fig. 11. Overall utilities and ranking.
wherewi is theith attribute weight,xji is the consequence for alternativeSj in theith attribute andui(x
ji )
is the utility associated with the above consequence. For the reasons described in[41,42], we consider(1) to be a valid approach.The additive model is used to assess, on the one hand, average overall utilities, on which the ranking
of alternatives is based and, on the other hand, minimum and maximum overall utilities, which givefurther insight into the robustness of this ranking. Average overall utilities are obtained by taking intoaccount the mid-points of the uniformly distributed consequence intervals in the respective attributes,their respective average component utilities and the average normalized attribute weights. To assess theminimum overall utilities, the system takes the lower end-points of the imprecise attribute weights, thelower end-point of the consequence intervals if the respective component utility function is increasing,or the upper end-point if it is decreasing, and the lower utilities in the imprecise utilities correspondingto the above consequences.The system provides a graphical representation with bars, which includes their overall utilities and
ranking, seeFig. 11. The vertical lines on each bar represent the average utilities, while the ends of therectangles are the minimum and maximum utilities.The technologies are ranked as in[16,23]. However, the average overall utilities do not match up
due to some mistakes in the above papers, where erroneous component utilities are associated with thetechnology consequences for some attributes.As shown inFig. 11, the best ranked technologies areceramic can-in-canandvitrification can-in-
can, with equal overall utilities. It is clear that, taking into account the average utilities, one of thesestrategies shouldbe recommended. Lookingat theoverlappedutility intervals (robustnessof the rankingofalternatives), however, we can conclude that the information obtained by this evaluation is not meaningfulenough to definitively recommend a technology. In the next section, several SAs in the GMAA systemaimed at outputting more meaningful results will be introduced.The system provides different displays of ranking results. Thestacked bar rankingis similar to the
alternatives classification but provides more detail on how the alternative’s average utilities for the at-tributes affect the average utility of the overall objective. Themeasure utilities for alternativesdisplaysa bar graph showing performance of a single alternative for the attributes, taking into account average

A. Jiménez et al. / Computers & Operations Research 33 (2006) 1081–1101 1093
Fig. 12. Compare alternatives graph.
Fig. 13. Normalized average weights and imprecise alternative consequences forceramic can-in-can.
consequences and individual utilities, andwhere thewidth of an attribute is proportional to its weight. Thecompare alternatives graphprovides a detailed comparison of the differences between two alternatives,see Fig.12. Finally, thepaired attributes correlationdisplay evaluates/compares alternative componentutilities with respect to pairs of selected attributes.Another display that can be useful for the DM is shown inFig. 13. It includes the assigned average
normalized weights in the objectives hierarchy and the imprecise consequences of a selected (Ceramic

1094 A. Jiménez et al. / Computers & Operations Research 33 (2006) 1081–1101
Fig. 14. Ranking of alternatives forhuman health and safety.
Can-in-can) alternative in the different attributes. The system reminds the DM which attributes are ratedon a subjective scale (Sub. Scale) or using discrete values (Discrete Value).It is also possible to select another objective to rank by.Fig. 14shows the ranking of alternatives for
human health and safety(Human H&S).
6. Sensitivity analysis
DA is typically an iterative process. Once the model has been built SA is performed. This step shouldbe considered as a means of stimulation that makes the DM think about the problem in more depth andcan give further insight into the robustness of the recommendations. Ríos Insua[18] and Ríos Insua andFrench[19] introduce a framework for SA in multi-objective decision-making.Several types of SA are provided by the GMAA System. Following Ríos Insua and French[19] they
can be classed aspure SA, where the critical judgements are identified for closer consideration, anddecision making with partial information, which takes advantage of the imprecise inputs (alternativeconsequences, component utilities and weights).Classical SA and the assessment of stability weight intervals can be considered as pure SA. Classical
SA essentially involves examining changes in the ranking of alternatives as a function of the inputparameters (weights, component utilities or alternative consequences) varying within a reasonable range.Any alternative consequence, component utility or weight can be changed and the system takes charge ofhow this change is propagated through the objectives hierarchy and automatically recalculates the overallutilities for each alternative and the resulting ranking.Furthermore, the stability weight interval for any objective at any level in the hierarchy can be assessed.
In this case average normalized weight for the considered objective can vary without affecting the overallranking of alternatives. For instance, the current average normalized weight and the stability interval fordiversionis shown inFig. 15.The stability weight interval is[0.093,0.41], i.e., the average normalized weight fordiversioncould be
changed within the specified interval without leading to changes in the ranking of alternatives. However,

A. Jiménez et al. / Computers & Operations Research 33 (2006) 1081–1101 1095
Fig. 15. Weight stability interval fordiversion.
if the new value is outside the interval, for instance 0.42, a new alternatives ranking is output. Thus,this SA can be useful for identifying weight objectives to which the ranking of alternatives is sensitive.For instance, in the disposition of surplus plutonium problem, the objectives with the narrowest weightstability intervals areenvironmental, safety and health(ES&H), investment costs(Invest. Cost) andlife-cycle costs(L-cycle Cost), whose intervals are[0,0.029], [0.564,0.647] and[0.353,0.436], respectively.So, the DM should think about them more closely.The other two SAs provided by the system, the assessment of non-dominated and potentially optimal
alternatives and the application of Monte Carlo simulation techniques, can be considered asdecisionmaking with partial information.Asmentionedabove, the information obtained from the alternatives evaluation, bymeans of the additive
multiattribute utility model, is not always meaningful enough to definitively recommend an alternative,i.e., we get very overlapped imprecise overall utilities. In these cases, the above techniques play a veryimportant role. Theymay providemoremeaningful information, and an interactive process can be carriedout by tightening the respective imprecise alternative consequences, component utilities and weightsand reassessing the non-dominated and potentially optimal alternatives or performing the Monte Carlosimulation techniques again, see[43].
6.1. Non-dominated and potentially optimal alternatives
The concepts of dominance and potential optimality have been widely studied by several authors. Anumber of methods have been proposed to test dominance and potential optimality considering bothweight and utility imprecision, see, e.g.,[44,45].In this SA, we intend to take advantage of the imprecise information collected during the assignment
of component utilities and weights and the entered uncertain alternative consequences to definitely rejectbad alternatives, mainly by discarding dominated and/or non-potentially optimal alternatives. Thus, theconsequence of any alternativeSj in the ith attribute,xj
i , belongs to an certain interval[xjLi , x
jUi ], the
utility associated with any alternative consequencexji is impreciseui(x
ji ) ∈ [uLi (x
ji ), uUi (x
ji )] and the
ith attribute weight is impreciseki ∈ [kLi , kUi ].

1096 A. Jiménez et al. / Computers & Operations Research 33 (2006) 1081–1101
According to these considerations, given two alternativesSr andSt , the alternativesSr dominatesSt
if f ∗rt >0, wheref ∗
rt is the optimal value of the optimization problem (2), see[18,19]
min frt = u(Sr) − u(St ) =n∑
i=1kiui(x
ri ) −
n∑
i=1kiui(x
ti )
s.t xrLi �xr
i �xrUi , i = 1,2, . . . , n,
xtLi �xt
i �xtUi , i = 1,2, . . . , n,
kLi �ki �kUi , i = 1,2, . . . , n,
uLi (xri )�ui(x
ri )�uUi (xr
i ), i = 1,2, . . . , n,
uLi (xti )�ui(x
ti )�uUi (xt
i ), i = 1,2, . . . , n. (2)
On the other hand, from a mathematical point of view, the alternativeSr is potentially optimal, if theoptimum value of the optimization problem (3),f ∗
r , is less than or equal to 0, see[18,19],
min fr
s.t.n∑
i=1kiui(x
ri ) −
n∑
i=1kiui(x
ti ) + fr �0 ∀t = r,
xjLi �x
ji �x
jUi ∀i, j,
kLi �ki �kUi ∀i,
uLi (xji )�ui(x
ji )�uUi (x
ji ) ∀i, j. (3)
Optimization problems (2) and (3) are non-linear. However, they can be easily transformed into linearoptimization problems, as shown in[20].In the disposition of surplus plutoniumproblem, only four out of the 13 technologies are non-dominated
and potentially optimal, seeFig. 16. Consequently, the DM should confine his/her attention to thesetechnologies and the remainder should be discarded from further consideration.Further details about the dominance between alternatives can be also viewed, seeFig. 17. The position
of the alternative in the rows and columns depends on the alternatives ranking in the table shown inFig.17, and only the necessary optimization problems are solved, i.e., if the result of the dominance problemis greater than zero, the alternative placed in this column is dominated so it can be discarded.
6.2. Monte Carlo simulation techniques for SA
This kind of sensitivity analysis usesMonteCarlo simulation, see[21,22], allows simultaneous changesof the weights and generates results that can be easily analyzed statistically to provide more insight intothe multi-attribute model recommendations.The attribute weights will be selected at random using a computer simulation program so that the
results of many combinations of weights can be explored efficiently. The system uses a multiplicativelinear congruential generator based on Schrage’s method, first published in 1979, and later refined in1983, see[46]. It provides a virtually infinite sequence of statistically independent random numbers,uniformly distributed between 0 and 1.

A. Jiménez et al. / Computers & Operations Research 33 (2006) 1081–1101 1097
Fig. 16. Non-dominated and potentially optimal alternatives.
Fig. 17. Dominance details.
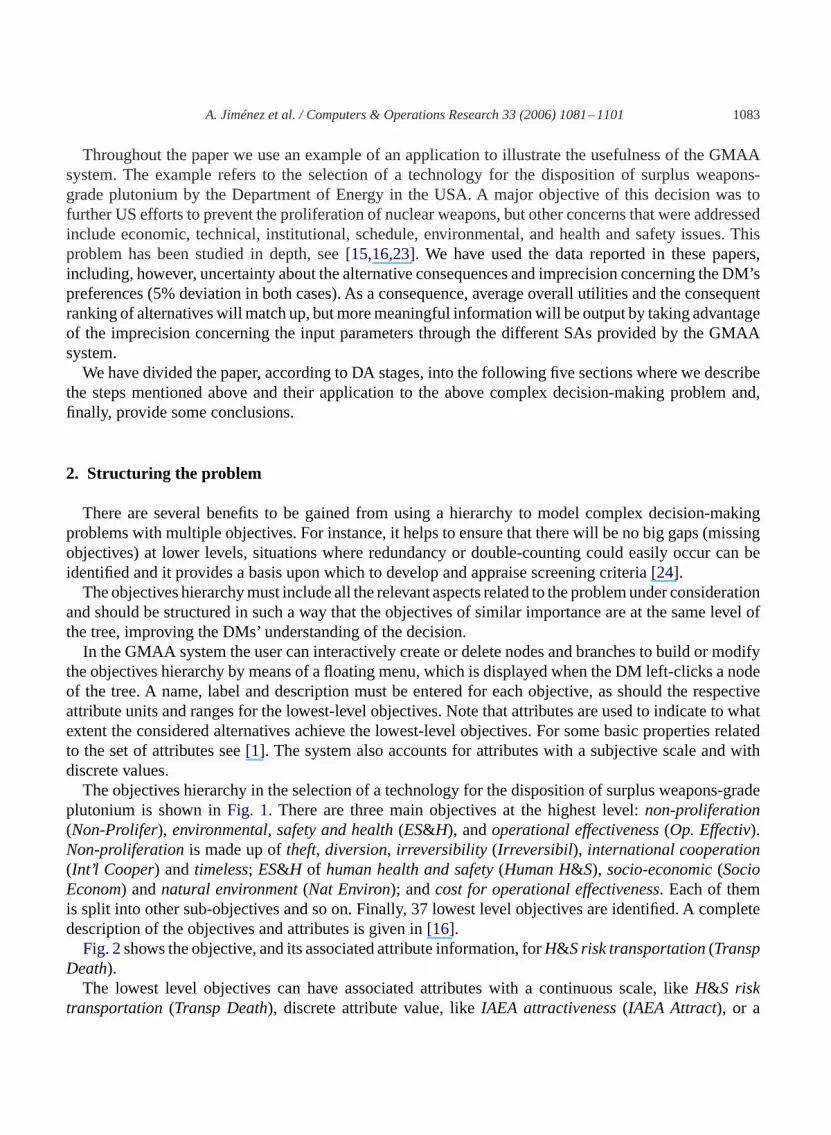
While the simulation is running, the system computes several statistics about the rankings of eachalternative, like mode, minimum, maximum, mean, standard deviation and the 25th, 50th and 75th per-centiles. This information can be useful for discarding some available alternatives, aided by a display thatpresents a multiple boxplot for the alternatives.Three general classes of simulation are provided by the GMAA system:random weights, rank order
weightsandresponse distribution weights. In the random weights option, weights for the attributes aregenerated completely at random, which implies no knowledge whatsoever of the relative importanceof the attributes. In the rank order weights option, attribute weights are randomly generated preservinga total or partial attribute rank order, which places substantial restrictions on the domain of possibleweights that are consistent with the DM’s judgement of criteria importance, leading to more meaningfulresults. Finally, the response distribution weights option recognizes that the weight elicitation procedures
1098 A. Jiménez et al. / Computers & Operations Research 33 (2006) 1081–1101
Fig. 18. Resulting multiple boxplot.
Fig. 19. Associated statistic measures.
are subject to variation and attribute weights are now randomly assigned values taking into account thenormalized attribute weight intervals provided by the DM in the weight elicitation methods.Fig. 18shows the resulting boxplot for the disposition of surplus plutonium problem for the response
distribution weights option, i.e., attribute weights have been randomly generated from the normalizedweight intervals shown inFig. 10.It is clear that more meaningful information for the DM is output than in the overall utility intervals,
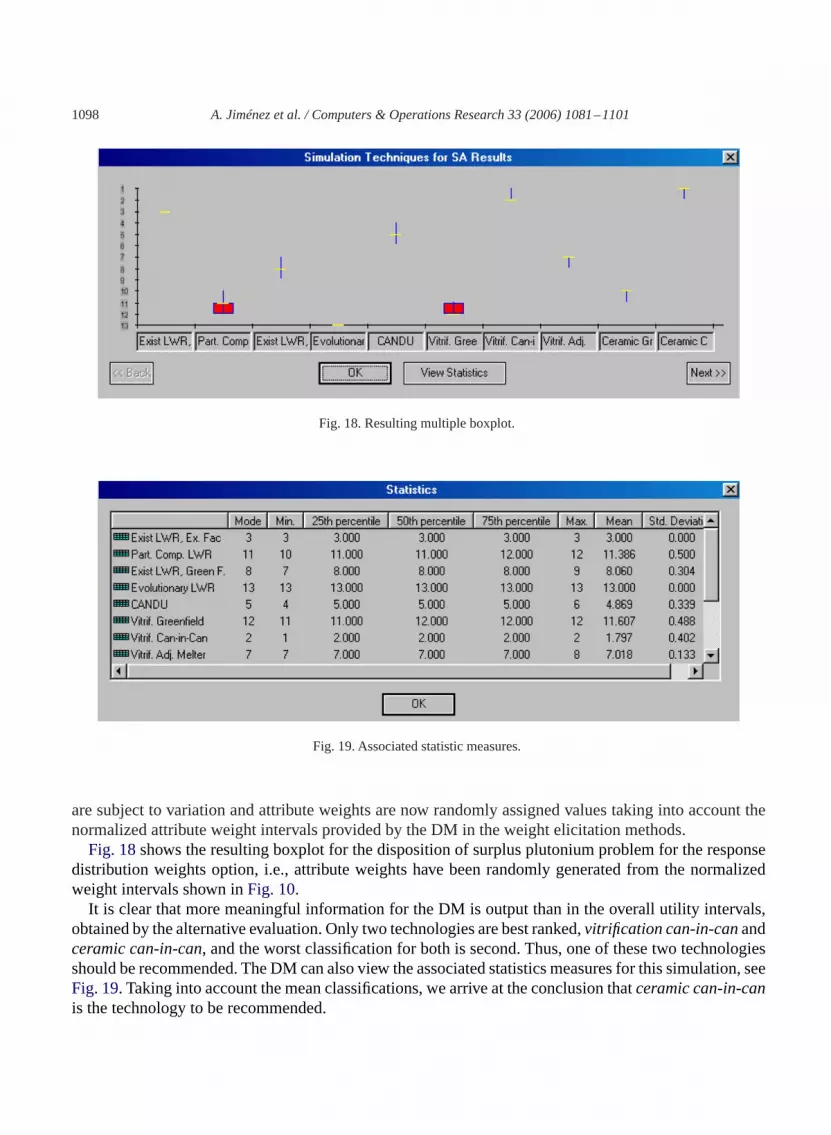
obtained by the alternative evaluation. Only two technologies are best ranked,vitrification can-in-canandceramic can-in-can, and the worst classification for both is second. Thus, one of these two technologiesshould be recommended. The DM can also view the associated statistics measures for this simulation, seeFig. 19. Taking into account the mean classifications, we arrive at the conclusion thatceramic can-in-canis the technology to be recommended.

A. Jiménez et al. / Computers & Operations Research 33 (2006) 1081–1101 1099
7. Conclusion
This paper presents a comprehensiveDSSbasedonanadditivemulti-attribute utilitymodel. The systemis very user friendly and makes provision for all the stages of the DA cycle, from construction of theobjectives hierarchy to evaluation of the set of alternatives for ranking. It accounts for uncertainty aboutthe alternative consequences (real problems are usually plagued with uncertainty), and admits incompleteinformation about the DM’s preferences, which is less demanding for a single DM and also makes thesystem suitable for group decision support.A ranking of alternatives based on average overall utilities is output. Moreover, imprecise overall
utilities are also assessed. These utilities give further insight into the robustness of this ranking. However,in some cases, the information obtained from the alternatives evaluation is not meaningful enough todefinitively recommend an alternative. In these cases, some of the SAs provided by the system, theassessment of non-dominated and potentially optimal alternatives and the application of Monte Carlosimulation techniques, play a very important role. They may provide more meaningful information, andan iteration process can be carried out by tightening the respective imprecise alternative consequences,component utilities and/or weights.The GMAA system is not developed and implemented ad hoc for one complex decision-making
problem, it is designed to aid the DM in a range of problems where DA can be especially useful. Thesystem is illustrated throughout the paper using a well-known application example, the selection of atechnology for the disposition of surplus weapons-grade plutonium. This example illustrates the mainfeatures and usefulness of the system.
Acknowledgements
This paper was supported by the Ministry of Science and Technology Projects DPI 2001-3731 andBFM2002-11282-E, and by the Ministry of Education and Science TSI2004-06801-C04-04.
References
[1] Keeney RL, Raiffa H. Decision with multiple objectives: preferences and value-tradeoffs. NewYork: Wiley; 1976.[2] Belton V. Multiple criteria decision analysis—practically the only way to choose. In: Hendry LC, Englese RW., editors.
Operational research tutorial papers. Birmingham: Operational Research Society; 1990. p. 53–101.[3] Clemen RT. Making hard decisions: an introduction to decision analysis. Beltmon: Duxbury Press; 1996.[4] Kirkwood CW. Strategic decision making: multiobjective decision analysis with spreadsheets. Beltmon: Duxbury Press;
1997.[5] Appelgren A, Bergström U, Brittain JE, Gallego E, H˚akanson L, Heling R, Monte L. An outline of a model-based expert
system to identify optimal remedial strategies for restoring contaminated aquatic ecosystem: the Project MOIRA. Roma:ENEA; 1996.
[6] Ríos Insua D, Gallego E, Mateos A, Ríos-Insua S. MOIRA: a decision support system for decision making on aquaticecosystem contaminated by radioactive fallout. Annals of Operations Research 2000;95:341–64.
[7] Monte L, Brittain J, Hakanson L, Gallego E, Zheleznyak M, Voitsekhovitch O, Kryshev I, Marinov K. Implementingcomputerised methodologies to evaluate the effectiveness of countermeasures for restoring radionuclide contaminatedfresh water ecosystems. Roma: ENEA; 2001.
[8] Monte L, Gallego E, H˚akanson L, Brittain JE. Moira models and methodologies for assessing the effectiveness ofcountermeasures in complex aquatic systems contaminated by radionuclides. Roma: ENEA; 1999.

1100 A. Jiménez et al. / Computers & Operations Research 33 (2006) 1081–1101
[9] Jiménez A, Ríos-Insua S, Mateos A. A decision support system for multiattribute utility evaluation based on impreciseassignments. Decision Support Systems 2003;36(1):65–79.
[10] Gallego E, Jiménez A, Mateos A, Sazykina T, Ríos-Insua S, Windergärd M. Application of multiattribute analysismethodologies to the evaluation of the effectiveness of remedial strategies with the MOIRA system. In: Monte L,Brittain JE, Hakanson L, Gallego E, Zheleznyak M, Voitsekhovitch O, Krishev I, Petrov KM., editors. Implementingcomputerised methodologies to evaluate the effectiveness of countermeasures for restoring radionuclide contaminatedfresh water ecosystems. Rome: ENEA; 2001. p. 111–30.
[11] Ríos-Insua S, Jiménez A, Mateos A. A timed-dependent decision support system for multiattribute decision-making.Integrated Computer-Aided Engineering 2004;11(1):63–75.
[12] Corner JL, Kirkwood CW. Decision analysis applications in the operations research literature, 1970–1989. OperationsResearch 1991;39:206–19.
[13] Keefer DL, Corner JL, Kirkwood CW. Decision analysis applications in the operations research literature, 1990–2001.Technical report. Arizona State University, USA, 2002.
[14] Buede DM, Bresnik TA. Applications of decision analysis to the military systems acquisition process. Interfaces1992;22(6):110–25.
[15] Dyer JS,EdmundsT,Butler JC, Jia J.Aproposalmethodology for theanalysisandselectionofalternatives for thedispositionof surplus weapons-usable plutonium. Amarillo National Resource Center for plutonium technical paper, USA, 1996.
[16] Dyer JS, Edmunds T, Butler JC, Jia J. Evaluation of alternatives for the disposition of surplus weapons-usable plutonium.Amarillo National Resource Center for plutonium technical paper, USA, 1997.
[17] Mateos A, Ríos-Insua S, Gallego E. Postoptimal analysis in a multi-attribute decision model for restoring contaminatedaquatic ecosystems. Journal of the Operational Research Society 2001;52:1–12.
[18] Ríos InsuaD.Sensitivity analysis inmultiobjectivedecisionmaking. Lecturenotes in economicsandmathematical systems,vol. 347, Berlin: Springer; 1990.
[19] Ríos InsuaD, FrenchS.A framework for sensitivity analysis in discretemulti-objective decision-making. European Journalof Operational Research 1991;54:176–90.
[20] MateosA, JiménezA,Ríos InsuaS.Amultiattribute solving dominanceandpotential optimality in imprecisemulti-attributeadditive problems. Reliability Engineering and System Safety 2003;79:253–62.
[21] Butler J, Jia J, Dyer J. Simulation techniques for the sensitivity analysis ofmulti-criteria decisionmodels. European Journalof Operational Research 1997;103:531–46.
[22] Jiménez A, Ríos-Insua S, Mateos A, Monte-Carlo Simulation techniques in a multi-attribute decision support system.Proceedings of the 12th IASTED international conference on applied simulation and modelling. ACTA Press; 2003. p.85–90.
[23] Dyer JS, EdmundsT, Butler JC, Jia J.Amultiattribute utility analysis of alternatives for the disposition of surplus weapons-grade plutonium. Operations Research 1998;46(6):749–62.
[24] Brownlow SA, Watson SR. Structuring multi-attribute value hierarchies. Journal of the Operational Research Society1987;38:309–17.
[25] Weber M. Decision making with incomplete information. European Journal of Operational Research 1987;28:44–57.[26] von Nitzsch R,Weber M. Utility function assessment on amicro-computer: an interactive procedure.Annals of Operations
Research 1998;16:149–60.[27] Ríos S, Ríos-Insua S, Ríos Insua D, Pachón JG. Experiments in robust decisionmaking. In: Ríos S., editor. Decision theory
and decision analysis: trends and challenges. Boston: Kluwer; 1994. p. 233–42.[28] Jarke M, Jelassi MT, Shakun MF. MEDIATOR: towards a negotiation support system. European Journal of Operational
Research 1987;31:314–34.[29] Mumpower JL. The judgement policies of negotiators and the structure of negotiation problems. Management Science
1991;37:1304–24.[30] VerkamaM,HämäläinenRP, EthamoH.Multi-agent interaction processes: from oligopoly theory to decentralized artificial
intelligence. Group Decision and Negotiation 1992;2:137–59.[31] Verkama M, Hämäläinen RP, Ethamo H. Modeling and computational analysis of reactive behaviour in organizations. In:
Carley KM, Prietula MJ., editors. Computational organizational theory. New Jersey: Hillsdale; 1994.[32] Hämäläinen RP. On-line group decision support by preference programming in traffic planning. Group Decision and
Negotiation 1996;5:485–500.[33] Fishburn PC. Decision and value theory. NewYork: Wiley; 1964.

A. Jiménez et al. / Computers & Operations Research 33 (2006) 1081–1101 1101
[34] Fishburn PC. Utility theory for decision making. NewYork: Wiley; 1970.[35] Hull J, Moore PG, Thomas H. Utility and its measurement. Journal of the Royal Statistical Society 1973;136:226–47.[36] Holloway CA. Decision making under uncertainty: models and choices. New Jersey: Prentice-Hall; 1979.[37] Mosteller F, Nogee P. An experimental measurement of utility. Journal of Political Economy 1951;59:371–404.[38] Schlaifer R. Analysis of decisions under uncertainty. NewYork: McGraw-Hill; 1969.[39] French S. Decision theory: an introduction to the mathematics of rationality. Chichester: Ellis Horwood; 1986.[40] French S, Papamichail DKN, Ranyard DC, Smith JQ. Design of a decision support system for use in the event of a nuclear
accident. RODOS report (WG5)-TN(97)-04, 1997.[41] Raiffa H. The art and science of negotiation. Cambridge: Harvard University Press; 1982.[42] Stewart TJ. Robustness of additive value function method in MCDM. Journal of Multi-Criteria Decision Analysis
1996;5:301–9.[43] MateosA, JiménezA, Ríos-Insua S. Modelling individual and global comparisons for multi-attribute preferences. Journal
of Multicriteria Decision Analysis 2004;13:1–14.[44] Eum YS, Park KS, Kim SH. Establishing dominance and potential optimality in multi-criteria analysis with imprecise
weight and value. Computers and Operations Research 2001;28:397–409.[45] Lee KS, Park KS, Kim SH. Dominance, potential optimality, imprecise information and hierarchical structure in multi-
criteria analysis. Computers and Operations Research 2002;29:1267–81.[46] Bratley P, Fox BL, Schrage EL. A guide to simulation. NewYork: Springer; 1983.


