Embed Size (px)
Citation preview

www.elsevier.com/locate/foodqual
Food Quality and Preference 18 (2007) 440–449
A comparison of serial monadic and attribute-by-attribute protocolsfor simple descriptive analysis with untrained judges
Rie Ishii, Hyung-Kyung Chang, Michael O’Mahony *
Department of Food Science and Technology, University of California, Davis, CA 95616, USA
Received 16 September 2004; received in revised form 6 May 2006; accepted 6 May 2006Available online 20 May 2006
Abstract
Two experiments were performed in which untrained judges were required to perform a descriptive analysis, using a serial monadicprotocol and an attribute-by-attribute protocol. They reached ‘criterion’ performance more rapidly using the attribute-by-attribute pro-tocol, indicating that they were using a relative scaling strategy. Criterion performance required judges to rate all attributes according tothe rank order of their physical strengths. Later, they reached criterion performance with the serial monadic protocol, indicating thatduring experimentation, they had learned to establish sufficient intensity exemplars for an absolute scaling strategy.� 2006 Elsevier Ltd. All rights reserved.
Keywords: Descriptive analysis; Flavor profiling; Serial monadic; Attribute-by-attribute; Scaling; Congnitive strategies; Relative scaling strategy; Abs-olute scaling strategy
1. Introduction
Descriptive analysis requires judges to give numericalratings for appropriate attributes to a set of foods or otherproducts (Gacula, 1997; Hootman, 1992). Lawless (1999)has critically reviewed assumptions, issues and alternativeapproaches for descriptive analysis applied to odor stimuli.Nevertheless, many of his points apply to food in general.Some of the better known variations of descriptive analysisare the flavor profile and profile attribute analysis (Cairn-cross & Sjostrom, 1950; Caul, 1957; Neilson, Ferguson, &Kendall, 1988; Sjostrom, Cairncross, & Caul, 1957), theSpectrum method (Meilgaard, Civille, & Carr, 1991), theQuantitative Flavor Profile or QFP (Stampanoni, 1993,1994) and Quantitative Descriptive Analysis or QDA(Stone & Sidel, 1993, 1998; Stone, Sidel, Oliver, Woodlsey,& Singleton, 1974). The former methods use trained judgeswho would be assumed to be more sensitive to attribute dif-ferences than consumers, while the latter method (QDA)
0950-3293/$ - see front matter � 2006 Elsevier Ltd. All rights reserved.
doi:10.1016/j.foodqual.2006.05.003
* Corresponding author. Tel.: +1 530 756 5493; fax: +1 530 752 4759.E-mail address: [email protected] (M. O’Mahony).
uses discriminating consumers of the product. In terms ofgoals and usage (O’Mahony, 1995), the former methodscould be said to be using the panel as an analytical instru-ment (Sensory Evaluation I), while the latter is regardedas getting as close as possible to measuring the perceptionsof a sample of discriminating consumers under normal con-ditions of consumption (Sensory Evaluation II).
An essential part of descriptive analysis is ‘scaling’, themaking of numerical estimates of the intensities of the var-ious sensory attributes of the product. It is thus relevant toask questions about the cognitive processes taking placeduring scaling. In the psychophysical literature there aretwo models, with Zwislocki and co-workers (Zwislocki,1983; Zwislocki & Goodman, 1980) arguing for an ‘abso-lute’ model and Mellers (1983a, 1983b) arguing for a rela-tive model. Care must be taken here because the definitionsof ‘absolute’ and ‘relative’ can vary somewhat; Zwislocki(1983) accused Mellers of not understanding his definitionof ‘absolute’, which appeared to be based on an idea of thenumber of transformations possible with the data.
In the present discussion, the absolute model regards thesensation strength elicited by a stimulus attribute as being

R. Ishii et al. / Food Quality and Preference 18 (2007) 440–449 441
compared to a set of exemplar sensation strengths stored inmemory, each associated with a given numerical value.Stimuli are thus compared to ‘absolute’ exemplars in mem-ory to obtain numerical ratings, rather than compared withone another. The relative model assumes that the sensationstrengths of the stimuli in an experiment are compared withone another and numbers assigned accordingly. Essen-tially, the process is one of ranking the stimuli in orderof intensity, while using numerical estimates to describethe spacing between the ranks.
A calibrated instrument could be said to use a ‘cognitive’process that was absolute. Calibration is by definition, thestorage of exemplars of intensity strength in memory, eachassociated with a given numerical value. On the otherhand, a judge who ranks a set of stimuli in order of increas-ing intensity and then spaces them so that similar intensi-ties are closer together and dissimilar intensities arefurther apart, may be presumed to be using a relative cog-nitive strategy. Although the absolute vs relative nature ofscaling is generally argued in terms of a dichotomy, the twoprocesses may also be regarded as two ends of a contin-uum, with the possibility of gradual change from one tothe other.
Ellermeier, Westphal, and Heidenfelder (1991) obtaineddata with pain stimulation that they claimed were consis-tent with the absoluteness of scales. Laming (1984) usedarguments including the limits to transmission of informa-tion when making category judgments, to support the rela-tive model. Lawless (Lawless, 1983; Lawless & Malone,1986) used context effects and the fact that judges wouldspace stimuli with even relatively small physical differences,across the whole length of a scale, to argue that scaling wasrelative. Certainly, context effects (Lee, Kim, & O’Mahony,2001a; Parducci, 1963, 1965, 1968; Rankin & Marks, 1991;Riskey, 1986; Riskey, Parducci, & Beauchamp, 1979; Schif-ferstein, 1994, 1995, 1996; Schifferstein & Frijters, 1992;Stillman, 1993; Vickers & Roberts, 1993) would supportthe relative nature of scaling: indeed Mellers used sucheffects to argue against Zwislocki.
Research into scaling errors (Jeon, O’Mahony, &Kim, 2004; Kim & O’Mahony, 1998; Koo, Kim, &O’Mahony, 2002; Lee, Kim, & O’Mahony, 2001b; Park,Jeon, O’Mahony, & Kim, 2004) also supports the relativemodel. The more that judges were able to re-taste stimuliand modify their scores, the fewer were the scaling errors.Scaling errors here were defined as giving a perceptiblystronger stimulus a score equal to or less than a percepti-bly weaker stimulus. This result would not be predictedfrom an absolute model, but would be predicted from arelative model. Thus, the weight of evidence suggests thatwithout special training, judges use a relative cognitivestrategy.
If a judge were to be using a relative cognitive process,then, an attribute-by-attribute protocol would be expectedto be more appropriate for descriptive analysis. Here,a judge would score each food for a given attribute,while being allowed to re-taste and re-evaluate scores until
satisfied that the scores represented the ‘correct spacing’between the ranked intensities. The judges would thenmove on to consider the next attribute, then the thirdand so on until all attributes had been considered. Sucha protocol would not make extensive demands on mem-ory, because judges would re-taste stimuli as often asrequired should their intensities be forgotten. Fewer scal-ing errors would be expected. Yet, although expected tobe more accurate in terms of scaling errors, such a proto-col would for many applications be time consuming. How-ever, this is not an insuperable obstacle: the flash profilingmethod (Dairou & Seiffermann, 2002; Delarue & Loe-scher, 2004; Delarue & Sieffermann, 2004; Sieffermann,2000) uses such a protocol.
Yet, descriptive analysis is usually performed using aserial monadic protocol. Here, the first food is assessedfor the intensities of all its attributes, which are givenappropriate scores. Then a second food is assessed in thesame way, then a third food and a fourth, etc. For a judgeusing a relative cognitive process, the demands on memoryare considerably greater. An attribute sensation from thefirst food might be forgotten by the time that attributewas to be assessed for the third or fourth food. Conse-quently, the serial monadic protocol would be expectedto be prone to scaling errors. Therefore, the hiddenassumption behind the serial monadic protocol is that thejudges are using an absolute cognitive process for scaling.If scaling were sufficiently absolute, the attribute intensitiesof each food would be compared with sets of exemplarintensities in the memory, rather than with each other. Ifthe intensity of an attribute for the first food were to be for-gotten while the third food was being assessed, it would notmatter.
Mazzucchelli and Guinard (1999) compared monadicand attribute-by-attribute protocols, in a related samplesdesign, for descriptive analysis of nine formulations of milkchocolate. During training, 18 judges developed 20 sensoryattributes for the chocolates. After training, four chocolatesamples were served to judges per session. They wereassessed using either a serial monadic or an attribute-by-attribute protocol, with intensities being estimated ona 10-point category scale. From resulting ANOVA, LSD,PCA analyses and spider web plots, they found that bothmethods gave similar profiles and concept alignment. Theattribute-by-attribute protocol produced significant differ-ences for more attributes (14 vs 6), but the procedure tooklonger.
The focus of the present study is narrower than that ofMazzicchelli and Guinard. It is to compare serial monadicand attribute-by-attribute protocols specifically in termsof the times required to acquire the requisite skill requiredfor error-free scaling. It is a study in skill acquisition. Forthis, it can be argued that part of the training for a descrip-tive panel must involve the establishment of intensity exem-plars in memory. Accordingly, if judges have not establishedthe necessary exemplars, it can be hypothesized that theywould achieve appropriate performance levels (no scaling

442 R. Ishii et al. / Food Quality and Preference 18 (2007) 440–449
errors) more rapidly using an attribute-by-attribute proto-col than with a serial monadic protocol. The goal of thisstudy is to test this hypothesis.
In the first experiment, judges were required to makesimple descriptive analysis judgments for a set of vanillapuddings using two protocols: serial monadic and attri-bute-by-attribute. They performed each protocol alter-nately until they achieved criterion performance on each.By criterion performance was meant that for each pudding,the intensity of each attribute was scored according to therank order of the physical attribute strengths. In this way,issues of differences in the way judges space the numbers ontheir scales were avoided.
Part of training for descriptive analysis is to learn toidentify and then consider separately the sensory attributesthat are present together in the product. This can requireconsiderable training, and it is an interesting topic forresearch, concerning issues of mixture suppression andenhancement (Breslin, 1996; Breslin & Beauchamp, 1995,1997; Calvino, Garcıa-Medina, & Cometto-Muniz, 1990;McBride & Finlay, 1990; Pangborn, 1960; Schifferstein &Frijters, 1990) as well as the synthetic or analytic natureof the blending of attributes (Erickson, 1982; Erickson &Covey, 1980; Erickson, Priolo, Warwick, & Schiffman,1990; Laing & Francis, 1989; O’Mahony, Atassi-Sheldon,Rothman, & Murphy-Ellison, 1983; Rochman, Guinard,& O’Mahony, 1997). Yet, these were not the issues to bestudied here and were thus avoided. Accordingly, thevanilla pudding stimuli were presented in such a way thatjudges did not have to learn to perceive each attributeseparately.
Instead of mixing sensory attributes together in a singlesample of pudding, each attribute was presented singly in aseparate pudding sample. Thus, tasting each pudding sam-ple only required the assessment of an individual easilyidentified attribute. This prevented other variables con-cerned with stimulus identification, interfering with thegoal of the experiment. Four attributes were chosen forthe puddings: sweetness, brandy flavor, texture and visualappearance of thickness. The relatively small numbers ofattributes and products allowed the experiment to be per-formed within a short time-frame, yet did not affect thelogic of the experiment.
In a second confirmatory study, the experiment wasbroadened and modified to test the robustness of theresults. Different experimenters were used. The stimuliwere more varied than the previous pudding samples,ranging from color chips, through liquid stimuli to jellies.More sensory attributes were used at more intensity levels,to increase the demands on memory and the mannerof stimulus presentation was varied. The two alternativeprotocols were presented on separate days, rather thanin a single session as in the first experiment. This wasto lessen the chance of responses for one protocolbeing remembered and influencing the responses for theother. The effects of withdrawing standards were alsostudied.
2. Experiment 1
2.1. Materials and methods
2.1.1. Judges
Eight judges (2M, 6F, age range 21–42 years) weretested. All were students and friends at the University ofCalifornia, Davis. All but one were naıve to sensory testingand the goals of the experiment. All had fasted (except forwater) for at least 2 h before testing. All were non-smokers.
2.1.2. Stimuli
Various modifications of a base vanilla pudding wereprepared. The base pudding, itself, was prepared by addingone packet (96 g) of ‘Jello Brand Instant Pudding mix’(Kraft Foods, Inc. White Plains, New York) to a mixtureof 375 ml of low fat milk (2% fat) + 250 ml of whole milk(3.75% fat), both from Lucky’s supermarket (AmericanProcurement & Logistics, Co. Salt Lake City, Utah).
Modifications of this base pudding were preparedfor judgments of added sweet taste, brandy flavor(aroma), texture by mouth, and visual appearance of‘thickness‘. For each of these attributes, puddings of twostrengths were prepared. Preliminary experimentation hadensured that the different attribute intensities were easilydiscriminable.
For judgments of sweetness, the base pudding was pre-pared with 6 g or 14 g of added aspartame. (‘Equal’, Nutra-Sweet, Co. Deerfield, Illinois). Here, the sucrose or fructosewas not used so as to avoid the possibility of texturechange. For judgments of brandy flavor, the base puddingwas prepared with 3 ml or 7 ml of added brandy flavoring(Schilling Imitation Brandy Extract, McCormick & Co.,Inc. Hunt Valley, Maryland). In both cases, the aspartameor brandy extract was first mixed with the milk. The pud-ding mix was then added and mixed with a hand mixer(General Electric Hand Mixer, General Electric, Bridge-port, Connecticut) for 2 min on ‘mix’ speed.
For judgments of texture and visual appearance ofthickness, the same two puddings were prepared, althoughjudges were not aware of this. For the less thick pudding,one packet of the pudding mix was added to 125 ml ofwhole milk + 375 ml of ‘half and half’ (10% fat). For thethicker pudding, one packet of the pudding mix was addedto 250 ml of whipping cream (33.3% fat) + 250 ml of ‘halfand half’ (both from Lucky’s, see above). The pudding mixwas added to the milk/cream and mixed by electric mixer(2 min for less thick puddings, 2.5 min thicker pudding)as above.
For judgments of sweetness, brandy flavor and textureby mouth, samples of pudding were served in plastic cups(1 oz plastic cups, Solo Cup Co. Urbana, Illinois), fillingapprox 80% of the cup. For judgments of texture bymouth, the cups were covered with paper portion cups toobscure visual cues (2 oz portion cups, S.E. Rykoff &Co., Los Angeles, California). Judges tasted and swallowedthe puddings using white plastic spoons (Dixie Brand,

R. Ishii et al. / Food Quality and Preference 18 (2007) 440–449 443
James River Corp., Norwalk, Connecticut). For judgmentsof visual appearance of thickness, puddings were presentedin larger diameter paper portion cups, allowing a greatersurface area to be inspected (4 oz portion cups, S.E. Rykoff& Co., Los Angeles, California).
For each of the four attributes, comparison standardswere presented on a separate tray for judges to refer to dur-ing the experiment, as reminders of the sensations elicitedby each attribute. Five standards were presented: the basepudding and one pudding for each of the four attributes.For these latter, the attribute intensity was greater thanwould be encountered in the experiment, for easy recogni-tion. Numerical scores were not associated with these stan-dards. They were prepared in the same manner as before.For sweetness, 16 g of aspartame was added; for brandy fla-vor, 10 ml of brandy extract was added. For the texture bymouth/visual thickness standards, one packet of puddingmix was added to 312.5 ml of whipping cream + 187.5 mlof ‘half and half’ (whipping time 2.5 min).
For attribute-by-attribute testing, the puddings werepresented on a white plastic cutting tray (VWR ScientificProducts, San Francisco, CA) in four rows, one row foreach attribute. In each row, there were four puddings (total16). In each row, for a given attribute, there was at leastone pudding at the higher intensity level, one at the lowerlevel and one base pudding (attribute absent). As therewere four stimuli in the row, one of these levels occurredtwice. Which level occurred twice was chosen randomly.
For serial monadic testing, four trays (‘products’) wereprepared for each experimental session. Here, a productconsisted of a white plastic cutting tray with four cups ofpudding, each one representing one of the four attributes.The four trays were presented one after the other. The posi-tion of the attribute stimuli was the same for each tray, soas to allow judges to identify the stimuli as easily as possi-ble. Over the four trays, as with the attribute-by-attributecondition, each attribute was represented at least once ateach intensity level, while one level was presented twice.Twelve trays, each with a different randomized combina-tion of attributes, were prepared and for any given experi-mental session. Four were chosen randomly forpresentation to the judge, with the proviso that the totalnumber of times that each attribute occurred at each inten-sity level was the same as in the attribute-by-attribute con-dition. An additional tray was also presented on whichwere the base pudding and the four standards representingeach attribute.
Puddings were prepared on the day of testing. Afterpreparation, puddings were stored in the fridge to beremoved and placed in the cups immediately before testing.
2.1.3. Procedure
In each experimental session, judges were required torate the pudding stimuli following a serial monadic proto-col and then following an attribute-by-attribute protocol.Half the judges performed the serial monadic protocol firstand half performed the attribute-by-attribute protocol first.
For each judge this order was reversed from session tosession.
For the attribute-by-attribute protocol, the judge tastedeach row of puddings for a given attribute and rated theintensity of each on a 10-point unstructured category scale.While rating a given attribute, the judges could re-tasteeach pudding as often as desired and amend their scores.Having finished one attribute, judges then went on to ratethe next attribute in the next row. The attributes were eval-uated in the random order. For sweetness and brandy fla-vor, the scales were labeled at the ends: ‘not present’ (0)and ‘very sweet’ or ‘very strong brandy flavor’ (9). The tex-ture scales were labeled ‘very thin’ (0) and ‘very thick’ (9).All scores were entered on a single response sheet.
For the serial monadic protocol, judges were first pre-sented with one of the trays (‘products’), and required torate each of the four puddings for its appropriate attributewhich was indicated to the judges by its position on thetray. Responses were written on a response sheet with fourscales, one for each attribute. The scales were as for theattribute-by-attribute protocol. After finishing the ratingsfor one ‘product’, the tray and the response sheet wereremoved and replaced by the tray and response sheet forthe next ‘product’. In this way, the judges could not re-tasteany stimuli from previous trays nor could they see theirscores for those products.
Judges used a spoon to taste the puddings to be judgedfor sweetness and brandy flavor. For visual appearance ofthickness, the judges merely viewed the puddings. For tex-ture by mouth, the judge shut her eyes, while the experi-menter used a spoon to sample the pudding. This wasthen handed to the judge to taste without viewing the sam-ple. In this way no visual cues were given.
At the beginning of an experimental session, rapportwas established with any demographic details being taken.The judges rinsed the mouth five times and then were pre-sented with the tray of standards. These they tasted toremind themselves of the attributes. They then proceededto taste the puddings on the four ‘product’ trays. The trayof standards was available throughout, for judges toremind themselves of the attributes to be assessed.
Throughout testing, judges were able to rinse ad lib asdesired. During testing, the experimenter remained withthe judges to record any comments. At the end of the session,judges were questioned to ensure that there were no artifac-tual cues and to gain feedback about the testing session.
Testing was continued until criterion performance hadbeen attained for each protocol. This means that for eachattribute, the pudding with the higher level of attributewas to receive the highest score, the pudding with the lowerlevel of attribute was to receive the second highest score,while the puddings with the attribute absent were to receivea zero score (or for texture judgments, equal lowest score).Judges were not given information about the number ofintensity levels present for each attribute and feedbackwas not given to the judges regarding their performance,so that they had to attain criterion performance by their
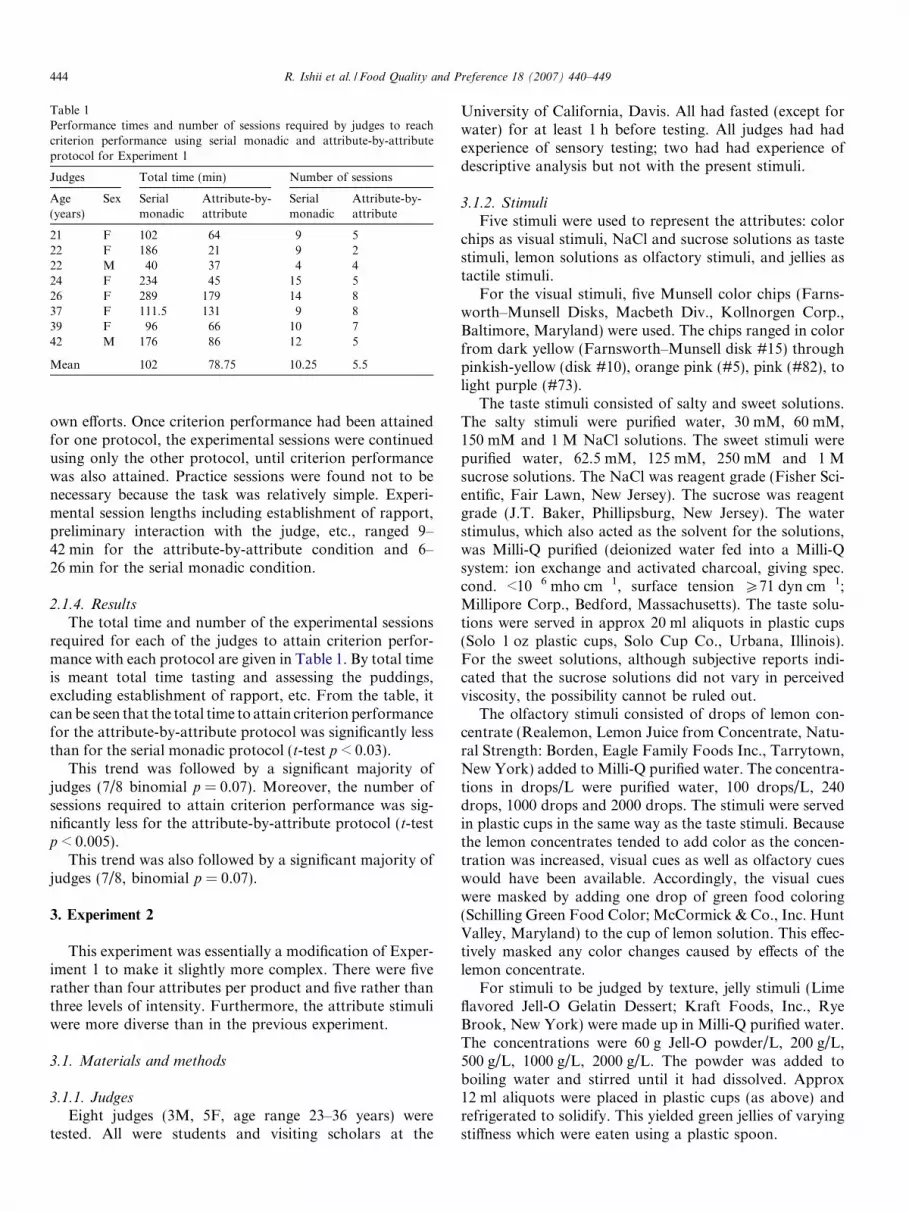
Table 1Performance times and number of sessions required by judges to reachcriterion performance using serial monadic and attribute-by-attributeprotocol for Experiment 1
Judges Total time (min) Number of sessions
Age(years)
Sex Serialmonadic
Attribute-by-attribute
Serialmonadic
Attribute-by-attribute
21 F 102 64 9 522 F 186 21 9 222 M 40 37 4 424 F 234 45 15 526 F 289 179 14 837 F 111.5 131 9 839 F 96 66 10 742 M 176 86 12 5
Mean 102 78.75 10.25 5.5
444 R. Ishii et al. / Food Quality and Preference 18 (2007) 440–449
own efforts. Once criterion performance had been attainedfor one protocol, the experimental sessions were continuedusing only the other protocol, until criterion performancewas also attained. Practice sessions were found not to benecessary because the task was relatively simple. Experi-mental session lengths including establishment of rapport,preliminary interaction with the judge, etc., ranged 9–42 min for the attribute-by-attribute condition and 6–26 min for the serial monadic condition.
2.1.4. Results
The total time and number of the experimental sessionsrequired for each of the judges to attain criterion perfor-mance with each protocol are given in Table 1. By total timeis meant total time tasting and assessing the puddings,excluding establishment of rapport, etc. From the table, itcan be seen that the total time to attain criterion performancefor the attribute-by-attribute protocol was significantly lessthan for the serial monadic protocol (t-test p < 0.03).
This trend was followed by a significant majority ofjudges (7/8 binomial p = 0.07). Moreover, the number ofsessions required to attain criterion performance was sig-nificantly less for the attribute-by-attribute protocol (t-testp < 0.005).
This trend was also followed by a significant majority ofjudges (7/8, binomial p = 0.07).
3. Experiment 2
This experiment was essentially a modification of Exper-iment 1 to make it slightly more complex. There were fiverather than four attributes per product and five rather thanthree levels of intensity. Furthermore, the attribute stimuliwere more diverse than in the previous experiment.
3.1. Materials and methods
3.1.1. JudgesEight judges (3M, 5F, age range 23–36 years) were
tested. All were students and visiting scholars at the
University of California, Davis. All had fasted (except forwater) for at least 1 h before testing. All judges had hadexperience of sensory testing; two had had experience ofdescriptive analysis but not with the present stimuli.
3.1.2. StimuliFive stimuli were used to represent the attributes: color
chips as visual stimuli, NaCl and sucrose solutions as tastestimuli, lemon solutions as olfactory stimuli, and jellies astactile stimuli.
For the visual stimuli, five Munsell color chips (Farns-worth–Munsell Disks, Macbeth Div., Kollnorgen Corp.,Baltimore, Maryland) were used. The chips ranged in colorfrom dark yellow (Farnsworth–Munsell disk #15) throughpinkish-yellow (disk #10), orange pink (#5), pink (#82), tolight purple (#73).
The taste stimuli consisted of salty and sweet solutions.The salty stimuli were purified water, 30 mM, 60 mM,150 mM and 1 M NaCl solutions. The sweet stimuli werepurified water, 62.5 mM, 125 mM, 250 mM and 1 Msucrose solutions. The NaCl was reagent grade (Fisher Sci-entific, Fair Lawn, New Jersey). The sucrose was reagentgrade (J.T. Baker, Phillipsburg, New Jersey). The waterstimulus, which also acted as the solvent for the solutions,was Milli-Q purified (deionized water fed into a Milli-Qsystem: ion exchange and activated charcoal, giving spec.cond. <10�6 mho cm�1, surface tension P71 dyn cm�1;Millipore Corp., Bedford, Massachusetts). The taste solu-tions were served in approx 20 ml aliquots in plastic cups(Solo 1 oz plastic cups, Solo Cup Co., Urbana, Illinois).For the sweet solutions, although subjective reports indi-cated that the sucrose solutions did not vary in perceivedviscosity, the possibility cannot be ruled out.
The olfactory stimuli consisted of drops of lemon con-centrate (Realemon, Lemon Juice from Concentrate, Natu-ral Strength: Borden, Eagle Family Foods Inc., Tarrytown,New York) added to Milli-Q purified water. The concentra-tions in drops/L were purified water, 100 drops/L, 240drops, 1000 drops and 2000 drops. The stimuli were servedin plastic cups in the same way as the taste stimuli. Becausethe lemon concentrates tended to add color as the concen-tration was increased, visual cues as well as olfactory cueswould have been available. Accordingly, the visual cueswere masked by adding one drop of green food coloring(Schilling Green Food Color; McCormick & Co., Inc. HuntValley, Maryland) to the cup of lemon solution. This effec-tively masked any color changes caused by effects of thelemon concentrate.
For stimuli to be judged by texture, jelly stimuli (Limeflavored Jell-O Gelatin Dessert; Kraft Foods, Inc., RyeBrook, New York) were made up in Milli-Q purified water.The concentrations were 60 g Jell-O powder/L, 200 g/L,500 g/L, 1000 g/L, 2000 g/L. The powder was added toboiling water and stirred until it had dissolved. Approx12 ml aliquots were placed in plastic cups (as above) andrefrigerated to solidify. This yielded green jellies of varyingstiffness which were eaten using a plastic spoon.

R. Ishii et al. / Food Quality and Preference 18 (2007) 440–449 445
The five stimuli were served to judges on white cuttingtrays, as in Experiment 1. In a given experimental session,four trays each with different levels of intensity for the fivestimuli, were used. For each stimulus, four of the five pos-sible levels of intensity were randomly chosen. The stimuliwere presented with the NaCl solution in the top left-handcorner of tray, the sucrose solution in the top right-handcorner, the lemon solution in the bottom left hand corner,and the jelly in the bottom right-hand corner; the colorchip was in the center of tray. The jelly stimulus was cov-ered by a paper cup to prevent the judge seeing any visualtexture cues. Before sampling this stimulus, the judges wereblindfolded and the experimenter presented them with aspoonful of jelly. For all the other stimuli, judges servedthemselves.
As in Experiment 1, a tray of standard stimuli was madeavailable during experimentation, to remind the judges ofthe sensations elicited by each attribute. This consisted ofpairs of each of the five types of stimulus. Each pair con-sisted of the strongest and weakest version of each of thefive stimulus types (for color, Farnsworth–Munsell disks#15 and #73). The stimuli were presented as describedabove except that the jelly stimuli were not covered.
3.1.3. Procedure
As in Experiment 1, judges were required to rate thestimuli using an attribute-by-attribute protocol or a serialmonadic protocol. As in Experiment 1, the two protocolswere presented alternately to the judges. Half the judgesbegan with the serial monadic protocol, while half startedwith the attribute-by-attribute protocol. They continuedto assess the stimuli using the two protocols alternately,until they had reached criterion performance. All judgesachieved criterion performance first in the attribute-by-attribute condition. After this, judges continued in furthersessions with just the serial monadic protocol. Once theyhad reached criterion performance with the serial monadicprotocol, they were required to continue, using this proto-col in further sessions but this time without access to thestandards. However, in this condition, feedback was given.The purpose of this part of the experiment was to get ameasure of a judge’s deterioration in performance whenstandards were withdrawn. It provided a measure of thejudge’s reliance on the standards. With standards available,a judge could be reminded of the sensation elicited by eachattribute. With no standards, the judge had to try to recallthe appropriate sensation, while the feedback was beinggiven. Once judges had reached criterion performance inthis condition, the experiment was terminated.
For the serial monadic protocol, judges were presentedwith a tray of standard stimuli and four trays of stimulilabeled with 3-digit random numbers. They sampled thestimuli in the following order: color disk, NaCl, sucrose,lemon, jelly. They rated the intensities of the stimuli onunstructured 9-point category scales on a single responsesheet, labeled with the corresponding 3-digit random num-ber. The scales were labeled at the ends: ‘yellow’ (1) and
‘purple’ (9) for the color disks, ‘least salty’ (1) and ‘mostsalty’ (9) for NaCl solutions, ‘least sweet’ (1) and ‘mostsweet’ (9) for sucrose solutions, ‘least lemon’ (1) and‘most lemon’ (9) for lemon drinks, ‘most liquid’ (1) and‘most solid’ (9) for jellies. The scale was modified from thatused in Experiment 1; the ‘0’ score indicating completeabsence of an attribute was omitted. Before assessing thejelly stimulus, judges were blindfolded. The cover wasremoved from the stimulus and the experimenter presenteda spoonful to the judge’s open mouth. Because the judgeswere blindfolded, the experimenter filled in the responsesheet for this stimulus. Before sampling each stimulus,except for the color disk, the judge rinsed her mouth withpurified water ad lib until any taste from prior stimulihad vanished. When the judge was blindfolded, the exper-imenter assisted with this. Also, at the beginning of theexperiment, after establishment of rapport and the record-ing of any necessary experimental details, the judges rinsedat least six times to cleanse the mouth.
When the judges had finished assessing the first tray, itwas removed along with the response sheet, and they weregiven a second tray to assess in the same way. They thencontinued with a third and fourth tray. Judges were notrequired to rinse between trays; they only rinsed beforetasting appropriate stimuli as described above. Throughoutthe experiment, judges were able to sample the standardstimuli as often as desired.
For the attribute-by-attribute protocol, stimuli were pre-sented in a different manner from that used in Experiment1. Judges were presented simultaneously with the four traysof stimuli, identical to those used for the serial monadicprotocol. The tray of standard stimuli was also presented(total 5 trays). They first inspected the color disks and ratedthem on the unstructured 9-point category scale describedabove. There were four scales on the response sheet, eachlabeled with the appropriate 3-digit random numbers.Judges were able to inspect each color chip as often asdesired and alter any scores on the response sheet, shouldthey feel it necessary. Having completed rating the colorchips, they went on to rate the NaCl stimuli with a secondresponse sheet, with all the appropriate scales presented.Judges could taste each NaCl stimulus as often as desiredand alter their ratings accordingly. Before tasting eachstimulus, the judge was required to rinse the mouth asdescribed above. The other stimuli were assessed in themanner described above.
Before experimentation started, the judges were foundto require a couple of practice sessions as a screening toensure that they could understand the task and that theattribute intensity levels were easily discriminable. The firstpractice session was used to ensure discriminability; thesecond was to familiarize them with the methods.
For the first practice session, the judge was initiallygiven all five color disks and required to rank them frommost yellow to most purple. Having done this, they wererequired to repeat the task. Next, they were required torank the NaCl solutions in order of increasing intensity,

Table 3Added performance times required for the serial monadic protocol, oncecriterion performance had been achieved and the reference standardsremoved for Experiment 2
Judges Extra timerequired (min)
Extra number ofsessions requiredAge (years) Sex
23 M 26.4 323 F 14.3 224 F 16.7 224 M 78.3 629 F 24.5 233 F 25.1 236 F 91.7 936 M 29.6 2
Mean 38.3 3.5
446 R. Ishii et al. / Food Quality and Preference 18 (2007) 440–449
using the protocol used in the attribute-by-attribute exper-iments described above. Once they had finished ranking,they were required to sample the stimuli again to ensurethat they produced the same rank order. Next, the sucrosethen the lemon stimuli were ranked in the same way.Finally, the jelly stimuli were ranked by the blindfoldedjudges using the same protocol and being assisted by theexperimenter. All judges completed these tasks satisfacto-rily without error, indicating that none of the stimuli wereconfusable.
For the second practice session, the use of the scales andresponse sheets was explained. The judges were then pre-sented with five trays to be assessed using the attribute-by-attribute protocol described above. In this case, all fivestimulus levels were presented instead of a selection of fourthat was used in the experimental sessions. During thisexercise, the experimenter interacted with judges to assistthem with their task. Finally, the judge was given a singletray and a tray of standards and required to assess the stim-uli according to the serial monadic protocol describedabove. Once the judges were confident in their tasks, theexperiment could begin.
Experimental session lengths for the attribute-by-attri-bute protocols, the serial monadic protocols and thecontinuing serial monadic protocols after standards werewithdrawn ranged approx 1/4–1/2 h.
3.1.4. Results
The total time and the number of experimental sessionsrequired for each of the judges to attain criterion perfor-mance with each protocol are given in Table 2. As in Exper-iment 1, total time refers only to the time taken with tastingand assessing the stimuli. From the table, it can be seen thatthe total experimental times to reach criterion performancewere significantly less for the attribute-by-attribute protocol(t-test p < 0.0004), a trend followed by all judges (binomialp = 0.008). It can also be seen that the number of experi-mental sessions required to attain criterion performancewas significantly less for the attribute-by-attribute protocol(t-test p < 0.001). This trend was followed by all but one ofthe judges (binomial p = 0.07).
Table 2Performance times and number of sessions required by judges to reachcriterion performance using serial monadic and attribute-by-attributeprotocols for Experiment 2
Judges Total time (min) Number of sessions
Age(years)
Sex Serialmonadic
Attribute-by-attribute
Serialmonadic
Attribute-by-attribute
23 M 145.4 38.9 13 423 F 26.7 21.8 2 224 F 96.9 31.1 11 324 M 135.2 53.6 13 629 F 82.4 20.4 6 233 F 130.4 25.5 9 236 F 98.6 22.9 7 236 M 93.7 21.4 6 2
Mean 101.2 29.5 8.4 2.9
After judges had achieved criterion performance in theserial monadic condition, they were required to continuein this condition but without access to the standards. Thiswas to investigate whether judges deteriorated in their per-formance once standards were removed and only feedbackwas given. The further times required for this, along withthe number of sessions required are given in Table 3. Itcan be seen from the table that once standards were nolonger accessible, criterion performance could not beachieved until considerable further testing (38% more) withfeedback had been undergone. This indicated the extent ofreliance that the judges had on the standards.
All judges had had experience of sensory testing.However, only two judges had had experienced with thistype of experiment. One of these (F, 23 years, see Table2) only needed two sessions for each protocol to achievecriterion performance, with a difference in times of only5 min Her initial performance with the serial monadic pro-tocol was better than for the other judges. It may behypothesized that the skills acquired in the prior study car-ried over into the present study. However, for the otherjudge (F, 24 years) prior experience did not seem to beof any assistance; her performance resembled that of theother judges.
4. Discussion
Prior to the experiment, judges had not been trained indescriptive analysis for the stimuli used and had not estab-lished exemplars for intensities for the attributes they weremeasuring. Their attainment of criterion performancesooner with the attribute-by-attribute protocol was pre-dicted from previous reasoning (Lawless, 1983; Lawless& Malone, 1986; Mellers, 1983a, 1983b) and research, indi-cating that such judges use a relative rather than an abso-lute cognitive strategy for scaling (Jeon et al., 2004; Kim &O’Mahony, 1998; Koo et al., 2002; Lee et al., 2001a, 2001b;Parducci, 1963, 1965, 1968; Park et al., 2004; Rankin &Marks, 1991; Riskey, 1986; Riskey et al., 1979; Schiffer-stein, 1994, 1995, 1996; Schifferstein & Frijters, 1992; Still-man, 1993; Vickers & Roberts, 1993).

R. Ishii et al. / Food Quality and Preference 18 (2007) 440–449 447
Reaching criterion performance more rapidly using theattribute-by-attribute protocol also supports the conten-tion that the memory of stimulus intensities is prone toerror, even over short time intervals. Thus, the present datalend general support to past studies on the forgetting of theintensities of flavor components over time. Some of thepast studies cannot be directly supported by the presentdata because the time differences used were not comparableto those in the present study (Mojet & Koster, 2002) or thestimuli were confusable (Avancini de Almeida, Cubero, &O’Mahony, 1999; Cubero, Avancini de Almeida, &O’Mahony, 1995). Nevertheless, the present results do sup-port earlier research indicating how judges rapidly forgetintensities of sensory attributes. For texture judgements,Harker, Gunson, Brookfield, and White (2002) notedhow judges were not accurate at comparing the hardnessof apples eaten 1 min apart. Taste studies requiring judgesto match taste intensities of previously tasted stimuli, bymixing strong and weak components, indicated a tendencyto overestimate the intensity of stimuli tasted immediatelybeforehand (Theunissen, Tuorila, & Ahlstrom, 1993; Tuor-ila, Theunissen, & Ahlstrom, 1996; Vanne, Laurinen, &Tuorila, 1998; Vanne, Tuorila, & Laurinen, 1998). Fortaste and odor stimuli, Barker and Weaver (1983) requiredjudges to state whether a stimulus was greater, lesser orequal in intensity to stimuli tasted 1 min before; they founda tendency to underestimate the intensity of the previousstimulus. Either way, memory of stimulus intensities wasprone to error.
However, despite attaining criterion performance soonerwith the attribute-by-attribute protocol, judges eventuallyattained criterion performance with the serial monadic pro-tocol. It can be argued that during the experimentation,judges gradually learned to establish sufficient exemplarsneeded for criterion performance, to judge whether an attri-bute was absent, relatively weak or relatively strong. Thiswould have been easier in Experiment 1, which only hadthree intensity levels for each attribute, and harder inExperiment 2 with its greater number of intensity levels.It can be argued that the latter’s greater difficulty wasreflected in the fact that judges made extensive use of thestandards and that when the standards were removed,judges needed a further period of time to recapture crite-rion performance. Thus, for a serial monadic protocol, partof training for descriptive analysis must involve the estab-lishment of intensity exemplars. It might save time if train-ing were to involve tasks that addressed this facet directly.Certainly, the use of intensity standards would appear to beof some help.
For simplicity and brevity, the present experiments usedonly four or five attributes. With these comparatively fewattributes, it was possible for judges to establish sufficientexemplars to be able to categorize the intensities broadlyat three or five levels. Had they had training beforehandto establish exemplars, then it would be hypothesized thatwithout all the necessary re-tasting of stimuli and stan-dards, they would reach criterion performance sooner with
the serial monadic protocol. This is currently beingaddressed. It is interesting to note that one of the judgesin Experiment 2, who had performed descriptive analysisbefore, was comparable in her performance for bothprotocols.
Given that training establishes intensity exemplars, it isworth speculating how many sets of exemplars might beneeded for a descriptive analysis, using 20 or 30 attributes.Would this require 20 or 30 sets of exemplars? If so, itwould require a considerable feat of memory. It wouldseem more likely that certain attributes would share setsof exemplars. This is a topic for future research.
Many multivariate statistical methods assume indepen-dence of ratings for a given attribute over food samples.This assumes that judges rate intensities using an absolutecognitive strategy. Yet, it may be argued that even trainedjudges will make intensity comparisons with stimuli fromtheir experience. There would always be an element of rela-tivity in their scaling strategy. This could be better repre-sented if the issue of absolute vs relative cognitivestrategies is conceived as a continuum rather than a dichot-omy. Then, it might be that the strategy for scaling indescriptive analysis, gradually moves from the relative endto the absolute end during training but may never quitereach it.
It is not the intention of the authors to recommendabandoning the serial monadic protocol for descriptiveanalysis. The intention is to understand what is requiredduring training. It is also to suggest alternatives. Shouldthe descriptive panel be used over a long period, andshould there be a large number of attributes, then a serialmonadic protocol would take less time once the judgeshad been trained. Overall, time and money would be saved.Yet, should the panel only be assembled for a single exper-iment, it might be worth considering an attribute-by-attri-bute protocol. Certainly the measurement would takelonger but the training time would be much reduced andthe overall time might be shorter. Training for a serialmonadic protocol might be reduced should the judges beregular users of the product; their experience with the prod-uct might have gone a long way towards identifying attri-butes and establishing intensity exemplars. These areconsiderations that allow choices for how descriptive anal-ysis can be approached.
Consumers can be regarded as untrained judges. Forsome projects, they are required to taste a series of foodsand use rating scales to represent their degree of liking ordisliking for the various attributes of these foods. A serialmonadic protocol is generally used. Besides the fact thatsuch a protocol can elicit responses regarding attributesthat the untrained consumer does not usually attend toor the fact that such responses are prone to suggestion,the present research would suggest that an attribute-by-attribute protocol would be expected to be a less errorprone than a serial monadic protocol. It would thus be amore powerful approach, generating less ‘noise’ in the sys-tem, with subsequent clearer results.

448 R. Ishii et al. / Food Quality and Preference 18 (2007) 440–449
References
Avancini de Almeida, T. C., Cubero, E., & O’Mahony, M. (1999). Same-different discrimination tests with interstimulus delays up to one day.Journal of Sensory Studies, 14, 1–18.
Barker, L. M., & Weaver, C. A. (1983). Rapid, permanent, loss of memoryfor absolute intensity of taste and smell. Bulletin of the Psychonomic
Society, 21, 281–284.Breslin, P. A. S. (1996). Interactions among salty, sour and bitter com-
pounds. Trends in Food Science and Technology, 7, 390–399.Breslin, P. A. S., & Beauchamp, G. K. (1995). Suppression of bitterness by
sodium: Variation among bitter taste stimuli. Chemical Senses, 20, 609–623.Breslin, P. A. S., & Beauchamp, G. K. (1997). Salt enhances flavor by
suppressing bitterness. Nature, 387, 563.Cairncross, S. E., & Sjostrom, L. B. (1950). Flavor profiles—A new
approach to flavor problems. Food Technology, 4, 308–311.Calvino, A. M., Garcıa-Medina, M. R., & Cometto-Muniz, J. E. (1990).
Interactions in caffeine-sucrose and coffee-sucrose mixtures: Evidenceof taste and flavor suppression. Chemical Senses, 15, 505–519.
Caul, J. (1957). The profile method in flavor analysis. Advances in Food
Research, 7, 1–40.Cubero, E., Avancini de Almeida, T. C., & O’Mahony, M. (1995).
Cognitive aspects of difference testing: Memory and interstimuluseffects. Journal of Sensory Studies, 10, 307–324.
Dairou, V., & Seiffermann, J.-M. (2002). A comparison of 14 jamscharacterized by conventional profile and a quick original method, theFlash Profile. Journal of Food Science, 67, 826–834.
Delarue, J., & Loescher, E. (2004). Dynamics of food preferences: A casestudy with chewing gums. Food Quality and Preference, 15, 771–779.
Delarue, J., & Sieffermann, J.-M. (2004). Sensory mapping using flashprofile. Comparison with a conventional descriptive method for theevaluation of the flavour of fruit dairy products. Food Quality and
Preference, 15, 383–392.Ellermeier, W., Westphal, W., & Heidenfelder, M. (1991). On the
‘‘absoluteness” of category and magnitude scales of pain. Perception
and Psychophysics, 49, 159–166.Erickson, R. P. (1982). Studies on the perception of taste: Do primaries
exist?. Physiology and Behavior 28, 57–62.Erickson, R. P., & Covey, E. (1980). On the singularity of taste sensations:
What is a taste primary? Physiology and Behavior, 25, 527–533.Erickson, R. P., Priolo, C. V., Warwick, Z. S., & Schiffman, S. S. (1990).
Synthesis of tastes other than the ‘primaries’: Implications for neuralcoding theories and the concept of ‘suppression’. Chemical Senses, 15,495–504.
Gacula, M. C. (1997). Descriptive sensory analysis in practice. Trumbull,Connecticut: Food and Nutrition Press Inc.
Harker, F. R., Gunson, F. A., Brookfield, P. L., & White, A. (2002). Anapple a day: The influence of memory on consumer judgment ofquality. Food Quality and Preference, 13, 173–179.
Hootman, R. C. (1992). Descriptive analysis testing. ASTM manual series
MNL13. Philadelphia, Pennsylvania.Jeon, S. Y., O’Mahony, M., & Kim, K. O. (2004). A comparison of
category and line scales under various experimental protocols. Journal
of Sensory Studies, 19, 49–66.Kim, K. O., & O’Mahony, M. (1998). A new approach to category scales
of intensity I: Traditional versus rank-rating. Journal of Sensory
Studies, 241–249.Koo, T. Y., Kim, K. O., & O’Mahony, M. (2002). Effects of forgetting on
performance on various intensity scaling protocols: Magnitudeestimation and labeled magnitude scale (Green scale). Journal of
Sensory Studies, 17, 177–192.Laing, D. G., & Francis, G. W. (1989). The capacity of humans to identify
odors in mixtures. Physiology and Behavior, 46, 809–814.Laming, D. (1984). The relativity of ‘absolute’ judgements. British Journal
of Mathematical and Statistical Psychology, 37, 152–183.Lawless, H. T. (1983). Contextual effects in category ratings. Journal of
Testing and Evaluation, 11, 346–349.
Lawless, H. T. (1999). Descriptive analysis of odors: Reality, model orillusion? Food Quality and Preference, 10, 325–355.
Lawless, H. T., & Malone, G. J. (1986). A comparison of rating scales:Sensitivity, replicates and relative measurement. Journal of Sensory
Studies, 1, 155–174.Lee, H. S., Kim, K. O., & O’Mahony, M. (2001a). How do the signal
detection indices react to frequency context bias for intensity scaling.Journal of Sensory Studies, 16, 33–52.
Lee, H. J., Kim, K. O., & O’Mahony, M. (2001b). Effects of forgetting onvarious protocols for category and line scales of intensity. Journal of
Sensory Studies, 16, 327–342.Mazzucchelli, R., & Guinard, J.-X. (1999). Comparison of monadic and
simultaneous presentation modes in a descriptive analysis of milkchocolate. Journal of Sensory Studies, 14, 235–248.
McBride, R. L., & Finlay, D. C. (1990). Perceptual integration of tertiarytaste mixtures. Perception and Psychophysics, 48, 326–330.
Meilgaard, M., Civille, G. V., & Carr, B. T. (1991). Sensory evaluation
techniques (2nd ed.). Boca Raton, FL: CRC Press Inc.Mellers, B. A. (1983a). Reply to Zwislocki’s views on ‘‘absolute” scaling.
Perception and Psychophysics, 34, 405–408.Mellers, B. A. (1983b). Evidence against ‘‘absolute” scaling. Perception
and Psychophysics, 33, 523–526.Mojet, J., & Koster, E. P. (2002). Texture and flavour memory in foods:
An incidental learning experiment. Appetite, 38, 110–117.Neilson, A. J., Ferguson, V. B., & Kendall, D. A. (1988). Profile methods:
Flavor Profile and Profile Attribute Analysis. In H. Moskowitz (Ed.).Applied sensory analysis of foods (Vol. I, pp. 21–41). Boca Raton,Florida: CRC Press.
O’Mahony, M. (1995). Sensory measurement in food science: Fittingmethod to goals. Food Technology, 49(April), 72–82.
O’Mahony, M., Atassi-Sheldon, S., Rothman, L., & Murphy-Ellison, T.(1983). Relative singularity/mixedness judgments for selected tastestimuli. Physiology and Behavior, 31, 749–755.
Pangborn, R. (1960). Taste interrelationships. Food Research, 25, 245–256.Parducci, A. (1963). Range–frequency compromise in judgment. Psycho-
logical Monographs, 77, 1–50.Parducci, A. (1965). Category judgment: A range–frequency model.
Psychology Review, 72, 407–418.Parducci, A. (1968). The relativism of absolute judgments. Scientific
American, 219, 84–90.Park, J. Y., Jeon, S. Y., O’Mahony, M., & Kim, K. O. (2004). Induction of
scaling errors. Journal of Sensory Studies, 19, 261–271.Rankin, K. R., & Marks, L. E. (1991). Differential context effects in taste
perception. Chemical Senses, 16, 617–629.Riskey, D. R. (1986). Use and abuses of category scales in sensory
measurement. Journal of Sensory Studies, 1, 217–236.Riskey, D. R., Parducci, A., & Beauchamp, G. (1979). Effects of context in
judgments of sweetness and pleasantness. Perception and Psychophys-
ics, 26, 171–176.Rochman, D., Guinard, J.-X., & O’Mahony, M. (1997). Eliminating
artifacts in the study of singularity/mixedness of taste stimuli. Journal
of Sensory Studies, 12, 181–193.Schifferstein, H. N. J. (1994). Sweetness suppression in fructose/citric acid
mixtures: A study of contextual effects. Perception and Psychophysics,
56, 227–237.Schifferstein, H. N. J. (1995). Contextual effects in difference judgments.
Perception and Psychophysics, 57, 56–70.Schifferstein, H. N. J. (1996). Cognitive factors affecting taste intensity
judgments. Food Quality and Preference, 7, 167–175.Schifferstein, H. N. J., & Frijters, J. E. R. (1990). Sensory integration in
citric acid/sucrose mixtures. Chemical Senses, 15, 87–109.Schifferstein, H. N. J., & Frijters, J. E. R. (1992). Contextual and
sequential effects on judgments of sweetness intensity. Perception and
Psychophysics, 52, 243–255.Sieffermann, J. M. (2000). Le Profil Flash: Un outil rapide et innovant
d’evaluation sensorielle descriptive. In: L’Innovation: de l’idee au
succes. Recontres Agoral 2000. Douziemes Recontres Scientifiques et

R. Ishii et al. / Food Quality and Preference 18 (2007) 440–449 449
Technologiques des Industries Alimentaires, 22 et 23 Mars, Montpelier(pp 335–340). Paris, TEC & DOC.
Sjostrom, L. B., Cairncross, S. E., & Caul, J. F. (1957). Methodology ofthe Flavor Profile. Food Technology, 11, 20–24.
Stampanoni, C. R. (1993). The ‘Quantitative Flavor Profiling’ technique.Perfumer and Flavorist, 18, 19–24.
Stampanoni, C. R. (1994). The use of standardized flavor languages andQuantitative Flavor Profiling techniques for flavored dairy products.Journal of Sensory Studies, 9, 383–400.
Stillman, J. A. (1993). Context effects in judging taste intensity: Acomparison of variable line and category rating methods. Perception
and Psychophysics, 54, 477–484.Stone, H., & Sidel, J. (1993). Sensory evaluation practices. San Diego,
California: Academic Press.Stone, H., & Sidel, J. (1998). Quantitative Descriptive Analysis: Develop-
ments, applications and the future. Food Technology, 52(August), 48–52.Stone, H., Sidel, J., Oliver, S., Woodlsey, A., & Singleton, R. C. (1974).
Sensory evaluation by Quantitative Descriptive Analysis. Food Tech-
nology, 28(November), 24–34.
Theunissen, M., Tuorila, H., & Ahlstrom, R. (1993). Recalling tasteintensities in sweetened and salted liquids. Food Quality and Prefer-
ence, 4, 97.Tuorila, H., Theunissen, M. J. M., & Ahlstrom, R. (1996). Recalling
taste intensities in sweetened and salted liquids. Chemical Senses, 21,29–34.
Vanne, M., Laurinen, P., & Tuorila, H. (1998). Ad libitum mixing in ataste memory task: Methodological issues. Chemical Senses, 23,379–384.
Vanne, M., Tuorila, H., & Laurinen, P. (1998). Recalling sweet tasteintensities in the presence and absence of other tastes. Chemical Senses,
23, 295–301.Vickers, Z., & Roberts, A. (1993). Liking of popcorn containing different
levels of salt. Journal of Sensory Studies, 8, 83–99.Zwislocki, J. J. (1983). Absolute and other scales: Question of validity.
Perception and Psychophysics, 33, 593–594.Zwislocki, J. J., & Goodman, D. A. (1980). Absolute scaling of
sensory magnitudes: A validation. Perception and Psychophysics, 28,28–38.