Embed Size (px)
Citation preview

Whole cotton seed a sFEED SUPPLEMENT FOE
SMALL RUMLNANTS

Project Team/Authors
University for Development Studies staff
Gabriel AyumTeyeHerbert KwablaDeiAnthony Amison AgbolosuBenjamin AlenyoregeJakper NaandamAddah WesehAbdul-Rahman Ibn IddrissTerry AnsahFred AdziteyPeter T. BirteebFrancis AddyJuliana BawahEdward Sallah
University of Glasgow staff Ian Jeffcoate
CollaboratorsAlbert Addo-Kwarfo ARIPatrick Mbii MoFA

Foreword
FOREWORD
The Northern Region of Ghana is home to most cotton companies in the country, There is, therefore a large annual output of whole cotton seed (WCS) in the region. In an outgrower programme of the various cotton companies, the farmers are given inputs to produce cotton and sell to the company. Though large quantities of WCS are produced annually in the region, little cotton seed is being used to improve growth or fattening and reproductive performance of small ruminants. Rearing of small ruminants (sheep and goats) is also a major source of livelihood for most rural farmers including those in the cotton outgrower scheme in Northern Ghana.
Mortality and morbidity are major constraints to increasing the flock size of small ruminants in the dry season when feed resources are scarce in the Northern Ghana. The utilization of WCS will help address these problems and increase household income, and also improve food and nutrition security
Under DelPHE project No: ACC/992/2, the Department of Animal Science of the University for Development Studies through several on-farm and on-station experiments has established the nutritional benefits of WCS in the feeding of small ruminants in terms of growth and reproduction. It also assessed the effect o f WCS on the meat and carcass qualities. This handbook sought to share the information on the benefits of improving performance of small ruminants with WCS, while at the same time maintaining the quality of their meat.
Prof. Gabriel A. TeyeLocal Project Coordinator, TamaleAugust, 2011

Acknowledgements
ACKNOWLEDGEMENTS
The project team is grateful to the Department for International Development (DFID) UK who provided the funds for the DelPHE project, and the British Council, Ghana for facilitating the project culminating in the production of this handbook. Our special commendation goes to the British Council Staff both local and abroad for the cordial working relationship they offered us.
We are equally grateful to the University for Development Studies, Ghana and the University of Glasgow, UK for allowing us time and space to undertake this project successfully.
This project was smoothly carried out because of the cooperation of team members, the livestock/cotton farmers, the cotton company, and other collaborators from both Universities which we duly appreciated
Lastly we are grateful to the laboratory staff, students, drivers and farm labourers who contributed in one way or the other to the success of this project

Summary
SUMMARY
Effect of Whole Cotton Seed Supplementation on Growth Performance of Small Ruminants
On-farm experiments were conducted in some communities in the Tamale Metropolis, Tolon-Kumbungu and Savelungu-Naton districts all in the Northern Region of Ghana. In one of the trials in Tolon, 181 sheep and 20 goats were used. Animals were weighed monthly for eight months. Those animals on whole cotton seed (WCS) supplementation recorded higher body weight gain per day than their non supplemented counterparts (11.5 against 9.2 g/day in sheep and 17.0 against 11.8 g/day in goats). Supplemented lambs also gained higher final weight than the non supplemented lambs (11.7 kg vs. 9.3 kg). In general, the supplemented animals were healthier and in good body conditions (Fig. 2).
In another experiment at Saatingli and Zugyuri communities, 72 sheep and 23 goats from five different farms were used. It was observed that, supplemented sheep gained higher weights per day than their non-supplemented counterparts (11.3 g vs. 7.7 g). In the case of the goats, the non- supplemented group showed negative growth that is weight lost.
Plate 1: Sheep looking emaciated before Plate 2: healthy sheep after cotton seed feedcotton seed feed supplementation supplementation
Effects of Whole Cotton Seed on the Fertility of Ewes and Growth Performance of LambsA total of 209 Ewes in three Districts (Savelugu-Naton, Tolon and Tamale) were studied for over five months. In all these Districts, lambs birth and monthly weights were higher for lambs from supplemented ewes clian non supplemented ones. This was a£:;Duted to the effect of WCS on the ewe’s milk production which resulted in higher lamb weight.This study recorded a survival rate of 97.1 % for supplemented lambs and 89.7 % for non supplemented lambs. This showed that improved nutrition could reduce mortality in lambs. Cotton seed which is abundant in the Region can be used to solve nutritional needs of ewes and lambs in the dry season.

Summary iv
Effect of Whole Cotton Seed on the Carcass and Meat quality of Small RuminantsThis study was both on-farm and on-station to evaluate the effects of WCS supplementation on the carcass and meat quality of Djallonke sheep. Parameters measured include; live weight, carcass length, bled weight, warm and cold carcass weight, primal cuts weight, visceral weight, longissimus dorsi, fillet, mesenteric fat and marbling fat contents. The eating quality, thus, the flavour, juiciness, tenderness and. the overall liking of the meat was also assessed by a taste panel of ten assessors. Supplementation had no adverse effect on carcass quality, but significantly improved juiciness and overall liking. The results suggested that whole cotton seed could be used as a supplementary feed to improve meat quality of the Djallonke sheep.
Effect of Whole Cotton Seed on worm load in Djallonke Sheep in peri-urban areasThree types of worms; Strongyle spp, Strongyloides spp, and Emiria spp. were identified in both supplemented and non-supplemented groups of animals. However, supplemented animals had lower worm load than their non-supplemented counterparts in all categories (rams, ewes, kids and lambs). Considering the economic importance of worms in animal production, farmers could take advantage of cotton seed supplementation to improve production.
Effect of Whole Cotton Seed on Haematological parameters in Djallonke SheepHaematological characteristics investigated include; Hb, PCV, RBC, WBC, MCV, MCH, MCHC and Leukocyte differential count. Results obtained indicated no adverse effect of cotton seed on any of the blood parameters studied. This suggests that the inclusion level of WCS (0.34 kg per animal per day) was probably too low to cause any changes in those parameters. These findings suggest that farmers can use WCS to maintain, fatten and improve the fertility of their animals without any detrimental effect on their physiology.
MAIN RECOMMENDATIONS
Whole Cotton seed could be fed to small ruminants as feed supplement at the recommended levels of 0.34 to 0.4 kg per animal per day to:1. Prevent weight loss during feed scarcity2. Minimize the incidence of worm load3. Improve eating quality of their meat

Table of Contents v
TABLE OF CONTENTS
Title page......................................................................................................................... iAuthors...................................................................................................................... •'.... iForeword.................................................................. ..................................................... -iAcknowledgements............................ ....... t.... ..............................................................-iiSummary and Main Recommendations............................................................................ iii-ivTable of Contents.............................................................................................................vAbbreviations....................................................................................................................viList of tables....................................................................................................................... viiList of photographs............................................................................................................ viii
CHAPTER ONEIntroduction....................................... ................................................................................ 1
CHAPTER TWOThe Research Projects...................................................................................................... 62.1 Effect of whole cotton seed supplementation on growth performance....................... 6
Experiment 1 : ........................................................................................................... 6Experiment 2:............................................................................................................ 8Experiment 3:................... .........................................................................................10
2.2 Effect of whole cotton seed on carcass and meat quality of Djallonkesheep and goats......................... ..... ...........................I ......................................••■■■Experiment 1:.................................................... ........................................................14Experiment 2:........................................................................... ............................••■■•19
2.3 The effect of whole cotton seed on worm load in Djallonke sheep and goats.............Experiment 1:.......................................................................................................... 23Experiment 2:.......................................................................................................... 24
2.4 Effect of whole cotton seed on blood parameters of Djallonke sheep and goats........Experiment 1:.......................................................................................................... 27Experiment 2:.......................................................................................................... 30
CHAPTER THREE.......................................................................................................... ^Conclusion and Recommendations...................................................................................-36References........................................................................................................................37

Abbreviations vi
ABBREVIATIONSADWG Average Daily Weight GainBWT Birth WeightCRED Center for Research on Economic DevelopmentCSFs - Colony-Stimulating FactorsCT/Kg ■ Condensed Tannins per KilogramDCP - Digestible Crude ProteinDM Dry MatterEDTA Ethylenediaminetetraacetic acidEE - Ether Extracte.p.g ij§ T ^ i4 egg per gramFAO - Food and Agriculture OrganisationFASDEP - Food and Agriculture Sector Development PolicyFEC i Faecal Egg CountDelPHE f Development Partnership for Higher EducationGDP Gross Domestic ProductGM-CSFs - Granulocytes Colony-Stimulating FactorsHb HaemoglobinKgTDN Kilogram of Total digestible NitrogenLPIU — Livestock Planning and Information UnitMeal ME - J Mega calories of Metabolisable energyMCH Mean Corpuscular HaemoglobinMCHC Mean Corpuscular Haemoglobin ConcentrationMCSFs Monocytes Colony-Stimulating FactorsMeal DE - Mega calories of digestable energyME/Kg f - Metabolisable energy per KilogramMJ ME/Kg - Megajoules of Metabolisable energy per KilogramNAES - Nyankpala Agriculture Experiment StationNCPA - National Cottonseed Production AssociationPCV Packed Cell VolumePg PicogramsPPR Peri-Parturient RiseRBCs ’ ’ Red Blood CellsRPM m Revolutions per MinuteSEM Standard Error of MeanSPSS - Statistical Package for Social ScienceSpp - SpeciesTLU ' - . i Tropical Livestock UnitTMS Tamale Meteorogical StationUDS University for Development StudiesWADG — West Africa Dwarf GoatWADS West Africa Dwarf SheepWBCs — White Blood CellsWCS Whole Cottonseed

List of tables Pa9e Nos.
Table 1 Effects of cotton seed supplementation on the growthperformance of ewes and their lambs............................................. ......... ®
Table 2 Effect of whole cottonseed supplementation on growthperformance of Djallonke sheep and g o a t s . ............p...................9
Table 3 Growth performance of female small ruminants (ewes and does)during whole cotton seed supplementation......... ........................- ............10
Table 4 Weight (kg) gain of male sheep (rams and castrates)..................................12Table 5 Live weights, carcass length, bled weight, warm and cold and
carcass weights of Djalonke Sheep and Goats.......................................... 15Table 6 Weights oiLongissimus dorsi, fillet, mesenteric fat and marbling
fat content of Djalonke Sheep and Goats........................ - ........................15Table 7 Weight of primal cuts of Djalonke sheep and Goats....... .............................16Table 8 Visceral weight of Djalonke Sheep and Goats........................................... 16Table 9 Eating quality of meat from Djalonke sheep and Goats............................... 17Tablel 0 Live weights, weights of warm and cold carcass, thigh, shoulder
and LD muscle................................................... ............ .......................20Table 11 Crude protein, ether extract, percentage moisture and drip loss of
LD muscle............................................................................................. 20Table 12 Eating qualities of the LD muscle......................... .................................... 21Table 13 The effect of cottonseed supplementation on Faecal worm Egg
Count (e.p.g) in Djallonke sheep.................... .........................................23Table 14 The means of worm load (eggs per gram of faecal sample) for
Non- cotton seed and cotton- seed supplemented sheep and goats............ 24Table 15 The incidences of different worm ova (e.p.g) in the various age
groups of sheep and goats......................................................................25Table 16 Effect of cotton seed supplementation on some haematological
parameters in Djallonke sheep.............................. ...................... jp f....... 28Table 17 Erythrocytes values in Djallonke Rams.......... ...........................................30Table 18 Leukocytes values in Djallonke Rams...................................................... 32Table 19 Biochemical Parameters of Djallonke Rams.................................. .............33
List of Tables ___________________________ vfi

List of Photographs
List of Photographs Page Nos.
Plate 1 Sheep looking emaciated before cotton seed feed supplementation............... iiiPlate 2 Healthy sheep after cotton seed feed supplementation.................................. iiiPlate 3 Bare grazing land with no grass for these animals during the dry
season, hence the need for supplementation.................
Plate 4 Tethering of animals during the rainy season due to intensive Cropping......... 3Plate 5 Experimental animals in an improved structure and cotton seed in a
wooden feeder.................................................................... .......................... 7
Plate.6 Weighing of an experimental animal with a hanging scale...............................7

Introduction 1
CHAPTER ONEINTRODUCTION
Small ruminants mostly reared in Northern Ghana are the West African Dwarf sheep also known as the Djallonke and the West African Dwarf (WAD) goat. They are raised by crop farmers as a secondary enterprise (Jahnke, 1982). The size and early maturity of sheep and goat give them distinct economic advantage in small holder situations. These include their efficient use of marginal lands, faster turn-over due to earlier sexual maturity and attainment of slaughter weight (Rege, 1994). In addition, they can be kept by anybody irrespective of hisI her religion, age or sex (Garri-Kwaku, 1992). Koney (1992) estimated that 41% of all small ruminants in Ghana are owned by illiterate subsistence farmers in the 3 Northern regions. Small ruminants are raised in small groups of about 5-10 animals per household with the numbers rising from the southern to northern parts of the country (Koney, 1992), and are managed under the traditional system. According to Oppong-Anane (2006), sheep and goats populations in Ghana stand at 3,112,000 and 3,925,000 respectively. About 40% of these populations are in the Northern Savanna Zone (LPIU, 1997). They play an important role in the socio-cultural life of the farming communities as partial determinant of wealth, offering of bridal dowry and contributes towards meeting food needs in addition to serving as a major source of income and means of rural poverty reduction (Koney, 1992; Alhassan et a!., 1995). Small ruminant farmers fatten male sheep for sale for the Islamic festivities (Eidul-Fitr and Eidul-Addah) when rams are used for sacrifice and therefore are more expensive than the ewe. They are also an important source of protein in Ghanaian dishes and form the most preferred type of meat (Annor-Frimpong and Danquah, 1993). In sub-saharan Africa, small ruminants supply over 3.2 million tonnes of meat per year, representing 72% of the total meat production (Rege, 1994).
The Djallonke sheep is hairy, small and stabilize ecotype which is highly prolific (Ngere and Aboagye, 1981). The rams have a mane and a throat ruff, and a thin tail of medium length (Gatenby, 1991). They have the advantage of almost universal acceptance of their meat and they play important socio-economic roles in Ghana. Though highly prolific, its multiplication in the tropics has not been up to expectation due to factors such as poor management practices and the high incidence of parasites and diseases (Isoun et al., 1985).
The West African Dwarf (WAD) goat is trypano-tolerant and is adapted -o the humid forest zone. Twinning is very common and average litter size range from 1.4 to 1.85. Goats are considered food security animals because they are frequently sold to buy food during the hunger periods when the food bams are empty (Karbo and Bruce, 2000). Goats are regarded as poor man’s cow (Peacock, 1996 and Stephen, 2005) because of their ability to provide sufficient meat, milk, income and skin to the small holder farmer and are highly adaptable to
Introduction 2
arid and semi-arid areas of Africa (FAO, 2003). Factors influencing this ability include their small body size, low metabolic requirements, ability to reduce metabolism and digestive efficiency in relation to feeding strategies, efficient usage of water, as well as their ability to economize the nitrogen requirements via urea recycling and nitrogen conservation (Silanikove, 2000).An aspect of small ruminant production that has militated against the industry over the years is inadequate supplementary feeding throughout the year. Erratic rainfall pattern and improper land use systems such as bush fires and fuel wood extraction, have led to the decline in the quality and quantity of the biomass which support livestock (Alhassan et al., 1995). Livestock feed and feeding have always been constraints in animal production in sub- Saharan Africa leading to reproductive waste, low birth weight and high pre-weaning mortalities (Sumberg, 1985 and Reynolds, 1986). In Northern Ghana, livestock production is associated with lots of constraints among which feeding is a crucial factor. Even in the rainy season, ruminants are underfed when confined due to cropping activities. The feeding problem is more serious during the dry season due to bushfires, low quality roughages and lack of supplementary feeding resulting in loss of body weight, high susceptibility to diseases, production of weak offspring and high pre-weaning mortalities (Ansah et al., 2006).
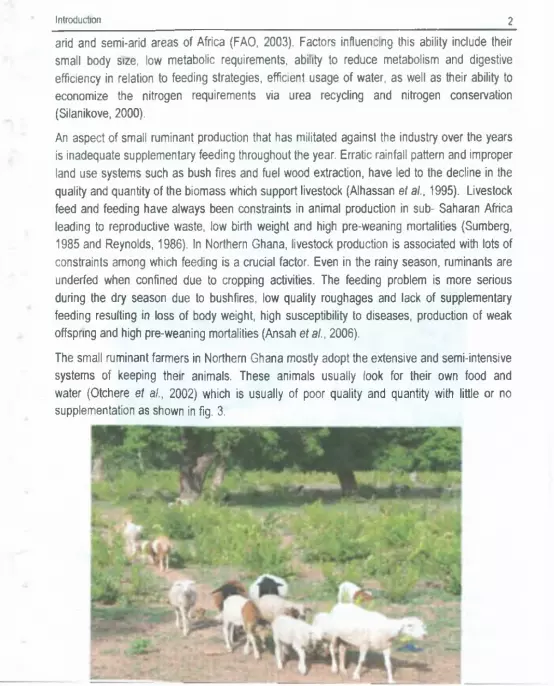
The small ruminant farmers in Northern Ghana mostly adopt the extensive and semi-intensive systems of keeping their animals. These animals usually look for their own food and water (Otchere et al., 2002) which is usually of poor quality and quantity with little or no supplementation as shown in fig. 3.

Introduction 3
Climatic conditions in the savannah zone do not permit the growth of natural forage throughout the year (Carles, 1983). Nutrition and body condition of ewes have been found, to have significant effect on ovulation and lambing rates of all breeds of sheep. Whole cotton seed has been used with satisfactory results for supplemental protein for beef cattle and presumably could be used in a similar manner for sheep and goat (Cuilison et al., 1987). Feeding strategies that maintain or increase lambing/kidding in sheep and goat, and reduce lamb/kid mortality are therefore very important in every feeding programme. Apart from the unfavourable climatic conditions and genetic factors that limit performance, nutrition is the most important factor associated with the slow growth of small ruminants in Ghana.
Tethering of animals during the rainy season (Fig 4) to prevent crop destruction results in their inability to meet nutritional requirements. This accounts partly for abortion, weight loss, susceptibility to diseases and pests and sometimes death (Otchere et al., 2002).
Plate 4 . Tethering of animals during the rainy season due to intensive cropping
One alternative for increasing small ruminant production which has not been given much attention is the use of agricultural by-products as feed supplement. These are the products left after harvesting and processing of agricultural produce. Examples include cassava, yam and sweet potato peels, whole cottonseed (WCS) and cereal bran. For increased small ruminant production to be achieved, feed supplementation using agricultural by-products is necessary to support the scarce ~nd low quality roughage-based feed espec ially during the dry season.
The efficient use of agricultural by-products such as whole cottonseed as supplementary feed for optimum growth performance and increased small ruminant production will be helpful. Most farmers in Northern Ghana, however, spread the cottonseed left after planting on the field as waste.
Introduction 4
Cotton is a tropical crop which requires abundant sunshine, long warm growing season and good rainfall distribution (Koli, 1973). This makes it suitable for Northern Ghana. Cottonseed is a by-product obtained from ginning of cotton and is often feed to farm animals without adverse effect. It has a chemical composition of 92% dry matter, 23% crude protein, 21% crude fiber, 0.16% Ca, 0.75% P, 4.23% Mcal/kg and 3.47% MEcal/kg (Church 1991). Cotton seeds are source of by-pass proteins, vitamin, A, D and E, as well as cycloid prepanoid fatty acids which are implicated in energy and milk production in sheep and cattle. Although WCS has been widely used in cattle feeding systems, its use for small ruminants, has not been fully exploited (Arieli, 1998). Karbo and Bruce (2000) reported that 22 200 - 24 220 metric tons of cotton seed are produced annually in Northern Ghana hence, cotton seed could be readily available feed supplement in the dry season. Though WCS may be a very good source of protein and oils to small ruminants, this may not be known to local farmers, particularly those in Northern part of Ghana.
In India, Asia and Iraq as well as Latin America cotton seed meals served as an engine of growth and production in small ruminants industry (Hendraton, et al; 1991). Though Cotton seed contain gossypol a toxic compound (0.03-0.3%) which is injurious to swine, poultry and young calves when fed as supplement (Haridraton, et al; 1991), in adult sheep, goats and cattle, there is no ill- effect of feeding cotton seeds. In sheep and goats, the detoxification mechanism is found to be inactivated in the rumen (Church, 1991). Apart from the energy production, cotton has high content of crude protein and fibre as well as reduced methane production. It has traditional advantages due to its high lipids content and possibly low heat increment (Ariel; 1992). Cotton seeds as well as meals and cake prepared from it are rich in protein than the corresponding materials from a number of other oil bearing seeds commonly used as feed supplement and concentrates for feeding sheep, goats and cattle.
When ruminants are fed with good quality and quantity of cotton seeds supplement they have ability to withstand diseases and endo-parasites infestation (Hadjipanayiotou, et at, 1993). Feeding sheep on cotton seed during grazing improved their growth and weight gain by 72% and increased milk yield in the lactation mothers due to the presence of prolactin and progesterone hormone as compared to non supplement group (Habib et al, 1991).
Helminthosis is widespread in tropical Africa and seriously affect the productivity of small ruminants. Worms found in the animal causes a progressive emaciation, reduced feed consumption, weight loss and listlessness which generally slows growth performance of the animals. Koney (1992) noted that worms are responsible for considerable ecc..omic loss in livestock production and that, the most common health problem of domestic sheep, especially young lambs, is internal parasites (worms). The extensive system of rearing small ruminants predisposes them to gastrointestinal worms in the dry season when they graze stubble close to the ground. However, good quality cotton seeds supplementation can masks the effects of

Introduction 5
worms’ infestation and improved the growth rate of the animal. Beside the role of whole cottonseed in meeting the protein and energy needs of the animal, it also plays an important role in worm control through the effect of gossypol on worms of the gastrointestinal tract (Rochfort, 2008). Not much has been done on effects of cottonseed supplementation on worm load in small ruminants, particularly in sub Saharan Africa.According to Vestergaard et al. (1997) and Langholz and Balliet (1997), tenderness of meat tends to be higher when animals grow rapidly particularly just before slaughter. Feeding of small ruminants is therefore aimed at ensuring requirement for optimum production (Ranjhan, 2001). Feeding have effect on meat quality therefore this study is to find out if supplementing small ruminants with whole cotton seed will have any effect on the quality of mutton and chevon.A number of conditions can decrease red blood cells production, these include ingestion of toxic materials and chemotherapeutic agents such as chloramphenicol which depresses the bone marrow erythrocyte protein, (Sirois, 1995). A number of hormonal and dietary factors are needed for haemoglobin production, adequate protein, iron, and vitamins are very essential for haemoglobin production. Cobalt and copper are also used for the syntheses, (Hollinghead, 1981). There is however, little or no information on the effects of feeding these WCS to, small ruminants on blood formation.OBJECTIVESThese studies were designed to investigate the effect of whole cottonseed supplementation on Djallonke sheep and goats under the extensive system of management in the following areas:❖ Growth and reproductive performance❖ Weight gain of rams, with the intention of using it for fattening rams for market❖ Worm load in different age groups of sheep and goats❖ Blood parameters❖ The carcass and meat qualities

The Research Projects 6
CHAPTER TWOTHE RESEARCH PROJECTS2.1 EFFECT OF WHOLE COTTON SEED SUPPLEMENTATION ON GROWTH PERFORMANCE Experiment 1 Study AreaThe first study was in the Tolon/Kumbungu District. The specific communities were Yobzeri, Tali and Gbrumani. The area experiences a unimodal rainfall pattern with an average annual rainfall of 1060 mm and the highest is recorded around August and September. The rainy season starts in May/June and ends in October whiles the dry season extends from November to April. Temperatures are within the range of 20°C and 42°C. The cold dry harmattan and bushfires are some of the characteristics of the dry season in the area with the harmattan lasting three months (November-February); (NAES, 1984). The vegetation of the area is characterised by abundant grasses with sparse trees. Examples of the grasses include Andropogon gayanus, Cynodon dactylon and Cenchrus ciliaris. Some leguminous trees or shrubs found in the area are Leucaena leucocephala, Gliricidia sepium, Cajanus cajan, Centrocema pubescens, and Stylosanthes humilis. Crops usually cultivated in the area include maize, rice, guinea com, cowpea, yam, cassava and cotton.
Materials and methods Experimental AnimalsA total of 134 ewes and 37 lambs were used for this experiment Management PracticesThe animals were housed in landcrete pens roofed with thatch or iron sheet (Fig.5). The animals were confined in pens at night and released in the morning for grazing and return later in the evening in the dry season. In the mornings, the non-supplemented animals were released first for grazing then the supplemented animals were confined and fed with 0.34kg whole cottonseed per animal in feeding troughs before releasing them. In the wet season the animals are tethered because of cropping activities. Water is provided in watering troughs. The animals were routinely dewormed using Albendazole. Animals suffering from pneumonia, foot rot and sores were also treated using oxytetracycline injection, wound powder and iodine respectively. The pens were cleaned every two weeks and the beddings replaced.
Data CollectionThe weight of the animals were taken monthly for a period of nine months using a hanging weighing scale (Fig.6) for mature sheep and lambs, and kitchen sosjle for the newly-bom lambs. The data was use. io compute average daily weight gain as fc'iows.ADWG = • final weight - initial weigh x 1000
number of daysInitial weight was defined as the weight of the animals at the beginning of the experiment while final weight was the last weight of the animals at the end of the experiment

The Research Projects 7
Plate 6. Weighing of an experimental animal with a hanging scale

The Research Projects 8
Statistical AnalysisThe 2-tailed t-test was used to compare initial weights, final weights and average daily weight gain in all the groups of sheep and goats studied. All comparisons were done at 5% level of significance
Results and DiscussionBoth supplemented ewes and lambs gained weight slightly higher per day than their unsupplemented counterparts though the differences were not significant (P>0.05) (Table 1). A similar observation was made by Peprah and Amoako (2008) who reported that animals on cotton seed supplementation gained higher per day than those not on supplementation. The weight gain by the supplemented ewes and lambs may be attributed to the high energy and protein content of the whole cotton seed (Charray et al., 1992).
Table 1: Effects of cotton seed supplementation on the growth performance of ewesand their lambs.
Parameter Supplemented Mea ±sem
Non-Supplemented Mean ± sem
P-Value
Ewes (n=75) (n=59)Initial Weight (kg) 20.55 ± 0.55 19.89 ± 0 .63 0.43
ADWG (g/d) 7.02 ± 1 .3 2 6.37 ± 2 .08 0.78Final Weight (kg) 22.13 ± 0 .4 8 21.21 ± 0 .57 0.22
Lambs (n=22) (n=15)Initial Weight (kg) 4.86 ± 0.43 3.07 ± 0 .2 4 0.03
ADWG (g/d) 26.65 ± 2 .12 24.24 ±3.11 0.51Final Weight (kg) 11.68 ± 0 .56 9.33 ± 0.85 0.02
ADWG = average daily weight gain.
Experiment 2The experiment was conducted on-farm during the dry season over a period of 98 days, Sixty six (66) Djallonke sheep (ewes and rams) and twenty two (22) goats (bucks and nannies) were used for the study.
Experimental Animals and dietThe animals were randomly divided into two; supplemented (S) and non-supplemented (NS). Each of the two groups consisted of ewes, rams, bucks and nannies. The mean initial weights of the animals were taken. The animals were dewormed with an Albendazole. The qua' jties given to the various animals were bav^d on their initial weights. Animals were fed 0.34 kg per day.

The Research Projects 9
Data CollectionThe procedures used in experiment 1 were used. The supplemented animals were confined and fed with cotton seeds daily in the mornings before being released to join the other flock for grazing. The weights of the animals were determined every two (2) weeks. Daily feed intake and left over were also recorded throughout the experimental period.
Analysis of DataThe data was analysed using ANOVA by Genstat (edition 3).
Results and DiscussionThe effect of whole cottonseed supplementation on growth performance of Djallonke sheep and goat are shown in Table 2. Though the initial weights of the supplemented sheep (25.23 kg) was higher than that of non supplemented groups (20.70 kg) (P<0.05), there was, however, no significant differences (P>0.05) in the average daily weight gain and final weight between supplemented and non supplemented sheep. The weight gain per day were however, marginally higher for the supplemented than the non-supplemented group. The insignificant effect of supplementation on average daily weight gain reoorded in this study might be attributed to the fact that most of the animals used were already old and not expected to make any significant gains in weight.
Table 2: Effect of whole cottonseed supplementation on growth performance ofDjallonke sheep and goats.
Parameter Supplemented Non-Supplemented P-ValueMea ±sem Mean ± sem
Sheep (n=33) (n=33)Initial Weight (kg) 25.23 ± 1.10 20.69 ± 1 .6 4 0.025
ADWG (g/d) 11.28 ± 4 .74 7.66 ± 3 .19 0.527Final Weight (kg) 25.95 ± 0 .9 6 23.14 ± 0 .97 0.440
Goats (n=15) (n=7)Initial Weight (kg) 14.87 ± 1 .12 17.93 ±2.11 0.263
ADWG (g/d) 4.08 ± 2 .94 -1.75 ± 5 .29 0.309Final Weight (kg) 14.77 ± 1 .29 17.43 ± 1.99 0.267
ADWG = average daily weight gain.
The initial weights of the goats did not differ significantly (P>0.05) between supplemented and non-supplemented. However, while the supplemented goats gained 4.08g/day the non-supplemented goats lost 1.75g/day (Table 2).
The results of the growth performance o' the females (ewes and does) are presented in Table3. The average initial weights, daily weight gained and final weights of supplemented does did not differ significantly (P>0.05) from that of non supplemented does. Similarly, there were no differences (P>0.05) in the average initial weights, daily weight gained and final weights of supplemented and non-supplemented ewes. In this study, the whole cottonseed resulted in marginal weight gain of 5.17g/day in the supplemented does as against the weight

The Research Projects 10
loss of -2.45 g/day in the non-supplemented does. Similarly, ewes on supplementation significantly (P<0.05) gained 7.20g/day than non-supplemented ewes that lost -3.38 g/day. The findings of this study suggest that supplementary feeding plays a vital role in the improvement of nutritional status of animals. This agrees with Crowder and Chheda (1982), that supplementation of animal diet with energy or nitrogen yielding feedstuff's during long period of nutritional inadequacy improve body status of animals by increasing their body weight as observed for the ewes from the supplemented group.
Table 3: Growth performance of female small ruminants (ewes and does) duringwhole cottonseed supplementation
Parameter Supplemented Non-Supplemented P-Value Mea ± sem Mean ± sem
Does (n=9) (n=6)Initial Weight (kg) 18.30 ± 1.16 19.75 ± 1 .30 0.633
ADWG (g/d) 5.17 ± 4 .75 -2.45 ± 6 .2 0 0.341Final Weight (kg) 18.89 ± 0 .76 19.25 ± 0 .9 7 0.441
Ewes (n=25) (n=21)Initial Weight (kg) 26.44 ± 0 .862 26.64 ± 1.02 0.879
ADWG (g/d) 7.20 ± 3 .8 2 -3.38 ± 3 .33 0.047Final Weight (kg) 26.80 ± 0.93 26.17 ± 0 .6 3 0.592
ADWG = average daily weight gain.
Experiments Study AreaThese studies were conducted on-farm in all the three districts: Savelugu, Tolon and Tamale concurrently. The temperature, rainfall pattern and vegetation are the same as described in experiment 1.
Materials and methodsExperimental animalsA total of 209 ewes were used for this study. The feeding trial lasted for five months.
Housing and ManagementThe sheep were semi-intensively managed. They were released on free range between the hours of 8 am and 6 pm. Rice straw was used as bedding materials in the pen. The housing unit was routinely cleaned and old straws replaced with new ones. The animals were washed with acaricide o clean them off ectoparasites and dewormed against endoparasites. Foot trimming of over grown hooves and veterinary attention were given when these were necessary. A total of 114 ewes were supplemented with whole cottonseed and 95 were without supplementation. Supplementary feeding was done early morning before the animals went out for grazing. Water was provided twice daily, in the afternoon and evening. Mating was unrestricted in the herd.

The Research Projects 11
Data collectionLambs birth weights were taken within 24 hours of birth and where it was not possible to weigh at the right times, an estimate was made after a few days of birth. Lambs were weighed on monthly basis using a spring balance. These weights were used to calculate lamb growth rate. Prolificacy was calculated as the total number of lambs bom alive per number of ewes lambing (Gatenby, 1991). The rate of lamb survivability was determined as a proportion of lambs weaned to the number of lambs born (Ngere and Aboagye, 1981).
Statistical AnalysisThe data was analysed using AN OVA by Genstat (edition 3).
Results and discussion Survivability of lambsMortality was very low in all the three districts. Generally, death rate was slightly higher (6.9 %) in the non supplemented lambs compared to the supplemented ones (5.7%). These results agree with the findings of other studies. Fomuyam and Mboni (1989) stated that supplemented Djallonke lambs in Cameroon had a 100% survival rate. In Ghana, Ngere and Aboagye (1981) reported 99% survival rate in Djallonke lambs. Similarly, Sum berg and Mack (1985) reported 84% survival rate in Cote d’lvoir. This study also recorded survival 97.1 % for supplemented lambs and 89.7 % non supplemented lambs in all the three districts. Some mortality could be linked to nutritional deficiency therefore, good nutrition may help correct mortality
Effect of whole cottonseed on growth performance lambs according to sexIn general, the supplemented males were heavier (P>0.05) than the non supplemented males, the same applies to the females. Fall et al., (1982), also recorded birth weight of males at 1.66 kg and 1.52 kg for females. No significant difference was observed between the mean growth performance of male (2.6 kg) and female (2.5 kg) lambs that were under cottonseed supplementation. Males however, tended to have higher weight gain than females. The same applies to the lambs under no cottonseed supplementation. This might be due to the fact that males put on muscle which caused an increase in weight. This agrees to the findings of Tuah and Baah (1985) who studied frie effect of sex of the lamb growth among the Djallonke sheep and found males (1.82 kg) to weigh significantly more than females (1.70 kg) at birth. Also according to Wilson (1987), sex had significant effects on the lamb growth up to 12 month of age.
Effect of whole cottonseed on Weight gain of male sheep (rams and castrates)In Savelugu-Nanton, the mean initial and final weights for the supplemented were 10.47 and 15.98 Kg while that for non-supplemented were 8.60 and 12.43 Kg (Table 4). The mean daily weight gains were 36.2 and 25.2g for the supplemented and non- supplemented groups respectively.

The Research Projects 12
Table 4: Weight (kg) gain of male sheep (rams and castrates)District Treatment Initial wt(kg) Final wt(kg) Wt gain (g/d)
Savelugu Supplemented 10.47 15.98 36.20Non-supplemented 8.60 12.43 25.20
Tamale Supplemented 13.02 16.70 24.20
Non-supplemented 11.52 13.47 14.50
Tolon Supplemented 11.72 15.95 27.80
Non-supplemented 10.15 12.88 17.90Seed 2.461 1.811 3.30
P-value 0.505 0.115 0.01
In the Tamale Metropolis, the mean initial and final weights for the supplemented and non-supplemented animals were 13.02 and 16.70 kg, 11.70 and 13.47kg respectively (Table 4). The supplemented recorded a mean daily weight gain of 24.2g while the non-supplemented recorded 14.50g.
In the Tolon district, the supplemented animals recorded a mean daily weight gain of 27.80g while the non-supplemented recorded 17.90g. In all the three districts, there were significant differences (P<0.01) (Table 4) in the weight gains between supplemented and non-supplemented animals.
From the results, it was clear that the supplemented animals in the three districts made good use of cotton seed and that might have caused the increases in weight gain as compared to non-supplemented ones. This conforms to the observation of Kassu (1989), that agricultural by-products are contributors to high turnover in ruminants.
Cottonseed utilization and side effectNo side-effect of cottonseed was seen during the trial period. No feeding related death was recorded throughout the trial. According to Rao and Pirate (1973), cottonseed and its products contain an anti-nutritive factor known as gossypol which is a polyphenolic compound which is harmful to monogastrics. Ruminants are however, less susceptible to gossypol toxicity because of the detoxification mechanism present in the rumen. This might be why no adverse effect was realized in the animals fed the cottonseed. Frazer et al (1973) noted that, readily available protein by-product such as cottonseed increased digestibility and utilization of forage and provided the needed protein for growth.

The Research Projects 13
2.2 EFFECT OF WHOLE COTTON SEED ON CARCASS AND MEAT QUALITY OF DJALLONKE SHEEP AND GOATS
Experiment 1This study was conducted on-farm in three districts, Savelugu, Tolon and Tamale. The animals used for the carcass evaluation were sampled from those used for the growth performance trials.
Feeding and Management, Slaughtering and SamplingAfter twelve months of feeding, a total of twenty-six animals; twenty sheep and six goats were randomly selected for slaughtering at the University for Development Studies Meat Processing Unit. Eleven were selected from Tolon district, Ten (10) from Savelugu district and five (5) from Tamale. The final live weights of the selected animals were recorded before slaughtering. The animals were bled by severing the carotid arteries in the jugular furrow close to the head.Singeing was done by the use of fire and a knife to scrape off the hair on the skin. Evisceration was done immediately after singeing according to standard procedures.
Carcass and meat quality evaluation Carcass WeightImmediately after evisceration, hot carcass weights were taken using a digital scale. The carcasses were then chilled overnight and cold carcass weights were taken 24 hours after slaughtering using the same equipment.
Carcass LengthCarcass lengths were measured using a tape measure from the pelvic bone to the anterior edge of the first rib.
Weights of Primal cuts, Muscles and VisceralsThe weights of the various primal cuts were taken. These included the head, neck and legs. Fillet and M longissimus dorsi were the main muscles that were also weighed. Weights of filled and empty rumen as well as other viscerals were also taken.
FatsFats around the recticulo-rumen (omental) and around the intestines (mesenteric) were also removed and weighed for each carcass.
Sensory analysisEating quality was assessed by a taste panel consisting of ten assesors who evaluated the following characteristics: tenderness, juiciness, colour and flavour. The longissimus dorsi samples were thawed initially at room temperature and then stored overnight in a refridgerator set at 1°C. The thawed longissimus dorsi were sliced into five chops of 2.5cm thickness and griddled an internal temperature of 70°C in an over Turbo fan blue Sealed, UK). During the cooking, the chops were turned over every three ruinutes. Chops were then trimmed of all adhering fats. Two rectangular samples were cut from each chop, wrapped in pieces of coded foil and presented to the assessors. Assessors used an eight-point category scales (1-8) to evaluate the parameters as follows; tenderness (1-extremely tough, 8-extremely tender),

The Research Projects 14
juiciness; (1-extremely dry, 8-extremely juicy), chevon and mutton flavour; (1-extremely weak, 8-extremely strong), abnormal flavour; (1-extremely weak, 8-extremely strong) and overall liking; (1-dislike very much, 8-like very much)
Determination of fat content in the muscles (Sortec fat extraction system)Crude fat content of samples was determined by the ether extraction method (AOAC 2003; method 991.36) using a Soxtec system (Foss UK Ltd. Dicot UK). Six grams of each sample were weighed and dried in an oven (J.P. Selecta, s.a). The samples were re-weighed after drying using the same equipment. From each dried sample, 3g of meat were blended using a blender and a ceramic laboratory mortar into fine particles. The powder was transferred into sample thimbles. Aluminium beakers were labelled and weighed; 50ml of petroleum ether were measured and poured into each aluminium beaker. The beakers containing the ether were placed into the extractor (J.P. Selecta, s.a, Det-Gras 6).The procedure was four- stages extraction process. The first phase which lasted for 45 minutes is the boiling phase which accelerates the extraction process. The second phase involves rinsing the samples with the ether vapours and the ether condensed from the cooled relux column which also lasts for about 60 minutes. The third phase is the ether recovery phase, where the condensed ether is retained in the upper part o f the cooler. Ten minutes is required to recover the 50ml of ether. The last phase is the ether evaporation phase which eliminates remnants of ether by passing air over the aluminium beaker. The aluminium beaker is taken from the extractor and re-weighed. The difference in weights is taken as the weight of the extracted fats.
Statistical AnalysisStatistical analysis was performed using Minitab version 15.0 (Minitab, PA, USA). All data were analysed using a general linear model of analysis of variance (ANOVA) using diets as factor.
ResultsSupplementation did not have any significant effect (P>0.05) on the carcass parameters measured for the sheep. Similarly, supplementation did not have any significant effect (P>0.05) on the caracass values for goats (Table5).
Supplementation did not also have significant effect (P>0.05) on longissimus dorsi, mesenteric fat, fillet and marbling fat between the treatments (Table 6). There was marginal increase in mesenteric and marbling fat for supplemented group than the control whilst the mean weights of longissimus dorsi and fillet were relatively smaller in the supplemented sheep. The fillets, longissimus dorsi and mesenteric fats weights were also relatively higher in the supplemented group in the goats.
There were no significant difference (P>0.05) between the treatments for weights of primal cuts in both the sheep and then goats (Table 7).

The Research Projects 15
Table 5: Live weights, carcass length, bled weight, warm and cold and carcassweights of Djalonke Sheep and Goats
Parameters Sheep GoatsWeights (kg) Diets S.e.d P-Value Diets S.e.d P-Value
NS S NS SLive 16.16 14.83 1.64 0.43 9.21 11.29 3.51 0.59Warm carcass 7.02 6.41 0.83 0.48 4.48 5.35 1.35 0.55
Cold carcass 6.94 6.34 0.83 0.48 4.18 5.19 1.29 0.48
Bled 15.35 13.85 1.59 0.36 8.52 10.88 3.42 0.53
Carcass length (cm)
49.50 46.45 1.90 0.13 41.00 41.17 4.76 0.97
NS- non supplemented S- supplemented; Sed: Standard error of difference.
Table 6. Weights of Longissimus dorsi, fillet, mesenteric fat and marbling fat content of Djalonke Sheep and Goats
Parametersweights(g)
Sheep Goats
Diets S.e.d P-Value Diets S.e.d P-Value
NS S NS S
Fillet 73.20 72.80 9.29 0.97 21.08 68.00 21.08 0.38
Mesenteric fat 0.47 0.48 0.02 0.84 0.27 0.53 0.27 0.25
Longissimusdorsi
350.0 330.0 0.05 0.75 230.0 290.0 0.07 0.43
Marbling fat 0.13 0.17 0.06 0.82 0.11 0.16 0.07 0.55
Sed: standard error of difference; NS- non supplemented; S-supplemented

The Research Projects 16
Table 7: Weight of primal cuts of Djalonke sheep and GoatsPrimal cuts weiahts(ka)
Sheep Goats
Diets S.e.d P-Value Diets S.e.d P-ValueNS S NS S
Neck 0.61 0.59 0.06 0.74 0.34 0.37 0.09 0.73
Belly 2.87 2.56 0.31 0.33 1.30 1.29 0.29 0.98
Legs 0.33 0.30 0.03 0.35 0.17 0.18 0.04 0.87
Head 1.10 1.03 0.11 0.51 0.70 0.67 0.15 0.87
Hind quarters 3.08 2.71 0.35 0.31 1.80 1.38 0.60 0.39
Fore quarters 3.26 3.05 0.42 0.62 2.03 2.45 0.61 0.53
Sed: standard error of difference; NS- non supplemented; S-supplemented
Table 8: Visceral weight of Djalonke Sheep and GoatsParameters (g) Sheep Goats
Diets S.e.d P-Value Diets S.e.d P-ValueNS S NS S
Kidney 90.0 78.8 10.90 0.32 42.0 40.7 12.88 0.92Lungs 355.6 317.2 44.83 0.40 198.7 208.0 62.79 0.89Spleen 59.8 52.6 9.38 0.45 26.0 28.7 10.28 0.81Heart 102.4 85.2 13.53 0.22 51.3 55.3 13.50 0.78Liver 345.8 332.8 43.97 0.77 240.7 268.7 96.23 0.79Empty rumen (kg) 0.64 0.51 0.08 0.11 0.38 0.38 0.12 0.98Full Intestine (kg) 1.30 1.16 0.17 0.40 0.69 0.59 0.15 0.54Empty intestine (kg)i 0.76 0.72 0.12 0.72 0.40 0.33 0.13 0.62
Sed: standard error of difference; NS- non supplemented; S-supplemented
Supplementation significantly improved juiciness (P<0.001) in both sheep and goats such that the supplemented animals were more juicy than the controls (Table 9). The other attributes, flavour and tenderness were slightly better in both the supplemented sheep and goats than the control groups.

The Research Projects 17
Table 9: Eating quality of meat from Djalonke sheep and GoatsAttributes sheep Goats
Diets S.e.d P-Value Diets S.e.d P-ValueNS S NS S
Flavour 3.7 4.0 0.17 0.12 5.3 5.4 0.46 0.78
Juiciness 4.2 5.1 0.23 0.00 4.7 5.7 0.50 0.05
Tenderness 4.4 4.7 0.24 0.27 4.5 5.2 0.43 0.09
Overall liking 5.2 5.7 0.23 0.32 4.9 5.7 0.48 0.11
Sed: standard error of difference; NS- non supplemented; S-supplemented
DiscussionsLive weights and carcass characteristics.According to Payne (1990), as animals grow, their carcass becomes an increasing proportion of their live weights. The carcasses of the control group were relatively heavier and longer. This is due to the fact that the controls were relatively older than the supplemented and as such they have longer carcass length and relatively heavier carcass weight. Though the control sheep were relatively bigger and longer the difference in carcass characteristics were not significant (P>0.05). This shows that supplementation with whole cotton seed had noadverse effect on growth performance, warm and cold carcass weights.
Weights of m Longissimus dorsi, Fillet, Mesenteric fat and Marbling fatThe results for this study demonstrated that supplementation did not have any influence onthe longissimus dorsi, fillet, mesenteric fat and marbling fat. During the process o f evisceration it was observed that fat colour for control varied from white to yellow which may be particularly due to the amount of grass consumed by the animals which contains carotenoid pigments, this is consistent with similar reports by (Wood and Fisher, 1986). The fat colour for those on the supplemented diet varies from creamy to yellowish. The relatively higher carcass weights found in the control sheep was not reflected in the longissimus dorsi and fillets weights. Instead both the control and supplemented groups had similar weights for longissimus dorsi and fillets. This indicates that the relatively younger supplemented animals were able to produce muscles of similar weights because of the supplementation. This suggests that whole cotton seed has potentials for increased carcass yields. The relatively better marbling levels (Table 6) in the muscles from the supplemented animals positively affected juiciness and eating quality. These results support the statement by wood et al. (1990) that low levels of intramuscular fat (marbling) reduce eating quality whiles as high marbling levels improve eating qualities.

The Research Projects 18
Weights of Primal CutsThe relatively higher live and carcass weights found in the control sheep was not reflected in the weights of primal cuts. Instead, both the control and supplemented groups had similar weights for primal cuts indicating that, the apparently younger supplemented group was able to produce similar cuts because of the additional feed. These results support the statement by Mtenga and Kitalyi (1990) that supplementation reduces age to slaughter, increase carcass quality and output and thereby improves access to animal protein and income. Without the supplementation the relatively smaller sheep could not have produced similar carcass yields.
Visceral ComponentsThe lack of significant differences in visceral weights between the treatments for both sheep and goats is a reflection o f their similar carcass and primal cuts weights. These results indicate that the cotton seed had no negative effect on the development of the visceral components.
Eating qualityThe improved juiciness in both the mutton and chevon is a positive effect of whole cotton seed on eating quality. The juiciness could be attributed to a higher water binding capacity and marbling induced by the cotton seed. The improved juiciness had positive effect on the other vital attributes such as tenderness and flavour which were relatively better in the supplemented group.
Experiment 2This study was conducted on-station at the Nyankpala campus of the University for Development Studies to validate the results obtained from the on-farm studies
Materials and methodsA total of twelve (12) Djallonke rams of similar age and an average initial weight of 14kg were randomly allocated to three (3) treatments with four (4) replicates. The supplemented groups were confined and fed with cotton seeds daily in the morning by 6:00am before being released to join the other flock on the range. The treatment levels were as follows: Control: OgWCS, T1:200gWCS and T2:400gWCS. The experiment lasted for fifteen weeks.
Slaughtering and SamplingAt the end o f the feeding trial, the animals were taken to the UDS Meat Processing Laboratory. The final live weights of the animals were recorded before slaughtering. The slaughtering, Carcass and meat qualities evaluation processes were done as described in experiment 1 above
Drip LossFifty grams of the left LD was hanged from a nylon thread in a transparent polythene bag, the ends of the bag fasten :d and hang in a refrigerator at +2 °C for a period of 72 hours.
Fat (ether extract) extractionCrude fat content of samples was determined by the ether extraction method (AOAC 2003; method 991.36) using a Soxtec system (Foss UK Ltd. Dicot UK) as discribed in experiment 1.
The Research Projects 19
Moisture determinationCrucibles were weighed and approximately 3 g o f each sample was weighed into the crucible while the weight of the samples plus crucibles were noted using a digital scale model: Sartarious AG Gottingen (Germany) and noted “W i”. The samples plus the crucibles were put in an oven (J.P. Selecta, S.A) and the oven set at 105 °C for three (3) hours. The crucibles with the samples were put in a desiccator to cool. The samples plus crucibles were weighed using the same digital scale and was noted ‘W . Estimation of the moisture content was done using the formula “W 1-W 2”
Estimation of crude protein by digestion methodWeighed samples were put into digestion tubes. Two Kjeltabs were added to each tube and 15 ml of concentrated sulphuric acid was added to each tube and gently mixed to wet filter paper and samples were then loaded onto the digestion block which was set at 420 °C for 30 minutes. All samples were distilled using automated/manual Kjeldahl distillation systems (Pro-Nitro ll).The digested samples were placed into the Pro-Nitro II after the addition of 50 ml of 40% NaOH and distilled for nine (9) minutes. The distillates were collected into receiver solution (4% Boric Acid) and the crude protein estimated by multiplying the nitrogen content by 6.25.
Sensory AnalysisEating quality was assessed by a fifteen (15) taste panellist who evaluated the intensity of these characteristics: tenderness, juiciness, colour and flavour. The right LD musle was thawed at room temperature. The thawed LD was sliced into five chops of 3.5 cm thickness and griddled to a core temperature of 70 °C (using turbofan blue sealed oven, UK). During the cooking period/ the chops were turned over every five minutes. Chops were then trimmed of all adhering fats. Three rectangular samples were cut from each chop, wrapped in pieces of labelled foil and presented to the assessors. Bread was used as a neutralizer alongside water. Assessors used a five-point category scale to evaluate sample: tenderness (1 very tender, 5 very tough), Juiciness; (1 very juicy, 5 very dry), Lamb flavour; (1 very strong, 5- very weak), and overall liking; (1 - like very much, 5 - dislike very much).
All data were analysed using the general linear model o f analysis o f variance (ANOVA) of Minitab version 15.0 (Minitab, PA USA).
ResultsEffect of whole cotton seed on Live, warm and cold carcass, thigh, shoulder and LD muscle weightsSupplementation did not have any significant effect (P>0.05) on live, warm and cold carcass weights for the various treatments (Table 1). However, mean live weights were relatively higher in the supplemented groups than in the control group. Similarly, there was no significant difference (P>0.05) in v, ights among the various treatments for th ': i, shoulder and LD muscle, a reflection of the non-significance live and carcass weights (TablelO).

The Research Projects 20
TablelO: Live weights, weights of warm and cold carcass, thigh, shoulder andLD muscle
Weights (kg) Control T1 T 2 Sed/ P-value
Live 11.50 14.50 15.50 4.858 0.70Warm carcass 7.83 8.34 8.75 2.860 0.96
Cold carcass 6.95 5.63 6.00 2.154 0.79
Thigh 0.59 0.55 0.54 0.220 0.97
Shoulder 0.36 0.37 0.36 0.147 0.99
LD Muscle 0.55 0.48 0.48 0.211 0.85
/Standard error of difference; T1-0g, T2-200g, T3-400g cotton seed
Effect of whole cotton seed on crude protein, ether extract, percentage moisture and drip loss in the LD muscleThere was no significant difference (P>0.05) observed for the various treatment on crude protein, ether extract, and percentage moisture (Tab le 'll). However, drip loss was significantly (P<0.05 reduced in the supplemented groups. An indication that cotton seed supplementation did not have any adverse effect on crude protein level, ether extract and percentage moisture but improved moisture retention in the meat.
Table 11 Crude protein, ether extract, percentage moisture and drip loss of LD muscleControl Trt 1 Trt 2 Sed/ P-value
Crude protein (%) 50.31 53.51 53.45 4.421 0.70
Ether extract (%) 1.96 1.66 1.57 0.360 0.54
Moisture content (%) 53.40 57.38 57.31 5.242 0.67
Drip loss (mg) 3.5b 2.2a 2.5a 0.480 0.05
/ Standard error of difference; means in the same row with similar superscripts are not significantly different (P>0.05)
Eating qualities of LD muscleThere were signific??t differences (P<0.001) between the various treatments for juiciness and overall liking (Table 12). There was also a significant diffe.ence (P<0.05) in tenderness between the various treatments. There were no significant differences (P>0.05) in colour and flavour.

The Research Projects 21
Table 12: Eating qualities of the LD muscleAttributes Control Trt 1 Trt 2 Sed P-value
Colour 1.73 1.67 1.53 0.241 0.70
Tender 2.803 2.10^ 2.67^ 0.310 0.05
Juicy 3.20a 1.70b 2.40ab 0.280 0.00
Lamb flavour 1.67 1.93 1.45 0.252 0.19
Overall liking 2.90a 1.6b 2.50ab 0.243 0.00
f Standard error of difference; means in the same row with similar superscripts are not significantly different ( P>0.05)
DiscussionThe insignificant differences observed in weights for warm and cold carcasse, thigh, shoulder and LD muscle were an indication that whole cotton seed had no adverse effect on growth and development of the animal hence, similar carcass yields. This suggests that cotton seed has a potential for use as a supplement for sheep. This result is in agreement with a previous report that, there is a potential for increased carcass yield when sheep and goats are supplemented with cotton seed (Kwarteng, 2009). Supplementation with whole cotton seed positively improved crude protein level and percentage moisture, and relatively reduced ether extracts and drip loss in the LD muscle (Table 11).
There was relatively high moisture content in the supplemented groups than the control, and a corresponding less drip loss from the supplemented groups. Even though the supplemented muscles contain more moisture, they were able to retain this moisture making these muscles more juicy, tender and likened than the controlled muscles. This suggests that, the supplemented groups had a better water holding capacity than that of the control which could have an advantage for further processing. Water holding capacity (WHC) is the ability of meat to retain its water during application of external forces such as heating, cutting, mincing and processing (Boles, 2003). Increase in water holding capacity improves tenderness of the flesh when cooked (Lawrie, 2006). Kwarteng (2009) reported that there was no adverse effect on meat quality of small ruminants when supplemented with cotton seed and that a positive eating attributes of juiciness was as a result of the better water holding capacity induced as a result of cotton seed supplementation; a statement which is in agreement with the findings of this experiment.

The Research Projects 22
2.3 THE EFFECT OF WHOLE COTTON SEED ON WORM LOAD IN DJALLONKE SHEEP AND GOATS
Experiment 1 Study areaThis study was carried out at Saatingli and Zagyuri communities, within the Tamale metropolis.
System of management of animalsThe animals under supplementation were confined and fed with whole cottonseed 1-2 hours before they were released to feed on the natural vegetation. Non supplemented animals were not fed on whole cottonseed. The animals are kept under extensive system of management. They are partially housed in pens roofed with thatch and walled with bricks or sticks in the night and allowed to roam on their own during the day and return to the pen in the evening. The pens are usually located near the farmer's house. The housing unit is routinely cleaned and old sticks and straw replaced with new ones. All animals are washed with disinfectant once every four months using acaricide solution. Necessary preventive and curative measures are carried out when animals were detected to be sick.
The Experimental Animals and ProcedureA total of 54 Djallonke sheep were randomly selected from 6 flocks in the two communities. Prior to the study, the experimental animals were dewormed. Three flocks were on cottonseed supplementation while the other three were not.
Collection of faecal samplesThe experimental animals were restrained and 5 grams of faecal samples were collected directly from the rectum of each animal using a rubber hand gloves to prevent self and sample contamination. The samples were then kept in a clearly labeled container and sent to the Pong-Tamale Central Veterinary Laboratory for processing and examination the same day. The concentration method was used in processing the faecal samples since it has the advantage of giving a good concentration of worm eggs and makes identification easier.
Identification of helminth Eggs and interpretation of egg countIdentification of the various helminth ova was made by the morphology (size, shape and structure) o f the egg with the aid of a microscope and with a guide from a helminthological chart. The sum total of eggs seen in one chamber of the McMaster counting was multiplied by a factor of 100. This represents the total amount of eggs per gram (e.p.g.) of faecal sample for the individual animal.
Statistical AnalysisThe two- tailed f test was used to determine the differences in initial weights, average daily weight gain, and final weights of all the groups o f animals studied. All comparisons were done at 5% level of significance.

The Research Projects 23
Results and discussionThe mean faecal worm egg counts in the animals supplemented with cottonseed were lower (P<0.05) than in the non-supplemented (Table13). The lower faecal egg counts in the supplemented animals could be attributed to the effect of gossypol as indicated by (Rochfort, 2008). Even though the faecal egg count in supplemented animals was far lower than non-supplemented animals, the worm load in the supplemented animals was still high generally above 2000 as indicated by Troncy (2005). This may be attributed to poor management practices (Blood et al., 1989). In the case of young animals, they relied more on their mother’s milk and only took the cottonseed occasionally. They were also not in position to handle gossypol like the mother (Knights and Lloyd, 2005). This explains why they still recorded high faecal egg load (Table 13).
Table 13: The effect of cottonseed supplementation on Faecal worm Egg Count (e.p.g) in Djallonke sheep.
Category of sheep FEC in supplemented Animals
FEC innon-supplemented animals
P Value
Rams 1,266.7 ± 187.8 3,566.7 ± 551.0 0.001
Ewes 2,111.1 ±275.1 4,922.2 ± 630.7 0.001
Lambs 6,311.1 ±1181.0 16,644.4 ± 1558.8 0.000
FEC= faecal egg count, e.p.g =egg per gram
High faecal egg count of nematode and coccidia parasites were observed in the experimental animals during the study. The predominant gastrointestinal parasites identified were strongyles and to a lesser extent coccids. Strongyles were most frequently endemic and usually caused varying degrees of stunting rather than death (Carles, 1983). It is clear that although coccids did not record high values, there were enough macrogametes (females) and microgametes (males) in the intestinal tract, but it could not produce more oocyst because this function was suppressed by high strongyle ova population (Urquhart et al., 1992). No trematode eggs were seen probably because the habitats in these communities were unfavourable for the molluscan intermediate hosts o f trematodes.
Experiment 2
Study areaThis study was carried out in Tali, Yobzeri, and Gbrumani communities in the Tolon - Kumbungu district
Exnerimental procedureA ' .al of 72 sheep and 23 goats from 5 differe i farms were used for this study. The animals were grouped into; the supplemented group and non supplemented group. A total of 34 sheep consisting o f 26 females and 8 males were put under supplementation, while 38 sheep (25 females and 13 males) were not supplemented. A total of 15 goats including 9 females, 6 males were put under supplementation. Non supplemented goats were 8 consisting of 6 females, 2 males. The supplemented animals were fed about 2 % of body weight of whole

The Research Projects 24
cottonseed each morning before they were allowed to go out for grazing. Both supplemented and non supplemented animals were weighed every 4 weeks.
Collection of faecal samplesThe animals were restrained and 5 grams of faecal samples were collected directly from the rectum of each animal and processed for examination the same day as described in experiment 1 above.
Identification of helminth Eggs and interpretation of egg countIdentification of the various helminth ova was made by the procedure outlined above.
Analysis of resultsThe T-test (2-tailed) of SPSS was used to determine the effect of cottonseed supplementation on worm egg load in the various groups of sheep. All comparisms were done at 5 % level of significance.
Results and Discussion
Table 14: The means of worm load (eggs per gram of faecal sample) for non cotton - seed and cotton- seed supplemented sheep and goats.
Species Age groups of animal Non- supplemented Supplemented L.S.D P-values
Sheep Ewes 294.1 262.1 0.19 0.009
Rams 252.4 198.1 0.24 0.028
Lambs 289.2 198.1 0.34 0.013
Goats Nanny 454.0 389.0 1.64 0.467
Billy 444.0 424.0 2.01 0.464
Kids 373.0 330.0 2.03 0.740
From Table 14, the mean wormload recorded in ewes which were not fed on cotton seeds were significantly higher than the wormload from ewes on cotton seeds feed Supplementation. Similarly in the rams, the mean wormload from rams not fed cotton seeds was statically higher than the warmload from rams fed cotton seed. The mean worm load for the lambs followed similar partterns for the ewes and rams.
The means of wormload (e.p.g) for non cotton seeds supplemented and supplemented goats are also presented in Table 14. The mean wormload for nanny goats fed cotton seed was relatively lower than the mean wormload for the not supplemted nanny goats t l r ugh the difference was not significant. Sim1' . ly, in the Billy goats and kids, the non -c o 4!:on sdeds supplemented animals had relatively higher wormloads than the cotton seeds supplemented groups.

The Research Projects 25
Table 15: The incidences of different worm ova (e.p.g) in the various age groups of sheep and goats.
Age groups of sheep and goats
No of animals
Strongyles Spp Strongyloides spp Emeria Spp
NS adults 35 688.8 77.77 1522.2
NS young ones 18 265.8 60.0 1302.5
S adults 35 172.2 11.11 520.0
S young ones 18 85.0 7.5 261.11
e. p. g =egg per gram; NS= non-supplemented; S= supplemented
The eggs of gastro-intestinal parasites observed were from Strongyles, Strongyloides and Emeria species in both adults and young ones. The predominant gastro-intestinal parasites indentified in the adults and young ones were Emeria, followed by Strongyles and Strongyloides species being the least. Again, the supplemented groups recorded lower worm egg count of all the parasites compared to the supplemented animals.
The lower mean worm load in sheep supplemented with cotton seeds is possibly due the effect of whole cotton seed. According to Suzanne (2003) dietary cotton seeds (gossypol) appear to enhance rams and lambs immune system response to worm load and other diseases. Well fed animals are less reliable to diseases infections (Balton et al ; 1952) Me Donald (1985) reported that adults ruminants suffered badly from worm load but Lambs and kids developed some resistance to worm infestation and that high feeding level can masks the effects of worm load and infestation. The low wormload recorded in cotton seeds supplemented sheep compared to non- cotton seeds supplemented sheep is in line with the report of Brasilin et al (2009) that worm egg presence in faeces decreased in gossypol fed sheep. From the results all age groups on the cotton seeds diet had lower worm load than non-fed sheep. The Livestock Production Programme LPP, (2009) reported that sheep fed with 50g/kg cotton seeds supplementary diet had reduced worm load.
The Research Projects 26
2.4 EFFECT OF WHOLE COTTON SEED ON BLOOD PARAMETERS
Experiment 1
Study AreaThis study was carried out at the Tali and Gburimani communities in the Tolon -Kumbungu district of Northern Region of Ghana.
Housing and ManagementThe experimental animals were kept under the semi-intensive system of management. A group of the animals was supplemented with cotton seed at 0.34 kg per animal per day for 8 months while the other was not. Both supplemented and unsupplemented animals were confined and provided with water. The unsupplemented group was released in the morning and the supplemented group was fed cotton seed. The supplemented group was usually released after consuming the cotton seed to graze on natural pasture until about 5:30 pm when the two groups were driven back to their pens. The animals were locked up in pens roofed with thatch with beddings. The animals were dewormed after every two months.
Experimental AnimalsA total of 30 Djallonke sheep from four different flocks were randomly selected for the study. Each of the four flocks had both animals on cotton seed supplementation and those without supplementation. Cotton seed supplementation was done for 8 months. In all 15 animals were supplemented with 0.34 kg of cotton seed per animal per day while the remaining 15 were not.
Experimental procedure Collection of Blood SampleWhole blood sample was drawn from the external jugular vein of each animal using vacutainer needle into EDTA anticoagulated vacutainer tubes. The tubes were then inverted gently to mix the blood with the anticoagulant. The samples were then preserved on ice and sent to the UDS laboratory for processing and examination.
Processing and examination of blood samples in the laboratory Packed cell volume (PCV) and HaemoglobinPlain capillary tubes were filled with EDTA anticoagulated blood samples and one end of each tube was sealed with crystaseal. The filled tubes were placed in microhematocrit centrifuge and centrifuged for 5 minutes at 10,000 RPM. The centrifugal force layered the blood components according to weight. The heaviest components were the RBCs and were pushed to the bottom of the tube. Above the red blood cells, a small greyish area designated as the “buffy coat” was found in each tube. This area consisted of WBCs and platelets. The microhematocrit PCV was determined by measuring the height of the packed red cell column using the hematocrit r j'e r. The haemoglobin was obtained by div:ding the PCV by 3 and expressed in gram per decilitre.

The Research Projects 27
Total RBCs CountRefrigerated samples were warmed at room temperature and remixed before use. Blood dilution pipette with calibrations designated as 0.5, 1.0 and 101 was used. A rubber aspirating tube with a plastic mouthpiece was attached to the pipette and blood drawn to the 0.5 mark using gentle suction. Heymen’s dilution fluid and isotonic salt solution were then drawn to the 101 mark to achieve a dilution ratio o f 1:200.To minimize measurement error from air bubbles and ensure proper mixing of blood and diluent, the pipette was rolled slightly between the fingers while filling. A rubber pipette closure was applied and the pipette mixed by hand. The diluent in the stem of the pipette was then discarded and the hemacytometer was charged by touching the tip o f the pipette to the groove at the lower edge of the cover glass. The sample flowed directly into the ruled area. The centre square and four corner squares of the Neubauer rulings consisting of nine large squares were counted. The count was done in an orderly fashion from one end of the square, across to the other side, then down one microscopic field and back across until all cells within the square were counted. Cells that were touching the line between two squares were counted with that square that is those that were touching either the top or the left line. As a rule, cells that were touching either the bottom or right lines were not counted. Squares from each side o f the hemacytometer were counted separately and the two numbers were averaged. The number of cells in a microliter of blood was then determined by the following calculations:
Number o f cells counted (average of the two sides)(dilution ratio) * (volume of one square) x (number of squares counted)
The value obtained was converted to scientific notation by multiplying the number of cells by 106 l\j|.
Erythrocyte IndicesThe mean corpuscular volume was calculated by multiplying the PCV value by 10 and then dividing by the total red blood cell count. The mean haemoglobin concentration was calculated by multiplying the haemoglobin concentration by 10 and then dividing by the total red blood cell count. The mean corpuscular haemoglobin concentration was calculated by multiplying the haemoglobin concentration by 100 and then dividing by the PCV value.
Total WBCs CountThe same procedure was used as in total RBCs count except that, a small blood dilution pipette which has calibration marks at 0.5, 1 and 11 was used. Glacial acetic acid capable of lysing RBCs was used. The pipette was filled with the blood sample up to the 0.5 mark. Glacial acetic acid was drawn to the 11 mark to achieve a dilution of 1:20. The charged hemacytometer was placed in a moist chamber for about 20 minutes. This allowed the cells to settle and prevented desiccation. The four corner squares designated as W on the h:: nocytometer were counted in the same fashion as in total RBCs count. The number of ceils was determined by using the same formula as in total RBCs count. The value obtained was converted to scientific notation by multiplying the number of cells by 103/|j I.

The Research Projects 28
White Blood Cell Differential CountWedge smears were prepared by placing a drop of blood near the ends of clean glass slides. The edge of a spreader slide was used to spread the drop into an even film. The spreader slide was held at an angle of about 30° and brought into contact with the drop. Blood spread along the edge of the slide by capillary action. The spreader slide was then pushed forward with a steady, firm and even motion and a thin fiim of blood was formed. The smears were then air-dried. The smears were fixed in alcohol, stained with Wright-Giemsa stain and air-dried. The smears were placed on the microscope stage and examined under scanning lens. With the low-power lens in place, the area just adjacent to the feathered edge of the smear where the monolayer begins was located. The count proceeded in an orderly fashion from this area inwards toward the thick area of the smear. Using *100 objective lens with oil immersion in place, over one hundred WBCs were counted and classified using the commonly used pattern for examination of differential blood film.
Results and discussionThe effect of cotton seed supplementation on leukocyte and erythrocyte profiles in Djallonke sheep has shown no significant differences (P > 0.05) between supplemented and nonsupplemented groups (Table 15).
Table 16: Effect of cotton seed supplementation on some haematological parameters in Djallonke sheep.
Parameter Supplementedn=15
Non-supplementedn=15
P-value
Hb (g/dl) 11.91 ± 0.17 11.55 ± 0.20 0.397
PCV (%) 35.53 ±0.51 34.60 ± 0.55 0.630
RBC (><106/|jl) 4.62 ± 6.85 4.49 ± 6 .96 0.691
WBC (x103/l|jl) 6.69 ±0.41 6.49 ± 0.32 0.493
MCV (fl) 72.33 ± 4.63 77.11 ± 0.29 0.067
MCH (pg) 25.75 ±6.01 25.8 ±4.01 0.225
MCHC (g/dl) 33.45 ± 6.89 33.47 ± 8.26 0.433
Neutrophils (%) 49.47 ± 1.63 54.73 ± 1.56 0.872
Lymphocytes (%) 40.73 ± 1 .42 36.60 ± 2.26 0.210
Eosinophils (%) 6.07 ± 0.82 8.87 ± 1 .29 0.096
Monocytes (%) 0.53 ± 0 19 0.40 ± 0.16 o .3 v ;
Basophils (%) 0.33 ± 0.13 0.20 ± 011 0.116

The Research Projects 29
Neutrophils were the most numerous white blood cells in the leukocyte differential counts (Table 15). A similar observation was made by Hollinghead (1981). Lymphocytes were the second largest, confirming the observation of Martini (2004). Monocytes and eosinophils were the third and fourth largest respectively, with basophils being least o f the leukocyte differential counts. A similar result was obtained by Sirois (1995). Results of leukocytes values from both supplemente and non-supplemented Djallonke sheep were similar and this could be attributed to the fact that cotton seed at the levels fed had no effect on leukocyte formation.
The similarity between total RBC counts, Hb and PCV of supplemented and unsupplemented animals supports the report by Mena et al. (2004) that PCV and haemoglobin concentration are not affected by up to 15 % inclusion level of cottonseed. Erythrocyte indices including MCV, MCH and MCHC provide an objective and quantitative measure of the status of the red blood cells and their content of haemoglobin. The insignificant influence of cotton seed on haematological parameters in supplemented animals may be attributable to the fact that, the inclusion level was probably too low to cause any harm to the animals.
Experiment 2
Study AreaThis study was conducted on station at the the small ruminant experimental unit o f the University fcr Development Studies (UDS), Nyankpala campus, in Tolon-Kumbungu District, in the Northern Region of Ghana.
Experimental animalsThe animals were grouped into three with an average weight o f 14kg and put on three different levels of whole cotton seed. The levels were T1 (Og), T2 (200g) and T3 (400g). Each treatment had four replicates. The cottonseed was crushed with corn mill before feeding to animals to improve voluntary intake.
Housing and managementThe animals were housed individually in a wooden pen measuring 1.5m x 3m at night. In the morning they are fed with whole cotton seed from 6 am -10 am after which they were released for grazing.
Experimental designCompletely Randomized Design was used for this experiment with each treatment replicated four times.
Data collectionBlood sample was collected as described in experiment 1. Also, determination of Packed Cell Volume, estimation of Haemoglobin and RBC, determination of total WBC and WBCs differentials Counts were all performed according to the procedures outlined above in experiment 1.
Cholesterol LevelCholesterol kit contains cholesterol reagent (buffer), enzyme and cypress diagnostic standard solution (1.111 mg/dl). The reagent was mixed with the enzyme before used. Then 1.0 ml of the mixture was drawn in to each separate test tube where 10 ql of the standard solution was added to all the test tubes except one test tube which was left blank to check errors. 10ql of the blood samples were added to each test tube except the standard and the blank. These were then incubated for 5 minutes at 37°C in a precistem waterbath, after which the samples were

The Research Projects 30
transferred into a cuvette and readings were taken by the U V I vis spectrophotometer (JENWAY) at 550 nanometers. Values were calculated by [(Absorbance sample/Absorbance standard) X (200) X standard concentrations)].
Total Protein ContentThe Protein kit solution was already mixed and the procedure is the same as that of the Cholesterol except that, this had no blank and 25ql of the blood samples were added to 25 ql of the standard solution (0.961 mg/dl) and 25i{l of the already mixed solution and incubated for 5minutes at 37°C and readings were taken at 546 nanometers. Calculations were done the same as that of cholesterol except that 200 was not multiplied with the standard concentration. Thus: [(Absorbance sample/Absorbance standard) X standard concentration].
Albumin ContentAlbumin kit had neither standard nor blank, but procedure was the same as that of the protein. So 5nl of the solution was added to 5i[l of the samples and incubated for 5minutes at the same temperature and read at 630 nanometers. Calculations: [(Absorbance samples/Absorbance standards) X standard concentration].
Data AnalysisData was analyzed using ANOVA by Genstat (3rd edition (2008))
Results and discusions
Table 17: Erythrocytes values in Djallonke Rams
Parameter T1 T2 T3 SED P<0.05
Packed Cell Volume (%) 28.00 26.75 25.00 1.44 0.208
Haemoglobin (g/dl) 9.30 8.92 8.30 0.47 0.199
Red Blood Cells (x106/|jl) 3.60 3.48 3.20 0.19 0.185
MCV (fl) 77.80 76.90 78.10 0.37 0.051
MCH (pg) 25.80 25.68 25.90 0.07 0.057
MCHC (g/dl) 33.20 33.43 33.20 0.08 0.064
T1-0g, T2-200g, T3-400g cotton seed
There were no significant difference (P0.05) in packed cell volume between all the treatment means, but there were slight variations between the supplemented groups o f animals (T2 and T3) and that of the control groups of animals (Table 17). Highest mean PCV was recorded for T1 (28.00) with T3 given the lowest PCV (25.00). There was a decrease in PCV with an increase in whole cottonseed supplementation. T 1 PCV values recorded in the supplemen’ j groups fell below the 27 - 45% as reported by B ijod et al., (1994). However, the result agrees with Sirois, (1995) who reported that, normal PCV should range between 20-38 percent in sheep.
Haemoglobin was higher in T1 (9.30 followed by T2 (8.92 and T3 (8.30. There was however no significant difference (p>0.05 between T1, T2 and T3. Therefore, there were reduction in Hb values with increase in whole cottonseed supplementation and this may be attributed to the effect of gossypol in whole cottonseed supplementation or caused by iron deficiency, anemia, and

The Research Projects 31
thalassemia (an inherited disease in which globins’ chain production is deficient). Except for the control which were within normal ranges, the rest of the values were below normal as reported by Blood et al., (1994) who reported values between 9 to 15 (g/dl) of the Hb, but contrary to Esonu et a l, (2001), who indicated that, the haemoglobin concentration in blood was associated with the availability of nutrients in the animal's body.
Red Blood Cells were low in T2 (3.48) and T3 (3.20) but high in T1 (3.60. This shows no significant difference (P>0.05) between treatments. The red blood cells decreased in the supplemented group and this may be due to lower levels of iron and other toxic substances present in the cottonseed. This means that cottonseed at higher inclusion level have the tendency to decrease red blood cells in the animal’s immune system. Red blood cells helps in circulation of oxygen and carbon dioxide throughout the animal’s system, therefore this should not be over produced in order to cause dehydration, hypoxia (decrease oxygen) or polycythemia Vera. This result agrees with Sirois, (1995) who indicated that, ingestion of toxic materials and chemotherapeutic agents are among others which can decrease red blood cells production.
Mean Corpuscular Volume (MCV) in T2 (76.90 was the lowest followed by T1 (77.80 but T3 (78.10 was the highest, this shows no significant difference (P>0.05) between treatment means (Table 17). This means that, the 200g were not enough to increase the MCV but as the treatment level went higher up to 400g, it was enough to raise the value high. These findings were not in agreement with Ihekwumere et al., (2008) who reported lower values of Mean Corpuscular Voiume (MCV) in goats fed with only basal feed but higher in goats that were supplemented with concentrates and pergonal, and added that there were similarity among supplemented feed treatments. The values were so high that it was even more than twice as reported by Olayemi et al., (2000) to be 31 and 25 fermtoliters for intensive and extensive systems of management respectively.
Mean Corpuscular Haemoglobin (MCH) was slightly high in T3 (25.90 low in T2 (25.6 and moderate in T1 (25.80. However, there was no significant differences (P0.05) between them. In the initial results, the values for the supplemented groups were lower but higher in the final results than the control group. This implied that, cottonseed can increase MCH value at 400g of supplementation. This will help the animal transport oxygen and carbon dioxide throughout the body and this may be attributed to the effect of gossypol in whole cottonseed or caused by iron deficiency, anemia or chronic diseases. Therefore values were not similar among treatments, and this is not in agreement with Ihekwumere et al., (2008), who reported similar values among supplemented groups and dissimilar for control.
Mean Corpuscular Haemoglobin Concentration (MCHC) was high in T2 (33.43 but low in both T1 (33.20 and T3 (33.20 which shows no significance difference (P>0.05) between treatments. At treatment level 200 (T2), the MCHC value was higher but when the concentration was increased to level 400 the value dropped slightly to be the same as the control but these values wc o within ranges as reported by Sirois, (191-5). This implies that increasing WCS to 40; g can reduce MCHC values slightly.

The Research Projects 32Table 18: Leukocytes values in Djallonke Rams
Parameter T1 T2 T3 SED P<0.05White Blood Cells (x109/|jl) 18.25 14.15 17.75 1.60 0.095Neutrophils (%) 36.00 39.25 40.50 2.03 0.167Lymphocytes (%) 56.50 54.75 53.00 2.39 0.411Eosinophils (%) 5.50 3.50 5.00 1.16 0.290Monocytes (%) 1.50 1.50 1.00 0.74 0.752Basophils (%) 0.50 1.00 0.50 0.55 0.606
In table 18, the White Blood Cells were low in T2 (14.15 followed by T3 (17.75but high in T1 (18.25). There were no significant difference (P>0.05) between treatments but there was increased in values when the treatment levels went higher. This agrees with Olayemi e ta l., (2000) who indicated similarities in leucocytes count for both intensive and extensive system of management in West African Dwarf sheep, and concluded that there was no significant difference between management systems. Observations from the initial result from table 4 indicated that all the values for white blood cells were doubled in the final results in able 7 but showed no significant differences between the control and the treatment groups. The values were higher than the 5 and 11x109/l reported by Scott et al, (2006). However, it agreed with Ebwe-Nwiyi etal, (2000) who also concluded a range between (11.86) to (16.17).
The white blood cell differential counts did not show any significant differences (P>0.05) between treatments. Neutrophils were lower in T1 (36.00 but higher in both T2 (39.25 and T3 (40.50. Thus, significant differences (P0.05) were not recorded between treatments. The Neutrophils values were increased as the level of supplementation increased but did not correspond to normal values indicated by Sirois (1995) who stated clearly that fifty to seventy percent of the circulating white blood cells were Neutrophils. This may be attributed to the effect of gossypol in whole cottonseed to increase the values from one treatment level to another, and this increased in the number o f Neutrophils provides the animals with immune defense mechanism to fight against foreign invaders in the animal’s system to keep them healthy.
Lymphocytes did not show any significant difference (P>0.05) between treatment, but minor differences existed between them. Even though, the values increased from the initial results in table 4, it might not be due to the gossypol effect of whole cottonseed that was supplemented and these values ranges between 50 to 60% of the total white blood cells differential counts. These results were contrary to Martin, (2004) who also indicated lymphocyte count to be about 20 to 30% of the total white blood cells population o f the blood. The higher number of lymphocytes obtained can be the effects o f whole cottonseed, this help to prevent the animals from infection.
Eosinophils did not vary significantly (P>0.05) between treatment means but only show small variations. There was hi.qher increase in the control and 400g of cottonseed supplementation than in the 200g of supple entation. This shows that, an increased the level of supplementation improves the Eosinophils level. Eosinophils are responsible for regulating inflammatory response, which means that the increase in Eosinophils were beneficial to the animals.
Monocytes did not show significant difference (P>0.05) between treatments. Highest value was recorded for T1 and T2 with the lowest record for T3. Thus the values for T1 were different from that o f T3 but the same as T2. When compared with the initial results, there were slight increase in

The Research Projects 33al! the treatments and this may be due to either infection or gossypol effect in cottonseed. This result agrees with Tate, (1991) who reported that an increase in the number of Monocytes is often associated with chronic infection.
The initial test showed no values for Basophils but at the end of the experiment, values were recorded, these values were high in T2 (1.00 but the same value in T1 (0.50 and T3 (0.50 and these did no vary significantly (P>0.05) between treatments group. This may be gossypol effect in whole cottonseed that was supplemented even though the control has also been improved. This may be useful to the animals to resist from diseases. Gossypol is very useful as it helps to improve the quantity of Basophils in the animal blood and this agrees with similar to work done by Thibodeau, (1987) who reported heparin to be highly active anti-coagulant obtained from Basophils for prevention of intravascular coagulation, while Tate, (1991) also reported heparin to prevent formation of blood clots.
Table 19: Biochemical Parameters of Djallonke Rams.
Parameter T1 T2 T3 SED P<0.05Cholesterol (mg/di) 4.65 4.50 4.50 0.16 0.579Total Protein (mg/dl) 4.90 6.10 10.70 3.38 0.275Albumin (mg/dl) 5.15 4.95 4.50 0.25 0.739
The serum biochemistry in table 8 did not also show any significant variations (P>0.05) in all the treatment means.
Cholesterol level did not vary significantly (P>0.05) between treatments but T1 (4.65 was higher than both T2 (4 50 and T3 (4.50. This means the supplementation was enough to increase cholesterol levels. In this case, the level of serum cholesterol in the supplemented animals is not in iine with Esonu et al., (2001), who concluded that the level of cholesterol in serum has been associated with the quantity and quality of protein supplied, but agrees with ihekwumere e i si., (2008) who indicated significant differences between supplemented group and non-supplemented group.
There were no significant difference (P>0.05) between treatment means in total protein but there exist slight differences between supplemented and non-supplemented groups of animals. Total protein was low in T1 (4.90, followed by T2 (6.10 and highest by T3 (10.70). The supplemented groups of animals did not show significant differences between treatments, thus they were almost the same but increased slightly from one treatment level to the other. This statement agreed with Steed and Oldham (1978) who reported that, low protein diet resulted in a dramatic increase in low serum diet and lipoprotein concentration.
There were no significant difference in albumin concentration (P>0.05) but there exist variations in treatment means, thus T3 (5.50 was higher, followed by T1 (5.15 and T2 (4.95 respectively. From the initial r J ts showed that, there was slight decreac In albumin level in the final results of the supplem...ied groups of animals. This statement dbc.grees with Blood et al, (1994) who reported low albumin level as a result of long-standing low protein status. The proximate analysis proved that, crude protein content of whole cottonseed is high for about 23% and this is high enough to raise the Albumin content.

Conclusion and Recommendations 34
CHAPTER THREEConclusion
Although there were no significant differences in the initial weights, average daily weight gain and final weights of sheep and goats on cotton seed supplementation, animals on supplementation were still able to maintain their weight. The preliminary results of the study suggest that cotton seeds can be used to improve the productivity of small ruminants especially during the dry season.
Cotton seed contains considerable high quantities of crude protein, crude fibre, energy and fatty acid and its inclusion in the ration of small ruminants could help improve the growth and reproductive performance of small ruminants. The accessibility and availability of this supplement in the dry season in northern Ghana is an added advantage.
In the lambs, however, the supplemented group gained significantly higher per day than the non supplemented group.
The blood values for the various blood parameters were observed to be generally similar in both animals on cotton seed supplementation and unsupplemented animals.
The worm load in animals supplemented with cottonseed was far lower than those which were not supplemented
From the results of the study, it can be concluded that the utilization of whole cotton seed has no adverse effect on the carcass quality of small ruminants. Generally the eating qualities were positively affected by the supplementation. Whole cotton seed did not have any detrimental effect on small ruminants. It however, showed potential for improvement in primal cuts and eating quality attributes.
Recommendations
Cotton seed could be fed to livestock as feed supplement since it is cheap and easy to obtain.
It is also recommend that cotton seeds be used as feed supplement in small ruminants to minimize the incidence of worm load
Ruminants should be supplemented with 400g of whole cotton seed or lower since higher inclusion levels did not have significant effect on the blood parameters.
References 35REFERENCESAlhassan, W.S; Karbo, N and Anamoah,B (1995). A review of small ruminant pilot project of SRDP, LACOSREP and SCIMP, IFAD Ghana.
Amoako, K. K. (2008). A study into the effect of whole cottonseed on the growth and reproductive performance of small ruminants at Yobzeri in the Tolon/Kumbungu Districtof the Northern Region of Ghana. BSc. Dissertation, University for Development Studies, Tamale. Pp 17-23.
Ansah, T., Gzoagbe, G.S.K., Yahuza, R. and Adzitey, F. (2006). Knowledge ofFarmers in the Utilisation of Crop Residues and Agricultural By-products for Dry season Feeding of Ruminants; A Case Study in the Yendi District: Pp: 13-18
Arieli, A. (1998).Whole cottonseed in Dairy cattle feeding: A review. Animal Feed Sci.Technol 72:97.
Arieli, A. (1992) Energetic value o f whole cottonseed fed for maintenance on sheep at different levels in the diet. Livestock Production Science31:301-311.
Arieli, K. (1992). Note on village system of small ruminant production in Ghana and bibliography of Ghana in Small Ruminant Research. Group study No. SRCSILCA, Addis Ababa, Ethiopia.
Ayekelo, P. (2002). The effect of Deworming on the Haematology of Djallonke and Sahelian Sheep Vaccinated Against Peste des petits ruminants (PPR). pp 26 - 37.
Bhatia, D. R. and Mohan, M. (1971) Annual report, Central Sheep and Wool Research Institute. Avikanagar series In: Ranjhan, S.K. (2001) Animal nutrition in the tropics, 5th revised edition, vikas publishing house PVT LMT. Pp 371.
Blood, D.C., Radostits, O.M and Gay, C.C. (1989). Veterinary Medicine (7th Edition). Baillier Tindall: London, pp. 1016.
Carles, A. B. (1983), Sheep production in the tropics, Low-price edition, Oxford University Press, Pp 108-121.
Charray, J., Humbert, J. M., and Letif, J. (1992). Manual in sheep production in the Humid Tropics of Africa. Page: 106-172.
Charry, J., Humbert, J. M. and J. Levif, (1992). Manual of sheep production in the humid tropics of Africa. C.A.B. publishers. Willinford UK. pp 58-62.
Chaturvedi, M.L. and Kidwai.W.A (1969) In: Ranjhan, S. K. (2001) Animal nutrition in the tropics,5th revised edition, Vikas publishing house PVT LMT. 371 p
Church. D. C. (1991), Livestock Feeds and Feeding, Prentice Hall, Eaglewood Blackwell Cliffs, New Jersey 3rd edition, pp 26-27. 305-367C r o w d e r l.V . and Cheddar, H.R. (1982). Tropical Grassland Husbandry. Longman Group Ltd, New ork, 562p.
Cullison, A. E. and Lowery, R .S. (1987). Feeds and Feeding. Prentice Hall, Eaglewood Blackwell Cliffs, New Jersey. pp185-200.
Esonu B. O., Enenalom O. O., Udubibie A. I., Herbert U., Ekpor C. F., Okoli I. C. and

References 36Iheukwumere F. C., (2001). Performance and blood chemistry of weaner pigs fed raw mucuna (velvef bean) meal, Tropical Animal Production Investigation, 4; 49 -55.
Fall, A., Diop, M., Sandford, J., Wissocq, Y. J., Durkin. J. and Trail, J. C. M. (1982). Evaluation of productivity of Djallonke sheep and N’dama cattle at the Center for de Recherches Zoo techniques, Kolda, Senegal. KCA (International Livestock Center for Africa). Research report No. 3, Addis Ababa, Ethiopia. Pp: 2-39.
Frandson, R.D. and Spurgeon, T.L. (1992). Anatomy and Physiology of Farm Animals. 5th Edition, Lea and Febige, Pennsylvania, pp 2 3 2 -2 3 6 .
Fraser, C.M., Archibald, J., blood, D.C.,Henderson,J.A., Howell, D.G.,Kitchell,R.L. (1973).Sheep Nutrition. The Merck Veterinary Manual.pp 1222 -1228.
Gatenby, R. M (1991) SHEEP. The Tropical Agriculturalist. CTA/Macmillan Publication. Pp. 1-55, 77-81.
Gillespie, J.R. (1983). Modern Livestock and Poultry Production. 2ndEdition. Delmar Publishers INC. Canada. Pp. 380-389.
Hollinghead, M. (1981) Veterinary Hematology, The veterinary clinics of North America, Small animal practice, vol. 11, WB Sanders Co. LTD Philadephia. Pp 36-41.
Haenlein, G.F.W. (2001) Past,Present, Future perspective of small ruminants dairy research .Journal Dairy Sci. 84: 2097-2115.
Iheukwumere, F. C., Abu A. H. and Ndubuisi E. C., (2008). Effect of FSH+LH(Pergonal‘) treatement and concentrate supplementation on Haematology, Immune status and serum Metabolite of West African Dwarf goats, Journal of Animal and Veterinary Advances 7(1): 46 - 50.
Isoun, F., Amakiri, M.J, Ikegwuonu, S., Aire, T.A and Olowo- Okuron M.0.(1985). Anatomy and Physiology of Tropical Livestock. Longman Group UK Ltd. Pp 31 - 33.
Jahnke, H. E. (1982). Livestock production systems and livestock development in Tropical Africa. Kieler Wissenchaftsverlag Vauk.kiel,Germany. Pp. 253
Jenkins, W.L, Brander, G.C, Pugh, D.M. and Bywater, R.J.(1991). Veterinary Applied Pharmacology and Therapeutics. Baillieve Tindal, London, pp 1678.
Karbo, N. and Bruce, J. (2000). Contribution of livestock production to food security in Northern Ghana. Overview, Conference Proceeding for International Development of Agriculture; Ghana report (August 2000) 41 p.
Knights, G. and Lloyd, D,, (2005). Livestock Nutrition, supplementary feeding of sheep, using cottonseed. The state of Queensland (Department of Primary Industries and Fisheries) File no. SW0071.
Koney, E.B.M. ( 1 9 P Livestock Production and Health in Ghar;y. Advent Press, Osu, Accra, pp 23-77.
Kassu, Y. (1989). Overcoming the constraints of nitrogen availability to improve crop residue utilization by ruminants in Burkina Faso. ARNAD. Proceeding of the 4th annual conference. Pp 79-104.

Koli, S. E. (1973). A guide to cotton cultivation in Ghana. 1st edition. Ghana Publishing Corporation pp. 10-22.
Langholz, H.J. and Ballet, H. (1997). Husbandry and breed effects on suckler cow performance under extensive grassland farming conditions in Germany. In "E ffects of extension on animal performance and product quality". Occational publication No.4.
LPIU (Livestock Planning and Information Unit) (1997). 1996 livestock census. Ministry of Food and Agriculture. Accra. 5pp.
Mohan, D. E. and Shield, A.M. (1980). Effect of protein sequences on performance and carcass characteristics of growing finishing swine. Journal of Animals science 55 (5): 1340.
Mena, H., Santos, J. E. P., Huber, J. T., Tarazon, M. and Calhoun, M. C., (2004). The Effect of varying Gossypol intake from whole cottonseed and cottonseed meal on lactating and blood parameter in lactating dairy cows. Journal of Science, 87(8): 1206-2518.
Mtenga, L.A. and Kitalyi, A.J. (1990). Performance and carcass composition of Tanzania goats fed Chloris gayana hay with supplements containing different levels of protein. Small ruminant research 3(1): 1-8. mucoprotein, and their reversal by polyethylene glycol and pH. J. Sci. Food andAgric. 28:126-136.
NAES (Nyankpala Agriculture Experiment Station). (1984). Report on on-farm experimentation training workshop. NAES, Nyankpala, Ghana. Pp, 123-144.
Ntifu-Siaw, E. and Gharty, N. T. K., (1988), Traditional Animals Husbandry in farming communities, A preliminary study of three ecological zones of Southern Ghana, Proceeding of the 18th and 19th Ghana Society o f Animal production (GSAP) Symposium, held from 24th to 27th August and 2nd-26th October 1988, Pp 58-62.
Ngere, L. O. and Aboagye, G. (1981). Reproductive Performance of the West African Dwarf and Nungua Black Head sheep of Ghana. Animal production. 33:249-252.
Okorie J. U., (1983). a Guide to livestock production in Nigeria. Macmillan Education, London, Pp 174-175.
Olayemi, F. O., Farotimi, J. O and Fagbohun, O. A., (2000). Haematology of West African Dwarf Sheep under two different management systems in Nigeria, African Journals, Biomed Research, Vol. 3; 1 9 7 - 198.
Otchere, E. O., Abebrese, A., Karbo, N., Dei H. K. and Djang-Fordjour, K. T.(2002). Productivity of small ruminants in the Tolon/Kumbungu District of the northern region of Ghana.
Peacock, C. (1996). Improving Goats Production in the Tropics. A Manual for Development Workers. FARM-Africa and Oxfam (UK and Ireland) 1996. Pp: 1-91.
Peprah, D. (2008). Evic ts of whole cotton seed supplementation „,) growth performance of small ruminants in the Tolon/Kumbungu District of Northern Region. BSc. Dessertation, University for Development Studies, Tamale, pp: 16-22.
References 37

References 38Payne, W. J. A (1990). An Introduction to Animal Husbandry in the Tropics, 4th Edition, Longman, Singapore publishers (pte) LTD, Singapore, 132p.
Ranjhan, S. K. (2001). Animal Nutrition in the Tropics. Fifth Revised Edition. Pp 359-384.
Reynolds, L. (1986). Small Ruminant Production: The present situation and possible nutritional interventions for improvement. ILCA (International Livestock Centre for Africa) Bulletin 25:13-16.Addis Ababa, Ethiopia.
Rege, J.E.O. (1994) Indigenous African small ruminants. A case for characterization and improvement. Proceedings of the second biennial conference of the African small ruminant research network, AICC, Arusha.Tanzania 7^-11th December,1994 ILCA,CTA. Addis Ababa, Ethiopia 266: 207-209.
SARI, (Savannah Agricultural Research Institute). Annual report (2002). Nyankpala, Tamale.
Shahidi, F. (1990). Rapseed and canola: Global Production and Distribution. In: Shahidi F. (Ed) Canola Rapseed : Production, Chemistry, Nutrition and Processing Technology, Van Nostrand Reinhold. New York. Pp 3 — 13.
Silanikove, N. (2000). The physiological basis of adaptation in goats to harsh environments. Small Rumin. Res. 35:181-193.
Sirois, M. (1995).Veterinary Laboratory Clinical Procedures. Mosby College Publishing. Mosby - Year Book, Inc., Missouri. Pp 24 -1 4 6 .
Sumberg, J. E. (1985). Small Ruminant Feed Production in Farming Systems Context. In: Sumberg J.E. and Cassaday K. (ed), Sheep and Goats in Humid West AfricaProceedings of the Workshop on Small Ruminant Production Systems in the Humid Zone of West Africa..
Sement,G. /1S68). th e tropical agricu^aralist, cotton2nd edition. CTA/Macmillan publication pp. 1-30.
sumberg, J. E. and Mack, S. D. (1985). Village production of West African Dwarf goats and sheep in Nigeria. Tropical Animal Health and Production. Pp 17:135-140.
Tate, S. S., (1991). Essentials of Anatomy and Physiology. A Mosby Imprint of Mosby-year Book Inc. Westline Industrial Drive, St. Louis Missouri Pp 123.
Thibodeau G. A., (1987), Anatomy and Physiology, Times Mirror/ Mosby College Publishing, Westline Industrial Drive, St. Louis Mo pp. 424-431
Troncy, P.M. (2005). Helminths of Livestock and Poultry in Tropical Africa. 2nd edition CAB International, Wallingford. UK. Pp.148.
Tuah, A.K. and Baah, J. (1985). The reproductive performance, Pre-weaning lamb growth rate and Pre weaning lamb mortality of Djallonke Sheep in the forest belt in Ghana. Tropical Animal Health and Production, 17:107-113.
Turkson, P. K. (1992). The Practices and Problems of rural women involved in small ruminant production. Proceedings of the West Africa commonwealth Veterinary Association/ Ghana Veterinary Medical Association, p.20-30, Accra, September 7- 12 1992.
References 39Upton, M. (1985). Models of improved production systems for small ruminants. Sheep and goat production in West Africa Proceedings of workshop on small ruminant
Urquhart, G.M. Armour. J. Duncan, J. L., Dunn, A. M. and Jennings, F. W. (1992). Veterinary Parasitology. Longman Scientific and Technical. U.K. Pp.217-224.
Vestergaad, M., Ramsgaard J.L. and Refsgard A.H. (1997). Influence of housing, floor space allowance and grazing in young bulls. 11. "E ffects on meat and eating quality". In: Effects of extension on animal performance and product quality. Occational publication No4 of concerted action AIR3-CT3-0947.
Wilson, R. T. (1987). Livestock production in Mali: Environmental factors affecting weight in traditionally managed goats and sheep production. Animal Science Journal 64:191-300
Wood J. D., and Fisher, A.V. (1986). Carcass and meat quality: Definition and measurement; Division of Food Animal Science, School of Veterinary Science, University of Langford, Bristol, UK. Pp 30-33.

Designed and Printed by MUETPRESS Tel: 244-796584 / 020-82t)3412 / 277-154980


![cds-taking-stock-dfid[1].pdf - Cities Alliance](https://img.pdfslide.net/doc/110x75/633fca89874e5b0341017cd7/cds-taking-stock-dfid1pdf-cities-alliance.jpg)


