Embed Size (px)
Citation preview

1190 PHYTOPATHOLOGY
Epidemiology
Aflatoxin Contamination of Commercial Cottonseed in South Texas
Ramon Jaime-Garcia and Peter J. Cotty
U.S. Department of Agriculture-Agricultural Research Service-SRRC, 1100 Robert E. Lee Blvd., New Orleans, LA 70124. Accepted for publication 29 April 2003.
ABSTRACT
Jaime-Garcia, R., and Cotty, P. J. 2003. Aflatoxin contamination of com-mercial cottonseed in South Texas. Phytopathology 93:1190-1200.
Aflatoxins are toxic fungal metabolites produced by several members of Aspergillus section Flavi. U.S. federal regulations limit the use of aflatoxin-contaminated cottonseed. Cottonseed with aflatoxin content of 20 ng/g or higher may not enter the profitable dairy market. Between 4,472 and 9,949 truckloads of cottonseed from 31 to 35 gins in South Texas were analyzed for aflatoxin content each year from 1997 to 2001 upon receipt at the Valley Co-op Oil Mill in Harlingen, TX. The highest levels of contamination occurred in 1999, with an average aflatoxin con-tent of 112 ng/g and 66% of the cottonseed truckloads exceeding 20 ng/g. Years 1997 and 2000 had the lowest aflatoxin levels, averaging 24 ng/g,
with the lowest incidence (16%) of the truckloads exceeding 20 ng/g in 1997. In general, aflatoxin contamination increased as the ginning season progressed. Rainfall after boll opening correlated highly with aflatoxin content, with rainfall in July explaining over 50% of the observed vari-ability in aflatoxin content. South Texas was divided into four regions: Rio Grande Valley, Coastal Bend, Upper Coast, and Winter Garden. Geostatistical analyses revealed recurrent patterns of high and low con-tamination. The greatest contamination occurred from the central Coastal Bend region through the southern Upper Coast region. The Rio Grande Valley region experienced the least contamination during the study period.
Additional keywords: A. flavus, geographic information systems, indi-cator kriging, kriging, spatial analysis, variogram.
Aflatoxins are toxic metabolites produced by asexual fungi
belonging to Aspergillus section Flavi (12). The aflatoxin content of food and feed is limited by regulation throughout most of the world (29,35). Aflatoxin contamination long has been a concern for the cottonseed industry because aflatoxins in contaminated seed can be readily transferred to milk of dairy cows as aflatoxin M1 (1,34). Cottonseed is a preferred feed for dairy cows and, in the United States, regulations prohibit aflatoxin concentrations of >0.5 µg/kg in milk (30). Milk exceeding that limit may be discarded and the producing dairy quarantined (11). In order to prevent unacceptable aflatoxin levels in milk, regulations prohibit feeding dairy cows cottonseed with aflatoxin at �20 ng/g (30). Aflatoxin contamination of cottonseed causes significant economic loss annually. In the United States, contamination is most severe in the desert production regions of Arizona, the Imperial Valley of California, and South Texas (11,31).
Cottonseed contributes �15% of farmer income from cotton. Dairies and oil mills compete for cottonseed and largely determine the ultimate price of the seed. Dairies typically pay a premium for cottonseed; therefore, in areas where aflatoxin contamination of cottonseed is common, the aflatoxin contamination of whole cottonseed is the most important factor determining its value (11). The process through which Aspergillus flavus, the primary causal agent, contaminates cottonseed with aflatoxins has been divided into two phases (11). The first phase is associated with damage to developing bolls and partial suture opening (11,31), generally during June and early July in South Texas. The second phase occurs when the mature crop is exposed to high humidity and warm temperature either before or after harvest (3,11). Cotton boll opening in South Texas starts in late June. Contamination in the
second phase can be increased by late rain, late irrigation, and even dew or high relative humidity (9,32). Delayed harvest pre-disposes cottonseed to aflatoxin contamination by increasing aflatoxin production in the second phase (3).
Geographic information systems (GIS) and geostatistics can be used to describe, analyze, and display spatial patterns of a wide variety of variables at any scale and, by both improving manage-ment of resources and revealing causal relationships among geo-graphically variable factors, aid in the solution of real world prob-lems. These technologies have been applied in diverse agriculture disciplines, including soil science (37), entomology (4,23), medi-cal entomology (27), and plant pathology (19,26,40).
Geostatistics offer means both to describe spatial continuity, an essential feature of many natural phenomena, and to adapt clas-sical statistical regression techniques to estimate values at un-sampled locations (14,18). Furthermore, the modeling of spatial continuity can be used to assess uncertainty associated with esti-mated values (20). Kriging, an important geostatistical tool, is a regression technique for interpolation of spatially correlated data. Geostatistics have been used to analyze plant disease epidemics (5,17,21,22,33,36,40), develop regional risk assessment for tomato virus management (25), describe pathogen genetic structure at a regional scale (19), and describe patterns of population density and strain composition of the causal agent of aflatoxin contami-nation, A. flavus (28).
The objectives of the present study were to (i) document and describe geographic variation in aflatoxin contamination of cotton-seed in South Texas, (ii) identify the areas in South Texas with the greatest risk of aflatoxin contamination, (iii) assess temporal patterns of aflatoxin contamination in the South Texas cottonseed crop, and (iv) use temporal and spatial patterns of contamination to identify factors associated with aflatoxin contamination in South Texas.
MATERIALS AND METHODS
Sampling. Between 4,472 and 9,949 truckloads of cottonseed from 31 to 35 gins in South Texas were analyzed for aflatoxin
Corresponding author: P. J. Cotty; E-mail address: [email protected]
Publication no. P-2003-0707-01R This article is in the public domain and not copyrightable. It may be freely re-printed with customary crediting of the source. The American PhytopathologicalSociety, 2003.

Vol. 93, No. 9, 2003 1191
content each year from 1997 to 2001 (Table 1) upon receipt at the Valley Co-op Oil Mill in Harlingen, TX. Cores of cottonseed (3 to 5 kg each) were taken from six locations in each truck with a vacuum sampler with a 6.3-cm internal-diameter intake tube. Samples were combined, immediately split, and subdivided. One of the resulting single 5- to 8-kg composite samples subsequently was cracked with a roller and sieved to separate kernels from hulls (approximately 250 g of kernels per sample were obtained). The resulting kernels were mixed and a 40-g kernel subsample was taken, ground, and analyzed for aflatoxin content. Aflatoxin con-tent was obtained with either Aflatest (Vicam, Watertown, MA) or Veratox (Neogen Corporation, Food Safety Division, Lansing, MI) following the manufacturer’s instructions. The resulting afla-toxin data were provided by the oil mill for analysis. Aflatoxin data (ng/g) were organized by region and gin of origin and date of receipt at the mill. Percentage of cottonseed (truckloads) with
aflatoxin content equal to or higher than 20 ng/g (Percent Over 20) was calculated for each date and gin of origin.
Data analysis. The study area was >450 km long by 100 km wide, extending from the Rio Grande Valley in the south to Fort Bend County in the north. The Winter Garden area, a separate area close to San Antonio, TX, also was included in the study. Each gin analyzed was geo-referenced in the Universal Transverse Mercator (UTM) projected coordinate system. The UTM system gives the positions in meters and is preferred over latitude-longitude in decimal degrees because position coordinates in me-ters facilitate the correct computation of distances between sample locations in a plane (two dimensions), which is required in a geo-statistical analysis. The total area was divided into four geo-graphic regions (Rio Grande Valley, Coastal Bend, Upper Coast, and Winter Garden). These four regions were subdivided into smaller areas presenting similar features to determine if aflatoxin contamination is significantly influenced by spatial or geographic factors. The features used to demark areas include soil type, precipitation, altitude, and latitude (data not shown). This process resulted in a total of 12 areas (Fig. 1).The minimum and maxi-mum number of cottonseed truckloads per area and the total number of cottonseed truckloads each year are presented in Table 1. Analysis of variance was used to assess differences among areas in aflatoxin content, the natural logarithm of aflatoxin con-tent, and the Percent Over 20. Regression analyses for the Percent Over 20 as a function of time (Julian days) were performed for each region. Both linear and nonlinear (exponential) models (b0 + b1 × X and b0 × eb1 × X, respectively) were evaluated using SAS 8.0
Fig. 1. Map of South Texas showing the 12 areas included in the aflatoxin study.
TABLE 1. Minimum and maximum number of cottonseed truckloads per area and total number of cottonseed truckloads per year analyzed for aflatoxin content in South Texas from 1997 to 2001
Number of cottonseed truckloads
Year Minimum Maximum Total
1997 143 1,182 5,183 1998 74 1,559 4,472 1999 224 1,755 9,949 2000 146 1,328 9,144 2001 263 1,321 7,968

1192 PHYTOPATHOLOGY
(SAS Institute, Cary, NC). Multiple linear regression analyses with monthly average weather variables were performed for the annual averages of both aflatoxin content and Percent Over 20 using the stepwise procedure of SAS 8.0. For the weather vari-ables, the closest weather station to each gin was used. Monthly total rain and the monthly average of maximum, median, and minimum temperature were tested. Only gins (n = 11) from the Coastal Bend and Upper Coast regions with a weather station both within 25 miles and having archive data for at least 4 years of the study were included in the analyses. This resulted in a total of 50 data points for each weather variable.
Spatial analysis. Spatial analysis of aflatoxin contamination of cottonseed was performed using geostatistics (26) to determine if geographic location significantly influences the extent to which cottonseed becomes contaminated with aflatoxins and to identify areas with greatest contamination problems. Geostatistical analy-ses were performed on both the annual average aflatoxin content and annual Percent Over 20 to obtain patterns of aflatoxin contamination throughout South Texas. The mean values for the entire season for each gin were used in these analyses. Indicator kriging (18,20) of the aflatoxin content was used to generate maps of the probabilities that cottonseed would have an annual average aflatoxin content of 20 ng/g or higher.
Variogram analyses. Variograms describe spatial autocorrela-tion. The lower the variogram value, the higher the spatial auto-correlation or spatial continuity (18). In geostatistics, variogram values derived from the data (experimental variograms) are fit with model variogram functions using three parameters called the range, nugget, and sill (18,20). The range is the distance over which the spatial autocorrelation occurs. The nugget and sill esti-mate the magnitude of the variability: the nugget estimating very short-range variability and measurement error and the sill estimat-ing total variability. By selecting a model variogram function and values for the parameters, a mathematical description of the spatial autocorrelation that can be used for surface interpolation (kriging) is developed. Omnidirectional experimental variograms were obtained using the VARIOWIN 2.1 software (Y. Pannatier, 1994; Institute of Mineralogy and Petrography, University of Lausanne, Switzerland) for aflatoxin content and Percent Over 20. Indicator variograms were obtained to determine the probability of cottonseed exceeding the 20 ng/g action level using VARIOWIN 2.1 software. Variogram equations and procedures to develop experimental variograms and fit model variograms followed previ-ously described procedures (14,15,18,20,24). The maximum dis-tance between sample locations (gins) was �450 km and the minimum distance was 2.5 km.
Kriging and map display. Model variograms were used in ordinary block kriging for estimation in unsampled areas. Block kriging uses point data and the variogram model to estimate values in blocks or grids. SURFER 7.0 (Golden Software, Inc., Golden, CO) and ArcGIS (version 8.0 for Windows; ESRI, Red-lands, CA) were used for block kriging. Indicator kriging prob-ability maps for aflatoxin contamination of �20 ng/g were ob-tained by using the indicator variograms and transforming the data to an indicator data set with aflatoxin values below 20 ng/g = 0 and aflatoxin values of �20 ng/g = 1. ArcGIS (version 8.0 for Windows) was used for indicator kriging. Interpolation of values for unsampled areas by block kriging was performed on a grid (2 by 2 km) with a search neighborhood of 60,000 m and a maximum of 12 sample locations. Mean seasonal values for all gins were used for kriging procedures. ArcGIS (version 8.0 for Windows) was used to create views and layouts of the kriged values with previously digitized features as background.
RESULTS
Aflatoxin contamination of commercial cottonseed in South Texas is a perennial problem that presents both temporal and spatial (regional) variation. Both the annual average aflatoxin con-tent and the percentage of cottonseed truckloads with aflatoxin content of �20 ng/g (Percent Over 20) differed significantly across crop seasons from 1997 to 2001, ranging from 24.0 to 112.3 ng/g and 15.5 to 65.7%, respectively (Table 2). Highest levels of con-tamination occurred in 1999, with aflatoxin averaging 112.3 ng/g and an average of 65.7% of cottonseed truckloads with aflatoxin content of �20 ng/g. Lowest levels of contamination occurred in 1997 and 2000, with 24.0 and 24.4 ng/g, respectively, and 15.5 and 19.6% of cottonseed with aflatoxin content of �20 ng/g (Table 2). In general, the most severe aflatoxin contamination occurred from the northern portion of the Coastal Bend Region (north of Corpus Christi, TX) through the central portion of the Upper Coast region (around Port Lavaca and Victoria, TX) (Table 2; Figs. 2 and 3). When the data were analyzed by area (Fig. 1) statistically significant (P = 0.05) differences were found. Al-though 7 of the 12 areas had contamination levels not significantly less than the most severe in at least 1 of the 5 years, the areas with the highest levels of contamination were again mostly located from the northern Coastal Bend region to the central Upper Coast region. The only exception to this trend was the Winter Garden region in 1998, which had the highest average aflatoxin content (105 ng/g) that year (Table 2). However, this region had a low Percent Over 20 average (28.6%) compared with the northwest
TABLE 2. Aflatoxin content and percentage of cottonseed with aflatoxin content of >20 ng/g from gins in different areas of South Texas from 1997 to 2001y Aflatoxin content (ng/g) Percentage of cottonseed with aflatoxin >20 ng/g
Areaz 1997 1998 1999 2000 2001 1997 1998 1999 2000 2001
SRGV 11.6 DEFG(b) 12.8 B(b) 75.6 CDE(a) 10.5 D(b) 16.7 FG(b) 8.6 C(bc) 11.1 E(bc) 53.7 D(a) 7.3 D(c) 12.8 E(b) NRGV 7.4 FG(b) 17.6 B(b) 100.9 CD(a) 15.4 CD(b) 19.7 EFG(b) 8.3 C(b) 12.5 DE(b) 62.4 BCD(a) 11.5 CD(b) 12.7 E(b) SCB 7.3 FG(d) 40.1 B(b) 82.2 CDE(a) 30.0 AB(bc) 13.3 G(cd) 9.5 C(c) 31.3 BC(b) 62.4 BCD(a) 22.5 ABC(bc) 13.1 E(c) SECB 31.9 BCD(b) 35.6 B(b) 145.9 B(a) 25.9 ABC(b) 21.8 DEFG(b) 30.8 A(b) 30.2 BCD(b) 73.1 ABC(a) 19.9 BC(b) 17.9 DE(b) SWCB 8.9 EFG(c) 36.9 B(b) 87.0 CDE(a) 31.1 AB(b) 16.9 FG(bc) 7.2 C(d) 41.7 AB(b) 69.5 ABC(a) 28.0 AB(bc) 20.3 DE(cd) NWCB 40.5 ABC(c) 90.0 A(b) 145.5 B(a) 23.4 BC(d) 32.2 CDE(cd) 28.0 AB(c) 53.3 A(b) 81.2 A(a) 23.4 ABC(c) 26.7 CDE(c) NECB 59.2 A(b) 34.7 B(c) 192.1 A(a) 25.7 ABC(c) 35.5 CD(c) 37.5 A(b) 33.4 BC(b) 76.2 AB(a) 19.3 BCD(c) 29.3 BCD(bc) NCB 26.1 CDEF(c) 26.8 B(c) 148.4 B(a) 36.0 A(bc) 62.9 A(b) 27.0 AB(c) 18.6 CDE(c) 74.4 AB(a) 33.5 A(c) 54.7 A(b) SUC 47.5 AB(c) 86.7 A(b) 105.9 C(a) 28.0 AB(d) 50.1 AB(c) 28.8 AB(c) 37.4 AB(bc) 71.8 ABC(a) 28.7 AB(c) 42.4 AB(b) CUC 28.9 BCDE(bc) 26.2 B(c) 103.2 CD(a) 37.2 A(bc) 44.8 BC(b) 15.1 BC(d) 18.5 CDE(cd) 68.4 ABC(a) 28.5 AB(c) 42.6 AB(b) NUC 4.3 G(c) 24.1 B(b) 70.5 DE(a) 25.8 ABC(b) 28.3 DEF(b) 10.3 C(c) 28.8 BCDE(bc) 63.6 BCD(a) 28.3 AB(bc) 35.4 BC(b) WG 8.3 FG(c) 105.4 A(a) 63.3 E(b) 28.5 AB(bc) 30.5 DEF(bc) 6.1 C(c) 28.6 BCDE(b) 60.3 CD(a) 33.3 A (b) 25.9 CDE(b) South Texas 24.0 (c) 36.6 (b) 112.3 (a) 24.4 (c) 33.8 (b) 15.5 (d) 22.4 (c) 65.7 (a) 19.6 (c) 28.3 (b)
y Values followed by the same letter are not significantly different according to Tukey’s HSD test (P = 0.05). Capital letters indicate comparisons among areas (within columns) and lowercase letters indicate comparisons across years (within rows).
z South Rio Grande Valley (SRGV), North Rio Grande Valley (NRGV), South Coastal Bend (SCB), Southeast Coastal Bend (SECB), Southwest Coastal Bend (SWCB), Northwest Coastal Bend (NWCB), Northeast Coastal Bend (NECB), North Coastal Bend (NCB), South Upper Coast (SUC) Central Upper Coast (CUC), North Upper Coast (NUC), and Winter Garden (WG).
Vol. 93, No. 9, 2003 1193
Coastal Bend area (53.3%), which also had a high average of afla-toxin content (90 ng/g) in 1998 (Table 2). Seed produced in the southern Rio Grande Valley area had Percent Over 20 and average aflatoxin values significantly lower than four of the six Coastal Bend areas, and the South Upper Coast area during each season analyzed (Table 2). The northern Rio Grande Valley, Winter Garden, southern Coastal Bend, and northern Upper Coast areas each were not significantly different from the southern Rio Grande Valley area in at least one, but not all seasons (Table 2).
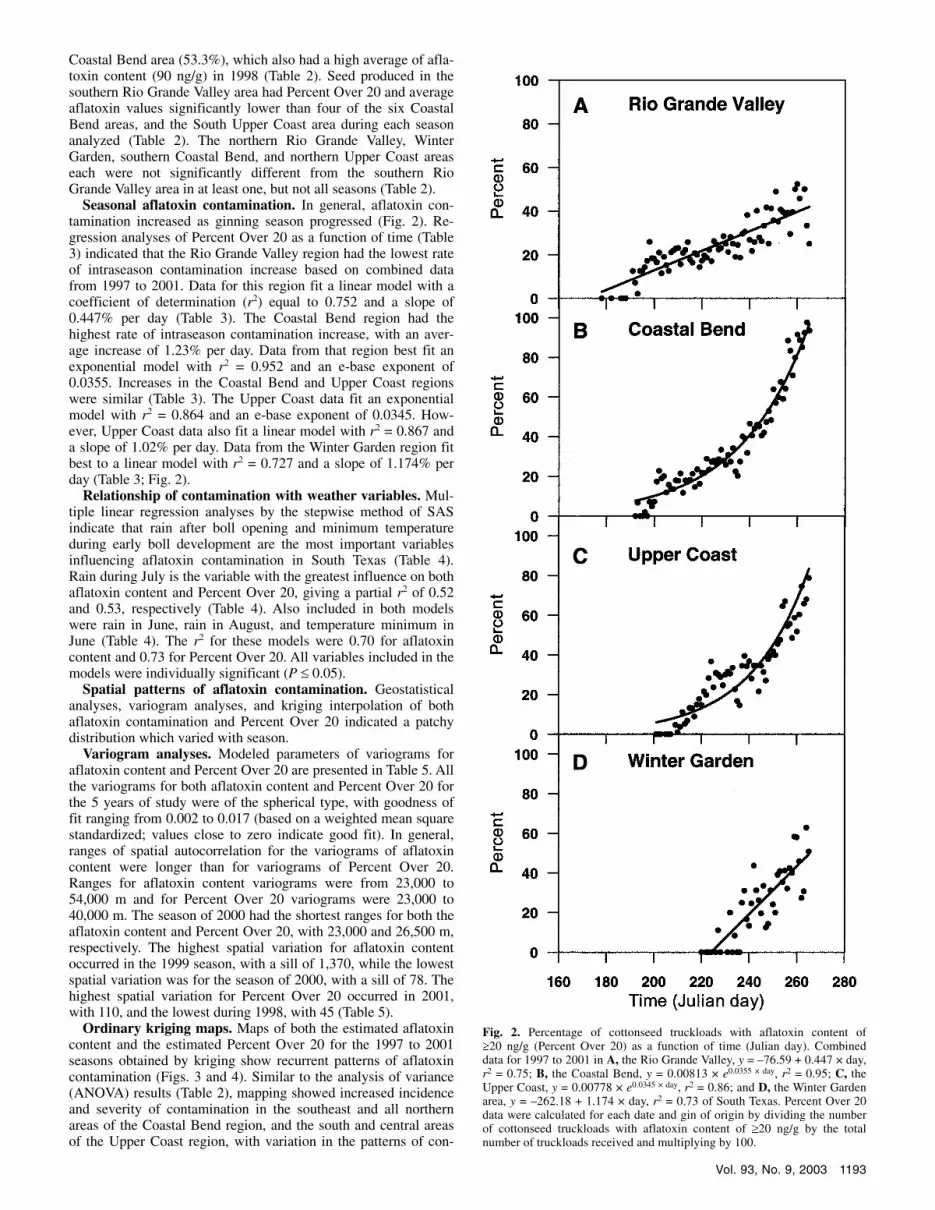
Seasonal aflatoxin contamination. In general, aflatoxin con-tamination increased as ginning season progressed (Fig. 2). Re-gression analyses of Percent Over 20 as a function of time (Table 3) indicated that the Rio Grande Valley region had the lowest rate of intraseason contamination increase based on combined data from 1997 to 2001. Data for this region fit a linear model with a coefficient of determination (r2) equal to 0.752 and a slope of 0.447% per day (Table 3). The Coastal Bend region had the highest rate of intraseason contamination increase, with an aver-age increase of 1.23% per day. Data from that region best fit an exponential model with r2 = 0.952 and an e-base exponent of 0.0355. Increases in the Coastal Bend and Upper Coast regions were similar (Table 3). The Upper Coast data fit an exponential model with r2 = 0.864 and an e-base exponent of 0.0345. How-ever, Upper Coast data also fit a linear model with r2 = 0.867 and a slope of 1.02% per day. Data from the Winter Garden region fit best to a linear model with r2 = 0.727 and a slope of 1.174% per day (Table 3; Fig. 2).
Relationship of contamination with weather variables. Mul-tiple linear regression analyses by the stepwise method of SAS indicate that rain after boll opening and minimum temperature during early boll development are the most important variables influencing aflatoxin contamination in South Texas (Table 4). Rain during July is the variable with the greatest influence on both aflatoxin content and Percent Over 20, giving a partial r2 of 0.52 and 0.53, respectively (Table 4). Also included in both models were rain in June, rain in August, and temperature minimum in June (Table 4). The r2 for these models were 0.70 for aflatoxin content and 0.73 for Percent Over 20. All variables included in the models were individually significant (P � 0.05).
Spatial patterns of aflatoxin contamination. Geostatistical analyses, variogram analyses, and kriging interpolation of both aflatoxin contamination and Percent Over 20 indicated a patchy distribution which varied with season.
Variogram analyses. Modeled parameters of variograms for aflatoxin content and Percent Over 20 are presented in Table 5. All the variograms for both aflatoxin content and Percent Over 20 for the 5 years of study were of the spherical type, with goodness of fit ranging from 0.002 to 0.017 (based on a weighted mean square standardized; values close to zero indicate good fit). In general, ranges of spatial autocorrelation for the variograms of aflatoxin content were longer than for variograms of Percent Over 20. Ranges for aflatoxin content variograms were from 23,000 to 54,000 m and for Percent Over 20 variograms were 23,000 to 40,000 m. The season of 2000 had the shortest ranges for both the aflatoxin content and Percent Over 20, with 23,000 and 26,500 m, respectively. The highest spatial variation for aflatoxin content occurred in the 1999 season, with a sill of 1,370, while the lowest spatial variation was for the season of 2000, with a sill of 78. The highest spatial variation for Percent Over 20 occurred in 2001, with 110, and the lowest during 1998, with 45 (Table 5).
Ordinary kriging maps. Maps of both the estimated aflatoxin content and the estimated Percent Over 20 for the 1997 to 2001 seasons obtained by kriging show recurrent patterns of aflatoxin contamination (Figs. 3 and 4). Similar to the analysis of variance (ANOVA) results (Table 2), mapping showed increased incidence and severity of contamination in the southeast and all northern areas of the Coastal Bend region, and the south and central areas of the Upper Coast region, with variation in the patterns of con-
Fig. 2. Percentage of cottonseed truckloads with aflatoxin content of �20 ng/g (Percent Over 20) as a function of time (Julian day). Combined data for 1997 to 2001 in A, the Rio Grande Valley, y = –76.59 + 0.447 × day, r2 = 0.75; B, the Coastal Bend, y = 0.00813 × e0.0355 × day, r2 = 0.95; C, the Upper Coast, y = 0.00778 × e0.0345 × day, r2 = 0.86; and D, the Winter Garden area, y = –262.18 + 1.174 × day, r2 = 0.73 of South Texas. Percent Over 20 data were calculated for each date and gin of origin by dividing the number of cottonseed truckloads with aflatoxin content of �20 ng/g by the total number of truckloads received and multiplying by 100.

1194 PHYTOPATHOLOGY
tamination among seasons (Figs. 3 and 4). However, surface maps showed details within and between areas missed by the ANOVA. Two small subareas showed recurrent high contami-nation during the 5-year study. Both are immediately adjacent to the Gulf of Mexico, one in the northeast Coastal Bend area and the other in the south Upper Coast area. For 2000 and 2001, the highest contamination extended from the northern Coastal Bend areas through the Upper Coast. The Rio Grande Valley
experienced the lowest contamination throughout the study period (Figs. 3 and 4).
Indicator kriging maps. Maps of the probability that cotton-seed produced at a location will have aflatoxin of �20 ng/g were generated by indicator kriging. In 1999, contamination was se-vere, and cottonseed produced throughout South Texas had a >80% probability of equaling or exceeding an aflatoxin content of 20 ng/g (Fig. 5). However, in the other 4 years studied, cottonseed
Fig. 3. Estimated aflatoxin content (ng/g; parts per billion [ppb]) in cottonseed ginned in South Texas during the seasons of 1997 to 2001 based on block kriging (blocks, 2 by 2 km) of the annual average aflatoxin content data from commercial cottonseed received at the Valley Co-op Oil Mill in Harlingen, TX, from gins in South Texas. A search neighborhood radius of 60,000 m and a maximum of 12 sample points (gins) were used to generate the kriging estimates.

Vol. 93, No. 9, 2003 1195
produced in the Rio Grande Valley region had a much lower prob-ability of unacceptable contamination. In most years, the probabil-ity throughout the valley was <20%. On the other hand, cotton-seed ginned on the Port Lavaca peninsula, in the south Upper Coast area, and the San Patricio peninsula, in the Northeast Coastal Bend area, had >60% probability of unacceptable afla-toxin levels in all seasons studied. (Fig. 5).
DISCUSSION
Aflatoxin contamination of commercial cottonseed in South Texas presents both temporal and spatial variation. Temporal vari-ation occurs both between and within seasons. Even though there is variation in aflatoxin contamination among seasons, levels of contamination observed during the seasons with least contamina-
TABLE 3. Regression models for Percent Over 20 as a function of time for cottonseed ginned in four regions of South Texasz
Region Type Model R2 P > F
Rio Grande Valley Exponential 0.3739 × e0.0181 × day 0.73 <0.0001 Linear –76.59 + 0.447 × day 0.75 <0.0001 Coastal Bend Exponential 0.00813 × e0.0355 × day 0.95 <0.0001 Linear –222.6 + 1.129 × day 0.86 <0.0001 Upper Coast Exponential 0.00778 × e0.0345 × day 0.86 <0.0001 Linear –208.54 + 1.02 × day 0.87 <0.0001 Winter Garden Exponential 0.000177 × e0.0478 × day 0.69 <0.0001 Linear –262.18 + 1.174 × day 0.73 <0.0001
z Regression models were fit to the combined data for the 1997 throughout 2001. Percent Over 20 = percentage of cottonseed with aflatoxin content of �20 ng/g.
TABLE 5. Variogram models for cottonseed aflatoxin content (ng/g) and Percent Over 20, and indicator variograms for aflatoxin content with a threshold of 20 ng/gw
Lag distance
Variable, year Interval Maximum Type Nugget Sill Range (m) IGFx
Aflatoxin content 1997 11,000 88,000 Spherical 15 178 52,500 0.004 1998 8,600 68,800 Sphericaly 0 575 54,000 0.007 1999 8,500 68,000 Spherical 0 1,370 50,000 0.017 2000 6,600 52,800 Spherical 18 78 23,000 0.015 2001 7,600 60,800 Spherical 30 190 38,500 0.005 1997–2001 6,500 52,000 Spherical 60 400 27,800 0.015
Percent Over 20 1997 6,500 52,000 Spherical 20 81 40,000 0.002 1998 6,500 52,000 Spherical 0 45 31,500 0.001 1999 6,100 48,800 Spherical 0 95 30,000 0.003 2000 6,900 55,200 Spherical 0 61 26,500 0.006 2001 6,650 53,200 Spherical 5 110 37,500 0.008 1997–2001 6,400 51,200 Spherical 60 195 23,000 0.012
Indicator variogramsz 1997 11,000 88,000 Spherical 0.06 0.20 52,500 0.016 1998 11,600 92,800 Spherical 0.06 0.18 52,500 0.025 1999 … … … … … … … 2000 6,600 52,800 Spherical 0.08 0.24 45,000 0.017 2001 7,600 60,800 Spherical 0.1 0.33 38,500 0.035 1997–2001 7,950 63,600 Spherical 0.05 0.168 23,000 0.023
w Percent Over 20 = percentage of cottonseed with aflatoxin content of �20 ng/g; indicator variograms of aflatoxin content with a threshold of 20 ng/g aflatoxin values of <20 ng/g = 0 and aflatoxin values of �20 ng/g = 1.
x IGF = indicative goodness of fit based on a weighted mean square standardized, where values close to zero indicate good fit. y The model variogram was first fit to a standardized variogram. z Indicator variograms of aflatoxin content with a threshold of 20 ng/g aflatoxin values of <20 ng/g = 0 and aflatoxin values of �20 ng/g = 1.
TABLE 4. Regression models for aflatoxin content in cottonseed and Percent Over 20 as a function of weather variables in South Texas from 1997 to 2001y
Independent variablez Estimated coefficient R2 Standard error P > F
Aflatoxin content Model … 0.704 … <0.001 Intercept –392.3 … 133.49 0.005 June rain (jnr) 6.8 0.035 2.17 0.039 July rain (jlr) 13.55 0.519 3.24 <0.001 August rain (agr) 4.15 0.092 1.51 <0.002 June temp min (jntmn) 5.34 0.058 1.80 0.005
Percent Over 20 Model … 0.728 … <0.001 Intercept –131.4 … 63.38 0.044 June rain (jnr) 3.61 0.052 1.03 0.007 July rain (jlr) 6.22 0.529 1.54 <0.001 August rain (agr) 2.63 0.117 0.71 <0.001 June temp min (jntmn) 1.91 0.03 0.86 0.031
y Percent Over 20 = percentage of cottonseed with aflatoxin content of �20 ng/g. z Aflatoxin content: 1/4 = -392.3 + (6.8 × jnr) + (13.55 × jlr) + (4.15 × agr) + (5.34 × jntmn). Percent Over 20: 1/4 = –131.4 + (3.61 × jnr) + (6.22 × jlr) +
(2.63 × agr) + (1.91 × jntmn). 1/4 = estimated aflatoxin content or estimated Percent Over 20.

1196 PHYTOPATHOLOGY
tion still are of considerable economic importance. For instance, during 1997 and 2000 (when the lowest aflatoxin contamination occurred), the average aflatoxin content for both seasons was 24 ng/g and the percentage of cottonseed exceeding 20 ng/g was 15.5 and 19.6 for 1997 and 2000, respectively (Table 2). Although most seed produced in South Texas had relatively low aflatoxin content in these two seasons, in areas 8 (North Coastal Bend) and
9 (South Upper Coast), between 27 and 38% of cottonseed could not be sold in the lucrative dairy market due to unacceptable aflatoxin content (Table 2; Figs. 3 and 4). Very high aflatoxin contamination occurred in 1999 when unacceptable aflatoxin content occurred in at least half of the cottonseed produced in all the South Texas areas, and over 70% of the cottonseed produced within the Coastal Bend and Upper Coast regions was unaccept-
Fig. 4. Estimated percentage of cottonseed with aflatoxin content of �20 ng/g (Percent Over 20) in South Texas during the seasons of 1997 to 2001 based on block kriging (blocks, 2 by 2 km) of the annual average Percent Over 20 data from commercial cottonseed received at the Valley Co-op Oil Mill in Harlingen, TX, from gins in South Texas. A search neighborhood radius of 60,000 m and a maximum of 12 sample points (gins) were used to generate the kriging estimates.

Vol. 93, No. 9, 2003 1197
able for dairy use (Table 2; Fig. 4). These frequencies of contami-nation suggest significant investment in technologies to limit contamination may be warranted.
Variation among seasons in aflatoxin content occurs in most areas and on most crops with aflatoxin problems (39). This vari-ation has been attributed to climatic factors, especially drought and high temperature, in corn (6,38,39) and peanut (6,7,39), with
increased contamination being associated with reduced rainfall. In South Texas, seasonal variation in aflatoxin content of cottonseed also is associated with variation in rainfall. However, increased contamination is associated with increased rain, as suggested by the regression models in Table 4. In the desert valley production areas of Arizona, cotton is irrigated and the majority of cottonseed contamination has been associated with exposure of the mature
Fig. 5. Probability of having an aflatoxin content of �20 ng/g in cottonseed ginned in South Texas from 1997 through 2001 based on indicator kriging (blocks, 2 by 2 km) of the annual average aflatoxin content of commercial cottonseed received at the Valley Co-op Oil Mill in Harlingen, TX. Aflatoxin content was transformed to an indicator data set with aflatoxin values below 20 ng/g = 0 and aflatoxin values of �20 ng/g =1. A search neighborhood radius of 60,000 m and a maximum of 12 sample points (gins) were used to generate the kriging estimates.

1198 PHYTOPATHOLOGY
crop (open bolls) to increased humidity and warm temperature (3,11). Irrigation practices vary in South Texas from supplemental to no irrigation and precipitation has an important influence on crop survival, yield, and aflatoxin content. The quantity of rain that crops receive in South Texas varies geographically during the growing season and between seasons. Our data suggest that precipitation occurring when mature bolls are present, from June to August, is the environmental factor with the greatest influ- ence on aflatoxin contamination of cottonseed in South Texas (Table 4). Rainfall in July explained >50% (r2 = 0.52) of the variability in annual average aflatoxin content. Rainfall in August also explains a significant (9 to 12%) component of the toxin variability. Even a superficial examination supports this conclu-sion. For instance, the 1999 cotton season had the highest pre-cipitation from June to August of the 5 years examined (368 mm) and the cottonseed produced that year had the highest levels of aflatoxin observed (Table 2; Figs. 2 and 3). On the other hand, 1997 and 2000 had the lowest precipitation (105 and 87 mm, respectively) and the lowest levels of contamination (Table 2; Figs. 2 and 3). The association of rain with aflatoxin contami-nation probably is attributable to the second phase of the con-tamination process, which occurs when mature bolls, harvested cotton, or ginned seed are exposed to high humidity and warm temperatures (11). The majority of cottonseed aflatoxin contami-nation in the desert production areas of Arizona occurs during the second phase (3,9,11).
In general, aflatoxin contamination in South Texas increased as the ginning seasons progressed for all the areas (Fig. 2). However, the rate of increase varied by area as indicated by regression models of Percent Over 20 as a function of time (Table 3; Fig. 2). The percentage of cottonseed with aflatoxin content above the 20 ng/g threshold for dairy use (30) is very low in the beginning of the ginning season; however, toward the end of the season, >40% of cottonseed, regardless of the region within which the gin resides, contains aflatoxin at >20 ng/g. The slowest rates of in-crease in aflatoxin content during the ginning season occurred in the Lower Rio Grande Valley. This also was the region with the lowest contamination. Increases in aflatoxin contamination fit a linear regression model for both the Lower Rio Grande Valley and the Winter Garden regions, with the Rio Grande Valley having a smaller slope (0.5% per day) than the Winter Garden region (1.174% per day). However, because the ginning season is much shorter in the Winter Garden region than the Rio Grande Valley, the incidence of unacceptable cottonseed lots was similar for these two regions (Fig. 2). Both the slower rate of increase and the lower aflatoxin content observed for the Rio Grande Valley may reflect, in part, both earlier harvest and earlier initiation of ginning. However, date of ginning is insufficient to explain all the differences among regions. For example, incidences of contami-nation were lower for cottonseed ginned in the Valley (32.6%, P < 0.01) or Winter Garden (33.1%, P < 0.01) regions between Julian day 240 and Julian day 265 than for cottonseed ginned during the same period in either the Coastal Bend (67.4%, P < 0.01) or the Upper Coast (50.5%, P < 0.01) regions. Aflatoxin increases in the Coastal Bend and the Upper Coast areas fit exponential models reflecting rates of increase that escalate as the ginning season progresses. Thus, the greatest rates of increase occur toward the end of the season as the incidence of cottonseed lots exceeding 20 ng/g approaches 100% (Table 3). Differences among regions in rates of increase in cottonseed aflatoxin incidence can be largely explained by differences among regions in climatic conditions, as discussed above.
In Arizona, delayed harvest is known to result in cottonseed with increased aflatoxin content due to increases in the second phase of the contamination process (3). This phenomenon is the most likely cause of the observed increases in the levels of afla-toxin contamination during the ginning season in South Texas. These results suggest that, throughout South Texas, earlier harvest
will result in reduced contamination. However, compared with other regions in the United States, South Texas already has a very early harvest and substantially earlier harvest may not be eco-nomically feasible.
Geostatistical analyses of the spatial structure of both cotton-seed aflatoxin content and the percent of cottonseed with aflatoxin content �20 ng/g (Percent Over 20) indicate spatial autocor-relation of aflatoxin contamination at a regional scale in South Texas. Models for both variables in all the years presented spherical variograms, which indicate patchy distributions. The nugget was small compared with the sill in all the models, indi-cating that variation in aflatoxin content depends strongly on sepa-ration distances between gins. Spatial autocorrelation varied with season, presenting ranges of influence from 23,000 to 54,000 m (Table 5) for an area extending >550,000 m in length. The sea- sons of 1997 to 1999 had ranges for aflatoxin content of 50,000 to 54,000 m, whereas the season of 2000 had the shortest at 23,000 m. Year 2000 also presented the shortest range (26,500 m) for Percent Over 20, whereas the longest range (40,000 m) was for the 1997 season (Table 5). These range values suggest that aflatoxin contamination is regionalized with patches of higher contamination problems, which may change in size with season. These patches are locations with increased risk to which control efforts should be preferentially directed. This may include in-creased efforts toward early harvest and early ginning and en-couragement of rotation to crops not susceptible to aflatoxin contamination.
Identification of recurrent patterns of areas with higher afla-toxin contamination provides a basis for selecting initial locations for intensive efforts to manage aflatoxins (i.e., through biological control with atoxigenic strains of A. flavus). Surface maps ob-tained by kriging of spatially autocorrelated variables can be com-pared over multiple seasons in order to identify recurrent patterns of agricultural problems at a regional scale (19,25,26). These recurrent patterns are difficult to detect by classical ANOVA tech-niques. Surface maps of aflatoxin contamination in South Texas from 1997 to 2001 show some areas with either recurrent low or recurrent high aflatoxin problems (Figs. 2 and 3). The Rio Grande Valley region had consistently low aflatoxin contamination during the study period (Figs. 3 and 4). On the other hand, aflatoxin contamination was highly prevalent in the southeast and northern areas of the Coastal Bend region and the south area of the Upper Coast region (Figs. 3 and 4). The Rio Grande Valley region differs from the Coastal Bend and Upper Coast in several factors that influence aflatoxin contamination. For instance, the Coastal Bend and Upper Coast regions normally have higher precipitation levels than the Rio Grande Valley. As discussed above, precipitation during July and August is the factor most closely correlated with contamination in South Texas (Table 4). Rainfall patterns (data not shown) may explain some of the changing spatial pattern of afla-toxin contamination across seasons. For instance, highest con-tamination in 1997 and 1998 occurred mostly from the southeast of the Coastal Bend region to the southern part of the Upper Coast; whereas, for the seasons of 2000 and 2001, the highest levels shifted north, occurring from the northern Coastal Bend to the northern Upper Coast (Figs. 3 to 5). These shifts in aflatoxin contamination correlate with shifts in the pattern of precipitation (data not shown). Additional variability could be explained by other factors that are spatially variable in South Texas, including differing soil types, differing aflatoxin-producing potential of A. flavus communities (10), and differences in harvest or ginning time. For instance, on average, fields from the southeast Coastal Bend to southern Upper Coast have heavier (clay) soils than fields in the Lower Rio Grande Valley to the southern Coastal Bend. Heavier soils hold moisture longer than sandy soils and, thus, ex-tend exposure of open bolls to increased humidity. This increased humidity could favor the second phase of aflatoxin contamination (3,11). Furthermore, there are differences in strains of A. flavus in

Vol. 93, No. 9, 2003 1199
the different areas. The percent of A. flavus strain S associated with commercial cottonseed from gins in the Coastal Bend to Upper Coast regions is significantly higher than for those from the Rio Grande Valley (13), and strain S isolates produce higher afla-toxin levels in cottonseed than typical or L strain isolates (8,10,16).
Late harvesting and ginning has been documented to increase aflatoxin contamination in the desert areas of Arizona (3,9). In the present study, this also is a main factor influencing aflatoxin con-tamination in South Texas (Table 3; Fig. 2). Harvest and ginning time influence the spatial patterns of aflatoxin contamination. For instance, the area of lowest contamination, the Lower Rio Grande Valley, usually is harvested and ginned earliest (Fig. 2).
Recurrent spatial patterns of aflatoxin contamination as re-vealed by indicator kriging interpolation of the 5 years of data show that both the Port Lavaca Peninsula and the San Patricio Peninsula have consistently high levels of contamination. Through-out the study, both the Port Lavaca Peninsula and the San Patricio Peninsula presented a >60% probability of producing cottonseed with aflatoxin content >20 ng/g (Fig. 5). These two areas would be good candidates for initial efforts to develop aflatoxin manage-ment practices for South Texas similar to the biocontrol program used to manage aflatoxins in Arizona (2).
ACKNOWLEDGMENTS
This work was supported by grants from the Cotton Foundation, the Texas State Support Program of Cotton Incorporated, U.S. Department of Agriculture Multi-Crop Aflatoxin Working Group, and the Texas Cottonseed Crushers Association. We thank the Valley CO-OP Oil Mill, Harlingen, TX, for assistance in several aspects of the work.
LITERATURE CITED
1. Allcroft, R., and Carnaghan, R. B. A. 1963. Groundnut toxicity: An examination for toxin in human food products from animals fed toxic groundnut meal. Vet. Rec. 75:259-263.
2. Antilla, L., and Cotty, P. J. 2000. The ARS-ACRPC partnership to con-trol aflatoxin in Arizona cotton: Current status. (Abstr.) Mycopathologia 155:164.
3. Bock, C. H., and Cotty, P. J. 1999. The relationship of gin date to aflatoxin contamination of cottonseed in Arizona. Plant Dis. 83:279- 285.
4. Byrne, D. N., Rathman, R. J., Orum, T. V., and Palumbo, J. C. 1996. Localized migration and dispersal by the sweet potato whitefly, Bemisia tabaci. Oecologia 105:320-328.
5. Chellemi, D. O., Rohrbach, K. J., Yost, R. S., and Sonoda, R. M. 1988. Analysis of the spatial pattern of plant pathogens and diseased plants using geostatistics. Phytopathology 78:221-226.
6. Cole, R. J., Hill, R. A., Blankenship, P. D., Sanders, T. H., and Garren, K. H. 1982. Influence of irrigation and drought stress on invasion by Aspergillus flavus of corn kernels and peanut pods. Dev. Ind. Microbiol. 23:229-236.
7. Cole, R. J., Sanders, T. H., Dorner, J. W., and Blankenship, P. D. 1989. Environmental conditions required to induce preharvest aflatoxin con-tamination of groundnut: Summary of six years research. Pages 279-287 in: Aflatoxin Contamination of Groundnut: Proc. Int. Workshop. D. McDonald and V. K. Mehan, eds. ICRISAT, India.
8. Cotty, P. J. 1989. Virulence and cultural characteristics of two Aspergillus flavus strains pathogenic on cotton. Phytopathology 79: 808-814.
9. Cotty, P. J. 1991. Effect of harvest date on aflatoxin contamination of cottonseed. Plant Dis. 75:312-314.
10. Cotty, P. J. 1997. Aflatoxin-producing potential of communities of Aspergillus section Flavi from cotton producing areas in the United States. Mycol. Res. 101:698-704.
11. Cotty, P. J. 2001. Cottonseed losses and mycotoxins. Pages 9-13 in: Compendium of Cotton Diseases. T. L. Kirkpatrick and C. S. Rothrock, eds. The American Phytopathological Society Press, St. Paul, MN.
12. Cotty, P. J., Bayman, P., Egel, D. S., and Elias, K. S. 1994. Agriculture, aflatoxins and Aspergillus. Pages 1-27 in: The Genus Aspergillus: From Taxonomy and Genetics to Industrial Application. K. A. Powel, A. Renwick, and J. F. Peverdy, eds. Plenum Press, New York.
13. Cotty, P. J., Jaime-Garcia, R., and Kobbeman, K. 2001. The S strain of A. flavus in South Texas. (Abstr.) Phytopathology 91(suppl.):S19.
14. Cressie, N. 1993. Geostatistics: A tool for environmental modelers. Pages 414-421 in: Environmental Modeling with GIS. M. F. Goodchild, B. O. Parks, and L. T. Steyaert, eds. Oxford University Press, Cambridge.
15. Deutsch, C. V., and Journel, A. G. 1992. GSLIB Geostatistical Software Library and User’s Guide. Oxford University Press, Cambridge.
16. Garber, R. K., and Cotty, P. J. 1997. Formation of sclerotia and afla-toxins in developing cotton bolls infected by the S strain of Aspergillus flavus and potential for biocontrol with an atoxigenic strain. Phyto-pathology 87:940-945.
17. Gottwald, T. R., Avinent, L., Llácer, G., Hermoso de Mendoza, A., and Cambra, M. 1995. Analysis of the spatial spread of sharka (Plumb pox virus) in appricot and peach orchards in eastern Spain. Plant Dis. 79:266-278.
18. Isaaks, E. H., and Srivastava, R. M. 1989. An Introduction to Applied Geostatistics. Oxford University Press, Cambridge.
19. Jaime-Garcia, R, Orum, T. V., Felix-Gastelum, R., Trinidad-Correa, R., VanEtten, H. D., and Nelson, M. R. 2001. Spatial analysis of Phytoph-thora infestans genotypes and late blight severity on tomato and potato in the Del Fuerte Valley using geostatistics and geographic information systems. Phytopathology 91:1156-1165
20. Journel, A. G. 1989. Fundamentals of Geostatistics in Five Lessons. American Geophysical Union, Washington, D.C.
21. Larkin, R. P., Gumpertz, M. L., and Ristaino, J. B. 1995. Geostatistical analysis of Phytophthora epidemic development in commercial bell pepper fields. Phytopathology 85:191-203.
22. Lecoustre, R., Fargette, D., Fauquet, C., and de Reffye, P. 1989. Analy- sis and mapping of the spatial spread of African cassava mosaic virus using geostatistics and the kriging technique. Phytopathology 79:913-920.
23. Liebhold, A. M., Rossi, R. E., and Kemp, W. P. 1993. Geostatistics and geographic information systems in applied insect ecology. Annu. Rev. Entomol. 38:303-327.
24. Myers, D. E. 1991. Interpolation and estimation with spatially located data. Chemom. Intell. Lab. Syst. 11:209-228.
25. Nelson, M. R., Felix-Gastelum, R., Orum, T. V., Stowell, L. J., and Myers, D. E. 1994. Geographic information systems and geostatistics in the design and validation of regional plant virus management programs. Phytopathology 84:898-905.
26. Nelson, M. R., Orum, T. V., Jaime-Garcia, R., and Nadeem, A. 1999. Applications of geographic information systems and geosta- tistics in plant disease epidemiology and management. Plant Dis. 83:308-319.
27. Nicholson, M. C., and Mather, T. N. 1996. Methods for evaluating Lyme disease risks using geographic information systems and geospatial analysis. J. Med. Entomol. 33:711-720.
28. Orum, T. V., Bigelow, D. M., Cotty, P. J., and Nelson, M. R. 1999. Using predictions based on geostatistics to monitor trends in Aspergillus flavus strain composition. Phytopathology 89:761-769.
29. Park, D. L., Lee, L. S., Price, R. L., and Pohland, A. E. 1988. Review of the decontamination of aflatoxin by ammoniation: Current status and Regulation. J. Assoc. Off. Anal. Chem. 71:685-703.
30. Park, D. L., and Troxell, T. C. 2002. U.S. perspective in mycotoxin regu-latory issues. Pages 277-285 in: Mycotoxins and Food Safety. Advances in Experimental Medicine and Biology. V. 504. J. W. DeVries, M. W. Trucksess, and L. S. Jackson, eds. Kluwer Academic/Plenum Publishers, New York.
31. Russell, T. E. 1982. Aflatoxins in cottonseed. Univ. Ariz. Coop. Ext. Serv. Publ. Q422.
32. Russell, T. E., Watson, T. F., and Ryan, G. F. 1976. Field accumu- lation of aflatoxin in cottonseed as influenced by irrigation termination dates and pink bollworm infestation. Appl. Environ. Microbiol. 31:711-713.
33. Stein, A., Kocks, C. G., Zadoks, J. C., Frinking, H. D., Ruissen, M. A., and Myers, D. E. 1994. A geostatistical analysis of the spatio-temporal development of the downy mildew epidemics in cabbage. Phytopathol-ogy 84:1227-1239.
34. van Egmond, H. P. 1989. Aflatoxin M1: Occurrence, toxicity, regulation. Pages 11-55 in: Mycotoxins in Dairy Products. Chapter 2. H. P. van Egmond, ed. Elsevier Applied Science, New York.
35. van Egmond, H. P. 2002. Worldwide regulations for mycotoxins. Pages 257-269 in: Mycotoxins and Food Safety. J. W. DeVries, M. W. Trucksess, and L. S. Jackson, eds. Advances in Experimental Medi- cine and Biology. V. 504. Kluwer Academic/Plenum Publishers, New York.
36. Webster, R., and Boag, B. 1992. Geostatistical analysis of cyst nematodes in soil. J. Soil Sci. 43:583-595.

1200 PHYTOPATHOLOGY
37. White, J. G., Welch, R. M., and Norvell, W. A. 1997. Soil zinc map of the USA using geostatistics and geographic information systems. Soil Sci. Soc. Am. J. 61:185-194.
38. Widstrom, N. W. 1996. The aflatoxin problem with corn grain. Pages 219-280 in: Advances in Agronomy, vol. 56. Academic Press, San Diego, CA.
39. Wilson, D. M., and Payne, G. A. 1994. Factors affecting Aspergillus
flavus group infection and aflatoxin contamination of crops. Pages 309-325 in: The Toxicology of Aflatoxins. Human Health, Veterinary, and Agricultural Significance, Chapter 14. D. L. Eaton and J. D. Groopman, eds. Academic Press, San Diego, CA.
40. Wu, B. M., van Bruggen, H. C., Subbarao, K. V., and Pennings, G. G. H. 2001. Spatial analysis of lettuce downy mildew using geostatistics and geographic information systems. Phytopathology 91:134-142.