Embed Size (px)
Citation preview
COM
MU
NITY DEVELOPMENT IN
VES
TMEN
TS
CENTER FOR
Community Development
INVESTMENT REVIEW
FEDE
RAL
RESE
RVE
BANK
OF
SAN
FRAN
CISC
O www.frbsf.org/cdinvestments
Volume 3, Issue 1, 2007
ArticlesA History of Emerging Domestic MarketsGlenn Yago, Betsy Zeidman, Alethea Abuyuan
Who’s Counting? Measuring Social Outcomes from Targeted Private EquityJanneke Ratcliffe
Panning for Gold in Inner City MarketsPrabal Chakrabarti
Investment Intermediaries in Economic Development: Linking Public Pension Funds to Urban RevitalizationLisa A. Hagerman, Gordon L. Clark, and Tessa Hebb
The Brookings Urban Markets Initiative: Using Information to Drive Change Alyssa Stewart Lee
CommentaryGregory B. FairchildUniversity of Virginia
Phil AngelidesRiverview Capital Investments and former California State Treasurer
Michael A. StegmanMacArthur Foundation
Table of Contents
ARTICLES
A History of Emerging Domestic Markets ................................................................................................ 1Glenn Yago, Betsy Zeidman, Alethea AbuyuanThe Milken Institute’s Center for Emerging Domestic Markets has been a leader in researching and writing about the issue of expanding investment in traditionally undervalued and undercapitalized entrepreneurs, enterprises and communities, including women and ethnic business owners, urban cores, rural areas and low-income populations. This article traces the evolution of the emerging domestic market concept and provides a guide to the existing literature.
Who’s Counting? Measuring Social Outcomes from Targeted Private Equity ........................................... 23Janneke RatcliffeThe potential of private equity investment in emerging domestic markets to deliver strong financial returns while also giving rise to public benefits has drawn the attention of both venture and economic development capital, as well as policymakers and researchers. Ratcliffe examines this strategy and shares some real world examples of how funds are performing in their double-bottom line objectives.
Panning for Gold in Inner City Markets ................................................................................................... 39Prabal ChakrabartiChakrabarti discusses how the Institute for a Competitive Inner City has a long history of shining light on investment opportunities in the inner city. Through their Inner City 100 competition, they have collected an impressive database of EDM companies. But their greatest opportunity to bring investment to the inner city might be to expand the database and mine their existing data more deeply. More data in the form that inves-tors need holds the potential for bringing even more capital to EDM companies.
Investment Intermediaries in Economic Development: Linking Public Pension Funds to Urban Revitalization ............................................................................ 45Lisa A. Hagerman, Gordon L. Clark, and Tessa HebbIt is difficult for large investors, such as pension funds, to make investments in EDMs because they must make very large investments. The investments in communities of need, however, are usually small. The most successful strategy to overcome these two problems is for investors to work in concert with intermediaries that can aggregate the investments and community partners that understand both the need of communities and know how to tell “the story” to investors.
The Brookings Urban Markets Initiative: Using Information to Drive Change .......................................... 67Alyssa Stewart LeeUrban residents are more likely than their suburban counterparts to be underserved by retail services. The implications for urban residents and urban communities are far reaching. Recent research has shown that the costs of the basics—such as food, clothing, and even insurance—are often higher for low- to moderate-income residents. Appropriate access to goods and retail services must be a part of any agenda to create healthy communities. This article outlines the role of information as a critical part of the framework for urban retail success benefiting residents, communities, and the private sector.
Commentary
Gregory B. Fairchild, University of VirginiaThe Challenges of Evolution.................................................................................................................... 79
Phil Angelides, Riverview Capital Investments and former California State TreasurerBuilding Stronger Communities with Smart Investments ........................................................................ 83
Michael A. Stegman, MacArthur FoundationAn Overlooked Source of Emerging Domestic Market Capital: Can Anyone Spell Escheats? .................. 85
ForewordBy David Erickson June 2007
Center for Community Development Investments
In many ways, Harvard Business School Professor Michael Porter reignited the discussion about the missed opportunities for investing in inner cities and emerging domestic markets (EDMs) in the mid-1990s. His research on concentrated purchasing power along with the
efficiencies associated with access to transportation systems and workers argued that inner cities might have an unrecognized competitive advantage for business success and economic growth.1 As important as Porter’s message was, the notion of undervalued markets in economi-cally distressed communities is an old one. In the 1950s, for example, Illinois Senator Paul Douglas introduced legislation that promised a sort of “foreign aid” for investing in communi-ties that were left behind – mining and factory towns where industry had moved on. He wrote in his memoirs that these communities were rich in “social capital” and that an infusion of cash could leverage existing resources.�
Taken together, the articles in this issue of the Review provide a contemporary look at this discussion of undervalued markets. The overview article by Glenn Yago, Betsy Zeidman, and Alethea Abuyuan, reviews the evolving concept of EDM, a term the Milken Institute coined in the 1990s; it also surveys the existing literature. Other articles, for example Michael Stegman’s discussion of using unclaimed property as a source for EDM investment, provide insights into the new directions that this field might take.
In particular, two themes emerge in this issue of the Review. First, in nearly every article, authors call for better data on markets, entrepreneurs, and investment opportunities. As Alyssa Lee from Brookings’ Urban Markets Initiative explains, we are in the dark about the true potential for urban retail markets. Similarly, Prabal Chakrabarti shows that we need to know more about EDM entrepreneurs and their companies. Finally, Lisa Hagerman and Janneke Ratcliffe both look at the data problem from the investor side of the equation. Here too, there is a need to understand these markets so that institutional investors can fold community development investments into their overall investing strategy.
A second theme is that recent success in investing in EDMs has started to generate some confusion about how to measure the impact of this work. In the past few years there have been spectacular breakthroughs in leveraging finance in EDMs. For example, in his article, Phil Angelides describes the pioneering work at CalPERS and CalSTRS—two of the world’s largest pension funds—where billions of dollars have been steered toward EDM investment. In this new world, where ever-growing funds are invested with more than just a financial return in mind, we need to develop a better understanding of what the social and environmental benefits are to this type of investment. Greg Fairchild calls us to task on this point, and asks the really tough questions of whether we are providing significant social benefit or not. Going forward, how we explain the social benefit of double-bottom line investing will have to be more standardized, transparent, and easy to explain.
Our partner in this issue was Betsy Zeidman of the Milken Institute who was a great help in pulling this issue together. We also look forward to hearing from you on which ideas you think show the most promise to unlock new sources of capital for emerging domestic markets.
1 Porter, M. E. “The Competitive Advantage of the Inner City.” Harvard Business Review 73, no. 3 (May-June 1995).
� Douglas, Paul H. In the Fullness of Time: The Memoirs of Paul H. Douglas (New York: Harcourt Brace Jovanovich, Inc., 197�), 514.
FEDERAL RESERVE BANK OF SAN FRANCISCO
Community Development INVESTMENT REVIEW 1
A History of Emerging Domestic MarketsGlenn Yago, Betsy Zeidman, Alethea Abuyuan
The Milken Institute
The �000 U.S. Census dramatically illustrated what many observers already knew — that America’s racial and ethnic make-up is diversifying rapidly. Over the next 40 years, if projections hold, more than 85 percent of U.S. population growth will come from ethnic groups.� In fact, the size and share of these ethnic groups is so
significant that the combination of America’s African American and Hispanic consumer markets is larger than the GDP of all but nine countries in the world.�
With this diversity comes a change in the make-up of business ownership in the country. This is a trend that has been building over time. In the 1960s, as desegregation opened up opportunities for African-Americans and other ethnic minorities, they began to move into new fields of business. Over time, as access to education and employment opened up, the new managers possessed higher levels of training and experience, and stronger professional networks. While it is not yet an even playing field, aspiring entrepreneurs have steadily increased their ability to build companies in a variety of industries. Women have also steadily entered the ranks of business ownership in large numbers.
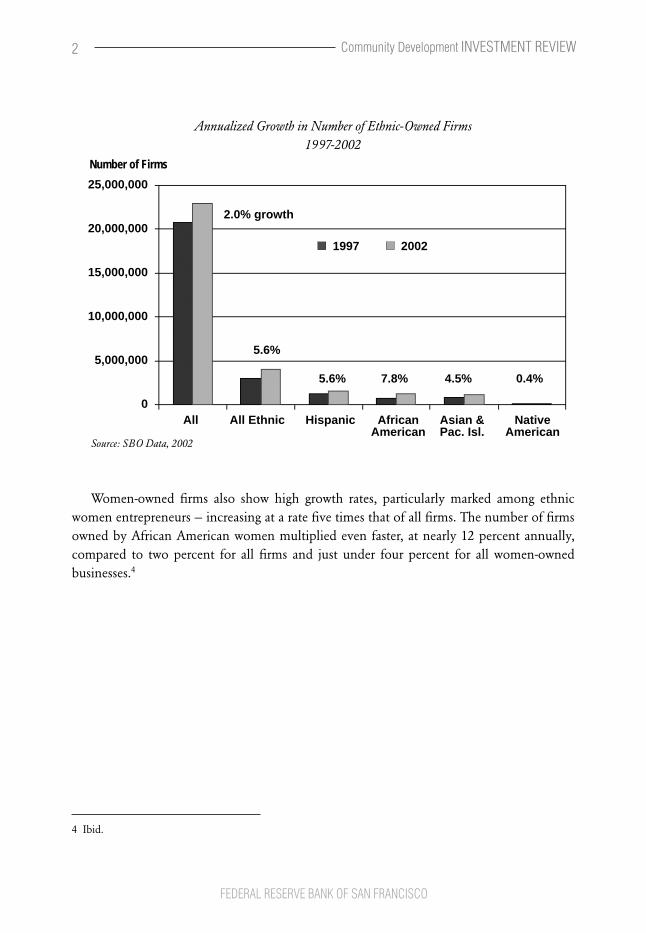
Between 1997 and �00� (the most recent comprehensive data on ethnic- and women-owned firms), the number of firms owned by African-Americans, Hispanics, and Asian- Americans grew at nearly three times the rate of all firms (with the number of African-American businesses increasing at almost four times the rate).�
1 U.S. Department of Commerce Minority Business Development Agency. September 1999. “Minority Population Growth: 1995 to �050.”
� Jeffrey M. Humphreys. “The multicultural economy, �006.” Georgia Business and Economic Conditions, 66:6 (�006), 1.
3 U.S. Census Bureau. 199�. “Survey of Minority and Women-Owned Business Enterprises”; and U.S. Census Bureau. �00�. “Survey of Business Owners.”
FEDERAL RESERVE BANK OF SAN FRANCISCO
Community Development INVESTMENT REVIEW2
4 Ibid.
Annualized Growth in Number of Ethnic-Owned Firms1997-2002
2.0% growth
5.6%
5.6% 7.8% 4.5% 0.4%
All All Ethnic Hispanic African Asian & Native American Pac. Isl. American
25,000,000
20,000,000
15,000,000
10,000,000
5,000,000
0
1997 2002
Number of Firms
Source: SBO Data, 2002
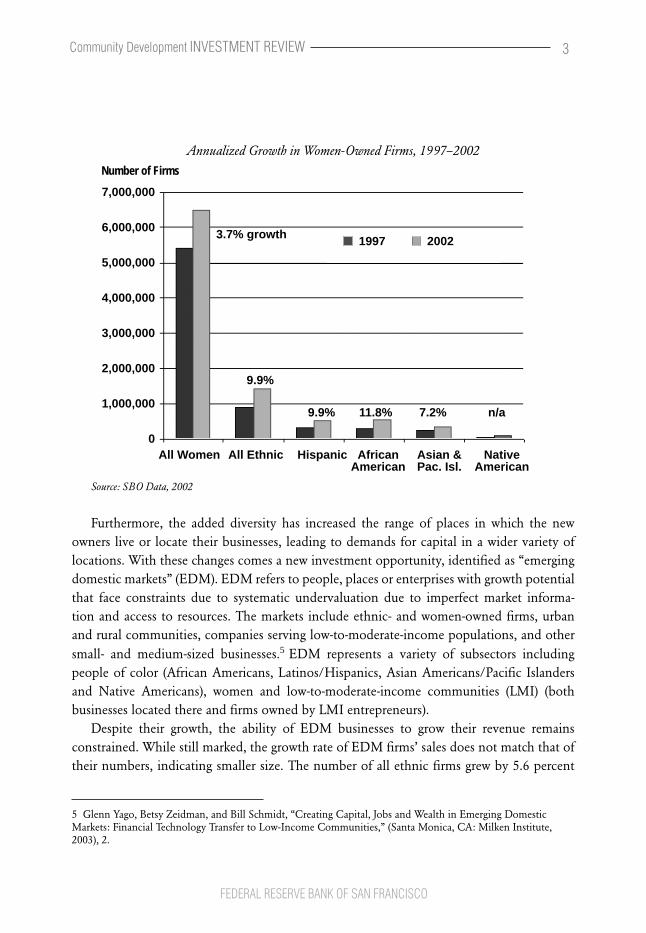
Women-owned firms also show high growth rates, particularly marked among ethnic women entrepreneurs — increasing at a rate five times that of all firms. The number of firms owned by African American women multiplied even faster, at nearly 1� percent annually, compared to two percent for all firms and just under four percent for all women-owned businesses.4
FEDERAL RESERVE BANK OF SAN FRANCISCO
Community Development INVESTMENT REVIEW 3
Annualized Growth in Women-Owned Firms, 1997–2002
All Women All Ethnic Hispanic African Asian & Native American Pac. Isl. American
7,000,000
6,000,000
5,000,000
4,000,000
3,000,000
2,000,000
1,000,000
0
Number of Firms
9.9%
3.7% growth
9.9% 11.8% 7.2% n/a
1997 2002
Source: SBO Data, 2002�
Furthermore, the added diversity has increased the range of places in which the new owners live or locate their businesses, leading to demands for capital in a wider variety of locations. With these changes comes a new investment opportunity, identified as “emerging domestic markets” (EDM). EDM refers to people, places or enterprises with growth potential that face constraints due to systematic undervaluation due to imperfect market informa-tion and access to resources. The markets include ethnic- and women-owned firms, urban and rural communities, companies serving low-to-moderate-income populations, and other small- and medium-sized businesses.� EDM represents a variety of subsectors including people of color (African Americans, Latinos/Hispanics, Asian Americans/Pacific Islanders and Native Americans), women and low-to-moderate-income communities (LMI) (both businesses located there and firms owned by LMI entrepreneurs).
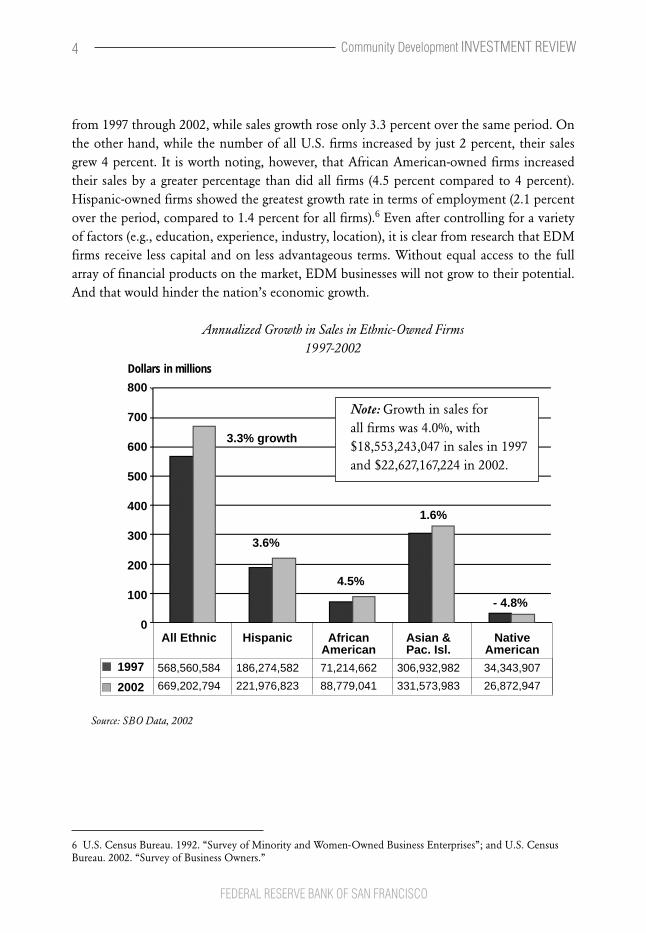
Despite their growth, the ability of EDM businesses to grow their revenue remains constrained. While still marked, the growth rate of EDM firms’ sales does not match that of their numbers, indicating smaller size. The number of all ethnic firms grew by 5.6 percent
5 Glenn Yago, Betsy Zeidman, and Bill Schmidt, “Creating Capital, Jobs and Wealth in Emerging Domestic Markets: Financial Technology Transfer to Low-Income Communities,” (Santa Monica, CA: Milken Institute, �003), �.
FEDERAL RESERVE BANK OF SAN FRANCISCO
Community Development INVESTMENT REVIEW4
from 1997 through �00�, while sales growth rose only 3.3 percent over the same period. On the other hand, while the number of all U.S. firms increased by just � percent, their sales grew 4 percent. It is worth noting, however, that African American-owned firms increased their sales by a greater percentage than did all firms (4.5 percent compared to 4 percent). Hispanic-owned firms showed the greatest growth rate in terms of employment (�.1 percent over the period, compared to 1.4 percent for all firms).� Even after controlling for a variety of factors (e.g., education, experience, industry, location), it is clear from research that EDM firms receive less capital and on less advantageous terms. Without equal access to the full array of financial products on the market, EDM businesses will not grow to their potential. And that would hinder the nation’s economic growth.
Annualized Growth in Sales in Ethnic-Owned Firms1997-2002
800
700
600
500
400
300
200
100
0
Dollars in millions
3.3% growth
3.6%
4.5%
1.6%
- 4.8%
Note: Growth in sales for all firms was 4.0%, with $18,553,�43,047 in sales in 1997 and $��,6�7,167,��4 in �00�.
All Ethnic Hispanic African Asian & Native American Pac. Isl. American
568,560,584 186,274,582 71,214,662 306,932,982 34,343,907
669,202,794 221,976,823 88,779,041 331,573,983 26,872,947
1997
2002
Source: SBO Data, 2002
6 U.S. Census Bureau. 199�. “Survey of Minority and Women-Owned Business Enterprises”; and U.S. Census Bureau. �00�. “Survey of Business Owners.”
FEDERAL RESERVE BANK OF SAN FRANCISCO
Community Development INVESTMENT REVIEW 5
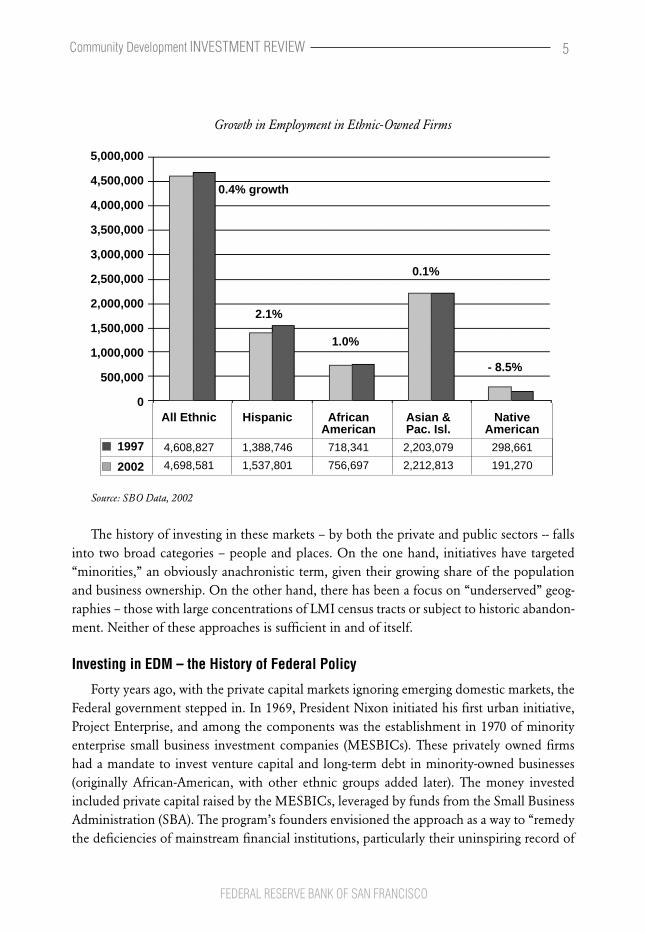
Growth in Employment in Ethnic-Owned Firms
5,000,000
4,500,000
4,000,000
3,500,000
3,000,000
2,500,000
2,000,000
1,500,000
1,000,000
500,000
0 All Ethnic Hispanic African Asian & Native American Pac. Isl. American
4,608,827 1,388,746 718,341 2,203,079 298,661
4,698,581 1,537,801 756,697 2,212,813 191,270
1997
2002
2.1%
1.0%
0.1%
- 8.5%
0.4% growth
Source: SBO Data, 2002
The history of investing in these markets – by both the private and public sectors -- falls into two broad categories – people and places. On the one hand, initiatives have targeted “minorities,” an obviously anachronistic term, given their growing share of the population and business ownership. On the other hand, there has been a focus on “underserved” geog-raphies – those with large concentrations of LMI census tracts or subject to historic abandon-ment. Neither of these approaches is sufficient in and of itself.
Investing in EDM – the History of Federal Policy
Forty years ago, with the private capital markets ignoring emerging domestic markets, the Federal government stepped in. In 1969, President Nixon initiated his first urban initiative, Project Enterprise, and among the components was the establishment in 1970 of minority enterprise small business investment companies (MESBICs). These privately owned firms had a mandate to invest venture capital and long-term debt in minority-owned businesses (originally African-American, with other ethnic groups added later). The money invested included private capital raised by the MESBICs, leveraged by funds from the Small Business Administration (SBA). The program’s founders envisioned the approach as a way to “remedy the deficiencies of mainstream financial institutions, particularly their uninspiring record of
FEDERAL RESERVE BANK OF SAN FRANCISCO
Community Development INVESTMENT REVIEW6
financing minority-owned firms.”� The MESBIC program eventually was supplanted by the Specialized Small Business
Investment Company (SSBIC) program, which was merged into the Small Business Invest-ment Company (SBIC) program in 1995. Despite worthy intentions to fill a clear capital gap, these approaches never achieved their desired outcomes. The reasons were many:
• Too many MESBICs/SSBICs remained too small to effectively cover operating expenses and/or achieve portfolio diversification. As an example, Bates’ analysis of all MESBICs operating in 1993 found that the typical fund had revenues of 7.3 cents per asset dollar against 8.4 cents in expenses.
• Many MESBICs incurred large losses from their venture capital investments, perhaps reflecting an inability to cover the cost of strong due diligence.
• The most stable MESBICs invested greater sums in bank CDs than in minority-owned businesses, hardly the approach envisioned by the program.�
• SBA leverage came in the form of debentures, generating a mismatch between the SSBICs source of capital and its use of funds for long-term equity positions.�
While the MESBIC/SSBIC program addressed EDM capital needs through a people-based approach, the Community Reinvestment Act (CRA) took a place-based strategy. Enacted by Congress in 1977 in response to concerns over discrimination in lending, CRA directed banks and thrifts to meet the credit needs of all borrowers in their communities, consistent with sound banking practices. It specifically challenges them to reach out to poten-tial customers in LMI areas (as defined by the percent of LMI residents within a census tract). Compliance for larger banks is evaluated via lending, investment and service tests.
Research shows that during its 30 year life, CRA has made an impact on EDM place-based lending. Despite the lack of strong enforcement mechanisms, the prospect of public disclosure of a below-average rating leads many banks to improve.�0 Additionally, consolidation in the banking industry puts CRA on the table in increasing numbers of merger applications.
Perhaps more significantly, bankers found that CRA loans were good business. A �001 survey of depository institutions reported that 86 percent found CRA small business loans at least as profitable as non-CRA small business loans.�� More recently, Bostic and Robinson
7 Timothy Bates, “Financing the Development of Urban Minority Communities: Lessons of History” Economic Development Quarterly 14 (�000): ��8.
8 Ibid, ��� and ��8.
9 Glenn Yago and Michael Harrington, “Mainstreaming Minority Business: Financing Domestic Emerging Markets,” (Santa Monica, CA: Milken Institute, 1999).
10 Kenneth H. Thomas, “CRA’s �5th Anniversary: The Past, Present & Future,” (�00�).
11 Board of Governors of the Federal Reserve Board, “Evaluating the Profitability of CRA Loans,” in Capital Connections (Board of Governors of the Federal Reserve Board �001).
FEDERAL RESERVE BANK OF SAN FRANCISCO
Community Development INVESTMENT REVIEW 7
studied data reported pursuant to CRA agreements and found that not only did institutions increase their small business lending upon initiation of an agreement, but that the increase continued even after the agreement’s expiration.��
Despite these findings, there is continued debate about CRA. Issues include the cost burden on smaller banks, the strength of enforcement, and whether to extend its applica-tion beyond depository institutions as more small business lending is provided by insurance and securities firms, and other non-bank lenders. The CRA Modernization Act of �007, introduced in March, addresses some of these concerns. These include extending CRA obli-gations within a financial holding company, and requiring satisfactory ratings by securities company, mortgage bank, and insurance company affiliates of such holding companies.
Since 1990, several new place-based initiatives have been launched. These include the Community Development Financial Institutions (CDFI) Fund, established by the Riegle Community Development and Regulatory Improvement Act of 1994, as a bipartisan initia-tive. The CDFI Fund supports community development lenders through direct investments and loans, technical assistance and other financial incentives encouraging capital flow to LMI populations. The Fund also administers the New Markets Tax Credit (NMTC) program, launched in �000. The NMTC provides taxpayers a credit for investments in designated community development entities (CDEs), designed to enable these entities to raise more long-term capital from the private markets. Since its inception, the Fund has allocated $1�.1 billion of the $19.5 billion it is authorized to provide during its life.��
A January �007 GAO report concluded that the NMTC appeared to be successful in increasing investment in LMI communities. Banks and individuals accounted for 70% of the investors, and other regulatory considerations (such as CRA compliance for financial institu-tions) may explain some of the flow of funds into NMTC vehicles. However the GAO survey conducted for the report found that some corporate investors were shifting funds from other assets to NMTC projects, and that some individual investors were tapping new sums to participate in NMTC deals. Of the allocations awarded to date, about 75 percent was used for commercial real estate construction and rehabilitation, with the balance for fixed assets and working capital for businesses.��
While the NMTC is currently place-based in its approach to EDM, that strategy may change. The American Jobs Creation Act of �004 did revise the NMTC guidelines to enable people-based strategies as well, by adding “targeted populations” to those eligible for
1� Raphael W. Bostic and Breck L. Robinson, “CRA Agreements and Small Business Lending: Is There a “there” There?” (paper presented at the Federal Reserve Bank of Chicago Conference on Bank Structure and Performance, �006).
13 CDFI Fund. http://www.cdfifund.gov/who_we_are/about_us.asp.
14 US Government Accountability Office, “Tax Policy: New Markets Tax Credit Appears to Increase Investment by Investors in Low-Income Communities, but Opportunities Exist to Better Monitor Compliance,” ed. GAO (�007).
FEDERAL RESERVE BANK OF SAN FRANCISCO
Community Development INVESTMENT REVIEW8
investment. Such populations include businesses that derive at least 50 percent of its gross income from activity with low-income individuals; at least 40 percent of whose employees are low-income, or at least 50 percent of which is owned by low-income individuals. The regulations have not been finalized.��
Private Capital Finds EDM
While government efforts to foster EDM investing – both the major ones described above and others on the state and local level, by the mid-1990s, the private sector was discov-ering the EDM opportunity on its own. Ever in search of new sources of returns, the capital markets were seeking unexplored territory. Two publications played a role in validating this interest. Michael Porter’s Harvard Business Review article, “The Competitive Advantage of the Inner City,” identified key strengths of traditionally overlooked urban areas (the “places”) and provided a strong business motive for capturing those strengths.�� It provided private capital with a rationale for engaging in place-based approaches to EDM. In the late 1990s, the Milken Institute coined the term “emerging domestic markets,” (EDM)�� identifying the rapidly diversifying base of entrepreneurs (the “people”) as targets for investment just as significant as the international emerging markets that were a staple of institutional inves-tors’ asset allocation. Its later report, Creating Capital, Jobs & Wealth in Emerging Domestic Markets: Financial Technology Transfer to Low-Income Communities,” explored the role of financial innovation in opening channels of capital to EDM businesses.
It is worth noting an interesting parallel in choosing to describe markets as “emerging.” In the early 1980s, terminology such as “third world” and “less developed countries (LDCs)” was standard. Frequently, and often unnecessarily, that label tainted assets from those markets, yielding undervalued assessments and excessive and arbitrary discounts. Antoine van Agtmael, then serving as division chief for the World Bank’s treasury operations and deputy director of the International Finance Corporation’s Capital Markets Department, coined the term “emerging markets.” Within twenty years of the change in definition and accompanying analysis of investment opportunities, emerging markets internationally came to contribute a majority of the global GDP for the first time since 18�0.��
Similarly, antiquated language and labels from the 1960s (e.g., “minority business”) dominated and arrested development in thinking and understanding about U.S. ethnic markets. As demographics in a number of states shift, it has become arithmetically incorrect to refer to ethnic markets as having “minority” status. As U. S. cities began to evolve in
15 Ibid., 11.
16 Michael E. Porter, “The Competitive Advantage of the Inner City,” Harvard Business Review, no. May-June (1995).
17 Yago and Harrington, “Mainstreaming Minority Business: Financing Domestic Emerging Markets.”
18 Antoine van Agtmael, The Emerging Markets Century: How a New Breed of World Class Companies is Overtaking the World (New York: Free Press, �007).
spatially polycentric patterns, discussions of “inner cities” (which were increasingly in the suburbs as well) became misleading. Shifting the terminology to more inclusively describe these firms, places and entrepreneurs as emerging domestic markets better captures the range of investment opportunities. It also more accurately captures the dynamics between the emerging asset and sub-asset classes characterized by new entrants into business, real estate and homeownership. In short, the broader base of economic participation in both labor force and capital ownership required clearer, more terminology that mainstreamed, rather than marginalized, the growing investment opportunities. In this journal, Greg Fairchild offers another perspective on the challenges of language.
The exploration of the investment opportunities emerged in a wide variety of innovative private, and public/private, sector efforts to deploy capital in EDM arenas. Several of these are described below. They are by no means a comprehensive list, but they offer an overview of the historical activity laying the groundwork for EDM investing.
Some of the seemingly simplest innovations were the adaptation of practices successful in mainstream finance to EDM firms. As an example, securitization is an approach widely used in the capital markets. The mortgage loan was the first to be widely securitized in the 1970s, but a secondary market has developed for other debt instruments, such as corporate loans and credit card debt. Securitization of the small business loans guaranteed under the Small Business Administration (SBA) 7(a) and 504 programs is a relatively standard practice, but the market is undeveloped for the un-guaranteed portions of small business loans. Virtu-ally the only noticeable effort in securitizing community development loans (those most directly link to EDM firms) is that of the Community Reinvestment Fund (CRF). CRF has been securitizing real estate and small business EDM loans for nearly �0 years, using philan-thropic capital as a credit enhancement. Its recoveries against defaults have varied by security type, with loans secured by real estate averaging 97 percent and unsecured loans averaging recovery levels of �7 percent.�� In �004 and �006, CRF offered the first rated community development securitizations, totaling over $100 million, comprised primarily of small busi-ness loans backed by real estate. Importantly, the amount of credit enhancement required for the second offering was less than that of the first, indicating greater market acceptance of the product.
As noted above, the funds launched through the SBA’s MESBIC and SSBIC program were generally too small to reach scale and successfully see returns from EDM investments. However, several evolved into independent venture capital (VC) firms, and met the needs of institutional investors, including public and private pension funds, banks and insurance companies.
The resulting network of funds investing in ethnic-owned businesses is represented today by the National Association of Investment Companies. Most of the funds have no remaining
19 Standard & Poor’s, “Pre-Sale: CRF USA-18, LLC,” (�006).
Community Development INVESTMENT REVIEW 9
FEDERAL RESERVE BANK OF SAN FRANCISCO
SBA affiliation.�0 Bates and Bradford found that these funds (and fund of funds—Fairview Capital) succeeded where the SBA-chartered entities failed by operating differently in several ways. They raised enough capital to diversify their portfolio and contribute additional rounds of financing. (Their median capitalization was $40 million as compared to $10 million for the SBA vehicles.) Their average investment size was four times greater than their predeces-sors. Additionally, as survivors of the MESBIC/SSBIC program, the founding NAIC firms possessed enormous experience to share with their counterparts.�� Given the relative youth of the industry, few studies have analyzed EDM-targeted fund performance, but Bates and Bradford show EDM funds (as represented by funds targeting minority-owned businesses) have enjoyed strong returns with a mean internal rate of return of �3.9 percent (surpassing the �0.� percent, ten-year trailing average for the private equity industry). Today NAIC member firms have over $5 billion under management, with over 50% provided by public pension funds (compared with over 70% from the government in 1990).��
In addition to the minority-focused venture capital funds, two other types of funds specif-ically target EDM communities—Community Development Venture Capital (CDVC) funds and Double Bottom Line (DBL) funds. Both of these place-based EDM strategies make equity investments in distressed areas, with a stated interest in both risk-adjusted market rate financial returns and ancillary benefits to the region, such as job and wealth creations, and overall economic growth. CDVC funds focus on business investment, while approximately 60% of the DBL funds are invested in inner city real estate funds.�� Within the industry, there is debate over the finer points of difference between CDVC funds and DBL funds, but their goals and target returns are quite similar, and both have raised the profile of EDM as an investment opportunity.
Among one of the strongest factors in raising awareness of EDM has been the activity of public pension funds. The California Public Employees’ Retirement System (CalPERS) has been a leader, investing in two minority-focused VC funds as early as 199� (Fairview Capital in Connecticut and Bastion Capital of Los Angeles).�� In �001, CalPERS implemented the California Initiative, a commitment of $475 million from its alternative assets allocation to “traditionally underserved markets primarily, but not exclusively, in California,” and the first major EDM program by a leading public pension fund.�� The California Initiative was
�0 Timothy Bates and William Bradford, “Minorities and Venture Capital,” (Kansas City, MO E. M. Kauffman Foundation, �003).
�1 Timothy Bates, William Bradford, and Julia Sass Rubin, “The Viability of the Minority-Oriented Venture-Capital Industry Under Alternative Financing Arrangements,” Economic Development Quarterly �0, no. 178 (�006).
�� Bates and Bradford, “Minorities and Venture Capital,” 11, and interview with Samuel Boyd, National Association of Investment Companies, May 14, �007.
�3 Strategic Development Solutions, “Double and Triple Bottom Line Fund Consulting.” http://www.strategicds.com/dbl-fund.html.
�4 T. Hellman, “Allied Equity Partners,” (Palo Alto, CA: Stanford University Graduate School of Business, �001).
�5 CalPERS Investment Committee, Agenda Item 51, May 14, �001 �001.
FEDERAL RESERVE BANK OF SAN FRANCISCO
Community Development INVESTMENT REVIEW10
based on the premise that “underserved markets” (fundamentally equivalent to EDM) were less efficient than traditional markets, but held the potential for superior investment opportunity. CalPERS allocated funds to 10 partnerships throughout the state, with allocations ranging in size from $10 million to $�00 million, and investment stage from seed through buyout. Shortly thereafter, the California State Teachers’ Retirement System (CalSTRS) committed $300 million to several of the same partnerships. Other funds have implemented similar programs, including Massachusetts Pension Reserves Investment Management (MassPRIM), New York State Common Retirement Fund, and New York City Employee Retirement System. (Former California State Treasurer Phil Angelides, one of the driving forces behind the California Initiative, provides an institutional investor’s perspective in his article in this issue.)
Six years later, CalPERS has deemed its program successful. CalPERS has invested nearly 70 percent of its allocated funds in 131 companies with a one-year net IRR of 5.6 percent, closely tracking the Venture Economics Median for private equity. The EDM companies range in size from three to more than ��,000 employees, with employment having grown seven percent, and LMI employment by 11 percent. The percentage of women or ethnic officers and key managers at the California Initiative companies generally exceeded that of the general California business population.�� (For a more detailed discussion of pension fund investing, see Lisa Hagerman’s article in this issue.)
Other types of institutional investors are increasingly looking at EDM investment options. Insurance companies have invested capital through such vehicles as Impact Community Capital, an LLC owned by the eight major insurance companies active in California (repre-senting more than $�� billion in annual premiums), makes and manages EDM investments, often through pooling and securitization. The California Organized Investment Network (COIN) posts notices of EDM opportunities to facilitate connections with interested insurers. Additionally, insurance companies appear as investors in CDVC and DBL funds and other EDM-targeted vehicles.
Outstanding Issues – A Review of the Literature
The above sections of this laid out the current demographics and the history of activity in providing capital to EDM firms. Despite the upward trend and the array of new vehicles, there is still a capital gap. What follows is a review of some of the key literature on this topic.
The Capital GapIt has been widely shown that ethnic, female, and low-income entrepreneurs have less
access to equity and debt capital than do white, male, and more affluent business owners.�� Canner analyzes Community Reinvestment Act (CRA) data from 1996 and 1997, and finds
�6 CalPERS and Pacific Community Ventures, “Impacting California’s Underserved Communities: Taking a Second Look,” (�007).
�7 Bates, Timothy and William Bradford. �003. “Minorities and Venture Capital: A New Wave in American Busi-ness,” Kauffman Foundation.
Community Development INVESTMENT REVIEW 11
FEDERAL RESERVE BANK OF SAN FRANCISCO
that “for all ethnic groups, the number of small-business loans falls with increases in neigh-borhood racial composition.”�� Bostic and Lampani looks specifically at African-American-owned firms. After controlling for “loan, firm, owner, and local market characteristics,” the authors conclude there is a statistically significant difference in loan approval rates between white- and African American-owned firms.�� Even when African-American entrepreneurs successfully secure financing, the amount of the bank loan is, on average, less than that of white borrowers with identical financial characteristics.�0 This gap is also evident for Latino-owned firms.��
Research findings by the Federal Reserve Bank of Chicago seem to reaffirm those of the above. By looking at the geographic distribution of CRA-related small-business lending, it finds that “the number and dollar value of loans are greater in upper-income neighborhoods than in low-income neighborhoods.”�� Furthermore, it has been demonstrated in several U.S. cities that the share of loans to upper-income areas exceeds that of the lower-income neighborhoods. This has been proved nationwide, as well as in Milwaukee and Washington, D.C.�� Immergluck takes additional steps to account for firm density, firm size, and indus-trial mix in the Chicago metropolitan area.�� Holding those variables constant, lower-income neighborhoods are still found to receive fewer loans. These findings are mirrored in a study by Cavaluzzo and Wolken on small business loan rejections, personal wealth, and discrimination.�� By examining the impact of personal wealth (home ownership, home equity, personal net wealth) combined with personal credit history of the principal owner, the business credit history of the firm, and additional explanatory variables, the authors find that greater personal wealth is inversely correlated with loan denial. More interestingly, they discovered substantial “unexplained differences in denial rates between African American-,
�8 Canner, Glenn B. 1999. “Evaluation of CRA Data on Small-Business Lending,” Business Access to Capital and Credit, Federal Reserve Bank of Chicago.
�9 Bostic, Raphael W. and K. Patrick Lampani. March 1999. “Racial Differences in Patterns of Small-Business Finance: The Importance of Local Geography,” Proceedings of the Federal Reserve Bank of Chicago.
30 Bates, Timothy. 1991. “Commercial Bank Financing of White- and Black-Owned Small-Business Start-Ups.” Quarterly Review of Economics and Business. 31(1); Bates, Timothy. 1997. “Unequal Access: Financial Institution Lending to Black- and White-Owned Small-business Start-Ups,” Journal of Urban Affairs, 19.
31 Morales, Angel and Javier Saade. Fall �000. “Hispanic-American Venture Capital: Financing the Growth of the Latino Market,” Journal of Private Equity.
3� Federal Reserve Bank of Chicago. November �001. “�000 CRA Small-Business Lending Profile.”
33 Squires, Gregory and Sally O’Conner. 1999. “Access to Capital: Milwaukee’s Small-Business Lending Gap,” Woodstock Institute Research Paper Series; and National Community Reinvestment Coalition. December �000. “United States Small-business Lending Trends, 1996 to 1999.”
34 Immergluck, Daniel. 1999. “Intraurban Patterns of Small-Business Lending: Findings from the New Commu-nity Reinvestment Act Data,” Business Access to Capital and Credit, Federal Reserve Bank of Chicago.
35 Ken Cavalluzo and John Wolken, “Small Business Loan Turndowns, Personal Wealth and Discrimination,” (Federal Reserve Board, �00�).
FEDERAL RESERVE BANK OF SAN FRANCISCO
Community Development INVESTMENT REVIEW12
Hispanic-, Asian-, and white-owned firms.”�� This observation inevitably brings up the issue of discrimination.
Blanchard, Yao, and Zinger finds similar results in a study of black-owned and Hispanic-owned businesses. The authors found “substantial, statistically significant evidence of discrim-ination” against such firms despite factoring in additional control variables and accounting for possible endogeneity.�� They also find that “discrimination in small business lending may take the form of statistical discrimination, driven by lenders’ stereotypes about the ability of black- and Hispanic-owned businesses to succeed under some circumstances.”�� In addition, black-owned businesses face discrimination in interest rates with some types of lenders.
Challenges Facing EDM BusinessThis particular challenge could be one of the major reasons why the differences between
African-American business ownership rates and white business ownership rates are striking. In a comprehensive study on access to financial capital among African-American businesses, Robb and Fairlie finds that lower rates of business ownership among blacks are due to lower levels of net worth, lower levels of start-up capital (which limits growth potential), and higher levels of loan rejection. These all contribute to lower rates of business success compared with their white and Asian counterparts, lower sales and profits, and less employment among black-owned businesses.�� The authors state that “these constraints not only hurt economic progress among blacks, but also create more general efficiency loss in the economy”. Finally, they reiterate Blanchard, Yao and Zinger’s call for more oversight of the lending community to prevent discrimination, in addition to technical assistance programs for financial literacy and training.�0
In an earlier study, Fairlie and Robb focuses on success and why black-owned businesses do not fare as well as white-owned businesses. Using data from the Characteristics of Busi-ness Owners Survey, the authors try to determine whether the role of families, inheritances, and business human capital can help explain the lower rates of business success among African-Americans. They found that black business owners are at a disadvantage because they are “less likely to have had a self-employed family member owner prior to starting their business and are less likely to have worked in that family member’s business”.�� Given the
36 Ibid.
37 Lloyd Blanchard, Bo Zhao, and John Yinger, “Do Credit Market Barriers Exist for Minority and Woman Entre-preneurs?,” in Center for Policy Research Working Paper No. 74 (Syracuse, New York: Center for Policy Research Maxwell School of Citizenship and Public Affairs, �005).
38 Ibid.
39 Alicia Robb and Robert W. Fairlie, “Access to Financial Capital Among U.S. Businesses: The Case of African-American Firms,” in CES Discussion Papers, ed. Sang V. Nguyen (Washington, DC: Center for Economic Studies, �006).
40 Ibid.
41 Robert W. Fairlie and Alicia Robb, “Why Are Black Businesses Less Successful Than White-Owned Businesses? The Role of Families, Inheritances, and Business Human Capital,” in CES Discussion Papers, ed. Sang V. Nguyen (Washington, DC: Center for Economic Studies, �005).
Community Development INVESTMENT REVIEW 13
FEDERAL RESERVE BANK OF SAN FRANCISCO
lack of direct work experience, black business owners do not acquire the general and specific business know-how, which leads to less successful business outcomes.
Despite the serious obstacles facing African-American entrepreneurs, evidence suggests that African-Americans continue to be optimistic about their business environment and in fact are almost twice as likely as whites to start a business, according to a study by Phillip Kollinger and Maria Minniti. In other words, “the under-representation of black Americans among established entrepreneurs is not due to lack of trying but may instead be due to stronger barriers to entry and higher failure rates” as discussed earlier.�� Kollinger and Minn-iti’s findings have obvious significance in that they strengthen the argument for eliminating discrimination in lending and improving access to capital, financial services, and technical assistance among black entrepreneurs.
Hispanics, the fastest growing ethnic group in the US, exhibit business ownership trends and characteristics similar to those of their African-American counterparts. Lofstrom and Wang perform an analysis of the self-employed gap between Hispanics (of Mexican descent and other Latin-American descent) whites, and discover that “while Mexican-Hispanics are less likely to enter self-employment relative to whites, other Hispanics are more likely to start a business”.�� Even though Mexicans in their home country have high self-employment rates, this is not reflected in the Mexican immigrant population, with only six percent of Mexican immigrants self-employed in the U.S.��
Not unlike the case with African-Americans, there are large differences in business survival rates between Hispanic-owned and white-owned businesses, also seemingly due to differ-ences in education and financial wealth. Fairlie and Woodruff find that self-employment rates among Mexican immigrants improve with legal status, fluency in English, and for men, living in ethnic enclaves.��
Cavaluzzo and Cavaluzzo state that the capital gap for female entrepreneurs is not as clear as for minority and low-income business owners. They also fail to identify loan approval bias against female entrepreneurs.�� Nevertheless, women-owned firms are less likely to apply for and use external financing.�� Women-owned firms, furthermore, pay a higher interest rate on
4� Ibid.
43 Magnus Lofstrom and Chunbei Wang, “Hispanic Self-Employment: A Dynamic Analysis of Business Owner-ship,” in IZA Discussion Paper No. �101 (Bonn: IZA, �006).
44 Robert W. Fairlie and Christopher Woodruff, “Mexican Entrepreneurship: A Comparison of Self-Employ-ment in Mexico and the United States,” in IZA Discussion Paper Series No. �039 (Bonn: Institute for the Study of Labor, �006).
45 Ibid.
46 Cavaluzzo, Ken and Lind Cavaluzzo. 1998. “Market Structure and Discrimination: The Case of Small-busi-nesses,” Journal of Money Credit and Banking, 30(4).
47 National Women’s Business Council. September �00�. “Getting to Success: Helping Women Business Owners Gain Access to Capital.”
FEDERAL RESERVE BANK OF SAN FRANCISCO
Community Development INVESTMENT REVIEW14
average than comparable male-owned businesses.�� Although women own approximately 40 percent of all businesses in the United States, they receive less than 5 percent of all venture capital investment.��
The Data GapAs noted at the outset, one of the key reasons that EDM firms face capital constraints is
information asymmetries—the lack of robust data on the markets. Without comprehensive, reliable demographic and financial information, financial decision makers, business leaders and public policy officials are unable to price risk and evaluate opportunities effectively.
Research continually reinforces the view that systems for capturing and sharing market data on lower-income populations remain undeveloped.�0 This in turn prevents financial institutions from developing innovative investment products. Clark and Gaillard find that the greatest barrier to growth and success of the emerging financial market is the lack of reli-able financial-return data.��
Sabety and Carlson argue that new information sources are needed to expose potential investment opportunities in urban locations. In comparison to middle-class and wealthier locales outside inner cities, “urban areas may be currently experiencing a shortage of invest-ment and market activity because their investment potential is not well-captured by current information resources.”�� The development of new data sources would improve urban market activity and reveal new investment opportunities.
In instances when information is collected, the data are not generally in a format useful to investors. For example, the Office of Advocacy of the U.S. Small Business Administration reviews bank lending activities in �00�−�003 as recorded in CRA reports.�� The focus of the SBA report is an analysis of the level of lending to small businesses, but this is measured only in aggregate. Characteristics of individual loans are missing, and their is no loan perfor-mance data. In addition, there is no race or gender data reported under CRA (see the National
48 Coleman, S. �000. “Access to Capital and Terms of Credit: A Comparison of Men and Women-Owned Busi-nesses,” Journal of Small Business Management, 38.
49 Brush, Candida, Nancy Carter, Elizabeth Gatewood, Patricia Greene, and Myra Hart. “Gatekeepers of Venture Growth: A Diana Project Report on the Role and Participation of Women in the Venture Capital Industry,” Kauffman Foundation, �004.
50 Weissbourd, Robert. June �00�. “Banking on Technology: Expanding Financial Markets and Economic Opportunity,” The Brookings Institution; Ou, Charles. �004. “Statistical Databases for Economic Research on the Financing of Small Firms in the United States.” Working Paper, SBA Office of Advocacy.
51 Clark, Catherine H. and Josie Taylor Gaillard. August �003. “RISE Capital Market Report: The Double Bottom Line Private Equity Landscape in �00�–�003.” Research Initiative on Social Enterprise.
5� Sabety, J. Pari and Virginia L. Carlson. July �004. “Using Information to Drive Change: New Ways to Move Urban Markets,” The Brookings Institution Urban Markets Initiative.
53 U.S. Small Business Administration, Office of Advocacy. March �005. “Small Business and Micro Business Lending in the United States, for Data Years �00�-�003.”
Community Development INVESTMENT REVIEW 15
FEDERAL RESERVE BANK OF SAN FRANCISCO
Community Reinvestment Coalition analysis of CRA lending from 1996 to 1999).�� Several papers argue that improving the quantity and quality of EDM data could increase
the supply of capital to emerging small businesses. Carr and Schuetz along with Brush contend that an expanded collection of transaction data tracking investment performance by gender, ethnicity, and geographic location would improve the financial services environment for lower-income and minority households.��
Improving Granularity, and Usefulness of DataEnhanced information would allow banks to conduct data mining (the analysis of large
datasets) to uncover investment opportunities across markets and industries.�� One very promising application of data mining is credit scoring, a form of statistical analysis used to predict the probability that a loan applicant will default. Small-business credit scoring is rela-tively new the first model was introduced by Fair, Isaac in 1995 and differs from traditional credit scoring in that it combines limited information on the firm with consumer data about the small-business owner.��
The personal credit history of a business owner has been shown to be an accurate predictor of a small business’s repayment performance. In many cases, credit scoring has helped to increase small business lending by simplifying the approval process and reducing the need for a strong relationship between the bank and the loan applicant.�� “Research strongly suggests that small-business credit scoring has increased small-business credit availability in a number of dimensions, including: increasing the quantity of credit extended; increasing lending to relatively opaque, risky borrowers; increasing lending within low-income areas; [increasing] lending over greater distances; and increasing loan maturity.”�� The rise in lending has been most noticeable in the number of loans under $100,000 extended by large banks,�0 which are
54 National Community Reinvestment Coalition. December �000. “United States Small Business Lending Trends, 1996 to 1999.”
55 Carr, James H. and Jenny Schuetz. August �001. “Financial Services in Distressed Communities: Issues and Answers,” Fannie Mae Foundation; Brush, Candida G., Nancy Carter, Elizabeth Gatewood, Patricia G. Greene, and Myra M. Hart. October �001. “An Investigation of Women-led Firms and Venture Capital Investment,” CB Associates.
56 Wasserman, Miriam. “Mining Data.” Spring �000. Federal Reserve Bank of Boston. See http://www.bos.frb.org/ economic/nerr/rr�000/q3/mining.htm
57 Berger W., Allen N., Scott Frame, and Nathan H. Miller. �00�. “Credit Scoring and the Availability, Price, and Risk of Small-Business Credit,” Finance and Economics Discussion Series �00�–�6, Board of Governors of the Federal Reserve System.
58 Fair, Isaac. May �006. “Leveraging Fair, Isaac Analytics and Decision Technology to Improve Profitability in Small-Business Lending Markets,” Fair, Isaac Guide for Using Predictive Small-business Analytic Models.
59 Berger, Allen N. and W. Scott Frame. May �005. “Small-Business Credit Scoring and Credit Availability,” Federal Reserve Bank of Atlanta Working Paper Series.
60 Akhavein, Jalal, W. Scott Frame, and Lawrence J. White. May �001. “The Diffusion of Financial Innovations: An Examination of the Adoption of Small-Business Credit Scoring by Large Banking Organizations,” Proceed-ings, Federal Reserve Bank of Chicago; Peek, Joe and Eric S. Rosengren. March/April 1998. “The Evolution of Banking Lending to Small Business,” New England Economic Review; and Berger, Frame, and Miller �00�.
FEDERAL RESERVE BANK OF SAN FRANCISCO
Community Development INVESTMENT REVIEW16
using credit scoring as a means to expand into the small-business lending market.�� Frame, Srinivasan and Woosley examine a sample of large U.S. banks and find that credit
scoring leads to an 8.4 percent increase in the portfolio share of small-business loans: on average $4 billion per institution.�� In the Federal Reserve Bank of Atlanta’s district, the use of credit scoring increased small-business lending by $16.4 million per low- or moderate-income area served and the probability that a large banking organization would make small-business loans in the area by 3.8 percent.�� Peterson and Rajan find that increased avail-ability of credit scoring data allows banks to lend to more distant small-business borrowers.�� Further, credit scoring mitigates the potential harmful default effects of distance lending because it improves the ability of lenders to assess and price default risks.��
Both government agencies and independent researchers suggest that government, nonprofit organizations and the private lenders and investors collaborate to improve EDM data. Hawke recommends joining data from the U.S. Census, private marketing and “non traditional” sources (e.g., utility bills) to better understand the economic importance of EDM.�� Yago, Zeidman, Magula & Sederstrom categorize the wide array of EDM-related data (from financial institutions, government agencies, trade associations, nonprofits and information management companies; using different units of measurement, including business owner, business type, financing type and financial performance) and recommend forming a consortium to build a relational database to pool diverse data, masked to preserve confidentiality.��
As we note in Emerging Domestic Markets: Increasing Capital by Improving Data, “no new financial market or asset class has emerged over the past thirty years without consider-able investment in building the informational infrastructure about firm and project finance characteristics, financial and economic performance, and the relationship between these and macroeconomic and institutional dynamics.”��
61 Loretta J. Mester. September 1997. “What’s the Point of Credit Scoring?” Business Review, Federal Reserve Bank of Philadelphia.
6� Frame, W. Scott, Aruna Srinivasan, and Lynn Woosley. �001. “The Effect of Credit Scoring on Small-Business Lending,” Journal of Money, Credit and Banking, 33(3).
63 Frame, W. Scott, Michael Padhi, and Lynn Woolsey. April �001. “The Effect of Credit Scoring on Small-Busi-ness Lending in Low- and Moderate-Income Areas,” Federal Reserve Bank of Atlanta.
64 Peterson, Mitchell A. and Raghuram G. Rajan. October �000. “Does Distance Still Matter? The Information Revolution in Small-business Lending,” Northwestern University.
65 DeYoung, Robert, Dennis Glennon, and Peter Nigro. March �006. “Borrower-Lender Distance, Credit Scoring, and the Performance of Small-Business Loans,” FDIC Center for Financial Research, Working Paper No. �006-04.
66 John Hawke, “Growing Diverse Banking Markets: Going Beyond Traditional Measures,” Comptroller of the Currency Administrator of National Banks Community Development Newsletter (�001).
67 Yago, Glenn, Betsy Zeidman et al., “Emerging Domestic Markets: Increasing Capital by Improving Data,” (Santa Monica, CA: �007).
68 Ibid.
Community Development INVESTMENT REVIEW 17
FEDERAL RESERVE BANK OF SAN FRANCISCO
The history of emerging domestic markets is rich and ripe with potential for continuing growth. Yet challenges remain to obtaining capital, and the full variety of capital products. If business, government, the social sector and philanthropy, do not access all available informa-tion, EDM businesses will not be able to achieve their potential, investors will not reach their target returns, and the country’s economic growth will be constrained.
ReferencesAcs, Zoltan J. “The development and expansion of secondary markets for small business loans,” Proceedings, Federal Reserve Bank of Chicago. March 1999, 6�5–643.
Afshar, Anna. “Use of Alternative Credit Data Offers Promise, Raises Issues.” New England Commu-nity Developments. Federal Reserve Bank of Boston. Third Quarter, �005.
Akhavein, Jalal, W. Scott Frame and Lawrence J. White. “The Diffusion of Financial Innovations: An Examination of the Adoption of Small Business Credit Scoring by Large Banking Organizations,” Proceedings, Federal Reserve Bank of Chicago, May �001: �94–314.
Bates, Timothy. “Commercial Bank Financing of White- and Black-Owned Small Business Start-Ups.” Quarterly Review of Economics and Business. 31:1 (1991): 64–80.
Bates, Timothy. “Unequal Access: Financial Institution Lending to Black- and White-Owned Small Business Start-Ups.” Journal of Urban Affairs. 19 (1997): 487–495.
Bates, Timothy. “Financing the Development of Urban Minority Communities: Lessons of History “ Economic Development Quarterly 14 (�000): ��7-41.
Bates, Timothy, and William Bradford. “Minorities and Venture Capital.” Kansas City, MO: E. M. Kauffman Foundation, �003.
Bates, Timothy, William Bradford, and Julia Sass Rubin. “The Viability of the Minority-Oriented Venture-Capital Industry Under Alternative Financing Arrangements.” Economic Development Quar-terly �0, no. 178 (�006).
Berger, Allen N. and W. Scott Frame. “Small Business Credit Scoring and Credit Availability.” Federal Reserve Bank of Atlanta Working Paper Series. May �005. �4 pp.
Berger, Allen N., W. Scott Frame and Nathan H. Miller, April �00�. “Credit Scoring and the Avail-ability, Price, and Risk of Small Business Credit,” Finance and Economics Discussion Series �00�–�6, Board of Governors of the Federal Reserve System (U.S.). 31 pp.
Bitler, Marianne, Alicia Robb, and John Wolken. Federal Reserve Bulletin. (4) (�001): 183–�05.
Blanchard, Lloyd, Bo Zhao, and John Yinger. “Do Credit Market Barriers Exist for Minority and Woman Entrepreneurs?” In Center for Policy Research Working Paper No. 74. Syracuse, New York: Center for Policy Research Maxwell School of Citizenship and Public Affairs, �005.
Board of Governors of the Federal Reserve Board. “Evaluating the Profitability of CRA Loans.” In Capital Connections: Board of Governors of the Federal Reserve Board �001.
Bostic, Raphael W. and K. Patrick Lampani. “Racial Differences in Patterns of Small Business Finance: The Importance of Local Geography.” Federal Reserve Bank of Chicago. March 1999: 149–179.
Bostic, Raphael W., and Breck L. Robinson. “CRA Agreements and Small Business Lending: Is There a “there” There?” Paper presented at the Federal Reserve Bank of Chicago Conference on Bank Structure and Performance �006.
Boston Consulting Group. “The New Agenda for Minority Business Development.” June �005.
FEDERAL RESERVE BANK OF SAN FRANCISCO
Community Development INVESTMENT REVIEW18
Bostrup, Tore. “Introduction to Relational Databases – Part 1: Theoretical Foundation.” 15 Seconds. May ��, �00�. http://www.15seconds.com/issue/0�05��.htm.
Boyd, J. “Environmental Liability Reform and Privatization in Central and Eastern Europe.” European Journal of Law and Economics Volume 3 (1996): 39-60.
Brenner, Glen, Keon Holmes, Robert Munroe, and Zuhairah Scott. “The Unique Fundraising Chal-lenges of Private Equity Funds Focused on the Emerging Domestic Market.” National Association of Investment Companies. June �005. �6 pp.
The Brookings Institution. “Urban Retail Performance Metrics (RPM Suite): Information to Change the Climate of Urban Retail Investment.” �005. � pp.
Brush, Candida G., Nancy Carter, Elizabeth Gatewood, Patricia G. Greene, and Myra M. Hart. “An Investigation of Women-Led Firms and Venture Capital Investment.” CB Associates. October �001. 36 pp.
California Reinvestment Committee. “No Credit for Those Who Need It: Uncle Sam Ignores Small and Minority Business.” January 1994.
CalPERS Investment Committee. Agenda Item 51, May 14, �001 �001.
CalPERS, and Pacific Community Ventures. “Impacting California’s Underserved Communities: Taking a Second Look.” �007.
Canner, Glenn B. “Evaluation of CRA Data on Small Business Lending.” Business Access to Capital and Credit. Chicago: Federal Reserve Bank of Chicago, 1999: 53–83.
Carr, James H. and Jenny Schuetz. “Financial Services in Distressed Communities: Issues and Answers.” Fannie Mae Foundation. August �001. 30 pp.
Cavaluzzo, Ken and Lind Cavaluzzo. “Market Structure and Discrimination: The Case of Small Busi-nesses.” Journal of Money, Credit and Banking. 30:4 (1998): 771–79�.
Cavalluzo, Ken, and John Wolken. “Small Business Loan Turndowns, Personal Wealth and Discrimina-tion.” Federal Reserve Board, �00�.
Clark, Catherine H. and Josie Taylor Gaillard. “RISE Capital Market Report: The Double Bottom Line Private Equity Landscape in �00�–�003.” Research Initiative on Social Enterprise. August �003. 51 pp.
Codd, E. F. “A Relational Model of Data for Large Shared Data Banks.” Communications of the ACM. 13.6 (1970): 377–387.
Coleman, S. “Access to Capital and Terms of Credit: A Comparison of Men- and Women-Owned Busi-nesses.” Journal of Small Business Management. 38 (�000): 37–5�.
Collins, John. “Multi-Dimensional Databases: Introduction.” Design-Ireland.NET. November �7, �003. http://www.design-ireland.net/multi/multi5.php.
Community Reinvestment Fund. “CRF USA �003/�004 Annual Report.” May, �005.
DeYoung, Robert, Dennis Glennon, Peter Nigro. “Borrower-Lender Distance, Credit Scoring, and the Performance of Small Business Loans” FDIC Center for Financial Research Working Paper No. �006–04. March �006.
Dunkelberg, William C. and Holly Wade. “NFIB Small Business Economic Trends.” National Federa-tion of Independent Business. September �005. 19 pp.
Federal Reserve Bank of Chicago. “CRA Small Business Lending Profile.” November �001. 4 pp.
Fair, Isaac. “Leveraging Fair, Isaac Analytics and Decision Technology to Improve Profitability in Small Business Lending Markets.” Fair, Isaac Guide for Using Predictive Small Business Analytic Models, May �006.
Community Development INVESTMENT REVIEW 19
FEDERAL RESERVE BANK OF SAN FRANCISCO
Fairlie, Robert W., and Alicia Robb. “Why Are Black Businesses Less Successful Than White-Owned Businesses? The Role of Families, Inheritances, and Business Human Capital.” In CES Discussion Papers, edited by Sang V. Nguyen. Washington, DC: Center for Economic Studies, �005.
Fairlie, Robert W., and Christopher Woodruff. “Mexican Entrepreneurship: A Comparison of Self-Employment in Mexico and the United States.” In IZA Discussion Paper Series No. �039. Bonn: Institute for the Study of Labor, �006.
Frame, W. Scott, Aruna Srinivasan and Lynn Woolsey. “The Effect of Credit Scoring on Small Business Lending.” Journal of Money, Credit and Banking. 33:3 (�001): 813–8�5.
Frame, W. Scott, Michael Padhi and Lynn Woolsey. “The Effect of Credit Scoring on Small Business Lending in Low- and Moderate-Income Areas.” Federal Reserve Bank of Atlanta. April �001. �4 pp.
Gentry, Bradford S. Private Capital Flows and the Environment: Lessons from Latin America. Chel-tenham, UK: Edward Elgar, 1998.
Grehan, Rick. “Introduction to ODBMS.” ODBMS.ORG: Object Database Management Systems. �005. http://odbms.org/introduction.html.
Haus, Erik. “Re: A Data Consortium.” E-mail to the author. December 15, �005.
Hawke, John. “Growing Diverse Banking Markets: Going Beyond Traditional Measures.” Comptroller of the Currency Administrator of National Banks Community Development Newsletter (�001).
Hellman, T. “Allied Equity Partners.” Palo Alto, CA: Stanford University Graduate School of Business, �001.
Immergluck, Daniel. “Intraurban Patterns of Small Business Lending: Findings from the New Commu-nity Reinvestment Act Data.” Business Access to Capital and Credit. Chicago: Federal Reserve Bank of Chicago, 1999: 1�3–138.
Information Policy Institute. “Giving Underserved Consumers Better Access to the Credit System: The Promise of Non-Traditional Data.” July �005. 3� pp.
ING. “ING Gazelle Index.” December �005. http://www.gazelleindex.com.
Initiative for a Competitive Inner City. “State of the Inner City Economies Research Data for Inner Cities of the 100 Largest Central Cities.” Chart. Mimeo.
Kollinger, Philipp, and Maria Minniti. ”Not for Lack of Trying: American Entrepreneurship in Black and White.” In DIW Berlin Discussion Papers 574: German Institute for Economic Research, �006.
Lofstrom, Magnus, and Chunbei Wang. “Hispanic Self-Employment: A Dynamic Analysis of Business Ownership.” In IZA Discussion Paper No. �101. Bonn: IZA, �006.
Lozano, Fernando. “Introduction to Relational Database Design.” EDM/�. Mimeo. http://www.edm�.com/061�/msql7.html.
Office, US Government Accountability. “Tax Policy: New Markets Tax Credit Appears to Increase Investment by Investors in Low-Income Communities, but Opportunities Exist to Better Monitor Compliance.” edited by GAO, �007.
Mester, Loretta J. “What’s the Point of Credit Scoring?” Business Review, Federal
Reserve Bank of Philadelphia, Sep 1997, 3–16.
Morales, Angel and Javier Saade. “Latino-American Venture Capital: Financing the Growth of the Latino Market.” Journal of Private Equity. Fall �000: 55–63.
Moy, Kristin and Alan Okagaki. “Changing Capital Markets and Their Implications for Community Development Finance.” The Brookings Institution. �001.
FEDERAL RESERVE BANK OF SAN FRANCISCO
Community Development INVESTMENT REVIEW20
National Community Reinvestment Coalition. “United States Small Business Lending Trends, 1996 to 1999.” December �000. 1� pp.
National Women’s Business Council. “Getting to Success: Helping Women Business Owners Gain Access to Capital.” September �00�. 30 pp.
Ou, Charles. “Statistical Databases for Economic Research on the Financing of Small Firms in the United States.” Working Paper, Small Business Administration, Office of Advocacy, �004.
Peek, Joe and Eric S. Rosengren. “The Evolution of Banking Lending to Small Business.” New England Economic Review. March/April 1998: �7–36.
Porter, Michael E. “The Competitive Advantage of the Inner City.” Harvard Business Review, no. May-June (1995).
Private Equity International. “Battleground States: A Geographic Guide to Public Disclosure Develop-ments Across America.” Private Equity International. December/January �004/�005: 50-51.
Robb, Alicia, and Robert W. Fairlie. “Access to Financial Capital Among U.S. Businesses: The Case of African-American Firms.” In CES Discussion Papers, edited by Sang V. Nguyen. Washington, DC: Center for Economic Studies, �006.
Robins, Charles and Robert Toomey. “Keeping the ‘Private’ in Private Equity: Dealing with FOIA Concerns.” Weil. Gotshal & Manges, March �004.
Robb, Alicia. “Databases for Research on Women and Minority Entrepreneurship: Bootcamp �005.” Presentation. Foundation for Sustainable Development. �005.
Sabety, J. Pari and Virginia L. Carlson. “Using Information to Drive Change: New Ways to Move Urban Markets.” The Brookings Institution Urban Markets Initiative. July �004. 19 pp.
Squires, Gregory and Sally O’Conner. “Access to Capital: Milwaukee’s Small Business Lending Gap.” Woodstock Institute Research Paper Series. 1999.
Standard & Poor’s. “Pre-Sale: CRF USA-18, LLC.” �006.
Strategic Development Solutions. “Double and Triple Bottom Line Fund Consulting. http://www.strategicds.com/dbl-fund.html.”
Thomas, Kenneth H. “CRA’s �5th Anniversary: The Past, Present & Future.” (�00�).
U.S. Board of Governors of the Federal Reserve System. “Call Report Instruction Book Update.” Federal Deposit Insurance Company. June �005. 86 pp.
U.S. Bureau of the Census. “1997 Survey of Business Owners and Self-Employed Persons.” 1997.
U.S. Bureau of the Census. “�00� Survey of Business Owners (SBO).” Presentation. Economic Census �00�.
U.S. Bureau of the Census. “Characteristics of Business Owners Survey.” February �3, �004. http://www.census.gov/csd/cbo/.
U.S. Bureau of the Census. Nonemployer Statistics. September �6, �005. http://www.census.gov/epcd/nonemployer/.
U.S. Bureau of the Census. “Survey of Income and Program Participation.” February 14, �00�. http://www.bls.census.gov/sipp/.
U.S. Bureau of Labor Statistics. “National Longitudinal Surveys.” �005. http://stats.bls.gov/nls/
U.S. Bureau of Labor Statistics and Bureau of the Census. CPS. May 9, 1996. http://bls.census.gov/cps/overmain.htm.
Community Development INVESTMENT REVIEW 21
FEDERAL RESERVE BANK OF SAN FRANCISCO
U.S. Department of Commerce. Panel Study of Income Dynamics. �005. http://psidonline.isr.umich.edu.
U.S. Department of Housing and Urban Development. “Public-Sector Loans to Private-Sector Busi-nesses: An Assessment of HUD-Supported Local Economic Development Lending Activities.” July �003. �38 pp.
U.S. General Accounting Office. “Community and Economic Development Loans: Securitization Faces Significant Barriers.” Report to Congressional Requestors, October �003.
U.S. Federal Financial Institutions Examination Council. “A Guide to CRA Data Collection and Reporting.” January �001. 64 pp.
U.S. Minority Business Development Agency. “Accelerating Job Creation and Economic Productivity: Expanding Financing Opportunities for Minority Businesses.” U.S. Department of Commerce. �004. 40 pp.
U.S. Minority Business Development Agency. “Minority Purchasing Power: �000 to �045.” The Emerging Minority Marketplace, September �000.
U.S. Minority Business Development Agency. “Minority Population Growth: 1995 to �050.” The Emerging Minority Marketplace, September 1999.
U.S. Small Business Administration, Office of Advocacy. “The Small Business Economy.” Washington: U.S. Government Printing Office, �004.
U.S. Small Business Administration, Office of Advocacy. “Small Business and Micro Business Lending in the United States for Data Years �00�–�003.” March �005. 84 pp.
VentureOne. “VentureOne: Venture Capital and Private Equity Research and Information.” �006. http://www.ventureone.com/.
Wasserman, Miriam. “Mining Data.” Spring �000. Federal Reserve Bank of Boston. http://www.bos.frb.org/economic/nerr/rr�000/q3/mining.htm.
Weil Gotshal & Manges. “Keeping the ‘Private’ in Private Equity: Dealing with FOIA Concerns.” Almeida Capital. March �004. http://www.altassets.net.
Weissbourd, Robert. “Banking on Technology: Expanding Financial Markets and Economic Opportu-nity.” The Brookings Institution. June �00�. 4� pp.
Weissbourd, Robert and Christopher Berry. “The Market Potential of Inner-City Neighborhoods: Filling the Information Gap.” The Brookings Institution. March 1999. �6 pp.
Yago, Glenn, Rebecca L. Ford and Judith Gordon. Economic Prosperity, Women and Access to Credit: Best Practices in the Financial Markets. Los Angeles: Milken Institute and National Women’s Business Council, �000.
Yago, Glenn, and Michael Harrington. “Mainstreaming Minority Business: Financing Domestic Emerging Markets.” Santa Monica, CA: Milken Institute, 1999.
Yago, Glenn, Betsy Zeidman, Teresa Magula, and Jon Sederstrom. “Emerging Domestic Markets: Increasing Capital by Improving Data.” Santa Monica, CA, �007.
Yago, Glenn, Betsy Zeidman, and Bill Schmidt. “Creating Capital, Jobs and Wealth in Emerging Domestic Markets: Financial Technology Transfer to Low-Income Communities.” 108. Santa Monica, CA: Milken Institute, �003.
FEDERAL RESERVE BANK OF SAN FRANCISCO
Community Development INVESTMENT REVIEW22
FEDERAL RESERVE BANK OF SAN FRANCISCO
Community Development INVESTMENT REVIEW 23
Who’s Counting?Measuring Social Outcomes from Targeted Private Equity
Janneke Ratcliffe Center for Community Capitalism, University of North Carolina at Chapel Hill
The term “private equity”� might invoke images of big buyouts such as Clear Channel Communications and Chrysler. But private equity is also a potential source of capital to fund business growth or innovation for smaller companies. While mainstream venture capital tends to concentrate in particular places and
industries, an evolving asset class referred to as “underserved,” or emerging domestic markets (EDM), is directing capital to more diverse and traditional business types. The potential of this sector to deliver strong financial returns while also giving rise to public benefits has drawn the attention of both venture and economic development capital, as well as policy-makers and researchers.
EDM portfolios tend to feature businesses different from typical venture capital portfo-lios; they are often largely composed of retailers, financial service entities, makers and distrib-utors of consumer products, business service providers, and computer hardware companies—sectors that, when combined, account for only 10 percent of mainstream venture capital investments.� EDM investors seek favorable returns by channeling capital to underserved sectors: minority-run ventures, inner-city companies, rural enterprises, and ventures that hire lower-skilled workers or supply underserved customer groups. In this pursuit, they can have positive indirect benefits in the form of job creation, economic stimulus in disadvantaged communities, and ownership and management opportunities for minorities and women.
The Center for Community Capitalism, with funding from the Kauffman Foundation, is exploring the hypothesis that profit-driven investing can achieve measurable societal benefits in line with mission-targeted investing—but on a larger scale. Further, we seek to understand which particular activities within the private equity arena can deliver high returns to both financial and social bottom lines.
The EDM Market Opportunity
Private equity can take many forms, from buyouts of large companies to early-stage venture funding of startups, and the sums are substantial. In �006, venture capital funds
1 We use the term to mean non-publicly-traded equity and near equity investments in enterprises, including venture, mezzanine, and buyout funding, but excluding angel and owner/friends/family investments.
� Figures for �006, see PricewaterhouseCoopers and National Venture Capital Alliance �007, 3.
FEDERAL RESERVE BANK OF SAN FRANCISCO
Community Development INVESTMENT REVIEW24
and buyout and mezzanine funds raised about $130 billion (NVCA, �007). In the same year, venture firms reported investing $�5.5 billion in 3,416 deals (PricewaterhouseCoopers, �007).
While this sounds like a lot of capital, it is not a common tool for most businesses. Sixty percent of venture capital goes to just four industries: software, biotech, medical devices, and telecommunications.� Previous surveys of small business firms found that less than 1 percent used external equity capital. Although firms that were younger or larger were more likely to have tapped private equity, the percent of either using external equity was still below 3 percent (Ou and Haynes, �006).
The fact that businesses need to be of a certain scale (actual or potential) to tap private equity limits the universe of candidates for funding. While there are a reported �3 million firms in the United States, less than one-quarter have employees, and of those employer firms only about �0 percent have annual sales above $1 million.�
Venture capital and private equity are even less accessible to certain categories of busi-nesses, such as those that are located far from financial centers and those owned by minority or female entrepreneurs. These underserved markets might offer significant potential for future investment as illustrated by the following facts:
• Eight percent of employer firms in this country are owned by racial minorities, and close to 4 percent are owned by Hispanics.� Yet minority-owned companies receive less than � percent of Venture Capital (Milken Institute, �000).
• The IRS predicts that Latinos will soon own one in ten businesses. Growth rates in the number of minority-owned ventures are three to four times higher than for white-owned businesses (Boyd, �006).
• Population trends put minority purchasing power at one-third the total purchasing power by �0�0 (up from one-fifth in �000) (He and Hobbs, �000). The dramatic growth in the Hispanic population, projected to grow at three times the overall popu-lation rate by �0�0 is creating new markets (Pew Hispanic Center, �005).
• The inner city, home to 8 percent of the U.S. population according to the Initiative for a Competitive Inner City (ICIC), offers retail, hiring, and investment opportuni-ties that are often overlooked. The “Inner city 100” has seized on these advantages: 445 businesses selected since 1999 with average annual sales of $�0 million and an impressive 54 percent average annual growth rate (ICIC �006). Yet these companies and their inner-city peers often struggle to find growth capital.
• Rural enterprises account for 19 percent of all businesses but receive less than � percent of venture capital (Schmitt, �003).
3 Ibid.
4 U.S. Census Bureau; Statistics about Business Size, �00�.
5 Ibid., �00� Survey of Business Owners.
FEDERAL RESERVE BANK OF SAN FRANCISCO
Community Development INVESTMENT REVIEW 25
Small and mid-sized businesses have been described as the backbone of the economy. According to the U.S. Small Business Administration, small businesses provide approximately 75 percent of net new jobs added.� To put the job-creation potential of the small and mid-sized business sector in perspective, the 5 percent of firms with between $1 million and $50 million in revenues account for 35 percent of U.S. nonfarm, private-sector jobs.� Although only 1 percent of black-owned businesses have over $1 million in annual receipts, these firms employ more than half the workforce of all black-owned firms.� Thus, this particular slice of the small business universe can be an important component of an area’s economic engine. Moreover, there is a compelling case to be made that the economy can benefit from strengthening the number, size, and capital of emerging enterprises. According to a Boston Consulting Group study, “Large minority-owned businesses can create the kind of explosive and transformative growth that is needed to invigorate minority communities, inner-city markets, minority entrepreneurs and business leaders” (Boston Consulting Group, �005, 1).
The Milken Institute includes the following under the umbrella of EDM: “ethnic- and women-owned firms, urban and rural communities, companies serving low-to-moderate-income populations, and other small- and medium-sized businesses,” all of whom face constraints in accessing capital due to “systemic undervaluation.” The book Untapped: Creating Value in Underserved Markets describes “a multi-trillion-dollar opportunity that is largely untapped. This market has some of the fastest-growing companies and fastest-growing business opportunities. It is also a market with the fastest-growing workforce and a rapidly expanding supplier base” (Weiser et al., �006, 1). Additionally, in its case for greater recogni-tion of the value of the asset class, Pacific Community Ventures (PCV) describes the oppor-tunity as “investing in an array of traditional, brick-and-mortar businesses with revenues between $5 and $30 million that are located in distinct, untapped geographies” (Douglas et al., �006, 1). These sketches suggest a typical company profile: an existing business with a demonstrated market and track record but hemmed in by lack of capital. With a sizable cash infusion from equity investors, often coupled with specialized expertise, the enterprise can grow to the next level, at which point the investor hopes to realize a return.
The business case for EDM private equity is founded on two factors: (1) growth poten-tial, and (�) a lack of competition from other capital sources. These two factors suggest the opportunity to capitalize on a market imperfection. A landmark study of the financial performance of minority-focused venture capital funds over a 15-year period by Timothy Bates and William Bradford found that the returns were “certainly no lower—and perhaps higher—than those of mainstream funds” (Bates and Bradford, forthcoming, 14). Despite this performance, the field is projected to remain underserved by mainstream funds due to a lack of relationships, the poor fit between EDM business types and mainstream venture capital preferences, and discrimination.
6 http://www.census.gov/epcd/www/smallbus.html.
7 U.S. Census Bureau, Statistics about Business Size, �00�.
8 Ibid., U.S. Census Bureau, �00� Survey of Business Owners.
FEDERAL RESERVE BANK OF SAN FRANCISCO
Community Development INVESTMENT REVIEW26
The public case for EDM investing grows directly out of this business case and the notion that by filling a capital gap EDM investing yields economic benefits for communities, employees, customers, and entrepreneurs. Investors benefit as well, and while each investor comes to the table looking for a particular blend of social and economic returns, very few are willing to give up economic returns for social returns, which are typically regarded as by-products of investing. Conditions giving rise to social returns include:
• Minority-owned employer firms have created more than 4.7 million jobs.�
• Black-owned businesses are much more likely to hire minorities than white-owned businesses. While the vast majority of black-owned firms hire workforces that are mostly nonwhite, white-owned firms—even those operating in minority communi-ties—hire predominantly white workforces (Bates, �006). Emphasizing high-potential black entrepreneurs, Bates suggests: “With increased access to capital, black firms can form, grow, and create jobs, often hiring those who need employment most” (�35).
• Minority entrepreneurs tend to enter business with lower levels of personal wealth and face barriers when tapping traditional financing sources, contributing to lower rates of success and growth (Robb and Fairlie, �006); EDM investing can help over-come the capitalization barrier.
• Urban and inner-city companies create jobs where they are most needed. For example, the 445 Inner City 100 companies recognized from 1999 through �006 employ 73,000 people, nearly half of whom are inner-city residents. Of these companies, 31 percent are minority-owned, almost three times the national average (ICIC, �006).
However plausible the theoretical connections between EDM investing and social bene-fits are, there have been only a handful of attempts to document the connection. In the next sections of this essay, I describe notable sources of targeted private equity and then provide early evidence of favorable social outcomes of three EDM investment vehicles.
Alternative Sources of Equity Capital: CDVCFs, SBICs, and EDM Investors
Most providers of equity capital do not target mid-sized, traditional enterprises. Excep-tions include Small Business Investment Companies (SBICs), Community Development Venture Capital Funds (CDVCFs) and New Markets Venture Capital Funds (NMVCFs), and a cadre of profit-oriented EDM funds. In the overview of these targeted investors and their social returns follows, there will be some overlap between categories.
CDVCFs. These funds are “mission-driven organizations that benefit low-wealth people and communities while working to earn solid financial returns,” according to the website of the industry’s trade association, the Community Development Venture Capital Alliance (CDVCA). Tracing its roots to Appalachia in the 1970s, the CDVC industry has since grown
9 U.S. Census Bureau, �00� Survey of Business Owners.
FEDERAL RESERVE BANK OF SAN FRANCISCO
Community Development INVESTMENT REVIEW 27
to more than 80 funds and $900 million under management. Because of the relative youth of the CDVC industry, few funds have existed long enough to mature and report conclusive financial results. The three oldest funds reported a 15.5 percent gross IRR�0 on 31 invest-ments made between 197� and 1997 that have since been realized, including just seven total write-offs (Tesdell, �007).
To successfully navigate the implied trade-off between financial and social returns, CDVCFs seek low-cost sources of capital, primarily from banks, government, and founda-tions. As of �003, 4� percent of CDVCF capital came from banks, which are motivated by the Community Reinvestment Act. Government and foundations combined constituted another �9 percent of CDVCF capitalization in �003. Nondepository financial institutions (such as pension funds and insurance companies) are another important, growing source of capital to the industry.
CDVCA developed an impact assessment tool as a template for individual funds to tailor to their own needs. Many individual CDVCFs report detailed results individually as well. For example, the companies in SJF Venture’s $13 million investment portfolio added 1,0�1 jobs from investment through �005, about one new job per $13,000 invested, 75 percent of which went to LMI individuals (Broughton and Klein, �006). Pacific Community Ventures (PCV) tracks the number of “designated” employees working for their portfolio companies.�� As of �005, PCV reports 1,531 designated employees in its nine-company/$10 million portfolio, two-thirds of whom are minorities (PCV, �006). To gauge job quality as well as quantity, SJF Ventures, PCV, and other CDVCFs also track such metrics as change in wage levels, benefits provision, wealth-building and profit-sharing programs, and training and promotion oppor-tunities for target employees.
The CDVC industry has historically estimated a social yield of one full-time job added for just under $15,000 invested (CDVCA, �001). For �005, sixteen CDVC funds reported a 48 percent increase in employment at portfolio companies since the time of first investment. Data from a subset of CDVCFs indicate that 6� percent of portfolio company employees are low income, that 41 percent of the companies are in low- to-moderate income (LMI) areas and that 3� percent are in rural areas (CDVCA, n.d.).
Certainly CDVCFs have been pioneers in applying “the tools of venture capital…to grow small businesses that create good jobs for low-income people and promote entrepreneurial capacity in economically distressed urban and rural areas” (CDCVA �00�, �). The industry has amassed a capital pool of nearly $1 billion, more than doubling in size since �000. However, this model faces constraints because of a lack of scale capital available in the market at that particular risk/return/social impact offering. Additional hindrances include the small scale
10 Caution should be observed when comparing venture IRRs since funds usually report their returns net of fees and may include unrealized investments; see Schmitt �004.
11 Designated employees are those hired below a certain compensation level who either live in an LMI area or were hired through an employment program.
FEDERAL RESERVE BANK OF SAN FRANCISCO
Community Development INVESTMENT REVIEW28
of the individual funds and attendant lower management fees, coupled with the high costs of making complex but relatively small investments that often require technical assistance (Rubin, �001). To illustrate, the average CDVC investment is around $350,000 compared to $7 million for mainstream venture capital, and small transactions can require as much work as large ones. The average CDVC fund at just over $10 million is modest compared to $�99.5 million for the average venture fund.�� In short, these funds explicitly invest for social returns and have made an impact, but structural conditions may hamper their ability to carry their results to a more substantial scale.
SBICs. Since 1958, the U.S. Small Business Administration’s (SBA) Small Business Invest-ment Company program has fostered venture and mezzanine financing for small business growth. Most of this equity and near equity capital has been channeled through two different programs: the Debenture program and the Participating Securities program. In the former, private, for-profit funds use low-interest ten-year SBA-guaranteed debt to leverage private capital; in the latter, the SBA takes an equity stake in the funds. In �004, following a period of poor financial performance that mirrored trends in the overall venture capital market, the SBA ceased funding new SBICs under the Participating Securities program. It continues to fund the debenture mechanism. In both models, the subsidization of a substantial portion of capital allows SBICs to generate below-market returns in the aggregate while providing market-level returns to private capital. For example, the Participating Securities program had an overall IRR of �.5 percent for the 1994 to �004 vintage years as of September �004, while the private investors earned a 17.7 percent IRR (SBA, n.d.).
As of the end of �005, the SBIC industry had capital “resources” of $�3 billion�� in 418 funds, averaging $55 million. In the �006 fiscal year, SBICs made 3,674 investments in �,1�1 companies totaling $�.9 billion. The average investment was $788,580, or $1.4 million per company. The split between debenture and participating securities was roughly 45/55 (SBA, �006).
For the most part, the SBIC program is not designated for particular geographic places or types of companies but instead targets all small businesses because they are viewed as economic growth engines.�� In fiscal year �006, nearly one-third of SBIC financing went to manufacturers, followed by “Information” (15.5 percent) and “Professional, Scientific and Technical Services” (1� percent). SBICs reported on 958 companies with a combined work-force of 1�9,�56 and median employment of only 35 prior to receiving financing, and with average pre-financing sales of $16 million (median $5.5 million). Some �3 percent of SBIC-program financing went to low- and moderate-income areas in �006 (SBA, �006). Histori-cally, just 5 percent or less of SBIC dollars have been invested in minority-owned companies
1� Figure for �005, according to the National Venture Capital Association. http://www.nvca.org/faqs.html. Accessed April 1�, �007.
13 According to http://www.sba.gov/INV/faq.html accessed on March 7, �008, this includes $6.3 billion of SBA-sourced funds and $5.1 billion of SBA commitments plus $1� billion of private capital.
14 Generally, for purposes of the SBIC Program, “small” means a company whose net worth does not exceed $18 million and whose net income does not exceed $6 million.
FEDERAL RESERVE BANK OF SAN FRANCISCO
Community Development INVESTMENT REVIEW 29
and 3 percent or less in women-owned companies.��
Over the years, SBA has earmarked funding for certain categories. From 197� to 1996, it offered special terms for funds invested in minority and disadvantaged enterprises through the Minority Enterprise Small Business Investment Company (MESBIC) program, later renamed the Specialized Small Business Investment Company (SSBIC) program. SSBICs accounted for less than 1 percent of SBIC dollars invested in �006. The New Markets Venture Capital (NMVC) program was enacted in �001. These special debentures carry no interest for the first five years and are coupled with operational assistance grants to enable the funds to provide technical assistance to companies. Six funds, all CDVCFs, participated in the inaugural round of this program. By March �006, they had invested $3�.� million in 75 companies with 1,6�6 jobs “created or maintained.” More than 90 percent of the investments were in low-income areas (CDVCA, �006).
EDM Funds. A third approach to providing patient, high-risk, growth capital to targeted business types represents a growing force due to the interest of larger-scale, profit-oriented investors. This field includes minority-oriented venture funds such as the members of the National Association of Investment Companies, which reports around $5 billion under management altogether. It also includes some SBICs and CDVCFs as well as bank-managed funds. The typical investors—banks, insurance companies, corporations, and public pension funds—are seeking market rates of return without tangible subsidy. Along the spectrum of financial and social return requirements, this group of funds is most closely positioned to mainstream venture capital and private equity. If EDM investments produce sustained returns to these private-sector investors, the pool of capital is potentially enormous.
Case Studies: Examples of Making Investments in EDMs
Benchmarking financial results using agreed upon metrics such as IRR or the ratio of distri-butions to investments is relatively straightforward. However, measuring societal benefits is less cut and dried. The data included from these three case studies represent only the starting point of an effort to document the total returns, both financial and social, from EDM private equity. At this stage, the indicators are both basic and preliminary, focusing on employ-ment (number of jobs, changes in employment levels, share of jobs going to disadvantaged workers), community (characteristics of places where business are located), and entrepreneur-ship (characteristics of business owners and managers). These rough but widely understood indicators can ultimately enable comparison to other development financing activities.
The business model for each of the three examples is summarized below, followed by a side-by-side illustration of the early results of social measurements.
15 For example, in FY �006, 3.6 percent of SBIC dollars were invested in minority-owned companies and 1.3 percent in women-owned; in FY �004, the shares were 5.� percent and �.3 percent, respectively (U.S. SBA: SBIC Program Financing to Small Business-Fiscal Year �006; ibid., Fiscal Year �004) .

FEDERAL RESERVE BANK OF SAN FRANCISCO
Community Development INVESTMENT REVIEW30
Banc of America Capital Access Funds (BACAF)
Formed in 1997, Banc of America Capital Access Funds is housed within the bank’s primary private equity management division, which manages around $7 billion in private equity capital. Bank of America describes itself as one of the oldest private equity investors in the banking industry and, through BACAF, one of the largest investors in underserved markets.
The “Fund of Funds” approach is enabling Bank of America to consolidate a consider-able amount of capital and deliver it to underserved markets through about 15 private equity funds. BACAF combines Bank of America’s previous experiences in EDM private equity with sizable investments of $175 million from two of the ten largest pension funds in the world: CalPERS and CalSTRS (Hebb �006 and CalSTRS). Combined, these pension funds have more than $378 billion in assets as of January �007 and combined private equity invest-ments of more than $�1 billion.�� The BACAF represents less than .5 percent of the total private equity funding pool.
Bank of America sums up its investment criteria as seeking to make investments of between $5 million and $15 million—not to exceed �0 percent of the total private capital raised by each fund. By the third quarter of �006, BACAF had invested or committed to invest in 13 funds with total expected combined capital of more than $� billion. At that early stage, these funds had invested in only 44 companies. The funds have an average size of $155 million but range from under $50 million to over $500 million. BACAF’s total commitment ranges from $5 million to $15 million (from a � to a �0 percent stake). The allocation by asset type is about half buyout funds, 30 percent growth-oriented funds, and the remainder venture and mezzanine.
Among the 13 funds to which BACAF has committed:
• Ten focus on ethnic minority opportunities
• Ten focus on low- to moderate-income geographies
• Eleven have at least one ethnic minority partner
• Three have at least one female partner ��
Investment strategies of the funds are just as diverse. The funds target a broad spectrum of investment size: some will consider investments as small as $1 million, while others aim to make investments larger than $35 million.
The types of companies and markets represented are also diverse, consistent with the principles of underserved and EDM investing. Less than one-quarter of BACAF compa-nies funded to date are in the mainstream venture-capital sectors of software and biotech. Conversely, 45 percent of the BACAF portfolio companies are in sectors that receive about
16 Investment portfolio as of January �007. Private equity figure does not include funds committed but not yet invested. From pension funds’ websites www.CalSTRS.com and www.CalPERS.com. Accessed March 1, �007.
17 Many funds span more than one category and are therefore counted multiple times.
FEDERAL RESERVE BANK OF SAN FRANCISCO
Community Development INVESTMENT REVIEW 31
10 percent of mainstream venture-capital investments such as financial services, retailing, and business services.��
Annual revenues for the portfolio companies are broadly distributed, with 15 percent reporting baseline year revenues of $500,000 or less and 15 percent reporting in excess of $50 million.��
Average investment size is comparable to that of mainstream venture capital due to the presence of two very large investments. With the majority of investments falling between $1 and $5 million, the median is just above $3 million, significantly larger than for CDVCs and SBICs.
California is home to the largest share (45 percent) of BACAF’s underlying company investments; New York and New Jersey combined account for another �1 percent of the companies; and the remaining 34 percent is distributed in ten other states. Table 1 shows early social outcome measurement results for BACAF.
The California Public Employees Retirement System (CalPERS)
CalPERS’ “California Initiative” has thus far committed close to $1 billion in EDM investments. The initial round of $475 million, launched in �001, was funded through ten investment firms, including $100 million in BACAF (described above), Garage Technology Bank, Pacific Community Ventures, and Yucaipa Corporate Initiatives Fund, and features investments made through the various partners as well as direct co-investments. As with BACAF, the funds covered the spectrum of investment types, from seed, to venture, growth, middle-market, and corporate. By late �006, these funds had invested in 130 companies. CalPERS reported a preliminary average annual return of 16.3 percent on those investments as of late �005 (Hebb, �006). And, in �006, CalPERS announced a further $500 million investment through yet another investment partner, Hamilton Lane (Cutland �006).
The primary objective of the California Initiative is “to earn attractive risk-adjusted rates of return” (CalPERS, �007) and to that end CalPERS is reportedly aiming for an annual rate of return in the 15–�0 percent range (Hebb, �006). “Positive impact on underserved markets” is described as an “ancillary benefit” (CalPERS, �007) that is to be realized as a result of the emphasis on investing activities: “providing capital to areas . . . that have histori-cally had limited access to institutional equity capital, employing workers living in economi-cally disadvantaged areas, and supporting women and minority entrepreneurs and managers” (CalPERS and PCV, �007).
CalPERS engaged PCV to research, collect, and evaluate these indirect benefits on an annual basis. The launch of the California Initiative predates the inception of the BACAF, thus there are two years of data to report. Findings shared below in Table 1 (as of �006) are from the report “Impacting California’s Underserved Communities: Taking a Second Look.”
18 44 companies reporting as of June �006.
19 For �005; �0 companies reporting revenue figures.
FEDERAL RESERVE BANK OF SAN FRANCISCO
Community Development INVESTMENT REVIEW32
The nine investment partners (other than BACAF) had invested in 89 companies as of
that date. As with BACAF, the portfolio features a diversity of business types, with 38 percent of the investments going to consumer-related companies and service and communications accounting for another 37 percent. Employment size of firms ranges from three to ��,000.
NewSpring Capital
NewSpring Capital is not a mission-driven investor, but it set out to measure what kind of social benefit it had in EDM communities. NewSpring Capital is a family of targeted private equity funds focused on the Mid-Atlantic region. Since the group’s founding in 1999, NewSpring has grown to three funds with more than $340 million of capital under management. The NewSpring Capital family of funds includes:
• NewSpring Ventures, a venture fund providing equity capital to growth- and expan-sion-stage companies focused on enabling technologies, business services, and infor-mation technology.
• Commerce Health Ventures, a diversified health-care private equity fund that invests in biopharmaceutical, health-care services, and medical device companies.
• NewSpring Mezzanine Capital, a mezzanine private equity fund and an SBIC focused on late-stage and buy-out opportunities in business services, information technology, health care, and specialty manufacturing.
Fund management has recognized the growing interest of investors in understanding the potential social benefits of private equity. And in response to the ongoing discussion about the effects of private equity on the larger economy, in early �007 management took the initia-tive to gauge the employment and economic outcomes of their own investments. The find-ings suggest that even though the social implications were considered after the investments were made, they were similar to those realized in the two case studies with stated ancillary benefits objectives and even to outcomes reported by explicitly mission-driven investors.
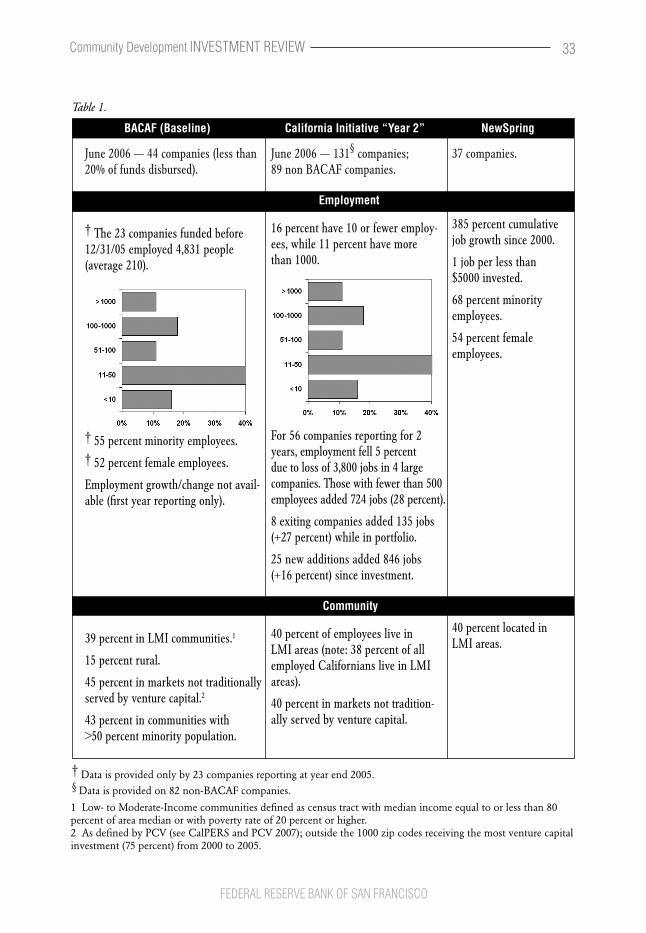
FEDERAL RESERVE BANK OF SAN FRANCISCO
Community Development INVESTMENT REVIEW 33
37 companies.
385 percent cumulative job growth since 2000.
1 job per less than $5000 invested.
68 percent minority employees.
54 percent female employees.
40 percent located in LMI areas.
BACAF (Baseline) California Initiative “Year 2” NewSpring
June 2006 — 131§ companies; 89 non BACAF companies.
Employment
16 percent have 10 or fewer employ-ees, while 11 percent have more than 1000.
For 56 companies reporting for 2 years, employment fell 5 percent due to loss of 3,800 jobs in 4 large companies. Those with fewer than 500 employees added 724 jobs (28 percent).
8 exiting companies added 135 jobs (+27 percent) while in portfolio.
25 new additions added 846 jobs (+16 percent) since investment.
Community
40 percent of employees live in LMI areas (note: 38 percent of all employed Californians live in LMI areas).
40 percent in markets not tradition-ally served by venture capital.
June 2006 — 44 companies (less than 20% of funds disbursed).
† The 23 companies funded before 12/31/05 employed 4,831 people (average 210).
† 55 percent minority employees. † 52 percent female employees.
Employment growth/change not avail-able (first year reporting only).
39 percent in LMI communities.1
15 percent rural.
45 percent in markets not traditionally served by venture capital.2
43 percent in communities with >50 percent minority population.
1 Low- to Moderate-Income communities defined as census tract with median income equal to or less than 80 percent of area median or with poverty rate of �0 percent or higher.� As defined by PCV (see CalPERS and PCV �007); outside the 1000 zip codes receiving the most venture capital investment (75 percent) from �000 to �005.
† Data is provided only by �3 companies reporting at year end �005.§
Data is provided on 8� non-BACAF companies.
Table 1.

FEDERAL RESERVE BANK OF SAN FRANCISCO
Community Development INVESTMENT REVIEW34
38.6 percent minority owned/ managed.
23 percent at least 50 percent owned by minorities.
5 percent women owned/managed.
16 percent of companies serve under-served customer groups (eg: ethnic or minority markets).†On average, health insurance and disability were each provided to nearly half of workers, retirement to a third.
Funds enter into side letter agreement to submit preinvestment profiles, quarterly updates and annual employ-ment data. Data tracked by UNC with Kauffman Foundation funding. Confidentiality restrictions.
15 percent minority owned/ officers.
12 percent women owned/officers.
Other
Share of companies offering the following benefit to at least 75 percent of employees:
Health insurance: 80 percent.
Retirement plan: 60 percent.
Paid vacation: 83 percent.
Stock options or other wealth building mechanism: 55 percent.
Data Collection and Analysis
Third party (PCV) engaged by CalPERS to evaluate annually. Anonymous data collected from funds; companies. Submission includes residential zip code for each employee.
23 percent minority owned/managed.
One-time voluntary data gathering by fund manager.
Entrepreneurship
Nationally, minorities own 12 percent of employer firms and 7 percent of firms with revenues> $1MM; Women own 10 percent of firms with revenues >$1MM
Conclusion
What do these nascent measurement efforts reveal? They give early indications that certain private equity investments may result in substantial benefits in the way of economic development by capitalizing underserved but promising businesses. At the same time, they highlight the need for more consistency and rigor in measuring the social outcomes of such investment.
Perhaps the most intriguing point is that there is a growing interest among fund managers, for-profit investors, banks, and foundations in dedicating resources to collect this nonfi-nancial data. As previously noted, CalPERS has just announced an additional $500 million commitment to the California Initiative, while CalSTRS recently made a $�00 million
† Data is provided only by �3 companies reporting at year end �005.
FEDERAL RESERVE BANK OF SAN FRANCISCO
Community Development INVESTMENT REVIEW 35
commitment to Bank of America’s underserved fund of funds (PIOnline �007). These devel-opments coincide with a shift in bank and foundation investment strategies, recently high-lighted in an American Banker commentary: “Large banks, whose CRA related investments in community development banks have been a significant source of funding, are seeking higher financial and social returns on their investments. Also, private foundations increas-ingly are requesting specific measures of social benefits” (Hanley and Norwell, �007).
This trend comes at a time when SBA funding for SBICs has been dampened by the wind-down of the Participating Securities program, and federal funding for community develop-ment finance seems designed to do more with less. For example, by �006, appropriations for the Community Development Financial Institutions Fund had ebbed to $54.5 million, less than half of its �001 peak of $118 million (CDFI Coalition). New community development programs, such as the New Markets Tax Credit, are designed to use relatively thin incentives to leverage billions of dollars of private investments in low-income communities.
Encouraged by the Community Reinvestment Act, profit-oriented financial companies have worked through such intermediaries as SBICs and Community Development Finan-cial Institutions (CDFIs) to explore previously overlooked markets, and in the process have identified attractive opportunities for direct loans and investments. As mainstream providers of capital increase competition for the higher-quality segments of underserved markets, they create new challenges for those in the vanguard of community development finance. In a telling sign of changing times, the CDFI membership organization, originally known as the National Community Capital Association, changed its name to the Opportunity Finance Network and emphasizes its role in “finding opportunities that others miss.”
There will still remain many financing opportunities that require mission-driven financing, but activities where the convergence of social and financial returns can be clearly demon-strated stand to attract substantial amounts of private capital.
Janneke Ratcliffe is Associate Director for the Center for Community Capitalism and directs the Center’s research in Financial Services and Community Development Finance. She brings a 20-year background as a practitioner in financial services and economic development, including Self-Help, GE Capital, and as executive director of a nonprofit that financed small businesses.
The Center for Community Capitalism at the University of North Carolina at Chapel Hill engages in multidisciplinary research and outreach activities that explore ways to apply private-sector approaches to revitalization of America’s distressed communities. The Center’s work focuses on techniques that are effective in building wealth and assets in disadvantaged communities and are sustainable from a business perspective.
References Bates, Timothy. “The Urban Development Potential of Black-owned Businesses.” Journal of the American Planning Association 7�.� (Spring �006): ��7(11). Academic OneFile. Thomson Gale. University of North Carolina, Chapel Hill. April 18, �007
FEDERAL RESERVE BANK OF SAN FRANCISCO
Community Development INVESTMENT REVIEW36
Bates, Timothy, and William Bradford. forthcoming. “Traits and Performance of the Minority-Venture Capital Industry.” Prepared for the Annals of the American Academy of Political and Social Science forthcoming special issue on minority entrepreneurship.
Boston Consulting Group. �005. “The New Agenda for Minority Business Development,” June �005.
Boyd, Samuel J. �006. Publisher’s Letter. The Journal of EDM Finance. Spring �006.
Broughton, Anne Claire, and Adam Klein. �006. SJF Advisory Services Mission Results �006.
CalPERS and Pacific Community Ventures. �007. CalPERS California Initiative, “Impacting Califor-nia’s Underserved Communities: Taking a Second Look.”
CalPERS. �007. CalPERS Investment Office, Memo To: Members of the Investment Committee, February �0, �007. //www.calpers.ca.gov/eip-docs/about/board-cal-agenda/agendas/invest/�0070�/item05b-00.pdf. Accessed April 1�, �007.
CalSTRS. California Teachers’ Retirement System Alternative Investments Portfolio Performance As of September 30, �006. http://www.calstrs.com/Investments/portfolio /privequityperformance.pdf. Accessed April 18, �007.
Coalition of Community Development Financial Institutions (CDFI Coalition). CDFI Fund Appro-priations History. http://www.cdfi.org/approp.asp accessed April 17, �007.
Community Development Venture Capital Alliance (CDVCA). no date. Information provided by CDVCA prepared for CDFI Data Project (CDP) forthcoming �005 report. See http://www.cdfi.org/cdfiproj.asp for further information and published reports.
Community Development Venture Capital Alliance (CDVCA). �001. CDVCA Report on the Industry ’01: Spreading Equity.
Community Development Venture Capital Alliance (CDVCA). �00�. Report on the Industry ’0�.
Community Development Venture Capital Alliance (CDVCA). �006. “The New Markets Venture Capital Program: Providing Equity Capital and Expertise to Entrepreneurs in Low-Income Urban and Rural Communities.” July �006.
Cutland, Laura, �006. “CalPERS Aims $500M at Under-Invested Areas.” Silicon Valley/San Jose Business Journal. October �0, �006. Accessed online at http://www.bizjournals.com/sanjose on March 13, �007.
Douglas, Penelope, Beth Sirull, and Pete November. �006. “Development Investment Capital: Three Steps to Establishing an Asset Class for Emerging Domestic Markets.” Pacific Community Ventures, April �006.
Hanley, Claude A., Jr., and Stephanie A. Norwell. �007. “Viewpoint: Surviving Changes in Commu-nity Development.” American Banker 17�.4 (January 5, �007): 11.
He, Wan, and Frank Hobbs. �000. “The Emerging Minority Marketplace, Minority Purchasing Power: �000–�045.” Minority Business Development Agency, U.S. Department of Commerce. September �000.
Hebb, Tessa. �006. “Public Pension Funds and Urban Revitalization, California Case Study A: Private Equity CalPERS’ California Initiative.” Labor and Worklife Program, Harvard Law School. May �006.
Initiative for a Competitive Inner City (ICIC). �006. “Eight Years of the Inner City 100.” www.icic.org. Accessed October �, �006.
Milken Institute, Center for Emerging Domestic Markets: www.milkeninstitute. org/research/research.taf?cat=detail&ID=17. Accessed October �, �006.
FEDERAL RESERVE BANK OF SAN FRANCISCO
Community Development INVESTMENT REVIEW 37
Milken Institute. �000. “The Minority Business Challenge: Democratizing Capital for Emerging Domestic Markets.” Minority Business Development Agency, U.S. Department of Commerce. September �000
National Venture Capital Association (NVCA) and Thomson Financial. �007. “Private Equity Fund-raising Recedes in Fourth Quarter.” January 16, �007. www.nvca.org/ pdf/4Q�006Fundraisingfinal.pdf. Accessed March 13, �007.
Ou, Charles, and George W. Haynes. �006. “Acquisition of Additional Equity Capital by Small Firms: Findings from the National Survey of Small Business Finances.” Small Business Economics �7: 157–68. Copyright Springer �006.
Pacific Community Ventures (PCV). �006. “Pacific Community Ventures’ �005 Portfolio, Expanding Social Return.” April �006.
Pew Hispanic Center. �005. “Hispanics: A People in Motion.” Copyright �005 Pew Research Center. January �005.
PIOnline.com (Pensions and Investments). �007. Hirings. Posted March 19, �007. www.pionline.com/apps/pbcs.cll/article?AID=�0070319. Accessed April 1�, �007.
PricewaterhouseCoopers and National Venture Capital Alliance. �007. Money Tree Report: Full year and Q4 �006 U.S. Results.
Robb, Alicia M., and Robert W. Fairlie. �006. “Tracing Access to Financial Capital Among African-Americans from the Entrepreneurial Venture to the Established Business.” Conference Proceedings, Research Conference on Entrepreneurship Among Minorities and Women. June 19–�0, �006. Chapel Hill, UNC Kenan Flagler Business School.
Rubin, Julia Sass. �001. “Community Development Venture Capital: A Double-Bottom Line Approach to Poverty Alleviation.” Conference Proceedings, Changing Financial Markets and Community Development, April 4–6, �001. Washington, DC: Federal Reserve System, 1�1–54.
Schmitt, Brian. �003. “Assessing the Availability of Traditional Venture Capital in the US: A Prelimi-nary Analysis.” Community Development Venture Capital Alliance. May �003.
Schmitt, Brian. �004. “Financial Returns and the Double-Bottom Line Venture Capital:What Do We Know?” The Community Development Venture Capital Alliance. November �004.
Tesdell, Kerwin. �007. “Investing for Social Equity. Community Developments Spring �007–Commu-nity Development Venture Capital: A Catalyst for Double Bottom-Line Results.” Office of the Comptroller of the Currency. http://www.occ.gov/cdd/CDVC-Ezine�007/cd/index.html.
U.S. Small Business Administration (SBA) Investment Division. No date. Small Business Investment Company Program Financial Performance Report for Cohorts 1994–�004, through September �0, �004.
U.S. Small Business Administration (SBA). �006. SBIC Program Financing to Small Business-Fiscal Year �006. www.sba.gov/aboutsba/sbaprograms/inv/
inv_aboutus_program_financing.html. Accessed March �007.
Weiser, John, Michele Kahane, Steve Rochlin, and Jessica Landis. �006. “Untapped: Creating Value in Underserved Markets.” San Francisco: Berrett-Koehler Publishing, �006.
Romance-seekers used to depend on contacts through friends, relatives, colleagues, or even luck to find true love. Then came the Internet, and online dating sites, which now offers a way to select a mate by sorting through thousands of people. The experience of investors seeking businesses for investment returns is not so
different. Investors have always relied on referrals, industry insider knowledge, and other personal networks. Yet over the years, in many markets, they have culled information from large databases such as Thompson Financial, Standard & Poor’s, or Dun & Bradstreet in order to find vital sources of deals. In well-developed securities markets, these data are rich and meaningful enough to foster a robust capital market.
This system for sharing data breaks down, however, when seeking information on privately held companies, especially smaller companies, because most information is kept confiden-tial. For sources that do provide data about private companies, some of the data may be esti-mated according to an “average” firm in that industry. Other data show only broad ranges for sales or number of employees. These figures can be way off and difficult to track over time. Because investors continue to use familiar habits and sources when looking for privately held businesses, they may overlook good investments.
Companies located in low- and moderate-income (LMI) and predominantly minority areas—emerging domestic markets—have an added burden because they are not part of the investors’ network of contacts. In addition, inner cities are often misperceived as lacking any businesses of size and scale, so investors are not looking for opportunities there.
Initiative for a Competitive Inner City’s Inner City 100
To show the investment opportunity in mixed-income, high-density, and predominantly minority urban areas, the Initiative for a Competitive Inner City (ICIC), a national not-for-profit founded by Harvard Business School Professor Michael E. Porter, launched the Inner City 100 program in 1998. Skepticism that enough fast-growing companies would be found evaporated in light of the nearly 10,000 nominations for the Inner City 100 over the past nine years. The program has proved that there are ample possibilities for investment in emerging domestic markets, or EDMs, but strong mechanisms do not exist to connect the larger universe of inner-city companies to potential investors. One missing element is market data, and the Inner City 100 program itself offers a promising strategy to fill this gap.
Each year, ICIC seeks nominations across the country’s inner cities and selects the top 100 fastest-growing companies from among the applicants. An applicant must: (1) be an independent for-profit corporation, partnership, or proprietorship; (2) be headquartered in
Panning for Gold in Inner City MarketsPrabal Chakrabarti
Federal Reserve Bank of Boston
Community Development INVESTMENT REVIEW 39
FEDERAL RESERVE BANK OF SAN FRANCISCO
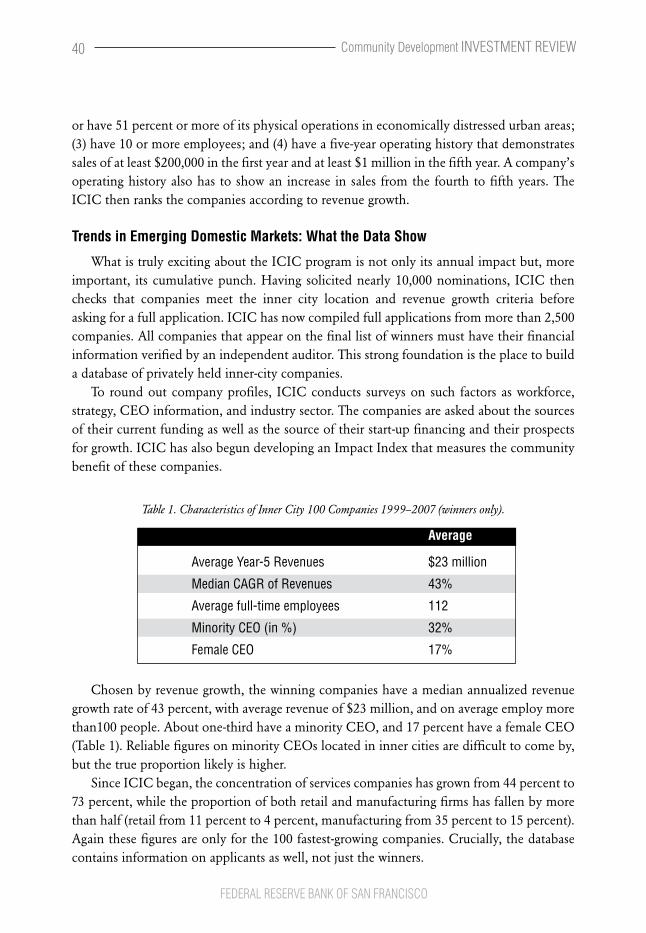
FEDERAL RESERVE BANK OF SAN FRANCISCO
Community Development INVESTMENT REVIEW40
or have 51 percent or more of its physical operations in economically distressed urban areas; (3) have 10 or more employees; and (4) have a five-year operating history that demonstrates sales of at least $�00,000 in the first year and at least $1 million in the fifth year. A company’s operating history also has to show an increase in sales from the fourth to fifth years. The ICIC then ranks the companies according to revenue growth.
Trends in Emerging Domestic Markets: What the Data Show
What is truly exciting about the ICIC program is not only its annual impact but, more important, its cumulative punch. Having solicited nearly 10,000 nominations, ICIC then checks that companies meet the inner city location and revenue growth criteria before asking for a full application. ICIC has now compiled full applications from more than �,500 companies. All companies that appear on the final list of winners must have their financial information verified by an independent auditor. This strong foundation is the place to build a database of privately held inner-city companies.
To round out company profiles, ICIC conducts surveys on such factors as workforce, strategy, CEO information, and industry sector. The companies are asked about the sources of their current funding as well as the source of their start-up financing and their prospects for growth. ICIC has also begun developing an Impact Index that measures the community benefit of these companies.
Table 1. Characteristics of Inner City 100 Companies 1999–2007 (winners only).
Average
AverageYear-5Revenues $23million
MedianCAGRofRevenues 43%
Averagefull-timeemployees 112
MinorityCEO(in%) 32%
FemaleCEO 17%
Chosen by revenue growth, the winning companies have a median annualized revenue growth rate of 43 percent, with average revenue of $�3 million, and on average employ more than100 people. About one-third have a minority CEO, and 17 percent have a female CEO (Table 1). Reliable figures on minority CEOs located in inner cities are difficult to come by, but the true proportion likely is higher.
Since ICIC began, the concentration of services companies has grown from 44 percent to 73 percent, while the proportion of both retail and manufacturing firms has fallen by more than half (retail from 11 percent to 4 percent, manufacturing from 35 percent to 15 percent). Again these figures are only for the 100 fastest-growing companies. Crucially, the database contains information on applicants as well, not just the winners.
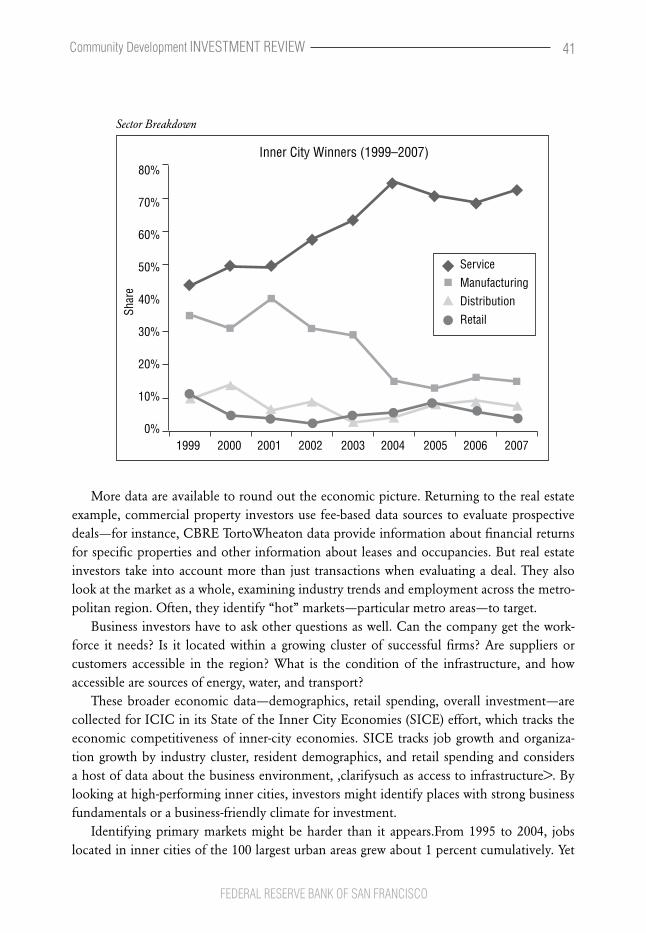
Sector Breakdown
1999 2000 2001 2002 2003 2004 2005 2006 2007
80%
70%
60%
50%
40%
30%
20%
10%
0%
InnerCityWinners(1999–2007)
Shar
e
Service
Manufacturing
Distribution
Retail
More data are available to round out the economic picture. Returning to the real estate example, commercial property investors use fee-based data sources to evaluate prospective deals—for instance, CBRE TortoWheaton data provide information about financial returns for specific properties and other information about leases and occupancies. But real estate investors take into account more than just transactions when evaluating a deal. They also look at the market as a whole, examining industry trends and employment across the metro-politan region. Often, they identify “hot” markets—particular metro areas—to target.
Business investors have to ask other questions as well. Can the company get the work-force it needs? Is it located within a growing cluster of successful firms? Are suppliers or customers accessible in the region? What is the condition of the infrastructure, and how accessible are sources of energy, water, and transport?
These broader economic data—demographics, retail spending, overall investment—are collected for ICIC in its State of the Inner City Economies (SICE) effort, which tracks the economic competitiveness of inner-city economies. SICE tracks job growth and organiza-tion growth by industry cluster, resident demographics, and retail spending and considers a host of data about the business environment, ,clarifysuch as access to infrastructure>. By looking at high-performing inner cities, investors might identify places with strong business fundamentals or a business-friendly climate for investment.
Identifying primary markets might be harder than it appears.From 1995 to �004, jobs located in inner cities of the 100 largest urban areas grew about 1 percent cumulatively. Yet
Community Development INVESTMENT REVIEW 41
FEDERAL RESERVE BANK OF SAN FRANCISCO
this aggregate performance masks large variation. Ten inner cities grew their employment base by more than 15 percent over this period, with Anaheim and Jersey City growing by more than 30 percent!
Income data show similar variation. Taken together, more than �� million inner-city residents had a median household income of $�5,000 in �004. Once again, there is diversity in the numbers. The percentage of residents with income between $35,000 and $50,000 is comparable to the nation as a whole (14 percent to 17 percent nationwide).
Even if they have good sources of data, investors face several challenges. First, essential data are missing. For example, investors need consistent information about returns on invest-ment over a period of time, using standard financial measures, to allow them to place the investments into their broader portfolio, or to characterize the risk to their own investors. They also need to understand how returns are affected by the business cycle.
Second, beauty is in the eye of the beholder. While every investor is looking for a strong balance sheet, each one has a particular niche or angle they find most attractive. Investors need to be able to make investment decisions using characteristics that are salient to their own circumstances. For example, some investors may be seeking highly leveraged compa-nies, while others might concentrate on cash flow.
Third, investors need a searchable platform that fits with their retrieval and analysis systems. Using financial analysis software, data users want to apply their own models or selection criteria to the data. Finally, they need to analyze and use the data while allowing the company to maintain its competitive secrets.
With the right amount of investment and collaboration, these issues could be overcome to create a robust database for investors. Many other markets have overcome similar obsta-cles. Getting real estate firms to collect data in a standardized way and be protected from confidentiality concerns was not an easy process, but the industry recognized the value to everyone as a whole. Multiple listing services perform a similar function, as do data collected by the insurance industry. But it is interesting to think about how certain geographic areas can systematically be overlooked. In a conversation with ICIC, one collector of commercial real estate data admitted that his organization doesn’t cover the inner-city market, and so even this well-established database is not as exhaustive as it seems. Without reliable data about companies, the engine of the capital market lacks the right spark.
Going forward, I suggest five steps to start building a comprehensive database:
1. Collectmoreextensivefinancialinformationoveramultiyearperiod. Company screens often use a set of simple rules about financial statements such as debt-equity ratios and profit growth. These data could allow the creation of an inner-city invest-ment index, which, like Standard & Poor’s 500 Index, would allow investors to track and analyze the risks and returns.
2. CombineICICdatawithothersources. Many sources of business data, such as busi-ness credit reports, can be linked to the ICIC data. The Ewing and Marion Kauffman
FEDERAL RESERVE BANK OF SAN FRANCISCO
Community Development INVESTMENT REVIEW42
Foundation operates a database, administered by Fintel LLC, that contains small business data from a sample of companies across the United States. This sample can be crossed with inner-city geographies to show aggregated figures for return on investment and other data by inner-city market. The State of the Inner City Econo-mies itself serves as a kind of umbrella for a host of private and public sources and could be expanded to include more.
3. Investintechnologytosharedatawhilemaintainingadequatecontrolsthatprotectconfidentiality. Companies need a searchable, accessible portal to run their own analyses. Currently, the ICIC data are stored on SQL servers that are queried inter-nally. A web-based portal could serve as a window into this data platform and allow easy but controlled access. Agreements with inner-city companies should emphasize that providing a controlled window into their finances will help companies as a whole. As with other databases, confidentiality can be protected and competitive advantage preserved even with more transparency.
4. Expandmarketingeffortstoincludemorefirmsandcovermoreinner-citymarkets. Inner City 100 applicants are partly a reflection of ICIC’s efforts and the marketing efforts of partners like the U.S. Conference of Mayors and corporate partners. SICE data currently cover the 100 largest inner cities. Over time, this coverage could be expanded to smaller cities, inner ring suburbs, and other underserved areas.
5. Thesystemshouldbemission-drivenandbuiltspecificallyforinvestorpurposes. Databases that try to be comprehensive can be unwieldy for investors, especially given the time pressure of making investment decisions. Information that is impor-tant to economic development practitioners, marketers, and planning officials could muddle the picture for investors. Investors need a format that suits their needs. The most successful market information systems are built around a single customer focus. For example, the private company PCi provides data and software that helps bank compliance officers meet obligations under the Community Reinvestment Act Others may find the software useful, but it was built with a core purpose in mind. Commercial real estate databases are similarly purpose-specific.
Capital investment in business is not a panacea for economic development. Workforce, education, and other private and public policies matter. More narrowly, having data is not the only lever needed to help raise capital, no more than Match.com is the only dating game in town. ICIC’s Inner City Economic Forum’s Capital Connections program recognizes this, again echoing the matchmaking world, by providing “speed dating” to match investors and businesses. Companies and investors trade places in �0-minute sessions designed to pitch their businesses, and businesses are educated about private equity even before investment.
The great advantage of data is that more of it offers more benefits to everyone. Once the initial investment in data collection and dissemination takes hold, an additional investor will not crowd out another. In economic terms, data are non-rival. Each investor’s consumption of information, like breathing, does not diminish the use by others.
Community Development INVESTMENT REVIEW 43
FEDERAL RESERVE BANK OF SAN FRANCISCO
FEDERAL RESERVE BANK OF SAN FRANCISCO
Community Development INVESTMENT REVIEW44
Creative users build tools to filter and sort through data. The airlines reservation system SABRE is an example. First, the computerized reservation system stitched together fares across a dizzying combination of routes. Later, Internet websites tapped into the extensive system to sift through them for fares. Computerized software in the mortgage industry uses data about borrowers to automate the underwriting process, extend credit to millions of homeowners previously shut out of the market, and provide an income stream to lenders.
Moreover, because investors, whether lenders or equity providers, typically provide tech-nical assistance with investment, the companies themselves can benefit from the interaction. So without a better system, inner-city companies that might be able to grow with such assis-tance don’t receive it, and the situation of underinvestment persists. With fewer companies able to grow, the market as a whole might look less promising than it really is.
There is good reason to believe that building upon ICIC’s set of data about inner-city companies and economies can benefit the market and help investors snare promising firms that could use capital and technical assistance. With some creative thinking, institutional investors and foundations, government agencies, or nonprofits have the capacity and the means to make this happen.
Prabal Chakrabarti is Deputy Director of Community Affairs at the Federal Reserve Bank of Boston. Previously, Prabal was Deputy Director of Research at the Initiative for a Competitive Inner City. There, he directed research assessing the economic competitiveness of inner cities. Previously, Prabal served in economic policy at the U.S. Treasury, and was a manager at the Ernst & Young Center for Business Innovation. He has consulted internationally, including to the United Nations Development Program. He holds a M.S. from M.I.T., a M.A. from Oxford as a Marshall Scholar, and a B.S. from the University of Illinois.
ReferencesState of the Inner City Economies, (�007) Initiative for a Competitive Inner City.Inc. Magazine/ICIC Inner City 100, (�007) Initiative for a Competitive Inner City.
Investment Intermediaries in Economic Development:Linking Public Pension Funds to Urban Revitalization
Lisa A. Hagerman, Gordon L. Clark, and Tessa Hebb University of Oxford, School of Geography at the Centre for the Environment
Harvard Law School, Pensions & Capital Stewardship Project, Labor and Worklife Program
Investing in America’s inner cities is an innovative practice in which large institutional investors, such as public pension funds, can enjoy financial and social returns while spurring economic growth in underserved emerging domestic markets (EDMs).� These investments are made through traditional assets (fixed income) and alternative assets
(equity real estate and private equity). Contrary to market perception, targeted investments can produce competitive risk-adjusted returns along with secondary social benefits, such as jobs, workforce housing, and an increased tax base.
Pension funds with targeted investment policies have been explicit and public about their desire to find investment opportunities in the underserved markets. Hebb (�005) highlights the California Public Employees’ Retirement System’s (CalPERS) targeted investment policy language referring to the “California Emerging Market Investments” in which “underserved markets would include urban and rural areas undergoing or in need of revitalization where there are assets (e.g., an available labor pool, underused infrastructure) conducive to business development” (CalPERS �005). New York City Employees Retirement System’s (NYCERS) economically targeted investment policy (adopted 198�) and MassPRIM’s policy (adopted �003) include both a geographic target and a requirement to fill a capital gap that reaches an underserved market (NYCERS �005, MassPRIM �006).
As interested and motivated as the pension funds may be, it is difficult for a large investor to make investments in EDMs. To start, large capital investors, such as pension funds, must make very large investments. The investments in communities of need, however, are small. Furthermore, those small investments are often out-of-the-ordinary, specialized investments, which require an in-depth understanding of “the story” because there is often little standard-ized data to analyze. In our research, we have found that the most successful strategies to overcome these two problems is for investors to work in concert with intermediaries—one set (investment vehicles) that deal with aggregating the investments to a scale that makes economic sense for the pension funds, and another set (community partners) that under-stand the need of communities and also know how to tell “the story” to investors.
1 The Milken Institute defines the Emerging Domestic Markets to a market that “refers to people, places or enterprises with growth potential that face capital constraints due to systematic undervaluation as a result of imperfect market information. These markets include ethnic- and women-owned firms, urban and rural commu-nities, companies serving low-to-moderate-income populations, and other small- and medium-sized businesses” (http://www.milkeninstitute.org/research).
Community Development INVESTMENT REVIEW 45
FEDERAL RESERVE BANK OF SAN FRANCISCO
FEDERAL RESERVE BANK OF SAN FRANCISCO
Community Development INVESTMENT REVIEW46
Investing in higher-risk, illiquid, targeted investments are part of an active portfolio and are more time-intensive than a passively managed portfolio. As such, pension funds that have adopted formal policies limit their total investments in this category to two percent of total assets in line with their broader strategic asset allocation policy. Pension funds seek portfolio diversification through a strategic asset allocation policy in which the fund or its consultants set a target percentage to each asset class—traditional and alternative investments. Allocating two percent of total assets to targeted investments contributes to the fund’s overall strategic asset allocation policy and adds to the fund’s portfolio diversification.
A public pension fund’s decision to invest in emerging domestic markets is driven first and foremost by its fiduciary duty and overarching mission to achieve competitive financial returns for its pension fund retirees and beneficiaries. Public pension funds, as with any institutional fund, seek to outperform the market. Investments targeted to EDM can both achieve good returns and help overall fund performance by diversifying the pension fund’s portfolio. A well-diversified portfolio is made up of a spectrum of asset classes as a means of spreading risk across classes. Targeted investments in EDM can play a part in this strategy to seek out investments that may have been overlooked by traditional sources of capital.
In addition to return and diversification goals, public pension funds target investments to benefit the economic climate where their beneficiaries live and work. Often public employees retire in their state. For example, the New York State and Local Retirement System (New York State Common) has 77 percent of retirees and beneficiaries that remain New York State resi-dents (NYSLRS �006). Pension funds therefore adopt targeted investment policies to seek competitive returns while also allowing a fund to create healthy communities benefiting their retirees and beneficiaries.�
We estimate that there are approximately $11 billion of public-sector pension fund commitments (across all asset classes) in urban revitalization, emerging domestic markets, or, more broadly, economic development, through either formal targeted investment policies or one off investments as of �007.� We also find that momentum for this type of investment seems to be picking up. Recently several new public-sector pension fund investors in urban revitalization include the Connecticut Retirement Plans and Trust Funds (CRPTF), Contra Costa County Retirement System, Los Angeles City, County, Fire and Police, and increased investment from CalPERS, CalSTRS, New York City and State (moving into private equity), and MassPRIM.
� Similarly some foundations (e.g., F. B. Heron Foundation) are taking up “mission related” market-rate invest-ments through their endowments as (similar to a public pension fund) investments to benefit their underlying constituents and help achieve their mission of creating healthy, sustainable communities. Pensions & Investments (October 16, �006) reported that in a new survey from the Council on Foundations, U.S. foundations are slowly taking a riskier approach with their investments and increasing the number of outside managers.
3 For a complete breakdown of dollars committed across public pension funds and asset classes, see Pension Funds & Urban Revitalization website: http://urban.ouce.ox.ac.uk. This number does not include broad in-state targeting, but, rather, specific programs designed to stimulate economic activity in underserved capital markets or urban and rural underdeveloped areas.
Obstacles for Pension Funds in EDM Investments
One significant obstacle pension funds face is a history of failed economically targeted investments (ETIs) from the 1980s that have resulted in negative perceptions of investments in the underserved markets.� In part, many of those failed investments were driven by an overly aggressive effort to achieve the social benefits first, and the market rates of return came second.
To make matters worse, critics argue that ETI investments are prone to political interfer-ence (Romano 1993) and can distract pension funds from their mission. They argue that these investments are politically motivated and can be referred to as “Politically Targeted Invest-ments—PTIs,” in which politicians promote the social returns for their own political gain.
Some critics also view these investments as running counter to the fund’s fiduciary duty. While public-sector pension funds are exempt from ERISA (1974 federal law over private pension funds) and are governed by varied state laws, ERISA standards and its treatment of economically targeted investments (ETIs) are cited as a transferable legal framework. The Department of Labor issued an interpretative bulletin (1994) stating that private pension funds may pursue ETIs as long as they meet standard prudent investment guidelines and seek appropriate risk/return characteristics (U.S. Department of Labor 1994).
Other obstacles include pension fund consultants (gatekeepers) who may not be inclined to track targeted investments because they are not an established asset class, or they are more time consuming and costly, or pension funds themselves may not have dedicated staff to review and monitor targeted investments. By far, however, the main problem with pension funds making targeted investment in the emerging domestic markets is that the deals are too small, hard to find, and require in-depth knowledge of what a community needs for its improvement.
Overcoming Obstacles: The Help of Intermediaries
Bringing investments to scale so they are attractive to a large institutional investor (e.g., public-sector pension fund) is a challenge. Reaching the underserved markets and finding the untapped investment opportunities in urban and rural communities is a specialized process that requires an in-depth understanding of the market and an ability to break through market barriers such as high information and transaction costs. Our research shows that overcoming these barriers requires investment intermediaries that can aggregate investments to scale, making them viable for large public-sector pension funds.
Public pension funds do not have the time or expertise to actively manage specialized urban investments. Investment vehicles intervene, using their expertise in economic prin-
4 See Hagerman et al. (�005), which cites past failed or politically motivated investments such as Pennsylvania state employees’ and public school employees’ $70 million investment in an in-state Volkswagen plant, Alaska public employees’ and teachers’ retirement systems’ $165 million loan (35% of total assets) for in-state mortgages in 1980, and Connecticut pension fund’s $�5 million (47% stake in the company) investment in a distressed local firm (Colt Firearms of Colt Industries) in 1990.
Community Development INVESTMENT REVIEW 47
FEDERAL RESERVE BANK OF SAN FRANCISCO
FEDERAL RESERVE BANK OF SAN FRANCISCO
Community Development INVESTMENT REVIEW48
ciples and government subsidies, to organize and produce scale. An investment vehicle can source deals and deploy capital into the community through limited partnerships and limited liability companies and in some cases a fund-of-funds. Clark (�000, 19�) notes that “interme-diaries are functionally located between pension funds and financial services markets offering expertise in project-based investment management and management of the flow of funds.”
The specialized investment fund, through its urban investing expertise, helps the insti-tutional investor place large pools of capital in the underserved markets. The investment vehicle is the entity that knows and understands the underserved markets and how to find the deals. They also have a deep knowledge of the range of subsidies, guarantees, and tax credits that are often required to make these deals with market rates of return for the investor. As a result, these investment vehicles are able to lower the transaction costs of these types of investments. The investment vehicles have a specialized skill set enabling them to replicate these types of deals and build on their preexisting expertise in a way that a pension fund would not be able to do.
Investment vehicles specialize in different asset classes such as fixed income, equity real estate, and private equity (early- and later-stage venture capital).� Fixed-income debt-based investments are usually the first asset class by which a pension fund undertakes investments in economic development. Fixed-income investments in economic development are often backed by government guarantees and are a conventional option for the large institutional investor. Equity real estate is a growing industry and the asset class through which invest-ments can make the greatest impact on urban revitalization. Private equity investment vehi-cles make investments in mission-oriented companies across industry sectors.
Investment Vehicles and the Importance of Scale
Investment vehicles and pension funds both need scale to make investing in the urban market viable and profitable. An institutional investor will only make an investment if it meets the minimum amount required because it has tremendous pressure to place billions of dollars in investments with healthy returns. And similarly, investment vehicles need scale to be able to organize and produce developments and ventures of size that yield the targeted returns. The investment vehicle reaches scale in their investments by pooling assets, reducing transaction costs, and partnering with community development corporations. The invest-ment vehicle needs scale in their transactions to be able to transform neighborhoods and mission-driven companies, and thus achieve the targeted returns. Without scale, the invest-ments would be too insignificant and could not generate the economic revitalization needed to ultimately produce the market rates of return when exiting on the investment.
5 This article is drawn from a longer paper, “Investment Intermediaries in Economic Development: Linking Pension Funds to Urban Revitalization” by Hagerman et al., available on the Pension Funds & Urban Revitaliza-tion website: http://urban.ouce.ox.ac.uk.
FEDERAL RESERVE BANK OF SAN FRANCISCO
Community Development INVESTMENT REVIEW 49
As important as scale is, it is hard to achieve. Barriers to reaching scale in the emerging domestic markets include access to accurate information and high transaction costs. Daniels (�005) has identified market barriers that help explain why capital does not easily flow to low-income neighborhoods:
1. Inadequate risk management. Conventional investment vehicles do not adequately pool and spread risk among a range of sophisticated institutional investors
�. Managers do not price the transaction up to the associated risk
3. Information and transaction costs. Often it costs too much to find out who are the players and where the opportunities lie within the inner city
4. Market prejudice. With “pre-judgment” and a lack of good information, a conven-tional manager may see lack of growth, uncertainty, and no opportunity
Government regulations also can deter development in the underserved markets. For example, inadvertent tax and regulatory policies and transportation and infrastructure poli-cies can have the unintended consequence of placing a hidden cost on potential underserved neighborhoods.
An investment vehicle achieves scale through its product knowledge expertise and access to local information, something the institutional investor lacks. An investment vehicles’ competitive advantage is in overcoming barriers by pooling assets, establishing a niche in the marketplace, and minimizing its transaction costs through experience. An investment vehicle with on-the-ground knowledge can also help create a market that previously did not exist. Merton and Bodie (�004) refer to the “innovation spiral” and the role of intermediaries as providers of new financial markets.
An Investment Vehicle That Achieves Scale
The Community Preservation Corporation (CPC), a not-for-profit community developer in New York City, was created to fill the gap left by traditional bank lenders in the 1970s and has since expanded its base of capital providers with permanent financing from public-sector pension funds such as the New York City Retirement System (NYCERS). In this example (Hagerman et al. �005), NYCERS makes forward-rate commitments (commits to buy a loan up to �4 months at a long-term lock-in interest rate) to the originator, a private lender such as CPC. CPC then has the certainty to make the construction loan as the guaranteed take-out financing is in place, and after construction CPC converts the loan to permanent financing and sells it at par to NYCERS. CPC is the entity that has the track record and understands the neighborhood, developers, and operating costs of the project. NYCERS makes the commit-ment subject to the State of New York Mortgage Agency (SONYMA) insuring the loan.
CPC organizes and produces scale in its ability to nurture development specialists. Before CPC came into being, no one thought of specializing in converting dilapidated buildings into rentals on a larger scale. With the help of CPC financing, and community development
expertise, subcontractors often become general contractors and sometimes even owners of these community development projects (Community Preservation Corporation �005).
The community partner as an intermediary
In community-based investing, the community intermediary—or community partner—serves as the intermediary between the investment fund manager and the economic devel-opment area. The institutional investor (e.g., the public-sector pension fund) sets broad geographic targets, while the investment vehicle narrows those targets to realize the benefits in the community. The investment vehicle collects and deploys the money, often working in partnership with a community partner who ensures that the investment provides tangible benefits to a community. While the investment vehicle provides structure in the financial sense, the community partner does so in the geographic sense. In effect, the community partner also serves the role of an intermediary.
The community partner is the essential link for a successful urban revitalization invest-ment venture. It can ensure that a current residents’ interests are considered and any new investment is not simply an exercise in gentrification Embedding a community partner in the deal translates into enhanced communities through investments that improve quality of life in the economic development area. Community partners also help collaboration with local government.
One type of community partner is a community development corporation (CDC). Investment vehicles recognize that CDCs have the local insight to transform neighborhoods and promote companies that are both economically viable and benefit the community. CDCs also bring relationships with local government. In doing so, CDCs help get invest-ments to scale—allowing for neighborhoods to be significantly improved in the interests of the community. The partnerships empower CDCs, as well as other community partners, to foster further investment in the community. These organizations serve an important role in ensuring that the urban equity real estate investment or venture capital fund incorporates the needs of the community and realizes social returns.
Linking the Investment Vehicle to the Community
Economic development consultants can be instrumental in bringing the community into the transaction. The consultant is a connector between investors and the local community organizations. As a result, they help formalize the role of the community partner to ensure that the social returns embedded in the project are realized. An example of such a consultant is Economic Innovation International Inc., known as a “fund builder” in the community-based investing industry. The firm was founded in 1971 to identify and build market solutions to social problems. Since 1997, Economic Innovation has been building what the industry refers to as “double bottom line” private equity funds and has built more than $� billion of these funds, which have both a financial and a social objective (www.economic-innovation.com).
FEDERAL RESERVE BANK OF SAN FRANCISCO
Community Development INVESTMENT REVIEW50
FEDERAL RESERVE BANK OF SAN FRANCISCO
Community Development INVESTMENT REVIEW 51
Economic Innovation International structures the fund so that the not-for-profit sponsor is embedded in the operating agreement and shares in the fund’s management fee and carried interest. The sponsor is considered a “special limited partner” (in a Limited Partnership legal framework) or “special member” (in a Limited Liability Company legal framework) of the fund depending on how the fund is organized. This not-for-profit sponsor can often be the “community development catalyst” that may identify the development site, seek out the joint-venture developer, or provide technical assistance (Flynn et al. �007).
Economic Innovation has created a model that includes a not-for-profit sponsor orga-nization, a community partner in place to monitor and ensure that the social returns are realized. Economic Innovation has built several regional families of funds often working in partnership with economic development consultants (Strategic Development Solutions, Sustainable Systems, and Economics Research Associates). The firm contributes to feasibility studies for assessing the level of market demand in the region in order for an investment to achieve risk-adjusted market rates of return.
The first private equity fund incorporating a not-for-profit sponsor model in a contrac-tual arrangement with the for-profit fund manager was Genesis LA. Genesis LA was formed in 1998 by Los Angeles Mayor Richard Riordan and Deputy Mayor Rocky Delagillo after the 199� LA Riot and the 1994 Northridge earthquake. The not-for-profit sponsor corporation was formerly established in �000. According to former president and CEO of Genesis LA, Deborah La Franchi, “Genesis LA currently has seven funds with more than $450 million of capital under management with a pipeline of over $1.5 billion in deals. The partnership with fund managers supports a full time professional staff of more than eight without any public or charitable support.”
The Bay Area Family of Funds is another example of the not-for-profit sponsor model in a contractual arrangement with a for-profit fund manager. One of the funds is the JP Morgan Bay Area Equity Fund (BAEF), a venture capital fund investing in companies in consumer products and services, technology, clean-tech, and health-care fields.� BAEF is part of a “regional” investment initiative in that it aims to foster local business ventures linked to the larger regional economy. In other words, companies that receive investments should connect urban areas to regional, national, and global economic activity (Flynn et al. �007). The fund’s social mission includes providing entry-level jobs for low- and moderate-income community residents, as well as staff benefits, health care, financial literacy, and equity sharing (Office of the Comptroller of the Currency �005).
For-profit equity real estate funds also work with community partners. Urban Strategy America Fund, a New Boston Real Estate Fund (through its Olmsted Green project), has part-nered with a local community development corporation, Lena Park CDC. In this example, the CDC played a vital role in project development, working directly with the local community.
6 The JP Morgan Bay Area Equity Fund (BAEF) is part of the Bay Area Family of Funds that also includes a real estate fund; Bay Area Smart Growth Fund (SGF) and the Bay Area California Environmental Redevelopment Fund (CERF). The not-for-profit sponsor is the Bay Area Council.
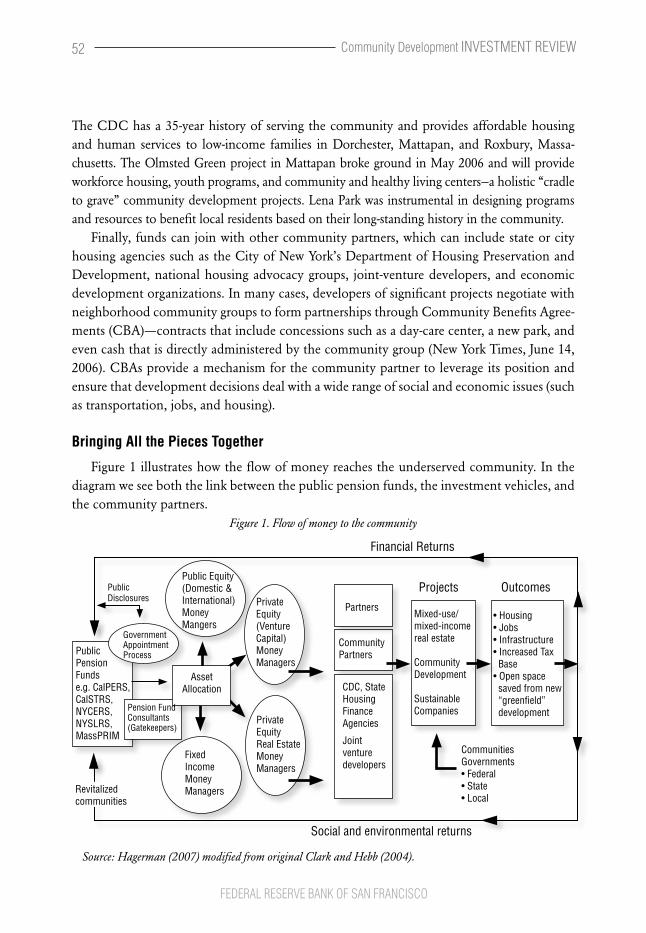
FEDERAL RESERVE BANK OF SAN FRANCISCO
Community Development INVESTMENT REVIEW52
The CDC has a 35-year history of serving the community and provides affordable housing and human services to low-income families in Dorchester, Mattapan, and Roxbury, Massa-chusetts. The Olmsted Green project in Mattapan broke ground in May �006 and will provide workforce housing, youth programs, and community and healthy living centers—a holistic “cradle to grave” community development projects. Lena Park was instrumental in designing programs and resources to benefit local residents based on their long-standing history in the community.
Finally, funds can join with other community partners, which can include state or city housing agencies such as the City of New York’s Department of Housing Preservation and Development, national housing advocacy groups, joint-venture developers, and economic development organizations. In many cases, developers of significant projects negotiate with neighborhood community groups to form partnerships through Community Benefits Agree-ments (CBA)—contracts that include concessions such as a day-care center, a new park, and even cash that is directly administered by the community group (New York Times, June 14, �006). CBAs provide a mechanism for the community partner to leverage its position and ensure that development decisions deal with a wide range of social and economic issues (such as transportation, jobs, and housing).
Bringing All the Pieces Together
Figure 1 illustrates how the flow of money reaches the underserved community. In the diagram we see both the link between the public pension funds, the investment vehicles, and the community partners.
Figure 1. Flow of money to the community
Source: Hagerman (2007) modified from original Clark and Hebb (2004).
FEDERAL RESERVE BANK OF SAN FRANCISCO
Community Development INVESTMENT REVIEW 53
How Funds Invest: Types of Investment Vehicles
Pension funds invest in urban revitalization through investment vehicles that act as a channel for large institutional dollars to flow into the urban economic development areas. Pension funds invest in investment vehicles through three asset classes: fixed income (including credit enhancement), equity real estate, and private equity (early- and later-stage venture capital):
1. Fixed Income is a debt-based real estate and small business development finance product investing in affordable housing through construction loans and permanent loans, job-creation programs, and mortgage-backed securities. Additionally, in the case of the credit enhancement product, a pension fund will “loan” its credit rating to a municipality or state agency for a fee. This allows the agency to access capital at a lower cost. Fixed income is generally the easiest option for a pension fund to adopt because investing in mortgage-backed securities is often already a part of its fixed-income strategy.
�. Equity Real Estate is a real estate finance product investing in the potential growth in market value of the investment property. Investments are made in mixed-use, mixed-income greyfields (urban infill development) and brownfields (clean-up of environ-mentally contaminated properties). Pension fund investing in equity real estate is a more established form of community-based investing and it is the one that has seen the greatest impact on urban revitalization.
3. Private Equity (early- and later-stage venture capital, and often mezzanine capital) is the business finance product investing in mission-oriented companies (consumer products, health care, technology, and women and minority-owned firms in or near low-moderate income areas) at the early stage of the company’s development and the expansion stage of the company. Private equity (business finance) is an emerging vehicle for pension funds to invest in urban revitalization.
Table 1 provides examples of the types of investment vehicles organized by asset class. The funds listed are mission-oriented funds that seek to achieve first and foremost a high financial return and, second, community benefits. In this sense they are often referred to as double-bottom-line funds. However, pension funds tend to refer to them as funds that target economic development or underserved capital markets.
The table profiles a small selection of investment vehicles to give the reader an idea of the types of funds offered across fixed income, equity real estate, and private equity (early- and later-stage venture capital). The table shows the fund name, date founded, and how it is structured. In terms of the fund structure, the table includes both for-profit and nonprofit entities. Some vehicles are legally organized through a contractual model in which a for-profit fund manager contracts with a nonprofit sponsor. In another example, the ownership model occurs, in which the nonprofit community organization owns the for-profit fund
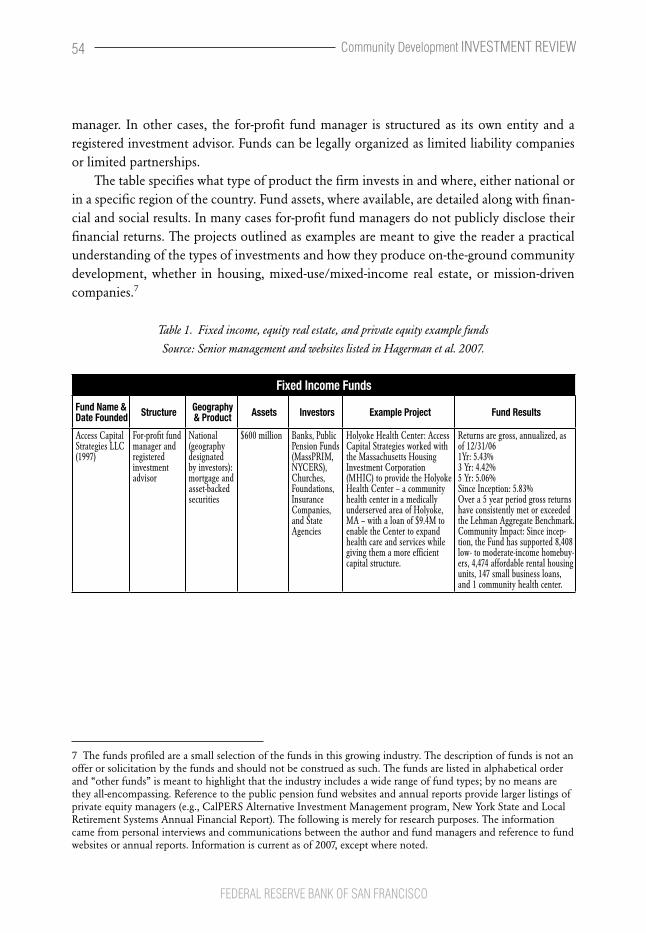
FEDERAL RESERVE BANK OF SAN FRANCISCO
Community Development INVESTMENT REVIEW54
manager. In other cases, the for-profit fund manager is structured as its own entity and a registered investment advisor. Funds can be legally organized as limited liability companies or limited partnerships.
The table specifies what type of product the firm invests in and where, either national or in a specific region of the country. Fund assets, where available, are detailed along with finan-cial and social results. In many cases for-profit fund managers do not publicly disclose their financial returns. The projects outlined as examples are meant to give the reader a practical understanding of the types of investments and how they produce on-the-ground community development, whether in housing, mixed-use/mixed-income real estate, or mission-driven companies.�
Table 1. Fixed income, equity real estate, and private equity example funds
Source: Senior management and websites listed in Hagerman et al. 2007.
7 The funds profiled are a small selection of the funds in this growing industry. The description of funds is not an offer or solicitation by the funds and should not be construed as such. The funds are listed in alphabetical order and “other funds” is meant to highlight that the industry includes a wide range of fund types; by no means are they all-encompassing. Reference to the public pension fund websites and annual reports provide larger listings of private equity managers (e.g., CalPERS Alternative Investment Management program, New York State and Local Retirement Systems Annual Financial Report). The following is merely for research purposes. The information came from personal interviews and communications between the author and fund managers and reference to fund websites or annual reports. Information is current as of �007, except where noted.
Fixed Income Funds
Fund Name & Date Founded Structure Geography
& Product Assets Investors Example Project Fund Results
Access Capital Strategies LLC (1997)
For-profit fund manager and registered investment advisor
National (geography designated by investors): mortgage and asset-backed securities
$600 million Banks, Public Pension Funds (MassPRIM, NYCERS), Churches, Foundations, Insurance Companies, and State Agencies
Holyoke Health Center: Access Capital Strategies worked with the Massachusetts Housing Investment Corporation (MHIC) to provide the Holyoke Health Center – a community health center in a medically underserved area of Holyoke, MA – with a loan of $9.4M to enable the Center to expand health care and services while giving them a more efficient capital structure.
Returns are gross, annualized, as of 12/31/06 1Yr: 5.43% 3 Yr: 4.42% 5 Yr: 5.06% Since Inception: 5.83% Over a 5 year period gross returns have consistently met or exceeded the Lehman Aggregate Benchmark. Community Impact: Since incep-tion, the Fund has supported 8,408 low- to moderate-income homebuy-ers, 4,474 affordable rental housing units, 147 small business loans, and 1 community health center.

AFL-CIO Housing Invest-ment Trust (1981)
Common law business trust registered under the investment company act of 1940. Approxi-mately 94% of the non-cash investments are insured or guaranteed by the U.S. government or a government-sponsored enterprise
National: financing for development, rehabilitation, or preserva-tion of real estate, con-struction and permanent fi-nancing, fixed or floating rate forward commitments, secured bridge loans
$3.6 billion in net assets
Taft-Hartley funds, public pension funds
Victory Center of Roseland, Chicago, IL Working with the Illinois Hous-ing Development Authority (IHDA), the Trust made an $8 million financial commitment for construction of the $20.7 million Victory Center of Rose-land Supportive Living Facility. Residents of the 124-unit facility are very low-, low- and moder-ate-income elderly who are able to take advantage of a wide array of services. The building’s ground floor has 10,000 square feet of community space. HIT Investment: $8.05 million.
Annualized net returns for period ending 10/31/06 10yr: 6.57%, 5year: 4.8%, 3 yr: 4.02%, 1yr; 5.43% (consistently outperformed Lehman Aggregate Bond Index). Over past 10yrs created or preserved over 37,000 units of multifamily housing in 175 projects nationwide, 65% of which were affordable to low-moderate income households. 100% union labor construction on projects it finances.
Commu-nity Capital Management (formerly CRA Fund Advisors) (1998)
For-profit fund manager and registered investment advisor
National (geography designated by investors): mortgage & asset backed securities, taxable municipal bonds
$825 million in assets under man-agement as of 9/30/2006; $1.85 billion of economi-cally- and geographi-cally-targeted investments made since 1999
Banks, MassPRIM, foundations, state agencies, insurance funds
Tuscan Place Apartments is a Low Income Housing Tax Credit property located in Miami, Florida where 47% of the 199 units are restricted to families with incomes at or below 50% of area median income. The balance of the units (53%) are restricted to families with incomes at or below 60% of area median income. The property offers Welfare to Work programs through the Edgewater One Stop Career Center; First-Time Homebuyer seminars and job training. In addition, the property will include a library and playground for kids.
Annualized net returns for pe-riod ending: 7-Year 6.11%, 5-Year, 5.02%, 3-Year, 3.67%, 1-Year 4.05%, 4Q2006 1.12%: Since Inception 5.82% (consistently outperformed the Lehman Aggregate Bond Index). As of 12/31/06:128,000 affordable rental housing units, 4,600 home mortgages for low- to moderate-income individuals, $30.5 million in affordable health care facilities, $139 million in com-munity development, $296 million in down payment assistance and statewide homeownership pro-grams, $93 million in job creation and job training programs.
Community Preservation Corporation (1974)
Ownership model, the Community Preservation Corporation (CPC) is a not-for-profit community development mortgage lender that owns a for-prof-it subsidiary, CPCR
5 boroughs of NYC, Hudson Valley, upstate NY, New Jer-sey: financing low, moderate, and middle income com-munities
As of fiscal year ended 6/30/2006: CPC closed $674M in new financings. In 32 year history $5.4 billion in public-pri-vate debt. Accumulated fund balance $65.3M (acts as FHA approved lender & seller/servicer for Fannie Mae & Fred-die Mac)
Banks and savings institutions, insurance companies, churches, Fan-nie mae, Fred-die mac and public sector pension funds (NYCERS, NYC Police, NYC Fire, NYC Teachers, and New York State Com-mon)
The Imperial (Crown Heights, Brooklyn) is one of six buildings containing 72 units financed by CPC for $12.4 million. In addition to CPC’s construction financing, HPD provided 1% funding. This restored building consists of 35 rental units, of which 25% will be affordable to households earning no more than 50% of area median income. 50% will be affordable to low-income households earning no more than 60% of area median income (CPC 2006 Annual Report).
In 2006 financed preservation and development of over 6,700 housing units representing over $670 mil-lion in 317 separate transactions. In its 32-year history 117,000 units of housing representing $5.4 billion in public-private debt to low and moderate income markets.
Fixed Income FundsFund Name & Date Founded Structure Geography
& Product Assets Investors Example Project Fund Results
Community Development INVESTMENT REVIEW 55
FEDERAL RESERVE BANK OF SAN FRANCISCO

Equity Real Estate FundsFund Name & Date Founded
Structure Geography & Product
Assets Investors Example Project Fund Results
Bay Area Smart Growth Fund I Pacific Coast Capital Partners (fund manager) (2001) part of the Bay Area Family of Funds
Contrac-tual model, for-profit fund man-ager (PCCP) contracts with the not-for-profit fund sponsor (Bay Area Council)
Ten county Northern California Bay Area: mixed-use mixed-income real estate.
Fund I: $66M
Banks, insurance companies, private foun-dations, and individual investors
SGF Marin City Gateway Retail Center (GRC), a shopping center (national chains) surrounded by more prosperous areas. SGF invested $7.1 million in partnership with the Marin City Community Land Corporation (MC-CLC) that bought out the real estate partner. Revenues from the property now flow through MCCLC and profits are used to fund community projects such as the de-velopment of a garden, playgrounds, ball fields, and a library. Excerpt from OCC Report, “Bay Area Funds Focus on Double Bottom Line”
Financial returns not disclosed. Social returns: • 111 permanent jobs created, 930 jobs projected, and 1010 jobs preserved for a total of 2,051 permanent jobs • 809 for-sale homes being built or renovated, with at least 230 units affordable to purchasers at 80% of area median income or lower • 585,554 sq. ft. of new or upgraded retail development and 577,000 sq. ft. of new or upgraded office/light industrial development • construction projects utilized green construction measures
Cherokee Investment Partners (1993)
For-profit fund manager model with a nonprofit affiliate
National and International: remediation of environmen-tally impaired sites.
Fund I (1995): $50M Fund II(1998) $250 M Fund III (2002) $620M, and Fund IV (2006) $1.2 billion
Pension funds (public and private), insurance companies, university endowments
Cherokee Denver is a 50-acre mixed-use revitaliza-tion of a 2.3 million square foot former rubber manu-facturing complex located in Denver, Colorado on the South Platt River near I-25. Cherokee will create a world-class, transit-oriented urban village on the site, integrating with existing neighborhoods and Denver’s citywide assets.
Financial returns not disclosed. Social Returns: Through its work on 4,680 acres in North America and Europe, Cherokee will create an estimated 28,600 homes, 3.8 million square feet of retail space, 1 million square feet of office space and almost 3 million square feet of industrial space on formerly contaminated, underutilized land. Cherokee’s brownfield redevelopment efforts have preserved approximately 20,000 greenfield acres to date.
CPC Resources (1992)
Ownership model, CPC Resources is a for-profit subsidiary of the Community Preservation Corporation (nonprofit manager)
5 boroughs of NYC, Hudson Valley, upstate NY, and New Jersey: mixed-income, mixed-use projects infill construction.
Opportu-nity Fund I $42.5M, Opportu-nity Fund II $93M
Banks, insurance companies, pension funds
$6 million investment in former 11 acre Domino sugar processing plant in Williamsburg, Brooklyn (waterfront). Site to feature affordable housing, open public space, community facilities, and waterfront esplanade. Completed (10-year project): renovation and revitalization of the 12,271-unit Parkchester condominium joint ven-ture was formed, Parkches-ter Preservation Company (PPC), to acquire 6,361 unsold residential units, 500,000 square feet of commercial space and five parking garages.
Financial returns not disclosed. Social returns: As of June 2006 completed or under construc-tion 1,100 units in 30 projects. Recently completed the 12, 271 unit Parkchester redevelopment. Developments with 4,500 more housing units are in various stages of planning.
FEDERAL RESERVE BANK OF SAN FRANCISCO
Community Development INVESTMENT REVIEW56

UrbanAmerica (1988)
For-profit fund man-ager model
National: Class A development, retail, office, mixed-use (including a residential component) and ground up development.
Fund I $120M net assets, Fund II $400M net assets
Public pension funds, ERISA pension funds, banks, insurance companies, foundations and high net worth individuals
Eastover Shopping Center, Oxon Hill, MD, 249,047 SF shopping center ac-quired in 2000; Value add: · Increased rent at lease expiration for several tenants-Foot Locker rent increased 325%, Rainbow rent increased 85% · Consummated deal to bring full-service police station to site. Increased safety brings better ten-ants and more customers.
Financial results not disclosed. Social returns: permanent and construction jobs, and minority vendor services employed.
Urban Strategy America (USA Fund) (2005) a New Boston Real Estate Fund (1994)
For-profit fund man-ager model, subsidiary of established real estate company
East Coast: retail, office, residential, mixed-use and ground up development.
First Double Bottom Line Fund I: $170M
Pension funds (MassPRIM & CT), insur-ance compa-nies, banks, foundations
Olmsted Green (former Boston State Hospital) will transform 42 acres in Bos-ton to create homeowner-ship opportunities, jobs, nursing care, training, and health and fitness facili-ties. Community partner is Lena Park Community Development Corporation. Project will be built in four phases over four years with an estimated total cost of $143.5 million. The infrastructure required for the project will be publicly financed, including $37 million of institutional development by others.
Financial returns not disclosed. Social returns: • Create housing for sale and for rent that address all levels of affordability, • Permanent & construction jobs, • Infrastructure to benefit the broader community (i.e. transit, traffic, utility) • Undertake projects of a scale that have a significant impact on community, • Create retail and office environments by blending local and national tenants to create stability and growth, • Empower local minority and women development entities by offering expertise and financing in a joint venture structure. • Develop and acquire “Green Buildings” that utilize sustainable and energy efficient technology.
Equity Real Estate FundsFund Name & Date Founded
Structure Geography & Product
Assets Investors Example Project Fund Results
Other types of equity real estate funds: AFL-CIO BIT, American Ventures (Urban Initiatives Funds (South Florida, New Mexico)-mezzanine debt funds), Bridge Housing Corporation, California Urban Investment Partners, Canyon Johnson Urban Fund, City Investment Fund, CIM Opportunity Fund, Genesis LA Family of Funds (Real Estate Funds I&II, Workforce Housing Funds I&II), Kennedy Wilson, Lionstone Group, McFarlane Partners, Nehemiah Sacramento Valley Fund , San Diego Smart Growth Fund, Maryland Regional Workforce Housing Fund I, Portland Family of Funds, Phoenix Realty Group.
Community Development INVESTMENT REVIEW 57
FEDERAL RESERVE BANK OF SAN FRANCISCO

Private Equity FundsFund Name & Date Founded
Structure Geography & Product
Assets Investors Example Project Fund Results
Banc of America Capital Access Funds (1997)
For-profit fund manager model, a fund of funds
National: women, mi-norities, low & moderate income areas, & underserved markets.
N/A Public pension funds
Asset allocation includes: Altos Ventures, Ascend Ventures, Fulcrum Capital Partners, Nogales Investors, Rustic Canyon/Fontis Partners, Syncom .
Financial results not disclosed. Social returns: job creation in low & moderate income areas, & underserved markets, women & ethnic minority ownership, em-ployee benefits.
JP Morgan Bay Area Equity Fund, of the Bay Area Family of Funds (2003)
Contractual model, for-profit fund manager (JP Morgan) contracts with the nonprofit fund sponsor (Bay Area Council)
Ten county Northern California Bay Area: mis-sion-driven companies - consumer products, technology, healthcare.
$75M Banks, insurance companies, a public pension fund, private foundations, and individual investors
$2.2 million in venture capital to Elephant Pharmacy, it has generated 70 new entry-level jobs for the local community. The pharmacy is a start-up busi-ness, combining traditional pharmaceutical products with complimentary and alternative products.
Financial results not disclosed. Social returns: $11.8 million invested in 7 companies to date, produc-ing 69 jobs. • Launched a state, regional, and local effort to keep po-tential investment Solaicx, a solar company, in California to create over 350 jobs.
Oregon Invest-ment Fund, a Credit Suisse Fund of Funds (2004)
For-profit fund manager model, a fund of funds, Dela-ware Limited Partnership
Oregon and the Pacific Northwest: growth of small busi-nesses.
Fund-of-funds: $105M
Oregon Public Employees Re-tirement Fund (as directed by HB 3613)
Sherbrooke Capital: focuses on the health and wellness sector. This fund invests in areas of both health (fitness and “wellness”) and con-sumer products. Sherbrooke is designed to capitalize on these areas in Oregon as well as throughout the country.
Financial results not disclosed. Social returns: job creation in Oregon and Pacific Northwest.
SJF Ventures (1999)
For-profit fund manager model, with a not-for-profit affiliate, SJF Advisory Services
Primarily Eastern U.S.: mission-driv-en companies focus in clean tech, con-sumer health products.
Fund I (1999) : $17.1M Fund II (2006): target $30M
Banks, community finance trade organizations, foundations, individual investors, state agencies
Representative companies include: Intechra (Jackson, MS), providing IT asset disposition services and electronics waste recycling nationwide (200 employees); Ryla Teleservices (Ken-nesaw, GA), a contact center using an engaged workforce to deliver quality call center services domestically (375 employees); Home Bistro (Plattsburgh, NY), direct mail gourmet frozen food (89 employees).
Financial results not disclosed. Social returns: Over 1,200 good paying jobs created since SJF invest-ment, of which 67 % are from minority groups and 77 % are women. 71 % of the jobs created by SJF portfolio companies are entry-level positions; 75% of SJF port-folio companies pay 50% or more of health care premium costs. Eight companies have implemented broad-based stock option plans. Envi-ronmental benefits include electronics waste recycling, energy efficiency consulting, solar energy installation, reduced water and fertilizer use by vegetable growers and nurseries.
Other types of private equity funds, community development, fund of funds: CDVCA Central Fund, CEI Ventures, Credit Suisse First Boston Customized Funds (NY Common Co-Investment Fund), DFJ New England, Easton Hunt Capital Partners, High Peaks Venture Partners, NY Co-Investment Program (Hamilton Lane), Nogales Investors, Pacific Community Ventures, Yucaipa Companies.
FEDERAL RESERVE BANK OF SAN FRANCISCO
Community Development INVESTMENT REVIEW58
Benchmarking Financial, Social, and Environmental Returns
Community-based investing takes a holistic approach to investment that produces finan-cial returns and an improved quality of life both for those in the revitalized area and for the pension fund beneficiaries. The investment returns include financial, social, and envi-ronmental outcomes. Financial returns are measured against industry benchmarks. Increas-ingly, social returns are also being quantified, as are the environmental outcomes (although universally accepted benchmarks are not yet in place). The social and environmental returns complement the financial returns and are now being tracked in some cases as rigorously as the financial outcomes.
Financial returns are measured through risk-adjusted (adjusted for illiquidity and risk of the investment) internal rates of return (IRR) and in investment multiples (for example, �X—return of two times value of the initial capital investment). The IRR is interpreted as the expected return on the investment less the cost of capital and calculates what the investor would have earned over the time horizon of the investment.
In private equity, low or negative returns at the early stages of an investment are part of the “J-Curve” effect, when funds are incurring management fees and expenses but have not yet exited on the investment. When the investment venture has matured, the fund exits and the financial returns, net of management fees, are realized (Hebb �005).
Most investments have well-established financial benchmarks. Indices such as the Lehman Aggregate Bond Index provide a benchmark for fixed-income investments. The National Council of Real Estate Investment Fiduciaries (NCREIF) Property Index is used for benchmarking equity real estate fund performance. The benchmark, however, is meant for more stable, leased assets and has limitations in comparing value-added opportunistic real estate with inherent higher risk. There is no universally accepted industry index for private equity due to many factors such as timing issues, cash flows, and the absence of a stan-dardized market (University of California �005). Firms such as Thomson Financial Venture Economics can have success in gathering fund performance returns and placing investment vehicles in upper and lower quartiles and creating customized performance benchmarks for private equity funds.
Data on financial returns of targeted investments are slowly becoming available. For example, in the case of the fixed-income product, the NYCERS ten-year net return (as of the end of �006) forward rate commitment program yielded 8.19 percent, outperforming the established benchmark of the Lehman Aggregate Bond Index of 6.�4 percent (NYC Comptroller’s Office, Office of Economically Targeted Investments).
Within real estate, a CalPERS recent investment committee report (April �007) referred to overall real estate returns and the CURE initiative. The report stated that “by September 30, �006, CalPERS’ trailing one-, three-, and five-year returns outperformed the NPI (NCREIF
Community Development INVESTMENT REVIEW 59
FEDERAL RESERVE BANK OF SAN FRANCISCO
Property Index) by 10 to 17.� percent. Much of this outperformance can be attributed to strong returns in the Core, Housing, and CURE programs.”� Within private equity, CalPERS reported (March �007) in a press release that on the California Initiative the one-year net return of 5.6 percent was in line with Venture Economics Median returns for private equity, although it noted that investments were still too young for meaningful results.� One of the funds invested in through the California Initiative is Green Equity Investors III, L.P. with performance returns of a net IRR of ��.5 percent and an investment multiple of �.3X.�0
The social metrics are being measured, and while there is not yet any standardization, funds are beginning to define and report on the nonfinancial returns (Clark and Rosenz-weig et al. �004). The Community Development Venture Capital Alliance has produced a promising start with its “Measuring Impacts Toolkit” (CDVCA �005), which guides firms on the process of measuring social impacts. Other funds engaged in measuring the social impacts include the Banc of America Capital Access Funds, CEI Ventures, Pacific Commu-nity Ventures, and SJF Advisory Services.
Social benefits to a community also can be made explicit through a CEO letter of intent that locks in the commitment to realize the employee and community benefits. . For example, SJF Ventures Fund codifies its commitment to social goals through a “Community Development Assessment” performed with the company prior to investment. During the assessment, SJF’s not-for-profit affiliate, SJF Advisory Services, looks at ways they can assist the company with employee benefits (health-care and wealth-creating packages) and poten-tial training grants (Broughton �006).
Environmental benefits are now being tracked too. For example, Cherokee Investment Partners uses its Environmental Management System to assess its performance against envi-ronmental policies, objectives, targets, and other environmental criteria. As stated by the firms’ senior management:
Cherokee’s Environmental Management System is ISO 14001:�004 and certified by the International Organization for Standardization for environmental management. In addition, the company’s annual Sustain-ability Report summarizes progress on key environmental and social performance indicators. One such indicator is the number of contami-nated acres that Cherokee cleans up and redevelops, which corresponds to the number of acres of open space saved from new “greenfield” devel-opment. (Cherokee Investment Partners �005)
Cherokee and other investment firms are also tracking green certification on individual buildings. Buildings can be measured for their environmental impacts and receive a green
8 CalPERS Investment Committee Report April 16, �007 Global Real Estate (http://www.calpers.ca.gov/index.jsp?bc=/utilities/search/search.xml.
9 http://www.calpers.ca.gov/index.jsp?bc=/about/press/pr-�007/march/initiative-program.xml.
10 As of September 30, �006. http://www.calpers.ca.gov/index.jsp?bc=/investments/assets/equities/aim/private-equity-review/aim-perform-review/home.xml.
FEDERAL RESERVE BANK OF SAN FRANCISCO
Community Development INVESTMENT REVIEW60
building certification validated by external third-party systems such as the U.S. Green Building Council’s Leadership in Energy and Environmental Design (LEED). LEED is a nationally accepted benchmark for the design, construction, and operation of successful green buildings per the U.S. Green Building Council.�� Investment vehicles are incorporating green construction certification into their investment criteria. Investments are being made in companies with clean technology objectives and real estate developments incorporate public transportation links aimed at reducing traffic congestion.
Conclusion
Lessons learned show that pension funds need investment and community partners to place large pools of institutional capital in the underserved emerging domestic markets. These intermediaries enable pension funds to invest in smaller underserved communities that lie outside traditional streams of investments. We argue that financial and community intermediaries provide expertise to achieve both financial and social returns. They help by structuring investment vehicles that serve a market niche and are able to source deals along with community partners.
Investments can take different forms. Pension funds do not take excessive risk and the first entry point to targeted investing is through fixed income that may include a government guarantee. Equity real estate and private equity deals are riskier investments in which invest-ment vehicles overcome market barriers, pool assets, and spread risk to yield the targeted returns to the public pension fund.
Our research shows that investments that fall outside a selection process, without a formal request for proposals (RFP), can be politically motivated and prone to failure. Targeted investments that are programmatic and select investment vehicles through a formal competi-tive bidding process are most likely to succeed. For example, in order to reduce staff time taken away from the core portfolio, the MassPRIM board adopted a policy to go to market once a year with an economically targeted investment (ETI) Request for Proposal (RFP). It has since issued two ETI RFPs, one in December �005 and another in �006. The process includes checks and balances (among the search committee, investment committee, and full board) that block political interference (Hagerman et al. �006). Such practice in the selection of investment vehicles follows the prudent investor rule and, first and foremost, trustee and staff ’s fiduciary duty to achieve competitive risk-adjusted rates of return.
Achieving good financial, social, and environmental returns and measuring them are essential for the growth of targeted investments. The success of an investment vehicle is measured through internal rates of return measured against established benchmarks. The benchmarks are meant as a comparison or a way to judge against an existing agreed-upon
11 “LEED promotes a whole-building approach to sustainability by recognizing performance in five key areas of human and environmental health: sustainable site development, water savings, energy efficiency, materials selec-tion, and indoor environmental quality” (http://www.usgbc.org/DisplayPage.aspx?CategoryID=19).
Community Development INVESTMENT REVIEW 61
FEDERAL RESERVE BANK OF SAN FRANCISCO
industry standard. The difficulty in the emerging domestic markets (equity real estate and private equity funds) is that an agreed-upon industry standard does not necessarily exist. Not being able to benchmark investment vehicles in the private equity markets satisfactorily, in comparison to the established public markets, is a challenge, although consulting firms are producing customized benchmarks and analysis.
On the social impacts, there is no universally accepted industry yardstick to date for testing how well an investment vehicle performs on its targeted social returns. However, funds can measure their results against national living wage statistics, national figures of employee-based health-coverage plans, and the percentage of women and minority managers against national and state business ownership as seen in the case of Pacific Community Ventures reporting for CalPERS (�007).
Success in this area shows that the institutional investor and investment vehicle form a symbiotic relationship that allows for scale to both effectively transform neighborhoods and yield financial returns to the institutional investor. Without these intermediaries, large pools of capital would not be placed in the economic development area. The institutional investor relies on the investment fund manager for its expertise in successfully deploying capital to deliver both the financial and ancillary benefits.
Investment vehicles described in this study are successful conduits for pension fund’s seeking competitive market rates of return in the emerging domestic markets.�� As more pension funds take up this strategy of investing in economic development, we expect to see more investment vehicles established rather than a consolidation of funds. New investment vehicles are continually being formed as firms compete for pension fund dollars and seek profitable returns in the underserved markets. Regional investment vehicles offer pension fund investors the ability to achieve scale through a diversified fund and reciprocal targeted investing possibilities. Alternatively, state-based investment vehicles assure pension fund investors that the fund will invest the majority of the dollars in their state. It is too early in the creation of this industry to make an assessment on which model is more effective for the institutional investor.
Looking ahead, we recognize that relationship building among institutional investors, investment vehicles, and community partners is essential. The community partner is the entity that knows the local community and is able to think about the investment in terms of success for the community and its residents. Without the knowledge and influence of the community partner, we can often see gentrification rather than revitalization.
1� These investments are now considered to be part of the third generation of community based investing. The first and second generation included a heavier reliance on government guarantees, subsidies, and acceptable lower rates of return. In the emerging third generation urban economic development is recognized as an economic opportunity seeking market rates of return. Daniels and Nixon (�003) set forth the three generations of commu-nity based investing in the “Making markets work for inner city revitalization” paper presented at the Inner City Economic Forum in New York.
FEDERAL RESERVE BANK OF SAN FRANCISCO
Community Development INVESTMENT REVIEW62
The community-based investing industry is growing as fund managers seek opportuni-ties in the emerging domestic markets. As the industry matures, investment vehicles will continue to link pension funds to urban revitalization. As we look forward, we anticipate more pension funds adopting targeted investment policies, issuing RFPs, and placing capital into the emerging domestic markets through investment vehicles.
The ability to transfer ideas into action through dissemination of information among a cross section of stakeholders is vital. Research projects such as the Pension Funds & Urban Revitalization Initiative sponsored by the Rockefeller and Ford Foundations bring together pension fund officers and trustees, investment vehicles, and community partners. We are already seeing more municipalities making investments and new retirement systems adopting policies modeled after current system’s policies, such as in the case of the Vermont Pension Investment Committee adopting a policy in August �006 modeling MassPRIM’s targeted investing criteria (Hagerman �006).��
The outlook for increased investment by public-sector pension funds in the emerging domestic markets is bright as investment vehicles compete for institutional capital and source difficult deals in the underserved communities. We hope that further outreach to pension fund trustees and officers will bring awareness and more large institutional capital into emerging domestic markets through necessary partnerships with both the investment vehicles and community partners as the link to the revitalized urban area.
Lisa A. Hagerman is a DPhil Candidate in Economic Geography at the University of Oxford and a researcher for the Pension Funds & Urban Revitalization Initiative of the Labor & Worklife Program of the Harvard Law School. The research is supported by the Rockefeller and Ford Foundations.
Gordon L Clark (DSc, Oxford) was appointed the Halford Mackinder Professor of Geography at the University of Oxford in 1995 and is currently the Director of the Oxford University Centre for the Envi-ronment. He is also affiliated with Oxford’s Institute of Ageing, and is a Senior Research Associate in the Labor and Worklife Program of the Harvard Law School.
Tessa Hebb (DPhil, Oxford) is a Senior Research Associate at both the Labor and Worklife Program of the Harvard Law School and the School of Geography at the Oxford University Centre for the Environ-ment, University of Oxford.
13 Mass PRIM adopted its ETI policy after Massachusetts State Treasurer Cahill’s transition team contracted McKinsey & Company to conduct a pro-bono study to evaluate ETIs modeling former California State Treasurer Phil Angelides’s “California Initiative” (Hagerman et al. �006).
Community Development INVESTMENT REVIEW 63
FEDERAL RESERVE BANK OF SAN FRANCISCO
References Broughton, C., and A. Klein. �006. SJF Advisory Services Mission Impacts Report, http://www.sjfund.com/index.php?id=18.
CalPERS. �005. Statement of Investment Policy for Economically Targeted Investing, February 14, �005, Sacramento.
CalPERS and Pacific Community Ventures. February �007. California Initiative Impacting California’s Underserved Communities: Taking a Second Look. http://www.calpers.ca.gov/eip-docs/about/board-cal-agenda/agendas/invest/�0070�/item05b-0�.pdf.
Cherokee Investment Partners, LLC. �005. Sustainability Report, http://www.cherokeefund.com/risk.html.
Clark C., W. Rosenzweig, D. Long, and S. Olsen. January �004. Double Bottom Line Project Report: Assessing Social Impact in Double Bottom Line Ventures Methods Catalog, www.riseproject.org/DBL_Methods Catalog.pdf.
Clark, G. L. �000. Pension Fund Capitalism. New York: Oxford University Press.
Clark, G. L. �005. “Money Flows Like Mercury: The Geography of Global Finance.” Geografiska Annaler: 87B (�): 99–1�.
Clark, G. L., and T. Hebb. �004. U.S. Public Sector Pension Funds and Urban Renewal. Project proposal presented to the Rockefeller Foundation, New York.
Community Development Venture Capital Alliance. �005. Measuring Impacts Toolkit, New York.
Community Preservation Corporation. �005. Corporate Overview, New York.
Daniels, B., and N. James �003. Making markets work for inner city revitalization. Paper presented at the Inner City Economic Forum, New York.
Daniels, B., and Economic Innovation International, Inc. �005. Market Assessment and Investment Strategy for a Maryland Community Development Fund. Boston.
Flynn et al. �007. The Double Bottom Line Handbook: A practioner’s Guide to Regional Double Bottom Line Investment Initiatives & Funds. (Forthcoming).
Hagerman, L., et al. �007. Investment Intermediaries in Economic Development: Linking public pension funds to urban revitalization. Oxford University Centre for the Environment, WP 07-09.
Hagerman, L. December �006. Summary proceedings of the Regional Investment Roundtable on Pension Funds & Urban Revitalization in Boston, MA. http://urban.ouce.ox.ac.uk/network/notes061�06.pdf
Hagerman, L., et al. �006. Massachusetts Pension Reserves Investment Management Board: Urban investing through a transparent selection process. Oxford University Centre for the Environment, WP 06-16.
Hagerman, L. et al. �005. Pension Funds and Urban Revitalization: Competitive returns and a revital-ized New York. Oxford University Centre for the Environment, WP 05-13.
Hebb, T. �005a. California Case Study A: Private Equity CalPERS’ California Initiative.
Oxford University Centre for the Environment, WP 05-15.
Hebb, T. �005b. California Case Study B: Real Estate CalPERS’ California Urban Real Estate Initiative. Oxford University Centre for the Environment, WP 05-16.
Massachusetts Pension Reserves Investment Management Board. December �006. Request for Proposals Commonwealth of Massachusetts Based Economically Targeted Investments (ETI) Program Invest-ment Management Services. Boston.
FEDERAL RESERVE BANK OF SAN FRANCISCO
Community Development INVESTMENT REVIEW64
Merton, R.C. and Bodie Z. �004. The Design of Financial Systems: Towards a Synthesis of Function and Structure. National Bureau of Economic Research, Working Paper 106�0 http://www.nber.org/papers/w106�0
New York City Employees’ Retirement System. �005. Economically Targeted Investment Policy. New York, New York.
New York State and Local Retirement System. �006. Comprehensive Annual Financial Report for Fiscal Year Ended March 31, �006. Albany, New York.
Office of the Comptroller of the Currency Administrator of National Banks. Summer �005.
Community Developments Investments: Investment Intermediaries: Help Banks Achieve a Double Bottom Line. http://www.occ.treas.gov/cdd/eZine/summer05/index.html.
Romano, R. 1993. Public pension fund activism in corporate governance reconsidered. Columbia Law Review 93 (4): 795-853.
U.S. Department of Labor. �004. Interpretive Bulletin Relating to the Fiduciary Standard under ERISA in Considering Economically Targeted Investments, title �9, volume 9, chapter XXV, 336. Washington, DC: U.S. Government Printing Office.
University of California, Office of the Treasurer. May �005. 60� Benchmarks for Private Equity, Committee on Investments. http://www.universityofcalifornia.edu/regents/regmeet/may05/60�attach pdf.
Community Development INVESTMENT REVIEW 65
FEDERAL RESERVE BANK OF SAN FRANCISCO
The Brookings Urban Markets Initiative: Using Information to Drive Change
Alyssa Stewart LeeUrban Markets Initiative, Brookings Institution
Urban residents are more likely than their suburban counterparts to be underserved by retail services. The implications for urban residents and urban communities are far reaching. They spend more time and money traveling to access goods and retail services that tend to be more plentiful and less expensive in suburban
markets. Recent research has shown that the costs of the basics—such as food, clothing, and even insurance—are often higher for low- to moderate-income residents.� In other words, it’s expensive to be poor. Further exacerbating the situation, many of the services that tend to locate in urban markets push residents further outside the economic mainstream with payday lenders in place of retail banks and convenience stores and fast-food outlets replacing grocery stores.
Appropriate access to goods and retail services must be a part of any agenda to create healthy communities. This article outlines the role of information as a critical part of the framework for urban retail success benefiting residents, communities, and the private sector. It points to some successes, highlights some efforts currently under way to address informa-tion gaps, and provides direction for future efforts.
The Pyramid of Retail Success
Access to goods and retail services has been primarily in the hands of the private sector. Therefore, the levers for systemic change in this area are the principal investors—retailers, developers, banks, and venture capitalists. The Brookings Institution Urban Market Initiative recently completed an analysis of successful retail investment in urban communities from this perspective. The research hits on three core findings:�
1. The corporate perspective on urban markets must be properly aligned with true market realities. � Retail investment in urban areas, or lack thereof, flows from the corporate strategy. If that strategy cannot adjust to market realities, then the trajec-tory of all decisions is misaligned.
1 Matthew Fellows, High Cost of Being Poor. (Washington: The Brookings Institution �006).
� Alyssa Lee and Pari Sabety eds., “Retailers Operating at a Profit: Case Studies of Urban Retail Success” (New York: International Council of Shopping Centers, forthcoming).
3 For the purpose of this article, banks are considered as sources of capital. The retail location of banks is included in the perspective of retailers.
Community Development INVESTMENT REVIEW 67
FEDERAL RESERVE BANK OF SAN FRANCISCO
�. The right data, analytic methods, and tools that capture true urban market purchasing potential must be used by private-sector investors. The lack of goods and retail services in some urban markets is due to imperfect information, not absence of a viable market. These information gaps occur when information on human, economic, and physical assets is not available.�
3. Better information and analytic tools can facilitate private-sector investment, but some urban communities may never be “market ready” without some help from the public and nonprofit sectors.�
Beginning with the Right Decision-making Frame
For some retailers, making an investment decision requires a different perspective, one that enables a more accurate assessment of a neighborhood’s economic strengths and weak-nesses. This different perspective—a different frame of reference—is one of the most critical and often ignored steps in the decision-making process. Often the frames that guide analysis in urban markets are relics of the past guided by assumptions and preconceptions that misdi-rect the decision process.
Sometimes retailers are pushed to broaden their decision-making frame by an imperative to grow. In 1995, Old Navy had more than 3,000 stores and was looking for new areas in which to expand. With comparable store sales margins shrinking, the company developed a “diversity initiative.” This effort, pioneered by Mickey Drexler of Old Navy, targeted new and alternative markets. The objective was to explore whether urban stores could provide a big increase in sales for the 3,000-store company overall. The initiative was an opportunity to explore the possibility of serving customers who traveled across town just to shop.
After reviewing the leading research on urban buying power, the Old Navy team traveled around the country working with its local real estate crews to identify urban opportunities.� The key criteria were simple, but they clearly articulated the company understanding of how to evaluate urban markets: no national retailers present, location in a core city area, and a diverse customer base. The search identified 100 sites that fit the criteria in formerly neglected neighborhoods across the country, such as Chicago’s working-class neighborhood of Austin. The team estimated that this new store represented a $7 million urban sales growth opportunity for the Old Navy company.
4 Amy Helling and David Sawicki, “Race and Residential Accessibility to Shopping and Services,” Housing Policy Debate 14 (1 and �) (�003): 69–101. This study systematically explores the impact of different market barriers to explain the low level of access to retail and shopping opportunities in inner city, minority neighborhoods.
5 Weissbourd, Robert. The Market Potential of Inner-City Neighborhoods: Filling the information Gap (Washington, DC, The Brookings Institution, 1999).
6 Old Navy relied on Initiative for a Competitive Inner City/Harvard studies of retail in inner cities, the International Council of Shopping Centers (ISCS) data on retail properties, and the Business for Social Responsibility/ICSC report on purchasing power.
FEDERAL RESERVE BANK OF SAN FRANCISCO
Community Development INVESTMENT REVIEW68
Local entrepreneurs have one major advantage over large national retailers: they have better local knowledge and start with a broader frame. For example, Princess Jenkins wanted to open a women’s wear store in her Harlem neighborhood. She knew from personal expe-rience, not reams of demographic data, that the area was underserved for women’s wear. “Women came into my building every night with Bloomingdale’s bags,” Jenkins said of her neighbors. “They had the money; they just couldn’t spend it in Harlem.” As a part of the community fabric, Ms. Jenkins understood the market realities and potential of her commu-nity. As a small-business woman, she had enough local knowledge and sufficient access to capital to invest in her community.� The challenge for the local entrepreneur is to get other investors interested in investing their idea so they can grow. Doing that without data, however, is almost impossible.
Some investors get comfortable with urban markets by forming partnerships the way Star-bucks Coffee has done by creating a joint venture with Johnson Development Corporation. Vice President of Starbuck’s Store Development Cydnie Horwat says, “Our Urban Coffee Opportunities joint venture has essentially shown that Starbucks can penetrate demographi-cally diverse neighborhoods in underserved communities, such as our store in Harlem, which is not something that we had previously looked at.”�
Changing the frame for decision making is about changing the perception of corporate executives to dispel incorrect assumptions and preconceptions about urban markets reali-ties. Sometimes this understanding is buried within corporations in the heads of lower-level employees. Banking offers a great example of this phenomenon. While CRA-motivated bankers understand the dynamics of urban markets, this knowledge often is not translated throughout the bank. At Wells Fargo, sharing information across the bank departments was critical to changing the frame. By inserting a couple of questions in the overall loan processing system of the bank to flag potential community development deals, the company was able to identify many successful investments from the commercial side of the bank that qualified as community development activities.
Gathering Intelligence
Framing is, in essence, asking the right questions. Getting to the answers to those ques-tions is achieved through a process known as the information cycle.� Starting with raw data, an analyst adds value to create pieces of information that together “tell a story.” Once value-added information is created, a decision maker or investor provides their own insights and cognitive knowledge of the situation to turn that information into actionable knowledge. It is only at this step that data can enable an investment decision.
7 Lee and Sabety eds., “Retailers Operating at a Profit.”
8 J. Francica, “Location Analysis Tools Help Starbucks Brew Up New Ideas,” Business Geographics 8(8) (�000), 3�–33
9 Pari Sabety and Virginia Carlson, “Using Information to Drive Change: New Ways of Moving Markets.” (Wash-ington: Brookings Institution, �003).
Community Development INVESTMENT REVIEW 69
FEDERAL RESERVE BANK OF SAN FRANCISCO
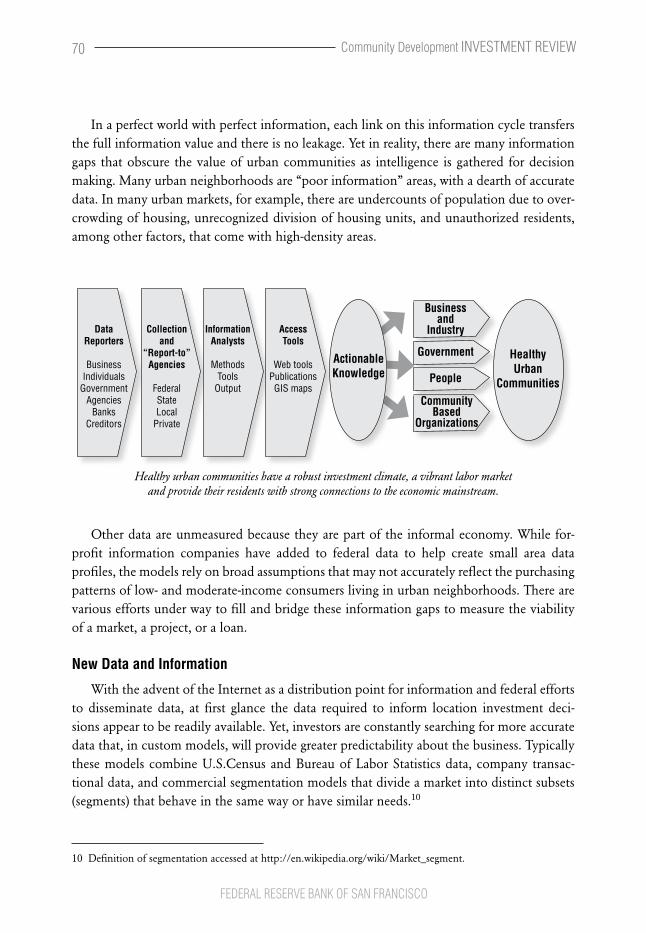
In a perfect world with perfect information, each link on this information cycle transfers the full information value and there is no leakage. Yet in reality, there are many information gaps that obscure the value of urban communities as intelligence is gathered for decision making. Many urban neighborhoods are “poor information” areas, with a dearth of accurate data. In many urban markets, for example, there are undercounts of population due to over-crowding of housing, unrecognized division of housing units, and unauthorized residents, among other factors, that come with high-density areas.
Healthy urban communities have a robust investment climate, a vibrant labor market and provide their residents with strong connections to the economic mainstream.
Other data are unmeasured because they are part of the informal economy. While for-profit information companies have added to federal data to help create small area data profiles, the models rely on broad assumptions that may not accurately reflect the purchasing patterns of low- and moderate-income consumers living in urban neighborhoods. There are various efforts under way to fill and bridge these information gaps to measure the viability of a market, a project, or a loan.
New Data and Information
With the advent of the Internet as a distribution point for information and federal efforts to disseminate data, at first glance the data required to inform location investment deci-sions appear to be readily available. Yet, investors are constantly searching for more accurate data that, in custom models, will provide greater predictability about the business. Typically these models combine U.S.Census and Bureau of Labor Statistics data, company transac-tional data, and commercial segmentation models that divide a market into distinct subsets (segments) that behave in the same way or have similar needs.�0
10 Definition of segmentation accessed at http://en.wikipedia.org/wiki/Market_segment.
FEDERAL RESERVE BANK OF SAN FRANCISCO
Community Development INVESTMENT REVIEW70
The foundation of the private-sector demographic data used for retail decisions is the U.S. Census Bureau. Historically, comparable data on communities and neighborhoods across the country were gathered once every ten years by the Census. This lack of timely, compa-rable data on small areas made it difficult to capture the demographic and economic impacts in dense and rapidly changing neighborhoods like those that characterize urban communi-ties. Recently, however, the Census has developed innovative methods for collecting small area socioeconomic data to fill information gaps. The American Community Survey (ACS)
provides robust annual neighborhood data on demographic and housing characteristics.�� The Census’ Local Employment Dynamics (LED) partnership is another emerging data tool that could have tremendous implications for market actors to better understand the local economy.��
Even with these improvements, however, the U.S. Census data will not solve all of the information gaps that obscure market realities in urban communities. The Census has finan-cial, operational, and regulatory constraints that keep it from providing all the data that are necessary. Therefore, additional data sets are required to better understand the traditional indicators of retail potential—household counts, household and disposable income, and market competition.
Social Compact has developed the DrillDown to focus specifically on this issue. The DrillDown market analysis is an indirect census that counts the population and the number of housing units using multiple data sets from public and private sources to build real-time market profiles of low-income areas.�� The DrillDown data derive more precise measures of households, household size, income, local residential investment, and daytime populations. The number of households is critical to any retail analysis. Building on an accurate count derived through the analysis of traditional data, along with other sources such as anonymous credit bureau data utility data, local government data sets like property value data and prop-erty crime, and business-license data form the basis of the DrillDown approach. This new and comprehensive analysis results in better indictors of market strength, market stability, and market potential.
One of the serious misunderstandings of the urban emerging domestic market is a lack of understanding of the informal economy.�� The informal economy runs on cash transactions that are, almost by definition, uncounted. Therefore, measuring this economy relies on the use of proxy variables that can approximate the actual economic activity in a low-income
11 American Community Survey Data will be available on all communities in �010. Data on communities over 60,000 residents will become available in �006.
1� This application joins Census data with wage and employment data from state administrative records to provide information on the local labor market, such as employment, job creation, and earnings by industry, age and sex. More information is available at http://lehd.dsd.census.gov/led/led/led.html.
13 Social Compact, “Neighborhood Market Drill-Down” available at http://www.socialcompact.org/market.htm.
14 Jamie Aldersaide, John Talmage and Yusef Freedom, Measuring the Informal Economy-One Neighborhood at a Time (Washington: Brookings Institution, �006).
Community Development INVESTMENT REVIEW 71
FEDERAL RESERVE BANK OF SAN FRANCISCO
neighborhood. One neighborhood analysis uses eight proxies derived from a combination of publicly and privately available data, including:
• Percentage of households with a total income of less than $30,000
• Ratio of household expenditures to income
• Percentage of households with no banking relationships or credit histories
• Percentage of utility payments made in cash
• The prevalence of check-cashing operations per acre in the profiled neighborhood
• The prevalence of check-cashing operations per household in the profiled neighborhood
• Modeled versus actual housing costs
• Percentage of the neighborhood’s population that is foreign-born
Supplementing these proxies with survey data will yield a powerful measure of this impor-tant component of urban neighborhood market activity.�� To date, this work has identified $4.4 billion of unrecorded purchasing power in more than 100 urban neighborhoods across the county.��
LISC MetroEdge pioneered new methodology to understand the viability of urban markets. Traditional measures of retail trade potential are based on four major datasets: (1) the Census of Retail Trade (CRT) conducted every five years by industry types, (�) the Monthly & Annual Surveys of Retail Trade data from the U.S. Census, (3) current-year demographic estimates, and (4) Global Insights’ current-year national retail sales forecast. Demographic characteristics are used to develop regression models for 1� separate retail categories as well as total retail sales for 76 geographic regions.
The results of the LISC MetroEdge retail scan bring to bear robust data that incorporate local market nuances that would be missed in a national-level analysis. MetroEdge adds to an analysis of retail trade potential for urban areas, retail-attractiveness variables such as population change, middle-class concentration, residential building permits issued (absolute numbers and trends), residential loans for housing improvements (absolute numbers and trends), and crime data. These variables of retail attractiveness rely heavily on local data to supplement the national data used by many retailers and brokers. Housing trends are confirmed using Home Mortgage Disclosure Act (HMDA) data and building-permit data are obtained from the city. MetroEdge uses actual crime activity data as opposed to national
15 Important work undertaken by the Economic Roundtable in Los Angeles to identify the size of the informal economic labor market, and international examples in South Africa, India and Germany among others will be critical to furthering methods to define informal economic activity in local markets in the United States to support appropriate policy interventions.
16 Chicago, Cleveland, Houston, Jacksonville, New York City, Oakland, Santa Ana, and Washington, DC Drill-Down Analysis.
FEDERAL RESERVE BANK OF SAN FRANCISCO
Community Development INVESTMENT REVIEW72
crime models that make assumptions about criminal activity based on demographic charac-teristics of neighborhoods. MetroEdge also employs focus groups to determine neighbor-hood retail market demand. Based on these techniques, an analysis of Chicago found that two of every three dollars of retail spending were spent outside the city.��
Innovative data and methods—whether developed by the public sector or through leaders such as Social Compact, Institute for a Competitive Inner City, or MetroEdge—have demon-strated the value that predictive information plays in the marketplace, as well as the sources of bias in that information. This need for greater predictability is accentuated as investors try to understand new urban markets. In the mainstream market, data are available to enable benchmarking, and the creation of different asset markets. In urban markets, however, gaps remain in benchmarking performance and therefore, investors and capital providers are less inclined to deploy capital.��
New data can provide benchmarks to understand which investments outperform and which underperform. For banks, information is needed on past loan performance, default ratios, charge-offs, and recoveries by types of assets to help inform risk assessments. For equity investors, historic operating data to quantify the future parameters of performance are needed to maximize return on investment and manage their development efforts effec-tively. Some of the most valuable data in this realm would provide attributes and variables created through the aggregation of actual transactional or performance data provided by a large number of competitors. These data must develop out of a shared need for affordable information that can feed into customized models for risk analysis.
These factors are the concept behind Urban Retail Performance Metrics (RPM).�� The objective is to reduce information asymmetry for investors, governments, and lenders. The chief benefits of these data are that they can dramatically narrow the information gap on urban commercial neighborhoods, and deliver the data in metrics that facilitate prudent and precise decision-making in the marketplace while lowering transaction costs.
17 Metroedge, “The Metroedge Primer: A New Approach to Finding Untapped Markets.” available at http://www.metro-edge.com/demographics/methodology.asp and Social Compact, “Neighborhood Market Drill-Down” available at http://www.socialcompact.org/services.htm.
18 The Urban Markets Initiative, “Maximizing The Returns Of Urban Retail And Commercial Development Using Advances In Information Theory, Modeling Simulation and Decision Support Tools event transcript (March �005).
19 The concept for Urban RPM originated from discussions at the Urban Markets Initiative Roundtable entitled “Maximizing the Returns of Urban Retail and Commercial Development Using Advances In Information Theory, Modeling Simulation and Decision Support Tools.” Charles Tansey of NeighborWorks America, as a former banker, believed this data could be used to better understand community development. Robert Haslach conceived of the data being gathered as a consortium of companies from his previous experience at Claritas, and Alyssa Lee of the Urban Markets Initiative conceived the use of a neighborhood types as a way to both privatize the data and to expand the application to communities that were currently underserved. In the past two years we have tested feasibility and tweaked this concept, and are now prepared to bring it to fruition.
Community Development INVESTMENT REVIEW 73
FEDERAL RESERVE BANK OF SAN FRANCISCO
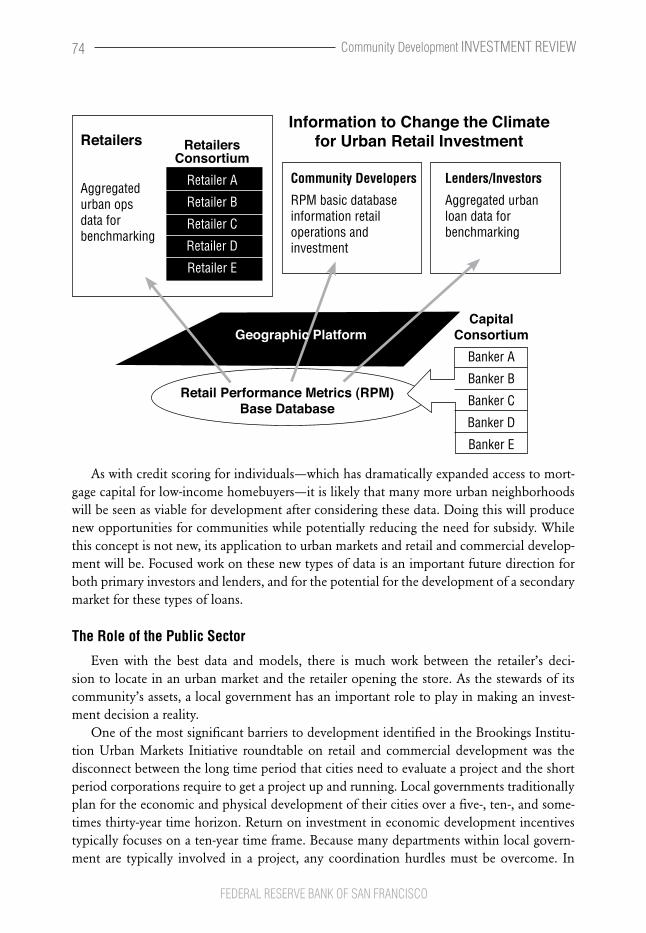
Retailers
Aggregatedurbanopsdataforbenchmarking
RetailersConsortium
RetailerA
RetailerB
RetailerC
RetailerD
RetailerE
Community Developers
RPMbasicdatabaseinformationretailoperationsandinvestment
Lenders/Investors
Aggregatedurbanloandataforbenchmarking
Retail Performance Metrics (RPM)Base Database
CapitalConsortium
BankerA
BankerB
BankerC
BankerD
BankerE
Geographic Platform
Information to Change the Climatefor Urban Retail Investment
As with credit scoring for individuals—which has dramatically expanded access to mort-gage capital for low-income homebuyers—it is likely that many more urban neighborhoods will be seen as viable for development after considering these data. Doing this will produce new opportunities for communities while potentially reducing the need for subsidy. While this concept is not new, its application to urban markets and retail and commercial develop-ment will be. Focused work on these new types of data is an important future direction for both primary investors and lenders, and for the potential for the development of a secondary market for these types of loans.
The Role of the Public Sector
Even with the best data and models, there is much work between the retailer’s deci-sion to locate in an urban market and the retailer opening the store. As the stewards of its community’s assets, a local government has an important role to play in making an invest-ment decision a reality.
One of the most significant barriers to development identified in the Brookings Institu-tion Urban Markets Initiative roundtable on retail and commercial development was the disconnect between the long time period that cities need to evaluate a project and the short period corporations require to get a project up and running. Local governments traditionally plan for the economic and physical development of their cities over a five-, ten-, and some-times thirty-year time horizon. Return on investment in economic development incentives typically focuses on a ten-year time frame. Because many departments within local govern-ment are typically involved in a project, any coordination hurdles must be overcome. In
FEDERAL RESERVE BANK OF SAN FRANCISCO
Community Development INVESTMENT REVIEW74
addition, there are necessary opportunities for citizen participation, planning commission input and approval, and city council involvement. While this coordination process within a local government may make sense, it does not square with the time frame of the retailer.
Retailers expect a store to mature to its maximum potential within two to three years of its conception. The business process is designed to expedite store location and development. Real estate professionals within retail corporations are frequently given incentives to turn a store from a developing enterprise into a revenue-producing one as quickly as possible. As one retail real estate professional noted, every day that a project spends in development is one more day the store is not generating revenue. Thus “speed to market” is a critical issue for the retailer.
Speed to market is enhanced in traditional suburban development where there is a clear site, clear of environmental concerns, with the proper zoning in place. Urban markets are typically characterized by redevelopment of an existing shell within the context of a neigh-borhood. Redevelopment of prime locations, such as corner lots, coincides with environ-mentally damaging previous uses (a gasoline station, for example).
The appropriate zoning may be in place to allow retail uses in urban areas, but it may not have been adjusted to reflect the current realities, such as the need for lower parking ratios to fit with the proposed site. Even as retailers work to develop physical store prototypes for urban markets, each urban market faces different challenges depending on the physical stock. This requires retailers to spend more time custom-fitting their product to these markets.
To respond to the needs of regional and national retailers, cities across the country have developed business processes to enhance the ability of a retailer to gain speed to market. There is no “one size fits all” process for a city, but given the core objectives discussed above, there are best practices from which to learn. Chicago, Milwaukee, and Huntington Park, California, provide three examples of notable programs.
The Retail Chicago initiative links local retail brokers and local community development corporations to ensure that all interested retailers are provided not only with up-to-date market data but also with the right contacts in the neighborhoods seeking investment. More than 140 delegates throughout the city partner with Retail Chicago, including the Oleary Group, CDCs, Chambers of Commerce, and other community groups. Maps for each of the 50 wards highlight such key data elements as adjusted retail sales potential and leakage, as well as key trend data on home prices, permits, and rents. Finally, Retail Chicago enables self-certification for the architect to fast-track the permit process. All these processes are helping Retail Chicago achieve its four-point objectives to: (1) stop sales bleed to suburb (and increase tax revenue), (�) reduce blight, (3) improve access to goods and services, and (4) increase employment.
The City of Milwaukee created the Development Incentive Zone to speed the approval process for the development of Midtown Center, anchored by Walmart. Under Mayor John Norquist, Milwaukee established a commitment to the principles of new urbanism, a move-ment to create pedestrian-friendly neighborhoods that contain many different types of uses. Given that framework, the city spelled out its requirements exactly, including driveways that are at grade with the city streets so that drivers are not aware of a physical transition
Community Development INVESTMENT REVIEW 75
FEDERAL RESERVE BANK OF SAN FRANCISCO
when entering private space; store entrances that are articulated on the buildings’ roof lines; rooftop equipment screened from view; and the consideration of which walls would contain the most windows. These design improvements got the attention of the Congress for the New Urbanism, which recognized the project with an award.
Huntington Park, near Los Angeles, joined Home Depot’s team and proactively part-nered to address governmental, regulatory, and citizens’ concerns. In addition to providing up-to-date demographic and property data, the city developed two teams to address all of the critical issues to facilitate the retail development. The first group oversaw planning, design, site assemblage, community concerns, and safety and environmental regulations. The second group was responsible for economic issues, such as financing, subsidies, and other formal incentives. The provision of equity-through-development incentives and creative financing provided support for infrastructure and other soft development costs that was essential to make the deal work.
The examples of best practices above focus on capturing opportunity that is external to the city and converting it to a local asset. In addition, any strategy for encouraging external investment in emerging domestic markets must be altered slightly to help local small busi-ness retailers too. The majority of goods and retail services in our urban communities are provided today by local small businesses. Yet, as the case of Princess Jenkins in Harlem illustrates, these entrepreneurs often move into business outside the formalized business processes noted above. New information advances that are making urban market decisions more transparent need to be available to local entrepreneurs to enable them to better manage risk and to align their services to the needs of the community. One way to achieve this objective is to imbed critical data into small business development centers that can serve to support the information needs of this important group of investors. The important naviga-tion functions provided by Retail Chicago and the City of Huntington Park are also acces-sible to local businesses to better support their success.
Formalizing Feedback: Building a Knowledge Base
Finally, formalizing the learning from experience is a crucial step to support good future decision making. For example, Home Depot’s performance in its Southside Chicago invest-ment helped to lay the groundwork for other locations in metropolitan areas, such as the new Manhattan Home Depot, with retail selections geared to the unique needs of urban consumers. In another case, the market research firm Claritas worked with LISC’s MetroEdge to develop new micro-segmentation models to better reflect the realities of urban neighborhoods.
Another need in the local community is to develop the mechanisms that will provide continuous market feedback from those on the ground to keep in touch with urban market realities.�0 The problem is twofold: (1) to incubate and develop new data sources, tools, and technologies that, taken together, have the potential to better describe urban markets; and
�0 Lee and Sabety, forthcoming. See also International Council of Shopping Centers, “Developing Successful Retail in Underserved Markets” (�004) for discussion of key issues.
FEDERAL RESERVE BANK OF SAN FRANCISCO
Community Development INVESTMENT REVIEW76
(�) to accelerate the deployment and use of these tools to spur investment in urban markets. Similar complex problems in the realm of science and technology that involve collaboration among public-sector, nonprofit enterprises, academics, and private-sector firms have devel-oped “collaboratories” to assist them in accelerating developments in their field. “Collabo-ratories” are open virtual and physical “laboratory” spaces in which participants identify an agenda, solicit partners in the work, and educate the field as a whole about the results of the work. An informal version of this capacity exists in practice through the networks, acquain-tanceships, and alliances that respond to specific issues and funding priorities of governments, foundations, and the private sector. But what the field lacks is a formal networking capacity to share insights, build on institutional learning, co-develop tools, develop standards, replicate successful approaches, and leverage investments. To respond to this need, the Brookings Insti-tution Urban Markets Initiative established the Urban Markets Collaboratory (www.urban-marketlab.org), a new portal to aggregate information and resources on urban markets.��
Conclusion
Information is a key support in public- and private-sector interventions to transform poor, segregated neighborhoods into economically vibrant, diverse communities. The lack of data and information in urban markets has created asymmetrical investment patterns that disenfranchise our urban cores. Yet today, thanks to technological advances, we have more information about our operations, transactions, and loan portfolios than ever before. With that information and technology, together we have the power to value urban markets in ways that we have only dreamed of in the past.
New market data generated in part by socially motivated companies is reaching market-driven investors, but more fine-grained data are required. Comparative data must be provided so that urban market decision making can become more predictable; as data improves, it must be delivered efficiently and with lower transaction costs.
Advances in data and information are critical to changing perceptions of what urban markets are and are not. In addition, the right frame on market realities enables both the private and public sector to embrace the right strategies to identify market opportunities. Finally, the “last mile” of a local government’s support can tip the investment scales in favor of emerging domestic markets.
Alyssa Lee is Acting Director of the Urban Markets Initiative (UMI) at the Brookings Institution Metropolitan Policy Program. UMI aims to improve the quality of the information available on urban communities and use it to unleash the full power of those markets while connecting them to the economic mainstream (http://www.brookings.edu/metro/umi.htm).
�1 www.urbanmarketlab.org is supported by the Urban Markets Initiative at the Brookings Institution.
Community Development INVESTMENT REVIEW 77
FEDERAL RESERVE BANK OF SAN FRANCISCO
The Challenges of Evolution: EDM Initiatives in Private Equity in Conception and Practice
Gregory B. FairchildUniversity of Virginia, Darden Graduate School of Business
The term “emerging domestic markets” (EDM) has generated considerable prac-tical and scholarly interest in economic opportunities in communities that have largely been overlooked by the investment community as a whole. The explicitly economic perspective offered by EDM and the positive associations with interna-
tional emerging markets have contributed to growing investor interest in low-income and minority communities. However, the lack of clarity in definitions may have created unin-tended consequences for the investment professionals attempting to develop these markets. In this essay, I describe three examples of how loose definitions have created dilemmas for private equity professionals managing what have been termed EDM-targeted funds. If we agree that language matters, then these cautionary tales call for a greater degree of clarity among opinion leaders when discussing these opportunities.
One area of growing research interest, including my own, has been the performance of the private equity funds generating returns through investments in what have been called EDMs. Although careful studies of the industry are in their nascent stage, a select group of private equity firms has been operating in the arena for several decades such as Syncom Ventures, Pacesetter Capital Group, and Opportunity Capital Partners. Timothy Bates and William Bradford have been answering the question many have wondered: Do these funds produce market-rate returns? Their work indicates that these funds generate comparable returns to those operating in the general market (see Bates and Bradford, �004; Bates, Brad-ford and Rubin, �006).
Over the past 1� months, I have interviewed private equity funds, funds-of-funds, emerging manager administrators, and pension fund trustees on their varied perspectives on the industry as it evolves in definition, scope, and diversification. While the specific focus of my research has been on understanding the role of social relationships in influencing fund-raising, syndication, and valuation of portfolio firms, fieldwork has revealed other chal-lenges that arise from indistinct definitions in practice. Many popular conceptions about the missions of these funds, their strategic orientations, and the professionals who run them do not always match the reality in the field, and I discuss why these differences can create considerable challenges.
Emerging Domestic Markets versus Minority Markets
Some evidence of the increasing regard for EDM as a descriptor is the decision in �005 by the decades-old National Association of Investment Companies (NAIC) to sponsor the Journal of EDM Finance as its industry’s trade publication. I should note that I wrote an article
Community Development INVESTMENT REVIEW 79
FEDERAL RESERVE BANK OF SAN FRANCISCO
for the publication’s inaugural issue that provided my own definition of the term (Fairchild, �005). My fieldwork reveals some ambiguity about the use of the term. Some funds have embraced it, citing the well-developed tastes potential fund investors have for international emerging markets (Asian Tigers, Ireland, former Eastern bloc nations, for example). However, more than one investment professional expressed reservations about the direct comparison to developing international regions. Some questioned whether it was a wise strategy to legiti-mate America’s minority markets, entrepreneurs, and professionals through comparisons to intact nations with dramatically different histories and different institutional and economic contexts.
Still others expressed dissatisfaction with the fuzzy definitions of the term and ques-tioned whether women-owned firms should be included in some popular definitions. While everyone acknowledged that the inclusion of women in the definition was helpful in attracting capital to the space, others objected to the inclusion of women as an under-served market. Firms with long histories of investment in minority markets and dedicated to growing minority-owned firms felt that the fundamental challenges for white women firm owners were substantially different from those of minority managers of either gender. The inclusion of women in some definitions left some investment professionals having to explain to potential portfolio companies or pension fund investors that their expertise related to race and ethnicity, and not to gender.
Confusion with Community Development Venture Capital
Given the centrality of minority consumer and labor markets in many EDM definitions, many of the funds’ investment professionals expressed frustration with confusion they expe-rienced in explaining the explicitly investment-driven objectives of their funds relative to the related, but mission-driven Community Development Venture Capital funds (CDVCs).
These managers viewed their peers as mainstream, economically oriented private equity firms, and many felt that equating their funds with community-development funds reflected a belief that minority markets were not viable investments on economic terms alone. “This is not a hobby or a charitable activity,” said the founding manager of one long-term, minority-targeted fund. The manager went on to explain the rationale for the fund’s decision to decline the invitation to pitch for investment funds from a leading multinational investment bank because they were offering “sorry money” (funds without the expectation of market-return discipline). “We don’t attend social entrepreneurship events,” said another. “Why is it that whenever the owners, markets, or employees are black or brown, the investment is mission driven? If we believe in the fundamental growth opportunities in these markets, the mission or community impact is simply an added benefit.” Another frequently expressed frustration was that potential fund investors with a “social” orientation were often surprised by the market-rate compensation demanded by the investment teams. Finally, some felt that such confusion diminished the interests in larger funds in co-investing in the industry, and my own research shows an unusually high level of syndication with other minority-targeted funds.
FEDERAL RESERVE BANK OF SAN FRANCISCO
Community Development INVESTMENT REVIEW80
Fund-Raising Rhetoric versus Investment Profile
A third area of challenge for the evolving industry is the variance between the rationale under which funds were raised and the eventual portfolio of companies invested. Many states and localities have created emerging manager programs in efforts to expand the pool of investment professionals deploying public pension funds in the field (and the definitions of these programs vary as well). Many pension fund trustees have an interest in increasing investments in minority and low-income communities, and have created initiatives designed to foster this type of investment activity (CalPERS’ $475 million initiative is an example). In response, an increasing number of funds have responded, marketing their purported exper-tise in underserved markets, inner-city areas, or their social connections to often overlooked minority entrepreneurs. However, once funds have been raised, finding viable deals that fit these profiles may be limiting, and dilemmas can result (e.g., an ostensibly inner-city focused fund deciding whether to invest in an attractive firm located in a rural county). As a result, some of the dollars that pension fund trustees have earmarked for placement in minority communities are not reaching them.
If public policy and investor interest in EDM private equity expands, questions of defini-tion, explicit or implicit social missions, and clarity of investment principles will likely grow as well. Industry associations should work to educate potential investors on the diversity of strategic orientations within the field, as well as the factors that critically delineate them from seemingly similar investing arenas. If the greater investment community fully embraces EDM-focused funds, questions about differentiators of performance across funds will surely follow. Scholars should move beyond efforts to answer whether the set of EDM funds offers market rates to determining how variance in strategic orientations results in return differ-ences across funds. For investment funds defined by consumer markets or demography of managers rather than by product categories, or industries, critical answers may be more than just semantic.
Greg Fairchild is the assistant professor of Business Administration at the University of Virginia, Darden Graduate School of Business. His research focuses on entrepreneurship and economic growth. He is grateful to the Ewing Marion Kauffman Foundation for their support of his research on the role of social relationships in minority-targeted private equity.
ReferencesBates, T., W. Bradford, and J. Rubin. �006. “The Viability of Minority-Targeted Venture Capital Industry under Alternative Financing Arrangements.” Economic Development Quarterly �0, no. �, 178–91.
Bates, T., and W. Bradford. �004. “Analysis of Venture-capital Funds that Finance Minority-owned businesses.” Review of Black Political Economy 3�, no. 1, 37–46.
Fairchild, G. �005. “What Is the Emerging Domestic Market?” Journal of EDM Finance. Inaugural Issue. Summer �005. Washington, DC: National Association of Investment Companies.
Community Development INVESTMENT REVIEW 81
FEDERAL RESERVE BANK OF SAN FRANCISCO
Building Stronger Communities with Smart Investments
Phil AngelidesRiverview Capital Investments
When I took office as California State Treasurer in 1999 and joined the governing boards of California’s two major pension funds—CalPERS and CalSTRS—I was struck by the fact that our retirement funds were investing billions of dollars in overseas emerging markets while at the same time
overlooking investment opportunities in our own emerging markets—California’s inner cities. While our pension funds were willing to take a chance half a world away, they hadn’t yet tapped into the great potential of our urban communities, which offered many assets, including a strong workforce, available infrastructure, and strategic locations.
Thoughtful leaders such as Michael Porter, professor at the Harvard Business School and Founder of the Initiative for a Competitive Inner City (ICIC), had made the case about the tremendous potential of inner-city communities, but few investors were willing to be the first to make the foray into these markets. Our pension funds were in a unique position, as the first- and second-largest pension funds in the country with combined assets of over $400 billion, to take on the prudent risk of being a market leader in these untapped markets, and at the same time reap sound returns for pensioners.
To seize this opportunity, in �000 I launched a new initiative, “The Double Bottom Line: Investing in California’s Emerging Markets,” which has now directed more than $14 billion in investment capital to spur economic progress in California’s inner cities, and has tapped into the growing pool of talented ethnic and minority investment managers to deploy capital in a way that uplifts California’s diverse communities.
Across California, the Double Bottom Line is building wealth, and building the great economic potential of California’s urban neighborhoods while creating jobs, housing, and new opportunities. Over the last seven years, our pension funds have demonstrated that it is possible to invest in the potential of our own workers, entrepreneurs, and communities, and at the same time earn head-turning returns. For example, in downtown Los Angeles, the Double Bottom Line has transformed blighted blocks into bright new housing complexes. Businesses have returned to areas where they once fled. And in East Oakland, we are turning a parking lot into a thriving urban community with housing, parks, and shopping—all adja-cent to a major transit center.
But perhaps most important, the Double Bottom Line has catalyzed a wave of reinvest-ment, by public pension funds and private investors, in urban centers across the country, giving hope to communities that once struggled to attract investors.
Community Development INVESTMENT REVIEW 83
FEDERAL RESERVE BANK OF SAN FRANCISCO
A few of the Double Bottom Line investments:
• CalPERS and CalSTRS have committed $800 million in private equity investments to boost business development in underserved communities.
• Our pension funds have committed more than $4.9 billion to urban, infill real estate ventures, investments that are transforming inner-city blocks into thriving neighbor-hoods and centers of commerce. Of this, nearly $700 million has been made avail-able for affordable housing focused on California families.
• The State’s Investment Account has invested nearly $3 billion in Community Rein-vestment Act home loans, helping more working California families become home-owners, and boosting homeownership in struggling neighborhoods.
• The State Treasurer’s Office increased—from approximately $1.9 billion in January 1999 to $8 billion in January �007—deposits in California community lending insti-tutions and credit unions, many serving inner-city and rural areas, helping these institutions expand home and business lending in California’s communities.
And all this has been accomplished while earning solid returns for pensioners and taxpayers. As an example, CalPERS has earned annual returns of ��.� percent from its Cali-fornia Urban Real Estate partnerships since the program’s inception in �001.
The public sector has begun to do its part, but real transformation of our cities will come only when private investors recognize the tremendous potential these areas still have. And the numbers are in.
According to a recent ICIC report, “The revenue and profit potential in the inner city is enormous. The estimated 7.7 million households in America’s inner cities possess over $85 billion per year in retail spending power. This amounts to nearly 7% of total retail spending in the U.S.”
As urban communities grow rapidly, private investors need to renew their efforts to partner with proven inner-city investors, mentor emerging managers, and take a hard look at the rapidly changing demographics in our own communities, which are the economic drivers in our society.
Phil Angelides is President of Riverview Capital Investments and former California State Treasurer.
FEDERAL RESERVE BANK OF SAN FRANCISCO
Community Development INVESTMENT REVIEW84
An Overlooked Source of Emerging Domestic Market Capital:
Can Anyone Spell Escheats?�
Michael A. StegmanThe John D. and Catherine T. MacArthur Foundation
It was about four years ago that I first came across the idea that state unclaimed property funds might be a promising new source of public capital for making equity investments in companies located in or serving emerging domestic markets (EDM). Richard Moore, the newly elected state treasurer of North Carolina was scheduled to make brief remarks
at an inner-city economic forum that would follow presentations by two California public pension fund managers, who discussed the pitfalls and promises—and their early experiences, mostly positive—with their EDM investment programs. With North Carolina’s reputation for fiscal conservatism, the mood of the crowd was that if this progressive politician could convince a skeptical General Assembly to authorize the creation of an alternative investment program mirrored after those in California and New York, among others, this would not only be good for small, minority- and women-owned companies and EDMs in North Carolina, but, perhaps, motivate other southern and conservative states to follow suit.
But instead of joining the parade, Moore marched to a different tune. He suggested that rather than proponents of double bottom line investing trying to convince conservative legis-latures like his own to authorize their public pension system managers to create alternative investment programs, they should do what he was planning to do in North Carolina: look for other pots of nonappropriated money that lacked the fiduciary obligation associated with managing public pension funds. In North Carolina, Moore noted, the biggest overlooked pool of potential EDM investment capital was the state’s unclaimed and abandoned property, or escheat, fund, whose balance at the time of his remarks stood at nearly $550 million.
Technically, “escheat” is the “reversion of property to a governmental entity in the absence of legal claimants or heirs” (Florida Department of Financial Services, �005). In the American legal tradition, property rights are derived from state law, not federal law, which means that “each state defines what, when, where, and how property devolves to the state” (Testa, �004). North Carolina’s initial foray into escheat policies dates back more than two hundred years, when the North Carolina University Act of 1789 transferred abandoned property to the University of North Carolina (NC Department of the Treasurer, �00�). In
* This article is based on a September �00� unpublished paper by Michael A. Stegman and Aaron McKethan titled: “Escheat Funds: An Overlooked Source of Public Capital for Business Development in North Carolina,” which was based on research funded by the Rockefeller Foundation. The opinions expressed in this op-ed are those of the author, and not those of the John D. and Catherine T. MacArthur Foundation.
*
Community Development INVESTMENT REVIEW 85
FEDERAL RESERVE BANK OF SAN FRANCISCO
1970, North Carolina voters approved a constitutional amendment that assigned unclaimed property to a new Escheat Fund that would be overseen by the Office of the State Treasurer (Sanders, n.d.).
While unclaimed property reverts to the state upon evidencing proof of rightful owner-ship, individual claimants can regain ownership regardless of how long the property has remained in state hands. North Carolina has no statute of limitations when it comes to recovering unclaimed property, but from years of experience and accumulated data the Treasurer’s office has established expected reclaim and recovery rates, which help determine how liquid the fund needs to be to meet current and anticipated demands from claimants. Because escheat receipts are neither tax-generated nor subject to severe fiduciary obligations such as those associated with state pension funds, they are more flexible than most other state revenues. With a balance of $548 million in fiscal �004 and growing, North Carolina’s Escheat Fund thus represents a significant untapped resource that potentially could be put to effective use in promoting business development and wealth creation in underinvested regions of North Carolina.
Before discussing Moore’s successful strategy for opening up his state’s unclaimed prop-erty fund for possible EDM investments, it is important to place North Carolina’s escheat fund into a larger national context. A quick Internet search, for example, finds that since its inception in 1969, Minnesota’s escheat program has collected $3�6 million in unclaimed property, returning 44 percent to rightful owners, and had $184 million on hand at the end of fiscal �004 (Minnesota Department of Commerce, �004). At the same point, California’s escheat fund balance was $599 million (California State Controller’s Office, �005); Indi-ana’s was $�85 million (IndianaUnclaimed.com, �005), and Maryland’s was more than $�00 million (Comptroller of Maryland, �003). South Dakota took in $5 million in receipts in fiscal �005, which was significantly greater than the previous four-year average of $3.8 million (South Dakota Office of the State Treasurer, �005). Oregon takes in about $16 million a year in new, unclaimed property receipts while it returns about $4 million to owners (Oregon Department of State Lands, �004). Finally, if there was any question of the potential of unclaimed property receipts to contribute to important state priorities, Texas put an end to such doubt when it announced in October �003 that its unclaimed property-fund balance had topped $1 billion, while taking in an additional $71 million in gross receipts that year (Texas Comptroller of Public Accounts, �003).
Further explorations on the Web turned up other sources of significant unclaimed prop-erty funds. These funds may not necessarily find their way into a state’s escheat fund balance, but they potentially could be tapped as sources of EDM capital. When it comes to aban-doned property, even nickels and dimes add up, especially when the unclaimed property is bottles—as in soft drinks. According to www.containerrecycling.org, ten states collect some or all unclaimed bottle deposits. California, Massachusetts, and Michigan collect 100 percent of unclaimed bottle deposits, and Michigan collects 75 percent. “In �000, aban-doned deposits amounted to $84.7 million in New York, $�8.5 million in Massachusetts, and
FEDERAL RESERVE BANK OF SAN FRANCISCO
Community Development INVESTMENT REVIEW86
$�3.5 million in Michigan” (Container Recycling Institute, n.d.). Because fewer people are redeeming bottles than in the past, unclaimed deposits are rising, having increased in Massa-chusetts from $�0 million in 1997 to $31 million in �001. You can also bet that potential big new sources of significant unclaimed property are the dormant balances on bank cards whose owners cannot be located, as well as on stored value card balances on such things as phone and gift cards.
Identifying a source of public capital for potential EDM investing that is free from the fiduciary obligations that apply to pension fund managers is one thing; freeing it up for actual investing is quite another. This is because most public monies are already spoken for by one politically powerful constituency or interest or another. This was true in North Caro-lina and in other states as well, but this didn’t torpedo Richard Moore’s campaign—it just modified his and his legislative allies’ strategy.
Despite its theoretical flexibility, the state of North Carolina has imposed certain restric-tions on both the spending and investment sides of escheated receipts. Under the state constitution, all earnings and interest generated from escheat investments must be used for educational purposes—specifically “to aid worthy and needy students who are residents of this State and are enrolled in public institutions of higher education in this State” (North Carolina Constitution). Historically, the General Assembly has appropriated the annual earn-ings from Escheat Fund investments to the State Education Assistance Authority (SEAA), which administers postsecondary education programs of student financial assistance (North Carolina General Statutes, �001c). For the fiscal year ending June �004, the allocation to SEAA from escheat fund earnings was more than $36 million, an increase of 150 percent over five years earlier.1
Presumably like most others, the receipts and balances of the North Carolina Escheat Fund are invested in two primary portfolios: the Long- and Short-term Investment Funds (LTIF and STIF), both of which are pooled accounts holding surplus funds from various government operations, including the North Carolina state retirement system.� The LTIF holds fixed-income investments that are typically not needed to meet current obligations, generally defined as not being needed for between 1� and �4 months. Because the STIF serves as a cash management account, it is invested in shorter-term instruments that can be readily liquidated to meet current needs. Although their maturity profiles may vary, both escheat pools are conservatively invested in such low-risk instruments as U.S. Treasuries, Fannie Mae and Ginnie Mae mortgage-backed securities, other asset-backed debt, and corpo-rate bonds (North Carolina General Statutes, �001a).
1 The Treasurer does withhold from investment income an amount equal to projected expenses of the Escheat Fund. Thus, total transfers to SEAA equal total Escheat Fund investment income minus a small amount for Escheat Fund administration. In �004, the value of administrative expenses was $�.4 million.
� All investment performance data provided by Pam Wortham, Deputy Treasurer of the North Carolina Department of Treasury.
Community Development INVESTMENT REVIEW 87
FEDERAL RESERVE BANK OF SAN FRANCISCO
In �004, and again two years later, the Treasurer put forth a legislative proposal that would allow up to �0 percent of the Escheat Fund principal to be allocated to investments that had the potential to produce “long-term economic benefits to the State of North Carolina from the creation or retention of jobs, wages, tax revenues and other economic growth.3” Eligible investments would be economic-development-related debt and equity instruments, including limited partnerships in venture capital funds, business loans guaranteed by the U.S. Small Business Administration that were made to North Carolina companies, and letters of credit or similar debt or credit enhancements of commercial bank loans made to North Carolina businesses. Because this request applied to how escheat funds could be invested, and not to how earnings could be used, Moore’s proposal did not require a constitutional amendment.
Although the General Assembly took no action on the proposal during its �004–5 session, there seemed to be little organized opposition to it, so Moore tried again and succeeded in the following session. Although obviously not fatal, one of the reasons for its initial lack of success was that the contemporary concept of emerging domestic markets and double-bottom-line investing was tied up in obsolete notions of concessionary returns, social investing, an imbalance between risks and potential rewards, and in the rather uneven performance of so-called economically targeted investment programs (ETIs) that several state pension funds had mounted in the 1980s and early 1990s. Research suggests that the poorest performing ETI programs failed because pension fund managers had limited experience investing in this new asset class, and that these investments were perceived as having been undertaken more for social purposes than for earning risk-adjusted market rates of return (Daniels and Nixon �003; Gabrieli �004).
What is interesting was not so much the argument that EDM companies were potential engines of jobs and wealth in underinvested areas of the state that eventually won the day for Moore. Rather, it was a sense among education advocates in the General Assembly who saw rapidly escalating tuition costs at the state’s public colleges and universities, especially at the flagship Chapel Hill campus, as a major threat to upward mobility for the sons and daughters of factory workers and others who see a college education as a ticket to the middle class. This winning legislative strategy is reflected in the approved measure’s title: An Act to Establish a Modern Investment Program for the Prudent and Appropriate Management of the Escheat Fund, for the Benefit of “Needy and Worthy” Students as Provided for in the State Constitution (NC General Assembly, �005b). The second time around, a majority of the legislators supported Moore’s argument that a more modern investment strategy that included the option of allocating up to �0 percent of the Escheat Fund surplus in non-fixed-income securities (such as real estate, private equity, or public equity) can help grow both
3 “Changes needed to allow Escheat Fund investments that provide additional benefit of supporting the economic development and growth of North Carolina, including North Carolina-based businesses.” A document containing legislative changes to North Carolina General Statute 147-69.� (b) (11). Provided to authors by Andrew Silton, Office of NC Treasurer (November �004).
FEDERAL RESERVE BANK OF SAN FRANCISCO
Community Development INVESTMENT REVIEW88
North Carolina businesses and investment earnings—ultimately leaving “more money avail-able for tuition assistance” (Rice �004).
Passage of the measure was no doubt also aided by a positive assessment of the fiscal impact by the General Assembly’s Fiscal Research Division. The Legislative Fiscal Note accompanying Senate Bill 341 (NC General Assembly, �005a) estimated that shifting up to �0 percent of the excess Escheat Fund balance “should increase the average annual investment income over the long run, when compared to the annual return under the current portfolio.” “In theory,” continues the Note, “the increase in annual income should be around 10% . . . although the rise in yield [will also cause] a modest rise in the volatility of the annual return.”
How applicable is Richard Moore’s North Carolina experience compared to other states? I think quite applicable, for two reasons. First, according to the National Association of Escheat Administrators in �003, half of all states reporting data for the survey deposited escheat funds in their respective general fund, which means that there are no prior politically powerful claims on this capital except in a very general way on behalf of all taxpayers. In these states, it would be up to EDM proponents to forge effective coalitions and make their case.
In the thirteen states that deposit escheat funds in trust funds dedicated to a range of social programs, it would be necessary for EDM advocates to evaluate whether to compete with entrenched interests for a piece of the action, or to make a Richard Moore—type argu-ment that these states should reexamine their respective escheat-fund investment programs, in the expectation that by adopting more modern investment strategies they may be able to increase yields, and thus increase allocations to their priority social programs. The key point here is that this would not require any change to established allocation practices.
Michael A. Stegman, Ph.D., is the Director of Policy for the Program on Human and Community Development at the John D. and Catherine T. MacArthur Foundation. He serves as the Foundation’s lead observer of domestic policy issues, working to translate policy trends and position program strategies in affordable housing, community change, mental health, juvenile justice, education, and urban and regional policy within the larger context of local, state, and national policy developments.
ReferencesCalifornia State Controller’s Office. (�005). Comprehensive annual financial report (CAFR) year ended June 30, �004. Sacramento.
Comptroller of Maryland. (�003). Locating unclaimed property owners. Retrieved September 10, �005, from https://interactive.marylandtaxes.com/unclaim/default.asp.
Container Recycling Institute. (n.d.). The fate of unclaimed or “abandoned” deposits. Retrieved September 10, �005, from http://www.toolkit.container-recycling.org/GetTheFacts/other/unclaimed.htm.
Daniels, B. and J. H. Nixon. (�003). Making Markets Work for Inner City Revitalization,
Inner City Economic Forum, New York City, October 16, �003.
Fairchild, G. B. (no date). In Your Own Backyard: Investment Opportunities in Emerging Domestic Markets, Council of Urban Investors Institute.
Community Development INVESTMENT REVIEW 89
FEDERAL RESERVE BANK OF SAN FRANCISCO
Field, R. L. (1996). Forgotten but not gone: Escheatment of stored value cards. The Electric Banking Law and Commerce Report 1(�), 11–13.
Florida Department of Financial Services. (�005). Statewide financial statements (SWFS) year end reporting requirement #13. Retrieved September 10, �005 from http://www.fldfs.com/aadir/state-wide_financial_reporting/rules/rule13.pdf.
Gabrieli, C. (�004). Economically Targeted Investments: Key Success Factors. Retrieved March 30, �005, from: http://www.nast.net/�004.neast.naupa/Chris%�0Gabrieli%�0Economically%�0Targeted%�0Investing.ppt
IndianaUnclaimed.com (�005). Retrieved September 11, �005, from https://secure.in.gov/apps/ag/ucp/Minnesota Department of Commerce. (�004). Facts about unclaimed property. Retrieved September 10, �005, from http://www.state.mn.us/portal/mn/jsp/content.do?id=-536881373&subchannel=null&sc�=null&sc3=null&contentid=5368844�1&contenttype=EDITORIAL&programid=536884474&agency=Commerce.
North Carolina Department of the Treasurer. (�00�). Unclaimed property manual: A guide to the unclaimed property program in North Carolina. Retrieved September 10, �005, from https://www.treasurer.state.nc.us/NR/rdonlyres/FB�1C�78-1A69-41E5-868F-884F44F3AF�4/0/escman_pdf.pdf.
North Carolina Constitution. Article IX, Section 10.
North Carolina General Assembly. (�005a). Legislative Fiscal Note to Accompany Senate Bill 341.
North Carolina General Assembly. (�005b). Modern Escheat Investment Program, Senate Bill 341/S.L. �005-�5�, �005-�006 Cong.
North Carolina General Statutes. (n.d.). Escheats and Abandoned Property, G.S. 116B.
North Carolina General Statutes. (�001a). Investments Authorized for General Fund and Highway Funds Assets, G.S. 147-69.1.
North Carolina General Statutes. (�001b). North Carolina Global TransPark Authority: Powers of the Authority, G.S. 63A-4(a)(��).
North Carolina General Statutes. (�001c). State Education Assistance Authority, G.S. 116-�01.
Oregon Department of State Lands. (�004). Unclaimed property FAQs. Retrieved September 10, �005, from http://statelands.dsl.state.or.us/upabout.htm.
Rice, D. (�004). State finds a golden cache; senate taps escheats fund to use in budget. Winston-Salem Journal, �7 June, p. 1.
Sanders, J. (n.d.). Our constitutions: A historical perspective. Retrieved September 10, �005, from http://statelibrary.dcr.state.nc.us/nc/stgovt/preconst.htm.
South Dakota Office of the State Treasurer. (�005). Unclaimed property page. Retrieved September 10, �005, from http://www.sdtreasurer.com/default.asp?page=unclaimed_property_page.
Testa, A. J., Jr. (�004). Escheat: Financial statement considerations. Retrieved September 10, �005, from http://www.nysscpa.org/cpajournal/�004/804/essentials/p50.htm.
Texas Comptroller of Public Accounts. (�003). Unclaimed property fund hits $1 billion. Retrieved September 10, �005, from http://www.window.state.tx.us/news/31013up.html.
FEDERAL RESERVE BANK OF SAN FRANCISCO
Community Development INVESTMENT REVIEW90
Community Development INVESTMENT REVIEW
The Community Affairs Department of the Federal Reserve Bank of San Francisco created the Center for Community Development Invest-ments to research and disseminate best practices in providing capital to low- and moderate-income communities. Part of this mission is accomplished by publishing the Community Development Investment Review three times a year. The Review brings together experts to write about various community development investment topics including:
Finance—new tools, techniques, or approaches that increase the volume, lower the cost, lower the risk, or in any way make investments in low-income communities more attractive;
Collaborations—ways in which different groups can pool resources and expertise to address the capital needs of low-income communities;
Public Policy—analysis of how government and public policy influence community development finance options;
Best Practices—showcase innovative projects, people, or institutions that are improving the investment opportunities in low-income areas.
The goal of the Review is to bridge the gap between theory and practice and to enlist as many viewpoints as possible—government, nonprofits, financial institutions, and beneficiaries. As a leading economist in the community development field describes it, the Review provides “ideas for people who get things done.” For submission guidelines and themes of upcoming issues, visit our website: www.frbsf.org/cdinvestments. You may also contact David Erickson, Federal Reserve Bank of San Francisco, 101 Market Street, Mailstop 620, San Francisco, California, 94105-1530.
Center for Community Development InvestmentsFederal Reserve Bank of San Francisco
www.frbsf.org/cdinvestments
Advisory Committee
Frank Altman, Community Reinvestment Fund John Quigley, University of California, Berkeley
Jim Carr, Fannie Mae Foundation Benson Roberts, LISC
Andrew Kelman, Bank of America Securities Ruth Salzman, Ruth Salzman Consulting
Judd Levy, Community Development Trust Ellen Seidman, ShoreBank Corporation
Kirsten Moy, Aspen Institute Bob Taylor, Wells Fargo
Mark Pinsky, Opportunity Finance Network Kerwin Tesdell, Community Development Venture Capital Alliance
Center for Community Development Investments Staff
Joy Hoffmann, FRBSF Vice President John Olson, Senior Advisor(415) 974-2228 (415) 974-2989Joy.K.Hoffmann@ sf.frb.org [email protected] Scott Turner, Community Development Director David Erickson, Review Editor(415) 974-2722 (415) [email protected] [email protected]

Free subscriptions and additional copies are available upon request from the Community Development Department, Federal Reserve Bank of San Francisco, 101 Market Street, San Francisco, California 94105, or call (415) 974-3467.
Change-of-address and subscription cancellations should be sent directly to the Community Development Department. Please include the current mailing label as well as any new information.
The views expressed are not necessarily those of the Federal Reserve Bank of San Francisco or the Federal Reserve System. Material herein may be reprinted or abstracted as long as the Community Development Investment Review is credited.
Community Development INVESTMENT REVIEW


