Embed Size (px)
Citation preview

MATHEMATICAL BIOSCIENCES doi:10.3934/mbe.2009.xx.xxAND ENGINEERINGVolume xx, Number 0xx, xx 20xx pp. 1–xx
A MATHEMATICAL MODEL OF ACUTE INFLAMMATORY
RESPONSE TO ENDOTOXIN CHALLENGE
Anirban Roy
Department of Chemical and Petroleum Engineering; University of Pittsburgh1249 Benedum Hall; Pittsburgh, PA 15261, USA
Silvia Daun
Department of Mathematics; University of Pittsburgh
301 Thackeray Hall; Pittsburgh, PA 15261, USA
Gilles Clermont
Department of Critical Care Medicine; University of Pittsburgh Medical Center3550 Terrace Street; Pittsburgh, PA 15261
Jonathan Rubin
Department of Mathematics; University of Pittsburgh
301 Thackeray Hall; Pittsburgh, PA 15261, USA
Yoram Vodovotz
Department of Surgery; University of Pittsburgh Medical CenterW944 Biomedical Sciences Tower, Pittsburgh, PA 15213
Claudio Lagoa
Nationwide Children’s Hospital700 Children’s Dr; Columbus, OH 43205
Robert S. Parker
Department of Chemical and Petroleum Engineering; University of Pittsburgh1249 Benedum Hall; Pittsburgh, PA 15261, USA
Key words and phrases. Mathematical model, Inflammation, Cytokines, Sepsis.The first author is currently at Medtronic Diabetes, Northridge, CA.
1

2A. ROY, S. DAUN, G. CLERMONT, J. RUBIN, Y. VODOVOTZ, C. LAGOA, AND R. S. PARKER
Abstract. The body responds to endotoxins by triggering the acute inflam-matory response system to eliminate the threat posed by gram-negative bac-teria (endotoxin) and restore health. However, an uncontrolled inflammatoryresponse can lead to tissue damage, organ failure, and ultimately death; this
is clinically known as sepsis. Pro-inflammatory mediators (e.g., interleukin-6(IL − 6) and tumor necrosis factor (TNF )) up-regulate the inflammatory re-sponse, and anti-inflammatory mediators (e.g., interleukin-10 (IL−10)) down-regulate the inflammatory signals. In this work, an 8-state (8-D) differential
equation model of the acute inflammatory response system to endotoxin chal-lenge was developed. Endotoxin challenges at 3 and 12 mg/kg were admin-istered to rats, and dynamic cytokine data for IL-6, TNF, and IL-10 were
obtained and used to calibrate the model. Finally, model validation was per-formed by comparing the model predictions at an endotoxin challenge level of6 mg/kg with experimental data from rats at the same level. This 8-D modelsuccessfully captured the cytokine dynamics after perturbation with endotoxin
at various challenge levels, which indicates that the model may provide in-sight into the interactions between phagocytic cells and pro/anti-inflammatorymediators.
1. Introduction. The body generates an acute inflammatory response to acutebiological stress, such as bacterial infection or tissue trauma. This response consistsof a well orchestrated cascade of events mediated by several types of cells and effectormolecules; the desired outcome of this response is the containment and eliminationof invading pathogens and the repair of damaged tissues [1, 2]. Most of the time,the acute inflammatory response subsides and the body returns to a basal stateof health. However, an excessive inflammatory response can lead to tissue damage(rather than repair), organ dysfunction, or possibly death [11].
When initiated by infection, such an excessive response is clinically known assepsis, which is one of the leading causes of death in modern intensive care units[4, 5]. To control the inflammatory response, organisms have developed regula-tory mechanisms such as pro- and anti-inflammatory mediators. In general, thepro-inflammatory effectors (e.g., interleukin-6 (IL− 6) and tumor necrosis factor α(TNF (t))) up-regulate inflammation and control infections; the anti-inflammatoryelements (e.g., interleukin-10 (IL − 10)) down-regulate the inflammatory actions,ideally after infection control has been achieved [1]. Both types of mediators con-tribute to the initiation of tissue repair.
Our previous work focused on either low-order [6] phenomenological or high-complexity [7, 8, 9] models of the inflammatory response cascade. The latter in-crease biologic accuracy at the expense of possible parameter identifiability con-cerns, necessitating either significant data requirements or assumptions for mathe-matical structure and parameter values. In contrast, low-order models may over-simplify the biology, but formal mathematical analysis is facilitated by such struc-tures. Our previously-developed low-order model [6] consisted of an inflammatorystimulus (pathogen) and early-and-late pro-inflammatory mediators which captureda variety of clinically relevant scenarios, including return to health, sterile death(pathogen free), and septic death (pathogen overload). We later extended the modelby incorporating anti-inflammatory mediators, based on their value in restoringhealth and preventing sterile death [10]. Although these models provided insightinto key drivers of inflammatory response outcome, they were not calibrated to ex-perimental data. Hence, the existing low-order models provide little insight intoquantitatively precise approaches to altering inflammatory responses.
A MATHEMATICAL MODEL OF INFLAMMATORY RESPONSE 3
In this work, we synthesize an intermediate-scale model of acute inflammatoryresponse to endotoxin challenge and calibrate the model parameters to data fromrat studies. Major pro-inflammatory cytokines like IL6(t) and TNF (t), as wellas anti-inflammatory cytokines, like IL10(t) and CA(t) (a biologically-motivatedlumped surrogate representing slow acting anti-inflammatory mediators, such as theTransforming Growth Factor-β1 (TGF-β1) cytokine and cortisol) were incorporatedin the model. Similar to [10], a non-measurable tissue damage marker was alsoincluded in the model to quantify the tissue damage caused due to the endotoxinchallenge and activated phagocytic cells (N(t)). The primary objective of thiswork was to ground the intermediate inflammatory response model in experimentaldata, thereby providing a model that captures the dynamic blood concentrations ofthe major pro- and anti-inflammatory cytokines resulting from introduction of anendotoxin challenge (P (t)) in rats.
2. Materials and Methods.
2.1. Experimental Data. Experiments on three cohorts of Sprague-Dawley ratswere performed according to an IACUC-approved protocol at the University ofPittsburgh, Department of Surgery, to study the acute inflammatory response toendotoxin insults at various dose levels. Rats weighed approximately 200 g, andrats received endotoxin (Escherichia Coli) at dose levels of either 3, 6, or 12 mg/kg,intraperitoneally. Blood samples were collected when rats were sacrificed at 0, 1, 2,4, 8, 12, and 24 hr after endotoxin administration (4 rats sacrificed per time pointper endotoxin dose level). Concentrations of IL6, IL10, and TNF were measuredin triplicate using commercially available ELISA kits (R & D Systems, Minneapolis,MN).
2.2. Mathematical Model of Acute Inflammation. The acute inflammationmodel consists of eight ordinary differential equations (ODEs). The dependentvariables used in the model include: endotoxin concentration (P (t)); total num-ber of activated phagocytic cells (N(t)), which includes all the activated immuneresponse cells (such as neutrophils, monocytes, etc.); a non-accessible tissue dam-age marker (D(t)); concentrations of pro-inflammatory cytokines IL-6 (IL6(t)) andtumor necrosis factor (TNF (t)); concentration of the anti-inflammatory cytokineIL-10 (IL10(t)); a tissue damage driven non-accessible IL-10 promoter (YIL10(t));and a non-accessible state representing slow acting anti-inflammatory mediators(CA(t)).
A schematic diagram of the model capturing all the major interactions betweenthe eight states is shown in Figure 1. Introduction of P (t) into the system activatesN(t). Once activated, N(t) up-regulates production/release of all the inflammatorymediators (TNF (t), IL6(t), IL10(t), and CA(t)) [12]. The pro-inflammatory cy-tokines have a positive feedback on the system; thereby, they further activate N ,and up-regulate other cytokines [12, 14]. On the other hand, the anti-inflammatorycytokine and mediators have a negative feedback on the system. Hence, IL10(t) andCA(t) inhibit the activation of N(t) and up-regulation of other cytokines [15, 16].The model also incorporates tissue damage due to activated phagocytic cells, rep-resented by a damage marker, D(t). Tissue damage further up-regulates activationof N(t) [18] and also contributes to up-regulation of IL10(t) [19, 20].
The endotoxin insult injected intraperitoneally in the rats is a bolus administra-tion, which initiates the inflammatory cascade. The ODE describing the dynamics

4A. ROY, S. DAUN, G. CLERMONT, J. RUBIN, Y. VODOVOTZ, C. LAGOA, AND R. S. PARKER
of P (t) can be written as:
dP (t)
dt= −dP · P (t) (1)
P (t) decays exponentially with a rate equal to dP . The decay rate was fixed at3 hr−1, which is consistent with the values obtained from published literature [3,24, 25]. The initial conditions (t = 0) for Eq. (1) are either 3, 6, or 12 mg/kgdepending on the endotoxin dose level.
P
DN
IL-6
IL-10
CA
Down-regulate
Up-regulate
TNF-α
Figure 1. Schematic diagram of inflammatory response systemchallenged by endotoxin

A MATHEMATICAL MODEL OF INFLAMMATORY RESPONSE 5
Resting phagocytic cells are activated by the presence of endotoxin in the system.The equations representing activation of N(t) can be mathematically written as:
dN(t)
dt= kN ·
R(t)
xN + R(t)− dN · N(t) (2)
R(t) = [kNP · P (t) + kND · D(t)] · [(1 + kNTNF · fUPNTNF (t))
·(1 + kNIL6 · fUPNIL6(t))] · fDNNCA(t) · fDNNIL10(t) (3)
fUPNTNF (t) =TNF (t)
xNTNF + TNF (t)(4)
fUPNIL6(t) =IL6(t)
xNIL6 + IL6(t)(5)
fDNNCA(t) =xNCA
xNCA + CA(t)(6)
fDNNIL10(t) =xNIL10
xNIL10 + IL10(t)(7)
Here, Eq. (2) represents the total number of activated phagocytic cells (N(t)). Pa-rameters kN and dN represent the rate of activation and elimination of N(t), respec-tively. Activation of N(t) is driven by P (t) and D(t), through R(t), as shown in Eq.(3). Throughout this work, functions with nomenclature fUPij(t) and fDNij(t)represent up-regulating (UP ) and down-regulating (DN) effects of inflammatorymediator j on mediator i. These up- or down-regulating functions are dimension-less and bounded, having values between 0 and 1. Functions, fUPNTNF (t) andfUPNIL6(t) indicate the up-regulating effects of TNF (t) and IL6(t) on N(t), re-spectively. Both these functions are Michaelis-Menten type equations, as shown inEq. (4) and (5). As the concentrations increase, the values of the up-regulatingfunctions also increase, approaching 1 asymptotically. Gain parameters kNTNF andkNIL6 scale the up-regulating functions fUPNTNF (t) and fUPNIL6(t) to capturethe appropriate effects on N(t), respectively. The inhibitory effects of CA(t) andIL10(t) are captured by the down-regulating functions fDNNCA(t) and fDNNIL10(t),respectively. Here, as the variables increase, the values of the functions decrease, ap-proaching 0 asymptotically (see Eq. (6) and (7)). Parameters xN , xNTNF , xNIL6,xCA, and xNIL10 are the half-saturation constants determining the concentrationlevel of the variables at which the corresponding up-regulating or down-regulatingfunction will reach half of its saturation point. The initial condition (t = 0) for Eq.(2) is N(0) = 0.
The tissue damage caused by the inflammatory response to endotoxin challengeis modeled as follows:
dD(t)
dt= kD ·
N(t)6
x6D + N(t)6
− dD · D(t) (8)
Parameters kD and dD represent the rate of generation and the rate of elimination ofthe non-measurable tissue damage marker, D(t). Elevated D(t) further contributesto the activation of N(t) (3) [18] and production of IL10(t) [19, 20]. Parameter xD
is the half-saturation constant. A 6th-order Hill function was utilized in order toaccurately capture the data. Further explanation regarding the choice of the Hillfunction coefficient is provided in Section 3.3. The initial condition (t = 0) for Eq.(8) is D(0) = 0.
The anti-inflammatory moderator, CA(t), represents a combination of variousinflammation inhibitory mediators, including the cytokine Transforming Growth

6A. ROY, S. DAUN, G. CLERMONT, J. RUBIN, Y. VODOVOTZ, C. LAGOA, AND R. S. PARKER
Factor-β1 (TGF-β1) and cortisol. The CA(t) equation is written as:
dCA(t)
dt= kCA · N(t) − dCA · CA(t) + sCA (9)
Parameters kCA and dCA represent the rate of CA(t) production/secretion andclearance, respectively. At basal conditions, the system is assumed to be slightlyanti-inflammatory. This was achieved by introducing a constant, sCA, into theODE. Hence, at t = 0 and N(0) = 0, CA(0) = sCA
dCA.
The dynamics of IL-6, which is predominantly considered a pro-inflammatorymediator, can be mathematically written as:
dIL6(t)
dt= kIL6 ·
(
N(t)4
x4IL6 + N(t)4
)
· [1 + kIL6TNF · fUPIL6TNF (t)
+kIL6IL6 · fUPIL6IL6(t)] · fDNIL6IL10(t) · fDNIL6CA
−dIL6 · IL6(t) (10)
fUPIL6TNF (t) =TNF (t)
xIL6TNF + TNF (t)(11)
fUPIL6IL6(t) =IL6(t)
xIL6IL6 + IL6(t)(12)
fDNIL6IL10(t) =xIL6IL10
xIL6IL10 + IL10(t)(13)
fDNIL6CA(t) =xIL6CA
xIL6CA + CA(t)(14)
The up-regulation of IL6(t) production is governed by the activated N(t). Pro-duction of IL6(t) is further up-regulated by the presence of elevated TNF (t) andIL6(t) itself, and this is captured by the up-regulating functions fUPIL6TNF andfUPIL6IL6(t), respectively. The inhibitory effects of the anti-inflammatory cy-tokines were captured by the down-regulating functions fDNIL6IL10(t) andfDNIL6CA(t), respectively. The clearance rate of IL6(t) is represented by the pa-rameter dIL6(t). Once again, Section 3.3 further explains the selection of the Hillfunction coefficient. Parameters xIL6, xIL6TNF , xIL6IL6, xIL6CA, and xIL6IL10 arethe half-saturation constants. The initial condition (t = 0) for Eq. (10) is IL6(0)= 0.
Pro-inflammatory TNF-α concentration can be represented by the followingequations:
dTNF (t)
dt= kTNF · N(t)1.5 · [1 + kTNFTNF · fUPTNFTNF (t)]
·fDNTNFCA(t) · fDNTNFIL10 · fDNTNFIL6
−dTNF · TNF (t) (15)
fUPTNFTNF (t) =TNF (t)
xTNFTNF + TNF (t)(16)
fDNTNFCA(t) =x6
TNFCA
x6TNFCA + CA(t)6
(17)
fDNTNFIL10(t) =xTNFIL10
xTNFIL10 + IL10(t)(18)
fDNTNFIL6(t) =xTNFIL6
xTNFIL6 + IL6(t)(19)

A MATHEMATICAL MODEL OF INFLAMMATORY RESPONSE 7
The rate of production of TNF (t) due to activation of N(t) is governed by theparameter kTNF , and the rate of clearance of TNF (t) is represented by the pa-rameter dTNF . A power of 1.5 was assigned to N(t) instead of a Michaelis-Mentenor Hill type expression in order to capture the rapid production and elimination ofTNF (t). Further justification for the proposed TNF (t)-state (Eq. (15)) is providedin Section 3.3. The function fUPTNFTNF (t) represents the up-regulating effect ofTNF (t) on its own production. The functions fDNTNFCA(t), fDNTNFIL10(t)and fDNTNFIL6(t) represent the inhibitory effect of anti-inflammatory cytokinesCA(t), IL10(t), and pro-inflammatory cytokine IL6(t) (which in some instances,such as this, acts as an anti-inflammatory mediator [21]), respectively. ParametersxTNFTNF , xTNFCA, xTNFIL10, and xTNFIL6 are the half-saturation constants. A6th-order Hill function for fDNTNFCA(t) modeled the rapid suppression of CA onthe TNF (t) dynamics. The initial condition (t = 0) for Eq. (15) is TNF (0) = 0.
The dynamics of IL10(t), which is a strong anti-inflammatory cytokine, can berepresented by the following equations:
dIL10(t)
dt= kIL10 ·
(
N(t)3
x3IL10 + N(t)3
)
· [1 + kIL10IL6 · fUPIL10IL6(t)
+kIL10TNF · fUPIL10TNF (t)] − dIL10 · fDNIL10d(t) · IL10(t)
+YIL10(t) + sIL10 (20)
dYIL10(t)
dt= kIL102 ·
D(t)4
x4IL102 + D(t)4
− dIL102 · YIL10(t) (21)
fUPIL10IL6(t) =IL6(t)4
x4IL10IL6 + IL6(t)4
(22)
fUPIL10TNF (t) =TNF (t)
xIL10TNF + TNF (t)(23)
fDNIL10d(t) =xIL10d
xIL10d + IL10(t)(24)
Here, Eq. (20) captures the circulating IL10(t) levels. Unlike the other measuredcytokines, the IL10(t) dynamics demonstrate two distinct peaks separated by ap-proximately 4 to 6 hr when perturbed by endotoxin challenge. The first surgeof IL10(t) production is predominantly attributed to N(t), which is captured bya 3rd-order Hill equation multiplied by the parameter kIL10 (first RHS term ofEq. (20)). Production of IL10(t) is further up-regulated by the presence of ele-vated pro-inflammatory cytokines like IL6(t) and TNF (t), which are representedby the up-regulation functions fUPIL10IL6(t) and fUPIL10TNF (t), respectively.The production of IL10(t) in the basal state is represented by the constant sIL10
(as observed in experimental data). Hence, at t = 0 and N(0) = 0, IL10(0) =sIL10·xIL10d
(dIL10·xIL10d−sIL10). It has been shown in a previous study that the rate of elimina-
tion of IL10(t) is inversely proportional to the circulating concentration of IL10(t)[22]. This phenomenon is captured by a down-regulating function, fDNIL10d(t),coupled with the parameter dIL10, as shown in Eq. (20). Further discussion of theEq. (20) structure is presented in Section 3.3.
The second surge in IL10(t) production is attributed to tissue damage D(t) [19,20], and the dynamics of this D-induced effect are captured by the variable YIL10(t)in Eq. (20). The dynamics of YIL10(t) are represented by the ODE (21); here therate of production of YIL10(t) is represented by the parameter kIL102 coupled witha 4th-order Hill equation (first term in RHS of Eq. (21)), which is driven by D(t).

8A. ROY, S. DAUN, G. CLERMONT, J. RUBIN, Y. VODOVOTZ, C. LAGOA, AND R. S. PARKER
Once again, this is data-motivated (see the further discussion in Section 3.3). Therate of elimination of YIL10(t) is given by parameter dIL102. Parameters xIL10,xIL102, xIL6IL10, xIL10TNF , and xIL10d are the half-saturation constants.
2.3. Parameter Estimation Technique. Some parameters in the model werespecified. The clearance rate of endotoxin (P (t)) captured by the parameter dP inEq. (1) was obtained from the literature [24, 25]. Parameters (sCA) and (sIL10)from Eqs. (9) and (20) were extracted directly from the experimental data, respec-tively. The rest of the model parameters were estimated by fitting the rat data ofthe cytokines IL6, TNF , and IL10 at endotoxin dose challenge levels of 3 and 12mg/kg, simultaneously.
Inflammation model parameters were estimated using the nonlinear least-squarestechnique as described in [26]. The normalized residual is obtained as:
χ2 ≡
QP∑
i=1
[
yi − y(ti, θ1...θM )
σi
]2
(25)
Here, yi is the measured data at time ti, which has a standard deviation of σi. Themodel prediction is given by y(ti, θ1...θM ), where θj represent model parameters.Eq. (25) is the objective of a weighted minimization having ( 1
σi)2 as the weights
and θj as the degrees of freedom. QP is the total number of data points and M isthe total number of model parameters. Parameter optimization was performed byusing the fminsearch.m function from the MATLAB Optimization Toolbox ( c©2008The Mathworks Inc., Natick, MA).
Model validation was accomplished by fixing the estimated parameters and sim-ulating the model at an intermediate dose level of 6 mg/kg. Values of inflammationmodel parameters are provided in Table 1.
2.4. Akaike’s Information Criterion (AIC). AIC [27] was employed to estab-lish a quantitative comparison between the proposed inflammation model structureand candidate simplifications. When comparing two models containing differentvalues of M , the model with the lower AIC value is preferred. The value of AICcan be calculated from the following equation [27]:
AIC = QP ln
(
χ2
QP
)
+ 2M (26)
The criterion may be minimized over choices of M (the number of model parameters)to yield a trade-off between the quality of fit of the model, which lowers the sumsquared error (χ2 from Eq. (25)), and the model’s complexity, which is measuredby M .
2.5. Parametric Sensitivity by Finite Difference Method. The model pa-rameters in equations (1)-(24), will vary in their effect on state and output dynam-ics as a function of operating state and time. Sensitivity analysis, as calculated byfinite difference [28, 29], is employed to identify the model parameters that havesignificant impact on model predictions. Though local, this knowledge can be usedto inform the design of future experiments for elucidating model dynamics and pa-rameter values. A drawback of finite difference-based sensitivity analysis is that theinformation is not global, but the constrained nature of the parameter region (pa-rameter estimates will not change sign) makes global analysis highly conservativeand beyond the scope of the present study.

A MATHEMATICAL MODEL OF INFLAMMATORY RESPONSE 9
Table 1. Parameters of the inflammation model.
No. Parameter Value Unit No. Parameter Value Unit
1 dp 3 hr−1 24 xIL6IL10 1.1818 pgmL
2 kN 5.5786e7 hr−1 25 kIL6IL6 122.92 –
3 xN 14.177 N − unit 26 xIL6IL6 1.987e5 pgmL
4 dN 0.1599 hr−1 27 xIL6CA 4.2352 pgmL
5 kNP 41.267 N−unit·kgmg
28 kTNF 3.9e-8 pg
mL·N−unit1.5
6 kND 0.013259 N−unitD−unit
29 dTNF 2.035 hr−1
7 xNTNF 1693.9509 pgmL
30 xTNFIL10 2.2198e7 pgmL
8 xNIL6 58080.742 pgmL
31 xTNFCA 0.19342 pgmL
9 xNCA 0.07212 pgmL
32 kTNFTNF 1.0e-10 –
10 xNIL10 147.68 pgmL
33 xTNFTNF 9.2969e6 pgmL
11 kNTNF 12.94907 – 34 xTNFIL6 55610 pgmL
12 kNIL6 2.71246 – 35 kIL10TNF 2.9951e-5 –
13 kD 2.5247 D−unithr
36 xIL10TNF 1.1964e6 pgmL
14 dD 0.37871 hr−1 37 kIL10IL6 4.1829 –15 xD 1.8996e7 N − unit 38 xIL10IL6 26851 pg
mL
16 kCA .154625e-8 pgmL·hr·N−unit
39 kIL10 1.3374e5 pgmL·hr
17 dCA .31777e-1 hr−1 40 dIL10 98.932 hr−1
18 sCA 0.004 pgmL·hr
41 xIL10 8.0506e7 N − unit
19 kIL6TNF 4.4651 – 42 sIL10 1187.2 pgmL·hr
20 xIL6TNF 1211.3 pgmL
43 xIL10d 791.27 pgmL
21 kIL6 9.0425e7 pgmL·hr
44 kIL102 1.3964e7 YIL10−Unit
hr
22 dIL6 0.43605 hr−1 45 dIL102 0.0224 hr−1
23 xIL6 1.7856e8 N − unit 46 xIL102 37.454 D − unit
The inflammation model can be expressed as a set of Qx differential equationswith Qx states (x) and M parameters (θ). The Qx by M parameter sensitivitymatrix can be calculated by using the finite difference approximation method, inwhich the sensitivity coefficients (si,j) are calculated from the difference of nominaland perturbed solutions [28, 29], as follows:
si,j(t) =∂xi(t)
∂θj
=xi(θj + ∆θj , t) − xi(θj , t)
∆θj
(27)
where, i ∈ [1, Qx], j ∈ [1, M ].To facilitate direct comparison of responses across different parameters, normal-
ized sensitivity coefficients (si,j(t)) are calculated [28]:
si,j(t) =∂xi(t)
∂θj
·θj
xi
(28)
For the evaluation of dynamic sensitivity, an L2-norm operation is performed tocalculate the relative sensitivity (RS) aggregated over time. RS can be mathemat-ically expressed as:
RSi,j =1
QT
√
√
√
√
QT∑
k=1
|si,j(tk)|2 (29)
Here, tk (k ∈ [1, QT ]) are the times when a sample was collected, and QT is thenumber of sample points observed for a given entity (e.g., IL6(t), TNF (t), etc.).

10A. ROY, S. DAUN, G. CLERMONT, J. RUBIN, Y. VODOVOTZ, C. LAGOA, AND R. S. PARKER
3. Results.
3.1. Parameter Estimation. Simulation studies of the inflammatory responsewere performed at endotoxin challenge levels of 3 and 12 mg/kg. The diffusion rateof P (t) (endotoxin) into the blood stream was very rapid from the intraperitonealadministration site [23]. Hence, the endotoxin challenge was modeled as an impulse,and P (t) was modeled as a first-order ordinary differential equation with an impulseinput as shown in Figure 2 (a). A fast clearance rate of P (t) (dP = 3 hr−1 [24, 25])caused circulating endotoxin levels to approach zero at approximately 2 hr.
0 2 40
3
6
9
12
P (
mg/
kg)
0 10 200
2
4
x 107
N (
Cel
l Cou
nt)
0 10 200
2
4
Time (Hr)
D
0 10 200
0.2
0.4
Time (Hr)
CA (
pg/m
L)a b
c d
Figure 2. Simulation results of inflammation model response toendotoxin challenge level of 3 (solid line) and 12 (dashed line)mg/kg. The absicca of the top left plot (a) is set at a differenttime range (0 to 4 hr) than the other plots (0 to 25 hr).
The endotoxin bolus rapidly activates phagocytic cells, as shown in Figure 2(b). The total cell count, N(t), peaked at t=1.6 hr for both endotoxin dose levels.Activation of N(t) caused tissue damage, which is quantified by a unitless tissuedamage marker, as shown in Figure 2 (c). Up-regulation of anti-inflammatorymoderators, CA(t), as shown in Figure 2 (d), was also a result of N(t).
As an important part of the inflammatory cascade initiated by the endotoxinchallenge, the production of IL6(t) was up-regulated by N(t), as shown by thesolid lines in Figure 3. The IL6(t) concentration was at its basal level until thefirst hour post endotoxin challenge. After the initial delay, IL6(t) concentrationincreased rapidly and peaked at approximately 4 hr for both challenge levels. Themodel prediction of IL6(t) at both challenge levels fit the data well.

A MATHEMATICAL MODEL OF INFLAMMATORY RESPONSE 11
0 5 10 15 20 250
5000
10000
IL6
(pg/
mL)
Endotoxin dose: 3 (mg/kg)
0 5 10 15 20 250
5000
10000
15000
Time (Hr)
IL6
(pg/
mL)
Endotoxin dose: 12 (mg/kg)
Figure 3. Model simulation comparison of IL-6 between the pro-posed model Eq. (10) (solid line) and its alternate versions, AV-1,Eq. (30) (dashed line) and, AV-2, Eq. (31) (dotted line) againstexperimental data (circle) (mean ± SD) in response to endotoxinchallenge of 3 mg/kg (top) and 12 mg/kg (bottom).
Production of TNF (t) was up-regulated due to the endotoxin insult. Blood con-centration of TNF (t) increased steeply almost immediately after the introductionof the endotoxin challenge, as shown by the solid lines in Figure 4. After peaking atapproximately 2 hr for both the challenge levels, TNF (t) concentration decreasedrapidly to its basal level, unlike the other measured cytokines. The model predic-tions of TNF (t) concentration are consistent with the experimental data and arewithin one standard deviation (SD) of the mean measurement at all time points.
Production of the anti-inflammatory cytokine IL10(t) was also up-regulated bythe endotoxin challenge. The dynamics of IL10(t) involved more dynamic featuresthan the other measured cytokines. The solid lines in Figure 5 show that the IL10(t)concentration at both challenge levels had two distinct peaks. The initial productionof IL10(t) was mostly up-regulated by N(t), which peaked at approximately 2hr for both the challenge levels. The latter peak was driven by D(t) and wascaptured by introducing Eq. (21) in the model. The model predictions of IL10(t)are consistently within one SD of the data, as shown by the solid lines in Figure 5.
3.2. Model Validation. Once all the parameters of the inflammation model wereestimated from the 3 and 12 mg/kg endotoxin challenge data (nominal values areshown in Table 1), the model predictions were validated by comparing model sim-ulations with available data at a 6 mg/kg endotoxin challenge level. Parameter

12A. ROY, S. DAUN, G. CLERMONT, J. RUBIN, Y. VODOVOTZ, C. LAGOA, AND R. S. PARKER
0 5 10 15 20 250
1000
2000
TN
F (
pg/m
L)
Endotoxin dose: 3 mg/kg
0 5 10 15 20 250
1000
2000
3000
Time (Hr)
TN
F (
pg/m
L)
Endotoxin dose: 12 mg/kg
Figure 4. Model simulation comparison of TNF-α between theproposed model Eq. (15) (solid line), AV-3 Eq. (32) (dashed line),and AV-4 Eq. (33) (dotted line) against experimental data (circle)(mean ± SD) in response to endotoxin challenge of 3 mg/kg (top)and 12 mg/kg (bottom).
values were not changed in the validation simulations. Comparison between modelpredictions and experimental data of IL6(t), TNF (t), and IL10(t) at an endotoxinlevel of 6 mg/kg are shown in Figure 7.
In general, the model predictions of the measured cytokines were consistent withthe experimental data. It can be observed that, in the case of TNF (t) concentration(Figure 7: middle), the data collected at 1 hr is inconsistent with samples collectedat the same time point for endotoxin dose levels of 3 and 12 mg/kg. Hence, themodel over-predicts TNF (t) at the 1 hr time point. For further evaluation, the 6mg/kg endotoxin experiment should be repeated to (in)validate the first hour mea-surement. The model also over-predicts IL10(t) concentration at the last samplingpoint (t = 24 hr) as shown in Figure 7 (bottom); further refinement of the modelif the 6 mg/kg data set were employed would focus on reducing the peak shift inIL10(t) at lower challenge doses.
3.3. Model Structure Justification. AIC, as described in Section 3.1, is a widelyused statistical method for quantifying the trade-off between model fit and modelcomplexity, as measured by the total number of parameters. While modeling bi-ological systems where a limited number of measured data points are available,

A MATHEMATICAL MODEL OF INFLAMMATORY RESPONSE 13
0 5 10 15 20 250
100
200
IL10
(pg
/mL)
Endotoxin dose: 3 mg/kg
0 5 10 15 20 250
200
400
600
800
Time (Hr)
IL10
(pg
/mL)
Endotoxin dose: 12 mg/kg
Figure 5. Model simulation comparison of IL-10 between the pro-posed model, Eq. (20), (solid line), AV-5 Eq. (34) (dashed line),and AV-6 Eq. (35) (dotted line) against experimental data (circle)(mean ± SD) in response to endotoxin challenge of 3 mg/kg (top)and 12 mg/kg (bottom).
over-fitting, over-parameterization, and the introduction of under-justified nonlin-earities are significant concerns. Parameter identifiability (a priori), estimationquality, and model uniqueness must be addressed when complex models are de-veloped from small data sets. In contrast, compact low parameter count modelsmay be structurally identifiable a priori, but they may also yield poor predictiveaccuracy as measured by model fit (e.g., (weighted) least-squares error). Hence, abalance should be reached in terms of model complexity and accuracy, and AICprovides such a balancing metric.
In modeling IL6(t) with Eq. (10), a 4th-order Hill function (N(t)4/(x4IL6 +
N(t)4)) was introduced to capture the one hour delay in IL6(t) response to endo-toxin challenge. The inclusion of this function was necessary to capture the dataaccurately (where accuracy is quantitated using Eq. (25)). Addition of this nonlin-earity increased the model complexity by one parameter (xIL6) versus a linear-in-N(t) version of Eq. (10) without a Hill function, which can be written as:
dIL6(t)
dt= kIL6 · N(t) · [1 + kIL6TNF · fUPIL6TNF (t) + kIL6IL6 · fUPIL6IL6(t)]
fDNIL6IL10(t) · fDNIL6CA − dIL6 · IL6(t) (30)
14A. ROY, S. DAUN, G. CLERMONT, J. RUBIN, Y. VODOVOTZ, C. LAGOA, AND R. S. PARKER
0 5 10 15 20 250
10000
IL6
(pg/
mL)
0 5 10 15 20 250
2000
4000
TN
F (
pg/m
L)
0 5 10 15 20 250
200
400
Time (Hr)
IL10
(pg
/mL)
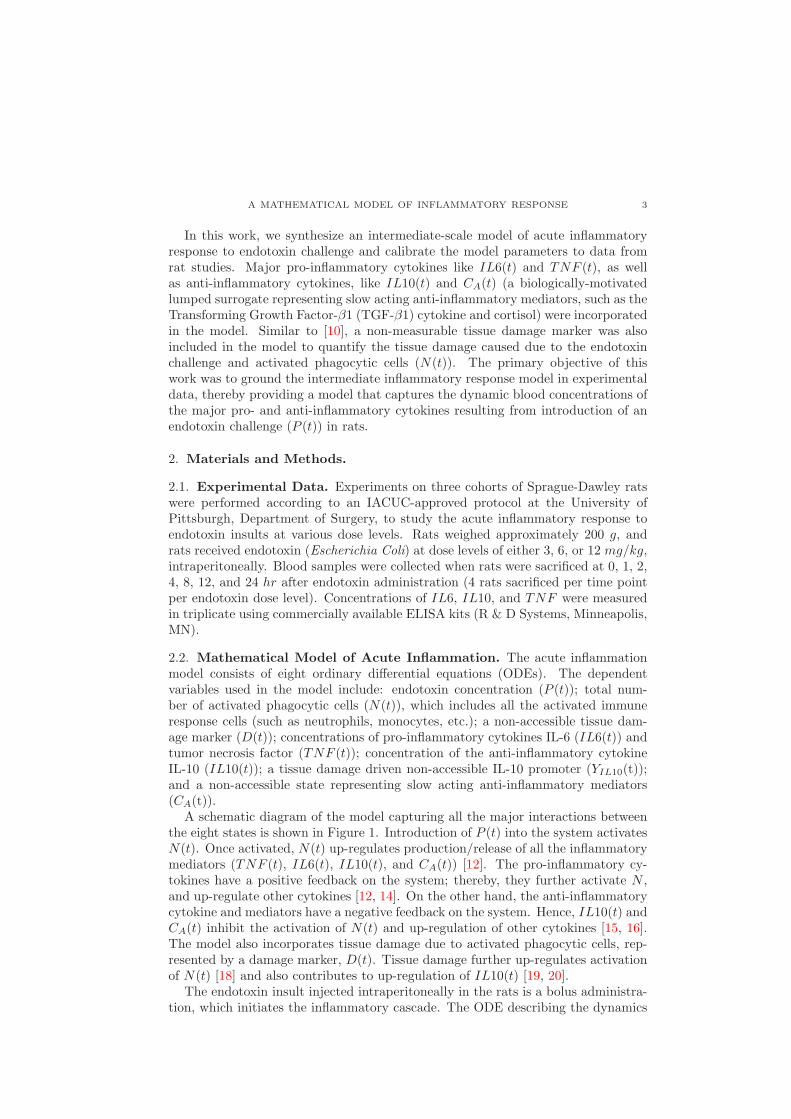
Figure 6. Model validation simulation (solid line) of IL-6 (top),TNF-α (middle), and IL-10 (bottom) versus experimental data (cir-cle) (mean ± SD) in response to endotoxin challenge of 6 mg/kg.
A comparison of IL6(t) predictions from the proposed model (solid line) and analternate version of the model, AV-1, is provided as the dashed line in Figure 3.Calculated AIC values of both models are given in Table 2. It is clear from the AICvalues and the Figure that the nonlinear model is superior to the linear-in-N(t)version.
Furthermore, any Hill function with order < 4 in the IL6(t) state compromisedthe model accuracy. The IL6(t) state with a 3rd-order Hill function can be writtenas:
dIL6(t)
dt= kIL6 ·
(
N(t)3
x3IL6 + N(t)3
)
· [1 + kIL6TNF · fUPIL6TNF (t)
+kIL6IL6 · fUPIL6IL6(t)] · fDNIL6IL10(t) · fDNIL6CA
−dIL6 · IL6(t) (31)
The prediction for model AV-2, in Eq. (31), is provided as the dotted line in Figure3. Once again, from Table 2 it is evident that the AIC value indicates the superiorityof the proposed model over AV-2.
The rapid rise and fall of TNF (t) necessitated the use of two nonlinear termsto capture the dynamic profile. This was primarily captured by assigning the N(t)forcing term a power of 1.5. A second effect included was a 6th-order Hill func-tion for fDNTNFCA(t) in Eq. (17) to rapidly suppress the TNF (t) levels after achallenge. Any order lower than 6 compromised the model accuracy for TNF (t)

A MATHEMATICAL MODEL OF INFLAMMATORY RESPONSE 15
production, particularly after the 2 hr time point. For comparison, a simplifiedversion (eliminating the N(t) nonlinearity) of Eq. (15) can be written as (AV-3):
dTNF (t)
dt= kTNF · N(t) · [1 + kTNFTNF · fUPTNFTNF (t)]
fDNTNFCA(t) · fDNTNFIL10 · fDNTNFIL6
−dTNF · TNF (t) (32)
The TNF (t) predictions from the proposed model (solid line) and AV-3 (dashedline) are provided in Figure 4. It is evident that the TNF (t) dynamics predicted byAV-3 are not as rapid as that observed in the experimental data. For structural con-sistency, another version of the TNF (t)-state with a Michaelis-Menten expressionwas formulated as follows (AV-4):
dTNF (t)
dt= kTNF ·
(
N(t)
xTNF + N(t)
)
· [1 + kTNFTNF · fUPTNFTNF (t)]
fDNTNFCA(t) · fDNTNFIL10 · fDNTNFIL6
−dTNF · TNF (t) (33)
The model prediction from AV-4 (dotted line) is also presented in Figure 4. Onceagain, it is clear that a Michaelis-Menten formulation, which added an extra pa-rameter (xTNF ), is inadequate to capture the fast dynamics of TNF (t) accurately.The calculated AIC values from Table 2 reveal that the proposed model is superiorto the two alternate model structures.
The dynamic profile of IL-10 response to the endotoxin challenge justifies furthernonlinear terms in the model. The 2-hour data point mean value for the 12 mg/kgchallenge is 3.6 times higher than that for the 3 mg/kg challenge. To capturethis nonlinear scaling, a 3rd-order Hill function (N(t)3/(x3
IL10 + N(t)3)) was used,as shown in Eq. (20). While the inclusion of this nonlinearity added an extraparameter (xIL10), comparison with simpler models demonstrates its need. Analternate linear (in terms of N(t)) version of the IL10-state can be written asfollows (AV-5):
dIL10(t)
dt= kIL10 · N(t) · [1 + kIL10IL6 · fUPIL10IL6(t)
+kIL10TNF · fUPIL10TNF (t)] − dIL10 · fDNIL10d(t) · IL10(t)
+YIL10(t) + sIL10 (34)
This reduced the model complexity by one parameter (xIL10). A comparison of themodel predictions from the proposed model (solid lines) and the alternate version(dashed lines) is provided in Figure 5. It is clear that AV-5 is unable to capture thenonlinearities that exist in the IL10(t) dynamics between endotoxin dose levels of3 and 12 mg/kg, especially during the first peak.
IL-10 dynamics after the initial peak, are affected by IL6(t). A 4th-order Hillfunction for the fUPIL10IL6(t) dynamics (Eq. (22)) was necessary to delay theeffects of IL6(t) on IL10(t), as any lower-order Hill expression resulted in a fasterelimination of IL10(t) after reaching the first peak thus causing the model to under-predict the IL10(t) dynamics at the 4 hr time point.
The tissue damage-mediated second surge of IL-10 concentration required theuse of a 6th-order Hill function (N(t)n/(xn
D +N(t)n), where n = 6) in Eq. (8). Thehigher-order Hill function was necessary to accurately capture the second peak inthe IL10(t) concentration, which occurred after an initial decrease as observed at

16A. ROY, S. DAUN, G. CLERMONT, J. RUBIN, Y. VODOVOTZ, C. LAGOA, AND R. S. PARKER
the 4 hr time point in the experimental data. A comparison of model predictionsbetween the proposed model and alternate versions of Eq. (8) represented by 4th-order (n = 4), AV-7, and 2nd-order (n = 2), AV-8, Hill functions are presented inFigure 6. It is evident that lower-order (n < 6) Hill expressions in Eq. (8) resultin slower IL10(t) dynamics, especially after the 4 hr time point. The calculatedAIC values presented in Table 2 clearly indicate that the proposed model is againsuperior to these alternate versions, particularly for fitting the 3 mg/kg dose results.
0 5 10 15 20 250
100
200
IL10
(pg
/mL)
Endotoxin dose: 3 (mg/kg)
0 5 10 15 20 250
200
400
600
800
Time (Hr)
IL10
(pg
/mL)
Endotoxin dose: 12 (mg/kg)
Figure 7. Model simulation comparison of damage-mediated IL-10 between the proposed model with a 6th-order Hill function inEq. (20) (solid line), AV-7 with a 4th-order Hill function in Eq.(20) (dashed line), and AV-8 with a 2nd-order Hill function in Eq.(20) (dotted line) against experimental data (circle) (mean ± SD)in response to endotoxin challenge of 3 mg/kg (top) and 12 mg/kg(bottom).
To accurately capture the IL10(t) dynamics (20) at longer times for variousendotoxin challenge levels, it was necessary to reduce the rate of elimination ofIL10(t) with increasing endotoxin dose level. This was achieved by introducingthe down-regulating function, fDNIL10d (Eq. (24)). The down-regulation in themodel is physiologically motivated by studies showing that elevated levels of IL10(t)reduce its own rate of elimination from the blood stream [22]. An alternate version

A MATHEMATICAL MODEL OF INFLAMMATORY RESPONSE 17
Table 2. Calculated AIC values of the proposed model and itsalternate versions.
Endotoxin DoseModel (Eq.) 3 mg/kg 12 mg/kgIL-6 (10) 102.7 115.1AV-1 (30) 120.9 123.3AV-2 (31) 110.1 120.3TNF (15) 96.0 102.0AV-3 (32) 111.5 104.4AV-4 (33) 108.6 102.7IL-10 (20) 65.2 75.8AV-5 (34) 88.2 90.4AV-6 (35) 80.7 95.2Effect of D onIL-10 (8) 65.2 75.8AV-7 75.6 76.2AV-8 81.9 77.5
of Eq. (20) without the fDNIL10d function can be written as (AV-6):
dIL10(t)
dt= kIL10 ·
(
N(t)3
x3IL10 + N(t)3
)
· [1 + kIL10IL6 · fUPIL10IL6(t)
+kIL10TNF · fUPIL10TNF (t)] − dIL10 · IL10(t)
+YIL10(t) + sIL10 (35)
Due to the absence of the fDNIL10d term, AV-6 has one less parameter (xIL10d).Figure 5 shows the model prediction of IL10(t) from AV-6 (dotted lines). Lookingat the AIC values in Table 2, once again it is clear that the proposed model (20) issuperior to both alternate versions.
3.4. Parameter Sensitivity Analysis. A parametric relative sensitivity matrix(RSi,j) was generated using the finite difference method as described in Section2.5. The matrix was comprised of 8 rows (i ∈ [1,8]), representing the states, and46 columns (j ∈ [1,46]), representing all the parameters of the model. A graphicalrepresentation of the RSi,j values is provided in Figure 8. The x-axis lists parame-ters by number; this mapping is provided in Table 1. Each of the subplots in Figure8 represent the parametric relative sensitivity values corresponding to a particularstate (as shown in figure sub-titles). A higher RSi,j value indicates the state is moresensitive to the specified parameter.
In order to investigate the interactions between the various states of the proposedmodel, the parameters were grouped according to their association with each state,as indicated in Table 3. In Table 4, the contributions of each of these parametergroups, in terms of percentage relative sensitivity (%RS), to a particular state arelisted. The %RS of a parameter group for each state is calculated by taking thesum of the relative sensitivity of each parameters in that particular group dividedby the sum of reletive sensitivity of the entire parameter set (M = 46) for thatspecific state.
It is evident from the %RS values of Table 4 that each state is sensitive tochanges in its own parameters and the parameters associated with states P (t) (as

18A. ROY, S. DAUN, G. CLERMONT, J. RUBIN, Y. VODOVOTZ, C. LAGOA, AND R. S. PARKER
0 5 10 15 20 25 30 35 40 45
2
4
6P
0 5 10 15 20 25 30 35 40 45
10
20
30N
0 5 10 15 20 25 30 35 40 45
5
10
15
Rel
ativ
e S
ensi
tivity
D
0 5 10 15 20 25 30 35 40 45
5
10
CA
0 5 10 15 20 25 30 35 40 45
20406080
IL6
0 5 10 15 20 25 30 35 40 45
20406080
TNF
0 5 10 15 20 25 30 35 40 45
20406080
Parameters
IL10
0 5 10 15 20 25 30 35 40 45
204060
yIL10
Figure 8. Parametric relative sensitivity analysis of the inflam-mation model for all the eight states.
Table 3. Parameters grouped according to their state association.
Parameter groups Parameters
θP dp
θN kN , xN , dN , kNP , kND, xNTNF , xNIL6, xNCA, kNTNF , kNIL6
θD kD, dD, xD
θCAkCA, dCA, sCA
θIL6 kIL6TNF , xIL6TNF , kIL6, dIL6, xIL6, xIL6IL10, kIL6IL6, xIL6IL6,xIL6CA
θTNF kTNF , dTNF , xTNFIL10, xTNFCA, kTNFTNF , xTNFTNF , xTNFIL6
θIL10 kIL10TNF , xIL10TNF , kIL10IL6, xIL10IL6, kIL10, dIL10, xIL10, sIL10,
xIL10d
θYIL10kIL102, dIL102, xIL102
endotoxin is the initiator) and N(t) (as activated phagocytic cells are the primarydriving force of the inflammatory action). In addition, the individual states arevariably sensitive to other states when measured directly. The dynamics of theactivated phagocytic cells, N(t), are more sensitive to parameter changes associated

A MATHEMATICAL MODEL OF INFLAMMATORY RESPONSE 19
Table 4. Percentage relative sensitivity (%RS) of grouped param-eters for each state.
States % RSθP θN θD θCA
θIL6 θTNF θIL10 θYIL10
P (t) 100 0 0 0 0 0 0 0N(t) 14 65.1 0.2 1.8 2.3 6.0 10.2 0.4D(t) 12.2 41.9 28.1 1.5 2.0 5.4 9.4 0.2CA(t) 13.2 46.7 0.1 23.0 2.0 5.4 9.4 0.2
IL − 6(t) 5.4 17.2 7.0 1.4 36.3 5.5 22.9 4.3TNF (t) 9.6 24.2 0.4 20.0 4.1 34.6 6.9 0.2
IL − 10(t) 8.9 32.8 29.7 1.1 3.2 4.3 7.6 12.4YIL10(t) 9.1 31.4 31.8 1.1 1.5 4 6.7 14.4
with IL10(t) (θIL10), than to those of IL6(t) (θIL6) and TNF (θTNF ). StateIL6(t) also demonstrates higher sensitivity to parameters associated with IL10(t)(θIL10) than TNF . For the TNF (t) state, sensitivities to parameters associatedwith CA(t) (θCA
) are dramatically higher than IL6(t) (θIL6) and IL10(t) (θIL10).The IL10(t) state and the unobserved filter, YIL10(t) are primarily sensitive toparameters associated with D(t) (θD) and the parameters of the unobserved state,YIL10(t). Other cytokine state parameters show lower sensitivity to IL − 10(t)directly, although they likely drive systemic anti-inflammatory response throughsecondary effects via N(t) and D(t).
4. Discussion. This work extends a previously developed 3-D model of the acuteinflammatory response to pathogen or endotoxin to an 8-D differential equationmodel of the acute inflammatory response system, primarily by representing the dy-namics of a variety of specific cytokines previously treated as more abstract factors.Model parameter values were calibrated to achieve a close fit, in the least-squaressense, to longitudinal rat data for 3 of the 8 state variables, which were measuredfollowing endotoxin dose challenges at 3 mg/kg and 12 mg/kg. Moreover, withthese fixed parameter values, the model predicted the response to an intermedi-ate endotoxin challenge of 6 mg/kg. The model also described the time course ofthe unobserved activation of phagocytic cells by endotoxin, as well as unaccessiblevariables, like tissue damage (D) caused by the activated phagocytic cells and theslow-acting anti-inflammatory mediator (CA). The data and the resulting modelresponse display significant nonlinearity across the three challenge levels. Hence,the accurate prediction of the intermediate dose without the need for additionalparameter or parameter value changes supports the validity of the model structure,as well as its interpolative, and possibly extrapolative, utility.
Improving biological fidelity and reproducing data accurately were of prime im-portance in this work; care was taken that the added complexity reflected knowninflammatory physiology. This came at a cost of a considerable increase in thenumber of equations and parameters. This exercise is representative of the ongoingchallenge of balancing biological fidelity, often yielding large equation dimension andhighly parameterized models, with accuracy of, and confidence in, model parame-ters based on fits to experimental data. Unlike chemical or physical interactions,which are generally well characterized, biological interactions are often poorly quan-tified and causality is often not established with certainty. Hence, the problem of

20A. ROY, S. DAUN, G. CLERMONT, J. RUBIN, Y. VODOVOTZ, C. LAGOA, AND R. S. PARKER
synthesizing and identifying the simplest system that can be expected to providereasonable quantitative predictions is difficult and pervasive. System simplicitycan be debated on (non)linear, dimensional, and parametric grounds, even with-out the added complexity of dynamics, where time is the independent variable. Inthe present case, we opted to minimize the number of state variables and to avoidexplicit time delays; the price was increased nonlinearity in the model. It couldbe argued that one should always strive to minimize nonlinearity. Clearly, the in-clusion of additional intermediates (first-order filter equations) or explicit delayswould have significantly reduced the need for Hill equation-type nonlinearities. Itcould also be argued that our use of sigmoidal activation functions is not rooted onany demonstrable co-operativity phenomena. In their favor, these functions avoidthe use of pure delays, which present additional challenges to simulators and op-timization algorithms, without significantly increasing the number of parametersthat must be identified.
Beyond model structure is the evaluation of model performance – how well doesthe model fit or predict the data? The present model generates substantially betterfits than those obtained with our previous models [6, 3]. A critique of our fittingefforts could be our lack of a 12-hour time point, which would allow for a bettercharacterization of the later phase of the inflammatory dynamics. Unfortunately itwas impractical to maintain personnel overnight for that purpose. In synthesizingthe model, we found that appropriate interdisciplinary input, from expert inflam-mation biologists and experimentalists, was of great value in determining appropri-ate experimental time points and in defining heuristically appropriate behavior ofthe model. The term “heuristically appropriate” refers to the process of definingbiologically motivated or consistent accessory constraints to assist the parameterestimation process. For example, since all animals survived the insult, we imposedthe constraint that damage asymptotically returned to zero. Similarly, parameterranges explored by the fitting algorithm were restricted based on inferences fromthe literature or expert opinion.
Parameter fitting was performed using a gradient-based optimization routine.Given the nonlinear nature and ill-posedness of parameter estimation from data fordynamic models, it can be expected that other parameter sets could have yielded fitsof similar quality. Lower-dimensional models will typically have smoother objectivefunctions due to the monotonic nonlinearities used in the model and the smallernumber of parameters requiring identification. Hence, reducing the number of non-identifiable parameters should result in a smaller number of different parametersets yielding high-quality fits. Much like statistical models, parsimony may improvethe chances of broader validity, yet it usually results in a decreased ability to fitdata well. However, contrary to statistical modeling, parsimony cannot overrulebiological plausibility, as broader validity of biological models is rooted in theirability to represent mechanisms active in the biological system. Accordingly, thereis no preferred technique to reduce biologically-motivated dynamical models beyondtaking advantage of time scale differences and algebraic dependencies.
A logical first step in reducing parameter dimension in a nonlinear model is para-metric sensitivity analysis, with sensitivities calculated at all available time points.Insensitivity implies that either the parameter is varied outside of the biologicallyrelevant range, or the biology represented by the insensitive parameter does notimpact the outcome of interest in a significant way. Because of the first possibility,insensitivity should not immediately dictate model reduction. High sensitivity, on
A MATHEMATICAL MODEL OF INFLAMMATORY RESPONSE 21
the other hand, may help guide model reduction [29], specifically when sensitivi-ties between two parameters are correlated. Accordingly, such prediction is mostappropriate if sensitivity is observed to be consistent across parameter sets of anensemble of fits to a given dataset [31]. Model reduction techniques arguably standon firmer ground if such a consistency is observed. The ultimate goal of our modeldevelopment and fitting efforts is to create an ensemble of models that reflect, giventhe variability of the observed data, the range of parameter sets that could havegenerated this data (see also [31]).
In contrast to the biologically-motivated, but heuristic, approach to model struc-ture analysis and parameter identification discussed above, a mathematically rig-orous analysis of the experiment would have the ability to establish shortcomingsin the model-data combination, leading to changes in either the model or experi-ment to better couple the model and data. A formal test of a model structure anddata set for well-posedness of the parameter estimation problem is to evaluate thea priori identifiability of the model given the data [33, 35, 34]. The theory statesthat a model is a priori identifiable if, under the ideal conditions of noise free mea-surements and error free model structure, the unknown parameters of the proposedmodel can be uniquely recovered from the measured data collected during the ex-periment [33]. A variety of methods have been developed for (non)linear a priori
global identifiability, including power series [36], similarity transform [35], and dif-ferential algebra [34, 37]. The recent work of [37] employs Grobner basis techniquesto evaluate identifiability for nonlinear polynomial (or rational) systems; given theclass of saturating nonlinearities used in the present work, a detailed analysis of theproposed model via functional approximation or another transformation is beyondthe scope of the present work.
In summary, we propose that the development of top-down models of biologicalprocesses that target quantitative validation and prediction should: (i) primarilyreflect known biological interactions among model components; (ii) be developed byinterdisciplinary teams where data collection is planned with modeling as a primaryconsideration; and (iii) apply relevant literature and appropriate heuristics, basedon experimental observations, to guide model development. Thereafter, sensitivityand identifiability analysis-guided model reduction (both dimensional and paramet-ric) can be employed to reduce model complexity. Finally, ensemble creation andvalidation on separate datasets are necessary steps to the formulation of biologicallyrelevant, quantitatively accurate dynamical models of complex processes.
Acknowledgments. Funding for this work was provided by the NIH NHLBI#1R01HL080926.
22A. ROY, S. DAUN, G. CLERMONT, J. RUBIN, Y. VODOVOTZ, C. LAGOA, AND R. S. PARKER
REFERENCES
[1] C. Nathan, Points of control in inflammation, Nature, 420 (2002), 846–852.[2] I. Mackay and F. S. Rosen, Advances in immunilogy N. Engl. J. Med., 343 (2000), 338–344.[3] J. Day, J. Rubin, Y. Vodovotz, C. C. Chow, A. Reynolds, and G. Clermont, A reduced
mathematical model of the acute inflammatory response II. Capturing scenarios of repeatedendotoxin administration, J. Theor. Biol., 242 (2006), 237–256.
[4] R. J. Goris, T. P. te Boekhorst, J. K. Nuytinck, J. S. Gimbrere, Multiple-organ failure.
Generalized autodestructive inflammation?, Arch. Surg., 120 (1985), 1109-1115.[5] P. Y. Bochud and T. Calandra, Pathogenesis of sepsis: new concepts and implications for
future treatment, B. M. J., 326 (2003), 262–266.[6] R. Kumar, G. Clermont, Y. Vodovotz, and C. C. Chow, The dynamics of acute inflammation,
J. Theor. Biol., 230 (2004), 145–155.[7] C. C. Chow, G. Clermont, R. Kumar, C. Lagoa, Z. Tawadrous, D. Gallo, B. Betten, J. Bartels,
G. Constantine, M. P. Fink, T. R. Billiar, and Y. Vodovotz, The Acute inflammatory response
in diverse shock states, Shock, 24 (2005), 74–84.[8] J. M. Prince, R. M. Levy, J. Bartels, A. Baratt, J. M. Kane III, C. Lagoa, J. Rubin, J. Day,
J. Wei, M. P. Fink, S. M. Goyert, Gi. Clermont, T. R. Billiar, and Y. Vodovotz, In silicoand in vivo approach to elucidate the inflammatory complexity of CD14-deficient mice, Mol.
Med., 12 (2005), 88–96.[9] C. E. Lagoa, J. Bartels, A. Baratt, G. Tseng, G. Clermont, M. P. Fink, T. R. Billiar, and
Y. Vodovotz, The role of initial trauma in the host’s response to injury and hemorrhage:Insights from a correlation of mathematical simulations and hepatic transcriptomic analysis,
Shock 26 (2006), 592–600.[10] A. Reynolds, J. Rubin, G. Clermont, J. Day, Y. Vodovotz, and G. B. Ermentrout, A reduced
mathematical model of the acute inflammatory response. I. Derivation of model and analysis
of anti-inflammation, J. Theor. Biol., 242 (2006), 220–236.[11] F. A. Bozza, J. I. Salluh, A. M. Japiassu, M. Soares, E. F. Assis, R. N. Gomes, M. T. Bozza,
H. C. Castro-Faria-Neto, and P. T. Bozza, Cytokines profiles as markers of disease severityin sepsis: a multiplex analysis, Critical Care, 11(2) (2007), R49.
[12] B. D. Freemanand and C. Natanson, Anti-inflammatory therapies in sepsis and septic shock,Expert Opin. Investig. Drugs, 9 (2000), 1651–1663.
[13] J. S. Hadley, J. E. Wang, S. J. Foster, C. Thiemermann, and C. J. Hinds, Peptidoglycan ofstaphylococcus aureus upregulates monocyte expression of CD14, toll-like receptor 2 (TLR2),
and TLR4 in human blood: possible implications for priming of lipopolysaccharide signaling,Infection and Immunity, 73(11) (2005), 7613–7619.
[14] G. Bellingan, Inflammatory cell activation in sepsis, Br. Med. Bull., 55 (1999), 12–29.
[15] M. Pretolani, Interleukin-10: an anti-inflammatory cytokine with therapeutic potential, Clin.Exp. Allergy, 29 (1999), 1164–1171.
[16] M. R. Pinsky, Sepsis: a pro- and anti-inflammatory disequilibrium syndrome, Contrib.Nephrol., 132 (2001), 354–366.
[17] D. Rittirsch, L. Marco Hoesel, and P. A. Ward, The disconnect between animal models ofsepsis and human sepsis, J. Leukoc. Biol., 81 (2007), 137–143.
[18] P. Matzinger, The danger model: a renewed sense of self, Science, 296 (2002), 301–305.
[19] P. V. Giannoudis, R. M. Smith, S. L. Perry, A. J. Windsor, R. A. Dickson, and M. C. Bel-lamy, Immediate IL-10 expression following major orthopaedic trauma: relationship to anti-inflammatory response and subsequent development of sepsis, Intensive Care Med., 26(8)(2000), 1076-1081.
[20] K. Kamm, W. Vanderkolk, C. Lawrence, M. Jonker, and A. T. Davis, The effect of traumaticbrain injury upon the concentration and expression of interleukin-1beta and interleukin-10in the rat, J. Trauma, 60(1) (2006), 152–157.
[21] Z. Xing Z, J. Gauldie, G. Cox, H. Baumann, M. Jordana, X. F. Lei, M. K. Achong, IL-6 isan antiinflammatory cytokine required for controlling local or systemic acute inflammatoryresponses, J. Clin. Invest., 101(2) (1998), 311–320.
[22] I. Y. Rosenblum, R. C. Johnson, and T. J. Schmahai1, Preclinical safety evaluation of re-
combinant human interleukin-10, Regulatory Toxicology and Pharmacology, 35(1) (2002),56–71.

A MATHEMATICAL MODEL OF INFLAMMATORY RESPONSE 23
[23] M. J. P. Lenczowski, A. M. Van Dam, S. Poole, J. W. Larrick, and F. J. Tilders, Role of circu-
lating endotoxin and interleukin-6 in the ACTH and corticosterone response to intraperitonealLPS Tilders, Am. J. Physiol. Regul. Integr. Comp. Physiol., 273 (1997), 1870–1877.
[24] M. H. Iversen and R. G. Hahn, Acute effects of vitamin A on the kinetics of endotoxin inconscious rabbits, Intensive Care Med., 25 (1999), 1160–1164.
[25] A. E. Warner, M. M. DeCamp Jr., R. M. Molina, and J. D. Brain, Pulmonary removal ofcirculating endotoxin results in acute lung injury in sleep, Lab. Invest., 59 (1988), 219–230.
[26] E. Carson and C. Cobelli, “Modelling methodology for physiology and medicine”, AcademicPress, San Diego, CA, 2001.
[27] H. Akaike, A bayesian extension of the minimum AIC procedure of autoregressive modelfitting, Biometrika, 66 (1979), 237–242.
[28] H. Yue, M. Brown, J. Knowles, H. Wang, D. S. Broomhead, and D. B. Kell, Insights into the
behaviour of systems biology models from dynamic sensitivity and identifiability analysis: acase study of an NF-κβ signalling pathway, Mol. Biosyst., 2 (2006), 640–649.
[29] D. E. Zak, G. E. Gonye, J. S. Schwaber, and F. J. Doyle III, Importance of input perturbationsand stochastic gene expression in the reverse engineering of genetic regulatory networks:
insights from an identifiability analysis of an in silico network, Genome Res., 13 (2003),2396–2405.
[30] S. Daun, R. S. Parker, A. Roy, J. Rubin, and G. Clermont, Parameter identifiability in amodel of the acute inflammatory response, J. Crit. Care, 22(4) (2007), 345.
[31] S. Daun, J. Rubin, Y. Vodovotz, A. Roy, R. Parker, and G. Clermont, An ensemble of modelsof the acute inflammatory response: results from parameter reduction, J. Theor. Biol., 2532008, 843–853.
[32] B. Hancioglu, G. Clermont, and, D. Swigon, Ensemble models for human immune responseto influenza A virus infection, J. Crit. Care, 22(4) (2007), 339.
[33] S. Audoly, L. D. Angio, M. P. Saccomani, and C. Cobelli, Global identifiability of linearcompartmental models, IEEE Trans. Biomed. Eng., 45 (1998), 36–47.
[34] L Ljung and S. T. Glad, On global identifiability for arbitrary model parameterizations, Au-tomatica, 30(2) (1994), 265–276.
[35] M. J. Chappel and K. R. Godfrey, Structural identifiability of the parameters of a nonlinear
batch reactor model, Math. Biosci., 108 (1992), 245–251.[36] H. Pohjanpalo, Systems identifiability based on the power series expansion of the solution,
Math. Biosci., 41 (1978), 21–33.[37] S. Audoly and G. Bellu and L. D. Angio and M. P. Saccomani and C. Cobelli, Global identi-
fiability of nonlinear models of biological systems, IEEE Trans. Biomed. Eng., 48(1) (2001),55–65.
E-mail address: [email protected]