Embed Size (px)
Citation preview

Mississippi State University Mississippi State University
Scholars Junction Scholars Junction
Theses and Dissertations Theses and Dissertations
12-10-2005
A Micro-Cooling, Heating, And Power (M-CHP) Instructional A Micro-Cooling, Heating, And Power (M-CHP) Instructional
Module Module
Jason Ryan Oliver
Follow this and additional works at: https://scholarsjunction.msstate.edu/td
Recommended Citation Recommended Citation Oliver, Jason Ryan, "A Micro-Cooling, Heating, And Power (M-CHP) Instructional Module" (2005). Theses and Dissertations. 181. https://scholarsjunction.msstate.edu/td/181
This Graduate Thesis - Open Access is brought to you for free and open access by the Theses and Dissertations at Scholars Junction. It has been accepted for inclusion in Theses and Dissertations by an authorized administrator of Scholars Junction. For more information, please contact [email protected].

A micro-COOLING, HEATING, AND POWER
(m-CHP) INSTRUCTIONAL MODULE
By
Jason Ryan Oliver
A ThesisSubmitted to the Faculty of Mississippi State University
in Partial Fulfillment of the Requirements for the Degree of Master of Science
in Mechanical Engineering in the Department of Mechanical Engineering
Mississippi State, Mississippi
December 2005

Name: Jason Ryan Oliver
Date of Degree: December 9, 2005
Institution: Mississippi State University
Major Field: Mechanical Engineering
Major Professor: Dr. B.K. Hodge
Title of Study: A micro-COOLING, HEATING, AND POWER (m-CHP) INSTRUCTIONAL MODULE
Pages in Study: 209
Candidate for Degree of Master of Science
Cooling, Heating, and Power (CHP) is an emerging category of energy
systems consisting of power generation equipment coupled with thermally
activated components. The application of CHP systems to residential and small
commercial buildings is known as micro-CHP (m-CHP). This instructional
module has been developed to introduce engineering students to m-CHP. In the
typical engineering curriculum, a number of courses could contain topics related
to m-CHP. Thermodynamics, heat transfer, HVAC, heat and power, thermal
systems design, and alternate energy systems courses are appropriate m-CHP
topics. The types of material and level of analysis for this range of courses vary.
In thermodynamics or heat transfer, basic problems involving a m-CHP flavor are
needed, but in an alternate energy systems course much more detail and content
would be required. This instructional module contains both lecture material and a
compilation of problems/exercises for both m-CHP systems and components.

ii
TABLE OF CONTENTS
Page
LIST OF TABLES ................................................................................... vi
LIST OF FIGURES ................................................................................. viii
NOMENCLATURE ................................................................................. xv
CHAPTER
I. m-CHP ........................................................................................ 1
II. EUROPEAN EXPERIENCE with m-CHP..................................... 8
III. THE m-CHP SYSTEM ................................................................. 13
Distributed Power Generation ........................................... 13 Reciprocating Engines................................................ 14 Microturbines .............................................................. 15 Stirling Engines........................................................... 17 Rankine Cycle Engines............................................... 18 Fuel Cells.................................................................... 20 Heat Recovery .................................................................. 21 Thermally Activated Devices............................................. 23 Desiccant Dehumidifiers ............................................. 23 Absorption Chillers...................................................... 24
IV. PRIME MOVERS......................................................................... 26
Reciprocating Engines ...................................................... 26 Technology Overview ................................................. 26 Application .................................................................. 37 Heat Recovery............................................................ 39 Cost ............................................................................ 40 Advantages and Disadvantages ................................. 40 Exercises .................................................................... 42 Manufacturers............................................................. 44

iii
CHAPTER Page
Microturbines..................................................................... 47 Technology Overview ................................................. 47 Application .................................................................. 58 Heat Recovery............................................................ 59 Cost ............................................................................ 59 Advantages and Disadvantages ................................. 60 Exercises .................................................................... 61 Manufacturers............................................................. 63 Stirling Engines ................................................................. 66 Technology Overview ................................................. 66 Application .................................................................. 73 Heat Recovery............................................................ 74 Cost ............................................................................ 74 Advantages and Disadvantages ................................. 75 Exercises .................................................................... 76 Manufacturers............................................................. 77 Rankine Cycle Engines ..................................................... 80 Technology Overview ................................................. 80 Application .................................................................. 86 Heat Recovery............................................................ 86 Cost ............................................................................ 87 Exercises .................................................................... 87 Manufacturers............................................................. 89 Fuel Cells .......................................................................... 90 Technology Overview ................................................. 90 PEMFC .............................................................. 96 SOFC ................................................................. 99 PAFC ................................................................. 104 MCFC................................................................. 106 Application ....................................................... .......... 109 Heat Recovery................................................. .......... 110 Cost ................................................................. .......... 111 Advantages and Disadvantages ...................... .......... 112 Exercises ......................................................... .......... 114 Manufacturers.................................................. .......... 116
V. HEAT RECOVERY ...................................................................... 118
Technology Overview........................................................ 119 Heat Exchanger Analysis .................................................. 123 Application ........................................................................ 129 Gas-to-Gas Heat Exchangers..................................... 130 Gas-to-Liquid Heat Exchangers.................................. 131

iv
CHAPTER Page
Liquid-to-Liquid Heat Exchangers............................... 132 Exercises .................................................................... 133
VI. ABSORPTION CHILLERS........................................................... 134
Technology Overview........................................................ 134 Refrigerant-Adsorbent Selection ....................................... 138 Types of Absorption Chillers ............................................. 140 System Analysis................................................................ 143 Application ........................................................................ 153 Cost................................................................................... 155 Exercises .......................................................................... 155 Manufacturers ................................................................... 158
VII. DESICCANT DEHUMIDIFICATION TECHNOLOGIES ............... 161
Introduction ....................................................................... 161 Sub-cooling Systems vs. Desiccant Systems ................... 162 Summary of Principles of Sub-cooling Systems................ 164 Summary of Principles of Desiccant Systems................... 165 Types of Desiccant Systems............................................. 167 General Classifications ............................................... 167 Solid Adsorbents......................................................... 167 Liquid Absorbents ....................................................... 169 Regeneration .............................................................. 170 Solid Desiccant Systems................................................... 170 Cost Considerations.......................................................... 174 Manufacturers ................................................................... 176
VIII. BIOFUELS ................................................................................... 180
Introduction ....................................................................... 180 Biomass ............................................................................ 181 Anaerobic Digestion .......................................................... 183 Thermal Gasification ......................................................... 184 Liquid Fuels from Biomass................................................ 188 Ethanol Fermentation ................................................. 188 Chemical Synthesis of Methanol ................................ 190 Pyrolysis Oils .............................................................. 191 Vegetable Oils ............................................................ 193 Potential of Biofuels .......................................................... 195 Economic Assessment...................................................... 197

v
CHAPTER Page
IX. CONCLUSIONS .......................................................................... 200
REFERENCES ............................................................................ 205
Books ................................................................................ 205 Journal Articles.................................................................. 206 Internet References........................................................... 207 Manufacturer Websites ..................................................... 209

vi
LIST OF TABLES
TABLE Page
4.1 Overview of Reciprocating Engine Technology (http://www.energy.ca.gov/distgen/) ................................. 38
4.2 Overview of Microturbine Technology (http://www.energy.ca.gov/distgen) .................................. 49
4.3 Overview for Stirling Engine Technology (http://www.energy.ca.gov/distgen) .................................. 73
4.4 Fuel Requirements for Fuel Cells (Laramie, et al., 2003)............. 94
4.5 Characteristics of Fuel Cells (http://www.oit.doe.gov).................. 96
4.6 Overview of Fuel Cell Characteristics (www.energy.ca.gov/distgen/) ........................................... 109
4.7 Projected Long-Term Costs of Fuel Cell Technologies (www.energy.ca.gov/distgen/) ........................................... 112
4.8 Advantages and Disadvantages of Fuel Cell Types (www.energy.ca.gov/distgen/ ............................................ 114
5.1 Waste Heat Characteristics of Prime Mover Technologies .......... 119
5.2 Summary of Effectiveness-NTU Relationships for Heat Exchangers ....................................................................... 127
6.1 State Points for the Ammonia/water System in Figure 6.10......... 151
6.2 Matching of Power Generation and Absorption Technology (Devault, Garland, Berry, and Fiskum, 2002).................... 153
6.3 RS Means Cost Data for a 100 Ton Absorption Chiller Installation......................................................................... 155

vii
TABLE Page
6.4 Table for Problem 1 ..................................................................... 155
6.5 Table for Problem 2 ..................................................................... 156
6.6 Table for Problem 3 ..................................................................... 156
6.7 Table for Problem 6 ..................................................................... 157
8.1 Producer Gas Constituents from Various types of Gasifiers (Goswami, et al, 2000) ...................................................... 186
8.2 Ethanol Fermentation of Various Energy Crops (Goswami, et al, 2000) ...................................................... 189
8.3 Properties of Ethanol and Gasoline (Laraminie and Dicks, 2003) ............................................. 189
8.4 Properties of Methanol and Gasoline (Laraminie and Dicks, 2003) ............................................. 191
8.5 Cost Information for Production Methods of Biofuels (Goswami, et al, 2000) ...................................................... 199
9.1 Rankings for Distributed Power Generating Technologies........... 201

viii
LIST OF FIGURES
FIGURE Page
1.1 Schematic of an m-CHP System ................................................. 1
1.2 2001 U.S. Electrical Consumption by Building Sector (http://www.eia.doe.gov ......................................................... 2
1.3 Efficiency of Central Power Generation ....................................... 5
1.4 Efficiency of Combined-Cycle Power Generation ........................ 5
1.5 Efficiency of m-CHP System........................................................ 6
3.1 Model D13-2, 12-kW Diesel Engine Generator Set from Caterpillar (http://www.cat.com) ............................................. 14
3.2 Capstone C30 Microturbine (www.capstone.com) ...................... 17
3.3 SOLO 9-kW Stirling Engine (http://www.stirling-engine.de/engl/index.html) ................. 18
3.4 Cogen Microsystems 2.5-kW Rankine Cycle m-CHP Unit (www.cogenmicro.com) .................................................... 19
3.5 Plug Power Fuel Cell Unit (www.plugpower.com) ....................... 21
3.6 MiniPAC Desiccant Dehumidifier by Bry-Air (http://www.bry-air.com) ................................................... 24
3.7 Yazaki Energy Systems WFCS Series 10-ton Absorption Chiller (www.yazakienergy.com) ...................................... 25
4.1 Four-stroke Reciprocating IC Engine (www.personal.washentaw.cc.mi.us) ............................... 27

ix
FIGURE Page
4.2 Pressure-Specific Volume and Temperature-Entropy Diagrams for the Air-Standard Otto Cycle ......................................... 28
4.3 Otto Cycle Thermal Efficiency as a Function of Compression Ratio.................................................................................. 30
4.4 Example 4-1................................................................................. 31
4.5 Compression-ignition Engine (hyperphysics.phy-astr.gsu.edu/hbase/thermo/diesel.html) 34
4.6 Pressure-Specific Volume and Temperature-Entropy Diagrams for the Air-Standard Diesel Cycle ...................................... 35 4.7 Otto and Diesel Cycle Thermal Efficiencies as Functions of Compression Ratio............................................................ 37
4.8 Generac Model MMC 4G15 15-kW Reciprocating Engine Generator (http://www.generac.com) ............................... 44
4.9 Model D13-2, 12-kW Diesel Engine Generator Set from Caterpillar (http://www.cat.com) ........................................................ 45
4.10 Cummins Model GNAA 60 Hz 6-kW Spark-ignited Generator Set (http://www.cumminspower.com) ............................... 45
4.11 Deutz Model 1008F Diesel Engine Generator Set (http://deutzusa.com) ....................................................... 46
4.12 Kohler Model 6ROY, 6-kW Diesel Engine Generator Set (www.kohler.com) ............................................................ 46
4.13 Microturbine Components and Operation .................................... 48
4.14 Pressure-Specific Volume and Temperature-Entropy Diagrams for the Ideal Brayton Cycle ..................................................... 50
4.15 Air-standard Brayton Cycle Efficiency as a Function of Pressure Ratio.................................................................................. 52
4.16 Temperature-Entropy Diagram of a Real Microturbine Cycle ...... 53

x
FIGURE Page
4.17 Temperature-Specific Entropy Diagram including Recuperator Effects ............................................................................... 55
4.18 Example 4-2................................................................................. 56
4.19 Capstone C30 Microturbine (http://www.capstoneturbine.com/) . 63
4.20 Elliot Systems 100-kW TA CHP Unit (www.elliottmicroturbines.com) ........................................ 64
4.21 Ingersoll-Rand 70-kW PowerWorks™ Microturbine (www.irpowerworks.com/) ................................................ 64
4.22 TURBEC 100-kW T100 CHP Microturbine (www.turbec.com/) ... 65
4.23 Bowman Power Systems 80-kW Microturbine System (www.bowman.com) ......................................................... 65
4.24 Two-cylinder Stirling Engine Diagram (www.keveny.com/vstirling.html) ................................ 68
4.25 Pressure-Specific Volume and Temperature-Entropy Diagrams for the Stirling Cycle .......................................................... 69
4.26 Example 4-3................................................................................. 71
4.27 AC and DC WhisperGen Micro-CHP Units (www.whispergen.com) .................................................... 77
4.28 BG Microgen Micro-CHP Unit (www.microgen.com) .................. 78
4.29 1-kW ENATEC Field Prototype CHP Unit – Full System (http://www.enatec.com) .................................................. 78
4.30 SOLO 9-kW Stirling Engine (www.stirling-engine.de/engl/l) ........ 79
4.31 Stirling Engine, Inc. ST – 5 (http://www.waoline.com/science/NewEnergy/Motors/StirlingCie.htm ..................... 79
4.32 Rankine Cycle Engine Schematic................................................ 81
4.33 Ideal Rankine Cycle Temperature Entropy Diagram.................... 81

xi
FIGURE Page
4.34 Rankine Cycle Engine Diagram for Example 4-4......................... 83
4.35 Example 4-4................................................................................. 84
4.36 Enginion 4.6-kW SteamCell Unit (www.enginion.com) ............... 89
4.37 Cogen Microsystems 2.5-kW Rankine Cycle m-CHP Unit (www.cogenmicro.com) .................................................... 89
4.38 PAFC Electrochemistry (http://www.fctec.com/fctec) .................. 91
4.39 Example 4-5................................................................................. 93
4.40 SOFC Reactions (http://www.fctec.com/fctec) ............................. 100
4.41 SOFC Stack Assembly (Oosterkamp, et. al)................................ 103
4.42 PAFC Reactions (http://www.fctec.com/fctec) ............................. 105
4.43 MCFC Reactions (http://www.fctec.com/fctec)............................. 107
4.44 CFCL 1-kW Technology Demonstrator System (http://www.cfcl.com.au/html/) ........................................... 116
4.45 CFCL’s 5-kW m-CHP Concept Unit (http://www.cfcl.com.au/html/) ........................................... 116
4.46 Plug Power Fuel Cell Unit (www.plugpower.com)........................ 117
4.47 Baxi Technology 1.5-kW m-CHP Fuel Cell Unit (www.baxitech.co.uk) ........................................................ 116
5.1 Main Types of Transmural Recuperators with Fluids in Single-phase ..................................................................... 121
5.2 Temperature-area Diagram of Parallel and Counterflow Arrangements.................................................................... 122
5.3 Cross-flow Heat Exchangers ....................................................... 123
5.4 Shell-and-tube Heat Exchanger................................................... 123

xii
FIGURE Page
5.5 Cross-flow Heat Exchanger for Example 5-1 ............................... 127
5.6 Example 5-1................................................................................. 128
5.7 Classification of Waste Heat Recovery Heat Exchangers (Recreated from the CRC Handbook of Energy Efficiency) . 129
6.1 Vapor-Compression Cycle Schematic ......................................... 135
6.2 Basic Absorption Cycle Schematic .............................................. 137
6.3 Ammonia/Water Absorption Cycle ............................................... 140
6.4 Double-Effect Water/Lithium Bromide Absorption Chiller Schematic ............................................................................... 142
6.5 Enthaply-Concentration Diagram for Ammonia/water System (Felder, et al., 1986).......................................................... 145
6.6 Absorber .................................................................................... 146
6.7 First-Stage Generator Schematic ................................................ 147
6.8 Heat Exchanger Schematic ......................................................... 148
6.9 Pump Schematic.......................................................................... 149
6.10 Single-stage Ammonia/water Absorption Chiller for Example 6-1 151
6.11 Example 6-1................................................................................. 152
6.12 Yazaki Energy Systems WFCS Series 10-ton Absorption Chiller (www.yazakienergy.com) .................................................. 158
6.13 Robur Model ACF 60-00 Gas-fired Absorption Chiller (www.robur.com)............................................................... 159
6.14 Carrier Model 16NK Absorption Chiller (www.global.carrier.com) 159
6.15 Trane Classic ® Absorption Chiller (www.trane.com) .................. 160

xiii
FIGURE Page
6.16 Single-effect Absorption Chiller by York International (www.york.com) ................................................................ 160
7.1 Sub-cooling Dehumidification Process (Chamra, et al., 2000)..... 163
7.2 ASHRAE Comfort Zones (ASHRAE Fundamentals, 2001).......... 164
7.3 Damp Duct Symptoms (Chamra, et al., 2000) ............................. 165
7.4 (a) Desiccant Wheel (Meckler, et al., 1995) (b) Corrugated and Hexagonal Channel Shapes (Chamra, et al., 2000).......... 169
7.5 Liquid Desiccant System (Chamra, et al., 2000).......................... 170
7.6 Solid Desiccant Dehumidification System (Chamra, et al., 2000) 171
7.7 Dry Desiccant Dehumidification Process (Chamra, et al., 2000) . 172
7.8 Ventilated Desiccant Dehumidification System Configuration (Chamra, et al., 2000) ....................................................... 172
7.9 Ventilated Desiccant Dehumidification System Configuration (Chamra, et al., 2000) ....................................................... 173
7.10 MiniPAC Desiccant Dehumidifier by Bry-Air (http://www.bry-air.com/) ................................................... 176
7.11 Desiccant Dehumidifier Cassettes by Bry-Air (http://www.bry-air.com/) ................................................... 176
7.12 Munters HC/M/MG Off the Shelf Desiccant Dehumidifiers (75-300 scfm) (www.muntersamerica.com) ...................... 177
7.13 DehuTech 160 (www.dehutech.com)........................................... 177
7.14 Dri-Eaz DriTec Pro150 (www.dri-eaz.com) .................................. 178
7.15 Drykor Residential Comfort Conditioner (www.drykor.com)......... 179
7.16 Dryomatic DCX Desiccant Dehumidifier (www.dryomatic.com) ... 179
8.1 Basic Anaerobic Process (Goswami, et al, 2000) ........................ 184

xiv
FIGURE Page
8.2 Schematic of a Downdraft Gasifier (Bricka, 2004) ....................... 187
8.3 Schematic of an Updraft Gasifier (Bricka, 2004).......................... 187
8.4 Schematic of a Fluid-bed Gasifier (Bricka, 2004)......................... 188
8.5 Fast Pyrolysis Production Process (Goswami, et al, 2000).......... 192
8.6 Biodiesel Production from Seed Oil (Goswami, et al, 2000) ........ 194
8.7 Oil Production and Consumption (http://devafdc.nrel.gov/pdfs/energysecurity.pdf) .............. 196
8.8 Theoretical Representation of Cost of Fuels as a Function of Time .................................................................................. 198

xv
NOMENCLATURE
C capacity ratio
Cc capacity of the cold fluid
Ch capacity of the hot fluid
COP coefficient of performance
cp constant pressure specific heat
cv constant volume specific heat
G Gibbs energy
h specific enthalpy
i enthalpy
k ratio of specific heats
m mass
m mass flow rate
n the number of moles of gas
NTU number of transfer units
p pressure
Qin heat addition to the system during the cycle
Qout heat rejected from the system during the cycle
Q in heat added in the generator

xvi
Q out heat rejected in the absorber
q rate of heat transfer
r compression ratio
R the gas constant
rc cutoff ratio
s specific entropy
T temperature
u specific internal energy
UA conductance
v specific volume
V Volume
W work of a given cycle
PW power requirement for pump operation
x concentration
Greek
T log mean temperature difference
T change in temperature between two states
heat exchanger effectiveness
recrecuperator effectiveness
efficiency

xvii
Subscripts
HX denotes heat exchanger
MAX denotes maximum rate of heat transfer of the heat exchanger
evaporator rate of heat transfer in the evaporator
generator rate of heat transfer in the condensor
C denotes compressor
in indicates a quantity is input to the system
Diesel denotes the Diesel cycle
net indicates a net quantity of a given cycle
Otto denotes the Otto cycle
p denotes a pump
Stirling denotes the Stirling cycle
T denotes a turbine
fc the electrical conversion efficiency of a fuel cell
i indicates the current efficiency of a fuel cell
Rank denotes the Rankine cycle
th indicates the thermal efficiency of a fuel cell
v indicates the voltage efficiency of a fuel cell

1
CHAPTER I:
micro-CHP
Micro-cooling, heating, and power (m-CHP) is decentralized electricity
generation coupled with thermally activated components for residential and small
commercial applications. m-CHP systems can simultaneously produce heat,
cooling effects, and electrical power. The “micro” regime is typically designated
as less than fifteen kilowatts electric (< 15 kWe).
The concept of m-CHP is illustrated in Figure 1.1. A prime mover, such as
a reciprocating engine, drives a generator which produces electrical power. The
waste heat from the prime mover is recovered and used to drive thermally
activated components, such as an absorption chiller or desiccant dehumidifier,
and to produce hot water or warm air through the use of heat exchangers.
Prime
Mover
Generator/
Power
Conditioner
Absorption
ChillerHeat
Exchanger
Desiccant
Device
Heat
Exchanger
Building
Cooling
Building
Heating
Building
Humidity
Control
Hot waterElectrical
Power
Waste Heat
Reject Heat
Figure 1.1: Schematic of an m-CHP System
2
Cooling, heating, and power (CHP) has proven beneficial in many
industrial situations by increasing the overall thermal efficiency, reducing the total
power requirement, and providing higher quality, more reliable power. Applying
CHP technology to smaller scale residential and small commercial buildings is an
attractive option because of the large potential market.
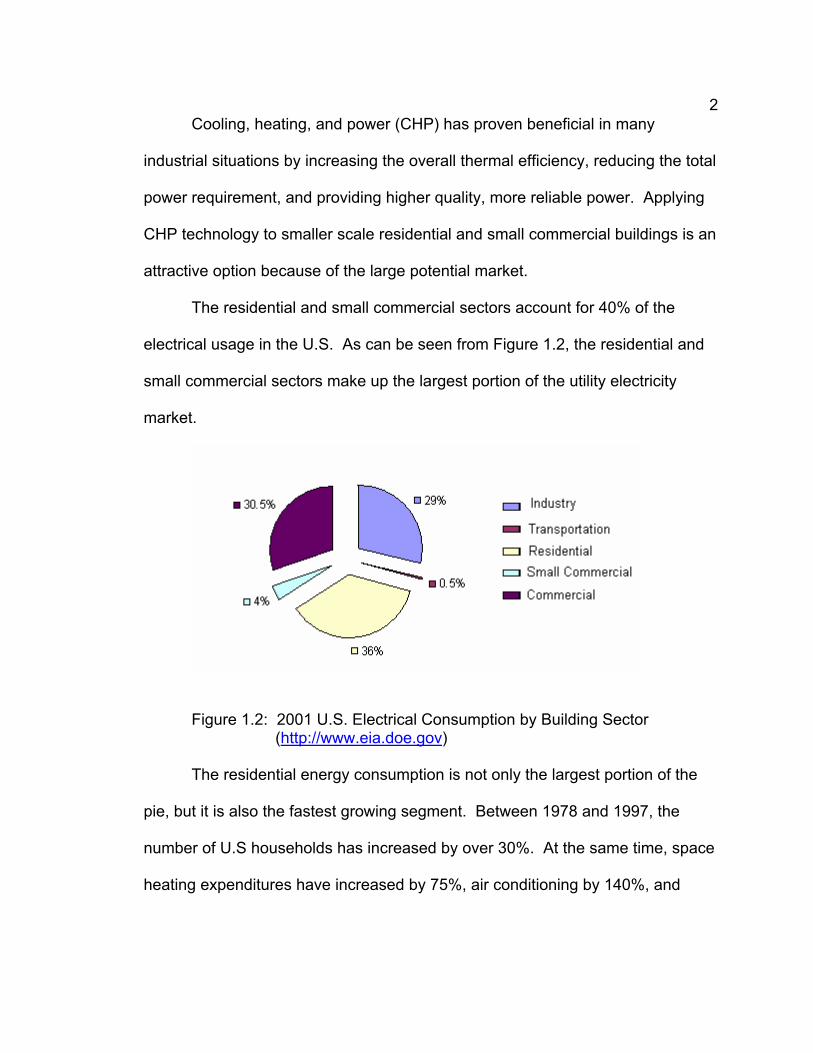
The residential and small commercial sectors account for 40% of the
electrical usage in the U.S. As can be seen from Figure 1.2, the residential and
small commercial sectors make up the largest portion of the utility electricity
market.
Figure 1.2: 2001 U.S. Electrical Consumption by Building Sector(http://www.eia.doe.gov)
The residential energy consumption is not only the largest portion of the
pie, but it is also the fastest growing segment. Between 1978 and 1997, the
number of U.S households has increased by over 30%. At the same time, space
heating expenditures have increased by 75%, air conditioning by 140%, and

3
water heating by 184%. The largest increase in household energy expenditures
was for home appliances, which increased by 210%.
As a result of such large increases, residential energy consumption is
projected to increase 25% from 2001-2025. The question is: Why should m-CHP
be considered a viable option to meet the needs of the U.S. residential and small
commercial market?
The basis of this answer can be found by applying the “wells to wheels”
analysis concept to the energy production for a single residence. The idea of
“wells to wheels” is that the whole system must be considered from fuel
harvesting to the energy (in some final form) that is used. In addition, each time
that fuel is converted, packaged, or transported, there is an associated loss of
energy. The more conversion and transportation steps in a process, the greater
the associated energy losses.
In the U.S. as of 2004, electricity is generated by coal (50%), nuclear
(20%), natural gas (18%), hydro (7%), petroleum (3%), and various renewable
energy methods (2%). The traditional method of electrical power generation and
distribution is based on large, centrally-located power plants. Central means that
the power plant is located on a hub surrounded by major electric load centers.
Once the electricity is produced, the power must be delivered to the end
user. Delivery is achieved by a utility transmitting the electricity to a substation
through a high-voltage electrical grid. At the substation, the high-voltage
electricity is transformed, or stepped down, to a lower voltage to be distributed to

4
individual customers. The electricity is then stepped down a final time by an on
site transformer before being used by the customer. The number of times that
the electricity must be transformed depends largely upon the distance the power
is transmitted and the number of substations used in distributing the electricity.
Inefficiencies are associated with the traditional methods of electrical
power generation and delivery. To begin, the majority of the energy content of
the fuel is lost at the power plant through the discharge of waste heat.
Traditional power plants convert about 30% of a fuel’s available energy into
electric power. Highly efficient combined-cycle power plants convert about 50%
of the available energy into electric power. Further energy losses occur in the
transmission and distribution of electric power to the individual user.
Inefficiencies and pollution issues associated with conventional power plants
have provided the motivation for new developments in on-site power generation.
The overall efficiencies of central power generation and distributed combined-
cycle power generation are shown in Figures 1.3 and 1.4.

5
Figure 1.3: Efficiency of Central Power Generation
Figure 1.4: Efficiency of Combined-Cycle Power Generation
Once the electric power reaches the end user, the electricity is used to run
central heat and air conditioners, appliances, lighting, and in some cases, water
heating. These are the same end uses that could be provided by an m-CHP
system at a greater overall thermal efficiency. Micro-combined heat and power
units utilize waste heat while simultaneously producing electric power for a

6
residence or building. The waste heat is used to meet space and water heating
requirements and to provide cooling if an absorption chiller is incorporated into
the system. Heating and cooling are major end uses of residential energy.
Because the heating and cooling loads of the space are being met without total
dependence on electrically-driven thermal components, the overall electric load
of the residence will be reduced.
Another advantage of m-CHP is that there are no losses associated with
power distribution and transmission as opposed to the traditional power
generation method. m-CHP systems can utilize about 75% of the fuels available
energy to provide electric and thermal energy. A m-CHP system can produce an
overall efficiency of about 75% while a modern combined-cycle power plant will
have an overall efficiency of around 50%. The overall efficiencies of a m-CHP
system is shown in Figure 1.5.
Figure 1.5: Efficiency of m-CHP System

7
Larger homes, higher energy costs, volatile fuel markets, electricity
blackouts, power security, power quality, and increasing concern for
environmental issues have all helped open the door for m-CHP. RKS, a leading
market research firm, found that more than 38% of high-income households, (i.e.,
incomes greater than $50,000) are interested in generating their own electricity.
(Micro-CHP Technologies Roadmap, U.S. DOE)
8
CHAPTER II:
EUROPEAN EXPERIENCES WITH m-CHP
Many factors have spurred the European community to explore alternative
methods for power generation. The blackouts in North America and Europe
placed a focus on reducing consumer dependence on traditional grid-distributed
electricity. At the same time, many European nations set carbon-dioxide
reduction targets in accordance with the Kyoto Protocol. One of the methods
identified capable of helping nations achieve both goals is domestic CHP.
Feasibility studies for the use of m-CHP in Europe began in the early
1990s and since that time, several m-CHP technologies have been developed
and investigated. However, since m-CHP is viewed differently in Europe and
because differences in markets and climatic conditions exist in Europe, the
technologies developed and used in Europe may not be directly applicable to the
U.S. market.
To begin, European m-CHP is typically viewed as “A direct replacement
for a boiler in a hydronic heating system, which simultaneously produces heat
and electrical power.” (Harrison, 2003a) Basically, the unit replaces the boiler in
the conventional central heating system and the electricity produced is
considered a by-product. Also, until recently, most technologies and applications
9
identified as having potential for m-CHP have focused on natural gas fired
applications. Because of the manner in which m-CHP is viewed, units have been
designed for ease of implementation into the majority of European homes. This
has lead to great market potential for m-CHP units in the European residential
sector.
m-CHP systems have the potential to have an installed capacity of 22
GWe in the United Kingdom and a potential of 60 GWe installed capacity in
Europe by 2010. Approximately 40 million homes have been identified as
suitable candidates for m-CHP. In the UK, 14 – 18 million of the 24 million
households have been identified as candidates for m-CHP. Around 18 million
homes in the UK are provided with gas-fired central heating. Based on the rate
for replacing standard boilers in the UK, an estimated 600,000 new m-CHP
systems could be installed or retrofitted in place of conventional boilers each
year. Over a 25 year span, this technology could reach 16 million UK homes.
“At present, the marginal cost of replacing boilers [with m-CHP units] suggests a
payback period of 5 – 8 years.” Current goals are to have one million units
installed in Europe by 2010 (Flin, 2005).
With one-third of the UK’s carbon dioxide emissions coming from domestic
energy consumption, the prospect of reduced emissions by implementing m-CHP
has great appeal. When replacing a natural gas-fired boiler, a typical m-CHP unit
with 1 kW of electrical output could potentially save 1.7 tons per year of carbon
dioxide emissions (Harrison, 2003a). Potentially, the UK could reduce carbon
10
dioxide emissions by 9 – 12 million tons per year through m-CHP (Flin, 2005).
The potential is to reduce carbon dioxide emissions in Europe by 40 million tons
per year using natural gas fired m-CHP (Harrison, 2003a).
Because of the existing market potential, several companies, such as
SenerTec, Power Plus Technologies, Whisper Tech, Siemens Westinghouse,
Honda, and Plug Power have developed m-CHP units with the intention of mass
marketing. The prime movers used in the m-CHP units range from internal
combustion engines and micro-turbines to Stirling engines and fuel cells.
Though the technology differs and considerations for each system are different,
common characteristics needed by all prime movers are
Low noise and vibration
Low maintenance – essentially maintenance free
Small size and low weight
Reliable and simple operation
Easy installation
Low capital cost
Common challenges have also been identified in the European market.
Many of these challenges stem from the incorporation of m-CHP systems into the
current infrastructure of the electrical utilities and from the variation of electric
and thermal loads due to geographic location. Other challenges arise from
overcoming the inertia of the utility market. “Three major obstacles currently
existing to market penetration are cost, the requirement for market

11
transformation, and developing the necessary maintenance skill base (Flin,
2005).” Some of these challenges also exist for the U.S. market. Other
challenges include
Control of the unit and a network of units to ensure optimal performance
Selecting the right technology for the environment in which the unit is to be placed
Developing units with the ability to be controlled and diagnosed remotely
Designing the entire system for minimum costs (Flin, 2005)
Several lessons can be drawn from the success and failure of the
technologies developed in Europe. When selecting a prime mover for a system,
two of the most important considerations are the heat-to-power ratio and
operating cost (Harrison, 2003c). Experience has shown that, “m-CHP operation
follows thermal demand and generates electricity according to that demand
profile (Harrison, 2003b).” Because of this, many of the prime movers with
higher efficiencies did not perform as well as less efficient prime movers that
provided a suitable match of thermal and electric loads. Also, high efficiency
corresponds to higher stresses and temperatures, which in turn leads to high
material and production costs and issues with service life (Harrison, 2003c).
The European experience has also shown that gaining the cooperation
and participation of the distributed network operators (European equivalent of
local utility providers) is crucial (Harrison, 2003c). Due to the high price of
energy storage and the need to draw power from the grid at peak times, m-CHP
units need to be grid connected. If an m-CHP unit is not grid connected, then the

12
systems must either be oversized for base load operation (thus requiring energy
storage in the form of batteries) or be provided with a peaking load generator (to
accompany the base load generator). In either case, the cost of the m-CHP
system increases drastically, decreasing market appeal.
By involving the network operators and the electric utilities, the issue of
buying from the grid and selling electricity to the grid raises the problem of
metering. To fully utilize m-CHP, energy companies must develop means that
would allow them to aggregate and dispatch electricity remotely and measure the
flow of electricity into and out of a location (Flin, 2005).
Another widely recognized concern of implementing m-CHP into the
European market is quality installation and professional service support. Service
support has been a vital component in the success or failure of several European
technologies. As stated by Harrison, “Poor initial support has led to some
products, such as heat pumps and condensing boilers being considered
unreliable and undesirable by the general public in some states (Harrison,
2003c).”
In conclusion, Halliday-Pegg (Cambridge Consultants) states, “It is clear
that domestic CHP will shake up the home energy market, but there are still
fundamental questions which must be addressed, and much development and
cost reduction is required to transform promising technology into viable products
and services for the mass market. Market penetration will only be possible when
the systems are at a cost the market can bear (Flin, 2005).”

13
CHAPTER III:
THE m-CHP SYSTEM
Micro-cooling, heating, and power combines distributed power generation
with thermally activated components to meet the cooling, heating, and power
needs of residential and small commercial buildings. The success of CHP
systems for large-scale application coupled with the development of power
generation equipment and thermally activated components on a smaller scale
have contributed to the development of m-CHP applications. Distributed power
generation technologies and thermally activated components will be introduced
and briefly discussed.
Distributed Power Generation
A number of technologies are commercially available or under
development for generating electric power (or mechanical shaft power) onsite or
near site where the power is used. Distributed power generation is a required
component of m-CHP systems. Fuel cells, reciprocating engines, Stirling
engines, Rankine cycle engines, and microturbines are prime movers that have
the most potential for distributed power generation for m-CHP systems.
14
Reciprocating Engines
Reciprocating engines can be used to produce shaft power. The shaft
power can then be used to drive a generator to produce electrical power. The
shaft power can also be used to operate equipment such as compressors and
pumps. The application of reciprocating engines is widespread and highly
developed. Reciprocating engines use natural gas, propane, gasoline, diesel
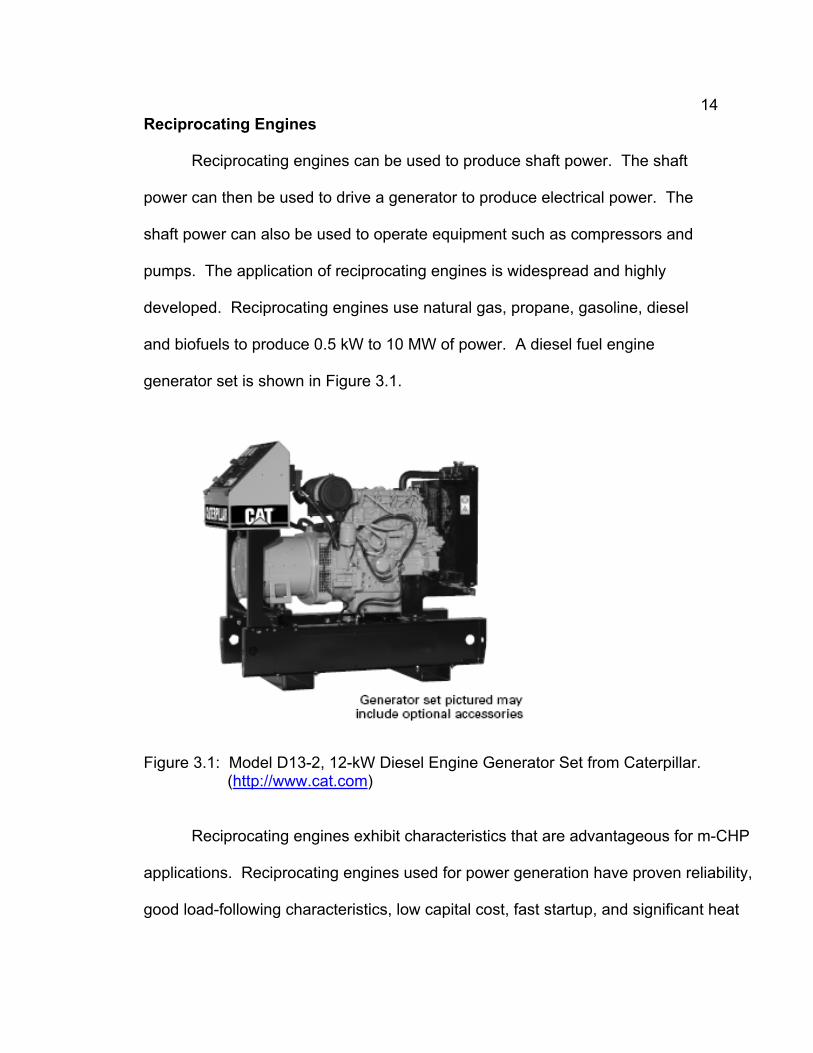
and biofuels to produce 0.5 kW to 10 MW of power. A diesel fuel engine
generator set is shown in Figure 3.1.
Figure 3.1: Model D13-2, 12-kW Diesel Engine Generator Set from Caterpillar. (http://www.cat.com)
Reciprocating engines exhibit characteristics that are advantageous for m-CHP
applications. Reciprocating engines used for power generation have proven reliability,
good load-following characteristics, low capital cost, fast startup, and significant heat

15
recovery potential. Recent advances in combustion design and exhaust catalyst have
also helped reduce overall emissions of reciprocating engines. Currently,
reciprocating engines are the most widely used distributed energy technology. Typical
electrical conversion efficiencies are in the range of 25% to 40%. The overall thermal
efficiencies of these systems increase with the incorporation of thermally activated
components.
The thermal energy in the engine cooling system and exhaust gases from
reciprocating engines can often be recaptured and used for space heating, for
hot water heating and for driving thermally activated components. Shaft power
from the engine can also be used to power thermal components, such as gas
vapor compression chillers. Such chillers are very similar to electric-driven
chillers with the exception that the compressor is driven by the reciprocating
engine rather than an electric motor.
Emissions of reciprocating engines tend to be higher than that of other
distributed generation equipment. Due to the emissions and noise emitted by
these engines, care must be exercised in the location of the engine with respect
to the occupants of the building. In some areas, local air quality standards may
limit the use of reciprocating engines.
Microturbines
Microturbines were derived from turbocharger technologies found in large
trucks or the turbines in aircraft auxiliary power units (APUs) and have a capacity
range of 25 kW to 500 kW. Microturbines utilize a variety of fuels including

16
natural gas, propane, and biofuels. Electrical energy efficiencies of 25% to 30%
are capable with the use of regenerators. Microturbines have fewer moving parts
than other generation equipment of similar capacity, creating the potential for
reduced maintenance intervals and cost. Though the generating capacity of
microturbines is above the range defined in the m-CHP regime, microturbines
have considerable potential in on-site power generation applications such as
apartment complexes and clusters of small commercial buildings.
The waste heat from a microturbine is primarily in the form of hot exhaust
gases. This heat is suitable for powering a steam generator, indirect heating of a
building, allocation to thermal storage devices, or use in heat-driven cooling
systems. Most designs incorporate recuperators that limit the amount of heat
available for m-CHP applications.
Microturbines have relatively low emissions and noise and also have low
maintenance costs. Another advantage is that microturbines are relatively small in
size or footprint. The fuel flexibility and quantity of hot exhaust gases make
microturbines an advantageous technology for m-CHP and cogeneration
applications. The Capstone C30, a 30-kW microturbine, is pictured in Figure 3.2.

17
Figure 3.2: Capstone C30 Microturbine. (www.capstone.com)
Stirling Engines
The Stirling engine is a type of external combustion piston engine which
uses a temperature difference to produce motion. The cycle is based on the
behavior of a fixed volume of gas. The heat source used to provide the
temperature difference can be supplied by a wide variety of fuels or solar energy.
The Stirling engine has only seen use in specific and somewhat limited
applications. However, recently many companies have begun research and
development related to Stirling engines due to their potential for m-CHP
applications and solar power stations.
Stirling engines typically have an electrical efficiency in the range of 12%
to 25%. This efficiency can be increased with the use of recuperators. The
operation of a Stirling engine requires that one side of the engine remain hot

18
while the other side remains cool. This requirement makes heat recovery an
integral part of the operation of a Stirling engine. Heat can be recovered from
dissipation of the heat source and through the use of heat exchangers on the
cool side of the engine. Stirling engines have low emissions and create low
noise levels. These engines are also mechanically simple, and because there is
no internal combustion, the maintenance requirements of Stirling engines are
relatively low. However, due to design, Stirling engines are heavy and large for
the amount of power generated. Stirling engines also have one of the higher
capital costs of distributed power generation technologies. The SOLO 9-kW
Stirling engine based m-CHP unit is shown in Figure 3.3.
Figure 3.3: SOLO 9-kW Stirling Engine (http://www.stirling-engine.de/engl/index.html)
Rankine Cycle Engines
Rankine cycle engines are based upon the well known thermodynamic
cycle that is used in most commercial electric power plants. The shaft power
from a Rankine cycle engine is used to drive an electric generator in the same

19
manner as reciprocating or Stirling engines. Rankine cycle engines have
relatively low electrical conversion efficiency. However, as m-CHP technologies
are designed to follow the thermal load, this low electrical efficiency becomes
less of a drawback because significant thermal energy that can be recovered
from a Rankine cycle engine. The durability and performance characteristics of
Rankine cycle engines are also well known, and low production costs are a
potential benefit.
The construction of a Rankine cycle engine allows heat to be recaptured
easily through the use of a condenser, which is already a component in the
engine cycle. Currently, Rankine cycle engines for m-CHP applications are in
the development stage. As a result, cost and specific performance
characteristics are not yet defined. A Cogen Microsystems 2.5-kW m-CHP unit
based on a Rankine cycle engine is pictured in Figure 3.4.
Figure 3.4: Cogen Microsystems 2.5-kW Rankine Cycle m-CHP Unit (www.cogenmicro.com)

20
Fuel Cells
Fuel cells are electrochemical energy conversion devices that produce
electrical power rather than shaft power. Unlike the technologies discussed
previously, fuel cells have no moving parts and, thus, no mechanical
inefficiencies. Four major types of fuel cells will be discussed: proton exchange
membrane (PEMFC), solid oxide (SOFC), phosphoric acid (PAFC), and molten
carbonate (MCFC) fuel cells. Each of these fuel cell types operate differently and
exhibit different performance characteristics.
In general terms, fuels cells combine a hydrogen based fuel input and
gaseous stream containing oxygen in the presence of a catalyst to initiate a
chemical reaction. The products of this reaction vary for each type of fuel cell but
typically are electrical power, heat, and water. In some instances, other product
gases such as carbon dioxide are formed. As a pure hydrogen-rich fuel is
required by most fuel cells, hydrogen reformers are often included in a fuel cell
system.
Like batteries, fuel cells produce direct current (DC) electrical power. This
requires that an inverter and power conditioner be used to transform the DC
current into alternating current (AC) at the appropriate frequency for use in the
majority of applications.
Fuel cells can achieve high electrical efficiencies as compared to other
distributed power generation equipment. Fuel cells exhibit quiet operation and
low emissions. Also, the absence of mechanical components decreases

21
maintenance. Unfortunately, the costs of fuel cells are relatively high as
compared to other technologies. The fuel flexibility of fuel cells is also low as
very pure streams of hydrogen are the only suitable fuel for certain types of fuel
cells. In some instances, the energy required to reform the input fuel greatly
decreases the overall efficiency of a fuel cell system. Still, fuel cells are a
promising technology that hold potential for m-CHP applications. A Plug Power
fuel cell is shown in Figure 3.5.
Figure 3.5: Plug Power Fuel Cell Unit (www.plugpower.com)
Heat Recovery
In most m-CHP applications, heat recovery is accomplished by ducting the
exhaust gas from a prime mover to a heat exchanger to capture the thermal
energy in the gas stream. Generally, these heat exchangers are air-to-water
heat exchangers, where the exhaust gases flow over a fin-tube heat exchanger
surface and the heat is used to produce hot water, or in some cases, steam. For

22
prime movers that include a cooling jacket that circulates engine coolant, a liquid-
to-liquid heat exchanger can also be used to recover waste heat in the form of
hot water. The hot water can then be used directly or used to operate thermally
activated components, such as desiccant dehumidifiers and absorption chillers.
Many of the thermal technologies used in the construction of an m-CHP system
require hot water at pressures of 15 – 150 psig. If needed, additional heat can
be supplied through a duct burner to provide additional steam or hot water.
Depending on the amount of waste heat available and the emission
concentrations of the prime mover, air-to-air heat exchangers can be used for
space heating for a building. However, air-to-air heat exchangers often have
lower effectivenesses than air-to-liquid heat exchangers.
In most m-CHP installations, a flapper damper or diverter valve is used to
control the flow of exhaust gases to the recovery heat exchanger. The flapper
can be used to divert a portion of the exhaust to the atmosphere to maintain
desired design conditions at the recovery heat exchanger. Exhaust gases can
also be used to drive an enthalpy wheel or desiccant dehumidifier in an m-CHP
system. An enthalpy wheel uses the exhaust gases to heat one side of a rotating
wheel with a medium that absorbs the heat and then transfers the heat to the
incoming air flow on the opposite side of the wheel. Temperature has a strong
relationship to the usefulness of waste heat. The term “quality” is often used to
describe the usefulness of waste heat in these terms.

23
Thermally Activated Devices
Thermally activated devices are technologies that utilize thermal energy
rather than electric energy to provide heating, cooling, or humidity control. The
primary thermally activated components used in m-CHP systems are desiccant
dehumidifiers and absorption chillers.
Desiccant Dehumidifiers
The comfort level of a conditioned space is determined by the temperature
and the relative humidity. Humidity control is also important to protect the health
of the occupants inhabiting the conditioned space. The humidity level should
remain below 60% Relative Humidity (RH) to prevent growth of mold, bacteria,
and other harmful organisms in buildings and to prevent adverse health effects.
Traditionally, a single piece of equipment, a cold coil, has been used for
both the temperature and humidity control for a conditioned space.
Dehumidification effects have been achieved by reducing the temperature of the
process air below its dew point. Moisture in the air condenses on the surface of
cooling coils over which the air passes. Cooler air containing less moisture can
then be sent to the conditioned space. However, in some cases, the temperature
of the air leaving the cooling coils is below the comfort level and the air must be
reheated to the desired temperature.
Desiccants are materials that directly absorb moisture from air. Desiccant
dehumidifiers can be used to reduce the moisture content of air. In an m-CHP

24
system, recovered heat is used for regenerating the desiccant material in
dehumidifiers. Desiccant dehumidifiers satisfy the latent load by reducing the
relative humidity of the air. Sensible cooling is provided by a cold coil from
absorption chillers or conventional air conditioning units. Desiccant dehumidifiers
operate in series or parallel with other cooling system components. A Bry-Air,
MiniPACTM desiccant dehumidifier is pictured in Figure 3.6.
Figure 3.6: MiniPAC Desiccant Dehumidifier by Bry-Air (http://www.bry-air.com/)
Absorption Chillers
Absorption chillers use heat as the primary energy source for driving an
absorption refrigeration cycle. Little electrical power is needed for most
absorption chiller designs (0.02 kW/ton) as compared to electric driven chillers
(0.47 to 0.88 kW/ton). Absorption chillers also have fewer moving parts as
compared to electric chillers and exhibit quieter operation than electric chillers.
Commercially available absorption chillers can utilize steam, hot water,
exhaust gases, and direct combustion as heat sources. Absorption chillers that
utilize hot water and exhaust gases are prime candidates for providing some or

25
all of the cooling load in an m-CHP system. Modern absorption chillers can also
provide heat in the winter and feature electronic controls that allow quick start-up,
automatic purge, and greater turndown capacity than many electric chillers.
Maintenance contracts and warranties, comparable to those for electric chillers,
are also available for absorption chillers.
Absorption chillers come in single-effect and multiple-effect configurations.
Multiple-effect absorption chillers have higher capital cost than single-effect
chillers. However, multiple effect absorption chillers are more energy efficient
and, therefore, are less expensive to operate. The attractiveness of absorption
chillers for m-CHP applications depends on capital costs, operational costs, and
cooling load requirements. A Yazaki Energy Systems, Inc. 10-ton capacity
WFC-S Series absorption chiller is shown in Figure 3.7.
Figure 3.7: Yazaki Energy Systems WFCS Series 10-ton Absorption Chiller.(www.yazakienergy.com)

26
CHAPTER IV:
PRIME MOVERS
Reciprocating Engines
Technology Overview
Fossil fueled internal combustion (IC) engines are in widespread and
diverse use. Available IC engines range from small portable gasoline engines to
large 50,000 horsepower diesel engines. An IC engine is powered by the
expansion of the hot combustion products of fuel directly acting within the engine.
IC engines require air, fuel, compression, and a combustion source to function.
The two types of combustion engines which are most significant to stationary
power generation are the spark-ignition, four-stroke reciprocating IC engines and
the compression-ignited engines, typically using diesel fuel.
Basic engine terminology is schematically illustrated in Figure 4-1. The
bore is the cylinder diameter. The piston is at top dead center (TDC) when the
cylinder volume is a minimum. When the piston is moved to the position where
the cylinder volume is at a maximum, the piston is at bottom dead center (BDC).
The stroke is the distance between TDC and BDC. The displacement volume,
usually just called the displacement, is the volume displaced as the piston moves
from TDC to BDC - the area of the bore times the stroke

27
Figure 4.1: Four-stroke Reciprocating IC Engine (www.personal.washtenaw.cc.mi.us)
The four-stroke IC engine is a spark-ignited reciprocating engine that
operates on the basis of the Otto cycle. The major components of the four-stroke
IC engine are an ignition source (spark plug), cylinder, piston, connecting rod,
intake and exhaust valves, and a crankshaft shown in Figure 4.1. The basic IC
engine model is the air-standard Otto cycle, in which heat is added
instantaneously while the piston is at top dead center and in which heat is
rejected at constant volume.
The air-standard Otto cycle consists of four internally reversible processes
in series. The pressure-specific volume (pv) and temperature-entropy (Ts)
diagrams for the air-standard Otto cycle are shown in Figure 4.2. As the piston
moves from BDC to TDC, an isentropic compression of air comprises Process 1

28
– 2. Process 2 – 3 is a constant volume heat transfer to the air from an external
source. Combustion begins as the heat is added to the compressed working
fluid. The piston moves from TDC to BDC in Process 3 – 4 through an isentropic
expansion, the power stroke. Process 4 – 1 is constant volume heat rejection
with the piston at bottom dead center to complete the cycle.
1
2
3
4
1
2
3
4
p
a b ab
T
s
(a) p (b) Ts
Figure 4.2: Pressure-Specific Volume and Temperature-Entropy Diagrams for the Air-Standard Otto Cycle.
The expressions for the work accomplished by the cycle (WOtto), the heat
added (Qin), and the thermal efficiency ( Otto) can be determined through the
application of the first law of thermodynamics. Applying the air-standard
assumptions of constant specific heats and ideal gas properties, the following
relationships are employed.
34 12( )
OttoW m u u (4-1a)
3 4 2 1( ) ( )
OttoW m u u m u u (4-1b)
29
3 2 4 1( )
Otto vW m c T T T T (4-1c)
3 2( )
inQ m u u (4-2a)
3 2( )
in vQ c m T T (4-2a)
Otto
Otto
in
W
Q (4-3a)
3 2 4 1
3 2
( )
( )
v
Otto
v
c m T T T T
c m T T (4-3b)
4 11
2 3 2
/ 11
/ 1Otto
T TT
T T T (4-3c)
For the isentropic compression and expansion process, the compression
ratio (r) is the ratio of the volume of the working fluid when the piston is at BDC to
the volume of the working fluid when the piston is at TDC. Noting from Figure 4-
2 that V2 = V3 and V1 = V4, the expression for the compression ratio can be
expressed as
rV
V
V
V
1
2
4
3
(4-4)
For an air-standard analysis, the isentropic relationships for pressure,
temperature, and volume are as follows:
31 2 4
2 1 4 3
1kk
k
k
pp V Vand r
p V p Vr (4-5)
T
T
V
V rand
T
T
V
V r
k
k
k
k
1
2
2
1
1
1
4
3
3
4
1
1
1 1 (4-6)

30
where k is the ratio of the specific heats (Cp/Cv). For an air-standard analysis, k
is 1.4. Since T3/T2 = T4/T1, the thermal efficiency becomes
Otto
T
T1
1
2
(4-7)
The efficiency can also be expressed in terms of the compression ratio and ratio
of specific heats as
Otto kr
11
1 (4-8)
For a working fluid with constant specific heats, the thermal efficiency will
increase with an increase in the compression ratio. The ideal Otto cycle thermal
efficiency is shown as a function of the compression ratio in Figure 4.3. The
figure demonstrates that the change in the compression ratio from 1 to 10 has
the greatest effect on the thermal efficiency of an Otto engine.
0 5 10 15 20 250
20
40
60
80
Compression Ratio
Cy
cle
Eff
icie
ncy
(%
)
Figure 4.3: Otto Cycle Thermal Efficiency as a Function of Compression Ratio

31
Example 4-1.
The temperature at the beginning of the compression of an air-standard Otto cycle with a compression
ratio of 9 is 550 R, the pressure is 1 atm and the cylinder volume is 0.9 ft 3. The maximum temperature
during the cycle is 1600 R. For air, c v = 0.171 Btu/lb-R and c p = 0.24 Btu/lb-R. Determine (a) the
temperature and pressure at the end state of each cycle, (b) the thermal efficiency, (c) the net work per
cycle, (d) the amount of heat rejected per cycle, and (e) the maximum temperature and pressure of the
rejected heat.
Solution:
Schematic
1
2
3
4
1
2
3
4
p
va b ab
T
s
O tto
(a) pv (b) Ts
Given Data:
T1
550R Temperature before compression stroke
T3
1600R Maximum temperature
r 9 Compression ratio
P1
1atm Pressure before the compression stroke
V1
0.02ft3 Cylinder volume
cv
0.171BTU
lb R
Constant volume specific heat
cp
0.24BTU
lb R
Constant pressure specific heat
Rg
0.06855BTU
lb R
Gas constant of air
Figure 4.4: Example 4-1

32
Characteristics of the air-standard Otto cycle:
1. The air in the piston cylinder assembly is a closed system.
2. The compression and expansion processes are adiabatic.
3. All processes are internally reversible.
4. The air is modeled as an ideal gas with an air-standard analysis.
5. Kinetic and potential energy effects are negligible.
(a) Determine the temperature, pressure, and specific internal energy (u) at each principal state in the
cycle.
Using T1,
u1
cv
T1
u1
94.05BTU
lb
Internal Energy at State 1
For an isentropic compression (Process 1-2)
T2
T1
rk 1
T2
1.325 103
R Temperature at State 2
and
P2
P1
rk
P2
21.674atm Pressure at State 2
Using T2,
u2
cv
T2
u2
226.494BTU
lb
Internal Energy at State 2
Process 2-3 occurs at constant volume. Using the ideal gas equation,
V3
m R T3
P3
and V2
m R T2
P2
with V2
V3
yields
P3
P2
T3
T2
P3
26.182atm Pressure at State 3
Using T3,
u3
cv
T3
u3
273.6BTU
lb
Internal energy at State 3
For an isentropic compression (Process 3-4)
T4
T3
rk 1
T4
664.39R Temperature at State 4
and
P4
P3
1
kk
P4
16.346atm Pressure at State 4
Using T4,
u4
cv
T4
u4
113.611BTU
lb
Internal energy at State 4
Figure 4.4 (continued)

33
(b) The thermal efficiency is determined based on the compression ratio.
Equation 4-8 gives the thermal efficiency of the air-standard Otto cycle as
Otto1
1
rk 1
Otto58.476% Thermal efficiency
(c) The net work produced per cycle can be calculated with the internal energy known at each point in
the cycle.
The mass (m) is calculated using the ideal gas law.
m1
P1
V1
Rg
T1
m1
1.443 103
lb
Equation 4-1b expresses the net work per cycle as
WOtto
m1
u3
u4
u2
u1
WOtto
0.04BTU Net work per cycle
(d) The heat rejected per cycle is
Qrej
m1
u4
u1
Qrej
0.028BTU Reject heat per cycle
(e) The pressure and temperature of the rejected heat is at the maximum at the beginning of the heat
rejected process.
P4
16.346atm Maximum pressure of Qrej
T4
664.39R Maximum temperature of Qrej
Figure 4.4 (continued)
Compression-ignition reciprocating engines operate on the basis of the
Diesel cycle. An illustration of a combustion-ignition cylinder is shown in Figure
4.5. The ideal, air-standard Diesel cycle is similar to the model of the ideal, air-
standard Otto cycle.

34
Figure 4.5: Compression-ignition Engine. (hyperphysics.phy-astr.gsu.edu/hbase/thermo/diesel.html)
The air-standard Diesel cycle is a cycle in which the heat addition occurs
during the constant pressure process that begins with the piston at top dead
center. The pressure-specific volume (pv) and temperature-entropy (Ts)
diagrams for the air-standard Diesel cycle are shown in Figure 4.6. The cycle
consists of four internally reversible processes in series. Process 1 – 2 is an
isentropic compression, the same as the Otto cycle. In Process 2 – 3, heat is
transferred to the working fluid at constant pressure, and Process 2 – 3 also
makes up the first part of the power stroke. The remainder of the power stroke is
completed through an isentropic expansion in Process 3 – 4. In Process 4 – 1,
heat is rejected from the air while the piston is at bottom dead center.

35
Figure 4.6: Pressure-Specific Volume and Temperature-Entropy Diagrams for the Air-Standard Diesel Cycle.
While the spark-ignition engine compresses a fuel/air mixture, the
compression-ignition engine requires the working fluid to be compressed to a
high temperature and pressure before fuel is added. The addition of the fuel to
the high temperature, high pressure working fluid initiates combustion.
Application of the first law to the ideal Diesel cycle yields the expressions
for the net work accomplished by the cycle, (WDiesel), the heat added (Qin), and
the heat rejected (Qout), and the thermal efficiency ( Diesel).
3 2( )
inQ m h h (4-8a)
3 2( )
in pQ m c T T (4-8b)
4 1( )
outQ m u u (4-9a)
4 1( )
out pQ m c T T (4-9b)

36
Diesel in outW Q Q (4-10a)
3 2 4 1( ) ( )
Diesel p pW m c T T c T T (4-10b)
Diesel
Diesel
in
W
Q (4-11)
Both a compression ratio (r) and a cutoff ratio (rc) are defined for the Diesel cycle.
The cutoff ratio is the ratio of the volume when the fuel flow is cut off to the
volume when the fuel flow is started.
1
2
3
2
c
VrV
Vr
V
The compression ratio for the Diesel cycle is based only on the isentropic
compression and not the isentropic expansion. The air-standard thermal
efficiency of the Diesel cycle is
Diesel k
c
k
cr
r
k r1
1 1
11
( ) (4-12)
The thermal efficiency of the Diesel cycle differs from the thermal
efficiency of the Otto cycle by the bracketed term in the equation (4.12). Diesel
engines must always have a cutoff ratio greater than unity (rc > 1). Otto engines
typically have higher thermal efficiencies than Diesel engines at the same
compression ratio. Still, better overall thermal efficiencies are achieved by Diesel
engines because they can operate at higher compression ratios than Otto
engines. Diesel engines can achieve compression ratios as high as 25:1 and
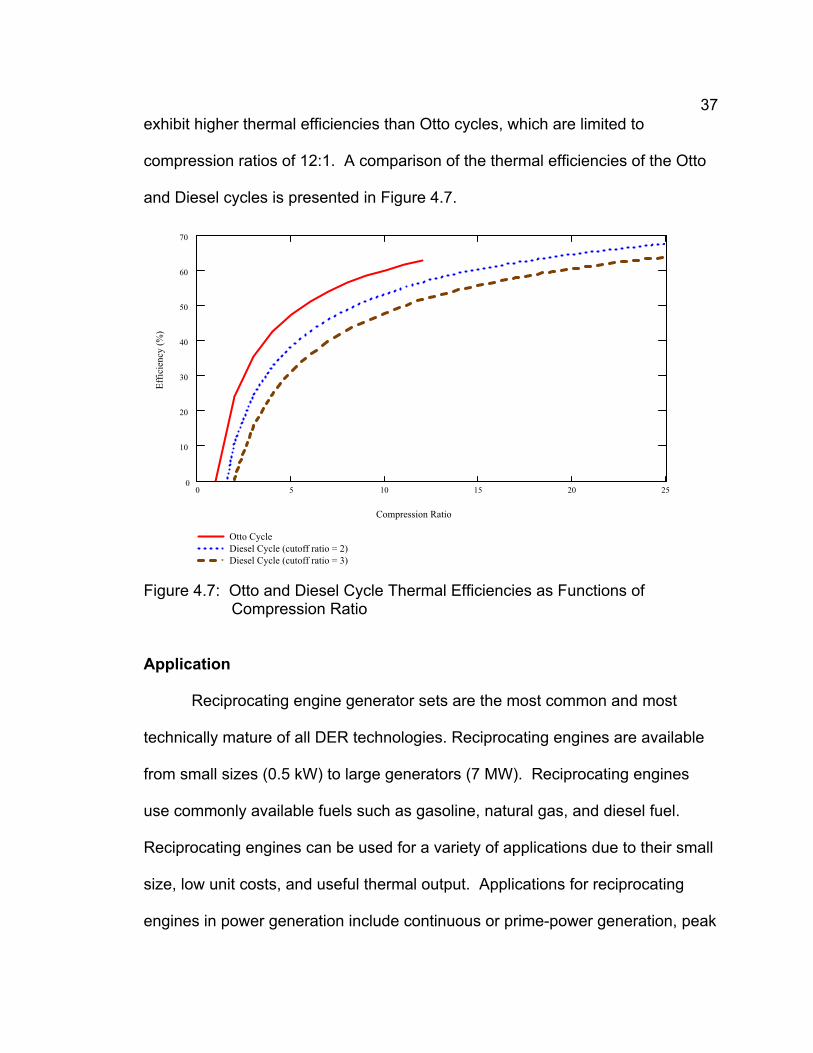
37
exhibit higher thermal efficiencies than Otto cycles, which are limited to
compression ratios of 12:1. A comparison of the thermal efficiencies of the Otto
and Diesel cycles is presented in Figure 4.7.
0 5 10 15 20 250
10
20
30
40
50
60
70
Otto Cycle
Diesel Cycle (cutoff ratio = 2)
Diesel Cycle (cutoff ratio = 3)
Compression Ratio
Eff
icie
ncy
(%
)
Figure 4.7: Otto and Diesel Cycle Thermal Efficiencies as Functions of Compression Ratio
Application
Reciprocating engine generator sets are the most common and most
technically mature of all DER technologies. Reciprocating engines are available
from small sizes (0.5 kW) to large generators (7 MW). Reciprocating engines
use commonly available fuels such as gasoline, natural gas, and diesel fuel.
Reciprocating engines can be used for a variety of applications due to their small
size, low unit costs, and useful thermal output. Applications for reciprocating
engines in power generation include continuous or prime-power generation, peak

38
shaving, back-up power, premium power, remote power, standby power, and
mechanical drive use. An overview of reciprocating engine characteristics is
presented in Table 4.1.
Table 4.1: Overview of Reciprocating Engine Technology (http://www.energy.ca.gov/distgen/)
Reciprocating Engines Overview
Commercially Available Yes
Size Range 0.5 kW – 7 MW
Fuels Natural gas, diesel, landfill gas, digester gas
Efficiency 25 – 45%
Environmental Emission controls required for NOx and CO
Other Features Cogeneration (some models)
Commercial Status Products are widely available
Reciprocating engines are an ideal candidate for applications in which there is
a substantial need for hot water or low pressure steam. The thermal output can be
used in an absorption chiller to provide cooling. Comparatively low installation costs,
suitability for intermittent operation, and high temperature exhaust make combustion
engines an attractive option for m-CHP. Internal combustion engines utilize proven
technologies with a well established infrastructure for mass production and marketing.
The development of combustion engines has also formed a maintenance
infrastructure with certified technicians and relatively inexpensive and available parts
are available. Due to the long history and widespread application, internal combustion
engines are a more developed technology than most prime movers considered for m-
CHP.

39
Heat Recovery
Traditional large-scale electric power generation is typically about 30% efficient,
while combined cycle plants are typically 48% efficient. In either case, the reject heat
is lost to the atmosphere with the exhaust gases. In an internal combustion engine,
heat is released from the engine through coolant, surface radiation, and exhaust.
Engine-driven m-CHP systems recover heat from the jacket water, engine oil, and
engine exhaust. Low pressure steam or hot water can be produced from the
recovered heat, and can be used for space heating, domestic hot water, and
absorption cooling.
Heat from the engine jacket coolant is capable of producing 200 F (93 C)hot
water and accounts for approximately 30 % of the energy input from the fuel. Engines
operating at high pressure or equipped with ebullient cooling systems can operate at
jacket temperatures of up to 265 F (129 C). Engine exhaust heat can account for 10 –
30 % of the fuel input energy and exhaust temperatures of 850 F –1200 F (455 C –
649 C) are typical. Because exhaust gas temperatures must be kept above
condensation thresholds, only a portion of the exhaust heat can be recovered. Heat
recovery units are typically designed for a 300 F – 350 F exhaust outlet temperature to
avoid corrosive effects of condensation in the exhaust piping. Low-pressure steam
(~15 psig) and 230 F (110 C) hot water are typically generated using exhaust heat
from the engine. The combined heat recovery of the coolant and exhaust in
conjunction with the work produced by combustion can utilize approximately 70 – 80%
of the fuel energy.

40
Cost
Reciprocating internal combustion (IC) engines are the traditional
technology for emergency power all over the world. They have the lowest first
costs among DER technologies. The capital cost of a basic gas-fueled generator
set (genset) package ranges from $300-$900/kW, depending on size, fuel type,
and engine type. Generally speaking, the overall engine cost increases as power
output increases. The total installed cost can be 50-100% more than the engine
itself. Additional costs include balance of plant (BOP) equipment, installation
fees, engineering fees, and other owner costs. Installed costs of m-CHP projects
using IC engines typically range between $800/kW - $1500/kW.
The maintenance costs over the life of IC engines can be significant. The
core of the engine maintenance is in the periodic replacement of engine oil,
coolant, and spark plugs (if spark ignition). Routine inspections and/or
adjustments are also necessary. Maintenance costs of gas and diesel IC
engines range between $0.007-$0.015/kWh and $0.005-$0.010/kWh
respectively. (http://www.energy.ca.gov/distgen/equipment/.html)
Advantages and Disadvantages
Reciprocating engines are generally less expensive than competing
technologies. They also have start-up times as low as ten seconds, compared to
other technologies that may take several hours to reach steady-state operation.
Through years of technology advancements, reciprocating engines have climbed

41
in efficiency from under 20% to over 30%. Today's most advanced natural gas-
fueled IC engines have electrical efficiencies (based on lower heating value,
LHV) close to 45% and are among the most efficient of the commercially
available prime mover technology. Lower heating values neglect the energy in
the water vapor formed by the combustion of hydrogen in the fuel. This water
vapor typically represents about 10% of the energy content. Therefore the lower
heating values for natural gas are typically 900 - 950 Btu per cubic foot.
Advantages of reciprocating engines include:
Available in a wide range of sizes to match the electrical demand.
Fast start-up and adjustable power output “on the fly.”
Minimal auxiliary power requirements, generally only batteries are required.
Demonstrated availability in excess of 95%.
In load following applications, high part-load efficiency of IC engines maintains economical operation.
Relatively long life and reliable service with proper maintenance.
Very fuel flexible.
Natural gas can be supplied at low pressure.
Disadvantages of IC engines are:
Noisy operation.
Require maintenance at frequent intervals.
Relatively high emissions to the atmosphere.

42
Exercises
For air-standard analysis cv = 0.171 Btu/lb-R and cp = 0.24 Btu/lb-R.
1. A piston-cylinder arrangement has a cylinder diameter (bore) of 60 mm and performs a 100 mm stroke. If the clearance volume, the volume above top- dead-center, is 75 cm3, what is the compression ratio?
2. A four-cylinder, four-stroke IC engine has a bore of 3.0 in. and a stroke of 2.7 in. The clearance volume is 14 % of the cylinder volume when the piston is at bottom dead center. What are (a) the compression ratio, (b) the cylinder displacement (volume displaced by cylinder), and (c) the engine displacement?
3. An air-standard analysis is to be performed on a spark-ignited IC engine with a compression ratio of 9.0. At the start of compression, the pressure and temperature are 100 kPa and 300 K, respectively. The heat addition per unit mass of air is 600 kJ/kg. Determine (a) the net work, (b) the thermal efficiency, (c) the heat rejected during the cycle, and (d) the maximum temperature and pressure of the rejected heat.
4. An Otto cycle operates on an air-standard basis. The properties of the air prior To compression are p1 = 1 bar, T1 = 310 K, and V1 = 100 cm3. The compression ratio of the cycle is 8 and the maximum temperature is 900 K. Determine (a) the heat addition in kJ, (b) the net work in kJ, (c) the thermal efficiency, and (d) the availability transfer from the air accompanying the heat rejection process, in kJ, for T0 = 310 K, p0 = 1 bar.
5. Consider a four-stroke, spark-ignited engine with four cylinders. Each cylinder undergoes a process like the cycle in Problem 2. If the engine operates at 1500 rpm, determine the net power output in kW.
6. Prior to the compression stroke in an Otto cycle, the pressure and temperature are 14.7 psi and 540 R, respectively. The compression ratio is 6, and the heat addition per unit mass of air is 250 Btu/lb. Find (a) the maximum temperature of heat rejection, in R, (b) the maximum pressure of heat rejection, in psi, and (c) the thermal efficiency if the cycle is modeled on a cold-air standard basis with specific heats evaluated at 540 R.
7. A four-stroke two-cylinder Otto engine has a bore of 2.5 in, a stroke of 3.5 in, and a compression ratio of 7.2:1. The intake air is at 14.7 psi and 40 F with compression and expansion processes that are reversible and adiabatic. If 300 Btu/lbm air is added and the engine speed is 300 rpm, determine (a) the

43
net work per cycle, (b) the work per minute, and (c) the rate of heat rejection in Btu/hr.
8. A four-cylinder, four-stroke IC engine has a bore of 1.7 in. and a stroke of 3.1 inches. The clearance volume is 16 % of the cylinder volume when the piston is at bottomdead center and the crankshaft rotates at 1100 rpm. The processes in the cylinders are modeled as a cold air-standard Otto cycle with a pressure of 14.7 psi and a temperature of 80 F at the beginning of compression. The maximum temperature in the cycle is 1800 R. Based on this model, calculate (a) the net work per cycle, (b) the power developed by the engine, (c) the amount of heat rejected, (d) the maximum temperature and pressure of heat rejection, and (e) the thermal efficiency of the cycle.
9. A diesel cycle is modeled on a cold air-standard basis with specific heats calculated at 300 K. At the beginning of compression, the pressure and temperature are 112 kPa and 273 K, respectively. After heat addition, the pressure is 1.2 MPa and the temperature is 1200 K. Determine (a) the compression ratio, (b) the cutoff ratio, (c) the heat rejected by the cycle, and (d) the thermal efficiency of the cycle.
10. An air standard diesel cycle has a compression ratio of 16 and a cutoff ratio of 2. Before compression, p1 = 14.7 psi, V1 = 0.4 ft3, and T1 = 320 R. Calculate (a) the heat added, (b) the heat rejected, (c) the thermal efficiency, (d) the maximum temperature and pressure of the rejected heat, and (e) the availability transfer from the air accompanying the heat rejection process for T0 = T1 and p0 = p1.
11. The maximum temperature of a cold air-standard diesel cycle is 1200 K. The pressure and temperature before compression are 84 kPa and 290 K, respectively. With an air mass of 6 grams and compression ratios of 14, 19, and 21, calculate (a) the net work of the cycle, (b) the heat rejected during the cycle, and (b) the thermal efficiency of the cycle.

44
Manufacturers
Generac Power Systems, Inc. headquartered in Waukesha, Wisconsin
manufactures a complete line of residential/light commercial standby
generators that can be installed during new construction or retrofitted into
existing homes and businesses. These systems range from 7 to 40
kilowatts of output, in both air- and liquid-cooled models. All models are
factory-built for natural gas operation and can be reconfigured for liquid
propane (LP gas) operation. The 15-kW liquid cooled Generac model
MMC 4G15 Engine is pictured in Figure 4.8.
Figure 4.8: Generac Model MMC 4G15 15-kW Reciprocating Engine Generator (http://www.generac.com)
Caterpillar headquartered in Peoria, Illinois, manufactures diesel generator sets
from 7 to 16,200 kW, and gas-powered generator sets, from 9 to 6,000 kW.
Figure 4.9 shows a model D13-2, 12-kW diesel engine generator set from
Caterpillar.

45
Figure 4.9: Model D13-2, 12-kW Diesel Engine Generator Set from Caterpillar(http://www.cat.com)
Cummins, based in Columbus, Indiana, is a manufacturer of engines and
power generators for many applications. Cummins products operate on a wide
variety of fuels and have power outputs of 2 kW to 2 MW. Figure 4.10 pictures
a Cummins model GNAA 60 Hz 6-kW spark-ignited generator set that can run
off either natural gas or propane. Cummins also offers models that use
gasoline and diesel as fuels.
Figure 4.10: Cummins Model GNAA 60 Hz 6-kW Spark-ignited Generator Set (http://www.cumminspower.com)
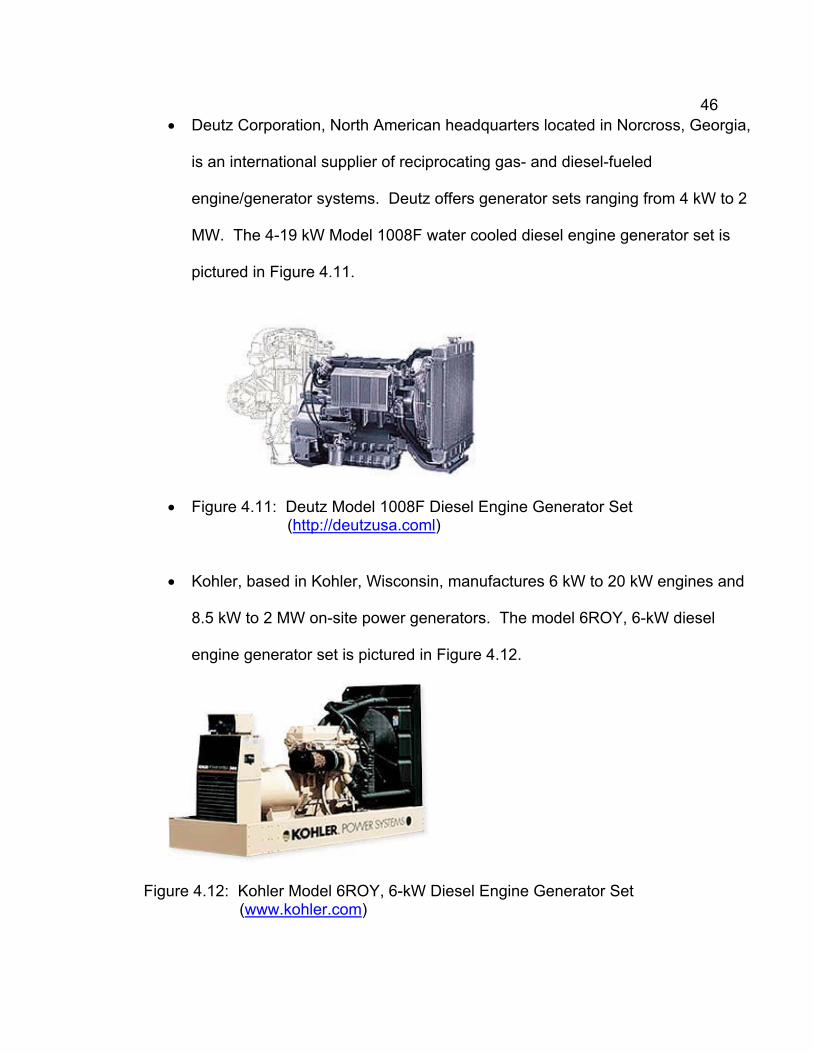
46
Deutz Corporation, North American headquarters located in Norcross, Georgia,
is an international supplier of reciprocating gas- and diesel-fueled
engine/generator systems. Deutz offers generator sets ranging from 4 kW to 2
MW. The 4-19 kW Model 1008F water cooled diesel engine generator set is
pictured in Figure 4.11.
Figure 4.11: Deutz Model 1008F Diesel Engine Generator Set (http://deutzusa.coml)
Kohler, based in Kohler, Wisconsin, manufactures 6 kW to 20 kW engines and
8.5 kW to 2 MW on-site power generators. The model 6ROY, 6-kW diesel
engine generator set is pictured in Figure 4.12.
Figure 4.12: Kohler Model 6ROY, 6-kW Diesel Engine Generator Set(www.kohler.com)
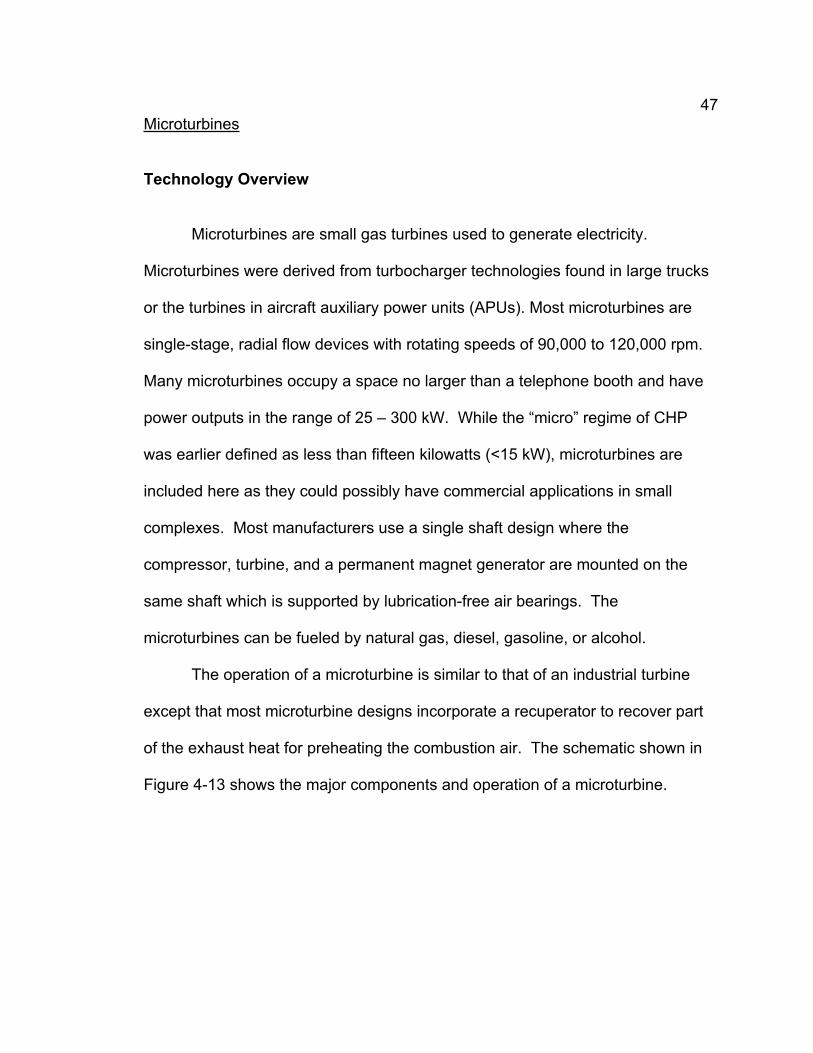
47
Microturbines
Technology Overview
Microturbines are small gas turbines used to generate electricity.
Microturbines were derived from turbocharger technologies found in large trucks
or the turbines in aircraft auxiliary power units (APUs). Most microturbines are
single-stage, radial flow devices with rotating speeds of 90,000 to 120,000 rpm.
Many microturbines occupy a space no larger than a telephone booth and have
power outputs in the range of 25 – 300 kW. While the “micro” regime of CHP
was earlier defined as less than fifteen kilowatts (<15 kW), microturbines are
included here as they could possibly have commercial applications in small
complexes. Most manufacturers use a single shaft design where the
compressor, turbine, and a permanent magnet generator are mounted on the
same shaft which is supported by lubrication-free air bearings. The
microturbines can be fueled by natural gas, diesel, gasoline, or alcohol.
The operation of a microturbine is similar to that of an industrial turbine
except that most microturbine designs incorporate a recuperator to recover part
of the exhaust heat for preheating the combustion air. The schematic shown in
Figure 4-13 shows the major components and operation of a microturbine.

48
Figure 4.13: Microturbine Components and Operation
As can be seen in Figure 4.13, air enters the compressor and is pre-
heated for combustion in the recuperator. The air mixes with the fuel in the
combustor, and the combusted air/fuel mixture expands through the turbine. The
rotation of the turbine drives the shaft which powers both the compressor and
generator. The exhaust from the turbine is fed back through the recuperator to
preheat the combustion air.
Unrecuperated microturbines produce electricity from natural gas at
efficiencies around 15%. Microturbines equipped with recuperators obtain
electrical efficiencies in the range of 20% - 30%. The difference in electrical
efficiency is that the preheated combustion resulting from the recuperator
reduces the amount of fuel required. Overall system efficiencies of 85% can be
reached when microturbines are coupled with thermally-activated components for

49
heat recovery. As compared to industrial turbines, microturbines have very low
emissions. Table 4.2 lists an overview of microturbine technology.
Table 4.2: Overview of Microturbine Technology (http://www.energy.ca.gov/distgen)
Microturbine Overview
Commercially Available Yes (Limited)
Size Range 25 – 500 kW
Fuel Natural gas, hydrogen, propane, diesel
Efficiency 20 – 30% (Recuperated)
Environmental Low (< 9 – 50 ppm) NOx
Other Features Cogen (50 – 80°C water)
Commercial Status Small volume production, commercial prototypes now.
The simplest model for gas turbines is the air-standard Brayton cycle. The
air-standard model is comprised of isentropic compression and expansion
processes and reversible, constant-pressure heat addition and rejection. Air is
the working fluid and is modeled as an ideal gas with constant specific heat
throughout the cycle. The pressure-specific volume (pv) and temperature-
entropy (Ts) diagrams for the air-standard ideal Brayton cycle are shown in
Figure 4.14.

50
Figure 4.14: Pressure-Specific Volume and Temperature-Entropy Diagrams forthe Ideal Brayton Cycle
On the T-s diagram, area 2-3-a-b-2 represents the heat added per unit of
mass flowing and area 1-4-a-b-1 represents the heat rejected per unit mass
flowing. On the p-v diagram, area 1-2-a-b-1 represents the compressor work
input per unit mass flowing and area 3-4-b-a-3 represents the turbine work output
per unit mass flowing. The enclosed area on each diagram of Figure 4-14 can
be viewed as the net work output (pv) and net heat added (Ts).
Application of the first law of thermodynamics to the model determines the
expression for turbine work (WT), compressor work (WC) net work (Wnet), heat
added (Qin), and cycle efficiency ( ).
1 2CW m h h (4-13a)
1 2( )
C pW m c T T (4-13b)
3 4TW m h h (4-14a)

51
3 4( )
T pW m c T T (4-14b)
3 2inQ m h h (4-15a)
3 2( )
in pQ m c T T (4-15b)
net T CW W W (4-16a)
3 4 1 2( ) ( )
net p pW m c T T c T T (4-16b)
3 1 2 4( )
net pW m c T T T T (4-16c)
net
in
W
Q (4-17a)
3 1 2 4
3 2
T T T T
T T (4-17b)
1 4
3 2
1T T
T T (4-17c)
Since the specific heats are constant, then
34
1 2
TT
T T (4-18)
For an isentropic process,
1
2 2
1 1
k
kT p
T p (4-19)
where k is the ratio of specific heats (Cp/Cv). A similar relationship can be written
for T3 and T4 with P3 and P4. The cycle efficiency becomes

52
1
2
1
11
k
kp
p
(4-20)
The thermal efficiency of the air-standard Brayton cycle is as function of
the pressure ratio (P2/P1). The Brayton cycle is primarily described by the
pressure ratio, the turbine inlet temperature, the compressor inlet temperature,
the isentropic turbine efficiency, and the isentropic compressor efficiency. The
effect of pressure ratio on the efficiency is shown in Figure 4.15.
0 5 10 15 20 25 300
10
20
30
40
50
60
70
Pressure Ratio
Eff
icie
ncy
(%
)
Figure 4.15: Air-standard Brayton Cycle Efficiency as a Function of PressureRatio
The air-standard Brayton cycle includes the assumptions that the
compressor and turbine operate isentropically and that there is no pressure drop
during heat addition and rejection. These assumptions are not realistic in a
microturbine cycle. In a real gas turbine cycle, irreversibilities in all processes

53
cause the working fluid specific entropy to increase. However, the irreversibilities
in the heat exchanger process are less significant than those in the compression
and expansion processes and are often ignored. The Ts diagram in Figure 4.16
illustrates the effects of irreversibilities in a microturbine cycle.
Figure 4.16: Temperature-Entropy Diagram of a Real Microturbine Cycle
The isentropic compressor efficiency is defined as the ratio of the
isentropic compressor work to the actual compressor work, when both are
compressed through the same pressure ratio. The isentropic turbine efficiency is
defined as the ratio of actual work of expansion to the isentropic work of
expansion, when both expand from the same initial state to the same final
pressure. The expressions for the isentropic compressor efficiency and the
isentropic turbine efficiency are
2 1
2 1
s
C
h h
h h (4-21)

54
3 4
3 4
T
s
h h
h h (4-22)
For constant specific heats, the isentropic compressor and expansion efficiencies
become
1
2
1
2
1
1
k
k
C
P
P
T
T
(4-23)
4
3
1
4
3
1
1
T k
k
T
T
P
P
(4-24)
The compressor work (WComp) and the turbine work (WTurb) for a gas
turbine cycle become
1
2
1
1
1
k
k
Comp
C
PCpW m T
P (4-25)
1
4
3
3
1
k
k
T T
PW m Cp T
P (4-26)
where the constant pressure specific heat is that of air (1.004 kJ/kg-K) for the
compressor and that of the combustion products (1.148 kJ/kg-K) for the turbine.
The ratio of specific heats, k, is 1.4 for the compressor and for the combustion
products in the turbine is 1.333. The constant pressure specific heat for the
combustion products is generally taken as the average of the compressor and

55
turbine Cp values, and the constant pressure specific heat in the heat rejection
process is generally assumed to be that of air.
As mentioned earlier, most microturbine designs incorporate a
recuperator, as shown in Figure 4.13, to preheat the air exiting the compressor
before the entering the combustor. The effect of the recuperator is to heat the air
from state 2 to state x as indicated in Figure 4.17. Hence, energy from a fuel
source is required only to increase the air temperature from state x to state 3,
rather than from state 2 to state 3.
Figure 4.17: Temperature-Specific Entropy Diagram including RecuperatorEffects
The heat added by the fuel per unit of mass flowing is then given by
3in xQ h h (4-27)
The effectiveness of a recuperator depends upon its construction, but typical
recuperator effectiveness values for microturbines range between 65% and 80%.
The effectiveness of the recuperator ( rec) is defined as the ratio of the actual

56
enthalpy increase of the air flowing through the compressor side of the
recuperator to the maximum theoretical enthalpy increase.
2
4 2
x
rec
h h
h h (4-28)
For a microturbine with prescribed pressure ratios, the work required of
the compressor is a function of the inlet temperature (T1). As T1 decreases, the
work required of the compressor decreases and the net work accomplished by
the power plant is enhanced. However, a decrease in T1 will result in a lower
inlet temperature to the combustor (T2); hence, the fuel/air ratio in the combustor
will have to increase to meet the prescribed turbine inlet temperature (T3). An
increase in T3 will enhance both the turbine work and the net work. The turbine
inlet temperature is limited by the thermal-mechanical properties of the materials
used in construction of the turbine.
Example 4-2
A microturbine has a inlet temperature of 1500 F, a compression ratio of 14, and compressor and
turbine efficiencies of 82% and 89%, respectively. The ambient conditions are 90 F and 1 atm.
Sketch (a) the T-s diagram for this engine and determine (b) the net work for the cycle, (c) the
engine thermal efficiency, and (d) the available waste heat rejected to the ambient air.
Solution:
Given Information:
T1
459.67 90( )R Compressor inlet temperature
T3
459.67 1500( )R Turbine inlet temperature
c0.83 Compressor efficiency
t0.89 Turbine efficiency
PR 14 Pressure Ratio
Figure 4.18: Example 4-2

57
The following property values are used for the working fluid:
cpc
1.004kJ
kg K
Specific heat of air
cpt
1.148kJ
kg K
Specific heat of combustion products
cpAve
cpc
cpt
2
Average specific heat
kc
1.4 cp/cv for air
kt
1.333 cp/cv of combustion products
(a) Sketch the T-s diagram for this engine.
1
2s
3
4s
ab
T
s
p = constant
42
(b) Determine the net work of the engine.
The compressor and turbine exit temperatures:
T2
T1
1c
1PR
kc
1
kc
1 T2
1.295 103
R
T4
T3
1t
11
PR
kt
1
kt
T4
1.118 103
R
Compressor work and turbine work
Wc
cpc
T1
T2
Wc
178.743BTU
lb
Wt
cpt
T3
T4
Wt
230.873BTU
lb
Figure 4.18 (continued)

58
The net work of the turbine can be found as
Wnet
Wc
Wt
Wnet
52.13BTU
lb
Net work
(c) Determine the thermal efficiency of the turbine.
Qs
cpAve
T3
T2
Qs
170.806BTU
lb
Wnet
Qs
30.52% Thermal efficiency
(d) What is the amount of waste heat available from the cycle?
Qwaste
cpt
T1
T4
Qwaste
155.742BTU
lb
Available waste heat
The negative sign on the waste heat results from the sign convention used applying the first law of
thermodynamics. Heat added to the system is positive and heat rejected from the system is negative.
Figure 4.18 (continued)
Application
Markets for microturbines include commercial and light industrial facilities.
Microturbines can be used for stand-by power, power quality and reliability, peak
shaving, and cogeneration applications. In addition, because microturbines are
being developed to utilize a variety of fuels, microturbines are used for resource
recovery and landfill gas applications. Microturbines produce between 25 and
500 kW of power and are well-suited for small commercial establishments such
as restaurants, hotels, motels, small offices, retail stores.
The development of the microturbine technology for transportation
applications is also in progress. Automotive companies are interested in
microturbines to provide a lightweight and efficient fossil-fuel-based energy
source for hybrid electric vehicles, especially buses. Microturbines are also

59
being developed to utilize a variety of fuels and are being used for resource
recovery and landfill gas applications.
Heat Recovery
The waste heat from a microturbine is primarily in the form of hot exhaust
gases. This heat is suitable for powering a steam generator, heating of a
building, allocation to thermal storage devices, or use in absorption cooling
system. However, most designs incorporate a recuperator that limits the amount
of heat available for m-CHP applications.
The manner in which the waste heat can be used depends upon the
configuration of the turbine system. In a non-recuperated turbine, the exhaust
gas typically exits at a temperature between 1000 – 1100 F (538 – 594 C). A
recuperated turbine can provide waste heat for heating and operating an
absorption cooling system at exhaust temperatures around 520 F (271 C). The
recovered heat can also be used to drive a desiccant dehumidification device.
The use of the recovered heat influences the selection of the microturbine with or
without a recuperator.
Cost
The capital costs of microturbines range from $700 - $1,100/kW when
mass produced. These costs include all hardware, associated manuals,
software, and initial training. Adding heat recovery components increases the

60
cost by $75- $350/kW. Installation and site preparation can increase the capital
costs by 30-50%. Manufacturers are striving for future capital costs of
microturbines to be below $650/kW. This goal appears feasible if the market
expands and sales volumes increase.
With fewer moving parts, vendors hope their microturbines can provide
higher reliability and require less maintenance than conventional reciprocating
engine generators. The single-shaft design with air bearings will not require
lubricating oil or water. Microturbines that use lubricating oil should not require
frequent oil changes as the oil is isolated from the combustion products.
Manufacturers expect microturbines to require maintenance once-a-year
when the technology matures and are targeting maintenance intervals of 5,000 –
8,000 hours. Actual maintenance costs and intervals for mature microturbines
are less well known since there is a limited base of empirical data from which to
draw conclusions. Forecasted maintenance costs for microturbines range from
$0.005 – $0.016 per kWh, slightly lower than the costs for small reciprocating
engine systems.
Advantages and Disadvantages
The operation of a microturbine offers several advantages. Microturbines
have fewer moving parts than IC engines. The limited number of moving parts
and the low lubrication requirements allow microturbines long maintenance
intervals. Accordingly, microturbines have lower operating costs in terms of cost

61
per kilowatt of power produced. Another advantage of microturbines is their
relatively small size for the amount of power that is produced. Microturbines are
also light weight and have relatively low emissions. Potentially, one of the
greatest advantages of microturbines is their ability to utilize a number of fuels,
including waste fuels or biofuels. Microturbines have great potential in
cogeneration applications because microturbines produce a large quantity of
clean, hot exhaust gases compared to other distributed generators.
The primary disadvantages of microturbines are that they have a low fuel
to electrical efficiency. Also, with higher elevation and increased ambient
temperatures, microturbines experience a loss of power output and efficiency.
The ambient temperature directly affects the temperature of the air at the intake.
A gas turbine will operate more effectively when colder air is available at the
intake. A gas turbine cycle must compress the inlet air and the greater the
compression, the greater efficiency. Another potential disadvantage is that
microturbines experience more efficient operation and require less maintenance
when operated continuously.
Exercises
1. A 25-kW microturbine meets all of the electricity requirements of an office building. The set point for the thermostat remains at 68°F. The turbine inlet temperature is 1,800°F and the compressor and turbine have efficiencies of 0.72 and 0.80, respectively. The shaft work produced by the turbine is completely converted into electrical power. If the compressor pressure ratio is 8, determine the compressor and turbine work in kJ/kg, the net work in kJ/kg, and the thermal efficiency of the microturbine.

62
2. The minimum and maximum temperatures of an ideal Brayton cycle are 290 K and 1300 K, respectively. The pressure ratio is that which maximizes the net work developed by the cycle per unit mass of air-flow. Using a cold air- standard analysis, determine per unit of mass of air flow (a) the compressor work, (b) the turbine work, and (c) the thermal efficiency of the cycle. 3. An ideal Brayton cycle is modeled on an air-standard basis. The compression ratio of the cycle is 9 with air entering the compressor at T1 = 70 F, p1 = 14.7 psi, with a mass flow rate of 35,000 lb/hr. If the turbine inlet temperature is 1,150 F, determine (a) the thermal efficiency, (b) the net power developed, and (c) the amount of waste heat available for recovery.
4. The net power developed by an ideal air-standard Brayton cycle is 2.5 x 10⁴
Btu/hr. The pressure ratio for the cycle is 10, and the minimum and maximum temperatures are 520 R and 1800 R, respectively. Calculate (a) the thermal efficiency of the cycle, (b) the mass flow rate of the air, and (c) the amount of waste heat available for recovery.
5. A stationary gas turbine has compressor and turbine efficiencies of 0.85 and 0.90, respectively, and a pressure ratio of 12. Determine the work of the compressor and the turbine, the net work, the turbine exit temperature, and the thermal efficiency for 80 F ambient and 1000 F turbine inlet temperatures.
6. A simplified analysis is performed on a gas turbine engine cycle with a Compression ratio of 7 to 1. The compressor and turbine inlet temperatures are 320 K and 1100 K, respectively. The compressor has an efficiency of 0.84 and the turbine has an efficiency of 0.88. Calculate the thermal efficiency of (a) the ideal Brayton cycle, (b) the actual gas turbine cycle, and (c) the amount of waste heat available for recovery.

63
Manufacturers
Capstone Turbine Corporation, based in Chatsworth, California, is a leader
in the commercialization of low-emission, high-reliability microturbine power
generators. The company offers 30-kW and 60-kW systems for distributed
energy resource applications. The Capstone C30, a 30-kW microturbine, is
pictured in Figure 4.19.
Figure 4.19: Capstone C30 Microturbine. (http://www.capstoneturbine.com/)
Elliot Energy Systems, located in Stuart, Florida, develops and
manufactures the 100-kW TA CHP unit shown in Figure 4.20.

64
Figure 4.20: Elliot Systems 100-kW TA CHP Unit
(www.elliottmicroturbines.com)
Ingersoll-Rand Energy Systems of Portsmouth, New Hampshire develops
the PowerWorks™ line of microturbine generators with output of 70 kW,
pictured in Figure 4.21.
Figure 4.21: Ingersoll-Rand 70-kW PowerWorks™ Microturbine
(www.irpowerworks.com/)

65
TURBEC, recently purchased by API Com, an Italian company,
manufactures a 100-kW microturbine that is equipped for cogeneration.
The 100-kW T100 CHP is shown in Figure 4.22.
Figure 4.22: TURBEC 100-kW T100 CHP Microturbine (www.turbec.com/)
Bowman Power Systems is a U.K. company that develops 80-kW
microturbine power generation systems for DER and mobile power
applications. The system is pictured in Figure 4.23.
Figure 4.23: Bowman Power Systems 80-kW Microturbine System
(www.bowman.com)

66
Stirling Engines
Technology Overview
The Stirling engine is a heat engine invented in 1816 by Robert Stirling, a
Scottish clergyman. The Stirling engine is a type of external combustion piston
engine which uses a temperature difference to create motion in the form of shaft
work. The Stirling cycle uses an external heat source, which could be anything
from petroleum based product, to solar energy, to the heat produced by decaying
plants. No combustion takes place inside the cylinders of the engine. To date,
there has not been a successful mass-market application for the Stirling engine.
However, recently companies such as Microgen and WhisperTech have
developed m-CHP systems based on the Stirling engine technology.
The operation of a Stirling engine is based upon the behavior of a fixed
amount of air or gas such as helium or hydrogen enclosed in the cylinders of the
engine. Two gas properties allow for the operation of a Stirling engine: (1) for a
constant amount of gas in a fixed volume as the temperature is increased, the
pressure will increase, and (2) when a fixed amount of gas is compressed, the
temperature of that gas will increase.
Stirling engines use a displacer piston to move the enclosed gas back and
forth between the hot and cold reservoirs. The gas expands at the hot reservoir
and displaces a power piston, producing work while at the same time forcing the
gas to move to the cold reservoir. At the cold reservoir, the gas contracts,
67
retrieving the power piston and closing the cycle. The operation of a Stirling
engine can be best understood by examining the operation of a two-cylinder (or
alpha) Stirling engine. A step-by-step diagram of a two-cylinder Stirling engine
and further explanation on the operation of the Stirling engine are shown in
Figure 4.24. In the two-cylinder Stirling engine, one cylinder is kept hot while the
other is kept cool. In Figure 4.24, the lower-left cylinder is heated by burning
fuel. The other cylinder is kept cool by an air cooled sink. In a two-cylinder
Stirling engine each piston acts as both a power piston and displacer piston.
The pressure-specific volume (pv) and temperature-entropy (Ts) diagrams
for the Stirling cycle are shown in Figure 4.25. The Stirling cycle consists of four
internally reversible processes in series: an isothermal compression from state 1
to state 2 at temperature TC, a constant-volume heating from state 2 to state 3,
an isothermal expansion from state 3 to state 4 at temperature TH, and a
constant-volume cooling from state 4 to state 1 to complete the cycle. A
regenerator can be used to utilize the heat rejected in Process 4-1 to be used to
aid the heat input process during Process 2-3.
The thermal efficiency of the Stirling cycle is equal to that of the Carnot
cycle when both constant volume heating and constant volume cooling are
employed. The Stirling cycle is a reversible cycle.

68
Step 3: Expansion. Now, most of
the gas in the system has just been
driven into the hot cylinder. The
gas heats and expands driving
both pistons inward.
Step 4: Heat Transfer. At this
point, the gas has expanded (about
3 times in this example). Most of
the gas (about 2/3rds) is still
located in the hot cylinder. Flywheel
momentum carries the crankshaft
the next 90 degrees, transferring
the bulk of the gas to the cool
cylinder to complete the cycle.
Step 1: Compression. At this
point, the majority of the gas has
been shifted to the cool cylinder.
As the gas cools and contracts,
both pistons are drawn outward.
Step 2: Heat Transfer. The now
contracted gas is still located in the
cool cylinder. Flywheel momentum
carries the crank another 90
degrees, transferring the gas to back
to the hot cylinder.
Hot
Cool
Hot
Cool
Hot
Cool
Hot
Cool
Figure 4.24: Two-cylinder Stirling Engine Diagram(www.keveny.com/vstirling.html)

69
Figure 4.25: Pressure-Specific Volume and Temperature-Entropy Diagrams forthe Stirling Cycle.
The expressions for the work accomplished by the cycle (WStirling), the heat
added (Qin), and the thermal efficiency ( Stirling) can be determined through the
application of the first law of thermodynamics. For an ideal monatomic gas
Cv=3/2*R. For a thermally perfect gas
p V n R T (4-29a)
n R Tp
V (4-29b)
Where p is pressure, V is volume, R is the ideal gas constant, n is the number of
moles of the gas, and T is the respective temperature. The work of the cycle is
expressed as:
StirlingW p dV (4-30)
From examination of the cycle and substituting the relationship from the ideal gas
law, the work per unit mass becomes

70
Stirling H
dVW R T
V (4-31a)
34ln
b
H
a
VW R T
V (4-31b)
14ln
a
C
b
VW R T
V (4-31c)
lnb
Stirling H C
a
VW R T T
V (4-31d)
3 2ln
b
Stirling
a
VW R T T
V (4-31e)
Note that TH = T3 = T4, and TC = T1 = T2 due to the isothermal processes. The
heat transfer into the system per unit mass can be expressed as:
in vQ n c T (4-32a)
3( ) ln
2
b
in H C H
a
VQ R T T R T
V (4-32b)
3 2
3( ) ln
2
b
in H
a
VQ R T T R T
V (4-32c)
The expression for the cycle efficiency is:
Stirling
Stirling
in
W
Q (4-33a)
3 2
3 2 3
ln
3( ) ln
2
b
a
Stirling
b
a
VR T T
V
VR T T R T
V
(4-33b)

71
While the Stirling engine is always less efficient that the Carnot engine, the
difference becomes small when Vb is much greater than Va and TH is much
greater than TC.
Example 4-3
A Stirling engine has a volume ratio of Vb/Va = 2.0 and operates with helium as the working fluid.
The operating conditions of the engine are TH = 473 K and TC = 298 K. Determine the (a) work
per unit mass of the cycle, (b) the heat input per unit mass, and (c) the thermal efficiency of the
cycle.
Input the given information.
TH
473K TC
298K Vratio
2 Vratio
Vb
VaInput the gas constant for helium.
RHe
2.0769kJ
kg K
(a) The work of the cycle (Equation 4-31d) is
WStirling
RHe
TH
TC
ln Vratio
WStirling
251.93kJ
kg
(b) The heat put into the cycle per unit mass (Equation 4-32b) is
Qin
3
2R
HeT
HT
CR
HeT
Hln V
ratioQ
in1.226 10
3 kJ
kg
(c) The efficiency of the cycle is defined as
Stirling
WStirling
Qin
Stirling20.547%
or substituting for WStirling and Qin
Stirling
RHe
TH
TC
ln Vratio
3
2R
HeT
HT
CR
HeT
Hln V
ratio
Stirling20.547%
Figure 4.26: Example 4-3

72
Stirling engines come in three configurations, alpha, beta and gamma. An
alpha Stirling engine contains two separate power pistons, one “hot” piston and
one “cold” piston. The hot piston is placed in the heat exchanger with the higher
temperature while the cold piston is in the heat exchanger with the lower
temperature. While the alpha configuration has a high power-to-volume ratio, the
high temperature used for the “hot” piston and its seals typically creates technical
problems.
A beta Stirling engine uses a single power piston arranged coaxially on
the same shaft as the displacer piston. The displacer piston moves the working
gas from the hot heat exchanger to the cold heat exchanger, but does not extract
any power from the working fluid. As the working gas is displaced to the hot end
of the cylinder, the gas expands and moves the power piston, producing work.
As the working fluid is moved to the cold side of the cylinder, the fluid contracts
and the power piston is moved in the opposite direction due to the external
atmospheric pressure. As the beta configuration does not require moving seals
in the hot portion of the engine, higher compression ratios can be achieved.
A gamma Stirling engine is a beta Stirling engine in which the power
piston is not mounted coaxially to the displacer piston. The advantage of the
gamma Stirling engine is that it is often mechanically simpler and can be used in
multi-cylinder Stirling engines. However, the gamma Stirling produces lower
compression ratios.

73
Application
Stirling engines are an old technology; however their use became limited
with the improvement of steam engines and the invention of the Otto cycle
engine. Recent interest in distributed energy has revived interest in Stirling
engines. Stirling engines can be used in a variety of applications due to their
thermal output, simple operation, low production costs, and relatively small size.
Applications for Stirling engines include power generation units for space crafts
and vehicles, small aircraft, refrigeration, m-CHP, solar dish application, and
small scale residential or portable power generation. An overview of Stirling
engine characteristics is presented in Table 4.3.
Table 4.3: Overview for Stirling Engine Technology (http://www.energy.ca.gov/distgen)
Stirling Engine Overview
Commercially Available Yes, mostly in Europe
Size Range <1 kW - 25 kW
Fuel Natural gas primarily but broad fuel flexibility is possible
Efficiency 12 – 20% (Target: >30%)
Environmental Potential for very low emissions
Other Features Cogen (some models)
Commercially available Stirling engines can produce between 1 kW – 25
kW. Stirling engine technology has been widely used in England and Europe
with great success, particularly in the m-CHP arena. However, a very small
percentage of the world’s electrical capacity is currently provided through the use
of Stirling engines.
74
Heat Recovery
Traditional large-scale electric power generation is typically about 30%
efficient, while combined cycle power plants are approximately 48% efficient. In
either case, the reject heat is lost to the atmosphere with the exhaust gases.
Stirling engines are typically in the range of 15 – 30% efficient, with many
reporting efficiencies of 25 – 30%. The overall efficiencies of these systems can
be greatly increased by recovering the waste heat.
A high percentage of the Stirling engine heat losses will go to the cooling
fluid instead of into the exhausts, which makes the Stirling engine suitable for
combined heat and power generation. Typical operating temperatures range
from 1200 – 1470 F (650 – 800 C), resulting in electrical engine conversion
efficiencies of around 30% to 40% when a recuperator is included in the engine
system. These high operating temperatures can convert into high quality waste
heat. The reject heat can be recaptured through piping the cooling fluid through
a heat exchanger and by ducting the exhaust gases through a heat exchanger to
produce hot water.
Cost
The capital costs of Stirling engines are comparably high and vary greatly
depending upon manufacturer ($2,000 - $50,000). And, overall cost increases
with size. However, several companies have targeted Stirling technology for m-
CHP units and have achieved relative success. These companies include
PowerGen, WhisperTech, Sunpower, and ENATEC.

75
Advantages and Disadvantages
Some advantages of Stirling engines are:
The burning of the fuel air mixture can be more accurately controlled due to the external heat source.
Emission of unburned fuel can be eliminated as a continuous combustion process can be used to supply heat.
Less lubrication is required leading to greater periods between overhauls because the bearings and seals are placed on the cool side.
Simplicity of design; no valves are needed, fuel and intake systems are very simple.
Low noise and vibration free operation.
Low maintenance and high reliability.
Multi-fuel capability.
Long service life.
Some disadvantages of Stirling engines are:
High costs.
Low efficiencies.
Require both input and output heat exchangers which must withstand the working fluid pressure and resist corrosion effects.
Relatively large for the amount of power they produce due to the heat exchangers.
Cannot experience instantaneous start-up.
Power output is relatively constant and rapid change to another level is difficult to achieve.
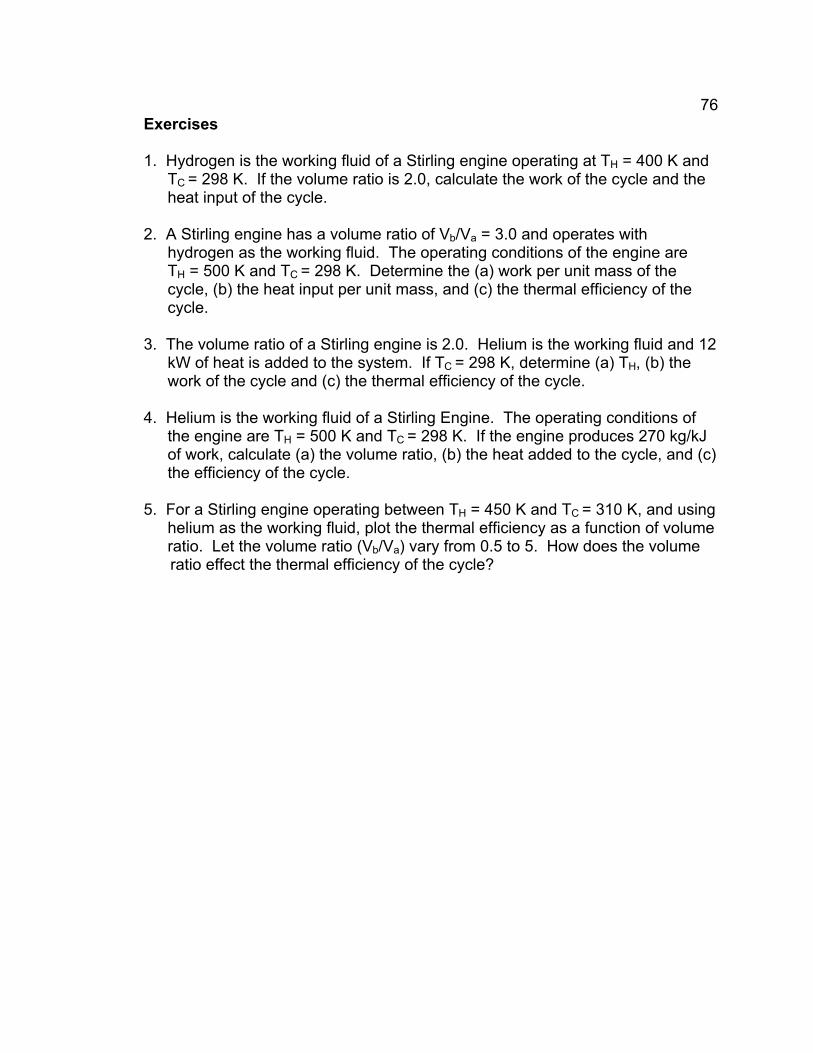
76
Exercises
1. Hydrogen is the working fluid of a Stirling engine operating at TH = 400 K and TC = 298 K. If the volume ratio is 2.0, calculate the work of the cycle and the heat input of the cycle.
2. A Stirling engine has a volume ratio of Vb/Va = 3.0 and operates with hydrogen as the working fluid. The operating conditions of the engine are TH = 500 K and TC = 298 K. Determine the (a) work per unit mass of the cycle, (b) the heat input per unit mass, and (c) the thermal efficiency of the cycle.
3. The volume ratio of a Stirling engine is 2.0. Helium is the working fluid and 12 kW of heat is added to the system. If TC = 298 K, determine (a) TH, (b) the work of the cycle and (c) the thermal efficiency of the cycle.
4. Helium is the working fluid of a Stirling Engine. The operating conditions of the engine are TH = 500 K and TC = 298 K. If the engine produces 270 kg/kJ of work, calculate (a) the volume ratio, (b) the heat added to the cycle, and (c) the efficiency of the cycle.
5. For a Stirling engine operating between TH = 450 K and TC = 310 K, and using helium as the working fluid, plot the thermal efficiency as a function of volume ratio. Let the volume ratio (Vb/Va) vary from 0.5 to 5. How does the volume ratio effect the thermal efficiency of the cycle?

77
Manufacturers
There are a relatively large number of companies that are developing and
manufacturing Stirling engines and/or complete generator sets for m-CHP. Five
of these companies are listed as follows:
WhisperTech, located in Christchurch, New Zealand, manufactures the AC
and DC WhisperGen generator sets illustrated in Figure 4.27. The AC
WhisperGen (left) uses a four-cylinder Stirling cycle fuelled by hydrogen and
natural gas to produce up to 1.2 kW of electrical power at 220 – 240V, as well
as 8 kW of thermal energy via a sealed liquid circulation system. The DC
WhisperGen (right) uses a four-cylinder Stirling engine fuelled by automotive
grade diesel and produces up to 0.8 kW electric and 5.5 kW of thermal
energy via a sealed liquid circulation system.
Figure 4.27: AC and DC WhisperGen Micro-CHP Units (www.whispergen.com)
The BG Group has developed the BG Microgen, which uses a linear free
piston Stirling engine. The output of this unit has not yet been specified. The
BG Microgen is shown in Figure 4.28.
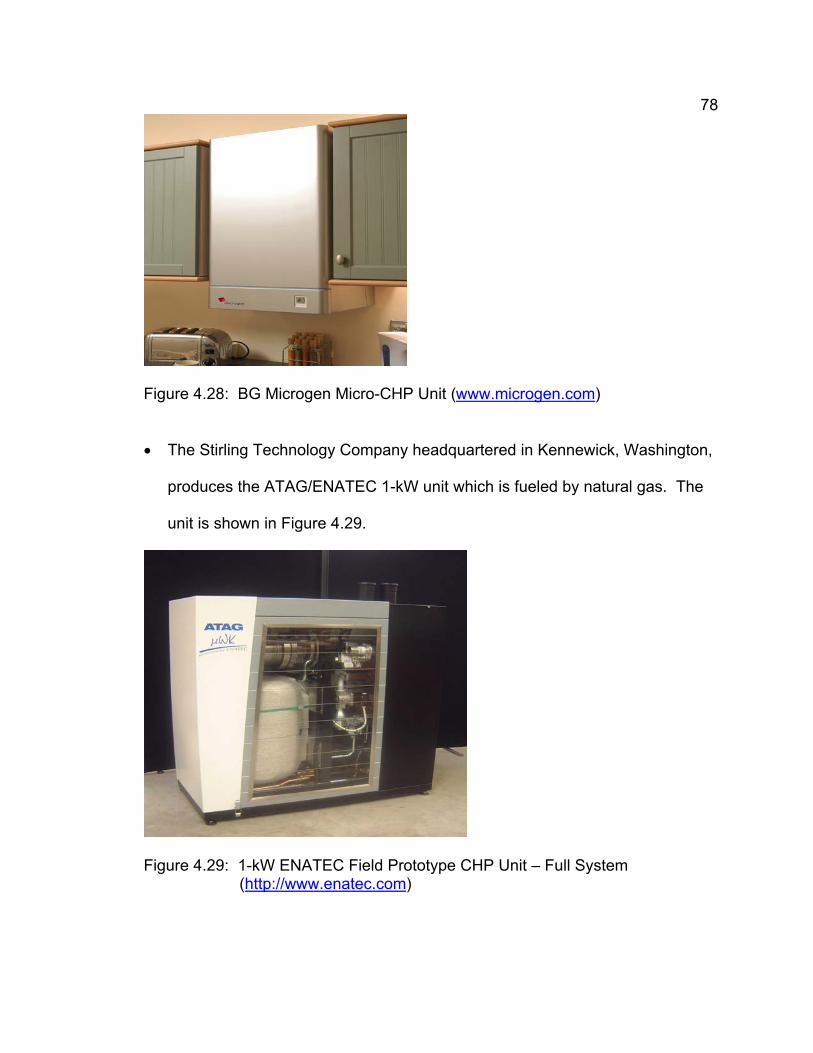
78
Figure 4.28: BG Microgen Micro-CHP Unit (www.microgen.com)
The Stirling Technology Company headquartered in Kennewick, Washington,
produces the ATAG/ENATEC 1-kW unit which is fueled by natural gas. The
unit is shown in Figure 4.29.
Figure 4.29: 1-kW ENATEC Field Prototype CHP Unit – Full System (http://www.enatec.com)

79
SOLO, out of Sindelfingen, Germany manufactures Stirling engines that
produce from 2 – 9 kW of electrical power as well as 8 – 26 kW of thermal
energy when fueled by natural gas or liquid gas. The company also produces
models that are solar powered. The model used for m-CHP is shown in
Figure 4.30.
Figure 4:30: SOLO 9-kW Stirling Engine (www.stirling-engine.de/engl/l)
Stirling Engine, Inc. headquartered in Phoenix, Arizona manufactures the
Stirling based ST – 5. Virtually any combustible material is a suitable fuel for
the ST-5. Power outputs are not listed for the ST – 5. The ST – 5 is shown in
Figure 4:31.
Figure 4:31: Stirling Engine, Inc. ST – 5. (http://www.waoline.com/science/NewEnergy/Motors/StirlingCie.htm)
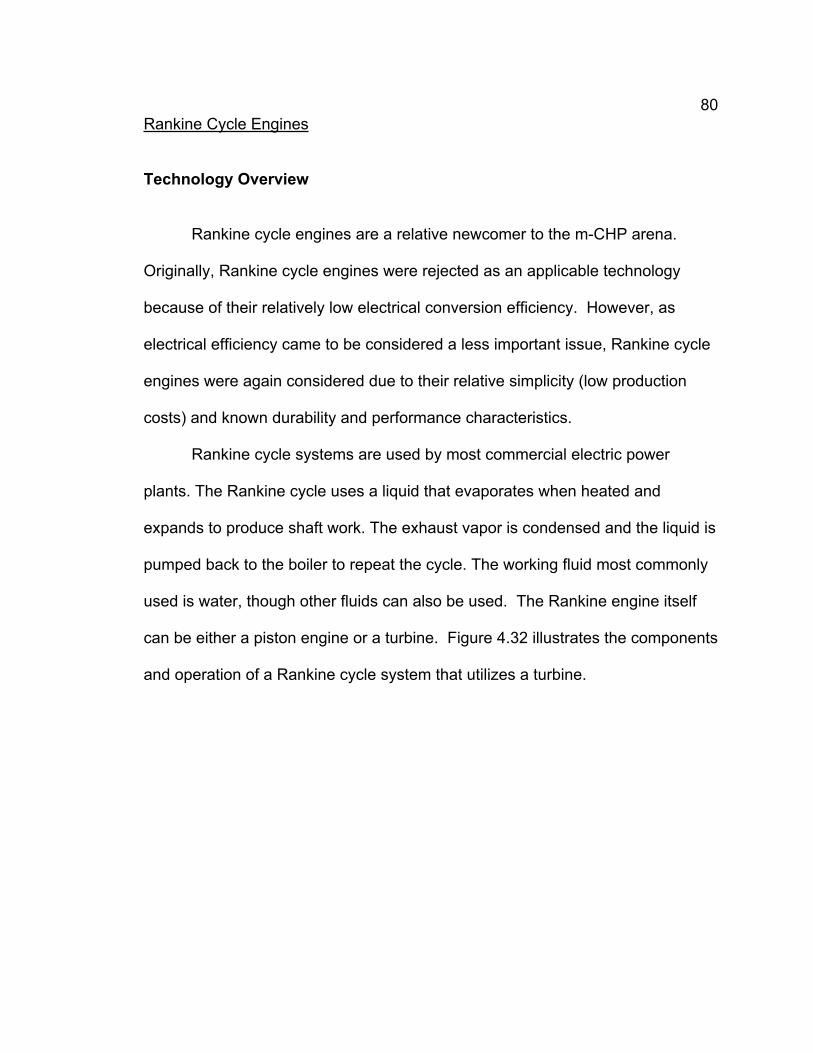
80
Rankine Cycle Engines
Technology Overview
Rankine cycle engines are a relative newcomer to the m-CHP arena.
Originally, Rankine cycle engines were rejected as an applicable technology
because of their relatively low electrical conversion efficiency. However, as
electrical efficiency came to be considered a less important issue, Rankine cycle
engines were again considered due to their relative simplicity (low production
costs) and known durability and performance characteristics.
Rankine cycle systems are used by most commercial electric power
plants. The Rankine cycle uses a liquid that evaporates when heated and
expands to produce shaft work. The exhaust vapor is condensed and the liquid is
pumped back to the boiler to repeat the cycle. The working fluid most commonly
used is water, though other fluids can also be used. The Rankine engine itself
can be either a piston engine or a turbine. Figure 4.32 illustrates the components
and operation of a Rankine cycle system that utilizes a turbine.

81
Figure 4.32: Rankine Cycle Engine Schematic
As can be seen from Figure 4.31, the Rankine cycle is a closed-loop
cycle. The temperature-entropy diagram for the ideal Rankine cycle is shown in
Figure 4.33.
Figure 4.33: Ideal Rankine Cycle Temperature Entropy Diagram
82
Conservation of mass and application of the first law yield expressions for
the work of the turbine (Wt), the work of the pump (Wp), the net work (Wnet), the
heat transfer into the system (Qin), and the efficiency ( Rank). The work of the
turbine and work of the pump can be expressed as
1 2tW m h h (4-34)
4 3pW m h h (4-35)
The work input into the system is denoted as negative work; the net work of the
cycle can be expressed as
net t pW W W (4-36a)
1 2 4 3( ) ( )
netW m h h h h (4-36b)
The heat transfer supplied by the boiler is
1 4inQ m h h (4-38)
The heat transfer leaving the system at the condenser is
2 3outQ m h h (4-39)
The thermal efficiency of the Rankine cycle can be expressed as the net work of
the system divided by the heat input into the system.
net
Rank
in
W
Q (4-40a)
1 3 2 4
1 4
Rank
h h h h
h h (4-40b)
2 3
1 4
1Rank
h h
h h (4-40c)

83
The net work output equals the net heat input for the ideal Rankine cycle. Thus,
the thermal efficiency can also be expressed in terms of the heat transfer terms
and finally in terms of temperatures in the following manner:
in out
Rank
in
Q Q
Q (4-41a)
1out
Rank
in
Q
Q (4-41b)
1out
Rank
in
T
T (4-41c)
where Tout denotes the temperature on the steam side of the condenser of the
ideal Rankine cycle and Tin denotes the average temperature of heat addition at
the boiler.
Figure 4.34: Rankine Cycle Engine Diagram for Example 4-4
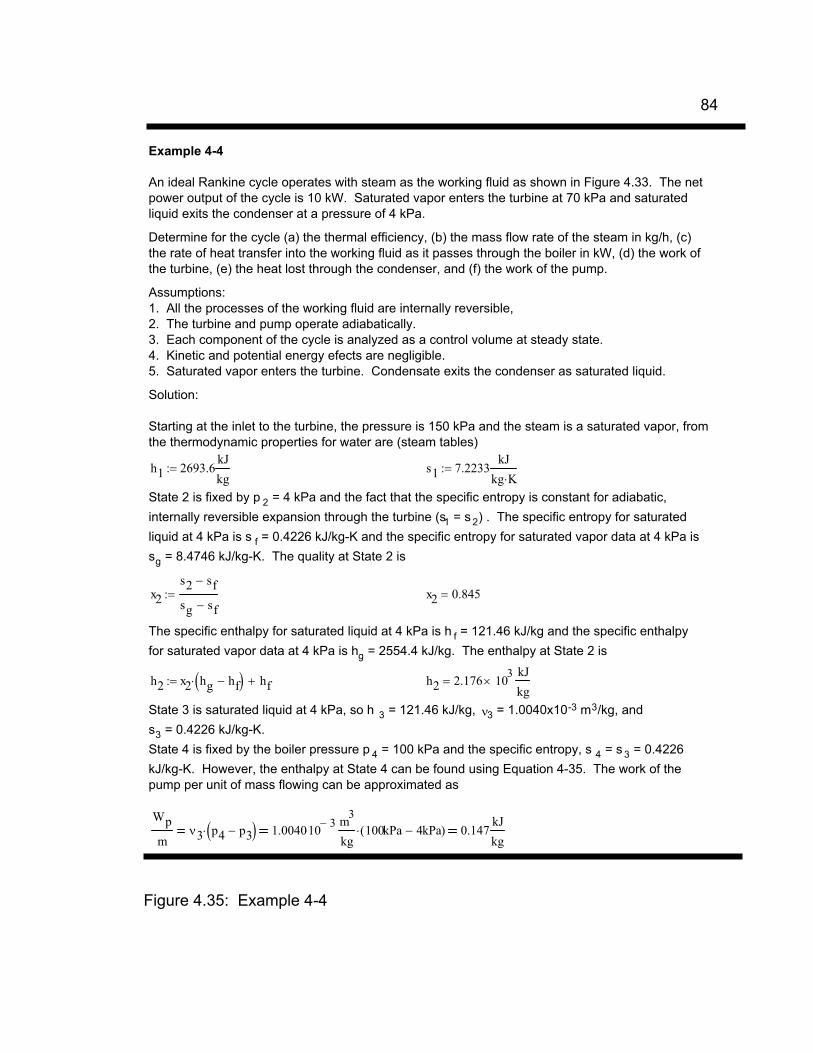
84
Example 4-4
An ideal Rankine cycle operates with steam as the working fluid as shown in Figure 4.33. The net
power output of the cycle is 10 kW. Saturated vapor enters the turbine at 70 kPa and saturated
liquid exits the condenser at a pressure of 4 kPa.
Determine for the cycle (a) the thermal efficiency, (b) the mass flow rate of the steam in kg/h, (c)
the rate of heat transfer into the working fluid as it passes through the boiler in kW, (d) the work of
the turbine, (e) the heat lost through the condenser, and (f) the work of the pump.
Assumptions:
1. All the processes of the working fluid are internally reversible,
2. The turbine and pump operate adiabatically.
3. Each component of the cycle is analyzed as a control volume at steady state.
4. Kinetic and potential energy efects are negligible.
5. Saturated vapor enters the turbine. Condensate exits the condenser as saturated liquid.
Solution:
Starting at the inlet to the turbine, the pressure is 150 kPa and the steam is a saturated vapor, from
the thermodynamic properties for water are (steam tables)
h1
2693.6kJ
kgs1
7.2233kJ
kg K
State 2 is fixed by p 2 = 4 kPa and the fact that the specific entropy is constant for adiabatic,
internally reversible expansion through the turbine (s1 = s 2) . The specific entropy for saturated
liquid at 4 kPa is s f = 0.4226 kJ/kg-K and the specific entropy for saturated vapor data at 4 kPa is
sg = 8.4746 kJ/kg-K. The quality at State 2 is
x2
s2
sf
sg
sf
x2
0.845
The specific enthalpy for saturated liquid at 4 kPa is h f = 121.46 kJ/kg and the specific enthalpy
for saturated vapor data at 4 kPa is hg = 2554.4 kJ/kg. The enthalpy at State 2 is
h2
x2
hg
hf
hf
h2
2.176 103 kJ
kg
State 3 is saturated liquid at 4 kPa, so h 3 = 121.46 kJ/kg, 3 = 1.0040x10⁻³ m3/kg, and
s3 = 0.4226 kJ/kg-K.
State 4 is fixed by the boiler pressure p 4 = 100 kPa and the specific entropy, s 4 = s 3 = 0.4226
kJ/kg-K. However, the enthalpy at State 4 can be found using Equation 4-35. The work of the
pump per unit of mass flowing can be approximated as
Wp
m3
p4
p3
1.0040103 m
3
kg100kPa 4kPa( ) 0.147
kJ
kg
Figure 4.35: Example 4-4

85
From the first law of thermodynamics, the work of the pump is
Wp
mh
4h
3
0.147kJ
kgh
4121.46
kJ
kgh
4121.607
kJ
kg
(a) Determine the thermal efficiency of the system.
The efficiency of the system can be determined as
Rank1
h2
h3
h1
h4
Rank20.107%
(b) Determine the mass flow rate of the fluid through the system.
The net work of the system is given as 10 kW. The mass flow rate through the system can be
determined using from the first law of thermodynamics.
Wnet
m h1
h2
h4
h3
so that
m
Wnet
h1
h2
h4
h3
m 0.019kg
s
(c) Determine the rate of heat transfer into the fluid passing through the boiler.
The heat transfer into the fluid passing through the boiler can be determined using either Equation
4-40a because both the net work of the cycle and efficiency are known, or Equation 4-38 can be
used since both the flow rate and enthalpies at States 1 and 4 are known. Both methods will be
demonstrated here.
Using Equation 4-40a
Rank
Wnet
Qin
Qin
Wnet
Rank
Qin
49.735kW
Using Equation 4-38
Qin
m h1
h4
Qin
49.735kW
(d) Determine the work of the turbine.
The work of the turbine can be determined as
Wt
m h1
h2
Wt
10.003kW
Figure 4.35 (continued)

86
(e) Determine the heat loss through the condenser.
From the first law of thermodynamics, the heat loss through the condenser is
Qout
m h2
h3
Qout
39.735kW
(f) Determine the work of the pump.
The work of the pump can be found applying the first law of thermodynamics to the pump
Wp
m h4
h3
Wp
2.835 W
Figure 4.35 (continued)
Generally speaking, as compared to other technologies, the Rankine cycle
engines have one of the lowest electrical conversion efficiencies. The thermal
efficiencies of most other competing technologies are also higher than that of the
Rankine cycle engines.
Application
The advantage of the Rankine cycle for power plants is that the working
fluid is a liquid. Many times this liquid is water, which is a cheap and readily
available resource. Currently, companies such as the Baxi Group, Enginion, and
Cogen Microsystems are exploring the possibility of using Rankine Cycle engines
for m-CHP.
Heat Recovery
As the Rankine cycle is a closed-loop, which incorporates a condenser,
heat recovery can be achieved easily at the condenser. However, as most of the

87
Rankine cycle engine technologies for m-CHP are still under development, the
quality and quantity of heat that can be recaptured is currently not well defined.
Cost
Unfortunately, little is known about potential costs of small-scale Rankine
cycle units for m-CHP. As more of these technologies complete the field trial
stage of development, more information concerning capital and maintenance
costs will be available.
Exercises
1. The turbine of an ideal Rankine cycle generates 12 kW of power while the pump requires 2.2 kW of power. If the heat input to the cycle is 20 kW, determine the net work of the cycle and the thermal efficiency of the cycle.
2. In an ideal Rankine cycle, the pump increases the pressure of water from 10 psia to 22 psia. The turbine produces 15 hp. If the mass flow rate through the system is 15 lb/min, determine the net work of the cycle and the heat added to the cycle if the plant has an efficiency of 40%.
3. A steam plant receives heat from a source at a rate of 10 kW. The plant operates with a boiler pressure of 80 kPa and a condenser pressure of 6 kPa. If the plant operates as an ideal Rankine cycle, calculate (a) the cycle efficiency, (b) the net work of the cycle, (c) the required mass flow rate of the working fluid, and (d) the heat rejected at the condenser.
4. An ideal Rankine cycle operates with steam as the working fluid. The net power of the plant is 8 kW. The pumping power requirement is 1.4 kW. The boiler pressure is 70 kPa and the condenser pressure is 10 kPa. Determine (a) the work of the turbine, (b) the mass flow rate of the working fluid, (c) the heat input into the cycle, (d) the cycle efficiency, and (e) the waste heat rejected through the condenser.
5. The efficiency of an ideal Rankine cycle is 45%. Steam exits the boiler at 25 psia and the condenser operates at 12 psia. If the flow rate of water exiting the condenser is 20 lbm/min, determine (a) the heat input to the cycle, (b) the

88
net work of the cycle, (c) the work of the turbine, (d) the work of the pump, and (e) the heat rejected through the condenser.
6. An ideal Rankine cycle operates with steam as the working fluid. The net power output of the cycle is 10 kW. Saturated vapor enter s the turbine at 80 kPa and 210 C. Saturated liquid exits the condenser at a pressure of 4 kPa. Find (a) the heat input into the cycle, (b) the thermal efficiency of the cycle, (c) the mass flow rate of the working fluid, and (d) the heat rejected by the cycle.

89
Manufacturers
Enginion, based in Berlin, Germany is the developer of the SteamCell.
The SteamCell pictured in Figure 4.36 has an output of 4.6-kW electrical
and 25-kW of thermal energy. A trial installation is scheduled for 2005.
Figure 4.36: Enginion 4.6-kW SteamCell Unit (www.enginion.com)
Cogen Microsystems, based in Australia manufacture 2.5-kW and 10-kW
units based on Rankine cycle engines. Market release is expected in
2007. A 2.5-kW unit is pictured in Figure 4.37.
Figure 4.37: Cogen Microsystems 2.5-kW Rankine Cycle m-CHP Unit (www.cogenmicro.com)
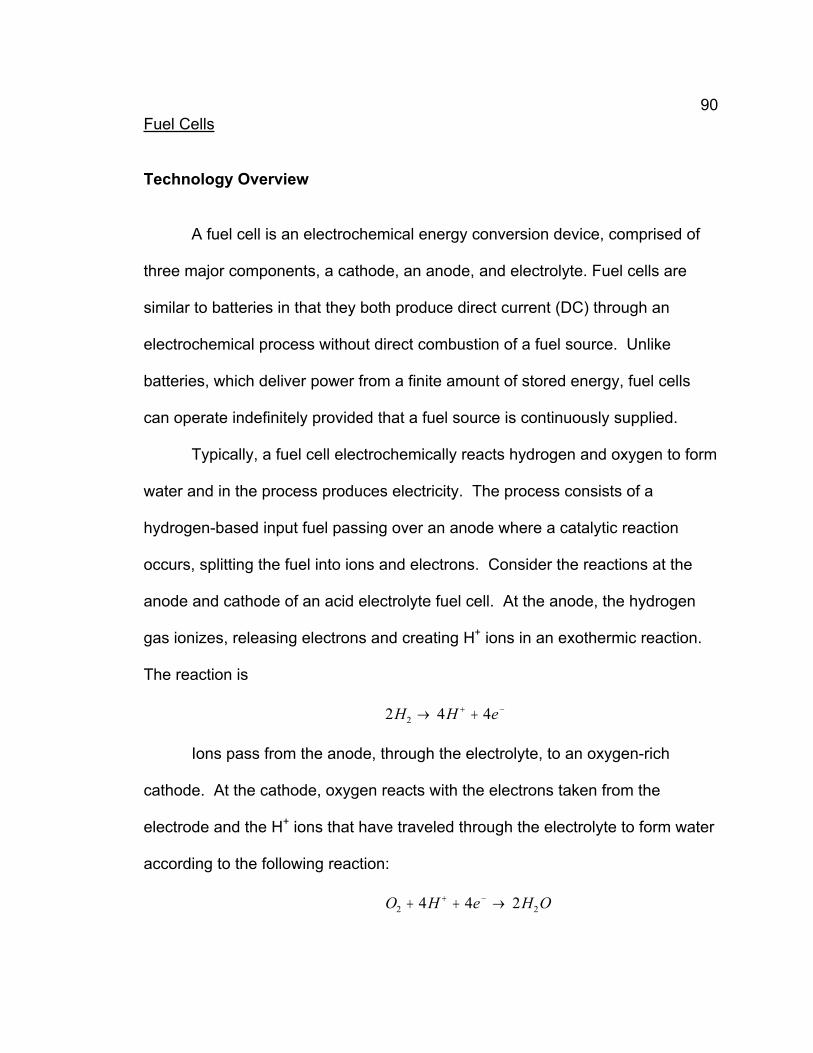
90
Fuel Cells
Technology Overview
A fuel cell is an electrochemical energy conversion device, comprised of
three major components, a cathode, an anode, and electrolyte. Fuel cells are
similar to batteries in that they both produce direct current (DC) through an
electrochemical process without direct combustion of a fuel source. Unlike
batteries, which deliver power from a finite amount of stored energy, fuel cells
can operate indefinitely provided that a fuel source is continuously supplied.
Typically, a fuel cell electrochemically reacts hydrogen and oxygen to form
water and in the process produces electricity. The process consists of a
hydrogen-based input fuel passing over an anode where a catalytic reaction
occurs, splitting the fuel into ions and electrons. Consider the reactions at the
anode and cathode of an acid electrolyte fuel cell. At the anode, the hydrogen
gas ionizes, releasing electrons and creating H+ ions in an exothermic reaction.
The reaction is
2 4 42H H e
Ions pass from the anode, through the electrolyte, to an oxygen-rich
cathode. At the cathode, oxygen reacts with the electrons taken from the
electrode and the H+ ions that have traveled through the electrolyte to form water
according to the following reaction:
O H e H O2 2
4 4 2

91
For the reactions to occur simultaneously, electrons produced at the anode must
pass through an electric circuit to the cathode while the H+ ions pass through the
electrolyte. A schematic diagram of the reaction occurring in a phosphoric acid
fuel cell (PAFC) is illustrated in Figure 4.38.
Figure 4.38: PAFC Electrochemistry (http://www.fctec.com/fctec)
The performance of a fuel cell can be analyzed by using the Gibbs
function or Gibbs free energy of reaction. The Gibbs free energy of reaction is an
indication of the maximum work that can be achieved from combining two
substances in a chemical reaction.
The maximum theoretical work (WMAX) is the difference in the Gibbs free
energy (G) of the reactants and the products of the chemical reaction.
MAX react prodW G G (4-42)

92
The Gibbs free energy is a function of the enthalpy (h), entropy (s), and
temperature (T) associated with the chemical compound of interest at a specific
state of matter and is defined as
G h T s (4-43)
The temperature-entropy product represents the loss due to changes in entropy.
The maximum work that can be achieved by a fuel cell is
MAX react prod react prodW h h T s s (4-44)
And the thermal efficiency ( th) is defined as
react prod
th
react prod
G G
h h (4-45)
The thermal efficiency of a fuel cell typically ranges from 82 – 94% in ideal
cases. The thermal efficiency of a fuel cell as defined in Equation 4-45 is not the
actual electrical conversion efficiency achieved by the fuel cell. Due to ohmic
losses resulting from concentration polarization and activation polarization the
electrical conversion efficiency of a fuel cell ( fc) generally falls between 40 –
60%. The ohmic losses are accounted for using a voltage efficiency ( v) and a
current efficiency ( i). The electrical conversion efficiency of a fuel cell is defined
as the product of the thermal, voltage, and current efficiencies.
fc th v i (4-46)

93
Example 4-5
A PEMFC (hydrogen-oxygen) fuel cell has liquid water as a product when it operates at 363 K.
What is the maximum work that the fuel cell can achieve per mole of reactant and what is the
thermal efficiency?
2 2 22 2H O H OThe overall reaction for a PEMFC is:
The thermodynamic properties needed are obtained from the JANAF thermodynamic tables:
hO2
0kcal
molesO2
41.395cal
mole K
hH2
0kcal
molesH2
24.387cal
mole K
hH2O
57.433kcal
molesH2O
36.396cal
mole K
The enthalpy of formation for the products and reactants are
hprod
2mole hH2O
hprod
114.866kcal
hreact
2mole hH2
1mole hO2
hreact
0kcal
The entropy of the products and reactants are
sprod
2mole sH2O
sprod
0.0731
Kkcal
sreact
2mole sH2
1mole sO2
sreact
0.091
Kkcal
The maximum work the PEMFC can achieve is determined using Equation 4-44
WMAX
hreact
hprod
Toper
sreact
sprod
WMAX
4.545 105
J per 2 moles of reactant
Combining Equations 4-42 and 4-45, the thermal efficiency of the fuel cell becomes
th
WMAX
hreact
hprod
th94.51%
Figure 4.39: Example 4-5
The components needed for the operation of a fuel cell system vary
depending on the type of fuel cell used and the fuel. Common major

94
components for a fuel cell system include a fuel reformer (processor), the fuel
cell “stack,” and a power conditioner. The fuel reformer, also known as a fuel
processor, generates hydrogen-rich gas from the supply fuel and removes
poisons from the fuel stream. Poisoning and fuel flexibility are two major
considerations when selecting a fuel cell. Nitrogen, phosphorous, arsenic,
antimony, oxygen (in specific instances), sulfur, selenium and tellurium (Group
VA and VI A on the Periodic Table) are typical poisons for fuel cells. Table 4.4
displays the fuel requirements of each fuel cell type.
Table 4.4: Fuel Requirements for Fuel Cells (Laramie, et al., 2003)
Gas Species PEMFC PAFC MCFC SOFC
H2 Fuel Fuel Fuel Fuel
COPoison(>10 ppm)
Poison(>0.5%)
Fuel Fuel
CH4 Diluent Diluent Diluent Diluent
CO2 and H2O Diluent Diluent Diluent Diluent
S (as H2S and COS)
Fewstudies, to date
Poison(>50 ppm)
Poison(>0.5ppm)
Poison(>1.0ppm)
Fuel reformers are needed because the fuel is often in the form of
hydrocarbons, such as methane, and the hydrogen concentration is not at a level
suitable for operation. The fuel cell “stack” consists of layers of the cathode,
anode, and electrolyte mentioned earlier. A power conditioner converts the direct
current (DC) electricity generated by the fuel cell into alternating current (AC)
electricity at the appropriate voltage and frequency.

95
Fuel cells are categorized by the electrolyte used to transport ions
between the cathode and the anode (or vise versa). Fuel cell technologies
include molten carbonate (MCFC), alkaline (AFC), proton exchange membrane
(PEMFC), solid oxide (SOFC), direct methanol (DMFC), and phosphoric acid
(PAFC). While PEMFC are arguably the most advanced of the fuel cell
technologies, the low operating temperatures are not ideal for CHP applications,
particularly if the waste heat is required to drive thermally activated components.
Because high temperature or high quality waste is heat needed for m-CHP
applications, the solid oxide (SOFC) and the molten carbonate (MCFC)
configurations are two likely candidates. Direct methanol fuel cells also hold
some potential because a hydrogen reformer is not required, thereby reducing
the system costs. Currently, the PEMFC and the SOFC are regarded as having
the most potential for m-CHP. Table 4.5 shows the characteristics of the five
major types of fuel cell technologies.

96
Table 4.5: Characteristics of Fuel Cells (http://www.oit.doe.gov)
PEMFC
Proton exchange membrane fuel cells (PEMFC) use an ion-conducting
polymer as the electrolyte. The electrolyte works well at low temperatures,
typically around 175 – 212 F (80 – 100 C), which allows for fast start-up. The

97
polymer membrane construction varies depending on manufacturer; however a
standard practice uses a modified polymer known as polytetrafluoroehtylene
(PTFE), or as it is commonly know, Teflon®. Because the electrolyte is a solid
polymer, electrolyte loss is not an issue with regard to stack life. Most PEMFC’s
use platinum as the catalyst for both the anode and the cathode. Hydrogen is
used as the fuel at the anode, and air or oxygen is supplied to the cathode. The
reactions that occur within a generic PEMFC are as follows:
2
2 2
2 2 2
Anode Reaction: 2 2
CathodeReaction: 4 4 2
Overall Reaction: 2 2
H H e
O H e H O
H O H O
The electrode reactions are shown in Figure 4.37. Hydrogen ions and
electrons are produced from the fuel gas at the anode. The hydrogen ions travel
through the electrolyte to the cathode. Electrons pass through an outside circuit
to join the hydrogen ions and oxygen atoms at the cathode to produce water and
product gases. The solid electrolyte does not absorb the water. The operation of
a PEMFC requires a certain level of water be maintained in the stack; however,
too much water, or a “flood” of water, will shut the fuel cell down. The optimum
water level creates water management issues in that the amount of water
remaining in the fuel cell stacks and the amount of water rejected must be
carefully controlled.
The primary advantage of the PEMFC is that extensive development has
resulted in increased electrical efficiency and decreased size and material
requirements. However, there are several disadvantages of using a PEMFC for

98
m-CHP applications. The operating temperature is too low to drive the thermally
activated components of the m-CHP system. Water management and humidity
control are critical issues in the operation of a PEMFC. There must be sufficient
water content in the polymer electrolyte as the proton conductivity is directly
proportional to the water content. However, there must not be so much water
that the electrodes are bonded to the electrolyte, blocking the pores in the
electrodes or the gas diffusion layer. Also, due to poisoning issues, relatively
pure hydrogen is needed at the anode and a hydrogen reformer is necessary,
which increases the overall costs of the system.
The American Council for an Energy Efficient Economy (ACEEE)
Emerging Technologies & Practices (2004) performed a theoretical study on a
residential CHP system using a 2-kW PEMFC as the power generation device.
The economics indicated that with the estimated costs of the PEMFC unit and
maintenance cost, the cost of the electricity generated would be $0.18/kWh.
Therefore the installation of the 2-kW PEMFC unit would only be advantageous
in an area that has an electrical cost higher than $0.18/kWh, or in an area where
grid electricity is unavailable.
Thermally activated components were included only implicitly in the study,
and the systems were not sized large enough to have excess power either to
store or sell to the electricity grid. The study listed several major market barriers:
dwindling natural gas supplies, introducing and integrating a new technology and

99
overcoming the inertia of the established market, and uncertain system reliability.
Also to be considered is how and who will provide system maintenance.
The Entergy Centre of the Netherlands (ECN) experimented with a 2 kW
PEMFC m-CHP system. The system uses natural gas, and the fuel cell operates
at approximately 65 C. For system operation, natural gas is desulphurised and
converted to hydrogen rich gas in the reformer. The study showed that a start-up
time of 2.5 hours was needed when starting from cold conditions to steady
operating conditions where the rejected heat could be used to aid the reforming
process. This start-up time was reduced to 45 minutes when transitioning from
hot stand-by conditions. Characteristics demonstrated by the system include:
Gross (electrical + thermal) efficiency of fuel processor varies from 70% at
1 kW to 78% at full load (10 kW)
Stack electrical conversion efficiency of 40% at 2 kW and 42% at 1 kW
Recovered 53% of the waste heat (LHV basis)
The results of this study predicted a payback period of five years for a 1 kW
m-CHP system costing 1000 – 1500 EUR ($1300 - $2000), taking into account
the market value of Dutch natural gas, electric rates in the Netherlands, and local
energy tariffs. Note that system costs of $1300-$2000 is a theoretical value the
manufacturers hope to achieve.
SOFC
Solid oxide fuel cells use an oxide ion-conducting ceramic material as the
electrolyte. The anode of a SOFC is usually a cermet composed of nickel and
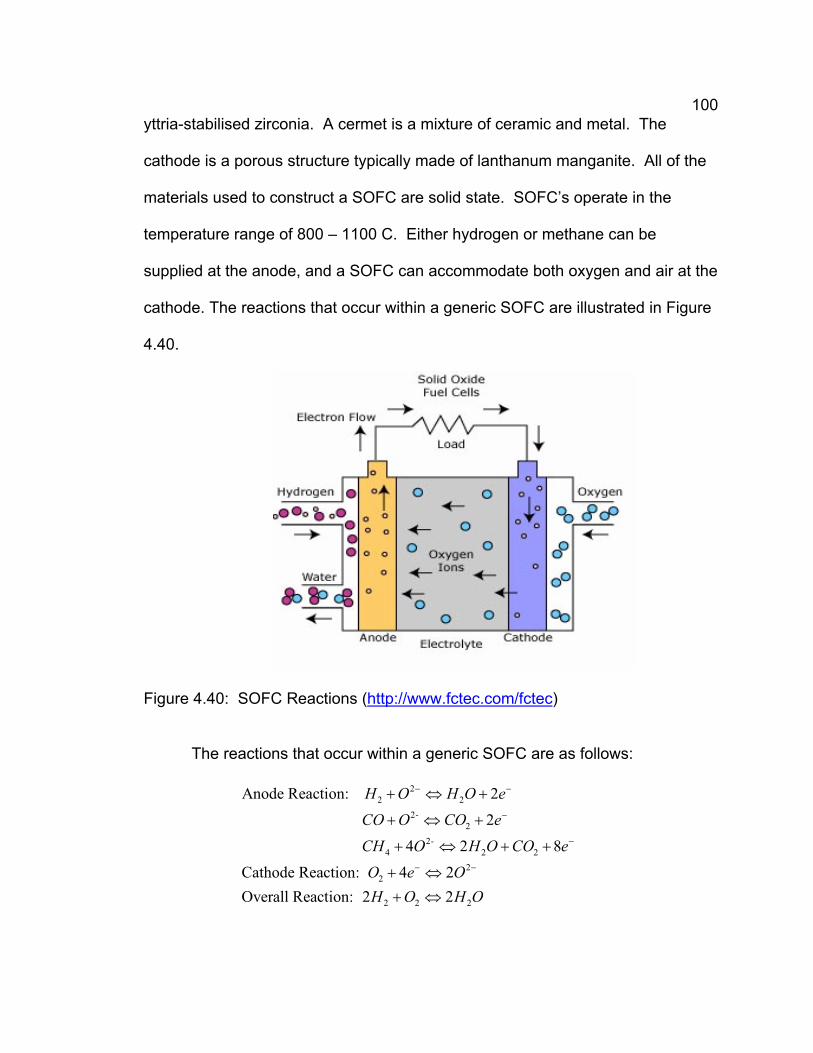
100
yttria-stabilised zirconia. A cermet is a mixture of ceramic and metal. The
cathode is a porous structure typically made of lanthanum manganite. All of the
materials used to construct a SOFC are solid state. SOFC’s operate in the
temperature range of 800 – 1100 C. Either hydrogen or methane can be
supplied at the anode, and a SOFC can accommodate both oxygen and air at the
cathode. The reactions that occur within a generic SOFC are illustrated in Figure
4.40.
Figure 4.40: SOFC Reactions (http://www.fctec.com/fctec)
The reactions that occur within a generic SOFC are as follows:
2
2 2
2-
2
2-
4 2 2
2
2
2 2 2
Anode Reaction: 2
2
4 2 8
Cathode Reaction: 4 2
Overall Reaction: 2 2
H O H O e
CO O CO e
CH O H O CO e
O e O
H O H O

101
In the SOFC reactions, hydrogen or carbon monoxide in the fuel stream
reacts with oxide ions traveling through the electrolyte. These reactions produce
water and carbon dioxide and disperse electrons to the anode. The electrons
pass through the exterior load and return to the cathode. At the cathode, the
electrons are used to ionize the oxygen molecules from the air. The oxide ions
then enter the electrolyte and the process begins again.
Solid oxide fuel cells have several advantages from an m-CHP point of
view. First, the high operating temperatures are attractive for driving thermally
activated components and for heating domestic hot water. The construction
negates any electrolyte management issues or water management difficulties.
The presence of nickel at the cathode can be used as an internal reforming
catalyst, eliminating the need for a reformer and reducing system cost.
The SOFC has challenges and disadvantages. The high temperatures
result in construction and material difficulties. The elevated temperatures also
decrease the open-circuit voltage achieved by a SOFC because the Gibbs free
energy of formation of the products (water) tends to be less negative. The
reduced open-circuit voltage leads to a decrease in electrical efficiency.
However, the advantage of the quality of the waste heat overcomes the small
decrease in the system efficiency.
Solid oxide fuel cells hold perhaps the most promise for m-CHP
applications. The European Commission has recognized the natural gas
powered, high-temperature fuel cell as being among the most efficient and

102
environmentally friendly means of achieving distributed cogeneration. Several
m-CHP systems using SOFC technology have been developed and tested.
Ceramic Fuel Cells Limited (CFCL) has been developing flat plate SOFC
technology for thirteen years. In 2004 CFCL announced an all-ceramic stack
design capable of volume fabrication for a 1-kW m-CHP fuel cell system targeting
the residential market. The SOFC stack developed by CFCL has been designed
with commercial requirements in mind. The stack has the ability to reform fuel at
the anode without the use of an external reformer and operates at temperatures
of 1470 – 1600 F (800 – 870 C). The SOFC stack utilizes a modular design that
allows stacks to be arranged in parallel to generate power in a range of 1 – 10
kW.
An example of an SOFC installed for residential m-CHP use is at the
Canadian Centre for Housing Technology in Ottawa. The unit is a 5-kW system
that operates on natural gas, using a tubular arrangement developed by Siemens
Westinghouse Power Corporation. The unit has the ability to use low fuel
pressures which decreases operational costs. The system also includes an
inverter that meets residential standards and output control that allows the
system to output/receive electricity to the grid. The SOFC unit has been placed
in a research house that incorporates simulated occupancy and an “intensively
monitored real world environment.” Researchers intend to monitor heating,
ventilation, and air-conditioning conditions to develop methods for better controls
systems and grid connections.

103
The Energy Research Centre of the Netherlands (ENC) has also
experimented with the use of a 1-kW SOFC m-CHP unit. The system operates
with an HXS 1000 Premiere fuel cell system installed in September 2002. The
unit has a thermal output of 2.5 kW and is equipped with an auxiliary heater. The
unit is fueled by natural gas, and the operating temperature is approximately 900
C. The SOFC cells are manufactured by InDEC and are arranged in a stack
assembly. The system is pictured in Figure 4.41.
Figure 4.41: SOFC Stack Assembly (one cell shown) (Oosterkamp, et. al)
The operation of the system begins with the desulphurization of the
natural gas which is mixed with de-ionized water vapor. The mixture is internally
reformed at the anode, and carbon monoxide and hydrogen are consumed at the
anode. Waste heat is recovered by the combustion of the mixture of anode “off

104
gas” (water vapor and carbon dioxide) and cathode exhaust. The combustion
provides sensible heat to the storage vessel. (Oosterkamp, et. al)
The SOFC m-CHP system operates in a heat following mode and has
demonstrated the following performance:
Electrical efficiency of 25-32% at full load
Thermal efficiency of 53-60% on LHV basis
Total efficiency of approximately 85%
However, the study also found that the electrical efficiency does decrease
over time. The efficiency decrease is rather fast for strongly dynamic system
operation, but is also noticeable for a more stable and steady operation.
PAFC
Phosphoric acid fuel cells are generally considered the “first
generation” technology. PAFC fuel cells typically operate at a temperature of
390 F (200 C) and can achieve 40 % to 50 % fuel to electrical efficiencies on a
lower heating value basis (LHV). The PAFC operates similar to the PEMFC.
The PAFC uses a proton-conducting electrolyte (phosphoric acid), and the
reactions occur on highly-dispersed electrocatalyst particles supported on carbon
black. Phosphoric acid (H3PO4) is the only common inorganic acid that has
enough thermal, chemical, and electrochemical stability and low volatility to be
considered as an electrolyte for fuel cells. Typically, platinum is used as the
catalyst at both the anode and cathode. The reactions that occur within a
generic PAFC are as follows:

105
2
2 2
2 2 2
Anode Reaction: 2 2
Cathode Reaction: ( ) 4 4 2
Overall Reaction: 2 2
H H e
O g H e H O
H O H O
In the PAFC reactions, hydrogen is ionized at the anode to produce two
hydrogen ions and two electrons. The hydrogen ions pass through the
electrolyte to the cathode while the electrons travel through a load in an external
circuit. At the cathode, the hydrogen ions, electrons, and oxygen react to form
water. The reactions that occur in the PAFC are shown in Figure 4.42.
Figure 4.42: PAFC Reactions (http://www.fctec.com/fctec)
The PAFC has experienced success in the large-scale CHP arena and
holds potential for the m-CHP market. However, currently few manufacturers are
pursuing development of PAFC m-CHP based system but have expressed more
interest in the SOFC and PEMFC fuel cells. One reason for manufacturers’ lack
of interest in PAFC fuel cells is that the PAFC fuel cell uses only pure hydrogen

106
as fuel and other fuel cell types have the capability to utilize a fuel other than a
pure hydrogen stream. This selection could also result from potential hazards
the electrolyte (phosphoric acid) could pose to inhabitants in the event of a leak.
The PAFC requires an external fuel reformer, increasing the production cost.
MCFC
Molten Carbonate Fuel Cells (MCFC) are high-temperature fuel cells and
promise the highest fuel-to-electricity efficiencies for carbon based fuels. The
higher operating temperature allows the MCFC’s to use natural gas directly
without the need for a fuel reformer. MCFC have also been used with low-Btu
fuel gas from industrial processes and other fuel sources. Developed in the mid
1960s, improvements have been made in fabrication methods, performance and
endurance.
The MCFC operates differently than the fuel cells previously discussed.
MCFC’s use an electrolyte composed of a molten mixture of alkali metal
carbonate salts, which is retained in a ceramic matrix of LiAlO2. Two mixtures
are currently used: lithium carbonate and potassium carbonate or lithium
carbonate and sodium carbonate. To melt the carbonate salts and achieve high
ion mobility through the electrolyte, MCFC’s operate at temperatures of 600-700
C. When heated to a temperature of around 650 C, the salts melt and become
conductive to carbonate ions (CO32-). These ions flow from the cathode to the
anode where they combine with hydrogen to give water, carbon dioxide and

107
electrons. Electrons are routed through an external circuit back to the cathode,
generating electricity and by-product heat.
Unlike other fuel cells, carbon dioxide as well as oxygen needs to be
delivered to the cathode. The carbon dioxide and oxygen react to form
carbonate ions, which provide the means of ion transfer between the cathode
and anode. At the anode, the carbonate ions are converted back into carbon
dioxide. There is a net transfer of CO2 from the cathode to the anode; one mole
of CO2 is transferred for every two moles of electrons. The operation of a MCFC
is illustrated in Figure 4.43. The reactions occurring in the MCFC are
2-
3 2 2 2
2
2 2 3
2 2 2 2 2
Anode Reaction: CO 2
1Cathode Reaction: C ( ) 22
1Overall Reaction: ( ) 2 ( )2
H H O CO e
O g O e CO
H O CO cathode H O CO anode
Figure 4.43: MCFC Reactions (http://www.fctec.com/fctec)

108
The higher operating temperature of the MCFC creates both advantages
and disadvantages compared to fuel cells such as the PAFC and PEMFC with
lower operating temperatures. The higher operating temperature allows fuel
reforming of natural gas to occur internally, eliminating the need for a fuel
reformer. The MCFC can also utilize standard materials for construction, such as
stainless steel and nickel-based catalysts. The by-product heat from an MCFC
can be used to generate domestic hot water, space heating and cooling, and
even high-pressure steam.
The high operating temperatures and the electrolyte chemistry of the
MCFC also lead to disadvantages. The high temperature requires significant time
to reach operating conditions and correspondingly slow response time to
changing power demands. These characteristics make the MCFC less attractive
for dynamic power applications and restrict it to constant-power supply
applications. The carbonate electrolyte can also cause electrode corrosion
problems. Due to the use of the carbonate ions as the charge carrier, the supply
of carbon dioxide to the cathode must be carefully controlled in order to achieve
optimum performance.
Each fuel cell type has both advantages and disadvantages over its
counterparts. The selection of the “best” fuel cell will depend upon the details of
the application. An overview of fuel cell characteristics is given in Table 4.6.

109
Table 4.6: Overview of Fuel Cell Characteristics (www.energy.ca.gov/distgen/)
Fuel Cells Overview
PAFC SOFC MCFC PEMFC
Commercially Available
Yes Yes Yes Yes
Size Range 100-200 kW 1 kW - 10 MW 250 kW - 10 MW 3-250 kW
FuelNatural gas, landfill gas, digester gas,
propane
Natural gas, hydrogen, landfill gas, fuel oil
Natural gas, hydrogen
Natural gas, hydrogen, propane,
diesel
Efficiency 36-42% 45-60% 45-55% 25-40%
Environmental Nearly zero emissions Nearly zero emissions Nearly zero emissions
Nearly zero emissions
Other Features Cogen (hot water) Cogen (hot water, LP
or HP steam) Cogen (hot water, LP or HP steam)
Cogen (80°C water)
CommercialStatus
Some commercially available
Commercialization likely in 2004
Some commercially available
Some commercially available
Application
Fuel cells are being developed for stationary power in small
commercial and residential markets and as peak shaving units for commercial
and industrial uses. Some fuel cells, such as PEMFC, are currently undergoing
development for use in automobiles and portable power applications.
Phosphoric acid fuel cells have been installed at medical, industrial, and
commercial facilities throughout the country, and the 200-kW size is a good
match for distributed generation applications. The operating temperature is about
400 F, which is suitable for co-generation applications. Developers are targeting
commercial and light industrial applications in the 100-200 kW power range, for
both electric-only and cogeneration applications.
The high efficiency and high operating temperature of MCFC units makes
them most attractive for base-loaded power generation, either in electric-only or

110
cogeneration modes. Potential applications for the MCFC are industrial,
government facilities, universities, and hospitals.
Solid oxide fuel cells are being considered for a wide variety of
applications, especially in the 5 – 250 kW size range. These applications include
small commercial buildings, industrial facilities, m-CHP, and base load utility
applications.
Proton exchange membrane fuel cells are currently undergoing the most
rapid development of any fuel cell type. Part of this development has been
driven by the desire of automotive manufacturers to develop a fuel cell powered
automobile. This surge in development has led to breakthroughs for stationary
power applications as well. Research is aimed at commercial-sized power
generation (e.g., Ballard's 250 kW unit) and residential power generation (e.g.,
Plug Power's 3-5 kW units). For the units to achieve market potential, natural
gas is selected as the fuel of choice. Reject system heat in the form of hot water
makes them particularly attractive for cogeneration, which is included in almost
all products currently under development.
Heat Recovery
The type of fuel cell determines the temperature of the heat rejected
during operation and directly influences the fuel cell type’s suitability for m-CHP
applications. Low temperature fuel cells create waste heat suitable for producing
hot water and in some cases, low pressure steam. Lower temperature fuel cells
such as the PAFC and PEMFC produce lower quality waste heat and are

111
suitable for small commercial and industrial cogeneration applications. The
MCFC and the SOFC operate at high temperatures and are capable of producing
waste heat that can be used to generate steam for use in a steam turbine, or
combined cycle microturbine. If space cooling is considered and an absorption
chiller is to be used, the recaptured heat should be at a temperature of at least
185 F (85 C).
Cost
The initial cost of fuel cells is higher than those of other electricity
generation technologies. The only product available commercially today is the
PureCell 200 (formerly PC-25)™ built by UTC Power. The cost of the unit is
approximately $4,000/kW. The installed cost of the unit approaches $1.1 million.
At a rated output of 200 kW, this translates to about $5,500/kW, installed.
However, on January 3, 2005, Delphi Corp., in partnership with the DOE’s
advanced fuel cell development program, reported that researchers have
exceeded the government’s $400/kW power cost goal for fuel cells. At this price,
fuel cells could compete with traditional gas turbine and diesel electric generators
and become viable power suppliers for the transportation sector. Table 4.7
shows the uninstalled projected long-term costs of fuel cell technologies. The
price of $400/kW is not included in Table 4-7 as the information was only recently
released and currently, the development has not been proven for production
costs in a fuel cell of substantial size.

112
Table 4.7: Projected Long-Term Costs of Fuel Cell Technologies (www.energy.ca.gov/distgen/)
Emerging Fuel Cell Technologies
TechnologyProjected Cost (Long-term, Uninstalled)
MCFC $1,200-1,500/kW
SOFC $1,000-1,500/kW
PEMFC Initially $5,000/kW Long term $1,000/kW
As no combustion is occurring, and there are no moving parts, fuel cells
are expected to have minimal maintenance requirements. The primary
maintenance will be focused on preventing poisoning of the catalyst and periodic
inspection and maintenance to the fuel supply system and fuel reformers. The
cell stack itself will not require maintenance until the end of its service life. The
maintenance and reliability of the system still needs to be proven in a long-term
demonstration. Maintenance costs of a fuel cell are expected to be comparable
to that of a microturbine, ranging from $0.005-$0.010/kWh (based on an annual
inspection visit to the unit). (http://www.energy.ca.gov/distgen/)
Advantages and Disadvantages
Each fuel cell type will have advantages and disadvantages in certain
areas, both as compared to other fuel cell technologies and other DER
equipment. Table 4.8 displays some of the advantages of the four primary types
of fuel cells.

113
Fuel cells convert chemical energy directly into electricity without the
combustion process. As a result, a fuel cell does not incur losses resulting from
mechanical inefficiencies. Fuel cells can achieve high efficiencies in energy
conversion terms, especially where the waste heat from the cell is utilized in
cogeneration. A high power density allows fuel cells to be a relatively compact
source of electric power, a benefit in applications with space constraints. In a fuel
cell system, the fuel cell itself is often smaller than the other components of the
system such as the fuel reformer and power inverter.
Fuel cells, due to their nature of operation, are extremely quiet in
operation. This allows fuel cells to be used in residential or built-up areas where
the noise pollution is undesirable. Unfortunately, the primary disadvantage of the
fuel cells is the cost. The two basic reasons are high component costs compared
to other energy systems technology and fuel cell operation requires a continuous,
highly selective, expensive fuel supply.

114
Table 4.8: Advantages and Disadvantages of Fuel Cell Types(www.energy.ca.gov/distgen/)
PAFC
Advantages Disadvantages
Quiet
Low emissions High Costs
High efficiency
Proven reliability Low energy density
PEMFC
Advantages Disadvantages
Quiet
Low emissions High Costs
High efficiency Limited field test experience
Synergy with Automotive R&D
Low temperature waste heat may limit cogeneration
potential
SOFC
Advantages Disadvantages
Quiet
Low emissions High Costs
High efficiency
High energy density
Self reforming
Planar SOFC's are still in the R&D stage but recent developments in low
temperature operation show promise
MCFC
Advantages Disadvantages
Quiet
Low emissions High Costs
High efficiency
Self reforming Need to demonstrate long
term reliability
Exercises
1. A SOFC fuel cell has liquid water as a product when it operates at 700 K. What is the maximum work that the fuel cell can achieve per mole of reactant?
2. For the SOFC of problem 1, what is the thermal efficiency?

115
3. If the PEMFC of Example 4-5 has current and voltages efficiencies of 80%, what is the electrical conversion efficiency of the fuel cell?
3. A MCFC has liquid water and carbon dioxide as the products when is operates at 400 K. What is the maximum work that the fuel cell can achieve and what is the thermal efficiency?
4. What is the thermal efficiency and the maximum work that a PAFC can achieve when operating at 373 K and liquid water is the product?
6. A PEMFC operating at 298 K produces liquid water. If the current efficiency and voltage efficiencies are 75% and 85%, respectively, determine the electrical conversion efficiency of the fuel cell.

116
Manufacturers
Ceramic Fuel Cells Limited (CFCL) of Victoria, Australia, develops and
manufactures SOFC based m-CHP units. Figures 4.44 and 4.45 show a
1-kW m-CHP demonstration unit and CFCL’s 5-kW concept unit,
respectively.
Figure 4.44: CFCL 1-kW Technology Demonstrator System(http://www.cfcl.com.au/html/)
Figure 4.45: CFCL’s 5-kW m-CHP Concept Unit (http://www.cfcl.com.au/html/)

117
Plug Power of Latham, New York manufactures fuel cell units for
continuous, standby, and emergency applications with two lines of fuel
cells, GenSys and GenCore. GenSys systems provide continuous power
supply. GenCore systems provide standby power for buildings.
Figure 4.46: Plug Power Fuel Cell Unit (www.plugpower.com)
Baxi Technologies, of the Baxi Group produces a m-CHP fuel cell unit.
Baxi’s networkable fuel cell produces 1.5 kW of electrical output, 3 kW of
thermal output, and includes a 15-kW integral boiler. The beta unit shown
in Figure 4.47 is 1.7 m high.
Figure 4.47: Baxi Technology 1.5-kW m-CHP Fuel Cell Unit(www.baxitech.co.uk)

118
CHAPTER V:
HEAT RECOVERY
Electrical power generation devices do not convert 100% of an energy
source potential into usable energy. Electrical efficiencies of reciprocating
engines, microturbines, Stirling engines, and fuel cells are about 50%, 30%,
30%, and 60%, respectively. This means that the electrical power generation
devices fail to utilize 40% - 70% of the available energy. Energy that is not
converted to electrical or shaft power is rejected from the process in the form of
waste heat. In order to utilize more of the energy stored in a given fuel and
increase the overall thermal efficiency of a system, heat recovery must be
incorporated into a system. Heat recovery converts waste heat to useful energy
and is primarily accomplished through the use of heat exchangers.
Distributed energy generation prime movers possess waste heat that can
be recovered as useful energy. The type of prime mover determines the
characteristics of the waste heat and the effectiveness with which useful energy
can be recovered. Waste heat is typically released in the form of hot exhaust
gases, process steam, or process liquids/solids. The usable temperature for
heat recovery is listed for various prime movers in Table 5.1. Potential uses for
the waste heat are hot water, space heating and cooling, and process steam.

119
Table 5.1: Waste Heat Characteristics of Prime Mover Technologies
Usable Temp. for m-CHP (°F)
Diesel Engine 180 - 900
Natural Gas Engine 300 - 500
Stirling Engine 800 - 1000
Fuel Cell 140 - 750
Microturbine 400 - 650
Recovered heat that is utilized in the power generation process is internal
heat recovery, and recovered heat that is used for other processes is external
heat recovery. Recuperators, turbochargers, and combustion pre-heaters are
examples of internal heat recovery. Absorption chillers, desiccant
dehumidification devices, and heat recovery steam generators are examples of
external heat recovery components. Recovered heat is classified as low-
temperature when less than 445 F (<230 C), medium-temperature 445 F – 1202
F (230 C – 650 C), or high-temperature when greater than 1202 F (>650 C). The
majority of heat exchangers used in m-CHP are used for external heat recovery.
Technology Overview
Because combustion exhaust gases or process liquids cannot be used
directly in many applications, heat exchangers are used to facilitate the transfer
of waste heat thermal energy to heat recovery applications. Devices that transfer
energy between fluids at different temperatures by heat transfer modes are
known as heat exchangers. Heat exchangers come in a wide variety of sizes,
shapes, and types and utilize a wide range of fluids. Applications for heat
exchangers are vast, ranging from heating and air-conditioning systems, to

120
chemical processing and power production in large plants. Heat exchanger
classification is based upon component and fluid characteristics. Several
classification schemes have been proposed for heat exchangers. Hewitt et al.
suggests the following four-tiered system:
1. Recuperator/Regenerator
2. Direct-contact/Transmural heat transfer
3. Single phase/Two-phase
4. Geometry
A recuperator is based on a continuous transfer of heat between two fluid
streams. A regenerator is a device which uses a heat-absorbing material,
alternately cooled and heated in a batch mode, to transfer heat between two
streams; these are often rotary devices. Direct-contact heat exchangers, such as
a feedwater heater used in a power plant, allow the two fluids to come into
contact with each other. Transmural heat exchangers separate the two fluid
streams using a wall or series of walls. Single phase/two-phase refers to the
physical state of the fluids flowing in the heat exchanger. Single-phase flow
implies that both fluids are either completely gaseous or liquid. If evaporation or
condensation is taking place, the device involves two phases. Geometry refers
to the basic shape of the heat-exchanger passages that contain the fluid.
This section will focus on transmural recuperators with fluids in single-
phase; however, other arrangements will also be discussed. Transmural

121
recuperators with single-phase flow can be divided further by flow arrangement
into the following categories:
Counterflow
Cross-flow
Parallel flow
Counterflow and parallel flow tube-within-a-tube and cross-flow
configurations are shown in Figure 5.1.
Figure 5.1: Main Types of Transmural Recuperators with Fluids in Single-phase
The temperature versus area diagrams for the parallel flow and
counterflow arrangements are shown in Figure 5.2. In the parallel arrangement,
the fluid temperatures approach each other so that the temperature difference
T1 is much greater in magnitude than T2. If the length of the heat exchanger
were extended long enough in parallel flow, the exit temperatures of each of the
fluids would be approximately equal. The counterflow average T will be larger
than the parallel flow average T.

122
Th
in
Th
out
Tc
in
Tc
out
T1
T2T
Th
in
Th
out
Tc
in
Tcout
T1
T2
T
Figure 5.2: Temperature-area Diagram of Parallel and Counterflow Arrangements
Cross-flow heat exchangers are arranged so that the two fluids flow
perpendicular to each other as shown in Figure 5.3. An important concept when
discussing cross-flow heat exchangers is mixing. A fluid is said to be unmixed if
the passageway contains the same discrete portion of fluid throughout its
traverse of the exchanger. If the fluid passageways are such that fluid from one
passageway can mix with fluid from others, the fluid is mixed. In Figure 5.3,
mixed and unmixed arrangements are illustrated. Cross-flow heat exchangers
are classified as both fluids unmixed, both fluids mixed, or one fluid mixed and
one fluid unmixed.
When several tubes are placed inside a shell, the classical single-pass
shell-and-tube heat arrangement results. A schematic of a shell-and-tube heat
exchanger with one shell pass and one tube pass is illustrated in Figure 5.4.

123
Baffles are often placed inside a shell-and-tube heat exchanger to promote
higher heat transfer rates and increase the effectiveness of the heat exchanger.
Figure 5.3: Cross-flow Heat Exchangers
Figure 5.4: Shell-and-tube Heat Exchanger
Heat Exchanger Analysis
Heat transfer in a heat exchanger usually involves convection in each fluid
and conduction through the walls separating the two fluid streams. The two
methods used to design or analyze heat exchangers are the Log-Mean

124
Temperature Difference (LMTD) method and the Number of Transfer Units (NTU)
method.
The LMTD method utilizes a log mean temperature, the effective average
temperature across the length of the heat exchanger. The heat transfer rate
between two fluids separated by a surface is
( )h c
q UA T T UA T (5-1)
where the log mean temperature difference ( T ) is
2 1
2
1
ln
T TT
TT
(5-2)
The temperature differences T1 and T2 are the same temperature
differences represented in Figure 5.2. The UA in Equation (5-1) is known as the
conductance and is the product of the overall heat transfer coefficient (U) and the
area (A) on which U is based.
The NTU method is derived around the formal definition of effectiveness.
The heat exchanger effectiveness is defined as the ratio of the actual rate of heat
transfer to the maximum possible rate of heat exchange.
Actual Rate of Heat Transfer
Maximum Possible Rate of Heat Transfer (5-3)
The maximum possible rate of heat transfer would be obtained in a
counterflow heat exchanger of infinite heat transfer area. In such a unit, the
outlet temperature of the warmer fluid equals the inlet temperature of the colder
fluid when h ch p c p
m c m c , and the outlet temperature of the colder fluid equals the

125
inlet temperature of the warmer fluid whenc hc p h p
m c m c . m is the mass flow rate
of each of the respective fluid, and pc is the constant pressure specific volume of
the respective fluids. The subscripts c and h are used to denote the cold and hot
streams, respectively. The product p
m c is the capacity of the fluid.
The NTU method introduces the following definitions
hh h pC m c (5-4)
cc c pC m c (5-5)
min
max
CC
C (5-6)
with Cmin being the smaller capacity and Cmax the larger. Next, the number of
transfer units (NTU) is defined as
min
UANTU
C (5-7)
The effectiveness is defined as
min( )
in inh c
q
C T T (5-8)
The effectiveness becomes
min
( )
( )
in out
in in
h h h
h c
C T T
C T T (5-9)
min
( )
( )
out in
in in
c c c
h c
C T T
C T T (5-10)
The rate of heat transfer is given by

126
min( )
in inh cq C T T (5-11)
The relationship between the effectiveness and NTU of different heat
exchanger configurations can be derived analytically. Table 5.2 presents these
relationships.
Another important issue when selecting heat exchangers is the effect of
pressure drops. The pressure drop in a heat exchanger determines how much
pumping power must be supplied to achieve the effective heat transfer.
Excessive pressure drop can negate energy savings from thermal energy
recovery. Also, many thermally activated components require a specific
temperature and pressure at the inlet to perform their desired function.
Performance data are available for heat exchangers that fit a wide variety of
scenarios, but the scale and uniqueness of m-CHP present many new heat
recovery scenarios.

127
Table 5.2: Summary of Effectiveness-NTU Relationships for Heat Exchangers
Exchanger Type
Effectiveness NTU
ParallelFlow:
single pass
1 exp (1 )
1
NTU C
C
ln 1 (1 )
1
CNTU
C
Counterflow: single pass
1 exp (1 )
1 exp (1 )
NTU C
C NTU C
1 1ln
1 1NTU
C C
Shell and tube (one shell pass, 2,4,6,etc.,
tubepasses)
11
2 2
12 2
1 12 2
1 exp (1 )
2 1 (1 )
1 exp (1 )
NTU C
C C
NTU C
12 2
1(1 ) ln
1
ENTU C
E
1
12 2
2 (1 )
(1 )
C
E
C
Cross flow (both
streams unmixed)
0.22 0.781
1 exp exp( ( ) ) 1NTU C NTUC
Cross flow (stream
Cmin
unmixed)
11 exp 1 exp( )C NTU
C
1ln 1 ln(1 )NTU C
C
Cross flow (stream
Cmax
unmixed)
11 exp 1 exp ( )( )NTU C
C
1ln ln(1 ) 1NTU C
C
Figure 5.5: Cross-flow Heat Exchanger for Example 5-1

128
Example 5-1
A diesel engine driven generator is to be installed in an m-CHP system. In order to produce hot
water, the hot exhaust gases are passed through a cross-flow heat exchanger with both fluids
unmixed. The operating conditions are :
Engine Exhaust
Temperature (F) 300.0 65.0
Pressure (psia) 16.1 30.0
Flow rates (lbm/hr) 760.0 193.0
Density (lbm/ft3) 0.0316 62.43
Specific Heat (Btu/lbm F) 0.251 1.003
If the conductance of the heat echanger is 2.0x10³ Btu/lb*F, determine the effectiness of the heat
exchanger and the exit temperature of the water.
The subscripts E and W will be used to denote the exhaust and water streams, respectively, and
the subscripts 1 and 2 will be used to denote the entrance and exit conditions, respectively.
Input the given operating conditions
TE1
300F TW1
65F mE
760lb
hrm
W193
lb
hrUA 2 10
3 BTU
hr F
The constant pressure specific heats of the respective streams are
cpW
1.003BTU
lb FcpE
0.251BTU
lb F
The thermal capacity of each fluid stream is calculated as
CE
mE
cpE
CE
190.76BTU
hr F
CW
mW
cpW
CW
193.579BTU
hr F
The maximum and minimum capacities are defined as
Cmin
190.76BTU
hr FC
max193.579
BTU
hr F
Determine the capacity ratio.
C
Cmin
Cmax
C 0.985
Determine the number of transfer units (NTU) using the definition of NTU
NTUUA
Cmin
NTU 10.484
Determine the effectiveness of the heat exchanger using the effectiveness equation for a cross-flow
heat echanger with both fluids unmixed found in Table 5-2.
1 exp1
CNTU
0.22exp C NTU
0.781 0.817
Figure 5.6: Example 5-1

129
Solving equation 5-9 for the exit temperature of the water,
TW2
Cmin
TE1
TW1
CW
TW1
TW2
254.194F
Figure 5.6 (continued)
Application
Waste heat recovery heat exchangers may be classified as gas-to-gas,
gas-to-liquid, and liquid-to-liquid. The various types of these classifications are
displayed in Figure 5.7.
Gas-to-Gas Waste
Heat Recovery
Plat-fin and prime-
surface heat
exchangers
Heat pipe heat
exchangers
Rotary
Regenerators
Convection
Recuperators
Liquid coupled
heat exchangers
Gas-to-Liquid
Waste Heat
Recovery
Waste heat boilers Economizers Fluidized bed heat
exchangers
Heat pipe heat
exchangers
Liquid-to-Liquid
Waste Heat
Recovery
Shell-and-tube
heat exchangersPlate heat
exchangers
(a)
(b)
(c)
Figure 5.7: Classification of Waste Heat Recovery Heat Exchangers. (Recreated from the CRC Handbook of Energy Efficiency).

130
Gas-to-Gas Heat Exchangers
Gas-to-gas waste heat recovery exchangers can be used as recuperators
to preheat combustion air in IC engines and microturbines. Rotary regenerators
are often used in Stirling engines to recover and store heat. Gas-to-gas heat
exchangers find many applications in m-CHP systems.
Metallic radiation recuperators, convection recuperators, and a runaround
coil are the three primary types of gas-to-gas heat exchangers. A metallic
radiation recuperator is a tube-in-tube heat exchanger that consists of two
concentric metal tubes. Hot exhaust (flue) gas flows through the inner tube, and
the air to be preheated flows through the outer tube or annulus. This type of
recuperator can act as a part of a chimney, flue, or exhaust line. The majority of
the heat is transferred from the hot gas to the inner wall through radiation. The
heat transfer in the outer tube then takes place through convection. Air and gas
flowing in counterflow is the most desirable arrangement because this
arrangement has a high performance. Metallic radiation recuperators typically
achieve an effectiveness of 40% or lower. Though metallic radiation
recuperators could be used in m-CHP applications, their use will likely be limited
by the relatively low effectiveness which would result in large heat exchangers.
Convection recuperators are cross-flow heat exchangers with flue gases
flowing normal to a tube bundle with air to be preheated flowing in the tubes.
Convection recuperators can be used in low-temperature applications such as
131
space heating, direct-fired absorption chillers, or return air heating in a desiccant
dehumidification system.
A runaround coil consists of two connected heat exchangers that circulate
a working fluid. The working fluid is heated by the waste gas with one heat
exchanger and then circulated to the other heat exchanger where the fluid heats
a stream of cool air. Runaround coils are used in HVAC applications and can be
coupled with distributed generation components to produce warm air for district
heating, to heat return air for desiccant dehumidification devices, or to fire an
absorption chiller (Shah, 1997).
Gas-to-Liquid Heat Exchangers
Gas-to-liquid heat exchangers include economizers, waste heat boilers,
heat-pipe heat exchangers, fluidized-bed, and thermal fluid heaters.
Economizers and thermal fluid heaters are used for low- to medium-temperature
waste heat recovery while waste heat boilers, heat-pipe heat exchangers, and
fluidized bed heat exchangers are used for medium- to high-temperature heat
recovery. Economizers are most often used with boilers to preheat the boiler
feedwater. In other applications, economizers are referred to as a process fluid
or water heaters. An economizer is an individually finned-tube bundle, with gas
flowing outside normal to the finned tubes and water flowing inside the tubes.
Thermal fluid heaters are double-pipe heat exchangers that use waste
heat gases to heat a high-temperature organic heat transfer fluid. Thermal fluid
heaters operate on the same principle as a domestic warm-water system, except

132
that the water is replaced by a high-temperature organic heat transfer fluid. The
heat transfer fluid can be circulated and used for heating and heat-driven
absorption chillers.
Fluidized-bed heat exchangers utilize water, steam, or another heat
transfer fluid heated by waste heat gases that flow over a bed of finely divided
solid particles. As the waste heat fluid reaches a critical velocity, the particles
begin to float, and the resulting mixture acts as a fluid.
Economizers and thermal fluid heaters are more likely to be used in m-
CHP systems than either boilers or fluidized-bed heat exchangers due to the
amount of thermal energy available for heat recovery and the size requirements
of fluidized-bed heat exchangers. Process steam is also less likely to be needed
for m-CHP applications, eliminating the need for waste heat boilers.
Liquid-to-Liquid Heat Exchangers
Liquid-to-liquid waste heat recovery heat exchangers are typically used in
industrial applications. Shell-and-tube heat exchangers and plate heat
exchangers are typically used for liquid-to-liquid heat recovery. Liquid coolant
systems in reciprocating engines offer liquid-to-liquid heat recovery opportunities
from hot oil and other liquid coolants. However, liquid-to-liquid heat recovery will
not be as significant a contributor in m-CHP applications as are gas-to-gas and
gas-to-liquid waste heat recovery exchangers. (Shah, 1997)

133
Exercises
1. Water flowing at 4 kg/s is cooled by air flowing at 10 kg/s in a cross flow heat exchanger. The conductance of the heat exchanger is 700 W/K and the entrance temperature of the water is 373 K. Determine the NTU and effectiveness of the heat exchanger.
2. A counterflow tube-within-a-tube heat exchanger is used to heat water from 20 C to 95 C at a rate of 1.2 kg/s. The heating is accomplished by engine coolant water circulating at 160 C and 2 kg/s. The overall heat transfer coefficient is 640 W/C. Determine the effectiveness of the heat exchanger.
3. A cross-flow heat exchanger with an effectiveness of 0.8 is used to heat water at 75 F and 100 lb/ min to a temperature of 110 F. Heat is supplied by exhaust gases flowing at 150 F and 200 lb/min. What is the conductance of the heat exchanger?
4. Hot oil is to be cooled by water in a 1-shell-pass and 8-tube-passes heat exchanger. The overall heat transfer coefficient is 545 W/K. Water flows through the tubes at a rate o 0.2 kg/s and the oil through the shell at a rate of 0.3 kg/s. The water and oil enter at temperatures of 20 C and 150 C, respectively. Determine the rate of heat transfer of the in the heat exchanger and the outlet temperatures of the water and oil.
5. A counterflow tube-within-a-tube heat exchanger is used to heat water from 80 F to 150 F at a rate of 120 lb/min. The heating is accomplished by engine coolant water circulating at 200 F and 150 lb/min. If the conductance of a heat exchanger is varied from 200 Btu/hr*R to 1000 Btu/hr* R, what is the effect on the effectiveness of the heat exchanger?

134
CHAPTER VI:
ABSORPTION CHILLERS
Technology Overview
Absorption chiller technologies are one of a group of technologies
classified as heat pumps. Heat pumps may be either heat driven or work driven.
Absorption technologies are heat driven, transferring heat from a low
temperature to a high temperature using heat as the driving energy. Heat pumps
operate on the principle of the absorption refrigeration cycle, which is similar to
the vapor-compression cycle. Both the absorption refrigeration cycle and the
vapor-compression cycle will be examined to draw analogies between the two.
Vapor-compression refrigeration systems are the most common
refrigeration systems in use today. The vapor-compression cycle is a work-
driven cycle that is illustrated in Figure 6.1. In the vapor-compression cycle, work
is input to compress the refrigerant to a high pressure and temperature at State
2. At State 2, the refrigerant condensation temperature is below the ambient
temperature. As the high-pressure and high-temperature refrigerant vapor
passes through the condenser, heat is rejected to the ambient air and the
refrigerant vapor condenses to a liquid to achieve State 3. The high-pressure
liquid at State 3 passes through an expansion valve. As the liquid passes

135
through the expansion valve, the refrigerant experiences a reduction in both
temperature and pressure to reach State 4. At State 4, the boiling temperature of
the refrigerant is lower than that of the surroundings. The low-pressure liquid
refrigerant passes through the evaporator, absorbing heat from the ambient
environment when boiling occurs in the evaporator and creating a low-pressure
refrigerant vapor at State 1. The low-pressure refrigerant vapor at State 1 enters
the compressor completing the cycle.
Figure 6.1: Vapor-Compression Cycle Schematic
The absorption cycle has some features in common with the vapor
compression cycle. For example, the absorption cycle has a condenser, an
evaporator, and an expansion valve. However, the absorption cycle and the
vapor-compression cycle differ in two very important aspects. The absorption

136
cycle uses a different compression process and different refrigerants than the
vapor-compression cycle.
The absorption cycle operates on the principle that some substances
(absorbents) have an affinity for other liquids or vapors and will absorb them
under certain conditions. Instead of compressing a vapor between the
evaporator and condenser as in Figure 6.1, the refrigerant of an absorption
system is absorbed by an absorbent to form a liquid solution. The liquid solution
is then pumped to a higher pressure. Because the average specific volume of a
liquid is much smaller than that of the refrigerant vapor, significantly less work is
required to raise the pressure of the refrigerant to the condenser pressure. This
corresponds to less work input for an absorption system as compared to a vapor-
compression system.
Because the absorbent used in the absorption cycle forms a liquid
solution, some means must also be introduced to retrieve the refrigerant vapor
from the liquid solution before the refrigerant enters the condenser. This process
involves heat transfer from a relatively high-temperature source. Because the
thermal energy input into the system is much higher than the work input through
the pump, absorption chillers are considered to be heat driven. The components
used to achieve the pressure increase in an absorption chiller are viewed as a
“thermal compressor” and replace the compressor in the vapor-compression
cycle shown in Figure 6.1. The components of the absorption cycle are shown
schematically in Figure 6.2. The components of the thermal compressor are a

137
pump, an absorber, and a (heat) generator and are shown to the right of the
dashed Z-Z line. The components to the left of the dashed Z-Z line are the same
as the ones used in the vapor-compression system.
Figure 6.2: Basic Absorption Cycle Schematic
The operation of the absorption cycle shown in Figure 6-2 is as follows: At
State 1, the low-pressure refrigerant vapor exits the evaporator and enters the
absorber. In the absorber, the refrigerant vapor is dissolved in an absorbent and
rejects the heat of condensation and the heat of mixing to form a liquid solution.
The refrigerant/absorbent solution is then pumped to the condenser pressure and
passed to the generator. In the generator, heat is added to the
refrigerant/absorbent solution to vaporize the refrigerant, removing the refrigerant
from the solution. The liquid absorbent has a higher boiling temperature than the
refrigerant and, therefore, stays in the liquid form. There are two streams exiting

138
the generator. The refrigerant exits to the condenser at a high temperature and
pressure (State 2) while the absorbent passes through an expansion valve,
decreasing the pressure of the absorbent to the evaporator pressure before
entering the absorber again.
The remainder of the operation is much the same as the vapor
compression cycle. The high-temperature, high-pressure refrigerant vapor at
State 2 enters the condenser with a pressure such that the ambient temperature
is higher than the condensation temperature of the refrigerant. The refrigerant
vapor condenses as it passes through the condenser, rejecting heat to the
ambient environment to achieve State 3. At State 3, the high-pressure, low-
temperature liquid refrigerant enters the expansion valve where the refrigerant
experiences a decrease in pressure to the evaporator pressure. The low-
pressure, low-temperature liquid refrigerant that results at State 4 is at a pressure
such that the boiling temperature of the refrigerant is lower than the ambient
temperature of the environment. As the liquid refrigerant passes through the
evaporator, the refrigerant boils, absorbing heat from the ambient air. The
refrigerant exits the evaporator as a high-temperature, low-pressure vapor to
complete the cycle.
Refrigerant-Absorbent Selection
Though all absorption chillers operate on the basic cycle presented in
Figure 6.2, each chiller design is dependent on the refrigerant-absorbent
selection. Current refrigerant/ absorber media for absorption chillers are either

139
water/lithium bromide or ammonia/water. Water/lithium bromide absorption
chillers utilize water as the refrigerant and lithium bromide as the absorbent.
Because water is used as the refrigerant, applications for the water/lithium
bromide absorption chillers are limited to refrigeration temperatures above 0 C.
This combination of refrigerant and absorbent is advantageous in areas where
toxicity is a concern because lithium bromide is relatively non-volatile.
Absorption machines based on water/lithium bromide are typically configured as
water chillers for air-conditioning systems in large buildings. Water/lithium
bromide chillers are available in sizes ranging from 10 to 1500 tons. The
coefficient of performance (COP) of these machines typically falls in the range of
0.7 to 1.2 (Herold, Radermacher, and Klein, 1996).
The ammonia/water combination utilizes ammonia as the refrigerant and
water and the absorbent. The use of the ammonia as the refrigerant allows
much lower refrigerant temperatures (the freezing temperature of ammonia is
-77.7 C); however, the toxicity of ammonia is a factor that has limited the use of
ammonia/water chillers to well-ventilated areas. In commercial and residential
building applications where there is insufficient ventilation, emissions from an
ammonia/water absorption chiller could be harmful to occupants.
The primary selling point of ammonia/water absorption chillers is their
ability to provide direct gas-fired and air-cooled air conditioning. Ammonia/water
absorption chillers are commonly sold as a single component in an air-
conditioning system; however, use is restricted in some densely populated areas.

140
Ammonia/waster chillers are available in capacities ranging from 3 to 25 tons
with COPs generally around 0.5 (Herold, Radermacher, and Klein, 1996).
A schematic of an absorption cycle of ammonia/water is shown in Figure
6.3. The addition of a heat exchanger is common in all absorption chillers to
increase the efficiency of the thermal compressor. The hot solution leaving the
generator is used to preheat the refrigerant/absorbent solution entering the
generator. A rectifier is also included in the system of an ammonia/water chiller.
This is because the ammonia vapor leaving the generator often includes a low
concentration of water vapor. This water vapor will freeze in the expansion
valve, negating the operation of the system.
Figure 6.3: Ammonia/Water Absorption Cycle

141
Types of Absorption Chillers
Absorption chillers are classified as single-effect, double-effect, or triple
effect. Single-effect absorption chillers contain one stage of generation, such as
the systems shown in Figures 6.2 and 6.3. Single-effect absorption chillers use
low-pressure steam or hot water as the energy source. Typical temperature
requirements range from 200 to 270 F (93 to 132 C). Steam-powered systems
operate at pressures between 9 and 15 psig. When the supplied temperatures
are below the design specifications, the chiller capacity is reduced.
Double-effect absorption systems use a second generator, condenser,
and heat exchanger that operate at higher temperature. A double-effect
water/lithium bromide absorption system is shown schematically in Figure 6.4.
Refrigerant vapor is recovered from the first-stage generator in the high-
temperature condenser. The refrigerant/absorbent in the second-stage
generator is at a lower temperature than the solution in the first-stage generator.
The refrigerant vapor from the first stage generator flows through the second-
stage generator where a portion of the refrigerant condenses back into liquid
while the remainder remains in the vapor phase. Additional refrigerant is
vaporized in the second-stage generator by the high temperature and the heat of
vaporization supplied by the refrigerant from the first-stage generator. The
refrigerant vapor from both generator stages flows to the condenser while the
absorbent solution flows back to the absorber.

142
Figure 6.4: Double-Effect Water/Lithium Bromide Absorption Chiller Schematic
The purpose of the two stages that make up the double-effect absorption
cycle is to increase the COP of the cycle. This is made possible through the use
of the recuperative heat exchangers used in the system. Double-effect chillers
yield higher COPs than single-effect chillers. The COP for double-effect
absorption chillers varies from 1.0 to 1.2 for water/lithium bromide chillers
(Herold, Radermacher, and Klein, 1996).
Triple-effect absorption chillers have been in prototype development for
several years. These chillers will be direct-fired and are expected to provide a
50% thermal efficiency improvement over double-effect absorption chillers.

143
Triple-effect absorption chillers do not feature a distinct third generator stage;
rather they use internally-recovered heat to achieve high efficiencies. Triple-
effect water/lithium bromide chillers can achieve COPs of 1.6 and greater
(Petchers, 2003).
One of the most promising absorption technologies is the generator-
absorber heat exchange (GAX) cycle. GAX chillers use an ammonia/water
working fluid. GAX-cycle systems hold great potential for residential and light-
commercial applications and provide capacities as low as 3 tons. GAX
absorption chillers have obtained COPs of approximately 0.7 (DeVault, et al.,
2002).
System Analysis
An absorption refrigeration system consists of a working fluid undergoing
a series of thermodynamic processes. Refrigerant and absorbent flow in a
closed-loop system that includes adiabatic and non-adiabatic mixing, heating and
cooling, pumping, and throttling. Each of these processes can be analyzed by
energy and mass balances. The thermodynamic properties of the working fluid
are essential for applying conservation of mass and energy relationships to a
system.
Absorption systems use homogenous binary mixtures as working fluids. A
homogenous mixture is a uniform composition that cannot be separated into its
constituents by pure mechanical means. The thermodynamic properties of the
working fluid will change throughout the cycle as the fluid flows through

144
components such as the generator, the evaporator, the expansion valves, and
the heat exchangers.
Unlike pure substances, the thermodynamic state of a mixture cannot be
determined by two independent properties. The concentration of a mixture (x)
must be known along with two independent properties of the mixture to
determine the thermodynamic state. The concentration of a mixture is defined as
the ratio of the mass of one constituent to the mass of the mixture. For example,
an ammonia/water mixture with a concentration of 0.3 contains 0.3 lbm of
ammonia for every 10 lbm of ammonia/water mixture.
The properties of binary mixtures can be represented using an enthalpy-
concentration (i-x) diagram. The liquid and vapor regions of the enthalpy-
concentration diagram are of the interest for the working fluids used in absorption
chillers. An example of an enthalpy-concentration diagram for an ammonia/water
system is given in Figure 6.5. In the i-x diagram, the enthalpy is plotted in the
vertical axis, and the concentration is plotted on the horizontal axis. Lines of
constant temperature as well as condensing and boiling lines are plotted to aid in
determining the thermodynamic properties at any point.

145
Figure 6.5: Enthaply-Concentration Diagram for Ammonia/water System. (Felder, et al., 1986)
An analysis of the thermodynamic processes in the absorption cycle is
possible once all the thermodynamic properties are determined. The generator,
evaporator, condenser, absorber, and rectifier all have refrigerant flowing through
them and heat transfer and mass transfer occurring. Figure 6.6 presents a
schematic of the thermodynamic processes that occur within the absorber.

146
1m
2m
Absorber3m
q
Figure 6.6: Absorber
Mass balance and energy equations for the absorber are
1 2 3m m m (6-1)
1 1 2 2 3 3m x m x m x (6-2)
1 1 2 2 3 3m i m i m i q (6-3)
Substitution and simplification of equations 6-1, 6-2, and 6-3 yields expressions
for the enthalpy and concentration of the stream exiting the absorber (stream 3)
2
3 1 2 1
3
( )m
x x x xm
(6-4)
2
3 1 2 1
3 3
( )m q
i i i im m
(6-5)
The last term in Equation 6-5 represents the loss of enthalpy through heat
rejection during the process. Equations 6-4 and 6-5 can be used to identify the
concentration and enthalpy of the fluid stream exiting the absorber.

147
The mass and energy balance equations for a first-stage or single-effect
generator can be determined in the same manner as for the absorber. A
schematic of the thermodynamic processes occurring within the first-stage
generator is shown in Figure 6.7.
1m
2m
3m
q
Figure 6.7: First-Stage Generator Schematic
Mass balance and energy equations for the first-stage generator are
1 2 3m m m (6-6)
1 1 2 2 3 3m x m x m x (6-7)
1 1 3 3 2 2m i q m i m i (6-8)
Substitution and simplification of Equations 6-6, 6-7, and 6-8 yields expressions
for the enthalpy and concentration of the refrigerant vapor stream exiting the
absorber (stream 2)
1 1 3 3
2
1 3
m x m xx
m m (6-9)
1 1 3 3
2
1 3
m i q m ii
m m (6-10)
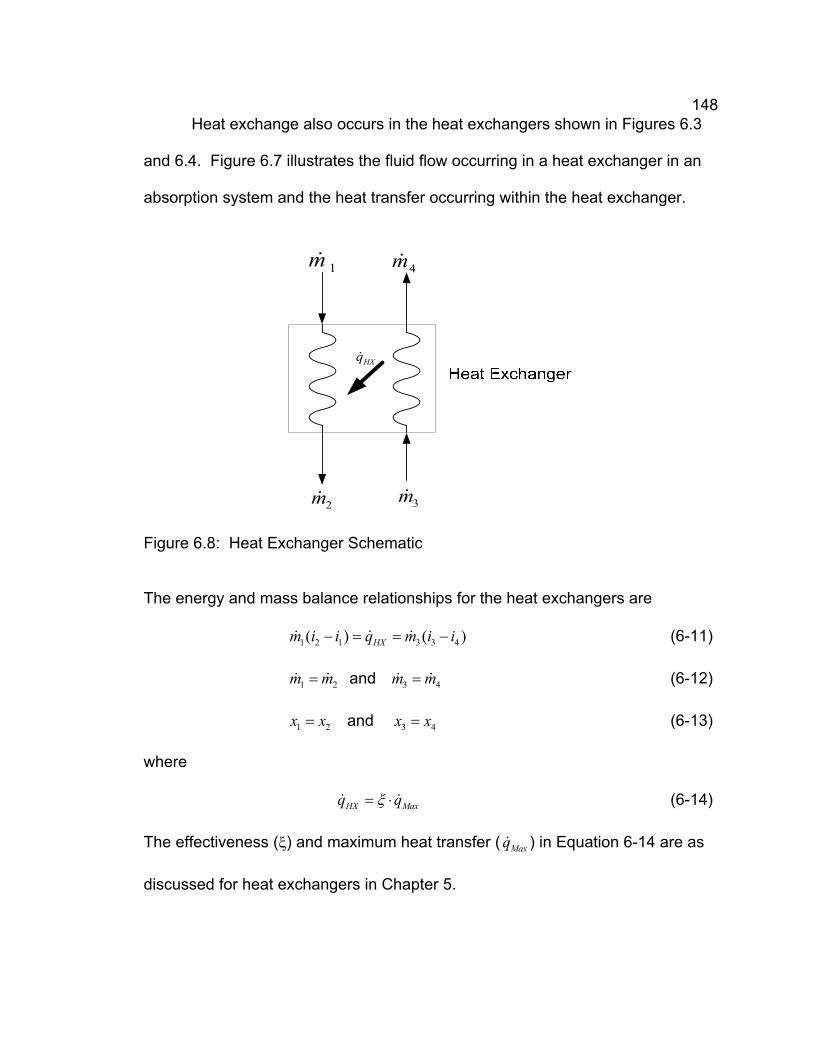
148
Heat exchange also occurs in the heat exchangers shown in Figures 6.3
and 6.4. Figure 6.7 illustrates the fluid flow occurring in a heat exchanger in an
absorption system and the heat transfer occurring within the heat exchanger.
HXq
4m
1m
2m 3
m
Figure 6.8: Heat Exchanger Schematic
The energy and mass balance relationships for the heat exchangers are
1 2 1 3 3 4( ) ( )
HXm i i q m i i (6-11)
1 2m m and
3 4m m (6-12)
1 2x x and
3 4x x (6-13)
where
HX Maxq q (6-14)
The effectiveness ( ) and maximum heat transfer (Maxq ) in Equation 6-14 are as
discussed for heat exchangers in Chapter 5.

149
Another thermodynamic process encountered in the absorption
refrigeration cycle is throttling. Throttling is achieved through the use of an
expansion valve as illustrated in Figures 6.1 – 6.4. In an expansion valve, the
fluid experiences a decrease in pressure and temperature as it exits the valve.
Because only one stream enters and exits the valve and the process has no
external heat source or sink, the mass and energy balance for a throttling device
yields m1=m2, i1=i2, and x1=x2.
At least one pump is required in an absorption system to pump the low-
pressure refrigerant/vapor solution from the evaporator pressure to the
condenser pressure. Figure 6.9 schematically represents the energy transfer
required for the fluid.
PW
1m
2m
Figure 6.9: Pump Schematic
The power requirement of the pump in an absorption system is minimal
and is often neglected in an overall performance analysis. The pumping power
can be calculated as
1
2 1( )
P
P
mW p p (6-15)

150
where is the specific volume of the solution, p1 and p2 are the pressures
entering and leaving the pump, respectively, and P is the pump efficiency.
The coefficient of performance for the absorption cycle can be obtained by
applying the first and second laws of thermodynamics. Neglecting pump work,
the actual COP of an absorption cycle is defined as
( )evaporator
Actual
generator
qCOP
q (6-16)
A first law expression when all processes in the absorption cycle are
irreversible is given in Equation 6-17. Equation 6-17 is based on the Carnot
cycle and yields unrealistic results. This equation demonstrates that increasing
the generator or evaporator temperatures will produce higher efficiencies in the
absorption cycle.
( )( )
( )
e g o
Max
g o e
T T TCOP
T T T (6-17)
where Te is the temperature of the refrigerated region associated with the vapor,
Tg is the temperature associated with the heat supplied to the generator, and To
is the temperature of the ambient air associated with heat rejected at the
absorber and condenser.
Increasing the evaporator temperature may not always be a practical
means to increase the COP. Increasing the generator temperature is often a
more feasible and desirable method to increase the COP of the absorption cycle.
Multiple-effect absorption systems offer more cooling than single-effect chillers
because more heat can be added to the refrigerant through additional generator

151
stages. Because the additional heat that is added is often recovered from the
first stage generator, this option is very desirable because the heat supplied to
the generator is not increasing. The quality of waste heat available to an
absorption chiller in an m-CHP system is vital to the success of the overall
system performance, especially in areas where the cooling load is high.
The following example is derived from an example in Absorption Chillers
and Heat Pumps (Herold, et al., 1996) and provides and analysis of an
ammonia/water absorption system. Graphical methods, energy balances and
mass balance equations, and COP relationships are implemented to determine
the system performance.
v
1
2
34
Evaporator
Condensor
Expansion
Valve
Qin
Qout
Pump
Absorber
Generator
W’in
Q’out
Q’in
Heat Exchanger
109
6
5
7
8
12
11
Figure 6.10: Single-stage Ammonia/water Absorption Chiller for Example 6-1

152
Table 6.1: State Points for the Ammonia/water System in Figure 6.10
State i (J/kg) m (kg/s) p (kPa)
Vapor
Quality T (C) x (kg/kg)
1 42.30 0.100 240.20 - 40.00 0.37
2 39.20 0.100 1555.00 - 40.50 0.37
3 306.80 0.100 1555.00 0.02 110.70 0.37
4 401.60 0.086 1555.00 - 131.00 0.27
5 0.90 0.086 1555.00 - 40.50 0.27
6 0.90 0.086 240.20 - 40.70 0.27
7 1547.00 0.015 1555.00 1.00 108.00 0.94
8 246.70 0.001 1555.00 - 108.00 0.37
9 1294.00 0.014 1555.00 1.00 44.00 1.00
10 190.10 0.014 1555.00 0.00 40.00 1.00
11 190.10 0.014 240.20 0.20 14.50 1.00
12 1246.00 0.014 240.20 0.99 10.00 1.00
Example 6-1
An ideal single-stage ammonia/water absorption system is given as shown in Figure 6-10. The
evaporator saturation temperature at the outlet is assumed to be -10 C with saturated vapor leaving.
The mass flow rate of solution through the solution pump is 0.10 kg/sec. The temperature of the
saturated liquid leaving the absorber and the condensor is 40 C. The difference in mass fraction of
the two solution streams is given to be 0.10. The rectifier prodeuces a vapor with a mass fraction of
0.999634 ammonia. The pump efficiency is taken to be 100% and the effectiveness of the solution
heat exchanger is taken as 1.0. Find the COP, the amounts of heat exchanged, and the work
performed by the pump. (Note: "Q" and "m" are heat rate and mass flow rate, respectively.)
Solution:
Using binary mixture analysis methods along with an enthalpy-concentration chart for ammonia-water
(or using suitable software) the state points can be found for all conditions as shown in Table 6-1.
Based on the values in Table 6-1, and the equations specified in this chapter, the following detailed
results are obtained.
The pump power, WP is
Wp
p2
p1
m1
P
Wp
0.158kW Wp
0.212hp
with = 0.0012 m3/kg, the specific volume of the rich solution, and a pump efficiency of 1.0.
Assuming a heat exchanger effectiveness of 1.0, the amount of heat exchanged in the solution heat
exchanger can be found by writing an energy balance on either side.
Qshx
m2
i3
i2
Qshx
9.979tons
Figure 6.11: Example 6-1

153
The heat losses and gains of the remaining components can be found by their respective energy
balance equations.
Qabsorber
m12
i12
m6
i6
m1
i1
Qabsorber
3.906tons
Qrectifier
m7
i7
m9
i9
m8
i8
Qrectifier
1.397tons
Qgenerator
m7
i7
m4
i4
m8
i8
m3
i3
Qgenerator
7.734tons
Qcondensor
m9
i9
i10
Qcondensor
4.457tons
Qevaporator
m9
i12
i11
Qevaporator
4.336tons
The actual COP of this absorption system is evaluated as
COPactual
Qevaporator
Qgenerator
COPactual
0.561
Figure 6.11: Example 6-1 (continued)
Application
Absorption chillers can be directly fired or indirectly fired. Direct-fired
absorption chillers utilize a natural gas burner and can supply waste heat for a
desiccant dehumidification device or hot water. Direct-fired chillers are often
used in areas where electric rates are high and gas utilities offer lower rates or
rebate programs to replace vapor-compression chillers.
Indirect-fired fired absorption chillers are utilized where there is an existing
source of heat that can be recovered. The supplied heat can be in the form of
hot water, steam, or exhaust gases. All of the prime mover technologies that are
applicable to m-CHP can produce waste heat sufficient to drive an absorption
chiller. This coupling ability makes absorption cycle chiller systems very
desirable for m-CHP applications. An absorption chiller in an m-CHP system

154
may not utilize all of the waste heat that is input into the chiller. Just as with
direct-fired chillers, this remaining heat may be used in a desiccant
dehumidification device or to produce hot water.
The temperature of the waste heat available from a power source
determines the appropriate absorption configuration. Table 6.2 matches the
waste heat temperatures typical of various prime movers with appropriate
absorption configurations. The match is based on the temperature of the waste
heat that could be obtained to drive the generator in an absorption chiller cycle.
Table 6.2. Matching of Power Generation and Absorption Technology. (Devault, Garland, Berry, and Fiskum, 2002)
Power Generation and Absorption Technology
Power Source Temperature (F) Matching Technology
Microturbine ~600 Triple-, double-, or single-
effect
Reciprocating Engine ~180 Single-effect
SOFC ~900 Triple-, double-, or single-
effect
PAFC ~250 Double-effect or single effect
PEMFC ~140 Single-effect
Absorption chillers offer many advantages over electric chillers, especially
when there is a source of waste heat available. As compared to electric chillers,
absorption chillers have lower operating costs, shorter payback periods, quiet
operation, low maintenance, and high reliability. Absorption systems also
operate at lower pressures and offer safer operation. However, absorption
chillers have higher initial costs and are not as widely available as electric
chillers.

155
Vapor-compression systems are much more widely manufactured and
more available than absorption chillers. Still, the fact that absorption chillers do
not have mechanical compressors and have fewer moving parts gives absorption
technologies an advantage over vapor-compression systems in terms of lower
maintenance, higher reliability and quieter operation.
Cost
The capital cost of installing an absorption chiller is generally more than
installing an equivalent electric or engine-driven chiller. The RS Means
Mechanical Cost Data for a 100 ton steam or water-fired absorption chiller is
presented in Table 6.3.
Table 6.3: RS Means Cost Data for a 100 Ton Absorption Chiller Installation
Cost Source Cost ($)
Material 110,500
Labor 7,975
Total 118,475
Exercises
1. Two solution streams are adiabatically mixed at the same temperature. Assuming the process occurs at a constant pressure, determine the mass flow rate, quality, and enthalpy of the outlet state. Table 7.6 gives the properties of the inlet streams.
Table 6.4: Table for Problem 1
m (kg/s) x (%LiBr) i (J/kg)
1 0.23 50 107.32
2 0.81 60 145.67

156
2. Consider a generator in an ammonia/water absorption cycle operating at steady state with the operating conditions specified in Table 7.7, where streams 1 and 2 are the inlet streams and stream 3 is the outlet stream. Find the required heat input that is to be supplied by a waste heat source assuming negligible pressure losses and a constant pressure throughout the system.
Table 6.5: Table for Problem 2
m (kg/s) x (%NH3) i (J/kg)
1 0.54 50 107.32
2 145.67
3 0.81 60 210.36
3. A double-effect water/lithium bromide absorption chiller has the operating conditions specified in Table 7.8, determine the enthalpy of the solution leaving the absorber and entering the pump. 87.5 kJ/s of energy is rejected during the absorption process. Assume negligible pressure losses and isobaric conditions.
Table 6.6: Table for Problem 3
m (kg/s) x (%LiBr) i (J/kg)
From Evaporator 0.32 35 90.5
From Generator/HX to Pump
0.16 40 75.3
4. A microturbine supplies waste heat to a water/LiBr absorption chiller at 400 F. The ambient temperature is 75 F, and the chiller produces chilled water at 45 F. What is the maximum coefficient of performance this system can attain?
5. The mass flow rate of refrigerant vapor entering the absorber from the evaporator is 0.35 kg/s. The enthalpies of the streams on the inlet and outlet sides of the evaporator are 100 kJ/kg and 150 kJ/kg respectively. If an internal combustion engine provides 27.5 kJ/s of energy to the generator, determine the actual coefficient of performance of the absorption chiller.
6. The absorption system above removes heat from the refrigerant in the condenser at a rate of 25 kJ/s. Determine (a) the rate of heat transfer in the evaporator, the absorber, and the generator, (b) the power required of the pump, and (c) the coefficient of performance.
7. Table 6.7 refers to an absorption system like the one analyzed in Example 1. Determine the mass flow rate, the pressure, and the concentration of all the streams in the system.

157
Table 6.7: Table for Problem 6
i (kJ/kg) m (kg/s) p (kPa) T (C) x (kg/kg)
1 -80.0 0.10 150.0 50.00
2 -22.3 52.00
3 256.30 125.00
4 1450.0 145.00
5 5.60 52.00 0.25
6 5.60 0.08 55.00
7 1360.20 115.00 0.92
8 0.003 115.00 0.40
9 60.00
10 1150 50.00
11 10.00 1.00
12 1095.4 0.02 25.00
8. Assuming that To = 55 C, Tg = 145 C, and Te = 10 C, determine the maximum possible COP. What is the refrigerating efficiency of this chiller?

158
Manufacturers
Yazaki Energy Systems, Inc. in Dallas, TX manufacture water fired chillers
in 10-, 20-, and 30-ton capacities in the WFC-S Series. The WFC-S
series water-fired chiller is pictured in Figure 6.12.
Figure 6.12: Yazaki Energy Systems WFCS Series 10-ton Absorption Chiller.(www.yazakienergy.com)
Robur Corporation, located in Evansville, Indiana, utilizes GAX technology
in the production of ammonia/water chillers. Robur manufacturers 3- and
5-ton units that can be packaged together to meet capacity requirements.
The model ACF 60-00 is shown in Figure 6.13.

159
Figure 6.13: Robur Model ACF 60-00 Gas-fired Absorption Chiller. (www.robur.com)
Carrier Corporation located in, Syracuse, New York manufactures the
model 16NK double-effect, steam-fired absorption chiller which offers
capacities from 98- to 1323-tons. The unit is pictured in Figure 6.14.
Figure 6.14: Carrier Model 16NK Absorption Chiller. (www.global.carrier.com)
Trane, founded in La Crosse, Wisconsin, manufactures both single-effect
and double-effect chillers that are direct-, steam-, and water-fired, Figure
6.15 illustrates the Trane Classic ® single-effect steam- or water-fired
absorption chiller with capacities of 112-465 tons.

160
Figure 6.15: Trane Classic ® Absorption Chiller (www.trane.com)
York International, based in York, Pennsylvania, manufactures single- and
double-effect absorption chillers that can be driven by natural gas,
propane, oil, high-pressure steam, or waste heat sources. Figure 6.16
pictures a single-effect absorption chiller available in capacities from 100
tons to 1,500 tons.
Figure 6.16: Single-effect Absorption Chiller by York International.(www.york.com)

161
CHAPTER VII:
DESICCANT DEHUMIDIFICATION TECHNOLOGIES
Introduction
Controlling humidity in a conditioned space can be important for a number
of reasons. Concerns include humidity damage to moisture sensitive items,
product protection from moisture degradation (foods, grains, and seeds), mildew
growth, corrosion, and health issues. In the last thirty years, applications have
expanded for desiccant technologies to include supermarkets, hospitals,
refrigerated warehouses, ice rinks, hotels, and retail establishments. Recently,
development has turned to applying desiccant dehumidification to commercial
and residential buildings.
Desiccants are materials that attract and hold moisture. A desiccant
dehumidifier is a device that employs a desiccant material to produce a
dehumidification effect. The process involves exposing the desiccant material to
a high relative humidity air stream, allowing the desiccant to extract and retain a
portion of the water vapor, and then exposing the same desiccant to a lower
relative humidity air stream where the retained moisture is drawn from the
desiccant.

162
This chapter presents an overview of desiccant dehumidification. The
principles of the sub-cooling system are introduced to contrast the differences
between desiccant and conventional air dehumidification and to highlight the
advantages of desiccant dehumidification. Also discussed are the principles of
desiccant systems, types of desiccant systems, and cost considerations for
choosing desiccant systems. Desiccant dehumidification technologies are an
attractive component of an m-CHP system because desiccant regeneration
provides an excellent use for waste heat.
Sub-cooling Systems vs. Desiccant Systems
In traditional air-conditioning systems, such as the units installed in most
U.S. homes, dehumidification is achieved by cooling a moist air stream to a
temperature below the dewpoint so that water (liquid) condenses out of the air.
This process is familiar to anyone who has seen moisture condense on the
exterior of a glass of ice water on a humid day. An example of the sub-cooling
process is illustrated on a psychometric chart in Figure 7.1. The processes
shown are for air being cooled and dehumidified from conditions of 95 F dry bulb
(db) and 75 F wet bulb (wb) to 77 F db and 58 grains/lbmda. The resulting air lies
approximately in the center of the ASHRAE Summer Comfort Zone shown in
Figure 7.2. Initially, the dry bulb temperature of the air decreases, while the
moisture content remains constant. The dry bulb temperature continues to
decrease as moisture begins to condense out of the air onto the cooling coil,
resulting in a decrease in the moisture content. In order to deliver air at the
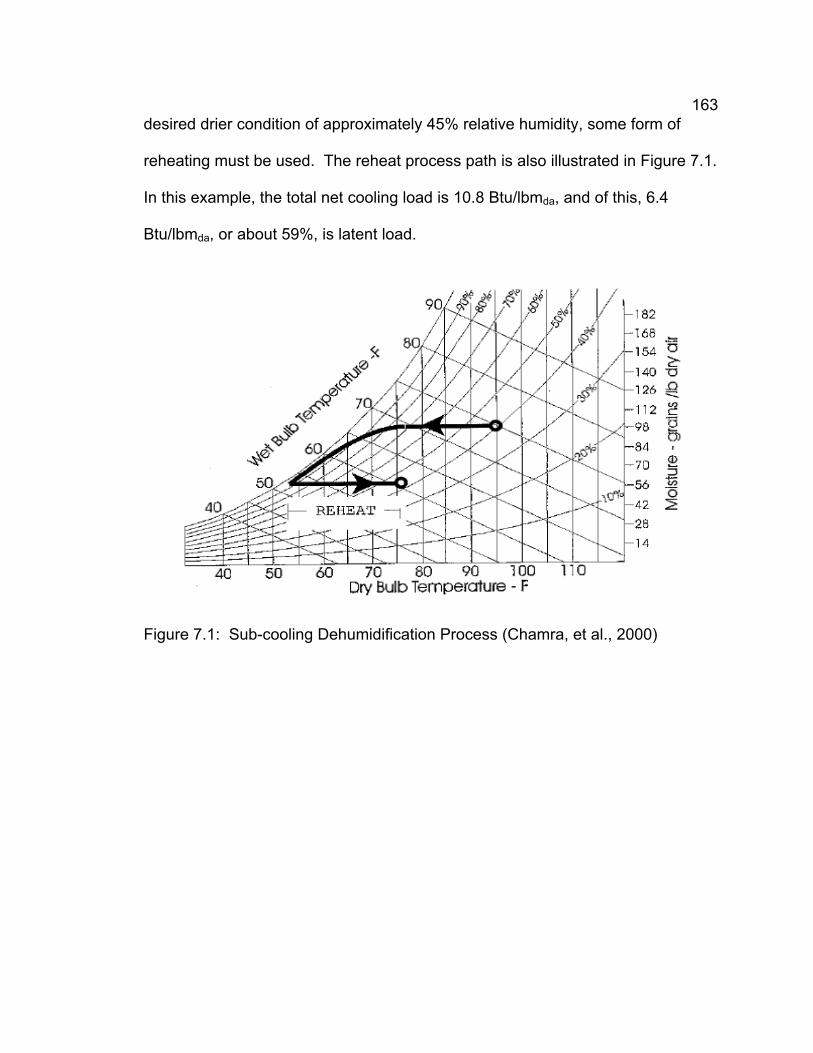
163
desired drier condition of approximately 45% relative humidity, some form of
reheating must be used. The reheat process path is also illustrated in Figure 7.1.
In this example, the total net cooling load is 10.8 Btu/lbmda, and of this, 6.4
Btu/lbmda, or about 59%, is latent load.
Figure 7.1: Sub-cooling Dehumidification Process (Chamra, et al., 2000)

164
Figure 7.2: ASHRAE Comfort Zones (ASHRAE Fundamentals, 2001)
Summary of the Principles of Sub-cooling Systems
The same equipment is used for both the sensible cooling and
dehumidification in the conventional system. If independent humidity and
temperature control are required in a system, a provision for reheat of the cooled
air must be included. In the example above, the net cooling load is 10.8
Btu/lbmda, but the load on the cooling coil is 16 Btu/lbmda with the difference (5.3
Btu/lbmda) being added back in during the reheat process. Thus, energy is used
both for the extra cooling and for reheat.

165
Another disadvantage of this approach is that the air leaving the
evaporator coil is nearly saturated, with relative humidity typically above 90%.
This moist air travels through duct work until the air is either mixed with dryer air
or reaches the reheat unit. The damp ducts, along with the wet evaporator coils
and standing water in a condensate pan (Figure 7.3), can generate problems
with microbial growth and the associated health and odor problems.
Figure 7.3: Damp Duct Symptoms (Chamra, et al., 2000)
Summary of Principles of Desiccant Systems
Desiccant dehumidification systems remove moisture from the air by
forcing the water vapor directly into a desiccant material. The moisture from the
air is attracted to desiccants since an area of low vapor pressure is created at the
surface of the desiccant. The pressure exerted by the water in the air is higher,
so the water molecules move from the air to the desiccant and the air is
dehumidified.

166
The functioning of desiccant material might be compared to the action of a
sponge in collecting a liquid. When the sponge is dry, it soaks up the liquid
effectively. Once it becomes saturated, the sponge is taken to a different spot,
the liquid is expelled by squeezing the sponge, and the sponge is ready to
absorb more liquid. In a desiccant system, if the desiccant material is cool and
dry, its surface vapor pressure is low, and moisture is attracted and absorbed
from the air, which has a higher vapor pressure. After the desiccant material
becomes wet and hot, it is moved to another air stream and the water vapor is
expelled by raising the temperature (this step is called "regeneration"). After
regeneration, the desiccant material is ready to be brought back to absorb more
water vapor. Unlike the conventional cooling coil, the water vapor does not
condense, but rather remains a vapor throughout all processes.
Desiccants can be either solids or liquids. The difference between solid
and liquid desiccants is their reaction to moisture. Some simply collect moisture
like a sponge collects water. These desiccants are called adsorbents and are
mostly solid materials. Silica gel is an example of a solid adsorbent. Other
desiccants undergo a chemical or physiological change as they collect moisture.
These are called absorbents and are usually liquids or solids, which become
liquid as they absorb moisture. Lithium chloride collects water vapor by
absorption. Sodium chloride, common table salt, is another example of an
absorbent.

167
Types of Desiccant Systems
General Classifications
Most commercial desiccant dehumidification systems use as their working
material either a solid adsorbent or a liquid absorbent. Briefly, absorption is a
process in which the nature of the absorbent is changed, either physically,
chemically, or both. The change may include formation of a hydrate or phase
change. An adsorbent, on the other hand, does not change either physically or
chemically during the sorption process.
A variety of factors dictate whether an adsorbent will be commercially
useful. These include cost, long-term stability, moisture removal characteristics
(rate, capacity, saturation conditions, suitable temperatures), regeneration
requirements (rate of moisture surrender as a function of temperature and
humidity), availability, and manufacturing considerations.
Solid Adsorbents
Silica gels and zeolites are used in commercial desiccant equipment.
Other solid desiccant materials include activated aluminas and activated
bauxites. The desiccant material choice for a particular application depends on
factors such as the regeneration temperature, the level of dehumidification, and
the operating temperature.
Solid desiccant materials are arranged in a variety of ways in desiccant
dehumidification systems. A large desiccant surface area in contact with the air

168
stream is desirable. A way to bring regeneration air to the desiccant material is
necessary.
The most common configuration for commercial space conditioning is the
desiccant wheel shown in Figure 7.4a. The desiccant wheel rotates continuously
between the process and regeneration air streams. The wheel is constructed by
placing a thin layer of desiccant material on a plastic or metal support structure.
The support structure, or core, is formed so that the wheel consists of many
small parallel channels coated with desiccant. Both "corrugated" and hexagonal
(Figure 7.4b) channel shapes are currently in use. The channels are small
enough to ensure laminar flow through the wheel. Some kind of sliding seal must
be used on the face of the wheel to separate the two streams. Typical rotation
speeds are between 6 and 20 revolutions per hour. Wheel diameters vary from
one foot to over twelve feet. Air filters are an important component of solid
desiccant systems. Dust or other contaminants can interfere with the adsorption
of water vapor and quickly degrade the system performance. All commercial
systems include filters and maintenance directions for keeping the filters
functioning properly.

169
Figure 7.4: (a) Desiccant Wheel (Meckler, et al., 1995) (b) Corrugated andHexagonal Channel Shapes (Chamra, et al., 2000)
Liquid Absorbents
Some materials that function as liquid absorbents are ethylene glycol,
sulfuric acid, and solutions of the halogen group such as lithium chloride, calcium
chloride, and lithium bromide (ASHRAE Fundamentals Handbook, 2001). A
generic configuration for a liquid desiccant system is illustrated in Figure 7.5. The
process air is exposed to a concentrated desiccant solution in an absorber,
usually by spraying the solution through the air stream. As the solution absorbs
water vapor from the air stream, the solution concentration drops, and the weak
solution is taken to a regenerator where heat is used to drive off the water (which
is carried away by a regeneration air stream) and the concentrated solution is
returned to the absorber.

170
Figure 7.5: Liquid Desiccant System (Chamra, et al., 2000)
Regeneration
For solid or liquid systems, regeneration energy can be drawn from a
variety of sources. In an m-CHP system, regeneration energy is drawn from the
waste heat of a power-generation component. Due to the relatively low
temperature requirements of regeneration (< 250 F or < 120 C), waste heat
provided by combustion turbines, IC engines, and any of the fuel cell
technologies is capable of supplying heat at regeneration temperatures. The
thermal energy produced in many m-CHP systems is sufficient to meet the input
requirements for absorption refrigeration as well as desiccant regeneration.
Solid Desiccant Systems
Figure 7-6 illustrates the components of a generic solid desiccant
dehumidification system. At a minimum, the system will include separated

171
process and regeneration air-streams for the desiccant device and some kind of
heater to raise the temperature of the regeneration air.
Figure 7.6: Solid Desiccant Dehumidification System (Chamra, et al., 2000)
The approximate path of the process air through a desiccant device is
shown in Figure 7.7 for the same inlet and outlet conditions as were shown for
the sub-cooling system (Figure 7.1). Note that, as indicated by the path from
point 1 to point 2 in Figure 7.7, the desiccant process increases the dry bulb
temperature of the process air. For solid desiccant materials, this increase is a
result of the "heat of adsorption" which consists of the latent heat of vaporization
of the adsorbed liquid plus an additional "heat of wetting." Heat of wetting is the
energy released during dehumidification, in excess of the latent heat of
vaporization. The path from point 1 to point 2 is close to a line of constant
enthalpy. After the dehumidification process, the process air must undergo a
sensible cooling process to reach the end point.

172
Figure 7.7: Dry Desiccant Dehumidification Process (Chamra, et al., 2000)
There are a wide variety of desiccant dehumidification system
configurations available. The process and regeneration air inlet conditions and
outlet requirements call for different configurations that are suited to individual
situations. For illustration purposes, two simple examples are shown in Figures
7.8 and 7.9.
Figure 7.8: Ventilated Desiccant Dehumidification System Configuration(Chamra, et al., 2000)

173
Figure 7.9: Ventilated Desiccant Dehumidification System Configuration(Chamra, et al., 2000)
Figure 7.8 illustrates a possible configuration for a desiccant system that is
designed for operation in a ventilation situation; that is, 100 % outside air used to
supply the conditioned space. The regeneration air for this illustration is taken
completely from within the conditioned space and exhausted outside. The
outside air starts at State 1 at approximately 95 F db, 75 F wb. From State 1 to
State 2, the sensible temperature increases and the moisture content decreases
as the outside air passes through a desiccant wheel. From State 2 to State 3, the
hot air rejects some heat to the regeneration air stream via a heat exchanger.
Finally, the air stream is cooled to the design supply condition by passing through
a conventional cooling coil (State 3 to State 4).
The regeneration air stream starts at approximately 75 F db, 40 % rh.
From State 5 to State 6, this air stream acquires heat from the process air stream
through a heat exchanger, and from State 6 to State 7 the regeneration stream is
further heated to bring it to an appropriate temperature for desiccant

174
regeneration. Finally, the regeneration air is cooled and humidified as it extracts
moisture from the desiccant wheel (State 7 to State 8). At State 8, the
regeneration stream is exhausted to the outside.
Figure 8-9 illustrates a re-circulating configuration; 100 % of the process
air is drawn from the conditioned space (and all is returned to the conditioned
space). The regeneration air is 100 % outside air. The equipment arrangement is
identical to that of the ventilation illustration in Figure 7.8, only the air stream
conditions are different.
Cost Considerations
In many cases, the additional benefits provided by a desiccant system will
lead to greater overall capital equipment cost. However, since the latent part of
the cooling load is shifted from electrical energy to thermal energy, desiccant
dehumidification systems can potentially have lower operating costs, particularly
if waste heat can be utilized. In m-CHP systems, waste heat can be used to
regenerate the desiccant. This makes desiccant dehumidification appealing to
m-CHP applications, especially when an absorption chiller is incorporated into
the system to provide the sensible cooling load.
Because the humidity and temperature can be controlled independently
with a desiccant dehumidification and cooling system, the system performance is
often more effective than that obtainable with conventional systems. Analysis of
the sensible heat ratio (SHR) suggests the energy cost savings potential that a
desiccant system may have. The SHR is the ratio of sensible cooling load to the

175
total cooling load (sensible load plus latent load). A sensible heat ratio close to
unity implies that very little moisture is removed from the air, while a sensible
heat ratio close to zero indicates that most of the load is latent cooling. Air-
conditioned environments often have SHR values well below unity, which results
in greater energy consumption for a sub-cooling system than that of a desiccant
dehumidification and cooling system that meets the same temperature/humidity
requirements.
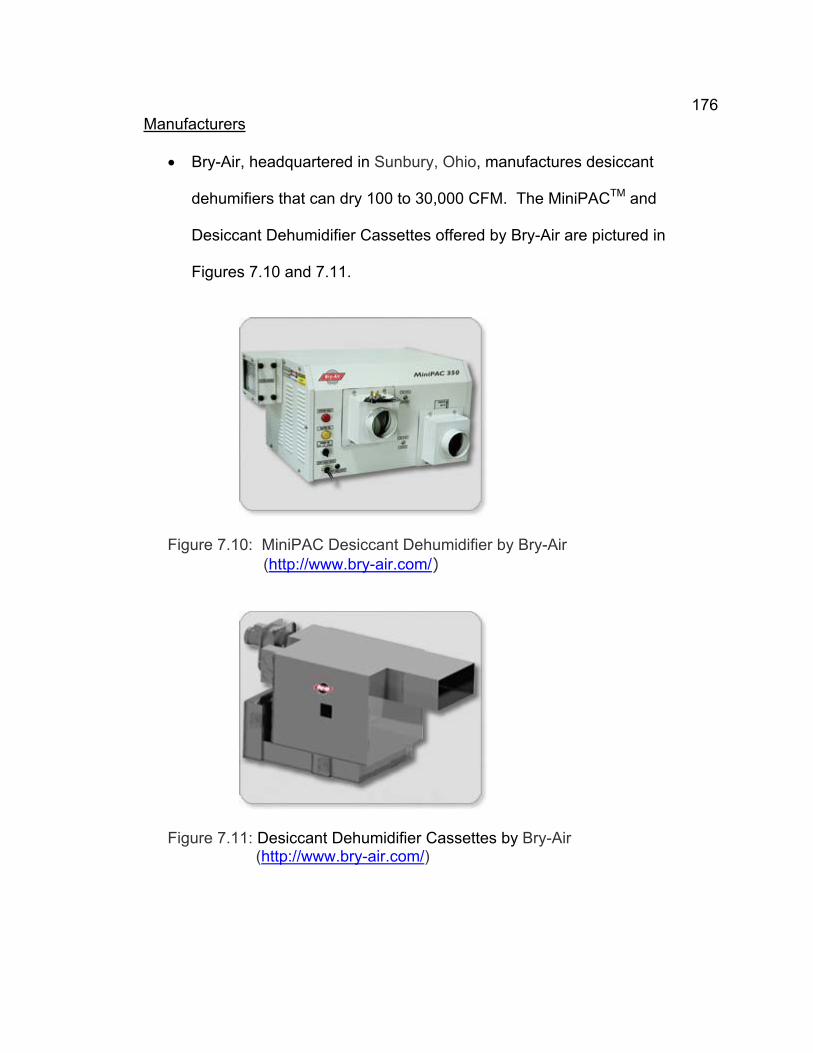
176
Manufacturers
Bry-Air, headquartered in Sunbury, Ohio, manufactures desiccant
dehumifiers that can dry 100 to 30,000 CFM. The MiniPACTM and
Desiccant Dehumidifier Cassettes offered by Bry-Air are pictured in
Figures 7.10 and 7.11.
Figure 7.10: MiniPAC Desiccant Dehumidifier by Bry-Air
(http://www.bry-air.com/)
Figure 7.11: Desiccant Dehumidifier Cassettes by Bry-Air (http://www.bry-air.com/)
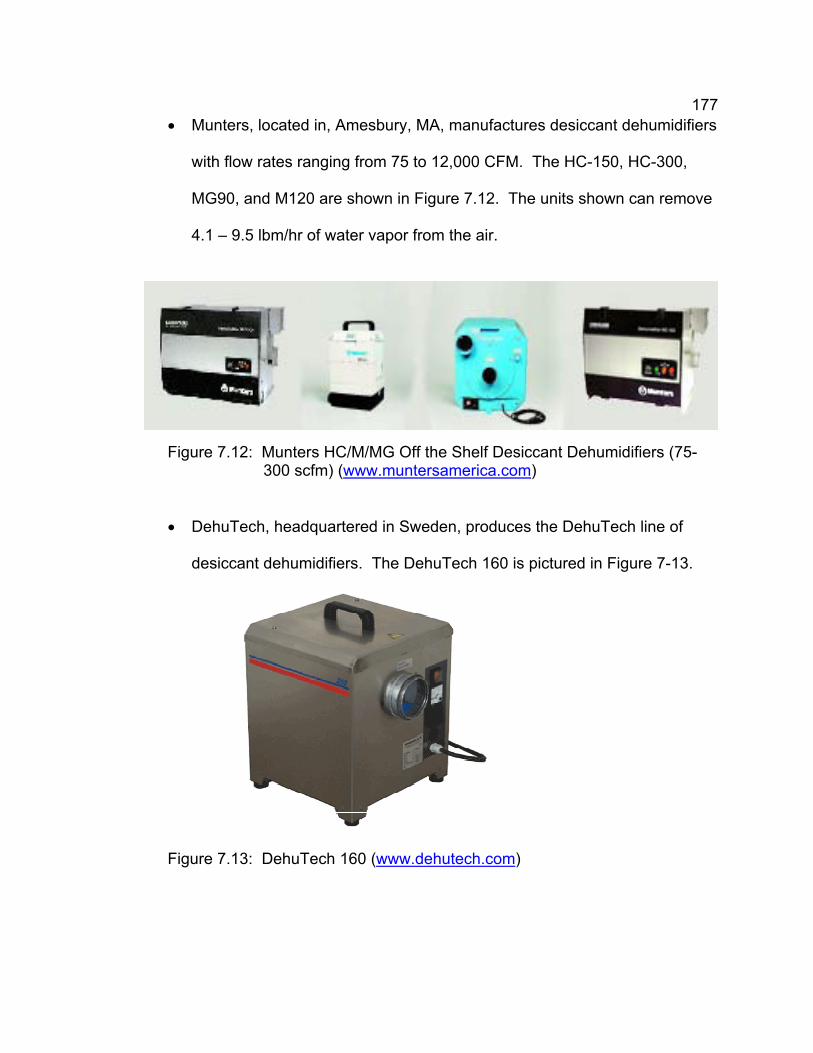
177
Munters, located in, Amesbury, MA, manufactures desiccant dehumidifiers
with flow rates ranging from 75 to 12,000 CFM. The HC-150, HC-300,
MG90, and M120 are shown in Figure 7.12. The units shown can remove
4.1 – 9.5 lbm/hr of water vapor from the air.
Figure 7.12: Munters HC/M/MG Off the Shelf Desiccant Dehumidifiers (75- 300 scfm) (www.muntersamerica.com)
DehuTech, headquartered in Sweden, produces the DehuTech line of
desiccant dehumidifiers. The DehuTech 160 is pictured in Figure 7-13.
Figure 7.13: DehuTech 160 (www.dehutech.com)

178
Dri-Eaz located in Burlington, WA manufacturers a small line of desiccant
dehumidifiers. The Dro-Eaz DriTec Pro150 pictured in Figure 7.14
processes 88 CFM to remove 27.5 pints/day of water vapor at 60%
relative humidity and 68 F.
Figure 7.14: Dri-Eaz DriTec Pro150 (www.dri-eaz.com)
Drykor, located in Fayetteville, Georgia manufactures a product line of
dehumidifiers. Drykor's Alpha-Release Residential Comfort Conditioner
provides cooling/heating, dehumidification, filtration of particles, and
removal of bacteria and microorganisms. The Drykor RCC is shown in
Figure 7.15.

179
Figure 7.15: Drykor Residential Comfort Conditioner (www.drykor.com)
Dryomatic headquartered in Frederick, Maryland, manufactures industrial
and commercial scale desiccant dehumidifiers, The model DCX Series
rotary type desiccant dehumidifier is shown in Figure 7.16.
Figure 7.16: Dryomatic DCX Desiccant Dehumidifier (www.dryomatic.com)

180
CHAPTER VIII:
BIOFUELS
Introduction
In 2003, for the fourth year in a row, biomass was the leading source of
renewable energy in the United States, providing 2.9 Quadrillion Btu (Quads) of
energy. Biomass was the source for 47% of all renewable energy or 4% of the
total energy produced in the United States (http://www.eere.energy.gov/).
Agriculture and forestry residues, and in particular residues from paper mills, are
the most common biomass resources used for generating electricity and for
providing industrial process heat and steam as well as for a variety of biobased
products. Agriculture and forestry residues are the organic byproducts of food,
fiber, and forest production. In fact, 48% or 1.1 Quads of biomass energy was
consumed by the pulp and paper industry. Current biomass consumption in the
United States is dominated by industrial use, largely derived from wood. Use of
liquid transportation fuels such as ethanol and biodiesel, however, currently
derived primarily from agricultural crops, is increasing dramatically. In 2003
ethanol produced from corn reached 2.81 billion gallons.
Ethanol and biodiesel, made from plant matter instead of petroleum, can
be blended with or directly substituted for gasoline and diesel, respectively.

181
Unlike gasoline and diesel, biofuels contain oxygen. Adding biofuels to
petroleum products allows the fuel to combust more completely, thus reducing air
pollution. (http://www.eree.energy.gov/biomass)
The purpose of this section is to provide introductory level information
about biofuels and discuss the potential benefits of biofuels relating to m-CHP.
The various methods of producing biofuels and issues relating to cost of biofuels
will also be discussed.
Biomass
Biomass is any material of recent biological origin. Examples include
crops and forests. Biomass as a solid has several disadvantages as compared
to liquids such as petroleum or gases such as natural gas. Solid biomass
generally has a lower energy density and results in a bulky fuel that is difficult to
transport. Solid biomass also has limited applications, for example conventional
engines and boilers do not accommodate solid fuels. The goal of many biomass
processes is to convert solid fuel into more useful forms: gaseous or liquid fuels.
Mechanisms to perform this conversion include anaerobic digestion of wet
biomass to produce methane and gasification of dry biomass to produce
flammable gas mixtures of H2, CO, and CH4. Liquid fuels can be obtained
through the fermentation of sugars to ethanol, thermochemical conversion of
biomass to pyrolysis oils or methanol, and processing of vegetable oils to
biodiesel.

182
Before beginning to discuss the methods of converting biomass to more
useful forms, several terms that are relative to most conversion processes need
to be defined.
Carbohydrates: compounds that include sugars, cellulose, and a wide variety of other cellular products.
Cellulose: the chief constituent of the cell walls of plants (C6H10O5)X
Ester: Any class of organic compounds that react with water to produce alcohols and organic or inorganic acids.
Glycerol: a clear, colorless, viscous, sweet-tasting liquid belonging to the alcohol family of organic compounds.
Hemicellulose: complex carbohydrates that surround the cellulose fibers of a plant cell.
Hydrolysis: the breaking point of a hydrogen bond in long-chained organic molecules.
Lignin: complex oxygen-containing organic substance that, with cellulose, forms the chief constituent of wood.
Protein: any group of nitrogenous organic compounds of high molecular weight synthesized by plants and animals that are required for life processes.
Starch: a white granular organic chemical produced by all plants
Sugar: any number of sweet, colorless, water-soluble compounds present in the sap of seed plants and the milk of mammals and making up the simplest group of carbohydrates.
Triglycerides: esters in which three molecules of one or more different fatty acids are linked to the alcohol glycerol.
Biogas: the product of anaerobic digestion containing CH4 and CO2,typically 55-75% methane by volume.

183
Waste material: any material of recent biological origin discarded because it has no apparent value or represent nuisances/pollutants to the local environment, (e.g. agricultural residues, yard waste, municipal solid waste, sewage, and food processing waste).
Energy crop: plants grown specifically for energy and harvested/planted periodically, (e.g. wood and herbaceous annuals/perennials).
The last two items defined, waste materials and energy crops, are
considered the main categories of biomass feedstocks. Waste materials have
the advantage of low cost; however, this advantage is often negated as waste
materials have a large variability and can be complex to convert to a more useful
fuel. Energy crops contain significant amounts of oils, sugars, starches, and
lignocellulose, increasing the energy value. Strategies that do not include
harvesting the lignocellulose waste the greatest portion of the energy crop.
Anaerobic Digestion
Anaerobic digestion is the decomposition of organic waste to gaseous
fuels by bacteria in an oxygen-free environment. The process occurs in three
steps. The first step is hydrolysis and fermentation where bacteria break down
carbohydrates, proteins, and fats into simple acids, alcohols, and neutral
compounds. Hydrogen (H2) and carbon dioxide (CO2) are the products.
Complex products are degraded into acetate, hydrogen (H2), and carbon
dioxide (CO2) during the second process, transitional acetonic dehydrogenation.
Any oxygen (O2) that was present after the anaerobic digestion is consumed
during the transitional acetonic dehydrogenation. The final step is

184
methanogensis during which acetate is converted into methane by methane-
forming bacteria. The basic anaerobic process is illustrated schematically in
Figure 8.1.
Figure 8.1: Basic Anaerobic Process (Goswami, et al, 2000)
Typically, the thermodynamic efficiency of converting the dry matter to
methane is about 60% with methane yields ranging between 8,000 – 9,000 ft3/ton
of volatile solids added to a digester.
Thermal Gasification
Thermal gasification is the conversion of solid carbonaceous fuels into
flammable gas mixtures called producer gas. Producer gas is a mixture of
carbon monoxide (CO), hydrogen (H2) methane (CH4), nitrogen (N2), carbon
dioxide (CO2), and higher hydrocarbons. The producer gas can be burned
directly or used as a feedstock for liquid fuels. Gasification occurs through the
parallel processes of combustion and pyrolysis. Combustion is the rapid

185
oxidation of fuel. Combustion is an exothermic reaction resulting in the release
of large quantities of heat. Pyrolysis is the thermal degradation of a solid fuel into
a variety of simple gases and organic vapors.
Heat is supplied to drive the reactions in the thermal gasification process.
As heat is added, moisture is removed at 212 F (100 C). When the temperature
increases to 752 F (400 C), the complex structure of the biomass starts to
breakdown and gases, vapors, and liquids are released. Many of the
components that are released are flammable and contribute to the heating value
of the product gas released from the gasifier. After the components are
released, a porous solid composed of carbon and ash, known as char, remains.
The fuel’s volatile percentage corresponds roughly to the pyrolysis yields, while
fixed carbon and ash determine the char yield. As the temperature approaches
1292 F (700 C), the char begins to react with oxygen, carbon dioxide, and water
vapor to produce more flammable gas. The primary reactions are as follows:
Carbon-oxygen Reaction 2
2 2C O CO
Boudouard Reaction 2
2C CO CO
Carbon-water Reaction 2 2
C H O H CO
Water-shift Reaction 2 2 2
CO H O H CO
Hydrogenation Reaction 2 4
2C H CH
The gasification reactions are reversible and result in a complex
equilibrium dependent upon the temperature, pressure and proportion of fuel and
oxygen as well as steam added to the gasifier. Methane formation is favored in

186
the conditions of low temperature, high pressure, low oxygen concentration, and
high water vapor content. Table 8.1 presents the gas compositions from various
types of gasifiers. The higher heating value (HHV) is an important value when
addressing the usefulness of a fuel. Higher heating values for a fuel include the
full energy content as defined by bringing all products of combustion to 77 F (25
C). As the HHV increases, the fuel becomes more useful.
Table 8.1: Producer Gas Constituents from Various types of Gasifiers (Goswami, et al, 2000)
Gaseous Constituents (vol. % dry) Gas Quality
Gasifier Type H2 CO CO2 CH4 N2HHV
(MJ/m3)Tars Dust
Air-blownfluidized bed
9 14 20 7 50 5.4 Medium High
Air-blowndowndraft
17 21 13 1 48 5.7 Low Medium
Oxygen-blowndowndraft
32 48 15 2 3 10.4 Low Low
Indirect-heatedfluidized bed
31 48 0 21 0 17.4 Medium High
Arrangements of downdraft, updraft, and fluidized bed gasifiers are shown
schematically in Figures 8.2, 8.3, and 8.4, respectively.

187
Figure 8.2: Schematic of a Downdraft Gasifier (Bricka, 2004)
Figure 8.3: Schematic of an Updraft Gasifier (Bricka, 2004)

188
Figure 8.4: Schematic of a Fluid-bed Gasifier (Bricka, 2004)
Liquid Fuels from Biomass
Ethanol Fermentation
Ethanol (C2H5OH) can be burned in modified internal combustion engines,
but is more commonly used as a five percent blend in gasohol. Ethanol is
produced by fermentation. Fermentation is the decomposition of complex
organic molecules into simple compounds through the action of microorganisms.
The feedstock for ethanol production must be high in sugars. Examples of these
feedstocks are sugar cane, sugar beets, and sorghum. Carbohydrates, such as
starches, can serve as feedstocks if the carbohydrates can be broken down into
sugars susceptible to fermentation. Cellulose and hemicellulose can be
converted to fermentable sugars, though the process is relatively difficult. In the

189
United States, corn is the basis of the ethanol fuel industry. The typical yields of
ethanol fermentation for a variety of energy crops are presented in Table 8.2.
Table 8.2: Ethanol Fermentation of Various Energy Crops (Goswami, et al, 2000)
Feedstock Yield (Liters/ton) Classification
Sorghum 80 Sugar crop
Sugar beets 90-100 Sugar crop
Sugar cane 75 Sugar crop
Corn 350-400 Starch crop
Wheat 400 Starch crop
Artichoke 90 Starch crop
Poplar 400 Lignocellulose crop
Corn Stover 400 Lignocellulose crop
Corn cobs 510 Lignocellulose crop
Wheat straw 490 Lignocellulose crop
As compared to methanol, ethanol can only be made from a much
narrower range of feedstock. The properties pertaining to the use of ethanol as a
fuel as compared to gasoline are shown in Table 8.3.
Table 8.3: Properties of Ethanol and Gasoline (Laraminie and Dicks, 2003)
Fuel Ethanol Gasoline
Chemical Formula C2H5OH C8H18
Molecular Weight 46.07 114.2
Freezing Point (C) -114.1 -56.8
Boiling Point (C) 78.3 125.7
Enthaply of Combustion at 25 C (kJ/mol) 1275.9 5512.0
Heat of Vaporisation (kJ/kg) 839.3 368.1
Liquid density (kg/m3) 789 702
Specific heat at STP (J/mol-K) 112.4 188.9
Autoignition temperature in air (C) 423 220

190
Chemical Synthesis of Methanol
Methanol (CH3OH) is a liquid fuel that can be burned in modified internal
combustion engines or blended with gasoline in a mixture that is 85 percent
methanol and 15 percent gasoline. This methanol/gas mixture is also known as
M85. Methanol is produced through the combination of carbon monoxide and
hydrogen by the reaction
2 32CO H CH OH
The carbon monoxide and hydrogen can be procured by the carbon-water
reaction by gasifying biomass. Gasification often yields less hydrogen than the
2:1 ratio needed to produce methanol, the syn gas mixture is often reacted with
steam to produce more hydrogen. Syn gas is an acronym for Synthetic gas. In
general, Syn gases are composed primarily of hydrogen, carbon monoxide,
carbon dioxide, perhaps methane, and possibly small amounts of other
components (hydrogen sulfide, phenolics, etc.). The reaction of the syn gas and
water vapor produces hydrogen and carbon dioxide according to the following
reaction.
2 2 2CO H O CO H
The yield of methanol is 480 – 565 liter/ton. The process of thermal
decomposition by gasification is essentially the same for all biomass feedstock.
The properties pertaining to the use of methanol as a fuel as compared to
gasoline are shown in Table 8.4.

191
Table 8.4: Properties of Methanol and Gasoline (Laraminie and Dicks, 2003)
Methanol Gasoline
Chemical Formula CH3OH C8H18
Molecular Weight 32.04 114.2
Freezing Point (C) -98.8 -56.8
Boiling Point (C) 64.7 125.7
Enthaply of Combustion at 25 C (kJ/mol) 638.5 5512.0
Heat of Vaporisation (kJ/kg) 1129 368.1
Liquid density (kg/m3) 786 702
Specific heat at STP (J/mol-K) 76.6 188.9
Autoignition temperature in air (C) 464 220
Pyrolysis Oils
Pyrolysis is the thermal decomposition of organic compounds in the
absence of oxygen. The products achieved by pyrolysis depend upon the rate
and duration of heating. Liquid yields exceeding 70 percent are possible using
fast pyrolysis conditions. Fast pyrolysis conditions allow a residence time of less
than half a second and occur at temperature ranges of 450 – 600 C and also
involve rapid quenching of the products. The rapid quenching process is
essential if high-molecular weight gases are to be produced. The pyrolysis liquid
obtained from fast pyrolysis is a low viscosity, dark brown liquid with
concentrations of 15-20 percent water. Slow pyrolysis results in a black, tarry
liquid.
The fast pyrolysis liquid is a complex mixture of hydrocarbons from the
lignin in the feedstock. Pyrolysis liquids can be used as a direct substitute for
heating oil. The heating value of pyrolysis oils falls in the range of 17-20 MJ/kg
with an average density of 1280 kg/m3. The yield of pyrolysis oil is approximately

192
135 gal/ton of feedstock. The fast pyrolysis process is illustrated schematically in
Figure 8.5.
Figure 8.5: Fast Pyrolysis Production Process (Goswami, et al, 2000)
Many difficulties are encountered in using pyrolysis liquids. Storage is
difficult because of polymerization and corrosion. The high oxygen and water
content render the liquids incompatible with conventional hydrocarbon fuels. The
liquid quality of pyrolysis oils is also very poor, lower than Bunker C heavy fuel
oil.
These qualities make upgrading pyrolysis oils to more conventional fuel
desirable. Upgrading the pyrolysis liquids is possible through the use of
hydrotreatment. Hydrotreating involves the addition of hydrogen at high pressure
and uses a catalyst to result in high quality products with maximum fuel yield.

193
Vegetable Oils
Vegetable oil can be obtained using grains and seeds as the feedstock.
Grains and seeds have relatively high concentrations of vegetable oils with high
energy content. Unfortunately, the viscosity of most vegetable oils is about
twenty times that of diesel fuel, and direct use as a fuel would lead to the coking
of injectors and rings. Vegetable oils can be chemically modified into methyl or
ethyl esters to produce excellent diesel fuel. These vegetable oil esters that are
suitable for use as diesel fuel are also known as biodiesel. Biodeisel can be
used in unmodified diesel engines with no operational problems. Feedstocks for
biodiesel include soybean, sunflower, cottonseed, corn, peanut, safflower, waste
cooking oils, and animal fat. The production of biodiesel from oil seed is
illustrated in Figure 8.6.

194
Figure 8.6: Biodiesel Production from Seed Oil (Goswami, et al, 2000)
A vital step in producing biodiesel from seed oils is shown in Figure 8.6 at
the transesterfication reactor. Transesterfication is the process by which
triglycerides in vegetable oil are reacted with methanol or ethanol to produce
esters and glycerol. In the reaction, one triglyceride molecule [G1(FA)3] reacts
with three methanol molecules [MeOH] to produce three esters molecules
[MeFA] and one glycerol molecule [G1(OH)3] according to the reaction
3 31( ) 3 3 1( )G FA MwOH MeFA G OH
where FA represents the fatty acid component.

195
Potential of Biofuels
Currently, the United States imports more than 53% of the petroleum it
uses for transportation fuel. The U.S. Department of Energy (DOE) estimates
that this will increase to 75% by 2010. Inevitably, this heavy dependence on
imported oil makes oil supply vulnerable to international politics, economics, and
military activities. The DOE, the U.S. fuels industry, automotive manufacturers,
and the agricultural and forestry products industries are working together to ease
our dependence on foreign oil and improve our energy security by bringing
biofuels to the marketplace.
The United States has a vast biomass resource. Oil-bearing crops such as
soybeans can be used to make biodiesel; residues from food and nonfood crops
can be converted into liquid fuels such as ethanol. The nation’s forests contain
many small-diameter trees and underbrush that can be used to produce fuel.
In the 1960’s, the discovery of oil outpaced oil consumption. Today, 75
million barrels per day are consumed while only 15 million barrels are
discovered; a deficit that continues to grow. Figure 8.7 illustrates the oil
consumption and production of industrialized areas.

196
Figure 8.7: Oil Production and Consumption (http://devafdc.nrel.gov/pdfs/energysecurity.pdf)
The reality that the consumption of fossil fuel based oils far exceeds the
production of oils in all major areas except for Africa and the Middle East means
that the potential for developing mass production of biofuels is very high.
Potential uses for biofuels include automotive, power generation, mechanical
lubrication, plastics production, and many others. Biofuels have an exceptionally
high potential for use in an m-CHP system.
The local availability and potential decrease in resource costs are
attractive for m-CHP systems. The fact that m-CHP systems are not mobile also
increases the range of biofuels that could potentially be used because storage
issues will be reduced. Biofuels would be an ideal fuel source for the external
combustion Stirling Engine, and can be easily used in slightly modified
reciprocating engines.
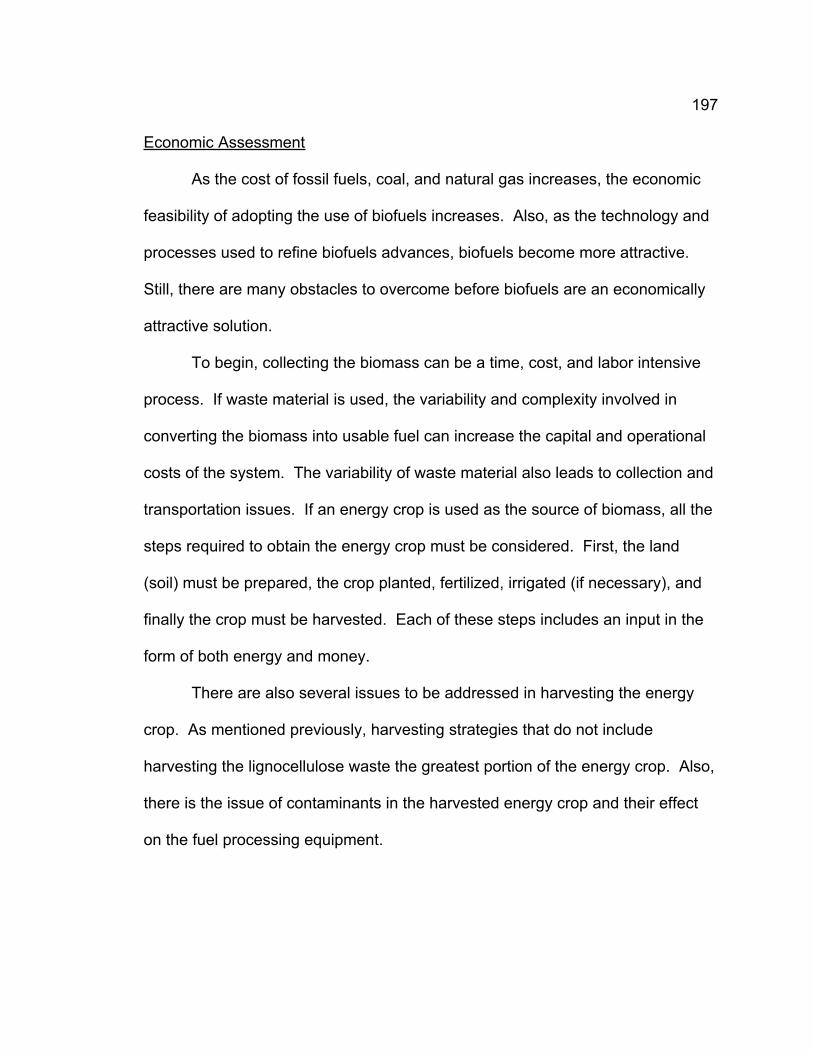
197
Economic Assessment
As the cost of fossil fuels, coal, and natural gas increases, the economic
feasibility of adopting the use of biofuels increases. Also, as the technology and
processes used to refine biofuels advances, biofuels become more attractive.
Still, there are many obstacles to overcome before biofuels are an economically
attractive solution.
To begin, collecting the biomass can be a time, cost, and labor intensive
process. If waste material is used, the variability and complexity involved in
converting the biomass into usable fuel can increase the capital and operational
costs of the system. The variability of waste material also leads to collection and
transportation issues. If an energy crop is used as the source of biomass, all the
steps required to obtain the energy crop must be considered. First, the land
(soil) must be prepared, the crop planted, fertilized, irrigated (if necessary), and
finally the crop must be harvested. Each of these steps includes an input in the
form of both energy and money.
There are also several issues to be addressed in harvesting the energy
crop. As mentioned previously, harvesting strategies that do not include
harvesting the lignocellulose waste the greatest portion of the energy crop. Also,
there is the issue of contaminants in the harvested energy crop and their effect
on the fuel processing equipment.

198
A major issue to be addressed for biofuels to become feasible is that the
required infrastructure does not yet exist. To establish such an infrastructure
would take a large capital investment and a significant amount of time.
Still, biofuels hold significant potential for future energy production,
particularly in the area of m-CHP and other niche applications. One argument
predicts that as time continues and advances in biofuel production are made, and
as the cost of traditional fuels, such as natural gas and gasoline increases, the
cost curves of the two fuels will intersect as shown in Figure 8.8. In Figure 8.8
the cost of each fuel is plotted as a function of time. At some unknown date, X,
the cost of biofuels will become equal to or less than the cost of traditional fuels.
At this point, biofuels will become an economically viable option for the masses.
The curves in Figure 8.8 do not represent actual cost data, but are used only for
representation.
Figure 8.8: Theoretical Representation of Cost of Fuels as a Function of Time

199
A long-term economic assessment which encompasses all aspects and
issues for producing biofuels as compared to traditional fuels has not yet been
completed. Until such a study is done, much discussion of economic feasibility is
generic and not quantitative. To give a better perspective, the cost information
for the various production methods of biofuels is presented in Table 8.5.
Table 8.5: Cost Information for Production Methods of Biofuels (Goswami, et al,2000)
Anaerobic Digester $63,000 - $122,00 ton/day of capacity
$5.10 - $6.10/GJ
Gaseous
Fuels
Gasification Plant 50 MW atmospheric pressure $15 million
50 MW pressurized $60 million
Ethanol Plant Typical of petrochemical plants. Have
Capital Investment with economy of scale
$0.26/liter (gasoline $0.20/liter)
Lignocellulose basis $0.36/liter
Corn Starch Facility 5,000 bb/day
$0.55 - $1.10/liter capacity
Methanol Plant 5,000 bb/day capacity cost $380 million
$0.57/liter production cost
Pyrolysis Liquid Plant 5,000 bb/day capacity cost $60 million
$0.17/liter production cost
Liquid Fuels
Biodiesel $0.33/liter production cost

200
CHAPTER IX:
CONCLUSIONS
m-CHP is a developing paradigm in energy systems. The driving potential
behind m-CHP systems is the thermal efficiency that these systems can achieve
and the significant portion of the energy market that lies within the “micro”
regime. Projected system efficiencies of 80% are well above the overall thermal
efficiencies produced by standard energy systems. m-CHP systems have the
potential to increase the overall thermal efficiency, reduce the total power
requirement, and provide higher quality, more reliable power than conventional
systems. Larger homes, higher energy costs, volatile fuel markets, electricity
blackouts, power security, power quality, and lower emissions are additional
characteristics that make m-CHP attractive.
A variety of distributed power generation (DPG) technologies may be
selected for an m-CHP system. Table 9.1 illustrates how these technologies
compare in efficiency, cost, technology status, emissions, noise, and load
matching flexibility. The technologies are ranked from those having the most
positive characteristics to those having the most negative characteristics. For
example, fuel cells have the quietest operation and, therefore, the best
characteristics in the noise category, and reciprocating engines generate

201
significant noise and, therefore, the most negative characteristics in this
category. The rankings in Table 9.1 are based on the technologies as a whole
and may vary in some instances.
Table 9.1. Rankings for Distributed Power Generating Technologies
Rankings for DPG Technologies
Category Most Positive Least Positive
Efficiency Fuel Cells Reciprocating Stirling Microturbine Rankine
Technology
StatusReciprocating Microturbine Fuel Cells Stirling Rankine
Cost Reciprocating Microturbine Fuel Cells Stirling Rankine
Emissions Fuel Cells Stirling Microturbine Rankine Reciprocating
Noise Fuel Cells Stirling Microturbine Rankine Reciprocating
Load
Matching
Flexibility
Reciprocating Fuel Cells Microturbine Stirling Rankine
The thermally activated components discussed in this module are non-
competing technologies. The selected use of either an absorption chiller or
desiccant dehumidifier is based upon the needs of the application rather than
performance. A system configuration requiring only latent cooling would
incorporate an absorption chiller. If both cooling and dehumidification are
required, both a desiccant dehumidifier and absorption chiller can be included in
an m-CHP system.

202
Despite the potential benefits of m-CHP systems, numerous significant
obstacles and challenges must be addressed if m-CHP is to be successful in the
United States. Research must be conducted to validate m-CHP systems and
components. Likewise, efforts must be made to reduce installed initial capital
costs of m-CHP systems. These issues can be resolved with time and the
application of good engineering practices. The more difficult issues to overcome
are characteristics of the market to which m-CHP systems apply.
In order for m-CHP systems to succeed, maintenance and service support
issues must be addressed. Large scale CHP systems are typically installed in
large factories, hospitals, or other facilities which employ a full-time maintenance
staff. Retaining a full-time maintenance staff for a single m-CHP system is
neither practical nor economically feasible. Expecting the owner to maintain the
system is also impractical because of technical complexity and safety issues.
Still, providing professional, timely service and maintenance will be a crucial part
of successful m-CHP system operation. More than one potential technology has
become a distant memory because of poor maintenance and technical support.
This situation leads to a very important question: Who will provide maintenance
and support? Should this responsibility fall on utility providers, individual m-CHP
system manufacturers, or independent maintenance contractors?
Another important issue to address is the inclusion and cooperation of
local electrical utilities. Ideally, an m-CHP system would provide the exact
amount of electrical power needed instantaneously, continually throughout the

203
day. While designing such a system is possible, unfortunately, the increase in
system complexity and increased capital costs would be a detriment to early
system installations. Initially, most m-CHP systems will likely be designed as
constant-power output or base-load systems. This implies that at some point the
power requirement will not be met, or that the requirement will be exceeded.
Realistically, both cases will occur within a 24-hour period. For example, in the
United States, the base electrical load for the average home is approximately 2
kW while the peak electrical demand is slightly over 4 kW. (EIA) If a 3 kWe m-
CHP system were installed in this situation, part of the time more energy will be
provided than could be used and for a portion of the time more energy will be
required than could be provided.
One option is to size the system for base electrical load. This option
requires that the system include an energy storage device or be connected to the
electrical grid to provide the peak electrical load. Another option is to size the
system for peak electrical load. This option requires that the excess energy be
stored, transferred to the electrical grid, or simply rejected as a loss. In all
instances, either energy storage or grid connectivity is required. Energy storage
is expensive and increases the system size and initial costs. In many instances,
a more economically attractive option is for the m-CHP system to be grid
connected.
Grid connectivity will require the inclusion and cooperation of local
electrical utilities to establish an infrastructure and pricing system to
204
accommodate m-CHP installations. Grid connectivity also requires the use of
two-way metering. The Institute of Electrical and Electronics Engineers-United
States of America (IEEE-USA) has developed a series of standards for
interconnection of distributed energy resources with the electricity grid. The
IEEE 1547 2003 Standard for Interconnecting Distributed Resources With
Electrical Systems is the first in the 1547 series of planned interconnection
standards. The standard establishes technical requirements for electrical power
systems (EPS or electrical grids) interconnecting with distributed generators such
as fuel cells, photovoltaics, microturbines, reciprocating engines, wind
generators, large turbines, and other local generators. Additional IEEE
interconnection standards activities are now designated under the 1547 series of
standards.
Before a full-market drive for installation of m-CHP systems is attempted,
an in-depth case study of an m-CHP system should be performed. Also, a full
economic assessment including all capital costs and the potential effects of the
volatile fuel market should be conducted. The selection and price of fuel to be
used in an m-CHP system is very important. A small percent change in the
market demand creates a large change in the cost of many fuels.

205
REFERENCES
Books
1. Moran, Michael J., and Shapiro, Howard N., Fundamentals of Engineering Thermodynamics, 4th edition, New York: John Wiley and Sons, 2000
2. Caton, Jerald A., and Turner, W. Dan, “Cogeneration,” CRC Handbook of Energy Efficiency, New York: CRC Press, Inc., 1997.
3. Peltchers, Neil, Combined Heat and Power Handbook: Technologies and Applications, The Fairmont Press, Inc., Georgia, 2003
4. Hodge, B.K., and Taylor, Robert P., Analysis and Design of Energy Systems, 3rd edition, New Jersey: Prentice Hall, Inc. 1999.
5. Chamra, Louay, Parsons, Jim A., James, Carl, Hodge, B.K., and Steele, W. Glenn, Desiccant Dehumidification Curriculum Module for Engineering/Technology HVAC Courses, Mississippi State University, 2000.
6. Harold, Keith E., Klein, Sanford A., and Radermacher, Reinhard. Absorption Chillers and Heat Pumps, New York: CRC Press, Inc., 1996.
7. Shah, Ramesh K., “Recuperators, Regenerators and Compact Heat Exchangers,” CRC Handbook of Energy Efficiency, New York: CRC Press, Inc., 1997.
8. Boyce, Meherwan P., Handbook for Cogeneration and Combined Cycle Power Plants, New York: ASME Press, 2002
9. Cengel, Yunus A., Heat Transfer: A Practical Apprach, 2nd edition, New York: McGraw Hill, 2003
10. Laraminie, James, and Dicks, Andrew, Fuel Cell Systems Explained, 2nd
edition, West Sussex: Wiley, 200

206
11. Stull, D.R., et al., JANAF Thermochemical Tables, Michigan: Dow Chemical Company, 1965
12. Urieli, Isreal, and Berchowitz, David M., Stirling Cycle Engine Analysis,Great Britain: Adam Hilger Ltd.,1984
13. Senft, James R., Ringbom Stirling Engines, New York: Oxford University Press, 1993
14. Hardy, J.D, Cooling, Heating, and Power for Building Instructional Module, Mississippi State University, 2004
15. Goswami, D.Y., Kreith, F., and Kreider, J., Principles of Solar Engineering, 2nd edition, Taylor and Francis Pub., 2000.
16. Felder, Richard M., and Rausseau, Ronald W., ElementaryPrinciples of Chemical Processes, 2nd edition, New York: John Wiley and Sons, 1986
17. RS Means Mechanical Cost Data 24th Annual Edition, Kingston, Maryland:RS Means Company Inc. 2001
Journal Articles
1. “The micro-CHP Technologies Roadmap: Meeting 21st Century Residential Energy Needs” December 2003 United States Department of Energy Office of Energy Efficiency and Renewable Energy
2. Alanne, Kari, and Saari, Arto, 2003, “Sustainable Small-scale CHP Technologies for Buildings: The Basis for Multi-perspective Descision Making,” Renewable & Sustainable Energy Reviews, Helsinki University of Technology, Hut, Finland
3. Harrison, J., 2003a, “Micro CHP in Rural Areas,” EarthScan James & James. 1 January, 2003.
4. Harrison, J. 2003b, “Micro CHP in Europe” EA Technology. Presentation at the 2003 National Micro CHP Technology Pathways Workshop.
5. Harrison, J., 2003c, “Towards a Strategy for micro CHP in the USA Domestic Markets,” EA Technology © June 2003.

207
6. Flin, D., 2005, “Domestic CHP in Europe,” Cogeneration and On-Site Power Production, Jan. – Feb. 2005, pp. 43 – 49.
7. Pehnt, P., Praetorius, B., Foscher, C., Schnieder, L., Cames, M., and VoB, J.P,, 2004, “Micro CHP – a Sustainable Innovation?,” Transformation and Innovation in Power Systems, Berlin/Heidelberg
8. Harrison, J. and Redford, S., “Domestic CHP: What Are the Potential Benefits,” Report for Energy Saving Trust, Capenhurst, Chester
9. “Micro Gas Turbines and Heat-Driven Cooling,” Australian National Training Authority, © 2003
10. “Commercial Micro-CHP Using Fuel Cells and Microturbines,” EmergingTechnologies and Practices: 2004 American Council for an Energy-Efficient Economy
11. Basso, Thomas S. and DeBlasio, Richard, “IEEE 1547 Series of Standards: Interconnection Issues,” IEEE Transactions on Power Electronics, Vol. 19, No. 5, September 2004
Internet References
1. http://www.microchap.info, micro CHP website maintained by Jeremy Harrison
2. http://www.eia.doe.gov, DOE Energy Information Administration.
3. http://www.energy.ca.gov/distgen/, California Distributed Energy Resources Guide.
4. http://www.eere.energy.gov/, DOE Energy Efficiency and Renewable Energy (EERE).
5. http://www.eere.energy.gov/de/, DOE Distributed Energy Resources Distributed Energy Program.
6. http://en.wikipedia.org/wiki/Internal_combustion_engine, “Internal Combustion Engine,” Wikipedia, 10 May, 2005
7. http://www.siu.edu/~autoclub/frange.html, “Fundamentals of the Four Stroke Internal Combustion Engine,” 10 May, 2005

208
8. http://www.eren.doe.gov/der/chp/pdfs/chprev.pdf, “Review of Combined Heat and Power Technologies,” ONSITE SYCOM Energy Corporation, October 1999.
9. http://www.platts.com/Research, “Microturbines: Lessons Learned from Early Adopters,” E Source Multi-Client Market Research Studies, 2003
10. http://physics.about.com/cs/thermodynamic, Anderson, Joseph, “Determine the Efficiency of the Stirling Cycle,”9 June, 2005
11. http://www.energy.ca.gov/distgen/, California Distributed Energy Resources Guide.
12. http://www.eren.doe.gov, DOE Energy Efficiency and Renewable Energy Network (EREN).
13. http://en.wikipedia.org/Stirling_engine, “Stirling Engine,” Wikipedia, 13 April, 2005
14. http://www.howstuffworks.com, How Stuff Works
15. http://www.keveny.com/Vstirling.html, Keveny, Matt, 2000, “Two Cylinder Stirling Engine”
16. http://www.bnl.gov/est/files/pdf/No.%2003.pdf, Butcher, Tom, 2003, “MicroCHP The next Level in Efficiency,”
17. http://hyperphysics.phy-astr.gsu.edu/hbase/thermo/diesel.html, Georgia State University Physics Website
18. http://www.iit.edu/~smart/garrear/fuelcells.htm
19. http://www.fctec.com/fctec, The U.S. Department of Defense (DoD) Fuel Cell Test and Evaluation Center
20. http://www.ieeeusa.org/policy/positions/interconnection.html, IEEE-USA Position Statement on Standards for Interconnection of Distributed Energy Resources
21. http://www.oit.doe.gov, DOE Industrial Technologies Program
22. http://www.eere.energy.gov/biomass, DOE Biomass Program

209
Manufacturer Websites
Reciprocating Engines Fuel Cells
www.generac.com www.cfcl.com.auwww.cat.com www.plugpower.comwww.cumminspower.com www.baxitech.co.ukwww.deutzusa.comwww.kohlerr.com
Microturbines Absorption Chillers
www.capstoneturbine.com/ www.yazakienergy.comwww.irpowerworks.com/ www.robur.comwww.elliottmicroturbines.com www.global.carrier.comwww.turbec.com/ www.trane.comwww.bowmanpower.com www.york.com
Stirling Engines Desiccant Dehumidifiers
www.whispergen.com http://www.bry-air.com/www.microgen.com www.muntersamerica.comwww.enatec.com www.dehutech.comwww.stirling-engine.de/engl/ www.dri-eaz.comwww.waoline.com www.drykor.com
www.dryomatic.com
Rankine Cycle Engines
www.enginion.comwww.cogenmicro.com


