Embed Size (px)
Citation preview

Al
Ba
b
a
KLLLMH
1
tlorcditiwpufificG
1d
Ecological Indicators 22 (2012) 53–63
Contents lists available at ScienceDirect
Ecological Indicators
jo ur nal homep age: www.elsev ier .com/ locate /eco l ind
multifunctional assessment method for compromise optimisation of linearandscape elements
urghard C. Meyera,∗, Torsten Wolfb, Ralf Grabaumb
Technische Universität Dortmund, Fakultät Raumplanung, Lehrstuhl Landschaftsökologie und Landschaftsplanung, August-Schmidt-Straße 10, 44221 Dortmund, GermanyOLANIS GmbH, Leipzig, Germany
r t i c l e i n f o
eywords:andscape functionandscape planningandscape modellingulticriteria decision makingedges
a b s t r a c t
The importance of linear landscape elements is the topic of a wide-ranging discussion. This paper demon-strates a methods framework for the modelling and visualisation of optimal allocation of linear elementsby multifunctional risk assessment. We use the example of hedgerows to describe an optimisationtechnique for such planning.
Using the GIS tool “Line Generator”, developed by the authors, a network of existing and new potentiallines was defined and exemplified by hedgerows and rows of trees. A spatial risk assessment of the linesfor selected landscape functions is then quantified. Goals of landscape development such as presettingthe spatial orientation of linear elements are integrated into the framework. The authors developed the
software LNOPT 2.0, a linear programming combined with game theory.The methods were tested in an agricultural region in Saxony-Anhalt in Germany by integrating theopposing functions “wind erosion risk”, “water erosion risk” and “habitat suitability for the farmlandbird Corn Bunting (Emberiza Calandra)”. Results lead to optimise the benefit of a limited length of newlinear elements. This combined method is a step towards making both the planning and the integrationof multi-functional assessments into land use decisions objective and achievable by GIS.
. Introduction
From the earliest settlements, human activities have createdhe cultural landscape, a diverse mosaic of man-made structures,andscape elements and land uses. In most parts of the world, therganisation of land mosaics and land uses is spatially and geomet-ically organised along linear structures and elements. Land usehange, resulting from the diverse, complex and multi-functionalemands of modern society, poses risks to these cultural landscapes
n particular when essential landscape functions are neglected inhe pursuit of intensive arable agriculture. Positive and negativempacts of linear land uses/landscape elements, e.g. streets, rail-
ays, paths, hedges, waters, are analysed by the landscape planningractice by using models of landscape functions. Man-made landses in a linear form are linear landscape elements. Landscapeunctions are defined as the capacity of the landscape to performnherent services for society, economy and environment. A modi-
ed landscape functional approach is recently applied also in theontext of the ecosystem services assessments (MEA, 2005; Deroot, 2006).∗ Corresponding author. Tel.: +49 231 755 7499, fax: +49 231 755 4877.E-mail address: [email protected] (B.C. Meyer).
470-160X/$ – see front matter © 2011 Elsevier Ltd. All rights reserved.oi:10.1016/j.ecolind.2011.07.020
© 2011 Elsevier Ltd. All rights reserved.
Often land use prioritizes one single function only, e.g. theproduction of cereals. However, analysis of multi-functionality ofland use may reveal overlaying and conflicting functions in thesame landscape. Early approaches in landscape ecology, whichaimed to optimise the spatial organisation of land use changesin regions, tried to solve connectivity, biodiversity and networkproblems by integrating different functions (e.g. Mander et al.,1988; Yahner et al., 1995; Meyer, 1997; Opdam et al., 2006). Theseapproaches included linear elements but without modelling theirspatial distribution. The term “multi-functionality” is used in land-scape planning when a multitude of layers must be integrated inland use decision-making, especially when confronting differentlandscape functional assessments (Gruehn and Kenneweg, 2001;Meyer, 2006; Mander et al., 2007).
Because of the common focus on agriculture or farms, only a fewintegrative model systems usable in agricultural landscapes havebeen developed to support the planning perspective (Carron andLe Cotty, 2006; Rossing et al., 2007). Linear landscape elements arenot integrated in such systems. For landscape planning, the opti-mal spatial allocation of linear elements has been impeded by thelack of an integrated modelling and visualisation tool which allows
overlaying of risk assessments.Design, spatial organisation and planning of the sustainablelandscape is normally achieved following the methodological stepsof (1) formulation of the landscape problem, (2) assessment of the

5 cal Ind
llpveoeg(truop
lfmaaGrtlfald
sfaa(aaq
seafmt(fifwcahrtdctan
taac(ec
4 B.C. Meyer et al. / Ecologi
andscape functions and (3) integration of several functions in theandscape by the distribution of new land uses to solve landscaperoblems. A scenario approach is commonly used to clarify andisualise these future landscapes (Grabaum et al., 1999; Bastiant al., 2006; Mander et al., 2007). In recent decades multiple meth-ds for landscape function assessment have been developed (Markst al., 1989; Bastian and Schreiber, 1994). These methods inte-rate detailed knowledge of the principles of different sciencese.g. biology, geography, hydrology, soil science) in a land use con-ext. Results are normally published as maps showing landscapeisk surfaces. Rule- and GIS-based models (Meyer et al., 2003) aresed to analyse and to assess the functional risks. Advanced meth-ds are linking mathematical and statistical tools, spatial data andredictive modelling.
The assessment of landscape functions is a suitable approach inand use decision-making, especially when land use and conflictingunctions are opposed. In such circumstances, a decision-making
ethod which integrates contradictory land uses is essential. Theuthors developed the framework of “multi-criteria landscapessessment and optimisation” (MULBO) (Meyer, 2006; Meyer andrabaum, 2008). By linking validated assessment tools flexibly at
egional level (Gruehn, 2005), and by solving the landscape func-ional risks at the local scale level, MULBO distributes an optimaland use pattern. Knowledge is needed (1) about the effects of dif-erent linear landscape elements on landscape functions and (2)bout the linkage of the spatial distributions of land uses on theandscape functions (Grabaum et al., 2006b; Meyer et al., 2010). Aiscussion of hedgerows in a multi-functional context now follows.
The literature concerning the planning of hedgerows and otheremi-natural elements (e.g. ecotones, field margins) and multi-unctionality in arable landscapes is very diverse. It includes (1)ssessments of their overall importance, (2) landscape structurend species relationships, and the functioning of habitat networks,3) hydrological functions, and land use–soil-nutrient interlink-ges. However, both spatial assessment of the landscape structurend advice for landscape management and planning (e.g. necessaryuantities of semi-natural elements) are often neglected.
Forman and Baudry (1984) have given a first orientation in land-cape ecology about hedgerows and hedgerow systems. Baudryt al. (2000) propose as a definition for a hedgerow “that althoughny row of woody vegetation can be a corridor or a barrieror ecological processes, it may not be a ‘hedgerow’ if it is not
anaged”. Furthermore, “a hedgerow, whether planted or spon-aneous, always has a human component”. Marshall and Moonen2002) summarise former research about the major functions ofeld margins in agro-ecosystems in terms of their functional role
or agronomy (land ownership, stock fencing, shelter, windbreak,eed and pest control, game and wood) environment (pollution
ontrol, eutrophication, pesticides, erosion, snow and water flow,nd siltation), nature conservation (species refugia, biodiversity,abitat, feeding, breeding, corridor and movement), recreation andural development (access, walking, driving, hunting, tourism, aes-hetics, culture and heritage), and wildlife function (species habitat,iversity, movement of species, connectivity, overwintering, pestontrol and sometimes crop pest source). When linking the func-ions into the context of arable farms Marshall and Moonen (2002)lso describe the requirements and potential functions of semi-atural field margins in good agricultural practice.
Le Cœur et al. (2002) point out a shift in landscape ecologyo incorporate the main impacts of crop succession, land usend management practices in the landscape or farming mosaicnalysis. Consequently, the investigation of effects is compli-
ated, as exemplified by Grashof-Bokdam and van Langevelde2004) who analysed the “disappearance of semi-natural landscapelements, the so-called green veining”, from intensively used agri-ultural landscapes of Europe. Based of an analysis of 39 studiesicators 22 (2012) 53–63
Grashof-Bokdam and van Langevelde (2004) could “not verify thespecies–area relation for green veining, nor the effect of amount,spatial configuration or management intensity on this relation,because only few studies quantified the found effects and no studieswere found on the effect of management intensity or spatial con-figuration on the species–area curve in green veining”. Obviouslythe matrix effects of the adjacent fields on corridors and the differ-ent scales of species dispersal and movement are important for theunderstanding of the biodiversity complexity and the subsequentformulation of management advice.
The hydrological functions of linear elements on their adjacentfields and their land use–soil-nutrient interlinkages are the sub-ject of interesting investigations. In a long time series analysis,Ryszkowski and Kedziora (2007) explored the impact of riparianbuffer zones and their functioning on nutrient retention and nutri-ent control (see also Mander et al., 1997). Dorioz et al. (2006)reviewed the impacts of grass buffer stripes on phosphorus dynam-ics. Pärn et al. (2010) analysed the correspondence of vegetationborders to the horizontal redox barriers of a Northern Europeanmoraine plain in Estonia. They conclude that “the margins of ripar-ian mires act as redox geochemical barriers” and that “the ecotonesmay represent functional boundaries for delineating wetlands andplanning the sustainable use of agricultural landscapes”.
A long research tradition exists to solve the problem of soil ero-sion by wind and water and measures to reduce the unwantedprocesses of soil erosion. Assessment procedures based on rulebased systems and also on biophysical models have been devel-oped, and further developed, for landscape assessment of winderosion risk (e.g. Smith et al., 1992) and water erosion risk(Schwertmann et al., 1987) by using the revised universal soil lossequation. Hydrological modelling and land use information is com-bined for the assessment of landscape retention function (Markset al., 1989).
Assessment and advice to landscape managers and planners, tohelp achieve an optimal distribution of linear landscape elementsand a healthy landscape structure, is seldom given for single func-tions. Only a few examples can be given in this context to clarify thisproblem. For example, Meier et al. (2005) developed an approachto identify the optimal land use distribution of riparian zones andecological networks in Estonia for biodiversity. With the aim ofsolving the problem of non-point pollution, Hirt et al. (2005) quan-tified, at river catchment scale the effect of nitrogen run-off fromdrainage systems, a relatively unrecognised man-made subsurfacelinear element. Kantelhardt et al. (2003) have analysed the corre-lation between agricultural site and soil conditions and the densityof existing and future hedgerow networks.
The integration of different landscape assessments in land usedecision-making is solved in MULBO by multi-criteria optimisa-tion techniques based on linear programming combined with thegame theory (Grabaum and Meyer, 1998; Grabaum and Kildal,2004). Explicit spatial assessments of landscape functions are usedto indicate the carrying capacity of a landscape or a territory assubsets of multi-functionality. Details on the seven-step methodMULBO can also be found at www.mulbo.de. The most recentoptimisation techniques use maximising approaches to solve spa-tial problems, whereas MULBO calculates optimal compromises ofland use scenarios to assist decision-making (Holzkämper et al.,2006; Holzkämper and Seppelt, 2007a, 2007b; Rossing et al., 2007;Seppelt and Voinov, 2003).
The MULBO land use scenarios are used by planners to dis-cuss land use options with stakeholders, and to develop alternativesolutions during the planning process. Thus the semi-automatic
assessment and localisation of linear landscape elements havebecome options in landscape modelling and planning. The tech-nique for the optimal spatial distribution of linear landscapeelements has now been integrated into the MULBO framework
B.C. Meyer et al. / Ecological Ind
Fe
(lpthdsg
2
b
••
•
2
pttni
sw
ig. 1. Framework for the optimal distribution of linear landscape elements (Meyert al., 2007a).
and is the subject of this paper and is described in the fol-owing methods section. This paper explains (1) methodologicalroblems and the solution to integrate linear elements into spa-ial assessments, (2) examples demonstrating the assessment ofedgerows in a multi-functional context, and (3) optimal hedgerowistributions calculated using land use optimisation. Finally ahort discussion about future methodological development isiven.
. Method
The grid based optimisation of linear landscape element distri-ution follows three main steps (Fig. 1):
The generation of a potential line grid with an ArcGIS extension,The assessment of the effects of the line grid on landscape func-tions,The optimal localisation on the new line grid by optimisation andby inclusion of predefined restrictions.
.1. Step 1: generation of a potential line grid
The lack of a potential line grid was identified by the authors asrimarily a programming or computer problem. In contradictiono the finite spatial information included into the areal optimisa-ion of MULBO (by optimising the distribution of polygons) theumber of new lines to be distributed in an area is theoretically
nfinite.The generation of a potential line grid should be organised by
imple rules. For that, only straight lines adjustable in length andith defined headings are discussed. The authors developed the
icators 22 (2012) 53–63 55
software tool “Line Generator” to produce the grid of potential lines.This software tool is implemented as an ESRI ArcGIS extension.
The criteria of length, geometrical structure and orientationare to be pre-determined for the generation of a potential linegrid. This restriction was solved by the adaptation of the con-cept of compass rose for linear landscape elements. The newpotential line segments start at a regular point pattern withorientations of North-South, South-North, East-West, West-East,Northeast-Southwest, Southwest-Northeast, Northwest-Southeastand Southeast-Northwest. The length of the potential line segmentsis arbitrary. The tool starts with reading bounding coordinates ofthe study area and only needs the desired line segment length asinput data. Shorter line length results in longer time for optimisa-tion computing.
By generating line elements, it should be stressed that a poten-tial line grid should be modelled in the optimisation area. This isanalogous to the spatial optimisation of areal land uses, where thearea of optimisation is delimited for the inclusion of a finite numberof smallest geometries (Grabaum and Meyer, 1998). For that, theline grid has been clipped with the area of optimisation. This clipresults in several line segments of different length and orientation.Due to simplify the creation of predefined line sets new lines pat-tern still start for all optimisation areas in the regular point pattern.In the future other linear structures can be handled in the line gridby GIS operations (e.g. soil unit borders, contour lines of the relief).Clipping with optimisation area may result in new lines to smallfor optimisation concern. The authors applied a 10% rule (10% ofthe defined length) as exclusion selection criterion for the minimalline length.
As a result of the line grid generation, a multitude of line seg-ments of different length were available.
2.2. Step 2: assessing the effects of the line grid on landscapefunctions
On the basis of analysed knowledge about the impact of linearlandscape elements on landscape functions assessments are car-ried out by using the GIS assessment tools available for MULBO (seeMeyer and Grabaum, 2008). The selection of assessment methodsdepends on the landscape problems and also on landscape goals tobe achieved. The tools include assessment procedures transformedinto predictive rule base models and adapted for the application ofthe assessment of linear landscape elements. As a major differenceto common spatial assessment methods applied on the smallestcommon geometry (polygon) the assessment information from theunderlying clipping polygon were transferred to the lines. Becauseof the transfer operation one line segment could be formally split-ted into smaller segments of different assessment values. To geta unique value of the whole line segment, the splitted parts arereunified and average value were calculated and mathematicallyrounded. This is a formal need for the optimisation run to computewith integer values and making line length less different.
For the different classes of linear landscape elements (e.g.hedges, tree lines) a table of assessment were created in orderto formulise the impact of each landscape element on each land-scape function including cumulative and opposing effects. As thereis only basic knowledge concerning some of the landscape func-tions, further landscape ecological research is needed. Examples oflandscape ecological assessments are presented in the applicationsection of this paper.
This second step of the framework results in an attributed line
grid and includes the assessment values for each assessment. Theoutput corresponds well to the data structure needed for the land-scape optimisation programme LNOPT 2.0 (Grabaum and Meyer,1998; Grabaum and Kildal, 2004).
56 B.C. Meyer et al. / Ecological Indicators 22 (2012) 53–63
gth (G
2o
opbmptt(
poebts(lswc
lf
2
adbe(m
with the biotope type’s geometry (see 500 m in Fig. 2). See Table 1for the total length and the number of the line segments related tothe predefined line length.
Table 1Total length and number of line segments related to the predefined line length inthe test area Barnstädt (Grabaum et al., 2006a).
Predefined line Total length of line Number of
Fig. 2. Line Grid of 500 m grid len
.3. Step 3: the optimal localisation on the new line grid byptimisation and by inclusion of predefined restrictions
The goal of the multi-criteria optimisation is the localisationf limited new linear landscape elements and to maximise theirositive effect of concerned landscape functions. As there coulde rivalling goals, the method has to find a compromise. Theethod used for such mathematical problems is based on linear
rogramming and game theory. For the compromise optimisationhe software LNOPT 2.0 was used. The complete description ofhe mathematical background is published by Grabaum and Meyer1998).
First, the goals of optimisation for solving of multi-functionalroblems have to be formalized. The assessment results are used asptimisation input. This leads to the definition of restrictions on lin-ar elements, especially for the length (in meter), e.g. as formulatedy stakeholders on the basis of discursive processes. Another poten-ial predefinition included into the optimisation process could be aet of restrictions on element classes depending on areal propertiese.g. only on the fields of the plot owner A or B tree rows should beocated). Weighted optimisation allows preference of specific land-cape function. Therefore scenarios with different sets of weightsere predefined. This study calculates with optimal and weighted
ompromises of the functions (Grabaum and Meyer, 1998).This resulted in a distribution map showing how to place new
inear landscape elements at the line segments. This can be inputor further planning steps.
.4. Application in the case study area Barnstädt in Germany
The study area Barnstädt in Saxony-Anhalt in Germany of anrea of 4240 ha is an intensively used arable landscape. Sufficientata exist from the year 1996, concerning the distribution of the
iotope types and the field crops for the year 2004 as well for sev-ral spatial GIS data used for the assessment of landscape functionsclimate data, soil data, digital elevation model, historical land useaps; Grabaum et al., 2006b).
rabaum et al., 2006a,b, changed).
Arable fields characterized by very large sizes dominate the landuse with 86% of the area. Near-natural structures cover only 40 ha(approx 1%). Despite of some plantings of hedges and tree rows forerosion control there are few linear structures of total 90 km lengththat corresponds to a length of 25 m/ha.
The scenario formulation step was applied by local stakeholdersby choosing the problems of water and wind erosion and the lackof suitable habitats for the Corn Bunting. These problems shouldbe reduced by the location of new hedges. The scenario goal andmethodological pre-setting were the optimal spatial allocation of10 km of new hedges. This length of 10 km was a first restriction foroptimisation.
2.5. Generation of the line grid
As a first step, the geometry of the study area has been loadedinto a new ESRI ArcMap document file. Starting the Line Generatorthe boundaries X-Min, X-Max, Y-Min, and Y-Max are placed auto-matically and the lines are generated. The resulting line grid hasbeen clipped to the polygon geometry to be included in the optimi-sation run. The study focuses on arable fields to extract them froma biotope type mapping. We used the presetting line grid lengthof 100, 200 and 500 m. As described above line segments with lessthan 10% of the line grid length have been deleted after clipping
length [m] segments [km] segments
100 1232.87 13,193200 622.19 3858500 246.19 841

B.C. Meyer et al. / Ecological Indicators 22 (2012) 53–63 57
Table 2Assessment of the protection of new potential line segments to minimise wind erosion risk (Grabaum et al., 2006a, changed).
Assessment class Predefined length of line segments 200 m Predefined length of line segments 500 m
Number of line segments Length [m] Number of line segments Length [m]
I (very low) 1543 290,495 237 83,538II (low) 437 81,633 182 70,526
6651
132
2
mTb(
••
•
esledtarb(r
•
•
•
asttfl
f
III (medium) 342
IV (high) 300V (very high) 1236
.6. Assessment of the line grid for landscape functions
Landscape functions obviously affected by linear landscape ele-ents, have been selected and analysed by the case of hedges.
he following main functions have been taken into considerationy using standard tools from literature adapted to GIS by MULBOMeyer and Grabaum, 2008):
Wind erosion risk, methodological basis: Smith et al. (1992)Water erosion risk, methodological basis: Universal Soil LossEquation, USLE, adapted to Germany by Schwertmann et al.(1987)Habitat suitability for the Corn Bunting, methodological basis:Meyer et al. (2007b).
The functioning of the model applied is explained by using thexample of wind erosion risk analysis and assessment. Comparableteps of risk analysis and assessment were applied for the otherandscape functions. The impacts of current and of new landscapelements for wind erosion control are assessed by the approachescribed by Smith et al. (1992) (see Grabaum et al., 1999). First,he approach defines buffer zones not endangered by wind erosionround existing landscape elements depending on their height. Itesults in areas “not endangered by wind erosion” or “endangeredy wind erosion” (status quo). By intersecting the assessed areaspolygons) with the new potential lines, three different types ofesults have been computed:
First type: a line segment is located in an area not endangered bywind erosion with full length (risk value V). No additional linearlandscape is needed for further reduction of the wind erosion risk,because the impacts of a new line element were ““I (very low)”(benefit value class)”.Second type: a line segment is located in an area endangered bywind erosion with full length (risk value I). New linear landscapeelements will have positive impacts on wind erosion risk reduc-tion. The protection impact of a linear landscape element will be“very high”.Third type: a line segment is partly located in areas with andwithout wind erosion risk. An average and rounded (integer)value between I and V have been computed for this type of linesegments. That means the protective influence of new linear land-scape elements were “medium” and tends to higher impact if acurrent endangered area covers the majority of the line lengthand vice versa.
Fig. 3 and Table 2 show the high number of line segments in thessessment class “very high” (benefit) located in areas of wind ero-ion risks. An optimisation run only focused on the goal to minimisehe risk on wind erosion will find a multitude of potential placeso locate new linear landscape elements. This was also due to the
act there is no exclusion of line element buffers already partiallyocated in protected areas.The authors have not included more complex buffering rulesor the calculation which take into account the increasing
,198 112 33,576,692 90 22,966,176 220 35,584
complexity on the line buffering problems when intersecting sev-eral layers of information. The results shown in Fig. 3 are createdfor planning issues. The results are well suited for interpretation ofthe functional problem of wind erosion risk and are also usable forthe multi-criteria landscape optimisation as they offer a method-ological approach for enhancing the wind erosion protection.
The type of linear landscape element is essential for the goal ofthe assessment of different land uses because of their height. In ourexample we predefined a protective effect of each line segmentat the reduction of wind erosion risk based at an average heightof 10 m. The approach demonstrated in this paper is easily to bemodified by a redefinition of selected protection classes of differentlinear landscape elements, e.g. for tree rows, gappy tree rows andhedgerows without or with trees. A hedgerow with high trees nor-mally will have a higher protection impact than a gappy tree row.
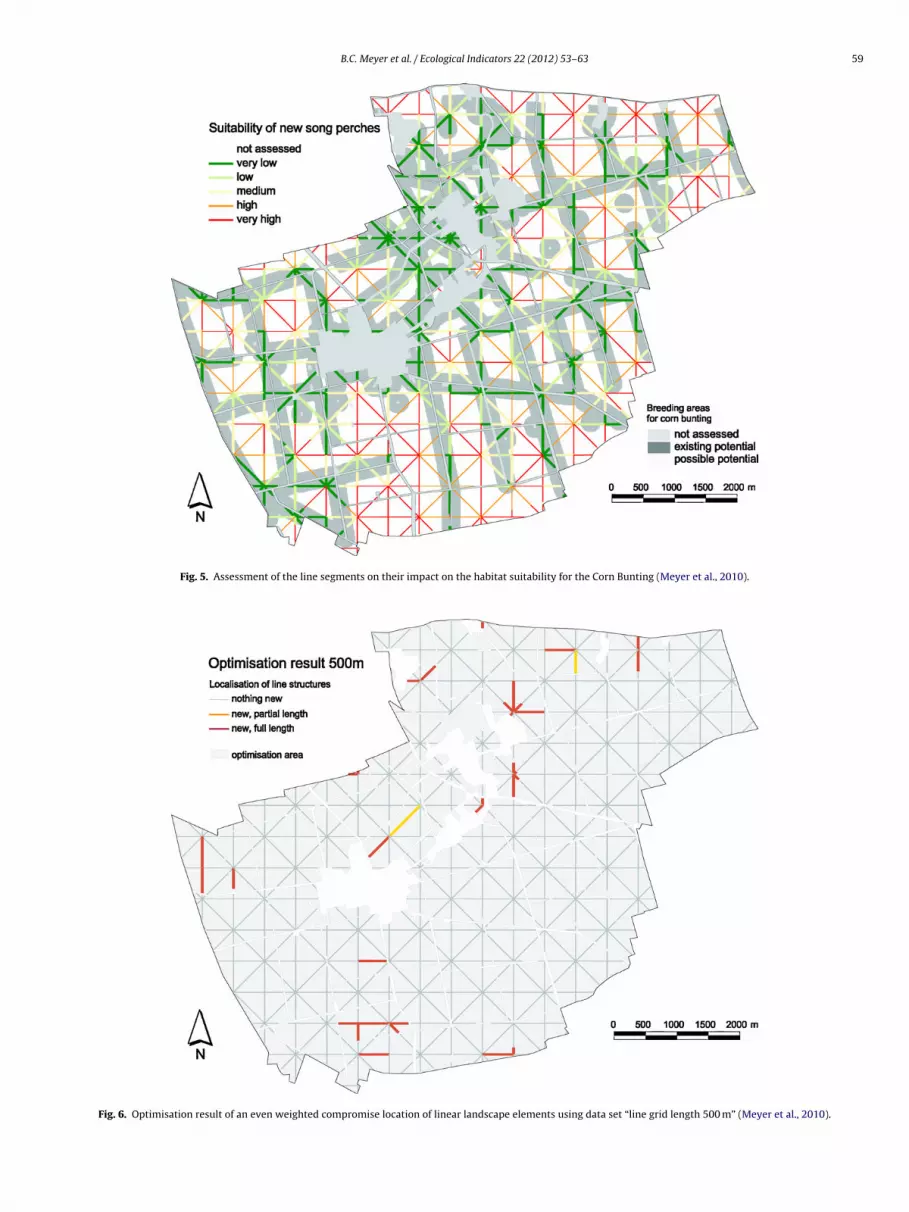
Assessment of the wind erosion risks were followed by assess-ments of water erosion risk (Fig. 4) and of the habitat suitabilityfor the Corn Bunting (Fig. 5). The assessment results were inte-grated into the optimisation process by the methodological stepsas described for the wind erosion risk assessment.
2.7. Multi-criteria optimisation on the location of linearlandscape elements
The assessed line grids have been optimised by the inclusion offollowing targets of the reduction of risks of
• Wind erosion, (by giving shelter, e.g. with high linear altitude),• Water erosion (by reducing the slope length),• Quality of habitats for the Corn Bunting.
By taking the predefined length of linear segments of 100, 200and 500 m the following goals and restrictions have been definedfor our scenario example. A total length of new linear landscapeelements (hedgerows) of 10 km should be located.
Scenarios formulated by different weights of the goal functionsare calculated with the software tool LNOPT 2.0 for the three datasets wind erosion, water erosion and quality of habitats for the CornBunting (each data set is defined by its predefined line grid length).In this paper we demonstrate only results at the basis of the dataset“line grid length 500 m”. This data set includes 841 line elements ofa total length of 246.19 km (see Table 1). The compromise in Fig. 6was calculated by using equally weighted functions. The derivedcompromise solution is well balanced between the three functions.
The optimal compromise distributes 10 km of new linear ele-ments with 36 line elements of different length. In comparison tothe assessment maps (Figs. 3–5), the localisation of new line ele-ments occurs in areas where all risks can be minimised for theselected functions through the optimisation. Table 3 shows theresults of the target values calculated by LNOPT 2.0. Comparing sin-gle minimisation of single erosion risks and maximisation of habitat
suitability of Corn Bunting with the compromise solution exam-ple clarifies the changes of the functional quality of the landscape.This demonstrates the integrative capabilities for land use decisionmaking using LNOPT 2.0.
58 B.C. Meyer et al. / Ecological Indicators 22 (2012) 53–63
Fig. 3. Assessment of potential line segments and impact on the reduction of wind erosion risk (Meyer et al., 2010).
Fig. 4. Assessment of the line segments on their impact on the reduction of water erosion risk.
B.C. Meyer et al. / Ecological Indicators 22 (2012) 53–63 59
Fig. 5. Assessment of the line segments on their impact on the habitat suitability for the Corn Bunting (Meyer et al., 2010).
Fig. 6. Optimisation result of an even weighted compromise location of linear landscape elements using data set “line grid length 500 m” (Meyer et al., 2010).

60 B.C. Meyer et al. / Ecological Indicators 22 (2012) 53–63
Fig. 7. Assessment of the actual wind erosion risk (Meyer et al., 2007a, changed).
Table 3Comparison of target values optimised with LNOPT 2.0 on the basis of the data set line grid length 500 m (Meyer et al., 2010).
Solution New distributed lineelements (m)
Target value winderosion risk
Target value watererosion risk
Target value habitat suitabilityfor the Corn Bunting
Actual land use 0 587,941 717,110 699,366Minimisation wind erosion risk 10,000 627,941 730,088 738,046
14,34720,57823,580
rrBSp
l1rg(4
TA2
Minimisation water erosion risk 10,000 6Maximisation habitat suitability Corn Bunting 10,000 6Compromise 10,000 6
Part of the MULBO framework is an assessment of the scenarioesults after the optimisation run. Again the function “wind erosionisk” was used to demonstrate the changes in the case study areaarnstädt, optimised on the basis of land use data of the year 1997.tarting from status quo, 55% of the whole arable land suffers aotential risk of wind erosion (Fig. 7).
Following Smith et al. (1992) an average height of potentialinear landscape element (hedgerow) of 10 m, creates a buffer of00 m along each landscape element to protect from wind erosion
isk to be added to the status quo. When using the data set “linerid length 500 m” the additionally protected area is only 245.1 haFig. 8). Table 4 shows the rise of wind erosion protected area of9.4% of the optimisation area. When using the data set of “line gridable 4ssessment of wind erosion risks in the case study area Barnstädt (Grabaum et al.,006a, changed).
Assessment Unit Actual land use Additional data set500 m line elements
Potentially not risky [ha] 1918.65 2099.66[%] 45.25 49.52
potentially risky [ha] 2322.62 2140.20[%] 54.75 50.48
749,532 719,889 727,013 739,366
744,291 734,196
length 200 m” a protected area of additionally 297.6 ha has been cal-culated by the optimisation. When buffering the linear landscapeelements allocated by the optimisation run on the basis of the “linegrid length 200 m” data set, the protected area increases to 49.52%of the total arable land.
The new buffers are distributed optimal in areas with benefit inreduction of wind erosion risks. Only a small part of the new bufferareas were located in areas not endangered by wind erosion. Thisnot endangered area would have approx. 62 ha when using the dataset “line grid length 200 m” respectively to 57 ha when using thedata set “line grid length 500 m”. These overlaps of buffers and risk-free areas are explained as follows: First, the assessment methodwas applied if a new line element were located in an area whichhas potential risks of wind erosion and not the risks of belongingto buffers. Second, the optimisation run calculates a compromiseof all goal functions. For this purpose, lines could be located tominimise the risks for one of the other functions included in theoptimisation run without maximising the protection against winderosion.
3. Discussion
The optimal distribution of linear landscape structures hasbeen realised by using the framework of multi-criteria landscape

B.C. Meyer et al. / Ecological Indicators 22 (2012) 53–63 61
ts on t
ag“tplmbfottnaesm
ofapadtlc
“Asit
Fig. 8. Wind erosion risk by using the optimised landscape elemen
ssessment and optimisation (MULBO). The technical procedure forenerating a potential line grid has been explained. The GIS ToolLine Generator” has been developed by the authors to solve thisype of problem. This uses the geometric concept of a regular pointattern with lines in all compass rose directions to produce new
ine grids. However, the application of the technique in practiceay be problematic without adaptation of the scenario outcomes
y formal landscape planning. Other possible and helpful solutionsor the allocation of linear landscape elements, such as the creationf double lines, circles or wavy lines, are not achievable with thisool. It would be interesting to compare the approach described inhis paper with alternative methods for generating potential lineets. However, up to now, no other approaches to generation andpplication are available in the literature. A flexible integration ofxisting linear elements (borders, ecotones or other linear land-cape elements, etc.) by the user can widen the applicability of theethodology.Another problem refers to the assessment of the single segments
f the potential line grid (or parts of them). For that reason, weollowed a GIS-based assessment approach which is common andpplicable in planning. For wind erosion protection, water erosionrotection and suitability as habitat for the Corn Bunting, highlypplicable methods have been found in the literature, or have beeneveloped by the authors during research projects, as described inhe methods part of this paper. The methods used are available forandscape assessments as applied in landscape planning and natureonservation science and practice.
The number of lines could be balanced on the basis of the toolLine Generator” in accordance with the desired maximal length.
fter demonstrating the framework were applicable in the casetudy area, the example shows the expected ability to find and tontegrate best solutions, which include several functions relatingo land use compromises. When linear landscape elements are ofhe data set “line grid set 500 m” (Grabaum et al., 2006a, changed).
importance to solve several functional problems, such as complexwater functions, the scenario application of linear land uses willhelp integrate several problems into land use decision-making.
As discussed in the introduction to this paper, the assessmentof landscape functions is a suitable approach in land use decision-making, especially when land use and conflicting functions areopposed. Modern integrative methods often use the optimisationof one single function (e.g. cost) or one goal as their main objective(e.g. Seppelt and Voinov, 2003; Holzkämper and Seppelt, 2007a).Groot et al. (2010) have designed a hedgerow network for a multi-functional agricultural landscape by balancing trade-offs betweenecological quality, landscape character and implementation costs,and also by modifying the location of the hedgerows in their spa-tial context. Their approach can be linked to the method proposedin this article. Linking methods seems to be a practicable routefor solving landscape problems from a planning perspective. Inthis context, most farm modelling approaches examining agricul-tural funding neglect essential aspects of the landscape system(e.g. waters, hedgerows, woods, moving species, scale effects, etc.)by excluding the full landscape matrix from the modelling prob-lem (Rossing et al., 2007). Moreover, methods to solve erosion andnon-point pollution problems can probably be enhanced by theinclusion of functional modelling and the optimal location of linearlandscape elements.
Karr and Schlosser (1978) summarised how water resourcesin agricultural watersheds can be improved by effective multidis-ciplinary planning, especially by varying management practices.However, the effects of linear landscape elements were not takeninto consideration. Today, the control of non-point sources of pol-
lution from agricultural land is better understood. Pärn et al. (2010)for example state, that ecotones may represent functional bound-aries for delineating wetlands and, in planning, the sustainable useof agricultural landscapes.
6 cal Ind
qathabcssps
tc2ai
4
bttcosnetpssdlmbtgs
clfts
A
m
R
B
B
B
C
D
D
2 B.C. Meyer et al. / Ecologi
It should be mentioned that, as a first step, a comprehensiveuantification of linear landscape elements using biotope types on
regional scale is needed, as Hirt et al. (2011) have demonstrated byhe example of a river catchment in Eastern Germany. The compre-ensive quantification may provide orientation about the type andmount of new linear elements to the unsolved planning problemeyond the allocation by a site and landscape-adapted specifi-ation. Landscape analysis by linking major landscape aspectstatistically (e.g. for geology, soil, hydrology and historical timeteps of landscape elements existence), could orientate landscapelanning towards an adapted length and types of potential mea-ures. Such basic information was missing, however.
Additional methods to analyse scenario distributions of poten-ial landscape elements also seem to be straightforward in theontext of green veining (Grashof-Bokdam and van Langevelde,004). Such analysis can improve the linkage between planningnd natural and bio-physical systems in comparison to stakeholderntegration approaches as described by Opdam et al. (2006).
. Conclusion
In practice, the implementation of the proposed method shoulde based on discussions, analysis and assessment carried outogether with land owners and stakeholders. The optimisation run,o distribute potential linear landscape elements, was easily appli-able and repeatable by the usage of the software LNOPT 2.0. Thenly restrictions or assumptions needed when running the optimi-ation are a maximal length of the proposed linear elements. Theumber of lines could be modified with the tool “Line Generator”,.g. by setting the desired maximal length. By demonstrating thathe framework was applicable to the case study area, the exam-le highlights the expected ability to find and to integrate bestolutions to land use compromises which include several land-cape functions. A focal point for future research will rely on theevelopment of methods for the analysis and the assessment of
andscape functions primarily influenced by linear landscape ele-ents. Furthermore the integration of multiple functions on the
asis of optimisation methods should be better linked in futureo experimental approaches in landscape modelling when investi-ating the interlinkages and the behaviour or complex landscapeystems.
The advantages of the proposed method for applied planning arelear, as they encompass the multi-functional linkage of differentandscape risks (described in the form of landscape functions) anduture land uses (in the form of linear elements), without neglectinghe spatial context of the area to which they are applied, and theocietal needs for landscape development.
cknowledgement
Comments from two anonymous referees helped to improve theanuscript.
eferences
astian, O., Krönert, R., Lipsky, Z., 2006. Landscape diagnosis on different space andtime scales – a challenge for landscape planning. Landsc. Ecol. 21 (3), 359–374.
astian, O., Schreiber, K.-F. (Eds.), 1994. Analyse und ökologische Bewertung derLandschaft. Gustav Fischer, Jena, Stuttgart.
audry, J., Bunce, R.G.H., Burel, F., 2000. Hedgerows: an international perspective ontheir origin, function and management. J. Environ. Manage. 60 (1), 7–22.
arron, P., Le Cotty, T., 2006. A review of the different concepts of multifunctionalityand their evolution. Eur. Ser. Multifunct. 10, 179.
e Groot, R., 2006. Function-analysis and valuation as a tool to assess land use con-flicts in planning for sustainable, multi-functional landscapes. Landsc. UrbanPlan. 75 (3–4), 175–186.
orioz, J.M., Wang, D., Poulenard, J., Trevisan, D., 2006. The effect of grass bufferstrips on phosphorus dynamics – a critical review and synthesis as a basis for
icators 22 (2012) 53–63
application in agricultural landscapes in France. Agric. Ecosyst. Environ. 117 (1),4–21.
Forman, R.T.T., Baudry, J., 1984. Hedgerows and hedgerow networks in landscapeecology. J. Enviro. Manage. 8 (6), 499–510.
Grabaum, R., Meyer, B.C., 1998. Multicriteria optimization of landscapes using GIS-based functional assessments. Landsc. Urban Plan. 43 (1–3), 21–34.
Grabaum, R., T. Kildal, 2004. Entwicklung einer Softwarelösung für eine neueMethode der Landschaftsoptimierung in Verbindung mit dem Verbundpro-jekt 4.1 am UFZ-Umweltforschungszentrum Leipzig-Halle GmbH: Bedeutungvon Landschaftsstrukturen und Landnutzung für das Überleben von Tier- undPflanzenarten – Final Report. OLANIS Expertensysteme GmbH, Leipzig.
Grabaum, R., Meyer, B.C., Mühle, H., 1999. Landschaftsbewertung und-optimierung.Ein integratives Konzept zur Landschaftsentwicklung. UFZ-Bericht 32/1999,Leipzig, p. 109.
Grabaum, R., Wolf, T., Meyer, B.C., 2006a. Verortung linearer Landschaftsstruk-turen mittels mehrkriterieller Optimierung. In: Rödel, R., Aurada, K.D. (Eds.),Kooperation und Integration: Beiträge zum 16. Kolloquium Theorie und quanti-tative Methoden in der Geographie. Gemeinsame Tagung der Arbeitskreise AKTheorie und Quantitative Methoden in der Geographie und AK GeographischeInformationssysteme in der Deutschen Gesellschaft für Geographie (DGfG), 39.Greifswalder Geographische Arbeiten, pp. 49–61.
Grabaum, R., Meyer, T., Gerung, J., Wolf, T., Friedrich, K.E., Kildal, T., Schreiner, V.,Meyer, B.C., 2006b. The digital user manual for the multicriteria assessment andoptimisation method (MULBO). In: Meyer, B.C. (Ed.), Sustainable Land Use inIntensively Used Agricultural Regions, 1338. Landscape Europe, Wageningen,Alterra Report, pp. 127–132.
Grashof-Bokdam, C.J., van Langevelde, F., 2004. Green veining: landscape deter-minants of biodiversity in European agricultural landscapes. Landsc. Ecol. 20,417–439.
Groot, J.C.J., Jellema, A., Rossing, W.A.H., 2010. Designing a hedgerow network ina multifunctional agricultural landscape: balancing trade-offs among ecolog-ical quality, landscape character and implementation costs. Eur. J. Agron. 32,112–119.
Gruehn, D., 2005. Zur Validität von Bewertungsmethoden in der Landschafts-und Umweltplanung. Handlungsbedarf, methodisches Vorgehen und Konse-quenzen für die Planungspraxis, aufgezeigt am Beispiel der Validitätsprüfungpraxistauglicher Verfahrensansätze zur Bewertung von boden-, wasser-und klimarelevanten Landschaftsfunktionen. Mensch & Buch Verlag, Berlin,pp. 577.
Gruehn, D., Kenneweg, H., 2001. Leitbilder und Mehrzieloptimierung in der örtlichenLandschaftsplanung. BfN-Skripten 71. Bundesamt für Naturschutz, Bonn.
Hirt, U., Mewes, M., B.C. Meyer, 2011. A new approach to comprehensive quantifica-tion of linear landscape elements using biotope types on a regional scale. Physicsand Chemistry of the Earth. doi:10.1016/j.pce.2011.05.005. in press.
Hirt, U., Hammann, T., Meyer, B.C., 2005. Mesoscalic estimation of nitrogen dischargevia drainage systems. Limnologica 35 (3), 206–219.
Holzkämper, A., Lausch, A., Seppelt, R., 2006. Optimizing landscape configuration toenhance habitat suitability for species with contrasting habitat requirements.Ecol. Model. 198 (3–4), 277–292.
Holzkämper, A., Seppelt, R., 2007a. Evaluating cost-effectiveness of conservationmanagement actions in an agricultural landscape on a regional scale. Biol. Con-serv. 136 (1), 117–127.
Holzkämper, A., Seppelt, R., 2007b. Short communication: a generic tool for opti-mising land-use patterns and landscape structures. Environ. Model. Software22 (12), 1801–1804.
Kantelhardt, J., Osinski, E., Heissenhuber, A., 2003. Is there a reliable correlationbetween hedgerow density and agricultural site conditions? Agric. Ecosyst. Env-iron. 98 (1–3), 517–527.
Karr, J.R., Schlosser, I.J., 1978. Water resources and the land-water interface. Science301, 229–234.
Le Cœur, D., Baudry, J., Burel, F., Thenail, C., 2002. Why and how we should study fieldboundary biodiversity in an agrarian landscape context. Agric. Ecosys. Environ.89 (1–2), 23–40.
Mander, Ü., Jagomägi, J., Külvik, M., 1988. Network of compensative areas as anecological infrastructure of territories. In: Schreiber, K.F. (Ed.), Connectivity inLandscape Ecology, 29. Münstersche Geographische Arbeiten, pp. 35–38.
Mander, Ü., Kuusemets, V., Lohmus, K., Mauring, T., 1997. Efficiency and dimen-sioning of riparian buffer zones in agricultural catchments. Ecol. Eng. 8 (4),299–324.
Mander, Ü., Wiggering, H., Helming, K. (Eds.), 2007. Multifunctional Land Use:Meeting Future Demands for Landscape Goods and Services. Springer, Berlin,Heidelberg, p. 421.
Marks, R., Müller, M.J., Leser, H., Klink, H.-J. (Eds.), 1989. Anleitung zur Bewertungdes Leistungsvermögens des Landschaftshaushaltes (BA LVL). Forschungen zurDeutschen Landeskunde 229, Trier, 222 pp.
Marshall, E.J.R., Moonen, A.C., 2002. Field margins in northern Europe: their func-tions and interactions with agriculture. Agric. Ecosyst. Environ. 89, 5–21.
MEA (Millennium Ecosystem Assessment), 2005. Ecosystems and Human Well-being: Synthesis. Island Press, Washington, DC.
Meier, K., Kuusemets, V., Luig, J., Mander, Ü., 2005. Riparian buffer zones as ele-ments of ecological networks: case study on Parnassius mnemosyne distribution
in Estonia. Ecol. Eng. 24, 531–537.Meyer, B.C., 1997. Landschaftsstrukturen und Regulationsfunktionen in Intensiva-grarlandschaften im Raum Leipzig-Halle. Regionalisierte Umweltqualitätsziele– Funktionsbewertungen – multikriterielle Landschaftsoptimierung unter Ver-wendung von GIS (PhD thesis). UFZ-Bericht 24/1997, Leipzig, 218 pp.

cal Ind
M
M
M
M
M
M
B.C. Meyer et al. / Ecologi
eyer, B.C. (Ed.), 2006. Sustainable land use in intensively used agricultural regions.Alterra Report No. 1338, Landscape Europe, Wageningen (www2.alterra.wur.nl/Webdocs/PDFFiles/Alterrarapporten/AlterraRapport1338.pdf).
eyer, B.C., Grabaum, R., 2008. MULBO – model framework for multicritieria land-scape assessment and optimisation. A support system for spatial land usedecision. Landsc. Res. 33 (2), 155–179.
eyer, B.C., Grabaum, R., Wolf, T., 2007a. Localisation of linear landscape elementsusing multi-criteria optimisation. In: Bunce, R.G.H., Jongman, R.H.G., Hojas, L.,Weel, S. (Eds.), 25 Years of Landscape Ecology: Scientific Principles in Practice,Part 2, Theme 6–11, Workshops, Proceedings of the 7th IALE World Congress.Wageningen, The Netherlands. IALE Publication series 4, pp. 971–972.
eyer, B.C., Grabaum, R., Wolf, T., 2010. Model for the optimal localisation of linearlandscape elements based on functional assessments. In: Fabos, J.G., Ryan, R.L.,Lindhult, M.S., Kumble, P., Kollanyi, L., Ahern, J., Jombach, S. (Eds.), Proceedingsof the Fabos Conference on Landscape and Greenway Planning 2010. July 8–11,Budapest, Hungary, pp. 97–103.
eyer, B.C., U. Hirt and M. Mewes, 2003. Landschaftsstrukturen zur Ableitung
von Landschaftsindikatoren im Einzugsgebiet der mittleren Mulde. UFZ-Bericht5/2003, Leipzig, 86 pp.eyer, B.C., Mammen, K., Grabaum, R., 2007b. A spatially explicit model for inte-grating species assessments into landscape planning as exemplified by the CornBunting (Emberiza calandra). J. Nat. Conserv. 15 (2), 94–108.
icators 22 (2012) 53–63 63
Opdam, P., Steingroever, E., Van Rooij, S., 2006. Ecological networks: a spatial con-cept for multi-actor planning of sustainable landscapes. Landsc. Urban Plan. 75,322–332.
Pärn, J., Remm, K., Mander, Ü., 2010. Correspondence of vegetation boundariesto redox barriers in a Northern European moraine plain. Basic Appl. Ecol. 11,54–64.
Rossing, W.A.H., Zander, P., Josien, E., Groot, J.C.J., Meyer, B.C., Knierim, A., 2007.Integrative modelling approaches for analysis of impact of multifunctional agri-culture: a review for France, Germany and The Netherlands. Agric. Ecosyst.Environ. 120, 41–57.
Ryszkowski, L., Kedziora, A., 2007. Modification of water flows and nitrogen fluxesby shelterbelts. Ecol. Eng. 29, 388–400.
Schwertmann, U., Vogl, W., Kainz, M., 1987. Bodenerosion durch Wasser. Vorhersagedes Abtrags und Bewertung von Gegenmaßnahmen. Ulmer, Stuttgart.
Seppelt, R., Voinov, A., 2003. Optimization methodology for land use patterns –evaluation based on multiscale habitat pattern comparison. Ecol. Model. 168,217–231.
Smith, J.A., Lyon, D.J., Dickey, E.C., Rickey, P., 1992. Emergency Wind Erosion Control.University of Nebraska NebGuide Publication, G75-282-A.
Yahner, T.G., Korostoff, N., Johnson, T.P., Battaglia, A.M., Jones, D.R., 1995. Culturallandscapes and landscape ecology in contemporary greenway planning, designand management: a case study. Landsc. Urban Plan. 33, 295–316.


