Embed Size (px)
Citation preview

Vol.:(0123456789)
Social Indicators Research (2022) 159:281–317https://doi.org/10.1007/s11205-021-02747-y
1 3
ORIGINAL RESEARCH
Multidimensionl Poverty and The Role of Social Capital in Poverty Alleviation Among Ethnic Groups in Rural Vietnam: A Multilevel Analysis
Anh Thu Quang Pham1 · Pundarik Mukhopadhaya2
Accepted: 21 June 2021 / Published online: 8 July 2021 © The Author(s), under exclusive licence to Springer Nature B.V. 2021
AbstractThis paper empirically examines the disparities over time across six dimensions of pov-erty (monetary, education, health, housing, basic services, and durable assets) between eth-nic minority and majority households in rural Vietnam. Using the five-wave panel data of the Vietnam Access to Resources Household Survey (VARHS) 2008–2016, we observe improvements in most non-monetary dimensions of poverty for both ethnic groups, while the monetary dimension shows the highest degrees of deprivation and the lowest rate of decrease during the studied period. Health is the only dimension in which ethnic minor-ity households are not only better off than those of majority households during the studied period, but also report improvement. We further explore the role of social capital in eth-nic minorities and non-minorities at household and community levels in multiple dimen-sions of poverty by employing multilevel models. Our study reports the significant effects social capital have at the community level on reducing poverty in the monetary, education, housing, and basic services dimensions for ethnic minorities, while social capital at the household level shows significant effects on monetary, basic services, and durable assets. These findings indicate that policy makers ought to consider the role of social capital when designing poverty alleviation strategies for the country.
Keywords Multilevel · Multidimensional · Poverty · Rural · Vietnam · Minority
This research is funded by Ho Chi Minh City Open University under the grant number E.2020.11.1.
* Pundarik Mukhopadhaya [email protected]
Anh Thu Quang Pham [email protected]
1 Faculty of Economics & Public Management, Hochiminh City Open University, Ho Chi Minh City, Vietnam
2 Department of Economics, Macquarie University, Sydney, Australia

282 A. T. Q. Pham, P. Mukhopadhaya
1 3
1 Introduction
Vietnam is the 15th most populous country in the world, with nearly 65 per cent of the population living in rural areas (Hollweg et al., 2019). The country has experienced sus-tained high economic growth during the last decades, accompanied by remarkable reduc-tion in poverty and improvement in social indicators.1 However, its rural areas still lag far behind in the development of the country with poverty rates in rural areas consistently nearly three times that in urban areas (GSO, 2018). The number of people living under the national poverty line2 in rural areas of Vietnam is even higher than the total population of some countries in the world such as Sweden, Israel, and Austria.3 Hence, it is an arduous task for the government of Vietnam to eliminate rural poverty since more than 11 million poor citizens live in rural areas, accounting for more than 90 per cent of the country’s poor.
Although only 15 per cent of the total population in Vietnam, ethnic minority groups constituted 47 per cent in 2012 and 73 per cent in 2016 of the total poor (Pimhidzai, 2018). According to the Vietnam Population and Housing Census 2019 (GSO, 2020), more than 85 per cent of ethnic minorities reside in rural areas,4 which are the least developed parts of the country comprising the poorest and least educated of the population. Therefore, reduc-tion of the poverty issue in Vietnam cannot be addressed without scrutinizing the poverty of ethnic minority groups. In spite of a sizeable literature on the disparity between and among ethnic minority and majority groups in Vietnam (Van de Walle & Gunewardena, 2001; Epprecht et al., 2011; Imai et al., 2011; Dang, 2012), all these previous studies applied traditional uni-dimensional poverty measurements which have been criticised in current vigorous debates for their limitations in capturing the multidimensional nature of poverty (Sen, 1987, 1988), Baker & Grosh, 1994), or in Alkier et al., 2015)). Furthermore, the importance of capturing the intertemporal poverty of households has been recently noted in the literature.5 However, the number of studies on intertemporal poverty of eth-nic groups in Vietnam is still limited and examined only monetary dimension of poverty (Baulch et al., 2007; Dang, 2012; Imai et al., 2011; Kang & Imai, 2012). In contrast to earlier contributions, this paper explores the comparative poverty situation in multiple dimensions of the minority groups in Vietnam as opposed to the majorities. We adopt a framework to further capture the intertemporal poverty of these two groups for the period 2008–2016.
The most popular multidimensional measure of poverty advocated by UNDP is based on separating population into the groups of poor and non-poor by using arbitrary cut-offs like the one commonly used in the case of monetary poverty measures. This method is restric-tive because a huge amount of information is lost in the oversimplification and arbitrary
1 During the period 1998–2018, Vietnam recorded an average annual real GDP growth rate of 6.6 per cent (ADB, 2018). The poverty rate based on the national poverty line (USD3.2 a day) decreased from 58 per cent in 1990 to 9.8 per cent in 2016 (World Bank, 2018). The Human Development Index (HDI) of the country has risen gradually from 0.475 in 1990 to 0.692 in 2017, an annual compound growth rate of 1.41 per cent, one of the highest rates among the medium human development countries.2 The national poverty lines adopted by the Vietnam government are based on the poverty lines of the Min-istry of Labour, Invalids and Social Affairs (MOLISA) for 2008, 2010, 2012, 2014, and 2016, updated by CPI for rural areas are 290, 400, 530 605, and 630 (1000VND/person/month) respectively.3 According to the World Development Indicators (2019), the rural population of the country in 2014 was estimated at around 60 million with 18.6 per cent being income poor; the income poverty headcount rate in 2014 was 13.5 per cent with the national population at around 91 million people.4 Table 8 in the Appendix provides the rural–urban distribution of two ethnic groups of people in Vietnam.5 For example, Ravallion and Jalan (1998) in China, McCulloch and Baulch (2000) in Pakistan, Calvo and Dercon (2009) in Ethiopia, Bossert et al. (2012) in EU countries.

283Multidimensionl Poverty and The Role of Social Capital in Poverty…
1 3
choices of poverty thresholds particularly where information is mostly ordinal (see Alkire & Foster, 2019; Silber, 2011; Ravallion, 2011). This study uses the fuzzy approach to provide insights not only on the magnitude of the poverty gap but also on the evolution of deprivation over time in both monetary and non-monetary dimensions between ethnic minorities and majorities particularly in rural Vietnam. The findings will help policy mak-ers gain a deeper understanding of the disparity issues between these groups in fighting against poverty.
In the existing literature the term social capital refers to the resources available to indi-viduals through their social interactions. There has been increasing empirical evidence that social capital plays a crucial role in sustainable development and the poverty alleviation.6 The study by Batjargal and Liu (2004) in China demonstrates social capital as key means for mobilizing and enhancing financial capital and economic information which facilitate the alleviation of poverty. In another study in the US, Rupasingha and Goetz (2007) argue that poverty alleviation strategies must be accompanied by efforts to enlarge social capital to increase the efficiency of poverty reduction programs. Grootaert (1999) in Indonesia, and Narayan et al. (1999) in Bolivia show that the social capital endowment of a household not only has significant influence on the household’s poverty but also that the magnitude of the influence is significantly greater than that of both the human capital and physical capi-tal of the household. In general, however, all previous studies only investigate the impacts of social capital on the monetary dimension of poverty, measured by income or consump-tion levels of households. Our study will explore the impact of social capital on both mon-etary and non-monetary dimensions of poverty in rural Vietnam.
This analysis is important because the government of Vietnam has implemented vari-ous social support programs which merely emphasize improving the human capital and the physical capital to support ethnic minority and poor households.7 It appears that social cap-ital is neglected in the poverty alleviation strategies of the country. The current study there-fore endeavors to explain the role of social capital on both monetary and non-monetary dimensions of poverty between the two ethnic groups in rural Vietnam by using five-wave balanced panel data of the Vietnam Access to Resources Household Survey (VARHS), which is conducted every 2 years in the rural areas of 12 provinces in Vietnam from 2008 to 2016.8
Several previous studies have applied social capital at individual or household level (also called “micro level”),9 at community/neighbourhood/organization levels10 (“meso
6 See, among others, Grootaert (1999); Knack (2002); Woolcock (2002); Fafchamps and Lund (2003); Zhang et al. (2017).7 According to the Ministry of Labour, Invalids and Social Affairs (MOLISA), on an annual average the total state budget in the period 2012–2014 allocated for social support programs reached nearly VND 25,500 billion, including health care for the poor (VND12,500 billion); education, training and vocational training for the poor (nearly VND12,000 billion); accommodation support, clean water and electricity pro-vision (VND1000 billion).8 Without using any poverty lines, the fuzzy set approach considers poverty as “a matter of degree” with regard to the household’s position in the deprivation distribution, that is, all households in a population belong to poverty but to different degrees.9 In America, Coleman (1988); in South Africa, Haddad and Maluccio (2003)).10 In Italy, Putnam et al. (1994); in Indonesia, Grootaert (1999); in Russia, Rose (1999); in South Africa, Maluccio et al. (2000).

284 A. T. Q. Pham, P. Mukhopadhaya
1 3
level”), and at national/regional levels11 (“macro level”). However, these existing studies have largely constrained the operationalization of social capital at single levels linear anal-ysis,12 which either aggregates up to higher level (commune level, for instance) informa-tion or disaggregates down to household level information. Since households in the same commune tend to be more similar to each other than to those in different communes, the previous studies with single level analysis is prone to generating spurious outcomes.13
We argue that not only individual/household characteristics, but also regional or national factors, such as social capital at the commune level, might impact on the poverty status of its residents. Thus our research contributes further to the existing literature by employing a multilevel analysis to investigate the influences of social capital at different levels (household level and community level) on households’ poverty in multiple dimen-sions (income, education, health, basic services), after controlling the household character-istics (like age, household size, ethnic majority/minority). The multilevel analysis allows estimation of separate error terms at each level of analysis through which we can avoid violation of the assumption that originates in single-level regression models. While it can-not be explained by the use of single level regression analysis in previous research, multi-level analysis offers a comprehensive analytical framework to examine cross-level interac-tions14 to explicitly differentiate between household level and community-level variables (for instance, the level of social capital endowments in a community) and their changes over time. This helps policy makers formulate more efficient interventions against poverty at both micro and macro levels.
The remainder of the paper is structured as follows. The next section briefly discusses the existing literature ad theoretical framework. Section 3 describes the data and methodol-ogy. Section 4 provides the explanation of variables used in the study. Section 5 discusses the poverty profiles and social capital of Vietnam. The estimation results are presented and discussed in Sect. 6. The final section summarizes and concludes.
2 Literature Review
Since the seminal contribution of Sen (1976), several recent studies put forward various alternative approaches to capturing the multifaceted nature of poverty. Sen (1987) in his capability approach introduces two notions as elementary sources of information in place of income: (i) “functionings”, denoting the diverse doings and beings of a person, in other words, the realized achievements of an individual; and (ii) “capabilities”, referring to the individual’s autonomy in pursuing and achieving a life that is valued. The capa-bility approach is a broad normative theoretical foundation that provides a framework for
11 In China, Bartolini and Sarracino (2015).12 The conventional multiple/single level regression model usually analyses all variables at different levels (individual/household/community) at one single level (Hox et al., 2017). For example, level of education is a variable at the individual level; household size is a variable at the household level; and total number of membership in formal groups in a community is a variable at the community level. Unlike single level, the multilevel framework has further advantages because it appropriately handles variables that are measured at different levels, which allows the possibility of examining micro-level (household) and macro-level (com-mune, district, province) determinants of poverty simultaneously.13 Due to this within-administrative area correlation, households within the same administrative region are not independent. In technical terms, this group dependence can lead to a violation of the independence assumption of linear regression (Hox et al., 2017).14 Interactions between household characteristics and community social capital.

285Multidimensionl Poverty and The Role of Social Capital in Poverty…
1 3
assessment and evaluation of multidimensional poverty (Robeyns, 2005). It is applied widely in multidimensional measures of poverty depending on the availability of data.15
In their study, Castañeda et al. (2018) report that the number of global monetary poor is 766 million, based on the global monetary poverty line of $1.90 per day (2011 PPP). In 2020, the World Bank predicts that additional 150 million people around the world may be pushed into extreme poverty due to the COVID-19 pandemic.16 Out of those living below the poverty line, more than 79 percent are living in rural areas, accounting for more than 50 percent of the global population. The proportion of rural residents, especially in developing countries, that living below the poverty line is almost three times higher than the propor-tion of the those living in urban areas. However, bulk of previous rural poverty studies have only focused on examining monetary dimension of poverty and the number of multidimen-sional poverty researches is still limited.17
Since 2010, based on the capability approach, the United Nations Development Pro-gramme (UNDP onwards) has provided reports of global Multidimensional Poverty Index (MPI onwards) including three dimensions: education, health and standard of living. Agui-lar and Sumner (2020) find that rural inhabitants tend to overlap deprivation in education and assess to basis services (clean water, sanitation, electricity, and housing condition). The report of World Bank (2020) shows that the rural poor, both in monetary measures and multidimension poverty measures, overwhelmingly are female, have no or low level of education, and large size family with high number of children. Using data from developing countries, Khan (2000, 2001) found that the rural poor is strongly associated with political environment, ethnicity, high dependency ratios, and social policy biases.
The concept of social capital has been receiving increased attention from scholars over the past two decades after prominent works by Bourdieu (1986), Coleman (1988), and Putnam (1993). According to Bourdieu (1986), social capital encompasses economic resources that individuals or groups obtain from participating in social networks, including membership of groups. Coleman (1988) defines social capital as networks, trust, and norms that a person reaps from relations and interactions between individuals. While Bourdieu (1986) puts emphasis on the benefits that individuals themselves derive from their social capital, Coleman (1988) underlines the advantages of a person’s investment in social capi-tal for all members belonging to the same groups, organisations, or countries (Habibov & Afandi, 2017). As an extension of Coleman’s work, however, Putnam (1993) highlights the role of social capital at community or social organization level on enhancing the efficiency of society by facilitating coordination and cooperation.
The relationship between social capital and poverty has also received increasing interest from both theoretical and empirical researchers. The social capital literature has argued that social capital can reduce poverty through at least three channels: the sharing of informa-tion useful to the poor among group memberships; enhanced collective decision making; and a decrease in opportunistic behaviour (Grootaert & Narayan, 2001), Grootaert and Van Bastelar, 2002, Zhang et al., 2017, Osei & Zhuang, 2020). According to Collier (2002), the development of social capital is time intensive and can often replace financial and physical
15 For example, among others, Qizilbash and Clark (2005), Alkire and Foster (2011a, 2011b), Batana (2013), Battiston et al (2013), Zeumo et al. (2014). Suppa (2018); Bourguignon and Chakravarty (2019)).16 See at COVID-19 to add as many as 150 million extreme poor by 2021. https:// www. world bank. org/ en/ news/ press- relea se/ 2020/ 10/ 07/ covid- 19- to- add- as- many- as- 150- milli on- extre me- poor- by- 202117 Among others, for example. Fan et al. (2000), Dao (2004), Du et al. (2005), and Arouri et al. (2017)

286 A. T. Q. Pham, P. Mukhopadhaya
1 3
capital. Therefore, the poor may tend to depend more on social capital than those who are wealthier since the former face a lower opportunity cost of time and have lower stocks of private capital than the latter. Putnam (1994) argues that social capital proxied by norms and trust shared among members in a society or in a whole population is likely to be pro-portionally more favourable to the poor. For example, while rich households have collateral assets as means of reassuring lenders, poor households can access credit based on social sanction to increase income or smooth their vulnerability to income.
The positive and significant impact of social capital on poverty, measured as household per capita income or expenditure, and household welfare are well demonstrated in empiri-cal research (see, among others, Grootaert et al., 2002a, 2002b) in Burkina Faso; Haddad & Maluccio, 2003 in South Africa; Aker, 2007 in Tanzania; Abdul-Hakim et al., 2010 in Malaysia; Guagnano et al., 2016 in Europe). In other developing countries, the works of Narayan and Pritchett (1999) in rural Tanzania and Grootaert (1999) in Indonesia show that household participation in different groups, as a proxy for social capital, has stronger positive and significant influences on household outcomes compared to human capital. Using panel data from South Africa as an extension of these two works, Maluccio et al. (2000) not only report a consistent effect of group membership on household welfare but also find that the difference of this influence over time.
In Vietnam, the number of studies examining the relationship between social capital and household welfare is still limited. Van Ha et al. (2004) investigated the role of social capital on household welfare at Duong O village in Vietnam with 105 observations of general and paper-recycling households. They identified number of group memberships, social rela-tions, trust, and reciprocity as of social capital. The empirical results show that, in contrast to previous studies in other countries, number of group memberships does not significantly affect household welfare, while the other three indicators of social capital have far stronger impacts on household income compared to human and labour capital. Recent research by Tarp (2017) using VARHS data reports that membership in formal groups or mass organi-sations (FGs) as well as in other informal/voluntary groups18 (IGs) do not have significant effects on household welfare in rural areas of Vietnam. Our study differs from Tarp’s study by examining the effect of social capital not only at the household level but also at com-mune level on multiple dimensions of poverty.
3 Data and Methodolgy
3.1 Data Source: the Vietnam Access to Resources Household Survey (VARHS)
This study utilizes the data of the Vietnam Access to Resources Household Survey (VARHS), conducted in the rural areas of 12 provinces in Vietnam 2008–2016. The first VARHS19 was conducted in 2002 and has been implemented every 2 years since 2006. The
18 Mass organisation in Vietnam encompasses the Women’s Union, Farmers’ Union, Youth Union, and Vet-erans’ Union, while volunteer groups include business associations, credit groups, religious groups, sports and cultural groups, groups for the elderly, and a number of other groups (Tarp, 2017).19 The VARHS is a collaboration between the Central Institute of Economic Management (CIEM), the Institute for Labour Studies and Social Affairs (ILSSA), the Institute of Policy and Strategy for Agricul-ture and Rural Development (IPSARD), Hanoi, Vietnam and Development Economics Research Group (DERG), Department of Economics, University of Copenhagen. For further information of questionaries and data, see https:// www. wider. unu. edu/ event/ waves- varhs- data
287Multidimensionl Poverty and The Role of Social Capital in Poverty…
1 3
survey covers access to resources for rural households so as to inform our understanding of the characteristics and operations of rural land markets, the relative roles of various credit sources, and the importance of access to employment and input and output markets for income generation. Since the questionnaire section on social capital in the VARHS 2006 is different to that of later years, this paper includes five waves of VARHS; 2008–2016. Due to inconsistencies in household identification across surveys often with missing values, our balance panel sample embraces 2560 households, yielding 12,800 observations in total.
3.2 Methodology
3.2.1 Measurement of Multiple Dimensions of Poverty—Fuzzy Approach
Despite its popularity, the Alkire Foster (AF) approach20 has critical shortcomings (Alkire & Santos, 2013; Ravallion, 2011; Silber, 2011). First, the AF measure of poverty identifies individual/household/family as either poor or not poor by using arbitrary poverty thresh-olds, (for example, poverty line). Thus AF measure can lead to a situation in which a sub-stantial amount of information is lost when households are multidimensionally deprived, but fails to surpass the second cut-off (Makdissi & Wodon, 2004). Second, this measure shares the dichotomous weakness of the monetary poverty measure by classifying the pop-ulation as two groups (poor and non-poor) on the basis of the deprivation cut-off. In the AF framework it is not possible to identify an individual as somewhat poor. Betti et al. (2006) argue that the poverty situation of an individual should be regarded as “a matter of degree” instead of a distinct cut-off simply dividing the population into the poor and the non-poor. Third, Ravallion (2011) criticises that the aggregation of the dimensions into a comprehen-sive number is questionable. Ravallion elaborates further that “the weights on deprivations are set by the analyst, with no obvious reason to suppose that they would be accepted by those one is trying to help by measuring poverty: policy makers and, of course, poor peo-ple” (Ravallion, 2011: 242).
To overcome the limitations of the AF approach, we utilize a relative measure of pov-erty, proposed by Betti et al (2006). This fuzzy approach following the framework of Ceri-oli and Zani (1990)21 does not use the arbitrary cut-off and includes people who are some-what poor to measure multidimensional poverty in Vietnam. Moreover this considers that all households are subject to poverty but of different degrees, so that each has a certain pro-pensity for poverty in the continuum range of [0, 1] (Verma & Betti, 2002). Furthermore, the fuzzy approach constructs a weighting procedure deriving directly from data without using any arbitrary sets by analysts as described below.22
20 Other approaches for the measurement of multidimensional poverty have been proposed during the last decades are scaling and ranking solutions, multivariate data reduction techniques, regression approach (see Chiappero-Martinetti and Roche, 2009 and Yang and Mukhopadhaya, 2016 for a detailed discussion). See also more examples on fuzzy set in https:// ophi. org. uk/ fuzzy- sets- appro ach/21 The first attempts applying the fuzzy set theory to measure multidimensional poverty, based on the capa-bility approach, are studies of Chiappero-Martinetti (1994, 1996, 2000), followed by various other empiri-cal studies (among others, Chakravarty, 2019; Costa and De Angelis, 2008; Deutsch and Silber, 2005; Qizilbash and Clark, 2005).22 See Yang and Mukhopadhaya (2016) for the demonstration of the computation of AF and fuzzy meas-ures of poverty with a hypothetical data.
288 A. T. Q. Pham, P. Mukhopadhaya
1 3
Pham et al. (2020) uses a similar approach to create poverty maps of multiple dimen-sions of poverty in Vietnam for regional poverty targeting and Pham and Mukhopadhaya (2018) analyse the multidimensional poverty of the migrants’ households in Vietnam. This current study differs from the above two research because we use of a longitudinal obser-vation covering 2008–2016 that allows us to portray a dynamic picture of poverty of rural Vietnam. Fattore (2016) proposed an approach that combines fuzzy set theory and partial order set theory (poset)23 to make a multidimensional evaluation and comparison, or order among profiles. The partial order set approach has advance attributes, for instance, no scal-ing and aggregation procedure. However, the computational complexity of the evaluation procedure prevents the popularity of this method. Furthermore, the partial order set theory especially suitable only for ordinal nature of data (Fattore & Arcagni, 2018).
We follow the approach of Betti et al. (2006) to measure the deprivation of households in rural areas of Vietnam. Unlike the Alkire-Foster and other measures of poverty, this method allows for the possibility of determining the separate magnitudes of income and non-income dimensions of household deprivation that we are interested in. The generalised formulation of a fuzzy measurement of deprivation �h is expressed algebraically as follows:
where �h is the propensity to monetary poverty of household h, varying between 0 (not at all poor) and 1 (totally poor). Fh is a cumulative distribution function, which is the share of households less poor than household h. Lh represents the Lorenz which is the proportion of the total income earned by all households who are less poor than household h. The com-bination of the actual disparities in deprivation with the cumulative distribution function makes this fuzzy measure of poverty highly sensitive to the distribution of each indicator.
For the non-monetary dimensions that consist mainly of ordinal and dichotomous vari-ables, we first calculate a deprivation measure for each indicator, djh where j indicates each dimension and h denotes each household, and then integrate each indicator into one index using a pre-assigned weight. The indicators are transformed into the interval 0–1 to deter-mine the deprivation score for each non-monetary dimension by the formula:
where Z is ordered categories of some deprivation indicator j, with z = 1 representing the most deprived, and z = Z the least deprived situation. Let zh be the category to which house-hold h belongs. However, most variables in this study are binary indicators. Hence, djh = 1 (deprived) or djh = 0 (non-deprived).
The underlying motivations of the estimated weight are: (i) the weight is not affected by the inclusion of irrelevant dimensions, (ii) the weight is only marginally changed by small correlations, and (iii) the weight is reduced proportionately to the number of redun-dant variables. The weight proposed by Betti and Verma (1999) reflects the rarity of the indicator within households in terms of deprivation. For example, if only 10 percent of the population seem to be deprived in an indicator, it should be weighted more heavily than
(1)�h =[1 − Fh
][1 − Lh
]
(2)djh =Z − z1
Z − 11 ≤ zh ≤ Z
23 Other studies utilize the poset to ranking multidimensional poverty, for example, Neggers and Kim, 1998, Annoni et al. (2008), Beycan et al. (2019), Alaimo et al. (2020), among others.

289Multidimensionl Poverty and The Role of Social Capital in Poverty…
1 3
another indicator in which 90 percent is deprived. Thus the weight of an indicator is simply a function of the inverse of the average of correlations with all the indicators in the dimen-sion (including the indicator itself).
For convenience, the weights of the indicators are standardized to sum to 1 within each dimension. Then, a deprivation score is computed for each dimension as follows ( � ∶ 1,2… , n):
where wj is the weight of indicator j. Applying Eq. (1), we define a household’s degree of deprivation in non-monetary dimension � as:
where F�
h is a distribution function of S estimated for household h, in dimension � and L�
h
represents the value of the Lorenz curve of S for household h in dimension � , calculated according to the form below:
where wk is individual sample weights. After obtaining various poverty values for each household, the aggregate poverty is computed as an average of all households’ poverty.
3.2.2 Multilevel Models of Alternative Poverty Dimensions
The VARHS data have a hierarchical structure in which sampled households are nested within communities. The repercussion of this structure is that several variables of house-holds sampled in the same community are likely to correlate, which violates the basic assumption of traditional regression models concerning the independence of observa-tions. Neglecting this within-cluster correlation may result in an underestimation of the standard errors of the estimates, which in turn may lead to overstatement of the accuracy of estimated parameters (Goldstein, 2011; Hox et al., 2017; Raudenbush & Bryk, 2002). To overcome this issue our study applies three-level linear random intercept models with household h nested within survey-wave w, which is nested within community c to estimate simultaneously the impacts of variables at household and commune levels on six dimen-sions of poverty. Our proposed multilevel models can be described as follows:
In Eq. (6) propensities of monetary and non-monetary poverty (�hwc) are estimated on a vector of household h, survey-wave w, and community c variables using Eq. (1) or (3). X(1)hwc , X(2)wc , X(3)c are vectors of household, survey-wave, and community-level explana-tory variables, respectively; and �1, �2, �3 are vectors of estimated coefficients. While coefficients �1 explain the effects of household-level variables, �2 capture the variations
(3)S�h =∑
j
wjdjh
(4)��
h=[1 − F
�
h
][1 − L
�
h
]
(5)�1 − L
�
h
�=
∑k wkSk
��Sk⟩Sh∑k wkSk
��Sk⟩S1
(6)�hwc = �wc + �1X(1)hwc + �2X(2)wc + �3X(3)c + �hwc
(7)�wc = �c + �wc
(8)�c = �0 + �c

290 A. T. Q. Pham, P. Mukhopadhaya
1 3
occurring over the periods covered in a given community, �3 inform the influences of com-munity-specific factors measured by average values of community-level variables. Further-more, we only allow the random intercepts �wc and �c as seen in Eqs. (7) and (8), to vary randomly in our models. This means that we allow the average poverty measurements to vary randomly across survey-waves and across communities in our random intercept mul-tilevel models. The residual �hwc is assumed to follow a normal distribution with a mean of zero, and variance of �2, being constant over households, waves, and communities. The multilevel models applied in this study allow us to explore the influence of social capital not only at household level but at community level also on multiple dimensions of poverty during the studied period in rural Vietnam.
4 Variables
4.1 Dimensions of Poverty
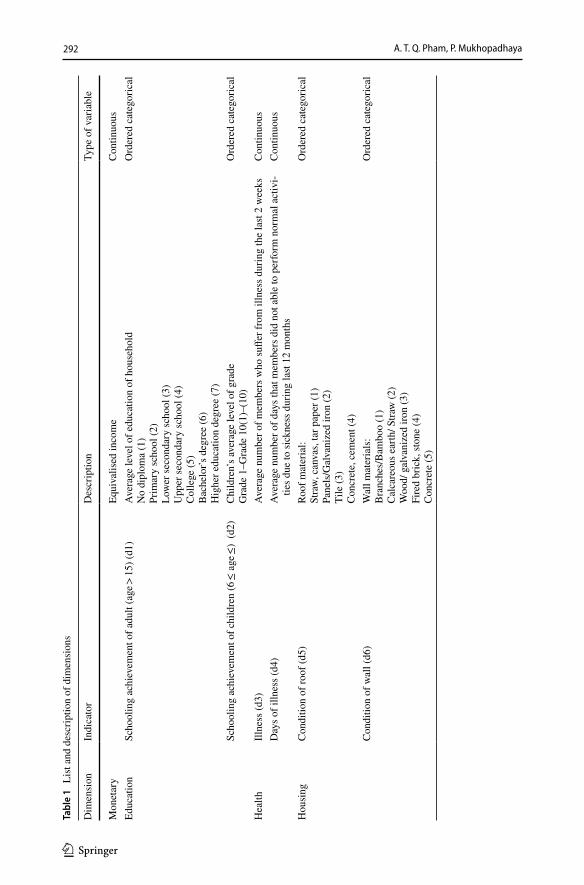
There are a monetary and five non-monetary poverty measures in our study that are esti-mated by using Eqs. (1) and (3). To measure monetary poverty, the equivalised house-hold income is used by applying the modified OECD scale.24 Total household income from all sources is included.25 For non-income dimensions, choosing the appropriate sup-plementary dimensions is extremely important because they bear an instrumental power. It is expected that the chosen dimensions are effective implements for alleviating one or more other domains of deprivation and inequality. On the one hand, the potential indicators that a measure of living standards might reflect are broad, covering infrastructure, housing materials, possession of durable goods, health status, education level, and basic services. Moreover, according to Alkire (2007), the dimensions of work, empowerment, culture, social relationships, the living environment, and safety from violence are important con-siderations. On the other hand, limitations of available data constrain dimensions. A report from the World Bank (Pimhidzai, 2018) points out that the poor in rural Vietnam are con-strained by their low levels of education, financial situation, physical assets and productive assets. Households in rural Vietnam are also disadvantaged by having limited access to basic services and financial services. Therefore, with the intention of maximizing the avail-able information in the VARHS data, and based on our analysis for choosing dimensions in this section, the selected domains in this study include 22 indicators grouped into five dimensions: education, health, housing, basic services, and durable assets. A detailed list of the variables is provided in Table 1.26
Education: The positive impacts of level of education on poverty reduction found in various welfare studies make education one of the most important dimensions for investi-gating the multidimensional nature of poverty (see, among others, for Australia: Callander et al. (2012), for developing countries: Alkire and Santos (2010), for Latin America: San-tos et al. (2015)). There are various studies of Vietnam showing that the education levels of both adults and children in rural areas are much lower than those for people in urban
24 To construct the equivalent scale, the first adult in the household is given a point 1, while each extra member who is 15 years or above is assigned 0.5, and each member under the age of 15 is given 0.3 (see De Vos and Zaidi, 1997).25 Comprising wages, salary, and incomes from the services, agricultural, fishery and forestry sectors.26 See also Pham and Mukhopadhaya, (2018); Pham et al., (2020, 2021).

291Multidimensionl Poverty and The Role of Social Capital in Poverty…
1 3
areas, which have the higher average levels of the country (Dollar et al., 2004; Ha & Har-pham, 2005; Harpham et al., 2005; Nguyen et al., 2015). This implies that rural households face disadvantaged education conditions than do urban households. Hence, based on the Sustainable Development Goals (SDGs; also called Global Goals for Sustainable Develop-ment) on education, we introduce two indicators to measure the education dimension: aver-age schooling achievement of adult members and children.
Health: According to the third SDG, ensuring healthy lives is vital for sustainable development. In previous empirical studies and the standard health indicators used by the UNDP, adult and child malnutrition and the mortality rates of infants or under 5-year-olds in a household are usually used in the construction of the Human Development Index (HDI) (Alkire & Santos, 2014) and health conditions, that is, whether there is the pres-ence of disability or of chronic illness among family members (Martinetti, 1994, 2000). However, there is no such information collected in the VARHS data that can be used to directly measure this health dimension. Therefore, to maximize the available information in the VARHS data, this study encompasses two indicators in the health dimension. The first determines a household as deprived in health if the family includes a member who was sick in the last 2 weeks. The second indicator determines a household as poor in the health dimension if there is any household member who was sick and was not able to perform normal activities due to sickness.
Housing and Basic services: Housing and accessibility to basic services are used in numerous poverty analyses and comprise an important part of minimum cost-of-living (see, for example, for the US: Shinn and Gillespie (1994), for UK: Tunstall et al. (2013), for Columbus: Holloway et al. (1998); for New Zealand: Cheer et al. (2002). In Vietnam, various studies have indicated that quality of housing and access to basic services have statistically significant impacts on the poverty status of households (Fritzen, 2002; Minot, 2000; Baulch and Dat, 2010; Nguyen et al., 2013). Hence, there are two ordered indicators that measure the conditions of roofs and walls to define the housing dimension. We include clean water, improved sanitation, and cooking fuel as three indicators of basic services that are recognized in the SDGs as important.
Durable assets: Ownership of radio, television, telephone, and motorbike or bicycle is used as indicators of poverty in numerous studies (see, among others, for Asian countries: Kabeer (2006); for Africa: Sahn and Stifel (2000); Heltberg and Tarp (2002); for Mozam-bique: Stifel and Christiaensen (2007); for Vietnam: Minot (2000)). In our study, a house-hold is deprived in durable assets when it does not have any one of the goods from the list.
It is worth noting that previous studies usually apply aggregated measures across diverse dimensions to develop multidimensional poverty measures. In Vietnam, Van Phan and O’Brien (2019) shows that the interrelationship between the dimensions of poverty or wellbeing. It is argued that there could be misleading and meaningless results when decreasing all the information to a sole index (Betti & Verma, 2008). Therefore, we do not combine income and non-income indicators in one index to allow the possibility of determining these separate effects on household deprivation. For lower-middle developing country, the monetary variables and non-monetary variables have equally important role in the measurement of poverty.
4.2 Independent and Control Variables
Having 54 officially recognized ethnic groups, Vietnam is an ethnically diverse country with the Kinh or Viet being the most dominant group accounting for 85 percent of the
292 A. T. Q. Pham, P. Mukhopadhaya
1 3
Tabl
e 1
List
and
des
crip
tion
of d
imen
sion
s
Dim
ensi
onIn
dica
tor
Des
crip
tion
Type
of v
aria
ble
Mon
etar
yEq
uiva
lised
inco
me
Con
tinuo
usEd
ucat
ion
Scho
olin
g ac
hiev
emen
t of a
dult
(age
> 15
) (d1
)A
vera
ge le
vel o
f edu
catio
n of
hou
seho
ldN
o di
plom
a (1
)Pr
imar
y sc
hool
(2)
Low
er se
cond
ary
scho
ol (3
)U
pper
seco
ndar
y sc
hool
(4)
Col
lege
(5)
Bac
helo
r’s d
egre
e (6
)H
ighe
r edu
catio
n de
gree
(7)
Ord
ered
cat
egor
ical
Scho
olin
g ac
hiev
emen
t of c
hild
ren
(6 ≤
age
≤)
(d2)
Chi
ldre
n’s a
vera
ge le
vel o
f gra
deG
rade
1–G
rade
10(
1)–(
10)
Ord
ered
cat
egor
ical
Hea
lthIll
ness
(d3)
Ave
rage
num
ber o
f mem
bers
who
suffe
r fro
m il
lnes
s dur
ing
the
last
2 w
eeks
Con
tinuo
usD
ays o
f illn
ess (
d4)
Ave
rage
num
ber o
f day
s tha
t mem
bers
did
not
abl
e to
per
form
nor
mal
act
ivi-
ties d
ue to
sick
ness
dur
ing
last
12 m
onth
sC
ontin
uous
Hou
sing
Con
ditio
n of
roof
(d5)
Roof
mat
eria
l:St
raw
, can
vas,
tar p
aper
(1)
Pane
ls/G
alva
nize
d iro
n (2
)Ti
le (3
)C
oncr
ete,
cem
ent (
4)
Ord
ered
cat
egor
ical
Con
ditio
n of
wal
l (d6
)W
all m
ater
ials
:B
ranc
hes/
Bam
boo
(1)
Cal
care
ous e
arth
/ Stra
w (2
)W
ood/
gal
vani
zed
iron
(3)
Fire
d br
ick,
ston
e (4
)C
oncr
ete
(5)
Ord
ered
cat
egor
ical

293Multidimensionl Poverty and The Role of Social Capital in Poverty…
1 3
Tabl
e 1
(con
tinue
d)
Dim
ensi
onIn
dica
tor
Des
crip
tion
Type
of v
aria
ble
Bas
ic se
rvic
esW
ater
(d8)
Mai
n w
ater
drin
king
supp
ly:
Rai
nwat
er (1
)U
npro
tect
ed sp
ring
sour
ces (
2)Pr
otec
ted
sprin
g so
urce
s (3)
Han
d-du
g, n
on-r
einf
orce
d an
d un
cove
red
wel
ls (4
)H
and-
dug
and
cove
red
wel
ls (5
)D
eep
drill
wel
ls (6
)Pu
blic
tap
wat
er (7
)Pr
ivat
e ta
p w
ater
insi
de th
e ho
use
(8)
Ord
ered
cat
egor
ical
Sani
tatio
n (d
9)H
ouse
hold
s with
som
e of
the
follo
win
g:N
o to
ilet (
1)To
ilet d
irect
ly o
ver t
he w
ater
(2)
Dou
ble
vaul
ts c
ompo
se la
trine
(3)
Squa
t toi
let (
4)Fl
ush
toile
t with
sept
ic ta
nk/s
ewag
e pi
pes (
5)
Ord
ered
cat
egor
ical
Ener
gy (d
10)
Mai
n so
urce
of l
ight
ing/
cook
ing:
Can
dle/
othe
r (1)
Ker
osen
e/ga
s (2)
Bat
tery
/die
sel e
ngin
e (3
)El
ectri
city
(4)
Ord
ered
cat
egor
ical

294 A. T. Q. Pham, P. Mukhopadhaya
1 3
Tabl
e 1
(con
tinue
d)
Dim
ensi
onIn
dica
tor
Des
crip
tion
Type
of v
aria
ble
Dur
able
ass
ets
Vehi
cle
(d11
)H
ouse
hold
doe
s not
ow
n an
y bi
ke o
r mot
orbi
keD
icho
tom
ous
Tele
phon
e (d
12)
Hou
seho
ld d
oes n
ot o
wn
any
tele
phon
e, in
clud
ing
mob
ile p
hone
Dic
hoto
mou
s
TV (d
13)
Hou
seho
ld d
oes n
ot o
wn
any
blac
k-an
d-w
hite
or c
olou
r tel
evis
ion
Dic
hoto
mou
s
Rad
io (d
14)
Hou
seho
ld d
oes n
ot o
wn
any
radi
oD
icho
tom
ous
Frid
ge (d
15)
Hou
seho
ld d
oes n
ot o
wn
any
frid
geD
icho
tom
ous
Feed
grin
ding
mac
hine
(d16
)H
ouse
hold
doe
s not
ow
n an
y fe
ed g
rindi
ng m
achi
neD
icho
tom
ous
Ric
e m
illin
g m
achi
ne (d
17)
Hou
seho
ld d
oes n
ot o
wn
any
rice
mill
ing
mac
hine
Dic
hoto
mou
s
Gra
in h
arve
sting
mac
hine
(d18
)H
ouse
hold
doe
s not
ow
n an
y gr
ain
harv
estin
g m
achi
neD
icho
tom
ous
Pesti
cide
spra
yers
(d19
)H
ouse
hold
doe
s not
ow
n an
y pe
stici
de sp
raye
rsD
icho
tom
ous
Trac
tor (
d20)
Hou
seho
ld d
oes n
ot o
wn
any
tract
orD
icho
tom
ous
Plou
gh (d
21)
Hou
seho
ld d
oes n
ot o
wn
any
plou
ghD
icho
tom
ous
Car
t (d2
2)H
ouse
hold
doe
s not
ow
n an
y ca
rtD
icho
tom
ous

295Multidimensionl Poverty and The Role of Social Capital in Poverty…
1 3
population. In this study, a household is defined as part of an ethnic minority if the house-hold head is not of Kinh or Viet ethnicity.
While previous studies focus on investigating income poverty or multidimensional poverty using a sole index (see Van Phan & O’Brien, 2019; Pham et al, 2020, 2021), we observe separately multiple dimensions of poverty of households (in this way we by-pass the problem of substitutability and complementarity issue between dimensions/indicators of a sole index multidimensional poverty measure) in rural Vietnam using multilevel analy-sis. Since it includes parameter coefficients measured in different levels as well as cross-level interaction parameters, the multilevel regression model is more complicated than the single-level multiple regression. It is suggested that the multilevel models comprise only those parameter coefficients that are of interest in the study or have demonstrated their worth in previous studies to reduce computational problems (Hox et al., 2017). Therefore, we include in our analysis a set of control variables in order to account for the impacts of other features at household level. Our list of household level control variables account for household head’s age, average age of all members of household, sex of household head, household size with number of adult and children. These households’ socio-economic characteristics are mostly included in household welfare studies in Vietnam (Baulch & Masset, 2003; Glewwe, 2004; and Imai et al., 2011) and other developing countries (in Thailand: Kakwani, 2000); in Malaysia: Mok et al., 2007); in Peru: Calvo, 2008). Our interest parameters are ethnic and social capital variables at household level, community level, survey-wave level and cross-level interaction variables. The summarized information of all variables is presented in Table 2.
The number of indicators and dimensions of social capital used in the empirical stud-ies usually depends on the availability of information. Following the literature (Narayan & Pritchett, 1999; Grootaert, 1999; Maluccio et al., 2000), the proxies of social capital in this study focus on the group membership in formal and informal groups. The data limitation does not allow to capture any other dimension of social capital (such as trust in the soci-ety). Our study, however, contributes to the literature of social capital by explicitly differ-entiating between relationships among social capital at household and community levels, and associations among changes that arise within communities over times. These relation-ships were not investigated in previous studies. Furthermore, the designs of policy inter-ventions relating to group membership seem to be more straightforward and simpler.
Previous studies (among others, see Narayan & Pritchett, 1999; Grootaert, 1999; Maluc-cio et al., 2000, Zhu & Thomas, 2013; Vyncke et al., 2013) used a multiplicative index constructed from household membership in groups and the features of those groups as a proxy for social capital. This index has been criticized for its arbitrary scaling in the index formualtion and the challenge of interpreting, since the effect of one dimension in the index is not independent on other dimensions of social capital (Maluccio et al., 2000). To avoid such weaknesses, we apply each indicator of social capital separately to examine the effect of each variable on the deprivation status of households.27 Furthermore, while previous studies examine the impacts of social capital on monetary dimension of static poverty only, this study investigates the influence of each dimension of social capital on multiple dimen-sions of dynamic poverty for ethnic groups in Vietnam.
It is worth noting that in Vietnam the government’s consideration of social organiza-tions have concentrated on the development of formal groups (FGs) or mass organizations.
27 See Zhu and Thomas (2013) in the U.S, Vyncke et al. (2013) in the European Union.
296 A. T. Q. Pham, P. Mukhopadhaya
1 3
Therefore, mass organizations play a dominant role in Vietnam with strong grassroots links and a huge number of memberships. Nevertheless, not all of them are deeply anchored in civil society since some of their members automatically become members through their public sector employment. On the other hand, voluntary organizations or informal groups (IGs) have usually embarked on a local development purpose with one of their main activi-ties being poverty reduction. Furthermore, a number of different laws and regulations apply to Vietnam’s voluntary organizations, and a relatively high level of government discretion exists when deciding whether to register an organization. While most mass organizations rely on state subsidies to maintain their operation, voluntary organizations receive funds from international sources (Nørlund & Nam, 2007).
Therefore, we distinguish the relative impact of membership of FGs and IGs on house-holds’ multiple dimensions of poverty by using two indicators measured by the total num-ber of active memberships per household in each group: active members of FG and active members of IG. Following studies of Narayan and Pritchett (1999), Grootaert (1999), and Maluccio et al. (2000), people are considered active members of a group when they regu-larly attend group meetings. It is assumed that a household with higher number of active members will have more access to valuable information and a stronger tie with that group, which facilitates access to public services, and thus could have benefits for the household itself.
For variables at community level, we first aggregate social capital variables at house-hold level, and then take the average value of those aggregate values over the five waves of the study. The presence of community averages in the analysis enables us to disentangle the influences of cross-community differences from the impacts which arise within com-munities over time. At survey-wave level we observe the changes in community-level vari-ables that take place in a given community over time by using differences from community means of community-level variables. The coefficients estimated for the changes in social capital at community level ( ΔFG and ΔIG) and for community averages (
−
FG and −
IG ) can be explained as within-household and between-household effects in models regressing dep-rivation on independent and control variables. For example, in regression models for panel data for this study, the coefficient of ΔFG notifies what changes in deprivation levels are associated with a one-unit change in active memberships of formal groups over time. The coefficient of
−
IG notifies what difference in poverty is associated with one unit of active memberships in informal groups’ difference between communities.
5 Multidimensional Povety and Social Capital in Rural Vietnam
5.1 Monetary and Non‑monetary Poverty
Table 3 reports summary measures of monetary and non-monetary poverty during the studied period. It is observed that poverty measures in rural areas of Vietnam slightly improve in all dimensions apart from durable assets. The measures of monetary poverty are illustrated in the first two rows of Table 3. The first row represents the percentages of households who answered “yes” to the question “Is your household currently classified as poor by the authorities (MOLISA)?”,28 and the second row illustrates the monetary poverty
28 See footnote 2.

297Multidimensionl Poverty and The Role of Social Capital in Poverty…
1 3
measurements as fuzzy monetary based on Eq. (1). The pattern in both measures of the monetary dimension is consistent with the decreasing trend of poverty in rural Vietnam issued by official statistics (GSO, 2016).29
There is a wide gap in annual change rates between the official poverty rate and the pro-pensity to monetary poverty. While the average annual change in MOLISA’s poverty rates decreased nearly 2 per cent over the studied period, the reduction in that aspect with fuzzy poverty measures is around 0.3 per cent only. It is claimed that the traditional approach applied by MOLISA overemphasises small movements of households near to the poverty line but does not take into account movements of households far from the poverty line (Verma et al., 2017), while the fuzzy approach reflects the movements of households at all positions in the distribution. That may be the most likely cause of this substantial differ-ence between the two measurements.
The government of Vietnam launched the National Targeted Programme on New Rural Development (NTP–NRD) in 2009 and considered it the primary instrument for reduc-ing considerable well-being disparities between urban and rural areas. The first stage of the NTP-NRD (2011–2015) focused mainly on improving services and infrastructure in rural Vietnam, such as roads, schools, and water supplies, while targets of raising incomes and productivity gained less attention. As a consequence of this, improvement is reported in most non-monetary dimensions of poverty, while the monetary dimension shows the highest degrees of deprivation and the lowest rate of decrease during the studied period (Table 3). The exceptions are the deterioration in the health and durable assets dimensions with the average annual rate increasing by 0.8 and 0.6 per cent, respectively. The dismal performance in the monetary poverty clearly indicates that attention towards an inclusive growth of income is needed in rural Vietnam.
Table 2 Definition and descriptive statistics of variables
Variable Obs Mean SD Min Max
Household-level variables Age of household’s head 12,800 51.823 13.283 18.00 107.00 Average age of members 12,800 34.72 13.75 8.33 107.00 Female-headed household 12,800 0.179 0.383 0.00 1.00 Number of adult members 12,800 3.441 1.378 1.00 11.00 Number of children 12,800 1.092 1.208 0.00 9.00 Migrate household 12,800 0.227 0.419 0.00 1.00 Ethnic minority household 12,800 0.336 0.472 0.00 1.00 Active memberships in formal groups (FGs) 12,800 1.41 1.148 0.00 9.00 Active memberships in informal groups (IGs) 12,800 0.35 0.074 0.00 10.00
Survey-wave level variables Change in active memberships of FGs ( ΔFG) 2315 −0.015 2.74 −23.40 22.60 Change in active memberships of IGs ( ΔIG) 2315 −0.004 1.466 −15.20 10.60
Community-level variables
Average of active memberships in FGs ( −
FG) 463 7.53 10.754 0.00 76.80
Average of active memberships in IGs ( −
IG) 463 1.892 2.79 0.00 22.60
29 The study of Grimm et al. (2016) provides the same results in terms of monetary poverty in Vietnam.

298 A. T. Q. Pham, P. Mukhopadhaya
1 3
Although education poverty seems the worst in all non-monetary dimensions, it reports the highest improvement with a decreasing rate nearly three times that of the other dimen-sions. This finding is consistent with studies on poverty reduction and economic devel-opment in the country. For example, according to the UNDP (2015), Vietnam achieved the second Millennium Development Goal, that is, universal primary education by 2010; 5 years earlier than the target time. The percentage rates of net enrolment at primary and lower secondary education in the country are 99 and 87.2 per cent, respectively. In a recent study Pimhidzai (2018) notes that Vietnam’s achievement in education is far more impres-sive than comparable countries in the region.
To examine the gap between ethnic minority and majority households in rural Vietnam, Table 4 provides comparisons of average levels of poverty in both monetary and non-mon-etary dimensions across ethnic groups and years. First, the minority households seem to be worse off than those of non-minority households in most dimensions except health. Avail-able studies on the monetary gaps between ethnic minority and majority groups in Vietnam make similar observations (see, Baulch et al., 2007; Imai et al., 2011; Dang, 2012; Singhal & Beck, 2015; Cuong et al., 2015).
The second interesting findings derived from Table 4 is that ethnic minority house-holds report improvement in the education and health dimensions only, while their counterparts show progress in the other dimensions. Specifically, ethnic minorities are even better off in the health dimension than those of the ethnic majority households during the studied period. The gap between the two ethnic groups in the health dimen-sion increased during the studied period, accounting for an average annual change rate of around 52 per cent in favour of the minorities. Most previous studies before 2000 provide evidence of disadvantages in accessing the health system for ethnic minor-ity groups compared to the ethnic majority (see, for example, Nga et al., 1999; Desai, 2000; Van de Walle & Gunewardena, 2001). Since then, the government of Vietnam has launched policies and programs to improve utilization of health facilities for ethnic minorities and the poor, including the Health Care Fund for the Poor in 2002.30 The government project relating to financing and health insurance, the Population Coverage Rate, has made remarkable achievements in health financing. According to the report of MOLISA, in 2019, more than 85 per cent of Vietnam’s population are covered by health insurance which achieved the objective of 80 per cent of Vietnamese to be insured by
Table 3 Measurements of poverty in rural Vietnam, by dimensions and years
Average annual change rate = ∑�
Vt+1−Vt
Vt
�
4× 100 , where V is value of poverty
Dimensions\Year 2008 2010 2012 2014 2016 Average annual change rate (%)
MOLISA 0.212 0.153 0.213 0.154 0.168 −1.868Monetary 0.434 0.429 0.429 0.432 0.429 −0.287Education 0.402 0.398 0.389 0.379 0.377 −1.589Health 0.298 0.337 0.318 0.250 0.293 0.816Housing 0.365 0.363 0.359 0.357 0.359 −0.412Basic services 0.344 0.336 0.341 0.341 0.336 −0.576Durable assets 0.383 0.392 0.380 0.380 0.392 0.612
30 Social Health Insurance in 1992 is also worth mentioning.

299Multidimensionl Poverty and The Role of Social Capital in Poverty…
1 3
2020 (Van Tien et al., 2011). These health policies make a huge contribution towards a better situation in the health dimension of the ethnic minority households in particular.
It is worth noting that although the ethnic minorities group has higher levels of depri-vation than their non-minority counterpart in education, only the former shows a reduc-tion in deprivation during the period 2008–2016. Education is also the only dimension that reports reduction in the gap between the two ethnic groups with a decrease of 7.4 per cent. The report from MOLISA (2015) shows that the government spent nearly USD 352 million on average annually over the period 2010–2015 to support the poor in edu-cation programs. Our findings indicate the success of social support programs for eth-nic minority households and the poor for the reduction of education deprivation in the country in the period 2008–2010. This pattern is consistent with the result of Singhal and Beck (2015) who make a simple descriptive comparison of education attainment of the children alone.
Third, the figures in Table 4 also reveal that the largest gaps between the minorities and non-minorities is not in monetary but in the housing and basic services dimensions. The average gaps between the two ethnic groups is around 0.43 for the two dimensions. Given the fact that most ethnic minorities live in remote areas where the lack of access to clean water, energy and improved sanitation can have relatively serious impacts, the government of Vietnam has proactively implemented and installed the National Targeted Program for Rural Water Supply and Sanitation for the period 2012–2015. Although the UNDP’s (2015) report shows a higher percentage of households were using improved sanitation facilities and had access to clean water during 2002–2012, the regions with
Table 4 Disparity in different dimensions of poverty in rural Vietnam at household level, by year and ethnic
*Note: Δ is the differences between minorities and non-minorities. The differences between the both ethnic groups are statistically significant at 99 per cent in all dimensions and years
Dimensions Ethnic 2008 2010 2012 2014 2016 Average annual change rate (%)
Monetary Minorities 0.600 0.552 0.613 0.603 0.634 1.67Non-minorities 0.351 0.367 0.336 0.345 0.325 − 1.71Δ 0.249 0.185 0.277 0.258 0.309 9.22
Education Minorities 0.593 0.575 0.549 0.521 0.516 − 3.38Non-minorities 0.305 0.309 0.309 0.308 0.306 0.07Δ 0.287 0.266 0.241 0.213 0.210 − 7.46
Health Minorities 0.274 0.312 0.264 0.202 0.193 − 7.40Non-minorities 0.310 0.349 0.345 0.274 0.343 3.97Δ − 0.036 − 0.038 − 0.081 − 0.072 − 0.150 54.29
Housing Minorities 0.639 0.645 0.653 0.656 0.657 0.70Non-minorities 0.227 0.220 0.211 0.206 0.208 − 2.07Δ 0.412 0.425 0.442 0.449 0.448 2.15
Basic services Minorities 0.624 0.615 0.634 0.635 0.629 0.20Non-minorities 0.203 0.196 0.193 0.192 0.189 − 1.75Δ 0.421 0.419 0.442 0.442 0.440 1.11
Durable assets Minorities 0.405 0.402 0.461 0.458 0.517 6.55Non-minorities 0.340 0.387 0.340 0.340 0.330 − 0.33Δ 0.065 0.015 0.122 0.117 0.187 172.33

300 A. T. Q. Pham, P. Mukhopadhaya
1 3
the highest population of ethnic minorities still have the lowest percentage of house-holds using clean water and hygienic toilets. In terms of improvement in household con-ditions, over 500,000 poor households benefited from the program supporting the poor to build houses across the country during the period 2009–2012 (UNDP, 2015). This is to note that the ethnic minorities face high levels of deprivation in the housing dimen-sion due to shifting cultivation and migratory customs, which is the main obstacles in improving their housing conditions.
5.2 Group Membership of the Rural Vietnamese
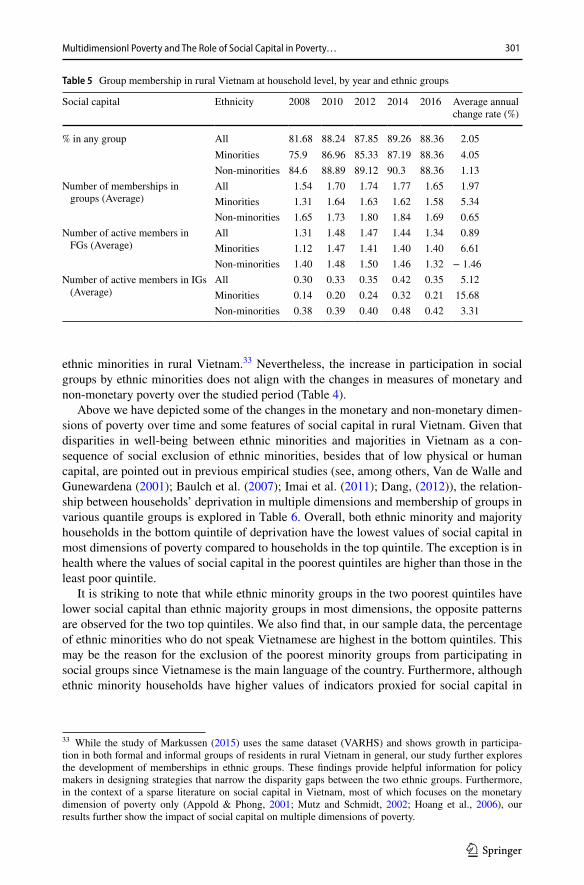
Table 5 displays descriptive statistics for group memberships and active members in dif-ferent groups at the household level. The data show that household members in rural Viet-nam are much inclined to be in a group. During 2008–2016, the percentage of households with at least one membership were more than 80 per cent. The group memberships are measured by the total number of memberships in a household in different groups. In the case where there is more than one household member participating in the same group, it is treated as a single membership only.31
On average, each household was a member of 1.54 groups in 2008, which increased by 7.3 per cent to 1.65 in 2016. Although formal groups dominate households’ total number of active members, the average annual growth rate of active membership in informal groups from 2008 to 2016 is relatively higher than that in formal groups; 5.12 and 0.89 per cent, respectively. It should be noted that formal groups/mass organisations in Vietnam are criti-cised by a deficiency of civil society independence since their members do not necessarily suggest activity or participation (employees from public sectors automatically become for-mal groups’ members) (Nørlund & Dinh, 2006). While the primary line of responsibility of mass organizations in Vietnam is to the government and not to members, citizens, or com-munities (Norlund, 2007), informal organizations usually have developed with local devel-opment’s purpose, for instance, credit, assistance to the poor. Since informal organizations have higher levels of civil society independence than mass organizations, the increasing numbers of members in informal groups indicates a crucial pace in the advancement of an independent civil society in the country.32
We also present in Table 6 information on social capital as a comparison between eth-nic minorities and majorities. The VARHS records that while differences in most dimen-sions of deprivation between ethnic minorities and majorities are substantial (Table 4), the disparity levels between these groups are less severe in social capital. Table 5 shows that over the studied period, while the values of other indicators are relatively equal among ethnic minorities and majorities, the number of active members of the minorities in infor-mal groups ranges from one-third to three-fifths that of the non-minorities. However, the growth in participation by groups of the minorities (nearly 16 per cent) is much higher than that of the non-minorities (around 3 per cent), denoting an increase in social integration of
31 The assumption of this measurement is that the social capital of a household does not increase when it has more than one member in a group (Maluccio et al., 2000).32 CIVICUS, the World Alliance for Citizen Participation, has a broad-based definition of civil society in Vietnam including “many people are members of one or more civil society organization (CSO), and numer-ous CSOs of varying levels of independence are active in the country” (page 1, available online at https:// www. adb. org/ sites/ defau lt/ files/ publi cation/ 28969/ csb- vie. pdf).
301Multidimensionl Poverty and The Role of Social Capital in Poverty…
1 3
ethnic minorities in rural Vietnam.33 Nevertheless, the increase in participation in social groups by ethnic minorities does not align with the changes in measures of monetary and non-monetary poverty over the studied period (Table 4).
Above we have depicted some of the changes in the monetary and non-monetary dimen-sions of poverty over time and some features of social capital in rural Vietnam. Given that disparities in well-being between ethnic minorities and majorities in Vietnam as a con-sequence of social exclusion of ethnic minorities, besides that of low physical or human capital, are pointed out in previous empirical studies (see, among others, Van de Walle and Gunewardena (2001); Baulch et al. (2007); Imai et al. (2011); Dang, (2012)), the relation-ship between households’ deprivation in multiple dimensions and membership of groups in various quantile groups is explored in Table 6. Overall, both ethnic minority and majority households in the bottom quintile of deprivation have the lowest values of social capital in most dimensions of poverty compared to households in the top quintile. The exception is in health where the values of social capital in the poorest quintiles are higher than those in the least poor quintile.
It is striking to note that while ethnic minority groups in the two poorest quintiles have lower social capital than ethnic majority groups in most dimensions, the opposite patterns are observed for the two top quintiles. We also find that, in our sample data, the percentage of ethnic minorities who do not speak Vietnamese are highest in the bottom quintiles. This may be the reason for the exclusion of the poorest minority groups from participating in social groups since Vietnamese is the main language of the country. Furthermore, although ethnic minority households have higher values of indicators proxied for social capital in
Table 5 Group membership in rural Vietnam at household level, by year and ethnic groups
Social capital Ethnicity 2008 2010 2012 2014 2016 Average annual change rate (%)
% in any group All 81.68 88.24 87.85 89.26 88.36 2.05Minorities 75.9 86.96 85.33 87.19 88.36 4.05Non-minorities 84.6 88.89 89.12 90.3 88.36 1.13
Number of memberships in groups (Average)
All 1.54 1.70 1.74 1.77 1.65 1.97Minorities 1.31 1.64 1.63 1.62 1.58 5.34Non-minorities 1.65 1.73 1.80 1.84 1.69 0.65
Number of active members in FGs (Average)
All 1.31 1.48 1.47 1.44 1.34 0.89Minorities 1.12 1.47 1.41 1.40 1.40 6.61Non-minorities 1.40 1.48 1.50 1.46 1.32 − 1.46
Number of active members in IGs (Average)
All 0.30 0.33 0.35 0.42 0.35 5.12Minorities 0.14 0.20 0.24 0.32 0.21 15.68Non-minorities 0.38 0.39 0.40 0.48 0.42 3.31
33 While the study of Markussen (2015) uses the same dataset (VARHS) and shows growth in participa-tion in both formal and informal groups of residents in rural Vietnam in general, our study further explores the development of memberships in ethnic groups. These findings provide helpful information for policy makers in designing strategies that narrow the disparity gaps between the two ethnic groups. Furthermore, in the context of a sparse literature on social capital in Vietnam, most of which focuses on the monetary dimension of poverty only (Appold & Phong, 2001; Mutz and Schmidt, 2002; Hoang et al., 2006), our results further show the impact of social capital on multiple dimensions of poverty.

302 A. T. Q. Pham, P. Mukhopadhaya
1 3
Tabl
e 6
Soc
ial c
apita
l and
mul
tiple
dim
ensi
ons o
f pov
erty
in ru
ral V
ietn
am, b
y et
hnic
gro
ups a
nd q
uint
les o
f pov
erty
* G
M is
num
ber o
f mem
bers
hips
in g
roup
s**
The
re a
re n
o ob
serv
atio
ns a
t the
four
th q
uint
ile o
f the
hea
lth d
imen
sion
Pove
rtySo
cial
Cap
ital
Qui
ntile
Poor
est
23
4Le
ast p
oor
Min
oriti
esM
ajor
ities
Min
oriti
esM
ajor
ities
Min
oriti
esM
ajor
ities
Min
oriti
esM
ajor
ities
Min
oriti
esM
ajor
ities
Mon
etar
yG
roup
(%)
80.3
888
.96
83.1
188
.73
87.9
789
.21
92.0
187
.74
94.2
187
.37
GM
*1.
351.
591.
511.
711.
671.
781.
931.
791.
991.
75FG
1.22
1.20
1.31
1.42
1.45
1.48
1.60
1.48
1.63
1.45
IG0.
170.
530.
230.
420.
260.
450.
320.
410.
230.
34Ed
ucat
ion
Gro
up (%
)78
.91
84.7
985
.74
86.6
284
.82
85.2
693
.85
88.2
894
.87
92.7
8G
M1.
351.
631.
511.
651.
521.
501.
941.
732.
212.
02FG
1.15
1.31
1.32
1.35
1.35
1.12
1.78
1.41
1.84
1.77
IG0.
180.
420.
230.
360.
250.
480.
250.
450.
270.
37H
ealth
**G
roup
(%)
89.6
089
.07
86.8
089
.85
87.2
292
.19
––
82.8
287
.15
GM
1.70
1.74
1.62
1.77
1.68
2.07
1.50
1.71
FG1.
401.
271.
361.
401.
491.
80–
–1.
341.
49IG
0.41
0.58
0.24
0.50
0.28
0.49
-–
0.17
0.31
Hou
sing
Gro
up (%
)83
.12
75.2
783
.77
84.9
887
.25
87.9
796
.02
87.8
495
.83
92.2
9G
M1.
501.
331.
461.
571.
801.
671.
951.
732.
191.
95FG
1.31
1.09
1.27
1.34
1.60
1.37
1.70
1.43
1.89
1.58
IG0.
190.
290.
180.
290.
360.
390.
420.
480.
340.
50B
asic
serv
ices
Gro
up (%
)79
.10
83.8
388
.78
84.1
994
.38
89.1
193
.99
88.9
692
.68
89.5
6G
M1.
331.
351.
691.
601.
941.
762.
001.
792.
111.
80FG
1.14
1.13
1.52
1.36
1.70
1.46
1.75
1.47
1.77
1.45
IG0.
180.
290.
230.
320.
300.
400.
270.
430.
560.
48D
urab
le a
sset
sG
roup
(%)
89.3
688
.00
86.0
489
.22
86.3
586
.52
83.7
087
.02
74.8
490
.32
GM
1.76
1.86
1.65
1.83
1.61
1.71
1.40
1.60
1.24
1.73
FG1.
561.
691.
421.
561.
401.
461.
241.
331.
061.
20IG
0.27
0.30
0.23
0.39
0.22
0.37
0.18
0.38
0.16
0.60

303Multidimensionl Poverty and The Role of Social Capital in Poverty…
1 3
most poverty dimensions at the fourth and fifth quintiles, the active memberships in infor-mal groups of ethnic minority households are always lower than that of ethnic majority households in all dimensions.
It also is interesting to see that ethnic minority households reveal different patterns of relationship between social capital and deprivation of households in some non-monetary dimensions. The ethnic minorities at the highest quintile in durable assets have the lowest social capital. At the poorest quintile, ethnic minority households have the lowest social capital in the education and basic services dimensions, whereas their ethnic majority coun-terparts report the lowest social capital in the housing dimension.
To summarize, there is some evidence to suggest that our proxy measures for social capital are correlated with changes in measures of poverty in these descriptive analyses. This effect does appear to be stronger for ethnic minority groups than for majority groups. Hence, we will consider these types of impacts in the next section.
6 Efect of Social Capital on Poverty: Different Dimensions and Etthnic Groups
This study contrast itself to previous studies by applying multilevel regression models to overcome a number of limitations of previous studies which employed the single-level analysis to investigate the influence of social capital on poverty. First, previous studies employed single-level regression models which do not takes into consideration the hierar-chical or nested structure of household survey data, where households (the lowest level) are nested within communities/districts/provinces (higher levels). As a consequence, the esti-mated standard errors of regression coefficients of the single-level analysis are too small, and this leads to an overstatement of statistical significance (Walsh, 1947). Second, the sin-gle-level studies cannot provide the cross-level analysis relating the relationships between variables measured in different levels, such as social capital at commune level and vari-ables at household level (Pham et al., 2020). Applied in this study, the findings of cross-level analysis point out that the effect of a household level variable such as minority ethnic characteristic on poverty may depend on the average social capital of the other households in the community. Therefore, by applying the multilevel regression models to examine whether there are impacts of social context on poverty of households provide more cru-cial information in designing anti-poverty policies. The tests of results show that multilevel models are preferred to single models (see Table 9 in the Appendix).
We explore the impacts of social capital on monetary and non-monetary deprivation in rural Vietnam as well as its multiple effects on the welfare of minority households. Applying Eq. (5), Table 7 reports on the fixed parts of the multilevel models predicting the degrees of deprivation of rural households in Vietnam in multiple dimensions.
In our models, monetary and non-monetary deprivations are regressed on a set of household, survey-wave, and community-level predictors. The coefficients of the control variables inform the effects of household characteristics on multiple dimensions of pov-erty. Most control variables in Table 7 show significant influence on poverty dimensions. Having more children or being female-headed families increases the propensity to most dimensions of poverty for households, whereas families with at least one member that has migrated away from home have a lower propensity to most dimensions. These results are consistent with previous studies on the monetary dimension in Vietnam (for exam-ple, Baulch & Dat, 2011; Dollar et al., 2004; Justino et al., 2008; Wiens, 1998) and other

304 A. T. Q. Pham, P. Mukhopadhaya
1 3
developing countries (see, among others, Du et al., 2005) for China; Geda et al., 2008 for Ethiopia; Hassan & Birungi, 2011 for Uganda).
Regarding independent variables, as expected, ethnic minority households are on aver-age more deprived in most dimensions, the exception is in the health dimension. The coef-ficient of minority in Table 7 is negatively and significantly associated with health depri-vation, suggesting that being a minority household is significantly associated with lower deprivation in the health dimension. It is worth noting that, in 2009 the government of Vietnam passed the Health Insurance Law, which offers up to 100 per cent subsidies on health insurance premiums for the very poor, ethnic minorities, the elderly, and all children under 6 years of age. The studies of Capuno et al., (2006), Huong et al. (2007), and Wag-staff (2010) show significant effects of the Vietnam’s Health Insurance Program and Health Care Fund for the poor and ethnic minorities on the reduction of out-of-pocket spending for health care. These health policies and programs make a huge contribution towards a better situation in the health dimension of the country (see Table 3) and of minorities (see Table 7).
Since the purpose of this study is to investigate the relative effects of active member-ships in formal and informal groups on multidimensions of poverty, we do not include “the percentage in any groups” and “number of memberships in groups” in the empirical mod-els. The regression results indicate that the coefficients of social capital at household level have significant effects on most poverty dimensions. Households with higher numbers of active members in formal groups have significantly lower propensity for deprivation in all monetary and non-monetary dimensions. The exception is the coefficient of active mem-bership in formal groups on durable assets, revealing that higher numbers of active mem-bers of households increase the level of deprivation in durable assets.
It should be noted that indicators used to measure deprivation levels of durable assets dimension are mostly agricultural machines (feeding grinding, rice milling, or grain har-vesting machines). The households participating in formal groups like Women’s Union, Farmers’ Union, Youth Union can share or lease these costly equipments from the group they have memberships (World Bank Group, 2016). The sharing machinery reduces not only the initial large investment in these equipments but also the cost of maintenance them for small farming and landholdings in rural Vietnam. Therefore, households who have formal groups’ memberships have less motivation in possessing these durable assets. In contrast to formal groups’ memberships, the more active members in informal groups, the more deprived households in the monetary, education, and health dimensions, and the less deprived in housing and basic services.
Results in different dimensions of poverty show that the relationship between the growth in social capital ( ΔFG and ΔIG) and propensity for deprivation is not statistically significant. Given the fact that the growth rates in social capital are relatively small during the studied period, it is not surprising that these two variables of social capital at survey-wave level do not have significant effects on the deprivation status of households. The only exception is ΔIG where the variable measuring the change of active members in informal groups over time correlates with decreasing monetary deprivation.
The coefficients of social capital at the commune level ( −
FG and −
IG ) inform what differ-ence in the level of deprivation is associated with one unit of active membership difference between communities. The statistically significant coefficients of
−
FG and −
IG indicate the importance of social capital on most poverty dimensions. Households living in communi-ties with higher active memberships in formal groups have significantly higher depriva-tion in the monetary, health, housing, and basic services dimensions than those living in communities with lower active memberships in formal groups. On the other hand, living

305Multidimensionl Poverty and The Role of Social Capital in Poverty…
1 3
Tabl
e 7
Mul
tiple
dim
ensi
ons o
f pov
erty
and
soci
al c
apita
l (m
ultil
evel
regr
essi
ons)
Varia
bles
Mon
etar
yEd
ucat
ion
Hea
lthH
ousi
ngB
asic
Ser
vice
sD
urab
le a
sset
s
Con
trol v
aria
bles
Hou
seho
ld h
ead’
s age
0.00
1***
0.00
0**
0.00
2***
0.00
0−
0.00
00.
000
Ave
rage
age
of H
H0.
002*
**−
0.00
1***
0.00
6***
−0.
000
0.00
0−
0.00
3***
Fem
ale
head
ed H
H0.
036*
**−
0.00
20.
062*
**0.
012*
*0.
019*
**−
0.07
0***
Tota
l num
ber o
f adu
lts−
0.00
3−
0.02
6***
−0.
002
−0.
003*
−0.
001
0.02
2***
Tota
l num
ber o
f chi
ldre
n0.
037*
**0.
142*
**0.
021*
**−
0.00
10.
011*
**−
0.00
7**
Mig
rate
−0.
027*
**−
0.05
8***
−0.
008
−0.
019*
**−
0.01
5***
0.00
1In
depe
nden
t var
iabl
esM
inor
ity0.
235*
**0.
142*
**−
0.00
7*0.
264*
**0.
275*
**0.
023*
*A
ctiv
e m
embe
rshi
ps in
FG
s (FG
)−
0.01
0***
−0.
016*
**−
0.00
7**
−0.
007*
**−
0.00
6***
0.02
4***
Act
ive
mem
bers
hips
in IG
s (IG
)0.
009*
*0.
013*
**0.
023*
**−
0.00
7**
−0.
007*
**0.
002
ΔFG
−0.
000
−0.
000
−0.
001
−0.
000
0.00
1−
0.00
1ΔIG
−0.
003*
*−
0.00
10.
001
0.00
00.
001
0.00
0−
FG
0.00
2***
−0.
000
0.00
1*0.
003*
**0.
004*
**0.
001
− IG−
0.00
7**
0.00
1−
0.00
1−
0.01
3***
−0.
017*
**−
0.00
7**
Inte
ract
ion
betw
een
min
ority
var
iabl
e an
d:M
igra
te−
0.03
0**
−0.
036*
**−
0.01
9*−
0.02
1**
−0.
028*
Act
ive
mem
bers
hips
in F
Gs (
FG)
−0.
012*
**A
ctiv
e m
embe
rshi
ps in
IGs (
IG)
−0.
028*
**−
0.01
7**
ΔFG
−0.
002*
ΔIG
−0.
008*
**0.
007*
**−
0.00
3*−
0.00
8**
−
FG
0.00
1**
0.00
1*0.
001*
*− IG
−0.
008*
**−
0.01
5***
−0.
017*
**−
0.01
6***
Con
stan
t0.
246*
**0.
360*
**0.
008
0.29
4***
0.24
9***
0.30
7***
Obs
erva
tions
12,8
0012
,800
12,8
0012
,800
12,8
0012
,800

306 A. T. Q. Pham, P. Mukhopadhaya
1 3
***
p < 0.
01, *
* p <
0.0
5, *
p <
0.1
Tabl
e 7
(con
tinue
d)
Varia
bles
Mon
etar
yEd
ucat
ion
Hea
lthH
ousi
ngB
asic
Ser
vice
sD
urab
le a
sset
s
Num
ber o
f gro
ups
463
463
463
463
463
463

307Multidimensionl Poverty and The Role of Social Capital in Poverty…
1 3
in communities with higher active memberships in informal groups helps households less deprived in the monetary, housing, basic services, and durable assets dimensions.
It is worth noting that the results shown in Table 7 suggest that active participation in associational life has impacts on multiple dimensions of poverty, and not only for those who directly participate, it also creates spillovers to other households. However, there are different effects between variables proxied for social capital at household and community levels. For example, the FG of households has a negative effect on their own propensities to deprivation in most dimensions but have a positive effect on other inhabitants in their community, and vice versa. This implies that the density of active membership in formal groups in a community has a crowding-out effect on the poverty of that community. By contrast, active participation in formal groups by households in a community has a crowd-ing-in effect on poverty.
Our results are consistent with previous studies investigating the role of social capital on poverty in rural areas (for example, Grootaert & Narayan, 2001 in Bolivia; Grootaert et al., 2002a, 2002b in Burkina Faso; Van Ha et al., 2004) in Vietnam; Yusuf, 2008 in Nige-ria). However, while much of the previous research focuses on monetary poverty only and does not show the relative importance of participating in different types of groups, the pre-sent study examines the relative effects of associational life between formal and informal groups in rural areas. We further investigate the impacts of social capital at the community level on monetary and non-monetary dimensions.
While Narayan and Pritchett (1999) find that the social capital of the village has an effect on household incomes, our study reports significant effects of social capital at both household and community levels on the monetary and non-monetary poverty of house-holds. The most likely reasons for this divergence in results may be the use of an aggregate index of social capital and neglect of the hierarchical structure of data in the preceding study. Hox et al. (2017) point out that aggregating data from many lower levels into fewer higher-level units and ignoring the hierarchical structure of data prompt the loss of much information and reduces the power of statistical analysis. To avoid this problem, we employ separate indicators for social capital and multilevel models in the analysis to estimate the relative influence of social capital at household and community levels on dimensions of poverty.
To examine the role of social capital on households’ deprivation in multiple dimensions for ethnic minorities, our study employs a set of interactions between the minority variable and the social capital at household, survey-wave, and community levels. First, the statisti-cally significant negative values of interactions between household-level social capital and “minority” show that ethnic minority households with more memberships in formal and informal groups have lower propensity for deprivation in the monetary, basic, and durable assets dimensions. Thus, the difference in poverty between ethnic minority and majority households is smaller with more social capital.
Second, the cross-level interactions between “minority” and two variables measuring changes over time of social capital ( ΔFG and ΔIG ) have significant association with dep-rivation of households. In our sample data, for example, living in a community with an increasing number of active members in informal groups correlates with lower deprivation for ethnic minority households in the monetary, housing, and durable assets dimensions. Last but not least, ethnic minority households living in a community with higher mem-berships in informal groups,
−
IG , reduce their disparities with ethnic majority households in monetary, education, housing, and basic services; whereas higher a number of mem-berships in formal groups significantly increases levels of variation between minority and majority group inhabitants in education, housing, and basic services.

308 A. T. Q. Pham, P. Mukhopadhaya
1 3
Furthermore, the interaction between “minority” and “migrate” indicates that migration has the largest effects on most poverty dimensions of ethnic minority households. Migra-tion found to be influencing positively on poverty alleviation has been explored in several studies (see, among others, in China: Du et al. (2005), in Nepal: Lokshin et al. (2010), in Ecuador: Bertoli and Marchetta (2014)). However, few studies have drawn on any system-atic comparison research into the effects of migration on poverty between ethnic minority and majority groups. Our result is one of the first empirical evidence proving that migra-tion can help ethnic minorities facing less deprivation in most dimensions of poverty com-pared to ethnic majorities. This is an important implication for policy makers to design more efficient poverty alleviation programs to reduce poverty and inequality gaps between ethnic minority and majority households in Vietnam.
During the last few decades, the goverment of Vietnam has released various poverty alleviation policies and social support programs in an effort to eliminate extreme poverty and promote a harmonious society. Although these programs and policies show some accomplishments in poverty reduction in the country, their efficiency is still limited due to the overlap in designing and implementing poverty programs and policies (Van de Walle, 2004; Hoang et al., 2016; and Cuong et al., 2015). In this context, our findings suggest that policy makers should consider social capital as an instrument in designing poverty alle-viation policies. It is worth noting that ethnic minorities are non-Vietnamese speakers and mostly have reside in rural areas. Therefore, the programs focusing to remove the language barrier can provide ethnic minorities more opportunities to improve their welfare status by participating in social groups, migrating to areas with higher paid job, as well as accessing public services.
7 Conclusions
Using a balanced panel data from the Vietnam Access to Resources Household Survey (VARHS), the study has shown that ethnic minority households have substantially higher levels of deprivation in most dimensions of poverty than ethnic majority households. Given the fact that ethnic minority groups and the poor residents in remote and rural areas where there are abundant disadvantages in physical conditions and less economic oppor-tunities, the government of Vietnam has launched various programs aimed at reducing the welfare gap between ethnic minorities and majorities. Nevertheless, the improvements are only observed in health and education dimensions. The minorities are even better off than their counterparts in health dimension. The contribution of these programs has minor influ-ence in solving the crucial challenges of economic and social improvements between these groups due to the constraints of the government’s budget and the lack of effectiveness, equitability and sustainability of these programs (Pimhidzai, 2018).
Over the past two decades, the role of social capital in improvement of household welfare has gained increasing interest from poverty scholars in academic and policy cir-cles. Past studies have concentrated on investigating the effects of social capital on the welfare of households measured by per capita income or expenditures or the probability of being poor. The other aspects of households’ welfare have been neglected, such as accessing basic services, housing, and so forth. Furthermore, the effects of social capi-tal at higher levels, such as community level, and the interactive correlations between household social resources and community characteristics have received much less attention. The present study fills these gaps in the existing literature on social capital’s

309Multidimensionl Poverty and The Role of Social Capital in Poverty…
1 3
effects on poverty by utilizing multilevel analysis to simultaneously investigate these effects, proxied by active participation in civic groups, on multiple dimensions of pov-erty at both household and community levels.
While it reports significant effects from households’ participation in local associa-tions and social resources, this study enriches the literature by proposing that the social context in which households are embedded, particularly the density level of participa-tion in civic groups within the community, is an influential factor in alleviating poverty. Moreover, our analysis documents the divergence between social capital at household and community levels. That is, active membership in formal groups reduces levels of deprivation in many dimensions for households who directly participate but increases these levels for other households living in the same community. By contrast, active participation in informal groups has positive spillovers on households living within community.
We found that ethnic minorities with higher social capital have lower deprivation lev-els in most of poverty dimensions. It is worth noting that these ethnic minorities mostly live in rural and remote areas. The language barrier and their minority status prevent them to participate in social and economic activities outside their communities which could have helped them with better opportunities to improve their living standard. In rural Vietnam, formal organizations are considered the most important formal groups since there are strong connections between those organizations and the state, and some-times they are involved in the process of deciding policies in local governments (Tarp, 2017). Hence, being members of these formal organizations helps households possess better information on access to local services, such as formal credit which improves household welfare. Since social capital is more common among households in rural areas than urban areas (Hofferth & Iceland, 1998; Sherman, 2006), the findings of our study support the idea of reducing the disparities between ethnic minority and majority groups in rural areas by encouraging household in participation in social groups.
Appendix

310 A. T. Q. Pham, P. Mukhopadhaya
1 3
Tabl
e 8
Pop
ulat
ion
of V
ietn
am b
y et
hnic
gro
ups,
urba
n/ru
ral 2
019
Sour
ce: V
ietn
am P
opul
atio
n an
d H
ousi
ng C
ensu
s, 20
19
Who
le c
ount
ry (P
erso
n)Pr
opor
tion
of ru
ral
popu
latio
n (%
)Et
hnic
Maj
ority
(P
erso
n)Pr
opor
tion
of p
opul
a-tio
n (%
)Et
hnic
Min
ority
(P
erso
n)Pr
opor
tion
of p
opul
atio
n (%
)
Popu
latio
n (P
erso
n)96
,208
,984
100
82,0
85,8
2610
014
,123
,158
100
Urb
an (P
erso
n)33
,122
,548
34.4
31,1
68,8
3938
1,95
3,70
913
.8Ru
ral (
Pers
on)
63,0
86,4
3665
.650
,916
,987
6212
,169
,449
86.2

311Multidimensionl Poverty and The Role of Social Capital in Poverty…
1 3
We run the likelihood ratio tests (LR tests) to evaluate how well the multilevel model fits the data by comparing the log likelihood of the two nested models. The statistically significant in difference test indicates that the model with more variables is a better fit model (see Hox et al., 2017, p 16–17). In each dimension, we estimate and compare two nested models: (i) a model without any parameter (null model) and a model includes variables at household level, survey-wave level, and community level (model 2), (ii) model 2 and full model consisting of all variables at three levels and cross-level interac-tions (model 3). In other words, the null model is nested in the model 2 which is nested in the model 3. The results presented in table 8 indicate that the full models fit signifi-cantly better than model 2 and null models.
References
Abdul-Hakim, R., Abdul-Razak, N. A., & Ismail, R. (2010). Does social capital reduce poverty? A case study of rural households in Terengganu, Malaysia. European Journal of Social Sciences, 14(4), 556–566.
Aguilar, G. R., & Sumner, A. (2020). Who are the world’s poor? A new profile of global multidimensional poverty. World Development, 126, 104716.
Aker, J. C. (2007). Social networks and household welfare in Tanzania: working together to get out of pov-erty. Available at SSRN 995941.
Alaimo, L. S., Arcagni, A., Fattore, M., & Maggino, F. (2020). Synthesis of multi-indicator system over time: A poset-based Approach. Social Indicators Research, 1–23.
Alkire, S. (2007). Choosing dimensions: The capability approach and multidimensional poverty. Chronic Poverty Research Centre Working Paper, (88).
Alkire, S., & Foster, J. (2011a). Counting and multidimensional poverty measurement. Journal of Public Economics, 95(7–8), 476–487.
Alkire, S., & Foster, J. (2011b). Understandings and misunderstandings of multidimensional poverty meas-urement. The Journal of Economic Inequality, 9(2), 289–314.
Alkire, S., & Foster, J. (2019). The role of inequality in poverty measurement. Available at https:// ophi. org. uk/ the- role- of- inequ ality- in- pover ty- measu rement/
Alkire, S., & Santos, M. E. (2010). Acute multidimensional poverty: A new index for developing coun-tries. United Nations development programme human development report office background paper, (2010/11).
Alkire, S., & Santos, M. E. (2013). A multidimensional approach: Poverty measurement and beyond. Social Indicators Research, 112(2), 239–257.
Alkire, S., & Santos, M. E. (2014). Measuring acute poverty in the developing world: Robustness and scope of the multidimensional poverty index. World Development, 59, 251–274.
Annoni, P., Fattore, M., & Bruggemann, R. (2008). Analyzing the structure of poverty by fuzzy partial order. Multicriteria ordering and ranking: Partial orders, ambiguities and applied issues, 107–124.
Table 9 Likelihood ratio tests to evaluate the dif-ference between nested models
Note: *** p < 0.01
LR �2
2
Model 2 Model 3
Income 816.66*** 40.84***Education 5904.49*** 55.63***Health 1070.84*** 0.48Housing 629.26*** 70.85***Basic Services 873.57*** 86.17***Durable Assets 754.85*** 51.54***

312 A. T. Q. Pham, P. Mukhopadhaya
1 3
Appold, S. J., & Phong, D. T. (2001). Patron-client relationships in a restructuring economy: An explora-tion of interorganizational linkages in Vietnam. Economic Development and Cultural Change, 50(1), 47–76.
Arouri, M., Youssef, A. B., & Nguyen, C. (2017). Does urbanization reduce rural poverty? Evidence from Vietnam. Economic Modelling, 60, 253–270.
Asian Development Bank. (2018). Key Indicators for Asia and the Pacific. www. adb. org/ stati stics, https:// data. adb. org/ datas et/ viet- namkey- indic ators.
Baker, J. L., & Grosh, M. E. (1994). Poverty reduction through geographic targeting: How well does it work? World Development, 22(7), 983–995.
Bartolini, S., & Sarracino, F. (2015). The dark side of Chinese growth: Declining social capital and well-being in times of economic boom. World Development, 74, 333–351.
Batana, Y. M. (2013). Multidimensional measurement of poverty among women in Sub-Saharan Africa. Social Indicators Research, 112(2), 337–362.
Batjargal, B., & Liu, M. (2004). Entrepreneurs’ access to private equity in China: The role of social capital. Organization Science, 15(2), 159–172.
Battiston, D., Cruces, G., Lopez-Calva, L. F., Lugo, M. A., & Santos, M. E. (2013). Income and beyond: Multidimensional poverty in six Latin American countries. Social Indicators Research, 112(2), 291–314.
Baulch, B., & Dat, V. H. (2011). Poverty Dynamics in Vietnam, 2002 to 2006. Edward Elgar Publishing.Baulch, B., & Masset, E. (2003). Do monetary and nonmonetary indicators tell the same story about chronic
poverty? A study of Vietnam in the 1990s. World Development, 31(3), 441–453.Baulch, B., Chuyen, T. T. K., Haughton, D., & Haughton, J. (2007). Ethnic minority development in
Vietnam. The Journal of Development Studies, 43(7), 1151–1176.Bertoli, S., & Marchetta, F. (2014). Migration, remittances and poverty in Ecuador. The Journal of
Development Studies, 50(8), 1067–1089.Betti, G., & Verma, V. (1999). Measuring the degree of poverty in a dynamic and comparative context:
a multi-dimensional approach using fuzzy set theory. In Proceedings, ICCS-VI (Vol. 11, p. 289).Betti, G., & Verma, V. (2008). Fuzzy measures of the incidence of relative poverty and deprivation: A
multi-dimensional perspective. Statistical Methods and Applications, 17(2), 225–250.Betti, G., Cheli, B., Lemmi, A., & Verma, V. (2006). Multidimensional and longitudinal poverty: An
integrated fuzzy approach. In A. Lemmi & G. Betti (Eds.), Fuzzy Set Approach to Multidimen-sional Poverty Measurement (pp. 115–137). Springer-Verlag.
Beycan, T., Vani, B. P., Bruggemann, R., & Suter, C. (2019). Ranking Karnataka districts by the multi-dimensional poverty index (MPI) and by applying simple elements of partial order theory. Social Indicators Research, 143(1), 173–200.
Bossert, W., Chakravarty, S. R., & d’Ambrosio, C. (2012). Poverty and time. The Journal of Economic Inequality, 10(2), 145–162.
Bourdieu, P. (1986). The forms of capital. In J. G. Richardson (Ed.), Handbook of theory and research for the sociology of education (pp. 241–258). Greenwood Press.
Callander, E. J., Schofield, D. J., & Shrestha, R. N. (2012). Towards a holistic understanding of pov-erty: A new multidimensional measure of poverty for Australia. Health Sociology Review, 21(2), 141–155.
Calvo, C. (2008). Vulnerability to multidimensional poverty: Peru, 1998–2002. World Development, 36(6), 1011–1020.
Calvo, C., & Dercon, S. (2009). Chronic poverty and all that (pp. 29–59). Oxford University Press, Oxford.Capuno, J. J., Oanh, T. T. M., Thanh, N. T., & Tien, T. V. (2006). Health care for the poor: a situation
analysis. Report submitted to the Ministry of Health, Government of Vietnam under the MOH-WB Technical Assistance Project for the Northern Uplands Project. Hanoi, Vietnam.
Castañeda, A., Doan, D., Newhouse, D., Nguyen, M. C., Uematsu, H., & Azevedo, J. P. (2018). A new profile of the global poor. World Development, 101, 250–267.
Cerioli, A., & Zani, S. (1990). A fuzzy approach to the measurement of poverty. In Income and wealth distribution, inequality and poverty (pp. 272–284). Springer, Berlin, Heidelberg.
Chakravarty, S. R. (2019). An axiomatic approach to multidimensional poverty measurement via fuzzy sets. In Poverty, Social Exclusion and Stochastic Dominance (pp. 123–141). Springer, Singapore.
Cheer, T., Kearns, R., & Murphy, L. (2002). Housing policy, poverty, and culture:‘discounting’decisions among Pacific peoples in Auckland, New Zealand. Environment and Planning c: Government and Policy, 20(4), 497–516.
Chiappero-Martinetti, E., & Roche, J. M. (2009). Operationalization of the capability approach, from theory to practice: A review of techniques and empirical applications (pp. 157–203). Debating global society.

313Multidimensionl Poverty and The Role of Social Capital in Poverty…
1 3
Coleman, J. S. (1988). Social capital in the creation of human capital. American Journal of Sociology, 94, S95–S120.
Collier, P. (2002). Social Capital and Poverty: A Microeconomic Perspective [w:] The Role of Social Capital in Development. An Empirical Assessment, ed. Ch. Grootaert, T. van Bastelaer.
Costa, M., & De Angelis, L. (2008). The multidimensional measurement of poverty: A fuzzy set approach. Statistica, 68(3/4), 303–319.
COVID-19 to add as many as 150 million extreme poor by 2021. https:// www. world bank. org/ en/ news/ press- relea se/ 2020/ 10/ 07/ covid- 19- to- add- as- many- as- 150-million-extreme-poor-by-2021
Cuong, N. V., Tung, P. D., & Westbrook, D. (2015). Do the poorest ethnic minorities benefit from a large-scale poverty reduction program? Evidence from Vietnam. The Quarterly Review of Eco-nomics and Finance, 56, 3–14.
Dang, H. A. (2012). Vietnam: A widening poverty gap for ethnic minorities. Indigenous Peoples, Pov-erty and Development”. Cambridge University Press, Forthcoming.
Dao, M. Q. (2004). Rural poverty in developing countries: an empirical analysis. Journal of Economic Studies.
De Vos, K., & Zaidi, M. A. (1997). Equivalence scale sensitivity of poverty statistics for the member states of the European community. Review of Income and Wealth, 43(3), 319–333.
Desai, J. (2000). Vietnam through the lens of gender: Five years later. Food and Agriculture Organiza-tion of the United Nations Manuscript.
Deutsch, J., & Silber, J. (2005). Measuring multidimensional poverty: An empirical comparison of vari-ous approaches. Review of Income and Wealth, 51(1), 145–174.
Dollar, D., Glewwe, P., & Agrawal, N. (Eds.). (2004). Economic growth, poverty, and household welfare in Vietnam. The World Bank.
Du, Y., Park, A., & Wang, S. (2005). Migration and rural poverty in China. Journal of Comparative Eco-nomics, 33(4), 688–709.
Epprecht, M., Müller, D., & Minot, N. (2011). How remote are Vietnam’s ethnic minorities? An analysis of spatial patterns of poverty and inequality. The Annals of Regional Science, 46(2), 349–368.
Fafchamps, M., & Lund, S. (2003). Risk-sharing networks in rural Philippines. Journal of Development Economics, 71(2), 261–287.
Fan, S., Hazell, P., & Thorat, S. (2000). Government spending, growth and poverty in rural India. American Journal of Agricultural Economics, 82(4), 1038–1051.
Fattore, M. (2016). Partially ordered sets and the measurement of multidimensional ordinal deprivation. Social Indicators Research, 128(2), 835–858.
Fattore, M., & Arcagni, A. (2018). A reduced posetic approach to the measurement of multidimensional ordinal deprivation. Social Indicators Research, 136(3), 1053–1070.
Fritzen, S. (2002). Growth, inequality and the future of poverty reduction in Vietnam. Journal of Asian Eco-nomics, 13(5), 635–657.
Geda, A., Shimeles, A., & Zerfu, D. (2008). Finance and poverty in Ethiopia: A household-level analysis. In Financial Development, Institutions, Growth and Poverty Reduction (pp. 61–86). Palgrave Mac-millan, London.
Glewwe, P. (2004). An overview of economic growth and household welfare in Vietnam in the 1990s. Eco-nomic growth, poverty, and household welfare in Vietnam, 1–26.
Goldstein, H. (2011). Multilevel Statistical Models (Vol. 922). John Wiley & Sons.Grimm, M., Waibel, H., & Klasen, S. (Eds.). (2016). Vulnerability to Poverty: Theory, measurement and
determinants, with case studies from Thailand and Vietnam. Springer.Grootaert, C. (1999). Social capital, household welfare, and poverty in Indonesia. The World Bank.Grootaert, C., & Narayan, D. (2001). Local institutions, poverty, and household welfare in Bolivia. The
World Bank.Grootaert, C., & Van Bastelar, T. (Eds.). (2002). Understanding and measuring social capital: A multi-
disciplinary tool for practitioners. The World Bank.Grootaert, C., Oh, G. T., & Swamy, A. V. (1999). The local level institutions study: Social capital and
development outcomes in Burkina Faso. Washington, DC: World Bank, Social Development Family, Environmentally and Socially Sustainable Development Network.
Grootaert, C., Oh, G. T., & Swamy, A. (2002b). Social capital, household welfare and poverty in Burkina Faso. Journal of African Economies, 11(1), 4–38.
GSO (General Statistics Office of Vietnam) (2016). Statistical Yearbook of Vietnam 2016. Statistical Pub-lishing House.
GSO (General Statistics Office of Vietnam) (2018). Statistical Yearbook of Vietnam 2018. Statistical Pub-lishing House.

314 A. T. Q. Pham, P. Mukhopadhaya
1 3
GSO (General Statistics Office of Vietnam) (2020). The 2020 Vietnam population and housing census: com-pleted results. Statistical Publishing House.
Guagnano, G., Santarelli, E., & Santini, I. (2016). Can social capital affect subjective poverty in Europe? An empirical analysis based on a generalized ordered logit model. Social Indicators Research, 128(2), 881–907.
Ha, T. T., & Harpham, T. (2005). Primary education in Vietnam: Extra classes and outcomes. International Education Journal, 6(5), 626–634.
Habibov, N., & Afandi, E. (2017). Community-level social capital and household strategies for coping with global crisis in transitional countries. Social Indicators Research, 130(2), 687–710.
Haddad, L., & Maluccio, J. A. (2003). Trust, membership in groups, and household welfare: Evidence from KwaZulu-Natal, South Africa. Economic Development and Cultural Change, 51(3), 573–601.
Harpham, T., Huong, N. T., Long, T. T., & Tuan, T. (2005). Participatory child poverty assessment in rural Vietnam. Children & Society, 19(1), 27–41.
Heltberg, R., & Tarp, F. (2002). Agricultural supply response and poverty in Mozambique. Food Policy, 27(2), 103–124.
Hassan, R., & Birungi, P. (2011). Social capital and poverty in Uganda. Development Southern Africa, 28(1), 19–37.
Hoang, L. A., Castella, J. C., & Novosad, P. (2006). Social networks and information access: Implications for agricultural extension in a rice farming community in northern Vietnam. Agriculture and Human Values, 23(4), 513–527.
Hoang, Q. D., Dufhues, T. B., & Buchenrieder, G. (2016). Individual social capital and access to rural ser-vices in Northern Vietnam. International Journal of Social Economics.
Hofferth, S. L., & Iceland, J. (1998). Social capital in rural and urban communities 1. Rural Sociology, 63(4), 574–598.
Holloway, S. R., Bryan, D., Chabot, R., Rogers, D. M., & Rulli, J. (1998). Exploring the effect of public housing on the concentration of poverty in Columbus, Ohio. Urban Affairs Review, 33(6), 767–789.
Hollweg, C. H., Sáez, S., Aguiar, A. H., Walmsley, T. L., Narayanan, G. B., Aguiar, A., & Francois, J. (Eds.). (2019). World Development Indicators (database). World Bank.
Hox, J. J., Moerbeek, M., & Van de Schoot, R. (2017). Multilevel analysis: Techniques and applications. Routledge.
Huong, D. B., Phuong, N. K., Bales, S., Jiaying, C., Lucas, H., & Segall, M. (2007). Rural health care in Vietnam and China: Conflict between market reforms and social need. International Journal of Health Services, 37(3), 555–572.
Imai, K. S., Gaiha, R., & Kang, W. (2011). Poverty, inequality and ethnic minorities in Vietnam. Interna-tional Review of Applied Economics, 25(3), 249–282.
Justino, P., Litchfield, J., & Pham, H. T. (2008). Poverty dynamics during trade reform: Evidence from rural Vietnam. Review of Income and Wealth, 54(2), 166–192.
Kabeer, N. (2006). Poverty, social exclusion and the MDGs: The challenge of ‘durable inequalities’ in the Asian context.
Kakwani, N. (2000). On measuring growth and inequality components of poverty with application to Thai-land. Journal of Quantitative Economics, 16(1), 67–80.
Kang, W., & Imai, K. S. (2012). Pro-poor growth, poverty and inequality in rural Vietnam. Journal of Asian Economics, 23(5), 527–539.
Khan, M. (2000). Rural poverty in developing countries. Rural Poverty in Developing Countries, 2000(78), 1–32.
Khan, M. M. H. (2001). Rural poverty in developing countries: Implications for public policy. International Monetary Fund
Knack, S. (2002). Social capital, growth and poverty: A survey of cross-country evidence. The role of social capital in development: An empirical assessment, 42–82.
Lokshin, M., Bontch-Osmolovski, M., & Glinskaya, E. (2010). Work-related migration and poverty reduc-tion in Nepal. Review of Development Economics, 14(2), 323–332.
Makdissi, P., & Wodon, Q. (2004). Fuzzy targeting indices and orderings. Bulletin of Economic Research, 56(1), 41–51.
Maluccio, J., Haddad, L., & May, J. (2000). Social capital and household welfare in South Africa, 1993–98. The Journal of Development Studies, 36(6), 54–81.
Markussen, T. (2015). Social and political capital in rural Viet Nam (No. 2015/087). WIDER Working Paper.
Martinetti, E. C. (1994). A new approach to evaluation of well-being and poverty by fuzzy set theory. Gior-nale degli economisti e annali di economia, 367–388.

315Multidimensionl Poverty and The Role of Social Capital in Poverty…
1 3
Martinetti, E. C. (2000). A multidimensional assessment of well-being based on Sen’s functioning approach. Rivista internazionale di scienze sociali, 207–239.
McCulloch, N., & Baulch, B. (2000). Simulating the impact of policy upon chronic and transitory poverty in rural Pakistan. The Journal of Development Studies, 36(6), 100–130.
Minot, N. (2000). Generating disaggregated poverty maps: An application to Vietnam. World Development, 28(2), 319–331.
Mok, T. Y., Gan, C., & Sanyal, A. (2007). The determinants of urban household poverty in Malaysia. Jour-nal of Social Sciences, 3(4), 190–196.
Mutz, G., & Schmidt, A. (2002). About the Use of Underlying Value-Systems: Social Capital Formation and Institution Building in Transitional Vietnam,pp 109–123.
Narayan, D., & Pritchett, L. (1999). Cents and sociability: Household income and social capital in rural Tan-zania. Economic development and cultural change, 47(4), 871–897.
Narayan, D., Patel, R., Schafft, K., Rademacher, A., and Koch-Schulte, S. (1999). Can anyone hear us? Voices from 47 countries.
Neggers, J., & Kim, H. S. (1998). Basic posets. World Scientific.Nga, N. N., Chuyen, T. T. K., Bales, S., & Haughton, J. (1999). Health and Wealth in Vietnam: An Analysis
of Household Living Standards. Institute of Southeast Asian Studies.Nguyen, C., Linh, V., & Nguyen, T. (2013). Urban poverty in Vietnam: determinants and policy implica-
tions. International journal of development issues.Nguyen, L. D., Raabe, K., & Grote, U. (2015). Rural–urban migration, household vulnerability, and welfare
in Vietnam. World Development, 71, 79–93.Nørlund, I., & Dinh, D. N. (2006). The emerging civil society: An initial assessment of civil society in Viet-
nam. CIVICUS.Norlund, I. (2007). Civil society in Vietnam. Social organisations and approaches to new concepts. Asien,
105, 68–90.Nørlund, I., & Nam, U. V. (2007). Filling the gap: The emerging civil society in Viet Nam. Viet Nam Union
of Science and Technology Associations.Osei, C. D., & Zhuang, J. (2020). Rural poverty alleviation strategies and social capital link: The mediation
role of Women entrepreneurship and social innovation. SAGE Open, 10(2). https:// doi. org/ 10. 1177/ 21582 44020 925504
Pham, A. T. Q., & Mukhopadhaya, P. (2018). Measurement of poverty in multiple Dimensions: The case of Vietnam. Social Indicators Research, 138(3), 953–990.
Pham, A. T. Q., Mukhopadhaya, P., & Vu, H. (2020). Targeting administrative regions for multidimensional poverty alleviation: A study on Vietnam. Social Indicators Research, 150(1), 143–189.
Pham, A. T. Q., Mukhopadhaya, P., & Vu, H. (2021). Estimating poverty and vulnerability to monetary and non-monetary poverty: The case of Vietnam. Empirical Economics. https:// doi. org/ 10. 1007/ s00181- 020- 01991-4
Pimhidzai, O. (2018). Climbing the ladder: poverty reduction and shared prosperity in Vietnam (Eng-lish). Washington, D.C. : World Bank Group. Access from: http:// docum ents. world bank. org/ curat ed/ en/ 20698 15228 43253 122/ Climb ing- the- ladder- pover ty- reduc tion- and- shared- prosp erity- in- Vietn am
Putnam, R. (1993). The prosperous community: Social capital and public life. The american prospect, 13(Spring), Vol. 4. Available online: http:// www. prosp ect. org/ print/ vol/ 13
Putnam, R. D. (1994). Social capital and public affairs. Bulletin of the American Academy of Arts and Sci-ences, 5–19.
Putnam, R. D., Leonardi, R., & Nanetti, R. Y. (1994). Making democracy work: Civic traditions in mod-ern Italy. Princeton university press.
Qizilbash, M., & Clark, D. A. (2005). The capability approach and fuzzy poverty measures: An applica-tion to the South African context. Social Indicators Research, 74(1), 103–139.
Raudenbush, S. W., & Bryk, A. S. (2002). Hierarchical linear models: Applications and data analysis methods (Vol. 1). Sage.
Ravallion, M. (2011). On multidimensional indices of poverty. The Journal of Economic Inequality, 9(2), 235–248.
Ravallion, M., & Jalan, J. (1998). Determinants of transient and chronic poverty: evidence from rural China. The World Bank.
Robeyns, I. (2005). The capability approach: A theoretical survey. Journal of Human Development, 6(1), 93–117.
Rose, R. (1999). What Does Social Capital Add to Individual Welfare?: An Empirical Analysis of Rus-sia (No. 318). Centre for the Study of Public Policy, University of Strathclyde.

316 A. T. Q. Pham, P. Mukhopadhaya
1 3
Rupasingha, A., & Goetz, S. J. (2007). Social and political forces as determinants of poverty: A spatial analysis. The Journal of Socio-Economics, 36(4), 650–671.
Sahn, D. E., & Stifel, D. C. (2000). Poverty comparisons over time and across countries in Africa. World development, 28(12), 2123–2155.
Santos, M. E., Villatoro, P., Mancero, X. and Gerstenfeld, P. (2015). A Multidimensional Poverty Index for Latin America (No. ophiwp079). Queen Elizabeth House, University of Oxford.
Sen, A. (1976). Poverty: An ordinal approach to measurement. Econometrica: Journal of the Economet-ric Society, 44(2), 219–231.
Sen, A. K. (1987). Commodities and Capabilities: Professor Dr. P. Hennipman Lectures in Economics, 1982 Delivered at the University of Amsterdam. Oxford: Oxford University Press.
Sen, A. (1988). The standard of living. Cambridge University Press. Cambridge: MA.Sherman, J. (2006). Coping with rural poverty: Economic survival and moral capital in rural America.
Social Forces, 85(2), 891–913.Shinn, M., & Gillespie, C. (1994). The roles of housing and poverty in the origins of homelessness. Ameri-
can Behavioral Scientist, 37(4), 505–521.Silber, J. (2011). A comment on the MPI index. Journal of Economic Inequality, 9(3), 479–481.Singhal, S., & Beck, U. (2015). Ethnic disadvantage in Vietnam: Evidence using panel data (No.
2015/097). WIDER Working PaperStifel, D., & Christiaensen, L. (2007). Tracking poverty over time in the absence of comparable consump-
tion data. The World Bank Economic Review, 21(2), 317–341.Suppa, N. (2018). Towards a multidimensional poverty index for Germany. Empirica, 45(4), 655–683.Tarp, F. (Ed.). (2017). Growth, Structural Transformation, and Rural Change in Viet Nam: A Rising
Dragon on the Move. Oxford University Press.Tunstall, R., Bevan, M., Bradshaw, J., Croucher, K., Duffy, S., Hunter, C., ... & Wilcox, S. (2013). The
links between housing and poverty: an evidence review. York: JRF.UNDP (2015). Country report: 15 years achieving the Viet Nam Millennium Development Goals. Assess
at: https:// www. vn. undp. org/ conte nt/ vietn am/ en/ home/ libra ry/ mdg/ count ry- report- mdg- 2015. htmlVan de Walle, D. (2004). The static and dynamic incidence of Vietnam’s public safety net (Vol. 842, p.
189). World Bank Publications.Van de Walle, D., & Gunewardena, D. (2001). Sources of ethnic inequality in Viet Nam. Journal of
Development Economics, 65(1), 177–207.Van Phan, P., & O’Brien, M. (2019). Multidimensional wellbeing inequality in a developing country: A
case study of Vietnam. Social Indicators Research, 145(1), 157–183.Van Ha, N., Kant, S., & MacLaren, V. (2004). The contribution of social capital to household welfare
in a paper-recycling craft village in Vietnam. The Journal of Environment & Development, 13(4), 371–399.
Van Tien, T., Phuong, H. T., Mathauer, I., & Phuong, N. T. K. (2011). A HEALTH FINANCING REVIEW OF VIET NAM. World Health Organization. https:// www. who. int/ health_ finan cing/ docum ents/ oasis_f_ 11- vietn am. pdf.
Verma, V., & Betti, G. (2002). Longitudinal measures of income poverty and life-style deprivation. Univer-sità di Padova, Dipartimento di scienze statistiche
Verma, V., Betti, G., & Gagliardi, F. (2017). Fuzzy measures of longitudinal poverty in a comparative perspective. Social Indicators Research, 130(2), 435–454.
Vyncke, V., De Clercq, B., Stevens, V., Costongs, C., Barbareschi, G., Jónsson, S. H., Darias, C. S., Kebza, V., Currie, C., & Maes, L. (2013). Does neighbourhood social capital aid in levelling the social gradient in the health and well-being of children and adolescents? A Literature Review. BMC Public Health, 13(1), 65.
Wagstaff, A. (2010). Estimating health insurance impacts under unobserved heterogeneity: The case of Vietnam’s health care fund for the poor. Health Economics, 19(2), 189–208.
Walsh, J. E. (1947). Concerning the effect of intraclass correlation on certain significance tests. The Annals of Mathematical Statistics, 88–96.
Wiens, T. B. (1998). Agriculture and rural poverty in Vietnam. Household Welfare and Vietnam’s Tran-sition, 1998, 61–98.
Woolcock, M. (2002). Social capital in theory and practice: Reducing poverty by building partnerships between states, markets and civil society. Social Capital and Poverty Reduction: which role for the civil society organizations and the state, 20–44.
World Bank. (2018). World development report 2019: The changing nature of work. Washington, DC: USA.World Bank Group. (2016). Transforming Vietnamese Agriculture: Gaining More for Less. World Bank.Yang, J., & Mukhopadhaya, P. (2016). China’s War Against the Many Faces of Poverty: Towards a New
Long March. Routledge.

317Multidimensionl Poverty and The Role of Social Capital in Poverty…
1 3
Yusuf, S. A. (2008). Social capital and household welfare in Kwara State. Nigeria. Journal of Human Ecol-ogy, 23(3), 219–229.
Zeumo, V. K., Tsoukiàs, A., & Somé, B. (2014). A new methodology for multidimensional poverty meas-urement based on the capability approach. Socio-Economic Planning Sciences, 48(4), 273–289.
Zhang, Y., Zhou, X., & Lei, W. (2017). Social capital and its contingent value in poverty reduction: Evi-dence from Western China. World Development, 93, 350–361.
Zhu, L., & Thomas, B. (2013). School-based obesity policy, social capital, and gender differences in weight control behaviors. American Journal of Public Health, 103(6), 1067–1073.
Publisher’s Note Springer Nature remains neutral with regard to jurisdictional claims in published maps and institutional affiliations.


