Embed Size (px)
Citation preview
A new space technology for ocean observation: the SMOS mission
JORDI FONT, JOAQUIM BALLABRERA-POY, ADRIANO CAMPS, IGNASI CORBELLA, NÚRIA DUFFO, ISRAEL DURAN, MIKHAIL EMELIANOV,
LUIS ENRIQUE 1, PERE FERNÁNDEZ, CAROLINA GABARRÓ, CRISTINA GONZÁLEZ 2, VERÓNICA GONZÁLEZ, JÉRÔME GOURRION,
SÉBASTIEN GUIMBARD, NINA HOAREAU, AGUSTÍ JULIÀ 3, SOFIA KALARONI, ANNA KONSTANTINIDOU 4, ALFREDO L. ARETXABALETA 5, JUSTINO MARTÍNEZ,
JORGE MIRANDA 6, ALESSANDRA MONERRIS 7, SERGIO MONTERO, BAPTISTE MOURRE 8, MIRIAM PABLOS, FERNANDO PÉREZ, MARIA PILES,
MARCOS PORTABELLA, ROBERTO SABIA 9, JOAQUÍN SALVADOR, MARCO TALONE 10, FRANCESC TORRES, ANTONIO TURIEL,
MERCÈ VALL-LLOSSERA and RAMÓN VILLARINO 11
SMOS Barcelona Expert Centre, Institut de Ciències del Mar/Unitat de Tecnologia Marina, CSIC and Departament de Teoria del Senyal i Comunicacions, Universitat Politècnica de Catalunya, Barcelona, Spain.
E-mail: [email protected], [email protected]
1 Now with Institut de Ciències Fotòniques, Castelldefels, Spain.2 Now with Institut Català de Ciències del Clima, Barcelona, Spain.
3 Deceased.4 Now with Hellenic Centre for Marine Research, Anavyssos, Greece.
5 Now with US Geological Survey, Woods Hole, Massachusetts, USA.6 Now with Dep. Teoría de la Señal y Comunicaciones, Univ. Alcalá de Henares, Spain.
7 Now with Civil Engineering, Monash Univ., Clayton, Australia.8 Now with NATO Undersea Research Centre, La Spezia, Italy.
9 Now with ESA-ESRIN, Frascati, Italy.10 Now with Serco Spa, Frascati, Italy.
11 Now with Dept. Eng. Electrònica, Elèctrica i Automàtica, Univ. Rovira i Virgili, Tarragona, Spain.
SUMMARY: Capability for sea surface salinity observation was an important gap in ocean remote sensing in the last few decades of the 20th century. New technological developments during the 1990s at the European Space Agency led to the proposal of SMOS (Soil Moisture and Ocean Salinity), an Earth explorer opportunity mission based on the use of a microwave interferometric radiometer, MIRAS (Microwave Imaging Radiometer with Aperture Synthesis). SMOS, the first satellite ever addressing the observation of ocean salinity from space, was successfully launched in November 2009. The determination of salinity from the MIRAS radiometric measurements at 1.4 GHz is a complex procedure that requires high performance from the instrument and accurate modelling of several physical processes that impact on the microwave emission of the ocean’s surface. This paper introduces SMOS in the ocean remote sensing context, and summarizes the MIRAS principles of operation and the SMOS salinity retrieval approach. It describes the Spanish SMOS high-level data processing centre (CP34) and the SMOS Barcelona Expert Centre on Radiometric Calibration and Ocean Salinity (SMOS-BEC), and presents a preliminary validation of global sea surface salinity maps operationally produced by CP34.
Keywords: remote sensing, ocean salinity, microwave radiometry, interferometry, SMOS mission, salinity maps, validation.
Scientia Marina 76S1September 2012, 249-259, Barcelona (Spain)
ISSN: 0214-8358doi: 10.3989/scimar.03621.19K
ADVANCES IN SPANISH PHYSICALOCEANOGRAPHYM. Espino, J. Font, J.L. Pelegrí, A. Sánchez-Arcilla (eds.)
250 • J. FONT et al.
SCI. MAR., 76S1, September 2012, 249-259. ISSN 0214-8358 doi: 10.3989/scimar.03621.19K
INTRODUCTION
Satellite remote sensing has been a common tool in oceanography since the mid-1970s (Gower 2010). Infrared and visible images of the coastal and open ocean obtained from polar orbiting satellites have been regularly provided by space agencies and widely used by the research community to incorporate synoptic information from large areas to many oceanographic studies. Thanks to this imagery, it has been possible to better interpret the sparse data gathered from a mov-ing vessel in a moving ocean. Surface structures, such as meandering fronts or eddies, became apparent in instantaneous views of the ocean skin due to thermal or colour differences between adjacent water masses. Soft gradients “observed” at sea, often generated from interpolation of data collected at sparse hydrographic stations by a steaming research vessel in a period of several days, were not always true. And even high-resolution horizontal sampling along straight or com-plex navigation lines could fail to provide a realistic view of the oceanographic phenomena taking place in a relatively small area, because the spatial and tempo-ral variability could not be properly separated. Satel-lite remote sensing was fundamental in evidencing the high percentage of ocean energy that is accumulated at the intermediate (tens to hundreds of km, days-weeks) scales that we know as oceanic mesoscale (Robinson 1983), and even the occurrence of smaller-scale dy-namically relevant phenomena. Later on, when it was possible to embark portable satellite receiving stations, or thanks to near-real-time transmission of satellite de-rived maps, the sampling strategy of a research vessel could be adapted and fine-tuned to efficiently track the evolution of a certain surface structure that could have been missed or only partially sampled without the help of a synoptic view from space (Chic et al. 1997).
With the pioneering but short-lived Seasat mission in 1978 (Born et al. 1979), satellite observation of the ocean expanded to the domain of microwaves. In the mid-1980s several radar altimeters initiated the provi-sion of very accurate (to a few cm) nadir measurements of the sea surface height, and scatterometers provided a reliable determination of surface winds—quantitative information on ocean variables never observed before
from space. Satellite altimetry was a real revolution for large-scale ocean observation: precise sea-level values far from coast were available for assimilation in ocean circulation numerical models. This contributed to the implementation of operational oceanography, and the improvement of realistic forecasts of large-scale phe-nomena such as El Niño (Hulburt et al. 2009), an im-portant social need after the very strong 1981-82 event.
However, up to recently, remote sensing missions still lacked the technology required to measure one of the fundamental variables in driving ocean dy-namics and in linking ocean circulation to the Earth climate. Salinity, a key component for understanding the global water cycle and hence the evolution of the climate in the present context of global warming, had never been the objective of satellite missions. Sea surface salinity is one of the Essential Climate Vari-ables (ECV) defined by the Global Climate Observ-ing System (GCOS) to support the work of the United Nations Framework Convention on Climate Change (UNFCCC) and the Intergovernmental Panel on Cli-mate Change (IPCC).
How can sea surface salinity (SSS) be measured from space? All bodies spontaneously emit electro-magnetic radiation in a large range of wavelengths. At low frequencies, including microwaves, the brightness temperature of the body (TB, the quantity to be meas-ured by a radiometer, and related to the emitted power) is proportional to its physical temperature. When the emitting body is seawater, the proportionality coef-ficient—the emissivity—depends on the dielectric constant, which depends on conductivity, which in turn depends on salinity (see e.g. Lagerloef and Font 2010). Therefore, by measuring emissivity we can deduce salinity.
THE SMOS MISSION
In 1998 the European Space Agency (ESA) issued the first call for Earth Explorer Opportunity Missions within its new Earth observation programme, the Liv-ing Planet Programme. A large group of European scientists and technologists proposed SMOS, which was selected by ESA as one of the two first explorer missions out of more than 30 submitted proposals.
RESUMEN: Una nUeva tecnología espacial para la observación del océano: la misión SMOS. – La imposibilidad de observar la salinidad superficial del mar desde el espacio era uno de los problemas importantes para la teledetección oceánica a finales del siglo XX. Nuevos desarrollos tecnológicos durante los años 90 en la Agencia Espacial Europea llevaron a formular la propuesta de SMOS (Soil Moisture and Ocean Salinity), una misión de oportunidad de observación de la Tierra basada en un radiómetro interferométrico de microondas, MIRAS (Microwave Imaging Radiometer with Aperture Synthesis). SMOS, el primer satélite que intenta observar la salinidad desde el espacio, fue lanzado en noviembre de 2009. La determinación de salinidad a partir de las mediciones de MIRAS a 1,4 GHz es un procedimiento complejo que requiere un excelente funcionamiento del instrumento y una modelización muy precisa de los procesos físicos que intervienen en la emisión de la superficie del océano en el dominio de las microondas. Este artículo presenta SMOS en el contexto de la teledetección oceánica, y resume los principios de operación de MIRAS y el enfoque utilizado en SMOS para obtener la salinidad. Describe el Centro español de Proceso de datos SMOS de alto nivel (CP34) y el Centro Experto SMOS en Barcelona para Calibración Radiométrica y Salinidad Oceánica (SMOS-BEC), así como presenta una primera validación de los mapas globales de salinidad superficial producidos operacionalmente por el CP34.
Palabras clave: teledetección, salinidad oceánica, radiometría en microondas, interferometría, misión SMOS, mapas de salinidad, validación.
SMOS, A NEW SPACE TECHNOLOGY FOR OCEAN OBSERVATION • 251
SCI. MAR., 76S1, September 2012, 249-259. ISSN 0214-8358 doi: 10.3989/scimar.03621.19K
SMOS (Soil Moisture and Ocean Salinity) (Silvestrin et al. 2001, Kerr et al. 2001, 2010), relying on recent technological developments in the domain of micro-wave radiometry (Martín-Neira and Goutoule 1997), aimed to provide for the first time a global and con-tinuous coverage of both geophysical variables (salin-ity and moisture) with a suitable temporal and spatial resolution and accuracy for climatic studies, and in the case of SSS for large-scale oceanography (Font et al. 2004). Several international panels of experts had raised the concern that the lack of a regular provision of these two variables was hampering the possibility of significantly improving our capacity for weather forecasting. SMOS expects to demonstrate that this gap can be filled, and to provide relevant informa-tion for other applications such as water resources and crop management, natural risk prevention and ocean circulation modelling.
SMOS is an ESA-led cooperative mission in part-nership with the French space agency Centre National d’Études Spatiales (CNES) and the Spanish Centro para el Desarrollo Tecnológico Industrial (CDTI). For the first time, Spain is playing a fundamental role in a European space mission. In addition to the large additional financial contribution, Spanish engineers (Universitat Politècnica de Catalunya, Barcelona) are part of the core team that designed the technological concept and made possible its implementation, Spanish industries were responsible for the construction of the instrument and its most innovative components (prime contractor, EADS CASA Espacio, Madrid; receiv-ers, Mier Comunicaciones, La Garriga), and Spanish scientists are in charge of leading the development of the SSS retrieval algorithms (ICM-CSIC, Barcelona), including the role of SMOS Co-Lead Investigator (J. Font). Other Spanish universities and research institu-tions have also contributed to the SMOS preparation and are now playing an important role in validating its products. SMOS, further known as ESA’s water mis-sion (Drinkwater et al. 2009), started its implementa-tion in 2000 and was finally launched on November 2, 2009 from the Plesetsk cosmodrome in Russia. It entered in operations phase in May 2010 (http://www.esa.int/esaLP/LPsmos.html). The primary SMOS data receiving station and the SMOS Data Processing Ground Segment (DPGS) are installed in the European Space Astronomy Centre (ESAC), an ESA establish-ment in Villafranca del Castillo, near Madrid. SMOS is a milestone not only in the history of Earth observation techniques, but in the capacity of Spain to undertake and lead space missions, with the corresponding poten-tial for future advancements in this field.
The frequency band measured by SMOS is 1.4 GHz, as it is close to the maximum sensitivity of TB to changes in salinity and minimizes the impact of other parameters influencing it. In addition, this is a frequen-cy band in which human-made emissions are forbidden by international conventions because it is kept for pas-sive observations, so the risk of interference should not
be an issue. At this frequency the penetration of the ra-diation in the ocean, and therefore the thickness of the emitting surface layer, is around 1 cm. The principles of SSS and soil moisture determination by microwave radiometry were sufficiently known (Swift and McIn-tosh 1983), but no satellite mission had been attempted so far to measure these variables because of the very large scanning antennas required to obtain the desired spatial resolution (few tens of km).
MIRAS, an interferometric polarimetric radiometer
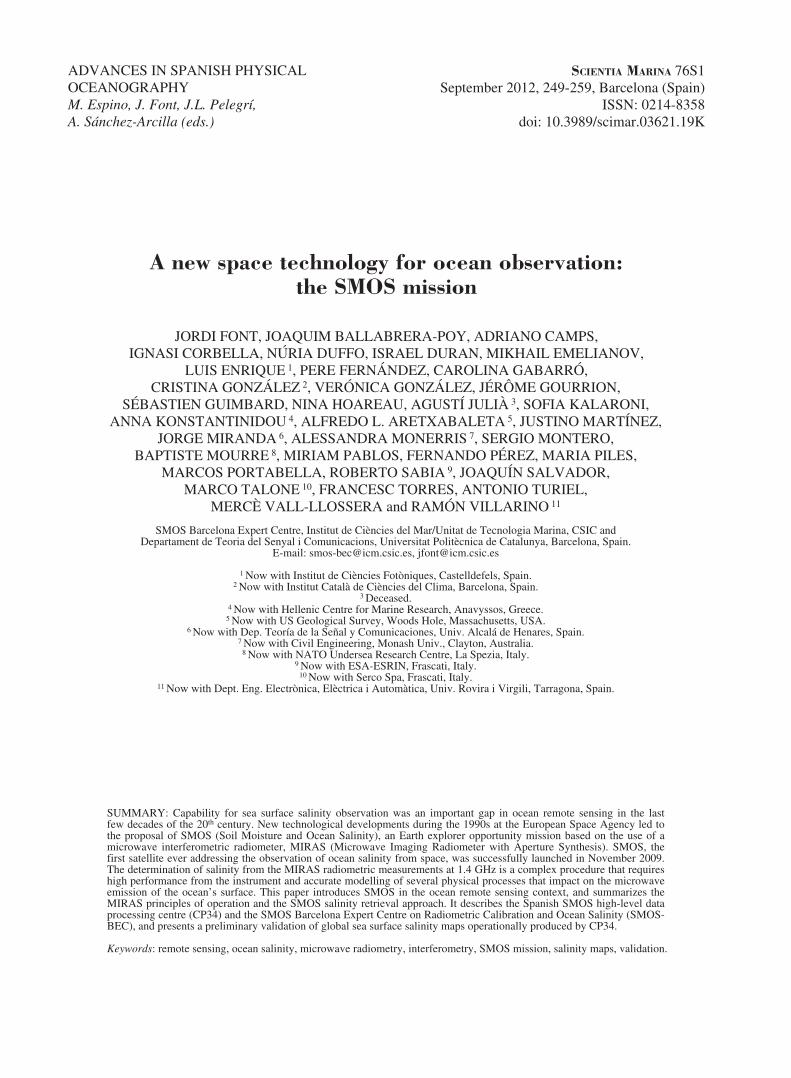
To avoid the need for such a large antenna, the ap-proach implemented in SMOS is to use a large number of small, fully polarimetric antennas (up to 69 with a 20 cm diameter), deployed along three 4 m arms form-ing a Y shape. That is, to exploit the same principle that was used in radioastronomy for more than 50 years to achieve a very big synthetic antenna from an array of antennas (up to 25 m diameter) distributed on the ground along several km. This instrumental design, known as MIRAS (Microwave Imaging Radiometer with Aperture Synthesis, Fig. 1), is the result of an innovative technological concept developed by ESA (McMullan et al. 2008) through the implementation in two dimensions of synthetic aperture radiometry, first proposed for Earth observation by LeVine and Good (1983) and Ruf et al. (1988) as a way to increase the angular resolution of individual antennas.
MIRAS is based on an interferometric technique, for which the raw measurements are the complex cross-correlations between the signals collected by all pairs of antennas. In MIRAS a total of (69×68)/2=2346 dig-ital correlations are measured every 1.2 seconds. After a process of internal and external calibration (Brown et al. 2008), these correlations, together with the av-erage TB measured at low spatial resolution by three dedicated radiometers on board, become the so-called
Fig. 1. – Artist’s view of SMOS in flight configuration. The lower part shows the MIRAS radiometer with its 69 antennas along the
three arms (credit: ESA-AOES Medialab).
252 • J. FONT et al.
SCI. MAR., 76S1, September 2012, 249-259. ISSN 0214-8358 doi: 10.3989/scimar.03621.19K
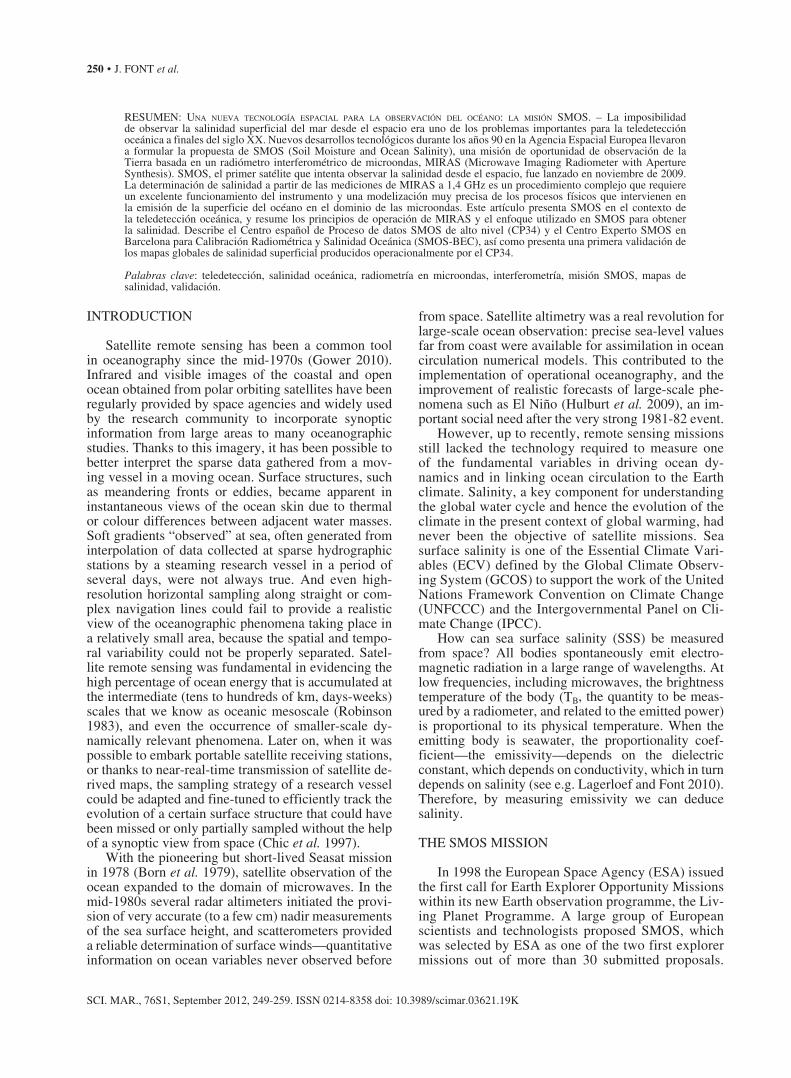
complex visibility. This is a two-dimensional function of the relative distance between antennas in each pair. In a first-order approximation, the source TB image, as a function of the spatial directions (director cosines), is equal to the two-dimensional Fourier transform of this visibility function (Corbella et al. 2004). The TB image is then retrieved from the calibrated visibility by using a suitable inversion algorithm, which is essentially an inverse Fourier transform. In the end, this can be shown to be equivalent to synthesizing a narrow antenna beam at each spatial direction or pixel. The principal advan-tage of this technique is that, unlike a classical total power radiometer, it does not require any mechanical scanning to achieve a complete map of TB: A full image snapshot is obtained at a time each 1.2 seconds in the case of SMOS. On the other hand, the image has mul-tiple incidence angles, mixed polarization and different radiometric quality (sensitivity and resolution) depend-ing on the spatial direction (Fig. 2), and this has to be taken into account in the higher-level data processing. As stated above, this technique is fundamentally the same as the one used in radioastronomy, but now the large field of view present in Earth observation induces non-negligible effects of individual antenna patterns, obliquity factor and decorrelation due to limited band-width (fringe-washing function).
MIRAS is also the first fully polarimetric radiometer that uses the interferometric technique. It measures se-quentially all four Stokes parameters (see e.g. Lahtinen et al. 2003 for the definition) by taking advantage of a specially designed switching schema (Martín-Neira et al. 2002). The availability of the full Stokes vector from SMOS is being used to improve the knowledge of the Faraday rotation induced by the ionosphere and
also other applications related to measuring winds over the ocean.
MIRAS is the first ever space-borne interferometric radiometer, and its development and manufacture have been a large technological challenge. In addition to the innovative instrumental concept itself, it includes many state-of-the-art subsystems and some of them (for example the optical harness) provide solutions that have been implemented in space for the first time. Two years after launch it continues to operate successfully with all parameters within their expected range of vari-ation, except for long-term stability that is measured to be 0.24 K/year when the mission requirement was 0.18 K/year. Although it still has some margin for im-provement, it is already providing fairly well calibrated data to the scientific end users, making an important step forward in the accurate measurement of the soil moisture and ocean salinity at a global scale. Details of MIRAS and interferometric polarimetric radiometry can be found in Font et al. (2010), together with abun-dant bibliographic references.
Retrieving salinity from SMOS microwave measurements
In the configuration selected for SMOS orbits (755 km height, antenna plane tilted 32.5º from horizontal), in a trade-off between soil moisture and ocean salin-ity scientific and operational requirements, the result of the interferometric process for each of the four po-larimetric components (Font et al. 2008) is a curved hexagonal field of view, almost 1000 km wide, formed by pixels from 30 to 100 km, with varying incidence angle and radiometric resolution depending on their location with respect to the antenna boresight in each snapshot. The reconstructed image is remapped to a 15-km regular grid, although there is signal correlation between adjacent grid points.
The approach to determining the salinity of the ocean surface imaged at each SMOS overpass is based on a convergence loop that compares, for any single spot on the surface, the TB measured at different an-gles while the spot is inside the field of view in suc-cessive satellite snapshots with the TB theoretically emitted by the surface at the corresponding incidence angles. The latter is computed by a forward model of the ocean emission taking into account the actual seawater conditions. During the iterative estimation, the value of SSS is corrected from a first guess until an optimal fit with the measured TB is reached. The relationship between temperature, salinity, angle of observation, frequency and the radiation polariza-tion state with the microwave TB is given, from basic principles, only for a flat-sea condition (Klein and Swift 1977). The effect of the sea roughness upon the TB, the main source of geophysical error in salinity remote sensing (Yueh et al. 2001), is taken into ac-count as a correction to the flat-sea value. Moreover, further corrections must be made considering that
Fig. 2. – SMOS field of view. Incidence angle (dashed lines) ranges from 0° to 65°, spatial resolution (dashed-dotted lines) from 32 to 100 km, and radiometric sensitivity (dashed-dotted) from 2.5 K at antenna boresight to 5 K (generated by the UPC SMOS End-to-end
Performance Simulator, SEPS).
SMOS, A NEW SPACE TECHNOLOGY FOR OCEAN OBSERVATION • 253
SCI. MAR., 76S1, September 2012, 249-259. ISSN 0214-8358 doi: 10.3989/scimar.03621.19K
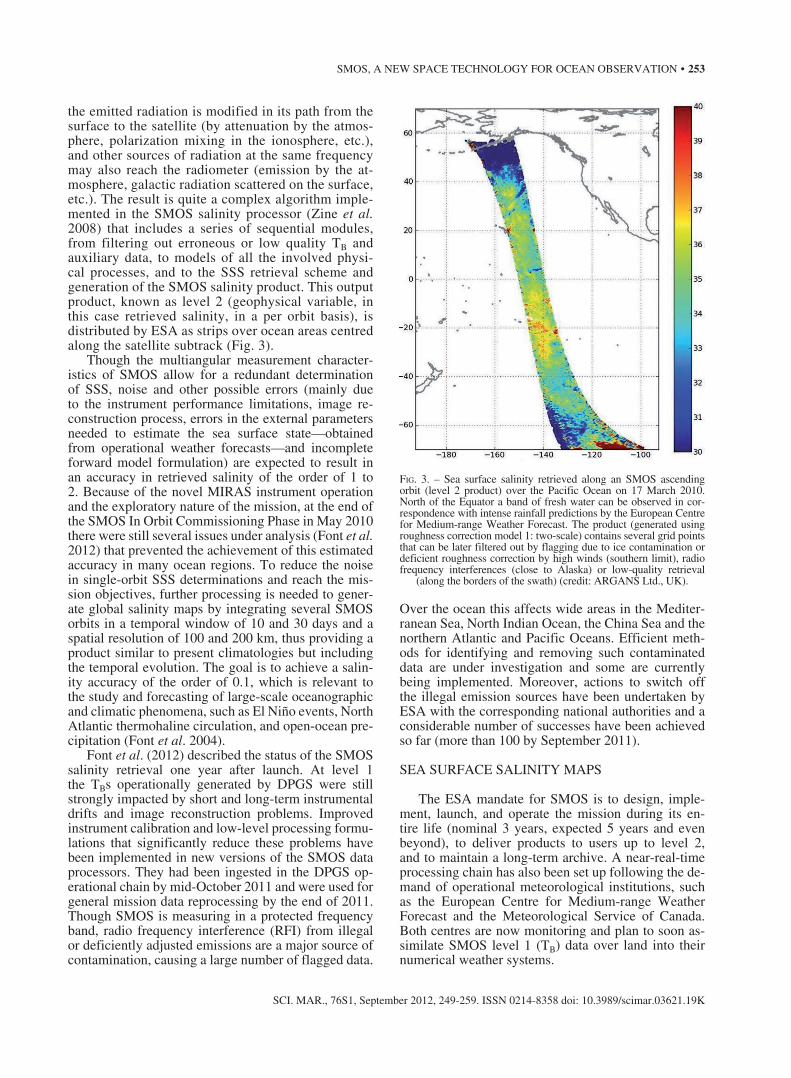
the emitted radiation is modified in its path from the surface to the satellite (by attenuation by the atmos-phere, polarization mixing in the ionosphere, etc.), and other sources of radiation at the same frequency may also reach the radiometer (emission by the at-mosphere, galactic radiation scattered on the surface, etc.). The result is quite a complex algorithm imple-mented in the SMOS salinity processor (Zine et al. 2008) that includes a series of sequential modules, from filtering out erroneous or low quality TB and auxiliary data, to models of all the involved physi-cal processes, and to the SSS retrieval scheme and generation of the SMOS salinity product. This output product, known as level 2 (geophysical variable, in this case retrieved salinity, in a per orbit basis), is distributed by ESA as strips over ocean areas centred along the satellite subtrack (Fig. 3).
Though the multiangular measurement character-istics of SMOS allow for a redundant determination of SSS, noise and other possible errors (mainly due to the instrument performance limitations, image re-construction process, errors in the external parameters needed to estimate the sea surface state—obtained from operational weather forecasts—and incomplete forward model formulation) are expected to result in an accuracy in retrieved salinity of the order of 1 to 2. Because of the novel MIRAS instrument operation and the exploratory nature of the mission, at the end of the SMOS In Orbit Commissioning Phase in May 2010 there were still several issues under analysis (Font et al. 2012) that prevented the achievement of this estimated accuracy in many ocean regions. To reduce the noise in single-orbit SSS determinations and reach the mis-sion objectives, further processing is needed to gener-ate global salinity maps by integrating several SMOS orbits in a temporal window of 10 and 30 days and a spatial resolution of 100 and 200 km, thus providing a product similar to present climatologies but including the temporal evolution. The goal is to achieve a salin-ity accuracy of the order of 0.1, which is relevant to the study and forecasting of large-scale oceanographic and climatic phenomena, such as El Niño events, North Atlantic thermohaline circulation, and open-ocean pre-cipitation (Font et al. 2004).
Font et al. (2012) described the status of the SMOS salinity retrieval one year after launch. At level 1 the TBs operationally generated by DPGS were still strongly impacted by short and long-term instrumental drifts and image reconstruction problems. Improved instrument calibration and low-level processing formu-lations that significantly reduce these problems have been implemented in new versions of the SMOS data processors. They had been ingested in the DPGS op-erational chain by mid-October 2011 and were used for general mission data reprocessing by the end of 2011. Though SMOS is measuring in a protected frequency band, radio frequency interference (RFI) from illegal or deficiently adjusted emissions are a major source of contamination, causing a large number of flagged data.
Over the ocean this affects wide areas in the Mediter-ranean Sea, North Indian Ocean, the China Sea and the northern Atlantic and Pacific Oceans. Efficient meth-ods for identifying and removing such contaminated data are under investigation and some are currently being implemented. Moreover, actions to switch off the illegal emission sources have been undertaken by ESA with the corresponding national authorities and a considerable number of successes have been achieved so far (more than 100 by September 2011).
SEA SURFACE SALINITY MAPS
The ESA mandate for SMOS is to design, imple-ment, launch, and operate the mission during its en-tire life (nominal 3 years, expected 5 years and even beyond), to deliver products to users up to level 2, and to maintain a long-term archive. A near-real-time processing chain has also been set up following the de-mand of operational meteorological institutions, such as the European Centre for Medium-range Weather Forecast and the Meteorological Service of Canada. Both centres are now monitoring and plan to soon as-similate SMOS level 1 (TB) data over land into their numerical weather systems.
Fig. 3. – Sea surface salinity retrieved along an SMOS ascending orbit (level 2 product) over the Pacific Ocean on 17 March 2010. North of the Equator a band of fresh water can be observed in cor-respondence with intense rainfall predictions by the European Centre for Medium-range Weather Forecast. The product (generated using roughness correction model 1: two-scale) contains several grid points that can be later filtered out by flagging due to ice contamination or deficient roughness correction by high winds (southern limit), radio frequency interferences (close to Alaska) or low-quality retrieval
(along the borders of the swath) (credit: ARGANS Ltd., UK).
254 • J. FONT et al.
SCI. MAR., 76S1, September 2012, 249-259. ISSN 0214-8358 doi: 10.3989/scimar.03621.19K
The Spanish SMOS high-level processing centre (CP34) and the SMOS Barcelona Expert Centre (SMOS-BEC)
To generate higher level products, both France and Spain committed to design, fund, implement and oper-ate additional SMOS data processing centres. While these additional products are initially global gridded maps (level 3), later products will be proposed through the integration of the SMOS data with other sources of information (level 4), both from Earth observation satellites, such as the US-Argentina Aquarius salin-ity mission (Lagerloef et al. 2008) launched in June 2011, and from in situ measurement systems. The two processing centres have a data production and distri-bution component (PDC) plus expertise centres (EC) responsible for proposing, designing and testing the processing algorithms. The French PDC Centre Aval de Traitement de Données SMOS (CATDS) is installed in the Institut français de recherche pour l’exploitation de la mer (IFREMER, Brest), while the Spanish Centro de Proceso de datos SMOS de niveles 3 y 4 (CP34) is operating at the ESAC station next to the official ESA SMOS DPGS.
For ocean products, the objective of level 3 process-ing is to improve the quality of the retrieved SSS through noise reduction and to create more manageable products. In the present implementation six different salinity products are provided by the CP34:
Product 1: Characterized by keeping the maximum spatial resolution (15 km) to locate salinity gradients. Only temporal weighted averaging of the retrieved SSS is performed according to the measurement uncertainty for each grid point at level 2. Product 1 is calculated every 3 days over the last 10 days.
Product 1b: Characterized by high spatial resolution (30 km). Spatio-temporal weighted averaging of SSS is performed according to the measurement uncertainty at level 2. Product 1b is calculated every 3 days over the last 3 days.
Product 2: Spatial and temporal averaging using the optimal interpolation method (objective analysis) over the level 2 products. The product fulfils the Glo-bal Ocean Data Assimilation Experiment (GODAE) resolution requirements for salinity and is defined on a regular 200-km-spaced grid and calculated every 10 days over the last 10 days.
Product 3: Spatial and temporal averaging using the optimal interpolation method on the level 2 prod-ucts. The product is defined to be compared to existing climatologies and is provided in a regular grid spaced 100 km and calculated every 10 days over the last 30 days. Both products 2 and 3 use the World Ocean Atlas (WOA) monthly climatology (Antonov et al. 2010) as the background field for the objective analysis.
Product 3a: Seasonal average of product 3, calculat-ed every 3 months over the last 3 months (JFM, AMJ, JAS, and OND). The spatial resolution is the same as for product 3 (100 km).
Product 3b: Yearly average of product 3, calculated every year over the last 12 months. The spatial resolu-tion is the same as for product 3 (100 km).
Three versions of each product are generated using ascending, descending, and both types of orbits (Fig. 4). This is because of the differences between ascend-ing (morning, 6 am at the Equator) and descending (evening, 6 pm at the Equator) passes, in terms not only of ocean conditions (possible vertical stratification in the evening due to diurnal heating), but also of exter-nal sources radiation (heating on the instrument due to relative sun position, different situation of galactic noise in the field of view). In each level 3 SSS prod-uct, the absolute salinity value is accompanied by its anomaly (difference between the absolute value and a predefined temporal mean), the predefined mean value, and computation errors for both the absolute and mean values. As in the level 2 data delivered by DPGS, the CP34 level 3 products provide three different SSS val-ues because the SMOS salinity retrieval algorithm uses three alternative options for the roughness correction of the flat-sea emission (Zine et al. 2008). Two of these correction models are based on theoretical approaches, and one is derived from statistical fitting of experimen-tal observations obtained previous to SMOS launch (Camps et al. 2004). With the analysis of SMOS data acquired during the commissioning phase and beyond, these models have been tuned or modified (Font et al. 2012, Guimbard et al. 2012) and will probably con-verge in the future to a single formulation.
The SMOS Barcelona Expert Centre on Radiomet-ric Calibration and Ocean Salinity (SMOS-BEC, http://www.smos-bec.icm.csic.es/) acts as an expertise centre for the CP34. The SMOS-BEC is a joint initiative of the Spanish National Research Council (CSIC) and the Universitat Politècnica de Catalunya (UPC). It was established in 2007 and is formed by scientists, engi-neers, technicians and PhD students from both institu-tions involved in SMOS activities.
The SMOS-BEC researchers contribute to ESA activities by acting as an Expert Support Laboratory for level 1 (UPC) and level 2 salinity (ICM) during the SMOS mission development, the commissioning phase after launch, and the operations phase. At present, in ad-dition to analysing and proposing solutions to the vari-ous aspects of the data processing at all levels that still require improvement, the SMOS-BEC team is studying alternative image reconstruction or salinity retrieval ap-proaches, and possible new products for the CP34, and preparing the exploitation of SMOS data, such as their assimilation into ocean circulation numerical models. Although it is not one of its primary focuses, the group is also addressing the analysis of SMOS data over land.
SMOS, A NEW SPACE TECHNOLOGY FOR OCEAN OBSERVATION • 255
SCI. MAR., 76S1, September 2012, 249-259. ISSN 0214-8358 doi: 10.3989/scimar.03621.19K
Users interested in CP34 products can register at http://www.cp34-users.cmima.csic.es/. Maps and NetCDF files areare directly available at http://tarod.cmima.csic.es.
Validation of global SMOS sea surface salinity maps
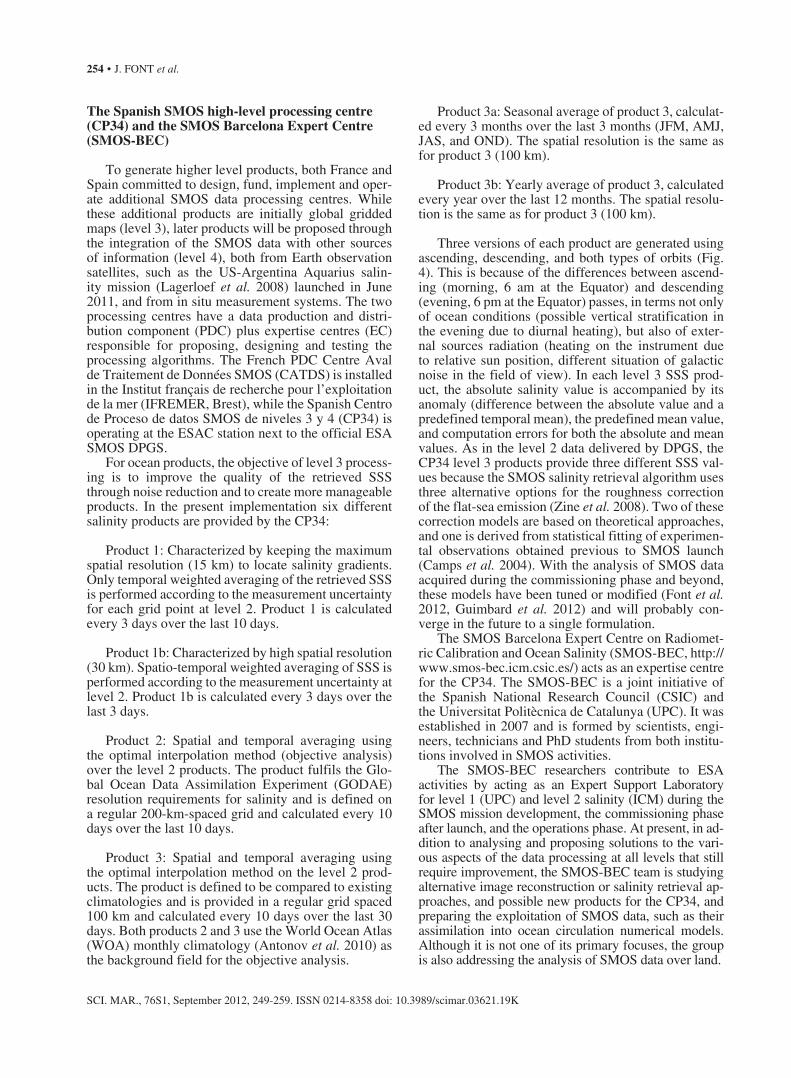
Figure 4 is an SSS map (CP34 Product 1) generated from ascending and descending orbits during 10 days in August 2010. The original data have been reprocessed using the latest versions of level 1, level 2 and level 3 SMOS processors available in September 2011 that introduce better instrument calibrations and several improvements in the image reconstruction and salin-ity retrieval. The map displays the main features of the climatological salinity for August, as reported by the WOA 2009 (Antonov et al. 2010), e.g. high salinities in the centre of the subtropical gyres, with maximum values in the N. Atlantic, low salinities in the N. and equatorial Pacific, Indonesia and around the southern cone of America, the dipole in the N. Indian Ocean, etc. But it also shows specific salient details such as the plume of the Amazon meandering eastwards along the equatorial Atlantic and a marked strip of salini-ties lower than usual reaching the central and western equatorial Pacific.
However, the map evidences some of the problems that the SSS determination by SMOS is still facing. As explained above, the RFI prevents salinity from being retrieved in several areas, which are masked in white on the map mainly around Eurasia and the Gulf
of Guinea. Alternative retrieval methods with a more accurate filtering of corrupted angular measurements are being tested to expand the areas where SSS can be successfully retrieved. Another problem that still requires investigation and processing improvement at level 1 is the contamination over ocean areas due to the Gibbs phenomenon caused by the large TB differ-ence in the land/ocean and ice/ocean transitions. This can be observed in the anomalously high SSS along the border of the ice extension in the Southern Ocean, which is also masked. A less evident problem that af-fects the SMOS level 3 maps is the loss of sensitivity of the microwave emission to salinity in cold waters and a lower performance of the present roughness effect cor-rections by high winds.
As mentioned herein, SMOS is a completely new Earth observation mission from both the instrumental and algorithmic points of view. Therefore, the valida-tion of the products it provides is a fundamental step to demonstrate the feasibility of the proposed approach for future operational missions to regularly provide soil moisture and ocean salinity. Evaluation of SMOS salin-ity data can be better performed using averaged maps, such as the CP34 level 3 products (Fig. 4), than using the much noisier single level 2 products distributed by ESA (Fig. 3). In a preliminary step the SMOS-derived SSS maps have been compared to equivalent products from in situ observations, such as WOA climatologies and the interpolated maps from the Argo array of drift-ing profiling floats, which has the advantage of provid-ing salinity distributions for the same temporal window
Fig. 4. – SMOS sea surface salinity map for 13 to 22 August 2010 (CP34 Product 1) built from both ascending and descending orbits. Data reprocessed at SMOS-BEC using the latest versions of level 1, level 2 and level 3 SMOS processors available in September 2011. The selected
roughness correction model is number 3: semi-empirical formulation developed by SMOS-BEC (Guimbard et al. 2012)
256 • J. FONT et al.
SCI. MAR., 76S1, September 2012, 249-259. ISSN 0214-8358 doi: 10.3989/scimar.03621.19K
as SMOS measurements instead of climatological av-eraged values.
We present here the first global validation of SMOS SSS maps by computing their differences against the 7.5-m-deep salinity field interpolated from Argo data. The Argo deep drifting floats record temperature and salinity profiles in the range 0 to 2000 m once every ten days and transmit the data when they reach the surface. However, to prevent the sensors from being negatively impacted by particles close to the surface, the water pumping system stops operating through a pressure control, so it does not measure in the top 5 to 10 m. In-terpolating the salinity profile at the 7.5 m depth makes the estimate of the uppermost salinity value more ro-bust than the exotic salinity values often found in the Argo profiles near the surface. However, as the ocean layer sensed by SMOS is only the first cm because of the frequency used (Srokosz 1995), the validation with Argo has to be taken with the prevention that a surface vertical salinity gradient may exist and be relevant in areas affected by heavy rainfall.
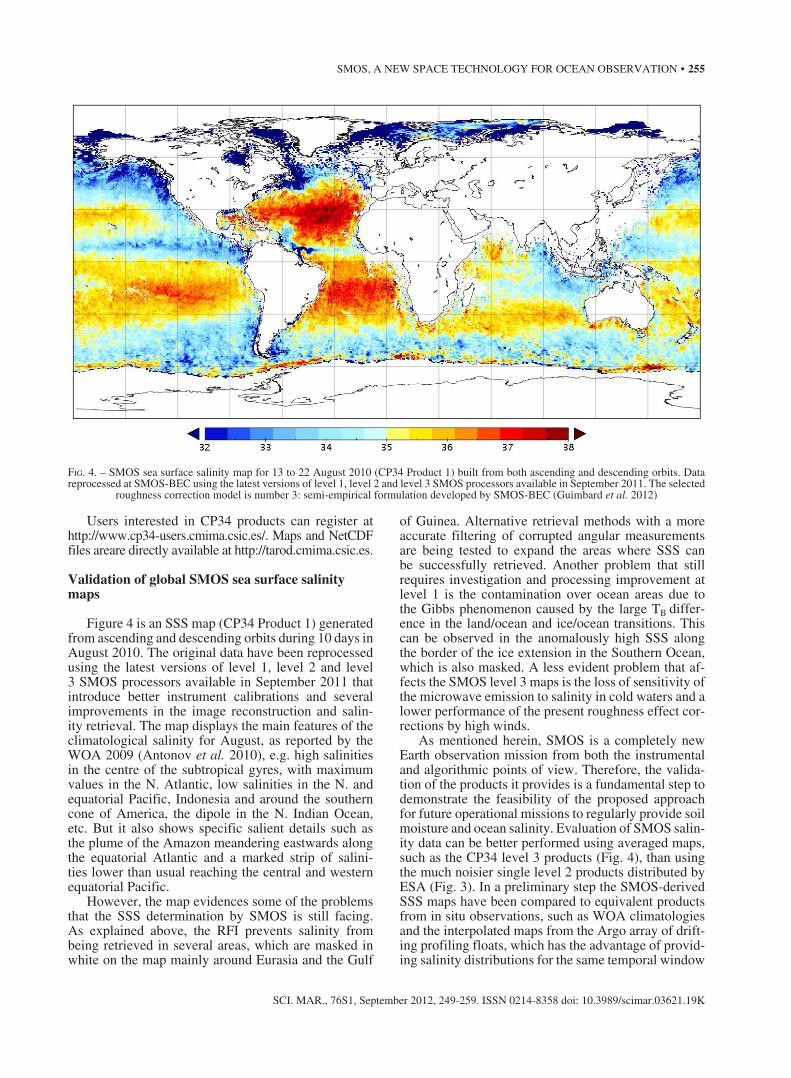
While two complementary validation approaches could be used to validate SMOS (that is, measuring the spatial and temporal coherence of the reconstruct-ed salinity and the similarity to the in situ data), here only the resemblance to the in situ Argo data is inves-tigated. For this global validation exercise we have used the reprocessed August 2010 SMOS measure-ments to take advantage of the latest improvements in the processors. The SMOS salinity values not flagged as incorrect by the level 2 processor, are binned in 0.5° by 0.5° boxes before being compared to the sur-face value of Argo. For this validation of CP34 10-day SSS maps, the 11-20 August SMOS salinities are compared against all the valid August surface salinity data. This provided a total of 7009 pairs of SMOS-Argo salinity values.
The two first panels in Figure 5 display the SMOS and Argo salinities at the selected points, while the third one shows the difference of SMOS minus Argo at the same points. Statistics over the whole data set indicate that the SMOS-retrieved SSS has a fresh bias of 0.01 compared with Argo, while the root mean square of the differences is about 0.7. These values are larger than the salinity differences between the 0 to 5 m and the 5 to 10 m layers measured by Boutin and Martin (2006), so we can consider in a preliminary approximation that the Argo salinity field at 7.5 m is a good reference for validating the SMOS CP34 SSS maps.
The geographical distribution of the differences clearly indicates that they are not random, because the largest values (positive or negative) tend to be con-centrated in specific regions, while most of the map shows discrepancies below 0.5. A salient feature is the accumulation of positively biased values around 50ºS to 60ºS along the border of the sea-ice-covered area, which may be due to contaminated SMOS meas-urements (as reported in the description of Figure 4) that are not properly filtered out by quality criteria. A
large group of negative anomalies can be seen in the northernmost Atlantic, close to the Arctic. These can be explained by RFI contamination not fully detected/flagged by the level 1 and 2 processors, although they may also be influenced by the above-mentioned loss of sensitivity of TB to SSS under low SST conditions. Sig-
Fig. 5. – Collocated surface salinity determinations on 11 to 20 August 2011 from a SMOS CP34 level 3 product (first panel) and the Argo array of profiling floats at 7.5 m below the surface (second panel). The third panel shows the difference between the two SSS fields and indicates that relevant disagreements are concentrated in specific areas affected by special environmental conditions or by problems in the SMOS level 1 and 2 data processing. The last panel
is a histogram of the SMOS-Argo SSS differences.
SMOS, A NEW SPACE TECHNOLOGY FOR OCEAN OBSERVATION • 257
SCI. MAR., 76S1, September 2012, 249-259. ISSN 0214-8358 doi: 10.3989/scimar.03621.19K
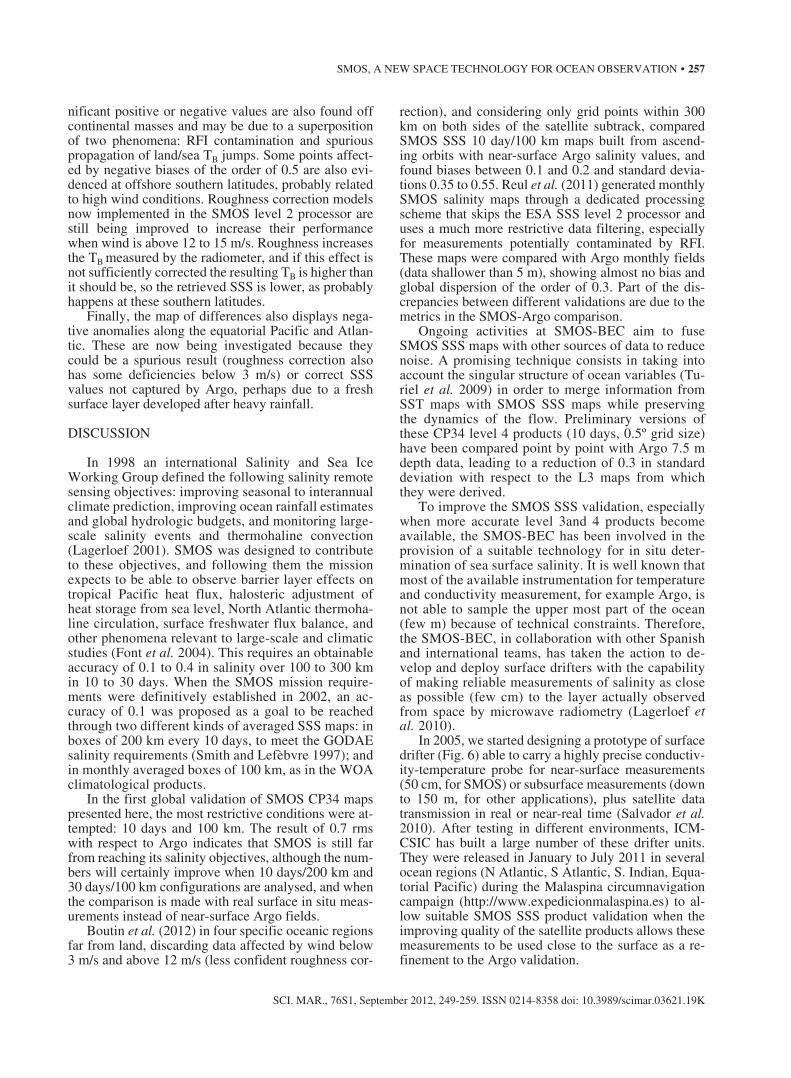
nificant positive or negative values are also found off continental masses and may be due to a superposition of two phenomena: RFI contamination and spurious propagation of land/sea TB jumps. Some points affect-ed by negative biases of the order of 0.5 are also evi-denced at offshore southern latitudes, probably related to high wind conditions. Roughness correction models now implemented in the SMOS level 2 processor are still being improved to increase their performance when wind is above 12 to 15 m/s. Roughness increases the TB measured by the radiometer, and if this effect is not sufficiently corrected the resulting TB is higher than it should be, so the retrieved SSS is lower, as probably happens at these southern latitudes.
Finally, the map of differences also displays nega-tive anomalies along the equatorial Pacific and Atlan-tic. These are now being investigated because they could be a spurious result (roughness correction also has some deficiencies below 3 m/s) or correct SSS values not captured by Argo, perhaps due to a fresh surface layer developed after heavy rainfall.
DISCUSSION
In 1998 an international Salinity and Sea Ice Working Group defined the following salinity remote sensing objectives: improving seasonal to interannual climate prediction, improving ocean rainfall estimates and global hydrologic budgets, and monitoring large-scale salinity events and thermohaline convection (Lagerloef 2001). SMOS was designed to contribute to these objectives, and following them the mission expects to be able to observe barrier layer effects on tropical Pacific heat flux, halosteric adjustment of heat storage from sea level, North Atlantic thermoha-line circulation, surface freshwater flux balance, and other phenomena relevant to large-scale and climatic studies (Font et al. 2004). This requires an obtainable accuracy of 0.1 to 0.4 in salinity over 100 to 300 km in 10 to 30 days. When the SMOS mission require-ments were definitively established in 2002, an ac-curacy of 0.1 was proposed as a goal to be reached through two different kinds of averaged SSS maps: in boxes of 200 km every 10 days, to meet the GODAE salinity requirements (Smith and Lefèbvre 1997); and in monthly averaged boxes of 100 km, as in the WOA climatological products.
In the first global validation of SMOS CP34 maps presented here, the most restrictive conditions were at-tempted: 10 days and 100 km. The result of 0.7 rms with respect to Argo indicates that SMOS is still far from reaching its salinity objectives, although the num-bers will certainly improve when 10 days/200 km and 30 days/100 km configurations are analysed, and when the comparison is made with real surface in situ meas-urements instead of near-surface Argo fields.
Boutin et al. (2012) in four specific oceanic regions far from land, discarding data affected by wind below 3 m/s and above 12 m/s (less confident roughness cor-
rection), and considering only grid points within 300 km on both sides of the satellite subtrack, compared SMOS SSS 10 day/100 km maps built from ascend-ing orbits with near-surface Argo salinity values, and found biases between 0.1 and 0.2 and standard devia-tions 0.35 to 0.55. Reul et al. (2011) generated monthly SMOS salinity maps through a dedicated processing scheme that skips the ESA SSS level 2 processor and uses a much more restrictive data filtering, especially for measurements potentially contaminated by RFI. These maps were compared with Argo monthly fields (data shallower than 5 m), showing almost no bias and global dispersion of the order of 0.3. Part of the dis-crepancies between different validations are due to the metrics in the SMOS-Argo comparison.
Ongoing activities at SMOS-BEC aim to fuse SMOS SSS maps with other sources of data to reduce noise. A promising technique consists in taking into account the singular structure of ocean variables (Tu-riel et al. 2009) in order to merge information from SST maps with SMOS SSS maps while preserving the dynamics of the flow. Preliminary versions of these CP34 level 4 products (10 days, 0.5º grid size) have been compared point by point with Argo 7.5 m depth data, leading to a reduction of 0.3 in standard deviation with respect to the L3 maps from which they were derived.
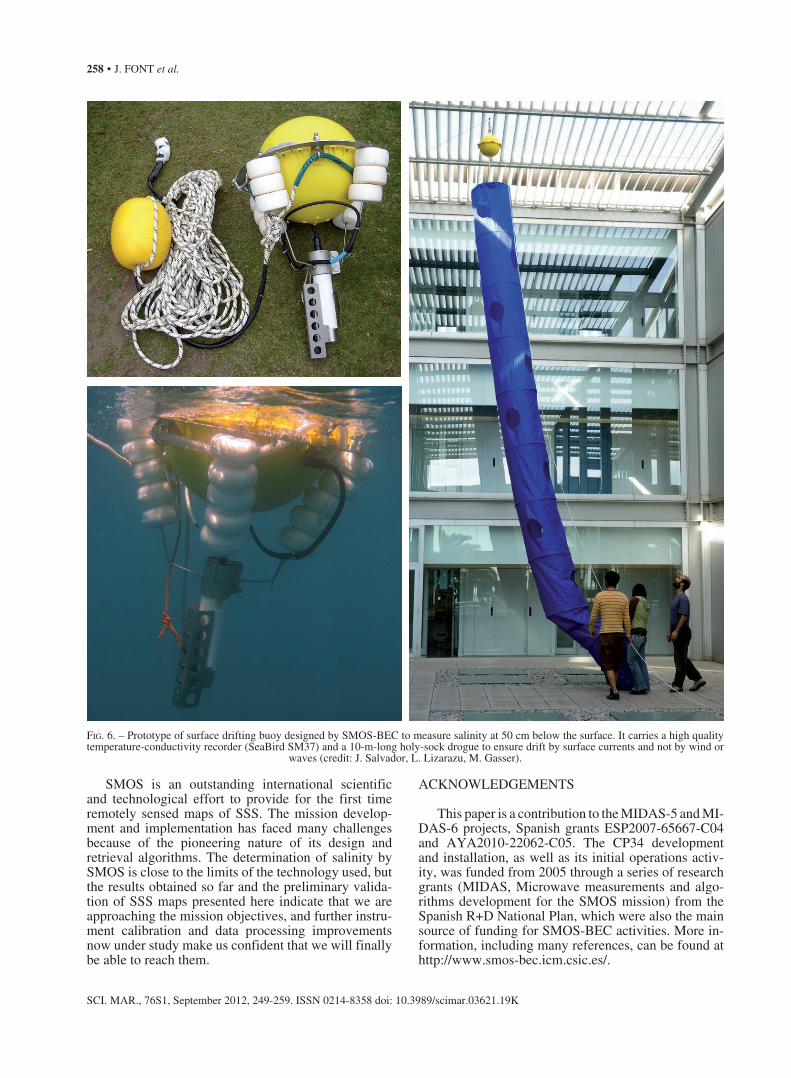
To improve the SMOS SSS validation, especially when more accurate level 3and 4 products become available, the SMOS-BEC has been involved in the provision of a suitable technology for in situ deter-mination of sea surface salinity. It is well known that most of the available instrumentation for temperature and conductivity measurement, for example Argo, is not able to sample the upper most part of the ocean (few m) because of technical constraints. Therefore, the SMOS-BEC, in collaboration with other Spanish and international teams, has taken the action to de-velop and deploy surface drifters with the capability of making reliable measurements of salinity as close as possible (few cm) to the layer actually observed from space by microwave radiometry (Lagerloef et al. 2010).
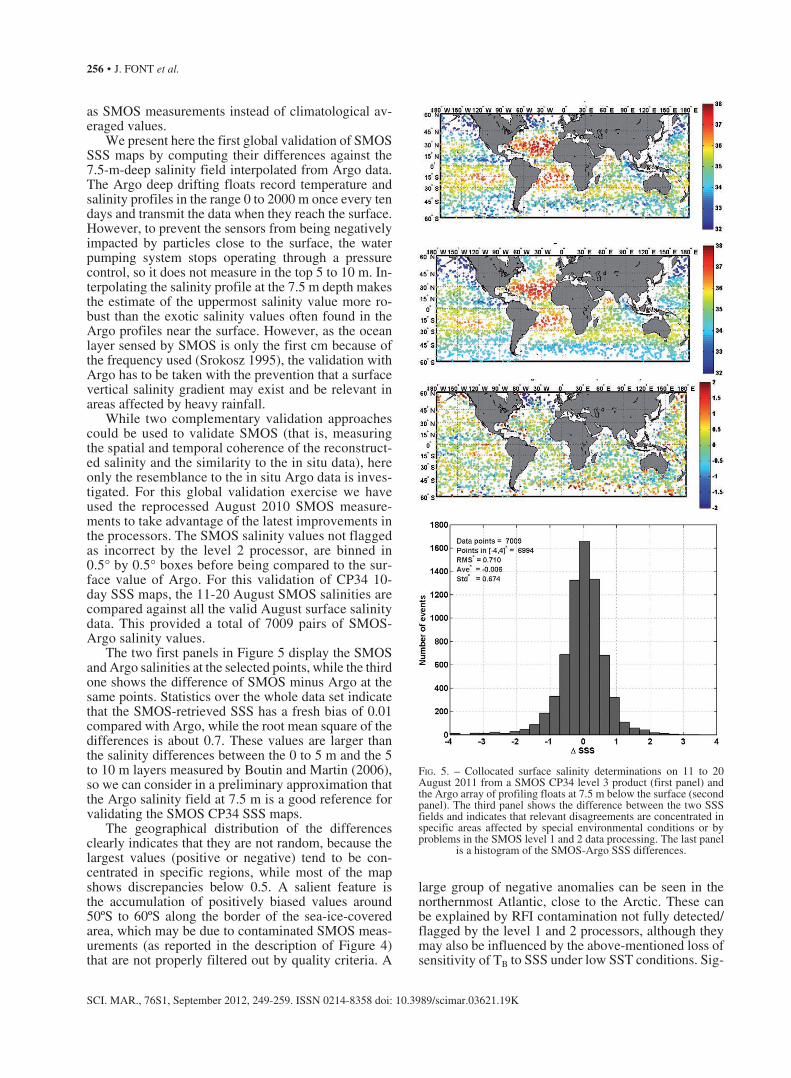
In 2005, we started designing a prototype of surface drifter (Fig. 6) able to carry a highly precise conductiv-ity-temperature probe for near-surface measurements (50 cm, for SMOS) or subsurface measurements (down to 150 m, for other applications), plus satellite data transmission in real or near-real time (Salvador et al. 2010). After testing in different environments, ICM-CSIC has built a large number of these drifter units. They were released in January to July 2011 in several ocean regions (N Atlantic, S Atlantic, S. Indian, Equa-torial Pacific) during the Malaspina circumnavigation campaign (http://www.expedicionmalaspina.es) to al-low suitable SMOS SSS product validation when the improving quality of the satellite products allows these measurements to be used close to the surface as a re-finement to the Argo validation.
258 • J. FONT et al.
SCI. MAR., 76S1, September 2012, 249-259. ISSN 0214-8358 doi: 10.3989/scimar.03621.19K
SMOS is an outstanding international scientific and technological effort to provide for the first time remotely sensed maps of SSS. The mission develop-ment and implementation has faced many challenges because of the pioneering nature of its design and retrieval algorithms. The determination of salinity by SMOS is close to the limits of the technology used, but the results obtained so far and the preliminary valida-tion of SSS maps presented here indicate that we are approaching the mission objectives, and further instru-ment calibration and data processing improvements now under study make us confident that we will finally be able to reach them.
ACKNOWLEDGEMENTS
This paper is a contribution to the MIDAS-5 and MI-DAS-6 projects, Spanish grants ESP2007-65667-C04 and AYA2010-22062-C05. The CP34 development and installation, as well as its initial operations activ-ity, was funded from 2005 through a series of research grants (MIDAS, Microwave measurements and algo-rithms development for the SMOS mission) from the Spanish R+D National Plan, which were also the main source of funding for SMOS-BEC activities. More in-formation, including many references, can be found at http://www.smos-bec.icm.csic.es/.
Fig. 6. – Prototype of surface drifting buoy designed by SMOS-BEC to measure salinity at 50 cm below the surface. It carries a high quality temperature-conductivity recorder (SeaBird SM37) and a 10-m-long holy-sock drogue to ensure drift by surface currents and not by wind or
waves (credit: J. Salvador, L. Lizarazu, M. Gasser).
SMOS, A NEW SPACE TECHNOLOGY FOR OCEAN OBSERVATION • 259
SCI. MAR., 76S1, September 2012, 249-259. ISSN 0214-8358 doi: 10.3989/scimar.03621.19K
REFERENCES
Antonov J. I., Seidov D., Boyer T.P., Locarnini R.A., Mishonov A.V., Garcia H.E., Baranova O.K., Zweng M.M., Johnson D.R. 2010. World Ocean Atlas 2009, Volume 2: Salinity. In: Levitus S. (ed.) NOAA Atlas NESDIS 69, U.S. Government Printing Of-fice, Washington, D.C., 184 pp.
Born G.H., Dunne J.A., Lame D.B. 1979. Seasat mission overview. Science 204: 1405-1406.
Boutin J., Martin N. 2006. ARGO upper salinity measurements: Perspectives for L-band radiometers calibration and retrieved sea surface salinity validation, IEEE Geosci. Remote S. 3: 202-206.
Boutin J., Martin N., Yin X., Font J., Reul N., Spurgeon P. 2012. First assessment of SMOS measurements over open ocean: Part II sea surface salinity. IEEE T. Geosci. Remote 50: 1662-1674.
Brown M.A., Torres F., Corbella I., Colliander A. 2008. SMOS calibration. IEEE T. Geosci. Remote 46: 646-658.
Camps A., Font J., Vall-llossera M., Gabarró C., Corbella I., Duffo N., Torres F., Blanch S., Aguasca A., Villarino R., Enrique L., Miranda J., Arenas J.J., Julià A., Etcheto J., Caselles V., Weill A., Boutin J., Contardo S., Niclòs R., Rivas R., Reising S.C., Wursteisen P., Berger M., Martín-Neira M. 2004. The WISE 2000 and 2001 field experiments in support of the SMOS mis-sion: sea surface L-band brightness temperature observations and their application to sea surface salinity retrieval. IEEE T. Geosci. Remote 42: 804-823.
Chic O., Font J., Sandven S. 1997. ERS-2 SAR near real time data used in the sampling strategy of an oceanographic cruise in the western Mediterranean. In: Guyenne T.D., Danesy D. (eds.), Space at the service of our environment. 3rd ERS-1 Symposium, ESA Publication SP-414, pp. 1433-1438.
Corbella I., Duffo N., Vall-llossera M., Camps A., Torres F. 2004. The visibility function in interferometric aperture synthesis ra-diometry. IEEE T. Geosci. Remote 42: 1677-1682.
Drinkwater M., Kerr Y.H., Font J., Berger M. 2009. Exploring the water cycle of the blue planet. The Soil Moisture and Ocean Salinity mission. ESA Bull-Eur Space 137: 6-15.
Font J., Lagerloef G.S.E., Le Vine D.M., Camps A., Zanifé O.Z. 2004. The determination of surface salinity with the European SMOS space mission. IEEE T. Geosci. Remote 42: 2196-2205.
Font J., Camps A., Ballabrera-Poy J. 2008. Microwave aperture synthesis radiometry: Setting the path for operational sea salin-ity measurement from space. In: Barale V., Gade M. (eds.), Re-mote sensing of European seas. Springer-Verlag, pp. 223-238.
Font J., Camps A., Borges A., Martín-Neira M., Boutin J., Reul N., Kerr Y.H., Hahne A., Mecklenburg S. 2010. SMOS: The challenging measurement of sea surface salinity from space. P. IEEE 98: 649-665.
Font J., Boutin J., Reul N., Spurgeon P., Ballabrera-Poy J., Chuprin A., Gabarró C., Gourrion J., Hénocq C., Lavender S., Martin N., Martínez J., McCulloch M., Meirold-Mautner I., Mugérin C., Petitcolin F., Portabella M., Sabia R., Talone M., Tenerelli J., Turiel A., Vergely J.L., Waldteufel P., Yin X., Zine S., Delwart S. 2012. SMOS first data analysis for sea surface salinity deter-mination. Int. J. Rem. Sens. (in press).
Gower J.F.R. 2010. Oceans from space, a once-a-decade review of progress: Satellite oceanography in a changing world. In: Barale V., Gower J.F.R., Alberotanza L. (eds.), Oceanography from Space. Springer Science+Business Media B.V., pp. 1-12.
Guimbard S., Gourrion J., Portabella M., Turiel A., Gabarró C., Font J. 2012. SMOS semi-empirical ocean forward model ad-justment. IEEE Trans. Geosci. Remote 50: 1676-1687.
Hurlburt H.E., Brassington G.B., Drillet Y., Kamachi M., Benkiran M., Bourdallé-Badie R., Chassignet E.P., Jacobs G.A., Le Gal-loudec O., Lellouche J.M., Metzger E.J., Oke P.R., Pugh T.F., Schiller A., Smedstad O.M., Tranchant B., Tsujino H., Usui N., Wallcraft A.J. 2009. High-resolution global and basin-scale ocean analyses and forecasts. Oceanography 22: 110-127.
Kerr Y.H., Waldteufel P., Wigneron J.P., Martinuzzi J.M., Font J., Berger M. 2001. Soil moisture from space: the Soil Moisture and Ocean Salinity (SMOS) mission. IEEE T. Geosci. Remote 39: 1729-1735.
Kerr Y.H., Waldteufel P., Wigneron J.P., Delwart S., Cabot F., Boutin J., Escorihuela M.J., Font J., Reul N., Gruhier C., Juglea S.E., Drinkwater M.R., Hahne A., Martín-Neira M., Mecklen-burg S. 2010. The SMOS mission: New tool for monitoring key
elements of the global water cycle. P. IEEE 98: 666-687.Klein L.A., Swift C.T. 1977. Improved model for dielectric con-
stant of sea-water at microwave frequencies. IEEE T. Antenn. Propag. 25: 104-111.
Lagerloef G.S.E. 2001. Satellite Measurements of Salinity. In: Steele J., Thorpe S., Turekian K. (eds.) Encyclopedia of Ocean Sciences. Academic Press, pp. 2511-2516.
Lagerloef G.S.E., Colomb F.R., Le Vine D.M., Wentz F., Yueh S.H., Ruf C., Lilly J., Gunn J., Chao Y., deCharon A., Feldman G., Swift C.T. 2008. The Aquarius/SAC-D mission designed to meet the salinity remote sensing challenge. Oceanography 21: 68-81.
Lagerloef G.S.E., Boutin, J. Chao Y., Delcroix T., Font J., Niiler N., Reul N., Riser S., Schmitt R., Stammer D., Wentz F. 2010. Resolving the global surface salinity field and variations by in-tegrating satellite and in situ observations. In: Hall J., Harrison D.E., Stammer D. (eds.), Proceedings of OceanObs’09: Sus-tained Ocean Observations and Information for Society (Vol. 2), ESA Publication WPP-306 II-1-51
Lagerloef G.S.E., Font J. 2010. SMOS and Aquarius/SAC-D missions: The era of spaceborne salinity measurements is about to begin. In: Barale V., Gower J.F.R., Alberotanza L. (eds.), Oceanography from Space. Springer Science+Business Media B.V., pp. 35-58.
Lahtinen J., Gasiewski A.J., Klein M., Corbella I. 2003. A calibra-tion method for fully polarimetric microwave radiometers. IEEE T. Geosci. Remote 41: 588-602.
LeVine D.M., Good J.C. 1983. Aperture synthesis for microwave radiometers in space. NASA Technical memorandum 85033.
Martín-Neira M., Goutoule J.M. 1997. A two-dimensional aperture-synthesis radiometer for soil moisture and ocean salinity obser-vations. ESA Bull-Eur Space 92: 95-104.
Martín-Neira M., Ribó S., Martín-Polegre A.J. 2002. Polarimetric mode of MIRAS. IEEE T. Geosci. Remote 40: 1755-1768.
McMullan K., Brown M., Martín-Neira M., Rits W., Ekholm S., Marti J., Lemanzyk J. 2008. SMOS: The payload. IEEE T. Geo-sci. Remote 46: 594-605.
Reul N., Tenerelli J., Chapron B. Fournier S., Paul F. 2011. First Sea Surface Salinity products from SMOS Generated at the Centre Aval de Traitement des Données SMOS. Presented at SMOS Science Workshop, 27-29 September 2011, Arles, France.
Robinson A.R. (ed.) 1983. Eddies in Marine Science, Springer-Verlag, 609 pp.
Ruf C.S., Swift C.T., Tanner A.B., Le Vine D.M. 1988. Interfero-metric synthetic aperture microwave radiometry for the remote sensing of the Earth. IEEE T. Geosci. Remote 26: 597-611.
Salvador J., Fernández P., Julià A., Font J., Pelegrí J.L. 2010. A new buoy for measurement and real time transmission of surface sa-linity. Rapp. Comm. Int. Mer Medit.39: 176.
Silvestrin P., Berger M., Kerr Y.H., Font J. 2001. ESA’s second Earth Explorer Opportunity Mission: The Soil Moisture and Ocean Salinity mission - SMOS. IEEE Geosc. Rem. Sens. Newsl. 118: 11-14.
Smith N., Lefèbvre M. 1997. The Global Ocean Data Assimilation Experiment (GODAE). Presented at International Sympo-sium Monitoring the Oceans in the 2000s: An Integrated Ap-proach,15-17 October 1997, Biarritz, France.
Srokosz M.A. 1995. Ocean surface salinity - the why, what and whether. In: Guyenne T.D. (ed.) Proc. Consultative Meeting on Soil Moisture and Ocean Salinity Measurement Requirements and Radiometer Techniques (SMOS), ESA Publication WPP-87, pp. 49-56.
Swift C.T., McIntosh R.E. 1983. Considerations for microwave re-mote sensing of ocean surface salinity. IEEE T. Geosci. Remote 21: 480-491.
Turiel A., Nieves V., García-Ladona E., Font J., Rio M.H., Larnicol G. 2009. The multifractal structure of satellite sea surface tem-perature maps can be used to obtain global maps of streamlines. Ocean Sci. 5: 447-460.
Yueh S.H., West R., Wilson W.J., Li F.K., Njoku E.G., Rahmat-Samii Y. 2001. Error sources and feasibility for microwave re-mote sensing of ocean surface salinity. IEEE T. Geosci. Remote 39: 1049-1060.
Zine S., Boutin J., Font J., Reul N., Waldteufel P., Gabarró C., Ten-erelli J., Petitcolin F., Vergely J.L., Talone M., Delwart S. 2008. Overview of the SMOS sea surface salinity prototype processor. IEEE T. Geosci. Remote 46: 621-645.
Received March 4, 2011. Accepted November 9, 2011.Published online August 7, 2012.


