Embed Size (px)
Citation preview

JOURNAL OF GEOPHYSICAL RESEARCH, VOL. 97, NO. E8, PAGES 13,067-13,090, AUGUST 25, 1992
Magellan Mission Summary
R.S. SAUNDERS, A.J. SPEAR, P.C. ALLIN, R.S. AUSTIN, A.L. BERMAN, R.C. CHANDLEE, J. CLARK, A.V. DECHARON, E.M. DE JONG, D.G. GRIFFITH, J.M. GUNN, S. HENSLEY, W.T.K. JOHNSON, C.E. KIRBY,
K.S. LEUNG, D.T. LYONS, G.A. MiCH•LS, J. MILLER, R.B. MORRIS, A.D. MORRISON, R.G. PIERESON, J.F. SCOTT, S.J. SHAFFER, J.P. SLONSKI, E.R. STOFAN, T.W. THOMPSON, AND S.D. WALL
Jet Propulsion Laboratory, California Institute of Technology, Pasadena, California
Magellan started mapping the planet Venus on September 15, 1990, and after one cycle (one Venus day or 243 Earth days) had mapped 84% of the planer's surface. This returned an image data volume greater than all past planetary missions combined. Spacecraft problems were experienced in flight. Changes in operational pro- cedures and reprogramming of onboard computers minimized the amount of mapping data lost. Magellan data processing is the largest planetary image-processing challenge to date. Compilation of global maps of tectonic and volcanic features, as well as impact craters and related phenomena and surface processes related to wind, weathering, and mass wasting, has begun. The Magellan project is now in an extended mission phase, with plans for additional eyries out to 1995. The Magellan project will fill in mapping gaps, obtain a global gravity data set between mid-September 1992 and May 1993, acquire images at different view angles, and look for changes on the surface from one cycle to another caused by surface activity such as volcanism, faulting, or wind activity.
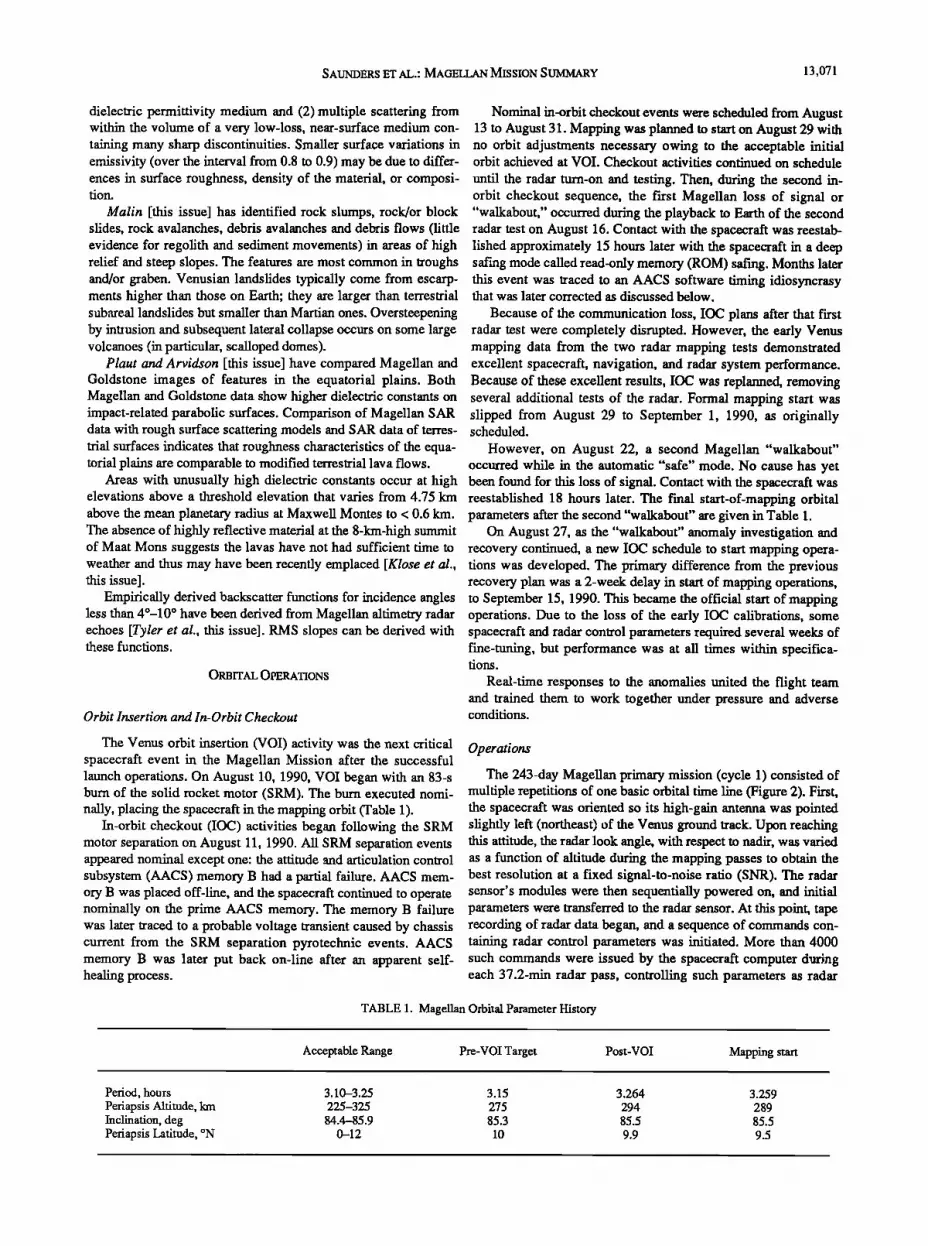
INTRODUCTION This trajectory is illustrated in Figure 1. Cruise to the planet took 15 months. Three midcourse trajectory correction maneuvers
This report provides a framework for more detailed articles were required to ensure that the spacecraft would approach the containing science results that follow. The Magellan "Six-Month planet at the right time and in the right geometric position for Report" is the combined set of papers by the members and associ- ates of the Magellan science teams, which is somewhat loosely insertion into Venus orbit. During the Earth-to-Venus cruise,
Magellan made 1.5 rotations around the Sun. (This provided defined as the analysis of the bulk of the prime mission data, made Galileo with an October 1989 launch and a direct route to Venus.) up of cycle 1, a 243-day mission that was expected to map The description in this paper applies to the cycle 1 primary between 70% and 95% of the planet. The various data products mission, which was accomplished in the 8 months between are also described. Articles by Saunders et al. [1990], Pettengill et al. [1991], and Johnson [1991] contain additional information. September 15, 1990, and May 15, 1991. Similar procedures have
been used with some modification for all mapping cycles. The The Magellan project's scientific goal, and a requirement of Magellan Mission, as of the date of this revised manuscript, is the mission, was to map at least 70% of the surface of Venus at a
resolution better than 300 m, using a single radar sensor that col- nearing the end of the third 8-month cycle of imaging. In the first cycle, 84% of the planet was imaged with left-looking SAR. In
lects synthetic aperture radar (SAR) images, radar altimetry, and cycle 2, from May 15, 1991 to January 15, 1992, approximately radiometry data at 2.4 GHz. A single "Prime Mission" of 243 ' 50% of the planet was mapped right-looking with two major gap- days' duration, termed cycle 1, the time it takes Venus to turn
once on its axis beneath the plane of the spacecraft orbit, was filling sequences, bringing global coverage up to 97%. Cycle 3 designed to accomplish the objective. coverage is again left-looking, with an incidence angle profile that
Magellan's orbit is near-polar with a 3.25-hour period. provides stereo when viewed with cycle 1 images. Cycle 3 cover- Mapping data are obtained starting from the north pole, sweeping age has a number of gaps and got off to a shaky start on January out20-km-wide swaths as the spacecraft moves southward during 21, 1992. In cycle 3, owing to problems with the spacecraft the periapsis part of each orbit. The distance to the planet varies telecommunications transmitter, data were sent back at 43% of the
initial rate, providing less than half the latitudinal coverage of from about 2000 km near the north pole to 290 km at 10øN lati- tude. Thirty-seven minutes of data were taken in each orbit during cycle 1. Approximately 35% of Venus will be available in the cycle 1, imaging the planet from the north pole to about 70øS lati- cycle 3 stereo mode. At the end of cycle 3, in mid-September tude. 1992, periapsis will be lowered frbm the present 290 km to
The mission's scientific objectives were (1) to provide a global approximately 180 km and 360 ø of periapsis tracking for Doppler characterization of land forms and tectonic features; (2) to distin- gravity field measurements will be obtained. Spacecraft lifetime
and funding uncertainties combine to provide an unpredictable guish and understand impact processes; (3) to define and explain erosion, deposition, and chemical processes; and (4) to model the interior density distribution.
The Magellan spacecraft was launched aboard the space shutfie Atlantis on May 4, 1989, with just 10 s to spare in the launch win- dow on that day. A few hours later, Magellan was deployed by the shutfie crew, and the Inertial Upper Stage was fired, placing the spacecraft into a trans-Venus interplanetary trajectory.
Copyright 1992 by the American Geophysical Union
Paper number 92.IE01397 0148-0227/92/92JE-01397505.00
future beyond cycle 4. The project is considering a high-risk maneuver to aerobrake the spacecraft into a close near-circular orbit to allow collection of global high-resolution gravity data and possibly radar data.
PR•C•P• MAGELLAN Scn• ••GS
Magellan has provided a fundamental data set for global assessment of volcanism, tectonism, impact processes, and surface processes. The papers that accompany this article provide details of the ongoing analyses of these fields of planetary geologic study. The basic framework for Venus geology was compiled by
13,067

13,068 SAUNDERS ET AL.: MAGELLAN MISSION SLIMMARY
MAGELLAN TRAJECTORY
VENUS AT
ARRIVAL
O/9O
VENUS AT
LAUNCH
5/4/89
EARTH
ORBIT
EARTH AT
ARRIVAL (VOl) 8/10/90
EARTH AT LAUNCH 5/4/89
diameter. Volcanic cones, smaller than shields, are also seen, but both features are most likely basaltic in composition. Other con- stmctional features include domes, which consist of lava with high effective viscosity and thus are probably of more silicic composi- tion. Domes range in diameter from about 15 km to 90 km and are typically circular in plan and a few hundred meters in height. Scalloped domes are common and appear to have experienced failure on their flanks. There is scattered evidence of pyroclastic deposits even though explosive activity is less likely to occur on Venus than on Earth because of the dense Venusian atmosphere, thus indicating that volatile contents in some of the magmas are large in comparison with those on Earth [Guest et al., this issue].
Stofan et al. [this issue] describe and discuss coronae, a unique category of Venus features that are classified as volcanotectonic. Coronae are surrounded by an annulus of tectonic features ranging from extensional to compressional and have variable topography. The distribution of coronae is not random; they are concentrated
the Pioneer Venus Team [Masursky et al., 1980] and the scientists who analyzed the Venera 15 and 16 image data [Barsukov et al., 1986]. Their assessment of the global importance of plains and highlands was basically correct.
The Magellan radar instrument has mapped 97% of Venus, providing an improved global topographic map, global images, reflectivity, and emissivity. The mean radius, from the new altimetry data, is 6051.84 km. Venus's topography is unimodal,
nae dominated by concentric graben, which may indicate different stages in corona evolution [Stofan et al., this issue; Squyres et al., this issue]. Similarities between radially fractured domes and shield volcanoes also suggest a genetic similarity.
More than 1660 volcanic land forms, related features, and vol- canic deposits have been identified [Head et al., this issue]. These include over 550 shield fields; 274 intermediate volcanoes 20- 100 km in diameter; 156 large volcanoes greater than 100 km in diameter; 86 calderalike structures, not including those associated with shield volcanoes; 175 coronae; 259 arachnoids (defined as unlike Earth's, which has a bimodal distribution of heights
representing continents and ocean basins. More than 80% of the having inner concentric and outer radial ridges and fractures); 50 novae (radial-fracture features); 53 lava flow fields; and 50 sinu- surface of Venus lies within 1 km of the mean. Average
kilometer-scale slopes greater than 30 ø are not uncommon on the SW slope of Maxwell Montes, southern face of Danu Montes, and chasmata to the east of Thetis Regio [Ford and Pettengill, this issue].
The improved value for the rotation period is 243.0185 + 0.0001 days. The north pole position is 272.76 ø + 0.02 ø right ascension; 67.16 ø + .01 ø declination [Davies et al., this issue].
Venus can be subdivided simply into surfaces that appear to be mostly volcanic plains dotted with thousands of individual vol- canic constructs and tectonically deformed highland plateaus. Volcanic plains, generally lowlands, make up about 85% of the planet. The remaining 15% is highland, dominated by complex ridge terrain, sometimes referred to as tessera. Highland plateaus appear to be characterized by compressional features [Bindschadler et al., this issue (a)]. Examples are Western Ishtar Terra, Thetis Regio, and Phoebe Regio.
ous lava channels. The 145 steep-sided domes have morphologies similar to terrestrial domes that formed by viscous, andesitic, dacitic, and rhyolitic lavas. Steep-sided domes on Venus are located in areas that suggest they may be composed of evolved magma [Pavri et al., this issue]. A large number of steep-sided domes are almost perfectly circular in map view, the so-called pancake domes. Magellan images of the region for the Venera 8 landing site have indicated that the lander landed on mottled plains, a stratigraphically younger plains complex, and near a steep-sided dome and a caldera. It had previously been determined that the site was one of two Venera landing sites with nontholeiitic compositions. These may be regions of evolved crust [Basilevsky et al., this issue]. The similarity in the shape of seven large steep- sided "pancake domes" as compared with a theoretical model of an axisymmetric gravity current spreading over a rigid horizontal surface suggests that the domes were formed by a fluid with a Newtonian viscous theology [McKenzie et al., this issue (b)].
The majority of volcanic land forms are consistent with basaltic compositions; steep-sided domes and festoons may repre-
Volcanism is the most widespread and important geologic sent more evolved compositions; sinuous rilles may have been phenomenon on Venus. Volcanic features are broadly distributed created from more fluid, ultramafic magma. The wide range of globally, unlike plate boundary concentrations typical of Earth. morphologies indicates a broad spectrum of intrusive and extra- The most widespread terrain type on Venus is lowland volcanic sive processes. There are at least two occurrences of thick, lobate plains. The most extensive volcanic units consist of flood lavas. A flows with steep margins, suggesting a high-viscosity lava [Moore variety of volcanic construct features are seen. These include et al., this issue]. Head et al. [this issue] find little evidence for clusters of edifices, probably shield volcanoes, 10 km or less in extensive pyroclastic deposits or land forms consistent with pre-
Fig. 1. Magellan interplanetary trajectory. Magellan was hunched on May in a few groups and along several chains. Coronae share many 4, 1989, and was transferred to a trajectory that took the spacecraft morphologic characteristics with volcanic rises; their morphology around the Sun 1.5 times in 15 months. Magellan reached Venus on suggests that coronae resulted from either smaller manfie plumes August 10, 1990, when the firing of a solid rocket slowed the space- craft so it could be captured by Venus's gravity; a near-nominal orbit or shorter lived mantle plumes rather than from volcanic rises. was achieved, as shown in Table 1. This circuitous interplanetary Crosscutting relationships in several examples of coronae suggest cruise allowed the October 1989 launch of the Galileo spacecraft, that formation of radial troughs precedes formation of concentric using a direct trajectory to Venus for its gravity flyby in February ridges and troughs. This suggests a genetic link between radially 1990. fractured domes (coronae dominated by radial troughs) and coro-

SAUNDERS ET AL.: MAGELLAN MISSION SUMMARY 13,069
dictions for Venus conditions. The large size of volcanic features provides evidence of large magma reservoirs. The scale of resur- facing by individual features and deposits is typically much less than 125,000 km 2. The areal distribution, abundance, and size- frequency distribution of large volcanic features strongly suggest that they are the surface manifestation of manfie plumes or hot spots.
Volcanic features are not distributed randomly on Venus. The deficiency of volcanic features in lowlands may be due to an altitude-dependent inhibition of volatile exsolution and the result- ing production of neutral buoyancy zones sufficient to form magma reservoirs and favoring flood lavas [Head et al., this issue]. Large edifices and reservoir-related features form at higher elevations. A major concentration of volcanic features, 2-4 times the global average, is found in the Beta-Afla-Themis region.
According to Head et al. [this issue], the impact crater data and volcanic distribution support either a catastrophic resurfacing some 500 m.y. ago or a more local or regional resurfacing model. A regional resurfacing model would imply a volcanic flux of 0.5 km3/yr, similar to the intraplate volcanic flux on Earth.
Baker et al. [this issue] have examined sinuous channel fea- tures that are seen on the plains of Venus. They have mapped about 200 channel and valley land form complexes. Channel types include (1)simple, which include sinuous rilles, canali, or high width-to-depth ratio channels, (2)complex, and (3)compound channels. Channels are globally distributed, with the large, canall
a wide variety of styles and spatial scales (1- to 10-km scales to 100- to 1000-km scales). Deformation is manifested both in widely distributed strain of modest magnitude and in areas of con- centrated extension and shortening. Several regions show evi- dence of lateral extension and collapse during and following crustal compression. Extension is expressed in two forms: quasi- circular coronae and broad rises with linear rift zones. Evidence
for horizontal displacements suggests that extensional deformation may be limited to a few tens of kilometers (e.g., the split crater in Devana Chasma). There appear to be a few large offset strike-slip faults, but more commonly, there is limited local horizontal shear across zones of crustal shortening. The presence of slopes in excess of 20o-30 ø over scales of tens of kilometers indicates active tectonics. Deformation is distributed across broad zones on
Venus, unlike on Earth, which has narrow zones of deformation at rigid plate boundaries. Craters and other features produced by geologic processes have been disrupted by tectonic activity, con- tributing to the likelihood that Venus has been tectonically active throughout its history.
Westem Ishtar Terra provides an abundance of tectonic fea- tures [Smrekar and Solomon, this issue]. Troughs and lineations interpreted to be graben and normal faults trend perpendicular to topographic slopes in the mountain belts and plateau margins of Ishtar Terra. This suggests that the graben sets formed as a result of gravitational spreading. Models suggesting rams for extensional failure and topographic relaxation indicate that either the crust of
type occurring in the plains. Some channels have streamlined hills Western Ishtar Terra is much stronger than that predicted by flow and spill relationships, where they cross ridges, that are similar to features in terrestrial flood channels. Morphologies of the chan- nels suggest several hypotheses for formation by the fluids, which could include ultramafic silicate melts, sulfur, and carbonate lava. Each of these lava types would have different, but profound, implications for Venusian geology. The channels have extreme longitudinal uniformity. If they formed by flowing liquid, the sur- faces on which they flowed were uniform and nearly level, approaching an equipotential surface. The longitudinal profiles of most of the channels vary in elevation by hundreds of meters along the channels, indicating postchannel deformation of the plains surfaces.
Lava flows on Venus have a wide range of radar reflectivity from very dark, smooth surfaces to bright, rough surfaces. Campbell and Campbell [this issue] have examined the radar properties of Venusian lava flows and compared them with terres- trial flows. Scattering in lava flows in Eistla, North Sedna Planitia, and South Lavinia is less than that of terrestrial pahoehoe lavas. The most radar-bright areas equal or exceed the radar-brightness of terrestrial a' a. These Venusian volcanic deposits have typical dielectric constants of 3-5, which are in the low values for terres- trial basalt flows. The observations suggest that the volcanic deposits in these areas are similar to terrestrial pahoehoe and tran- sitional flows, whereas a'a flows are uncommon or absent.
Many of the volcanic land forms are associated with swarms of radar-bright lineaments. These are interpreted to be linear fracture zones, in many cases troughs. Many of the systems of linear troughs have geometries that resemble dike swarms on the Earth. Many are more than 1000 km in length and are estimated to be 30-50 m in width. The magnitude of regional stress that can be estimated from the dike patterns is about 3 MPa, similar to that of the Earth's dike swarms [McKenzie et al., this issue (c)].
Tectonics
laws or the relief and high slopes have been actively built and maintained until recently in comparison with the 500 m.y. mean surface age of Venus, that is, within the past few tens of million years or less, rather than the past few hundred million years.
Correlation of large shield volcanoes with geoid anomalies suggests mantle upwelling [Herrick and Phillips, this issue]. Downwelling may occur in the plains. No specific correlations with gravity models are found for coronae. Smaller geoid to topo- graphic ratios, which suggest crustal compensation in areas of thickened crust, correlate well with highland tessera regions. The lack of hot spot tracks does not support Earthlike tectonics for Venus.
Although no evidence for Earth-style plate tectonics has been found on Venus, features associated with some coronae and arcu- ate trenches in the Dali-Diana trough system have morphology that resembles terrestrial subduction trenches [McKenzie et al., this issue (a)].
Sandwell and Schubert [this issue] examine the structural models that might apply to large coronae. The trench and outer rise morphology around major coronae suggests that the litho- sphere is flexed downward, possibly by loading or as a conse- quence of a surrounding passive lithosphere that is subducting and rolling back underneath an expanding corona. From analysis of these features, elastic thicknesses and bending moments were determined with values similar to those of terrestrial trenches
(e.g., the Mariana, Middle America, and Aleutian trenches). Many of the tectonic features of Venus are found in the com-
plex ridge terrain (CRT). Bindschadler et al. [this issue (a), (b)] have studied the CRT regions of Venus. According to them, the morphology of tectonic features comprising CRT in Alpha Regio and the stratigraphic relationships they reveal support a mantle downwelling model better than a hot spot model for CRT forma- tion. Linear deformation zones (LDZ) in Alpha Regio CRT are interpreted to be shear zones. Small graben in Alpha are believed
Solomon et al. [this issue] summarize the tectonic features of to have formed from gravitational relaxation of the highlands in Venus. Magellan mapping has revealed deformational features of the latest stage of CRT development.

13,070 SAUNDERS ET AL.: MAGELLAN MISSION SUMMARY
Impact Processes
Schaber et a/.[this issue] have studied the impact craters of Venus. Impact craters provide important clues to the geologic evo- lution of planetary surfaces, since they form randomly in time and space. Unfortunately, there are too few impact craters on Venus to estimate surface ages other than on a global scale. The slow rate of surface modification processes on Venus is evidenced by the fact that most Venusian impact craters appear unmodified by any weathering process. Below 35 km, there are few craters because of the shielding effect of the atmosphere. Crater diameters range from 2 to 275 km. The analysis reported to date lists 817 craters observed on 89% of Venus [Schaber et al., this issue]. The esti- mated surface age is between 200 m.y. and 700 m.y. The crater evidence is interpreted to indicate a period of catastrophic resur- facing by volcanism and relatively little volcanic activity since. As on other cratered surfaces in the solar system, there is a progres- sion of crater morphologies with increasing diameter from flat- floored, central peak, peak ring, to multiring craters. Craters smaller than 30 km are commonly irregular or multiple strikes from disrupted projectiles. The percentage of craters with bright volcanic-appearing outflows increases with increasing diameter as well as asymmetry of crater ejecta deposits. Bright outflows appear to have been created by a low-viscosity fluid that may be likened to pyroclastic flows from volcanoes on Earth. Bright and dark "splotches," typically about 20 km in diameter, are shock wave signatures of asteroidal bodies that did not survive passage through the atmosphere.
Phillips et al. [this issue] took an independent look at impact craters and related phenomena. They deduce, from the number of impact craters, a production age, or mean surface age, of about 500 m.y. Their analysis supports catastrophic global volcanic resurfacing some 500 m.y. ago or smaller-scale equilibrium resur- facing occurring in small events spread over time, covering approximately 1 km2/yr. Statistical analysis of the crater distribu- tion shows that it cannot be distinguished from a completely ran- dom distribution on the sphere. Their studies show that the small- est craters whose numbers are not affected by the atmosphere are 30 km in diameter. It is observed that there may be a lower crater density near those craters that are partly filled by volcanic mate- rial. This suggests that some craters have been completely cov- ered.
The atmosphere of Venus has a profound effect on all aspects of impact cratering. Schultz [this issue] finds that cratedess radar- bright scour zones (splotches) are the result of atmospheric crater- ing, where energy is transferred from the impactor to the atmo- sphere directly prior to impact or indirectly after impact through deceleration of ejecta and impact-generated vapor; the maximum impactor size undergoing this type of failure is 3-4 km. Run-out flows, or outflows, extend to about a crater radius from the rim before following local slopes as low as 0.03ø; they are seen as thin turbidity flows, which may indicate volatile-rich impactors (25% of the crater population), or laminar flows, which may indicate silicate or iron-rich impactors (58%). Others are composite flows. High-resolution images of well-preserved impact crater mor- phologies reveal stages of impact crater formation in the following order: atmospheric cratering, which creams the splotch; indirect transfer of kinetic energy to the atmosphere before excavation, forming radar-bright halos and downrange rim depressions; for- marion of run-out flows; emplacement of ejecta, including pressure-differential scouring and redirected ejecta flows by recovery winds; and late stage fallout from recondensed vapor, forming radar-dark parabolas. Crater scaling relations are con-
trolled by atmospheric pressure rather than gravity, and a reduc- tion in cratering efficiency may result in smaller crater diameters and underestimation of the surface age.
A significant crater-related phenomenon is the large parabolic halos associated with many impact craters. The parabolas may be bright or dark and are always open to the west, with the crater near the focus. Campbell et al. [this issue] have studied these features and found 54 parabolic-shaped and nine approximately circular large surficial impact crater-related features in Magellan SAR images and emissivity data. All the parabolic features are (with six exceptions) oriented E-W with the apex at the east end. Sizes of these features range from several hundred to 2000 km, and the dimensions are loosely correlated with the sizes of their impact basins. About one-third of all craters > 15 km in diameter have
bright floors, and half of these have parabolic features (note that almost all craters with parabolas have basins with high reflectivity/low emissivity). No features have been found overly- ing the parabolas, indicating that they are among the youngest features on the surface of the planet; this suggests that radar-bright craters may be young and unmodified. The observed patterns and geologic associations are consistent with a model of small parti- cles injected into the upper atmosphere at the time of impact and carried to the west by the E-W zonal winds. The size of the indi- vidual particles can be as large as 1 to 2 cm; the deposit depth is a few centimeters to a few meters.
Surface Properties
A somewhat unexpected finding in the Magellan images was the abundant wind streaks. These features have been mapped and classified by Greeley et al. [this issue]. There is widespread evi- dence of eolian activity; more than 3400 wind streaks have been identified. Most streaks are seen between 17øS and 30øS latitude,
and at 5øN-53øN on smooth plains. Streaks are usually associated with deposits from nearby impact craters and with debris within some tectonically deformed terrains. Wind streaks are generally oriented with the downwind direction toward the equator, consis- tent with the Hadley model of atmospheric circulation. Other eolian features discovered include dune fields and possibly yardangs.
A broad study of Venus surface processes was conducted by Arvidson et al. [this issue]. They find evidence for weathering, mass wasting, and eolian activity operating on a continuous basis. Stratigraphically young flows in Sedna Planitia have radar signa- tures similar to those of terrestrial a'a and pahoehoe flows; older flows have backscatter characteristics similar to terrestrial flows
degraded by weathering or buried by eolian deposits. The parabolic crater deposits, made up of fine debris distributed by high-speed zonal E-W winds, are determined to be centimeters thick from their microwave properties. High radar reflectivity in most of the highlands implies an elevation-dependent surface- atmospheric interaction; evidence in Western Ova Regio indicates that this alteration occurs at a lower rate than mass wasting and eolian activities. The average plains resurfacing rate by surface processes is of the order of 10 '2 i. trn•r. This is comparable to rock erosion rams on Mars.
Magellan has confirmed previous findings of extremely low values of radio-thermal emissivity, with some as low as 0.3 [Pettengill et al., this issue]. The global mean value of emissivity is 0.845, corresponding to a dielectric permittivity of 5.1, a value consistent with dry basaltic surface material. Possible explanations for anomalously low values of emissivity are (1)an interaction with a single interface between the atmosphere and a high-
SAUNDERS ET AL.: MAGELLAN MISSION SUMMARY 13,071
dielectric permittivity medium and (2) multiple scattering from Nominal in-orbit checkout events were scheduled from August within the volume of a very low-loss, near-surface medium con- 13 to August 31. Mapping was planned to start on August 29 with taining many sharp discontinuities. Smaller surface variations in no orbit adjustments necessary owing to the acceptable initial emissivity (over the interval from 0.8 to 0.9) may be due to differ- orbit achieved at VOI. Checkout activities continued on schedule ences in surface roughness, density of the material, or composi- until the radar turn-on and testing. Then, during the second in- tion. orbit checkout sequence, the first Magellan loss of signal or
Malin [this issue] has identified rock slumps, rock/or block "walkabout," occurred during the playback to Earth of the second slides, rock avalanches, debris avalanches and debris flows (little radar test on August 16. Contact with the spacecraft was teestab- evidence for regolith and sediment movements) in areas of high lished approximately 15 hours later with the spacecraft in a deep relief and steep slopes. The features are most common in troughs safing mode called read-only memory (ROM) safing. Months later and/or graben. VenusJan landslides typically come from escarp- this event was traced to an AACS software timing idiosyncrasy ments higher than those on Earth; they are larger than terrestrial that was later corrected as discussed below. sub,xreal landslides but smaller than Martian ones. Oversteepening Because of the communication loss, IOC plans after that first by intIusion and subsequent lateral collapse occurs on some large radar test were completely disrupted. However, the early Venus volcanoes (in particular, scalloped domes). mapping data from the two radar mapping tests demonstrated
Plaut and Arvidson [this issue] have compared Magellan and excellent spacecraft, navigation, and radar system performance. Goldstone images of features in the equatorial plains. Both Because of these excellent results, IOC was replanned, removing Magellan and Goldstone data show higher dielectric constants on several additional tests of the radar. Formal mapping start was impact-related parabolic surfaces. Comparison of Magellan SAR slipped from August 29 to September 1, 1990, as originally data with rough surface scattering models and S AR data of terres- scheduled.
trial surfaces indicates that roughness characteristics of the equa- However, on August 22, a second Magellan "walkabout" torial plains are comparable to modified terrestrial lava flows. occurred while in the automatic "safe" mode. No cause has yet
Areas with unusually high dielectric constants occur at high been found for this loss of signal. Contact with the spacecraft was elevations above a threshold elevation that varies from 4.75 km reestablished 18 hours later. The final start-of-mapping orbital above the mean planetary radius at Maxwell Montes to < 0.6 km. parameters after the second "walkabout" are given in Table 1. The absence of highly reflective material at the 8-km-high summit On August 27, as the "walkabout" anomaly investigation and of Maat Mons suggests the lavas have not had sufficient time to recovery continued, a new IOC schedule to start mapping opera- weather and thus may have been recently emplaced [Klose et al., tions was developed. The primary difference from the previous this issue]. recovery plan was a 2-week delay in start of mapping operations,
Empirically derived backscatter functions for incidence angles to September 15, 1990. This became the official start of mapping less than 4ø-10 ø have been derived from Magellan altimetry radar operations. Due to the loss of the early IOC calibrations, some echoes [Tyler et al., this issue]. RMS slopes can be derived with spacecraft and radar control parameters required several weeks of these functions. fine-tuning, but performance was at all times within specifica-
tions.
ORBITAL OPERATIONS Real-time responses to the anomalies united the flight team and trained them to work together under pressure and adverse
Orbit Insertion and In-Orbit Checkout conditions.
The Venus orbit insertion (VOI) activity was the next critical Operations spacecraft event in the Magellan Mission after the successful launch operations. On August 10, 1990, VO! began with an 83-s The 243-day Magellan primary mission (cycle 1) consisted of bum of the solid rocket motor (SRM). The bum executed nomi- multiple repetitions of one basic orbital time line (Figure 2). First, nally, placing the spacecraft in the mapping orbit (Table 1). the spacecraft was oriented so its high-gain antenna was pointed
In-orbit checkout (IOC) activities began following the SRM slightly left (northeast) of the Venus ground track. Upon reaching motor separation on August 11, 1990. All SRM separation events this attitude, the radar look angle, with respect to nadir, was varied appeared nominal except one: the attitude and articulation control as a function of altitude during the mapping passes to obtain the subsystem (AACS) memory B had a partial failure. AACS mem- best resolution at a fixed signal-to-noise ratio (SNR). The radar ory B was placed off-line, and the spacecraft continued to operate sensor's modules were then sequentially powered on, and initial nominally on the prime AACS memory. The memory B failure parameters were transferred to the radar sensor. At this point, tape was later traced to a probable voltage transient caused by chassis recording of radar data began, and a sequence of commands con- current from the SRM separation pyrotechnic events. AACS taining radar control parameters was initiated. More than 4000 memory B was later put back on-line after an apparent self- such commands were issued by the spacecraft computer dating healing process. each 37.2-min radar pass, controlling such parameters as radar
TABLE 1. Magellan Orbital Parameter History
Acceptable Range Pre-VOI Target Post-VOI Mapping start
Period, hours 3.10-3.25 3.15 3.264 3.259 Periapsis Altitude, km 225-325 275 294 289 Inclination, deg 84.4-85.9 85.3 85.5 85.5 Periapsis Latitude, øN 0-12 10 9.9 9.5

13,072 SAUNDERS ET AL.: MAGELLAN MISSION SUMMARY
MAGELLAN
MAPPING ORBIT PROFILE
PLAYBACK 57.2 MIN
MOMENTUM DESATURATION
STARCAL 14 MIN
APOAPSIS 8458 KM
(5256 MI)
DSN LOCKUP PERIAPSIS
289 KM (180 MI) (9.5øN LATITUDE)
PERIOD = 3.26 HR
MAPPING DURATION 37.2 MIN
PLAYBACK 56.6 MIN
DSN LOCKUP
Fig. 2: Magellan mapping orbit profile. Nominal spacecraft operations in Magellan's elliptical orbit around Venus are described clockwise from the north pole: (1) the mapping data acquisition begins near the north pole when the large antenna is pointed at the surface and the radar is tumed on, (2) mapping continues for 37.2 min to fill the onboard tape recorder, (3) the first portion of tape recorder playback commences near the south pole immediately after mapping, (4) a star calibration and momentum wheel unloading for attitude control is conducted at apoapsis, and finally (5) the second portion of tape recorder playback is conducted between apoapsis and the start of mapping at the north pole. During the second cycle, the start and end of mapping were delayed in order to map more of the southern hemisphere. The period for each orbit was 3.2 hours with two playback periods of 57 min each. Only a few minutes of unused time existed in each orbit.
pulse repetition frequency and the timing of echo sampling. time for each orbit. The data management subsystem (DMS) plan- Following completion of this pass, the spacecraft was reoriented net program computed the maximum mapping data collection so its high-gain antenna was pointed to Earth, and playback of the time within the orbital constraints and generated the appropriate recorded data began. Playback duration was 112 min, which was block parameters. The mission sequence planner program con- split into two sessions by a 14-min maneuver at apoapsis that straint checked the sequence, computed Deep Space Network allowed the spacecraft attitude reference to be updated by check- (DSN) acquisition and handover times, and formatted the ing the positions of two reference stars. Following completion of sequence file for the Spacecraft Team. the second playback session, the next mapping and playback cycle The Spacecraft Team analysts used the SOP to generate addi- began with the spacecraft orienting its high-gain antenna back to tional parameters for proper sequence execution. The Upload Venus. A small variation to this cycle consisted of beginning Preparation Group of the Spacecraft Team ran these parameters every other radar pass at the north pole (immediate swath), while and the SOP through the sequence generation program (SEQGEN) the intervening passes began approximately 11 min after passage to produce a sequence of commands. of the spacecraft over the north pole (delayed swath). In this way, The Mission and Sequence Design Team and the Spacecraft more latitudinal coverage was obtained, and swath overlap at Team each ran through the command software twice during the 6- either end of the orbit was reduced.
During the primary mission, the command sequence generation process covered a 6-week period and involved four major soft- ware program sets to generate 1-week mapping sequences. The process began with the Mission Planning Team, who determined times when the radar data collection might have to be interrupted, such as during solar superior conjunction and apoapsis occulta- tion.
Six weeks before each sequence started, the Mission Planning
week sequence development process with a loop back iteration for incorporating fixes to any errors that were found in the first check. On the day the command sequence was uplinked to the spacecraft, the Radar System Engineering Team used the radar mapping sequencing software (RMSS) to generate the attitude profile for the spacecraft to follow during the mapping data collection and a table of radar conlxol parameters that specified pulsing and listen- ing times.
The fourth program set used to generate the sequence was the Team provided the Mission and Sequence Design Team with the navigation subsystem. The onboard star calibrations allowed the basic data collection strategy and approximate mapping duration. spacecraft to provide the accurate pointing of the antenna required
The Mission and Sequence Design Team ran several programs for radar data collection, but the spacecraft position in space also in the mission and sequence design subsystem to produce a skele- had to be accurately predicted. Every week, the orbit determina- tal orbital profile (SOP). The orbit averaging and timing program tion program was used to determine the spacecraft orbit and then used the propagated orbit to determine the radar mapping start to propagate forward with the double precision trajectory program
SAUNDERS ET AL.: MAGELLAN MISSION SUMMARY 13,073
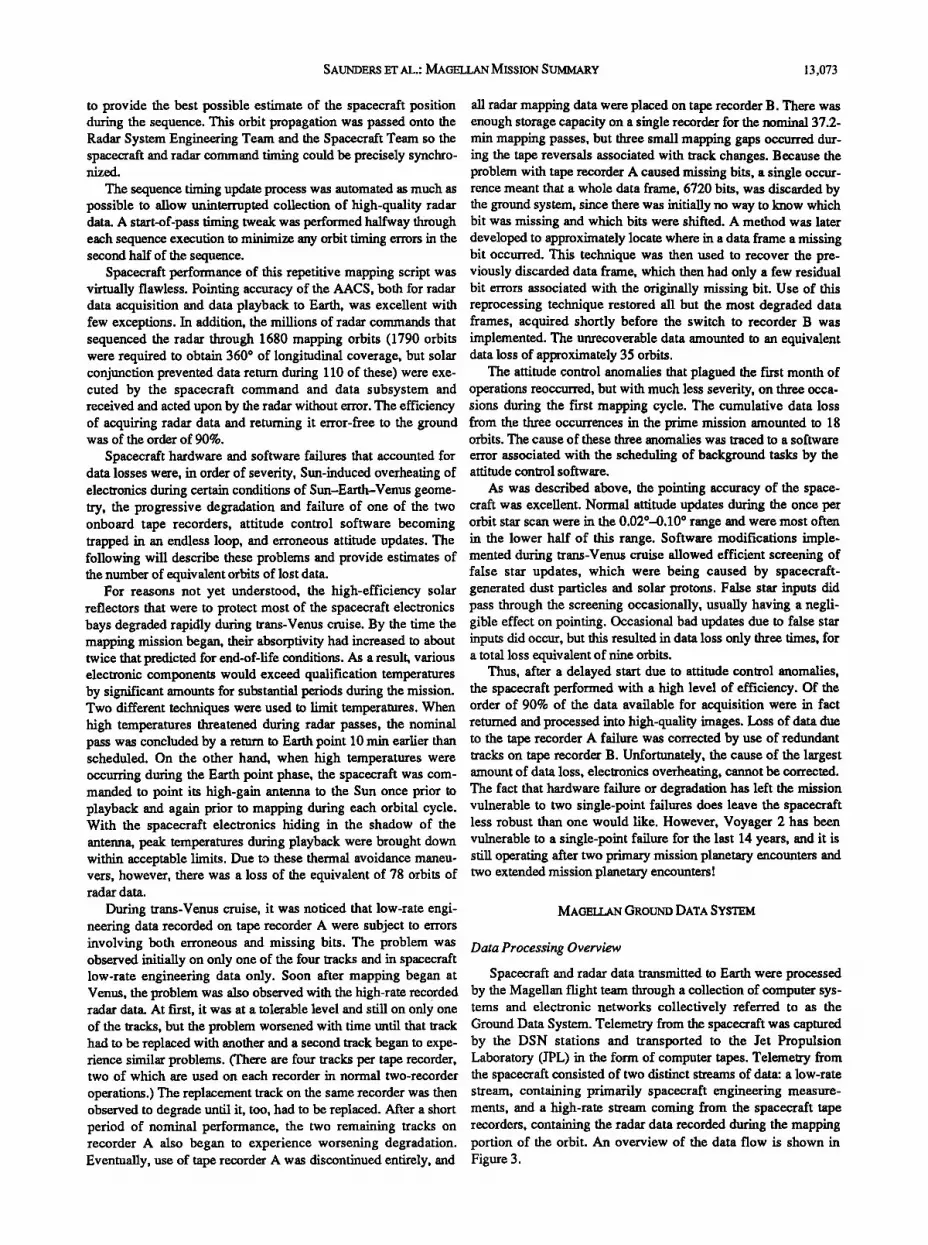
to provide the best possible estimate of the spacecraft position all radar mapping data were placed on tape recorder B. There was during the sequence. This orbit propagation was passed onto the enough storage capacity on a single recorder for the nominal 37.2- Radar System Engineering Team and the Spacecraft Team so the min mapping passes, but three small mapping gaps occurred dur- spacecraft and radar command timing could be precisely synchro- ing the tape reversals associated with track changes. Because the nized. problem with tape recorder A caused missing bits, a single occur-
The sequence timing update process was automated as much as fence meant that a whole data frame, 6720 bits, was discarded by possible to allow uninterrupted collection of high-quality radar the ground system, since there was initially no way to know which data. A start-of-pass timing tweak was performed halfway through bit was missing and which bits were shifted. A method was later each sequence execution to minimize any orbit timing errors in the developed to approximately locate where in a data frame a missing second half of the sequence. bit occurred. This technique was then used to recover the pre-
Spacecraft performance of this repetitive mapping script was viously discarded data frame, which then had only a few residual virtually flawless. Pointing accuracy of the AACS, both for radar bit errors associated with the originally missing bit. Use of this data acquisition and data playback to Earth, was excellent with reprocessing technique restored all but the most degraded data few exceptions. In addition, the millions of radar commands that frames, acquired shortly before the switch to recorder B was sequenced the radar through 1680 mapping orbits (1790 orbits implemented. The unrecoverable data amounted to an equivalent were required to obtain 360 ø of longitudinal coverage, but solar data loss of approximately 35 orbits. conjunction prevented data return during 110 of these) were exe- The attitude control anomalies that plagued the first month of cured by the spacecraft command and data subsystem and operations reoccurred, but withmuch less severity, on three occa- received and acted upon by the radar without error. The efficiency sions during the first mapping cycle. The cumulative data loss of acquiring radar data and returning it error-free to the ground from the three occurrences in the prime mission amounted to 18 was of the order of 90%. orbits. The cause of these three anomalies was traced to a software
Spacecraft hardware and software failures that accounted for error associated with the scheduling of background tasks by the data losses were, in order of severity, Sun-induced overheating of attitude control software. electronics during certain conditions of Sun-Earth-Venus geome- As was described above, the pointing accuracy of the space- try, the progressive degradation and failure of one of the two craft was excellent. Normal attitude updates during the once per onboard tape recorders, attitude control software becoming orbit star scan were in the 0.02ø-0.10 ø range and were most often trapped in an endless loop, and erroneous attitude updates. The in the lower half of this range. Software modifications imple- following will describe these problems and provide estimates of mented during trans-Venus cruise allowed efficient screening of the number of equivalent orbits of lostdata. false star updates, which were being caused by spacecraft-
For reasons not yet understood, the high-efficiency solar generated dust particles and solar protons. False star inputs did reflectors that were to protect most of the spacecraft electronics pass through the screening occasionally, usually having a negli- bays degraded rapidly during trans-Venus cruise. By the time the gible effect on pointing. Occasional bad updates due to false star mapping mission began, their absorptivity had increased to about inputs did occur, but this resulted in data loss only three times, for twice that predicted for end-of-life conditions. As a result, various a total loss equivalent of nine orbits. electronic components would exceed qualification temperatures Thus, after a delayed start due to attitude control anomalies, by significant amounts for substantial periods during the mission. the spacecraft performed with a high level of efficiency. Of the Two different techniques were used to limit temperatures. When order of 90% of the data available for acquisition were in fact high temperatures threatened during radar passes, the nominal returned and processed into high-quality images. Loss of data due pass was concluded by a return to Earth point 10 min earlier than to the tape recorder A failure was corrected by use of redundant scheduled. On the other hand, when high temperatures were tracks on tape recorder B. Unfortunately, the cause of the largest occurring during the Earth point phase, the spacecraft was com- amount of data loss, electronics overheating, cannot be corrected. manded to point its high-gain antenna to the Sun once prior to The fact that hardware failure or degradation has left the mission playback and again prior to mapping during each orbital cycle. vulnerable to two single-point failures does leave the spacecraft With the spacecraft electronics hiding in the shadow of the less robust than one would like. However, Voyager 2 has been antenna, peak temperatures during playback were brought down vulnerable to a single-point failure for the last 14 years, and it is within acceptable limits. Due to these thermal avoidance maneu- still operating after two primary mission planetary encounters and vets, however, there was a loss of the equivalent of 78 orbits of two extended mission planetary encounters! radar data.
During trans-Venus cruise, it was noticed that low-rate engi- MAGE• GROUND DATA SYSTEM neering data recorded on tape recorder A were subject to errors
involving both erroneous and missing bits. The problem was Data Processing Overview observed initially on only one of the four tracks and in spacecraft low-rate engineering data only. Soon after mapping began at Spacecraft and radar data transmitted to Earth were processed Venus, the problem was also observed with the high-rate recorded by the Magellan flight team through a collection of computer sys- radar data. At first, it was at a tolerable level and still on only one rems and electronic networks collectively referred to as the of the tracks, but the problem worsened with time until that track Ground Data System. Telemetry from the spacecraft was captured had to be replaced with another and a second track began to expe- by the DSN stations and transported to the Jet Propulsion rience similar problems. (There are four tracks per tape recorder, Laboratory (JPL) in the form of computer tapes. Telemetry from two of which are used on each recorder in normal two-recorder the spacecraft consisted of two distinct streams of data: a low-rate operations.) The replacement track on the same recorder was then stream, containing primarily spacecraft engineering measure- observed to degrade until it, too, had to be replaced. After a short ments, and a high-rate stream coming from the spacecraft tape period of nominal performance, the two remaining tracks on recorders, containing the radar data recorded during the mapping recorder A also began to experience worsening degradation. portion of the orbit. An overview of the data flow is shown in Eventually, use of tape recorder A was discontinued entirely, and Figure 3.
13,074 SAUNDERS ET AL.: MAGELLAN MISSION SUMMARY
cr
Z
c•
n- !

SAUNDERS ET AL.: MAGELLAN MISSION SUMMARY 13,075
Following formatting and recording at the antenna site, data engineering data extraction from the radar data stream, SAR and were sent electronically to JPL through a combination of ground altimeter data extraction, and generation of the output EDR tape. and satellite links provided by the National Aeronautics and Space The data acquisition function of MHR read in telemetry from Administration (NAS A) Communications Network (NASCOM). the ODR and associated ancillary data and passed them to the next The usual mode was to ship to JPL the magnetic tapes that con- MHR function. Data acquisition stripped telemetry from the labels rained the high-rate science data transmitted from the spacecraft at put on at the data source and revised the telemetry into a form 268.8 kbits/s, because the high data volume exceeded the capacity readable by the next function. For all input sources except previ- of the electronic links. ously frame-synchronized data, the next function was frame syn-
The high-rate data shipped on original data record (ODR) tapes chronization. to JPL were first processed by the Magellan high-rate (MHR) pro- Frame synchronization in the MHR was the process by which cessor, which removed tape-recorded and station-overlapped data, radar composite data (RCD) records, and recorded engineering frame-synchronized and time-ordered the data, separated the data (RED) records were extracted from the raw telemetry stream. altimetry from the S AR data, and selected the highest quality data RED records contained full engineering frames recorded during available for inclusion on the SAR experiment data record (SAR periods in the orbit when the radar was turned off or was in EDR), and the altimeter experiment data record (ALT EDR). The standby mode and real-time engineering data were not being S AR EDR was provided to the S AR Data Processing Team transmitted. RCD records contained pieces of engineering and (SDPT), who used the Magellan SAR Data Processing Subsystem radar data recorded while the radar was in mapping mode. Frame (SDPS) to transform the raw SAR data into full-resolution basic synchronization was used as an early means of eliminating data of image data records (F-BIDRs). The F-BIDRs were provided to the poor quality. Image Data Processing Team, who used them to generate large Key field correction took place during the frame- area mosaicked image products. The Data Management and synchronization phase, as bit corruptions of specific fields were Archive Team (DMAT) tracked the production and archived all corrected when the raw data value did not maintain the expected data products and provided a central catalog of the status of all value or sequence. Fields that were corrected included the format data products. The overall throughput required each processing identifier (FID), the spacecraft clock (SCLK), radar and engineer- team to process a week's worth of data (54 orbits) in one 5-day ing data extraction and decommutation, and other fields important work week. The high-level processing flow is illustrated in to engineering data processing. Key field correction was used to Figure 4. maintain data flow in situations where relatively good quality data
would have been discarded because of bit errors to fields used in
Magellan High-Rate (MHR) Processing later processing. Overlap removal, where the best frame was selected from
The primary steps in producing EDRs at the MHR were data among duplicate frames, took place after RCD and RED frames acquisition, frame synchronization and correction of key fields were synchronized and the SCLK field was corrected. Duplicate critical to further processing, data overlap removal, spacecraft frames contained the same corrected SCLK value, caused by over-
ODR
via
DMAT
Spacecraft] ,
Deep Space
Network
(DSN)
Magellan [ EDR SAR Data Itigh-rate ; I'rocessing
Processor I via Subsystem (MHR) DMAT (SDPS)
• via F-BIDR Imaging LAN
Image Data Processing Subsystem
(IDPS)
lapping DSN station coverage and track switching on the space- craft tape recorders. The best data were chosen using a selection algorithm that utilized the SCLK reference status, DSN-provided SNR, and user preference.
Following overlap removal, engineering and radar data extrac- tion took place. Engineering extraction was the process by which complete engineering minor frames were built from engineering data contained in RCD and RED frames. The first 800 bytes of the RED frame were pulled out and built into the appropriate engi- neering data structure. Engineering data were synchronously embedded in the RCD frames. The engineering frame was built even when individual RCD frames were missing, with each miss- ing group flagged in the header of the engineering data structure. Engineering data were put onto the EDR in minor frame format, and decommutated and sent downstream for later analysis by other flight teams.
Radar data extraction, also called SAR/altimeter burst (SAB) extraction, was a multistep process by which SAR and altimeter
Fig. 4. Overview of spacecraft downlink signals. Spacecraft downlink sig- data frames were built from the pieces contained in the RCD nals during playback of the onboard tape recorder were received and recorded onto original data records (ODRs) at the Deep Space stream. The output S AR and altimeter files contained the basic Network (DSN) stations. These ODR tapes were shipped to the Jet information used in later systems to produce image and science Propulsion Laboratory (JPL), where they were processed into experi- products. Extraction began by using another synchronization pro- ment data records (EDRs) by the Magellan high-rate (MHR) processor. cess to locate the beginning of an SAB frame. The first 108 bytes A key step in this ODR-to-EDR conversion was the selection of the best data when two different DSN complexes were simultaneously of the radar data burst header were Golay-decoded to produce a tracking the spacecraft. The EDRs were created on an orbit-by-orbit 54-byte S AB header record. The S AB header record contained basis. Subsequent ground processing of these EDRs by the synthetic information regarding the burst it was associated with and was aperture radar (SAR) Data Processor Subsystem (SDPS) created the attached to both S AR and altimeter frames output from the full-resolution basic image data records (F-BIDRs), the orbit-by-orbit extraction process. The burst length was validated with data from SAR images. These F-BIDRs were subsequently mosaicked by the image data processor subsystem (IDPS) to produce complete SAR the header and used to extract SAR and altimeter data and to images, the mosaicked image data records (MIDRs). Further details of locate the next burst. The SAR, altimeter, and SAB header records the SDPS and IDPS processing are given in Figures 5, 6, and 7. were then prepared for the next function, output generation.

13,076 SAUNDERS ET AL.: MAGE• MISSION SLIMMARY
The output generation function generated EDR products by brief description of the design given here helps to explain some of packaging and ordering extracted data, ancillary files, and statisti- the operational descriptions that follow. cal information gathered during processing and by writing them to The Magellan radar instrument operates in a burst mode. The 6250 bits-per-inch (bpi) tapes. All data were written to the tape in instrument is controlled to acquire batches of S AR data, radar 32,500-byte blocks and labeled according to ANSI tape standards. altimeter data, and microwave radiometer data on a time division SAR EDR products contain data from only one orbit and include multiplex basis. A typical radar burst would involve transmission the following files: Volume Header, orbit header record (OHR), of 150 to 800 SAR pulses, 17 altimeter pulses, and a 50-ms data quality summary (DQS), fitted ephemeris, spacecraft radiometer listening period. A typical cycle 1 orbit would involve clock/spacecraft event time (SCLK/SCET) coefficients, DSN acquiring data corresponding to approximately 5000 bursts during monitor, mapping quaternion polynomial coefficients (MQPC), each orbit. radar processing bandwidth (PBW), decommutation and decali- The altitude of the spacecraft varied in the range from 290 km bration (DECOM/DECAL), spacecraft engineering, SAB header to 2000 km during the radar mapping phase of each orbit. These data, SAR data, and volume trailer. altitude variations (and the associated spacecraft velocity vector
Deep Space Network Acquisition Of Magellan High-Rate Telemetry Data
The NASA DSN is responsible for the acquisition and provi- sion to the Magellan project of all radar mapping data generated and transmitted by the Magellan spacecraft. Major improvements were implemented in the DSN telemetry system to assure that a high percentage of transmitted data was successfully acquired and provided to the Magellan project.
The network currently includes 12 Deep Space Stations posi- tioned at three Deep Space Communications Complexes, which are located on three continents: at Goldstone, in Southern
California's Mojave Desert; near Madrid, Spain; and near Canberra, Australia. The locations in Spain, Australia, and
changes) had to be accounted for in the control of the radar sensor. Special radar mapping sequencing software (RMSS) was used
to calculate optimized sensor operating parameter values to be used for each burst of radar data. This software was first used to
calculate an optimized S AR antenna look-angle profile. The soft- ware was then used to calculate, optimized values for SAR pulse repetition frequency, data sampling gate position, receiver gain settings, etc. These control parameters were incorporated into command files that were periodically transmitted to the spacecraft.
The radar sensor utilizes a block-adaptive quantizer (BAQ) to transform each original 8-bit SAR data sample within a "block" (subset) of samples into a compressed 2-bit format. Each such block of samples is accompanied by a "threshold" value that is related to the signal variance within that block. These threshold
California are approximately 120 ø apart in longitude, which values are telemetered to Earth along with the associated set of 2- ensures continuous observation and suitable overlap for transfer- bit compressed samples. (The number of bits required for the threshold values is much less than the number of bits associated ring the spacecraft radio link from one complex to the next.
The DSN telemetry data flow path is shown in Figure 5. Signals are collected by the antenna under the control of the antenna mechanical subsystem; they are then amplified by low- noise maser amplifiers in the antenna microwave subsystem, detected and downconverted via the ultrasensitive S- and X-band receivers in the receiver-exciter subsystem, demodulated, decoded, and synchronized in the telemetry subsystem, and, finally, formatted, recorded, transmitted, and routed to the project at IPL.
DSN Telemetry System Performance During the Magellan Prime Mission
During the Magellan prime mission, one or more DSN stations were continuously supporting the Magellan spacecraft, with the exception of an approximately 15-day period centered about solar superior conjunction (November 2, 1990). During each 3.26-hour orbit, radar data were acquired and recorded for 37.2 min by the Magellan spacecraft at 804.6 kbits/s. Subsequently, these data were replayed (within the same orbit) in two separate, approxi- mately 57-min, playback periods, at 268.8 kbits/s. At the start of each playback period, the DSN had 1 min from the time of signal appearance to acquire the signal and to lock up the end-m-end telemetry system to avoid the loss of any radar mapping data.
For the Magellan prime mission, the high-rate telemetry data capture rate was 99.14% of the data transmitted by the spacecraft. During the prime mission, there were five failures that resulted in data losses greater than 30 min, and these are characterized in Table 2.
RADAR OPERATIONS
Radar System Overview
Saunders et al., [1990], and Johnson, [1991], provide a description of the Magellan radar system design. The relatively
with the block of data samples.) Each burst of radar data is accompanied with a report of the
associated sensor control parameter values and of the threshold values used in the BAQ encoding. A Golay error-correcting code is applied to the data frame "headers" that contain the parameter values associated with that radar burst. (No special error protec- tion is applied to the radar data samples.)
The radar data are initially recorded on the spacecraft tape recorder (because the high-gain antenna is pointed toward Venus to support the SAR operation) and later telemetered to Earth. The radar data are incorporated into experiment data records (EDRs) along with necessary ancillary data. There are separate EDRs for the SAR and altimeter data. (The radiomerry data are included in the frame headers, and those headers are included in both the SAR EDRs and the ALT EDRs.)
The SAR data undergo intensive processing to transform them into image data. These image data and associated ancillary data are incorporated into F-BIDRs. Each F-BIDR contains all the image data corresponding to one orbit. The F-BIDRs are then used to produce a variety of mosaicked image data products. The fol- lowing sections contain additional details regarding the following topics: radar sensor operations, S AR processing, image mosaick- ing, and radar system performance.
RADAR SENSOR OPERATIONS
Sensor Control
The complexity of the radar instrument control process was driven by the following factors: dynamic variations in operating condi- tions due to the elliptical orbit, narrow SAR operating margins due to the antenna pattern constraints and data rate constraints, desire for near-optimum radar system performance, and con- straints regarding commanding frequency and command process complexity. The primary inputs into the radar command genera-

SAUNDERS ET AL.: MAGELLAN MISSION SUMMARY 13,077
z

13,078 SAUNDERS ET AL.: MAGELLAN MISSION SUMMARY
TABLE 2. DSN Data Losses in Excess of 30 Min
Date Complex Loss, Failure Characterization min
Oct. 1, 1990 Madrid 122 Hardware, complex-wide power failure
Nov. 12, 1990 Canberra 147 Hardware, complex-wide fail- ure of frequency and tim- ing system
Dec. 10, 1990 Canberra 48 Documentation, error in pre-
April 10, 1991 Madrid 44
April 25, 1991 Goldstone 108
Hardware, antenna azimuth decoder power supply fail- ure
Procedural, mislabeled cables caused loss of connection
to data recorders
tion process were predicted spacecraft ephemeris for the next operating period; special science requirements regarding look angles, polarization, image swath width, etc.; predicted terrain elevation during the next operating period; and special engineering requirements pertaining to spacecraft safety.
The RMSS was designed to assure that a prescribed set of min- imum performance requirements would bc met without violating a prescribed set of operating constraints. Further, it implemented a prescribed performance optimization process to maximize the uti- lization of design margins. Performance characteristics treated by the RMSS included the following: requirements regarding the along-track and cross-track resolution, requirements regarding the minimum number of SAR looks, requirements regarding the thermal SNR, requirements regarding the signal-to-ambiguity ratio, constraints regarding the maximum data recording rate, con-
dicted acquistion frequency straints regarding the maximum instrument power consumption, and constraints regarding the data buffer capacity.
The RMSS also calculated the azimuth processing bandwidth to be used in the SAR processor so the specified azimuth ambigu- ity requirements would be met.
The normal rate of radar command updating was twice-per- week during cycle 1. Each upload contained the necessary com- mand information to control approximately 5000 separate bursts of radar data. The spacecraft had the capability to update radar sensor control parameters as rapidly as 15 times per second.
SAR PROCESSING
The SAR Data Processing Team (SDPT) was responsible for The RMSS was designed to calculate a set of parameters to performing the ground processing of SAR data to produce image
control the SAR antenna look-angle profile and a set of parame- data (Figure 6). Data processing by the SDPT was on an orbit-by- ters to control various aspects of the radar sensor operation. The orbit basis, resulting in an output data product composed of radar set of sensor control parameters enabl,ed control of the following image data acquired from each individual orbit. In the normal aspects of sensor operation: (1) SAR pulse repetition frequency, flow of operations, SAR EDRs were made available to SDPT for (2) number of pulses per SAR burst, (3) time between SAR bursts, processing into image data several weeks after the data were (4) duration and position of SAR echo sampling windows, transmitted to Earth. A small fraction (about 5%) of the data, (5) receiver gain settings for SAR, altimeter and radiometer however, were expedited to SDPT within 2 days of data collection modes, and (6) position of altimeter echo sampling window. to allow timely assessment of the data acquisition process. The
EDR
AND
DDPRL
EDR
LOG-IN
COMPILED
DDPRL ...I PROC
SCHED'G
I
BASELINE
PROCESSING
QUEUE
BIDR RECEIPT MESSAGE,
(TEDR + DDPRL), (XEDR + DDPRL)
•..I PROC SCHED'G
F-BIDR
MODIFIED DATA ON PROCESSING DUAL-PORTED
QUEUE .-I F-BIDR DISKS '"1 GENERAT'N
F-BIDR• TAPE, SDPSDF
RDRL •
BIDR TAPE
AND PRINT
LOG-OUT
F-BIDR TAPE
AND PRINT TO
DMAT
BIDR
OFFLOAD
TO IDPS / BIDR • • FULL QA
BIDR RELEASE I F-BIDR MESSAGE •' QA LOG
F-BIDR
THERMAL
PRINTS BIDRP
GENERAT'N
• AND QA F-BIDRP
Fig. 6. Overview of the synthetic aperture radar (SAR) image processing. The raw SAR signals from the orbit-by-orbit experiment data records (EDRs) were processed to produce SAR images for each orbit as full-resolution basic image data records (F-BIDRs). A key auxiliary product was the thermal prints of these F-BIDRs, which permitted both quality control checks of the SAR images and a quick assessment of new geologic features observed by Magellan. This EDR-to-F-BIDR processing proceeded on orbit-by-orbit basis (i.e., one EDR and one F-BIDR per orbit). Subsequent mosaicking of these F-BIDRs pro- duced the complete SAR image mosaics via the processing flow shown in Figures 7 and 8.

SAUNDERS ET AL.: MAGELLAN MISSION SUMMARY 13,079
processing throughput capability of SDPT was approximately 60 It was decided that it would be better to process all of the data orbits per week, whereas the normal weekly data acquisition rate the same way rather than to implement corrections for these of the radar was roughly 53. This difference enabled expedited processing and the accommodation of some special processing and makeup processing to account for operations errors.
The S AR EDR was the primary input data product to the SAR Data Processing Subsystem (SDPS). The content of each SAR EDR consisted of all the engineering information and S AR data necessary for SDPS to proceed with processing of one single
errors. Consequently, the pixel values in the Magellan F-BIDRs are based on the following approximation to the intended backscatter function:
fa (0) = (0.0118) cos (0 + 0.5ø)/[sin (0 + 0.5 ø) +
0.111 cos (0 + 0.5ø)] 3
orbit. The SAR EDR contained SAR data and all ancillary data The 8-bit F-BIDR pixel values are normally allowed to have required for SAR signal processing. The ancillary data included values in the range from 1 to 251. (The values 0 and 252 through spacecraft ephemeris data, SAR processing bandwidth file, point- 255 were reserved to be used as special marker flags.) A pixel ing quatemion coefficient file, sensor telemetry data, and SAR value of 101 represents a measured backscatter function that is burst header. The SAR burst header contained the burst timing equal to that of the model. The relative backscatter coefficient information in spacecraft clock units, the pulse repetition fre- value for other pixel values is given by the following expression: quency, the dimension of the burst, and the threshold values used for adaptive quantization of the SAR signal. These ancillary data relative backscatter coefficient = 0.2 (pixel value - 101) dB were necessary in the derivation of the control parameters to con- The F-BIDRs were provided to the Magellan Image Data trol the signal processing for each burst. Processing Team (IDPT) for the generation of mosaickeri image
The SAR data processing task was performed on the SDPS, data products. The SDPT produced a reduced resolution version of which consisted of two ground processors: the primary SAR pro- the same product that was recorded on a temporary image strip cessor (PSP) and the engineering SAR processor (ESP). The PSP, produced using a thermal image recording device. The thermal having a processing throughput capability of more than 15 times print provided one of the means for the quality assurance engineer that of the ESP, was the processing unit that performed the radar at SDPT to assess the quality of the F-BIDR. The thermal print data processing functions to reduce raw SAR data into image data also allowed the members of the Science Team to preview the in normal routine operations. The ESP was routinely used to per- data, to perform additional quality control for gap monitoring and form quality assurance functions on the image data generated by science acceptance, and to screen the data for areas of scientific the PSP, in addition to hosting the electronic link that fed image interest. data to the image data processor subsystem (IDPS). The ESP also To accompany the F-BIDR, SDPT also provided ancillary data served as a backup processor to support radar system performance products, including a summary report of data quality, summary of verdication in the event the PSP was malfunctioning. observed processing, and product anomalies. Because of the
SDPT Data Products
The primary output data product generated by the SDPT was the F-BIDR. Each F-BIDR contains all the image data corre- sponding to one orbit plus prescribed ancillary files. The details regarding the content and format of F-BIDRs is available in the F-BIDR Software Interface Specification that is a part of the Magellan data archive. The pixel values contained in the F-BIDRs are expressed in terms of the actual observed radar backscatter
numerous changes made to the SDPS software in response to various problems affecting the processing of the SAR data, SDPT also maintained a log of the processing history, including the date of processing, software version used, and product version pro- duced. This information was compiled and stored in the Magellan data archive.
F-BIDR Characteristics
The image data produced from SAR data collected from 89øN coefficient value relative to a prescribed backscatter model that is latitude to 89øS latitude were processed into sinusoidal equal-area a function of signal incidence angle. projection. Image data within 10 ø of the poles were processed into
The prescribed reference backscatter model as a function of the oblique-sinusoidal projection. All image data were resampled at a incidence angle 0 is given by [Muhleman, 1964; Pettengill et al., pixel spacing of 75 m in both the along-track and cross-track 1988]
j•O) -- K 1 cos O[(sin 0+ K 2 cos 0) 3 The intended values for the coefficients were as follows:
K1 = 0.0188
K2= 0.111
Because of a document misprint, the SAR processor was imple- mented using the following value•:
= 0.08
K2=0.111
Also, after rite start of data processing operations, an error was discovered in a S AR processor software indexing routine that caused the processor to use a value of (O + 0.5 ø) in place of the intended value of O.
TABLE 3. Number of Looks and Pixel Resolution
Cross-Track Latitude Number of Ground
Looks Resolution
Along-Track Resolution
+90 14 250 110 +82 15 211 110 +60 9 155 110 +45 8 125 110 +30 6 108 110 +10 5 101 110 -10 5 108 110 -25 5 125 110 -40 11 155 110 -62 15 211 110 -70 14 250 110

13,080 SAUNDERS ET AL.: MAGELLAN MISSION SUMMARY
dimensions. The number of looks and image resolution, however, processing using data collected during the furst cycle generally vary as a function of latitude. The values of these parameters dur- was finished on-time or ahead of schedule after initial start-up ing the first mission cycle are presented in Table 3. delays. In fact, more processing was accomplished than planned,
F-BIDR Processing Status
About 1500 orbits were successfully processed during the first cycle of operations from September 13, 1990, through May 15, 1991, covering about 84% of the planet. Image data for over 4000 orbits have been produced spanning about two times the area of the planet. Discounting all gaps and overlaps in the data, image data covering about 97% of the planet have been acquired.
Image Mosaicking
mainly because processing efficiencies improved as experience was gained and changes were made to the processing procedures.
IMAGE DATA PROCESSING OPERATIONS
Image-processing analysts used daily inputs of the orbit- oriented data to creme various mosaicked products, some utilizing the full resolution of the SAR image data, and others providing synoptic perspectives of large portions of the globe. The analysts and photo technicians directly supported the Magellan science investigators and the JPL Public Information Office, with special- ized processing of the data to meet the need for timely release of
The Multimission Image Processing Laboratory (MIPL) at JPL information about scientific fmdings at professional society meet- was used to produce a wide variety of mosaicked image data ings, in journal articles, and in the news media. products from the F-BIDRs described above. The pacing require- In order to facilitate the processing of the Magellan data, the merit for IDPT operations was to maintain a processing through- IDPT performed five primary functions: (1) processing control, put rate of one week's worth of input data processed in one (2) quality assurance, (3) image processing, (4) photo processing, week's time. In accordance with that strict requirement, image and (5) software sustaining. Figure 7 is a graphical representation
SAR DATA PROCESSING TEAM DATA MANAGEMENT & ARCHIVE TEAM
F-BIDRs OUTPUT DIGITAL DATA AND PHOTOPRODUCTS
IMAGE DATA PROCESSING TEAM .• ..:• :.'"•"'•.?•'.•i:•. •'..:•-.•.• ..... ß :•:•'.':•.•:".x! ........ ' ............... ' ........ :• -•'.:•:•!i::. .:% '.': ;:• • ::?•. '..'::.%. •::.:... ........ QUALIlY :::•..... •.. ,:.x.: .....
..... "' •, .'}>;:;(" •; CONTROL }J;•}::., '• •" ..:•:•'.' .• ....'•:.. ........... •: •: •' •:.. •::..
.... .... .....::'". :' .... ..:•,.: •'.: •5•. • ::• '*•:•:•:5::..
.:.• .... •.•. :.:. • :.• // '"•;::•:• ....
< "% .....
.:f•?' • DIGITAL DAIA .• Z o EXP•OED:•:.. '::::•?:•}• ....
:J•• • ........ •:'.... ' • • FIL• "::.::::. '::•?:.. INSTRUCTIONS • ..... SIAlUS .....
STATUS NSTRUCTONS' ................ ...........
z • •
Fig. 7. Overview of synthetic aperture radar (SAR) image mosaic processing. This portion of the ground processing by the image data processor subsystem 0DPS) created complete SAR images by mosaicking the orbit-by-orbit full-resolution basic image data records (the F-BIDRs). These complete SAR images were produced as digital mosaicked image data records (MIDRs) and as photographic mosaicked image data record photographs (MIDRPs).

SAUNDERS ET AL.: MAGELLAN MISSION SUMMARY 13,081
of the relationships between these functions. The processing con- trol function provided the overall guidance by evaluating status reports and formulating instructions and schedules for team activi- ties. The quality assurance function was the focal point for all input products, in-progress data, and output data products used by or processed by the team. The image-processing function per- formed the image processing of data products. Analysts processed input data and transferred them via the electronic link with the SDPS into their designated final form as digital and photo data products. The final products consisted of digital recordings on "write once read many" (WORM) optical disks, magnetic tape files, and exposed film. The other f'mal products were transferred to DMAT for distribution and/or archiving, also after being released by the quality assurance function. The photo processing function processed the exposed film generated by the Multimission Image Processing System (MIPS) facility. The pro- cessed positive and negative transparencies were used in the pro- duction of multiple copy negatives, contact prints, and enlarge- ment prints that then were distributed to the science investigators by DMAT. Finally, the software sustaining function provided continuing software support for the Magellan-specific image- processing software.
Mosaicked Image Characteristics
F-BIDRs, which are about 220,000 lines by about 300 sam- ples, are stored on WORM optical disks (as working copies of the data) and on computer-compatible magnetic tape for archive pur- poses. The WORM copies of the F-BIDRs were the basic input for additional processing that resulted in mosaics.
Mosaics were the prime IDPT output product. There are four standard types of mosaics, each of which are 7168 lines by 8196 samples: the full-resolution mosaickeri image data record (F-MIDR), which used the full 75-m •esolution of the input F-BIDR, and the three levels of compressed resolution mosaics, C1-MIDR, C2-MIDR, and C3-MIDR (compressed-resolution mosaicked image data record, with data compressed once, twice, and thrice, respectively, corresponding to 225-m, 675-m, and
SAR DATA PROCESSING SUBSYSTEM
F-BIDR VIA
IMAGING LAN
IMAGE DATA PROCESSING SUBSYSTEM
DIS•--•• f
IN-PROGRESS DATA
MIPs DATA
PROCESSORS
J WORKING DATA
MOSAICS • / I DISTRIBUTION DATA CATALOG DATA
• DISTRIBUTION DATA
Fig. 8. Overview of image data processing data flow. The ground process- ing that created the mosaicked image data records used both magnetic disks and write once read many (WORM) storage devices as well as displays to hold and store the orbit-by-orbit data while the synthetic aperture radar (SAR) image mosaics were being created. The transfer of the orbit-by-orbit data from the SAR data processing subsystem was facilitated by an electronic local area network (LAN) connection between the two data processing subsystems. When these mosaics were completed, they were stored on computer-compatible tapes, on compact disks-read-only memory (CD-ROMs), and on photographs. Catalog data on directory files permit tracking of completed mosaics.
RADAR SYSTEM PERFORMANCE
In general, the radar system performance was excellent and the 2025-m pixels), also derived from the F-BIDR. Each stage of compression involved averaging the values of 3 x 3 arrays of cycle 1 data products usually meet all specified performance pixels from the next higher resolution version of the image data. requirements. Known exceptions are documented in the Magellan
When processing of a particular product was completed, the data were written to magnetic tape for archiving and to a WORM optical disk as working copies for further processing. A set of premastering tapes were produced for a mastering vendor who manufactured cow. pact disks-read-only memory (CD-ROMs). Each CD-ROM contains about 650 Mbytes of data.
Image-Processing Status
data archive.
Several tests were performed to assess the radiometric accu- racy of the SAR system. The results indicate that the end-to-end absolute calibration is within _+ 2 dB. This is well within the spec- died requirement of + 5 dB [Madsen, 1991].
Several types of relative radiometric comparisons of the Magellan radar data were performed. Comparison of the overlap region imaged on adjacent orbits around periapsis showed a rela- tive cross-track difference of less than + 1 dB. Although there is
Image-processing operations for the unusually large data- good cross-track radiometric calibration, it is still possible to see a handling task posed by Magellan included innovative approaches "venetian blind" effect at orbit boundaries in mosaicked images. such as data transfer via fiber optic local area network (LAN), This effect is the result of small errors in pointing, navigation, data storage and access using optical disk technology, and data topography model, and processing, which caused a slightly differ- distribution via CD-ROM. But much of the success of the opera- ent radiometric correction factor to be used for the same scatterer tions came because of the integration of Magellan-specific capac- in the processor. The relative calibration in the along-track direc- ities with existing multimission facilities. Thus, products were tion within a single orbit cannot be determined directly because processed in a reasonably efficient and timely manner to minimize the incidence angle and scene are changing. However, measure- the backlog of unprocessed data. The relationship between the ments made between the overlap region on adjacent orbits show various data product types is shown in Figure 8. excellent agreement, indicating good relative along-track calibra-
F-BIDRs were produced for all cycle 1 orbits for which SAR tion. Relative radiometric analyses have compared regions of the data were acquired, beginning with orbit 376 and continuing planet contained in the overlap region of orbits in cycle 1 and through 2164. All required MIDRs corresponding to cycle 1 have cycle 2. The average difference across the orbit is 0.14 dB, indi- been completed. caring excellent cycle-to-cycle relative radiometric accuracy. Note

13,082 SAUNDERS ET AL.: MAGELLAN MISSION SUMMARY
that this compares quite well with the 2-dB relative along-track radiometric accuracy requirement on the Magellan radar.
Resolution and Peak Sidelobe Ratio Measurements
Measurements of the system resolution and peak sidelobe ratio (PSLR) for the Magellan radar were performed by examining tar- gets of opportunity found in the images. The best features studied for this purpose were found at 27.4øN latitude in orbit 1661. Two features were identified that are bright as compared with the back- ground (approximately 22 dB and 19 dB above the background). They were used to get resolution and PSLR bounds (Figure 9).
Fig. 9. Synthetic aperture radar (SAR) image of the narrow, radar-bright' feature that demonstrated that the radar sensor met the resolution requirement of 120 m. This feature, located just north of Hecate Chasma, is about 10 km long with a width of less than 100 m or the approximate resolution of the radar system. Magellan radar response to this feature is shown in Figure 10.
I LIGHTNING BOLT PSLR MEASUREMENTS
10.0 i
0.0-
•' -10.0 O
-2O.0
-30.0 -100.0 -60.0 -20.0 20.0 60.0 100.0
PIXEL (75 m)
Fig. 10. Synthetic aperture radar (SAR) signal response to the narrow, radar-bright surface feature shown in Figure 9. The narrow width of this response indicates that Magellan met its resolution requirement of 120 m. Furthermore, the level of the peak relative to the low levels surrounding the peak indicates that the Magellan radar had an excel- lent peak sidelobe ratio (PSLR) of -18.8 dB.
Note that the range compression sidelobes are clearly visible as ghosts of the jagged bright feature. Just north of this feature, an azimuth ambiguity is visible in the image (not seen in Figure 9)
:•i and was used to measure a signal-to-ambiguity ratio of approxi- ::;::::. mately -13 rib to -16 dB. Figure 10 shows a plot of a slice through i;i!? the jagged feature at the point where the signal was largest. The :? peak sidelobe is -18.8 dB as compared with the ideal point target .•;11i!: PSLR of -22 dB. Thus it may be concluded that the PSLR for the ? Magellan radar system is better than -18.8 dB in the range dimen- ....... sion. This value is well within the specification value of-13.5 dB. ß Another target of opportunity that yielded extremely good res- :... olution was found by the altimeter on orbit 1628. This target was
an unusually bright pointlike target. Comparisons with target sim- ulator data made during ground tests were similar. Measurements were within 1 dB of the expected values, indicating that the radar was operating nominally. The target was estimated to have an area of about 1 km 2 by inverting the range equation and independently
.... by projecting the range and azimuth resolution estimates onto the 'i!i: planeifs surface.
Resolution measurements in both the along-track and cross- -. track direction were made using the bright target of small extent
located just north of the jagged feature discussed above as seen in ß
Figure 9. Good PSLR measurements were not possible because the target was insufficiently bright as compared with the back- ground. The 3-dB resolution is 120 m in both the cross-track and along-track directions. The expected cross-track resolution is 118 m for imaging geometry at 27.4øN and 120 m in the along- track direction, giving excellent agreement with the measure- ments.
Navigation Error Effects on SAR Data
Predicted ephemerides for the Magellan spacecraft were used in generating radar command sequences; post facto (final) ephemerides were used as the basis for S AR data processing and mosaicking of image strips. Errors in the predicted ephemeris

SAUNDERS ET AL.: MAGELLAN MISSION SUMMARY 13,083
result in suboptimal collection of SAR data, which cannot, in gen- but that can be associated with a product by virtue of its identifica- eral, be compensated for in the processing. tion with a particular orbit, upload, time range, or other key value.
Final ephemeris data during cycle 1 were accurate and met the Records of processing and distribution are also maintained in the 150-m radial and 1-km along-track and cross-track requirements catalog. The catalog data will be transferred to PDS after valida- except for orbits around the solar superior conjunction gap. tion. Because final ephemeris data were so good, the mosaicking could As of March 1992, 721 mosaicked images had been released generally be done satisfactorily with a dead-reckoning process for distribution to the science community and distributed as photo based upon the final ephemeris. products by DMAT. The total number of products distributed by
Since the spacecraft ephemeris data were provided in an inet- DMAT exceeds 150,000. Distribution of all products from map- tial reference frame relative to the planet rotation, determination ping cycle 1 was completed by January 1, 1992. of accurate latitude and longitude coordinates in Magellan SAR imagery not only required accurate ephemeris data but also required precise knowledge of the Venusian rotation rate and pole position. In order to improve coordinate location in cycle 2, data from imagery in the overlap region of orbits from cycle 1 and cycle 2 were used to get an improved estimate of the Venus rota- tion rate. The method employed a tie-pointing procedure to locate the same points in orbits from cycle 1 and cycle 2 and computed their position offsets. Data from a number of orbit pairs yielded an average displacement at the equator of 1078 m. This displacement has been incorporated into the geodetic location process for cycle 2 data.
DATA MANAGEME• AND ARCHIVE
SCIENCE TEAM
The Magellan Science Team has actively participated in the mission to Venus from the original formulation of science objec- tives for the progenitor Venus Orbiting Imaging Radar (VOIR) mission, through the development of capabilities requirements on the Magellan spacecraft and support of the design and qualifica- tion of the radar instrument, to the current analysis and reporting of the Magellan SAR data being returned. The organization of the team is is shown in Figure 11.
The Magellan Project Scientist serves as an advocate for science at the project level. The remainder of the science team interfaces with the project for both uplink and downlink activities through the Science Support Team (SST). These activities include
Magellan is the first planetary flight project to employ a single negotiation of the science requirements on the project, providing project team to collect, maintain, and distribute the scientific data technical inputs and guidance to the mission planning and to the products created by the mission. These products include the raw science data production processes, analysis of the science data, data transmitted to Earth by the spacecraft, the intermediate prod- and generation of reports on the science results of the mission. ucts created by the several processing teams of the project, the The data analysis and reporting, conducted under the auspices final products distributed to the investigators for scientific analy- of the Project Science Group, has included preparation of the "45- sis, and the products created by investigators at their home insti- Day Report" (published as a special issue of Science, April 12, tutions. The activities of the Data Management and Archive Team 1991) and the 6-Month Report (this special issue). Additional (DMAT) ensure that a complete and well-documented data set science reports will be published through the end of the mission. will be available after the end of the project for long-term scien- In addition to the project reports, Magellan investigators have also tific research. presented technical papers at the American Geophysical Union
While DMAT distributed products directly to the Magellan (AGU), the Geological Society of America (GSA), and the investigators, the data products are made available to the scientific Division of Planetary Science (DPS) of the American community through the National Space Science Data Center Astronomical Society and have made informal presentations at (NSSDC), NASA's Regional Planetary Image Facilities, and public schools and universities, before technical and civic organi- NASA's Planetary Data System (PDS). DMAT distributed the zations, at the project contractors facilities, at NASA centers, and data products to these organizations on an ongoing, weekly basis. at NASA Headquarters. The Science Team also supports the Distribution followed the release of the products by the Project Public Information Office activities, including press conferences, Scientist. technical conference and meeting displays, and publication of
DMAT is currently storing more than 23,000 magnetic tapes in review articles, lithograph sets, and posters. the archive facility for eventual transfer to NSSDC. More than 15,000 working library tapes have been produced. Over 3000 of Science Team Members and Structure these have been recycled, and more than 4000 have been trans- ferred to PDS. DMAT has collected approximately 9000 photo The Magellan Project Scientist and Deputy Project Scientist products, in the form of prints, negatives, positives, and slides. are R. Stephen Saunders and Ellen R. Stofan. The other members More than 14,000 pages of paper records and computer listings of the Science Team are listed in Table 4, and are divided into the are held in the working library. Paper records will be available Radar Investigation Group (RADIG)and the Gravity Investigation through the JPL Regional Planetary Image Facility after the end of Group (GRAVIG). An executive subset of the RADIG, the Project the mission. Science Group (PSG), is comprised of the Project Scientist, the
RADIG and GRAVIG principal investigators (PIs), and the Chairs The data products catalog is maintained in a relational data of the RADIG Task Teams.
base on a dedicated data base processor. The data base is accessi- ble from a personal computer running the Data Management and RADIG Archive Subsystem software or via the JPL Multi-Mission Image Processing System DEC VAX computers. The catalog contains The Magellan RADIG was formed in 1984 by combining the information about each data product, including its identification SAR and Altimetry Investigation groups of the VOIR mission. number, the generator of the product, the range of coverage (such The RADIG participated in the selection of parameters for the as date and time, orbit numbers, or latitude and longitude), and SAR radar system, the design of calibration and test procedures, certain other identifying information. The catalog also contains the planning of the in-flight operations that related to the radar information that is not linked specifically to an individual product system, and the laying out of the processing and presentation of

13,084 SAUNDERS ET AL.: MAGELLAN MISSION SUMMARY
!- o LLI
LLI
N
w
Zowz• o-•) •,•o o _•rrw rr •w•O•
Oz
o
•oo o
> ..j•w ICZ: •: • • I
m •-0_ool m o•'r•l •z -o•
-I I øø •1 /•ø•l
• ••1 / / ol • m • m m
• i• ,.o•m j• Ios•Ol
/ •ol .• I I ! I i I •dE z
z
z fl- I o!::zu- , •z<
I I ø" I I
z•wm
i i i

SAUNDERS ET AL.: MAGELLAN MISSION SUMMARY 13,085
TABLE 4. Magellan Investigators
Group Members
RADIG Investigators Victor R. Baker, University of Arizona Joseph H. Binsack, Massachusetts Institute of Technology Donald B. Campbell, Comell University, Ithaca, New York John E. Guest, University of London Observatory William M. Kaula, University of Calffomia, Los Angeles Kurt L. Lambeck, Australian National University Franz W. Lebefi, Vexcel Corporation Dan P. Mckenzie, Bullard Laboratories, England Barry E. Parsons, University of Oxford, England Gerald Schaber, U.S. Geological Survey, Flagstaff Gerald Schubert, University of Califomia, Los Angeles Manik Talwani, Houston Area Research Center John A. Wood, Smithsonian Astrophysical Observatory
PSG Members Raymond E. Arvidson Georges Balmino Joe M. Boyce (Co-Chair, Prog Sci) Merton E. Davies Charles Elachi James W. Head
Gordon Pettengill (RADIG PI) Roger Phillips Keith Raney R. Stephen Saunders (Chair, Proj Sci) William L. Sjogren (GRAVIG PI) Laurence A. Soderblom Sean C. Solomon
Leonard Tyler
GRAVIG Investigators Mohan Ananda, Aerospace Corporation Nicole Borderies, JPL B. Moynot, CNES, France
Guest Investigators* E. L. Akim, Institute of Applied Mathematics, Russia W. Bruce Banerdt, JPL A. T. Basilevsky, Vemadsky Institute, Russia Richard M. Goldstein, JPL Ronald Greeley, Arizona State University, Tempe Randolph L. Kirk, U.S. Geological Survey, Flagstaff Michael C. Malin, Arizona State University, Tempe George E. McGill, University of Massachusetts, Amherst Henry J. Moore, U.S. Geological Survey, Menlo Park Duane O. Muhleman, Califomia Institute of Technology, Pasadena David Sandwell, University of California, San Diego, Geological Research Division, La
Jolla, Califomia Peter Schultz, Brown University, Providence, Rhode Island Virgil L. Sharpton, Lunar and Planetary Institute, Houston, Texas Steven W. Squyres, Comell University, Ithaca, New York John Suppe, Princeton University, Princeton, New Jersey Donald L. Turcotte, Comell University, Ithaca, New York A. V. Zakharov, U.S.S.R. Academy of Sciences, Russia
*Guest Investigators are assigned to the RADIG or GRAVIG as appropriate.
the data. One of its most important tasks is to interpret the data resulting from the mission and to publish the results of its studies. The interpretation of the Venus data includes description of the major surface units on Venus in terms of their radar scattering behavior, radiothermal emissivity and altitude, characterization of the principal types of geological processes that produced these units, formulation and tests of hypotheses for the evolution of observed geologic features, search for and interpretation of corre- lations between gravitational inhomogeneities and the topography
for corresponding areas of the Venus surface, and development of hypotheses to explain the observed correlations. The results of these investigations are being used to infer the likely geological and geophysical evolution of Venus as a planet and axe being compared with observations on other terrestrial bodies, including Earth. The ultimate objective is to further the understanding of the evolution of the solar system.
RADIG is broken up into task groups, process groups, and science analysis and planning teams. The primary responsibilities

13,086 SAUNDERS ET AL.: MAGELLAN MISSION SLIMMARY
of the task groups are organization and completion of scientific gap and the thermally induced "hide gap," which together reports and support of the systematic analysis of the data. The accounted for 9.4% of the lost mapping coverage. When not filling process groups are responsible for analysis processes operating or these gaps, the radar would be operated in a right-looking mode having operated on the surface of Venus. The primary function of necessary to image the south pole and thus fill the south polar gap. the science analysis teams is to systematically analyze the elec- Unlike the cycle 1 incidence angle profile, which had been tronic and photographic data products and to identify geologic variable, the right-looking incidence angle profile during cycle 2 features and enter them into the geologic data base. Science analy- sis and planning teams are made up of coinvestigators and guest investigators. A significant part of their analysis effort is done at their home institutions.
G RA VIG
Gravity data were fu'st gathered during cycle 3 of the mission over the region of Artemis Chasma. The complete 360 ø of gravity mapping will not be completed until the end of cycle 4. The cur- rent mission plan includes lowering periapsis for cycle 4 and pos- sible circularization of the spacecraft orbit at the end of cycle 4 in May 1993.
GRAVIG is composed of an American team (including one Russian member) and a French team. The GRAVIG PIs are W. Sjogren (USA) and G. Balmino (France). They are jointly responsible for determining the gravity field of Venus. The teams are integrated insofar as it is necessary to avoid overlap, but will perform independent reductions to analyze the gravity data. GRAVIG tasks also include software checkout, verification and modification, data acquisition, development of various spherical harmonics models, and correlation of Pioneer Venus Orbiter
(PVO) gravity data with Magellan altimetry. GRAVIG will also produce geoid, accelerations, and isostasy maps and SAR/Doppler ephemeris in support of the geodesy control net being developed by RADIG. The gravity investigators will work with the PSG Geophysics Working Group to develop models of the planet's internal structure that fit the gravity observations and also incor- porate measurements of surface topography and structure as mea- sured by the SAR and altimeter, as well as constraints suggested by other disciplines. These models will in turn constrain scenarios on planetary formation and thermal history. They will also serve as a basis for comparative planetology.
FUTURE PLANS FOR EXTENDEr) MISSION
As has been the case with most of the exploratory probe mis- sions conducted by NASA, the defined prime mission represents only the beginning of the useful science that can ultimately be accomplished. A recent example is the Voyager 2 spacecraft, which went on to be the first and only probe to visit Uranus (January 1986) and Neptune (August 1989) after completing its prime mission objectives at Jupiter and Sattma. In this regard, Magellan is proving to be no exception.
Cycle 2
Planning for the first extended mission cycle (cycle 2) began during the fall of 1990 and was completed during the spring of 1991. The defined science goals were to fill significant missing data from cycle 1, reimage previously viewed terrain with a new SAR mode, perform an orbit trim maneuver (OTM) to interleave the cycle 2 altimetry ground track with the cycle 1 ground track, and perform a limited number of special tests to explore new SAR modes for use in later cycles.
The Magellan PSG decided that only two of the cycle 1 gaps warranted filling, using the left-looking incidence angle profile that had been used exclusively in cycle 1: the superior conjunction
had a constant value of 25 ø from about 75øN to 60øS. Below 60øS,
the incidence angle was reduced in order to map the south pole. Constant incidence angle data are useful in decorrelating inci- dence angle effects from actual topographic differences in the images. Table 5 lists incidence angle versus latitude for nominal left-looking data and cycle 2 right-looking data.
The thermal problems that developed near the end of cycle 1 were predicted to continue throughout cycle 2 and into early cycle 3. As a result, only about 50% of the planer's surface was mapped during cycle 2.
Cycle 1 altimetry coverage was undersampled by a factor of 2 in the equatorial region because the width of the altimeter swath there was only 10 km, while the planet rotates almost 21 km each orbit. In order to fill these missing data, an OTM was performed at the beginning of cycle 2 to shift the altimeter ground track to bisect the cycle 1 ground track.
Three special SAR tests were developed and conducted during cycle 2 to assist in planning future cycles. These were (1) a high- resolution SAR mode in which the azimuth resolution was
increased from 120 m to 60 m; (2) a stereo test utilizing a left- looking incidence angle profile designed to yield stereo pairs when combined with the cycle 1 images; and (3) a polarimetry test in which vertical transmit, vertical receive (VV), instead of nomi- nal horizontal transmit, horizontal receive (HH), data were col- lected. The enormous success of the stereo test in cycle 2 argued overwhelmingly for reimaging the planet with the stereo incidence angle. In addition, during cycle 2, a radioscience occultation experiment was performed in which the S- and X-band telemetry carrier signals were used to probe the Venusian atmosphere.
Gravity Collection and Plans for Cycles 3 and 4
Gravity data are acquired by measuring small changes in the X- and S-band Doppler signatures caused by perturbations in the orbit that result from irregularities in the mass distribution of the planet. Since sensitivity of the orbit to gravity anomalies is highly dependent upon spacecraft altitude, near periapsis is where it is most desirable to collect gravity data. Since the SAR can only function at these lower altitudes, the collection of high-resolution gravity data and S AR on the same orbit is not possible. However, sufficient sampling of the gravity field is possible by collecting one gravity orbit out of four; SAR data can be collected during the other three orbits.
While cycle 1 was extremely successful by all science mea- sures, failure of the primary spacecraft tape recorder occurred dur- ing cycle 1. The remaining recorder continues to function nomi- nally, but loss of this second unit would terminate the ability to collect $AR data. Near the end of the second cycle, the primary X-band high-rate data telemetry modulator also failed. However, this transmitter is still able to support Doppler gravity data collec- tion. Loss of the backup X-band transmitter would likewise termi- nate all S AR capability. Neither the tape recorder nor the backup X-band transmitter is required to collect high-resolution gravity data; thus the situation argued that maximum use of the S AR should be made while the capability still existed. There was also the consideration of the effect of the thermal problems that resulted in reduced mapping coverage. Predictions were for cycle
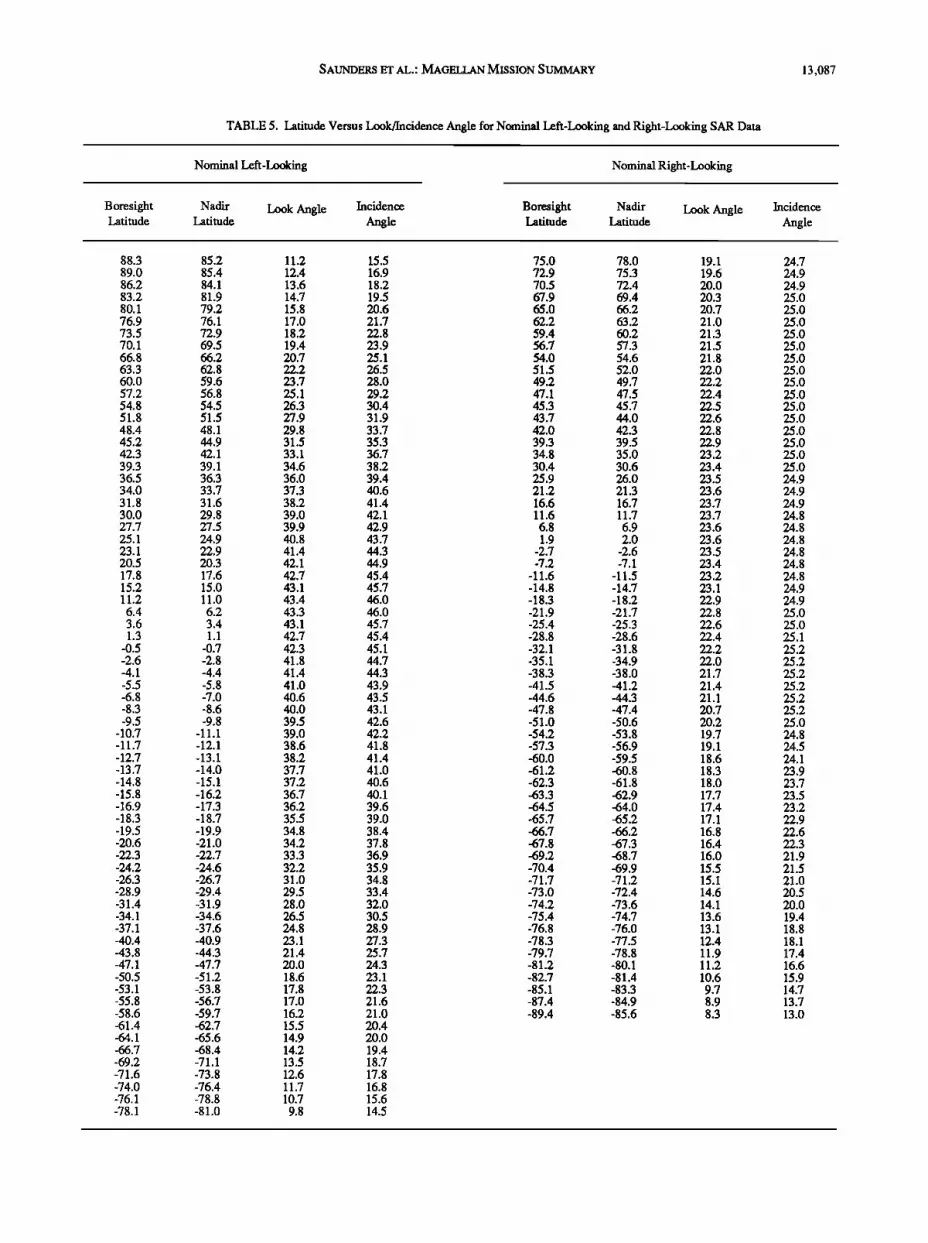
SAUNDERS ET AL.: MAGELLAN MISSION SUMMARY 13,087
TABLE 5. Latitude Versus Look/Incidence Angle for Nominal Left-Looking and Right-Looking SAR Data
Nominal Left-Looking Nominal Right-Looking
Boresight Latitude
Nadir
Latitude Look Angle Incidence Boresight Nadir Look Angle
Angle Latitude Latitude Incidence
Angle
88.3 89.0 86.2 83.2 80.1 76.9 73.5 70.1 66.8 63.3 60.0 57.2 54.8 51.8 48.4 45.2 42.3 39.3 36.5 34.0 31.8 30.0 27.7 25.1 23.1 20.5 17.8 15.2 11.2
6.4 3.6 1.3
-0.5 -2.6 -4.1 -5.5 -6.8 -8.3 -9.5
-10.7 -11.7 -12.7 -13.7 -14.8 -15.8 -16.9 -18.3 -19.5 -20.6 -22.3 -24.2 -26.3 -28.9 -31.4 -34.1 -37.1 -40.4 -43.8 -47.1 -50.5 -53.1 -55.8 -58.6 -61.4 -64.1 -66.7 -69.2 -71.6 -74.0 -76.1 -78.1
85.2 85.4 84.1 81.9 79.2 76.1 72.9 69.5 66.2 62.8 59.6 56.8 54.5 51.5 48.1 44.9 42.1 39.1 36.3 33.7 31.6 29.8 27.5 24.9 22.9 20.3 17.6 15.0 11.0 6.2 3.4 1.1
-0.7 -2.8 -4.4 -5.8 -7.0 -8.6 -9.8
-11.1 -12.1 -13.1 -14.0 -15.1 -16.2 -17.3 -18.7 -19.9 -21.0 -22.7 -24.6 -26.7 -29.4 -31.9 -34.6 -37.6 -40.9 -44.3 -47.7 -51.2 -53.8 -56.7 -59.7 -62.7 -65.6 -68.4 -71.1 -73.8 -76.4 -78.8 -81.0
11.2 15.5 75.0 78.0 19.1 12.4 16.9 72.9 75.3 19.6 13.6 18.2 70.5 72.4 20.0 14.7 19.5 67.9 69.4 20.3 15.8 20.6 65.0 66.2 20.7 17.0 21.7 62.2 63.2 21.0 18.2 22.8 59.4 60.2 21.3 19.4 23.9 56.7 57.3 21.5 20.7 25.1 54.0 54.6 21.8 22.2 26.5 51.5 52.0 22.0 23.7 28.0 49.2 49.7 22.2 25.1 29.2 47.1 47.5 22.4 26.3 30.4 45.3 45.7 22.5 27.9 31.9 43.7 44.0 22.6 29.8 33.7 42.0 42.3 22.8 31.5 35.3 39.3 39.5 22.9 33.1 36.7 34.8 35.0 23.2 34.6 38.2 30.4 30.6 23.4 36.0 39.4 25.9 26.0 23.5 37.3 40.6 21.2 21.3 23.6 38.2 41.4 16.6 16.7 23.7 39.0 42.1 11.6 11.7 23.7 39.9 42.9 6.8 6.9 23.6 40.8 43.7 1.9 2.0 23.6 41.4 44.3 -2.7 -2.6 23.5 42.1 44.9 -7.2 -7.1 23.4 42.7 45.4 - 11.6 - 11.5 23.2 43.1 45.7 -14.8 -14.7 23.1 43.4 46.0 -18.3 -18.2 22.9 43.3 46.0 -21.9 -21.7 22.8 43.1 45.7 -25.4 -25.3 22.6 42.7 45.4 -28.8 -28.6 22.4 42.3 45.1 -32.1 -31.8 22.2 41.8 44.7 -35.1 -34.9 22.0 41.4 44.3 -38.3 -38.0 21.7 41.0 43.9 -41.5 -41.2 21.4 40.6 43.5 -44.6 -44.3 21.1 40.0 43.1 -47.8 -47.4 20.7 39.5 42.6 -51.0 -50.6 20.2 39.0 42.2 -54.2 -53.8 19.7 38.6 41.8 -57.3 -56.9 19.1 38.2 41.4 -60.0 -59.5 18.6 37.7 41.0 -61.2 -60.8 18.3 37.2 40.6 -62.3 -61.8 18.0 36.7 40.1 -63.3 -62.9 17.7 36.2 39.6 -64.5 -64.0 17.4 35.5 39.0 -65.7 -65.2 17.1 34.8 38.4 -66.7 -66.2 16.8 34.2 37.8 -67.8 -67.3 16.4 33.3 36.9 -69.2 -68.7 16.0 32.2 35.9 -70.4 -69.9 15.5 31.0 34.8 -71.7 -71.2 15.1 29.5 33.4 -73.0 -72.4 14.6 28.0 32.0 -74.2 -73.6 14.1 26.5 30.5 -75.4 -74.7 13.6 24.8 28.9 -76.8 -76.0 13.1 23.1 27.3 -78.3 -77.5 12.4 21.4 25.7 -79.7 -78.8 11.9 20.0 24.3 -81.2 -80.1 11.2 18.6 23.1 -82.7 -81.4 10.6 17.8 22.3 -85.1 -83.3 9.7 17.0 21.6 -87.4 -84.9 8.9 16.2 21.0 -89.4 -85.6 8.3 15.5 20.4 14.9 20.0 14.2 19.4 13.5 18.7 12.6 17.8 11.7 16.8 10.7 15.6 9.8 14.5
24.7 24.9 24.9 25.0 25.0 25.0 25.0 25.0 25.0 25.0 25.0 25.0 25.0 25.0 25.0 25.0 25.0 25.0 24.9 24.9 24.9 24.8 24.8 24.8 24.8 24.8 24.8 24.9 24.9 25.0 25.0 25.1 25.2 25.2 25.2 25.2 25.2 25.2 25.0 24.8 24.5 24.1 23.9 23.7 23.5 23.2 22.9 22.6 22.3 21.9 21.5 21.0 20.5 20.0 19.4 18.8 18.1 17.4 16.6 15.9 14.7 13.7 13.0

13,088 SAUNDERS ET AL.: MAGE• MISSION SUMMARY
3 to be similar to cycle 1, i.e., minimal thermal constraints, allow- try transmitter on January 3, 1992, the remaining 75 orbits of the ing a high percentage of the planet to be mapped. Because the cycle 1 thermal gap were not filled. Previous operation of the thermal restrictions have a larger impact on SAR mapping than on backup transmitter had disclosed a signal distortion problem that gravity data collection, it was decided that the emphasis in cycle 3 resulted in degraded performance. After switching back to this should be on SAR mapping and on gravity collection during cycle backup unit, a series of tests demonstrated that the high-rate 4. Furthermore, high-resolution gravity data can only be collected downlink of SAR data could be maintained with some changes to when periapsis is unocculted from Earth. This condition is met for the operation of the spacecraft. Most significantly, the data rate all of cycle 4, allowing 360 ø of longitudinal coverage to be had to be reduced from the nominal 268 to 115 kbits/s. This obtained. resulted in a reduction in the amount of possible mapping cover-
Thus, after careful consideration of these issues, the plan for age. Additionally, the transmitter temperature had to be main- cycles 3 and 4 was developed. Cycle 3 will emphasize SAR and tained within a narrow regime (approximately 50 ø to 55øC). Even with a limited amount of targeted gravity; approximately 4 weeks with these operational constraints, it should be possible to map over Artemis Chasma. Ad(tiQonally, as in cycle 2, a few special between 30% and 35% of the planeifs surface with the stereo inci- tests of new SAR modes will be conducted during cycle 3. Of dence angle. Filling the remaining 75 orbits of the cycle 1 thermal particular interest is the test of a high-resolution altimetry mode in gap is now planned for the end of cycle 3. which the S AR is commanded to operate in an altimetry mode.
Cycle 4 will emphasize the collection of high-resolution gravity Beyond Cycle 4: Aerobraking Magellan? data with a limited amount of SAR mapping. To improve the quality of the gravity data, an OTM will be performed at the The Magellan project is developing an option to aerobrake beginning of cycle 4 to lower periapsis from 290 to 180 km. Magellan into a circular orbit during the first 100 to 150 days fol- Periapsis altitude will drop to a minimum of 165 km about 6 lowing the end of cycle 4. A circular orbit is deskable because the months into the cycle due to gravitational interactions with the data quality can be improved significantly for both the radar and Sun. the gravity science experiments. Figure 12 illustrates that low cir-
Because of the failure of the modulator in the X-band teleme- cular orbits are much more sensitive to simulated mass coneentra-
80
• 60
o• o) 40
2o
o 0
LU -20
O -4o o
-60
-80 -80 -60 -40 -20 0 20 40 60
LATITUDE (degrees) LEGEND
......................... 150 KM CIRCULAR ORBIT
........................... 250 KM CIRCULAR ORBIT
, NOMINAL ORBIT
80
Fig. 12. Theoretical spacecraft accelerations for elliptical and circular Magellan orbits. These curves show the spacecraft accelera- tions from mass deficiencies and excesses equally spaced from pole to pole. Each mass deficiency or excess was equivalent to a 300-km-diameter disk. The solid curve shows the accelerations expected for Magellan current (cycles 1, 2, and 3) orbit. The dashed curves show the accelerations for circular orbits at 150 and 250 km above the surface. Realistic postaerobraking orbits will likely be between altitudes of 150 km (just skimming the atmosphere) to 250 km. Also note that the improvement at peri- apsis when the altitude is reduced from 250 km down to 150 km. This provides insight into the gravity measurement improve- ments that will be obtained with the orbit trim planned for the beginning of cycle 4, when 360 ø of gravity operations start.

SAUNDERS ET AL.: MAGELLAN MISSION SUMMARY 13,089
_IPL Aerobraking Magellan
Initiate Aerobraking
Uo Direction of '
Apoapsis
Series of ,•V's to
Lower Periapsis Gradually ipto the Upper Fringe of the Atmosphere. ( :30 m/sec Total = 15 Kg Propellant )
_ Periapsis (altitude Exaggerated)
Before Starting Aerobraking:
Periapsis = 289.57 Km Apoapsis = 8458.5 Km Period = 3.2594 Hours
Aerobraking Direction of Motion
Series of AV's to
Control Temperature by Controlling Periapsis Altitude. (9 rn/sec Total = 5 Kg Propellant during 100 days)
AV due to Drag = 1. m/sec / orbit
During Aerobraking:
Periapsis = 132 to 142 Km Apoapsis = 8458 to 250 Km Period = 3.23 to 1.51 Hours
Drag AV = 1,301 m/sec #Orbits = 1,200 for 120 øCMaximum
Circularization
Series of bV's to Gradually Raise Periapsis as the Orbit Becomes Nearly Circular. ( 31 m/sec Total = 16 Kg Propellant
Circular Orbit:
Periapsis = 250 Km Apoapsis = 250 Km Period = 1.53 Hours
Fig. 13. Phases of Magellan aerobraking. The steps toward circularizafion of Magellan's orbit will be conducted by first lowering the pefiapsis in one relatively large orbit trim. The lowered pefiapsis ensures that the spacecraft will experience small amounts of atmospheric drag on each pefiapsis passage. During the middle portions of aerobraking, the apoapsis will continue to decrease; small orbit trims will be occurring to keep the pefiapsis at an optimal altitude such that each pass experiences some drag and the spacecraft is still high enough in the atmosphere to escape heating. The final phase of aerobraking will raise the pefiapsis in a relatively large orbit trim to a circular orbit some 250 km above the surface.
tions on the surface of an otherwise homogeneous spherical planet than the current highly elliptical orbit. This increased sensitivity enhances the quality of the gravity science data. A low circular orbit allows the radar parameters to be changed such that signifi- cantly better resolution can be obtained, especially near the poles. However, obtaining high-resolution gravity data in a circular orbit is sufficient rationale to try to circularize the orbit. This signifi- cantly improved science return is the primary reason for circular- izing the Magellan orbit.
There is insufficient propellant to circularize the Magellan orbit propulsively. Aerodynamic drag is the only means available to provide the 1300 m/s required to reduce the apoapsis altitude from more than 8000 km to less than 500 km (i.e., reduce the orbital period from 3.26 hours to 1.51 hours). Figure 13 illustrates the following three phases of the simplified aerobraking strategy:
1. Use a propulsive maneuver to lower the periapsis into the outer fringes of the atmosphere.
avoid excessive aerodynamic heating, yet low enough for the drag to gradually lower the periapsis speed (0.8 m/s/orbit for a 200-day aerobrake duration). A "tail-first" attitude with the maximum solar panel area (backside) exposed to the flow is an aerodynamically stable attitude with the maximum exposed surface area (24 m 2) for maximum drag (i.e., minimum duration).
3. Use a propulsive maneuver to raise periapsis out of the atmosphere to stop aerobraking when the apoapsis altitude has reached the target value (approximately 250 km).
Significant effort is being spent to prepare an aerobraking mission plan. Although there are still many open issues, none of them suggests that Magellan cannot be aerobraked successfully. The current status of the Magellan aerobraking concept is dis- cussed in more detail by Lyons et al. [1991].
SUMMARY
The documentation of the Magellan significant science find- 2. Use a series of small propulsive maneuvers to keep the peri- ings, flight operations, and the data processing is a continuing
apsis in a well-defined periapsis corridor that is high enough to process. This report can only provide a brief summary to help

13,090 SAUNDERS ET AL.: MAGELLAN MISSION SUMMARY
future users of the data understand some of the properties. The Magellan data will be used for planetary geologic analyses and comparative planetology for many years. It is anticipated that the full record of the dam-taking sequences and the processing will be available through the National Space Science Data Center and the Planetary Data System of NASA.
Acknowledgments. The authors thank A. L. Albee and E. D. Miner for helpful suggestions that improved the manuscript.
REFERENCES
and G. Schubert, Pioneer Venus radar results: Geology from images and altimetry, J. Geophys. Res., 85, 8232-8260, 1980.
McKenzie, D., P.G. Ford, C. Johnson, B. Parsons, D. Sandwell, R.S. Saunders, and S.C. Solomon, Features on Venus generated by plate boundary processes, J. Geophys. Res., this issue (a).
McKenzie, D., P.G. Ford, F. Liu, and G.H. Pettengill, Pancakelike domes on Venus, J. Geophys. Res., this issue (b).
McKenzie, D., J.M. McKenzie, and R.S. Saunders, Dyke emplacement on Venus and on Earth, J. Geophys. Res., this issue (c).
Moore, H.J., J.J. Plaut, P.M. Schenk, and J.W. Head, An unusual volcano on Venus, J. Geophys. Res., this issue.
Muhleman, D.O., Radar scattering from Venus and the Moon, Astron. J., 69, 34-41, 1964
Arvidson, R.E., R. Greeley, M. Malin, R.S. Saunders, N. Izenberg, Pavri, B., J.W. Head, K.B. Klose, and L. Wilson, Steep-sided domes on J.J. Plaut, E.R. Stofan, and M. Shepard, Surface modification of Venus Venus: Characteristics, geologic setting, and emption conditions from
Magellan data, J. Geophys. Res., this issue. as inferred from Magellan observations of plains, J. Geophys. Res., Pettengill, G.H., P.G. Ford, and B.D. Chapman, Venus: Surface electro- this issue.
Baker, V.R., G. Komatsu, T.J. Parker, V.C. Gulick, J.S. Kargel, and magnetic properties, J. Geophys. Res., 93, B-12, 14,881-14,892, 1988. J.S. Lewis, Channels and valleys on Venus: Preliminary analysis of Pettengill, G.H., P.G. Ford, W.T.K. Johnson, R.K. Raney, and Magellan data, J. Geophys. Res., this issue. L.A. Soderblom, Magellan: Radar performance and data products,
Barsukov, V.L., et al., The geology and geomorphology of the Venus sur- face as revealed by the radar images obtained by Veneras 15 and 16, Proc. Lunar Planet Sci. Conf. I6th, Part 2, J. Geophys. Res., 91, suppl., D378-D398, 1986.
Basilevsky, A.T., O.V. Nikolaeva, and C.M. Weitz, Geology of the Venera 8 landing site region from Magellan data: Morphological and geochemical considerations, J. Geophys. Res., this issue.
Bindschadler, D.L., A. deCharon, K.K. Betatan, S.E. Smrekar, and J.W. Head, Magellan observations of Alpha Regio: Implications for formation of complex ridged terrains on Venus, J. Geophys. Res., this issue (a).
Bindschadler, D.L., G. Schubert, and W.M. Kaula, Coldspots and hotspots: Global tectonics and mantle dynamics of Venus, J. Geophys. Res., this issue (b).
Campbell, B.A., and D.B. Campbell, Analysis of volcanic surface mor- phology on Venus from comparison of Arecibo, Magellan, and ter- restrial airborne radar data, J. Geophys. Res., this issue.
Campbell, D.B., N.J.S. Stacy, W.I. Newman, R.E. Arvidson, E.M. Jones, G.S. Musser, A.Y. Roper, and C. Schaller, Magellan observations of extended impact crater features on Venus, J. Geophys. Res., this issue.
Davies, M.E., T.R. Colvin, P.G. Rogers, P.W. Chodas, W.L. Sjogren, E.L. Akim, V.A. Stepanyantz, Z.P. Vlasova, and A.I. Zakharov, The rotation period, direction of the north pole, and geodetic control net- work of Venus, J. Geophys. Res., this issue.
Ford, P.G., and G.H. Pettengill, Venus topography and kilometer-scale slopes, J. Geophys. Res., this issue.
Greeley, R., R.E. Arvidson, C. Elachi, M.A. Geringer, J.J. Plaut, R.S. Saunders, G. Schubert, E.R. Stofan, E.J.P. Thouvenot, S.D. Wall, and C.M. Weitz, Eolian features on Venus: Preliminary Magellan results, J. Geophys. Res., this issue.
Guest, J.E., M.H. Bulmer, J. Aubele, K. Beratan, R. Greeley, J.W. Head, G. Michaels, C. Weitz, and C. Wiles, Small volcanic edifices and vol- canism in the plains of Venus, J. Geophys. Res., this issue.
Head, J.W., L.S. Crumpier, J.C. Aubele, J.E. Guest, and R.S. Saunders, Venus volcanism: Classification of volcanic features and structures, associations, and global distribution from Magellan data, J. Geophys. Res., this issue.
Herrick, R.R., and R.J. Phillips, Geological correlations with the interior density structure of Venus, J. Geophys. Res., this issue.
Johnson, W.T.K., Magellan imaging radar mission to Venus, IEEE Proc., 79, 777-790, 1991.
Science, 252, 260-265, 1991. Pettengill, G.H., P.G. Ford, and R.J. Wilt, Venus surface radio-thermal
emission as observed by Magellan, J. Geophys. Res., this issue. Phillips, R.J., R.R. Herrick, R.E. Grimm, R.F. Raubertas, I.C. Sarkar,
R.E. Arvidson, and N. Izenberg, Impact crater distribution on Venus: Implications for planetary resurfacing history, J. Geophys. Res., this issue.
Plaut, J.J., and R.E. Arvidson, Comparison of Goldstone and Magellan radar data in the equatorial plains of Venus, J. Geophys. Res., this issue.
Sandwell, D.T., and G. Schubert, Flexural ridges, trenches, and outer rises around coronae on Venus, J. Geophys. Res., this issue.
Saunders, R.S., G.H. Pettengill, R.E. Arvidson, W.L. Sjogren, W.T.K. Johnson, and L. Pieri, The Magellan Venus radar mapping mission, J. Geophys. Res., 95, 8339-8355, 1990.
Schaber, G.G., R.G. Strom, H.J. Moore, L.A. Soderblom, R.L. Kirk, D.J. Chadwick, L.R. Gaddis, J.M. Boyce, D.D. Dawson, and J. Russell, Geology and distribution of impact craters on Venus: What are they telling us?, J. Geophys. Res., this issue.
Schultz, P.H., Atmospheric effects on ejecta emplacement and crater for- marion on Venus from Magellan, J. Geophys. Res., this issue.
Smrekar, S.E., and S.C. Solomon, Gravitational spreading of high terrain in Ishtar Terra, Venus, J. Geophys. Res., this issue.
Solomon, S.C., S.E. Smrekar, D.L. Bindschadler, R.E. Grimm, W.M. Kaula, G.E. McGill, R.J. Phillips, R.S. Saunders, G. Schubert, S.W. Squyres, and E.R. Stofan, Venus tectonics: An overview of Magellan observations, J. Geophys. Res., this issue.
Squyres, S.W., D.M. Janes, G. Baer, D.L. Bindschadler, G. Schubert, V.L. Sharpton, and E.R. Stofan, The morphology and evolution of coronae on Venus, J. Geophys. Res., this issue.
Stofan, E.R., V.L. Sharpton, G. Schubert, G. Baer, D. B indschadler, D.M. Janes and S.W. Squyres, Global distribution and characteristics of coronae and related features on Venus: Implications for origin and relation to mantle processes, J. Geophys. Res., this issue.
Tyler, G.L., R.A. Simpson, M.J. Maurer, and E. Holmann, Scattering properties of Venus surface: Preliminary results from Magellan, J. Geophys. Res., this issue.
P.C. Allin, R.S. Austin, A.L. Berman, R.C. Chandlee, J. Clark, A.V. deCharon, E.M. De John, D.G. Griffith, J.M. Gunn,
Klose, K.B., J.A. Wood, and A. Hashimoto, Mineral equilibria and the S. Hensley, W.T.K. Johnson, C.E. Kirby, K.S. Leung, D.T. Lyons, high radar reflectivity of Venus mountain tops, J. Geophys. Res., this G.A. Michaels, J. Miller, R.B. Morris, A.D. Morrison, issue.
Lyons, D.T., W. Sjogren, W.T.K. Johnson, D. Schmitt, and A. McRonald, R.G. Piereson, R.S. Saunders (corresponding author), J.F. Scott, Aerobraking Magellan, Paper AAS 91-420 presented at AAS/AIAA Astrodynamics Specialist Conference, Durango, Colo., Aug. 19-22, 1991.
Madsen, S.N., Radiometric calibration of the Magellan radar system, JPL Internal Tech. Memo 3348-91-11 ](intemal document), Jet Propulsion Lab., Pasadena, Calif., Feb. 12, 1991.
Malin, M.C., Mass movements on Venus: Preliminary results from Magellan cycle 1 observations, J. Geophys. Res., this issue.
Masursky, H., W.M. Kaula, G.E. McGill, G.H. Pettengill, G.G. Schaber,
S.J. Shaffer, J.P. Slonski, A.J. Spear, E.R. Stofan, T.W. Thompson, and S.D. Wall, Jet Propulsion Laboratory, Mail Stop 91-69, 4800 Oak Grove Drive, Pasadena, CA 91109.
(Received November 27, 1991; revised June 17, 1992;
accepted June 17, 1992)


