Embed Size (px)
Citation preview

Fuel 101 (2012) 74–83
Contents lists available at ScienceDirect
Fuel
journal homepage: www.elsevier .com/locate / fuel
A parametric investigation of the Chilled Ammonia Process from energyand economic perspectives
Gianluca Valenti ⇑, Davide Bonalumi, Ennio MacchiPolitecnico di Milano, Dipartimento di Energia, Via R. Lambruschini 4, 20156 Milano, Italy1
a r t i c l e i n f o
Article history:Received 12 October 2010Received in revised form 3 June 2011Accepted 23 June 2011Available online 14 July 2011
Keywords:Ultra Super CriticalPost-combustion captureChilled Ammonia Process
0016-2361/$ - see front matter � 2011 Elsevier Ltd. Adoi:10.1016/j.fuel.2011.06.035
⇑ Corresponding author. Tel.: +39 02 2399 3845; faE-mail address: [email protected] (G. Vale
1 http://www.gecos.polimi.it.
a b s t r a c t
As carbon dioxide anthropogenic generation and climate change appear to be correlated, carbon capturebecomes advisable, in particular if applied to coal-fired power plants. The Chilled Ammonia Process (CAP)is a promising technology to be proved for the purpose. Continuing an ongoing study, this work examinesthe integration of Ultra Super Critical (USC) power plants with CAP, conducting a parametric investigationon the design parameters of the capture block in order to find the optimum from an energy perspective,analyzing then in details the power block and estimating ultimately the overall investment and annualcosts. The commercial code Aspen Plus and the in-house research code GS are employed. The index SPEC-CA is adopted as preferred figure of merit of the global performance. With respect to a reference plant of758 MWe net electric production at 45.2% net electric efficiency, the carbon capture of 88.4% of the gen-erated CO2 reduces the net electrical power by 19% and the net electrical efficiency by 8.6% points. Theoptimum SPECCA is 3:22 MJ=kgCO2
and the corresponding specific heat duty to the reboiler is2:46 MJ=kgCO2
. Finally, despite the investment cost of the capture block is about 15% of the power block,the cost of electricity increases from 59.9 to 82.4 €/MWhe because of the net electric efficiency penalty,the additional operation and maintenance costs as well as the consumable costs. The resulting cost ofavoided CO2 is 38:6 €=tCO2 . For comparison, the European Benchmark Task Force (EBTF) computes for con-ventional MEA a SPECCA of more than 4 MJ=kgCO2
, a cost of electricity of approximately 92 €/MWhe and acost of avoided CO2 of about 51 €=tCO2 .
� 2011 Elsevier Ltd. All rights reserved.
1. Introduction
The ongoing scientific discussion does not focus on whether fos-sil fuels will have to meet a major portion of the short- and themid-future energy demand, but rather on how they will be mosteffectively exploited in doing so, in terms of the overall efficiencyand the environmental impact. At the same time, renewablesources will have to be more diffusely implemented in the energyinfrastructure to allow independence from fossils in the far future.In this outlook, coal will play most likely a primary role among theconventional sources, being the most abundant and diffuse of all.However, as carbon dioxide anthropogenic generation and climatechange appear to be correlated, the capture of that generated car-bon dioxide and its storage in geological formations turns to beadvisable. There are three classes of capture technologies that arebeing investigated worldwide: (i) those that capture the carbon be-fore the combustion process, named pre-combustion capture, (ii)those after the combustion, called post-combustion capture, and(iii) those that have the combustion occur in high-purity oxygen,
ll rights reserved.
x: +39 02 2399 3913.nti).
said oxy-combustion, in order to generate flue gases at a high con-centration of carbon dioxide that can be sequestered after a lessenergy-intensive clean-up with respect to the previous two classes.
Post-combustion capture has the large benefit of being readilyapplicable to already existing power plants, both coal- or naturalgas-fired. The carbon capture can be accomplished by adsorptionor chemical absorption. The use of amine aqueous solutions forthe chemical absorption is widely used in other industrial sectors,such as the oil&gas or the urea industries. Currently, the so-calledadvanced amines are under intensive analysis by industrial andacademic centers with the common scope of reducing the energydemand when applied to the power generation industry. In the re-cent years, the alternative chemical absorption in ammonia aque-ous solutions has been proposed. In particular, the absorption inchilled working conditions, a process commercially named ChilledAmmonia Process (CAP), is considered a promising technology thatstill needs further numerical modeling and pilot testing to prove itsviability.
As a continuation of an older investigation [1] and an extensionof a more recent one by the authors [2], this work simulates in de-tails the integration between modern Ultra Super Critical (USC)power plants and the conventional layout for CAP, which wasimplemented by the company Alstom in the pilot plant that has

Nomenclature
gCO2carbon capture efficiency (nondimensional), see Section4.8
ge net electrical efficiency (nondimensional), see Section4.8
AB absorberAC air-coolerCAP Chilled Ammonia ProcessCCS Carbon Capture and StorageCH chillerCM compressorCOE Cost Of ElectricityCOP Coefficient Of PerformanceCC contact coolerE specific CO2 emission ðkgCO2
=MWheÞ, see Section 4.8EBTF European Benchmark Task ForceEOS Equation Of StateFGD Flue Gas DesulfurizationFN fanFP7 European Commission Seventh Framework Programme
HC hydrocycloneHR heat rate (MJth/MWhe), see Section 4.8HX heat exchangerGS gas steamLP low pressureMEA MonoEthanolAmineO&M Operation & MaintenancePM pumpPR purgeRB reboilerREF reference, see Section 4.8RG regeneratorSPECCA Specific Primary Energy Consumption For Carbon
Avoided ðMJth=kgCO2Þ, see Section 4.8 and Eq. (1)
USC Ultra Super CriticalWK water knockoutWT washing towerqco2
specific heat duty ðMJth=kgCO2Þ, see Section 4.8
G. Valenti et al. / Fuel 101 (2012) 74–83 75
recently concluded the experimental operation, as indicated bySherrick et al. [3], but outdated by a modified version for the plantsthat will be built, as depicted by Black et al. [4]. The numerical re-sults referred to the former layout have the advantage of beingcomparable against the experimental results, which however havebeen limitedly diffused so far. The extension includes (i) a reviewof the literature of experimental studies that may be adopted incalibrating or validating the thermodynamic codes, (ii) the model-ing of the removal of the ammonia slipping out of the absorber and(iii) an estimation of the investment as well as the operation costsof both capture and power islands and their influence on the CostOf Electricity (COE).
The following sections describe in sequence: (i) the scope of thework and the methodology adopted in seeking it, (ii) the review of anumber of articles from the open literature providing experimentalvapor–liquid equilibrium data in the region of interest for CAP, (iii)the modeling approach, comprising both the energy and the eco-nomic analyses, and the simulations launched with the developedmodels and (iv) the results along with the discussion of the trends.
2. Scope and methodology
The scope of this work is (i) to identify the design parameters ofthe capture block and (ii) to quantify their influence on the energyperformance indexes of the overall plant through a parametricinvestigation in order to determine the optimal set of values. Thisoptimal set is used to define the best case. Moreover, (iii) to modelprecisely the integration between the carbon capture and thepower generation through a specific investigation of the best case.Finally, (iv) to evaluate the investment cost and the operationalcost of the capture block, which result in an increase in the overallcost of the generated electricity. For the sole parametric analysis,the power block is simulated in an approximate manner in orderto handily calculate the electrical power loss due to the steamextraction. Subsequently, the accurate model of the power blockis coupled to the optimal capture block. The energy analysis is exe-cuted with the commercial software Aspen Plus version 2006.5,outlined on the company webpage [5], and the GS (which standsfor Gas Steam) in-house software, developed for over two decadesof research in the field of power plant design and outlined on the
authors’ webpage [6]. Finally, the economical assessment is con-ducted in similarity to the existing amine plants.
3. Experimental data bibliography review
This paragraph reviews the experimental vapor–liquid andvapor–liquid-solid equilibrium data that can be found in the openliterature and exploited for either the calibration or the validationof the thermodynamic models used to simulate CAP. The NH3–H2Ois widely studied for application as a refrigerating fluid or as aworking fluid in the Kalina cycle. The CO2–H2O is considered forvarious physical chemistry phenomena. The CO2–NH3–H2O systemis researched for process water treatment and for urea production;unfortunately, the available information regards primarily the solevapor–liquid equilibrium, whereas it comprises rarely the salt pre-cipitation because the investigated temperatures are higher thanthose employed in CAP.
For the binary water–carbon dioxide system at low pressure areview of experimental study is described in the paper of Carrollet al. [7]. For high pressures instead many investigations can befound in literature dated in the mid of the last century. The workof Wiebe in 1941 [8] resumes the three previous ones started byWiebe and Gaddy in 1939 [9–11] and it reports data between12 �C and 100 �C at pressures up to 700 atm. In the study of Mark-ham and Kobe (1941) some measurements are reported for tem-perature of 0–40 �C and atmospheric pressure [12]. Foratmospheric pressure more data in a similar range of temperatureare given by: Harned and Davis (1943) for 0–50 �C [13], Morrisonand Billet (1952) for 13–75 �C [14], Murray and Riley (1971) for1–35 �C [15]. Higher pressures and temperature are included inthe study of Zawisza and Malesinska (1981) that spans 0.2–5 MPa and 50–200 �C [16]. Contemporary experiments are carriedout by Valtz et al. (2004) for 5–45 �C up to 8 MPa [17] and by Hanet al. (2009) for 40–70 �C and 4.33–18.34 MPa [18].
For the water–ammonia system an exhaustive review for theexperimental works over a very wide range of operating conditionsis given by Tillner-Roth and Friend [19]. Therefore, their manu-script can be adopted as a starting point to choose the most appro-priate references for the application of interest. Old experiences onthis mixture are witnessed by Mittasch’s article back in 1927 [20],

Table 1General assumptions (unless otherwise stated).
Parameter Unit Value
AmbientTemperature �C 15
Air-coolersEnd temperature �C 25Specific electric consumption MWe/MWth 0.0159
ChillersEvap. minimum temp. difference �C 3Condensation temperature �C 30COP/COP of Carnot cycle % 65
Electric motorsElectro-mechanical efficiency % 95
FansIsentropic efficiency % 90
PumpsHydraulic efficiency % 80
76 G. Valenti et al. / Fuel 101 (2012) 74–83
which reports (p, T, x) data from 0 �C to 60 �C. Shortly later (1933) awork performed by Clifford and Hunter [21] presents (p, T, x, y)measurements that cover temperatures between 60 �C and150 �C for low ammonia concentrations. More recent (1987) isthe work of Gillespie et al. [22], in which (p, T, x, y) data and(p, T, x) data span a wide range of compositions and temperatures.
The ternary system is investigated by Burrows and Lewis in apaper dated as early as 1912 [23]. In a more recent work, 1982,Pawllkowski et al. [24] investigate vapor–liquid equilibria of manysystems, including CO2–NH3–H2O, by way of gas–liquid chroma-tography for temperatures from 100 to 150 �C. Kawazuishi andPrausnitz [25] report a set of experimental values from previousworks from other scientists, difficult though to locate, with thescope of calibrating the expressions of dissociation equilibriumconstants and Henry’s constants for temperatures of 100–205 �Cand total liquid-phase concentrations to 10 m. Göppert and Maurer[26] report vapor–liquid equilibrium data in the temperature rangebetween 333.15 and 393.15 K at pressures up to about 7 MPa forwater-rich mixtures to about 16 molal for ammonia and 13 molalfor carbon dioxide. In 1992 Pelkie et al. [27] use conductivity mea-surements to estimate the ammonium ion NHþ4
� �concentration at
25 �C and over a wide range of pressures and concentrations; inter-estingly, they also conduct a comparison against two commercialcodes of that period, one of which is Aspen. The vapor–liquid–solidequilibrium is studied in the paper of Kurz et al. [28] which focuseson the solubility of weak electrolyte gases into the aqueous phasein the temperature range from 313 K to 353 K at total pressures upto 0.7 MPa. In a subsequent investigation, the enthalpy changesupon partial evaporation of aqueous solutions, including CO2–NH3–H2O, are reported by Rumpf et al. [29] at temperatures from313 to 393 K. Finally, speciation is measured with 13C NMR byHolmes et al. [30] at 25 and 35 �C and by Mani et al. [31] at roomtemperature.
4. Models and simulations
The overall plant consists of a power block and a capture block.The power side includes Flue Gas Desulfurization (FGD) fromwhich the exhausts are directed to the capture side. The powerblock, either in the approximated model or in the detailed one, istreated as a whole system whereas, in contrast, the islands com-prising the capture block are simulated separately. These islandsare: (i) exhaust chilling, (ii) carbon dioxide absorption, regenera-tion and gas washing (which will be shorten as abs/reg/wash inthe following), (iii) ammonia removal, and (iv) carbon dioxidecompression. A schematic layout of the capture block is illustratedby Fig. 1. The general assumptions for this study are reported inTable 1.
A
A A A
FGD
CHIMNEY
NH3
AMMONIA REMOVAL
EXHAUSTS CHILLING
HCL
CH5
CH4CH3
CH1 CH2
PM1 PM2 PM3
CC2CC1 CC3
HX1 HX2 HX3
FN1
AC1
PM4 PM5
PM6
AB HC
HX4HX6
H
WT1 HX7
FN2
WT3
PR1
PR2
Fig. 1. Schematic layout of the capture block based on the Chilled Ammonia Process thaoperation names).
4.1. Power block for the parametric investigation
The effects of the steam extraction on the power generationwithin the parametric investigation are computed starting from atypical expansion curve of a Low Pressure (LP) turbine. The extrac-tion pressure is determined by the regeneration temperatureallowing for a minimal temperature difference between the con-densing steam and the solution. Prior to entering the reboiler,the steam is attempered with part of the liquid water exiting thereboiler itself. The possibility of a further integration with powerblock, by exploiting the exiting liquid water for other purposes,such as in the deaerator or in a pre-heating line, is not consideredin this model. The numerical assumptions for this model are in-cluded in Table 2.
4.2. Power block for the best case investigation
As explained, the best case capture block is integrated with adetailed model of the power block forming the best case investiga-tion. The reference plant is based on an USC boiler and is notequipped with carbon capture. For the case of carbon capture,the steam for the reboiler is extracted from the turbine cross-overand, once exploited, redirected into the water pre-heating line. Thegeneral arrangement layout for these plants refer to an inland sitewith natural draft cooling towers and delivery of the coal by rail.Assumptions regarding site conditions (ambient temperature,cooling water temperature, etc.), equipment efficiency are fromthe common framework documents of the EBTF (European Bench-marking Task Force) [32,33], an European Commission Seventh
PIPE
STEAM
H2O
CONDENSATE
CO2 COMPRESSION
ABSORPTION/REGENERATION/
GAS WASH
PM7PM8
RGRB
X5
WT2
AC2
AC3 AC4
CM1 CM2
WK
PR3AC5
CM3
N
t is investigated in the present work (refer to the section Nomenclature for the unit

Table 2Assumptions for the approximated power block model.
Parameter Unit Value
Low pressure turbine-generatorIsentropic efficiency % 88End pressure bar 0.05End vapor title % 93Exit velocity m/s 250Electrical efficiency % 98
ReboilerMinimum temperature difference �C 10Steam superheated temperature �C 5Steam subcooled temperature �C 0
Reference power plantNet electrical efficiency, geREF % 45.0Specific CO2 emission, EREF kgCO2
=kWh 0.83
G. Valenti et al. / Fuel 101 (2012) 74–83 77
Framework Programme (FP7) project funded with the scope ofestablishing a consolidated common framework for internationaldissemination. The reference power plant has a net electric poweroutput of 758 MWe and a net electric efficiency of 45.2%, both atnominal conditions. The generated carbon dioxide mass flow is143kgCO2
=s at a concentration of 14.5% on a volume dry basis.
4.3. Exhaust chilling island
Flue gases from the FGD are chilled by way of three contactcoolers (CC1 thru CC3) operating in series and at decreasing tem-perature levels. The first cooler works with an ambient air-cooledwater loop (AC1), the other two with closed chilled water loops(CH1 and CH2). The evaporation temperature of the coldest chiller(CH2) varies in a manner explained in Section 4.7, whereas theevaporation temperature of the other chiller (CH1) is managed todivide equally the load over the two chillers. Since exhausts fromthe FGD are saturated, each contact cooler loop has a purge toevacuate the condensing water. All contact purges are exploitedin the ammonia removal island, which is described in Section4.5. Between the second and the third contact coolers, a fan(FN1) is placed to outset the pressure losses of all coolers and ab-sorber. This island is modeled in Aspen Plus employing the Peng–Robinson Equation Of State (EOS). The assumptions are depicted inTable 3.
4.4. Carbon dioxide absorption/regeneration/washing
The capture layout is conventional and derived from the work ofSherrick et al. [3]. It comprises an absorber (AB) and a regenerator(RG) with, interposed, a recuperative heat exchanger (HX5) as wellas a pump (PM5) on the rich solution entering the recuperator anda chilling exchanger (CH4-HX6) on the lean solution exiting therecuperator. For difficulties in converging the simulation, theabsorber and the regenerator are not modeled as columns but each
Table 3Assumptions for the exhaust chilling island.
Parameter Unit Value
ExhaustsPressure bar 1.04Temperature �C 49Composition: % (vol. dry)
CO2 14.5N2 82.3O2 3.2H2O content Saturated
ColumnsPressure drop bar 0.01
of them as three flash drums connected in series. The rich solutionfrom the absorber is pumped into a hydrocyclone (HC) that sepa-rates the solid, which is sent to regeneration with a small portionof liquid, from the bulk of the liquid, which is chilled (CH3-HX4)and recycled to the absorber to keep the absorber itself cold, beingthe absorption reaction exothermal. The evaporation temperatureof the two chillers (CH3 and CH4) serving the lean and rich solu-tions into the absorber varies as outlined in Section 4.7. Both gasstreams exiting from the absorber and the regenerator are washedwith chilled and cooled water towers respectively (WT1 and WT2)to recover the ammonia. This third chiller (CH5) has an evapora-tion temperature constantly set at �1 �C. The design parametersof this island are detailed in Section 4.7, while the general assump-tions in Table 4.
The thermodynamic electrolyte model and library employed arethose built in Aspen Plus and detailed in the software documenta-tion [34]. The validation of the binary systems, CO2–H2O and NH3–H2O, in the region of interest against the experimental data above-mentioned is conducted. For the sole NH3–H2O, a comparisonagainst computed data from Refprop, a sophisticated thermody-namic code by NIST [35], is also conducted. Just a limited numberof results from this validation are visualized in Fig. 2, showing agood agreement between computed and measured values, whichis in general true for the other cases not illustrated here. A simplevalidation against the ternary system is illustrated in Fig. 3 show-ing an acceptable yet not remarkable agreement. The ternaryAspen Plus model for application to amine and ammonia is underanalysis worldwide. Regarding the ammonia application, type ofprecipitated salts, list of reactions and their equilibrium constantsare in the focus of those studies. The first results are only currentlybeing published: Lin et al. [36] conduct a general investigation onthe Aspen Plus electrolyte model, whereas Mathias et al. [37] a spe-cific study on CAP thermochemistry and process.
4.5. Ammonia removal
The ammonia slipping from the absorber wash is reduced totraces by acid washing in a dedicated tower (WT3). The acid solu-tion is generated by adding aqueous HCl to all purges from thechilling island. The resulting liquid stream is assumed to be pro-cessed in an existing water treatment facility. The ammonia re-moval island includes a forced fan (FN2) to overcome thepressure loss in the column. Modeling is conducted in Aspen Plusemploying the built-in electrolyte model and parameter library.The assumed parameters are visualized in Table 5. Also Mathiaset al. [37] address the ammonia slip issue, employing though waterwashing and stripping, which increases the thermal load of thecapture block and, thus, the steam extraction from the powerblock.
4.6. Carbon dioxide compression
The compression island includes a two-stage air-intercooledcompressor (CM1–AC3–CM2) followed by an air-aftercooler
Table 4Assumptions for the absorption/regeneration/washing island.
Parameter Unit Value
ColumnsPressure drop bar 0.03
PumpsHydraulic efficiency % 85
RecuperatorMinimum temperature difference �C 5
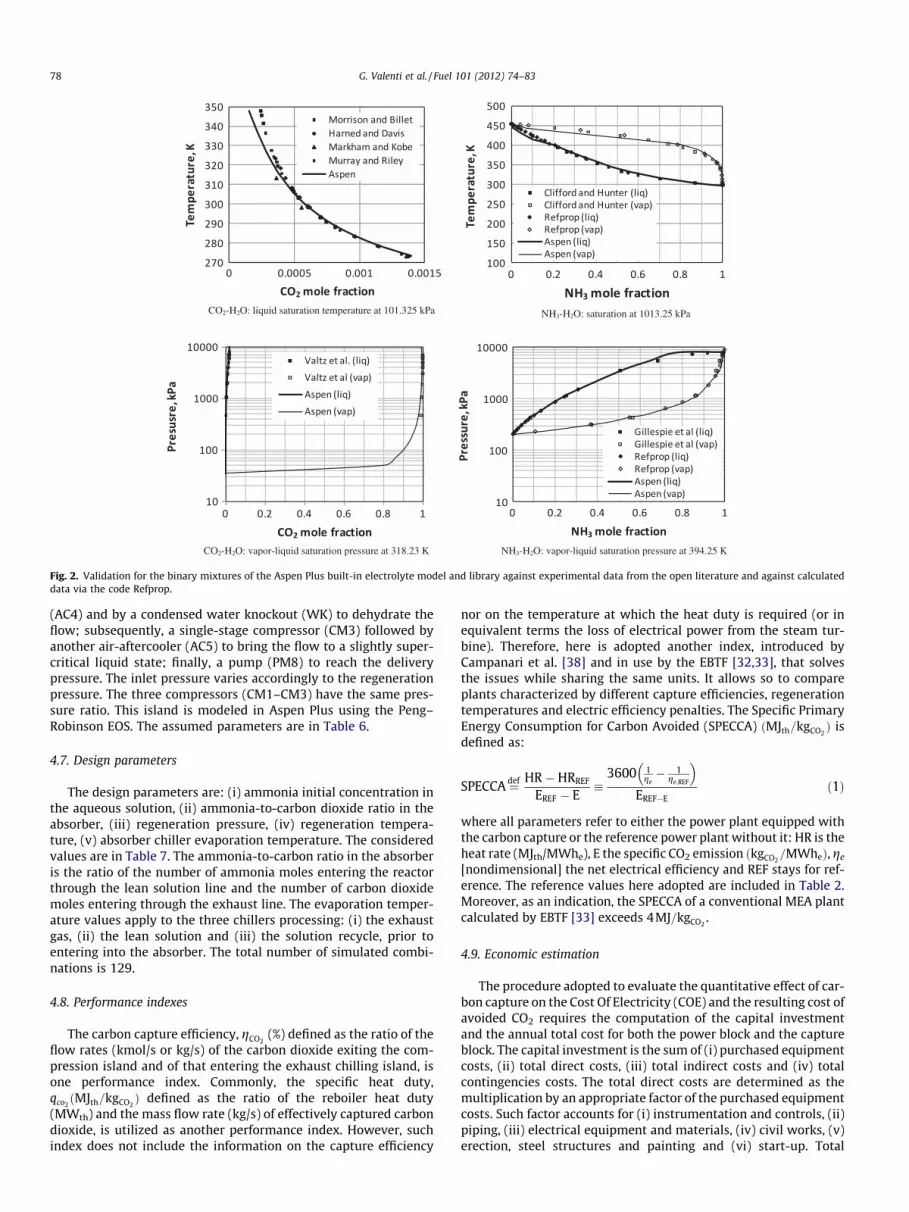
Fig. 2. Validation for the binary mixtures of the Aspen Plus built-in electrolyte model and library against experimental data from the open literature and against calculateddata via the code Refprop.
78 G. Valenti et al. / Fuel 101 (2012) 74–83
(AC4) and by a condensed water knockout (WK) to dehydrate theflow; subsequently, a single-stage compressor (CM3) followed byanother air-aftercooler (AC5) to bring the flow to a slightly super-critical liquid state; finally, a pump (PM8) to reach the deliverypressure. The inlet pressure varies accordingly to the regenerationpressure. The three compressors (CM1–CM3) have the same pres-sure ratio. This island is modeled in Aspen Plus using the Peng–Robinson EOS. The assumed parameters are in Table 6.
4.7. Design parameters
The design parameters are: (i) ammonia initial concentration inthe aqueous solution, (ii) ammonia-to-carbon dioxide ratio in theabsorber, (iii) regeneration pressure, (iv) regeneration tempera-ture, (v) absorber chiller evaporation temperature. The consideredvalues are in Table 7. The ammonia-to-carbon ratio in the absorberis the ratio of the number of ammonia moles entering the reactorthrough the lean solution line and the number of carbon dioxidemoles entering through the exhaust line. The evaporation temper-ature values apply to the three chillers processing: (i) the exhaustgas, (ii) the lean solution and (iii) the solution recycle, prior toentering into the absorber. The total number of simulated combi-nations is 129.
4.8. Performance indexes
The carbon capture efficiency, gCO2(%) defined as the ratio of the
flow rates (kmol/s or kg/s) of the carbon dioxide exiting the com-pression island and of that entering the exhaust chilling island, isone performance index. Commonly, the specific heat duty,qco2ðMJth=kgCO2
Þ defined as the ratio of the reboiler heat duty(MWth) and the mass flow rate (kg/s) of effectively captured carbondioxide, is utilized as another performance index. However, suchindex does not include the information on the capture efficiency
nor on the temperature at which the heat duty is required (or inequivalent terms the loss of electrical power from the steam tur-bine). Therefore, here is adopted another index, introduced byCampanari et al. [38] and in use by the EBTF [32,33], that solvesthe issues while sharing the same units. It allows so to compareplants characterized by different capture efficiencies, regenerationtemperatures and electric efficiency penalties. The Specific PrimaryEnergy Consumption for Carbon Avoided (SPECCA) ðMJth=kgCO2
Þ isdefined as:
SPECCA ¼def HR �HRREF
EREF � E�
3600 1ge� 1
ge;REF
� �
EREF�Eð1Þ
where all parameters refer to either the power plant equipped withthe carbon capture or the reference power plant without it: HR is theheat rate (MJth/MWhe), E the specific CO2 emission ðkgCO2
=MWheÞ, ge
[nondimensional] the net electrical efficiency and REF stays for ref-erence. The reference values here adopted are included in Table 2.Moreover, as an indication, the SPECCA of a conventional MEA plantcalculated by EBTF [33] exceeds 4MJ=kgCO2
.
4.9. Economic estimation
The procedure adopted to evaluate the quantitative effect of car-bon capture on the Cost Of Electricity (COE) and the resulting cost ofavoided CO2 requires the computation of the capital investmentand the annual total cost for both the power block and the captureblock. The capital investment is the sum of (i) purchased equipmentcosts, (ii) total direct costs, (iii) total indirect costs and (iv) totalcontingencies costs. The total direct costs are determined as themultiplication by an appropriate factor of the purchased equipmentcosts. Such factor accounts for (i) instrumentation and controls, (ii)piping, (iii) electrical equipment and materials, (iv) civil works, (v)erection, steel structures and painting and (vi) start-up. Total

Fig. 3. Validation for the ternary mixture of the Aspen Plus built-in electrolytemodel and library against experimental data from the open literature.
Table 5Assumptions for the ammonia removal island.
Parameter Unit Value
ColumnPressure drop bar 0.02
Table 6Assumptions for the compression island.
Parameter Unit Value
CompressorsIsentropic efficiency % 85Last compressor end pressure bar 80
Air-coolersIntercooler end temperature �C 351st aftercooler end temperature �C 35
PumpDelivery pressure bar 110Hydraulic efficiency % 75
Table 7Assumptions for the design parameters.
Parameter and values Unit
Ammonia initial concentration: 0.095a,b, 0.10, 0.15, 0.20c kg/kgNH3-to-CO2 ratio: 2.0a,b, 2.5b, 3.0, 3.5c, 4.0b kmol/kmolRegeneration pressure: 20, 30c, 40a barRegeneration temperature: 100b, 115c, 120a,b, 125, 135 �CChiller evaporation temperature: �1a, 4c, 9b �C
a Value adopted also in the previous work [1].b Not all possible combinations with other parameters are run.c Value adopted in the best case of the present work.
G. Valenti et al. / Fuel 101 (2012) 74–83 79
indirect costs are determined as the multiplication by anotherappropriate factor of the sum of purchased equipment and of totaldirect costs to account for (i) yard improvements, (ii) servicefacilities, (iii) engineering and supervision and (iv) building (includ-ing service). The total contingencies costs are determined as themultiplication by a factor of the sum of all previous costs to accountfor (i) contingency, (ii) capital fee and (iii) working capital. Roughly,
the total capital investment is three times as much the cost of thepurchased equipment. In its turn, the annual total cost is the sumof (i) annualized capital investment, (ii) purchased fuel cost, (iii)Operation & Maintenance (O&M) costs and (iv) consumables costs.The annualized capital investment is calculated multiplying thecapital investment by a factor that accounts for (i) constructiontime and phases, (ii) interest rate and (iii) plant life. Such annual-ized-investment factor is computed by equating at the startup in-stant both the present value of the payment installments duringthe construction and a discounted cash flow during the lifetime.Roughly, the annualized investment is 10% of the total investment.Consumables include makeup water, makeup ammonia and hydro-gen chloride (HCl). The COE is computed as the ratio between theannual total cost and the annual net electric production, which isdetermined from the net electrical power and the capacity factor.The cost of avoided CO2 is computed as the ratio of the incrementalCOE and of the reduction of specific CO2 emission due to carboncapture.
The bulk of the information is derived from the work of theEuropean Benchmarking Task Force [33], which however adoptsconventional MEA as capture technology. All costs of the powerblock are taken identical to those by the EBTF. The capital invest-ment of the capture block is instead derived from those of EBTFassessing the purchased equipment costs by similarity, exceptionmade for chillers, and adopting all the above-mentioned factorsidentical. Similarity requires the scaling of the MEA costs by twofactors, (i) one accounting for equipment capacity and (ii) the otherfor construction material. The equipment capacity may be the elec-trical (fans, pumps, compressors, air coolers), or thermal power(reboiler and heat exchangers) or the volume flow rate (columns).The equipment capacity factor is computed as a power law withexponent 0.7 if the capacity is either the electrical or thermalpower (that is doubling the capacity less than doubles the costand vice versa). Otherwise, such factor is linear (that is doublingthe capacity doubles the cost and vice versa). The constructionmaterial factor accounts simply for the proportional reduction ofthe cost due to the possibility of adopting lower quality steels inCAP than in MEA because the solutions are less corrosive. Finally,the costs of the installed chillers are computed by way of thepower law with exponent 0.7 with respect to a reference chiller.All the assumed parameters are given in Table 8.
5. Results and discussion
Before presenting the parametric and best case investigation re-sults, some preliminary considerations are introduced that, despiteapproximate, may be of use in the critical review of results of anystudy on CAP.
5.1. Preliminary considerations
The enthalpy flux of the chilled exhausts entering the abs/reg/wash island is roughly equal to the sum of the enthalpy fluxes ofall exiting streams (treated gases, regenerated carbon dioxide

Table 8Assumptions for the economic estimation.
Parameter Unit Value
Capital investment factorsTotal direct cost 1.090a
Total indirect cost 0.140b
Total contingencies 0.175c
FinancialConstruction time years 4Interest rate % 8Plant lifetime years 401st installment % 302nd thru 4th installment % 205th installment % 10
Annual total costFuel cost €/GJ 3Hydrogen chloride (33% solution) €/t 100Makeup ammonia €/t 400Makeup water €/t 0.35Capacity factor h/year 7500
Construction materialStainless steel €/kg 1.0AISI 304 €/kg 2.3AISI 316 €/kg 4.0
ChillersReference capacity MWf 1Reference cost k€ 100
a With respect to total purchased equipment cost.b With respect to sum of purchased equipment and total direct costs.c With respect to sum of purchased equipment, total direct and total indirect
costs.
Table 10Results of the exhaust chilling and the compression islands.
Electrical loss Unit Value
Exhaust chillingChiller evaporation at: kWhe=kgCO2
�1 �C 0.0186a
+4 �C 0.0160a
+9 �C 0.0138a
Carbon dioxide compressionCompressor starting from: kWhe=kgCO2
20 bar 0.265b
30 bar 0.183b
40 bar 0.127b
a Referred to CO2 entering the chilling island.b Referred to CO2 entering the compression island.
80 G. Valenti et al. / Fuel 101 (2012) 74–83
and purges). Consequently, the sum of the mechanical and thermalpowers into the system shall be roughly equal to the sum of thosefrom the system. Neglecting the power to pumps, the main input isthe reboiler heat duty. The main output is the chilling load. Thus, inapproximate terms, the chilling load is equal to the heat duty.Moreover, as it will be shown, the electrical power loss from thepower block is between one fifth and a quarter of the heat duty.The electrical power consumed by the chillers is about one fifth– a quarter of the chilling load, assuming a Coefficient Of Perfor-mance (COP) of 4–5. So, the electrical power loss equals approxi-mately the chiller electrical consumption. Any increase of thereboiler heat duty has a ‘‘two-times’’ effect on the electricity pen-alty through both the power loss from the power block and thepower consumption by the chillers.
5.2. Parametric investigation
The electric loss due to steam extraction referred to the heatduty is in Table 9. The estimation of the electrical cost of chillingthe exhausts at the considered evaporation temperatures and ofcompressing the carbon dioxide from the considered regenerationpressures are in Table 10.
The influence of all five design parameters is well defined, asseen in Fig. 4. This figure though does not include the electrical
Table 9Results of the approximated power block.
Electrical loss Unit Value
Regenerating at: MWe/MWth
100 �C 0.118a
115 �C 0.212a
125 �C 0.234a
135 �C 0.256a
a Referred to boiler heat duty.
consumption of the ammonia removal island, which is anyhowmuch lower than the consumptions of all other islands. The in-crease of NH3 concentration in the initial solution has remarkablebenefits over the SPECCA and the capture efficiency, however itsupper value is limited by the intention to keep at moderate levelsthe ammonia slip into the ammonia removal island (not shown).The ammonia-to-carbon dioxide ratio has an optimum value fromthe SPECCA perspective, despite an increase leads to higher captureefficiencies. Regeneration pressure has a modest effect on SPECCAbut a negative influence on the capture. In contrast, the lower theregeneration temperature the lower the SPECCA, but at the cost ofa reduced capture that may reach inacceptable levels. Finally, high-er evaporation temperatures of those chillers serving the absorberyield better values of SPECCA, but again at the cost of lower captureefficiency and higher ammonia slip (not shown).
5.3. Best case investigation
The energy results of the investigation with the detailed powermodel are shown in Table 11, in absolute terms, and in Table 12, inspecific terms. For comparison, Table 12 recalls the energy resultsfrom the previous work by the authors [1]. However, the two casesare not directly comparable because the design parameters differ,as indicated by Table 7, and the thermodynamic models also differ.The estimation of the purchased equipment costs are given inTable 13. The corresponding total capital costs are reported inTable 14, while the costs made specific to either the net producedelectricity or the avoided CO2 are in Table 15. The best case layoutcaptures 88.4% of the generated carbon dioxide, reducing the netelectrical power by 19%, from 758 to 614 MWe, and the electricalefficiency by 8.6% points, from 45.2% to 36.6%. The computed spe-cific heat duty to the reboiler is 2:46MJ=kgCO2
, whereas SPECCA is3:22MJ=kgCO2
. The cost of the capture block is approximately 15%of the cost of the power block, respectively 180 and 1165 M€,and it yields an increase of the COE from 59.9 to 82.4 €/MWhe, cor-responding to an increment of about 38%. With respect to the pastresults, the reboiler heat duty is 60% higher, leading to losses great-er by about 60%, which is in agreement with the reasoning in Sec-tion 5.1, and to SPECCA greater by 76%. The cost of avoided CO2
turns to be 38:6€=tCO2 .
5.4. Net electrical efficiency and SPECCA dependence on the heat duty
Due to the uncertainty on the thermochemistry calculated bythe Aspen Plus modeling, the influence of the heat duty, which isstrictly related to the heat of reaction, on both the net electricalpower plant and SPECCA is here analyzed. The numerical resultsfor the best case are taken as starting point. In particular, the ratio

Fig. 4. Influence of the design parameters on the performance indexes (excluding the electrical consumption of the ammonia removal island that is anyhow minor withrespect to all other consumptions).
Table 11Results of the energy analysis of the reference and the best case plants.
Parameter Unit Reference Best case
Net electrical power MWe 758 614Net electrical efficiency, ge % 45.2 36.6Capture efficiency, gCO2
% NA 88.4Specific CO2 emission, E kgCO2
=kWhe 0.679 0.0971SPECCA MJ=kgCO2
NA 3.22a
a SPECCA computed by EBTF for MEA exceeds 4MJ=kgCO2.
Table 12Comparison of a previous study by the authors [1] and the best case of the presentwork.
Parameter Unit Previous Best case
Reboiler heat duty, qCO2MJ=kgCO2
1.53 2.46Electrical loss due to: kWhe=kgCO2
steam extraction 0.0959 0.1645exhaust chilling 0.0207 0.0181abs/reg/wash 0.0657 0.115ammonia removal NA 0.0044compression 0.0134 0.0183Total loss 0.195 0.318Net electrical efficiency, ge % 39.2 36.6SPECCA MJ=kgCO2
1.84 3.22a
a SPECCA computed by EBTF for conventional MEA exceeds 4MJ=kgCO2.
G. Valenti et al. / Fuel 101 (2012) 74–83 81
of the chilling load in the abs/reg/wash island and the heat duty(which is roughly unity, as reasoned in Section 5.1) is employed.
Assuming the power consumption for exhausts chilling, pump-ing and carbon dioxide compression are constant, a variation of theheat duty influences only the electrical power loss from the powerblock, which can be computed as illustrated in Section 4.1, and theelectrical consumption for the chillers in the abs/reg/wash island,which can be computed from the mentioned chilling load-to-heatduty ratio. The net electrical power and, thus, the net electrical effi-ciency as linear functions of the heat duty can be determined.Being the specific emission inversely proportional to the net
electrical power at a fixed capture efficiency, SPECCA as a non-linear function of the heat duty is calculated.
Fig. 5 illustrates the yielded net electrical efficiency and SPECCAfor the best case with a variable heat duty. Reasonably, it provesthat the thermodynamic uncertainty has a marked effect on theoverall performances. Moreover, it confirms the results of Table12. Because the SPECCA of a conventional MEA plant computed

Table 14Results of the economic estimation of the total capital cost.
Item Expenditure (M€) Cumulative (M€)
Capture blockPurchased equipment 64.2 64.2Total direct costs 70.0 134Total indirect costs 18.8 153Total contingencies 26.8 180Total capture block 180 NA
Integrated plantCapture block 180 180Power block 1165 1345Integrated plant 1345 NA
Table 15Results of economic estimation of the annual and specific costs.
Parameter Reference Best case
Annual costs (M€/year)Annualized investmenta 118 136Purchased fuel 136 136Operation and maintenance 58 68Consumables 28 38Total 340 378
Cost specific to electricity (€/MWhe)Annualized investment 20.8 29.6Purchased fuel 23.9 29.5Operation and maintenance 10.3 14.8Consumables 4.9 8.4Cost Of Electricity (COE) 59.9 82.3b
Cost specific to carbon dioxide ð€=tCO2 ÞCost of avoided CO2 NA 38.6b
a The resulting factor for annualizing the investment is 10.1%.b Cost of electricity and cost of avoided CO2 computed by EBTF for conventional
MEA are about 92 €/MWhe and 51€=tCO2 respectively.
Fig. 5. The SPECCA index and the net electric efficiency as functions of the heatduty.
Table 13Results of the economic estimation of the purchased equipment cost.
Equipment Installed units Expenditure (M€)
Exhaust chillingDirect contact cooler 3 2.8Pumps 3 2.3Air cooler 1 0.6Chillers 2 1.4Blower 1 1.3
Absorption/regeneration/gas washAbsorber column 3 11.5Absorber chillers 12 9.7Recycle pump 3 1.0Hydrocyclone 3 3.8Washing column 3 0.5Washing pump 3 0.8Washing chillers 3 1.0Lean-rich exchanger 3 6.8High pressure pump 2 3.3Lean liquid chiller 4 3.4Reboiler 2 2.2Stripper 2 1.6Condenser 2 0.01Condenser pump 2 0.3Condenser air cooler 2 0.3Storage vessel 2 0.4
Ammonia removalColumn 2 0.1Blower 1 1.1
CO2 compressionCompression train 1 8.0
Capture blockTotal NA 64.2
82 G. Valenti et al. / Fuel 101 (2012) 74–83
by EBTF is greater than 4MJ=kgCO2, therefore there is still a 20%-
margin of error on the heat duty within which the ChilledAmmonia is competitive, at least energy wise.
6. Conclusions
The integration of USC plants with CAP is assessed by way of aparametric investigation to determine the optimal design parame-ters of the capture block from an energy perspective and by a moredetailed best case investigation of the overall plant from both en-ergy and economic perspectives. The thermodynamic model ofthe chemical absorption is validated against experimental datafrom the open literature indicating a good agreement for binarymixtures and acceptable for ternary. In the parametric investiga-tion five parameters are singularly varied: (i) ammonia initial con-centration in the aqueous solution, (ii) ammonia-to-carbon dioxideratio in the absorber, (iii) regeneration pressure, (iv) regenerationtemperature, and (v) absorber chiller evaporation temperature.Carbon capture efficiency is one of the main figure of merits mon-itored in this work. In addition, SPECCA is used as performance in-dex instead of the specific heat duty, which is anyhow reported forcompleteness. With respect to a reference power plant of 758 MWe
of net electrical production at the efficiency of 45.2%, carbon cap-ture reduces the net electrical power by 19% and the net electricalefficiency by 8.6% points. SPECCA is 3:22MJ=kgCO2
while the spe-cific heat duty 2:46MJ=kgCO2
. The capital investment of the captureblock is a relatively small portion of that of the power block, how-ever, due to other costs and due to the performance penalties, theCOE increases significantly of 38%, that is from 59.9 to 82.4€/MWhe. The cost of avoided CO2 turns to be 38:6€=tCO2 . For com-parison, the EBTF computes for conventional MEA a SPECCA ofmore than 4MJ=kgCO2
, a cost of electricity of approximately 92 €/MWhe and a cost of avoided CO2 of about 51€=tCO2 . The sensitivityanalysis on the heat duty uncertainty shows that there is an appre-ciable margin within which CAP remains competitive with respectto MEA.
Acknowledgments
The authors acknowledge gratefully the support by Enel SpA.
References
[1] Valenti G, Bonalumi D, Macchi E. Energy and exergy analyses for the carboncapture with the chilled ammonia process (CAP). Energy Procedia2009;1(1):1059–66. doi:10.1016/j.egypro.2009.01.14.
[2] Valenti G, Bonalumi D, Macchi E. Modeling of ultra super critical power plantsintegrated with the chilled ammonia process. In: Proceedings of the 10thInternational conference on greenhouse gas technologies, Amsterdam, TheNederlands; 2010.

G. Valenti et al. / Fuel 101 (2012) 74–83 83
[3] Sherrick B, Hammond M, Spitznogle G, Muraskin D, Black S, Cage M. CCS withAlstom’s Chilled Ammonia Process at AEP’s mountaineer plant. In: proceedingsof MEGA conference, Baltimore, Maryland, USA; 2008.
[4] Black J, Kozak F, Leadri J-F, Muraskin D,Cage M, Sherrick B, et al. CCS project:Chilled Ammonia process at the AEP Mountaineer Plant. In: Proceedings ofCOAL-GEN, Pittsburgh, PA, USA; 2010.
[5] www.aspentech.com.[6] www.gecos.polimi.it/software/gs.html.[7] Carroll JJ, Slupsky JD, Mather AE. The solubility of carbon dioxide in water at
low pressure. J Phys Chem Ref Data 1991;20(6):1201–9. doi:10.1063/1.55590.[8] Wiebe R. The binary system carbon dioxide–water under pressure. Chem Rev
1941;29(3):475–81. doi:10.1021/cr60094a00.[9] Wiebe R, Gaddy VL. The solubility in water of carbon dioxide at 50�, 75� and
100�, at pressures to 700 atmospheres. J Am Chem Soc 1939;61(2):315–8.doi:10.1021/ja01871a02.
[10] Wiebe R, Gaddy VL. The solubility of carbon dioxide in water at varioustemperatures from 12� to 40� and at pressures to 500 atmospheres. Criticalphenomena. J Am Chem Soc 1940;62(4):815–7. doi:10.1021/ja01861a03.
[11] Wiebe R, Gaddy VL. Vapor phase composition of carbon dioxide–watermixtures at various temperatures and at pressures to 700 atmospheres. J AmChem Soc 1941;63(2):475–7. doi:10.1021/ja01847a03.
[12] Markham AE, Kobe KA. The solubility of carbon dioxide and nitrous oxide inaqueous salt solutions. J Am Chem Soc 1941;63(2):449–54. doi:10.1021/ja01847a02.
[13] Harned HS, Davis Jr R. The ionization constant of carbonic acid in water andthe solubility of carbon dioxide in water and aqueous salt solutions from 0� to50�. J Am Chem Soc 1943;65(10):2030–7. doi:10.1021/ja01250a05.
[14] Morrison TJ, Billett F. The salting-out of non-electrolytes. Part II. The effect ofvariation in non-electrolyte. J Chem Soc 1952:3819–22. doi:10.1039/JR952000381.
[15] Murray CN, Riley JP. The solubility of gases in distilled water and sea water –IV. Carbon dioxide. Deep-sea Res 1971;18:533–41. doi:10.1016/0011-7471(71)90077-.
[16] Zawisza A, Malesinska BY. Solubility of carbon dioxide in liquid water and ofwater in gaseous carbon dioxide in the range 0.2–5 MPa and at temperaturesup to 473 K. J Chem Eng Data 1981;26(4):388–91. doi:10.1021/je00026a01.
[17] Valtz A, Chapoy A, Coquelet C, Paricaud P, Richon D. Vapour–liquid equilibriain the carbon dioxide–water system, measurement and modelling from 278.2to 318.2 K. Fluid Phase Equilibr 2004;226:333–44. doi:10.1016/j.fluid.2004.10.01.
[18] Han JM, Shin HY, Min B-M, Han K-H, Cho A. Measurement and correlation ofhigh pressure phase behavior of carbon dioxide + water system. J Ind EngChem 2009;15(2):212–6. doi:10.1016/j.jiec.2008.09.01.
[19] Tillner-Roth R, Friend DG. Survey and assessment of available measurementson thermodynamic properties of the mixture {water + ammonia}. J Phys ChemRef Data 1998;27(45):45–61. doi:10.1063/1.55601.
[20] Mittasch A, Kuss E, Schlueter H. Dichten und dampfdrucke von wafirigenammoniaklosungen und von flussigem Stickstofftetroxyd fur dastemperaturgebiet 0� bis 60�. Zeitschrift für anorganische und allgemeineChemie 1927;159(1):1–36. doi:10.1002/zaac.1926159010.
[21] Clifford II, Hunter E. The system ammonia–water at temperatures up to 150 �Cand pressure up to twenty atmospheres. J Phys Chem 1933;37(1):101–18.doi:10.1021/j150343a01.
[22] Gillespie PC, Wilding WV, Wilson GM. Vapor–liquid equilibriummeasurements on the ammonia–water system from 313 to 589 K. AIChESymp Ser 1987;83(256):97–127.
[23] Burrows GH, Lewis GN. The equilibrium between ammonium carbonate andammonium carbamate in aqueous solution at 25�. J Am Chem Soc1912;34(8):993–5. doi:10.1021/ja02209a00.
[24] Pawllkowski EM, Newman J, Prausnltz JM. Phase equilibria for aqueoussolutions of ammonia and carbon dioxide. Ind Eng Chem Process Des Dev1982;21(4):764–70. doi:10.1021/i200019a03.
[25] Kawazuishi K, Prausnitz JM. Correlation of vapor–liquid equilibria for thesystem ammonia–carbon dioxide–water. Ind Eng Chem Res1987;26(7):1482–5. doi:10.1021/ie00067a03.
[26] Göppert U, Maurer G. Vapor–liquid equilibria in aqueous solutions ofammonia and carbon dioxide at temperatures between 333 and 393 K andpressures up to 7 MPa 1988;41(2):153–85. doi:10.1016/0378-3812(88)80042-.
[27] Pelkie JE, John Concannon P, Manley DB, Poling BE. Product distributions in theCO2–NH3–H2O system from liquid conductivity measurements. Ind Eng ChemRes 1992;31(9):2209–15. doi:10.1021/ie00009a01.
[28] Kurz F, Rumpf B, Maurer G. Vapor–liquid–solid equilibria in the system NH3–CO2–H2O from around 310 to 470 K: new experimental data and modeling.Fluid Phase Equilibr 1995;104:261–75. doi:10.1016/0378-3812(94)02653-I.
[29] Rumpf B, Weyrich F, Maurer G. Enthalpy changes upon partial evaporation ofaqueous solutions containing ammonia and carbon dioxide. Ind Eng Chem Res1998;37(8):2983–95. doi:10.1021/ie970808.
[30] Holmes PE, Naaz M, Poling BE. Ion concentrations in the CO2�NH3�H2Osystem from 13C NMR spectroscopy. Ind Eng Chem Res 1998;37(8):3281–7.doi:10.1021/ie970778.
[31] Mani F, Peruzzini M, Stoppioni P. CO2 absorption by aqueous NH3 solutions:speciation of ammonium carbamate, bicarbonate and carbonate by a 13C NMRstudy. Green Chem 2006;11(8):995–1000. doi:10.1039/B602051.
[32] Franco F, Anantharaman R, Bolland O, Booth N, van Dorst E, Ekstrom C, et al.Common framework and test cases for transparent and comparable techno-economic evaluations of CO2 capture technologies – the work of the EuropeanBenchmarking Task Force 2010. In: Proceedings of the 10th internationalconference on greenhouse gas technologies, Amsterdam, The Nederlands;2010.
[33] European benchmarking task force. D 4.9 European best practise guidelines forassessment of CO2 capture technologies; 2011.
[34] Rate-based model of the CO2 capture process by NH3 using Aspen Plus.Accessible for registered user at support.aspentech.com.
[35] www.nist.gov/data/nist23.htm.[36] Lin Y, Kate AT, Mooijer M, Delgado J, Fosbøl P, Thomsen K. Comparison of
activity coefficient models for electrolyte systems. AIChE J2010;56(5):1334–51. doi:10.1002/aic.1204.
[37] Mathias M, Reddy S, O’Connell JP. Quantitative evaluation of the chilled-ammonia process for CO2 capture using thermodynamic analysis and processsimulation. Int J Greenhouse Gas Control 2010;4(2):174–9. doi:10.1016/j.ijggc.2009.09.01.
[38] Campanari S, Chiesa P, Manzolini G. CO2 capture from combined cyclesintegrated with molten carbonate fuel cells. Int J Greenhouse Gas Control2010;4(3):441–51. doi:10.1016/j.ijggc.2009.11.00.


