Embed Size (px)
Citation preview

ARTICLE OPEN
A principled machine learning framework improves accuracyof stage II colorectal cancer prognosisNeofytos Dimitriou1, Ognjen Arandjelović1, David J. Harrison2 and Peter D. Caie2
Accurate prognosis is fundamental in planning an appropriate therapy for cancer patients. Consequent to the heterogeneity of thedisease, intra- and inter-pathologist variability, and the inherent limitations of current pathological reporting systems, patientoutcome varies considerably within similarly staged patient cohorts. This is particularly true when classifying stage II colorectalcancer patients using the current TNM guidelines. The aim of the present work is to address this problem through the use ofmachine learning. In particular, we introduce a data driven framework which makes use of a large number of diverse types offeatures, readily collected from immunofluorescence imagery. Its outstanding performance in predicting mortality in stage IIpatients (AUROC= 0:94), exceeds that of current clinical guidelines such as pT stage (AUROC= 0:65), and is demonstrated on acohort of 173 colorectal cancer patients.
npj Digital Medicine (2018) 1:52 ; doi:10.1038/s41746-018-0057-x
INTRODUCTIONColorectal cancer (CRC) is the third most common cancerworldwide and the leading cause of death among gastrointestinaltumours.1,2 Annually, there are 1.4 million new cases and morethan half a million of deaths worldwide.1 A typical CRC diagnosisrequires the evaluation of histopathological slides from a biopsy orresected specimen by a pathologist.3,4 Subsequent to a positivediagnosis, prognosis is assessed based on the tumour-node-metastasis (TNM) staging system.5 The TNM stage is considered byfar one of the best predictors of CRC6 and as a consequence,statistics specific to the stage primarily guide therapy. However,stages that exhibit higher variability in survival, encounter greateruncertainty. Stage II patients do not experience nodal (N) ordistant (M) metastasis of their cancer and so only the depth oflocal invasion (T) is reported under TNM staging. Stage II CRCpatients countenance an estimated 20% of 5-year poor prognosis,and 35% of 10 years poor prognosis.7,8 Nevertheless, there are nodefinite criteria for selecting which, if any, stage II patients shouldundergo adjuvant chemotherapy with different trials reachinginconsistent conclusions.9,10 It is therefore imperative to improveupon the prognosis of stage II CRC patients to better aid clinicalguidance, reduce the survivability variance, and consequently,ameliorate treatment research.Histopathological review of patient tissue sections by a
pathologist remains subjective and thus suffers from inherentinter- and intra-observer variability. This affects TNM staging,especially due to the introduction of criteria within the stagingguidelines, which are harder to standardize.11,12 Nevertheless, thishas a greater negative impact when reporting features indepen-dent of TNM that may aid in determining stage II patients with ahigher risk of disease specific death.11,12 One such feature ishistological grading, or equivalently differentiation, currentlywithin the core data set of international reporting guidelines forCRC.3,13 Despite attempts to maintain consistency in reporting thisfeature, such as moving from a three-tiered system down to two
tiers, reproducibility issues persist.3,13 Other promising histopatho-logical features for further stratifying stage II CRC patients includelymphatic vessel invasion and tumour budding.14–16 However,they are currently listed within non-core data items,3 despiteconsistent demonstration of their prognostic significance. This hasbeen attributed to the high observer variability and hence,methodological shortcomings of quantifying these features in astandardized manner.17,18
Both medical practice and research are moving towards a morenuanced approach in clinical decision-making. Pathology is nowembracing the era of digitization with a multitude of interdisci-plinary studies employing techniques from fields such imageanalysis, machine learning (ML) and deep learning.19–22 The use ofthese techniques markedly increases efficiency and efficacycompared to traditional methods, while removing the subjectivityimposed by the human pathologist.23–25 Moreover, multiplexeddetection of target proteins is becoming more commonplace inpathology research through wider adoption of immunofluores-cence (IF). Data collected through IF provide a multi-dimensionalrepresentation of the tumour micro-environment with eachbiomarker co-registered to the same physical coordinates in thetissue. In addition, utilizing specific antibodies to visualizehistopathological features overcomes common issues of reportingfrom H&E stained tissue, such as retraction artefact confoundinglymphatic vessel invasion and high density immune infiltrateobscuring tumour buds.17,18 Therefore, employment of techniquesfrom the aforementioned fields on IF data have the potential toexploit multidimensional data, ranging from morphometric tospatial characteristics of selected histopathological features, andaid in improving prognosis for stage II CRC patients.The present work builds upon previous efforts in the field,26
which make use of image analysis for the extraction ofhistopathological features (such as nuclear grade, tumour buddingand lymphatic vessel invasion, cellular shape, size, texture, etc.), apriori known or expected to be salient, and simple statistical
Received: 15 March 2018 Revised: 22 August 2018 Accepted: 4 September 2018
1School of Computer Science, University of St Andrews, St Andrews KY16 9SX, UK and 2School of Medicine, University of St Andrews, St Andrews KY16 9TF, UKCorrespondence: Neofytos Dimitriou ([email protected])
www.nature.com/npjdigitalmed
Published in partnership with the Scripps Translational Science Institute

techniques for the subsequent inference. In particular, we describea principled and data driven framework which uses modernmachine learning to predict the survival outcome for a stage II CRCpatient from a large number of histopathological features.
RESULTSFull feature set based prognosisEach baseline classifier’s hyperparameter values were learnt bymaximizing the corresponding average area under the receiveroperating characteristic curve (AUROC) on the validation datacorpus. Table 1 summarizes the results. The average AUROC acrossall classifiers was found to be 0.89 both for 5- and 10-yearprognosis. One-way analysis of variance (ANOVA) and Tukey’shonest significance difference test (THSD) showed no statisticalsignificance between classifiers for 10-year prognosis. The onlystatistically significant difference is that between naïve Bayes (NB)
and logistic regression (LR)-based approaches for 5-year prognosis(ANOVA p value < 0.01, THSD p value < 0.003).To demonstrate the importance of model selection, we also
compared the performance of all classifiers using hyperparametervalues, which were learnt as described in the previous section, andwith the a priori set hyperparameters values as in the existingliterature. As expected, using the latter approach a drop in theaverage AUROC was observed both for 5- and 10-year prognosis,to respectively 0.82 (approximately 8.0% drop) and 0.85 (approxi-mately 4.5% drop). The results are visualized in Fig. 1.
Reduced feature setsFeature selection. The evaluation of each subset of features wasperformed by tenfold cross-validation on the training data. Toreduce outcome variability caused by stochastic effects we adaptthe method proposed by Dune et al.27. In particular, we performedsequential floating forward search (SFFS) and sequential floating
Table 1. Average AUROC and standard deviation (for n= 200) of trained classifiers on the training set using 20-times repeated tenfold cross-validation
LSVM RSVM LR RF KNN NB
5 year 0.89 ± 0.12 0.89 ± 0.13 0.91 ± 0.12 0.89 ± 0.13 0.88 ± 0.12 0.86 ± 0.14
10 year 0.89 ± 0.13 0.89 ± 0.12 0.91 ± 0.119 0.90 ± 0.13 0.89 ± 0.13 0.88 ± 0.12
LSVM linear kernel SVM, RLSVM radial basis function kernel SVM
Fig. 1 Tukey’s significance difference test. No hyperparameter learning was employed in the experiments corresponding to the plots a and b,in contrast to c and d
A principled machine learning framework improves accuracyyN Dimitriou et al.
2
npj Digital Medicine (2018) 52 Published in partnership with the Scripps Translational Science Institute
1234567890():,;

backwards search (SFBS) 40 times using different randompartitions, each time retaining the feature subset that achievedthe best performance. Following aggregation—see Figs. 2 and 3—the subsets from SFFS and SFBS were combined and featuresordered based on the frequency of occurrence. Starting with anempty set, features were added in an incremental fashion basedon their average AUROC rank, estimated through 20-timesrepeated tenfold cross-validation. The subset of features thatachieved the highest averaged AUROC was selected for eachprognostic term, as summarized in Table 2.
Experiments. We followed the same approach to classifiertraining, model selection, and evaluation as in the previous
section. The sole difference is that instead of the full feature set,for this set of experiments a reduced set of selected features (asdescribed previously) was used.As expected, we observed a significant improvement in
performance already at the coarsest level of analysis, with theaverage AUROC across classifiers reaching 0.94, both for 5- and 10-year prognosis. In line with our previous findings, no statisticallysignificant difference was observed between different classifiers,except for the inferiority of random forest (RFs) for 10-yearprognosis (ANOVA p < 0.0001, THSD p < 0.01). Just as in theprevious set of experiments, our data driven approach tohyperparameter selection was always found to effect a statisticallysignificant improvement over their being set a priori; see Fig. 4.
Fig. 2 Frequency of occurrence of each feature from the 20 runs of SFFS and SFBS each for 5-year prognosis. Only features with at least oneoccurrence are shown for clarity
Fig. 3 Frequency of occurrence of each feature from the 20 runs of SFFS and SFBS each for 10-year prognosis. Only features with at least oneoccurrence are shown for clarity
A principled machine learning framework improves accuracyyN Dimitriou et al.
3
Published in partnership with the Scripps Translational Science Institute npj Digital Medicine (2018) 52

Final testingWe started by examining training set performance of differentclassifiers using 20-times repeated tenfold cross-validation. It canbe readily seen that classifiers trained on the subset of featuresselected by SFFS and SFBS performed better, as illustrated inTables 1 and 3. Though simple, the best performing classifier wasfound to be KNN-based classifier (with the Minkowski distancemetric) both for 5-year (k= 36) and 10-year prognosis (k= 28).Kaplan-Meier (KM) survival curves were employed to visualize
the difference in survivability between the predicted prognosisgroups, and the log-rank test used for objective quantificationthereof. For 5-year prognosis, our KNN-based approach achievedthe AUROC of 0.77, effecting a good separation patients into highand low-risk (p value < .02). On 10-year prognosis, the classifierachieved the AUROC of 0.94, significantly outperforming thecurrent clinical gold standard of pT stage (AUROC of 0.65), and
even better separation between high- and low-risk patients (log-rank test p < .0001). The sensitivity of 42.9%, specificity of 89.2%,and accuracy of 81.8% were achieved for 5-year prognosis, andthe sensitivity of 100%, specificity of 84%, and accuracy of 88.9%,for 10-year prognosis. The differentiation (poor/moderate vs.good) and T stage discrimination (T3 vs. T4) results aresummarized in Figs. 5, 6 and 7, as well as in Table 4.
DISCUSSIONCRC is a highly heterogeneous disease, which limits the prognosticaccuracy of the TNM staging system or the reporting based onindividual features such as tumour budding,28 or lymphatic vesselinvasion and density.29 Prior work on the use of automated imageanalysis and ML applied to other types of cancer has focused onparameters solely from tumour cells.20,21 However, the evidence
Table 2. Features of significance to both prognosis terms, and those which were specific to a particular term; seven and six features were used for 5and 10-year prognosis, respectively
# Features
Unique to 5-year prognosis 4 Nuclei in tumour mean DAPI intensity, number of CK objects with no associated nuclei, sum area of vessels, averageDAPI intensity (tumour area)
Unique to 10-year prognosis 3 Nuclei in tumour mean D240 intensity, mean compactness of tumour glands, number of PDCs
Common to both prognoses 3 Nuclei in tumour bud mean DAPI intensity, tumour gland relative area (%), sum area of vessels
CK pancytokeratin, PDCs poorly differentiated clusters
Fig. 4 Tukey’s significance difference test. No hyperparameter learning was employed in the experiments corresponding to the plots a and b,in contrast to c and d
A principled machine learning framework improves accuracyyN Dimitriou et al.
4
npj Digital Medicine (2018) 52 Published in partnership with the Scripps Translational Science Institute

Table 3. Average AUROC and standard deviation (for n= 200) of each trained classifier using only features selected by SFFS and SFBS
LSVM RSVM LR RF KNN NB
5 years 0.95 ± 0.08 0.95 ± 0.08 0.95 ± 0.08 0.93 ± 0.11 0.95 ± 0.08 0.93 ± 0.10
10 years 0.95 ± 0.08 0.95 ± 0.08 0.95 ± 0.08 0.92 ± 0.10 0.95 ± 0.07 0.94 ± 0.09
The experiments were performed by 20 times repeating tenfold cross-validation on training data.
Fig. 5 ROC curves for the two prognostic terms of interest
Fig. 6 KM curves for 5-year prognosis
A principled machine learning framework improves accuracyyN Dimitriou et al.
5
Published in partnership with the Scripps Translational Science Institute npj Digital Medicine (2018) 52
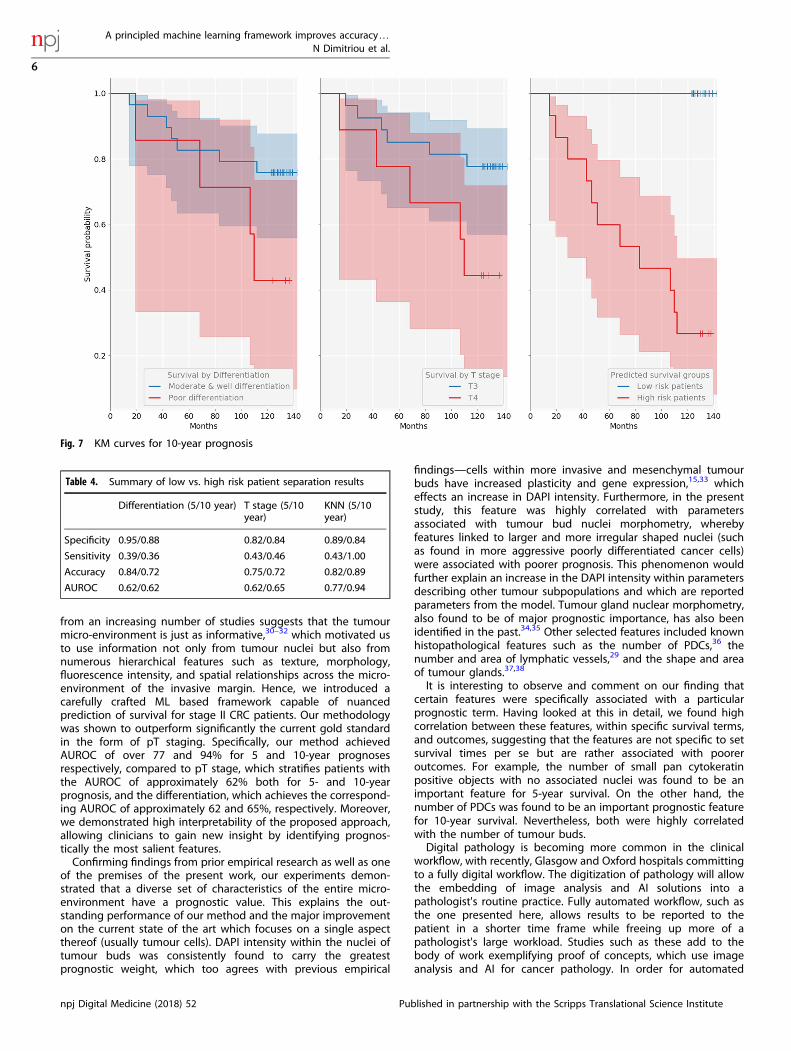
from an increasing number of studies suggests that the tumourmicro-environment is just as informative,30–32 which motivated usto use information not only from tumour nuclei but also fromnumerous hierarchical features such as texture, morphology,fluorescence intensity, and spatial relationships across the micro-environment of the invasive margin. Hence, we introduced acarefully crafted ML based framework capable of nuancedprediction of survival for stage II CRC patients. Our methodologywas shown to outperform significantly the current gold standardin the form of pT staging. Specifically, our method achievedAUROC of over 77 and 94% for 5 and 10-year prognosesrespectively, compared to pT stage, which stratifies patients withthe AUROC of approximately 62% both for 5- and 10-yearprognosis, and the differentiation, which achieves the correspond-ing AUROC of approximately 62 and 65%, respectively. Moreover,we demonstrated high interpretability of the proposed approach,allowing clinicians to gain new insight by identifying prognos-tically the most salient features.Confirming findings from prior empirical research as well as one
of the premises of the present work, our experiments demon-strated that a diverse set of characteristics of the entire micro-environment have a prognostic value. This explains the out-standing performance of our method and the major improvementon the current state of the art which focuses on a single aspectthereof (usually tumour cells). DAPI intensity within the nuclei oftumour buds was consistently found to carry the greatestprognostic weight, which too agrees with previous empirical
findings—cells within more invasive and mesenchymal tumourbuds have increased plasticity and gene expression,15,33 whicheffects an increase in DAPI intensity. Furthermore, in the presentstudy, this feature was highly correlated with parametersassociated with tumour bud nuclei morphometry, wherebyfeatures linked to larger and more irregular shaped nuclei (suchas found in more aggressive poorly differentiated cancer cells)were associated with poorer prognosis. This phenomenon wouldfurther explain an increase in the DAPI intensity within parametersdescribing other tumour subpopulations and which are reportedparameters from the model. Tumour gland nuclear morphometry,also found to be of major prognostic importance, has also beenidentified in the past.34,35 Other selected features included knownhistopathological features such as the number of PDCs,36 thenumber and area of lymphatic vessels,29 and the shape and areaof tumour glands.37,38
It is interesting to observe and comment on our finding thatcertain features were specifically associated with a particularprognostic term. Having looked at this in detail, we found highcorrelation between these features, within specific survival terms,and outcomes, suggesting that the features are not specific to setsurvival times per se but are rather associated with pooreroutcomes. For example, the number of small pan cytokeratinpositive objects with no associated nuclei was found to be animportant feature for 5-year survival. On the other hand, thenumber of PDCs was found to be an important prognostic featurefor 10-year survival. Nevertheless, both were highly correlatedwith the number of tumour buds.Digital pathology is becoming more common in the clinical
workflow, with recently, Glasgow and Oxford hospitals committingto a fully digital workflow. The digitization of pathology will allowthe embedding of image analysis and AI solutions into apathologist's routine practice. Fully automated workflow, such asthe one presented here, allows results to be reported to thepatient in a shorter time frame while freeing up more of apathologist's large workload. Studies such as these add to thebody of work exemplifying proof of concepts, which use imageanalysis and AI for cancer pathology. In order for automated
Fig. 7 KM curves for 10-year prognosis
Table 4. Summary of low vs. high risk patient separation results
Differentiation (5/10 year) T stage (5/10year)
KNN (5/10year)
Specificity 0.95/0.88 0.82/0.84 0.89/0.84
Sensitivity 0.39/0.36 0.43/0.46 0.43/1.00
Accuracy 0.84/0.72 0.75/0.72 0.82/0.89
AUROC 0.62/0.62 0.62/0.65 0.77/0.94
A principled machine learning framework improves accuracyyN Dimitriou et al.
6
npj Digital Medicine (2018) 52 Published in partnership with the Scripps Translational Science Institute

image analysis and AI to be translated into the clinic furtherregulatory approved validation studies must be applied utilizinglarge patient cohorts sourced from multiple institutions.In summary, the present work made several important
contributions: (i) a principled framework for data driven ML basedprecise prognosis of stage II CRC cancer outcomes, (ii) significantlybetter performance than the current state of the art, (iii) clinicalinsight into the disease, and (iv) demonstrated the generalpotential of modern ML in digital pathology and health care morebroadly. Following the highly promising results reported herein,our future work will focus on the application of computer visionand ML directly on histopathological tissue slides, so as to avoidthe loss of information associated with ‘atomization’ of theprocess39 effected by human driven feature extraction and thesubsequently applied learning from these. Additionally, in order toincrease the potential for clinical adoption of the developedmethodologies, it will likely be of interest to consider how theresults should be presented to the clinician.40,41
METHODSOur experimental data were obtained from tissue samples of 180 Scottishpatients who had been diagnosed with CRC and who underwent surgicalresection, with a minimum follow-up of 11.5 years. Patients thatsuccumbed within 5 days of the surgery were excluded to ensure thatsurgical complications did not contribute to the cause of death, as werethe three patients that received therapy due to potential effects on the
relevant micro-environment and hence survival.42 Table 5 summarizes thekey clinical and demographic characteristics of the cohort.The use of tissue samples was approved by the East of Scotland
Research Ethics Service (13/ES/0126). Further ethical clearance was notrequired as the acquired data was anonymized. For more detailed patientinformation please see the previous work of Caie et al.26
FeaturesThe digitization of the tissue samples, and subsequent quantification andextraction of histological features were part of the work completed by Caieet al.26 Both are briefly described hereunder but interested readers shouldrefer to Caie et al.26 and the corresponding supplementary document for amore thorough overview.Tissue samples were prepared for multiplex immunofluorescence with
pan cytokeratin and D2-40 antibodies, along with DAPI stain for thedetection of epithelial cells, lymphatic vessels, and cell nuclei. The invasivefront was manually identified through the pan cytokeratin channel of eachwhole-slide image captured at 40× magnification. Fifteen evenly spacedhigh-resolution (200× magnification) images were captured across theinvasive front of each sample. Regions of interest (ROIs) (including stroma,tumour glands, invasive tumour subpopulations, lymphatic vasculature,and cell nuclei) were detected and segmented from each imported imageusing Definiens AG image analysis software package. Each ROI wasdescribed by a collection of morphometric, spatial, and fluorescencerelated characteristics associated with each patient, resulting in 123histopathological features (independent variables); for further detail seeSupplementary Document.For each patient, pathological and demographic features were collected
as well. The former set comprises the level of differentiation, site of primarytumour, and the corresponding disease stage, and the latter the patient’sage, gender, survival status at multiple clinically relevant follow-upintervals, and (where applicable) time until death. Except for the survival
Table 5. Summary of patient cohort statistics
Number of patients 173
Age (years)
Range 62.5 ± 33.5
Median 67
Gender
Male 86 (50%)
Female 87 (50%)
T Stage
TX 1 (1%)
T1 6 (3%)
T2 7 (4%)
T3 122 (71%)
T4 37 (21%)
N Stage
N0 163 (94%)
N1 8 (5%)
N2 1 (1%)
N3 1 (1%)
M Stage
MX 9 (5%)
M0 161 (93%)
M1 3 (2%)
Site
Rectum 56 (32%)
Colon 117 (68%)
Differentiation
Undetermined 3 (2%)
Poor 25 (14%)
Moderate 138 (80%)
Good 7 (4%)
Table 6. The search space of each classifier based on the distributionsover its hyperparameters (n.b. F denotes feature count; for biasedcategorical distributions, tuples (ps, v) designate the samplingprobability and the value assigned)
Classifier Hyperparameter Distribution Values
SVM, linearkernel
C Log-uniform [ln (1e−5), ln(1e2)]
Class weight Categorical Balanced or none
SVM, RBFkernel
C Log-uniform [ln (1e−5), ln(1e2)]
Gamma Log-uniform [ln (1e−3), ln(1e3)]
Class weight Categorical Balanced or none
LR Type of penalty Categorical L1 or L2
C Log-uniform [ln (1e−5), ln(1e2)]
Class weight Categorical Balanced or none
RF Number of trees Log-uniforminteger
[10, 1000]
Criterion Categorical Gini or entropy
Maximum features Biasedcategorical
(0.2, √F), (0.1, ln F),(0.1, F), (0.6,U(0, F))
Maximum depth Biasedcategorical
(0.1, 2), (0.1, 3),(0.1, 4), (0.7, none)
Bootstrap Categorical True or False
Class weight Categorical Balanced or none
KNN K Log-uniforminteger
[1, 50]
Weights Categorical Uniform, orEuclidean distance
Metric Categorical Balanced or none
P Categorical Balanced or none
A principled machine learning framework improves accuracyyN Dimitriou et al.
7
Published in partnership with the Scripps Translational Science Institute npj Digital Medicine (2018) 52

status, which was the dependent variables of interest in the present work,the remaining features were used for the analysis of experimental results,and not for the actual learning and prediction.
Data preparationWe followed the standard approach to algorithm training and evaluation,by splitting the cohort dynamically into non-overlapping training,validation (or development), and test subsets. In particular, data were firstrandomly (with stratification) split into two, 70 and 30%, the latter beingthe test subset. Using tenfold cross-validation, the former, large subset wasin each iteration of the process further randomly split into training andvalidation subsets.It is worth noting that, given the key aim of the present work, while the
evaluation corpus contain only stage II patients, we decided to includedifferently staged patients in the training corpus. Our hypothesis was thatin spite of not being the target population for our prediction, usefulpathological patterns could be learnt from this data too, allowing a degreeof interpolation to take place. Stratified sampling was employed in order tomaintain the prognosis distribution of each cohort as a means ofcountering the imbalanced nature of our data, and thus avoid classunder-representation.43 Lastly, features were normalized to zero mean andunity variance.
Baseline classification and performance assessmentThe problem at hand was formalized as a binary, supervised classificationtask, whereby the prediction was that of a good or bad prognosis, i.e.survived or not, respectively. We adopted several well-understood baselineclassifiers, with different underlying assumptions (explicit or implicit) andmathematical underpinnings. In particular, we compared classifiers basedon support vector machines,44 RFs,45 k-nearest neighbours (KNN),46 NB,47
and LR.48 In an effort to capture performance adequately on a highlyimbalanced data set, the AUROC49 is adopted as the primary performancemeasure. In addition, for the sake of consistency with related work andease of comparative analysis, we also report specificity and sensitivity, andaccuracy.
Model selectionThe capability of a model to represent information, as well the efficiency itslearning is governed by a number of parameters. These parameters,referred to as hyperparameters, need to be set prior to training. However,finding the optimal or close to optimal set of hyperparameter values ischallenging. The commonly used and probably the simplest approach, inthe form of a grid search has limited applicability due to its intractabilityfor complex models. A random search over predefined ranges ofhyperparameters often produces better results while being computation-ally less demanding.50 However, both techniques are naïve as they do nottake into account historical patterns.Sequential model based global optimization (SMBO) techniques adopt a
more sophisticated approach, approximating the possibly computationallyexpensive fitness function with a simpler surrogate.51 Different SMBOapproaches optimize different criteria which then guide the surrogate ofthe fitness function. The one adopted herein is tree-structured Parzenestimator (TPE), which optimizes the so-called ‘expected improvement’.Conceptually, TPE initially behaves like a random search, subsequentlyrefining the search so that hyperparameter values associated with poorperformance are not re-visited.51,52 This process is guided probabilistically,using suitable densities or distributions associated with the type ofhyperparameter. Those used in the present work are summarized in Table6. Finally, as the loss function we used the negated AUROC resulting fromtenfold cross-validation, averaged over 20 independent runs and using 500iterations.
Feature selectionIn order to address potential problems associated with the so-called curseof dimensionality, which becomes of increasing concern with a largenumber of features, we examined the use of dimensionality reduction inthe context of the problem at hand.53,54 In particular, motivated by theirsuccessful use in the existing literature55 we employed SFFS and SFBS,55–57
which respectively perform recursive removal or addition of features in anattempt to improve a specific metric, until the desired reduction in thefeature number is attained.
Code availabilityFull code is available from the authors upon request.
DATA AVAILABILITYThe data used in this work is available from the authors upon reasonable request.
ACKNOWLEDGEMENTSWe would like to thank and acknowledge NHS Lothian, and is particular Mrs FrancesRae, for providing the tissue, clinical data, and ethical clearances associated with thepresent work.
AUTHOR CONTRIBUTIONSN.D., O.A., and P.C. conceived of the presented idea, and contributed to thedevelopment of the technical approach and experimental analysis. D.H. supervisedthe project and facilitated access to data. All authors discussed the results andcontributed to the final manuscript.
ADDITIONAL INFORMATIONSupplementary information accompanies the paper on the npj Digital Medicinewebsite (https://doi.org/10.1038/s41746-018-0057-x).
Competing interests: The authors declare no competing interests.
Publisher's note: Springer Nature remains neutral with regard to jurisdictional claimsin published maps and institutional affiliations.
REFERENCES1. Ferlay, J. et al. Cancer incidence and mortality worldwide: sources, methods and
major patterns in globocan 2012. Int. J. Cancer 136, E359–E386 (2015).2. Langner, C. & Schneider, N. Prognostic stratification of colorectal cancer patients:
current perspectives. Cancer Manag Res 291 (2014). https://doi.org/10.2147/cmar.s38827.
3. Loughrey, M. B., Quirke, P. & Shepherd, N. A. Dataset for colorectal cancer his-topathology reports. The Royal College of Pathologists 343, 1–47 (2014).
4. Brenner, H., Kloor, M. & Pox, C. P. Colorectal cancer. Lancet 383, 1490–1502(2013).
5. Edge, S. B. & Compton, C. C. The American Joint Committee on cancer: the 7thedition of the AJCC cancer staging manual and the future of TNM. Ann. Surg.Oncol. 17, 1471–1474 (2010).
6. Fleming, M., Ravula, S., Tatishchev, S. F. & Wang, H. L. Colorectal carcinoma:pathologic aspects. J. Gastrointest. Oncol. 3, 153–173 (2012).
7. Compton, C. C. Optimal pathologic staging: defining stage II disease. Clin. CancerRes. 13, 6862s–6870s (2007).
8. Nauta, R., Stablein, D. M. & Holyoke, D. Survival of patients with stage b2 coloncarcinoma. Arch. Surg. 124, 180 (1989).
9. Barone, C. Adjuvant chemotherapy of colon cancer current strategies. Eur. J.Cancer Suppl. 6, 60–63 (2008).
10. Lombardi, L. et al. Adjuvant colon cancer chemotherapy: where we are andwhere well go. Cancer Treat. Rev. 36, S34–S41 (2010).
11. Lea, D., Håland, S., Hagland, H. R. & Søreide, K. Accuracy of TNM staging incolorectal cancer: a review of current culprits, the modern role of morphologyand stepping-stones for improvements in the molecular era. Scand. J. Gastro-enterol. 49, 1153–1163 (2014).
12. Maguire, A. Controversies in the pathological assessment of colorectal cancer.World J. Gastroenterol. 20, 9850 (2014).
13. von Karsa, L. et al. European guidelines for quality assurance in colorectal cancerscreening and diagnosis: overview and introduction to the full supplementpublication. Endoscopy 45, 51–59 (2012).
14. Lai, Y.-H. et al. Tumour budding is a reproducible index for risk stratification ofpatients with stage II colon cancer. Colorectal Dis. 16, 259–264 (2014).
15. Lugli, A., Karamitopoulou, E. & Zlobec, I. Tumour budding: a promising parameterin colorectal cancer. Br. J. Cancer 106, 1713–1717 (2012).
16. Lin, M. et al. Intratumoral as well as peritumoral lymphatic vessel invasion cor-relates with lymph node metastasis and unfavourable outcome in colorectalcancer. Clin. & Exp. Metastas-. 27, 123–132 (2010).
17. Kojima, M. et al. Pathological diagnostic criterion of blood and lymphatic vesselinvasion in colorectal cancer: a framework for developing an objective patholo-gical diagnostic system using the Delphi method, from the Pathology Working
A principled machine learning framework improves accuracyyN Dimitriou et al.
8
npj Digital Medicine (2018) 52 Published in partnership with the Scripps Translational Science Institute

Group of the Japanese Society for Cancer of the Colon and Rectum. J. Clin. Pathol.66, 551–558 (2013).
18. Zaorsky, N. G., Patil, D., Freedman, G. M. & Tuluc, M. Differentiating lymphovas-cular invasion from retraction artifact on histological specimen of breast carci-noma and their implications on prognosis. J. Breast Cancer 15, 478 (2012).
19. Korbar, B. et al. Deep-learning for classification of colorectal polyps on whole-slide images. Clin Orthop Relat Res. abs/1703.01550 (2017).
20. Vandenberghe, M. E. et al. Relevance of deep learning to facilitate the diagnosisof HER2 status in breast cancer. Sci. Rep. 7, 45938 (2017).
21. Wang, X. et al. Prediction of recurrence in early stage non-small cell lung cancerusing computer extracted nuclear features from digital H&E images. Sci Rep. 7(2017). https://doi.org/10.1038/s41598-017-13773-7.
22. Rao, A. et al. Identification of histological correlates of overall survival in lowergrade gliomas using a bag-of-words paradigm: a preliminary analysis based onhematoxylin & eosin stained slides from the lower grade glioma cohort of thecancer genome atlas. J. Pathol. Inform. 8, 9 (2017).
23. Galon, J. et al. Towards the introduction of the ‘immunoscore’ in the classificationof malignant tumours. J. Pathol. 232, 199–209 (2013).
24. Thakur, S. S. et al. The use of automated ki67 analysis to predict oncotype DX risk-of-recurrence categories in early-stage breast cancer. PLoS One 13, e0188983(2018).
25. Bankhead, P. et al. Integrated tumor identification and automated scoringminimizes pathologist involvement and provides new insights to key biomarkersin breast cancer. Lab. Invest. 98, 15–26 (2017).
26. Caie, P. D., Zhou, Y., Turnbull, A. K., Oniscu, A. & Harrison, D. J. Novel histo-pathologic feature identified through image analysis augments stage II colorectalcancer clinical reporting. Oncotarget 7, 44381–44394 (2016).
27. Dunne, K., Cunningham, P. & Azuaje, F. Solutions to instability problems withsequential wrapper-based approaches to feature selection. J. Mach. Learn. Res.,1–22 (2002).
28. Horcic, M. et al. Tumor budding score based on 10 high-power fields is a pro-mising basis for a standardized prognostic scoring system in stage ii colorectalcancer. Hum. Pathol. 44, 697–705 (2013).
29. Cacchi, C. et al. Clinical significance of lymph vessel density in T3 colorectalcarcinoma. Int. J. Colorectal Dis. 27, 721–726 (2012).
30. Sugai, T. et al. Vascular invasion and stromal s100a4 expression at the invasivefront of colorectal cancer are novel determinants and tumor prognostic markers.J. Cancer 8, 1552–1561 (2017).
31. Heindl, A., Nawaz, S. & Yuan, Y. Mapping spatial heterogeneity in the tumormicroenvironment: a new era for digital pathology. Lab. Invest. 95, 377–384(2015).
32. Isella, C. et al. Stromal contribution to the colorectal cancer transcriptome. Nat.Genet. 47, 312–319 (2015).
33. Bhangu, A. et al. Epithelial mesenchymal transition in colorectal cancer: seminalrole in promoting disease progression and resistance to neoadjuvant therapy.Surg. Oncol. 21, 316–323 (2012).
34. Nakashima, Y. et al. Nuclear atypia grading score is a useful prognostic factor inpapillary gastric adenocarcinoma. Histopathology 59, 841–849 (2011).
35. Eynard, H. G., Soria, E. A., Cuestas, E., Rovasio, R. A. & Eynard, A. R. Assessment ofcolorectal cancer prognosis through nuclear morphometry. J. Surg. Res. 154,345–348 (2009).
36. Barresi, V., Bonetti, L. R., Ieni, A., Caruso, R. A. & Tuccari, G. Poorly differentiatedclusters: clinical impact in colorectal cancer. Clin. Colorectal Cancer 16, 9–15(2017).
37. Hynes, S. O. et al. Back to the future: routine morphological assessment of thetumour microenvironment is prognostic in stage II/III colon cancer in a largepopulation-based study. Histopathology 71, 12–26 (2017).
38. Rajaganeshan, R. et al. The influence of invasive growth pattern and microvesseldensity on prognosis in colorectal cancer and colorectal liver metastases. Br. J.Cancer 96, 1112–1117 (2007).
39. Arandjelović, O. A new framework for interpreting the outcomes of imperfectlyblinded controlled clinical trials. PLoS One 7, e48984 (2012).
40. Osuala, R. & Arandjelović, O. Visualization of patient specific disease risk. In Proc.IEEE International Conference on Biomedical and Health Informatics 241–244,Orlando, Florida, USA (2017).
41. Li, J. & Arandjelović, O. Intuitive and interpretable visual communication of acomplex statistical model of disease progression and risk. In Proc. International
Conference of the IEEE Engineering in Medicine and Biology Society 4199–4202,(2017).
42. O’Neil, M. & Damjanov, I. Histopathology of colorectal cancer after neoadjuvantchemoradiation therapy. Open Pathol. J. 3, 91–98 (2009).
43. Kohavi, R. A study of cross-validation and bootstrap for accuracy estimation andmodel selection. In Proceedings of the 14th International Joint Conference onArtificial Intelligence—Volume 2, IJCAI'95, 1137–1143 (Morgan Kaufmann Pub-lishers Inc., San Francisco, CA, USA, 1995).
44. Barracliffe, L., Arandjelović, O. & Humphris, G. Can machine learning predicthealthcare professionals’ responses to patient emotions? In Proc. InternationalConference on Bioinformatics and Computational Biology 101–106 (Honolulu,Hawaii, USA 2017).
45. Karsten, J. & Arandjelović, O. Automatic vertebrae localization from CT scansusing volumetric descriptors. In Proc. International Conference of the IEEE Engi-neering in Medicine and Biology Society 576–579, (2017).
46. Nigri, E. & Arandjelović, O. Light curve analysis from Kepler spacecraft collecteddata. In Proc. ACM International Conference on Multimedia Retrieval 93–98,Bucharest, Romania (2017).
47. Beykikhoshk, A., Arandjelović, O., Phung, D., Venkatesh, S. & Caelli, T. UsingTwitter to learn about the autism community. Social. Netw. Anal. Min. 5, 5–22(2015).
48. Birkett, C., Arandjelović, O. & Humphris, G. Towards objective and reproduciblestudy of patient-doctor interaction: automatic text analysis based VR-CoDESannotation of consultation transcripts. In Proc. International Conference of the IEEEEngineering in Medicine and Biology Society 2638–2641, (2017).
49. Ling, C. X., Huang, J. & Zhang, H. Auc: A statistically consistent and more dis-criminating measure than accuracy. In Proceedings of the 18th International JointConference on Artificial Intelligence, IJCAI'03, 519–524 (Morgan Kaufmann Pub-lishers Inc., San Francisco, CA, USA, 2003).
50. Bergstra, J. & Bengio, Y. Random search for hyper-parameter optimization. J.Mach. Learn. Res. 13, 281–305 (2012).
51. Bergstra, J. S., Bardenet, R., Bengio, Y. & Kégl, B. Algorithms for hyper-parameteroptimization. In Shawe-Taylor, J., Zemel, R. S., Bartlett, P. L., Pereira, F. & Wein-berger, K. Q. (eds.) Advances in Neural Information Processing Systems 24,2546–2554 (Curran Associates, Inc., 2011).
52. Hutter, F., Hoos, H. H. & Leyton-Brown, K. Sequential model-based optimizationfor general algorithm configuration. In Proceedings of the 5th International Con-ference on Learning and Intelligent Optimization, 507–523 (Springer-Verlag, 2011).https://doi.org/10.1007/978-3-642-25566-3_40.
53. Guyon, I. & Elisseeff, A. An introduction to variable and feature selection. J. Mach.Learn. Res. 3, 1157–1182 (2003).
54. Chandrashekar, G. & Sahin, F. A survey on feature selection methods. Comput. &Electr. Eng. 40, 16–28 (2014).
55. Gurcan, M. N. et al. Histopathological image analysis: a review. Ieee. Rev. Biomed.Eng. 2, 147–171 (2009).
56. Pudil, P., Novovičová, J. & Kittler, J. Floating search methods in feature selection.Pattern Recognit. Lett. 15, 1119–1125 (1994).
57. Jain, A. & Zongker, D. Feature selection: evaluation, application, and small sampleperformance. IEEE. Trans. Pattern Anal. Mach. Intell. 19, 153–158 (1997).
Open Access This article is licensed under a Creative CommonsAttribution 4.0 International License, which permits use, sharing,
adaptation, distribution and reproduction in anymedium or format, as long as you giveappropriate credit to the original author(s) and the source, provide a link to the CreativeCommons license, and indicate if changes were made. The images or other third partymaterial in this article are included in the article’s Creative Commons license, unlessindicated otherwise in a credit line to the material. If material is not included in thearticle’s Creative Commons license and your intended use is not permitted by statutoryregulation or exceeds the permitted use, you will need to obtain permission directlyfrom the copyright holder. To view a copy of this license, visit http://creativecommons.org/licenses/by/4.0/.
© The Author(s) 2018
A principled machine learning framework improves accuracyyN Dimitriou et al.
9
Published in partnership with the Scripps Translational Science Institute npj Digital Medicine (2018) 52