Embed Size (px)
Citation preview

http://dij.sagepub.com/Drug Information Journal
http://dij.sagepub.com/content/45/2/187The online version of this article can be found at:
DOI: 10.1177/009286151104500213
2011 45: 187Drug Information JournalBeltangady
Christy Chuang-Stein, Simon Kirby, Jonathan French, Ken Kowalski, Scott Marshall, Mike K. Smith, Paul Bycott and MohanA Quantitative Approach for Making Go/No-Go Decisions in Drug Development
Published by:
http://www.sagepublications.com
On behalf of:
Drug Information Association
can be found at:Drug Information JournalAdditional services and information for
http://dij.sagepub.com/cgi/alertsEmail Alerts:
http://dij.sagepub.com/subscriptionsSubscriptions:
http://www.sagepub.com/journalsReprints.navReprints:
http://www.sagepub.com/journalsPermissions.navPermissions:
http://dij.sagepub.com/content/45/2/187.refs.htmlCitations:
What is This?
- Mar 1, 2011Version of Record >>
by guest on October 25, 2013dij.sagepub.comDownloaded from by guest on October 25, 2013dij.sagepub.comDownloaded from by guest on October 25, 2013dij.sagepub.comDownloaded from by guest on October 25, 2013dij.sagepub.comDownloaded from by guest on October 25, 2013dij.sagepub.comDownloaded from by guest on October 25, 2013dij.sagepub.comDownloaded from by guest on October 25, 2013dij.sagepub.comDownloaded from by guest on October 25, 2013dij.sagepub.comDownloaded from by guest on October 25, 2013dij.sagepub.comDownloaded from by guest on October 25, 2013dij.sagepub.comDownloaded from by guest on October 25, 2013dij.sagepub.comDownloaded from by guest on October 25, 2013dij.sagepub.comDownloaded from by guest on October 25, 2013dij.sagepub.comDownloaded from by guest on October 25, 2013dij.sagepub.comDownloaded from by guest on October 25, 2013dij.sagepub.comDownloaded from by guest on October 25, 2013dij.sagepub.comDownloaded from by guest on October 25, 2013dij.sagepub.comDownloaded from

B I O S T A T I S T I ( S 187
A Quantitative Approach for Making Go/No-Go Decisions in
Drug Development Christy Chuong-Stein
Statistics. Pfizer Inc
Simon Kirby Statistics, Pfizer Inc
Jonathan French Global Pharmacometrics.
Pfizer Inc
Ken Kowolski Ann Arbor Pharmacometrics
Group, Michigan
Scott Marshall Global Pharmacometrics.
Pfizer Inc
Mike K. Smith Global Pharmacometrics,
Pfizer Inc
Paul Bycott Statistics, Pfizer Inc
Mohon Beltongady Statistics. Pfizer Inc
There are many decision points along the prod- uct development continuum. Formal clinical milestones, such as the end of phase I, phase 2a (proof of mechanism or proof of concept), and phase 2b provide useful decision points to critically evaluate the accumulating data. At each milestone, sound decisions begin with ask- ing the right questions and choosing the appro- priate design as well as criteria to make goho- go decisions. It is also important that knowledge about the new investigational product, gained either directly from completed trials or indirect- ly from similar products for the same disorder, be systematically incorporated into the evalua-
tion process. In this article, we look at metn'cs that go beyond type 1 and type 11 error rates as- sociated with the traditional hypothesis test approach. We draw on the analogy between di- agnostic tests and hypothesis tests to highlight the need for confirmation and the value offor- mally updating our prior belief about a com- pound's effect with new data. Furthermore, we show how incorporating probability distribu- tions that characterize current aidence about the true treatment efect could help us make de- cisions that specifically address the need at each clinical milestone. We illustrate the above with examples.
Key Words Diagnostic test; Negative predictive value; Positive predictive value; Model- based drug development;
Prior distribution; Probability ofa successful trial
Correspondence Address Christy Chuang-Stein.
5857 Stoney Brook Road, Kalamazoo MI 49009
(email: Chris ty.j.chuang-stein @pfizer.com).
I N T R O D U C T I O N Discovery and development of new medicines to extend or improve the life of patients is a challenging and expensive endeavor. The cost of developing a new drug is estimated to be be- tween $800 million and $2 billion US dollars (1). Taking a molecule from a laboratory bench to market and then to successful delivery to pa- tients takes many years, and the success rate is very low. In this long journey, data need to be constantly evaluated to decide if the develop- ment should be continued or resources should be focused on other alternatives. Formal clini- cal milestones, such as the end of phase 1, phase 2a (proof of mechanism or proof of con- cept, POC), and phase 2b trials provide useful decision points to critically evaluate the accu- mulating data and make important decisions. Enabling these decisions to be as fully informed as possible requires using all available data with sound quantitative methods and skills.
Because of the high attrition rate of com- pounds moving through early development, an emphasis at this stage should be to make cor- rect decisions (correct go and correct no-go). A correct go decision is important so that re-
sources are not wasted on inferior compounds and diverted from the development of medi- cines of value to patients. History has shown that a go decision based on ambiguous findings often leads to future studies that fail again and again. A correct no-go is also important so that a valuable medicine is not terminated prema- turely. Thus designing a trial to increase the chance of correct decisions at each step is para- mount.
When evaluating various options for making decisions, a sponsor often computes the proba- bility of different types of erroneous decisions under various assumptions of the treatment ef- fect. Often missing from this approach is a rig- orous examination of how likely the assumed treatment effect is to be true. Considering that a sponsor typically gains more information about the product as development moves from the exploratory phase to the confirmatory phase, it is critical for a sponsor to take advan- tage of the increasing body of knowledge in de- vising criteria to drive milestone decisions.
A critical component of choosing among al- ternative decision criteria is the selection of a metric to help evaluate the operating character-
Dnq IilfonnaUon.Jo~iniu1. Vd. 45. pp. 187-202.201 I 0092-8615/201 I Printed in the USA. All nghts reserved. Copyright 0 201 1 Drug Informdon Association. Inc.
Submitted for Publication: Judy 14,2010 Accepted for Riblication: Novcmbcr 10, 2010

Chuang-Stein et al. 188 B l O S T A T l S T l C S
I
Not RW Ho (No-Go) RW Ho (W Total
Ho 1 -a U* 1 .oo 1, B** 1 - B 1 .oo
Truth
Total Meaningless a isha iypa I m mte.
** p ishiypa II ww rate.
istics of the decision criteria. To be useful, the metric should reflect the objectives of the cur- rent development stage. As mentioned earlier, a metric early on might be the probability of mak- ing correct decisions. When deciding whether to move into a confirmatory stage, a good met- ric is the probability that there will be a suc- cessful confirmatory trial outcome. The latter conveys an unconditional concept that com- bines the conditional concept of statistical power with our cumulative knowledge about the treatment effect.
In this article, we discuss an approach that in- corporates prior information in a systematic fashion using metrics that are relevant to the various stages of drug development. Incorporat- ing prior information in designing a trial and setting up decision criteria are not new (eg, 2-11). What is unique about this article is its exposition on the value of updating evidence from accumulating information, similar to that in a serial diagnostic strategy that employs in- creasingly expensive and accurate tests to in- crease the positive and negative predictive val- ues of the test results. Besides the diagnostic test analogy, the article offers different metrics specifically for different development strategies that could be framed under a unified approach.
In the next section, we review the traditional hypothesis testing approach. We draw an analo- gy between hypothesis testing and a diagnostic test. The analogy leads to a discussion of posi- tive predictive value and negative predictive value. The similarity between hypothesis testing and diagnostic testing explains why moving into the confirmatory stage based on a single posi-
tive POC in areas with little therapeutic success could be very risky. In the fourth section, we dis- cuss how the continuum of drug development leads to an iterative process for collecting and using information to help us make decisions. Following that, we discuss the choice of metrics. The choices are then illustrated using examples.
C L I N I C A L T R I A L H Y P O T H E S I S T E S T I N G V I E W E D A S A D I A G N O S T I C T E S T Let A denote the measure of treatment effect of interest. In this article, we discuss decision cri- teria in the context of efficacy evaluation even though the discussion is equally applicable to prespecified safety endpoints. Without loss of generality, we will assume A to be a relative mea- sure comparing a new treatment to a control on a primary endpoint. We will assume that higher values on the primary endpoint represent a more favorable outcome. Thus, a positive A im- plies that the new treatment is more efficacious than the control.
The traditional hypothesis testing approach in designing a clinical trial could be described as shown in Table 1 (12). Under this approach, a null hypothesis of H, : A I A, is tested against H, : A > A,. Here, A, could be 0. In practice, we often choose A, in such a way that the new treatment will be worthy of moving forward if it has an effect greater than A,. The decision cri- terion is set in such a way that the maximum probability of rejecting H, when A 5 A, is bounded by a prespecified value a (called the significance level), while the probability of re- jecting H, when A = Aa for a chosen A. (> Ao) is

Qpantitative Approach for Go/No-Go Decisions B l O S T A T l S T l C S 169
given by a prespecified value 1 - p (called pow- er at A,,). In this article, we equate rejecting H, to data supporting a go decision. Unless other- wise stated, a failure to reject H, means that the data support a no-go decision. We adopt this simple convention, knowing that there are al- ways other considerations that may lead a spon- sor to make a different decision. Under this construct, a is called the type I error rate and p the type I 1 error rate for A = A,,. We discuss the possibility of including a “gray zone” later, where failing to reject H, may still lead to a go decision depending on the outcome of other factors. Under this approach, one will compare the P value obtained from testing H, versus H,, to a to decide if H, should be rejected (U).
When developing a diagnostic test for a dis- ease (or a condition), a diagnostic company chooses a cutoff value on a predicting assay to achieve a desirable sensitivity and specificity for the test. Sensitivity in this context is the probability of diagnosing the disease when the disease is present. Specificity is the probability of diagnosing disease absence when the dis- ease is indeed absent. Assume that high values on the predictive assay are associated with dis- ease presence. If a high cutoff value is selected, the test will have low sensitivity, that is, miss the diagnosis-a potentially high-risk proposi- tion in major disease settings. On the other hand, a low cutoff will result in declaring too many as having the disease when they in fact do not-perhaps causing an undue anxiety for those tested and their caregivers. The choice of the cutoff is usually balanced to manage these two concerns. Diagnostic tests that man- age these concerns well are usually considered the gold standard.
Consider for the time being a simplistic situa- tion where H, : A = A, is tested against Ha : A = A,, and we consider H, synonymously as the presence of a disease. Under this analogy, what we call power (ie, 1 - p) under a hypothe- sis testing approach is sensitivity for a diagnos- tic test. Similarly, what we call correct negative probability (1 - a) is specificity. As such, the use and implication of a diagnostic test are readily applied to a hypothesis test. This analo-
gy between clinical trials and diagnostic tests was pointed out by Pater and Willan (14) nearly 3 decades ago.
Type I and type I1 error rates as well as sensi- tivity and specificity are all conditional proba- bilities. They describe the chance of commit- ting different types of errors assuming different states of nature. While the marginal total for each row in Table 1 is 1.0 by construction, the column totals are meaningless. To make them meaningful, we need information on how likely the truth is A = A,or A = Aa in the simplified case (and A I A, or A > A, in the more general case). For a diagnostic test, there is generally a reasonable estimate for the prevalence of a dis- ease (or a condition) with prevalence defined as the probability that an individual drawn ran- domly from a population has the disease. The common practice of following up a positive re- sult from an initial diagnostic test with a more expensive test to get a more accurate diagnosis highlights the stepwise decision-making pro- cess in disease diagnosis. We elaborate on the analogy between hypothesis tests and diagnos- tic tests in the next section.
P O S I T I V E P R E D I C T I V E A N D N E G A T I V E P R E D I C T I V E V A L U E S Consider first the simple case of H, : A = A, and H , : A = A,,. Assume that, in the absence of information specific to the new molecular enti- ty (NME) under development, industry-wide ex- perience suggests that there is an 80% chance that the NME has no effect (ie, H, is true). So, the chance that Ha is true is 20%. This 20% fig- ure is often cited as the proportion of NMEs reaching the registration stage among those entering phase 2 testing. We can use the as- sumed probabilities of H, and Ha and the con- ditional probabilities in Table 1 to construct the unconditional probabilities in Table 2. These unconditional probabilities represent the joint distribution of the row (truth) and the column (decision) variables. For example, (1 - a) x 0.8 is the probability that H, is true and we make a no-go decision.
In Table 2. the four probabilities associated with the four (truth, decision) combinations
Drug Information Journal

190 B I O S T A T I S T I C S Chuang-Stein et al.
T A B L E 2 I
Ho (1 - a) x 0.80 a x 0.80 0.80 Ha B x 0.20 (1 - S) x 0.20 0.20
Truth
Total (1 - a) x 0.80 + fi x 0.20 a x 0.80 + (1 - B) x 0.20 1 .oo
sum to 1.0. The row marginal totals represent the probabilities of H, and H,, that is, 0.8 and 0.2 respectively. The column marginal totals represent the probability of reaching a no-go decision and a go decision. The probability of a go decision, a x 0.8 + (1 - p) x 0.2, includes the probability of (Ho, Rejecting HJ.
Among the four combinations in Table 2, the two diagonal ones (H,, Not Rejecting H, and H,, Rejecting H,) represent correct (truth, deci- sion) combinations. For convenience, we will call the decisions in these two combinations correct decisions. The probability of correct de- cisions is (1 - a) x 0.8 + (1 - p) x 0.2. Simi- larly, the probability of incorrect decisions, de- fined as the off-diagonal combinations of H,, Rejecting H, and H,, Not Rejecting H,, is a x 0.8 + p x 0.20. The relative occurrence of the two types of incorrect decisions, conve- niently referred to as incorrect go and incorrect no-go, is a x 0.8 to x 0.2. What is the impact of these two types of incorrect decisions? To as- certain the impact, one could create a utility function that reflects the relative cost associat- ed with making these two erroneous decisions.
We now return to the analogy between a hy- pothesis test and a diagnostic test. The real val- ue of a diagnostic test lies in its ability to cor- rectly predict the presence of the disease with a positive test result (positive predictive value, PPV) and its ability to correctly predict the ab- sence of the disease with a negative test result (negative predictive value, NPV). For a diagnos- tic test, PPV and NPV can be obtained via Bayes' rule, using the sensitivity and specificity of the test, as well as the prevalence of the disease in the tested population. Let P(D) denote the prev-
alence of the disease and P(ND) = 1 - P(D). Bayes' rule leads to the expression for PPV and NPV in Eq. 1.
PPV = P(D I Positive Test) PID) x Sensitivitv
P(D) * Sensitivity + P(ND) * (1 -Specificity)
NPV = P(ND I Negative Test) PIND) x SDecificitv
P(ND) * Specificity + P(D) * (1 -Sensitivity)
As with a diagnostic test, the value of a hypoth- esis test (with its accompanying go and no-go decision rules) lies in its ability to correctly pre- dict the presence of an effective product with a go decision and its ability to correctly predict the absence of an effective product with a no- go decision. The former is the positive predic- tive value while the latter is the negative predic- tive value. As an illustration, assume that a in Table 1 is set at 0.10 and p at 0.20. Further- more, assume that P(H,) is 0.20. Setting P(D) =
0.20, Sensitivity = 0.80, Specificity = 0.90 in Eq. 1, the PPV [= P(H,I Rejecting H,)] is 0.67. In other words, the chance of A = A, increases from 20% to 67% with the rejection of the null hypothesis A = A". Like a diagnostic test where PPV and NPV depend on sensitivity, specificity, and disease prevalence, P(H,I Rejecting HJ de- pends on a, p, and P(H,). In Table 3, we include different scenarios reflecting different values of these three parameters. As can be seen, when the prior information suggests a 10% chance for A = A,, the chance of A = A" is still less than 50% even after the hypothesis testing approach with a = 0.10 and p = 0.20 rejects the null hy- pothesis of A = Ao. The corresponding NPV, the

Quantitative Approach for Go/No-Go Decisions B I 0 S T A T I S T I ( 5 191
a = 0.05 a = 0.10 $ = 0.10 $ = 0.20 $ = 0.10 $ = 0.20
P w
0.10 0.67 0.64 0.50 0.47 0.30 0.89 0.87 0.79 0.77 0.50 0.95 0.94 0.90 0.89 0.70 0.98 0.97 0.95 0.95
probability for A = A. conditional on not re- jecting H, : A > A,, goes up to 98% (from 90%). It should be noted that the concept of PPV has also been applied to molecular epidemiology studies (15).
The discussion on PPV is particularly relevant for diseases with very little (or no) therapeutic success such as stroke and preventive vaccines for HIV. The POC study in such situations is like performing the first diagnostic test. Based on the past experience of product development for the disease, the chance that the new treatment will possess the desirable property could be quite low (eg, <lo%). A positive POC, although increasing the odds that the new treatment has the desired efficacy, will require confirmation in view of a positive predictive value that might still be too low. As a result, a positive POC should be viewed with caution since this is analogous to having a positive diagnostic test result in a population with an extremely low dis- ease prevalence. In the latter case, it is typical to obtain additional verification before taking any definitive action because of the low PPV. Simi- larly, what we saw in the positive POC study for a disease with very little past success could be a random high treatment effect in a universe of ineffective therapies. It needs additional verifi- cation before rushing into expensive, large con- firmatory phase 3 studies. The history of drug development has shown many such disappoint- ments and large loss of resources fueled by this unwarranted enthusiasm.
V I E W I N G A O N A C O N T I N U U M In a traditional drug development program, de- cisions to move into phase 2a, phase 2b, and
phase 3 are made sequentially. The chance that the new treatment possesses the desirable prop- erty should be continuously updated. The posi- tive predictive value at one stage becomes the prior information for the next stage. This pro- cess of collecting information and updating the evidence of a treatment effect continues as more trials are completed and new data become available. In general, the positive predictive val- ue should be reasonably high for a drug to move into the confirmatory stage.
In practice, we rarely deal with simple hypoth- eses. Instead, the hypotheses are usually com- posite, such as H , : A I A, and H, : A > b,, and our knowledge about A can be captured by a continuous probability distribution or a dis- crete probability distribution over a moderate to large number of values. We can easily extend Table 2 to handle this more general case. The extension is illustrated in Table 4, where A, is replaced by a generic TV (target value). In Table 4, the probabilities are obtained by integrating the conditional probability weighted by the probability distribution assumed for the treat- ment effect over relevant regions for A. For ex- ample, assuming that our knowledge of A from existing data could be described by P(AIPrior Data), the probability of correct no-go can be determined as in Eq. 2. Simulations can be used to compute this probability.
P(Correct No-Go I A) P(A I Prior Data)dA (2) I,,, A fundamental question is how to determine the probability distribution P(AIPrior Data). An- swering this question is central to the model- based drug development (MBDD) paradigm
T A B L E 3
Drug Information Journal

192 B l O S T A T l S T l C S Chuang-Stein et al.
I Dodsioa I I A B L t 4 I I
Not RW H, (No-Go) Raiad H, (Go) Totd
A S Tr' Correct No-Go Incorrect Go P(A s rv) A > rv Incorrect No-Go Correct Go P(A > TV/
Tnrth I I
(16). The concept of MBDD has evolved from the wide application of pharmacokinetic (PK) and pharmacodynamic (PD) modeling across the early learning phase of drug development (17,18). Substantial methodological develop- ment and integration with the statistical as- pects of study design and decision making has led the pharmaceutical industry to employ these approaches (719-22) beyond the tradi- tional PWPD modeling. While the principle goal of MBDD is to improve the predictive per- formance of the drug development process, our focus here is to use existing MBDD techniques to more accurately derive P(AIPrior Data) before designing the next study.
An important step is the analysis of existing internal and external trial results for other treatments for the same indication. This could involve weighing different sources of informa- tion (23) or conducting a meta-analysis to char- acterize the exposure (dose or concentration) response relationship for individual and classes of compounds across time (24-26). We would like to remind our readers that while models can characterize the uncertainty in the estimat- ed parameters and variability across the studied population, they rely on the plausibility of the underlying assumptions.
The utility of the model-based approach to design dose-ranging studies has previously been demonstrated (27). Going forward, the ap- proach will benefit from the posting of all trials as well as their results at ClinicalTrials.gov. Mak- ing all trial results available online could help minimize publication bias. Since the require- ment of posting trials and trial results became broadly effective only within the last 10 years, it
will be a while for this practice to fully bear fruit. In general, analysis of individual subject- level data is preferred, as it allows a more in- depth evaluation of previous and future trial designs (28,29).
For an NME with a mechanism of action simi- lar to previously developed compounds, predic- tions can be made based on the meta-analysis of prior study results. Relatively simple pharmaco- logical principles together with observed differ- ences in PK (eg, clearance, distribution, plasma protein binding) and PD (in vivo and in vitro po- tency, receptor occupancy) can be used to scale for the NME (30,31). Assumptions in this case are generally considered reasonable, and P(AIPrior Data) is usually sufficiently well char- acterized to derive the unconditional probabili- ties for the metrics of interest (Choice of Metric section) and to evaluate both potential study de- signs and decision criteria (Examples section).
For the first NME in a new class, P(AIPrior Data) will require the development and applica- tion of models that characterize the pharmacol- ogy of the drug, the biology of the target, the physiology of the system, and its linkage to the disease of interest (32,33). While the knowledge in utilization of this integrated systems ap- proach continues to evolve. it is clear that a large number of assumptions will always be re- quired. As such, sole reliance on the subsequent predictions for the purposes of study design and decision criteria may not be prudent. In this case, generic industry experience for other drug classes. such as the average industry suc- cess rate among candidates for the target indi- cation (eg, the 20% figure used in the previous section) could form the basis for a first in class

Quantitative Approach for &/No-Go Decisions B I 0 S T A T I S T I t S 193
NME P(AIPrior Data) derivation at the begin- ning of a development program.
For all NMEs, as more data become available, the reliance on preclinical data or generic in- dustry experience will diminish. The distribu- tion will be increasingly based on experience in humans with the NME under development. Nevertheless, extrapolation from biomarker to outcome measure, or from a more homogenous phase 2 population to a more heterogeneous phase 3 population, will still be required. The former can be accomplished by employing the principles outlined above and the latter is dis- cussed in the last section of this article. When planning a trial, P(AIPrior Data) could also depend on the population selected to partici- pate in the new trial. This is normally codified through the inclusion and exclusion criteria. For example, past data might suggest that the effect is likely to be higher in patients with moderate to severe disease. So, a higher effect could be anticipated if the trial enrolls mostly patients with moderate or severe disease.
As mentioned earlier, the distribution char- acterizing available evidence on the treatment effect should be updated as more data become available. When deciding whether to launch a phase 3 program, a sponsor should critically assess the probability of A > TV, where TV is an explicit expectation for the treatment to be commercially viable. This assessment needs to be an integral part of the overall decision. It is our opinion that a failure to do the above is partially responsible for the high phase 3 fail- ure rate that has been adversely impacting the pharmaceutical industry over the past 20 years.
C H O I C E O F M E T R I C Choosing a metric that explicitly reflects the stagewise objective of a trial is an integral part of selecting decision criteria. Because the prob- ability of a treatment being successful is usually low at the exploratory stage, the probability of making a correct decision is often important at this stage. In addition, depending on whether the new treatment is the first in the class or one of several in a class with marketed products, a
sponsor might be more willing to accept an in- correct go decision rather than an incorrect no-go decision. We illustrate this with an exam- ple in the next section.
The situation with the confirmatory stage is a bit different. At this stage, we should, in theory, be reasonably sure that a new treatment has an effect. As such, a desirable outcome often means a go decision. A good metric to assist a spon- sor's internal planning is the probability of a successful trial, or P(Go) for a chosen definition of trial success. The minimum efficacy require- ment for regulatory approval is a statistically significant treatment effect (typically at the two-sided 5% significance level) that is also clinically meaningful, demonstrated tradition- ally in two independent trials. So a definition of success at the trial level could be statistical sig- nificance plus an estimated treatment effect that exceeds a prespecified threshold. This threshold could be something specified in the minimally acceptable commercial profile for the product.
The probability of a successful trial is called assurance by O'Hagan et al. (4) or average pow- er by Chuang-Stein (5). For example, if the re- quirement for success is two-sided P value < 0.05 and estimated treatment effect T > TV', then this probability could be derived as
JP(P < 0.05,T > TV * I A) P(A I Prior data)dA. (3)
The assurance in Eq. 3 could contribute to the sample size decision in a confirmatory trial, as described in Chuang-Stein and Yang (11). We illustrate this in the next section.
Even though success rate is fundamentally important to a phase 3 trial, it is still relevant to consider P(Correct Decisions) at this stage. This is because there are often plans to conduct additional trials to support product differentia- tion or obtain additional indications for the same product. It is essential that attention be paid to continuously making correct decisions beyond the initial regulatory submission. As a result, a sponsor should always strive to design studies that have a high chance of leading to correct decisions.
Drug Lnformation Journal

194 B I 0 S T A T I S T I C S Chuang-Stein et al.
E X A M P L E S THE CASE OF SC-75416 SC-75416 was a selective COX-2 inhibitor devel- oped for the treatment of acute and chronic pain. Because of the available data on pain management medications, various modeling in- cluding an exposure-response meta-analysis was performed for several marketed NSAIDs (nonsteroidal anti-inflammatory drugs) and COX-2 inhibitors to scale between acute dental pain and chronic osteoarthritis pain doses (8- 10). Specifically, a logistic-normal PWPD model was developed to model pain relief (PR) scores measured on a five-point ordinal scale. A drop- out model was assumed for the time of rescue using a discrete hazard that depended on the most recent observed PR score prior to the res- cue (ie, a missing-at-random dropout mecha- nism). These models facilitated leveraging data from several different NSAIDs and COX-2 in- hibitors assuming that they have the same max- imum drug effect and differ only in their po- tency. This is a reasonable assumption since NSAIDs and COX-2 inhibitors are expected to have the same mechanism of action.
At the time SC-75416 entered clinical devel- opment, it was felt that a three-point advantage over ibuprofen in TOTPAR6 (total pain relief at 6 hours in a dental pain model) would consti- tute a clinically relevant improvement in pain relief relative to ibuprofen. The first POC trial of SC-75416 failed to demonstrate the desirable effect. When analyzing patient blood levels of SC-75416, it was discovered that blood levels of SC-75416 failed to reach the target level. Based on PK-PD modeling using results from first and second generations of COX-2 inhibitors as well as the results from the POC trial, Kowalski et al. (9) postulated that if the blood levels of SC- 75416 could get to the target level, there was a high chance that SC-75416 could have the de- sirable treatment effect. In fact, their modeling led them to use a normal distribution with mean 3.27 and standard deviation 0.60, that is, N(3.27;(0.60)2), to project their belief of the treatment effect A in TOTPAR6 of SC-75416 over ibuprofen.
A new parallel dose-ranging trial with an equal allocation ratio for the high dose of SC- 75416 and ibuprofen was planned and subse- quently conducted using a new formulation (9). In this section, we use the prior distribution concluded by Kowalski et al. to help evaluate different design options. While there are many possible design and decision combinations, we include two for illustration:
Option A. Sample size: 225 patients per group, standard deviation of TOTPAR6 assumed to be Z Decision criteria:
Go: If the lower bound of a 95% confidence inter- val (LCL,,) for A is >O and the point estimate for A is >3.0. No-go: If the lower bound of a 95% confidence in- terval for A is 10 or the point estimate for A is 53.0.
Option B. Sample size: 150 patients per group, standard deviation of TOTPAR6 assumed to be Z Decision criteria:
Go: If the lower bound of a 90% confidence inter-
val (LCL,,) for A is >O and the point estimate for A is >2.5. No-go: If the lower bound of a 90% confidence in- terval for A is 10 or the point estimate for A is S 2 . 5 .
Option A was considered by Kowalski et al. (7.8) and Smith et al. (10). Option B can be viewed as a study design and decision criteria that might be applied in a more resource-constrained set- ting. In Tables 5 and 6, we include the estimat- ed probabilities of the four cells obtained by simulations. In the simulations, a random vari- able representing the treatment effect A was first drawn from N(3.27;(0.60)2). Given the val- ue for A, a pair of independent random vari- ables that represented the observed values for the sufficient statistics for A and the common variance in a trial of a given sample size were generated. These simulated values were as- sessed if they met the go criterion. This process was repeated 10,000 times. The numbers of times the results fell in each of the four combi- nations were recorded and the relative frequen- cies reported in Tables 5 and 6. It should be noted that under both options, the require-

Qwmtitative Approach for Go/No-Go Decisions B I 0 S T A T I S T I C S 195
A 1 3 0.23 0.10 0.33 (0.33)'
0.1 5 0.52 0.67 (0.67)
Total 0.38 (0.38)
0.62 '(0.62)
1 .oo
T A B L E 5
ment on the point estimate (for A) dominates that on the LCL,, and LCL,,. Under option A, P(Correct Decisions) is 0.75 (= 0.23 + 0.52) and P(Go) is 0.62 (= 0.10 + 0.52). The corre- sponding figures under option B are 0.74 and 0.78, respectively. While P(Correct Decisions) is similar under the two options, P(Go) differs by 0.16. This difference comes from option B hav- ing an 8% higher chance for incorrect go while option A has a 7% higher chance for incorrect no-go. The contrast between these options is summarized in Table Z
Because option A enrolls more subjects and has a stricter go decision criterion, one would expect it to have a higher positive predictive value. Under the assumption that A follows an N(3.27;(0.60)2) distribution, the positive and negative predictive values for option A are ap- proximately 84% and 60%. The corresponding figures for option B are 77% and 64%, respec- tively. Both PPV and NPV under either option
are higher than the prior probabilities of 67% and 33%, respectively.
What we offer in Tables 5-7 is a framework to facilitate the choice using information that re- flects the likely performance of the compound under consideration. Since P(A > TV) serves as a reference point for the probability of a go de- cision based on the available data prior to con- ducting the new trial, we would generally expect a decision rule to satisfy P(Go) < P(A > TV). Under option B, we have P(Go) > P(A > TV) in- stead. The latter is the result of an increased in- correct go probability, traded off for a decreased incorrect no-go probability.
An alternative decision rule to option B is to consider the following:
Go: I f the lower limit of a one-sided lOO(1 - a,)% confidence interval for A is >O and the upper limit of a one-sided lOO(1 - a*)% confidence interval for A is >TV.
I T A B L E 6 Tntb
0.14 0.1 8 0.32 (0.33)*
0.08 0.60 0.68 (0.67)
Total 0.22 0.78 1 .oo (0.22) (0.78)
* N u t n l # r r i n ~ ~ I h c t # ~ d O f f t O t o t r r o ~ p l a c e s .
Drug Idormation Journal

196 B I 0 S T A T I S T I C S Chuang-Stein et al.
F I G U R E 1
Plot of assurance against sample size (per group) assuming a normal distri- bu tion N (3.2 7; (0. 6)2) for the treatment effect A and a successful outcome defined by a two-sided P value <0.05 and a point estimate (under thefre- quentist approach) for A >2 points.
1% > 0, obuned Diff. > 3.0 n = 225/grp
1% > 0, Observed Diff. > 2.5 n = 15O/grp
P(c0rrect Decisiom) 0.75 0.74 P(c0rrect Go) 0.52 0.60
0.8 - g 0.6 -
d 0.4 -
0.2 -
1 I I I I I I
0 50 100 150 200 250 300
Sample Size
fllnmect DedsMns) 0.25 0.26 /‘(Incorrect Go) 0.10 0.18 P(lnc0rrect No-Go) 0.1 5 0.08 RGo) 0.62 0.78
No-go: If the lower limit of a one-sided 100 (1 - a,)% confidence interval for A is 10 or the upper limit of a one-sided lOO(1 - aJ% confi- dence interval for A is <W.
Different values of a, and a, can be used as tuning parameters to make trade-offs between incorrect go and incorrect no-go decisions. Note that a, = 0.5 corresponds to the point es- timate that was used in the option A and 0 cri- teria. For the same a,, a smaller oc, corresponds to a less stringent go criterion. This alternative approach has the advantage of offering a uni- fied formulation that relies on the specification of oc, instead of a threshold on the point esti- mate to define the go criterion.
In addition to P(Correct Decision), P(1ncor- rect Go), and P(1ncorrect No-Go), the decision on which decision criterion to choose depends on other factors such as available resources (budget and drug supply) and timeline deci-
sions. Equally important is the need for data on exposure and safety experience. A clinical team needs to consider all these factors in making the best choice.
We next consider the planning of a hypothet- ical confirmatory trial where a successful out- come is defined by a two-sided P value ~0.05 and a point estimate for the treatment effect greater than 2 points. We choose 2 points here purely for illustration purposes. In other words, Tv’ in Eq. 3 is set at 2. Again, we assume that available information suggests that treatment effect could be described by a normal distribu- tion N(3.27;(0.60)2). We would like to point out that this distribution speaks strongly of our confidence in the effect of the new treatment. Under this distribution, two standard devia- tions less than the mean is still greater than 2.0.
Substituting N(3.27;(0.6)2) for P(AIPrior Data) in Eq. 3, we could calculate P(Tria1 Success) for various sample sizes per group. Terming this probability assurance, we plot in Figure 1 assur- ance against the sample size per group. We could find the sample size necessary to obtain a desired level of assurance such as 80%.
In general, we recommend comparing sample size obtained above to that calculated under the traditional sample size approach. If the as- surance approach requires a much higher sam- ple size or, worse still, the assurance fails to reach a target level (eg, 80%) despite a reason- ably large sample size, a trialist should take a serious look and decide if there is enough in-
Quantitative Approach for Go/No-Go Decisions B I 0 S T A T I 5 T I ( S 197
formation to justify progressing the develop- ment to the confirmatory stage.
For additional literature on using assurance in sample size consideration for confirmatory trials, we encourage readers to read Chuang- Stein and Yang (11) and Chuang-Stein. Kirby, Hirsch, and Atkinson (34).
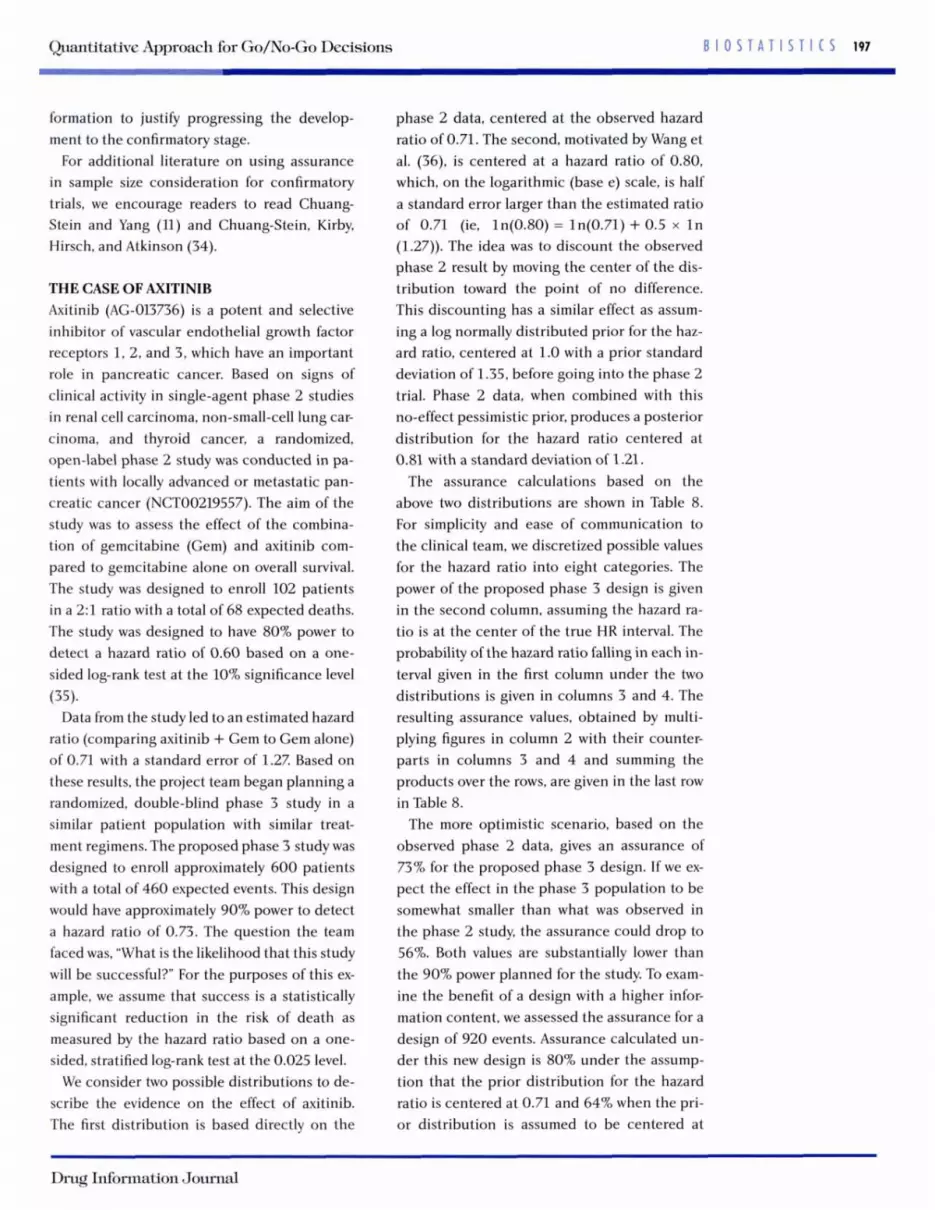
THE CASE OF AXITINIB Axitinib (AG-Ol3736) is a potent and selective inhibitor of vascular endothelial growth factor receptors 1 ,2 , and 3, which have an important role in pancreatic cancer. Based on signs of clinical activity in single-agent phase 2 studies in renal cell carcinoma, non-small-cell lung car- cinoma, and thyroid cancer, a randomized, open-label phase 2 study was conducted in pa- tients with locally advanced or metastatic pan- creatic cancer (NCT00219557). The aim of the study was to assess the effect of the combina- tion of gemcitabine (Gem) and axitinib com- pared to gemcitabine alone on overall survival. The study was designed to enroll 102 patients in a 2:l ratio with a total of 68 expected deaths. The study was designed to have 80% power to detect a hazard ratio of 0.60 based on a one- sided log-rank test at the 10% significance level
Data from the study led to an estimated hazard ratio (comparing axitinib + Gem to Gem alone) of 0.71 with a standard error of 1.27. Based on these results, the project team began planning a randomized, double-blind phase 3 study in a similar patient population with similar treat- ment regimens. The proposed phase 3 study was designed to enroll approximately 600 patients with a total of 460 expected events. This design would have approximately 90% power to detect a hazard ratio of 0.73. The question the team faced was, "What is the likelihood that this study will be successful?" For the purposes of this ex- ample, we assume that success is a statistically significant reduction in the risk of death as measured by the hazard ratio based on a one- sided, stratified log-rank test at the 0.025 level.
We consider two possible distributions to de- scribe the evidence on the effect of axitinib. The first distribution is based directly on the
(35).
phase 2 data, centered at the observed hazard ratio of 0.71. The second, motivated by Wang et al. (36), is centered at a hazard ratio of 0.80, which, on the logarithmic (base e) scale, is half a standard error larger than the estimated ratio of 0.71 (ie, ln(0.80) = ln(O.71) + 0.5 x I n (1.27)). The idea was to discount the observed phase 2 result by moving the center of the dis- tribution toward the point of no difference. This discounting has a similar effect as assum- ing a log normally distributed prior for the haz- ard ratio, centered at 1.0 with a prior standard deviation of 1.35, before going into the phase 2 trial. Phase 2 data, when combined with this no-effect pessimistic prior, produces a posterior distribution for the hazard ratio centered at 0.81 with a standard deviation of 1.21.
The assurance calculations based on the above two distributions are shown in Table 8. For simplicity and ease of communication to the clinical team, we discretized possible values for the hazard ratio into eight categories. The power of the proposed phase 3 design is given in the second column, assuming the hazard ra- tio is at the center of the true HR interval. The probability of the hazard ratio falling in each in- terval given in the first column under the two distributions is given in columns 3 and 4. The resulting assurance values, obtained by multi- plying figures in column 2 with their counter- parts in columns 3 and 4 and summing the products over the rows, are given in the last row in Table 8.
The more optimistic scenario, based on the observed phase 2 data, gives an assurance of 73% for the proposed phase 3 design. If we ex- pect the effect in the phase 3 population to be somewhat smaller than what was observed in the phase 2 study, the assurance could drop to 56%. Both values are substantially lower than the 90% power planned for the study. To exam- ine the benefit of a design with a higher infor- mation content, we assessed the assurance for a design of 920 events. Assurance calculated un- der this new design is 80% under the assump- tion that the prior distribution for the hazard ratio is centered at 0.71 and 64% when the pri- or distribution is assumed to be centered at
Drug Information Journal

198 B I 0 S T A T I S T I ( S Chuang-Stein et al.
T A B L E 8 Probability Thai lma HR Is in tk Ramgo in C h 1 Assrmiag Log
N d Distribrtlon for HR Centered at ha V h Bdow Witb 1.27 SD Mscoumted
Power Witb Observed HR Observed HR True HR 460 Events (0.71) (0.W c0.4* 1 .oo 0.02 0.002 0.4-0.5 1 .oo 0.06 0.02 O.SO.6 1 .oo 0.1 7 0.09 0.M1.7 1 .oo 0.23 0.17
0.7-0.8 0.87 0.21 0.21 0.84.9 0.41 0.1 5 0.19 0.9-1 .O 0.08 0.09 0.14 >1 .o** 0.01 0.08 0.18 Assurance 0.73 0.56
SWial p w assuming h tnn HR isathcmtw of d intend i n k firrf cdumn untbra design of 460 wants odh probabiliilhalhhw HR #Is within h various ranges untbrtwodishibucionrchomctecidng exisling e v i d m obouth hw HR. 'POW# c o l d at HR = 0.35. **POW# ~~kubtd at HR = 1.05.
0.80. When compared to the design with 460 events, the probability of a successful phase 3 study increases only modestly when the num- ber of events doubles. This indicates the assur- ance is sensitive to the information content of the phase 3 design, but it is more sensitive to the assumptions about the distribution of the true treatment effect. This fact is also pointed out in Carroll (37).
One could consider the probability of con- cluding a statistically significant reduction in mortality and observing a hazard ratio below a chosen threshold, for example, 0.80. This addi- tional condition could easily be handled using simulations and is not further discussed here.
C O N C L U S I O N In this article, we discuss a decision paradigm that focuses on the probability of making the correct decisions based on prespecified efficacy criteria and a probability distribution to char- acterize the current evidence about the true treatment effect. Under this paradigm, study design and decision criteria are considered in
tandem. While this approach will require sub- stantial effort up front to design the study prop- erly, we believe the time and effort will be well spent because the study will likely yield deci- sions whose properties are carefully investigat- ed and calibrated in advance.
The decision criteria considered in our pro- posal are based on data that will be collected in the trial under planning. This reflects the fre- quentist practice. The criteria are prespecified and evaluated with the help of available infor- mation about the likely effect of the compound. While unexpected results could always overrule prespecified criteria, we consider criteria estab- lished a priori have built-in safeguards against post hoc decisions that could bias the opinion toward a go decision.
Instead of basing criteria on data from a sin- gle study, a sponsor could use P(A > TV I All existing data) to decide, at the end of phase 2, whether the cumulative data are positive enough to move into phase 3. For example, if this probability is around 80%. a sponsor might deem the chance of reaching the registration
Quantitative Approach for Go/No-Go Decisions B I O S T A T I S T I C S 199
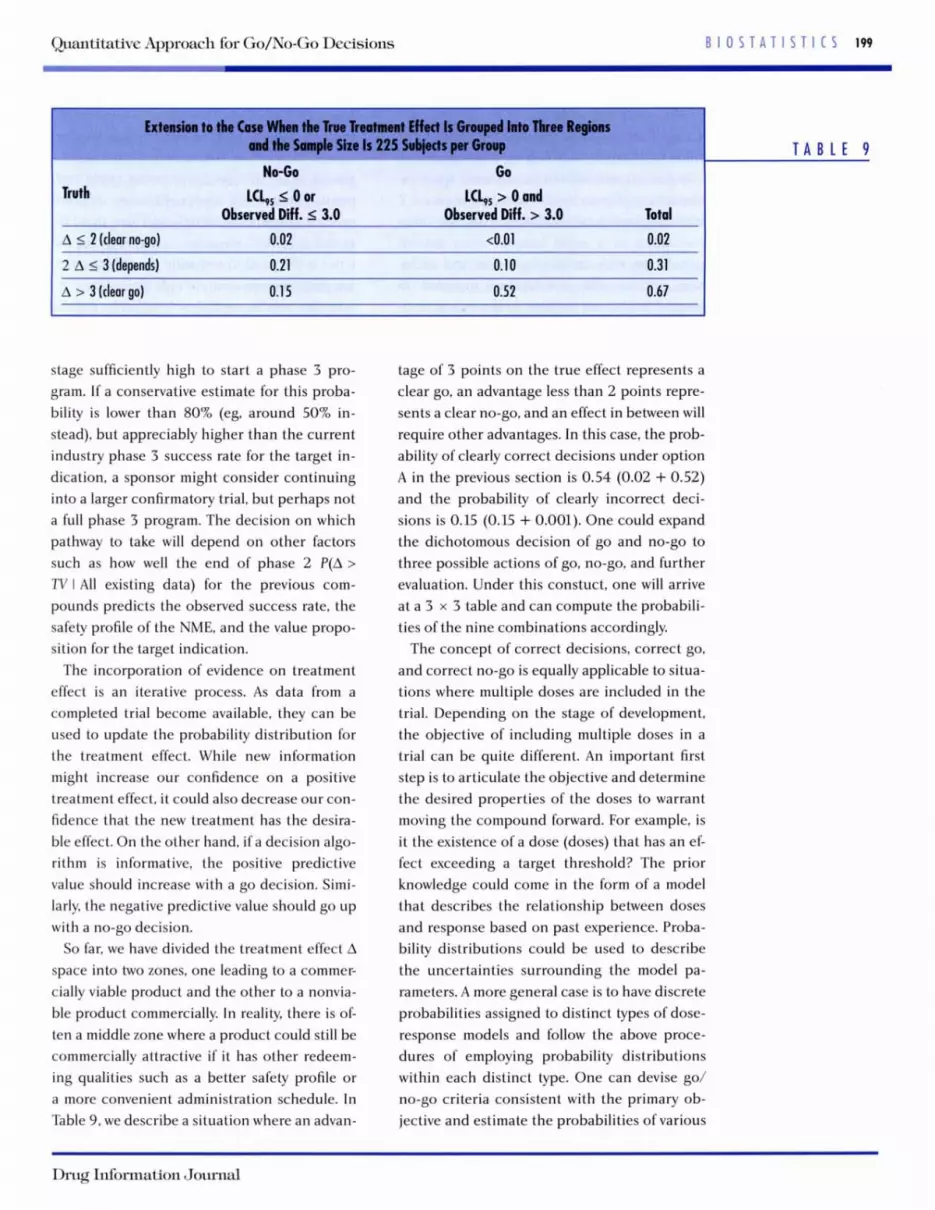
WO-GO Go T d LCL, soor Lclqs>0wd
A I 2 (dear nogo) 0.02 <0.01 0.02 Observed Diff. s 3.0 Observed Diff. > 3.0 Total
2AI3(depends) 0.21 0.10 0.31 A > 3(deargo) 0.1 5 0.52 0.67
stage sufficiently high to start a phase 3 pro- gram. If a conservative estimate for this proba- bility is lower than 80% (eg, around 50% in- stead), but appreciably higher than the current industry phase 3 success rate for the target in- dication, a sponsor might consider continuing into a larger confirmatory trial, but perhaps not a full phase 3 program. The decision on which pathway to take will depend on other factors such as how well the end of phase 2 P(A > 7’V I All existing data) for the previous com- pounds predicts the observed success rate, the safety profile of the NME, and the value propo- sition for the target indication.
The incorporation of evidence on treatment effect is an iterative process. As data from a completed trial become available, they can be used to update the probability distribution for the treatment effect. While new information might increase our confidence on a positive treatment effect, it could also decrease our con- fidence that the new treatment has the desira- ble effect. On the other hand, if a decision algo- rithm is informative, the positive predictive value should increase with a go decision. Simi- larly, the negative predictive value should go up with a no-go decision.
So far, we have divided the treatment effect A space into two zones, one leading to a commer- cially viable product and the other to a nonvia- ble product commercially. In reality, there is of- ten a middle zone where a product could still be commercially attractive if it has other redeem- ing qualities such as a better safety profile or a more convenient administration schedule. In Table 9, we describe a situation where an advan-
tage of 3 points on the true effect represents a clear go, an advantage less than 2 points repre- sents a clear no-go, and an effect in between will require other advantages. In this case, the prob- ability of clearly correct decisions under option A in the previous section is 0.54 (0.02 + 0.52) and the probability of clearly incorrect deci- sions is 0.15 (0.15 + 0.001). One could expand the dichotomous decision of go and no-go to three possible actions of go, no-go, and further evaluation. Under this constuct, one will arrive at a 3 x 3 table and can compute the probabili- ties of the nine combinations accordingly.
The concept of correct decisions, correct go, and correct no-go is equally applicable to situa- tions where multiple doses are included in the trial. Depending on the stage of development, the objective of including multiple doses in a trial can be quite different. An important first step is to articulate the objective and determine the desired properties of the doses to warrant moving the compound forward. For example, is it the existence of a dose (doses) that has an ef- fect exceeding a target threshold? The prior knowledge could come in the form of a model that describes the relationship between doses and response based on past experience. Proba- bility distributions could be used to describe the uncertainties surrounding the model pa- rameters. A more general case is to have discrete probabilities assigned to distinct types of dose- response models and follow the above proce- dures of employing probability distributions within each distinct type. One can devise go/ no-go criteria consistent with the primary ob- jective and estimate the probabilities of various
T A B L E 9
Drug Information Journal

200 B l O S T A T l S T l C S Chuang-Stein et al.
(truth, decision) combinations accordingly. This will be a subject for future research be- cause of its critical role in drug development.
In general, care should be exercised when ex- trapolating efficacy results observed in phase 2 trials to phase 3 trials. Phase 2 trials are often conducted in a more homogeneous patient population with stricter inclusion and exclu- sion criteria. The investigators included in phase 2 trials tend to come from medical cent- ers with substantial research experience. In ad- dition, phase 2 trials tend to be more closely monitored and data tend to be more complete. By comparison, phase 3 trials typically enroll a more heterogeneous population and could in- clude patients from diverse geographic regions with limited information on how differences in ethnic factors, medical practice, and patient compliance might impact treatment effect. Therefore, depending on where phase 2 data came from, it might be prudent to discount the treatment effect observed in phase 2 trials when projecting likely treatment effect in phase 3 trials. The need to look at how translatable phase 2 data are to phase 3 studies and options to account for differences between these two phases has been the subject of much research work (36,38-42). Another option that has gained increasing attention recently is to rely on modeling to help predict treatment effect (along with measure of uncertainty) in a more heterogeneous population (20). To do the lat- ter, a sponsor will need a reasonable amount of data from diverse populations.
Another major source of treatment effect in- flation from phase 2 to phase 3 results from se- lection. Barring safety issues, a sponsor typical- ly selects doses that are associated with the best observed treatment effect in phase 2. I f the se- lected dose is among several doses in a flat re- gion of the dose-response curve, the observed treatment effect, corresponding to the maxi- mum order statistic, will be an overestimate of the treatment effect (43.44). Bias resulting from selection in this case should be appropriately adjusted for in the analysis.
We have focused on efficacy assessment in this article. The principles discussed here could
be applied to efficacy and safety concurrently. Both options A and B contain dual require- ments. One of the requirements could be re- placed by a criterion on a chosen safety end- point. Alternatively, one could assess different product concepts separately and view them to- gether to make a decision. A challenge for the latter is the need to reconcile possibly conflict- ing performances over multiple endpoints.
In this article, we did not explicitly address monetary cost associated with the value of in- formation or the quality of the decisions. Read- ers who are interested in the use of decision- theoretical approach to drug development are encouraged to read Julious and Swank (45) and Burman et al. (46).
Drug development is becoming more com- plex. The pharmaceutical industry is increas- ingly relying on more quantitative approaches to help meet the challenges facing product de- velopment in the 21st century. The value of these quantitative approaches should be judged by the value they can bring to the drug develop- ment process. With increasing availability of so- phisticated tools and proper education, we are confident that the seemingly complicated ap- proach discussed here could become a routine practice in the future.
Acknowledgments-The authors want to thank Wayne Ewy and Matt Hutmacher. who contributed to the de- velopment of the approach discussed here while they were employed at Pfizer.
R E F E R E N C E S Masia N. The cost of developing a new drug. In
Focus on Intellectual Property Rights. US Depart- ment of State; April 23. 2008. http://www .america.gov/st/business-English/2008/Apri1/2 0080429230904myleen0.5233981 .html. Parmar MK, Ungerleider RS, Simon R. Assessing whether to perform a confirmatory randomized clinical trial. I Natl Cancer Inst. 1996;88:1645- 1651. Lee SJ, Zelen M. Clinical trials and sample size considerations: another perspective. Stat Sci. 2000;15(2):95- 110.

Qwntitative Approach for Go/No-Go Decisions B I O S T A T l S T I C S 201
4.
5.
6.
7.
8.
9.
10.
11.
12.
13.
14.
15.
16.
O'Hagan A, Stevens JW, Campbell MJ. Assurance in clinical trial design. Pharm Stat. 2005;4:187- 201. Chuang-Stein C. Sample size and the probability of a successful trial. Pharm Stat. 2006;5:305-309. Hobbs BP, Carlin BP. Practical Bayesian design and analysis for drug and device clinical trials.
Kowalski KG. Ewy W, Hutmacher MM. Miller R. Krishnaswami S. Model-based drug develop- ment-a new paradigm for efficient drug devel- opment. Biopharm Rep. 2007;15(2):2-22. Kowalski KG, French JL, Smith MK, Hutmacher MM. A model-based framework for quantitative decision-making in drug development. Present- ed at the American Conference on Pharmaco- metrics, Tucson AZ, March 12, 2008. http:// t u c so n 20 08 .go-a cop.0 rg/pd fs/ 8 - Kowa 1 ski -FINAL.pdf Kowalski KG, Olson S, Remmers AE, Hutmacher MM. Modeling and simulation to support dose selection and clinical development of SC-75416. a selective COX-2 inhibitor for the treatment of acute and chronic pain. Clin Pharm Ther. 2008;
Smith MK. French J , Kowalski K, Ewy W. En- hanced quantitative decision making-reducing the likelihood of incorrect decisions. Presented at the PAGE (Population Approach Group in Eu- rope) Predictive Modeling in Drug Development Satellite Meeting, St. Petersburg. Russia, June 23. 2009. Chuang-Stein C. Yang R. A revisit of sample size decision in confirmatory trials. Stat Biopharm Res.
Fleiss JL. Design and Analysis of Clinical Experi- ments. New York Wiley; 1999. Browner WS, Newman TB. Are all significant p-values created equal? ]AM. 1987;257:2459- 2463. Pater JL. Willan AR. Clinical trials as diagnostic tests. Control Clin Trials. 1984;5:107-113. Wacholder S. Chanock S. Garcia-Closas M, El Ghormli L, Rothman N. Assessing the probability that a positive report is false: an approach for molecular epidemiology studies. ] Natl Cancer lnst. 2004:96:434-442. US Department of Health and Human Services,
Biopharm Stat. 2008;18:54-80.
83 :857-866.
2010;2:239-248.
17.
18.
19.
20.
21.
22.
23.
24.
25.
26.
27.
Food and Drug Administration. lnnovation or stagnation? Challenge and opportunity on the critical path to new medical products. 2004. http://www.fda.gov/downloads/Science Research/SpecialTopics/CriticalPathInitiative/ CriticalPathOpportunitiesReports/ucm 113411 .pdf. Peck CC, Barr WH, Benet LZ, et al. Opportunities for integration of pharmacokinetics, pharmaco- dynamics and toxicokinetics in rational drug de- velopment. Clin Pharmacol fier. 1992;51:465- 473. Sheiner LB. Learning versus confirming in clini- cal drug development. Clin Pharmacol Ther.
Grasela TH, Dement CW. Kolerman OG, et al. Pharmacometrics and the transition to model- based development. Clin Pharm Ther. 2007;82:
Lalonde RL. Kowalski KG, Hutmacher MM. et al. Model-based drug development. Clin Pharm Ther.
Zhang L, Sinha V, Forgue T, et al. Model-based drug development: the road to quantitative phar- macology. ] Pharmacokinet Pharmacodyn. 2006;33:
1997;61:275-291.
U7-142.
2007;82:21-32.
369-393. Zhang L, Pfister M. Meibohm B. Concepts and challenges in quantitative pharmacology and model-based drug development. AAPS ]. 2008; 1 0 552 - 559. Ades A, Sutton AJ. Multiple parameter evidence synthesis in epidemiology and medical decision- making: current approaches. ] R Stat Soc. A. 2006; 169:5-35. Mandema JW, Hermann D. Wang W, et al. Model- based development of gemcabene. a new lipid- altering agent. AAPS]. 2005;7:ESU-E522. Ahn JE, French JL. Longitudinal aggregate data model-based meta-analysis with NONMEM: ap- proaches to handling within treatment arm cor- relation. ] Pharmacokinet Pharmacodyn. 2010;37:
Ito K. Ahadieh S, Corrigan B, French J , Fullerton T, Tensfeldt T, Alzheimer's Disease Working Group. A disease progression meta-analysis model in Alzheimer's disease. Alzheimers Dement.
179-201.
2010;6:39-53. Smith MK, Marshall S. A Bayesian design and
Drug Information Journal

202 B I0 S T A T I S T I I S Chuang-Stein et al.
28.
29.
30.
31.
32.
33.
34.
analysis for dose-response using informative pri- or information. 1 Biopharm Stat. 2006;16:695- 709. Santen G, van Zwet E, Danhof M, Della Pasqual 0. From trial and error to trial simulation. Part 1: the importance of model-based drug develop- ment for antidepressant drugs. Clin Pharmacol Ther. 2009;86:248-254. Santen G, Horrigan J. Danhof M. Della Pasqual 0. From trial and error to trial simulation. Part 2: an appraisal of current beliefs in the design and analysis of clinical trials for antidepres- sant drugs. Clin Pharmacol Ther. 2009;86:255- 261. Sultana SR, Marshall S. Davis J , Littman BH. Ex- periences with dose finding in patients in early drug development: the use of biomarkers in ear- ly decision making in appropriate dose selec- tion-how to optimize clinical drug develop- ment. Ernst Schering Foundation Symp Proc. 2007;
de Greef R. Target occupancy biomarkers: schiz- ophrenia. In: Danhof M, Van der Graaf PH, Hol- ford NHG, eds. Measurement and Kinetics ofin Vivo Drug Effects: Advances in Simultaneous Pharmacoki- netic/Pharmacodynamic Modelling. 6th Interna- tional Symposium. Leiden/Amsterdam Center for Drug Research: 2010:67-70. Danhof M. Della Pasqua 0, Knibbe CAI, de Lange ECM, Voskuyl RA, Ploeger BA. Quantitative sys- tems pharmacology: what are the targets? In: Danhof M, Van der Graaf PH. Holford NHG, eds. Measurement and Kinetics of in Vivo Drug Effects: Advances in Simultaneous Pharmacokinetic/Pharma- codynamic Modelling. 6th International Symposium. Leiden/Amsterdam Center for Drug Research:
Van der Graaf PH. Benson N. Bridging systems biology and PKPD: towards novel drugs. In: Dan- hof M, Van der Graaf PH, Holford NHG, eds. Measurement and Kinetics of in Vivo Drug Effects: Advances in Simultaneous Pharmacokinetic/Phara- codynamic Modelling. 6th International Symposium. LeidedAmsterdarn Center for Drug Research; 2010:17-22. Chuang-Stein C, Kirby S, Hirsch I . Atkinson G.
59~65- 79.
2010: 5 - 12.
35.
36.
3%
38.
39.
40.
41.
42.
43.
44.
45.
46.
The role of the minimum clinically important difference and its impact on designing a trial. Pharm Stat. 2010. Published online. DO1
Spano JP, Chodkiewicz C, Maurel J. et al. Efficacy of gemcitabine plus axitinib compared with gem- citabine alone in patients with advanced pancre- atic cancer: an open-label randomized phase I I study. Lancet. 2008:371:2101-2108. Wang SJ, Hung HMJ. O’Neill RT. Adapting the sample size planning of a phase 111 trial based on phase I1 data. Pharm Stat. 2006;5:85-9% Carroll KJ. Back to basics: explaining sample size in outcome trials, are statisticians doing a thor- ough job? Pharm Stat. 2009;8:333-345. Staquet MJ, Rozencweig M. Von Hoff DD, Mugia FM. The delta and epsilon errors in the assess- ment of clinical trials. Cancer Treat Rep. 1979;63: 1917-1921. Simon R. Randomized clinical trials and research strategy. Cancer Treat Rep. 1982;66:1083-108% Simon R. Some practical aspects of the interim monitoring of clinical trials. Stat Med. 1994:U:
Berger J, Sellke T. Testing of a point null hypoth- esis: the irreconcilability of significance levels and evidence. ]Am Stat Assoc. 1987;82:112-122. Liu PY, LeBlanc M, Desai M. False positive rates of randomized phase I1 designs. Control Clin Trials.
Stallard N, Todd S. Whitehead J. Estimation fol- lowing selection of the largest of two normal means. 1 Stat Plan Infer. 2008:l38:1629- 1638. Bauer P, Koenig F, Brannath W, Posch M. Selec- tion and bias-two hostile brothers. Stat Med.
10.1002/pst459.
1401 - 1409.
1999;20:343-352.
2010;29( 1):l- 13. Julious SA. Swank DJ. Moving statistics beyond the individual clinical trial: applying decision science to optimize a clinical development plan. Pharm Stat. 2005;4( 1):37-46. Burman CF, Grieve AP, Senn S. Decision analysis in drug development. In: Dmitrienko A, Chuang- Stein C, Agostino R. ed. Pharmaceutical Statistics Using SAS: A Practical Guide. Cary, NC: SAS Insti- tute; 2007385 -428.
Mike K. Smith has disclosed that he has received grantdresearch support and that he is a stock shareholder of Pfizer. Ken Kowalski has disclosed that he is a paid consultant to Pfizer Inc. Jonathan French has disclosed that he is a stock shareholder of Pfizer Inc. Mohan Beltangady, Paul Bycott, Christy Chuang-Stein. Simon Kirby, and Scott Marshall report no relevant relationships to disclose.