Embed Size (px)
Citation preview
Atmos. Chem. Phys., 17, 9485–9518, 2017https://doi.org/10.5194/acp-17-9485-2017© Author(s) 2017. This work is distributed underthe Creative Commons Attribution 3.0 License.
A review of current knowledge concerning PM2.5 chemicalcomposition, aerosol optical properties and theirrelationships across ChinaJun Tao1, Leiming Zhang2, Junji Cao3, and Renjian Zhang4
1South China Institute of Environmental Sciences, Ministry of Environmental Protection, Guangzhou, China2Air Quality Research Division, Science and Technology Branch, Environment and Climate Change Canada, Toronto, Canada3Key Laboratory of Aerosol Chemistry and Physics, Institute of Earth Environment, Chinese Academy of Sciences,Xi’an, China4Key Laboratory of Regional Climate-Environment for Temperate East Asia, Institute of Atmospheric Physics,Chinese Academy of Sciences, Beijing, China
Correspondence to: Leiming Zhang ([email protected])
Received: 23 March 2017 – Discussion started: 18 April 2017Revised: 30 June 2017 – Accepted: 3 July 2017 – Published: 8 August 2017
Abstract. To obtain a thorough knowledge of PM2.5 chemi-cal composition and its impact on aerosol optical propertiesacross China, existing field studies conducted after the year2000 are reviewed and summarized in terms of geographical,interannual and seasonal distributions. Annual PM2.5 wasup to 6 times the National Ambient Air Quality Standards(NAAQS) in some megacities in northern China. AnnualPM2.5 was higher in northern than southern cities, and higherin inland than coastal cities. In a few cities with data longerthan a decade, PM2.5 showed a slight decrease only in thesecond half of the past decade, while carbonaceous aerosolsdecreased, sulfate (SO2−
4 ) and ammonium (NH+4 ) remainedat high levels, and nitrate (NO−3 ) increased. The highest sea-sonal averages of PM2.5 and its major chemical componentswere typically observed in the cold seasons. Annual aver-age contributions of secondary inorganic aerosols to PM2.5ranged from 25 to 48 %, and those of carbonaceous aerosolsranged from 23 to 47 %, both with higher contributions insouthern regions due to the frequent dust events in northernChina. Source apportionment analysis identified secondaryinorganic aerosols, coal combustion and traffic emission asthe top three source factors contributing to PM2.5 mass inmost Chinese cities, and the sum of these three source factorsexplained 44 to 82 % of PM2.5 mass on annual average acrossChina. Biomass emission in most cities, industrial emissionin industrial cities, dust emission in northern cities and ship
emission in coastal cities are other major source factors, eachof which contributed 7–27 % to PM2.5 mass in applicablecities.
The geographical pattern of scattering coefficient (bsp)
was similar to that of PM2.5, and that of aerosol absorptioncoefficient (bap) was determined by elemental carbon (EC)mass concentration and its coating. bsp in ambient conditionof relative humidity (RH)= 80 % can be amplified by about1.8 times that under dry conditions. Secondary inorganicaerosols accounted for about 60 % of aerosol extinction co-efficient (bext) at RH greater than 70 %. The mass scatteringefficiency (MSE) of PM2.5 ranged from 3.0 to 5.0 m2 g−1 foraerosols produced from anthropogenic emissions and from0.7 to 1.0 m2 g−1 for natural dust aerosols. The mass absorp-tion efficiency (MAE) of EC ranged from 6.5 to 12.4 m2 g−1
in urban environments, but the MAE of water-soluble organiccarbon was only 0.05 to 0.11 m2 g−1. Historical emissioncontrol policies in China and their effectiveness were dis-cussed based on available chemically resolved PM2.5 data,which provides the much needed knowledge for guiding fu-ture studies and emissions policies.
Published by Copernicus Publications on behalf of the European Geosciences Union.
9486 J. Tao et al.: A review of current knowledge concerning PM2.5 chemical composition
1 Introduction
Knowledge of spatiotemporal variations in chemical and op-tical properties of atmospheric aerosols is needed in address-ing regional and global air quality and climate issues (Fuzziet al., 2015; Ginoux et al., 2012; Li et al., 2016c; Liao et al.,2015; Monks et al., 2009; Qian et al., 2015). Aerosol con-centrations across China have been at extremely high levelsin the recent two decades, largely caused by rapidly increasedenergy consumption (Chan and Yao, 2008; Fang et al., 2009;Guan et al., 2014; Wang and Hao, 2012; Zhang et al., 2013b).The frequency of haze has also been increased significantlydue to light extinction of atmospheric aerosols, especiallyPM2.5 (Li and Zhang, 2014; Pui et al., 2014; Watson, 2002).The Ministry of Environmental Protection of China thus pro-mulgated NAAQS to include daily and annual PM2.5 stan-dards starting in early 2012. As a result, real-time PM2.5 datain 74 Chinese cities have been recorded since 2013.
Light extinction, the sum of light scattering and absorp-tion, is controlled by not only PM2.5 levels, but also its chem-ical composition, size distribution and hygroscopic poten-tial of its major components, and meteorological conditions(Hand and Malm, 2007a; Malm et al., 2003; Pitchford et al.,2007; Zhang et al., 2014a). High humidity combined withlarge fractions of hygroscopic chemical components (e.g.,sulfate, nitrate, ammonium and some organic matter) can en-hance light extinction and haze intensity (Liu et al., 2011,2013b; Zhang et al., 2015b; Zieger et al., 2013). A large num-ber of studies has been conducted in China in recent yearsinvestigating PM2.5 composition, aerosol optical properties,aerosol hygroscopic properties and haze formation mecha-nisms (Guo et al., 2014; Jing et al., 2015; Liang et al., 2016;Liu et al., 2011, 2012; Pan et al., 2009; Tao et al., 2014b;Wang et al., 2015b; Yan et al., 2008, 2009; Yang et al., 2011b;Zheng et al., 2016). However, knowledge of long-term trendsof PM2.5 concentration, especially its major chemical com-ponents, is still limited (Fontes et al., 2017), and few studieshave focused on the geographical pattern of PM2.5 composi-tion across China and its impact on aerosol optical properties(Li et al., 2017b). The present study aims to gain such knowl-edge through a thorough review of available studies.
Considering the large number of publications, only groundmeasurement data of chemical composition of PM2.5, aerosolscattering and absorption coefficients, and aerosol hygro-scopic properties published after the year 2000 in scientificpapers of Science Citation Index (SCI) journals are reviewedand summarized in this study. A total of about 150 articlesmet the above criteria including 100 articles on PM2.5 chem-ical composition and source apportionment, 40 articles onaerosol optical properties and 10 articles on aerosol hygro-scopic properties. Many of these articles focused on severalof the biggest cities, such as Beijing, Shanghai, Guangzhouand Hong Kong, while other studies focused on cities suchas Tianjin, Shijiazhuang, Jinan, Nanjing, Hangzhou, Fuzhou,Xiamen, Shenzhen, Chengdu, Chongqing, Xi’an, Lanzhou,
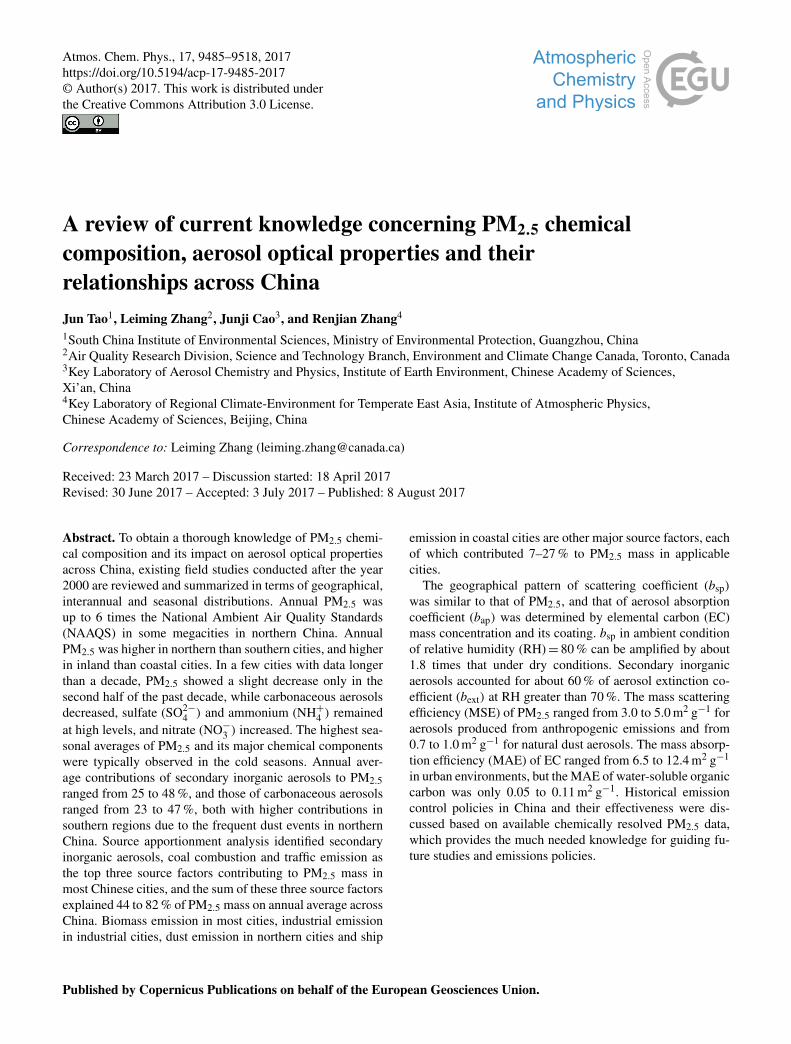
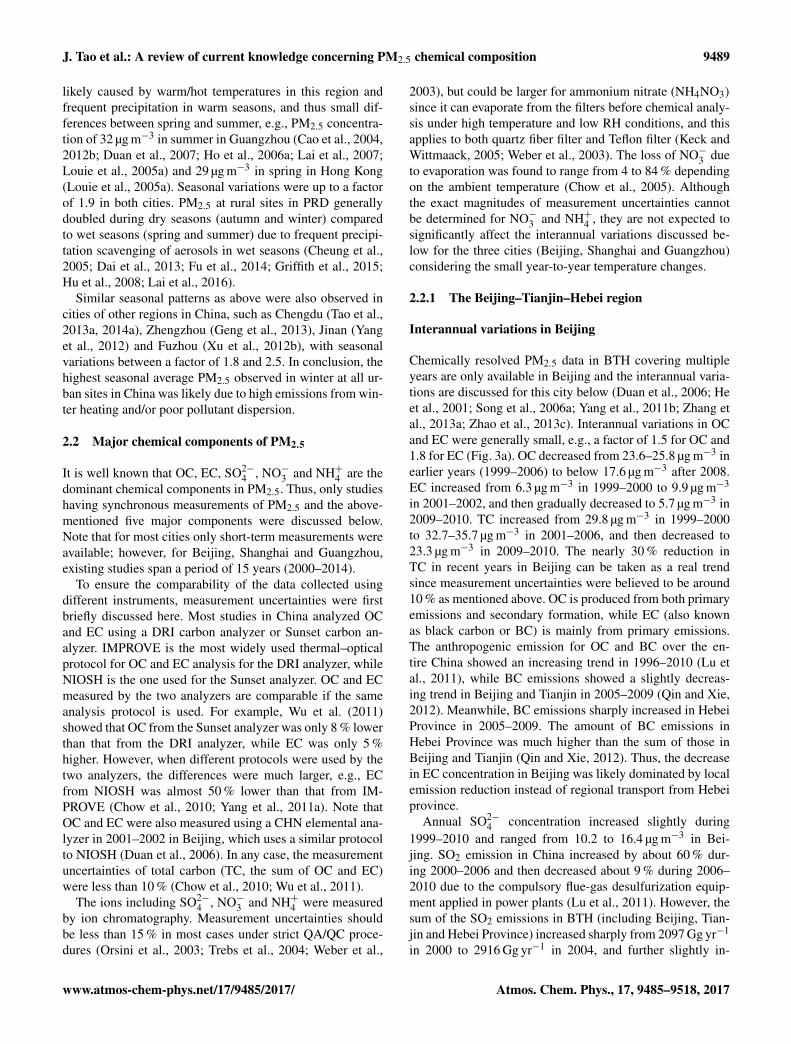
Figure 1. Geographical regions and location of cities with measure-ments.
Zhengzhou, Wuhan, Changsha, Haikou and several back-ground sites (Fig. 2). Geographical and temporal patterns ofPM2.5 and its major chemical components including SO2−
4 ,NO−3 , NH+4 , organic carbon (OC) and EC, and aerosol op-tical properties are generated, source-apportionment analy-sis results are summarized and relationships between aerosoloptical properties and PM2.5 chemical composition are ex-plored. Recommendations are also provided for alleviatingPM2.5 levels and reducing haze occurrence.
2 Spatiotemporal patterns of PM2.5 and its majorchemical components
In this section, available measurements of chemically re-solved PM2.5 are reviewed and summarized in terms of ge-ographical distributions, interannual variations and seasonalpatterns. Measurements are grouped based on geographi-cal regions, such as the Beijing–Tianjin–Hebei (BTH) inthe North China Plain, the Yangtze River Delta (YRD), thePearl River Delta (PRD), the Sichuan Basin and other re-gions (Fig. 1). Five dominant chemical components of PM2.5(SO2−
4 , NO−3 , NH+4 , OC and EC) are discussed in detail. Datareviewed in this section are all listed in Table S1 in the Sup-plement.
2.1 PM2.5 mass
Filter-based measurements of PM2.5 were mainly carriedout in urban cities of BTH (Beijing, Tianjin, Shijiazhuangand Chengde), YRD (Shanghai, Nanjing and Hangzhou),PRD (Guangzhou, Hong Kong, Zhongshan and Shenzhen),Sichuan Basin (Chongqing, Chengdu and Neijiang), andother cities (e.g., Jinan, Xi’an, Lanzhou, Zhengzhou, Wuhan,Changsha, Fuzhou, Xiamen and Haikou). Geographical char-acteristics of annual PM2.5 are first discussed followed byinterannual variations and seasonal patterns.
Atmos. Chem. Phys., 17, 9485–9518, 2017 www.atmos-chem-phys.net/17/9485/2017/
J. Tao et al.: A review of current knowledge concerning PM2.5 chemical composition 9487
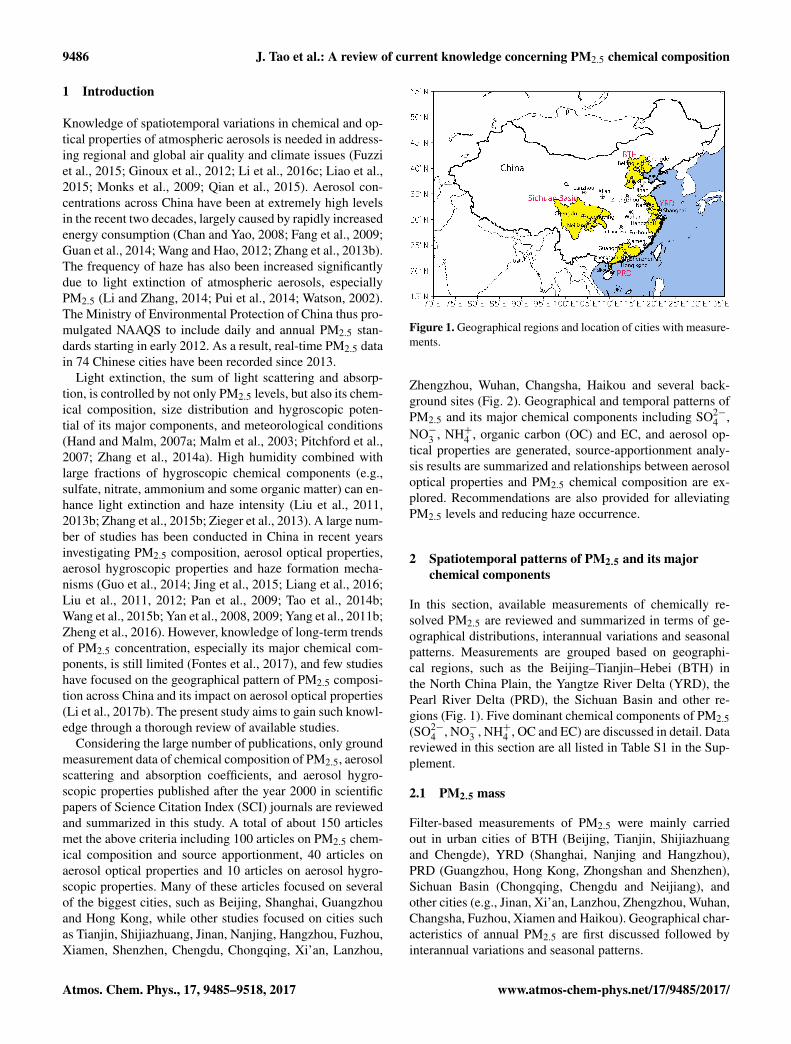
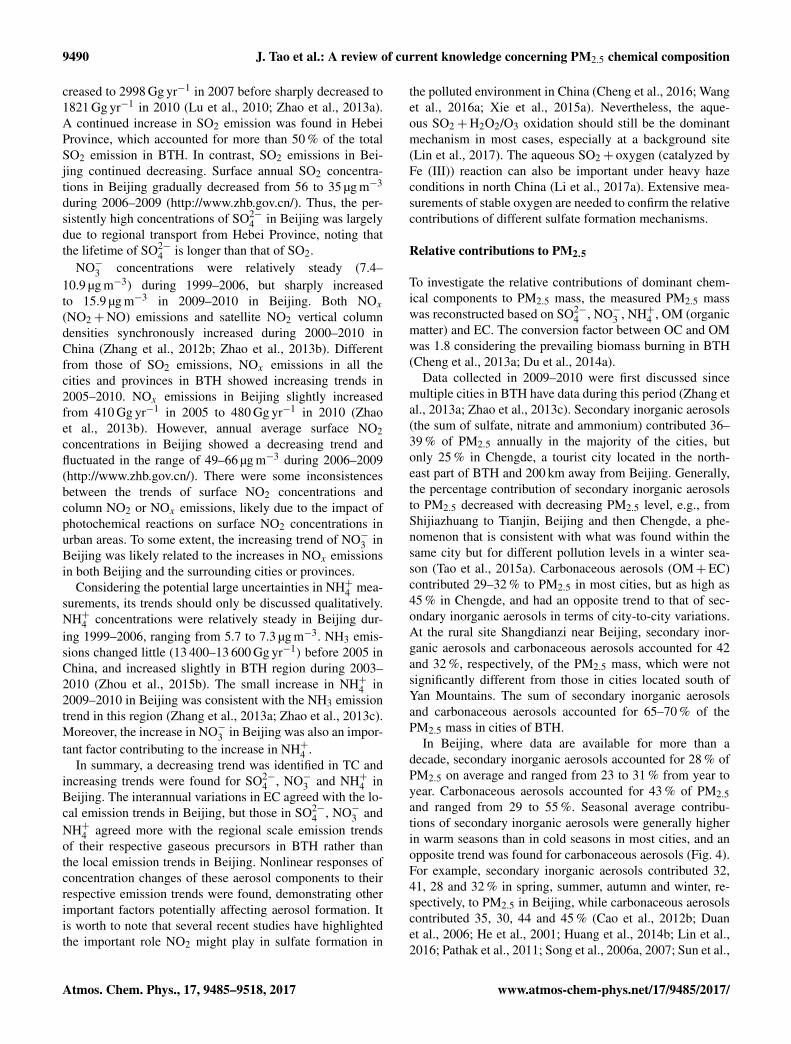
Figure 2. Annual PM2.5 mass concentration in various Chinesecities with filter-based measurements: (a) categorized into regionsand (b) lined with latitude.
2.1.1 Geographical distributions
Annual mean PM2.5 mass concentrations in major cities indifferent regions are plotted in Fig. 2a. Regional annual meanand standard deviation (SD) values were calculated using an-nual mean data of all the cities where data are available. Re-gional annual mean PM2.5 was 115± 29, 96± 28, 50± 16and 100± 35 µg m−3 in BTH (Y. Chen et al., 2014a; Duan etal., 2006; He et al., 2001, 2012; Song et al., 2006a; Tian et al.,2016; Wang et al., 2005; Yang et al., 2011a, b; Zhang et al.,2013a; Zhao et al., 2013c; Zhou et al., 2015a; Zíková et al.,2016), YRD (Feng et al., 2009; Li et al., 2015a, 2016a; Liuet al., 2015; Ming et al., 2017; Wang et al., 2006, 2016b; Yeet al., 2003; Zhao et al., 2015b), PRD (Hagler et al., 2006;Huang et al., 2013; Louie et al., 2005a; Tao et al., 2014c,2017) and Sichuan Basin (Y. Chen et al., 2014b; Tao et al.,2013a, 2014a; Wang et al., 2017a; Yang et al., 2011b), re-spectively, which was 3 to 6 times, 2 to 3 times, 1 to 2 timesand 3 to 6 times NAAQS, respectively.
Within each region, the highest annual averagePM2.5 concentration was observed in Shijiazhuang(191 µg m−3), Hangzhou (121 µg m−3), Guangzhou(65 µg m−3) and Chengdu (111 µg m−3) in BTH, YRD,PRD and Sichuan Basin, respectively. Outside the above-mentioned four regions, annual PM2.5 at individual citieswas 183± 25 µg m−3 (Geng et al., 2013; Wang et al., 2015a,2017b), 177± 15 µg m−3 (Shen et al., 2009; Wang et al.,
2015c; Zhang et al., 2011b), 89 µg m−3 (Wang et al., 2016c),149 µg m−3 (Yang et al., 2012), 110± 4 µg m−3 (Xionget al., 2017; Zhang et al., 2015a), 106 µg m−3 (Tang etal., 2017), 66± 22 µg m−3 (Zhang et al., 2011a, 2012a,2016), 44 µg m−3 (Xu et al., 2012c) and 21 µg m−3 (Liu etal., 2017a) in Zhengzhou, Xi’an, Lanzhou, Jinan, Wuhan,Changsha, Xiamen, Fuzhou and Haikou, respectively. ThesePM2.5 levels were comparable to some of the cities withinthe four regions, e.g., Zhengzhou, Xi’an and Jinan toShijiazhuang, Wuhan to Nanjing and Chengdu, and Fuzhouand Xiamen of Fujian Province to Guangzhou. Cities inFig. 2a are rearranged in Fig. 2b from northern to southernlatitudes. Except for a few cities, such as Chengde andBeijing, there was a decreasing trend in annual PM2.5 massconcentration with decreasing latitude. Moreover, annualPM2.5 mass concentrations in western or inland cities werehigher than those in eastern or coastal cities along the samelatitudes. The geographical patterns of the filter-based PM2.5measurements agreed well with the online monitoring ofPM2.5 in 31 provincial capital cities in China (Wang et al.,2014c).
Filter-based measurements of PM2.5 at rural sites in Chinawere limited and mainly conducted at Shangdianzi of Bei-jing, Conghua and Tianhu of Guangzhou, and Hok Tsui ofHong Kong (Hagler et al., 2006; Lai et al., 2016; Louie et al.,2005a; Zhao et al., 2013c). Rural PM2.5 was around half ofthat in the cities of the same region. A similar geographicalpattern was seen in rural PM2.5 as in the urban, e.g., annualPM2.5 at the rural site of BTH (Shangdianzi) was 72 µg m−3,which was 2 times that (35 µg m−3) at the rural sites of PRD.
2.1.2 Interannual variations
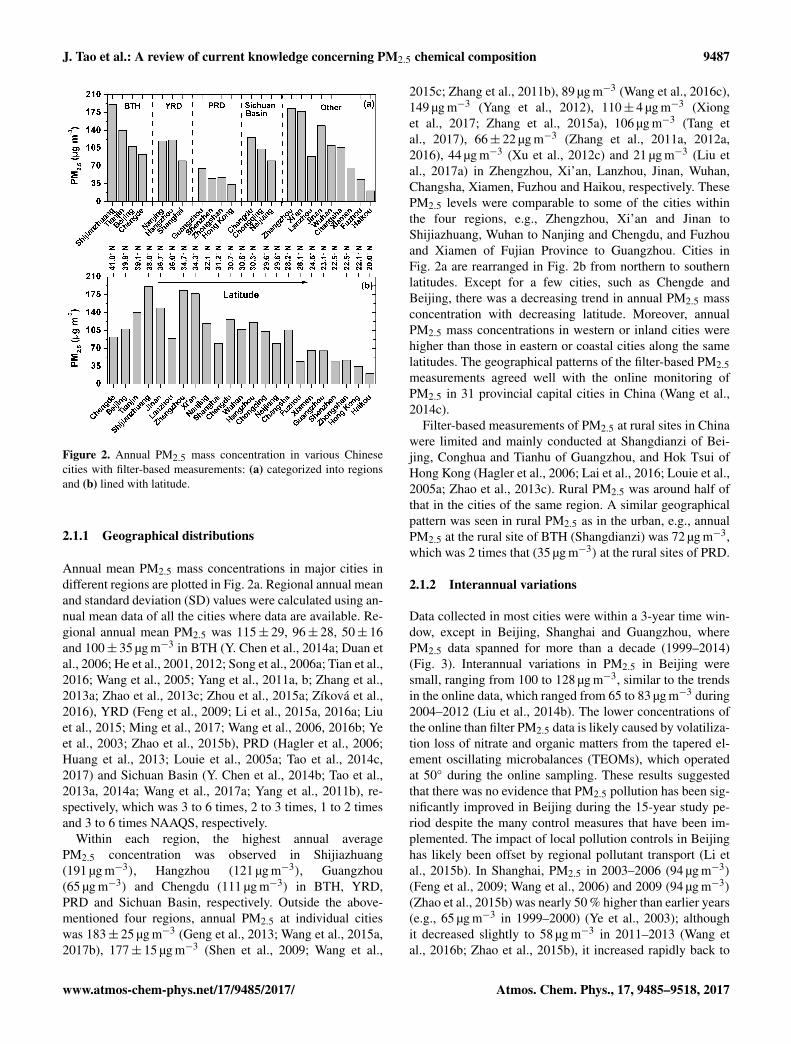
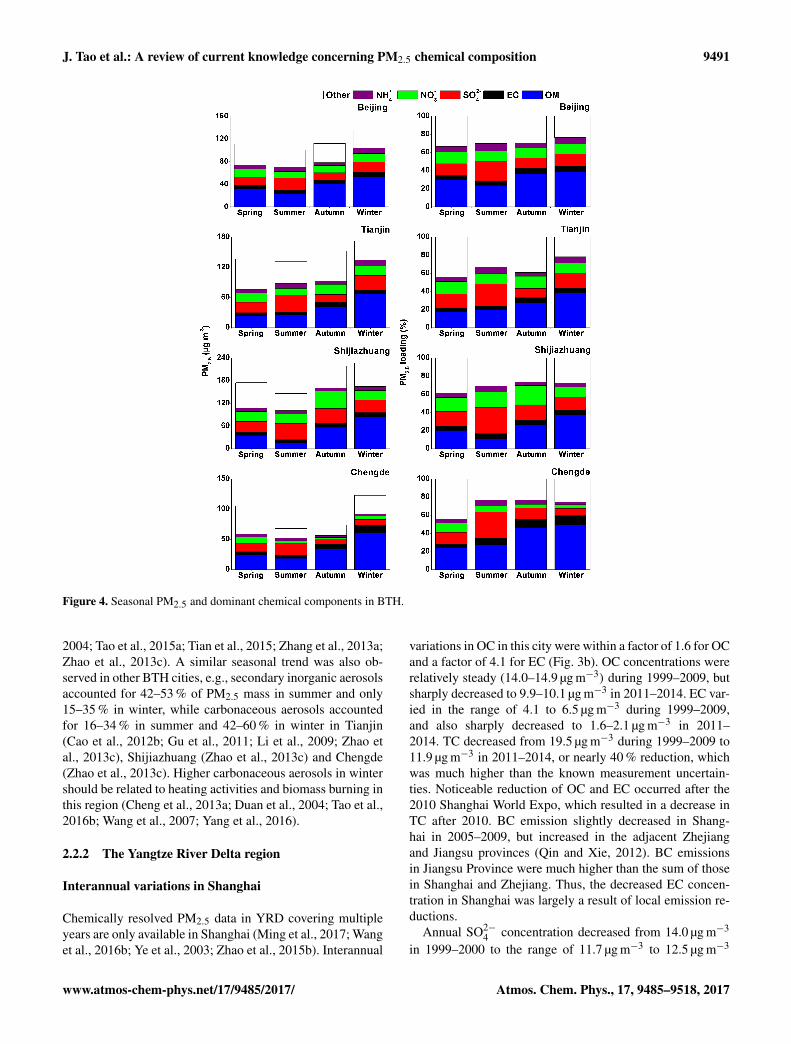
Data collected in most cities were within a 3-year time win-dow, except in Beijing, Shanghai and Guangzhou, wherePM2.5 data spanned for more than a decade (1999–2014)(Fig. 3). Interannual variations in PM2.5 in Beijing weresmall, ranging from 100 to 128 µg m−3, similar to the trendsin the online data, which ranged from 65 to 83 µg m−3 during2004–2012 (Liu et al., 2014b). The lower concentrations ofthe online than filter PM2.5 data is likely caused by volatiliza-tion loss of nitrate and organic matters from the tapered el-ement oscillating microbalances (TEOMs), which operatedat 50◦ during the online sampling. These results suggestedthat there was no evidence that PM2.5 pollution has been sig-nificantly improved in Beijing during the 15-year study pe-riod despite the many control measures that have been im-plemented. The impact of local pollution controls in Beijinghas likely been offset by regional pollutant transport (Li etal., 2015b). In Shanghai, PM2.5 in 2003–2006 (94 µg m−3)
(Feng et al., 2009; Wang et al., 2006) and 2009 (94 µg m−3)
(Zhao et al., 2015b) was nearly 50 % higher than earlier years(e.g., 65 µg m−3 in 1999–2000) (Ye et al., 2003); althoughit decreased slightly to 58 µg m−3 in 2011–2013 (Wang etal., 2016b; Zhao et al., 2015b), it increased rapidly back to
www.atmos-chem-phys.net/17/9485/2017/ Atmos. Chem. Phys., 17, 9485–9518, 2017
9488 J. Tao et al.: A review of current knowledge concerning PM2.5 chemical composition
Figure 3. Interannual variations in PM2.5 and dominant chemical components in Beijing (a), Shanghai (b) and Guangzhou (c).
95 µg m−3 in 2013–2014 (Ming et al., 2017). In Guangzhou,PM2.5 in 2002–2003 (71 µg m−3) (Hagler et al., 2006) and in2009–2010 (77 µg m−3) (Tao et al., 2014c) were kept at sta-ble levels and then decreased to 48 µg m−3 in 2014 (Tao etal., 2017).
2.1.3 Seasonal patterns
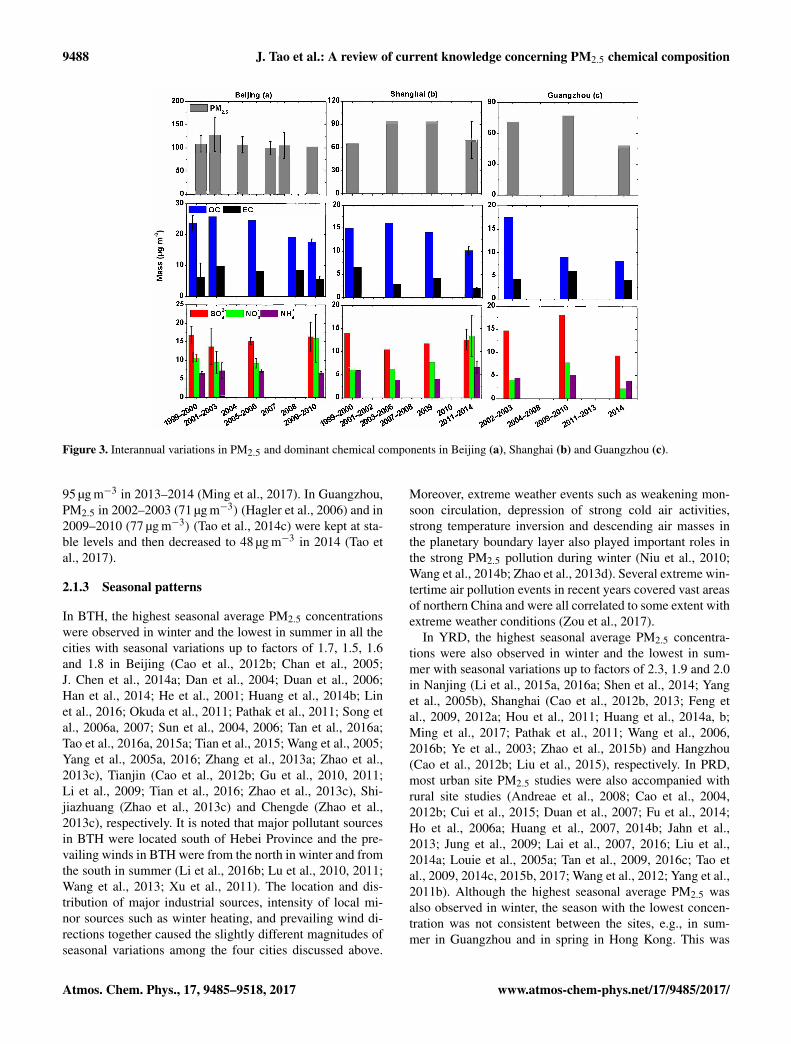
In BTH, the highest seasonal average PM2.5 concentrationswere observed in winter and the lowest in summer in all thecities with seasonal variations up to factors of 1.7, 1.5, 1.6and 1.8 in Beijing (Cao et al., 2012b; Chan et al., 2005;J. Chen et al., 2014a; Dan et al., 2004; Duan et al., 2006;Han et al., 2014; He et al., 2001; Huang et al., 2014b; Linet al., 2016; Okuda et al., 2011; Pathak et al., 2011; Song etal., 2006a, 2007; Sun et al., 2004, 2006; Tan et al., 2016a;Tao et al., 2016a, 2015a; Tian et al., 2015; Wang et al., 2005;Yang et al., 2005a, 2016; Zhang et al., 2013a; Zhao et al.,2013c), Tianjin (Cao et al., 2012b; Gu et al., 2010, 2011;Li et al., 2009; Tian et al., 2016; Zhao et al., 2013c), Shi-jiazhuang (Zhao et al., 2013c) and Chengde (Zhao et al.,2013c), respectively. It is noted that major pollutant sourcesin BTH were located south of Hebei Province and the pre-vailing winds in BTH were from the north in winter and fromthe south in summer (Li et al., 2016b; Lu et al., 2010, 2011;Wang et al., 2013; Xu et al., 2011). The location and dis-tribution of major industrial sources, intensity of local mi-nor sources such as winter heating, and prevailing wind di-rections together caused the slightly different magnitudes ofseasonal variations among the four cities discussed above.
Moreover, extreme weather events such as weakening mon-soon circulation, depression of strong cold air activities,strong temperature inversion and descending air masses inthe planetary boundary layer also played important roles inthe strong PM2.5 pollution during winter (Niu et al., 2010;Wang et al., 2014b; Zhao et al., 2013d). Several extreme win-tertime air pollution events in recent years covered vast areasof northern China and were all correlated to some extent withextreme weather conditions (Zou et al., 2017).
In YRD, the highest seasonal average PM2.5 concentra-tions were also observed in winter and the lowest in sum-mer with seasonal variations up to factors of 2.3, 1.9 and 2.0in Nanjing (Li et al., 2015a, 2016a; Shen et al., 2014; Yanget al., 2005b), Shanghai (Cao et al., 2012b, 2013; Feng etal., 2009, 2012a; Hou et al., 2011; Huang et al., 2014a, b;Ming et al., 2017; Pathak et al., 2011; Wang et al., 2006,2016b; Ye et al., 2003; Zhao et al., 2015b) and Hangzhou(Cao et al., 2012b; Liu et al., 2015), respectively. In PRD,most urban site PM2.5 studies were also accompanied withrural site studies (Andreae et al., 2008; Cao et al., 2004,2012b; Cui et al., 2015; Duan et al., 2007; Fu et al., 2014;Ho et al., 2006a; Huang et al., 2007, 2014b; Jahn et al.,2013; Jung et al., 2009; Lai et al., 2007, 2016; Liu et al.,2014a; Louie et al., 2005a; Tan et al., 2009, 2016c; Tao etal., 2009, 2014c, 2015b, 2017; Wang et al., 2012; Yang et al.,2011b). Although the highest seasonal average PM2.5 wasalso observed in winter, the season with the lowest concen-tration was not consistent between the sites, e.g., in sum-mer in Guangzhou and in spring in Hong Kong. This was
Atmos. Chem. Phys., 17, 9485–9518, 2017 www.atmos-chem-phys.net/17/9485/2017/
J. Tao et al.: A review of current knowledge concerning PM2.5 chemical composition 9489
likely caused by warm/hot temperatures in this region andfrequent precipitation in warm seasons, and thus small dif-ferences between spring and summer, e.g., PM2.5 concentra-tion of 32 µg m−3 in summer in Guangzhou (Cao et al., 2004,2012b; Duan et al., 2007; Ho et al., 2006a; Lai et al., 2007;Louie et al., 2005a) and 29 µg m−3 in spring in Hong Kong(Louie et al., 2005a). Seasonal variations were up to a factorof 1.9 in both cities. PM2.5 at rural sites in PRD generallydoubled during dry seasons (autumn and winter) comparedto wet seasons (spring and summer) due to frequent precipi-tation scavenging of aerosols in wet seasons (Cheung et al.,2005; Dai et al., 2013; Fu et al., 2014; Griffith et al., 2015;Hu et al., 2008; Lai et al., 2016).
Similar seasonal patterns as above were also observed incities of other regions in China, such as Chengdu (Tao et al.,2013a, 2014a), Zhengzhou (Geng et al., 2013), Jinan (Yanget al., 2012) and Fuzhou (Xu et al., 2012b), with seasonalvariations between a factor of 1.8 and 2.5. In conclusion, thehighest seasonal average PM2.5 observed in winter at all ur-ban sites in China was likely due to high emissions from win-ter heating and/or poor pollutant dispersion.
2.2 Major chemical components of PM2.5
It is well known that OC, EC, SO2−4 , NO−3 and NH+4 are the
dominant chemical components in PM2.5. Thus, only studieshaving synchronous measurements of PM2.5 and the above-mentioned five major components were discussed below.Note that for most cities only short-term measurements wereavailable; however, for Beijing, Shanghai and Guangzhou,existing studies span a period of 15 years (2000–2014).
To ensure the comparability of the data collected usingdifferent instruments, measurement uncertainties were firstbriefly discussed here. Most studies in China analyzed OCand EC using a DRI carbon analyzer or Sunset carbon an-alyzer. IMPROVE is the most widely used thermal–opticalprotocol for OC and EC analysis for the DRI analyzer, whileNIOSH is the one used for the Sunset analyzer. OC and ECmeasured by the two analyzers are comparable if the sameanalysis protocol is used. For example, Wu et al. (2011)showed that OC from the Sunset analyzer was only 8 % lowerthan that from the DRI analyzer, while EC was only 5 %higher. However, when different protocols were used by thetwo analyzers, the differences were much larger, e.g., ECfrom NIOSH was almost 50 % lower than that from IM-PROVE (Chow et al., 2010; Yang et al., 2011a). Note thatOC and EC were also measured using a CHN elemental ana-lyzer in 2001–2002 in Beijing, which uses a similar protocolto NIOSH (Duan et al., 2006). In any case, the measurementuncertainties of total carbon (TC, the sum of OC and EC)were less than 10 % (Chow et al., 2010; Wu et al., 2011).
The ions including SO2−4 , NO−3 and NH+4 were measured
by ion chromatography. Measurement uncertainties shouldbe less than 15 % in most cases under strict QA/QC proce-dures (Orsini et al., 2003; Trebs et al., 2004; Weber et al.,
2003), but could be larger for ammonium nitrate (NH4NO3)
since it can evaporate from the filters before chemical analy-sis under high temperature and low RH conditions, and thisapplies to both quartz fiber filter and Teflon filter (Keck andWittmaack, 2005; Weber et al., 2003). The loss of NO−3 dueto evaporation was found to range from 4 to 84 % dependingon the ambient temperature (Chow et al., 2005). Althoughthe exact magnitudes of measurement uncertainties cannotbe determined for NO−3 and NH+4 , they are not expected tosignificantly affect the interannual variations discussed be-low for the three cities (Beijing, Shanghai and Guangzhou)considering the small year-to-year temperature changes.
2.2.1 The Beijing–Tianjin–Hebei region
Interannual variations in Beijing
Chemically resolved PM2.5 data in BTH covering multipleyears are only available in Beijing and the interannual varia-tions are discussed for this city below (Duan et al., 2006; Heet al., 2001; Song et al., 2006a; Yang et al., 2011b; Zhang etal., 2013a; Zhao et al., 2013c). Interannual variations in OCand EC were generally small, e.g., a factor of 1.5 for OC and1.8 for EC (Fig. 3a). OC decreased from 23.6–25.8 µg m−3 inearlier years (1999–2006) to below 17.6 µg m−3 after 2008.EC increased from 6.3 µg m−3 in 1999–2000 to 9.9 µg m−3
in 2001–2002, and then gradually decreased to 5.7 µg m−3 in2009–2010. TC increased from 29.8 µg m−3 in 1999–2000to 32.7–35.7 µg m−3 in 2001–2006, and then decreased to23.3 µg m−3 in 2009–2010. The nearly 30 % reduction inTC in recent years in Beijing can be taken as a real trendsince measurement uncertainties were believed to be around10 % as mentioned above. OC is produced from both primaryemissions and secondary formation, while EC (also knownas black carbon or BC) is mainly from primary emissions.The anthropogenic emission for OC and BC over the en-tire China showed an increasing trend in 1996–2010 (Lu etal., 2011), while BC emissions showed a slightly decreas-ing trend in Beijing and Tianjin in 2005–2009 (Qin and Xie,2012). Meanwhile, BC emissions sharply increased in HebeiProvince in 2005–2009. The amount of BC emissions inHebei Province was much higher than the sum of those inBeijing and Tianjin (Qin and Xie, 2012). Thus, the decreasein EC concentration in Beijing was likely dominated by localemission reduction instead of regional transport from Hebeiprovince.
Annual SO2−4 concentration increased slightly during
1999–2010 and ranged from 10.2 to 16.4 µg m−3 in Bei-jing. SO2 emission in China increased by about 60 % dur-ing 2000–2006 and then decreased about 9 % during 2006–2010 due to the compulsory flue-gas desulfurization equip-ment applied in power plants (Lu et al., 2011). However, thesum of the SO2 emissions in BTH (including Beijing, Tian-jin and Hebei Province) increased sharply from 2097 Gg yr−1
in 2000 to 2916 Gg yr−1 in 2004, and further slightly in-
www.atmos-chem-phys.net/17/9485/2017/ Atmos. Chem. Phys., 17, 9485–9518, 2017
9490 J. Tao et al.: A review of current knowledge concerning PM2.5 chemical composition
creased to 2998 Gg yr−1 in 2007 before sharply decreased to1821 Gg yr−1 in 2010 (Lu et al., 2010; Zhao et al., 2013a).A continued increase in SO2 emission was found in HebeiProvince, which accounted for more than 50 % of the totalSO2 emission in BTH. In contrast, SO2 emissions in Bei-jing continued decreasing. Surface annual SO2 concentra-tions in Beijing gradually decreased from 56 to 35 µg m−3
during 2006–2009 (http://www.zhb.gov.cn/). Thus, the per-sistently high concentrations of SO2−
4 in Beijing was largelydue to regional transport from Hebei Province, noting thatthe lifetime of SO2−
4 is longer than that of SO2.NO−3 concentrations were relatively steady (7.4–
10.9 µg m−3) during 1999–2006, but sharply increasedto 15.9 µg m−3 in 2009–2010 in Beijing. Both NOx
(NO2+NO) emissions and satellite NO2 vertical columndensities synchronously increased during 2000–2010 inChina (Zhang et al., 2012b; Zhao et al., 2013b). Differentfrom those of SO2 emissions, NOx emissions in all thecities and provinces in BTH showed increasing trends in2005–2010. NOx emissions in Beijing slightly increasedfrom 410 Gg yr−1 in 2005 to 480 Gg yr−1 in 2010 (Zhaoet al., 2013b). However, annual average surface NO2concentrations in Beijing showed a decreasing trend andfluctuated in the range of 49–66 µg m−3 during 2006–2009(http://www.zhb.gov.cn/). There were some inconsistencesbetween the trends of surface NO2 concentrations andcolumn NO2 or NOx emissions, likely due to the impact ofphotochemical reactions on surface NO2 concentrations inurban areas. To some extent, the increasing trend of NO−3 inBeijing was likely related to the increases in NOx emissionsin both Beijing and the surrounding cities or provinces.
Considering the potential large uncertainties in NH+4 mea-surements, its trends should only be discussed qualitatively.NH+4 concentrations were relatively steady in Beijing dur-ing 1999–2006, ranging from 5.7 to 7.3 µg m−3. NH3 emis-sions changed little (13 400–13 600 Gg yr−1) before 2005 inChina, and increased slightly in BTH region during 2003–2010 (Zhou et al., 2015b). The small increase in NH+4 in2009–2010 in Beijing was consistent with the NH3 emissiontrend in this region (Zhang et al., 2013a; Zhao et al., 2013c).Moreover, the increase in NO−3 in Beijing was also an impor-tant factor contributing to the increase in NH+4 .
In summary, a decreasing trend was identified in TC andincreasing trends were found for SO2−
4 , NO−3 and NH+4 inBeijing. The interannual variations in EC agreed with the lo-cal emission trends in Beijing, but those in SO2−
4 , NO−3 andNH+4 agreed more with the regional scale emission trendsof their respective gaseous precursors in BTH rather thanthe local emission trends in Beijing. Nonlinear responses ofconcentration changes of these aerosol components to theirrespective emission trends were found, demonstrating otherimportant factors potentially affecting aerosol formation. Itis worth to note that several recent studies have highlightedthe important role NO2 might play in sulfate formation in
the polluted environment in China (Cheng et al., 2016; Wanget al., 2016a; Xie et al., 2015a). Nevertheless, the aque-ous SO2+H2O2/O3 oxidation should still be the dominantmechanism in most cases, especially at a background site(Lin et al., 2017). The aqueous SO2+ oxygen (catalyzed byFe (III)) reaction can also be important under heavy hazeconditions in north China (Li et al., 2017a). Extensive mea-surements of stable oxygen are needed to confirm the relativecontributions of different sulfate formation mechanisms.
Relative contributions to PM2.5
To investigate the relative contributions of dominant chem-ical components to PM2.5 mass, the measured PM2.5 masswas reconstructed based on SO2−
4 , NO−3 , NH+4 , OM (organicmatter) and EC. The conversion factor between OC and OMwas 1.8 considering the prevailing biomass burning in BTH(Cheng et al., 2013a; Du et al., 2014a).
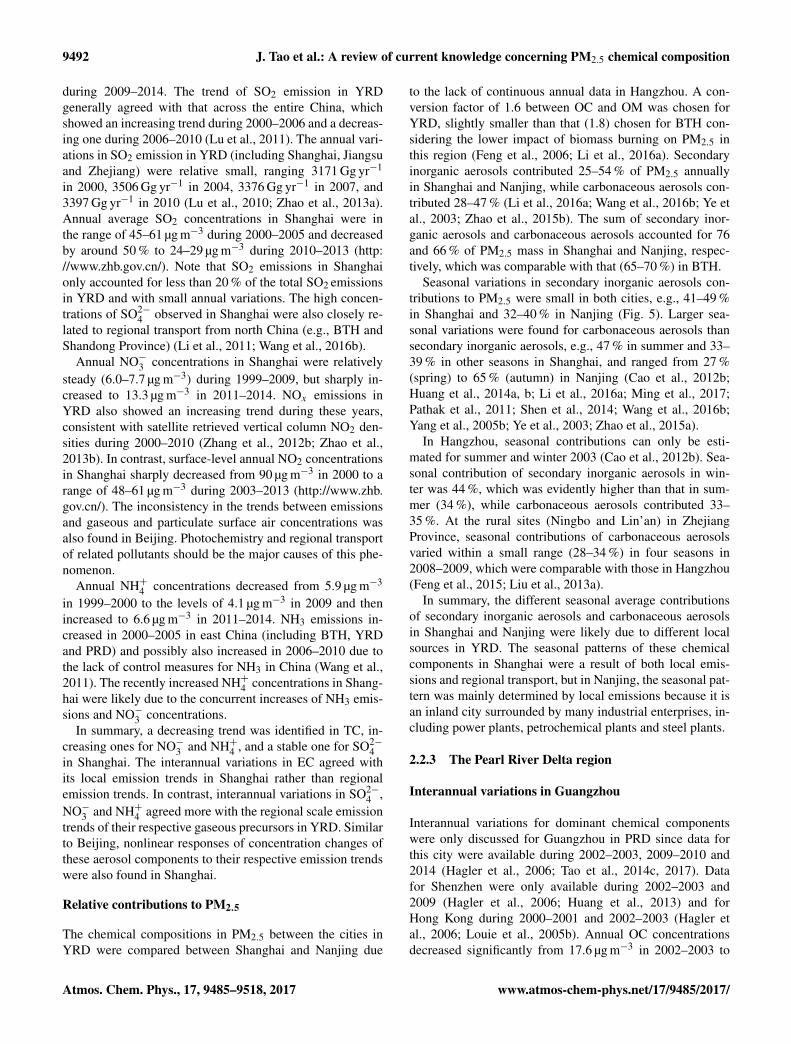
Data collected in 2009–2010 were first discussed sincemultiple cities in BTH have data during this period (Zhang etal., 2013a; Zhao et al., 2013c). Secondary inorganic aerosols(the sum of sulfate, nitrate and ammonium) contributed 36–39 % of PM2.5 annually in the majority of the cities, butonly 25 % in Chengde, a tourist city located in the north-east part of BTH and 200 km away from Beijing. Generally,the percentage contribution of secondary inorganic aerosolsto PM2.5 decreased with decreasing PM2.5 level, e.g., fromShijiazhuang to Tianjin, Beijing and then Chengde, a phe-nomenon that is consistent with what was found within thesame city but for different pollution levels in a winter sea-son (Tao et al., 2015a). Carbonaceous aerosols (OM+EC)contributed 29–32 % to PM2.5 in most cities, but as high as45 % in Chengde, and had an opposite trend to that of sec-ondary inorganic aerosols in terms of city-to-city variations.At the rural site Shangdianzi near Beijing, secondary inor-ganic aerosols and carbonaceous aerosols accounted for 42and 32 %, respectively, of the PM2.5 mass, which were notsignificantly different from those in cities located south ofYan Mountains. The sum of secondary inorganic aerosolsand carbonaceous aerosols accounted for 65–70 % of thePM2.5 mass in cities of BTH.
In Beijing, where data are available for more than adecade, secondary inorganic aerosols accounted for 28 % ofPM2.5 on average and ranged from 23 to 31 % from year toyear. Carbonaceous aerosols accounted for 43 % of PM2.5and ranged from 29 to 55 %. Seasonal average contribu-tions of secondary inorganic aerosols were generally higherin warm seasons than in cold seasons in most cities, and anopposite trend was found for carbonaceous aerosols (Fig. 4).For example, secondary inorganic aerosols contributed 32,41, 28 and 32 % in spring, summer, autumn and winter, re-spectively, to PM2.5 in Beijing, while carbonaceous aerosolscontributed 35, 30, 44 and 45 % (Cao et al., 2012b; Duanet al., 2006; He et al., 2001; Huang et al., 2014b; Lin et al.,2016; Pathak et al., 2011; Song et al., 2006a, 2007; Sun et al.,
Atmos. Chem. Phys., 17, 9485–9518, 2017 www.atmos-chem-phys.net/17/9485/2017/
J. Tao et al.: A review of current knowledge concerning PM2.5 chemical composition 9491
Figure 4. Seasonal PM2.5 and dominant chemical components in BTH.
2004; Tao et al., 2015a; Tian et al., 2015; Zhang et al., 2013a;Zhao et al., 2013c). A similar seasonal trend was also ob-served in other BTH cities, e.g., secondary inorganic aerosolsaccounted for 42–53 % of PM2.5 mass in summer and only15–35 % in winter, while carbonaceous aerosols accountedfor 16–34 % in summer and 42–60 % in winter in Tianjin(Cao et al., 2012b; Gu et al., 2011; Li et al., 2009; Zhao etal., 2013c), Shijiazhuang (Zhao et al., 2013c) and Chengde(Zhao et al., 2013c). Higher carbonaceous aerosols in wintershould be related to heating activities and biomass burning inthis region (Cheng et al., 2013a; Duan et al., 2004; Tao et al.,2016b; Wang et al., 2007; Yang et al., 2016).
2.2.2 The Yangtze River Delta region
Interannual variations in Shanghai
Chemically resolved PM2.5 data in YRD covering multipleyears are only available in Shanghai (Ming et al., 2017; Wanget al., 2016b; Ye et al., 2003; Zhao et al., 2015b). Interannual
variations in OC in this city were within a factor of 1.6 for OCand a factor of 4.1 for EC (Fig. 3b). OC concentrations wererelatively steady (14.0–14.9 µg m−3) during 1999–2009, butsharply decreased to 9.9–10.1 µg m−3 in 2011–2014. EC var-ied in the range of 4.1 to 6.5 µg m−3 during 1999–2009,and also sharply decreased to 1.6–2.1 µg m−3 in 2011–2014. TC decreased from 19.5 µg m−3 during 1999–2009 to11.9 µg m−3 in 2011–2014, or nearly 40 % reduction, whichwas much higher than the known measurement uncertain-ties. Noticeable reduction of OC and EC occurred after the2010 Shanghai World Expo, which resulted in a decrease inTC after 2010. BC emission slightly decreased in Shang-hai in 2005–2009, but increased in the adjacent Zhejiangand Jiangsu provinces (Qin and Xie, 2012). BC emissionsin Jiangsu Province were much higher than the sum of thosein Shanghai and Zhejiang. Thus, the decreased EC concen-tration in Shanghai was largely a result of local emission re-ductions.
Annual SO2−4 concentration decreased from 14.0 µg m−3
in 1999–2000 to the range of 11.7 µg m−3 to 12.5 µg m−3
www.atmos-chem-phys.net/17/9485/2017/ Atmos. Chem. Phys., 17, 9485–9518, 2017
9492 J. Tao et al.: A review of current knowledge concerning PM2.5 chemical composition
during 2009–2014. The trend of SO2 emission in YRDgenerally agreed with that across the entire China, whichshowed an increasing trend during 2000–2006 and a decreas-ing one during 2006–2010 (Lu et al., 2011). The annual vari-ations in SO2 emission in YRD (including Shanghai, Jiangsuand Zhejiang) were relative small, ranging 3171 Gg yr−1
in 2000, 3506 Gg yr−1 in 2004, 3376 Gg yr−1 in 2007, and3397 Gg yr−1 in 2010 (Lu et al., 2010; Zhao et al., 2013a).Annual average SO2 concentrations in Shanghai were inthe range of 45–61 µg m−3 during 2000–2005 and decreasedby around 50 % to 24–29 µg m−3 during 2010–2013 (http://www.zhb.gov.cn/). Note that SO2 emissions in Shanghaionly accounted for less than 20 % of the total SO2 emissionsin YRD and with small annual variations. The high concen-trations of SO2−
4 observed in Shanghai were also closely re-lated to regional transport from north China (e.g., BTH andShandong Province) (Li et al., 2011; Wang et al., 2016b).
Annual NO−3 concentrations in Shanghai were relativelysteady (6.0–7.7 µg m−3) during 1999–2009, but sharply in-creased to 13.3 µg m−3 in 2011–2014. NOx emissions inYRD also showed an increasing trend during these years,consistent with satellite retrieved vertical column NO2 den-sities during 2000–2010 (Zhang et al., 2012b; Zhao et al.,2013b). In contrast, surface-level annual NO2 concentrationsin Shanghai sharply decreased from 90 µg m−3 in 2000 to arange of 48–61 µg m−3 during 2003–2013 (http://www.zhb.gov.cn/). The inconsistency in the trends between emissionsand gaseous and particulate surface air concentrations wasalso found in Beijing. Photochemistry and regional transportof related pollutants should be the major causes of this phe-nomenon.
Annual NH+4 concentrations decreased from 5.9 µg m−3
in 1999–2000 to the levels of 4.1 µg m−3 in 2009 and thenincreased to 6.6 µg m−3 in 2011–2014. NH3 emissions in-creased in 2000–2005 in east China (including BTH, YRDand PRD) and possibly also increased in 2006–2010 due tothe lack of control measures for NH3 in China (Wang et al.,2011). The recently increased NH+4 concentrations in Shang-hai were likely due to the concurrent increases of NH3 emis-sions and NO−3 concentrations.
In summary, a decreasing trend was identified in TC, in-creasing ones for NO−3 and NH+4 , and a stable one for SO2−
4in Shanghai. The interannual variations in EC agreed withits local emission trends in Shanghai rather than regionalemission trends. In contrast, interannual variations in SO2−
4 ,NO−3 and NH+4 agreed more with the regional scale emissiontrends of their respective gaseous precursors in YRD. Similarto Beijing, nonlinear responses of concentration changes ofthese aerosol components to their respective emission trendswere also found in Shanghai.
Relative contributions to PM2.5
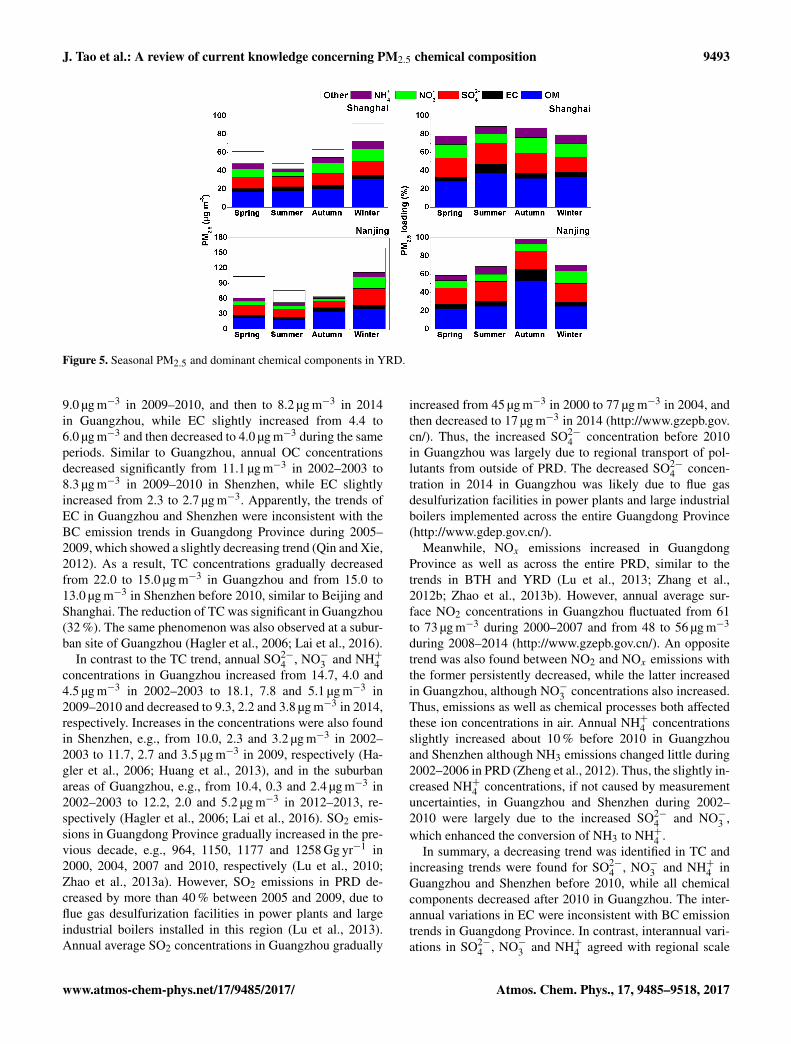
The chemical compositions in PM2.5 between the cities inYRD were compared between Shanghai and Nanjing due
to the lack of continuous annual data in Hangzhou. A con-version factor of 1.6 between OC and OM was chosen forYRD, slightly smaller than that (1.8) chosen for BTH con-sidering the lower impact of biomass burning on PM2.5 inthis region (Feng et al., 2006; Li et al., 2016a). Secondaryinorganic aerosols contributed 25–54 % of PM2.5 annuallyin Shanghai and Nanjing, while carbonaceous aerosols con-tributed 28–47 % (Li et al., 2016a; Wang et al., 2016b; Ye etal., 2003; Zhao et al., 2015b). The sum of secondary inor-ganic aerosols and carbonaceous aerosols accounted for 76and 66 % of PM2.5 mass in Shanghai and Nanjing, respec-tively, which was comparable with that (65–70 %) in BTH.
Seasonal variations in secondary inorganic aerosols con-tributions to PM2.5 were small in both cities, e.g., 41–49 %in Shanghai and 32–40 % in Nanjing (Fig. 5). Larger sea-sonal variations were found for carbonaceous aerosols thansecondary inorganic aerosols, e.g., 47 % in summer and 33–39 % in other seasons in Shanghai, and ranged from 27 %(spring) to 65 % (autumn) in Nanjing (Cao et al., 2012b;Huang et al., 2014a, b; Li et al., 2016a; Ming et al., 2017;Pathak et al., 2011; Shen et al., 2014; Wang et al., 2016b;Yang et al., 2005b; Ye et al., 2003; Zhao et al., 2015a).
In Hangzhou, seasonal contributions can only be esti-mated for summer and winter 2003 (Cao et al., 2012b). Sea-sonal contribution of secondary inorganic aerosols in win-ter was 44 %, which was evidently higher than that in sum-mer (34 %), while carbonaceous aerosols contributed 33–35 %. At the rural sites (Ningbo and Lin’an) in ZhejiangProvince, seasonal contributions of carbonaceous aerosolsvaried within a small range (28–34 %) in four seasons in2008–2009, which were comparable with those in Hangzhou(Feng et al., 2015; Liu et al., 2013a).
In summary, the different seasonal average contributionsof secondary inorganic aerosols and carbonaceous aerosolsin Shanghai and Nanjing were likely due to different localsources in YRD. The seasonal patterns of these chemicalcomponents in Shanghai were a result of both local emis-sions and regional transport, but in Nanjing, the seasonal pat-tern was mainly determined by local emissions because it isan inland city surrounded by many industrial enterprises, in-cluding power plants, petrochemical plants and steel plants.
2.2.3 The Pearl River Delta region
Interannual variations in Guangzhou
Interannual variations for dominant chemical componentswere only discussed for Guangzhou in PRD since data forthis city were available during 2002–2003, 2009–2010 and2014 (Hagler et al., 2006; Tao et al., 2014c, 2017). Datafor Shenzhen were only available during 2002–2003 and2009 (Hagler et al., 2006; Huang et al., 2013) and forHong Kong during 2000–2001 and 2002–2003 (Hagler etal., 2006; Louie et al., 2005b). Annual OC concentrationsdecreased significantly from 17.6 µg m−3 in 2002–2003 to
Atmos. Chem. Phys., 17, 9485–9518, 2017 www.atmos-chem-phys.net/17/9485/2017/
J. Tao et al.: A review of current knowledge concerning PM2.5 chemical composition 9493
Figure 5. Seasonal PM2.5 and dominant chemical components in YRD.
9.0 µg m−3 in 2009–2010, and then to 8.2 µg m−3 in 2014in Guangzhou, while EC slightly increased from 4.4 to6.0 µg m−3 and then decreased to 4.0 µg m−3 during the sameperiods. Similar to Guangzhou, annual OC concentrationsdecreased significantly from 11.1 µg m−3 in 2002–2003 to8.3 µg m−3 in 2009–2010 in Shenzhen, while EC slightlyincreased from 2.3 to 2.7 µg m−3. Apparently, the trends ofEC in Guangzhou and Shenzhen were inconsistent with theBC emission trends in Guangdong Province during 2005–2009, which showed a slightly decreasing trend (Qin and Xie,2012). As a result, TC concentrations gradually decreasedfrom 22.0 to 15.0 µg m−3 in Guangzhou and from 15.0 to13.0 µg m−3 in Shenzhen before 2010, similar to Beijing andShanghai. The reduction of TC was significant in Guangzhou(32 %). The same phenomenon was also observed at a subur-ban site of Guangzhou (Hagler et al., 2006; Lai et al., 2016).
In contrast to the TC trend, annual SO2−4 , NO−3 and NH+4
concentrations in Guangzhou increased from 14.7, 4.0 and4.5 µg m−3 in 2002–2003 to 18.1, 7.8 and 5.1 µg m−3 in2009–2010 and decreased to 9.3, 2.2 and 3.8 µg m−3 in 2014,respectively. Increases in the concentrations were also foundin Shenzhen, e.g., from 10.0, 2.3 and 3.2 µg m−3 in 2002–2003 to 11.7, 2.7 and 3.5 µg m−3 in 2009, respectively (Ha-gler et al., 2006; Huang et al., 2013), and in the suburbanareas of Guangzhou, e.g., from 10.4, 0.3 and 2.4 µg m−3 in2002–2003 to 12.2, 2.0 and 5.2 µg m−3 in 2012–2013, re-spectively (Hagler et al., 2006; Lai et al., 2016). SO2 emis-sions in Guangdong Province gradually increased in the pre-vious decade, e.g., 964, 1150, 1177 and 1258 Gg yr−1 in2000, 2004, 2007 and 2010, respectively (Lu et al., 2010;Zhao et al., 2013a). However, SO2 emissions in PRD de-creased by more than 40 % between 2005 and 2009, due toflue gas desulfurization facilities in power plants and largeindustrial boilers installed in this region (Lu et al., 2013).Annual average SO2 concentrations in Guangzhou gradually
increased from 45 µg m−3 in 2000 to 77 µg m−3 in 2004, andthen decreased to 17 µg m−3 in 2014 (http://www.gzepb.gov.cn/). Thus, the increased SO2−
4 concentration before 2010in Guangzhou was largely due to regional transport of pol-lutants from outside of PRD. The decreased SO2−
4 concen-tration in 2014 in Guangzhou was likely due to flue gasdesulfurization facilities in power plants and large industrialboilers implemented across the entire Guangdong Province(http://www.gdep.gov.cn/).
Meanwhile, NOx emissions increased in GuangdongProvince as well as across the entire PRD, similar to thetrends in BTH and YRD (Lu et al., 2013; Zhang et al.,2012b; Zhao et al., 2013b). However, annual average sur-face NO2 concentrations in Guangzhou fluctuated from 61to 73 µg m−3 during 2000–2007 and from 48 to 56 µg m−3
during 2008–2014 (http://www.gzepb.gov.cn/). An oppositetrend was also found between NO2 and NOx emissions withthe former persistently decreased, while the latter increasedin Guangzhou, although NO−3 concentrations also increased.Thus, emissions as well as chemical processes both affectedthese ion concentrations in air. Annual NH+4 concentrationsslightly increased about 10 % before 2010 in Guangzhouand Shenzhen although NH3 emissions changed little during2002–2006 in PRD (Zheng et al., 2012). Thus, the slightly in-creased NH+4 concentrations, if not caused by measurementuncertainties, in Guangzhou and Shenzhen during 2002–2010 were largely due to the increased SO2−
4 and NO−3 ,which enhanced the conversion of NH3 to NH+4 .
In summary, a decreasing trend was identified in TC andincreasing trends were found for SO2−
4 , NO−3 and NH+4 inGuangzhou and Shenzhen before 2010, while all chemicalcomponents decreased after 2010 in Guangzhou. The inter-annual variations in EC were inconsistent with BC emissiontrends in Guangdong Province. In contrast, interannual vari-ations in SO2−
4 , NO−3 and NH+4 agreed with regional scale
www.atmos-chem-phys.net/17/9485/2017/ Atmos. Chem. Phys., 17, 9485–9518, 2017
9494 J. Tao et al.: A review of current knowledge concerning PM2.5 chemical composition
Figure 6. Seasonal PM2.5 and dominant chemical components in PRD.
emission trends of their respective gaseous precursors inGuangdong Province rather than PRD. Similar to Beijing andShanghai, nonlinear responses of concentration changes ofthese aerosol components to their respective emission trendswere also found in Guangzhou and Shenzhen.
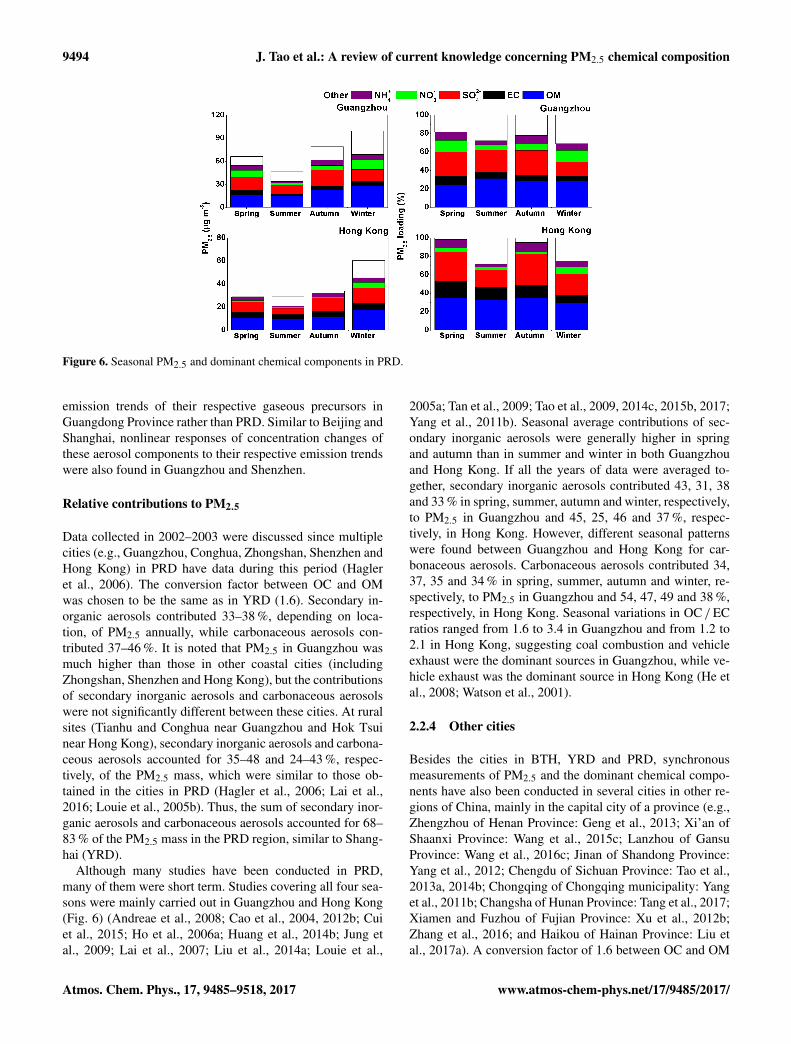
Relative contributions to PM2.5
Data collected in 2002–2003 were discussed since multiplecities (e.g., Guangzhou, Conghua, Zhongshan, Shenzhen andHong Kong) in PRD have data during this period (Hagleret al., 2006). The conversion factor between OC and OMwas chosen to be the same as in YRD (1.6). Secondary in-organic aerosols contributed 33–38 %, depending on loca-tion, of PM2.5 annually, while carbonaceous aerosols con-tributed 37–46 %. It is noted that PM2.5 in Guangzhou wasmuch higher than those in other coastal cities (includingZhongshan, Shenzhen and Hong Kong), but the contributionsof secondary inorganic aerosols and carbonaceous aerosolswere not significantly different between these cities. At ruralsites (Tianhu and Conghua near Guangzhou and Hok Tsuinear Hong Kong), secondary inorganic aerosols and carbona-ceous aerosols accounted for 35–48 and 24–43 %, respec-tively, of the PM2.5 mass, which were similar to those ob-tained in the cities in PRD (Hagler et al., 2006; Lai et al.,2016; Louie et al., 2005b). Thus, the sum of secondary inor-ganic aerosols and carbonaceous aerosols accounted for 68–83 % of the PM2.5 mass in the PRD region, similar to Shang-hai (YRD).
Although many studies have been conducted in PRD,many of them were short term. Studies covering all four sea-sons were mainly carried out in Guangzhou and Hong Kong(Fig. 6) (Andreae et al., 2008; Cao et al., 2004, 2012b; Cuiet al., 2015; Ho et al., 2006a; Huang et al., 2014b; Jung etal., 2009; Lai et al., 2007; Liu et al., 2014a; Louie et al.,
2005a; Tan et al., 2009; Tao et al., 2009, 2014c, 2015b, 2017;Yang et al., 2011b). Seasonal average contributions of sec-ondary inorganic aerosols were generally higher in springand autumn than in summer and winter in both Guangzhouand Hong Kong. If all the years of data were averaged to-gether, secondary inorganic aerosols contributed 43, 31, 38and 33 % in spring, summer, autumn and winter, respectively,to PM2.5 in Guangzhou and 45, 25, 46 and 37 %, respec-tively, in Hong Kong. However, different seasonal patternswere found between Guangzhou and Hong Kong for car-bonaceous aerosols. Carbonaceous aerosols contributed 34,37, 35 and 34 % in spring, summer, autumn and winter, re-spectively, to PM2.5 in Guangzhou and 54, 47, 49 and 38 %,respectively, in Hong Kong. Seasonal variations in OC / ECratios ranged from 1.6 to 3.4 in Guangzhou and from 1.2 to2.1 in Hong Kong, suggesting coal combustion and vehicleexhaust were the dominant sources in Guangzhou, while ve-hicle exhaust was the dominant source in Hong Kong (He etal., 2008; Watson et al., 2001).
2.2.4 Other cities
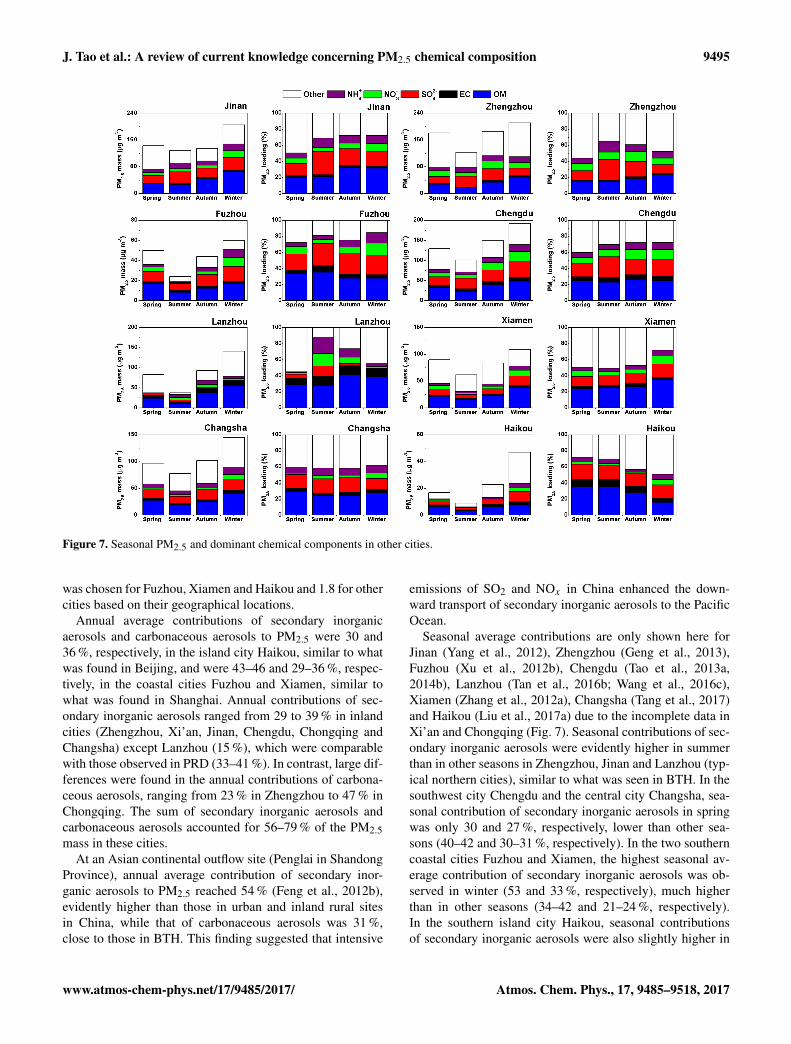
Besides the cities in BTH, YRD and PRD, synchronousmeasurements of PM2.5 and the dominant chemical compo-nents have also been conducted in several cities in other re-gions of China, mainly in the capital city of a province (e.g.,Zhengzhou of Henan Province: Geng et al., 2013; Xi’an ofShaanxi Province: Wang et al., 2015c; Lanzhou of GansuProvince: Wang et al., 2016c; Jinan of Shandong Province:Yang et al., 2012; Chengdu of Sichuan Province: Tao et al.,2013a, 2014b; Chongqing of Chongqing municipality: Yanget al., 2011b; Changsha of Hunan Province: Tang et al., 2017;Xiamen and Fuzhou of Fujian Province: Xu et al., 2012b;Zhang et al., 2016; and Haikou of Hainan Province: Liu etal., 2017a). A conversion factor of 1.6 between OC and OM
Atmos. Chem. Phys., 17, 9485–9518, 2017 www.atmos-chem-phys.net/17/9485/2017/
J. Tao et al.: A review of current knowledge concerning PM2.5 chemical composition 9495
Figure 7. Seasonal PM2.5 and dominant chemical components in other cities.
was chosen for Fuzhou, Xiamen and Haikou and 1.8 for othercities based on their geographical locations.
Annual average contributions of secondary inorganicaerosols and carbonaceous aerosols to PM2.5 were 30 and36 %, respectively, in the island city Haikou, similar to whatwas found in Beijing, and were 43–46 and 29–36 %, respec-tively, in the coastal cities Fuzhou and Xiamen, similar towhat was found in Shanghai. Annual contributions of sec-ondary inorganic aerosols ranged from 29 to 39 % in inlandcities (Zhengzhou, Xi’an, Jinan, Chengdu, Chongqing andChangsha) except Lanzhou (15 %), which were comparablewith those observed in PRD (33–41 %). In contrast, large dif-ferences were found in the annual contributions of carbona-ceous aerosols, ranging from 23 % in Zhengzhou to 47 % inChongqing. The sum of secondary inorganic aerosols andcarbonaceous aerosols accounted for 56–79 % of the PM2.5mass in these cities.
At an Asian continental outflow site (Penglai in ShandongProvince), annual average contribution of secondary inor-ganic aerosols to PM2.5 reached 54 % (Feng et al., 2012b),evidently higher than those in urban and inland rural sitesin China, while that of carbonaceous aerosols was 31 %,close to those in BTH. This finding suggested that intensive
emissions of SO2 and NOx in China enhanced the down-ward transport of secondary inorganic aerosols to the PacificOcean.
Seasonal average contributions are only shown here forJinan (Yang et al., 2012), Zhengzhou (Geng et al., 2013),Fuzhou (Xu et al., 2012b), Chengdu (Tao et al., 2013a,2014b), Lanzhou (Tan et al., 2016b; Wang et al., 2016c),Xiamen (Zhang et al., 2012a), Changsha (Tang et al., 2017)and Haikou (Liu et al., 2017a) due to the incomplete data inXi’an and Chongqing (Fig. 7). Seasonal contributions of sec-ondary inorganic aerosols were evidently higher in summerthan in other seasons in Zhengzhou, Jinan and Lanzhou (typ-ical northern cities), similar to what was seen in BTH. In thesouthwest city Chengdu and the central city Changsha, sea-sonal contribution of secondary inorganic aerosols in springwas only 30 and 27 %, respectively, lower than other sea-sons (40–42 and 30–31 %, respectively). In the two southerncoastal cities Fuzhou and Xiamen, the highest seasonal av-erage contribution of secondary inorganic aerosols was ob-served in winter (53 and 33 %, respectively), much higherthan in other seasons (34–42 and 21–24 %, respectively).In the southern island city Haikou, seasonal contributionsof secondary inorganic aerosols were also slightly higher in
www.atmos-chem-phys.net/17/9485/2017/ Atmos. Chem. Phys., 17, 9485–9518, 2017
9496 J. Tao et al.: A review of current knowledge concerning PM2.5 chemical composition
Figure 8. Annual PM2.5 and dominant chemical components in China.
winter (30 %) than in other seasons (21–27 %), similar to thecoastal cities Fuzhou and Xiamen.
Seasonal average contributions of carbonaceous aerosolswere evidently higher in cold seasons than in warm sea-sons in the three northern cities (Zhengzhou and Jinan andLanzhou) due to heating activities and biomass burning, sim-ilar to BTH. Surprisingly, a similar seasonal pattern was alsofound in one coastal city Xiamen, e.g., 38 % in winter ver-sus 27–30 % in other seasons. In contrast, higher seasonalcontributions were found in warm season than in cold sea-sons in the southern coastal city (Fuzhou) and the southernisland city (Haikou). No seasonal variations were found inthe southwest inland city Chengdu (29–32 %) and the centralinland city Changsha (28–33 %). The summed contributionsof secondary inorganic aerosols and carbonaceous aerosolswere evidently lower in spring than in other seasons in mostof the northern cities (e.g., Jinan, Lanzhou, Zhengzhou andBTH), likely due to the frequent spring dust storm events innorthern China.
2.2.5 Summary of PM2.5 chemical properties
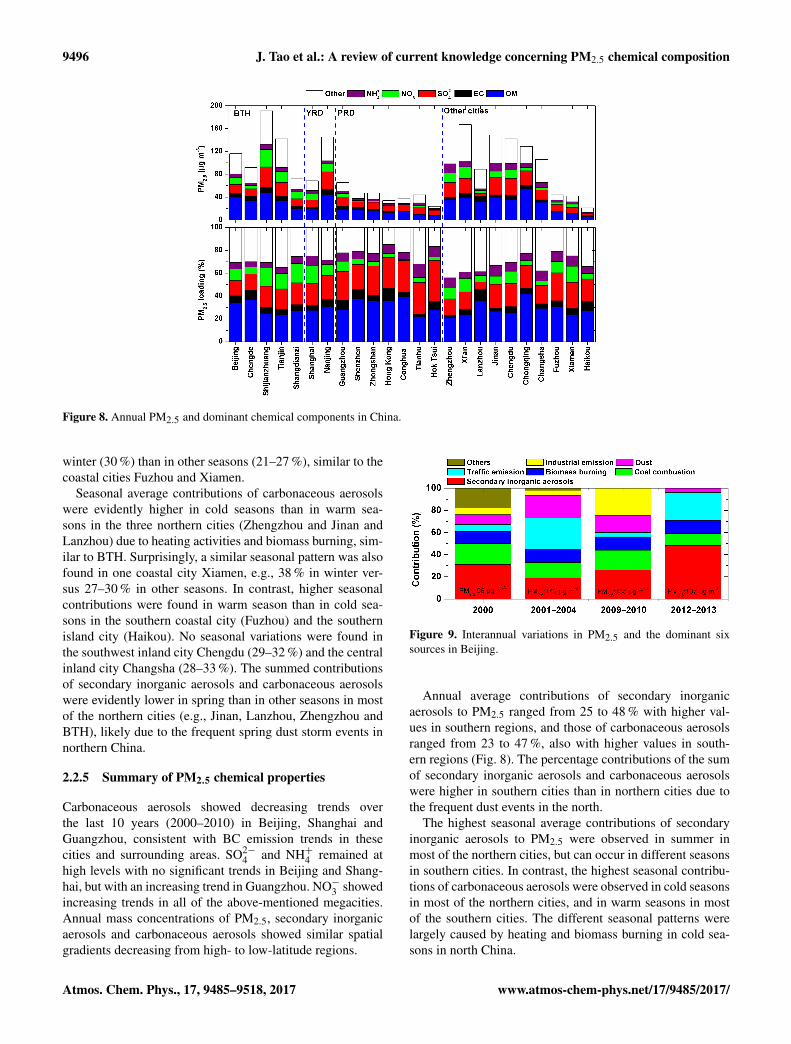
Carbonaceous aerosols showed decreasing trends overthe last 10 years (2000–2010) in Beijing, Shanghai andGuangzhou, consistent with BC emission trends in thesecities and surrounding areas. SO2−
4 and NH+4 remained athigh levels with no significant trends in Beijing and Shang-hai, but with an increasing trend in Guangzhou. NO−3 showedincreasing trends in all of the above-mentioned megacities.Annual mass concentrations of PM2.5, secondary inorganicaerosols and carbonaceous aerosols showed similar spatialgradients decreasing from high- to low-latitude regions.
Figure 9. Interannual variations in PM2.5 and the dominant sixsources in Beijing.
Annual average contributions of secondary inorganicaerosols to PM2.5 ranged from 25 to 48 % with higher val-ues in southern regions, and those of carbonaceous aerosolsranged from 23 to 47 %, also with higher values in south-ern regions (Fig. 8). The percentage contributions of the sumof secondary inorganic aerosols and carbonaceous aerosolswere higher in southern cities than in northern cities due tothe frequent dust events in the north.
The highest seasonal average contributions of secondaryinorganic aerosols to PM2.5 were observed in summer inmost of the northern cities, but can occur in different seasonsin southern cities. In contrast, the highest seasonal contribu-tions of carbonaceous aerosols were observed in cold seasonsin most of the northern cities, and in warm seasons in mostof the southern cities. The different seasonal patterns werelargely caused by heating and biomass burning in cold sea-sons in north China.
Atmos. Chem. Phys., 17, 9485–9518, 2017 www.atmos-chem-phys.net/17/9485/2017/
J. Tao et al.: A review of current knowledge concerning PM2.5 chemical composition 9497
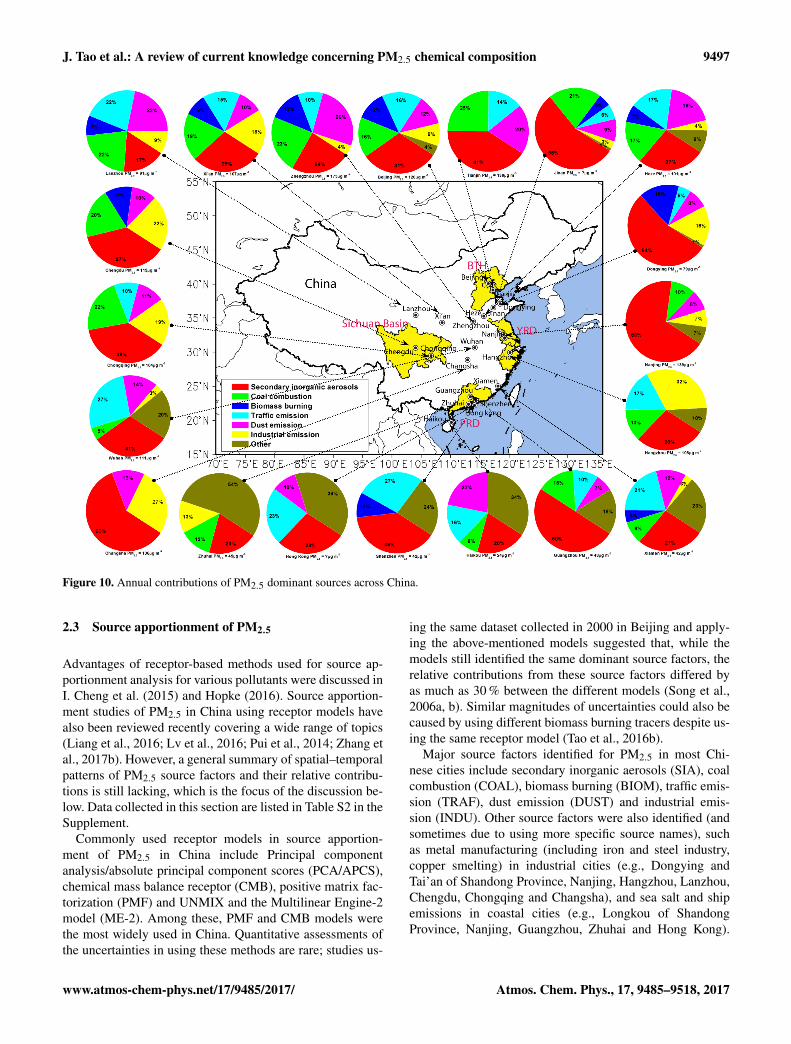
Figure 10. Annual contributions of PM2.5 dominant sources across China.
2.3 Source apportionment of PM2.5
Advantages of receptor-based methods used for source ap-portionment analysis for various pollutants were discussed inI. Cheng et al. (2015) and Hopke (2016). Source apportion-ment studies of PM2.5 in China using receptor models havealso been reviewed recently covering a wide range of topics(Liang et al., 2016; Lv et al., 2016; Pui et al., 2014; Zhang etal., 2017b). However, a general summary of spatial–temporalpatterns of PM2.5 source factors and their relative contribu-tions is still lacking, which is the focus of the discussion be-low. Data collected in this section are listed in Table S2 in theSupplement.
Commonly used receptor models in source apportion-ment of PM2.5 in China include Principal componentanalysis/absolute principal component scores (PCA/APCS),chemical mass balance receptor (CMB), positive matrix fac-torization (PMF) and UNMIX and the Multilinear Engine-2model (ME-2). Among these, PMF and CMB models werethe most widely used in China. Quantitative assessments ofthe uncertainties in using these methods are rare; studies us-
ing the same dataset collected in 2000 in Beijing and apply-ing the above-mentioned models suggested that, while themodels still identified the same dominant source factors, therelative contributions from these source factors differed byas much as 30 % between the different models (Song et al.,2006a, b). Similar magnitudes of uncertainties could also becaused by using different biomass burning tracers despite us-ing the same receptor model (Tao et al., 2016b).
Major source factors identified for PM2.5 in most Chi-nese cities include secondary inorganic aerosols (SIA), coalcombustion (COAL), biomass burning (BIOM), traffic emis-sion (TRAF), dust emission (DUST) and industrial emis-sion (INDU). Other source factors were also identified (andsometimes due to using more specific source names), suchas metal manufacturing (including iron and steel industry,copper smelting) in industrial cities (e.g., Dongying andTai’an of Shandong Province, Nanjing, Hangzhou, Lanzhou,Chengdu, Chongqing and Changsha), and sea salt and shipemissions in coastal cities (e.g., Longkou of ShandongProvince, Nanjing, Guangzhou, Zhuhai and Hong Kong).
www.atmos-chem-phys.net/17/9485/2017/ Atmos. Chem. Phys., 17, 9485–9518, 2017
9498 J. Tao et al.: A review of current knowledge concerning PM2.5 chemical composition
Contributions of dominant source factors to PM2.5 are dis-cussed below in detail on a regional basis.
2.3.1 The Beijing–Tianjin–Hebei region
Studies in Beijing covered multiple years and mostly used thePMF model (Fig. 9). If averaging the results from the yearsin 2000 (Song et al., 2006b), 2001–2004 (Zhang et al., 2007),2009–2010 (Zhang et al., 2013a), and 2012–2013 (Zíková etal., 2016), the six source factors (SIA, COAL, BIOM, TRAF,DUST and INDU) accounted for 31± 12, 16± 4, 12± 1,16± 13, 12± 7 and 9± 11%, respectively, of the PM2.5 massin Beijing. There was an increasing trend for SIA contribu-tions (from 19 to 48 %), a decreasing trend for COAL (from19 to 11 %) and a stable trend for BIOM (11–12 %) dur-ing 2000–2013. There was more uncertainties in identifyingTRAF and INDU than other source factors due to the differ-ences in the source profiles.
A study in Tianjin in 2013–2014 only identified four domi-nant sources (SIA, COAL, TRAF and DUST) using the Mul-tilinear Engine-2 model (ME-2), which accounted for 41, 25,14 and 20 %, respectively, of the annual average PM2.5 mass(Tian et al., 2016). Compared with results in 2012–2013 inBeijing (Zíková et al., 2016), the contributions of SIA werecomparable in the two cities, but those of COAL and DUSTwere much higher in Tianjin than Beijing. However, the re-sults from an earlier study in Tianjin in 2009–2010 weremuch more comparable to those in Beijing during the sameyears in terms of PM2.5 levels and source attributions (Zhaoet al., 2013c), implying faster decrease in COAL contributionin Beijing than Tianjin.
Seasonal results of source apportionment analysis are alsoavailable for Beijing (Huang et al., 2014b; Song et al., 2007;Wu et al., 2014; Zheng et al., 2005; Zhang et al., 2013a;Zíková et al., 2016). In most cases, SIA was the largest con-tributor in spring, summer and autumn, accounting for 26–61 % of the PM2.5 mass, while COAL was the largest con-tributor in winter, accounting for 13–57 % of the PM2.5 mass.The contributions of the other sources were lower than thoseof SIA and COAL, but subject to seasonal variations. Forexample, the largest seasonal contribution of BIOM was inautumn and of DUST in spring.
2.3.2 The Yangtze River Delta region
Studies for 1 year or longer were only made in Nanjing (Liet al., 2016a) and Hangzhou (Liu et al., 2015). Metal man-ufacturing was identified as a source factor in both Nanjingand Hangzhou, while ship emissions were also identified inNanjing. Annual contributions of SIA to PM2.5 mass reached68 % in Nanjing, while all the other sources (COAL, DUST,sea salt and ship emissions, and metal manufacturing) eachcontributed 10 % or less. In contrast, metal manufacturing,SIA, TRAF and COAL accounted for 32, 28, 17 and 13 %,respectively, of the PM2.5 mass in Hangzhou. Evidently, the
contributions of SIA in Nanjing were much higher than thosein Hangzhou and cities in BTH. The contributions of COALin Nanjing and Hangzhou were similar, but were evidentlylower than those in cities in BTH.
Similar to the cities in BTH, the largest seasonal aver-age contribution of SIA in Nanjing was in summer and ofCOAL in winter. Only winter data were available in Shang-hai (Huang et al., 2014b), and the contributions of SIA andDUST to PM2.5 were similar between Shanghai and Nanjing.
2.3.3 The Pearl River Delta region
Studies covering 1 year or longer were available inGuangzhou (Tao et al., 2017), Shenzhen (Huang et al., 2013),Hong Kong (Guo et al., 2009a), and suburban Zhuhai (Tao etal., 2017) and suburban Hong Kong (Huang et al., 2014c).On an annual basis, SIA contributed 50 % to PM2.5 massin Guangzhou, while other sources (ship emissions, COAL,TRAF and DUST) each contributed 7–17 %. In Shenzhen,SIA, TRAF and BIOM accounted for 39, 27 and 10 %, re-spectively, of the PM2.5 mass. In Hong Kong, SIA, TRAF,oil residue (related to Ni and V, or ship emissions), DUST,and sea salt accounted for 28, 23, 19, 10, and 7 %, respec-tively, of the PM2.5 mass.
Slightly different sources factors were identified in subur-ban studies. Annual contributions from mixed source (fromregional transport), secondary nitrate and chloride, shipemissions, COAL, and electronic industries accounted for36, 20, 18, 13, and 13 %, respectively, of the PM2.5 massin suburban Zhuhai, while SIA, BIOM, sea salt, residual oilcombustion (related to Ni and V, or ship emission), DUST,and TRAF accounted for 39, 20, 17, 12, 7, and 5 %, respec-tively, of the PM2.5 mass in suburban Hong Kong.
Despite the slightly different source factors identified be-tween urban and suburban sites in PRD, SIA was the largestcontributor to PM2.5 mass in this region. Ship emissions wereidentified in this region, but not in northern China, and thissource factor contributed more than 10 % of the PM2.5 massin all the studies except the one for Shenzhen. Similar to thecities in northern China, a high contribution from coal com-bustion was also found in Guangzhou and suburban Zhuhai.
Seasonal results of source apportionment analysis wereavailable for four seasons in suburban Hong Kong (Huanget al., 2014c), winter in Guangzhou (Huang et al., 2014b),and summer and winter in Foshan (Tan et al., 2016c) andHong Kong (Ho et al., 2006b). SIA was the largest contribu-tor to PM2.5 among all the identified source factors in everyseason in suburban Hong Kong (30–45 %) and in winter inGuangzhou (59 %). In contrast, INDU was the largest con-tributor in winter in Foshan (39 %), a typical industrial cityin PRD (Tan et al., 2016c). In suburban Hong Kong, seasonalaverage contribution of SIA was the lowest in summer, differ-ent from what was found for cities in BTH and YRD, whilethat of sea salt and ship emissions were the highest in sum-
Atmos. Chem. Phys., 17, 9485–9518, 2017 www.atmos-chem-phys.net/17/9485/2017/
J. Tao et al.: A review of current knowledge concerning PM2.5 chemical composition 9499
mer due to the prevailing air masses from the South ChinaSea (Huang et al., 2014c).
2.3.4 Other cities
Studies covering 1 year or longer were mostly conducted forprovincial capital cities, including Jinan (Yang et al., 2013),Zhengzhou (Geng et al., 2013), Xi’an (Wang et al., 2015c),Lanzhou (Wang et al., 2016c), Chengdu (Tao et al., 2014a),Chongqing (Chen et al., 2017), Changsha (Tang et al., 2017),Wuhan (Xiong et al., 2017), Xiamen (Zhang et al., 2016) andHaikou (Liu et al., 2017a), and for an inland city Heze (Liu etal., 2017b) and a regional background site (located in YellowRiver Delta National Nature Reserve in the city of Dongy-ing) (Yao et al., 2016), both in Shandong Province. Annualresults were available from most studies, but were aggre-gated from seasonal results for Wuhan and Haikou. All thesites were grouped into four regions for easy discussion, i.e.,northwest China (Lanzhou and Xi’an), southwest China orSichuan Basin (Chengdu and Chongqing), eastern and cen-tral China (Jinan, Zhengzhou, Heze, Dongying, Wuhan andChangsha), and south coastal cities (Xiamen and Haikou).
The two northwest cities showed the same top four domi-nant source factors, although with slightly different percent-age contributions to PM2.5 mass, e.g., 29 % from SIA, 19 %from COAL, 17 % from DUST and 15 % from TRAF inXi’an, and 17 % from SIA and 22 % from the other threesources in Lanzhou. The lower SIA contribution in Lanzhouwas likely due to the dry climate inhibiting formation of SIA.Similar results to those in Xi’an were also obtained in ruralXi’an, with SIA, COAL, DUST and TRAF contributing 31,16, 20 and 13 %, respectively, to the PM2.5 mass (Wang et al.,2015c). The two southwest cities (Chengdu and Chongqing)showed nearly the same source-apportionment analysis re-sults with SIA contributing just below 40 % and COAL andINDU each contributing around 20 % to PM2.5 mass.
The same top four dominant source factors (SIA, COAL,DUST and TRAF) found in the two northwest cities werealso found in other capital cities (Jinan, Zhengzhou andWuhan, except Changsha) and a medium-sized city (Heze)in eastern and central China, which accounted for 24–55, 14–23, 5–26 and 5–27 % of the PM2.5 mass, depending on loca-tion. In Changsha, SIA, a mixed source of INDU and BIOM,and DUST accounted for 60, 27 and 13 %, respectively, ofPM2.5 mass. SIA, BIOM and INDU were the most impor-tant sources, accounting for 54, 16 and 16 %, respectively, ofPM2.5 mass in a regional background site in Dongying. Simi-lar source-apportionment results were found between the twosouth coastal cities (Xiamen and Haikou) with SIA, TRAF,DUST, COAL and sea salt accounting for 20–27, 16–21, 12–22, 8–9 and 6–10 %, respectively, of the PM2.5 mass.
Seasonal results of source apportionment analysis areavailable for four seasons in Jinan (Yang et al., 2013), a re-gional site in Dongying (Yao et al., 2016), Chengdu (Tao etal., 2014a), Chongqing (Chen et al., 2017), Wuhan (Xiong et
al., 2017) and Haikou (Liu et al., 2017a), for summer and au-tumn in Tai’an of Shandong Province (Liu et al., 2016a) andXi’an (Xu et al., 2016), for summer and winter in Lanzhou(Tan et al., 2017), and for winter in Longkou (a coastal sitein Shandong Province) (Zong et al., 2016).
In most seasons, SIA was the largest contributor toPM2.5 mass, e.g., in Jinan (30–45 %), Tai’an (27 %), a re-gional site in Dongying (35–72 %), Chengdu (33–44 %),Chongqing (24–52 %), Wuhan (23–41 %), Lanzhou (15–33 %) and Haikou (11–26 %), except during spring in Wuhanand summer in Haikou, when DUST was the largest contrib-utor; during winter in Longkou and Xi’an, when COAL wasthe largest contributor; and during summer in Lanzhou, whensmelting industry was the largest contributor. Only winterdata were available in Longkou, and ship emissions con-tributed 9 % to PM2.5 mass, similar to what was found inthe cities of PRD.
2.3.5 Summary of PM2.5 source apportionment studies
SIA, COAL and TRAF were the dominant source factors inmost cities in China (Fig. 10). On an annual average, the sumof these three factors accounted for 63–80 % of PM2.5 massin the cities of BTH region, 58–78 % in the cities of YRDregion, 51–67 % in the cities of PRD region, 51–61 % in thenorthwest cities, 57–60 % in the southwest cities, 57–82 %in the eastern and central cities, and 44–57 % in the southcoastal cities. The contributions of DUST were significant(7–26 %) in northern cities and a central city (Zhengzhou), ofINDU significant (19–27 %) in typical industrial cities (e.g.,Chengdu, Chongqing, Changsha), and of ship emission sig-nificant (7–19 %) in coastal and river cities (e.g., Longkou,Nanjing, Guangzhou, Zhuhai, Hong Kong). High seasonalcontributions were found for SIA in summer, COAL in win-ter, DUST in spring and ship emission in summer in applica-ble cities.
It should be noted that SIA chemical compounds areformed by reactions in the atmosphere involving primaryemissions of gaseous precursors that can be produced fromany of the identified sources factors discussed above aswell as from sources seldom mentioned in source apportion-ment studies such as agricultural emissions and many natu-ral sources. However, sources of the gaseous precursors areoften undetermined in source apportionment studies result-ing in a large proportion of PM2.5 that cannot be explained(Karagulian et al., 2015). If the SIA contributions can be al-located to specific types of primary emissions, the overallpercentage contributions from each of the identified sourcefactor should be much higher, especially for COAL, TRAF,INDU and BIMO due to their high emission rates of primarypollutants of gaseous species. To identify the various types ofprimary emission sources, datasets containing trace elementand other chemical markers need to be included in sourceapportionment models (Lee and Hopke, 2006). Combiningreceptor-based analysis results with source-based studies us-
www.atmos-chem-phys.net/17/9485/2017/ Atmos. Chem. Phys., 17, 9485–9518, 2017
9500 J. Tao et al.: A review of current knowledge concerning PM2.5 chemical composition
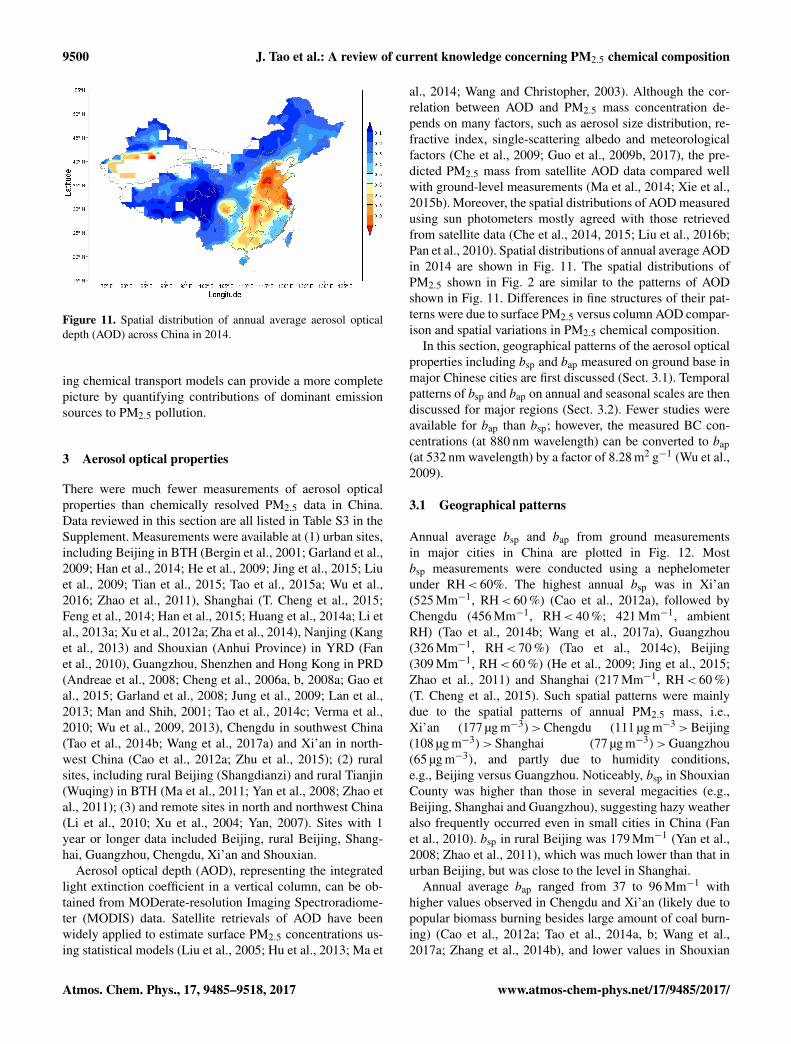
Figure 11. Spatial distribution of annual average aerosol opticaldepth (AOD) across China in 2014.
ing chemical transport models can provide a more completepicture by quantifying contributions of dominant emissionsources to PM2.5 pollution.
3 Aerosol optical properties
There were much fewer measurements of aerosol opticalproperties than chemically resolved PM2.5 data in China.Data reviewed in this section are all listed in Table S3 in theSupplement. Measurements were available at (1) urban sites,including Beijing in BTH (Bergin et al., 2001; Garland et al.,2009; Han et al., 2014; He et al., 2009; Jing et al., 2015; Liuet al., 2009; Tian et al., 2015; Tao et al., 2015a; Wu et al.,2016; Zhao et al., 2011), Shanghai (T. Cheng et al., 2015;Feng et al., 2014; Han et al., 2015; Huang et al., 2014a; Li etal., 2013a; Xu et al., 2012a; Zha et al., 2014), Nanjing (Kanget al., 2013) and Shouxian (Anhui Province) in YRD (Fanet al., 2010), Guangzhou, Shenzhen and Hong Kong in PRD(Andreae et al., 2008; Cheng et al., 2006a, b, 2008a; Gao etal., 2015; Garland et al., 2008; Jung et al., 2009; Lan et al.,2013; Man and Shih, 2001; Tao et al., 2014c; Verma et al.,2010; Wu et al., 2009, 2013), Chengdu in southwest China(Tao et al., 2014b; Wang et al., 2017a) and Xi’an in north-west China (Cao et al., 2012a; Zhu et al., 2015); (2) ruralsites, including rural Beijing (Shangdianzi) and rural Tianjin(Wuqing) in BTH (Ma et al., 2011; Yan et al., 2008; Zhao etal., 2011); (3) and remote sites in north and northwest China(Li et al., 2010; Xu et al., 2004; Yan, 2007). Sites with 1year or longer data included Beijing, rural Beijing, Shang-hai, Guangzhou, Chengdu, Xi’an and Shouxian.
Aerosol optical depth (AOD), representing the integratedlight extinction coefficient in a vertical column, can be ob-tained from MODerate-resolution Imaging Spectroradiome-ter (MODIS) data. Satellite retrievals of AOD have beenwidely applied to estimate surface PM2.5 concentrations us-ing statistical models (Liu et al., 2005; Hu et al., 2013; Ma et
al., 2014; Wang and Christopher, 2003). Although the cor-relation between AOD and PM2.5 mass concentration de-pends on many factors, such as aerosol size distribution, re-fractive index, single-scattering albedo and meteorologicalfactors (Che et al., 2009; Guo et al., 2009b, 2017), the pre-dicted PM2.5 mass from satellite AOD data compared wellwith ground-level measurements (Ma et al., 2014; Xie et al.,2015b). Moreover, the spatial distributions of AOD measuredusing sun photometers mostly agreed with those retrievedfrom satellite data (Che et al., 2014, 2015; Liu et al., 2016b;Pan et al., 2010). Spatial distributions of annual average AODin 2014 are shown in Fig. 11. The spatial distributions ofPM2.5 shown in Fig. 2 are similar to the patterns of AODshown in Fig. 11. Differences in fine structures of their pat-terns were due to surface PM2.5 versus column AOD compar-ison and spatial variations in PM2.5 chemical composition.
In this section, geographical patterns of the aerosol opticalproperties including bsp and bap measured on ground base inmajor Chinese cities are first discussed (Sect. 3.1). Temporalpatterns of bsp and bap on annual and seasonal scales are thendiscussed for major regions (Sect. 3.2). Fewer studies wereavailable for bap than bsp; however, the measured BC con-centrations (at 880 nm wavelength) can be converted to bap(at 532 nm wavelength) by a factor of 8.28 m2 g−1 (Wu et al.,2009).
3.1 Geographical patterns
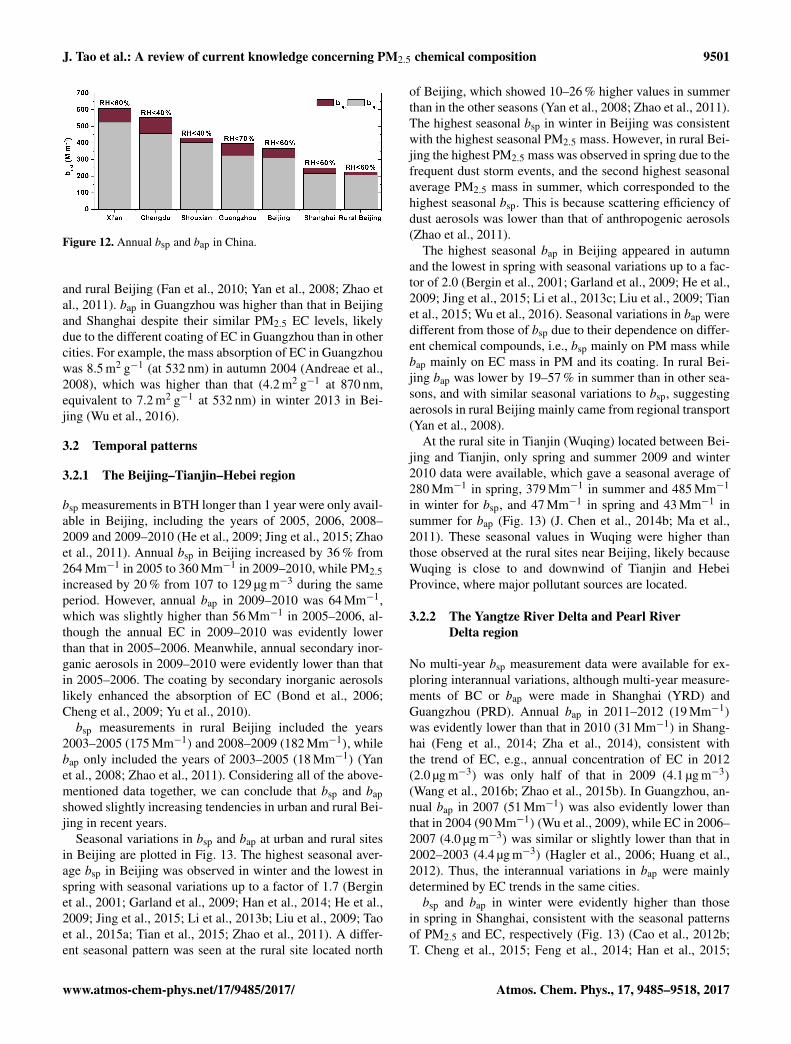
Annual average bsp and bap from ground measurementsin major cities in China are plotted in Fig. 12. Mostbsp measurements were conducted using a nephelometerunder RH < 60%. The highest annual bsp was in Xi’an(525 Mm−1, RH < 60 %) (Cao et al., 2012a), followed byChengdu (456 Mm−1, RH < 40 %; 421 Mm−1, ambientRH) (Tao et al., 2014b; Wang et al., 2017a), Guangzhou(326 Mm−1, RH < 70 %) (Tao et al., 2014c), Beijing(309 Mm−1, RH < 60 %) (He et al., 2009; Jing et al., 2015;Zhao et al., 2011) and Shanghai (217 Mm−1, RH < 60 %)(T. Cheng et al., 2015). Such spatial patterns were mainlydue to the spatial patterns of annual PM2.5 mass, i.e.,Xi’an (177 µg m−3) > Chengdu (111 µg m−3 > Beijing(108 µg m−3) > Shanghai (77 µg m−3) > Guangzhou(65 µg m−3), and partly due to humidity conditions,e.g., Beijing versus Guangzhou. Noticeably, bsp in ShouxianCounty was higher than those in several megacities (e.g.,Beijing, Shanghai and Guangzhou), suggesting hazy weatheralso frequently occurred even in small cities in China (Fanet al., 2010). bsp in rural Beijing was 179 Mm−1 (Yan et al.,2008; Zhao et al., 2011), which was much lower than that inurban Beijing, but was close to the level in Shanghai.
Annual average bap ranged from 37 to 96 Mm−1 withhigher values observed in Chengdu and Xi’an (likely due topopular biomass burning besides large amount of coal burn-ing) (Cao et al., 2012a; Tao et al., 2014a, b; Wang et al.,2017a; Zhang et al., 2014b), and lower values in Shouxian
Atmos. Chem. Phys., 17, 9485–9518, 2017 www.atmos-chem-phys.net/17/9485/2017/
J. Tao et al.: A review of current knowledge concerning PM2.5 chemical composition 9501
Figure 12. Annual bsp and bap in China.
and rural Beijing (Fan et al., 2010; Yan et al., 2008; Zhao etal., 2011). bap in Guangzhou was higher than that in Beijingand Shanghai despite their similar PM2.5 EC levels, likelydue to the different coating of EC in Guangzhou than in othercities. For example, the mass absorption of EC in Guangzhouwas 8.5 m2 g−1 (at 532 nm) in autumn 2004 (Andreae et al.,2008), which was higher than that (4.2 m2 g−1 at 870 nm,equivalent to 7.2 m2 g−1 at 532 nm) in winter 2013 in Bei-jing (Wu et al., 2016).
3.2 Temporal patterns
3.2.1 The Beijing–Tianjin–Hebei region
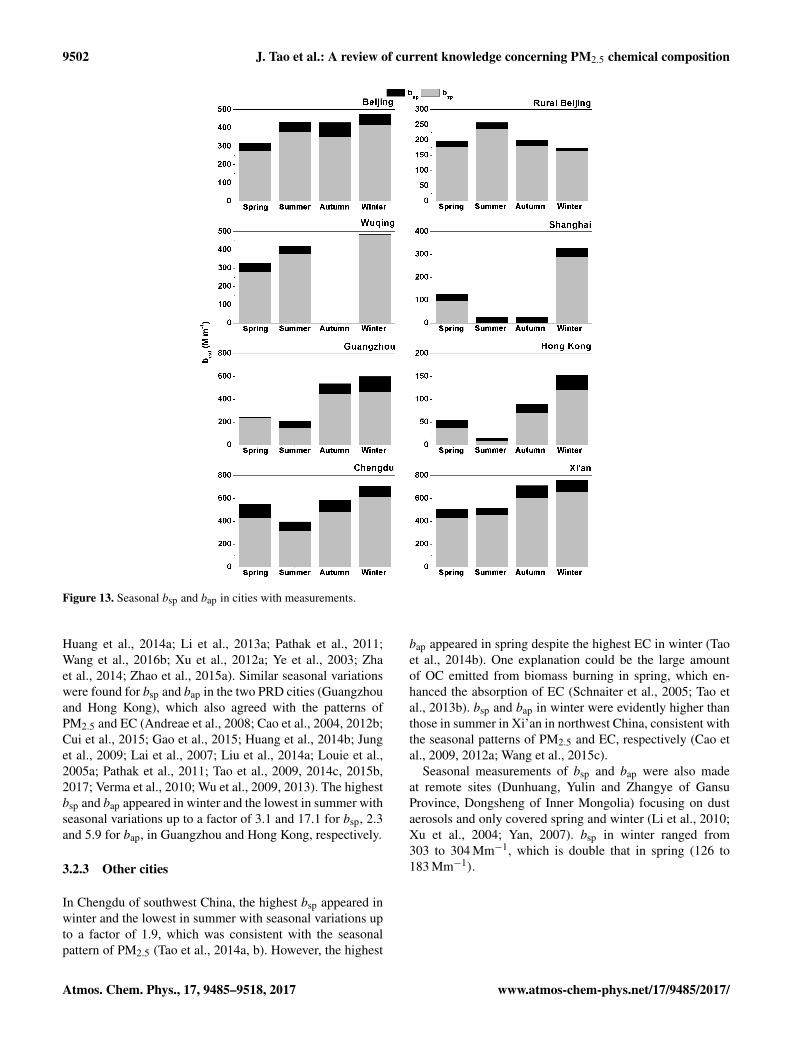
bsp measurements in BTH longer than 1 year were only avail-able in Beijing, including the years of 2005, 2006, 2008–2009 and 2009–2010 (He et al., 2009; Jing et al., 2015; Zhaoet al., 2011). Annual bsp in Beijing increased by 36 % from264 Mm−1 in 2005 to 360 Mm−1 in 2009–2010, while PM2.5increased by 20 % from 107 to 129 µg m−3 during the sameperiod. However, annual bap in 2009–2010 was 64 Mm−1,which was slightly higher than 56 Mm−1 in 2005–2006, al-though the annual EC in 2009–2010 was evidently lowerthan that in 2005–2006. Meanwhile, annual secondary inor-ganic aerosols in 2009–2010 were evidently lower than thatin 2005–2006. The coating by secondary inorganic aerosolslikely enhanced the absorption of EC (Bond et al., 2006;Cheng et al., 2009; Yu et al., 2010).
bsp measurements in rural Beijing included the years2003–2005 (175 Mm−1) and 2008–2009 (182 Mm−1), whilebap only included the years of 2003–2005 (18 Mm−1) (Yanet al., 2008; Zhao et al., 2011). Considering all of the above-mentioned data together, we can conclude that bsp and bapshowed slightly increasing tendencies in urban and rural Bei-jing in recent years.
Seasonal variations in bsp and bap at urban and rural sitesin Beijing are plotted in Fig. 13. The highest seasonal aver-age bsp in Beijing was observed in winter and the lowest inspring with seasonal variations up to a factor of 1.7 (Berginet al., 2001; Garland et al., 2009; Han et al., 2014; He et al.,2009; Jing et al., 2015; Li et al., 2013b; Liu et al., 2009; Taoet al., 2015a; Tian et al., 2015; Zhao et al., 2011). A differ-ent seasonal pattern was seen at the rural site located north
of Beijing, which showed 10–26 % higher values in summerthan in the other seasons (Yan et al., 2008; Zhao et al., 2011).The highest seasonal bsp in winter in Beijing was consistentwith the highest seasonal PM2.5 mass. However, in rural Bei-jing the highest PM2.5 mass was observed in spring due to thefrequent dust storm events, and the second highest seasonalaverage PM2.5 mass in summer, which corresponded to thehighest seasonal bsp. This is because scattering efficiency ofdust aerosols was lower than that of anthropogenic aerosols(Zhao et al., 2011).
The highest seasonal bap in Beijing appeared in autumnand the lowest in spring with seasonal variations up to a fac-tor of 2.0 (Bergin et al., 2001; Garland et al., 2009; He et al.,2009; Jing et al., 2015; Li et al., 2013c; Liu et al., 2009; Tianet al., 2015; Wu et al., 2016). Seasonal variations in bap weredifferent from those of bsp due to their dependence on differ-ent chemical compounds, i.e., bsp mainly on PM mass whilebap mainly on EC mass in PM and its coating. In rural Bei-jing bap was lower by 19–57 % in summer than in other sea-sons, and with similar seasonal variations to bsp, suggestingaerosols in rural Beijing mainly came from regional transport(Yan et al., 2008).
At the rural site in Tianjin (Wuqing) located between Bei-jing and Tianjin, only spring and summer 2009 and winter2010 data were available, which gave a seasonal average of280 Mm−1 in spring, 379 Mm−1 in summer and 485 Mm−1
in winter for bsp, and 47 Mm−1 in spring and 43 Mm−1 insummer for bap (Fig. 13) (J. Chen et al., 2014b; Ma et al.,2011). These seasonal values in Wuqing were higher thanthose observed at the rural sites near Beijing, likely becauseWuqing is close to and downwind of Tianjin and HebeiProvince, where major pollutant sources are located.
3.2.2 The Yangtze River Delta and Pearl RiverDelta region
No multi-year bsp measurement data were available for ex-ploring interannual variations, although multi-year measure-ments of BC or bap were made in Shanghai (YRD) andGuangzhou (PRD). Annual bap in 2011–2012 (19 Mm−1)
was evidently lower than that in 2010 (31 Mm−1) in Shang-hai (Feng et al., 2014; Zha et al., 2014), consistent withthe trend of EC, e.g., annual concentration of EC in 2012(2.0 µg m−3) was only half of that in 2009 (4.1 µg m−3)
(Wang et al., 2016b; Zhao et al., 2015b). In Guangzhou, an-nual bap in 2007 (51 Mm−1) was also evidently lower thanthat in 2004 (90 Mm−1) (Wu et al., 2009), while EC in 2006–2007 (4.0 µg m−3) was similar or slightly lower than that in2002–2003 (4.4 µg m−3) (Hagler et al., 2006; Huang et al.,2012). Thus, the interannual variations in bap were mainlydetermined by EC trends in the same cities.
bsp and bap in winter were evidently higher than thosein spring in Shanghai, consistent with the seasonal patternsof PM2.5 and EC, respectively (Fig. 13) (Cao et al., 2012b;T. Cheng et al., 2015; Feng et al., 2014; Han et al., 2015;
www.atmos-chem-phys.net/17/9485/2017/ Atmos. Chem. Phys., 17, 9485–9518, 2017
9502 J. Tao et al.: A review of current knowledge concerning PM2.5 chemical composition
Figure 13. Seasonal bsp and bap in cities with measurements.
Huang et al., 2014a; Li et al., 2013a; Pathak et al., 2011;Wang et al., 2016b; Xu et al., 2012a; Ye et al., 2003; Zhaet al., 2014; Zhao et al., 2015a). Similar seasonal variationswere found for bsp and bap in the two PRD cities (Guangzhouand Hong Kong), which also agreed with the patterns ofPM2.5 and EC (Andreae et al., 2008; Cao et al., 2004, 2012b;Cui et al., 2015; Gao et al., 2015; Huang et al., 2014b; Junget al., 2009; Lai et al., 2007; Liu et al., 2014a; Louie et al.,2005a; Pathak et al., 2011; Tao et al., 2009, 2014c, 2015b,2017; Verma et al., 2010; Wu et al., 2009, 2013). The highestbsp and bap appeared in winter and the lowest in summer withseasonal variations up to a factor of 3.1 and 17.1 for bsp, 2.3and 5.9 for bap, in Guangzhou and Hong Kong, respectively.
3.2.3 Other cities
In Chengdu of southwest China, the highest bsp appeared inwinter and the lowest in summer with seasonal variations upto a factor of 1.9, which was consistent with the seasonalpattern of PM2.5 (Tao et al., 2014a, b). However, the highest
bap appeared in spring despite the highest EC in winter (Taoet al., 2014b). One explanation could be the large amountof OC emitted from biomass burning in spring, which en-hanced the absorption of EC (Schnaiter et al., 2005; Tao etal., 2013b). bsp and bap in winter were evidently higher thanthose in summer in Xi’an in northwest China, consistent withthe seasonal patterns of PM2.5 and EC, respectively (Cao etal., 2009, 2012a; Wang et al., 2015c).
Seasonal measurements of bsp and bap were also madeat remote sites (Dunhuang, Yulin and Zhangye of GansuProvince, Dongsheng of Inner Mongolia) focusing on dustaerosols and only covered spring and winter (Li et al., 2010;Xu et al., 2004; Yan, 2007). bsp in winter ranged from303 to 304 Mm−1, which is double that in spring (126 to183 Mm−1).
Atmos. Chem. Phys., 17, 9485–9518, 2017 www.atmos-chem-phys.net/17/9485/2017/
J. Tao et al.: A review of current knowledge concerning PM2.5 chemical composition 9503
4 Relationships between aerosol optical properties andPM2.5 mass concentrations
4.1 Mass scattering efficiency of PM2.5
bsp and PM2.5 mass concentration have been found to cor-relate well in numerous field studies (Andreae et al., 2008;Han et al., 2015; Hand and Malm, 2007b; Jung et al., 2009;Pu et al., 2015; Tao et al., 2014b, c, 2015a, 2016a; Tian etal., 2015; Wang et al., 2012b; Zhao et al., 2011). A parame-ter describing their relationship is defined as mass scatteringefficiency (MSE), which is the slope of the linear regressionof bsp against PM2.5 mass. MSE was found to vary with lo-cation and season due to the variations in PM2.5 chemicalcomposition. Some of the variations may due to differentsampling conditions, e.g., ambient (controlled RH < 60 %)versus dry condition (controlled RH < 40 %), online versusfilter-based PM2.5 sampling. Available MSE data are dis-cussed here, although uncertainties from measurements willnot be addressed in this study.
In BTH, annual average PM2.5 MSE was higher in Bei-jing (5.9 m2 g−1) than in rural Beijing (4.8 m2 g−1) basedon online PM2.5 mass (Zhao et al., 2011). In urban Beijingin winter of 2013, PM2.5 MSE increased to 4.9 m2 g−1 dur-ing a heavily pollution episode and decreased to 3.6 m2 g−1
during clean days, due to a large fraction of soluble inor-ganic components (e.g., (NH4)2SO4 and NH4NO3) in PM2.5under heavy polluted conditions (Tao et al., 2015a). In ru-ral Beijing in 2005–2010, dust episodes had lower PM2.5MSE (0.7 m2 g−1) and anthropogenic pollution episodes hadhigher PM2.5 MSE (4.3 m2 g−1) (Pu et al., 2015).
In YRD, annual average PM2.5 MSE ranged from3.8 m2 g−1 in Ningbo to 5.3 m2 g−1 in Hangzhou with aregional urban average (including the cities of Nanjing,Shanghai, Suzhou, Hangzhou and Ningbo) of 4.1 m2 g−1 in2011–2012 (Cheng et al., 2013b). PM2.5 MSE in Lin’an(4.0 m2 g−1), a rural site of YRD, was close to the regionalurban average value in YRD (Xu et al., 2002). PM2.5 MSEin Shanghai reached 5.6 m2 g−1 in winter of 2012 (Han etal., 2015), which was higher than that in Beijing in the sameseason (Tao et al., 2015a).
In PRD, annual average PM2.5 MSE in Guangzhou was3.5 m2 g−1 with seasonal average ranging from 2.3 m2 g−1
in summer to 4.5 m2 g−1 in autumn in 2009–2010 (Tao etal., 2014c). These values were close to 4.2 m2 g−1 (An-dreae et al., 2008) and 2.7 m2 g−1 (Jung et al., 2009) mea-sured in the same city in autumn of 2004. However, PM2.5MSE in rural Guangzhou (Wanqingsha, south of Guangzhou)was 5.3 m2 g−1 (Wang et al., 2012), which was evidentlyhigher than that in Guangzhou in the same season (Tao etal., 2014c).
In southwest China, seasonal average PM2.5 MSE rangedfrom 3.5 to 4.4 m2 g−1 in Chengdu in 2011 (Tao et al.,2014b). In northwest China, PM2.5 MSE was 3.0 m2 g−1 foranthropogenic pollution and 1.0 m2 g−1 for dust pollution at
a remote site (Yulin, located at the interface of the desert andloess regions, Shanxi Province), which was similar to ruralBeijing (Xu et al., 2004).
In summary, annual PM2.5 MSE typically ranged from 3.5to 5.9 m2 g−1 in urban areas in China with higher values innorth China and lower values in south China. Seasonal av-erage PM2.5 MSE typically ranged from 2.3 to 5.6 m2 g−1
with higher values in winter and autumn and lower values inspring and summer. Generally, PM2.5 MSE typically rangedfrom 3.0 to 5.0 m2 g−1 for anthropogenic pollution and from0.7 to 1.0 m2 g−1 for natural dust aerosols.
4.2 Mass absorption efficiency of EC andorganic matter
EC is the dominant absorption species in PM2.5. Simi-lar to PM2.5 MSE, the slope between bap and EC masswas defined as mass absorption efficiency (MAE) of EC.Various instruments have been used to measure bap in-cluding an Aethalometer, multi-angle absorption photometer(MAAP), Radiance Research particle soot absorption pho-tometer (PSAP) and photoacoustic spectrometer (PAS), withthe first two instruments measuring attenuation of the sam-ple on the filter for estimating BC mass concentration, andthe last two measuring bap directly. Most studies in Chinaused an Aethalometer and MAAP. BC mass concentrations(880 nm) were converted to bap (532 nm) using an empiricalconstant of 8.28 m2 g−1, which was obtained by the regres-sion between BC mass and bap synchronously measured inautumn in Guangzhou, keeping in mind that application of anempirical constant obtained from one specific study to othercases may cause large uncertainties (Wu et al., 2009).
EC MAE was 7.5–8.5 m2 g−1 in winter and 9.4 m2 g−1
in summer in Beijing (632 nm) (Cheng et al., 2011; Wuet al., 2016). The higher EC MAE in summer was likelydue to more coating of EC in higher ambient humidity (Wuet al., 2016). BC MAE was 6.5 m2 g−1 at 532 nm in au-tumn in Shenzhen of PRD (Lan et al., 2013). However, BCMAE was 12.4 m2 g−1 at 532 nm in winter in Xi’an (Wanget al., 2014a). Moreover, EC MAE of diesel was 8.4 m2 g−1
(632 nm), which was higher than those (3.0–6.8 m2 g−1)
of biomass burning sources (e.g., crop residual and wood)(Cheng et al., 2011).
Organic matter or brown carbon is also a strong light ab-sorbing material at short wavelengths. Available MAE valuesof OC include 0.76 m2 g−1 (532 nm) in autumn in 2008 inGuangzhou (Andreae et al., 2008). Moreover, available MAEvalues of water-soluble organic carbon (WSOC) include 1.79and 0.71 m2 g−1 (365 nm) in winter and summer, respec-tively, in Beijing (Cheng et al., 2011). The WSOC MAEsof wood, grass, corn and diesel tractors were 0.97, 0.90,1.05 and 1.33 m2 g−1 (365 nm), respectively, which weremuch higher than that of gasoline motorcycles (0.20 m2 g−1,365 nm) (Du et al., 2014b). Evidently, the MAEs of OC or
www.atmos-chem-phys.net/17/9485/2017/ Atmos. Chem. Phys., 17, 9485–9518, 2017
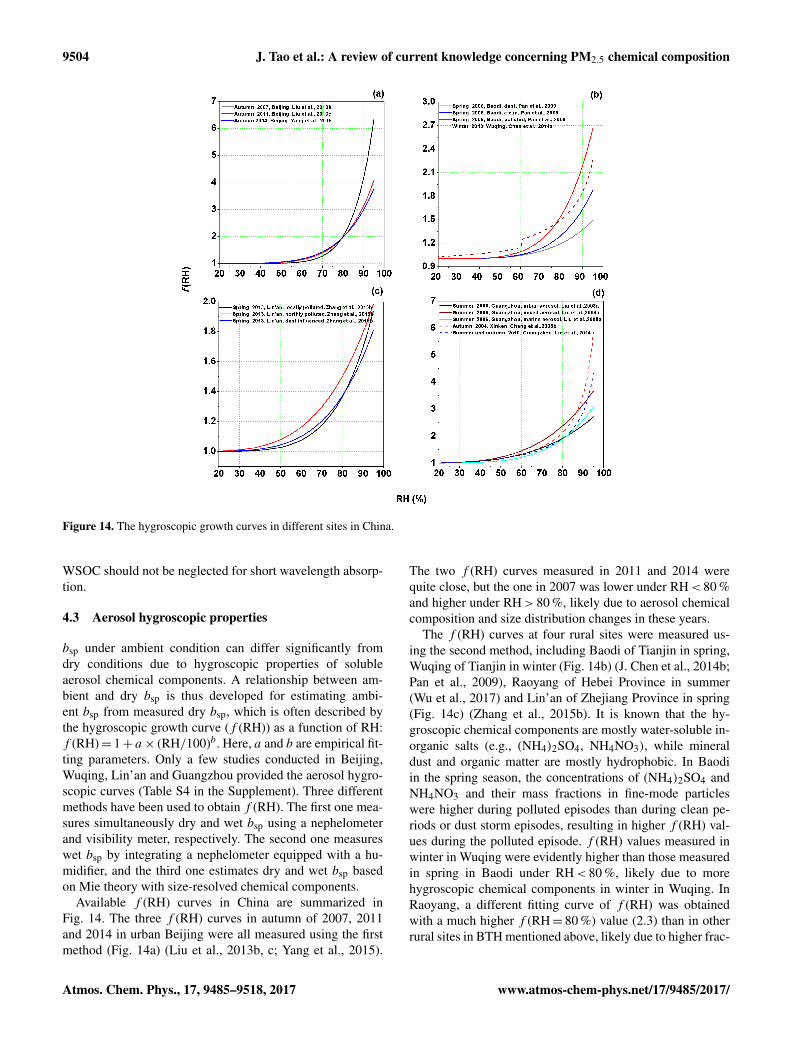
9504 J. Tao et al.: A review of current knowledge concerning PM2.5 chemical composition
Figure 14. The hygroscopic growth curves in different sites in China.
WSOC should not be neglected for short wavelength absorp-tion.
4.3 Aerosol hygroscopic properties
bsp under ambient condition can differ significantly fromdry conditions due to hygroscopic properties of solubleaerosol chemical components. A relationship between am-bient and dry bsp is thus developed for estimating ambi-ent bsp from measured dry bsp, which is often described bythe hygroscopic growth curve (f (RH)) as a function of RH:f (RH)= 1+ a× (RH/100)b. Here, a and b are empirical fit-ting parameters. Only a few studies conducted in Beijing,Wuqing, Lin’an and Guangzhou provided the aerosol hygro-scopic curves (Table S4 in the Supplement). Three differentmethods have been used to obtain f (RH). The first one mea-sures simultaneously dry and wet bsp using a nephelometerand visibility meter, respectively. The second one measureswet bsp by integrating a nephelometer equipped with a hu-midifier, and the third one estimates dry and wet bsp basedon Mie theory with size-resolved chemical components.
Available f (RH) curves in China are summarized inFig. 14. The three f (RH) curves in autumn of 2007, 2011and 2014 in urban Beijing were all measured using the firstmethod (Fig. 14a) (Liu et al., 2013b, c; Yang et al., 2015).
The two f (RH) curves measured in 2011 and 2014 werequite close, but the one in 2007 was lower under RH < 80 %and higher under RH > 80 %, likely due to aerosol chemicalcomposition and size distribution changes in these years.
The f (RH) curves at four rural sites were measured us-ing the second method, including Baodi of Tianjin in spring,Wuqing of Tianjin in winter (Fig. 14b) (J. Chen et al., 2014b;Pan et al., 2009), Raoyang of Hebei Province in summer(Wu et al., 2017) and Lin’an of Zhejiang Province in spring(Fig. 14c) (Zhang et al., 2015b). It is known that the hy-groscopic chemical components are mostly water-soluble in-organic salts (e.g., (NH4)2SO4, NH4NO3), while mineraldust and organic matter are mostly hydrophobic. In Baodiin the spring season, the concentrations of (NH4)2SO4 andNH4NO3 and their mass fractions in fine-mode particleswere higher during polluted episodes than during clean pe-riods or dust storm episodes, resulting in higher f (RH) val-ues during the polluted episode. f (RH) values measured inwinter in Wuqing were evidently higher than those measuredin spring in Baodi under RH < 80 %, likely due to morehygroscopic chemical components in winter in Wuqing. InRaoyang, a different fitting curve of f (RH) was obtainedwith a much higher f (RH= 80 %) value (2.3) than in otherrural sites in BTH mentioned above, likely due to higher frac-
Atmos. Chem. Phys., 17, 9485–9518, 2017 www.atmos-chem-phys.net/17/9485/2017/
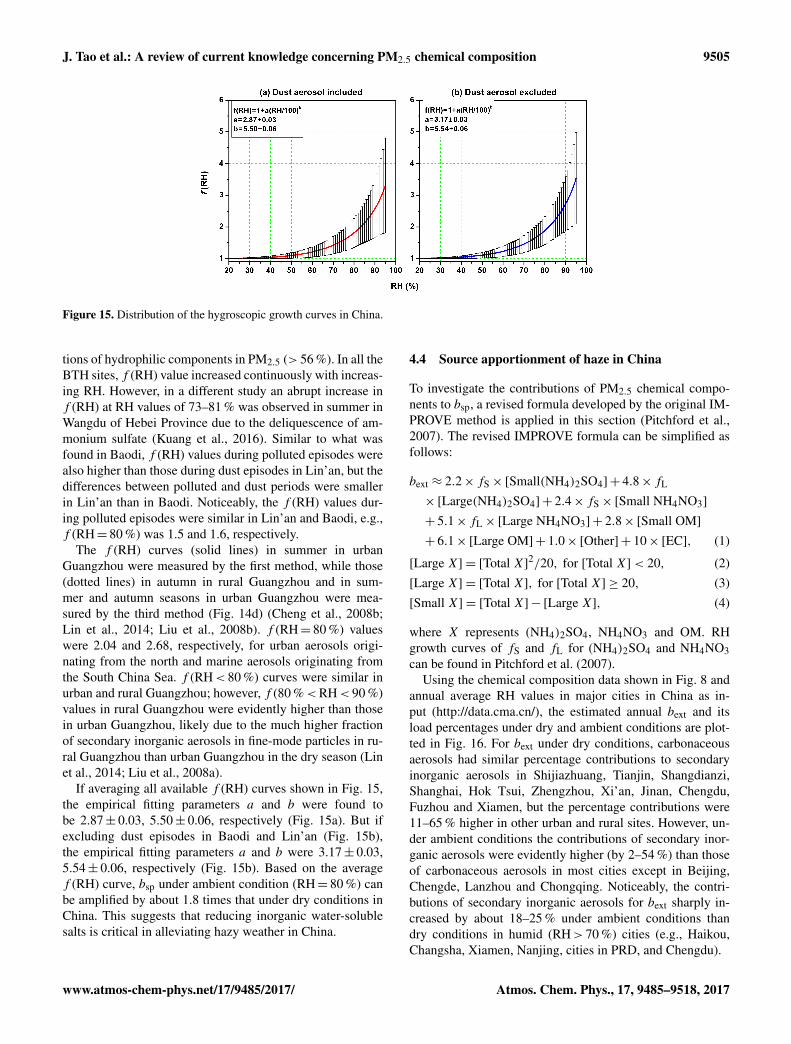
J. Tao et al.: A review of current knowledge concerning PM2.5 chemical composition 9505
Figure 15. Distribution of the hygroscopic growth curves in China.
tions of hydrophilic components in PM2.5 (> 56 %). In all theBTH sites, f (RH) value increased continuously with increas-ing RH. However, in a different study an abrupt increase inf (RH) at RH values of 73–81 % was observed in summer inWangdu of Hebei Province due to the deliquescence of am-monium sulfate (Kuang et al., 2016). Similar to what wasfound in Baodi, f (RH) values during polluted episodes werealso higher than those during dust episodes in Lin’an, but thedifferences between polluted and dust periods were smallerin Lin’an than in Baodi. Noticeably, the f (RH) values dur-ing polluted episodes were similar in Lin’an and Baodi, e.g.,f (RH= 80 %) was 1.5 and 1.6, respectively.
The f (RH) curves (solid lines) in summer in urbanGuangzhou were measured by the first method, while those(dotted lines) in autumn in rural Guangzhou and in sum-mer and autumn seasons in urban Guangzhou were mea-sured by the third method (Fig. 14d) (Cheng et al., 2008b;Lin et al., 2014; Liu et al., 2008b). f (RH= 80 %) valueswere 2.04 and 2.68, respectively, for urban aerosols origi-nating from the north and marine aerosols originating fromthe South China Sea. f (RH < 80 %) curves were similar inurban and rural Guangzhou; however, f (80 % < RH < 90 %)values in rural Guangzhou were evidently higher than thosein urban Guangzhou, likely due to the much higher fractionof secondary inorganic aerosols in fine-mode particles in ru-ral Guangzhou than urban Guangzhou in the dry season (Linet al., 2014; Liu et al., 2008a).
If averaging all available f (RH) curves shown in Fig. 15,the empirical fitting parameters a and b were found tobe 2.87± 0.03, 5.50± 0.06, respectively (Fig. 15a). But ifexcluding dust episodes in Baodi and Lin’an (Fig. 15b),the empirical fitting parameters a and b were 3.17± 0.03,5.54± 0.06, respectively (Fig. 15b). Based on the averagef (RH) curve, bsp under ambient condition (RH= 80 %) canbe amplified by about 1.8 times that under dry conditions inChina. This suggests that reducing inorganic water-solublesalts is critical in alleviating hazy weather in China.
4.4 Source apportionment of haze in China
To investigate the contributions of PM2.5 chemical compo-nents to bsp, a revised formula developed by the original IM-PROVE method is applied in this section (Pitchford et al.,2007). The revised IMPROVE formula can be simplified asfollows:
bext ≈ 2.2× fS×[Small(NH4)2SO4] + 4.8× fL
×[Large(NH4)2SO4] + 2.4× fS×[Small NH4NO3]
+ 5.1× fL×[Large NH4NO3] + 2.8×[Small OM]+ 6.1×[Large OM] + 1.0×[Other] + 10×[EC], (1)
[Large X] = [Total X]2/20, for [Total X]< 20, (2)[Large X] = [Total X], for [Total X] ≥ 20, (3)[Small X] = [Total X] − [Large X], (4)
where X represents (NH4)2SO4, NH4NO3 and OM. RHgrowth curves of fS and fL for (NH4)2SO4 and NH4NO3can be found in Pitchford et al. (2007).
Using the chemical composition data shown in Fig. 8 andannual average RH values in major cities in China as in-put (http://data.cma.cn/), the estimated annual bext and itsload percentages under dry and ambient conditions are plot-ted in Fig. 16. For bext under dry conditions, carbonaceousaerosols had similar percentage contributions to secondaryinorganic aerosols in Shijiazhuang, Tianjin, Shangdianzi,Shanghai, Hok Tsui, Zhengzhou, Xi’an, Jinan, Chengdu,Fuzhou and Xiamen, but the percentage contributions were11–65 % higher in other urban and rural sites. However, un-der ambient conditions the contributions of secondary inor-ganic aerosols were evidently higher (by 2–54 %) than thoseof carbonaceous aerosols in most cities except in Beijing,Chengde, Lanzhou and Chongqing. Noticeably, the contri-butions of secondary inorganic aerosols for bext sharply in-creased by about 18–25 % under ambient conditions thandry conditions in humid (RH > 70 %) cities (e.g., Haikou,Changsha, Xiamen, Nanjing, cities in PRD, and Chengdu).
www.atmos-chem-phys.net/17/9485/2017/ Atmos. Chem. Phys., 17, 9485–9518, 2017
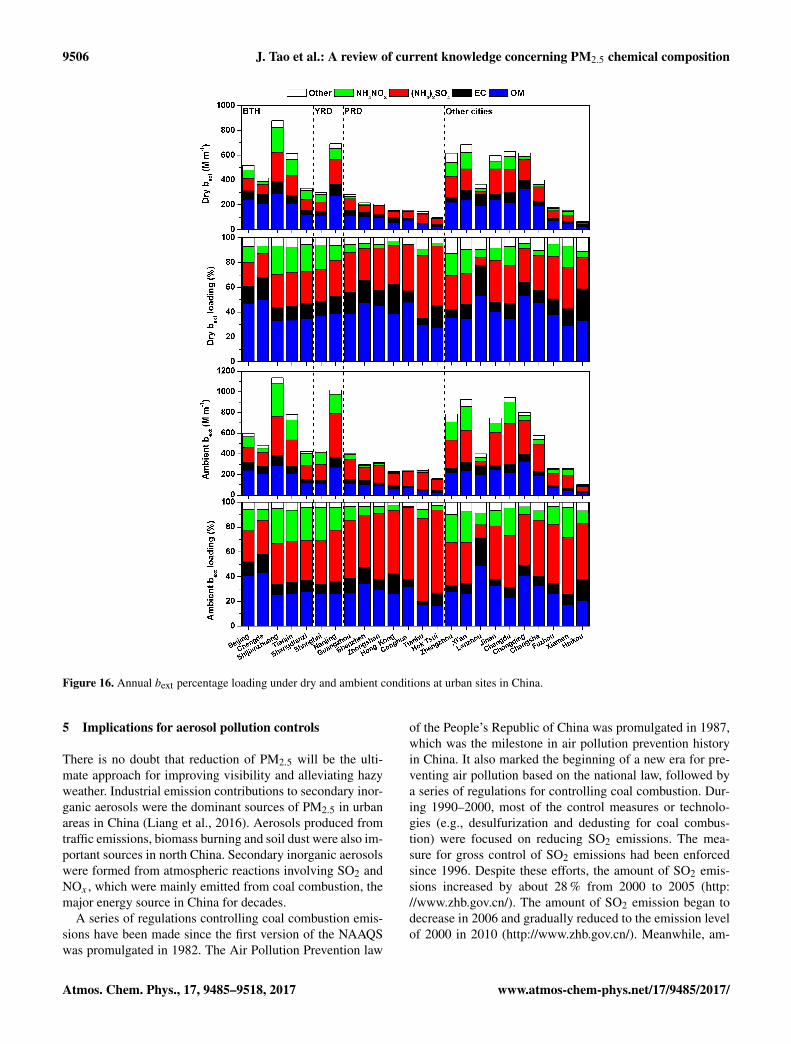
9506 J. Tao et al.: A review of current knowledge concerning PM2.5 chemical composition
Figure 16. Annual bext percentage loading under dry and ambient conditions at urban sites in China.
5 Implications for aerosol pollution controls
There is no doubt that reduction of PM2.5 will be the ulti-mate approach for improving visibility and alleviating hazyweather. Industrial emission contributions to secondary inor-ganic aerosols were the dominant sources of PM2.5 in urbanareas in China (Liang et al., 2016). Aerosols produced fromtraffic emissions, biomass burning and soil dust were also im-portant sources in north China. Secondary inorganic aerosolswere formed from atmospheric reactions involving SO2 andNOx , which were mainly emitted from coal combustion, themajor energy source in China for decades.
A series of regulations controlling coal combustion emis-sions have been made since the first version of the NAAQSwas promulgated in 1982. The Air Pollution Prevention law
of the People’s Republic of China was promulgated in 1987,which was the milestone in air pollution prevention historyin China. It also marked the beginning of a new era for pre-venting air pollution based on the national law, followed bya series of regulations for controlling coal combustion. Dur-ing 1990–2000, most of the control measures or technolo-gies (e.g., desulfurization and dedusting for coal combus-tion) were focused on reducing SO2 emissions. The mea-sure for gross control of SO2 emissions had been enforcedsince 1996. Despite these efforts, the amount of SO2 emis-sions increased by about 28 % from 2000 to 2005 (http://www.zhb.gov.cn/). The amount of SO2 emission began todecrease in 2006 and gradually reduced to the emission levelof 2000 in 2010 (http://www.zhb.gov.cn/). Meanwhile, am-
Atmos. Chem. Phys., 17, 9485–9518, 2017 www.atmos-chem-phys.net/17/9485/2017/
J. Tao et al.: A review of current knowledge concerning PM2.5 chemical composition 9507
bient annual SO2 concentration in urban cities in China alsodecreased from 57 µg m−3 in 2005 to 40 µg m−3 in 2010(http://www.zhb.gov.cn/). Apparently, the emission controlefforts for reducing SO2 emissions since 2006 have been ef-fective.
The control measures for NO2 only began with the con-trol of vehicular emissions in 1995, but the inclusion of NO2in the gross control indexes did not happen until 2010. Newcoal power plants were also required to denitrate after 2010.The emissions of NOx actually increased from 1996 to 2010,as seen in the vertical column NO2 derived from satellitedata (Zhang et al., 2012b). Although annual average ambientNO2 at the surface fluctuated from 30 to 40 µg m−3 during2000–2010 in China (http://www.zhb.gov.cn/), annual aver-age ambient NO2 in megacities (e.g., Beijing, Shanghai andGuangzhou) slowly increased. Evidently, the control of emis-sions of nitrate gaseous precursors was not very effective dur-ing 2000–2010.
Despite the above-mentioned control measures, sulfateconcentrations remained high and nitrate concentrations evengradually increased in megacities in China. More recently,the Clean Air Action Plan (CAAP) for improving air qualitywas promulgated and implemented by the State Council ofthe People’s Republic of China in 2013 (http://www.gov.cn).This plan aims to reduce the PM2.5 annual mass concentra-tions by 25, 20 and 15 % of the 2012 levels in BTH, YRD andPRD, respectively. Key industries, including power plants,iron and steel smelting, petroleum chemical, cement, non-ferrous metals smelting and chemical production, were re-quired to implement stricter emission standards in key re-gions including most megacities in China (http://www.zhb.gov.cn). Accordingly, annual average PM2.5 in China fromonline monitored data at 74 cities gradually decreased from72 µg m−3 in 2013 to 50 µg m−3 in 2015, showing somepromising results from the series of control measures.
One factor that needs to be considered in future pollu-tion reduction is the nonlinearity of chemistry (Cheng et al.,2016). For example, a model sensitivity study suggested apotential increase in NO−3 mass concentrations due to the in-creased atmospheric oxidizing capacity, even with decreas-ing NOx emissions (Zhao et al., 2013a). Furthermore, in-creased atmospheric oxidizing capacity may also enhance theconversion of volatile organic compounds to OM. In fact, thecontribution of secondary organic aerosols to PM2.5 was alsohigh and could increase further in typical megacities in China(He et al., 2011; Huang et al., 2014b; Sun et al., 2013). An-other factor that requires more attention is ammonia emis-sions from agricultural activities in rural areas and humanactivities in cities. Ammonia emissions can enhance PM2.5pollution substantially, especially in ammonia-limited (acidaerosols) areas (Wang et al., 2011). This topic needs furtherinvestigation through both modeling simulation and field ob-servations.
To improve the air quality across China, the followingrecommendations are provided based on the major chemi-
cal components contributing to PM2.5 and their impact onaerosol optical properties. Emissions produced from coalcombustion, in both the industrial sectors and in residentialareas, need to be further reduced. While advanced pollutioncontrol technologies should be adopted in the medium termin major industrial sectors consuming coal, cleaner energysources should be considered a long-term goal (Cao et al.,2016). Providing cleaner energy to the vast rural and urbanareas in north China for heating and cooking can reduce notonly coal combustion emissions but also biomass burningemissions. Efficient use of fertilizers in agriculture is neededto reduce nitrogen emissions especially ammonia (Behera etal., 2013). Educating the public to reduce meat consumptionin their daily lives, especially in the more affluent developedregions, can reduce the nitrogen footprint substantially andthus nitrogen emissions (Galloway et al., 2014), in additionto the potential benefits to human health. Traffic emissions inmegacities may also need to be constrained, such as devel-oping more efficient public transportation systems and limit-ing the use of personal automobiles. Having more vegetationcoverage is especially important in arid or semi-arid areasas well as urban areas in reducing dust emissions (Baldauf,2017), aside from the biological benefits. The continued ex-pansion of the three northern region shelter forests in northChina can potentially reduce dust emissions by increasingthe dry deposition removal of aerosols (Zhang et al., 2017a).
Data availability. Data used in this study are from literature sur-veys and are available in the Supplement of this paper.
The Supplement related to this article is available onlineat https://doi.org/10.5194/acp-17-9485-2017-supplement.
Competing interests. The authors declare that they have no conflictof interest.
Acknowledgements. This study was supported by the NationalNatural Science Foundation of China (no. 41475119).
Edited by: Yun QianReviewed by: three anonymous referees
References
Andreae, M. O., Schmid, O., Yang, H., Chand, D., Zhen Yu, J.,Zeng, L. M., and Zhang, Y. H.: Optical properties and chemi-cal composition of the atmospheric aerosol in urban Guangzhou,China, Atmos. Environ., 42, 6335–6350, 2008.
www.atmos-chem-phys.net/17/9485/2017/ Atmos. Chem. Phys., 17, 9485–9518, 2017
9508 J. Tao et al.: A review of current knowledge concerning PM2.5 chemical composition
Baldauf, R.: Roadside vegetation design characteristics that can im-prove local, near-road air quality, Transport. Res. D-Tr. E., 52A,354–361, 2017.
Behera, S. N., Sharma, M., Aneja, V. P., and Balasubramanian, R.:Ammonia in the atmosphere: A review on emission sources, at-mospheric chemistry and deposition on terrestrial bodies, Envi-ron. Sci. Pollut. Research, 20, 8092–8131, 2013.
Bergin, M. H., Cass, G. R., Xu, J., Fang, C., Zeng, L., Yu, T.,Salmon, L. G., Kiang, C. S., Tang, X. Y., and Zhang, Y.: Aerosolradiative, physical, and chemical properties in Beijing duringJune 1999, J. Geophys. Res., 106, 17969–17980, 2001.
Bond, T. C., Habib, G., and Bergstrom, R. W.: Limi-tations in the enhancement of visible light absorptiondue to mixing state, J. Geophys. Res., 111, D20211,https://doi.org/10.1029/2006JD007315, 2006.
Cao, J., Lee, S., Ho, K., Zou, S., Fung, K., Li, Y., Watson, J. G., andChow, J. C.: Spatial and seasonal variations of atmospheric or-ganic carbon and elemental carbon in Pearl River Delta Region,China, Atmos. Environ., 38, 4447–4456, 2004.
Cao, J., Zhu, C., Chow, J. C., Watson, J. G., Han, Y., Wang, G.,Shen, Z., and An, Z.: Black carbon relationships with emissionsand meteorology in Xi’an, China, Atmos. Res., 94, 194–202,2009.
Cao, J., Wang, Q., Chow, J. C., Watson, J. G., Tie, X., Shen, Z.,Wang, P., and An, Z.: Impacts of aerosol compositions on visibil-ity impairment in Xi’an, China, Atmos. Environ., 59, 559–566,2012a.
Cao, J., Shen, Z., Chow, J. C., Watson, J. G., Lee, S., Tie, X., Ho,K., Wang, G., and Han, Y.: Winter and summer PM2.5 chemicalcompositions in fourteen Chinese cities, J. Air Waste Manage.,62, 1214–1226, 2012b.
Cao, J., Cohen, A. M., Hansen, J. E., Lester, R. K., Peterson, P. F.,and Xu, H.: China-U.S. cooperation to advance nuclear power,Science, 353, 547–548, 2016.
Cao, J.-J., Zhu, C.-S., Tie, X.-X., Geng, F.-H., Xu, H.-M., Ho, S. S.H., Wang, G.-H., Han, Y.-M., and Ho, K.-F.: Characteristics andsources of carbonaceous aerosols from Shanghai, China, Atmos.Chem. Phys., 13, 803–817, https://doi.org/10.5194/acp-13-803-2013, 2013.
Chan, C. K. and Yao, X.: Air pollution in mega cities in China,Atmos. Environ., 42, 1–42, 2008.
Chan, C. Y., Xu, X., Li, Y. S., Wong, K. H., Ding, G. A., Chan, L.Y., and Cheng, X.: Characteristics of vertical profiles and sourcesof PM2.5, PM10 and carbonaceous species in Beijing, Atmos.Environ., 39, 5113–5124, 2005.
Che, H., Yang, Z., Zhang, X., Zhu, C., Ma, Q., Zhou, H., and Wang,P.: Study on the aerosol optical properties and their relationshipwith aerosol chemical compositions over three regional back-ground stations in China, Atmos. Environ., 43, 1093–1099, 2009.
Che, H., Xia, X., Zhu, J., Li, Z., Dubovik, O., Holben, B.,Goloub, P., Chen, H., Estelles, V., Cuevas-Agulló, E., Blarel,L., Wang, H., Zhao, H., Zhang, X., Wang, Y., Sun, J., Tao,R., Zhang, X., and Shi, G.: Column aerosol optical propertiesand aerosol radiative forcing during a serious haze-fog monthover North China Plain in 2013 based on ground-based sun-photometer measurements, Atmos. Chem. Phys., 14, 2125–2138,https://doi.org/10.5194/acp-14-2125-2014, 2014.
Che, H., Zhang, X.-Y., Xia, X., Goloub, P., Holben, B., Zhao,H., Wang, Y., Zhang, X. C., Wang, H., Blarel, L., Damiri,
B., Zhang, R., Deng, X., Ma, Y., Wang, T., Geng, F., Qi, B.,Zhu, J., Yu, J., Chen, Q., and Shi, G.: Ground-based aerosolclimatology of China: aerosol optical depths from the ChinaAerosol Remote Sensing Network (CARSNET) 2002–2013, At-mos. Chem. Phys., 15, 7619–7652, https://doi.org/10.5194/acp-15-7619-2015, 2015.
Chen, J., Qiu, S., Shang, J., Wilfrid, O. M. F., Liu, X., Tian, H.,and Boman, J.: Impact of relative humidity and water solubleconstituents of PM2.5 on visibility impairment in Beijing, China,Aerosol Air Qual. Res., 14, 260–268, 2014a.
Chen, J., Zhao, C. S., Ma, N., and Yan, P.: Aerosol hygroscopicityparameter derived from the light scattering enhancement factormeasurements in the North China Plain, Atmos. Chem. Phys., 14,8105–8118, https://doi.org/10.5194/acp-14-8105-2014, 2014b.
Chen, Y., Schleicher, N., Chen, Y., Chai, F., and Norra, S.: Theinfluence of governmental mitigation measures on contamina-tion characteristics of PM2.5 in Beijing, Sci. Total Environ.,490, 647–658, https://doi.org/10.1016/j.scitotenv.2014.05.049,2014a.
Chen, Y., Xie, S., Luo, B., and Zhai, C.: Character-istics and origins of carbonaceous aerosol in theSichuan Basin, China, Atmos. Environ., 94, 215–223,https://doi.org/10.1016/j.atmosenv.2014.05.037, 2014b.
Chen, Y., Xie, S., Luo, B., and Zhai, C.: Particulate pollu-tion in urban Chongqing of southwest China: Historicaltrends of variation, chemical characteristics and sourceapportionment, Sci. Total Environ., 584–585, 523–534,https://doi.org/10.1016/j.scitotenv.2017.01.060, 2017.
Cheng, I., Xu, X., and Zhang, L.: Overview of receptor-based source apportionment studies for speciated atmo-spheric mercury, Atmos. Chem. Phys., 15, 7877–7895,https://doi.org/10.5194/acp-15-7877-2015, 2015.
Cheng, T., Xu, C., Duan, J., Wang, Y., Leng, C., Tao, J., Che, H., He,Q., Wu, Y., and Zhang, R.: Seasonal variation and difference ofaerosol optical properties in columnar and surface atmospheresover Shanghai, Atmos. Environ., 123, 315–326, 2015.
Cheng, Y., Lee, S. C., Ho, K. F., Wang, Y. Q., Cao, J. J., Chow, J. C.,and Watson, J. G.: Black carbon measurement in a coastal areaof South China, J. Geophys. Res., 111, 1–11, 2006a.
Cheng, Y., Wiedensohler, A., Eichler, H., Su, H., Gnauk, T.,Brüggemann, E., Herrmann, H., Heintzenberg, J., Slanina, J., andTuch, T.: Aerosol optical properties and related chemical appor-tionment at Xinken in Pearl River Delta of China, Atmos. Envi-ron., 42, 6351–6372, 2008a.
Cheng, Y., He, K.-B., Zheng, M., Duan, F.-K., Du, Z.-Y., Ma,Y.-L., Tan, J.-H., Yang, F.-M., Liu, J. M., Zhang, X. L., We-ber, R. J., Bergin, M. H., and Russell, A. G.: Mass absorptionefficiency of elemental carbon and water-soluble organic car-bon in Beijing, China, Atmos. Chem. Phys., 11, 11497–11510,https://doi.org/10.5194/acp-11-11497-2011, 2011.
Cheng, Y., Engling, G., He, K.-B., Duan, F. K., Ma, Y. L., Du, Z.Y., Liu, J. M., Zheng, M., and Weber, R. J.: Biomass burningcontribution to Beijing aerosol, Atmos. Chem. Phys., 13, 7765–7781, https://doi.org/10.5194/acp-13-7765-2013, 2013a.
Cheng, Y., Zheng, G., Wei, C., Mu, Q., Zheng, B., Wang, Z., Gao,M., Zhang, Q., He, K., Carmichael, G., Pöschl, U., and Su,H.: Reactive nitrogen chemistry in aerosol water as a sourceof sulfate during haze events in China, Sci. Adv., 2, e1601530,https://doi.org/10.1126/sciadv.1601530, 2016.
Atmos. Chem. Phys., 17, 9485–9518, 2017 www.atmos-chem-phys.net/17/9485/2017/
J. Tao et al.: A review of current knowledge concerning PM2.5 chemical composition 9509
Cheng, Y. F., Eichler, H., Wiedensohler, A., Heintzenberg,J., Zhang, Y. H., Hu, M., Herrmann, H., Zeng, L. M.,Liu, S., and Gnauk, T.: Mixing state of elemental car-bon and non-light-absorbing aerosol components derivedfrom in situ particle optical properties at Xinken in PearlRiver Delta of China, J. Geophys. Res., 111, D20204,https://doi.org/10.1029/2005JD006929, 2006b.
Cheng, Y. F., Wiedensohler, A., Eichler, H., Heintzenberg, J.,Tesche, M., Ansmann, A., Wendisch, M., Su, H., Althausen, D.,and Herrmann, H.: Relative humidity dependence of aerosol op-tical properties and direct radiative forcing in the surface bound-ary layer at Xinken in Pearl River Delta of China: An observationbased numerical study, Atmos. Environ., 42, 6373–6397, 2008b.
Cheng, Y. F., Berghof, M., Garland, R. M., Wiedensohler, A.,Wehner, B., Muller, T., Su, H., Zhang, Y., Achtert, P., and Nowak,A.: Influence of soot mixing state on aerosol light absorptionand single scattering albedo during air mass aging at a pol-luted regional site in northeastern China, J. Geophys. Res., 114,D00G10, https://doi.org/10.1029/2008JD010883, 2009.
Cheng, Z., Wang, S., Jiang, J., Fu, Q., Chen, C., Xu, B., Yu, J., Fu,X., and Hao, J.: Long-term trend of haze pollution and impactof particulate matter in the Yangtze River Delta, China, Environ.Pollut., 182, 101–110, 2013b.
Cheung, H. C., Wang, T., Baumann, K., and Guo, H.: Influence ofregional pollution outflow on the concentrations of fine particu-late matter and visibility in the coastal area of southern China,Atmos. Environ., 39, 6463–6474, 2005.
Chow, J. C., Watson, J. G., Lowenthal, D. H., and Magliano, K. L.:Loss of PM2.5 nitrate from filter samples in central California,Journal of The Air & Waste Management Association, 55, 1158-1168, 2005.
Chow, J. C., Watson, J. G., Crow, D., Lowenthal, D. H., and Mer-rifield, T.: Comparison of IMPROVE and NIOSH carbon mea-surements, Aerosol Sci. Tech., 34, 23–34, 2010.
Cui, H., Chen, W., Dai, W., Liu, H., Wang, X., and He,K.: Source apportionment of PM2.5 in Guangzhou com-bining observation data analysis and chemical trans-port model simulation, Atmos. Environ., 116, 262–271,https://doi.org/10.1016/j.atmosenv.2015.06.054, 2015.
Dai, W., Gao, J., Cao, G., and Ouyang, F.: Chemical com-position and source identification of PM2.5 in the sub-urb of Shenzhen, China, Atmos. Res., 122, 391–400,https://doi.org/10.1016/j.atmosres.2012.12.004, 2013.
Dan, M., Zhuang, G., Li, X., Tao, H., and Zhuang, Y.: The charac-teristics of carbonaceous species and their sources in PM2.5 inBeijing, Atmos. Environ., 38, 3443–3452, 2004.
Du, Z., He, K., Cheng, Y., Duan, F., Ma, Y., Liu, J., Zhang, X.,Zheng, M., and Weber, R.: A yearlong study of water-soluble or-ganic carbon in Beijing I: Sources and its primary vs. secondarynature, Atmos. Environ., 92, 514–521, 2014a.
Du, Z., He, K., Cheng, Y., Duan, F., Ma, Y., Liu, J., Zhang, X.,Zheng, M., and Weber, R.: A yearlong study of water-solubleorganic carbon in Beijing II: Light absorption properties, Atmos.Environ., 89, 235–241, 2014b.
Duan, F., Liu, X., Yu, T., and Cachier, H.: Identification and estimateof biomass burning contribution to the urban aerosol organic car-bon concentrations in Beijing, Atmos. Environ., 38, 1275–1282,2004.
Duan, F., He, K., Ma, Y., Yang, F., Yu, X., Cadle, S., Chan, T., andMulawa, P.: Concentration and chemical characteristics of PM2.5in Beijing, China: 2001–2002, Sci. Total Environ., 355, 264–275,2006.
Duan, J., Tan, J., Cheng, D., Bi, X., Deng, W., Sheng, G., Fu, J.,and Wong, M. H.: Sources and characteristics of carbonaceousaerosol in two largest cities in Pearl River Delta Region, China,Atmos. Environ., 41, 2895–2903, 2007.
Fan, X., Chen, H., Xia, X., Li, Z., and Cribb, M.: Aerosol opticalproperties from the Atmospheric Radiation Measurement Mo-bile Facility at Shouxian, China, J. Geophys. Res., 115, D00K33,https://doi.org/10.1029/2010JD014650, 2010.
Fang, M., Chan, C. K., and Yao, X.: Managing air quality in arapidly developing nation: China, Atmos. Environ., 43, 79–86,2009.
Feng, J., Chan, C. K., Fang, M., Hu, M., He, L., and Tang, X.: Char-acteristics of organic matter in PM2.5 in Shanghai, Chemosphere,64, 1393–1400, 2006.
Feng, J., Sun, P., Hu, X., Zhao, W., Wu, M., and Fu, J.: The chem-ical composition and sources of PM2.5 during the 2009 ChineseNew Year’s holiday in Shanghai, Atmos. Res., 118, 435–444,https://doi.org/10.1016/j.atmosres.2012.08.012, 2012a.
Feng, J., Zhong, M., Xu, B., Du, Y., Wu, M., Wang, H., and Chen,C.: Concentrations, seasonal and diurnal variations of black car-bon in PM2.5 in Shanghai, China, Atmos. Res., 147, 1–9, 2014.
Feng, J., Hu, J., Xu, B., Hu, X., Sun, P., Han, W., Gu, Z., Yu,X., and Wu, M.: Characteristics and seasonal variation of or-ganic matter in PM2.5 at a regional background site of theYangtze River Delta region, China, Atmos. Environ., 123, 288–297, https://doi.org/10.1016/j.atmosenv.2015.08.019, 2015.
Feng, J. L., Guo, Z. G., Zhang, T. R., Yao, X., Chan, C. K., andFang, M.: Source and formation of secondary particulate matterin PM2.5 in Asian continental outflow, J. Geophys. Res., 117,D03302, https://doi.org/10.1029/2011JD016400, 2012b.
Feng, Y., Chen, Y., Guo, H., Zhi, G., Xiong, S., Li, J., Sheng, G., andFu, J.: Characteristics of organic and elemental carbon in PM2.5samples in Shanghai, China, Atmos. Res., 92, 434–442, 2009.
Fontes, T., Li, P., Barros, N., and Zhao, P.: Trends of PM2.5 concen-trations in China: A long term approach, J. Environ. Manage.,196, 719–732, 2017.
Fu, X., Wang, X., Guo, H., Cheung, K., Ding, X., Zhao, X.,He, Q., Gao, B., Zhang, Z., Liu, T., and Zhang, Y.: Trends ofambient fine particles and major chemical components in thePearl River Delta region: Observation at a regional backgroundsite in fall and winter, Sci. Total Environ., 497–498, 274–281,https://doi.org/10.1016/j.scitotenv.2014.08.008, 2014.
Fuzzi, S., Baltensperger, U., Carslaw, K., Decesari, S., Denier vander Gon, H., Facchini, M. C., Fowler, D., Koren, I., Langford,B., Lohmann, U., Nemitz, E., Pandis, S., Riipinen, I., Rudich,Y., Schaap, M., Slowik, J. G., Spracklen, D. V., Vignati, E.,Wild, M., Williams, M., and Gilardoni, S.: Particulate matter,air quality and climate: lessons learned and future needs, At-mos. Chem. Phys., 15, 8217–8299, https://doi.org/10.5194/acp-15-8217-2015, 2015.
Gao, Y., Lai, S., Lee, S., Yau, P. S., Huang, Y., Cheng, Y., Wang,T., Xu, Z., Yuan, C., and Zhang, Y.: Optical properties of size-resolved particles at a Hong Kong urban site during winter, At-mos. Res., 155, 1–12, 2015.
www.atmos-chem-phys.net/17/9485/2017/ Atmos. Chem. Phys., 17, 9485–9518, 2017
9510 J. Tao et al.: A review of current knowledge concerning PM2.5 chemical composition
Galloway, J. N., Winiwarter, W., Leip, A., Leach, A. M.,Bleeker, A., and Erisman, J. W.: Nitrogen footprints:Past, present and future, Environ. Res. Lett., 9, 115003,https://doi.org/10.1088/1748-9326/9/11/115003, 2014.
Garland, R. M., Yang, H., Schmid, O., Rose, D., Nowak, A.,Achtert, P., Wiedensohler, A., Takegawa, N., Kita, K., Miyazaki,Y., Kondo, Y., Hu, M., Shao, M., Zeng, L. M., Zhang, Y. H., An-dreae, M. O., and Pöschl, U.: Aerosol optical properties in a ruralenvironment near the mega-city Guangzhou, China: implicationsfor regional air pollution, radiative forcing and remote sensing,Atmos. Chem. Phys., 8, 5161–5186, https://doi.org/10.5194/acp-8-5161-2008, 2008.
Garland, R. M., Schmid, O., Nowak, A., Achtert, P., Wieden-sohler, A., Gunthe, S. S., Takegawa, N., Kita, K., Kondo, Y.,and Hu, M.: Aerosol optical properties observed during Cam-paign of Air Quality Research in Beijing 2006 (CAREBeijing-2006): Characteristic differences between the inflow and out-flow of Beijing city air, J. Geophys. Res., 114, D00G04,https://doi.org/10.1029/2008JD010780, 2009.
Geng, N., Wang, J., Xu, Y., Zhang, W., Chen, C., and Zhang, R.:PM2.5 in an industrial district of Zhengzhou, China: Chemicalcomposition and source apportionment, Particuology, 11, 99–109, 2013.
Ginoux, P., Prospero, J. M., Gill, T. E., Hsu, N. C., andZhao, M.: Global-scale attribution of anthropogenic and nat-ural dust sources and their emission rates based on MODISDeep Blue aerosol products, Rev. Geophys., 50, RG3005,https://doi.org/10.1029/2012RG000388, 2012.
Griffith, S. M., Huang, X. H. H., Louie, P. K. K., and Yu, J. Z.: Char-acterizing the thermodynamic and chemical composition factorscontrolling PM2.5 nitrate: Insights gained from two years of on-line measurements in Hong Kong, Atmos. Environ., 122, 864–875, https://doi.org/10.1016/j.atmosenv.2015.02.009, 2015.
Gu, J., Bai, Z., Liu, A., Wu, L., Xie, Y., Li, W., Dong, H., and Zhang,X.: Characterization of Atmospheric Organic Carbon and Ele-ment Carbon of PM2.5 and PM10 at Tianjin, China, Aerosol AirQual. Res., 10, 167–176, 2010.
Gu, J., Bai, Z., Li, W., Wu, L., Liu, A., Dong, H., and Xie, Y.: Chem-ical composition of PM2.5 during winter in Tianjin, China, Par-ticuology, 9, 215–221, 2011.
Guan, D., Su, X., Zhang, Q., Peters, G. P., Liu, Z., Lei,Y., and He, K.: The socioeconomic drivers of China’s pri-mary PM2.5 emissions, Environ. Res. Lett., 9, 024010,https://doi.org/10.1088/1748-9326/9/2/024010, 2014.
Guo, H., Ding, A. J., So, K. L., Ayoko, G. A., Li, Y., and Hung, W.T.: Receptor modeling of source apportionment of Hong Kongaerosols and the implication of urban and regional contribution,Atmos. Environ., 43, 1159–1169, 2009a.
Guo, J., Zhang, X., Che, H., Gong, S., An, X., Cao, C., Guang, J.,Zhang, H., Wang, Y., and Zhang, X.: Correlation between PMconcentrations and aerosol optical depth in eastern China, At-mos. Environ., 43, 5876–5886, 2009b.
Guo, J., Xia, F., Zhang, Y., Liu, H., Li, J., Lou, M., He, J., Yan, Y.,Wang, F., Min, M., and Zhai, P.: Impact of diurnal variability andmeteorological factors on the PM2.5 – AOD relationship: Impli-cations for PM2.5 remote sensing, Environ. Pollut., 221, 94–104,https://doi.org/10.1016/j.envpol.2016.11.043, 2017.
Guo, S., Hu, M., Zamora, M. L., Peng, J., Shang, D., Zheng, J., Du,Z., Wu, Z., Shao, M., and Zeng, L.: Elucidating severe urban haze
formation in China, P. Natl. Acad. Sci. USA, 111, 17373–17378,2014.
Hagler, G. S. W., Bergin, M. H., Salmon, L. G., Yu, J. Z.,Wan, E. C. H., Zheng, M., Zeng, L. M., Kiang, C. S., Zhang,Y. H., Lau, A. K. H., and Schauer, J. J.: Source areas andchemical composition of fine particulate matter in the PearlRiver Delta region of China, Atmos. Environ., 40, 3802–3815,https://doi.org/10.1016/j.atmosenv.2006.02.032, 2006.
Han, T., Liu, X., Zhang, Y., Qu, Y., Gu, J., Ma, Q., Lu, K., Tian, H.,Chen, J., and Zeng, L.: Characteristics of aerosol optical prop-erties and their chemical apportionments during CAREBeijing2006, Aerosol Air Qual. Res., 14, 1431–1442, 2014.
Han, T., Qiao, L., Zhou, M., Qu, Y., Du, J., Liu, X., Lou, S., Chen,C., Wang, H., and Zhang, F.: Chemical and optical propertiesof aerosols and their interrelationship in winter in the megacityShanghai of China, J. Environ. Sci., 27, 59–69, 2015.
Hand, J. L. and Malm, W. C.: Review of the IMPROVE equation forestimating ambient light extinction coefficients, CIRA, ColoradoState University, 2007a.
Hand, J. L. and Malm, W. C.: Review of aerosol massscattering efficiencies from ground-based measure-ments since 1990, J. Geophys. Res., 112, D16203,https://doi.org/10.1029/2007JD008484, 2007b.
He, K., Yang, F., Ma, Y., Zhang, Q., Yao, X., Chan, C. K., Cadle,S., Chan, T., and Mulawa, P.: The characteristics of PM2.5 inBeijing, China, Atmos. Environ., 35, 4959–4970, 2001.
He, K., Zhao, Q., Ma, Y., Duan, F., Yang, F., Shi, Z., andChen, G.: Spatial and seasonal variability of PM2.5 acidity attwo Chinese megacities: insights into the formation of sec-ondary inorganic aerosols, Atmos. Chem. Phys., 12, 1377–1395,https://doi.org/10.5194/acp-12-1377-2012, 2012.
He, L. Y., Hu, M., Zhang, Y. H., Huang, X. F., and Yao, T. T.: Fineparticle emissions from on-road vehicles in the Zhujiang Tunnel,China, Environ. Sci. Technol., 42, 4461–4466, 2008.
He, L. Y., Huang, X. F., Xue, L., Hu, M., Lin, Y., Zheng,J., Zhang, R., and Zhang, Y. H.: Submicron aerosol analy-sis and organic source apportionment in an urban atmospherein Pearl River Delta of China using high-resolution aerosolmass spectrometry, J. Geophys. Res.-Atmos., 116, D12304,https://doi.org/10.1029/2010JD014566, 2011.
He, X., Li, C. C., Lau, A. K. H., Deng, Z. Z., Mao, J. T., Wang, M.H., and Liu, X. Y.: An intensive study of aerosol optical proper-ties in Beijing urban area, Atmos. Chem. Phys., 9, 8903–8915,https://doi.org/10.5194/acp-9-8903-2009, 2009.
Ho, K. F., Lee, S. C., Cao, J. J., Chow, J. C., Watson, J. G., andChan, C. K.: Seasonal variations and mass closure analysis ofparticulate matter in Hong Kong, Sci. Total Environ., 355, 276–287, 2006a.
Ho, K. F., Cao, J. J., Lee, S. C., and Chan, C. K.: Source apportion-ment of PM2.5 in urban area of Hong Kong, J. Hazard. Mater.,138, 73–85, 2006b.
Hopke, P. K.: Review of receptor modeling methods for source ap-portionment, J. Air Waste Manage., 66, 237–259, 2016.
Hou, B., Zhuang, G., Zhang, R., Liu, T., Guo, Z., and Chen, Y.:The implication of carbonaceous aerosol to the formation ofhaze: Revealed from the characteristics and sources of OC/ECover a mega-city in China, J. Hazard. Mater., 190, 529–536,https://doi.org/10.1016/j.jhazmat.2011.03.072, 2011.
Atmos. Chem. Phys., 17, 9485–9518, 2017 www.atmos-chem-phys.net/17/9485/2017/
J. Tao et al.: A review of current knowledge concerning PM2.5 chemical composition 9511
Hu, M., Wu, Z., Slanina, J., Lin, P., Liu, S., and Zeng, L.: Acidicgases, ammonia and water-soluble ions in PM2.5 at a coastal sitein the Pearl River Delta, China, Atmos. Environ., 42, 6310–6320,2008.
Hu, X., Waller, L. A., Alhamdan, M. Z., Crosson, W. L., Estes, M.G., Estes, S., Quattrochi, D. A., Sarnat, J. A., and Liu, Y.: Es-timating ground-level PM2.5 concentrations in the southeasternU.S. using geographically weighted regression, Environ. Res.,121, 1–10, 2013.
Huang, G., Cheng, T., Zhang, R., Tao, J., Leng, C., Zhang, Y., Zha,S., Zhang, D., Li, X., and Xu, C.: Optical properties and chem-ical composition of PM2.5 in Shanghai in the spring of 2012,Particuology, 13, 52–59, 2014a.
Huang, H., Lee, S. C., Cao, J. J., Zou, C. W., Chen, X. G., andFan, S. J.: Characteristics of indoor/outdoor PM2.5 and elementalcomponents in generic urban, roadside and industrial plant areasof Guangzhou city, China, J. Environ. Sci., 19, 35–43, 2007.
Huang, H., Ho, K. F., Lee, S. C., Tsang, P. K., Ho, S.S. H., Zou, C. W., Zou, S. C., Cao, J. J., and Xu, H.M.: Characteristics of carbonaceous aerosol in PM2.5: PearlDelta River Region, China, Atmos. Res., 104–105, 227–236,https://doi.org/10.1016/j.atmosres.2011.10.016, 2012.
Huang, R. J., Zhang, Y., Bozzetti, C., Ho, K. F., Cao, J. J., Han, Y.,Daellenbach, K. R., Slowik, J. G., Platt, S. M., and Canonaco,F.: High secondary aerosol contribution to particulate pollutionduring haze events in China, Nature, 514, 218–222, 2014b.
Huang, X., Yun, H., Gong, Z., Li, X., He, L., Zhang, Y., and Hu, M.:Source apportionment and secondary organic aerosol estimationof PM2.5 in an urban atmosphere in China, Sci. China-Earth Sci.,57, 1352–1362, 2013.
Huang, X. H. H., Bian, Q., Ng, W. M., Louie, P. K. K., and Yu, J.Z.: Characterization of PM2.5 major components and source In-vestigation in suburban Hong Kong: a one year monitoring study,Aerosol Air Qual. Res., 14, 237–250, 2014c.
Jahn, H. J., Kraemer, A., Chen, X. C., Chan, C. Y., Engling, G., andWard, T. J.: Ambient and personal PM2.5 exposure assessment inthe Chinese megacity of Guangzhou, Atmos. Environ., 74, 402–411, 2013.
Jing, J., Wu, Y., Tao, J., Che, H., Xia, X., Zhang, X., Yan, P., Zhao,D., and Zhang, L.: Observation and analysis of near-surface at-mospheric aerosol optical properties in urban Beijing, Particuol-ogy, 18, 144–154, 2015.
Jung, J., Lee, H., Kim, Y. J., Liu, X., Zhang, Y., Gu, J., and Fan,S.: Aerosol chemistry and the effect of aerosol water content onvisibility impairment and radiative forcing in Guangzhou duringthe 2006 Pearl River Delta campaign, J. Environ. Manage., 90,3231–3244, 2009.
Kang, H., Zhu, B., Su, J., Wang, H., Zhang, Q., and Wang, F.: Anal-ysis of a long-lasting haze episode in Nanjing, China, Atmos.Res., 120, 78–87, 2013.
Karagulian, F., Belis, C. A., Dora, C. F. C., Prüss-Ustün, A. M.,Bonjour, S., Adair-Rohani, H., and Amann, M.: Contributions tocities’ ambient particulate matter (PM): A systematic review oflocal source contributions at global level, Atmos. Environ., 120,475–483, 2015.
Keck, L. and Wittmaack, K.: Effect of filter type and temperatureon volatilisation losses from ammonium salts in aerosol matter,Atmos. Environ., 39, 4093–4100, 2005.
Kuang, Y., Zhao, C. S., Ma, N., Liu, H. J., Bian, Y., Tao, J. C.,and Hu, M.: Deliquescent phenomena of ambient aerosols onthe North China Plain, Geophys. Res. Lett., 43, 8744–8750,https://doi.org/10.1002/2016GL070273, 2016.
Lai, S., Zhao, Y., Ding, A., Zhang, Y., Song, T., Zheng, J., Ho, K.F., Lee, S., and Zhong, L.: Characterization of PM2.5 and themajor chemical components during a 1-year campaign in ruralGuangzhou, Southern China, Atmos. Res., 167, 208–215, 2016.
Lai, S. C., Zou, S. C., Cao, J. J., Lee, S. C., and Ho, K. F.: Char-acterizing ionic species in PM2.5 and PM10 in four Pearl RiverDelta cities,South China, J. Environ. Sci., 19, 939–947, 2007.
Lan, Z., Huang, X., Yu, K., Sun, T., Zeng, L., and Hu, M.: Light ab-sorption of black carbon aerosol and its enhancement by mixingstate in an urban atmosphere in South China, Atmos. Environ.,69, 118–123, 2013.
Lee, J. H. and Hopke, P. K.: Apportioning sources of PM2.5 in St.Louis, MO using speciation trends network data, Atmos. Envi-ron., 40, S360–S377, 2006.
Li, B., Zhang, J., Zhao, Y., Yuan, S., Zhao, Q., Shen, G., and Wu,H.: Seasonal variation of urban carbonaceous aerosols in a typi-cal city Nanjing in Yangtze River Delta, China, Atmos. Environ.,106, 223–231, https://doi.org/10.1016/j.atmosenv.2015.01.064,2015a.
Li, C., Tsay, S., Fu, J. S., Dickerson, R. R., Ji, Q., Bell, S. W.,Gao, Y., Zhang, W., Huang, J., and Li, Z.: Anthropogenic airpollution observed near dust source regions in northwesternChina during springtime 2008, J. Geophys. Res., 115, D00K22,https://doi.org/10.1029/2009JD013659, 2010.
Li, G., Bei, N., Cao, J., Huang, R., Wu, J., Feng, T., Wang, Y.,Liu, S., Zhang, Q., Tie, X., and Molina, L. T.: A possible path-way for rapid growth of sulfate during haze days in China, At-mos. Chem. Phys., 17, 3301–3316, https://doi.org/10.5194/acp-17-3301-2017, 2017a.
Li, H., Wang, Q., Yang, M., Li, F., Wang, J., Sun, Y.,Wang, C., Wu, H., and Qian, X.: Chemical characteri-zation and source apportionment of PM2.5 aerosols in amegacity of Southeast China, Atmos. Res., 181, 288–299,https://doi.org/10.1016/j.atmosres.2016.07.005, 2016a.
Li, L., Chen, C. H., Fu, J. S., Huang, C., Streets, D. G., Huang,H. Y., Zhang, G. F., Wang, Y. J., Jang, C. J., Wang, H. L.,Chen, Y. R., and Fu, J. M.: Air quality and emissions in theYangtze River Delta, China, Atmos. Chem. Phys., 11, 1621–1639, https://doi.org/10.5194/acp-11-1621-2011, 2011.
Li, L., Chen, J., Wang, L., Melluki, W., and Zhou, H.: Aerosol sin-gle scattering albedo affected by chemical composition An in-vestigation using CRDS combined with MARGA, Atmos. Res.,124, 149–157, 2013a.
Li, M. and Zhang, L.: Haze in China: Current and future challenges,Environ. Pollut., 189, 85–86, 2014.
Li, P., Yan, R., Yu, S., Wang, S., Liu, W., and Bao, H.: Rein-state regional transport of PM2.5 as a major cause of severehaze in Beijing, P. Natl. Acad. Sci. USA, 112, E2739–E2740,https://doi.org/10.1073/pnas.1502596112, 2015b.
Li, W., Bai, Z., Liu, A., Chen, J., and Chen, L.: Characteristicsof Major PM2.5 Components during Winter in Tianjin, China,Aerosol Air Qual. Res., 9, 105–119, 2009.
Li, X., He, K., Li, C., Yang, F., Zhao, Q., Ma, Y., Cheng, Y., Ouyang,W., and Chen, G.: PM2.5 mass, chemical composition, and light
www.atmos-chem-phys.net/17/9485/2017/ Atmos. Chem. Phys., 17, 9485–9518, 2017
9512 J. Tao et al.: A review of current knowledge concerning PM2.5 chemical composition
extinction before and during the 2008 Beijing Olympics, J. Geo-phys. Res., 118, 12158–12167, 2013b.
Li, X., He, K., Li, C., Yang, F., Zhao, Q., Ma, Y., Cheng, Y., Ouyang,W., and Chen, G.: PM2.5 mass, chemical composition, and lightextinction before and during the 2008 Beijing Olympics, J. Geo-phys. Res.-Atmos., 118, 12158–12167, 2013c.
Li, Y., Meng, J., Liu, J., Xu, Y., Guan, D., Tao, W., Huang, Y., andTao, S.: Interprovincial Reliance for Improving Air Quality inChina: A Case Study on Black Carbon Aerosol, Environ. Sci.Technol., 50, 4118–4126, 2016b.
Li, Y. J., Sun, Y., Zhang, Q., Li, X., Li, M., Zhou, Z., and Chan, C.K.: Real-time chemical characterization of atmospheric particu-late matter in China: A review, Atmos. Environ., 158, 270–304,https://doi.org/10.1016/j.atmosenv.2017.02.027, 2017b.
Li, Z., Lau, W. K., Ramanathan, V., Wu, G., Ding, Y., Manoj,M. G., Liu, J., Qian, Y., Li, J., Zhou, T., Fan, J., Rosenfeld,D., Ming, Y., Wang, Y., Huang, J., Wang, B., Xu, X., Lee, S.S., Cribb, M., Zhang, F., Yang, X., Takemura, T., Wang, K.,Xia, X., Yin, Y., Zhang, H., Guo, J., Zhai, P. M., Sugimoto,N., Babu, S. S., and Brasseur, G. P.: Aerosol and MonsoonClimate Interactions over Asia, Rev. Geophys., 54, 866–929,https://doi.org/10.1002/2015rg000500, 2016c.
Liang, C. S., Duan, F. K., He, K. B., and Ma, Y. L.: Re-view on recent progress in observations, source identificationsand countermeasures of PM2.5, Environ. Int., 86, 150–170,https://doi.org/10.1016/j.envint.2015.10.016, 2016.
Liao, H., Chang, W., and Yang, Y.: Climatic effects of air pollutantsover China: A review, Adv. Atmos. Sci., 32, 115–139, 2015.
Lin, M., Biglari, S., Zhang, Z., Crocker, D., Tao, J., Su, B., Liu,L., and Thiemens, M. H.: Vertically uniform formation path-ways of tropospheric sulfate aerosols in East China detected fromtriple stable oxygen and radiogenic sulfur isotopes, Geophys.Res. Lett., 44, https://doi.org/10.1002/2017GL073637, 2017.
Lin, Y., Hsu, S., Chou, C. C. K., Zhang, R., Wu, Y., Kao, S., Luo,L., Huang, C., Lin, S., and Huang, Y.: Wintertime haze deteriora-tion in Beijing by industrial pollution deduced from trace metalfingerprints and enhanced health risk by heavy metals, Environ.Pollut., 208, 284–293, 2016.
Lin, Z. J., Zhang, Z. S., Zhang, L., Tao, J., Zhang, R. J., Cao, J. J.,Fan, S. J., and Zhang, Y. H.: An alternative method for estimatinghygroscopic growth factor of aerosol light-scattering coefficient:a case study in an urban area of Guangzhou, South China, At-mos. Chem. Phys., 14, 7631–7644, https://doi.org/10.5194/acp-14-7631-2014, 2014.
Liu, B., Song, N., Dai, Q., Mei, R., Sui, B., Bi, X.,and Feng, Y.: Chemical composition and source ap-portionment of ambient PM2.5 during the non-heatingperiod in Taian, China, Atmos. Res., 170, 23–33,https://doi.org/10.1016/j.atmosres.2015.11.002, 2016a.
Liu, B., Li, T., Yang, J., Wu, J., Wang, J., Gao, J., Bi, X.,Feng, Y., Zhang, Y., and Yang, H.: Source apportionment anda novel approach of estimating regional contributions to ambi-ent PM2.5 in Haikou, China, Environ. Pollut., 223, 334–345,https://doi.org/10.1016/j.envpol.2017.01.030, 2017a.
Liu, B., Wu, J., Zhang, J., Wang, L., Yang, J., Liang, D., Dai, Q.,Bi, X., Feng, Y., Zhang, Y., and Zhang, Q.: Characterization andsource apportionment of PM2.5 based on error estimation fromEPA PMF 5.0 model at a medium city in China, Environ. Pol-
lut., 222, 10–22, https://doi.org/10.1016/j.envpol.2017.01.005,2017b.
Liu, D., Li, J., Zhang, Y., Xu, Y., Liu, X., Ding, P., Shen, C.,Chen, Y., Tian, C., and Zhang, G.: The use of levoglucosan andradiocarbon for source apportionment of PM2.5 carbonaceousaerosols at a background site in east China, Environ. Sci. Tech-nol., 47, 10454, https://doi.org/10.1021/es401250k, 2013a.
Liu, G., Li, J., Wu, D., and Xu, H.: Chemical com-position and source apportionment of the ambientPM2.5 in Hangzhou, China, Particuology, 18, 135–143,https://doi.org/10.1016/j.partic.2014.03.011, 2015.
Liu, J., Li, J., Zhang, Y., Liu, D., Ding, P., Shen, C., Shen, K., He,Q., Ding, X., and Wang, X.: Source apportionment using radio-carbon and organic tracers for PM2.5 carbonaceous aerosols inGuangzhou, south China: contrasting local- and regional-scalehaze events, Environ. Sci. Technol., 48, 12002–12011, 2014a.
Liu, P. F., Zhao, C. S., Göbel, T., Hallbauer, E., Nowak, A., Ran,L., Xu, W. Y., Deng, Z. Z., Ma, N., Mildenberger, K., Henning,S., Stratmann, F., and Wiedensohler, A.: Hygroscopic propertiesof aerosol particles at high relative humidity and their diurnalvariations in the North China Plain, Atmos. Chem. Phys., 11,3479–3494, https://doi.org/10.5194/acp-11-3479-2011, 2011.
Liu, S., Hu, M., Slanina, S., He, L., Niu, Y., Bruegemann, E.,Gnauk, T., and Herrmann, H.: Size distribution and source anal-ysis of ionic compositions of aerosols in polluted periods atXinken in Pearl River Delta (PRD) of China, Atmos. Environ.,42, 6284–6295, 2008a.
Liu, X., Chen, Q., Che, H., Zhang, R., Gui, K., Zhang, H.,and Zhao, T.: Spatial distribution and temporal varia-tion of aerosol optical depth in the Sichuan basin, China,the recent ten years, Atmos. Environ., 147, 434–445,https://doi.org/10.1016/j.atmosenv.2016.10.008, 2016b.
Liu, X., Cheng, Y., Zhang, Y., Jung, J., Sugimoto, N., Chang, S.Y., Kim, Y. J., Fan, S., and Zeng, L.: Influences of relative hu-midity and particle chemical composition on aerosol scatteringproperties during the 2006 PRD campaign, Atmos. Environ., 42,1525–1536, 2008b.
Liu, X., Zhang, Y., Jung, J., Gu, J., Li, Y., Guo, S., Chang,S., Yue, D., Lin, P., and Kim, Y. J.: Research on the hygro-scopic properties of aerosols by measurement and modelingduring CAREBeijing-2006, J. Geophys. Res., 114, D00G16,https://doi.org/10.1029/2008JD010805, 2009.
Liu, X., Zhang, Y., Cheng, Y., Hu, M., and Han, T.: Aerosol hygro-scopicity and its impact on atmospheric visibility and radiativeforcing in Guangzhou during the 2006 PRIDE-PRD campaign,Atmos. Environ., 60, 59–67, 2012.
Liu, X., Gu, J., Li, Y., Cheng, Y., Qu, Y., Han, T., Wang,J., Tian, H., Chen, J., and Zhang, Y.: Increase of aerosolscattering by hygroscopic growth: Observation, modeling, andimplications on visibility, Atmos. Res., 132–133, 91–101,https://doi.org/10.1016/j.atmosres.2013.04.007, 2013b.
Liu, X. G., Li, J., Qu, Y., Han, T., Hou, L., Gu, J., Chen, C., Yang,Y., Liu, X., Yang, T., Zhang, Y., Tian, H., and Hu, M.: Formationand evolution mechanism of regional haze: a case study in themegacity Beijing, China, Atmos. Chem. Phys., 13, 4501–4514,https://doi.org/10.5194/acp-13-4501-2013, 2013c.
Liu, Y., Sarnat, J. A., Kilaru, V., Jacob, D. J., and Koutrakis, P.:Estimating ground-level PM2.5 in the eastern United States using
Atmos. Chem. Phys., 17, 9485–9518, 2017 www.atmos-chem-phys.net/17/9485/2017/
J. Tao et al.: A review of current knowledge concerning PM2.5 chemical composition 9513
satellite remote sensing, Environ. Sci. Technol., 39, 3269–3278,2005.
Liu, Z., Hu, B., Wang, L., Wu, F., Gao, W., and Wang, Y.: Seasonaland diurnal variation in particulate matter (PM10 and PM2.5) atan urban site of Beijing: analyses from a 9-year study, Environ.Sci. Pollut. R., 22, 627–642, 2014b.
Louie, P. K., Watson, J. G., Chow, J. C., Chen, A., Sin, D. W.,and Lau, A. K.: Seasonal characteristics and regional transport ofPM2.5 in Hong Kong, Atmos. Environ., 39, 1695–1710, 2005a.
Louie, P. K. K., Chow, J. C., Chen, L. W. A., Watson, J. G., Le-ung, G., and Sin, D. W. M.: PM2.5 chemical composition inHong Kong: urban and regional variations, Sci. Total Environ.,338, 267–281, https://doi.org/10.1016/j.scitotenv.2004.07.021,2005b.
Lu, Q., Zheng, J., Ye, S., Shen, X., Yuan, Z., and Yin, S.: Emis-sion trends and source characteristics of SO2, NOx , PM10 andVOCs in the Pearl River Delta region from 2000 to 2009, Atmos.Environ., 76, 11–20, 2013.
Lu, Z., Streets, D. G., Zhang, Q., Wang, S., Carmichael, G.R., Cheng, Y. F., Wei, C., Chin, M., Diehl, T., and Tan,Q.: Sulfur dioxide emissions in China and sulfur trends inEast Asia since 2000, Atmos. Chem. Phys., 10, 6311–6331,https://doi.org/10.5194/acp-10-6311-2010, 2010.
Lu, Z., Zhang, Q., and Streets, D. G.: Sulfur dioxide andprimary carbonaceous aerosol emissions in China andIndia, 1996–2010, Atmos. Chem. Phys., 11, 9839–9864,https://doi.org/10.5194/acp-11-9839-2011, 2011.
Lv, B., Zhang, B., and Bai, Y.: A systematic analysis of PM2.5 inBeijing and its sources from 2000 to 2012, Atmos. Environ., 124,98–108, https://doi.org/10.1016/j.atmosenv.2015.09.031, 2016.
Ma, N., Zhao, C. S., Nowak, A., Müller, T., Pfeifer, S., Cheng, Y.F., Deng, Z. Z., Liu, P. F., Xu, W. Y., Ran, L., Yan, P., Göbel,T., Hallbauer, E., Mildenberger, K., Henning, S., Yu, J., Chen,L. L., Zhou, X. J., Stratmann, F., and Wiedensohler, A.: Aerosoloptical properties in the North China Plain during HaChi cam-paign: an in-situ optical closure study, Atmos. Chem. Phys., 11,5959–5973, https://doi.org/10.5194/acp-11-5959-2011, 2011.
Ma, Z., Hu, X., Huang, L., Bi, J., and Liu, Y.: Estimating ground-level PM2.5 in China using satellite remote sensing, Environ. Sci.Technol., 48, 7436–7444, 2014.
Malm, W. C., Day, D. E., Kreidenweis, S. M., Collett, J. L.,and Lee, T.: Humidity-dependent optical properties of fineparticles during the Big Bend Regional Aerosol and Vis-ibility Observational Study, J. Geophys. Res., 108, 4279,https://doi.org/10.1029/2002JD002998, 2003.
Man, C. K. and Shih, M. Y.: Light scattering and absorption proper-ties of aerosol particles in Hong Kong, J. Aerosol Sci., 32, 795–804, 2001.
Ming, L., Jin, L., Li, J., Fu, P., Yang, W., Liu, D., Zhang,G., Wang, Z., and Li, X.: PM2.5 in the Yangtze RiverDelta, China: Chemical compositions, seasonal variations, andregional pollution events, Environ. Pollut., 223, 200–212,https://doi.org/10.1016/j.envpol.2017.01.013, 2017.
Monks, P. S., Granier, C., Fuzzi, S., Stohl, A., Williams, M. L., Aki-moto, H., Amann, M., Baklanov, A., Baltensperger, U., and Bey,I.: Atmospheric composition change – Global and regional airquality, Atmos. Environ., 43, 5268–5350, 2009.
Niu, F., Li, Z., Li, C., Lee, K., and Wang, M.: Increaseof wintertime fog in China: Potential impacts of weak-
ening of the Eastern Asian monsoon circulation and in-creasing aerosol loading, J. Geophys. Res., 115, D00K20,https://doi.org/10.1029/2009JD013484, 2010.
Okuda, T., Matsuura, S., Yamaguchi, D., Umemura, T., Hanada,E., Orihara, H., Tanaka, S., He, K., Ma, Y., and Cheng, Y.: Theimpact of the pollution control measures for the 2008 BeijingOlympic Games on the chemical composition of aerosols, At-mos. Environ., 45, 2789–2794, 2011.
Orsini, D. A., Ma, Y., Sullivan, A., Sierau, B., Baumann, K.,and Weber, R. J.: Refinements to the particle-into-liquid sam-pler (PILS) for ground and airborne measurements of watersoluble aerosol composition, Atmos. Environ., 37, 1243–1259,https://doi.org/10.1016/S1352-2310(02)01015-4, 2003.
Pan, L., Che, H., Geng, F., Xia, X., Wang, Y., Zhu, C., Chen, M.,Gao, W., and Guo, J.: Aerosol optical properties based on groundmeasurements over the Chinese Yangtze Delta Region, Atmos.Environ., 44, 2587–2596, 2010.
Pan, X. L., Yan, P., Tang, J., Ma, J. Z., Wang, Z. F., Gbaguidi,A., and Sun, Y. L.: Observational study of influence of aerosolhygroscopic growth on scattering coefficient over rural areanear Beijing mega-city, Atmos. Chem. Phys., 9, 7519–7530,https://doi.org/10.5194/acp-9-7519-2009, 2009.
Pathak, R. K., Wang, T., Ho, K., and Lee, S.: Characteristics of sum-mertime PM2.5 organic and elemental carbon in four major Chi-nese cities: implications of high acidity for water-soluble organiccarbon (WSOC), Atmos. Environ., 45, 318–325, 2011.
Pitchford, M., Malm, W., Schichtel, B., Kumar, N., Lowenthal, D.,and Hand, J.: Revised algorithm for estimating light extinctionfrom IMPROVE particle speciation data, J. Air Waste Manage.,57, 1326–1336, 2007.
Pu, W., Zhao, X., Shi, X., Ma, Z., Zhang, X., and Yu, B.: Impactof long-range transport on aerosol properties at a regional back-ground station in Northern China, Atmos. Res., 153, 489–499,2015.
Pui, D. Y., Chen, S.-C., and Zuo, Z.: PM2.5 in China: Measure-ments, sources, visibility and health effects, and mitigation, Par-ticuology, 13, 1–26, 2014.
Qian, Y., Yasunari, T. J., Doherty, S. J., Flanner, M. G., Lau, W. K.M., Ming, J., Wang, H., Wang, M., Warren, S. G., and Zhang,R.: Light-absorbing Particles in Snow and Ice: Measurement andModeling of Climatic and Hydrological Impact, Adv. Atmos.Sci., 32, 64–91, 2015.
Qin, Y. and Xie, S. D.: Spatial and temporal variation ofanthropogenic black carbon emissions in China for theperiod 1980–2009, Atmos. Chem. Phys., 12, 4825–4841,https://doi.org/10.5194/acp-12-4825-2012, 2012.
Schnaiter, M., Linke, C., Mohler, O., Naumann, K. H., Saathoff,H., Wagner, R., Schurath, U., and Wehner, B.: Absorp-tion amplification of black carbon internally mixed withsecondary organic aerosol, J. Geophys. Res., 110, D19204,https://doi.org/10.1029/2005JD006046, 2005.
Shen, G., Xue, M., Yuan, S., Zhang, J., Zhao, Q., Li, B., Wu, H.,and Ding, A.: Chemical compositions and reconstructed light ex-tinction coefficients of particulate matter in a mega-city in thewestern Yangtze River Delta, China, Atmos. Environ., 83, 14–20, https://doi.org/10.1016/j.atmosenv.2013.10.055, 2014.
Shen, Z., Cao, J., Arimoto, R., Han, Z., Zhang, R., Han, Y., Liu,S., Okuda, T., Nakao, S., and Tanaka, S.: Ionic composition of
www.atmos-chem-phys.net/17/9485/2017/ Atmos. Chem. Phys., 17, 9485–9518, 2017
9514 J. Tao et al.: A review of current knowledge concerning PM2.5 chemical composition
TSP and PM2.5 during dust storms and air pollution episodes atXi’an, China, Atmos. Environ., 43, 2911–2918, 2009.
Song, Y., Xie, S., Zhang, Y., Zeng, L., Salmon, L. G., and Zheng,M.: Source apportionment of PM2.5 in Beijing using princi-pal component analysis/absolute principal component scores andUNMIX, Sci. Total Environ., 372, 278–286, 2006a.
Song, Y., Zhang, Y., Xie, S., Zeng, L., Zheng, M., Salmon, L. G.,Shao, M., and Slanina, S.: Source apportionment of PM2.5 inBeijing by positive matrix factorization, Atmos. Environ., 40,1526–1537, 2006b.
Song, Y., Tang, X., Xie, S., Zhang, Y., Wei, Y., Zhang, M., Zeng, L.,and Lu, S.: Source apportionment of PM2.5 in Beijing in 2004,J. Hazard. Mater., 146, 124–130, 2007.
Sun, Y., Zhuang, G., Wang, Y., Han, L., Guo, J., Dan, M., Zhang,W., Wang, Z., and Hao, Z.: The air-borne particulate pollution inBeijing – concentration, composition, distribution and sources,Atmos. Environ., 38, 5991–6004, 2004.
Sun, Y., Zhuang, G., Tang, A., Wang, Y., and An, Z.:Chemical Characteristics of PM2.5 and PM10 in Haze-Fog Episodes in Beijing, Environ. Sci. Technol., 40, 3148,https://doi.org/10.1021/es051533g, 2006.
Sun, Y. L., Wang, Z. F., Fu, P. Q., Yang, T., Jiang, Q., Dong, H. B.,Li, J., and Jia, J. J.: Aerosol composition, sources and processesduring wintertime in Beijing, China, Atmos. Chem. Phys., 13,4577–4592, https://doi.org/10.5194/acp-13-4577-2013, 2013.
Tan, J., Duan, J., He, K., Ma, Y., Duan, F., Chen, Y., and Fu, J.:Chemical characteristics of PM2.5 during a typical haze episodein Guangzhou, J. Environ. Sci., 21, 774–781, 2009.
Tan, J., Duan, J., Zhen, N., He, K., and Hao, J.: Chemical char-acteristics and source of size-fractionated atmospheric parti-cle in haze episode in Beijing, Atmos. Res., 167, 24–33,https://doi.org/10.1016/j.atmosres.2015.06.015, 2016a.
Tan, J., Xiang, P., Zhou, X., Duan, J., Ma, Y., He, K.,Cheng, Y., Yu, J., and Querol, X.: Chemical character-ization of humic-like substances (HULIS) in PM2.5 inLanzhou, China, Sci. Total Environ., 573, 1481–1490,https://doi.org/10.1016/j.scitotenv.2016.08.025, 2016b.
Tan, J., Duan, J., Ma, Y., He, K., Cheng, Y., Deng, S., Huang,Y., and Si-Tu, S.: Long-term trends of chemical charac-teristics and sources of fine particle in Foshan City, PearlRiver Delta: 2008–2014, Sci. Total Environ., 565, 519–528,https://doi.org/10.1016/j.scitotenv.2016.05.059, 2016c.
Tan, J., Zhang, L., Zhou, X., Duan, J., Li, Y., Hu, J., and He, K.:Chemical characteristics and source apportionment of PM2.5 inLanzhou, China, Sci. Total Environ., 601–602, 1743–1752, 2017.
Tang, X., Chen, X., and Tian, Y.: Chemical composition andsource apportionment of PM2.5 – A case study from oneyear continuous sampling in the Chang-Zhu-Tan urban ag-glomeration, Atmospheric Pollution Research, 8, 885–899,https://doi.org/10.1016/j.apr.2017.02.004, 2017.
Tao, J., Ho, K., Chen, L., Zhu, L., Han, J., and Xu, Z.: Effectof chemical composition of PM2.5 on visibility in Guangzhou,China, 2007 spring, Particuology, 7, 68–75, 2009.
Tao, J., Cheng, T., Zhang, R., Cao, J., Zhu, L., Wang, Q., Luo, L.,and Zhang, L.: Chemical composition of PM2.5 at an urban siteof Chengdu in southwestern China, Adv. Atmos. Sci., 30, 1070–1084, 2013a.
Tao, J., Zhang, L., Engling, G., Zhang, R., Yang, Y., Cao, J., Zhu,C., Wang, Q., and Luo, L.: Chemical composition of PM2.5 in an
urban environment in Chengdu, China: Importance of springtimedust storms and biomass burning, Atmos. Res., 122, 270–283,https://doi.org/10.1016/j.atmosres.2012.11.004, 2013b.
Tao, J., Gao, J., Zhang, L., Zhang, R., Che, H., Zhang, Z., Lin, Z.,Jing, J., Cao, J., and Hsu, S.-C.: PM2.5 pollution in a megacityof southwest China: source apportionment and implication, At-mos. Chem. Phys., 14, 8679–8699, https://doi.org/10.5194/acp-14-8679-2014, 2014a.
Tao, J., Zhang, L., Cao, J., Hsu, S. C., Xia, X., Zhang,Z., Lin, Z., Cheng, T., and Zhang, R.: Characterizationand source apportionment of aerosol light extinction inChengdu, southwest China, Atmos. Environ., 95, 552–562,https://doi.org/10.1016/j.atmosenv.2014.07.017, 2014b.
Tao, J., Zhang, L., Ho, K., Zhang, R., Lin, Z., Zhang, Z., Lin,M., Cao, J., Liu, S., and Wang, G.: Impact of PM2.5 chemi-cal compositions on aerosol light scattering in Guangzhou - thelargest megacity in South China, Atmos. Res., 135–136, 48–58,https://doi.org/10.1016/j.atmosres.2013.08.015, 2014c.
Tao, J., Zhang, L., Gao, J., Wang, H., Chai, F., and Wang,S.: Aerosol chemical composition and light scattering dur-ing a winter season in Beijing, Atmos. Environ., 110, 36-44,https://doi.org/10.1016/j.atmosenv.2015.03.037, 2015a.
Tao, J., Zhang, L., Zhang, Z., Huang, R., Wu, Y., Zhang, R.,Cao, J., and Zhang, Y.: Control of PM2.5 in Guangzhouduring the 16th Asian Games period: Implication forhazy weather prevention, Sci. Total Environ., 508, 57–66,https://doi.org/10.1016/j.scitotenv.2014.11.074, 2015b.
Tao, J., Gao, J., Zhang, L., Wang, H., Qiu, X., Zhang, Z., Wu,Y., Chai, F., and Wang, S.: Chemical and optical characteris-tics of atmospheric aerosols in Beijing during the Asia-PacificEconomic Cooperation China 2014, Atmos. Environ., 144, 8–16,https://doi.org/10.1016/j.atmosenv.2016.08.067, 2016a.
Tao, J., Zhang, L., Zhang, R., Wu, Y., Zhang, Z., Zhang, X., Tang,Y., Cao, J., and Zhang, Y.: Uncertainty assessment of source at-tribution of PM2.5 and its water-soluble organic carbon contentusing different biomass burning tracers in positive matrix fac-torization analysis – a case study in Beijing, China, Sci. TotalEnviron., 543, 326–335, 2016b.
Tao, J., Zhang, L., Cao, J., Zhong, L., Chen, D., Yang, Y., Chen,D., Chen, L., Zhang, Z., Wu, Y., Xia, Y., Ye, S., and Zhang,R.: Source apportionment of PM2.5 at urban and suburban ar-eas of the Pearl River Delta region, south China – With em-phasis on ship emissions, Sci. Total Environ., 574, 1559–1570,https://doi.org/10.1016/j.scitotenv.2016.08.175, 2017.
Tian, P., Wang, G., Zhang, R., Wu, Y., and Yan, P.: Im-pacts of aerosol chemical compositions on optical prop-erties in urban Beijing, China, Particuology, 18, 155-164,https://doi.org/10.1016/j.partic.2014.03.014, 2015.
Tian, Y. Z., Chen, G., Wang, H. T., Huang-Fu, Y.Q., Shi, G.L., Han, B., and Feng, Y. C.: Source regional contributionsto PM2.5 in a megacity in China using an advanced sourceregional apportionment method, Chemosphere, 147, 256–263,https://doi.org/10.1016/j.chemosphere.2015.12.132, 2016.
Trebs, I., Meixner, F. X., Slanina, J., Otjes, R., Jongejan, P., andAndreae, M. O.: Real-time measurements of ammonia, acidictrace gases and water-soluble inorganic aerosol species at a ru-ral site in the Amazon Basin, Atmos. Chem. Phys., 4, 967–987,https://doi.org/10.5194/acp-4-967-2004, 2004.
Atmos. Chem. Phys., 17, 9485–9518, 2017 www.atmos-chem-phys.net/17/9485/2017/
J. Tao et al.: A review of current knowledge concerning PM2.5 chemical composition 9515
Verma, R. L., Sahu, L. K., Kondo, Y., Takegawa, N., Han, S., Jung,J. S., Kim, Y. J., Fan, S., Sugimoto, N., Shammaa, M. H., Zhang,Y. H., and Zhao, Y.: Temporal variations of black carbon inGuangzhou, China, in summer 2006, Atmos. Chem. Phys., 10,6471–6485, https://doi.org/10.5194/acp-10-6471-2010, 2010.
Wang, J. and Christopher, S. A.: Intercomparison between satellite-derived aerosol optical thickness and PM2.5 mass: Implicationsfor air quality studies, Geophys. Res. Lett., 30, 2095–2099, 2003.
Wang, G., Zhang, R., Gomez, M. E., Yang, L., Zamora, M. L., Hu,M., Lin, Y., Peng, J., Guo, S., and Meng, J.: Persistent sulfateformation from London Fog to Chinese haze, P. Natl. Acad. Sci.,113, 13630–13635, 2016a.
Wang, H., Shi, G., Tian, M., Zhang, L., Chen, Y., Yang, F., and Cao,X.: Aerosol optical properties and chemical composition appor-tionment in Sichuan Basin, China, Sci. Total Environ., 577, 245–257, https://doi.org/10.1016/j.scitotenv.2016.10.173, 2017a.
Wang, H. L., Qiao, L. P., Lou, S. R., Zhou, M., Ding, A.J., Huang, H. Y., Chen, J. M., Wang, Q., Tao, S. K.,Chen, C. H., Li, L., and Huang, C.: Chemical composi-tion of PM2.5 and meteorological impact among three yearsin urban Shanghai, China, J. Clean. Prod., 112, 1302–1311,https://doi.org/10.1016/j.jclepro.2015.04.099, 2016b.
Wang, J., Li, X., Jiang, N., Zhang, W., Zhang, R., and Tang,X.: Long term observations of PM2.5-associated PAHs: Com-parisons between normal and episode days, Atmos. Environ.,104, 228–236, https://doi.org/10.1016/j.atmosenv.2015.01.026,2015a.
Wang, L., Zhou, X., Ma, Y., Cao, Z., Wu, R., and Wang, W.: Car-bonaceous aerosols over China–review of observations, emis-sions, and climate forcing, Environ. Sci. Pollut. R., 23, 1671–1680, 2015b.
Wang, P., Cao, J., Shen, Z., Han, Y., Lee, S., Huang,Y., Zhu, C., Wang, Q., Xu, H., and Huang, R.: Spatialand seasonal variations of PM2.5 mass and species during2010 in Xi’an, China, Sci. Total Environ., 508, 477–487,https://doi.org/10.1016/j.scitotenv.2014.11.007, 2015c.
Wang, Q., Shao, M., Liu, Y., William, K., Paul, G., Li, X., Liu,Y., and Lu, S.: Impact of biomass burning on urban air qualityestimated by organic tracers: Guangzhou and Beijing as cases,Atmos. Environ., 41, 8380–8390, 2007.
Wang, Q., Huang, R. J., Cao, J., Han, Y., Wang, G., Li, G., Wang, Y.,Dai, W., Zhang, R., and Zhou, Y.: Mixing state of black carbonaerosol in a heavily polluted urban area of China: Implicationsfor light absorption enhancement, Aerosol Sci. Tech., 48, 689–697, https://doi.org/10.1080/02786826.2014.917758, 2014a.
Wang, Q., Jiang, N., Yin, S., Li, X., Yu, F., Guo, Y.,and Zhang, R.: Carbonaceous species in PM2.5 and PM10in urban area of Zhengzhou in China: Seasonal varia-tions and source apportionment, Atmos. Res., 191, 1–11,https://doi.org/10.1016/j.atmosres.2017.02.003, 2017b.
Wang, S. and Hao, J.: Air quality management in China: Issues,challenges, and options, J. Environ. Sci., 24, 2–13, 2012.
Wang, S., Xing, J., Jang, C., Zhu, Y., Fu, J. S., and Hao, J.: Impactassessment of ammonia emissions on inorganic aerosols in EastChina using response surface modeling technique, Environ. Sci.Technol., 45, 9293–9300, 2011.
Wang, X., Ding, X., Fu, X., He, Q., Wang, S., Bernard, F., Zhao, X.,and Wu, D.: Aerosol scattering coefficients and major chemicalcompositions of fine particles observed at a rural site in the cen-
tral Pearl River Delta, south China, J. Environ. Sci., 24, 72–77,2012.
Wang, Y., Jia, C., Tao, J., Zhang, L., Liang, X., Ma, J., Gao, H.,Huang, T., and Zhang, K.: Chemical characterization and sourceapportionment of PM2.5 in a semi-arid and petrochemical –industrialized city, Northwest China, Sci. Total Environ., 573,1031–1040, https://doi.org/10.1016/j.scitotenv.2016.08.179,2016c.
Wang, Y., Zhuang, G., Tang, A., Yuan, H., Sun, Y., Chen, S., andZheng, A.: The ion chemistry and the source of PM2.5 aerosol inBeijing, Atmos. Environ., 39, 3771–3784, 2005.
Wang, Y., Zhuang, G., Zhang, X. Y., Huang, K., Xu, C., Tang, A. H.,Chen, J. M., and An, Z.: The ion chemistry, seasonal cycle, andsources of PM2.5 and TSP aerosol in Shanghai, Atmos. Environ.,40, 2935–2952, 2006.
Wang, Y., Yao, L., Wang, L., Liu, Z., Ji, D., Tang, G., Zhang, J.,Sun, Y., Hu, B., and Xin, J.: Mechanism for the formation ofthe January 2013 heavy haze pollution episode over central andeastern China, Sci. China-Earth Sci., 57, 14–25, 2014b.
Wang, Y., Ying, Q., Hu, J., and Zhang, H.: Spatial and temporalvariations of six criteria air pollutants in 31 provincial capitalcities in China during 2013–2014, Environ. Int., 73, 413–422,https://doi.org/10.1016/j.envint.2014.08.016, 2014c.
Wang, Z., Li, J., Wang, Z., Yang, W., Tang, X., Ge, B., Yan, P., Zhu,L., Chen, X., and Chen, H.: Modeling study of regional severehazes over mid-eastern China in January 2013 and its implica-tions on pollution prevention and control, Sci.China-Earth Sci.,57, 3–13, 2013.
Watson, J. G.: Visibility: Science and regulation, J. Air Waste Man-age., 52, 628–713, 2002.
Watson, J. G., Chow, J. C., and Houck, J. E.: PM2.5 chemical sourceprofiles for vehicle exhaust, vegetative burning, geological mate-rial, and coal burning in Northwestern Colorado during 1995,Chemosphere, 43, 1141–1151, 2001.
Weber, R., Orsini, D., Duan, Y., Baumann, K., Kiang, C. S.,Chameides, W. L., Lee, Y. N., Brechtel, F. J., Klotz, P. J.,and Jongejan, P.: Intercomparison of near real time monitorsof PM2.5 nitrate and sulfate at the U.S. Environmental Protec-tion Agency Atlanta Supersite, J. Geophys. Res., 108, 8421,https://doi.org/10.1029/2001JD001220, 2003.
Wu, C., Ng, W. M., Huang, J., Wu, D., and Yu, J. Z.: Determinationof Elemental and Organic Carbon in PM2.5 in the Pearl RiverDelta Region: Inter-Instrument (Sunset vs. DRI Model 2001Thermal/Optical Carbon Analyzer) and Inter-Protocol Compar-isons (IMPROVE vs. ACE-Asia Protocol), Aerosol Sci. Tech.,46, 610–621, 2011.
Wu, D., Mao, J., Deng, X., Tie, X., Zhang, Y., Zeng, L., Li, F.,Tan, H., Bi, X., and Huang, X.: Black carbon aerosols and theirradiative properties in the Pearl River Delta region, Sci. ChinaSer. D, 52, 1152-1163, 2009.
Wu, D., Wu, C., Liao, B., Chen, H., Wu, M., Li, F., Tan, H.,Deng, T., Li, H., Jiang, D., and Yu, J. Z.: Black carbonover the South China Sea and in various continental loca-tions in South China, Atmos. Chem. Phys., 13, 12257–12270,https://doi.org/10.5194/acp-13-12257-2013, 2013.
Wu, S., Deng, F., Wei, H., Huang, J., Wang, X., Hao, Y.,Zheng, C., Qin, Y., Lv, H., Shima, M., and Guo, X.: As-sociation of Cardiopulmonary Health Effects with Source-Appointed Ambient Fine Particulate in Beijing, China: A Com-
www.atmos-chem-phys.net/17/9485/2017/ Atmos. Chem. Phys., 17, 9485–9518, 2017
9516 J. Tao et al.: A review of current knowledge concerning PM2.5 chemical composition
bined Analysis from the Healthy Volunteer Natural Reloca-tion (HVNR) Study, Environ. Sci. Technol., 48, 3438–3448,https://doi.org/10.1021/es404778w, 2014.
Wu, Y., Zhang, R., Tian, P., Tao, J., Hsu, S. C., Yan, P., Wang, Q.,Cao, J., Zhang, X., and Xia, X.: Effect of ambient humidity on thelight absorption amplification of black carbon in Beijing duringJanuary 2013, Atmos. Environ., 124, 217–223, 2016.
Wu, Y., Wang, X., Yan, P., Zhang, L., Tao, J., Liu, X., Tian, P.,Han, Z., and Zhang, R.: Investigation of hygroscopic growth ef-fect on aerosol scattering coefficient at a rural site in the south-ern North China Plain, Sci. Total Environ., 599–600, 76–84,https://doi.org/10.1016/j.scitotenv.2017.04.194, 2017.
Xie, Y., Ding, A., Nie, W., Mao, H., Qi, X., Huang, X., Xu, Z., Ker-minen, V. M., Petaja, T., and Chi, X.: Enhanced sulfate formationby nitrogen dioxide: Implications from in situ observations at theSORPES station, J. Geophys. Res., 120, 12679–12694, 2015a.
Xie, Y., Wang, Y., Zhang, K., Dong, W., Lv, B., and Bai, Y.: DailyEstimation of Ground-Level PM2.5 Concentrations over BeijingUsing 3 km Resolution MODIS AOD, Environ. Sci. Technol., 49,12280–12288, 2015b.
Xiong, Y., Zhou, J., Schauer, J. J., Yu, W., and Hu, Y.:Seasonal and spatial differences in source contributions toPM2.5 in Wuhan, China, Sci. Total Environ., 577, 155–165,https://doi.org/10.1016/j.scitotenv.2016.10.150, 2017.
Xu, H., Cao, J., Chow, J. C., Huang, R. J., Shen, Z., Chen, L. W.A., Ho, K. F., and Watson, J. G.: Inter-annual variability of win-tertime PM2.5 chemical composition in Xi’an, China: Evidencesof changing source emissions, Sci. Total Environ., 545, 546–555,2016.
Xu, J., Bergin, M., Yu, X., Liu, G., Zhao, J., Carrico, C., and Bau-mann, K.: Measurement of aerosol chemical, physical and ra-diative properties in the Yangtze delta region of China, Atmos.Environ., 36, 161–173, 2002.
Xu, J., Bergin, M. H., Greenwald, R., Schauer, J. J., Shafer, M.M., Jaffrezo, J. L., and Aymoz, G.: Aerosol chemical, physical,and radiative characteristics near a desert source region of north-west China during ACE-Asia, J. Geophys. Res., 109, D19S03,https://doi.org/10.1029/2003JD004239, 2004.
Xu, J., Tao, J., Zhang, R., Cheng, T., Leng, C., Chen, J., Huang,G., Li, X., and Zhu, Z.: Measurements of surface aerosol opti-cal properties in winter of Shanghai, Atmos. Res., 109, 25–35,2012a.
Xu, L., Chen, X., Chen, J., Zhang, F., He, C., Zhao, J., and Yin, L.:Seasonal variations and chemical compositions of PM2.5 aerosolin the urban area of Fuzhou, China, Atmos. Res., 104–105, 264–272, https://doi.org/10.1016/j.atmosres.2011.10.017, 2012b.
Xu, L., Chen, X., Chen, J., Zhang, F., He, C., Zhao, J., and Yin, L.:Seasonal variations and chemical compositions of PM2.5 aerosolin the urban area of Fuzhou, China, Atmos. Res., 104, 264–272,2012c.
Xu, W. Y., Zhao, C. S., Ran, L., Deng, Z. Z., Liu, P. F., Ma,N., Lin, W. L., Xu, X. B., Yan, P., He, X., Yu, J., Liang,W. D., and Chen, L. L.: Characteristics of pollutants and theircorrelation to meteorological conditions at a suburban site inthe North China Plain, Atmos. Chem. Phys., 11, 4353-4369,https://doi.org/10.5194/acp-11-4353-2011, 2011.
Yan, H.: Aerosol scattering properties in northern China, Atmos.Environ., 41, 6916–6922, 2007.
Yan, P., Tang, J., Huang, J., Mao, J. T., Zhou, X. J., Liu, Q., Wang,Z. F., and Zhou, H. G.: The measurement of aerosol optical prop-erties at a rural site in Northern China, Atmos. Chem. Phys., 8,2229–2242, https://doi.org/10.5194/acp-8-2229-2008, 2008.
Yan, P., Pan, X., Tang, J., Zhou, X., Zhang, R., and Zeng,L.: Hygroscopic growth of aerosol scattering coeffi-cient: A comparative analysis between urban and sub-urban sites at winter in Beijing, Particuology, 7, 52–60,https://doi.org/10.1016/j.partic.2008.11.009, 2009.
Yang, F., He, K., Ye, B., Chen, X., Cha, L., Cadle, S. H., Chan,T., and Mulawa, P. A.: One-year record of organic and elemen-tal carbon in fine particles in downtown Beijing and Shanghai,Atmos. Chem. Phys., 5, 1449–1457, https://doi.org/10.5194/acp-5-1449-2005, 2005a.
Yang, F., Huang, L., Duan, F., Zhang, W., He, K., Ma, Y.,Brook, J. R., Tan, J., Zhao, Q., and Cheng, Y.: Carbonaceousspecies in PM2.5 at a pair of rural/urban sites in Beijing, 2005–2008, Atmospheric Chemistry and Physics, 11, 7893–7903,https://doi.org/10.5194/acp-11-7893-2011, 2011a.
Yang, F., Tan, J., Zhao, Q., Du, Z., He, K., Ma, Y., Duan, F., Chen,G., and Zhao, Q.: Characteristics of PM2.5 speciation in repre-sentative megacities and across China, Atmos. Chem. Phys., 11,5207–5219, https://doi.org/10.5194/acp-11-5207-2011, 2011b.
Yang, H., Yu, J. Z., Ho, S. S. H., Xu, J., Wu, W., Wan, C. H., Wang,X., Wang, X., and Wang, L.: The chemical composition of inor-ganic and carbonaceous materials in PM2.5 in Nanjing, China,Atmos. Environ., 39, 3735–3749, 2005b.
Yang, H., Chen, J., Wen, J., Tian, H., and Liu, X.: Com-position and sources of PM2.5 around the heating peri-ods of 2013 and 2014 in Beijing: Implications for effi-cient mitigation measures, Atmos. Environ., 124, 378–386,https://doi.org/10.1016/j.atmosenv.2015.05.015, 2016.
Yang, L., Zhou, X., Wang, Z., Zhou, Y., Cheng, S., Xu, P., Gao,X., Nie, W., Wang, X., and Wang, W.: Airborne fine particu-late pollution in Jinan, China: concentrations, chemical compo-sitions and influence on visibility impairment, Atmos. Environ.,55, 506–514, 2012.
Yang, L., Cheng, S., Wang, X., Nie, W., Xu, P., Gao,X., Yuan, C., and Wang, W.: Source identification andhealth impact of PM2.5 in a heavily polluted urban at-mosphere in China, Atmos. Environ., 75, 265–269,https://doi.org/10.1016/j.atmosenv.2013.04.058, 2013.
Yang, Y. R., Liu, X. G., Qu, Y., An, J. L., Jiang, R., Zhang,Y. H., Sun, Y. L., Wu, Z. J., Zhang, F., Xu, W. Q., and Ma,Q. X.: Characteristics and formation mechanism of continuoushazes in China: a case study during the autumn of 2014 inthe North China Plain, Atmos. Chem. Phys., 15, 8165–8178,https://doi.org/10.5194/acp-15-8165-2015, 2015.
Yao, L., Yang, L., Yuan, Q., Yan, C., Dong, C., Meng, C., Sui, X.,Yang, F., Lu, Y., and Wang, W.: Sources apportionment of PM2.5in a background site in the North China Plain, Sci. Total Environ.,541, 590–598, https://doi.org/10.1016/j.scitotenv.2015.09.123,2016.
Ye, B., Ji, X., Yang, H., Yao, X., Chan, C. K., Cadle, S. H., Chan,T., and Mulawa, P. A.: Concentration and chemical compositionof PM2.5 in Shanghai for a 1-year period, Atmos. Environ., 37,499–510, 2003.
Yu, H., Wu, C., Wu, D., and Yu, J. Z.: Size distributions of ele-mental carbon and its contribution to light extinction in urban
Atmos. Chem. Phys., 17, 9485–9518, 2017 www.atmos-chem-phys.net/17/9485/2017/
J. Tao et al.: A review of current knowledge concerning PM2.5 chemical composition 9517
and rural locations in the pearl river delta region, China, At-mos. Chem. Phys., 10, 5107–5119, https://doi.org/10.5194/acp-10-5107-2010, 2010.
Zha, S., Cheng, T., Tao, J., Zhang, R., Chen, J., Zhang, Y., Leng,C., Zhang, D., and Du, J.: Characteristics and relevant remotesources of black carbon aerosol in Shanghai, Atmos. Res., 135,159–171, 2014.
Zhang, F., Zhao, J., Chen, J., Xu, Y., and Xu, L.: Pollution charac-teristics of organic and elemental carbon in PM2.5 in Xiamen,China, J. Environ. Sci., 23, 1342–1349, 2011a.
Zhang, F., Xu, L., Chen, J., Yu, Y., Niu, Z., and Yin, L.: Chemicalcompositions and extinction coefficients of PM2.5 in peri-urbanof Xiamen, China, during June 2009–May 2010, Atmos. Res.,106, 150–158, 2012a.
Zhang, F., Wang, Z., Cheng, H., Lv, X., Gong, W., Wang, X., andZhang, G.: Seasonal variations and chemical characteristics ofPM2.5 in Wuhan, central China, Sci. Total Environ., 518–519,97–105, https://doi.org/10.1016/j.scitotenv.2015.02.054, 2015a.
Zhang, L., Sun, J. Y., Shen, X. J., Zhang, Y. M., Che, H., Ma,Q. L., Zhang, Y. W., Zhang, X. Y., and Ogren, J. A.: Observa-tions of relative humidity effects on aerosol light scattering in theYangtze River Delta of China, Atmos. Chem. Phys., 15, 8439–8454, https://doi.org/10.5194/acp-15-8439-2015, 2015b.
Zhang, N., Zhuang, M., Tian, J., Tian, P., Zhang, J., Wang, Q., Zhou,Y., Huang, R., Zhu, C., Zhang, X., and Cao, J.: Developmentof source profiles and their application in source apportionmentof PM2.5 in Xiamen, China, Front. Environ. Sci. Eng., 10, 17,https://doi.org/10.1007/s11783-016-0879-1, 2016.
Zhang, Q., Geng, G., Wang, S., Richter, A., and He, K.:Satellite remote sensing of changes in NOx emissions overChina during 1996–2010, Chinese Sci. Bull., 57, 2857–2864,https://doi.org/10.1007/s11434-012-5015-4, 2012b.
Zhang, R., Jing, J., Tao, J., Hsu, S.-C., Wang, G., Cao, J., Lee,C. S. L., Zhu, L., Chen, Z., Zhao, Y., and Shen, Z.: Chemi-cal characterization and source apportionment of PM2.5 in Bei-jing: seasonal perspective, Atmos. Chem. Phys., 13, 7053–7074,https://doi.org/10.5194/acp-13-7053-2013, 2013a.
Zhang, R., Li, Q., and Zhang, R.: Meteorological conditionsfor the persistent severe fog and haze event over easternChina in January 2013, Sci. China-Earth Sci., 57, 26–35,https://doi.org/10.1007/s11430-013-4774-3, 2014a.
Zhang, T., Cao, J., Tie, X., Shen, Z., Liu, S., Ding, H., Han, Y.,Wang, G., Ho, K., and Qiang, J.: Water-soluble ions in atmo-spheric aerosols measured in Xi’an, China: seasonal variationsand sources, Atmos. Res., 102, 110–119, 2011b.
Zhang, T., Cao, J., Chow, J. C., Shen, Z., Ho, K., Ho, S. S. H., Liu,S., Han, Y., Watson, J. G., and Wang, G.: Characterization andseasonal variations of levoglucosan in fine particulate matter inXi’an, China, J. Air Waste Manage., 64, 1317–1327, 2014b.
Zhang, W., Guo, J., Sun, Y., Yuan, H., Zhuang, G., Zhuang,Y., and Hao, Z.: Source apportionment for urban PM10 andPM2.5 in the Beijing area, Chinese Sci. Bull., 52, 608–615,https://doi.org/10.1007/s11434-007-0076-5, 2007.
Zhang, X., Wu, L., Zhang, R., Deng, S., Zhang, Y., Wu, J.,Li, Y., Lin, L., Li, L., Wang, Y., and Wang, L.: Evaluatingthe relationships among economic growth, energy consumption,air emissions and air environmental protection investment inChina, Renewable and Sustainable Energy Reviews, 18, 259–270, https://doi.org/10.1016/j.rser.2012.10.029, 2013b.
Zhang, X., Du, J., Huang, T., Zhang, L., Gao, H., Zhao, Y., and Ma,J.: Atmospheric removal of PM2.5 by man-made three northernregions shelter forest in northern China estimated using satelliteretrieved PM2.5 concentrations, Sci. Total Environ., 593–594,713–721, 2017a.
Zhang, Y., Cai, J., Wang, S., He, K., and Zheng, M.: Review ofreceptor-based source apportionment research of fine particulatematter and its challenges in China, Sci. Total Environ., 586, 917–929, https://doi.org/10.1016/j.scitotenv.2017.02.071, 2017b.
Zhao, B., Wang, S., Wang, J., Fu, J. S., Liu, T., Xu, J., Fu, X., andHao, J.: Impact of national NOx and SO2 control policies onparticulate matter pollution in China, Atmos. Environ., 77, 453–463, 2013a.
Zhao, B., Wang, S. X., Liu, H., Xu, J. Y., Fu, K., Klimont, Z.,Hao, J. M., He, K. B., Cofala, J., and Amann, M.: NOx emis-sions in China: historical trends and future perspectives, At-mos. Chem. Phys., 13, 9869–9897, https://doi.org/10.5194/acp-13-9869-2013, 2013b.
Zhao, M., Huang, Z., Qiao, T., Zhang, Y., Xiu, G., and Yu, J.:Chemical characterization, the transport pathways and potentialsources of PM2.5 in Shanghai: Seasonal variations, Atmos. Res.,158, 66–78, 2015a.
Zhao, M., Qiao, T., Huang, Z., Zhu, M., Xu, W., Xiu, G., Tao, J., andLee, S.: Comparison of ionic and carbonaceous compositions ofPM2.5 in 2009 and 2012 in Shanghai, China, Sci. Total Environ.,536, 695–703, https://doi.org/10.1016/j.scitotenv.2015.07.100,2015b.
Zhao, P. S., Dong, F., He, D., Zhao, X. J., Zhang, X. L., Zhang,W. Z., Yao, Q., and Liu, H. Y.: Characteristics of concentrationsand chemical compositions for PM2.5 in the region of Beijing,Tianjin, and Hebei, China, Atmos. Chem. Phys., 13, 4631–4644,https://doi.org/10.5194/acp-13-4631-2013, 2013c.
Zhao, X., Zhang, X., Pu, W., Meng, W., and Xu, X.: Scattering prop-erties of the atmospheric aerosol in Beijing, China, Atmos. Res.,101, 799–808, 2011.
Zhao, X. J., Zhao, P. S., Xu, J., Meng„ W., Pu, W. W., Dong,F., He, D., and Shi, Q. F.: Analysis of a winter regional hazeevent and its formation mechanism in the North China Plain, At-mos. Chem. Phys., 13, 5685–5696, https://doi.org/10.5194/acp-13-5685-2013, 2013d.
Zheng, J., Hu, M., Peng, J., Wu, Z., Kumar, P., Li, M., Wang, Y., andGuo, S.: Spatial distributions and chemical properties of PM2.5based on 21 field campaigns at 17 sites in China, Chemosphere,159, 480–487, 2016.
Zheng, J. Y., Yin, S. S., Kang, D. W., Che, W. W., and Zhong, L. J.:Development and uncertainty analysis of a high-resolution NH3emissions inventory and its implications with precipitation overthe Pearl River Delta region, China, Atmos. Chem. Phys., 12,7041–7058, https://doi.org/10.5194/acp-12-7041-2012, 2012.
Zheng, M., Salmon, L. G., Schauer, J. J., Zeng, L., Kiang, C. S.,Zhang, Y., and Cass, G. R.: Seasonal trends in PM2.5 source con-tributions in Beijing, China, Atmos. Environ., 39, 3967–3976,2005.
Zhou, B., Shen, H., Huang, Y., Li, W., Chen, H., Zhang, Y.,Su, S., Chen, Y., Lin, N., Zhuo, S., Zhong, Q., Liu, J., Li,B., and Tao, S.: Daily variations of size-segregated ambientparticulate matter in Beijing, Environ. Pollut., 197, 36–42,https://doi.org/10.1016/j.envpol.2014.11.029, 2015a.
www.atmos-chem-phys.net/17/9485/2017/ Atmos. Chem. Phys., 17, 9485–9518, 2017
9518 J. Tao et al.: A review of current knowledge concerning PM2.5 chemical composition
Zhou, Y., Shuiyuan, C., Lang, J., Chen, D., Zhao, B., Liu, C., Xu,R., and Li, T.: A comprehensive ammonia emission inventorywith high-resolution and its evaluation in the Beijing–Tianjin–Hebei (BTH) region, China, Atmos. Environ., 106, 305–317,https://doi.org/10.1016/j.atmosenv.2015.01.069, 2015b.
Zhu, C., Cao, J., Ho, K., Chen, L. W. A., Huang, R., Wang, Y., Li,H., Shen, Z., Chow, J. C., and Watson, J. G.: The optical prop-erties of urban aerosol in northern China: A case study at Xi’an,Atmos. Res., 160, 59–67, 2015.
Zieger, P., Fierz-Schmidhauser, R., Weingartner, E., and Bal-tensperger, U.: Effects of relative humidity on aerosol lightscattering: results from different European sites, Atmos. Chem.Phys., 13, 10609–10631, https://doi.org/10.5194/acp-13-10609-2013, 2013.
Zíková, N., Wang, Y., Yang, F., Li, X., Tian, M., andHopke, P. K.: On the source contribution to BeijingPM2.5 concentrations, Atmos. Environ., 134, 84–95,https://doi.org/10.1016/j.atmosenv.2016.03.047, 2016.
Zong, Z., Wang, X., Tian, C., Chen, Y., Qu, L., Ji, L., Zhi,G., Li, J., and Zhang, G.: Source apportionment of PM2.5at a regional background site in North China using PMFlinked with radiocarbon analysis: insight into the contributionof biomass burning, Atmos. Chem. Phys., 16, 11249–11265,https://doi.org/10.5194/acp-16-11249-2016, 2016.
Zou, Y., Wang, Y., Zhang, Y., and Koo, J. H.: Arctic sea ice, Eurasiasnow, and extreme winter haze in China, Sci. Adv., 3, e1602751,https://doi.org/10.1126/sciadv.1602751, 2017.
Atmos. Chem. Phys., 17, 9485–9518, 2017 www.atmos-chem-phys.net/17/9485/2017/


