Embed Size (px)
Citation preview
Louisiana State University Louisiana State University
LSU Digital Commons LSU Digital Commons
LSU Historical Dissertations and Theses Graduate School
1991
A Role Theoretical Model of Consumer Satisfaction With A Role Theoretical Model of Consumer Satisfaction With
Professional Services. Professional Services.
Teri Root Shaffer Louisiana State University and Agricultural & Mechanical College
Follow this and additional works at: https://digitalcommons.lsu.edu/gradschool_disstheses
Recommended Citation Recommended Citation Shaffer, Teri Root, "A Role Theoretical Model of Consumer Satisfaction With Professional Services." (1991). LSU Historical Dissertations and Theses. 5148. https://digitalcommons.lsu.edu/gradschool_disstheses/5148
This Dissertation is brought to you for free and open access by the Graduate School at LSU Digital Commons. It has been accepted for inclusion in LSU Historical Dissertations and Theses by an authorized administrator of LSU Digital Commons. For more information, please contact [email protected].

INFORMATION TO USERS
This manuscript has been reproduced from the microfilm master. UMI films the text directly from the original or copy submitted. Thus, some thesis and dissertation copies are in typewriter face, while others may be from any type of computer printer.
The quality of this reproduction is dependent upon the quality of the copy submitted. Broken or indistinct print, colored or poor quality illustrations and photographs, print bleedthrough, substandard margins, and improper alignment can adversely affect reproduction.
In the unlikely event that the author did not send UMI a complete manuscript and there are missing pages, these will be noted. Also, if unauthorized copyright material had to be removed, a note will indicate the deletion.
Oversize materials (e.g., maps, drawings, charts) are reproduced by sectioning the original, beginning at the upper left-hand corner and continuing from left to right in equal sections with small overlaps. Each original is also photographed in one exposure and is included in reduced form at the back of the book.
Photographs included in the original manuscript have been reproduced xerographically in this copy. Higher quality 6" x 9" black and white photographic prints are available for any photographs or illustrations appearing in this copy for an additional charge. Contact UMI directly to order.
University Microfilms International A Bell & Howell Information C o m p a n y
3 0 0 North Z e e b R o a d . Ann Arbor, Ml 4 8 1 0 6 - 1 3 4 6 USA 3 1 3 / 7 6 1 - 4 7 0 0 8 0 0 / 5 2 1 - 0 6 0 0

Order N um ber 9200091
A role theoretical m odel o f consum er satisfaction w ith professional services
Shaffer, Teri R oot, Ph .D .
The Louisiana State University and Agricultural and Mechanical Col., 1991
U M I300 N. Zeeb Rd.Ann Arbor, MI 48106

A ROLE THEORETICAL MODEL OF CONSUMER SATISFACTION WITH PROFESSIONAL SERVICES
A Dissertation
Submitted to the Graduate Faculty of the Louisiana State University and
Agricultural and Mechanical College in partial fulfillment of the
requirements for the degree of Doctor of Philosophy
in
Interdepartmental Program in Business Administration
byTeri Root Shaffer
B.A., University of California at Santa Barbara, 1981May 1991

ACKNOWLEDGEMENTS
The completion of this dissertation would not have been possible without the
help, support, and encouragement of many people. I wish to thank those individuals
whose efforts brought me to and through the dissertation process.
First, I thank Dan Sherrell for his support as a major professor. I cannot
imagine finding a better major professor. Throughout my studies, Dan gave me the
independence I wanted, but was always there to provide the assistance I needed. I
feel honored to have had the opportunity to work under D an’s direction. I thank the
other members of my committee for their contributions and assistance: Drs.
William Black, Joseph F. Hair, Jr., Fak Koray, Rick Netemeyer, and Perry
Prestholdt. I am especially grateful to Rick Netemeyer for his statistical counseling
and critical reviews. I thank fellow graduate students Jill Attaway, Jim Boles,
Debbie Easterling, and Mitch Griffin for many hours of insightful conversation and
discussion of this and related research topics but I thank them mostly for their
undying friendship. Their friendships made life as a doctoral student bearable.
I am especially grateful to my family. I thank my parents, John and Jeannie
Root, for encouraging me to be independent and to choose my own directions in
life. I also I thank them for providing unconditional love and support no matter
which directions I chose. I thank my sisters, Kathi Ayala and Lori Oakley. I thank
Kathi for sharing interests that provided me with a welcome diversion from the
academic world. I thank Lori for always being able to make me laugh. I thank my
aunt, Jean Shaffer, for being my female role model of recent years.

Lastly, my deepest thanks go to my husband, Shafe. Shafe has taught me
that true success means achieving a balance in life. I thank Shafe and our furry
little family for giving me that balance every day of my life.

FORWARD
For Shafe
The best "bud" a woman could have in life
iv
TABLE OF CONTENTS
Page
Acknowledgements ........................................................................................................... ii
F o r w a rd ................................................................................................................................. iv
List o f Tables ................................................................................................................. xi
List o f F ig u r e s ................................................................... .............................................. xv
A b s tra c t ................................................................................................................................ xviii
Chapter
1. THE RESEARCH TOPIC .............................................................................. 1Introduction ........................................................................................................ 1
Distinctive Features of S e rv ices ........................................................ 2Services Classification ....................................................................... 4Importance o f Process Factors inConsumer Evaluation Processes for S e rv ic e s ................................ 5Professional Services .......................................................................... 6
Role Theoretical Analysis of Consumer S a tisfac tio n ................................ 7
The Dissertation Research ............................................................................. 9A Model o f Consumer Satisfaction with Professional S e rv ice s 11
Influence of Consumer Involvement on S a tis fa c tio n ................................ 13
Contributions o f the Research ....................................................................... 14
Organization of the S tu d y ................................................................................ 18
2. LITERATURE R E V IE W ................................................................................. 19
Role T h e o r y ........................................................................................................ 19Role E x p e c ta tio n s ................................................................................ 20Effects of Role Expectations on Role P e rfo rm a n c e ................... 22Summary ............................................................................................... 24
v
Chapter Page
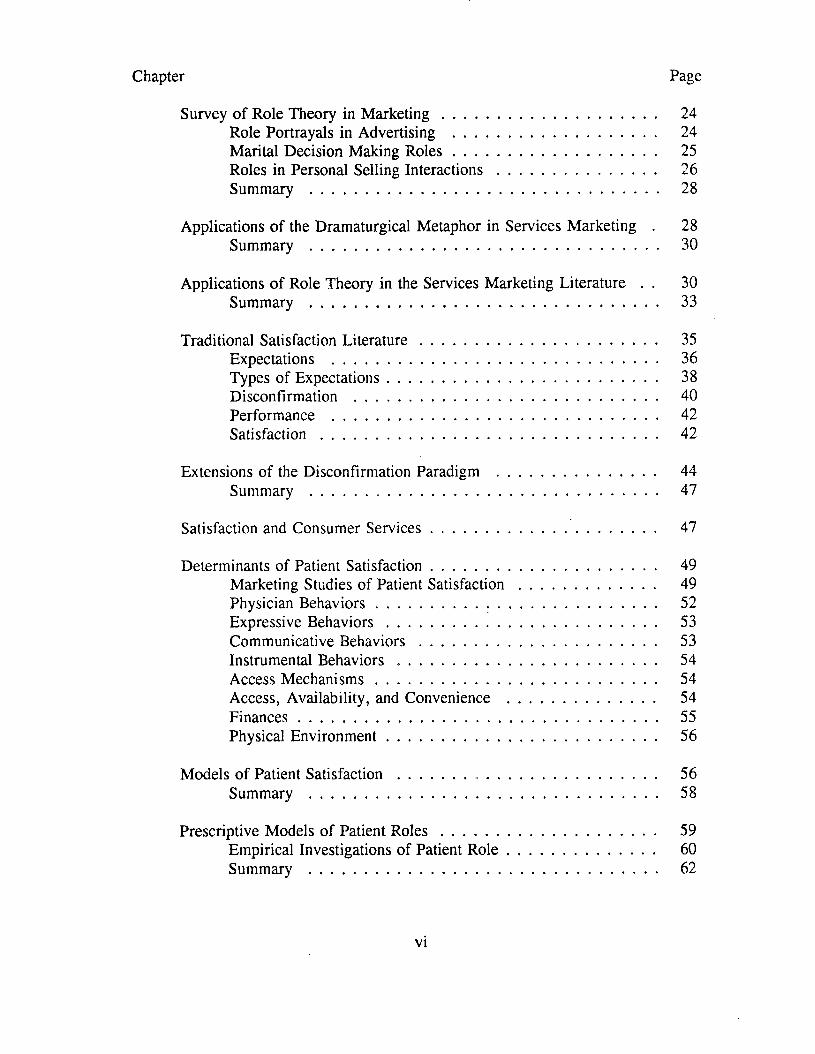
Survey o f Role Theory in M a rk e tin g .......................................................... 24Role Portrayals in Advertising ....................................................... 24Marital Decision Making R o le s ....................................................... 25Roles in Personal Selling In te ra c tio n s ........................................... 26Summary ............................................................................................... 28
Applications o f the Dramaturgical Metaphor in Services Marketing . 28Summary ............................................................................................... 30
Applications o f Role Theory in the Services Marketing Literature . . 30Summary ............................................................................................... 33
Traditional Satisfaction L i te ra tu re .................................................................... 35Expectations ......................................................................................... 36Types of Expectations.......................................................................... 38Discontinuation ................................................................................... 40Performance ......................................................................................... 42Satisfaction ............................................................................................ 42
Extensions of the Disconfirmation Paradigm .............................................. 44Summary .................. 47
Satisfaction and Consumer S e rv ic e s ................................................................. 47
Determinants of Patient Satisfaction................................................................. 49Marketing Studies of Patient Satisfaction ..................................... 49Physician B eh a v io rs ............................................................................. 52Expressive B e h a v io rs .......................................................................... 53Communicative Behaviors ................................................................ 53Instrumental B e h a v io rs ....................................................................... 54Access M ech an ism s............................................................................. 54Access, Availability, and Convenience ........................................ 54F in a n c e s .................................................................................................. 55Physical E n v iro n m en t............................................................................. 56
Models o f Patient S a tis fa c t io n ..................... 56Summary ............................................................................................... 58
Prescriptive Models o f Patient R o l e s .............................................................. 59Empirical Investigations of Patient R o le ............................................ 60Summary .................................................................................................. 62
vi
Chapter Page
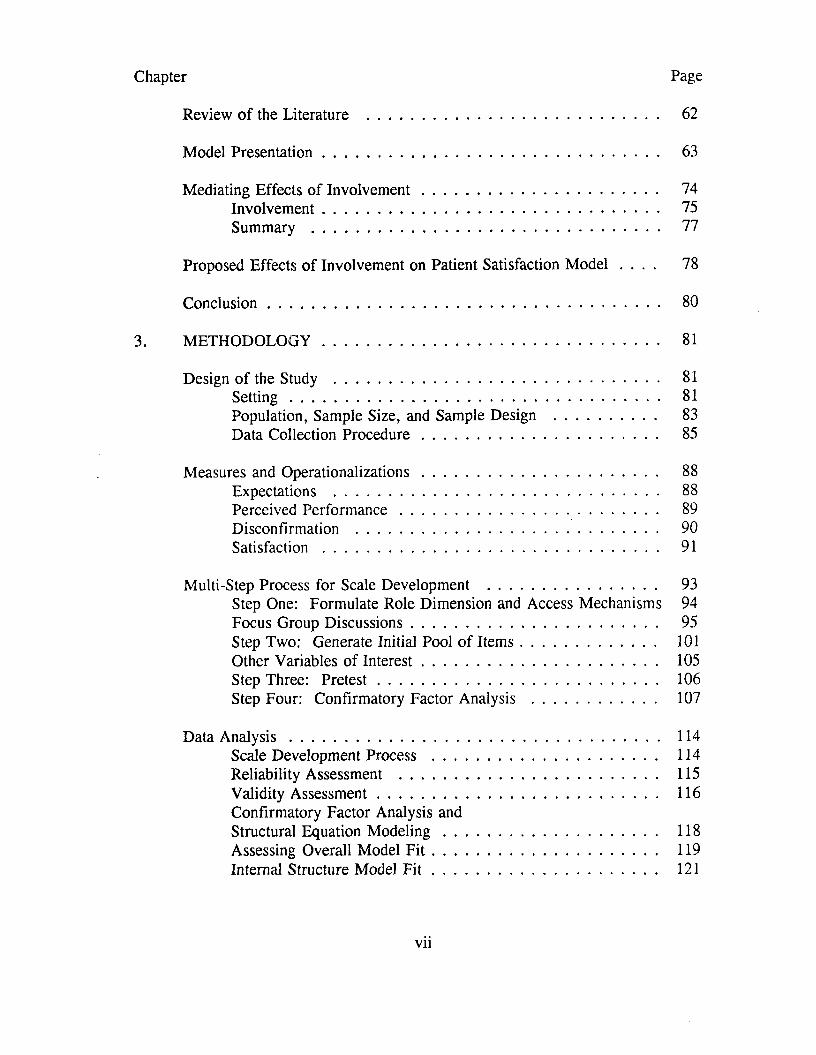
Review o f the Literature ................................................................................... 62
Model P resen ta tio n ............................................................................................... 63
Mediating Effects o f In v o lv em en t.................................................................... 74Involvem ent............................................................................................ 75Summary ............................................................................................... 77
Proposed Effects o f Involvement on Patient Satisfaction Model . . . . 78
C o n c lu sio n .............................................................................................................. 80
3. M E T H O D O L O G Y ............................................................................................ 81
Design of the Study ............................................................................................ 81S e t t in g ..................................................................................................... 81Population, Sample Size, and Sample Design ............................ 83Data Collection P ro c e d u re ................................................................ 85
Measures and O perationalizations.................................................................... 88Expectations ......................................................................................... 88Perceived P e rfo rm a n ce ...................................................................... 89Disconfirmation .................................................................................. 90Satisfaction ........................................................................................... 91
Multi-Step Process for Scale Development ................................................. 93Step One: Formulate Role Dimension and Access Mechanisms 94Focus Group D iscussions................................................................... 95Step Two: Generate Initial Pool o f I te m s ..................................... 101Other Variables of In te re s t................................................................ 105Step Three: P r e te s t ............................................................................ 106Step Four: Confirmatory Factor Analysis .................................. 107
Data A n a ly s is ..................................................................................................... 114Scale Development Process ............................................................. 114Reliability Assessment ...................................................................... 115Validity A ssessm en t............................................................................ 116Confirmatory Factor Analysis andStructural Equation M o d e lin g .......................................................... 118Assessing Overall Model F i t ............................................................. 119Internal Structure Model F i t ............................................................. 121
vii
Chapter Page
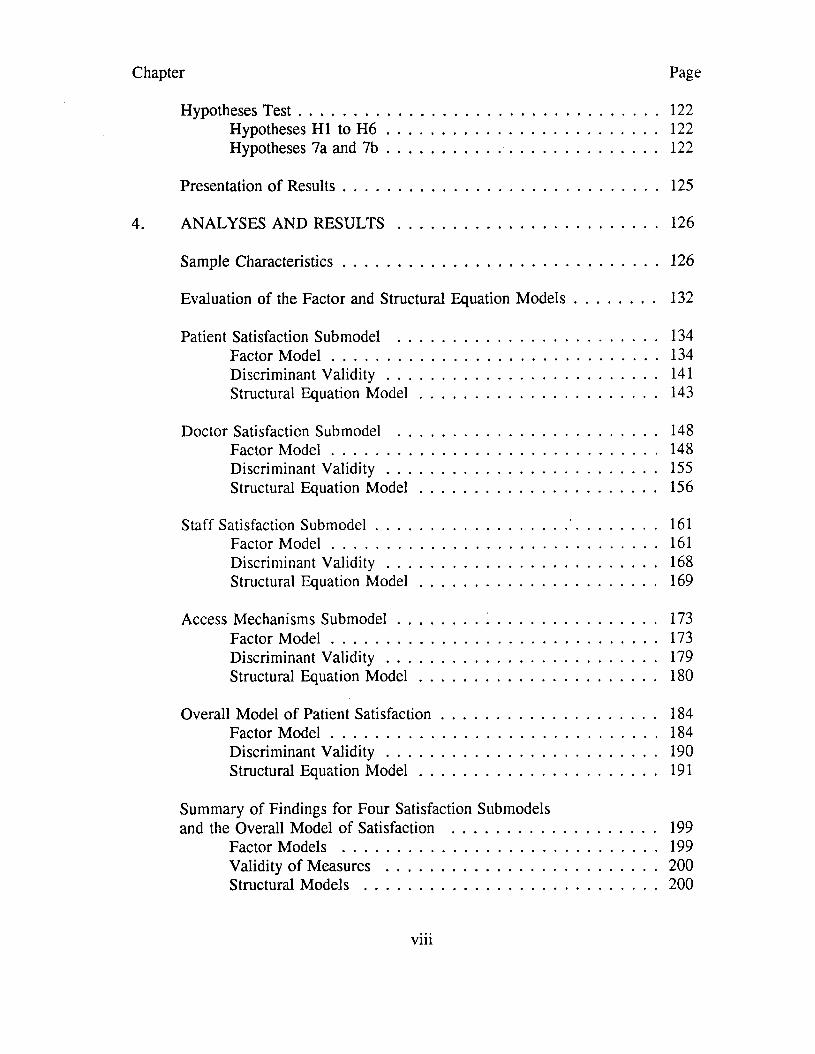
Hypotheses T e s t ..................................................................................................122Hypotheses H I to H 6 ......................................................................... 122Hypotheses 7a and 7 b ......................................................................... 122
Presentation o f R esu lts ......................................................................................125
4. ANALYSES AND R E S U L T S .......................................................................... 126
Sample C haracteristics ......................................................................................126
Evaluation of the Factor and Structural Equation M o d e ls ...................... 132
Patient Satisfaction Submodel ...................................................................... 134Factor M o d e l .........................................................................................134Discriminant V a l id i ty ......................................................................... 141Structural Equation M o d e l ................................................................ 143
Doctor Satisfaction Submodel ...................................................................... 148Factor M o d e l .........................................................................................148Discriminant V a lid i ty ......................................................................... 155Structural Equation M o d e l ................................................................ 156
Staff Satisfaction S u b m o d e l................................................... ' ...........................161Factor M o d e l .........................................................................................161Discriminant V a lid i ty ......................................................................... 168Structural Equation M o d e l ................................................................ 169
Access Mechanisms S u b m o d e l..................... i ................................................. 173Factor M o d e l .........................................................................................173Discriminant V a l id i ty ......................................................................... 179Structural Equation M o d e l ................................................................ 180
Overall Model o f Patient S a tisfac tion .......................................................... 184Factor M o d e l .........................................................................................184Discriminant V a l id i ty ......................................................................... 190Structural Equation M o d e l ................................................................ 191
Summary of Findings for Four Satisfaction Submodelsand the Overall Model o f Satisfaction ....................................................... 199
Factor Models ......................................................................................199Validity o f Measures ......................................................................... 200Structural Models ............................................................................... 200
viii
Chapter Page
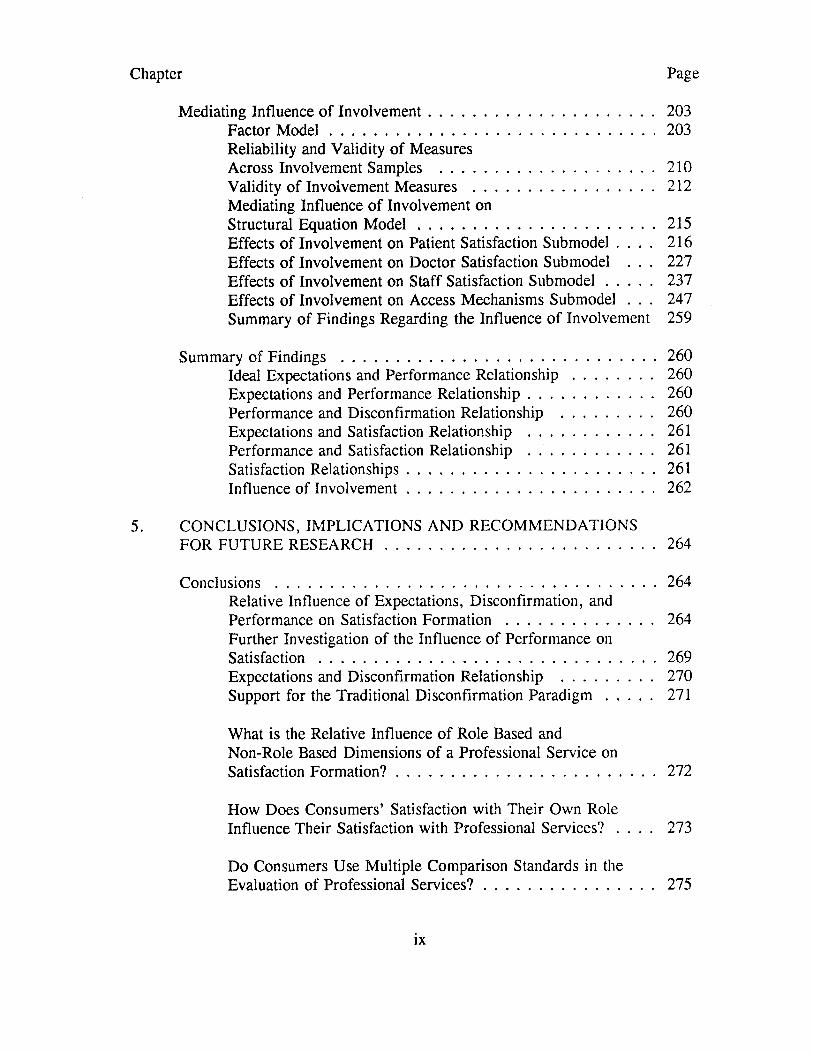
Mediating Influence o f Involvem ent.................................................................203Factor M o d e l ............................................................................................203Reliability and Validity o f MeasuresAcross Involvement Samples ..............................................................210Validity of Involvement Measures .....................................................212Mediating Influence o f Involvement onStructural Equation M o d e l ....................................................................215Effects of Involvement on Patient Satisfaction Submodel . . . . 216Effects o f Involvement on Doctor Satisfaction Submodel . . . 227Effects o f Involvement on Staff Satisfaction S u b m o d e l.. 237Effects of Involvement on Access Mechanisms Submodel . . . 247Summary of Findings Regarding the Influence o f Involvement 259
Summary of Findings .........................................................................................260Ideal Expectations and Performance R e la tio n sh ip ..........................260Expectations and Performance R elationship ......................................260Performance and Disconfirmation Relationship ......................... 260Expectations and Satisfaction Relationship ................................... 261Performance and Satisfaction Relationship . ................................ 261Satisfaction R elationships.......................................................................261Influence o f Invo lvem en t.......................................................................262
5. CONCLUSIONS, IMPLICATIONS AND RECOMMENDATIONSFOR FUTURE R E S E A R C H .............................................................................264
Conclusions ...........................................................................................................264Relative Influence of Expectations, Disconfirmation, andPerformance on Satisfaction Formation ............................................264Further Investigation of the Influence o f Performance onS a tis fa c tio n ...............................................................................................269Expectations and Disconfirmation Relationship ......................... 270Support for the Traditional Disconfirmation P a ra d ig m 271
What is the Relative Influence o f Role Based and Non-Role Based Dimensions o f a Professional Service on Satisfaction F o rm atio n ? ..........................................................................272
How Does Consumers’ Satisfaction with Their Own Role Influence Their Satisfaction with Professional Services? . . . . 273
Do Consumers Use Multiple Comparison Standards in the Evaluation of Professional S e rv ic e s? ..................................................275
ix
Chapter Page
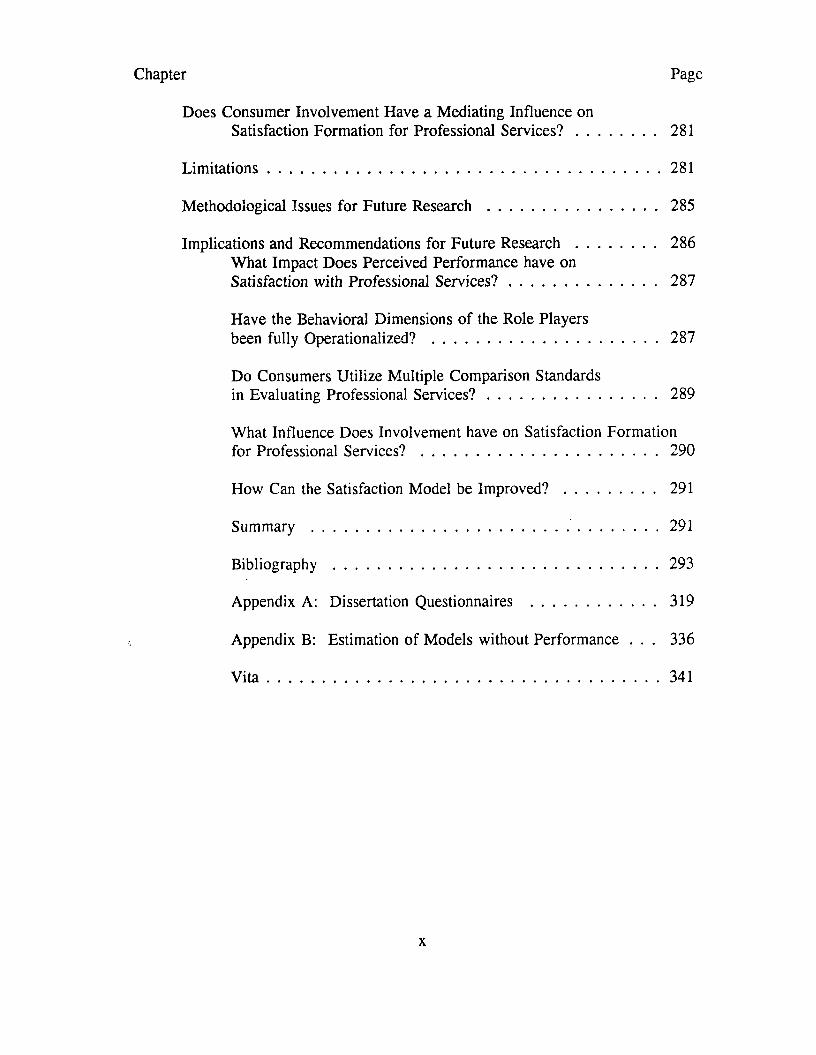
Does Consumer Involvement Have a Mediating Influence onSatisfaction Formation for Professional S e rv ic e s? ......................281
L im ita tio n s ...........................................................................................................281
Methodological Issues for Future Research .............................................. 285
Implications and Recommendations for Future Research ......................286W hat Impact Does Perceived Performance have onSatisfaction with Professional S e rv ic e s? ........................................287
Have the Behavioral Dimensions o f the Role Playersbeen fully Operationalized? ............................................................. 287
Do Consumers Utilize Multiple Comparison Standards in Evaluating Professional S e rv ic e s? ..............................................289
W hat Influence Does Involvement have on Satisfaction Formation for Professional Services? ................................................................ 290
How Can the Satisfaction Model be Improved? ......................... 291
Summary ...................................................................... ........................291
Bibliography ........................................................................................ 293
Appendix A: Dissertation Questionnaires ..................................319
Appendix B: Estimation of Models without Performance . . . 336
V i ta ...........................................................................................................341
x
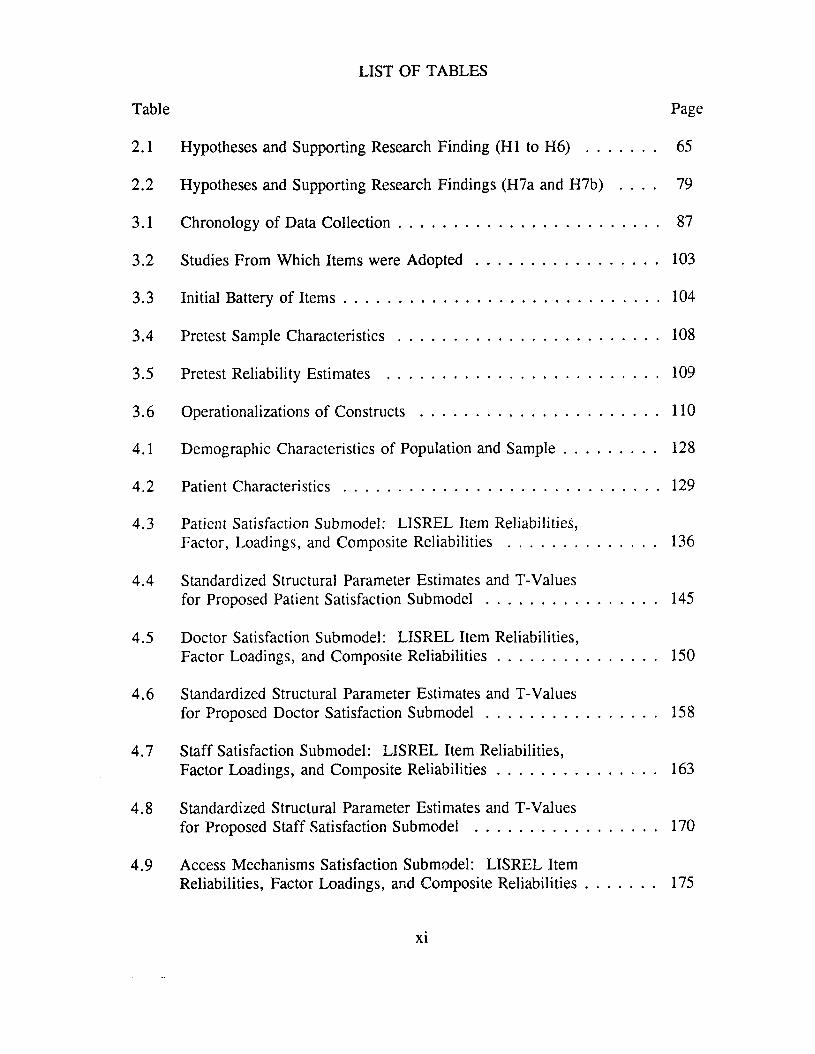
LIST OF TABLES
Table Page
2.1 Hypotheses and Supporting Research Finding (HI to H6) .................... 65
2.2 Hypotheses and Supporting Research Findings (H7a and H7b) . . . . 79
3.1 Chronology o f Data C o llec tio n ........................................................................ 87
3.2 Studies From Which Items were A d o p te d ................................................... 103
3.3 Initial Battery of I te m s ...........................................................................................104
3.4 Pretest Sample C h a rac te ris tic s ............................................................................108
3.5 Pretest Reliability Estimates ...............................................................................109
3.6 Operationalizations of Constructs ...................................................................... 110
4.1 Demographic Characteristics of Population and S a m p le .......................... 128
4.2 Patient C h arac te ris tic s ...........................................................................................129
4.3 Patient Satisfaction Submodel: LISREL Item Reliabilities,Factor, Loadings, and Composite Reliabilities ........................................ 136
4.4 Standardized Structural Parameter Estimates and T-Valuesfor Proposed Patient Satisfaction S u b m o d e l.............................................. 145
4.5 Doctor Satisfaction Submodel: LISREL Item Reliabilities,Factor Loadings, and Composite R e liab ilitie s ........................................... 150
4.6 Standardized Structural Parameter Estimates and T-Valuesfor Proposed Doctor Satisfaction S u b m o d e l.............................................. 158
4.7 Staff Satisfaction Submodel: LISREL Item Reliabilities,Factor Loadings, and Composite R e liab ilitie s ........................................... 163
4.8 Standardized Structural Parameter Estimates and T-Valuesfor Proposed Staff Satisfaction Submodel ................................................. 170
4.9 Access Mechanisms Satisfaction Submodel: LISREL ItemReliabilities, Factor Loadings, and Composite R eliab ilities................... 175
xi
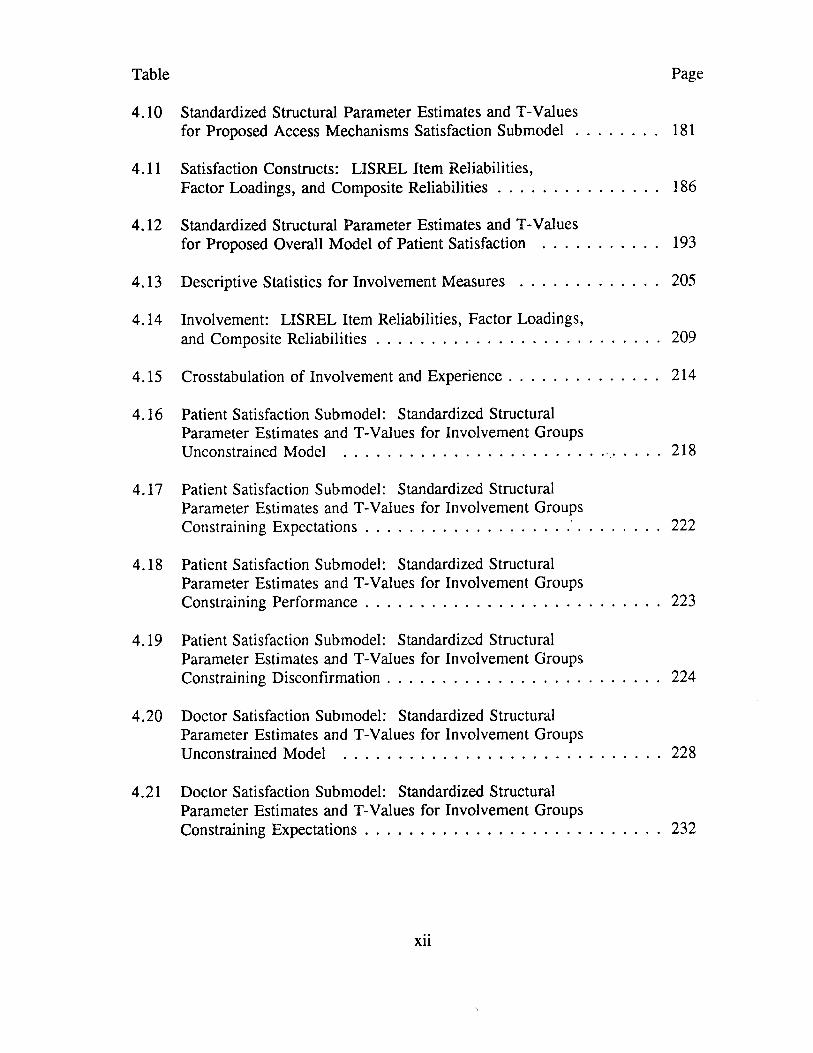
Table Page
4.10 Standardized Structural Parameter Estimates and T-Valuesfor Proposed Access Mechanisms Satisfaction S u b m o d e l...................... 181
4.11 Satisfaction Constructs: LISREL Item Reliabilities,Factor Loadings, and Composite R e liab ilitie s ........................................... 186
4.12 Standardized Structural Parameter Estimates and T-Valuesfor Proposed Overall Model o f Patient Satisfaction ............................... 193
4.13 Descriptive Statistics for Involvement Measures .......................................... 205
4.14 Involvement: LISREL Item Reliabilities, Factor Loadings,and Composite R e liab ilitie s ................................................................................ 209
4.15 Crosstabulation of Involvement and E xperience ............................................. 214
4.16 Patient Satisfaction Submodel: Standardized StructuralParameter Estimates and T-Values for Involvement Groups Unconstrained Model ......................................................................... 218
4.17 Patient Satisfaction Submodel: Standardized StructuralParameter Estimates and T-Values for Involvement Groups Constraining E xpectations...................................................... ' ...........................222
4.18 Patient Satisfaction Submodel: Standardized StructuralParameter Estimates and T-Values for Involvement Groups Constraining P erfo rm ance................................................................................... 223
4.19 Patient Satisfaction Submodel: Standardized StructuralParameter Estimates and T-Values for Involvement Groups Constraining D isconfirm ation............................................................................. 224
4.20 Doctor Satisfaction Submodel: Standardized StructuralParameter Estimates and T-Values for Involvement Groups Unconstrained Model ......................................................................................... 228
4.21 Doctor Satisfaction Submodel: Standardized StructuralParameter Estimates and T-Values for Involvement Groups Constraining E xpec tations................................................................................... 232
xii
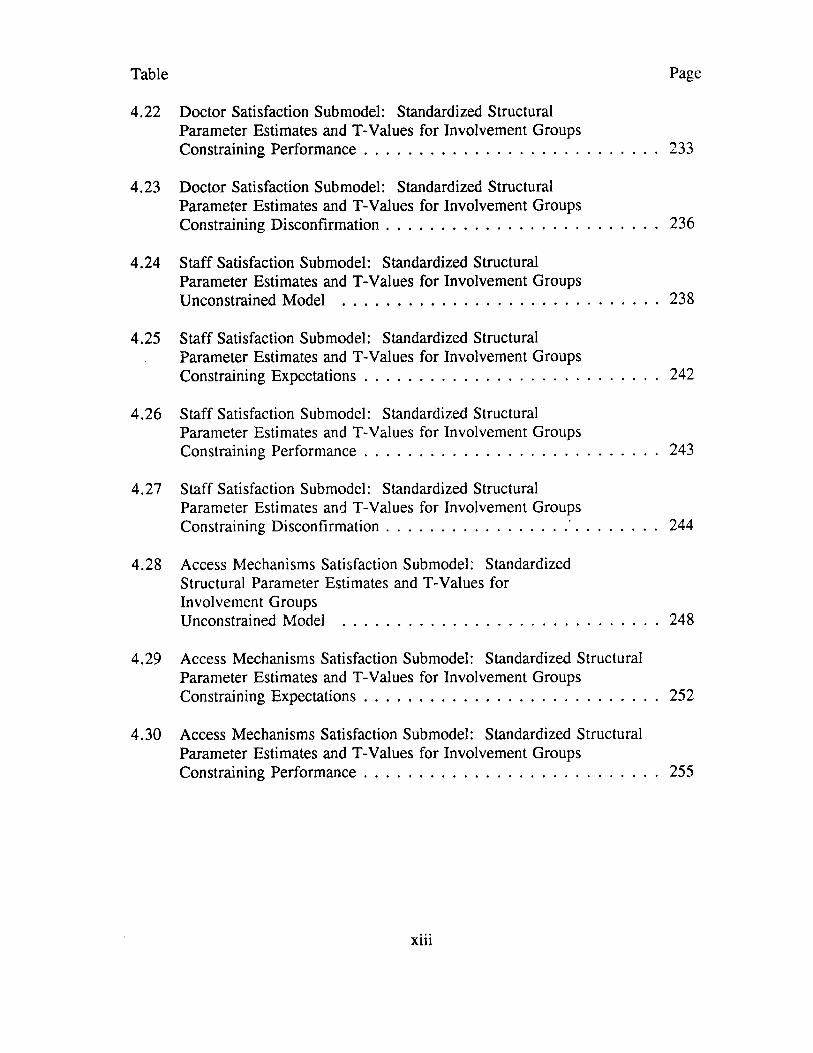
Table Page
4.22 Doctor Satisfaction Submodel: Standardized Structural Parameter Estimates and T-Values for Involvement Groups Constraining P erfo rm an ce ...................................................................................233
4.23 Doctor Satisfaction Submodel: Standardized Structural Parameter Estimates and T-Values for Involvement Groups Constraining D isconfirm ation............................................................................. 236
4.24 Staff Satisfaction Submodel: Standardized StructuralParameter Estimates and T-Values for Involvement Groups Unconstrained Model ......................................................................................... 238
4.25 Staff Satisfaction Submodel: Standardized StructuralParameter Estimates and T-Values for Involvement Groups Constraining E xpectations................................................................................... 242
4.26 Staff Satisfaction Submodel: Standardized StructuralParameter Estimates and T-Values for Involvement Groups Constraining P erfo rm ance ...................................................................................243
4.27 Staff Satisfaction Submodel: Standardized StructuralParameter Estimates and T-Values for Involvement Groups Constraining D isconfirm ation................................................ ' ...........................244
4.28 Access Mechanisms Satisfaction Submodel: StandardizedStructural Parameter Estimates and T-Values for Involvement GroupsUnconstrained Model ......................................................................................... 248
4.29 Access Mechanisms Satisfaction Submodel: Standardized StructuralParameter Estimates and T-Values for Involvement Groups Constraining E xpectations................................................................................... 252
4.30 Access Mechanisms Satisfaction Submodel: Standardized StructuralParameter Estimates and T-Values for Involvement Groups Constraining P erfo rm an ce ................................................................................... 255
xiii
Table Page
4.31 Access Mechanisms Satisfaction Submodel: Standardized StructuralParameter Estimates and T-Values for Involvement Groups Constraining D isconfirm ation .............................................................................256
4.32 Summary o f Significant Differences Across Involvement Groups . . . 260
4.33 Summary o f Tests o f Hypotheses Across Individual Submodel Testsand Overall Model T e s t ......................................................................................263
B. 1 Standardized Structural Parameter Estimates and T-Values forPatient Satisfaction Submodel without Performance ............................... 337
B.2 Standardized Structural Parameter Estimates and T-Values forDoctor Satisfaction Submodel without P e r fo rm a n c e ............................... 338
B.3 Standardized Structural Parameter Estimates and T-Values forStaff Satisfaction Submodel without Performance ......................................339
B.4 Standardized Structural Parameter Estimates and T-Values forAccess Mechanisms Satisfaction Submodel without Performance . . . 340
xiv
LIST OF FIGURESFigure Page
2.1 The Disconfirmation P a ra d ig m ....................................................................... 35
2.2 Patient Submodel: Hypothesized R elationsh ips......................................... 68
2.3 Doctor Submodel: Hypothesized R elationships......................................... 69
2.4 Staff Submodel: Hypothesized R e la tio n sh ip s ............................................ 70
2.5 Access Mechanisms Submodel: Hypothesized R elationships................. 71
2.6 Total Model: Hypothesized R elationsh ips.................................................. 72
4.1 Patient Submodel: Hypothesized Relationships ......................................... 146
4.2 Patient Submodel: Significant Standardized StructuralParameter E s t im a te s ............................................................................................ 147
4.3 Doctor Submodel: Hypothesized R elationships......................................... 159
4.4 Doctor Submodel: Significant Standardized StructuralParameter E s t im a te s ............................................................................................ 160
4.5 Staff Submodel: Hypothesized R ela tio n sh ip s ............................................ 171
4.6 Staff Submodel: Significant Standardized StructuralParameter E s t im a te s ............................................................................................ 172
4.7 Access Mechanisms Submodel: Hypothesized R elationships................. 182
4.8 Access Mechanisms Submodel: Significant Standardized StructuralParameter E s t im a te s ............................................................................................ 183
4.9 Total Model: Hypothesized R elationsh ips.................................................. 197
4.10 Total Model: Significant Standardized StructuralParameter E s t im a te s ............................................................................................ 198
4.11 Histogram for Semantic Differential Involvement M e a s u r e s .................... 206
4.12 Histogram for Likert Involvement Measures ............................................... 207
xv
Figure Page
4.13 Patient Submodel: Low Involvement Sample Significant Standardized Structural Parameter EstimatesUnconstrained Model .........................................................................................219
4.14 Patient Submodel: High Involvement Sample Significant Standardized Structural Parameter EstimatesUnconstrained Model .........................................................................................220
4.15 Patient Submodel: Low Involvement Sample Significant Standardized Structural Parameter EstimatesConstraining D isconfirm ation .............................................................................225
4.16 Patient Submodel: High Involvement Sample Significant Standardized Structural Parameter EstimatesConstraining D isconfirm ation.............................................................................226
4.17 Doctor Submodel: Low Involvement Sample Significant Standardized Structural Parameter EstimatesUnconstrained Model .........................................................................................229
4.18 Doctor Submodel: High Involvement Sample Significant Standardized Structural Parameter EstimatesUnconstrained Model ............................................................' .......................... 230
4.19 Doctor Submodel: Low Involvement Sample Significant Standardized Structural Parameter EstimatesConstraining P erfo rm ance ...................................................................................234
4.20 Doctor Submodel: High Involvement Sample Significant Standardized Structural Parameter EstimatesConstraining P erfo rm an ce ...................................................................................235
4.21 Staff Submodel: Low Involvement Sample Significant Standardized Structural Parameter EstimatesUnconstrained Model .........................................................................................239
4.22 Staff Submodel: High Involvement Sample Significant Standardized Structural Parameter EstimatesUnconstrained Model .........................................................................................240
xvi
Figure Page
4.23 Staff Submodel: Low Involvement Sample Significant Standardized Structural Parameter EstimatesConstraining D isconfirm ation..........................................................................245
4.24 Staff Submodel: High Involvement Sample Significant Standardized Structural Parameter EstimatesConstraining D isconfirm ation..........................................................................246
4.25 Access Mechanisms Submodel: Low Involvement SampleSignificant Standardized Structural Parameter Estimates Unconstrained Model ......................................................................................249
4.26 Access Mechanisms Submodel: High Involvement SampleSignificant Standardized Structural Parameter Estimates Unconstrained Model ......................................................................................250
4.27 Access Mechanisms Submodel: Low Involvement SampleSignificant Standardized Structural Parameter EstimatesConstraining E xpectations................................................................................253
4.28 Access Mechanisms Submodel: High Involvement SampleSignificant Standardized Structural Parameter EstimatesConstraining E xpectations..................................................... ' ...........................254
4.29 Access Mechanisms Submodel: Low Involvement SampleSignificant Standardized Structural Parameter EstimatesConstraining D isconfirm ation..........................................................................257
4.30 Access Mechanisms Submodel: High Involvement SampleSignificant Standardized Structural Parameter EstimatesConstraining D isconfirm ation..........................................................................258
xvii
ABSTRACT
The objectives o f the dissertation were: 1) examine the relative influence of
expectations, performance, and disconfirmation on satisfaction with professional
services; 2) assess the relative influence o f role based and non-role based
dimensions o f a professional service on satisfaction; 3) conceptualize and test the
influence o f consumer role constructs on satisfaction with professional services; and
4) examine the influence o f involvement on satisfaction formation for professional
services.
Prior to seeing their doctor, one hundred and thirty-one orthopedic patients
completed a questionnaire concerning their expectations for their own role, the
doctor’s role, the s ta ffs role, and access mechanisms (non-role based dimensions
such as waiting time, parking spaces, etc.) Respondents completed a second
questionnaire at home following their visit concerning perceptions of performance,
disconfirmation, and satisfaction.
Four submodels of satisfaction formation were constructed to explain
satisfaction with patient, doctor, staff, and access mechanisms performance. These
submodels were tested separately via LISREL VI, and then integrated into an overall
model o f patient satisfaction.
The main premise o f the dissertation research was that role based dimensions
are more important predictors of satisfaction for professional services than non-role
based dimensions. This proposition was supported. Findings regarding the relative
influence o f expectations, performance, and disconfirmation on satisfaction
formation were fairly consistent with the disconfirmation paradigm from the
consumer product domain. Conclusions regarding the impact o f consumer
satisfaction with their own role on overall satisfaction were somewhat limited by
multicollinearity among the satisfaction formation constructs. Findings regarding the
influence o f involvement on satisfaction formation were also inconclusive. Based on
the dissertation results, role theory appears to be an useful conceptual perspective
from which to model consumers’ immediate satisfaction with professional services.
xix
CHAPTER ONE
The Research Topic
Introduction
Consumers now spend just over half o f their after-tax income on services
such as travel, recreation, credit, product rentals and repairs, personal care,
education, medicine, and shelter (Berman and Evans 1989). We are fast becoming a
service economy. As with goods producers, the primary objective o f service
producers is to ensure their own economic survival through the development and
provision of service offerings that satisfy consumer needs (Zeithaml 1981; Hill
1986). In order to attain this goal, service marketers must understand consumer
evaluation processes. Most o f what is known about consumer evaluation processes
is based on product decisions. The typical outcomes of consumer evaluation
processes for both products and services are thought to include:
satisfaction/dissatisfaction, purchase, patronage, loyalty, and word-of-mouth activity.
A growing body of literature supports the notion that the unique characteristics of
services necessitate different evaluation processes (Berry 1980; Lovelock 1981;
Zeithaml 1981; Gronroos 1982). Thus, while the outcomes o f consumer evaluation
processes for services may be similar to those for products, the components and role
o f evaluation processes differ between products and services and therefore deserve to
be studied.
This dissertation focuses on explaining and predicting
satisfaction/dissatisfaction outcomes o f consumer evaluation processes for
1
2
professional services. A role theoretical model o f consumer satisfaction is
developed and tested in the context of health care services. The study investigates
the influence o f role expectations on role performance evaluations and consumer
satisfaction. In addition, the potential mediating influence o f customer involvement
on performance evaluation processes and satisfaction formation is examined.
The first chapter provides a review o f the distinctive features of services.
Then, the characteristics o f professional services are discussed, along with the
resultant consequences for consumer evaluation processes. Next, the use of role
theory as a conceptual framework within which to model satisfaction with
professional health care services is presented. The proposed model o f consumer
satisfaction with professional services is discussed briefly, along with the expected
contributions of the research. Finally, an outline of the dissertation is given.
Distinctive Features of Services
Several authors have attempted to identify the features that distinguish
services from products (Rathmell 1974; Eiglier, Langeard, Lovelock, Bateson, and
Young 1977; Shostack 1977; Liechty and Churchill 1979; Zeithaml 1981). From
their research three service characteristics have been agreed upon. They include:
(1) intangibility, (2) nonstandardization, and (3) inseparability.
Perhaps the most distinguishing characteristic of services is intangibility
(Rathmell 1966, 1974; Judd 1968; Bessom 1973; Bateson 1977; Eiglier et. al. 1977;
Shostack 1977; Uhl and Upah 1979; Berry 1980; Lovelock 1981). The concept of
intangibility has two meanings: 1) that which cannot be touched, impalpable, and
3
2) that which cannot be easily defined, formulated, or grasped mentally (Berry
1980). The intangible nature o f services makes it difficult for consumers to
formulate firm expectations about service performance prior to the service
experience. Intangibility may also make it difficult for consumers to make
evaluations about the delivered service.
A second characteristic of services is heterogeneity or nonstandardization
(Bessom and Jackson 1975; Berry 1980). For services that are "people-based"
rather than "equipment-based", the human component involved in performing the
service often creates variability in services outcomes which are not present in
machine dominated services (Berry 1980). Nonstandardization o f services increases
the potential for customization, while at the same time increasing the potential for
inconsistencies in service quality. Variations in service quality may arise from
demand fluctuations, service perishability, and differential levels o f contact
employees’ commitment, skill, and experience. Variability in service delivery
means that the same service delivered at the same time, in the same place, and by
the same firm may differ significantly both from one customer to the next, and for
the same customer across encounters (Booms and Nyquist 1981). Since expectations
about a service encounter are at least partially based on past experience
(Parasuraman, Zeithaml, and Berry 1985), inconsistencies across service encounters
may contribute to instability in consumer expectations and, consequently difficulty in
achieving customer satisfaction.
A third characteristic o f services is the inseparability o f production and
4
consumption (Regan 1963; Gronroos 1978; Carmen and Langeard 1980; Upah
1980). The characteristic o f simultaneity creates an intensive and complex
customer/firm interface for services not found for most goods (Booms and Nyquist
1981). For services where no tangible object is exchanged and where service
quality is difficult to measure, the provider-client interaction provides the experience
that is essentially the service from the consumers’ perspective (Friedman and
Churchill 1987). In these service situations, the manner o f service delivery may be
the critical ingredient in producing consumer satisfaction. Inseparability of
production and consumption also means that in contrast to products, the consumer is
present during the production process. What is important to recognize about the
presence o f the consumer is that the consumer by his/her behavior will have an
impact on the service delivered (Gronroos 1982). The quality o f and satisfaction
with many services will depend not only on provider performance but also on
consumer performance.
Services Classification
Researchers have developed several approaches for classifying goods and
services. For instance, Shostack (1977) suggests that goods and services be placed
along an intangibility-tangibility continuum. Nelson (1970) suggested that goods can
be distinguished in terms of two categories o f attributes: search properties and
experience properties. Search properties are attributes which a consumer can assess
prior to purchase and consumption, whereas experience properties are attributes
which can only be assessed after purchase and/or during consumption. Darby and
5
Kami (1973) add a third category o f attributes: credence properties. Credence
properties are attributes o f a product or service which a consumer may find
impossible to evaluate even after purchase and consumption. Relative to most
products, most services tend to be high in experience and credence properties and
low in search properties. Consequently, services are generally more difficult to
evaluate than products. "Difficulty in evaluation, in turn, forces consumers to rely
on different cues and processes when evaluating services" (Zeithaml 1981, p. 186).
Cues for evaluating services are derived primarily from the physical environment of
the service organization and the customer’s interaction with the organization’s
personnel (Booms and Nyquist 1981).
Importance o f Process Factors in Consumer Evaluation Processes for Services
Due to the evaluation difficulties described above, process factors often
provide the dominating influence on consumers’ perceptions of and satisfaction with
services. In many service situations, the consumer lacks the skills necessary to
evaluate the instrumental performance or technical competence of the service
provider. As a consequence, the consumer must rely on the expressive performance
o f the service provider to make his/her evaluations. In the service context, the
expressive performance relates to the buyer-seller interactions (Gronroos 1984). "In
pure service situations where no tangible object is exchanged, and the service quality
itself is difficult to measure (e.g. financial planning, health care), customer
satisfaction and repeat patronage may be determined solely by the quality o f the
personal encounter" (Solomon, Surprenant, Czepiel, and Gutman 1985, p. 100). As
an example, patients incapable o f evaluating a physician’s medical diagnosis may
base their evaluations on the physician’s "bedside manner".
Professional Services
The characteristics o f professional services make them particularly difficult
for consumers to evaluate. Professional services tend to be high in both experience
and credence properties and low in search properties. This means that most
professional service attributes can only be evaluated during and/or after consumption
and that some attributes are impossible for consumers to evaluate even after
consumption. Many professional services can also be characterized by a provider-
client information asymmetry. Professionals typically claim competence over a
narrow and unique body of knowledge and skills. The client being unschooled in
the esoteric knowledge to which the professional has access, presumably finds
himself rendered incapable of evaluating the professional’s technical competence
(Segall and Burnett 1980). Often the content of a professional’s response does not
provide an immediate solution to a client’s problem. This means that a consumer’s
assessment o f technical competence can only be made over time. For instance, the
correctness o f a physician’s diagnosis and treatment can be determined only with
time (e.g. was the illness cured ?). The nature o f professional services suggests that
"the client’s immediate satisfaction with professional service encounters will be a
consequence o f the mode of the professional’s response rather than o f its content"
(Ben-Sira 1976, p. 5). That is, consumers’ satisfaction with a particular service
encounter will be determined largely by process rather than outcome factors.
7
There are several factors contributing to the importance o f understanding
consumer evaluation processes for professional services. First, as a subset of
services, professional services now employ an estimated 4 million individuals (Gelb,
Smith, and Gelb 1988). Thus, professional services represent a large portion o f our
economic activity. Second, professional services have been especially hard hit by
increased competition (Webster in prep.). Faced with fierce competition,
professionals are becoming increasingly sensitive to marketing issues. Third, among
service marketers, professionals may have the most difficult task o f creating client
satisfaction (Gelb, Smith and Gelb 1988). For many professional services, the client
may "have to" rather than "want to" purchase the service. In this situation, the
client may bring fear and/or hostility to the purchase, thus making client satisfaction
more difficult to obtain. Often a client is referred to or sent to the provider, rather
than choosing him or her on their own. "Thus, professionals usually lack one
advantage with which other marketers begin: a buyer who is predisposed in their
favor because he or she selected them" (Gelb, Smith, and Gelb 1988, p. 2).
Finally, because professional services are so poorly understood by most clients, a
"job well done" in terms of the technical dimensions of the service may not be
enough to create a satisfied buyer (Bloom 1984). Therefore, other dimensions o f the
service encounter (i.e ., the process dimension) must also be managed to create client
satisfaction.
Role Theoretical Analysis of Consumer Satisfaction
As Bloom (1984) suggests, clients of professional services often lack the
8
skills necessary to objectively evaluate the technical dimension o f professional
services. For this reason, consumers attempt to make judgements o f a service based
on other tangible cues. In a professional service setting, one o f the more important
cues available to consumers is their perception o f the provider’s overt behavior.
The importance of behavioral dimensions for consumer evaluations o f professional
services makes these encounters particularly amenable to a role theoretical analysis
o f consumer satisfaction (Solomon, Surprenant, Czepiel, and Gutman 1985). That
is, within the context of professional services, a comparison of customers’
expectations of how a professional should or will act during a service encounter with
a professional’s actual role performance may provide a richer foundation from which
to explain customer satisfaction than simply comparing service outcome expectations
with performance. As an example, in the context of most health care services the
service outcome is the treatment and/or cure o f the patient’s ailment. As was
suggested earlier, consumers are often ill-equipped to immediately judge medical
service outcomes. It can be argued then that patients largely base their immediate
evaluation of a particular service encounter (i.e. a physician office visit) on their
expectations and perceptions o f the physician’s behavior. For this reason, role
theory appears to be an appropriate conceptual framework from which to model
consumers’ immediate satisfaction with professional service encounters.
Role theory is the study o f the conduct associated with certain socially
defined positions rather than o f the particular individuals who occupy these positions
(Solomon, Surprenant, Czepiel, and Gutman 1985). The focus o f role theory is on
behaviors that can be typically expected of an occupant in a given position within a
particular social content (Kretch, Crutchfield, and Ballachey 1962). Two theoretical
constructs o f primary importance in role theory are role expectations and role
enactment. In the context o f service encounters, Solomon, et. al. (1985) posit that
satisfaction is a function of the congruence between behaviors expected by the role
players (role expectations) and perceived behaviors (role performance or enactment).
Although the application o f role theory to services marketing is relatively
recent (Solomon, Surprenant, Czepiel, and Gutman 1985; Crosby and Cowles 1986;
Gardner 1987), role theory is not new to marketing. Role theory has been applied
to the study o f role portrayals in advertising (Courtney and Lockeretz 1971; Wagner
and Banos 1973; Sexton and Haberman 1974; Venkatesan and Losco 1975; Belkaoui
and Belkaoui 1976; Duker and Tucker 1977), husband/wife decision making (Davis
1970; Cunningham and Green 1974, Green and Cunningham 1975) and personal
selling (Kernan and Sommers 1966, 1967; Tosi 1966; Sommers and Kernan 1969;
Calder 1977).
The Dissertation Research
Since Solomon et. a l .’s (1985) earlier conceptual work, there have been few
empirical investigations of service satisfaction from a role theoretical perspective.
In one study investigating satisfaction with life insurance services, empirical support
was found for the relationship between the contact person’s role performance and
customer interaction satisfaction (Crosby and Cowles 1986). Similarly, Day and
Bodur (1978) found that the quality o f provider performance (i.e. role performance)
10
was the most frequent reason given for customer satisfaction/dissatisfaction with
various services. Gardner (1987) suggests that satisfaction is at least partially
impacted by the difference between role expectations and role behavior for
professional services. Thus, there is some empirical evidence suggesting that
provider role performance and role disconfirmation are significant determinants of
consumer satisfaction (Day and Bodur 1978; Crosby and Cowles 1986).
However, a review of the relevant research highlights a number o f major
deficiencies in the services literature. First, a systematic investigation of the
structural relationships between role expectations, performance, disconfirmation, and
satisfaction has not been conducted in the literature. Previous research has
examined the influence of either provider performance or disconfirmation on
consumer satisfaction, but not both. For this reason, little is known about the
relative influence of expectations, performance, and disconfirmation on consumer
evaluation processes for professional services.
Second, research examining the effects o f consumers’ expectations and
perceptions of their own role on satisfaction is virtually nonexistent. "Since services
are interactive, the customer’s own performance is a causal variable affecting the
outcomes that needs to be measured and controlled for in satisfaction monitoring"
(Czepiel and Sabalava 1988, p. 12).
Finally, the influence o f involvement on consumer evaluation processes for
services has yet to be investigated. Research in the product satisfaction literature
suggests that the relative influence o f expectations, performance, and disconfirmation
11
on satisfaction will be at least partially determined by the consum er’s level of
involvement. Similar research in the context o f services has not been empirically
studied.
This dissertation attempts to address these deficiencies. The research
presented here will: 1) systematically investigate the full set of interrelationships
among expectations, performance, disconfirmation, and satisfaction for health care
services, 2) utilize a role theoretical foundation to explain service satisfaction with
health care services, 3) conceptualize and test the influence of consumer role
expectations and behavior on satisfaction with health care services, and 4) examine
the influence of involvement on satisfaction formation for health care services.
A Model of Consumer Satisfaction With Professional Services
For the most part, the product satisfaction literature has relied primarily on
the disconfirmation paradigm to explain consumer satisfaction processes. Consistent
with this tradition, the service literature has also adopted the disconfirmation
paradigm to explain consumer satisfaction processes (Riordan, Oliver, and Donnelly
1977; Smith and Housten 1983; Parasuraman, Zeithaml and Berry 1985; Hill 1986;
Baumgarten and Hensel in prep.; Brown and Swartz 1987). The disconfirmation
paradigm as described by Churchill and Surprenant (1982) holds that:
satisfaction is related to the size and direction o f the disconfirmation experience and where disconfirmation is related to the person’s initial expectations. More specifically, an individual’s expectations are (1) confirmed when a product performs as expected; (2) negatively disconfirmed when the product performs more poorly than expected; and (3) positively disconfirmed when the product performs better than expected. Satisfaction will result when expectations are confirmed or positively disconfirmed (pp. 491-92).
12
Recent product satisfaction studies have focused on the structural
relationships among expectations, performance, and disconfirmation (Oliver 1980;
Churchill and Surprenant 1982; Oliver and Bearden 1983; Tse and Wilton 1988).
Results from these studies suggest that satisfaction is directly influenced by
expectations, performance and disconfirmation. The relative strength o f influence of
each construct may depend on mediating factors such as product type (Day 1977;
Churchill and Surprenant 1982) and consumer involvement (Oliver and Bearden
1983; Barber and Venkatraman 1986).
In a recent article, Tse and Wilton (1988) extend the product satisfaction
literature by examining multiple models of consumer satisfaction formation. The
results o f their laboratory study suggest that product expectations, disconfirmation
and perceived performance all assume distinct roles in consumer satisfaction/
dissatisfaction (i.e. CS/D) formation and should therefore be modeled separately.
Replicating Churchill and Surprenant’s (1982) finding, perceived product
performance was the most significant predictor o f satisfaction in this study.
In addition, Tse and W ilton’s results provide initial empirical evidence for
the presence o f multiple comparison standards. Expectations and ideal expectations
appear to represent different constructs contributing separately to the CS/D
formation process. Ideal expectations represent consumers’ optimal performance
whereas expectations represent consumers’ anticipated performance. Tse and
Wilton (1988) also found that subjective approaches (consumer’s subjective
evaluation o f the difference between product performance and a comparison
13
standard) to model disconfirmation capture determinants o f CS/D formation better
than the often used subtractive approaches (algebraic difference between product
performance and a comparison standard).
This dissertation incorporates Tse and W ilton’s recent findings for product
satisfaction into a role theoretical model o f satisfaction for professional services.
First, role expectations, performance, and disconfirmation are modeled separately.
Since the model is from the consumers’ perspective, the distinction is made between
consumers’ perceptions o f their own role and consumers’ perceptions o f the
provider’s role. Second, multiple comparison standards are used. Both ideal role
and expected role are examined individually.
Influence o f Consumer Involvement on Satisfaction
Previous research suggests that the relative importance o f expectations,
performance and disconfirmation on consumer satisfaction/dissatisfaction formation
may be influenced by a number o f factors such as product type, and consumer
involvement (Day 1977; Churchill and Surprenant 1982; Oliver and Bearden 1983).
Several researchers found consumer evaluation processes to differ by product type.
Disconfirmation was found to be the best predictor o f satisfaction for nondurable
goods, whereas product performance was found to be the best predictor of
satisfaction for durable goods (Day 1977; Churchill and Surprenant 1982).
Consumer involvement may also play an important role in satisfaction processes
(Oliver and Bearden 1983; Barber and Venkatraman 1986). According to Oliver
and Bearden (1983) high involvement decreases one’s sensitivity to pre-usage
14
phenomena (i.e ., expectations) and increases one’s sensitivity to outcome phenomena
(i.e ., performance). Low involvement, in contrast, decreases consumers’ motivation
to process performance distinct from prior evaluations.
This dissertation study examines the effects o f consumer involvement on
satisfaction/dissatisfaction formation for professional services. It is likely that the
level o f consumer involvement will vary across different types o f service situations.
For instance, in the context o f health care services, level o f involvement may vary
according to the degree of consumer experience, the type o f care sought, the
seriousness o f the illness, the costs involved in care, and the personality of the
person seeking care. In situations of high consumer involvement, it will be argued
that the perception of role performance exerts the dominating influence on consumer
satisfaction. In contrast, in situations of lower consumer involvement role
expectations and disconfirmation should primarily determine consumer satisfaction.
Contributions of the Research
In today’s competitive marketplace, one way for professionals to gain a
competitive edge is to adopt a "client-centered" approach with a view toward doing
a better job o f meeting consumer needs and maximizing consumer satisfaction
(Connor and Davidson 1985). In order to adopt a customer orientation,
professionals must first understand consumer evaluation processes for their services.
This study attempts to increase our understanding o f the determinants of consumer
satisfaction with professional services.
The dissertation research makes a number of theoretical contributions to the
literature. The study provides an initial investigation of the structural relationships
among ideal expectations, expectations, performance, disconfirmation and
satisfaction for professional services. Understanding these relationships may enable
us to better explain the influential elements underlying consumer
satisfaction/dissatisfaction formation. Most researchers agree that a distinctive
feature o f services is the presence o f consumers in the production and delivery of
services. Yet empirical investigations o f the influence o f consumers’ role on
satisfaction evaluations is conspicuously absent from the literature. By explicitly
incorporating consumer role constructs into a model o f satisfaction, this study
provides the first empirical investigation o f the influence o f consumer role
expectations and performance on satisfaction/dissatisfaction processes for
professional services. Finally, the study includes consumer involvement as an
important mediating factor impacting consumer evaluation processes. Although a
number o f researchers have suggested that involvement (Barber and Venkatraman
1986) may influence consumer satisfaction processes for services, to date, empirical
evidence is lacking.
The dissertation research also makes a number of managerial contributions.
Empirical evidence for the relationship between consumer role expectations and
satisfaction suggest that providers may either alter their expectations and behavior to
match consumers’ expectations or they may alter consumers’ expectations to match
their behavior. Altering their own behaviors and expectations can only occur if
professionals are aware o f the factors that consumers use to evaluate their services.
16
This study attempts to understand more fully the manner in which consumers use
roles in making satisfaction evaluations.
One way for altering consumer expectations is through educational and/or
promotional communications. Advertising campaigns, community workshops, and
brochures may be used to inform consumers o f what to expect in professional
service encounters. Creating more realistic expectations through educational
programs should provide foundations for continued patronage, client loyalty,
favorable word-of-mouth activity and client referrals. It may be that the findings of
this study suggest that some o f the educational communications focus on altering
consumer expectations of their own role. The role o f involvement in consumer
evaluation processes would suggest that expectation management is particularly
important for low involvement encounters or routine visits.
It has been suggested that the joint assignment o f roles occurs during the first
encounter and persists throughout subsequent encounters (Solomon, Surprenant,
Czepiel and Gutman 1985). This implies that service providers should actively
solicit consumer role expectations during the initial service encounter. This helps
develop a climate o f realistic expectations and open communication. In the context
of health care, this has been referred to as "the negotiated approach to patienthood"
(Lazare, Eisenthal, Frank, and Stoeckle 1987). Active elicitation of consumer
expectations will enable the professional to adapt the service encounter to meet
individual needs and desires.
Findings indicating a disparity between consumers’ notion of ideal roles and
17
expected roles would suggest areas in which professionals could do a better job of
meeting consumer role expectations. A discrepancy between ideal expectations and
expectations may also indicate areas in which consumers hold unrealistically high
expectations. As previously discussed, communications may be needed to generate
more realistic consumer expectations.
The importance o f role performance to consumer satisfaction assessment
suggests that practitioners focus their attention on the performance aspect of
professional services. Since consumers have a difficult time evaluating the technical
dimensions o f professional services, they often confine their judgements to the mode
o f interaction. To increase consumer satisfaction, providers should concentrate their
efforts on improving nontechnical dimensions o f role performance such as caring
behaviors or information-giving behaviors. The importance o f these role dimensions
suggest that in addition to technical training, professionals should be provided with
training designed to improve communication and interpersonal skills. In situations
o f high involvement, performance management becomes particularly important.
18
Organization o f the Study
This dissertation is divided into five parts. Chapter I provides a brief
introduction to the study. Chapter II reviews literature in the following areas: role
theory, satisfaction, and involvement. From the insights gained in both the literature
review and selected theories, a model o f consumer satisfaction with professional
services is presented. In Chapter III, the methodology and research design are
reviewed. Chapter III also includes findings from the questionnaire pretest.
Chapter IV presents findings from the full study. And finally, Chapter V draws
upon the findings to state conclusions and implications and to suggest future research
directions.
CHAPTER TWO
Literature Review
The dissertation research develops a model o f consumer satisfaction with
professional services and tests it within the context o f health care services. The
purpose o f this chapter is to review the literature relevant to the dissertation topic,
identify major issues in the body o f research, and state hypotheses o f the proposed
model.
The plan o f Chapter Two is as follows:
1) Review relevant research in the areas o f role theory,
consumer product satisfaction, service
quality/satisfaction, patient satisfaction, and
involvement. The proposed role theoretical model of
consumer satisfaction with health care services will be
presented following a critical review of the literature.
2) Examine and review model constructs in light o f consumer satisfaction
formation for professional services, in particular health care services.
3) Summarize the findings and issues in the literature reviewed in the
chapter. State the model hypotheses.
Role Theory
Role theory is an approach based on the dramaturgical metaphor.
Dramaturgy has its roots in the Symbolic Interactionist school o f thought. The
fundamental premise underlying this school o f thought is that man is a symbol user
19
20
who strives to create and maintain a definition of reality to which others respond.
As a ’subtheory’ o f this perspective, dramaturgy cloaks social interaction in a
theoretical framework utilizing terms and concepts familiar to a dramatic production.
The focus o f dramaturgy is on the strategies and actions required to create and
maintain a favorable impression before an audience. This may be accomplished
through successful management o f ’expression given o f f by the actors and their
physical surroundings (Goffman 1959; Grove and Fisk 1983).
A role theoretical perspective emphasizes people as social actors who learn
roles or clusters of behaviors appropriate to the many positions they occupy in
society. "Role, a term borrowed directly from the theater, is a metaphor intended to
denote that conduct adheres to certain "parts" (or positions) rather than to the
players who read or recite them" (Sarbin and Allen 1968, p. 489). The emphasis of
role theory is on overt social conduct expected of and associated with certain
socially defined positions rather than of the particular individuals who occupy those
positions (Kretch, Crutchfield, and Ballachey 1962; Solomon, et. al. 1985). The
constructs o f role expectations and role performance are fundamental to role theory.
Role Expectations
Role expectations provide the conceptual bridge between role behavior and
social structure (Sarbin and Allen 1968). Role expectations can be defined as
"collections of cognitions-beliefs, subjective probabilities, and elements of
knowledge- which specify in relation to complementary roles the rights and duties,
the appropriate conduct, for persons occupying a particular position" (Sarbin and
Allen 1968, p. 498). Roles within a social structure are highly interdependent.
Expected behaviors for one role player must take into account the behavior of other
role players. The totality o f complementary roles related to a given role is referred
to as a role set (Merton 1957). For example, a role set for a physician would
include such complementary roles as patient, nurse, medical technician, and office
employee. The role expectations of a physician are then reciprocal to these
complementary roles, meaning as the physician gives orders, the nurse follows
them.
Role expectations may differ in content as a function o f the viewpoint o f the
person assessing the role expectations. For this reason, it is useful to distinguish
between role expectations held by the role occupant and role expectations held by
occupants of complementary positions. For any given role perform er, we can
distinguish between: (a) the role perform er’s definition of his/her own rights and
duties (role conception), (b) his/her estimate o f the way other role players with
whom he/she interacts defines his/her rights and duties, (c) others’ definition o f the
rights and duties of the role performer, and (d) the role perform er’s definition of
the rights and duties o f occupants in complementary positions. Once again we see
the interdependent nature of social roles. Behavior will result from a role player’s
definition of his/her own rights and duties and from his/her definition o f the rights
and duties o f others.
Role expectations provide more than guidelines for behavior. They specify
not only what actions a given role player is expected to perform , but also the
22
manner in which these actions are to be performed. In other words, role
expectations operate as imperatives pertaining to a person’s conduct and attitudes
while he enacts a role. By specifying "how", "should" and "is", these imperatives
ensure that the role enactment will be appropriate (Sarbin and Allen 1968).
Role expectations also tend to facilitate social interaction by providing role
players with a means of predicting one another’s behavior. In role theoretic terms,
this is referred to as "taking the role o f the other" (Mead 1935). "Taking the role of
the other" is a empathetic process which allows role performers to anticipate others’
expected role behavior. This also enables the role perform er to adapt his/her own
behavior to the predicted behavior of others (Rose 1962). For example, a client of
H & R Block anticipates the tax preparer’s request for records, and consequently
adapts his/her own behavior by bringing relevant records to the first meeting.
Effects o f Role Expectations on Role Performance
Role expectations influence role performance by inducing conformity to
group norms (Sarbin and Allen 1968). Conformity may be brought about through
overt pressure from others, role commitment, sensitivity to the reactions o f others,
and imitation.
Role expectations specify "appropriate" behaviors for an occupant in a given
position within some social context. Role expectations suggest that an occupant o f a
social position ought to do particular things in specified ways and ought to hold
specific beliefs. The normative aspect o f expectations reflects the evaluative nature
o f roles. The evaluative character o f role expectations implies that approval or
23
disapproval by other people will depend largely on whether one’s role performance
conforms to their expectations.
Conformity to role expectations may result from the overt pressure of
significant others or third parties. Role structure enhances the influence o f role
expectations on role enactment. Role structure simply means that some of the roles
one plays in society are interrelated. Failure in one role may cause failure in other
related roles. This can create a situation where sanctions emanate from more than
one complementary role perform er thereby increasing the pressure to conform to
role expectations. Willingness to conform to group norms will be particularly strong
when the role performer is committed to the role.
Role commitment and overt conformity pressures are not the only
mechanisms by which role expectations influence role enactment. Role expectations
also influence persons with whom a role performer interacts. Occupants of
complementary positions will interpret and react differently to a role perform er’s
behavior according to whether or not it is perceived as conforming to role
expectations. Approval/disapproval of the role perform er’s behavior is conveyed
through verbal and nonverbal communications. For instance, disapproval o f the role
perform er’s behavior may be expressed through a verbal reprimand as well as a
nonverbal facial expression. A customer at a restaurant expecting to be served and
then left alone, may convey his/her disapproval o f a waiter’s chit-chat verbally with
"Thank you, that will be all!" and/or nonverbally with a scornful facial expression.
Thus, a role perform er may conform to role expectations because o f a sensitivity to
24
the reactions o f others.
Finally, conformity may result through imitation. By observing the role
behavior o f others, both in similar positions and in complementary positions, a role
player may gain insight into what behaviors are appropriate for his/her position
(Stouffer and Toby 1951). A novice to a self-serve gas station, for instance, may
watch other customers and employees to determine what is expected o f a self-serve
customer. S/he may notice that the employees’ primary role is to take payments
from customers and that customers are responsible for all other behaviors (i.e .,
turning on the pump, pumping gas, checking oil, etc.).
Summary
The existence of a relatively standardized set o f behaviors associated with a
given social position makes it possible to study the structure and content o f roles
apart from the individuals who occupy those positions. Thus, the emphasis o f role
theory is on predicting and explaining behavior based on social structural variables
rather than on individual difference variables.
Survey of Role Theory in Marketing
Until recently, the application of role theory in marketing has been limited
primarily to the areas o f role portrayals in advertising, marital decision making, and
personal selling. (For a comprehensive review, see Wilson and Bozinoff 1980).
M ore recently, role theory has been applied to the study of service encounters.
Role Portrayals in Advertising
In the studies investigating role portrayals in advertising, role theory has been
25
applied on such a global level as to make them of limited use. None o f the articles
define the term "role" (Belkauoui and Belkauoui 1976; Courtney and Lockeretz
1971; Duker and Tucker 1977; Sexton and Haberman 1974; Venkatesan and Losco
1975; W agner and Banos 1973). In these articles, role generally refers to a
stereotype o f a life role:
This global life role approach stresses more o f the simple labeling o f the role such as ’mother’ or ’sex object’ rather than the expectations o f those roles in terms o f behavior. Given that a role is a cluster o f behavioral expectations, roles should be defined beyond simplistic labels" (Wilson and Bozinoff 1980,p. 118).
None o f the studies o f role portrayals in advertising have investigated
whether there exists a common set o f behavioral expectations for these stereotypic
life roles. Failure to define role portrayals in terms o f behavioral expectations limits
one’s ability to recognize and track broad social trends important to marketers.
Marital Decision Making Roles
The studies investigating marital decision making define roles in terms of
behaviors (Davis 1970; Cunningham and Green 1974, Green and Cunningham
1975). However, most of these studies focus on actual behaviors rather than
expected behaviors. The primary emphasis is on who decided when, where, etc., to
buy a product. A richer application o f role theory would consider the effects of
both role expectations and role performance. One might also examine the process of
role assignment for marital decision making, as well as the influence o f role
consensus on satisfaction with marital decision making, with product/service choice,
store choice, etc. Wilson and Bozinoff (1980) suggest that an interesting study
26
might involve eliciting expected behaviors o f dyadic partners in different situations
and then clustering these behaviors into recognizable roles such as "purchaser",
"information gatherer" and "influencer".
Roles in Personal Selling Interactions
Applications o f role theory to study role portrayals in advertising failed to
define roles in terms o f behaviors and failed to consider the influence o f role
expectations on behavior. Applications o f role theory to study husband/wife
decision making defined roles in terms o f behaviors but failed to consider role
expectations. Consistent with sociological and social psychological research, "roles"
in the personal selling studies have been defined in terms of expectations, norms,
and activity patterns. In one o f the earlier studies, Evans (1963) found that
successful insurance agents fulfilled customer’s expectations concerning similarity,
expertise, friendliness, and personal interest.
In another study, Tosi (1966) attempted to relate role consensus to job
performance criteria. "Role consensus may be defined as the extent o f agreement
between parties regarding behavior pertinent to a given situation" (Tosi 1966, p.
518). The concept o f role consensus represents the degree to which people agree on
the normative aspects o f behavior. Both wholesale drug salespeople and retail
pharmacists were questioned with respect to what salespeople should do while
performing the selling task. Although, Tosi did not find the hypothesized
relationship between role consensus and performance (as measured by percentage of
business or number o f suppliers), the study is interesting for several other reasons.
27
First, this study, unlike many other role theoretical studies in marketing, describes
in detail the types o f behaviors which comprise the wholesale drug salesperson’s
role. Through a detailed description o f behaviors, Tosi (1966) was able to
operationalize the role o f salespeople.
Secondly, Tosi suggests that role consensus or the mere agreement between
the buyer and seller with respect to normative behavior is not the critical
determinant o f satisfaction. "It is more important that the custom er’s perceptions of
the salesman’s ’actual’ performance are consistent with his ’ideal’ perceptions of
salesman’s performance" (Tosi 1966, p. 525). Thus, Tosi implies the potential use
o f a disconfirmation approach to satisfaction.
Riordan, Oliver and Donnelly (1977) found support for the relationship
between role congruence and salesperson performance. The defihition o f role
congruence used in this study however, differs from that o f Tosi (1966). Riordan,
Oliver, and Donnelly (1977) define role congruence strictly from the consumer’s
perspective. It is defined as the absolute difference between a consumer’s
perceptions o f actual and ideal insurance agents. When defined as such, role
congruence was found to be a significant discriminator o f consumer purchase
behavior for insurance policies. This provides additional support for Tosi’s (1966)
conclusion. It would appear that success o f a salesperson is better predicted by the
match between a customer’s perceptions o f actual and ideal role performance than
the match between a salesperson and a customer’s perceptions o f what "should" be
done in the selling situation.
28
Summary
The contribution o f role theory to the study of role portrayals in advertising,
marital decision making, and personal selling interactions is contingent upon the
operationalization o f the role concept. I f one is to use role theory as a theoretical
framework for empirical research, a caveat is in order. Roles must be richly
described in terms o f specific activities and behaviors that, after all, make up the
roles themselves (Wilson and Bozinoff 1980). Roles should also be described in
terms of expectations, performance, and consensus among role players.
Applications of the Dramaturgical Metaphor in Services Marketing
Recently, a number o f approaches based on the dramaturgical metaphor have
been suggested as useful frameworks for studying service interactions. As a review,
dramaturgical approaches cloak the service encounter in a theoretical framework
utilizing terms and concepts familiar to a dramatic production. Lovelock (1981)
contends that service marketers must assume "dramatists and choreographer" roles.
Grove and Fisk (1983) examine the applicability of dramaturgy to the study of
services marketing. Smith and Housten (1983) propose a consumer evaluation
process based on the concept o f service scripts. Solomon, Surprenant, Czepiel, and
Gutman (1985) develop a role theoretical perspective for studying dyadic interactions
in the service encounter. All o f these approaches rely to some extent on the
dramaturgical metaphor. Grove and Fisk (1983) discuss three dramaturgical
components o f service performance:
1) setting-combination o f effects offered by decor, furnishings, and physical layout.
29
2) personal front-aspects o f the service providers’ personal appearance and manner.
3) impression management-service providers’ performance.
Grove and Fisk (1983) suggest that each o f these dramaturgical components of the
service performance has potential symbolic meaning for the consumer, and may
therefore be influential in creating consumer satisfaction.
Although script based approaches for studying service encounters arise from
the work in cognitive psychology, many cognitive psychologists also rely on the
heuristic value of the dramaturgical metaphor. Central to cognitive psychology is
the concept o f schema: "a unit o f generic knowledge about some stimulus domain
which is stored in memory and guides the processing o f information about any
particular instance o f that domain" (Smith and Housten 1983, p. 60). People
develop schemata for different stimulus domains: object classes, people and
personality types, social and occupational roles, and events. Smith and Housten
(1983) propose an evaluation process for services that is based on expectations
defined by event schemata or scripts. Smith and Housten (1983) suggest that service
transactions be conceptualized as an event, composed o f a set of ordered actions,
actors, and objects.
While the previous research focused on event schemata to investigate
consumer evaluations for services, Solomon, Surprenant, Czepiel, and Gutman
(1985) present a theoretical framework for studying dyadic interactions based on role
schemata. These authors assert that service encounters can be characterized as role
performances. Viewing service transactions from a role theoretical perspective is
30
advantageous because:
Role theory compels us to adopt an interactive approach since roles are defined in a social context. Furthermore, appropriate role enactment is determined by the reactions o f others. The quasi-ritualized nature o f role behavior makes it possible to examine the structure and content o f interacting roles apart from the specific individuals occupying the roles" (Solomon, et. al. 1985, p. 108).
Summary
W hile all these approaches share in common the use of the dramaturgical
metaphor, they differ in their emphasis and applicability. The dramaturgical
framework reviewed by Grove and Fisk (1983) focuses on the entire dramatic
production: the audience, the actors, the front stage, the back stage, and the
performance. This perspective is most relevant to service organizations that serve
many people simultaneously with a great deal o f personal contact such as airlines,
spectator sports and restaurants (Grove and Fisk 1983). Script-based approaches
focus on the action sequences that comprise a service event. This approach is most
relevant for routinized services that consumers have frequent exposure to such as
restaurant dining and banking transactions (Smith and Housten 1983). A role
theoretical approach emphasizes the roles people play in the service setting. This
approach is most relevant for dyadic service interactions such as professional
services (Solomon, Surprenant, Czepiel and Gutman 1985).
Applications o f Role Theory in the Services Marketing Literature
Since Solomon (1985) et. a l .’s earlier conceptual work, there have been
several empirical investigations of consumer satisfaction from a role theoretical
perspective. Results from these studies indicate that role theory holds promise as a
31
theoretical framework for studying satisfaction with services.
Surprenant and Solomon (1987) examined the influence o f personalization
strategies in a bank setting on service provider evaluations, service organization
evaluations and service satisfaction. These authors contend that role definitions
within a service setting will dictate the amount o f personalization expected but not
necessarily the way in which personalization is implemented. The effects of
personalization will depend on such factors as the nature o f the service being
delivered, the behaviors included in the role script, and the particular personalization
strategy implemented.
Results from the study indicated that option personalization, allowing the
customer to choose from a set of alternatives, affected trust in the bank and
satisfaction with the offering. Programmed personalization, embellishment of
routinized actions with personal referents, exerted strong effects on evaluations of
employee confidence and sociability, bank warmth and trust, and satisfaction with
employee effectiveness and friendliness. Customized personalization, assisting the
customer in attaining the best possible form of the service offered to fit their needs,
had positive effects on the perceptions of employee helpfulness and sociability, bank
warmth, and satisfaction with the friendliness o f the service provider.
Crosby and Cowles (1986) examined the relationship between the contact
person’s role performance and the customer’s interaction satisfaction. Borrowing
from the personal selling literature, Crosby and Cowles (1986) suggest that a service
provider’s primary role is to solve the client’s immediate and long term problems.
32
From this perspective, steps in the problem solving process might be viewed as the
expectation and performance evaluation dimensions in a role consensus model.
Using predictor variables adapted from a problem solving approach, Crosby
and Cowles (1986) were able to account for over 40% of the variance in customer
satisfaction with life insurance salespersons. The role behaviors which contributed
significantly to consumer satisfaction were: agent represents customer when conflict
with company arise, agent explains different types o f policies, agent identifies an
array o f policy alternatives, and agent recommends criteria for evaluating life
insurance.
For her dissertation, Gardner (1987) conducted a series o f case studies, focus
groups, and personal interviews for the purpose o f examining the relationship
between consumer role expectations for service providers and consumer satisfaction
with legal, accounting and dental services. Her research indicated that consumers
make the distinction between ideal and probabilistic role expectations. Replicating
earlier findings (Crosby and Cowles 1986), Gardner (1987) found provider role
enactment to be an important determinant o f consumer satisfaction for professional
services. The aspects o f provider role performance which appear to contribute most
to consumer satisfaction are being on time, greeting the client in a warm and
friendly manner, putting the client at ease, asking the client appropriate questions,
answering all the clients questions, and specifying a time frame for job completion.
Gardner (1987) also found preliminary evidence for a role theoretical model of
professional service satisfaction based on the traditional disconfirmation paradigm.
33
She found that for the most part, consumer expectations matched the actual
professional role behavior. When performance failed to match expectations
however, consumers expressed dissatisfaction.
Summary
Results from these studies tend to support the viability o f role theory as a
conceptual framework from which to study dyadic service interactions. Gardner’s
research provides some conceptual insight into provider role determinants of
consumer satisfaction for professional services. However, methodological
limitations force the reader to consider these findings exploratory at best. Small
consumer sample sizes (n = 3 for the case studies, n = 21 for the focus groups,
and n = 15 for the personal interviews) limit one’s ability to draw statistically
powerful inferences based on the results of her studies. Sample selection is also of
concern. Gardner required that her participants have some prior experience with the
service in question. However, to participate in the focus groups, the respondents
were not required to have purchased the service within any specified time period.
To participate in the interviews, respondents were required to have purchased the
service within the last two years. Consequently, the quality of her findings is based
on the participant’s ability to recall role expectations and perceptions of role
performance over relatively long periods o f time.
Another limitation o f Gardner’s studies is the simultaneous measurement of
expectations, performance, and satisfaction. Oliver (1981) strongly recommends
that expectations be measured prior to the shopping experience and product usage or
34
in this case, the service encounter. He warns that expectations can be measured in
retrospect, but this approach introduces a subtle interaction between actual outcomes
and prior expectancies.
Finally, Gardner fails to systematically and empirically investigate the
relationship between satisfaction and various role theoretical constructs. She makes
the distinction between ideal role expectations, probabilistic role expectations, and
perceived role performance but she fails to investigate the independent effects of
each on satisfaction.
Crosby and Cowles (1986) provide empirical evidence for the relationship
between provider role performance and satisfaction. Although their findings suggest
that role theory has potential value for predicting and explaining consumer
satisfaction with services, their study is limited in that it only considers one linkage.
An natural extension of this research would be a systematic investigation of the
relationship between satisfaction and other role constructs, such as role expectations
and satisfaction.
Research on product satisfaction has focused on the relationships among
expectations, disconfirmation, perceived performance, and satisfaction. Research of
this type has yet to be applied to services (Smith, Bloom, and Davis 1986). Insights
into the determinants o f satisfaction with professional services may be gained by
adapting the findings of the product satisfaction literature to a role theoretical model
o f consumer service satisfaction. For this reason, the product satisfaction literature
is now reviewed.
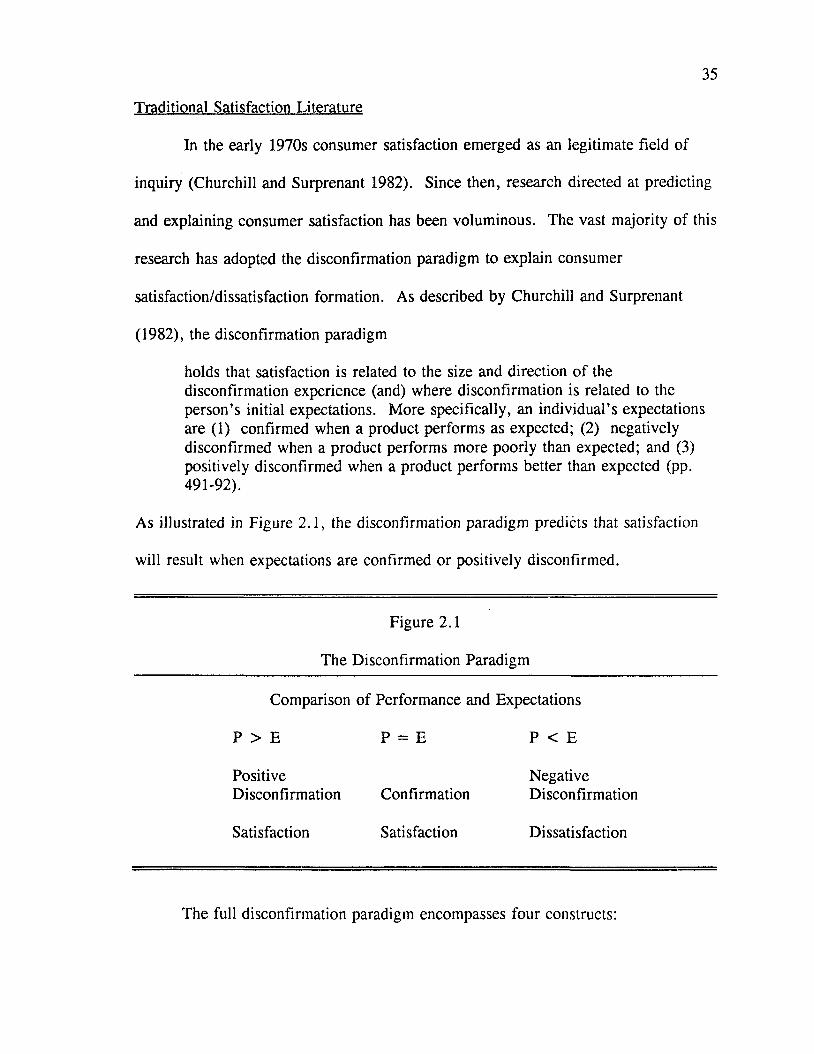
35
Traditional Satisfaction Literature
In the early 1970s consumer satisfaction emerged as an legitimate field of
inquiry (Churchill and Surprenant 1982). Since then, research directed at predicting
and explaining consumer satisfaction has been voluminous. The vast majority of this
research has adopted the disconfirmation paradigm to explain consumer
satisfaction/dissatisfaction formation. As described by Churchill and Surprenant
(1982), the disconfirmation paradigm
holds that satisfaction is related to the size and direction o f the disconfirmation experience (and) where disconfirmation is related to the person’s initial expectations. More specifically, an individual’s expectations are (1) confirmed when a product performs as expected; (2) negatively disconfirmed when a product performs more poorly than expected; and (3) positively disconfirmed when a product performs better than expected (pp. 491-92).
As illustrated in Figure 2.1, the disconfirmation paradigm predicts that satisfaction
will result when expectations are confirmed or positively disconfirmed.
Figure 2.1
The Disconfirmation Paradigm
Comparison of Performance and Expectations
P > E ►d II ffl P < E
Positive NegativeDisconfirmation Confirmation Disconfirmation
Satisfaction Satisfaction Dissatisfaction
The full disconfirmation paradigm encompasses four constructs:
36
expectations, disconfirmation, performance, and satisfaction. A review of relevant
research for each o f these four constructs follows.
Expectations
In one o f the earliest studies investigating the effects o f expectations and/or
disconfirmation on product evaluations, Cardozo (1964) found that when
performance expectations were negatively disconfirmed, (the product performed
worse than expected), respondents rated the product lower than when performance
expectations were confirmed (the product performed as expected). These findings
seem to suggest that a contrast effect is operating. That is, consumers magnify the
discrepancy between expectations and perceived performance so that the product is
perceived as performing much better/worse than it was in actuality (Oliver 1977).
Olshavsky and M iller (1972, pp. 20-21) argue that a methodological artifact
(incomparable scales for high and low expectation conditions) in Cardozo’s (1965)
study makes his findings suspect. In fact, with the exception o f Cardozo (1964), the
balance o f the empirical research supports an assimilation effect rather than a
contrast effect (Olshavsky and Miller 1972; Anderson 1973; Olson and Dover 1979).
Evidence for an assimilation effect means that consumers perceive discrepant
product performance in the general vicinity o f their expectations.
Olshavsky and M iller (1972) found that subjects in the high expectation/low
performance condition rated the product higher than subjects in the low
expectation/low performance condition, while subjects in the low expectation/high
performance condition rated the product lower than subjects in the high
37
expectation/high performance condition. It would appear that the size of the
discrepancy between expectations and perceived performance influences subsequent
product ratings, and that performance evaluations tend to assimilate toward
manipulated expectations whether positively or negatively disconfirmed (Olshavsky
and M iller 1972). These results suggest that expectations exert a direct effect on
perceived product performance. Since neither satisfaction nor expectancy
disconfirmation were measured, the results o f this study tells us nothing about the
impact o f expectations on disconfirmation and satisfaction.
Further empirical support for a positive relationship between expectations and
perceived product performance is provided by two later studies. In a thorough
investigation of the relationship between manipulated expectation levels and ratings
for a ballpoint pen, Anderson (1973) found that with the exception o f the high
expectancy extreme, postexposure judgements did tend to assimilate toward prior
expectations. Olson and Dover (1979) also manipulated subject’s product
expectations. Once again, compared to a control group (those receiving no prior
information) product ratings for the experimental group (those receiving prior
information) assimilated toward expectations.
After a thorough review o f the satisfaction literature, LaTour and Peat (1979)
concluded that the relationship between expectations and satisfaction is likely to be
complex. One o f the factors that contributes to this complexity is the existence of
different types o f expectations. The following section provides a brief review o f the
different types o f expectations noted in the literature.
38
Types o f Expectations
M iller (1977) describes four different types o f expectations that can provide a
subjective standard fo rjudging a product or service: ideal, expected, minimum
tolerable, and deserved. Ideal product performance represents the maximum or
optimal level o f product or service performance that a consumer ideally hopes for.
It reflects what performance "can be" (Tse and Wilton 1988). "Ideal" expectations
seem to be most relevant for high involvement products/services, since highly
involved consumers tend to have "higher" expectations (Oliver 1980).
Minimum tolerable, on the other hand, represent the least acceptable level.
Minimum expectations seem to be most relevant for low involvement purchase
situations. The "minimum tolerable" standard implies a conjunctive decision making
rule (Bettman 1979) that consumers are likely to use to reduce the cognitive and
physical effort o f searching and evaluating (Barber and Venkatraman 1986).
Expected product performance, deriving from expectancy theory (Tolrnan
1932), represents an anticipated level o f performance. It represents what consumers
believe to be the most likely performance. The construct reflects what performance
"will (probably) be" (M iller 1977; Liechty and Churchill 1979; Tse and Wilton
1988). Expected product performance is influenced by the average product
performance (Miller 1977) and by advertising effects (Olson and Dover 1979).
Expected product performance is the most commonly used comparison standard in
consumer satisfaction research.
Borrowing from equity theory (Adams 1963), equitable product performance
39
or deserved product performance represents the level of product performance a
consumer ought to receive or deserves to receive, given the consumers’ investments
and costs in procuring the product or service (Miller 1977; Liechty and Churchill
1979; W oodruff, Cadotte, and Jenkins 1983). Equitable product performance is
likely to be affected by the price paid and the effort invested (Jacoby 1976) and by
previous product experience (Woodruff, Cadotte, and Jenkins 1983).
Recently, Tse and Wilton (1988) compared the effects of three comparison
standards (ideal, equitable, and expected product performance) on three dependent
variables (perceived performance, subjective disconfirmation, and satisfaction). In
this study, equitable product performance did not appear to be related to any of the
three dependent variables. Since this is inconsistent with previous findings, Tse and
Wilton (1988) caution against eliminating the comparison standard altogether. They
suggest a more reasonable inference is that the equity comparison standard was
poorly operationalized. None o f the comparison standards were significantly related
to subjective disconfirmation. This is comparable to previous findings in the
literature. The influence of ideal and expected comparison standards on perceived
performance and satisfaction was quite dissimilar:
For expectation, the effect on satisfaction is direct and positive; for ideal, it is indirect (through perceived performance) and negative. This result is intuitively appealing. I f one is prepared to accept both assimilation/contrast explanations in CS/D formation, the results suggest that ideal as an anchor may tend to evoke a contrast effect on the evaluation o f the experience, whereas expectation may evoke an assimilation effect (Tse and Wilton 1988, pp. 208-9).
Tse and W ilton’s (1988) research supports LaTour and Peat’s (1979) earlier
40
contention that the expectation-satisfaction relationship is likely to be complex.
Apparently, some o f this complexity arises from the existence o f multiple
comparison standards and their differential impact on perceived product performance
and satisfaction.
Disconfirmation
In criticism of the earlier research on the disconfirmation o f expectations,
W eaver and Brickman (1974) "argued that a separate disconfirmation effect may
exist independent o f the outcome and expectation treatments and that studies
manipulating only expectation and performance may have obscured this possibility"
(Oliver 1977, p. 482). In response to this criticism, the disconfirmation effect was
measured independently of expectations in a number of studies. The disconfirmation
effect implicit in the expectation theories o f consumer satisfaction was found to be a
significant predictor of postexposure affect and intention to buy. Therefore,
disconfirmation can be viewed independently of product performance expectations
(Oliver 1980). Oliver (1980) proposed that satisfaction results from an additive
combination o f expectation level and subsequent disconfirmation. Empirical support
for this proposition has been reported by Swan (1977), Oliver (1979), Gilly (1979),
Linda and Oliver (1979).
Studies measuring disconfirmation independently have used one of several
approaches to operationalize the construct. Some of the studies measured the
objective discrepancy between expectations and performance ratings to arrive at a
difference score (Trawick and Swan 1980). This type o f disconfirmation has been

41
referred to as "inferred disconfirmation" (Swan and Trawick 1981) and "subtractive
disconfirmation" (Tse and Wilton 1988). Other studies attempted to capture
consumers’ perception that performance was better or worse than expected (Oliver
1980). These studies used "better than expected-worse than expected" scales to
measure disconfirmation. This type of disconfirmation has been referred to as
"perceived disconfirmation" (Trawick and Swan 1980) and "subjective
disconfirmation" (Tse and Wilton 1988).
In empirical comparisons o f subtractive disconfirmation and subjective
disconfirmation, results have been mixed. Swan and Trawick (1981) found
subtractive disconfirmation to outperform subjective disconfirmation in predicting
satisfaction. However, the authors speculate that this result may be due to an
unreliable subjective disconfirmation measure. The subtractive disconfirmation
measure in this study was based on the sum of five items whereas the subjective
disconfirmation measure was based on a single indicator. Swan and Trawick (1981,
p. 66) acknowledge that their finding "should be the subject o f future research, since
in theory, satisfaction should be more closely related to perceived than to inferred
disconfirmation."
Other studies indicate that subjective disconfirmation measures display a
more meaningful relationship to satisfaction (Oliver 1980). Tse and Wilton (1988,
pp. 209) conclude that "in a comparison of the subjective and subtractive approaches
to model disconfirmation, the former would be superior. The subtractive approach
contains an inherent confound when predicting satisfaction and does not capture all
42
the determinants of CS/D formation." The subjective approach to modeling the
disconfirmation construct will be used in this research.
Performance
Traditionally, the importance o f performance in the satisfaction literature has
been as a standard o f comparison by which to assess disconfirmation. Olshavsky
and M iller (1972) and Olson and Dover (1976) manipulated actual product
performance. However, their focus was on the relationship between expectations
and product performance ratings rather than between product performance (either
perceived or actual) and satisfaction. It was not until recently that researchers began
to investigate the independent effects of performance on satisfaction (Churchill and
Surprenant 1982; Tse and Wilton 1988). Findings from these studies will be
reviewed shortly.
Satisfaction
"The concept o f satisfaction has defied exact specification even in those
disciplines having a long-standing tradition of satisfaction" (Oliver 1981, p. 26). In
marketing, there have been a number o f different conceptualizations of satisfaction.
For instance, Hunt (1977) summarized the ideas o f a number o f speakers at the first
consumer satisfaction conference and concluded that satisfaction is an evaluation
rendered that the (product ownership and usage) experience was at least as good as
it was supposed to be. Similarly, Engel and Blackwell (1982) conceive satisfaction
to be an evaluation that the chosen alternative is consistent with prior beliefs with
respect to that alternative. Howard and Sheth (1969) define satisfaction as the
43
buyer’s cognitive state of being adequately or inadequately rewarded for the
sacrifices he has undergone.
LaTour and Peat (1979) assert that satisfaction is a general evaluative
response to a product not unlike attitude. These authors argue that "the primary
distinction between satisfaction and attitude derives from temporal positioning:
attitude is positioned as a predecision construct and satisfaction is a postdecision
construct". Oliver (1980, 1981) views attitude as the consum er’s relatively enduring
affective orientation for a product, store, or process (e.g. customer service), while
satisfaction is the emotional reaction following a disconfirmation experience which
acts on the base attitude level and is consumption-specific. According to Oliver then
satisfaction arises from expectancy disconfirmation and decays over time into overall
attitude toward a product.
As noted by Westbrook and Reilly (1983), a major shortcoming o f these
definitions of satisfaction is their dependence upon a particular theory o f consumer
satisfaction, notably the disconfirmation of expectations paradigm. Westbrook and
Reilly (1983) advance an alternative conceptualization o f consumer satisfaction based
on Locke’s (1969) seminal analysis of job satisfaction. Locke (1976) described job
satisfaction as the pleasurable or positive emotional state resulting from the appraisal
of one’s job. Adapting this definition to consumer satisfaction, Westbrook and
Reilly (1983, p. 256) define consumer satisfaction as
an emotional response to the experiences provided by, or associated with, particular products or services purchased, retail outlets, or even molar patterns o f behavior such as shopping and buyer behavior, as well as the overall marketplace.
Recently, the focus o f product satisfaction research has shifted from the
traditional disconfirmation paradigm to examining the structural relationships among
expectations, disconfirmation, performance, and satisfaction. It may be that
conceptualizations o f satisfaction based on the traditional disconfirmation paradigm
are not appropriate for structural models o f satisfaction. Alternatives such as
W estbrook and Reilly’s (1983) may be more applicable for the current stream of
satisfaction research. In this study, satisfaction is assessed on both an overall
affective basis and an attribute-specific basis.
Extensions o f the Disconfirmation Paradigm
Several studies provide an extension of the disconfirmation paradigm by
examining the structural relationships among expectations, disconfirmation,
performance, and satisfaction for products. In a two-stage field study, Oliver (1980)
examined the relationships among expectations, disconfirmation, satisfaction and the
traditional criteria o f attitude and intention. Results from O liver’s (1980) study
indicates that satisfaction is at least partially determined by a linear combination of
an adaptation level component (expectations or prior attitude) and disconfirmation.
Churchill and Surprenant (1982, p. 493) noted that one o f the crucial
deficiencies in the consumer satisfaction literature is "that no study has investigated
the full set o f interrelationships among expectations, perceived performance,
disconfirmation and satisfaction." In an attempt to fill this gap, Churchill and
Surprenant (1982) conducted an experiment involving satisfaction formation for two
products, a video disc player and a hybrid chrysanthemum. Unlike previous
45
research, both expectations and performance were manipulated independently for
each product, and each subject’s perceived expectations, perceived product
performance, subjective disconfirmation, and satisfaction were subsequently
measured.
The results suggest that the effects are different for the two products. For
the plant, the traditional disconfirmation model performed reasonably well.
Although expectations and perceived performance also directly affected satisfaction,
subjective disconfirmation exerted the strongest influence on satisfaction. For the
video disc player, the results were different in several important respects.
Satisfaction with the video disc player was determined solely by perceived product
perform ance. Neither initial expectations nor subjective disconfirmation had any
direct influence on satisfaction.
In terms of other linkages, initial expectations had a positive influence on
perceived product performance for both products. The relationship between
expectations and disconfirmation was negative for the plant and positive for the
video disc player. In both cases, the relationship was significant but small.
Perceived product performance exerted a positive influence on disconfirmation for
both products.
Churchill and Surprenant (1982) offer a number of alternative explanations
for their findings. One obvious explanation is that the effects o f expectations,
disconfirmation and performance on satisfaction differ for durable and nondurable
goods. A second explanation is that the artificial setting of the experiment did not
46
allow satisfaction as it is typically conceived to operate. The validity o f the findings
depends largely on how well the imagined role-playing situations actually produced
the vicarious experience necessary for satisfaction formation to occur. A third
explanation involves measures. For the video disc player, the performance and
satisfaction measures were highly correlated with some between-con struct
correlations slightly higher than the within-construct correlations. Perhaps the
performance and satisfaction measures were actually capturing the same construct.
M ore recently, Tse and Wilton (1988) empirically examined the role of
perceived product performance using Churchill and Surprenant’s model (1982).
These researchers compared Churchill and Surprenant’s model with alternative
satisfaction/dissatisfaction models including the traditional disconfirmation model and
Oliver’s (1980) two variable model (expectation and disconfirmation). Their
findings indicate that the model of consumer satisfaction formation which treats
perceived performance, expectations, and disconfirmation independently
outperformed other models. Replicating findings for the video disc player in
Churchill and Surprenant’s (1982) study, perceived product performance (for a new
electronic, hand-held, miniature record player) outperformed any other satisfaction
model. Based on these findings, Tse and Wilton (1988) conclude that expectations,
disconfirmation, and perceived performance exert independent effects on satisfaction
and should therefore be modeled separately.
Oliver and Bearden (1983) extend the literature by investigating satisfaction
processes across involvement levels. These authors examined satisfaction processes
47
for high and low involvement users o f an appetite suppressant. In a three wave field
study, relationships among expectation, pre-attitude, pre-intention, disconfirmation,
satisfaction, post-attitude, and post-intention for different involvement levels were
examined. Unfortunately, these authors did not examine the independent effects of
perceived product performance. Oliver and Bearden (1983) suggest that under
conditions o f high involvement, purchase outcomes such as performance will have
the dominating influence on satisfaction formation. In contrast, under conditions of
low involvement, consumers will be less inclined to process performance distinct
from prior expectations so disconfirmation will have the dominating influence on
satisfaction formation.
Summary
Recently, the emphasis in product satisfaction research has shifted from
validation of the traditional disconfirmation paradigm to an examination o f the
structural relationships among expectations, perceived performance, disconfirmation,
and satisfaction. Empirical evidence supports the independent effects of
expectations, perceived performance, and disconfirmation on satisfaction. The
relative impact o f each may depend on such mediating factors as product type
(Churchill and Surprenant 1982) and consumer involvement (Oliver and Bearden
1983). Support is also found for a positive relationship between expectations and
perceived performance, and between perceived performance and disconfirmation.
Satisfaction and Consumer Services
While the consumer satisfaction/dissatisfaction literature continues to grow at
48
a substantial rate, comparatively little attention has been paid to consumer
satisfaction for services (Liechty and Churchill 1979; Zeithaml 1981; Hill 1986).
Yet, Liechty and Churchill (1979) suggest that consumer dissatisfaction may be
higher for services than for products due to the inherent characteristics o f services.
For instance, the human element involved in the delivery o f many services decreases
the service firm ’s ability to control the quality o f service delivered. Consequently,
chances o f consumer dissatisfaction are increased. In fact, several empirical studies
indicate that the vast majority o f reasons given for dissatisfaction were directly
related to the quality o f the supplier performance (Day and Bodur 1977; Quelch and
Ash 1981; Bitner, Booms and Tetreault 1988).
In a study o f satisfaction with 73 categories o f services and intangible
products, the most frequently cited source o f dissatisfaction was provider
performance: "the service was provided in a careless, impersonal manner" (Day
and Bodur 1977, p. 264). In a later study, this was found to be true for professional
services as well (Quelch and Ash 1981). O f relevance to this study, the professional
services cited as most dissatisfying were medical services. In another study, the
three major sources of satisfaction/dissatisfaction for hotel, restaurant, and airline
services were also related to provider performance: 1) employee response to
service delivery system failures; 2) employee response to customer needs and
requests; and 3) unprompted and unsolicited employee actions that exhibit
extraordinary behavior (Bitner, Booms, and Tetreault 1988).
All these studies indicate that provider performance is a dominant source of
49
consumer satisfaction/dissatisfaction for many services. Further support for the
importance o f provider performance is found in the patient satisfaction literature.
As the context o f this study is medical services, a review o f the patient satisfaction
literature is warranted.
Determinants o f Patient Satisfaction
Understanding the determinants o f patient satisfaction has been a major thrust
of research in both the health care marketing literature and the medical sociology
literature. Although patient satisfaction studies have dealt with numerous aspects of
medical services, basically the determinants of patient satisfaction can be classified
in one o f two broad categories: physician behaviors and access mechanisms (Pascoe
1983; Smith, Bloom and Davis 1986). Access mechanisms represent nonbehavioral
aspects of the medical encounter such as convenience factors. To gain a better
understanding of physician behaviors and access mechanisms, studies of patient
satisfaction from both the marketing and medical sociology literature are reviewed.
Marketing Studies of Patient Satisfaction
Smith, Bloom, and Davis (1986) propose a conceptual model o f patient
satisfaction consisting o f three domains: (1) an instrumental domain which
corresponds to professional qualities of the physician, (2) an expressive domain
which corresponds to personal qualities o f the physician, and (3) access
mechanisms, which correspond to cost/convenience factors. These authors found
that physicians and patients are generally in agreement with respect to the
importance o f physicians’ professional qualities and access mechanisms. There did
50
however, appear to be a lack o f agreement concerning the importance o f physicians’
personal qualities. "The personal qualities deemed less important by the physicians
themselves, appeared to be more important to patients and the area o f least
satisfaction" (Smith, Bloom, and Davis 1986, p. 323).
In several other marketing studies, empirical support is found for medical
service dimensions similar to those proposed by Smith, Bloom, and Davis (1986).
Adapting the service quality model proposed by Parasuraman, Zeithaml, and Berry
(1985, 1986), Baumgarten and Hensel (in prep.) found that patients evaluated
medical practitioners on three key dimensions: 1) technical skills o f the physician
and staff, 2) interpersonal skills o f the physician and staff, and 3) tangibles of
medical setting. These dimensions closely parallel those proposed by Smith, Bloom,
and Davis (1986). The first dimension is concerned with the doctor’s technical
ability to solve medical problems. The second dimension is concerned with the
doctor’s ability to provide friendly, courteous, informative, and personalized service.
The third dimension is concerned with tangibles such as physical facilities,
equipment, and decor.
Virtually every patient in this study indicated that they felt incapable o f
objectively evaluating the technical performance o f the medical provider. To
compensate for this inability, patients with prior knowledge of the physician’s
reputation (via referrals and personal recommendations) relied more heavily on this
information to evaluate the service. In contrast, patients with no prior knowledge
relied more heavily on their observations of interpersonal relations and tangibles to
evaluate the service.
Brown and Swartz (1987) also applied the Gaps model of service quality
(Parasuraman, Zeithaml, and Berry 1985) to explore the concept o f satisfaction with
professional services. Service quality perceptions were collected from both
physicians and their respective patients. A stepwise regression analysis resulted in
ten service dimensions which contribute to overall patient satisfaction with medical
practices. Once again, these ten determinants could be further classified into
physician behaviors and access mechanisms. Consistent with previous findings, the
most significant predictors of overall satisfaction were related to physician
behaviors:
"“listening to the patient "“giving information and explanations "“being cautious and thorough "“being sincerely interested in patient "“giving the patient attention and time."“showing professionalism "“being competent
Other significant predictors o f overall satisfaction include:
"“availability "“reasonable fees "“use o f latest technologies "“diagnostic skills "“availability o f brochures.
In another marketing study, 148 out o f 161 reasons given for dissatisfaction
with pediatricians and general practitioners had to do with physician performance
(Stewart, Hickson, Ratheshwar, Pechmann, and Altemeier 1985). Specific physician
behaviors reported as sources o f dissatisfaction included: doctor was not interested
52
in child’s behavior; doctor had no concern for child; physician showed no concern
for the patient; the child was not getting better; and doctor appeared incompetent
that is he/she did not appear to know what he/she was doing. Other sources of
dissatisfaction included: office too far away; found another MD more convenient;
and staff was rude.
From these marketing studies, there appear to be two primary sources of
patient satisfaction/ dissatisfaction: 1) physician behaviors and 2) access
mechanisms. These categories are repeatedly found in the medical sociology
literature as well. Within these two broad categories, there are a number o f specific
dimensions which have been shown to affect patient satisfaction. A review o f the
medical sociology literature reveals three physician conduct dimensions: expressive
behaviors, communicative behaviors, and instrumental behaviors. The literature also
shows five access mechanisms: access, availability, convenience, finances, and
physical environment. We will now turn to a review of these specific dimensions.
Physician Behaviors
Studies of patient satisfaction have shown that patients expect to have a
comfortable and warm interaction with a physician who appears technically
competent and gives adequate information about one’s illness (Wolf, Putnam, James,
and Stiles 1978). Findings consistently indicate that patient satisfaction is
significantly influenced by these three dimensions of the physician’s performance:
expressive, communicative, and instrumental dimensions (Vuori, Aaaku, Aine,
Erkko, and Johansson 1972; Needle and M urray’s 1977).
53
Expressive Behaviors
Behaviors representative of the physician’s expressive role include showing
warmth and concern, being friendly, showing a personal interest in the patient,
accepting the patient, treating the patient as an individual, discussing the patient’s
concerns, reassuring the patient, putting the patient at ease, and taking sufficient
time with the patient. There is abundant research supporting the positive
relationship between the physician’s expressive role performance and patient
satisfaction (Korsch, Gozzi, Francis 1968; Freemon, Negrete, Davis and Korsch
1971; Korsch and Negrete 1972; Vuori, Aaku, Aine, Erkko, and Johansson 1972;
Wriglesworth and Williams 1975; Ben-Sira 1976; Berkanovic and Marcus 1976;
Needle and Murray 1977; DiMatteo, Prince, and Taranta 1979; W olf, Putnam,
James and Stiles 1978; Stiles, Putnam, W olf and James 1979; Friedman, DiMatteo,
Taranta 1980; Segall and Burnett 1980; and Wilson and McNamara 1982).
Communicative Behaviors
Behaviors representative o f the physician’s communicative role include giving
explanations in a language that can be understood by the patient, giving clear
explanations and instructions, asking questions, clarifying questions, and listening to
the patient. Once again, empirical support for a positive relationship between
physician communicative performance and patient satisfaction is plentiful (Francis,
Korsch, and M orris 1969; Freemon, Negrete, Davis and Korsch 1971; Housten and
Pasanen 1972; Korsch and Negrete 1972; Comstock and Slome 1973; King and
Goldman 1975; Kincey, Bradshaw and Ley 1975; W are and Snyder 1975;
54
W riglesworth and Williams 1975; Berkanovic and Marcus 1976; Jenry 1976;
Blanchard, Treadwell, and Blanchard 1977; Doyle and W are 1977; W ooley, Kane,
Hughes, and W right 1978; Stiles, Putnam, W olf and James 1979; Aday, Andersen
and Fleming 1980; Eisenthal, Koopman, and Lazare 1983; and Strull, Lo, and
Charles 1984).
Instrumental Behaviors
Behaviors representative o f the physician’s instrumental role include
thoroughness in examining the patient, establishing a diagnosis, and care in
examining the patient before arriving at a diagnosis. A direct relationship between
patient’s perception o f the physician’s competence and subsequent satisfaction has
been established in a number o f studies (Vuori, Aaku, Aine, Erkko, and Johansson
1972; Ben-Sira 1976, 1982; Needle and Murray 1977; Greene, W einberger, and
Mamlin 1980; Gillette, Byrne and Cranston 1982; and Wilson and McNamara
1982).
Access Mechanisms
Access mechanisms (so called by Ware and Snyder 1975; Doyle and Ware
1977; M anglesdorf 1979; Smith, Bloom, and Davis 1986) represent the
nonbehavioral aspects of the medical encounter: access, availability, convenience,
finances, and the physical environment.
Access. Availability, and Convenience
With one noted exception (Wolinsky 1976), research results provide
overwhelming evidence that the dimensions of accessibility, availability and
55
convenience are positively correlated with patient satisfaction. Satisfaction has been
shown to increase with lessened appointment difficulty, availability o f more
appointment hours, decreased travel demands to obtain care, and less waiting time
(Diesher, Engel, Spielholz, and Standfact 1965; Caplan and Sussman 1966; Aday
and Andersen 1975; Berkanovic and Marcus 1976; Ludy, Gagnon, and Caiola 1977;
Shortell, Richardson, LoGerfo, Diehr, Weaver, and Green 1977; Aday, Andersen
and Fleming 1980; Gray 1980; Greene, Weinberger, and Mamlin 1980; Mechanic,
Greenley, Clearly, Hoeper and Wenzel 1980; Fox and Storms 1981; Greenly and
Schoenherr 1981; Penchansky and Thomas 1981; W einberger, Greene, and Mamlin
1981; Linn, Linn, and Stein 1982).
Finances
Cost of medical care appears to be inversely related to patient satisfaction.
In one national study, cost of care was the most criticized aspect o f medical care
(Aday, Andersen and Fleming 1980). Caplan and Sussman (1966) found a positive
association between satisfaction with medical charges and overall satisfaction with
the health care organization. In another study, a reduction in health care costs as a
result o f switching health plans was associated with increased satisfaction (Ashcraft,
Penchansky, Berki, Fortus, and Gray 1978). Hulka and his associates (1971) found
patients with medical insurance were more satisfied with their health care.
However, in a later study, Wolinsky (1976) failed to find an association between
medical insurance coverage and satisfaction.
56
Physical Environment
Satisfaction has also been associated with the pleasantness of the patient’s
surroundings (Housten and Pasanen 1972) and negatively associated with hospital
size (Brooks 1973; Aday, Andersen, and Fleming 1980).
In summary, there is strong empirical evidence in the health care literature
for the relationship between physician behaviors (expressive, communicative, and
instrumental) and patient satisfaction and between access mechanisms (such as
availability, accessibility, convenience, cost, and physical environment) and patient
satisfaction.
Models o f Patient Satisfaction
Most o f the research previously reviewed has focused on determining the
medical service dimensions critical to patient evaluation processes. Little o f this
research has been based on solid sociopsychological theories o f patient satisfaction
(Locker and Dunt 1978). For this reason, the patient satisfaction literature has been
criticized:
Very little o f the satisfaction research has been theory-testing or theory- building: that is, research designed to provide data that would explain the associations between satisfaction and patient and service characteristics or between satisfaction and subsequent patient behaviors" (Linder-Pelz 1982, 577).
The implicit theory underlying much of the patient satisfaction research is
discrepancy theory. Similar to definitions o f product satisfaction in the traditional
disconfirmation paradigm, patient satisfaction is defined as the difference between
actual outcome and some comparison standard such as expectations or ideal
57
performance. Previous attempts to model patient satisfaction in the marketing
literature (Baumgarten and Hensel in prep.; Brown and Swartz 1987) have followed
a discrepancy model proposed by Parasuraman, Zeithaml, and Berry (PZB) (1985).
The PZB model o f service quality specifies a set of key discrepancies or gaps
between management perceptions o f service quality, management specifications of
service components, and actual service delivery, on the one hand, and consumer
perceptions and expectations o f service quality, on the other hand. Although, this
model was originally developed as a conceptualization of service quality, it has also
been utilized to model service satisfaction. The argument is made that service
quality is a global judgement or attitude whereas satisfaction is transaction specific
(Parasuraman, Zeithaml, and Berry 1986). Since the primary distinction between
the two constructs is temporal, the PZB model (1986) has been applied to study both
service quality and service satisfaction.
Most studies in the medical sociology literature have also implicitly used
discrepancy theory to model patient satisfaction. Patient satisfaction researchers
generally refer to satisfaction as a matching of expected care with the perception of
the care actually received (e.g. Korsch, Gozzi, and Francis 1968; Risser 1975;
Larsen and Rootman 1976; Ashcraft, Penchansky, Berki, Fortus, and Gray 1978;
Pope 1978; Greene, Weinberger, and Mamlin 1980; Fox and Storms 1981;
W einberger, Greene and Mamlin 1981; Zastowny, Roghmann, and Hengst 1983).
In contrast to discrepancy-based studies, studies based on fulfillment theory
suggest that satisfaction results from the service received regardless o f how much
58
one feels they should and/or want to receive (Pascoe 1983). Several health care
studies have implicitly used fulfillment theory (Korsch, Gozzi, Francis 1968; Noyes,
Levy, Chase, and Udry 1974; Vertinsky, Thompson, and Uyeno 1974; Larsen and
Rootman 1976; Ashcraft, Penchansky, Berki, Fortus, and Gray 1978). Studies
based on fulfillment theory emphasize the independent effects o f performance on
satisfaction whereas, studies based on discrepancy theory emphasis the effect of
performance in relation to expectations.
Summary
Previous attempts to model patient satisfaction using discrepancy and
fulfillment approaches can be faulted as suffering from both conceptual and
empirical weaknesses (Lawler 1973; Pascoe 1983). The assumption of fulfillment
theories is that objective service outcomes determine satisfaction'. This approach
ignores the evaluative process of comparing service outcomes with psychological
standards. Discrepancy approaches, on the other hand, acknowledge this
comparative process but they neglect the possibility that service performance will
have an independent impact on satisfaction. Years ago, Churchill and Surprenant
(1982) criticized product satisfaction researchers for neglecting to investigate the
interrelationships among expectations, perceived performance, disconfirmation, and
satisfaction. This criticism may be echoed today for the patient satisfaction
literature. To date, the interrelationships among patient expectations, patient’s
perceptions o f medical services rendered, disconfirmation and patient satisfaction
have not been adequately considered in the health care literature.
59
Previous attempts to model patient satisfaction may also be faulted for
ignoring the interactive nature o f medical services. As this review indicates, the
role o f the service provider has been well documented. However, the recipient of
the service also has a role to play (Solomon, Surprenant, Czepiel, and Gutman
1985). For the most part, this role has been largely ignored in the patient
satisfaction research. "Since services are interactive, the custom er’s own
performance is a causal variable affecting outcomes that needs to be measured and
controlled for in satisfaction monitoring" (Czepiel and Sabalava 1988, p. 12). In the
marketing literature, research concerning the patient’s role is virtually nonexistent.
While research is scant in the medical sociology literature, there are several
theoretical and empirical pieces which may provide some insights into patient roles
and their influence on satisfaction.
Prescriptive Models o f Patient Roles
Based on the concept o f the sick role, Parsons (1951) introduced one o f the
earliest models o f patient behavior. Parsons believed that sick people are granted
certain privileges on the basis o f their illness. Such privileges include exemptions
from responsibilities for one’s own health and exemptions from the performance of
normal social responsibilities. According to Parsons, the sick person also has
certain obligations including the motivation to get well, seek technically competent
help, trust the doctor, and comply with the medical regimen. This conceptualization
sees the patient as having a relatively passive role in his/her medical care.
Later, Szasz and Hollender (1956) present an alternative to Parsons’
60
formulation o f the patient role. They present three models of doctor-patient
relationships: activity-passivity, guidance-cooperation, and mutual participation.
The appropriateness o f each model is determined by the degree o f patient control
which in turn is determined by the nature o f the illness. In an activity-passivity
relationship, the patient is completely helpless and passive and the physician assumes
an authoritative role. This model is appropriate for emergency care. In a guidance-
cooperative relationship, the patient participates by cooperating with the medical
regimen. This model is appropriate for the care of acute disorders, especially
infectious disorders. In a mutual participation relationship, the patient is regarded as
an equal participant in the delivery of health care. The physician’s role in this type
of relationship is to help the patient to help him/herself. This last model is
appropriate for the care of chronic disorders.
Similar to the mutual participation model proposed by Szasz and Hollender
(1956), today’s conceptualization o f the patient role is characterized by an active
patient concept. According to this view, the ’activated’ patient rejects the passivity
of sick role behavior and assumes some responsibility for his/her own care. The
patient’s responsibilities include defining as clearly and honestly as possible the
nature o f the problem, asking questions, stating preferences, offering opinions,
proposing alternatives, expecting to be heard, seeking second opinions, and stating
the type of intervention being sought from the physician (Quill 1983; Steele,
Blackwell, Gutmann, and Jackson 1987).
Empirical Investigations of Patient Role
61
To date, most o f the work on patient behavior has prescribed how patients
ought to behave (according to the various authors), rather than describing how
patients expect, desire or actually behave. In one of the few noted exceptions,
Vertinsky, Thompson, and Uyeno (1974) surveyed subjects to determine the role
orientations preferred by patients in clinical decision making. Eight activity
dimensions were identified. The activity dimensions were related to the patient’s
propensity to seek information and second opinions, the patient’s participation in
decision making, the patient’s tendency to supplement physician orders with
additional drugs or treatment.
In several other studies (Lorber 1975; Tagliacozzo and Mauksch 1979),
hospital patients were asked what they believe their physicians and nurses expected
of them. They were also asked about their own role preferences. Findings from
these studies indicate that patients do differentiate between role expectations and role
preferences. When asked what was expected of them by their physicians and
nurses, "they responded with considerable consistency, indicating that several rules
for ’proper’ conduct o f patients are well defined and widely shared" (Tagliacozzo
and Mauksch 1979, p. 188). Respondents thought they were expected to be co
operative, trusting, confident, undemanding, respectful and considerate. Findings
also indicate that hospitalized patients frequently resent the passivity and submission
expected by doctors and nurses (Lorber 1975). There is also evidence that some
patients fear they will be deprived o f adequate care if they do not conform to
physician and nurse expectations (Tagliacozzo and Mauskch 1979).
62
Summary
To date much o f the research on patient role has been prescriptive rather than
descriptive. There is limited evidence that patients do distinguish between role
expectations and role preferences. It would appear from this scant review that
patients desire greater participation in medical encounters than they believe is
expected o f them. Further research is needed: 1) to conceptualize the patient role
in the service encounter, and 2) to examine the associations among patient role
expectations, performance, disconfirmation, and satisfaction.
Review of the Literature
From the literature review we can note a number o f major deficiencies in
the services satisfaction literature in general and the patient satisfaction literature in
particular.
1. Unlike the product satisfaction literature, there has yet to be a
systematic investigation o f the full set o f interrelationships among
expectations, performance, disconfirmation, and satisfaction in the
services marketing literature. This finding holds for the health care
literature as well. For the most part, researchers have adopted the
disconfirmation paradigm to study service satisfaction. Yet product
satisfaction research has moved beyond this traditional paradigm to
study the structural relationships among expectations, performance,
disconfirmation, and satisfaction. It can be argued that service
satisfaction research should do likewise.
63
2. Thus far, the application of role theory to the study o f service
satisfaction has been rather limited. The criticism previously voiced
may be repeated: researchers have failed to investigate the
associations among role expectations, performance, disconfirmation
and satisfaction. In general, researchers have either adopted the
disconfirmation paradigm to study satisfaction or they have studied the
isolated influence of role performance on satisfaction. A natural
extension would be to study the full set o f interrelationships among
the different role constructs.
3. While most researchers would agree that consumers often have a
participatory role in the service encounter, research in the services
marketing literature has virtually ignored the customer/client role and
its influence on constructs such as satisfaction. Given the
interactional emphasis of role theory, it is surprising that studies based
on this theoretical framework have neglected to examine the
consumer’s role in the service encounter. In the words o f Solomon,
Surprenant, Czepiel, and Gutman (1985, p. 101), "the quality o f the
subjective product-the service experience-is the true outcome o f a
service interaction. This is manufactured by both parties and must be
approached as such."
Model Presentation
This research attempts to address the issues presented in the previous section.

64
The proposed model specifies interrelationships among expectations, performance,
disconfirmation, and satisfaction for health care services. The hypothesized
relationships are summarized in Table 2.1. Also included in Table 2.1 are previous
studies which have found support for the proposed hypotheses.
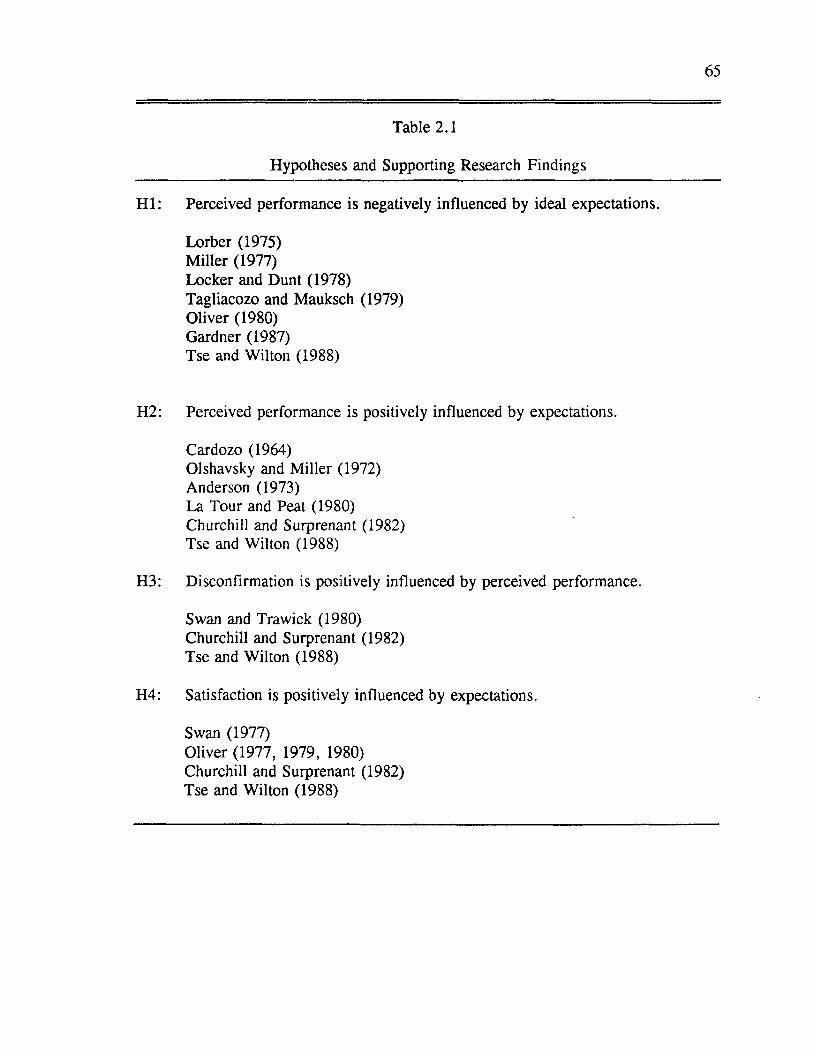
65
Table 2.1
Hypotheses and Supporting Research Findings
H I: Perceived performance is negatively influenced by ideal expectations.
Lorber (1975)M iller (1977)Locker and Dunt (1978)Tagliacozo and Mauksch (1979)Oliver (1980)Gardner (1987)Tse and Wilton (1988)
H2: Perceived performance is positively influenced by expectations.
Cardozo (1964)Olshavsky and M iller (1972)Anderson (1973)La Tour and Peat (1980)Churchill and Surprenant (1982)Tse and Wilton (1988)
H3: Disconfirmation is positively influenced by perceived performance.
Swan and Trawick (1980)Churchill and Surprenant (1982)Tse and Wilton (1988)
H4: Satisfaction is positively influenced by expectations.
Swan (1977)Oliver (1977, 1979, 1980)Churchill and Surprenant (1982)Tse and Wilton (1988)
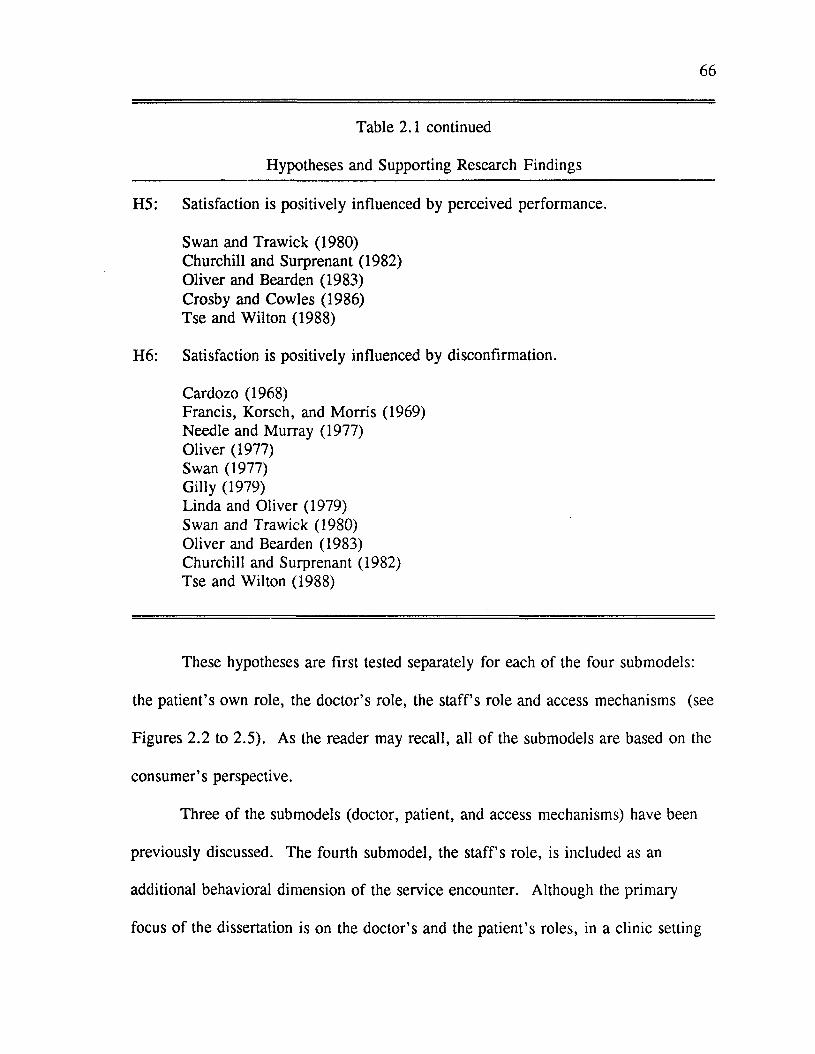
66
Table 2.1 continued
Hypotheses and Supporting Research Findings
H5: Satisfaction is positively influenced by perceived performance.
Swan and Trawick (1980)Churchill and Surprenant (1982)Oliver and Bearden (1983)Crosby and Cowles (1986)Tse and Wilton (1988)
H6: Satisfaction is positively influenced by disconfirmation.
Cardozo (1968)Francis, Korsch, and M orris (1969)Needle and Murray (1977)Oliver (1977)Swan (1977)Gilly (1979)Linda and Oliver (1979)Swan and Trawick (1980)Oliver and Bearden (1983)Churchill and Surprenant (1982)Tse and Wilton (1988)
These hypotheses are first tested separately for each of the four submodels:
the patient’s own role, the doctor’s role, the s ta ffs role and access mechanisms (see
Figures 2.2 to 2.5). As the reader may recall, all o f the submodels are based on the
consumer’s perspective.
Three o f the submodels (doctor, patient, and access mechanisms) have been
previously discussed. The fourth submodel, the staff’s role, is included as an
additional behavioral dimension of the service encounter. Although the primary
focus o f the dissertation is on the doctor’s and the patient’s roles, in a clinic setting
67
the patient interacts with other role players including nurses, technicians, and
receptionists. It is felt that patients’ evaluation o f the s ta ffs role may also impact
their overall evaluation o f the service. For this reason, the s ta ffs role is included as
a submodel.
After the interrelationships are examined for each o f the four submodels, the
submodels are then integrated into an overall model o f patient satisfaction (see
Figure 2.6). The purpose o f the overall model of satisfaction is to determine the
relative impact o f patient satisfaction with their own role, the doctor’s role, the
s ta ffs role, and the access mechanisms on overall satisfaction with the clinic.
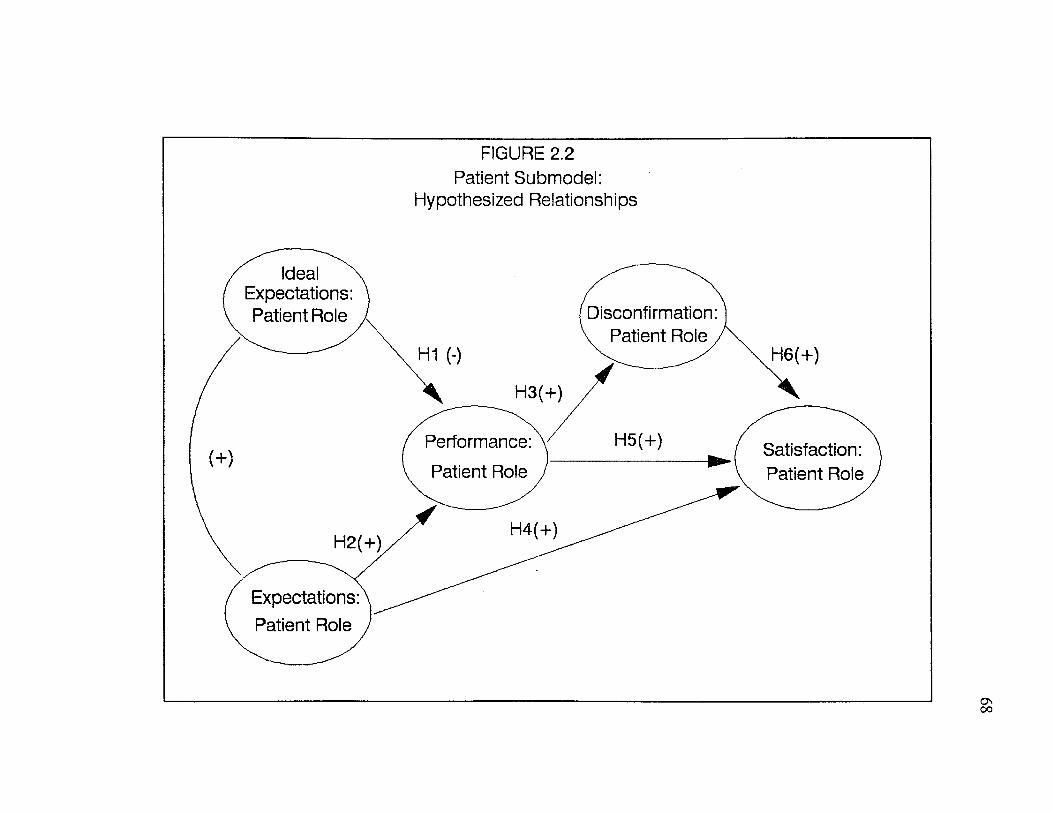
FIGURE 2.2Patient Submodel:
Hypothesized Relationships
Ideal Expectations: Patient Role Disconfirmation:
v Patient Role,H6(+)H1 (-)
H5(+)Performance: Patient Role
Satisfaction: Patient Role
H4(+)
Expectations: Patient Role
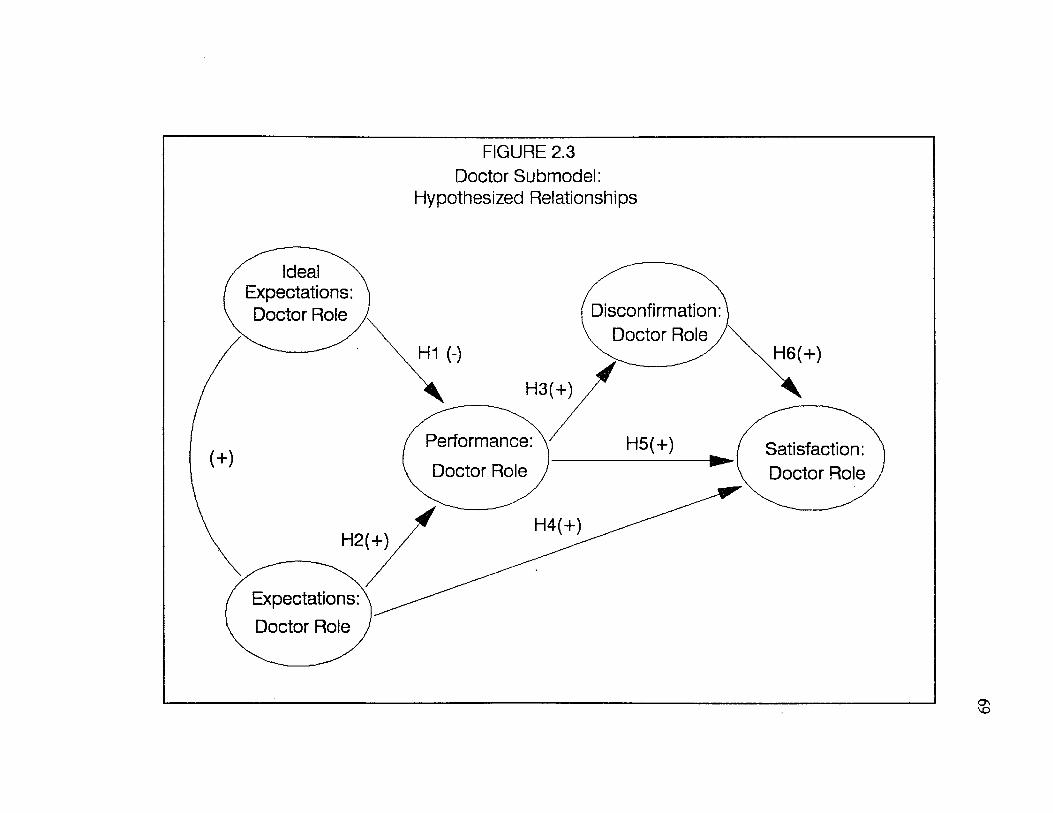
FIGURE 2.3 Doctor Submodel:
Hypothesized Relationships
Ideal Expectations: Doctor Role Disconfirmation:
, Doctor Role /H6(+)
Performance: Satisfaction: Doctor RoleDoctor Role
H4(+)H2(+)
Expectations: Doctor Role
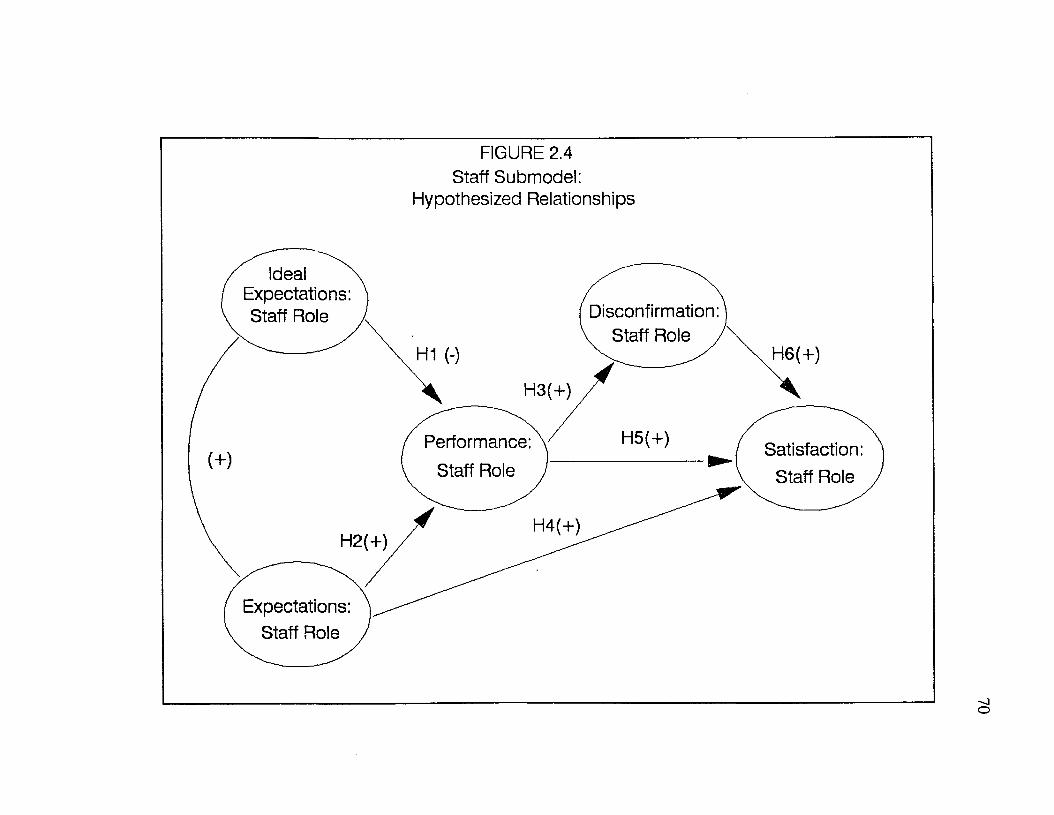
FIGURE 2.4Staff Submodel:
Hypothesized Relationships
Ideal Expectations: Staff Role Disconfirmation:
, Staff Role /H6(+)H1 (-)
H5(+)Performance: Staff Role
Satisfaction: Staff Role
H2(+)
Expectations: Staff Role

FIGURE 2.5Access Mechanisms Submodel
Hypothesized Relationships
Ideal Expectations: Access Mech. Disconfirmation:
, Access Mech.,H1 (-) H6(+)
H3(+)
Performance: Access Mech.
Satisfaction: Access Mech.
H4(+)H2(+)
Expectations: Access Mech.
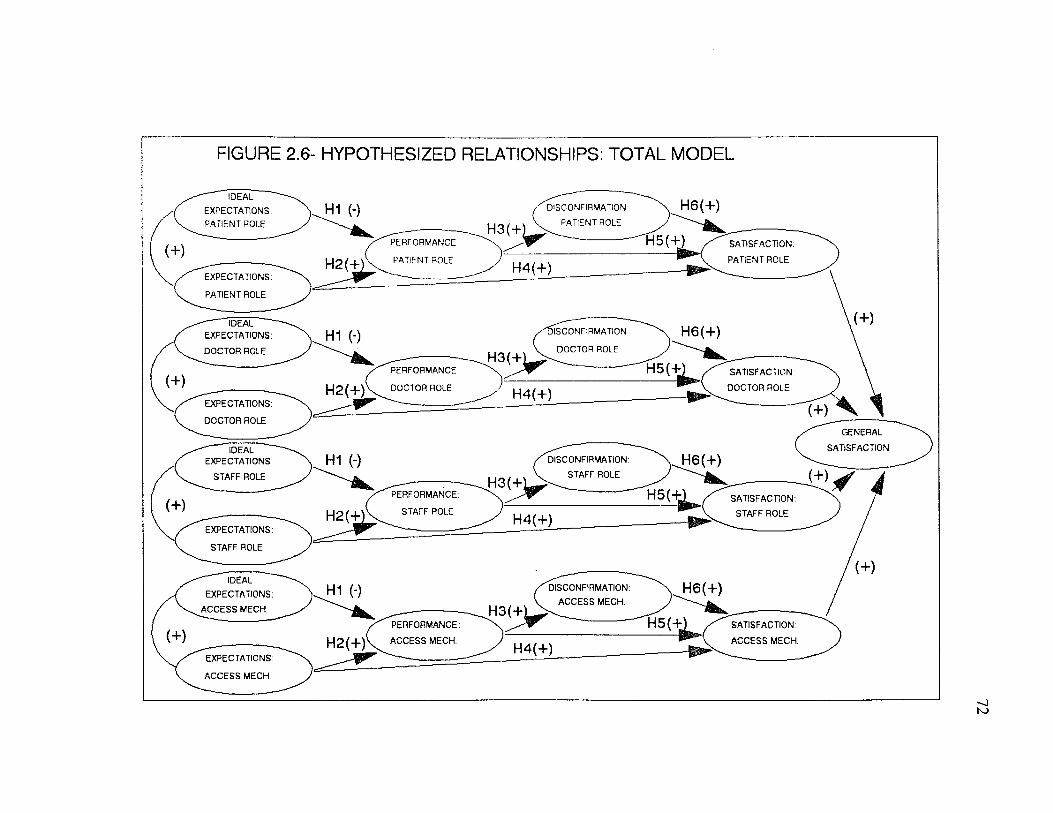
FIGURE 2.6- HYPOTHESIZED RELATIONSHIPS: TOTAL MODEL
IDEAL
EXPECTATIONS:
PATIENT ROLE
H6(+)H1 (-) DISCONFIRMATION
PATIENT ROLE
H5 (+)PERFORMANCE SATISFACTION:
PATIENT ROLEPATIENT ROLEH 2(+ H4(+)EXPECTATIONS:
PATIENT ROLE
IDEAL EXPECTATIONS:
DOCTOR ROLE
H6(+)ilSCONFIRMATIONH1 (-)DOCTOR ROLE
H3(+;H5(+'PERFORMANCE SATISFACTION:
H2(+) DOCTOR ROLE DOCTOR ROLEH4(+)EXPECTATIONS:
DOCTOR ROLEGENERAL
SATISFACTIONIDEALEXPECTATIONS: H1 0 H6(+)DISCONFIRMATION:
STAFF ROLESTAFF ROLE
H5(-LPERFORMANCE: SATISFACTION:
STAFF ROLESTAFF ROLEH 2 (+ H4(+)EXPECTATIONS:
STAFF ROLE
IDEAL
EXPECTATIONS:
A C C E SS MECH.
H6(+)H1 (-) DISCONFIRMATION:
A C CESS MECH.
PERFORMANCE:
A C CESS MECH.
SATISFACTION:
A C CESS M ECH.H2(+) H4(+)EXPECTATIONS:
A C C E SS MECH.
73
Constructs o f the provider role submodel include ideal provider role,
provider role expectations, provider role performance, and provider role
disconfirmation. Ideal provider role represents the types o f behavior that a
consumer ideally hopes the provider will perform during the service encounter. It
represents desirable role behavior. Provider role expectations represent the types of
behavior that a consumer believes the provider is most likely to perform . Provider
role performance represents a consumer’s perceptions o f the provider’s actual
behavior. Provider role disconfirmation represents a consumer’s subjective
assessment of the discrepancy between prior expectations and actual performance
with respect to the provider’s behavior.
Constructs of the consumer role submodel include ideal own role, own role
expectations, own role performance, and own role disconfirmation. Consumer role
constructs are defined similarly to the provider role constructs. Ideal own role
represents the types o f behavior that a consumer ideally hopes to perform during the
service encounter. This construct represents desirable patient behavior. Own role
expectations represent the types of behavior that a consumer believes he/she is most
likely to perform. Own role performance represents a consumer’s perceptions of
his/her actual behavior during the service encounter. Own role disconfirmation
represents a consumer’s subjective assessment o f the discrepancy between prior
expectations and actual performance with respect to his/her own role.
Constructs o f the staff role submodel include ideal staff role, staff role
expectations, staff role performance, and staff role disconfirmation. Ideal staff role
74
represents the types o f behavior that a consumer ideally hopes cashiers and
receptionists, nurses, and xray and cast technicians will perform during the service
encounter. Staff role expectations represent the types o f behavior that a consumer
believes the staff is most likely to perform. Staff role performance represents a
consum er’s perceptions o f the s ta ffs actual behavior during the service encounter.
Staff role disconfirmation represents a consumer’s subjective assessment o f the
discrepancy between prior expectations and actual performance with respect to the
s ta ffs role.
Constructs o f the access mechanisms submodel include ideal access
mechanisms, access mechanisms expectations, access mechanisms performance, and
access mechanisms disconfirmation. Ideal access mechanisms represent what a
consumer ideally hopes for in terms of access, availability, convenience, finances,
and physical environment of the service. Expected access mechanisms represents
what a consumer considers most likely to occur in terms o f access mechanisms.
Access mechanisms performance represents a consumer’s perceptions o f the
accessibility, availability, convenience, cost and physical environment o f the service.
Access mechanisms disconfirmation represents a consum er’s subjective assessment
o f the discrepancy between prior expectations and actual performance with respect to
access mechanisms.
Mediating Influence of Involvement
Adding to the deficiencies noted earlier, the satisfaction research in the
services marketing literature and the health care literature can be faulted for

75
neglecting to investigate the possibility o f mediating effects such as involvement on
satisfaction formation. In the context of product satisfaction, Oliver and Bearden
(1983) found that high involvement decreases one’s sensitivity to expectations while
low involvement causes the general tone o f expectations to influence post-usage
evaluations. In other words, under conditions o f low involvement the traditional
disconfirmation paradigms performs reasonably well but under conditions o f high
involvement perceived performance dominants the satisfaction process. This type of
research has yet to be conducted for services. This research examines the role of
involvement on consumer satisfaction formation for health care services. A brief
review of the involvement research pertinent to this study is now provided.
Involvement
Although research on involvement goes back to Sherif and Cantril’s work in
1947, the term involvement was first popularized by Krugman (1965, 1966).
Krugman (1966, p. 584) defined involvement as the number o f conscious bridging
experiences or personal references per minute, that the subject makes between the
content of the persuasive stimulus and the content of his own life. Since Krugman’s
earlier definition o f involvement, countless other definitions have been set forth
(Day 1970; Bowen and Chaffe 1974; Houston and Rothschild 1978; Bloch 1981).
Despite great variation in the definitions o f involvement, there appears to be a
general consensus that involvement means personal relevance or importance (Antil
1984; Greenwald and Leavitt 1985). Beyond this general consensus however,
various approaches to the involvement construct differ with respect to four
76
dimensions: 1) content, 2) object, 3) nature, and 4) intensity (Costley 1988).
The content dimension refers to the different types o f involvement:
situational involvement, enduring involvement, and response involvement (Housten
and Rothschild 1978). Situational involvement is the degree o f involvement elicited
from an individual’s concern for his/her behavior in a situation. Product-related
stimuli such as cost, elapsed time o f consumption, and complexity o f the
product/service and/or social psychological stimuli such as presence or absence of
relevant others during purchase and/or consumption combine to create situational
involvement.
Enduring involvement reflects the strength of the preexisting relationship
between an individual and the situation in which behavior will occur. This type of
involvement represents the consumer’s ongoing concern with a product/service that
transcends situational circumstances. Housten and Rothschild (1978) suggest that
enduring involvement is a function of 1) prior experience with the object, issue or
situation and 2) strength o f values to which the product is related.
Response involvement reflects the complexity or extensiveness o f consumer
decision making. According to Housten and Rothschild (1978), situational and
enduring involvement combine to influence response involvement. Although
situational and enduring involvement elicit similar responses, the temporal patterns
of behavioral response appear to differ across involvement types (Richins and Bloch
1986). Richins and Bloch (1986) found that behavioral responses resulting from
situational involvement decayed over time.
77
It has been noted that involvement must have a focus (Mitchell 1979). That
is, to be involved one must be involved with something. In the context o f consumer
behavior, the object o f involvement may be a product, an ad, or a situation (Costley
1988). One may also add services as potential objects o f involvement. In this
dissertation, the object of involvement is the patient’s upcoming office visit with a
physician.
Involvement may be affective or cognitive in nature (Park and Young 1983;
Park and McClung 1986). As with other constructs, affective involvement
represents the expressive, emotional type o f involvement whereas cognitive
involvement represents the functional type of involvement.
Generally, intensity of involvement is referred to in terms o f high and low.
There have been some arguments made for measuring involvement profiles (Laurent
and Kapferer 1985) or measuring involvement on a continuum rather than as a
dichotomy (Antil 1984). Measurement issues will be discussed in Chapter Three.
Summary
Empirical evidence supports the notion that involvement influences
satisfaction processes for products (Oliver and Bearden 1983). The relative
influence o f expectations/disconfirmation and performance appears to depend largely
upon one’s involvement with the product in question. Although more empirical
research is warranted, high involvement appears to strengthen the impact o f product
performance on satisfaction. In contrast, the traditional disconfirmation paradigm
appears to hold relatively well for low involvement situations. It remains to be seen
78
whether these findings hold for services as well.
This research extends the work of Oliver and Bearden (1983) by examining
the influence o f involvement on satisfaction processes for health care services.
Traditionally, health care has been considered a high involvement situation.
However, it is not the product or service per se that is involving but the personal
meaning or significance the individual attributes to the characteristics o f that product
or service that results in involvement (Antil 1984). In other words, it is the
individual’s interpretation of the stimuli and not the stimuli itself that determines the
level o f involvement. Thus, people vary in their level o f involvement which is why
it is dangerous to assume that a particular product or service will be "high
involvement" for all consumers (Antil 1984). Patient involvement may vary with
the level of risk and uncertainty associated with type o f care sought, the seriousness
o f the illness, the costs involved in care, and the personality of the person seeking
care (Barber and Venkatraman 1986).
Proposed Effects o f Involvement on Patient Satisfaction Model
Following Oliver and Bearden (1983), the influence of involvement on
satisfaction formation for health care services will be investigated by examining the
proposed model separately for groups of patients with varying degrees o f reported
involvement. Table 2.2 summarizes the hypotheses regarding the influence of
involvement on patient satisfaction formation. Also included in Table 2.2 are
previous studies which support hypothesis 7a and 7b.
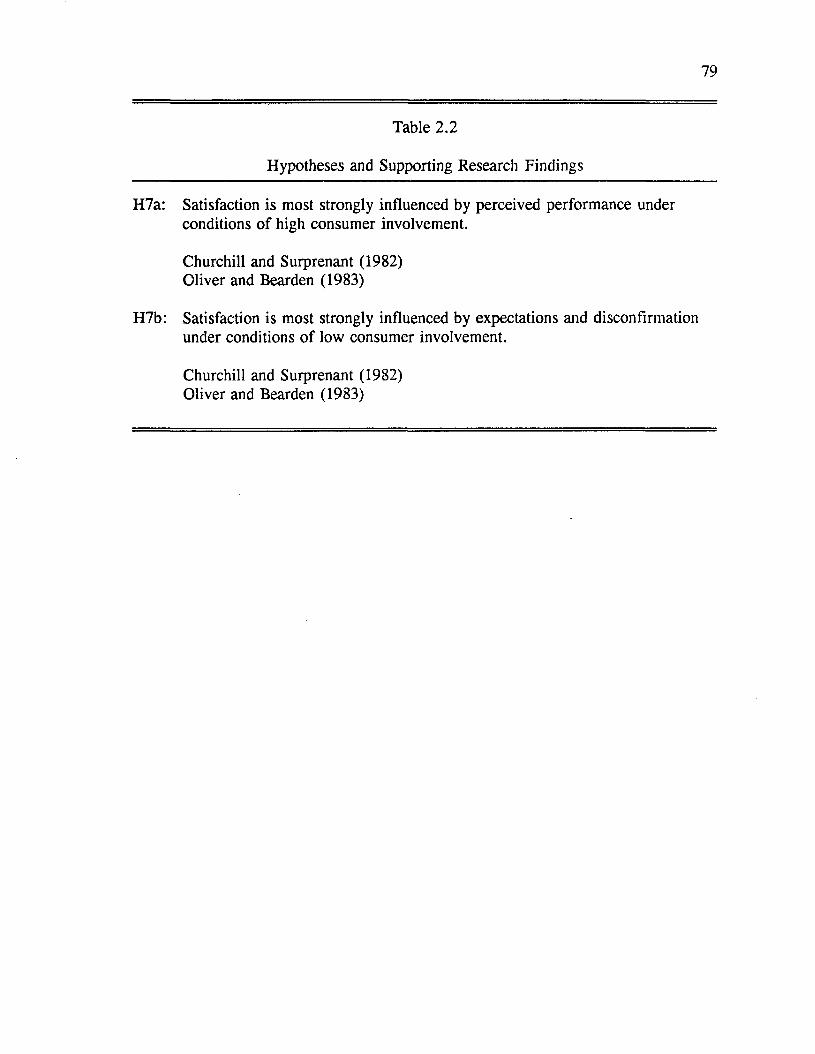
79
Table 2.2
Hypotheses and Supporting Research Findings
H7a: Satisfaction is most strongly influenced by perceived performance underconditions o f high consumer involvement.
Churchill and Surprenant (1982)Oliver and Bearden (1983)
H7b: Satisfaction is most strongly influenced by expectations and disconfirmation under conditions o f low consumer involvement.
Churchill and Surprenant (1982)Oliver and Bearden (1983)

80
Conclusion
The research presented here proposes a model o f consumer satisfaction with
health care services. This research extends previous work in the services marketing
literature and the health care literature by attempting to develop and test a more
comprehensive model o f patient satisfaction. Unlike previous research on patient
satisfaction, the proposed model:
1) Examines the structural relationships among expectations,disconfirmation, performance, and satisfaction for health care services.
2) Examines more fully the influence of role dimensions andnonbehavioral dimensions (access mechanisms) on satisfaction with health care services.
3) Conceptualizes and tests the influence o f consumer role expectations and behavior on satisfaction with health care services.
4) Examines the influence o f involvement on satisfaction formation forhealth care services.
CHAPTER 3
Methodology
Chapter Three describes research methods and analyses and is divided into
three sections. The first section outlines the design o f the study. Included in this
section is a description o f the study setting, sample design and data collection
procedure. The second section presents measures and operationalizations o f the
model constructs. Included in this section is a description o f the questionnaire
development process which consisted of a literature review, two focus groups, and a
questionnaire pretest. Also included in this section is a discussion o f relevant
measurement issues. The third section outlines the analyses for the measurement
and structural models. Also included in this section, is a description of how the
effects of involvement were tested.
Design o f the Study
Setting
In Chapter One, the characteristics o f professional services were presented
and the argument was made that these characteristics make professional services,
particularly the technical dimensions of professional services, difficult for consumers
to evaluate. Difficulty in evaluation forces consumers to rely on different cues and
processes when evaluating professional services. The assertion was made that one
o f the most important cues available to consumers for evaluating these types of
services is their observations and perceptions of the provider’s behavior. Consumer
reliance on the behavioral dimensions of professional services suggests that role
81
82
theory may provide a useful conceptual framework in which to model consumer
satisfaction.
Although the argument was made that the proposed model is applicable
across a wide variety o f professional services, the model was initially tested within
the context o f one type o f professional service, medical services. In Chapter Two, a
review o f the applications of role theory in the marketing literature strongly
suggested that the usefulness o f role theory as a conceptual framework was highly
contingent upon the operationalization of the role concept. Roles should be richly
described in terms o f activities, attitudes, and behaviors o f the role players. It was
felt that to develop role measurements that would generalize across diverse
professional services would inhibit the author’s ability to thoroughly describe both
the professional’s and the client’s roles. Rather than risk the use o f poor role
operationalizations, the author choose to initially limit the test o f the model to one
type of professional service. O f course, the alternative is to develop separate role
measurements for each type o f professional service. Given limited resources, this
alternative was not viable at this time. It does, however, provide an interesting
extension of the present study.
Medical services were chosen as the context o f this study for a number of
reasons. First, in at least one study of satisfaction with professional services
medical services were cited as being the most dissatisfying o f professional services
(Quelch and Ash 1981). Being both important and dissatisfying to consumers,
medical services would appear to be a worthy context in which to test the proposed
83
model. Second, the wealth o f health care literature provided valuable insight into
the behavioral dimensions that comprise the physician’s role. Although research on
the patient’s role was less voluminous, there were at least several studies in the
medical sociology literature that provided some initial guidance regarding the
behavioral dimensions o f the patient’s role. Research for other professional services
was far less expansive. For these reasons, medical services appeared to be a good
choice for an initial test of the proposed model.
Population. Sample Size, and Sample Design
The population from which the sample was drawn consisted o f adult patients
aged 18 or older in the Baton Rouge, Louisiana, metropolitan area. A judgement
sampling procedure was utilized to sample 320 patients. 130 patients completed
usable first and second questionnaires for a response rate of 41%. The following
constraints were observed:
-respondents visited the physician during the study period;-respondents displayed varying degrees o f involvement with the upcoming office visit;-respondents were able to complete the first questionnaire (assessing expectations) prior to seeing the doctor.
The source o f study participants was obtained from a large orthopedic clinic.
One large group practice was chosen over many independent practices to ease the
data collection procedure. In exchange for the clinic’s participation in the study, the
researcher agreed to provide the clinic with a summary of the research results. The
report included a summary o f patient expectations, patient perceptions o f the clinic’s
performance, and overall patient satisfaction with the clinic. The researcher also
84
made recommendations for improving patient satisfaction. A profile o f the clinic’s
patient base was also included in the report.
Respondents recruited for the study were offered a monetary incentive which
consisted o f a lottery distributing two prizes among the study participants. Each of
the lottery winners received $50 towards a dinner at M ansur’s Restaurant in Baton
Rouge, Louisiana.
The sampling design was considered acceptable because the focus o f the
dissertation was theory testing rather than application. Several researchers have
argued in support o f this position (Suchman 1962; Calder et. al 1981, 1982, 1983).
Furthermore, in this situation random sampling designs would have increased the
risk o f obtaining descriptions and evaluations of health care that relied on
experiences several years old. Locker and Dunt (1978) caution that respondents
who have not recently experienced the health care service will base their responses
on socially stereotyped conceptions o f providers and services. They suggest several
alternative approaches: 1) identify patients who have evidence of similar levels of
service experience and then to analyze the data separately for the different groups,
2) restrict the sample to individuals who have received primary care in the year
prior to the interview, and 3) limit the study population by interviewing patients
immediately after a consultation and measure satisfaction with that consultation only
(Locker and Dunt 1978). The later approach was chosen for this study so that
respondents could be questioned both before and after the medical consultation.
This allowed the researcher to avoid measuring expectations in retrospect as
85
suggested by Oliver (1981). For these reasons, it was felt that a judgmental
sampling design was more appropriate than a random sampling design for this study.
Data Collection Procedure
The data collection procedure is described in this section. It is also
summarized in Table 3.1. The researcher solicited participation from patients as
they arrived for their appointments. At this time, the researcher informed the
patient that the clinic, in conjunction with the Louisiana State University Department
o f M arketing, was conducting a study on patient satisfaction. Participation in the
study required the patient to complete two questionnaires. The first questionnaire
contained measurements for: ideal provider role, ideal own role, ideal access
mechanisms, expected provider role, expected own role, expected access
mechanisms, and involvement. Respondents completed the first questionnaire while
waiting to see the doctor. As the patients left the clinic, they were given a second
questionnaire. The second questionnaire contained measurements for: provider role
disconfirmation, own role disconfirmation, access mechanisms disconfirmation,
perceived provider performance, perceived own role performance, perceived access
mechanisms performance, and satisfaction. Respondents were instructed to take the
second questionnaire home, complete it, and then mail it in the envelope provided.
The second questionnaire also contained some demographic and classification
questions.
Lottery registration was accomplished with a stamped, addressed postcard
containing spaces for the respondent’s name, address, and telephone number.
86
Respondents found this postcard in the envelope of the second questionnaire. It was
felt that a lottery registration form separate from the questionnaire would assure
respondents o f their confidentiality. Respondents were instructed in the cover letter
to complete the lottery registration postcard after they had returned the second
questionnaire. There was also a reminder at the end o f the second questionnaire.
To be eligible respondents had to return the second questionnaire within a specified
period o f time.
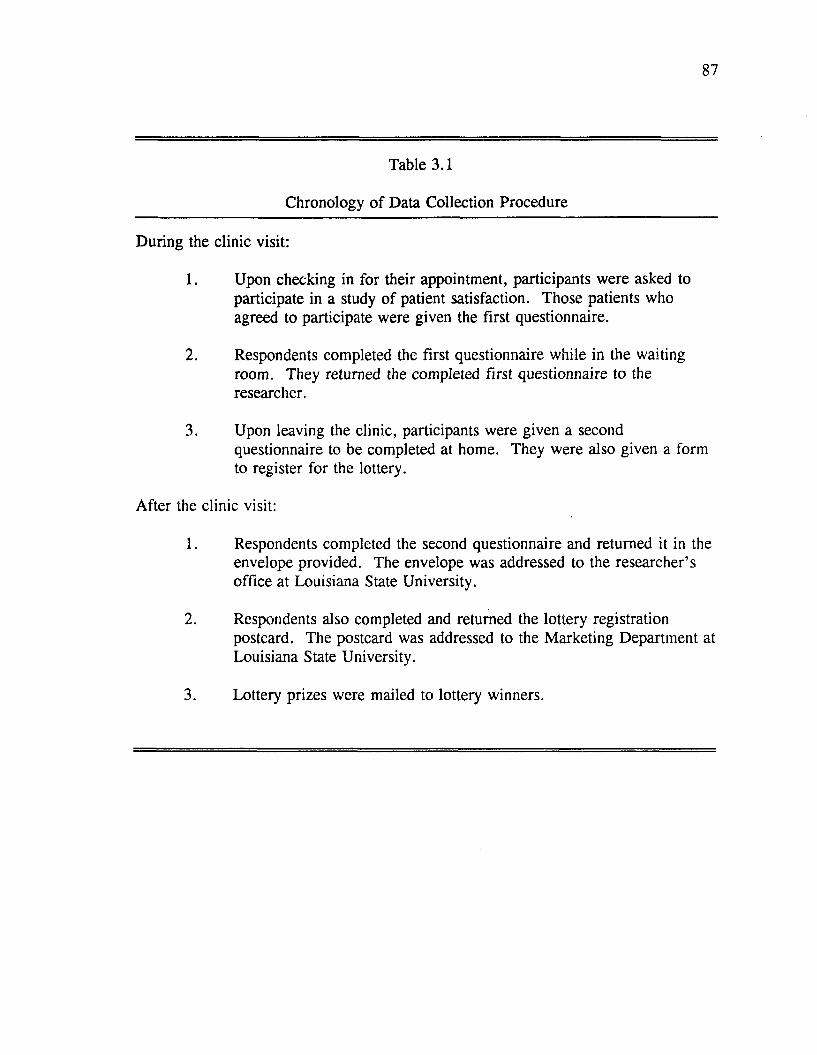
87
Table 3.1
Chronology o f Data Collection Procedure
During the clinic visit:
1. Upon checking in for their appointment, participants were asked to participate in a study of patient satisfaction. Those patients who agreed to participate were given the first questionnaire.
2. Respondents completed the first questionnaire while in the waiting room. They returned the completed first questionnaire to the researcher.
3. Upon leaving the clinic, participants were given a second questionnaire to be completed at home. They were also given a form to register for the lottery.
After the clinic visit:
1. Respondents completed the second questionnaire and returned it in the envelope provided. The envelope was addressed to the researcher’s office at Louisiana State University.
2. Respondents also completed and returned the lottery registration postcard. The postcard was addressed to the Marketing Department at Louisiana State University.
3. Lottery prizes were mailed to lottery winners.
88
Measures and Operationalizations
Five constructs comprised the theoretical model: 1) ideal performance, 2)
expected performance, 3) perceived performance, 4) disconfirmation, and 5)
satisfaction. The next several sections o f this chapter discuss how each o f these five
constructs was measured in the dissertation research. Since each of the five model
constructs was measured separately for the provider’s role, the patient’s own role,
the s ta ffs role and access mechanisms, a multi-step process was undertaken to
develop behavior-specific and access mechanism-specific measures. This process is
outlined following a general discussion o f the model measurements. Finally,
measurements for other constructs o f interest are discussed separately in a later
section o f this chapter.
1. Expectations
As suggested by previous researchers (Miller 1977; Tse and Wilton 1988)
multiple comparison standards were assessed in this research. Following the recent
work by Tse and Wilton (1988), both ideal expectations and expectations were
measured. Ideal expectations and expectations were defined in Chapter Two. As a
review, ideal expectations represent the maximum or optimal level o f product or
service performance that a consumer ideally hopes for. Expectations represent an
anticipated level o f performance. Both ideal expectations and expectations were
measured separately for the provider’s role, the patient’s own role, the staff’s role
and access mechanisms. Expectations were measured as the perceived belief
probabilities associated with the occurrence of specific physician behaviors, specific
89
patient behaviors, specific staff behaviors and specific access mechanisms. Ideal
expectations were measured as the perceived desirability associated with the
occurrence o f specific physician behaviors, specific patient behaviors, specific staff
behaviors and specific access mechanisms. The scale development for ideal
expectations and expectations will be explicated in a later section (see Multi-Step
Process for Scale Development).
A number of problems with measuring expectations in retrospect have been
noted earlier in this chapter (see Oliver 1981). For this reason, measurement of
ideal expectations and expectations were taken before seeing the physician
(Questionnaire One).
2. Perceived Performance
Until Churchill and Surprenant’s (1982) research, performance was not
traditionally measured as a construct distinct from disconfirmation. Churchill and
Surprenant (1982) assessed perceived product performance by using both a single
item global measure and a multi-item, attribute-specific measure whereby responses
to individual attributes are summed to generate the overall construct. Attribute-
specific measures of perceived performance were employed in this study.
Perceptions o f physician role performance, own role performance, staff role
performance and service access mechanism performance were measured separately.
Respondents were asked to indicate on a 5-point agree-disagree scale whether
specific physician behaviors, patient behaviors, staff behaviors and access
mechanisms occurred during the office visit with the doctor. The development o f
90
the perceived performance scales will be discussed later (see Multi-Step Process for
Scale Development). Measurements for perceived performance were secured after
the service encounter (Questionnaire Two).
3. Disconfirmation
Different approaches for operationalizing the disconfirmation construct were
discussed in Chapter Two. In review, the two basic approaches are: subtractive
disconfirmation and subjective disconfirmation. Subtractive disconfirmation is
measured by taking the algebraic difference between respondent’s prior expectations
and their perceptions o f service performance. Subjective disconfirmation is
measured as consumers’ perception that the service performance was better or worse
than expected. With the exception o f one study (Swan and Trawick 1980),
subjective approaches to modeling disconfirmation have been shown to be superior
to subtractive approaches (Oliver 1980; Tse and Wilton 1988). Subtractive
disconfirmation has also been noted to result in lower reliabilities due to the use of
difference scores (Prakash and Lounsbury 1983). For these reasons, subjective
disconfirmation was utilized in this study. Once again, subjective disconfirmation
was measured separately for the physician’s performance, one’s own performance as
patients, the staff’s performance and access mechanism performance. The better-
and worse-than-expected scale which has been successfully used in the literature
(Oliver 1977, 1980; Swan and Trawick 1980; Linda and Oliver 1979; Westbrook
and Oliver 1981) was used for individual role behaviors and access mechanisms as
well as for overall impressions o f the service provided. Further elaboration of the
91
disconfirmation scales is provided later in this chapter (See Multi-Step Process for
Scale Development). Disconfirmation will be assessed after the service encounter
(Questionnaire Two).
4. Satisfaction
Traditionally satisfaction has been measured using one o f two methods.
Respondents have either been asked to talk openly about the product or service or
they have been asked to respond to a series o f direct questions about their
satisfaction with the product or service. In some studies, both methods have been
employed. There is evidence that the two methods produce different results (Locker
and Dunt 1978). Respondents may report satisfaction/dissatisfaction with particular
attributes of a product or aspects of a service when asked directly yet they fail to
spontaneously mention these attributes or aspects in response to open ended
questions. This is similar to the problem of under-reporting which has received
considerable research attention. The problem of under-reporting can be avoided by
the concurrent use o f both methods. Locker and Dunt (1978) suggest that
respondents be asked to comment favorably and critically on the services they have
received and then follow these comments by a series o f direct questions on different
aspects o f the service.
Another critical issue in the measurement o f satisfaction is the manner in
which satisfaction with a product or service may be rated. According to Henley and
Davis (1967), there are three approaches commonly used in the patient satisfaction
literature:

92
1) a global evaluation,2) a satisfaction measure for each aspect o f an individual’s medical care,3) a composite measure derived from separate responses to each aspect
o f an individual’s medical care.
Locker and Dunt (1978) provide a discussion of these three approaches.
Global evaluations which ask respondents how satisfied they are in general tend to
be very crude measures o f satisfaction. The majority o f studies indicate that level of
satisfaction varies with different aspects o f a service. Because global evaluations are
very general, they tend to mask these differences. Since they do not take into
account specific instances o f dissatisfaction, global evaluations also tend to be biased
towards the satisfaction end o f the scale. Global evaluations are also too crude to
allow comparisons across services. Finally, global evaluations provide no means of
identifying what aspects o f a service need to be improved in order to increase
customer satisfaction.
In contrast to global evaluations, the other two approaches to rating
satisfaction distinguish between separate facets of a service. One approach treats
items as discrete facets o f the service, the other composites individual items to arrive
at an overall score o f satisfaction. Locker and Dunt (1978) recommend that
respondents be asked to describe what happened during the service encounter before
they rate themselves on a satisfied-dissatisfied scale. This should enhance the
validity of the satisfaction ratings (Locker and Dunt 1978). This approach was
adhered to for this dissertation.
In the marketing literature, all three approaches have been employed.
Churchill and Surprenant (1982) used both global evaluations and attribute-specific
93
evaluations in their study. Oliver (1980) relied on a six item global evaluation
scale. Studies have also varied in terms o f the types o f scaling used. The most
common being verbal, graphic, Likert, and semantic differential. In a multi-trait,
multi-method analysis o f the various measurement approaches specific to the
satisfaction construct, W estbrook and Oliver (1981) found that the Likert and
semantic-differential scales had the highest reliabilities and convergent and
discriminant validity. M oore and Shuptrine (1984) found similar results: a
multiple-item Likert scale represented the satisfaction construct better than a percent
scale or a delighted-terrible scale.
Following Locker and D unt’s (1978) recommendation, satisfaction in this
study was measured using both open and close ended questions. First, respondents
were given an open ended question regarding their overall evaluation o f the service.
Then respondents were required to respond to a Likert item scale based on O liver’s
(1980) satisfaction scale. These items are global in nature. The second
questionnaire also contained Likert scales which are more specific in nature. These
scales address satisfaction with aspects o f the physician’s role, satisfaction with
aspects o f one’s own role, satisfaction with the staff, and satisfaction with the
service access mechanisms. The development o f the satisfaction scales will be
elaborated on in the next section o f this chapter.
Multi-Step Process for Scale Development
The construction of role specific scales and access mechanism specific scales
followed the measurement development procedure outlined by Churchill (1979):
94
1. The dimensions o f the physician role constructs, patient role
constructs, and access mechanisms were specified.
2. An initial sample o f items was generated. Through consultation with
expert judges, poorly worded or redundant items were then
eliminated.
3. The initial scale items were administered to a pretest sample. Sample
items were evaluated in terms o f internal consistency and factor
structure. Items that did not meet statistical criteria were eliminated.
The reduced scale was again evaluated in terms o f internal consistency
and factor structure.
4. Confirmatory factor analyses were also run as a means o f further
instrument refinement.
The next sections outline these steps in greater depth.
STEP ONE: FORMULATE ROLE DIMENSIONS AND ACCESS MECHANISM DIMENSIONS
First, drawing on over seventy articles published in either the health care
marketing literature or the sociology o f medicine literature, role dimensions and
service access mechanisms of importance to health care consumers were identified.
As reviewed in Chapter Two, the literature suggested three dimensions for the
provider’s role: 1) expressive behaviors, 2) communicative behaviors, and 3)
instrumental behaviors. Three similar role dimensions were identified for the
patient’s own role: 1) expressive behaviors, 2) communicative behaviors, and 3)
decision making behaviors. Five access mechanisms were consistently found in the
95
literature: 1) access, 2) availability, 3) convenience, 4) finances and 5) physical
environment.
Focus Group Discussions
To assist in the formulation o f role dimensions, two focus group discussions
were conducted. It was hoped that the discussions would provide further evidence
for the role dimensions identified in the literature. The focus group discussions
were directed to explore both patients’ expectations and perceptions of medical
personnel role behavior and patients’ expectations and perceptions o f their own role
behavior. Since service access mechanisms are well documented in the literature,
they were not included as topics of discussion during the focus group interviews,
although in some instances they did come up in conversation.
The two focus group interviews were conducted through a large hospital in
Baton Rouge, Louisiana. Each session lasted several hours. The first group
consisted o f seven women. Within the past year, all of these participants had been
OB\GYN patients at the participating hospital. The second group consisted o f eight
women and two men. These participants are or were recent patients o f the infertility
program at the hospital. All participants were between the ages o f 18 and 44. Most
o f the participants lived in Baton Rouge, Louisiana. A few participants lived in
areas adjacent to Baton Rouge such as Zachary and Denham Springs, Louisiana.
The procedure utilized for both focus groups was as follows: the focus
group moderator explained the research topic and outlined a number o f ground rules.
A series o f open-ended questions were discussed. The sessions were recorded on an
96
audio cassette.
A review o f the focus group transcripts revealed a great deal o f consistency
between the two groups with respect to behaviors expected o f medical personnel.
The behaviors mentioned most often by the group participants can be loosely
classified into one o f several categories: caring behaviors, communicative
behaviors, and technical behaviors.
1. The following behaviors are representative o f what could be called
CARING BEHAVIORS:
♦Caring for the patient’s well-being♦Being concerned♦Being sympathetic♦Being empathetic♦Getting involved with the patient♦Acting as an advocate for the patient♦Feeling for the patient♦Being sensitive to the patient’s needs♦Respecting the patient’s wishes♦Allowing the patient a voice in their medical care♦Being supportive♦Being kind♦Being friendly♦Being warm♦Being considerate♦Extending common courtesies♦Not being rude♦Being reassuring♦Being comforting♦Making the patient feel comfortable ♦Putting the patient at ease ♦Giving full attention to the patient ♦Giving personalized treatment and attention ♦Spending time with the patient ♦Not rushing the patient♦Being understanding o f the patient’s physical and mental state
The participants often referred to these types o f behaviors as the doctor’s or
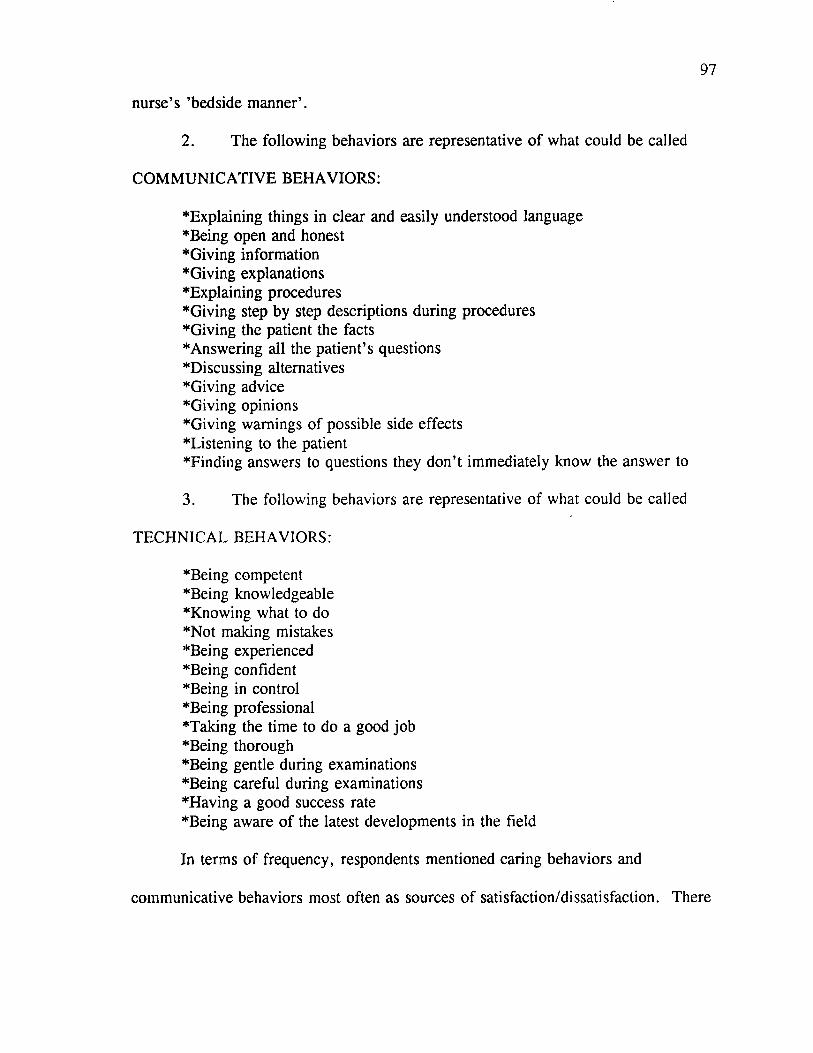
97
nurse’s ’bedside m anner’.
2. The following behaviors are representative o f what could be called
COMM UNICATIVE BEHAVIORS:
♦Explaining things in clear and easily understood language♦Being open and honest♦Giving information♦Giving explanations♦Explaining procedures♦Giving step by step descriptions during procedures♦Giving the patient the facts♦Answering all the patient’s questions♦Discussing alternatives♦Giving advice♦Giving opinions♦Giving warnings o f possible side effects ♦Listening to the patient♦Finding answers to questions they don’t immediately know the answer to
3. The following behaviors are representative of what could be called
TECHNICAL BEHAVIORS:
♦Being competent♦Being knowledgeable♦Knowing what to do♦Not making mistakes♦Being experienced♦Being confident♦Being in control♦Being professional♦Taking the time to do a good job♦Being thorough♦Being gentle during examinations♦Being careful during examinations♦Having a good success rate♦Being aware o f the latest developments in the field
In terms o f frequency, respondents mentioned caring behaviors and
communicative behaviors most often as sources o f satisfaction/dissatisfaction. There
98
appears to be a strong relationship between the medical s ta ffs ’bedside manner’ and
patient satisfaction. Showing that you care about a patient and giving the patient
personalized attention appears to contribute to the patient’s feeling o f satisfaction.
Good communication between medical personnel and the patient also appears to
contribute to patient satisfaction. Many o f the participants in both focus groups
stated a preference or in fact, a right to be actively involved in the decision making
process o f their own health care. These patients considered it part o f the medical
s ta ffs role to support them in this preference or right.
While caring behaviors and communicative behaviors were mentioned more
frequently than technical behaviors, the point was made several times that no matter
how wonderful a member o f the medical s ta ffs bedside manner or no matter how
wonderful the communication between a member of the medical staff and a patient,
the bottom line is technical performance. In the words, of several participants:
"I need to know that the guy knows what he’s doing above anything else."
"No matter what personality this man has, no matter how good his bedside manner is, the bottom line is you want a baby. Let’s get right down to it, you don’t care who gets you pregnant, just as long as you get good results."
It may be that technical performance is a necessary but nonsufficient
condition for patient satisfaction. It appears that patient satisfaction also depends
largely upon the medical s ta ffs performance with respect to both caring and
communicative roles. As well as, their ability to support the patient in his/her role
as decision making participants.
With respect to the patient’s own role, a review o f the focus group transcripts
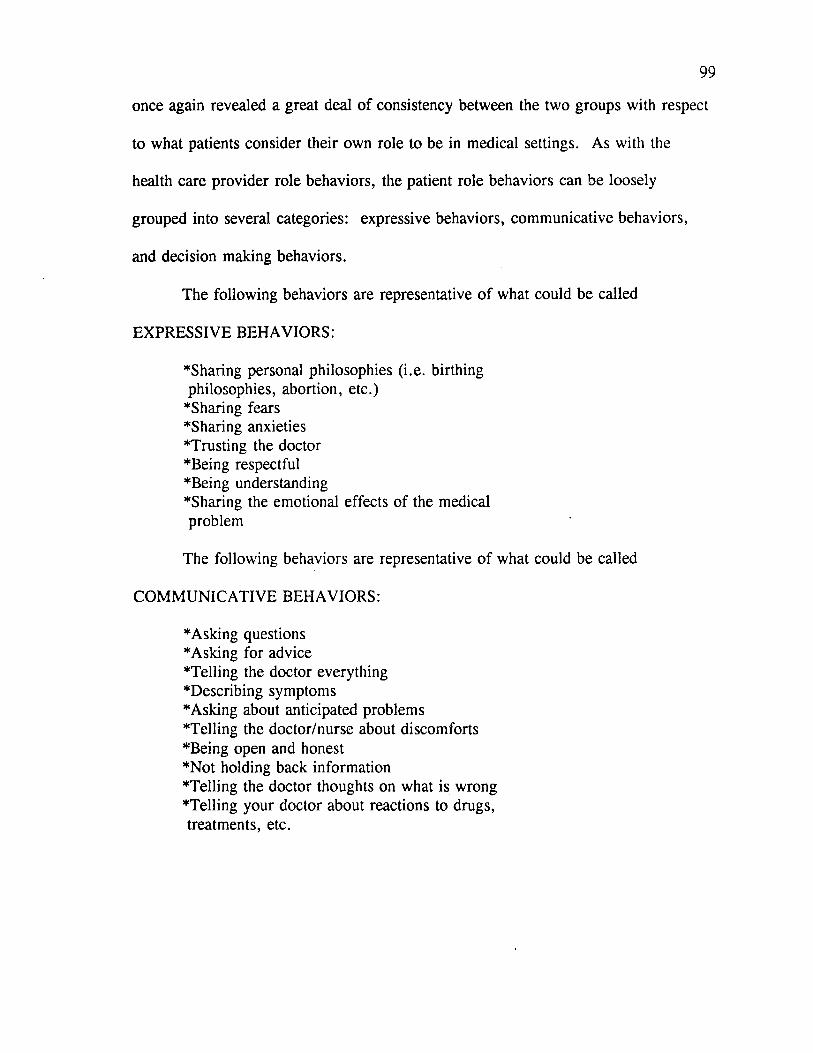
99
once again revealed a great deal o f consistency between the two groups with respect
to what patients consider their own role to be in medical settings. As with the
health care provider role behaviors, the patient role behaviors can be loosely
grouped into several categories: expressive behaviors, communicative behaviors,
and decision making behaviors.
The following behaviors are representative o f what could be called
EXPRESSIVE BEHAVIORS:
♦Sharing personal philosophies (i.e. birthing philosophies, abortion, etc.)
♦Sharing fears ♦Sharing anxieties ♦Trusting the doctor ♦Being respectful ♦Being understanding♦Sharing the emotional effects of the medical problem
The following behaviors are representative o f what could be called
COMMUNICATIVE BEHAVIORS:
♦Asking questions ♦Asking for advice ♦Telling the doctor everything ♦Describing symptoms ♦Asking about anticipated problems ♦Telling the doctor/nurse about discomforts ♦Being open and honest ♦Not holding back information ♦Telling the doctor thoughts on what is wrong ♦Telling your doctor about reactions to drugs, treatments, etc.
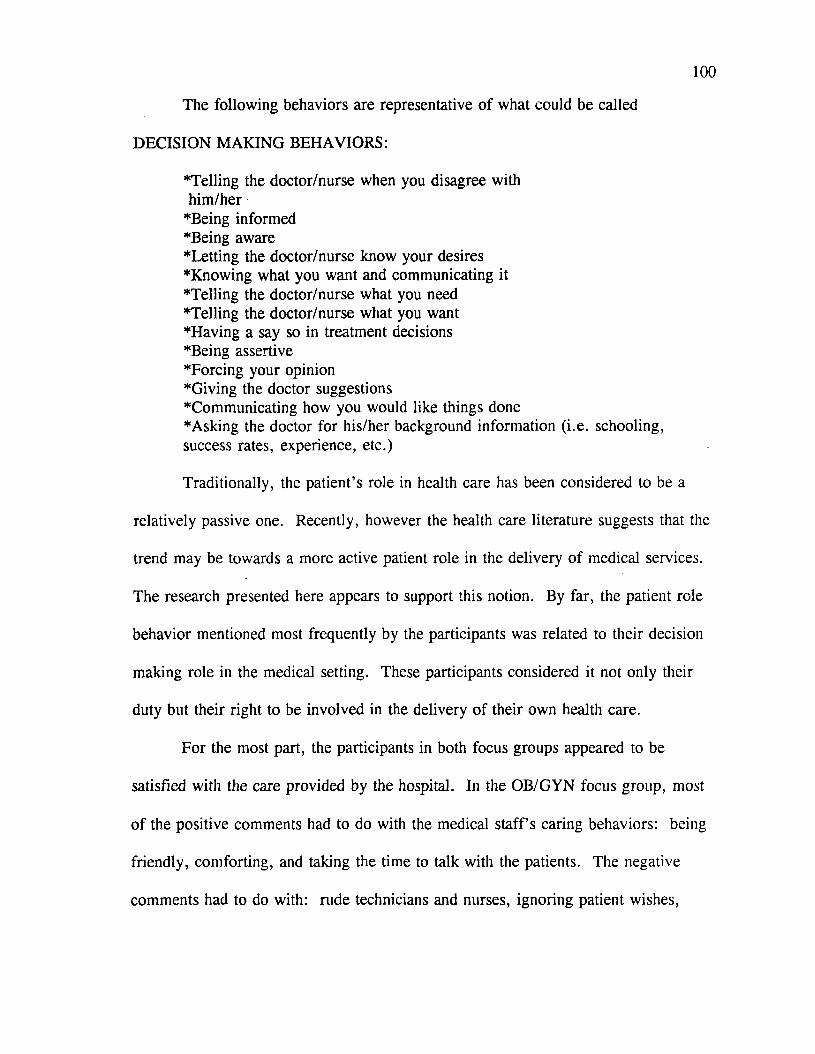
100
The following behaviors are representative o f what could be called
DECISION MAKING BEHAVIORS:
T e llin g the doctor/nurse when you disagree with him /her
*Being informed ♦Being aware♦Letting the doctor/nurse know your desires♦Knowing what you want and communicating it♦Telling the doctor/nurse what you need♦Telling the doctor/nurse what you want♦Having a say so in treatment decisions♦Being assertive♦Forcing your opinion♦Giving the doctor suggestions♦Communicating how you would like things done♦Asking the doctor for his/her background information (i.e. schooling,success rates, experience, etc.)
Traditionally, the patient’s role in health care has been considered to be a
relatively passive one. Recently, however the health care literature suggests that the
trend may be towards a more active patient role in the delivery of medical services.
The research presented here appears to support this notion. By far, the patient role
behavior mentioned most frequently by the participants was related to their decision
making role in the medical setting. These participants considered it not only their
duty but their right to be involved in the delivery of their own health care.
For the most part, the participants in both focus groups appeared to be
satisfied with the care provided by the hospital. In the OB/GYN focus group, most
o f the positive comments had to do with the medical s ta ffs caring behaviors: being
friendly, comforting, and taking the time to talk with the patients. The negative
comments had to do with: rude technicians and nurses, ignoring patient wishes,
101
nonresponsiveness and lack o f attention o f floor nurses, bad experiences with
anesthesiologists, not accommodating the patients with special desires, and the
business office-billing mistakes, rudeness, perception of unfair fees.
The comments by the fertility patients tended to be extremely positive, much
more so than the OB/GYN patients. Positive comments from this group focused on
the caring behaviors o f the staff at the hospital: caring about the patient, treating the
patient as a person, being warm and friendly, making the patient feel comfortable,
understanding the patient, understanding the emotions faced by the patient, listening
to the patient, accommodating the patient and the husband of the patient, being
available to the patient, showing the patient how treat themselves, and giving the
patient confidence. The negative comments appeared to represent isolated events.
A major source of dissatisfaction with the hospital for these patients was the
operation of the business office and the admissions office.
STEP TWO: GENERATE INITIAL POOL OF ITEMS
The second step was to generate a sample o f items for each o f the model
constructs. With the exception o f satisfaction, corresponding items were constructed
for ideal performance, expected performance, perceived performance, and
disconfirmation. In other words, items were similar for each of these constructs but
phrased differently. For example, an item written to measure ideal performance in
terms of the doctor’s communicative role read, "I wish the doctor would carefully
explain why he/she does certain things" (5 point agree-disagree format). The
corresponding item for expected performance read, "The doctor will carefully
102
explain why he/she does certain things" (5 point likely-unlikely format). The
corresponding item for perceived performance read, "The doctor carefully explained
why he/she did certain things" (5 point agree-disagree format). The corresponding
item for disconfirmation read, "The extent to which the doctor explained why he/she
did certain things" (5 point better than-worse than expected format). For each of the
role dimensions and access mechanisms, general disconfirmation and satisfaction
items were also constructed. Extending our example, a general disconfirmation item
for provider’s communicative role read, "My expectations o f the amount o f
information provided to me by my doctor w ere:" (5 point better than-worse than
expected format). A behavior-specific satisfaction item read, "How satisfied are you
with your doctor’s provision o f information" (5 point satisfied-dissatisfied format).
Whenever possible items constructed in previous research were adapted for
this study. Some items that were originally constructed as macro measures o f health
care satisfaction were rewritten as micro measures (see Table 3.2 for a list o f studies
from which items were adapted). The majority o f items, particularly for the patient
role constructs, were composed by the author and subjected to expert judgement.
The initial battery o f items generated for each construct is summarized in Table 3.3.

103
Table 3.2
Studies From Which Items W ere Adopted
Provider Role:
Hulka, Zyzanski, Cassel, and Thompson (1970) Ware, Synder, and W right (1976)W olf, Putnam, James, and Stiles (1978)Davies and W are (1981)Linder-Pelz (1982)Eisenthal, Koopman, and Lazare (1983) Parasuraman, Zeithaml, and Berry (1986) Brown and Swartz (1987)
Patient Role:
Vertinsky, Thompson, and Uyeno (1974)Lorber (1975)Eisenthal, Koopman, and Lazare (1983)Brown and Swartz (1987)
Access Mechanisms:
Hulka, Zyzanski, Cassel, and Thompson (1970) Larsen and Rootman (1976)Ware, Synder, and W right (1976)W olf, Putnam, James, and Stiles (1978))Davies and Ware (1981)Linder-Pelz (1982)Parasuraman, Zeithaml, and Berry (1986) Brown and Swartz (1987)
Satisfaction:
Oliver (1980)
Involvement:
Zaichkowsky (1985)
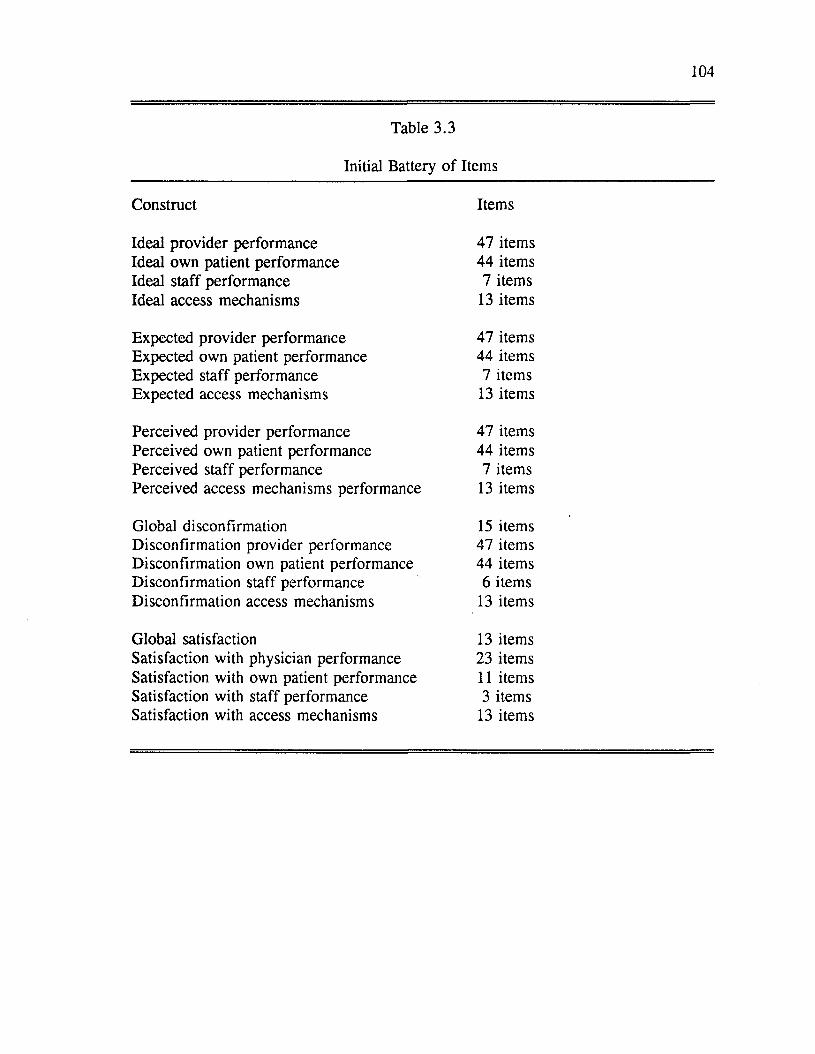
104
Table 3.3
Initial Battery o f Items
Construct Items
Ideal provider performance 47 itemsIdeal own patient performance 44 itemsIdeal staff performance 7 itemsIdeal access mechanisms 13 items
Expected provider performance 47 itemsExpected own patient performance 44 itemsExpected staff performance 7 itemsExpected access mechanisms 13 items
Perceived provider performance 47 itemsPerceived own patient performance 44 itemsPerceived staff performance 7 itemsPerceived access mechanisms performance 13 items
Global disconfirmation 15 itemsDisconfirmation provider performance 47 itemsDisconfirmation own patient performance 44 itemsDisconfirmation staff performance 6 itemsDisconfirmation access mechanisms 13 items
Global satisfaction 13 itemsSatisfaction with physician performance 23 itemsSatisfaction with own patient performance 11 itemsSatisfaction with staff performance 3 itemsSatisfaction with access mechanisms 13 items
105
Items for overall satisfaction, ideal performance, and perceived performance
were scaled according to a 5-point Likert-type format (whereby 1 = strongly agree
and 5 = strongly disagree). Items for expected performance were scaled according
to a 5-point format (whereby 1 = very likely and 5 = very unlikely). Items for
satisfaction with the physician’s behavior, satisfaction with one’s own behavior,
satisfaction with the s ta ffs behavior and satisfaction with access mechanisms were
scaled according to a 5-point format (whereby 1 = completely dissatisfied and 5 =
completely satisfied). Items for disconfirmation were scaled according to a 5-point
format (whereby 1 = worse than and 5 = better than).
Other Variables of Interest
In Chapter Two, involvement was presented as a possible mediating effect in
the proposed role theoretical model. Involvement in this study was measured in two
ways-by a semantic differential scale and by a Likert scale. The first scale, the
Personal Involvement Inventory, was originally developed by Zaichkowsky (1985)
and later revised by McQuarrie and Munson (1987). Although the original
inventory contained 20 items, only 16 were included in the pretest questionnaire.
The other four items did not appear to be appropriate for this research. The second
scale was developed for this research by the author and consisted o f 13 items
designed to measure perceived importance of the doctor’s visit.
Standard demographics were utilized to determine gender, age, marital status,
education, and income.
106
STEP THREE: PRETEST
The pretest sample consisted o f 116 adults aged 18 or older. Respondents
resided in either the metropolitan area of Baton Rouge, Louisiana or San Francisco,
California. Table 3.4 provides a summary o f the pretest sample characteristics.
The measurements for the following constructs were included in the pretest
questionnaire: satisfaction (global, doctor’s role, patient’s own role), perceived
performance (doctor’s role and patient’s own role), disconfirmation (global for
doctor’s role and patient’s own role), ideal expectations (doctor’s role and patient’s
own role), involvement, and perceived importance. Due to space limitations, scales
for the staff and access mechanisms submodels were not included in the pretest.
Also due to space limitations, items for only one comparison standard were
pretested, ideal expectations. As was previously discussed, items measuring
expectations were similar to items measuring ideal expectations. It was felt that the
scales for expectations and ideal expectations could be refined by pretesting only one
o f these comparison standards.
The procedure for scale refinement was as follows: 1) Initial reliabilities
based on Cronbach’s Alpha were run for each o f the constructs. Items for the
various scales were initially evaluated in terms o f corrected item-total correlations.
Those items with corrected item-total correlations below .40 were eliminated.
2) For each of the constructs, principle components analysis was
conducted on the remaining items. Items were eliminated at this stage if they had
factor loadings below .50 and/or if they did not exhibit simple structure.
107
3) Reliabilities were run on the reduced scales. Again, items with
corrected item total correlations below .40 were eliminated.
STEP FOUR: CONFIRMATORY FACTOR ANALYSES
As a means o f further instrument refinement, confirmatory factor analyses
were run. A separate model was run for the satisfaction constructs, provider role
constructs, patient role constructs, and involvement constructs. At this stage,
individual items were eliminated if they had standardized loadings o f less than .70
and/or if they exhibited poor content validity. The resulting reliability estimates are
shown in Table 3.5. All construct reliability coefficients were well within what is
considered acceptable ranges in marketing and psychology research (.70 to .80)
(Nunnally 1978). Table 3.6 provides a summary o f the operationalization of
constructs.
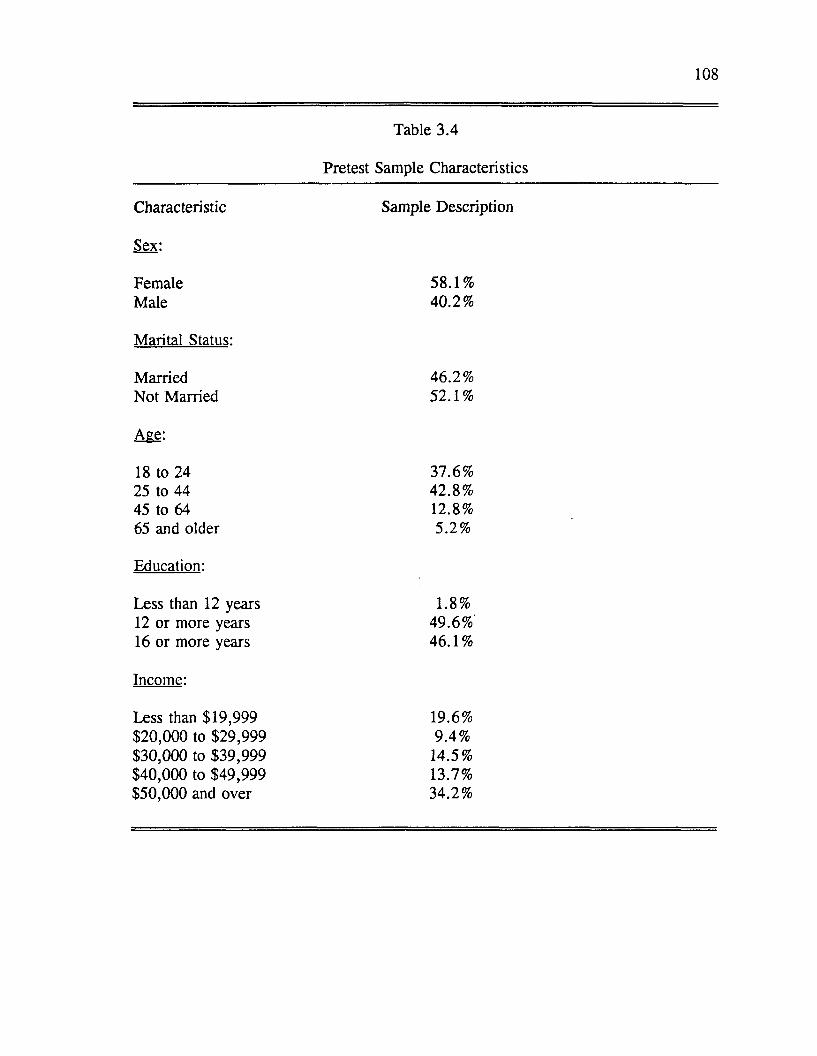
108
Table 3.4
Pretest Sample Characteristics
Characteristic Sample Description
Sex:
Female 58.1%Male 40.2%
Marital Status:
Married 46.2%Not M arried 52.1%
Age:
18 to 24 37.6%25 to 44 42.8%45 to 64 12.8%65 and older 5.2%
Education:
Less than 12 years 1.8%12 or more years 49.6%16 or more years 46.1%
Income:
Less than $19,999 19.6%$20,000 to $29,999 9.4%$30,000 to $39,999 14.5%$40,000 to $49,999 13.7%$50,000 and over 34.2%
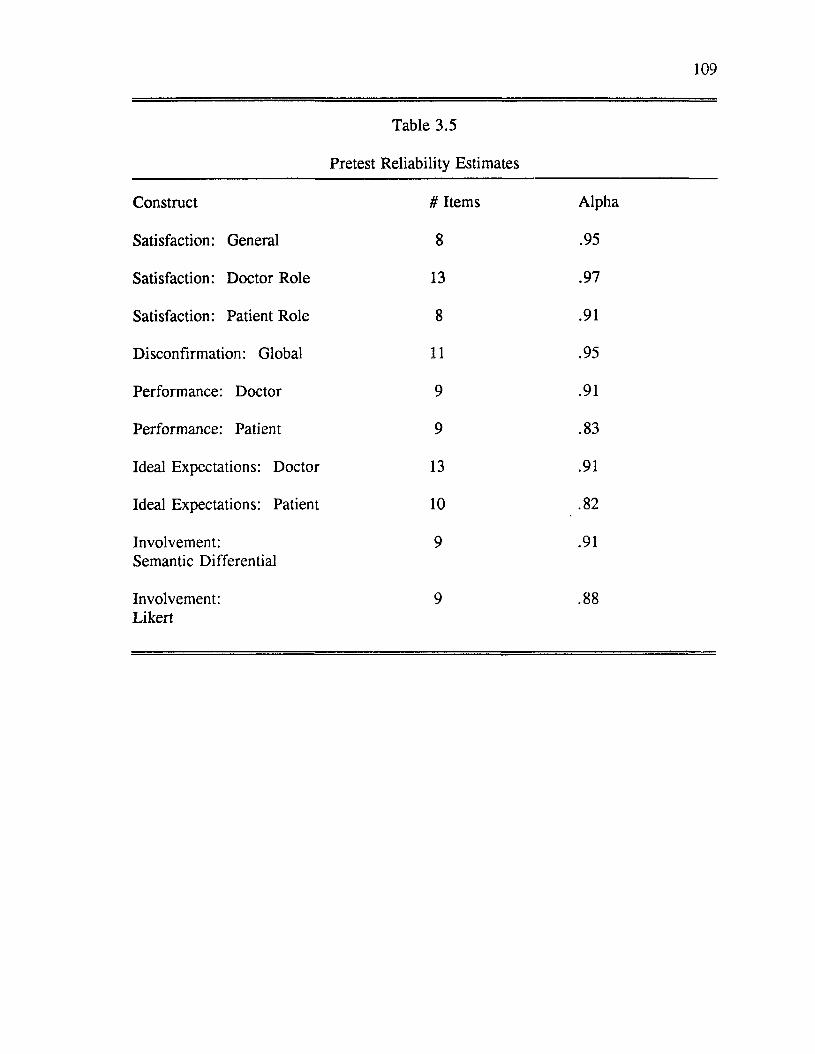
109
Table 3.5
Pretest Reliability Estimates
Construct # Items Alpha
Satisfaction: General 8 .95
Satisfaction: Doctor Role 13 .97
Satisfaction: Patient Role 8 .91
Disconfirmation: Global 11 .95
Performance: Doctor 9 .91
Performance: Patient 9 .83
Ideal Expectations: Doctor 13 .91
Ideal Expectations: Patient 10 .82
Involvement: Semantic Differential
9 .91
Involvement:Likert
9 .88
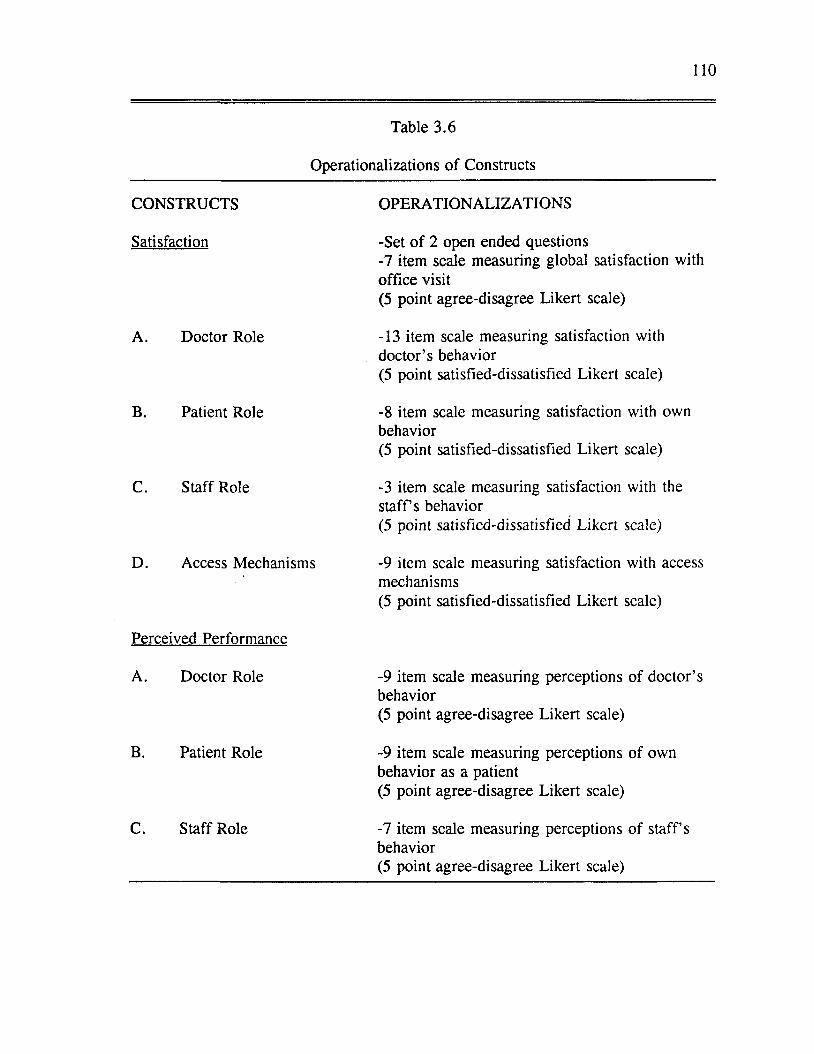
110
Table 3.6
Operationalizations of Constructs
CONSTRUCTS OPERATIONALIZATIONS
Satisfaction -Set o f 2 open ended questions-7 item scale measuring global satisfaction withoffice visit(5 point agree-disagree Likert scale)
A. Doctor Role -13 item scale measuring satisfaction with doctor’s behavior(5 point satisfied-dissatisfied Likert scale)
B. Patient Role -8 item scale measuring satisfaction with own behavior(5 point satisfied-dissatisfied Likert scale)
C. Staff Role -3 item scale measuring satisfaction with the s ta ffs behavior(5 point satisfied-dissatisfied Likert scale)
D. Access Mechanisms -9 item scale measuring satisfaction with access mechanisms(5 point satisfied-dissatisfied Likert scale)
Perceived Performance
A. Doctor Role -9 item scale measuring perceptions of doctor’s behavior(5 point agree-disagree Likert scale)
B. Patient Role -9 item scale measuring perceptions of ownbehavior as a patient(5 point agree-disagree Likert scale)
C. Staff Role -7 item scale measuring perceptions o f staff’s behavior(5 point agree-disagree Likert scale)
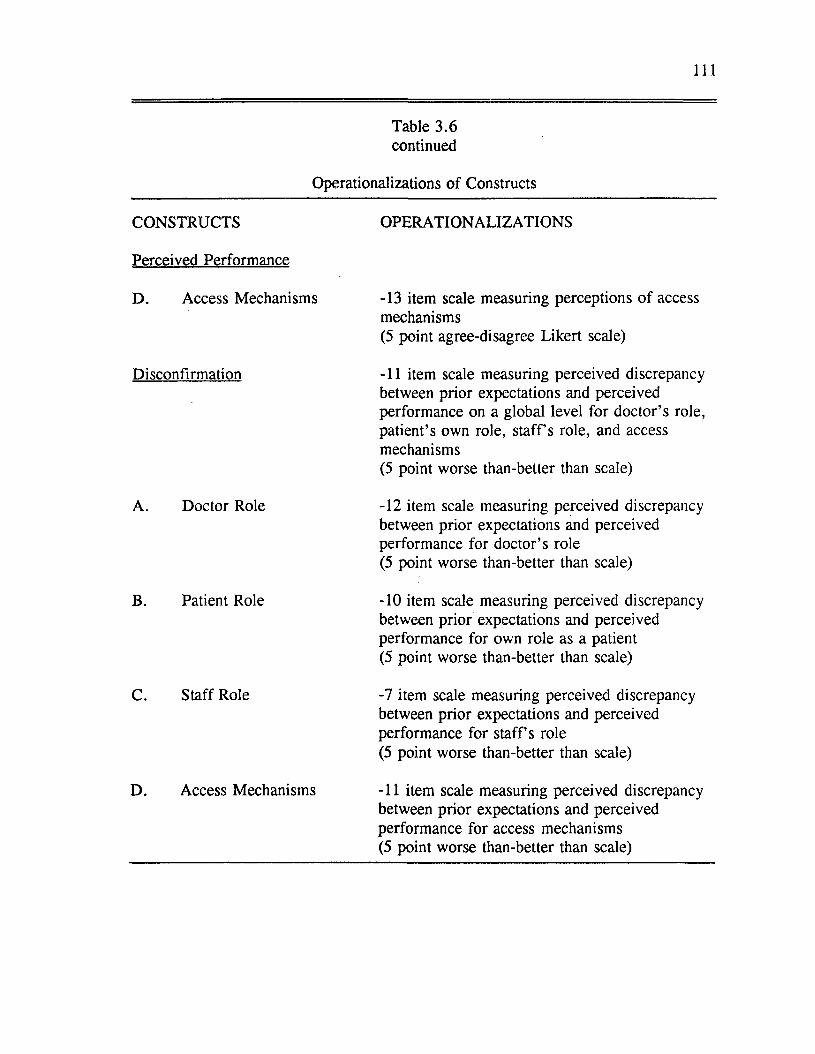
I l l
Table 3.6 continued
Operationalizations o f Constructs
CONSTRUCTS OPERATIONALIZATIONS
Perceived Performance
D . Access Mechanisms -13 item scale measuring perceptions o f access mechanisms(5 point agree-disagree Likert scale)
Disconfirmation -11 item scale measuring perceived discrepancy between prior expectations and perceived performance on a global level for doctor’s role, patient’s own role, staff’s role, and access mechanisms(5 point worse than-better than scale)
A. Doctor Role -12 item scale measuring perceived discrepancy between prior expectations and perceived performance for doctor’s role (5 point worse than-better than scale)
B. Patient Role -10 item scale measuring perceived discrepancy between prior expectations and perceived performance for own role as a patient (5 point worse than-better than scale)
C. Staff Role -7 item scale measuring perceived discrepancy between prior expectations and perceived performance for staff’s role (5 point worse than-better than scale)
D. Access Mechanisms -11 item scale measuring perceived discrepancy between prior expectations and perceived performance for access mechanisms (5 point worse than-better than scale)
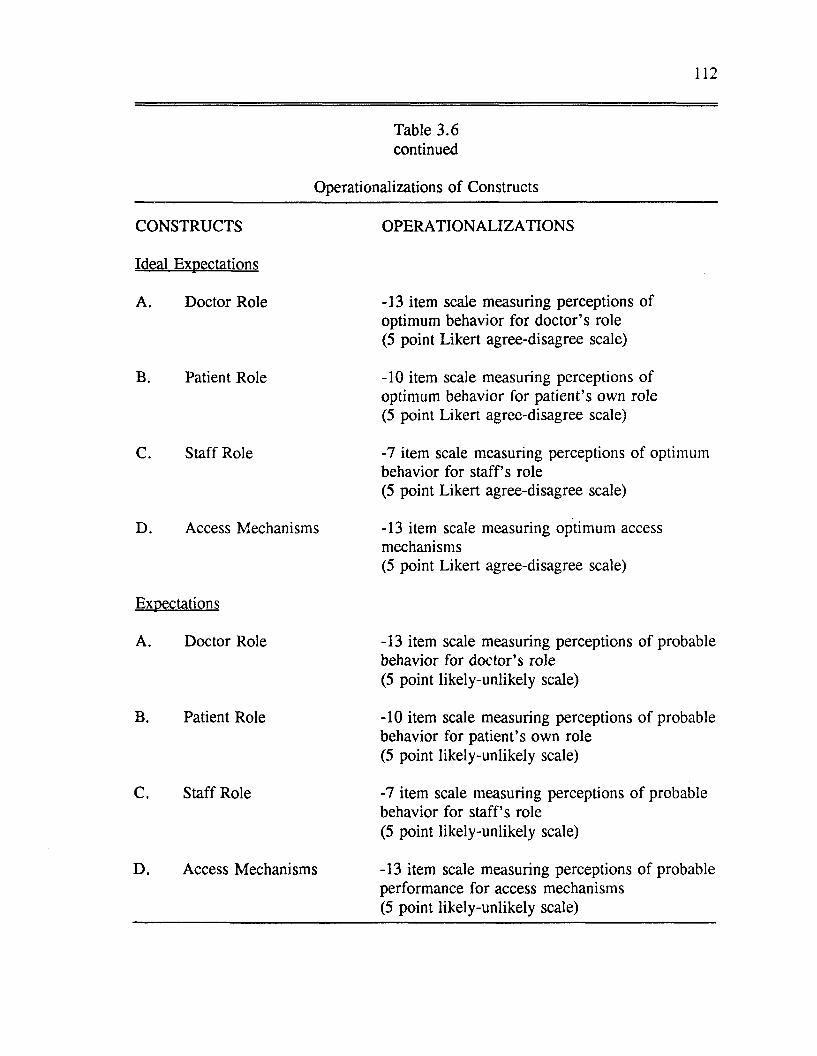
112
Table 3.6 continued
Operationalizations of Constructs
CONSTRUCTS OPERATIONALIZATIONS
Ideal Expectations
A. Doctor Role -13 item scale measuring perceptions of optimum behavior for doctor’s role (5 point Likert agree-disagree scale)
B. Patient Role -10 item scale measuring perceptions of optimum behavior for patient’s own role (5 point Likert agree-disagree scale)
C. Staff Role -7 item scale measuring perceptions of optimumbehavior for staff’s role(5 point Likert agree-disagree scale)
D. Access Mechanisms -13 item scale measuring optimum access mechanisms(5 point Likert agree-disagree scale)
Expectations
A. Doctor Role -13 item scale measuring perceptions o f probable behavior for doctor’s role (5 point likely-unlikely scale)
B. Patient Role -10 item scale measuring perceptions of probable behavior for patient’s own role (5 point likely-unlikely scale)
C. Staff Role -7 item scale measuring perceptions o f probable behavior for staff’s role (5 point likely-unlikely scale)
D. Access Mechanisms -13 item scale measuring perceptions o f probable performance for access mechanisms (5 point likely-unlikely scale)
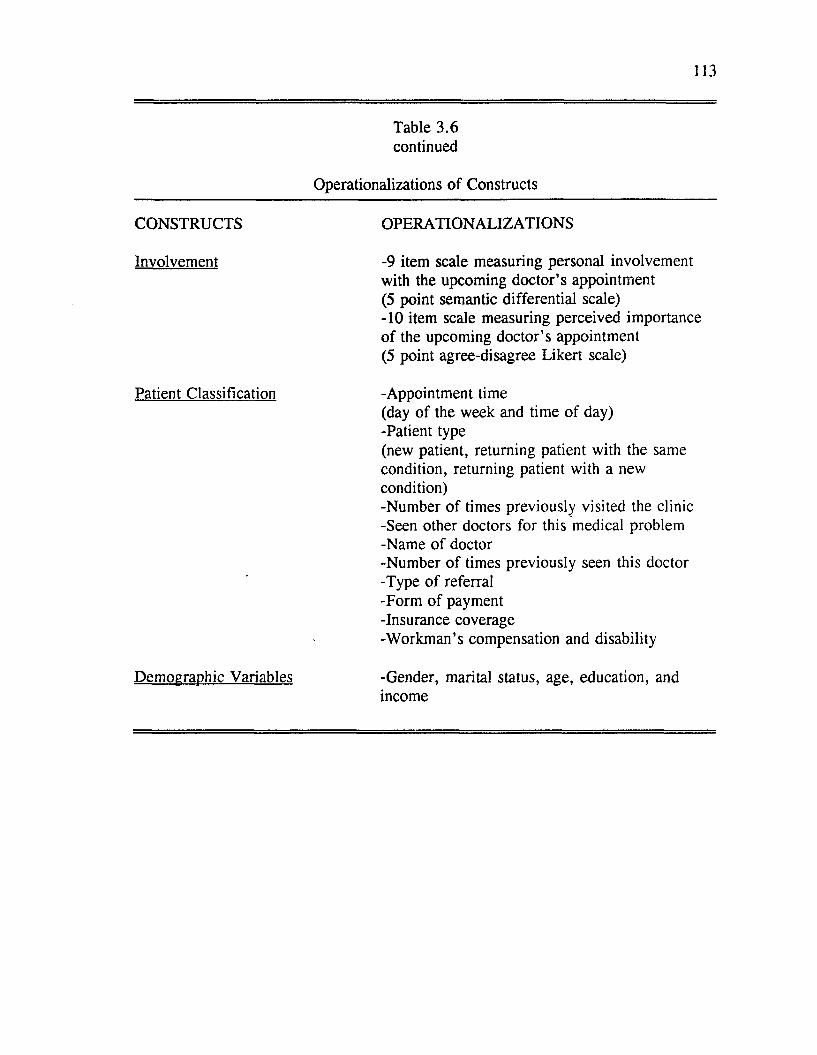
113
Table 3.6 continued
Operationalizations o f Constructs
CONSTRUCTS OPERATIONALIZATIONS
Involvement -9 item scale measuring personal involvementwith the upcoming doctor’s appointment (5 point semantic differential scale)-10 item scale measuring perceived importance o f the upcoming doctor’s appointment (5 point agree-disagree Likert scale)
Patient Classification -Appointment time(day of the week and time of day)-Patient type(new patient, returning patient with the same condition, returning patient with a new condition)-Number of times previously visited the clinic -Seen other doctors for this medical problem -Name of doctor-Number o f times previously seen this doctor -Type o f referral -Form of payment -Insurance coverage-W orkman’s compensation and disability
Demographic Variables -Gender, marital status, age, education, and income
114
Data Analysis
This section is divided into six sections. The first section describes the scale
development procedures employed for the role constructs, access mechanisms
constructs, and involvement. The next two sections present reliability and validity
assessment. Next the confirmatory factor analyses and structural equation modeling
is described. The fifth section describes the proposed hypotheses testing. The final
section describes how the proposed mediating effects o f involvement was tested.
Scale Development Process
As discussed in the previous section, the development o f scales for this study
represents a multistage process. This process closely followed the methodology for
developing better measures of marketing constructs proposed by Churchill (1979).
During this process, every effort was made to ensure construct reliability and to test
for validity.
The scale development process consisted of four stages. In stage one,
dimensions of the role constructs and access mechanisms were specified. These
dimensions were derived from an extensive review o f the marketing and sociology
o f medicine literature and from the results o f two focus group discussions. In stage
two, an initial pool o f items was constructed. In stage three, the initial pool of
items were administered to a sample o f respondents. These items were tested using
standard psychometric procedures. In stage four, final scale modifications were
made. The criteria utilized for evaluating the scales for internal consistency and
validity will be discussed in the following section.
115
Reliability Assessment
According to Peter (1979) reliability indicates the degree to which measures
are free from random or chance error. With repetition, reliable scales will produce
consistent results across various samples and situations. Three prim ary methods
exist for assessing reliability: test-retest, alternative forms, and internal consistency.
Internal consistency reliability was utilized in this research. The most common
criterion for estimating reliability based on internal consistency is coefficient alpha.
In most cases, alpha is an appropriate criterion because the largest source of
measurement error is generally due to sampling of content (Nunnally 1978).
While there are no hard and fast rules regarding how large alpha should be,
Nunnally (1978) recommends that in the early stages o f research reliability
coefficients of .70 are acceptable. Over a five year period across five marketing
publications, Peter (1979) calculated the median internal consistency correlation
(primarily Cronbach’s alpha) reported in the surveyed marketing studies to be .72.
Following guidelines established in marketing and psychology, construct reliability
coefficients of .70 will be considered sufficient for this study.
With the advent o f structural equation models such as LISREL, researchers
are now using individual item reliabilities provided by the programs. Using the
LISREL program one can calculate the individual item reliability by squaring the
standardized factor loading for that particular item. Construct reliabilities can also
be calculating following a procedure outlined by Fom ell and Larcker (1981).
Construct reliabilities are calculated by summing the squared factor loadings and

116
dividing by the summated squared factor loadings plus the summated theta delta
diagonals.
When one computes reliability using coefficient alpha the assumption is made
that the items have equal reliabilities. This assumption is not made when computing
reliabilities using LISREL which means that the composite reliability may be
underestimated (Gerbing and Anderson 1988). In practice, the risk of
underestimation is small unless the number o f items in the scale is very small and/or
the item reliabilities are very discrepant (Gerbing and Anderson 1988).
Validity Assessment
After testing the reliabilities of the measures, validity assessment was
undertaken. Validity is typically defined as the degree to which instruments measure
constructs which they are purported to measure. There are several different types of
validity: content validity, criterion-related validity, and construct validity.
Content validity is concerned with the extent to which items of an instrument
reflect the full domain o f the construct. Obtaining content validity requires that one
specify the domain o f the content and then construct/select items associated with the
domain o f the content (Zeller and Carmines 1980). Since there is no objective
criterion for determining whether a measure has obtained content validity, one must
rely on "reason regarding the adequacy with which important content has been cast
in the form of test items" (Nunnally 1967, p .82).
Criterion-related validity is concerned with the extent to which a measure is
related to some criterion variable o f interest. For example, since role theory
117
suggests that role expectations for one role player are interrelated to expectations for
other role players in the role set, one way to validate the ideal performance scale for
the physician is to calculate the correlation between this scale and the ideal
performance scale for the patient. If the correlation is high, the measure would be
considered valid for that criterion.
Although there are once again no hard and fast rules with respect to how
high this correlation needs to be to consider the measure valid, there are a number
o f guidelines. The most common guideline is whether the correlation achieves
statistical significance (Lundstrom and Lamont 1976; Szybillo, Binstock, and
Buchanan 1979; Zaichkowsky 1985). This tends to be a very liberal guideline since
statistical significance is sensitive to variations in sample size. With large samples
statistical significance can achieved with small correlations. To be o f practical
significance, most researchers in social sciences consider correlations around .30 or
greater to be acceptable (Ajzen and Fishbein 1980). This researcher will follow the
later guideline: in testing criterion-related validity, significant correlations o f .30 or
above will be taken as evidence that a measure is assessing the construct o f interest
and is related to the criterion.
Construct validity is concerned with the extent to which measures correspond
with latent constructs (Peter 1981). The process o f construct validation is an ever
extending process o f development and testing. In other words, construct validation
can not be established with a single study. Zeller and Carmines (1980) propose
construct validation to consist o f three stages. First, theoretical relationships
118
between constructs must be specified. Second, empirical relationships between the
measures o f the constructs must be examined. Third, empirical evidence must be
interpreted in terms of how it clarifies the construct validity o f the measure.
Cronbach (1951) suggest that construct validation requires the development and
testing o f a "nomological network". That is, constructs need to be shown to be
related to each other in an increasingly complex network of hypotheses and
relationships.
For this research, evidence o f construct validity will be provided to the extent
that hypothesized relationships between constructs are statistically significant and
correlations are greater than .30.
Confirmatory Factor Analysis and Structural Equation Modeling
Confirmatory factor analysis allows the researcher a number o f advantages
over exploratory factor analysis. Constraints may be imposed by the researcher to
determine which pairs of factors are correlated, which observed variables are
affected by a common factor, which observed variables are affected by a unique
factor and which pairs o f unique factors are correlated. Confirmatory factor
analysis also allows the researcher to perform statistical tests to determine whether
the sample data are consistent with the theory or the proposed model (Long 1983).
As an extension of confirmatory factor analysis, structural equation modeling
provides a means o f testing both the measurement model and the proposed
theoretical model. Based on theory, the researcher provides a model which proposes
relationships among a set of observed variables in terms of a generally smaller
119
number o f unobserved or latent variables. First, the measurement model is
examined by linking observed variables to latent variables through a factor analytic
model. Second, the causal relationships among the latent variables are specified
through a structural equation model.
In this research, confirmatory factor analysis and structural equation
modeling was employed to test the proposed model hypotheses. The LISREL
program (Joreskog and Sorbom 1984) provided the estimation program for the
analyses.
Assessing Overall Model Fit
Several indicators were used to evaluate the adequacy o f the factor and
structural equation models. First, the results were examined for abnormal results
such as negative error variances, correlations greater than one, and extremely large
parameter estimates. In the advent of these problems, specification, identification,
and input errors were checked for.
Second, global measures of fit were examined. A measure o f fit commonly
used in the literature is the chi-square statistic. The chi-square goodness o f fit
statistic provides a test o f the null hypotheses that a given model provides an
acceptable fit o f the observed model. If the values o f chi-square are larger than the
critical value than the null hypotheses is rejected. This would suggest that the
proposed model did not generate the observed data. The chi-square statistic has
spurred a great deal o f controversy (Darden 1981; Fornell and Larcker 1981;
Fom ell 1983). The major criticism of the chi-square statistic is that if the null

120
hypothesis is rejected, the research hypothesis is also rejected which is a reversal of
the traditional role o f hypotheses in statistical theory. This also means that the
ability to reject the research hypothesis or power is not known. Not knowing power
could result in rejecting the model when it is correct and supporting the model when
it is incorrect (Fomell 1983).
Another criticism of the chi-square goodness-of-fit test is that it only
compares two covariance matrices, it does not support conclusions about the
significance o f variable relationships in the model. A low and insignificant chi-
square which implies a good fit may also indicate low and insignificant construct
relationships. Weak observed relationships among variables actually increases the
probability of obtaining a good fit (Fomell and Larcker 1981). This means that with
low enough correlations the chances of supporting an incorrect model will be
increased.
A number o f alternatives to the chi-square goodness-of-fit test have been
proposed. Joreskog and Sorbom (1984) advocate an adjusted goodness-of-fit index
(AGFI). This index provides an indication of the relative amount o f variances and
covariances jointly accounted for by the hypothesized model. From a pragmatic
view, AGFI values o f roughly .9 or greater tend to suggest a meaningful model
(Bagozzi and Yi 1988).
Another alternative to the chi-square statistic is the root mean square residual
(RMSR). This index is the average o f the residual variances and covariances. One
advantage of this index is that it can be used to compare the fits of different models
121
to the same data. RMSR values should be low (Bagozzi and Yi 1988). Generally
acceptable RMSR values are in the range o f .03 to .09 (Han 1989; McQuiston
1989).
A third alternative to the chi-square test statistic is the normed fit index
(NFI). The NFI developed by Bentler and Bonett (1980) indicates the relative
decrease in lack o f fit between two nested models. One o f the models, the "null"
model is more restricted than the other. For the "null" model the
variance/covariance matrix of the observed variables is hypothesized as a diagonal
matrix with the all off-diagonal elements equal to zero.
For this research, these indexes along with the chi-square statistic was
utilized in evaluating how well the model fit the data. The following was used as
evaluative criteria: 1) nonsignificant chi-square statistic (p-value > .05), 2)
satisfactory goodness o f fit index (AGFI > .9), 3) low RMSR (in the range of .03
to .09), 4) satisfactory normed fit index (NFI > .9).
Internal Structure Model Fit
The global measures o f fit outlined in the previous section provide an
indication o f the overall adequacy o f the proposed model but they tell us little about
particular parameters or about aspects o f the model’s internal structure. In order to
assess internal structure, measurement equations and their respective reliabilities
were inspected. Reliabilities were derived from individual item reliabilities,
composite reliabilities, and the average variance extracted from a set o f measures of
a latent variable. Based on the suggestions o f Bagozzi and Yi (1988, p. 82), the
122
following was used as criteria for assessing internal structure fit: 1) high individual
item reliabilities (greater than .5); 2) high composite reliabilities (greater than .6);
3) average variance extracted greater than .5; 4) significant parameter estimates
confirming hypotheses; and 5) normalized residuals less than 2.
Hypotheses Tests
Hypotheses H I to H6-Structural Model Test
Hypotheses H I to H6 were tested jointly through the use o f a structural
equation model which specifies the linkages between observed variable indicators
and latent constructs. It also specifies causal paths between constructs. The
proposed role theoretical model o f service satisfaction was tested using LISREL VI.
The hypotheses were tested separately for each submodel and then jointly for an
overall model o f satisfaction. Evaluative criteria for model fit and internal structure
have been discussed earlier in this chapter.
H7a and H7b
In the previous analyses, the LISREL VI program was used to analyze data
from a single sample. The LISREL program was also used to analyze data from the
involvement samples simultaneously. Multi-sample LISREL analysis has been used
in several research studies (Joreskog 1971; McGaw and Joreskog 1971; Sorbom
1974, 1975, 1978, 1981; Joreskog and Sorbom 1980; Sorbom and Joreskog 1981;
W erts et. al. 1976, 1977; Alwin and Jackson 1981; M are and Mason 1981; and
Lomax 1983).
First, confirmatory factor analyses were performed on the two involvement
123
scales (the semantic differential scale and the Likert scale). Items that appeared to
be detracting from the internal consistency and unidimensionality o f the scales were
eliminated at this stage. Respondents were then classified into different involvement
groups. Patient involvement categories were defined by a median split as is
commonly done in the marketing literature.
Once categories o f involved patients were identified, multi-sample LISREL
analyses were used to test whether the correlation matrices o f the observed variables
were equal for different groups. "In general, any degree of invariance can be
tested, from the one extreme where all parameters are assumed to be invariant over
groups to the other extreme where there are no constraints across the groups"
(Joreskog and Sorbom 1988, p.228). To define equality constraints between groups,
one specifies the constrained elements as free for the first group, and equality
constraints in each of the other groups (Joreskog and Sorbom 1988). To assess the
impact o f involvement on the proposed structural models, four separate multi-sample
analyses were performed for each submodel: 1) with the expectations to
satisfaction parameter constrained to be equal, 2) with the performance to
satisfaction parameter constrained to be equal, 3) with the disconfirmation to
satisfaction parameter constrained to be equal, and 4) with the constraints relaxed.
The overall goodness-of-fit measures for the models with equality constraints
imposed was compared to the chi-square statistic when the equality constraints were
relaxed. A drop in the value o f the chi-square statistic when the constraints were
relaxed compared to the value o f the chi-square statistic when constraints were
124
imposed suggest that the hypothesis o f equal correlation matrices between
involvement groups is tenable (Joreskog and Sorbom 1988). To test the significance
o f the difference in the estimates of any particular coefficient (or set o f coefficients)
in the high and low involvement samples, a difference chi-square procedure
discussed by Hayduk (1987) was used. First, stacked models with the previously
discussed coefficients constrained to be equal were estimated, and then the model
was reestimated with the coefficients unconstrained. The difference between the chi-
square values and degrees o f freedom is a test o f whether the freeing o f coefficients
gave a significant improvement in fit.
In addition to the chi-square difference test, the proposed hypotheses
regarding the influence o f involvement on the proposed theoretical model were
tested by comparing the patterns of relationships found for the two samples. First,
significant predictors of satisfaction were ranked in magnitude. Second, the order of
the predictors of satisfaction were compared for the two involvement samples. In
review, it was predicted that performance would rank first followed by expectations
and disconfirmation for the high involvement sample. Conversely, it was predicted
that expectations and disconfirmation would rank first followed by performance for
the low involvement sample.
125
Presentation o f Results
The primary findings o f this research is presented in two separate chapters.
Chapter four discusses sample characteristics, analyses results for both the overall
measurement model and structural model and findings regarding mediating
influences o f consumer involvement on satisfaction formation. Chapter five presents
a discussion o f the results, research and managerial implications, and
recommendations for future research.

CHAPTER FOUR
Analysis and Results
Chapter four describes analyses and results. As was discussed in previous
chapters, the proposed theoretical model can be thought o f as consisting o f four
submodels: doctor, patient, staff, and access mechanisms submodels. The approach
taken in analyzing the dissertation data was to test the proposed hypotheses for each
o f the submodels separately and then to integrate the submodels into an overall
model o f patient satisfaction.
The organization o f the chapter follows this approach. The chapter begins
with a description o f the obtained sample. The next four sections o f the chapter
present the analyses and results for each of the submodels. In each o f these
sections, both the measurement model and theoretical model are evaluated. First,
the dimensionality of the submodels are evaluated via confirmatory factor analysis.
Second, the proposed hypotheses are tested for each o f the structural submodels.
These four submodels are then integrated into an overall model o f patient
satisfaction. Following the presentation o f results for the overall model o f patient
satisfaction, the results from a test o f the hypothesized effects o f involvement on the
model is presented. The final section o f the chapter provides a brief summary of the
findings.
Sample Characteristics
To assess the representativeness of the dissertation sample, the demographic
characteristics of the dissertation sample were compared to characteristics o f the
126
127
adult population residing in the Baton Rouge metropolitan area (see Table 4.1).
Every attempt was made to sample patients across different days o f the week
and times o f the day. Care was also taken to sample both new patients and old
patients. Patients were classified as new patients (NP), old patients with a new
medical condition (OPNC), and old patients with the same condition (OPSC). Table
4.2 shows that with the exception o f old patients with a new condition, a relatively
equal proportion o f patients were obtained across different days o f the week,
appointment times, and types o f patients.
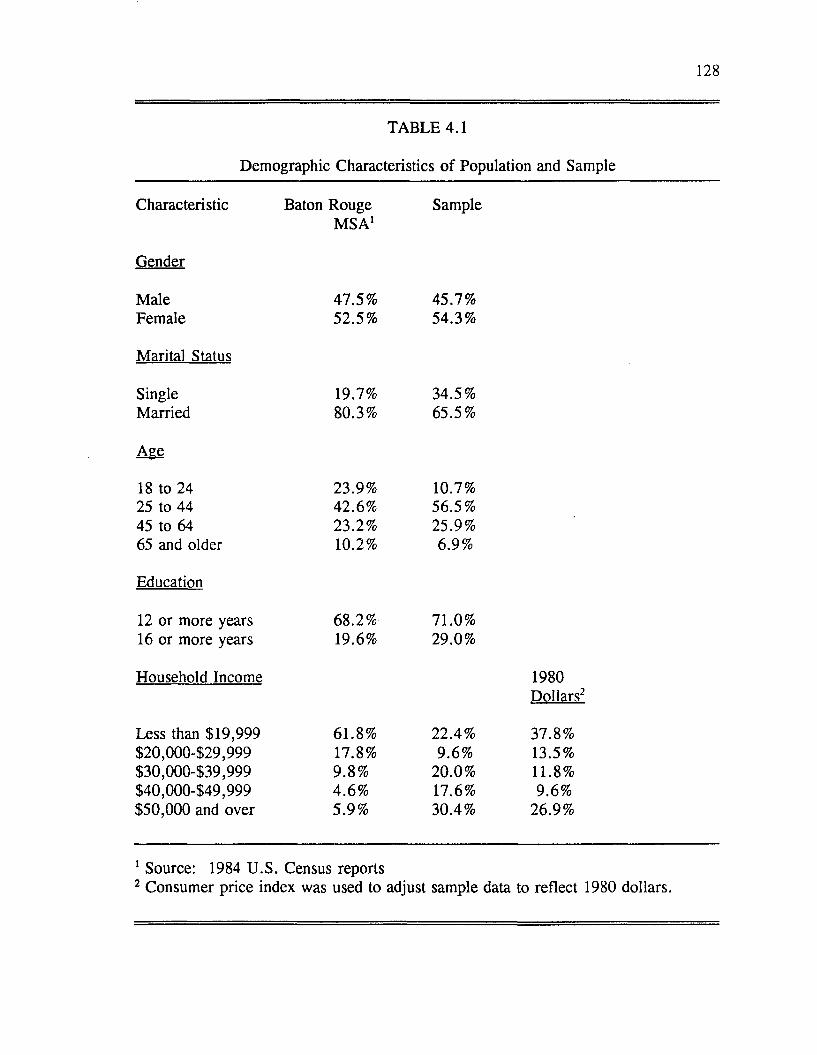
128
TABLE 4.1
Demographic Characteristics o f Population and Sample
Characteristic Baton Rouge M SA1
Sample
Gender
Male 47.5% 45.7%Female 52.5% 54.3%
Marital Status
Single 19.7% 34.5%Married 80.3% 65.5%
Age
18 to 24 23.9% 10.7%25 to 44 42.6% 56.5%45 to 64 23.2% 25.9%65 and older 10.2% 6.9%
Education
12 or more years 68.2% 71.0%16 or more years
Household Income
19.6% 29.0%
1980Dollars2
Less than $19,999 61.8% 22.4% 37.8%$20,000429,999 17.8% 9.6% 13.5%$30,000439,999 9.8% 20.0% 11.8%$40,000449,999 4.6% 17.6% 9.6%$50,000 and over 5.9% 30.4% 26.9%
1 Source: 1984 U .S. Census reports2 Consumer price index was used to adjust sample data to reflect 1980 dollars.
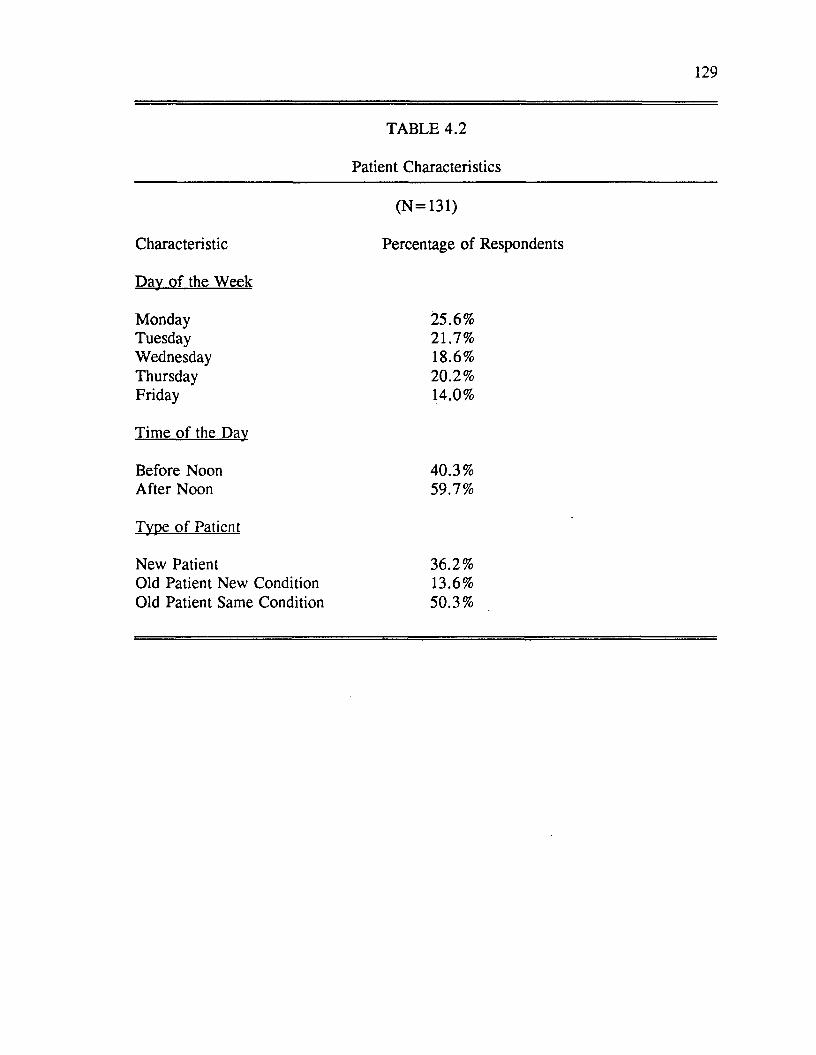
129
Characteristic
Day o f the Week
MondayTuesdayWednesdayThursdayFriday
Time o f the Day
Before Noon After Noon
Type o f Patient
New PatientOld Patient New Condition Old Patient Same Condition
TABLE 4.2
Patient Characteristics
(N =131)
Percentage o f Respondents
25.6%21.7%18.6%20.2 %14.0%
40.3%59.7%
36.2%13.6%50.3%
130
Although the questionnaires were pretested, the pretest o f the first
questionnaire did not occur in a clinic setting. Consequently, several problems that
occurred in collecting the data in a clinic setting were not anticipated. As the reader
will recall, the first questionnaire contained measurements for ideal expectations,
expectations, involvement and some patient classification questions. The length of
questionnaire prohibited many patients from completing the entire questionnaire
prior to seeing the doctor.
Another problem associated with the first questionnaire was the similarity of
items measuring ideal expectations and expectations. Some patients complained that
they were asked the same questions over and over again. Some of the patients
responded to the similarity in items measuring ideal expectations and expectations by
leaving entire sections o f the first questionnaire incomplete.
Accordingly, the first questionnaire was modified during data collection.
Two different versions of the first questionnaire were distributed. The modified
versions of the questionnaire contained measurements for either ideal expectations or
expectations, but not both. O f the 131 respondents, 57 received the original
questionnaire containing measurements for both ideal expectations and expectations,
32 received a version of the modified questionnaire containing measurements for
expectations, and 42 received a version of the modified questionnaire containing
measurements for ideal expectations.
Although modifying the first questionnaire helped solve some of the data
collection problems, it also created an analysis problem. The calculation of

131
maximum likelihood estimates assumes a listwise covariance matrix. In this case,
the use o f listwise matrices would result in an exceedingly small sample size (N =
57). An alternative to using listwise matrices is to use pairwise matrices whereby
each covariance is based on only cases which have complete information for that
particular pair of variables rather than for all the variables on the list. Hayduk
(1987) suggests that
the use of pairwise matrices in LISREL should be avoided but not blindly condemned. We must weigh the relative costs o f violating the assumption of a listwise matrix against the cost of using an unrealistic listwise m atrix ....W e [Entwisle and Hayduk 1982] have encountered situations in which a longitudinal data collection procedure was combined with shifts in data collection strategies in ways such that few cases had full information on all of the variables o f interest but where we nonetheless felt comfortable depending on pairwise matrices (Hayduk 1987, p. 327).
Hayduk (1987) refers to a data collection situation which is very similar to
the situation found in this dissertation research: a longitudinal data collection was
combined with a shift in collection strategies resulting in very few cases with full
information. It was felt that using pairwise matrices was preferable over using
unrealistic listwise matrices. However, the researcher did adhere to a number of
recommendations put forth by Hayduk (1987): 1) the n entered into the LISREL
program was the minimum n for any covariance in the pairwise matrix, 2) the final
model was rerun using the listwise matrix, and 3) the estimates and output were
viewed tentatively. Hayduk (1987) contends that entering the minimum N may be
overly conservative if almost all o f the covariances in the matrix are calculated on
larger N ’s. In this research a compromise was sought, both the factor and structural
models were estimated with the minimum n (n = 55) and maximum n (n = 131)
132
entered into the program. With the exception o f the chi-square statistic, there were
no differences in parameter estimates or fit statistics as a result of the different
sample sizes. The chi-square values for both sample sizes are reported in the tables
contained in this chapter. The models were also rerun using listwise matrices. The
patterns o f significant relationships were similar whether pairwise or listwise
matrices were used.
Evaluation o f the Factor and Structural Equation Models
As outlined in Chapter Three, several indicators were used to evaluate the
adequacy of the factor models. First, results were examined for abnormalities such
as negative error variances, correlations greater than one, and extremely large
parameter estimates. Second, global measures o f fit were examined. As specified
earlier in Chapter Three, the following evaluative criteria have been suggested in the
literature and were used in this research: 1) a nonsignificant chi-square statistic (p-
value > .05), 2) satisfactory goodness of fit indices (GFI and AGFI between .8
and .9), 3) a low root mean square residual (RMSR between .03 and .09), and 4)
a satisfactory normed fit index (NFI > .9).
After examining global measures of fit, internal structure was assessed by
examining measurement equations and their respective reliabilities. Based on the
suggestions o f Bagozzi and Yi (1988, p .82), the following were used as evaluative
criteria for the measurement models: 1) high individual item reliabilities (greater
than .5); 2) high composite reliabilities (greater than .6); 3) average variance
extracted greater than .5; and 4) normalized residuals less than 2. These four
133
criteria, along with the measures o f overall model fit, give an indication of the
unidimensionality and internal consistency o f the scales.
Consideration was given to eliminating individual indicators that appeared to
be detracting from the unidimensionality o f the scales. Individual items were
considered for elimination if they exhibited low individual item reliabilities (less than
.5) and/or if they corresponded to standardized residuals o f a magnitude greater than
2 which would suggest that the item(s) were detracting from the unidimensionality of
the scales. Once the researcher felt confident in the internal consistency of the
scales, composite measures for each o f the constructs were calculated by summing
individual indicators. Composite reliabilities were then calculated as per the
procedure discussed in Chapter Three. Measurement error variances were fixed at
one minus the composite reliabilities for the structural models.
In assessing the adequacy of the structural models, the following were used
as criteria: 1) global measures of fit as previously discussed and 2) significant
parameter estimates confirming hypotheses. Since models with few degrees of
freedom will have high values o f GFI, AGFI, AND NFI and low chi-square values,
more appropriate criteria for model acceptability include significant parameter
estimates confirming the hypotheses and explained variance for the endogeneous
constructs, particularly satisfaction.
In review, the following hypotheses were tested:
H I: Perceived performance is negatively influenced by ideal expectations.
H2: Perceived performance is positively influenced by expectations.
134
H3: Disconfirmation is positively influenced by perceived performance.
H4: Satisfaction is positively influenced by expectations.
H5: Satisfaction is positively influenced by perceived performance.
H6: Satisfaction is positively influenced by disconfirmation.
The hypotheses were tested separately for each submodel and then for an
overall model o f patient satisfaction.
Patient Satisfaction Submodel
Factor Model
The patient satisfaction submodel consists o f five constructs: ideal
expectations, expectations, performance, disconfirmation and satisfaction. All of
these constructs were measured with respect to the patients’ perceptions o f their own
role in the service encounter. Confirmatory factor analysis (CFA) was performed
on the five summed scales which constitute the patient satisfaction submodel
measures. Results o f the individual item analysis (reflected by the standardized
residuals and individual reliabilities) suggested that a number o f items would
improve the scales if eliminated. The specific items considered for deletion
included: items 7, 8 ,9, and 10 for ideal expectations, items 7, 8, 9, and 10 for
expectations, items 2 and 9 for performance, and items 4, 7, 8, 9, and 10 for
disconfirmation (See Appendix A: Dissertation Questionnaires). To assess the
impact o f eliminating these items, CFA was rerun after these items were deleted.
The factor model (CFA) tested for the revised scales showed improvement over the
original model. Eliminating these items produced higher item and composite
135
reliabilities and fewer standardized residuals greater than 2.
The revised factor model (CFA) for the patient satisfaction submodel
exhibited a goodness o f fit (GFI) value o f .70 and an adjusted goodness o f fit
(AGFI) value of .65. Both o f these fall short of the previously stated criterion.
However, the chi-square value was statistically nonsignificant which suggests a
reasonable fit o f the proposed factor model. The root mean square residual statistic
o f .06 was within acceptable ranges and the normed fit index o f .8 was close to the
criterion o f .9.
The item reliabilities and factor loadings from the CFA for the 5 scales are
presented in Table 4.3. Construct reliabilities were calculated following the
procedure outlined by Fornell and Larcker (1981). This procedure was discussed in
Chapter Three. The construct reliabilities are also contained in Table 4.3. In
addition, the global measures o f fit for the patient satisfaction factor model are
presented.
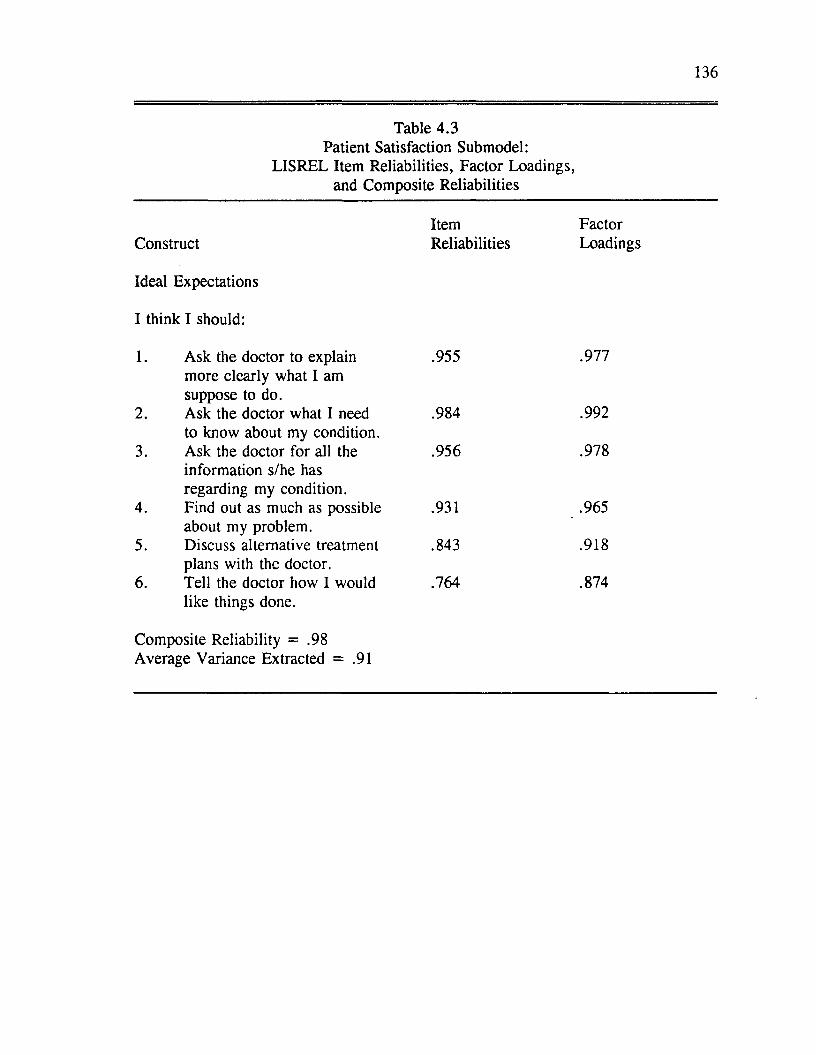
136
Table 4.3 Patient Satisfaction Submodel:
LISREL Item Reliabilities, Factor Loadings, and Composite Reliabilities
Item FactorConstruct Reliabilities Loadings
Ideal Expectations
I think I should:
1. Ask the doctor to explain .955 .977more clearly what I amsuppose to do.
2. Ask the doctor what I need .984 .992to know about my condition.
3. Ask the doctor for all the .956 .978information s/he hasregarding my condition.
4. Find out as much as possible .931 .965about my problem.
5. Discuss alternative treatment .843 .918plans with the doctor.
6. Tell the doctor how I would .764 .874like things done.
Composite Reliability = .98Average Variance Extracted = .91
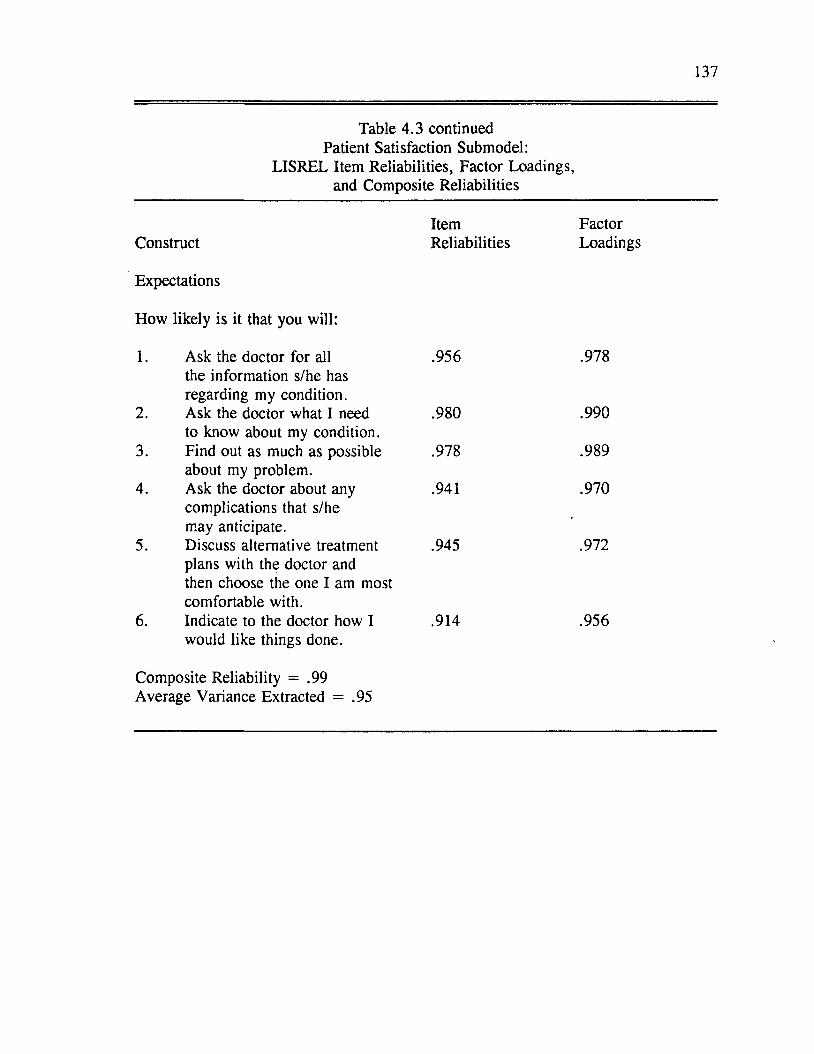
137
Table 4.3 continued Patient Satisfaction Submodel:
LISREL Item Reliabilities, Factor Loadings, and Composite Reliabilities
Construct
Expectations
How likely is it that you will:
1. Ask the doctor for all the information s/he has regarding my condition.
2. Ask the doctor what I need to know about my condition.
3. Find out as much as possible about my problem.
4. Ask the doctor about any complications that s/he may anticipate.
5. Discuss alternative treatment plans with the doctor and then choose the one I am most comfortable with.
6. Indicate to the doctor how I would like things done.
ItemReliabilities
FactorLoadings
.956
.980
.978
.941
.945
.914
.978
.990
.989
.970
.972
.956
Composite Reliability = .99Average Variance Extracted = .95
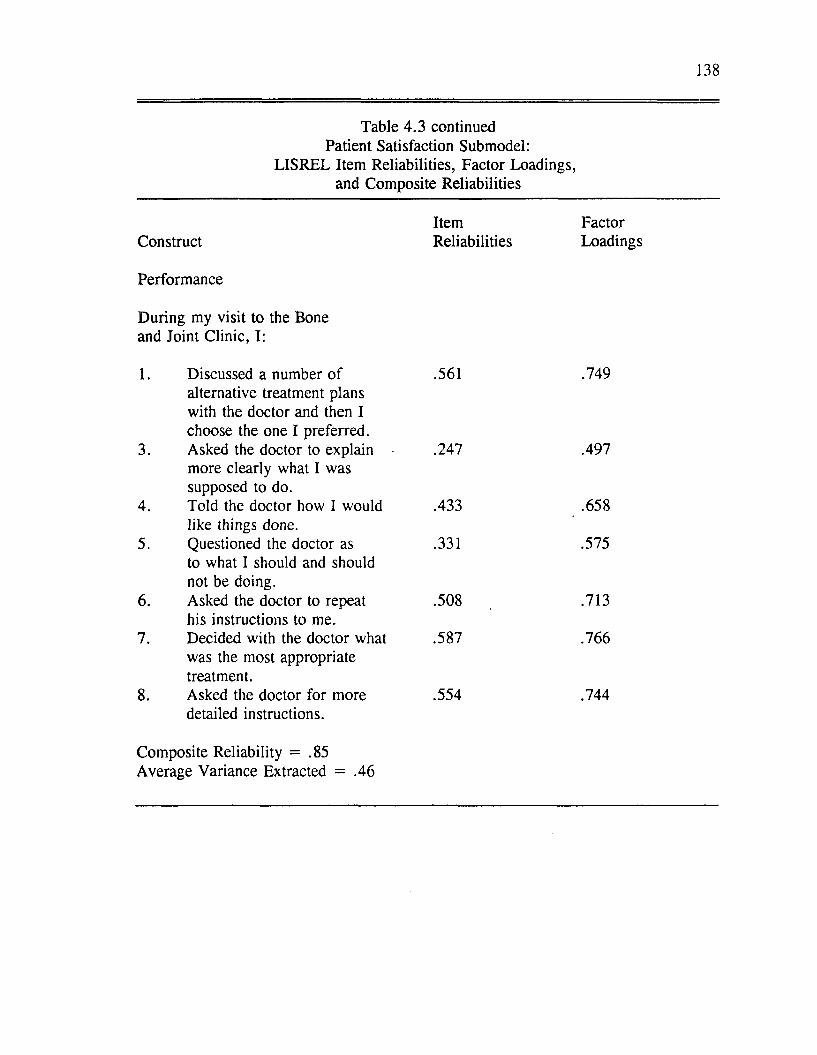
138
Table 4.3 continued Patient Satisfaction Submodel:
LISREL Item Reliabilities, Factor Loadings, and Composite Reliabilities
Item FactorConstruct Reliabilities Loadings
Performance
During my visit to the Bone and Joint Clinic, I:
1. Discussed a number o f .561 .749alternative treatment plans with the doctor and then I choose the one I preferred.
3. Asked the doctor to explain .247 .497more clearly what I wassupposed to do.
4. Told the doctor how I would .433 .658like things done.
5. Questioned the doctor as .331 .575to what I should and shouldnot be doing.
6. Asked the doctor to repeat .508 .713his instructions to me.
7. Decided with the doctor what .587 .766was the most appropriatetreatment.
8. Asked the doctor for more .554 .744detailed instructions.
Composite Reliability = .85 Average Variance Extracted = .46
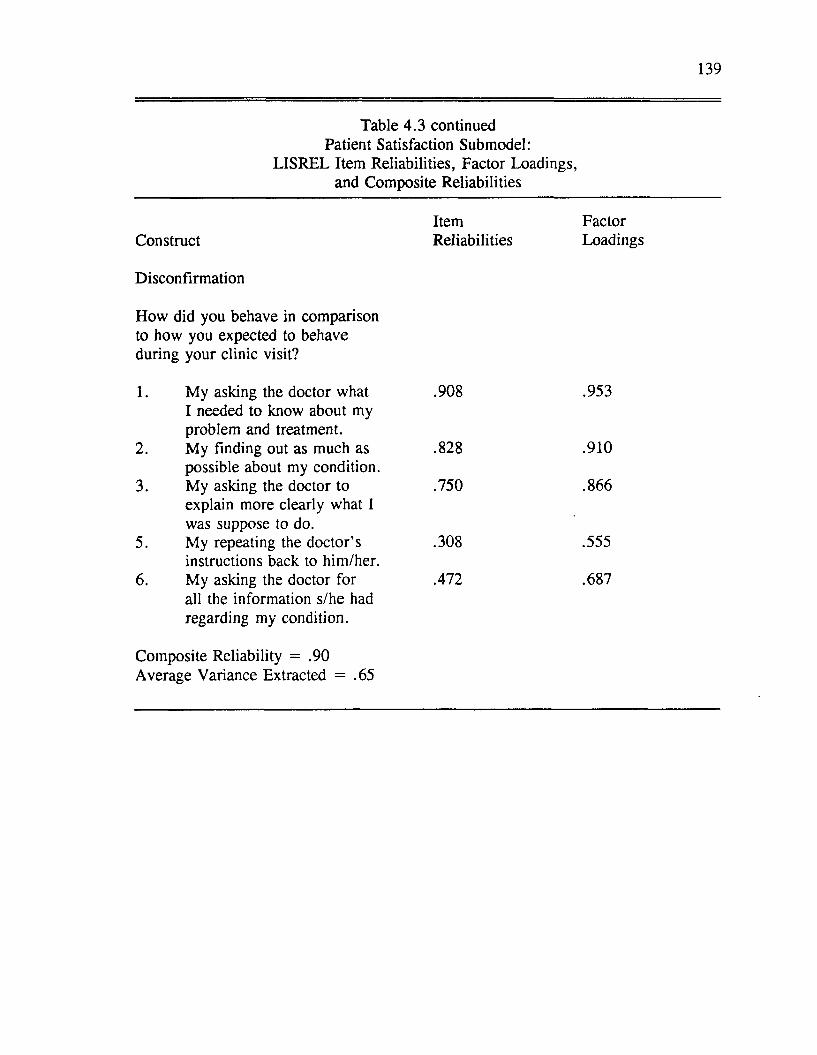
139
Table 4.3 continued Patient Satisfaction Submodel:
LISREL Item Reliabilities, Factor Loadings, and Composite Reliabilities
Item FactorConstruct Reliabilities Loadings
Disconfirmation
How did you behave in comparison to how you expected to behave during your clinic visit?
1. My asking the doctor what .908 .953I needed to know about myproblem and treatment.
2. My finding out as much as .828 .910possible about my condition.
3. My asking the doctor to .750 .866explain more clearly what Iwas suppose to do.
5. My repeating the doctor’s .308 .555instructions back to him/her.
6. My asking the doctor for .472 .687all the information s/he hadregarding my condition.
Composite Reliability = .90Average Variance Extracted = .65
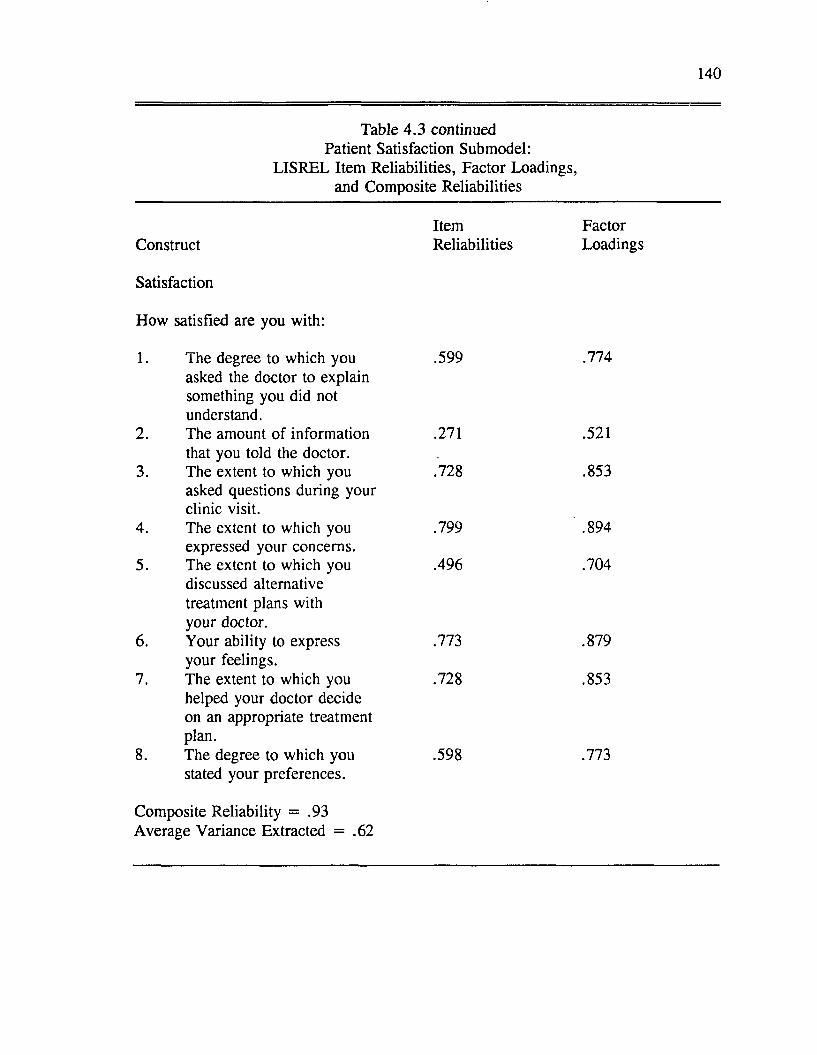
140
Table 4 .3 continued Patient Satisfaction Submodel:
LISREL Item Reliabilities, Factor Loadings, and Composite Reliabilities
Item FactorConstruct Reliabilities Loadings
Satisfaction
How satisfied are you with:
1. The degree to which you .599 .774asked the doctor to explainsomething you did not understand.
2. The amount of information .271 .521that you told the doctor.
3. The extent to which you .728 .853asked questions during yourclinic visit.
4. The extent to which you .799 .894expressed your concerns.
5. The extent to which you .496 .704discussed alternativetreatment plans with your doctor.
6. Your ability to express .773 .879your feelings.
7. The extent to which you .728 .853helped your doctor decideon an appropriate treatment plan.
8. The degree to which you .598 .773stated your preferences.
Composite Reliability = .93 Average Variance Extracted = .62
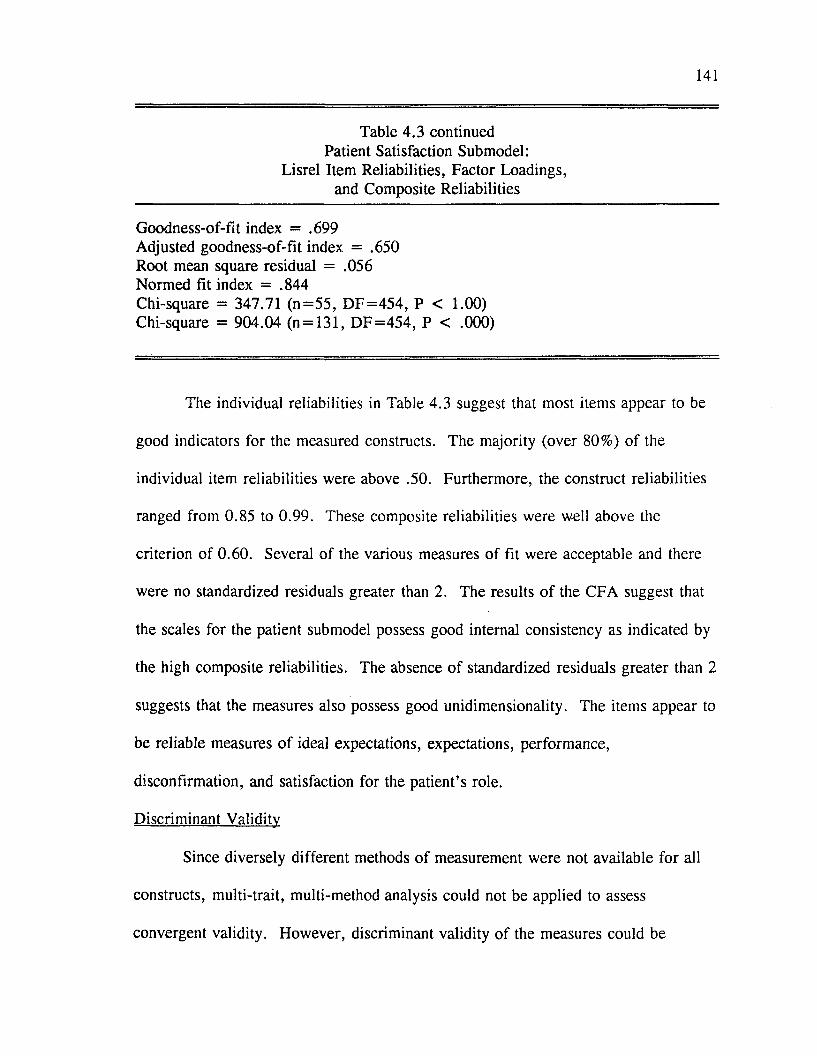
141
Table 4.3 continued Patient Satisfaction Submodel:
Lisrel Item Reliabilities, Factor Loadings, and Composite Reliabilities
Goodness-of-fit index = .699 Adjusted goodness-of-fit index = .650 Root mean square residual = .056 Normed fit index = .844Chi-square = 347.71 (n = 5 5 , D F = 454 , P < 1.00) Chi-square = 904.04 (n = 131, D F = 454 , P < .000)
The individual reliabilities in Table 4.3 suggest that most items appear to be
good indicators for the measured constructs. The majority (over 80%) of the
individual item reliabilities were above .50. Furthermore, the construct reliabilities
ranged from 0.85 to 0.99. These composite reliabilities were well above the
criterion of 0.60. Several of the various measures of fit were acceptable and there
were no standardized residuals greater than 2. The results o f the CFA suggest that
the scales for the patient submodel possess good internal consistency as indicated by
the high composite reliabilities. The absence o f standardized residuals greater than 2
suggests that the measures also possess good unidimensionality. The items appear to
be reliable measures o f ideal expectations, expectations, performance,
disconfirmation, and satisfaction for the patient’s role.
Discriminant Validity
Since diversely different methods o f measurement were not available for all
constructs, multi-trait, multi-method analysis could not be applied to assess
convergent validity. However, discriminant validity o f the measures could be
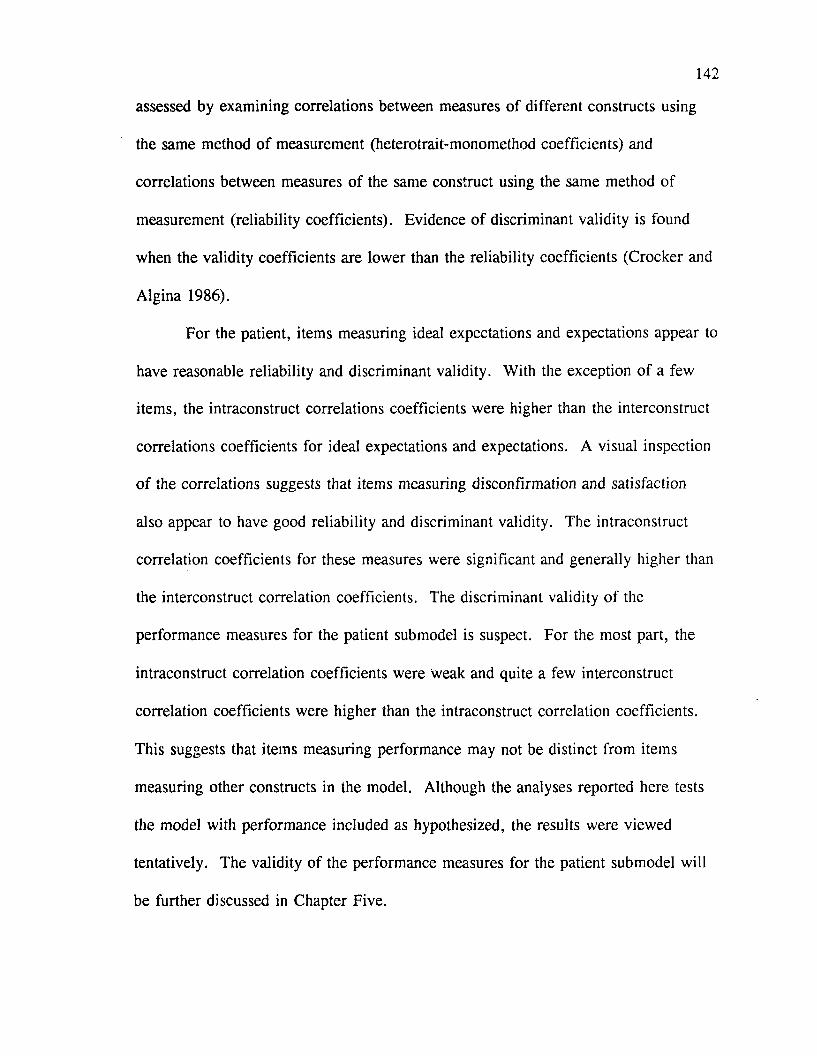
142
assessed by examining correlations between measures o f different constructs using
the same method o f measurement (heterotrait-monomethod coefficients) and
correlations between measures o f the same construct using the same method of
measurement (reliability coefficients). Evidence o f discriminant validity is found
when the validity coefficients are lower than the reliability coefficients (Crocker and
Algina 1986).
For the patient, items measuring ideal expectations and expectations appear to
have reasonable reliability and discriminant validity. With the exception o f a few
items, the intraconstruct correlations coefficients were higher than the interconstruct
correlations coefficients for ideal expectations and expectations. A visual inspection
o f the correlations suggests that items measuring disconfirmation and satisfaction
also appear to have good reliability and discriminant validity. The intraconstruct
correlation coefficients for these measures were significant and generally higher than
the interconstruct correlation coefficients. The discriminant validity of the
performance measures for the patient submodel is suspect. For the most part, the
intraconstruct correlation coefficients were weak and quite a few interconstruct
correlation coefficients were higher than the intraconstruct correlation coefficients.
This suggests that items measuring performance may not be distinct from items
measuring other constructs in the model. Although the analyses reported here tests
the model with performance included as hypothesized, the results were viewed
tentatively. The validity of the performance measures for the patient submodel will
be further discussed in Chapter Five.
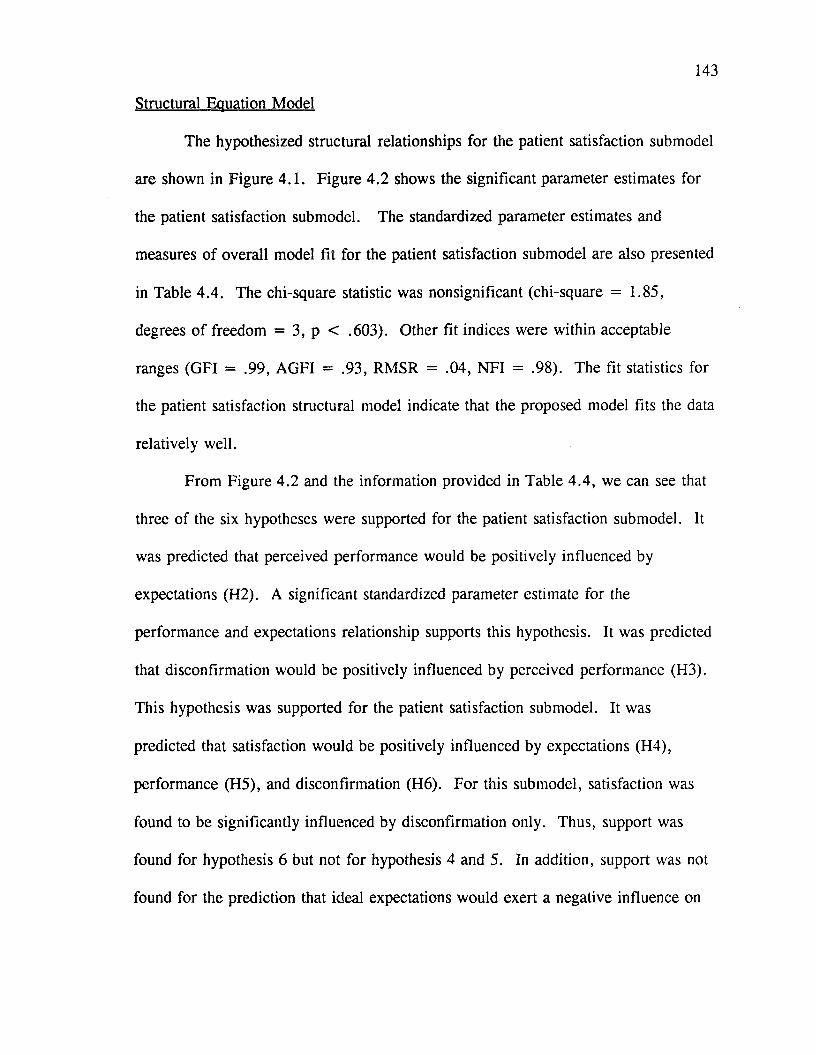
143
Structural Equation Model
The hypothesized structural relationships for the patient satisfaction submodel
are shown in Figure 4.1. Figure 4.2 shows the significant parameter estimates for
the patient satisfaction submodel. The standardized parameter estimates and
measures o f overall model fit for the patient satisfaction submodel are also presented
in Table 4.4. The chi-square statistic was nonsignificant (chi-square = 1.85,
degrees o f freedom = 3, p < .603). Other fit indices were within acceptable
ranges (GFI = .99, AGFI = .93, RMSR = .04, NFI = .98). The fit statistics for
the patient satisfaction structural model indicate that the proposed model fits the data
relatively well.
From Figure 4.2 and the information provided in Table 4 .4 , we can see that
three of the six hypotheses were supported for the patient satisfaction submodel. It
was predicted that perceived performance would be positively influenced by
expectations (H2). A significant standardized parameter estimate for the
performance and expectations relationship supports this hypothesis. It was predicted
that disconfirmation would be positively influenced by perceived performance (H3).
This hypothesis was supported for the patient satisfaction submodel. It was
predicted that satisfaction would be positively influenced by expectations (H4),
performance (H5), and disconfirmation (H6). For this submodel, satisfaction was
found to be significantly influenced by disconfirmation only. Thus, support was
found for hypothesis 6 but not for hypothesis 4 and 5. In addition, support was not
found for the prediction that ideal expectations would exert a negative influence on

144
performance (H I). In summary, partial support was found for the proposed patient
satisfaction submodel.
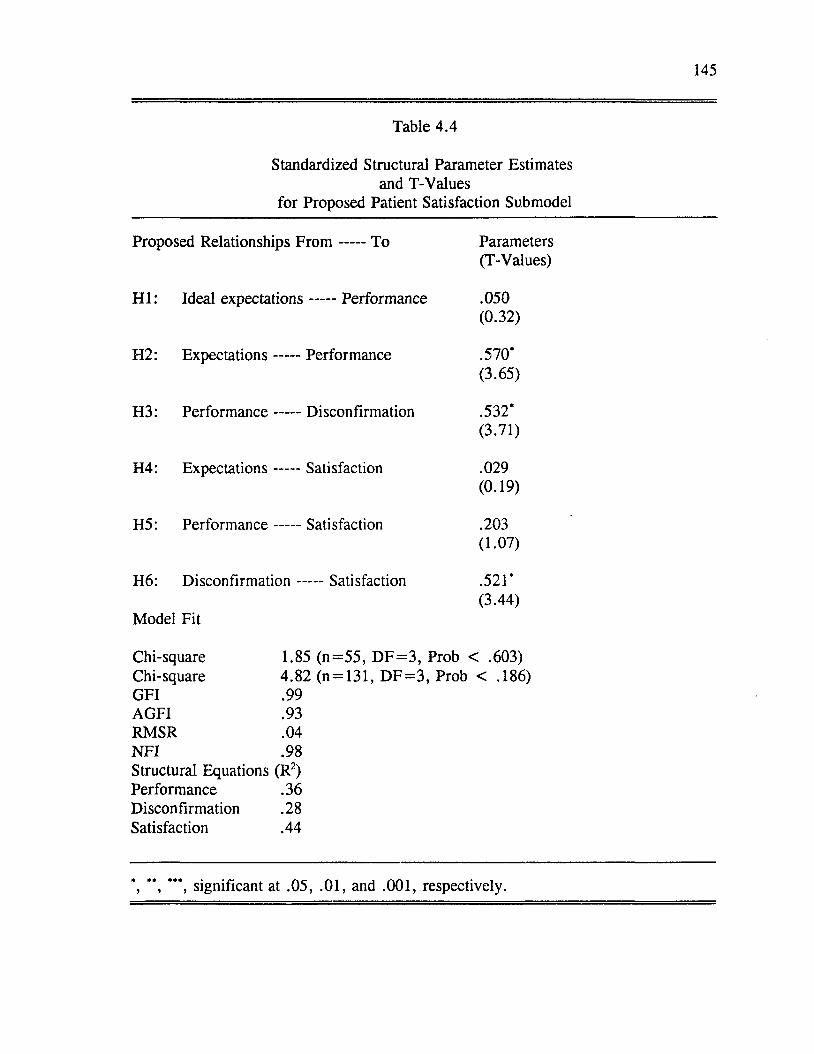
145
Table 4.4
Standardized Structural Parameter Estimates and T-Values
for Proposed Patient Satisfaction Submodel
Proposed Relationships F r o m ----- To Parameters(T-Values)
H I: Ideal expectations----- Performance .050(0.32)
H2: Expectations ----- Performance .570*(3.65)
H3: Performance ----- Disconfirmation .532*(3.71)
H4: Expectations ----- Satisfaction .029(0.19)
H5: Performance ----- Satisfaction .203(1.07)
H6: D isconfirm ation.......Satisfaction
Model Fit
.521*(3.44)
Chi-square 1.85 (n= 55 , D F = 3 , Prob < .603)Chi-square 4.82 (n = 131, D F = 3 , Prob < .186)GFI .99AGFI .93RMSR .04N FI .98Structural Equations (R2)Performance .36 Disconfirmation .28 Satisfaction .44
*, **, ***, significant at .05, .01, and .001, respectively.
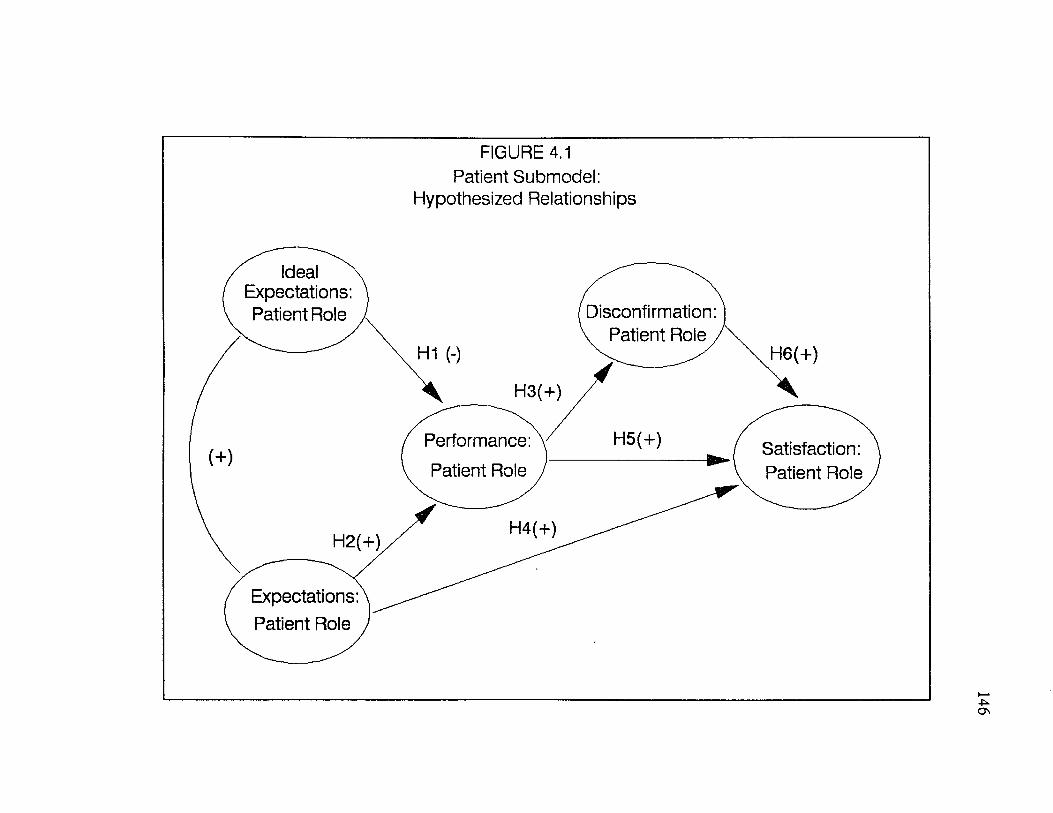
FIGURE 4.1 Patient Submodel:
Hypothesized Relationships
Ideal Expectations: Patient Role Disconfirmation:
v Patient Role,H1 (-) H6(+)
H5(+)Performance: Patient Role
Satisfaction: Patient Role
Expectations: Patient Role
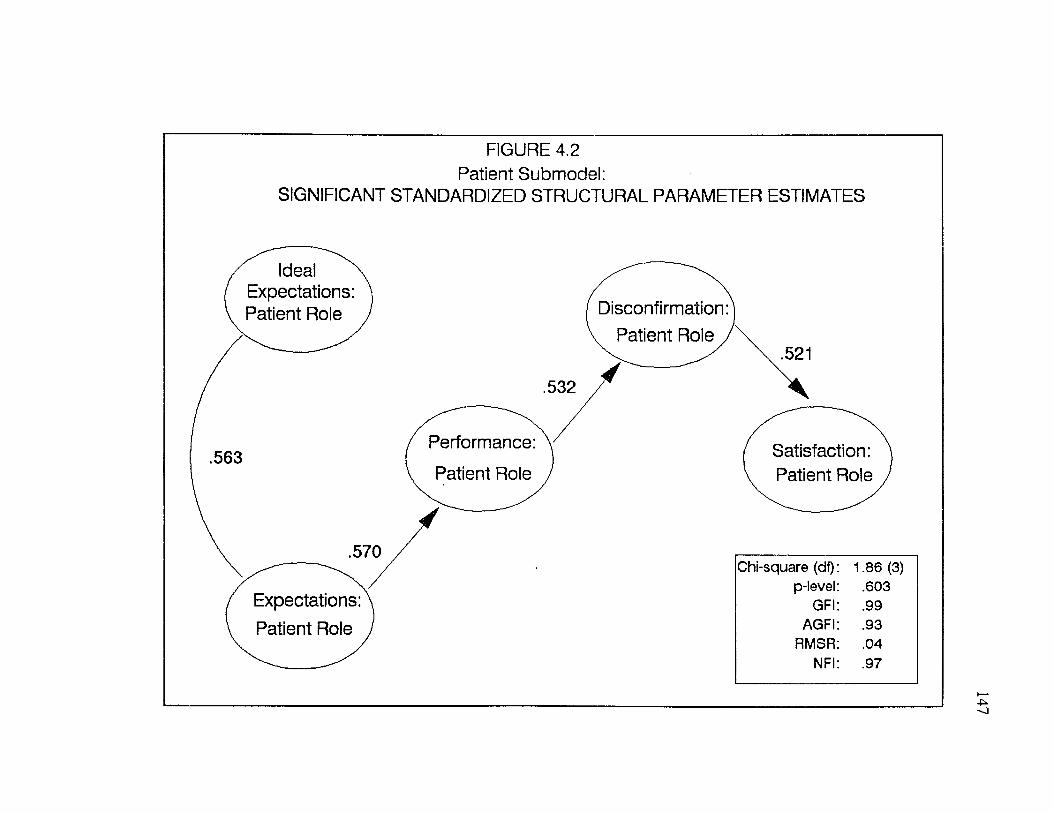
FIGURE 4.2 Patient Submodel:
SIGNIFICANT STANDARDIZED STRUCTURAL PARAMETER ESTIMATES
Ideal Expectations: Patient Role Disconfirmation
Patient Role
Performance
Patient RoleSatisfaction: Patient Role
Expectations: Patient Role
Chi-square (df) 1.86 (3)p-level .603
GFI .99AGFI .93
RMSR .04NFI .97

148
Doctor Satisfaction Submodel
Factor Model
As with the patient satisfaction submodel, the doctor satisfaction submodel
consisted o f five constructs: ideal expectations, expectations, performance,
disconfirmation and satisfaction. All of these constructs were measured with respect
to the patients’ perceptions of the doctor’s role in the service encounter. Once
again, confirmatory factor analysis (CFA) was performed on the five summed scales
which constitute the doctor satisfaction submodel measures.
Results o f the individual item analysis (reflected by the standardized residuals
and individual reliabilities) suggested that a number o f items would improve the
scales if eliminated. The specific items considered for deletion included: items 4
and 6 for performance, item 7 for disconfirmation, and items 4 and 6 for satisfaction
(See Appendix A: Dissertation Questionnaires). To assess the impact of eliminating
these items, CFA was rerun after these items were deleted. The factor model
(CFA) tested for the revised scales showed improvement over the original model:
reliabilities were increased and standardized residuals decreased.
The revised factor model (CFA) for the doctor satisfaction submodel
exhibited a goodness of fit (GFI) value o f .60 and an adjusted goodness o f fit
(AGFI) value of .57. These are both short of the previously stated criterion.
However, the chi-square value was nonsignificant which suggests a reasonable fit of
the proposed factor model. The root mean square residual statistic o f .05 was
acceptable. A normed fit index of .82 was close to the prespecified criterion of .9.

149
The item reliabilities and factor loadings from the CFA for the 5 scales are
presented in Table 4.5. Construct reliabilities and global measures o f fit for the
doctor satisfaction factor model are also contained in Table 4.5.
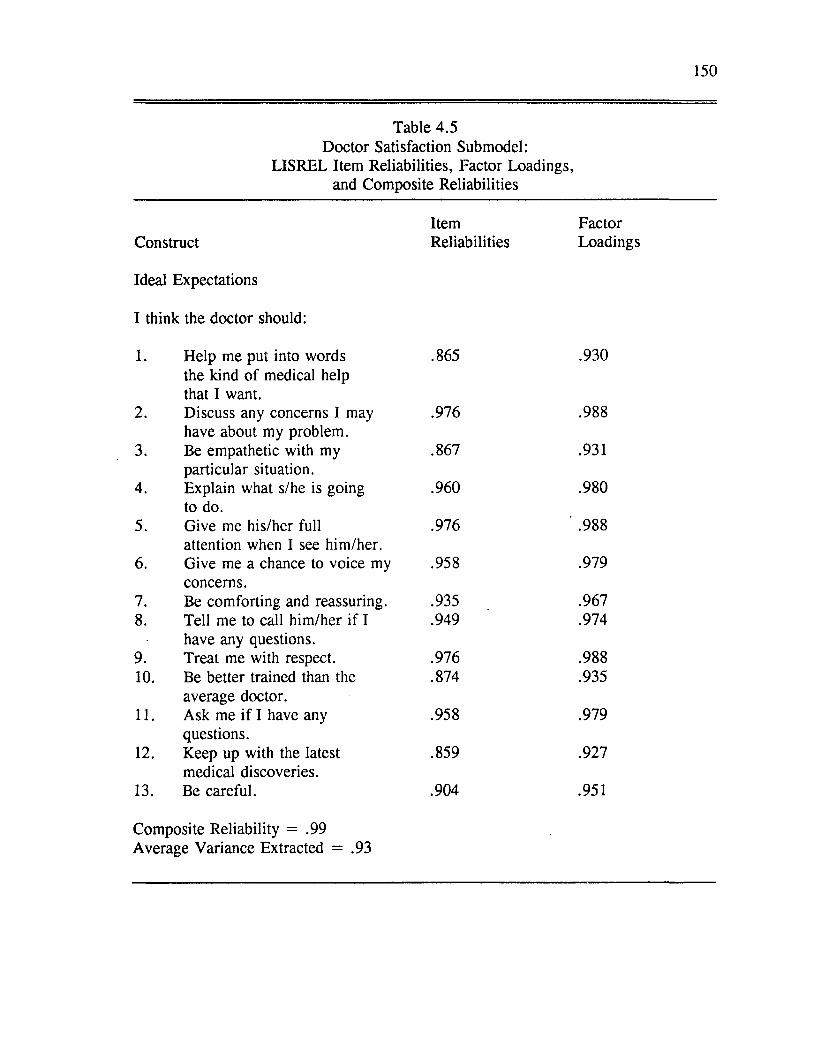
150
Table 4.5 Doctor Satisfaction Submodel:
LISREL Item Reliabilities, Factor Loadings, and Composite Reliabilities
Item FactorConstruct Reliabilities Loadings
Ideal Expectations
I think the doctor should:
1. Help me put into words the kind of medical help that I want.
.865 .930
2. Discuss any concerns I may have about my problem.
.976 .988
3. Be empathetic with my particular situation.
.867 .931
4. Explain what s/he is going to do.
.960 .980
5. Give me his/her full attention when I see him/her.
.976 ' .988
6. Give me a chance to voice my concerns.
.958 .979
7. Be comforting and reassuring. .935 .9678. Tell me to call him/her if I
have any questions..949 .974
9. Treat me with respect. .976 .98810. Be better trained than the
average doctor..874 .935
11. Ask me if I have any questions.
.958 .979
12. Keep up with the latest medical discoveries.
.859 .927
13. Be careful. .904 .951
Composite Reliability = .99Average Variance Extracted = .93
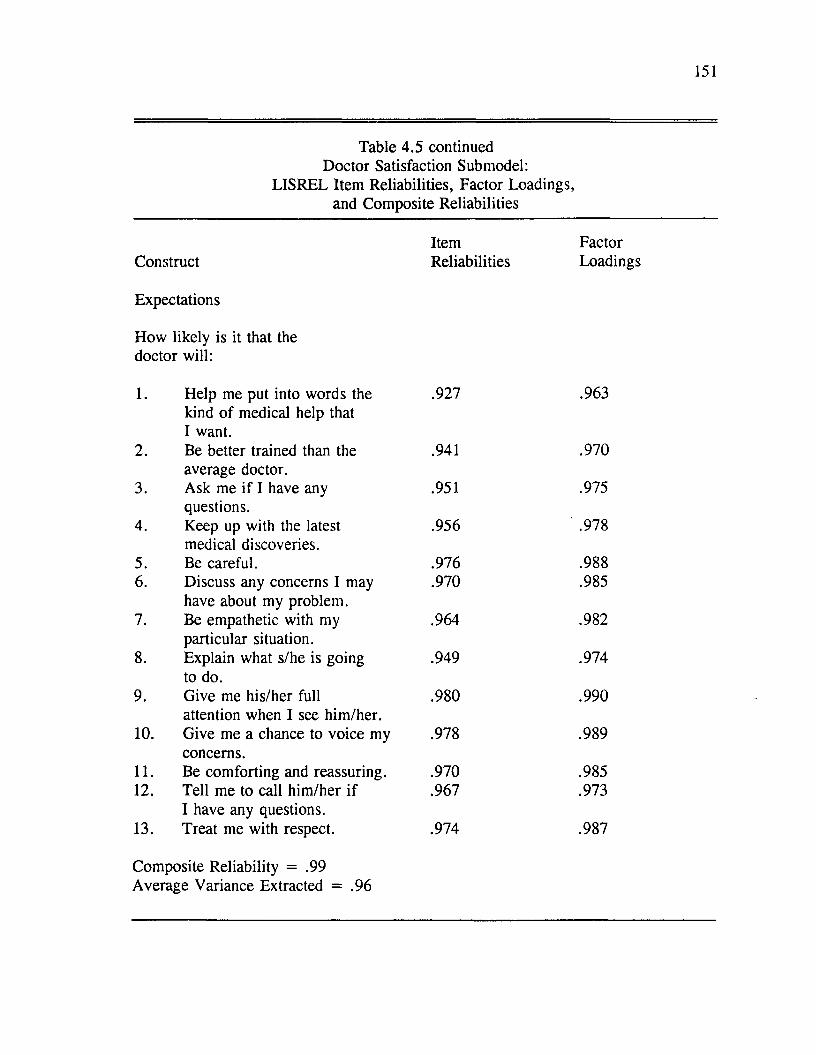
151
Table 4.5 continued Doctor Satisfaction Submodel:
LISREL Item Reliabilities, Factor Loadings, and Composite Reliabilities
Item FactorConstruct Reliabilities Loadings
Expectations
How likely is it that the doctor will:
1. Help me put into words the kind of medical help that I want.
.927 .963
2. Be better trained than the average doctor.
.941 .970
3. Ask me if I have any questions.
.951 .975
4. Keep up with the latest medical discoveries.
.956 ' .978
5. Be careful. .976 .9886. Discuss any concerns I may
have about my problem..970 .985
7. Be empathetic with my particular situation.
.964 .982
8. Explain what s/he is going to do.
.949 .974
9. Give me his/her full attention when I see him/her.
.980 .990
10. Give me a chance to voice my concerns.
.978 .989
11. Be comforting and reassuring. .970 .98512. Tell me to call him /her if
I have any questions..967 .973
13. Treat me with respect. .974 .987
Composite Reliability = .99Average Variance Extracted = .96
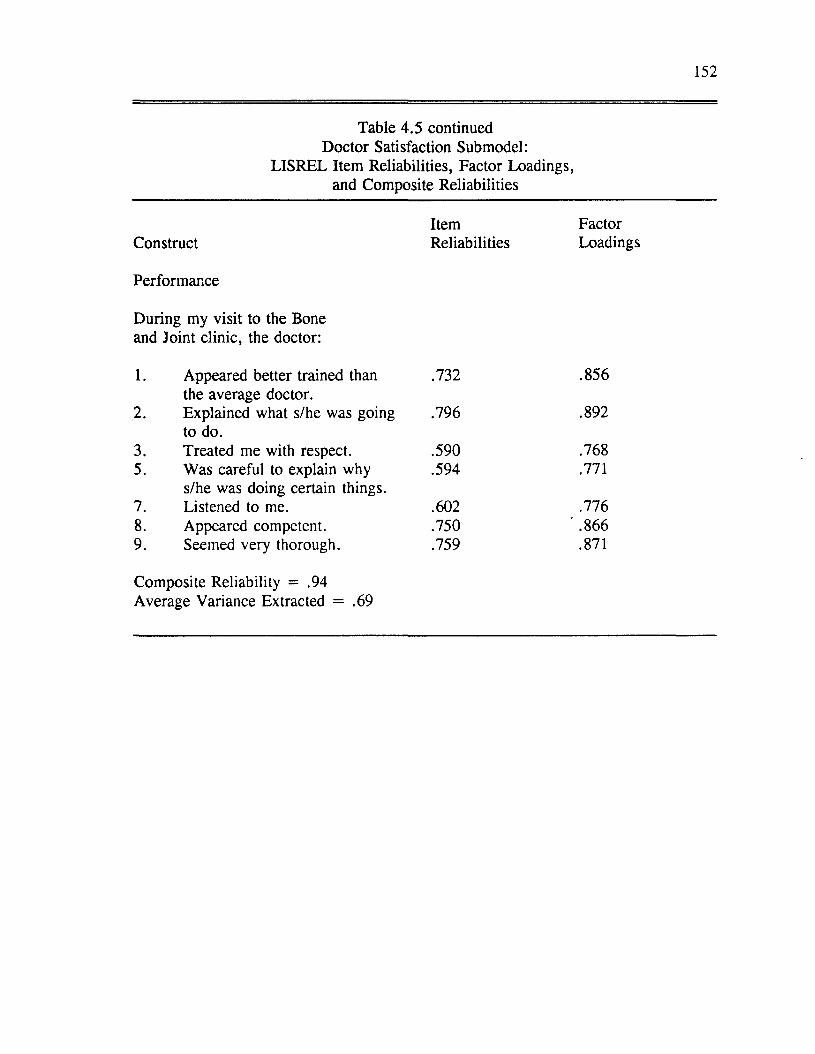
152
Table 4.5 continued Doctor Satisfaction Submodel:
LISREL Item Reliabilities, Factor Loadings, and Composite Reliabilities
Item FactorConstruct Reliabilities Loadings
Performance
During my visit to the Bone and Joint clinic, the doctor:
1. Appeared better trained than the average doctor.
.732 .856
2. Explained what s/he was going to do.
.796 .892
3. Treated me with respect. .590 .7685. Was careful to explain why
s/he was doing certain things..594 .771
7. Listened to me. .602 .7768. Appeared competent. .750 ' .8669. Seemed very thorough. .759 .871
Composite Reliability = .94 Average Variance Extracted = .69
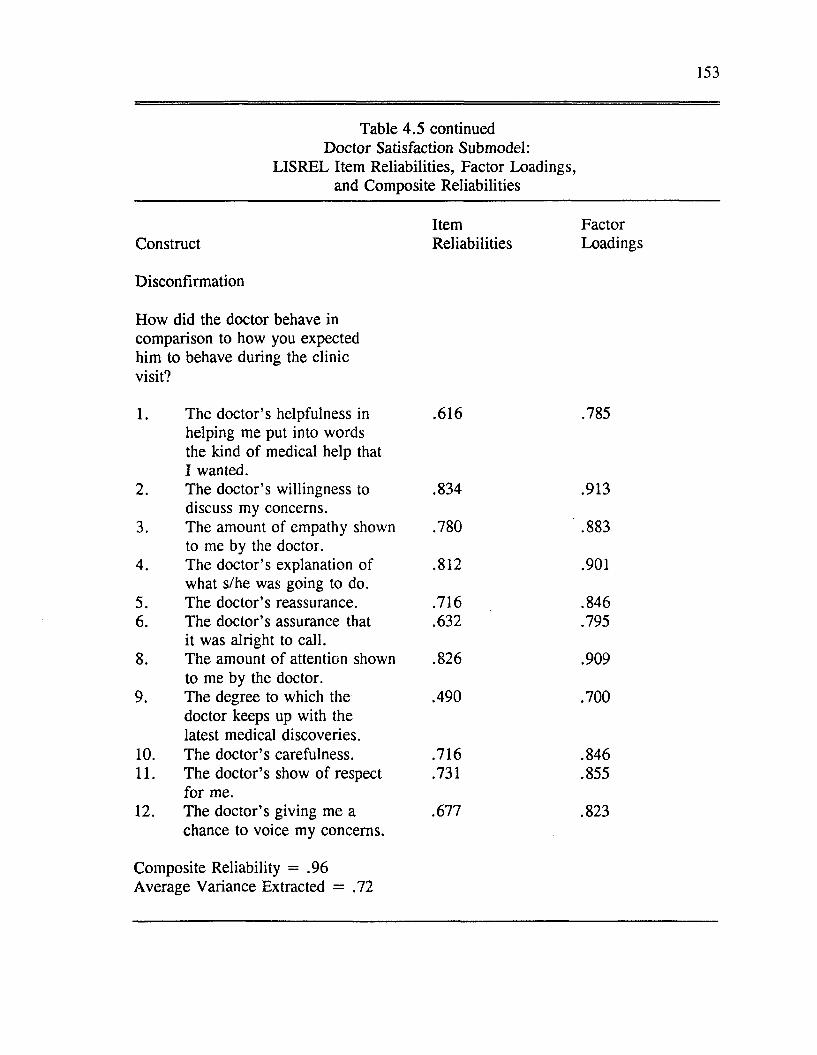
153
Table 4.5 continued Doctor Satisfaction Submodel:
LISREL Item Reliabilities, Factor Loadings, and Composite Reliabilities
Item FactorConstruct Reliabilities Loadings
Disconfirmation
How did the doctor behave in comparison to how you expected him to behave during the clinic visit?
1. The doctor’s helpfulness in helping me put into words the kind of medical help that I wanted.
.616 .785
2. The doctor’s willingness to discuss my concerns.
.834 .913
3. The amount o f empathy shown to me by the doctor.
.780 ' .883
4. The doctor’s explanation of what s/he was going to do.
.812 .901
5. The doctor’s reassurance. .716 .8466. The doctor’s assurance that
it was alright to call..632 .795
8. The amount of attention shown to me by the doctor.
.826 .909
9. The degree to which the doctor keeps up with the latest medical discoveries.
.490 .700
10. The doctor’s carefulness. .716 .84611. The doctor’s show of respect
for me..731 .855
12. The doctor’s giving me a chance to voice my concerns.
.677 .823
Composite Reliability = .96Average Variance Extracted = .72
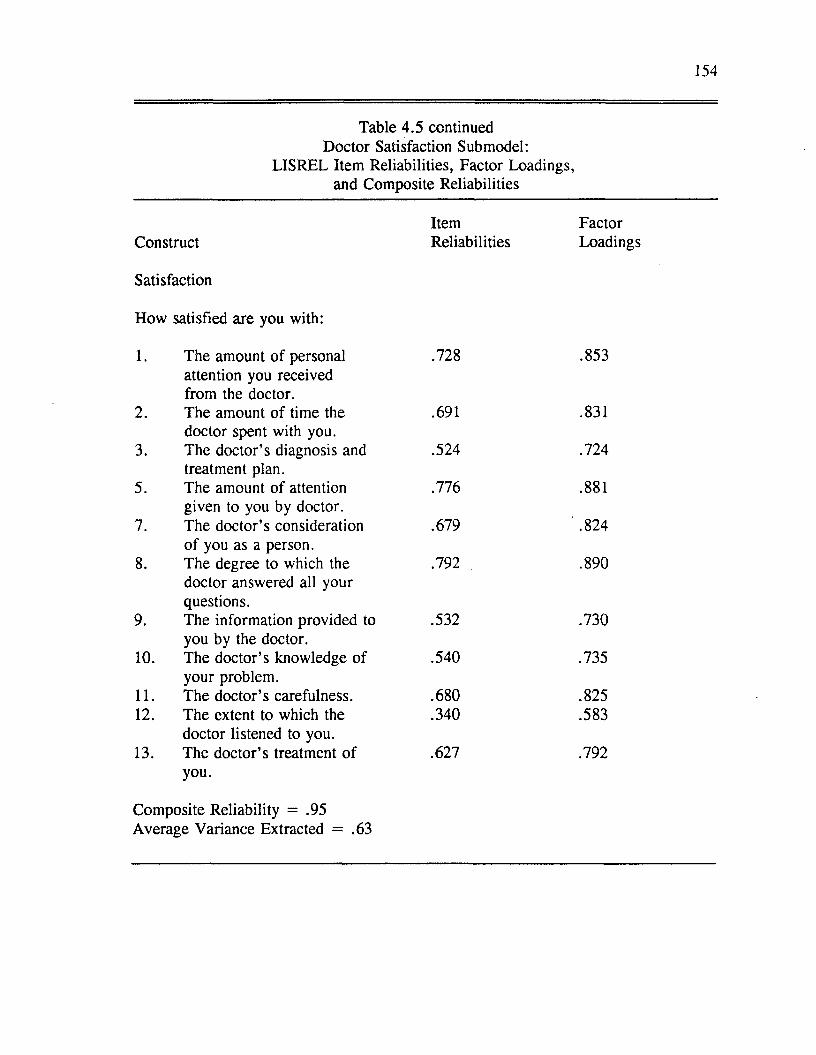
154
Table 4.5 continued Doctor Satisfaction Submodel:
LISREL Item Reliabilities, Factor Loadings, and Composite Reliabilities
Item FactorConstruct Reliabilities Loadings
Satisfaction
How satisfied are you with:
1. The amount o f personal .728 .853
2.
attention you received from the doctor.The amount o f time the .691 .831
3.doctor spent with you.The doctor’s diagnosis and .524 .724
5.treatment plan.The amount of attention .776 .881
7.given to you by doctor. The doctor’s consideration .679 ' .824
8.o f you as a person.The degree to which the .792 .890
9.
doctor answered all your questions.The information provided to .532 .730
10.you by the doctor.The doctor’s knowledge of .540 .735
11.your problem.The doctor’s carefulness. .680 .825
12. The extent to which the .340 .583
13.doctor listened to you. The doctor’s treatment of .627 .792you.
Composite Reliability = .95Average Variance Extracted = .63
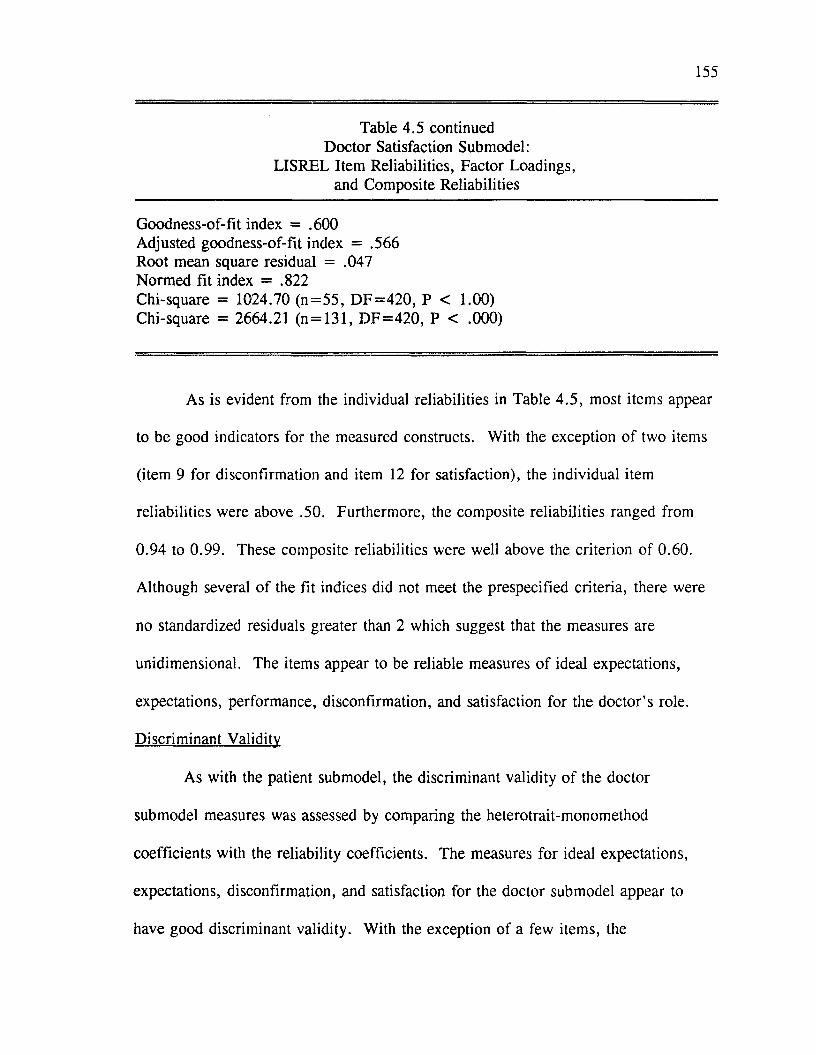
155
Table 4.5 continued Doctor Satisfaction Submodel:
LISREL Item Reliabilities, Factor Loadings, and Composite Reliabilities
Goodness-of-fit index = .600 Adjusted goodness-of-fit index = .566 Root mean square residual = .047 Normed fit index = .822Chi-square = 1024.70 (n= 55 , D F = 420 , P < 1.00) Chi-square = 2664.21 (n = 131, D F = 420 , P < .000)
As is evident from the individual reliabilities in Table 4.5, most items appear
to be good indicators for the measured constructs. With the exception o f two items
(item 9 for disconfirmation and item 12 for satisfaction), the individual item
reliabilities were above .50. Furthermore, the composite reliabilities ranged from
0.94 to 0.99. These composite reliabilities were well above the criterion of 0.60.
Although several of the fit indices did not meet the prespecified criteria, there were
no standardized residuals greater than 2 which suggest that the measures are
unidimensional. The items appear to be reliable measures of ideal expectations,
expectations, performance, disconfirmation, and satisfaction for the doctor’s role.
Discriminant Validity
As with the patient submodel, the discriminant validity o f the doctor
submodel measures was assessed by comparing the heterotrait-monomethod
coefficients with the reliability coefficients. The measures for ideal expectations,
expectations, disconfirmation, and satisfaction for the doctor submodel appear to
have good discriminant validity. With the exception of a few items, the
156
intraconstruct correlations coefficients were higher than the interconstruct
correlations coefficients for these constructs. Most o f the items measuring
performance were significantly correlated with items measuring other constructs, in
particular expectations, disconfirmation, and satisfaction. Some of the intraconstruct
correlation coefficients for the performance construct were smaller than the
interconstruct correlation coefficients. The hypotheses for the doctor submodel were
tested with performance included in the model. However, the results o f the
hypotheses tests were evaluated with the lack of evidence for the validity of the
performance measure in mind. This will be discussed in further detail in Chapter
Five.
Structural Equation Model
The hypothesized relationships for the doctor satisfaction submodel are shown
in Figure 4.3. The significant relationships are also shown in Figure 4.4. The
standardized parameter estimates and measures o f overall model fit for the doctor
satisfaction, submodel are presented in Table 4.6. The chi-square statistic was
nonsignificant (chi-square = 5.66, degrees o f freedom = 3, p < .129). With the
exception of the AGFI, other fit indices were within acceptable ranges (GFI = .958,
AGFI = .789, RMSR = .045, NFI = .955). The fit statistics for the doctor
satisfaction structural model indicate that the proposed model fits the data relatively
well.
From the information provided in Figure 4.4 and Table 4.6, we can see that
three o f the six hypotheses were supported for the doctor satisfaction submodel:
157
perceived performance was positively influenced by expectations (H2),
disconfirmation was positively influenced by performance (H3), and satisfaction was
positively influenced by performance (H5). It was predicted that performance would
be negatively influenced by ideal expectations (H I). Ideal expectations did not exert
a significant influence on performance. Satisfaction was not found to be
significantly influenced by expectations or disconfirmation. Therefore, no support
was found for H3, H4 or H6 for the doctor satisfaction submodel.

158
Table 4.6
Standardized Structural Parameter Estimates and T-Values
for Proposed Doctor Satisfaction Submodel
Proposed Relationships F ro m ----- To Parameters(T-Values)
H I: Ideal expectations----- Performance .252(2.03)
H2: Expectations ----- Performance .502*(4.04)
H3: Performance -----Disconfirmation .758**(7.32)
H4: Expectations -----Satisfaction .000(0.01)
H5: Performance -----Satisfaction .631*(3.87)
H6: D isconfirm ation-----Satisfaction
Model Fit
.258(1.80)
Chi-square 5.66 (n= 55 , D F = 3 , Prob < .129)Chi-square 14.72 (n = 131, D F = 3 , Prob < .002)GFI .958AGFI .789RMSR .045N FI .955Structural Equations (R2)Performance .415 Disconfirmation .576 Satisfaction .712
*, **, ***, significant at .05, .01, and .001, respectively.

FIGURE 4.3Doctor Submodel:
Hypothesized Relationships
Ideal Expectations: Doctor Role Disconfirmation:
v Doctor Role /H6(+)H1 (-)
H3(+)
Performance: Doctor Role
Satisfaction: Doctor Role
H2(+)
Expectations: Doctor Role
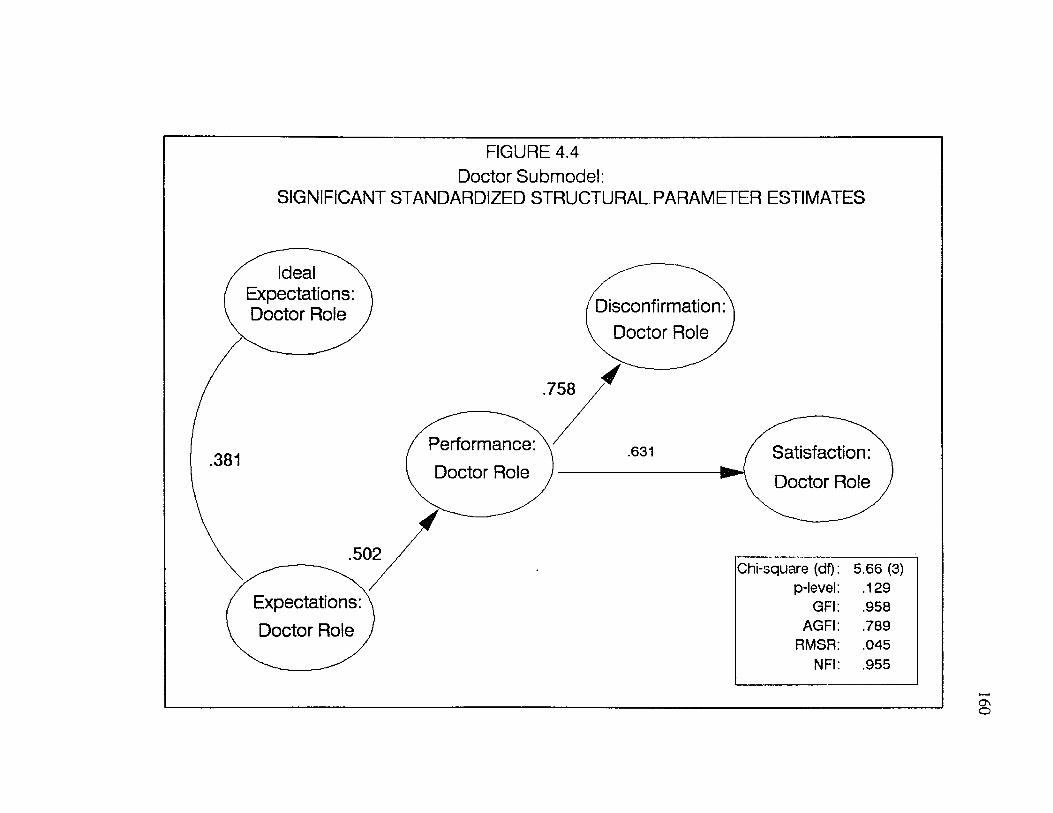
FIGURE 4.4 Doctor Submodel:
SIGNIFICANT STANDARDIZED STRUCTURAL PARAMETER ESTIMATES
Ideal Expectations: Doctor Role
.381
Disconfirmation: Doctor Role ,
758
Performance: Doctor Role
.631 Satisfaction: Doctor Role
Expectations: Doctor Role
Chi-square (df) 5.66 (3)p-level .129
GFI .958AGFI .789
RMSR .045NFI .955
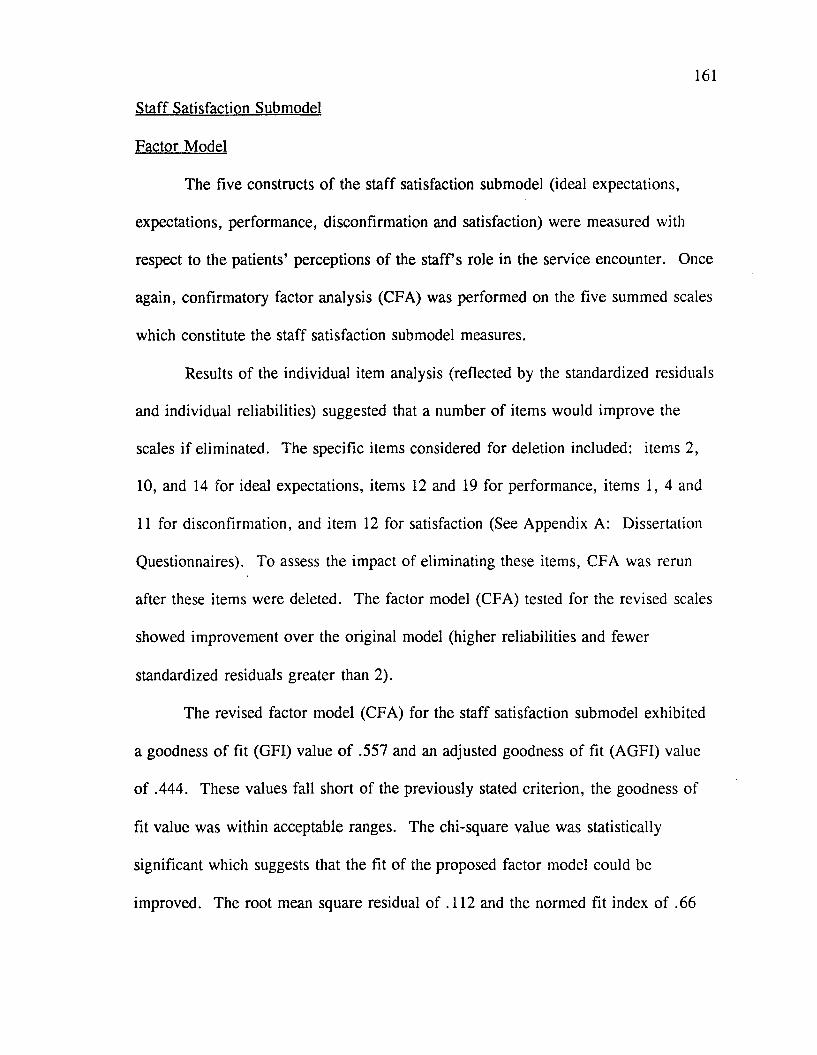
161
Staff Satisfaction Submodel
Factor Model
The five constructs o f the staff satisfaction submodel (ideal expectations,
expectations, performance, disconfirmation and satisfaction) were measured with
respect to the patients’ perceptions o f the s ta ffs role in the service encounter. Once
again, confirmatory factor analysis (CFA) was performed on the five summed scales
which constitute the staff satisfaction submodel measures.
Results of the individual item analysis (reflected by the standardized residuals
and individual reliabilities) suggested that a number o f items would improve the
scales if eliminated. The specific items considered for deletion included: items 2,
10, and 14 for ideal expectations, items 12 and 19 for performance, items 1, 4 and
11 for disconfirmation, and item 12 for satisfaction (See Appendix A: Dissertation
Questionnaires). To assess the impact of eliminating these items, CFA was rerun
after these items were deleted. The factor model (CFA) tested for the revised scales
showed improvement over the original model (higher reliabilities and fewer
standardized residuals greater than 2).
The revised factor model (CFA) for the staff satisfaction submodel exhibited
a goodness o f fit (GFI) value o f .557 and an adjusted goodness o f fit (AGFI) value
o f .444. These values fall short of the previously stated criterion, the goodness of
fit value was within acceptable ranges. The chi-square value was statistically
significant which suggests that the fit of the proposed factor model could be
improved. The root mean square residual of .112 and the normed fit index of .66

162
both fall short o f the criteria specified for these indices.
The item reliabilities and factor loadings from the CFA for the 5 scales are
presented in Table 4.7. Construct reliabilities and global measures of fit for the
staff satisfaction factor model are also contained in Table 4.7.
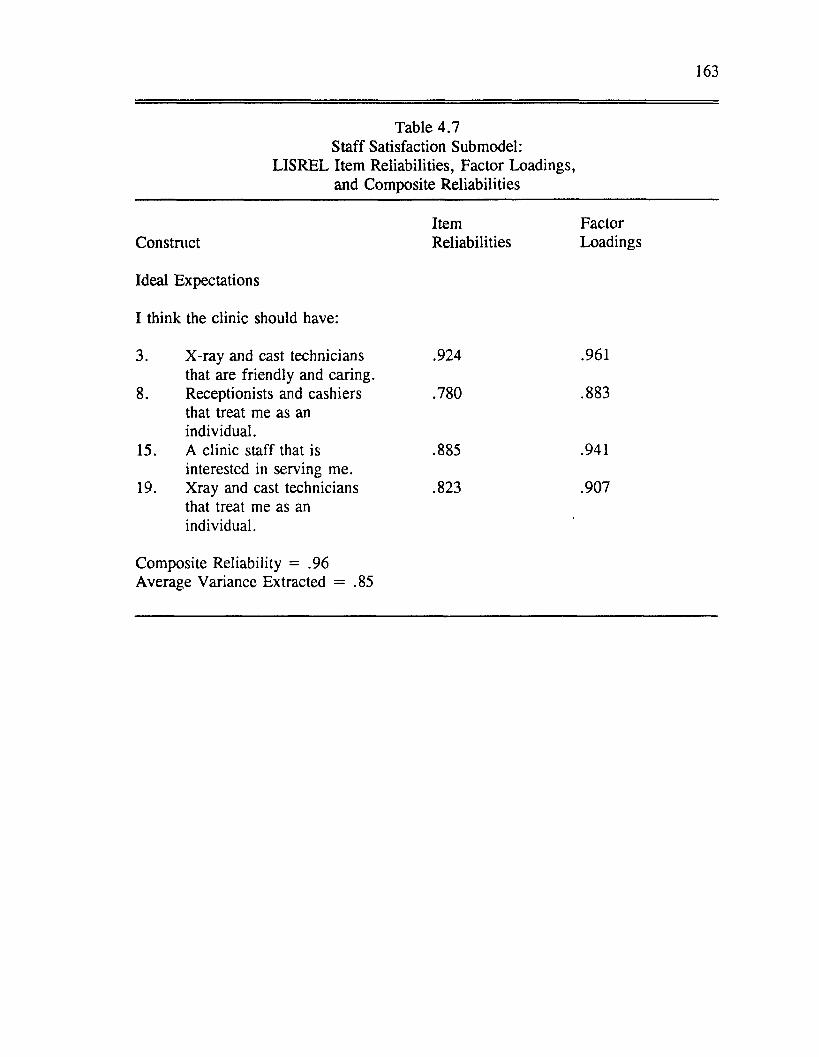
163
Table 4.7 Staff Satisfaction Submodel:
LISREL Item Reliabilities, Factor Loadings, and Composite Reliabilities
Item FactorConstnict Reliabilities Loadings
Ideal Expectations
I think the clinic should have:
3. X-ray and cast technicians .924 .961that are friendly and caring.
8. Receptionists and cashiers .780 .883that treat me as anindividual.
15. A clinic staff that is .885 .941interested in serving me.
19. Xray and cast technicians .823 .907that treat me as anindividual.
Composite Reliability = .96Average Variance Extracted = .85
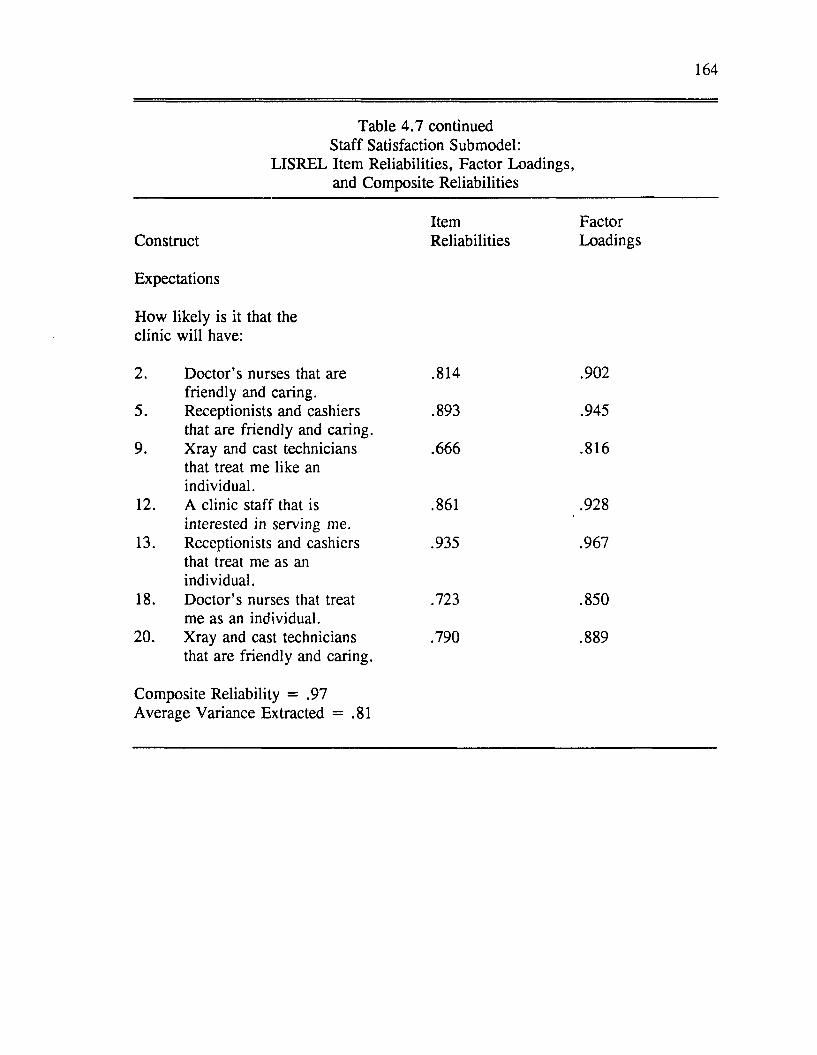
164
Table 4.7 continued Staff Satisfaction Submodel:
LISREL Item Reliabilities, Factor Loadings, and Composite Reliabilities
Item FactorConstruct Reliabilities Loadings
Expectations
How likely is it that the clinic will have:
2. Doctor’s nurses that are .814 .902friendly and caring.
5. Receptionists and cashiers .893 .945that are friendly and caring.
9. Xray and cast technicians .666 .816that treat me like an individual.
12. A clinic staff that is .861 .928interested in serving me.
13. Receptionists and cashiers .935 .967that treat me as anindividual.
18. Doctor’s nurses that treat .723 .850me as an individual.
20. Xray and cast technicians .790 .889that are friendly and caring.
Composite Reliability = .97Average Variance Extracted = .81
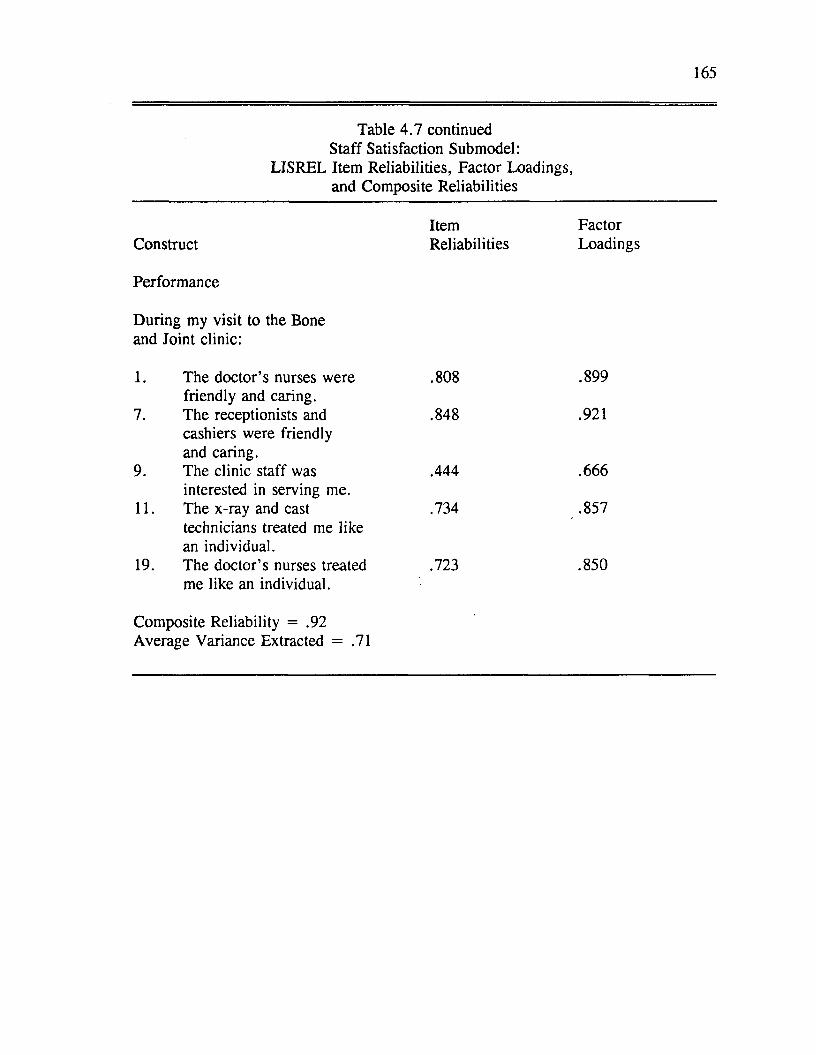
165
Table 4 .7 continued Staff Satisfaction Submodel:
LISREL Item Reliabilities, Factor Loadings, and Composite Reliabilities
Item FactorConstruct Reliabilities Loadings
Performance
During my visit to the Boneand Joint clinic:
1. The doctor’s nurses were .808 .899friendly and caring.
7. The receptionists and .848 .921cashiers were friendlyand caring.
9. The clinic staff was .444 .666interested in serving me.
11. The x-ray and cast .734 .857technicians treated me likean individual.
19. The doctor’s nurses treated .723 .850me like an individual.
Composite Reliability = .92Average Variance Extracted = .71
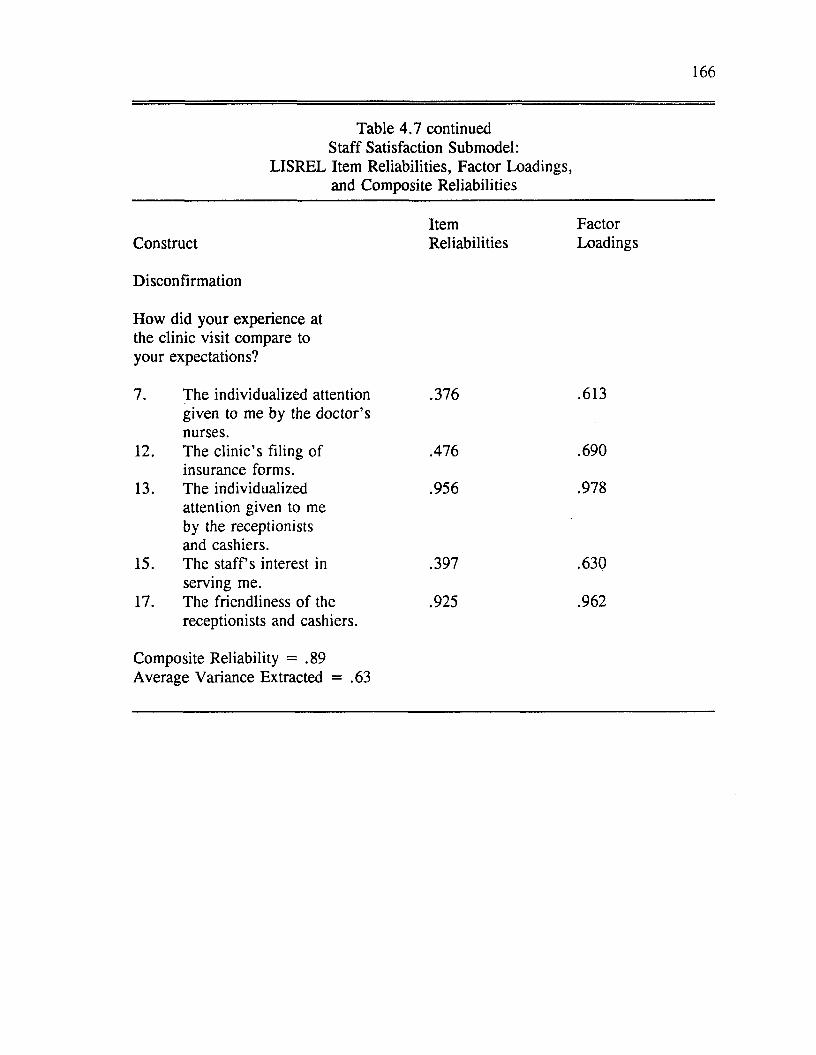
166
Table 4.7 continued Staff Satisfaction Submodel:
LISREL Item Reliabilities, Factor Loadings, and Composite Reliabilities
Item FactorConstruct Reliabilities Loadings
Disconfirmation
How did your experience atthe clinic visit compare toyour expectations?
7. The individualized attention .376given to me by the doctor’s nurses.
12. The clinic’s filing of .476 insurance forms.
13. The individualized .956attention given to me by the receptionists and cashiers.
15. The s ta ffs interest in .397serving me.
17. The friendliness of the .925receptionists and cashiers.
.613
.690
.978
.630
.962
Composite Reliability = .89Average Variance Extracted = .63
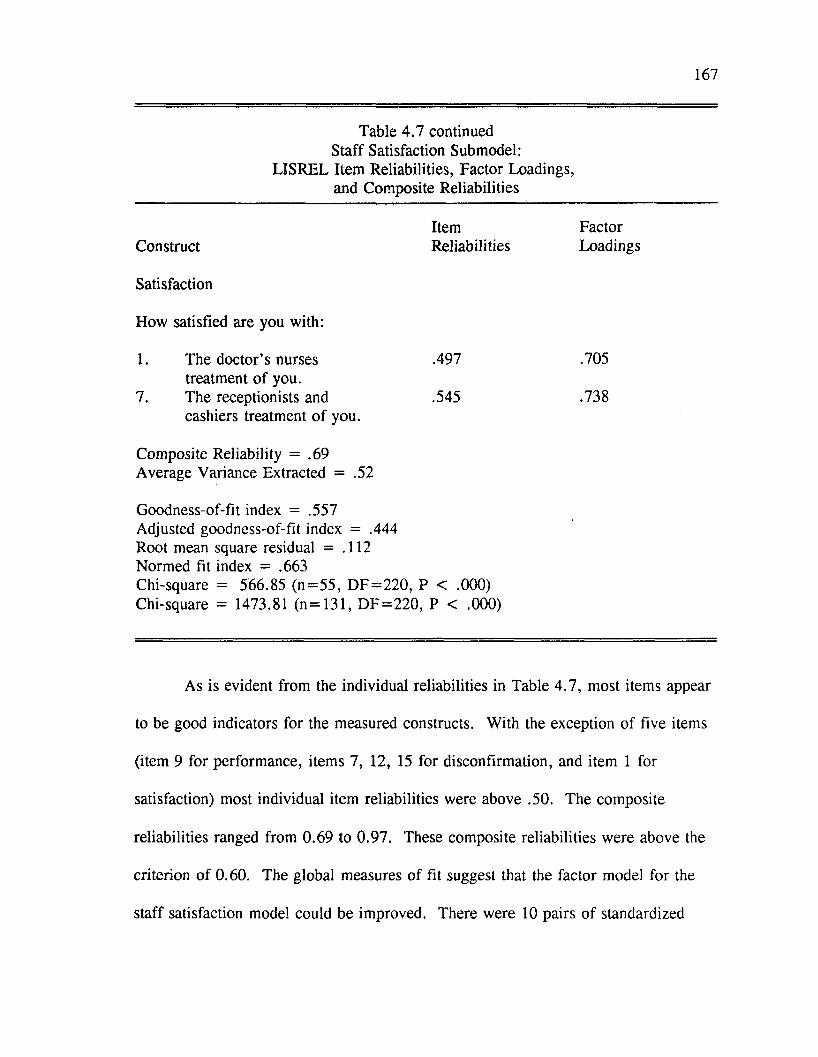
167
Table 4.7 continued Staff Satisfaction Submodel:
LISREL Item Reliabilities, Factor Loadings, and Composite Reliabilities
ConstructItemReliabilities
FactorLoadings
Satisfaction
How satisfied are you with:
1. The doctor’s nurses treatment o f you.
7. The receptionists andcashiers treatment o f you.
.497
.545
.705
.738
Composite Reliability = .69 Average Variance Extracted = .52
Goodness-of-fit index = .557 Adjusted goodness-of-fit index = .444 Root mean square residual = .112 Normed fit index = .663Chi-square = 566.85 (n= 55 , D F = 220 , P < .000) Chi-square = 1473.81 (n = 131, D F = 220 , P < .000)
As is evident from the individual reliabilities in Table 4 .7 , most items appear
to be good indicators for the measured constructs. With the exception of five items
(item 9 for performance, items 7, 12, 15 for disconfirmation, and item 1 for
satisfaction) most individual item reliabilities were above .50. The composite
reliabilities ranged from 0.69 to 0.97. These composite reliabilities were above the
criterion o f 0.60. The global measures of fit suggest that the factor model for the
staff satisfaction model could be improved. There were 10 pairs of standardized
168
residuals between 2 and 3 in magnitude implying the factor model could possess
better internal consistency and unidimensionality. However, the number of
standardized residuals greater than 2 was less than 5% of the total possible pairs.
The results o f the CFA suggest that the scales for the staff submodel possess
reasonable internal consistency and unidimensionality. Although the items for the
staff submodel appear to be moderately reliable measures o f ideal expectations,
expectations, performance, disconfirmation, and satisfaction for the staff’s role, they
are not as strong as the measures for the patient and doctor submodels.
Discriminant Validity
Similar to the patient and doctor submodels, the discriminant validity o f the
staff submodel measures was assessed by comparing the validity (heterotrait-
monomethod) coefficients with the reliability (homotrait-monomethod) coefficients.
For the staff submodel, items measuring ideal expectations, expectations,
disconfirmation, and satisfaction appear to have reasonable discriminant validity.
With the exception o f a few items, the reliability coefficients were higher than the
validity coefficients. The same can not be said for performance. In some cases, the
validity coefficients were higher than the reliability coefficients. This suggests that
the discriminant validity of this measure is questionable. The model will be tested
as hypothesized but the results must be viewed as tentative given the lack o f
evidence of discriminant validity. A discussion of this finding will be presented in
Chapter Five.
169
Structural Equation Model
The hypothesized relationships for the staff satisfaction submodel are
illustrated in Figure 4.5. The significant parameter estimates are shown in Figure
4.6. The standardized parameter estimates and measures of overall model fit for the
staff satisfaction submodel are presented in Table 4.8. The chi-square statistic was
nonsignificant (chi-square = 2.17, degrees o f freedom = 3, p < .569). Other fit
indices were within acceptable ranges (GFI = .983, AGFI = .917, RMSR = .032,
NFI = .981). The fit statistics for the staff satisfaction structural model indicate
that the proposed model fits the data relatively well.
From the information provided in Table 4.8 and Figure 4.6, we can see that
only two of the six hypotheses were supported for the staff satisfaction submodel:
perceived performance was positively influenced by expectations (H2) and
disconfirmation was positively influenced by performance (H3). Performance was
not significantly influenced by ideal expectations as proposed (H I). Satisfaction was
not significantly influenced by expectations (H4), performance (H5) or
disconfirmation (H6) as hypothesized. Although not statistically significant, the size
o f the parameter estimates between performance and satisfaction (.491) and between
disconfirmation and satisfaction (.401) suggest that these relationships may be
worthy of future research attention. Partial support was found for the proposed staff
satisfaction submodel.
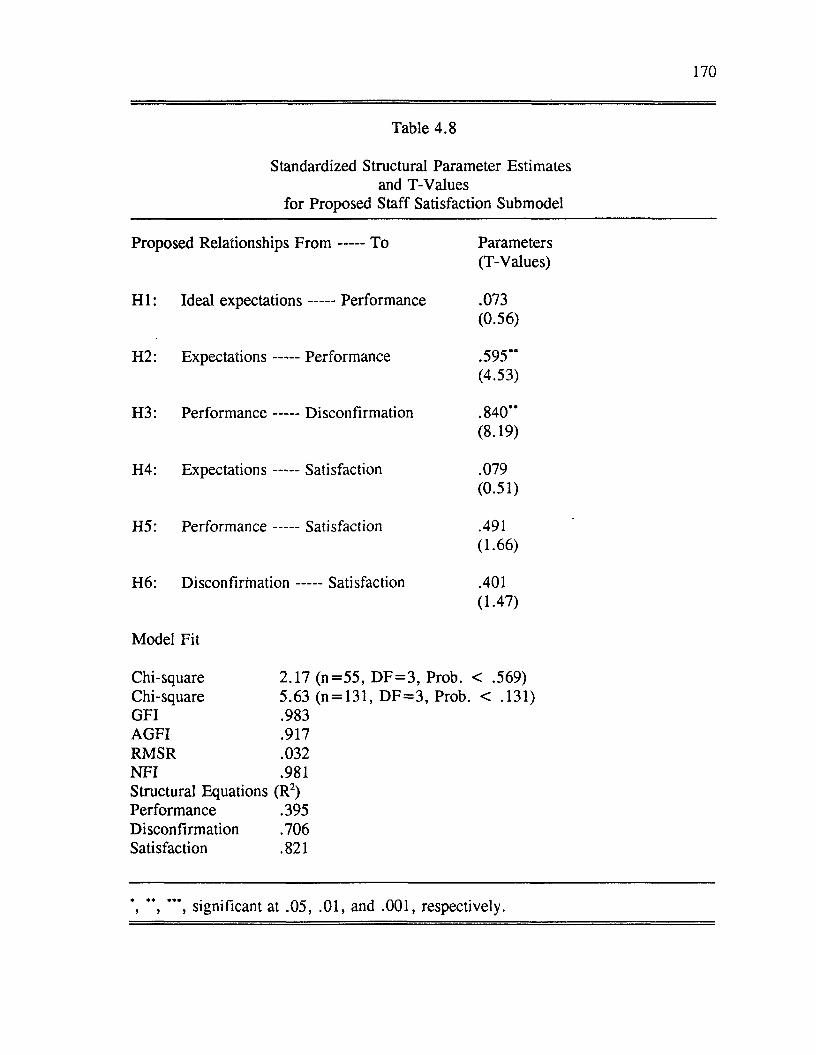
170
Table 4.8
Standardized Structural Parameter Estimates and T-Values
for Proposed Staff Satisfaction Submodel
Proposed Relationships F r o m ----- To Parameters(T-Values)
H I: Ideal expectations----- Performance .073(0.56)
H2: Expectations ----- Performance .595’*(4.53)
H3: Performance ----- Disconfirmation .840”(8.19)
H4: Expectations -----Satisfaction .079(0.51)
H 5: Performance -----Satisfaction .491(1.66)
H6: D isconfirm ation-----Satisfaction .401(1-47)
Model Fit
Chi-square 2.17 (n = 5 5 , D F = 3 , Prob. < .569)Chi-square 5.63 (n = 131, D F = 3 , Prob. < .131)GFI .983AGFI .917RMSR .032N FI .981Structural Equations (R2)Performance .395 Disconfirmation .706 Satisfaction .821
” , ” *, significant at .05, .01, and .001, respectively.

FIGURE 4.5 Staff Submodel:
Hypothesized Relationships
Ideal Expectations: Staff Role Disconfirmation:
v Staff Role /H1 (-) H6(+)
H5(+)Performance: Staff Role
Satisfaction: Staff Role
Expectations: Staff Role
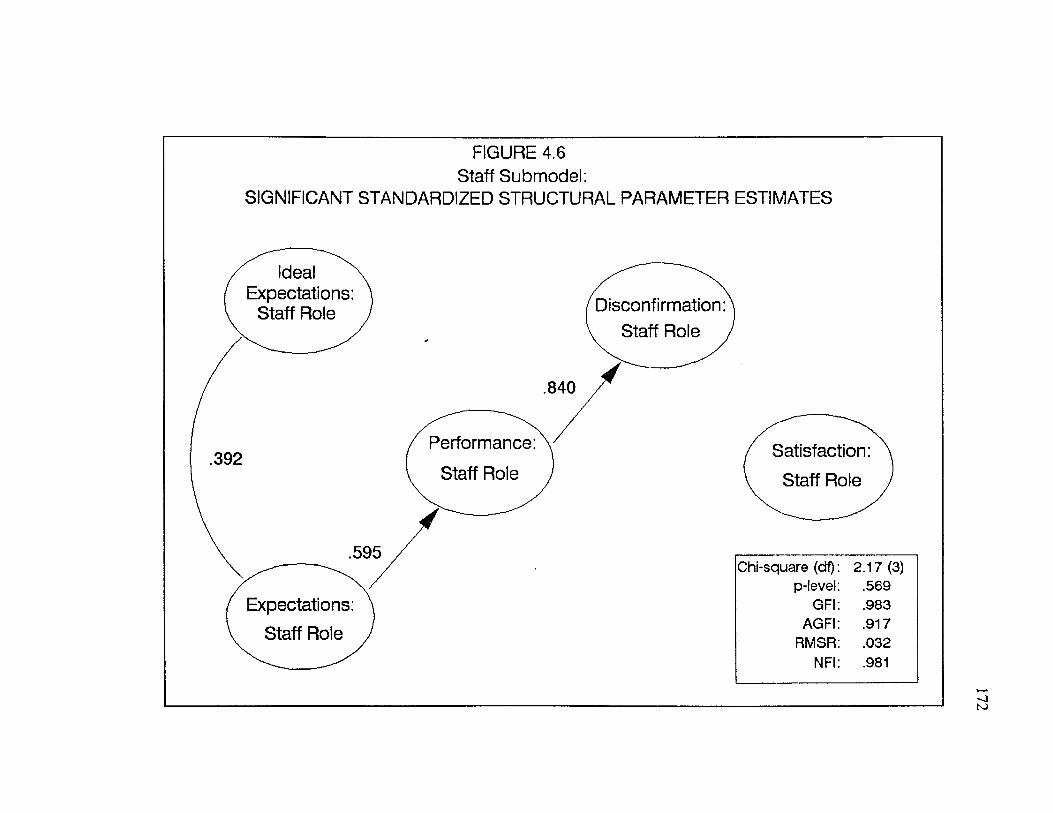
FIGURE 4.6 Staff Submodel:
SIGNIFICANT STANDARDIZED STRUCTURAL PARAMETER ESTIMATES
Ideal Expectations:
Staff Role Disconfirmation Staff Role
Performance: Satisfaction:
Chi-square (df): 2.17 (3) p-level: .569
GFI: .983AGFI: .917
RMSR: .032NFI: .981
Expectations: Staff Role
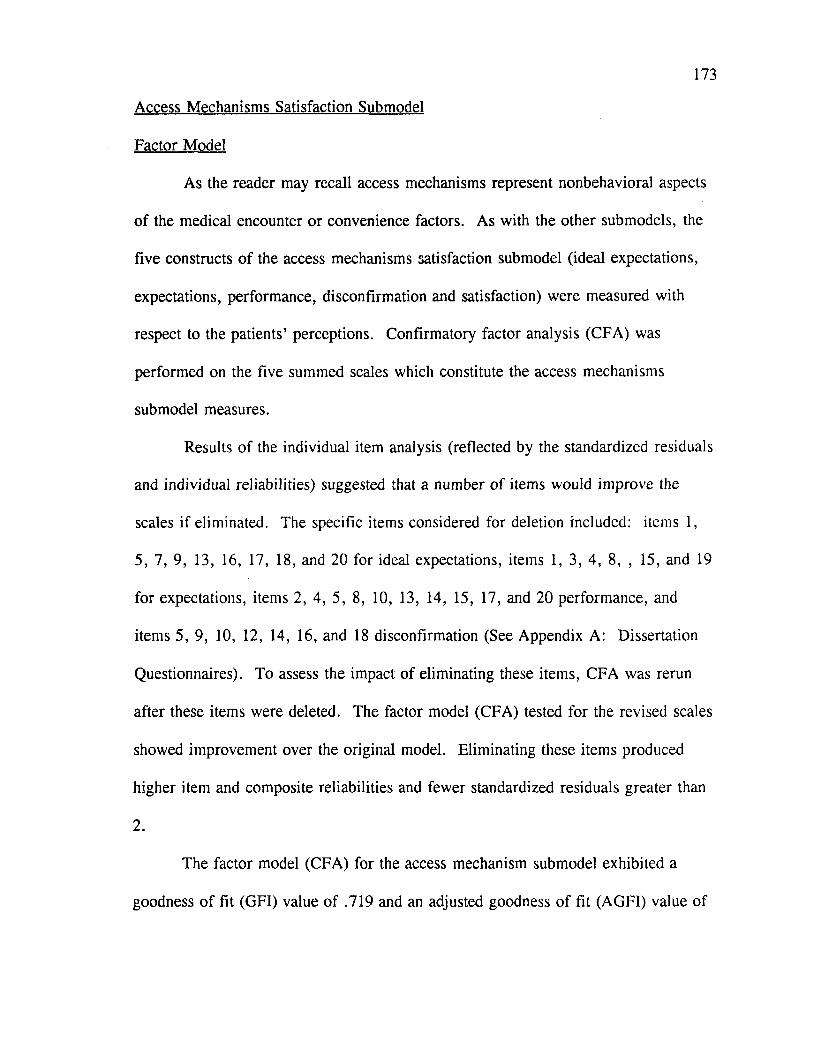
173
Access Mechanisms Satisfaction Submodel
Factor Model
As the reader may recall access mechanisms represent nonbehavioral aspects
o f the medical encounter or convenience factors. As with the other submodels, the
five constructs o f the access mechanisms satisfaction submodel (ideal expectations,
expectations, performance, disconfirmation and satisfaction) were measured with
respect to the patients’ perceptions. Confirmatory factor analysis (CFA) was
performed on the five summed scales which constitute the access mechanisms
submodel measures.
Results o f the individual item analysis (reflected by the standardized residuals
and individual reliabilities) suggested that a number o f items would improve the
scales if eliminated. The specific items considered for deletion included: items 1,
5, 7, 9, 13, 16, 17, 18, and 20 for ideal expectations, items 1, 3, 4, 8, , 15, and 19
for expectations, items 2, 4, 5, 8, 10, 13, 14, 15, 17, and 20 performance, and
items 5, 9, 10, 12, 14, 16, and 18 disconfirmation (See Appendix A: Dissertation
Questionnaires). To assess the impact of eliminating these items, CFA was rerun
after these items were deleted. The factor model (CFA) tested for the revised scales
showed improvement over the original model. Eliminating these items produced
higher item and composite reliabilities and fewer standardized residuals greater than
2 .
The factor model (CFA) for the access mechanism submodel exhibited a
goodness o f fit (GFI) value of .719 and an adjusted goodness o f fit (AGFI) value of
174
.643, both o f which do not meet the prespecified criteria. The chi-square value was
statistically significant which suggests that the fit o f the proposed factor model could
be improved. The root mean square residual o f .085 was within acceptable ranges
but the normed fit index o f .735 fell short o f the criterion (.9).
The item reliabilities and factor loadings from the CFA for the 5 scales are
presented in Table 4.9. Construct reliabilities and global measures o f fit for the
access mechanism satisfaction factor model are also contained in Table 4.9.
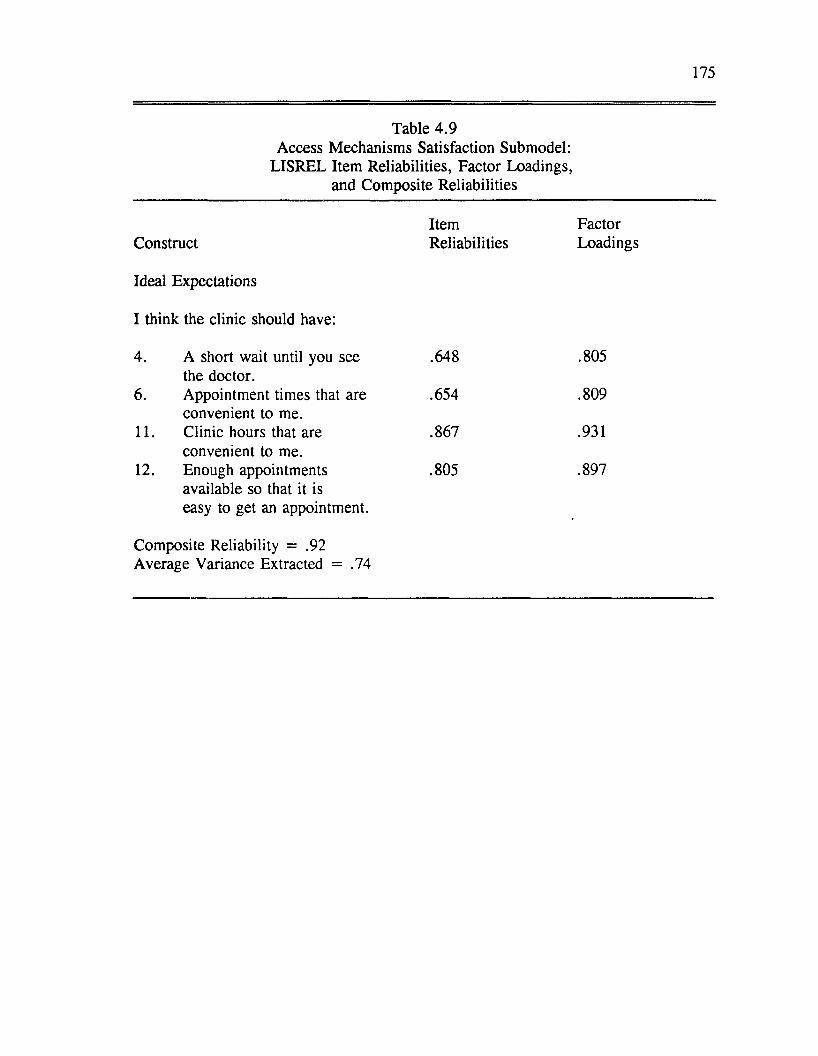
175
Table 4.9Access Mechanisms Satisfaction Submodel:
LISREL Item Reliabilities, Factor Loadings, and Composite Reliabilities
Item FactorConstruct
Ideal Expectations
I think the clinic should have:
Reliabilities Loadings
4. A short wait until you see the doctor.
.648 .805
6. Appointment times that are convenient to me.
.654 .809
11. Clinic hours that are convenient to me.
.867 .931
12. Enough appointments available so that it is easy to get an appointment.
Composite Reliability = .92 Average Variance Extracted = .74
.805 .897
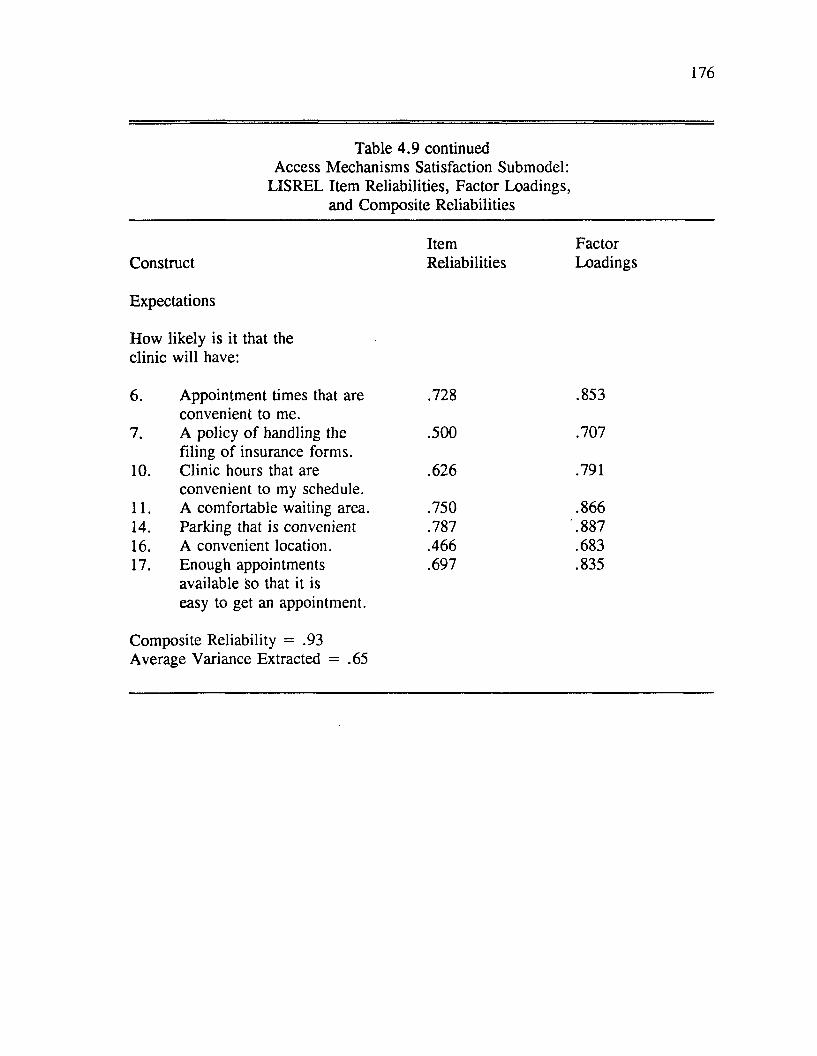
176
Table 4.9 continued Access Mechanisms Satisfaction Submodel:
LISREL Item Reliabilities, Factor Loadings, and Composite Reliabilities
Item FactorConstruct Reliabilities Loadings
Expectations
How likely is it that the clinic will have:
6. Appointment times that are convenient to me.
.728 .853
7. A policy o f handling the filing o f insurance forms.
.500 .707
10. Clinic hours that are convenient to my schedule.
.626 .791
11. A comfortable waiting area. .750 .86614. Parking that is convenient .787 .88716. A convenient location. .466 .68317. Enough appointments
available so that it is easy to get an appointment.
.697 .835
Composite Reliability = .93Average Variance Extracted = .65
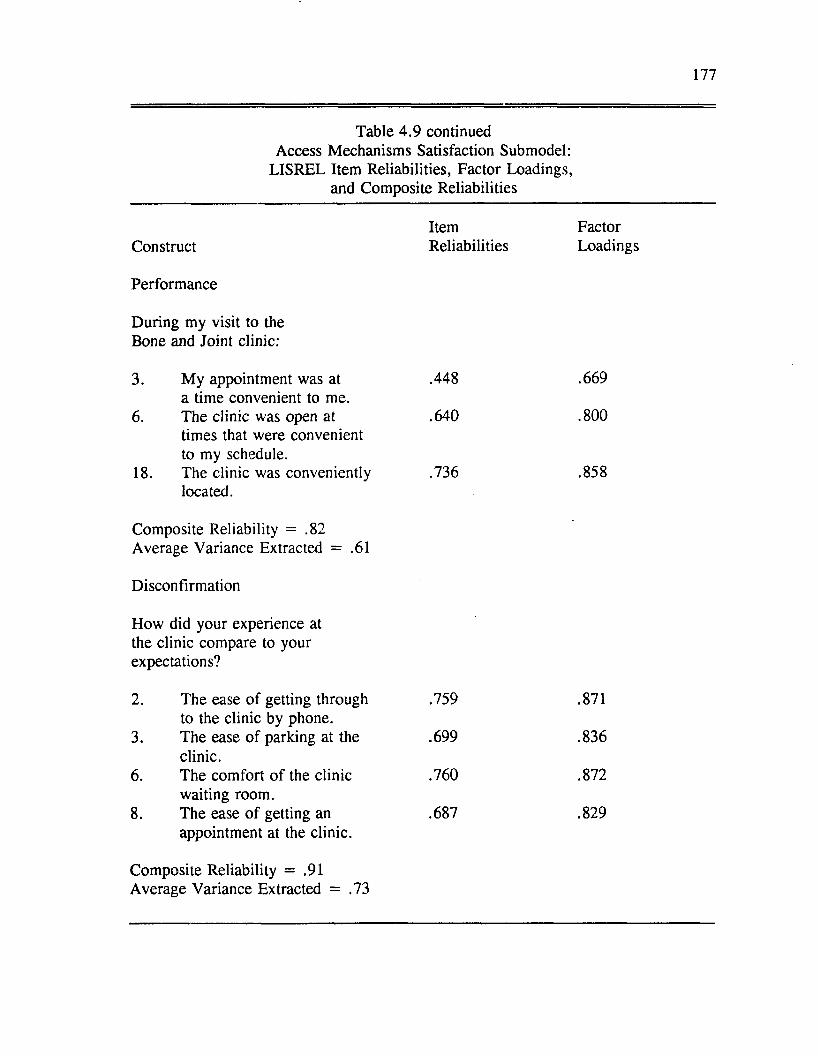
177
Table 4.9 continued Access Mechanisms Satisfaction Submodel:
LISREL Item Reliabilities, Factor Loadings, and Composite Reliabilities
Item FactorConstruct Reliabilities Loadings
Performance
During my visit to theBone and Joint clinic:
3. My appointment was at .448 .669a time convenient to me.
6. The clinic was open at .640 . 800times that were convenient to my schedule.
18. The clinic was conveniently .736 .858located.
Composite Reliability = .82Average Variance Extracted = .61
Disconfirmation
How did your experience at the clinic compare to your expectations?
2. The ease o f getting through to the clinic by phone.
.759 .871
3. The ease o f parking at the clinic.
.699 .836
6. The comfort o f the clinic waiting room.
.760 .872
8. The ease o f getting an appointment at the clinic.
.687 .829
Composite Reliability = .91Average Variance Extracted = .73
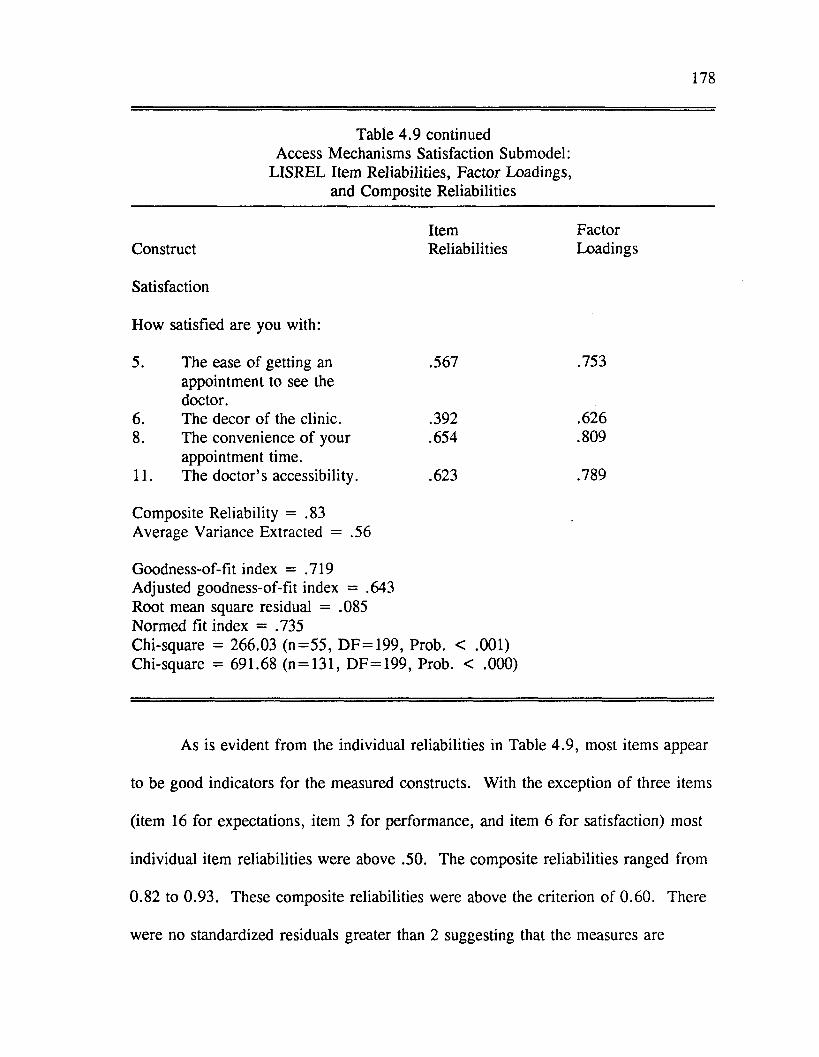
178
Table 4.9 continued Access Mechanisms Satisfaction Submodel:
LISREL Item Reliabilities, Factor Loadings, and Composite Reliabilities
Item FactorConstruct Reliabilities Loadings
Satisfaction
How satisfied are you with:
5. The ease o f getting an appointment to see the doctor.
.567 .753
6. The decor of the clinic. .392 .6268. The convenience o f your
appointment time..654 .809
11. The doctor’s accessibility. .623 .789
Composite Reliability = .83 Average Variance Extracted = .56
Goodness-of-fit index = .719 Adjusted goodness-of-fit index = .643 Root mean square residual = .085 Normed fit index = .735Chi-square = 266.03 (n= 55 , D F = 199 , Prob. < .001) Chi-square = 691.68 (n = 131, DF = 199, Prob. < .000)
As is evident from the individual reliabilities in Table 4 .9 , most items appear
to be good indicators for the measured constructs. With the exception o f three items
(item 16 for expectations, item 3 for performance, and item 6 for satisfaction) most
individual item reliabilities were above .50. The composite reliabilities ranged from
0.82 to 0.93. These composite reliabilities were above the criterion of 0.60. There
were no standardized residuals greater than 2 suggesting that the measures are
179
unidimensional. The results o f the CFA suggest that these scales appear to be fairly
reliable measures o f ideal expectations, expectations, performance, disconfirmation,
and satisfaction for the convenience aspects o f the service encounter. As with the
staff submodel measures, the measures for the access mechanisms submodel are not
as strong as those for the patient and doctor submodels.
Discriminant Validity
As with the other submodels, the discriminant validity o f the access
mechanisms measures was assessed by examining the correlations between items
supposedly measuring the same construct using the same measurement method
(reliability coefficients) and items supposedly measuring different constructs using
the same measurement method (heterotrait-monomethod coefficients). Evidence for
discriminant validity has been previously discussed.
By a visual inspection, items measuring ideal expectations, expectations,
disconfirmation and satisfaction for the access mechanisms submodel appear to
possess good discriminant validity. For the most part, the reliability coefficients for
these measures were significant and higher than the validity coefficients. As with
the other submodels, items measuring performance did not show evidence o f good
discriminant validity. Many o f the validity coefficients were stronger than the
reliability coefficients which suggests a lack o f discriminant validity. Again, the
hypotheses for the access mechanisms model were tested with performance included
in the model. Again, the results were viewed tentatively as discussed in Chapter
Five.
180
Structural Equation Model
The proposed relationships for the access mechanisms submodel are
presented in Figure 4.7. Figure 4.8 shows the significant parameter estimates for
the access mechanisms submodel. The standardized parameter estimates and
measures o f overall model fit for the access mechanisms satisfaction submodel are
presented in Table 4.10. The chi-square statistic was nonsignificant (chi-square =
8.89, degrees o f freedom = 3, p < .031). Several other fit indices were within
acceptable ranges or in the case of the NFI very near the prespecified criterion (GFI
= .935, RMSR = .065, NFI = .893). The AGFI value o f .675 fell short o f the
stated criterion. In general, the fit statistics for the access mechanisms satisfaction
structural model indicate that the proposed model fits the data relatively well.
From the information provided in Table 4.10 and Figure 4.8, we can see that
only two o f the six hypotheses were supported for the access mechanisms
satisfaction submodel: perceived performance was positively influenced by
expectations (H2) and disconfirmation was positively influenced by performance
(H3). Performance was not significantly influenced by ideal expectations as
proposed (H I). Satisfaction was not significantly influenced by expectations (H4),
performance (H5) or disconfirmation (H6) as hypothesized. Thus, the proposed
access mechanisms satisfaction submodel was only partially confirmed.
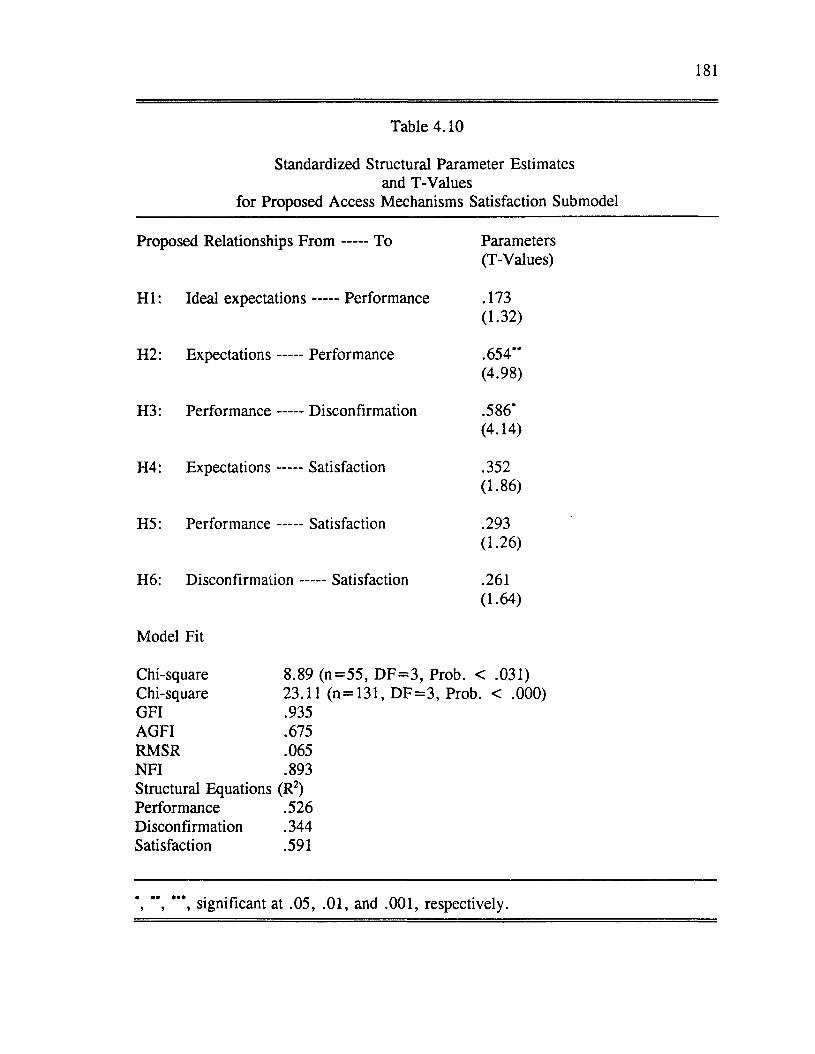
181
Table 4.10
Standardized Structural Parameter Estimates and T-Values
for Proposed Access Mechanisms Satisfaction Submodel
Proposed Relationships F r o m ----- To Parameters(T-Values)
H I: Ideal expectations----- Performance .173(1.32)
H2: Expectations -----Performance .654**(4.98)
H3: Performance -----Disconfirmation .586*(4.14)
H4: Expectations -----Satisfaction .352(1.86)
H5: Performance -----Satisfaction .293(1.26)
H6: D isconfirm ation-----Satisfaction .261(1.64)
Model Fit
Chi-square 8.89 (n= 55 , D F = 3 , Prob. < .031)Chi-square 23.11 (n = 131, D F = 3 , Prob. < .000)GFI .935AGFI .675RMSR .065NFI .893Structural Equations (R2)Performance .526Disconfirmation .344Satisfaction .591
*, **, ***, significant at .05, .01, and .001, respectively.
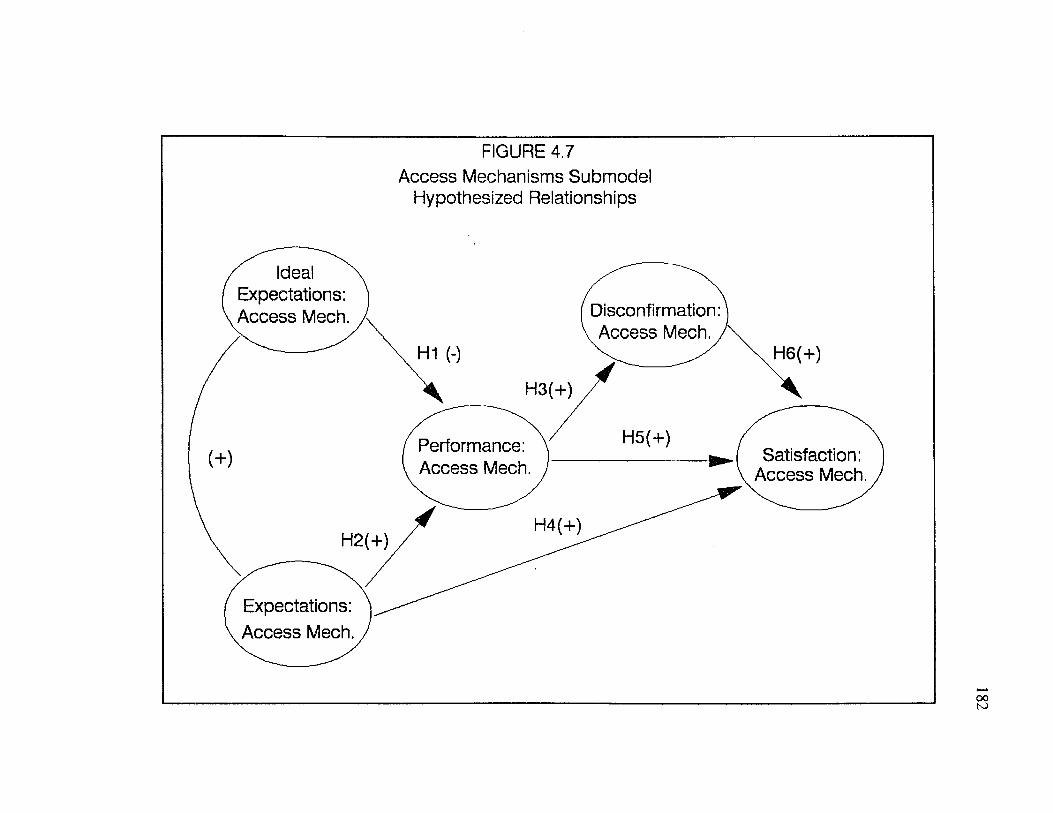
FIGURE 4.7Access Mechanisms Submodel
Hypothesized Relationships
Ideal Expectations: Access Mech. Disconfirmation:
. Access Mech.,H1 (-) H6(+)
H5(+)Performance: Access Mech.
Satisfaction: Access Mech.
H4(+)H2(+)
Expectations: Access Mech.
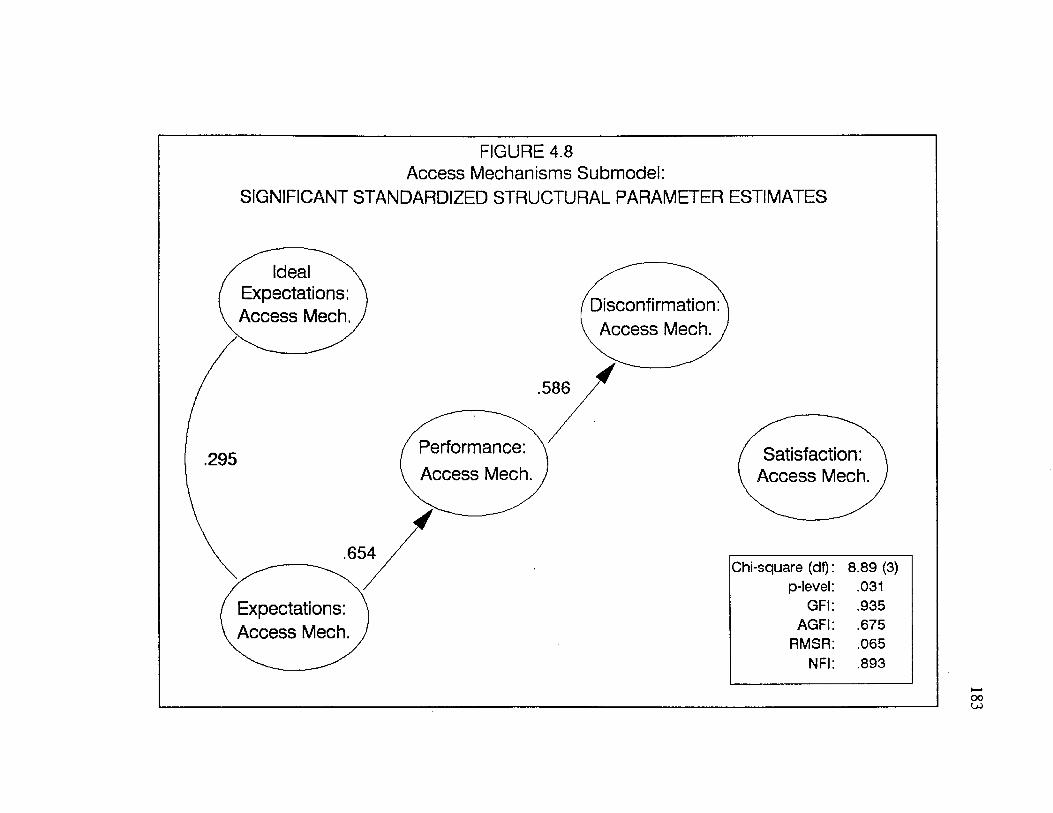
FIGURE 4.8 Access Mechanisms Submodel:
SIGNIFICANT STANDARDIZED STRUCTURAL PARAMETER ESTIMATES
Ideal Expectations: Access Mech. Disconfirmation
Access Mech.
Performance: Access Mech.
Expectations: Access Mech.
Satisfaction: Access Mech.
Chi-square (df) 8.89 (3)p-level .031
GFI .935AGFI .675
RMSR .065NFI .893
184
Overall Model o f Patient Satisfaction
Factor Model
Once the four submodels were evaluated, they were integrated into an overall
model o f patient satisfaction with the service encounter. The purpose of this stage
o f the analysis was to determine the relative influence o f patients’ satisfaction with
their own role, the doctor’s role, the s ta ffs role, and the convenience factors o f the
clinic service on their overall satisfaction with the clinic visit.
Although confirmatory factor analyses were previously performed on the
satisfaction measures during the individual tests o f the submodels, an additional
confirmatory factor analysis was performed on five satisfaction scales: satisfaction
with the patient’s own role, satisfaction with the doctor’s role, satisfaction with the
s ta ffs role, satisfaction with the access mechanisms, and satisfaction with the clinic
visit in general. This was done to determine whether there were unidimensional
measures o f satisfaction with different aspects o f the clinic visit and overall
satisfaction.
The factor model (CFA) for the satisfaction measures exhibited a goodness of
fit (GFI) value o f .700 and an adjusted goodness o f fit (AGFI) value of .650 which
are both short o f the criteria. The chi-square value was statistically nonsignificant
which suggests that the fit o f the proposed factor model was acceptable. The root
mean square residual of .072 was within acceptable ranges but the normed fit index
o f .774 fell short o f the criterion (.9).
The item reliabilities and factor loadings from the CFA for the 5 satisfaction

scales are presented in Table 4.11. Construct reliabilities and global measures of
for the satisfaction scales are also contained in Table 4.11.

186
Table 4.11 Satisfaction Constructs:
LISREL Item Reliabilities, Factor Loadings, and Composite Reliabilities
Item FactorConstruct Reliabilities Loadings
Satisfaction with Patient’s Own Role
How satisfied are you with:
1. The degree to which you .619 .787asked the doctor to explain something you did not understand.
3. The extent to which you .717 .847asked questions duringyour clinic visit.
4. The extent to which you .787 .887expressed your concerns.
5. The extent to which you .490 .700discussed alternativetreatment plans with your doctor.
6. Your ability to express .773 .879your feelings.
7. The extent to which you .733 .856helped your doctor decideon an appropriate treatment plan.
8. The degree to which you .610 .781stated your preferences.
Composite Reliability = .93Average Variance Extracted = .68
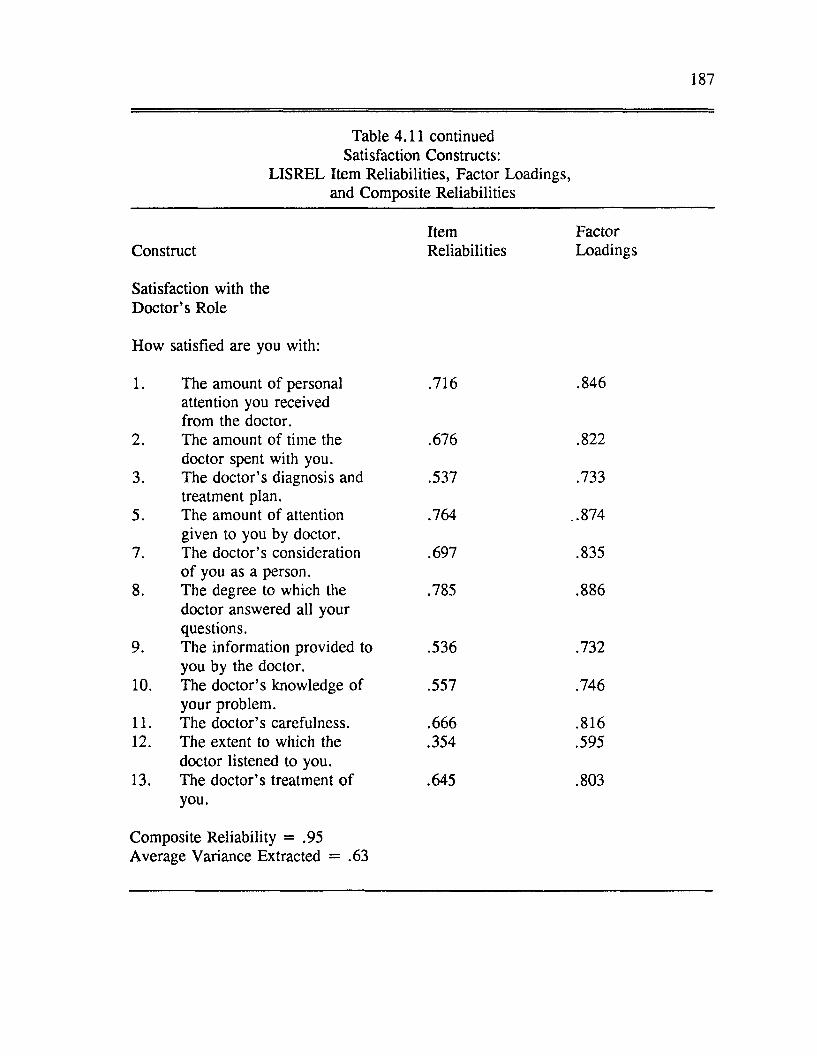
187
Table 4.11 continued Satisfaction Constructs:
LISREL Item Reliabilities, Factor Loadings, and Composite Reliabilities
Item FactorConstruct Reliabilities Loadings
Satisfaction with the D octor’s Role
How satisfied are you with:
1. The amount o f personal .716 .846
2.
attention you received from the doctor.The amount of time the .676 .822
3.doctor spent with you.The doctor’s diagnosis and .537 .733
5.treatment plan.The amount o f attention .764 ..874
7.given to you by doctor. The doctor’s consideration .697 .835
8.o f you as a person.The degree to which the .785 .886
9.
doctor answered all your questions.The information provided to .536 .732
10.you by the doctor.The doctor’s knowledge of .557 .746
11.your problem.The doctor’s carefulness. .666 .816
12. The extent to which the .354 .595
13.doctor listened to you. The doctor’s treatment o f .645 .803you.
Composite Reliability = .95Average Variance Extracted = .63
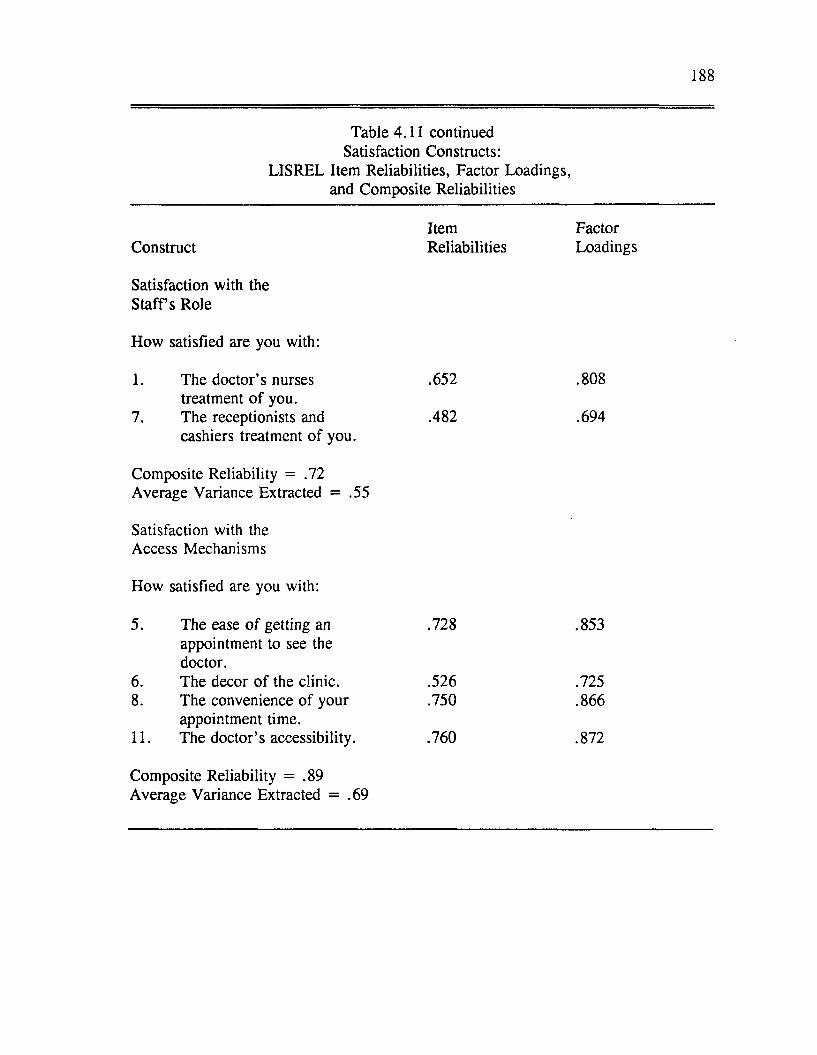
188
Table 4.11 continued Satisfaction Constructs:
LISREL Item Reliabilities, Factor Loadings, and Composite Reliabilities
Item FactorConstruct
Satisfaction with the S ta ffs Role
How satisfied are you with:
Reliabilities Loadings
1. The doctor’s nurses treatment o f you.
.652 .808
7. The receptionists andcashiers treatment o f you.
Composite Reliability = .72 Average Variance Extracted = .55
Satisfaction with the Access Mechanisms
How satisfied are you with:
.482 .694
5. The ease o f getting an appointment to see the doctor.
.728 .853
6. The decor o f the clinic. .526 .7258. The convenience of your
appointment time..750 .866
11. The doctor’s accessibility.
Composite Reliability = .89 Average Variance Extracted = .69
.760 .872
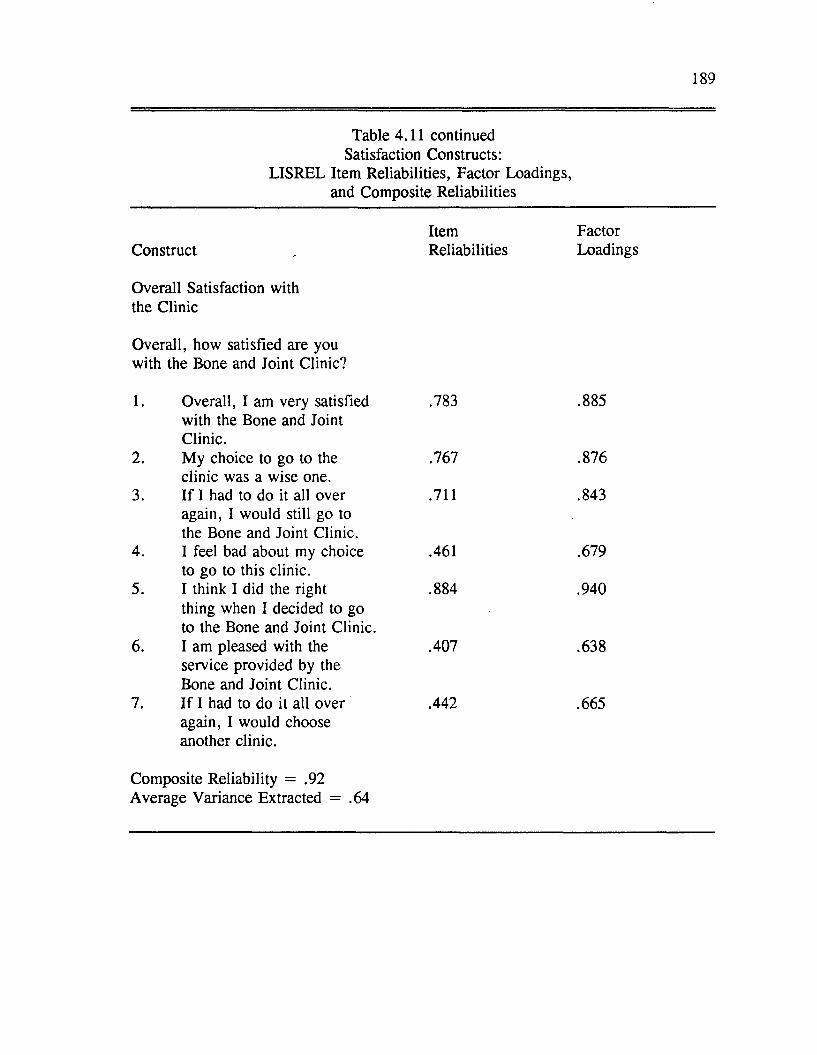
189
Table 4.11 continued Satisfaction Constructs:
LISREL Item Reliabilities, Factor Loadings, and Composite Reliabilities
Item FactorConstruct . Reliabilities Loadings
Overall Satisfaction with the Clinic
Overall, how satisfied are you with the Bone and Joint Clinic?
1. Overall, I am very satisfied .783 .885with the Bone and JointClinic.
2. My choice to go to the .767 .876clinic was a wise one.
3. If I had to do it all over .711 .843again, I would still go tothe Bone and Joint Clinic.
4. I feel bad about my choice .461 .679to go to this clinic.
5. I think I did the right .884 .940thing when I decided to goto the Bone and Joint Clinic.
6. I am pleased with the .407 .638service provided by theBone and Joint Clinic.
7. If I had to do it all over .442 .665again, I would chooseanother clinic.
Composite Reliability = .92Average Variance Extracted = .64
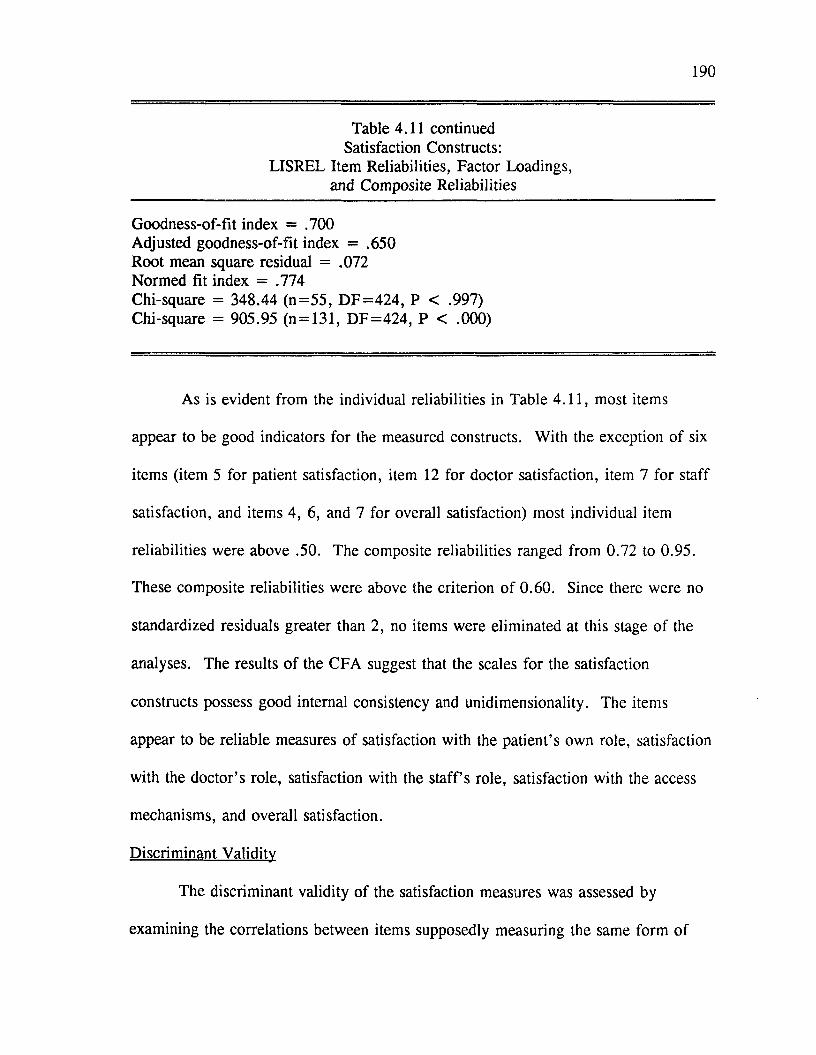
190
Table 4.11 continued Satisfaction Constructs:
LISREL Item Reliabilities, Factor Loadings, and Composite Reliabilities
Goodness-of-fit index = .700 Adjusted goodness-of-fit index = .650 Root mean square residual = .072 Normed fit index = .774Chi-square = 348.44 (n= 55 , D F = 4 2 4 , P < .997) Chi-square = 905.95 (n = 131, D F = 424 , P < .000)
As is evident from the individual reliabilities in Table 4.11, most items
appear to be good indicators for the measured constructs. With the exception of six
items (item 5 for patient satisfaction, item 12 for doctor satisfaction, item 7 for staff
satisfaction, and items 4, 6, and 7 for overall satisfaction) most individual item
reliabilities were above .50. The composite reliabilities ranged from 0.72 to 0.95.
These composite reliabilities were above the criterion o f 0.60. Since there were no
standardized residuals greater than 2, no items were eliminated at this stage of the
analyses. The results o f the CFA suggest that the scales for the satisfaction
constructs possess good internal consistency and unidimensionality. The items
appear to be reliable measures of satisfaction with the patient’s own role, satisfaction
with the doctor’s role, satisfaction with the s ta ffs role, satisfaction with the access
mechanisms, and overall satisfaction.
Discriminant Validity
The discriminant validity o f the satisfaction measures was assessed by
examining the correlations between items supposedly measuring the same form of
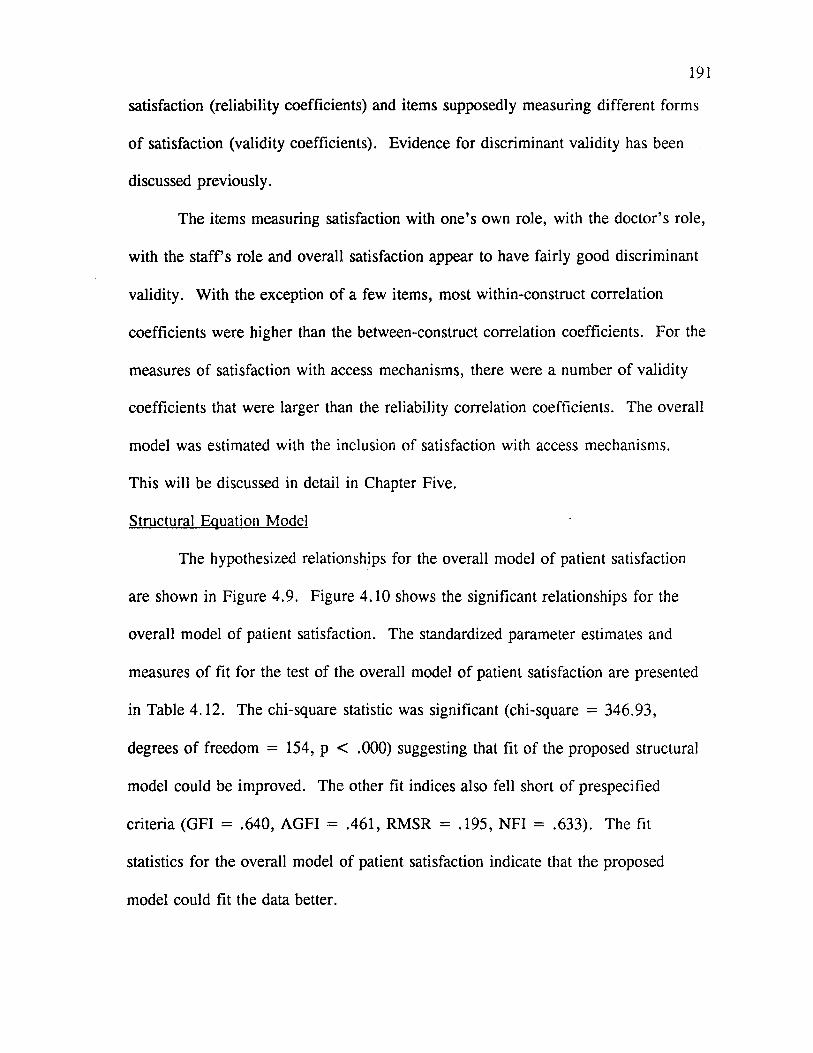
191
satisfaction (reliability coefficients) and items supposedly measuring different forms
o f satisfaction (validity coefficients). Evidence for discriminant validity has been
discussed previously.
The items measuring satisfaction with one’s own role, with the doctor’s role,
with the s ta ffs role and overall satisfaction appear to have fairly good discriminant
validity. With the exception o f a few items, most within-construct correlation
coefficients were higher than the between-construct correlation coefficients. For the
measures o f satisfaction with access mechanisms, there were a number o f validity
coefficients that were larger than the reliability correlation coefficients. The overall
model was estimated with the inclusion of satisfaction with access mechanisms.
This will be discussed in detail in Chapter Five.
Structural Equation Model
The hypothesized relationships for the overall model o f patient satisfaction
are shown in Figure 4.9. Figure 4.10 shows the significant relationships for the
overall model of patient satisfaction. The standardized parameter estimates and
measures o f fit for the test o f the overall model o f patient satisfaction are presented
in Table 4.12. The chi-square statistic was significant (chi-square = 346.93,
degrees o f freedom = 154, p < .000) suggesting that fit of the proposed structural
model could be improved. The other fit indices also fell short of prespecified
criteria (GFI = .640, AGFI = .461, RMSR = .195, NFI = .633). The fit
statistics for the overall model o f patient satisfaction indicate that the proposed
model could fit the data better.
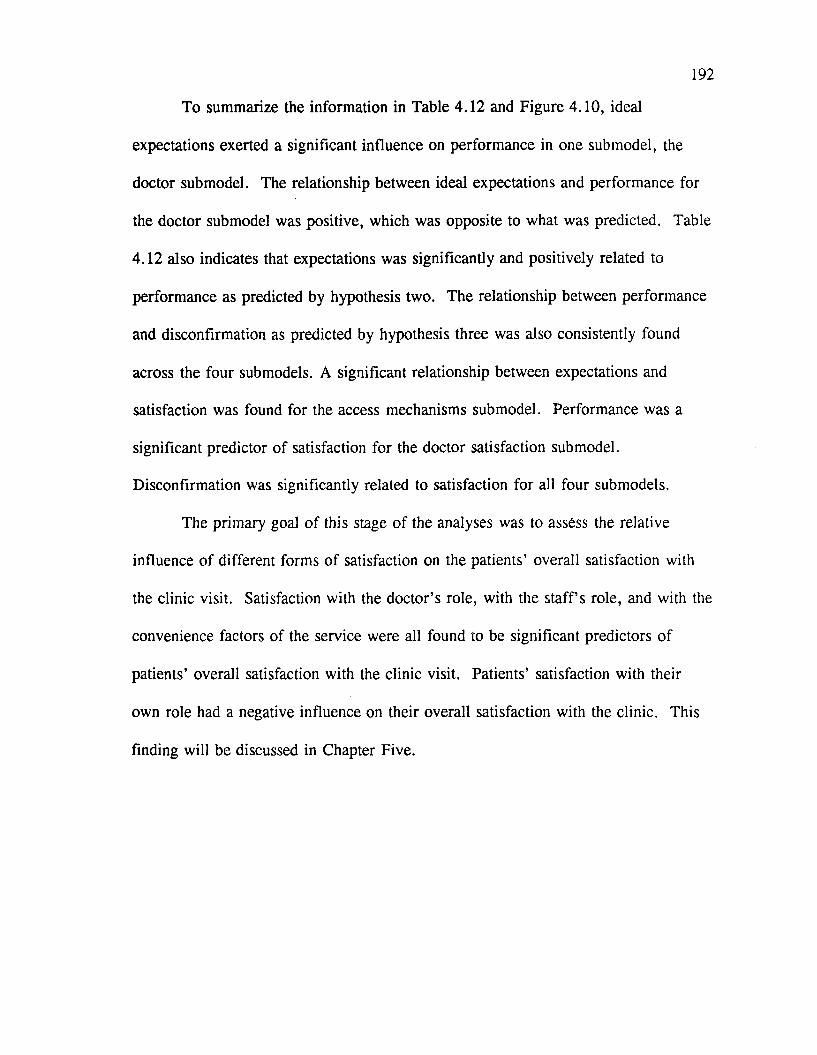
192
To summarize the information in Table 4.12 and Figure 4.10, ideal
expectations exerted a significant influence on performance in one submodel, the
doctor submodel. The relationship between ideal expectations and performance for
the doctor submodel was positive, which was opposite to what was predicted. Table
4.12 also indicates that expectations was significantly and positively related to
performance as predicted by hypothesis two. The relationship between performance
and disconfirmation as predicted by hypothesis three was also consistently found
across the four submodels. A significant relationship between expectations and
satisfaction was found for the access mechanisms submodel. Performance was a
significant predictor o f satisfaction for the doctor satisfaction submodel.
Disconfirmation was significantly related to satisfaction for all four submodels.
The primary goal of this stage o f the analyses was to assess the relative
influence of different forms of satisfaction on the patients’ overall satisfaction with
the clinic visit. Satisfaction with the doctor’s role, with the staff’s role, and with the
convenience factors of the service were all found to be significant predictors of
patients’ overall satisfaction with the clinic visit. Patients’ satisfaction with their
own role had a negative influence on their overall satisfaction with the clinic. This
finding will be discussed in Chapter Five.
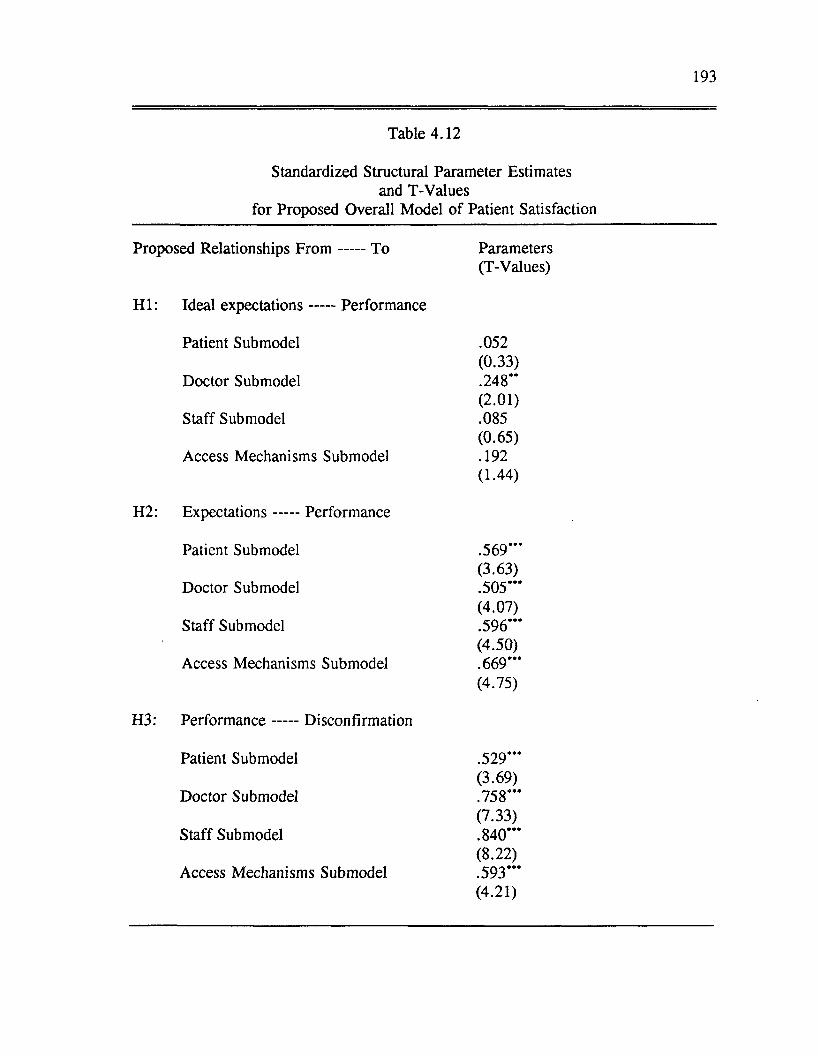
193
Table 4.12
Standardized Structural Parameter Estimates and T-Values
for Proposed Overall Model o f Patient Satisfaction
Proposed Relationships F ro m To Parameters(T-Values)
H I: Ideal expectations------ Performance
Patient Submodel .052(0.33)
Doctor Submodel .248**(2 .01)
Staff Submodel .085(0.65)
Access Mechanisms Submodel .192(1.44)
H2: Expectations------ Performance
Patient Submodel .569*’*(3.63)
Doctor Submodel .505***(4.07)
Staff Submodel .596*’*(4.50)
Access Mechanisms Submodel .669***(4.75)
H3: Perform ance------ Disconfirmation
Patient Submodel .529***(3.69)
Doctor Submodel .758***(7.33)
Staff Submodel .840*“(8 .22)
Access Mechanisms Submodel .593***(4.21)
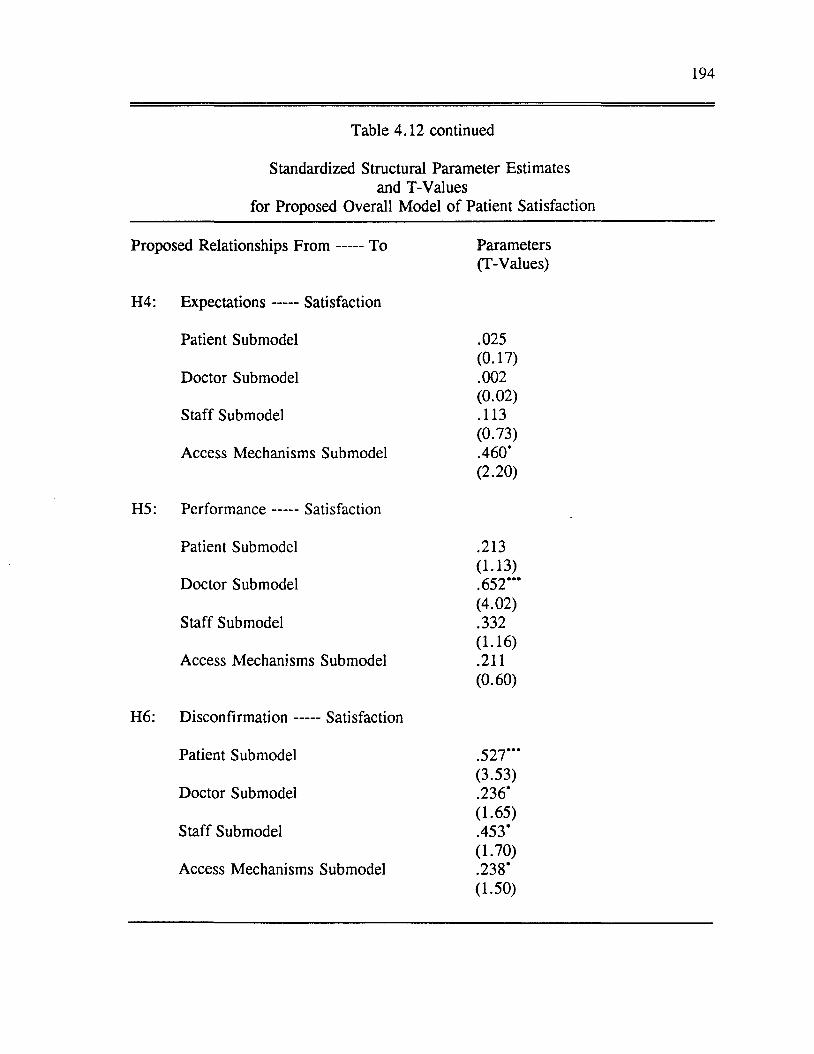
194
Table 4.12 continued
Standardized Structural Parameter Estimates and T-Values
for Proposed Overall Model o f Patient Satisfaction
Proposed Relationships F ro m To Parameters(T-Values)
H4: Expectations------ Satisfaction
Patient Submodel .025(0.17)
Doctor Submodel .002(0 .02)
Staff Submodel .113(0.73)
Access Mechanisms Submodel .460*
H5: Perform ance........ Satisfaction
(2 .20)
Patient Submodel .213(1.13)
Doctor Submodel .652***(4.02)
Staff Submodel .332(1.16)
Access Mechanisms Submodel .211(0.60)
H6: D isconfirm ation------ Satisfaction
Patient Submodel .527***(3.53)
Doctor Submodel .236*(1.65)
Staff Submodel .453’(1.70)
Access Mechanisms Submodel .238*(1.50)
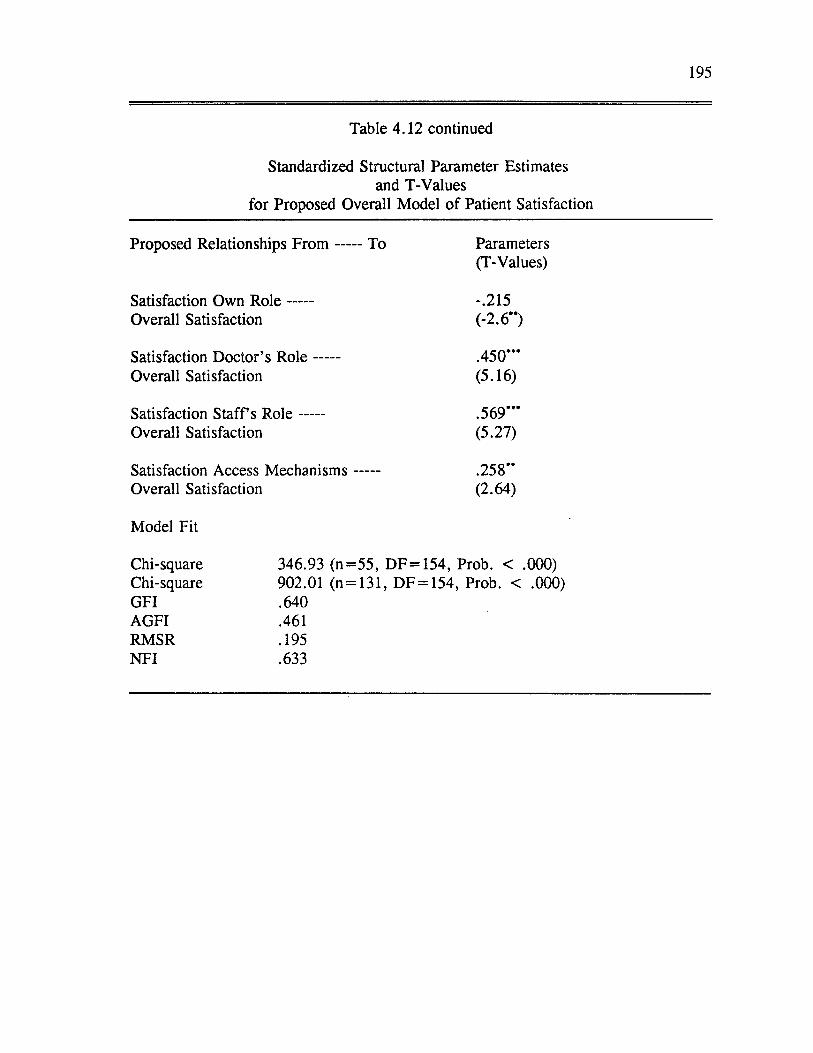
195
Table 4.12 continued
Standardized Structural Parameter Estimates and T-Values
for Proposed Overall Model o f Patient Satisfaction
Proposed Relationships F ro m To Parameters(T-Values)
Satisfaction Own R o le -.215Overall Satisfaction (-2.6**)
Satisfaction Doctor’s R o le .450***Overall Satisfaction (5.16)
Satisfaction S ta ffs R o le .569*’*Overall Satisfaction (5.27)
Satisfaction Access M echanism s .258”Overall Satisfaction (2.64)
Model Fit
Chi-square 346.93 (n= 55 , DF = 154, Prob. < .000)Chi-square 902.01 (n = 131, DF = 154, Prob. < .000)GFI .640AGFI .461RMSR .195NFI .633
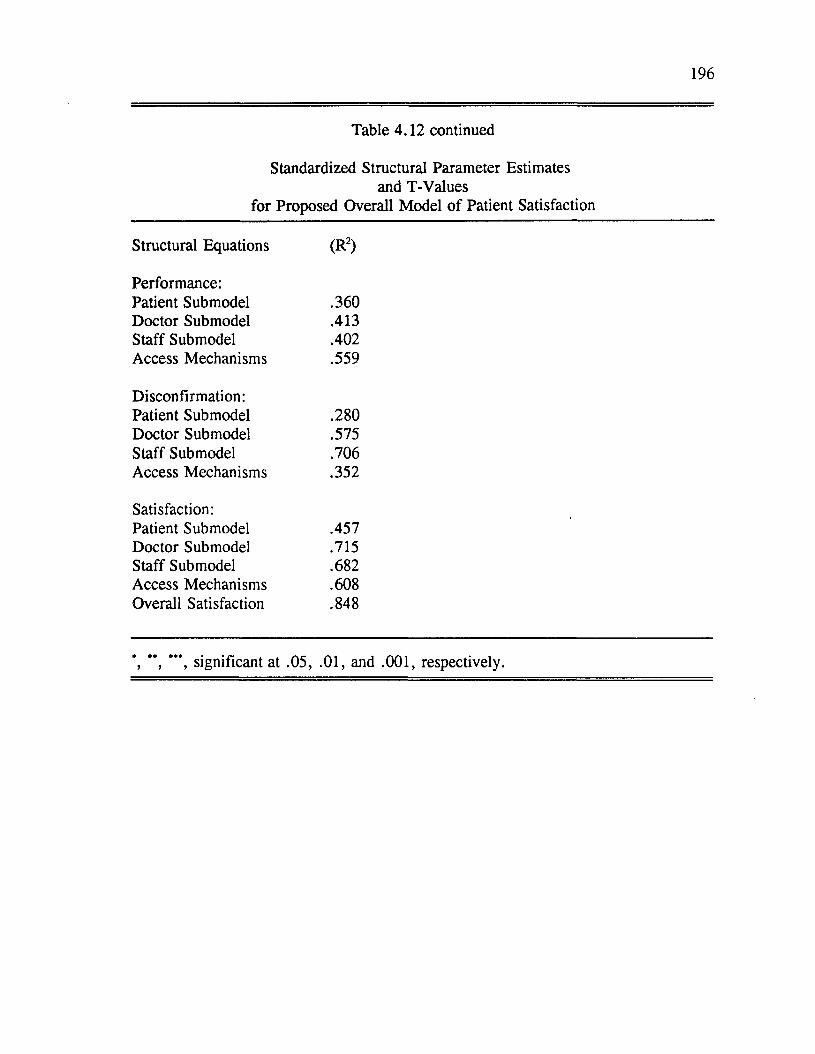
196
Table 4.12 continued
Standardized Structural Parameter Estimates and T-Values
for Proposed Overall Model o f Patient Satisfaction
Structural Equations (R2)
Performance:Patient Submodel .360Doctor Submodel .413Staff Submodel .402Access Mechanisms .559
Disconfirmation:Patient Submodel .280Doctor Submodel .575Staff Submodel .706Access Mechanisms .352
Satisfaction:Patient Submodel .457Doctor Submodel .715Staff Submodel .682Access Mechanisms .608Overall Satisfaction .848
**, ***, significant at .05, .01, and .001, respectively.
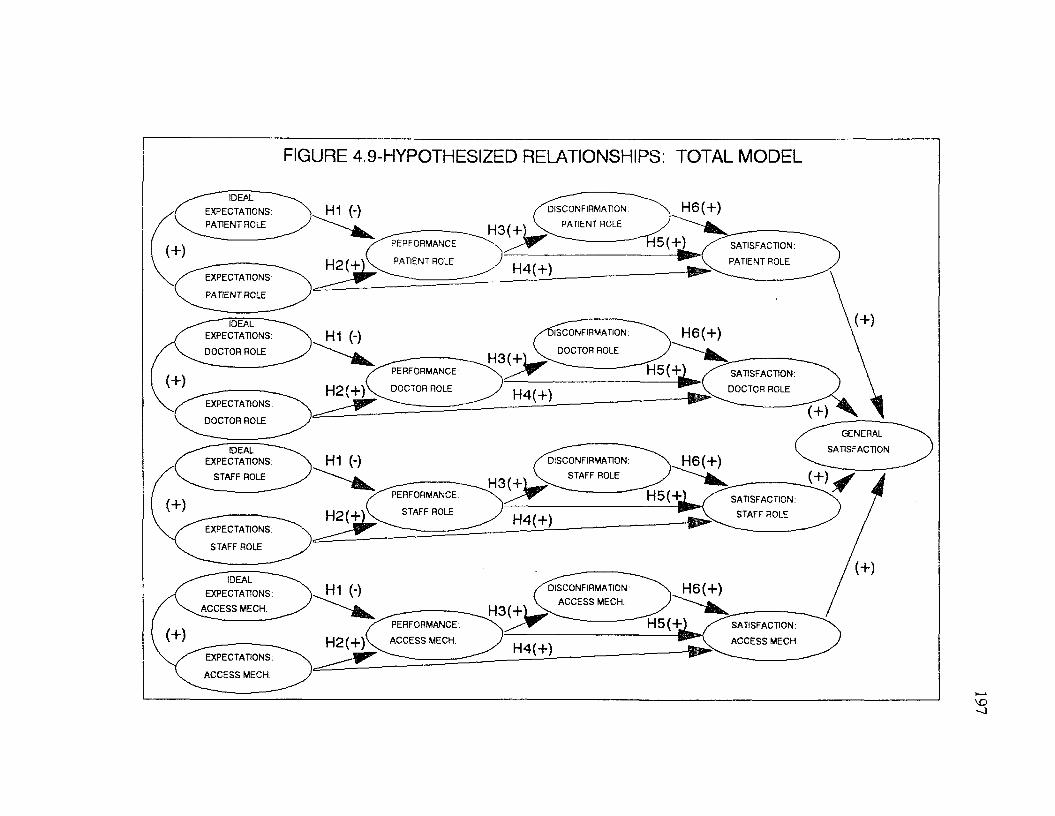
FIGURE 4.9-HYPOTHESIZED RELATIONSHIPS: TOTAL MODEL
IDEAL
EXPECTATIONS:
PATIENT ROLE
H 6(+)H1 (-) DISCONFIRMATION:
PATIENT ROLE
5(+)PERFORMANCE SATISFACTION:
PATIENT ROLEPATIENT ROLEH2(+' H 4(+)EXPECTATIONS:
PATIENT ROLE
IDEALEXPECTATIONS:
DOCTOR ROLE
H 6(+)IISCONFIRMATION.H1 (-)DOCTOR ROLE
H 5 (+PERFORMANCE SATISFACTION:
DOCTOR ROLE(+)H 2(+) DOCTOR ROLE H 4(+)
EXPECTATIONS:(+)
DOCTOR ROLE
GENERAL
SATISFACTIONIDEALEXPECTATIONS:
STAFF ROLE
H1 (-) H 6(+)DISCONFIRMATION:
STAFF ROLE
H5(+aPERFORMANCE: SATISFACTION:
STAFF ROLE(+) STAFF ROLE
H 2 ( t H 4(+)EXPECTATIONS:
STAFF ROLE
IDEAL
EXPECTATIONS:
A C CESS MECH.
H6(+)H1 (-) DISCONFIRMATION:
ACCESS MECH.
H 5 (+PERFORMANCE.
A C CESS MECH.
SATISFACTION:
A C CESS MECH.H2(+y H 4(+)EXPECTATIONS:
AC CESS MECH.
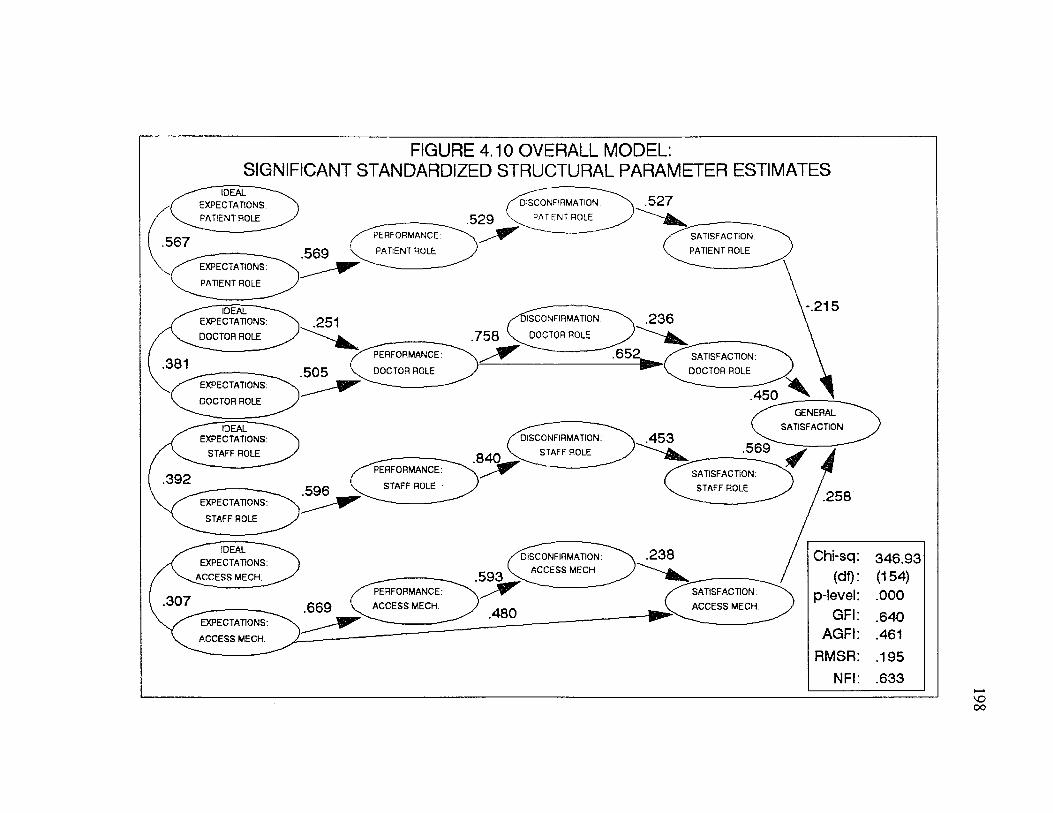
FIGURE 4.10 OVERALL MODEL:SIGNIFICANT STANDARDIZED STRUCTURAL PARAMETER ESTIMATES
IDEAL EXPECTATIONS
PATIENT ROLE
.567
EXPECTATIONS
PATIENT ROLE
IDEAL EXPECTATIONS:
DOCTOR ROLE
EXPECTATIONS
DOCTOR ROLE
IDEAL EXPECTATION!
STAFF ROLE
EXPECTATION
STAFF ROLE
IDEAL
EXPECTATIONS
AC C E SS MECH.
EXPECTATIONS
AC C E SS MECH.
DISCONFIRMATION
PATIENT ROLE
PERFORMANCE
PATIENT ROLE
SATISFACTION
PATIENT ROLE
ISCONFIRMATION
758 V DOCTOR ROLE
PERFORMANCE
DOCTOR ROLE
SATISFACTION
DOCTOR ROLE
GENERAL
SATISFACTIONDISCONFIRMATION
STAFF ROLE
PERFORMANCE
STAFF ROLESATISFACTION
STAFF ROLE
DISCONFIRMATION
ACCESS MECH.
PERFORMANCE:
ACCESS M ECH
SATISFACTION
AC C E SS M ECH
Chi-sq 346.93(df) (154)
p-level .000GFI .640
AGFI .461RMSR .195
NFI .633
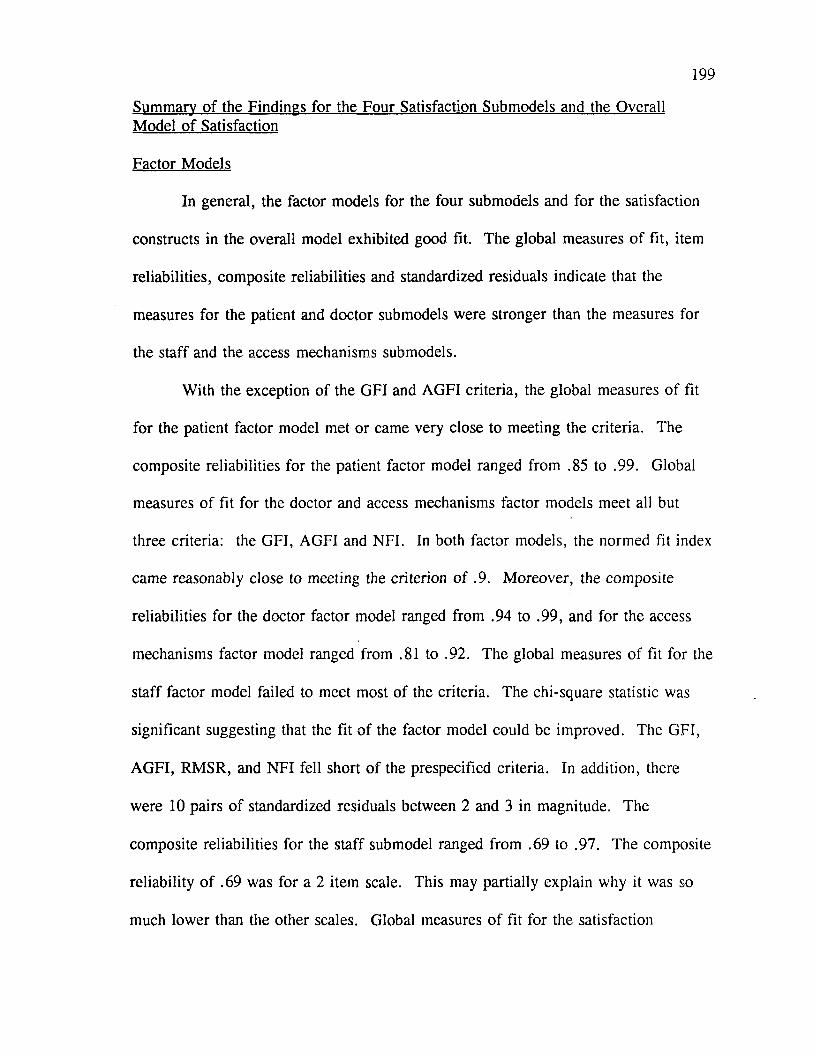
199
Summary o f the Findings for the Four Satisfaction Submodels and the Overall Model o f Satisfaction
Factor Models
In general, the factor models for the four submodels and for the satisfaction
constructs in the overall model exhibited good fit. The global measures o f fit, item
reliabilities, composite reliabilities and standardized residuals indicate that the
measures for the patient and doctor submodels were stronger than the measures for
the staff and the access mechanisms submodels.
With the exception of the GFI and AGFI criteria, the global measures of fit
for the patient factor model met or came very close to meeting the criteria. The
composite reliabilities for the patient factor model ranged from .85 to .99. Global
measures of fit for the doctor and access mechanisms factor models meet all but
three criteria: the GFI, AGFI and NFI. In both factor models, the normed fit index
came reasonably close to meeting the criterion of .9. M oreover, the composite
reliabilities for the doctor factor model ranged from .94 to .99, and for the access
mechanisms factor model ranged from .81 to .92. The global measures of fit for the
staff factor model failed to meet most of the criteria. The chi-square statistic was
significant suggesting that the fit o f the factor model could be improved. The GFI,
AGFI, RMSR, and NFI fell short of the prespecified criteria. In addition, there
were 10 pairs o f standardized residuals between 2 and 3 in magnitude. The
composite reliabilities for the staff submodel ranged from .69 to .97. The composite
reliability o f .69 was for a 2 item scale. This may partially explain why it was so
much lower than the other scales. Global measures o f fit for the satisfaction
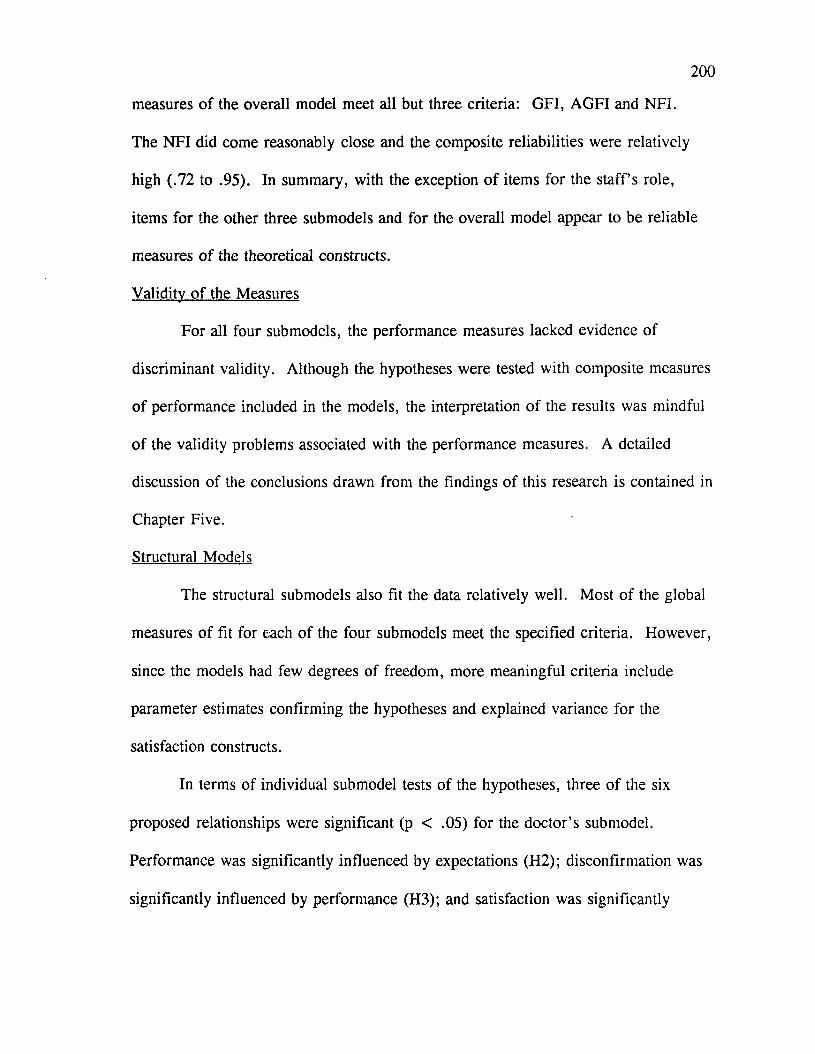
200
measures o f the overall model meet all but three criteria: GFI, AGFI and NFI.
The NFI did come reasonably close and the composite reliabilities were relatively
high (.72 to .95). In summary, with the exception o f items for the s ta ffs role,
items for the other three submodels and for the overall model appear to be reliable
measures o f the theoretical constructs.
Validity o f the Measures
For all four submodels, the performance measures lacked evidence of
discriminant validity. Although the hypotheses were tested with composite measures
o f performance included in the models, the interpretation o f the results was mindful
o f the validity problems associated with the performance measures. A detailed
discussion of the conclusions drawn from the findings of this research is contained in
Chapter Five.
Structural Models
The structural submodels also fit the data relatively well. Most o f the global
measures o f fit for each o f the four submodels meet the specified criteria. However,
since the models had few degrees of freedom, more meaningful criteria include
parameter estimates confirming the hypotheses and explained variance for the
satisfaction constructs.
In terms o f individual submodel tests of the hypotheses, three of the six
proposed relationships were significant (p < .05) for the doctor’s submodel.
Performance was significantly influenced by expectations (H2); disconfirmation was
significantly influenced by performance (H3); and satisfaction was significantly
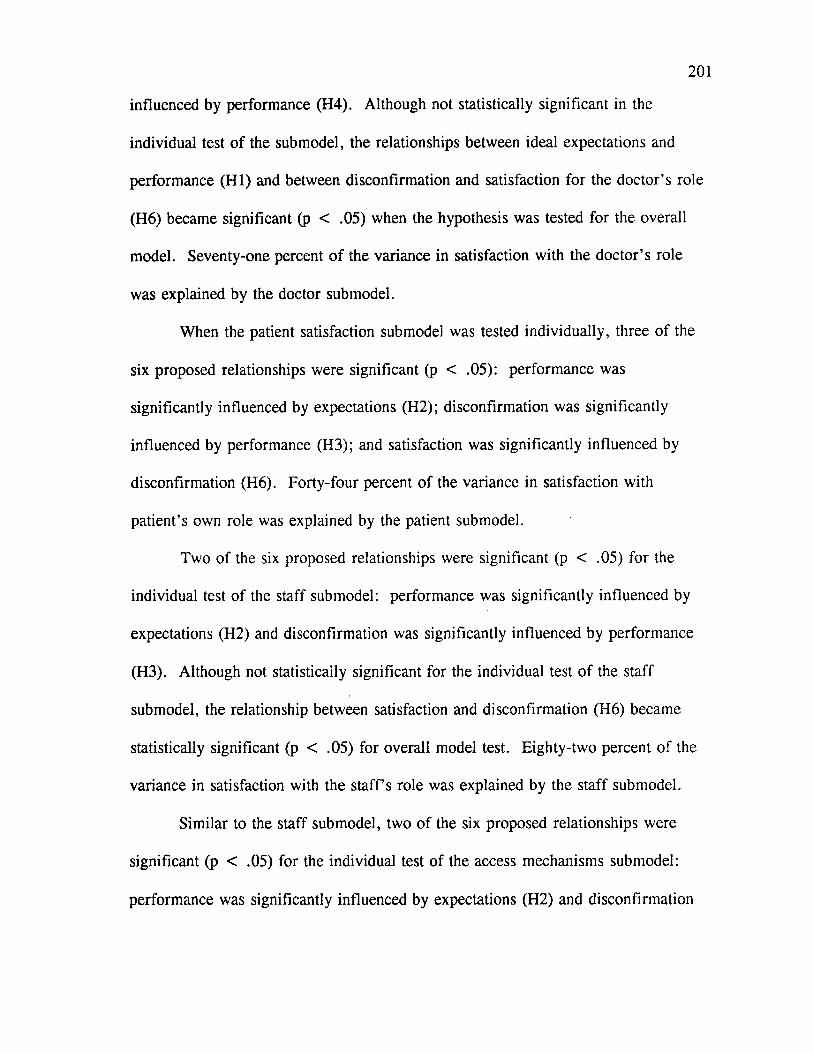
201
influenced by performance (H4). Although not statistically significant in the
individual test o f the submodel, the relationships between ideal expectations and
performance (H I) and between disconfirmation and satisfaction for the doctor’s role
(H6) became significant (p < .05) when the hypothesis was tested for the overall
model. Seventy-one percent o f the variance in satisfaction with the doctor’s role
was explained by the doctor submodel.
When the patient satisfaction submodel was tested individually, three o f the
six proposed relationships were significant (p < .05): performance was
significantly influenced by expectations (H2); disconfirmation was significantly
influenced by performance (H3); and satisfaction was significantly influenced by
disconfirmation (H6). Forty-four percent o f the variance in satisfaction with
patient’s own role was explained by the patient submodel.
Two of the six proposed relationships were significant (p < .05) for the
individual test of the staff submodel: performance was significantly influenced by
expectations (H2) and disconfirmation was significantly influenced by performance
(H3). Although not statistically significant for the individual test o f the staff
submodel, the relationship between satisfaction and disconfirmation (H6) became
statistically significant (p < .05) for overall model test. Eighty-two percent of the
variance in satisfaction with the staff’s role was explained by the staff submodel.
Similar to the staff submodel, two o f the six proposed relationships were
significant (p < .05) for the individual test o f the access mechanisms submodel:
performance was significantly influenced by expectations (H2) and disconfirmation
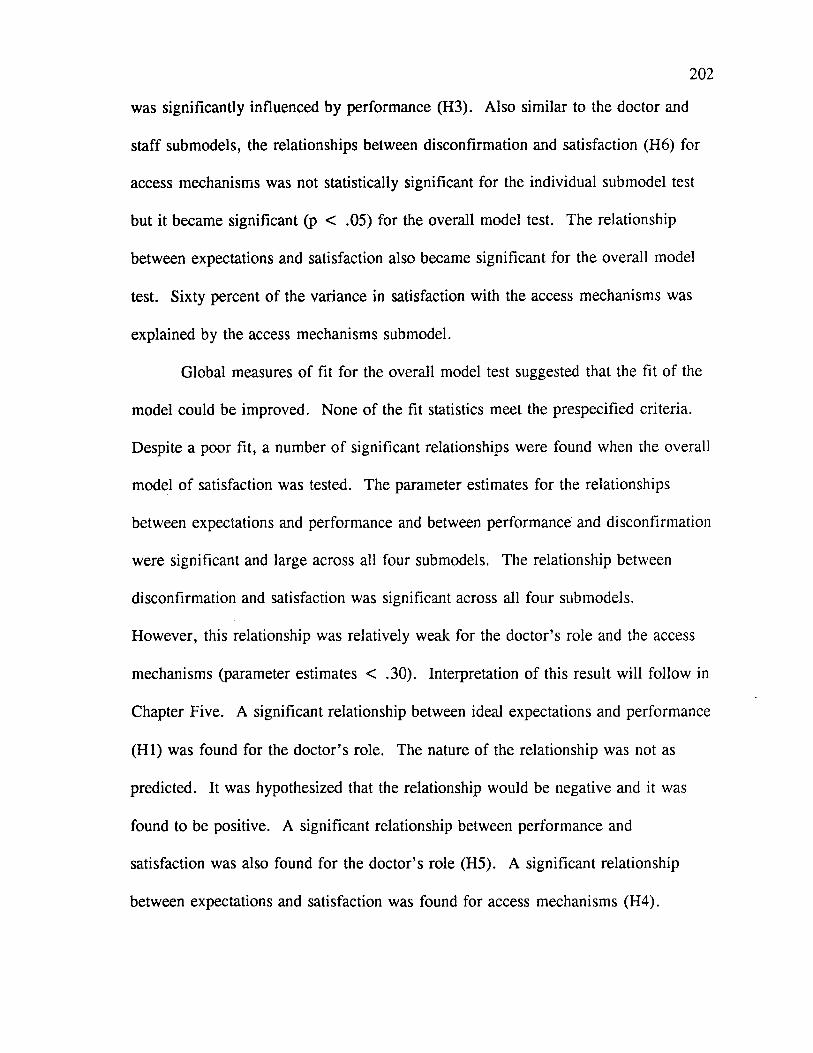
202
was significantly influenced by performance (H3). Also similar to the doctor and
staff submodels, the relationships between disconfirmation and satisfaction (H6) for
access mechanisms was not statistically significant for the individual submodel test
but it became significant (p < .05) for the overall model test. The relationship
between expectations and satisfaction also became significant for the overall model
test. Sixty percent o f the variance in satisfaction with the access mechanisms was
explained by the access mechanisms submodel.
Global measures o f fit for the overall model test suggested that the fit o f the
model could be improved. None of the fit statistics meet the prespecified criteria.
Despite a poor fit, a number o f significant relationships were found when the overall
model o f satisfaction was tested. The parameter estimates for the relationships
between expectations and performance and between performance and disconfirmation
were significant and large across all four submodels. The relationship between
disconfirmation and satisfaction was significant across all four submodels.
However, this relationship was relatively weak for the doctor’s role and the access
mechanisms (parameter estimates < .30). Interpretation o f this result will follow in
Chapter Five. A significant relationship between ideal expectations and performance
(H I) was found for the doctor’s role. The nature o f the relationship was not as
predicted. It was hypothesized that the relationship would be negative and it was
found to be positive. A significant relationship between performance and
satisfaction was also found for the doctor’s role (H5). A significant relationship
between expectations and satisfaction was found for access mechanisms (H4).
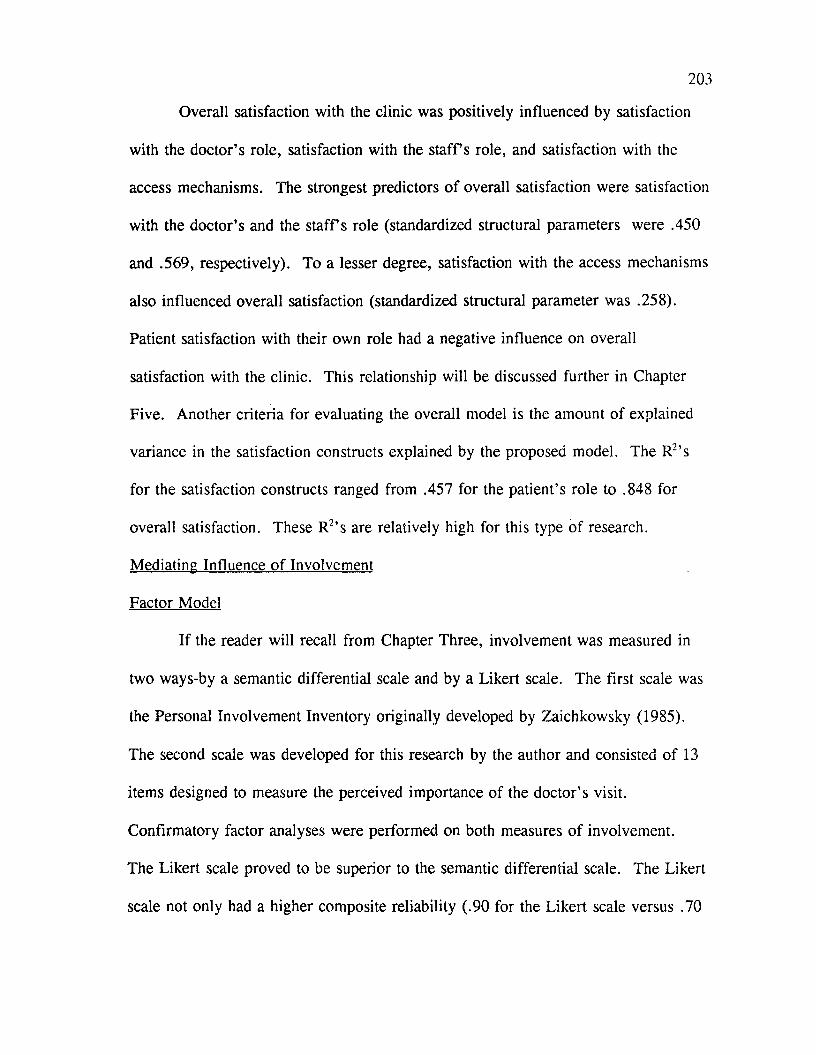
203
Overall satisfaction with the clinic was positively influenced by satisfaction
with the doctor’s role, satisfaction with the s ta ffs role, and satisfaction with the
access mechanisms. The strongest predictors o f overall satisfaction were satisfaction
with the doctor’s and the s ta ffs role (standardized structural parameters were .450
and .569, respectively). To a lesser degree, satisfaction with the access mechanisms
also influenced overall satisfaction (standardized structural parameter was .258).
Patient satisfaction with their own role had a negative influence on overall
satisfaction with the clinic. This relationship will be discussed further in Chapter
Five. Another criteria for evaluating the overall model is the amount of explained
variance in the satisfaction constructs explained by the proposed model. The R2’s
for the satisfaction constructs ranged from .457 for the patient’s role to .848 for
overall satisfaction. These R2’s are relatively high for this type of research.
Mediating Influence o f Involvement
Factor Model
If the reader will recall from Chapter Three, involvement was measured in
two ways-by a semantic differential scale and by a Likert scale. The first scale was
the Personal Involvement Inventory originally developed by Zaichkowsky (1985).
The second scale was developed for this research by the author and consisted o f 13
items designed to measure the perceived importance of the doctor’s visit.
Confirmatory factor analyses were performed on both measures of involvement.
The Likert scale proved to be superior to the semantic differential scale. The Likert
scale not only had a higher composite reliability (.90 for the Likert scale versus .70

for the semantic differential) but as evident in Table 4.13 and Figures 4.11 and 4.12
it also had greater variance. The variance associated with the Likert scale made it
possible to derive involvement groups by taking a median split. For these reasons,
only the Likert measure o f involvement was used in the analyses.
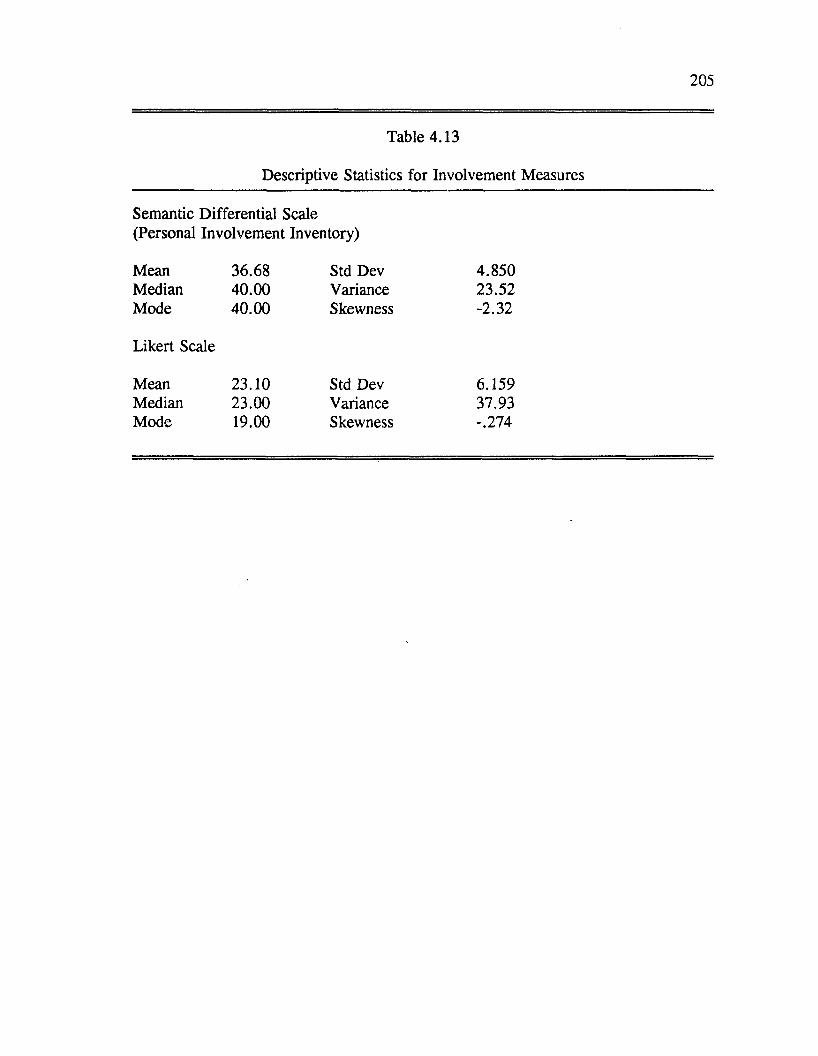
205
Table 4.13
Descriptive Statistics for Involvement Measures
Semantic Differential Scale (Personal Involvement Inventory)
Mean 36.68 Std Dev 4.850Median 40.00 Variance 23.52Mode 40.00 Skewness -2.32
Likert Scale
Mean 23.10 Std Dev 6.159Median 23.00 Variance 37.93Mode 19.00 Skewness -.274
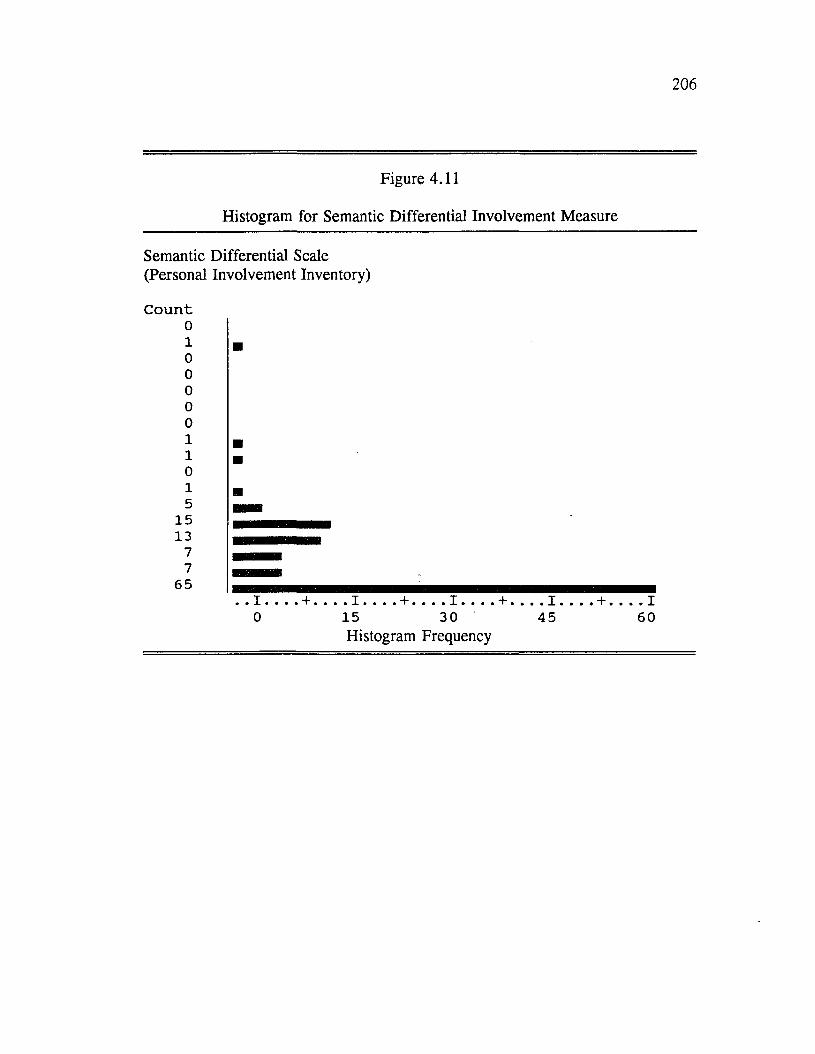
206
Figure 4.11
Histogram for Semantic Differential Involvement Measure
Semantic Differential Scale (Personal Involvement Inventory)
C o u n t010000011015
1513
77
65I ,0
+ . . 1 ____ + _____I _____15 30Histogram Frequency
. I45
+ , . I60
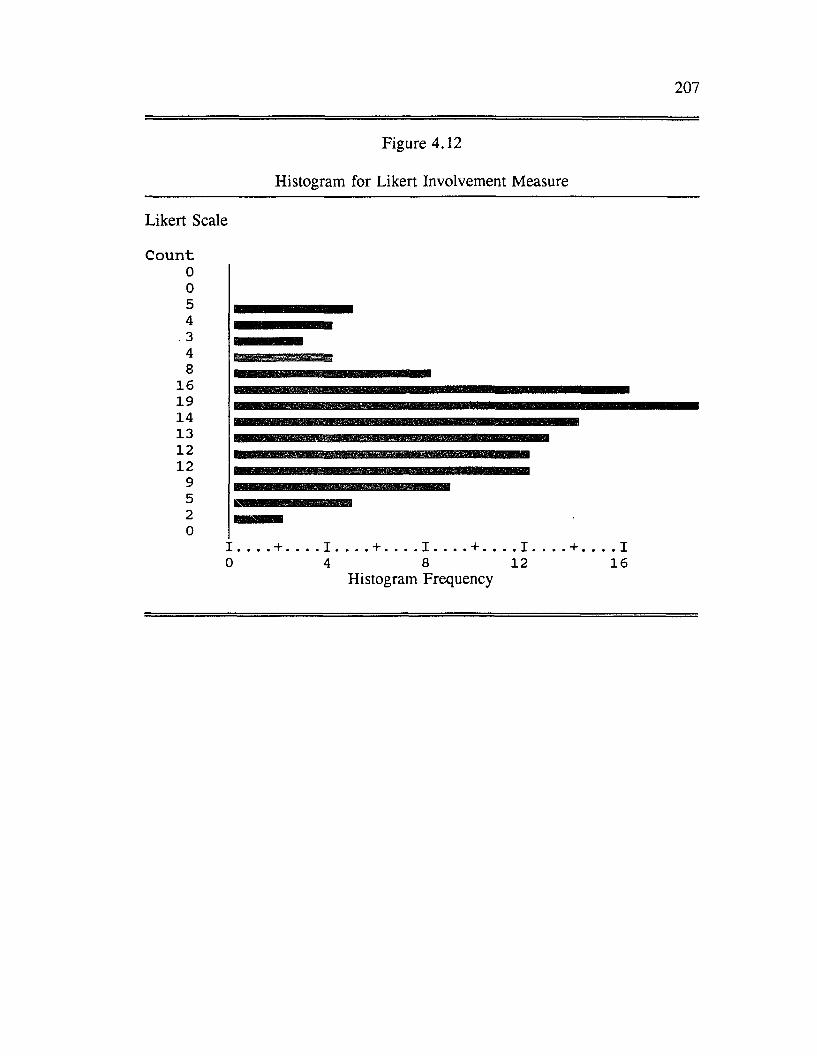
207
Figure 4.12
Histogram for Likert Involvement Measure
Likert Scale
C o u n t00543 H IM H fllllM48
161914131212
9520
][ ____ + _____ i . . 1 _____ + _____ I _____ + . . . . 10 4 8 12 16
Histogram Frequency
208
Confirmatory factor analysis (CFA) was performed on the Likert involvement
scale. Results o f the individual item analysis (reflected by the standardized residuals
and individual reliabilities) suggested that a number o f items would improve the
scale if eliminated. The specific items considered for deletion included: items 7, 9
and 10 (See Appendix A: Dissertation Questionnaires). To assess the impact of
eliminating these items, CFA was rerun after these items were deleted. The factor
model (CFA) tested for the revised scale showed higher reliabilities and fewer
standardized residuals of a large magnitude ( > 2). The chi-square value for the
revised factor model (CFA) for the involvement construct was statistically significant
which suggests that the fit of the proposed factor model could be improved.
However, other fit indices were within acceptable ranges or close to the prespecified
criterion (GFI = .881, AGFI = .761, and RMSR = .062).
The item reliabilities and factor loadings from the CFA for the involvement
construct are presented in Table 4.14. The construct reliability and global measures
o f fit for the involvement factor model are also contained in Table 4.14.
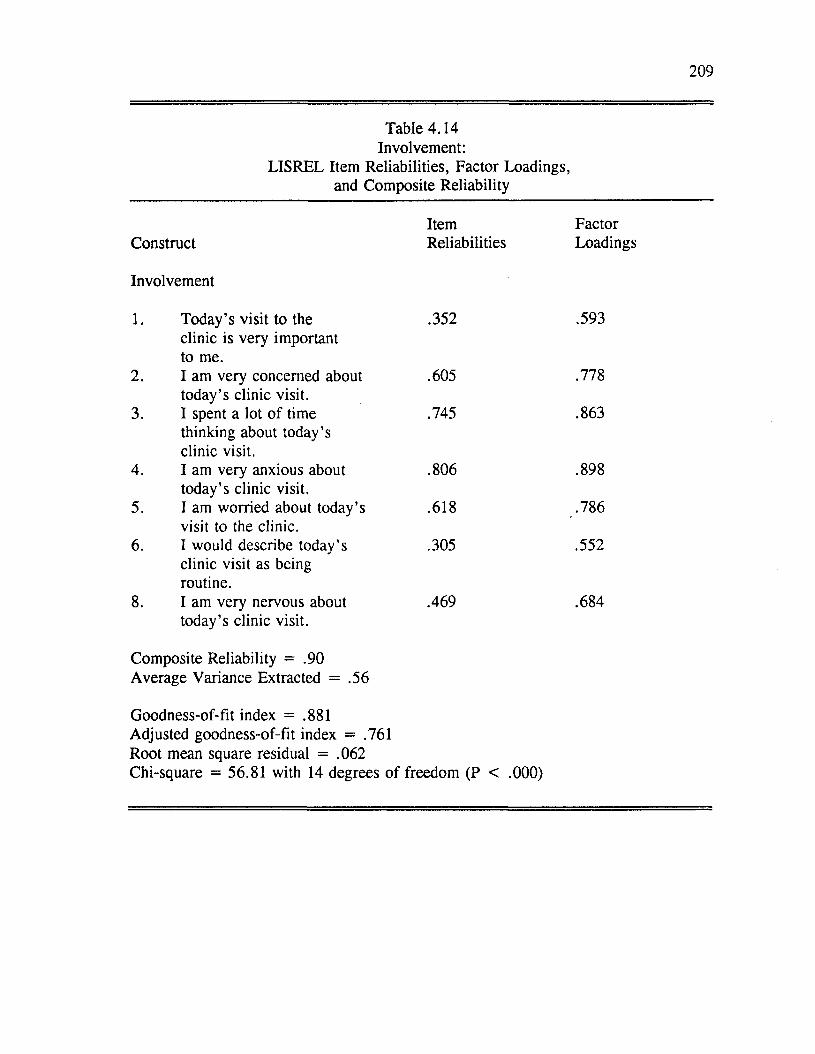
209
Table 4.14 Involvement:
LISREL Item Reliabilities, Factor Loadings, and Composite Reliability
Item FactorConstruct Reliabilities Loadings
Involvement
1. Today’s visit to the .352 .593clinic is very importantto me.
2. I am very concerned about .605 .778today’s clinic visit.
3. I spent a lot o f time .745 .863thinking about today’sclinic visit.
4. I am very anxious about .806 .898today’s clinic visit.
5. I am worried about today’s .618 .786visit to the clinic.
6. I would describe today’s .305 .552clinic visit as beingroutine.
8. I am very nervous about .469 .684today’s clinic visit.
Composite Reliability = .90 Average Variance Extracted = .56
Goodness-of-fit index = .881 Adjusted goodness-of-fit index = .761 Root mean square residual = .062Chi-square = 56.81 with 14 degrees o f freedom (P < .000)
210
As is evident from the individual reliabilities in Table 4.14, most items
appear to be good indicators for the involvement construct. Most o f the individual
item reliabilities were close to or above .50. The composite reliability was .90
which was well above the criterion o f 0.60. Most o f the global measures of fit were
acceptable. There were no standardized residuals greater than 2 which supports the
unidimensionality o f the involvement measure. The results o f the CFA for the
involvement construct suggest the items appear to be reliable measures o f
involvement.
Reliability and Validity o f Measures Across Involvement Samples
To verify that the internal consistency o f the scales did not differ across the
involvement samples, reliabilities for each o f the constructs (based on Cronbach’s
Alpha) were calculated separately for the high and low involvement sample. With
two exceptions, the reliability coefficients across the involvement samples were
either very similar or identical. The two exceptions had to do with the scales
measuring ideal expectations for the patient’s role and satisfaction with the s ta ffs
role. The scale measuring ideal expectations for the patient’s role was less reliable
for the high involvement sample (alpha=.49) than for the low involvement sample
(alpha= .83). The scale measuring satisfaction with the staff’s role was more
reliable for the high involvement sample (alpha=.60) than for the low involvement
sample (alpha= .35). I f the reader will recall, this scale consisted o f only two items
and in comparison to the other scales was the least reliable measure in the study. It
would appear that satisfaction with the s ta ffs role was not adequately captured for
211
either sample.
To verify the discriminant validity of the measures across involvement
samples, reliability coefficients (correlations between items supposedly measuring
the same construct using the same measurement method) and validity coefficients
(correlations between items supposedly measuring different constructs using the
same measurement method) were examined for each o f the involvement samples.
With the exception o f the performance measures, the items measuring the
patient submodel constructs appear to have good discriminant validity for both
involvement samples. The items measuring disconfirmation and satisfaction were
significantly correlated but the within-construct correlation coefficients were
generally higher than the between-construct correlations. For the high involvement
sample, many o f the items measuring performance and disconfirmation were
significantly correlated with some between-construct correlation coefficients higher
than some within-construct correlation coefficients. This was not the case for the
low involvement sample. If the reader will recall, the validity o f the performance
construct for the patient submodel presented a problem when the correlations were
run on the entire sample. This result will be discussed further in Chapter Five.
For the doctor’s role, an examination of the reliability and validity
coefficients suggests that items measuring expectations, disconfirmation, and
satisfaction possess reasonable discriminant validity for both involvement samples.
The items measuring ideal expectations did not have good reliability for the low
involvement sample. For the high involvement sample, items measuring ideal
212
expectations appeared to have both good reliability and discriminant validity. For
both samples, items measuring performance were again problematic. The measures
for performance were highly correlated with measures for disconfirmation and
satisfaction.
For the staff constructs, there were no major differences in the patterns of
within-construct and between-construct correlations across the two involvement
samples. As discussed previously, the items measuring performance do not appear
to possess good discriminant validity.
For the access mechanisms, the validity of the expectation and performance
items is questionable for the low involvement sample. Some o f the items measuring
expectations were highly correlated with items measuring satisfaction. The
performance measures for access mechanisms also lacked evidence o f discriminant
validity for the low involvement sample. For the high involvement sample, all the
measures including satisfaction appeared to have fairly good discriminant validity.
Validity o f the Involvement Measures
A concern related to the validity o f the involvement construct was that
patients’ level o f involvement was not independent o f their level o f experience with
the medical condition and clinic. To test the hypothesis that the two variables were
independent, a chi-square test o f independence was performed. Involvement groups
were categorized by taking a median split o f the Likert composite scale. Group one
was defined as patients with low involvement and group two as patients with high
involvement. Experience groups were categorized as new patients to the clinic

213
(NP), old patients with a new medical condition (OPNC), and old patients with the
same medical condition (OPSC). As shown in Table 4.15, the chi-square statistic
was nonsignificant. Thus, we can accept the hypothesis that the two variables are
independent.
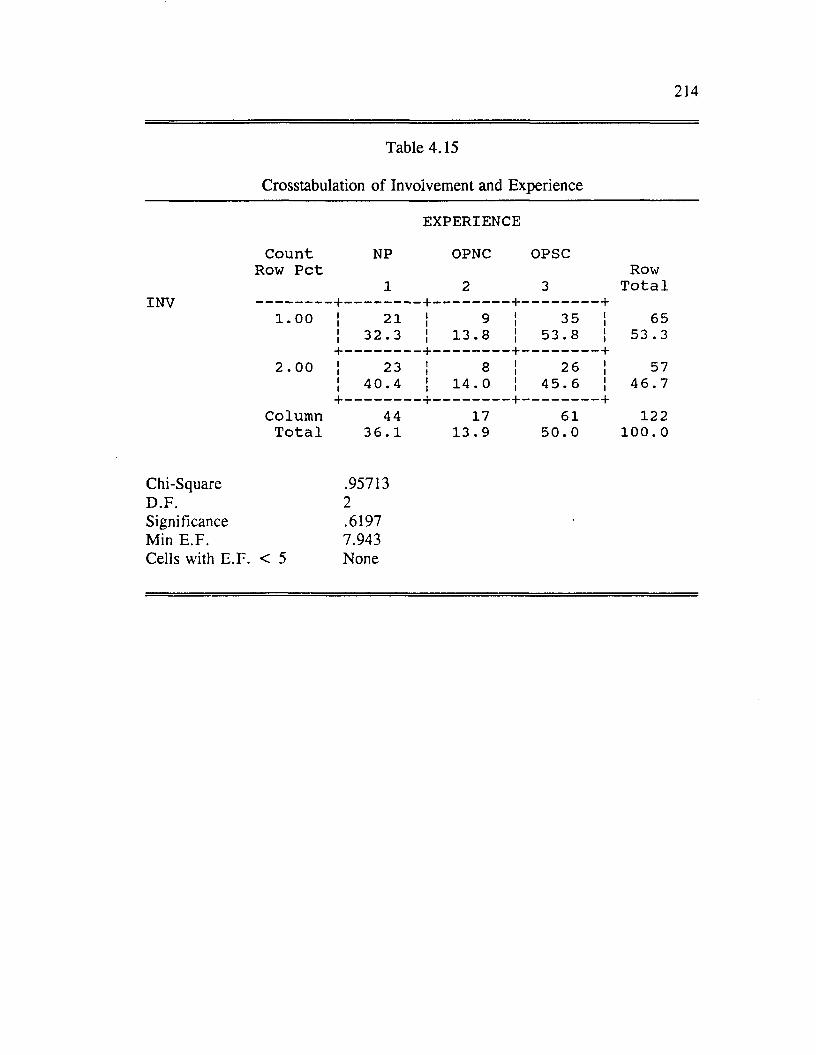
214
Table 4.15
Crosstabulation o f Involvement and Experience
EXPERIENCE
C o u n t NP OPNC OPSCRow P e t Row
_________- + -1
—I—2
_ + _3
- +T o t a l
1 . 0 0 ii 21 ii 9 ii 35 ii 65ii 3 2 . 3 ii 1 3 . 8 ii 53 . 8 ii 53 . 3
2 . 00+ -ii 23
- + -ii 8
- + -ii 26
- +ii 57
ii 4 0 . 4 ii 14 . 0 ii 4 5 . 6 ii 4 6 . 7
ColumnT o t a l
+ -44
3 6 . 117
1 3 . 9
- + -61
5 0 . 0
- +1 22
1 0 0 . 0
Chi-Square .95713D .F . 2Significance .6197Min E .F . 7.943Cells with E .F . < 5 None
215
Mediating Influence o f Involvement on Structural Equation Model
As is commonly done in the marketing literature, patient involvement
categories were defined by a median split (Oliver and Bearden 1983). Once these
involvement groups were derived, the structural equation models for each o f the four
submodels were reestimated using multi-sample LISREL analyses as discussed in
Chapter Three. To assess the impact o f involvement on the proposed structural
models, four separate multi-sample analyses were performed: 1) with the
relationship between expectations to satisfaction constrained to be equal across
involvement samples, 2) with the relationship between performance and satisfaction
constrained to be equal, 3) with the relationship between disconfirmation and
satisfaction constrained to be equal and 4) with the constraints relaxed. To test the
significance o f the difference in parameter estimates between the' two samples, the
chi-square difference procedure suggested by Hayduk (1987) and discussed in
Chapter Three was used. In addition, patterns o f relationships for each of the
submodels were examined. Significant parameter estimates predicting satisfaction
were ranked according to magnitude. For the high involvement sample, it was
predicted that performance would be the strongest predictor o f satisfaction followed
by expectations and disconfirmation (H7a). For the low involvement sample, it was
predicted that expectations and disconfirmation would be the strongest predictors of
satisfaction followed by performance (H7b).
In reporting the results o f the multi-sample LISREL analyses, four tables are
presented for each submodel. The first table for each submodel reports parameter
216
estimates and chi-square statistics for the unconstrained model. The unconstrained
model was the model that was reestimated relaxing the equality constraints between
the involvement samples. This first table is followed by two figures showing
significant parameter estimates for the unconstrained model under conditions of low
and high involvement. The next three tables for each submodel present parameter
estimates and chi-square statistics for the models with constrained parameters. The
chi-square difference tests are also presented in these tables. When significant
differences were found, two additional figures are provided to show the differences
between the involvement samples.
Effects of Involvement on Patient Satisfaction Submodel
To test the effects of involvement on the patient satisfaction structural model,
the submodel was reestimated using LISREL multi-sample analyses. Table 4.16
contains the standardized structural parameter estimates for the high and low
involvement groups when the constraints were relaxed. Figure 4.13 and Figure 4.14
show the significant parameter estimates for the low involvement sample and the
high involvement sample, respectively.
As indicated in Table 4.16 and Figures 4.13 and 4.14, the primary difference
between the low and high involvement groups was that hypothesis one was supported
for the low involvement group but not for the high involvement group. While ideal
expectations was significantly related to performance for the low involvement group,
it was in the direction opposite to what was predicted. The relationship was
predicted to be negative and it was positive. The relationship between ideal

expectations and performance was not hypothesized to be different for the two
involvement samples (refer to H7a and H7b on the previous page).
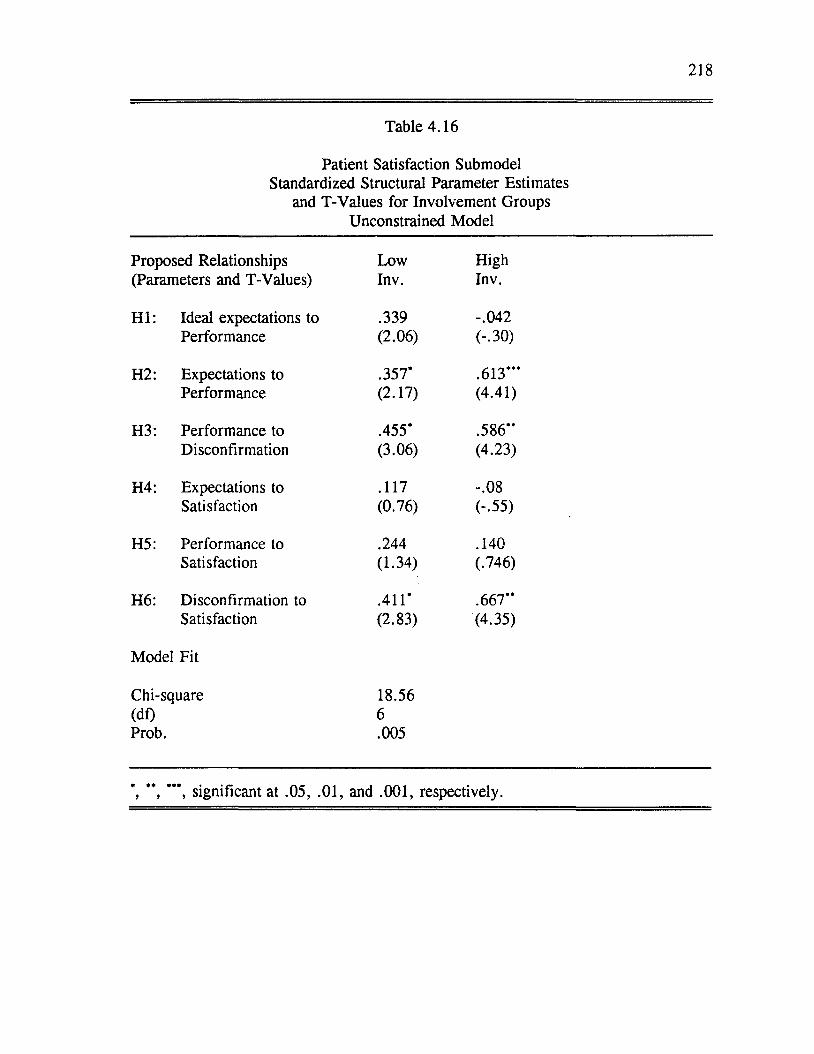
218
Table 4.16
Patient Satisfaction Submodel Standardized Structural Parameter Estimates
and T-Values for Involvement Groups Unconstrained Model
Proposed Relationships Low High(Parameters and T-Values) Inv. Inv.
H I: Ideal expectations to .339 -.042Performance (2.06) (-.30)
H2: Expectations to .357' .613 '''Performance (2.17) (4.41)
H3: Performance to .455' .586"Disconfirmation (3.06) (4.23)
H4: Expectations to .117 -.08Satisfaction (0.76) (-.55)
H5: Performance to .244 .140Satisfaction (1.34) (.746)
H6: Disconfirmation to .411' .667"Satisfaction (2.83) (4.35)
Model Fit
Chi-square 18.56(df) 6Prob. .005
', " , '" , significant at .05, .01, and .001, respectively.
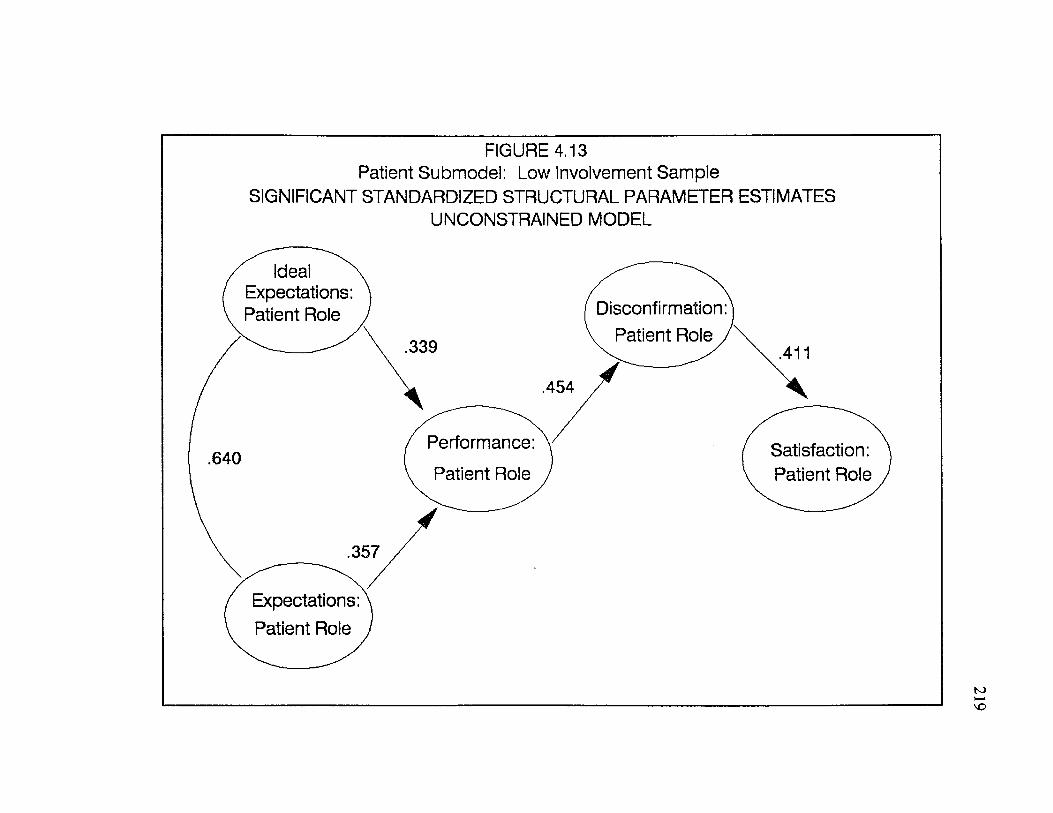
FIGURE 4.13 Patient Submodel: Low Involvement Sample
SIGNIFICANT STANDARDIZED STRUCTURAL PARAMETER ESTIMATESUNCONSTRAINED MODEL
Ideal Expectations: Patient Role Disconfirmation
Patient Role
Performance
Patient RoleSatisfaction: Patient Role
Expectations: Patient Role
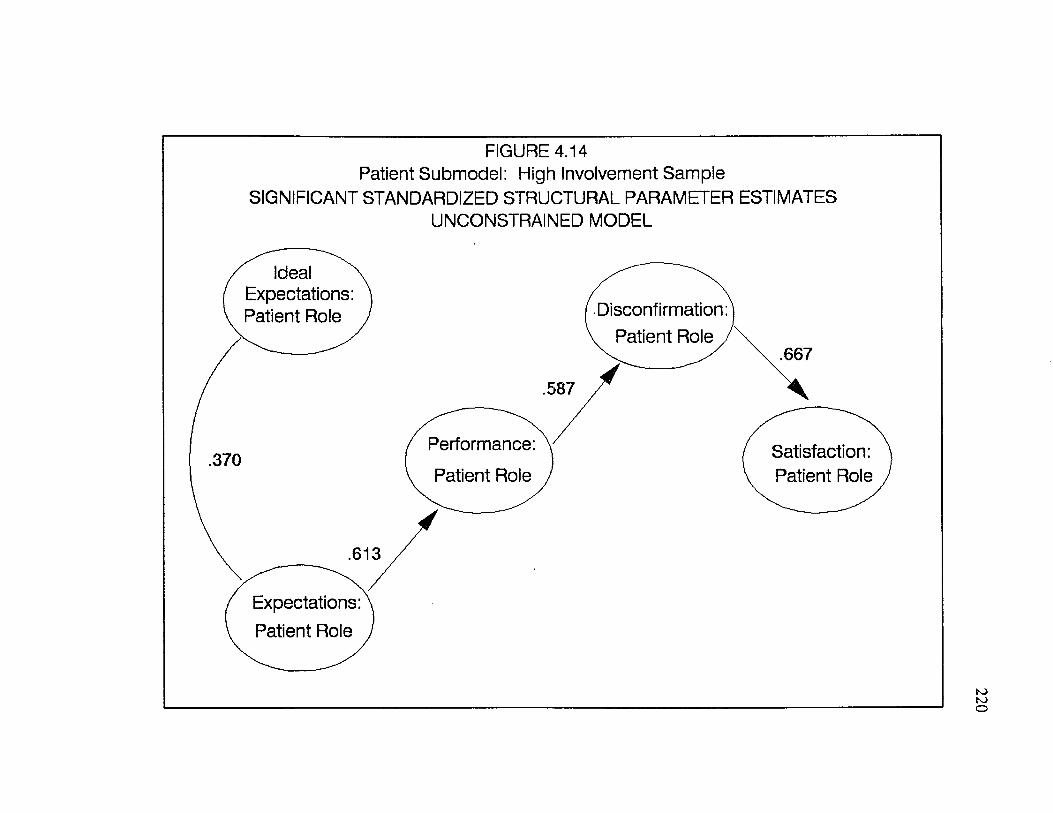
FIGURE 4.14 Patient Submodel; High Involvement Sample
SIGNIFICANT STANDARDIZED STRUCTURAL PARAMETER ESTIMATESUNCONSTRAINED MODEL
Ideal Expectations: Patient Role Disconfirmation:
v Patient Role j.667
.587
Performance: Satisfaction: Patient Role
.370Patient Role
.613
Expectations: Patient Role
220
221
The patient satisfaction submodel was reestimated three more times,
constraining the parameters between 1) expectations and satisfaction, 2)
performance and satisfaction, and 3) disconfirmation and satisfaction to be equal
between the high and low involvement groups. Tables 4.17, 4.18, and 4.19 show
the structural parameter estimates for each o f these constrained models, respectfully.
Also included in the tables are the chi-square difference tests.
The chi-square difference tests shown in Tables 4.17 and 4.18 suggest that
the hypotheses that the relationship between expectations and satisfaction and
between performance and satisfaction are equal across the two involvement samples
should be accepted. No significant differences in these parameters were found
across the different involvement groups for the patient satisfaction submodel.
As Table 4.19 and Figures 4.15 and 4.16 show significant differences across
involvement samples were found for the parameter between disconfirmation and
satisfaction. A significant chi-square difference between the constrained and
unconstrained model leads us to reject the hypothesis that the disconfirmation-
satisfaction relationship is equal between the two involvement groups. Under
conditions of high involvement, performance was the only significant predictor of
satisfaction. Under conditions o f low involvement, disconfirmation was the only
significant predictor o f satisfaction. Expectations was not a significant predictor of
satisfaction.

222
Table 4.17
Patient Satisfaction Submodel Standardized Structural Parameter Estimates
and T-Values for Involvement Groups Constraining Expectations to Satisfaction to be Equal
Proposed Relationships Low High(Parameters and T-Values) Inv. Inv.
H I: Ideal expectations to .339* -.041Performance (2.06) (-.29)
H2: Expectations to .357* .608“Performance (2.17) (4.37)
H3: Performance to .455* .586“Disconfirmation (3.06) (4.22)
H4: Expectations to .117 .000Satisfaction (0.76) (.000)
H5: Performance to .243 .072Satisfaction (1.34) (0.46)
H6: Disconfirmation to .410* .687“Satisfaction (2.83) (4.48)
Model Fit
Chi-square 18.84(df) 7Prob .009
Chi-square difference .28(df) 1
’*, ***, significant at .05, .01, and .001, respectively.
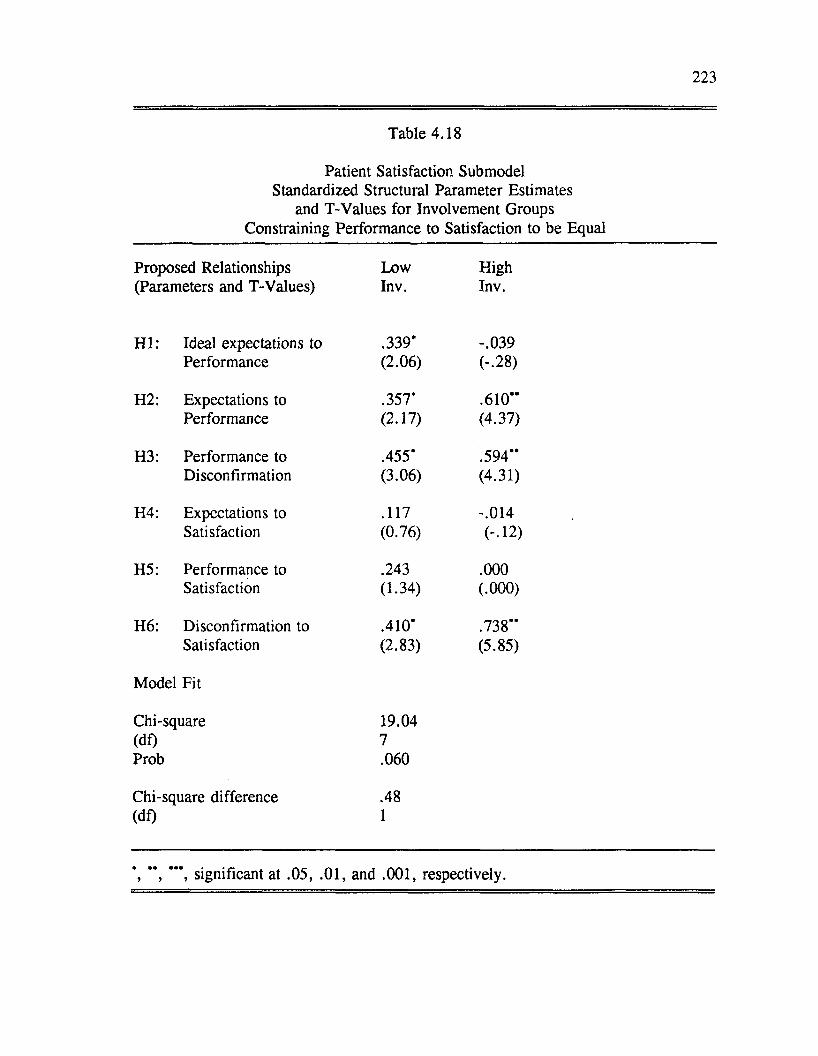
223
Table 4.18
Patient Satisfaction Submodel Standardized Structural Parameter Estimates
and T-Values for Involvement Groups Constraining Performance to Satisfaction to be Equal
Proposed Relationships Low High(Parameters and T-Values) Inv. Inv.
H I: Ideal expectations to .339’ -.039Performance (2.06) (-.28)
H2: Expectations to .357* .610”Performance (2.17) (4.37)
H3: Performance to .455* .594”Disconfirmation (3.06) (4.31)
H4: Expectations to .117 -.014Satisfaction (0.76) (-■12)
H5: Performance to .243 .000Satisfaction (1.34) (.000)
H6: Disconfirmation to .410* .738”Satisfaction (2.83) (5.85)
Model Fit
Chi-square 19.04(df) 7Prob .060
Chi-square difference .48(df) 1
’, ” , ***, significant at .05, .01, and .001, respectively.
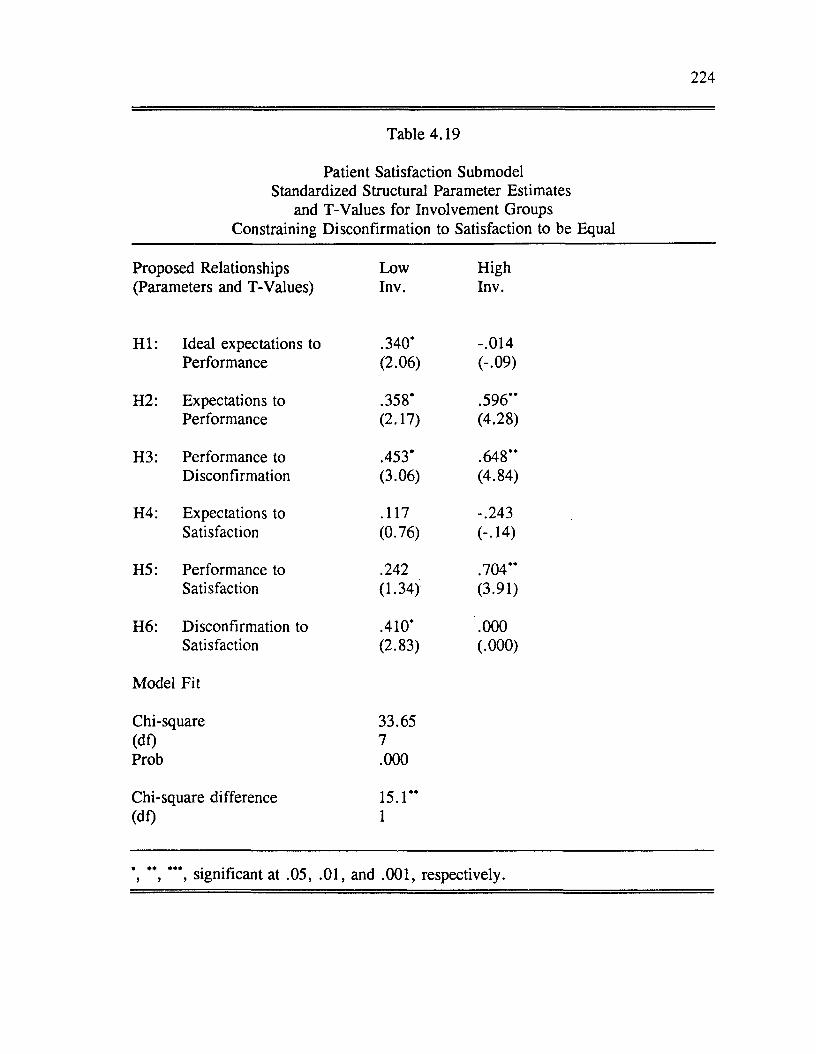
224
Table 4.19
Patient Satisfaction Submodel Standardized Structural Parameter Estimates
and T-Values for Involvement Groups Constraining Disconfirmation to Satisfaction to be Equal
Proposed Relationships Low High(Parameters and T-Values) Inv. Inv.
H I: Ideal expectations to .340* -.014Performance (2.06) (-.09)
H2: Expectations to .358* .596”Performance (2.17) (4.28)
H3: Performance to .453* .648”Disconfirmation (3.06) (4.84)
H4: Expectations to .117 -.243Satisfaction (0.76) (-.14)
H5: Performance to .242 .704**Satisfaction (1.34) (3.91)
H6: Disconfirmation to .410* .000Satisfaction (2.83) (.000)
Model Fit
Chi-square 33.65(df) 7Prob .000
Chi-square difference 15.1**(df) 1
*, ” , ***, significant at .05, .01, and .001, respectively.
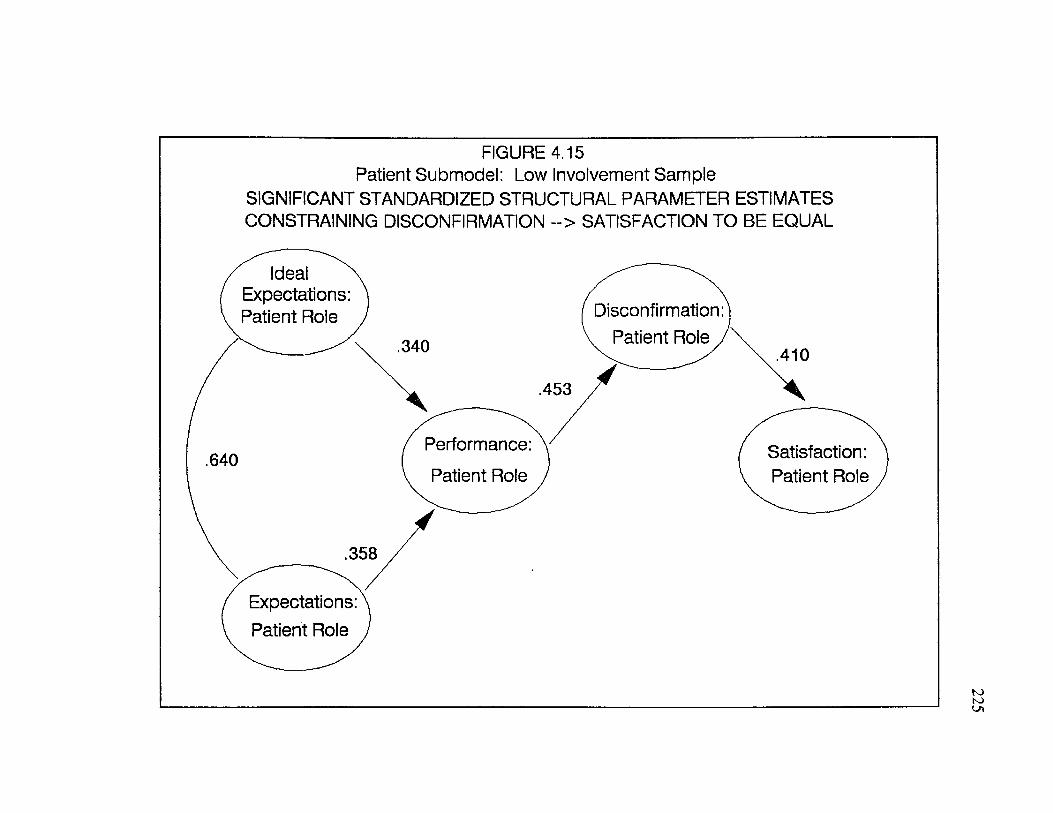
FIGURE 4.15 Patient Submodel: Low Involvement Sample
SIGNIFICANT STANDARDIZED STRUCTURAL PARAMETER ESTIMATES CONSTRAINING DISCONFIRMATION ~> SATISFACTION TO BE EQUAL
Ideal Expectations: Patient Role Disconfirmation:
, Patient Role j340 .410
.453
Performance: Satisfaction: Patient Role
.640Patient Role
.358
Expectations: Patient Role
225

FIGURE 4.16 Patient Submodel: High Involvement Sample
SIGNIFICANT STANDARDIZED STRUCTURAL PARAMETER ESTIMATES CONSTRAINING DISCONFIRMATION ~> SATISFACTION TO BE EQUAL
Ideal Expectations: Patient Role Disconfirmation:
. Patient Role j
.648
Performance: .704 Satisfaction: Patient Role
.371Patient Role
.596
Expectations: Patient Role
226

Effects o f Involvement on Doctor Satisfaction Submodel
227
As with the patient satisfaction submodel, the effects o f involvement on the
doctor satisfaction model were tested using multi-sample LISREL analyses. Table
4.20 contains the standardized structural parameter estimates for the high and low
involvement sample when the constraints specified earlier were relaxed. Figures
4.17 and 4.18 show the significant parameter estimates for the low involvement
sample and the high involvement sample, respectively.
As indicated in Table 4.20 and Figures 4.17 and 4.18, one difference
between the samples was that ideal expectations was a significant predictor of
performance for the low involvement sample but not for the high involvement
sample. The relationship was positive which is counter to hypothesis one. This
pattern was similar to that found for the patient submodel.
Another difference detected between the two groups for the doctor submodel,
was that disconfirmation was significant (at the .05 level) under conditions o f high
involvement but not under conditions o f low involvement. For both samples, the
strongest predictor o f satisfaction for the unconstrained doctor satisfaction submodel
was performance.

228
Table 4.20
Doctor Satisfaction Submodel Standardized Structural Parameter Estimates
and T-Values for Involvement Groups Unconstrained Model
Proposed Relationships Low High(Parameters and T-Values) Inv. Inv.
H I: Ideal expectations to .348* .216Performance (3.05) (1.61)
H2: Expectations to .504“ .460“Performance (4.41) (3.44)
H3: Performance to .756” * .763“ 'Disconfirmation (7.27) (7.40)
H4: Expectations to -.071 .069Satisfaction (-.65) (.676)
H5: Performance to .739” .543“Satisfaction (4.59) (3.50)
H6: Disconfirmation to .197 .319*Satisfaction (1.40) (2.28)
Model Fit
Chi-square 12.62(df) 6Prob. .050
’, *’, ***, significant at .05, .01, and .001, respectively.
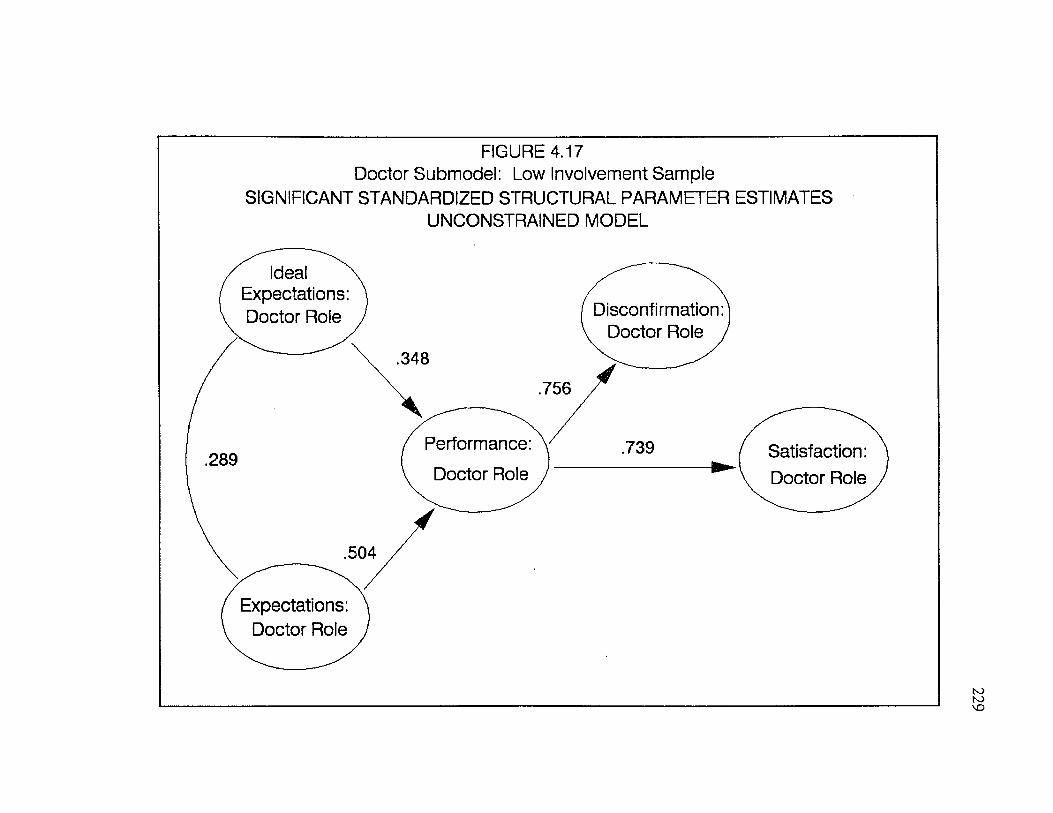
FIGURE 4.17 Doctor Submodel: Low Involvement Sample
SIGNIFICANT STANDARDIZED STRUCTURAL PARAMETER ESTIMATESUNCONSTRAINED MODEL
Ideal Expectations: Doctor Role Disconfirmation
Doctor Role
Performance: Doctor Role
Satisfaction Doctor Role
Expectations: Doctor Role

FIGURE 4.18 Doctor Submodel: High Involvement Sample
SIGNIFICANT STANDARDIZED STRUCTURAL PARAMETER ESTIMATESUNCONSTRAINED MODEL
Ideal Expectations: Doctor Role Disconfirmation:
Doctor Role ,.319
.763
Performance: .543 Satisfaction: Doctor Role
.430Doctor Role
.460
Expectations: Doctor Role
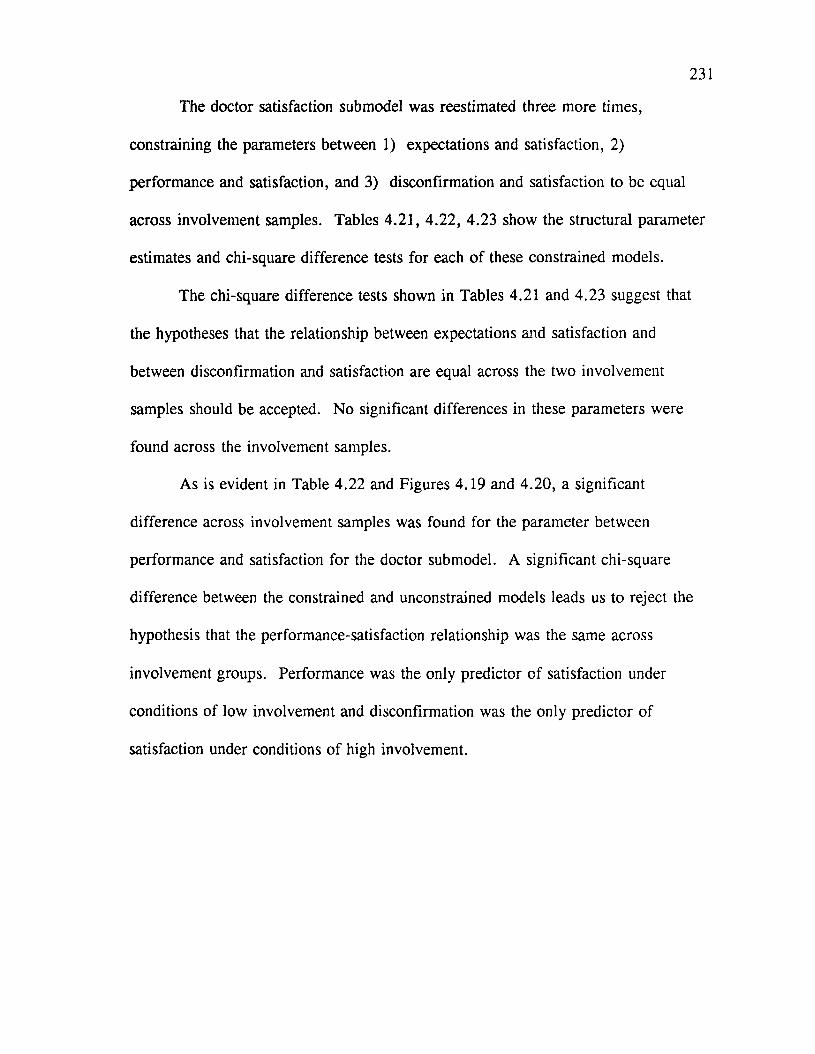
231
The doctor satisfaction submodel was reestimated three more times,
constraining the parameters between 1) expectations and satisfaction, 2)
performance and satisfaction, and 3) disconfirmation and satisfaction to be equal
across involvement samples. Tables 4.21, 4.22, 4.23 show the structural parameter
estimates and chi-square difference tests for each of these constrained models.
The chi-square difference tests shown in Tables 4.21 and 4.23 suggest that
the hypotheses that the relationship between expectations and satisfaction and
between disconfirmation and satisfaction are equal across the two involvement
samples should be accepted. No significant differences in these parameters were
found across the involvement samples.
As is evident in Table 4.22 and Figures 4.19 and 4.20, a significant
difference across involvement samples was found for the parameter between
performance and satisfaction for the doctor submodel. A significant chi-square
difference between the constrained and unconstrained models leads us to reject the
hypothesis that the performance-satisfaction relationship was the same across
involvement groups. Performance was the only predictor of satisfaction under
conditions o f low involvement and disconfirmation was the only predictor of
satisfaction under conditions o f high involvement.
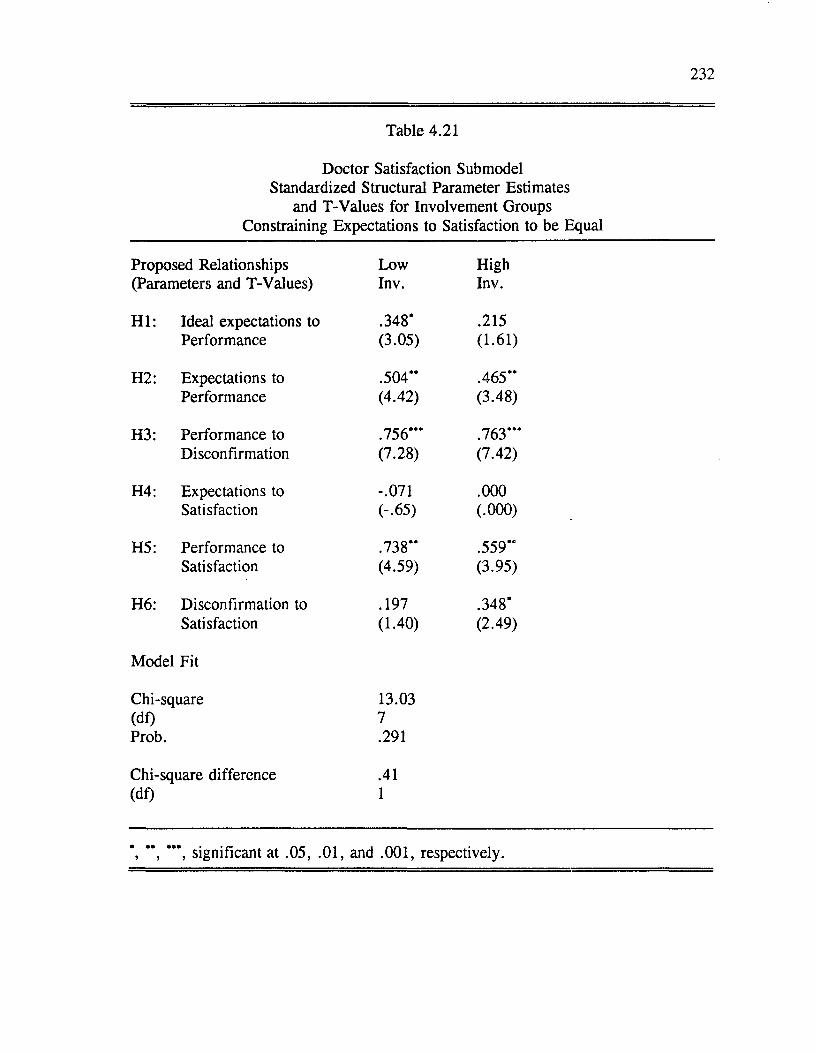
232
Table 4.21
Doctor Satisfaction Submodel Standardized Structural Parameter Estimates
and T-Values for Involvement Groups Constraining Expectations to Satisfaction to be Equal
Proposed Relationships Low High(Parameters and T-Values) Inv. Inv.
H I: Ideal expectations to .348* .215Performance (3.05) (1.61)
H2: Expectations to .504” .465”Performance (4.42) (3.48)
H3: Performance to .756” * .763” *Disconfirmation (7.28) (7.42)
H4: Expectations to -.071 .000Satisfaction (-.65) (.000)
H5: Performance to .738” .559”Satisfaction (4.59) (3.95)
H6: Disconfirmation to .197 .348*Satisfaction (1.40) (2.49)
Model Fit
Chi-square 13.03(df) 7Prob. .291
Chi-square difference .41(df) 1
*, ” , significant at .05, .01, and .001, respectively.

233
Table 4.22
Doctor Satisfaction Submodel Standardized Structural Parameter Estimates
and T-Values for Involvement Groups Constraining Performance to Satisfaction to be Equal
Proposed Relationships Low High(Parameters and T-Values) Inv. Inv.
H I: Ideal expectations to .348* .218Performance (3.07) (1.63)
H2: Expectations to .504** .460**Performance (4.42) (3.44)
H3: Performance to .756*** .777***Disconfirmation (7.28) (7.73)
H4: Expectations to -.072 .139Satisfaction (-.65) (1.31)
H5: Performance to .744** .000Satisfaction (4.59) (.000)
H6: Disconfirmation to .199 .710***Satisfaction (1.40) (6.60)
Model Fit
Chi-square 25.26(df) 7Prob. .001
Chi-square difference 12.64***(df) 1
*, ’*, ***, significant at .05, .01, and .001, respectively.
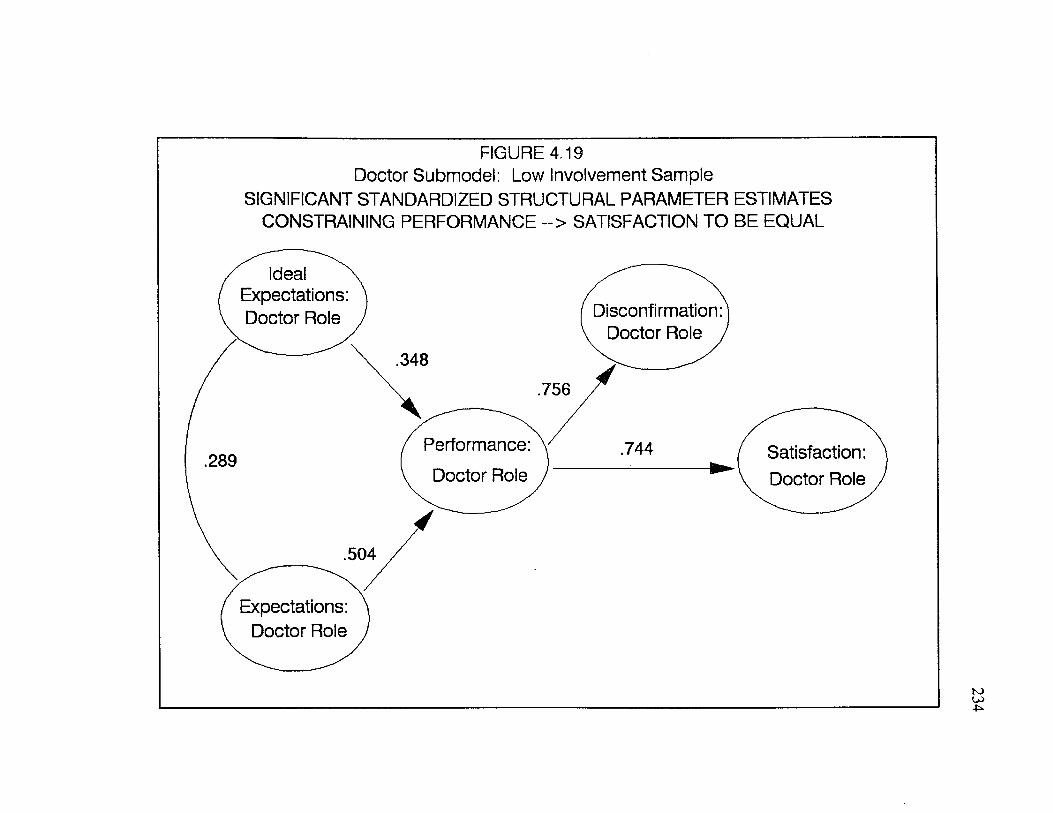
FIGURE 4.19 Doctor Submodel: Low Involvement Sample
SIGNIFICANT STANDARDIZED STRUCTURAL PARAMETER ESTIMATES CONSTRAINING PERFORMANCE ~> SATISFACTION TO BE EQUAL
Ideal Expectations: Doctor Role Disconfirmation
Doctor Role
Performance: Doctor Role
Satisfaction: Doctor Role
Expectations: Doctor Role
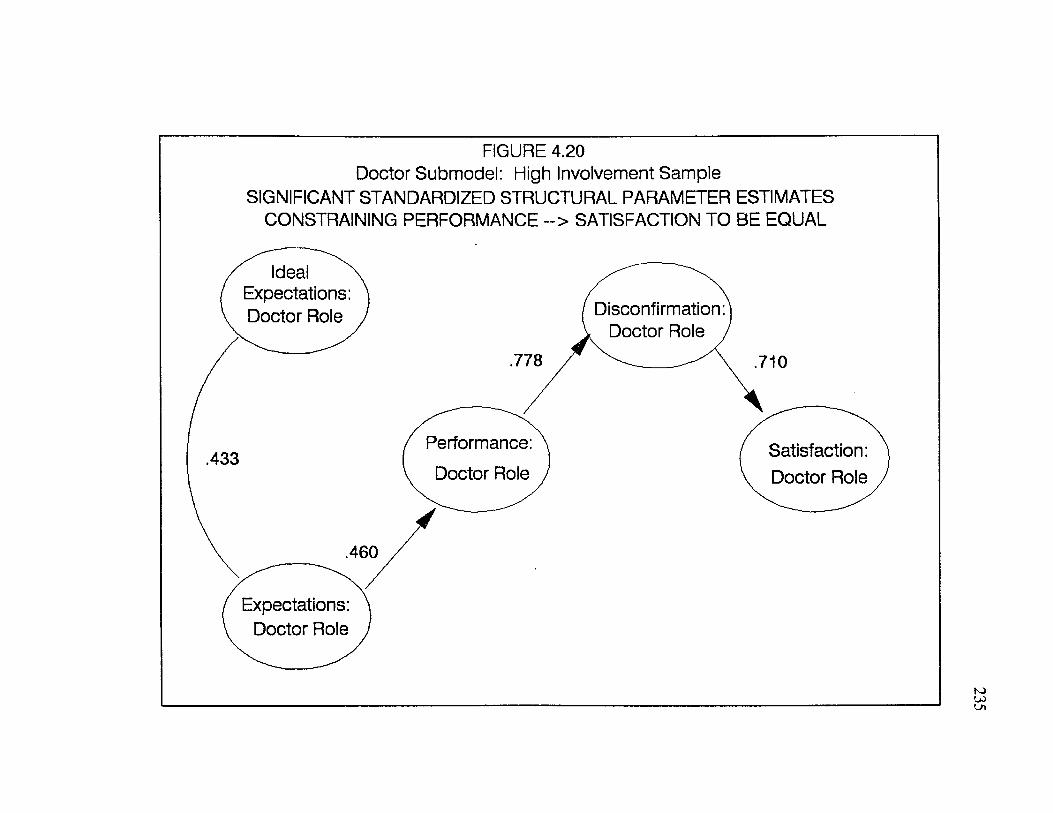
FIGURE 4.20 Doctor Submodel: High Involvement Sample
SIGNIFICANT STANDARDIZED STRUCTURAL PARAMETER ESTIMATES CONSTRAINING PERFORMANCE --> SATISFACTION TO BE EQUAL
Ideal Expectations Doctor Role Disconfirmation:
Doctor Role
Performance: Doctor Role
Satisfaction: Doctor Role
Expectations: Doctor Role
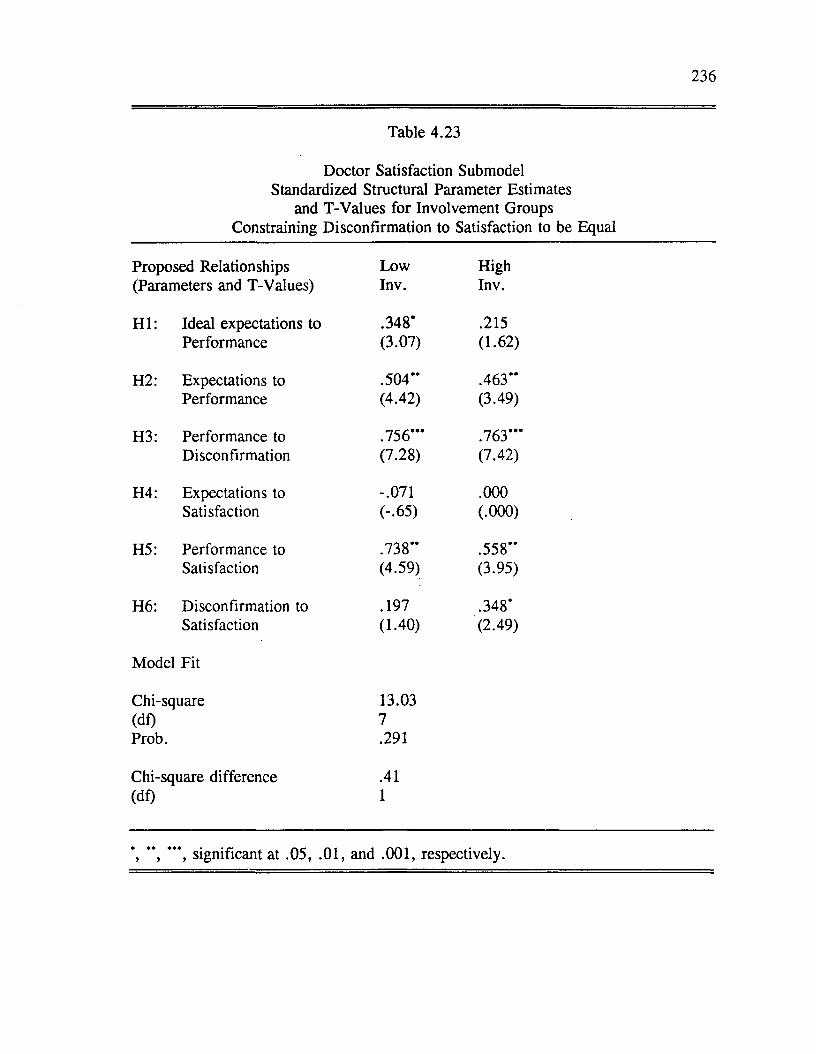
236
Table 4.23
Doctor Satisfaction Submodel Standardized Structural Parameter Estimates
and T-Values for Involvement Groups Constraining Disconfirmation to Satisfaction to be Equal
Proposed Relationships Low High(Parameters and T-Values) Inv. Inv.
H I: Ideal expectations to .348* .215Performance (3.07) (1.62)
H2: Expectations to .504** .463"Performance (4.42) (3.49)
H3: Performance to .756*** .763***Disconfirmation (7.28) (7.42)
H4: Expectations to -.071 .000Satisfaction (-.65) (.000)
H5: Performance to .738** .558"Satisfaction (4.59) (3.95)
H6: Disconfirmation to .197 .348*Satisfaction (1.40) (2.49)
Model Fit
Chi-square 13.03(df) 7Prob. .291
Chi-square difference .41(df) 1
" , ***, significant at .05, .01, and .001, respectively.
237
Effects o f Involvement on Staff Satisfaction Submodel
To assess the impact o f involvement on the staff satisfaction submodel, multi
sample analyses were again performed. Table 4.24 contains the standardized
structural parameter estimates for the high and low involvement groups when the
model was unconstrained. Figures 4.21 and 4.22 show the significant parameter
estimates o f the unconstrained model for the two involvement samples.
In Table 4.24 and Figures 4.21 and 4.22, we can see that the major
difference between the staff submodels based on high and low involvement samples
was that performance was the only significant predictor o f satisfaction for the low
involvement sample and disconfirmation was the only predictor o f satisfaction for
the high involvement sample.
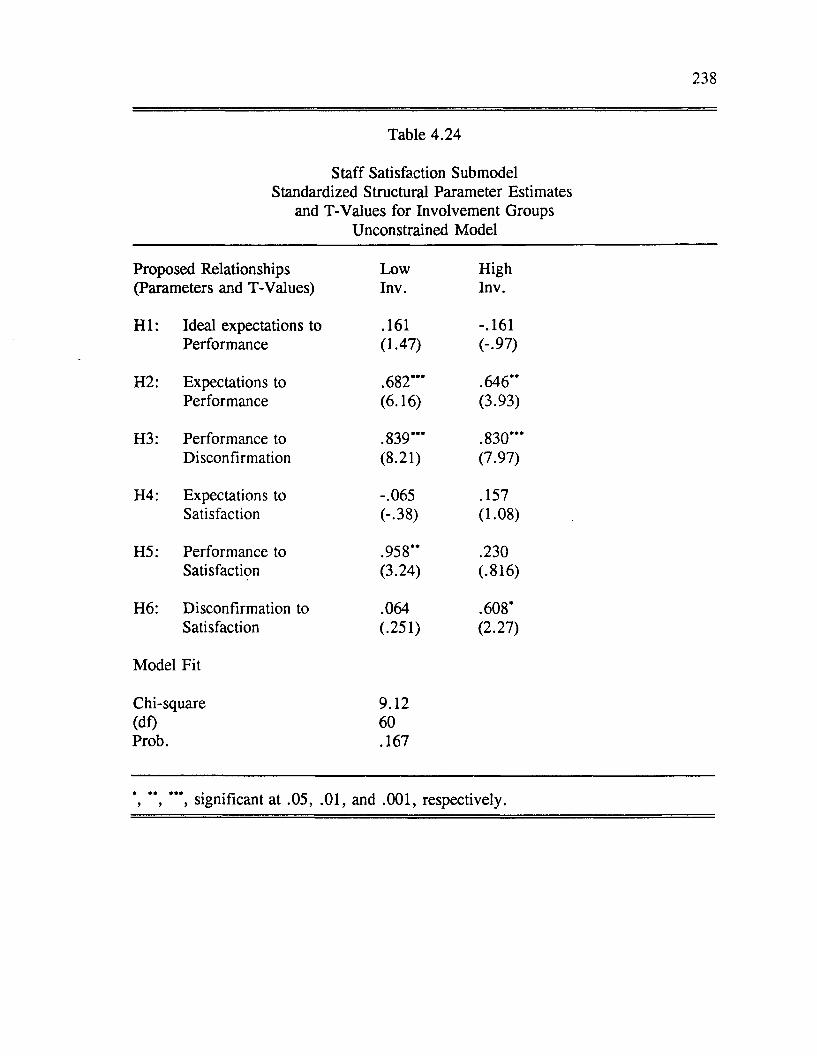
238
Table 4.24
Staff Satisfaction Submodel Standardized Structural Parameter Estimates
and T-Values for Involvement Groups Unconstrained Model
Proposed Relationships Low High(Parameters and T-Values) Inv. Inv.
H I: Ideal expectations to .161 -.161Performance (1.47) (-.97)
H2: Expectations to .682*** .646**Performance (6.16) (3.93)
H3: Performance to .839***
••ocooo
Disconfirmation (8.21) (7.97)
H4: Expectations to -.065 .157Satisfaction (-.38) (1.08)
H5: Performance to .958** .230Satisfaction (3.24) (.816)
H6: Disconfirmation to .064 .608*Satisfaction (.251) (2.27)
Model Fit
Chi-square 9.12(df) 60Prob. .167
*, **, ***, significant at .05, .01, and .001, respectively.

FIGURE 4.21 Staff Submodel: Low Involvement Sample
SIGNIFICANT STANDARDIZED STRUCTURAL PARAMETER ESTIMATESUNCONSTRAINED MODEL
Disconfirmation Staff Role
Performance: Staff Role
Satisfaction Staff Role
Expectations: Staff Role

FIGURE 4.22 Staff Submodel: High Involvement Sample
SIGNIFICANT STANDARDIZED STRUCTURAL PARAMETER ESTIMATESUNCONSTRAINED MODEL
Ideal Expectations:
Staff Role Disconfirmation: Staff Role ,
.608.830
Performance: Staff Role
Satisfaction: Staff Role
.620
.646
Expectations: Staff Role
241
As with the other submodels, the staff satisfaction submodel was reestimated
three more times, constraining the parameters between expectations and satisfaction,
performance and satisfaction, and disconfirmation and satisfaction to be equal
between the high and low involvement groups. Results from the multi-sample
analyses with constrained parameters for the staff submodel are presented in Tables
4.25, 4.26, 4.27.
As indicated in Tables 4.24, 4.25, and 4.26, when the unconstrained model
(Table 4.24) is compared to the models constraining the parameter between
expectations and satisfaction (Table 4.25) and the parameter between performance
and satisfaction (Table 4.26), no significant differences were found. In all three
models, performance was the only significant predictor o f satisfaction for the low
involvement sample and disconfirmation was the only predictor o f satisfaction for
the high involvement sample. When the unconstrained model (Table 4.24) is
compared to the model where the parameter between disconfirmation and satisfaction
was constrained (Table 4.27), a significant difference was found. The chi-square
difference was significant at the .05 level. When one examines the patterns of
relationships, we see that for this constrained model performance was the only
significant predictor o f satisfaction for both involvement samples.
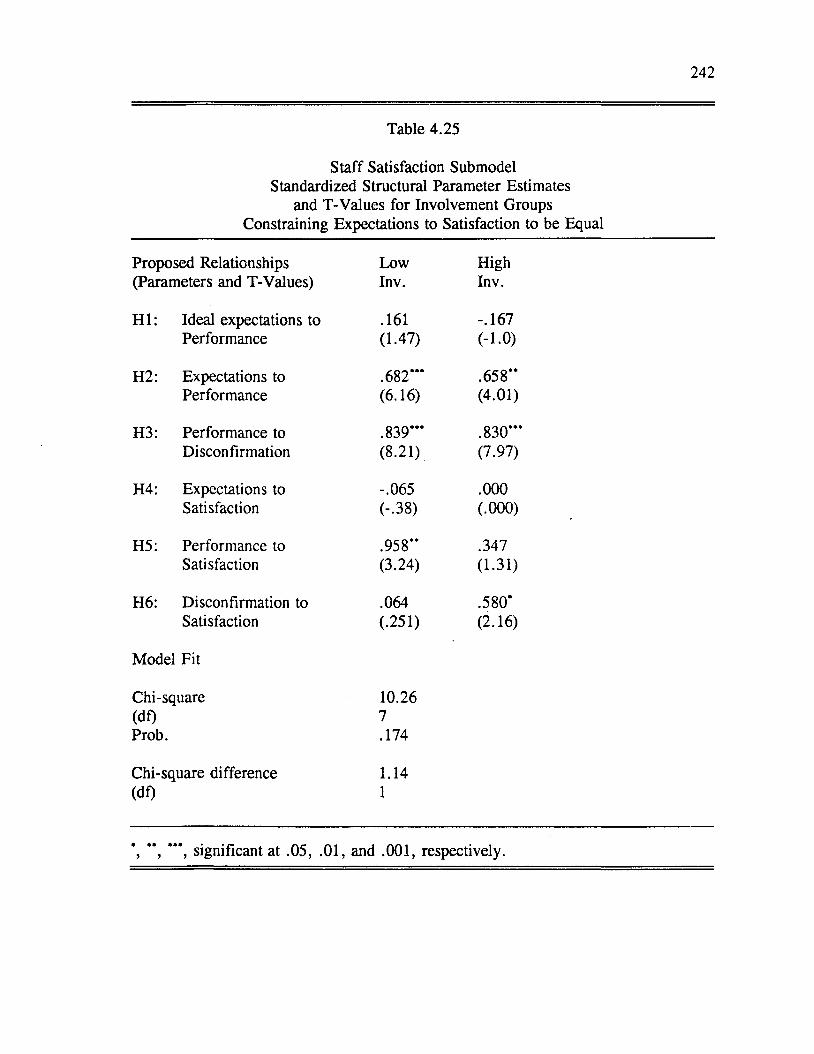
242
Table 4.25
Staff Satisfaction Submodel Standardized Structural Parameter Estimates
and T-Values for Involvement Groups Constraining Expectations to Satisfaction to be Equal
Proposed Relationships Low High(Parameters and T-Values) Inv. Inv.
H I: Ideal expectations to .161 -.167Performance (1.47) (-1.0)
H2: Expectations to .682’** .658“Performance (6.16) (4.01)
H3: Performance to .839’** .830***Disconfirmation (8.21) (7.97)
H4: Expectations to -.065 .000Satisfaction (-.38) (.000)
H5: Performance to .958** .347Satisfaction (3.24) (1.31)
H6: Disconfirmation to .064 .580’Satisfaction (.251) (2.16)
Model Fit
Chi-square 10.26(df) 7Prob. .174
Chi-square difference 1.14(df) 1
*, **, ***, significant at .05, .01, and .001, respectively.
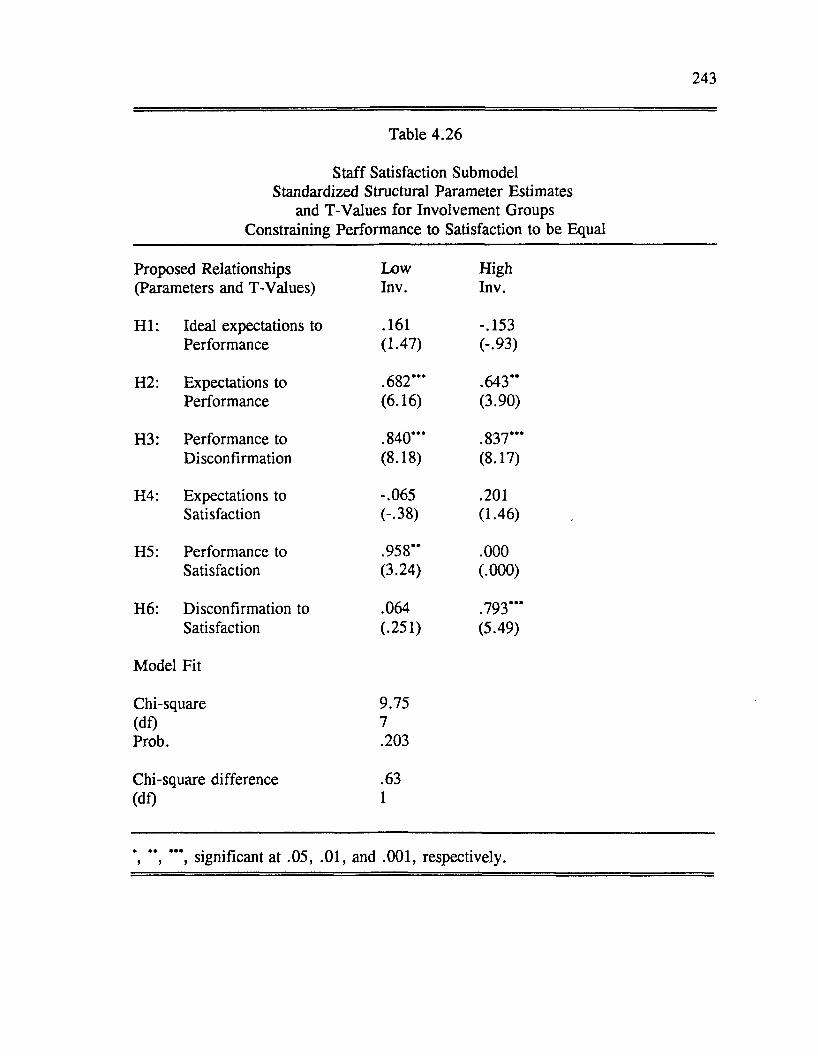
243
Table 4.26
Staff Satisfaction Submodel Standardized Structural Parameter Estimates
and T-Values for Involvement Groups Constraining Performance to Satisfaction to be Equal
Proposed Relationships Low High(Parameters and T-Values) Inv. Inv.
H I: Ideal expectations to .161 -.153Performance (1.47) (-.93)
H2: Expectations to .682*** .643“Performance (6.16) (3.90)
H3: Performance to .840*** .837“ *Disconfirmation (8.18) (8.17)
H4: Expectations to -.065 .201Satisfaction (-.38) (1.46)
H5: Performance to .958“ .000Satisfaction (3.24) (.000)
H6: Disconfirmation to .064 .793***Satisfaction (.251) (5.49)
Model Fit
Chi-square 9.75(df) 7Prob. .203
Chi-square difference .63(df) 1
*, **, ***, significant at .05, .01, and .001, respectively.
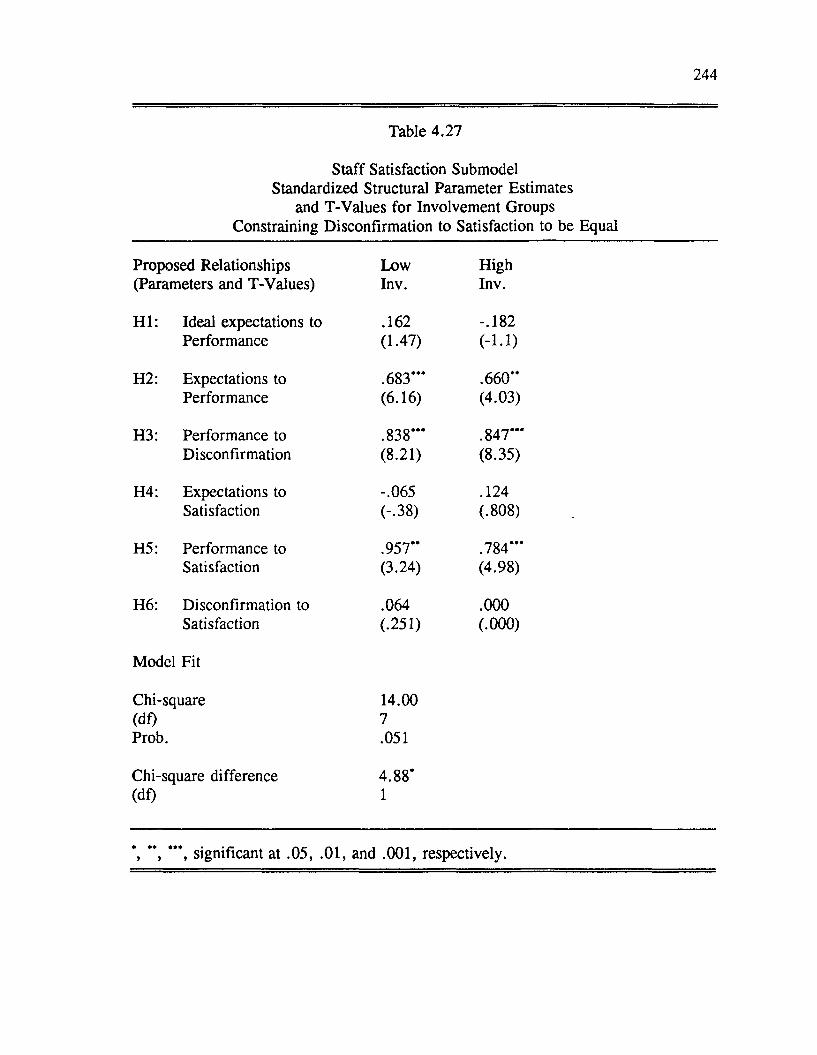
244
Table 4.27
Staff Satisfaction Submodel Standardized Structural Parameter Estimates
and T-Values for Involvement Groups Constraining Disconfirmation to Satisfaction to be Equal
Proposed Relationships Low High(Parameters and T-Values) Inv. Inv.
H I: Ideal expectations to .162 -.182Performance (1.47) (-1.1)
H2: Expectations to .683*** .660**Performance (6.16) (4.03)
H3: Performance to .838*** .847***Disconfirmation (8.21) (8.35)
H4: Expectations to -.065 .124Satisfaction (-.38) (.808)
H5: Performance to .957** .784***Satisfaction (3.24) (4.98)
H6: Disconfirmation to .064 .000Satisfaction (.251) (.000)
Model Fit
Chi-square 14.00(df) 7Prob. .051
Chi-square difference 4.88*(df) 1
\ **, *’*, significant at .05, .01, and .001, respectively.
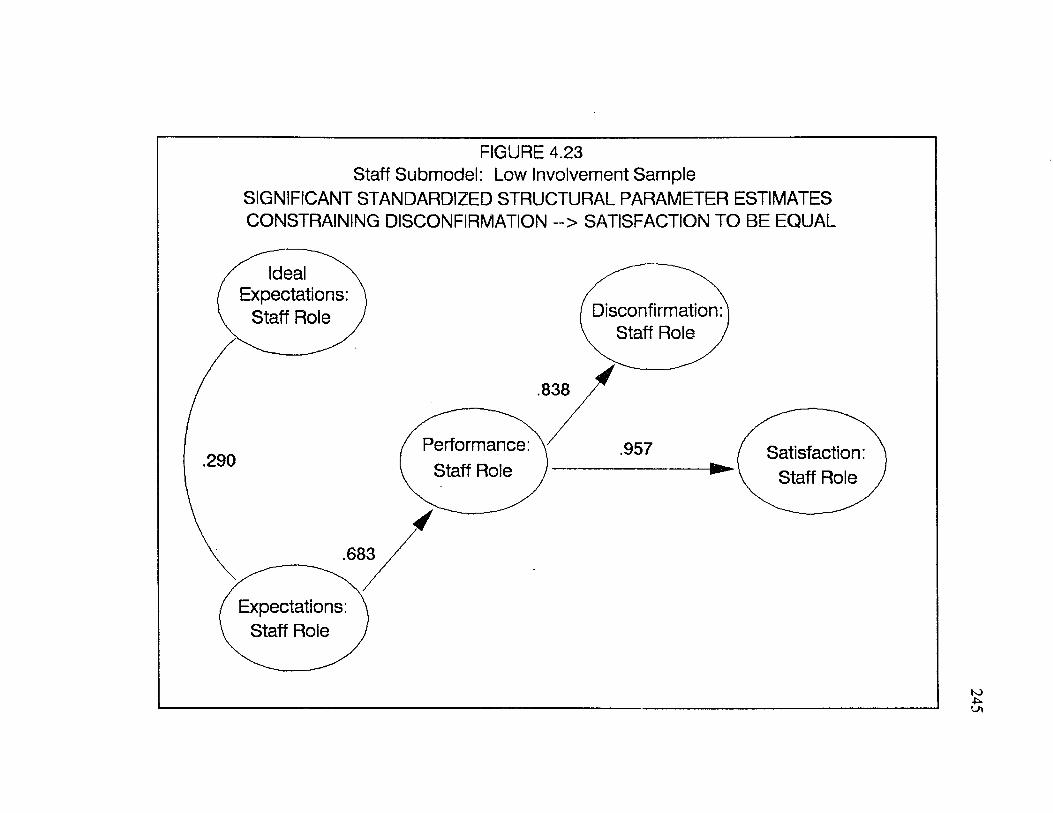
FIGURE 4.23 Staff Submodel: Low Involvement Sample
SIGNIFICANT STANDARDIZED STRUCTURAL PARAMETER ESTIMATES CONSTRAINING DISCONFIRMATION --> SATISFACTION TO BE EQUAL
.838
Performance: Staff Role
.957.290
.683
Expectations: Staff Role
Disconfirmation: Staff Role ,
Ideal Expectations:
Staff Role
Satisfaction: Staff Role

FIGURE 4.24Staff Submodel: High Involvement Sample
SIGNIFICANT STANDARDIZED STRUCTURAL PARAMETER ESTIMATESCONSTRAINING DISCONFIRMATION --> SATISFACTION TO BE EQUAL
Ideal ^ s\I Expectations: \ / \ V Staff Role J Disconfirmation:
. / V Staff Role J
/ .847 /
( Performance: \ 784 / 620 ( Staff Role )
Satisfaction: \ Staff Role J
.660
( Expectations: \I Staff Role J
246
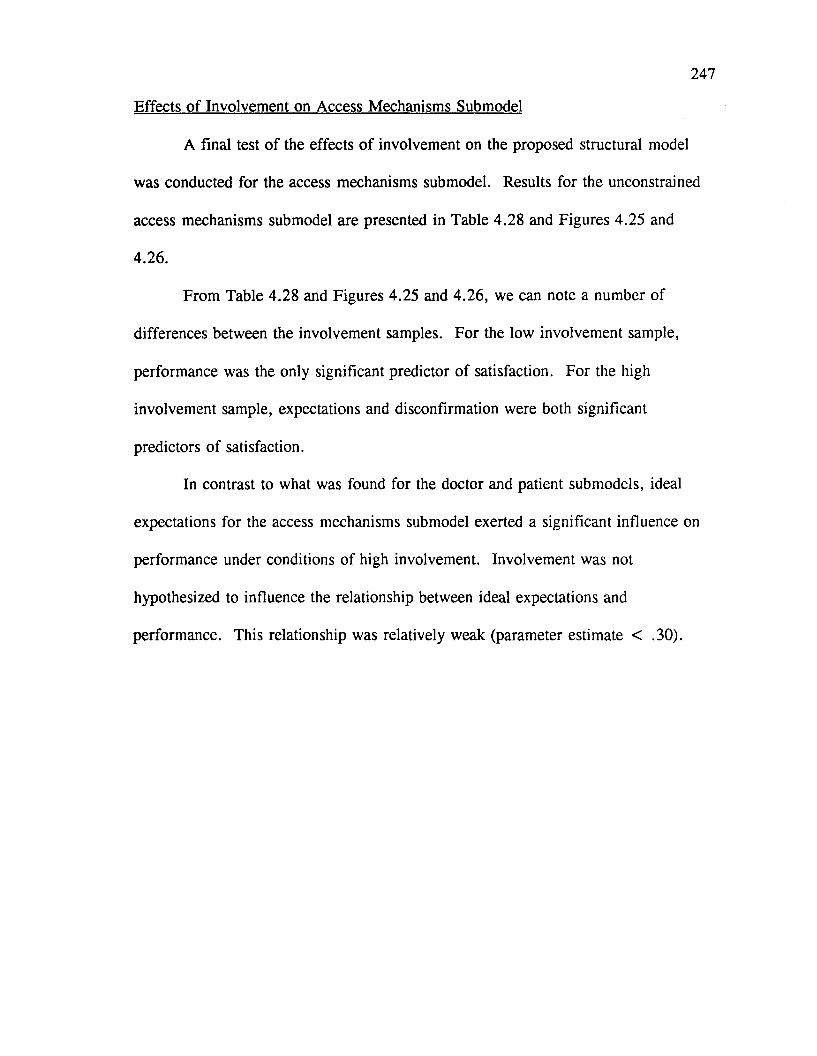
247
Effects o f Involvement on Access Mechanisms Submodel
A final test o f the effects o f involvement on the proposed structural model
was conducted for the access mechanisms submodel. Results for the unconstrained
access mechanisms submodel are presented in Table 4.28 and Figures 4.25 and
4.26.
From Table 4.28 and Figures 4.25 and 4.26, we can note a number of
differences between the involvement samples. For the low involvement sample,
performance was the only significant predictor of satisfaction. For the high
involvement sample, expectations and disconfirmation were both significant
predictors o f satisfaction.
In contrast to what was found for the doctor and patient submodels, ideal
expectations for the access mechanisms submodel exerted a significant influence on
performance under conditions of high involvement. Involvement was not
hypothesized to influence the relationship between ideal expectations and
performance. This relationship was relatively weak (parameter estimate < .30).
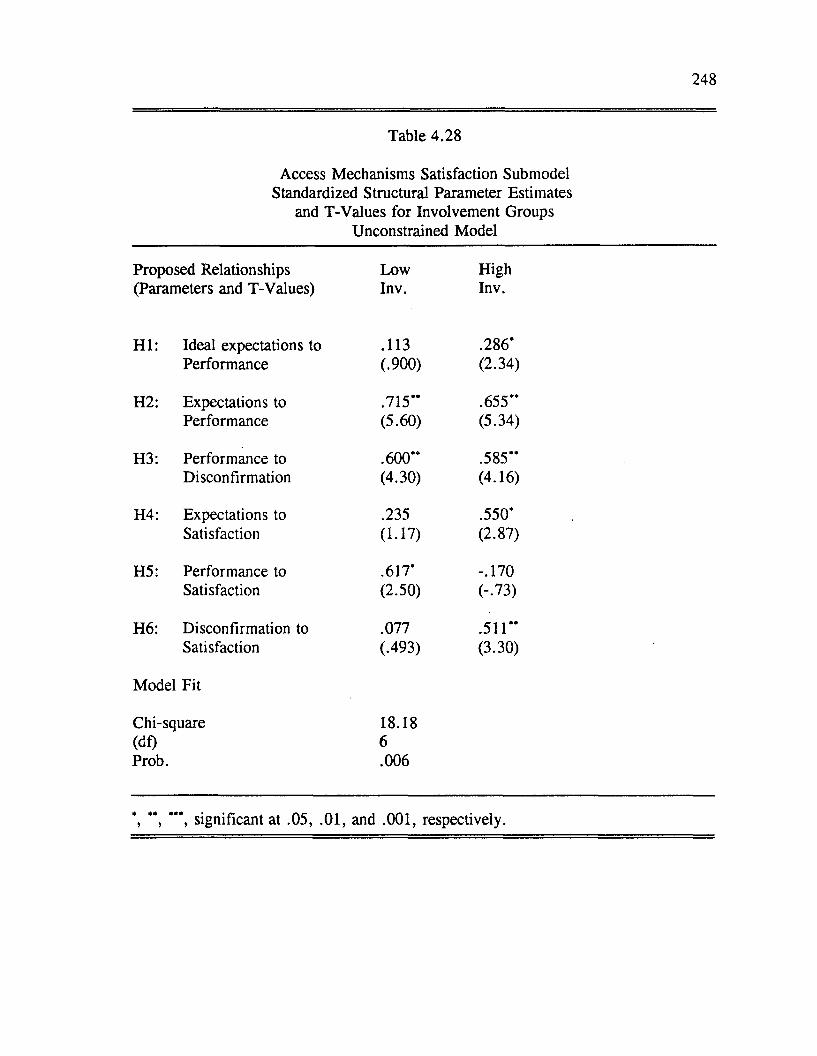
248
Table 4.28
Access Mechanisms Satisfaction Submodel Standardized Structural Parameter Estimates
and T-Values for Involvement Groups Unconstrained Model
Proposed Relationships Low High(Parameters and T-Values) Inv. Inv.
H I: Ideal expectations to .113 .286 'Performance (.900) (2.34)
H2: Expectations to .715’* .655"Performance (5.60) (5.34)
H3: Performance to .600** .585"Disconfirmation (4.30) (4.16)
H4: Expectations to .235 .550'Satisfaction (1.17) (2.87)
H5: Performance to .617' -.170Satisfaction (2.50) (-.73)
H6: Disconfirmation to .077 .511"Satisfaction (.493) (3.30)
Model Fit
Chi-square 18.18(dl) 6Prob. .006
, " , significant at .05, .01, and .001, respectively.
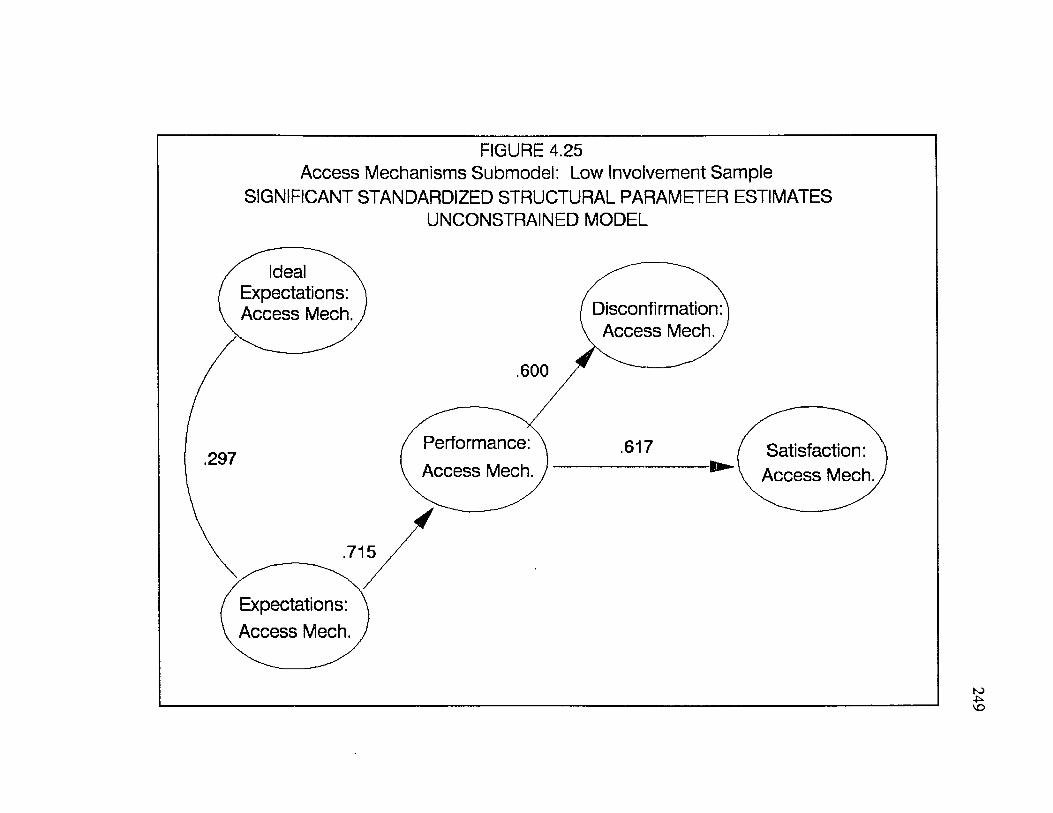
FIGURE 4.25Access Mechanisms Submodel: Low Involvement Sample
SIGNIFICANT STANDARDIZED STRUCTURAL PARAMETER ESTIMATESUNCONSTRAINED MODEL
Ideal N Expectations: Access Mech. Disconfirmation:
Access Mech. ,
.600
Performance: Access Mech.
.617 ( Satisfaction:I\ Access Mech.
.297
.715
Expectations: Access Mech.
249
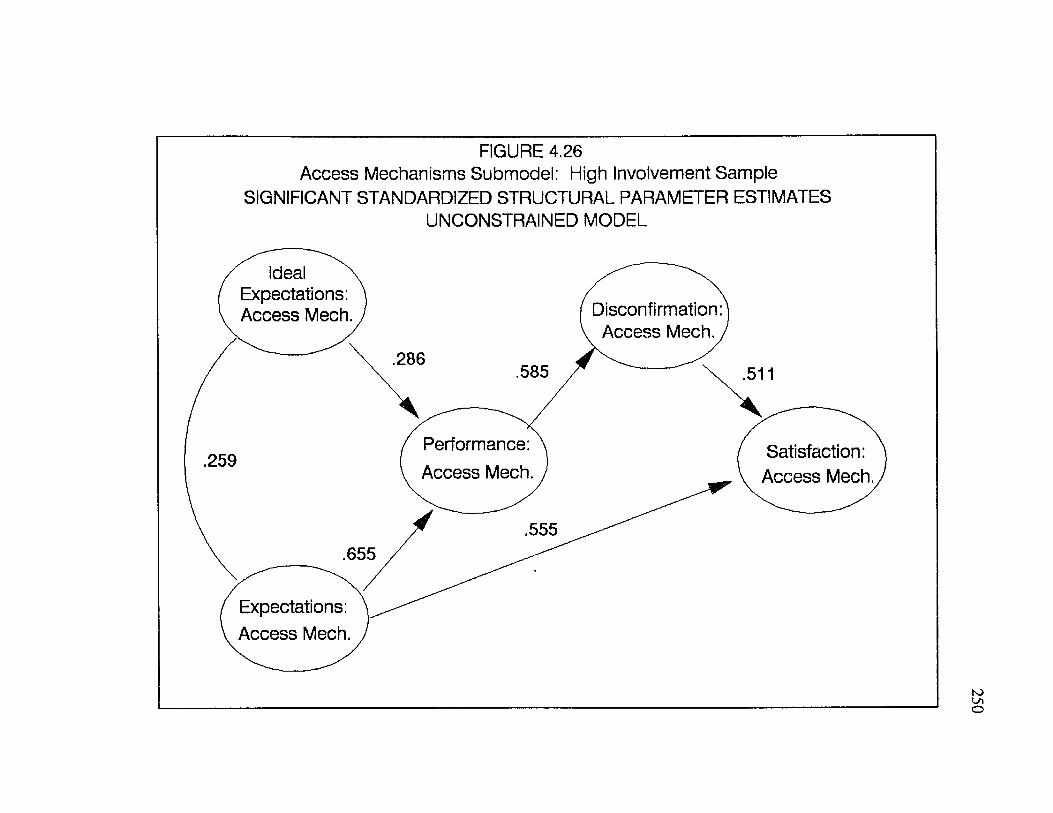
FIGURE 4.26Access Mechanisms Submodel: High Involvement Sample
SIGNIFICANT STANDARDIZED STRUCTURAL PARAMETER ESTIMATESUNCONSTRAINED MODEL
Ideal N Expectations: Access Mech. Disconfirmation:
Access Mech. ,.286
.585 .511
Performance: Access Mech.
Satisfaction: Access Mech.
.259
.555.655
Expectations: Access Mech.
250
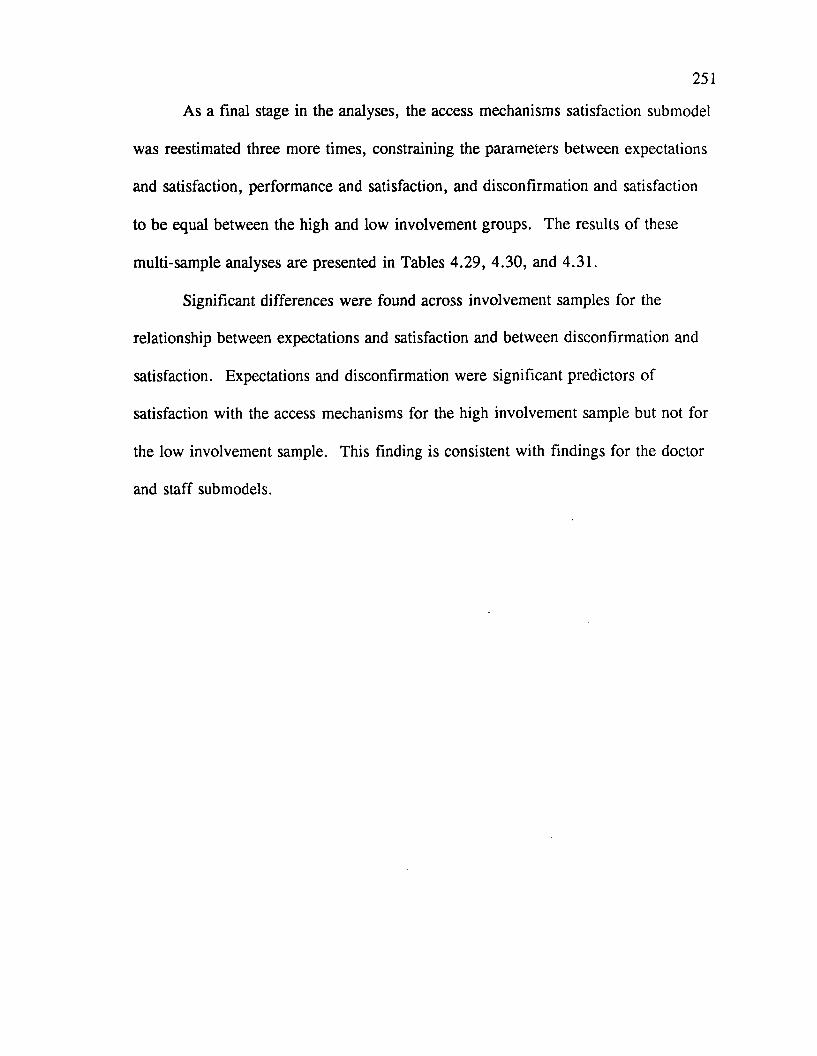
251
As a final stage in the analyses, the access mechanisms satisfaction submodel
was reestimated three more times, constraining the parameters between expectations
and satisfaction, performance and satisfaction, and disconfirmation and satisfaction
to be equal between the high and low involvement groups. The results o f these
multi-sample analyses are presented in Tables 4.29, 4.30, and 4.31.
Significant differences were found across involvement samples for the
relationship between expectations and satisfaction and between disconfirmation and
satisfaction. Expectations and disconfirmation were significant predictors of
satisfaction with the access mechanisms for the high involvement sample but not for
the low involvement sample. This finding is consistent with findings for the doctor
and staff submodels.

252
Table 4.29
Access Mechanisms Satisfaction Submodel Standardized Structural Parameter Estimates
and T-Values for Involvement Groups Constraining Expectations to Satisfaction to be Equal
Proposed Relationships Low High(Parameters and T-Values) Inv. Inv.
H I: Ideal expectations to .113 .251*Performance (.900) (2.07)
H2: Expectations to .716“ .677“Performance (5.60) (5.54)
H3: Performance to .600“ .589“Disconfirmation (4.30) (4.19)
H4: Expectations to .230 .000Satisfaction (1.17) (0.00)
H5: Performance to .604* .228Satisfaction (2.50) (1.37)
H6: Disconfirmation to .075 .592**Satisfaction (.493) (3.65)
Model Fit
Chi-square 25.57(df) 7Prob. .001
Chi-square difference 7.39“(df) 1
*, **, ***, significant at .05, .01, and .001, respectively.

FIGURE 4.27Access Mechanisms Submodel: Low Involvement Sample
SIGNIFICANT STANDARDIZED STRUCTURAL PARAMETER ESTIMATES CONSTRAINING EXPECTATIONS ~> SATISFACTION TO BE EQUAL
Ideal N Expectations: Access Mech. Disconfirmation:
Access Mech.,
.600
Performance: Access Mech.
.604 I Satisfaction:1V Access Mech.
.297
.716
Expectations: Access Mech.

FIGURE 4.28Access Mechanisms Submodel: High Involvement Sample
SIGNIFICANT STANDARDIZED STRUCTURAL PARAMETER ESTIMATES CONSTRAINING EXPECTATIONS ~> SATISFACTION TO BE EQUAL
Ideal N Expectations: Access Mech. Disconfirmation:
Access Mech. ,.251
.589 .592
Performance: Access Mech.
Satisfaction: Access Mech.
.259
.677
Expectations: Access Mech.

255
Table 4.30
Access Mechanisms Satisfaction Submodel Standardized Structural Parameter Estimates
and T-Values for Involvement Groups Constraining Performance to Be Equal
Proposed Relationships Low High(Parameters and T-Values) Inv. Inv.
H I: Ideal expectations to .113 .278*Performance (.900) (2.25)
H2: Expectations to .715*' .652**Performance (5.60) (5.28)
H3: Performance to .601" .580"Disconfirmation (4.30) (4.11)
H4: Expectations to .234 .448"Satisfaction (1.17) (3.45)
H5: Performance to .615* .000Satisfaction (2.50) (.000)
H6: Disconfirmation to .076 .467"Satisfaction (.493) (3.56)
Model Fit
Chi-square 18.82(df) 7Prob. .009
Chi-square difference .64(df) 1
*, " , ***, significant at .05, .01, and .001, respectively.

256
Table 4.31
Access Mechanisms Satisfaction Submodel Standardized Structural Parameter Estimates
and T-Values for Involvement Groups Constraining Disconfirmation to Satisfaction to be Equal
Proposed Relationships Low High(Parameters and T-Values) Inv. Inv.
H I: Ideal expectations to .113 .276*Performance (.900) (2.26)
H2: Expectations to .715** .658**Performance (5.60) (5.35)
H3: Performance to .600** .595**Disconfirmation (4.30) (4.25)
H4: Expectations to .230 .678**Satisfaction (1.17) (3.28)
H5: Performance to .605* .058Satisfaction (2.50) (.269)
H6: Disconfirmation to .075 .000Satisfaction (.493) (.000)
Model Fit
Chi-square 27.83(df) 7Prob. .000
Chi-square difference 9.65***(df) 1
*, **, ***, significant at .05, .01, and .001, respectively.
FIGURE 4.29Access Mechanisms Submodel: Low Involvement Sample
SIGNIFICANT STANDARDIZED STRUCTURAL PARAMETER ESTIMATES CONSTRAINING DISCONFIRMATION ~> SATISFACTION TO BE EQUAL
Ideal N Expectations: Access Mech. Disconfirmation:
Access Mech. ,
.600
Performance: Access Mech.
.605 [ Satisfaction:H r- i
\ Access Mech..297
.715
Expectations: Access Mech.
257

FIGURE 4.30Access Mechanisms Submodel: High Involvement Sample
SIGNIFICANT STANDARDIZED STRUCTURAL PARAMETER ESTIMATES CONSTRAINING DISCONFIRMATION ~> SATISFACTION TO BE EQUAL
Ideal N Expectations: Access Mech. Disconfirmation:
Access Mech. ,.276
.595
Performance: Access Mech.
Satisfaction: Access Mech.
.259
.678
.658
Expectations: Access Mech.
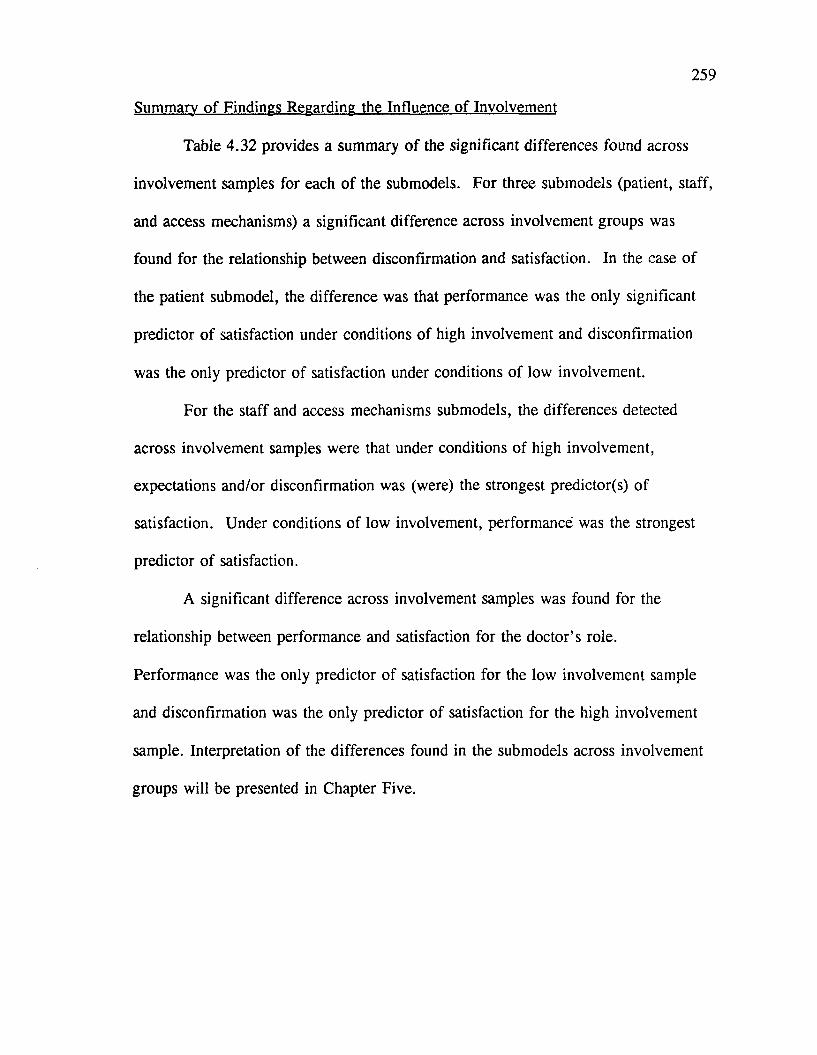
259
Summary o f Findings Regarding the Influence o f Involvement
Table 4.32 provides a summary o f the significant differences found across
involvement samples for each o f the submodels. For three submodels (patient, staff,
and access mechanisms) a significant difference across involvement groups was
found for the relationship between disconfirmation and satisfaction. In the case o f
the patient submodel, the difference was that performance was the only significant
predictor o f satisfaction under conditions o f high involvement and disconfirmation
was the only predictor o f satisfaction under conditions o f low involvement.
For the staff and access mechanisms submodels, the differences detected
across involvement samples were that under conditions of high involvement,
expectations and/or disconfirmation was (were) the strongest predictor(s) of
satisfaction. Under conditions of low involvement, performance was the strongest
predictor o f satisfaction.
A significant difference across involvement samples was found for the
relationship between performance and satisfaction for the doctor’s role.
Performance was the only predictor of satisfaction for the low involvement sample
and disconfirmation was the only predictor of satisfaction for the high involvement
sample. Interpretation of the differences found in the submodels across involvement
groups will be presented in Chapter Five.
260
Table 4.32
Summary o f Significant Differences Across Involvement Groups
SignificantChi-Sq.Difference
SupportforH7a and H7b
Patient Submodel Yes Yes
Doctor Submodel Yes No
Staff Submodel Yes No
Access Mechanisms Submodel Yes No
Summary of the Findings
Ideal Expectations and Performance Relationship
It was predicted that ideal expectations would exert a negative influence on
performance (H I). Ideal expectations was significantly related to performance for
the doctor’s role. Although statistically significant, the parameter estimate for this
relationship was relatively small (.25).
Expectations and Performance Relationship
It was predicted that expectations would exert a positive influence on
performance (H2). This relationship was significant for all four submodels and for
all tests (individual tests of the submodels and overall test).
Performance and Disconfirmation Relationship
Performance was hypothesized to exert a positive influence on
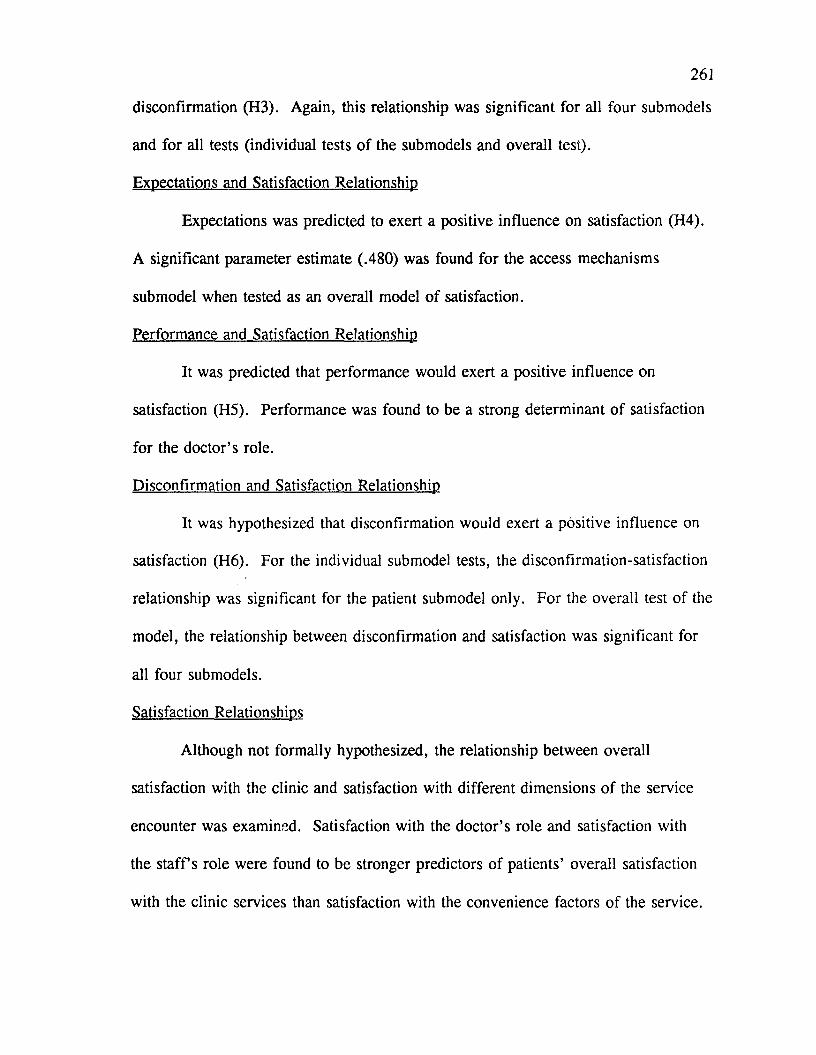
261
disconfirmation (H3). Again, this relationship was significant for all four submodels
and for all tests (individual tests of the submodels and overall test).
Expectations and Satisfaction Relationship
Expectations was predicted to exert a positive influence on satisfaction (H4).
A significant parameter estimate (.480) was found for the access mechanisms
submodel when tested as an overall model o f satisfaction.
Performance and Satisfaction Relationship
It was predicted that performance would exert a positive influence on
satisfaction (H5). Performance was found to be a strong determinant o f satisfaction
for the doctor’s role.
Disconfirmation and Satisfaction Relationship
It was hypothesized that disconfirmation would exert a positive influence on
satisfaction (H6). For the individual submodel tests, the disconfirmation-satisfaction
relationship was significant for the patient submodel only. For the overall test of the
model, the relationship between disconfirmation and satisfaction was significant for
all four submodels.
Satisfaction Relationships
Although not formally hypothesized, the relationship between overall
satisfaction with the clinic and satisfaction with different dimensions o f the service
encounter was examined. Satisfaction with the doctor’s role and satisfaction with
the s ta ffs role were found to be stronger predictors o f patients’ overall satisfaction
with the clinic services than satisfaction with the convenience factors of the service.
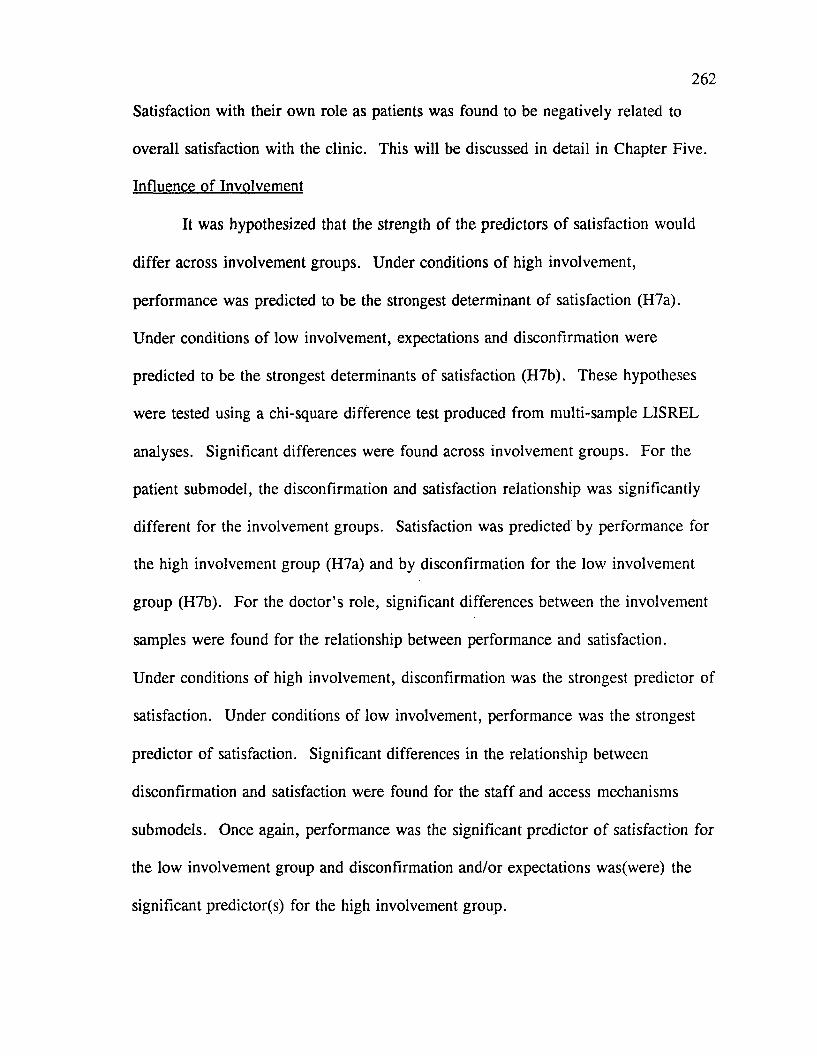
262
Satisfaction with their own role as patients was found to be negatively related to
overall satisfaction with the clinic. This will be discussed in detail in Chapter Five.
Influence o f Involvement
It was hypothesized that the strength o f the predictors o f satisfaction would
differ across involvement groups. Under conditions o f high involvement,
performance was predicted to be the strongest determinant of satisfaction (H7a).
Under conditions o f low involvement, expectations and disconfirmation were
predicted to be the strongest determinants o f satisfaction (H7b). These hypotheses
were tested using a chi-square difference test produced from multi-sample LISREL
analyses. Significant differences were found across involvement groups. For the
patient submodel, the disconfirmation and satisfaction relationship was significantly
different for the involvement groups. Satisfaction was predicted by performance for
the high involvement group (H7a) and by disconfirmation for the low involvement
group (H7b). For the doctor’s role, significant differences between the involvement
samples were found for the relationship between performance and satisfaction.
Under conditions o f high involvement, disconfirmation was the strongest predictor of
satisfaction. Under conditions of low involvement, performance was the strongest
predictor o f satisfaction. Significant differences in the relationship between
disconfirmation and satisfaction were found for the staff and access mechanisms
submodels. Once again, performance was the significant predictor o f satisfaction for
the low involvement group and disconfirmation and/or expectations was(were) the
significant predictor(s) for the high involvement group.
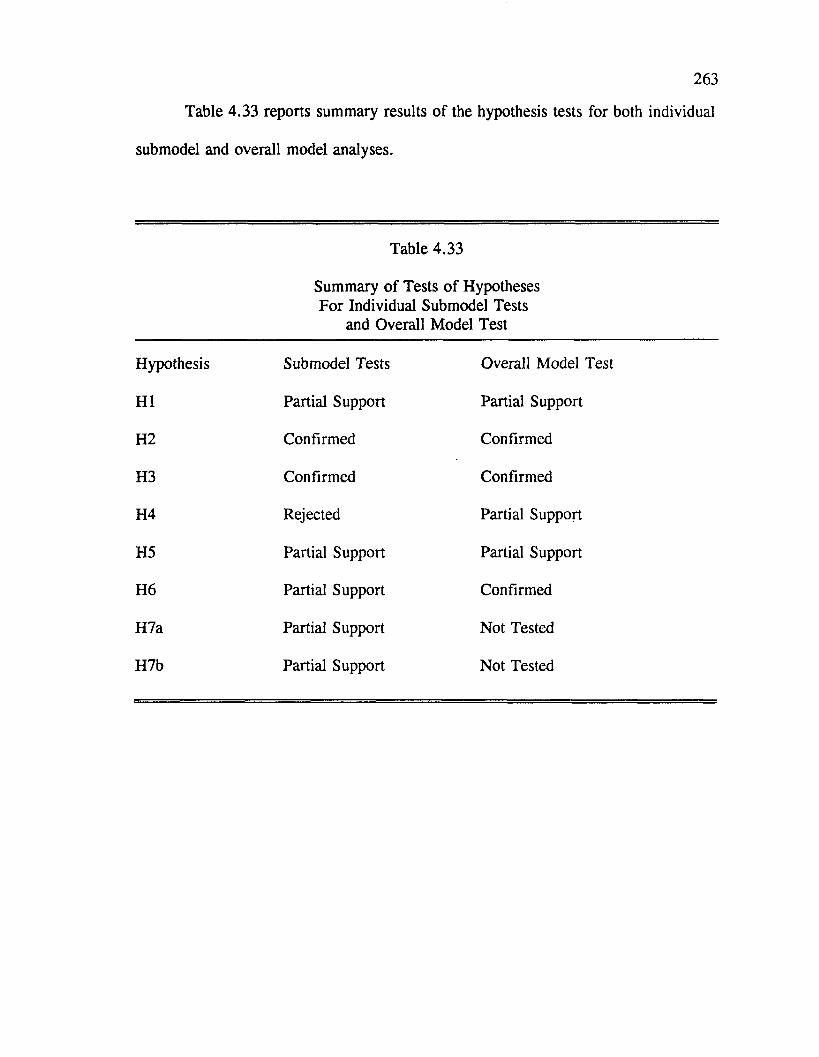
263
Table 4.33 reports summary results o f the hypothesis tests for both individual
submodel and overall model analyses.
Table 4.33
Summary o f Tests o f Hypotheses For Individual Submodel Tests
and Overall Model Test
Hypothesis Submodel Tests Overall Model Test
H I Partial Support Partial Support
H2 Confirmed Confirmed
H3 Confirmed Confirmed
H4 Rejected Partial Support
H5 Partial Support Partial Support
H6 Partial Support Confirmed
H7a Partial Support Not Tested
H7b Partial Support Not Tested
CHAPTER FIVE
Conclusions, Implications, and Recommendations for Future Research
Chapter Five first summarizes the results o f the dissertation research and then
its limitations. Implications o f the research and recommendations for future research
are presented in the final section.
Conclusions
This dissertation attempted to address five research questions:
1. What is the relative influence o f expectations, performance, and disconfirmation on consumer satisfaction with professional services?
2. What is the relative influence o f role based and non-role based dimensions (access mechanisms) o f a professional service on satisfaction formation?
3. How does consumers’ satisfaction with their own role influence their satisfaction with professional services?
4. Do consumers use multiple comparison standards in the evaluation of professional services?
5. Does consumer involvement have a mediating influence on satisfaction formation for professional services?
What is the Relative Influence of Expectations. Disconfirmation and Performance on Satisfaction Formation?
Previous research has focused on investigating the relative effects of
expectations, disconfirmation, and perceived performance on product satisfaction
(Churchill and Surprenant 1982; Tse and Wilton 1988). Findings from these studies
suggest that expectations exerts both a direct and indirect (through perceived
performance) effect on satisfaction; performance also exerts a direct and indirect
264
265
(through disconfirmation) influence on satisfaction; and disconfirmation exerts a
direct influence on satisfaction. This study extended previous satisfaction research
by examining the relative influence o f expectations, performance, and
disconfirmation on satisfaction formation in the context o f professional services.
Some o f the findings in this research are consistent with prior research
findings, while others are inconsistent. In the overall test o f the model, expectations
was found to exert both a direct and indirect effect on satisfaction with access
mechanisms. For the other submodels, expectations did not have a direct influence
on satisfaction. Instead, the influence of expectations on satisfaction was indirect
through perceived performance. In the individual tests o f the submodels, perceived
performance had a direct impact on satisfaction for the doctor submodel only. For
the patient submodel, the effect of performance on satisfaction Was indirect through
disconfirmation. For the overall test o f the model, perceived performance had a
direct impact on satisfaction with the doctor’s role and an indirect impact (through
disconfirmation) on patients’ satisfaction with their own role, with the s ta ffs role
and with the access mechanisms. When the submodels were tested individually,
disconfirmation had a direct influence on satisfaction with the patient’s role. In the
overall test o f the model, disconfirmation had a direct, although sometimes weak,
influence on satisfaction for all four submodels.
One of the most crucial issues that needs clarification is why the discrepancy
is found between the models for the patient’s role, the doctor’s role, the staff’s role
and access mechanisms. Why is performance a significant predictor o f satisfaction
266
for the doctor’s submodel only? This linkage has been supported in recent
satisfaction research (Churchill and Surprenant 1982; Tse and Wilton 1988), so why
was only moderate support for the direct linkage between performance and
satisfaction found in this research? Why does the disconfirmation paradigm perform
reasonably well in some submodels and not in others?
One explanation for the differential impact o f performance and
disconfirmation on satisfaction formation is that the evaluative processes differ
across the various dimensions of the service. Churchill and Surprenant (1982)
report differences in satisfaction formation for durable and nondurable products.
They suggest that one explanation for these differences is that "for durable products
performance differences (if present) are the major determinant o f satisfaction, and
conversely that the disconfirmation of initial expectations has little impact"
(Churchill and Surprenant 1982, pp. 503). Perhaps satisfaction formation also
differs across service dimensions. Like durable products, satisfaction with the
primary service provider, in this case the doctor, is determined largely by the
doctor’s performance.
A second explanation for the contradictory findings regarding the impact of
perceived performance on satisfaction formation relates to methodological
differences between this study and other satisfaction studies. In both o f the studies
that found support for the independent effects o f performance on satisfaction,
performance was first manipulated in an experimental setting and then perceptions of
performance were measured (Churchill and Surprenant 1982; Tse and Wilton 1988).
267
In this study, performance was not manipulated, rather patients’ perceptions of
actual service performance in a real-world setting were measured. Tse and Wilton
(1988) speculate that the strength o f the product manipulation in their study and in
Churchill and Surprenant’s (1982) study, may at least partially explain why
performance, in contrast to the traditional research findings, dominates all other
determinants in predicting consumer satisfaction/dissatisfaction. Thus, some o f the
association between performance and satisfaction reported in these two studies may
reflect demand characteristics. This would explain why their findings regarding
performance were not replicated entirely in this research.
A third explanation for the results presented here is an explanation that was
also offered by Churchill and Surprenant (1982) to explain their findings regarding
the role of performance in satisfaction formation. This explanation involves
measures. These researchers found high correlations between the performance and
satisfaction measures for the durable product with some between-construct
correlations higher than the within-construct correlations. As the reader will recall,
this is the data from which Churchill and Surprenant (1982) report performance to
be the only significant predictor o f satisfaction. They are not the only researchers
who report high correlations between performance and other constructs. Swan and
Trawick (1980) also found high correlations between performance and satisfaction.
Tse and Wilton (1988) found perceived performance to be highly correlated with
subjective disconfirmation (r2 = .73). As was discussed in Chapter Four,
performance measures in this study were also highly correlated with other measures,
268
particularly disconfirmation.
Since performance has been found to be highly correlated with other
constructs in a number o f studies including this dissertation, a natural question is
whether perceived performance is a distinct construct. Conceptually performance
may be different from disconfirmation and satisfaction, but perceptually performance
may be one and the same. In other words, researchers may conceptually define
performance as a distinct construct but do consumers perceive performance to be
distinct from prior expectations?
Perhaps performance is a distinct construct. The question then becomes have
we been successful in developing valid measures o f performance? Both Churchill
and Surprenant (1982) and Tse and Wilton (1988) admit that some o f their measures
were troublesome. Churchill and Surprenant (1982, p .500) report that "the evidence
on the convergent and discriminant validity of the measures [for the video disc
player] is not as strong as it is with the plant data". They also question whether "in,
spite o f conceptual differences between the constructs, are our operationalizations
likely to share method variance?" (Churchill and Surprenant 1982, p. 503). Tse and
Wilton (1988) voice a similar concern:
The r2^ reported here are higher than those in other studies (e.g. Bearden and Teel 1983; Oliver 1980) suggesting the possibility o f common methods variance in the measures. Though the discriminant validity results for comparison standards reported before suggest this is unlikely, the issue can be explored further by applying the multi-trait, multi-method procedure to the other measures [which they did not do for performance] (Tse and Wilton 1988, p. 210).
To conduct a valid test o f the relative effects o f expectations,
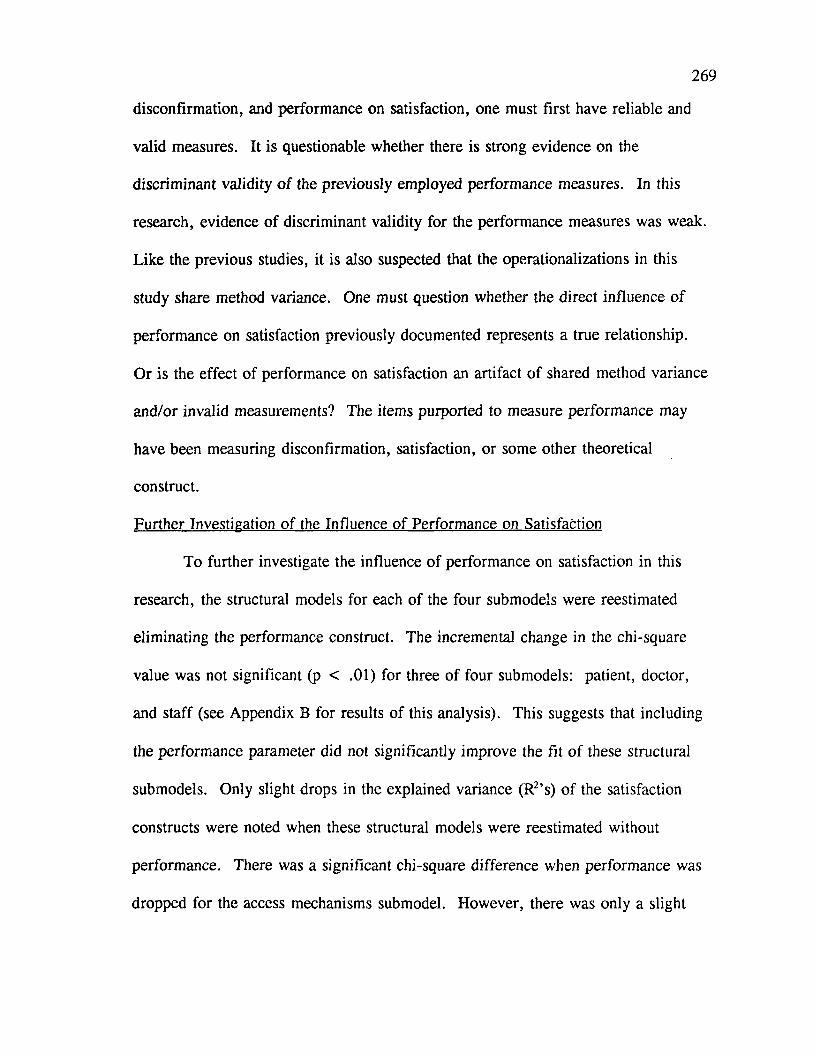
disconfirmation, and performance on satisfaction, one must first have reliable and
valid measures. It is questionable whether there is strong evidence on the
discriminant validity o f the previously employed performance measures. In this
research, evidence o f discriminant validity for the performance measures was weak.
Like the previous studies, it is also suspected that the operationalizations in this
study share method variance. One must question whether the direct influence of
performance on satisfaction previously documented represents a true relationship.
Or is the effect o f performance on satisfaction an artifact o f shared method variance
and/or invalid measurements? The items purported to measure performance may
have been measuring disconfirmation, satisfaction, or some other theoretical
construct.
Further Investigation o f the Influence o f Performance on Satisfaction
To further investigate the influence of performance on satisfaction in this
research, the structural models for each o f the four submodels were reestimated
eliminating the performance construct. The incremental change in the chi-square
value was not significant (p < .01) for three o f four submodels: patient, doctor,
and staff (see Appendix B for results o f this analysis). This suggests that including
the performance parameter did not significantly improve the fit o f these structural
submodels. Only slight drops in the explained variance (R2’s) o f the satisfaction
constructs were noted when these structural models were reestimated without
performance. There was a significant chi-square difference when performance was
dropped for the access mechanisms submodel. However, there was only a slight
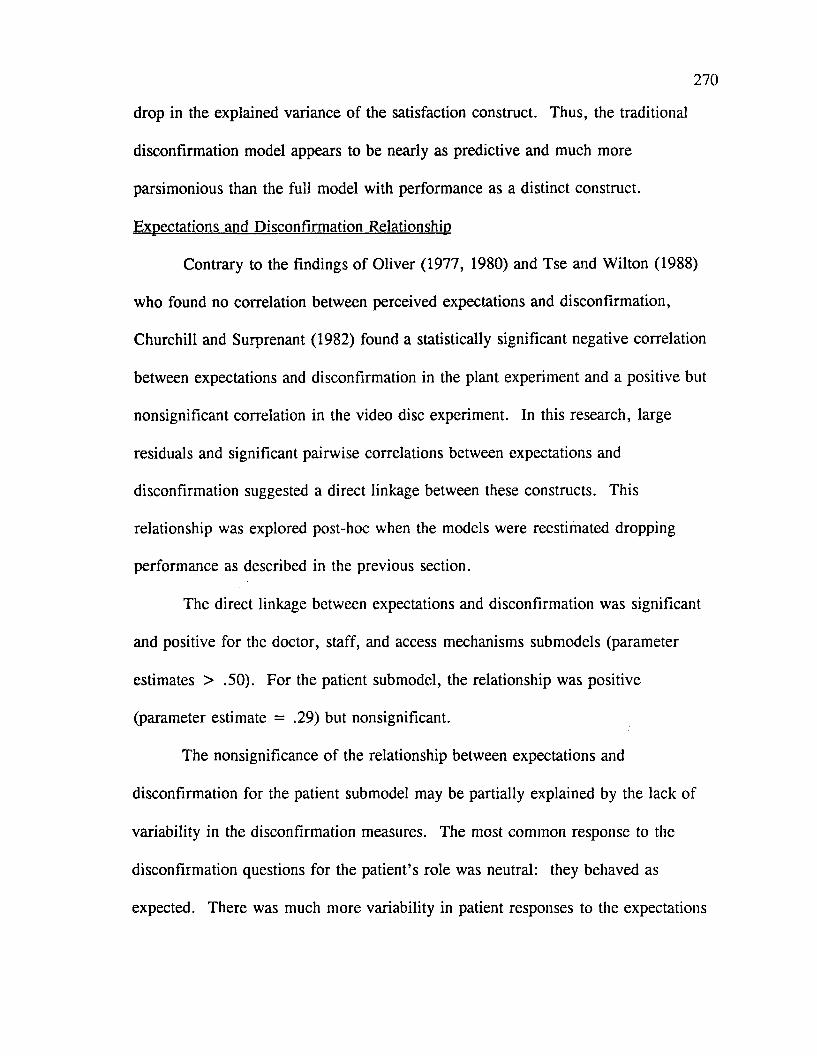
270
drop in the explained variance o f the satisfaction construct. Thus, the traditional
disconfirmation model appears to be nearly as predictive and much more
parsimonious than the full model with performance as a distinct construct.
Expectations and Disconfirmation Relationship
Contrary to the findings o f Oliver (1977, 1980) and Tse and Wilton (1988)
who found no correlation between perceived expectations and disconfirmation,
Churchill and Surprenant (1982) found a statistically significant negative correlation
between expectations and disconfirmation in the plant experiment and a positive but
nonsignificant correlation in the video disc experiment. In this research, large
residuals and significant pairwise correlations between expectations and
disconfirmation suggested a direct linkage between these constructs. This
relationship was explored post-hoc when the models were reestimated dropping
performance as described in the previous section.
The direct linkage between expectations and disconfirmation was significant
and positive for the doctor, staff, and access mechanisms submodels (parameter
estimates > .50). For the patient submodel, the relationship was positive
(parameter estimate = .29) but nonsignificant.
The nonsignificance o f the relationship between expectations and
disconfirmation for the patient submodel may be partially explained by the lack of
variability in the disconfirmation measures. The most common response to the
disconfirmation questions for the patient’s role was neutral: they behaved as
expected. There was much more variability in patient responses to the expectations
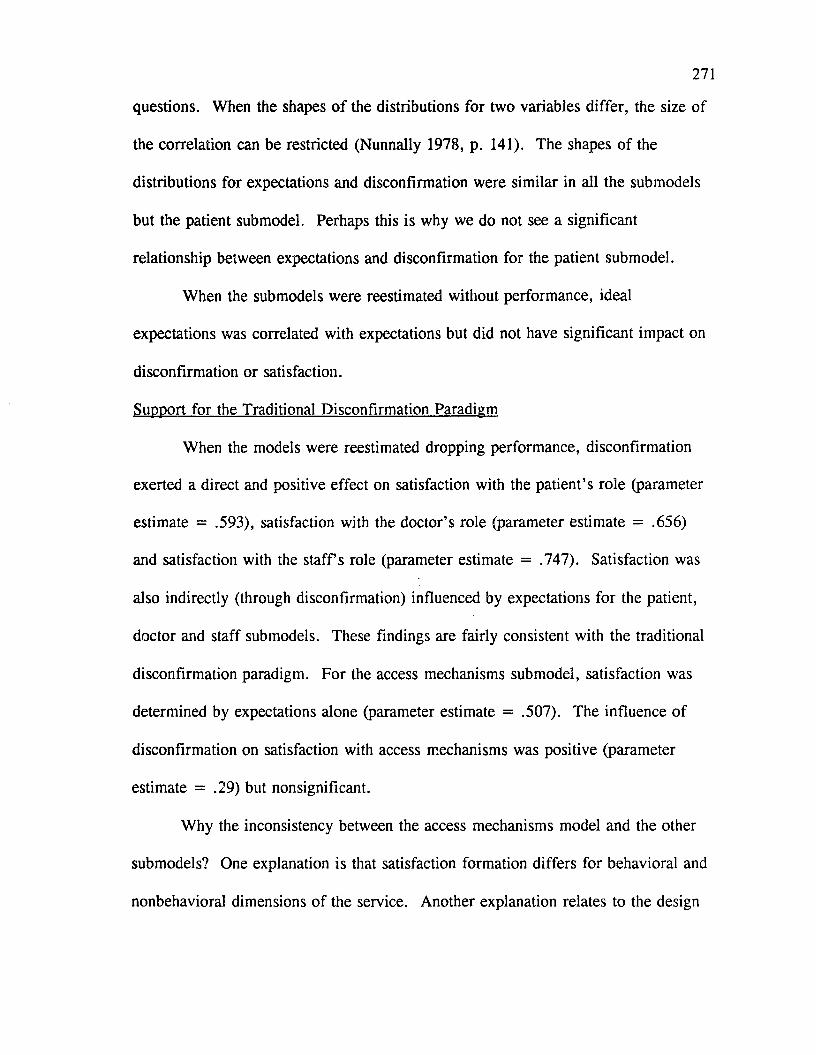
271
questions. When the shapes o f the distributions for two variables differ, the size of
the correlation can be restricted (Nunnally 1978, p. 141). The shapes o f the
distributions for expectations and disconfirmation were similar in all the submodels
but the patient submodel. Perhaps this is why we do not see a significant
relationship between expectations and disconfirmation for the patient submodel.
When the submodels were reestimated without performance, ideal
expectations was correlated with expectations but did not have significant impact on
disconfirmation or satisfaction.
Support for the Traditional Disconfirmation Paradigm
When the models were reestimated dropping performance, disconfirmation
exerted a direct and positive effect on satisfaction with the patient’s role (parameter
estimate = .593), satisfaction with the doctor’s role (parameter estimate = .656)
and satisfaction with the s ta ffs role (parameter estimate = .747). Satisfaction was
also indirectly (through disconfirmation) influenced by expectations for the patient,
doctor and staff submodels. These findings are fairly consistent with the traditional
disconfirmation paradigm. For the access mechanisms submodel, satisfaction was
determined by expectations alone (parameter estimate = .507). The influence of
disconfirmation on satisfaction with access mechanisms was positive (parameter
estimate = .29) but nonsignificant.
Why the inconsistency between the access mechanisms model and the other
submodels? One explanation is that satisfaction formation differs for behavioral and
nonbehavioral dimensions o f the service. Another explanation relates to the design
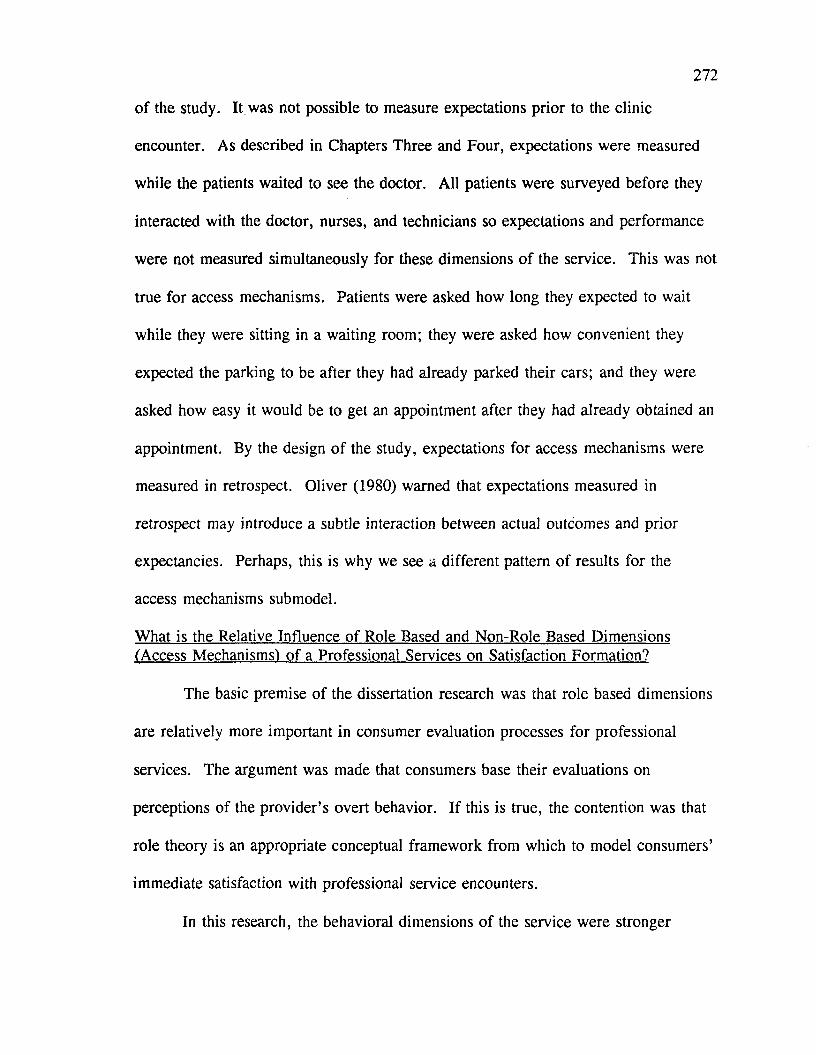
272
o f the study. It was not possible to measure expectations prior to the clinic
encounter. As described in Chapters Three and Four, expectations were measured
while the patients waited to see the doctor. All patients were surveyed before they
interacted with the doctor, nurses, and technicians so expectations and performance
were not measured simultaneously for these dimensions o f the service. This was not
true for access mechanisms. Patients were asked how long they expected to wait
while they were sitting in a waiting room; they were asked how convenient they
expected the parking to be after they had already parked their cars; and they were
asked how easy it would be to get an appointment after they had already obtained an
appointment. By the design o f the study, expectations for access mechanisms were
measured in retrospect. Oliver (1980) warned that expectations measured in
retrospect may introduce a subtle interaction between actual outcomes and prior
expectancies. Perhaps, this is why we see a different pattern o f results for the
access mechanisms submodel.
What is the Relative Influence of Role Based and Non-Role Based Dimensions (Access Mechanisms) o f a Professional Services on Satisfaction Formation?
The basic premise of the dissertation research was that role based dimensions
are relatively more important in consumer evaluation processes for professional
services. The argument was made that consumers base their evaluations on
perceptions o f the provider’s overt behavior. If this is true, the contention was that
role theory is an appropriate conceptual framework from which to model consumers’
immediate satisfaction with professional service encounters.
In this research, the behavioral dimensions o f the service were stronger
273
predictors o f satisfaction than the nonbehavioral dimensions. The two strongest
predictors o f overall satisfaction with the clinic were satisfaction with the doctor and
satisfaction with the staff. Satisfaction with the convenience factors o f the service or
the access mechanisms was significant but relatively less important.
From this research, one could conclude that consumers do indeed largely
base their evaluation o f professional services on their perceptions o f the role players’
behavior during the service encounter. Thus, role theory does appear to be an
appropriate framework from which to model consumers’ immediate satisfaction with
professional service encounters.
How Does Consumers’ Satisfaction With Their Own Role Influence Their Satisfaction With Professional Services?
Previous attempts to model patient satisfaction have ignored the interactive
nature o f medical services. A model o f consumer satisfaction based on role theory
cannot ignore the role the recipient o f the service also has to play. This research
provided an initial conceptualization and empirical test of the influence o f consumer
role expectations and behavior on satisfaction with health care services.
A key research question regarding consumers’ role in professional service
encounters is whether consumer satisfaction with their own role enhances their
satisfaction with the service. In the full test o f the model, patients’ satisfaction with
their own role exerted a significant negative impact on their overall satisfaction with
the clinic. One explanation for this finding is that the more dissatisfied patients are
with the clinic, the more satisfied they are with their own behavior. Patients may
magnify satisfaction with their own role when they are disappointed with the service
274
provided. For example, patients may feel that they arrived on time for their
appointments and yet the doctor kept them waiting. They may feel that they asked
the doctor appropriate questions and yet s/he provided insufficient answers in
response to their questions. In other words, they did everything right and they were
still dissatisfied.
An examination o f the simple pairwise correlation between patients’
satisfaction with their own role and overall satisfaction with the clinic (r2 = .54)
indicates that the relationship is significant and positive. This is in contrast to what
was found in the overall test o f the model. A plausible explanation for the
contradiction in findings is that collinearity among the satisfaction variables in the
overall test o f the model may have created an interpretative problem. The within
correlation coefficients for the satisfaction measures were higher than the between
correlation coefficients which suggests that the measures have good discriminant
validity. Nevertheless, the composite measure for patient satisfaction with their own
role was significantly correlated with composite measures for satisfaction with the
doctor’s role (r2 = .75) and for satisfaction with access mechanisms (r2 = .61). In
the overall test o f the model, these satisfaction measures were treated as prior
endogenous variables predicting overall satisfaction. Collinearity among independent
variables can create a number o f problems including negatively correlated beta
estimates. The fit statistics for the overall model suggest that the proposed model
does not fit the data well. Specification errors may have also created some of the
counter-intuitive results. Further investigation is needed to determine the influence
275
o f patient satisfaction with their own role on satisfaction with service encounters.
Do Consumers Use Multiple Comparison Standards in the Evaluation o f Professional Services?
This dissertation study provides an initial empirical examination o f the
presence o f multiple comparison standards in consumer satisfaction/dissatisfaction
formation for services. Multiple comparison standards have been suggested
conceptually by several researchers (Tolman 1932; Adams 1963; M iller 1977;
Liechty and Churchill 1979; W oodruff, Cadotte, and Jenkins 1983; Sirgy 1984) and
tested empirically for satisfaction with products (Tse and Wilton 1988).
Tse and Wilton (1988) found empirical support for two comparison
standards: ideal expectations and expectations. Both o f these comparison standards
were tested in this research. The results found in this study differed from those
found by Tse and Wilton (1988). First, the presence of ideal expectations was not
consistently found across the different submodels and across the different samples
(pooled, high, and low involvement samples). Second, these researchers found the
effects o f ideal expectations on satisfaction to be negative and indirect (through
perceived performance). In this study, the significant effects o f ideal expectations
on satisfaction were indirect (through perceived performance) but in contrast to Tse
and W ilton’s findings they were positive.
Why the conflicting results? In Tse and W ilton’s (1988) research, subjects
were instructed to act as potential customers in a test market trial o f a new
electronic, hand-held, miniature record player. Ideal product performance was
measured after the subjects read a one page description. Next, subjects were
276
exposed to an expectation manipulation and asked to evaluate expected product
performance. In this study, neither ideal expectations nor expectations were
manipulated. Thus, some o f the results regarding comparison standards reported by
Tse and Wilton (1988) may reflect demand characteristics.
Another explanation for why we don’t see a strong presence of ideal
expectations in this research is that perhaps the use o f different comparison standards
is influenced by individual difference variables like experience or involvement. It
has been proposed that ideal expectations is based on previous product experiences,
learning from advertisements, and word-of-mouth communication (M iller 1977;
Liecthy and Churchill 1979). Expected product performance is also likely to be
influenced by previous experiences with a product or a service. Maybe as
consumers become more experienced with a product or a service, their ideal
expectations assimilate toward their expectations. With experience, consumers no
longer make a distinction between ideal versus probabilistic expectations. Or maybe
they make the distinction between comparison standards but for certain products or
in certain service settings, one comparison standard has a dominate influence on
satisfaction. For example, in a medical setting patients may hope to wait five
minutes to see the doctor but realize that they will probably be kept waiting much
longer. So although, consumers make the distinction between ideal expectations and
expectations, as a comparison standard ideal expectations has less impact on
satisfaction assessments than probabilistic expectations. Unlike the subjects in Tse
and W ilton’s (1988) research who probably had relatively little experience with the
277
product, the subjects in this study were likely to have had some experience with
medical encounters prior to their clinic visit. The influence o f experience on the use
o f different comparison standards was not empirically tested here. However, in the
discussion that follows we see that the use o f ideal expectations as a comparison
standard may be influenced by another individual difference variable, involvement
level.
When tested on the entire sample, ideal expectations was found to exert a
positive and indirect influence on satisfaction with the doctor’s role. The
standardized structural parameter was small ( < .30) but significant. When we
examine the effects o f ideal expectations on satisfaction with the doctor’s role under
different conditions o f involvement, we see that ideal expectations is present only
under conditions o f low involvement (standardized structural parameter estimate =
.340).
One explanation for this finding is that the effect of ideal expectations on
satisfaction with the doctor’s role is mediated by involvement with the service.
However, one might predict that ideal expectations would have a stronger impact on
satisfaction formation under conditions o f high involvement rather than low
involvement. Under conditions o f high involvement, it would seem that patients
would be more motivated to use multiple comparison standards. It would also seem
that highly involved patients would be more likely seek or hope for ideal rather
satisfactory service performance. The opposite could be said o f patients with low
involvement. They may settle for satisfactory service performance.
278
Another plausible explanation for this finding is that the measures for ideal
expectations for the doctor’s role were not equally valid across involvement samples.
As was discussed in Chapter Four, measures for ideal expectations for the doctor’s
role lacked evidence o f discriminant validity for the low involvement sample. This
would suggest that for low involvement patients ideal expectations and expectations
are not distinct constructs. Perhaps low involvement patients are less motivated to
make the distinction between how they would like the doctor to behave and how
they think the doctor will behave.
Ideal expectations was also found to exert a positive and indirect influence on
patient’s satisfaction with their own role for the low involvement sample. It is
interesting that the relationship was significant under conditions o f low involvement.
One may think that if patients were to make a distinction between ideal and expected
behaviors with respect to their own role, they would be more likely to do so if they
were highly involved. Once again, an examination o f measurement differences
across involvement samples may provide a possible explanation for this finding.
The reliability coefficient for ideal expectations for the patient’s role was .49 for the
high involvement sample and .83 for the low involvement sample. The low
reliability o f the measures for ideal expectations may have attenuated the relationship
for the high involvement sample.
Since this research provides an initial conceptualization and operationalization
o f the consumer’s role in a service encounter, it is possible that the domain o f the
consumer’s role has not been adequately captured. The sociology o f medicine
literature suggests that people may approach their role as patients quite differently.
Concerned about a medical condition, patients who are highly involved with a visit
to the clinic but who perceive their role in the medical encounter to be relatively
passive may define ideal patient behavior as: seeking technically competent help,
trusting the doctor and following the medical regimen (Parsons 1951). Patients who
are also involved with a visit to the clinic but who perceive their role in a medical
encounter to be relatively active, may define ideal patient behavior as: asking
questions, stating preferences, proposing alternatives, expecting to be heard, seeking
second opinions, and stating the type o f intervention being sought from the physician
(Quill 1983; Blackwell, Gutmann, and Jackson 1987). An examination of the items
measuring ideal expectations for the patient’s role indicate a possible bias towards
the activated approach to patienthood (see Appendix A: Dissertation Surveys).
Although the literature suggests that more patients desire greater participation in
medical encounters, it is likely that there exists patients who still prefer a relatively
passive approach to patienthood. If this is true, ideal expectations for the patient’s
role may not have been fully operationalized in this research.
Ideal expectations was also found to exert a positive and indirect effect on
satisfaction with access mechanisms for the high involvement sample. The
reliability and validity o f the measures for ideal expectations were good. One
explanation for the significant but small ( < .30) relationship between ideal
expectations and performance is that highly involved patients make the distinction
between what they would ideally like to occur and what they believe is likely to
280
occur with respect to access mechanisms. These convenience factors of the service
are relatively more tangible than the role-based dimensions o f the service. It may be
easier for patients to make a distinction between ideal expectations and expectations
for such service dimensions as the amount o f waiting time and the convenience of
the parking than it is to make the distinction between ideal expectations and
expectations for such service dimensions as the clarity o f the doctor’s explanation.
Perhaps that is why we find the presence o f ideal expectations for access
mechanisms under conditions o f high involvement. Why doesn’t ideal expectations
exert an influence on satisfaction formation for access mechanisms under conditions
o f low involvement? Perhaps patients who are less involved in the visit rely simply
on probabilistic expectations as a comparison standard.
In summary, ideal expectations was found to exert an indirect effect on
satisfaction formation for some of the service dimensions. This relationship was
neither consistent across submodels nor across samples. The significant parameter
estimates were relatively small ( < .34) suggesting a weak relationship between ideal
expectations and perceived performance. Some o f the findings may be at least
partially attributable to measurement problems associated with the measures for ideal
expectations and performance. Based on these findings, one may conclude that
patients do not use multiple comparison standards in satisfaction formation for
medical services. However, since the findings here contradict previous findings in
the satisfaction research, another inference is that either the operationalization of
ideal expectations in this study was not a good operationalization o f the comparison
281
standard or the presence o f ideal expectations varies across service dimensions.
Rather than eliminating ideal expectations in research on satisfaction formation for
services, further research using this comparison standard appears warranted.
Does Consumer Involvement Have A Mediating Influence on Satisfaction Formation For Professional Services?
It was hypothesized that the relative impact o f expectations, performance and
discontinuation would be influenced by consumers’ level o f involvement with the
service. Lack of evidence for the discriminant validity o f the performance measures
raises some interpretative problems regarding the tests o f the proposed influence o f
involvement. Without valid measures, it is impossible to conduct a valid test o f the
proposed hypotheses. The results of the analyses regarding involvement were
inconsistent and in some cases, counter-intuitive. It is difficult to interpret these
results and draw conclusions when one o f the key variables in the hypotheses tests
was not validly measured. Further research is needed to develop reliable and valid
measures o f performance and to investigate the potentially mediating influences of
involvement on satisfaction formation for services.
Limitations
This section summarizes the major factors that must be considered in viewing
the results o f the dissertation. These factors limit the usefulness of the dissertation
research to other academic researchers and practitioners.
The first limitation originates from the use of judgement sampling. It was
felt that the advantages o f sampling patients who had recently experienced a service
encounter outweighed the disadvantages o f utilizing a judgement sample. Although

282
judgement sampling was used, every attempt was made to obtain a sample
representative o f the general population with respect to gender, age, education, and
income. The sample consisted o f slightly more married people, younger and older
people and less educated people than the general population.
The present study also attempted to obtain a balanced sample o f new and
returning patients. The sample consisted o f slightly more returning patients than
new patients. This is consistent with the daily patient profile for the clinic. On a
daily basis, the proportion o f returning patients is larger than the proportion o f new
patients. This made it difficult to obtain an equal proportion of new patients to
returning patients within the data collection period.
The characteristics of the sample does not appear to have an impact on the
basic objective o f understanding and explaining satisfaction formation. As long as
the sample demonstrates adequate variation, theory and concept testing can be
performed (Calder, Phillips, and Tybout 1981).
A second limitation of the dissertation research lies in its reliance on pairwise
matrices. The mathematics underlying the calculation o f maximum likelihood
estimates assumes we have a covariance matrix created by recording the value of
each case on all the variables included in the input matrix, a listwise matrix. The
costs involved in violating the assumption o f a listwise matrix are unknown.
Hayduk (1987) cautions that
in models using pairwise matrices, the reasonableness o f ultimate estimates should be assessed carefully, and the overall output should be viewed tentatively because responses o f chi-square, standard errors, and other program output to pairwise matrices is unknown...W hether using a listwise
283
or pairwise matrix, researchers should rerun the model using the "other"matrix and report any differences in results (Hayduk 1987, p. 327).
As discussed in Chapter Four, the models were rerun using listwise matrices.
Slight differences in fit statistics and the magnitude o f parameter estimates were
noted. However, no differences in the patterns o f relationships were found. To
provide further evidence for the stability o f the results, one might also reestimate the
models using only one of the two comparison standards. As the reader may recall,
these are the variables in which the data are incomplete. The models could be
estimated separately using ideal expectations as the comparison standard and then
using expectations. Since complete data would be available for these models,
listwise matrices could be used. With this approach, the sample size would not be
as drastically reduced as it was when listwise matrices were used to estimate the
models with both comparison standards included.
A third limitation o f the research concerns it methodology and measurements.
One of the most serious measurement issues is the lack of evidence for the
discriminant validity o f the performance measures employed in this study. Another
methodological issue relates to the distribution o f responses for some o f the variables
in this research. As in prior satisfaction/dissatisfaction studies, the distribution of
responses on some variables in this study is skewed and nonhomogeneous. The
impact o f deviations from normality or nonhomogeneous variable distributions
depends largely on sample size and the size o f the correlations assuming equivalent
distributions. Nunnally (1978) suggests that moderate-sized correlations are
relatively insensitive to differences in distribution shape assuming a fairly large
284
sample o f subjects is being investigated (e.g. o f at least 100). The results presented
here are based on pairwise correlations consequently the exact sample size is
unknown. Based on the criteria proposed by Nunnally (1978, p. 142), correlation
coefficients obtained from a minimum of 55 subjects and a maximum of 131 subjects
should be considered only moderately robust.
The final limitation of this research’s contribution lies in the interpretation of
the results for the proposed model. The use o f linear structural equation analysis
was deemed appropriate since the primary focus o f the research was to explore
model relationships and observe associations among model constructs. However,
causal interpretation o f the model is not appropriate. It is possible that some o f the
proposed constructs and relationships result from influences not included in the
model. The model tested in this dissertation focused on the influence of process
factors in determining consumer satisfaction with professional services. However,
there may be a number o f antecedent variables that impact consumer evaluation
processes for professional services. For example, patients’ prior experience with the
clinic, experience with other medical encounters, experience with the medical
condition, knowledge of the doctor’s reputation, insurance coverage, as well as other
variables may be associated with each of the proposed constructs. There are also a
number o f outcome variables such as effectiveness o f the treatment, length o f the
recovery period, and elimination of discomfort and pain which are excluded from
the model but are very likely to influence consumer satisfaction with the medical
service. To accurately understand and explain consumer satisfaction formation for
285
professional services, a longitudinal study is needed to examine the relationship
between antecedent, process, and outcome variables.
Methodological Issues for Future Research
The problems encountered in this study raise a number o f methodological
issues that should be addressed in future service satisfaction research. This
research, as well as other satisfaction research, report problems with the measures of
performance. This appears to be an important methodological issue that needs
serious attention by those who conduct research in the area o f service satisfaction.
Some of the problems associated with the performance measures in this study and in
past studies may be due in part to the simultaneous measurement o f performance,
disconfirmation, and satisfaction. This approach may introduce an interaction
between prior expectancies, perceptions o f performance and satisfaction assessments.
A three stage longitudinal study could eliminate some o f the measurement problems.
Future research should attempt to measure expectations before the service encounter
(t,), performance immediately following the service encounter (t2), and
disconfirmation and satisfaction shortly after the service encounter (t3).
The problem of shared method variance is a related measurement issue that
must be considered and dealt with in future service satisfaction research. In this
research, most o f the constructs were measured using similar measurement methods.
Shared method variance is indeed a possibility. This researcher was not able to
utilize multi-trait, multi-method (MTMM) analysis to fully investigate this issue
since dissimilar methods of measurement were not available for all the constructs of
286
interest. Future research should employ multiple methods o f measurement and apply
MTMM analysis to further explore the issue o f common methods variance. Also
future researchers should employ longitudinal designs whenever possible to help
limit the problem of common method variance.
Another measurement issue relates to the timing o f measurements. In this
research, ideal expectations and expectations for the access mechanisms were
measured in retrospect. Problems associated with this approach have already been
addressed and should be avoided in future research.
Another timing problem in this research was related to the measurement of
involvement. Involvement was measured at the clinic (q) while performance,
disconfirmation, and satisfaction were measured after the clinic visit (t2). These
were the constructs that involvement was hypothesized to influence yet they were
measured at different time intervals. This assumes that patients’ state of
involvement remained constant over time. This may not be a valid assumption.
Future research on the effects of involvement on satisfaction should attempt to
measure involvement at both time periods.
Implications and Recommendations for Future Research
The dissertation findings and its limitations also raise some broad conceptual
questions around which suggestions for future research are organized.
These are:
-What impact does perceived performance have on satisfaction with professional services?,
-Have the behavioral dimensions o f the role players been fully
287
operationalized?,
-Do consumers utilize multiple comparison standards in evaluatingprofessional services?,
-W hat influence does involvement have on satisfaction formation forprofessional services?
-How can the satisfaction model be improved?
W hat Impact Does Perceived Performance Have on Satisfaction with Professional Services?
Methodological limitations inhibited the researcher’s ability to fully address
this research question. As was previously discussed, further research effort should
be expended to develop reliable and valid measures o f performance for the different
dimensions of professional services. Since the role-based dimensions o f the service
appear to be more important in determining customer satisfaction with professional
services, much of the research effort should be directed at developing scales to
measure performance for the various role players in the service setting.
Once reliable and valid measures o f performance are developed, the relative
influence o f expectations, performance, and disconfirmation on satisfaction should be
investigated across different service settings. It may be that performance becomes
more or less important depending upon the properties (search, experience and
credence) o f the service.
Have the Behavioral Dimensions o f the Role Players Been Fully Operationalized?
The types o f behavior that comprise the doctor’s role have been well
documented in the literature. The research presented here is one o f the first studies
to describe in detail some o f the types o f behavior that comprise the patient’s role in
288
a medical encounter. Additional empirical research is needed to ensure that all
possible types o f patient behavior are included in the operationalization o f the
patient’s role. As was pointed out earlier, the scales developed here to
operationalize the patient’s role may have had a bias towards measuring a more
activated role orientation. Scale development efforts are required to develop more
balanced measures o f the patient’s role.
Another related research project would be to develop a measure to capture
patient’s role orientation: the traditional passive approach to patienthood or the more
recent activated approach to patienthood. This measurement could be administered
to new patients when information about the patient’s medical history is typically
obtained. Information regarding the patient’s role orientation would enable the
service providers to attempt their behavior to meet the individual needs o f their
clients.
Another interesting research question that warrants attention is what are some
o f the individual difference variables that influence role conception or orientation?
As with types o f expectations, one could hypothesize that the important antecedents
to role expectations include demographic variables such as education and age and
psychological variables such as locus o f control and perceived risk. One may also
ask whether role orientation is a stable characteristic o f the individual or does role
orientation change with the situation or setting? The role o f consumers in service
interactions has been virtually ignored in the literature to date. Consequently, there
are many more questions regarding consumers’ role in service encounters than there
289
are answers.
In this research, the focus o f the dissertation was on the doctors’ and the
patients’ roles. Less attention was given to describing the behaviors that comprise
the s ta ffs role. Consequently, the performance o f the factor model for the s ta ffs
role was much worse than for the other two role players. Yet, the most significant
predictor o f satisfaction with the clinic was satisfaction with the staff. Obviously,
staff members such as the nurses, technicians and receptionists are important role
players in the service encounter and therefore deserve research attention. In many
professional settings, the consumer may have more interaction with members o f the
staff than with the primary service provider. Again, more research is needed to
develop good operationalizations for the s ta ffs role in a service setting.
Do Consumers Utilize Multiple Comparison Standards in Evaluating Professional Services?
While multiple comparison standards have been suggested conceptually by a
number of researchers, to date there is little empirical evidence that consumers
employ different comparison standards in the process of evaluating products and
services. This study found only weak support for the impact o f ideal expectations
on satisfaction formation for medical services. Future research may be directed at
determining under what conditions consumers employ different comparison
standards? Is ideal expectations an appropriate comparison standard for products but
not for services? The service satisfaction literature suggests that there is a great deal
o f discontent among consumers with regard to the quality and delivery o f services,
in particular medical services. Do consumers feel that optimum service performance
290
is an unattainable goal and rather than hope for something that is rarely delivered,
they base their judgement o f the service on a more realistic goal, probable service
performance?
Another relevant research question is whether expectations represent stable
characteristics o f the individual. It has been suggested in the literature that
expectations are not stable but this assumption has not been empirically tested.
Further research is needed to determine antecedent variables that influence consumer
expectations. An extension o f this research would be to investigate possible
antecedent variables that influence role expectations. As was alluded to earlier, two
antecedent variables that may influence role expectations are involvement level or
experience. Other possible antecedent variables include age, socio-economic status,
gender, perceived risk, and locus of control.
What Influence Does Involvement Have on Satisfaction Formation for Professional Services?
Since the proposed influence of involvement on satisfaction formation for
professional services was not adequately tested in this study, further research is
needed before any conclusions can be drawn regarding the mediating influence of
involvement. Involvement was hypothesized to influence the magnitude to which
expectations, performance, and disconfirmation influence satisfaction. As discussed
earlier, the findings here suggest that involvement may also influence the use of
different comparison standards in evaluation processes for professional services.
Inconsistencies in the reliability and validity o f measures across involvement samples
also suggest that the question o f whether measures have been developed that are
291
equally reliable and valid across multiple samples.
How Can The Satisfaction Model Be Improved?
W hile many of the hypotheses proposed in this dissertation were supported, it
is likely that other factors influence consumer satisfaction with professional services.
For example, the inclusion o f some of the antecedent variables previously mentioned
may provide a richer understanding o f the processes that underlie consumer
satisfaction evaluations for professional services. The model focuses on the
interaction between role players in a service setting and yet interaction satisfaction
was not measured. The explanatory ability o f the model may be improved by
incorporating interpersonal or exchange satisfaction. The model does not measure
service outcomes and their influence on satisfaction. Service outcomes are likely to
influence such things as long-term satisfaction, continued patronage, and word-of-
mouth. In many service settings, this would require a longitudinal study. However,
the addition of this data would allow the researcher to investigate the relative
importance of consumer satisfaction with the interactive dimensions o f the service,
the convenience dimensions o f the service and the outcomes of the service.
Summary
In conclusion, this dissertation research provided an extension in three
prim ary areas: (1) the satisfaction research was broadened by testing relationships
found in the product satisfaction literature in the context o f professional services;
(2) the relative importance o f role-based and non-role based dimensions o f services
was investigated by assimilating role dimensions into a model o f service satisfaction;
292
and (3) the service satisfaction research was extended by conceptualizing and
empirically testing the impact o f consumers’ role on evaluation processes for
professional services.
Additionally, directions for future research were discussed. It is unlikely that
the research projects suggested here will lead to a perfect understanding o f consumer
satisfaction formation for professional services. It is hoped that the
recommendations for future research represent a potentially productive direction for
service satisfaction research.
Bibliography
Abdellah, F . G. and E. Levine (1957), "Developing a Measure o f Patient andPersonnel Satisfaction with Nursing Care," Nursing Research. 5, 100-108.
Adams, J. Stacy (1963), "Towards an Understanding o f Inequity," Journal of Abnormal and Social Psychology. 67 (October), 422-36.
Aday, L. A. and R. Andersen (1975), Access to Medical C are. Ann Arbor, MI: Health Administration Press.
Aday, L ., R. Andersen, and G.V. Fleming (1980), Health Care in U. S.: Equitable for Whom? Beverly Hills, CA: Sage.
Aeillo, Albert, John Czepiel, and Larry Rosenberg (1977), "Scaling the Heights o f Consumer Satisfaction: An Evaluation o f Alternative M easures," in Consumer Satisfaction. Dissatisfaction, and Complaining Behavior. Ralph L. Day, ed., Bloomington: Indiana University, 43.
Ajzen, Icek and Martin Fishbein (1980), Understanding Attitudes and Predicting Social Behavior. Englewood Cliffs, NJ: Prentice-Hall, Inc.
Alwin, Duane F. and David J. Jackson (1981), "Applications o f Simultaneous Factor Analysis to Issues o f Factorial Invariance," Factor Analysis and Measurement in Sociological Research: A Multi- Dimensional Perspective. David Jackson and Edgar Borgatta, eds., Beverly Hills: Sage.
Andersen, R ., J. Kravits, and O. Anderson (1971), "The Public’s View of the Crisis in Medical Care: An Impetus for Changing Delivery Systems," Economics and Business Bulletin. 24, 44-52.
Anderson, R. E. (1973), "Consumer Dissatisfaction: The Effect o f Disconfirmed Expectancy on Perceived Product Performance," Journal o f Marketing Research. 10, 38-44.
Antil, John H. (1984), "Conceptualization and Operationalization o f Involvement," in Advances in Consumer Research. 11, T. Kinnear, ed., Association for Consumer Research, 203-209.
Ashcraft, M ., R. Penchansky R ., S. E. Berki, R. S. Fortus, J. Gray (1978), "Expectations and Experience of HMO Enrollees After One Year: An Analysis o f Satisfaction, Utilization,and Costs," Medical Care. 16, 14-32.
293
294
Backman, Carl W . (1981), "Attraction in Interpersonal Relationships," in SocialPsychology: Sociological Perspectives. Rosenberg, M orris and Turner, eds., New York: Basic Books, Inc., 235-267.
Bagozzi, Richard P. and Youjae Yi (1988), "On the Evaluation o f StructuralEquation M odels," Journal o f the Academy o f M arketing Science. 16 (1), 74- 94.
Bales, Robert F . (1950), Interaction Process Analysis. Reading, MA: Addison- Wesley Publishing Company, Inc.
Barber, M ary Beth and M eera Venkatraman (1986), "The Determinants ofSatisfaction for a High Involvement Product: Three Rival Hypotheses and Their Implications in the Health Care Context," in Advances in Consumer Research. 12, R. Lutz, ed ., Association for Consumer Research, 316-320.
Bateson, John E. G. (1977), "Do We Need Service Marketing?" in Marketing Consumer Services: New Insights. (Report 77-115). Boston: Marketing Science Institute, 1-30.
Baumgarten, Steven A ., and James s. Hensel (In Preparation), "Enhancing the Perceived Quality of Medical Service Delivery Systems," unpublished working paper, The Institute for Medical Practice, University o f South Florida, Tampa, FL.
Belkaoui, A. and J. Belkaoui (1976), "A Comparative Analysis o f the RolePortrayed by Women in Print Advertisements: 1958, 1970, 1972," Journal o f Marketing Research. 13 (May), 168-72.
Ben-Sira, Zeev (1976), "The Function o f the Professional’s Affective Behavior in Client Satisfaction: A Revised Approach to Social Interaction Theory," Journal o f Health and Social Behavior. 17 (March), 3-11.
Ben-Sira, Zeev (1980), "Affective and Instrumental Components in the Physician- Patient Relationship: A Revised Approach to Social Interaction Theory," Journal o f Health and Social Behavior. 21, 170-180.
Ben-Sira, Zeev (1982), "Lay Evaluation o f Medical Treatment and Competence: Development o f a Model o f the Function o f the Physician’s Affective Behavior," Social Science and Medicine. 16, 1013-1019.
Bentler, P. M. and Douglas G. Bonnett (1980), "Significance Tests and Goodness of Fit in the Analysis of Covariance Structures," Psychological Bulletin. 88, 588-606.
295
Berkanovic, E. and A. L. Marcus (1976), "Satisfaction with Health Services: Some Policy Implications," Medical Care. 14, 873-879.
Berman, Barry and Joel R. Evans (1989), Retail M anagement. New York: Macmillian Publishing Company.
Berry, Leonard L. (1980), "Services Marketing is Different," Business. (May-June), 24-28.
Bessom, R .M . (1973), "Unique Aspects o f Marketing Services," Arizona Business Bulletin. 9 (November), 8-15.
Bessom, Richard M. and Donald W. Jackson, Jr. (1975), "Service Retailing: A Strategic Marketing Approach," Journal o f M arketing. 51 (2), 75-84.
Bettman, James (1979), An Information Processing Theory o f Consumer Choice. Reading, MA: Addison-Wesley.
Bice, T. W. and K. L. White (1971), "Cross-National Comparative Research on the Utilization o f Medical Services," Medical C are. 9, 253-271.
Bice, T. W. and E. Kalimo (1971), "Comparison of Health-Related Attitudes: ACross-National Factor Analytic Study," Social Science and M edicine. 5, 283- 318.
Bitner, Mary Jo, and Bernard H. Booms, and Mary Stanfield Tetreault (1988), "The Service Encounter: Diagnosing Favorable and Unfavorable Incidents," unpublished working paper No. 12, First Interstate Center for Services Marketing, Arizona State University, Tempe, AZ.
Blanchard, C. G ., T. W. Treadwell, and E. B. Blanchard (1977), "The Impact of Patient Satisfaction o f the Introduction o f Family Medical Residents into a Model Practice Facility," The Journal o f Family Practice. 4, 133-136.
Bloch, Peter H. (1981), "An Exploration into Scaling of Consumers’ Involvement with a Product Class," in Advances in Consumer Research. 8, K. Monroe, ed ., Association for Consumer Research, 61-65.
Bloom, Paul N. (1984), "Effective Marketing for Professional Services," Harvard Business Review. September-October, 102-110.
Bochner, Stephen (1983), "Doctors, Patients, and Their Cultures," in Doctor-Patient Communication. Pendelton and John Hasler, eds., New York: Academic Press.
296
Booms, Bernard H. and Jody L. Nyquist (1981), "Analyzing the Customer FirmCommunication Component o f the Services Marketing M ix," in Marketing of Services. J. Donnelly and W. George, eds., Chicago: American Marketing Association, 168-171.
Bowen, David E. and Benjamin Schneider (1984), "Boundary-Spanning RoleEmployees and the Service Encounter: Some Guidelines for Management and Research," in The Service Encounter. John A. Czepiel, M ichael R. Solomon, and Carol F . Surprenant, eds., Lexington: Lexington Books, 127- 147.
Bowen, Lawrence and Steven H. Chaffe (1974), "Product Involvement and Pertinent Advertising Appeals," Journalism Q uarterly. 51 (W inter), 613-621.
Bower, G. H ., J. B. Black, T. J. Turner (1979), "Scripts in M emory for Text," Cognitive Psychology. 11, 177-220.
Brody, David S. (1980), "The Patient’s Role in Clinical Decision M aking," Annals of Internal M edicine. 93, 718-22.
Brooks, C. H. (1973), "Association Among Distance, Patient Satisfaction, andUtilization o f Two Types of Inner-City Clinics," Medical C are. 11, 373-383.
Brown, Stephen and Teresa A. Swartz (1987), "A Dyadic Evaluation o f Professional Services Encounter," W orking Paper No. 8, First Interstate Center for Services Marketing, Arizona State University.
Calder, B. J. (1977), "Structural Role Analysis o f Organizational Buying: APreliminary Investigation," in Consumer and Industrial Buying Behavior. A. Woodside, J. Sheth, and P. Bennett, eds., New York: North-Holland.
Calder, B. J ., Lynn W. Phillips, and Alice Tybout (1981), "Designing Research for Application," Journal o f Consumer Research. 8 (September), 197-207.
Calder, B. J ., Lynn W . Phillips, and Alice Tybout (1982), "The Concept ofExternal Validity," Journal o f Consumer Research. 9 (December), 240-44.
Calder, B. J ., Lynn W . Phillips, and Alice Tybout (1983), "Beyond External Validity," Journal o f Consumer Research. 10 (June), 112-114.
Caplan, E. K ., M. B. Sussman (1966), "Rank Order o f Important Variables forPatient and Staff Satisfaction with Outpatient Service," Journal o f Health and Human Behavior. 7, 133-137.
297
Cardozo, R. N. (1964), "An Experimental Study o f Consumer Effort, Expectation, and Satisfaction," Journal o f Marketing Research. 2, 244-249.
Carmen, James M. and Eric Langeard (1980), "Growth Strategies o f Service Firm s," Strategic Management Journal. 1 (January-March), 7-22.
Churchill, Gilbert A. (1979), "A Paradigm for Developing Better Measures ofMarketing Constructs," Journal o f Marketing Research. 16 (February), 64- 73.
Churchill, Gilbert A ., Jr. and Carol Surprenant (1982), "An Investigation Into the Determinants o f Consumer Satisfaction," Journal o f Marketing Research. 19 (November),491-504.
Comstock, Lloyd and Cecil Slome (1973), "A Health Survey of Students:Satisfaction, Attitudes, and Knowledge," Journal o f the American College Health Association. 22 (2), 156.
Connor, Richard A. Jr. and Jeffrey P. Davidson (1985), Marketing Your Consulting and Professional Services. New York: John Wiley and Sons.
Costley, Carolyn L. (1988), "Meta Analysis o f Involvement Research, in Advances in Consumer Research. 15, M. Housten, ed., Association for Consumer Research, 554-568.
Counte, M. A. (1979), "An Examination o f the Convergent Validity o f ThreeMeasures o f Patient Satisfaction in an Outpatient Treatment Center," Journal o f Chronic Diseases. 32, 583-588.
Courtney, E. and S. W. Lockeretz (1971), "A W oman’s Place: An Analysis o f the Roles Portrayed by Women in Magazine Advertisements," Journal of Marketing Research. 8 (February), 92-5.
Crissy, W. J. E ., and William H. Cunningham, and Isabella C. M. Cunningham (1977), Selling: The Personal Force in M arketing. New York: John Wiley and Sons.
Crocker, Linda and James Algina (1986), Introduction to Classical and Modern Test Theory. New York: Holt, Rinehart, and Winston.
Cronbach, L. J. (1951), "Coefficient Alpha and the Internal Structure o f Tests," Psychometrika. 16, 297-334.
298
Cronbach, L. J. and P. E. Meehl (1955), "Construct Validity in Psychological Tests," Psychological Bulletin. 52 (May), 281-302.
Crosby, Lawrence and Deborah Cowles (1986), "A Role Consensus Model ofSatisfaction with Service Interaction Experiences," in Creativity in Services Marketing: W hat’s New. What W orks. W hat’s Developing. M. Venkatesan and D. Schmalensee, C. Marshall, eds., Chicago: American Marketing Association, 40-43.
Cunningham, C. M . and R. T . Green (1974), "Purchasing Roles in the U .S.Family, 1955 and 1973," Journal o f M arketing. 38 (October), 61-4.
Czepiel, John A. and Darius Sabalava (1988), "Service Quality, Satisfaction, and Performance: Implications for M easurem ent," Presentation made at the 7th Annual Services Marketing Conference, American Marketing Association.
Darby, M .R ., and E. Kami (1973), "Free Competition and the Optimal Amount of Fraud," Journal o f Law and Economics. 16 (April), 67-86.
Darden, William R. (1981), "Review o f Behavioral Modeling in M arketing," Annual Review of Marketing. Chicago, IL: American Marketing Association, 21-30.
Davies, A. R. and J. E. Ware, Jr. (1981), "Measuring Patient Satisfaction with Dental Care," Social Science and M edicine. 15A, 751-760.
Davis, Fred (1959), "The Cabdriver and His Fare: Facets o f a FleetingRelationship," American Journal of Sociology. 56 (September), 158-165.
Davis, H. L. (1970), "Dimensions of Marital Roles in Consumer Decision M aking," Journal o f Marketing Research. 7 (May), 168-70.
Day, George S. (1970), Buyer Attitudes and Brand Choice. New York: Free Press.
Day, Ralph (1977), "Toward a Process Model of Consumer Satisfaction," in Conceptualization and Measurement o f Consumer Satisfaction and Dissatisfaction. H. Keith Hunt, ed., Cambridge, MA: M arketing Science Institute, (May), 153-86.
Day, Ralph L. and Muzaffer Bodur (1977), "Consumer Response to Dissatisfaction with Services and Intangibles," in Consumer Satisfaction. Dissatisfaction, and Complaining Behavior. Ralph L. Day, ed., Division of Research: University o f Indiana, 263-272.
299
Day, Ralph L. and Steven Ash (1978), "Comparison o f Patterns ofSatisfaction/Dissatisfaction and Complaining Behavior for Durables, Non- Durables, and Services," in Consumer Satisfaction/Dissatisfaction and Complaining Behavior. Ralph L. Day and H. Keith Hunt, eds., Chicago, 111, 190-195.
Day, Ralph L. and Muzaffer Bodur (1978), "Consumer Response to Dissatisfaction with Services and Intangibles," in Advances in Consumer Research. 5, Hunt, ed ., Association for Consumer Research, 263-272.
Dholakia, Ruby R. and Brian Stemthal (1977), "Highly Credible Sources:Persuasive Facilitators o r Persuasive Liabilities?" Journal o f Consumer Research. 3, 223-32.
Diesher, R. W. and W. L. Engel, R. Spielholz, S. J. Standfact,(1965), "M others’ Opinions of their Pediatric Care," Pediatrics. 34, 82-90.
DiM atteo, M. R. and R. Hays (1980), "The Significance o f Patients’ Perceptions o f Physician Conduct: A Study of Patient Satisfaction with a Family Practice Center," Journal o f Community Health. 6, 18-34.
DiMatteo, M. R ., L. M. Prince, and A. Taranta (1979), "Patient’s Perceptions o f Physician Conduct: A Study of Patient Satisfaction in a Family Practice Center," Journal of Community Health. 4, 280-290.
Doyle, Barbara and John E. W are (1977), "Physician Conduct and Other Factors that Affect Consumer Satisfaction with Medical Care," Journal o f Medical Education. 52 (10), 793.
Droge, Cornelia (1989), "Shaping the Route to Attitude Change: Central Versus Peripheral Processing Through Comparative Versus Noncomparative Advertising," Journal o f Marketing Research. 26 (May), 193-204.
Duker, J. M. and L. R. Tucker (1977), "W omen’s Lib-ers Versus Independent Women: A Study o f Preferences for W omen’s Roles in Advertisements," Journal o f Marketing Research. 14 (November), 469-75.
Eiglier, P ., E. Langeard, C .H . Lovelock, J.E .G . Bateson, and R .F . Young (1977), M arketing Consumer Services: New Insights. Cambridge, MA: Marketing Science Institute.
300
Eisenthal, Sherman, Cheryl Koopman, and Aaron Lazare (1983), "Process Analysis o f Two Dimensions o f the Negotiated Approach in Relation to Satisfaction in the Initial Interview," The Journal o f Nervous and Mental D isease. 171 (1), 49-54.
Engel, James F. and Roger D . Blackwell (1982), Consumer Behavior. New York: Holt, Renehard, and Winston.
Evans, Franklin (1963), "Selling as a Dyadic Relationship-A New Approach," American Behavioral Scientist. 6 (May), 76.
Flanagan, John C. (1954), "The Critical Incident Technique," Psychological Bulletin. 51 (July), 327-357.
Fom ell, Claes (1983), "Issues in the Application o f Covariance Structure Analysis: A Comment," Journal o f Consumer Research. 9 (March), 443-448.
Fom ell, Claes and David F. Larcker (1981), "Evaluating Structural EquationModels with Unobservable Variables and M easurement Error," Journal of Marketing Research. 18 (February), 39-50.
Fox, J. G. and D. M. Storms (1981), "A Different Approach to Sociodemographic Predictors o f Satisfaction with Health Care," Social Science and M edicine. 15A, 557-564.
Francis, V ., B. M. Korsch, and M. J. Morris (1969), "Gaps in the Doctor-Patient Communication: Patient Response to Medical Advice," New England Journal o f Medicine. 280 (10), 535.
Freeling, Paul and Conrad M. Harris (1984), The Doctor-Patient Relationship. New York: Churchill Livingstone.
Freemon, B., V. F. Negrete, M. Davis, B. M. Korsch (1971), "Gaps in Doctor- Patient Communication: Doctor-Patient Interaction Analysis," Pediatric Research. 5, 298-311.
French, J. R. P ., Jr. (1956), "A Formal Theory o f Social Pow er," Psychological Review. 63, 181-194.
Friedm an, H. D. and J. Rubin (1967), "On Some Invariant Criteria For Grouping Data," Journal o f American Statistical Association. 62, 1159-1178.
301
Friedman, Margaret L. and Gilbert A. Churchill, Jr. (1987), "Using ConsumerPerceptions and a Contingency Approach to Improve Health Care Delivery," Journal o f Consumer Research. 13 (March), 492-510.
Friedm an, H. S., M. R. DiM atteo, A. Taranta (1980), "A Study o f the Relationship Between Individual Differences in Nonverbal Expressiveness and Factors of Personality and Social Interaction," Journal o f Research o f Personalities. 14, 351-364.
Friedson, Elliot (1961), Patient Views o f Medical Practice. New York: Russell Sage Foundation,
Gardner, Cheryl Anne (1987), "The Marketing Implications o f the Relationship Between Role Expectations and Consumer Satisfaction in Professional Services Encounters," Unpublished Dissertation.
Gelb, Betsy D ., Samuel V. Smith, and Gabriel M. Gelb (1988), "What Services Marketers Can Learn From The Professionals," Business Horizons. September-October.
Gerbing, David W. and James C. Anderson (1988), "An Updated Paradigm for Scale Development Incorporating Unidimensionality and Its Assessment," Journal o f Marketing Research. 25 (May), 186-192.
Gillette, J. L ., T. J. Byrne, and J. W. Cranston (1982), "Variables Affecting Patient Satisfaction with Health Care Services in the College Health Setting," Journal o f the American College Health Association. 30. 167-170.
Gilly, M ary C. (1979), "Complaining Consumers: Their Satisfaction withOrganizational Response," in New Dimensions of Consumer Satisfaction and Complaining Behavior. Ralph L. Day and H. Keith Hunt, eds., Bloomington, Indiana: Department o f M arketing, Indiana University.
Goffman, Erving (1961), Asylums. New York: Doubleday.
Goffman, Erving (1959), The Presentation o f Self in Everyday Life. New York: Doubleday and Co.
Goodwin, Cathy (1986), "Using Consumers’ Roles to Classify Services," in Creativity in Services Marketing: W hat’s New. W hat W orks. W hat’s Developing. M. Venkatesan, Diane M. Schmalensee, Claudia M arshal, eds., American Marketing Association, 159-163.
302
Gordon, Gerald (1966), Role Theory and Illness. New Haven, Conn: College and University Press.
Gray, L. C. (1980), "Consumer Satisfaction with Physician Provided Services: A Panel Study," Social Science and M edicine. 14A, 65-73.
Greene, James Y ., M orris W einberger, and Joseph J. Mamlin (1980), "Patient Attitudes Toward Health Care: Expectations o f Primary Care in a Clinic Setting," Social Science and M edicine. 14A, 133-138.
Green, R. T. and I. I. C. Cunningham (1975), "Feminine Role Perception andFamily Purchasing Decisions," Journal o f M arketing Research. 12 (August), 325-32.
Greenley, J. R. and R. A. Schoenherr (1981), "Organization Effects on Client Satisfaction with Humaneness of Service," Journal o f Health and Social Behavior. 22, 2-18.
Greenwald, Anthony G. and Clark Leavitt (1985), "Cognitive Theory and Audience Involvement," in Psychological Processes and Advertising Effects. Hillsdale, NJ: Lawrence Erlbaum, 221-240.
Gronroos, Christian (1978), "A Service-Oriented Approach to Marketing of Services," European Journal of M arketing. 12 (8), 588-601.
Gronroos, Christian (1982), "A Service Quality Model and Its Marketing Implications," European Journal of M arketing. 18, 36-44.
Gronroos, Christian (1982), "An Applied Service Marketing Theory," European Journal o f M arketing. 16 (7), 30-41.
Gronroos, Christian (1984), "A Service Quality Model and Its Marketing Implications," European Journal of M arketing. 18 (4), 36-44.
Grove, Stephen J. and Raymond P. Fisk (1983), "The Dramaturgy of ServicesExchange: An Analytical Framework for Services M arketing," in Emerging Perspectives on Services M arketing. L. Berry, G. Shostack, and G. Upah, eds., American Marketing Association, 45-49.
Gummesson, Evert (1979), "The Marketing o f Professional Services-AnOrganizational Dilemma," European Journal o f M arketing. 13 (5), 308-318.
Gutek, B. "Strategies for Studying Client Satisfaction," The Journal o f Social Issues. 34, 44-56.
303
Han, C. Min (1989), "Country Image: Halo or Summary Construct?," Journal of Marketing Research. 26 (May), 222-229.
Haug, Marie R. and Bebe Rootman (1981), "Practitioner o r Patient-W ho’s InCharge?" Journal o f Health and Social Behavior. 22 (September), 212-229.
Hayduk, Leslie A. (1987), Structural Equation Modeling with LISREL. Baltimore, MD: John Hopkins University Press.
Heider, Fritz (1958), The Psychology o f Interpersonal Relations. New York: John Wiley and Sons.
Henderson, Lawrence J. (1935), "Physician and Patient as a Social System," New England Journal o f M edicine. 212, 819-23.
Henley B. and M .S. Davis (1967), "Satisfaction and Dissatisfaction: A Study o f the Chronically 111 Aged Patient," Journal o f Health and Social Behavior. 8, 65.
Hill, Donna J. (1986), "Satisfaction and Consumer Services," in Advances inConsumer Research. 13, R. Lutz, ed., Association for Consumer Research, 311-315.
Hoelter, Jon W. (1983), "Factorial Invariance and Self-Esteem: Reassessing Race and Sex Differences," Social Forces. 61, 834-846.
Housten, Michael J. and Michael L. Rothschild (1978), "Conceptual andMethodological Perspectives on Involvement," in Research Frontiers in Marketing: Dialogues and Directions. Subhash C. Jain, ed ., Chicago: American Marketing Association, 184-187.
Houston, C. S. and W. E. Pasanen (1972), "Patients’ Perceptions o f Hospital Care," Hospitals. 46, 70-74.
Howard, John A. and Jagdish N. Sheth (1969), The Theory o f Buyer Behavior. New York: John Wiley & Sons.
Hulka, B. S ., S. J. Zyzanski, J. C. Cassel and S. J. Thompson (1970), "Scale for the Measurement o f Attitudes Toward Physicians and Primary Medical Care," Medical C are. 8, 429-436.
Hulka, B. S ., S. J. Zyzanski, J. C. Cassel and S. J. Thompson (1971), "Satisfaction with Medical Care in a Low Income Population," Journal o f Chronic Diseases. 24, 661-673.
304
Hunt, H. Keith (1977), "CS/D—Overview and Future Directions," inConceptualization and Measurement o f Consumer Satisfaction and Dissatisfaction. H. Keith Hunt, ed ., Cambridge, MA: M arketing Science Institute.
Jacoby, Jacob (1976), "Consumer Psychology and Industrial Psychology: Prospects for Theory Corporation and Conceptual Contribution," in Handbook of Industrial and Organizational Psychology. M arvin D. Dunnette, ed.,Chicago: Rand McNally College Publishing Company, 1031-62.
Jenry, Joanna (1976), "Patients’ Satisfaction and Dissatisfaction with Their Children’s Dentist," Journal o f Public Health. 33 (4), 211.
John, G. and J. C. Whitney (1982), "An Empirical Investigation o f the Serial Structure o f Scripts," in American Marketing Association Educators’ Conference Proceedings. Chicago: American Marketing Association, 75-79.
Joreskog, Karl (1971), "Simultaneous Factor Analysis in Several Populations," Psvchometrika. 57, 409-426.
Joreskog, Karl and Dag Sorbom (1980), "Simultaneous Analysis o f LongitudinalData From Several Cohorts," Research Report 80-5. University o f Uppsala, Department o f Statistics.
Joreskog, Karl G. and Dag Sorbom (1984), LISREL: Analysis o f Linear Structure Relationships bv the Method of Maximum Likelihood. Mooresville, IN: Scientific Software.
Joreskog, Karl G. and Dag Sorbom (1988), LISREL VII: A Guide to the Program and Applications. Chicago, IL: Spss Inc.
Judd, Robert C. (1968), "Similarities or Differences in Product and Service Retailing," Journal o f Retailing. 43 (4), 1-9.
Keman, J. B. and M. S. Sommers (1966), "The Behavioral Matrix: A Closer Look at the Industrial Buyer," Business Horizons. 9 Summer, 59-72.
Keman, J.B. and M. S. Sommers (1967), "Role Theory and Behavioral Style," Journal o f Purchasing. 3 (November), 27-38.
Kincey, J ., P. Bradshaw, and P. Ley (1975), "Patient’s Satisfaction and Reported Acceptance o f Advice in General," Journal o f the Royal College o f General Practitioners. 25, 558-566.
305
King, Stanley and Beth Goldman (1975), "Variables in Patient Satisfaction withMedical Care," Journal o f the American College Health Association. 24 (2), 100.
Korsch, B ., E. Gozzi, and V. Francis (1968), "Gaps in Doctor-Patient Communication and Patient Satisfaction," Pediatrics. 42, 855.
Korsch, B. M ., V. F. Negrete (1972), "Doctor-Patient Communication," Scientific America. 227 (August), 66-74.
Kretch, D ., R. Crutchfield, and E. Ballachey (1962), Individual in Society. New York: McGraw Hill.
Krugman, Herbert (1965), "The Impact o f Television in Advertising: Learning W ithout Involvement," Public Opinion Quarterly. 29, 349-356.
Krugman, Herbert (1966), "The Measurement o f Advertising Involvement," Public Opinion Quarterly. 30, 583-596.
Larsen, Donald E. and Irving Rootman (1976), "Physician Role Performance and Patient Satisfaction," Social Science and M edicine. 10, 29-32.
LaTour, Stephen A. and Nancy C. Peat (1980), "The Role o f Situationally-Produced Expectations, Others’ Experiences, and Prior Experience in Determining Consumer Satisfaction," in Advances in Consumer Research. 7, J. C. Olson, ed., Association for Consumer Research, 588-592.
LaTour, Stephen A. and Nancy C. Peat (1979), "Conceptual and Methodological Issues in Satisfaction Research," in Advances in Consumer Research. 6, W. L. Wilkie, ed., Association for Consumer Research, 431-440.
Laurent, Gilles and Jean-Noel Kapferer (1985), "Measuring Consumer Involvement Profiles," Journal o f Marketing Research. 22 (February), 41-53.
Lawler, E. E. (1973), Motivation in W ork Organizations. Belmont, CA:Wadsworth Publishing Company.
Lazare, Aaron, Sherman Eisenthal, Arlene Frank, and John D. Stoeckle (1987),"Studies on a Negotiated Approach to Patienthood," in Encounters Between Patients and Doctors: An Anthology. John D. Stoeckle, M .D ., ed., Cambridge, MA: The M IT Press.
306
Lehtinen, Uolevi and Jarmo R. Lehtinen (1982), "Service Quality: A Study of Quality Dimensions," unpublished working paper, Helinski: Service M anagement Institute, Finland OY.
Lewis, Robert C, and Bernard H. Booms (1983), "The Marketing Aspects ofService Quality," in Emerging Perspectives on Services M arketing. L. Berry, G. Shostack, and G. Upah, eds., Chicago: American Marketing Association, 99-107.
Liechty, M. and Gilbert A. Churchill, Jr. (1979), "Conceptual Insights intoConsumer Satisfaction with Services,"in Educators’ Conference Proceedings. Series 94, Neil Beckwith, et. a l., eds., Chicago: American Marketing Association, 509-15.
Linda, Gerald and Richard L. Oliver (1979), "Multiple Brand Analysis ofExpectation and Disconfirmation Effects on Satisfaction," paper presented at the 87th Annual Convention o f the American Psychological Association.
Linder-Pelz, S. (1982) "Toward a Theory o f Patient Satisfaction," Social Science M edicine. 16, 577-582.
Linder-Pelz, S. (1982), "Social Psychological Determinants o f Patient Satisfaction:A Test o f Five Hypotheses," Social Science and Medicine. 16, 583-589.
Linn, L. S ., B. S. Linn, and S. R. Stein (1982), "Satisfaction with Ambulatory Care and Compliance in .Older Patients," Medical Care. 20, 606-614.
Linn, L. S. and J. E. W are, J r ., and S. Greenfield (1980), "Factors Associated with the Relief from Chest Pain Following Emergency Care," Medical C are. 18, 624-634.
Linn, L. S. and S. Greenfield (1980), "Patient Suffering and Patient Satisfaction Among the Chronically 111," Medical Care. 20, 425- 431.
Locke, Edwin A. (1969), "What is Job Satisfaction?" Organizational Behavior and Human Perform ance. 4 (November), 309-336.
Locke, Edwin A. (1976), "The Nature and Causes o f Job Satisfaction," Handbook of Industrial and Organizational Psychology. Marvin D. Dunnette, ed ., New York: Holt, Rinehart, and Winston, 1297-1349.
Locker, D. and D. Dunt (1978), "Theoretical and Methodological Issues inSociological Studies of Consumer Satisfaction with Medical Care," Social Science and M edicine. 12, 283-292.
307
Lomax, R .G . (1983), "A Guide to Multiple-Sample Structural Equation M odeling," Behavior and Research Methods and Instrumentation. 15, 580-584.
Long, J. Scott (1983), Confirmatory Factor Analysis. Beverly Hills, CA: Sage Publications, Inc.
Lorber, Judith (1975), "Good Patients and Problem Patients: Conformity andDeviance in a General Hospital," Journal o f Health and Social Behavior. 16 (March), 213-225.
Lovelock, Christopher (1981), "Why Marketing M anagement Needs To Be Different for Services," in Marketing o f Services. J. Donnelly and W . George, eds., Chicago: American Marketing Association, 168-171.
Ludy, J ., J. Gagnon, and S. Caiola (1977), "The Patient-Pharmacist Interaction in Two Ambulatory Settings-Its Relationship to Patient Satisfaction and Drug Misuse," Drug Intelligence and Clinical Pharm acy. 11, 81-89.
Lundstrom, William J. and Lawrence M. Lamont (1976),"The Development o f aScale to Measure Consumer Discontent," Journal o f Marketing Research. 13 (November), 373-381.
Manglesdorf, David A. (1979), "Patient Satisfaction Questionnaire," Medical Care. 17 (1), 86.
M are, R .D . and W .M . Mason (1981), "Children’s Report o f ParentalSocioeconomic Status," in Social Measurement: Current Issues. G.W . Bohmstedt and E .F . Borgatta, eds., Beverly Hills: Sage Publications.
Marquis, M. Susan, Allyson R. Davies, and John E. W are, J r ., (1985), "Change in Medical Care Providers: A Causal Analysis o f the Consequences o f Patient Satisfaction," in Advances in Consumer Research. 12, E. Hirschman and M. Holbrook, eds., Association for Consumer Research, 263-264.
McGaw, B. and K.G. Joreskog (1971), "Factorial Invariance o f Ability Measures in Groups Differing in Intelligence and Socio-economic Status," British Journal o f Mathematical and Statistical Psychology. 24, 154-168.
McQuiston, Daniel H. (1989), "Novelty, Complexity, and Importance as Causal Determinants o f Industrial Buying Behavior," Journal o f M arketing. 53 (April), 66-79.
308
M cQuarrie, Edward F. and J. Michael Munson (1987), "The Zaichkowsky Personal Involvement Inventory: Modification and Extension," in Advances in Consumer Research. 14, M. Wallendorf, ed ., Association for Consumer Research, 36-40.
M ead, George H . (1935), "Mind, Self, and Society," in W orks o f M ead. Charles W . M orris, ed ., Chicago: University of Chicago.
Mechanic, D ., J. R. Greenley, P. D . Clearly, E. W. Hoeper, F. J. Wenzel (1980), "A Model o f Rural Health Care: Consumer Response Among Users o f the Marshfield Clinic," Medical Care. 18, 597-608.
M erton, R. K. (1957), "The Role Set," British Journal o f Sociology. 8, 196-120.
M iller, John A. (1977), "Exploring Satisfaction, Modifying Models, ElicitingExpectations, Posing Problems, and Making Meaningful M easurements," in Conceptualization and Measurement o f Consumer Satisfaction. Marketing Science Institute, 72-91.
Mitchell, Andrew A. (1979), "Involvement: A Potentially Important Mediator o f Consumer Behavior," in Advances in Consumer Research. 5, W. L. Wilkie, ed., Association for Consumer Research, 191-196.
Moore, Ellen M. and F. Kelly Shuptrine (1984), "Disconfirmation Effects on Consumer Satisfaction and Decision Making Processes," in Advances in Consumer Research. 11, T. Kinnear, ed., Association for Consumer Research, 299-304.
Needle, Richard H. and Barbara A. Murray (1977), "The Relationship BetweenRace and Sex of Health Provider, the Quality o f Care Provided, and Levels o f Satisfaction with Gynecological Care Among Black College W omen," American College Health Association. 26 (December), 127-131.
Nelson, E. C ., A. R. Jacobs, K. G. Johnson (1974), "Patients’ Acceptance ofPhysician’s Assistants," Journal o f American Medical Association. 228, 63- 67.
Nelson, P. (1970), "Advertising as Information, " Journal o f Political Economy. 81 (July/August), 729-754.
Noyes, R. W ., M. I. Levy, C. L. Chase, J. R. Udry (1974), "ExpectationFulfillment as a Measure o f Patient Satisfaction," American Journal of Obstretics and Gynecology. 118, 809-814.
309
Nunnally, Jum C. (1967), Psychometric Theory. New York, NY: McGraw-Hill,Inc.
Nunnally, Jum C, (1978), Psychometric Theory. New York, NY: McGraw-Hill,Inc.
Oliver, Richard L. (1977), "Effect o f Expectation and Disconfirmation onPostexposure Product Evaluations: An Alternative Interpretation," Journal of Applied Psychology. 62 (4), 480-86.
Oliver, Richard L. (1979), "Product Satisfaction as a Function o f Prior Expectations and Subsequent Disconfirmation: New Evidence," in New Dimensions of Consumer Satisfaction and Complaining Behavior. Ralph L. Day and H.Keith Hunt, eds., Bloomington, Ind.: School o f Business, Indiana University.
Oliver, Richard L. (1980), "A Cognitive Model o f the Antecedents andConsequences of Satisfaction Decisions," Journal o f Marketing Research. 17 (November), 460-9.
Oliver, Richard L. (1981), "Measurement and Evaluation o f Satisfaction Processes in Retail Settings," Journal o f Retailing. 57 (3), 24-48.
Oliver, Richard L. and William O. Bearden (1983), "The Role o f Involvement in Satisfaction Processes," in Advances in Consumer Research. 10, R. P. Bagozzi and A. M. Tybout, eds., Association for Consumer Research, 250- 255.
Oliver, Richard L. and John E. Swan (1989), "Consumer Perceptions ofInterpersonal Equity and Satisfaction in Transactions: A Field Survey Approach, " Journal o f M arketing. 53 (April), 21-35.
Olshavsky, R. W. and J. A. M iller (1972), "Consumer Expectations, Product Performance, and Perceived Product Quality," Journal o f Marketing Research. 9, 19-21.
Olson, J. C. and P. Dover (1979), "Effects o f Expectation Creation andDisconfirmation on Belief Elements in Cognitive Structure," in Advances in Consumer Research. 6, W. L. Wilkie, ed ., Association for Consumer Research, 168-175.
Parasuraman, A ., Valerie Zeithaml, and Leonard Berry (1985), "A ConceptualModel of Service Quality and Its Implications for Future Research," Journal o f M arketing. 49, No. 4 (Fall), 41-50.
310
Parasuraman, A ., Valerie Zeithaml, and Leonard Berry (1986), SEROUAL: AMultiple-Item Scale for Measuring Consumer Perceptions o f Service Quality. Cambridge, MA: M arketing Science Institute (No. 86-108).
Park, C. Whan and S. M ark Young (1983), "Types and Levels o f Involvement and Brand Attitude Form ation," in Advances in Consumer Research. 10, R. P. Bagozzi and A. M. Tybout, eds., Association for Consumer Research, 320- 323.
Park, C. Whan and Gordon W. McClung (1986), "The Effect o f TV ProgramInvolvement on Involvement with Commercials," in Advances in Consumer Research. 13, R. Lutz, ed ., Association for Consumer Research, 544-548.
Parsons, Talcott (1951), The Social System. New York: The Free Press, 428-73.
Pascoe, G. C ., C. C. Attkisson, and R. E. Roberts (1983), "Comparison of Indirect and Direct Approaches to Measuring Patient Satisfaction,"Evaluation and Program Planning. 6, 359-371.
Pascoe, Gregory C. (1983), "Patient Satisfaction in Primary Health Care: ALiterature Review and Analysis," Evaluation and Program Planning. 6, 185- 210 .
Penchansky, R. and J. W. Thomas (1981), "The Concept of Access: Definition and Relationship to Consumer Satisfaction," Medical C are. 19, 127-140.
Peter, J. Paul (1979), "Reliability: A Review of Psychometric Basics and Recent Marketing Practices," Journal o f Marketing Research. 28 (May), 133-145.
Peter, J. Paul (1981), "Construct Validity: A Review of the Basic Issues andMarketing Practices,” Journal o f Marketing Research. 28 (May), 133-145.
Pope, C. (1978), "Consumer Satisfaction in a Health Maintenance Organization," Journal o f Health and Social Behavior. 19, 291-303.
Prakash, Ved and John W. Lounsbury (1983), "A Reliability Problem in theMeasurement o f Disconfirmation o f Expectations," in Advances in Consumer Research. 10, R. P. Bagozzi and A. M. Tybout, eds., Association for Consumer Research, 244-249.
Pyszczynski, Thomas A. and Jeff Greenberg (1981), "Role o f Disconfirmed Expectations in the Instigation o f Attributional Processing," Journal o f Personality and Social Psychology. 40 (1), 31-38.
311
Quelch, John A. and Stephen B. Ash (1981), "Consumer Satisfaction withProfessional Services," in Marketing o f Services. James H. Donnelly and William R. George, eds., Chicago: American Marketing Association, 82-85.
Quill, Timothy E. (1983), "Partnerships in Patient Care: A Contractual Approach," Annals o f Internal M edicine. 98, 228-234.
Rathmell, J.M . (1966), "What is Meant by Services?", Journal o f M arketing. (October), 32-36.
Rathmell, J.M . (1974), Marketing in Service Sector. Cambridge, MA: Winthrop Publishers, Inc.
Regan, William J. (1983), "The Service Revolution," Journal o f M arketing. 47 (July), 57-62.
Richins, Marsha L. and Peter H. Bloch (1986), "After the New Wears Off: The Temporal Context o f Product Involvement," Journal o f Consumer Research. 13 (September), 280-285.
Richins, Marsha L. (1983), "Negative Word-of-Mouth by Dissatisfied Consumers:A Pilot Study," Journal of Marketing. 47, 68-78.
Riordan, Edward A ., Richard L. Oliver, and James H. Donnelly (1977), "The Unsold Prospect: Dyadic and Attitudinal Determinants," Journal of Marketing Research. 14 (November), 530-537.
Risser, N. (1975), "Development o f an Instrument to Measure Patient Satisfaction with Nurses and Nursing Care in Primary Care Settings," Nursing Research. 24, 45-52.
Rivkin, M. O ., and P. J. Bush (1974), "The Satisfaction Continuum in Health Care: Consumer and Provider Preferences," in Consumer Incentives for Health Care. S. J. Mushkin, ed., New York: Prodist.
Roberts, R. E ., G. C. Pascoe, and C. C. Attkisson (1983), "Relationship o f Service Satisfaction to Life Satisfaction and Perceived W ell-Being," Evaluation and Program Planning. 6, 373-383.
Roghmann, K. J ., A. Hengst, and T. R. Zastowny (1979), "Satisfaction withMedical Care: Its Measurement and Relation to Utilization," Medical C are. 17, 461-479.
312
Rose, Arnold M. (1962), "A Systematic Summary o f Symbolic Interaction Theory," in Human Behavior and Social Processes: An Interactionists’ Approach. Arnold M. Rose, ed ., Boston: Houghton Mifflin.
Sarbin, Theodore R. and Vernon L. Allen (1968), "Role Theory," in The Handbook of Social Psychology. 2nd ed., V. 1, Gardner Lindzey and Elliot Aronson, eds., Reading, MA: Addison Wesley.
Sasser, W . Earl, Jr., R. Paul Olsen, and D. Daryl W yckoff (1978), Management of Service Operations: Text and Cases. Boston: Allyn & Bacon.
Schank, Roger C. (1980), "Language and M emory," Cognitive Science. 4, 243-284.
Schank, Roger C. and R. P. Abelson (1977), Scripts. Plans. Goals and Understanding. Hillsdale, NJ: Lawrence Erlbaum Associates.
Segall, David S. and Margaret Burnett (1980), "Patient Evaluation o f Physician Role Performance," Social Science M edicine. 14A, 269-78.
Sexton, D. E. and P. Haberman (1974), "Women in Magazine Advertisements," Journal o f Advertising Research. 14 (August), 41-6.
Sherif, Muzafer and Hadley Cantril (1947), The Psychology o f Ego-Involvement. New York: Wiley.
Shortell, S. M ., W. C. Richardson, J. P. LoGerfo, P. Diehr, P. W eaver, K. E. Green (1977), "The Relationship Among Dimensions o f Health Services in Two Provider Systems: A Causal Modeling Approach," Journal o f Health and Social Behavior. 18, 139-159.
Shostack, G. Lynn (1977), "Breaking Free From Product M arketing," Journal of M arketing. 41 (April), 73-80.
Smith, Ruth A. and Michael J. Housten (1983), "Script-Based Evaluations o fSatisfaction with Services," in Emerging Perspectives in Services M arketing. Leonard L. Berry,G. Lynn Shostack, Gregory D. Upah, eds., Chicago: American Marketing Association, 59-61.
Smith, Ruth Belk, Paul N. Bloom, and Kelley Sonon Davis (1986), "Research on Patient Satisfaction: Potential Directions," in Advances in Consumer Research. 13, R. Lutz, ed., Association for Consumer Research, 321-326.
313
Solomon, Michael R ., Carol Surprenant, John A. Czepiel, and Evelyn G. Gutman (1985), "A Role Theoretical Perspective on Dyadic Interactions: The Service Encounter," Journal o f M arketing. 49 (Winter), 99-111.
Sommers, M. S. and J. B. Keman (1969), "Dyadic Interaction Processes," The Southern Journal o f Business. 4 (April), 2, 157-65.
Sorbom, D. (1974), "A General Method for Studying Differences in Factor Means and Factor Structures Between Groups," British Journal o f Mathematics and Statistical Psychology. 27, 229-239.
Sorbom, D. (1975), "Detection o f Correlated Errors in Longitudinal Data," British Journal o f Mathematical and Statistical Psychology. 28, 138-151.
Sorbom, D. (1978), "An Alternative to the Methodology for Analysis of Covariance," Psychometrika. 43, 381-396.
Sorbom, D. (1981), "Structural Equation Models with Structured M eans,’ inSystems under Indirect Observation: Causality. Structure, and Prediction. K.G. Joreskog and H. W old, eds., Amsterdam: North-Holland Publishing Co.
Sorbom, D. and K.G. Joreskog (1981), "The Use o f LISREL in Sociological Model Building," in Factor Analysis and Measurement in Sociological Research: A Multidimensional Perspective. E. Borgatta and D .J. Jackson, eds., Beverly Hills: Sage.
Steele, David J ., Barry Blackwell, Mary C. Gutmann, and Thomas C. Jackson(1987), "The Activated Patient: Dogma, Dream, or Desideratum?" Patient Education and Counseling. 10, 2-23.
Stewart, David W ., Gerald B. Hickson, Srinivasan Ratheshwar, Cornelia Pechmann, and William Altemeier (1985), "Information Search and Decision Strategies Among Health Care Consumers," in Advances in Consumer Research. 12, E. Hirschman and M. Holbrook, eds., Association for Consumer Research, 252- 257.
Stewart, M. A ., and J. Wanklin (1978), "Direct and Indirect Measures o f Patient Satisfaction with Physicians’ Services," Journal o f Community Health. 3, 195-204.
Stiles, William B ., Samuel M. Putnam, Matthew H. W olf, and Sherman A. James (1979), "Interaction Exchange Structure and Patient Satisfaction with Medical Interviews," Medical C are. 17 (6), 667-681.
314
Stiles, William B., Samuel M. Putnam, Sherman A. James, and Matthew H. W olf (1979), "Dimensions o f Patient and Physician Roles in Medical Screening Interviews," Social Science M edicine. 13A, 335-341.
Stouffer, S. A. and J. Toby (1951), "Role Conflict and Personality," American Sociological Review. 14, 707-717.
Strickland, S. P. (1972), U. S. Health Care: W hat’s Wrong and W hat’s R ight. Washington, D C: Potomac Associates.
Strull, William M ., Bernard Lo, and Gerald Charles (1984), "Do Patients W ant to Participate in Medical Decision Making?" Journal o f American Medical Association. 252 (21), 2990-2994.
Stryker, Sheldon and Anne Statham (1985), "Symbolic Interaction and RoleTheory," in The Handbook o f Social Psychology. Gardner Lindzev and Elliot Aronson, eds., 3rd ed ., New York: Random House, 311-78.
Suchman, E. A. (1962), "An Analysis o f ’Bias’ in Survey Research," Public Opinion Quarterly. 26, 102-111.
Suchman, E. A. (1964), "Sociomedical Variations Among Ethnic Groups," Journal o f Sociology. 70, 319-331.
Surprenant, Carol F. and Michael R. Solomon (1987), "Predictability andPersonalization in the Service Encounter," Journal o f M arketing. 51 (April), 86-96.
Swan, John and Linda Coombs (1976), "Product Performance and Consumer Satisfaction: A New Concept," Journal o f M arketing. (April), 26-33.
Swan, John E. (1977), "Consumer Satisfaction with a Retail Store Related to the Fulfillment o f Expectations on an Initial Shopping Trip," in Consumer Satisfaction. Dissatisfaction, and Complaining Behavior. Ralph L. Day, ed., Bloomington, IN: School o f Business, Indiana University.
Swan, John E. and Frederick I. Trawick (1979), "Testing an Extended Concept of Consumer Satisfaction, " in New Dimensions o f Consumer Satisfaction and Complaining Behavior. Ralph L. Day and Keith Hunt, eds., Bloomington,IN: University o f Indiana School o f Business, 56-61.
315
Swan, John E. and I. Frederick Trawick (1980), "Satisfaction Related to Predictive vs. Desired Expectations," in Refining Concepts and Measures o f Consumer Satisfaction and Complaining Behavior. H. Keith Hunt and Ralph L. Day, eds., Bloomington, IN: Indiana University, 7-12.
Swan, John E. and I. Frederick Trawick (1981), "Disconfirmation o f Expectations and Satisfaction with a Retail Service," Journal o f Retailing. 57 (3), Fall, 49- 67.
Szasz, T. S. and M. H. Hollender (1956), "A Contribution to the Philosophy ofMedicine: The Basic Models o f the Doctor/Patient Relationship," American Medical Association Archives o f Internal M edicine. 97 (May), 585-92.
Szybillo, George J ., Sharon Binstok, and Lauranne Buchanan (1979), "MeasureValidation of Leisure Time Activities: Time Budgets and Pyschographics," Journal o f Marketing Research. 16 (February), 74-79.
Tagliacozzo, Daisy L. and Hans O. Mauksch (1979), "The Patient’s View of the Patient’s Role," in Patients. Physicians, and Illnesses. E. Gartly Jaco, ed., The Free Press.
Tolman, E. C. (1932), Purposive Behavior in Animals and M en. New York: Appleton-Century.
Tosi, Henry L. (1966), "The Effects of Expectation Levels and Role Consensus on the Buyer-Seller Dyad," Journal of Business. 39 (October), 516-529.
Trawick, I. Fredrick and John E. Swan (1980), "Inferred and PerceivedDisconfirmation in Consumer Satisfaction," in Marketing in the 80’s. 46, Richard P. Bagozzi, et. a l., eds., Chicago: American Marketing Association, 97-100.
Tse, David K. and Peter C. W ilton, (1988), "Models o f Consumer SatisfactionFormation: An Extension," Journal o f Marketing Research. 25 (May), 204- 12 .
Uhl, Kenneth P. and Gregory D. Upah (1979), "The Marketing of Services: Why and How Is It Different?", Faculty Working Paper, University o f Illinois.
Upah, Gregory D. (1980), "Mass Marketing in Service Retailing: A Review and Synthesis o f Major M ethods," Journal of Retailing. 56 (Fall), 59-76.
Venkatesan, M. and J. Losco (1975), "Women in Magazine Ads: 1959-71," Journal o f Advertising Research. 15 (October), 5, 49-54.
316
Vertinsky, Ilan B ., William A. Thompson, and Dean Uyeno (1974), "Measuring Consumer Desire for Participation in Clinical Decision M aking," Health Services Research. 9 (Summer), 121-134.
Vuori, H ., T. Aaku, E. Aine, R. Errko, and R. Johannson (1972), "Doctor-Patient Relationships in Light o f Patient Experiences," Social Science and M edicine. 6, 723-736.
W agner, L. C. and J. B. Banos (1973), "A W oman’s Place: A Follow-Up Analysis o f the Roles Portrayed by Women in Magazine Advertisements," Journal of Marketing Research. 10 (May), 213-14.
W are, J. E. Jr. and M. K. Snyder (1975), "Dimensions o f Patient Attitudes Regarding Doctors and Medical Care," Medical C are. 13 (8), 669.
W are, J. E ., W. R. W right, M . K. Snyder, and G. C. Chu (1975), "ConsumerPerceptions o f Health Care Services: Implications for the Academic Medical Community," Journal o f Medical Education. 50, 839-848.
W are, J. E. Jr., M. K. Snyder, W. R. Wright (1976), Development and Validation o f Scales to Measure Patient Satisfaction with Health Care Services: Volume I of a Final Report. Part B: Results Regarding Scales Constructed from the Patient Satisfaction Questionnaire and Measures o f O ther Health Care Perceptions, National Technical Information Service, Springfield, VA, (NTIS No. PB 288-330).
W are, J. E ., Jr., M. K. Snyder, and W. R. Wright (1977), "Some Issues in the Measurement o f Patient Satisfaction with Health Care Services," P-6021, Santa Monica, CA: The Rand Corporation.
W are, J. E ., Jr., A. Davies-Avery, A. L. Stewart (1978), "The M easurement and Meaning o f Patient Satisfaction: A Review of the Recent Literature," Health and Medical Care Services Review. 1, 1-15.
W are, J. E ., M. K. Snyder, W . R. W right, and W. R. Davies (1983), "Defining and Measuring Patient Satisfaction with Medical Care," Evaluation and Program Planning. 6, 247-263.
W eaver, D. and P. Brickman (1974), "Expectancy, Feedback, and Disconfirmation as Independent Factors in Outcome Satisfaction," Journal o f Personality and Social Psychology. 30, 420-428.
317
W ebster, Cynthia (In preparation), "Decision Strategies and Information Search Patterns Among Professional Service Consumers," W orking Paper: St. M ary’s University, San Antonio, Tx.
W einberger, M ., J. Y. Greene, and J. J. Mamlin (1981), "Patient Perceptions ofHealth Care at an University-Based Ambulatory Care Clinic," The Journal of Ambulatory Care M anagement. 4, 55-64.
W einer, Bernard (1980), Human M otivation. New York: Holt, Rinehart, and Winston.
W erts, C .E ., D .A . Rock, R .L . Dinn, and K .G. Joreskog (1976), "A Comparison of Correlations, Variances, Covariances, and Regression W eights With or W ithout Measurement Errors," Psychological Bulletin. 83, 1007-1013.
W erts, C .E ., D .A . Rock, R .L . Dinn, and K.G. Joreskog (1977), "ValidatingPsychometric Assumptions Within and Between Populations," Educational and Psychological M easurement. 37, 863-871.
W estbrook, Robert A. and R. L. Oliver (1981), "Developing Better Measures of Consumer Satisfaction: Some Preliminary Results," in Advances in Consumer Research. 8, K. B. Monroe, ed ., Association for Consumer Research, 244-249.
Westbrook, Robert A. and Michael D. Reilly (1983), "Value-Percept Disparity: An Alternative to the Disconfirmation of Expectations Theory o f Consumer Satisfaction," in Advances in Consumer Research. 10, R. P. Bagozzi and A. M. Tybout, eds., Association for Consumer Research, 256-61.
Wilson, David T. and Lom e Bozinoff (1980), "Role Theory and Buying-Selling Negotiations: A Critical Overview," in Marketing in the Eighties. R. Bagozzi, ed., American Marketing Association Educators’ Conference Proceedings, 118-121.
Wilson, P ., and J. R. McNamara (1982), "How Perceptions o f a Simulated Physician-Patient Interaction Influence Intended Satisfaction and Compliance," Social Science and Medicine. 16, 1699-1704.
W olf, Matthew H ., Samuel M . Putnam, Sherman A. James, and William B. Stiles (1978), "The Medical Interview Satisfaction Scale: Development o f a Scale to Measure Patient Perceptions o f Physician Behavior," Journal o f Behavioral M edicine. 1 (4), 391-401.
318
Wolinsky, F . D. (1976), "Health Service Utilization and Attitudes Toward Health Maintenance Organizations: A Theoretical and Methodological Discussion," Journal o f Health and Social Behavior. 17, 221-236.
W oodruff, Robert B ., Ernest R. Cadotte, and Roger L. Jenkins (1983), "Modeling Consumer Satisfaction Processes Using Experienced-Based Norm s," Journal o f Marketing Research. 20 (August), 296-304.
Woolley, F . R ., R. L. Kane, C. C. Hughes, D. D . W right (1978), "The Effects of Doctor-Patient Communication on Satisfaction and Outcome o f Care," Social Science and M edicine. 12, 123-128.
W riglesworth, J. M ., J. T. Williams (1975), "The Construction o f an Objective Test to Measure Patient Satisfaction," International Journal o f Nursing Studies.12, 123-132.
Zaichkowsky, Judith Lynne (1985), "Measuring the Involvement Construct," Journal o f Consumer Research. 12 (December), 341-352.
Zastowny, T. R ., K. L. Roghmann, and A. Hengst (1983), "Satisfaction withMedical Care: Replications and Theoretical Reevaluation," Medical C are.21, 294-322.
Zeithaml, Valerie L. (1981), "How Consumer Evaluation Processes Differ Between Goods and Services," in Proceedings. Marketing Services Conference. Chicago: American Marketing Association, 186-190.
Zeller Richard A. and Edward G. Carmines (1980), Measurement in the SocialSciences: The Link Between Theory and D ata. New York, NY: Cambridge University Press.
Zurcher, Louis A. (1983), Social Roles: Conformity. Conflict, and Creativity. Beverly Hills: Sage Publications, Inc.

Appendix A: Dissertation Questionnaires
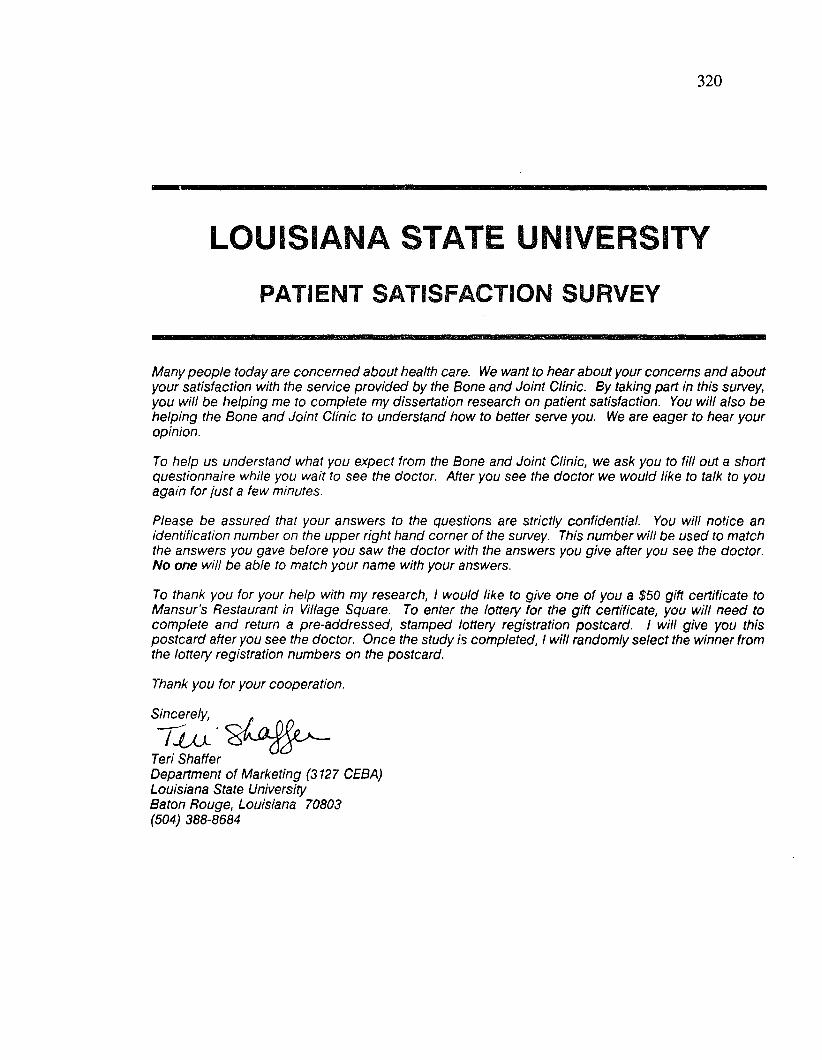
320
LOUISIANA STATE UNIVERSITYPATIENT SATISFACTION SURVEY
Many people today are concerned about health care. We want to hear about your concerns and about your satisfaction with the service provided by the Bone and Joint Clinic. By taking part in this survey, you will be helping me to complete my dissertation research on patient satisfaction. You will also be helping the Bone and Joint Clinic to understand how to better serve you. We are eager to hear your opinion.
To help us understand what you expect from the Bone and Joint Clinic, we ask you to fill out a short questionnaire while you wait to see the doctor. After you see the doctor we would like to talk to you again for just a few minutes.
Please be assured that your answers to the questions are strictly confidential. You will notice an identification number on the upper right hand corner of the survey. This number will be used to match the answers you gave before you saw the doctor with the answers you give after you see the doctor. No one will be able to match your name with your answers.
To thank you for your help with my research, I would like to give one of you a $50 gift certificate to Mansur’s Restaurant in Village Square. To enter the lottery for the gift certificate, you will need to complete and return a pre-addressed, stamped lottery registration postcard. I will give you this postcard after you see the doctor. Once the study is completed, I will randomly select the winner from the lottery registration numbers on the postcard.
Thank you for your cooperation.
Teri ShafferDepartment of Marketing (3127 CEBA) Louisiana State University Baton Rouge, Louisiana 70803 (504) 388-8684
Sinr.pmlu
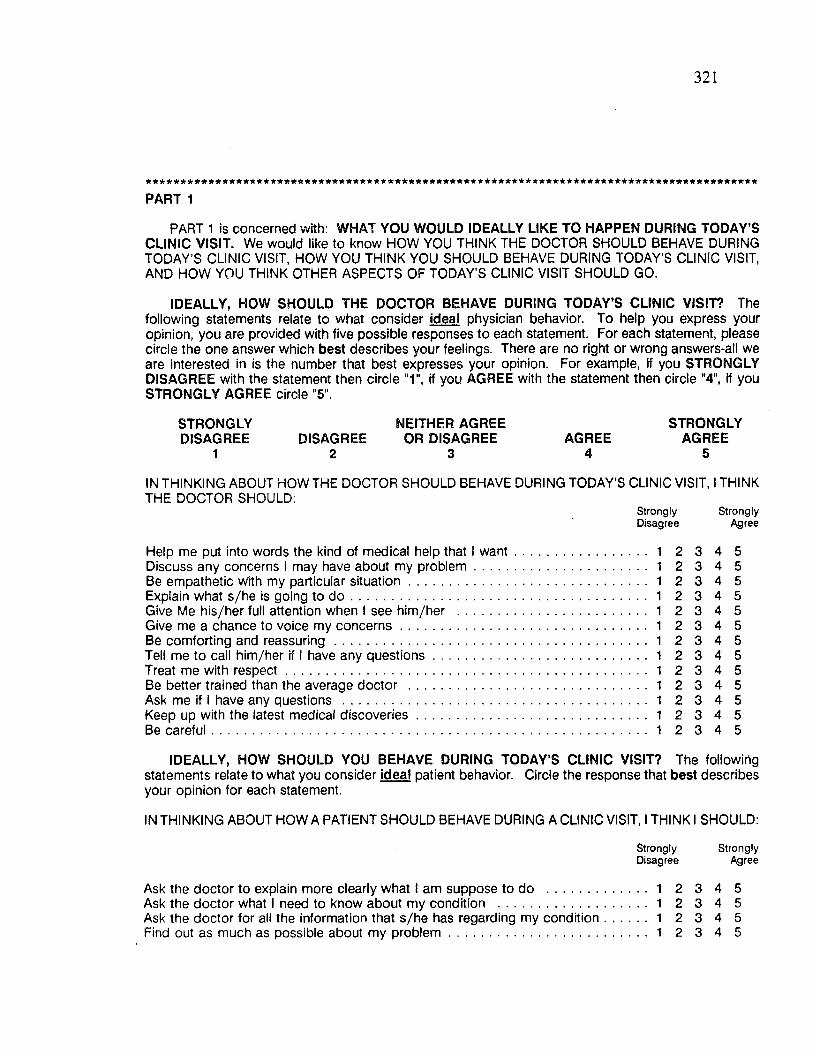
321
PART 1
PART 1 is concerned with: WHAT YOU WOULD IDEALLY LIKE TO HAPPEN DURING TODAY’S CLINIC VISIT. We would like to know HOW YOU THINK THE DOCTOR SHOULD BEHAVE DURING TODAY’S CLINIC VISIT, HOW YOU THINK YOU SHOULD BEHAVE DURING TODAY’S CLINIC VISIT, AND HOW YOU THINK OTHER ASPECTS OF TODAY’S CLINIC VISIT SHOULD GO.
IDEALLY, HOW SHOULD THE DOCTOR BEHAVE DURING TODAY’S CLINIC VISIT? Thefollowing statements relate to what consider ideal physician behavior. To help you express your opinion, you are provided with five possible responses to each statement. For each statement, please circle the one answer which best describes your feelings. There are no right or wrong answers-all we are interested in is the number that best expresses your opinion. For example, if you STRONGLY DISAGREE with the statement then circle "1", if you AGREE with the statement then circle "4”, if you STRONGLY AGREE circle "5".
STRONGLYDISAGREE
1DISAGREE
2
NEITHER AGREE OR DISAGREE
3AGREE
4
STRONGLYAGREE
5
IN THINKING ABOUT HOW THE DOCTOR SHOULD BEHAVE DURING TODAY’S CLINIC VISIT, I THINK THE DOCTOR SHOULD:
Strongly StronglyDisagree Agree
Help me put into words the kind of medical help that I want 1 2 3 4 5Discuss any concerns I may have about my problem 1 2 3 4 5Be empathetic with my particular situation 1 2 3 4 5Explain what s/he is going to d o 1 2 3 4 5Give Me his/her full attention when I see him/her ................................................... 1 2 3 4 5Give me a chance to voice my concerns................................................................... 1 2 3 4 5Be comforting and reassuring 1 2 3 4 5Tell me to call him/her if I have any questions.......................................................... 1 2 3 4 5Treat me with respect.................................................................................................. 1 2 3 4 5Be better trained than the average doctor ................................................................. 1 2 3 4 5Ask me if I have any questions ................................................................................... 1 2 3 4 5Keep up with the latest medical discoveries.............................................................. 1 2 3 4 5Be careful...................................................................................................................... 1 2 3 4 5
IDEALLY, HOW SHOULD YOU BEHAVE DURING TODAY’S CLINIC VISIT? The followingstatements relate to what you consider ideal patient behavior, your opinion for each statement.
Circle the response that best describes
IN THINKING ABOUT HOW A PATIENT SHOULD BEHAVE DURING A CLINIC VISIT, I THINK I SHOULD:
Ask the doctor to explain more clearly what I am suppose to do .............Ask the doctor what I need to know about my condition ...........................Ask the doctor for all the information that s/he has regarding my condition Find out as much as possible about my problem........................................
Strongly StronglyDisagree Agree
. . . 1 2 3 4 5
. . . 1 2 3 4 5
. . . 1 2 3 4 5
. . . 1 2 3 4 5
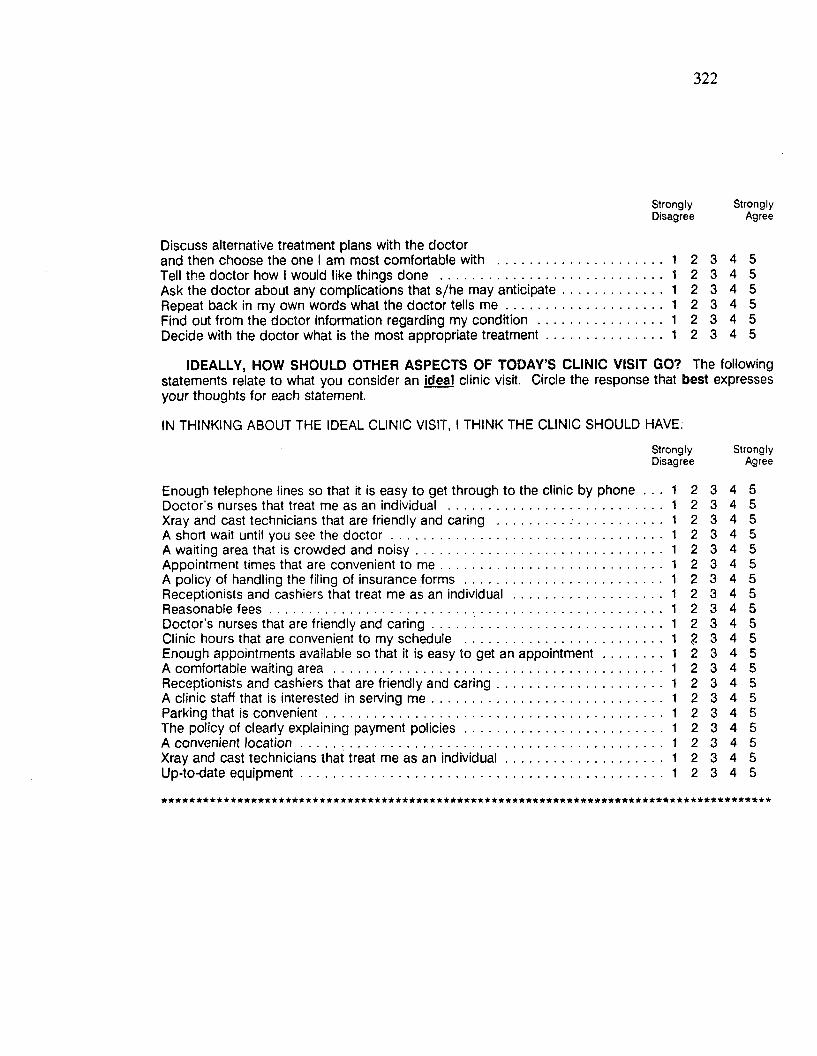
322
Strongly StronglyDisagree Agree
Discuss alternative treatment plans with the doctorand then choose the one I am most comfortable with ............................................ 1 2 3 4 5Tell the doctor how I would like things done ............................................................ 1 2 3 4 5Ask the doctor about any complications that s/he may anticipate........................... 1 2 3 4 5Repeat back in my own words what the doctor tells m e .......................................... 1 2 3 4 5Find out from the doctor information regarding my condition ................................. 1 2 3 4 5Decide with the doctor what is the most appropriate treatment............................... 1 2 3 4 5
IDEALLY, HOW SHOULD OTHER ASPECTS OF TODAY’S CLINIC VISIT GO? The followingstatements relate to what you consider an ideal clinic visit. Circle the response that best expressesyour thoughts for each statement.
IN THINKING ABOUT THE IDEAL CLINIC VISIT, I THINK THE CLINIC SHOULD HAVE:
Strongly StronglyDisagree Agree
Enough telephone lines so that it is easy to get through to the clinic by phone . . . 1 2 3 4 5Doctor’s nurses that treat me as an individual 1 2 3 4 5Xray and cast technicians that are friendly and caring 1 2 3 4 5A short wait until you see the doctor 1 2 3 4 5A waiting area that is crowded and noisy 1 2 3 4 5Appointment times that are convenient to m e 1 2 3 4 5A policy of handling the filing of insurance form s 1 2 3 4 5Receptionists and cashiers that treat me as an individual 1 2 3 4 5Reasonable fees 1 2 3 4 5Doctor’s nurses that are friendly and caring 1 2 3 4 5Clinic hours that are convenient to my schedule 1 2 3 4 5Enough appointments available so that it is easy to get an appointment 1 2 3 4 5A comfortable waiting area 1 2 3 4 5Receptionists and cashiers that are friendly and caring 1 2 3 4 5A clinic staff that is interested in serving m e .............................................................. 1 2 3 4 5Parking that is convenient........................................................................................... 1 2 3 4 5The policy of clearly explaining payment policies...................................................... 1 2 3 4 5A convenient location ..................................................................................... 1 2 3 4 5Xray and cast technicians that treat me as an individual.......................................... 1 2 3 4 5Up-to-date equipment.................................................................................................. 1 2 3 4 5

323
PART 2
Part 2 is concerned with: HOW YOU FEEL ABOUT TODAY’S CLINIC VISIT. In the first set of statements, we would like you to use the adjectives to express your feelings. Place a mark in one of the spaces provided to indicate how you feel about the clinic visit. In the example below, the mark indicates that the patient felt the visit was important.
IMPORTANT : x : UNIMPORTANT
TODAY'S CLINIC VISIT IS:
SOMETHING THATMATTERS TO MEUNIMPORTANTOF NO CONCERNIRRELEVANTUSELESSVALUABLEBENEFICIALESSENTIALNOT NEEDED
SOMETHING THATDOESN’T MATTER TO MEIMPORTANTOF CONCERNRELEVANTUSEFULWORTHLESSNOT BENEFICIALNONESSENTIALNEEDED
Next, we would like you to read each of the following statements and indicate how you feel abouttoday’s clinic visit by circling one response that best expresses your feelings.
Strongly StronglyDisagree Agree
Today's visit to the clinic is very important to m e ....................................................... 1 2 3 4 5I am very concerned about today’s clinic visit ........................................................... 1 2 3 4 5I spent a lot of time thinking about today’s clinic visit................................................ 1 2 3 4 5I am very anxious about today's clinic visit ............................................................... 1 2 3 4 5I am worried about today's visit to the clinic ............................................................. 1 2 3 4 5I would describe today’s clinic visit as being routine.................................................. 1 2 3 4 5Today's clinic visit is not very important to m e ........................................................... 1 2 3 4 5I am very nervous about today’s clinic visit ............................................................... 1 2 3 4 5I do not consider today’s clinic visit routine.............................................................. 1 2 3 4 5I am not worried about today’s clinic visit ................................................................. 1 2 3 4 5
The next few questions pertain to your current mood. Please indicate how strongly you agree or disagree with the following statements by placing an ’X’ in the appropriate space.
Currently I am in a good mood.
Strongly Disagree :__:_____:_____:_____ Strongly Agree
As I answer these questions I feel very cheerful.
Strongly Disagree Strongly Agree
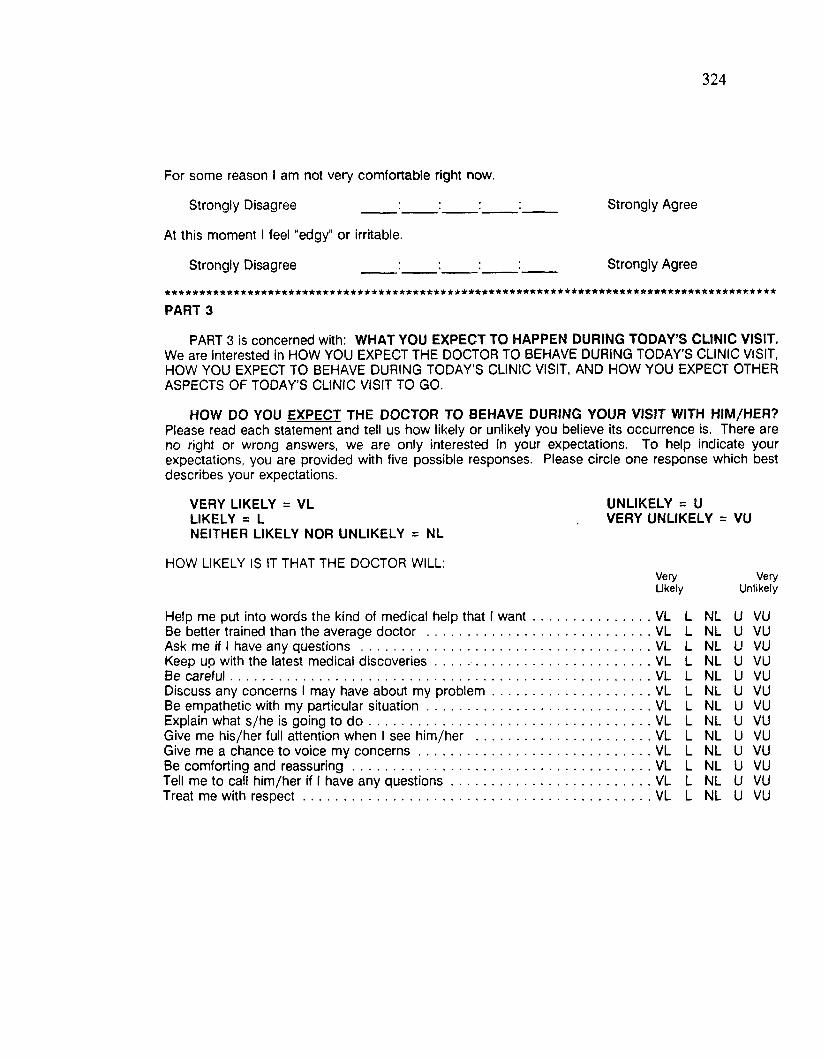
324
For some reason I am not very comfortable right now.
Strongly Disagree :_____ :_____:_____:____ Strongly Agree
At this moment I feel "edgy" or irritable.
Strongly Disagree :_____ :____j _____:____ Strongly Agree
PART 3
PART 3 is concerned with: WHAT YOU EXPECT TO HAPPEN DURING TODAY’S CLINIC VISIT.We are interested in HOW YOU EXPECT THE DOCTOR TO BEHAVE DURING TODAY’S CLINIC VISIT, HOW YOU EXPECT TO BEHAVE DURING TODAY’S CLINIC VISIT, AND HOW YOU EXPECT OTHER ASPECTS OF TODAY’S CLINIC VISIT TO GO.
HOW DO YOU EXPECT THE DOCTOR TO BEHAVE DURING YOUR VISIT WITH HIM/HER?Please read each statement and tell us how likely or unlikely you believe its occurrence is. There are no right or wrong answers, we are only interested in your expectations. To help indicate your expectations, you are provided with five possible responses. Please circle one response which best describes your expectations.
VERY LIKELY = VL LIKELY = LNEITHER LIKELY NOR UNLIKELY = NL
HOW LIKELY IS IT THAT THE DOCTOR WILL:Very VeryLikely Unlikely
Help me put into words the kind of medical help that 1 want............. ................VL L NL U VUBe better trained than the average doctor .......................................... ................VL L NL u VUAsk me if 1 have any questions ............................................................ ................VL L NL u VUKeep uo with the latest medical discoveries........................................ ................VL L NL u VUBe careful................................................................................................ ................VL L NL u VUDiscuss any concerns 1 may have about my problem........................ ................VL L NL u VUBe empathetic with my particular situation.......................................... ................VL L NL u VUExplain what s/he is going to d o .......................................................... ................VL L NL u VUGive me his/her full attention when 1 see him/her ............................. ................VL L NL u VUGive me a chance to voice my concerns............................................. ................VL L NL u VUBe comforting and reassuring............................................................... ................VL L NL u VUTell me to call him/her if 1 have any questions.................................... ................VL L NL u VUTreat me with respect............................................................................ ................VL L NL u VU
UNLIKELY = U VERY UNLIKELY = VU
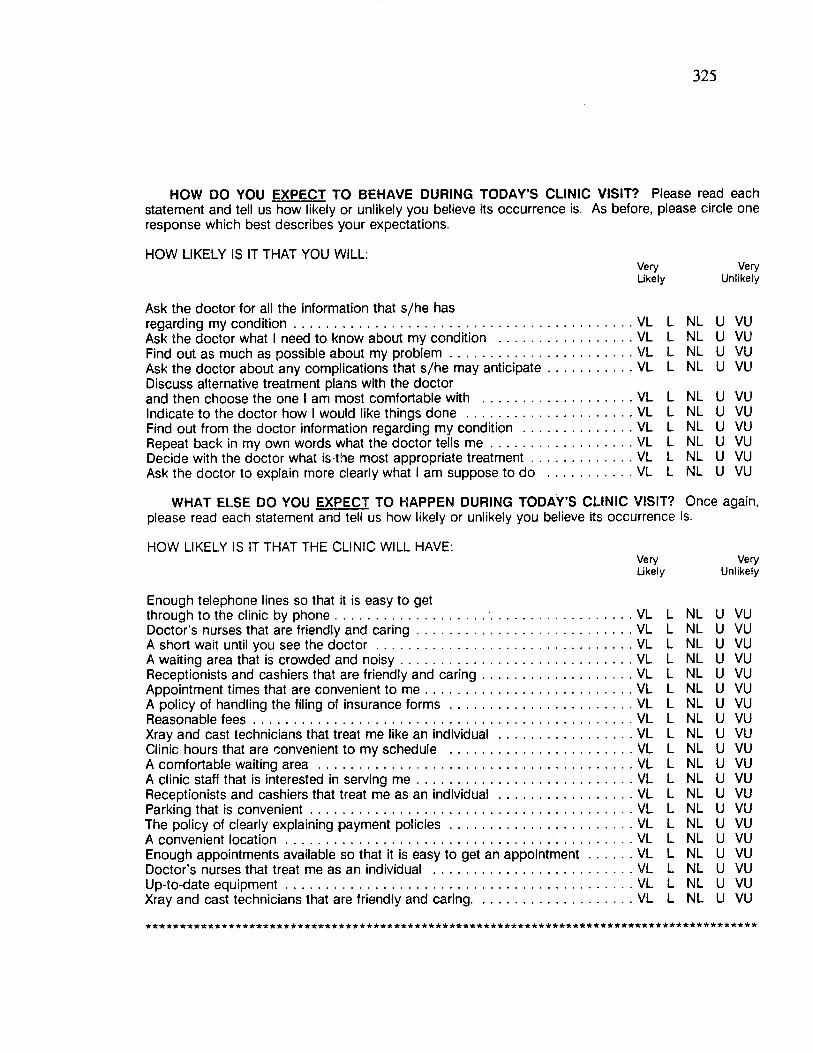
325
HOW DO YOU EXPECT TO BEHAVE DURING TODAY'S CLINIC VISIT? Please read each statement and tell us how likely or unlikely you believe its occurrence is. As before, please circle one response which best describes your expectations.
HOW LIKELY IS IT THAT YOU WILL:Very VeryLikely Unlikely
Ask the doctor for all the information that s/he hasregarding my condition...............................................................................................VL L NL U VUAsk the doctor what I need to know about my condition VL L NL U VUFind out as much as possible about my problem....................................................VL L NL U VUAsk the doctor about any complications that s/he may anticipate.........................VL L NL U VUDiscuss alternative treatment plans with the doctorand then choose the one I am most comfortable with VL L NL U VUIndicate to the doctor how I would like things done VL L NL U VUFind out from the doctor information regarding my condition VL L NL U VURepeat back in my own words what the doctor tells m e .........................................VL L NL U VUDecide with the doctor what is the most appropriate treatment..............................VL L NL U VUAsk the doctor to explain more clearly what I am suppose to do VL L NL U VU
WHAT ELSE DO YOU EXPECT TO HAPPEN DURING TODAY’S CLINIC VISIT? Once again,please read each statement and tell us how likely or unlikely you believe its occurrence is.
HOW LIKELY IS IT THAT THE CLINIC WILL HAVE:VeryLikely
VeryUnlikely
Enough telephone lines so that it is easy to getthrough to the clinic by phone........................................ ................................. . . . VL L NL u VUDoctor’s nurses that are friendly and caring................................................... . . . VL L NL u VUA short wait until you see the doctor.............................................................. . . . VL L NL u VUA waiting area that is crowded and noisy........................................................ . . . VL L NL u VUReceptionists and cashiers that are friendly and caring................................. . . . VL L NL u VUAppointment times that are convenient to m e................................................. . . . VL L NL u VUA policy of handling the filing of insurance form s.......................................... . . . VL L NL u VUReasonable fees ................................................................................................ . . . VL L NL u VUXray and cast technicians that treat me like an individual ............................. . . . VL L NL u VUClinic hours that are convenient to my schedule .......................................... . . . VL L NL u VUA comfortable waiting area .............................................................................. . . . VL L NL u VUA clinic staff that is interested in serving m e ................................................... . . . VL L NL u VUReceptionists and cashiers that treat me as an individual ............................. . . . VL L NL u VUParking that is convenient................................................................................ . . . VL L NL u VUThe policy of clearly explaining payment policies.......................................... . . . VL L NL u VUA convenient location....................................................................................... . . . VL L NL u VUEnough appointments available so that it is easy to get an appointment . . . . . . VL L NL u VUDoctor’s nurses that treat me as an individual ............................................... . . . VL L NL u VUUp-to-date equipment....................................................................................... . . . VL L NL u VUXray and cast technicians that are friendly and caring..................................... . . . VL L NL u VU
* * * * * * * * * * * * * * * * * * * * * * * * * * * * a * * * * * * * * * - * * * * * * * * * * * * * * * * * * * * * * * * * * * * * * * * * * * * * * * * * * * * * * * * * * *
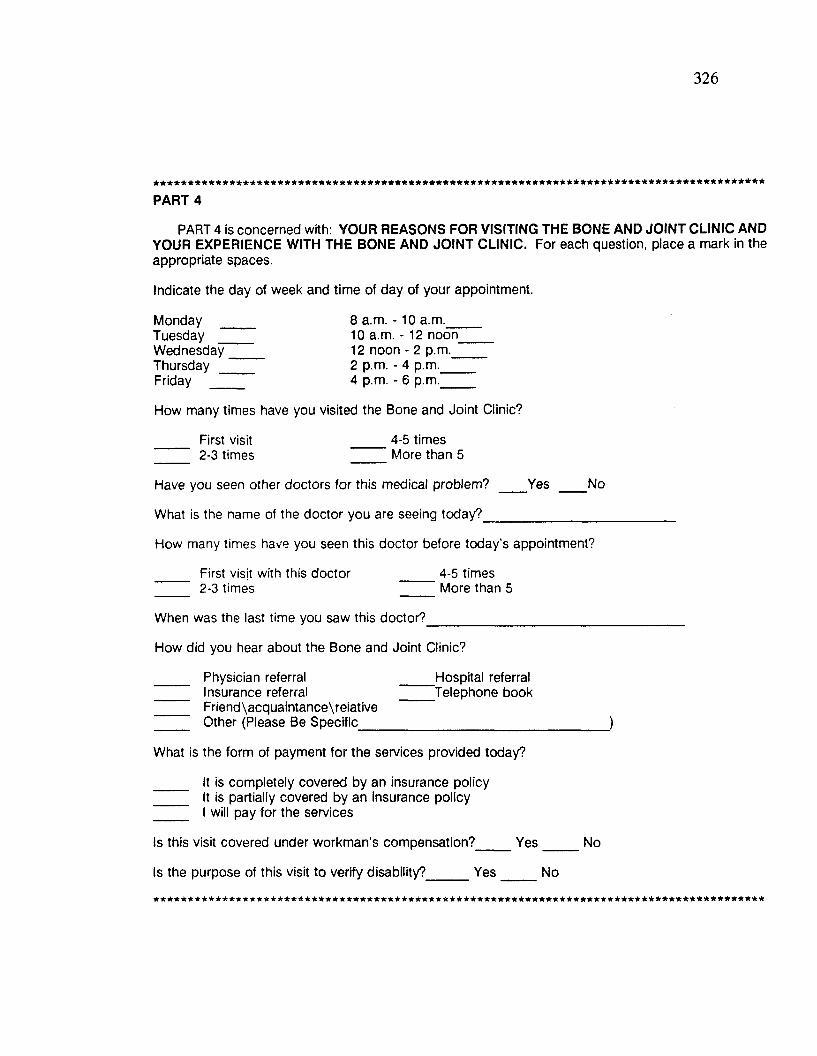
326
* * * * * * * * * * * * * * * * * * * * * * * * * * * * * * * * * * * * * * * * * * * * * * * * * * * * * * * * * * * * * * * * * * * * * * * * * * * * * * * * * * * * * * * * *
PART 4
PART 4 is concerned with: YOUR REASONS FOR VISITING THE BONE AND JOINT CLINIC AND YOUR EXPERIENCE WITH THE BONE AND JOINT CLINIC. For each question, place a mark in the appropriate spaces.
Indicate the day of week and time of day of your appointment.
Monday ____ 8 a.m.-10 a.m.____Tuesday ____ 10 a.m. - 12 noon____Wednesday 12 noon - 2 p.m.____Thursday ____ 2 p.m. - 4 p.m.____Friday ____ 4 p.m. - 6 p.m.____
How many times have you visited the Bone and Joint Clinic?
First visit 4-5 times2-3 times More than 5
Have you seen other doctors for this medical problem? Yes No
What is the name of the doctor you are seeing today?____________.
How many times have you seen this doctor before today’s appointment?
First visjt with this doctor 4-5 times2-3 times More than 5
When was the last time you saw this doctor?
How did you hear about the Bone and Joint Clinic?
Physician referral ____ Hospital referral Insurance referral ____ Telephone book Friend\acquaintance\relative Other (Please Be Specific________________________
What is the form of payment for the services provided today?
It is completely covered by an insurance policy It is partially covered by an insurance policy I will pay for the services
Is this visit covered under workman’s compensation? Yes No
Is the purpose of this visit to verify disability? Yes No

327
Thank you very much for helping me with my dissertation research by completing this questionnaire.
After you see the doctor, I will give you another questionnaire. This questionnaire is interested in your
satisfaction with today’s clinic visit. Please complete this questionnaire at home and mail the completed
questionnaire in the stamped, addressed envelope that will be provided.
I want to thank you for your help with my research. So in addition to fully funding this research, I
will personally purchase a $50 gift certificate to Mansur’s Restaurant located in Village Square. Your
name will be entered in a drawing for this gift certificate when you return the questionnaire and the
lottery registration postcard. Please do not forget to return both the questionnaire and the postcard.
If you have any questions about the survey please contact me at Louisiana State University.
TER! SHAFFER DEPARTMENT OF MARKETING (3127 CEBA)
LOUISIANA STATE UNIVERSITY BATON ROUGE, LOUISIANA 70803
(504) 388-8684
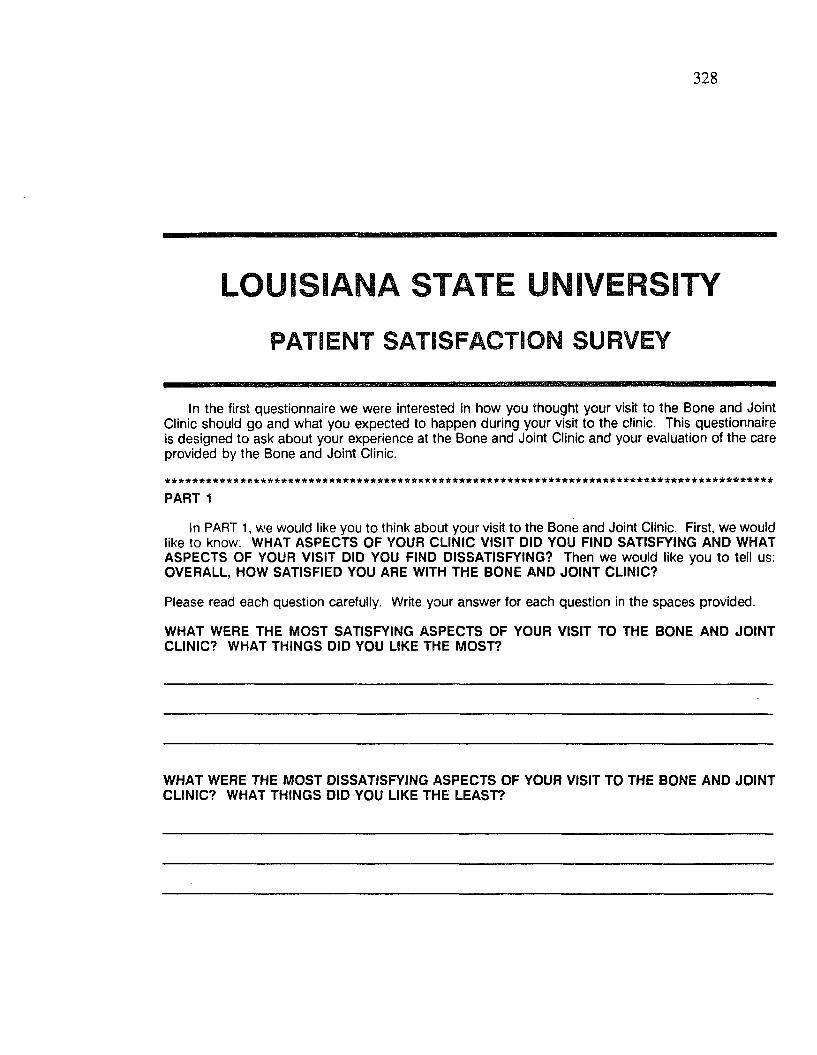
LOUISIANA STATE UNIVERSITYPATIENT SATISFACTION SURVEY
In the first questionnaire we were interested in how you thought your visit to the Bone and Joint Clinic should go and what you expected to happen during your visit to the clinic. This questionnaire is designed to ask about your experience at the Bone and Joint Clinic and your evaluation of the care provided by the Bone and Joint Clinic.
PART 1
In PART 1, we would like you to think about your visit to the Bone and Joint Clinic. First, we would like to know: WHAT ASPECTS OF YOUR CLINIC VISIT DID YOU FIND SATISFYING AND WHAT ASPECTS OF YOUR VISIT DID YOU FIND DISSATISFYING? Then we would like you to tell us: OVERALL, HOW SATISFIED YOU ARE WITH THE BONE AND JOINT CLINIC?
Please read each question carefully. Write your answer for each question in the spaces provided.
WHAT WERE THE MOST SATISFYING ASPECTS OF YOUR VISIT TO THE BONE AND JOINT CLINIC? WHAT THINGS DID YOU LIKE THE MOST?
WHAT WERE THE MOST DISSATISFYING ASPECTS OF YOUR VISIT TO THE BONE AND JOINT CLINIC? WHAT THINGS DID YOU LIKE THE LEAST?
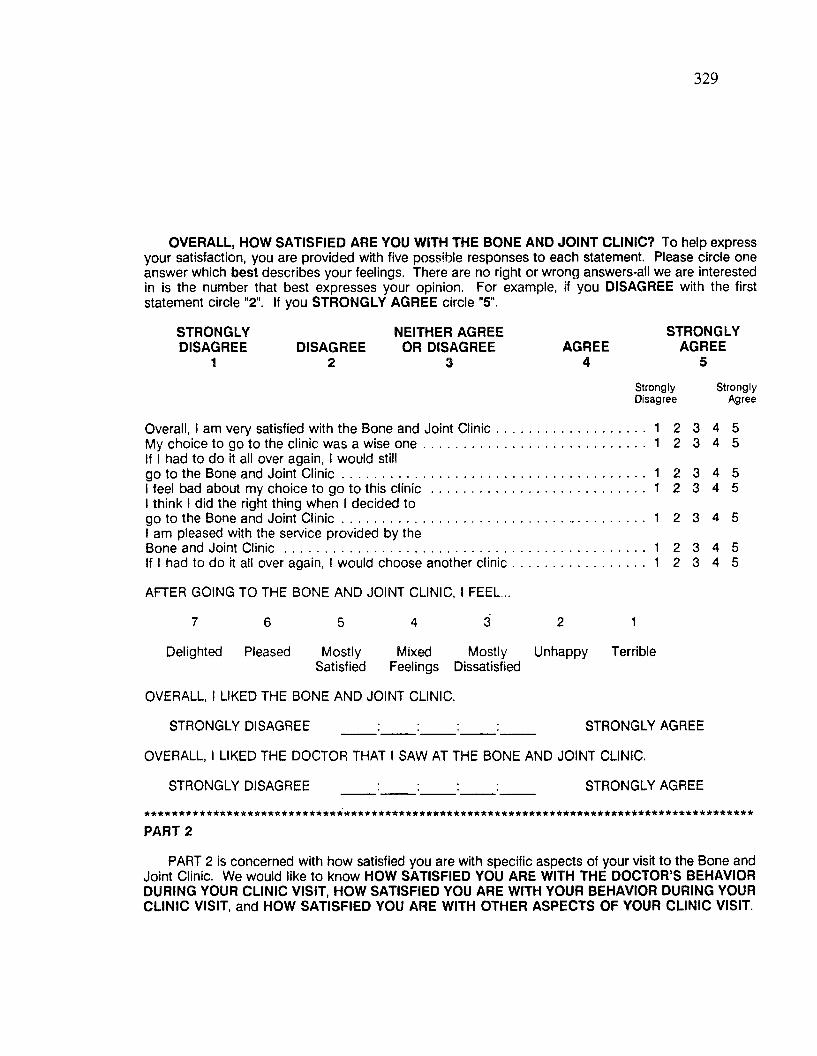
329
OVERALL, HOW SATISFIED ARE YOU WITH THE BONE AND JOINT CLINIC? To help express your satisfaction, you are provided with five possible responses to each statement. Please circle one answer which best describes your feelings. There are no right or wrong answers-all we are interested in is the number that best expresses your opinion. For example, if you DISAGREE with the first statement circle "2". If you STRONGLY AGREE circle "5".
STRONGLYDISAGREE
1DISAGREE
2
NEITHER AGREE OR DISAGREE
3AGREE
4
STRONGLYAGREE
5
StronglyDisagree
Overall, I am very satisfied with the Bone and Joint Clinic...........................................1 2My choice to go to the clinic was a wise one...............................................................1 2If I had to do it all over again, I would stillgo to the Bone and Joint Clinic.....................................................................................1 2I feel bad about my choice to go to this clinic ............................................................ 1 2I think I did the right thing when I decided togo to the Bone and Joint Clinic.................................................................................. 1 2I am pleased with the service provided by theBone and Joint Clinic 1 2If I had to do it all over again, I would choose another clinic 1 2
AFTER GOING TO THE BONE AND JOINT CLINIC, I FEEL...
7 6
Delighted Pleased
1
Mostly Mixed Mostly Unhappy TerribleSatisfied Feelings Dissatisfied
OVERALL, I LIKED THE BONE AND JOINT CLINIC.
STRONGLY DISAGREE
StronglyAgree
STRONGLY AGREE
OVERALL, I LIKED THE DOCTOR THAT I SAW AT THE BONE AND JOINT CLINIC.
STRONGLY DISAGREE STRONGLY AGREE
55
55
3 4 5
55
PART 2
PART 2 is concerned with how satisfied you are with specific aspects of your visit to the Bone and Joint Clinic. We would like to know HOW SATISFIED YOU ARE WITH THE DOCTOR'S BEHAVIOR DURING YOUR CLINIC VISIT, HOW SATISFIED YOU ARE WITH YOUR BEHAVIOR DURING YOUR CLINIC VISIT, and HOW SATISFIED YOU ARE WITH OTHER ASPECTS OF YOUR CLINIC VISIT.
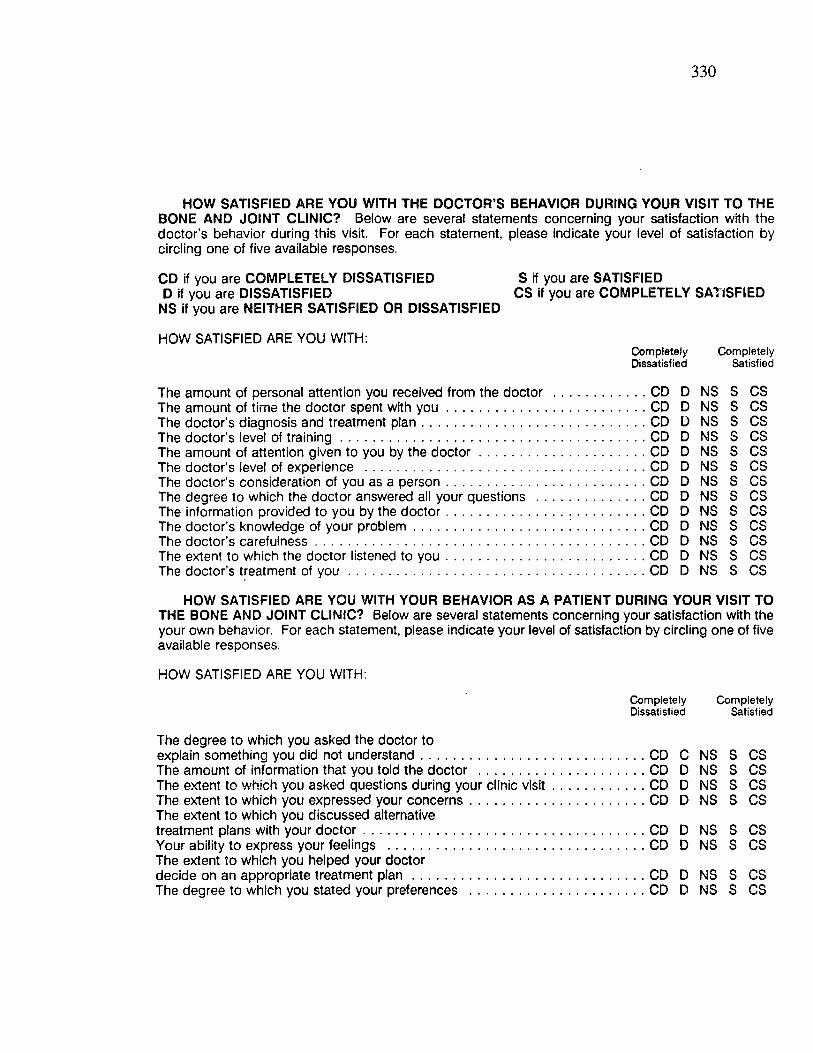
330
HOW SATISFIED ARE YOU WITH THE DOCTOR’S BEHAVIOR DURING YOUR VISIT TO THE BONE AND JOINT CLINIC? Below are several statements concerning your satisfaction with the doctor’s behavior during this visit. For each statement, please indicate your level of satisfaction by circling one of five available responses.
CD if you are COMPLETELY DISSATISFIED S if you are SATISFIEDD if you are DISSATISFIED CS if you are COMPLETELY SATISFIED
NS if you are NEITHER SATISFIED OR DISSATISFIED
HOW SATISFIED ARE YOU WITH:C om pletely C om pletelyDissatisfied Satisfied
The doctor’s level The amount of attf The doctor's level
CD D NS S CSCD D NS S CSCD D NS S CSCD D NS S CSCD D NS S CSCD D NS S CSCD D NS S CSCD D NS S CSCD D NS S CSCD D NS S CSCD D NS S CSCD D NS S CSCD D NS s CS
HOW SATISFIED ARE YOU WITH YOUR BEHAVIOR AS A PATIENT DURING YOUR VISIT TO THE BONE AND JOINT CLINIC? Below are several statements concerning your satisfaction with the your own behavior. For each statement, please indicate your level of satisfaction by circling one of five available responses.
HOW SATISFIED ARE YOU WITH:
C om pletely C om pletelyDissatisfied Satisfied
The degree to which you asked the doctor toexplain something you did not understand CD C NS S CSThe amount of information that you told the doctor .............................................. CD D NS S CSThe extent to which you asked questions during your clinic visit.......................... CD D NS S CSThe extent to which you expressed your concerns.................................................CD D NS S CSThe extent to which you discussed alternativetreatment plans with your doctor..............................................................................CD D NS S CSYour ability to express your feelings .......................................................................CD D NS S CSThe extent to which you helped your doctordecide on an appropriate treatment p lan ................................................................ CD D NS S CSThe degree to which you stated your preferences .................................................CD D NS S CS
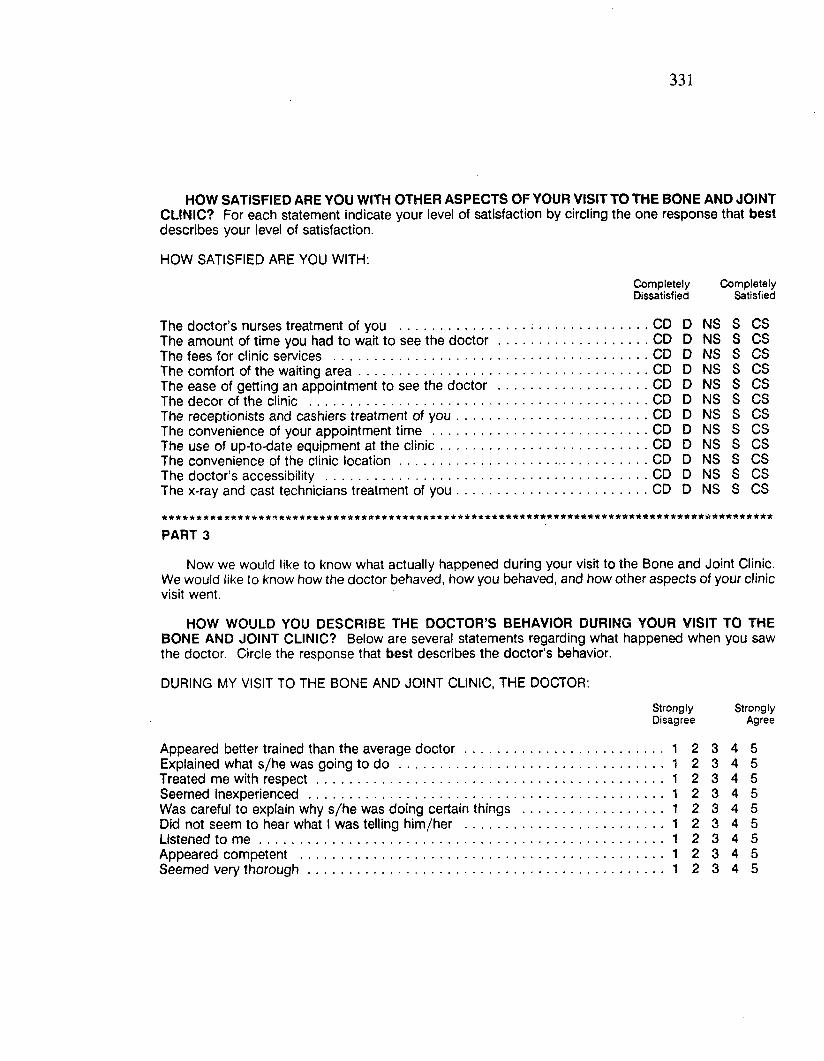
331
HOW SATISFIED ARE YOU WITH OTHER ASPECTS OF YOUR VISIT TO THE BONE AND JOINT CLINIC? For each statement indicate your level of satisfaction by circling the one response that best describes your level of satisfaction.
HOW SATISFIED ARE YOU WITH:npletely C om pletely satisfied Satisfied
CD D NS S CSCD D NS S CSCD D NS S CSCD D NS S CSCD D NS S CSCD D NS S CSCD D NS S CSCD D NS S CSCD D NS S CSCD D NS S CSCD D NS S CSCD D NS S CS
* * * * * * * * * * * * * * * * * * * * * * * * * * * * * * * * * * * * * * * * * * * * * * * * * * * * * * * * * * * * * * * * * * * * * * * * * * * * * * * * * * * * * * * * *
PART 3
Now we would like to know what actually happened during your visit to the Bone and Joint Clinic. We would like to know how the doctor behaved, how you behaved, and how other aspects of your clinic visit went.
HOW WOULD YOU DESCRIBE THE DOCTOR’S BEHAVIOR DURING YOUR VISIT TO THEBONE AND JOINT CLINIC? Below are several statements regarding what happened when you sawthe doctor. Circle the response that best describes the doctor’s behavior.
DURING MY VISIT TO THE BONE AND JOINT CLINIC, THE DOCTOR:
Strongly StronglyDisagree Agree
Appeared better trained than the average doctor............................... ....................1 2 3 4 5Explained what s/he was going to do ................................................. ......................1 2 3 4 5Treated me with respect........................................................................ ....................1 2 3 4 5Seemed inexperienced .......................................................................... ......................1 2 3 4 5Was careful to explain why s/he was doing certain things ............... ....................1 2 3 4 5Did not seem to hear what 1 was telling him/her ............................... ......................1 2 3 4 5Listened to m e ....................................................................................... ...................... 1 2 3 4 5Appeared competent ............................................................................ ......................1 2 3 4 5Seemed very thorough.......................................................................... ......................1 2 3 4 5
The doctor’s nurses treatment of you ......................The amount of time you had to wait to see the doctorThe fees for clinic services ..........................................The comfort of the waiting a rea .................................The ease of getting an appointment to see the doctorThe decor of the clinic ...............................................The receptionists and cashiers treatment of you.........The convenience of your appointment time ...............The use of up-to-date equipment at the clinic...........The convenience of the clinic location........................The doctor’s accessibility ............................................The x-ray and cast technicians treatment of you.........
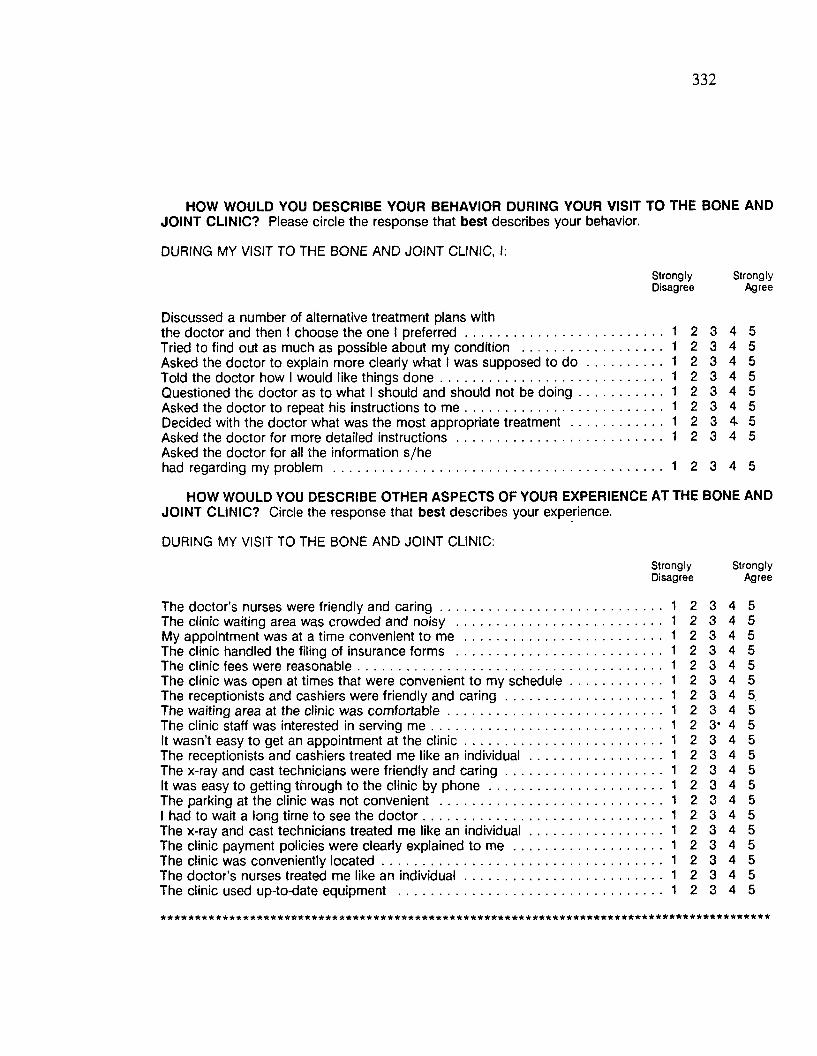
332
HOW WOULD YOU DESCRIBE YOUR BEHAVIOR DURING YOUR VISIT TO THE BONE ANDJOINT CLINIC? Please circle the response that best describes your behavior.
DURING MY VISIT TO THE BONE AND JOINT CLINIC, I:
Strongly StronglyDisagree Agree
Discussed a number of alternative treatment plans withthe doctor and then I choose the one I preferred..................................................... 1 2 3 4 5Tried to find out as much as possible about my condition ...................................... 1 2 3 4 5Asked the doctor to explain more clearly what I was supposed to d o .................... 1 2 3 4 5Told the doctor how I would like things done............................................................ 1 2 3 4 5Questioned the doctor as to what I should and should not be doing.........................1 2 3 4 5Asked the doctor to repeat his instructions to m e ..................................................... 1 2 3 4 5Decided with the doctor what was the most appropriate treatment 1 2 3 4 5Asked the doctor for more detailed instructions........................................................ 1 2 3 4 5Asked the doctor for all the information s/hehad regarding my problem 1 2 3 4 5
HOW WOULD YOU DESCRIBE OTHER ASPECTS OF YOUR EXPERIENCE AT THE BONE AND JOINT CLINIC? Circle the response that best describes your experience.
DURING MY VISIT TO THE BONE AND JOINT CLINIC:Strongly StronglyDisagree Agree
The doctor’s nurses were friendly and caring 1 2 3 4 5The clinic waiting area was crowded and noisy 1 2 3 4 5My appointment was at a time convenient to me 1 2 3 4 5The clinic handled the filing of insurance forms 1 2 3 4 5The clinic fees were reasonable 1 2 3 4 5The clinic was open at times that were convenient to my schedule 1 2 3 4 5The receptionists and cashiers were friendly and caring 1 2 3 4 5The waiting area at the clinic was comfortable.......................................................... 1 2 3 4 5The clinic staff was interested in serving m e ................................................................. 1 2 3* 4 5It wasn’t easy to get an appointment at the clinic 1 2 3 4 5The receptionists and cashiers treated me like an individual ................................... 1 2 3 4 5The x-ray and cast technicians were friendly and caring.......................................... 1 2 3 4 5It was easy to getting through to the clinic by phone............................................... 1 2 3 4 5The parking at the clinic was not convenient ............................................................ 1 2 3 4 5I had to wait a long time to see the doctor................................................................. 1 2 3 4 5The x-ray and cast technicians treated me like an individual.................................... 1 2 3 4 5The clinic payment policies were clearly explained to m e ........................................ 1 2 3 4 5The clinic was conveniently located............................................................................ 1 2 3 4 5The doctor's nurses treated me like an individual..................................................... 1 2 3 4 5The clinic used up-to-date equipment ........................................................................ 1 2 3 4 5
* * * * * * * * * * * * * * * * * * * * * * * * * * * * * * * * * * * * * * * * * * * * * * * * * * * * * * * * * * * * * * * * * * * * * * * * * * * * * * * * * * * * * * * * *
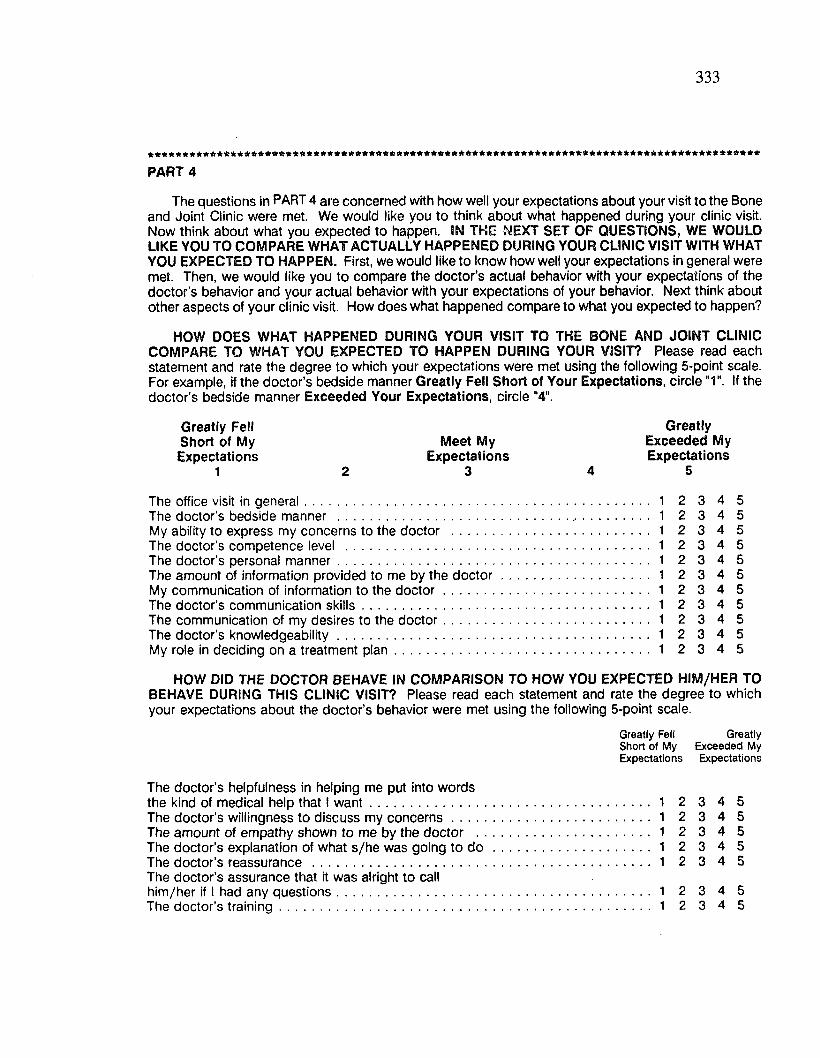
333
FART 4
The questions in PART 4 are concerned with how well your expectations about your visit to the Bone and Joint Clinic were met. We would like you to think about what happened during your clinic visit. Now think about what you expected to happen. IN THE NEXT SET OF QUESTIONS, WE WOULD LIKE YOU TO COMPARE WHAT ACTUALLY HAPPENED DURING YOUR CLINIC VISIT WITH WHAT YOU EXPECTED TO HAPPEN. First, we would like to know how well your expectations in general were met. Then, we would like you to compare the doctor’s actual behavior with your expectations of the doctor’s behavior and your actual behavior with your expectations of your behavior. Next think about other aspects of your clinic visit. How does what happened compare to what you expected to happen?
HOW DOES WHAT HAPPENED DURING YOUR VISIT TO THE BONE AND JOINT CLINIC COMPARE TO WHAT YOU EXPECTED TO HAPPEN DURING YOUR VISIT? Please read each statement and rate the degree to which your expectations were met using the following 5-point scale. For example, if the doctor’s bedside manner Greatly Fell Short of Your Expectations, circle "1". If the doctor’s bedside manner Exceeded Your Expectations, circle "4".
Greatly Fell GreatlyShort of My Meet My Exceeded MyExpectations Expectations Expectations
1 2 3 4 5
The office visit in general.............................................................................................. 1 2 3 4 5The doctor’s bedside manner 1 2 3 4 5My ability to express my concerns to the doctor 1 2 3 4 5The doctor’s competence level 1 2 3 4 5The doctor’s personal manner 1 2 3 4 5The amount of information provided to me by the doctor 1 2 3 4 5My communication of information to the doctor 1 2 3 4 5The doctor’s communication skills 1 2 3 4 5The communication of my desires to the doctor 1 2 3 4 5The doctor’s knowledgeability 1 2 3 4 5My role in deciding on a treatment plan 1 2 3 4 5
HOW DID THE DOCTOR BEHAVE IN COMPARISON TO HOW YOU EXPECTED HIM/HER TO BEHAVE DURING THIS CLINIC VISIT? Please read each statement and rate the degree to which your expectations about the doctor's behavior were met using the following 5-point scale.
Greatly Fell GreatlyShort of M y Exceeded My Expectations Expectations
The doctor's helpfulness in helping me put into wordsthe kind of medical help that I want............................................................................ 1 2 3 4 5The doctor’s willingness to discuss my concerns...................................................... 1 2 3 4 5The amount of empathy shown to me by the doctor ............................................... 1 2 3 4 5The doctor’s explanation of what s/he was going to d o .......................................... 1 2 3 4 5The doctor’s reassurance ............................................................................................ 1 2 3 4 5The doctor’s assurance that it was alright to callhim/her if I had any questions..................................................................................... 1 2 3 4 5The doctor’s training..................................................................................................... 1 2 3 4 5
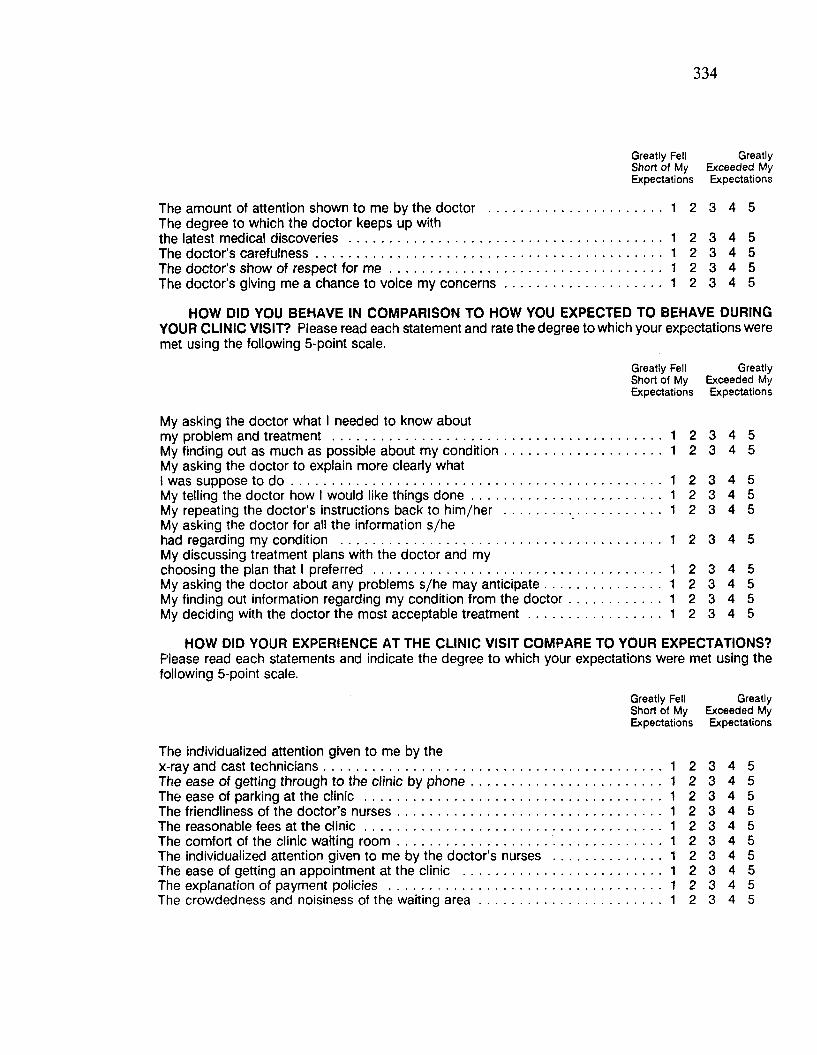
334
Greatly Fell GreatlyShort of M y Exceeded M y Expectations Expectations
The amount of attention shown to me by the doctor ............................................... 1 2 3 4 5The degree to which the doctor keeps up withthe latest medical discoveries ..................................................................................... 1 2 3 4 5The doctor’s carefulness............................................................................................. 1 2 3 4 5The doctor’s show of respect for m e ........................................................................ 1 2 3 4 5The doctor's giving me a chance to voice my concerns......................................... 1 2 3 4 5
HOW DID YOU BEHAVE IN COMPARISON TO HOW YOU EXPECTED TO BEHAVE DURING YOUR CLINIC VISIT? Please read each statement and rate the degree to which your expectations were met using the following 5-point scale.
Greatly Fell GreatlyShort of My Exceeded My Expectations Expectations
My asking the doctor what I needed to know aboutmy problem and treatment ........................................................................................... 1 2 3 4 5My finding out as much as possible about my condition............................................ 1 2 3 4 5My asking the doctor to explain more clearly whatI was suppose to d o ...................................................................................................... 1 2 3 4 5My telling the doctor how I would like things done..................................................... 1 2 3 4 5My repeating the doctor’s instructions back to him/her ............................................ 1 2 3 4 5My asking the doctor for all the information s/hehad regarding my condition ........................................................................................ 1 2 3 4 5My discussing treatment plans with the doctor and mychoosing the plan that I preferred ............................................................................... 1 2 3 4 5My asking the doctor about any problems s/he may anticipate................................ 1 2 3 4 5My finding out information regarding my condition from the doctor........................... 1 2 3 4 5My deciding with the doctor the most acceptable treatment..................................... 1 2 3 4 5
HOW DID YOUR EXPERIENCE AT THE CLINIC VISIT COMPARE TO YOUR EXPECTATIONS?Please read each statements and indicate the degree to which your expectations were met using the following 5-point scale.
Greatly Fell GreatlyShort of M y Exceeded My Expectations Expectations
The individualized attention given to me by thex-ray and cast technicians 1 2 3 4 5The ease of getting through to the clinic by phone 1 2 3 4 5The ease of parking at the clinic 1 2 3 4 5The friendliness of the doctor’s nurses 1 2 3 4 5The reasonable fees at the clinic................................................................................. 1 2 3 4 5The comfort of the clinic waiting room.......................................... 1 2 3 4 5The individualized attention given to me by the doctor’s nurses ............................. 1 2 3 4 5The ease of getting an appointment at the clinic ...................................................... 1 2 3 4 5The explanation of payment policies .......................................................................... 1 2 3 4 5The crowdedness and noisiness of the waiting a re a ................................................. 1 2 3 4 5
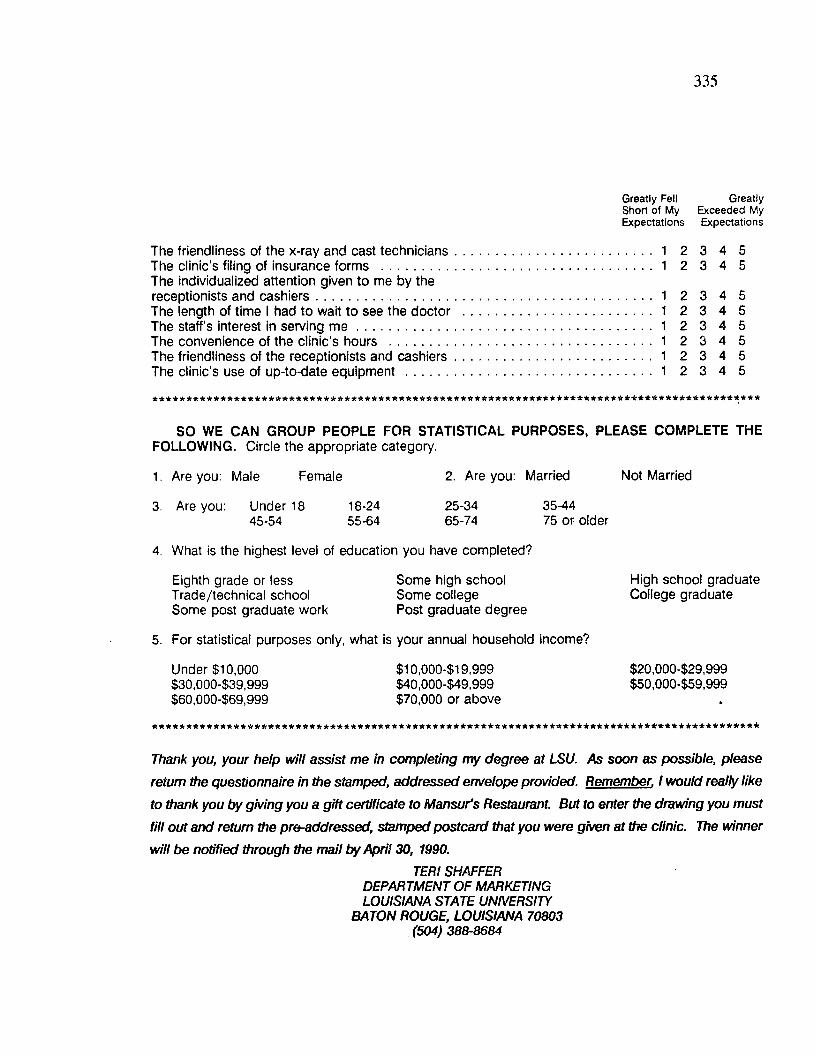
335
Greatly Fell GreatlyShort of M y Exceeded My Expectations Expectations
The friendliness of the x-ray and cast technicians..................................................... 1 2 3 4 5The clinic’s filing of insurance forms ......................................................................... 1 2 3 4 5The individualized attention given to me by thereceptionists and cashiers........................................................................................... 1 2 3 4 5The length of time I had to wait to see the doctor ................................................... 1 2 3 4 5The staff’s interest in serving m e ................................................................................ 1 2 3 4 5The convenience of the clinic’s hours ....................................................................... 1 2 3 4 5The friendliness of the receptionists and cashiers..................................................... 1 2 3 4 5The clinic's use of up-to-date equipment ................................................................... 1 2 3 4 5
a * * * * * * * * * * * * * * * * * * * * * * * * * * * * * * * * * * * * * * * * * * * * * * * * * * * * * * * * * * * * * * * * * * * * * * * * * * * * * * * * * * * * * * * *
SO WE CAN GROUP PEOPLE FOR STATISTICAL PURPOSES, PLEASE COMPLETE THE FOLLOWING. Circle the appropriate category.
1. Are you: Male Female 2. Are you: Married Not Married
3. Are you: Under 18 18-24 25-34 35-4445-54 55-64 65-74 75 or older
4. What is the highest level of education you have completed?
Eighth grade or less Some high school High school graduateTrade/technical school Some college College graduateSome post graduate work Post graduate degree
5. For statistical purposes only, what is your annual household income?
Under $10,000 $10,000-$19,999 $20,000-$29,999$30,000-$39,999 $40,000-$49,999 $50,000-$59,999$60,000-$69,999 $70,000 or above
Thank you, your help will assist me in completing my degree at LSU. As soon as possible, please
return the questionnaire in the stamped, addressed envelope provided. Remember. I would really like
to thank you by giving you a gift certificate to Mansur's Restaurant. But to enter the drawing you must
fill out and return the pre-addressed, stamped postcard that you were given at the clinic. The winner
will be notified through the mail by April 30, 1990.TERI SHAFFER
DEPARTMENT OF MARKETING LOUISIANA STATE UNIVERSITY
BATON ROUGE, LOUISIANA 70803 (504) 388-8684

Appendix B: Estimation o f Models without Performance
336

337
Table B .lStandardized Structural Parameter Estimates
and T-Values for Patient Satisfaction Submodel
without Performance
Proposed Relationships F r o m ----- To Parameters(T-Values)
Ideal expectations ----- Disconfirmation .175(1.04)
Expectations----- Disconfirmation .293(1.75)
Expectations----- Satisfaction .117(0.90)
Disconfirmation - -— Satisfaction .593*(4.33)
Model Fit
Chi-square .27 (n = 5 5 , DF = 1, Prob. < .601)Chi-square .71 (n = 131, DF = 1, Prob. < .399)GFI .997AGFI .973RMSR .015Structural Equations (R2)Disconfirmation .175Satisfaction .420
*, ’*, **’, significant at .05, .01, and .001, respectively.
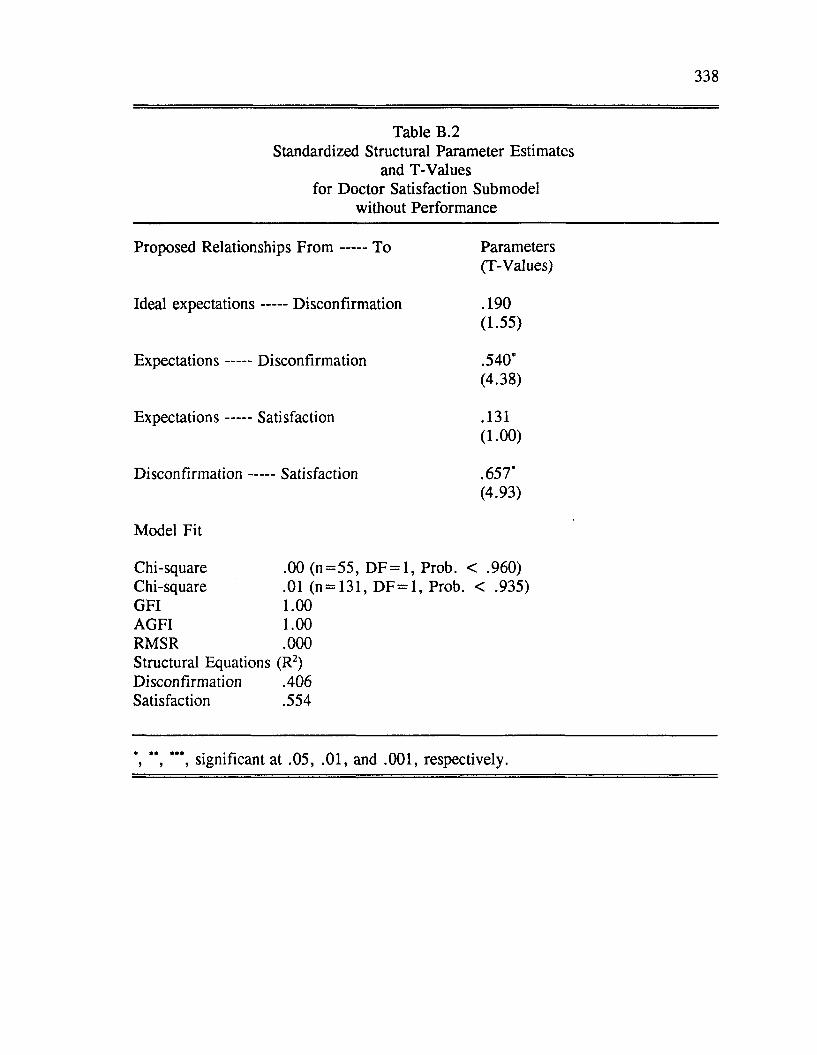
338
Table B.2Standardized Structural Parameter Estimates
and T-Values for Doctor Satisfaction Submodel
without Performance
Proposed Relationships F ro m To Parameters(T-Values)
Ideal expectations Disconfirmation . 190(1.55)
Expectations Disconfirmation .540*(4.38)
Expectation s Sati sfaction .131( 1.00)
D isconfirm ation Satisfaction .657*(4.93)
Model Fit
Chi-square .00 (n = 5 5 , DF = 1, Prob. < .960)Chi-square .01 (n = 131, DF = 1, Prob. < .935)GFI 1.00AGFI 1.00RMSR .000Structural Equations (R2)Disconfirmation .406Satisfaction .554
', **, significant at .05, .01, and .001, respectively.
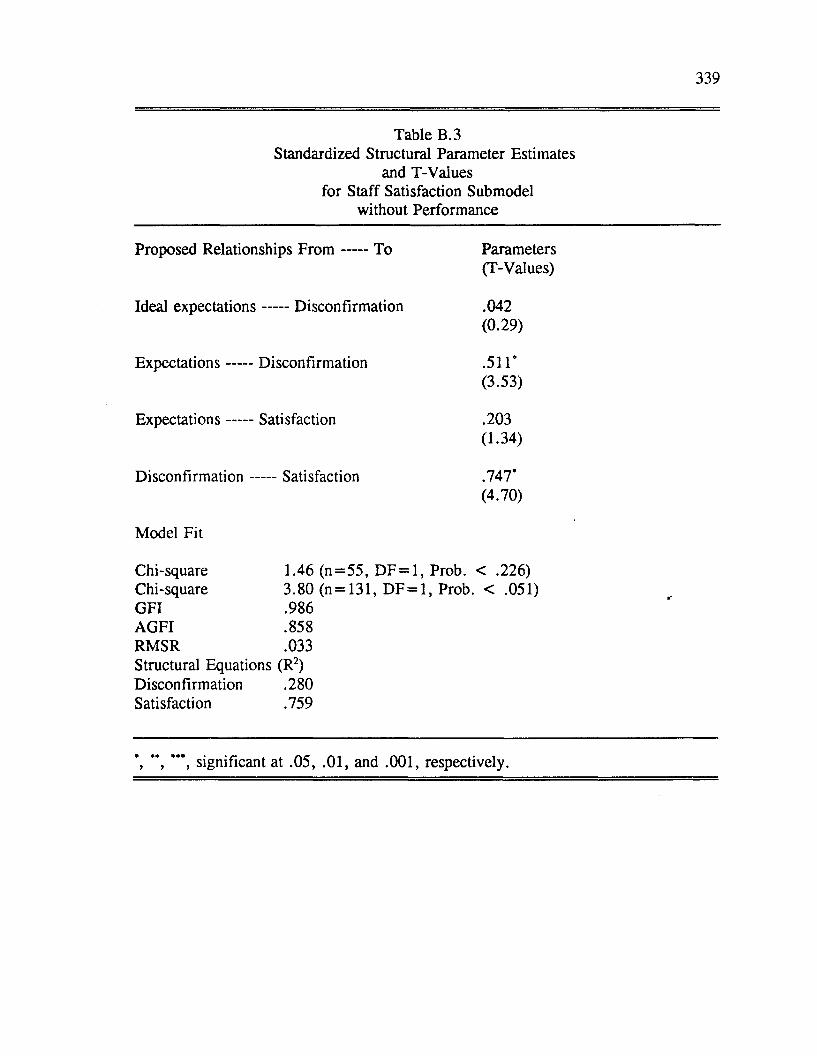
339
Table B.3Standardized Structural Parameter Estimates
and T-Values for Staff Satisfaction Submodel
without Performance
Proposed Relationships F r o m ----- To Parameters(T-Values)
Ideal expectations ----- Disconfirmation .042(0.29)
E xpectations----- Disconfirmation .511*(3.53)
E xpectations----- Satisfaction .203(1.34)
Disconfirmation - -— Satisfaction .747*(4.70)
Model Fit
Chi-square 1.46 (n= 55 , DF = 1, Prob. < .226)Chi-square 3.80 (n = 131, DF = 1, Prob. < .051)GFI .986AGFI .858RMSR .033Structural Equations (R2)Disconfirmation .280 Satisfaction .759
tr-
’, **’, significant at .05, .01, and .001, respectively.
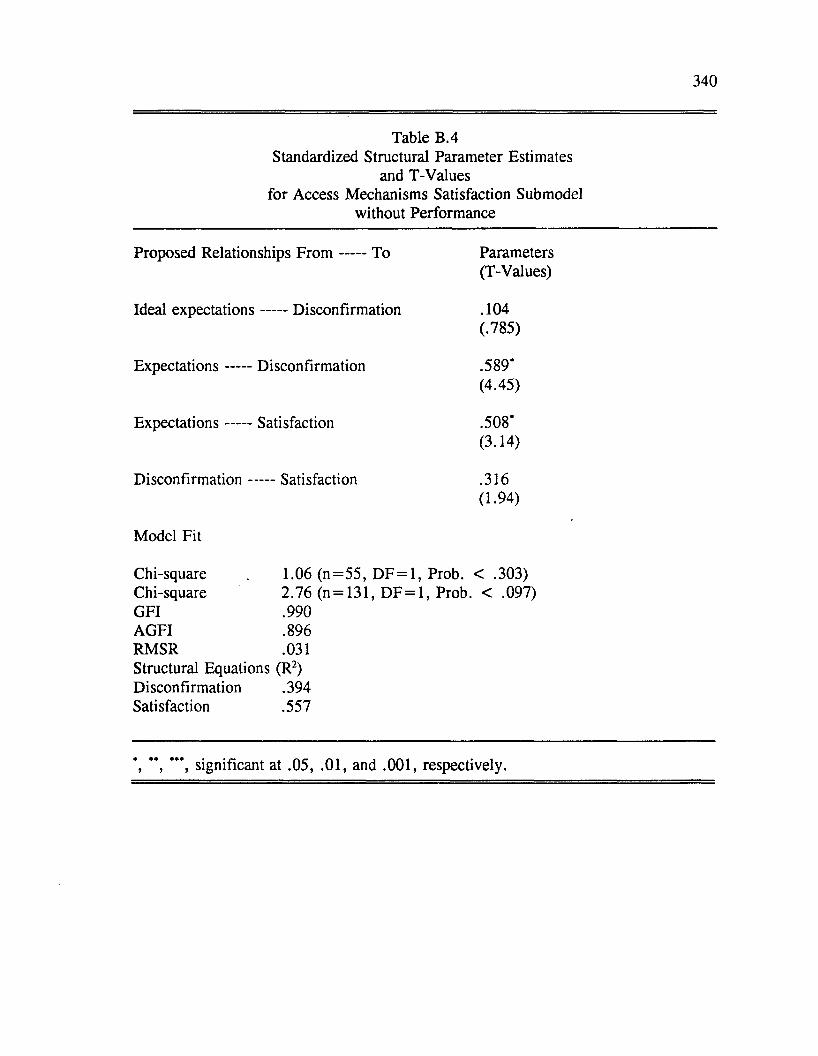
340
Table B.4Standardized Structural Parameter Estimates
and T-Values for Access Mechanisms Satisfaction Submodel
without Performance
Proposed Relationships F ro m ----- To Parameters(T-Values)
Ideal expectations ----- Disconfirmation .104(.785)
Expectations----- Disconfirmation .589’(4.45)
Expectations----- Satisfaction .508*(3.14)
Disconfirmation - -— Satisfaction .316(1.94)
Model Fit
Chi-square 1.06 (n = 5 5 , DF = 1, Prob. < .303)Chi-square 2.76 (n = 131, DF = 1, Prob. < .097)GFI .990AGFI .896RMSR .031Structural Equations (R2)Disconfirmation .394Satisfaction .557
*, " , significant at .05, .01, and .001, respectively.
VITA
T en Root Shaffer was bom on January 1, 1958 in Castro Valley, California.
She grew up in Alameda, California graduating from St. Joseph Notre Dame High
School in 1976. She studied Sociology at the University o f California at Santa
Barbara and received a Bachelor o f Arts with Honors in 1981. In the year that
followed her undergraduate studies, Teri spent working and traveling in Europe.
Upon returning to the United States, she took a position in the retail industry in San
Fransisco, California.
In August of 1982, her husband, Gary P. Shaffer, received a graduate
fellowship to complete his doctorate in marine sciences at Louisiana State
University. After working in the travel industry in Baton Rouge, Louisiana for
several years, Teri decided to return to graduate school and pursue a master’s
degree in Marketing. Teri found that she really enjoyed the field o f marketing and
the academic environment. From the recommendation o f several faculty members at
Louisiana State University she decided to continue her graduate studies at that
university. She received her Ph.D . in Business Administration in May o f 1991
(major field: Marketing, minor field: Social Psychology; supporting field:
Quantitative Business Analysis).
341
Candidate:
Major Field:
Title of Dissertation:
DOCTORAL EXAMINATION AND DISSERTATION REPORT
Teri Root Shaffer
Business Administration (Marketing)
A Role Theoretical Model of Consumer Satisfaction
with Professional Services
Approved:
/ O w e / 1 o f . QLuaMJ Major P ' ------ * ’ -------Major Professor and Chairman
~ ^A a -
Dean of the Graduate School
EXAM INING COMMITTEE:
Date of Examination:
March 1, 1991


