Embed Size (px)
Citation preview
Freshximler Biology (1993) 30, 369-376
A seasonal study of phosphorus deficiency in a eutrophicreservoir
i NEDOMA,* PETRA PORCALOVA, JAROSLAVA KOMARKOVA AND V O J T E C HVYHNALEKHydwbiological Institute, Academy of Sciences of Czech Republic, Na sddkdch 7, CS-37005 Ceskd Bud^jovicc, Czech
Republic
*Autbor to whom correspondence should be addressed
SUMMARY
1. Seston elemental composition (C, N, P) and the orthophosphate uptake rate constant,k{upi), were measured in the epilimnion of the eutrophic fomov Reservoir in the periodMarch-August 1989.2. Seasonal series of log C/P, log N/P and log [/:(upt)] values were highly correlated (r' inthe range 0.84—0.93), but, based on literature-derived criteria, fc(upt) values indicatedstronger P defidency than did the C/P values.3. The results showed moderate to strong phosphorus deficiency in summer, moderatedefidency at the end of the spring peak of phytoplankton, and no defidency early in thespring or during the spring clear-water period.
Introduction
Nutrient defidency is an important factor infiu-endng seasonal development of phytoplanktonin aquatic ecosystems. Its relative importance, com-pared with other factors such as grazing pressure,light intensity or water column stability, differsamong lakes and changes considerably during theannual cycle (Reynolds, 1984; Sommer et al., 1986;Vanni & Temte, 1990). The most frequently defidentnutrient in temperate freshwater lake ecosystems isphosphorus (Dillon & Rigler, 1974).
In the Rimov Reservoir, a eutrophic water bodywith a high load of nutrients from its main tributary(the Mal§e river —about 5gm"^year~' of total phos-phorus and about 200gm"^year~^ of total nitrogen),the seasonal development of plankton generallyfollows the pattern described for other eutrophicwater bodies: a spring phytoplankton maximum, aclear-water period and a second peak of phytoplank-ton in summer (Sommer et al., 1986). Some evidenceindicates, however, that mechanisms controlling thisdevelopment in the fomov Reservoir could differfrom those generally proposed for eutrophic systems(the PEG model; Sommer et al., 1986): despite the
high nutrient input, a possible role for phosphoruslimitation in spring phytoplankton developmenthas been suggested (Komarkova, 1989; Vyhnaiek,1989; Brandl et ah, 1989a,b; Vyhnaiek ct al., 1991).In summer, P deficiency in the fomov Reservoirmay be occurring, but little direct evidence has beenavailable (Brandl ct al., 1989b).
The actual degree of P defidency at a given localitycan be estimated, among other methods, by measuringthe molar ratio of organic carbon to total phosphorusin seston (Healey & Hendzel, 1980; Gage & Gorham,1985), the turnover time of dissolved orthophosphate(Rigler, 1964; Lean et al, 1983) or the rate constant oforthophosphate uptake (Currie, 1990), which is aparameter closely related to the turnover time.
In this study, two independent methods to assessphosphorus status (seston C/P, N/P ratios; ortho-phosphate uptake rate constant) were used andcompared to identify periods of phosphorus defidencyin the eutrophic fomov Reservoir.
Material and Methods
The fomov Reservoir (South Bohemia, Czech Repub-lic) is a eutrophic, dimictic water body, positively
370 /. Nedoma et al.
stratified from March to October. It has a maximumdepth of 43 m (mean 16 m), maximum volume of34 X 10*'m^ and a theoretical retention time of 92 days.For more detailed characterization of the reservoirsee Hejzlar & Straskraba (1989). Integrated samples(0-2 m) were obtained with a tube sampler at sevensites across the reservoir near the dam. The sampleswere filtered immediately through a 100 im sieveand transported to the laboratory for further analyses.
Soluble reactive phosphorus (SRP) was measuredin Whatman GF/C filtered water samples according toStephens (1963). Total phosphorus (TP) was analysedas SRP after HCIO4 digestion (Popovsky, 1970).Samples for total dissolved phosphorus (TDP) wereWhatman GF/C filtered and preserved by addition ofH2SO4 (0.1% final concentration) before analysis. Toestimate hot water extractable phosphorus (HWEP)in seston, duplicate 250-1000 ml subsamples werefiltered through Whatman GF/C filters. Filters werestored at -20°C before analyses. HWHP was esti-mated as SRP released during 1-hour boiling of filtersplaced in 50 ml of double-distilled water (Fitzgerald& Nelson, 1966).
For analyses of elemental composition of seston,seston from 10—221 of water sample was concentratedusing a modified Foerst centrifuge, and freeze-dried. Organic carbon, nitrogen and hydrogen weremeasured with a CHN-CORDER NT-3 analyser(Yanaco). Total phosphorus was determined as above.
To determine the rate constant of orthophosphateuptake /f(upt), duplicate 100 ml aliquots of watersample were supplemented with 0.1 MBq of carrier-free [ 2p].HPO3 (ROTOP, Dresden, Germany), andincubated at tbe in situ temperature for 2-8b. Atappropriate time intervals, 2 ml subsamples werefiltered through Whatman GF/C filters. Radioactivityretained on the filters was measured with a BeckmanLS 7000 spectrometer as Cherenkov scintillation. Totalactivity was measured in unfiltered 2 m] subsamplesand did not change markedly (more than 10%) in thecourse of experiments. The 'c(upt) was determinedfrom the time course of ^ P incorporation into theparticles retained on the filters as the initial slope ofincorporation, using the method of Currie & Kalff(1984). The second degree polynomial equation:
P(%) = Po -h 100 k{upt)t + at^
where P(%) is filter-retained •'"P activity at time texpressed as per cent total • P activity, and P(, isfilter-retained •' P activity at zero time, was fitted to
the data using non-linear regression (Statgraphics).Data points where incorporation was higher than70% of the apparent equilibrium (plateau) level wereexcluded from the analysis (Currie, 1990). The poly-nomial model was chosen in preference to the twocompartment exchange (exponential) model (Currie &Kalff, 1984), because it gave better estimation of k{upi)in situations of slow PO4 uptake (^(upt) < 0.05h~^)when only a few per cent of total activity was incor-porated in the course of the experiment. When theuptake was rapid (/:(upt) >0.1 h^'), however, thetime courses of incorporation fitted the exponentialmodel extremely well.
Concentration of chlorophyll a (chl.a) was de-termined by the in vivo fiuorescence technique(Strickland & Parsons, 1968) during the spring whencyanobacteria were not present, or by the spectro-photometric method (Lorenzen, 1967) during thesummer when c}'anobacteria formed an importantpart of the phytoplankton biomass.
Samples for analyses of spedes composition ofphytoplankton were preserved with Lugol iodinesolution and cells were counted and measured usingKolkwitz's chambers and an inverted microscope(Olympus IMT 2) (Lund, 1951).
Zooplankton was sampled using an Apstein sam-pler, with 200 |im netting, by vertical hauls throughthe whole depth of the water column (Brandl et at.,1989a). Cladocera were separated by the flotationmethod according to StraSkraba (1964), and theirprotein biomass was determined by the biuret methodaccording to Blazka (1966).
Results
The development of chl.o concentration and phyto-plankton composition in the fti'mov Reservoir duringthe study period is shown in Fig. la and Table 1. Earlyin the spring and during the spring phytoplanktonmaximum (in April, maximum chl.a concentration =23 [xg 1 ~ ), phytoplankton was composed of flagellates(Chlorophyceae, Cryptophyceae and Chrysophyceae)and diatoms. During the subsequent clear-waterperiod (in May, chl.fl concentration = 1.4—4.5 ngl~'),diatoms and flagellates (Cryptophyceae) prevailed.Cyanobacteria occurred at the end of the clear-waterperiod, however no colonies were present and allchl.fl passed through the 1(X) fim mesh. Later in thesummer some phytoplankton particles greater than100 ^m in size appeared (usually less than 20% of total
March April Moy June
1989
July August
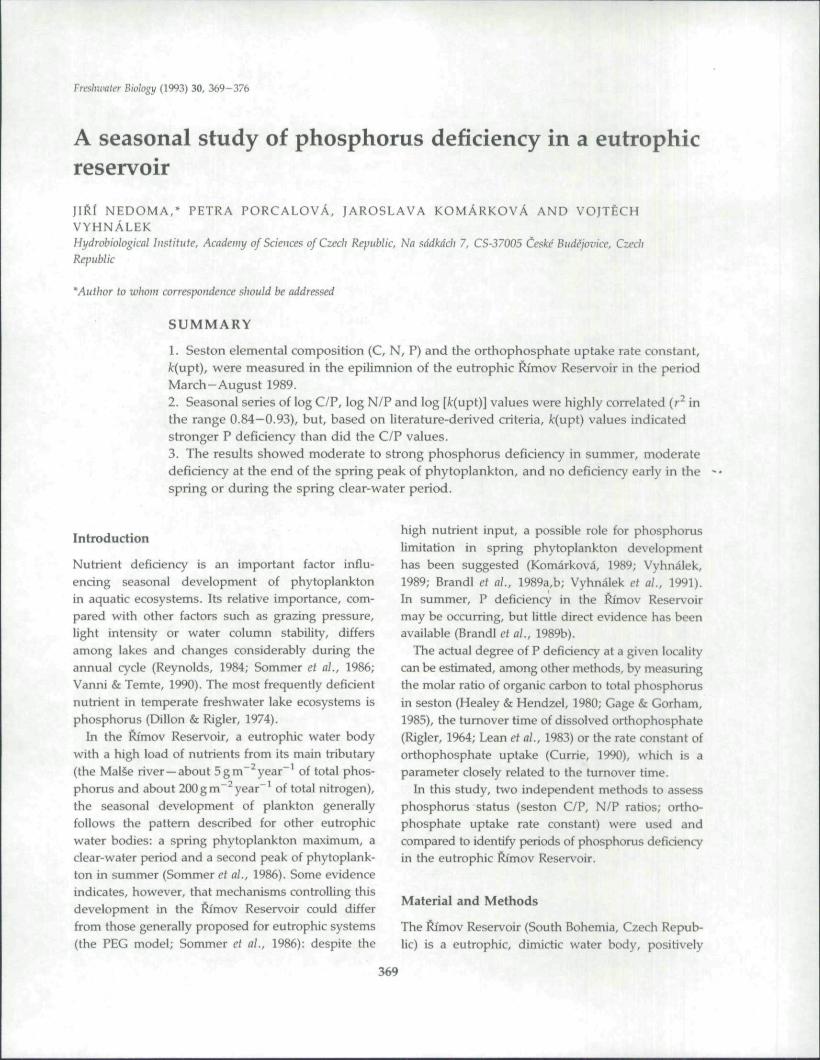
Fig. 1 Epilimnetic seasonal patterns of selected parametersin the ftimov Reservoir in 1989. (a) Chlorophyll n concentration(chin; squares) and dadoceran biomass (asterisks), (b) Totaldissolved phosphorus (TDP; triangles), soluble reactivephosphorus (SRP; filled squares) and hot water extractablephosphorus (HWEP; empty squares) concentrations.
Phosphorus deficiency in a eutrophic reservoir 371
chl.fl; Table 1); these were not included in analyses.The summer phytoplankton peak was formed byc)'anobacteria, diatoms and coccoid green algae; themaximum total chl.o concentration reached 45^gr^(maximum chl.fl< 100(im concentration was 37M.gr').
A broad spring peak in cladoceran biomass oc-curred in the second half of April and in May, whilein June the biomass decreased and remained ratherstable for the rest of the sample season (Fig. la).Daphnia galenta was the dominant cladoceran.
The concentration of SRP was relatively high(15-20 fig r ) in the spring, with a temporary decreaseduring the phytoplankton peak (Fig. lb). In summerit decreased to l-5[Lgr\ The TDP concentraHonchanged roughly in parallel with SRP concentration,being higher by about 5 fig 1"' in spring and by about10(igr' in summer (Fig. lb). Seston HWEP concen-tration was 5-6 ugl"' early in the spring; during thephytoplankton peak it decreased and remained withone exception (20 July) at a level of 1 -2 .g 1"' for therest of the sampling season (Fig. lb).
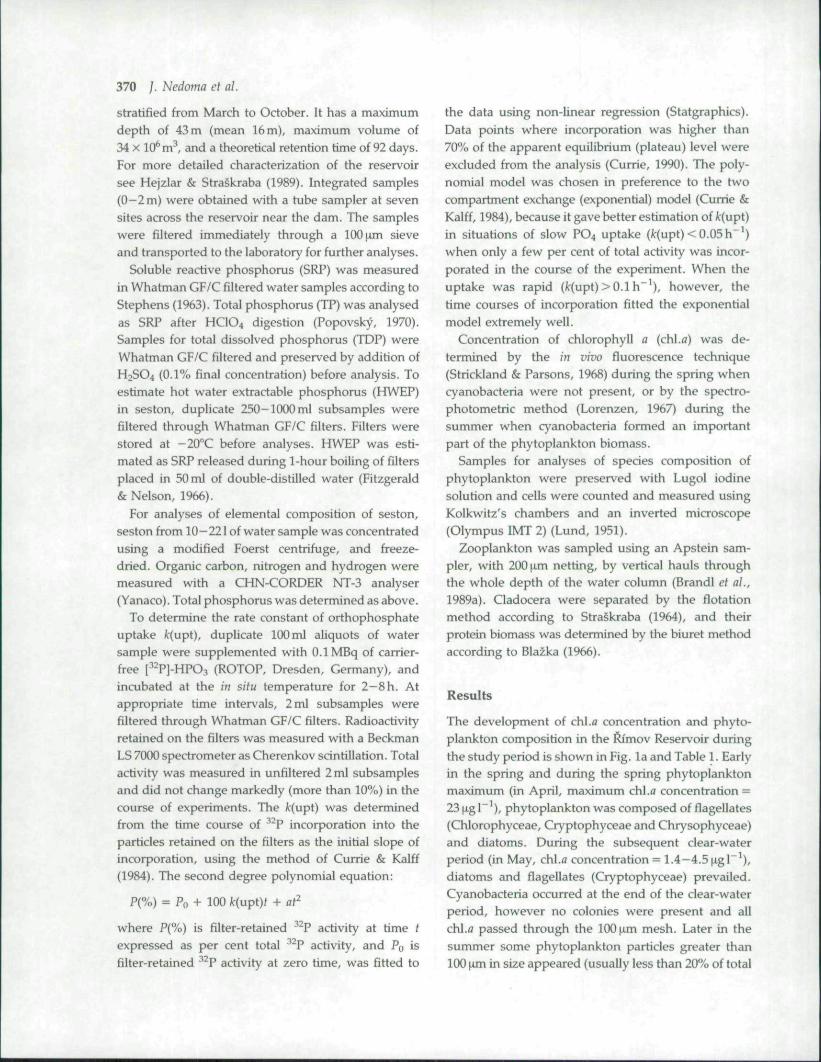
Examples of time courses of tracer '' P-PO4 incor-poration into particles are given in Fig. 2. Initialincorporation rate changed dramatically throughoutthe season. The orthophosphate uptake rate constant.
Table 1 Seasonal variations in concentration of chlorophyll a in particles <100|im (jigl '; per cent of total chl.n), in sestonelemental composition (per cent of seston dry weight), and in phytopiankton composition (per cent of total algal biovolumerepresented by genera forming more than 10% of total biovolume), in I imov Reservoir in 1989. n.a. = not available
Dominant phytoplankton
Chlamydomonas (20%), Rhodomonas (18%), Crj'ptomonas (10%)Cryptomonas (40%), Chlamydomonas (11%)Synedra (53%), Chiamydomonas (11%)Chlamydomonas, Pascherina (36%), Chrj'sochromulina (10%)Chrysochromulina (22%), Stephamxliscus (18%)Pianktospbaeria (17%), Rhodomonas (13%), Stephanodiscus (10%)Chlamydomonas (26%), Cryptomonas (19%)Stephanodiscus (707,.), Rhodomonas (14%)Synedra (26%), Stephanodiscus (24%), Rbodomonas (13%)Ankyra (39%), Synedra (14%), Cryptomonas (11%)Cryptomonas (38%), Anabaena (36%)Asterionella (78%)Asterionella (52%), Pediastrum (14%)Aulacoseira (44%), Willea (19%)Cryptomonas (27%), Staurastrum (21%)Staurastrum (31%), Volvox (27%)Anabaena (29%), Staurastrum (15%), Microcystis (IT/o)Microcystis (36%), Pianktospbaeria (14%) 'Aphanizomenon (41%), Microcj'stis (16%)Aphanizomenon (54%), Microc\'stis (247o)
Date
21 Marcb28 March4 April
13 April20 April26 April4 May
11 May16 May25 May
I June8 June
15 June22 June29 June6 July
13 July20 July11 August31 August
Chl.fl <
l^gl"'
13.58.32.0
23.315.416.45.62.61.44.52.6
10.17.39.14.82.55.9
11.837.117.6
100 nm
% total
10010010010010010010010010010010074
10054963992868293
Seston
%C
24.924.918.930.526.226.420.014.8n.a.n.a.n.a.18.822.922.332.9n.a.34.934.037.824.4
DW composition
%N
4.514.303.145.544.794.474.463.11n.a.n.a.n.a.3.413.733.244.68n.a.4.784.926.114.37
%P
0.800.720.530.670.720.460.740.41n.a.n.a.n.a.0.400.520.290.46n.a.0.340.520.40n.a.
%H
3.903.943.234.654.214.223.182.55n.a.n.a.n.a.3.223.723.665.00n.a.5.224.965.613.79
372 /. Nedoma et al.
50-
•D 40-«
k "S 30-a.
° 20-
300
120 i80
Time (min)
240 500
Fig. 2 Time courses of the Incorporation of carrier-free•''-P-PO4 into the particles retained on Whatman GF/C filters insamples collected from tbe epilimnion of the ftimov Reservoirin 1989. Sampling dates and the values of orthophospbateuptake rate constants, calculated as tbe initial slope of the datausing tbe second order )x>lynomial, are given for eachexperiment.
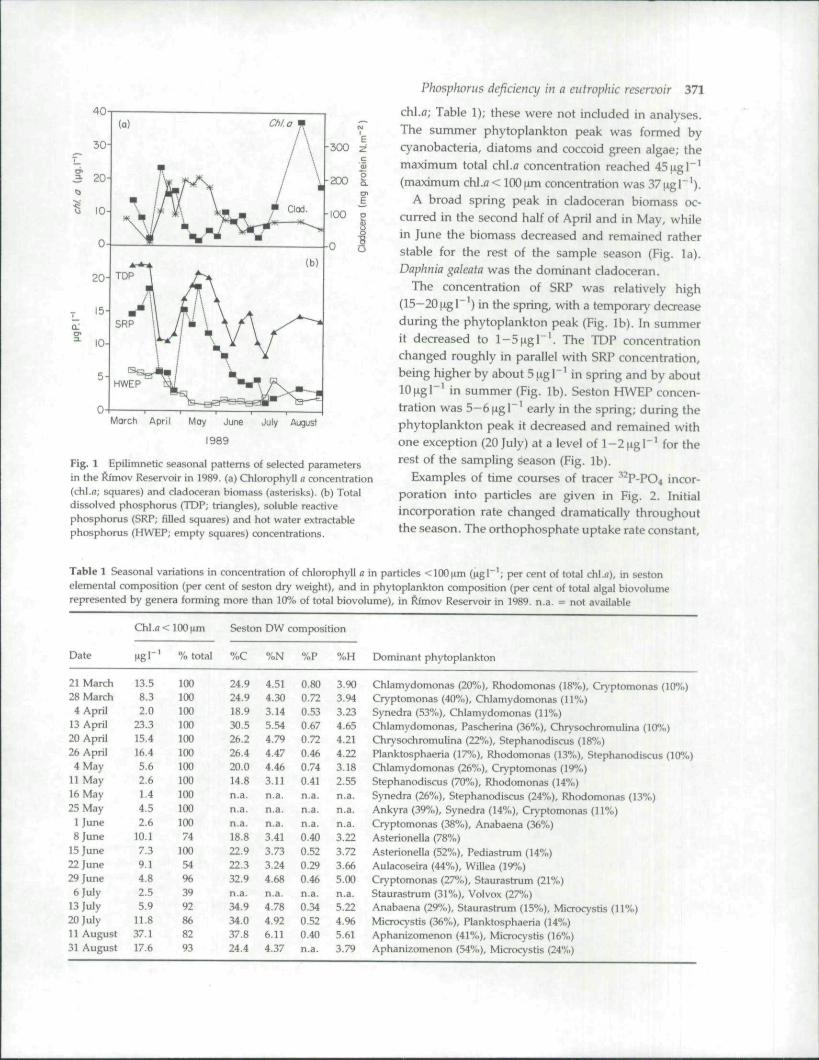
/c(upt), varied from 0.0016 h ^ during the culminationof the spring clear-water period to 10.6 h^ in sum-mer, tending to increase with decreasing SRP andwith increasing chl.fl concentrations (Fig. 3a, Table 2).When achieved (in summer experiments, whenk{upi) > 0.5 h"'), the apparent equilibrium level(plateau) of ^ P-PO4 incorporation occurred whenonly 35-65% of total added ^ P-PO4 was incorporated(Fig. 2-data on 29 July).
Seston elemental composition is shown in Table 1.Organic carbon content varied between 14.8% and38.8% of seston dry weight (DW), increasing withchl.fl concentration. In spring the sestonic molar C/Pratio varied in the range 70-121, with a temporary
March April May June July August
1989
Fig. 3 Epilimnetic seasonal patterns of nutrient statusestimators in the ftimov Reservoir in 1989. (a) Orthophosphateuptake rate constant (t(upt); triangles), seston C/P molarratio (squares); dashed line indicates the Redfield ratio level,C/P = 106:1. (b) Seston N/P (triangles) and N/C (squares)molar ratios; dashed line indicates tbe Redfield ratio level,common for N/P scale (16:1) and N/C scale (16:106 = 0.151).
increase to 148 at the end of the spring phytoplanktonbloom. In summer the ratio increased to valuesbetween 169 and 265 (Fig. 3a). The sestonic molarN/P raho changed in parallel with the C/P ratio inthe range 12.4-33.7, whereas the N/C ratio variedless, in the range 0.117-0.191 (Fig. 3b).
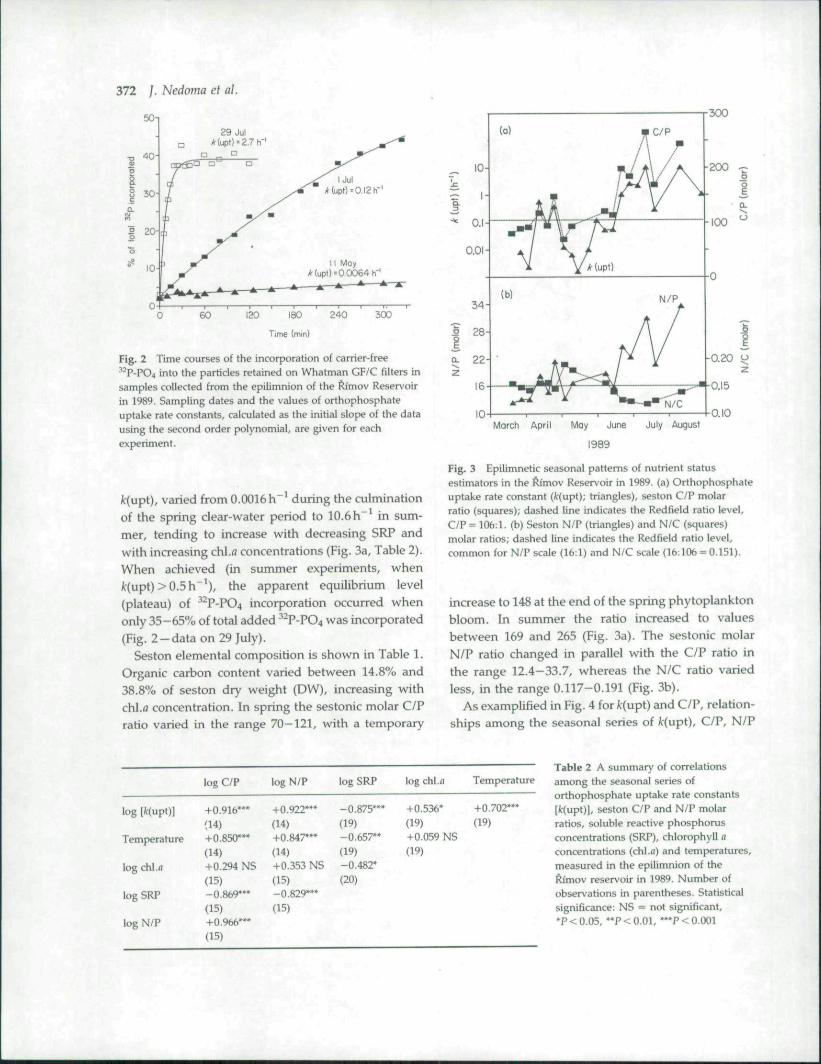
As examplified in Fig. 4 for k{upi) and C/P, relation-ships among the seasonal series of /r(upt), C/P, N/P
log |lc(upt)]
Temperature
log chl.fl
log SRP
log N/P
log C/P
+0.916*"(14)+0.850***(14)+0.294 NS(15)-0.869"*(15)+0.966***(15)
log N/P
+0.922*"(14)+0.847***(14)+0.353 NS(15)-0.829*"
(15)
log SRP
-0.875***(19)-0.657"(19)-0.482*(20)
log cht.ii
+0.536*(19)+0.059 NS(19)
Temperature
+0.702***(19)
Table 2 A summary of correlationsamong tbe seasonal series oforthophosphate uptake rate constants[Jf(upt)], seston C/P and N/P molarratios, soluble reactive pbospborusconcentrations (SRP), chlorophyll aconcentrations (cbl.fl) and temperatures,measured in the epilimnion of theftimov reservoir in 1989. Number ofobservations in parentheses. Statisticalsignificance: NS = not significant,*P < 0.05, " P < 0.01, ***P < 0.001
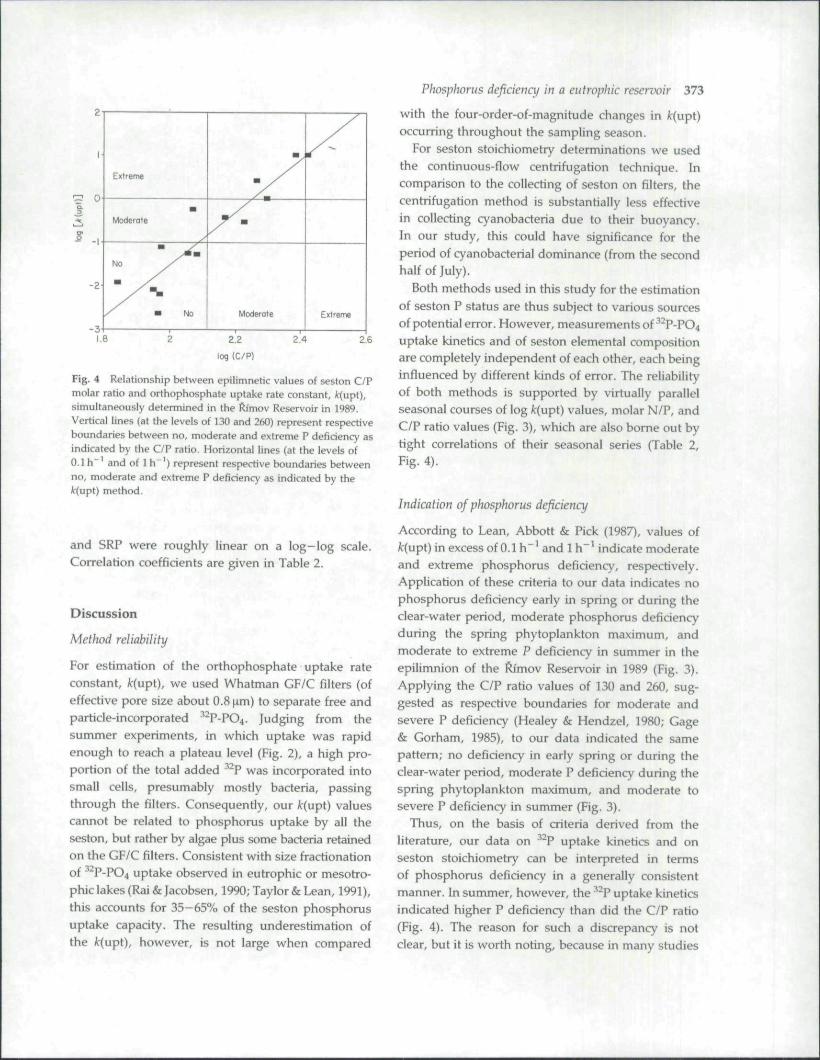
Fig. 4 Relationship between epilimnetic values of seston C/Pmolar ratio and ortbophosphate uptake rate constant, it(upt),simultaneously determined in tbe ftimov Reservoir in 1989.Vertical lines (at the levels of 130 and 260) represent respectiveboundaries between no, moderate and extreme P deficiency asindicated by the C/P ratio. Horizontal lines (at the levels of0.1 h"' and of 1 h"') represent respective boundaries betweenno, moderate and extreme P deficiency as indicated by the/c(upt) method.
and SRP were roughly linear on a log-log scale.Correlation coefficients are given in Table 2.
Discussion
Method reliability
For estimation of the orthophosphate uptake rateconstant, fc(upt), we used Whatman GF/C filters (ofeffective pore size about 0.8 nm) to separate free andparticle-incorporated ^"P-PO4. Judging from thesummer experiments, in which uptake was rapidenough to reach a plateau level (Fig. 2), a high pro-portion of the total added -'-P was incorporated intosmall cells, presumably mostly bacteria, passingthrough the filters. Consequently, our /r(upt) valuescannot be related to phosphorus uptake by all theseston, but rather by algae plus some bacteria retainedon the GF/C filters. Consistent with size fractionationof ^ P-PO4 uptake observed in eutrophic or mesotro-phic lakes (Rai&Jacobsen, 1990; Taylor & Lean, 1991),this accounts for 35-65% of the seston phosphorusuptake capacity. The resulting underestimation ofthe k{upt), however, is not large when compared
Phosphorus deficiency in a eutrophic reservoir 373
with the four-order-of-magnitude changes in Jt(upt)occurring throughout the sampling season.
For seston stoichiometry determinations we usedthe continuous-flow centrifugation technique. Incomparison to the collecting of seston on filters, thecentrifugation method is substantially less effectivein collecting cyanobacteria due to their buoyancy.In our study, this could have significance for theperiod of cyanobacterial dominance (from the secondhalf of July).
Both methods used in this study for the estimationof seston P status are thus subject to various sourcesof potential error. However, measurements of •* P-PO4uptake kinetics and of seston elemental compositionare completely independent of each other, each beinginfluenced by different kinds of error. The reliabilityof both methods is supported by virtually parallelseasonal courses of log fc(upt) values, molar N/P, andC/P ratio values (Fig. 3), which are also bome out bytight correlations of their seasonal series (Table 2,Fig. 4).
Indication of phosphorus deficiency
According to Lean, Abbott & Pick (1987), values ofk{npt) in excess of 0.1 h"^ and 1 h"' indicate moderateand extreme phosphorus deficiency, respectively.Application of these criteria to our data indicates nophosphorus deficiency early in spring or during theclear-water period, moderate phosphorus deficiencyduring the spring phytoplankton maximum, andmoderate to extreme P deficiency in summer in theepilimnion of the Ri'mov Reservoir in 1989 (Fig. 3).Applying the C/P ratio values of 130 and 260, sug-gested as respective boundaries for moderate andsevere P deficiency (Healey & Hendzel, 1980; Gage& Gorham, 1985), to our data indicated the samepattern; no deficiency in early spring or during theclear-water period, moderate P deficiency during thespring phytoplankton maximum, and moderate tosevere P deficiency in summer (Fig. 3).
Thus, on the basis of criteria derived from theliterature, our data on ' P uptake kinetics and onseston stoichiometry can be interpreted in termsof phosphorus deficiency in a generally consistentmanner. In summer, however, the P uptake kineticsindicated higher P deficiency than did the C/P ratio(Fig. 4). The reason for such a discrepancy is notclear, but it is worth noting, because in many studies
374 /. Nedoma et aJ.
conclusions about the degree of phosphorus deficiencyare based on one of these methods only. Simultaneousseasonal measurements of "P uptake rate and sestonstoichiometry were reported by Lean et al, (1983)from Lake Erie, but the temporal trends of the twoparameters were not consistent in that case. Moredata from different t\'pes of lakes seem to be necessaryto intercalibrate the two methods.
Another parameter reported to be of potential useas an indicator of P status, hot water extractablephosphorus (HWEP) (Fitzgerald & Nelson, 1966;Petterson, 1985), appeared to be of only limited usein this study, due to its modest temporal dynamics(Fig. 1). No significant correlation of HWEP with anyother P limitation estimator was found.
Phosphorus status and phytoplankton development
The overall pattern of seasonal development of phyto-plankton biomass and spedes composifion in theRimov Reservoir in 1989 (Table 1) was in accordancewith generalized patterns of the seasonality of phyto-plankton in temperate eutrophic freshwater lakesas described, for example, by Reynolds (1984) andSommere/ al. (1986).
In the early-spring period preceding the springphytoplankton bloom (up to the middle of April1989), the fomov Reservoir phytoplankton wasphosphorus saturated, judging from C/P ratio valuesin the range 80-92, the high concentration of HWEP,and the low values of the orthophosphate uptake rateconstant, A"(upt). Most probably, phytoplankton wascontrolled at this time by physical factors such aslight availability (deep mixing at a time when positivestratification was not yet stabilized), low temperature,or sedimentation.
During the spring peak of chl.fl concentration(in the second half of April), stable stratificationdeveloped, leading to the rapid depletion of SRPin the epilimnion. At the end of the spring phyto-plankton peak (26 April), moderate phosphorusdeficiency was detected (C/P = 147; fc(upt) nearly lh" 'indicating rapid orthophosphate turnover). Thereis controversy about the occurrence of P limitationduring the spring chl.fl peak and about the role that itplays in the triggering of the subsequent clear-waterperiod. While in some lakes the role of zooplanktongrazing has been well documented (Lampert ct al.,1986; Lampert, 1988), in others the spring phyto-
plankton depression seems to be primarily causedby P limitation (Van Donk, Mur & Ringelberg, 1989;Weise ct al., 1990). In the ftimov Reservoir, inductionof clear-water period by P deficiency was probablein 1986 (Brandl et al., 1989b) and in 1990 (Vyhnalek,Sed'a & Nedoma, 1993).
During the clear-water period, no P deficiency wasobserved. Phytoplankton was controlled by otherfactors, presumably by zooplankton (Lampert et al.,1986).
In summer, moderate to strong P deficiency wasdetected, which was, however, not stable throughoutthe whole period: several fluctuations of epilimnionP status were observed, reflected by parallel changesof all measured P deficiency estimators.
Summer P limitation, common in eutrophic lakes,is in many lakes gradually replaced by nitrogenlimitation during late summer (Sommer et al., 1986),but this does not seem to be the case of the fomovReservoir. Although the N/C molar ratio in summerdeCTeased to slightly below 0.125 (the border fornitrogen limitation suggested by Healey & Hendzel,1980), the high N/P ratios measured concurrently(21-34) indicate that phosphorus was much moredeficient in seston than nitrogen, and that limitationby nitrogen is not probable (Fig. 3). A certain decreaseof N content in P-Umited and strongly P-deficientcultures of the alga Sclenastrum minutum has alsobeen reported by Elrifi & Turpin (1985), who haveeven proposed that a certain decrease in the cellquota of the non-limiting nutrient in parallel to thedecrease in the cell quota of the limiting nutrientcould be a common occurrence.
It has been suggested that nitrogen deficiencyfavours development of blooms of N2-fixing cyano-bacteria (Smith, 1983). In August 1989, however, aheavy bloom of Aphanizornefwn fios-aquae appearedin the Rimov Reservoir under conditions of per-sistent high nitrogen availability and of increasingphosphorus deficiency. As pointed out by Hrbac ek(1964) and Komarkova (1983), resistance to zoo-plankton grazing and the ability to regulate buoyancyprobably give sufficient competitive advantage toAphanizomenon flos-aquae colonies to outgrow edibleand/or non-migrating species. Such a view seems tobe supported by the fact that Aphanizomenon wasaccompanied by another colonial but non-N2-fixingcyanobacterium, Microcystis aeruginosa, in the late-summer ftimov Reservoir phytoplankton.
Acknowledgments
We thank our colleagues L. Prochazkova, J. Kopa^ekand J. Hejzlar for providing the data about nutrientloading in the ftfmov Reservoir, and Z. Prachaf forexcellent technical assistance during zooplanktonsampling and protein detenriination. We are indebtedto Professor C. R. Townsend (University of Otago)and to an anonymous reviewer for helpful commentsand suggestions on an earlier version of this paper.
References
Blazka P. {1966) Bestimmung der Proteine in Materialaus Binnengewassern. Limnologica (Berlin), 4, 387- 396.
Brandl Z., Desortova B., Hrbacek J., Komarkova J.,Vyhnaiek V., Sed'a J. & Straskraba M. (1989a) Seasonalchanges of zooplankton and phytoplankton and theirmutual relations in some Czechoslovak reservoirs.Archiv fur Hydrobiologie, Beihefte Ergebnisse derLimmlogie, 33, 597-604.
Brandl Z., Komarkova J., Sed'a J., Vyhndlek V., Blazka P.& Cemy M. (1989b) Reservoir community structure:Effects of zooplankton maniuplation on phytoplanktondevelopment in experimental containers. Archiv fiirHydrobiologie, Beihefte Ergebnisse der Limnologie, 33,631-633.
Currie D.j. (1990) Phosphorus deficiency and its vari-ation among lakes. Canadian Journal of fisheries andAquatic Sciences. 47, 1077-1084.
Currie D.J. & Kalff ]. (1984) A comparison of the abilitiesof freshwater algae and bacteria to acquire and retainphosphorus. Limnology and Oceanography, 29, 298-310.
DiUon P.J. & Rigler F.H. (1974) The phosphorus-chlorophyll relationship in lakes. Limnology andOceanography, 19, 767-773.
Elrifil.R. &TurpinD.H. (1985) Steady-state consumptionand the concept of optimum nutrient ratios: a studywith phosphate and nitrate limited Selenasfrum minu-tum (Chlorophyta). journal ofPhycology, 21, 592-602.
Fitzgerald G.P. & Nelson T.C. (1966) Extractive andenzymatic analyses for limiting or surplus phosphorusin algae, journal of Phycology, 2, 32-37.
Cage M.A. & Gorham E. (1985) Alkaline phosphataseactivity and cellular phosphorus as an index of thephosphorus status of phytoplankton in Minnesotalakes. Freshwater Biology, 15, 227-233.
Healey E.P. & Hendzel L.L. (1980) Physiological indic-ators of nutrient deficiency in lake phytoplankton.Canadian Journal of Fisheries and Aquatic Sciences, 37,442-453.
Hejzlar J. & Stragkraba M. (1989) On the horizontal
Phosphorus deficiency in a eutrophic reservoir 375
distribution of limnological variables in fti'mov Reser-voir and other stratified Czechoslovak reservoirs.Archiv fiir Hydrobiologie, Beihefte Ergebnisse derLimnologie, 33, 41-55.
Hrbacek J. (1964) Contribution to the ecology of water-bloom-forming blue-green algae Aphanizomenonflos-aquae and Microcystis acruglnosa. Verhandlungender Internationale Vereinlgung fiir Theoretische undAngewandte Limnologie, 15, 837-846.
Komarkova J. (1983) Factors influencing the developmentof Aphanizomenon flos-aquae bloom in Czechoslovakeutrophic ponds. Schweizerische Zeitschrift fur Hydro-logie, 45, 301-305.
Komarkova J. (1989) Changes of phytoplankton assem-blage during the spring period in the moderatelyeutrophic fomov reservoir (South Bohemia). Archivfiir Hydrobiologie, Beihefte Ergebnisse der Limnologie,33, 419-433.
Lampert W. (1988) The relationship between zooplank-ton biomass and grazing: A review. Limnologica(Berlin), 19, 11-20.
Lamperl W., Fleckner W., Rai H. & Taylor B.E. (1986)Phytoplankton control by grazing zooplankton: astudy on the spring clear-water phase. Limnology andOceanography, 31, 478-490.
Lean D.R.S., Abbott A.A., Charlton M. N. & Rao S.S.(1983) Seasonal phosphate demand for lake Erieplankton. Journal of Great Lakes Research, 9, 83-91.
Lean D.R.S., Abbott A.A. & Pick F.R. (1987) Phosphorusdeficiency of Lake Ontario plankton. Canadian Journalof Aquatic Sciences, 44, 2069-2076.
Lorenzen C.]. (1967) Determination of chlorophyll andphycopigments: Spectrophotometric equations.Limnology and Oceanography, 12, 343-346.
Lund J.W.G. (1951) A sedimentation technique for algaeand other organisms. Hydrobiologia, 3, 390-394.
Petterson K. (1985) The availability of phosphorus andthe species composition of the spring phytoplanktonin lake Erken. Internationale Rei'ue der GesamtenHydrobiologie und Hydrographie, 70, 527-546.
Popovsky J. (1970) Determination of total phosphorusin fresh waters. Internationale Revue der GesamtenHydrobiologie und Hydrographie, 55, 435-443.
Rai H. & Jacobsen T.R. (1990) Phosphate ("' P)-uptakecapabilities of natural picoplankton and ultraplanktoncommunities in lakes of differing degrees of eutro-phication. Archiv fiir Hydrobiologie, 118, 421—435.
Reynolds, C.S. (1984) Phytoplankton periodicity: theinteractions of form, function and environmentalvariability. Freshwater Biology, 14, 111-142.
Rigler F.H. (1964) The phosphorus fractions and the turn-over time of inorganic phosphorus in different typesof lakes. Limnology and Oceanography, 9, 511—518.
376 /. Nedoma el al.
Sommer U., Gliwicz Z.M., Lampert W. & Duncan A.(1986) The PEG model of seasonal succession of plank-tonic events in fresh waters. Archivfur Hydrobiologie.106, 433-471.
Smith V.H. (1983) Low nitrogen to phosphorus ratiosfavor dominance by blue-green algae in lake phyto-plankton. Science, 195. 669-671.
Stephens K. (1963) Determination of low phosphateconcentrations in lake and marine waters. Limnologyand Oceanography, 8, 361-362.
Straskraba M. (1964)Preliminary results of a new methodfor quantitative sorting of freshwater net planktoninto main groups. Limnology and Oceanography. 9,268-270.
Strickland J.D.H. & Parsons T.R. (1968) A PracticalHandbook of Seawater Analysis. Fisheries ResearchBoard of Canada, Bulletin 167.
Taylor W.D.& Lean D.R.S. (1991) Phosphorus pool sizesand fluxes in the epilimnion of a mesotrophic lake.Canadian Journal of Fisheries and Aquatic Scietices, 48,1293-1301.
VanDonkE., Mur L.R. & Ringelberg J. (1989) A study ofphosphate limitation in Lake Maarsseveen; phosphateuptake kinetics versus bioassays. Hydrobiologia,188/189, 201-209.
Vanni M.J. &TemteJ. (1990) Seasonal patterns of grazing
and nutrient limitation of phytoplankton in an eutro-phic lake. Limnology and Oceanography. 35, 697-709.
Vyhnaiek V. (1989) Growth rates of phytoplanktonpopulations in ftimov Reservoir (Czechoslovakia)during the spring clear-water phase. Archiv furHydrobiologie, Beihefte Ergebnisse der Limnologie. 33,435-444.
Vhynalek V., KomarkovaJ., Sed'aJ., Brandl Z., SimekK.&: Johanisova N. (1991) Clear-water phase in the fti'movReservoir (South Bohemia): Controlling factors. Ver-handlungen der Internationale Vereinigung fiir TJieoretischeund Angewandte Limnologie, 24, 1336-1339.
Vyhnaiek V., Sed'a J. & Nedoma ]. (1993) Fate of thespring phytoplankton bloom in fomov Reservoir(Czechoslovakia): grazing, lysis and sedimentation.Verhandlungen der Internationale Vereinigiaig fiirTlieoretische und Angewandte Limnologie (in press).
Weise T., MuUer H., Pinto-Coelho R.M., Schweizer A.,Springmann D. & Baldringer G. (1990) Response ofthe microbial loop to the phytoplankton spring bloomin a large prealpine lake. Limnology and Oceanography,35, 781-794.
{Manuscript accepted 4 June 1993)