Embed Size (px)
Citation preview

Manterola et al
1
A sncRNA signature found in microvesicles of GBM patient serum serves as a diagnostic marker Lorea Manterola, Elizabeth Guruceaga, Jaime Gállego Pérez-Larraya, Marisol Gonzalez-Huarriz, Patricia Jauregui, Victor Segura, Nicolás Sampron, Cristina Barrena, Irune Ruiz, Sonia Tejada, Ricardo Diez-Valle, Amaia Agirre, Angel Ayuso, Javier Rodriguez, Alvaro Gonzalez, Ander Matheu, Teresa Tuñon, Idoya Zazpe, Enric Xipell, Adolfo Lopez de Munain, Jesús García-Foncillas, Sophie Paris, Jean Yves Delattre, Marta M. Alonso Affiliations of Authors Lorea Manterola, Nicolas Sampron, Cristina Barrena, Irune Ruiz, Ander Matheu and Adolfo López de Munain, Instituto Biodonostia and Hospital Universitario Donostia, San Sebastian, Spain, Elizabeth Guruceaga, Marisol Gonzalez-Huarriz, Patricia Jauregui, Victor Segura, Sonia Tejada, Ricardo Diez-Valle, Jaime Gallego, Javier Rodriguez, Alvaro Gonzalez, Enric Xipell, Marta M. Alonso, Center for Applied Medical Research (CIMA) and Clínica Universidad de Navarra (CUN), University of Navarra, Pamplona, Spain; Amaia Agirre, Polymat, University of the Basque Country, San Sebastian, Spain; Angel Ayuso, IMMA-CIOCC, Fundación Hospital de Madrid, Madrid, Spain; Jesús García-Foncillas, Fundación Jimenez-Díaz, Madrid, Spain; Jaime Gallego, Sophie Paris, Jean Yves Delattre, Pitie-Salpetriere, Paris, France; Teresa Tuñon and Idoya Zazpe, Complejo Hospitalario de Navarra, Pamplona, Spain. This work was supported by European Union (Marie Curie IRG270459 to MMA); Spanish Ministry of Health (ISCII PI10/00399 to MMA), Spanish Ministry of Science and Innovation (Ramón y Cajal contract RYC-2009-05571 to MMA); Diputación Foral de Guipuzcoa DFG 09/003 to LM) and Spanish Ministry of Health (Sara Borrell contractCD06/0275 to LM) Correspondence to: Marta M Alonso PhD, Department of Medical Oncology, Clínica Universidad de Navarra, CIMA Building, Avd/Pio XII, 55 Pamplona (Spain); Phone: +34-948194700-1017; e-mail: [email protected]
sncRNA signature in MVs isolated from GBM serum
Presented at the EANO10thAnnual Conference (Marseille, 6-9 September 2012) and the SNO 17th 2012 Annual Conference (Washington, 15-18 November 2012).
The authors indicated no potential conflicts of interest

Manterola et al
2
ABSTRACT
Purpose. Glioblastomas (GBMs) are the most frequent malignant brain tumors in adults, and
their prognosis remains dismal despite intensive research and therapeutic advances. Diagnostic
biomarkers would be clinically meaningful to allow for early detection of the tumor and for
those cases in which surgery is contraindicated or biopsies result inconclusive. Recent findings
show that GBM cells release microvesicles that contain a select subset of cellular proteins and
RNA. We undertook this study to assess whether we could find a miRNA signature in
microvesicles isolated from serum of GBM patients that could serve as a diagnostic tool.
Patients and Methods. To control disease heterogeneity we used patients with newly
diagnosed GBM. In the discovery stage, TLDA PCR based-arrays followed by individual
quantitative reverse transcriptase polymerase chain reaction (qRT-PCR) were used to test the
differences in the miRNAs expression level of serum microvesicles between 25 GBM patients
and 25 healthy controls paired by age and sex. The detected serum microvesicles non-coding
RNAs were then validated in 50 GBM patients. In addition we assess the expression of this
non-coding RNA signature in 9 brain metastasis and 15 gastrointestinal tumors.
Results. We found that the expression levels of one sncRNA (RNU6-1) and 2 miRNAs (miR-
320 and miR-574-3p) were significantly associated with a GBM diagnostic. In addition,
RNU6-1 was consistently an independent predictor of a GBM diagnostic.
Conclusions. Altogether our results uncovered a sncRNA signature in MVs isolated from
GBM patient serum that could be used as a differential diagnostic biomarker for patients with
GBM.

Manterola et al
3
INTRODUCTION
Glioblastoma multiforme (GBM) is the most frequent malignant primary brain tumor in adults.
Despite recent advances in treatment, which mainly consists on surgery and combined radio-
chemotherapy 1, the prognosis of GBM patients remains dismal with median overall survival
times of less than 15 months. Although neuroimaging may suggest its diagnosis, other brain
lesions such as abscesses, metastases and other types of tumors might share radiological
features with GBM 2. Hence, histological examination of the tumor tissue obtained by surgery
is currently mandatory for definite diagnosis. Therefore, the development of minimally
invasive tests for the detection and monitoring of GBM would be clinically meaningful,
especially in those cases in which biopsies result inconclusive or surgery is contraindicated
provide a significant advance in the diagnosis of this devastating disease. Although
conventional strategies for blood-based biomarker discovery have been shown promising, the
development of clinically validated cancer detection markers remains an unmet challenge for
many common cancers 3, especially GBM.
Exosomes are a type of microvesicles (MVs) formed by endosomal membrane invagination,
that later fuse to the plasmatic membrane and are released out of the cell 4. They are size and
shape homogeneous (30–100 nm in diameter), and their content and biological function depend
on the cell of origin 5. They are released under physiological conditions by various types of
cells (review in 6), and interestingly, they have been found circulating in peripheral blood 7 8.
Their release is increased in tumor cells 9,10 and it has been shown that cancer patients have
higher amount of circulating exosomes compared with healthy controls 11. Recently, two
different groups described the release of microvesicles (MVs), and more specifically
exosomes, from GBM cells 12,13. Importantly, these MVs isolated from the serum of GBM
patients have been pointed as potential biomarkers reservoirs 12,13. MVs are enriched in
miRNA, small non-coding RNAs (sncRNA) that play important roles in oncogenesis 14.
Manterola et al
4
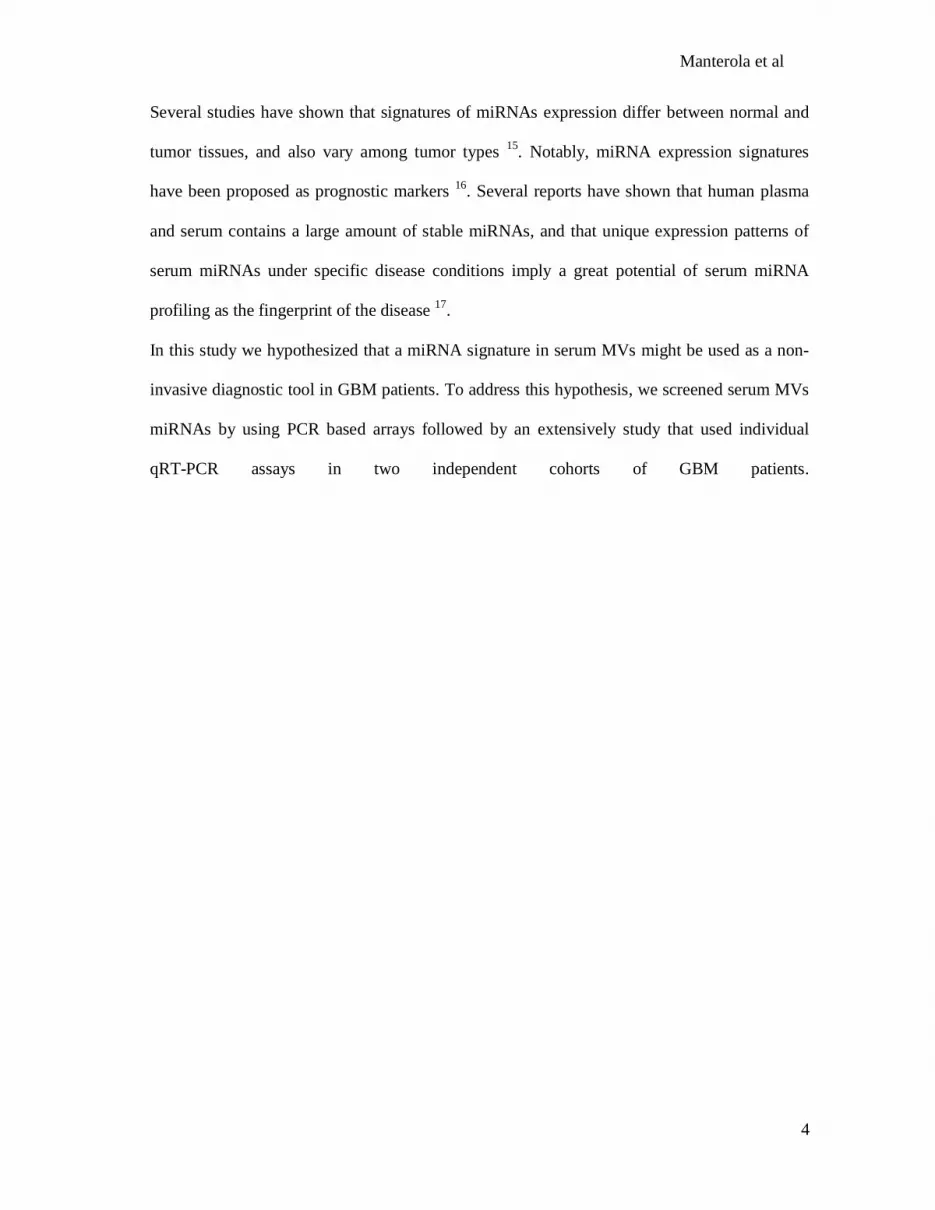
Several studies have shown that signatures of miRNAs expression differ between normal and
tumor tissues, and also vary among tumor types 15. Notably, miRNA expression signatures
have been proposed as prognostic markers 16. Several reports have shown that human plasma
and serum contains a large amount of stable miRNAs, and that unique expression patterns of
serum miRNAs under specific disease conditions imply a great potential of serum miRNA
profiling as the fingerprint of the disease 17.
In this study we hypothesized that a miRNA signature in serum MVs might be used as a non-
invasive diagnostic tool in GBM patients. To address this hypothesis, we screened serum MVs
miRNAs by using PCR based arrays followed by an extensively study that used individual
qRT-PCR assays in two independent cohorts of GBM patients.

Manterola et al
5
PATIENTS AND METHODS
Patients
For this study serum from 75 patients with histologically proven GBM, according to the World
Health Organization classification, were used. Serum samples were collected at the Pitié-
Salprètriere Hospital (Paris, France), Clínica Universidad de Navarra (CUN; Pamplona, Spain),
Hospital Universitario Donostia (San Sebastian, Spain), Basque Research Biobank-O+Ehun,
SanSebastian (SanSebastian, Spain), Complejo Hospitalario de Navarra (Pamplona, Spain) and
the Tumor Biobank of the Servicio Navarro de Salud-Osasunbidea (Pamplona, Spain). The
control group consisted of 55 healthy donors from the Basque Research Biobank-O+Ehun and
subjects recruited at CUN. The study protocol was approved by the Institutional Review Board,
and all the participants signed the informed consent form approved by the respective
Institutional Review Boards or Ethical Committees.
For the initial training group, serum samples from 25 GBM patients (14 men and 11 women;
media age 59.6 ± 10,6 years, range 30–75) and 25 healthy controls paired for sex and age were
included (14 men and 11 women; media age 60 ± 10,9 years, range 45–78) (Appendix Table
A1, online only). For the validation study, serum from additional 50 GBM patients (30 men
and 20 women; media age 61 ± 12.9 years, range 17–79) and 30 healthy control (14 men and
16 women; media age 54.3 ± 11.8 years, range 27–70) were analyzed (Appendix Table A2,
online only). Additionally, 9 serum samples from patients with brain metastases and 15
gastrointestinal cancers were also collected (Appendix Table A3 and A4, online only).
Microvesicle Isolation from Human Subjects.
Microvesicles (MVs) were isolated from the serum using Exoquick precipitation solution
according to the manufacturer’s recommendations (System Biosciences, Mountain View, CA,
USA).

Manterola et al
6
miRNA profiling by quantitative real-time PCR
miRNA expression was analyzed using the Applied Biosystems TaqMan® Human microRNA
A Array v2.1 (TaqMan Low Density Array, TLDA; Applied Biosystems, Foster City, CA) to
profile 381 mature miRNAs by qRT-PCR. Raw Ct values were calculated using the SDS
software version 2.4 using an automatic baseline settings and a threshold of 0.05.
Specific miRNAs were further validated by qRT-PCR using individual TaqMan miRNA
assays. All reactions were performed using a 7900HT RT-PCR instrument (Applied
Biosystems) and triplicate samples were used throughout.
TLDA data analysis
TLDA data were analyzed with R/Bioconductor 18. The analysis consisted in a filtering process
in order to eliminate miRNAs that were not detected in the experiment. We considered Ct
scores greater than 35 non-specific 19,20. Therefore, miRNAs that had a raw Ct value greater
than 35 in more than 50% of the patients or controls samples were excluded. Using these
filtering criteria we considered for statistical analysis only 48 miRNAs.
LIMMA (Linear Models for Microarray Data) was used to find out the differentially expressed
miRNAs 21. A False Discovery Rate (FDR) of 0.05 22 and an expression change (−ΔCt) of at
least 2 Ct was established as selection criteria. miRNA expression normalization was
performed following two different approaches: using the RNU48 as endogenous control and
using median normalization analysis 23. Both normalization methods identified almost the same
miRNAs de-regulated with a significant FDR supporting each other. We decided to use
RNU48 as endogenous control for further validation analysis because the feasibility to
implement one gene versus the median of the whole PCR array in the following validation
studies.

Manterola et al
7
Validation of TLDAs and the independent validation group
The normalization for the Ct values of the TLDA validation (individual miR qRT-PCR) and
the independent validation group of samples was performed using RNU48 as endogenous
control. Fold change was calculated as the difference of the mean normalized expression values
between GBM patients and controls (−ΔCt = mean (ΔCt GBM patients) – – mean (ΔCt
controls)). A t-test analysis was performed with R/Bioconductor 18 and miRNAs were
considered differentially expressed using a threshold of p<0.01.
Biomarker discovery using a classifier approach
A machine learning algorithm based on logistic regression was applied to classify patients and
identify the optimal separating miRNAs between GBM patients and healthy controls 24. The
performance of the classifiers was evaluated using Receiver Operator Characteristic (ROC)
analysis 25.

Manterola et al
8
RESULTS
Characterization of microvesicles isolated from GBM patient serum
The aim of this study was to determine whether a specific miRNAs profile found in MVs
isolated from the serum of GBM patients could serve as biomarker of the disease. First, we
isolated MVs from serum of GBM patients and healthy controls using an adsorption method
(Exoquick TM). Exoquick is a compound of undisclosed composition that has been proposed
on the market to precipitate by a single step exosomes from small volumes of serum or cell
culture supernatant. This method is less time consuming compared with the traditional method
of gradient ultra-centrifugation, and therefore it would be easier to implement in a clinical
setting.
In order to confirm their nature, we characterized the MVs that had been obtained from GBM
patients’ serum and healthy controls using Exoquick. We assessed the morphology and size
using transmission electron microscopy and dynamic light scattering. These analyses showed
two set of membrane like structures: one with a diameter ranging from 12.86 to 23.81 nm and
other set of MVs with sizes ranging from 157.9 to 210.8 nm (Fig 1A and B). We further
evaluated the expression of several MVs/exosomes markers by western blot in total serum and
in MVs isolated from healthy controls and GBM patients. We found that the expression of
exosomes related markers such as CD9, Lamp1, TSG 101 and Alix 5 was enriched in the MVs
of both controls and patients when compared with total serum (Fig 1C). Importantly, the
endoplasmic reticulum marker calnexin was not detected in these samples suggesting that our
samples were enriched with exosomes-like MVs. In addition, using flow cytometry we
detected the expression of CD9 and CD63, another exosome marker, in the surface of these
MVs. Interestingly, the expression of these markers was enriched in GBM patients’ MVs
(CD9=73.18%±10.02 and CD63=28.25±11.3) as compared with healthy control ones (CD9=
52.27±13.34; P<0.002 and CD63 10.16±2.7; P<0.001) (Fig 1D and E).

Manterola et al
9
Altogether our data showed that we were able to isolate exosome-like MVs from the serum of
GBM patients in a fast and reliable manner by using an adsorption method such as Exoquick.
Detection of Serum MVs miRNAs and their Association with GBM Diagnosis
In order to identify a tumor-derived miRNA signature in MVs isolated from the serum of GBM
patients we profiled the expression of 381 known miRNAs by using a microfluidic TaqMan
low density miRNA qRT-PCR array (TLDA) in 25 GBM patients matched by age and sex with
healthy donors. We generated a list of likely MVs-based miRNAs biomarker candidates for
GBM patients which satisfied the following criteria for additional individual qRT-PCR
validation: i) to be differentially expressed at least 2 Cts, and ii) to have a significant False
Discovery Rate (FDR; P<0.05). Overall, we found 7 miRNAs (miR483-5p, miR-574-3p, miR-
320, miR-197, miR-484, miR-146a and miR-223) and one small nuclear RNA (RNU6-1) that
met both criteria (Appendix Table A5, online only). These 8 sncRNAs were further subjected
to single qRT-PCR analyses to validate their expression in the same samples. This new
analysis confirmed the overexpression of RNU6-1, miR-320 and miR-574-3p in GBM patients
when subjected to single qRT-PCR. As shown in Table 1 and Fig 2A the expression levels of
the three sncRNAs were significantly different between the GBM patient group and the healthy
controls (P<0.0001 for RNU6-1; P =0.007 for miR-320; P <0.003 for miR-574-3p).
Intriguingly, the small nuclear RNA RNU6-1 was the one that resulted to be the most
upregulated in GBM patients (fold change, 2-ΔCT, = 387±1370) compared with healthy controls
(fold change=11.73±23.30; p<0.001). Next, we investigated whether the expression of each
single sncRNA or a combination of the three of them could have enough power to discriminate
between GBM patients and healthy controls. A machine learning algorithm based on logistic
regression was applied to the expression of each single sncRNA or the expression of the three
sncRNAs. The obtained classifier had a good diagnostic performance as shown by ROC

Manterola et al
10
analyses with an AUC of 0.926 (95% confidence interval (CI), 0.84 to 1; P <0.0001) for the
three sncRNA together, 0.852 (95% CI, 0.74 to 0.96; P <0.0001) for RNU6-1, 0.720 (95% CI,
0.56 to 0.87; P =0.0067) for miR-320, and 0.738 (95% CI, 0.58 to 0.89; P =0.0055) for miR-
574-3p (Fig 2B). At a cut-off value of 0.349 for the three sncRNAs, the sensitivity was 87%
and the specificity was 86%. At a cut-off value of 0.454 for RNU6-1, the sensitivity was 73%
and the specificity was 70%. At a cut-off values of 0.477 for miR-320, the sensitivity was 65%
and the specificity was 65%. At a cut-off value of 0.454 for miR-574-3p, the sensitivity was
59% and the specificity was 59%. These results suggested that either RNU6-1 alone or the
miR-320/miR-574-3p/RNU6-1 combined signature could have diagnostic value in GBM
patients.
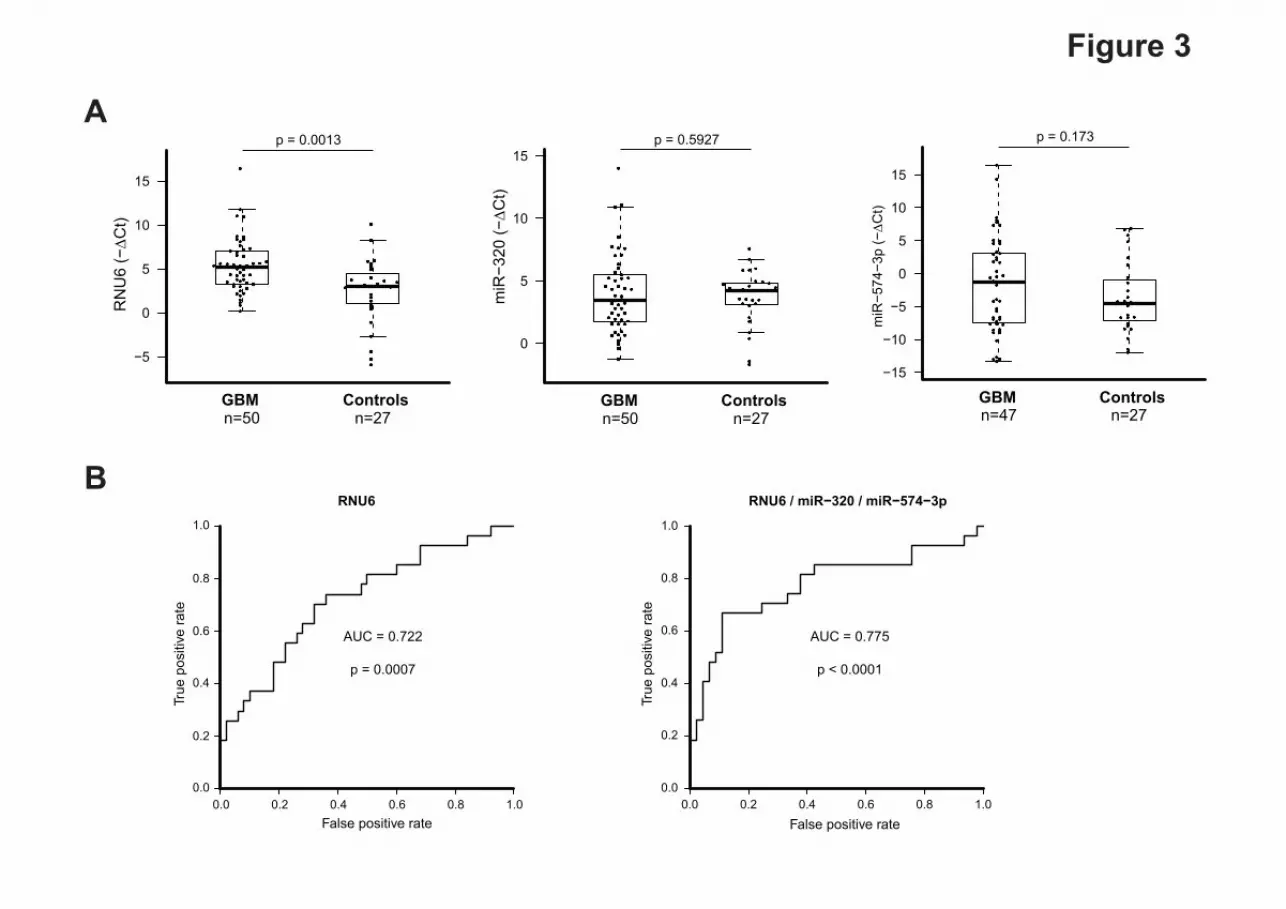
Independent validation of the diagnostic value of the sncRNA signature
To further verify the diagnostic value of the sncRNAs signature identified in the previous
cohort, the expression of the three sncRNA was assessed on an independent group of 80 serum
MVs samples which included 50 GBM patients and 30 healthy controls (App Table A2, online
only). In this new cohort only the expression of RNU6-1 was significantly elevated in GBM
patients (fold change: 1732±11590) compared with healthy controls (fold change: 63.79±210;
P<0.001) (Fig 3A). We did not find significant differences between GBM patients and healthy
controls in the expression levels of miR-320 and miR-574-3p (P=0.592 and P=0.173,
respectively). We then proceed to evaluate the diagnostic potential of these 3 sncRNAs in this
validation cohort. ROC curve analyses revealed that the expression levels of either RNU6-1
alone or the combination of the three sncRNAs found in the MVs were useful and robust
biomarkers for differentiating GBM patients from healthy controls, with an AUC of 0.722
(95% CI, 0.60 to 0.84; P =0.0007) for RNU6-1 and 0.775 (95% CI, 0.65 to 0.90; P <0.0001)
for the three markers together (Fig3). Importantly, at a cut-off value 0.372 for RNU6-1, the

Manterola et al
11
sensitivity was 66% and the specificity was 68%. Meanwhile, at a cut-off value of 0.374 for
the three sncRNA signature, the sensitivity was 70% and the specificity was 71%. These data
indicate that the signature of the 3 sncRNA has slightly higher power to discriminate between
GBM patients and healthy controls (Fig 3B).
Altogether our results support the notion that the expression levels of RNU6-1, miR-320 and
miR-574-3p found in MVs isolated from the serum has the power to discriminate healthy
individuals from GBM patients therefore could serve as diagnostic biomarker.
Analysis of the Diagnostic Value of the sncRNAs Signature in Other Malignancies
In order to evaluate the specificity of our sncRNA signature for the diagnosis of GBM we
analyzed the expression of RNU6-1, miR-320 and miR-574-3p in a set of sera from patients
with brain metastases (N= 9; See App Table3) and a variety of gastrointestinal tumors (N=15;
see App Table4). We compared the expression levels of these three sncRNA in the above
samples with the previous cohorts of healthy controls and GBM patients. Of importance, our
data showed that the expression levels of these three sncRNAs were not de-regulated neither in
patients with of brain metastases nor in those with gastrointestinal tumors (RNU6-1, P=0.1604;
miR-320, P=0.2709; miR574-3p, P=0.6337; Kruskal-Wallis test; Fig 4). In spite of these small
sample sizes, our results suggested that differential expression of miR-320/miR574-3p/RNU6-
1 levels might be specific of MVs isolated from the serum of patients with GBM, thus
underscoring the diagnostic value of this signature.

Manterola et al
12
DISCUSSION
In this study, we demonstrate for the first time that a sncRNA signature of 2 miRNAs (miR-
320 and miR-574-3p) and one small nuclear RNA (RNU6-1) found in MVs isolated from the
serum of GBM patients could serve as a potential diagnostic biomarker. Although previous
studies suggested the utility of plasma or serum miRNAs in GBM 26-28, to our knowledge this
is the first report on the quantitative assessment of miRNAs in MVs isolated from GBM
patients’ sera.
There is a paucity of robust biomarkers in GBM that allow early detection and monitoring
response to treatment. In the last years circulating miRNAs have emerged as ideal candidate
biomarkers since they are stable in plasma and serum 3, their expression is deregulated in
cancer 29 and appear to be tissue specific 30. Moreover, the notion that solid tumors including
GBM 12,13 shed large quantities of small, membranous MVs into the circulation has opened the
possibility to use theses MVs as potential sources of biomarkers to predict both diagnosis and
response to therapy. Several studies have demonstrated that these MVs serve as biocargos for
proteins, including epidermal growth factor receptor (EGFR) and its variant EGFRviii 12,31, as
well as RNA 13 and DNA 32. Therefore, in this study we explore the possibility of finding a
specific miRNA signature in serum MVs that would allow discerning GBM patients from
healthy controls.
Previous studies have addressed the diagnostic potential of circulating miRNAs from different
sources in GBM 26-28, but neither of them used MVs as sample candidates. One of these studies
used the cellular fraction of the blood and identified several miRNAs upregulated in their
samples 26. This study differs with ours not only in the source of miRNAs but also in the fact
that the patients were already subjected to different therapies. A second study used the
cerebrospinal fluid (CSF) to identify GBM and metastatic brain cancer miRNAs that could
serve as biomarkers 27. In this case they used a candidate approach based on previous miRNA

Manterola et al
13
profiling data 13,33,34. They generated a classification tree of brain cancer patients that allowed
distinguishing GBM patients from non-neoplastic lesions, low-grade gliomas and brain
metastases. This work provides useful information regarding the type of tumor, however
obtaining CSF samples in patients with brain masses seems more much more inconvenient than
drawing a single blood sample. A third study identified 7 miRNAs in the serum of GBM
patients using sequencing and in silico analysis 28. Their signature differs widely with our
signature due probably not only to the source of miRNAs but also to the fact that they used a
sequencing approach.
In our study it was striking to see that RNU6-1 was the main biomarker candidate to
distinguish between GBM patients and healthy controls since this RNA is part of the splicing
machinery and resides in the nucleus 35. Interestingly, it has been shown that RNU6-1 is
synthetized by RNA polymerase III which is negatively regulated by tumor suppressors such
as Rb, p53 or PTEN 37-39 and its enhanced activity has been shown essential for tumorogenesis
40. Therefore it could be possible that in the context of RB, p53 or PTEN pathway dysfunction,
which are prevalent in GBM, 41 RNU6-1 is overexpressed. Supporting this notion,
U6:SNORD44 ratio was found to be consistently higher in the sera of breast cancer patient,
regardless of ER status 42. Furthermore, RNU2, a counterpart component of RNU6-1 in the
spliceosome, has recently being detected circulating in serum and proposed as novel diagnostic
biomarker for pancreatic ductal adenocarcinoma and colorectal carcinoma 43. Nevertheless,
further studies would be needed to elucidate the molecular mechanism of RNU6-1
upregulation in GBM serum MVs.
In the fullness of time, our study provides a sncRNA signature found in serum MVs that
discriminates GBM patients from healthy controls and that could hence serve as a diagnostic
tool.

Manterola et al
14
References
1. Stupp R, Mason WP, van den Bent MJ, et al (2005) Radiotherapy plus concomitant and
adjuvant temozolomide for glioblastoma. N Engl J Med 352:987-96
2. Smirniotopoulos JG, Murphy FM, Rushing EJ, et al (2007) Patterns of contrast enhancement
in the brain and meninges. Radiographics 27:525-51
3. Mitchell PS, Parkin RK, Kroh EM, et al (2008) Circulating microRNAs as stable blood-
based markers for cancer detection. Proc Natl Acad Sci U S A 105:10513-8
4. Thery C, Zitvogel L, Amigorena S (2002) Exosomes: composition, biogenesis and function.
Nat Rev Immunol 2:569-79
5. Mathivanan S, Ji H, Simpson RJ (2010) Exosomes: extracellular organelles important in
intercellular communication. J Proteomics 73:1907-20
6. van der Vos KE, Balaj L, Skog J, et al (2011) Brain tumor microvesicles: insights into
intercellular communication in the nervous system. Cell Mol Neurobiol 31:949-59
7. Caby MP, Lankar D, Vincendeau-Scherrer C, et al (2005) Exosomal-like vesicles are present
in human blood plasma. Int Immunol 17:879-87
8. Hunter MP, Ismail N, Zhang X, et al (2008) Detection of microRNA expression in human
peripheral blood microvesicles. PLoS One 3:e3694
9. Bergmann C, Strauss L, Wieckowski E, et al (2009) Tumor-derived microvesicles in sera of
patients with head and neck cancer and their role in tumor progression. Head Neck 31:371-80
10. Kim JW, Wieckowski E, Taylor DD, et al (2005) Fas ligand-positive membranous
vesicles isolated from sera of patients with oral cancer induce apoptosis of activated T
lymphocytes. Clin Cancer Res 11:1010-20
11. Andre F, Schartz NE, Movassagh M, et al (2002) Malignant effusions and
immunogenic tumour-derived exosomes. Lancet 360:295-305

Manterola et al
15
12. Al-Nedawi K, Meehan B, Micallef J, et al (2008) Intercellular transfer of the
oncogenic receptor EGFRvIII by microvesicles derived from tumour cells. Nat Cell Biol
10:619-24
13. Skog J, Wurdinger T, van Rijn S, et al (2008) Glioblastoma microvesicles transport
RNA and proteins that promote tumour growth and provide diagnostic biomarkers. Nat Cell
Biol 10:1470-6
14. Valadi H, Ekstrom K, Bossios A, et al (2007) Exosome-mediated transfer of mRNAs
and microRNAs is a novel mechanism of genetic exchange between cells. Nat Cell Biol 9:654-9
15. Cortez MA, Bueso-Ramos C, Ferdin J, et al (2011) MicroRNAs in body fluids--the
mix of hormones and biomarkers. Nat Rev Clin Oncol 8:467-77
16. Calin GA, Ferracin M, Cimmino A, et al (2005) A MicroRNA signature associated
with prognosis and progression in chronic lymphocytic leukemia. N Engl J Med 353:1793-801
17. Hu Z, Chen X, Zhao Y, et al (2011) Serum microRNA signatures identified in a
genome-wide serum microRNA expression profiling predict survival of non-small-cell lung
cancer. J Clin Oncol 28:1721-6
18. Gentleman R (2005) Reproducible research: a bioinformatics case study. Stat Appl
Genet Mol Biol 4:Article2
19. Schmittgen TD (2008) Part B--microRNAs: microRNA methods. Methods 44:1-2
20. Schmittgen TD, Lee EJ, Jiang J, et al (2008) Real-time PCR quantification of
precursor and mature microRNA. Methods 44:31-8
21. Smyth GK (2004) Linear models and empirical bayes methods for assessing
differential expression in microarray experiments. Stat Appl Genet Mol Biol 3:Article3
22. Storey JD, Tibshirani R (2003) Statistical significance for genomewide studies. Proc
Natl Acad Sci U S A 100:9440-5

Manterola et al
16
23. Mestdagh P, Van Vlierberghe P, De Weer A, et al (2009) A novel and universal
method for microRNA RT-qPCR data normalization. Genome Biol 10:R64
24. Hastie T TR, Friedman J. (2001) The Elements of Statistical Learning: Prediction,
Inference and Data Mining. Springer Verlag, New York
25. Sing T, Sander O, Beerenwinkel N, et al (2005) ROCR: visualizing classifier
performance in R. Bioinformatics 21:3940-1
26. Roth P, Wischhusen J, Happold C, et al (2011) A specific miRNA signature in the
peripheral blood of glioblastoma patients. J Neurochem 118:449-57
27. Teplyuk NM, Mollenhauer B, Gabriely G, et al (2012) MicroRNAs in cerebrospinal
fluid identify glioblastoma and metastatic brain cancers and reflect disease activity. Neuro
Oncol 14:689-700
28. Yang C, Wang C, Chen X, et al (2013) Identification of seven serum microRNAs from
a genome-wide serum microRNA expression profile as potential noninvasive biomarkers for
malignant astrocytomas. Int J Cancer 132:116-27
29. Esquela-Kerscher A, Slack FJ (2006) Oncomirs - microRNAs with a role in cancer.
Nat Rev Cancer 6:259-69
30. Lu J, Getz G, Miska EA, et al (2005) MicroRNA expression profiles classify human
cancers. Nature 435:834-8
31. Graner MW, Alzate O, Dechkovskaia AM, et al (2009) Proteomic and immunologic
analyses of brain tumor exosomes. FASEB J 23:1541-57
32. Balaj L, Lessard R, Dai L, et al (2011) Tumour microvesicles contain retrotransposon
elements and amplified oncogene sequences. Nat Commun 2:180
33. Chan JA, Krichevsky AM, Kosik KS (2005) MicroRNA-21 is an antiapoptotic factor
in human glioblastoma cells. Cancer Res 65:6029-33

Manterola et al
17
34. Gabriely G, Yi M, Narayan RS, et al (2011) Human glioma growth is controlled by
microRNA-10b. Cancer Res 71:3563-72
35. Valadkhan S (2010) Role of the snRNAs in spliceosomal active site. RNA Biol 7:345-
53
36. Kunkel GR, Maser RL, Calvet JP, et al (1986) U6 small nuclear RNA is transcribed
by RNA polymerase III. Proc Natl Acad Sci U S A 83:8575-9
37. White RJ, Trouche D, Martin K, et al (1996) Repression of RNA polymerase III
transcription by the retinoblastoma protein. Nature 382:88-90
38. Cabarcas S, Watabe K, Schramm L (2010) Inhibition of U6 snRNA Transcription by
PTEN. Online J Biol Sci 10:114-125
39. Crighton D, Woiwode A, Zhang C, et al (2003) p53 represses RNA polymerase III
transcription by targeting TBP and inhibiting promoter occupancy by TFIIIB. EMBO J
22:2810-20
40. Marshall L, White RJ (2008) Non-coding RNA production by RNA polymerase III is
implicated in cancer. Nat Rev Cancer 8:911-4
41. Dunn GP, Rinne ML, Wykosky J, et al (2012) Emerging insights into the molecular
and cellular basis of glioblastoma. Genes Dev 26:756-84
42. Appaiah HN, Goswami CP, Mina LA, et al (2011) Persistent upregulation of
U6:SNORD44 small RNA ratio in the serum of breast cancer patients. Breast Cancer Res
13:R86
43. Baraniskin A, Nopel-Dunnebacke S, Ahrens M, et al (2013) Circulating U2 small
nuclear RNA fragments as a novel diagnostic biomarker for pancreatic and colorectal
adenocarcinoma. Int J Cancer 132:E48-57

Manterola et al
18
Acknowledgements
We thank Dr. Charles Lawrie (Instituto Biodonostia, SanSebastian, Spain) and Dr. Rubén Pío
(Center for the Applied Medical Research, Pamplona, Spain) for critical reading of the
manuscript

Manterola et al
19
FIGURE LEGENDS
Fig. 1 Characterization of microvesicles (MVs) isolated from GBM patients serum. (A)
Transmission electron microscopy analysis. Representative micrograph depicting MVs found
in the serum of GBM patients. Arrows point to membrane-like structures with different sizes;
(B) Determination of MVs size distribution by dynamic light scattering; (C) Evaluation by
western blot of the expression levels of several MVs/exosomes markers in total serum or in
MVs isolated from serum of either healthy controls (C) or GBM patient (P); (D) Determination
by flow cytometry of CD9 or CD63 expression on the surface of MVs isolated from healthy
controls or GBM patients serum.
Fig. 2 Detection of MVs small-non-coding RNAs (sncRNAs) and their association with GBM
diagnosis. (A) sncRNAs validation by individual quantitative reverse transcription polymerase
chain reaction in the training cohort. Expression levels of the individual sncRNAs are
normalized to RNU48. Fold change was calculated as the difference of the mean normalized
expression values between patients and controls MVs (−ΔCt = mean (ΔCt GBM patients) – –
mean (ΔCt controls)). A t-test analysis was performed with R/Bioconductor; (B) Receiver
operator characteristic curve (ROC) showing the true positive and false positive rate for the
training cohort for the three sncRNA signature or for each individual one.
Fig. 3 Validation of the diagnostic value of the sncRNA signature in an independent cohort.
(A) sncRNAs expression by individual quantitative reverse transcription polymerase chain
reaction in an independent cohort. Expression levels of the individual sncRNAs are normalized
to RNU48. Fold change was calculated as the difference of the mean normalized expression
values between patients and controls MVs (ΔCt = mean (ΔCt GBM patients) – –mean (ΔCt
controls)). A t-test analysis was performed with R/Bioconductor; (B) Receiver operator
characteristic curve (ROC) showing the true positive and false positive rate for the independent
cohort for the the three sncRNA signature or for RNU6-1 alone.

Manterola et al
20
Fig. 4 Analysis of RNU6-1/miR-320/miR-574-3p expression levels in other tumors. (A)
sncRNAs expression by individual quantitative reverse transcription polymerase chain reaction
in a cohort of metastasis to the brain (metastasis) and gastrointestinal tumors (GI) .Samples
were compared with the previous cohort of healthy controls and GBM patients. Expression
levels of the individual sncRNAs were calculated relative to corresponding RNU48. Fold
change was calculated as 2−ΔCt, were ΔCt= CTRNU48 – CTRNU6-1/miR-320/miR-574-3p. Statistically
significant differences were determined using a Kruskall-Wallis test.

<200 nm<50 nm
200 nm
A
TSG 101
LAMP1
CD9
C: HEALTHY CONTROL/ P: GBM PATIENT
ALIX
C
D
Figure 1
CD9
ControlN=10
GBMN=10
0
20
40
60
80
100
CD
9 ex
pres
sion
(%)
CD63
ControlN=10
GBMN=10
0
20
40
60
CD
63 e
xpre
ssio
n(%
)
E
Calnexin
P=0.002 P=0.001
157,9 – 210.8 nm
12,86-23.81 nmInte
nsity
(%)
Size (nm)
B

A
Figure 2
BRNU6 / miR−320 / miR−574−3p
False positive rate
True
pos
itive
rate
0.0 0.2 0.4 0.6 0.8 1.00.0
0.2
0.4
0.6
0.8
1.0
AUC = 0.926
p < 0.0001
RNU6
False positive rate
True
pos
itive
rate
0.0 0.2 0.4 0.6 0.8 1.00.0
0.2
0.4
0.6
0.8
1.0
AUC = 0.852
p < 0.0001
miR−320
False positive rate
True
pos
itive
rate
0.0 0.2 0.4 0.6 0.8 1.00.0
0.2
0.4
0.6
0.8
1.0
AUC = 0.719
p = 0.0067
miR−574-3p
False positive rate
True
pos
itive
rate
0.0 0.2 0.4 0.6 0.8 1.00.0
0.2
0.4
0.6
0.8
1.0
AUC = 0.738
p = 0.0055
••
•
•
•
•
•
•
•
•
•
•
•
•
•
•
••
•
•
•
•
•
•
•
•
•
•
•
•
•
•
•
•
•••
•
•
• ••
•
GBM Controls
−5
0
5
10
n=23 n=20
miR
−320
(−∆C
t)
p = 0.0076
•
• ••
•
•
•
•
•
•
••
•
•
•
•
•
• •
• •
••
•• •
•
•
•
•
••
•
•••••
•
GBM Controls
−10
−5
0
5
n=22 n=17
miR
−574
−3p
(−∆C
t)
p = 0.0031
•
•
••
•
•
• ••
•
•
••
•
•
•
•
••
••
•
••
•
•
•
•
•
•••
•
•
•
•
•
•
••
•• •••
•
GBM Controls
−5
0
5
10
n=24 n=22
RN
U6
(−∆C
t)
p < 0.001
A
Figure 3
BRNU6
False positive rate
True
pos
itive
rate
0.0 0.2 0.4 0.6 0.8 1.00.0
0.2
0.4
0.6
0.8
1.0
AUC = 0.722
p = 0.0007
RNU6 / miR−320 / miR−574−3p
False positive rate
True
pos
itive
rate
0.0 0.2 0.4 0.6 0.8 1.00.0
0.2
0.4
0.6
0.8
1.0
AUC = 0.775
p < 0.0001
•
•••
•
•
•
•
•
•
•
•
•
•
•
• • ••
•••
•
•
••
•
•
•
• •
• •
•
•••
•
••• • •
•
•
•
•
••
•
••
•
•
••
•••
•
•
•
•
•
•
••
•
•
•
•
•
• •
•
• •
GBM Controls
−5
0
5
10
15
n=50 n=27
RN
U6
(−∆C
t)p = 0.0013
•
• •
•
•• •
•
•
•
• •
••
•
••
•
•
•••
•
•
•••
•
• • •
••
•
•••
•
•
••
•
•
•
•
••
•
•
•
•
• •
•
•
•
•
•
•
••
••
•
•
•
•
•
• •• • •
•
•
••
GBM Controls
0
5
10
15
n=50 n=27
miR
−320
(−∆C
t)
p = 0.5927
•
•
•
•
•
•
•
•
•
•
•
•
•
••
•
• •• •
•
•
•
••
•
•
•
••
•
•
•
•
•
••
•
•
•
•
•
• •
•
••
••
•
•••
•• ••
• •••
•••
•
•
•
•
•
•
•
•
••
GBM Controls−15
−10
−5
0
5
10
15
n=47 n=27
miR
−574
−3p
(−∆C
t)
p = 0.173
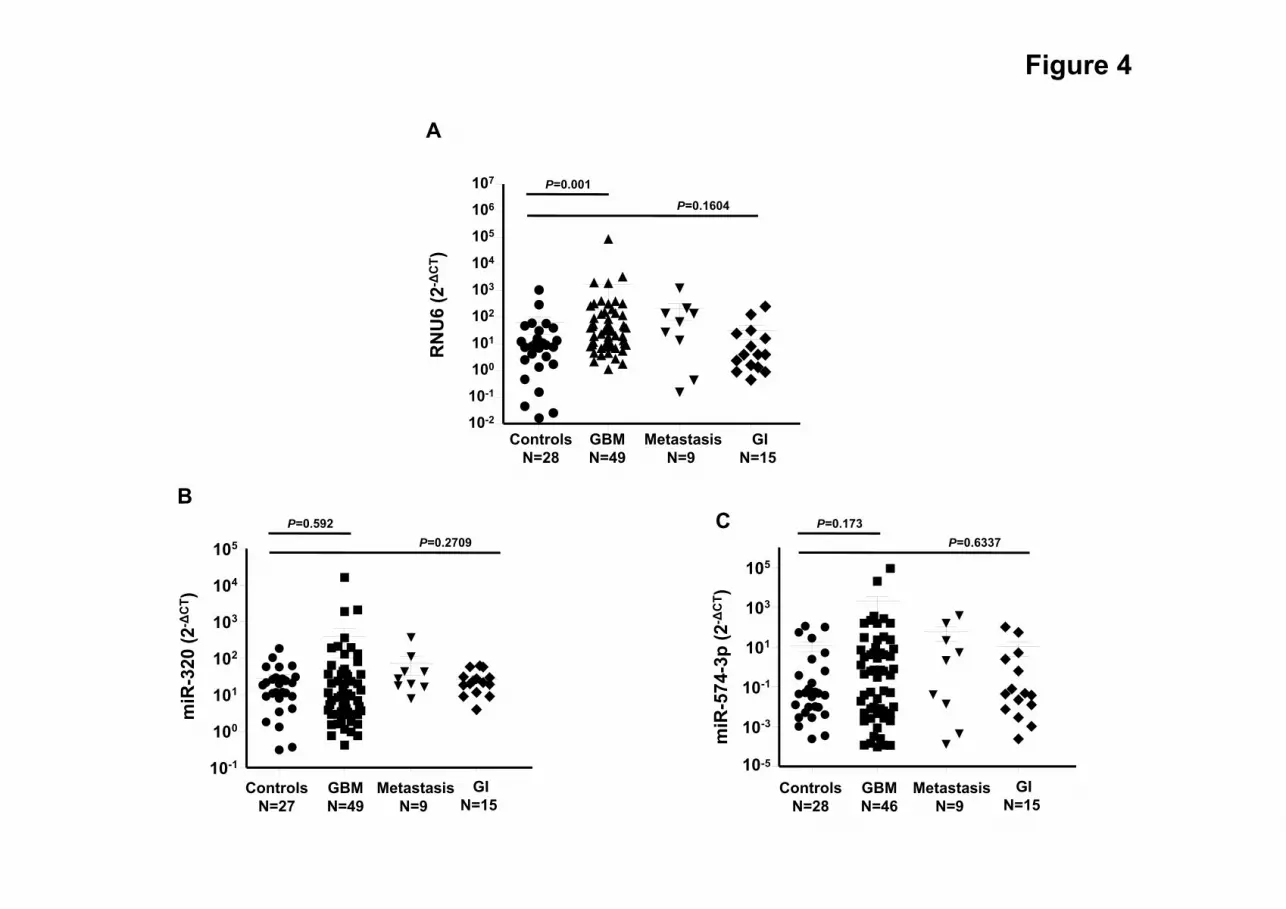
Figure 4
ControlsN=28
GBMN=49
MetastasisN=9
GIN=15
10-2
10-1
100
101
102
103
104
105
106
107
RN
U6
(2-Δ
CT )
B
10-1
100
101
102
103
104
105
miR
-320
(2-Δ
CT )
ControlsN=27
GBMN=49
MetastasisN=9
GIN=15
miR
-574
-3p
(2-Δ
CT )
10-5
10-3
10-1
101
103
105
ControlsN=28
GBMN=46
MetastasisN=9
GIN=15
C
A
P=0.001
P=0.1604
P=0.592P=0.2709
P=0.173P=0.6337

Table 1. Differentially expressed small non-coding RNAs in serum MVs of 25 GBM samples compared to 25 healthy controls paired by age and sex, after validation using single qRT-PCR analyses (change > 2 Ct and t-test p-value < 0.01 as a cut-off level)
microRNA −ΔCt p-value RNU6 4.5 <0.0001 miR-320 2.5 0.0076 miR-574-3p 3.1 0.0031


