Embed Size (px)
Citation preview

TECHNICAL REPORT
Simplified protocol for flow cytometry analysis offluorescently labeled exosomes and microvesiclesusing dedicated flow cytometer
Vendula Pospichalova1, Jan Svoboda2,3, Zankruti Dave1, Anna Kotrbova1,Karol Kaiser1, Dobromila Klemova4, Ladislav Ilkovics4, Ales Hampl4,Igor Crha5, Eva Jandakova6, Lubos Minar5, Vit Weinberger5 andVitezslav Bryja1,7*
1Faculty of Science, Masaryk University, Brno, Czech Republic; 2Cytometry and Microscopy Facility, Instituteof Microbiology, Academy of Sciences of the Czech Republic, Prague, Czech Republic; 3Bio-port Europe,Svinare, Czech Republic; 4Faculty of Medicine, Masaryk University, Brno, Czech Republic; 5Department ofObstetrics and Gynecology, Faculty Hospital Brno, Brno, Czech Republic; 6Department of Pathology,Masaryk University and University Hospital Brno, Brno, Czech Republic; 7Institute of Biophysics, Academy ofSciences of the Czech Republic, Brno, Czech Republic
Flow cytometry is a powerful method, which is widely used for high-throughput quantitative and qualitative
analysis of cells. However, its straightforward applicability for extracellular vesicles (EVs) and mainly exosomes
is hampered by several challenges, reflecting mostly the small size of these vesicles (exosomes: �80�200 nm,
microvesicles: �200�1,000 nm), their polydispersity, and low refractive index. The current best and most widely
used protocol for beads-free flow cytometry of exosomes uses ultracentrifugation (UC) coupled with floatation
in sucrose gradient for their isolation, labeling with lipophilic dye PKH67 and antibodies, and an optimized
version of commercial high-end cytometer for analysis. However, this approach requires an experienced
flow cytometer operator capable of manual hardware adjustments and calibration of the cytometer. Here,
we provide a novel and fast approach for quantification and characterization of both exosomes and
microvesicles isolated from cell culture media as well as from more complex human samples (ascites of ovarian
cancer patients) suitable for multiuser labs by using a flow cytometer especially designed for small particles,
which can be used without adjustments prior to data acquisition. EVs can be fluorescently labeled with protein-
(Carboxyfluoresceinsuccinimidyl ester, CFSE) and/or lipid- (FM) specific dyes, without the necessity of
removing the unbound fluorescent dye by UC, which further facilitates and speeds up the characterization of
microvesicles and exosomes using flow cytometry. In addition, double labeling with protein- and lipid-specific
dyes enables separation of EVs from common contaminants of EV preparations, such as protein aggregates or
micelles formed by unbound lipophilic styryl dyes, thus not leading to overestimation of EV numbers. Moreover,
our protocol is compatible with antibody labeling using fluorescently conjugated primary antibodies. The
presented methodology opens the possibility for routine quantification and characterization of EVs from
various sources. Finally, it has the potential to bring a desired level of control into routine experiments and
non-specialized labs, thanks to its simple bead-based standardization.
Keywords: exosomes; microvesicles; extracellular vesicles; quantification; flow cytometry; fluorescent labeling; CFSE;
lipophilic styryl dye; ascites
*Correspondence to: Vitezslav Bryja, Faculty of Science, Institute of Experimental Biology, Masaryk
University, Kamenice 753/5, building A36, CZ-625 00 Brno, Czech Republic, Email: [email protected]
Received: 23 July 2014; Revised: 3 March 2015; Accepted: 4 March 2015; Published: 31 March 2015
Exosomes (exs) are cell-derived vesicles that are
present in numerous biological fluids and also
in conditioned media (CM) of cell cultures. Exs
originate as multivesicular bodies within the endosomal
compartment of cells. However, cells also secrete other
types of extracellular vesicles (EVs), for example, micro-
vesicles (MVs), that are larger than exs and originate from
plasma membrane (1). All types of EVs are composed
of various protein and lipid species reflecting the status
and the cell of origin, and contain various cargo (DNA,
�
Journal of Extracellular Vesicles 2015. # 2015 Vendula Pospichalova et al. This is an Open Access article distributed under the terms of the CreativeCommons Attribution-NonCommercial 4.0 International License (http://creativecommons.org/licenses/by-nc/4.0/), permitting all non-commercial use,distribution, and reproduction in any medium, provided the original work is properly cited.
1
Citation: Journal of Extracellular Vesicles 2015, 4: 25530 - http://dx.doi.org/10.3402/jev.v4.25530(page number not for citation purpose)

RNA, protein) [reviewed in (2,3)]. EVs, and particularly
exs, are an important, yet only recently appreciated, mode
of intercellular communication (4) and thus have attracted
growing interest of the basic researcher community. More-
over, they have also gained lots of attention from clinical
researches as increasingly recognized high-potential bio-
markers of several diseases including cancer (5), as well as
possible therapeutic vehicles (6).
The exosomal field suffers from the lack of an easy,
fast, and reliable method for quantification and charac-
terization of these nanosized vesicles on a single particle
level. Currently, characterization of exs is mainly based on
the level of total amount of proteins and/or lipids in bulk
isolates from biological samples. However, the methods
used for bulk isolates, such as mass spectrometry or
western blotting (WB), are rigid because they cannot
dissect, whether the observed difference in protein/lipid
abundance reflects the change in number of exs or in
their composition mostly due to the absence of invariant
‘‘household’’ exs markers (7). Recent developments of
nanoparticle tracking analysis (NTA) (8) allow for enu-
merating and also sizing of individual exs on the basis
of Brownian motion. However, this light scattering�based
approach also harbors several inherent disadvantages,
for example, the ultimate need for multiple measure-
ments of samples at different dilutions and different
settings due to low dynamic range of the camera, which
does not cover the range of 5 order of magnitude differ-
ence between the light scattered by smallest and largest
EVs (9). Moreover, NTA technology is nowadays often
used to detect only size and not to discriminate the
composition of the particles (such as protein aggregates,
micelles and lipoprotein particles, or abundance of a
particular protein) thus often leading to overestimation
of EV numbers. These potential errors in enumeration
of EVs can only be partially limited by standardization of
NTA measurements (10).
To ease the flow cytometry (FC; in further text also
refers to ‘‘flow cytometer,’’ that is, instrument used
in flow cytometry) analyses, exs are often bound to beads
that provide larger surface and more scattered light.
However, this approach is inconvenient for subsequent
use of exs for functional studies. Moreover, the detection is
largely dependent on the abundance/availability of antigen
on the exs, which is recognized by the antibody coupled
to the beads reflecting both pro et contra associated
with high specificity of antibodies (11). Currently, the
only reliable protocol available for free exs and direct
FC analysis is a protocol for multiparameter FC analysis
developed by research group of Prof. Marca Wauben
(7,12). It allows for a high-resolution quantitative and
qualitative analysis of individual cell-derived vesicles using
an optimized configuration of the commercially available
high-end FC (BD Influx). This extremely useful and
exemplary protocol, though, demands an experienced
FC operator capable of manual hardware adaptations
with adjustments and calibration of the FC before use.
Moreover, the exs labeling part of the experimental
procedure, which yields multiple highly purified popula-
tions of exs, is also rather time and labor extensive and
therefore as such may be discouraging for users in clinical
labs or labs that do not highly specialize in the exs research.
Here, we present a simplified protocol for FC analysis
of EVs using UC followed by a sucrose cushion purifi-
cation step and simple fluorescent labeling step without
additional washes requiring prolonged UC. The FC
characterization is performed using a dedicated FC, where
no adjustments prior to measurements are needed. By
term dedicated FC [adopted from (9)], we specifically
refer to Apogee A50 Micro (Apogee Flow Systems,
Hertfordshire, UK), a FC specially developed for analysis
of small particles (9,13,14).
Materials and methods
Cell culture and labeling by CFSEHEK293 cells were cultured in DMEM supplemented
with 10% FBS, 2 mM L-glutamine, 50 units/ml penicillin,
and 50 units/ml streptomycin. Kuramochi and Ovsaho
cell lines were cultured in RPMI 1640 supplemented
with 10% FBS, 2 mM L-glutamine, 50 units/ml penicillin,
and 50 units/ml streptomycin. For isolation of exs, cells
were harvested with 0.05% trypsin/EDTA, washed twice
in PBS and plated at 50% confluence onto fresh plates
into RPMI 1640 or DMEM supplemented with vesicle-
free 10% FBS, 2 mM L-glutamine, 50 units/ml penicillin,
and 50 units/ml streptomycin. Supernatants were col-
lected 24�48 h later.
Vesicle-free medium was prepared as described in
Current Protocol in Cell Biology (15). In brief, medium
was supplemented by 20% FBS, 4 mM L-glutamine, 100
units/ml penicillin, and 100 units/ml streptomycin and
centrifuged at 100,000�g, 48C in SW28 rotor overnight
(16�18 h). Supernatant was filter sterilized using 0.22 mm
PVDF filter and 1 time diluted with DMEM or RPMI
1640 to reach the 10% FBS, 2 mM L-glutamine, 50 units/
ml penicillin, and 50 units/ml streptomycin concen-
trations. To harvest fluorescently labeled EVs, CFSE
(Carboxyfluoresceinsuccinimidyl ester, e-Bioscience) (or
DMSO as diluent control) was added to final concentra-
tion 2�20 mM into vesicle-free cell culture medium at
the time of seeding of the cells, which was typically onto
150 mm dish in 35 ml of culture media.
Ascites collectionPrimary ascites of ovarian cancer patients were collected
at the Department of Obstetrics and Gynecology, Faculty
Hospital Brno, Czech Republic, under the informed
consent of patients and IRB protocol of Vitezslav Bryja
Vendula Pospichalova et al.
2(page number not for citation purpose)
Citation: Journal of Extracellular Vesicles 2015, 4: 25530 - http://dx.doi.org/10.3402/jev.v4.25530

(MUNI/M/1050/2013) approved by the Ethics Commit-
tee of Faculty Hospital Brno.
Isolation of cells and EVsExs and MVs were isolated according to slightly modified
Current Protocol in Cell Biology (15). A scheme of the
isolation protocol is given in Fig. 2. In detail, cell culture
media or ascites were collected and transferred to 50-ml
centrifugation tubes. Live cells were pelleted upon 5 min
centrifugation at 200�g at 48C (designated P 0.2 � P,
pellet, 0.2 � relative centrifugation force (RCF) in thou-
sands of g). P 0.2 fraction from ascites usually contains red
blood cells (RBC), which were removed by washing with
ACK lysis buffer (150 mM NH4Cl, 10 mM KHCO3, 1 mM
EDTA) and subsequent pelleting. The RBC removal step
was repeated several times if necessary until both the pellet
and the supernatant were clear (without the red traces of
contaminating hemoglobin). Supernatants after live cell
pelleting (S 0.2) were transferred to new 50-ml centrifuga-
tion tubes and centrifuged at 1,500�g at 48C for 10 min to
remove cell debris (P 1.5). S 1.5 was transferred to 38-ml
thinwall polyallomer SW28 UC tubes (Beckman Coulter)
and centrifuged at 14,000�g (8,800 rpm for SW28 rotor �Beckman Coulter) for 1:10 h at 48C to isolate MVs (P 14).
The P 14 was resuspended in filtered (0.22 mm PVDF
filter) PBS and the centrifugation step was repeated to
wash MVs from non-specifically adhered proteins. S 14
was optionally filtered using 0.22 mm PVDF filter to
remove any contaminating MVs (larger than 220 nm) and
the S 14 filtrate or S 14 was transferred to fresh 38-ml
thinwall polyallomer SW28 UC tube and centrifuged for
100,000�g (23,500 rpm for SW28 rotor) at 48C for 3:10 h
using Optima XPN 90K Ultracentrifuge (Beckman Coul-
ter). Sucrose cushion (4 ml) (30% sucrose in 20 mM Tris
pH 7.6 in D2O, filter sterilized) was pipetted into new
SW28 tubes. S 100 was completely removed and P 100 was
resuspended in 30 ml of filtered PBS, gently laid onto
sucrose cushion, not to disturb the interface and UC for
100,000�g at 48C for 1:10 h. Approximately 6 ml of cushion
and PBS (to ensure no exs are lost at the interface) was
collected from the side of tube using 18-G needle fitted to
10 ml syringe, transferred to fresh tube, mixed with 30 ml
filtered PBS and ultracentrifuged (1:10 h, 100,000�g, 48C).
The supernatant was discarded and pellet of exs was re-
suspended in 100�200 ml of filtered PBS for further analysis.
Fluorescent labeling of exs prior to the measurementExs and MVs were isolated from ascites or CM as des-
cribed above using UC and sucrose cushion. To fluores-
cently label EVs proteins, the isolated EVs were incubated
in 100 nM to 10 mM CFSE (e-Bioscience) for 30 to 45 min
at 378C in the dark. Specifically, for measurements in
triplicate, 500-ml samples were prepared in 1.5 ml tubes
by diluting the isolated exs in 495 ml of filtered PBS
and adding 5 ml of 10 to 1,000 mM CFSE (or DMSO as
a diluent control), prepared according to manufacturer’s
instructions. After its cleavage of acetate groups by
esterases (16), which are present in cells as well as in
secreted EVs, CFSE has a peak excitation of 494 nm and
peak emission of 521 nm (17), which is ideally measured
using 488-nm (blue) laser excitation and 535/35 band
pass filter for detection. Alternatively, for fluorescent
labeling of exs lipids, the isolated exs were incubated
in 100 ng/ml to 10 mg/ml FM 1-43FX or FM 4-64FX
(Life Technologies) for 10 min at 378C in the dark.
Specifically, for measurements in triplicate, 500-ml samples
were prepared by diluting the isolated exs in 495 ml
of filtered PBS and supplementing it with 5 ml of 10 to
1,000 mg/ml FM dye (or HBSS as a diluent control),
prepared according to manufacturer’s instructions. After
incubation at 378C, tubes were gently flicked, liquid
collected at the bottom of the tubes and immediately
subjected to measurements by FC by inserting the 1.5-ml
tubes into the moving arm of the device. Of importance,
unbound fractions of CFSE, FM 1-43FX, or FM 4-64FX
do not seem to interfere with the FC measurements, unlike
the unbound fractions of PKH67 and Di- dyes, which need
to be separated by UC in sucrose gradient [(7), data
not shown].
Labeling of exs with antibodiesIsolated exs were labeled according to (7). In short,
isolated exs were incubated for 60 min with 10 ml of mouse
anti CD63-PE (MEM-259, Exbio, 1P-343). Prior to data
acquisition, the samples were diluted with 480 ml 0.22 mm
filtered PBS (final dilution 1:25). PE conjugated antibody
of unknown specificity (MOPC-21, Exbio, 1P-632) was
used as negative IgG1 isotype control for background fluo-
rescence. For double labeling with CFSE and anti EpCAM
antibody, exs were incubated for 45 min at 378C with anti
EpCAM-APC (e-Bioscience, 17-5791-80) or isotype control
(e-Bioscience, 17-4321-81) antibody and 1 mM CFSE.
Dedicated FC instrument settingsData were obtained using 2 individual Apogee A50/Micro
flow FCs equipped with 50 mW 405-nm (violet), 488-nm
(blue) and 638-nm (red) lasers. Parameters in the Control
panel were set to sheath pressure of 150 mbar and number
of flush cycles to 4. Peak is a preferred parameter to area
for light scatters (LSs) and fluorescence channels, as it
corresponds better to submicron particles than the area.
Particles with size several times smaller than the focused
laser beam are being exposed to the light continuously
across their path through the beam. Thus, the area of the
pulse corresponds more to the length of the path (or the
exposure time), than to the size of the particle. The peak
value of the pulse should remain consistent across the
particle path through the focused laser beam and should
only reflect the scattering properties of the particle, with
small or no regard to the length of the path (or exposure
time) (18).
Dedicated flow cytometry of extracellular vesicles
Citation: Journal of Extracellular Vesicles 2015, 4: 25530 - http://dx.doi.org/10.3402/jev.v4.25530 3(page number not for citation purpose)

On each day of measurements, the FC performance
was first verified using a reference bead mix. The reference
bead mix (ApogeeMix, Apogee Flow Systems, cat#1493)
composed of a mixture of plastic spheres with diameters
of 180 nm, 240 nm, 300 nm, 590 nm, 880 nm, and 1,300 nm
with a refractive index (RI) of 1.42, and 110-nm and
500-nm green fluorescent (excited by blue laser) beads
with RI of 1.59 (latex) were used. These beads were used
to assess the FC’s light scattering and fluorescence per-
formance (both sensitivity and resolution). This can easily
and quickly inform the user, whether the FC at current
settings is capable of quality measurements of EVs. These
beads were run several times during the acquisitions and at
the end of the day to control the quality of recorded data
among samples and stable FC performance during all
measurements. Reference bead mix was used to set the
PMT voltages and the thresholds for light scattering.
Furthermore, as 2 populations of these beads are fluor-
escent in green channel, they were used to set the PMT
voltages and the thresholds for fluorescent threshold
triggering in parallel. All measurements were performed
in log mode. The noise levels in PMT panel were kept
below 1 at all parameters, ideally below 0.5.
Use of 405-nm laser is preferable for determination of
light scattering, as it results in more scattered light and
thus better resolution and sensitivity at light scattering
detectors than 488-nm laser. However, as we used fluor-
escence threshold triggering in the blue part of spectrum,
we measured the samples with both 405-nm and 488-nm
lasers on. Importantly, we have not recorded photobleach-
ing of the fluorescent particles with 405-nm laser when we
compared the cytograms recorded with 405 nm, 488 nm, or
both lasers. It is highly advisable to check regularly on Live
camera window, whether the stream of particles is directed
to the middle of laser beam. This indicates that there is no
air bubble stuck in the tubing. In case of distorted particle
stream, extensive cleaning can be applied to the tubing
by selecting Clean valve button in the Control panel.
If cleaning the valve does not correct the stream flow, it is
preferable to replace the sheath fluid (dH2O water).
FC data acquisitionAfter FC calibration by reference bead mix, the FC tubing
was washed by 10% bleach to remove any particles which
might have had adhered within the tubing. This wash was
performed at sample flow rate 10.5�15 ml/min with 130-ml
sample volume for 120 s. To remove the bleach, further
wash was performed similarly with 0.22 mm filtered
PBS. Such bleach and PBS washes were included after
every positive sample, to exclude carryover of fluores-
cently positive events (EVs/fluorescent dye) between
samples. The cleanness of tubing was verified by subse-
quent acquisition of filtered PBS sample at sample flow
rate 0.75 or 1.5 ml/min with 130-ml sample volume for
120 s. This very low sample flow rate 0.75 or 1.5 ml/min
(0.75 ml/min is the minimum) was used for all measure-
ments and the time of acquisition was held constant for
all samples, at least 120 s (or until the data buffer was full �up to 5,000,000 events), to yield enough events. Samples
(500-ml) were just enough for measurements of 130-ml
per sample in triplicates, leaving approximately 20-ml
sample volume for data acquisition (more than 10 min
at flow rate 1.5 ml/min), as roughly 110 ml encompass the
dead volume of tubing of the FC.
Western blottingParental cells were lysed in NP40 lysis buffer (50 mM
Tris pH 7.4, 150 mM NaCl, 1 mM EDTA, 0.5%
NP40) supplied with 1�Complete protease inhibitor mix
(Roche), and 1� Phosphatase inhibitor cocktail (Calbio-
chem). Lysates were spun down (16,000�g, 10 min, 48C).
The total protein concentration was determined using
DCTM Protein Assay (Bio-Rad). The protein lysates and
isolated exs were mixed with 2�Laemmli buffer and
separated according to their molecular mass on 10�15%
SDS-PAGE and transferred to Immobilon-P Membrane
(Millipore). WB and antibody detection was performed
as described previously (19). The antibodies used were
rabbit anti Alix (gift from Pascale Zimmermann), mouse
anti CD63 (MEM-259, Exbio, 11-343), mouse anti
Golgin A1 (Invitrogen, A21270), mouse anti Hsc70 (Santa
Cruz, sc-24), and rabbit anti Tsg101 (Sigma Aldrich,
HPA006161).
TEM and immunogold labelingFor negative contrasting 10-ml drops of exs in PBS were
adsorbed at activated formwar membrane coated HF35Cu
with carbon EM grids (Pyser�SGI Limited) for 15 min,
stained with 2% ammonium molybdate for 20 s at RT,
washed with dH2O water and imaged using transmis-
sion electron microscopy (TEM) Morgagni 268D (FEI)
equipped with Mega ViewIII (Soft Imaging System) at
70 kV.
For immunogold labeling, isolated exs were mixed
1:1 with freshly prepared 8% paraformaldehyde and fixed
for 10 min at RT. Then they were resuspended in 5 ml
PBS and ultracentrifuged onto activated formwar mem-
brane coated HF35Cu with carbon EM grids (Pyser�SGI
Limited) placed at the bottom of the SW55Ti rotor UC
tubes (Beckman Coulter) for 1 h at 100,000�g, 48C. Grids
were blocked by 0.5% BSA�0.1% Tween 20 in PBS for
30 min, incubated with primary antibody anti CD63
(MEM-259, Exbio, 11-343, dilution 1:200 in 0.5% BSA
in PBS) overnight at 48C, washed 3 times for 15 min with
0.5% BSA in PBS, then incubated with secondary anti
mouse antibody conjugated with 10-nm gold particles
(G7652, Sigma Aldrich, dilution 1:40 in PBS) for 2 h at RT,
washed 3 times for 15 min in PBS and once with dH2O.
After staining with 2% ammonium molybdate for 20 s at
RT, grids were washed with dH2O water and imaged using
Vendula Pospichalova et al.
4(page number not for citation purpose)
Citation: Journal of Extracellular Vesicles 2015, 4: 25530 - http://dx.doi.org/10.3402/jev.v4.25530

TEM Morgagni 268D (FEI) equipped with Mega ViewIII
(Soft Imaging System) at 70 kV.
Statistical analysisGraph visualization, data transformation, linear regres-
sion analysis, and concentration calculations were per-
formed using Prism (version 5.0, GraphPad Software)
and Microsoft Office Excel (version 2010, Microsoft).
Results and discussion
Challenges of FC of EVs and the ways to overcomethemWe have decided to use FC to precisely quantify and
characterize exs and MVs. FC is a powerful method for
the high-throughput analysis of small particles which,
however, has its limitations. Specifically, there are 2 main
issues, which complicate FC-based analysis of EVs. First,
the size of the vesicles ranges from 80 up to more than
1,000 nm, with the majority formed by exs, which are
smaller than �200 nm. The vast majority of conventional
FC has the minimal detection limit for light scattering in a
range of 200�500 nm (20). In addition, the conventional
FC cannot discriminate accurately between particles that
differ by less than 100�200 nm in diameter (21). Second,
LS-based detection of EVs smaller than 200�300 nm is
severely compromised by overlapping noise derived from
optics, electronics, and buffers used.
To overcome these limitations we used a FC, which
is optimized for the detection of small particles. In the
further text we refer to this instrument as the ‘‘dedicated
FC.’’ Conventional FCs use forward scatter (FSC), which
detects the amount of light scattered at small angles
(0.5�158) and side scatter (SSC), which detects the light
scattered at the angle of 908. FSC is commonly interpreted
as an estimate of size for objects larger than 500 nm, for
example, cells, whereas SSC is used as a measure of their
internal complexity (18). The dedicated FC builds on the
fact that objects with sizes close to the observing light
wavelength, such as exs, scatter significantly more light
at larger angles (15�1508) due to diffraction (18,22). Thus,
the dedicated FC uses alternative LSs such as SALS (small
angle light scatter), MALS (middle angle light scatter),
and LALS (large angle light scatter) for determination
of light scattering. SALS, MALS, and LALS can be used
for relative particle sizing and the latter also for internal
complexity of the particles to limited extent.
Dedicated FC can thus, in principle, distinguish parti-
cles with the optical properties and size similar to exs and
thus MVs as well. Our testing of the reference bead mix
confirmed that dedicated FC is suitable for small particle
measurements giving exceptional small particle sensitivity
(approximately 100-nm latex beads) and resolution (dif-
ference of latex bead size in tens of nanometers) (Fig. 1a).
Silica beads were used as a size reference because they
have a RI of approximately 1.42 which is closer to the RI
of biological particles [approximately 1.4 for cells (23)
and 1.4090.02 for EVs (9)] than latex particles [RI of
1.59 (24)].
The reference bead mix used in our experiments is a
mixture of fluorescent and non-fluorescent spheres with
diameters from 110 to 1,300 nm. To assess the suitability
of individual LS detectors for detection of small parti-
cles, we have used the reference bead mix to assess the
coefficient of variation (CV) of the SALS, MALS, and
LALS detectors (reflecting the size of particles). With
the manufacturer’s default settings, we did not observe
CV �10%; actually in most cases CV was below 3%.
At the default manufacturer’s setting, the best resolution
and sensitivity for smallest particles was obtained on
SALS (Fig. 1a). However, it should be noted that the
device settings can be fine-tuned by experienced FC
operators for best performance at LALS and/or MALS
and yield better resolution and sensitivity for the expected
exs populations (we have used this setting in Fig. 6c).
Nevertheless, all other measurements in this study (shown
in Figs. 1, 3�5, 6d) were obtained using the default settings
to better illustrate the situation in non-specialized labs.
Reduction of noiseData shown in Fig. 1a suggest that dedicated FC is able
to detect particles with the properties � size and RI � very
similar to MVs and exs. The detection of EVs by
FC is, however, in parallel hampered by high level of
noise. In the next step, we thus decided to identify and
subsequently eliminate factors, which increase the noise
and may interfere with the interpretation of the analysis.
First, we found it critical to acquire the data at a low
flow rate (0.75 or 1.5 ml/min) for good LS resolution as
well as for the accurate discrimination between non-
fluorescent noise and fluorescent signals. This is likely
because higher flow rates increase the diameter of the
sample stream and allow the particles to move outside the
center of the laser spot, yielding lower intensity of light
scattering and fluorescent signals and increasing the CVs
accordingly.
Second, we tested the effect of 0.22 mm filtration of
PBS, which is used to dissolve the EV samples. As shown
in Fig. 1b, use of filtered PBS in all steps of FC mea-
surements greatly � 5.8 times � reduces the number of
small events recorded by the FC (Fig. 1b). In the next
experiments we took advantage of filtered PBS and used
this solution during the calibration of the instrument for
the fluorescent application in a way that the event rate
was not higher than 2 events/ml for 0.22 mm filtered
PBS in fluorescently positive region (quadrants A and B)
(Fig. 1b).
Third, we have attempted to reduce the noise by gating
events of interest using combination of 2 LSs. When using
the reference bead mix, it is possible to gate on the beads
Dedicated flow cytometry of extracellular vesicles
Citation: Journal of Extracellular Vesicles 2015, 4: 25530 - http://dx.doi.org/10.3402/jev.v4.25530 5(page number not for citation purpose)
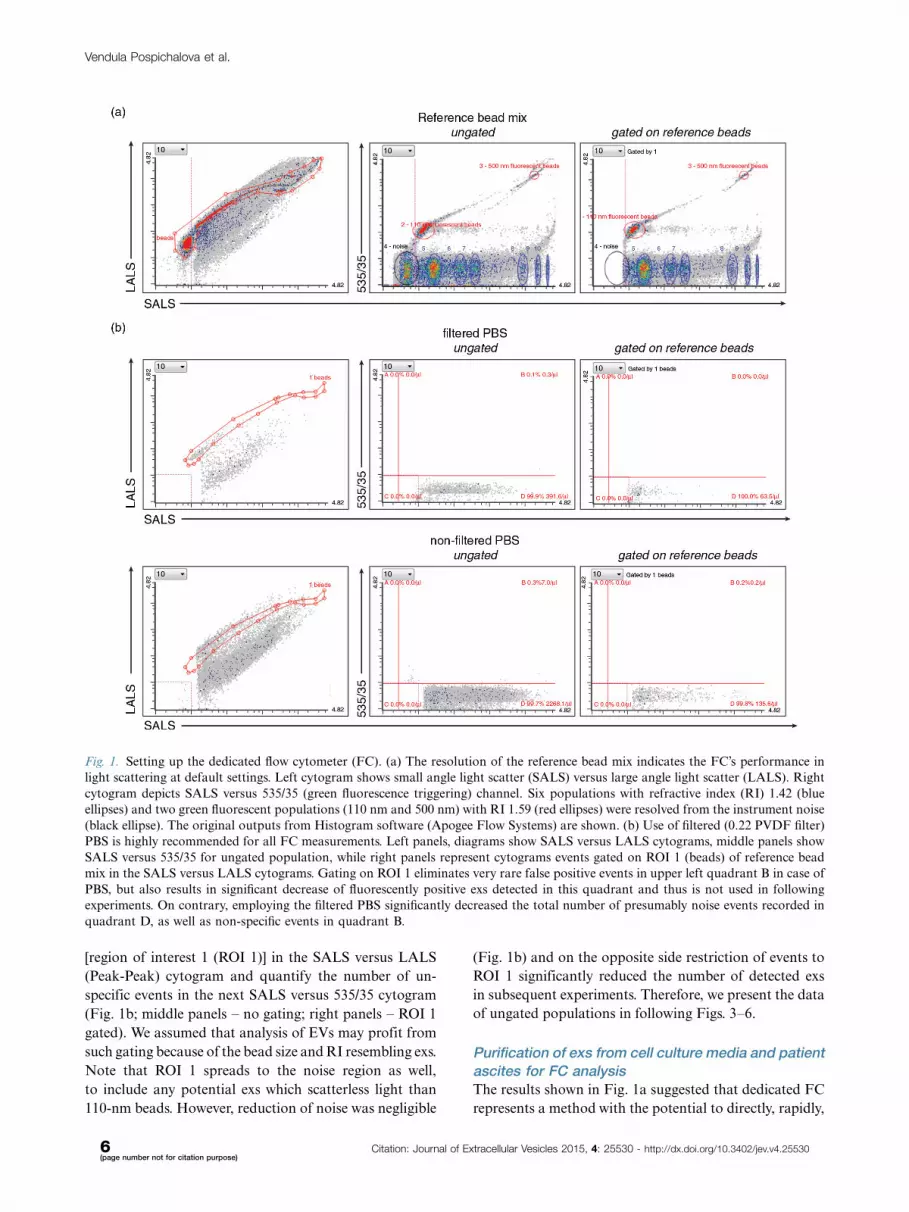
[region of interest 1 (ROI 1)] in the SALS versus LALS
(Peak-Peak) cytogram and quantify the number of un-
specific events in the next SALS versus 535/35 cytogram
(Fig. 1b; middle panels � no gating; right panels � ROI 1
gated). We assumed that analysis of EVs may profit from
such gating because of the bead size and RI resembling exs.
Note that ROI 1 spreads to the noise region as well,
to include any potential exs which scatterless light than
110-nm beads. However, reduction of noise was negligible
(Fig. 1b) and on the opposite side restriction of events to
ROI 1 significantly reduced the number of detected exs
in subsequent experiments. Therefore, we present the data
of ungated populations in following Figs. 3�6.
Purification of exs from cell culture media and patientascites for FC analysisThe results shown in Fig. 1a suggested that dedicated FC
represents a method with the potential to directly, rapidly,
Fig. 1. Setting up the dedicated flow cytometer (FC). (a) The resolution of the reference bead mix indicates the FC’s performance in
light scattering at default settings. Left cytogram shows small angle light scatter (SALS) versus large angle light scatter (LALS). Right
cytogram depicts SALS versus 535/35 (green fluorescence triggering) channel. Six populations with refractive index (RI) 1.42 (blue
ellipses) and two green fluorescent populations (110 nm and 500 nm) with RI 1.59 (red ellipses) were resolved from the instrument noise
(black ellipse). The original outputs from Histogram software (Apogee Flow Systems) are shown. (b) Use of filtered (0.22 PVDF filter)
PBS is highly recommended for all FC measurements. Left panels, diagrams show SALS versus LALS cytograms, middle panels show
SALS versus 535/35 for ungated population, while right panels represent cytograms events gated on ROI 1 (beads) of reference bead
mix in the SALS versus LALS cytograms. Gating on ROI 1 eliminates very rare false positive events in upper left quadrant B in case of
PBS, but also results in significant decrease of fluorescently positive exs detected in this quadrant and thus is not used in following
experiments. On contrary, employing the filtered PBS significantly decreased the total number of presumably noise events recorded in
quadrant D, as well as non-specific events in quadrant B.
Vendula Pospichalova et al.
6(page number not for citation purpose)
Citation: Journal of Extracellular Vesicles 2015, 4: 25530 - http://dx.doi.org/10.3402/jev.v4.25530

and precisely quantify exs and other EVs. In the next step
we decided to validate this assumption on real samples
and to implement this step into possibly routine workflow
for the isolation and analysis of exs and MVs.
As the first step in the workflow, we have chosen a
suitable purification method � that is, a method which is
relatively fast and unbiased. As such we decided to use
a protocol based on UC. UC is still regarded as the
gold standard for isolation of exs for basic research (25).
This is despite the increasing availability of other methods
because UC-based methods collect in an unbiased way
the exs, which may vary morphologically, biochemically,
and functionally. Separation of exs by sedimentation
only (�downward displacement) during UC is not
sufficient, although it is still used by many labs. Separation
of exs from other particulate material can be guaranteed
only by floatation (�upward displacement) (26). Upward
displacement can be performed either as an isopycnic
1:10 h; 14,000 x g
pellet
supernatant
pellet(microvesicles)
supernatant
supernatant
sucrose fraction (~5 ml)
pellet (exosomes)
pellet
S 1.5
S 14
exs
P 0.2cells
P 1.5
P14MVs
S 100
P 100
cell culture/ascites
conditioned medium/ascitic fluid/FBS(dilute with PBS if too viscous)
To isolate live cells
pellet (exosomes + contaminating proteins)
supernatant(PBS)
Resuspend P 100 pellet in 30 ml of PBS and carefully lay on top of
4 ml sucrose cushion (30 % sucrose in Tris/D2O). Upon ultracentrifugation, protein
aggregates form pellet at the bottom of the tube, while exs due to their micelle shape and buoyant
density float and concentrate at the interphase of sucrose cushion.
5 min; 200 x g
10 min; 1,500 x g
3:10 h; 100,000 x g
1:10 h; 100,000 x g
supernatant(PBS)
1:10 h; 100,000 x g
To extract microvesicles
Wash with PBS and resuspend in 100 - 1,000 µl PBS to analyze
To remove cell debris and apoptotic bodies
To wash exosomes
Resuspend in 100 - 200 µl PBSand analyze
To extract exosomes and contaminating proteins
To isolate exosomes
Mix sucrose fraction with PBSand ultracentrifuge
S 0.2
Optional step: filtration with 0.22 µm filter To remove any remaining MVs
Fig. 2. Isolation of microvesicles (MVs) and exosomes (exs) by ultracentrifugation (UC) and sucrose cushion. A schematic
representation of protocol used to isolate extracellular vesicles (EVs). Black boxes describe the purpose of each centrifugation step,
blue boxes contain additional instructions/explanation. Optional filtration step is indicated by italics. Green boxes depict fraction after
centrifugation at relative centrifugation force (RCF) indicated by number (in thousands�g). P, pellet; S, supernatant.
Dedicated flow cytometry of extracellular vesicles
Citation: Journal of Extracellular Vesicles 2015, 4: 25530 - http://dx.doi.org/10.3402/jev.v4.25530 7(page number not for citation purpose)

Fig. 3. (Continued)
Vendula Pospichalova et al.
8(page number not for citation purpose)
Citation: Journal of Extracellular Vesicles 2015, 4: 25530 - http://dx.doi.org/10.3402/jev.v4.25530

centrifugation where floatation in sucrose gradient is used
or as centrifugation into the sucrose cushion. Isopycnic
centrifugation yields high purity exs, but is technically
more demanding and more time consuming (16�22 h) (11).
In comparison to isopycnic centrifugation, sucrose cush-
ion has several advantages for use in our workflow: (a)
it is rapid (only 70 min); (b) the 30% sucrose in D2O has
a density of 1.19�1.2103 g/ml, which enables it to con-
centrate the majority of the exs (typical buoyant density
1.10�1.19 g/ml) in single low-volume fraction and to
increase purity of exs, due to the formation of a continuous
minigradient between 1.10 and 1.19 g/ml at the interphase
between cushion and PBS (27); and (c) given the density
of D2O is 1.11 g/ml, significantly less sucrose is required
to reach the cushion density of 1.21 g/ml than if prepared
in H2O, thus reducing potential hyperosmotic stress for
exs (27).
Based on the arguments above we have used the UC and
sucrose cushion-based protocol (schematized in Fig. 2)
to isolate EVs from several sources. We purified MVs
and exs from CM of 3 different cell lines � HEK293,
Kuramochi, and Ovsaho (last 2 derived from high-
grade serous ovarian cancer) and from primary patient
samples. We have chosen samples of malignant ascites,
that is, excessive fluid accumulated in the peritoneum
of patients with high-grade serous ovarian cancer (28),
which contains both cells, including ovarian cancer cells
and leukocytes, and numerous EVs of unknown function.
MVs and exs produced by cell lines and from primary
human material can be easily detected by a dedicated FC.
To distinguish EVs from the noise, we first stained them
with the fluorescent dyes. Two different green fluorescent
dyes � protein-specific (CFSE) and lipid-specific (FM 1-
43FX) � were tested. The initial comparison was performed
on MVs and exs produced by HEK293 cells into the cul-
ture media. EVs, labeled fluorescently by CFSE during
cell culture (HEK293 exs�CFSE in CM) or prior to
measurements by CFSE (HEK293 exs�CFSE) or FM 1-
43FX dye (HEK293 exs�FM 1-43FX) were isolated using
protocol outlined in Fig. 2 and subsequently analyzed
by dedicated FC (Fig. 3) and by TEM in parallel (Fig. 4a).
The gates corresponding to fluorescently labeled EVs
(ROI 1 in Fig. 3a�b) were set based on the acquisition
of the free dyes (unbound to EVs) at highest final con-
centrations used for labeling and non-labeled EVs. For
10 mg/ml FM 1-43FX measurement, we allowed a max-
imum of 6 events/ml in ROI 1 when ungated (Fig. 3b).
Using this setting, 10 mM CFSE label yielded a maximum
of 8 events/ml, 0.22 mm filtered PBS 51 event/ml and
similar events/ml were recorded for non-fluorescent EVs
(Fig. 3a). MVs are clearly larger than exs, as evidenced
by SALS histogram (Fig. 3c). Moreover, when S 14
was filtered prior to 100,000�g UC step to remove
all residual MVs and aggregated exs (designated as �F),
it resulted in decreased number of more scattering EVs
(Fig. 3) but also into significant loss of EVs detected,
when compared to exs isolated from parallel samples when
the 0.22 mm filtration step of S14 was not performed
(designated as �NF). Thus, we included the filtration
only as an optional step into the purification protocol
(Fig. 2). We have noted the difference in ROI 1 population
characteristics when labeled by lipophilic dye (membrane
surface labeling) in comparison with luminal labeling
by protein-specific dye CFSE. The surface labeling results
in seemingly larger EVs as they were more shifted in
SALS than if post stained with CFSE (Fig. 3). CFSE� exs
show more discrete fluorescent population when labeled
during the biogenesis of exs (HEK293 exs�CFSE in CM)
than population labeled by CFSE post isolation (HEK293
exs�CFSE) (Fig. 3a). Importantly, fluorescent staining
of MVs and exs from HEK293 CM did not affect
exosomal morphology/size as assessed by TEM (Fig. 4a).
The morphological characteristics of EVs isolated from
HEK293 cells with or without CFSE in culture medium
were unchanged and sizes corresponded to the expected
�80�200 nm in diameter, whereas the MVs were much
larger � hundreds of nm (Fig. 4a).
Next, we tested labeling of more complex exosomal
mixtures isolated from human samples � malignant ascites
of ovarian cancer patients. In Fig. 4b, we also demonstrate
that these exs can be labeled by CFSE or FM 1-43FX
dyes prior to FC data acquisition. Filtration with 0.22 mm
filter resulted again in significant loss of recorded events;
however, in such exs sample isolated from a complex mix-
ture, not all fluorescent events with high SALS value
could be eliminated by filtration, as these may also repre-
sent aggregates formed during labeling. In non-filtered
samples, we observed contamination of the sample by
Fig. 3. FC analysis of EVs isolated from cell culture media. (a) EVs were labeled by protein-specific (CFSE) fluorescent dye either
during their genesis in cells (HEK293 exs�CFSE in conditioned media(CM)) � middle panel, or just prior to measurements (HEK293
exs�CFSE) � lower panel. The upper panel consists of negative control samples � CFSE-only, HEK293 exs-only, HEK293 MVs-only.
(b) EVs were labeled by lipid-specific (FM 1-43FX) dye prior to measurements (HEK293 exs or MVs�FM 1-43FX). FM 1-43FX-
only represents negative control sample. (a�b) SALS versus CFSE or FM 1-43FX (both green fluorescence) cytograms of ungated
populations are plotted. The ROI statistics corresponds to fluorescent EVs. Note the difference between the appearance of exs
population from the same source (HEK 293 cells) stained with different dyes and/or prior or after isolation. (c) Histograms of SALS
of EVs from (a). Left, histogram of EVs labeled during cell culture. Middle, histogram of differentially labeled MVs isolated from
HEK293 cells. Right, histogram of differentially labeled exs isolated from HEK293 cells. F; S14 filtered through 0.22 mm filter; NF,
S14 non-filtered.
Dedicated flow cytometry of extracellular vesicles
Citation: Journal of Extracellular Vesicles 2015, 4: 25530 - http://dx.doi.org/10.3402/jev.v4.25530 9(page number not for citation purpose)
(b)
(c)
(a)
400 nm
HEK293 exs
400 nm
HEK293 exs + CFSE in CM
malignant ascites #1 exs - NF
500 nm
*
*
*
(d)
110 nm green fluorescent beads
Measured valuesInput values
dilution factor
slope: - 0.9903
slope: - 1.0465
slope: - 0.9890
slope: - 0.9832
slope: - 0.9877 CFSEFM 1-43FXHEK293 exs
malig. ascites # 1 exsmalig. ascites # 2 exs
Kuramochi exsOvsaho exs
HEK293 exs +CFSE in CMHEK293 exs + CFSEHEK293 exs + FM 1-43FX
malig. ascites 1 exs + CFSEmal. ascites 1 exs + FM 1-43FXmalig. ascites 2 exs + CFSEmal. ascites 2 exs + FM 1-43FX
Kuramochi exs + CFSE in CMKuramochi exs + CFSEKuramochi exs + FM 1-43FXOvsaho exs + CFSE in CMOvsaho exs + CFSEOvsaho exs + FM 1-43FX
1
10
100
1000
10000
10
100
1000
10000
100000
dilution factor
even
ts/u
l
even
ts/u
l
malignant ascites #1 exs - F + CFSE
malignant ascites #1 exs
CF
SE
SALS
malignant ascites #1 exs - F + FM 1-43FX
600 nm
HEK293 MVs
600 nm
HEK293 MVs + CFSE in CM
(e)
FM
1-4
3FX
SALS
malignant ascites #1 exs - NF + CFSE
110
01010
00
0.01
0.1 1 10 10
010
001010
010
00
10
4.82
4.82 4.82
1EVs 1EVs 1EVs
1EVs: Events=43812 Evt/µl=28967 ROI% of evts=8.8%1EVs: Events=35413 Evt/µl=23414 ROI% of evts=7.1%1EVs: Events=12 Evt/µl=8.0 ROI% of evts=0.0%
10
4.82
4.82
1EVs
1EVs: Events=11485 Evt/µl=7593 ROI% of evts=2.3%
4.82
4.82
4.82
10 10
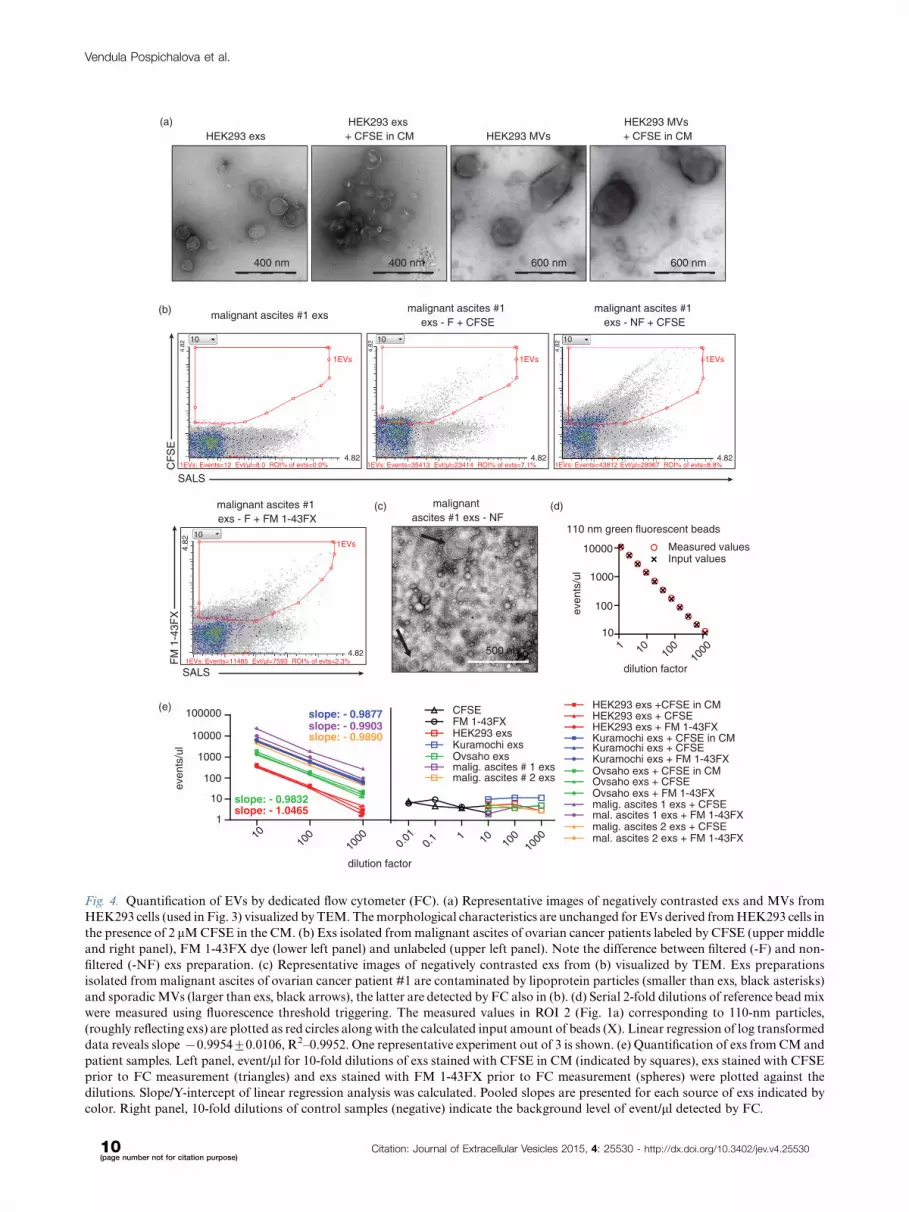
Fig. 4. Quantification of EVs by dedicated flow cytometer (FC). (a) Representative images of negatively contrasted exs and MVs from
HEK293 cells (used in Fig. 3) visualized by TEM. The morphological characteristics are unchanged for EVs derived from HEK293 cells in
the presence of 2 mM CFSE in the CM. (b) Exs isolated from malignant ascites of ovarian cancer patients labeled by CFSE (upper middle
and right panel), FM 1-43FX dye (lower left panel) and unlabeled (upper left panel). Note the difference between filtered (-F) and non-
filtered (-NF) exs preparation. (c) Representative images of negatively contrasted exs from (b) visualized by TEM. Exs preparations
isolated from malignant ascites of ovarian cancer patient #1 are contaminated by lipoprotein particles (smaller than exs, black asterisks)
and sporadic MVs (larger than exs, black arrows), the latter are detected by FC also in (b). (d) Serial 2-fold dilutions of reference bead mix
were measured using fluorescence threshold triggering. The measured values in ROI 2 (Fig. 1a) corresponding to 110-nm particles,
(roughly reflecting exs) are plotted as red circles along with the calculated input amount of beads (X). Linear regression of log transformed
data reveals slope �0.995490.0106, R2�0.9952. One representative experiment out of 3 is shown. (e) Quantification of exs from CM and
patient samples. Left panel, event/ml for 10-fold dilutions of exs stained with CFSE in CM (indicated by squares), exs stained with CFSE
prior to FC measurement (triangles) and exs stained with FM 1-43FX prior to FC measurement (spheres) were plotted against the
dilutions. Slope/Y-intercept of linear regression analysis was calculated. Pooled slopes are presented for each source of exs indicated by
color. Right panel, 10-fold dilutions of control samples (negative) indicate the background level of event/ml detected by FC.
Vendula Pospichalova et al.
10(page number not for citation purpose)
Citation: Journal of Extracellular Vesicles 2015, 4: 25530 - http://dx.doi.org/10.3402/jev.v4.25530

lipoprotein particles and also MVs (for TEM image
see Fig. 4c). This experiment, however, provides proof
of the principle that our methodology can also easily be
applied to the complex samples of biological fluids and
adapted for clinical use.
Dedicated FC represents a reliable method for thequantification of exs from different sourcesBased on the results in Figs. 1, 3, and 4 we concluded
that our simplified isolation and labeling protocol com-
bined with the dedicated FC (a) can easily distinguish
Fig. 5. Double labeling with protein� and lipid-specific dyes ensures precise enumeration of EVs. (a) MVs from HEK293 cells were pre-
labeled during their biogenesis by CFSE in CM and post-labeled by FM 4-64FX dye. Upper cytograms show ‘‘CFSE� gating first’’
strategy, lower diagrams show ‘‘FM 4-64FX� gating first’’ strategy. The total amount of double positive MVs is the same in both
strategies and equals the amount of EVs by direct gating for double positive MVs (right cytogram). (b) Exs from ascites of patient #1
were post-labeled by CFSE and FM 4-64FX dyes. Upper cytograms show ‘‘CFSE� gating first’’ strategy, whereas lower diagrams show
‘‘FM 4-64FX� gating first’’ strategy. The total amount of double positive MVs is the same in both strategies and equals the amount of
EVs by direct gating for double positive MVs (right cytogram). � NF, 0.22 mm non-filtered.
Dedicated flow cytometry of extracellular vesicles
Citation: Journal of Extracellular Vesicles 2015, 4: 25530 - http://dx.doi.org/10.3402/jev.v4.25530 11(page number not for citation purpose)

fluorescently labeled exs from non-fluorescent back-
ground, (b) does not affect the morphological character-
istics of exs, and (c) is applicable for analysis of exs from
both relatively uniform cell line CM as well as complex
clinical samples. So far, however, we did not evaluate the
suitability of our approach for the quantitative analysis.
To address this point, we first performed serial 2-fold
dilutions of the reference bead mix and plotted the
measured values of 110-nm fluorescent beads (events in
ROI 2 in Fig. 1a) together with the calculated input based
on the specified concentration of beads in the original
solution of reference bead mix. The number of beads in
ml recorded in a fixed time frame (120 s) was plotted
against the dilution factor of these beads and by linear
regression we verified that the fluorescent microparticles
of the approximate size of exs can be credibly quantified
across wide range of concentrations (Fig. 4d). To deter-
mine the inter-sample variation, 3 individual tubes with
identical reference bead mix dilutions were prepared and
the mean9standard error of the mean of 110-nm beads
acquired within 120 s was calculated. The intra-sample
variation was determined by quadruplicate measurements
of the same beads dilution in 120-s time intervals. The
inter- and intra-sample variations were relatively low, 7.0
Fig. 6. Characterization of exs derived from ascites using antibodies. (a) Presence of characteristic exs markers Alix, Hsp70 and Tsg101
as well as CD63, and absence of ‘‘antimarker’’ Golgin A1 (present in the cells of origin but absent from exs) was verified by western
blotting (WB) in cells (P 0.2 fraction) and exs from ovarian cancer patient #2. (b) TEM of exs isolated from ascites of ovarian cancer
patient #2. Exs marker CD63 is detected at the surface of exs by secondary antibodies conjugated to 10-nm gold particles. (c) CD63�,
exs derived from ascites of ovarian cancer patient #2 can be detected by FC analysis of CD63-PE antibody-stained exs (right panel).
Left panel, exs stained with isotype control antibody-PE. (d) Double labeling of exs from ascites of patient #1 by CFSE and EpCAM-
APC antibody reveals feasibility of double labeling and demonstrates that only 11.5% of CFSE� exs are EpCAM�. (e) Summary of
timing of the presented protocol. Each step is marked in the time scale by different color. For collection of EVs from conditioned media,
cells are plated a day ahead. Isolation of exs can be achieved in 1 day. Setting up the instrument and FC data acquisition can be
completed within the morning of the second day. � F, 0.22 mm filtered; � NF, 0.22 mm non-filtered.
Vendula Pospichalova et al.
12(page number not for citation purpose)
Citation: Journal of Extracellular Vesicles 2015, 4: 25530 - http://dx.doi.org/10.3402/jev.v4.25530
and 1.4%, respectively, which demonstrates that dedicated
FC has the potential to reliably quantify microparticles
across several orders of magnitude.
Using serial dilutions, we also assessed performance
of our protocol for exosomal preparations isolated from
HEK293, other cell lines (Kuramochi and Ovsaho), and
furthermore for the exs isolated from primary malignant
ascites of 2 ovarian cancer patients. The results of this
analysis are summarized in Fig. 4e. By linear regression
and comparison of slopes and intercepts of the 2 or 3
lines of exs derived from the same source, we showed
that numbers of recorded events/ml in dilutions corre-
sponded well to the expected calculated ratios, as slopes
of data from all individual samples were very close to the
theoretically expected value -1.
This analysis also allowed us to compare individual
labeling methods. First, the original amount of cells/CM
and the dilution was the same for the exs labeled during
the cell culture as was for the exs labeled prior to
measurements. This indicates, that the short time label-
ing by CFSE prior to measurements (post-labeling) is
as effective as the long-term cell labeling during their
biogenesis in cell culture (pre-labeling). The prolonged
exposure to CFSE, by which exs are believed to incorpo-
rate more CFSE, prior to and also after the release from
cells, yielded equally brightly labeled vesicles as the typical
CFSE labeling protocol, when the cells are labeled for
10 min in the tube and washed prior to seeding (data
not shown). Second, the amount of events/ml recorded
for exs�CFSE in CM were comparable to numbers of
exs�CFSE and exs�FM 1-43FX with the maximal CV
of 15.5% when different labeling approaches were com-
pared. The fact that lipid-specific dye (FM 1-43FX) and
protein-specific dye (CFSE) yield comparable numbers of
fluorescently labeled exs isolated from CM of several cell
lines (equal slopes and Y-intercepts) strongly indicates
that the labeling is specific for exs, which contain both
proteins and lipids. Slight differences between individual
labeling techniques � with more exs consistently detected
in CFSE-labeled samples (in comparison to FM 1-43FX)
� were found in ascites-derived exs (CV of 33 and 22%).
Such a discrepancy might be addressed by double labeling
of EVs.
Thus, as a next step, we investigated whether we
can double label the EVs with protein-specific and lipid-
specific dyes. This approach would enable the separation
of EVs from common contaminants of EV prepara-
tions, such as protein aggregates or micelles formed by
unbound lipophilic styryl dyes, and explain the differences
in EVs numbers obtained upon different labeling. We used
CFSE and avariant of FM dye fluorescent in red spectrum
� FM 4-64FX.
First, the EVs labeled during cell culture by CFSE
were post-labeled with FM 4-64FX dye. Surprisingly, only
44% of CFSE� MVs were also positive for FM 4-64FX,
whereas 63% of FM 4-64� MVs were also positive for
CFSE. Nevertheless, the total amount of double posi-
tive events recorded was the same regardless or the gating
strategy � CFSE� first, FM 4-64FX� first, or double posi-
tive (Fig. 5a). We also noticed, that incubation of these
CFSE pre-labeled EVs with FM 4-64FX dye greatly re-
duced their green fluorescence, resulting in non-detectable
green fluorescence of HEK 293 exs (data not shown) and
diminished green fluorescence of MVs, which was how-
ever still detectable and could be used for FC analysis
(Fig. 5a). Thus, we post-labeled EVs with both CFSE and
FM 4-64FX for 45 min at 378C and showed, that in the
case of exs isolated from malignant ascites, 56% of CFSE�
exs were also positive for FM 4-64FX, whereas 54% of
FM 4-64� MVs were also positive for CFSE. Similarly
as in Fig. 5a, the total amount of double positive events
was the same regardless of the gating strategy � CFSE�
first, FM 4-64FX� first, or double positive (Fig. 5b).
This suggests that single labeling with CFSE may lead
to overestimation of EV numbers; however, this over-
estimation is in the range of maximally tens of %, which
is not ideal, but still much less than has been reported for
other methods, such as NTA, which may overestimate the
numbers of EVs in range of orders of magnitude (9,10).
Dedicated FC is suitable for exosome characterizationby antibody labelingFor exs research it is not only important to enumerate
the vesicles on single particle level but it is of vital im-
portance to describe their further characteristics such
as quantitatively and qualitatively assessing their protein
composition and possible changes in protein abundance
under various conditions. FC is ideal for precise and
multiparameter characterization of EVs by staining with
antibodies and detection by a fluorochrome. As a proof
of principle of the suitability of the dedicated FC for this
type of assay, we decided to evaluate expression of typical
exs markers, tetraspanin CD63 (29), and EpCAM (30) on
the exs derived from human ascites.
First, we analyzed biochemical composition of the
exosomal sample by WB. This analysis showed positi-
vity for typical exosomal markers (Alix, Hsp70, Tsg101,
CD63) and negativity for ‘‘antimarkers’’ (Golgin A1),
which are present in cells of origin but absent from isolated
exs (Fig. 6a) (15,31,32). To further confirm presence of
CD63 in the exosomal fractions of human ascites, we
used immunolabeling with gold particles and were able to
detect CD63 on the surface of exs (Fig. 6b).
Knowing that the exs from malignant ascites are
CD63-positive, we decided to quantify the proportion of
CD63� exosomes. We have used R-Phycoerythrin-(PE)-
labeled primary antibody directed against CD63 antigen.
PE and APC were chosen as fluorochromes due to their
high quantum yields and extinction coefficients. Using this
approach, we were able to show by the PE-labeled primary
Dedicated flow cytometry of extracellular vesicles
Citation: Journal of Extracellular Vesicles 2015, 4: 25530 - http://dx.doi.org/10.3402/jev.v4.25530 13(page number not for citation purpose)

antibody that exs isolated from malignant ascites of
ovarian cancer patient #2 were CD63 positive (Fig. 6c).
Based on the total amount of exs stained by CFSE in
parallel tube, CD63� exs from malignant ascites made
38% of all CFSE� exs detected. Similarly, when we double
stained the exs derived from ascites of patient #1 with
CFSE and anti EpCAM antibody, we revealed that only
11% of CFSE� exs were positive for the cell adhesion
molecule EpCAM (Fig. 6d), which has also been widely
reported as an exs marker (30). Importantly, taken into
account that single labeling with CFSE may overesti-
mate the numbers of EVs as much as by 79%, the actual
proportion of CD63� exs and EpCAM� exs may be up
to 68 and 20%, respectively. This observation confirms
previously anticipated, though poorly studied, variability
among individual exosomal types and is consistent with
our observations made by TEM, when only a fraction
of ascites-derived exs stained with antimarker antibodies
(Fig. 6b).
Taken together, our data demonstrate that exs and
MVs from variant sources can be isolated, enumerated,
and characterized via a standardized protocol and dedi-
cated FC. Our protocol provides a fast � 10�12 h (Fig. 6e)
� way to purify, quantify, and characterize EVs for both
experimental as well as diagnostic purposes.
Summary and conclusionsIn the current study, we show that fluorescently labeled
exs can be directly quantified and characterized using
dedicated FC specifically designed for the analysis of
small particles. The usefulness of dedicated FC for EV
research was already demonstrated by others (13�15).
Here we go further and present an analytical pipeline that
does not require prior hardware adjustments of the device,
which were needed for high-end conventional FC with
the existing protocols (7,12). We show that EVs can be
fluorescently labeled by combination of unspecific protein-
and lipid-specific dyes and/or primary antibodies; staining
can be performed either during cell culture or just prior
to measurements. In the latter case, there is no need to
remove the unbound fluorescent dye or fluorescently
labeled antibody and after short incubation (5�45 min
for dyes, 60 min if antibodies are used) data can be readily
acquired. These properties allow implementing FC analy-
sis directly into a routine, approximately 12 h workflow for
purification and characterization of exs from both experi-
mental and diagnostic samples.
We are aware of the fact that our approach is inferior
to the existing exemplary FC protocol (7,12) in terms
of purity and uniformity of obtained vesicular popula-
tions and their characteristics. Main advantages of our
protocol are (a) its simplicity, (b) versatility, (c) minimal
requirements on FC operator, and (d) short time required
for analysis. As such it is suitable for and aimed at
multiuser and clinical lab, where it has the potential to
bring desired level of control to the experiments involving
exs and other small EVs. We believe that the ever-growing
exosomal basic research may benefit from our protocol
and the use of dedicated FC.
Authors’ contributionsVP and VB conceived and designed the research. VP, ZD,
AK, and KK isolated the EVs and characterized them
by WB. VP and JS acquired the FC data. DK, LI, and
AH performed the electron microscopy experiments. IC,
LM, and VW collected and EJ pathologically assessed
the ascites samples. VP and VB interpreted the data and
wrote the manuscript. Each author reviewed and made
critical comments to the manuscript.
Acknowledgements
We are grateful to Oliver Kenyon (Apogee Flow Systems) for
technical support. We also thank Karel Nejedly and Karel Soucek
(IBP CAS), Pavla Jendelova and Karolina Turnovcova (IEM CAS),
and Ondrej Hovorka for technical equipment; Igor Cervenka (FS
MUNI) for help with statistics; and Iva Kubikova for tips about TEM
of EVs. We thank Pascale Zimmermann (KU Leuven) for anti Alix
antibody.
Conflicts of interest and fundingJS is also a technical assistant at the local distributor of
Apogee Flow Systems � Bio-port Europe. No other conflicts
of interest apply. This work was supported by Grant Agency
of Masaryk University, project MUNI/M/1050/2013, as well
as by Grant Agency of the Czech Republic, project GAP301/
11/0747. VP and VB were supported by the Program of
Employment of Newly Graduated Doctors of Science for
Scientific Excellence (grant number CZ.1.07/2.3.00/30.0009)
cofinanced from European Social Fund and the state budget
of the Czech Republic. ZD is supported by the FP7 In-
ternational Training Network WntsApp (code 608180).
References
1. Thery C, Ostrowski M, Segura E. Membrane vesicles as
conveyors of immune responses. Nat Rev Immunol. 2009;9:
581�93.
2. Raposo G, Stoorvogel W. Extracellular vesicles: exosomes,
microvesicles, and friends. J Cell Biol. 2013;200:373�83.
3. Stoorvogel W, Kleijmeer MJ, Geuze HJ, Raposo G. The
biogenesis and functions of exosomes. Traffic. 2002;3:321�30.
4. Bobrie A, Thery C. Exosomes and communication between
tumours and the immune system: are all exosomes equal?
Biochem Soc Trans. 2013;41:263�7.
5. Properzi F, Logozzi M, Fais S. Exosomes: the future of
biomarkers in medicine. Biomark Med. 2013;7:769�78.
6. Johnsen KB, Gudbergsson JM, Skov MN, Pilgaard L, Moos T,
Duroux M. A comprehensive overview of exosomes as drug
delivery vehicles � endogenous nanocarriers for targeted
cancer therapy. Biochim Biophys Acta. 2014;1846:75�87.
7. van der Vlist EJ, Nolte�‘t Hoen EN, Stoorvogel W, Arkesteijn
GJ, Wauben MH. Fluorescent labeling of nano-sized vesicles
released by cells and subsequent quantitative and qualitative
analysis by high-resolution flow cytometry. Nat Protoc. 2012;
7:1311�26.
Vendula Pospichalova et al.
14(page number not for citation purpose)
Citation: Journal of Extracellular Vesicles 2015, 4: 25530 - http://dx.doi.org/10.3402/jev.v4.25530

8. Dragovic RA, Gardiner C, Brooks AS, Tannetta DS, Ferguson
DJ, Hole P, et al. Sizing and phenotyping of cellular vesicles
using Nanoparticle Tracking Analysis. Nanomedicine. 2011;
7:780�8.
9. van der Pol E, Coumans FA, Grootemaat AE, Gardiner C,
Sargent IL, Harrison P, et al. Particle size distribution of
exosomes and microvesicles determined by transmission elec-
tron microscopy, flow cytometry, nanoparticle tracking analy-
sis, and resistive pulse sensing. J Thromb Haemost. 2014;12:
1182�92.
10. Gardiner C, Ferreira YJ, Dragovic RA, Redman CW, Sargent
IL. Extracellular vesicle sizing and enumeration by nanopar-
ticle tracking analysis. J Extracell Vesicles. 2013;2:19671, doi:
http://dx.doi.org/10.3402/jev.v2i0.19671
11. Witwer KW, Buzas EI, Bemis LT, Bora A, Lasser C, Lotvall J,
et al. Standardization of sample collection, isolation and
analysis methods in extracellular vesicle research. J Extracell
Vesicles. 2013;2:20360, doi: http://dx.doi.org/10.3402/jev.v2i0.
20360
12. Nolte-‘t Hoen EN, van der Vlist EJ, Aalberts M, Mertens HC,
Bosch BJ, Bartelink W, et al. Quantitative and qualitative flow
cytometric analysis of nanosized cell-derived membrane vesi-
cles. Nanomedicine. 2012;8:712�20.
13. Chandler WL, Yeung W, Tait JF. A new microparticle size
calibration standard for use in measuring smaller microparti-
cles using a new flow cytometer. J Thromb Haemost. 2011;
9:1216�24.
14. Montoro-Garcia S, Shantsila E, Orenes-Pinero E, Lozano ML,
Lip GY. An innovative flow cytometric approach for small-size
platelet microparticles: influence of calcium. Thromb Hae-
most. 2012;108:373�83.
15. Thery C, Amigorena S, Raposo G, Clayton A. Isolation and
characterization of exosomes from cell culture supernatants
and biological fluids. Curr Protoc Cell Biol. 2006;Chapter
3:Unit 3.22.
16. Lyons AB. Divided we stand: tracking cell proliferation with
carboxyfluorescein diacetate succinimidyl ester. Immunol Cell
Biol. 1999;77:509�15.
17. Weston SA, Parish CR. New fluorescent dyes for lymphocyte
migration studies. Analysis by flow cytometry and fluorescence
microscopy. J Immunol Methods. 1990;133:87�97.
18. Bohren CF, Huffman DR. Absorption and scattering of light
by small particles. New York: Wiley; 1998. 544 p.
19. Bryja V, Schulte G, Arenas E. Wnt-3a utilizes a novel low
dose and rapid pathway that does not require casein kinase
1-mediated phosphorylation of Dvl to activate beta-catenin.
Cell Signal. 2007;19:610�6.
20. van der Pol E, Hoekstra AG, Sturk A, Otto C, van Leeuwen
TG, Nieuwland R. Optical and non-optical methods for
detection and characterization of microparticles and exosomes.
J Thromb Haemost. 2010;8:2596�607.
21. Lacroix R, Robert S, Poncelet P, Kasthuri RS, Key NS,
Dignat-George F, et al. Standardization of platelet-derived
microparticle enumeration by flow cytometry with calibrated
beads: results of the International Society on Thrombosis
and Haemostasis SSC Collaborative workshop. J Thromb
Haemost. 2010;8:2571�4.
22. Shapiro HM. Practical flow cytometry. New York: Wiley-Liss;
2003.
23. van Manen HJ, Verkuijlen P, Wittendorp P, Subramaniam V,
van den Berg TK, Roos D, et al. Refractive index sensing of
green fluorescent proteins in living cells using fluorescence
lifetime imaging microscopy. Biophys J. 2008;94:L67�9.
24. van der Pol E, van Gemert MJ, Sturk A, Nieuwland R,
van Leeuwen TG. Single vs. swarm detection of microparticles
and exosomes by flow cytometry. J Thromb Haemost. 2012;10:
919�30.
25. Momen-Heravi F, Balaj L, Alian S, Mantel PY, Halleck AE,
Trachtenberg AJ, et al. Current methods for the isolation of
extracellular vesicles. Biol Chem. 2013;394:1253�62.
26. Lotvall J, Hill AF, Hochberg F, Buzas EI, Di Vizio D,
Gardiner C, et al. Minimal experimental requirements for
definition of extracellular vesicles and their functions: a
position statement from the International Society for Extra-
cellular Vesicles. J Extracell Vesicles. 2014;3:26913, doi: http://
dx.doi.org/10.3402/jev.v3.26913
27. Lamparski HG, Metha-Damani A, Yao JY, Patel S, Hsu DH,
Ruegg C, et al. Production and characterization of clinical
grade exosomes derived from dendritic cells. J Immunol
Methods. 2002;270:211�26.
28. Kipps E, Tan DS, Kaye SB. Meeting the challenge of ascites in
ovarian cancer: new avenues for therapy and research. Nat Rev
Cancer. 2013;13:273�82.
29. Mathivanan S, Simpson RJ. ExoCarta: a compendium of
exosomal proteins and RNA. Proteomics. 2009;9:4997�5000.
30. Runz S, Keller S, Rupp C, Stoeck A, Issa Y, Koensgen D, et al.
Malignant ascites-derived exosomes of ovarian carcinoma
patients contain CD24 and EpCAM. Gynecol Oncol. 2007;
107:563�71.
31. Ghossoub R, Lembo F, Rubio A, Gaillard CB, Bouchet J,
Vitale N, et al. Syntenin-ALIX exosome biogenesis and
budding into multivesicular bodies are controlled by ARF6
and PLD2. Nat Commun. 2014;5:3477.
32. Pant S, Hilton H, Burczynski ME. The multifaceted exosome:
biogenesis, role in normal and aberrant cellular function, and
frontiers for pharmacological and biomarker opportunities.
Biochem Pharmacol. 2012;83:1484�94.
Dedicated flow cytometry of extracellular vesicles
Citation: Journal of Extracellular Vesicles 2015, 4: 25530 - http://dx.doi.org/10.3402/jev.v4.25530 15(page number not for citation purpose)


