Embed Size (px)
Citation preview

A Stochastic Design Approach for Aircraft Affordability
Dimitri N. Mavris Daniel A. DeLaurentis*
Aerospace System Design Laboratory (ASDL)School of Aerospace Engineering, Georgia Institute of Technology
Atlanta, GA 30332-0150http://alpha.cad.gatech.edu
Abstrac t A novel approach to assessing aircraft system
feasibility and viability over time is presented, withspecial emphasis on modeling and estimating theimpact of new technologies. The approach is anintegral part of an overall stochastic, life-cycle designprocess under development by the authors, which is toaddress the new measure for system value, affordability.Stochastic methods are proposed since the designprocess is immersed in ambiguity and uncertainty, bothof which vary with time as knowledge increases aboutthe system behavior. The specific task of examiningsystem feasibility and viability is encapsulated andexplained in five steps in this paper. The probabilisticapproach contained in these steps is compared to moretraditional, deterministic means for examining a designspace and evaluating technology impacts. Finally, thetechniques are implemented on an example problem tohighlight the additional realism and information that isobtained. The example is based on a High Speed CivilTransport vehicle design, and is meant to illustrate thepower of the technique on a current problem ofsignificant interest to the international aerospacecommunity.
Introduction & Motivation
Since its inception, the field of multidisciplinaryanalysis and design optimization (MDA/MDO) hasoperated under a deterministic paradigm. In this setting,a design objective is identified along with an associatedset of design parameters which are varied to determinethe settings which result in an extremal value for thedesign objective. Since these elementary parametersoften arise from multiple disciplines, addressing theirinteractions while seeking their optimal values haspotentially important benefits and thus has been thecharter of the MDO community. It is the authorsÕcontention that the design process must not only address
Assistant Professor, Manager ASDL, Senior Member AIAA* NASA Multidisciplinary Analysis Fellow, Ph.D. Candidate,
School of Aerospace, Student Member AIAACopyright © 1998 by Dimitri MavrisPublished by AIAA and ICAS with permission.
interactions between traditional aerospace disciplines(e.g. aerodynamics, structures, controls, propulsion),but should also account for Òlife cycleÓ disciplines (e.g.economics, reliability, manufacturability, safety,supportability, etc.). These disciplines can bring avariety of uncertainties of differing natures to the designproblem, especially as innovation occurs within andamongst the disciplines. It is the presence ofuncertainty which demands the use of a probabilisticapproach to design synthesis. Further, since therepresentations of these uncertainties can vary in time, astochastic treatment of the design activity is moreappropriate.
As these new life cycle disciplines join thetraditional ones in the realm of aerospace systemsanalysis, new measures of goodness (objectives) areneeded. Traditional choices such as gross take-offweight, acquisition cost, and payload individually fail tofully capture all of the life cycle characteristics of asystem. A new measure has been proposed to fill thisvoid, affordability. Affordability may be viewed as ameasure of value balancing the productÕs effectivenessagainst its associated cost and risk, for a given schedule.From a product userÕs viewpoint, effectiveness includescharacteristics such as capability (performance),reliability, maintainability, safety, and other suchsystem attributes, while the costs (those incurredthroughout the life cycle) include acquisition, operation,support, financing, and disposal. Clearly, affordabilityis a multi-attribute as well as multidisciplinary figure ofmerit. From a manufacturer/developer viewpoint,effectiveness includes the same characteristics as statedwhile cost in this case encompasses the engineeringresearch, design, development, manufacture, and testingcosts (i.e., the investment needed to bring the product tomarket).
The Òdesign processÓ in the most generic sense is acontinuum of decisions made with the intent of reachingan acceptable value of some objective while satisfying aset of constraints. Accurately assessing attributes ofaffordability, especially in the early stages of design, isdifficult due to the ambiguity of requirements and the

uncertainty in the analyses. However, as severalauthors have noted (Ref. 1), decisions made during theseearly stages often commit a large portion of theeventual life cycle cost. The process is beset bysignificant uncertainty, especially at the conceptualdesign stage. In searching for good design solutions,one is interested in both feasibility (which deals withconstraints) and viability (which deals with objectives)in a probabilistic way to account for the uncertainty.The notion of design evolution with time is illustratedin Figure 1. A generic objective, or measure of valuefor the design process, is displayed as a random variablewith a time-dependent probability distribution. As thedesign evolves, it is desirable to shrink the variabilityof this objective, as well as shift its mean to moredesirable levels (Figure 1 depicts a Òlower the betterÓscenario). This description is analogous to the conceptof Òprocess capability indicesÓ which are commonlyused in manufacturing to indicate process control.
Initial Distribution Reduced Variability and Improved Mean Response
Upper Specification
Lower Specification
Conceptual Preliminary Detail
Time
OEC Target
OE
C R
and
om
Variab
leO
bjective S
toch
astic Variab
le
Figure 1: Product Design ObjectiveEvolution
The key goal as outlined in Figure 1 is to shift theobjective distribution mean and control its variance (i.e.identify, model, and mitigate uncertainty). This goalfor the design evolves through: 1) small perturbationsin existing designs, and/or 2) large shifts in theunderlying nature of the system through the applicationof technologies. Design optimization or down selectionbegins with a baseline system. Selected designvariables are then adjusted through search techniques toarrive at the optimal solution. However, instances willoccur when even the ÒoptimalÓ solution does not satisfythe customer/market desires. In this case, changes of amore fundamental nature are required. These changestake the form of technology infusions, and have thepotential to significantly increase the feasible and viabledesign spaces. However, these advances are associated
with significant development expenses, production,and/or support costs. Further, the technologies benefitsare accompanied by uncertainty, specifically theuncertainty associated with readiness, or the chance theywill perform as currently estimated. The delineationbetween incremental improvements through designvariable perturbations and the shifting of the entiredesign space through technology infusion is exemplifiedin Figure 2, in one dimension. Revolutionary designsare characterized by the introduction of totally newvariables and new engineering solutions which wereinconceivable under the limits of previous designs. Theproblem becomes more complicated when theinteractions between multiple technologies are to bemodeled and their impact evaluated. This complicationis addressed in the method to be presented andillustrated.
As an example, one can consider the propellerdriven, piston engine aircraft as a baseline concept.This baseline is shown the lower left corner in Figure 2and represents a Ò1st GenerationÓ concept. The designspace around the baseline is multidimensional, thoughit is shown in one dimension in the figure, andrepresents the possible design alternatives. Eventually,a new technology, for example an advanced propeller, isintroduced which has the effect of providing a stepincrease in thrust/weight. This is an ÒevolutionaryÓimprovement.
However, the introduction of a new type of enginecycle, the turboprop engine, was ÒrevolutionaryÓ innature resulting in significant increases in enginethrust/weight ratio through new levels of overallefficiency. The turboprop then became the Ò2ndgenerationÓ baseline. Once again evolutionaryimprovements were made, shifting the design space tonew levels of thrust/weight but not significantlychanging the nature of the space itself (i.e. how thevarious design variables relate to each other). Withtime, a second revolution took place, this time in thedrive mechanism, where the jet replaced the propeller,and the Ò3rd generationÓ baseline is formed. Theturbojet engine then evolved through the addition of afan (single or multiple stage) and improvements instage design and flow mixing technology resulting inthe turbofan engine with even greater thrust/weight andoverall efficiency levels.

Development Timeline
Baseline Concept(e.g. Piston Engine,
Propeller Driven)
Ob
ject
ive:
En
gin
e T
hru
st/W
eig
ht
(ÒH
igh
er t
he
Bet
terÓ
) ÒNew TechnologyÓ,Evolutionary Design Space(e.g. Advanced Propeller)
Evo
lutio
nary
Revolutionary Ò3rd Generation Ó,Evolutionary Design Space
(e.g. High By-pass Turbofan)EEnnggiinnee CCyycc llee ::PPiiss ttoonn ttoo TTuurrbboopprroopp
DDrr iivvee SSyysstteemm::PPrrooppeell lleerr ttoo JJeett
Revolutionary
Ò2nd GenerationÓBaseline (e.g.
Turboprop)
Ò3rd GenerationÓBaseline (e.g.
Turbojet)
Ò2nd Generation Ó,Evolutionary Design Space(e.g. Advanced Turboprop)
Evo
lutio
nary
Evo
lutio
nary
Figure 2: Design Space Evolution: Representation in One Dimension
For the designer, in the setting just described, thegoal is to find the ÒlocationÓ in the design evolutionwhich maximizes the affordability to the customer.Given risk and technology readiness information and theneeds of the customer, a revolutionary design may notprovide the most affordable solution. There appears tobe a lack of a formal methodology for systemevaluation and design which accounts for all thesecomponents: uncertainty, life cycle design, feasibility,and technology infusion. The design methodologydescribed in this paper is an initial attempt to tacklethis problem. Subsequent to the description, themethod is illustrated in an example problem involving aHigh Speed Civil Transport (HSCT) concept. TheHSCT is an excellent example in that it will require acombination of both incremental and breakthroughimprovements, working in unison, to yield a feasibleand it will be very sensitive to cost and economicissues, which are both key to affordability.
Definitions
Since many of the concepts discussed in this paperare relatively new to the design community, a few keydefinitions are offered for clarity:
System Affordability: The ultimate goal of the designprocess, affordability represents value to thecustomer, including a balance between benefits,costs, availability, and risks.
Synthesis: The recomposition of various parts ordisciplines into a design alternative through someformal algorithm. An example is aircraft synthesisthrough fuel balance, mission-based sizing.
Metric: A Figure of Merit that characterizes a disciplineor function or their related technologies (e.g. L/Dfor aerodynamics, SFC for propulsion).
Feasible Alternative: A design alternative which isphysically realizable and satisfies all imposedconstraints.
Viable Alternative: A design alternative which isfeasible and meets or exceeds the customerobjective(s) (i.e. it is technically feasible andaffordable).
Metamodel: An approximation of a complex analysismodel. Typical metamodels include regressionmodels of complex computer programs based onexperimental designs (e.g. the Response SurfaceMethod), artificial neural networks, or fuzzy sets.
Uncertainty: An estimate of the difference betweenmodels and reality. Uncertainty is manifested whenquantities associated with the product cannot bedetermined exactly.

Probabilistic Analysis: Analysis which allows for theexamination of systems with imprecise orincomplete information (i.e. uncertainty andambiguity). In other words, a means of formingrelationships between input and output variables,accounting for the variability of the inputs.
Fast Probability Integration (FPI) [Ref. 2]: A family ofprobabilistic analysis techniques characterized bybetter efficiency and transparency than Òbrute forceÓprobabilistic techniques such as the Monte Carlo(MC) Simulation.
The focus of this paper is a step-by-step approachto the search for feasible and viable design spaces in aprobabilistic fashion, possibly incorporating theinfusion of new technologies. This particular task canbe described in five main steps, which are the subject ofthe next section and are shown in Figure 3.
The Five Steps for Investigating System Feasibility and Viability
1. Define the Problem to be Tackled Rationale : Identify objectives, constraints, design
variables (and associated ranges), analyses, uncertaintymodels, and metrics for each discipline and for thesystem level. This involves translating the customerrequirements to the items listed.
Description : Techniques such as the QualityFunction Deployment (QFD), Pugh and Tree Diagrams,morphological matrices, and activity network diagramsare often used to assist in defining the engineeringproblem to be addressed by mapping the customerÕsrequirements and desirements into engineering terms.This includes establishing relationships, metrics, andthe relative importance amongst the requirements.
Y
N
N
P(feas)< esmall
Problem DefinitionIdentify objectives, constraints,
design variables (and associatedside constraints), analyses,
uncertainty models, and metrics
1
x1
x2
x3
Determine System Feasibility
Des
ign
Spa
ce M
odel
Constraint Fault Tree
C1 C2 C3 C4
AND
P(feas)
2
FPI(AIS) or Monte Carlo
...
Relax Constraints? Y
Examine FeasibleSpace
x1
x2
x3
3Constraint
Cumulative DistributionFunctions (CDFs)
C1
P
C2
P
C3
P
Des
ign
Spa
ce M
odel
FPI(AMV)or
Monte Carlo
...
Relax ActiveConstraints
?
YInfuse New Technologies
Ci
P
Old Tech.New Tech.
Re-execute Step 3to Obtain New CDFs¥ Identify Technologies
¥ Through DoE/RSM and metrics from Step 1, obtain RSEs for: Ci = fcn (discipline metric ÒkÓ- factors)
¥ Use Òk-factorÓ RSEs to select app- ropriate technologies¥ Technology Readiness Distributions
4
5Robust Design Sim.
¥ Incorporate Uncertainty Models¥ Examine Viable Space for
Robust Solution through RDS
Figure 3: Five Steps to Investigating Feasibilityand Viability of Multidisciplinary Systems

2. Determine System Feasibility Rationale : This step is focused on obtaining an
aggregate estimate of the percentage of the design spacewhich contains feasible alternatives, or the probabilityof feasibility, P(feas). This information is essential,since if there is very little chance of obtaining a feasibledesign, there is no use in searching for viable/optimalones.
Description : The design space is investigated foroccurrences of combinations of design parameters whichresult in the satisfaction of all constraints. This isformulated as a reliability problem, utilizing fault treeanalysis.2 Uniform frequency distributions are assignedfor each design variable, indicating that all the pointswithin the space are equally likely to be selected duringthe feasibility computation. However, if uncertainty isto modeled at this stage, separate distributions for eachuncertain variable can be used. The box labeled Ò2Ó inFigure 3 depicts the computation of P(feas).
P(feas) is normally computed through a MonteCarlo simulation using the above mentioneddistributions and an analysis code which computes theconstraint values given settings of the variables. Thistask may be computationally expensive (especially ifthe required analyses are complex and a standard MonteCarlo approach is used to select points). However,through the use of the Adaptive Importance Sampling(AIS) technique from the FPI family described in Ref.3, the search efficiency can be improved. If thecomputational effort remains a problem, ametamodel/Monte Carlo approach can be used, asdescribed in Ref. 4. In any case, the result of this stepis a single number: the probability of feasibility,P(feas).
3. Investigate Active Constraints Rationale : As indicated in Figure 3, a decision node
occurs at the end of Step 2. If the system achieves anacceptable P(feas), then proceed to Step 5, whichinvolves the search for robust design solutions. If thesystem achieves an unacceptably low (or zero) P(feas),an investigation must be performed to find out whichconstraints are active and most restrictive. Crispdefinitions for the fuzzy modifiers ÒacceptableÓ andÒunacceptably lowÓ are at the discretion of the designer.
Description : If P(feas) is low, the constraints areinvestigated on an individual basis. Thus, unlike thesystem feasibility problem, there is no fault treestructure. The design variables are once again given
uniform distributions and a cumulative distributionfunction (CDF) for each constraint is formed whichrepresents the probability of achieving specific valuesfor the constraint. When the current constraint valuesfor the specific problem at hand are overlaid on theCDFs, the active constraints are clearly discovered.Once this identification is made, there are two avenuesavailable to Òopen the feasible spaceÓ (i.e. increaseP(feas)):
a) Relax the current active constraints (and return toStep 2)
b) Infuse new technologies in hopes of shifting thedesign space to overlap the feasible space (proceedto Step 4)
4. Infuse New Technologies (and perform TechnologyImpact Forecast)
Rationale : The infusion of new technologies maybe required to increase the P(feas) value. Newtechnologies almost always affect the underlyingphysics of the design space, but not necessarily thegeometry of the space itself, as defined through thedesign variable ranges (see Figure 2). New technologiescontain three elements whose impact must be accountedfor: benefits, penalties, and confidence estimates.
Description : For complex systems, the search forfeasible and viable solutions often will involve theapplication of multiple new technologies. The abilityto accurately predict the tradeoffs between (and within)alternative technologies from a benefit, risk, andaffordability viewpoint is of tremendous value to thedesigner/decision maker. This ability first requires theidentification of appropriate metrics related to each newtechnology. Normally, design parameters are used tofeed an analysis routine to generate metric values. Forexample, wing planform and airfoil geometry are inputsto an aerodynamics routine which computes forces andmoments which are subsequently integrated to form liftand drag estimates. For a ÒnewÓ aerodynamictechnology, such as Circulation Control, there may notbe an analysis routine which can translate theseconventional inputs into lift and drag estimates whichrepresent the performance of the technology. Aninterim solution is to define metrics for the newtechnology as a delta with respect to a currenttechnology baseline. This is done through theintroduction of technology Òk-factorsÓ. These factorsmodify the technology metrics as computed duringanalysis, simulating technology benefits (and penalties).Subsequently, the Response Surface Method (RSM) isused to form relationships between the constraints and

the various metric Òk-factorsÓ, so that Response SurfaceEquations (RSEs) are obtained for constraints as afunction of technology Òk-factorsÓ. These RSEs allowfor rapid sensitivity computation and for conductingbenefit/cost investigations for new technologies.
While the Òk-factorsÓ represent technologyimprovements in a generic way, a time comes whenspecific technologies are proposed. This newinformation must be modeled and utilized to create moreconfident technology impact assessments. The newinformation provided by specific technologies comes intwo forms: 1) numerical benefits and penalties tosystem metrics as estimated from research by thetechnologists and evaluation by designers 2) the relativereadiness of the technology as measured from a standardscale.5
The infusion of new technologies are targetedtowards opening the feasible design space by affectingthe constraints. However, in doing so, penalties maybe incurred in other disciplines as the ÒpriceÓ of thebenefits. For example, any type of auxiliary blowingor suction on the wing to improve aerodynamicperformance requires extra weight for ducting, possiblebleed mass flow from the engine(s), and additionalresearch, production, and maintenance costs. Thus, Òk-factorsÓ for penalties as well as benefits must beemployed to provide as accurate a picture as possible ofthe worth of a technology or set of technologies.
Benefit/penalties by themselves still do notcomplete the modeling required. The projected benefitsof new technologies contain an element of uncertainty;thus the estimated target benefit level is based onincomplete knowledge. This type of information isrepresented through probability distributions based on
the best available information on the readiness of thetechnology. Also, since these technologybenefits/penalties are estimates, it is logical to treattheir effects probabilistically instead ofdeterministically.
Figure 4 summarizes the technology modelingprocess, where benefits/penalties are modeled as stepchanges in the mean of a distribution formed to capturethe confidence estimate. The technology metrics shownfor illustration purposes are typical of those used forcommercial aircraft: lift-to-drag ratios, maximum liftcoefficients, component weights, specific fuelconsumption, and maintenance man hours per flighthour.
Once selected, new technologies are used in a re-execution of Step 3 to obtain new cumulativedistribution functions for the constraints. These newCDFs should show an increased probability of meetingthe constraints.
5. Robust Design SimulationSteps 1-4 are concerned with feasibility, since only
constraints are considered. When a large enoughfeasible space is found, this space can be searched forrobust solutions. Here, the objective function isintroduced, as well as any uncertainty models to beconsidered in the problem. RDS is a systematicprocedure for finding settings of design variables whichmaximize the probability of meeting or surpassing atarget for the objective, while satisfying the constraints.Step 5 is not covered in this paper, but the reader isencouraged to review Refs. 6 and 7 for detaileddescription of the RDS.
Objective = f(L/Dcruise, L/DTO, CLmax, (Wwing , SFC, MMH/FH, . .)
Constraint = f(L/Dcruise, L/DTO, CLmax, Wwing , SFC, MMH/FH, . .)
+10% +5% +7% -3% +5% -5%(Step Change in Mean)
(Variability)
1. Create functional relationships between Objectives/Constraints and technology metrics
2. Model technology benefits and penalties through metric Òk-factorsÓ
3. Assign probability distributions to the technology metrics to develop confidence estimates and CDFs
(Wwing)/ft^2
(Wwing)/ft^2
Figure 4: Addressing Technology Benefits, Penalties and Confidence

This 5-step process embodies a probabilisticmethodology for technology impact forecasting forfeasibility and viability, resource allocation, etc.Function approximation techniques, probabilisticanalysis methods, and optimization are all used in theappropriate places throughout the five steps.
Method Implementation
The implementation involves the system leveldesign of an High Speed Civil Transport (HSCT), toexpand on the concepts introduced and to show howrelevant the method is to current problems of interest.Once again, the HSCT problem centers on determiningdesign feasibility first and then economic viabilitythrough the RDS. A detailed application of this methodfor a subsonic, Very Large Transport (VLT) can befound in Ref. 8. General references on the HSCTaircraft and the use of the Response SurfaceMethodology (RSM) in its design include Refs. 9, 10,and numerous others found therein.
Step 1: Previous studies by the authors and theircolleagues have been carried out, such as those in Refs.6, 9, and 11, which document a detailed problemformulation for the HSCT design. The followingserves as a brief summary of the problem description forthe HSCT conceptual synthesis/design application:
Objective: min Average Required Yield per RevenuePassenger Mile ($/RPM)
A measure of Affordability for commercial aircraft, the$/RPM is the minimum (average) price, on a perpaying passenger mile basis, the airline must charge inorder to achieve specified return on investments (ROI)for the manufacturer and the airline itself. In this study,this metric is calculated using the Aircraft Life CycleCost Analysis (ALCCA) program, developed jointly bythe Aerospace Systems Design Laboratory at GeorgiaTech and NASA Ames System Analysis Branch.12
Acquisition Price (ACQ$) is also tracked as analternative objective.
Constraints: Takeoff Field Length (TOFL), FAR 36Flyover Noise (FON), FAR 36 Sideline Noise (SLN),Landing Approach Speed (VAPP)
In order to be economically viable, the HSCT mustbe certified to operate at all airports that its subsoniccompetitors utilize. This translates to severalperformance constraints, four of which are studied here.The constraint values are all in the Federal Aviation
Regulations (FARs). The TOFL constraint is themaximum of 115% of the all-engine operating takeoffdistance and the balanced field length. The balance fieldlength is the maximum of the following distances: Oneengine-out aborted takeoff distance, all enginesoperating aborted takeoff distance, and the one engineout takeoff distance.
The FON and SLN are computed at takeoff atobserver locations as described in the FAR Part 36regulations.13 The unit of measure is the EffectivePerceived Noise Level in decibels (EPNLdb). This unitcaptures both the frequency and time integrated effect ofa noise source. The limits for these two constraints area function of gross weight, to an upper limit where theybecome invariant with gross weight. For our purposes,the limits will be treated as constant as described inTable 1. Ref. 14 is an excellent reference on HSCTnoise issues and possible solutions. The approachspeed constraint is mainly a function of the allowablemaximum lift coefficient (CLmax) available in landingconfiguration (i.e. leading and trailing edge flapsdeflected). This maximum CL as well as a landing dragpolar are required inputs to the synthesis code, with themain landing-related outputs being the approach speedand the landing field length. The maximum angle ofattack for landing can also limit the CLmax. Table 1summarizes the objectives and constraints.
Design Variables: Wing geometry, engine cycleparameters, thrust-to-weight ratio, wing area
The wing geometry is defined parametrically through aset of Cartesian coordinates with origin at the wing rootleading edge. All of these values are normalized by thewing semi-span.
Table 1: Constraints and Objectives
Response RequirementAvg. Req. Yield/Rev. Psg.
Mile (¢/RPM)minimize
Takeoff Field Length (TOFL) < 11,000 ftFAR 36 Flyover Noise (FON) < 106 EPNLdBFAR 36 Sideline Noise (SLN) < 103 EPNLdB
Approach Speed(VAPP) < 155 kts
Metrics: Allowable CLmax ,CDsup, , Noise Suppression,Wnozzle, Acquisition cost complexity factor, Productioncost complexity factor, O&S cost complexity factor

Tools : Sizing/Synthesis code (specifically the FLightOPtimization System, FLOPS)15, various aerodynamicanalysis, airline/manufacturer economics
The symbols, ranges, and limits for the designvariables appear in Table 2. The HSCT baseline isassumed to have a cranked delta wing planform, asshown in Figure 5. Thus, the ÒkinkÓ location (thepoint of discontinuity in leading edge sweep) is animportant design parameter. Variables X1 and Y1 ,which define the kink location, are normalized by thesemi-span. The engine cycle is a Mixed Flow Turbofantype and the thrust per engine is in the 50-75,000 poundclass. There are four engines.
Y1
X1X5
Figure 5: HSCT Wing PlanformVariable Definitions
Step 2 : Using the DoE/RSM method, a set of systemlevel response surface equations (RSEs) for the HSCTdesign space was obtained. This set of metamodels isused in this step to investigate system feasibility bycomputing P(feas) via Monte Carlo Simulation.Prediction profiles for the models are given in Figure 6.
Table 2: Design Space Definition
VariableRange
Ò-1Ó Ò+1ÓThrust to Weight Ratio
(TWR) 0.28 0.32Wing Area, sq. ft.
(SW) 8500 9500Longitudinal Kink
Location (X1) 1.54 1.62Spanwise KinkLocation (Y1) 0.5 0.58
Root Chord(X5) 2.19 2.35
Overall Pressure Ratio(OPR) 19 21
Turbine InletTemperature (TIT), oR 3000 3250
Fan Pressure Ratio(FPR) 3.5 4.5
D%
GW
11.26671
-12.3424
0.000017
D%
$/R
PM
7 .86971
-8.51556
-0.00033
TOFL
14862.7
11219.8
12809.63
FON
123.1
117.46
120.8147
SLN
125.85
123.18
124.5515
VA
PP
174.9
150.8
161.6776
TWR
-1 10
SW
-1 10
X1
-1 10
Y1
-1 10
X5
-1 10
OPR
-1 10
TIT
-1 10
FPR
-1 10
0
0
Figure 6: Prediction Profiles for HSCT System Level Constraints

Takeoff and landing drag polars were not modifiedfrom case to case, but the field lengths and approachspeed vary due to the weight variation. Results for thegross weight and $/RPM responses are normalized to abaseline vehicle, due to the competition sensitive natureof these metrics. The baseline was chosen to be thevehicle corresponding to center point settings for thedesign variables. To compute P(feas), uniformdistributions are assigned to the control variables andthe noise variables are fixed at their expected value. Thevalue of P(feas) is quite important here, since it isdifficult to estimate the feasibility ratio graphically orby other means. However, one can still look at atraditional, deterministic design plot. Such a plot isshown in Figure 7. After the simulation is run, thecomputed probability is found as P(feas)»0.
H o r i z V e r t Fac torTWRSWX1Y1X5OPRTITFPR
Current X 0 0 0 0 0 0 0 0
Grid Density20 x 20
UpdImm
ResponseD%GWD%$/RPMTOFLFONSLNVAPP
Contour ¥ 0
11000 106 103 155
Current Y0.0000174-0.000333 12809.63
120.81475124.55147161.67755
Lo Limit ¥ ¥ ¥ ¥ ¥ ¥
1
TWR
- 1
D%$/RPM
- 1 SW 1
0.28
0.32
8500 9500
TWR
SW
TOFL, VAPP, FON, SLN are violated
D$/RPM
Figure 7: Design Space Snapshot:Multiple Constraint Violation
Step 3 : Since there is no feasible space, theindividual constraints must be investigated to see whichare the most restrictive. There are three options at thispoint to compute the constraint CDFs: 1) perform aMC simulation using the actual synthesis code, 2)perform a MC simulation using the above RSEs, or 3)use one of the FPI family of techniques. Option 1 willalmost always be impractical due to inordinatecomputing time. In the current case, the second optionof using a Monte Carlo simulation (5,000 samples) in
conjunction with FLOPS to create CDFs for TOFL,FON, SLN, and VAPP is selected. Refs. 2 and 16 arerecommended for details on the AMV method andinstances when it is of most usefulness. Figure 8below displays the CDFs for the four HSCT constraintsunder study. The individual probability within thisdesign space of achieving the TOFL, FON, SLN, andVAPP constraints was found to be approximately zero.Clearly, then, the nil value for P(feas) is not surprising.
.000
.250
.500
.750
1.000
11,500 12,188 12,875 13,562 14,250
Pro
babi
lity
Takeoff Field Length (TOFL), ft.
.000
.250
.500
.750
1.000
118.5 119.6 120.8 121.9 123.0
Pro
babi
lity
Flyover Noise (FON), EPNLdb
.000
.250
.500
.750
1.000
123.5 124.0 124.5 125.0 125.5
Pro
babi
lity
Sideline Noise (SLN), EPNLdb
.000
.250
.500
.750
1.000
152 157 161 166 170
Pro
babi
lity
Approach Speed (VAPP), kts.
Figure 8: CDFs for the FourConstraints, Monte Carlo Simulation
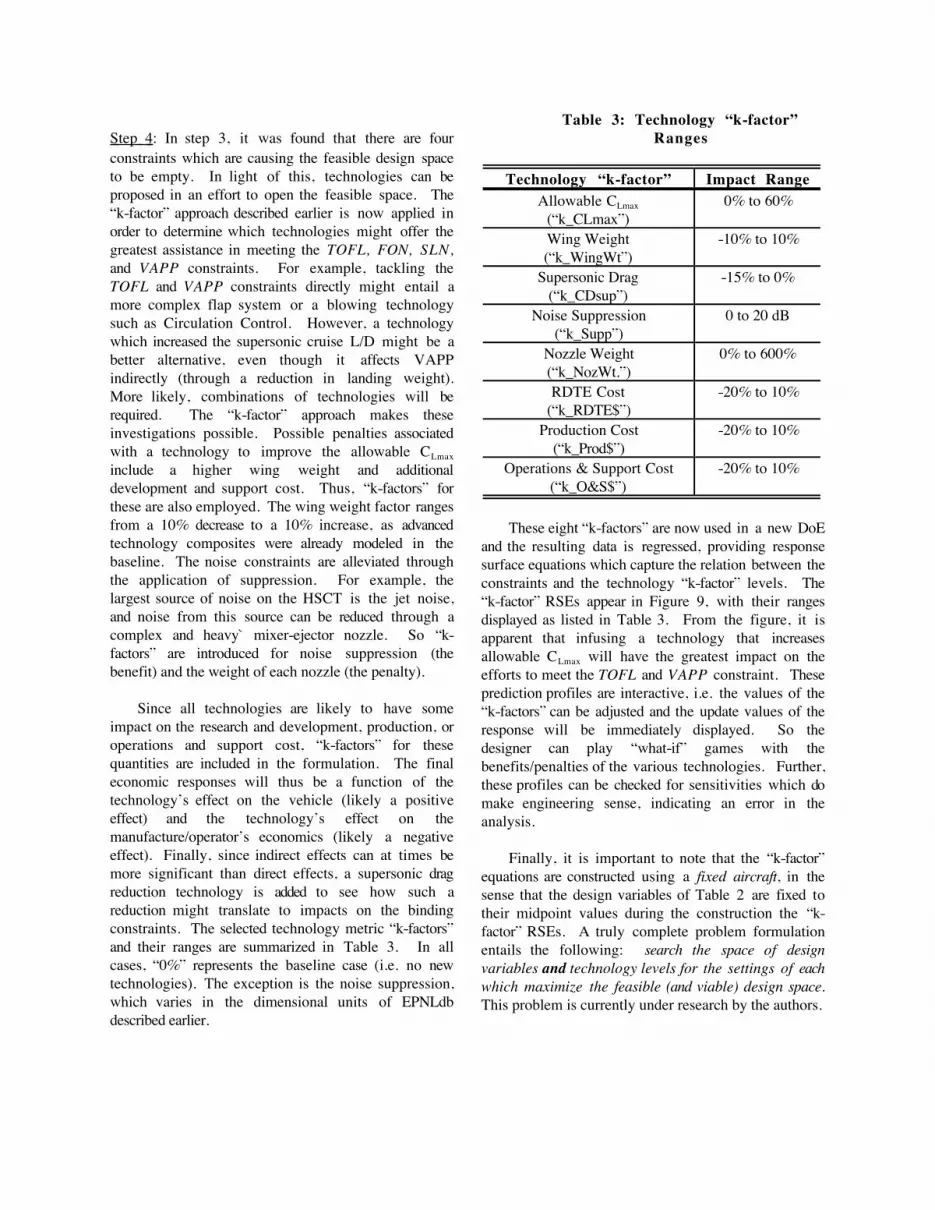
Step 4 : In step 3, it was found that there are fourconstraints which are causing the feasible design spaceto be empty. In light of this, technologies can beproposed in an effort to open the feasible space. TheÒk-factorÓ approach described earlier is now applied inorder to determine which technologies might offer thegreatest assistance in meeting the TOFL, FON, SLN,and VAPP constraints. For example, tackling theTOFL and VAPP constraints directly might entail amore complex flap system or a blowing technologysuch as Circulation Control. However, a technologywhich increased the supersonic cruise L/D might be abetter alternative, even though it affects VAPPindirectly (through a reduction in landing weight).More likely, combinations of technologies will berequired. The Òk-factorÓ approach makes theseinvestigations possible. Possible penalties associatedwith a technology to improve the allowable CLmax
include a higher wing weight and additionaldevelopment and support cost. Thus, Òk-factorsÓ forthese are also employed. The wing weight factor rangesfrom a 10% decrease to a 10% increase, as advancedtechnology composites were already modeled in thebaseline. The noise constraints are alleviated throughthe application of suppression. For example, thelargest source of noise on the HSCT is the jet noise,and noise from this source can be reduced through acomplex and heavy` mixer-ejector nozzle. So Òk-factorsÓ are introduced for noise suppression (thebenefit) and the weight of each nozzle (the penalty).
Since all technologies are likely to have someimpact on the research and development, production, oroperations and support cost, Òk-factorsÓ for thesequantities are included in the formulation. The finaleconomic responses will thus be a function of thetechnologyÕs effect on the vehicle (likely a positiveeffect) and the technologyÕs effect on themanufacture/operatorÕs economics (likely a negativeeffect). Finally, since indirect effects can at times bemore significant than direct effects, a supersonic dragreduction technology is added to see how such areduction might translate to impacts on the bindingconstraints. The selected technology metric Òk-factorsÓand their ranges are summarized in Table 3. In allcases, Ò0%Ó represents the baseline case (i.e. no newtechnologies). The exception is the noise suppression,which varies in the dimensional units of EPNLdbdescribed earlier.
Table 3: Technology Òk-factorÓRanges
Technology Òk-factorÓ Impact RangeAllowable CLmax
(Òk_CLmaxÓ)0% to 60%
Wing Weight(Òk_WingWtÓ)
-10% to 10%
Supersonic Drag(Òk_CDsupÓ)
-15% to 0%
Noise Suppression(Òk_SuppÓ)
0 to 20 dB
Nozzle Weight(Òk_NozWt.Ó)
0% to 600%
RDTE Cost(Òk_RDTE$Ó)
-20% to 10%
Production Cost(Òk_Prod$Ó)
-20% to 10%
Operations & Support Cost(Òk_O&S$Ó)
-20% to 10%
These eight Òk-factorsÓ are now used in a new DoEand the resulting data is regressed, providing responsesurface equations which capture the relation between theconstraints and the technology Òk-factorÓ levels. TheÒk-factorÓ RSEs appear in Figure 9, with their rangesdisplayed as listed in Table 3. From the figure, it isapparent that infusing a technology that increasesallowable CLmax will have the greatest impact on theefforts to meet the TOFL and VAPP constraint. Theseprediction profiles are interactive, i.e. the values of theÒk-factorsÓ can be adjusted and the update values of theresponse will be immediately displayed. So thedesigner can play Òwhat-ifÓ games with thebenefits/penalties of the various technologies. Further,these profiles can be checked for sensitivities which domake engineering sense, indicating an error in theanalysis.
Finally, it is important to note that the Òk-factorÓequations are constructed using a fixed aircraft, in thesense that the design variables of Table 2 are fixed totheir midpoint values during the construction the Òk-factorÓ RSEs. A truly complete problem formulationentails the following: search the space of designvariables and technology levels for the settings of eachwhich maximize the feasible (and viable) design space.This problem is currently under research by the authors.

D%
$RP
M17.54251
-15.7219
1.000038
D%
AC
Q$
17.01048
-14.242
1.99999
TOFL
13944
5770
9745.637
FON
121.6
99.21
108.8662
SLN
124.61
101.51
111.9564
VA
PP
161.6
111.8
134.3116
0
-10
%
25
dB
k_CLmax k_WingWt k_CDsup k_Supp k_NozWt k_RDTE$ k_Prod$ k_O&S$
0%
60
%
-10
%
10
%
0% 0
0%
600
%
-5%
10
%
-5%
10
%
-5%
10
%
0
Figure 9: Interactive Òk-FactorÓ Response Surface Equations
Incorporating Technology Confidence Estimates : Theactual benefits/penalties of proposed technologies areuncertain, due to the fact that the estimates are based onthe readiness. The lower the readiness, the higher theuncertainty in the estimate. As mentioned earlier,technology confidence information can be modeled byassigning probability distributions for each of themetric Òk-factorsÓ. In this way, the factors are modeledas random variables with specific distributioncharacteristics. Subsequently, a Monte Carlosimulation is performed for a fixed airplane, but withvariability in the responses due to the Òk-factorÓdistributions. Figure 9 indicates that technologieswhich provided noise suppression and increased CLmax
may create feasible space by affecting the HSCTÕsbinding noise, TOFL and VAPP constraints,respectively. An advanced mixer-ejector nozzle wouldbe a likely candidate technology to supply the noisesuppression while the use of Circulation Control hasbeen proposed as a potentially efficient low speed liftaugmentation system.17 The addition of a HybridLaminar Flow Control (HLFC) technology insupersonic flight helps in all areas by reducing theoverall vehicle weight, though it will, along with
Circulation Control, require bleed flow from the engineswhich may impact the engine sizing activity. At thisstage, in an actual technology impact forecast effort,specialists in these three technologies would be queriedfor their opinion on the benefits, penalties, readiness ofthe three concepts. With this information, frequencydistributions for the eight Òk-factorsÓ in the HSCTproblem are constructed, as shown in Table 4. Ofcourse, some Òk-factorsÓ will not be affected by sometechnologies. The expert opinion of the technologistsare key to forming these distributions in a meaningfulway, as they are intended to represent a forecast of thepossible impacts of specific technologies. For now, thepercentages in Table 4 are notional, and research iscontinuing in search of efficient ways of estimatingtechnology benefits/penalties.
Accurate estimates for the RDT&E, Production,and O&S cost penalties can be especially difficult, evenfor individuals most involved in a specific technologydevelopment program. One approach which can addinsight into the formation of cost penalty estimatesinvolves a decomposition of the major categories intotheir components and sub-components. For example,the RDT&E investment for a specific technology

consists of such items as engineering man hours cost,initial tooling cost, project management costs, etc.These categories may be much easier to estimate thanthe total RDT&E cost for a given technology. ThisÒzoomingÓ approach to new technology cost impactestimation is currently under investigation by theauthors.
If only the deterministic information in Table 4 isused, the effect of technology infusion is seen throughan update of the design space as displayed in Figure 7.The effective increase of 60% in allowable CLmax andfull suppression for the jet and fan are included in theaircraft sizing analysis. The new, or ÒevolutionaryÓdesign space snapshot is displayed in Figure 10. Thefeasible space has been increased tremendously, withregards to all the formerly binding constraints. This isindicated by the Òwhite spaceÓ region. However, forother combinations of design variables, the feasiblespace may be small, even with the infusion of newtechnologies. And, the additional information providedby the confidence estimates is not accounted for at all insuch a plot.
1
TWR
- 1
D%$/RPM
- 1 SW 1
H o r i z V e r t Fac torTWRSWX1Y1X5OPRTITFPR
Current X 0 0 0 0 0 0 0 0
Grid D20 x
ResponseD%$/RPMTOFLmodFONmodSLNmodVAPPmod
Contour 0
11000 106 103 155
Current Y-0.0003337809.629798.814749102.55147131.67755
0.28
0.32
8500 9500
TWR
SW
=0
Figure 10: New Design Space Plot,Showing the Opening of Feasible
Space
Table 4: Technology EstimateDistributions, An Example Scenario
K-FactorTech#1Mixer-EjectorNozzle
Tech#2CC
Tech#3
HLFC
ConfidenceEstimate Frequency
Distribution
Dk_CLmax - +60% -
0.50 0.53 0.55 0.57 0.60
Fre
quen
cy
Dk_WingWt
+3% +3% +2%
0.06 0.07 0.08 0.09 0.10
Fre
quen
cy
Dk_CDsup - - -15%-
-0.18 -0.17 -0.15 -0.14 -0.12
Fre
quen
cy
Dk_Supp 19db 4db -
20.90 21.95 23.00 24.05 25.10
Fre
quen
cy
Dk_NozWt +580% - -
5.59 5.70 5.80 5.91 6.01
Fre
quen
cy
Dk_RDTE$ +5% +2% +1%
0.06 0.07 0.08 0.09 0.10
Fre
quen
cy
Dk_Prod$ +5% +1% +2%
0.06 0.07 0.08 0.09 0.10
Fre
quen
cy
Dk_O&S$ +2% +2% +2%
0.03 0.04 0.06 0.07 0.09
Fre
quen
cy
To more completely examine the effects of thistechnology infusion on the HSCT, a Monte Carlosimulation consisting of 5,000 samples was performedusing the RSEs shown in Figure 9 and the randomvariable distributions in Table 4. The key results arecontained in the CDFs for the four active constraints(TOFL, FON, SLN, VAPP), which appear in Figure11. Under this technology scenario, the baselinevehicle has a probability of one (in the limit) ofmeeting all but the SLN constraints. The probabilityof meeting the SLN constraint is about 30%. Theusefulness of the CDF representation is apparent, inthat they give a estimate of the confidence in satisfyingthe constraints through the probability measure. Thistype of information is not available in the traditionaldeterministic design plot as in Figure 10.
In addition to feasibility, system viabilityobjectives can be investigated simultaneously. For the

HSCT, these technology improvements come with aprice: an increase in the ticket price required to ensureeconomic success of the aircraft. This can be seen inFigure 12, which contains the CDF for D%$/RPMwhich resulted from the Monte Carlo simulation used togenerate the constraint CDFs. For example, there is aprobability of about 50% that the percentage increasefor this objective would be about 4%, a modest but notinsignificant increase.
.000
.250
.500
.750
1.000
6,600 6,850 7,100 7,350 7,600
Pro
babi
lity
Takeoff Field Length (TOFL), ft.
.000
.250
.500
.750
1.000
99.2 99.9 100.6 101.3 102.0
Pro
babi
lity
Flyover Noise (FON), EPNLdb
Pro
babi
lity
.000
.250
.500
.750
1.000
102.0 102.8 103.5 104.2 105.0
Sideline Noise (SLN), EPNLdb
Pro
babi
lity
Approach Speed (VAPP), kts.
.000
.250
.500
.750
1.000
118.5 119.9 121.2 122.6 124.0
Figure 11: Technology ImpactForecast, Including Confidence
Estimates: Constraint CDFs forBaseline Aircraft
.000
.250
.500
.750
1.000
1.00 2.50 4.00 5.50 7.00
Pro
babi
lity
D%($ / RPM)
Figure 12: CDF for D%($/RPM)Objective
Step 5 : Having created a feasible space through the useof technology infusion, the designerÕs next task is tosearch in this space for robust design solutions. Thisdone through execution of the Robust DesignSimulation (RDS) methods. The performance of theRDS for the HSCT is outside the scope of this paper,but is described in the aforementioned references.
Current and Future Work
Key further developments in this approach includeresearch into the simultaneous examination of designvariables and technology levels in the search for feasibleand viable design spaces, in the presence oftechnological uncertainty. Also, investigations areunder way with regards to methods for consistent andaccurate predictions of technology benefits, penalties,and readiness levels.
Conclusions
This paper described elements of a novel approachin aerospace systems design, specifically for the task ofsearching for feasible and viable design spaces in aprobabilistic fashion, including the possibility ofincorporating new technologies. A five step procedurewas described, including steps for problem formulation,system feasibility estimation, individual constraintinvestigation, technology identification and impactforecasting, and robust optimization. A key focus wasthe ability to identify and choose among a group of newtechnologies whose infusion could benefit the systemperformance, while simultaneously accounting for theirpenalties and the relative confidence in their ultimateperformance .
Overall, the primary benefits gained from this newapproach are:¥ A comprehensive, step-by-step algorithm for
determining system feasibility and viability
· An intuitive and graphical examination of systemfeasibility without excessive analysis requirements
· Accessibility of information on the mostinfluential and binding constraints, and
· A logical, accurate way to assess the benefits andpenalties of new technologies (including confidenceestimates) in early design stages
The ease of implementation of the approach wasdemonstrated on an example problem involving thedesign space investigation for a High Speed CivilTransport aircraft. Since the original design space forthe baseline vehicle was found to have a very smallprobability of feasibility, technology Òk-factorsÓ wereused to identify technologies which could alleviate thebinding constraints. The effects of the identifiedtechnologies were simulated and the probability ofachieving feasible solutions was increased by theinfusion of new technologies, accounting for benefits,penalties, and confidence estimates in the forecast.
Acknowledgments
The authors wish to acknowledge the US NavyOffice of Naval Research (Grant N00014-97-1-0783),for sponsoring the technology impact forecastingmethodology portion of this research; the US NationalScience Foundation (DMI-9734234), for sponsoring theportion of this work related to development of astochastic approach to designing affordable,environmentally acceptable systems; and the NASALangley- Systems Analysis Branch (Grant NAG-1-1793), for sponsoring the development of many of thetools and models used in the HSCT implementation.The authors also thank Elena Garcia of the ASDL forher assistance in the economic analysis.
References
1 Schrage, D. P., and Mavris, D. N.,"Recomposition: The Other Half of the MDOEquation,Ó Multidisciplinary Design Optimization:State-of-the-Art, in Proceedings in AppliedMathematics- SIAM, Vol. 80, 1997, pp. 432-447.
2 Southwest Research Institute (SwRI), FPI UserÕs and Theoretical Manual , San Antonio, TX, 1995.
3 Wu, Y.T., ÒComputational Methods for EfficientStructural Reliability and Reliability SensitivityAnalysis,Ó AIAA Journal, Vol. 32, No. 8, Aug. 1995.pp. 1717-1723.
4 Bandte, O., Mavris, D. N., ÒA ProbabilisticApproach to Multivariate Constrained Robust DesignSimulation,Ó Oct. 1997, AIAA/SAE Paper 97-5508.
5 Mavris, D.N., Bandte, O., ÒA Method for theIdentification and Assessment of Critical Technologies
Needed for and Economically Viable HSCT,Ó Sept.1995, AIAA 95-3887.
6 Mavris, D.N., Bandte, O., and Schrage, D.P.,ÒApplication of Probabilistic Methods for theDetermination of an Economically Robust HSCTConfiguration,Ó 6th AIAA/USAF/ISSMO Symposiumon Multidisciplinary Analysis and Optimization,Bellevue, WA, 1996.
7 DeLaurentis, D.A., Calise, A., Schrage, D.P.,Mavris, D.N., ÒReduced Order Guidance Methods andProbabilistic Techniques in Addressing MissionUncertaintyÓ, Sept., 1996, AIAA 96-4174.
8 Mavris, D.N., Mantis, G.C., Kirby, M.R.,ÒDemonstration of a Probabilistic Technique for theDetermination of Aircraft Economic ViabilityÓ, Oct.1997, AIAA/SAE 97-5585.
9 DeLaurentis, D.A., Mavris, D.N., and Schrage,D.P., ÒSystem Synthesis In Preliminary AircraftDesign Using Statistical Methods,Ó Proceedings of the20th International Congress of the AeronauticalSciences (ICAS), Sorrento, Italy, September, 1996, pp.866-878.
10 Mavris, D.N., Bandte, O., and Schrage, D.P.,ÒEffect of Mission Requirements on the EconomicRobustness of an HSCT,Ó Journal of Parametrics,Vol. 17, No. 1, Spring 1997, pp. 53-77.
11 National Research Council, U.S. Supersonic Commercial Aircraft- Assessing NASAÕs High Speed Research Program , National Academy Press,Washington, D.C., 1997.
12 Galloway, T.L., and Mavris, D.N., Aircraft LifeCycle Cost Analysis (ALCCA) Program, NASA AmesResearch Center, September 1993.
13 DOT/FAA Noise standards: Aircraft Type andAirworthiness Certification, FAR Part 36, January 1,1990.
14 Olson, E.D., ÒAdvanced Takeoff Procedures forHigh Speed Civil Transport Community NoiseReduction,Ó SAE-92-1939, Oct. 1992.
15 McCullers, L.A. Flight Optimization SystemUserÕs Guide, Version 5.7, NASA Langley ResearchCenter, 1995.
16 Wu, J.T., Millwater, H.R., Cruse, T.A.,ÒAdvanced Probabilistic Structural Analysis Methodfor Implicit Performance Functions,Ó AIAA Journal,Vol. 28., No. 9, Sept. 1990. pp. 1663-1669.
17 Englar, R.J., Niebur, C.S., Gregory, S.D.,ÒPneumatic Lift and Control Surface TechnologyApplied to High Speed Civil TransportConfigurations,Ó Jan. 1997, AIAA 97-0036.


