Embed Size (px)
Citation preview
A New Measure of Medication Affordability
BECKY BRIESACHER,Division of Geriatric Medicine, University of Massachusetts Medical School, Worchester,Massachusetts, USA
DENNIS ROSS-DEGNAN,Harvard Medical School and Harvard Pilgrim Health Care, Boston, Massachusetts, USA
ALYCE ADAMS,Harvard Medical School and Harvard Pilgrim Health Care, Boston, Massachusetts, USA
ANITA WAGNER,Harvard Medical School and Harvard Pilgrim Health Care, Boston, Massachusetts, USA
JERRY GURWITZ, andDivision of Geriatric Medicine, University of Massachusetts Medical School, Worchester,Massachusetts, USA
STEPHAN SOUMERAIHarvard Medical School and Harvard Pilgrim Health Care, Boston, Massachusetts, USA
AbstractThis study developed a new measure of medication affordability that examines out-of-pocket drugexpenses relative to available household resources. The authors assessed the spending patterns of~2.1 million poor households (≤100% federal poverty level) of adults aged 51 and older by Medicaidstatus. The data were drawn from the 2000–2001 Health and Retirement Study. Household spendingwas categorized into three broad types: basic living, health care, and discretionary. Older (aged 51or older) poor households without Medicaid allocated about 72% of their total resources ($17,421,SE $783) to basic living needs. In comparison, those with Medicaid had scarcer total resources($12,498, SE $423) and allocated 85% to basic living needs. Medication costs consumed the largestproportion of health care expenses for both types of poor households (Medicaid: $463, SE $67; non-Medicaid: $970, SE $102). After paying for basic living needs and health care costs, these familieshad, on average, only $16 left each week. Poor families have very few resources available for anythingbeyond basic living needs, even when they have Medicaid coverage. There is no great reservoir ofdiscretionary funds to pay for increases in cost-sharing under Medicaid and Medicare Part D.
KeywordsAffordability; low-income; prescription drugs
Address correspondence to Becky Briesacher, Division of Geriatric Medicine, University of Massachusetts Medical School, 377Plantation Street, Biotech Four, Suite 315, Worcester, MA 01605, USA. [email protected]'s Disclaimer: Full terms and conditions of use: http://www.informaworld.com/terms-and-conditions-of-access.pdfThis article may be used for research, teaching and private study purposes. Any substantial or systematic reproduction, re-distribution,re-selling, loan or sub-licensing, systematic supply or distribution in any form to anyone is expressly forbidden.The publisher does not give any warranty express or implied or make any representation that the contents will be complete or accurateor up to date. The accuracy of any instructions, formulae and drug doses should be independently verified with primary sources. Thepublisher shall not be liable for any loss, actions, claims, proceedings, demand or costs or damages whatsoever or howsoever causedarising directly or indirectly in connection with or arising out of the use of this material.
NIH Public AccessAuthor ManuscriptSoc Work Public Health. Author manuscript; available in PMC 2010 June 29.
Published in final edited form as:Soc Work Public Health. 2009 ; 24(6): 600–612. doi:10.1080/19371910802672346.
NIH
-PA Author Manuscript
NIH
-PA Author Manuscript
NIH
-PA Author Manuscript

INTRODUCTIONAlthough appropriate use of prescription drugs can substantially improve health status,accessing these treatments may sometimes consume catastrophic proportions of availableincome. Even modest drug cost-sharing has the potential to endanger a poor family’s abilityto pay for the basic necessities of life when discretionary income is scarce (Nelson, Reeder, &Dickson, 1984; Soumerai, Ross-Degnan, Fortess, & Abelson, 1993). Recent surveys haveshown that low-income households often cut back on basic necessities or take less medicationthan prescribed due to out-of-pocket drug costs (Mojtabai & Olfson, 2003; Piette, Heisler, &Wagner, 2004a; Rector & Venus, 2004; Safran et al., 2002, 2005). Family budgets in low-income households are very tight, dominated by basic living needs for housing, food, andtransportation. Research has shown that incomes at even 200% of the federal poverty level(FPL) cannot be stretched to meet these basic living needs, much less accommodate increasingmedication costs (Boushey, Brocht, Gundersen, & Bernstein, 2001).
Little is known, however, about how much low-income individuals can pay for medicationswithout forcing families into financial crisis, yet the trend in public policy is to increase drugcost-sharing. Most states currently charge adult Medicaid recipients a co-payment forprescription drugs that ranges from a low of $0.50 to a high of $10 for branded drugs in thestate of Arizona (Crowley, Ashner, & Elam, 2003). Over the course of a year, these co-payments may accumulate into considerable sums, as individuals in this population receive anaverage of over 35 prescriptions per year (Mathematica Policy Research, 2004). The newMedicare Modernization Act of 2003 (MMA) also requires cost-sharing of Medicarebeneficiaries who enroll in the new drug benefit, including those with the lowest incomes. Ingeneral, cost-sharing was included in the policy to make the Medicare benefit similar instructure to private health insurance and to promote “personal responsibility” by making peopleaccountable for part of the costs of their care. Dual-eligible (Medicare and Medicaid)beneficiaries with incomes less than 135% of the FPL ($12,920 for individuals in 2005) qualifyfor premium subsidies yet must pay $1 to $5 per prescription. Estimates of the out-of-pocketdrug costs to dual-eligible beneficiaries range from $94 to $742 in 2006 (Mays, Brenner,Neuman, Cubanski, & Claxton, 2004; The Henry J. Kaiser Family Foundation, 2003). As theprogram evolves, cost-sharing is expected to increase, since the MMA stipulates that drug co-payments must be indexed to growth in per capita drug costs. In addition, since the majorityof state Medicaid programs currently charge $0 or $1 prescription co-payments for generics,average levels of cost-sharing are expected to increase after dual-eligible beneficiariestransition to the Medicare drug benefit (Crowley, Ashner, & Elam, 2003).
Ability to pay given competing demand for resources is an important concept for understandingthe true out-of-pocket burden of both routine and potentially catastrophic medication costs.The theory of welfare economics holds that individuals are the best judges of their welfare, butit also raises questions about what is reasonable for individuals to sacrifice. In the case of healthcare, it is widely accepted that individuals should be protected from catastrophic health carecosts and not expected to endure impoverishment to cope with health care costs (Kawabata,Xu, & Carrin, 2002). In practice, health care spending is identified as catastrophic in at leasttwo ways: (1) an absolute level of costs independent of available personal resources (e.g., theMedicare Part D specifies catastrophic drug costs as being greater than $5,100) or (2) a relativecost threshold determined explicitly according to available resources (Berki, 1986;Wyszewianski, 1986). The second view is less explored in policy and research, in part due tothe lack of information about the costs of living. Nevertheless, accounting for necessaryhousehold expenditures may be a valuable way for assessing the true affordability ofmedications.
BRIESACHER et al. Page 2
Soc Work Public Health. Author manuscript; available in PMC 2010 June 29.
NIH
-PA Author Manuscript
NIH
-PA Author Manuscript
NIH
-PA Author Manuscript

The affordability of prescription drug cost-sharing has been estimated in one of four ways. Thefirst is the proportion of people reporting problems in purchasing prescribed medications dueto cost (e.g., as measured in the Medicare Current Beneficiary Survey and the National HealthInterview Survey; Craig, Kreling, & Mott, 2003; Kennedy, Coyne, & Sclar, 2004; Safran etal., 2005). A second method is to assess reductions in essential medication use followingincreases in co-payments (Soumerai, Ross-Degnan, Avorn, McLaughlin, & Choodnovskiy,1991; Tamblyn et al., 2001). Both of these measures most likely underestimate the problem ofaffordability as they do not capture the many strategies families use to afford medications, suchas reducing other household spending. The third approach is to calculate the proportion ofpeople with large shares of income spent on medication costs (e.g., measured as a cost-to-income ratio; Gross et al., 1999). This measure is also problematic because income reportedin household surveys does not generally reflect a household’s true purchasing power (Xu etal., 2003). There is also no consensus on the threshold that indicates when burdensome costsbecome catastrophic; estimates vary from 5% to more than 20% of household income(Goldman & Smith, 2001; Hwang, Weller, Ireys, & Anderson, 2001; Rogowski, Lillard, &Kington, 1997). None of these three approaches provides a nuanced picture of how muchindividuals can afford in out-of-pocket medication costs after paying for the basic living needsof food, housing, clothing, and transportation.
A fourth approach for measuring the burden of medication costs is to assess out-of-pocket drugexpenses relative to the household’s capacity to pay given basic living expenditures, or its“effective income” (Xu et al., 2003). Effective income is the amount remaining from thehousehold’s total resource consumption after expenditures for food, clothing, housing, andtransportation.
The purpose of this pilot study is to examine the out-of-pocket medication spending of olderpoor families in relationship to their capacity to pay for anything else beyond basic living needs.We selected two groups for this study, poor families with Medicaid and those without Medicaidto demonstrate the extent to which Medicaid protects older adults against catastrophicmedication costs. These groups are also important for understanding the performance of ourmeasure under the circumstances of generous drug coverage, although our future goal is toassess catastrophic expenditure risk for at-risk groups. In addition, we assessed the sensitivityof the measure to self-assessed health status, although we anticipated significant differencesin the out-of-pocket costs for only the non-Medicaid population due to the comprehensive drugcoverage of Medicaid.
METHODSWe used the Health and Retirement Study (HRS), a longitudinal panel survey of adults aged51 and older. The HRS has been sponsored by the National Institute on Aging since 1992(Juster & Suzman, 1995; Willis, 1999). The survey gathers information on the economics,demographics, and health care of aging. Since economic well-being is a main focus, the HRSuses state-of-the-art survey bracketing techniques to provide high-quality data on income andwealth (Goldman & Zissimopoulos, 2003). The interviews are conducted in the home andfollow-up surveys occur every other year. By design, the survey oversamples Blacks,Hispanics, and residents of Florida, and it provides sampling weights scaled to the CurrentPopulation Survey (CPS) for yielding United States population estimates for older adults. In2000, 10,371 individuals participated in the HRS.
Our analysis merged the 2000 HRS core survey files with the 2001 supplemental HRS module,known as the Consumption and Activities Mail Survey (CAMS). The CAMS asks participantsto estimate household spending for major budget items, such as mortgage, food, or clothing,and it was sent to 5,000 households interviewed in the 2000 HRS core survey (with a response
BRIESACHER et al. Page 3
Soc Work Public Health. Author manuscript; available in PMC 2010 June 29.
NIH
-PA Author Manuscript
NIH
-PA Author Manuscript
NIH
-PA Author Manuscript

rate of 77%). The merged data set provides a broad array of information on the demographics,health status, insurance status, health care, household expenditures, income, and medicationuse for approximately 3,800 households of older adults.
We restricted our study sample to households in which the main HRS respondent or the spouse/partner reported Medicaid coverage in 2000 or in which the household income was at or below100% of the 2001 FPL. In addition, the household must have provided responses to the 2001CAMS. We allowed for only one respondent per household and excluded households in whichrespondents died or entered nursing homes before the end of the observation period (n=11).For individual-level assessments, such as sex, age, or health, we selected the value reported bythe main HRS respondent.
We applied the 2001 CPS inflation factor of 1.0285 to impute the 2001 income. All spendingvalues were trimmed at the 95% quintile as the HRS does not topcode extreme and unlikelyvalues and initial assessments showed that our measure was sensitive to outliers given the smallsample (Institute for Social Research, 2002).
Our analysis categorized expenditures into three broad types that are patterned after those usedin the Bureau of Labor Statistics Consumer Expenditure Survey: basic living needs, health-related expenses, and discretionary spending (Tan, 2000). This categorization scheme does notimply that health-related expenses are less important than basic living needs. Rather, thecategories have been developed to show that increases in health care spending for people withfixed incomes can come only from resources that have been allocated to discretionary or basicliving expenditures. Basic living expenditures comprised food, clothing, housing (mortgage/rent, home insurance, property tax, housing supplies/maintenance, utilities), and transportation(car payments, auto insurance, gas, and service maintenance). Discretionary expenditurescomprised dining out, vacations, tickets, hobbies, contributions, and gifts. Health-relatedexpenditures comprised prescription and over-the-counter drugs, hospital care, healthprofessional services, lab tests, eye care, dental services, and health insurance premiums. Weassessed the effective income of each household by summing all spending and subtracting basicliving needs costs. Then we assessed the affordability of medication and other health care costsby comparing spending levels on these items to the household’s effective income.
We also conducted subanalyses of the sample stratified into single- and multiple-personhouseholds to isolate cases in which household spending was incurred solely by a singleMedicaid recipient. These estimates are not reported here, but analyses showed similarrelationships to those with the total sample and are available upon request. All estimates weregenerated using the survey’s sampling weights, and standard errors were corrected for theclustered sampling design.
RESULTSWe identified 647 respondents, representing nearly 1 million households of older adults withMedicaid coverage and another 1.1 million with poverty-level income who are not yet coveredby Medicaid. Table 1 shows that the average 2001 household income for older poor familieswas $11,528 with Medicaid and $7,860 without Medicaid. Most of these households consistedof at least two people, and around 10% of them were supporting children. Compared to peoplein the non-Medicaid households, those in the Medicaid homes were more often of minorityrace and Hispanic ethnicity, had much lower levels of education, and less often owned theirhome. People in the Medicaid households also reported poorer levels of health; one in four(26.3%) rated their health status as poor compared to 9.3% of people in non-Medicaid homes.
The average annual total expenditures for older poor households were $12,498 with Medicaidand $17,421 without Medicaid. For items classified as basic living needs, non-Medicaid
BRIESACHER et al. Page 4
Soc Work Public Health. Author manuscript; available in PMC 2010 June 29.
NIH
-PA Author Manuscript
NIH
-PA Author Manuscript
NIH
-PA Author Manuscript
families generally spent more than Medicaid families across the board but especially forhousing ($6,795 versus $5,471) and transportation ($2,151 versus $937). Discretionaryexpenditures averaged around $703 for Medicaid families and $2,475 for non-Medicaidfamilies. The highest category of health care expenses in both groups was prescription andover-the-counter medications (Medicaid: $463; non-Medicaid: $970), followed by healthinsurance premiums (Medicaid: $346; non-Medicaid: $956).
Figure 1 demonstrates that older poor households generally allocate most of their resources tobasic living needs, regardless of absolute spending level or Medicaid status. Medicaidhouseholds at the top 90th quintile of spending devoted 82% of their resources to basic livingneeds expenditures, 8% to health-related expenses, and 10% to discretionary items. Thisproportional allocation remained fairly constant across the entire distribution of total spendingin Medicaid households. In comparison, non-Medicaid households at the top 90th quintile ofspending devoted 65% of their resources to basic living needs expenditures, 13% to health-related expenses, and 22% to discretionary items. However, in the bottom 10th quintile, thefamilies without Medicaid spent a larger share of resources on health care (18%), followed by11% on discretionary items after expending 71% on basic living needs.
Figure 2 illustrates how poor health influences the household spending of poor families. Ingeneral, Medicaid households substantially spent substantially more for health care as healthstatus declined, especially from good/fair ($990) to poor ($1,224). Conversely, as demand formedical care increased, spending for both basic living needs and discretionary items decreased,as did total spending. A similar pattern is also observed for the non-Medicaid households,although their average total spending amounts are always higher than the amounts spent byaverage Medicaid households at the same level of health status.
After paying for the basic living needs of food, clothing, housing, and transportation, olderhouseholds with Medicaid had about $1,800 per year available to pay for health care costs,including medications, and any discretionary expenses such as entertainment (Figure 3). Poorfamilies without Medicaid had $5,229 per year available for nonbasic living needsexpenditures. Figure 3 shows that the greater share of available resources (effective income)in older poor households are consumed by medical costs, particularly medications, as healthstatus declines. For Medicaid families, medication expenditures increased dramatically from9% to 30% of available resources as health status declined from excellent/very good to poor.Similarly, for non-Medicaid families, medication expenditures increased from 15% to 31% ofeffective income as health worsened. Other nondrug health care expenses were less sensitiveto health status and fell within a range of 9% to 18% of non–basic living household expendituresin both Medicaid and non-Medicaid families.
DISCUSSIONThis study is the first to directly measure the burden represented by out-of-pocket medicationexpenses faced by low-income households after paying for basic living expenses of food,clothing, transportation, and housing costs. Our analysis illustrated that poor families have veryfew resources available for anything beyond basic living needs, even when they have Medicaidcoverage. There was no great reservoir of discretionary funds to pay for increases in cost-sharing under Medicaid and Medicare Part D. We also found that these households spend arelatively large proportion of their available resources on medicines and other health care costsand that Medicaid provided less than comprehensive protection against these expenses. Thispattern held true for both single-person and multiple-person Medicaid households. We foundthat the large allocation of household expenditures to medications increased considerably withworsening health, to a high of 30% of non–basic living needs expenditures in both Medicaidand non-Medicaid families reporting poor health. In other words, after paying for basic living
BRIESACHER et al. Page 5
Soc Work Public Health. Author manuscript; available in PMC 2010 June 29.
NIH
-PA Author Manuscript
NIH
-PA Author Manuscript
NIH
-PA Author Manuscript

expenses and health care costs, older Medicaid families in poor health had, on average, only$16 each week for any discretionary purposes. Older non-Medicaid families in poor health hadonly $22 left each week after paying for basic living needs and medical care costs. This burdenwill more than likely worsen in the future as individuals reporting poor health are at high riskfor dying or requiring additional health care resources (Desalvo, Fan, McDonell, & Fihn,2005).
Does our conceptual framework of “basic living needs” versus “discretionary” expendituresoffer valid insights? Clearly, it is intuitively appealing to assess health care policies against theprotection they offer to sick families in need of food, clothing, housing, and transportation.However, it may also be true that spending for basic living needs contains discretionarycomponents (e.g., steak vs. hamburger). In fact, our analyses showed little evidence of optionalspending within the basic living needs categories. For food costs, our single-person Medicaidhomes spent only $38 per week, while the multiple-person Medicaid homes spent $75 per weekto feed three people. It should be noted, however, that the consumption portion of the HRSdoes not identify whether food stamps were used for these expenses and helped in stretchingthe family budget for food. For housing costs, their monthly costs ranged from only $362 to$522. Single- and multiple-person non-Medicaid homes spent between $474 and $604 onmonthly housing costs and $43 to $58 on weekly food purchases.
The results of this study should be interpreted in light of the strengths and weaknesses of theHRS data. We detected considerable discrepancies between the reported incomes of poorhouseholds and their reported expenditure levels. For instance, Medicaid households at themedian of household income (~$7,689) reported approximately $11,030 in expenses. Thisfinding has been noted elsewhere with other expenditure surveys of low-income families (Tan,2000). A possible reason for the discrepancy is the under-reporting of income by respondents,although the HRS employs bracketed survey techniques to collect these income data thatprovide more reliable estimates (Juster & Suzman, 1995). Other possible explanations includepoor families who may be drawing on their limited savings to make necessary expenditures,purchasing items on credit, or borrowing money or receiving assistance from family membersor friends. Furthermore, our estimates of household expenditures are lower than those reportedin the 2001 Consumer Expenditure Survey. In that survey, households with incomes of $5,000to $9,999 spent, on average, $16,625 (compared to our $12,498), while those making $10,000to $14,999 spent $20,642 (compared to our $17,421; U.S. Department of Labor Bureau ofLabor Statistics, 2003).
Given the overall population focus of the HRS, our sample was highly selective, which resultedin relatively small sample sizes. Because of this, we limited our analysis to larger subgroups,such as spending quintiles, and we present only bivariate relationships. Future work shouldreplicate these results with larger populations, account for overall wealth, and use multivariatetechniques to explore the relationships between ability to pay and key demographic andsocioeconomic factors.
It is particularly important to isolate the effects of poor health status on potentially catastrophichealth care costs from those of other factors such as older age or lower income. In addition,the impact of out-of-pocket payments for medications is not fully captured by examining levelsof spending. Some poor households without access to non-income resources must foregonecessary care rather than incur further debt (Piette, Heisler, & Wagner, 2004b; Rector &Venus, 2004) Also, a frequently reported strategy for avoiding medication costs is to obtainfree samples from physicians or to gain access to pharmaceutical company free care programs(Cox, Jernigan, Coons, & Draugalis, 2001). Households that relied upon such strategies tomaintain required therapy would have reported lower levels of medication spending in ouranalyses (Soumerai, Ross-Degnan, Avorn, McLaughlin, & Choodnovskiy, 1991; Tamblyn et
BRIESACHER et al. Page 6
Soc Work Public Health. Author manuscript; available in PMC 2010 June 29.
NIH
-PA Author Manuscript
NIH
-PA Author Manuscript
NIH
-PA Author Manuscript

al., 2001). Similarly, households that forego medications because of costs would have spendinglevels that underestimate their required need. However, our estimate of $463 for out-of-pocketmedication spending for dual-eligible beneficiaries in the HSR compares reasonably well withour internal estimate of $330 for the same group in the 2001 Medicare Current BeneficiarySurvey and an external estimate of $510 from the 2003 Medical Expenditure Panel Survey(The Henry J. Kaiser Family Foundation, 2003). Last, our analysis did not account for spendingon taxes, as these data are not captured in the HRS. This may have resulted in an overestimationof available income, but only for the few households with gross incomes above the taxationthresholds (Butrica, Goldwyn, & Johnson, 2005).
Our findings have implications for estimating how much older poor adults can afford to payfor medications, especially in light of their transition to the MMA rules after January 2006(Crowley, Ashner, & Elam, 2003). Of particular concern are Medicaid households that hadbeen paying $0.50 to $1.00 co-payments per prescription or even requesting Medicaid co-payment waivers. Even with the more generous coverage before Part D, they were still devotingbetween 9% and 30% of available non–basic living needs resources to medications. Giventhese slim margins, it is difficult to know how these households will manage the co-paymentincreases under the MMA. Those who continue to participate in Medicaid will likely facehigher cost-sharing and, consequently, greater financial burden as states attempt to reign inescalating drug costs.
It is important to remember that our Medicaid-enrolled study population had fairly completehealth and drug coverage. Disparities in household income and spending for health care arelikely to be far greater for the poor and near-poor Medicare beneficiaries who are not eligiblefor Medicaid or for other public insurance programs with drug benefits. Policies that do notaccount for a household’s available resources and ability to pay for cost-sharing for medicationsmay have serious negative consequences for important subgroups of the poor and near poor,even those with insurance coverage.
ReferencesBerki SE. A look at catastrophic medical expenses and the poor. Health Affairs (Millwood) 1986;5(4):
138–145.Boushey, H.; Brocht, C.; Gundersen, B.; Bernstein, J. Hardships in America: The real story of working
families. Washington, DC: Economic Policy Institute; 2001.Butrica, BA.; Goldwyn, JH.; Johnson, RW. Understanding expenditure patterns in retirement.
Washington, DC: The Urban Institute; 2005.Cox ER, Jernigan C, Coons SJ, Draugalis JL. Medicare beneficiaries’ management of capped prescription
benefits. Medical Care 2001;39(3):296–301. [PubMed: 11242323]Craig BM, Kreling DH, Mott DA. Do seniors get the medicines prescribed for them? Evidence from the
1996–1999 Medicare Current Beneficiary Survey. Health Affairs (Millwood) 2003;22(3):175–182.Crowley, JS.; Ashner, D.; Elam, L. Medicaid outpatient prescription drug benefits: Findings from a
national survey, 2003. Menlo Park, CA: The Henry J. Kaiser Family Foundation; 2003.Desalvo KB, Fan VS, McDonell MB, Fihn SD. Predicting mortality and healthcare utilization with a
single question. Health Services Research 2005;40(4):1234–1246. [PubMed: 16033502]Goldman DP, Smith JP. Methodological biases in estimating the burden of out-of-pocket expenses. Health
Services Research 2001;35(6):1357–1364. discussion 1365–1370. [PubMed: 11221824]Goldman DP, Zissimopoulos JM. High out-of-pocket health care spending by the elderly. Health Affairs
(Millwood) 2003;22(3):194–202.Gross DJ, Alecxih L, Gibson MJ, Corea J, Caplan C, Brangan N. Out-of-pocket health spending by poor
and near-poor elderly Medicare beneficiaries. Health Services Research 1999;34(1 Pt 2):241–254.[PubMed: 10199672]
BRIESACHER et al. Page 7
Soc Work Public Health. Author manuscript; available in PMC 2010 June 29.
NIH
-PA Author Manuscript
NIH
-PA Author Manuscript
NIH
-PA Author Manuscript

Hwang W, Weller W, Ireys H, Anderson G. Out-of-pocket medical spending for care of chronicconditions. Health Affairs (Millwood) 2001;20(6):267–278.
Institute for Social Research. Data description 2001 Consumption and Activities Mail Survey (CAMS).Ann Arbor: University of Michigan; 2002.
Juster RT, Suzman R. An overview of the health and retirement study. The Journal of Human Resources1995;30(supplement):S7–S56.
Kawabata K, Xu K, Carrin G. Preventing impoverishment through protection against catastrophic healthexpenditure. Bulletin of the World Health Organization 2002;80(8):612. [PubMed: 12219150]
Kennedy J, Coyne J, Sclar D. Drug affordability and prescription non-compliance in the United States:1997–2002. Clinical Therapeutics 2004;26(4):607–614. [PubMed: 15189758]
Mathematica Policy Research. Statistical compendium: Medicaid pharmacy benefit use andreimbursement in 1999. Rockville, MD: Centers for Medicare & Medicaid Services; 2004.
Mays, J.; Brenner, M.; Neuman, T.; Cubanski, J.; Claxton, G. Estimates of Medicare beneficiaries’ out-of-pocket drug spending in 2006. Washington, DC: The Henry J. Kaiser Family Foundation; 2004.
Mojtabai R, Olfson M. Medication costs, adherence, and health outcomes among Medicare beneficiaries.Health Affairs 2003;22(4):220–229. [PubMed: 12889771]
Nelson AA Jr, Reeder CE, Dickson WM. The effect of a Medicaid drug copayment program on theutilization and cost of prescription services. Medical Care 1984;22(8):724–736. [PubMed: 6433121]
Piette JD, Heisler M, Wagner TH. Cost-related medication underuse among chronically ill adults: Thetreatments people forgo, how often, and who is at risk. American Journal of Public Health 2004a;94(10):1782–1787. [PubMed: 15451750]
Piette JD, Heisler M, Wagner TH. Cost-related medication under-use: Do patients with chronic illnessestell their doctors? Archives of Internal Medicine 2004b;164(16):1749–1755. [PubMed: 15364667]
Rector TS, Venus PJ. Do drug benefits help Medicare beneficiaries afford prescribed drugs? HealthAffairs (Millwood) 2004;23(4):213–222.
Rogowski J, Lillard LA, Kington R. The financial burden of prescription drug use among elderly persons.Gerontologist 1997;37(4):475–482. [PubMed: 9279036]
Safran DG, Neuman P, Schoen C, Kitchman MS, Wilson IB, Cooper B, et al. Prescription drug coverageand seniors: Findings from a 2003 national survey. Health Affairs (Millwood) 2005:W5-152–W5-166.
Safran DG, Neuman P, Schoen C, Montgomery JE, Li W, Wilson IB, et al. Prescription drug coverageand seniors: How well are states closing the gap? Health Affairs (Millwood), Supp Web Exclusives2002:W253–W268.
Soumerai SB, Ross-Degnan D, Avorn J, McLaughlin T, Choodnovskiy I. Effects of Medicaid drug-payment limits on admission to hospitals and nursing homes. New England Journal of Medicine1991;325(15):1072–1077. [PubMed: 1891009]
Soumerai SB, Ross-Degnan D, Fortess EE, Abelson J. A critical analysis of studies of state drugreimbursement policies: Research in need of discipline. Milbank Quarterly 1993;71(2):217–252.[PubMed: 8510601]
Tamblyn R, Laprise R, Hanley JA, Abrahamowicz M, Scott S, Mayo N, et al. Adverse events associatedwith prescription drug cost-sharing among poor and elderly persons. Journal of the American MedicalAssociation 2001;285(4):421–429. [PubMed: 11242426]
Tan L. Spending patterns of public-assisted families. Monthly Labor Review 2000;123(5):29–35.The Henry J. Kaiser Family Foundation. Medicare and prescription drug spending chartpack (Report No.
6087). Washington, DC: The Henry J. Kaiser Family Foundation; 2003.U.S. Department of Labor, Bureau of Labor Statistics. Consumer expenditures in 2001 (Report No. 966).
Washington, DC: Bureau of Statistics; 2003.Willis RJ. Theory confronts data: How HRS is shaped by the economics of aging and how the economics
of aging will be shaped by the HRS. Labour Economics 1999;9:119–145.Wyszewianski L. Financially catastrophic and high-cost cases: Definitions, distinctions, and their
implications for policy formulation. Inquiry 1986;23(4):382–394. [PubMed: 2947859]Xu K, Evans DB, Kawabata K, Zeramdini R, Klavus J, Murray CJ. Household catastrophic health
expenditure: A multicountry analysis. Lancet 2003;362(9378):111–117. [PubMed: 12867110]
BRIESACHER et al. Page 8
Soc Work Public Health. Author manuscript; available in PMC 2010 June 29.
NIH
-PA Author Manuscript
NIH
-PA Author Manuscript
NIH
-PA Author Manuscript
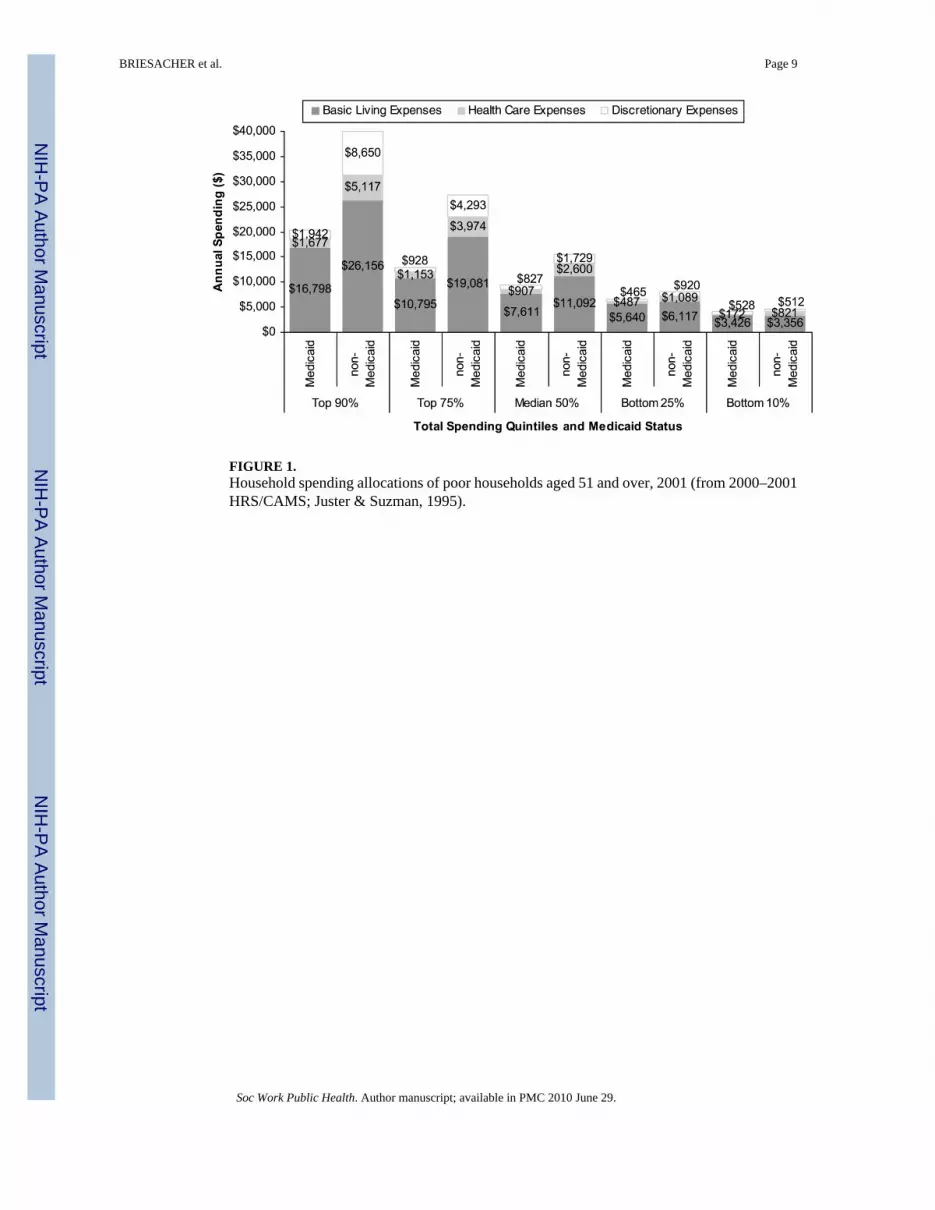
FIGURE 1.Household spending allocations of poor households aged 51 and over, 2001 (from 2000–2001HRS/CAMS; Juster & Suzman, 1995).
BRIESACHER et al. Page 9
Soc Work Public Health. Author manuscript; available in PMC 2010 June 29.
NIH
-PA Author Manuscript
NIH
-PA Author Manuscript
NIH
-PA Author Manuscript

FIGURE 2.Influence of health status on household spending of poor households aged 51 and over, 2001(from 2000–2001 HRS/CAMS; Juster & Suzman, 1995).
BRIESACHER et al. Page 10
Soc Work Public Health. Author manuscript; available in PMC 2010 June 29.
NIH
-PA Author Manuscript
NIH
-PA Author Manuscript
NIH
-PA Author Manuscript

FIGURE 3.Proportion of effective income spent by poor households aged 51 and over on medical care,2001 (from 2000–2001 HRS/CAMS; Juster & Suzman, 1995).
BRIESACHER et al. Page 11
Soc Work Public Health. Author manuscript; available in PMC 2010 June 29.
NIH
-PA Author Manuscript
NIH
-PA Author Manuscript
NIH
-PA Author Manuscript

NIH
-PA Author Manuscript
NIH
-PA Author Manuscript
NIH
-PA Author Manuscript
BRIESACHER et al. Page 12
TABLE 1
Description of Study Population
Medicaid Non-medicaid (≤100% 2001 FPL)
Population size (unweighted n) 996,000 (297) 1,147,000 (350)
2001 household income (SE) $11,582 ($856) $7,860 ($266)
Household characteristics
Average number of co-residents 2.1 2.5
% with co-residents younger than 18 9.6 16.0
Respondent characteristics
% aged ≥65 46.5 50.0
% female 78.0 79.3
% race
White/Caucasian 68.2 77.8
Black/African American 21.4 17.5
Other 10.3 4.7
% Hispanic 20.1 12.2
% with less than high school diploma/GED 62.8 37.8
% self-reported health status
Poor 26.3 9.3
Good/fair 61.1 53.9
Very good/excellent 12.6 36.8
% covered by Medicare 58.8 50.6
% homeowner 35.1 55.6
% census region
Northeast 19.7 17.1
Midwest 18.9 24.9
South 44.1 44.8
West 17.0 13.2
Average household expenditures (SE) $12,498 ($423) $17,421 ($783)
Basic living needs expenses
Food $3,079 ($214) $2,788 ($138)
Housing $5,471 ($199) $6,795 ($356)
Clothes/personal care $523 ($59) $686 ($71)
Transportationa $937 ($69) $2,151 ($151)
Discretionary expensesb $703 ($72) $2,475 ($208)
Health care expenses
Prescription/over-the-counter medications $463 ($67) $970 ($102)
Health services $175 ($25) $735 ($86)
Medical supplies $113 ($20) $240 ($42)
Health insurance premiums $346 ($34) $956 ($82)
Note. From 2000–2001 HRS/CAMS (Juster & Suzman, 1995).
aTransportation expenses include car payments, auto insurance, gas, and service maintenance.
Soc Work Public Health. Author manuscript; available in PMC 2010 June 29.

NIH
-PA Author Manuscript
NIH
-PA Author Manuscript
NIH
-PA Author Manuscript
BRIESACHER et al. Page 13
bDiscretionary expenses include dining out, vacations, tickets, hobbies, contributions, and gifts.
Soc Work Public Health. Author manuscript; available in PMC 2010 June 29.