Embed Size (px)
Citation preview

1999 Annual Report
A StrongerCompany
Better Positioned
United Dominion Realty Trust
10 South Sixth Street
Richmond, Virginia 23219-3802
804.780.2691
www.udrt.com
Un
ited Do
min
ion
Realty Tru
st A Stro
nger Co
mpany—
Better Po
sition
ed1999 An
nual R
eport

De
sig
n:
Fra
nk
lin
Str
ee
t M
ark
eti
ng
& A
dve
rtis
ing
P
ho
tog
rap
hy
: C
hip
Mit
che
ll
United Dominion Realty Trust, Inc., founded in 1972, is a leading
national apartment operating company with a strong focus on service
to its residents. United Dominion owns 82,000 completed apartment
homes in 301 communities, has 1,800 additional apartment homes
under development and employs approximately 2,400 associates.
The company acquires, repositions, develops, owns, manages and
selectively sells apartment communities nationwide. | United
Dominion’s goal is to provide an annual average shareholder return
of at least 15%. The company has a long and successful history as
a publicly traded real estate investment trust, having increased its
dividend every year for the past 23 years. | Over the past three years,
United Dominion has strategically repositioned itself to increase
long-term profitability. This process has entailed diversifying into
new markets in the West, Northwest and Midwest, upgrading the
quality of the portfolio, building development capability and
investing in systems and other technology. | United Dominion’s
common stock is traded on the New York Stock Exchange under
the symbol UDR.
U N I T E D D O M I N I O N R E A LT Y T R U S T, I N C .
C o n t e n t s
1 FINANCIAL HIGHLIGHTS
2 LETTER TO SHAREHOLDERS
8 OUR ASSETS
14 DEVELOPMENT
16 RESIDENT SATISFACTION
18 TECHNOLOGY
20 FINANCIAL SECTION
44 GENERAL INFORMATION

1
Years Ended December 31, 1999 1998 1997
Dollars in millions, except per share amounts and apartment homes owned
For the YearRental income $ 618.7 $ 478.7 $ 386.7Income from property operations excluding depreciation (NOI) 371.5 279.2 222.9Income before gains on sales of investments,
minority interests and extraordinary item 60.4 47.3 57.8Net income 93.6 72.3 70.1Distributions to preferred shareholders 37.7 23.6 17.3Net income available to common shareholders 55.9 48.7 52.8Funds from operations* 176.4 139.3 117.2Common distributions declared 109.6 107.8 88.6
Per ShareEarnings per common share-diluted $ 0.54 $ 0.49 $ 0.60Funds from operations-diluted 1.42 1.34 1.34Common distributions declared 1.06 1.05 1.01
At Year EndReal estate owned** $3,953.0 $3,952.8 $2,517.4Secured debt 1,000.1 1,072.2 417.3Unsecured debt 1,127.2 1,045.6 738.9Shareholders’ equity 1,310.2 1,374.1 1,058.4Number of common shares outstanding 102.7 103.6 89.2Number of completed apartment homes owned 82,154 86,893 62,789
* Funds from operations is defined as income before gains (losses) on sales of investments, minority interests of unitholders in operating partnership and extraordinary items (computed in accordance with generally accepted accounting principles) plus real estate depreciation, less preferred dividends and after adjustment for significant non-recurring items, if any.
** Includes real estate held for investment, real estate held for disposition and real estate under development, at cost.
F I N A N C I A L H I G H L I G H T S

I am pleased to report that the
changes to United Dominion
that began at the end of 1996 are
substantially complete. During 1999,
for the first time in our history,
we operated a national apartment
portfolio with excellent regional and market diversification. We continued
to upgrade our portfolio and narrow our product mix by selling an additional
7,400 non-core apartment homes during the year. In the process, we exited
some markets with limited growth prospects. We completed the development
of seven projects, six new communities and one second phase. Our increased
development capability, with acquisitions, gives us more investment options.
We continued to strengthen our management team, both at the senior level
and throughout our organization. Additionally, we invested in state-of-the-
art accounting and information systems that will provide operating and
marketing advantages as well as better tools to enhance decision making.
D E A R S H A R E H O L D E R S
2

Most importantly over the past three years, we
have become better apartment operators, more
focused on our resident customers. We are now
beginning to realize the benefits which come from
being a better positioned and stronger company,
including consistent net operating income (NOI)
growth, expanding operating margins, strong
expense control, operating efficiencies, lower
recurring capital expenditures and more cash flow
per apartment home. As a consequence, we
reported improved results for the year.
3
1 9 9 9 A C C O M P L I S H M E N T S
• Same community NOI growth of more than
5% for the third consecutive year.
• Recurring capital expenditures per apartment
down 20% from the average of the past three
years.
• Return on investment for the first year on
American Apartment Communities II
properties (AAC) of 9.1%.
• Seven development completions in five
different markets, with lease-ups generally
ahead of projected absorption.
• Apartment sales of $241 million as a key part
of upgrading the portfolio.
• A stock buyback program that resulted in
repurchasing $38 million of common stock
and OP units.
• Funds from operations (FFO) per share
growing at an increasing rate each quarter
compared to last year and 5.8% for the
full year.
• Systems upgrades and technology initiatives
that make us a technology leader among
apartment companies.
• Higher resident satisfaction than ever before,
as indicated on our resident surveys.
JOHN MCCANN,
CHAIRMAN & CHIEF EXECUTIVE OFFICER
(Center)
JOHN SCHNEIDER,
PRESIDENT & CHIEF OPERATING OFFICER
(Left)
BILL HAMILL,
EXECUTIVE VICE PRESIDENT &
CHIEF FINANCIAL OFFICER
(Right)

Results of Operations
For 1999, FFO, our primary earnings measure, was $176.4 million or
$1.42 per diluted share, compared with $139.3 million or $1.34 per
diluted share in 1998. The company reported total rental income of
$618.7 million, NOI of $371.5 million and net income available to
common shareholders of $55.9 million or $.54 per diluted share.
Our key earnings driver was same community NOI growth. In
1999, same community NOI grew 5.6% at the 51,316 apartments
owned throughout both years. NOI growth resulted from a 3.4%
increase in average rental rates, a 0.1% increase in economic occu-
pancy and a 0.6% decline in operating expenses. We enjoyed solid
rent growth in all but one of our ten largest markets, led by Orlando,
Houston, Dallas, Richmond and Tampa, where rent growth exceeded
4%. Occupancy climbed in all of our Mid-Atlantic markets, while
declines in Dallas, Houston, and Orlando were very modest. Much of
the decline in operating expenses was the result of the transfer of
water and sewer costs to our residents, the impact of economies of
scale and initiatives to do more of our apartment turnover work
in-house. With growing revenues and a modest decline in expenses,
our gross operating margin climbed 1.5%. We have been able to
consistently grow same community results year over year.
Primarily as a result of our significant acquisition activity over
the past two years to create a national apartment portfolio, non-
mature communities provided 40% of our revenues. The AAC port-
folio, our largest 1998 acquisition, provided a first-year return on
investment of 9.1%, slightly above the projected return. However,
our 1999 FFO per share growth was moder-
ated by disappointing returns from other
1998 acquisitions and costs associated with
the company’s repositioning, including
dispositions, increased development and
technology investments.
Financial Flexibility/Stock Buyback
United Dominion’s significant 1998 acquisition activity was financed
primarily with debt and, to a lesser extent, preferred stock. Since
completing the acquisitions, we have been committed to increasing
our financing flexibility by reducing debt and maintaining Baa2/ BBB
investment grade debt ratings. By doing so, our financing costs will
decrease, and our financing options will
increase.
During 1999, we used $141 million,
or 59%, of the proceeds from apartment
sales to repay outstanding debt. In 2000,
we will again use most of our divestiture
proceeds to repay debt.
In equity markets, the stock prices of
REITs continued to trade down in 1999.
Most REITs, including our company, are
trading at material discounts to the under-
lying net asset value (NAV) of their real
estate. For the benefit of our shareholders,
we took advantage of this opportunity and
bought back stock and operating partner-
ship units at a significant discount to our
NAV. Consistent with our commitment
to increase our financial flexibility, we
limited the repurchases to approximately
$38 million, which was 16% of the
proceeds from our divestitures in 1999.
LA PRIVADA, PHOENIX, AZ
KELLY CROSSING, DALLAS, TX
4

In 2000, we may repurchase additional shares of our common
stock and operating partnership units. Our board has authorized
the repurchase of up to 5.5 million shares, and by the end of 1999,
only 3.3 million shares and OP units had been repurchased. Any
such repurchases, however, will only be undertaken if our financial
flexibility would be sufficient to maintain Baa2/BBB debt ratings.
Looking Ahead
As a result of the changes made over the past three years, we
believe United Dominion is now much better positioned. We
upgraded our portfolio by selling more than 15,000 apartment
homes, added features to core communities to better position them
to compete in their markets and developed approximately 3,500
new homes, with another 700 nearing completion. We exited some
slower growing Southeast markets and invested in markets where
growth opportunities are better.
A key element for 2000 will be our success in growing average
occupancy during a time when economic growth may slow slightly,
and new apartment home completions remain near the levels
where they have been the past two years. We believe that occu-
pancy gains are achievable through a number of enhanced pro-
grams including renting more apartments over the Internet and
greater use of revenue maintenance tools to manage vacant inven-
tory. Assuming the national economy continues to grow, we’re
confident that we can deliver same community NOI growth in
2000 when our same communities will produce more than 90% of
company revenues.
While we expect consistent NOI
growth to once again drive our earnings
growth, expected higher interest rates, the
use of disposition proceeds to reduce debt,
and technology investments will offset
some of the NOI growth.
The combination of lower capital
expenditures plus steady NOI growth over
the three year period has increased cash
flow per apartment home approximately
30%, compared to 1996. Higher cash flow
and lowering our dividend payout ratio
allowed the company to internally generate
and retain more cash flow. Over the next
two years, we hope to increase retained
cash flow from a continuing decline in
capital expenditures and lowering our
dividend payout ratio, as FFO growth
outpaces dividend growth.
5

Over the past three years, the company has invested in both
the systems and people necessary to make us a more efficient and
better apartment operating company. Our stronger team and
enhanced systems provide us with longer-term operating and
marketing advantages and make us a technological leader in
our business.
While we have improved United Dominion’s positioning,
the external environment in which we operate is continuing to
change, and we must continue to change with it. Even though we
are a technology leader in the apartment business, we can only begin
to anticipate the impact that technology, including e-commerce, will
have on our business longer-term.
Technology-based opportunities, as well as other new initia-
tives, will be easier to pursue since Congress recently approved the
REIT Modernization Act that will become effective in 2001. These
new regulations will allow us to offer our residents additional services
and enable us to invest in synergistic businesses. As a result, these
regulations provide new ways for us to increase our profitability.
As we repositioned our company over the past few years, we
made substantial changes. Since we first embarked on our reposi-
tioning, the housing markets and financial environment have
changed significantly. Soon, the range of activities open to REITs will
expand. In view of all these changes, we believe that it is appropriate
to review and refine our business strategy. In the first half of 2000,
we will be undertaking a comprehensive assessment of the various
market segments in which we operate as well as an evaluation of
alternative investment opportunities avail-
able to us. We expect to complete this
process by the end of the summer.
Whatever refinements we make to our
business strategy will be done with the goal
of further improving the company’s long-
term earnings outlook and increasing the
level of returns generated for our share-
holders. We are excited about the prospects for United Dominion,
and we look forward to reporting to you on the strategy review.
In closing, I want to recognize and thank Jeff Bane, one of the
founders of United Dominion, who will retire from our Board of
Directors at the May annual shareholders’ meeting. Jeff has served
our company and shareholders very well as a director for almost 28
years, and his wise counsel will be missed.
I want to recognize our professional and hardworking associates
across the country, at our communities, in our area and regional
offices, and in our corporate headquarters for their dedication,
hard work, commitment to our customers, and willingness to
accept change to make us better. Thanks for all that you accom-
plished in 1999.
Finally, I want to thank our shareholders for their support. The
repositioning of United Dominion has been a substantial undertaking.
As a stronger and better positioned company, United Dominion has
greater opportunities to create value for our shareholders.
Sincerely,
John P. McCann
Chairman and CEO
February 11, 2000
PROVIDENCE COURT, CHARLOTTE, NC
ARBORS AT LEE VISTA, ORLANDO, FL
6

7

We have 82,000 quality apartment homes from
Baltimore to Fort Lauderdale to San Diego to
Seattle. Our 301 communities are an excellent
growth platform for generating increasing cash flow
and creating new sources of revenue by providing
other services for our more than 200,000 resident
customers. We have a deep and creative
management team and experienced
associates committed to continuous improvement.
We have made and will continue making financing
changes to increase our financing flexibility.
Change for the better has been a constant at
United Dominion over the past few years.
Our Assets
RANCHO VALLECITOS, SAN DIEGO, CA
8

9
Our Apartment Homes
Upgraded Portfolio
Over the past three years, in order to meet
our key operating objectives, including
more predictable NOI growth, lower capital
expenditures and greater management effi-
ciencies, we began narrowing our apartment
product focus to A and B grade communities.
Part of the impetus to do this was what we
saw as the evolution of the apartment industry
into a service business with opportunities to deliver additional
services to our residents and generate income in addition to rents.
To take full advantage of this, we needed to serve a resident
customer with more household income. We began the process
of upgrading our apartment portfolio through several initiatives:
• The sale of more than 15,000 of our older, slower growing apartments
where there was greater capital expenditure exposure. Dispositions
entailed exiting some markets, the largest being Greenville/Spartanburg,
South Carolina, which historically had been a slow growth market.
• The completion of the development of 3,500 new B+ and A apartment
homes during the past three years and assembling a development
pipeline as a source of further new product.
• The acquisition of B grade and above communities, many in markets
that offer better prospects for NOI growth.
• The addition of new features and enhanced amenities
including interior upgrades, security features,
garages, carports, storage units, water and sewer
submeters, business centers, and enlarged fitness
centers.
As a result of our upgrade program, we have
improved the overall quality of our portfolio.
Today, we have significantly higher average
rents and NOI, lower recurring and non-recurring
capital expenditures and consequently more
cash flow per apartment home.
A feature of better, higher rent communities is resident
customers with greater discretionary income. To capitalize on this,
we are introducing new resident services at our communities to
generate more non-rental income.
Geographical Diversity
Our objective has been to operate a national portfolio with both
regional and market diversification to minimize the risk of local
oversupply and economic cycles. For the first time in our history,
we are operating a truly national portfolio. On the West Coast,
Seattle, Portland, Sacramento, San Francisco, the Monterey
Peninsula, and Southern California became important markets
for us. Other new markets included Denver,
and in the Midwest, Columbus, Detroit and
Indianapolis. By the fourth quarter, western
markets were providing almost 20% of our
NOI and midwest markets another 8%.
As a result of the geographic diversifi-
cation achieved in 1998 and 1999, no single
market will provide more than 10% of our
NOI in 2000, and our 20 largest markets, which
include San Francisco, Columbus, the Monterey
Peninsula, and Southern California, will provide
76% of our 2000 NOI.
LEGACY HILL, NASHVILLE, TN
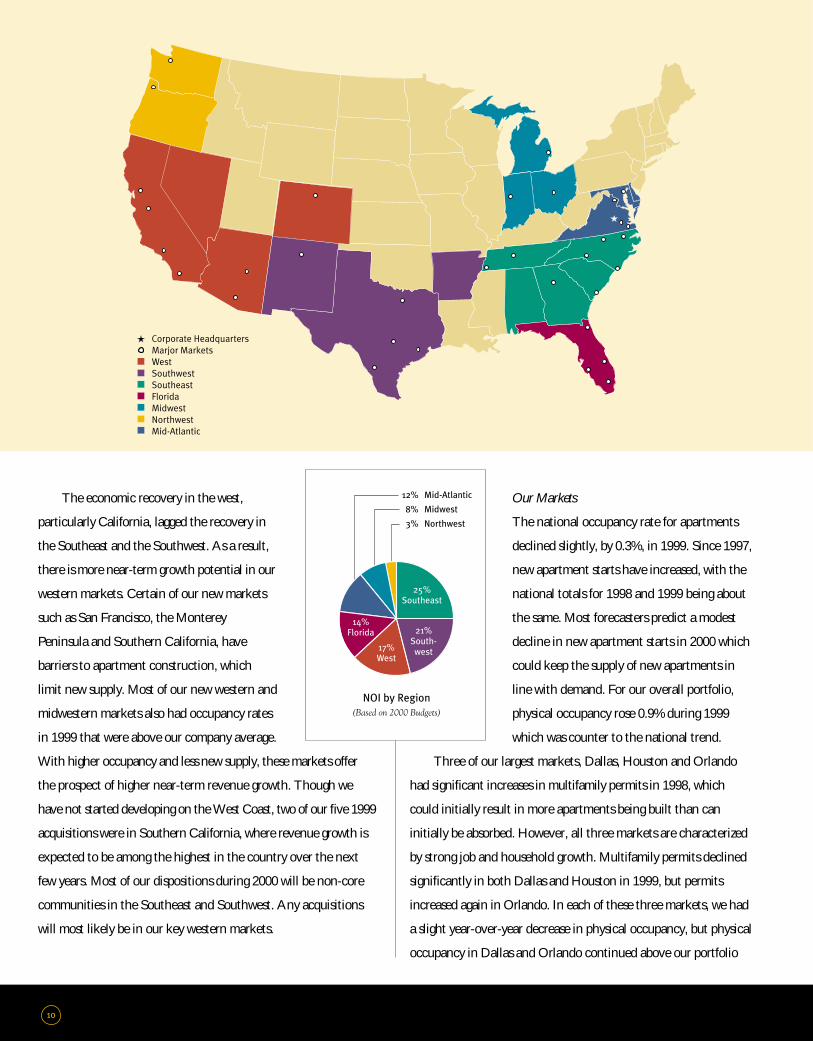
The economic recovery in the west,
particularly California, lagged the recovery in
the Southeast and the Southwest. As a result,
there is more near-term growth potential in our
western markets. Certain of our new markets
such as San Francisco, the Monterey
Peninsula and Southern California, have
barriers to apartment construction, which
limit new supply. Most of our new western and
midwestern markets also had occupancy rates
in 1999 that were above our company average.
With higher occupancy and less new supply, these markets offer
the prospect of higher near-term revenue growth. Though we
have not started developing on the West Coast, two of our five 1999
acquisitions were in Southern California, where revenue growth is
expected to be among the highest in the country over the next
few years. Most of our dispositions during 2000 will be non-core
communities in the Southeast and Southwest. Any acquisitions
will most likely be in our key western markets.
Our Markets
The national occupancy rate for apartments
declined slightly, by 0.3%, in 1999. Since 1997,
new apartment starts have increased, with the
national totals for 1998 and 1999 being about
the same. Most forecasters predict a modest
decline in new apartment starts in 2000 which
could keep the supply of new apartments in
line with demand. For our overall portfolio,
physical occupancy rose 0.9% during 1999
which was counter to the national trend.
Three of our largest markets, Dallas, Houston and Orlando
had significant increases in multifamily permits in 1998, which
could initially result in more apartments being built than can
initially be absorbed. However, all three markets are characterized
by strong job and household growth. Multifamily permits declined
significantly in both Dallas and Houston in 1999, but permits
increased again in Orlando. In each of these three markets, we had
a slight year-over-year decrease in physical occupancy, but physical
occupancy in Dallas and Orlando continued above our portfolio
O U R A S S E T S
10

average. We had solid rent growth in all three markets and strong
NOI growth in Houston and Orlando.
Multifamily permits increased in Charlotte, Raleigh, and
Tampa in 1999, three of our major markets, so these markets
could soften in the short-term. However, if the pattern that we’ve
seen over the past five years continues, there should be a precipitous
drop in permits in these markets in 2000. With a very diversified
portfolio, each year we expect some of our markets to be strong,
some to be average, and some to be weak. Among our mature
markets, Houston, Orlando, Tampa, Richmond and Nashville
were very strong for us in 1999.
Operations
Beginning in 1997, we refocused our company on serving our
resident customers. Each year since then, the scores on our resident
satisfaction surveys have risen. These surveys indicate that we are
better serving our resident customers, and that they are more satisfied
with their living experience in our communities. We believe that
this has contributed to our above market
average rent growth over the past two years.
Our operations group, including
on-site staff, know how to grow NOI. Since
1995, same community NOI has grown
more than 5% each year except 1996.
One of our objectives in 1999 was to
reduce operating expenses, which on a
same community basis, declined 0.6%.
We were a pioneer in the transfer of water
and sewer costs to residents when we
began submetering individual apartment
usage in 1995. By 1998, we made the
decision to transfer this cost to the residents
of all of our communities and to bear the
expense of using submeters, wherever we
could. As a result of this initiative, we reduced our water and
sewer expense in 1999. We did not have full penetration at all of
our communities being billed at year-end. The ramp up of water
and sewer reimbursement will continue throughout 2000 and will
further reduce utility expense. Additionally in 1999, we were able
to reduce certain operating expenses from size efficiencies, through
improved buying practices, and by our on-site staff doing more of
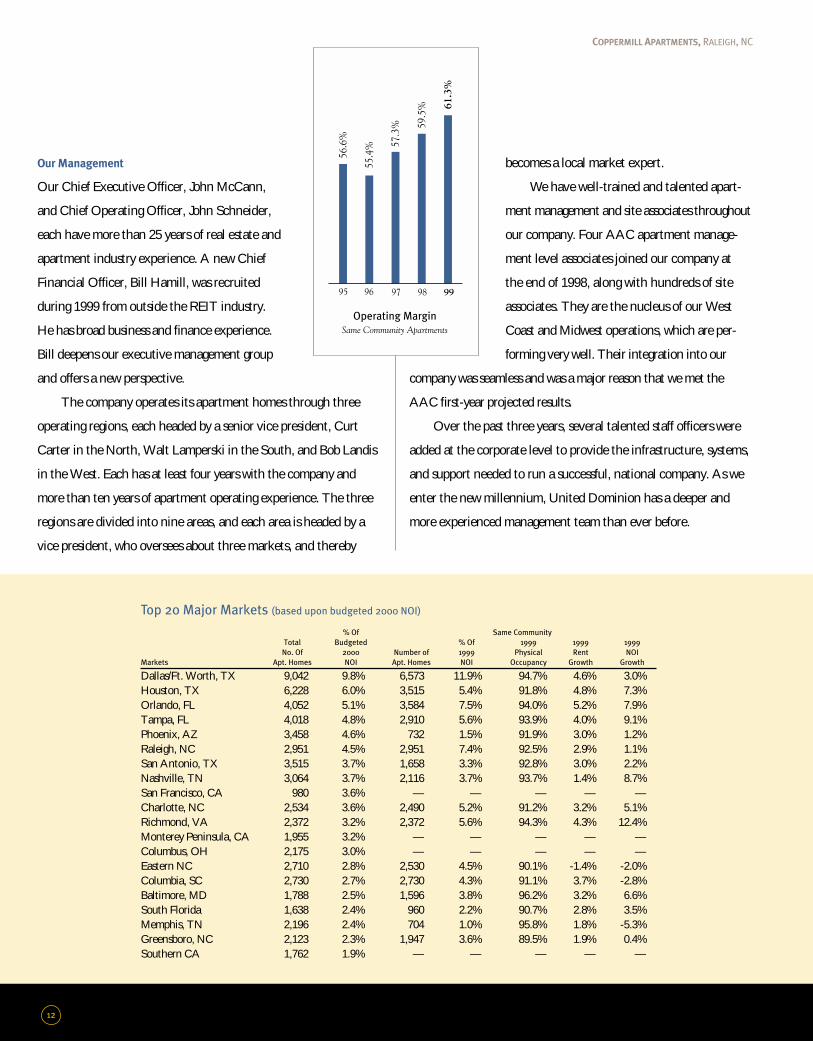
our turnover work. Since 1995, we have grown our same
community operating margin from 56.6% to 61.3% by upgrading
the portfolio, growing rents faster than expenses, adding
non-rental income, and by becoming better apartment operators.
We will undertake a number of new initiatives in 2000 to
grow non-rental income. During the year, we will roll out a
renter’s insurance product that takes advantage of volume discounts
and allows for monthly premium payments. We will also offer
high-speed Internet service at an attractive price, for the first time.
The changes in the REIT regulations that will be effective beginning
in 2001 will allow us to offer many more resident services.
2000 POST, SAN FRANCISCO, CA
Our Management
Our Chief Executive Officer, John McCann,
and Chief Operating Officer, John Schneider,
each have more than 25 years of real estate and
apartment industry experience. A new Chief
Financial Officer, Bill Hamill, was recruited
during 1999 from outside the REIT industry.
He has broad business and finance experience.
Bill deepens our executive management group
and offers a new perspective.
The company operates its apartment homes through three
operating regions, each headed by a senior vice president, Curt
Carter in the North, Walt Lamperski in the South, and Bob Landis
in the West. Each has at least four years with the company and
more than ten years of apartment operating experience. The three
regions are divided into nine areas, and each area is headed by a
vice president, who oversees about three markets, and thereby
becomes a local market expert.
We have well-trained and talented apart-
ment management and site associates throughout
our company. Four AAC apartment manage-
ment level associates joined our company at
the end of 1998, along with hundreds of site
associates. They are the nucleus of our West
Coast and Midwest operations, which are per-
forming very well. Their integration into our
company was seamless and was a major reason that we met the
AAC first-year projected results.
Over the past three years, several talented staff officers were
added at the corporate level to provide the infrastructure, systems,
and support needed to run a successful, national company. As we
enter the new millennium, United Dominion has a deeper and
more experienced management team than ever before.
12
COPPERMILL APARTMENTS, RALEIGH, NC
Top 20 Major Markets (based upon budgeted 2000 NOI)
% Of Same Community
Total Budgeted % Of 1999 1999 1999
No. Of 2000 Number of 1999 Physical Rent NOI
Markets Apt. Homes NOI Apt. Homes NOI Occupancy Growth Growth
Dallas/Ft. Worth, TX 9,042 9.8% 6,573 11.9% 94.7% 4.6% 3.0%Houston, TX 6,228 6.0% 3,515 5.4% 91.8% 4.8% 7.3%Orlando, FL 4,052 5.1% 3,584 7.5% 94.0% 5.2% 7.9%Tampa, FL 4,018 4.8% 2,910 5.6% 93.9% 4.0% 9.1%Phoenix, AZ 3,458 4.6% 732 1.5% 91.9% 3.0% 1.2%Raleigh, NC 2,951 4.5% 2,951 7.4% 92.5% 2.9% 1.1%San Antonio, TX 3,515 3.7% 1,658 3.3% 92.8% 3.0% 2.2%Nashville, TN 3,064 3.7% 2,116 3.7% 93.7% 1.4% 8.7%San Francisco, CA 980 3.6% — — — — —Charlotte, NC 2,534 3.6% 2,490 5.2% 91.2% 3.2% 5.1%Richmond, VA 2,372 3.2% 2,372 5.6% 94.3% 4.3% 12.4%Monterey Peninsula, CA 1,955 3.2% — — — — —Columbus, OH 2,175 3.0% — — — — —Eastern NC 2,710 2.8% 2,530 4.5% 90.1% -1.4% -2.0%Columbia, SC 2,730 2.7% 2,730 4.3% 91.1% 3.7% -2.8%Baltimore, MD 1,788 2.5% 1,596 3.8% 96.2% 3.2% 6.6%South Florida 1,638 2.4% 960 2.2% 90.7% 2.8% 3.5%Memphis, TN 2,196 2.4% 704 1.0% 95.8% 1.8% -5.3%Greensboro, NC 2,123 2.3% 1,947 3.6% 89.5% 1.9% 0.4%Southern CA 1,762 1.9% — — — — —

13
Financing
An objective of the company is to maintain Baa2/BBB investment
grade debt ratings and to improve our financing flexibility. During
the first half of 1999, we refinanced a significant portion of the debt
that resulted from our 1998 acquisitions in order to spread maturities
and to increase our financing flexibility. During the first four months
of the year, we sold $190 million of medium-term notes at a weighted
average interest rate of 7.6% and an average maturity of 4.3 years.
For many years, we borrowed in the unsecured corporate market
rather than by mortgaging our properties because terms, including
lower transaction costs, were more favorable. For the first time since
the 1980’s, we initiated non-tax-exempt mortgage financing because
interest rates in the secured mortgage market were significantly lower
than in the unsecured market. We closed a $200 million FNMA
revolving credit facility that is secured by mortgages on 19 properties.
The facility’s flexible terms permit us to fix the rate on all or a part of
the borrowings, substitute collateral, and extend the term.
The benefits of the 1999 debt financings were longer maturities,
a balanced maturity schedule and only modest financing to do in
2000. Our only major debt maturity during 2000 is a $150 million
unsecured note that matures in November. We will, however,
renew our revolving bank credit facility during the first half of 2000.
We will also sell at least $200 million of non-core communities. A
majority of the proceeds from dispositions will be utilized to reduce
debt and further increase our financing flexibility.

During 1999, we continued to expand our
development capability, both as a way of
upgrading our portfolio and increasing our
investment options. We are now
able to make investment choices
in targeted markets between acquiring and
developing. We have more balance between
acquisition and development capabilities,
and this will help us achieve better long-
term investment returns.
Development
14

15
During the year, we completed seven
development projects containing 1,846
apartment homes at a cost of $120 million.
These communities, in five different mar-
kets, were completed between March and
December. The company acted as the
general contractor on two of the develop-
ment projects. In general, leasing activ-
ity has produced absorption at or above
the levels in our marketing plans. The
three communities completed during the
fourth quarter were each 80% leased at
the time of completion with monthly
absorption averaging 28 homes, well above expectations. Each is
expected to stabilize with occupancy above 93%, well in advance of
the proforma stabilization date. The expected stabilized return on
the completed development projects is approximately 10%.
At the end of the year, we had six development projects under
construction, consisting of three second phases, and three new com-
munities, all in different markets. As part of our development
strategy, we plan to build almost all of our new starts as our own
general contractor, which we are doing on all six of the communities
now under construction. As the general contractor, we have more
control over the schedule, including building delivery, and can better
react to subcontractor labor shortages or material delays to meet
our objectives. Meeting the construction schedule is often critical
to achieving timely lease-up, given the seasonality of leasing activity.
We have continued to develop in markets where we have a very
strong operating group who are very
involved in the planning and design of the
product that we are delivering.
Our newest communities, located in
Nashville, Ft. Myers, Columbus, Houston
and Phoenix, offer architectural details and
community features that reflect the lifestyle of the
specific markets for which they are targeted. For example, some of
our new communities offer lap pools, putting greens, and herb
gardens. Most include attached and detached garages with some
of the attached garages being direct access. All communities
include wiring for high-speed Internet access and many have
built-in computer areas.
As part of our objective to increase our financing flexibility
in 2000, we plan to undertake a development joint venture with a
financial partner that will include three of the communities under
construction at year-end 1999 and two other starts in January
2000. This development joint venture will allow us to reduce our
development capital commitment, generate fee income as the
developer, general contractor, and apartment manager, and con-
tinue to increase our development experience and capability.
We plan to continue developing on the
best sites in our target markets, where
there is demand, with a goal of achieving
development returns in excess of 10%.
ALEXANDER COURT, COLUMBUS, OH
Development SummaryTotal
Apartment Apartment Dollars
Homes Homes Invested
Year Started Completed (in millions)
1995 60 60 $ 4.61996 1,320 105 $ 9.21997 736 1,067 $ 52.21998 1,772 890 $ 97.21999 860 1,514 $114.0
THE ASHLAR, FT. MYERS, FL

16
Every United Dominion associate is moti-
vated by a common purpose: to provide
our resident customers with high quality
apartment homes, an outstanding living
environment, uncompromising service,
and exceptional value.
Our teams of community
directors, marketing associates and service
associates strive to not only meet the
expectations of our resident customers,
but to exceed them.
ResidentSatisfaction

17
It Starts With Our People
The associates of United Dominion are focused
on serving and satisfying our resident customers
and earning their trust. We have successfully
met these objectives by:
• Empowering our associates to make timely and
responsible decisions, and to take the actions
necessary to achieve exceptionally high customer
satisfaction.
• Getting to know our residents in order to under-
stand their wants and needs. Our community associates work with
our management teams to find ways to continually improve the living
experience of our residents.
• Listening to and learning from one another, sharing ideas and develop-
ing best practices.
• Providing training and performance enhancing goals that teach us to pro-
vide residents with the best in well maintained communities and homes.
Dedication To Learning
Most of our associate education is provided locally, in the markets
where our associates live and work. By providing training and edu-
cational opportunities, we facilitate job success and enrich careers.
Our Certified Training Program takes advantage of our “best of the
best” on-site people to help new associates learn the basics of com-
munity operations. This is complemented with a curriculum of 30
industry, business, and management programs, which help us devel-
op professional, thoroughly trained associates who can succeed in
their positions and have an opportunity to grow within our compa-
ny. In addition, we offer a wide array of systems and software training
programs to build individual computer
skills, ensuring that United
Dominion will continue to
benefit from the best applica-
tions of new technologies.
SuperStar ServiceSM
We are committed to providing our residents
with SuperStar ServiceSM. This means that we
back our pledge to provide exceptional service
with a unique service guarantee. For example, if
we do not respond to service requests within 48
hours, residents may live rent free for one month.
Since the introduction of this SuperStar
ServiceSM program three years ago, we have had
an outstanding response from our residents—
and our associates. From the service manager in the field to the
accountant in the corporate office, SuperStar ServiceSM has become the
United Dominion credo.
Measuring Success
Three years ago we enlisted the services of CEL & Associates, Inc.,
the nation’s largest independent customer satisfaction surveyor for
the real estate industry. Each year, CEL measures our residents’
evaluation of our performance in the eight categories of service that
are the most critical factors in successful apartment management.
CEL then compares our scores with those of our peers to establish
best practices and set benchmark standards of excellence for our
industry.
We are very proud to report that United Dominion was the
Level 1 winner of the 1999 National Multifamily Customer Service
Award for Excellence. Winning this award means that we received
the highest customer satisfaction ratings of all companies with over
100 apartment communities under
management, surveyed by CEL.
It is a mark of achievement for
our company and especially
our community-
based associates.
Overall Satisfaction Rating
999897
82.2
%
76.0
%
73.7
%
LYNN MCAULIFFE,
TECHNICAL TRAINING MANAGER
SUSAN NORTHCUTT,
TRAINING DIRECTOR
NELLCINE FORD,
H.R. DEVELOPMENT SPECIALIST
ED WELLER,
SERVICE MANAGER, GRIFFIN CROSSING

We are committed to being a technology
leader in the apartment industry in order
to continue improving the efficiency of our
operations, gain marketing
advantages and because our
residents are constantly demanding a higher
level of electronic services.
18
TechnologyImproving

An Infrastructure For The New Millennium
United Dominion has made a substantial investment over the past
two years in talented people and state-of-the-art systems to
become a technology leader in the apartment industry.
In 1999, we undertook and successfully completed, on time
and on budget, the installation of our initial PeopleSoft financial
systems. This latest generation of web-based accounting and reporting
software is already providing improved financial controls and faster
access to better management information for our associates nation-
wide, and with reduced manual input. This system is modular,
scalable and compatible with other new application technologies,
so it is readily adaptable to the changing needs of our business.
Together with our joint-venture partner, AvalonBay
Communities, Inc., we are breaking new ground with the develop-
ment of a cutting-edge, web-based property management system.
Unlike existing site-based and primarily accounts receivable
oriented software, this centralized, real-time system focuses on
improving the functionality of our business. When integrated with
PeopleSoft and our new virtual private network, later this year, it
will provide us with the most advanced operating system in the
apartment industry. It will also give us virtual rental offices seven
days a week, 24 hours a day to respond to residents and prospects.
Today our resident customers want to connect with the
Internet from their apartment homes more conveniently and at
greater speeds to meet their work, shopping and leisure activity
needs. In 1999, we partnered with CAIS Internet, one of the lead-
ing Internet access companies, to provide high-speed broadband
Internet service to all of our communities. When completed in the
fall of 2000, this network will offer exceptional value to our resi-
dent-customers and provide us with a new non-rental income
opportunity. The company will also be able to use the high-speed
access lines provided by CAIS. This will strengthen our communi-
cations network at no incremental expense, with all of our offices
and communities connected at high speed and in real time.
As a part of our commitment to continual improvement,
United Dominion is adding a Director of E-Commerce to our
professional staff. We expect to complete our first comprehensive
e-commerce business plan later this year to take further advantage
of the economic opportunities afforded by these exciting new
technologies.
We are at the forefront of our industry in having made the
commitment and the investment in the people and the systems to
have the infrastructure needed in the new millennium. Some benefits
from our early commitment to the new technology will begin to be
realized in the latter part of 2000, but particularly in 2001.
19
PATRICK GREGORY,
INFORMATION SYSTEMS DIRECTOR
CHERYL KOZLOWSKI,
LEAD DATABASE ENGINEER
KEVIN CARTER,
SOFTWARE DEVELOPMENT MANAGER
THOMAS XAYACHACK,
DESKTOP SUPPORT ANALYST

F I N A N C I A L S E C T I O N C O N T E N T S
21 SELECTED FINANCIAL DATA
22 MANAGEMENT’S DISCUSSION & ANALYSIS OF
FINANCIAL CONDITION & RESULTS OF OPERATIONS
29 REPORT OF INDEPENDENT AUDITORS
30 CONSOLIDATED BALANCE SHEETS
31 CONSOLIDATED STATEMENTS OF OPERATIONS
32 CONSOLIDATED STATEMENTS OF CASH FLOWS
33 CONSOLIDATED STATEMENTS OF SHAREHOLDERS’ EQUITY
34 NOTES TO CONSOLIDATED FINANCIAL STATEMENTS
43 BOARD OF DIRECTORS

1 9 9 9 A n n u a l R e p o r t 21
Years Ended December 31, 1999 1998 1997 1996 1995
In thousands, except per share data and apartment homes owned
Operating Data (a)
Rental income $ 618,749 $ 478,718 $ 386,672 $ 241,260 $ 194,511Income before gains on sales of investments, minority
interests and extraordinary item 60,379 47,339 57,813 33,726 28,037Gains on sales of investments 37,995 26,672 12,664 4,346 5,090Extraordinary item—early extinguishment of debt 927 (138) (50) (23) —Net income 93,622 72,332 70,149 37,991 33,127Distributions to preferred shareholders 37,714 23,593 17,345 9,713 6,637Net income available to common shareholders 55,908 48,739 52,804 28,278 26,490Common distributions declared 109,607 107,758 88,587 55,493 48,610Weighted average number of common shares outstanding-basic 103,604 99,966 87,145 57,482 52,781Weighted average number of common shares outstanding-diluted 103,639 100,062 87,339 57,655 52,972Weighted average number of common shares, OP units and common
equivalents—diluted 124,127 103,793 87,656 57,724 52,972Per share:
Basic earnings per share $ 0.54 $ .49 $ .61 $ .49 $ .50Diluted earnings per share 0.54 .49 .60 .49 .50Common distributions declared 1.06 1.05 1.01 .96 .90
Balance Sheet Data (a)
Total real estate owned, at carrying value $3,953,045 $3,952,752 $2,517,398 $2,099,641 $1,205,685Accumulated depreciation 395,864 316,630 245,367 187,909 153,026Total real estate owned, net of accumulated depreciation 3,557,181 3,636,122 2,272,031 1,911,732 1,052,659Total assets 3,688,317 3,762,940 2,313,725 1,966,904 1,080,616Secured debt 1,000,136 1,072,185 417,325 376,560 180,481Unsecured debt 1,127,169 1,045,564 738,901 668,275 349,858Total debt 2,127,305 2,117,749 1,156,226 1,044,835 530,339Shareholders’ equity 1,310,212 1,374,121 1,058,357 850,379 516,389Number of common shares outstanding 102,741 103,639 89,168 81,983 56,375
Other Data (a)
Cash Flow DataCash provided by operating activities $ 190,876 $ 152,875 $ 137,903 $ 90,064 $ 66,428Cash used in investing activities (34,294) (276,142) (342,273) (161,572) (183,930)Cash (used in)/provided by financing activities (174,985) 148,875 191,391 82,056 113,145
Funds from Operations (b)
Income before gains on sales of investments, minority interests and extraordinary item $ 60,379 $ 47,339 $ 57,813 $ 33,726 $ 28,037
Adjustments:Depreciation of real estate owned, net of outside partners’ interests 120,543 99,588 76,688 47,410 38,939Distributions to preferred shareholders (37,714) (23,593) (17,345) (9,713) (6,637)Minority interests of outside partnerships (1,245) (111) — — —Non-recurring items:
Impairment loss on real estate owned and investments 19,300 — 1,400 290 1,700Loss on termination of an interest rate risk management agreement — 15,591 — — —Prior years’ employment and other taxes — — — — 395Adjustment for internal acquisition costs (c) — (544) (1,341) (901) (587)
Funds from operations-basic $ 161,263 $ 138,270 $ 117,215 $ 70,812 $ 61,847Adjustments:
Distributions to preferred shareholders Series D (Convertible) 15,154 986 — — —Funds from operations - diluted $ 176,417 $ 139,256 $ 117,215 $ 70,812 $ 61,847
Apartment Homes OwnedTotal apartment homes owned at December 31 82,154 86,893 62,789 55,664 34,224
Weighted average number of apartment homes owned during the year 85,926 70,724 58,038 37,481 31,242
(a) From 1996 to 1998, United Dominion completed the following statutory mergers: (i) South West Property Trust, Inc. on December 31, 1996 for an aggregate purchase price of $572 million, (ii) ASR InvestmentsCorporation Inc. on March 27, 1998 for an aggregate purchase price of $323 million, and (iii) AmericanApartment Communities II on December 7, 1998, for an aggregate purchase price of $794 million.
(b) Funds from operations (“FFO”) is defined as income before gains (losses) on sales of investments, minority interests and extraordinary items (computed in accordance with generally accepted accounting principles) plus real estate depreciation, less preferred dividends and after adjustment for significant non-recurring
items, if any. This definition conforms to recommendations set forth in a White Paper adopted by the National Association of Real Estate Investment Trusts (NAREIT) in early 1995. United Dominion considers FFO in evaluating property acquisitions and its operating performance and believes that FFO should be considered along with, but not as an alternative to, net income and cash flows as a measure ofUnited Dominion’s activities in accordance with generally accepted accounting principles and is not necessarily indicative of cash available to fund cash needs.
(c) Reflects the adjustment for internal acquisition costs that were capitalized prior to March 19, 1998.
S E L E C T E D F I N A N C I A L D ATA
U n i t e d D o m i n i o n R e a l t y Tr u s t , I n c .22
OverviewThis annual report contains forward-looking statements within the meaning ofSection 27A of the Securities Act of 1993, as amended, and Section 21E ofthe Securities Exchange Act of 1934, as amended. Such forward-looking state-ments include, without limitation, statements concerning property acquisitionsand dispositions, development activity and capital expenditures, capital raisingactivities, rent growth, occupancy and rental expense growth. Such statementsinvolve known and unknown risks, uncertainties and other factors which maycause the actual results, performance or achievement of United DominionRealty Trust, Inc. (“United Dominion”) to be materially different from theresults of operations or plans expressed or implied by such forward-lookingstatements. Such factors include, among other things, unanticipated adversebusiness developments affecting United Dominion, or its properties, adversechanges in the real estate markets and general and local economies and businessconditions. Although United Dominion believes that the assumptions underlyingthe forward-looking statements contained herein are reasonable, any of theassumptions could be inaccurate, and therefore there can be no assurance thatsuch statements included in this report will prove to be accurate. In light of thesignificant uncertainties inherent in the forward-looking statements includedherein, the inclusion of such information should not be regarded as a represen-tation by United Dominion or any other person that the results or conditionsdescribed in such statements or the objectives and plans of United Dominionwill be achieved. The following discussion should be read in conjunction withthe Consolidated Financial Statements and Notes thereto of United Dominionappearing elsewhere in this annual report.
United Dominion is a real estate investment trust (“REIT”) with activitiesrelated to the ownership, development, acquisition, renovation, management,marketing and strategic disposition of multifamily apartment communitiesnationwide. Management’s strategy is to be a national, highly efficient providerof quality apartment homes. During the past several years, United Dominionhas implemented this strategy through the acquisition of portfolios of higherquality communities, the disposition of non-strategic communities, a greatercommitment to development and the upgrade of its core portfolio of apart-ment communities. Through a combination of dispositions and acquisitionsover the past two years, United Dominion aggressively moved the companyinto better performing markets with attractive prospects for long-term growth.During this same period, more emphasis has been placed on higher qualitydevelopment projects. This strategy resulted in the upgrade of the overall qualityand average age of United Dominion’s portfolio which is now solidly positionedwith “B” and “A” grade communities. United Dominion seeks to be a marketleader by operating a sufficiently sized portfolio of apartments within each of itstarget markets in order to drive down operating costs through economies ofscale and management efficiencies. United Dominion believes that geographicmarket diversification increases investment opportunities and decreases therisk associated with cyclical local real estate markets and economies.
At December 31, 1999, United Dominion owned 301 communities with82,154 apartment homes nationwide, including 37 communities with 7,182 completed apartment homes included in real estate held for disposition and330 recently completed apartment homes included in real estate under devel-opment (see Table I).
Liquidity and Capital ResourcesUnited Dominion expects to meet its short-term financial requirementsthrough net cash provided by operations and borrowings under its unsecuredbank lines of credit. United Dominion believes that cash provided by operationswill be adequate to meet normal operating requirements and payment of distributions by United Dominion in accordance with REIT requirements inboth the short and long-term. In addition, budgeted capital expenditures andmonthly principal amortization of debt are also expected to be funded fromnet cash provided by operating activities.
United Dominion meets certain long-term liquidity requirements, such asscheduled debt maturities, development activity and significant capitalimprovements through: (i) the issuance of long-term secured and unsecuredborrowings, (ii) proceeds from the sales of assets, (iii) common and preferred
stock offerings, (iv) retained operating cash flow and (v) the use of unusedcredit facilities. To facilitate future fund raising activities in the public capitalmarkets, management believes that it is prudent to maintain shelf registrationstatement capacity. In this regard, United Dominion filed such a shelf registra-tion statement in December 1999 providing for the issuance of up to $700million in common shares, preferred shares and debt securities.
In March 2000, United Dominion sold $100 million of senior unsecured notesdue March 2003 at an interest rate of 8.625%. The proceeds from the offeringwere used to prepay certain mortgage debt and repay revolving bank debt.
United Dominion currently plans to establish during 2000, a program for thesale of up to $150 million aggregate principal amount of medium-term notes.
United Dominion has no significant maturities of debt until the fourth quarterof 2000 at which time approximately $175 million of secured and unsecureddebt will mature. At this time, management expects to refinance the maturingdebt with debt of similar characteristics and at prevailing market rates.
The following discussion explains the changes in net cash provided byoperating activities, net cash used in investing activities and net cash used infinancing activities which are presented in United Dominion’s ConsolidatedStatements of Cash Flows.
Operating ActivitiesFor the year ended December 31, 1999, United Dominion’s cash flow fromoperating activities was $190.9 million compared to $152.9 million in 1998.The increase was primarily due to the increased operating income fromUnited Dominion’s acquired communities as well as increases in propertyoperating income achieved through higher rent growth as discussed under“Results of Operations.”
Investing ActivitiesFor the year ended December 31, 1999, net cash used in investing activitieswas $34.3 million compared to $276.1 million for 1998, a decrease of $241.8million. During 1999, United Dominion shifted its focus from the acquisitionof real estate assets to the disposition and development of real estate assets.Changes in the level of investing activities from period to period reflect thechanging levels of United Dominion’s acquisition, capital expenditure, devel-opment and disposition programs, as well as the impact of the capital marketenvironment on these activities.
Disposition of InvestmentsAs part of its strategic repositioning, United Dominion determined that itwould selectively dispose of assets that are not in core markets, have a lowernet operating income growth rate than the overall portfolio or no longer meetthe operating and investment strategies of United Dominion. The dispositionprogram allows United Dominion to reduce the age of its existing portfolio,which should result in lower operating expense and capital expendituregrowth associated with the older communities.
During 1999, United Dominion sold 36 communities with 7,443 apart-ment homes for an aggregate sales price of $241.2 million and recognizedgains for financial reporting purposes of $38.0 million. These sales allowedUnited Dominion to exit certain markets that had low growth opportunitiesand improve the average age of the company’s overall apartment portfolio by selling communities with an average age of 25 years. During 1998, 18communities with 5,318 apartment homes and an average age of 25 yearswere sold for an aggregate sales price of $156.6 million, which resulted ingains for financial reporting purposes of $26.7 million.
Proceeds from the disposition program were used to strengthen the balancesheet by paying down debt, as well as to fund new development projects andto selectively repurchase shares of United Dominion’s preferred and commonstock. Where necessary to defer capital gain taxes, disposition proceeds havebeen reinvested in strategically attractive communities.
United Dominion intends to sell 6,000 to 7,000 apartment homes during2000. Proceeds from the 2000 dispositions, expected to be at levels similar to1999, are to be used to reduce debt, repurchase preferred shares, fund devel-opment activity and acquire communities through 1031 exchanges.
M A N A G E M E N T ’ S D I S C U S S I O N & A N A LY S I S O F F I N A N C I A L C O N D I T I O N
& R E S U LT S O F O P E R AT I O N S

1 9 9 9 A n n u a l R e p o r t 23
The following table summarizes United Dominion’s apartment market information by major geographic markets and other geographic areas (including realestate under development and excluding four commercial properties):
As of December 31, 1999 December 31, 1999
No. of No. of % of Carrying Year Ended Quarter Ended
Apartment Apartment Carrying Value Physical Physical
Area Communities Homes Value (in thousands) Occupancy Occupancy
Major MarketsDallas/Fort Worth, TX 29 9,042 11% $ 415,116 94.5% 94.8%Houston, TX 25 6,228 6% 238,123 90.5% 90.3%Phoenix, AZ 10 3,458 5% 198,702 91.5% 93.3%Orlando, FL 13 4,052 5% 194,569 94.1% 94.3%Tampa, FL 12 4,018 5% 179,307 92.4% 93.2%San Antonio, TX 12 3,515 4% 171,556 92.4% 92.5%Raleigh, NC 9 2,951 4% 146,528 92.5% 92.3%Nashville, TN 11 3,064 4% 144,107 89.7% 92.4%San Francisco, CA 4 980 4% 138,681 98.8% 99.5%Charlotte, NC 10 2,534 3% 128,190 91.2% 91.1%Columbus, OH 5 2,175 3% 118,268 92.8% 95.3%Wilmington, NC 10 2,710 3% 111,709 89.8% 93.7%Monterey Peninsula, CA 13 1,955 3% 111,474 93.1% 91.2%Memphis, TN 7 2,196 3% 105,859 93.9% 94.1%South Florida 6 1,638 3% 102,349 91.1% 90.8%Richmond, VA 8 2,372 3% 102,120 94.3% 97.0%Greensboro, NC 8 2,123 3% 102,091 88.8% 90.8%Columbia, SC 9 2,730 2% 97,414 91.1% 91.2%Southern California 6 1,762 2% 95,243 93.8% 93.4%Baltimore, MD 8 1,788 2% 85,368 96.2% 97.1%Atlanta, GA 6 1,426 2% 69,239 92.7% 94.4%Seattle, WA 5 1,159 1% 57,816 93.2% 96.9%Jacksonville, FL 3 1,157 1% 56,783 90.5% 92.0%Hampton Roads, VA 6 1,437 1% 54,655 95.1% 97.4%Sacramento, CA 2 914 1% 52,758 97.8% 98.1%Denver, CO 2 876 1% 44,942 93.5% 95.1%Detroit, MI 4 744 1% 42,910 94.9% 95.0%Washington, DC 3 615 1% 35,731 97.7% 98.4%Portland, OR 3 627 1% 34,353 91.2% 91.0%Indianapolis, IN 3 875 1% 28,699 94.0% 92.7%Austin, TX 2 542 1% 23,836 94.6% 97.4%
Other AreasOther Florida 7 1,665 1% 78,929 92.1% 94.6%Eastern Shore MD and Delaware 6 1,156 1% 52,553 96.3% 95.6%Other North Carolina 4 1,052 1% 48,876 94.7% 94.5%Other Virginia 6 1,154 1% 47,984 93.8% 94.7%Other Michigan 4 1,227 1% 47,535 90.5% 95.0%Other Midwest 5 969 1% 42,780 94.5% 95.0%Arkansas 2 512 1% 22,306 93.9% 95.3%Other Washington State 3 536 1% 21,914 83.3% 93.5%Nevada 1 384 1% 20,776 93.4% 96.8%New Mexico 3 530 1% 19,972 89.4% 90.6%Other Arizona 2 408 — 13,408 91.5% 94.8%Other Georgia 1 240 — 10,413 90.8% 95.9%Alabama 1 242 — 8,780 91.8% 91.7%Other Texas 1 248 — 8,330 85.4% 91.4%Other South Carolina 1 168 — 7,428 88.7% 93.0%
Total 301 82,154 100% $3,940,480 92.6% 93.6%
Subsequent to year-end, United Dominion sold three communities forapproximately $18.5 million. In addition, United Dominion entered into con-tracts to sell two communities with 285 apartment homes for an aggregate salesprice in excess of $17 million. For financial reporting purposes, aggregate gainson the sales of investments are not expected to be material. The transactions areexpected to close during the first and second quarters of 2000; however, therecan be no assurance that these transactions will be consummated as planned.
Real Estate under DevelopmentDuring 1999, United Dominion continued its commitment to development aspart of its strategic repositioning, shifting capital into development activity andaway from lower yielding acquisitions. During 1999, the development of over1,500 homes was completed, up from 890 homes completed during 1998.Development activity is focused in core markets that have locally based development teams, and strong operations managers in place.
Table I—Apartments by Market

U n i t e d D o m i n i o n R e a l t y Tr u s t , I n c .24
In addition to the apartment homes under development at December 31,1999 (see Table II), United Dominion has land held for future developmentwith a carrying value of $37.9 million. Future development activity will bebased upon the availability of capital and real estate fundamentals. Additionaldevelopment starts planned in 2000 are expected to be undertaken withfinancial partners through joint venture arrangements.
AcquisitionsDuring 1999, United Dominion curtailed its active pace of acquisitions,investing in new communities only when necessary to complete 1031exchanges in order to defer taxes on large capital gains. During 1999, usingproceeds from its disposition program, United Dominion acquired five com-munities with 1,230 apartment homes at a total cost (including closing costs)of $74.3 million or $60,400 per home during 1999. These communities arelocated in markets that are considered strategically important to UnitedDominion, such as Baltimore, Maryland, South Florida and Riverside andSan Diego, California.
During 2000, United Dominion does not anticipate acquiring communitiesexcept to reinvest a portion of the proceeds from property dispositions in orderto defer taxes on capital gains.
Capital ExpendituresUnited Dominion capitalizes those expenditures related to acquiring newassets, materially enhancing the value of an existing asset, or substantiallyextending the useful life of an existing asset. Expenditures necessary tomaintain an existing property in ordinary operating condition are expensedas incurred.
During 1999, United Dominion substantially completed the upgrade program which was part of the strategic plan to improve the overall qualityof its portfolio. Capital expenditures decreased from 1998 while the overallage and physical condition of the apartment portfolio has improved. For theyear ended December 31, 1999, $32.8 million or $639 per home was spent
on capital expenditures for United Dominion’s same communities (thoseacquired or developed prior to January 1, 1998). These capital improvementsincluded recurring capital expenditures, including floor coverings, HVACequipment, roofs, appliances, landscaping, siding, parking lots and other non-revenue enhancing capital expenditures, which aggregated $19.8 million or$386 per home. In addition, non-recurring / revenue enhancing capitalexpenditures, including water sub-metering, gating and access systems, theadditions of microwaves, washer-dryers, interior upgrades and new businessand fitness centers totaled $13.0 million or $253 per home for the year endedDecember 31, 1999. United Dominion reduced capital expenditures relatedto same communities throughout 1999, but will continue to selectively addrevenue enhancing improvements, which are budgeted to provide a highreturn on investment. Capital expenditures during 2000 are expected to beat levels similar to 1999.
In addition to capital improvements to its same communities, UnitedDominion invested approximately $42 million or $1,220 per home on itsnon-mature communities (those acquired or developed subsequent toJanuary 1, 1998) during 1999, which includes both recurring and revenueenhancing capital improvements.
Financing ActivitiesNet cash used in financing activities during 1999 was $175.0 million compared to net cash provided by financing activities of $148.9 million for1998. During 1999, as part of its strategic plan to improve its balance sheetposition, United Dominion used approximately 60% of the proceeds from itsdisposition program to pay down secured and unsecured debt. The remainingproceeds were used to acquire assets where necessary to complete 1031exchanges and, to a lesser extent, to repurchase shares of preferred and com-mon stock.
In January 1999, United Dominion established a program for the sale of up to $200 million aggregate principal amount of medium-term notes(the “MTN Program”). For the year ended December 31, 1999, United
Table II—Real Estate Under Development
During 1999, the following development projects were completed:
Total
No. Apt. Costs Cost per Date % Leased
Property Location Homes (Thousands) Home Completed at 12/31/99
New CommunitiesStone Canyon Houston, TX 216 $10,322 $47,800 3/99 89.4%Dominion Franklin Nashville, TN 360 26,347 73,200 3/99 91.4%Ashlar I Ft. Myers, FL 260 18,887 72,600 5/99 99.6%Alexander Court Columbus, OH 356 22,827 64,100 11/99 91.9%Sierra Foothills Phoenix, AZ 322 21,458 66,600 11/99 79.5%Legends at Park 10 Houston, TX 236 13,612 57,700 11/99 89.8%
1,750 113,453 64,800Additional PhasesHeritage Green II Columbus, OH 96 6,740 70,200 5/99 94.8%
Total 1,846 $120,193 $65,100
The following projects are under development at December 31, 1999:
Completed Costs Estimated Estimated Expected
No. Apt. Apt. to Date Costs Cost Completion
Property Location Homes Homes (Thousands) (Thousands) per Home Date
New Communities Ashton at Waterford Lakes Orlando, FL 292 204 $19,244 $ 21,000 $71,900 1Q00The Meridian Dallas, TX 250 82 11,403 16,500 66,000 2Q00Oaks at Weston Raleigh, NC 380 — 6,391 30,200 79,500 2Q01
922 286 37,038 67,700 73,400Additional PhasesDominion Crown Point II Charlotte, NC 220 44 10,016 14,800 67,300 1Q01Ashlar II Ft. Myers, FL 168 — 1,712 12,900 76,800 4Q00Escalante II San Antonio, TX 312 — 5,295 19,700 63,100 4Q00
700 44 17,023 47,400 67,700Total 1,622 330 $54,061 $115,100 $71,000

1 9 9 9 A n n u a l R e p o r t 25
Dominion sold an aggregate of $190 million of senior unsecured notes underthe MTN Program with a weighted average interest rate of 7.61%. Net pro-ceeds from the offerings were used to repay amortizing unsecured debt, repaymaturing mortgage debt, repay a $75 million senior unsecured note thatmatured in April 1999 and repay revolving bank debt.
During 1999, United Dominion closed on $195.7 million of a $200 millionrevolving credit facility with the Federal National Mortgage Association (the“FNMA Credit Facility”). The FNMA Credit Facility is for an initial term offive years, bears interest at a floating rate which can be fixed for periods of upto 270 days, and can be extended for an additional five or ten years at UnitedDominion’s discretion. The FNMA Credit Facility had a weighted averageinterest rate of 6.32% at December 31, 1999. United Dominion used interestrate swap agreements to limit its interest rate exposure on $57 million of thisborrowing (see Secured Credit Facilities in Note 3). The proceeds from theFNMA Credit Facility were used to repay a $91 million secured credit facilityassumed in connection with the American Apartment Communities II trans-action, to replace $58 million in maturing secured debt and the remainingproceeds were used to repay revolving bank debt.
United Dominion issued 1.6 million shares of its common stock andreceived $16.7 million under its Dividend Reinvestment and Stock PurchasePlan during 1999 that included $1.2 million in optional cash investments and$15.5 million of reinvested dividends.
For the year ended December 31, 1999, United Dominion paid distributionsto its common shareholders and unitholders in its operating partnershipsaggregating $118.8 million. The distribution to common shareholders andholders of operating partnership units equates to a dividend rate of $1.06 pershare or unit. In addition, $35.0 million of preferred dividends were paid toSeries A, B and D preferred shareholders.
In June 1999, the Board of Directors authorized the repurchase of up to 5.5million common shares, or 5% of the total common shares outstanding, usingproceeds from the disposition program. Such purchases will be made from timeto time in the open market or in privately negotiated transactions; the timing,volume and price of such purchases will be at the discretion of management and the Board of Directors. For the year ended December 31, 1999, UnitedDominion repurchased 2.6 million common shares at an average price of $11.22per share. The Board of Directors also approved the repurchase of up to $25million of United Dominion’s Series A and Series B Cumulative RedeemablePreferred Stock from time to time as market conditions permit. For the yearended December 31, 1999, United Dominion repurchased 31,440 Series A preferred shares at an average price of $19.76 per share and 53,700 Series B preferred shares at an average price of $18.35 per share. In addition, UnitedDominion redeemed one million operating partnership units for $12.0 million.
During 1999, using proceeds from its disposition program, United Dominionrepurchased $70.0 million of certain of its higher rate outstanding unsecured debt with a weighted average yield of 7.74%. In addition, in connection with thedisposition program, United Dominion was relieved of $57.7 million of mortgagedebt and $9.3 million of revolving bank debt.
Credit FacilitiesUnited Dominion has a $200 million three-year unsecured revolving creditfacility (the “Bank Credit Facility”) which expires in August 2000 and a $110million one-year unsecured line of credit (the “Line of Credit”) which expiresin August 2000 that are provided by a consortium of banks. Under the BankCredit Facility, pricing is based upon the higher of United Dominion’s seniorunsecured debt ratings from Standard & Poor’s Corporation and Moody’sInvestor Services that are currently BBB and Baa2, respectively. At these rat-ing levels, interest under the Bank Credit Facility is LIBOR plus 0.50% andinterest under the Line of Credit is LIBOR plus 1.0%. However, these ratesare subject to change as United Dominion’s credit ratings change. The BankCredit Facility also includes a $100 million competitive bid option, whichallows United Dominion to solicit bids from participating banks at rates belowthe contractual rate. At December 31, 1999, $277.6 million was outstandingunder these credit facilities leaving $32.4 million available for use.
The Bank Credit Facility and Line of Credit are subject to customaryfinancial covenants and limitations.
Derivative InstrumentsUnited Dominion, from time to time, uses derivative instruments to syntheticallyalter on-balance sheet liabilities or to hedge anticipated financing transactions.Derivative contracts did not have a material impact on the results of operationsduring 1999.
Market RiskUnited Dominion is exposed to market risk principally from interest rate riskassociated with variable rate notes payable and maturing debt that has to berefinanced. United Dominion does not hold financial instruments for tradingpurposes, but rather issues these financial instruments to finance owning andmanaging real estate. United Dominion’s interest rate sensitivity position ismanaged by its treasury department. Interest rate sensitivity is the relationshipbetween changes in market interest rates and the fair value of market rate sen-sitive assets and liabilities. United Dominion’s earnings are affected by changesin short-term interest rates on its variable rate debt and the repricing of fixedrate debt. A large portion of United Dominion’s market risk is exposure toshort-term interest rates from variable rate borrowings outstanding under itsbank credit facilities, which totaled $277.6 million at December 31, 1999. Theimpact on United Dominion’s financial statements of refinancing fixed ratedebt that matured during 1999 was not material.
At December 31, 1999, the notional value of United Dominion’s derivativeproducts for the purpose of managing interest rate risk was $177 million ofinterest rate swaps under which United Dominion pays a fixed rate of interestand receives a variable rate. These agreements effectively fix $177 million ofUnited Dominion’s variable rate notes payable to a weighted average fixedrate of 6.78% (see Note 5-Financial Instruments). At December 31, 1999, the aggregate fair market value of the interest rate swaps in a favorableposition to United Dominion would have been $626 thousand. If interest rateswere 100 basis points more or less at December 31, 1999, the fair marketvalue of the interest rate swaps would have increased or decreased approxi-mately $500 thousand, respectively.
If market interest rates for variable rate debt averaged 100 basis points morein 2000 than they did during 1999, United Dominion’s interest expense, afterconsidering the effects of its interest rate swap agreements, would increase, andincome before taxes would decrease by $4.0 million. Comparatively, if marketinterest rates for variable rate debt averaged 100 basis points more in 1999 thanit did in 1998, United Dominion’s interest expense, after considering the effectsof its interest rate swap agreements, would increase, and income before taxeswould decrease by $4.0 million. If market rates for fixed rate debt were 100 basispoints higher at December 31, 1999, the fair value of fixed rate debt would havedecreased from $1.55 billion to $1.50 billion. If market interest rates for fixedrate debt were 100 basis points lower at December 31, 1999, the fair value offixed rate debt would have increased from $1.55 billion to $1.62 billion.
These amounts are determined by considering the impact of the hypotheticalinterest rates on United Dominion’s borrowing cost and interest rate swap agree-ments. These analyses do not consider the effects of the reduced level of overalleconomic activity that could exist in such an environment. Further, in the eventof a change of such magnitude, management would likely take actions to furthermitigate its exposure to the change. However, due to the uncertainty of the specific actions that would be taken and their possible effects, the sensitivityanalysis assumes no change in United Dominion’s financial structure.
Results of OperationsUnited Dominion’s net income is primarily generated from the operations ofits apartment communities.
1999-vs-1998For 1999, net income available to common shareholders increased $7.2 million,with a corresponding increase of $.05 for both basic and diluted earnings pershare, compared to 1998. The increase per share was primarily attributable toaggregate gains on the sale of investments of $38.0 million ($.37 per share)for the year ended December 31, 1999, compared to $26.7 million ($.27 pershare) in 1998. However, the increases associated with the gain on sales ofinvestments were moderated in part due to the $19.3 million of impairmentlosses recorded during 1999. United Dominion’s non-mature communitieswith 31,454 apartment homes at December 31, 1999 provided a substantialportion of the increase in United Dominion’s operating income during 1999.

U n i t e d D o m i n i o n R e a l t y Tr u s t , I n c .26
1998-vs-1997For 1998, net income available to common shareholders decreased $4.1 million,with a corresponding decrease of $.12 and $.11 for basic and diluted earningsper share, respectively, compared to 1997. The decrease per share was primarilyattributable to the $15.6 million ($.15 per share) loss on the termination of aninterest rate risk management agreement during the fourth quarter of 1998.Net income available to common shareholders for the year ended December31, 1998 included aggregate gains on the sales of investments of $26.7 million($.27 per share) compared to $12.7 million ($.15 per share) in 1997.
Same Communities (See Table III)
1999-vs-1998 (51,316 apartment homes)In 1999, property rental income grew 3.1%, or approximately $11.1 million,reflecting an increase in average monthly rental rates of 3.4% while physicaloccupancy remained constant at 93.1%.
For 1999, property operating expenses at these same communities decreased0.6%, or $827 thousand. Utility expense decreased due to the continued transferof water and sewer costs to residents, repair and maintenance expense decreasedas a result of the upgrade program and taking more turnover work in-houseand property management expenses decreased due to better economies ofscale. However, these decreases were offset by an increase in personnel costsdue to higher salaries and benefit costs, an increase in real estate taxes, the addition of monitored alarms in more communities and higher technology costs.
As a result of the increase in property rental income and the decrease inproperty operating expenses, the operating margin (property operating incomedivided by property rental income) improved 1.5% to 61.3%.
1998-vs-1997 (47,875 apartment homes)Compared to the same period in 1997, property rental income from these com-munities grew 3.5%, or approximately $11.0 million, reflecting an increase inaverage monthly rental rates of 3.4%. During 1998, physical occupancy of 92.9%was the same as reported in 1997.
For 1998, property operating expenses at these communities were unchanged.Utility expenses decreased as a result of United Dominion’s water and sewersub-metering initiative and repair and maintenance expenses decreased asUnited Dominion continued to benefit from a centralized purchasing initia-tive and the upgrade program. However, these expense decreases were offsetby increases in real estate taxes primarily in certain Florida and Texas marketsand increases in personnel costs as United Dominion experienced pressure onwages due to low unemployment and tighter job markets.
Due to the increase in property rental income and the unchanged propertyoperating expenses, the operating margin improved 1.4% to 59.5%.
Non-Mature Communities (See Table IV)
1999-vs-1998Property rental income and property operating expenses increased from 1998to 1999 directly as a result of the increase in the weighted average number ofapartment homes owned during 1999. For the year ended December 31, 1999,average economic occupancy was 88.2%, and the operating margin was 58.8%for the non-mature communities.
United Dominion’s non-mature apartment portfolio can be categorized asfollows for the years ended December 31, 1999 and 1998:
1998 AcquisitionsAmerican Apartment Communities II, Inc. (AAC) On an average investment of $761 million, the AAC portfolio (13,728homes net of sales) provided a first year return on investment (property rentalincome less property operating expenses divided by the average capital investmentin real estate) of 9.1% which is slightly better than the projection of 9.0%made at the time of the acquisition. These communities achieved physicaloccupancy of 93.6%, which is higher than United Dominion’s average physicaloccupancy primarily due to the California markets included in this portfolio.For the year, these communities had an economic occupancy of 92.1% and anoperating margin of 62.7%.
1998 Acquisitions (Excluding AAC)For the 13,577 homes (net of sales) acquired in 1998, the return on investmentfor the year ended December 31, 1999, on an average investment of $611million was 8.4%. This return on investment was below amounts projectedfor 1999, however, these communities continue to be upgraded, repositionedand selectively sold, which is expected to improve overall operating resultsover the long-term. These communities had an economic occupancy of88.8% and an operating margin of 57.8%.
1999 AcquisitionsIncluded in this category are five communities with 1,230 apartment homesacquired by United Dominion during 1999 that are projected to provide afirst year return on investment of 9.0% on an initial investment of $74 million.These communities did not have a material impact on 1999 results of operations.
Disposition CommunitiesIncluded in this category are the 12,761 apartment homes sold for an aggregatesales price of $398 million as part of United Dominion’s strategic repositioning(see Disposition of Investments under Liquidity and Capital Resources) sinceJanuary 1, 1998. The communities sold during 1999 and 1998 had a capitaliza-tion rate (budgeted property operating income less a reserve placement dividedby the sales price) in the 10% range.
Development CommunitiesUnited Dominion developed 2,404 homes at various times since January 1, 1998,which included the completion of six new communities and one additionalphase to an existing community during 1999. Once stabilized, developmentcommunities are projected to generate an average return on investment inthe 10% range, however, the full impact on property operating income is notrealized until after the communities are stabilized, which is generally six months after construction is completed. United Dominion considers a development community stabilized on the earlier to occur of (i) one year after completion of construction or (ii) attainment of 90% physical occupancy.Construction activity is staged to allow for leasing and occupancy during theconstruction period in order to minimize the lease-up period subsequent tothe completion of construction.
1998-vs-1997Property rental income and property operating expenses increased from 1997to 1998 directly as a result of the increase in the weighted average number ofapartment homes owned during 1998. For the year ended December 31, 1998,average economic occupancy was 88.6%, and the operating margin was 55.7%for the non-mature communities.
1997 AcquisitionsOn an average investment of $355 million, the 1997 acquisitions which con-sisted of 8,524 apartment homes provided a 9.1% return on investment during1998. For the year, these communities had economic occupancy of 91.5% andan operating margin of 56.6%. During 1998, property operating expenses wereadversely impacted by (i) an increase in real estate taxes due to reassessments atseveral Florida communities and (ii) the delay in United Dominion’s implemen-tation of its water billing and reimbursement schedule for these communities.
1998 Acquisitions1998 Single AcquisitionsOn an average investment of $312 million, the 1998 acquisitions which consisted of 6,959 apartment homes provided an annualized return on invest-ment of 8.7%. These results were below the full year forecasted return oninvestment of 9.0% as a result of delays in water billing and reimbursementand market softness in San Antonio and Phoenix where United Dominionacquired communities in 1998.
ASR Investments Corporation (ASR)A total of 7,550 apartment homes were included in the ASR merger on March27, 1998, which provided the largest increase in property rental income andproperty operating expenses for United Dominion’s apartment portfolio during1998. The annualized return on investment for the ASR properties was 7.3%

1 9 9 9 A n n u a l R e p o r t 27
on an average investment of $313 million during 1998. The under-performanceof this portfolio was primarily attributable to weak markets in Phoenix, Tucsonand Albuquerque and certain assets were undergoing upgrading and reposition-ing. For the year ended December 31, 1998, these communities had economicoccupancy of 87.9% and an operating margin of 49.3%.
American Apartment Communities (AAC)This included the 14,001 apartment homes in the AAC merger on December 7,1998 for an initial investment of $767 million. This acquisition did not have amaterial effect on 1998 results of operations.
Disposition CommunitiesDuring 1998 and 1997, United Dominion sold approximately $225 million ofreal estate consisting of 30 communities with 7,888 apartment homes, the netproceeds from which were used to acquire newer communities that providehigher long-term returns on investment than the communities being sold.The properties sold during 1998 had a capitalization rate (budgeted propertyoperating income less a replacement reserve divided by the sales price) inexcess of 10%.
Development CommunitiesThese communities consisted of 1,957 apartment homes in five new communitiesand five additional phases to existing communities developed from January 1,1997 to December 31, 1998. Once stabilized, development communities areprojected to generate an average return on investment in excess of 10%.
Interest ExpenseDuring 1999, interest expense increased $47.5 million over the correspondingamount in 1998 as the weighted average amount of debt employed during 1999was higher than it was in 1998 ($2.1 billion in 1999 versus $1.5 billion in 1998).The increase in the weighted average amount of debt employed in 1999 is primarily due to debt assumed during 1998 to fund United Dominion’s invest-ment activities. The weighted average interest rate on this debt was 7.4% in
both 1999 and 1998. For 1999, 1998 and 1997, total interest capitalized was$5.2 million, $3.4 million and $2.6 million, respectively.
For 1998, interest expense increased $27.2 million over 1997. The weightedaverage amount of debt employed during 1998 was higher than it was in 1997($1.5 billion in 1998 versus $1.0 billion in 1997) which accounted for themajority of the increase in interest expense. The weighted average interestrate on this debt was slightly lower than it was in 1997, decreasing from 7.5%in 1997 to 7.4% in 1998 reflecting greater usage of lower rate short-term bankborrowings in 1998 ($238.6 million weighted average outstanding in 1998 versus $74.6 million in 1997).
General and AdministrativeDuring the year ended December 31, 1999, general and administrative expensesincreased $3.7 million, or 36.6%, over 1998, primarily due to the expandedoperations of United Dominion and its continued investment in professionalstaff, technology and scaleable accounting and information systems.
During 1998, general and administrative expenses increased by $3.1 millionover 1997. In 1998, United Dominion incurred increases in most of its generaland administrative expense categories which was directly attributable to theexpanded operations of United Dominion and its investment in infrastructure.The largest increases occurred in payroll and payroll-related expenses. Generaland administrative expense as a percentage of rental income increased 0.3%from 1.8% during 1997 to 2.1% during 1998 primarily due to (i) the addedinfrastructure costs incurred due to the expanded operations of UnitedDominion and (ii) the change in accounting for internal acquisition costs subsequent to March 19, 1998.
Impairment LossFor the year ended December 31, 1999, United Dominion recognized $18.3million in impairment losses on its real estate portfolio. At the beginning ofJune 1999, United Dominion embarked on an accelerated disposition plan fornon-strategic properties. As a result of the review of its real estate apartmentportfolio, 21 properties included in real estate held for investment were moved
Year Ended December 31, Year Ended December 31,
In thousands 1999 1998 % Change 1998 1997 % Change
Property rental income $617,298 $477,279 29.3% $477,279 $384,205 24.2%Property operating expenses (excluding
depreciation and amortization) (245,173) (198,877) 23.2% (198,877) (162,977) 22.0%Property operating income $372,125 $278,402 33.7% $278,402 $221,228 25.8%
Weighted average number of apartment homes 85,926 70,724 21.5% 70,724 58,038 21.9%Physical occupancy 92.6% 92.5% 0.1% 91.7% 92.3% -0.6%
Table V—All Communities
Year Ended December 31, Year Ended December 31,
In thousands 1999 1998 % Change 1998 1997 % Change
Property rental income $366,173 $355,038 3.1% $328,018 $316,995 3.5%Property operating expenses (excluding
depreciation and amortization) (141,721) (142,548) -0.6% (132,758) (132,712) 0.0%Property operating income $224,452 $212,490 5.6% $195,260 $184,283 6.0%
Physical occupancy 93.1% 93.1% 0.0% 92.9% 92.9% 0.0%Average monthly rental rates $ 631 $ 610 3.4% $ 602 $ 582 3.4%
Table III—Same Communities
Year Ended December 31, Year Ended December 31,
In thousands 1999 1998 % Change 1998 1997 % Change
Property rental income $251,125 $122,245 105.4% $149,262 $ 67,207 122.1%Property operating expenses (excluding
depreciation and amortization) (103,452) (56,333) 83.6% (66,120) (30,262) 118.5%Property operating income $147,673 $65,912 124.1% $83,142 $36,945 125.1%
Weighted average number of apartment homes 33,980 19,408 75.1% 22,849 10,164 124.8%
Table IV—Non-Mature Communities

U n i t e d D o m i n i o n R e a l t y Tr u s t , I n c .28
to real estate held for disposition during the second quarter. Accordingly,through the review and analysis of communities targeted for strategic disposition,an aggregate $7.1 million impairment loss was recognized on five communities inthe second quarter. Based on United Dominion’s review and analysis of the salesplanned for 2000 and the periodic evaluation of its apartment portfolio, an addi-tional $11.2 million impairment loss was recognized in the fourth quarter of1999, related principally to communities acquired in the ASR merger in 1998.
During 1997, the company recorded an impairment loss of $1.4 millionrelating to two communities included in United Dominion’s real estate heldfor investment. These communities were subsequently moved to real estateheld for disposition based upon management’s decision to dispose of theseproperties.
Distributions to Preferred ShareholdersDistributions to preferred shareholders totaled $37.7 million for 1999 com-pared to $23.6 million for 1998. The increase was a result of the issuance ofeight million shares of Series D 7.50% Cumulative Convertible RedeemablePreferred Stock in December 1998.
Distributions to preferred shareholders totaled $23.6 million for the yearended December 31, 1998 compared to $17.3 million for 1997. The increasewas a result of the issuance of six million shares of Series B 8.60% CumulativeRedeemable Preferred Stock in May 1997.
InflationUnited Dominion believes that the direct effects of inflation on UnitedDominion’s operations have been inconsequential.
Information TechnologyUnited Dominion is currently engaged in the development of an innovativeon-site property management system (the “system”) to enable management tocapture, review and analyze data to a greater extent than is possible usingavailable existing commercial software. United Dominion believes the new system will enable it to become a more efficient provider of a high quality living environment for its residents, and provide the scalability necessary tosupport future growth. These development activities are being conductedthrough a joint venture with another public multifamily real estate company.The system development process is currently managed by the employees ofUnited Dominion and its joint venture partner who have significant relatedproject management experience. The actual programming and documentationof the system is being conducted by employees and third party consultants underthe supervision of these experienced project managers.
Current projections indicate that total development costs over a three-yearperiod will be approximately $7.5 million (including hardware costs and expenses,the costs of employees and related overhead, and the costs of engaging thirdparty consultants) and that such development costs will be shared on an equalbasis by the joint venture partners. Once developed, the system would be usedin place of current property management information systems for which alicense fee is paid to third parties.
The system is currently projected to undergo an on-site test (i.e., a “beta test”)during the third quarter of 2000 and the system should be functional by thefourth quarter of 2000.
Neither United Dominion nor its joint venture partner have been engagedin the development of systems software. There are several risks associated withthe development of the system for internal use, such as: (i) the inability tomaintain the schedule or budget that has been projected for the developmentand implementation of the software, and (ii) the system may not have thefunctionality and efficiencies desired.
Year 2000United Dominion completed the transition to the Year 2000 with all of itscomputer platforms Year 2000 compliant and the transition took place withoutincident. There have been no reported problems with any equipment or software,nor have any disruptions with suppliers or vendors occurred. United Dominionwill continue to monitor its systems in 2000 to insure that any latent issueswith Year 2000 are identified and addressed.
Taxable REIT SubsidiaryIn December 1999, the REIT Modernization Act (“RMA”) was signed into law.The RMA contains several provisions that, when effective in 2001, will allowREITs to compete more effectively in the real estate industry by allowing REITsto offer the same types of services as other competitors in the marketplace. Themost important feature of the RMA is the allowance for REITs to create a taxableREIT subsidiary (“TRS”) that can provide services to residents and others with-out disqualifying the rents that a REIT receives from its residents.
Under the prior law, REITs were not allowed to provide non-customary ortenant specific services to its residents, such as concierge services, beyond a de minimus amount. As the apartment industry has become a competitivecustomer focused business, these constraints inhibited REITs from maintaininga competitive edge in attracting and maintaining residents. As such, the RMAhas several significant benefits for the REIT industry. REITs will be allowed,through a TRS, to provide a wide range of increasingly important services thatresidents have come to expect. In addition, the TRS will allow REITs to generate new sources of income for REIT shareholders.
Effective January 1, 2001, a REIT can own 100% of the stock of a TRS.However, the legislation contains a number of safeguards that would limit thesize of a TRS to ensure that REITs remain focused on their core business ofowning and operating real estate assets.
The RMA provides another significant change to the existing law. TheRMA changes the minimum distribution requirement from 95% to 90% ofthe REITs taxable income. This will allow REITs to retain a greater level ofcapital which can be used to invest back into expenditures to maintain thequality of their real estate assets as well as repay outstanding debt.
During 2000, United Dominion will determine the best uses of the TRS inorder to be in a position to take full advantage of the opportunities the newlegislation has to offer in 2001.

1 9 9 9 A n n u a l R e p o r t 29
The Board of Directors and ShareholdersUnited Dominion Realty Trust, Inc.
We have audited the accompanying consolidated balance sheets of United Dominion RealtyTrust, Inc. (the “Company”) as of December 31, 1999 and 1998, and the related consolidatedstatements of operations, shareholders’ equity, and cash flows for each of the three years inthe period ended December 31, 1999. These financial statements are the responsibility of theCompany’s management. Our responsibility is to express an opinion on these financial state-ments based on our audits.
We conducted our audits in accordance with auditing standards generally accepted in theUnited States. Those standards require that we plan and perform the audit to obtain reason-able assurance about whether the financial statements are free of material misstatement. Anaudit also includes examining, on a test basis, evidence supporting the amounts and disclosuresin the financial statements. An audit also includes assessing the accounting principles usedand significant estimate made by management, as well as evaluating the overall financialstatement presentation. We believe that our audits provide a reasonable basis for our opinion.
In our opinion, the financial statements referred to above present fairly, in all materialrespects, the consolidated financial position of United Dominion Realty Trust, Inc. atDecember 31, 1999 and 1998, and the consolidated results of its operations and its cash flowsfor each of the three years in the period ended December 31, 1999, in conformity withaccounting principles generally accepted in the United States.
Richmond, VirginiaJanuary 31, 2000
R E P O R T O F E R N S T & Y O U N G L L P, I N D E P E N D E N T A U D I T O R S

U n i t e d D o m i n i o n R e a l t y Tr u s t , I n c .30
December 31, 1999 1998
In thousands, except for share data
AssetsReal estate owned:
Real estate held for investment (Notes 2 and 9) $3,577,848 $3,643,245Less: accumulated depreciation 373,164 280,663
3,204,684 3,362,582Real estate under development 91,914 99,395Real estate held for disposition (net of accumulated depreciation
of $22,700 and $35,967) (Note 2) 260,583 174,145Total real estate owned, net of accumulated depreciation 3,557,181 3,636,122
Cash and cash equivalents 7,678 26,081Restricted cash 56,969 50,805Deferred financing costs 13,511 10,894Other assets 52,978 39,038
Total assets $3,688,317 $3,762,940
Liabilities and Shareholders’ EquitySecured debt (Note 3) $1,000,136 $1,072,185Unsecured debt (Note 4) 1,127,169 1,045,564Real estate taxes payable 30,887 29,078Accrued interest payable 17,867 20,714Security deposits and prepaid rent 20,738 21,125Distributions payable 36,020 31,423Accounts payable, accrued expenses and other liabilities 51,121 53,288
Total liabilities 2,283,938 2,273,377
Minority interests 94,167 115,442
Shareholders’ equity: (Notes 6 and 7)Preferred stock, no par value; $25 liquidation preference,
25,000,000 shares authorized;4,168,560 shares 9.25% Series A Cumulative Redeemable 104,214 105,000
issued and outstanding (4,200,000 in 1998)5,946,300 shares 8.60% Series B Cumulative Redeemable 148,658 150,000
issued and outstanding (6,000,000 in 1998)8,000,000 shares 7.50% Series D Cumulative Convertible Redeemable
issued and outstanding 175,000 175,000Common stock, $1 par value; 150,000,000 shares authorized
102,740,777 shares issued and outstanding (103,639,117 in 1998) 102,741 103,639Additional paid-in capital 1,083,687 1,090,432Distributions in excess of net income (296,030) (242,331)Deferred compensation - unearned restricted stock awards (305) —Notes receivable from officer-shareholders (7,753) (7,619)Total shareholders’ equity 1,310,212 1,374,121Total liabilities and shareholders’ equity $3,688,317 $3,762,940
See accompanying notes to consolidated financial statements.
C O N S O L I D AT E D B A L A N C E S H E E T S

1 9 9 9 A n n u a l R e p o r t 31
Years Ended December 31, 1999 1998 1997
In thousands, except per share data
RevenuesRental income $618,749 $478,718 $386,672Other non-property income 1,942 3,382 1,123
Total revenues 620,691 482,100 387,795
ExpensesRental expenses:
Personnel 66,968 51,219 53,315Real estate taxes and insurance 63,425 48,898 36,273Repair and maintenance 41,339 36,827 21,392Utilities 30,106 26,361 24,861Administrative and marketing 25,410 19,066 15,208Property management 18,475 16,945 12,299Other operating expenses 1,539 244 383
Real estate depreciation 121,727 99,588 76,688Interest 153,748 106,238 79,004Impairment loss on real estate and investments (Note 2) 19,300 — 1,400General and administrative 13,850 10,139 7,075Other depreciation and amortization 4,425 3,645 2,084Loss on termination of an interest rate risk management agreement (Note 5) — 15,591 —
Total expenses 560,312 434,761 329,982
Income before gains on sales of investments, minority interests and extraordinary item 60,379 47,339 57,813
Gains on sales of investments 37,995 26,672 12,664Income before minority interests and extraordinary item 98,374 74,011 70,477Minority interests of outside partners (1,245) (111) —Minority interests of unitholders in operating partnership (4,434) (1,430) (278)Income before extraordinary item 92,695 72,470 70,199Extraordinary item—early extinguishment of debt 927 (138) (50)Net income 93,622 72,332 70,149Distributions to preferred shareholders - Series A and B (22,560) (22,607) (17,345)Distributions to preferred shareholders - Series D (Convertible) (15,154) (986) —Net income available to common shareholders $ 55,908 $ 48,739 $ 52,804
Earnings per common share: (Note 1)Basic $ .54 $ .49 $ .61Diluted $ .54 $ .49 $ .60
Common distributions declared per share $ 1.06 $ 1.05 $ 1.01
Weighted average number of common shares outstanding—basic 103,604 99,966 87,145Weighted average number of common shares outstanding—diluted 103,639 100,062 87,339
See accompanying notes to consolidated financial statements.
C O N S O L I D AT E D S TAT E M E N T S O F O P E R AT I O N S

U n i t e d D o m i n i o n R e a l t y Tr u s t , I n c .32
Years Ended December 31, 1999 1998 1997
In thousands
Operating ActivitiesNet income $ 93,622 $ 72,332 $70,149Adjustments to reconcile net income to cash provided by
operating activities:Depreciation and amortization 126,152 103,233 78,772Minority interests 5,679 1,541 278Impairment loss on real estate and investments 19,300 — 1,400Amortization of deferred financing costs and other 5,184 2,061 1,706Gains on sales of investments (37,995) (26,672) (12,664)Extraordinary item—early extinguishment of debt (927) 138 50Net cash paid in mergers (8,417) — —Changes in operating assets and liabilities:
Increase in operating liabilities 3,640 30,682 8,830Increase in operating assets (15,362) (30,440) (10,618)
Net cash provided by operating activities 190,876 152,875 137,903
Investing ActivitiesProceeds from sales of investments 236,706 155,459 77,257Development of real estate assets (114,028) (97,222) (52,217)Acquisition of real estate, net of liabilities assumed (75,719) (169,808) (271,836)Capital expenditures - real estate assets (74,323) (100,398) (95,499)Capital expenditures - non-real estate assets (8,062) (2,876) (3,659)Net cash paid in mergers — (59,446) —Other investing activities 1,132 (1,851) 3,681
Net cash used in investing activities (34,294) (276,142) (342,273)
Financing ActivitiesNet reduction in secured debt (72,048) (98,792) (19,337)Net proceeds from the issuance of unsecured debt 83,828 307,482 69,936Payment of financing costs (6,719) (4,875) (2,836)Proceeds from the sale of preferred stock — — 145,068Proceeds from the issuance of common stock 17,250 76,686 100,751 Distributions paid to minority interests (9,200) (2,413) (144)Distributions paid to preferred shareholders (34,958) (22,611) (16,270)Distributions paid to common shareholders (109,608) (103,074) (85,777)Repurchase of operating partnership units (11,967) (3,528) —Repurchase of common and preferred stock (31,563) — —
Net cash (used in)/provided by financing activities (174,985) 148,875 191,391Net increase (decrease) in cash and cash equivalents (18,403) 25,608 (12,979)Cash and cash equivalents, beginning of year 26,081 473 13,452Cash and cash equivalents, end of year $ 7,678 $ 26,081 $ 473
Supplemental Information:Interest paid during the period $162,236 $104,858 $76,669Conversion of operating partnership units to common stock 3,947 7,542 —Non-cash transactions associated with the acquisition of properties:
Secured debt assumed — 116,326 60,052Issuance of common stock — 7,099 —Issuance of operating partnership units — 18,477 12,530
Non-cash transactions associated with mergers:Real estate assets acquired — 1,080,696 —Other operating assets acquired — 26,845 —Issuance of preferred stock — 175,000 —Issuance of common stock — 108,456 —Issuance of operating partnership units — 88,831 —Secured debt assumed — 637,188 —Operating liabilities assumed — 36,026 —Minority interests in partnerships assumed — 5,382 —
See accompanying notes to consolidated financial statements.
C O N S O L I D AT E D S TAT E M E N T S O F C A S H F L O W S

1 9 9 9 A n n u a l R e p o r t 33
Years Ended December 31, 1999 1998 1997In thousands, except per share amounts
Preferred StockBalance, beginning of year $ 430,000 $ 255,000 $ 105,000
Issuance of 8.60% Series B Cumulative Redeemable — — 150,000Issuance of 7.50% Series D Cumulative Convertible Redeemable
in connection with the acquisition of American Apartment Communities II — 175,000 —Purchase of preferred stock (2,128) — —
Balance, end of year $ 427,872 $ 430,000 $ 255,000
Common Stock, $1 Par ValueBalance, beginning of year $ 103,639 $ 89,168 $ 81,983
Issuance of common shares in public offerings — 2,804 4,000Issuance of common shares in the acquisition of ASR Investments Corporation — 7,743 —Issuance of common shares to employees, officers, and director- shareholders 72 78 333Issuance of common shares through dividend reinvestment
and stock purchase plan 1,598 2,825 2,852Issuance of common shares in connection with the acquisition of properties — 482 —Purchase of common stock (2,688) — —Issuance of restricted stock awards 46 — —Conversion of operating partnership units 74 539 —
Balance, end of year $ 102,741 $ 103,639 $ 89,168
Additional Paid-in CapitalBalance, beginning of year $1,090,432 $ 906,307 $ 814,795
Issuance of common shares in public offerings, net of issuance costs — 35,170 55,386Issuance of common shares in the acquisition of ASR Investments Corporation — 100,713 —Offering costs associated with the issuance of preferred shares — — (4,934)Issuance of common shares to employees, officers, and director-shareholders 665 801 4,170Issuance of common shares through dividend reinvestment
and stock purchase plan 15,049 33,821 36,890Issuance of common shares in connection with the acquisition of properties — 6,617 —Purchase of common stock (27,372) — —Purchase of preferred stock 626 — —Issuance of restricted stock awards 414 — —Adjustment for cash purchase and conversion of minority interests of
unitholders in operating partnerships 3,873 7,003 —Balance, end of year $1,083,687 $1,090,432 $ 906,307
Notes Receivable from Officer-ShareholdersBalance, beginning of year $ (7,619) $ (8,806) $ (5,926)
Principal repayments officer - shareholders 139 1,413 635Shares issued to officer-shareholders (273) (226) (3,515)
Balance, end of year $ (7,753) $ (7,619) $ (8,806)
Distributions in Excess of Net IncomeBalance, beginning of year $ (242,331) $ (183,312) $ (147,529)
Net income 93,622 72,332 70,149Common stock distributions declared ($1.06 per share for 1999,
$1.05 per share for 1998 and $1.01 per share for 1997) (109,607) (107,758) (88,587)Preferred stock distributions declared—Series A ($2.31 per share for 1999,
1998 and 1997) (9,688) (9,704) (9,713)Preferred stock distributions declared—Series B ($2.15 per share for 1999 and
1998 and $1.27 per share for 1997) (12,872) (12,903) (7,632)Preferred stock distributions declared—Series D ($1.89 per share for 1999 and
$.12 per share for 1998) (15,154) (986) —Balance, end of year $ (296,030) (242,331) $ (183,312)
Deferred Compensation - Unearned Restricted Stock AwardsBalance, beginning of year $ — $ — $ —
Issuance of restricted stock awards (460) — —Amortization of deferred compensation 155 — —
Balance, end of year $ (305) $ — $ —
Unrealized Gains on Securities Available-for-SaleBalance, beginning of year $ — $ — $ 2,056
Realized gain on securities available-for-sale — — (2,056)Unrealized gain on securities available-for-sale — — —
Balance, end of year $ — $ — $ —
Total Shareholders’ Equity $1,310,212 $1,374,121 $1,058,357
See accompanying notes to consolidated financial statements.
C O N S O L I D AT E D S TAT E M E N T S O F S H A R E H O L D E R S ’ E Q U I T Y

U n i t e d D o m i n i o n R e a l t y Tr u s t , I n c .34
Organization and formation United Dominion Realty Trust, Inc., a Virginiacorporation, was formed in 1972. United Dominion operates within one definedbusiness segment with activities related to the ownership, development, acquisition, renovation, management, marketing and strategic disposition ofmultifamily apartment communities nationwide. At December 31, 1999, UnitedDominion owned 301 communities with 82,154 completed apartment homesand had three communities and three additional phases to existing communitieswith 1,622 apartment homes under development.
Basis of presentation The accompanying consolidated financial statementsinclude the accounts of United Dominion and its subsidiaries, includingUnited Dominion Realty, L.P., its Operating Partnership, and HeritageCommunities L.P. (collectively, “United Dominion”). As of December 31,1999, there were 74,463,788 units in the Operating Partnership outstanding,of which 67,619,425, or 90.8%, were owned by United Dominion and 6,844,363,or 9.2%, were owned by non-affiliated limited partners. In connection withthe acquisition of ASR Investment Corporation in March 1998, UnitedDominion acquired Heritage Communities L.P., a Delaware limited partnership(the “Heritage OP”). As of December 31, 1999, there were 4,502,668 units inthe Heritage OP outstanding, of which 3,839,330, or 85.3%, were owned byUnited Dominion and 663,338, or 14.7%, were owned by non-affiliated limitedpartners. The consolidated financial statements of United Dominion includethe minority interests of the unitholders in the operating partnerships. Allsignificant inter-company accounts and transactions have been eliminated inconsolidation.
Income taxes United Dominion is operated as and elects to be taxed as a realestate investment trust (“REIT”) under the Internal Revenue Code of 1986,as amended (the “Code”). Generally, a REIT that complies with the provisionsof the Code and distributes at least 95% of its taxable income to its shareholderswill not be subject to U.S. federal income taxes. Accordingly, no provision hasbeen made for federal income taxes. However, United Dominion is subject tocertain state and local excise or franchise taxes.
The differences between net income available to common shareholders forfinancial reporting purposes and taxable income before dividend deductionsrelate primarily to temporary differences, principally real estate depreciation andthe tax deferral of certain gains on property sales. The temporary differences indepreciation result from differences in the book and tax basis of certain realestate assets and the differences in the methods of depreciation and lives of thereal estate assets.
For income tax purposes, distributions paid to common shareholders consistof ordinary income, capital gains, return of capital or a combination thereof. Forthe three years ended December 31, 1999, distributions paid per commonshare were taxable as follows:
1999 1998 1997
Ordinary income $ .620 $ .913 $ .727Long-term capital gain .129 — .021Return of capital .309 .127 .249
$1.058 $1.040 $ .997
Dividends declared on all series of United Dominion’s preferred stock representordinary income to preferred stockholders for tax purposes in the year paid.
Use of estimates The preparation of the financial statements in conformity withgenerally accepted accounting principles requires management to make estimatesand assumptions that affect the amounts reported in the financial statementsand accompanying notes. Actual results could differ from those estimates.
Reclassifications Certain reclassifications have been made to amounts in prioryears’ financial statements to conform with current year presentation.
Cash and cash equivalents Cash and cash equivalents include all cash and liquid investments with maturities of three months or less when purchased.
Real estate Real estate assets held for investment are carried at historicalcost less accumulated depreciation less any recorded impairment losses.
Expenditures for ordinary repair and maintenance costs are charged toexpense as incurred. Significant expenditures for improvements, renovationsand replacements related to the acquisition and improvement of real estateassets are capitalized at cost and depreciated over their estimated useful lives.
United Dominion recognizes impairment losses on long-lived assets used inoperations when there is an event or change in circumstance that indicatesan impairment in the value of an asset and the undiscounted future cashflows are not sufficient to recover the asset’s carrying value. If such indicatorsof impairment are present, an impairment loss is recognized based on theexcess of the carrying amount of the asset over its fair value.
For long-lived assets to be disposed of, impairment losses are recognizedwhen the fair value of the asset less estimated cost to sell is less than the carrying value of the asset. Real estate is classified as real estate held for disposition when management has committed to sell and is actively marketingthe property, and United Dominion expects to dispose of these propertieswithin the next twelve months. Real estate held for disposition is carried atthe lower of cost, net of accumulated depreciation or fair value less the cost todispose, determined on an asset by asset basis. Depreciation is not recordedon real estate held for disposition and gains (losses) from initial and subsequentadjustments to the carrying value of the assets, if any, are recorded as a separatecomponent of income from continuing operations.
Depreciation is computed on a straight-line basis over the estimated usefullives of the related assets which is 35 years for buildings, 10 to 35 years formajor improvements, and 5 to 20 years for furniture, fixtures, equipment andother assets.
All development projects and related carrying costs are capitalized andreported on the balance sheet as “real estate under development” until suchtime as the development project is completed. Upon completion, the totalcost of the building and associated land is transferred to real estate held forinvestment and the assets are depreciated over their estimated useful lives.The cost of development projects includes interest, real estate taxes, insur-ance and allocated development overhead during the construction period.
Interest and real estate taxes incurred during the development period arecapitalized as part of the real estate under development to the extent thatsuch charges do not cause the carrying value of the asset to exceed its netrealizable value. During 1999, 1998 and 1997, total interest capitalized was $5.2 million, $3.4 million and $2.6 million, respectively.
Commencing with the adoption of EITF No. 97-11, “Accounting forInternal Costs Relating to Real Estate Property Acquisitions” in March 1998,United Dominion expenses direct internal costs of identifying and acquiringoperating properties.
Revenue recognition United Dominion’s apartment homes are leased underoperating leases with terms generally of one year or less. Rental income is rec-ognized after it is earned and paid.
Restricted cash Restricted cash consists of escrow deposits held by lenders forreal estate taxes, insurance and replacement reserves and security deposits.
Deferred financing costs Deferred financing costs include fees and othercosts incurred to obtain debt financings and are generally amortized on astraight-line basis, which approximates the effective interest method, over aperiod not to exceed the term of the related debt. Unamortized financingcosts are written-off when debt is retired before its maturity date.
1. SUMMARY OF SIGNIFICANT ACCOUNTING POLICIES
N O T E S T O C O N S O L I D AT E D F I N A N C I A L S TAT E M E N T SD e c e m b e r 3 1 , 1 9 9 9

1 9 9 9 A n n u a l R e p o r t 35
Interest rate swap agreements United Dominion enters into interest rate swapagreements to alter the interest rate characteristics of outstanding debt instru-ments. Each interest rate swap agreement is designated with all or a portion ofthe principal balance and term of a specific debt obligation. The interest rateswaps involve the periodic exchange of payments over the life of the relatedagreements. Amounts received or paid on the interest rate swaps are recordedon an accrual basis as an adjustment to the related interest expense of the out-standing debt based on the accrual method of accounting. The related amountspayable to and receivable from counterparties are included in other liabilitiesand other assets, respectively. The fair value of and changes in the fair value asa result of changes in market interest rates for the interest rate swap agreementsare not reflected in the financial statements.
Gains and losses on terminations of interest rate swap agreements aredeferred as an adjustment to the carrying amount of the outstanding debt andamortized into interest expense over the remaining term of the original contractlife of the terminated swap agreement. In the event of early extinguishment of adesignated debt obligation, any realized or unrealized gain or loss from the swapwould be recognized in income coincident with the extinguishment gain or loss.There were no gains or losses on terminations of interest rate swap agreementsrecognized by United Dominion for the periods presented.
Any interest rate swap agreements that are not designated with outstandingdebt or notional amounts of interest rate swap agreements in excess of theoriginal amounts of the underlying debt obligations are recorded as an asset orliability at fair value, with the changes in the fair value recorded in otherincome or expense (fair value method).
Interest rate risk management agreements United Dominion enters intointerest rate futures contracts to hedge interest rate risk associated with anticipated debt transactions. United Dominion follows SFAS No. 80,“Accounting for Futures Contracts,” which permits hedge accounting foranticipatory transactions meeting certain criteria. Gains and losses, if any, onthese transactions are deferred as an adjustment to the carrying amount ofthe outstanding debt and amortized over the term of the related debt as anadjustment to interest expense. The fair values of interest rate risk managementagreements are not recognized in the financial statements.
At the time the anticipated transaction is no longer likely to occur, UnitedDominion would mark the derivative instrument to market and would recognizeany adjustment in the consolidated statement of operations.
Earnings per share Basic earnings per common share is computed basedupon the weighted average number of common shares outstanding during theyear. Diluted earnings per common share is computed based on commonshares outstanding plus the effect of dilutive stock options and other poten-tially dilutive common stock equivalents. The dilutive effect of stock optionsand other potentially dilutive common stock equivalents is determined usingthe treasury stock method based on United Dominion’s average stock price.The early extinguishment of debt does not have an effect on the earnings pershare calculation for the periods presented. The following table sets forth thecomputation of basic and diluted earning per share (dollars in thousands,except per share data):
1999 1998 1997
Numerator for basic and diluted earnings per share-net income available to common shareholders $ 55,908 $ 48,739 $ 52,804
Denominator:Denominator for basic earnings per share-weighted average shares 103,604 99,966 87,145
Effect of dilutive securities: Employee stock options 35 96 194
Denominator for dilutive earnings per share 103,639 100,062 87,339Basic earnings per share $ .54 $ .49 $ .61Diluted earnings per share $ .54 $ .49 $ .60
The effect of the conversion of the operating partnership units and convertiblepreferred stock is not dilutive and is therefore not included as a dilutive securityin the earnings per share computation. The weighted average effect of the con-version of the operating partnership units for the years ended December 31,1999, 1998 and 1997 was 8,180,409, 2,963,427, and 317,120, respectively. Theweighted average effect of the conversion of the convertible preferred stock forthe years ended December 31, 1999 and 1998 was 12,307,692 and 809,273,respectively.
Minority interests in operating partnerships Interests in operating partnershipsheld by limited partners are represented by operating partnership units (OPUnits). The operating partnerships’ income is allocated to holders of OP Unitsbased upon net income available to common shareholders and the weightedaverage number of OP Units outstanding to total common shares plus OPUnits outstanding during the period. Capital contributions, distributions andprofits and losses are allocated to minority interests in accordance with theterms of the individual partnership agreements. OP Units can be exchanged forcash or shares of United Dominion’s common stock on a one-for-one basis, atthe option of United Dominion. OP Units as a percentage of total OP Unitsand shares outstanding was 6.8%, 7.7% and 1.1% at December 31, 1999, 1998and 1997, respectively.
Minority interests in other partnerships United Dominion has limited partnersin certain real estate partnerships acquired as part of the acquisition ofAmerican Apartment Communities II on December 7, 1998. Net income forthese partnerships is allocated based on the percentage interest owned bythese limited partners in each respective real estate partnership.
Stock based compensation United Dominion has elected to followAccounting Principles Board Opinion No. 25, “Accounting for Stock Issuedto Employees” (“APB 25”) in accounting for its employee stock optionsbecause the alternative fair value accounting provided for under SFAS No.123, “Accounting for Stock Based Compensation,” requires the use of option valuation models that were not developed for use in valuing employee stockoptions. Under APB 25, because the exercise price of United Dominion’semployee stock options equals the market price of the underlying stock onthe date of grant, no compensation cost has been recognized.
Impact of recently issued accounting standards In June 1998, the FinancialAccounting Standards Board issued Statement No. 133, “Accounting forDerivative Instruments and Hedging Activities” (“Statement 133”), as amendedby Statement No. 137, “Accounting for Derivative Instruments and HedgingActivities – Deferral of the Effective Date of FASB Statement No. 133 – anAmendment of FASB Statement No. 133,” which is required to be adoptedin years beginning after June 15, 2000. Statement 133 permits early adoptionas of the beginning of any fiscal quarter after its issuance, however, UnitedDominion does not anticipate adopting Statement 133 until such time as it isrequired. Statement 133 will require United Dominion to recognize all deriva-tives on the balance sheet at fair value. Derivatives that are not hedges mustbe adjusted to fair value through income. If the derivative is a hedge, depend-ing on the nature of the hedge, changes in fair value of derivatives will eitherbe offset against the change in fair value of the hedged assets, liabilities, orfirm commitments through earnings or recognized in other comprehensiveincome until the hedged item is recognized in earnings. The ineffective portion of the derivative’s change in fair value will be immediately recognizedin earnings. United Dominion has not yet determined what the effect ofStatement 133 will be on earnings and the financial position of UnitedDominion, however, management does not anticipate that the adoption ofStatement 133 will have a significant effect on earnings or the financial position of United Dominion.

U n i t e d D o m i n i o n R e a l t y Tr u s t , I n c .36
2. REAL ESTATE OWNED
United Dominion operates in over 30 major markets dispersed throughout a 22state area. At December 31, 1999, the company’s largest apartment market wasDallas, Texas, where it owned 9.7% of its apartment homes, based upon carry-ing value. Excluding Dallas, Texas, United Dominion did not own more than5.5% of its apartment homes in any one market, based upon carrying value.
The following table summarizes real estate held for investment atDecember 31, (dollars in thousands):
1999 1998
Land and land improvements $ 636,905 $ 647,328Buildings and improvements 2,767,940 2,819,312Furniture, fixtures and equipment 166,826 169,364Construction in progress 6,177 7,241Real estate held for investment 3,577,848 3,643,245Accumulated depreciation (373,164) (280,663)Real estate held for investment, net $3,204,684 $3,362,582
The following is a summary of real estate owned by market at December 31,1999 (dollars in thousands):
Real Estate Held for Investment by Market (in order of carrying value and excluding real estate under development)
InitialNumber of Acquisition Carrying Accumulated Encum-
Communities Cost Value Depreciation brances
MarketDallas/Ft. Worth, TX 25 $312,391 $348,190 $28,588 $34,299 (A)
Phoenix, AZ 10 164,891 196,529 11,174 19,500 (A)
Houston, TX 15 139,969 183,991 11,875 43,546 (A)
Orlando, FL 13 146,114 175,325 24,667 41,298 (A)
San Antonio, TX 12 150,741 165,825 12,051 38,138 (A)
Tampa, FL 11 146,849 162,933 19,550 40,177 (A)
Raleigh, NC 9 123,071 139,336 23,894 15,202San Francisco, CA 4 128,754 138,681 3,320 68,751Columbus, OH 5 86,625 120,913 3,244 34,459Charlotte, NC 10 95,265 118,169 20,430 17,650Nashville, TN 8 83,987 116,954 9,253 —Wilmington, NC 10 80,116 111,709 23,421 —Monterey Peninsula, CA 13 100,762 111,474 2,930 703 (A)
Memphis, TN 7 95,594 103,723 10,110 33,032South Florida 6 96,137 102,349 10,310 (A)
Richmond, VA 8 75,101 100,058 24,772 2,917 (A)
Columbia, SC 9 83,053 97,332 19,490 5,000Southern California 6 94,583 95,243 2,102 6,034Other FL 8 56,901 86,616 11,308 —Greensboro, NC 5 63,359 78,175 8,625 —Atlanta, GA 6 57,669 69,224 10,347 10,841Baltimore, MD 6 58,846 65,439 10,796 18,260 (A)
Seattle, WA 5 63,998 57,816 2,341 28,684Jacksonville, FL 3 44,787 56,783 8,657 12,455Hampton, VA 6 42,741 54,653 15,238 (A)
Sacramento, CA 2 47,549 52,758 1,406 17,065 (A)
Other VA 6 29,510 47,439 9,337 2,780Denver, CO 2 44,195 44,111 1,298 —Other North Carolina 3 39,004 41,155 4,734 10,142Detroit, MI 4 38,126 40,254 1,111 635 (A)
Other Midwest 3 36,119 38,293 1,267 1,006 (A)
Washington DC 3 32,603 35,731 4,565 (A)
Eastern Shore MD 4 31,403 34,790 5,217 (A)
Portland, OR 3 41,892 34,353 1,163 1,542 (A)
Indianapolis, IN 2 29,988 26,263 938 304 (A)
Austin, TX 2 21,005 23,836 2,506 (A)
Arkansas 2 20,500 22,306 2,083 —Nevada 1 20,000 20,776 1,759 —Delaware 2 14,732 17,761 3,044 (A)
New Mexico 2 16,023 16,761 1,219 5,221 (A)
Arizona 2 11,891 13,408 780 4,618Other GA 1 8,590 10,413 2,244 (A)
264 $3,075,434 $3,577,848 $373,164 $514,259 (A)
Real Estate Held for Disposition (B)
InitialNumber of Acquisition Carrying Accumulated Encum-Properties Cost Value Depreciation brances
Apartments 37 $257,625 $ 270,718 $ 20,909 $66,407(A)
Commercial 4 11,082 12,565 1,791 3,07041 $268,707 $283,283 $22,700 $69,477(A)
Total 305 $3,344,141 $3,861,131 $395,864 $1,000,136(A)
(A)There are 21 communities encumbered by two REMIC financings aggregating $59.2 million, 19 communities encumbered by one secured note payable aggregating $195.7 million and 29 communities encumbered by fixed rate debt aggregating $161.5 million. The amount of this debt is not included in the encumbrances shown for the individual markets or in real estate held for disposition.
(B) Real estate held for disposition contributed property operating income (property rental income lessproperty rental expenses) in the aggregate amount of approximately $25.2 million for the year endedDecember 31, 1999. The properties classified as held for disposition at December 31, 1999 reflectproperties management has committed to sell during the next twelve months.
For the year ended December 31, 1999, United Dominion recognized $18.3 million in impairment losses on its real estate owned. At the beginning of June 1999, United Dominion embarked on an accelerated disposition plan for non-strategic properties. Accordingly, through the review and analysis ofcommunities targeted for strategic disposition, which included exiting one of United Dominion’s major markets and planned sales in 2000, an aggregate$14.8 million impairment loss was recognized on assets held for disposition.An impairment loss was indicated as a result of the net book value of theassets held for disposition being greater than the estimated fair market valueless the cost of disposal.
In connection with the periodic evaluation of its apartment portfolio, UnitedDominion recorded a $3.5 million impairment loss on three communitiesacquired in the ASR merger in 1998 which are classified in real estate held forinvestment. An impairment loss was indicated as the sum of the estimated futurecash flows from the assets was deemed to be less than their carrying amounts.
The following is a reconciliation of the carrying amount of real estate held forinvestment at December 31, (dollars in thousands):
1999 1998 1997
Balance at January 1 $3,643,245 $2,281,438 $2,007,612Real estate acquired 75,719 1,388,514 344,363Capital expenditures 72,096 98,872 96,102Transferred from development 116,787 23,350 65,475Impairment loss on real estate (3,500) — (1,400)Transferred to real estate held
for disposition (326,499) (148,929) (230,714)Balance at December 31 $3,577,848 $3,643,245 $2,281,438
The following is a reconciliation of accumulated depreciation for real estateheld for investment at December 31, (dollars in thousands):
1999 1998 1997
Balance at January 1 $280,663 $200,506 $173,291Depreciation expense for the year* 122,884 100,683 77,440Transferred to real estate held
for disposition (30,383) (20,526) (50,225)Balance at December 31 $373,164 $280,663 $200,506
*Includes $1,157, $1,095 and $752, for 1999, 1998, and 1997, respectively, classified as “Other depreciation and amortization” in the Consolidated Statements of Operations.

1 9 9 9 A n n u a l R e p o r t 37
3. SECURED DEBT
Secured debt, which encumber $1.9 billion or 48.0% of United Dominion’sreal estate owned, ($2.1 billion or 52.0% of United Dominion’s real estate
owned is unencumbered) consists of the following at December 31, 1999(dollars in thousands):
Fixed Rate DebtMortgage Notes Payable Fixed rate mortgage notes payable are generally duein monthly installments of principal and interest and mature at various datesfrom August 2000 through June 2034 and carry interest rates ranging from7.13% to 9.58%.
Tax-Exempt Secured Notes Payable Fixed rate mortgage notes payable whichsecure tax-exempt housing bond issues mature at various dates throughNovember 2025 and carry interest rates from 6.13% to 8.50%. Interest onthese notes is generally payable in semi-annual installments.
REMIC Financings United Dominion has two fixed rate REMIC financingswhich bear interest of 7.01% and 8.50% and mature in December 2000 andFebruary 2001, respectively. United Dominion makes monthly installments ofprincipal and interest over the term of the REMIC financings.
Secured Credit Facilities On March 18, 1999, United Dominion closed on thefirst part of a $200 million revolving credit facility with the Federal NationalMortgage Association (the “FNMA Credit Facility”). The FNMA CreditFacility is for an initial term of five years, bears interest at a floating rate whichcan be fixed for periods of up to 270 days, and can be extended for an addition-al five or ten years at United Dominion’s discretion. The $102.3 million initiallyborrowed under the terms of the FNMA Credit Facility had an interest rate of5.70%. In April 1999, United Dominion borrowed an additional $16.6 millionat an interest rate of 5.68% and $10.7 million at an interest rate of 5.72%. InAugust, an additional $66.1 million was borrowed under the FNMA CreditFacility which had an interest rate of 6.53%. At December 31, 1999, theFNMA Credit Facility had a weighted average floating rate of interest of6.32%. In order to limit a portion of its interest rate exposure on the FNMA
Credit Facility, United Dominion entered into three forward rate swap agree-ments. These agreements have an aggregate notional value of $57 millionunder which United Dominion pays a fixed rate of interest and receives a vari-able rate on the notional amount. The interest rate swap agreements effectivelychange United Dominion’s interest rate exposure on $57 million of secureddebt from a variable rate to a weighted average fixed rate of 6.65% (see Note 5-Financial Instruments).
Variable Rate DebtSecured Credit Facilities Variable rate secured credit facilities consists of $138.7million of the $195.7 million outstanding on the FNMA Credit Facility.
Tax-Exempt Secured Notes Payable Variable rate mortgage notes payablewhich secure tax-exempt housing bond issues mature at various dates fromDecember 2002 to April 2029. At December 31, 1999, these notes carryinterest rates ranging from 4.75% to 5.90%.
Mortgage Notes Payable Variable rate mortgage notes payable are generallydue in monthly installments of principal and interest and mature at variousdates from February 2001 through September 2027. At December 31, 1999,these notes carry interest rates ranging from 6.86% to 7.50%.
The extraordinary loss for the years ended December 31, 1998 and 1997resulted from the write-off of deferred financing costs on mortgage debt satisfied.
The aggregate maturities of secured debt for the five years subsequent toDecember 31, 1999 are as follows (dollars in thousands):
Weighted Average Weighted Average No. of Communities Principal Outstanding Interest Rate Years to Maturity Encumbered
1999 1998 1999 1999 1999
Fixed Rate DebtMortgage Notes Payable (a) $ 555,414 $ 618,997 7.81% 6.5 84Tax-Exempt Secured Notes Payable 96,699 125,405 6.91% 12.5 13REMIC Financings 59,167 75,919 7.78% 1.0 21Secured Credit Facilities 57,000 45,000 6.65% 14.0 —Total Fixed Rate Secured Debt 768,280 865,321 7.61% 7.4 118
Variable Rate DebtSecured Credit Facilities 138,675 — 6.18% 14.0 19Tax-Exempt Secured Notes Payable 66,616 64,895 4.96% 18.9 5Mortgage Notes Payable 26,565 141,969 7.34% 13.3 9Total Variable Rate Secured Debt 231,856 206,864 5.96% 15.3 33Total Secured Debt $ 1,000,136 $1,072,185 7.23% 9.2 151
(a) Includes fair value adjustments aggregating $14.8 million recorded in connection with two statutory mergers consummated in 1998.
Fixed Rate Variable RateMortgage Tax-Exempt REMIC Secured Secured Tax-Exempt Mortgage
Year Notes Bonds Financings Notes Notes Notes Notes Total
2000 $ 28,351 $ 1,150 $26,445 — — $ 1,500 $ 629 $ 58,0752001 64,845 1,402 32,722 — — 1,500 4,232 104,7012002 51,325 1,490 — — — 4,000 660 57,4752003 52,076 1,306 — — — 1,900 6,255 61,5372004 120,435 4,866 — — — 2,000 619 127,920Thereafter 238,382 86,485 — $57,000 $138,675 55,716 14,170 590,428
$555,414 $96,699 $59,167 $57,000 $138,675 $66,616 $26,565 $1,000,136

U n i t e d D o m i n i o n R e a l t y Tr u s t , I n c .38
A summary of unsecured debt at December 31, 1999 and 1998 is as follows(dollars in thousands):
1999 1998
Commercial BanksBorrowings outstanding under
credit facilities (a) (b) $ 277,600 $ 240,000
Insurance Companies—Senior Unsecured Notes7.98% due March, 2000–2003 (c) 29,800 37,228
Other (d) 4,931 5,836
Senior Unsecured Notes – Other7.25% Notes repaid April 1999 — 75,0008.13% Senior Notes due November 2000 146,150 150,0007.60% Medium-Term Notes due January 2002 55,000 —7.65% Medium-Term Notes due January 2003 (e) 10,000 —7.22% Medium-Term Notes due February 2003 12,000 —5.05% City of Portland, OR Bonds due October 2003 7,345 —7.67% Medium-Term Notes due January 2004 54,000 —7.73% Medium-Term Notes due April 2005 23,400 —7.02% Medium-Term Notes due November 2005 50,000 50,0007.95% Medium-Term Notes due July 2006 120,340 125,0007.07% Medium-Term Notes due November 2006 25,000 25,0007.25% Notes due January 2007 111,825 125,0008.50% Monthly Income Notes due November 2008 59,778 62,5008.50% Debentures due September 2024 (f) 140,000 150,000
814,838 762,500Total Unsecured Debt $1,127,169 $1,045,564
(a) Weighted average interest rate of 6.7% and 6.0% at December 31, 1999 and 1998, respectively. (b) At December 31, 1999 United Dominion had seven interest rate swap agreements associated with
commercial bank borrowing with an aggregate notional value of $110 million under which United Dominion pays a fixed rate of interest and receives a variable rate of interest on the notional amounts. The interest rate swaps effectively change United Dominion’s interest rate exposureon these borrowings from a variable rate to a weighted average fixed rate of approximately 6.77%.
(c) Payable annually in four equal principal installments of $7.4 million. (d) Includes $4.6 million and $5.4 million at December 31, 1999 and 1998, respectively, of deferred
gains from the termination of interest rate risk management agreements. (e) United Dominion has one interest rate swap agreement associated with these unsecured notes with
an aggregate notional value of $10 million under which United Dominion pays a fixed rate of interest and receives a variable rate on the notional amount. The interest rate swap agreementeffectively changes United Dominion’s interest rate exposure on the $10 million from a variable rate to a fixed rate of 7.65% (see Note 5-Financial Instruments).
(f) Debentures include an investor put feature which grants a one-time option to redeem debentures in September 2004.
For the year ended December 31, 1999, United Dominion recognized a $927thousand extraordinary gain related to the repurchase of $70.0 million of itsunsecured notes payable at less than face value.
Information concerning short-term bank borrowings is summarized in thetable that follows (dollars in thousands):
1999 1998 1997
Total revolving credit facilitiesand lines of credit at December 31 $310,000 $265,000 $265,000
Borrowings outstanding at December 31 277,600 240,000 135,600Weighted average daily borrowings
during the year 223,629 238,587 74,623Maximum daily borrowings
during the year 283,000 334,500(a) 135,600Weighted average daily interest rate
during the year 5.8% 6.1%(a) 6.3%Weighted average daily interest rate
at December 31 6.7% 6.0% 6.4%
(a) Includes balances on a $75 million bridge facility funded in July 1998 that matured in
November 1998.
At December 31, 1999, United Dominion had in place a syndicated three year$200 million unsecured revolving credit facility (the “Bank Credit Facility”) ofwhich $197.6 million was outstanding at December 31, 1999. The Bank CreditFacility will expire on August 4, 2000. Borrowings under the Bank CreditFacility generally bear interest at LIBOR plus .50%. United Dominion is alsorequired to pay a fee of .20% of the committed amount. This fee and the inter-est rate are both subject to change should United Dominion’s credit ratingschange.
At December 31, 1999, United Dominion had a $110 million syndicated364-day credit agreement (the “Line of Credit”) of which $80 million was out-standing at December 31, 1999. The Line of Credit will mature on September15, 2000. Borrowings under the Line of Credit generally bear interest atLIBOR plus 1.00%. United Dominion is also required to pay a fee of .20% ofthe committed amount. This fee and the interest rate are both subject tochange should United Dominion’s credit ratings change.
The Bank Credit Facility and the Line of Credit are subject to customaryfinancial covenants and limitations. The underlying loan agreements containcertain covenants which, among other things, require United Dominion tomaintain minimum consolidated tangible net worth, as defined, and maintaincertain financial ratios.
5. FINANCIAL INSTRUMENTS
4. UNSECURED DEBT
Fair Value of Financial InstrumentsThe following disclosures of estimated fair value of financial instruments weredetermined by United Dominion using available market information andappropriate valuation methodologies. Considerable judgement is necessary tointerpret market data and develop estimated fair value. Accordingly, the esti-mates presented herein are not necessarily indicative of the amounts UnitedDominion would realize on the disposition of the financial instruments. Theuse of different market assumptions or estimation methodologies may have amaterial effect on the estimated fair value amounts. The carrying amounts andestimated fair value of United Dominion’s financial instruments at December31, 1999 and 1998, both on and off-balance sheet, are summarized as follows(dollars in thousands):
1999 1998
Carrying Fair Carrying Fair
Amount Value Amount Value
Secured debt $1,000,136 $1,031,074 $1,072,185 $1,125,582Unsecured debt 1,127,169 1,102,605 1,045,564 1,068,868Interest rate swap agreements
—favorable/(unfavorable) — 626 — (1,321)
The following methods and assumptions were used by United Dominion inestimating the fair values set forth above.
Cash and cash equivalents The carrying amount of cash and cash equivalentsapproximates fair value.
Secured and unsecured debt Estimated fair value is based on mortgage rates,tax-exempt bond rates and corporate unsecured debt rates believed to beavailable to United Dominion for the issuance of debt with similar terms andremaining lives. The carrying amount of United Dominion’s variable ratesecured debt approximate fair value at December 31, 1999 and 1998. The car-rying amounts of United Dominion’s borrowings under variable rate unsecureddebt arrangements, short-term revolving credit agreements and lines of creditapproximate their fair values at December 31, 1999 and 1998.
Interest rate swap agreements Fair value is based on external market quotationsfrom investment banks.

1 9 9 9 A n n u a l R e p o r t 39
Derivative InstrumentsThe following table summarizes certain information pursuant to interest ratelimitation and swap contracts at December 31, 1999 (dollars in thousands):
Notional Fixed Type of Contract Fair
Amount Rate Contract Underlying Debt Maturity Value
$ 7,000 6.78% Swap FNMA 06/30/00 $23010,000 7.22% Swap FNMA 04/01/04 14140,000 6.49% Swap FNMA 04/01/04 17420,000 7.07% Swap Bank Credit Facility 05/01/00 (45)5,000 6.70% Swap Bank Credit Facility 06/01/00 (4)5,000 6.82% Swap Bank Credit Facility 07/01/04 915,000 6.48% Swap Bank Credit Facility 10/03/02 98
10,000 6.64% Swap Bank Credit Facility 10/03/02 15220,000 6.44% Swap Bank Credit Facility 01/24/00 1045,000 6.84% Swap Line of Credit 01/18/00 2310,000 7.65% Swap 4-year MTN 01/27/03 (244)
$177,000 $626
For all periods presented, United Dominion had no deferred gains or lossesrelating to terminated swap contracts.
Interest rate risk management agreements In order to reduce the interest raterisk associated with the anticipated issuance of unsecured debt during 1998,United Dominion entered into a $100 million (notional amount) fixed payforward starting swap agreement (interest rate risk management agreement)with an investment banking firm in July 1997. United Dominion settled theinterest rate risk management agreement on November 9, 1998, by paying$15.6 million to the counterparty. United Dominion was unable to issue theunsecured debt contemplated by the interest rate risk management agree-ment, and accordingly, the cost associated with this settlement is reflected inthe 1998 Statement of Operations. United Dominion has no interest rate riskmanagement agreements outstanding at December 31, 1999.
Risk of Counterparty Non-PerformanceUnited Dominion has not obtained collateral or other security to supportfinancial instruments. In the event of non-performance by the counterparty,United Dominion’s credit loss on its derivative instruments is limited to thevalue of the derivative instruments that are favorable to United Dominion atDecember 31, 1999. However, such non-performance is not anticipated asthe counterparties are highly rated, credit quality U.S. financial institutionsand management believes that the likelihood of realizing material losses fromcounterparty non-performance is remote.
6. EMPLOYEE BENEFIT PLANS
Profit Sharing PlanThe United Dominion Realty Trust, Inc. Profit Sharing Plan (the “Plan”) is adefined contribution plan covering all eligible full-time employees. Under thePlan, United Dominion makes discretionary profit sharing and matching con-tributions to the Plan as determined by the Compensation Committee of theBoard of Directors. Aggregate contributions, both matching and discretionary,which are included in United Dominion’s consolidated statements of opera-tions for the three years ended December 31, 1999, 1998 and 1997 were $2.2million, $550,000 and $646,000, respectively.
Stock Option PlanUnited Dominion’s 1985 Share Option Plan, (the “Option Plan”), authorizesthe grant of options, at the discretion of the Board of Directors, to certainofficers, directors and key employees of United Dominion, for up to ten mil-lion shares of United Dominion’s common stock which is limited to 8% of thenumber of shares of common stock issued and outstanding. The Option Plangenerally provides, among other things, that options be granted at exerciseprices not lower than the market value of the shares on the date of grant.Shares under options which subsequently expire or are canceled are availablefor subsequent grant. For options granted prior to December 12, 1995, theoptionee has up to five years from the date on which the options first becomeexercisable during which to exercise the options. For options granted on or afterDecember 12, 1995, the options have a ten year term. Options granted prior toDecember 9, 1997 vest on December 31 of the year subsequent to grant whileoptions granted on and after this date vest ratably over a three year period beginning on December 31 of the year subsequent to grant. OnDecember 8, 1998, United Dominion cancelled 1,047,165 options which weregranted on December 9, 1997 at $14.25. United Dominion subsequently issuedoptions on December 8, 1998 which vest over a three year period, at UnitedDominion’s then market price of $10.875.
Pro forma information regarding net income and earnings per share isrequired by SFAS No. 123 “Accounting for Stock Based Compensation”(“SFAS No. 123”), and has been determined as if United Dominion hadaccounted for its employee stock options under the fair value method ofaccounting as defined in SFAS No. 123. The fair value for these options wasestimated at the date of grant using a Black-Scholes option pricing model withthe following weighted average assumptions for 1999, 1998 and 1997:
1999 1998 1997
Risk free interest rate 6.7% 4.9% 4.8%Dividend yields 6.9% 6.6% 6.6%Volatility factor .144 .150 .150Weighted average expected life (years) 9 9 9
The weighted average fair value of options granted during 1999, 1998 and1997 was $.76, $.66 and $1.35, respectively.
For purposes of the pro forma disclosures, the estimated fair value of theoptions is amortized to expense over the options’ vesting period. UnitedDominion’s pro forma information is as follows (dollars in thousands, exceptper share amounts):
1999 1998 1997
Net income availableto common shareholders
As reported $55,908 $48,739 $52,804Pro forma 54,847 47,841 52,221
Earnings per common share-dilutedAs reported $ .54 $ .49 $ .60Pro forma .53 .48 .60

U n i t e d D o m i n i o n R e a l t y Tr u s t , I n c .40
7. SHAREHOLDERS’ EQUITY
Preferred Stock Both Series A and Series B Preferred Stock have no statedpar value and a liquidation preference of $25 per share. With no voting rightsand no stated maturity, the preferred stock in both series is not subject to anysinking fund or mandatory redemption and is not convertible into any othersecurities of United Dominion. The Series A and Series B Preferred Stock arenot redeemable prior to April 24, 2000 and May 29, 2007, respectively. On orafter these dates, the Series A and Series B Preferred Stock may be redeemedfor cash at the option of United Dominion, in whole or in part, at a redemptionprice of $25 per share plus accrued and unpaid dividends. The redemptionprice is payable solely out of the sales proceeds of other capital stock of United Dominion. All dividends due and payable on the Series A andSeries B Preferred Stock have been accrued or paid as of the end of each fiscalyear. United Dominion declared total distributions of $2.31 and $2.15 pershare on the Series A and Series B Preferred Stock respectively, during 1999.
On December 7, 1998, in connection with the AAC merger, UnitedDominion issued eight million shares of newly created Series D ConvertibleRedeemable Preferred Stock (Series D), with a liquidation preference of $25per share. The Series D has no voting rights, no stated maturity and is notsubject to any sinking fund or mandatory redemption. Series D is convertibleinto 1.5385 shares of common stock at the option of the holder of Series D atany time at $16.25 per share. The Series D is not redeemable prior toDecember 7, 2003. On or after this date, United Dominion may, at its option,redeem at any time all or part of the Series D at a price per share of $25,payable in cash, plus all accrued and unpaid dividends, provided that the current market price of the common stock at least equals the conversionprice, initially set at $16.25 per share. The redemption is payable solely out of the sale proceeds of other capital stock. In addition, United Dominion maynot redeem in any consecutive 12 month period a number of shares of SeriesD having an aggregate liquidation preference of more than $100 million.United Dominion declared total distributions of $1.89 per share on Series DPreferred Stock during 1999.
Officers’ Stock Purchase and Loan Plan Under the Officer Stock Purchaseand Loan Plan (the “Loan Plan”), certain officers have purchased commonstock at the then current market price with financing provided by UnitedDominion at an interest rate of 7%. The underlying notes mature betweenNovember 2001 and October 2006. A total of 848,500 shares have been issuedand 551,500 shares are available for future issuance under the Loan Plan.
Dividend Reinvestment and Stock Purchase Plan United Dominion’sDividend Reinvestment and Stock Purchase Plan (the “Stock Purchase Plan”)allows common and preferred shareholders the opportunity to purchase,through reinvestment of cash dividends, additional shares of United Dominion’scommon stock. As of December 31, 1999, 8,337,961 shares of common stockhad been issued under the Stock Purchase Plan. Shares in the amount of5,662,039 were reserved for further issuance under the Stock Purchase Plan atDecember 31, 1999. During 1999, 1,597,841 shares were issued under theStock Purchase Plan for a total consideration of approximately $16.7 million.
Restricted Stock Awards United Dominion’s 1999 Restricted Stock AwardsPlan authorizes the granting of restricted stock awards to employees, officersand directors of United Dominion. The shares of common stock vest ratablyover a three year period. Deferred compensation expense is recorded overthe vesting period and is based upon the value of the common stock on thedate of issuance. A total of 46,000 shares of restricted stock have been issuedunder the Restricted Stock Awards Plan as of December 31, 1999.
Purchase Rights On January 27, 1998, the Board of Directors authorized aShareholders Rights Plan (the “Rights Plan”) which will become exercisableonly if a person or group (the “Acquiring Person”) acquires or announces a tender offer for more than 15% of the outstanding common stock of UnitedDominion. Upon exercise, United Dominion may issue one share of commonstock in exchange for each right. Each right will entitle the holder to purchasefor $45 one thousandth of a share of Series C Preferred stock or, at the option ofUnited Dominion, common stock of United Dominion having a value of $90.
Options Outstanding
Shares Available Weighted Average Range of
For Future Grant Options Exercise Price Exercise Prices
Balance, December 31, 1996 1,970,040 1,775,216 $13.29 $7.44-$15.25Granted (1,841,000) 1,841,000 14.34 13.50-15.38Exercised — (116,495) 11.18 7.44-14.63Forfeited 51,000 (51,000) 15.09 13.13-15.38Balance, December 31, 1997 180,040 3,448,721 13.89 7.44-15.38Granted (1,137,665) 1,137,665 11.16 10.88-14.13Exercised — (73,490) 11.47 7.44-13.88Forfeited 1,153,883 (1,153,883) 14.28 7.44-15.38Additional shares authorized (a) 4,735,858 — — —Balance, December 31, 1998 4,932,116 3,359,013 12.89 7.44-15.38Granted (1,192,333) 1,192,333 10.02 9.63-11.19Exercised — (46,998) 9.87 9.19-10.25Forfeited 288,756 (288,756) 13.46 10.88-15.38Balance, December 31, 1999 4,028,539 4,215,592 $12.09 $9.19-$15.38
(a) The number of shares of common stock issuable upon the exercise of options outstanding is limited to 8% of the number of shares of common stock issued and outstanding.
Exercisable at December 31,1997 916,981 $12.67 $7.44-$15.381998 1,691,863 13.79 7.44-15.381999 2,042,505 13.28 9.19-15.38
A summary of United Dominion’s stock option activity during the three years ended December 31, 1999 is provided in the following table (dollars in thousands,except per share amounts):
The weighted average remaining contractual life on all options outstanding is7.5 years. Approximately 1,407,315 of share options had exercise pricesbetween $14.13 and $15.38, approximately 1,967,691 of share options had
exercise prices between $10.81 and $13.94 and approximately 840,586 ofshare options had exercise prices between $9.19 and $10.25.

1 9 9 9 A n n u a l R e p o r t 41
8. COMMITMENTS AND CONTINGENCIES
Land and Other LeasesUnited Dominion is party to three ground leases relating to operating com-munities. In addition, United Dominion is party to various other operatingleases related to the operation of its corporate and regional offices. Futureminimum lease payments for noncancelable land and other leases atDecember 31, 1999 are as follows (dollars in thousands):
2000 $ 2,1772001 1,8002002 1,7462003 1,5662004 1,444Thereafter 26,631
Total $35,364
United Dominion incurred $2.8 million, $1.6 million and $1.2 million of rentexpense for the years ended December 31, 1999, 1998 and 1997.
ContingenciesUnited Dominion is party to various legal actions which are incidental to itsbusiness. Management believes that these actions will not have a materialadverse affect on the consolidated balance sheets and statements of operation.
CommitmentsUnited Dominion is committed to completing its real estate currently underdevelopment which has an estimated cost to complete of $59.0 million atDecember 31, 1999.
9. ACQUISITIONS AND PRO FORMA FINANCIAL INFORMATION
On March 27, 1998, United Dominion completed the acquisition of ASRInvestments Corporation in a statutory merger (the “ASR Merger”). In connection with the ASR Merger, United Dominion acquired 39 communitieswith 7,550 apartment homes. Each share of ASR’s common stock was exchangedfor 1.575 shares of United Dominion’s common stock. The acquisition wasstructured as a tax-free transaction and was treated as a purchase for accountingpurposes. In connection with the acquisition, United Dominion acquired primarily real estate assets totaling $313.7 million. Consideration given byUnited Dominion included 7,742,839 shares of United Dominion’s commonstock valued at $14 per share for an aggregate equity value of $108.4 millionplus the issuance of 1,529,990 units in the ASR Operating Partnership valuedat $21.4 million. In addition, United Dominion assumed, at fair value, mortgagedebt totaling $179.4 million and other liabilities of $13.6 million.
On December 7, 1998, United Dominion completed the acquisition of American Apartment Communities II (“AAC”) in a statutory merger (the “AAC Merger”). In connection with the acquisition of AAC, UnitedDominion acquired 53 communities with 14,001 apartment homes. The AACMerger was structured as a tax-free merger and exchange of partnership unitsand was treated as a purchase for accounting purposes. In connection with theAAC Merger, United Dominion acquired primarily real estate assets totaling$766.9 million. The aggregate purchase price consisted of the following: (i)8,000,000 shares of United Dominion’s 7.5% Series D Convertible PreferredStock ($25 liquidation preference value) which is convertible into UnitedDominion’s Common Stock at $16.25 per share with a fair market value of$175 million, (ii) the issuance of 5,614,035 units of limited partnership interestin the Partnership with an aggregate fair market value of $67.4 million, (iii)the assumption of $457.7 million of secured notes at fair market value, (iv) theassumption of liabilities and minority interest aggregating $27.8 million and(v) $59.8 million of cash.
Information concerning unaudited pro forma results of operations ofUnited Dominion for the years ended December 31, 1998 and 1997 is setforth below. For 1998, such pro forma information assumes the following
transactions occurred on January 1, 1998: (i) the acquisition of ASR, (ii) theacquisition of AAC and (iii) the acquisition of 13 communities with 4,318apartment homes for an aggregate purchase price of $144 million. For 1997, inaddition to the acquisitions previously described, such pro forma informationassumes the following transactions occurred on January 1, 1997: (i) the acqui-sition by United Dominion of 17 communities with 5,659 apartment homes ata total cost of $219 million and (ii) the acquisition by ASR of 22 communitieswith 4,208 apartment homes at total cost of $176 million.
In addition to the ASR Merger and the AAC Merger, all of the acquisitionsdescribed have been accounted for as purchases of real estate and operatingresults for those communities are reflected in the accompanying consolidatedfinancial statements from their respective dates of acquisition.
Pro Forma
Year Ended December 31,
In thousands, except per share amounts 1998 1997
(Unaudited)
Rental income $597,460 $566,681Net income available to common shareholders
before extraordinary item 43,218 37,468Net income available to common shareholders 43,080 37,418Net income per common share before
extraordinary item-basic and diluted $ .41 $ .39Net income per common share—
basic and diluted .41 .39
The unaudited information is not necessarily indicative of what UnitedDominion’s consolidated results of operations would have been if the acquisi-tions had occurred at the beginning of each period presented. Additionally,the pro forma information does not purport to be indicative of UnitedDominion’s results of operations for future periods.
10. INDUSTRY SEGMENTS
United Dominion adopted Financial Accounting Standards Board (“FASB”)Statement No. 131, “Disclosure about Segments of an Enterprise and RelatedInformation”(“Statement 131”) in the fourth quarter of 1998. Statement 131superseded FASB Statement No. 14, “Financial Reporting for Segments of aBusiness Enterprise.” Statement 131 establishes standards for the way publicbusiness enterprises report information regarding reportable operating seg-ments. The adoption of Statement 131 did not affect the results of operationsor financial position of United Dominion.
United Dominion owns and operates multifamily apartment communitiesthroughout the United States which generated rental and other property relatedincome through the leasing of apartment units to a diverse base of tenants.
United Dominion separately evaluates the performance of each of its apartment communities. However, because each of the apartment communitieshave similar economic characteristics, facilities, services and tenants, the apart-ment communities have been aggregated into a single apartment communitiessegment. All segment disclosure are included in or can be derived from UnitedDominion’s consolidated financial statements.
All revenues are from external customers and no revenues are generatedfrom transactions with other segments. There are no tenants which contributed 10% or more of United Dominion’s total revenues during 1999,1998 or 1997.

U n i t e d D o m i n i o n R e a l t y Tr u s t , I n c .42
11. UNAUDITED SUMMARIZED CONSOLIDATED QUARTERLY FINANCIAL DATA
Summarized consolidated quarterly financial data for the year ended December 31, 1999 is as follows (dollars in thousands, except per share amounts):
Three Months Ended
March 31 June 30 (a) September 30 December 31 (b)
Rental income $153,791 $154,430 $155,523 $155,005Income before gains on sales of investments, minority interests
and extraordinary item 20,941 11,389 20,521 7,528Gains on the sales of investments 191 32,214 48 5,542Net income 20,082 40,800 19,876 12,864Distributions to preferred shareholders 9,439 9,440 9,441 9,394Net income available to common shareholders 10,643 31,360 10,435 3,470
Earnings per common share:Basic $ .10 $ .30 $ .10 $ .03Diluted $ .10 $ .30 $ .10 $ .03
Weighted average number of common shares outstanding-basic 103,932 104,324 103,439 102,735Weighted average number of common shares outstanding-diluted 103,935 104,338 103,490 102,807
(a) The second quarter of 1999 includes $32.2 million of gains on the sales of investments and a $7.1 million impairment loss on real estate and investments.
(b) The fourth quarter of 1999 includes $5.5 million of gains on the sales of investments and a $12.2 million impairment loss on real estate and investments.
Summarized consolidated quarterly financial data for the year ended December 31, 1998 is as follows (dollars in thousands, except per share amounts):
Three Months Ended
March 31 (a) June 30 September 30 December 31 (a) (b)
Rental income $104,249 $118,176 $123,475 $132,818Income before gains (losses) on sales
of investments, minority interests and extraordinary item 17,578 15,387 13,872 502Gains (losses) on the sales of investments (260) 20,721 13 6,198Net income 17,183 35,005 13,807 6,337Distributions to preferred shareholders 5,650 5,653 5,650 6,640Net income (loss) available to common shareholders 11,533 29,352 8,157 (303)
Earnings per common share:Basic $ .13 $ .29 $ .08 $ (.00)Diluted $ .13 $ .29 $ .08 $ (.00)
Weighted average number of common shares outstanding-basic 90,867 101,562 103,104 103,467Weighted average number of common shares outstanding-diluted 90,985 102,358 103,145 103,476
(a) United Dominion completed the acquisition of ASR Investments Corporation on March 27, 1998 and the acquisition of American Apartment Communities II on December 7, 1998.
(b) The fourth quarter of 1998 includes a $15.6 million charge associated with the termination of an interest rate risk management agreement.

1 9 9 9 A n n u a l R e p o r t 43
U N I T E D D O M I N I O N R E A LT Y T R U S T, I N C . S E N I O R O F F I C E R S
U N I T E D D O M I N I O N R E A LT Y T R U S T, I N C . B O A R D O F D I R E C T O R S
CORPORATE
John P. McCann, Chief Executive Officer
John S. Schneider, President
(Chief Operating Officer)
A. William Hamill, Executive Vice President
(Chief Financial Officer)
Blake W. Clemens, Senior Vice President
(Director of Acquisitions)
Thomas J. Corcoran, Senior Vice President
(Director of Human Resources)
Richard A. Giannotti, Senior Vice President
(Director of Development,
Northern and Southern Regions)
Patrick S. Gregory, Senior Vice President
(Director of Information Services)
Katheryn E. Surface, Senior Vice President
(General Counsel and Secretary)
Kevin W. Walsh, Senior Vice President
(Finance)
Mark E. Wood, Senior Vice President
(Director of Development, Western Region)
Patrick C. Egan, Vice President
(Property Controller)
James T. Flanagan, Vice President
(Acquisitions and Dispositions)
Robin R. Flanagan, Vice President
(Corporate Controller)
Susan Northcutt, Vice President
(Training)
Sarah S. Schimmels, Vice President
(Corporate Counsel
and Assistant Secretary)
Milton A. Scott, Jr., Vice President
(Acquisitions and Dispositions)
Thomas A. Spangler, Vice President
(Operations Planning)
NORTHERN REGION
Curtis W. Carter,Senior Vice President
(Director of Apartment Operations)
Catherine F. Bickmore, Vice President
(Area Director)
Emily A. Duke, Vice President
(Area Director)
Nancy J. Hovind, Vice President
(Senior Business Analyst)
SOUTHERN REGION
Walter J. Lamperski, Senior Vice President
(Director of Apartment Operations)
James M. Caley, Vice President
(Area Director)
Terry D. Fulbright, Vice President
(Senior Business Analyst)
Dennis E. Sandidge, Vice President
(Area Director)
WESTERN REGION
Robert C. Landis, Senior Vice President
(Director of Apartment Operations)
Ann W. Beal, Vice President
(Area Director)
Jerry A. Davis, Vice President
(Area Director)
Cheryl T. Ducote, Vice President
(Area Director)
Cheryl F. Pucci, Vice President
(Area Director)
Jeff C. Bane2
President, Blake & Bane, Inc.
Real Estate Broker, Richmond
R. Toms Dalton, Jr.3
Partner, Allen & Carwile
Attorney at Law, Waynesboro
Robert P. Freeman1, 3
Managing Director,
Wells Hill Partners, Ltd., New York
Jon A. Grove3, 4
Former President & Chief Executive Officer,
ASR Investments Corp., Tucson
James D. Klingbeil2, 4
Chairman & Chief Executive Officer,
American Apartment Communities III,
San Francisco
Barry M. Kornblau4
President, Summit Realty Group, Inc.,
Richmond
John P. McCann1
Chairman of the Board,
Chief Executive OfÏcer
Lynne B. Sagalyn1, 2
Director of the M.B.A. Real Estate Program
Columbia University Graduate
School of Business, New York
Mark J. Sandler1,3,4
Private Investor, New York
Robert W. Scharar2, 4
President, FCA Corporation, Houston
John S. Schneider1
Vice Chairman of the Board,
President, Chief Operating Officer
1—Executive Committee
2—Audit Committee
3—Compensation Committee
4—Corporate Governance Committee

U n i t e d D o m i n i o n R e a l t y Tr u s t , I n c .44
CORPORATE OFFICE
United Dominion Realty Trust, Inc.10 S. Sixth StreetRichmond, Virginia 23219-3802(804)780-2691(804)343-1912 FAXE-Mail: [email protected]: www.udrt.com
OUTSIDE COUNSEL
Hunton & WilliamsRiverfront Plaza, East Tower951 East Byrd StreetRichmond, Virginia 23219-4074
INDEPENDENT AUDITORS
Ernst & Young LLP901 East Cary StreetRichmond, Virginia 23219
TRANSFER AGENT
ChaseMellon Shareholder Services, L.L.C. One Mellon Bank Center500 Grant Street, Suite 2122Pittsburgh, Pennsylvania 15258Investor Information: (888) 237-5723
COMMON SHAREHOLDERS
As of January 31, 2000, the company had 9,004 common shareholders of record.
ASSOCIATES
As of January 31, 2000, the company had2,413 full and part-time associates.
ANNUAL MEETING
The Annual Meeting of Shareholders is scheduled for Tuesday, May 9, 2000, at 4:00 p.m., at the Omni Richmond Hotel in Richmond, Virginia. All shareholders are cordially invited to attend.
MEMBER
National Association of Real Estate Investment Trusts (NAREIT)
National Apartment AssociationNational Multi-Housing CouncilUrban Land Institute
INVESTOR SERVICES
For copies of the company’s Annual Report onForm 10-K, as reported to the Securities andExchange Commission (provided withoutcharge), or other investor assistance, please call,write or e-mail Investor Services at the corporateoffice, or refer to the website.
DIVIDEND REINVESTMENT
AND STOCK PURCHASE PLAN
The company offers its common and preferredshareholders the opportunity to purchase addi-tional shares of common stock through theDividend Reinvestment and Stock PurchasePlan. Information regarding the Plan can beobtained by contacting Investor Services.
COMMON STOCK PRICE
The table below sets forth the range of the highand low sales prices per share for each quarter ofthe last two years. Dividend information reflectsdistributions declared for each calendar quarterand paid approximately one month after the endof the quarter.
COMMON
DISTRIBUTIONS
1998 HIGH LOW DECLARED
1st Quarter $14 3/16 $13 3/4 $.26252nd Quarter 14 1/2 13 5/16 .26253rd Quarter 14 1/16 10 11/16 .26254th Quarter 12 10 1/16 .2625
COMMON
DISTRIBUTIONS
1999 HIGH LOW DECLARED
1st Quarter $11 1/4 $9 1/16 $.26502nd Quarter 11 15/16 9 13/16 .26503rd Quarter 12 1/16 10 3/4 .26504th Quarter 11 5/8 9 1/8 .2650
STOCK LISTING
New York Stock Exchange (NYSE)Symbols: UDR (Common)
UDRpfA (Preferred)UDRpfB (Preferred)
G E N E R A L I N F O R M AT I O N

De
sig
n:
Fra
nk
lin
Str
ee
t M
ark
eti
ng
& A
dve
rtis
ing
P
ho
tog
rap
hy
: C
hip
Mit
che
ll
United Dominion Realty Trust, Inc., founded in 1972, is a leading
national apartment operating company with a strong focus on service
to its residents. United Dominion owns 82,000 completed apartment
homes in 301 communities, has 1,800 additional apartment homes
under development and employs approximately 2,400 associates.
The company acquires, repositions, develops, owns, manages and
selectively sells apartment communities nationwide. | United
Dominion’s goal is to provide an annual average shareholder return
of at least 15%. The company has a long and successful history as
a publicly traded real estate investment trust, having increased its
dividend every year for the past 23 years. | Over the past three years,
United Dominion has strategically repositioned itself to increase
long-term profitability. This process has entailed diversifying into
new markets in the West, Northwest and Midwest, upgrading the
quality of the portfolio, building development capability and
investing in systems and other technology. | United Dominion’s
common stock is traded on the New York Stock Exchange under
the symbol UDR.
U N I T E D D O M I N I O N R E A LT Y T R U S T, I N C .
C o n t e n t s
1 FINANCIAL HIGHLIGHTS
2 LETTER TO SHAREHOLDERS
8 OUR ASSETS
14 DEVELOPMENT
16 RESIDENT SATISFACTION
18 TECHNOLOGY
20 FINANCIAL SECTION
44 GENERAL INFORMATION

1999 Annual Report
A StrongerCompany
Better Positioned
United Dominion Realty Trust
10 South Sixth Street
Richmond, Virginia 23219-3802
804.780.2691
www.udrt.com
Un
ited Do
min
ion
Realty Tru
st A Stro
nger Co
mpany—
Better Po
sition
ed1999 An
nual R
eport


