Embed Size (px)
Citation preview
Esterline Annual Report
2002

Esterline Technologies is a specialized manufacturing company principallyserving aerospace and defense markets. Esterline is headquartered in Bellevue,Washington, and is listed on the New York Stock Exchange with the tradingsymbol ESL.
pg 2
Letter toShareholders
pg 15
FinancialReview
pg 57
CorporateDirectory
pg 57
ShareholderInformation
pg 58
Operationsand Locations

Our company continues to refine its abilities.
In 2002, we took crucial steps to make Esterline more complete, able tooffer even more engineered solutions to our aerospace customers. Andwhile our form will continue to evolve, our focus will remain constant.
ESL
Letter to shareholders Esterline 2002 pg 2
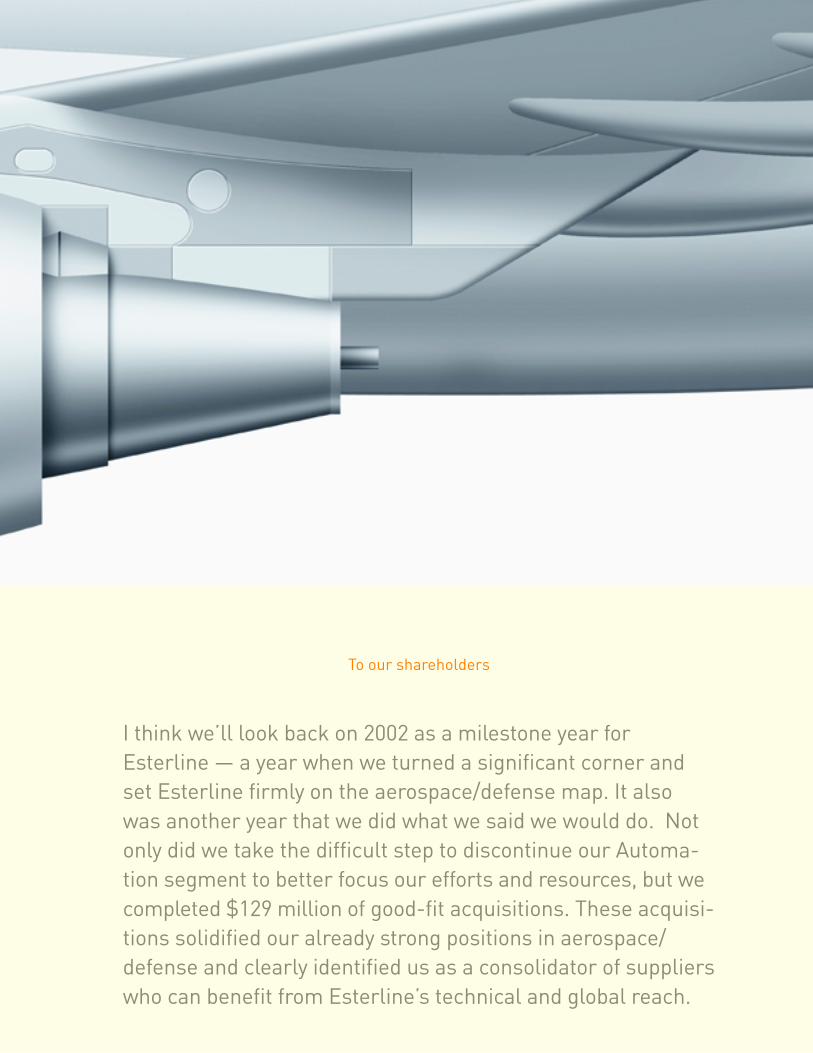
I think we’ll look back on 2002 as a milestone year forEsterline — a year when we turned a significant corner andset Esterline firmly on the aerospace/defense map. It alsowas another year that we did what we said we would do. Notonly did we take the difficult step to discontinue our Automa-tion segment to better focus our efforts and resources, but wecompleted $129 million of good-fit acquisitions. These acquisi-tions solidified our already strong positions in aerospace/defense and clearly identified us as a consolidator of supplierswho can benefit from Esterline’s technical and global reach.
To our shareholders
Letter to shareholders Esterline 2002 pg 4
The result of these efforts has provided good balance across commercial aerospace
and defense markets and also across a wide range of individual programs. From an end-
market perspective, Esterline’s continuing business is roughly 40-45% defense-related
and 35%-40% commercial aerospace. The remaining 20% is the application of these
technologies into industrial markets. Further, not one program represents more than
5% of total revenue.
For the year, even in some very difficult aerospace market conditions, Esterline’s income
from continuing operations exceeded $31 million on sales of nearly $435 million. By the
end of the year our run rate annualized at $500 million and company-wide backlog had
grown 26% to $282 million.
From a financial reporting perspective, the year was quite complicated. We began fiscal
2002 by early adopting the Financial Accounting Standards Board (FASB) statements on
goodwill and intangibles (142), which proved particularly complex in light of our acquisi-
tion activity. As I mentioned earlier, we discontinued our Automation segment. And, of
course, there was no shortage of new requirements — from Congress, the SEC and the
NYSE. We’ve done our very best to present this information in a form that is straight-
forward and as easy as possible to comprehend. Also, to reflect the change in the way
we view our continuing operations and to enhance understanding, we increased the
number of continuing reportable segments from two to three. This presentation will
give investors a much better idea of the company’s performance over the past several
years, and of the transformation that has taken place at Esterline during that time.
As you’ll see in the Business Segment Information note on page 49, we have categorized
our operations into three segments: Avionics & Controls, Sensors & Systems and
Advanced Materials. Operations within the Avionics & Controls segment focus on tech-
nology interface systems such as lighted switches and displays for commercial and
military aircraft, and similar devices for land- and sea-based military vehicles, secure
communications systems, specialized medical equipment and other high-end industrial
applications. The Sensors & Systems segment includes operations that produce high-
precision temperature and pressure sensors, fluid and motion control components and
other related systems principally for aerospace and defense customers. And Advanced
Materials focuses on process-related technologies including high-performance elastomer
products used for a wide range of military and commercial aerospace purposes, and
combustible ordnance and electronic warfare countermeasure products.
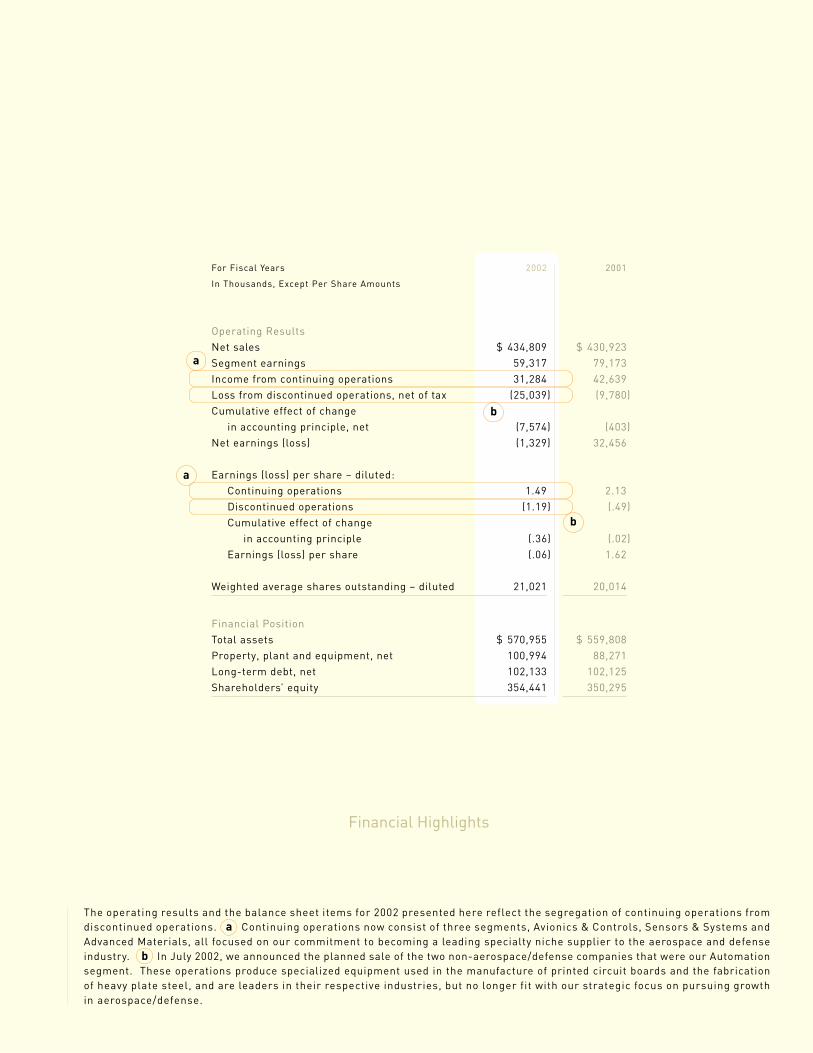
The operating results and the balance sheet items for 2002 presented here reflect the segregation of continuing operations fromdiscontinued operations. a Continuing operations now consist of three segments, Avionics & Controls, Sensors & Systems andAdvanced Materials, all focused on our commitment to becoming a leading specialty niche supplier to the aerospace and defenseindustry. b In July 2002, we announced the planned sale of the two non-aerospace/defense companies that were our Automationsegment. These operations produce specialized equipment used in the manufacture of printed circuit boards and the fabricationof heavy plate steel, and are leaders in their respective industries, but no longer fit with our strategic focus on pursuing growthin aerospace/defense.
Financial Highlights
For Fiscal Years 2002 2001
In Thousands, Except Per Share Amounts
Operating ResultsNet sales $ 434,809 $ 430,923Segment earnings 59,317 79,173Income from continuing operations 31,284 42,639Loss from discontinued operations, net of tax (25,039) (9,780)Cumulative effect of change
in accounting principle, net (7,574) (403)Net earnings (loss) (1,329) 32,456
Earnings (loss) per share – diluted:Continuing operations 1.49 2.13Discontinued operations (1.19) (.49)Cumulative effect of change
in accounting principle (.36) (.02)Earnings (loss) per share (.06) 1.62
Weighted average shares outstanding – diluted 21,021 20,014
Financial PositionTotal assets $ 570,955 $ 559,808Property, plant and equipment, net 100,994 88,271Long-term debt, net 102,133 102,125Shareholders’ equity 354,441 350,295
b
a
b
a
Letter to shareholders Esterline 2002 pg 6
While these three segments address varying market niches, I believe it’s important to
understand that all our operations have a number of common characteristics. In addi-
tion to being broadly aerospace/defense related, they all maintain leading market share
positions and also lead their respective markets in technology, focusing their efforts
on their customers’ critical performance needs. And this is where we really distinguish
ourselves: as we continue to expand our capabilities, we increasingly become our
customers’ “go-to supplier” for their tough problems.
MORE SOLUTIONS IN THE COCKPIT
Esterline has built a $100 million-plus presence outfitting the cockpits of the world’s
fleets of commercial and military aircraft — easily more than double the position we had
achieved only five years ago. Some of that growth has come from strategic acquisitions
of stand-alone operations and bolt-on product lines, as well as proactive research and
development of new products. Another important factor in this growth has been the
expansion of what I call our “tool kit” of solutions that enables us to answer with an
emphatic “yes” when our customers ask us: “Can you do this for us?” And they’re
asking more and more often. Whether it’s for a threat warning system for a fighter jet,
or programmable transponder for a commercial airliner, it requires a sophisticated elec-
tronic pilot interface on board the aircraft or the ground station — and that’s our
business.
For the past 65 years, there isn’t a Boeing commercial airplane that has flown without
our lighted switches in the cockpit. But we’ve also branched out significantly during
that time. On the commercial side of the aerospace market, we now also provide Airbus
and the major regional and business jet and helicopter manufacturers with a significant
portion of their lighted pushbutton and rotary switches, lighted panels, and pilot control
wheels and grips — not to mention the airline aftermarket and retrofit programs, which
represent more than a third of our activity.
On the military side, we’ve developed a much sought-after expertise in illuminated panels
and keyboards, programmable switches and active matrix liquid crystal displays (AMLCDs),
all capable of full sunlight and night vision readability. We also are the world’s leading
manufacturer of HOTAS (hands on throttle and stick) for virtually every type of fighter jet;
and of cyclic, collective and target acquisition grips for a wide array of military helicopters.
And here, too, parts and retrofit programs play an important role in our business model.
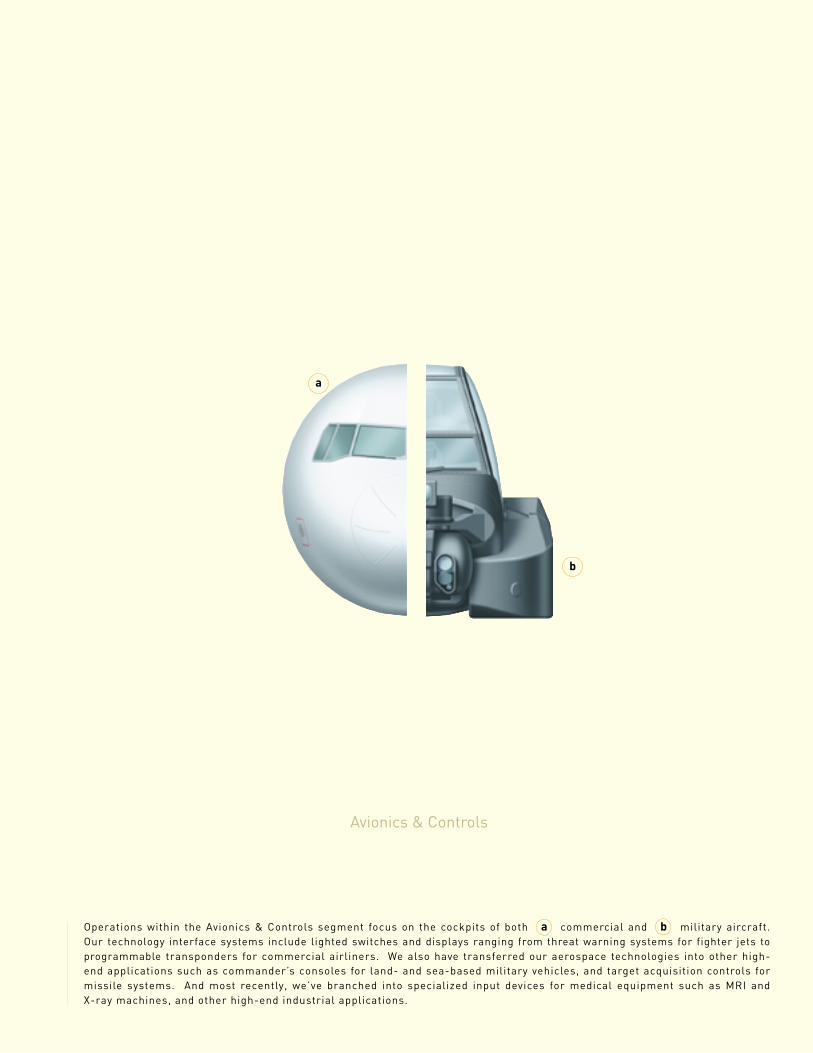
Avionics & Controls
Operations within the Avionics & Controls segment focus on the cockpits of both a commercial and b military aircraft.Our technology interface systems include lighted switches and displays ranging from threat warning systems for fighter jets toprogrammable transponders for commercial airliners. We also have transferred our aerospace technologies into other high-end applications such as commander’s consoles for land- and sea-based military vehicles, and target acquisition controls formissile systems. And most recently, we’ve branched into specialized input devices for medical equipment such as MRI andX-ray machines, and other high-end industrial applications.
b
a
Letter to shareholders Esterline 2002 pg 8
With the building blocks in place, we are moving our aerospace technologies into other
high-end applications. We now build the commander’s console for the Abrams tank and
Bradley fighting vehicle, and target acquisition controls for missile systems. And most
recently, we’ve branched into specialized input devices for medical equipment such as
MRI and X-ray machines, and industrial applications as well, fully leveraging our original
investments.
SENSORS ARE KEY TO ENGINE EFFICIENCY
Similar to the cockpit, we have built another $100 million-plus presence in high-
performance measurement systems, including fluid control and motion technology
components for the aerospace and defense industries. Currently, this segment is
predominantly European based, with manufacturing capabilities in five sites worldwide
— France, U.K., U.S.A., Spain and Russia. Through this segment we maintain solid
positions on virtually every European commercial and military aircraft and spacecraft
in production, and are making significant inroads into U.S. platforms. Our products
range from airborne optical radiation pyrometers for turbine blade surface temperature
measurement and pressure transducers for fuel management systems, to micro-motors
used for missile fin actuation or in-flight refueling probes. One particularly notable
example is our position as the sole supplier of temperature sensors on the CFM-56 jet
engine. This engine, which is manufactured by the joint venture of SNECMA in France
and GE Aircraft Engines in the U.S., was chosen to power nearly half of all mainline
commercial jets delivered in the past 15 years. With nearly 15,000 engines sold world-
wide to date, the CFM-56 is the only engine certified for the entire Boeing 737 family,
is used on the majority of Airbus A320s, plus the A340 long-haul quadjet, and a number
of military platforms.
We maintain extensive in-house research and development facilities, with various simu-
lation tools and specialized test equipment, including one of the few icing wind tunnels
in Europe. In addition, we actively participate in external research organizations, cur-
rently co-managing France’s Orléans University regional sensor facility where several
product and technology developments in the areas of sensing, monitoring and controls
are currently being conducted. Our investments in research and development in this
segment are aimed to ensure our participation in future aerospace programs as system
efficiencies and environmental friendliness become increasingly important determinants
for successful aerospace technologies.
Sensors & Systems
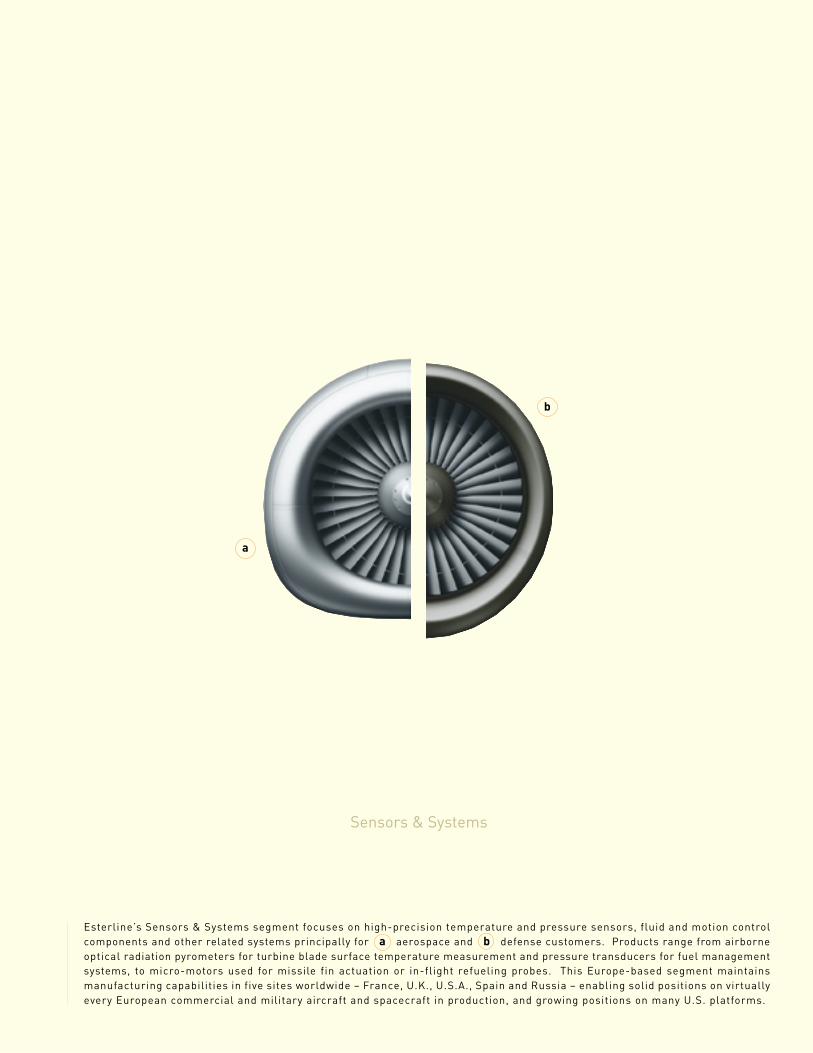
Esterline’s Sensors & Systems segment focuses on high-precision temperature and pressure sensors, fluid and motion controlcomponents and other related systems principally for a aerospace and b defense customers. Products range from airborneoptical radiation pyrometers for turbine blade surface temperature measurement and pressure transducers for fuel managementsystems, to micro-motors used for missile fin actuation or in-flight refueling probes. This Europe-based segment maintainsmanufacturing capabilities in five sites worldwide – France, U.K., U.S.A., Spain and Russia – enabling solid positions on virtuallyevery European commercial and military aircraft and spacecraft in production, and growing positions on many U.S. platforms.
b
a

Letter to shareholders Esterline 2002 pg 10
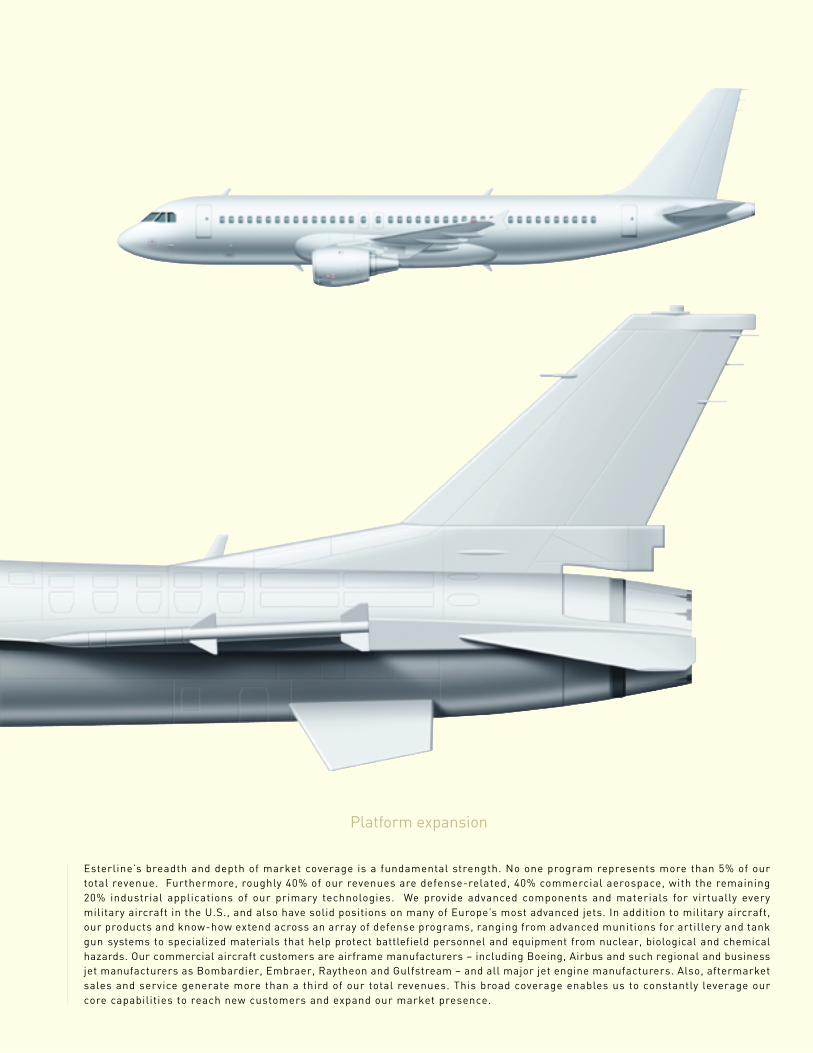
Esterline’s breadth and depth of market coverage is a fundamental strength. No one program represents more than 5% of ourtotal revenue. Furthermore, roughly 40% of our revenues are defense-related, 40% commercial aerospace, with the remaining20% industrial applications of our primary technologies. We provide advanced components and materials for virtually everymilitary aircraft in the U.S., and also have solid positions on many of Europe’s most advanced jets. In addition to military aircraft,our products and know-how extend across an array of defense programs, ranging from advanced munitions for artillery and tankgun systems to specialized materials that help protect battlefield personnel and equipment from nuclear, biological and chemicalhazards. Our commercial aircraft customers are airframe manufacturers – including Boeing, Airbus and such regional and businessjet manufacturers as Bombardier, Embraer, Raytheon and Gulfstream – and all major jet engine manufacturers. Also, aftermarketsales and service generate more than a third of our total revenues. This broad coverage enables us to constantly leverage ourcore capabilities to reach new customers and expand our market presence.
Platform expansion
Letter to shareholders Esterline 2002 pg 12
ACQUISITIONS ADD MORE SOLUTIONS
Although the subsidiary components of the Advanced Materials segment remain unchanged
from last year, this segment was the beneficiary of the lion’s share of our acquisition
activity during 2002. The first addition was the advanced aerospace polymers group of
Burke Industries. This innovative and promising business is a solid, strategic fit with
Esterline’s targeted growth strategy. The acquisition is significant to Esterline for several
reasons. First, we gain a tremendous amount of cutting-edge technology that adds to
what we already do and where we want to go. Burke was successful in its focus on
advanced materials for stealth military applications, a growing and important niche.
Burke had pointed its efforts to radar absorbing and electrically conductive materials.
This tied nicely into our existing advanced elastomer operation’s development of stealth
products. The acquisition also enables us to introduce our unique advantages in the
application of high heat-resistant silicone materials to many new customers.
Secondly, the sheer volume we picked up as part of this deal gave us a nice boost —
bringing the number of proprietary formulas to more than 10,000 and basically doubling
the number of products we sell in this area. We also were able to expand our geographic
reach with this acquisition. In addition to manufacturing locations in California, we
acquired a plant in Massachusetts, placing us in the aerospace center of the East Coast.
This brings us closer to our existing East Coast and European customers, and allows us
to expand on the strong relationships Burke had built over the years.
Finally, we added significantly to our engineering talent base. Finding good people is
a challenge for any business, and we’re pleased that this acquisition brought us a solid
team of experienced engineers. The ultimate result of the acquisition was our undisputed
number one position and widest range of elastomer solutions for the aerospace/defense
industry. From complex clamps and seals to critical fire barrier products capable of with-
standing 2000° Fahrenheit temperatures for sustained periods, to insulation for rocket
motors. And as in the other segments, we’re maximizing our investments by transferring
our technology to such diverse areas as fuel tank liners for space vehicles and low observ-
able materials for the new generation of naval ships.
Also, late in the year, we completed the acquisition of the Electronic Warfare Passive
Expendables Division of BAE SYSTEMS North America. This operation will mesh perfectly
with our Armtec Defense Products subsidiary, already the sole supplier to the U.S. Army
for combustible propellant casings. The new operations produce chaff and flares for the
U.S. military, products considered “mission critical” by the Department of Defense and
essential on all military aircraft — now and in the future. The manufacture of chaff and
flares is a business model that parallels that of combustible propellant casings — its
Advanced Materials
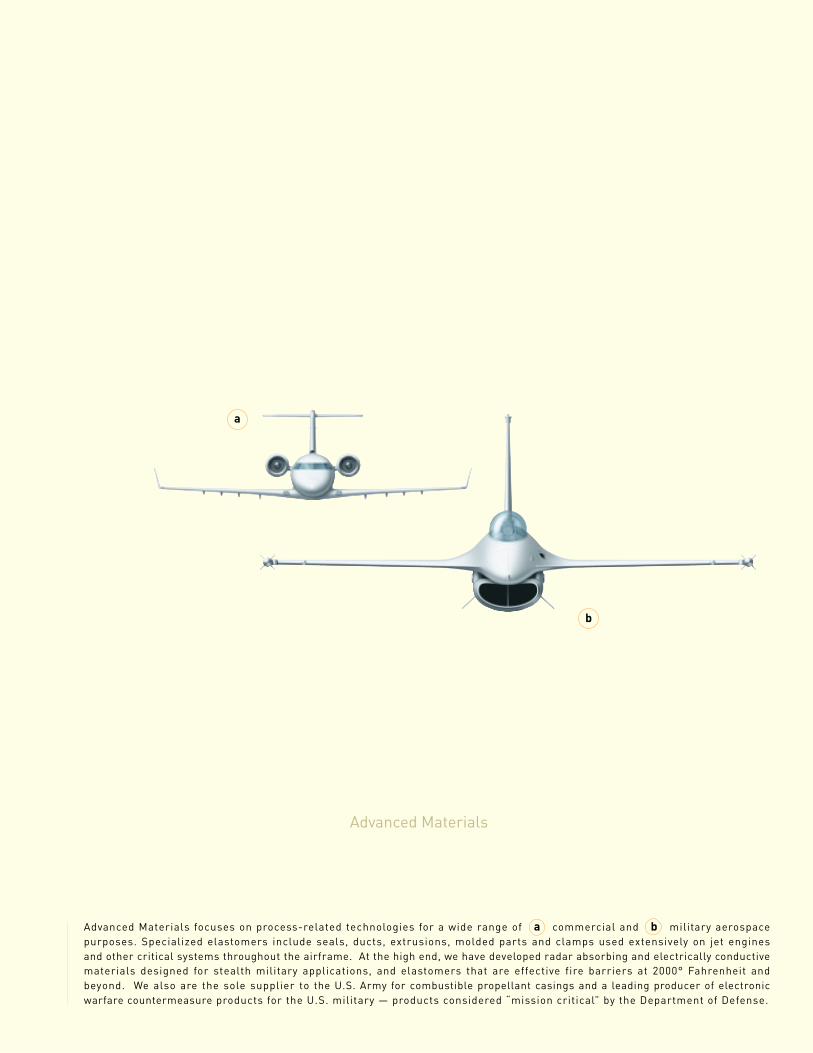
Advanced Materials focuses on process-related technologies for a wide range of a commercial and b military aerospacepurposes. Specialized elastomers include seals, ducts, extrusions, molded parts and clamps used extensively on jet enginesand other critical systems throughout the airframe. At the high end, we have developed radar absorbing and electrically conductivematerials designed for stealth military applications, and elastomers that are effective fire barriers at 2000° Fahrenheit andbeyond. We also are the sole supplier to the U.S. Army for combustible propellant casings and a leading producer of electronicwarfare countermeasure products for the U.S. military — products considered “mission critical” by the Department of Defense.
b
a
ROBERT W. CREMIN
CHAIRMAN, PRESIDENT AND CEO
Letter to shareholders Esterline 2002 pg 14
large account management with very similar operating procedures. It also entails a very
sophisticated product development front-end. For example, we maintain a unique “free
stream simulator” that generates sudden high-velocity air flow to determine what happens
when an expendable decoy is launched from an aircraft.
All of the acquisitions completed this year — as with the nineteen completed in the past
five years — involve technology that is right down our alley, and a perfect fit with our
overall strategy. That strategy is to be the leader in niche markets that we know and
understand, in businesses with high barriers to entry where we have the opportunity
to solve customers’ difficult technical issues. And we see plenty of opportunities for
additional strategic acquisitions — either in the form of stand-alone companies or bolt-
on product lines — fueled by the continued consolidation in the aerospace and defense
industry and giant OEMs spinning off non-core operations. And lastly, as I’ve pointed
out throughout this letter, we’ll achieve growth through sustained investments in
research and new product development.
Our operations — current and future — embrace the ideal of small company responsive-
ness with the muscle of a larger company. What we’re doing across Esterline is
increasing the opportunity to bring our customers more value through enabling tech-
nologies. The more of these technologies we can bring to bear, the more solutions we
can develop. The more success we have developing solutions, the more “face time” we
get with our customers. And the more face time we get, the more opportunities we have.
I cannot emphasize enough the individual employees — nearly 4,500 of them — who
make up Esterline. Given the state of our markets in 2002, Esterline performed remark-
ably well, and that performance would have been impossible without their efforts. It was
this success that prompted us to implement this year’s Employee Stock Purchase Plan,
which, of course, ties more employees with shareholder interests. I want to take this
opportunity to personally thank all of them for their hard work and the way they have
embraced our lean manufacturing efforts — or more precisely, taken lean and run with
it! With this caliber of people, I’m more confident than ever in our future.

pg 15
Financial Review
pg 16
FinancialCharts
pg 18
Management’sDiscussionand Analysis
pg 25
FinancialStatements
pg 33
Notes toConsolidatedFinancialStatements
pg 57
CorporateDirectory /InvestorInformation
pg 58
Operationsand Locations
Esterline 2002pg 16
0
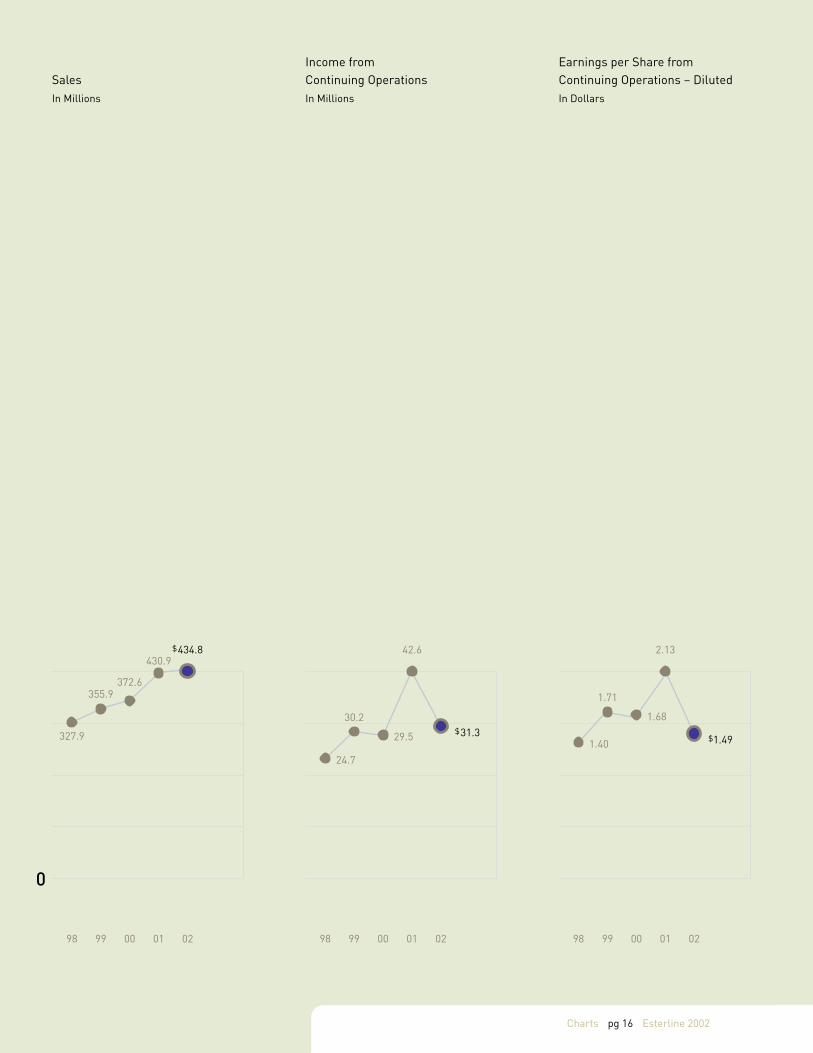
SalesIn Millions
98 0299 00 01
Income fromContinuing OperationsIn Millions
42.6
98 0299 00 01
Charts
Earnings per Share fromContinuing Operations – DilutedIn Dollars
2.13
1.40 $1.49
1.71
1.68
98 0299 00 01
$434.8430.9
372.6
327.9
355.9
$31.329.5
24.7
30.2
pg 17
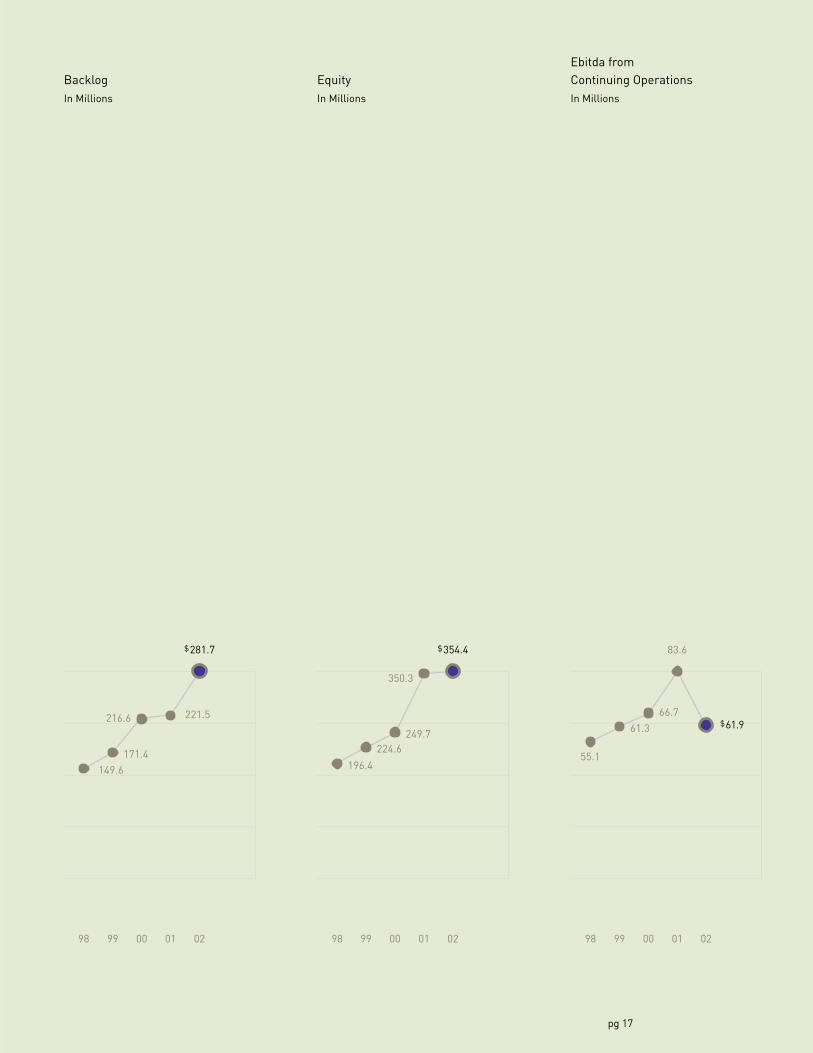
BacklogIn Millions
98 0299 00 01
EquityIn Millions
$354.4
350.3
249.7224.6
196.4
98 0299 00 01
Ebitda fromContinuing OperationsIn Millions
83.6
98 0299 00 01
$281.7
149.6
221.5216.6
171.4
66.7
61.3
55.1
$61.9
Esterline 2002pg 18
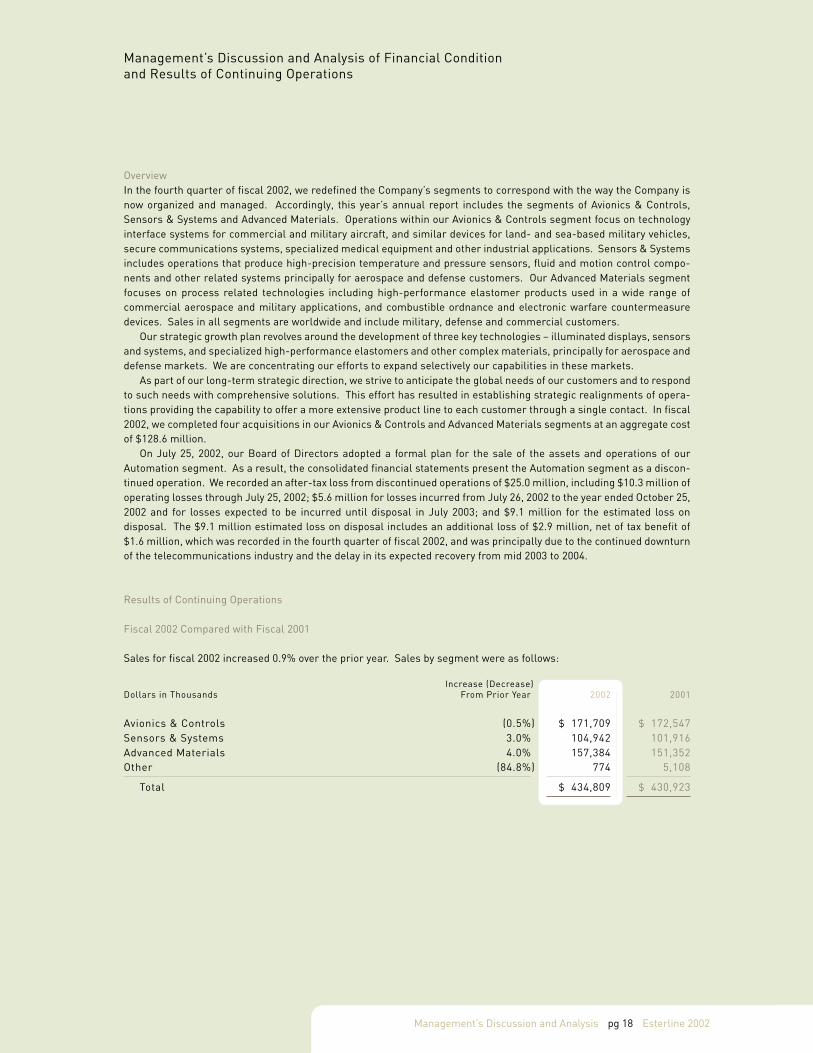
OverviewIn the fourth quarter of fiscal 2002, we redefined the Company’s segments to correspond with the way the Company isnow organized and managed. Accordingly, this year’s annual report includes the segments of Avionics & Controls,Sensors & Systems and Advanced Materials. Operations within our Avionics & Controls segment focus on technologyinterface systems for commercial and military aircraft, and similar devices for land- and sea-based military vehicles,secure communications systems, specialized medical equipment and other industrial applications. Sensors & Systemsincludes operations that produce high-precision temperature and pressure sensors, fluid and motion control compo-nents and other related systems principally for aerospace and defense customers. Our Advanced Materials segmentfocuses on process related technologies including high-performance elastomer products used in a wide range ofcommercial aerospace and military applications, and combustible ordnance and electronic warfare countermeasuredevices. Sales in all segments are worldwide and include military, defense and commercial customers.
Our strategic growth plan revolves around the development of three key technologies – illuminated displays, sensorsand systems, and specialized high-performance elastomers and other complex materials, principally for aerospace anddefense markets. We are concentrating our efforts to expand selectively our capabilities in these markets.
As part of our long-term strategic direction, we strive to anticipate the global needs of our customers and to respondto such needs with comprehensive solutions. This effort has resulted in establishing strategic realignments of opera-tions providing the capability to offer a more extensive product line to each customer through a single contact. In fiscal2002, we completed four acquisitions in our Avionics & Controls and Advanced Materials segments at an aggregate costof $128.6 million.
On July 25, 2002, our Board of Directors adopted a formal plan for the sale of the assets and operations of ourAutomation segment. As a result, the consolidated financial statements present the Automation segment as a discon-tinued operation. We recorded an after-tax loss from discontinued operations of $25.0 million, including $10.3 million ofoperating losses through July 25, 2002; $5.6 million for losses incurred from July 26, 2002 to the year ended October 25,2002 and for losses expected to be incurred until disposal in July 2003; and $9.1 million for the estimated loss ondisposal. The $9.1 million estimated loss on disposal includes an additional loss of $2.9 million, net of tax benefit of$1.6 million, which was recorded in the fourth quarter of fiscal 2002, and was principally due to the continued downturnof the telecommunications industry and the delay in its expected recovery from mid 2003 to 2004.
Results of Continuing Operations
Fiscal 2002 Compared with Fiscal 2001
Sales for fiscal 2002 increased 0.9% over the prior year. Sales by segment were as follows:
Increase (Decrease)Dollars in Thousands From Prior Year 2002 2001
Avionics & Controls (0.5%) $ 171,709 $ 172,547Sensors & Systems 3.0% 104,942 101,916Advanced Materials 4.0% 157,384 151,352Other (84.8%) 774 5,108
Total $ 434,809 $ 430,923
Management’s Discussion and Analysis
Management’s Discussion and Analysis of Financial Conditionand Results of Continuing Operations
pg 19
Avionics & Controls sales were impacted by a continued reduction in new aircraft build rates and a decrease inaftermarket spare sales. Additionally, the decrease in sales reflected the sale of a small unit in 2001. These decreaseswere partially offset by an increase in components such as cockpit displays and controls, and sales of similar devices tothe medical industry. Although Avionics & Controls order rates increased through the third quarter of fiscal 2002, orderrates declined 11.7% from the third quarter to the fourth quarter, and fiscal 2002 order rates were down 2.5% over fiscal2001. The decrease in fiscal 2002 order rates reflected current aerospace market conditions and was partially offset bythe acquisition of Janco Corporation and a small product line.
The increase in Sensors & Systems sales reflected new product introductions for aerospace markets and increasedvolumes for industrial/commercial applications, and was partially offset by reductions in new aircraft build rates. Orderrates in the fourth quarter increased over the previous three quarters and were even with the prior year fourth quarter.Fiscal 2002 order rates increased 9.8% over the prior year, due to the timing of receiving orders and increased orders foraerospace and industrial/commercial applications.
The increase in Advanced Materials sales reflected $25.8 million in incremental sales resulting from acquisitions ofBurke Industries’ Engineered Polymers Group (“Polymers Group”) in the third quarter of fiscal 2002 and the acquisitionof the Electronic Warfare Passive Expendables Division of BAE SYSTEMS North America (“Countermeasures”) in thefourth quarter of fiscal 2002. These sales gains were also partially offset by the decline in aircraft aftermarket spares,the decrease in airframe and jet engine build rates and the general economic slowdown. Advanced Materials orderrates declined in the second quarter of fiscal 2002 and increased sequentially in both the third and fourth quarter. Theincreased order rates reflected the acquisition of the Polymers Group and Countermeasures.
Sales to foreign customers, including export sales by domestic operations, totaled $140.1 million and $134.0 million,and accounted for 32.2% and 31.1% of our sales for fiscal 2002 and 2001, respectively.
Overall, gross margin as a percentage of sales was 32.6% and 37.4% for fiscal 2002 and 2001, respectively. Grossmargin by segment ranged from 27.8% to 38.7% in fiscal 2002, compared with 35.3% to 39.7% in the prior year. Thedecline in gross margin in Avionics & Controls was principally due to product mix and lower sales of aircraft aftermarketspares, and was partially offset by increased medical market margins from improved production efficiencies. The modestdecrease in gross margin in Sensors & Systems principally reflected the introduction of new complex products and theconsequent manufacturing learning curve. The decline in Advanced Materials gross margin reflected decreased marginsin both elastomeric products and combustible ordnance components. The decrease in elastomeric product marginsprimarily reflected sales mix, pricing pressures and unabsorbed fixed costs. The primary contributors were the declinein aftermarket spares sales, reduced sales to OEM and industrial/commercial customers, and an aircraft retrofitprogram completed principally in the prior year. The decline in combustible ordnance margins was the result of a pricedecrease partially offset by effective cost control.
Selling, general and administrative expenses (which include corporate expenses) decreased to $79.1 million in fiscal2002 compared with $81.1 million in the prior year. As a percentage of sales, selling, general and administrative ex-penses were 18.2% and 18.8% in fiscal 2002 and 2001, respectively. The decrease in selling, general and administrativeexpenses primarily reflected a $5.2 million decrease in amortization of goodwill due to the implementation of FinancialAccounting Standards No. 142, “Goodwill and Other Intangible Assets” (Statement No. 142), and was partially offset byincremental selling and administrative expenses associated with fiscal 2002 acquisitions, higher insurance expense andthe $1.0 million reduction in the pension benefit.
Research, development and related engineering spending increased to $15.4 million, or 3.5% of sales, in fiscal 2002compared with $14.2 million, or 3.3% of sales, in the prior year. This is consistent with our philosophy of continuallyinvesting in new products and capabilities regardless of the business cycle.
Esterline 2002pg 20
Segment earnings (which exclude corporate expenses) decreased 25.1% during fiscal 2002 to $59.3 million com-pared to $79.2 million in the prior year. The 15.4% decrease in Avionics & Controls reflected unfavorable product mix,principally due to the decrease in aircraft aftermarket sales. The 8.0% increase in Sensors & Systems was primarily dueto foreign currency exchange gains and improved operating efficiencies. The 37.5% decline in Advanced Materials re-flected unfavorable changes in aircraft sales mix, cancelled and delayed shipments, pricing pressures and unabsorbedfixed costs, and was partially offset by earnings of the newly acquired Polymers Group and Countermeasures. Oursuccessful efforts in lean manufacturing across all segments helped to partially offset unfavorable sales mix and pricingpressures on segment earnings.
In February 2001, we reached an agreement with several insurance companies settling an outstanding lawsuit thatwe brought to recover expenses associated with a disputed claim. We recorded a total recovery of $4.6 million of suchexpenses, of which $3.0 million was recorded in the second quarter of fiscal 2001 and the remaining $1.6 million wasrecorded in the third quarter of fiscal 2001.
During fiscal 2001, we recorded a $786,000 gain on derivative instruments from hedging against foreign currencyexchange fluctuations arising from the sale of certain products in a currency other than its functional currency, whichwas consistent with our adoption of Financial Accounting Standards No. 133, “Accounting for Derivative Instruments andHedging Activities” (Statement No. 133).
Interest income decreased to $1.8 million during fiscal 2002 compared with $3.3 million in the prior year, reflectingthe decrease in cash and cash equivalents due to the acquisitions as well as the decline in prevailing interest rates.Interest expense decreased to $7.1 million during fiscal 2002 compared with $7.7 million in the prior year, mainly due tothe repayment of long-term debt.
The effective income tax rate for continuing operations for fiscal 2002 was 25.1% compared with 36.4% in fiscal 2001.The effective tax rate differed from the statutory rate in fiscal 2002 and 2001, as both years benefited from various taxcredits. In addition, in fiscal 2002, we recognized a $2.9 million reduction in income taxes associated with the favorableresolution of ongoing income tax audits. Further, the decrease resulted from no longer amortizing goodwill for financialstatement purposes pursuant to Statement No. 142. Additionally, the relative effect of the export tax benefits andresearch and development tax credits increased in fiscal 2002 due to the reduction in income from continuing operationsbefore income taxes.
Income from continuing operations was $31.3 million, or $1.49 per share on a diluted basis, compared with $42.6million, or $2.13 per share, in the prior year. The Company incurred a net loss in fiscal 2002 of $1.3 million, or ($.06) pershare on a diluted basis, compared with net earnings of $32.5 million, or $1.62 per share, in the prior year.
Orders received in fiscal 2002 increased 13.6% to $495.0 million from $435.8 million in the prior year. Backlog at theend of fiscal 2002 was $281.7 million compared with $221.5 million at the end of the prior year. Backlog increasedsequentially across all segments from the fourth quarter of fiscal 2001. The acquisitions of the Polymers Group andCountermeasures represented approximately $55 million of the increase in backlog. Approximately $67.8 million isscheduled to be delivered after fiscal 2003. Backlog is subject to cancellation until delivery.
Fiscal 2001 Compared with Fiscal 2000
Sales for fiscal 2001 increased 15.7% over the prior year. Sales by segment were as follows:
Increase (Decrease)Dollars in Thousands From Prior Year 2001 2000
Avionics & Controls 19.7% $ 172,547 $ 144,104Sensors & Systems 10.6% 101,916 92,165Advanced Materials 17.0% 151,352 129,386Other (25.9%) 5,108 6,896
Total $ 430,923 $ 372,551
Management’s Discussion and Analysis
pg 21
Avionics & Controls, Sensors & Systems and Advanced Materials segment sales performance reflected new productintroductions and strength in the aerospace and defense industry. New product sales including cockpit lighting compo-nents, engine performance monitoring and sensing equipment, and advanced materials for high temperature applicationsenhanced existing product lines. The order rate for businesses serving aerospace and defense markets remained strongthrough the third quarter of fiscal 2001, bolstered by new product introductions which expanded the scope and capabili-ties of these operations. The tragic events of September 11 impacted the global aviation industry, including our operations.Avionics & Controls and Sensors & Systems fourth quarter orders dropped 7.8% from the third quarter of fiscal 2001,principally reflecting the decline in aircraft spares orders. Advanced Materials fourth quarter orders decreased by14.4% from the third quarter of fiscal 2001, mainly due to the timing of receiving orders. Additionally, Advanced Materialssales and orders were impacted by the drop in aftermarket aircraft spares orders and the continued weakness inindustrial/commercial demand due to the general economic slowdown.
Sales to foreign customers, including export sales by domestic operations, totaled $134.0 million and $115.9 millionin fiscal 2001 and 2000, respectively, and accounted for 31.1% of our sales for both years.
Overall, gross margin as a percentage of sales was 37.4% and 38.4% for fiscal 2001 and 2000, respectively. Grossmargin by segment ranged from 35.3% to 39.7% in fiscal 2001, compared with 35.7% to 40.6% in the prior year. Grossmargin for Avionics & Controls and Sensors & Systems was slightly lower than the prior year due to product mix.Increased sales volumes and higher margin product mix in Advanced Materials were offset by certain additional energycosts. These additional energy costs were due to the California energy crisis, which caused utility rate increases andshutdowns during prime production times during the first half of fiscal 2001. While Advanced Materials results were upoverall, the general economic slowdown affecting industrial/commercial customers had an adverse impact on salesvolumes and gross margin.
Selling, general and administrative expenses (which include corporate expenses) decreased to $81.1 million in fiscal2001 compared with $82.0 million in the prior year. As a percentage of sales, selling, general and administrativeexpenses were 18.8% and 22.0% in fiscal 2001 and 2000, respectively.
Research, development and related engineering spending increased to $14.2 million, or 3.3% of sales, in fiscal 2001compared with $12.4 million, or 3.3% of sales, in the prior year.
Segment earnings, which exclude corporate expenses, increased 30.5% during fiscal 2001 to $79.2 million comparedto $60.7 million in the prior year. By segment, Avionics & Controls earnings increased 33.3% to $31.3 million for fiscal2001 compared with $23.5 million in the prior year. Sensors & Systems earnings increased 25.2% to $11.4 million forfiscal 2001 compared with $9.1 million for the prior year. Advanced Materials earnings increased 41.1% to $35.0 millionfor fiscal 2001 compared with $24.8 million for the prior year. Sales volume increases, product mix and lean initiativesaccounted for the improvements in all segments.
In February 2001, we reached an agreement with several insurance companies settling an outstanding lawsuit thatwe brought to recover expenses associated with a disputed claim. We recorded a total recovery of $4.6 million of suchexpenses, of which $3.0 million was recorded in the second quarter of fiscal 2001 and the remaining $1.6 million wasrecorded in the third quarter of fiscal 2001.
During fiscal 2001, we recorded a $786,000 gain on derivative instruments from hedging against foreign currencyexchange fluctuations arising from the sale of certain products in a currency other than its functional currency, whichwas consistent with our adoption of Statement No. 133.
Interest income increased to $3.3 million during fiscal 2001 compared with $2.2 million in the prior year, reflectingthe increase in cash and cash equivalents from the public offering completed in February 2001. Interest expensedecreased to $7.7 million during fiscal 2001 compared with $8.1 million in the prior year.
The effective income tax rate for continuing operations for fiscal 2001 was 36.4% compared with fiscal 2000 at 34.8%.Both years benefited from various tax credits.
Income from continuing operations was $42.6 million, or $2.13 per share on a diluted basis, compared with $29.5million, or $1.68 per share, in the prior year.
Net earnings in fiscal 2001 were $32.5 million, or $1.62 per share on a diluted basis, compared with $32.6 million, or$1.85 per share, in the prior year. The decline in earnings per share on similar earnings reflects the issuance of 3.22million new shares in February 2001.
Esterline 2002pg 22
Orders received in fiscal 2001 increased 4.3% to $435.8 million from $417.8 million in the prior year. Backlog at theend of fiscal 2001 was $221.5 million compared with $216.6 million at the end of the prior year. Backlog increased duringthe first half of fiscal 2001 despite softness in industrial markets served by Advanced Materials. In our third fiscalquarter, backlog leveled off and in the fourth quarter backlog decreased across all segments, primarily reflecting theevents of September 11.
Liquidity and Capital ResourcesCash and cash equivalents at the end of fiscal 2002 totaled $22.5 million, a decrease of $97.4 million from the prior year,largely the result of utilizing cash for acquisitions completed during the year. Net working capital decreased to $121.2 millionat the end of fiscal 2002 from $219.2 million at the end of the prior year, also largely due to acquisitions.
Net accounts receivable were $79.5 million at the end of fiscal 2002 compared with $82.8 million at the end of theprior year. The change in accounts receivable was principally due to cash collections. Inventories were $71.3 million atthe end of fiscal 2002 compared to $88.3 million at the end of the prior year. The change in inventories was primarily dueto acquisitions and discontinued operations accounting. Accounts payable were $28.0 million at the end of fiscal 2002compared with $22.1 million at the end of the prior year. The change in accounts payable was primarily the result of thetiming of cash payments.
Net property, plant and equipment was $101.0 million at the end of fiscal 2002 compared with $88.3 million at the endof the prior year. Capital expenditures for fiscal 2002 were $15.1 million (excluding acquisitions) and included machineryand equipment and enhancements to information technology systems. Capital expenditures are anticipated to approxi-mate $17.5 million for fiscal 2003. We will continue to support expansion through investments in infrastructure includingmachinery, equipment, buildings and information systems.
Total debt decreased $7.7 million from the prior year to $103.0 million at the end of fiscal 2002, principally due torepayment of debt according to terms. Total debt outstanding at the end of fiscal 2002 consisted of $100.0 million underour 1999 Senior Notes and $3.0 million under various foreign currency debt agreements, including capital lease obliga-tions. The 1999 Senior Notes have maturities ranging from 5 to 10 years and interest rates from 6.00% to 6.77%. Webelieve cash on hand, funds generated from operations and other available debt facilities are sufficient to fund operatingcash requirements and capital expenditures through fiscal 2003. In addition, we believe we have adequate access tocapital markets to fund future acquisitions.
SeasonalityThe timing of our revenues is impacted by the purchasing patterns of our customers and, as a result, we do not generaterevenues evenly throughout the year. Moreover, our first fiscal quarter, November through January, includes significantholiday vacation periods in both Europe and North America. This leads to decreased order and shipment activity; conse-quently, first quarter results are typically weaker than other quarters and not necessarily indicative of our performancein subsequent quarters.
Market Risk ExposureWe have financial instruments that are subject to interest rate risk, principally debt obligations issued at a fixed rate.To the extent that sales are transacted in a foreign currency, we are also subject to foreign currency fluctuation risk.Furthermore, we have assets denominated in foreign currencies that are not offset by liabilities in such foreign currencies.Although we own a significant operation in France, historically we have not experienced material gains or losses dueto interest rate or foreign exchange fluctuations. In fiscal 2002, the foreign exchange rate for the Euro increased8.4% relative to the U.S. dollar.
Management’s Discussion and Analysis
pg 23
Critical Accounting PoliciesOur financial statements and accompanying notes are prepared in accordance with accounting principles generally ac-cepted in the United States. Preparing financial statements requires management to make estimates and assumptionsthat affect the reported amounts of assets, liabilities, revenue and expenses. Actual results may differ from estimatesunder different assumptions or conditions. These estimates and assumptions are affected by our application ofaccounting policies. Our critical accounting policies include revenue recognition, accounting for the valuation ofaccounts receivable balances, accounting for inventories at the lower of cost or market, accounting for tangible andintangible assets in business combinations, impairment of goodwill and long-lived assets, accounting for legal contingen-cies, and accounting for income taxes.
We record sales when title transfers to the buyer, which generally coincides with the shipment of products, or uponperformance of services rendered.
We establish an allowance for doubtful accounts for losses expected to be incurred on accounts receivable balances.Judgment is required in estimation of the allowance and is based upon collection history and creditworthiness ofthe debtor.
We account for inventories on a first-in, first-out method of accounting at the lower of its cost or market as requiredunder Accounting Research Bulletin No. 43 (ARB No. 43). The application of ARB No. 43 requires judgment in estimatingthe valuation of inventories. Such valuations require judgment in estimating future demand, selling prices and costof disposal.
We account for business combinations, goodwill and intangible assets in accordance with Financial AccountingStandards No. 141, “Business Combinations” (Statement No. 141), and Statement No. 142. In addition, we account forthe impairment of long-lived assets to be held and used in accordance with Financial Accounting Standards No. 121,“Accounting for the Impairment of Long-Lived Assets and for Long-Lived Assets to be Disposed Of” (Statement No. 121).Statement No. 141 specifies the types of acquired intangible assets that are required to be recognized and reportedseparate from goodwill. Statement No. 142 requires goodwill and certain intangible assets to be no longer amortized,but instead be tested for impairment at least annually. Statement No. 121 requires that a long-lived asset to be disposedof be reported at the lower of its carrying amount or fair value less cost to sell. The application of these statementsrequires judgment in estimating the valuation of assets and liabilities acquired in business combinations and currentreporting units’ tangible and intangible assets. Such valuations require judgment in estimating future cash flows,discount rates and estimated product life cycles. In making these judgments, we evaluate the financial health of thebusiness, including such factors as industry performance, changes in technology and operating cash flows.
We account for discontinued operations in accordance with Accounting Principles Board Opinion No. 30, “Reportingthe Results of Operations – Reporting the Effects of Disposal of a Segment of a Business and Extraordinary, Unusual andInfrequently Occurring Events and Transactions” (APB No. 30). APB No. 30 requires that if a loss is expected, it should berecorded at the measurement date when management commits to a plan to dispose a segment of a business. The lossfrom discontinuance is based upon estimates of net realizable value and estimated losses from the measurement dateto the expected disposal date. Judgment is required to estimate the selling price, selling expenses and future losses ofthe segment.
We are party to various lawsuits and claims, both as plaintiff and defendant, and have contingent liabilities arisingfrom the conduct of business. We are covered by insurance for general liability, product liability, workers’ compensationand certain environmental exposures, subject to certain deductible limits. We are self-insured for amounts lessthan our deductible and where no insurance is available. Financial Accounting Standards No. 5, “Accounting forContingencies,” requires that an estimated loss from a contingency should be accrued by a charge to income if it isprobable that an asset has been impaired or a liability has been incurred and the amount of the loss can be reasonablyestimated. Disclosure of a contingency is required if there is at least a reasonable possibility that a loss has beenincurred. We evaluate, among other factors, the degree of probability of an unfavorable outcome and the ability to makea reasonable estimate of the amount of loss.
Esterline 2002pg 24
We account for income tax in accordance with Financial Accounting Standards No. 109, “Accounting for IncomeTaxes.” The objectives of accounting for income taxes are to recognize the amount of taxes payable or refundable for thecurrent year and deferred tax liabilities and assets for the future tax consequences of events that have been recognizedin our financial statements or tax returns. Judgment is required in assessing the future tax consequences of events thathave been recognized in our financial statements or tax returns. Variations in the actual outcome of these future taxconsequences could materially impact our financial position and results of operations.
Recent Accounting PronouncementsIn October 2002, the Financial Accounting Standards Board issued Statement of Financial Accounting Standards No. 146,“Accounting for Costs Associated with Exit or Disposal Activities” (Statement No. 146), effective for exit or disposalactivities initiated after December 31, 2002. Under Statement No. 146, a commitment to a plan to exit or dispose of abusiness activity no longer creates an obligation that meets the definition of a liability. A liability for a cost associatedwith an exit or disposal activity will be recognized when the liability is incurred. We will implement Statement No. 146 inthe first quarter of fiscal 2003. We do not believe that application of Statement No. 146 will have a material effect on ourresults of operations or financial position.
In October 2001, the Financial Accounting Standards Board issued Statement of Financial Accounting StandardsNo. 144, “Accounting for the Impairment or Disposal of Long-Lived Assets” (Statement No. 144), effective for fiscal yearsbeginning after December 15, 2002. The Statement supersedes Financial Accounting Standards Board StatementNo. 121; however, it retains the fundamental provisions of Statement No. 121. Statement No. 144 also supersedesAPB No. 30 and extends the reporting of a discontinued operation to a component of an entity. Also, Statement No. 144requires operating losses from a component of an entity to be recognized in the period(s) in which they occur rather thanas of the measurement date as previously required under APB No. 30. We will implement Statement No. 144 in the firstquarter of fiscal 2003. We do not believe that application of Statement No. 144 will have a material effect on our resultsof operation or financial position.
Effective at the beginning of fiscal 2002, we adopted Statement No. 142. Under the new Statement, goodwill andintangible assets deemed to have indefinite lives are no longer amortized, but are subject to annual impairment tests inaccordance with the Statement. We conducted our initial impairment tests and determined that goodwill associatedwith a reporting unit in the Avionics & Controls segment was impaired as a result of applying Statement No. 142. Due toincreased competition in the electronic input industry, principally from companies headquartered in Asia, operatingprofits and cash flows were lower in the past fiscal year for this reporting unit. Based upon this trend, the earningsforecast for the next five years was lowered. A goodwill impairment loss of $7,574,000, net of an income tax benefit of$1,542,000, or $.36 per diluted share, was recognized and reported as a cumulative effect of a change in accountingprinciple upon the adoption of Statement No. 142 in the first quarter of fiscal 2002. The fair value of the affected reportingunit was estimated using a combination of the present value of expected cash flows and a market approach.
Effective at the beginning of fiscal 2001, we adopted Statement No. 133, as amended. The cumulative effect of thechange in accounting principle was a charge of $403,000 (net of tax), or $.02 per share on a diluted basis.
Management’s Discussion and Analysis
pg 25
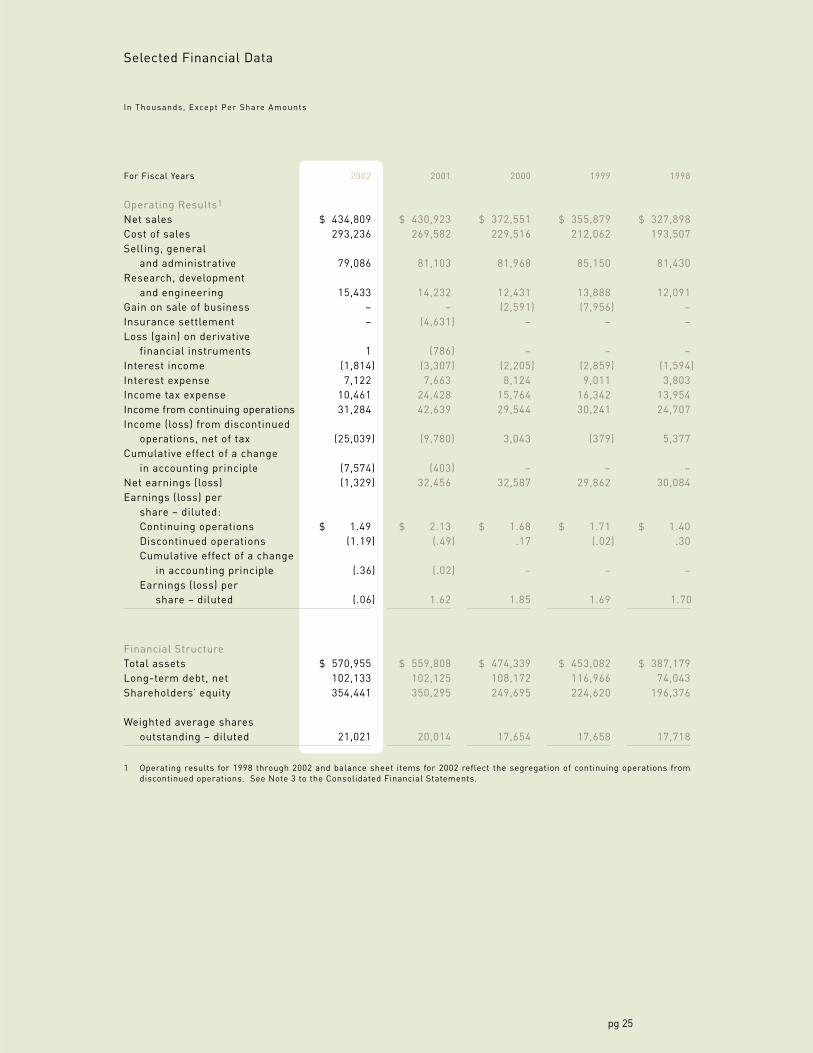
For Fiscal Years 2002 2001 2000 1999 1998
Operating Results1
Net sales $ 434,809 $ 430,923 $ 372,551 $ 355,879 $ 327,898Cost of sales 293,236 269,582 229,516 212,062 193,507Selling, general
and administrative 79,086 81,103 81,968 85,150 81,430Research, development
and engineering 15,433 14,232 12,431 13,888 12,091Gain on sale of business – – (2,591) (7,956) –Insurance settlement – (4,631) – – –Loss (gain) on derivative
financial instruments 1 (786) – – –Interest income (1,814) (3,307) (2,205) (2,859) (1,594)Interest expense 7,122 7,663 8,124 9,011 3,803Income tax expense 10,461 24,428 15,764 16,342 13,954Income from continuing operations 31,284 42,639 29,544 30,241 24,707Income (loss) from discontinued
operations, net of tax (25,039) (9,780) 3,043 (379) 5,377Cumulative effect of a change
in accounting principle (7,574) (403) – – –Net earnings (loss) (1,329) 32,456 32,587 29,862 30,084Earnings (loss) per
share – diluted:Continuing operations $ 1.49 $ 2.13 $ 1.68 $ 1.71 $ 1.40Discontinued operations (1.19) (.49) .17 (.02) .30Cumulative effect of a change
in accounting principle (.36) (.02) – – –Earnings (loss) per
share – diluted (.06) 1.62 1.85 1.69 1.70
Financial StructureTotal assets $ 570,955 $ 559,808 $ 474,339 $ 453,082 $ 387,179Long-term debt, net 102,133 102,125 108,172 116,966 74,043Shareholders’ equity 354,441 350,295 249,695 224,620 196,376
Weighted average sharesoutstanding – diluted 21,021 20,014 17,654 17,658 17,718
1 Operating results for 1998 through 2002 and balance sheet items for 2002 reflect the segregation of continuing operations fromdiscontinued operations. See Note 3 to the Consolidated Financial Statements.
Selected Financial Data
In Thousands, Except Per Share Amounts
Esterline 2002pg 26
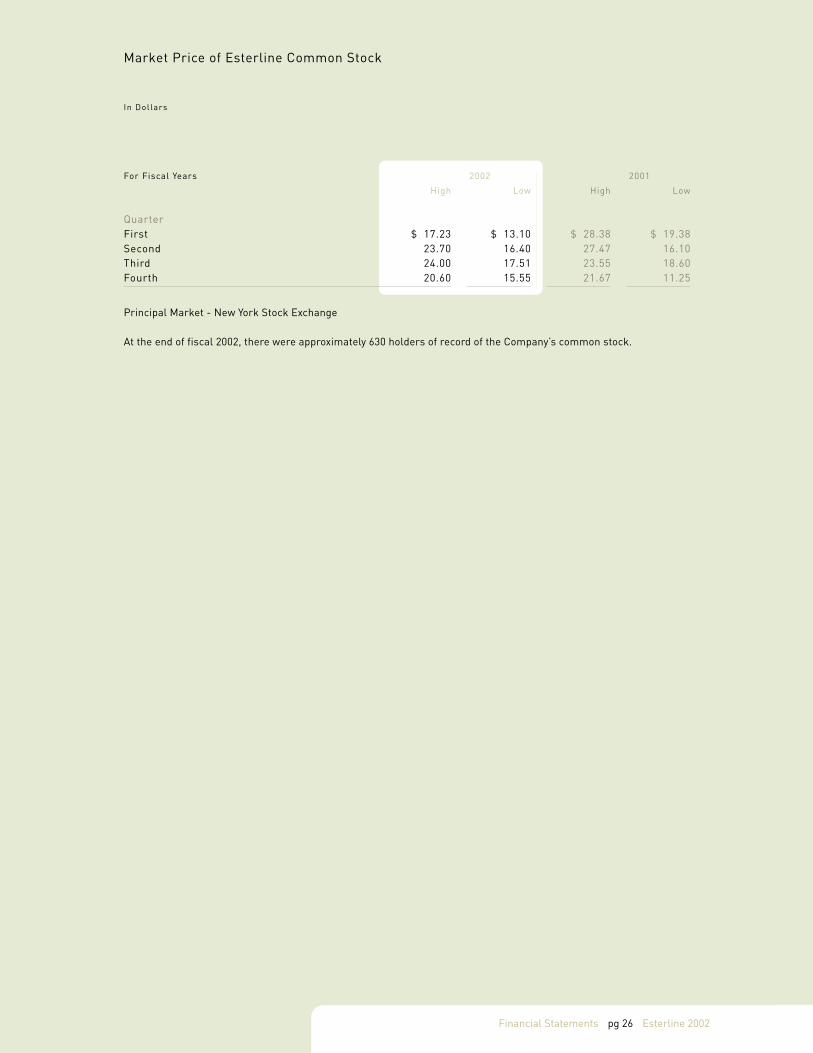
Market Price of Esterline Common Stock
In Dollars
For Fiscal Years 2002 2001
High Low High Low
QuarterFirst $ 17.23 $ 13.10 $ 28.38 $ 19.38Second 23.70 16.40 27.47 16.10Third 24.00 17.51 23.55 18.60Fourth 20.60 15.55 21.67 11.25
Principal Market - New York Stock Exchange
At the end of fiscal 2002, there were approximately 630 holders of record of the Company’s common stock.
Financial Statements
pg 27
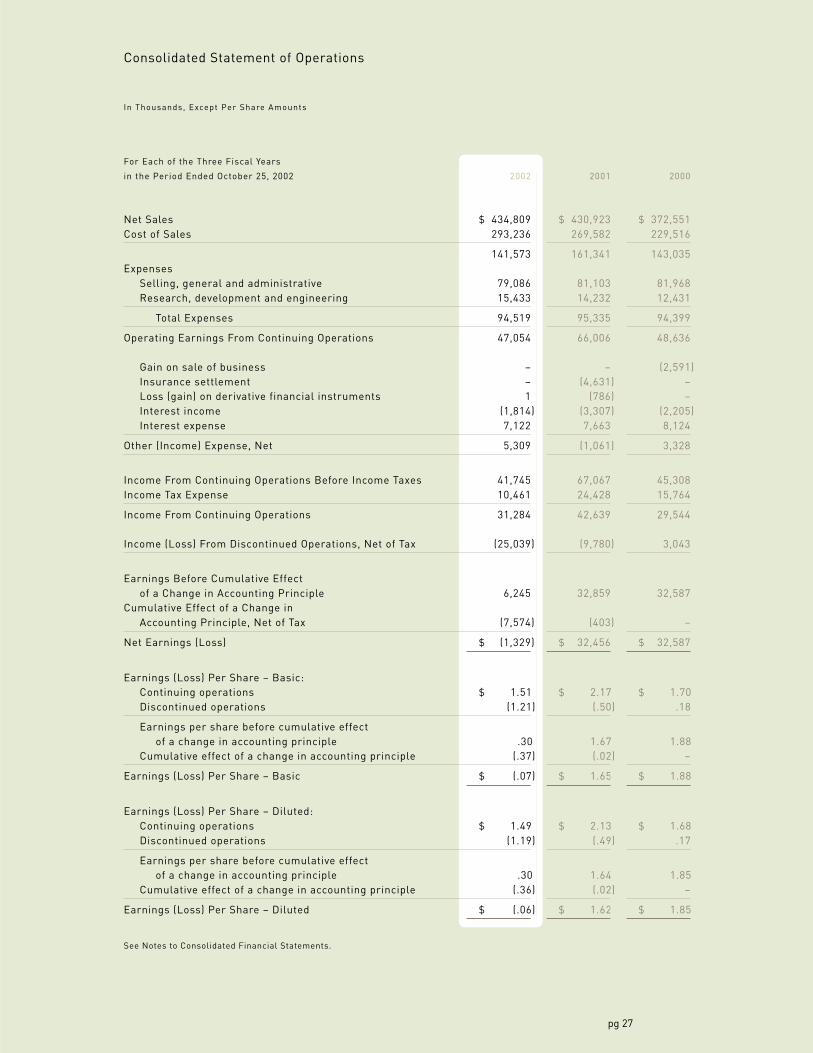
For Each of the Three Fiscal Years
in the Period Ended October 25, 2002 2002 2001 2000
Net Sales $ 434,809 $ 430,923 $ 372,551Cost of Sales 293,236 269,582 229,516
141,573 161,341 143,035Expenses
Selling, general and administrative 79,086 81,103 81,968Research, development and engineering 15,433 14,232 12,431
Total Expenses 94,519 95,335 94,399
Operating Earnings From Continuing Operations 47,054 66,006 48,636
Gain on sale of business – – (2,591)Insurance settlement – (4,631) –Loss (gain) on derivative financial instruments 1 (786) –Interest income (1,814) (3,307) (2,205)Interest expense 7,122 7,663 8,124
Other (Income) Expense, Net 5,309 (1,061) 3,328
Income From Continuing Operations Before Income Taxes 41,745 67,067 45,308Income Tax Expense 10,461 24,428 15,764
Income From Continuing Operations 31,284 42,639 29,544
Income (Loss) From Discontinued Operations, Net of Tax (25,039) (9,780) 3,043
Earnings Before Cumulative Effectof a Change in Accounting Principle 6,245 32,859 32,587
Cumulative Effect of a Change inAccounting Principle, Net of Tax (7,574) (403) –
Net Earnings (Loss) $ (1,329) $ 32,456 $ 32,587
Earnings (Loss) Per Share – Basic:Continuing operations $ 1.51 $ 2.17 $ 1.70Discontinued operations (1.21) (.50) .18
Earnings per share before cumulative effectof a change in accounting principle .30 1.67 1.88
Cumulative effect of a change in accounting principle (.37) (.02) –
Earnings (Loss) Per Share – Basic $ (.07) $ 1.65 $ 1.88
Earnings (Loss) Per Share – Diluted:Continuing operations $ 1.49 $ 2.13 $ 1.68Discontinued operations (1.19) (.49) .17
Earnings per share before cumulative effectof a change in accounting principle .30 1.64 1.85
Cumulative effect of a change in accounting principle (.36) (.02) –
Earnings (Loss) Per Share – Diluted $ (.06) $ 1.62 $ 1.85
See Notes to Consolidated Financial Statements.
Consolidated Statement of Operations
In Thousands, Except Per Share Amounts

Esterline 2002pg 28
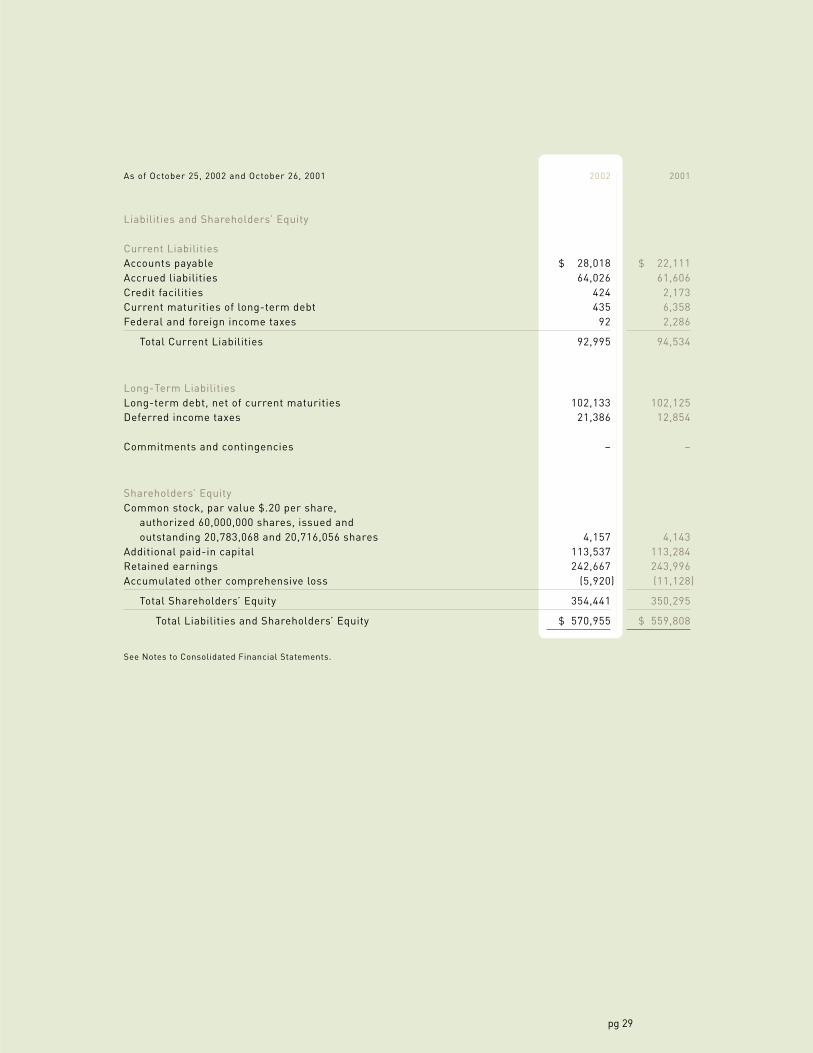
Consolidated Balance Sheet
In Thousands, Except Share and Per Share Amounts
As of October 25, 2002 and October 26, 2001 2002 2001
Assets
Current AssetsCash and cash equivalents $ 22,511 $ 119,940Cash in escrow 3,500 –Accounts receivable, net of allowances of $2,700 and $2,447 79,474 82,844Inventories 71,305 88,268Income tax refundable 6,180 –Deferred income tax benefits 25,069 17,005Prepaid expenses 6,193 5,683
Total Current Assets 214,232 313,740
Property, Plant and EquipmentLand 14,732 13,092Buildings 52,644 64,811Machinery and equipment 127,942 127,717
195,318 205,620Accumulated depreciation 94,324 117,349
100,994 88,271
Net Assets of Discontinued Operations 13,576 –
Other Non-Current AssetsGoodwill 158,006 135,369Intangibles, net 61,497 174Other assets 22,650 22,254
Total Assets $ 570,955 $ 559,808
See Notes to Consolidated Financial Statements.
Financial Statements
pg 29
As of October 25, 2002 and October 26, 2001 2002 2001
Liabilities and Shareholders’ Equity
Current LiabilitiesAccounts payable $ 28,018 $ 22,111Accrued liabilities 64,026 61,606Credit facilities 424 2,173Current maturities of long-term debt 435 6,358Federal and foreign income taxes 92 2,286
Total Current Liabilities 92,995 94,534
Long-Term LiabilitiesLong-term debt, net of current maturities 102,133 102,125Deferred income taxes 21,386 12,854
Commitments and contingencies – –
Shareholders’ EquityCommon stock, par value $.20 per share,
authorized 60,000,000 shares, issued andoutstanding 20,783,068 and 20,716,056 shares 4,157 4,143
Additional paid-in capital 113,537 113,284Retained earnings 242,667 243,996Accumulated other comprehensive loss (5,920) (11,128)
Total Shareholders’ Equity 354,441 350,295
Total Liabilities and Shareholders’ Equity $ 570,955 $ 559,808
See Notes to Consolidated Financial Statements.
Esterline 2002pg 30
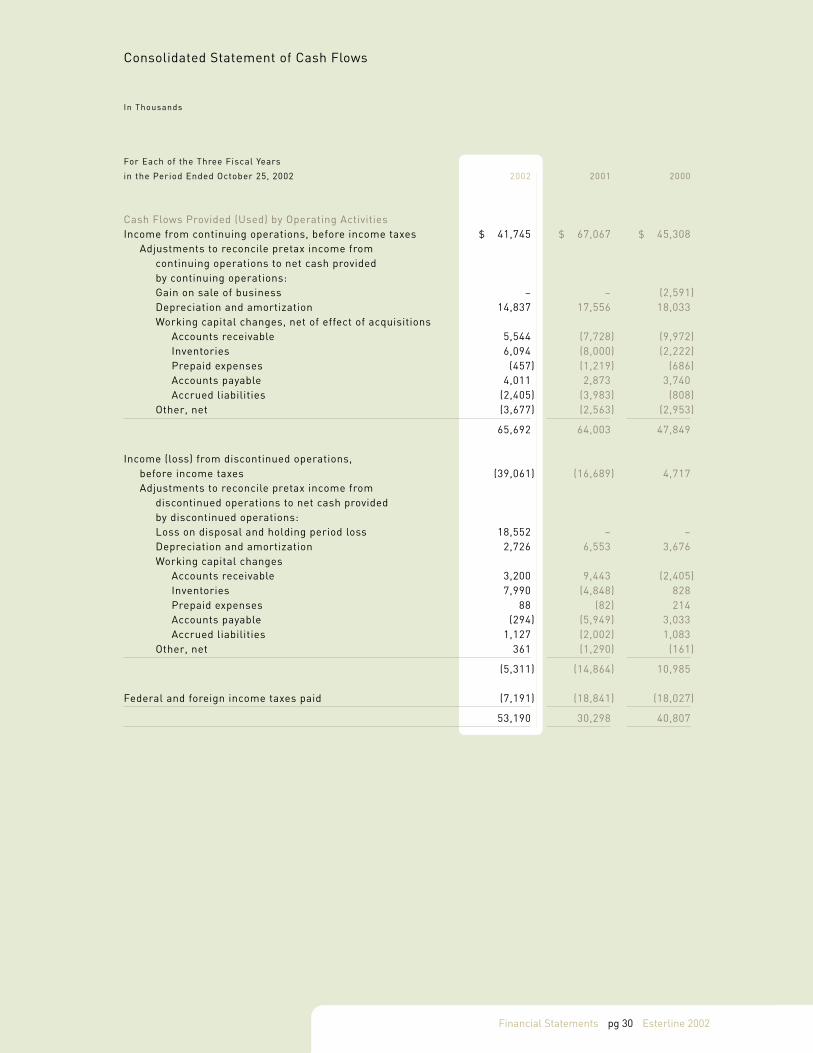
For Each of the Three Fiscal Years
in the Period Ended October 25, 2002 2002 2001 2000
Cash Flows Provided (Used) by Operating ActivitiesIncome from continuing operations, before income taxes $ 41,745 $ 67,067 $ 45,308
Adjustments to reconcile pretax income fromcontinuing operations to net cash providedby continuing operations:Gain on sale of business – – (2,591)Depreciation and amortization 14,837 17,556 18,033Working capital changes, net of effect of acquisitions
Accounts receivable 5,544 (7,728) (9,972)Inventories 6,094 (8,000) (2,222)Prepaid expenses (457) (1,219) (686)Accounts payable 4,011 2,873 3,740Accrued liabilities (2,405) (3,983) (808)
Other, net (3,677) (2,563) (2,953)
65,692 64,003 47,849
Income (loss) from discontinued operations,before income taxes (39,061) (16,689) 4,717Adjustments to reconcile pretax income from
discontinued operations to net cash providedby discontinued operations:Loss on disposal and holding period loss 18,552 – –Depreciation and amortization 2,726 6,553 3,676Working capital changes
Accounts receivable 3,200 9,443 (2,405)Inventories 7,990 (4,848) 828Prepaid expenses 88 (82) 214Accounts payable (294) (5,949) 3,033Accrued liabilities 1,127 (2,002) 1,083
Other, net 361 (1,290) (161)
(5,311) (14,864) 10,985
Federal and foreign income taxes paid (7,191) (18,841) (18,027)
53,190 30,298 40,807
Consolidated Statement of Cash Flows
In Thousands
Financial Statements
pg 31
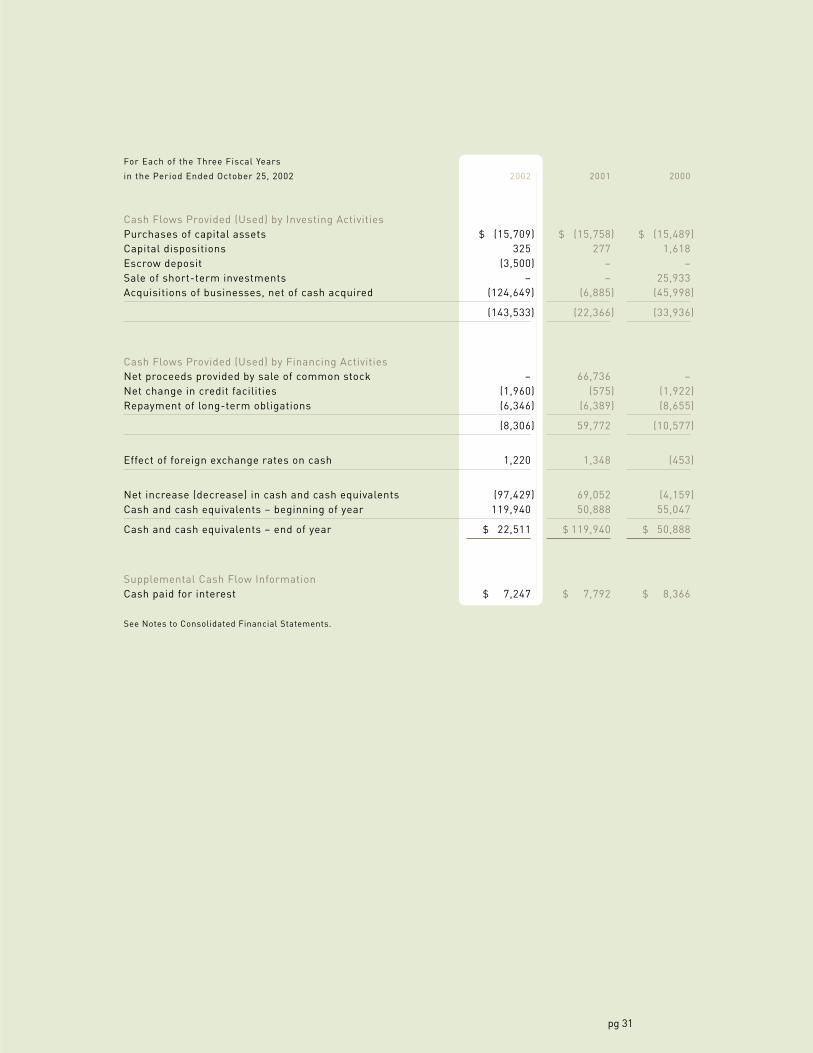
For Each of the Three Fiscal Years
in the Period Ended October 25, 2002 2002 2001 2000
Cash Flows Provided (Used) by Investing ActivitiesPurchases of capital assets $ (15,709) $ (15,758) $ (15,489)Capital dispositions 325 277 1,618Escrow deposit (3,500) – –Sale of short-term investments – – 25,933Acquisitions of businesses, net of cash acquired (124,649) (6,885) (45,998)
(143,533) (22,366) (33,936)
Cash Flows Provided (Used) by Financing ActivitiesNet proceeds provided by sale of common stock – 66,736 –Net change in credit facilities (1,960) (575) (1,922)Repayment of long-term obligations (6,346) (6,389) (8,655)
(8,306) 59,772 (10,577)
Effect of foreign exchange rates on cash 1,220 1,348 (453)
Net increase (decrease) in cash and cash equivalents (97,429) 69,052 (4,159)Cash and cash equivalents – beginning of year 119,940 50,888 55,047
Cash and cash equivalents – end of year $ 22,511 $ 119,940 $ 50,888
Supplemental Cash Flow InformationCash paid for interest $ 7,247 $ 7,792 $ 8,366
See Notes to Consolidated Financial Statements.
Esterline 2002pg 32
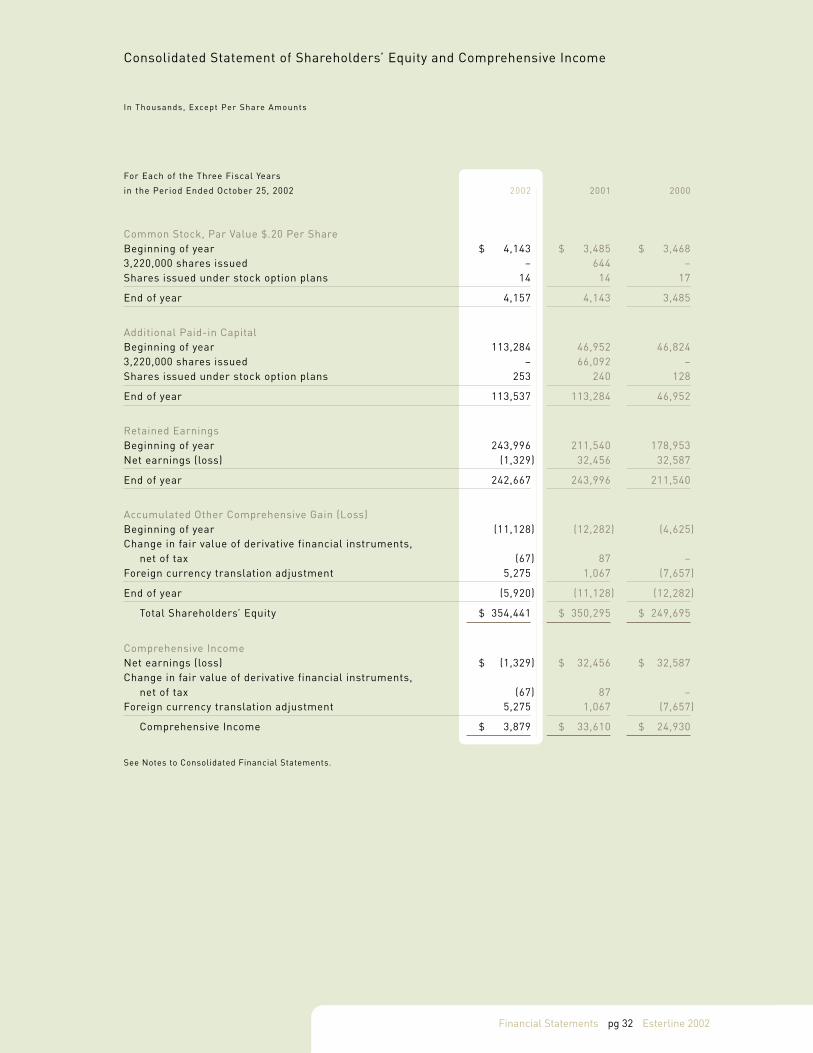
For Each of the Three Fiscal Years
in the Period Ended October 25, 2002 2002 2001 2000
Common Stock, Par Value $.20 Per ShareBeginning of year $ 4,143 $ 3,485 $ 3,4683,220,000 shares issued – 644 –Shares issued under stock option plans 14 14 17
End of year 4,157 4,143 3,485
Additional Paid-in CapitalBeginning of year 113,284 46,952 46,8243,220,000 shares issued – 66,092 –Shares issued under stock option plans 253 240 128
End of year 113,537 113,284 46,952
Retained EarningsBeginning of year 243,996 211,540 178,953Net earnings (loss) (1,329) 32,456 32,587
End of year 242,667 243,996 211,540
Accumulated Other Comprehensive Gain (Loss)Beginning of year (11,128) (12,282) (4,625)Change in fair value of derivative financial instruments,
net of tax (67) 87 –Foreign currency translation adjustment 5,275 1,067 (7,657)
End of year (5,920) (11,128) (12,282)
Total Shareholders’ Equity $ 354,441 $ 350,295 $ 249,695
Comprehensive IncomeNet earnings (loss) $ (1,329) $ 32,456 $ 32,587Change in fair value of derivative financial instruments,
net of tax (67) 87 –Foreign currency translation adjustment 5,275 1,067 (7,657)
Comprehensive Income $ 3,879 $ 33,610 $ 24,930
See Notes to Consolidated Financial Statements.
Consolidated Statement of Shareholders’ Equity and Comprehensive Income
In Thousands, Except Per Share Amounts
Financial Statements
pg 33
Notes to Consolidated Financial Statements
1. Accounting Policies
Nature of OperationsEsterline Technologies Corporation (the “Company”) designs, manufactures and markets highly engineeredproducts. The Company principally serves the aerospace and defense industry throughout the world, primarilyin the United States and Europe.
Principles of Consolidation and Basis of PresentationThe consolidated financial statements include the accounts of the Company and all subsidiaries. All signifi-cant intercompany accounts and transactions have been eliminated. Classifications have been changed forcertain amounts in prior periods to conform with the current year’s presentation. The Company’s fiscal yearends on the last Friday of October.
Management EstimatesTo prepare financial statements in conformity with accounting principles generally accepted in the UnitedStates, management is required to make estimates and assumptions that affect the reported amounts ofassets and liabilities, disclosure of contingent assets and liabilities at the date of the financial statements, andthe reported amounts of revenues and expenses during the reporting period. Actual results could differ fromthose estimates.
Derivative Financial InstrumentsThe Company is subject to risks associated with fluctuations in foreign currency exchange rates from the saleof products in currencies other than its functional currency. The Company’s policy is to hedge a portion ofthese forecasted transactions using forward exchange contracts, typically with maturities of less than oneyear. These forward contracts have been designated as cash flow hedges. The portion of the net gain or losson a derivative instrument that is effective as a hedge is reported as a component of other comprehensiveincome in shareholders’ equity and is reclassified into earnings in the same period during which the hedgedtransaction affects earnings. The remaining net gain or loss on the derivative in excess of the present value ofthe expected cash flows of the hedged transaction is recorded in earnings immediately. If a derivative doesnot qualify for hedge accounting, or a portion of the hedge is deemed ineffective, the change in fair value isrecorded in earnings. The amount of hedge ineffectiveness was not material. The Company does not enterinto any forward contracts for trading purposes.
Foreign Currency TranslationForeign currency assets and liabilities are translated into their U.S. dollar equivalents based on year-endexchange rates. Revenue and expense accounts are generally translated at average exchange rates.Aggregate exchange gains and losses arising from the translation of foreign assets and liabilities are includedin shareholders’ equity as a component of comprehensive income. Foreign currency transaction gains andlosses are included in results of operations and have not been significant in amount in the three fiscal yearsended October 25, 2002.
Cash Equivalents and Cash in EscrowCash equivalents consist of highly liquid investments with maturities of three months or less at the date ofpurchase. Fair value of cash equivalents approximates carrying value. Cash in escrow represents amountsheld in escrow pending finalization of a purchase transaction.
InventoriesInventories are stated at the lower of cost or market using the first-in, first-out (FIFO) method. Inventory costincludes material, labor and factory overhead.
Esterline 2002pg 34
Property, Plant and Equipment, and DepreciationProperty, plant and equipment is carried at cost and includes expenditures for major improvements. Depre-ciation is generally provided on the straight-line method based upon estimated useful lives ranging from 3 to30 years. Depreciation expense was $13,106,000, $12,108,000, and $12,497,000 for fiscal 2002, 2001 and 2000,respectively.
Long-lived AssetsThe carrying amount of long-lived assets, including goodwill attributable to those assets, is reviewed periodi-cally for impairment. An asset (other than goodwill) is considered impaired when estimated future cash flowsare less than the carrying amount of the asset. In the event the carrying amount of such asset is not deemedrecoverable, the asset is adjusted to its estimated fair value. Fair value is generally determined based upondiscounted future cash flows.
Goodwill and IntangiblesBeginning in fiscal 2002 with the adoption of Financial Accounting Standards No. 142, “Goodwill and OtherIntangible Assets” (Statement No. 142), goodwill is no longer amortized, but instead tested for impairment atleast annually. Prior to fiscal 2002, goodwill was amortized on a straight-line basis over the period of expectedbenefit which ranged from 10 to 40 years. Due to continued poor operating results and future prospects forthe Automation segment, the Company wrote off the $2.9 million of goodwill and intangible assets related tothat segment in the fourth quarter of fiscal 2001.
Intangible assets are amortized using the straight-line method over their estimated period of benefit, rangingfrom 2 to 20 years. The Company periodically evaluates the recoverability of intangible assets and takes intoaccount events or circumstances that warrant revised estimates of useful lives or that indicate that an impair-ment exists. Accumulated amortization of intangibles was $16,741,000 and $15,490,000, respectively, at theend of fiscal 2002 and 2001.
EnvironmentalEnvironmental exposures are provided for at the time they are known to exist or are considered reasonablyprobable and estimable. No provision has been recorded for environmental remediation costs which couldresult from changes in laws or other circumstances currently not contemplated by the Company. Costsprovided for future expenditures on environmental remediation are not discounted to present value.
Revenue RecognitionSales are generally recorded at the time of shipment of products or performance of services and are pre-sented net of sales returns and allowances.
Earnings Per ShareBasic earnings per share is computed on the basis of the weighted average number of common sharesoutstanding during the year. Diluted earnings per share also includes the dilutive effect of stock options.The weighted average number of shares outstanding used to compute basic earnings per share was 20,751,000,19,641,000, and 17,375,000 for the fiscal years 2002, 2001 and 2000 respectively. The weighted averagenumber of shares outstanding used to compute diluted earnings per share was 21,021,000, 20,014,000, and17,654,000 for the fiscal years 2002, 2001 and 2000 respectively.
Notes
pg 35
Recent Accounting PronouncementsIn October 2002, the Financial Accounting Standards Board issued Statement of Financial Accounting Stan-dards No. 146, “Accounting for Costs Associated with Exit or Disposal Activities” (Statement No. 146), effectivefor exit or disposal activities initiated after December 31, 2002. Under Statement No. 146, a commitment to aplan to exit or dispose of a business activity no longer creates an obligation that meets the definition of aliability. A liability for a cost associated with an exit or disposal activity will be recognized when the liability isincurred. The Company will implement Statement No. 146 in the first quarter of fiscal 2003. Managementdoes not believe that application of Statement No. 146 will have a material effect on the results of operationsor financial position of the Company.
In October 2001, the Financial Accounting Standards Board issued Statement of Financial AccountingStandards No. 144, “Accounting for the Impairment or Disposal of Long-Lived Assets” (Statement No. 144),effective for fiscal years beginning after December 15, 2002. The Statement supersedes Financial AccountingStandards Board Statement of Financial Accounting Standards No. 121, “Accounting for Impairment of Long-Lived Assets to be Disposed Of” (Statement No. 121); however, it retains the fundamental provisions of StatementNo. 121. Statement No. 144 also supersedes Accounting Principles Board Opinion No. 30, “Reporting theResults of Operations – Reporting the Effects of Disposal of a Segment of a Business, and Extraordinary,Unusual and Infrequently Occurring Events and Transactions” (APB No. 30), and extends the reporting ofa discontinued operation to a component of an entity. Also, Statement No. 144 requires operating losses froma component of an entity to be recognized in the period(s) in which they occur rather than as of the measure-ment date as previously required under APB No. 30. The Company will implement Statement No. 144 in thefirst quarter of fiscal 2003. Management does not believe that application of Statement No. 144 will have amaterial effect on the results of operation or financial position of the Company.
2. Accounting Changes
Effective at the beginning of fiscal 2002, the Company adopted Statement No. 142. Under the new Statement,goodwill and intangible assets deemed to have indefinite lives are no longer amortized, but are subject toannual impairment tests in accordance with the Statement. The Company conducted its initial impairmenttests and determined that goodwill associated with a reporting unit in the Avionics & Controls segment wasimpaired as a result of applying Statement No. 142. Due to increased competition in the electronic inputindustry, principally from companies headquartered in Asia, operating profits and cash flows were lower in thepast fiscal year for this reporting unit. Based upon this trend, the earnings forecast for the next five years waslowered. A goodwill impairment loss of $7,574,000, net of an income tax benefit of $1,542,000, or $.36 perdiluted share, was recognized and reported as a cumulative effect of a change in accounting principle upon theadoption of Statement No. 142 in the first quarter of fiscal 2002. The fair value of the affected reporting unitwas estimated using a combination of the present value of expected cash flows and a market approach.
Effective at the beginning of fiscal 2001, the Company adopted Financial Accounting Standards No. 133,“Accounting for Derivative Instruments and Hedging Activities” (Statement No. 133), as amended. The cumu-lative effect of the change in accounting principle was a charge of $403,000 (net of tax), or $.02 per share on adiluted basis.
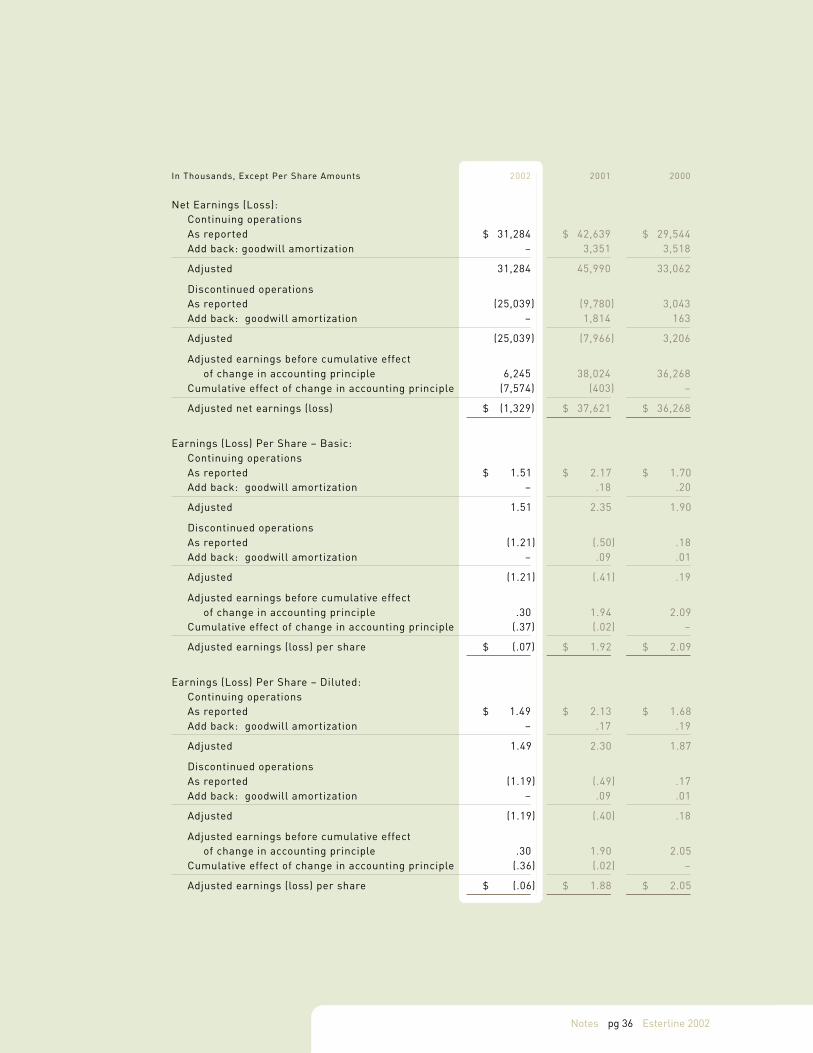
The following comparative table sets forth reported net earnings and earnings per share for fiscal 2002,2001 and 2000, exclusive of amortization expense related to goodwill that is no longer being amortized as aresult of the adoption of Statement No. 142.
Esterline 2002pg 36
2002 2001 2000
Net Earnings (Loss):Continuing operationsAs reported $ 31,284 $ 42,639 $ 29,544Add back: goodwill amortization – 3,351 3,518
Adjusted 31,284 45,990 33,062
Discontinued operationsAs reported (25,039) (9,780) 3,043Add back: goodwill amortization – 1,814 163
Adjusted (25,039) (7,966) 3,206
Adjusted earnings before cumulative effectof change in accounting principle 6,245 38,024 36,268
Cumulative effect of change in accounting principle (7,574) (403) –
Adjusted net earnings (loss) $ (1,329) $ 37,621 $ 36,268
Earnings (Loss) Per Share – Basic:Continuing operationsAs reported $ 1.51 $ 2.17 $ 1.70Add back: goodwill amortization – .18 .20
Adjusted 1.51 2.35 1.90
Discontinued operationsAs reported (1.21) (.50) .18Add back: goodwill amortization – .09 .01
Adjusted (1.21) (.41) .19
Adjusted earnings before cumulative effectof change in accounting principle .30 1.94 2.09
Cumulative effect of change in accounting principle (.37) (.02) –
Adjusted earnings (loss) per share $ (.07) $ 1.92 $ 2.09
Earnings (Loss) Per Share – Diluted:Continuing operationsAs reported $ 1.49 $ 2.13 $ 1.68Add back: goodwill amortization – .17 .19
Adjusted 1.49 2.30 1.87
Discontinued operationsAs reported (1.19) (.49) .17Add back: goodwill amortization – .09 .01
Adjusted (1.19) (.40) .18
Adjusted earnings before cumulative effectof change in accounting principle .30 1.90 2.05
Cumulative effect of change in accounting principle (.36) (.02) –
Adjusted earnings (loss) per share $ (.06) $ 1.88 $ 2.05
In Thousands, Except Per Share Amounts
Notes
pg 37
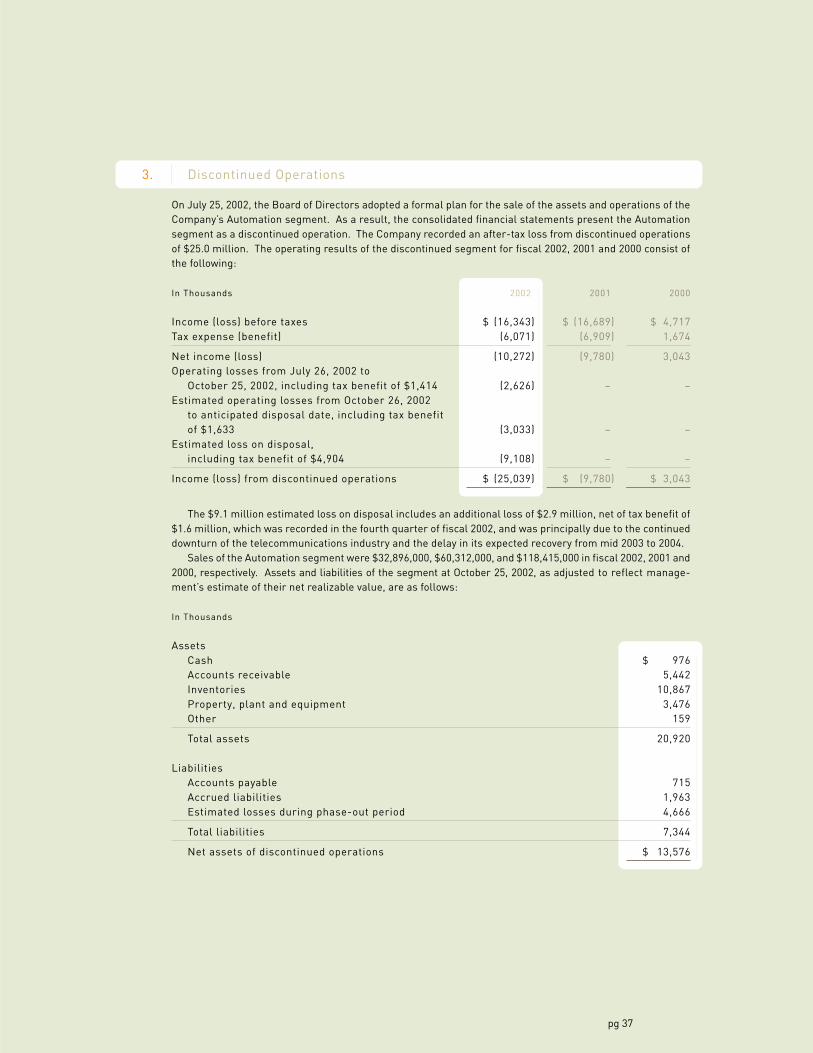
3. Discontinued Operations
On July 25, 2002, the Board of Directors adopted a formal plan for the sale of the assets and operations of theCompany’s Automation segment. As a result, the consolidated financial statements present the Automationsegment as a discontinued operation. The Company recorded an after-tax loss from discontinued operationsof $25.0 million. The operating results of the discontinued segment for fiscal 2002, 2001 and 2000 consist ofthe following:
In Thousands 2002 2001 2000
Income (loss) before taxes $ (16,343) $ (16,689) $ 4,717Tax expense (benefit) (6,071) (6,909) 1,674
Net income (loss) (10,272) (9,780) 3,043Operating losses from July 26, 2002 to
October 25, 2002, including tax benefit of $1,414 (2,626) – –Estimated operating losses from October 26, 2002
to anticipated disposal date, including tax benefitof $1,633 (3,033) – –
Estimated loss on disposal,including tax benefit of $4,904 (9,108) – –
Income (loss) from discontinued operations $ (25,039) $ (9,780) $ 3,043
The $9.1 million estimated loss on disposal includes an additional loss of $2.9 million, net of tax benefit of$1.6 million, which was recorded in the fourth quarter of fiscal 2002, and was principally due to the continueddownturn of the telecommunications industry and the delay in its expected recovery from mid 2003 to 2004.
Sales of the Automation segment were $32,896,000, $60,312,000, and $118,415,000 in fiscal 2002, 2001 and2000, respectively. Assets and liabilities of the segment at October 25, 2002, as adjusted to reflect manage-ment’s estimate of their net realizable value, are as follows:
In Thousands
AssetsCash $ 976Accounts receivable 5,442Inventories 10,867Property, plant and equipment 3,476Other 159
Total assets 20,920
LiabilitiesAccounts payable 715Accrued liabilities 1,963Estimated losses during phase-out period 4,666
Total liabilities 7,344
Net assets of discontinued operations $ 13,576
Esterline 2002pg 38
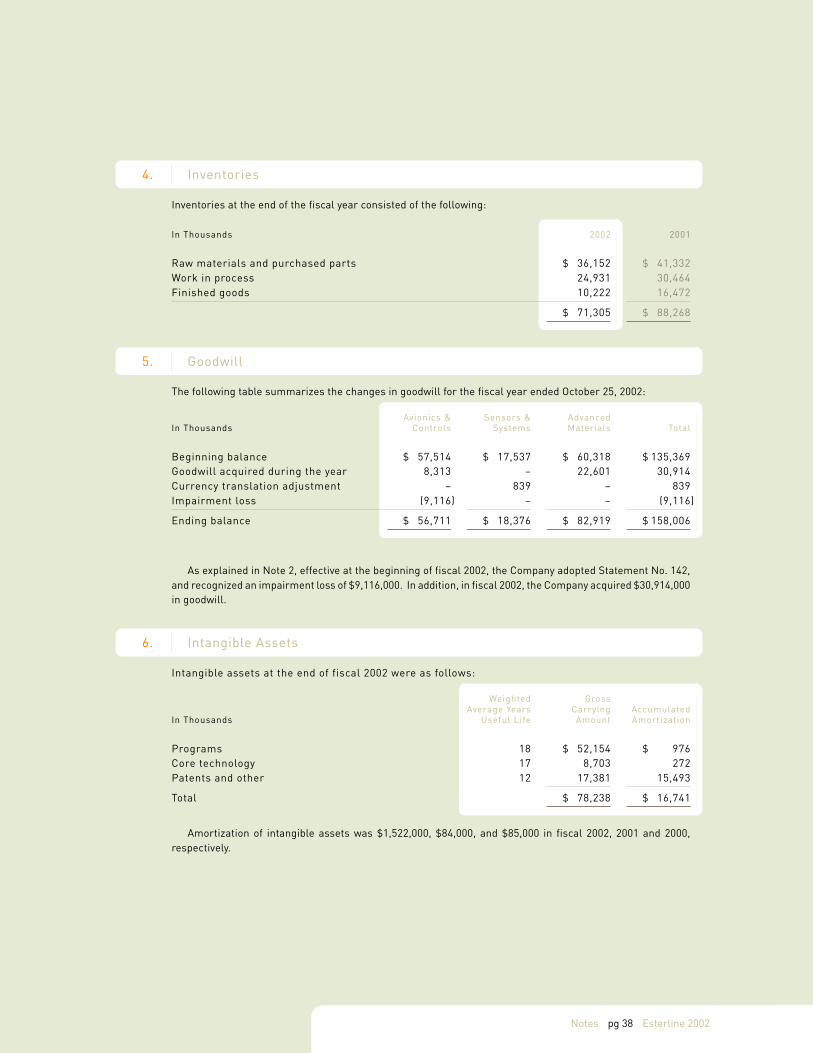
4. Inventories
Inventories at the end of the fiscal year consisted of the following:
In Thousands 2002 2001
Raw materials and purchased parts $ 36,152 $ 41,332Work in process 24,931 30,464Finished goods 10,222 16,472
$ 71,305 $ 88,268
5. Goodwill
The following table summarizes the changes in goodwill for the fiscal year ended October 25, 2002:
Avionics & Sensors & AdvancedIn Thousands Controls Systems Materials Total
Beginning balance $ 57,514 $ 17,537 $ 60,318 $ 135,369Goodwill acquired during the year 8,313 – 22,601 30,914Currency translation adjustment – 839 – 839Impairment loss (9,116) – – (9,116)
Ending balance $ 56,711 $ 18,376 $ 82,919 $ 158,006
As explained in Note 2, effective at the beginning of fiscal 2002, the Company adopted Statement No. 142,and recognized an impairment loss of $9,116,000. In addition, in fiscal 2002, the Company acquired $30,914,000in goodwill.
6. Intangible Assets
Intangible assets at the end of fiscal 2002 were as follows:
Weighted GrossAverage Years Carrying Accumulated
In Thousands Useful Life Amount Amortization
Programs 18 $ 52,154 $ 976Core technology 17 8,703 272Patents and other 12 17,381 15,493
Total $ 78,238 $ 16,741
Amortization of intangible assets was $1,522,000, $84,000, and $85,000 in fiscal 2002, 2001 and 2000,respectively.
Notes
pg 39
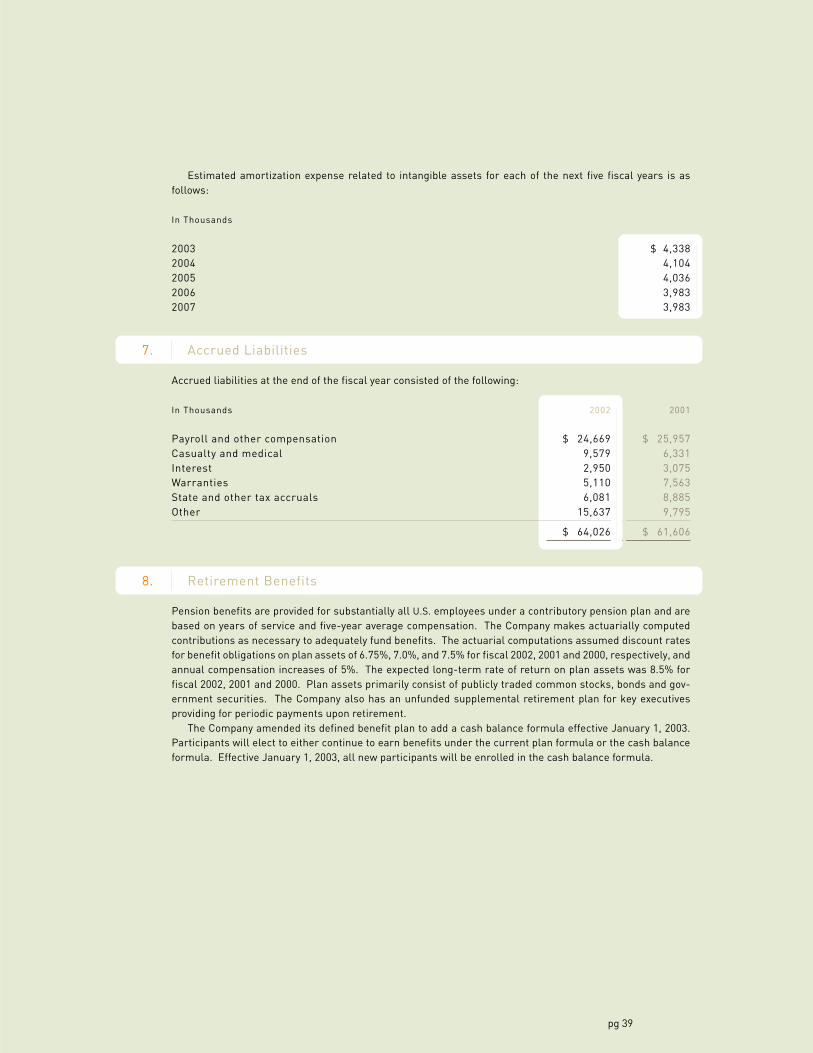
Estimated amortization expense related to intangible assets for each of the next five fiscal years is asfollows:
In Thousands
2003 $ 4,3382004 4,1042005 4,0362006 3,9832007 3,983
7. Accrued Liabilities
Accrued liabilities at the end of the fiscal year consisted of the following:
In Thousands 2002 2001
Payroll and other compensation $ 24,669 $ 25,957Casualty and medical 9,579 6,331Interest 2,950 3,075Warranties 5,110 7,563State and other tax accruals 6,081 8,885Other 15,637 9,795
$ 64,026 $ 61,606
8. Retirement Benefits
Pension benefits are provided for substantially all U.S. employees under a contributory pension plan and arebased on years of service and five-year average compensation. The Company makes actuarially computedcontributions as necessary to adequately fund benefits. The actuarial computations assumed discount ratesfor benefit obligations on plan assets of 6.75%, 7.0%, and 7.5% for fiscal 2002, 2001 and 2000, respectively, andannual compensation increases of 5%. The expected long-term rate of return on plan assets was 8.5% forfiscal 2002, 2001 and 2000. Plan assets primarily consist of publicly traded common stocks, bonds and gov-ernment securities. The Company also has an unfunded supplemental retirement plan for key executivesproviding for periodic payments upon retirement.
The Company amended its defined benefit plan to add a cash balance formula effective January 1, 2003.Participants will elect to either continue to earn benefits under the current plan formula or the cash balanceformula. Effective January 1, 2003, all new participants will be enrolled in the cash balance formula.
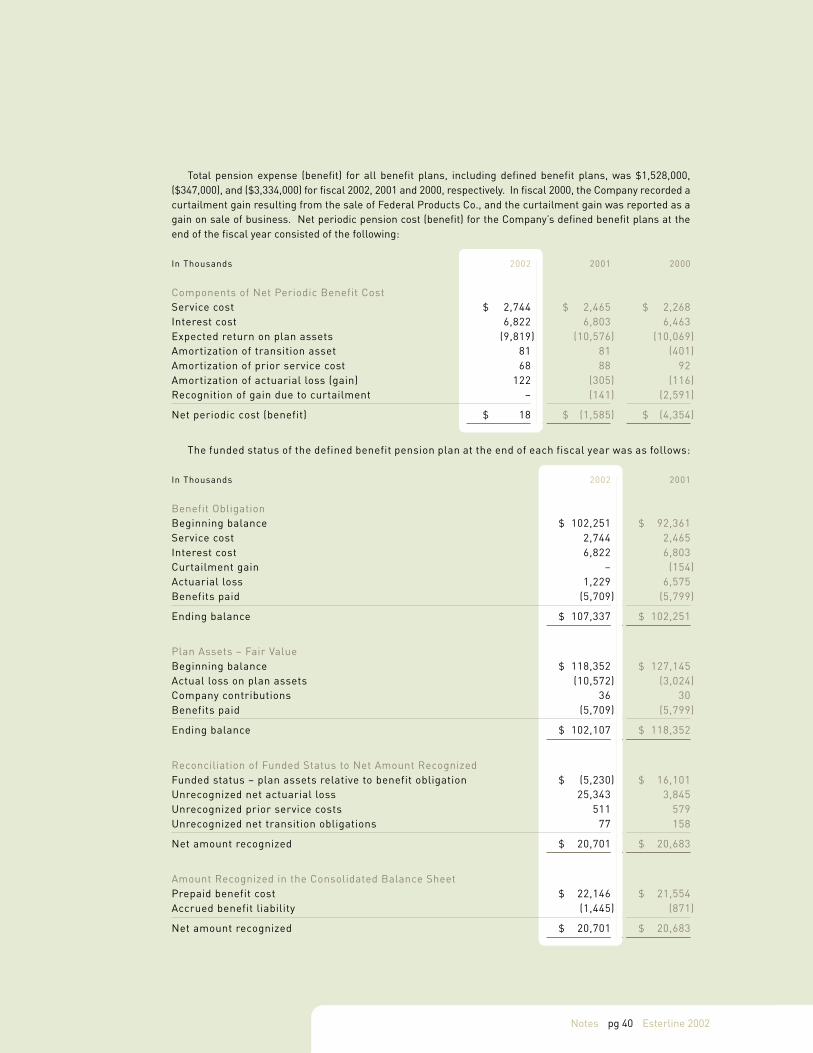
Esterline 2002pg 40
Total pension expense (benefit) for all benefit plans, including defined benefit plans, was $1,528,000,($347,000), and ($3,334,000) for fiscal 2002, 2001 and 2000, respectively. In fiscal 2000, the Company recorded acurtailment gain resulting from the sale of Federal Products Co., and the curtailment gain was reported as again on sale of business. Net periodic pension cost (benefit) for the Company’s defined benefit plans at theend of the fiscal year consisted of the following:
In Thousands 2002 2001 2000
Components of Net Periodic Benefit CostService cost $ 2,744 $ 2,465 $ 2,268Interest cost 6,822 6,803 6,463Expected return on plan assets (9,819) (10,576) (10,069)Amortization of transition asset 81 81 (401)Amortization of prior service cost 68 88 92Amortization of actuarial loss (gain) 122 (305) (116)Recognition of gain due to curtailment – (141) (2,591)
Net periodic cost (benefit) $ 18 $ (1,585) $ (4,354)
The funded status of the defined benefit pension plan at the end of each fiscal year was as follows:
In Thousands 2002 2001
Benefit ObligationBeginning balance $ 102,251 $ 92,361Service cost 2,744 2,465Interest cost 6,822 6,803Curtailment gain – (154)Actuarial loss 1,229 6,575Benefits paid (5,709) (5,799)
Ending balance $ 107,337 $ 102,251
Plan Assets – Fair ValueBeginning balance $ 118,352 $ 127,145Actual loss on plan assets (10,572) (3,024)Company contributions 36 30Benefits paid (5,709) (5,799)
Ending balance $ 102,107 $ 118,352
Reconciliation of Funded Status to Net Amount RecognizedFunded status – plan assets relative to benefit obligation $ (5,230) $ 16,101Unrecognized net actuarial loss 25,343 3,845Unrecognized prior service costs 511 579Unrecognized net transition obligations 77 158
Net amount recognized $ 20,701 $ 20,683
Amount Recognized in the Consolidated Balance SheetPrepaid benefit cost $ 22,146 $ 21,554Accrued benefit liability (1,445) (871)
Net amount recognized $ 20,701 $ 20,683
Notes
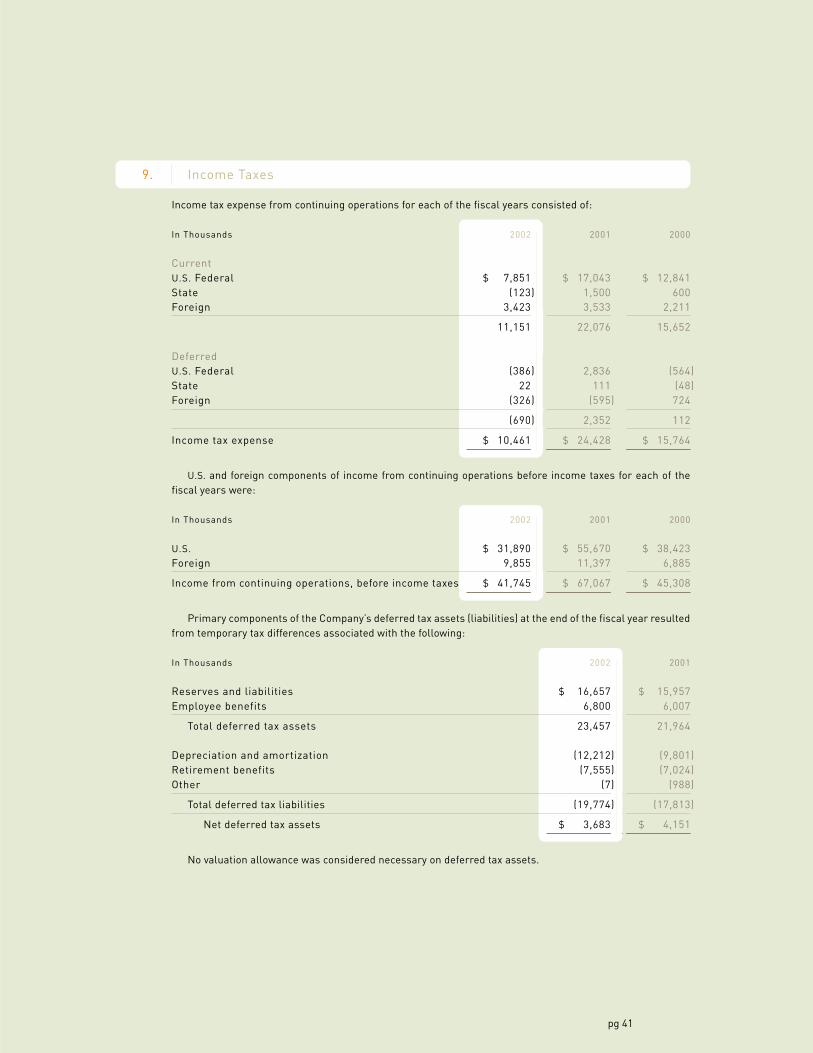
pg 41
9. Income Taxes
Income tax expense from continuing operations for each of the fiscal years consisted of:
In Thousands 2002 2001 2000
CurrentU.S. Federal $ 7,851 $ 17,043 $ 12,841State (123) 1,500 600Foreign 3,423 3,533 2,211
11,151 22,076 15,652
DeferredU.S. Federal (386) 2,836 (564)State 22 111 (48)Foreign (326) (595) 724
(690) 2,352 112
Income tax expense $ 10,461 $ 24,428 $ 15,764
U.S. and foreign components of income from continuing operations before income taxes for each of thefiscal years were:
In Thousands 2002 2001 2000
U.S. $ 31,890 $ 55,670 $ 38,423Foreign 9,855 11,397 6,885
Income from continuing operations, before income taxes $ 41,745 $ 67,067 $ 45,308
Primary components of the Company’s deferred tax assets (liabilities) at the end of the fiscal year resultedfrom temporary tax differences associated with the following:
In Thousands 2002 2001
Reserves and liabilities $ 16,657 $ 15,957Employee benefits 6,800 6,007
Total deferred tax assets 23,457 21,964
Depreciation and amortization (12,212) (9,801)Retirement benefits (7,555) (7,024)Other (7) (988)
Total deferred tax liabilities (19,774) (17,813)
Net deferred tax assets $ 3,683 $ 4,151
No valuation allowance was considered necessary on deferred tax assets.
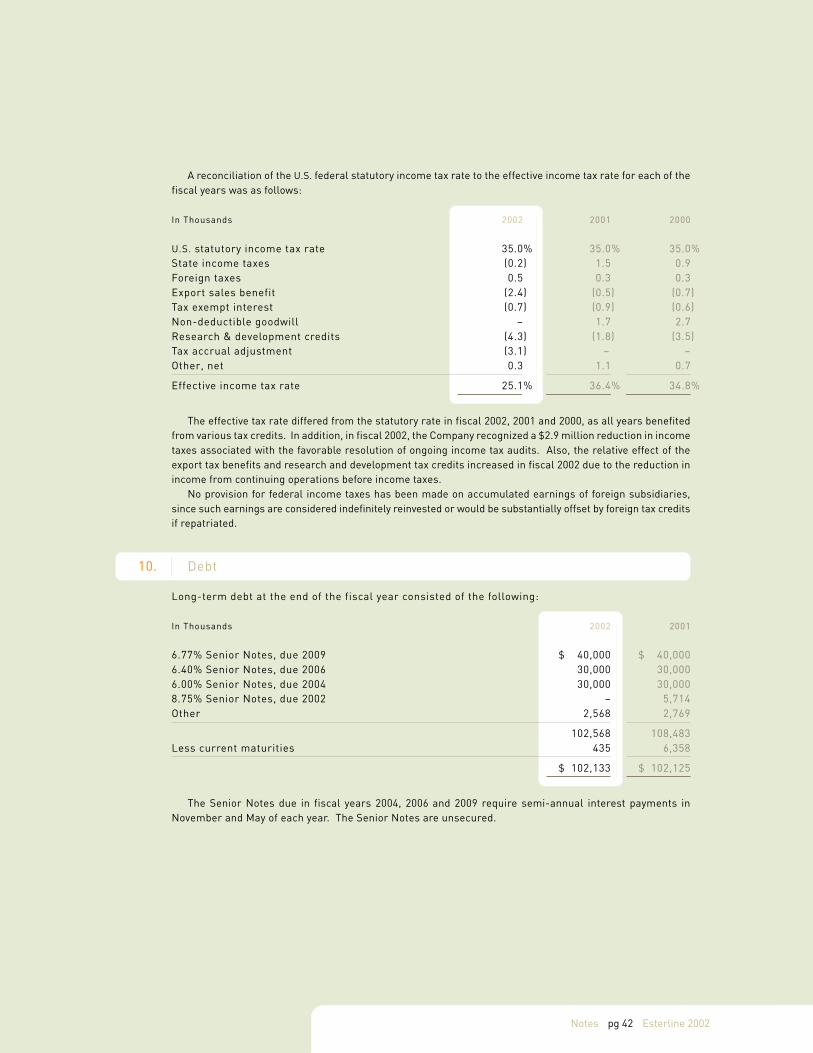
Esterline 2002pg 42
A reconciliation of the U.S. federal statutory income tax rate to the effective income tax rate for each of thefiscal years was as follows:
In Thousands 2002 2001 2000
U.S. statutory income tax rate 35.0% 35.0% 35.0%State income taxes (0.2) 1.5 0.9Foreign taxes 0.5 0.3 0.3Export sales benefit (2.4) (0.5) (0.7)Tax exempt interest (0.7) (0.9) (0.6)Non-deductible goodwill – 1.7 2.7Research & development credits (4.3) (1.8) (3.5)Tax accrual adjustment (3.1) – –Other, net 0.3 1.1 0.7
Effective income tax rate 25.1% 36.4% 34.8%
The effective tax rate differed from the statutory rate in fiscal 2002, 2001 and 2000, as all years benefitedfrom various tax credits. In addition, in fiscal 2002, the Company recognized a $2.9 million reduction in incometaxes associated with the favorable resolution of ongoing income tax audits. Also, the relative effect of theexport tax benefits and research and development tax credits increased in fiscal 2002 due to the reduction inincome from continuing operations before income taxes.
No provision for federal income taxes has been made on accumulated earnings of foreign subsidiaries,since such earnings are considered indefinitely reinvested or would be substantially offset by foreign tax creditsif repatriated.
10. Debt
Long-term debt at the end of the fiscal year consisted of the following:
In Thousands 2002 2001
6.77% Senior Notes, due 2009 $ 40,000 $ 40,0006.40% Senior Notes, due 2006 30,000 30,0006.00% Senior Notes, due 2004 30,000 30,0008.75% Senior Notes, due 2002 – 5,714Other 2,568 2,769
102,568 108,483Less current maturities 435 6,358
$ 102,133 $ 102,125
The Senior Notes due in fiscal years 2004, 2006 and 2009 require semi-annual interest payments inNovember and May of each year. The Senior Notes are unsecured.
Notes
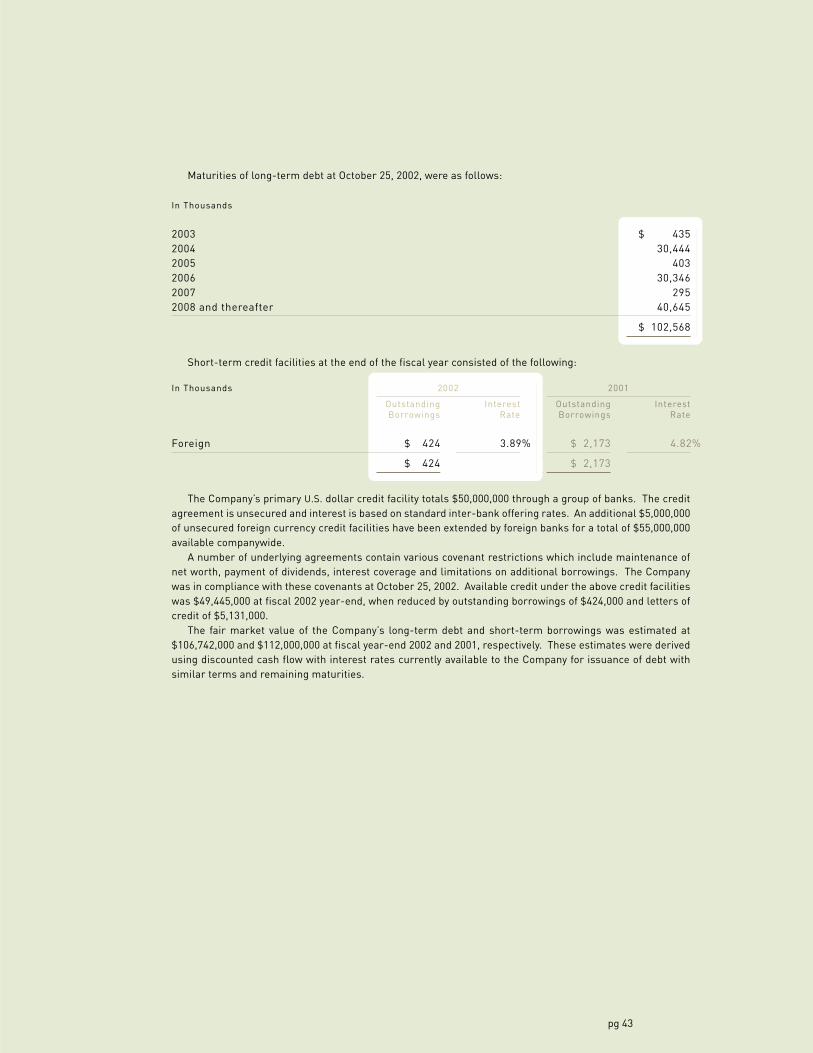
pg 43
Maturities of long-term debt at October 25, 2002, were as follows:
In Thousands
2003 $ 4352004 30,4442005 4032006 30,3462007 2952008 and thereafter 40,645
$ 102,568
Short-term credit facilities at the end of the fiscal year consisted of the following:
In Thousands 2002 2001
Outstanding Interest Outstanding InterestBorrowings Rate Borrowings Rate
Foreign $ 424 3.89% $ 2,173 4.82%
$ 424 $ 2,173
The Company’s primary U.S. dollar credit facility totals $50,000,000 through a group of banks. The creditagreement is unsecured and interest is based on standard inter-bank offering rates. An additional $5,000,000of unsecured foreign currency credit facilities have been extended by foreign banks for a total of $55,000,000available companywide.
A number of underlying agreements contain various covenant restrictions which include maintenance ofnet worth, payment of dividends, interest coverage and limitations on additional borrowings. The Companywas in compliance with these covenants at October 25, 2002. Available credit under the above credit facilitieswas $49,445,000 at fiscal 2002 year-end, when reduced by outstanding borrowings of $424,000 and letters ofcredit of $5,131,000.
The fair market value of the Company’s long-term debt and short-term borrowings was estimated at$106,742,000 and $112,000,000 at fiscal year-end 2002 and 2001, respectively. These estimates were derivedusing discounted cash flow with interest rates currently available to the Company for issuance of debt withsimilar terms and remaining maturities.
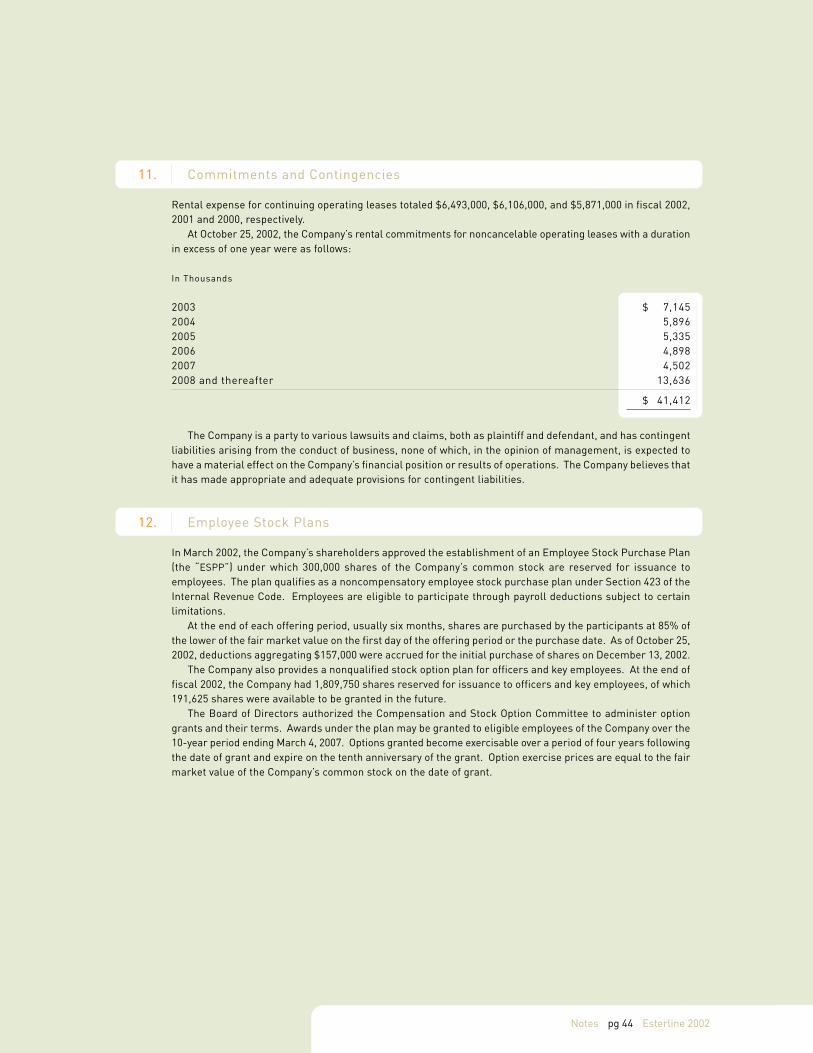
Esterline 2002pg 44
11. Commitments and Contingencies
Rental expense for continuing operating leases totaled $6,493,000, $6,106,000, and $5,871,000 in fiscal 2002,2001 and 2000, respectively.
At October 25, 2002, the Company’s rental commitments for noncancelable operating leases with a durationin excess of one year were as follows:
In Thousands
2003 $ 7,1452004 5,8962005 5,3352006 4,8982007 4,5022008 and thereafter 13,636
$ 41,412
The Company is a party to various lawsuits and claims, both as plaintiff and defendant, and has contingentliabilities arising from the conduct of business, none of which, in the opinion of management, is expected tohave a material effect on the Company’s financial position or results of operations. The Company believes thatit has made appropriate and adequate provisions for contingent liabilities.
12. Employee Stock Plans
In March 2002, the Company’s shareholders approved the establishment of an Employee Stock Purchase Plan(the “ESPP”) under which 300,000 shares of the Company’s common stock are reserved for issuance toemployees. The plan qualifies as a noncompensatory employee stock purchase plan under Section 423 of theInternal Revenue Code. Employees are eligible to participate through payroll deductions subject to certainlimitations.
At the end of each offering period, usually six months, shares are purchased by the participants at 85% ofthe lower of the fair market value on the first day of the offering period or the purchase date. As of October 25,2002, deductions aggregating $157,000 were accrued for the initial purchase of shares on December 13, 2002.
The Company also provides a nonqualified stock option plan for officers and key employees. At the end offiscal 2002, the Company had 1,809,750 shares reserved for issuance to officers and key employees, of which191,625 shares were available to be granted in the future.
The Board of Directors authorized the Compensation and Stock Option Committee to administer optiongrants and their terms. Awards under the plan may be granted to eligible employees of the Company over the10-year period ending March 4, 2007. Options granted become exercisable over a period of four years followingthe date of grant and expire on the tenth anniversary of the grant. Option exercise prices are equal to the fairmarket value of the Company’s common stock on the date of grant.
Notes
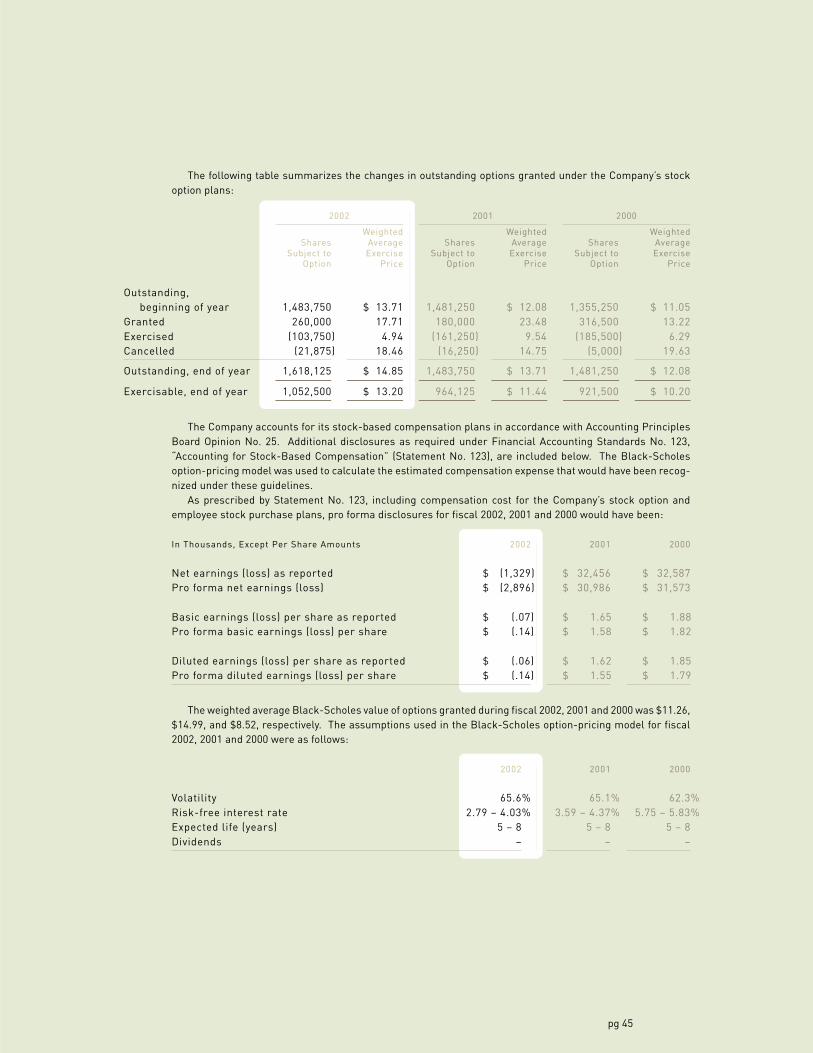
pg 45
The following table summarizes the changes in outstanding options granted under the Company’s stockoption plans:
2002 2001 2000
Weighted Weighted WeightedShares Average Shares Average Shares Average
Subject to Exercise Subject to Exercise Subject to ExerciseOption Price Option Price Option Price
Outstanding,beginning of year 1,483,750 $ 13.71 1,481,250 $ 12.08 1,355,250 $ 11.05
Granted 260,000 17.71 180,000 23.48 316,500 13.22Exercised (103,750) 4.94 (161,250) 9.54 (185,500) 6.29Cancelled (21,875) 18.46 (16,250) 14.75 (5,000) 19.63
Outstanding, end of year 1,618,125 $ 14.85 1,483,750 $ 13.71 1,481,250 $ 12.08
Exercisable, end of year 1,052,500 $ 13.20 964,125 $ 11.44 921,500 $ 10.20
The Company accounts for its stock-based compensation plans in accordance with Accounting PrinciplesBoard Opinion No. 25. Additional disclosures as required under Financial Accounting Standards No. 123,“Accounting for Stock-Based Compensation” (Statement No. 123), are included below. The Black-Scholesoption-pricing model was used to calculate the estimated compensation expense that would have been recog-nized under these guidelines.
As prescribed by Statement No. 123, including compensation cost for the Company’s stock option andemployee stock purchase plans, pro forma disclosures for fiscal 2002, 2001 and 2000 would have been:
In Thousands, Except Per Share Amounts 2002 2001 2000
Net earnings (loss) as reported $ (1,329) $ 32,456 $ 32,587Pro forma net earnings (loss) $ (2,896) $ 30,986 $ 31,573
Basic earnings (loss) per share as reported $ (.07) $ 1.65 $ 1.88Pro forma basic earnings (loss) per share $ (.14) $ 1.58 $ 1.82
Diluted earnings (loss) per share as reported $ (.06) $ 1.62 $ 1.85Pro forma diluted earnings (loss) per share $ (.14) $ 1.55 $ 1.79
The weighted average Black-Scholes value of options granted during fiscal 2002, 2001 and 2000 was $11.26,$14.99, and $8.52, respectively. The assumptions used in the Black-Scholes option-pricing model for fiscal2002, 2001 and 2000 were as follows:
2002 2001 2000
Volatility 65.6% 65.1% 62.3%Risk-free interest rate 2.79 – 4.03% 3.59 – 4.37% 5.75 – 5.83%Expected life (years) 5 – 8 5 – 8 5 – 8Dividends – – –
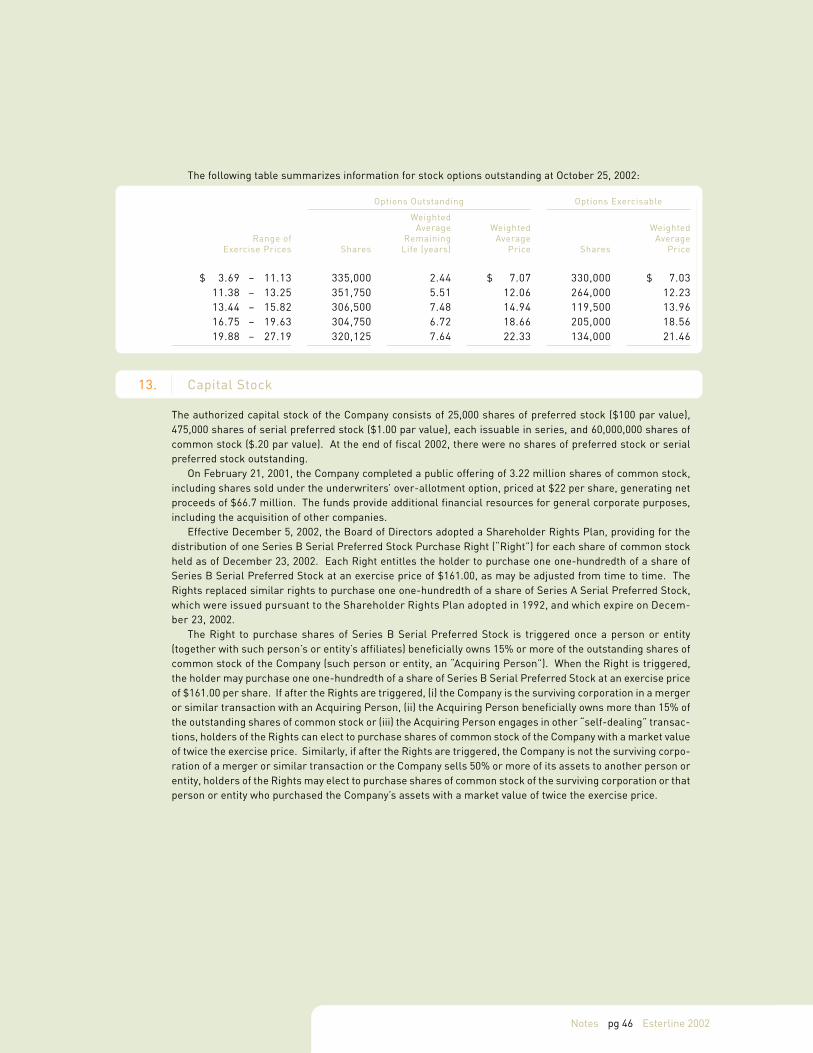
Esterline 2002pg 46
The following table summarizes information for stock options outstanding at October 25, 2002:
Options Outstanding Options Exercisable
WeightedAverage Weighted Weighted
Range of Remaining Average AverageExercise Prices Shares Life (years) Price Shares Price
$ 3.69 – 11.13 335,000 2.44 $ 7.07 330,000 $ 7.0311.38 – 13.25 351,750 5.51 12.06 264,000 12.2313.44 – 15.82 306,500 7.48 14.94 119,500 13.9616.75 – 19.63 304,750 6.72 18.66 205,000 18.5619.88 – 27.19 320,125 7.64 22.33 134,000 21.46
13. Capital Stock
The authorized capital stock of the Company consists of 25,000 shares of preferred stock ($100 par value),475,000 shares of serial preferred stock ($1.00 par value), each issuable in series, and 60,000,000 shares ofcommon stock ($.20 par value). At the end of fiscal 2002, there were no shares of preferred stock or serialpreferred stock outstanding.
On February 21, 2001, the Company completed a public offering of 3.22 million shares of common stock,including shares sold under the underwriters’ over-allotment option, priced at $22 per share, generating netproceeds of $66.7 million. The funds provide additional financial resources for general corporate purposes,including the acquisition of other companies.
Effective December 5, 2002, the Board of Directors adopted a Shareholder Rights Plan, providing for thedistribution of one Series B Serial Preferred Stock Purchase Right (“Right”) for each share of common stockheld as of December 23, 2002. Each Right entitles the holder to purchase one one-hundredth of a share ofSeries B Serial Preferred Stock at an exercise price of $161.00, as may be adjusted from time to time. TheRights replaced similar rights to purchase one one-hundredth of a share of Series A Serial Preferred Stock,which were issued pursuant to the Shareholder Rights Plan adopted in 1992, and which expire on Decem-ber 23, 2002.
The Right to purchase shares of Series B Serial Preferred Stock is triggered once a person or entity(together with such person’s or entity’s affiliates) beneficially owns 15% or more of the outstanding shares ofcommon stock of the Company (such person or entity, an “Acquiring Person”). When the Right is triggered,the holder may purchase one one-hundredth of a share of Series B Serial Preferred Stock at an exercise priceof $161.00 per share. If after the Rights are triggered, (i) the Company is the surviving corporation in a mergeror similar transaction with an Acquiring Person, (ii) the Acquiring Person beneficially owns more than 15% ofthe outstanding shares of common stock or (iii) the Acquiring Person engages in other “self-dealing” transac-tions, holders of the Rights can elect to purchase shares of common stock of the Company with a market valueof twice the exercise price. Similarly, if after the Rights are triggered, the Company is not the surviving corpo-ration of a merger or similar transaction or the Company sells 50% or more of its assets to another person orentity, holders of the Rights may elect to purchase shares of common stock of the surviving corporation or thatperson or entity who purchased the Company’s assets with a market value of twice the exercise price.
Notes
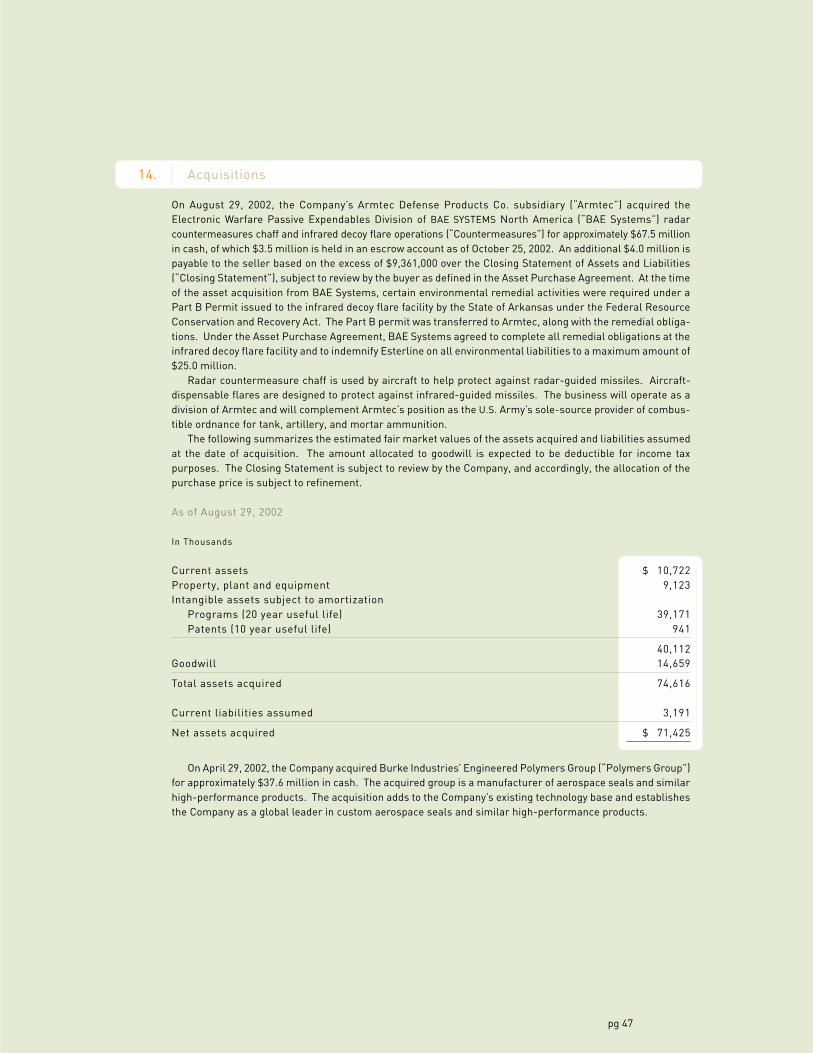
pg 47
14. Acquisitions
On August 29, 2002, the Company’s Armtec Defense Products Co. subsidiary (“Armtec”) acquired theElectronic Warfare Passive Expendables Division of BAE SYSTEMS North America (“BAE Systems”) radarcountermeasures chaff and infrared decoy flare operations (“Countermeasures”) for approximately $67.5 millionin cash, of which $3.5 million is held in an escrow account as of October 25, 2002. An additional $4.0 million ispayable to the seller based on the excess of $9,361,000 over the Closing Statement of Assets and Liabilities(“Closing Statement”), subject to review by the buyer as defined in the Asset Purchase Agreement. At the timeof the asset acquisition from BAE Systems, certain environmental remedial activities were required under aPart B Permit issued to the infrared decoy flare facility by the State of Arkansas under the Federal ResourceConservation and Recovery Act. The Part B permit was transferred to Armtec, along with the remedial obliga-tions. Under the Asset Purchase Agreement, BAE Systems agreed to complete all remedial obligations at theinfrared decoy flare facility and to indemnify Esterline on all environmental liabilities to a maximum amount of$25.0 million.
Radar countermeasure chaff is used by aircraft to help protect against radar-guided missiles. Aircraft-dispensable flares are designed to protect against infrared-guided missiles. The business will operate as adivision of Armtec and will complement Armtec’s position as the U.S. Army’s sole-source provider of combus-tible ordnance for tank, artillery, and mortar ammunition.
The following summarizes the estimated fair market values of the assets acquired and liabilities assumedat the date of acquisition. The amount allocated to goodwill is expected to be deductible for income taxpurposes. The Closing Statement is subject to review by the Company, and accordingly, the allocation of thepurchase price is subject to refinement.
As of August 29, 2002
In Thousands
Current assets $ 10,722Property, plant and equipment 9,123Intangible assets subject to amortization
Programs (20 year useful life) 39,171Patents (10 year useful life) 941
40,112Goodwill 14,659
Total assets acquired 74,616
Current liabilities assumed 3,191
Net assets acquired $ 71,425
On April 29, 2002, the Company acquired Burke Industries’ Engineered Polymers Group (“Polymers Group”)for approximately $37.6 million in cash. The acquired group is a manufacturer of aerospace seals and similarhigh-performance products. The acquisition adds to the Company’s existing technology base and establishesthe Company as a global leader in custom aerospace seals and similar high-performance products.
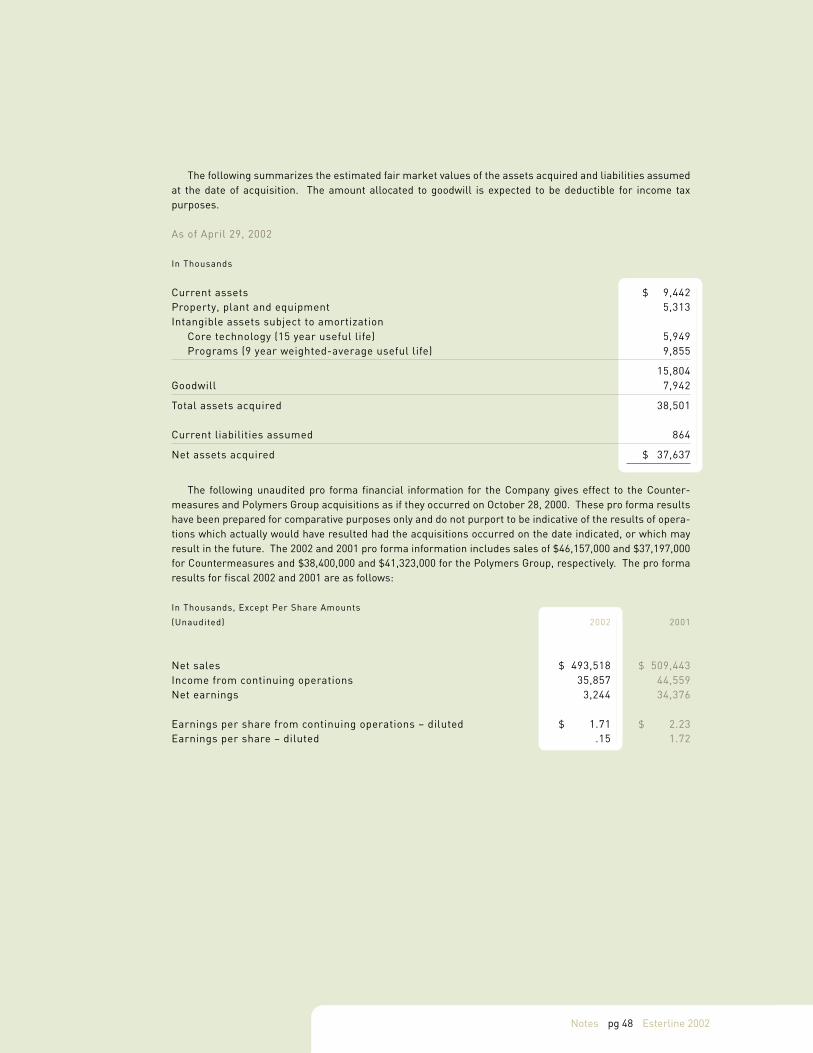
Esterline 2002pg 48
The following summarizes the estimated fair market values of the assets acquired and liabilities assumedat the date of acquisition. The amount allocated to goodwill is expected to be deductible for income taxpurposes.
As of April 29, 2002
In Thousands
Current assets $ 9,442Property, plant and equipment 5,313Intangible assets subject to amortization
Core technology (15 year useful life) 5,949Programs (9 year weighted-average useful life) 9,855
15,804Goodwill 7,942
Total assets acquired 38,501
Current liabilities assumed 864
Net assets acquired $ 37,637
The following unaudited pro forma financial information for the Company gives effect to the Counter-measures and Polymers Group acquisitions as if they occurred on October 28, 2000. These pro forma resultshave been prepared for comparative purposes only and do not purport to be indicative of the results of opera-tions which actually would have resulted had the acquisitions occurred on the date indicated, or which mayresult in the future. The 2002 and 2001 pro forma information includes sales of $46,157,000 and $37,197,000for Countermeasures and $38,400,000 and $41,323,000 for the Polymers Group, respectively. The pro formaresults for fiscal 2002 and 2001 are as follows:
In Thousands, Except Per Share Amounts
(Unaudited) 2002 2001
Net sales $ 493,518 $ 509,443Income from continuing operations 35,857 44,559Net earnings 3,244 34,376
Earnings per share from continuing operations – diluted $ 1.71 $ 2.23Earnings per share – diluted .15 1.72
Notes
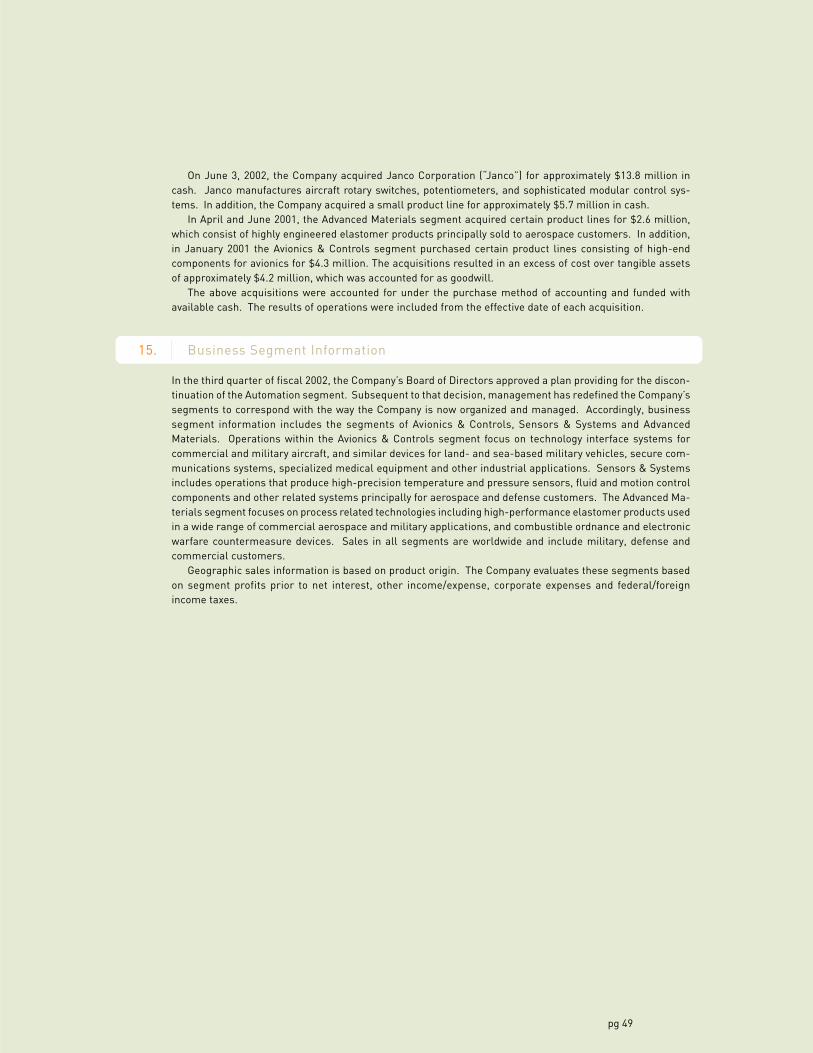
pg 49
On June 3, 2002, the Company acquired Janco Corporation (“Janco”) for approximately $13.8 million incash. Janco manufactures aircraft rotary switches, potentiometers, and sophisticated modular control sys-tems. In addition, the Company acquired a small product line for approximately $5.7 million in cash.
In April and June 2001, the Advanced Materials segment acquired certain product lines for $2.6 million,which consist of highly engineered elastomer products principally sold to aerospace customers. In addition,in January 2001 the Avionics & Controls segment purchased certain product lines consisting of high-endcomponents for avionics for $4.3 million. The acquisitions resulted in an excess of cost over tangible assetsof approximately $4.2 million, which was accounted for as goodwill.
The above acquisitions were accounted for under the purchase method of accounting and funded withavailable cash. The results of operations were included from the effective date of each acquisition.
15. Business Segment Information
In the third quarter of fiscal 2002, the Company’s Board of Directors approved a plan providing for the discon-tinuation of the Automation segment. Subsequent to that decision, management has redefined the Company’ssegments to correspond with the way the Company is now organized and managed. Accordingly, businesssegment information includes the segments of Avionics & Controls, Sensors & Systems and AdvancedMaterials. Operations within the Avionics & Controls segment focus on technology interface systems forcommercial and military aircraft, and similar devices for land- and sea-based military vehicles, secure com-munications systems, specialized medical equipment and other industrial applications. Sensors & Systemsincludes operations that produce high-precision temperature and pressure sensors, fluid and motion controlcomponents and other related systems principally for aerospace and defense customers. The Advanced Ma-terials segment focuses on process related technologies including high-performance elastomer products usedin a wide range of commercial aerospace and military applications, and combustible ordnance and electronicwarfare countermeasure devices. Sales in all segments are worldwide and include military, defense andcommercial customers.
Geographic sales information is based on product origin. The Company evaluates these segments basedon segment profits prior to net interest, other income/expense, corporate expenses and federal/foreignincome taxes.
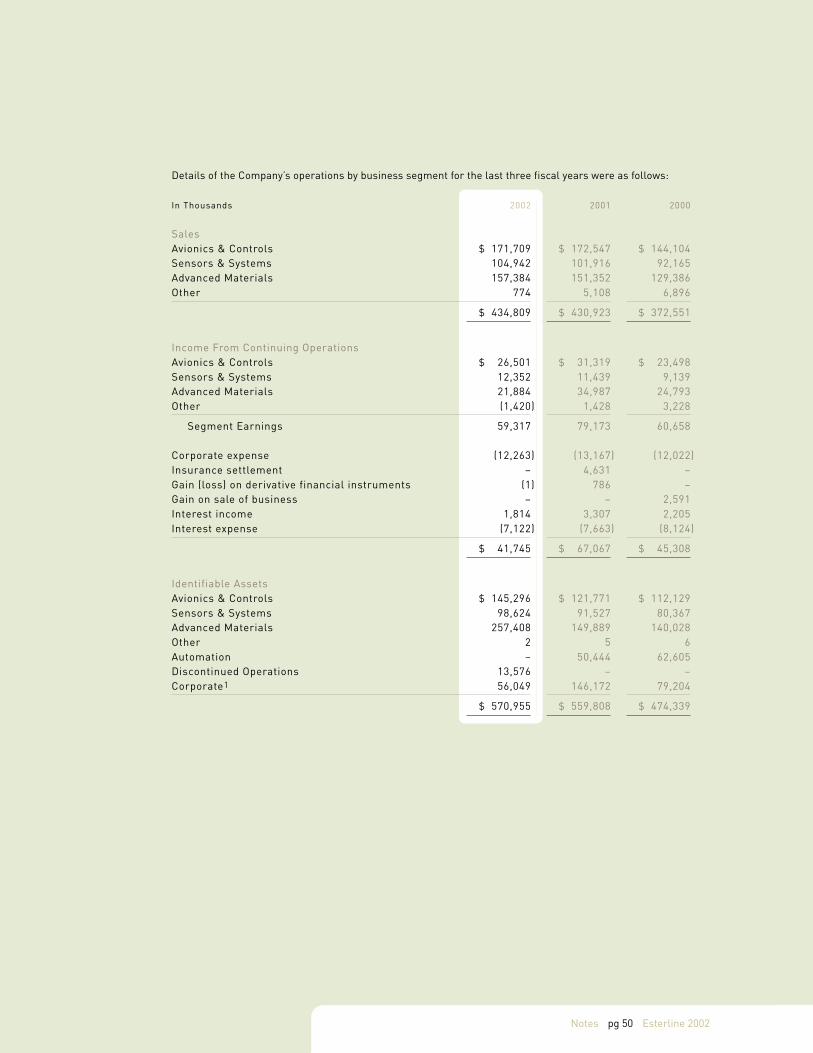
Esterline 2002pg 50
Details of the Company’s operations by business segment for the last three fiscal years were as follows:
In Thousands 2002 2001 2000
SalesAvionics & Controls $ 171,709 $ 172,547 $ 144,104Sensors & Systems 104,942 101,916 92,165Advanced Materials 157,384 151,352 129,386Other 774 5,108 6,896
$ 434,809 $ 430,923 $ 372,551
Income From Continuing OperationsAvionics & Controls $ 26,501 $ 31,319 $ 23,498Sensors & Systems 12,352 11,439 9,139Advanced Materials 21,884 34,987 24,793Other (1,420) 1,428 3,228
Segment Earnings 59,317 79,173 60,658
Corporate expense (12,263) (13,167) (12,022)Insurance settlement – 4,631 –Gain (loss) on derivative financial instruments (1) 786 –Gain on sale of business – – 2,591Interest income 1,814 3,307 2,205Interest expense (7,122) (7,663) (8,124)
$ 41,745 $ 67,067 $ 45,308
Identifiable AssetsAvionics & Controls $ 145,296 $ 121,771 $ 112,129Sensors & Systems 98,624 91,527 80,367Advanced Materials 257,408 149,889 140,028Other 2 5 6Automation – 50,444 62,605Discontinued Operations 13,576 – –Corporate1 56,049 146,172 79,204
$ 570,955 $ 559,808 $ 474,339
Notes
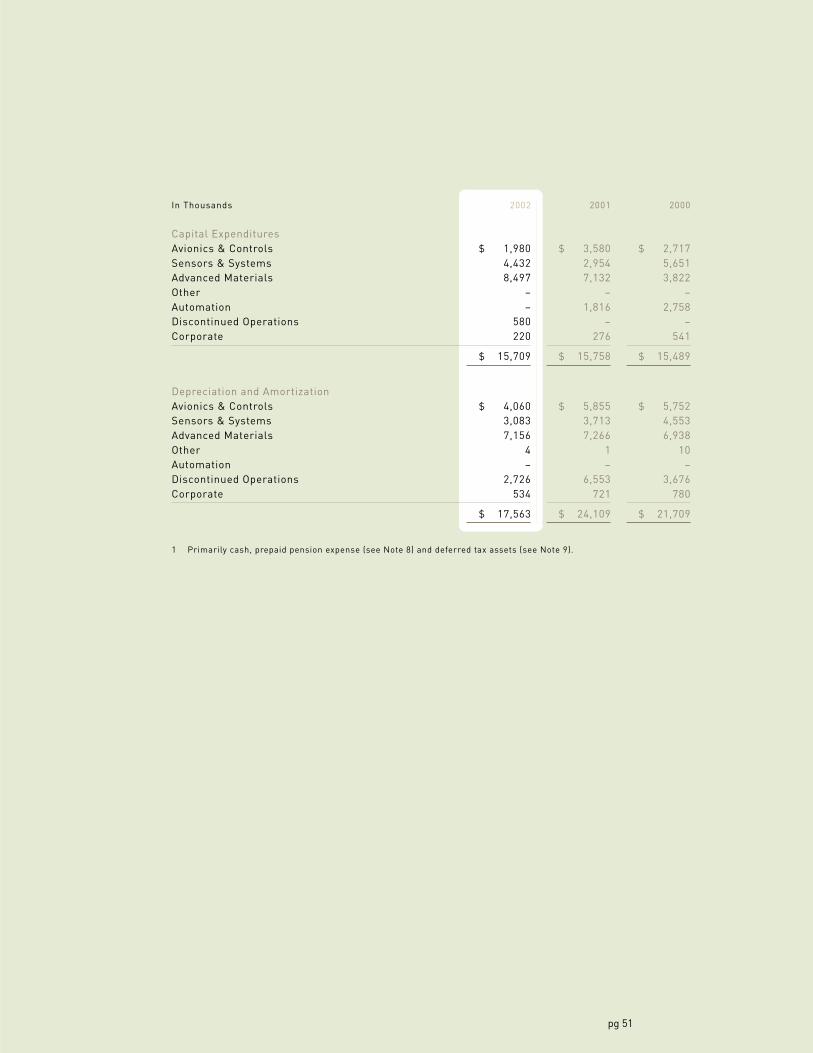
pg 51
In Thousands 2002 2001 2000
Capital ExpendituresAvionics & Controls $ 1,980 $ 3,580 $ 2,717Sensors & Systems 4,432 2,954 5,651Advanced Materials 8,497 7,132 3,822Other – – –Automation – 1,816 2,758Discontinued Operations 580 – –Corporate 220 276 541
$ 15,709 $ 15,758 $ 15,489
Depreciation and AmortizationAvionics & Controls $ 4,060 $ 5,855 $ 5,752Sensors & Systems 3,083 3,713 4,553Advanced Materials 7,156 7,266 6,938Other 4 1 10Automation – – –Discontinued Operations 2,726 6,553 3,676Corporate 534 721 780
$ 17,563 $ 24,109 $ 21,709
1 Primarily cash, prepaid pension expense (see Note 8) and deferred tax assets (see Note 9).
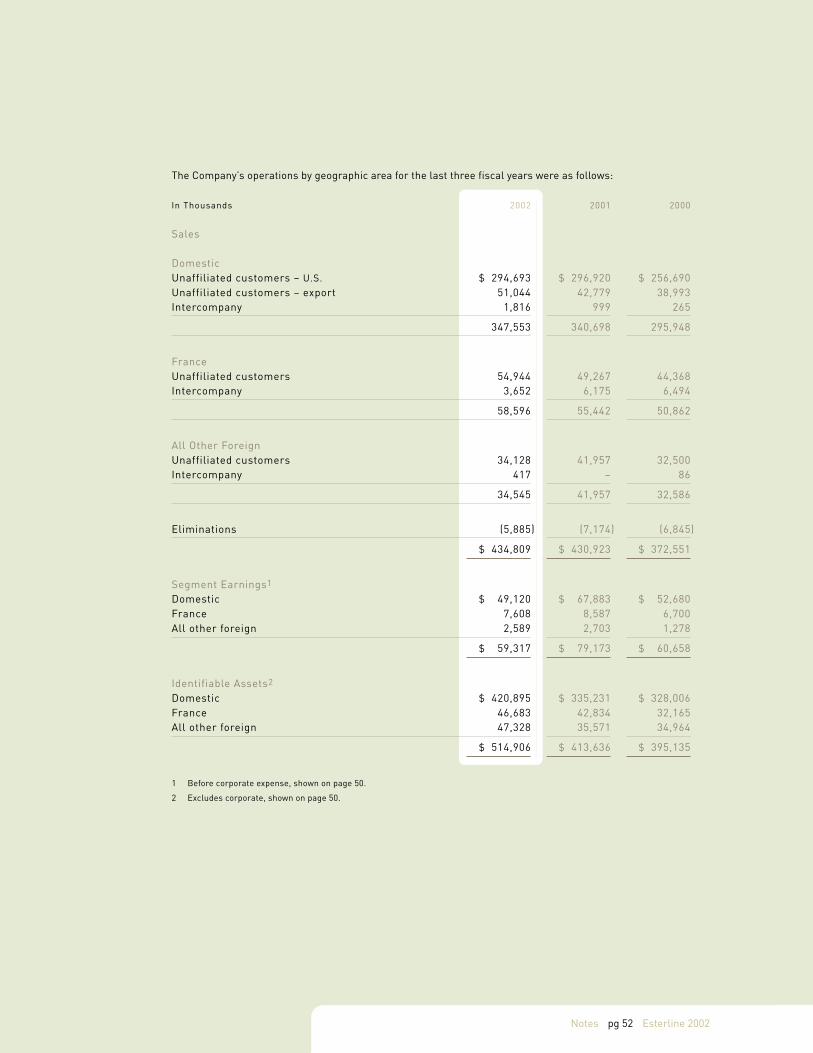
Esterline 2002pg 52
The Company’s operations by geographic area for the last three fiscal years were as follows:
In Thousands 2002 2001 2000
Sales
DomesticUnaffiliated customers – U.S. $ 294,693 $ 296,920 $ 256,690Unaffiliated customers – export 51,044 42,779 38,993Intercompany 1,816 999 265
347,553 340,698 295,948
FranceUnaffiliated customers 54,944 49,267 44,368Intercompany 3,652 6,175 6,494
58,596 55,442 50,862
All Other ForeignUnaffiliated customers 34,128 41,957 32,500Intercompany 417 – 86
34,545 41,957 32,586
Eliminations (5,885) (7,174) (6,845)
$ 434,809 $ 430,923 $ 372,551
Segment Earnings1
Domestic $ 49,120 $ 67,883 $ 52,680France 7,608 8,587 6,700All other foreign 2,589 2,703 1,278
$ 59,317 $ 79,173 $ 60,658
Identifiable Assets2
Domestic $ 420,895 $ 335,231 $ 328,006France 46,683 42,834 32,165All other foreign 47,328 35,571 34,964
$ 514,906 $ 413,636 $ 395,135
1 Before corporate expense, shown on page 50.
2 Excludes corporate, shown on page 50.
Notes
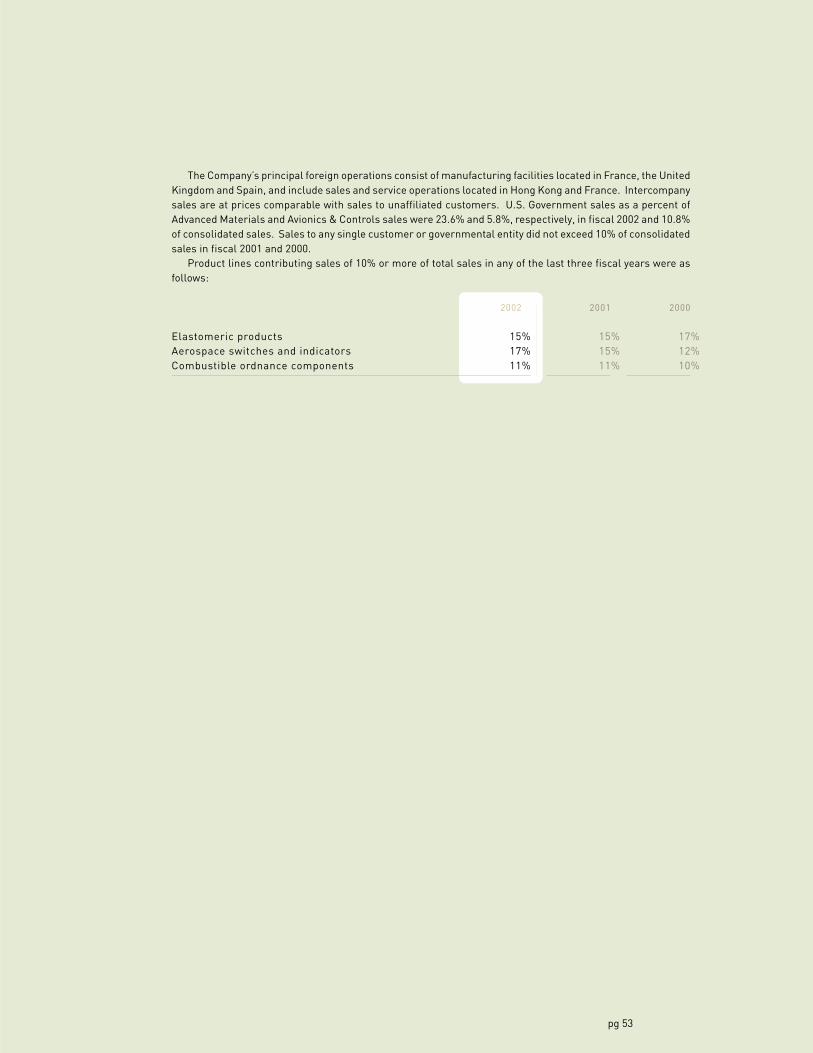
pg 53
The Company’s principal foreign operations consist of manufacturing facilities located in France, the UnitedKingdom and Spain, and include sales and service operations located in Hong Kong and France. Intercompanysales are at prices comparable with sales to unaffiliated customers. U.S. Government sales as a percent ofAdvanced Materials and Avionics & Controls sales were 23.6% and 5.8%, respectively, in fiscal 2002 and 10.8%of consolidated sales. Sales to any single customer or governmental entity did not exceed 10% of consolidatedsales in fiscal 2001 and 2000.
Product lines contributing sales of 10% or more of total sales in any of the last three fiscal years were asfollows:
2002 2001 2000
Elastomeric products 15% 15% 17%Aerospace switches and indicators 17% 15% 12%Combustible ordnance components 11% 11% 10%
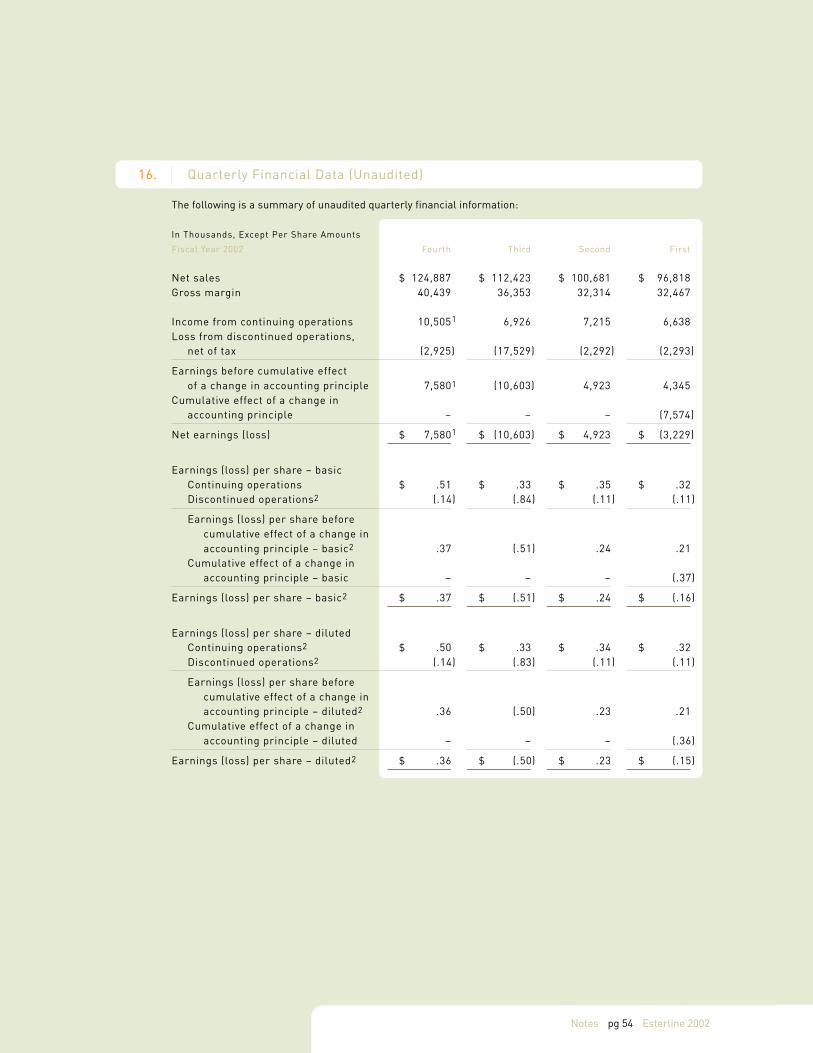
Esterline 2002pg 54
16. Quarterly Financial Data (Unaudited)
The following is a summary of unaudited quarterly financial information:
In Thousands, Except Per Share Amounts
Fiscal Year 2002 Fourth Third Second First
Net sales $ 124,887 $ 112,423 $ 100,681 $ 96,818Gross margin 40,439 36,353 32,314 32,467
Income from continuing operations 10,5051 6,926 7,215 6,638Loss from discontinued operations,
net of tax (2,925) (17,529) (2,292) (2,293)
Earnings before cumulative effectof a change in accounting principle 7,5801 (10,603) 4,923 4,345
Cumulative effect of a change inaccounting principle – – – (7,574)
Net earnings (loss) $ 7,5801 $ (10,603) $ 4,923 $ (3,229)
Earnings (loss) per share – basicContinuing operations $ .51 $ .33 $ .35 $ .32Discontinued operations2 (.14) (.84) (.11) (.11)
Earnings (loss) per share beforecumulative effect of a change inaccounting principle – basic2 .37 (.51) .24 .21
Cumulative effect of a change inaccounting principle – basic – – – (.37)
Earnings (loss) per share – basic2 $ .37 $ (.51) $ .24 $ (.16)
Earnings (loss) per share – dilutedContinuing operations2 $ .50 $ .33 $ .34 $ .32Discontinued operations2 (.14) (.83) (.11) (.11)
Earnings (loss) per share beforecumulative effect of a change inaccounting principle – diluted2 .36 (.50) .23 .21
Cumulative effect of a change inaccounting principle – diluted – – – (.36)
Earnings (loss) per share – diluted2 $ .36 $ (.50) $ .23 $ (.15)
Notes
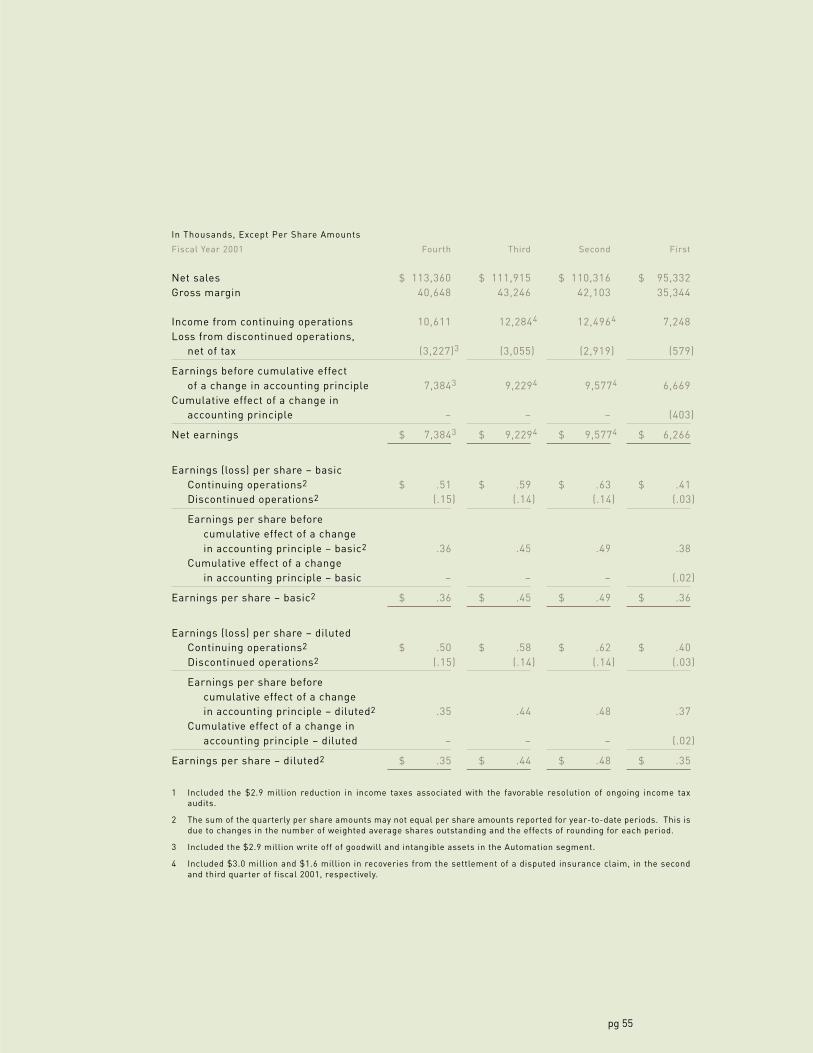
pg 55
In Thousands, Except Per Share Amounts
Fiscal Year 2001 Fourth Third Second First
Net sales $ 113,360 $ 111,915 $ 110,316 $ 95,332Gross margin 40,648 43,246 42,103 35,344
Income from continuing operations 10,611 12,2844 12,4964 7,248Loss from discontinued operations,
net of tax (3,227)3 (3,055) (2,919) (579)
Earnings before cumulative effectof a change in accounting principle 7,3843 9,2294 9,5774 6,669
Cumulative effect of a change inaccounting principle – – – (403)
Net earnings $ 7,3843 $ 9,2294 $ 9,5774 $ 6,266
Earnings (loss) per share – basicContinuing operations2 $ .51 $ .59 $ .63 $ .41Discontinued operations2 (.15) (.14) (.14) (.03)
Earnings per share beforecumulative effect of a changein accounting principle – basic2 .36 .45 .49 .38
Cumulative effect of a changein accounting principle – basic – – – (.02)
Earnings per share – basic2 $ .36 $ .45 $ .49 $ .36
Earnings (loss) per share – dilutedContinuing operations2 $ .50 $ .58 $ .62 $ .40Discontinued operations2 (.15) (.14) (.14) (.03)
Earnings per share beforecumulative effect of a changein accounting principle – diluted2 .35 .44 .48 .37
Cumulative effect of a change inaccounting principle – diluted – – – (.02)
Earnings per share – diluted2 $ .35 $ .44 $ .48 $ .35
1 Included the $2.9 million reduction in income taxes associated with the favorable resolution of ongoing income taxaudits.
2 The sum of the quarterly per share amounts may not equal per share amounts reported for year-to-date periods. This isdue to changes in the number of weighted average shares outstanding and the effects of rounding for each period.
3 Included the $2.9 million write off of goodwill and intangible assets in the Automation segment.
4 Included $3.0 million and $1.6 million in recoveries from the settlement of a disputed insurance claim, in the secondand third quarter of fiscal 2001, respectively.
Esterline 2002pg 56 Esterline 2002
To the Shareholders and the Board of DirectorsEsterline Technologies CorporationBellevue, Washington
We have audited the accompanying consolidated balance sheets of Esterline Technologies Corporation and subsidiariesas of October 25, 2002 and October 26, 2001 and the related consolidated statements of operations, shareholders’ equityand comprehensive income, and cash flows for each of the three fiscal years in the period ended October 25, 2002.These financial statements are the responsibility of the Company’s management. Our responsibility is to express anopinion on these financial statements based on our audits.
We conducted our audits in accordance with auditing standards generally accepted in the United States. Those stan-dards require that we plan and perform the audit to obtain reasonable assurance about whether the financial statementsare free of material misstatement. An audit includes examining, on a test basis, evidence supporting the amounts anddisclosures in the financial statements. An audit also includes assessing the accounting principles used and significantestimates made by management, as well as evaluating the overall financial statement presentation. We believe that ouraudits provide a reasonable basis for our opinion.
In our opinion, the financial statements referred to above present fairly, in all material respects, the consolidatedfinancial position of Esterline Technologies Corporation and subsidiaries at October 25, 2002 and October 26, 2001, andthe consolidated results of their operations and their cash flows for each of the three fiscal years in the period endedOctober 25, 2002, in conformity with accounting principles generally accepted in the United States.
As discussed in Note 2 to the consolidated financial statements, effective October 27, 2001, the Company changed itsmethod of accounting for goodwill in accordance with Statement of Financial Accounting Standards No. 142, “Goodwilland Other Intangible Assets.”
Seattle, WashingtonDecember 4, 2002
Report of Ernst & Young LLP, Independent Auditors
Report of Independent Auditors
pg 57
Directors
Robert W. CreminChairman, President andChief Executive OfficerEsterline Technologies
Richard R. AlbrechtExecutive VicePresident (Retired)CommercialAirplane GroupThe Boeing Company
Ross J. CentanniChairman, President andChief Executive OfficerGardner Denver, Inc.
Officers
Robert W. CreminChairman, President andChief Executive Officer
Stephen E. BartonGroup Vice President
James J. Cich, Jr.Group Vice President
Robert D. GeorgeVice President,Chief Financial Officer,Secretary and Treasurer
Marcia J. M. GreenbergVice PresidentHuman Resources
Larry A. KringGroup Vice President
Stephen R. LarsonVice PresidentStrategy and Technology
Esterline Technologies Information
Investor Information
CorporateHeadquarters10800 N.E. 8th StreetBellevue, WA 98004(425) [email protected]
Stock Exchange ListingNew York Stock ExchangeSymbol – ESL
www.esterline.com
Transfer Agentand RegistrarMellon Investor ServicesShareholder Services L.L.C.www.mellon-investor.com
Shareholder Relations(800) 522-6645
Outside of the U.S.(201) 329-8660
TDD Hearing Impaired(800) 231-5469
TDD Hearing ImpairedOutside of the U.S.(201) 329-8534
ShareholderCorrespondenceP.O. Box 3315South Hackensack, NJ07606
Overnight Delivery85 Challenger RoadRidgefield Park, NJ07660
John F. ClearmanSpecial Advisorto the Board (Retired)Milliman USA
Robert S. ClineChairman andChief Executive Officer(Retired)Airborne FreightCorporation
E. John FinnChairman (Retired)Dorr-OliverIncorporated
Anthony P. FranceschiniDirector, President andChief Executive OfficerStantec Inc.
Robert F. GoldhammerChairmanImClone Systems, Inc.
Wendell P. HurlbutChairman (Retired)Esterline Technologies
Jerry D. LeitmanChairman, President andChief Executive OfficerFuelCell Energy, Inc.
Annual Meetingof ShareholdersThe 2003 annual meeting ofshareholders will be held atthe Harbor Club – Bellevue,777 108th Avenue N.E.,Bellevue, WA, on Wednesday,March 5, 2003. The meetingwill start at 10:00 a.m.
10-K reportA copy of Esterline’s annualreport on Form 10-K filed withthe Securities and ExchangeCommission will be providedwithout charge upon writtenrequest to the corporateheadquarters, attention:Director, CorporateCommunications or throughour website.
Stock Held inStreet NameEsterline maintains a directmailing list to help ensurethat shareholders whosestock is held in street name(broker or similar accounts)receive information on atimely basis. If you would likeyour name added to this list,please send your request tothe corporate headquarters,attention: Director, CorporateCommunications.
Esterline 2002pg 58
Esterline Operations and Locations
Armtec Defense Products Co.85-901 Avenue 53Coachella, CA 92236
Hytek Finishes Co.8127 South 216th StreetKent, WA 98032
Kirkhill-TA Co.300 East Cypress StreetBrea, CA 92821
Advanced MaterialsSensors & Systems
Auxitrol Technologies168 Bureaux de la Colline92213 Saint-Cloud CedexFrance
Fluid Regulators Co.313 Gillett StreetPainesville, OH 44077
Muirhead AerospaceOakfield RoadPenge, LondonSE20 8EW, England
Avionics & Controls
Advanced Input Devices600 West Wilbur AvenueCoeur d’Alene, ID 83815
Janco Corporation3111 Winona AvenueBurbank, CA 91504
Korry Electronics Co.901 Dexter Avenue NorthSeattle, WA 98109
Mason Electric Co.605 8th StreetSan Fernando, CA 91340
Operations and Locations