Embed Size (px)
Citation preview

biblio.ugent.be
The UGent Institutional Repository is the electronic archiving and dissemination platform for all
UGent research publications. Ghent University has implemented a mandate stipulating that all
academic publications of UGent researchers should be deposited and archived in this repository.
Except for items where current copyright restrictions apply, these papers are available in Open
Access.
This item is the archived peer-reviewed author-version of:
A VCD robust mode analysis of induced chirality: the case of pulegone in chloroform
Valentin Paul Nicu, Elke Debie, Wouter Herrebout, Benjamin Van Der Veken, Patrick Bultinck,
Evert Jan Baerends
Chirality, 2010, 21, S287-S297
DOI: 10.1002/chir.20817
To refer to or to cite this work, please use the citation to the published version:
Nicu, V.P.; Debie, E.; Herrebout, W.; Van der Veken, B.; Baerends, E.J.; Bultinck, P. A robust
mode analysis of transfer of chirality in VCD: the case of pulegone in chloroform. Chirality,
2010, 21, S287-S297.

A VCD robust mode analysis of induced
chirality: the case of pulegone in chloroform
Valentin Paul Nicu†1, Elke Debie!, Wouter Herrebout",
Benjamin Van Der Veken", Patrick Bultinck#2, Evert Jan Baerends†‡3
†Theoretical Chemistry, Vrije Universiteit Amsterdam, De Boelelaan 1083,
1081 HV Amsterdam, The Netherlands
!BioTools, Inc., 17546 Bee Line Hwy, Jupiter, FL 33458
!Department of Chemistry, Syracuse University, Syracuse, NY 13244
" Department of Chemistry, University of Antwerp, Groenenborgerlaan 171 B-2020,
Antwerp, Belgium
# Department of Inorganic and Physical Chemistry, Ghent University, Krijgslaan
281-S3, B-9000, Ghent, Belgium
‡ Center for Superfunctional Materials, Dep. of Chemistry, Pohang University of Science
and Technology, San 31, Hyojadong, Namgu Pohang 790-784, South-Korea
1email: [email protected]: [email protected]: [email protected]
1

Abstract
Vibrational modes in an achiral molecule may acquire rotational strength by
complexation to a chiral molecule, as happens for achiral solvent molecules com-
plexed to a chiral solute. We investigate this transfer of chirality in vibrational
circular dichroism for the pulegone molecule in CDCl3 solvent from the point of
view of the robustness concept introduced recently. It turns out that the transfer of
chirality yields non-robust modes, which means that, although they are observed in
VCD experiments, the sign of these modes cannot be predicted reliably with stan-
dard (DFT) VCD calculations. This limits the usefulness of the induced chirality
phenomenon for obtaining information on the intermolecular interactions that give
rise to it.
2
1 Introduction
Although most often associated to a chiral carbon, chirality is a more general geometrical
property that is not limited to a chiral center. Indeed, there are many molecules that
are chiral without having a chiral center. An example in this regard is the transfer of
chirality where an achiral molecule—obviously lacking a chiral center—becomes optically
active upon interacting (e.g. by intermolecular hydrogen bonding) with a chiral molecule.
The phenomenon is most often encountered when considering (chiral) solute - (achiral)
solvent interactions, though it is not limited to this particular case. Experimentally,
such cases of induced chirality have been observed using both electronic (ECD) [1] and
vibrational (VCD) circular dichroism (VCD) [2–4] spectroscopy.
As suggested in reference [1], the presence of signals associated to the achiral moiety
in the ECD spectra might provide information about the relative orientation of the in-
teracting chiral and achiral molecules. Since VCD spectroscopy deals with vibrational
transitions rather than electronic transitions, one can expect that under normal circum-
stances VCD spectroscopy should provide more detailed structural information on the
relative orientation of the chiral and achiral moieties than ECD spectroscopy. However,
compared to ECD spectroscopy, much less attention has been paid in VCD spectroscopy
to the phenomenon of induced chirality in the solvent. For example only six papers have
been published on this subject in the period between 2007 and 2009, i.e. the combined
experimental and computational studies of Xu et al. [3, 5, 6] and Debie et al. [4, 7], and
the theoretical study of Nicu et al. [8].
The studies of Xu et al. [3,5,6] and Debie et al. [4,7] very clearly show that 1) the presence
of a chiral solute in an achiral solvent, such as for example H2O and CDCl3, may cause
the modes of the achiral solvent to become VCD active, and 2) it is possible not only to
find the VCD signals of the achiral solvent experimentally, but also to relate these VCD
3

signals through calculations to interactions between the solute and solvent molecules.
The theoretical investigation of Nicu et al. [8] has provided a very easy and intuitive expla-
nation of the mechanism responsible for the chirality transfer in VCD. Due to symmetry
constraints the electric and magnetic transition dipole moments (ETDM and MTDM)
associated to the fundamental transition of a given normal mode are perpendicular in
isolated achiral molecules. As a result the rotational strength, i.e. the inner product
between the ETDM and MTDM vectors of a given mode, is zero for all vibrational modes
of isolated achiral molecules. Since the VCD intensities are proportional to the rotational
strengths it is clear that all modes of achiral molecules will have zero VCD intensities.
When an achiral molecule is involved in a molecular complex however, its ETDMs and
MTDMs are perturbed and no longer perpendicular. Consequently, the modes of the achi-
ral molecule can exhibit non-zero VCD signals. However, because in weak complexation
of a solvent molecule to the solute, the perturbation is weak, it is expected that the angle
! between the ETDM and MTDM will deviate only slightly from 90$ and as a result the
rotational strength will be small.
The findings in the above mentioned papers, i.e. the possibility to measure and compute
chirality transfer e!ects on VCD spectra, and the identification of the mechanism respon-
sible for the chirality transfer, suggest that VCD spectra can indeed provide information
about the complexation between solute and solvent molecules involved in a molecular
complex, including information on the relative orientation of the molecules. This would
indeed be welcome, since current state-of-the-art calculations still have di"culty describ-
ing weak complexation accurately, in particular for large solute molecules. In that case
one has to take recourse to Density Functional Theory (DFT) calculations, which describe
(with a suitable functional) hydrogen bonding reasonably well, but not dispersion inter-
actions. Moreover, the DFT calculations are not su"ciently accurate to compute reliable
Boltzmann populations for the various conformations of the molecular complex.
4

The usefulness of the induced chirality phenomenon is, however, not beyond doubt. Since
it is to be expected that the modes of the achiral moiety have angles ! between the ETDM
and MTDM close to 90$, they should be classified as non-robust modes according to
Refs. [8,9]. In general non-robust modes are defined as having angles ! close to 90$. They
can easily change the angle through 90$ (hence change sign of the rotational strength) by
small computational perturbations (other choice of functional or basis set) or experimental
circumstances (e.g. di!erent solvent).
The goal of the present work is to investigate whether induced chirality in VCD spectra
yields indeed non-robust signals. It might be hoped that, even though the perturbation
due to the complexation is small, it would always lead to a deviation of the ! angle in the
same direction compared to 90$. In that case we would have weak but still robust induced
VCD bands. Using as an example the VCD spectrum of pulegone measured in CDCl3
solvent, we will investigate the robustness of the C$D stretching mode of the achiral
CDCl3 solvent which as shown recently by Debie et al. [7] exhibits a non-zero VCD signal
in the 1:1 pulegone–CDCl3 molecular complex.
The work is organized as follows: after some experimental, computational and method-
ological details, the concept of robustness is introduced and exemplified with a discussion
of the robust and non-robust normal modes in the VCD spectrum of pulegone between
850 and 1700 cm%1. Then the robustness of the C–D stretch mode of the achiral solvent
molecule that exhibits induced chirality is investigated in detail. We find that this mode,
like other modes with ! close to 90$, is non-robust. The sign and magnitude of the ro-
tational strength therefore cannot be reliably reproduced by standard DFT calculations.
This limits the usefulness of the induced VCD signals for obtaining information about the
structure and strength of the intermolecular interaction giving rise to the complexation
and the induced chirality.
5

2 Experimental and computational details
The samples of R-(+)-pulegone (98%) and S-($)-pulegone (98%) were obtained from
Sigma Aldrich. CDCl3 (99.8%) and CS2 (99.9%) were used as solvent, and were obtained
from Sigma Aldrich and Riedel-de Haen, respectively. All samples and solvents were used
without further purification. The VCD spectra were recorded on a Bruker IFS 66/S FTIR
spectrometer, coupled to a PMA37 VCD module. The IR absorbance spectra of pulegone
dissolved in CDCl3 and CS2 were recorded at a resolution of 4 cm%1; the corresponding
VCD spectra were recorded at a resolution of 6 cm%1. Depending on the spectral range
to be studied and the solvent used, di!erent experimental parameters were chosen. For
the measurements below 1800 cm%1 a demountable KBr cell with a path length of 100
µm was used in combination with a 1850 cm%1 long wave pass filter. The concentration
of pulegone for the solutions was set to 0.25 M. The CD stretching region was studied
using a demountable CaF2 cell with a path length of 100 µm and a 3000 cm%1 long wave
pass filter. The concentration of pulegone used in these studies was 1.5 M. The collection
time for the VCD spectra in the CD stretching region was set to 240 minutes. For all
VCD experiments, baseline corrections were introduced by recording the VCD spectra of
a racemic mixture, using exactly the same conditions as those used for the samples.
All calculations (geometry optimization, and IR/VCD calculations) are performed using
the Amsterdam Density Functional (ADF) program package [10–12]. The vibrational
rotational strengths are calculated using the implementation of Stephens’ equations for
VCD [13] in the ADF program package [14]. Analytical derivative techniques [15] are
employed for the calculation of the atomic polar and axial tensors (APTs and AAT),
and harmonic force field, within the framework of density functional theory. For the
calculation of AATs, London atomic orbitals [16] based on Slater-type orbitals, and the
common origin gauge are used.
6

The analysis of electric and magnetic transition dipole moments, of the normal modes,
and of the angles ! was done using the ToolsVCD program [8].
The calculated VCD spectra were simulated by representing the peaks as Lorentzian bands
[17] with half-width of 4 cm%1. The harmonic frequencies obtained from the B3LYP/6-
311+G(d,p) calculations were scaled by 0.967 (N%H· · ·Cl stretching). No scaling factor
was applied to the frequencies obtained from the OLYP/TZP and BP86/TZP calculations.
3 Methodology
3.1 Normal modes analysis
When comparing modes of a certain molecule in di!erent calculations (e.g. di!erent
functional, di!erent basis set) a one-to-one mapping between vibrational modes in the
di!erent calculations must be established first. We have done this by calculating overlaps
between normal modes.
Using the mass-weighted Cartesian displacement vectors, i.e. the eigenvectors of the mass-
weighted Hessian, a normalized 3N -dimensional vector (N being the number of atoms of
the molecule) is constructed for each normal mode:
"V (i) = "V!v1
x(i), v1y(i), v
1z(i), ..., v
Nx (i), vN
y (i), vNz (i)
"(1)
where v!k (i) is the kth Cartesian component of the mass-weighted displacement vector of
atom # in the normal mode i, and "V (i) is the 3N -dimensional vector associated with the
mode i.
The overlap #(i, j) of two modes i and j obtained from two di!erent calculations can
be expressed as the inner product of the vectors "V (i) and "U(j) associated with the two
7

modes:
#(i, j) = "V (i) · "U(j) =N#
!=1
x,y,z#
k
v!k (i)u!
k(j) (2)
The value of the scalar product #(i, j), gives an indication of how well the nuclear dis-
placement vectors of the modes i and j overlap. Two identical modes yield an overlap of
1. Thus, the closer # is to 1, the more similar are the modes i and j.
Finally, since the set of normal mode vectors {"V (i)} of a particular calculation are an
orthonormal basis (they are the eigenvectors of the mass-weighted Hessian), the normal
modes of one calculation can be expressed as linear combinations of the normal modes of
another calculation:
"V (i) =#
j
#(i, j)"U(j) (3)
The expansion coe"cients, #(i, j), are the normal mode overlaps defined in Eq. (2). They
satisfy:#
j
#2(i, j) = 1 (4)
Thus, an overlap of 0.90 between two modes means that the two modes di!er by 19%, i.e.
1.0 $ 0.92 = 0.19, whereas an overlap of 0.70 means that the two modes di!er by 51%,
i.e. 1.0$ 0.72 = 0.51 (“angle of 45$”).
3.2 The concept of robustness in VCD
The VCD intensity of the fundamental transition (|0& ' |1&) of the ith vibrational mode
is given by the rotational strength (R) [13]:
R(i) = "E01(i) · Im[ "M10(i)] (5)
where "E01(i) and "M10(i) are the electric and magnetic transition dipole moments of the
fundamental vibrational transition of the ith normal mode. (Note that "M10(i) is purely
imaginary.)
8
The sign of the R(i) is determined by the angle !(i) between the vectors "E01(i) and
Im[ "M10(i)]:
cos !(i) ="E01(i) · Im[ "M10(i)]
| "E01(i)||Im[ "M10(i)]|=
R(i)
| "E01(i)||Im[ "M10(i)]|(6)
where | "E01(i)| and |Im[ "M10(i)]| are the lengths of the vectors "E01(i) and Im[ "M10(i)],
respectively. Thus, if ! < 90$ then R(i) > 0, if ! > 90$ then R(i) < 0.
Computational studies of Nicu and Baerends [8, 9] have shown that when the angle !
of a normal mode is close to 90$ even a slight perturbation (e.g. the use of slightly
di!erent computational parameters) can change it through 90$. This observation led to the
introduction of the concept of robustness of the normal modes in a VCD spectrum. Robust
modes are characterized by angles ! that are far from 90$ (see below for quantification
of “far”). The VCD sign of the robust modes is characteristic and can be accurately
predicted by calculation as it is not sensitive to small perturbations. The non-robust
modes, on the other hand, have angles ! that are close to 90$. Their calculated VCD
sign should not be trusted as it can be changed by a small change in a computational
setting. Also experimental ”perturbations”, e.g. the change from one solvent to another,
can change the angle ! of a mode, again easily through 90$ if ! was close to 90$.
We can thus formulate as criterion for robustness of a normal mode in both experiment
and calculation that it should not, in a particular situation (given computational settings,
given experimental conditions of solvent, temperature etc.) have a ! that deviates more
than a given threshold from 90$, i.e. ! < 90$ $ $ or ! > 90$ + $ . A sensible value for $
has been determined in reference [9] by investigating the changes induced in the angles
! upon changing the exchange-correlation functional, i.e. BP86 vs. OLYP, using a test
group of 27 molecules. We will summarize the main results of that investigation.
In order to determine a safe value of $ we need to obtain an estimate of typical changes
$! of the angles ! upon changing the functional, e.g. $! = !(BP86)$ !(OLYP). For the
relevant modes (see below) the di!erences $! for the modes in a molecule turned out to
9

have a Gaussian distribution. The $! distributions are centered on the 0$ value, indicating
that one functional does not have a systematic bias to larger or smaller ! for all modes with
respect to the other functional. The $! distributions have, depending on the molecule,
standard deviations between 6$ and 10$. The maximum $!, i.e. $!max, was smaller than
30$ (which represents approximately (more than) three standard deviations) for all 27
molecules considered in reference [9]. Because 99.7% of the members of a distribution fall
within the range of three standard deviations, it was concluded in reference [9] that it is
a conservative criterium that for a mode to be classified as robust, a it should have an
angle ! that di!ers from 90$ by at least 30$ ($ is 30$).
A few cautioning remarks need to be made. First, we note that only BP86–OLYP mode
pairs with normal mode overlaps of at least 0.90 and significant VCD intensity were
considered for the statistics of $! (the relevant modes for the analysis mentioned above).
Actually, this covers a large fraction of all modes: 90% of the modes exhibit a normal
mode overlap of at least 0.90 with the corresponding mode in the calculation with the
other functional. The rest of the modes show an overlap with the corresponding mode
that is smaller, although usually at least 0.70. As discussed in section 3.1, the two modes
then may be very di!erent, e.g. an overlap of 0.7 means the modes di!er by 51%. This
is a consequence of mode mixing upon change in functional. Very large variation of
the ! angles (thus also of the VCD intensities) can be encountered upon mode mixing,
i.e. variations of 60$ $ 70$ for ! are not unusual. Some 10% of the modes exhibit such
behavior when going from BP86 to OLYP. When an occasional anomaly is encountered
when comparing signs of robust modes with experiment, it may be useful to check on
the possibility of mode mixing, or test it computationally. Second, not only modes that
mix cannot be used for analysis of the VCD spectrum, also normal modes with small
VCD intensities, i.e. small electric and magnetic dipole transition moments (EDTM and
MDTM) cannot be used. Large deviations of the angles ! have been observed for such
modes. Although both functionals have predicted small magnitudes for the EDTMs and
10

MDTMs of all these modes, often the relative orientation of these two vectors was very
di!erent in the BP86 and OLYP calculation. This suggests that the EDTMs and MDTMs
of small magnitude are also very sensitive to small perturbations and therefore cannot
be calculated very accurately. We note that an absolute measure, valid for all molecules,
to determine what should be considered small in this context cannot be given as the
magnitudes of the total EDTM and MDTM of a normal mode depend on the type of
mode and on the number of atoms involved in the normal mode motion, i.e. on the
molecule. However, unstable sign has been found in Ref. [9] if for a given molecule, the
EDTM (or MDTM) is less than 5% of the mean value of the EDTMs (MDTMs) of all
the modes of the respective molecule. We take as a conservative threshold a magnitude
of 10–20% of the mean value of the EDTM (or MDTM) values of the molecule.
3.3 Applying the concept of robustness
In practice, checking on the robustness of a mode is an additional test that improves the
reliability of the VCD predictions. This should be performed in what can be called the
“standard procedure” for determining the AC of a molecule from VCD calculation.
1) The standard approach is to perform first a single VCD calculation using computational
parameters (basis set, numerical integration accuracy, density functional) that are known
to yield both good agreement with experiment and also converged VCD quantities, i.e.
nuclear displacement vectors, and atomic axial and polar tensors. Then, using the criteria
described above the robustness of the modes in the calculated VCD spectrum should
be identified. We advocate to present the robustness of all modes in the plot of the
computational VCD spectrum by a dot indicating the value of the angle ! (90$ at the
baseline), see Refs. [8, 9] and Fig. 4 of this paper.
As the VCD sign of the robust modes can be accurately computed one should expect
11

to have good agreement between calculation and experiment for the modes identified as
robust (in the calculated VCD spectrum). If this is the case, one can simply ignore the
discrepancies observed between calculation and experiment for the non-robust modes.
This, is a very quick and accurate way of using VCD for determining the absolute con-
figuration of chiral compounds. However, it is important to realize that occasionally one
can encounter sign di!erences also for modes identified according to the above criteria as
robust. In case di!erent signs are encountered for one or a few of the robust modes, the
strategy to be followed is to examine whether the cause could be mixing of modes due
to a perturbation. From the displacement vectors of the calculated mode (e.g., do they
involve atoms that may participate in hydrogen bonding with the solvent?) and taking
into account the type of solvent used, one may detect if there is the possibility of mixing of
modes by solvent e!ects. In the calculations, one can check on proximity of other modes
as a cause of mode mixing. Suspicion of mode mixing can then be confirmed by perform-
ing a second calculation where the interaction is explicitly specified (e.g calculation for
the hydrogen-bonded complex) or a computational perturbation (di!erent functional) is
applied.
4 Robust modes and non-robust modes in the VCD
spectrum of pulegone
4.1 Calculated and experimental VCD spectra of pulegone in
CDCl3
Figure 1 shows a comparison between the experimental VCD spectra measured in CDCl3
(continuous line) and CS2 (dotted line) solvents and calculated VCD spectra obtained
12

from vacuum calculations performed for the pulegone molecule using the BP86, OLYP
and B3LYP functionals.
[Figure 1 about here.]
To point out the similarities/di!erences between the experimental and the various cal-
culated spectra, and to simplify their discussion, we have divided the frequency interval
between 1000 and 1800 cm%1 into 5 regions labeled from A to E (see Fig. 1).
As can be seen in Fig. 1, there is a fair agreement between calculations and experiment.
The calculated spectra reproduce most of the features that stand out in the experimen-
tal spectrum. As a result the OLYP, BP86 and B3LYP VCD spectra in Fig. 1 have
a similar appearance. However, it should be noted that when compared in detail the
calculated spectra are di!erent. Thus, a close examination of the experimental and cal-
culated VCD patterns in the regions A to E reveals the following hierarchies for the
three functionals: OLYP(BP86(B3LYP for region A (none of the calculations is able
to reproduce the $/+ patters in the experimental spectrum); B3LYP)BP86)OLYP
in region B; OLYP(BP86(B3LYP in region C; OLYP(BP86(B3LYP in region D;
OLYP)BP86>B3LYP in region E. Clearly, none of the three functionals can be con-
sidered as being overall superior.
Regarding the discrepancies between calculation and experiment observed in region A,
we note that, as Debie et al. have shown [7], they can be remedied by using continuum
solvation models in calculations for simulating the solvent e!ects, or by performing calcu-
lations for the 1:1 pulegone$CDCl3 molecular complex. In reference [7], Debie et al. have
found that when using the B3LYP functional, the best agreement between calculation and
experiment is obtained when the 1:1 pulegone$CDCl3 molecular complex is embedded in
a continuum solvation model.
13

These conclusions are true also for the calculations performed here with the OLYP and
BP86 exchange-correlation functionals. However, there are two reasons we have chosen
the vacuum calculations as the reference calculations for the discussion of the normal
modes robustness in the next section (hence the comparison between vacuum calculations
and experiment in Fig. 1). First, the calculated VCD spectra obtained by embedding
the molecular complex into a continuum solvation model reproduce the experimental
spectrum only marginally better than the spectra obtained from vacuum calculation for
the free pulegone. Second, we are interested to know how significant are the changes
induced in the VCD spectra by the use of various computational parameters (e.g. the use
of solvation models and/or di!erent functionals).
4.2 Identifying the robust and non-robust modes of pulegone
We illustrate the usefulness of the robust modes concept using the pulegone molecule in
CDCl3. We begin by assigning the robustness of the modes in the VCD spectrum of
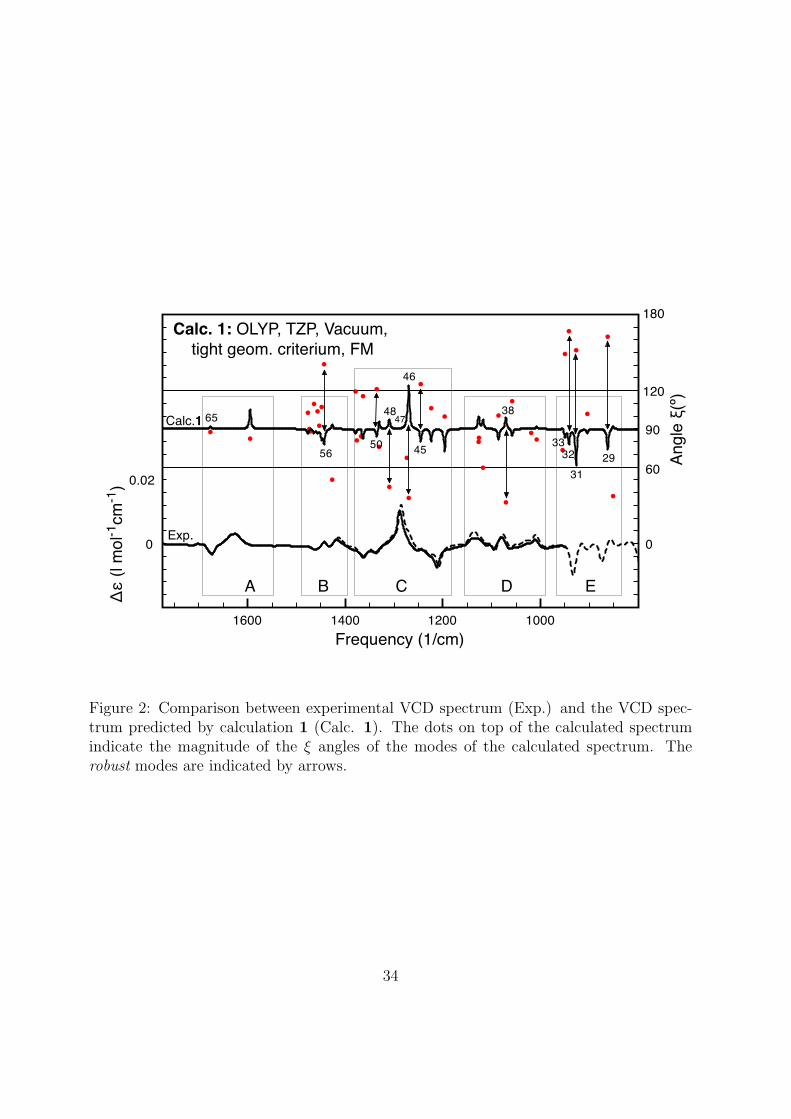
calculation 1 (the OLYP spectrum in Fig. 1). To do this, the values of the ! angles of
all modes in Fig. 1 have been plotted as dots on top of the calculated VCD spectrum
(see Fig. 2). In Fig. 2 the baseline of the calculated VCD spectrum is the 90$ line, the
Y-coordinate of each dot gives the magnitude of each ! angle (see the vertical right axis),
and the X-coordinate gives the frequency of the mode. For comparison, the experimental
spectrum is also shown in Fig. 2.
[Figure 2 about here.]
In the calculated spectrum, there are 38 modes with frequencies between 800 and 1800
cm%1. As can be seen in Fig. 2, only 13 of these 38 modes have angles ! that di!er from
90$ by more than 30$. Furthermore, out of these 13 modes, only 9 have significant VCD
intensities and therefore can be classified as robust, according to the criteria introduced
14

in Section 4. In Fig. 2, the robust modes have been indicated by arrows, and also labeled
with numbers. The modes that were not identified as robust, are non-robust modes.For
convenience, only the non-robust modes that are numbered will be discussed here.
4.3 Robust modes of pulegone
Having identified the robust and non-robust modes in the VCD spectrum of pulegone
obtained from calculation 1, we continue by investigating how the robust modes and (in
the next section) the non-robust modes are a!ected by the use of various computational
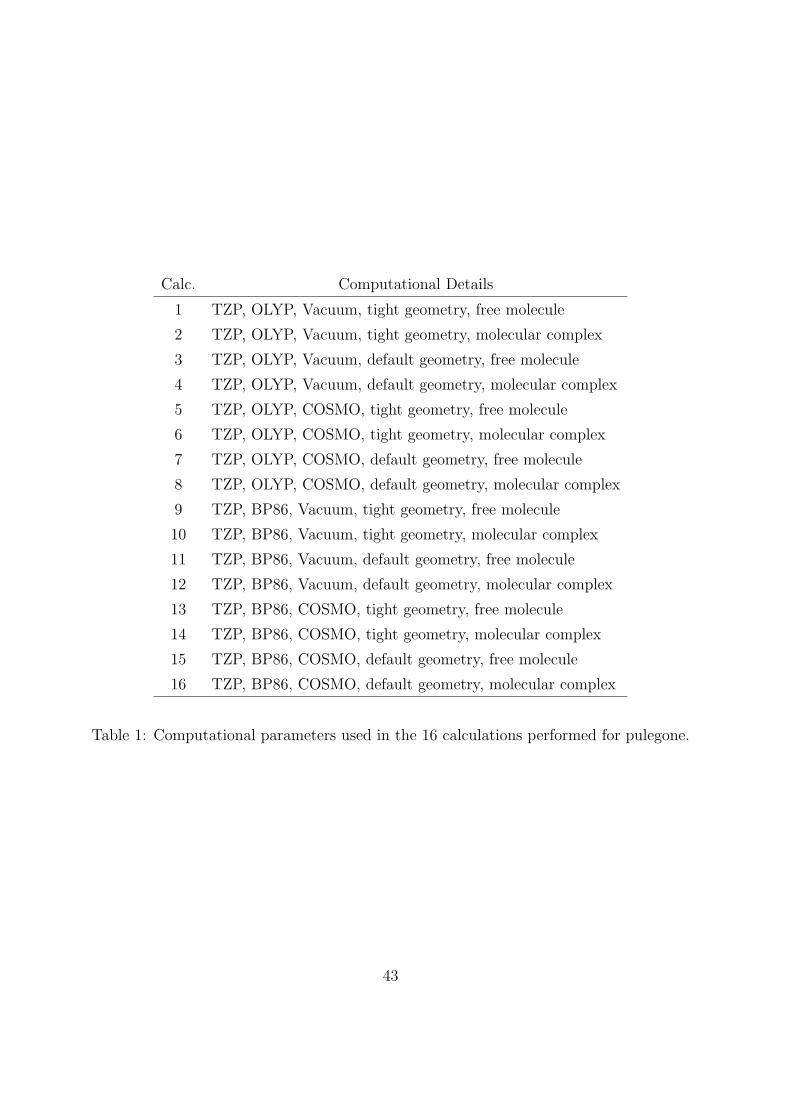
parameters. To this end we have investigated the di!erences between calculations per-
formed 1) with di!erent functionals (OLYP [18,19] vs. BP86 [20,21]), 2) with the COSMO
solvation models vs. calculations performed for the isolated molecule, 3) with di!erent
criteria for geometry optimization, i.e. very tight criterium (10%6 Hartree for the en-
ergy and 10%4 Hartree/Angstrom for the gradients) vs. the ADF default criterium (10%4
Hartree for the energy and 10%3 Hartree/Angstrom for the gradients), and 4) for the free
pulegone molecule vs. the 1:1 pulegone$CDCl3 molecular complex. By combining the
computational parameters mentioned above we have performed 16 di!erent calculations
for pulegone (labeled from 1 to 16). A list with the computational parameters used in
each of the 16 calculations is given in Table 1.
[Figure 3 about here.]
Finally, for the 1:1 pulegone$CDCl3 molecular complex, we have also investigated how
the relative orientation of the pulegone and CDCl3 molecules influence the VCD spectra.
The relative orientation of the solvent molecule towards pulegone was described using the
dihedral angles $1 and $2 (see Fig. 3). A systematic conformational analysis performed us-
ing the MMFF force field yielded 9 stable conformations for 1:1 pulegone$CDCl3 complex
(see reference [7] for a detailed description).
15

The di!erences between the 16 calculations have been judged with respect to our reference
calculation, i.e. the results of the calculations 2 to 16 have been compared against the
results of calculation 1. Thus, after establishing a one-to-one correspondence between the
modes of all calculations (as described in Section 3), we have monitored the di!erences
between the frequencies, rotational strengths, and ! angles of the modes obtained from
calculation 1 and their homologues obtained from the calculations 2 to 16.
In Fig. 4, the values of the angles ! predicted by the 16 calculations have been plotted
on top of the VCD spectrum of calculation 1. As before, the base line of the VCD
spectrum represents the 90$ line. The large vertical spreading of the dots in Fig. 4 clearly
shows that the angles ! are very sensitive to the computational parameters used in the
calculations. Since the various calculations predict slightly di!erent frequencies for the
normal modes, it is not immediately evident from the Fig. 4, without further information
like the mode overlaps we discussed earlier, which dots belong to the ”same” mode in the
di!erent calculations. Thus, we have encircled the dots associated with one mode; this
has been done for the modes that will be discussed in what follows (see Fig. 4).
For the calculations performed with the same functional the di!erences in the normal
modes frequencies caused by the various computational variables used are most of the
time smaller than 5 cm%1. When comparing di!erent functionals (OLYP and BP86) the
di!erences in frequencies are larger but still small, i.e. smaller than 15 cm%1 for modes
with frequency below 1300 cm%1, and smaller than 25 cm%1 for modes with frequency
above 1300 cm%1. There are some exceptional cases (modes 64 and 65), whose frequencies
are much more sensitive (variation up to 61.5 cm%1).
[Figure 4 about here.]
The ! angles associated to robust modes exhibit variations that are always smaller than
30$, i.e. $! < 30$ (see encircled dots associated with the modes 29, 31, 38, 45, 46,
16
48, 50 and 56 in Fig. 4). As a result, no changes across 90$ have been encountered for
these modes (robust modes by definition have ! angles that di!er from 90$ by more than
30$). It is therefore clear that all 16 calculations predict the same signs for all robust
modes, corroborating the definition of robustness. This is in complete agreement with
the conclusions obtained in reference [9], i.e. robust modes have a characteristic sign that
is not a!ected by small perturbations such as the use of slightly di!erent computational
parameters.
We should again [9] caution that sometimes modes strongly mix when going from one
calculation to another one. A look at the normal mode overlaps reveals that approximately
75% of studied modes, i.e. the modes with frequencies between 800 and 1800 cm%1, are
practically identical in all 16 calculations, i.e. the normal mode overlaps are very close to
1 (> 0.95). The rest of the modes (25%) mix when changing computational parameters,
i.e. these modes do not have an equivalent in calculation 1 and can be obtained only as
linear combinations of the modes of calculation 1. One should realize that the mixing
can create modes that can be very di!erent. As discussed in Section 3, two modes that
exhibit an overlap of 0.7 di!er by 51%. Thus, as shown previously [9], it is not unusual for
modes with overlaps of 0.7 to have ! angles that di!er by 60$ or more. This can be seen
indeed in Fig. 4 when looking at the mode 33 which mixes with mode 32 upon changing
computational parameters and exhibits angle variation up to 66.5$.
Finally, we would like to draw attention on the modes 28 and 57 which exhibit very large
variation of their angles !, i.e. 88.1$ and 56.1$, respectively. These modes do not mix upon
changing computational parameters. However, they have very small VCD intensities. As
discussed in Section 3.2 it is not unusual for modes with weak VCD signals to exhibit
large variation in !.
17

4.4 Non-robust modes of pulegone: the case of the C=O stretch
vibration
In the case of the non-robust modes, we have two distinct situations: modes that exhibit
changes across 90$ (e.g. mode 65), and modes that do not (e.g. modes 37, 44, etc.). Since
in reference [7] a lot of computational e!ort was invested in order to reproduce correctly
the sign the C=O stretching mode of pulegone, i.e. mode 65 (a non-robust mode), in the
following we will investigate this mode in detail.
[Figure 5 about here.]
Figure 5 shows a comparison of the values predicted by the 16 calculations in Table 1
for the angle ! of the C=O stretching mode of pulegone. In Fig. 5, the Y-coordinate
gives the magnitude of the ! angles, whereas the X-coordinate indicates the calculation
(from 1 to 16). The rotational strengths of the 16 calculations are also shown in Fig. 5.
As can be seen, all 16 calculations predict values for the angle ! that are very close to
90$, i.e. ! di!ers from 90$ by less than 5$ for 11 calculations, and by less than 9$ for
the other 5 calculations. Furthermore, the predicted values for ! are both larger and
smaller than 90$, i.e. in calculations 1, 3, 4, 9, and 11 ! > 90$ (thus, R < 0), whereas
in the rest of the calculation ! < 90$ (thus, R > 0). This clearly shows that even the use
of slightly di!erent computational parameters, e.g. di!erent convergence criteria for the
geometry optimization, can a!ect the prediction of the sign for the rotational strength
of the C=O stretching mode of pulegone. It should also be mentioned here that all
COSMO calculations, i.e. calculations 5, 6, 7, 8, 13, 14, 15 and 16, have predicted
the correct sign for the C=O stretching mode. However, in our opinion this is purely
fortuitous. Firstly, the use of solvation models in calculation is often unsuccessful [3, 22].
Secondly, as discussed above the changes induced in the ! angles upon using COSMO in
the calculations are too small (compared to the vacuum calculation) to be trusted.
18
[Figure 6 about here.]
Further, we investigate how the relative orientation of the pulegone and CDCl3 molecules
in the 1:1 pulegone$CDCl3 molecular complex a!ects the values of the angles ! of the
C=O stretching mode of pulegone. Figure 6 shows a comparison of the calculated values of
the ! angles for the 9 conformations of the molecular complex (A to I). The computational
parameters used to obtain the ! angles in Fig. 6 are identical to the ones used in calculation
2 (see Table 1 for details). As can be seen, the situation in Fig. 6 is very similar to the
one in Fig. 5. That is, the ! angles have values that are both larger and smaller than 90$
(89$ < ! < 94$).
Thus, based on the comparisons done in Figs. 5 and 6, and keeping in mind the large
spread in the values of angle ! in Fig. 6, it is clear that sign di!erences between calculated
and experimental VCD signals can easily occur for non-robust modes. This clearly shows
that sign discrepancies between experiment and calculation should be of no concern, if
they are associated to non-robust modes.
5 Transfer of chirality and robustness
In reference [7], Debie et al. have measured a weak but non-zero VCD signal for the C$D
stretching mode of CDCl3. This is a typical case of chirality transfer [1–4]. In this section
we investigate whether this mode is robust or non-robust.
We start our analysis of the C$D stretching mode by comparing its frequency, rotational
strength and angle ! in the free CDCl3 to those in the molecular complex (see Table 2).
As can be seen, in the free CDCl3 (FM) the ETDM and MTDM associated to the C$D
stretching mode are perpendicular, i.e. ! = 90.00$, whereas in the molecular complex
(MC) the angle ! is 91.87$. Since the ! di!ers from 90$ by less than 2$, it is clear that the
19

C$D stretching mode (in the molecular complex) would normally be classified as a non-
robust mode. To substantiate this classification, we investigate how the angle ! associated
to the C$D stretching mode of CDCl3 is a!ected by 1) the use of various computational
parameters, and 2) the relative orientation of the pulegone and CDCl3 molecules. Fig-
ure 7 compares the calculated ! angles of the C$D stretching mode obtained from the
8 calculations (in Table 1) performed for the molecular complex, i.e. calculations 2, 4,
6, 8, 10, 12, 14 and 16. Figure 8 shows a comparison of the calculated ! angles of
the C$D stretching mode for the 9 conformations of the molecular complex (A to I).
(Figures 7 and 8 show also the calculated rotational strengths for the C$D stretching
mode.)
[Figure 7 about here.]
[Figure 8 about here.]
As can be seen, all calculations predict positive and negative rotational strengths of very
small magnitude, and ! angles that are very close to 90$, i.e. 88$ < ! < 93$ in Fig. 7,
and 88$ < ! < 95$ in Fig 8. The situation is completely analogous to the one studied in
the previous section for the C=O stretching mode of pulegone. This clearly shows that
the angle ! close to 90$ for the induced chiral mode behaves precisely as in other cases:
it can change through 90$ and therefore change sign of the rotational strength by a small
perturbation. Induced chirality does not lead to robust modes.
It is interesting to point out that upon complexation the magnitudes of both the ETDM
and the MTDM of the C$D stretching mode have increased with a factor of approximately
60. This can be seen in Table 3 where the magnitudes and the Cartesian components
of both transition moments predicted by calculation 2, i.e. a molecular complex calcula-
tion, are compared to those computed for the free CDCl3 using identical computational
20

parameters. In fact, all 17 calculations performed here for the molecular complex i.e 2, 4,
6, 8, 10, 12, 14 and 16, and A to I, have predicted an enhancement of the magnitudes
of the electric and magnetic transition dipole moments.
The enhancement of the electric dipole transition moments results in an significant in-
crease of the IR intensity of the C$D stretching mode. This is observed in both calculation
(see Table 3) and experiment (see Fig S5 in the electronic supplementary information of
reference [4]).
The VCD intensity of the C$D stretching mode on the other hand, was found to be very
weak in experiment and also in most of the calculations (see Figs. 7 and 8). This apparent
contradiction can be explained easily. Firstly, all calculations have predicted ! angles that
are very close to 90$, i.e. 88$ < ! < 95$ (see Figs. 7 and 8). Thus, the large magnitudes
of the two dipole transition moments are counteracted by the very small values take by
cos !. Secondly, as shown in Fig. 8, the C$D stretching mode has di!erent VCD signs
in di!erent conformations of the 1:1 CDCl3–pulegone complex. Thus, in experiment one
can expect that the VCD signal will be even more reduced due to cancelation between
various conformations.
We can conclude that there is good qualitative agreement between calculation and ex-
periment for the frequency of the C-D stretching mode and for the enhancement of the
EDTM (visible in the IR experiment). However, it should be clear that the VCD sign
of the C$D stretching mode studied here can not be computed accurately. Non only
is this mode non-robust and therefore its sign can not be computed accurately, also the
Boltzmann weights of the various conformations can not be computed accurately. That
is because the relative energies of the various conformations of the 1:1 pulegone$CDCl3
complex are within 1 kcal/mol which is below the accuracy of DFT.
[Figure 9 about here.]
21

The enhancement of the ETDMs and MTDMs (thus of the IR and VCD intensities) of the
stretching modes is a very general phenomenon that is often encountered in complexation
phenomena involving intra- and inter-molecular hydrogen bonding interactions. It is a
consequence of the electronic charge that flows into the stretched bond a!ecting both
the magnitude of the electronic components of the ETDM and MTDM and also the
frequency of the mode. A detailed theoretical description of the mechanism responsible
for the enhancement on the IR and VCD intensities can be found in references [8, 23];
experimentally the phenomenon is well documented in references [24, 25]. In the case
of the 1:1 pulegone$CDCl3 molecular complex, the enhancement of the magnitude of
the ETDM and MTDM of the C$D stretching mode is caused by the donor-acceptor
interaction between the %& molecular orbital (MO) localized on the C$D bond as the
acceptor, and the occupied MO 42 of pulegone as the donor (see Fig. 9). We note that
this phenomenon is very often encountered for O$H and N$H bonds and that it is
somewhat remarkable that it occurs also for the C$D stretching mode since the %& MO
of the C$D bond is much higher in energy (thus less likely to mix with occupied MOs)
than the %& MOs of the O$H and N$H bonds. The fact that the frequency of the C$D
mode shifts with less than 2 cm%1 in the MC compared to the FM supports this last
a"rmation. (Upon complexation, calculations predict shifts up to a few hundred cm%1
for the frequencies of the O$H and N$Hs stretching modes [8, 23].) It is probable that
the abundance of CDCl3, since it is the solvent, leads in this case to an observable e!ect.
The CDCl3 do not have to compete with any other complexing agent, indeed the pulegone
molecules cannot avoid association with CDCl3 molecules.
6 Conclusions
In this paper we have investigated the robustness of the C-D stretch mode of an achiral
molecule (CDCl3) that exhibits induced chirality upon complexation to the chiral pulegone
22
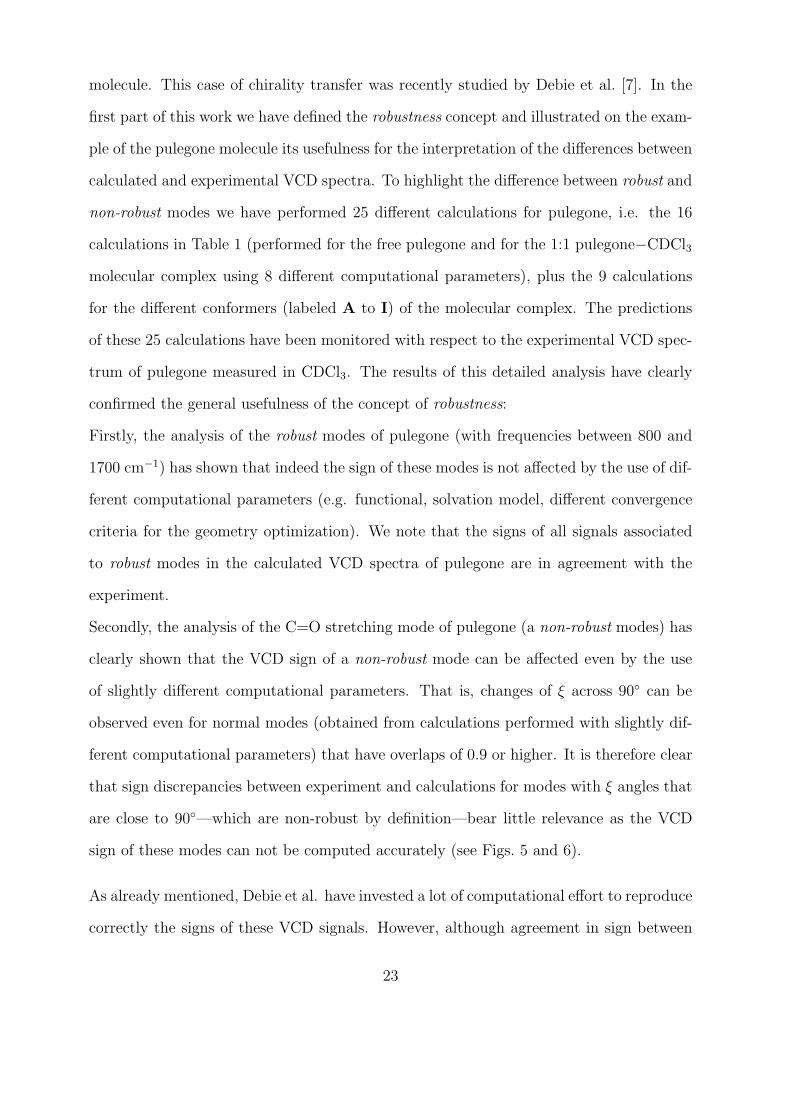
molecule. This case of chirality transfer was recently studied by Debie et al. [7]. In the
first part of this work we have defined the robustness concept and illustrated on the exam-
ple of the pulegone molecule its usefulness for the interpretation of the di!erences between
calculated and experimental VCD spectra. To highlight the di!erence between robust and
non-robust modes we have performed 25 di!erent calculations for pulegone, i.e. the 16
calculations in Table 1 (performed for the free pulegone and for the 1:1 pulegone$CDCl3
molecular complex using 8 di!erent computational parameters), plus the 9 calculations
for the di!erent conformers (labeled A to I) of the molecular complex. The predictions
of these 25 calculations have been monitored with respect to the experimental VCD spec-
trum of pulegone measured in CDCl3. The results of this detailed analysis have clearly
confirmed the general usefulness of the concept of robustness:
Firstly, the analysis of the robust modes of pulegone (with frequencies between 800 and
1700 cm%1) has shown that indeed the sign of these modes is not a!ected by the use of dif-
ferent computational parameters (e.g. functional, solvation model, di!erent convergence
criteria for the geometry optimization). We note that the signs of all signals associated
to robust modes in the calculated VCD spectra of pulegone are in agreement with the
experiment.
Secondly, the analysis of the C=O stretching mode of pulegone (a non-robust modes) has
clearly shown that the VCD sign of a non-robust mode can be a!ected even by the use
of slightly di!erent computational parameters. That is, changes of ! across 90$ can be
observed even for normal modes (obtained from calculations performed with slightly dif-
ferent computational parameters) that have overlaps of 0.9 or higher. It is therefore clear
that sign discrepancies between experiment and calculations for modes with ! angles that
are close to 90$—which are non-robust by definition—bear little relevance as the VCD
sign of these modes can not be computed accurately (see Figs. 5 and 6).
As already mentioned, Debie et al. have invested a lot of computational e!ort to reproduce
correctly the signs of these VCD signals. However, although agreement in sign between
23

theory and experiment was eventually obtained, the fact remains that the C=O stretching
mode is a non-robust mode and the agreement may be (entirely) fortuitous. As shown
here, from the moment a single, su"ciently good quality calculation reveals an angle too
close to 90$, the reliability of the predicted sign of the VCD band is heavily jeopardized.
In the second part of this work, the C$D stretching mode of the CDCl3 molecule in the
1:1 pulegone$CDCl3 molecular complex (a typical case of chirality transfer) has been
investigated. The complexation changes the angle between ETDM and MTDM of this
mode, which in the free achiral molecule is 90$. Since the complexation perturbation is
weak, the angle will not di!er much from 90$. This does not rule out that in the transfer
of chirality phenomenon the deviation would consistently be in the same direction, and
therefore the sign of the VCD signal still be robust. Our study study revealed, however,
that this particular case of an angle ! close to 90$ is no exception to the rule: the mode
is non-robust. As shown in Fig. 8, the VCD sign of this mode is conformation dependent.
Moreover, the use of slightly di!erent computational parameters yields di!erent signs for
the rotational strength of a given conformation (see Fig. 7). In view of previous experience
we would also expect that if the molecular complex would be in a di!erent solvent (not
the neat CDCl3 of the actual experiment) the sign of the VCD signal could also change. It
is therefore clear that in cases like the one studied here, i.e. a molecular complex formed
via a hydrogen bond between a chiral solute molecule and an achiral solvent molecule,
one can not use the agreement between the calculated and experimental VCD signals of
the modes of the achiral moiety to extract information about the molecular interaction,
e.g. the relative orientation of the two molecules involved in the molecular complex.
This limits the usefulness of the induced chirality phenomenon for the interpretation of
the intermolecular interactions that give rise to it. In future works, whenever induced
chirality is observed experimentally, first the robustness of the associated modes should
be checked carefully. If such a mode is not robust, which will usually be the case if the
transfer of chirality is by a relatively weak intermolecular interaction, we feel that no
24

conclusion on, e.g., the structure of the solvent solute complex can be drawn from an
agreement in sign between theory and experiment.
Acknowledgement
This work has been supported (EJB) by Korea Science and Engineering Foundation
(World Classs Univ. program: R32-2008-000-10180-0).
25

[Table 1 about here.]
26

[Table 2 about here.]
27

[Table 3 about here.]
28

References
[1] Stig Allenmark. induce circular dichroism by chiral molecular interaction. Chirality,
15 (2003) 409–422.
[2] Thomas Burgi, Angelo Vargas, Alfons Baiker. VCD spectroscopy of chiral cinchona
modifiers used in heterogeneous enantioselective hydrogenation: conformation and
binding of non-chiral acids. J. Chem. Soc., Perkin Trans. 2, 2002) 1596–1601.
[3] Martin Losada, Yunjie Xu. Chirality transfer through hydrogen-bonding: Exper-
imental and ab initio analyses of vibrational circular dichroism spectra of methyl
lactate in water. Phys. Chem. Chem. Phys., 9 (2007) 3127–3135.
[4] Elke Debie, Lize Jaspers, Patrick Bultinck, Wouter Herrebout, Benjamin Van Der
Veken. Induced solvent chirality: A VCD study of camphor in CDCl3. Chem. Phys.
Lett., 450 (2008) 426–430.
[5] M. Losada, H. Tran, Y. Xu. Lactic acid in solution: Investigations of lactic acid
self-aggregation and hydrogen bonding interactions with water and methanol using
vibrational absorption and vibrational circular dichroism spectroscopies. J. Chem.
Phys., 128 (2008) 014508.
[6] G. Yang, Y. Xu. Probing chiral solute-water hydrogen bonding networks by chirality
transfer e!ects: A vibrational circular dichroism study of glycidol in water. J. Chem.
Phys., 130 (2009) 164506.
[7] Elke Debie, Patrick Bultinck, Wouter Herreboutand, Benjamin van der Veken. Sol-
vent e!ects on IR and VCD spectra of natural products: an experimental and theo-
retical VCD study of pulegone. Phys. Chem. Chem. Phys., 10 (2008) 3498–3508.
[8] V. P. Nicu, J. Neugebauer, E. J. Baerends. E!ects of Complex Formation on Vibra-
tional Circular Dichroism Spectra. J. Phys. Chem. A, 112 (30) (2008) 6978–6991.
29

[9] V. P. Nicu, E. J. Baerends. Robust normal modes in vibrational circular dichroism
spectra. Phys. Chem. Chem. Phys., in press (2009) DOI: 10.1039/b823558a.
[10] Amsterdam Density Functional program. Theoretical Chemistry, Vrije Universiteit,
Amsterdam. URL: http://www.scm.com.
[11] G. Te Velde, F. M. Bickelhaupt, E. J. Baerends, C. Fonseca Guerra, S. J. A. Van
Gisbergen, J. G. Snijders, T. Ziegler. Chemistry with ADF. J. Comput. Chem., 22
(9) (2001) 931–967.
[12] C. Fonseca Guerra, J.G. Snijders, G. te Velde, E.J. Baerends. Towards an order-N
DFT method. Theor Chem Acc, 99 (1998) 391–403.
[13] P. J. Stephens. Theory of Vibrational Circular Dichroism. J. Phys. Chem., 89 (1985)
748–752.
[14] V. P. Nicu, J. Neugebauer, S. K. Wol!, E. J. Baerends. A vibrational circular dichro-
ism implementation within a Slater-type-orbital based density functional framework
and its application to hexa- and hepta-helicenes. Theor. Chem. Acc., 119 (1-3)
(2008) 245–263.
[15] Stephen K. Wol!. Analytical Second Derivatives in the Amsterdam Density Func-
tional Package. Int. J. Quant. Chem., 104 (2005) 645–659.
[16] F. London. The quantic theory of inter-atomic currents in aromatic combinations.
J. Phys. Radium, 8 (1937) 397–409.
[17] F. J. Devlin, P. J. Stephens, J. R. Cheeseman, M. J. Frisch. Ab Initio Prediction of
Vibrational Absorbtion and Circular Dichroism Spectra ofChiral Natural Products
Usind Density Functional Theory: &–Pinene. J. Phys. Chem. A, 101 (1997) 9912–
9924.
30

[18] N. C. Handy, A. J. Cohen. Left-right correlation energy. Mol. Phys., 99 (2001)
403–412.
[19] F. A. Hamprecht, A. J. Cohen, N. C Handy. Development and assessment of new
exchange-correlation functionals. J. Chem. Phys., 109 (1988) 6264–6271.
[20] A. D. Becke. Density-functional exchange-energy approximation with correct asymp-
totic behavior. Phys. Rev. A, 38 (1988) 3098–3100.
[21] J. P. Perdew. Density-functional approximation for the correlation energy of the
inhomogeneous electron gas. Phys. rev. B, 33 (1986) 8822–8824.
[22] Prasad L. Polavarapu, Neha Jeirath, Sheena Walia. Conformational sensitivity of
chiroptical spectroscopic methods: 6,6?-dibromo-1,1?-bi-2-naphthol. J. Phys. Chem.
A, 113 (2009) 54235431.
[23] V. P. Nicu, J. Autschbach, E. J. Baerends. Enhancement of IR and VCD intensities
due to charge transfer. Phys. Chem. Chem. Phys., 11 (2009) 1526–1538.
[24] G. C. Pimetel, A. L. McClellan. The Hydrogen Bond, W. H. Freeman and Company,
San Francisco and London. W. H. Freeman and Company, San Francisco and London,
1st ed., 1960.
[25] ed. Mansel Davies. Infra-red spectroscopy and Molecular structure. Elsevier Publish-
ing Company, Amsterdam - London - New York, 1st ed., 1983.
31

List of Figures
1 Comparison between experimental VCD spectrum (Exp.) and the calcu-lated VCD spectra obtained from OLYP, BP86 and B3LYP calculations.The experimental VCD spectrum obtained using CDCl3 as a solvent isgiven as a solid line, while the spectrum recorded for the solution in CS2 isgiven as a dashed line. . . . . . . . . . . . . . . . . . . . . . . . . . . . . . 33
2 Comparison between experimental VCD spectrum (Exp.) and the VCDspectrum predicted by calculation 1 (Calc. 1). The dots on top of thecalculated spectrum indicate the magnitude of the ! angles of the modesof the calculated spectrum. The robust modes are indicated by arrows. . . 34
3 The dihedral angles $1 and $2 varied during the conformational analysis ofthe 1:1 pulegone-CDCl3 molecular complex. . . . . . . . . . . . . . . . . . 35
4 Comparison of the values predicted by the calculations 1 to 16 for theangles ! of the modes 28 to 65. The VCD spectrum of calculation 1 is alsoshown. . . . . . . . . . . . . . . . . . . . . . . . . . . . . . . . . . . . . . . 36
5 Comparison of the values predicted by the calculation 1 to 16 for the angle! of the C=O stretching mode of pulegone (mode 65 in Figs. 2 and 4). . . 37
6 Comparison of the computed values for the angle ! of the C=O stretchingmode (mode 65 in Figs. 2 and 4) in the 9 conformations (A to I) of the 1:1pulegone$CDCl3 molecular complex. The computational parameters usedare identical to the ones used in calculation 2 (see Table 1). . . . . . . . . 38
7 Comparison of the values predicted by the calculations 2, 4, 6, 8, 10,12, 14 and 16 for the angle ! of the C$D stretching mode of CDCl3 (thatexhibited transfer of chirality) of the 1:1 pulegone$CDCl3 molecular complex. 39
8 Comparison of the computed values for the angle ! of the C$D stretchingmode of CDCl3 (that exhibited transfer of chirality) in the 9 conformations(A to I) of the 1:1 pulegone$CDCl3 molecular complex. The computa-tional parameters used are identical to the ones used in calculation 2 (seeTable 1). . . . . . . . . . . . . . . . . . . . . . . . . . . . . . . . . . . . . . 40
9 Representation of the MOs that play an important rol in the enhancementof the ETDM and MTDM of the C$D stretching mode, i.e. the %& MOof CDCL3 and the occupied MO 42 of pulegone. The last occupied MO ofthe 1:1 pulegone$CDCl3 complex is a linear combination of the MO 42 ofpulegone (99%), and the virtual MO 11 A1 of CDCl3 (< 1%). . . . . . . . 41
32

1000120014001600
Frequency (1/cm)
-0.025
0.000
0.025
EXP.
A B C D E
OLYP
!"
(l m
ol-1
cm
-1)
BP86
B3LYP
Figure 1: Comparison between experimental VCD spectrum (Exp.) and the calculatedVCD spectra obtained from OLYP, BP86 and B3LYP calculations. The experimentalVCD spectrum obtained using CDCl3 as a solvent is given as a solid line, while thespectrum recorded for the solution in CS2 is given as a dashed line.
33
1000120014001600
Frequency (1/cm)
0.02
0
Exp.
90
60
120
180
0
A B C D E
Calc.1
An
gle
!(º
)
"#
(l m
ol-1
cm
-1)
Calc. 1: OLYP, TZP, Vacuum,
tight geom. criterium, FM
29
31
38
45
46
48
5056 32
4765
33
Figure 2: Comparison between experimental VCD spectrum (Exp.) and the VCD spec-trum predicted by calculation 1 (Calc. 1). The dots on top of the calculated spectrumindicate the magnitude of the ! angles of the modes of the calculated spectrum. Therobust modes are indicated by arrows.
34

!1
!2
Figure 3: The dihedral angles $1 and $2 varied during the conformational analysis of the1:1 pulegone-CDCl3 molecular complex.
35

1000120014001600
Frequency (1/cm)
0
20
40
60
120
140
160
180
An
gle
! (
º)
28
90
2931
38
45
46
48
50
56
65
32
/33
47
/(4
6)
37
58
44
58
Figure 4: Comparison of the values predicted by the calculations 1 to 16 for the angles !of the modes 28 to 65. The VCD spectrum of calculation 1 is also shown.
36

0 2 4 6 8 10 12 14 16
Calculation
80
85
90
95
100
An
gle
! (
°)
1
2
3
4
5 6
7 8
9
10
11
1213
14
15
16
C=O stretch
R(10–44 esu2cm2)
R = 4.3
R = -7.1
R = 13.7
R = -12.9 R = -18.9
R = 3.2
R = -15.6
R = -13.1
R = 6.5
R = -1.5
R = 2.6
R = -14.3
R = -4.8
R = -32.2
R = -46.5
R = -6.3
Figure 5: Comparison of the values predicted by the calculation 1 to 16 for the angle !of the C=O stretching mode of pulegone (mode 65 in Figs. 2 and 4).
37

Conformation88
89
90
91
92
93
94
An
gle
! (
º)
A
B
C
D
EF G
H
I
R = -7.08
R = -8.39
R = -7.62
R = -0.78
R = 1.45
R = 0.46
R = -0.22
R = -0.67
R = -7.21C=O stretch
R(10–44 esu2cm2)
Figure 6: Comparison of the computed values for the angle ! of the C=O stretching mode(mode 65 in Figs. 2 and 4) in the 9 conformations (A to I) of the 1:1 pulegone$CDCl3molecular complex. The computational parameters used are identical to the ones used incalculation 2 (see Table 1).
38

Calculation88
89
90
91
92
93
An
gle
! (
º)
2
4
6
8
10
12
14
16
C–D stretch of CDCl3
R(10–44 esu2cm2)
R = -1.18R = -1.49
R = 0.43
R = -1.21
R = 0.82
R = -6.29
R = 3.80
R = -7.85
Figure 7: Comparison of the values predicted by the calculations 2, 4, 6, 8, 10, 12, 14and 16 for the angle ! of the C$D stretching mode of CDCl3 (that exhibited transfer ofchirality) of the 1:1 pulegone$CDCl3 molecular complex.
39

Conformation88
89
90
91
92
93
94
95
An
gle
! (
º)
A
B
C
DE
F
GH
I
C–D stretch of CDCl3
R(10–44 esu2cm2)
R = -1.18
R = -1.19R = -1.35
R = 0.95 R = 1.13
R = 0.45R = 0.18
R = 0.35
R = 1.44
Figure 8: Comparison of the computed values for the angle ! of the C$D stretching modeof CDCl3 (that exhibited transfer of chirality) in the 9 conformations (A to I) of the 1:1pulegone$CDCl3 molecular complex. The computational parameters used are identicalto the ones used in calculation 2 (see Table 1).
40

!! MO 42
Figure 9: Representation of the MOs that play an important rol in the enhancement ofthe ETDM and MTDM of the C$D stretching mode, i.e. the %& MO of CDCL3 and theoccupied MO 42 of pulegone. The last occupied MO of the 1:1 pulegone$CDCl3 complexis a linear combination of the MO 42 of pulegone (99%), and the virtual MO 11 A1 ofCDCl3 (< 1%).
41

List of Tables
1 Computational parameters used in the 16 calculations performed for pule-gone. . . . . . . . . . . . . . . . . . . . . . . . . . . . . . . . . . . . . . . . 43
2 Comparison of the frequencies (Freq.), rotational strengths (R), and an-gles ! associated to the C$D stretching mode in the 1:1 pulegone$CDCl3molecular complex (MC) and in the free CDCl3. . . . . . . . . . . . . . . . 44
3 Comparison of the Cartesian components of the total electric and mag-netic transition dipole moments (ETDM and MTDM) of the C$D stretch-ing mode in the free CDCl3 (FM) and in the pulegone$CDCl3 molecularcomplex (MC). . . . . . . . . . . . . . . . . . . . . . . . . . . . . . . . . . 45
42
Calc. Computational Details
1 TZP, OLYP, Vacuum, tight geometry, free molecule
2 TZP, OLYP, Vacuum, tight geometry, molecular complex
3 TZP, OLYP, Vacuum, default geometry, free molecule
4 TZP, OLYP, Vacuum, default geometry, molecular complex
5 TZP, OLYP, COSMO, tight geometry, free molecule
6 TZP, OLYP, COSMO, tight geometry, molecular complex
7 TZP, OLYP, COSMO, default geometry, free molecule
8 TZP, OLYP, COSMO, default geometry, molecular complex
9 TZP, BP86, Vacuum, tight geometry, free molecule
10 TZP, BP86, Vacuum, tight geometry, molecular complex
11 TZP, BP86, Vacuum, default geometry, free molecule
12 TZP, BP86, Vacuum, default geometry, molecular complex
13 TZP, BP86, COSMO, tight geometry, free molecule
14 TZP, BP86, COSMO, tight geometry, molecular complex
15 TZP, BP86, COSMO, default geometry, free molecule
16 TZP, BP86, COSMO, default geometry, molecular complex
Table 1: Computational parameters used in the 16 calculations performed for pulegone.
43

C$D stretching Freq. R !
MC: 2308.15 -1.18 91.87
free CDCl3: 2306.98 0.00 90.00
Table 2: Comparison of the frequencies (Freq.), rotational strengths (R), and angles !associated to the C$D stretching mode in the 1:1 pulegone$CDCl3 molecular complex(MC) and in the free CDCl3.
44

ETDMs (10%22esu·cm)
Atom Length X Y Z
ETDM in FM 1.07 -1.05 0.19 0.00
ETDM in MC 59.77 59.48 -4.63 -3.53
MTDM (10%24esu·cm)
Atom Length X Y Z
MTDM in FM 1.23 -0.08 -0.43 -1.15
MTDM in MC 60.34 2.84 18.09 57.49
Table 3: Comparison of the Cartesian components of the total electric and magnetictransition dipole moments (ETDM and MTDM) of the C$D stretching mode in the freeCDCl3 (FM) and in the pulegone$CDCl3 molecular complex (MC).
45


![C'\ jc UZcVTe RZU e` d^R]] WRc^Vcd 6]VTeZ`_ 3fUXVe - Daily](https://img.pdfslide.net/doc/110x75/631c25c776d2a4450503688a/c-jc-uzcvte-rzu-e-dr-wrcvcd-6vtez-3fuxve-daily-.jpg)


![7Rc^Vcd ScRgV hReVc TR__`_d W`c 5V]YZ ... - Daily Pioneer](https://img.pdfslide.net/doc/110x75/633266eb5696ca4473033492/7rcvcd-scrgv-hrevc-trd-wc-5vyz-daily-pioneer.jpg)


![?` YVRUhRj Z_ 8`ge WRc^Vcd eR]\d - Daily Pioneer](https://img.pdfslide.net/doc/110x75/6353f649ddac2ba80e037589/-yvruhrj-z-8ge-wrcvcd-erd-daily-pioneer.jpg)