Embed Size (px)
Citation preview

This document has been scanned from hard-copy archives for research and study purposes. Please note not all information may be current. We have tried, in preparing this copy, to make the content accessible to the widest possible audience but in some cases we recognise that the automatic text recognition maybe inadequate and we apologise in advance for any inconvenience this may cause.
FOREST & WOOD PRODUCTS RESEARCH & DEVELOPMENT CORPORATION
TECHNICAL PUBLICATION No.2
EVALUATION OF SANTIAGO DECLARATION
(MONTREAL PROCESS) INDICATORS OF SUSTAINABILITY
FOR AUSTRALIAN COMMERCIAL FORESTS.
A VICTORIAN MONTANE FOREST AS A CASE STUDY
Paul Dignan
Simon Murphy
Keith Cherry
Abdur Rab
fORfSl & WOOD PRODUCIS RESEARCH & DEVELOPMENT CORPORATION
~ CFTT
CENTRE FOR FOREST TREE TECHNOLOGY
EVALUATION OF SANTIAGO DECLARATION
(MONTREAL PROCESS)
INDICATORS OF SUSTAINABILITY FOR
AUSTRALIAN COMMERCIAL FORESTS.
A VICTORIAN MONTANE FOREST AS A CASE STUDY
Paul Dignan
Simon Murphy
K eith Cherry
Abdur Rab
Forest and Wood Products Research and Development Corporation (FWPRDC) March,1996
Authors:
Paul Dignan
Simon Murphy
Keith Cherry
AbdurRab
Scientific Editor:
CFIT Central Highland Research Centre, Noojee, Victoria
CFIT, Kew, Victoria
Flora, Fauna and Fisheries, ARI, Heidelberg, Victoria
Catchment and Land Management, KTRI, Frankston, Victoria
Michelle Johnstone Research Division" State Forests of New South Wales
Published by:
Research Division,
State Forests of New South Wales,
121-131 Oratava Avenue, West Pennant Hills, 2125
P.O. Box 100, Beecroft. 2119
Australia.
Copyright © 1996 by State Forests of New South Wales
ISBN 07310 6729 0
The research and development activities described in this pUblication were jointly funded by the Forest and Wood Products Research and Development Corporation (FWPRDC) and organisations listed in the study. The information and recommendations contained in this publication do not necessarily represent the policy of FWPRDC, or collectively or individually the participating organisations. No person should act on the basis of the contents of this publication, whether as to matters of fact or opinion or other content, without fIrst obtaining specifIc, independent professional advice which confIrms the information contained in this publication.
CONTENTS
INTRODUCTION
CASE STUDY AREA
CENTRAL HIGHLANDS
CENTRAL GIPPSLAND FOREST MANAGEMENT AREA
NEERIM OPERATIONS AREA
TANJIL BREN TRIAL SITE AND TOORONGO FOREST BLOCK
ASSESSMENT OF INDICATORS
CRITERION 1: CONSERVATION OF BIOLOGICAL DIVERSITY
CRITERION 2: MAINTENANCE OF PRODUCTIVE CAPACITY OF FOREST ECOSYSTEMS
CRITERION 3: MAINTENANCE OF FOREST ECOSYSTEM HEALTH AND VITALITY
CRITERION 4: CONSERVATION AND MAINTENANCE OF SOIL AND WATER RESOURCES
OUTCOMES
CRITERION 1: CONSERVATION OF BIOLOGICAL DIVERSITY
CRITERION 2: MAINTENANCE OF PRODUCTIVE CAPACITY OF FOREST ECOSYSTEMS
CRITERION 3: MAINTENANCE OF FOREST ECOSYSTEM HEALTH AND VITALITY
CRITERION 4: CONSERVATION AND MAINTENANCE OF SOIL AND WATER RESOURCES
CONCLUSIONS AND RECOMMENDATIONS
ACKNOWLEDGMENTS
REFERENCES
FWPRDC TECHNICAL PUBLICATION W 2
SANTIAGO DECLARATION INDICATORS OF SUSTAINABILITY A VICTORIAN MONT ANE FOREST AS A CASE STUDY
1
3
3
4
4
5
6
6
20
28
36
44
44
45
45
46
47
48
49
TABLES
Table 1. Public land in the Central Gippsland FMA 4 Table 2. EVCs in the Cent~al Highlands of Victoria 7 Table 3. Forest Habitat Classes identified for the Central Highlands [based on 8
Forest Habitat Classes for A2 (Refoge Habitats), B1 (Rare Habitats) and D1 (principle Characters of Habitat) Analyses]
Table 4. Reserve status of relatively extensive National Estate values sensitive to 11 disturbance
Table 5. Rare and threatened species of flora and fauna recorded in the Central 15 Highlands
Table 6. Total, gross productive and net productive areas at three levels of 22 ma:zagement
FIGURES
ii
Figure 1. Annual production of merchantable timber in the Central Gippsland FMA 27 for the period 1988 to 1991
Figure 2. A comparison of estimated total merchantable timber volume (pre-harvest) 28 for the SSP harvesting trials at Tanjil Bren and the volumes recorded as harvested for 50 treatment units ranging from 0.25 ha to 5.55 ha. The deviation is the difference between the estimate and the recorded harvest
SANTIAGO DECLARATION INDICATORS OF SUSTAlNABILITY A VICTORIAN MONT ANE FOREST AS A CASE STUDY
FWPRDC TECHNICAL PUBLICATION W 2

INTRODUCTION
International recognition of the importance of the maintenance of ecological diversity has resulted in a number of initiatives designed to ensure the sustainable management of the world's forests. Australia is a signatory to the Santiago Declaration on sustainable management of boreal and temperate forests (refer to Turner et al. 1996, Appendix 4), which includes the aim of maintaining or achieving sustainable management of forests by the year 2000. The Santiago Declaration includes seven criteria and associated indicators which it claims "characterise the conservation and sustainable management of temperate and boreal forests". The document also states that "given the wide differences in natural and social conditions among countries, the specific application and monitoring of the criteria and indicators, as well as the capacity to apply them, will vary from country to country based on national circumstances". The Forest & Wood Products Research & Development Corporation and the members of the Research Priorities Coordination Committee for the Standing Committee on Forestry are funding a national project to assess the applicability of the proposed criteria and indicators to Australian conditions and begin the process of applying them.
The objectives of this project have been described in Evaluation of Santiago Declaration (Jvfontreal Process) indicators of sustainability for Australian commercial forests (Turner et al. 1996) and are outlined below.
1. Review, define and further develop indicators of sustainable management for Australian production forests (native and plantation), based on the indicators proposed in the Santiago Declaration.
2. Apply selected indicators from (1) over a range of Forest Types to test for their general applicability .
3. Define and implement research programs which: - test and calibrate standard methodologies for measuring the selected indicators; - interpret and report on sustainability indicators; - provide alternative strategies for sustainable forest management based on the
indicators; and - identify further research and development priorities.
4. Provide a basis for the development of a cost-effective internationally recognised certification scheme for sustainably managed forests in Australia.
This report is part of the second part of this process. It deals with the application of the indicators to case study areas to test their applicability, the availability and suitability of information and, where necessary, identification of research and development requirements.
The specific objectives of this report are, in relation to the mountain ash (Eucalyptus regnans) dominated forests of the Central Highlands of Victoria and with regard to criteria 1 to 4 of the Santiago Declaration:
• to review and define the indicators associated with each criterion in terms of appropriate quantitative variables;
FWPRDC TECHNICAL PUBLICATION N° 2
SANTIAGO DECLARATION INDICATORS OF SUSTAINABILITY A VICTORIAN MONT ANE FOREST AS A CASE STUDY

• to identify. and assess available information relating to the variables (i.e. scale of measurement in relation to application scale, frequency of measurement in relation to.frequency required, monitoring method), with particular reference to appropriate management units 1
;
• where relevant, to assess the potential of experimental/research methodslresults to improve, replace or complement indicators or monitoring methods; and
• to recommend research and development requirements.
Criteria 5 to 7 need to be addressed at a strategic level (i.e. state or national).
1 For the purposes of this report, the management unit has been . arbitrarily defmed as an area of 10,000-50,000 ha. The reasoning for this range was primarily based on the size of existing case study research areas which were used within this project and which varied in size between States. An ecological basis for the definition of management unit size has been suggested for future use, i.e. the greatest area needed to measure a selection of parameters (the management/research requirements determine the size of the unit).
2 SANTIAGO DECLARATION INDICATORS OF SUSTAINABILITY A VICTORIAN MONT ANE FOREST AS A CASE STUDY
FWPRDC TECHNICAL PUBLICATION N° 2
CASE STUDY AREA
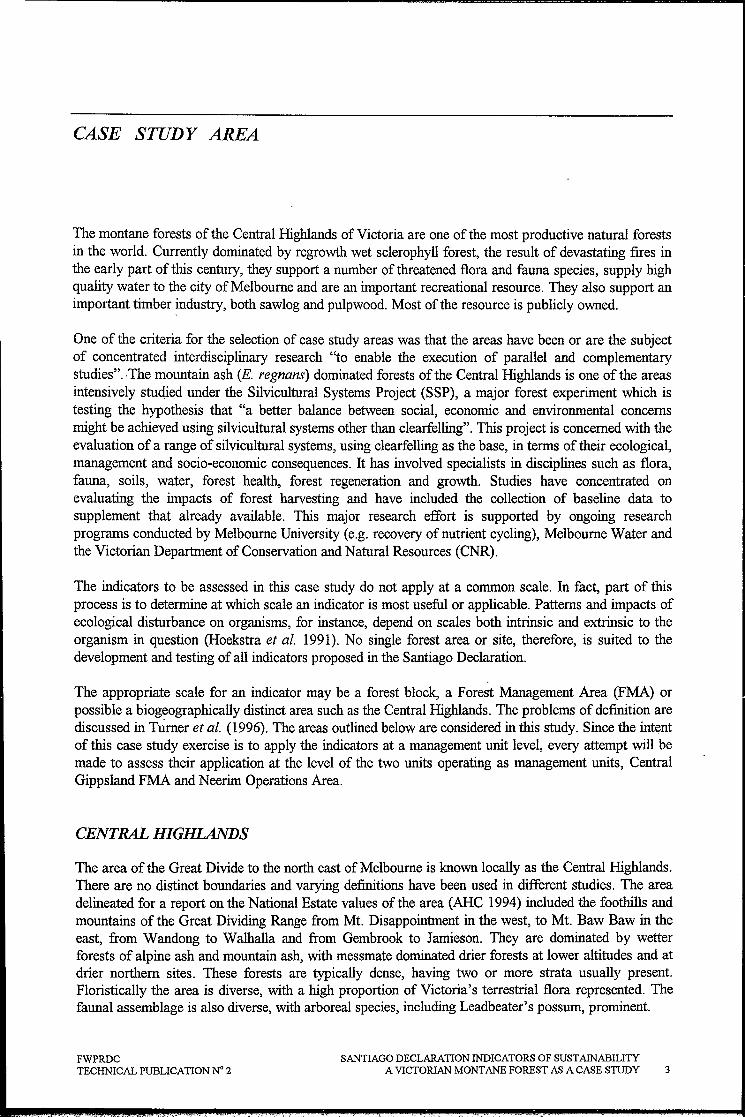
The montane forests of the Central Highlands of Victoria are one of the most productive natural forests in the world. Currently dominated by regrowth wet sc1erophyll forest, the result of devastating fires in the early part of this century, they support a number of threatened flora and fauna species, supply high quality water to the city of Melbourne and are an important recreational resource. They also support an important timber industry, both sawlog and pulpwood. Most of the resource is publicly owned.
One of the criteria for the selection of case study areas was that the areas have been or are the subject of concentrated interdisciplinary research "to enable the execution of parallel and complementary studies". ·The mountain ash (E. regnans) dominated forests of the Central Highlands is one of the areas intensively studjed under the Silvicultural Systems Project (SSP), a major forest experiment which is testing the hypothesis that "a better balance between social, economic and environmental concerns might be achieved using silvicultural systems other than clearfelling". This project is concerned with the evaluation of a range of silvicultural systems, using c1earfelling as the base, in terms of their ecological, management and socio-economic consequences. It has involved specialists in disciplines such as flora, fauna, soils, water, forest health, forest regeneration and growth. Studies have concentrated on evaluating the impacts of forest harvesting and have included the collection of baseline data to supplement that already available. This major research effort is supported by ongoing research programs conducted by Melbourne University (e.g. recovery of nutrient cycling), Melbourne Water and the Victorian Department of Conservation and Natural Resources (CNR).
The indicators to be assessed in this case study do not apply at a common scale. In fact, part of this process is to determine at which scale an indicator is most useful or applicable. Patterns and impacts of ecological disturbance on organisms, for instance, depend on scales both intrinsic and extrinsic to the organism in question (Hoekstra et al. 1991). No single forest area or site, therefore, is suited to the development and testing of all indicators proposed in the Santiago Declaration.
The appropriate scale for an indicator may be a forest block, a Forest Management Area (FMA) or possible a biogeographically distinct area such as the Central Highlands. The problems of definition are discussed in Turner et al. (1996). The areas outlined below are considered in this study. Since the intent of this case study exercise is to apply the indicators at a management unit level, every attempt will be made to assess their application at the level of the two units operating as management units, Central Gippsland FMA and Neerim Operations Area.
CENTRAL HIGHLANDS
The area of the Great Divide to the north east of Melbourne is known locally as the Central Highlands. There are no distinct boundaries and varying definitions have been used in different studies. The area delineated for a report on the National Estate values of the area (ARC 1994) included the foothills and mountains of the Great Dividing Range from Mt. Disappointment in the west, to Mt. Baw Baw in the east, from Wandong to Walhalla and from Gembrook to Jamieson. They are dominated by wetter forests of alpine ash and mountain ash, with messmate dominated drier forests at lower altitudes and at drier northern sites. These forests are typically dense, having two or more strata usually present. Floristically the area is diverse, with a high proportion of Victoria's terrestrial flora represented. The faunal assemblage is also diverse, with arboreal species, including Leadbeater's possum, prominent.
FWPRDC TECHNICAL PUBLICATION N° 2
SANTIAGO DECLARATION INDICATORS OF SUSTAINABILITY A VICTORIAN MONT ANE FOREST AS A CASE STUDY 3
The Central Highlands are included in the temperate climatic zones of Australia. Geologically it is part of the Tasman Geosyncline. Major recent fires, particularly the 1939 bushfires, have resulted in a bias in age class towards the younger or regrowth forest successional stages, although other successional stages are also well represented.
CENTRAL GIPPSLAND FOREST MANAGEMENT AREA
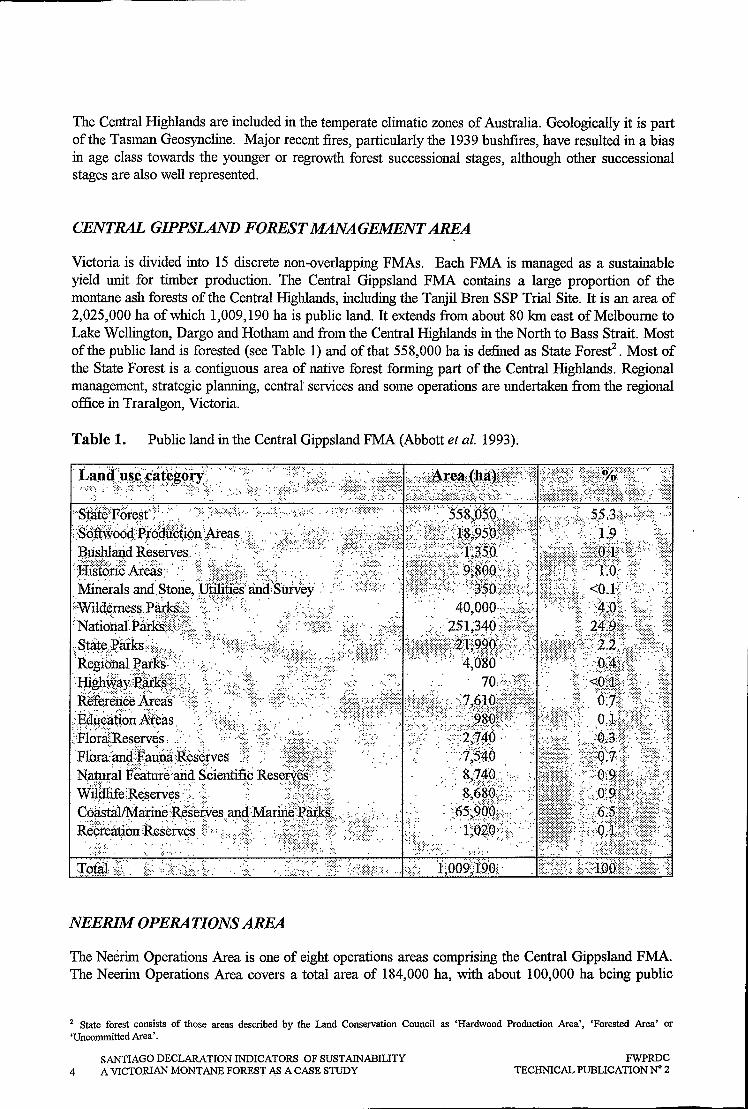
Victoria is divided into 15 discrete non-overlapping FMAs. Each FMA is managed as a sustainable yield unit for timber production. The Central Gippsland FMA contains a large proportion of the montane ash forests of the Central Highlands, including the Tanjil Bren SSP Trial Site. It is an area of 2,025,000 ha of which 1,009,190 ha is public land. It extends from about 80 km east of Melbourne to Lake Wellington, Dargo and Hotham and from the Central Highlands in the North to Bass Strait. Most of the public land is forested (see Table 1) and of that 558,000 ha is defined as State Forese. Most of the State Forest is a contiguous area of native forest forming part of the Central Highlands. Regional management, strategic planning, central services and some operations are undertaken from the regional office in Traralgon, Victoria.
Table 1. Public land in the Central Gippsland FMA (Abbott et al. 1993).
: ~~n~:~:~~~:::f.~!~g9,~!:;:: ... ": .. '.:': .: .. :\. -:: '
'.
" 'S:, ,
NEERIM OPERATIONS AREA
The Neerim Operations Area is one of eight operations areas comprising the Central Gippsland FMA. The Neerim Operations Area covers a total area of 184,000 ha, with about 100,000 ha being public
2 State forest consists of those areas described by the Land Conservation Council as 'Hardwood Production Area', 'Forested Area' or 'Uncommitted Area'.
4 SANTIAGO DECLARATION INDICATORS OF SUSTAINABILITY A VICTORIAN MONTANE FOREST AS A CASE STUDY
FWPRDC TECHNICAL PUBLICATION N° 2
land, of which about 90% is State Forest. It extends northwards from Mt Worth to Mt Matlock and east from the Bunyip river to Mt Baw Baw.
The operations areas are managed by a Forester in Charge and undertake local planning, implementation of operational plans. and programs and supervision and monitoring of operations. This is the management unit closest to that defined in Turner et al. (1996).
TANJIL BREN TRIAL SITE AND TOORONGO FOREST BLOCK
The SSP Trial Site is situated near Tanjil Bren in the Victorian Central Highlands. The forest is predominantly 1939 regrowth E. regnans (mountain ash) with the occasional over mature or regrowth E. cypellocarpa (mountain grey gum). At higher elevations E. nitens (shining gum) and E. delegatensis (alpine ash) are present while at the lower elevations on drier sites E. obliqua (messmate) may also be present. Stands are of moderate density (approximately 38 m2 ha-I basal area) with a top height of 50 m and average diameter at breast height of 55 cm. The understorey is usually dense and mesic. The elevation of the main SSP Trial Site ranges from 650 to 1000 m with slopes up to 40° and an annual rainfall of 1400 to 2100 mm. The major soil types are red gradational soils with some yellow-brown gradational soils. The parent material is predominantly metamorphic in origin. Comprehensive details of the vegetation communities and timber resources on the main SSP Trial Site are given in Mueck (1987), Incoll (1987) and Cumming (1992). Much of the SSP Trial Site is contained within the Toorongo Forest Block in the Neerim Operations Area.
FWPRDC TECHNICAL PUBLICATION N" 2
SANTIAGO DECLARATION INDICATORS OF SUSTAINABILITY A VICTORIAN MONT ANE FOREST AS A CASE STUDY 5
ASSESSMENT OF INDICATORS
CRITERION 1: CONSERVATION OF BIOLOGICAL DIVERSITY
Criterion 1 is composed of three sub-sections with specific indicators related to each. These subsections are:
• Ecosystem Diversity; • Species Diversity; and • Genetic Diversity.
li. ECOSYSTEM DIVERSITY
Indicator a. Extent of area by forest type relative to total forest area.
This indicator aims to provide a measure of the variability and distribution of flora and fauna communities. Within Victoria Forest Types are based on the numerically dominant composition of overstorey species. As their distribution is conveniently determined and mapped from remotely sensed data they have some value as an indicator for broad spatial scales, but at the management unit scale and finer they do not adequately represent biotic diversity. The spatial scale of application determines, in part, the detail and precision required of the system. To best represent floristic diversity of communities in the Central Highlands a classification system based on complete floristic composition is required.
Available data
Ecological Vegetation Classes (EVCs) and Floristic Vegetation Communities are systems employed in Victoria for classifying assemblages of plant species. An EVC is an assemblage of floristic communities that occur as a result of a common regime of ecological processes within a particular environment or habitat. This level of classification is considered appropriate for an area the size of the Central Highlands; however, a mapping resolution finer than the current 1:100,000 is required. A mapping scale of 1:25,000, is considered most appropriate. Twenty three EVCs have been identified and mapped for this area (Table 2). Classification and nomenclature for EVCs is consistent within Victoria but not beyond. To monitor biodiversity, particularly ecosystems that transcend State boundaries, a national classification system is required.
For smaller 'areas such as the Neerim Operations Area the more detailed classification of floristic communities is most appropriate. Within the Central Highlands quantitative floristic analysis has been conducted at 4,117 sites identifying 1,997 species of vascular plants. Analysis of floristic data provides a finer level of resolution, the sub-community. As an indicator this is suitable only for the small finite areas such as the Tanjil Bren SSP Trial Site. Together these levels of classification (EVC, community and sub-community) provide a nested hierarchy of floristic resolution.
As a surrogate for mapped faunal communities broad Forest Habitat Classes have been developed based on EVCs and selected subsets of growth classes. These are based on the assumption that the floristics and age of vegetation communities are major determinates of fauna habitat. In the Central Highlands 102 Forest Habitat Classes have been identified and are available at a mapped scale of
6 SANTIAGO DECLARATION INDICATORS OF SUST AINABILITY A VICTORIAN MONT ANE FOREST AS A CASE STUDY
FWPRDC TECHNICAL PUBLICATION N° 2
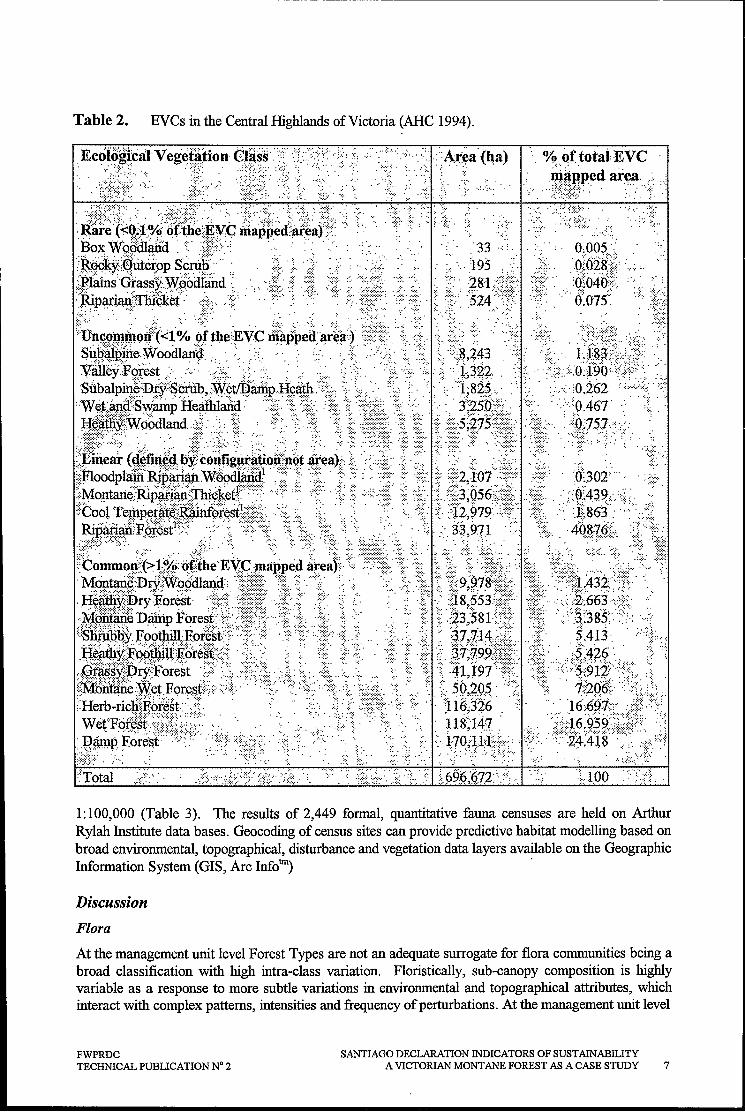
Table 2. EVCs in the Central Highlands of Victoria (AHC 1994).
....... ,.,' .. "., .. ," ..... : .. :::::'," ;.; ..
E~~:l~c~~ited)~~9Y jJ~hlins' GtassY·.:Wiiodiand '.: .':" . :r : :ltp~li~::Tiri~kb{': . .::. '.:" . ":-. -
:p~p Fore~t" ,::.': .': i/l~:i::': , .. . ,:.
.':
::; .::'
',: :' ..
'33 . :":'. 195 .'
1 ~.j~!~'
. ... ~ .. ~ftotai: EVe ,m~pped area
.; .: ," .:(:{~;i~~:~:;~~:< : .. ,
B~.30i:"· .'
: .. :;:::.' :;~:t. "i:(:.',.:. :: :::: -- :-::.-:' -t-: :J~~t{;;:_ :: ',' Ii;;:- ":::{:::::':'"
." \ ~1~~',1 tl~,.(?<; . "i\\ .. 11!f.1~if~: .h~Jii~i~~·i,i
..: ':: "':.:::::'"
'·\.1.00
1:100,000 (Table 3). The results of 2,449 formal, quantitative fauna censuses are held on Arthur Rylah Institute data bases. Geocoding of census sites can provide predictive habitat modelling based on broad environmental, topographical, disturbance and vegetation data layers available on the Geographic Information System (GIS, Arc Infotm) .
Discussion
Flora
At the management unit level Forest Types are not an adequate surrogate for flora communities being a broad classification with high intra-class variation. Floristically, sub-canopy composition is highly variable as a response to more subtle variations in environmental and topographical attributes, which interact with complex patterns, intensities and frequency of perturbations. At the management unit level
FWPRDC SANTIAGO DECLARATION INDICATORS OF SUSTAlNABILITY TECHNICAL PUBLICATION N° 2 A VICTORIAN MONT ANE FOREST AS A CASE STUDY 7
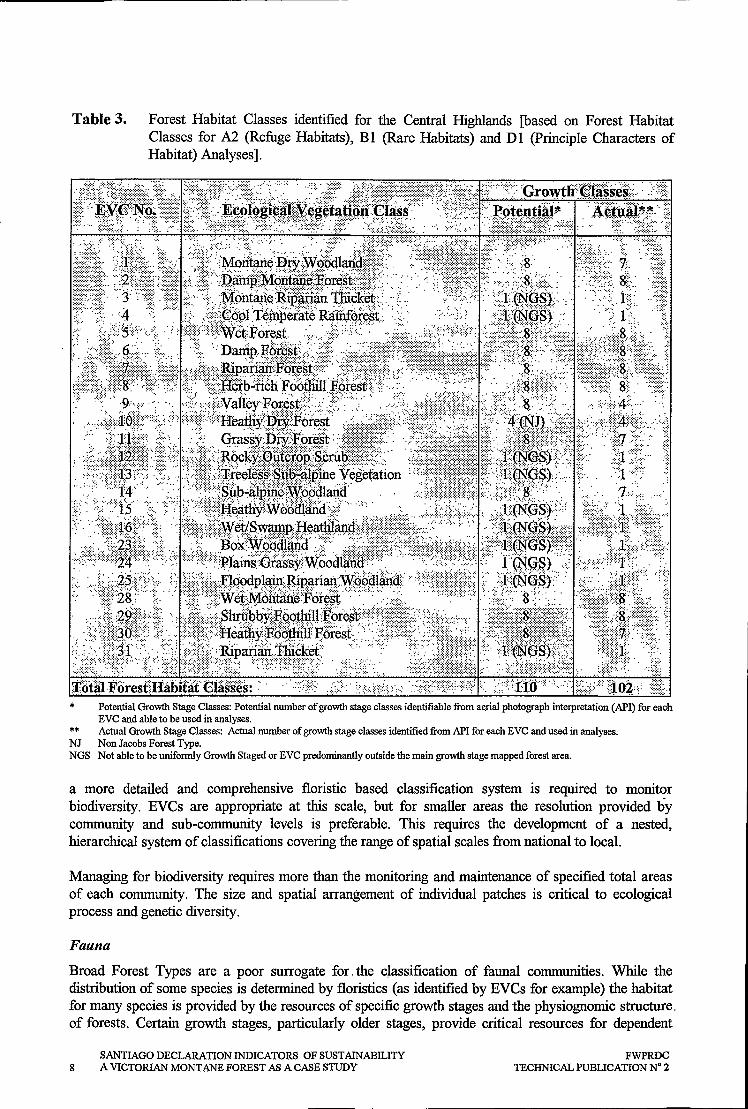
Table 3. Forest Habitat Classes identified for the Central Highlands [based on Forest Habitat Classes for A2 (Refuge Habitats), Bl (Rare Habitats) and Dl (Principle Characters of Habitat) Analyses].
*
** NJ NGS
Potential Growth Stage Classes: Potential number of growth stage classes identifiable from aerial photograph interpretation CAPI) for each EVC and able to be used in analyses. Actual Growth Stage Classes: Actual number of growth stage classes identified from API for each EVC and used in analyses. Non Jacobs Forest Type. Not able to be unifonnIy Growth Staged or EVC predominantly outside the main growth stage mapped forest area.
a more detailed and comprehensive floristic based classification system is required to monitor biodiversity. EVCs are appropriate at this scale, but for smaller areas the resolution provided by community and sub-community levels is preferable. This requires the development of a nested, hierarchical system of classifications covering the range of spatial scales from national to local.
Managing for biodiversity requires more than the monitoring and maintenance of specified total areas of each community. The size and spatial arrangement of individual patches is critical to ecological process and genetic diversity.
Fauna
Broad Forest Types are a poor surrogate for the classification of faunal communities. While the distribution of some species is determined by floristics (as identified by EVCs for example) the habitat for many species is provided by the resources of specific growth stages and the physiognomic structure. of forests. Certain growth stages, particularly older stages, provide critical resources for dependent
8 SANTIAGO DECLARATION INDICATORS OF SUST AINABILITY A VICTORIAN MONT ANE FOREST AS A CASE STUDY
FWPRDC TECHNICAL PUBLICATION N° 2
species. Physiognomic structure determines habitat by providing sites for movement, foraging and thermoregulation.
To provide a reliable surrogate for fauna communities the classification of vegetation communities needs to incorporate age class (or composition) and the physical structure of forests. These, with other mapped environmental variables, provide the parameters for modelling and mapping species and community habitats. The geographic spread of species is variable and often extensive, requiringconsistency in the classification and mapping of deterministic habitat parameters. Habitat classes developed for the Central Highlands are based on only two variables and are not validated; however predictive habitat modelling, examining all available data sets, and ordination analysis together have the potential to identify faunal communities and predict patterns of distribution. -
Notwithstanding the documented potential value of macroinvertebrates as indicators for monitoringbiodiversity, this review was restricted to vertebrate fauna due to logistic difficulties. Invertebrate aquatic fauna are considered to some degree under Indicator (f), Criterion 4.
Recommendations
l. For compatible data that covers a range of spatial scales a standardised hierarchical system of classifying floristic associations should be developed. A range of predictive, environmental variables need to be mapped at the required scale of 1:25,000 to predict past and present distributions of floristic communities. Predictive habitat models for species of fauna at risk should be developed from these environmental, EVC and age class data.
Indicator b. Extent of area by forest type and by age class or successional stage.
The maintenance of biodiversity is dependent on habitat resources being provided for all forest dependent organisms. Many plant and animal species are dependent on specific age classes (or multiaged combinations). This is particularly so for those dependent on older successional stages which, for most Forest Types, have been depleted and fragmented since European settlement.
The extent of age or successional stages is an indicator intended to monitor the persistence of forest biota through the temporal diversity of habitats. To be effective this indicator needs to also monitor both the size and spatial distribution of growth stages over time.
Growth stage mapping is based primarily on the structure and composition of the canopy which limits its value as an indicator at the management unit level. The frequency and intensity of understorey perturbations varies significantly within the one mapped growth stage resulting in varied understorey structure, floristics and faunal composition.
Available data
Within the Central Highlands growth stage mapping is derived from combining growth stage data steps with disturbance data. They are mapped at a scale of 1:25,000 for some areas with the remaining areas available at 1:40,000. For an area the size of the Central Highlands, complete coverage at a scale of 1:25,000 is considered to be the most appropriate as an indicator.
Discussion
Forest Types in the Central Highlands frequently occur as multi-aged stands of varying composition due to complex patterns and intensities of wildfire. The response of sub-canopy communities is more varied due to the diversity of species and their reproductive strategies. The classification of forest age in the Central Gippsland FMA considers only canopy composition and is limited in its representation of
FWPRDC TECHNICAL PUBLICATION W 2
SANTIAGO DECLARATION INDICATORS OF SUSTAINABILITY A VICTORIAN MONT ANE FOREST AS A CASE STUDY 9

multi-aged stands. If a system for classifying community age or successional stage is to be employed in monitoring biodiversity it needs to assess the age composition across all structural strata.
The delineation and mapping of age classes is problematic. The behaviour of wildfire within the Central Gippsland FMA results in transitional zones (often broad) with gradational proportions of differently aged trees whereas mapping requires discrete areas. Long-term monitoring of age classes will require the accurate recording of the type, extent and intensity of all perturbations on permanent data bases.
Recommendations
1. As for ecosystems, the monitoring of age classes requires the development of a system that assesses size and spatial distribution of stands. The development of a system for classifying the age of ecosystems needs to accommodate 'understorey age and succession. Further research into the response of understorey species to fire and their succession is required along with the development of an accurate, permanent and spatially explicit system of recording and storing disturbance data.
2. Multi-aged stands are an ecologically important component of Central Highland forests that need to be reviewed and incorporated in age class mapping. Extensive data is gathered by timber assessment teams. Research based on dendrochronology could establish predictive ageing techniques based on tree morphology (e.g. DBHOB, diameter at l.3 m over-bark).
Indicator c. Extent of area by forest type in protected area categories as defined by IUCN or other classification systems.
Available data
As part of a joint agreement between the Australian Heritage Commission (ARC) and CNR, areas of environmental significance in the Central Highlands were identified and the current extent of protection reviewed. Table 4 provides a summary of areas of National Estate value and existing and proposed reserves. Large and permanently protected forest areas are mapped at 1 :25,000 for the Central Highlands. These include Parks (Wilderness, National, State), Reference Areas and Reserves. Areas protected through the application of the Code of Forest Practice, although not currently mapped, can be added to the GIS at this scale.
As for vegetation communities protected, age classes need to be mapped at 1:25,000. Additional to the total coverage of age classes, mapping provides for spatial analysis, including the size of individual patches along with their juxtaposition and connectivity. In addition to being comprehensive, adequate and representative, a system of reserve design needs to incorporate these spatial parameters.
Discussion
The current size, composition and distribution of reserved forest needs to be critically reviewed if permanent reserves are to form the basis of a strategy for maintaining biodiversity. For a reserve system to be comprehensive and representative, the classification of biota requires a system more detailed than broad Forest Type. Consideration of the size and connectivity of individual patches, their ability to resist d~leterious edge effects, to provide for gene flow through meta-populations and to maintain population viability, is necessary.
SANTIAGO DECLARATION INDICATORS OF SUSTAINABILITY 10 A VICTORIAN MONTANEFOREST AS A CASE STUDY
FWPRDC TECHNICAL PUBLICATION W 2
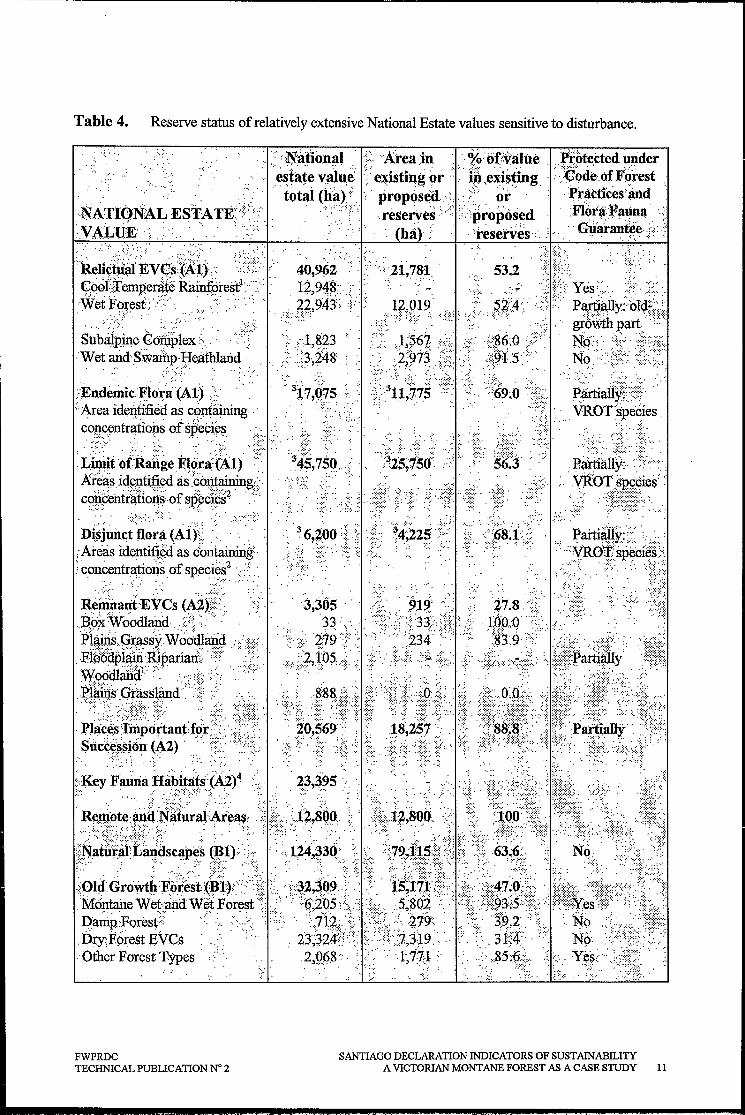
Table 4. Reserve status of relatively extensive National Estate values sensitive to disturbance .
.... . , '.;'
;", -,-:
.. ~ ," . ;. :t <Na::tion~l "f: "Area in '.' 'X,.:(>fValue .. :.~r~tc~ted ~tider
e~tat.e v~lue' ::::' e~isting or .::::. i~ ,e~i~ting .. : ·J~ode·.of F9J-cst totai (Mlr:: .. :' proPQs~d. .::::: or 'Jlr~ttices:'Md: .
·NATIONAL .ESTATE·:·:·'::::::·::·.:·· :.y ALUE' . ':: ,,:": .".
':":":/
Sub4pine Coniplex ,::: ... '. ". .: '-Wet alld·SWaihp·II~athIaiJ.d .
,', . .:::',.:,::',.(", " ,.', ':",
:·:;Endemie·F:lor~i·(Al) )'::' . . :'. Area idf1~tified as confuining .' c0H.c~ntra.tiopS of ~p'ep~~~.
. :" .. :: .. -.
":: .. :, ::. '. reserves' >'proposed :Flot'~nrauna ' .. ::: . '. .' _.' .' '. . Gli~~~fue.· .::: . ha .. :' . ':reserves '.' .' ": . ..' .:. .:
. . :}:: :.:\:~.:~tt~:. _:::"317,9:75 :;" .::
:.:- '
.; .. ', .,'
: .. ':' .. );$67, . . ::2;973'
',', ,,:: ',: .,':: :';::-- ';.'
.-:::;:.: .. 31l/17J
::',' 53,2
.:::::. '. "':':'69;0 .
'.'
,.' . ':'3':::::::::::' ' . · Liniit'ofRange .:E:lfjr~:(Al). ,,45,759 .. -( Ai~asi4@,l1tined as·:co.qtaining:::,:: . '':::: ... ::. '.'''. c?PfentratloiiS·of. s .. IJ. .. :.~ .. c~~~:', .. ':::: ." : .. :{": .
. ;: .' :.':; - .' '
D~~jui1ct flor~ (AIY{. ::::: .. ,-Areas ideiltifi~d' as cbntainllig:' :: concenti,~tions.of sp~cie~? ' .. :' :'::::-. -
•• • -H- .~ .. . .. :.: .. ::.,
Rempant:-EVCs (A:2):t!:::::. · .. ~:9i:'W0odIaild .. : .::)\::: --."'. Pl~ws:.Gr.<!Ssy .Woo'dla'Q4 .. :,/
· .FiB6dpi.~ ·ro.pariat{:: . :Ir ..
~~~dXlY····
· ~~t~~kdir~; ..... ' ,-. ':'"
.. '.-. -f . :'.'
FWPRDC TECHNICAL PUBLICATION N° 2
'3,305 .' 33: :' .. '
:'. :::,:,:. ''419 .. ': --2105 .
'::~:::':'?":"." .. :.:: . :.,.:}. '.::
. :,,: Paiti~py.::;:::: '':',: .. ;:.: .. : .~.~ZSp~i~
. ":' ..... :::::.:::;;i::::
SANTIAGO DECLARATION INDICATORS OF SUSTAINABILITY A VICTORIAN MONTANE FOREST AS A CASE STUDY 11
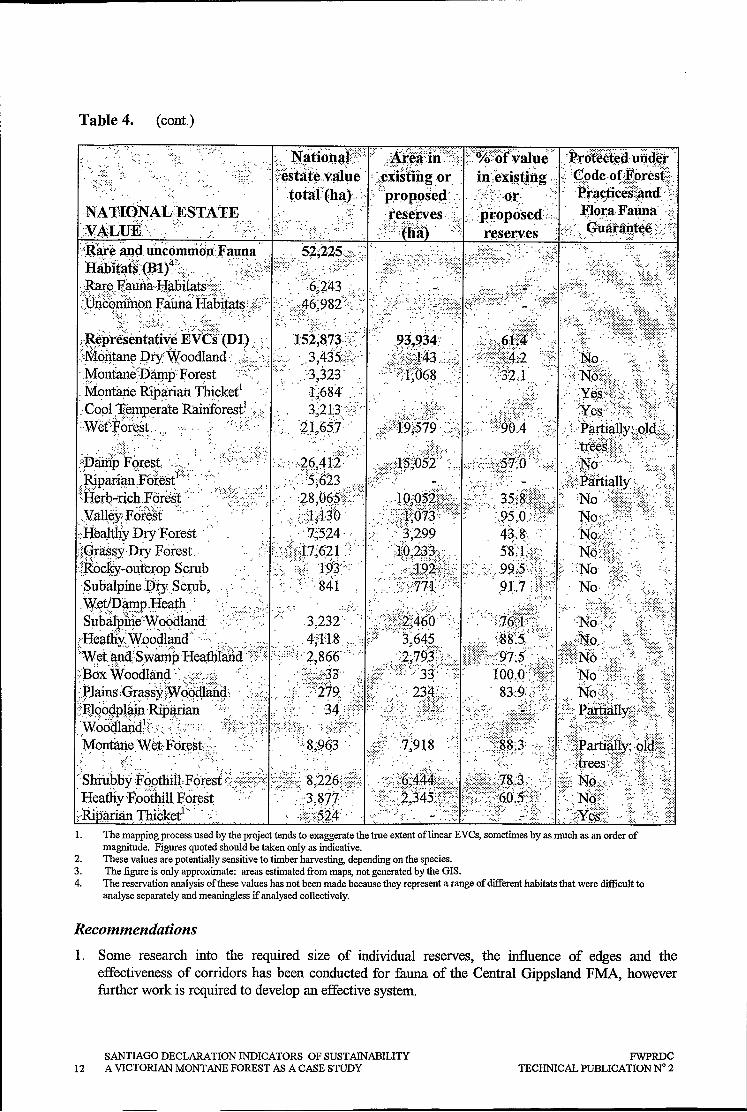
Table 4. (cont.)
".; ... .'. :~!t{;. ~~~1~;~~ ~'~~E5 ;·lI~~~· '. '.,: '.' "': .. ·(;h~tag~~).::.:::':::::
·NATIQNAli:ESTATE ·.:VALUif:·:·.·· ,'. ::-:){~r~ ~d. u:nc6mmo~:.li'auna Haolt~t~·::(B.l)4:·:::",." .' '.' .:, .. :,'. '. "\,,,;:
:!~ry~:~~;J; "~;'!!~~::~f' 93 9~ .. Montane'::Ofu)1~':Forest· '.' · ... : .. ~:~;~:it(::· ,:;,':{;;i!':~:j~~f:.· .. . 'Montarie' Riparian Thicket! t684·· .. :' :::" ·:CoolX.~!llper~te Rainforest! ':'" .3;·2g:::)F:":·· ,,::. ". ". . :: .. ·::::;:'i::ii,;:::::i:!:i;::::: :.We{foi~~~ ... ,' ":'" ',' " :Z),6~i7'" .:.:,{)':19~579· ".' .··90.4, .. ,c PartIally.:.:.QI~.".::,., ...
I~it,.·,· "., ····~:EI;7, ('~~;~~;':::~1r~ :~~~;,~: :jfealt4y DryJ'orest . ..... . . '1"524··· . >:" .' 3 299 43.:8'· . .': . No:.,>:'., . '. . '-::-." .
jSf~~t;~ ............. : ':;Jrti~2" ·.:;~~I%!1t .~~1~!i }'~r~.:,,·. ", .W~0J~p·~feat~ .: . . subii1plh,e':Woi?41and: .3,232" .
,,·HeathY':Woo4l;wd··· . :..... ' ... 4}fi.8'. ":Wet. '~~r:SwamlrHea,thiand'::'::':/:',i .' 2 866' ::.J30x SVoodltin,4 . .': .:::::::.:t":j:::',, ... . . <:;"::::~:?:f'3" )?lains:GrassY.:W9§.CUani:J, ":"'279' '.':., :::, .. , :::·F:1.90gpI~iP.·Rip~riall ".,:.:" .,.:. :( .:':.::':.' ":' 3{,=:t:'(\ :':':" .......... , .. ::., ..... :",,';:::"i:.' . ·.WOdmanqI.::::·:,,:-:, .:.:. \.':-:":" '. "" ''-':',\,',. .:. ::,,:"::::::}':"., . c.',:':', .. , ,.' .M.on~e.WetFore.st:::,.: . ":·:·:8;~6.3 .
)Shriib.bY ;P Qpthi1l., Foresl ':::;':::::;::i:::"':)':':
. Heathy'Foothm'For~st "': ... ' .. :/Ri··:a,rian. Thi~l<;etl"" ... ,
. :.
1. The mapping process used by the project tends to exaggerate the true extent oflinear EVCs, sometimes by as much as an order of magnitude. Figures quoted should be taken only as indicative.
2. These values are potentially sensitive to timber harvesting, depending on the species. 3. The figure is only approximate: areas estimated from maps, not generated by the GIS. 4. The reservation analysis of these values has not been made because they represent a range of different habitats that were difficult to
analyse separately and meaningless if analysed collectively.
Recommendations
1. Some research into the required size of individual reserves, the influence of edges and the effectiveness of corridors has been conducted for fauna of the Central Gippsland FMA, however further work is required to develop an effective system.
SANTIAGO DECLARATION INDICATORS OF SUSTAlNABILITY 12 A VICTORIAN MONT ANE FOREST AS A CASE STUDY
FWPRDC TECHNICAL PUBLICATION N° 2

2. The present system of reserves needs to be reviewed against the Federal Governments criteria for a comprehens.ive, adequate and representative system.
3. As reservation alone does not guarantee the maintenance of biodiversity, ongoing research and development of silvicultural and management systems is required
Indicator d Extent of areas by forest type in protected areas defined by age class or successional stage.
This indicator should ideally be integrated with Indicator (c) above and is considered as such in this report.
Indicator e. Fragmentation of forest types.
Fragmentation of habitat and populations can lead to local extinction, the loss of genetic diversity and a reduction in viability. The value and accuracy of any indicator measuring fragmentation is dependent on the classification and mapping of landscape units.
Fragmentation is a measure of changing landscapes ~hich requires base data against which to measure change. The current size, relative abundance and spatial distribution of successional stages of forests in the Central Highlands is already significantly altered through timber harvesting and changed fire regimes. It is therefore unsuitable as a basis against which to measure change. While pre-European distribution patterns offloristic communities (EVCs) can be modelled from environmental data layers, age classes are problematic. These need to be developed from studies on the frequencie~ and spatial patterns of fire. Additional baseline data can be derived from age and structure class maps of several water catchments protected from harvesting in the Central Highlands.
A vailable data
As well as environmental data, polygons of floristic communities, growth stages and derived fauna Habitat Classes in the Central Highlands are available on GIS for further modelling. When all are available at a scale of 1:25,000 spatial analysis to monitor fragmentation will be feasible. The indicator used would require further development, although indices (usually based on fractal analysis) are currently available (e.g. Ripple et al. 1991). Spatial values such as patch size, shape and isolation are readily determined; however, more research and development is required to interpret their ecological meanmg.
Discussion
With the age and composition of vegetation communities more precisely classified and mapped, the data is available to assess fragmentation. Monitoring fragmentation needs to address ecological as well as spatial separation, patch size and the composition of a patches matrix. The matrix of a patch determines the degree to which it acts as a barrier to gene flow and to the movement or dispersal of individuals. An extreme case is forest patches in an agricultural matrix. Most forests consist of habitat provided by vegetation of a particular floristic composition or age in a contrasting matrix. For many species the composition of the matrix (ecological isolation) is more important than its spatial dimensions. While indices of physical isolation can be derived from current spatial data bases, more knowledge of ecological processes and their scale within a forest landscape is required.
The boundaries between successional stages are also important. Sharp, linear, anthropogenic boundaries can have a significant influence on the biota of a patch. The scale of this influence is, in most cases, unknown, but it is known to vary with the composition and dynamics of its matrix.
FWPRDC SANTIAGO DECLARATION INDICATORS OF SUSTAINABILITY TECHNICAL PUBLICATION N° 2 A VICTORIAN MONT ANE FOREST AS A CASE STUDY 13
Recommendations
1. The distribution of communities and ages discussed above need to be mapped at a scale of 1 :25,000.
2. Systems for analysing fragmentation require further refinement and need to include the size, shape, and isolation of landscape components.
3. Research into the spatial requirements and the scales of isolation on the viability of species IS
required to establish standards for this indicator.
4. Research is required to determine the composition and scale of natural mosaics, particularly in relation to topographical influence. This can be used to provide objectives and models for systems of silviculture and their spatial application.
5. A spatial analysis of large areas excluded fro).n harvesting and an improved understanding of ecological processes and their scale within a forest landscape can provide a useful model for spatial planning and standards for this indicator.
lii. SPECIES DIVERSITY
Indicator a. The number of forest dependent species
This indicator is intended to directly monitor population responses of all species of flora and fauna. It requi~es quantitative surveys to be conducted periodically across species environmental and geographic ranges.
The term 'forest dependent' requires careful definition and needs to include species which extend beyond the boundaries of the Central Highlands. There are species that reside permanently or seasonally outside its boundaries yet are dependent on its resources for their existence.
Available data
In the Central Highlands (National Estate boundaries) 1,997 species of vascular plants and 426 species of vertebrate fauna have been recorded. Records of vascular plants and vertebrate fauna are stored on data bases linked to GIS "( 1.1 million flora records and 1.6 m fauna records).
The majority of both flora and fauna records from the Central Highlands are the result of specific surveys where some measure of effort (time, area, etc.) is recorded. While methods of floristic survey have remained relatively constant the methods employed for fauna censusing are varied, depending on the target taxa and project objectives. At remaining sites little data relating to forest structure or perturbation history has been collected. At 319 fauna census sites detailed structural data and some measure of age have been recorded.
Discussion
Monitoring species diversity requires a ,Standardised and quantitative assessment of species recorded across the range of environmental, successional and structural variation within the management area. While many species may be simultaneously monitored by a single method of assessment, some rare and cryptic species require specific techniques.
Although current assessment measures are quantitative, they do not provide a direct measure of population size. Natural fluctuations in populations, along with variation in seasonal activity and censusing, reduces the reliability of interpreting trends. To minimise variability strict sampling guidelines need to be adopted nationally and some baseline knowledge of natural fluctuations acquired.
SANTIAGO DECLARATION INDICATORS OF SUSTAINABILITY 14 A VICTORIAN MONT ANE FOREST AS A CASE STUDY
FWPRDC TECHNICAL PUBLICATION N° 2
In the Central Highlands, several catchments of 8,000 to 10,000 ha have remained unharvested and subject to little anthropogenic change other than four wheel drive tracks with restricted seasonal access. Such areas provide a valuable reference area against which to measure population trends of species (other than highly mobile species or those with very large home ranges). Species with low fecundity and high longevity pose the additional problem of a protracted period between cause and measured response. This can result in an inability to identify cause with the response being measured too late for ameliatorive management.
Recommendations
1. A precise definition and selection criteria for 'forest dependent' needs to be developed and applied.
2. If population trends and responses are to be monitored over the species complete range then a national, uniform monitoring system needs to be developed.
Indicator b. The status (rare, threatened, endangered or extinct) of forest dependent species at risk of not maintaining viable breeding populations, as determined by legislation or scientific assessment.
Legislative or scientific assessment defines this indicator in terms of conservation status. Its intent is valuable as a measure of population shifts of species at risk. In practice however assessment criteria are varied and, in some cases, subjective and influenced by public opinion. The identification of species at risk requires a system based on a detailed knowledge of a species ecology, threatening processes and population dynamics. Where this knowledge is lacking the precautionary principle needs to be applied in assigning conservation status. This is particularly so for 'sensitive' species dependent on the resources known or suspected as being depleted by current or future management regimes.
Population Viability Analysis (PV A) provides a useful tool for determining the risk presented to a species, but requires a knowledge of a species biology (including the spatial arrangement and interaction with sub-populations).
Available data
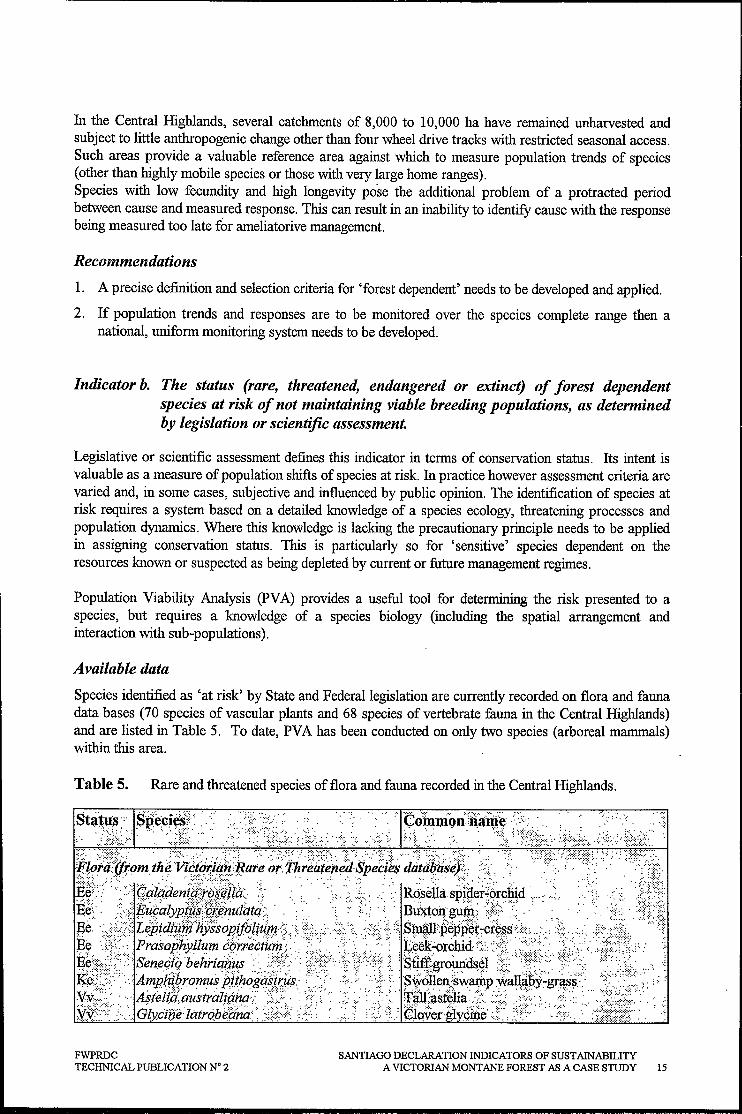
Species identified as 'at risk' by State and Federal legislation are currently recorded on flora and fauna data bases (70 species of vascular plants and 68 species of vertebrate fauna in the Central Highlands) and are listed in Table 5. To date, PVA has been conducted on only two species (arboreal mammals) within this area.
Table 5. Rare and threatened species of flora and fauna recorded in the Central Highlands.
FWPRDC SANTIAGO DECLARATION INDICATORS OF SUSTAINABILITY TECHNICAL PUBLICATION ND 2 A VICTORIAN MONT ANE FOREST AS A CASE STUDY 15
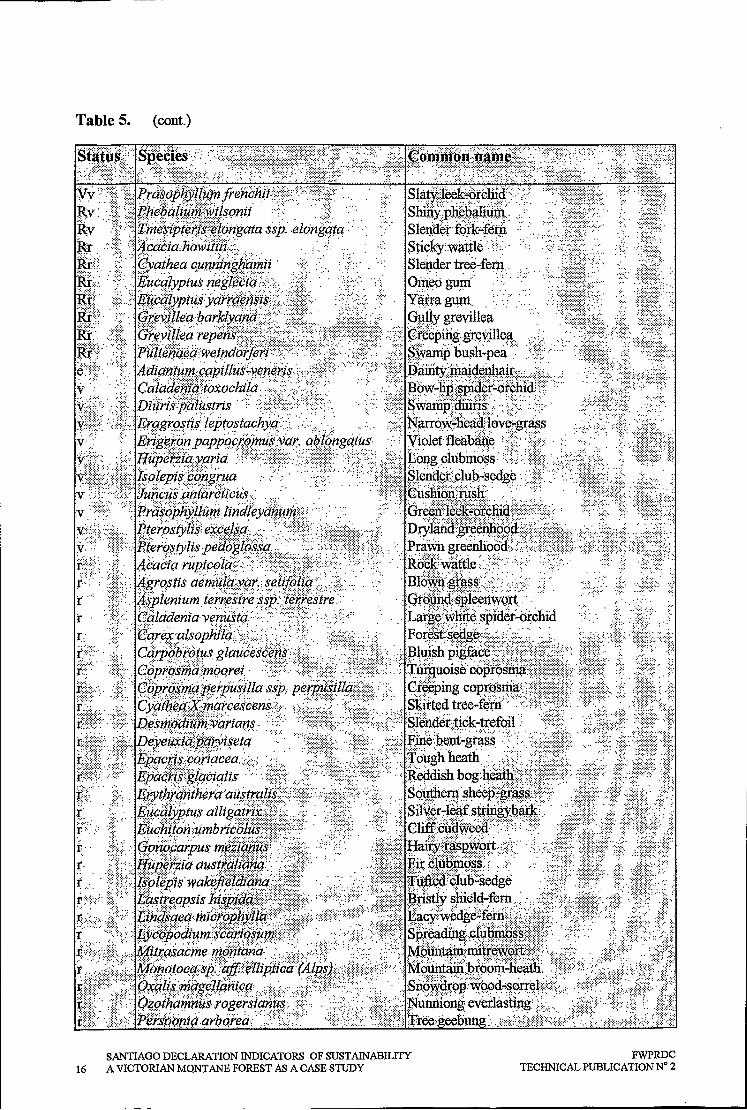
Table 5. (cont.)
SANTIAGO DECLARATION INDICATORS OF SUSTAlNABILITY 16 A VICTORIAN MONT ANE FOREST AS A CASE STUDY
FWPRDC TECHNICAL PUBLICATION N° 2
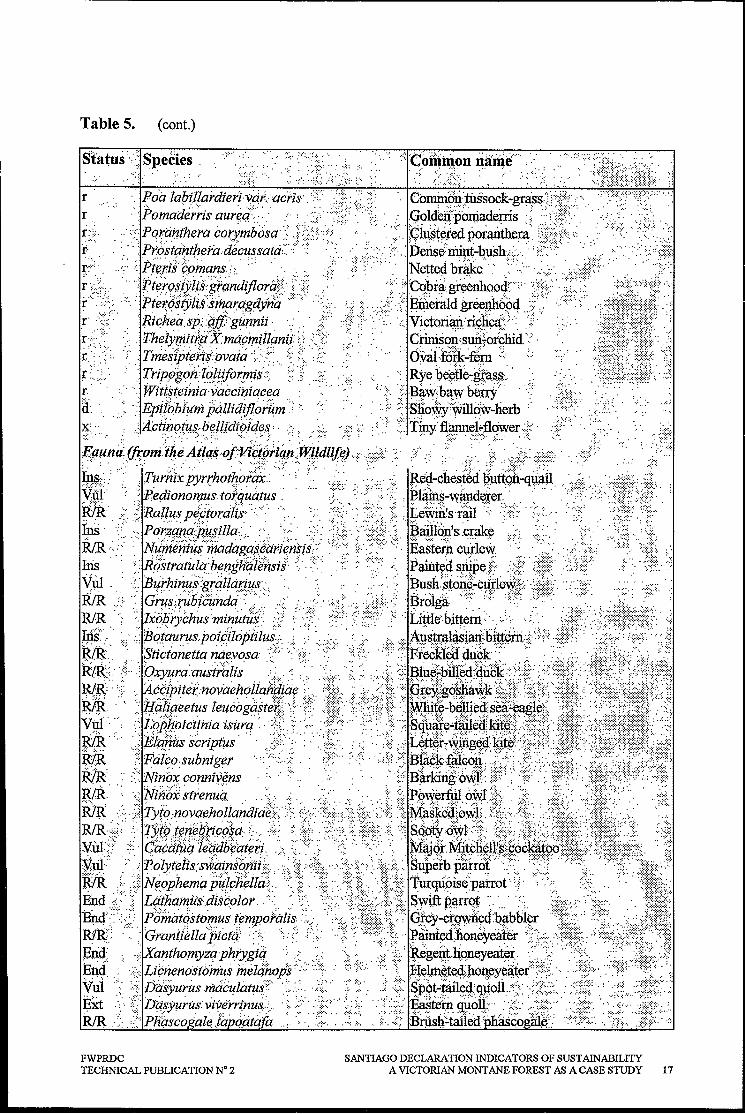
Table 5. (cont.)
Status :.;.:: Sp.eCies . :'. :',,': .'
.:::: 'Cofuitlon iianl~""" ./ ,::::. :;::::.. ., -:::'" .':. ,',
.. .... :"., .", ....
"'; .. :'::,',::.:
~ : .. Pomaderrls aurec/ .. ·.:.: .' .~~=J~=:~:~;r~s~::;~:::::~:.i·i;:!'::/ ..... r(::. '.: :::::: PQrantherCl co,y~bo~(r ::::. .. ..... : . :c.i~~t~ied poranthera··. :·:\::;::;;;::;:i·, . . :
f. .' : .. " Pf:6stantbeFa .. decussatd;·:> ..:':''':'.: ... : Deiis~{n1ini-bush"'i: .... ·· :i':':.::::"::·
r;].'.:::·.::.:: .. :,j"".\ :RF. :l::C::.;h:ie:;a:'~,::s:'P;e.·.· ... :::.aa.;:,'.E.:.a.ng"~U'·':'~n.·'dn'~l:'la.~.' ... :.·::· ... "g ..... :.::.;,'{ ii?~~I; <x
'Jp :.' ".::. VictQri@.·ti~~~a.~:::·::":.· . r:::.: .. :.:~':· <:. Theij/Jjlift:.i(X:mttrimillrmi(:::i·. .... . qini~~p'·:.suijro.r:9:bid.··.::·· f. ..::::. Tmestpiefii:,pvai~ ·: .. ·.::5::: .. \:=::::. ': .. ' . OvaHork-fem .::: .:'. . .... : r ::. :i:·· ": Trip9'goA:fo}iijonnis.:::: . :::: .. :;: .... : .;;,:: . :.: Rye l;'e~be~iif~~§·.: . r· :." ". Witisi"einic;"vaccthiacea . '::::::: . . r· :~~w:ib~w beuj/ .,.:. d ":': E ;fi/ .. ,:: 'lfdijz:"'" ':'" . :.?: :::::-:S~o~:\villo.w-herb : ~.,." ]C~~;;:~~j~~j~~m~: . . "".' ti:y,Yfl~~eri' f.allna: (frpm.th.e Atlq~.·oIvtt;tij'iiq.ll.:w.;ildlif~ .. }" .. ,..:/. :,: .:?' .. '{ .. " .... ::::i: .:::::::{::", . ~~::,,:,: :'.::: ·.:·Turfii~pyn:hotlJo;Jf·:: .:.::,-: .... :::::. ... . Re~~~hesf~~f~~tt$.t:qJ;ii·. Yii.f- ';"':: pedionon;us.-tof.qutt.tus '.' : Pl~ms-wanderer.·· .. . itiR: ...... { Rall14s pM.l"()l:dJ(s:··::.··':·· .... ;.. . :. te~~'s'~~il .'::: .. . ::::}t: ... · .:::.::.:: ..... :'.'
.>:'
~'~~G~b~d~:tHi$J" " ; y':~B';lm~l,!i. R!R .:.:;.:.. ru.~.:.ru Jcun a'· :. ',. ". ro ga .' .. ':'.:' .. : .. , R!R . ". lxqIjrychus ·minut!ts.:-:: ,::. ;:.: -: ti!tIe··bittem::,· . : . .'.-, '. i. ". . '. :::::::;/}::!i:!i!!!::i::;:',ii:::::::;(:' .:.:: 1#s:··:.·· ;::.:":': !3Q.t"a?/rus .. poic.iZoptilus.,,-.. .::::; A.ys.!Wl~iiui.Cb!rt~)::· . :.::?::.~?: .
End V~( Eit RIR .
FWPRDC TECHNICAL PUBLICATION N° 2
. : :: .. ', :','" . :·;~~;;:;~:;::i.;;:::;;:::{::··:::::::;: .'. ,,:,
SANTIAGO DECLARATION INDICATORS OF SUST AINABILITY A VICTORIAN MONT ANE FOREST AS A CASE STUDY 17
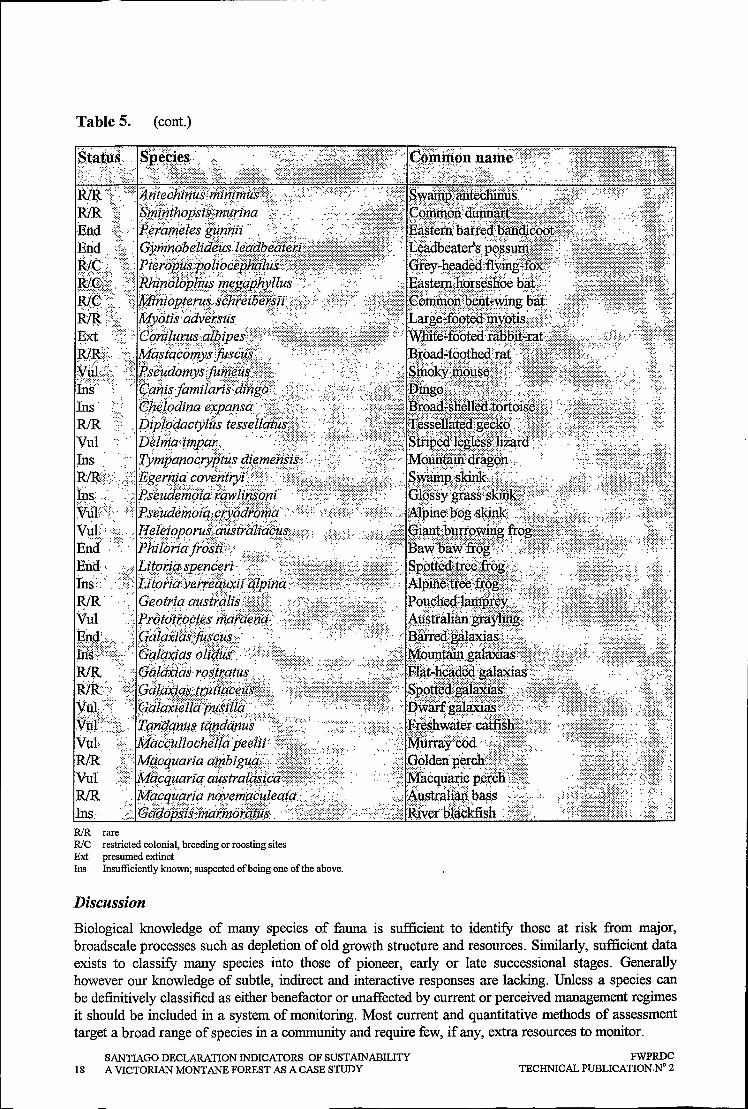
Table 5. (cont.)
R!R rare RlC restricted colonial, breeding or roosting sites Ext presumed extinct Ins Insufficiently known; suspected of being one of the above.
Discussion
Biological knowledge of many species of fauna is sufficient to identify those at risk from major, broadscale processes such as depletion of old growth structure and resources. Similarly, sufficient data exists to classify many species into those of pioneer, early or late successional stages. Generally however our knowledge of subtle, indirect and interactive responses are lacking. Unless a species can be definitively classified as either benefactor or unaffected by current or perceived management regimes it should be included in a system of monitoring. Most current and quantitative methods of assessment target a broad range of species in a community and require few, if any, extra resources to monitor.
SANTIAGO DECLARATION INDICATORS OF SUST AlNABILITY 18 A VICTORlANMONTANEFOREST AS A CASE STUDY
FWPRDC TECHNICAL PUBLICATION.N° 2

Recommendations
1. Listing of species at risk requires a scientific reassessment with any uncertainties listed until contrary data is available.
2. PVA needs to be conducted into all species at risk.
3. For species where there is insufficient information autecological studies should be conducted.
4. Systematic and periodic monitoring should be designed to census a broad range of species rather than selected 'indicator' species.
liii. GENETIC DIVERSITY'
Genetic diversity is a measure of the diversity within a species. Provided there is gene flow through meta-populations (i.e. populations are not isolated by fragmentation, etc.) it allows species to adapt to environmental shifts.
Knowledge of a species genetic diversity over its geographic and environmental range is a prerequisite to management. Species with similar reproductive strategies, longevity, etc. may have similar patterns of genetic diversity. However, for some genera such as Eucalyptus patterns are known to vary greatly between species.
Direct monitoring of the genetic diversity of many species of flora and fauna is impractical at the management unit level. A system which monitors phenotypic variation, the size of populations and the diversity of environments they occupy would be the most practical monitoring surrogate at this spatial scale. A comprehensive monitoring strategy is required if these surrogate measures are to act as indicators. Results would need to be viewed in conjunction with those of landscape and fragmentation monitoring. Although no measure of phenotypic variation is conducted in the Central Highlands, several recognised sub-species of plants are recorded. Current censusing of flora and fauna species is designed to meet the objectives of specific projects and is not stratified to sample the range of environmental variables required for this criterion.
Indicator a. Number of forest dependent species that occupy a small portion of their former range.
This indicator is intended to monitor and identify species with their gene pool depleted through a contraction of geographic range.
'Former range' is the standard against which to measure change and is assumed to be a species preEuropean distribution for which our current knowledge is imprecise. Further GIS mapping of environmental variables and habitat modelling would increase the reliability of predicted pre-European distributions. More recent declines in distribution may be indicated by flora and data bases although the methods, temporal and spatial pattern of survey effort were not designed for this purpose.
Recommendations
1. A standardised monitoring strategy needs to be developed and applied over the complete former range (including isolates) of each species.
2. Pre- European patterns of distribution need to be determined from predictive models for each species.
FWPRDC SANTIAGO DECLARATION INDICATORS OF SUSTAINABILITY TECHNICAL PUBLICATION N° 2 A VICTORIAN MONT ANE FOREST AS A CASE STUDY 19
Indicator b. Population levels of representative species from diverse habitats monitored across their range.
The diversity of environments to which a species is adapted reflects changes in the frequency of alleles and provides an indication of genetic diversity. The selection of 'representative' species is a complex issue requiring careful and explicit definition of objectives and criteria.
While flora and fauna sampling in the Central Highlands has been intense it has not been evenly distributed across all environmental gradients. Inconsistencies in sampling standards means much data cannot be directly used for the quantitative monitoring of shifts or absolute population size.
This is a potentially valuable indicator but it requires the development of a uniform monitoring strategy across the complete environmental range of a species former distribution. Careful consideration is required in defining the objectives and criteria for selecting 'representative' species.
Recommendations
1. Develop a uniform system of stratifying sampling across the complete environmental range determined for each species. This requires the development of predictive habitat models and the mapping of environmental variables as discussed above.
2. Systems of monitoring should include the identification and recording of recognised sub-species and forms.
CRITERION 2: MAINTENANCE OF PRODUCTIVE CAPACITY OF FOREST ECOSYSTEMS
This criterion is applied mainly to timber production management units, 'principally the Neerim Operations Area and the Central Gippsland FMA, since this is the level at which the information is utilised rather than at the biogeographic level. Indicators for this criterion are a combination of resource statements which can act as indicators of temporal changes in the forested land base and which are also important for interpretation of 'subsequent information/indicators, and indicators which relate to the performance of the forest management agency with regard to their objectives. Basic resource indicators are particularly important in systems where other indicators are expressed as proportions. The ability of forest managers to satisfy their quantitative objectives, such as managing for nondeclining wood-flows in an orderly transition to long-term sustainable yield, may be an important indicator of continuing confidence in their ability to manage for other values which are less easily quantified.
Indicator a. Area of forest land and net area of forest land available for timber production.
'Forest land' is defined as all land within the relevant area where the vegetation class is mapped as forest (GIS layer SVEG 100). This inCludes forest areas other than those defined as State Forest. Gross productive area is the area available and suitable for timber harvesting, while 'net area of forest land available for harvesting' is defined as the area available and suitable for timber harvesting after the 'gross productive area' has been adjusted for prescriptive exclusions (see Pearson and Featherston 1992). This definition is the basis of current sustainable yield calculations for Victorian forests.
SANTIAGO DECLARATION INDICATORS OF SUSTAINABILITY 20 A VICTORIAN MONT ANE FOREST AS A CASE STUDY
FWPRDC TECHNICAL PUBLICATION N" 2
These indicators can be applied to any area but they are only interpretable and meaningful at a large scale; possibly an area from which wood is supplied continuously over a rotation or an area managed as a long-term sustainable yield unit, such as a FMA. .
A vailable data
At the FMA level, information on these indicators is available through the Hardwood Resource Information System (RARIS), a computer database which provides access to resource information. HARIS stores data at a stand level and includes such information as Forest Type and associated level of productivity, total, gross productive and net productive areas, age of forest and either a statement of the current standing volume sawlog and roundwood (derived either from resource assessment programs or comparison with harvested volumes from nearby areas) or, in the case of regrowth, standing volume of sawlog estimated for a specified age. Current standing volume of sawlog and roundwood is also given for regrowth stands which are considered to contain merchantable timber.
The determination of net area available for timber harvesting is done on a compartment basis through the application of minimum stream and other protective buffers, exclusion of steep areas (greater than 30°) and other non-productive areas such as rock outcrops. However, this process is based on a combination of Aerial Photograph Interpretation (API) and existing maps, which are not consistent in identifying such features, consequently overestimation of available area is common. This net area is sometimes adjusted by means of locally derived correction factors, usually based on experience in nearby stands or compartments.
The information in HARIS is updated periodically to account for changes in forest area, composition or age class due to harvesting and regeneration, loss of resource through fire or other agent, changes in resource due to land use decisions and new data derived from assessments. The last review in Central Gippsland FMA was completed in 1991, incorporating changes due -to harvesting up to 1988. The HARIS data for Central Gippsland FMA is detailed in Wiseman and Featherston (1991).
CNR has recognised many of the short cornings of the HARIS database and has embarked on a program of improving and refining forest resource data, mainly through the establishment of the Statewide Forest Resource Inventory (SFRI). The mission statement for the SFRI is:
To provide Forest Managers with a reliable and complete set of forest resource information which is required to make informed decisions on sustainable yields and forest resource allocations, and which is accurate, timely and standardised.
Specific goals for the program include publishing a complete inventory of Victoria's public forest resource by June 1997, including a measure of precision on all estimates and providing all of the resource information required to review the sustainable yields in all FMAs by June 1996.
The SFRI program is based on API combined with field checking. Stands will be classified on the basis of:
• species (up to four eucalypt species, by percentages greater than 25%); • non-eucalypt category in some cases; • eucalypt crown cover class; • eucalypt crown form class; • current height class; and • year of origin.
FWPRDC SANTIAGO DECLARATION INDICATORS OF SUST AINABILITY TECHNICAL PUBLICATION N° 2 A VICTORIAN MONTANE FOREST AS A CASE STUDY 21
Stand mapping will be stored as a GIS layer (FOREST 25) using Arc Infotm. The GIS layer will be at a scale of 1:25,000 for all forest blocks with an estimated net available forest area of more than 100 ha. The minimum mappable area will generally be 5 ha, which is equivalent to an error tolerance of ± 10%. Other areas will be mapped at 1:100,000.
The determination of net area available for timber production, currently based on available information in HARlS will be done using GIS overlays of information such as land tenure, land use, steep and rocky reserves, wildlife corridors, etc. An exclusions layer will be compiled for each block which will then be checked for accuracy and correctness. This will be overlaid with the forest stand coverage and a statement of net av;Ulable forest area generated.
While this program is still in process it is not possible to assess .the outcome. However, capture and storage of the spatial data, at an appropriate scale such as that envisaged, in a computerised GIS should provide a suitable level of information to satisfy the requirements of the indicator.
The FOREST 25 layer will be complemented by a utilisation history layer based on harvesting records. The resource information will be integrated with the Coupe Management System (CMS, a personal computer based resource management and coupe tracking system) over the next three to five years.
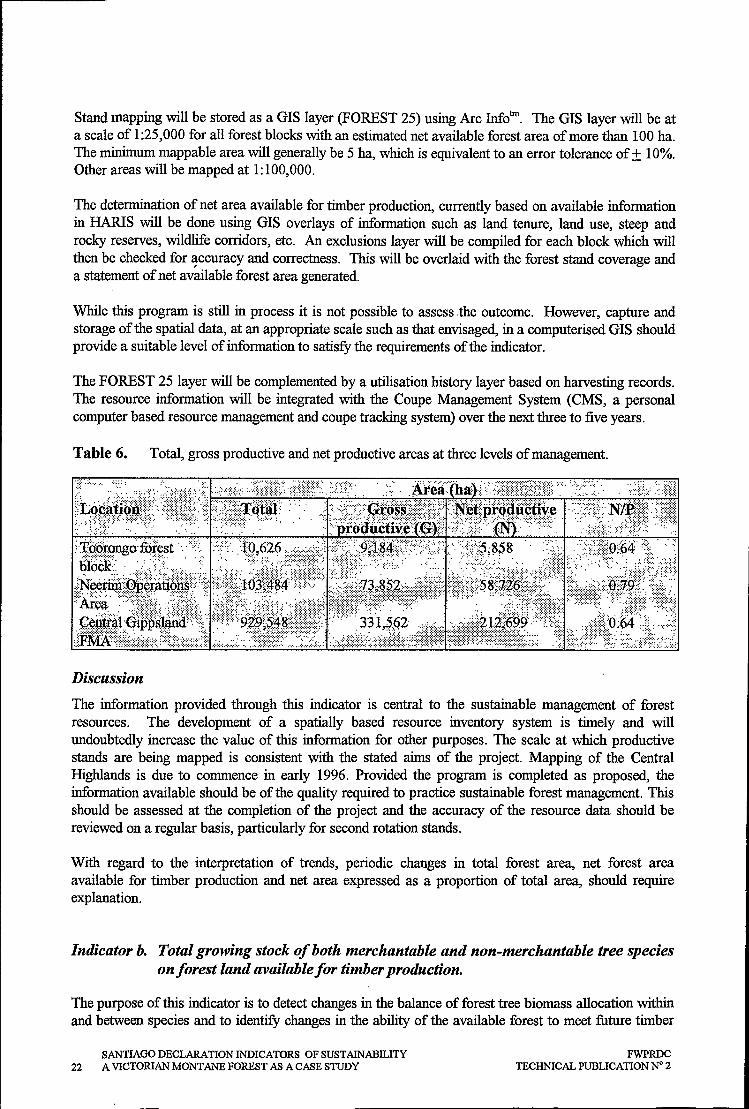
Table 6. Total, gross productive and net productive areas at three levels of management.
)(. :: ...... '. ':':.:.::. ::: ... :: .... :.::: ::.:':::::::.::: ': .. :::' . ::;:: ... ::::::;=; .. :: .. '. :-:,:. . . i\rea::·· .. ha· .:~: ·{"·::;:::::If:r~::;:;:§():::::; :.:.:. ::::::::::::: ... :::..... .::.: i~:~~~:~::
f:~~$'I!I'ftl<t5!it~' . ~ G~lvlfJi :~~<tl~ ·:':l;~~"; • ......... .... : .. : .. , ..... : .......... ':" .
. .... : .. :.
Discussion
The information provided through this indicator is central to the sustainable management of forest resources. The development of a spatially based resource inventory system is timely and will undoubtedly increase the value of this information for other purposes. The scale at which productive stands are being mapped is consistent with the stated aims of the projept. Mapping of the Central Highlands is due to commence in early 1996. Provided the program is completed as proposed, the information available should be of the quality required to practice sustainable forest management. This should be assessed at the completion of the project and the accuracy of the resource data should be reviewed on a regular basis, particularly for second rotation stands.
With regard to the interpretation of trends, periodic changes in total forest area, net forest area available for timber production and net area expressed as a proportion of total area, should require explanation.
Indicator b. Total growing stock of both merchantable and non-merchantable tree species on forest land available for timber production.
The purpose of this indicator is to detect changes in the balance of forest tree biomass allocation within and between species and to identify changes in the ability of the available forest to meet future timber
SANTIAGO DECLARATION INDICATORS OF SUST AINABILITY 22 A VICTORIAN MONTANE FOREST AS A CASE STUDY
FWPRDC TECHNICAL PUBLICATION N° 2
supply requirements. It may also be important here to detect harvested or otherwise disturbed areas that are not regenerated. It is applicable to an area managed as a long-term sustainable yield unit, otherwise fluctuations may be large and non-interpretable.
The units for expressing 'growing stock' may need to be refined. Resource information and stand growth rates are not defined for individual tree-species as such. In this case study area, growing stock of 'merchantable tree species' is defined as:
• area (ha) and standing volume of merchantable species (m3) of each Forest Type by year of origin
(10 yearly intervals).
Available data
Growing stock
Growing stock information by Forest Type is currently available from the compartment level upwards on the HARIS database. The source of 'growing stock' data in the HARIS database varies and each record is coded according to the level of reliability.
Standing volume is expressed as the estimated volume of sawlog and roundwood3 for mature/over mature forest areas and as the potential yield of C+ sawlog4 per ha at a specified age for regrowth stands (rotation age).
In general, standing volume estimation of M/OM is by a combination of stand classification and application of volume out-turns from forests of similar classification. It has a low level of reliability consistent with its being of lesser importance in a timber production context.
In the productive even-aged regrowth forests, the classification of stands is comprehensive, with definition on the basis of age, species, height and density. This data is used in the stand growth model STANDSIM (Opie 1972) to predict future volumes.
In uneven aged regrowth mixed species forests, determination of stand volume is by stand classification and periodic increment as determined using a series of continuous forest inventory plots.
The reliability of the information available on standing volumes increases with the productivity of the Forest Types and their contribution to future yields. The expression of regrowth stands as potential yield at a specified age is likely to be an acceptable alternative to standing volume estimates for these stands as this is more meaningful.
Proposals currently under consideration in the SFRI process would result in complete re-evaluation of standing volume estimates for all Forest Types with relatively high accuracy, although the actual level of accuracy would vary at a local level with the economic importance of individual Forest Types. All stand classes, as defined in the Stand class definitions and polygon labeling gUidelines for the SFRl (Elliot 1994), other than very rare classes, would be sampled. Sampling would be model based and enable the development of yield verses age curves. ST ANDSIM would be used to make growth predictions for the ash species group while the development of more complex models for mixed species forest would be addressed by a separate long-term project. Data collection would be designed to enable 'Whole Tree Mapping,5 to overcome the shortcomings inherent in the use of contemporary utilisation standards.
1 Roundwood in this instance includes all wood graded below C grade sawlogs (e.g. D grade logs, pUlpwood). 4 Sawlogs are graded from A (high grade) to D (Iow grade) according to size and quality. 5 TREEMAP, Irvine (1995).
FWPRDC SANTIAGO DECLARATION INDICATORS OF SUSTAINABILITY TECHNICAL PUBLICATION N° 2 A VICTORIAN MONT ANE FOREST AS A CASE STUDY 23

Providing this program is carried out as proposed, the level of information available on standing volume from the stand level upwards will satisfy the requi~ements for the indicator although the stand classification may not be fully compatible with other "Forest Type" classifications which put an emphasis on non-eucalypt elements. In particular, the Stand Classification system in FOREST 25 focuses entirely on describing the eucalypt component of the forest. Since "non-merchantable" is almost synonymous with "non-eucalypt", this part of the indicator will not be available through either of these sources. Depending on the definition of growing stock some estimate may be extrapolated through mapping of floristic communities. This would require mapping to the forest sub-type level at least.
Regeneration
It is fundamental to the sustainable management of forests that areas from which wood is removed are regenerated or otherwise adequately stocked. Reduction in standing volumes over time might indicate failure to regenerate, however it could possibly be due to other factors such as soil compaction. An indicator which demonstrated that cutover areas were regenerated or otherwise adequately stocked would be of value ill interpreting other indicators and would also have the benefit of initiating early remedial action.
Regeneration or stocking surveys are prescriptive following harvesting of native forests in Victoria. These are carried out according to a standard methodology (Dignan 1995). Stocking standards are not yet Forest Type specific, but a research program with this objective is currently under way. A formal, centralised reporting process has recently been introduced and annual figures produced, providing summary details down to the Operations Area level.
Regeneration or stocking surveys are prescriptive following harvesting of native forests in Victoria. These are carried out according to a standard methodology (Dignan 1995). Stocking standards are not yet Forest Type specific, but a research program with this objective is currently under way. A formal centralised reporting process has recently been introduced and annual figures produced, providing summary details down to the Operations Area level.
A suitable indicator for regeneration success would be a periodic comparison of the area successfully regenerated with the area harvested. A period of five years is suggested in order to smooth the effect of occasional poor years, but still give early indication of problems.
Discussion
This indicator as expressed is closely linked to Indicator (d), Criterion 2 and the potential for alternative/complementary indicators is discussed following consideration of Indicator (d). Integral to this indicator is a demonstration that the forest is being managed to an explicitly defined set of objectives, in most cases that of sustained wood flows, of a stated quality, in the context of multiple use management. While this is dealt with in Indicator (d) this indicator can be useful in demonstrating that progress is being made towards a balanced forest, where stands are harvested at a nominated rotation age, and that periodic sustained yields are achievable. Once this point is reached, this indicator and Indicator (d) can probably be combined as it will be transparent as to whether or not periodic forest growth is exceeded by removal. The alternative indicator might then be:
" period removal/periodic increment; or • area harvested / (area available / weighted rotation age).
SANTIAGO DECLARATION INDICATORS OF SUSTAINABILITY 24 A VICTORIAN MONT ANE FOREST AS A CASE STUDY
FWPRDC TECHNICAL PUBLICATION N° 2
Indicator c. The area and growing stock of plantations of native and exotic species.
Similar to the previous indicator for plantations on public land. Plantations on public land are managed by the Victorian Plantations Corporation, a State Owned Business. Resource information is available through the Forest Resource Inventory and Yield Regulation database and is of a suitable scale and quality to satisfy this indicator. There are no substantial plantations on private land within the Central Highlands or Neerim Operations Area. There are some softwood and hardwood plantations established on abandoned or low quality agricultural land in the Central Gippsland FMA, either owned by or managed by/for Australian Paper Manufacturers Forests Pty (APMF). Detailed resource data for these plantations are held by APMF.
Indicator d Annual removal of wood products compared to the volume determined to be sustainable.
The removal of all wood products from crown land is regulated by CNR and records are maintained at the FMA level, although there is no determination of sustainable yield for products other than sawlogs in the Central Gippsland FMA. Sustainable yield of grade C and better sawlogs (C+) is calculated on an FMA basis, other products (e.g. grade D sawlogs and residual roundwood) being considered as byproducts of sawlog harvesting and their yield derived from C+ sustainable yields. The objectives associated with the implementation of sustainable yield for Central Gippsland FMA are outlined in Pearson and Featherston (1992).
Sustainable yields for Central Gippsland FMA are determined on a periodic basis (15 year intervals)6 and the indicator definition should reflect this, particularly as annual removal can vary greatly depending on factors such as inclement weather and demand for sawn timber. The periodic sustainable yield also changes as the resource is moved towards a balanced forest where all stands are harvested at their nominated rotation age. Currently the Central Gippsland FMA forests are a mix of mature/over-mature stands and regrowth stands resulting from wildfire, mainly the 1939 fires. The current harvesting strategy is aimed at achieving long-term sustainable yield by the year 2062 by staged increases in periodic volumes harvested to achieve a smooth and progressive release of additional timber. The indicator should therefore reflect the sustainable yield for the period of measurement.
Ideally, the indicator used should include all wood products removed from the available area. However, removal of products such as firewood and posts are minor in the case study areas and not likely to have any impact on the productive capacity of the forest. Since the forests are managed for sawlog production, sustainable yields are not determined for residual roundwood, which is produced as a byproduct. However, since this component can be quite large it should be included in some aspect of any indicator. Sustainable yield calculations based on a product category may also not be appropriate as a long-term trend indicator since it may be subject to change. Two alternative indicators are considered in this case study, defined as:
• Total volume removed, including residual roundwood (m3)/sustainable yield of C+ for that period. • Volume of C + sawlogs removed/sustainable yield of C + for that period.
This indicator is only applicable to an area managed as a sustainable yield unit, such as an FMA.
6 15 year periods coincide with sawlog licensing periods.
FWPRDC SANTIAGO DECLARATION INDICATORS OF SUSTAINABILITY TECHNICAL PUBLICATION N° 2 A VICTORIAN MONT ANE FOREST AS A CASE STUDY 25
A vailable data
The calculation of sustainable yields for the Central Gippsland FMA is described in Featherston (1992) and Pearson and Featherston (1992). The objective guiding the process is stated in Featherston (1992) as:
To maximise the sawlog availability in period 1 (1987-2002), up to 183;000m3 C+ sawlogs, whilst ensuing a non-declining availability of sawlogs from each of the following sources: native ash forests, plantations, and mixed species forests, by controlling the annual volume harvested, with staged increases to intermediate volumes, until long-term sustainable yield is reached in the year 2062. "
This is extended to include the development of a balanced age class distribution throughout the forest (Pearson and Featherston 1992).
The calculations are l;>ased on data for net productive forest area; Forest Type, growth projections and standing volumes as detailed in the HARIS database. Limitations in the data "used for calculation and in the models used for prediction are discussed in Featherston (1992) and Pearson and Featherston (1992). In general, estimates for the Mountain Ash and Shining Gum Forest Type are believed to be relatively accurate, this Forest Type having been the subject of a number of detailed assessments. The other Forest Type growth estimates are not considered to have a high level of accuracy or reliability.
The" State Government legislation pertaining to sawlog supply levels [Forest (Timber Harvesting) Act, 1990], requires that sustainable yield levels be reviewed every five years from 1991. The next review is expected to result in major changes due to a change in calculation methodology. Specifically, the SFRI process will refine the current Forest Types classification, as discussed earlier, and the estimation of standing volume and predicted growth. This information will be processed using linear programming (FORPLAN) and periodic wood flows and long-term sustainable yield recalculated to optimize forest productivity for a range of values including timber. This will be undertaken as part of the production of the Central Gippsland FMA Management Plan.
Currently there is a disparity between sustainable yield and allocated wood flows, although sustainable yield is under review. hnprovement in estimation is expected to result from a more accurate base map/database, improved estimation of cut over areas and improved information exchange.
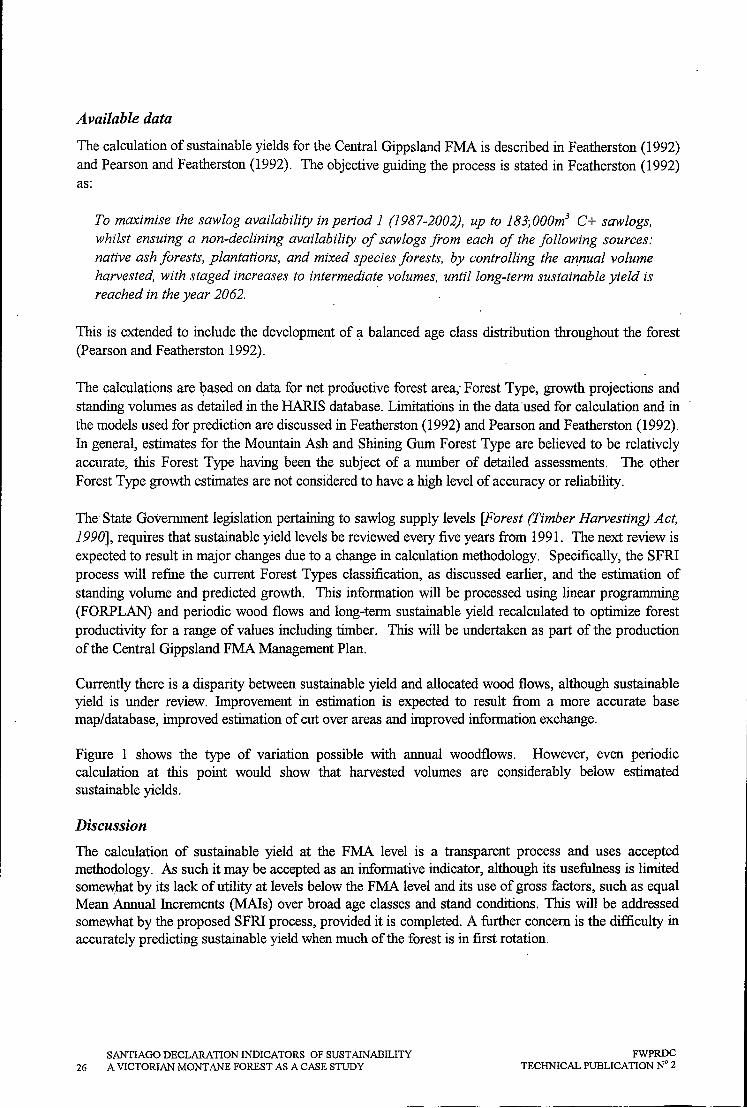
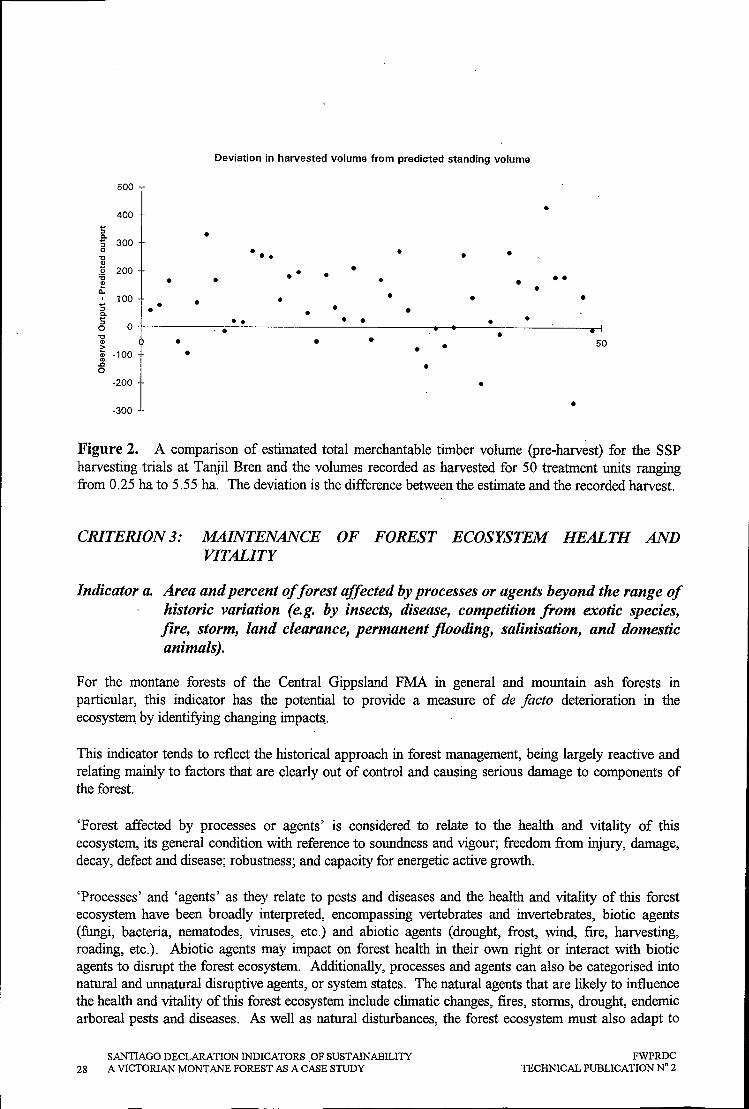
Figure 1 shows the type of variation possible with annual woodflows. However, even periodic calculation at this point would show that harvested volumes are considerably below estimated sustainable yields.
Discussion
The calculation of sustainable yield at the FMA level is a transparent process and uses accepted methodology. As such it may be accepted as an informative indicator, although its usefulness is limited somewhat by its lack of utility at levels below the FMA level and its use of gross factors, such as equal Mean Annual Increments (MAIs) over broad age classes and stand conditions. This will be addressed somewhat by the proposed SFRI process, provided it is completed. A further concern is the difficulty in accurately predicting sustainable yield when much of the forest is in first rotation.
SANTIAGO DECLARATION INDICATORS OF SUST AINABILITY 26 A VICTORIAN MONT ANE FOREST AS A CASE STUDY
FWPRDC TECHNICAL PUBLICATION N° 2
Harvested volume compared to Sustainable Yield: CGFMA
250
200
o o ::: 150
~
<:-E 100 ::i u
50
-- Harvested
-0- Sustainable
o +-----~-----r-----+----_+----~------r_--~ 1988 1989 1990 1991 1992 1993 ' 1994 1995
Year
Figure 1. Annual production of merchantable timber in the Central Gippsland FMA for the period 1988 to 1991.
An alternative or complementary indicator with utility at all levels relates to the accuracy of the data underlying the process. A comprehensive recording process exists for product output at the coupe level. Comparison of this with predicted volumes would enable accurate local evaluation of growing stock estimates and could easily be carried out. It would also have the advantage of accomodating review of sustainable yield estimates.
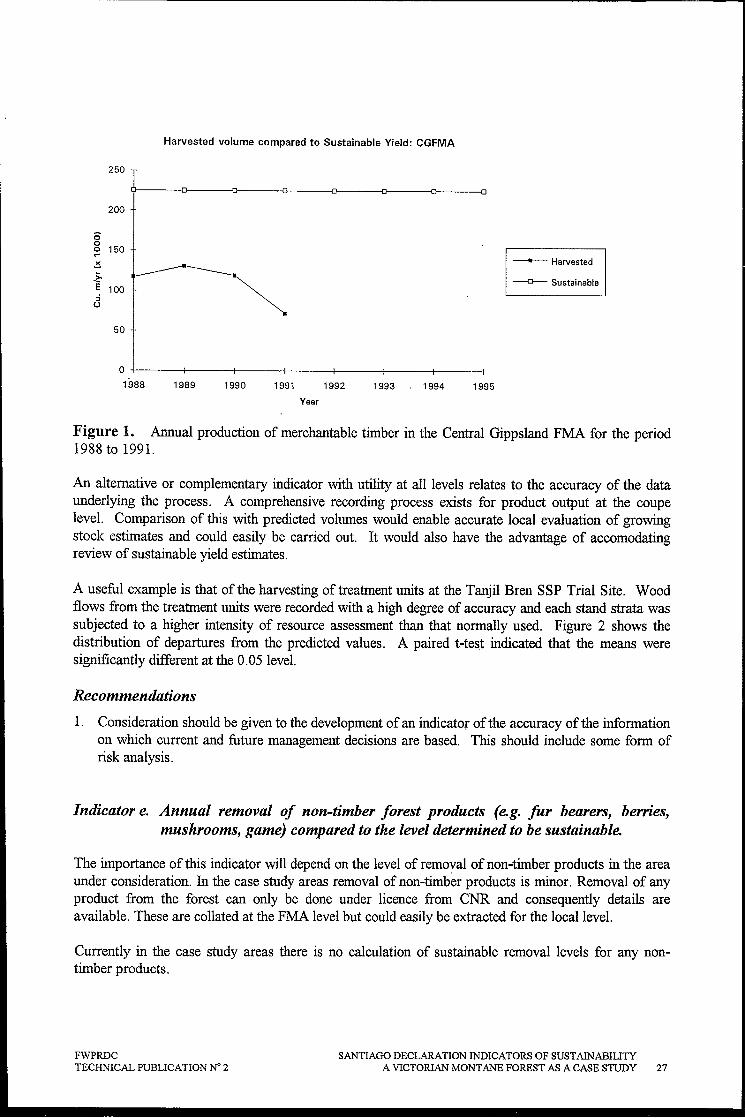
A useful example is that of the harvesting of treatment units at the Tanjil Bren SSP Trial Site. Wood flows from the treatment units were recorded with a high degree of accuracy and each stand strata was subjected to a higher intensity of resource assessment than that normally used. Figure 2 shows the distribution of departures from the predicted values. A paired t-tes,t indicated that the means were significantly different at the 0.05 level.
Recommendations
1. Consideration should be given to the development of an indicator of the accuracy of the information on which current and future management decisions are based. This should include some form of risk analysis.
Indicator e. Annual removal of non-timber forest products (e.g. fur bearers, berries, mushrooms, game) compared to the level determined to be sustainable.
The importance of this indicator will depend on the level of removal of non-timber products in the area under consideration. In the case study areas removal of non-timber products is minor. Removal of any product from the forest can only be done under licence from CNR and consequently details are available. These are collated at the FMA level but could easily be extracted for the local level.
Currently in the case study areas there is no calculation of sustainable removal levels for any nontimber products.
FWPRDC SANTIAGO DECLARATION INDICATORS OF SUSTAINABILITY TECHNICAL PUBLICATION N° 2 A VICTORIAN MONT ANE FOREST AS A CASE STUDY 27
Deviation in harvested volume from predicted standing volume
500
• 400 ... :> • c-S 300 0
"t> • • • • • • ~ 200 '5 • • ., • •• • • • •• .t
100 • ... • :> • B- •• :> 0 0 • "t> • .,
2: -100 • .,
'"
• • • • • • • • • • • • • • • 50 • •
.c 0 •
-200 • • -300
Figure 2. A comparison of estimated total merchantable timber volume (pre-harvest) for the SSP harvesting trials at Tanjil Bren and the volumes recorded as harvested for 50 treatment units ranging from 0.25 ha to 5.55 ha. The deviation is the difference between the estimate and the recorded harvest.
CRITERION 3: MAINTENANCE OF FOREST ECOSYSTEM HEALTH AND VITALITY
Indicator a. Area and percent of forest affected by processes or agents beyond the range of historic variation (e.g. by insects, disease, competition from exotic species, fire, storm, land clearance, permanent flooding, salinisation, and domestic animals).
For the montane forests of the Central Gippsland FMA in general and mountain ash forests in particular, this indicator has the potential to provide a measure of de facto deterioration in the ecosystem by identifying changing impacts ..
This indicator tends to reflect the historical approach in forest management, being largely reactive and relating mainly to factors that are clearly out of control and causing serious damage to components of the forest.
'Forest affected by processes or agents' is considered to relate to the health and vitality of this ecosystem, its general condition with reference to soundness and vigour; freedom from injury, damage, decay, defect and disease; robustness; and capacity for energetic active growth.
'Processes' and 'agents' as they relate to pests and diseases and the health and vitality of this forest ecosystem have been broadly interpreted, encompassing vertebrates and invertebrates, biotic agents (fungi, bacteria, nematodes, viruses, etc.) and abiotic agents (drought, frost, wind, fire, harvesting, roading, etc.). Abiotic agents may impact on forest health in their own right or interact with biotic agents to disrupt the forest ecosystem. Additionally, processes and agents can also be categorised into natural and unnatural disruptive agents, or system states. The natural agents that are likely to influence the health and vitality of this forest ecosystem include climatic changes, fires, storms, drought, endemic arboreal pests and diseases. As well as natural disturbances, the forest ecosystem must also adapt to
SANTIAGO DECLARATION INDICATORS .OF SUSTAINABILITY 28 A VICTORIAN MONT ANE FOREST AS A CASE STUDY
FWPRDC TECHNICAL PUBLICATION N" 2
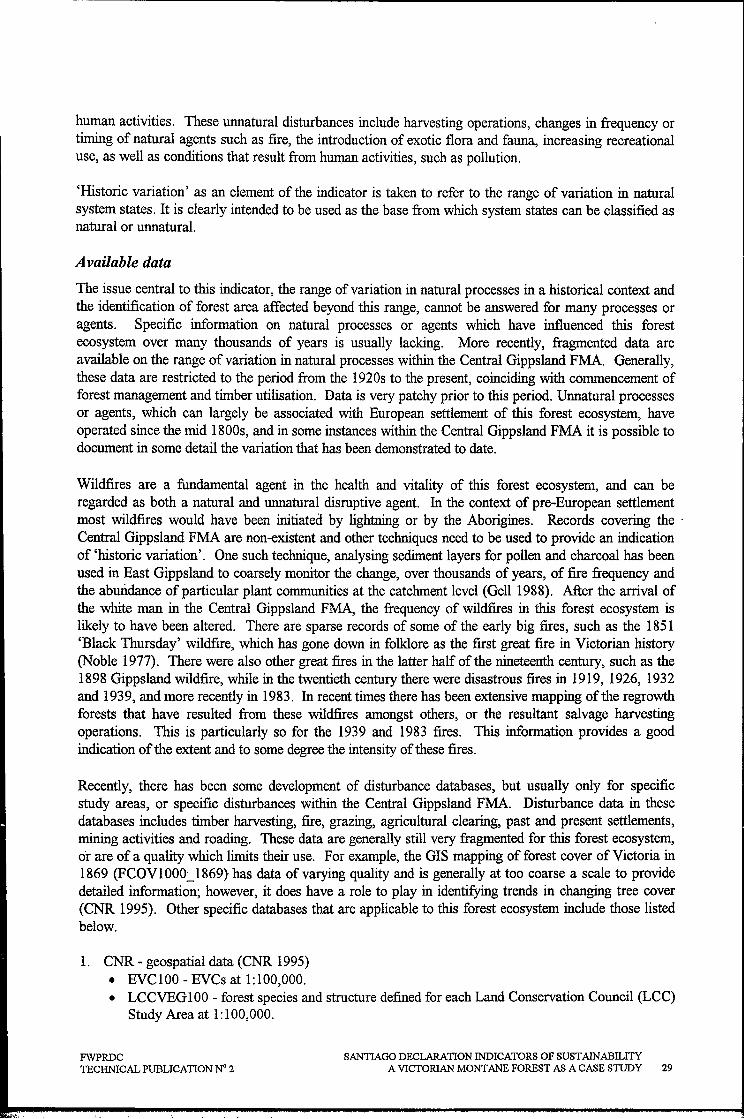
human activities. These unnatural disturbances include harvesting operations, changes in frequency or timing of natural agents such as fire, the introduction of exotic flora and fauna, increasing recreational use, as well as conditions that result from human activities, such as pollution.
'Historic variation' as an element of the indicator is taken to refer to the range of variation in natural system states. It is clearly intended to be used as the base from which system states can be classified as natural or unnatural.
A vailable data
The issue central to this indicator, the range of variation in natural processes in a historical context and the identification of forest area affected beyond this range, cannot be answered for many processes or agents. Specific information on natural processes or agents which have influenced this forest ecosystem over many thousands of years is usually lacking. More recently, fragmented data are available on the range of variation in natural processes within the Central Gippsland FMA. Generally, these data are restricted to the period from the 1920s to the present, coinciding with commencement of forest management and timber utilisation. Data is very patchy prior to this period. Unnatural processes or agents, which can largely be associated with European settlement of this forest ecosystem, have operated since the mid 1800s, and in some instances within the Central Gippsland FMA it is possible to document in some detail the variation that has been demonstrated to date.
Wildfires are a fundamental agent in the health and vitality of this forest ecosystem, and can be regarded as both a natural and unnatural disruptive agent. In the context of pre-European settlement most wildfires would have been initiated by lightning or by the Aborigines. Records covering the . Central Gippsland FMA are non-existent and other techniques need to be used to provide an indication of 'historic variation'. One such technique, analysing sediment layers for pollen and charcoal has been used in East Gippsland to coarsely monitor the change, over thousands of years, of fire frequency and the abundance of particular plant communities at the catchment level (Gell 1988). After the arrival of the white man in the Central Gippsland FMA, the frequency of wildfires in this forest ecosystem is likely to have been altered. There are sparse records of some of the early big fires, such as the 1851 'Black Thursday' wildfire, which has gone down in folklore as the first great fire in Victorian history (Noble 1977). There were also other great fires in the latter half of the nineteenth century, such as the 1898 Gippsland wildfire, while in the twentieth century there were disastrous fires in 1919, 1926, 1932 and 1939, and more recently in 1983. In recent times there has been extensive mapping of the regrowth forests that have resulted from these wildfires amongst others, or the resultant salvage harvesting operations. This is particularly so for the 1939 and 1983 fires. This information provides a good indication of the extent and to some degree the intensity of these fires.
Recently, there has been some development of disturbance databases, but usually only for specific study areas, or specific disturbances within the Central Gippsland FMA. Disturbance data in these databases includes timber harvesting, fire, grazing, agricultural clearing, past and present settlements, mining activities and roading. These data are generally still very fragmented for this forest ecosystem, or are of a quality which limits their use. For example, the GIS mapping of forest cover of Victoria in 1869 (FCOV 1 000: .. ) 869} has data of varying quality and is generally at too coarse a scale to provide detailed information; however, it does have a role to play in identifying trends in changing tree cover (CNR 1995). Other specific databases that are applicable to this forest ecosystem include those listed below.
1. CNR - geospatial data (CNR 1995) • EVC100 - EVCs at 1:100,000. • LCCVEG 1 00 - forest species and structure defined for each Land Conservation Council (LCC)
Study Area at 1:100,000.
FWPRDC SANTIAGO DECLARATION INDICATORS OF SUSTAlNABILITY TECHNICAL PUBLICATION N° 2 A VICTORIAN MONT ANE FOREST AS A CASE STUDY 29
• SVEG 1 00 - structural vegetation mapping based on LCC vegetation classification scheme, nominal input at 1:25,000, 1:50,000, 1:63,360.·
• TREE100_90 - tree coverage in 1990 at 1:100,000. • TREE 1 00_9093 - tree coverage in 1990 and 1993 at 1: 100,000. • FCOV500_7287 - forest cover changes from 1972 at 1:500,000. • STAG25 - emergent stags and live ash-type hollow-bearing trees outside patches of mature ash
forest at 1:25,000. • PSYLLID25 - distribution and severity ofpsyllid affected area at 1:25,000.
2. CNR - other databases • The Atlas of Victorian Wildlife (A VW). • Resource Assessment Mapping - structural vegetation mapping, nominal input at 1 :25,000. • Remote Sensing Images - generally aerial photographs at around 1:20,000, also some satellite
imagery and airborne videography. o HARlS - growing stock information by Forest Type. • SFRI database - growing stock information by specifically defined polygons stored as
FOREST 25 at 1:25,000. Includes four disturbance categories (light, medium, heavy damage and unaffected).
• Central Highlands Old-growth Forest Project disturbance dataset (ARC 1994) - disturbances resulting from human activity, mainly using records ofla,nd use since European settlement.
• Central Highlands Project disturbance dataset (ARC 1994) - disturbances resulting from human activity, mainly using records of land use since European settlement.
In relation to specific pests and diseases, there is a range of information available. At the broader level, the Flora Information System and the A VW databases have a range of data, from records based on formal survey quadrats to opportunistic records. These databases tend to focus on rare or threatened native species or the occurrence of specific weeds or vermin. They provide a good basis for a more detailed database on vascular flora and vertebrate fauna, however they do not include much information on invertebrate (mainly insect) pests or plant disease in the Central Gippsland FMA. Mountain ash dominated forests are attacked by a number of insect and fungal agents (e.g. Spurlegged phasmatid insect Didymuria violescens, and the Armillaria root rot fungus Armillaria spp.) and there has been extensive research and operational development work done on many of these insect and fungal agents. Consequently, consolidating this work into appropriate databases is an area that needs to be addressed. Recently, there has been the development of a database detailing the distribution and severity of the area affected by the psyllid insect Cardiaspina bilobata at 1:25,qOO.
The major physical agencies, other than fire, causing damage to this forest are harvesting, windthrow, frost and snow. The Tanjil Bren SSP Trial Site has provided good data relevant to the Central Gippsland FMA on these agents. The Trial found that for any silvicultural system involving harvesting through retained trees or regeneration, there was considerable potential for bole damage or injury to seedlings. The final felling of a two-stage shelterwood (four year regeneration period) in the Tanjil Bren SSP Trial Site revealed that 30 to 40% of the trees retained had substantial bole damage and degrade from the first felling. In addition, it caused serious damage to regeneration with 60 to 70% of seedlings/saplings being affected and 30% killed. Retained trees in seedtree and overwood systems, or exposed edges in clearfellings, carry an increased risk of windthrow during severe storms. A wind storm in the Tanjil Bren SSP Trial Site in November 1988 flattened over 30% of the standing trees in one of the shelterwood coupes. Frost damage in the form of frost heave of newly emerging germinants, or cambium kill, foliar damage or death to seedlings or saplings can be extremely sev~re under exposed conditions. It may result in an almost 100% loss of seedlings, especially from frost heave during the germinant stage.
SANTIAGO DECLARATION INDICATORS OF SUSTAINABILITY 30 A VICTORIAN MONT ANE.FOREST AS A CASE. STUDY
FWPRDC TECHNICAL PUBLICATION N° 2
With respect to alternative silvicultural systems, as specified in the Tanjil Bren SSP trials, subjective estimates of potential risks from destructive organisms and physical agencies in the Central Gippsland FMA have been summarised. These ratings are based on data collected from the trial and extensive research on insect and fungal pests and diseases in this FMA. There is a need to amalgamate this and other existing data into appropriate datasets that reflect the depth and quality of information required, as determined by further development of this indicator.
Experience has shown that for specific fungal and insect agents affecting this forest, one of the best ways to identify and monitor the degree and extent of impact is to use remote sensing techniques. Recently, remote sensing was used to identify the area of mountain ash forest affected by the indigenous psyllid insect Cardiaspina bilobata in the Central Gippsland FMA and other adjacent areas of mountain ash. A limited trial evaluated a range of data from both air and space borne sensors. The trial confinned the suitability of visual aerial photo interpretation using 70 mm colour aerial photography at photo scales of 1:10,000 to 1:20,000, and also confirmed the very labour intensive nature of this type of interpretation. Visual interpretation however of enhanced LANDSAT TM data did not provide reliable information for mapping the psyllid damage classes. Visual interpretation of the Digital Multispectral Video data was made very difficult by the 2 m pixel resolution, which was much poorer than that obtained by aerial photography. The trial highlighted the need for additional development in the areas of viewing angle, timing of imagery and the need to investigate other digital high resolution imagery. Oblique viewing of tree crowns by an aerial observer was found to be the most cost-effective method of mapping the psyllid defoliation. The psyllid trial reinforced the importance of remote sensing techniques as a tool central to detecting and monitoring the presence of specific pest and disease outbreaks at the earliest possible stage, so that appropriate remedial strategies are implemented while the threat is still manageable. There is an obvious need to further develop and evaluate remote sensing techniques suitable for mapping forests damaged by explicit pests and diseases. The major need is to identify digital imagery suitable for filling the niche between the high resolution but labour intensive conventional aerial photography and the gross mapping capabilities of satellite imagery.
Where existing sources of information in the Central Gippsland FMA do not provide an adequate indication of the historic variation of processes or agents, other approaches need to be developed. One approach worth considering is to use data on existing forest vegetation, its species composition, structure and location, and to assume that this physically expresses the range of historic variation of processes and agents that have affected the forest ecosystem in the past. In this case, the approach would be to identify and describe assemblages of floristic communities that represent the historic range of primary and secondary successional stages. Data could be collated for floristic communities that have occurred as a result of a common regime of ecological processes or agents within a particular environment or habitat, creating a reference baseline for historic variation. This approach would seem most appropriate for natural processes or agents but might also be suitable for unnatural processes or agents. The EVCs database would appear to provide a good basis for establishing such a reference baseline for this forest ecosystem.
Another approach, which is a variation on the approach outlined above, could involve developing ecosystem growth models. If health and vitality are to be maintained, growth and life spans commensurate with those acceptable for the site conditions, stand dynamics and plant species concerned also need to be maintained. Criterion 2, 'Maintenance of productive capacity of forest ecosystems', addresses some of these growth issues, so there should be some scope to share data. This approach would be fairly coarse as a measure of historic variation, even though monitoring of growth already occurs over most of this forest ecosystem. The level of accuracy of this growth data is variable, and besides, many factors can influence realised growth. Additionally, how sensitive growth is to health and vitality would need to be detennined and quantified for the identified component of the ecosystem.
FWPRDC SANTIAGO DECLARATION INDICATORS OF SUSTAINABILITY TECHNICAL PUBLICATION N° 2 A VICTORIAN MONT ANE FOREST AS A CASE STUDY 31
Discussion
An understanding of forest dynamics is critical to an understanding of health and vitality in the forest ecosystem. The death of individual trees is not necessarily a sign of forest death if it is a question of the natural, internal dynamics of the stand. For example,.in the regrowth mountain ash forests, growth is rapid with intense cqmpetition for light, nutrients and water and there is high mortality amongst developing saplings.
At the broader level, 'this ecosystem is generally the product of many thousands of years of evolution and adaptation to disturbance and stress. Significant changes in the level or pattern of natural disturbances may reflect a change in the health and vitality of this forest ecosystem. Succession in this forest is an ecological process that illustrates this point. Primary succession occurs when, over a very long period of time, one vegetation type replaces another, for example when .rainforest replaces the older growth stages of mountain ash dominated forest. Succession after a major disturbance such as wildfire is' often referred to as secondary succession, and can result in a mosaic of naturally induced growth stages, from senescing to regrowth. Thus, evaluation of ecosystem health and vitality must be based on an in-depth understanding of ecosystem dynamics in order to distinguish between natural system states and unnatural system states that may be indicative of a loss in health and vitality.
This ecosystem depends on periodic disturbances, with fire disturbance being the most fundamental force driving the dynamics of regeneration, succession and evolution. Consequently, an understanding of the natural variation of fire frequency and intensity in this forest is essential to any evaluation of whether health and vitality is being maintained. In the Central Gippsland FMA existing data is inadequate and needs to be further supplemented with dendrological studies and an appropriate evaluation of vegetation assemblages (e.g. EVCs).
Key questions in relation to this indicator are: what degree of change in forest ecosystem health and vitality is acceptable within the constraints of sustainable management; and over what time frame. Implicit in this is a knowledge of what to measure. The specific measures are often still being determined, but for some pests and diseases of regrowth mountain ash there is a good basis for determining actual levels of tolerable damage and identifying the measures that assist in determining what degree of change in forest ecosystem health and vitality is acceptable within the historical context. For example, the phasmatid insect D. violescens has been studied over the past 25 years, during which time about 2,630 ha of this Forest Type have been severely defoliated. Control measures have been adopted, with approximately 19,342 ha aerially sprayed to control the less destructive nymphal stages of this pest to prevent defoliation and to reduce phasmatid populations. These control measures have been found to be necessary because of unacceptable levels of tree mortality and lost growth. In some 30-year-old stands, 40% of trees in the co-dominant and suppressed category died after a single severe defoliation (Geary 1974), and over 80% of trees were killed after two severe defoliations in consecutive years; also, the diameter growth of the surviving trees was almost negligible during the two years after the second defoliation (Mazanec 1967). While no spraying has been necessary since 1975-76, a resurgence of large damaging populations can be expected where densely stocked stands of regenerated forest reach intermediate age. Measures are now available that will adequately predict stands whose health and vitality is unacceptably affected within the historical context. Research has also been done into other pests and diseases of regrowth mountain ash which should allow identification of initial measures. These pests and diseases include those listed below:
• Cardiospina bilobata (Psyllidae), sap-sucking lerp insect (Neumann 1976, Neumann et al. 1977, Neumann & Marks 1989, Taylor 1989).
• Phytophthora cinnamomi is a major cause of dieback in coastal forests in Victoria. However, it is generally restricted in its ability to cause diseases over the natural range of E. regnans. Where soil structure had been affected either by harvesting operations or by site preparation, or where diseased stock is used, then the risk of infection increased.
SANTIAGO DECLARATION INDICATORS OF SUSTAINABILITY 32 A VICTORIAN MONT ANE FOREST AS A CASE STUDY
FWPRDC TECHNICAL PUBLICATION N° 2

• Armillaria luteobubalina, a serious native pathogen in some mixed species forests of Victoria (Marks et al. 1982), has not been isolated from naturally occurring E. regnans forests. However, other Armillaria species, probably A. hinnulea (Nielsen 1991), have been found associated with death of retained trees following harvesting in a shelterwood system. There may be an interaction between this Armillaria species and the psyllid Cardiospina bilobata which is affecting similar sites.
• Mycosphaerella, Aulographina and Selmatosporium spp., foliage pathogens causing extensive defoliations periodically (Marks et al. 1982).
• Pythium spp. etc., 'Damping-off fungi can be a problem in the early stages of regeneration (Ashton and Willis 1982), and are associated with root decay and· death of germinating or recently established seedlings.
• Cylindrocarpon destructans, another fungus that appears to be implicated with poor seedling growth and decline.
• Chalara australis, fugus which enters a tree via wounds and subsequently kills mature myrtle beech (Kile and Hall 1988). It is believed that it is a native fungus, and that it may have a role in the regeneration of myrtle' beech. Harvesting operations, however, may exacerbate the disease. The size of buffers near these species needs to be determined in the light of this disease.
Other pests and diseases which have also had research but which probably require additional work before identification of initial measures can occur include:
" Xyleutes spp. (Cossidae), wood-degrading moths, including an unidentified speCIes of family Xyloryctidae (fIarris 1986).
• Platypus subgranosus (Platypodidae), wood-degrading ambrosia beetle. • Porotermes adamsoni (Termosidae), the tree-dwelling dampwood termite, has been the principal
wood-destroying agent in living E. regnans trees. • Prolasius pallidus (Formicidae), the most prolific seed-harvesting ant species on recently burnt
ashbed surfaces in regeneration areas (Ashton 1979, Neumann and Kassaby 1986, Neumann 1991).
All establishment, tending, protection and harvesting practices that contribute to a high standard of forest health and vigour assist in the prevention of serious insect pest and disease problems. The premise is that a vigorous healthy stand is more resistant to, and recovers more quickly from, the ravages of destructive agents than slow-growing forest. Healthy stands may also provide a good cultural buffer against newly introduced insect pests or diseases and stop them from producing epidemics (Neumann and Marks 1989). Beneficial silvicultural measures include:
• planting good quality growing stock or sowing high-quality seed of species, families or clones best adapted to the sites to be regenerated;
• avoiding competition by weeds and browsing by vertebrate pest animals [Neumann (ed.) 1991]; • maintaining good forest hygiene through the early removal of suppressed, dying, damaged, grossly
deformed or diseased trees; • using appropriate fertilisers at the time of planting; • preventing damage to trees from the effects of wildfire and harvesting machinery; and • adopting the shortest economically possible rotation cycle to avoid senescence, tree debilitation and
the associated slow growth rates.
Harvesting operations in systems where felling or extraction is through standing trees or regeneration must be designed and implemented to minimise damage. Coupe design and layout of snig tracks, extraction in short lengths and penalties for damage caused can all reduce the severity of the problem, Reduction in the incidence of windthrow requires careful attention to location and layout of coupes so as to minimise exposed edges or trees in wind-prone situations.
FWPRDC SANTIAGO DECLARATION INDICATORS OF SUST AINABILITY TECHNICAL PUBLICATION N° 2 A VICTORIAN MONT ANE FOREST AS A CASE STUDY 33

Shelterwood systems have clear potential to ameliorate frost effects but the exact specifications of overwood density and the timing of removal have not yet been investigated.
Scale considerations, both spatial and temporal, also have considerable bearing on this indicator in terms of both the on-site and off-site effects of management: For example, tim~er harvesting can be implemented using a range of silviculture which can significantly influence the intensity (number of trees felled/retained and area affected) and duration (period and frequency) of forest ecosystem disturbance both on site and off site.
Recommendations
1. Amalgamate existing disturbance data into an appropriate database to assist in identifying the temporal and spatial extent and nature of forest ecosystem disturbances.
2. Where existing sources of information do not provide an adequate indication of the historic variation of processes or agents other approaches need to be developed.
3. Amalgamate existing vegetation data (including non-vascular plants) and set up an appropriate database using vegetation assemblages to establish baseline data on species composition, structure and location of existing forest vegetation and relate this to the recommendation above. If possible, growth and lifespan data would be included as elements.
4. Further develop and evaluate remote sensing techniques suitable for mapping forests damaged by explicit pests and diseases.
5. Identify levels of damage which can be tolerated by vegetation (in explicit terms) resulting from attack by established pests and diseases and other damaging agents and processes.
6. Identify the threat from new pests and diseases.
7. Develop management strategies (management plans) to deal with specific damaging agents and processes that cause damage beyond tolerable levels; and control, exclude or eradicate new pests or diseases, within the bounds of all relevant Codes of Practice and other sustainability criteria.
Indicator b. Area and percent of forest land subjected to levels of specific air pollutants (e.g. sulphates, nitrates, ozone) or ultra violet B that may cause negative impacts on the forest ecosystem.
This indicator relates to physical factors of the regional environment that may have a negative impact on ecosystem health and vitality.
Air pollutants are suspected to have a significant cumulative impact on forest ecosystems by affecting regeneration, productivity, and species composition. Generally, this indicator has limited relevance for Australia at this stage, with specific air pollutants being of limited importance. There are local exceptions to this, the most well known being Queenstown in Tasmania, where air pollutants have denuded the hillsides around the town. Since the cessation of air borne pollutants from the local mine, vegetation has been re-establishing itself. This example does indicate the potential damage air pollutants can cause in severe cases. The impact of lower levels of air pollutants is not so clear though, and needs to be addressed, particularly where forests are downwind of major sources of air pollution (e.g. mountain ash forests north east of Melbourne), to determine what if any negative impacts on the forest ecosystem are evident.
In relation to ultra violet B, this element of the indicator does have some general relevance to Australia. The ozone hole over Antarctica, and the general reduction of ozone levels due to increasing levels of chlorofluorocarbons, have resulted in small increased levels of ultra violet B in Australia. There has
SANTIAGO DECLARATION INDICATORS OF SUSTAINABILITY 34 A VICTORIAN MONT ANE FOREST AS A CASE STUDY
FWPRDC TECHNICAL PUBLICATION N° 2
been extensive monitoring of ultra violet B, which has indicated that this increase is most pronounced in Southern Australia, with predictions that it will continue. There is currently no data on how the estimated increases in ultra violet B will affect forest ecosystems, but there is a possibility that there will be some negative impacts on their health and vitality. Some parts of Australia already have high levels of ultra violet B, with levels generally increasing with reducing latitude, so there is already vegetation which is well suited to higher levels of ultra violet B. Whether this vegetation infiltrates south, in response to a competitive advantage, as ultra violet B levels increase is probably worth monitoring. The use of vegetation databases and specific identified species to monitor this change would seem appropriate.
While in the long term this indicator may be yery important, currently, its importance in Australia will tend to be confined to specific sites.
Recommendations
1. Identify specific localities where air pollutants may cause negative impacts on forests, implement monitoring programs and develop management strategies.
2. Monitor ultra violet B levels and changes in vegetation assemblages, with a view to identifying specific indicators which reflect negative forest impacts.
Indicator c. Area and percent of forest land with diminished biological components . indicative of changes in fundamental ecological processes (e.g. soil, nutrient cycling, seed dispersion, pollination) and/or ecological continuity (monitoring of functionally important species such as nematodes, arboreal epiphytes, beetles, fungi, wasps, etc.).
This indicator is potentially the most important indicator, relating as it does to very short-lived species and the basic ecological processes. These species and processes 'are central to an evaluation of ecosystem health and vitality, but are not easily monitored in the detail, and with the understanding required, to allow immediate recognition of changes in ecological processes. Considerable baseline data is still required to achieve this position.
This indicator relates to the definition and monitoring of components and processes that are central to ecosystem health and vitality. The monitoring of forest structure or macro species such as vertebrates (Criterion 1) will tend to detect changes in ecological processes decades. after they have begun. Monitoring very short-lived species associated with specific ecological processes such as decomposition and nutrient cycling provides a more immediate indication of changes in ecological processes with potential importance to forests.
At the management unit level, selection and monitoring of key processes (e.g. regeneration) has the potential to provide productive indicators that can be used as the basis for early diagnosis and prevention, rather than cure, of problems relating to ecosystem health and vitality [refer to Indicator (a)]. For example, research is required to define explicit indicators of ongoing success in regeneration processes, particularly following ecosystem disturbance.
Other key indicators may be found in the invertebrate fauna and non-vascular flora that constitutes the early stages of food chains, on which higher organisms depend. Some factors of the physical environment (e.g. temperature and moisture regimes) may also provide effective indicators of pathogen activity (e.g. Phytophthora root rot). Remote or on-site sensing of non-visible wave lengths of the electro-magnetic spectrum also has the potential as an indicator of ecosystem health and vitality (e.g. infra-red sensing of moisture stress).
FWPRDC SANTIAGO DECLARATION INDICATORS OF SUSTAINABILITY TECHNICAL PUBLICATION N° 2 A VICTORIAN MONT ANE FOREST AS A CASE STUDY 35

Recommendations
l. Identify and define explicit key processes (e.g. regeneration) which are predictive indicators of ecosystem health and vitality.
2. Evaluate biotic and abiotic components to determine which are indicative of changes in fundamental ecological processes.
3. Monitor selected biotic and abiotic processes relating to the disturbance database to establish baseline relationships for these components.
CRITERION 4: CONSERVATION AND MAINTENANCE OF SOIL AND WATER RESOURCES .
Indicator a. Area and percent of forest land with significant soil erosion.
Soil erosion is an extremely important issue since soil is to a large extent a non-renewable resource and its loss has a major bearing on water quality, nutrient loss or redistribution and rate of revegetation. Furthermore, changes in soils and the consequent effects on vegetation and stream habitats may ultimately influence the populations and diversity of both forest and non-forest dependent biota. The critical factors influencing the extent and degree of erosion are site characteristics (slope, soil type and climate), site management (harvesting prescriptions, especially road and snig track layout) and the degree and extent of soil compaction.
The question of definition which must be addressed is what constitutes 'significant' soil erosion. For the purposes of this report the indicator is interpreted as:
• Area and proportion of forest land from which soil loss exceeds the tolerable limit.
Defining a tolerable limit requires information on soil formation rate and recovery rates after disturbance. Obviously both will vary with site characteristics and the nature of disturbance (e.g. high intensity bum versus mechanical clearing). Management practices have the potential to affect recovery rates in particular.
Available data
Currently, this indicator is not addressed directly and the information required to quantify it is not available at the management unit level. Direct measurement is likely to be difficult to undertake accurately at any large scale .. Rates of soil loss may be derived from the following.
• Information on site characteristics (soil type, slope, etc.) which are available at 1:25,000 on GIS. • Knowledge of the extent and type of soil disturbance over the landscape. This relates to the degree
of exposure and the condition of the soil factors which predispose the soil to erosion. Some information is available on this through research studies [e.g. information on proportion of logging coupes occupied by snig tracks, landings and disturbed general logging areas (Rab 1994, King 1993)].
• The ability to predict the rate of recovery of disturbed or exposed soil to an erosion resistant state. This is strongly related to the rate of colonisation by vegetation. This information may be extrapolated from some site specific studies (e.g. Strachan and King 1992). In the long term specific relationships will need to be established.
• Information on rainfall frequency and intensity patterns. This information is readily available through the Meteorological Service.
SANTIAGO DECLARATION INDICATORS OF SUST AINABILITY 36 A VICTORIAN MONT ANE FOREST AS A CASE STUDY
FWPRDC TECHNICAL PUBLICATION W 2
For the Tanjil Bren Trial Site 26 coupes were visually surveyed using a systematic grid sampling technique to determine the proportion of coupe area occupied by snig tracks, landings and general logging areas (Rab et al. 1994). The proportion of area where mineral soil was exposed was also determined for these categories. These results show that 55.4% to 80.7% of the coupe area had exposed mineral soil surface immediately after harvesting. Site preparation (e.g. slash burning) may increase the proportion of exposed mineral soil. Data are also available which will enable· the above proportions to be broken down to slope classes.
Discussion
Based on saturated hydraulic conductivity measurements and length of exposure of mineral soil (rates of vegetation recovery), it can be suggested that roads, snig tracks and landings are likely to be the major sources of soil erosion. At this stage, however, we cannot determine what the actual extent of soil loss following logging is in this FMA. Vegetation recovery data presented by Strachan and King (1992) suggests that the rate of soil loss in the general logging area will decrease with time and will become minimal at about five years after logging. Saturated hydraulic conductivity data and visual assessment of previously logged coupes presented by Jakobsen (1983) suggest that erosion from snig tracks and roads could occur even 25 years after logging. Again, the rate of soil loss is not well documented.
The type of information required to predict erosion at the forest coupe level is available through case studies (e.g. Tanjil Bren SSP Trial Site). However, methodology would need to be developed to specifically address the indicator and its applicability tested at the management unit level.
Indicator h. Area and percent of forest land managed primarily for protective functions (e.g. watersheds, flood protection, avalanche protection, riparian zones).
Since this indicator relates specifically to the soil and water resources criteria, the area of forest land managed primarily for protective functions may be interpreted as that which is managed specifically for soil and water protection. Areas so managed include streamside reserves and filter strips. In Victoria, permanent streams, springs, soaks, swampy ground and bodies of standing water are protected by a buffer zone of a minimum of 20 m of retained undisturbed vegetation. Intermittent streams and drainage lines are protected by a zone, referred to as a filter strip, of 5 m on either side within which trees may be harvested but machinery traffic excluded (DCFL 1989). These minimum widths are currently under review but are unlikely to decrease. Wider buffers are applied to major streams or rivers and in areas supplying water for human consumption.
The information required to address this indicator is readily available through GIS at a scale of 1:25,000, although in its suggested form it is relatively meaningless. An alternative indicator would be to describe the stream network in the appropriate management unit by the stream order and level of protection. Any change in status under this system would be transparent and calculations of the indicator made if required.
Indicator c. Percent of stream kilometres in forested catchments in which stream flow and timing has significantly deviated from the historic range of variation.
An extensive database of streamflow records is held for the major rivers in the State by the former Rural Water Commission and by Melbourne Water for the ash forests in particular.
The scale at which this indicator operates needs to be determined. For instance, there is ample evidence that timber harvesting has an impact on streamflow in low order streams, particularly when large proportions of the catchment are harvested over a short period (e.g. less than 10 years). However, there
FWPRDC SANTIAGO DECLARATION INDICATORS OF SUSTAINABILITY TECHNICAL PUBLICATION N° 2 A VICTORIAN MONT ANE FOREST AS A CASE STUDY 37
is little evidence to indicate that such local changes have significant impacts on the higher order streams and rivers. A recent study on a forested catchment in central Victoria which was subject to timber harvesting was unable to find any evidence of a deviation in streamflow from historic records (O'Shaughnessy et al. 1995).
The use of 'historic range of variation' to qualify 'significant' also creates difficulties in an Australian context. The ability to determine the historic range of variability will depend on the length of record of both land use and streamflow. Derivation of the range of variation will need to incorporate the asymmetry of streamflow patterns (stormflow and baseflow). There should be a measure of where the existing streamflow record fits within the longer-term patterns. Suitable indicators would need to incorporate both levels (e.g. annual, seasonal or monthly water yield, peak flows) and variability. Some methods are discussed in Australian Rainfall and Runoff(Pilgrim 1987).
Indicator d Area and percent of forest land with significantly diminished soil organic matter and/or changes in other soil chemical properties.
Timber harvesting and regeneration (e.g. fire) changes forest floor organic matter. Organic matter is important in promoting favourable soil aggregation and its loss is of special importance from a soil erodibility viewpoint. The removal of organic matter not only results in the breakdown of aggregates, but also precludes the further formation of aggregates by means of organic matter cementation. The loss of this cementing agent is particularly serious in view of the fact that organic matter is conducive to the formation of relatively large stable aggregates of the type which are resistant to erosion. Organic matter also provides a source of nitrogen, phosphorus and sulphur. Most Australian forests are limited by nitrogen and phosphorus availability and these are probably the most appropriate elements to monitor with respect to this indicator.
To address the indicator it is necessary to know both the effects of timber harvesting on soil organic matter and soil chemical properties and the rate of recovery of these properties. This will enable us to determine the area which is outside tolerable limits at any point in time.
It is necessary to define 'significantly diminished' soil organic matter. The JANIS (Joint ANZEC MCFFA National Forest Policy Statement Implementation Sub-Committee) Technical Working Group on Forest Use and Management (1994) suggested that a change of· greater than 15% could be considered detrimental. Using this as a guide, a relevant indicator would be:
o Area and proportion of forest land where soil organic matter content has been reduced by more than 15 % from the pre-harvest level.
Similarly, 'changes' in other soil chemical properties need to be defined. The following indicator is proposed for the purposes of this report.
• Area and proportion of forest land where soil phosphorous and nitrogen have changed by more than 10% from pre-harvest level.
A vailable data
The information required to address either of the above indicators is not available at any broad scale for the montane ash forests. Some' information is available from forest research. SSP databases contain relevant information as detailed below:
• data on soil organic matter changes due to timber harvesting for five logging coupes in the Neerim Operations Area (Rab 1994);
SANTIAGO DECLARATION INDICATORS OF SUSTAINABILITY 38 A VICTORIAN MONT ANE FOREST AS A CASE STUDY
FWPRDC TECHNICAL PUBLICATION N" 2

• data on changes in soil nitrogen and phosphorous for four logging coupes at the Tanjil Bren Trial Site (Baker et al. 1991; Maheswaran et al. 1991); and
• data on extent and type of soil disturbance (visually assessed) for 26 logging coupes in the Central Highlands (Rab et al. 1994).
Information is also available on the recovery of nutrient cycling processes (e.g. Attiwill1991). Further work is required to determine rates of recovery of soil organic matter.
Discussion
For the Tanjil Bren SSP Trial Site organic matter (loss on ignition) was measured in surface soil (0-100 mm) immediately after logging and seedbed preparation for a number of clearfelled coupes. Sampling was based on visually assessed soil disturbance categories and the proportion of each category by area was estimated using a post logging soil survey based on the visual classification (Rab et al. 1994). Organic matter content in each disturbance category was compared with that in the undisturbed-unbumt general logging area for each coupe and found to be statistically different. In each case the difference was greater than 15% of the undisturbed-unbumt category. This implies that visual assessment may have potential as a monitoring tool for this indicator. A similar approach was taken for soil chemical properties with similar results.
Recommendations·
1. Further research is required to establish the applicability of the results from Tanjil Bren to other soil and Forest Types.
2. Monitoring methods and sampling strategies must be developed for broad-scale applicability and cost-effectiveness, with some consideration given to the potential for remote sensing technology.
3 . Research is also required into the temporal dynamics of soil organic matter in particular.
Indicator e. Area and percent of forest land with significant compaction or change in soil physical properties resulting from human activities.
Timber harvesting operations cause soil compaction and soil profile changes. These result in changes in the physical properties of soil including bulk density, total porosity, aeration porosity, soil strength, infiltration and saturated hydraulic conductivity (Rab 1994). It may take over 25 years to recover from compaction. The long-term nature of changes in these properties makes this a highly relevant and important indicator.
Forest roading has even more severe effects and consequently longer recovery periods. Frequently, however, forest roads may be considered a permanent alteration and once a network has been established (i.e. once a full rotation has been completed) alterations should be minor. At this stage, therefore, forest roads will not be considered in terms of this indicator.
Changes in soil bulk density (more than 15%), total porosity (more than 10%) and aeration porosity (more than 20%) compared to pre-harvest values are used here as a measure of 'significant' change in soil physical properties. Changes of these magnitudes in the properties of soils of the Central Highlands can be expected to have detrimental consequences.
Information is not available at any management unit level with regard to changes in bulk density, aeration poro~ity and infiltration as a result of timber harvesting activities. Substantial work has been done in this area through the SSP; relevant databases include:
FWPRDC SANTIAGO DECLARATION INDICATORS OF SUST AINABILITY TECHNICAL PUBLICATION N" 2 A VICTORIAN MONT ANE FOREST AS A CASE STUDY 39

• bulk density, aeration porosity and saturated conductivity for visually assessed soil disturbance classes for five logging coupes in the Tanjil Bren area; and
• the aerial extent of visually assessed soil disturbance classes for 26 logging coupes in the Central Highlands.
These databases can be combined and, within limitations, an estimate of change in soil physical properties immediately following logging can be made for the Central Highlands. Given this, knowledge of the rate of recovery of soil from compaction and related physical property changes would enable us to provide an estimate of the area significantly affected at any point in time, which would satisfy the indicator. Some work has already been done in this regard, namely:
• permanent sampling plots established at the Tanjil Bren SSP Trial Site (in 1989). Covering a range of visual assessment categqries and providing early indications of recovery rates; and
•. a retrospective study carried out. by Jakobsen (1983) showing that bulk density in the primary silig tracks was significantly greater" compared to nearby undisturbed sites 32 years after logging.
Recommendations
1. Develop monitoring systems for soil physical change. This will need to take into account:. • the variation in soil type over the total area available for' harvesting and that within the
harvested areas; • the timing of harvesting operations; • the type of regeneration operation, possibly regional differences in rehabilitation techniques or
harvesting equipment; and • the level of accuracy required.
2. Determine rates of recovery of soil physical properties for the.main soil types.
3. Establish relationships between changes in soil physical properties and productive capacity for the main soil and Forest Types.
Indicator f Percent of water bodies in forest areas (e.g. stream kilometres, lake hectares) with significant variance of biological diversity from the historic range of variability.
This indicator means to integrate the various impacts on water quantity and quality, and in-stream habitat, using biological indicators. The best indicators for this purpose are the benthic aquatic macroinvertebrates which are well established as indicators of general environmental river health. Invertebrates react quickly to environmental degradation and are used to detect changes due to impacts that may not be picked up with water chemistry analyses (e.g. pollution pulses, storm-related sediment inputs). The taxonomy of freshwater macroinvertebrates is better known than other potential indicators (e.g. algae). The low diversity and migratory nature of many fish species makes it difficult to relate fish survey data to local environmental health.
As such, the indicator is relevant to monitoring the conservation and maintenance of soil and water resources. However, the indicator, as presented, could not be applied as data on historic range of variability is not available.
A more appropriate indicator would be:
• the percent of water bodies in forest areas with significant variation of biological diversity from that predicted from undisturbed sites.
SANTIAGO DECLARATION INDICATORS OF SUSTAINABILITY 40 A VICTORIAN MONT ANE FOREST AS A CASE STUDY
FWPRDC TECHNICAL PUBLICATION N° 2

Techniques and information that are directly applicable to this revised indicator are well understood and are under development and close to completion in the Australian context.
The approach to monitoring the revised indicator should be based on the RIVP ACS technique, initially developed in England. The aquatic macroinvertebrate fauna from a series of "reference" sites (undisturbed) is collected and identified. The data is analysed using multivariate techniques to produce groups of sites that constitute "bioregions" (areas with similar faunae). Physical and chemical characteristics of the stream sites (altitude, bed structure, water quality) are regressed or correlated to these regions. Predictive models can then developed so that, once the phys.icochemical characteristics of the site are known, the fauna at an unknown site can be predicted.
This simple approach forms the main basis of the National River Health Program (run by LWRRDC). Over 1400 river sites are currently being sampled, including many in Victoria. It is envisaged that predictive models will be available within the next 12 months.
The technique (and the rationale behind the techniques) is well established, having been used often to detect changes in stream macroinvertebrate fauna due to human impacts.
Information required to monitor the indicator includes:
• invertebrate collections from a series of reference sites; • physical and chemical characteristics of reference sites; • invertebrate collections from a series of monitoring sites; and • physical and chemical characteristics of monitoring sites.
This indicator is amenable to management units on a wide variety of scales. Different scales can be accomodated by altering the intensity of sampling. The River Health Initiative program is designed to be applied at a National and State scale. However, this produces a broad brush approach, with little fine detail at the landscape level.
The appropriate scale of monitoring for a temperate and boreal forest indicator is biogeographical -essentially the "bioregions" that are derived from the reference data. From preliminary data, this is likely to be mainly a combination of catchment and altitude variants. For a management unit such as the Central Highlands, this would be at the sub catchment level.
The monitoring program would need to adopt the Pulsed Monitoring strategy (Bryant 1996), with an initial intensive period (approximately three years) to determine the model, followed by longer frequency monitoring (every five years).
A vailable data
Data is currently being collected at a number of reference sites in the Central Highlands by the Victorian Environment Protection Authority as part of a Statewide network. Models for the State are expected within the next 12 months. It remains to be seen whether the statewide data set will contain sufficient information to characterise regions within the Central Highlands at the appropriate scale.
A number of other irregular data sets are available from Central Highlands areas which could also be included in the analysis.
FWPRDC . SANTIAGO DECLARATION INDICATORS OF SUST AINABILITY TECHNICAL PUBLICATION N° 2 A VICTORIAN MONT ANE FOREST AS A CASE STUDY 41
r--------------------------------------------------------------------------- ----.
Recommendations
1. The data collected through the River Health Initiative and other studies needs to be examined to detennine whether sufficient sites are available to characterise .Central Highland rivers and streams.
2. The available data needs to be evaluated to determine the suitability of the technique for this indicator.
Indicator g. Percent of water bodies in forest areas (e.g. stream kilometres, lake hectares) with significant variation from the historic range of variability in pH, dissolved oxygen, levels of chemicals, (electrical conductivity), sedimentation or temperature change.
Timber harvesting can result in changes to any of the above variables through alterations in various processes. All are fundamental to the functioning of stream and riparian ecosystems (Dignan et al. 1996). All have also been demonstrated to be at least limited to non-detectable changes by the application of management practices which combine the use of retained vegetative buffer strips and on-site erosion mitigation. However, the long-tenn consequences of sustained yield harvesting will need to be monitored with respect to these variables. .
Available data
Data on these· variables is routinely collected for 30 experimental catchments in the mountain ash forests of the Central Highlands. Some of these catchments have been subjected to experimental harvesting, including complete clearfelling (other than protective zones), however none of them are subjected to sustained yield harvesting. Protective measures similar to those applied through the Victorian Code of Forest Practices for Timber Production were successful in preventing changes to all variables (other than an increase in iron and a small but statistically significant increase in suspended sediment associated with the clearfelling operation (Grayson et al. 1993) during and following the operations. The available studies indicate, therefore, that maintenance of stream values is possible. However, due to the degree of dependence on appropriate management practices, they cannot be extrapolated to forest catchments which are continually harvested. There is no monitoring of the above variables for any Central Highlands catchments used for wood production.
Discussion
Accurate estimation of 'the historic range of variability', suggested as the basis for measurement of deviation, is difficult given the variability between catchments and the fact that no catchments in the wood production areas have been monitored to date. Also, given that the accuracy of streamwater monitoring for most of the variables involved increases as a nonlinear function of the number of observations and varies significantly with the fonn of sampling (e.g. stonn, flow increment, time increment) and the sampling interval, there would be difficulties in extrapolating such a value from other catchments, no matter how similar.
If we accept that the use of 'the historic range of variability' is unsuitable, then some other indicator of significant change must be fonnulated for each variable. Also, given that there are no suitable, currently monitored catchments for the extrapolation of results to wood production forests, there is a need for the establishment of a program of long-tenn monitoring of these fundamental variables in such catchments. Consideration should also be given to the establishment of independent best management practices monitoring to ensure that buffer and erosion management practices are satisfactorily implemented. This has been shown to be a good indicator of water quality in overseas studies.
SANTIAGO DECLARATION INDICATORS OF SUST AINABILITY 42 A VICTORIAN MONT ANE FOREST AS A CASE STUDY
FWPRDC TECHNICAL PUBLICATION N° 2

Recommendations
1. Research should be conducted to quantify the effect of changes in any of the water quality variables on the aquatic ecosystem.
2. A monitoring program for forested catchments used for wood production should be established. Particular attention should be paid to sampling intervals and timing.
3. Consideration should be given to the establishment of independent best management practices monitoring or similar quality control methodology to ensure that appropriate practices are maintained consistently over the forest resource.
Indicator h. Area and percent of forest land experiencing an accumulation of persistent toxic substances. .
This is not considered to be'a relevant issue in the case study areas.
FWPRDC SANTIAGO DECLARATION INDICATORS OF SUSTAINABILITY TECHNICAL PUBLICATION N" 2 A VICTORIAN MONT ANE FOREST AS A CASE STUDY 43
OUTCOMES
This report describes the outcomes of the application of some of the Santiago Declaration criteria to possible or potential management units both within and including the montane ash forests of the Central Highlands. The choice of this Forest Type or biogeographic' area as the focus of.this report, the case study area(s), was based on the concentration of interdisciplinary research brought to bear on it through the SSP. This project sought to evaluate the ecological and socio-economic effects of a range of alternative silvicultural practices. It had a strong emphasis on the monitoring of long-term impacts of timber harvesting. This intensive study site falls within the Neerim Operations Area which is in turn one of the basic field management units within the Central Gippsland FMA. The Neerim Operations Area also forms an important component of the Central Highlands biogeographical area.
Monitoring and evaluation of Santiago Declaration criteria involves one or more of these geographical levels depending on the criterion under consideration. For the purposes of this study criteria 1 to 4 were considered on the basis of their potential for utility at the management unit level.
1. Conservation of biological diversity. 2. Maintenance of productive capacity of forest ecosystems. 3. Maintenance cif forest ecosystem health and vitality. 4. Conservation and maintenance of soil and water resources.
Detailed discussion of each indicator with respect to application (available information) and requirements follow the review of the individual indicators. In more general terms, the outcomes are discussed here in relation to each criterion.
CRITERION 1: CONSERVATION OF BIOLOGICAL DIVERSITY
The maintenance of biodiversity requires adaptive management which responds to threats and measured change. The most effective indicators are those that identify cause, not merely measure response. Data available for the Central Highlands provide a valuable basis for the development and refinement of such indicators, however, quantified standards need to be established, through research, to provide base data against which change can be measured. As few species are confined to one management unit, methods, standards and nomenclature need to be uniform for all units.
Data available for the Central Highlands are extensive but vary in detail, applicability and mapped scale. The following summarises their value and limitations and the issues for their application as indicators for monitoring biodiversity:
• the resolution of effective community classification is determined by scale; • EVCs mapped at 1:25,000 provide an adequate indicator of floristic communities in management
areas the size of the Central Highlands; • the resolution provided by vegetation 'community' and 'sub-community' is suited to smaller
management areas; • Forest Types or floristic communities are a poor surrogate for faunal communities; • species of flora and fauna need to be monitored directly; • the use of 'indicator' species is a complex issue requiring explicit definitions of objectives and
criteria for their selection;
SANTIAGO DECLARATION INDICATORS OF SUSTAINABILITY 44 A VICTORIAN MONT ANE FOREST AS A CASE STUDY
FWPRDC TECHNICAL PUBLICATION N° 2
• the size and juxtaposition of EVes and age class polygons need to be monitored along with total area;
• direct monitoring of genetic diversity is impractical; and • monitoring populations across their geographic and environmental range IS a recommended
surrogate for genetic diversity.
The following development and refinement of cUITent data is required:
• for the management unit level all data needs to be mapped at 1:25,000; • a national, hierarchical system of vegetation community/ecosystem classification should be
developed; • detailed habitat models for species at risk, based on the floristics, age and structure of vegetation
plus environmental variables, are required to predict distributions and identify communities; • broad transitional ecotones of multi-aged stands are specific classes requiring mapping in age class
data layers; .
• a system of accurately recording the type, intensity and boundaries of disturbance on permanent data bases needs to be developed and GIS data layers periodically updated;
• a system for monitoring sub-canopy age needs to be developed; . • ideally, monitoring change requires a baseline knowledge of pre-European distribution patterns and
a fipatially explicit management plan as a standard; • data and systems for measuring fragmentation are available but require refinement and
standardisation; • methods of monitoring populations of flora and fauna across all environmental gradients need to be
standardised; and • the development of population monitoring methods needs to include an assessment of 'background'
fluctuations.
CRITERION 2: MAINTENANCE OF PRODUCTIVE CAPACITY OF FOREST ECOSYSTEMS
Monitoring systems and evaluation procedures for indicators of productivity in terms of wood production are probably the most advanced of any criteria. Further work is required on such things as estimation of net productive area, merchantable volume by size/age classes and improved monitoring systems at the local level. The scale at which sustainable yield management should be applied, however, is one issue that needs to be addressed. Two complementary indicators are proposed that can be applied at any level and address issues fundamental to the maintenance of productive capacity, but which are applicable over a range of scales, both temporal and spatial.
The addition of forest regeneration as a basic indicator of productivity over and above the existing Santiago Declaration indicators is recommended.
CRITERION 3: MAINTENANCE OF FOREST ECOSYSTEM HEALTH AND VITALITY
Ecosystem health' and vitality are criteria for which performance measures, monitoring systems and evaluation procedures for sustainability require considerable work to improve the current reactive approach. Understanding of key ecosystem processes (e.g. symbiotic and pathogenic relationships), development of remote sensing techniques and standards for evaluation of potential threats to ecosystem health and vitality are all key areas for research and development.
FWPRDC SANTIAGO DECLARATION INDICATORS OF SUSTAINABILITY TECHNICAL PUBLICATION N" 2 A VICTORIAN MONT ANE FOREST AS A CASE STUDY 45

CRITERION 4: CONSERVATION AND MAINTENANCE OF SOIL AND WATER RESOURCES
Soil and water conservation indicators are of considerable importance as they can be strongly influenced by the roading, harvesting and regeneration operations associated with wood production and other forest activities. Soil erosion, soil physical properties, soil nutrition and biological activity all require' the development of explicit performance measures, monitoring systems and evaluation procedures. In addition, 'the development of biological indicators of water quality and the local application of aquatic biota predictive models are important areas for future research. Consideration should also be given' to the development and implementation of cost-efficient forest code compliance/quality control procedures such as best m~agement practices monitoring.
SANTIAGO DECLARATION INDICATORS OF SUST AINABILITY 46 A VICTORIAN MONT ANE FOREST AS A CASE STUDY
FWPRDC TECHNICAL PUBLICATION N° 2

CONCLUSIONS AND RECOMMENDATIONS
The underlying principle for the management of all native forests in Australia is that of sustainability. However, sustainability is not a static concept which can be measured at a point in time. With respect to timber harvesting and other human influences on the forest the response time may measure far longer than planning horizons will permit. Hence, the emphasis on the development of indicators will reveal trends over time.
The intention of this study was to determine where we stood in relation to our ability to apply the basic indicators proposed in the Santiago Declaration. While not all criteria or indicators proposed can be considered directly applicable to the Australian situation, with refinement, most can be used not only for monitoring change but also for responding to change through adaptive management. However, if we accept that the ability to apply the indicators is fundamental to determining whether or not the forest areas concerned are managed sustainably, then it is clear that, with regard to some criteria in particular, there is insufficient knowledge to confidently assert this. The review demonstrates that, with a few exceptions, considerable work will be required before these criteria and indicators can be applied at the field level.
Application of bio-diversity indicators at ecosystem, species and genetic resource levels will require improved classification methods and monitoring systems and basic research into performance measures and evaluation standards. Protection of threatened species, invasion of exotic species, and altered gene pools associated with harvesting and regeneration for wood production are all seen as high priority areas for research and development action. In particular, resources should be directed at the development of protocols which will ensure consistency and uniformity in the collection of natural resource data to ensure maximum benefit is derived from both research and operational monitoring.
Further ecological research into the landscape application of reserves and silviculture is· required to provide standards for management plans and for assessing fragmentation, while ongoing autecological research into species at risk is required for the refinement of monitoring and management standards. The process, scale and pattern of natural perturbation and resultant habitat needs to be determined to provide standards for monitoring of fragmentation, population viability and refinement of spatial planning. Research is also required to assess the viability of populations at risk, to identify potentially threatening processes and to establish the magnitude of 'natural', annual and seasonal fluctuations of populations
Because of the commercial and social importance of forest management for wood production, considerable resources have been directed at developing the resource/management information systems required to address criteria dealing with forest productivity. Future efforts should be directed into developing stand and Forest Type classifications which can be utilised both for wood and non-wood values.
Much is known of the impact of timber harvesting activities on soil, and to a lesser extent water and aquatic, resources at the forest coupe level. However, extrapolation of this data to the broader local or regional scale requires the development of cost-effective monitoring techniques. Comprehension of such information will also require an understanding of the recovery of physical and biological properties following disturbance, and the impact of such disturbance on processes such as forest growth, health and vitality. Research is urgently required to establish an understanding of these fundamental processes.
FWPRDC SANTIAGO DECLARATION INDICATORS OF SUSTAINABILITY TECHNICAL PUBLICATION N" 2 A VICTORIAN MONT ANE FOREST AS A CASE STUDY 47

A CKNO WLEDGEMENTS
Valuable support was provided to this project by: T. Doeg, M. Papworth and R. Campbell. Many thanks for their involvement.
SANTIAGO DECLARATION INDICATORS OF SUSTAINABILITY 48 A VICTORIAN MONT ANE FOREST AS A CASE STUDY
FWPRDC TECHNICAL PUBLICATION N° 2
REFERENCES
Abbott, 1., Lamb, K. and Roberts, B. (1993). Statement of resources, uses and values for the Central Gippsland Forest Management Area. Dept. of Conservation and Natural Resources, Victoria.
Adams, T.O., Hook, D.D. and Floyd M.A. (1995). Effectiveness monitoring of silvicultural best management practices in South Carolina. South. J Appl. For. 19(4): 170-176.
Ashton, D.H. (1979). Seed harvesting by ants in forests of Eucalyptus regnans F Muell in Central Victoria. Aust. J Ecol. 4: 265-77.
Ashton; D.H. and Willis, EJ. (1982). Antagonisms in the regeneration of Eucalyptus regnans in the mature forest. 'In Newman, E.1. (ed.) The Plant Community as a Working Mechanism. Brit. Eco!. Soc. 1982.
Attiwill, P.A. (1991). Nutritional resilience of wet sclerophyll forest: Recovery after disturbance. Proc. 3rd Aust. For. Soils. & Nutr. Conf. 172-79.
Australian Heritage Commission (1994). National Estate values in the Central Highlands of Victoria. Draft Project Report. Ed and camp. by Aust. Heritage Commission. Publ. by Dept. of Conservation and Natural Resources, Victoria.
Baker, T.G., King, M.R., Rab, M.A., Maheswaran, J. and Pearson, A. (1991). Spatial variation in soil disturbance and seedling growth in harvested and regenerating Eucalyptus regnans forest. Proc. 3rd Aust. For. Soils. & Nutr. Conf.: 206.
Bryant, M.D. (1996). Pulsed monitoring for watershed and stream restoration. Fisheries 20: 6-13.
Conservation and Natural Resources, Dept. of (1995). Corporate Geospatial Data Library: Summary Report. Natural Resource Systems Branch, Dept. of Conservation and Natural Resources, Victoria.
Cumming, F.I. (1992). Tanjil Bren Site Pre-Harvest Timber Assessment. VSP Int. Rep. No. 12. Dept. of Conservation and Environment, Victoria.
DCFL (1989). Code of Forest Practices for Timber Production (Review No. 1). Dept. of Conservation, Forests and Lands, Victoria.
Dignan, P. (1995). Eucalypt Regeneration Surveys. Native Forest Silviculture Guideline No. 10, Dept. of Conservation and Natural Resources, Victoria.
Dignan, P., Kefford, B., Smith, N., Hopmans, P., and Doeg, T. (1996). The use of buffer strips for the protection of streams and stream dependant biota in forested ecosystems. Report to Director, Forest Service, Dept. of Conservation and Natural Resources, Victoria.
Elliot, P. (1994). Stand class definitions and polygon labeling guidelines for the Statewide Forest Resource Inventory. Dept. of Conservation and Natural Resources, Victoria.
Featherston, G.R. (1992). Timber Harvesting Strategy. Central Gippsland Forest Management Area, Dept. of Conservation and Natural Resources, Victoria.
FWPRDC SANTIAGO DECLARATION INDICATORS OF SUST AINABILITY TECHNICAL PUBLICATION N° 2 A VICTORIAN MONT ANE FOREST AS A CASE STUDY 49
Geary, AL. (1974). The biology of phasmatid plague populations and the effects of such populations on the increment of Eucalyptus regnans regrowth. Dip. For. (Vic.) Thesis, For. Comm. Victoria.
GelI, P.A (1988). The fire and vegetation history of the Upper Delegate River catchment, East Gippsland, Victoria, and its implications for forest management. M. Env. Sc. Thesis, Monash University, Victoria.
Grayson RB., Haydon S.R, Jayasuriya M.D.A and Finlayson B.L.· (1993). Water quality in mountain ash forests - separating the' impact of roads from those of logging operations. J. of Hydrology 150:459-480.
Harris, J.A (1986). Wood moth damage in mountain ash logs. Aust. For. 49: 246-48.
Hoekstra, T.W, AlIen, T.F.H. and Flather, C.H. (1991). Implicit scaling in ecological research. BioScience 41:148-154.
IncolI, W.D. (1987). Silvicultural Systems Project: Assessment of Timber Resources. Resource Assessment Report 87-1, Dept. Conservation, Forests and Lands, Victoria.
Irvine, M. (1995). Statewide Forest Resource Inventory: TREEMAP. Dept. of Conservation and Natural Resources, Victoria.
Jakobsen, B.F. (1983). Persistence of compaction effects in a forest Kraznozem. Aust. For. Res., 13:305-308. .
JANIS (1994). The development of consistent nationwide baseline environmental standards for native forests. Technical Working Group on Forest Use and Management Draft Report.
Kile, G.A and Hall, M.F. (1988). Assessment of Platypus subgranosus as a vector of Chalara australis, causal agent ofa vascular disease of Nothofagus cunnin 1988.
King, M.R, Hookey, P., Baker, T. and Rab, M.A (1993). The regeneration of Eucalyptus regnans under alternative silvicultural systems: 4. Effect of seedbed on seedling establishment. VSP Internal Rep. No. 16, Conserv. & Nat. Resources, Victoria.
Maheswaran, J., Baker, T.G. & Pearson, A (1991) The effect of fire on plant-available and microbial nutrients in harvested and regenerating mountain ash forests. Proc. 3rd Aust. For. Soils. & Nutr. Conf. :207.
Marks, G.C., Fuhrer, B.A and Walters, N.E.M. (1982). Tree diseases in Victoria. Handbook No. 1, For. Comm. Victoria.
Mazanec, Z. (1967). Mortality and diameter growth in mountain ash defoliated by phasmatids. Aust. For. 31:221-223.
Mueck, S.G. (1987). Alternative Silvicultural Systems Project: Vegetation Survey and Classification -Tanjil Bren Study Area (Central Gippsland Region). Resource Assessment Report 87-5, Dept. Conservation, Forests and Lands, Victoria.
Nathan, RJ. (1995). Evaporation analysis for Victoria. Dept. of Conservation and Natural Resources, Victoria.
Nathan, RJ. and McMahon, T.A (1991). Identification of homogenous regions for the purposes of regionalisation. J. Hydrol.
SANTIAGO DECLARATION INDICATORS OF SUSTAINABILITY 50 A VICTORIAN MONT ANE FOREST AS A CASE STUDY
FWPRDC TECHNICAL PUBLICATION N° 2
-~~~------~
Neumann, F.G. (1976). Egg production, adult longevity and mortality of the stick insect Didymuria violescens (Leach) (Phasmatodea:Phasmatidae) inhabiting mountain ash forests in Victoria. J. Aust. Ent. Soc. 15(2): 183-90.
Neumann, F.G. (1991). Responses of litter arthropods to major natural or artificial ecological disturbances in mountain ash forest. Aust. J. Eco!. 16: 19-32.
Neumann, F.G. (ed.) (1991). The problem of browsing animals in eucalypt/pine forest establishment, and research into techniques for minimising damage. Lands & Forests Tech. Rep. No. 6, Dept. of Conservation and Environment, Victoria.
Neumann, F.G., Harris, J.A. and Wood, C.B. (1977) The phasmatid problem in mountain ash forests of the Central Highlands of Victoria. Bull. No. 25, For. Comm. Victoria.
Neumann F.G.and Kassaby, FY. (1986). Effects of commercial pesticides in seed-coats on seeds and germinants of Eucalyptus regnans and their potential as seed protectants in the field. Aust. For. Res. 16:37-50.
Neumann, F.G. and Marks, G.C. (1989). Insect pests and diseases in native forests, pine plantations and forest nurseries - A discussion paper on their importance and management in Victoria. Res. Branch Rep. No. 340. Department of Conservation, Forests and Lands, Victoria.
Nielsen, P. (1991). Tree death in alternative felling systems at Tanjil Bren. Hons. Thesis, Dept. Appl. BioI. RMIT, Melbourne.
Noble, W.S. (1977). Ordeal By Fire: the week a state burned up. Pub I. by The Hawthorne Press, Melbourne.
O'Shaughnessy P., Fletcher, T. and Bren, L. (1995). A Report on the Effects of Forest Harvesting on Water Yield and Quality in the Lerderberg Catchment. For. Serv. Tech. Rep. No. 95-1, Dept. of Conservation and Natural Resources, Victoria.
Opie, J.E. (1972). STANDSIM - a general model for simulating the growth of evenaged stands. Proc. 3rd Conf. Advisory Grp. For. Stat, IUFRO Paris 1970, pp. 217-40.
Pearson, P.D. and Featherston, G.R. (1992). Forecast of Sustainable Yield for. Grade C and Better Sawlogs in the Central Gippsland Forest Management Area. Dept. of Conservation and Environment, Victoria.
Pilgrim, D.H. (ed.) (1987). Australian rainfall and runoff. A guide to flood estimation. Vol. 1, 374pp.
Rab, M.A. (1994). Changes in physical properties of a soil associated with logging of Eucalyptus regnans forest in southeastern Australia. For. Ecol. & Man., 70:215-229.
Rab, M.A., Baker, T.G. and King, M.R. (1994). Quantification of the degree and extent of soil disturbance on clearfelled coupes of mountain ash in the Victorian Central Highlands. VSP Internal Report No. 27, Dept. of Conservation and Natural Resources, Victoria.
Ripple, WJ., Bradshaw, G.A. and Spies, T.A. (1991). Measuring forest landscape patterns in the Cascade Range of Oregon, USA. Bio!. Conserv. 57:73-98.
Strachan, K. and King, M. (1992). The regeneration of Eucalyptus regnans under alternative silvicultural systems: 3. Germination and early survival (progress report on the first seasonal replicate). VSP Int. Rep. No. 10, Dept. of Conservation and Environment, Victoria.
FWPRDC SANTIAGO DECLARATION INDICATORS OF SUST AINABILITY TECHNICAL PUBLICATION W 2 A VICTORIAN MONT ANE FOREST AS A CASE STUDY 51
Taylor, K.L. (1989). Three new species of Cardiaspina Crawford (Homoptera: Psylloidea) from Australian eucalypts. J. Aust. ent. Soc., 28:4.5-52.
Turner, J. and Pribble, J. (1996). Evaluation of Santiago Declaration (Montreal Process) indicators of sustainability for Australian commercial forests. State Forests of New South Wales. 81 pp.
Wiseman, A. and Featherston, G.R. (1991). Hardwood Timber Resources in the Central Gippsland Forest Management Area. Dept. of Conservation and Environment, Victoria.
SANTIAGO DECLARATION INDICATORS OF SUSTAINABILITY 52 A VICTORIAN MONT ANE FOREST AS A CASE STUDY
FWPROC TECHNICAL PUBLICATION N° 2

I~
Copies and further infonnation are available from:
Publications Officer Research Division State Forests of NSW PO Box 100 Beecroft NSW 2119
Tel. (02) 872 0111 Fax. (02) 871 6941


