Embed Size (px)
Citation preview
1 State ProPerty authority 2011-12 annual rePort
n Contents
Letter of submission . . . . . . . . . . . . . . . . . . . . . . . . . . . . . . . . . . . . . . . . . . . . . . . . . . . . . . . . . . . . . . . . . . . . . . . . . . . . . . . . . . . . . . . . . . . . . . . . . . . . . . . . . . . . . . . . . . . . . . . . . . . . . 2
statement by the Chief exeCutive offiCer . . . . . . . . . . . . . . . . . . . . . . . . . . . . . . . . . . . . . . . . . . . . . . . . . . . . . . . . . . . . . . . . . . . . . . . . . . . . . . . . . . . 3
our Charter . . . . . . . . . . . . . . . . . . . . . . . . . . . . . . . . . . . . . . . . . . . . . . . . . . . . . . . . . . . . . . . . . . . . . . . . . . . . . . . . . . . . . . . . . . . . . . . . . . . . . . . . . . . . . . . . . . . . . . . . . . . . . . . . . . . . . . . . . . . . . 4
aims and objeCtives . . . . . . . . . . . . . . . . . . . . . . . . . . . . . . . . . . . . . . . . . . . . . . . . . . . . . . . . . . . . . . . . . . . . . . . . . . . . . . . . . . . . . . . . . . . . . . . . . . . . . . . . . . . . . . . . . . . . . . . . . . . . . . . 4
management and struCture . . . . . . . . . . . . . . . . . . . . . . . . . . . . . . . . . . . . . . . . . . . . . . . . . . . . . . . . . . . . . . . . . . . . . . . . . . . . . . . . . . . . . . . . . . . . . . . . . . . . . . . . . . . . . . 5
organisation chart . . . . . . . . . . . . . . . . . . . . . . . . . . . . . . . . . . . . . . . . . . . . . . . . . . . . . . . . . . . . . . . . . . . . . . . . . . . . . . . . . . . . . . . . . . . . . . . . . . . . . . . . . . . . . . . . . . . . . . . . . . . . . . . . . . . . . 5
organisationaL outComes and aChievements 2011-12 . . . . . . . . . . . . . . . . . . . . . . . . . . . . . . . . . . . . . . . . . . . . . . . . . . . . . . . . . . . 6
savings and efficiency outcomes . . . . . . . . . . . . . . . . . . . . . . . . . . . . . . . . . . . . . . . . . . . . . . . . . . . . . . . . . . . . . . . . . . . . . . . . . . . . . . . . . . . . . . . . . . . . . . . . . . . . . . . . . . . . 7
Planning and strategy group . . . . . . . . . . . . . . . . . . . . . . . . . . . . . . . . . . . . . . . . . . . . . . . . . . . . . . . . . . . . . . . . . . . . . . . . . . . . . . . . . . . . . . . . . . . . . . . . . . . . . . . . . . . . . . . . . . . 8
Portfolio management group . . . . . . . . . . . . . . . . . . . . . . . . . . . . . . . . . . . . . . . . . . . . . . . . . . . . . . . . . . . . . . . . . . . . . . . . . . . . . . . . . . . . . . . . . . . . . . . . . . . . . . . . . . . . . . . . . . . 8
sustainability . . . . . . . . . . . . . . . . . . . . . . . . . . . . . . . . . . . . . . . . . . . . . . . . . . . . . . . . . . . . . . . . . . . . . . . . . . . . . . . . . . . . . . . . . . . . . . . . . . . . . . . . . . . . . . . . . . . . . . . . . . . . . . . . . . . . . . . . 9
divestments, acquisitions and development group . . . . . . . . . . . . . . . . . . . . . . . . . . . . . . . . . . . . . . . . . . . . . . . . . . . . . . . . . . . . . . . . . . . . . . . . . . . . 10
major works in progress . . . . . . . . . . . . . . . . . . . . . . . . . . . . . . . . . . . . . . . . . . . . . . . . . . . . . . . . . . . . . . . . . . . . . . . . . . . . . . . . . . . . . . . . . . . . . . . . . . . . . . . . . . . . . . . . . . . . . . . . . . 11
external impacts on organisational performance . . . . . . . . . . . . . . . . . . . . . . . . . . . . . . . . . . . . . . . . . . . . . . . . . . . . . . . . . . . . . . . . . . . . . . . . . . . . . . . . . 11
finanCiaL PerformanCe 2011-12 . . . . . . . . . . . . . . . . . . . . . . . . . . . . . . . . . . . . . . . . . . . . . . . . . . . . . . . . . . . . . . . . . . . . . . . . . . . . . . . . . . . . . . . . . . . . . . . . . . . . . . 12
growth in financial operations . . . . . . . . . . . . . . . . . . . . . . . . . . . . . . . . . . . . . . . . . . . . . . . . . . . . . . . . . . . . . . . . . . . . . . . . . . . . . . . . . . . . . . . . . . . . . . . . . . . . . . . . . . . . . . . . 13
2011-12 operating result . . . . . . . . . . . . . . . . . . . . . . . . . . . . . . . . . . . . . . . . . . . . . . . . . . . . . . . . . . . . . . . . . . . . . . . . . . . . . . . . . . . . . . . . . . . . . . . . . . . . . . . . . . . . . . . . . . . . . . . . 14
2012-13 operating budget overview . . . . . . . . . . . . . . . . . . . . . . . . . . . . . . . . . . . . . . . . . . . . . . . . . . . . . . . . . . . . . . . . . . . . . . . . . . . . . . . . . . . . . . . . . . . . . . . . . . . . . 15
2011-12 independent audit outcome . . . . . . . . . . . . . . . . . . . . . . . . . . . . . . . . . . . . . . . . . . . . . . . . . . . . . . . . . . . . . . . . . . . . . . . . . . . . . . . . . . . . . . . . . . . . . . . . . . . . 16
audited finanCiaL information . . . . . . . . . . . . . . . . . . . . . . . . . . . . . . . . . . . . . . . . . . . . . . . . . . . . . . . . . . . . . . . . . . . . . . . . . . . . . . . . . . . . . . . . . . . . . . . . . . . . . . . . 17
statement by the Chief executive officer . . . . . . . . . . . . . . . . . . . . . . . . . . . . . . . . . . . . . . . . . . . . . . . . . . . . . . . . . . . . . . . . . . . . . . . . . . . . . . . . . . . . . . . . . . . . . . 17
independent auditor’s report . . . . . . . . . . . . . . . . . . . . . . . . . . . . . . . . . . . . . . . . . . . . . . . . . . . . . . . . . . . . . . . . . . . . . . . . . . . . . . . . . . . . . . . . . . . . . . . . . . . . . . . . . . . . . . . . . . 18
audited financial statements – year ended 30 june 2012 . . . . . . . . . . . . . . . . . . . . . . . . . . . . . . . . . . . . . . . . . . . . . . . . . . . . . . . . . . . . . . . . . . . 20
statutory and statistiCaL information . . . . . . . . . . . . . . . . . . . . . . . . . . . . . . . . . . . . . . . . . . . . . . . . . . . . . . . . . . . . . . . . . . . . . . . . . . . . . . . . . . . . . . 53
exemPtions and niL rePorts . . . . . . . . . . . . . . . . . . . . . . . . . . . . . . . . . . . . . . . . . . . . . . . . . . . . . . . . . . . . . . . . . . . . . . . . . . . . . . . . . . . . . . . . . . . . . . . . . . . . . . . . . . . . . 64
avaiLabiLity of annuaL rePort . . . . . . . . . . . . . . . . . . . . . . . . . . . . . . . . . . . . . . . . . . . . . . . . . . . . . . . . . . . . . . . . . . . . . . . . . . . . . . . . . . . . . . . . . . . . . . . . . . . . . . . . . 65
agenCy ContaCts . . . . . . . . . . . . . . . . . . . . . . . . . . . . . . . . . . . . . . . . . . . . . . . . . . . . . . . . . . . . . . . . . . . . . . . . . . . . . . . . . . . . . . . . . . . . . . . . . . . . . . . . . . . . . . . . . . . . . . . . . . . . . . . . . . 65
index . . . . . . . . . . . . . . . . . . . . . . . . . . . . . . . . . . . . . . . . . . . . . . . . . . . . . . . . . . . . . . . . . . . . . . . . . . . . . . . . . . . . . . . . . . . . . . . . . . . . . . . . . . . . . . . . . . . . . . . . . . . . . . . . . . . . . . . . . . . . . . . . . . . . . . . . . . . . 66
2 n Letter of submission
the hon . greg Pearce mLCminister for finance and servicesminister for the illawarraLevel 36, governor macquarie tower1 farrer Place sydney nsW 2000
dear minister
in accordance with the Annual Reports (Statutory Bodies) Act 1984 i have pleasure in submitting to you, for presentation to Parliament, a report on the activities and financial affairs of the state Property authority for the period from 1 july 2011 to 30 june 2012 .
yours sincerely
michael Coutts-trotter Chief executive officer state Property authority
bligh house Level 9 4-6 bligh street sydney nsW 2000 Phone: (02) 9273 3800 fax: (02) 9273 3911 abn 91 840 597 406 | www .spa .nsw .gov .au
3 State ProPerty authority 2011-12 annual rePort
the launch of the authority’s first Product and services Catalogue in 2011-12 underpinned its commitment to deliver quality support services to its client agencies . this complete guide to the full range of authority services joins the client helpdesk as a central element in the authority’s Client relationship management strategy . the helpdesk issued almost 12,000 work orders in response to repair and maintenance requests, recording a client satisfaction rating of just over 80 per cent .
2012-13 will see the authority working to consolidate its expanding property portfolio, which is expected to grow by an additional 49 owned and leased assets by march 2013 under its vesting program . the authority will also work to ensure it remains adaptable to respond to the decisions of government and its client agencies while achieving significant savings and economic benefits from cost effective portfolio management .
as we begin to meet the challenges in the year ahead, i am confident that we will continue to provide our stakeholders with high quality, professional property services, while supporting the government in achieving its strategic priorities and the implementation of broader public sector reform .
michael Coutts-trotter
Chief executive officer
in the year in review, the state Property authority continued its strong drive for savings and efficiencies in the management of the government’s generic property assets . the year also saw considerable effort focused on advising and supporting government in the implementation of a range of strategic property policy initiatives .
as at 30 june 2012, the authority had recorded savings and economic benefits of $38 .5m from the centralised acquisition, divestment, leasing and management of the government’s property portfolio . a $31 .0m financial distribution was also returned to government from surplus income from its rental operations along with $5 .8m from the net proceeds of asset sales .
While the authority continued to deliver its core business services of leasing, divestment and property management to client agencies, the year also saw the authority strengthen its role to that of the central leading agency in the management of government office space . it applied its specialist property planning and analysis skills to providing high level strategic advice on cost effective accommodation options for central government . it assumed a lead role in planning for the implementation of the government’s ‘decade of decentralisation’ initiative and applied its expertise in asset disposal to support the Property asset utilisation taskforce in identifying surplus assets for future sale .
the authority’s $24 .3m approved capital program for 2011-12 saw significant investment in improving the amenity of government-owned office buildings and supporting tenant agencies’ service delivery to the community . highlights included the successful delivery of a $5 .0m upgrade of the grafton government office building; delivered on time, $500,000 under budget and resulting in improved space utilisation and ongoing savings of $650,000 a year .
n statement by the Chief exeCutive offiCer
4 n our Charter the state Property authority is the nsW government’s specialist commercial real estate service provider . established in september 2006 under the state Property authority act 2006, the authority primarily deals in the acquisition, management and disposal of property vested in the Crown and government agencies; in particular generic properties such as offices, warehouses, depots and car parks .
the state Property authority is a non-controlled financial entity of the department of finance and services .
n aims and objeCtivesthe authority’s major focus is on the planning, acquisition and commercial management of the nsW government’s office accommodation portfolio, with the aim of achieving sustainable and efficient performance that meets agencies’ service delivery needs .
the authority’s principal objectives, as outlined in the state Property authority act 2006, are to:
n improve operational efficiencies in the use of properties by government agencies
n manage properties of government agencies in ways that support the delivery of government services by agencies
n advise the government on property matters
n operate at least as efficiently as any comparable business
With its specialist industry knowledge and expertise, the authority works closely with government agencies to manage property more efficiently and effectively and generate whole-of-government savings and economic benefits . the centralised leasing and management of the government’s property assets in the authority allows agencies to better focus on the delivery of key services to nsW communities .
the state Property authority reports to the minister for finance and services in the exercise of its functions . the authority also advises the treasurer on matters relating to the properties of government agencies and the authority’s performance against its business planning framework .
5 State ProPerty authority 2011-12 annual rePort
n management and struCture
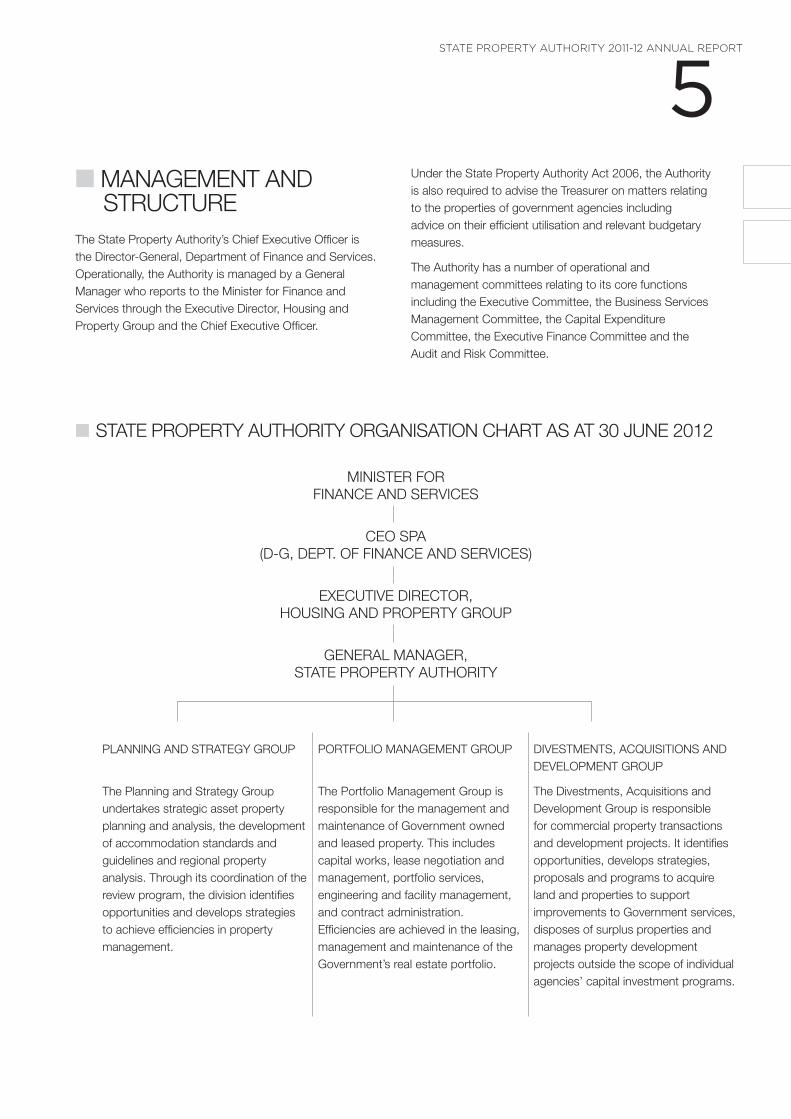
the state Property authority’s Chief executive officer is the director-general, department of finance and services . operationally, the authority is managed by a general manager who reports to the minister for finance and services through the executive director, housing and Property group and the Chief executive officer .
PLanning and strategy grouP
the Planning and strategy group undertakes strategic asset property planning and analysis, the development of accommodation standards and guidelines and regional property analysis . through its coordination of the review program, the division identifies opportunities and develops strategies to achieve efficiencies in property management .
PortfoLio management grouP
the Portfolio management group is responsible for the management and maintenance of government owned and leased property . this includes capital works, lease negotiation and management, portfolio services, engineering and facility management, and contract administration . efficiencies are achieved in the leasing, management and maintenance of the government’s real estate portfolio .
divestments, aCquisitions and deveLoPment grouP
the divestments, acquisitions and development group is responsible for commercial property transactions and development projects . it identifies opportunities, develops strategies, proposals and programs to acquire land and properties to support improvements to government services, disposes of surplus properties and manages property development projects outside the scope of individual agencies’ capital investment programs .
minister for finanCe and serviCes
Ceo sPa (d-g, dePt . of finanCe and serviCes)
exeCutive direCtor,housing and ProPerty grouP
generaL manager, state ProPerty authority
n state ProPerty authority organisation Chart as at 30 june 2012
under the state Property authority act 2006, the authority is also required to advise the treasurer on matters relating to the properties of government agencies including advice on their efficient utilisation and relevant budgetary measures .
the authority has a number of operational and management committees relating to its core functions including the executive Committee, the business services management Committee, the Capital expenditure Committee, the executive finance Committee and the audit and risk Committee .
6 during 2011-12 the authority was primarily focused on consolidating the management of its expanded property portfolio following the vesting of additional government assets . Considerable effort was also directed to providing high level advice and support to central government on a range of strategic policy initiatives aimed at achieving operational efficiencies in the use of government office accommodation .
over the reporting period the authority assisted the government’s Property asset utilisation taskforce in identifying surplus assets for disposal; provided advice to government on cost effective accommodation options for central government, including the department of Premier and Cabinet and nsW treasury; and developed property solutions and concept designs for service nsW’s customer
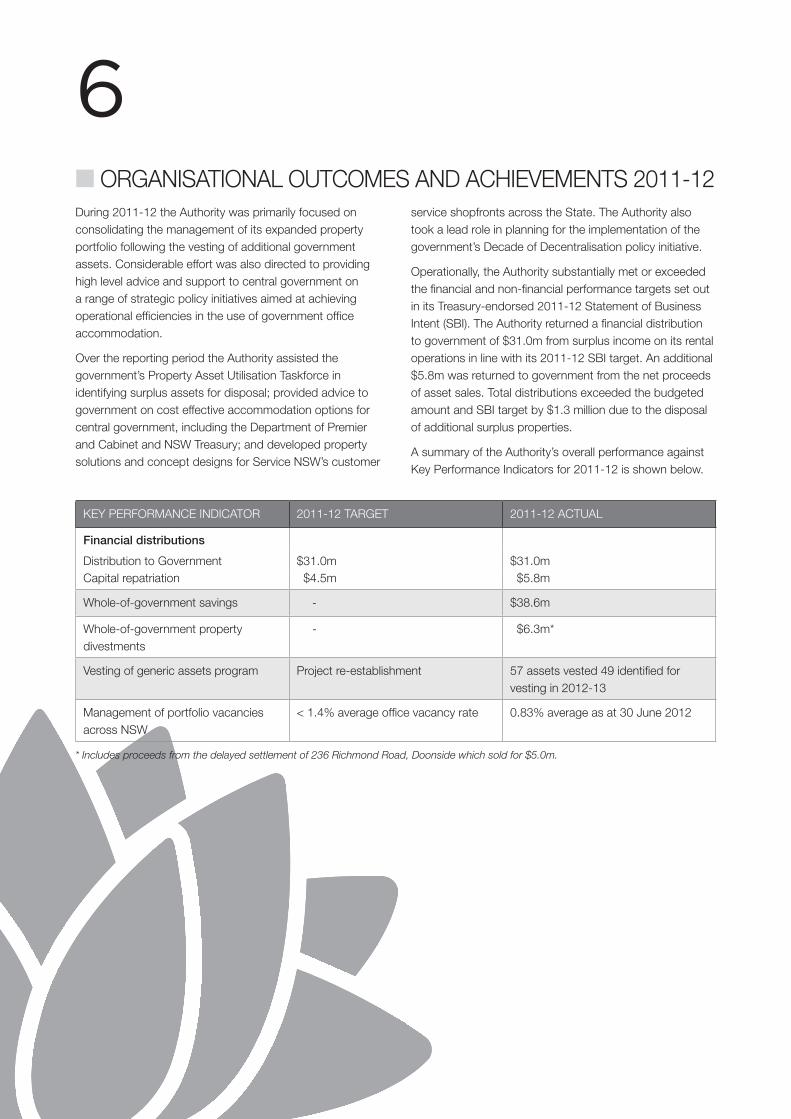
Key PerformanCe indiCator 2011-12 target 2011-12 aCtuaL
Financial distributions
distribution to government $31 .0m $31 .0mCapital repatriation $4 .5m $5 .8m
Whole-of-government savings - $38 .6m
Whole-of-government property divestments
- $6 .3m*
vesting of generic assets program Project re-establishment 57 assets vested 49 identified for vesting in 2012-13
management of portfolio vacancies across nsW
< 1 .4% average office vacancy rate 0 .83% average as at 30 june 2012
* Includes proceeds from the delayed settlement of 236 Richmond Road, Doonside which sold for $5.0m.
n organisationaL outComes and aChievements 2011-12service shopfronts across the state . the authority also took a lead role in planning for the implementation of the government’s decade of decentralisation policy initiative .
operationally, the authority substantially met or exceeded the financial and non-financial performance targets set out in its treasury-endorsed 2011-12 statement of business intent (sbi) . the authority returned a financial distribution to government of $31 .0m from surplus income on its rental operations in line with its 2011-12 sbi target . an additional $5 .8m was returned to government from the net proceeds of asset sales . total distributions exceeded the budgeted amount and sbi target by $1 .3 million due to the disposal of additional surplus properties .
a summary of the authority’s overall performance against Key Performance indicators for 2011-12 is shown below .
7 State ProPerty authority 2011-12 annual rePort
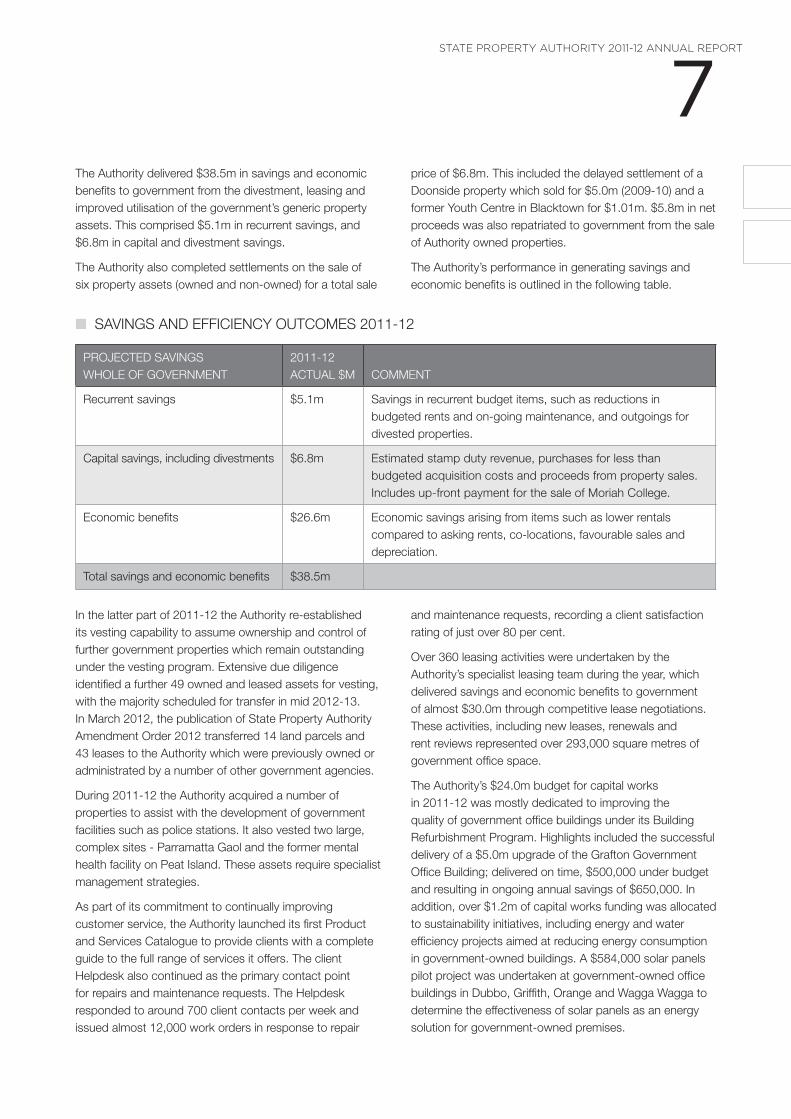
ProjeCted savings WhoLe of government
2011-12 aCtuaL $m Comment
recurrent savings $5 .1m savings in recurrent budget items, such as reductions in budgeted rents and on-going maintenance, and outgoings for divested properties .
Capital savings, including divestments $6 .8m estimated stamp duty revenue, purchases for less than budgeted acquisition costs and proceeds from property sales . includes up-front payment for the sale of moriah College .
economic benefits $26 .6m economic savings arising from items such as lower rentals compared to asking rents, co-locations, favourable sales and depreciation .
total savings and economic benefits $38 .5m
the authority delivered $38 .5m in savings and economic benefits to government from the divestment, leasing and improved utilisation of the government’s generic property assets . this comprised $5 .1m in recurrent savings, and $6 .8m in capital and divestment savings .
the authority also completed settlements on the sale of six property assets (owned and non-owned) for a total sale
n savings and effiCienCy outComes 2011-12
price of $6 .8m . this included the delayed settlement of a doonside property which sold for $5 .0m (2009-10) and a former youth Centre in blacktown for $1 .01m . $5 .8m in net proceeds was also repatriated to government from the sale of authority owned properties .
the authority’s performance in generating savings and economic benefits is outlined in the following table .
in the latter part of 2011-12 the authority re-established its vesting capability to assume ownership and control of further government properties which remain outstanding under the vesting program . extensive due diligence identified a further 49 owned and leased assets for vesting, with the majority scheduled for transfer in mid 2012-13 . in march 2012, the publication of state Property authority amendment order 2012 transferred 14 land parcels and 43 leases to the authority which were previously owned or administrated by a number of other government agencies .
during 2011-12 the authority acquired a number of properties to assist with the development of government facilities such as police stations . it also vested two large, complex sites - Parramatta gaol and the former mental health facility on Peat island . these assets require specialist management strategies .
as part of its commitment to continually improving customer service, the authority launched its first Product and services Catalogue to provide clients with a complete guide to the full range of services it offers . the client helpdesk also continued as the primary contact point for repairs and maintenance requests . the helpdesk responded to around 700 client contacts per week and issued almost 12,000 work orders in response to repair
and maintenance requests, recording a client satisfaction rating of just over 80 per cent .
over 360 leasing activities were undertaken by the authority’s specialist leasing team during the year, which delivered savings and economic benefits to government of almost $30 .0m through competitive lease negotiations . these activities, including new leases, renewals and rent reviews represented over 293,000 square metres of government office space .
the authority’s $24 .0m budget for capital works in 2011-12 was mostly dedicated to improving the quality of government office buildings under its building refurbishment Program . highlights included the successful delivery of a $5 .0m upgrade of the grafton government office building; delivered on time, $500,000 under budget and resulting in ongoing annual savings of $650,000 . in addition, over $1 .2m of capital works funding was allocated to sustainability initiatives, including energy and water efficiency projects aimed at reducing energy consumption in government-owned buildings . a $584,000 solar panels pilot project was undertaken at government-owned office buildings in dubbo, griffith, orange and Wagga Wagga to determine the effectiveness of solar panels as an energy solution for government-owned premises .
8 during the reporting period the authority continued to effectively manage its portfolio office vacancies through the active back filling of vacancies and the timely management of critical lease dates . 2011-12 saw the authority record an average office vacancy rate across the state of 0 .83%, comparing favourably against the sbi target of <1 .4% .
during the year the authority commenced a review of its own portfolio to identify and deliver cost savings and meet the service requirements for government-occupied property in Parramatta . it also completed Centre studies of dubbo, Liverpool/Campbelltown, Lismore/ballina, tweed heads and Wagga Wagga to assess the alignment of property assets with agencies’ service delivery needs . the implementation of recommendations from previous Centre studies of Wollongong and albury saw the authority working with state emergency services on planning and funding submissions for a new head office in Wollongong and with several agencies on the development of a multi-agency depot facility in albury .
implementation of the authority’s far West strategy continued throughout 2011-12 with the design and commencement of a new access centre for the department of family and Community services in Wilcannia . this pilot project will provide a model for future service delivery to remote and regional communities .
n PLanning and strategy grouP
throughout 2011-12 the Planning and strategy group (Psg) continued to provide advice to central government and government agencies on a range of property strategies . these activities included:
n developing, implementing and monitoring asset strategies and portfolio reviews
n reviewing agency office accommodation plans and strategies
n participating in and hosting whole-of-government property forums, including the national government Property group
n reviewing proposals for new and renewed leases for office accommodation
n facilitating agency cluster asset planning groups
n developing the authority’s asset strategy and forward capital works investment plan for the property portfolio under management .
in addition, considerable Psg resources were committed to a number of key projects . these included:
n assessing and pursuing options for central government’s longer term office accommodation requirements
n advising and implementing government’s ‘decade of decentralisation’ policy initiative, including developing a Cbd accommodation strategy
n reviewing agency business cases justifying a sydney Cbd presence
n investigating suitable accommodation options in far West nsW for human services agencies
n providing advice on the suitability of tenancies for service nsW tranche 1 one-stop shops across nsW
n working with the state emergency service to determine the long term accommodation requirements for its state headquarters in Wollongong and its various regional headquarters across nsW
n developing the business case and preparing for the delivery of a multi-agency depot facility in albury
n commencing a review of the authority’s property portfolio to identify and deliver cost savings and meet service requirements for government-occupied property in Parramatta
n completing Centre studies in dubbo, Liverpool/Campbelltown, Lismore/ballina, tweed heads and Wagga Wagga to assess the alignment of property assets with agencies’ service delivery needs . studies of tamworth and orange began .
in 2011-12 Psg developed and obtained ministerial approval for the authority’s annual total asset management (tam) Plan, as required by nsW treasury . the plan provides an overarching asset strategy with supporting implementation plans as a framework for asset maintenance and forward capital works . substantial work on the 2012-13 tam plan was progressed to place a stronger emphasis on increased asset utilisation, investment informed by costs avoided/potential savings, service delivery risks and alignment with government changes .
n PortfoLio management grouP
in 2011-12 the Portfolio management group (Pmg) was primarily focused on consolidating the portfolio under management following the transfer of additional owned and leased assets to the authority under its vesting program . Pmg now manages in excess of 1 .3m square metres of office space . over 1,150 property assets have been transferred to the authority in seven tranches under the vesting program since 1 july 2007 .
9 State ProPerty authority 2011-12 annual rePort
in 2011-12 Pmg completed 363 leasing activities, including new leases, lease renewals, lease options, market rent reviews, market searches and make good . negotiation activity over the period represented 293,315 square metres of office space . Competitive leasing activities by Pmgs specialist leasing team assisted in generating savings and economic benefits for government of almost $30 .0m .
during the reporting period Pmg retained both five d and united group services as its outsourced service providers of property and facilities management services . Pmg received ministerial approval to extend the five d contract for up to two years to allow the planned redistribution of the property portfolio in 2012-2013, which is expected to realise significant cost and operational synergies in facilities management .
the Pmg in-house property service team continued to achieve important savings during the period . almost $1 .05m in savings was generated from the realignment of facility service contracts and improved lease management oversight while managing an extensive portfolio over an area from Lithgow to Lidcombe . this also included specialised assets such as Peat island and the old Parramatta gaol .
over the reporting period Pmg procured discrete contracts for lift maintenance, ground maintenance and annual fire safety statements outside its current five d and united group services contracts . the reduction in the number of suppliers servicing the portfolio is expected to generate significant savings over the next three years as further discrete contracts for additional services are procured from the market place .
during 2011-12 Pmg managed a $24 .0m budget for improving the quality of government office buildings and amenity levels for clients under the authority’s building refurbishment Capital Program . major projects centred on government-owned buildings in bega, bourke, glen innes, grafton, moree, newcastle and Wollongong . regional centres secured the bulk of the authority’s capital commitment at $12 .27m, which included a $5 .0m refurbishment of the grafton government office building . sydney metropolitan projects received funding of $4 .1 million . these included essential building services, structural repairs and mechanical and fire services upgrades to buildings such as the mcKell building, the bidura Children’s Court, glebe and offices of the nsW Crime Commission .
Pmg also continued in its role as contract administrator for the outsourced property services contract for the nsW Police Property Portfolio . the police portfolio under management comprises a total of 1,391 leasehold and freehold properties, including 660 residential properties, 428 police stations and 303 other operational and land sites . these include office accommodation and specialist properties servicing the nsW Water Police, nsW Police air Wing and the goulburn Police training College .
over the reporting period the sPa helpdesk remained the primary contact point for Pmg clients for repairs and maintenance and general inquiries regarding government office accommodation . in 2011-12 the helpdesk handled an average of 700 communications per week . these included quality assurance on completed works, management reporting and client satisfaction call-back . almost 12,000 client work orders were issued and the facility achieved a client satisfaction rating of 81 percent over the reporting period .
to further underpin its Customer relationship management strategy, Pmg launched its first Product and services Catalogue to the nsW government sector in may 2012 . this catalogue outlines the integrated business approach to the services provided by the authority’s three service delivery teams and acts as a comprehensive, user friendly reference for client agencies on the full range of services offered by the authority .
n sustainabiLity
the authority remains a key delivery agency of the government’s nsW sustainability Policy and remains focused on reducing the impact of government-owned office buildings on the environment through reductions in utility usage .
in 2011-12 Pmg allocated $1 .24m to energy and water efficiency initiatives to achieve improvements in building sustainability ratings . these included upgrading air-conditioning systems, installing more efficient light fittings and controls, and water efficient plumbing fixtures .
solar panels were commissioned on the dubbo Premier Centre office building and the government office buildings in griffith, orange and Wagga Wagga as a pilot study to partly determine their effectiveness as an energy solution for government-owned premises . total capital expenditure on the program was $584,000 . smart metering was also installed within a further nine owned buildings throughout the sydney metropolitan area to assist with delivery of savings to client agencies .
10 all building refurbishment projects coordinated by Pmg in 2011-12 complied with sustainability principles and the government’s policy . environmental performance criteria were also incorporated into Pmgs service and supply contracts for its owned and leased premises .
the Pmg continued to negotiate the inclusion of the nsW green Lease schedules in all new and renewed office leases over 1,000 square metres under the nsW sustainability and national green Lease Policies .
n divestments, aCquisitions and deveLoPment grouP
during 2011-12, divestments, acquisitions and development group (dadg) continued to develop and implement property solutions aimed at delivering improvements to government services .
dadg identified opportunities and developed strategies to dispose of surplus assets and to acquire land and properties for the development of government infrastructure and related projects .
in accordance with the government’s policies on the disposal of surplus property assets, dadg managed the disposal of seven surplus government properties for approximately $2 .2m . this included the sale of a former youth Centre owned by the authority at 211 stephen street, blacktown for $1 .01m in november 2011 .
during the reporting period dadg project-managed the major internal refurbishment of the grafton government office building . the project was delivered on time, $500,000 under the budget of $5m . the project included converting a disused plant room into office space to increase the usable area by 380m2 and installing a modern office fit out . space utilisation was reduced from 21m2 per person to 14m2 per person, which generated savings of $650,000 per annum by consolidating government employees housed in separate premises .
Work on the title rectification Project continued over the period to investigate and transfer the titles of over 1,500 properties held in the name of former ministers for Public Works which are occupied or operated by a range of government agencies . this work will improve accountability for property management and the accuracy of information held in the government Property register . a total of 1,065 titles formerly held by Public Works ministers have been rectified to date with 700 completed in the 2011-12 financial year .
in 2011-12 dadg undertook a strategic and economic assessment of zoning changes on the authority’s and other government-owned assets arising from implementation of the standardised LeP . dadg reviewed 155 owned properties in 67 Local government areas, leading to the commencement of formal negotiations with 10 Councils to ensure the removal or mitigation of any negative impacts on government-owned assets .
during the reporting period dadg acquired a number of properties for the development of government facilities such as police stations . the group also vested into authority ownership a number of surplus properties . these include large or complex sites such as the Parramatta gaol and former Peat island mental health facility .
dadg also acquired six parcels of land and 24 easements for state and local government infrastructure projects, including:
n Wyangala dam upgrade for state Water
n Keepit dam upgrade for state Water
n Currajong sewerage for shoalhaven City
n mittagong water supply for Wingecarribee shire
in 2011-12, dadg assumed management of the authority’s vesting function . in the latter part of the year the vesting team commenced work on tranche 7 of the vesting program which is expected to include around 30 owned and 19 leased properties . the properties include the office facilities of Land & Property information, the Crown Lands office and the soil Conservation service, and a number of other generic government properties .
Projects managed by dadg during the year included:
Peat isLand – management of a surplus institutional facility and undertaking studies and consultation on its potential future use .
orange – management of the rezoning and concept plan for the ‘bloomfield’ site on behalf of the former department of industry and investment, as a staged residential subdivision of up to 550 lots and ancillary retail centre prior to its disposal .
hunters hiLL, sydney – Preparation of an environmental assessment and remediation action plan for three government-owned properties in nelson Parade affected by a former uranium processing plant which operated during the early part of last century .
11 State ProPerty authority 2011-12 annual rePort
Coffs harbour – Completion of a concept design and development application for an integrated precinct including a police station, courthouse and office accommodation for government agencies .
CentraL government aCCommodation – development and implementation of a strategy to replace leased office space occupied by ministers and central government agencies in governor macquarie tower following expiry of the government’s lease in 2014 .
serviCe nsW – Providing assistance to service nsW in assessing the suitability of potential properties for the government’s one-stop shop proposal, including development of concept designs for customer service shopfronts at the 19 locations across nsW .
WiLCannia aCCess Centre – designing and commencing delivery of a new access centre for family and Community services in Wilcannia as a pilot project for provision of infrastructure to enable delivery of services to disadvantaged communities in remote and regional areas .
aLbury dePot – acquiring the site for a proposed multi-agency depot facility in albury .
n major WorKs in Progress
Wilcannia access Centre – in april 2012 the authority awarded a $1 .3 million construction contract for delivery of the new access centre . Construction of the building was well underway by june 2012 and it will be completed in early 2012-13 .
nyngan access Centre – the authority commenced preparatory work to convert the government office building in nyngan into a new access centre . the $1 .7 million project is based around the new service delivery model adopted for the Wilcannia access Centre and is scheduled for completion in 2012-13 .
n externaL imPaCts on organisationaL PerformanCe
the leasing market has generally stabilised across major nsW office markets in the aftermath of the global financial Crisis, but continues to favour tenants . nevertheless, the sydney Cbds greater exposure to the global economy through the financial services sector, compared to other major office locations around australia, has made it more sensitive to the disorder currently being experienced in global financial markets .
the Property Council of australia reported an increase in vacancy rates for the calendar year ending 31 december 2011 in the sydney Cbd office market, with vacancy rates increasing from 9 .3% to 9 .6% over the previous 6 months . vacancy rates in Parramatta declined from 9 .3% to 9 .1% on the back of positive net absorption and no stock coming onto the market . While total vacancy rates have decreased in Parramatta, it is apparent that a two-tier market still exists, with a-grade office vacancy rates remaining below 2 .5% . this situation is likely to continue in the future with limited supply expected to come onto the market, resulting in higher rents for agencies located in a-grade office space .
While vacancy rates have increased, the authority’s centralised property management mandate has helped it to achieve recurrent and capital savings through improved leasing outcomes . increased rental incentives in some markets, in conjunction with favourable lease terms and conditions have assisted agencies in reducing the overall cost and risk in respect of their ongoing accommodation requirements .
12
finanCiaL PerformanCe summary
2011-12 aCtuaL
$’000
2011-12 budget
$’000
varianCe to budget
$’000
2012-13 budget
$’000
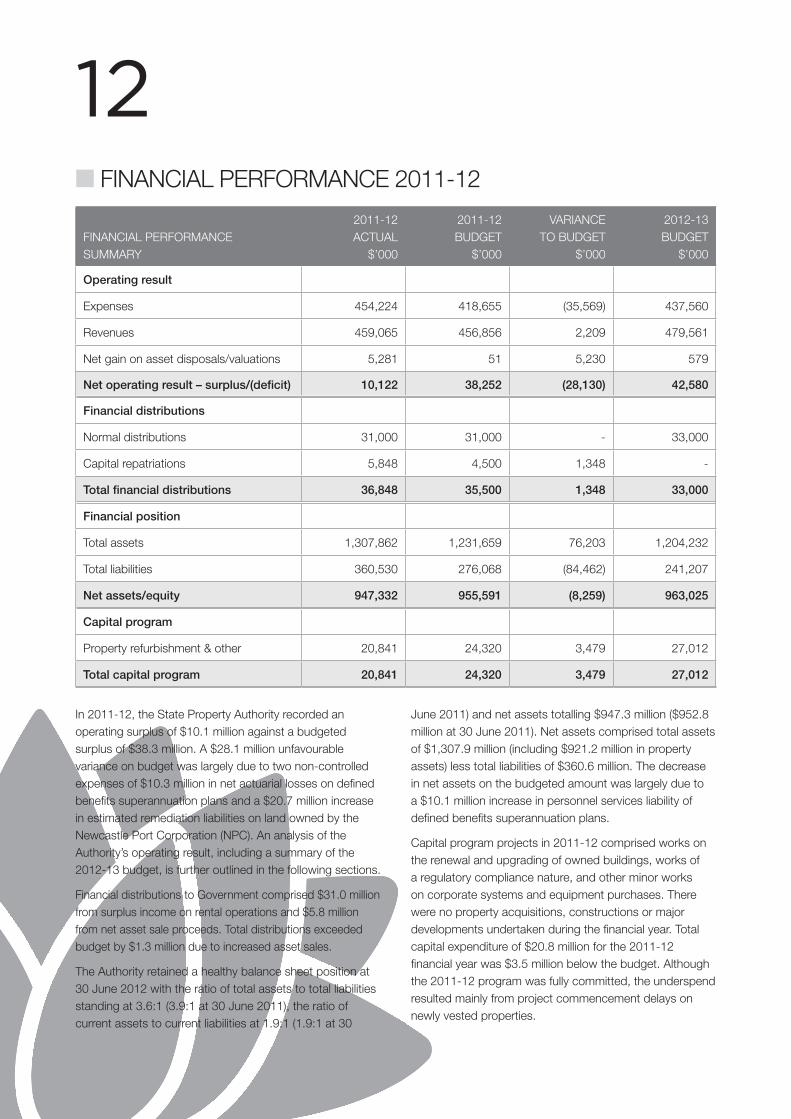
Operating result
expenses 454,224 418,655 (35,569) 437,560
revenues 459,065 456,856 2,209 479,561
net gain on asset disposals/valuations 5,281 51 5,230 579
Net operating result – surplus/(deficit) 10,122 38,252 (28,130) 42,580
Financial distributions
normal distributions 31,000 31,000 - 33,000
Capital repatriations 5,848 4,500 1,348 -
Total financial distributions 36,848 35,500 1,348 33,000
Financial position
total assets 1,307,862 1,231,659 76,203 1,204,232
total liabilities 360,530 276,068 (84,462) 241,207
Net assets/equity 947,332 955,591 (8,259) 963,025
Capital program
Property refurbishment & other 20,841 24,320 3,479 27,012
Total capital program 20,841 24,320 3,479 27,012
in 2011-12, the state Property authority recorded an operating surplus of $10 .1 million against a budgeted surplus of $38 .3 million . a $28 .1 million unfavourable variance on budget was largely due to two non-controlled expenses of $10 .3 million in net actuarial losses on defined benefits superannuation plans and a $20 .7 million increase in estimated remediation liabilities on land owned by the newcastle Port Corporation (nPC) . an analysis of the authority’s operating result, including a summary of the 2012-13 budget, is further outlined in the following sections .
financial distributions to government comprised $31 .0 million from surplus income on rental operations and $5 .8 million from net asset sale proceeds . total distributions exceeded budget by $1 .3 million due to increased asset sales .
the authority retained a healthy balance sheet position at 30 june 2012 with the ratio of total assets to total liabilities standing at 3 .6:1 (3 .9:1 at 30 june 2011), the ratio of current assets to current liabilities at 1 .9:1 (1 .9:1 at 30
june 2011) and net assets totalling $947 .3 million ($952 .8 million at 30 june 2011) . net assets comprised total assets of $1,307 .9 million (including $921 .2 million in property assets) less total liabilities of $360 .6 million . the decrease in net assets on the budgeted amount was largely due to a $10 .1 million increase in personnel services liability of defined benefits superannuation plans .
Capital program projects in 2011-12 comprised works on the renewal and upgrading of owned buildings, works of a regulatory compliance nature, and other minor works on corporate systems and equipment purchases . there were no property acquisitions, constructions or major developments undertaken during the financial year . total capital expenditure of $20 .8 million for the 2011-12 financial year was $3 .5 million below the budget . although the 2011-12 program was fully committed, the underspend resulted mainly from project commencement delays on newly vested properties .
n finanCiaL PerformanCe 2011-12
13 State ProPerty authority 2011-12 annual rePort
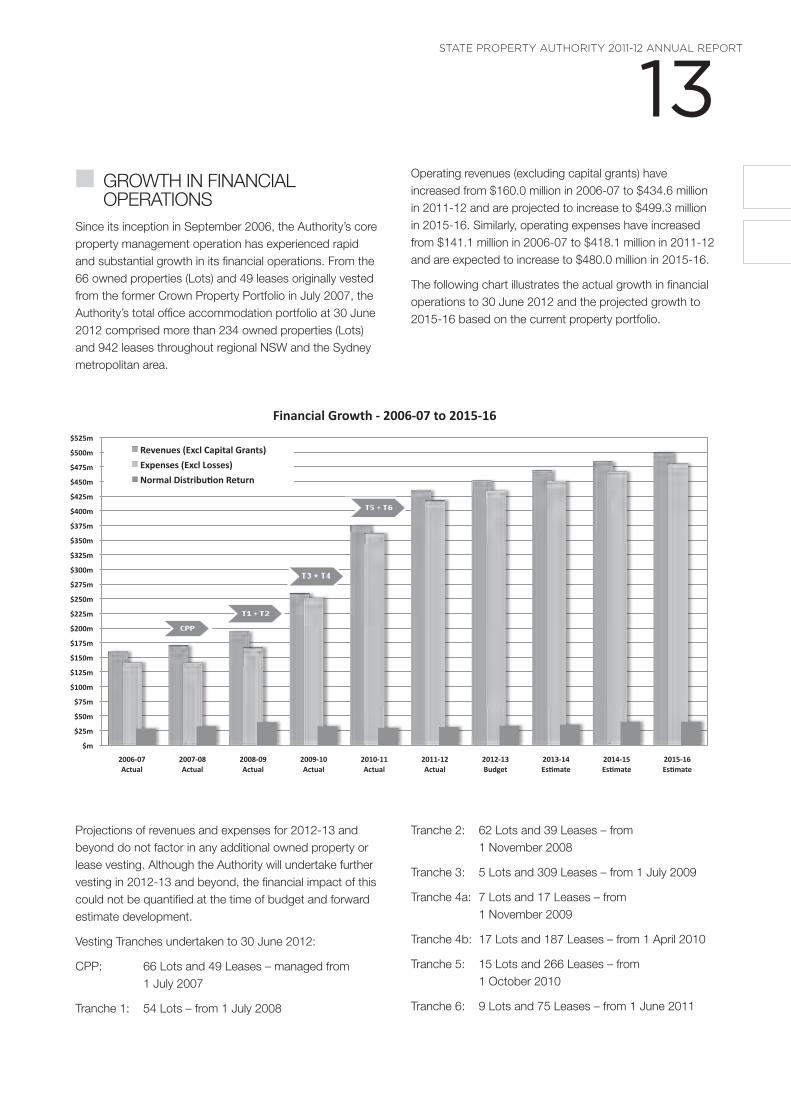
n groWth in finanCiaL oPerations
since its inception in september 2006, the authority’s core property management operation has experienced rapid and substantial growth in its financial operations . from the 66 owned properties (Lots) and 49 leases originally vested from the former Crown Property Portfolio in july 2007, the authority’s total office accommodation portfolio at 30 june 2012 comprised more than 234 owned properties (Lots) and 942 leases throughout regional nsW and the sydney metropolitan area .
operating revenues (excluding capital grants) have increased from $160 .0 million in 2006-07 to $434 .6 million in 2011-12 and are projected to increase to $499 .3 million in 2015-16 . similarly, operating expenses have increased from $141 .1 million in 2006-07 to $418 .1 million in 2011-12 and are expected to increase to $480 .0 million in 2015-16 .
the following chart illustrates the actual growth in financial operations to 30 june 2012 and the projected growth to 2015-16 based on the current property portfolio .
Projections of revenues and expenses for 2012-13 and beyond do not factor in any additional owned property or lease vesting . although the authority will undertake further vesting in 2012-13 and beyond, the financial impact of this could not be quantified at the time of budget and forward estimate development .
vesting tranches undertaken to 30 june 2012:
CPP: 66 Lots and 49 Leases – managed from 1 july 2007
tranche 1: 54 Lots – from 1 july 2008
tranche 2: 62 Lots and 39 Leases – from 1 november 2008
tranche 3: 5 Lots and 309 Leases – from 1 july 2009
tranche 4a: 7 Lots and 17 Leases – from 1 november 2009
tranche 4b: 17 Lots and 187 Leases – from 1 april 2010
tranche 5: 15 Lots and 266 Leases – from 1 october 2010
tranche 6: 9 Lots and 75 Leases – from 1 june 2011
SPA Financial Growth Grap.xlsx 8/11/12
STATE PROPERTY AUTHORITY
Financial Growth Since Inception
2006-07Actual
2007-08Actual
2008-09Actual
2009-10Actual
2010-11Actual
2011-12Actual
2012-13Budget
2013-14Estimate
2014-15Estimate
2015-16Estimate
Revenues (Excl Capital Grants) 159,985 169,798 193,869 258,651 375,010 434,619 450,692 468,862 483,376 499,313
Expenses (Excl Losses) 141,114 141,009 166,826 251,459 361,427 418,094 434,012 449,881 466,520 479,982
Operating Result (Underlying) 18,871 28,789 27,043 7,192 13,583 16,525 16,680 18,981 16,856 19,331
* Also excludes Gains/Losses on Assets & net land remediation expenses/revenues
FINANCIAL DISTRIBUTIONS
Normal Distribution Return 28,335 32,488 39,035 32,625 30,000 31,000 33,000 35,000 40,000 40,000
$m
$25m
$50m
$75m
$100m
$125m
$150m
$175m
$200m
$225m
$250m
$275m
$300m
$325m
$350m
$375m
$400m
$425m
$450m
$475m
$500m
$525m
2006-‐07 Actual
2007-‐08 Actual
2008-‐09 Actual
2009-‐10 Actual
2010-‐11 Actual
2011-‐12 Actual
2012-‐13 Budget
2013-‐14 Es;mate
2014-‐15 Es;mate
2015-‐16 Es;mate
Revenues (Excl Capital Grants)
Expenses (Excl Losses)
Normal Distribu;on Return
Financial Growth -‐ 2006-‐07 to 2015-‐16
T3 + T4
14
oPerating resuLt
2011-12 aCtuaL
$’000
2011-12 budget
$’000
varianCe to budget
$’000
2012-13 budget
$’000
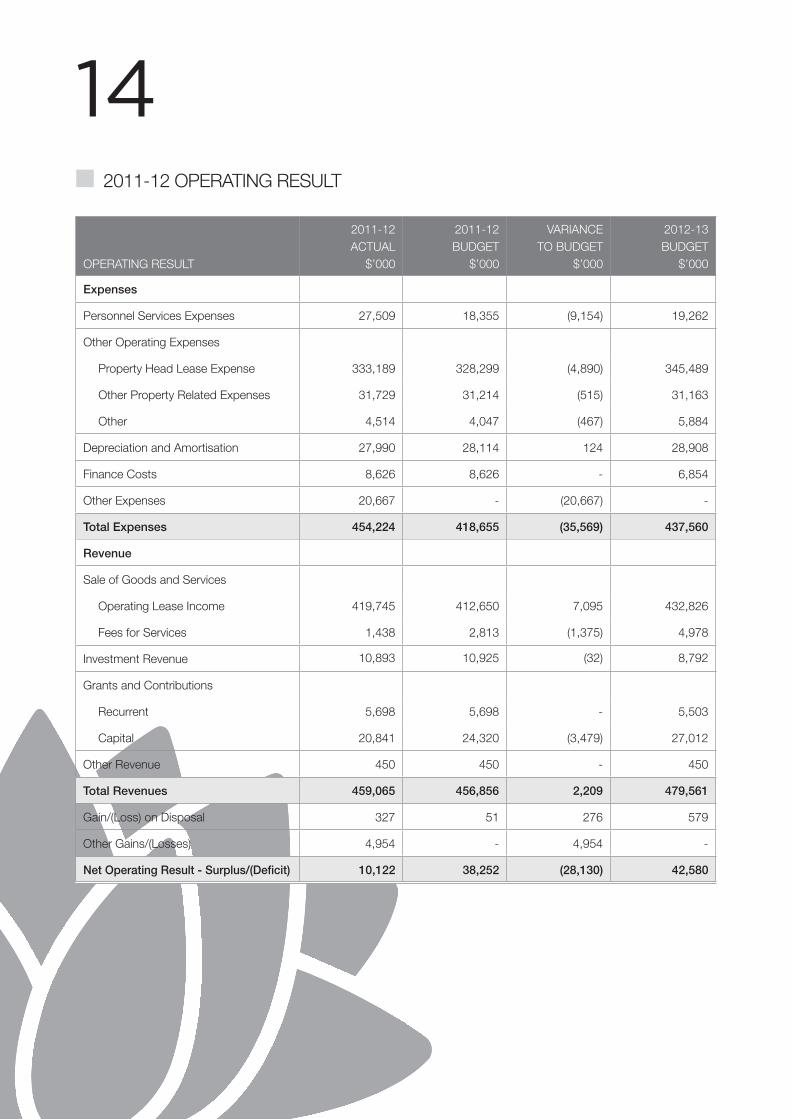
Expenses
Personnel services expenses 27,509 18,355 (9,154) 19,262
other operating expenses
Property head Lease expense 333,189 328,299 (4,890) 345,489
other Property related expenses 31,729 31,214 (515) 31,163
other 4,514 4,047 (467) 5,884
depreciation and amortisation 27,990 28,114 124 28,908
finance Costs 8,626 8,626 - 6,854
other expenses 20,667 - (20,667) -
Total Expenses 454,224 418,655 (35,569) 437,560
Revenue
sale of goods and services
operating Lease income 419,745 412,650 7,095 432,826
fees for services 1,438 2,813 (1,375) 4,978
investment revenue 10,893 10,925 (32) 8,792
grants and Contributions
recurrent 5,698 5,698 - 5,503
Capital 20,841 24,320 (3,479) 27,012
other revenue 450 450 - 450
Total Revenues 459,065 456,856 2,209 479,561
gain/(Loss) on disposal 327 51 276 579
other gains/(Losses) 4,954 - 4,954 -
Net Operating Result - Surplus/(Deficit) 10,122 38,252 (28,130) 42,580
n 2011-12 oPerating resuLt
15 State ProPerty authority 2011-12 annual rePort
the authority’s 2011-12 net operating result shows an unfavourable variance of $28 .1 million on budget . this variance to budget was largely due to the following non-controlled expenses:
n $10 .3 million in net actuarial losses in respect of personnel who are members of defined benefits superannuation plans . this was mainly due to a significant reduction in the discount rate used by the fund’s actuary to determine the present value of the defined benefits obligation . the rate reduced from 5 .28% at 30 june 2011 to 3 .06% at 30 june 2012 . as the authority is not an employer, all such actuarial losses must be recognised as an expense rather than an adjustment directly through equity .
n $20 .7 million in relation to increases in estimated remediation liabilities on land owned by the newcastle Port Corporation (nPC) . these estimates, which represent the best available to the authority, were provided by the hunter development Corporation (who manage the remediation works) on 31 may 2012 . the estimates relate to remediation works remaining on former bhP billiton port lands in newcastle, which was sold to the nPC in july 2009 . the authority retains the liability in its books due to an indemnity provided by the treasurer to the nPC at the time of sale . as the authority has no underlying asset, any increase in the remediation provision relating to these lands must be recognised as an expense .
Without these expenses, the operating surplus would have improved by $2 .9 million on the published budget – largely as a result of net revaluation gains on land and buildings .
in 2012-13, the authority will progress discussions with nsW treasury to address the ongoing accounting impacts and funding arrangements for its non-controlled remediation and personnel services liabilities .
total expenses of $454 .2 million for the year exceeded the budget by $35 .6 million . the increase over budget resulted mainly from the abovementioned non-controlled items and higher property head lease expenses of $4 .9 million . the increase in property head lease expenses was due to rental adjustments and new leases taken on throughout the year . the increases were all fully recovered from sub-letting to other government agency tenants .
total revenue of $459 .1 million was $2 .2 million higher than budget . the minor increase on budget is mainly attributed to an increase in operating lease income of $7 .1 million offset, in part, by lower capital grant receipts of $3 .5 million and lower fee for services revenue of $1 .4 million .
a $3 .5 million reduction in the expected capital contribution for the year was directly related to the delays in commencing programmed refurbishment works on the authority’s new stock of vested properties . government contribution funding for the authority’s capital program is received subsequent to the completion of works on individual projects . fee for services revenue was $1 .4 million lower than budget due to lower than planned resourcing levels available to undertake fee earning projects . this reduction was largely offset by lower personnel services expenses after excluding the superannuation actuarial losses outlined above .
n 2012-13 oPerating budget overvieW
the 2012-13 budget numbers shown in the above tables reflect the authority’s original budget as published in the state government’s 2012-13 budget Papers . the authority’s 2012-13 budget projects an operating surplus of $42 .6 million .
total expenses of $437 .6 million are budgeted in 2012-13 . the majority of these expenses relate to government agency occupied office accommodation properties and include head lease rental payments of $345 .5 million and other property related expenses (including outgoings, utilities, maintenance, finance costs and depreciation) totalling $72 .8 million . the significant increase in property head lease expense over the 2011-12 budget is directly associated with the additional leased property vesting which occurred in late 2010-11 .
budgeted total revenue of $479 .6 million includes $432 .8 million in operating lease income received from the authority’s portfolio of owned and leased office accommodation properties . as with property head lease expense, the increase in operating lease income over the 2011-12 budgeted amount is mainly due to the vesting of additional owned and leased properties in late 2010-11 .
total revenue in 2012-13 will also include $27 .0 million in capital contributions received from the state government which will largely be used to fund the authority’s government office building refurbishment program . a further $5 .5 million in recurrent contributions will also be received from the government to fund whole-of-government property related services provided by the authority to other government agencies .
16 further vesting is earmarked to occur during 2012-13, however the financial impact of this on the authority’s total revenues and expenses was not available at the time of budget development .
surplus cash generated from the authority’s operating activities is returned to the state government in the form of a normal financial distribution . the 2012-13 budget has targeted a normal financial distribution of $33 .0 million for the year .
n 2011-12 indePendent audit outCome
the above financial performance and budget information is unaudited financial information . audited financial information, including the primary financial statements and notes to the financial statements of the authority, is presented within the audited financial information section of this report .
the independent audit of the authority’s financial statements was completed by the audit office of nsW on 26 september 2012 . the audit office issued an unmodified independent auditor’s report on that date .
no significant matters were raised by the audit office within the statutory audit report .
17 State ProPerty authority 2011-12 annual rePort
n audited finanCiaL information statement by the Chief exeCutive offiCer
bligh house Level 9 4-6 bligh street sydney nsW 2000 Phone: (02) 9273 3800 fax: (02) 9273 3911 abn 91 840 597 406 | www .spa .nsw .gov .au
18
19 State ProPerty authority 2011-12 annual rePort
20
State Property Authority
Financial Statements
For the Year Ended 30 June 2012
21 State ProPerty authority 2011-12 annual rePort
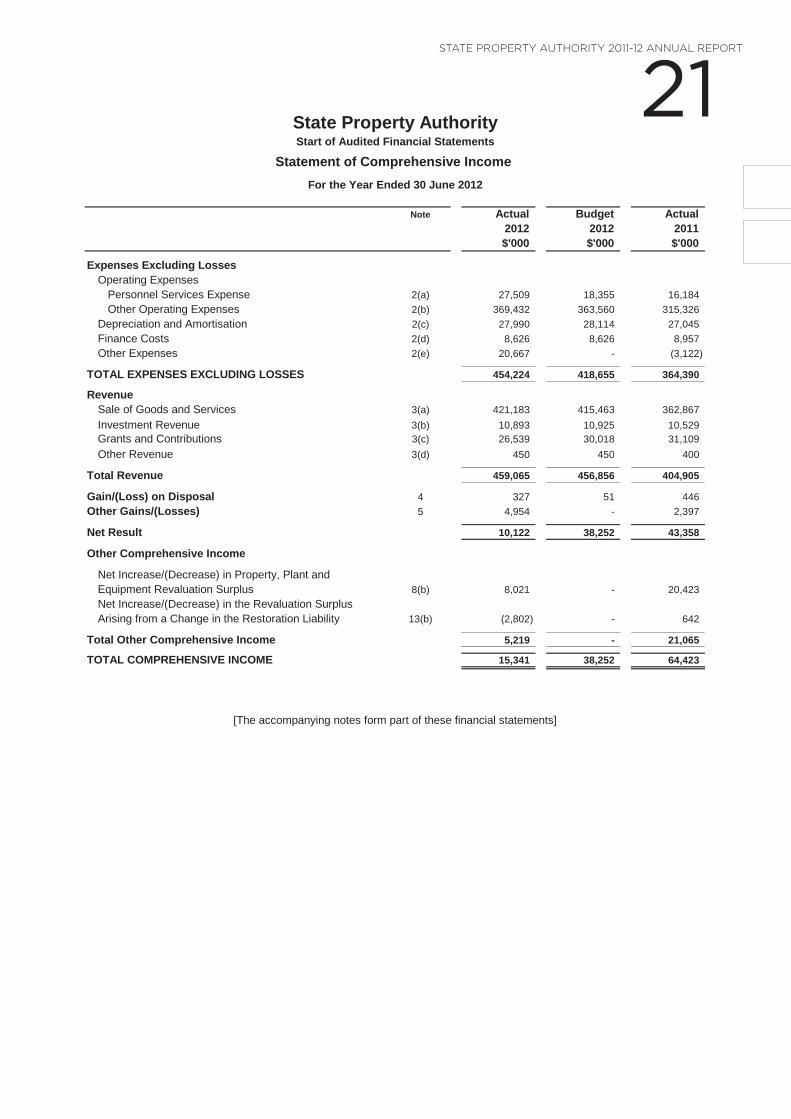
Note Actual Budget Actual2012 2012 2011$'000 $'000 $'000
Expenses Excluding LossesOperating Expenses
Personnel Services Expense 2(a) 27,509 18,355 16,184 Other Operating Expenses 2(b) 369,432 363,560 315,326
Depreciation and Amortisation 2(c) 27,990 28,114 27,045 Finance Costs 2(d) 8,626 8,626 8,957 Other Expenses 2(e) 20,667 - (3,122)
TOTAL EXPENSES EXCLUDING LOSSES 454,224 418,655 364,390
RevenueSale of Goods and Services 3(a) 421,183 415,463 362,867 Investment Revenue 3(b) 10,893 10,925 10,529 Grants and Contributions 3(c) 26,539 30,018 31,109 Other Revenue 3(d) 450 450 400
Total Revenue 459,065 456,856 404,905
Gain/(Loss) on Disposal 4 327 51 446 Other Gains/(Losses) 5 4,954 - 2,397
Net Result 10,122 38,252 43,358
Other Comprehensive Income
Net Increase/(Decrease) in Property, Plant andEquipment Revaluation Surplus 8(b) 8,021 - 20,423 Net Increase/(Decrease) in the Revaluation SurplusArising from a Change in the Restoration Liability 13(b) (2,802) - 642
Total Other Comprehensive Income 5,219 - 21,065
TOTAL COMPREHENSIVE INCOME 15,341 38,252 64,423
State Property AuthorityStart of Audited Financial Statements
Statement of Comprehensive Income For the Year Ended 30 June 2012
[The accompanying notes form part of these financial statements]
- 1 -
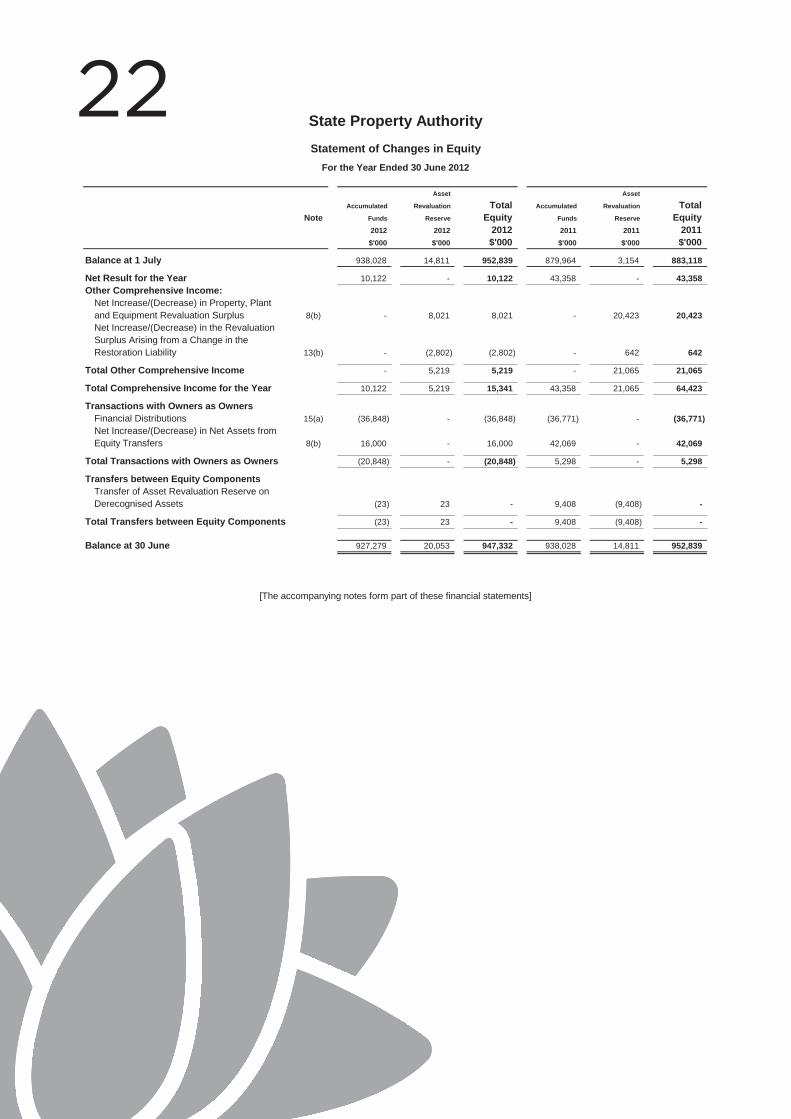
22 Asset Asset
Accumulated Revaluation Total Accumulated Revaluation TotalNote Funds Reserve Equity Funds Reserve Equity
2012 2012 2012 2011 2011 2011$'000 $'000 $'000 $'000 $'000 $'000
Balance at 1 July 938,028 14,811 952,839 879,964 3,154 883,118
Net Result for the Year 10,122 - 10,122 43,358 - 43,358 Other Comprehensive Income:
Net Increase/(Decrease) in Property, Plantand Equipment Revaluation Surplus 8(b) - 8,021 8,021 - 20,423 20,423 Net Increase/(Decrease) in the RevaluationSurplus Arising from a Change in theRestoration Liability 13(b) - (2,802) (2,802) - 642 642
Total Other Comprehensive Income - 5,219 5,219 - 21,065 21,065
Total Comprehensive Income for the Year 10,122 5,219 15,341 43,358 21,065 64,423
Transactions with Owners as OwnersFinancial Distributions 15(a) (36,848) - (36,848) (36,771) - (36,771) Net Increase/(Decrease) in Net Assets fromEquity Transfers 8(b) 16,000 - 16,000 42,069 - 42,069
Total Transactions with Owners as Owners (20,848) - (20,848) 5,298 - 5,298
Transfers between Equity ComponentsTransfer of Asset Revaluation Reserve onDerecognised Assets (23) 23 - 9,408 (9,408) -
Total Transfers between Equity Components (23) 23 - 9,408 (9,408) -
Balance at 30 June 927,279 20,053 947,332 938,028 14,811 952,839
State Property Authority
Statement of Changes in EquityFor the Year Ended 30 June 2012
[The accompanying notes form part of these financial statements]
- 2 -
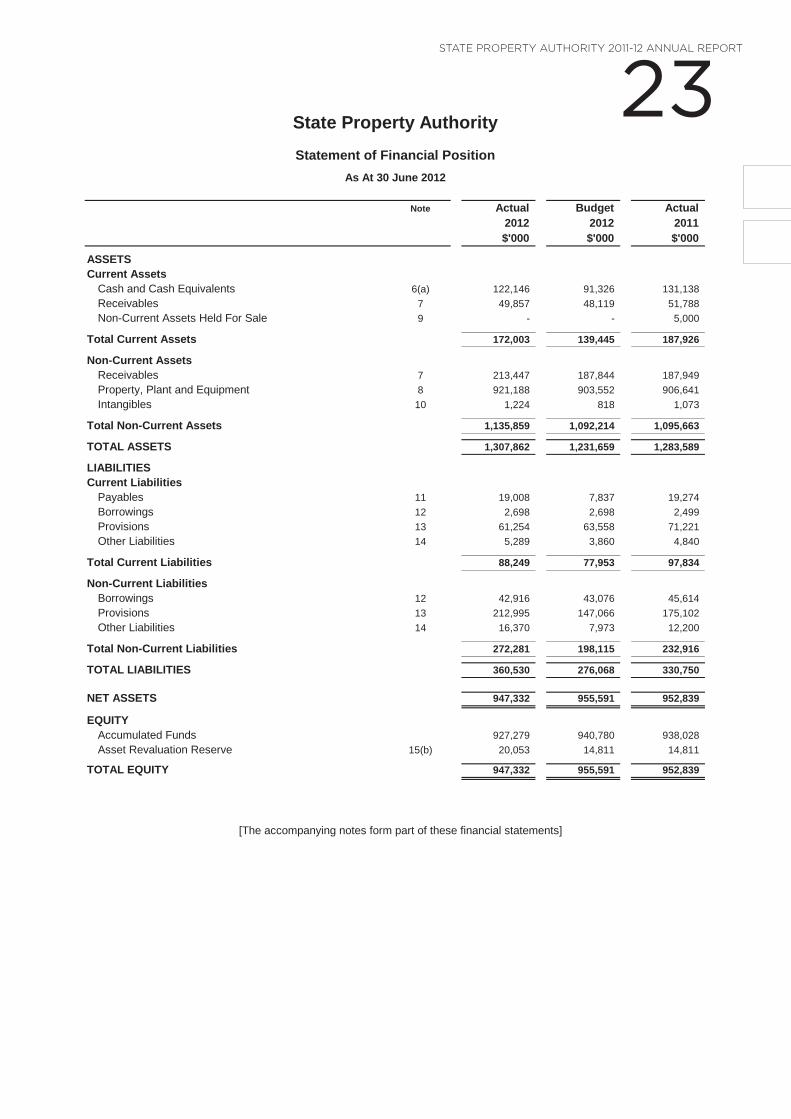
23 State ProPerty authority 2011-12 annual rePort
Note Actual Budget Actual2012 2012 2011$'000 $'000 $'000
ASSETSCurrent Assets
Cash and Cash Equivalents 6(a) 122,146 91,326 131,138 Receivables 7 49,857 48,119 51,788 Non-Current Assets Held For Sale 9 - - 5,000
Total Current Assets 172,003 139,445 187,926
Non-Current AssetsReceivables 7 213,447 187,844 187,949 Property, Plant and Equipment 8 921,188 903,552 906,641 Intangibles 10 1,224 818 1,073
Total Non-Current Assets 1,135,859 1,092,214 1,095,663
TOTAL ASSETS 1,307,862 1,231,659 1,283,589
LIABILITIESCurrent Liabilities
Payables 11 19,008 7,837 19,274 Borrowings 12 2,698 2,698 2,499 Provisions 13 61,254 63,558 71,221 Other Liabilities 14 5,289 3,860 4,840
Total Current Liabilities 88,249 77,953 97,834
Non-Current LiabilitiesBorrowings 12 42,916 43,076 45,614 Provisions 13 212,995 147,066 175,102 Other Liabilities 14 16,370 7,973 12,200
Total Non-Current Liabilities 272,281 198,115 232,916
TOTAL LIABILITIES 360,530 276,068 330,750
NET ASSETS 947,332 955,591 952,839
EQUITYAccumulated Funds 927,279 940,780 938,028 Asset Revaluation Reserve 15(b) 20,053 14,811 14,811
TOTAL EQUITY 947,332 955,591 952,839
[The accompanying notes form part of these financial statements]
State Property Authority
Statement of Financial PositionAs At 30 June 2012
- 3 -
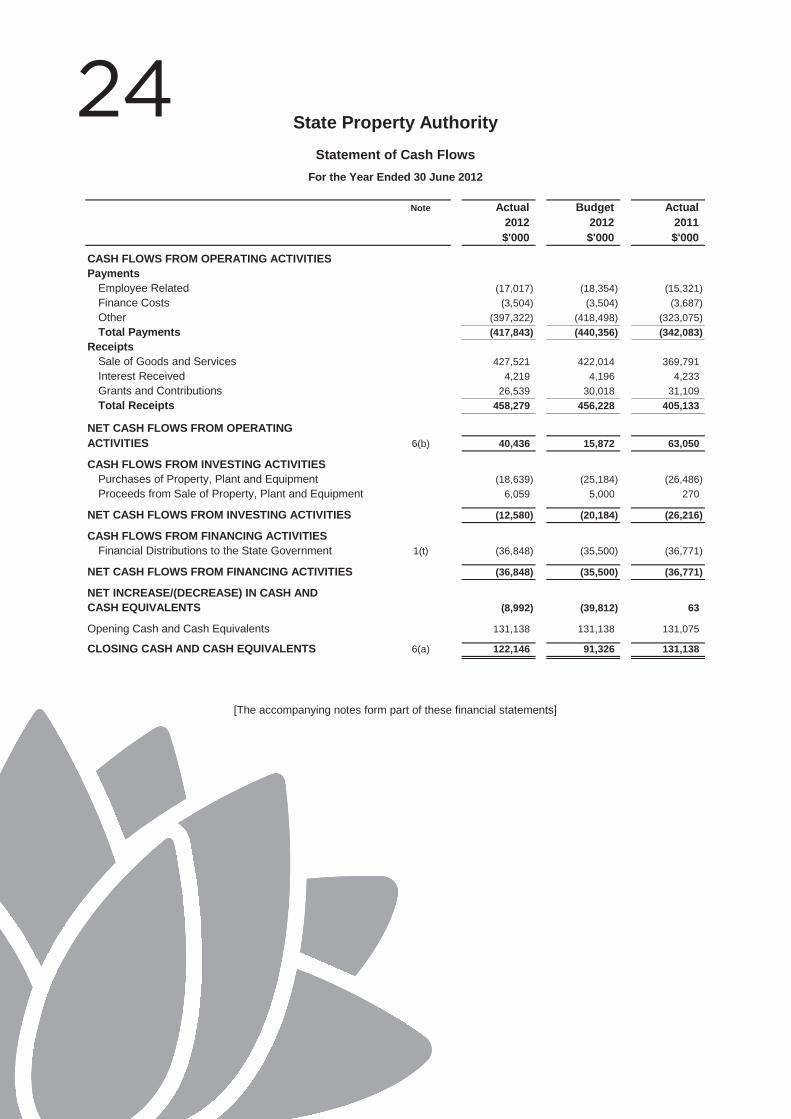
24 Note Actual Budget Actual
2012 2012 2011$'000 $'000 $'000
CASH FLOWS FROM OPERATING ACTIVITIESPayments
Employee Related (17,017) (18,354) (15,321) Finance Costs (3,504) (3,504) (3,687) Other (397,322) (418,498) (323,075) Total Payments (417,843) (440,356) (342,083)
ReceiptsSale of Goods and Services 427,521 422,014 369,791 Interest Received 4,219 4,196 4,233 Grants and Contributions 26,539 30,018 31,109 Total Receipts 458,279 456,228 405,133
NET CASH FLOWS FROM OPERATINGACTIVITIES 6(b) 40,436 15,872 63,050
CASH FLOWS FROM INVESTING ACTIVITIESPurchases of Property, Plant and Equipment (18,639) (25,184) (26,486) Proceeds from Sale of Property, Plant and Equipment 6,059 5,000 270
NET CASH FLOWS FROM INVESTING ACTIVITIES (12,580) (20,184) (26,216)
CASH FLOWS FROM FINANCING ACTIVITIESFinancial Distributions to the State Government 1(t) (36,848) (35,500) (36,771)
NET CASH FLOWS FROM FINANCING ACTIVITIES (36,848) (35,500) (36,771)
NET INCREASE/(DECREASE) IN CASH ANDCASH EQUIVALENTS (8,992) (39,812) 63
Opening Cash and Cash Equivalents 131,138 131,138 131,075
CLOSING CASH AND CASH EQUIVALENTS 6(a) 122,146 91,326 131,138
State Property AuthorityStatement of Cash Flows
For the Year Ended 30 June 2012
[The accompanying notes form part of these financial statements]
- 4 -
25 State ProPerty authority 2011-12 annual rePort
1. SUMMARY OF SIGNIFICANT ACCOUNTING POLICIES
(a) Reporting Entity
The State Property Authority (the Authority) was established under the State Property Authority Act 2006 (the Act). TheAuthority commenced operations on 1 September 2006 and is domiciled in Australia. Its principal business address is BlighHouse, 4-6 Bligh Street, Sydney NSW 2000. The Authority is a not-for-profit entity as profit is not its principal objective. TheAuthority is consolidated as part of the NSW Total State Sector Accounts.
Under the Act, the Authority is unable to employ staff. However, to enable it to exercise its functions, the Authority canobtain personnel services from Government agencies who are able to engage staff under Chapter 1A of the Public SectorEmployment and Management Act 2002. During 2011-12, all personnel services were provided by the Department ofFinance and Services (DFS). The DFS is a separate reporting entity and does not control the Authority for financial reportingpurposes.
These financial statements have been authorised for issue by the Authority's Chief Executive Officer on 23 September 2012.
(b) Basis of Preparation
The State Property Authority's financial statements are general-purpose financial statements prepared on a "going concern"basis and in accordance with:
(i) applicable Australian Accounting Standards (which include Australian Accounting Interpretations);(ii) the requirements of the Public Finance and Audit Act 1983 and Regulation; and(iii) the Financial Reporting Directions published in the Financial Reporting Code for NSW General Government Sector
Entities or issued by the Treasurer.
Where there are inconsistencies between the above requirements the legislative provisions prevail.
The financial statements have been prepared on an historical cost basis, except for property, plant and equipment andinvestment properties which have been measured at fair value, and non-current assets held for sale which have beenmeasured at the lower of the carrying amount or fair value less costs to sell.
The accrual basis of accounting has been adopted in the preparation of the financial statements, except for cash flowinformation.
In the process of applying the Authority's accounting policies, management have applied judgement and made keyassumptions and estimations. Those judgements, assumptions and estimations, which have the most significant effect onthe amounts recognised in the financial statements have been disclosed in the relevant notes to the financial statements.
All amounts are rounded to the nearest one thousand dollars ($'000) and are in Australian currency.
(c) Statement of Compliance
The financial statements and accompanying notes comply with Australian Accounting Standards (which include AustralianAccounting Interpretations).
There are a number of recently issued or amended Australian Accounting Standards and Interpretations which are not yeteffective and have not been adopted for the reporting period ending 30 June 2012. Management has reviewed each of theseStandards and Interpretations and considers that their early adoption will not have any material impact on the financialresults of the State Property Authority.
(d) Income Recognition
(i) Operating Lease Income
Operating lease income is recognised in accordance with AASB 117 "Leases". Lease income from operating leaseswhere the Authority is the lessor is recognised as income in the Statement of Comprehensive Income on a straight-linebasis over the lease term. Contingent rental income is recognised as income in the period in which it is earned.
State Property Authority
Notes to and Forming Part of the Financial StatementsFor the Year Ended 30 June 2012
- 5 -
26 State Property Authority
Notes to and Forming Part of the Financial StatementsFor the Year Ended 30 June 2012
(ii) Finance Lease Income
Finance lease income is recognised in accordance with AASB 117 "Leases". Lease income from finance leases wherethe Authority is the lessor is recognised as income in the Statement of Comprehensive Income over the lease period soas to allocate finance income over the lease term on a systematic and rational basis. This income allocation is basedon a pattern reflecting a constant period return on the Authority’s net investment in the lease.
The estimated unguaranteed residual value used in computing the Authority's gross investment in each lease isreviewed regularly. If there has been a reduction in the estimated unguaranteed residual value, the income allocationover the lease term is revised and any reduction in respect of amounts accrued is recognised immediately. Contingentrent from finance leases as lessor is recognised as income in the period in which it is earned.
(iii) Fees for Services Rendered
Revenue from the rendering of services is recognised when the service is provided or by reference to the stage ofcompletion (based on labour hours incurred to date).
(iv) Interest Income
Revenue is recognised using the effective interest method as set out in AASB 139 "Financial Instruments: Recognitionand Measurement".
(v) Grants and Contributions
Grants and contributions are recognised as income when the Authority obtains control over the assets comprising thegrant or contribution, it is probable that the economic benefits will flow to the entity, and the amount of the grant orcontribution can be measured reliably. Control is normally obtained upon the receipt of cash.
(vi) Sale of Property, Plant and Equipment
Revenue is recognised when the significant risks and rewards of ownership of the item of property, plant and equipmentpasses to the buyer and can be measured reliably. Specifically, with respect to property sales, the risks and rewardsare considered passed to the buyer at the time of settlement of the contract.
(vii) Emerging Asset Revenue
In accordance with TPP 06-08 "Accounting for Privately Financed Projects", the Opera House Car Park is an emergingasset which the Authority has a right to receive in 2043 under a privately financed infrastructure arrangement. The rightis being recognised as revenue and added to the asset value over the term of the car park concession. Any periodicrevaluations are accounted for in accordance with AASB 116 "Property Plant and Equipment".
(e) Provisions
Provisions are recognised when the Authority has a present legal or constructive obligation as a result of a past event, it isprobable that an outflow of resources will be required to settle the obligation and a reliable estimate can be made of theamount of the obligation.
The amount recognised as a provision is the best estimate of the expenditure required to settle the present obligation as atthe reporting date, taking into account the risks and uncertainties that surround the events and circumstances that affectthe provision. Where the effect of the time value of money is material, the provision amount is calculated as the presentvalue of the expenditure expected to be required to settle the obligation. The discount rate used in the calculation is apre-tax rate that reflects current market assessments of the time value of money and the risks specific to the liability. Therate does not reflect risks for which future cash flow estimates have been adjusted.
- 6 -
27 State ProPerty authority 2011-12 annual rePort
State Property Authority
Notes to and Forming Part of the Financial StatementsFor the Year Ended 30 June 2012
(i) Personnel Services Provision
The Authority receives personnel services from the Department of Finance and Services (DFS). The DFS is not aSpecial Purpose Service Entity and does not control the Authority under this arrangement (Note 1(a)). In accordancewith NSW Treasury Circular 11/19 "Financial and Annual Reporting Requirements Arising from Personnel ServiceArrangements", a liability representing the total amount payable to the DFS is recognised as a provision in theStatement of Financial Position.
As the Authority is not an employer, the disclosure requirements of AASB 119 "Employee Benefits" in respect ofemployee benefits do not apply. However, for clarity and transparency, the Personnel Services Provision isdisaggregated in the notes to the financial statements into its major components which include Annual Leave, LongService Leave On-costs and Unfunded Superannuation (Note 13(a)).
(ii) Land Remediation Provision
Where the Authority has a legal or constructive obligation to remediate an asset such as land, a provision is recognisedto reflect the net present value of the estimated future costs required to settle the Authority's remediation obligations(Note 13(b)). At the same time, where the Authority owns the underlying asset, the amount of the provision iscapitalised and added to the cost of the asset.
Periodic changes in the provision are accounted for in accordance with the requirements of AASB Interpretation 1"Changes in Existing Decommissioning, Restoration and Similar Liabilities" and the revaluation model requirements ofAASB 116 "Property, Plant and Equipment" for not-for-profit entities.
The discount applied to recognise the time value of money is unwound over the life of the provision. Any incrementalincrease resulting from the unwinding of the discount is recognised under Finance Costs within the Net Resultin the reporting period in which it occurs.
Other increases or decreases in the provision resulting from periodic changes to the estimated timing or amount offuture remediation costs, or changes to the discount rate used, alter the revaluation increase or decrease previouslyrecognised on the underlying asset. An increase in the provision is recognised in the Net Result except to theextent that it reverses any Asset Revaluation Reserve balance in respect of the underlying class of assets. A decreasein the provision is credited to the Asset Revaluation Reserve except to the extent that it reverses any previous increaserecognised in the Net Result in respect the underlying class of assets. Any changes to the Asset RevaluationReserve resulting from these provision increases or decreases are separately identified and disclosed within OtherComprehensive Income.
(f) Insurance
The Authority's insurance activities are conducted through the NSW Treasury Managed Fund of self insurance forGovernment agencies. The Authority carries a comprehensive range of insurances through the Treasury Managed Fundwhich cover property, public liability, workers compensation, motor vehicles and other contingencies. The expense(premium) is determined on past claims experience.
Properties owned by the Authority are insured for their replacement value. Management ensures that all insurance coversare current and adequate.
(g) Goods and Services Tax (GST)
Revenue, expenses and assets are recognised net of the amount of GST, except:
(i) the amount of GST incurred by the Authority as a purchaser that is not recoverable from the Australian Taxation Officeis recognised as part of the cost of acquisition of an asset or as part of an item of expense.
(ii) receivables and payables are stated with the amount of GST included.
(iii) Cash flows are included in the Statement of Cash Flows on a gross basis and the GST component of cash flows arisingfrom investing and financing activities, which are recoverable from, or payable to, the Australian Taxation Office, areclassified as operating cash flows.
(iv) Commitment amounts disclosed in the financial statements include the amount of GST recoverable from, or payable to,the Australian Taxation Office.
- 7 -
28 State Property Authority
Notes to and Forming Part of the Financial StatementsFor the Year Ended 30 June 2012
(h) Acquisition of Property, Plant and Equipment
Acquisition of property is recognised when the risks and rewards of the asset have passed to the buyer. This usuallycoincides with when the legal title passes to the buyer, which is upon settlement of a contract.
The cost method of accounting is used for the initial recording of all acquisitions of assets controlled by the Authority. Costis the amount of cash or cash equivalents paid or the fair value of the other consideration given to acquire the asset at thetime of its acquisition or construction or, where applicable, the amount attributed to that asset when initially recognised inaccordance with the specific requirements of other Australian Accounting Standards.
Assets acquired at no cost, or for nominal consideration, are initially recognised as assets and revenues at their fair value atthe date of acquisition. Fair value means the amount for which an asset could be exchanged between knowledgeable,willing parties in an arm's length transaction.
Computer equipment and furniture and fixtures with short useful lives are measured at depreciated historical cost, as asurrogate to fair value.
Where payment for an item is deferred beyond normal credit terms, its cost is the cash price equivalent. That is, thedeferred payment amount is effectively discounted at an asset-specific rate.
(i) Revaluation of Property, Plant and Equipment
Following initial recognition at cost, land and buildings are carried at a revalued amount, which is the fair value at the date ofthe revaluation less any subsequent accumulated depreciation on buildings and any subsequent accumulated impairmentlosses.
Physical non-current assets are valued in accordance with NSW Treasury Policy and Guidelines Paper 07-01 "Valuation ofPhysical Non-Current Assets at Fair Value". This policy adopts fair value in accordance with AASB 116 "Property, Plantand Equipment" and AASB 140 "Investment Property".
Property, plant and equipment is measured on an existing use basis, where there are no feasible alternative uses in theexisting natural, legal, financial and socio-political environment. However, in the limited circumstances where there arefeasible alternative uses, assets are valued at their highest and best use.
Fair value of property, plant and equipment is determined having regard to comparable market evidence or depreciatedreplacement cost approach. Fair value revaluations are made annually to ensure that the carrying amount does not differmaterially from its fair value at reporting date.
Any revaluation increment is credited to the Asset Revaluation Reserve included in the equity section of the Statement ofFinancial Position except to the extent that it reverses a revaluation decrease of the same class of assets previouslyrecognised in the Net Result, in which case the revaluation increment is recognised in the Net Result.
Any revaluation decrease is recognised in the Net Result, except to the extent that it reverses a revaluationincrease of the same class of assets previously recognised in the Asset Revaluation Reserve.
Revaluation increments and decrements are offset against one another within a class of non-current assets.
Where assets are revalued, the accumulated depreciation at the revaluation date is credited to the assets to which itrelates. The net assets are then increased or decreased by the revaluation increment or decrement.
Upon disposal, any revaluation surplus relating to the particular asset being sold is transferred to Accumulated Funds. Anitem of property, plant and equipment is derecognised upon disposal or when no further future economic benefits areexpected from its use or disposal. Any gain or loss on derecognition of the asset (calculated as the difference between thenet disposal proceeds and the carrying amount of the asset) is included in the Net Result in the year the asset isderecognised.
- 8 -
29 State ProPerty authority 2011-12 annual rePort
State Property Authority
Notes to and Forming Part of the Financial StatementsFor the Year Ended 30 June 2012
(j) Impairment of Property, Plant and Equipment
In accordance with AASB 136 "Impairment of Assets", an assessment is made at reporting date as to whether there is anyindication that the Authority's property, plant and equipment assets are impaired. This assessment is made after fair valuemeasurement under AASB 116 "Property Plant and Equipment".
If any indication of impairment exists, an estimate of the recoverable amount of the asset is made. Under AASB 136, therecoverable amount is defined as the higher of fair value less costs to sell and value in use.
If, and only if, the recoverable amount of the asset is less than the carrying amount, the carrying amount is reduced tothe recoverable amount. The reduction is an impairment loss and is treated as a revaluation decrease in accordance withAASB 116 "Property Plant and Equipment".
However, as fair value revaluations are made annually to ensure that carrying amounts do not differ materially from their fairvalue at reporting date, it is considered that assets are already recorded at their recoverable amount and impairment wouldonly arise if selling costs are material. Management considers that selling costs, in respect of the Authority's Property,Plant and Equipment assets, would be immaterial.
(k) Non-Current Assets Held For Sale
Non-current assets are classified as non-current assets held for sale where the assets are available for immediate sale, the sale is highly probable and where the carrying value will be principally recovered through a sale transaction rather than through continuing use.
Non-current assets held for sale are measured at the lower of their carrying amount at the time of such classification and their fair value less costs to sell. These assets are not depreciated while they are classified as held for sale.
(l) Depreciation and Amortisation of Property, Plant and Equipment
(i) Depreciation
Depreciation is provided for on a straight-line basis for all depreciable non-current assets so as to write off thedepreciable amount of each asset as it is consumed over its useful life to the Authority. Estimates of remaining usefullives are made on a regular basis for all assets, with annual reassessments for major items.
The Authority's buildings are separately componentised into the structure, air conditioning units and lifts where it canbe determined that these components:
(a) physically exist; and(b) are material enough to justify separate tracking; and(c) are capable of having a reliable value attributed to them; and(d) have differing estimated useful lives to the extent that failure to depreciate them separately would result in a material difference in the annual depreciation expense for the entity.
The starting useful lives of the Authority's items of property, plant and equipment are based on the following:
2012 2011Years Years
Buildings (Not Componentised) 40 40Buildings (Componentised)
Structure 40 40Air Conditioning Units 20 20Lifts 30 30
Computer Equipment and Software 3 3Furniture and Fittings 10 10Plant and Equipment and Office Equipment 5 5Leasehold Improvements 6 6
Heritage buildings are depreciated in accordance with the above useful life ranges. Fine Arts and Heritage items locatedwithin owned buildings are not depreciated as they do not have a limited useful life. These items are however subject toan annual impairment test to identify any impairment.
In accordance with AASB 5 "Non-current Assets Held for Sale and Discontinued Operations", any assets held for saleare not depreciated. Land is also not depreciated as land is not a depreciable asset.
- 9 -
30 State Property Authority
Notes to and Forming Part of the Financial StatementsFor the Year Ended 30 June 2012
(ii) Amortisation
Leased assets are amortised over the period of the lease or the life of the asset, whichever is the shorter.
(m) Capitalisation Thresholds
Plant and equipment and intangible assets costing $5,000 and above individually (or forming part of a network costing morethan $5,000) are capitalised.
Property expenditure that gives rise to an effective and material increase in the future economic benefits of the property tothe Authority is capitalised. The general threshold for property expenditure capitalisation is $30,000.
(n) Maintenance
Day-to-day servicing costs or maintenance are charged as expenses as incurred, except where they relate to thereplacement of a part or component of an asset, in which case the costs are capitalised and depreciated.
(o) Intangible Assets
Intangible assets are only recognised if it is probable that future economic benefits will flow to the Authority and the cost ofthe asset can be measured reliably.
The useful lives of intangible assets are assessed to be finite. Intangible assets are measured initially at cost andsubsequently at fair value only if there is an active market. As there is not an active market for the Authority's intangibleassets, the assets are carried at cost less accumulated amortisation.
The Authority's intangible assets (computer software) are amortised using the straight-line method over a period of three (3)years.
In general, intangible assets are tested for impairment where an indicator of impairment exists.
(p) Leases
A distinction is made between finance leases, which effectively transfer from the lessor to the lessee substantially all therisks and benefits incidental to ownership of the leased assets, and operating leases under which the lessor effectivelyretains all such risks and benefits.
(i) Finance Leases
Assets held under finance leases as lessee are recognised on inception at an amount equal to the fair value of theleased property, or if lower, the present value of the minimum lease payments. The corresponding liability to the lessoris included in the Statement of Financial Position as Finance Lease Liabilities under Borrowings (Note 12). Leasepayments are allocated between the principal component of the lease liability and the interest expense.
Finance leases as lessor in which substantially all the risks and rewards incidental to legal ownership are transferredby the Authority to the lessee, are classified in the Statement of Financial Position as Finance Lease Receivablesunder Receivables (Note 7(b)). Assets held under a finance lease arrangement are presented as a receivable at anamount equal to the net investment in the lease. Lessee finance lease payments are treated by the Authority asrepayment of principal and finance income over the lease term to reimburse and reward the Authority’s investment andservices. Lease payments relating to the period, excluding costs for services, are applied against the gross investmentin the lease to reduce both the principal and the unearned finance income.
- 10 -
31 State ProPerty authority 2011-12 annual rePort
State Property Authority
Notes to and Forming Part of the Financial StatementsFor the Year Ended 30 June 2012
(ii) Operating Leases
Operating lease payments are recognised in the Net Result and charged on a straight-line basis over the leaseterm. Lease incentives received which are less than $500,000 are recognised directly in the Net Result in theyear in which they are received. Lease incentives received which are greater than this amount are recogised in theStatement of Financial Position and are allocated to the Net Result over the lease term (Notes 14(a) and 2(b)).
In accordance with AASB 137 "Provisions, Contingent Liabilities and Contingent Assets", in the case of an onerouscontract, the present obligation under the contract is recognised and measured as a provision.
The terms of occupancy for government agencies occupying space in Authority owned premises is dictated in theMemorandum of Understanding (MoU) between the Authority and the agency. The provisions of the MoU are generallybased on market place conditions applicable to office buildings in commercial centres.
The term of the tenancy agreement is indefinite with the agency required to give 18 months notice prior to vacating.Termination of part tenancies is permitted subject to a variety of conditions being satisfied.
Rent reviews for owned government office buildings are conducted at two yearly intervals to update rentals to currentmarket rates. There are no ratchet clauses in place and tenants are charged an effective rental, which takes intoconsideration incentives available in the market place at a particular point in time.
Tenants will makegood the premises by undertaking a physical makegood or negotiating a financial settlement withthe Authority.
(q) Other Assets
Other assets are recognised on a cost basis.
(r) Financial Instruments
Financial instruments give rise to positions that are financial assets or liabilities of either the State Property Authority or itscounterparties. These include Cash at Bank, Receivables, Payables and Finance Lease Liabilities (Note 1(p)(i)).
(i) Cash and Cash Equivalents
Cash and short-term deposits in the Statement of Financial Position comprise cash at bank and in hand, restrictedcash and other short-term deposits with an original maturity of three months or less.
For the purpose of the Statement of Cash Flows, cash and cash equivalents consist of cash and cash equivalents asdefined above, net of outstanding bank overdrafts.
(ii) Loans and Receivables
Loans and receivables are non-derivative financial assets with fixed or determinable payments that are not quoted in anactive market. These financial assets are recognised initially at fair value, usually based on the transaction cost or facevalue. Subsequent measurement is an amortised cost using the effective interest method, less an allowance for anyimpairment of receivables. Any changes are recognised in the Net Result when impaired, derecognised orthrough the amortisation process.
Short-term receivables with no stated interest rate are measured at the original invoice amount where the effect ofdiscounting is immaterial. Such receivables, which generally have 30-day terms, are recognised and carried at originalinvoice amount less an allowance for any uncollectible amounts. An allowance for doubtful debts is made when there isobjective evidence that the Authority will not be able to collect the debts. Bad debts are written off when identified.
(iii) Payables
These amounts represent liabilities for goods and services provided to the Authority and other amounts. Payables arerecognised initially at fair value, usually based on the transaction cost or face value. Subsequent measurement is atamortised cost using the effective interest method. Short-term payables with no stated interest rate are measured atthe original invoice amount where the effect of discounting is immaterial.
(s) Impairment of Financial Assets
All financial assets, except those measured at fair value through the Net Result, are subject to an annual review forimpairment. An allowance for impairment is established when there is objective evidence that the entity will not be able tocollect all amounts due.
- 11 -
32 State Property Authority
Notes to and Forming Part of the Financial StatementsFor the Year Ended 30 June 2012
(t) Financial Distributions
As a Government business, the Authority operates under the State Government's Commercial Policy Framework. A keycomponent of this Framework is the requirement to make financial distributions to owners. In the Authority's case, its owneris the State Government. All payments of financial distributions are made to the Crown Finance Entity.
The nature and calculation of the required annual distributions is determined by NSW Treasury Policy and GuidelinesPaper, TPP 09-6 "Financial Distribution Policy for Government Businesses". The distributions made by the Authorityinclude normal distribution payments from cash operating surpluses and special distribution payments, or capitalrepatriations, from the sale of its own properties.
Normal distributions are payments made from current year cash surpluses. Treasury policy states that a governmentbusiness should not retain any cash in excess of its requirements for working capital, in addition to a contingency allowancefor an appropriate level of financial flexibility. Funds in excess of these requirements are returned to the State Government.
Capital repatriations, or special distributions, are additional one-off payments which represent capital repayments of theState Government’s equity in the Authority. In the Authority’s case, capital repatriation payments represent the full return ofthe net proceeds (ie. total proceeds less costs) of all Authority-owned property sales (Note 15(a)).
(u) Equity and Reserves
(i) Accumulated Funds
The category "Accumulated Funds" includes all current and prior period retained funds. All financial distributions aremade directly from Accumulated Funds.
(ii) Asset Revaluation Reserve
The total asset revaluation reserve is used to record increments and decrements on the revaluation of non-currentproperty plant and equipment and finance leases. This accords with the Authority's policy on the Revaluation ofProperty, Plant and Equipment (Note 1(i)). No financial distributions are made from the Asset Revaluation Reserve.
(v) Equity Transfers
The establishment of new statutory bodies or transfer of net assets between agencies as a result of an administrativerestructure, transfers of programs/functions and parts thereof between NSW public sector agencies are designated as acontribution by owners and recognised as an adjustment to Accumulated Funds. This treatment is in accordance withTreasury Policy and Guidelines Paper TPP 09-3 "Contributions By Owners Made to Wholly-Owned Public Sector Entities"and is consistent with Interpretation 1038 "Contributions by Owners Made to Wholly-Owned Public Sector Entities" andAustralian Accounting Standards.
Transfers arising from an administrative restructure between government agencies are recognised at the amount at whichthe asset was recognised by the transferor government agency immediately prior to the restructure. In most cases this willapproximate fair value. All other equity transfers are recognised at fair value.
(w) Budgeted Amounts
The budgeted amounts are drawn from the original budgeted financial statements presented to Parliament in respect of thereporting period, as adjusted for section 24 of the Public Finance and Audit Act 1983 where there has been a transfer of functions between departments. Other amendments made to the budget are not reflected in the budgeted amounts.
(x) Comparative Amounts
Comparative amounts for some expense and revenue items are reclassified to align with the presentation for the currentyear. The presentation for the current year is modified to comply with the requirements of the Financial Reporting Code(Code). The Treasurer under the delegation from the Public Finance and Audit Act 1983 issued the Code to apply for allgeneral government sector entities for years ending on or after 30 June 2012.
(y) Changes in Accounting Policy
There were no changes in accounting policy during 2011-12.
- 12 -
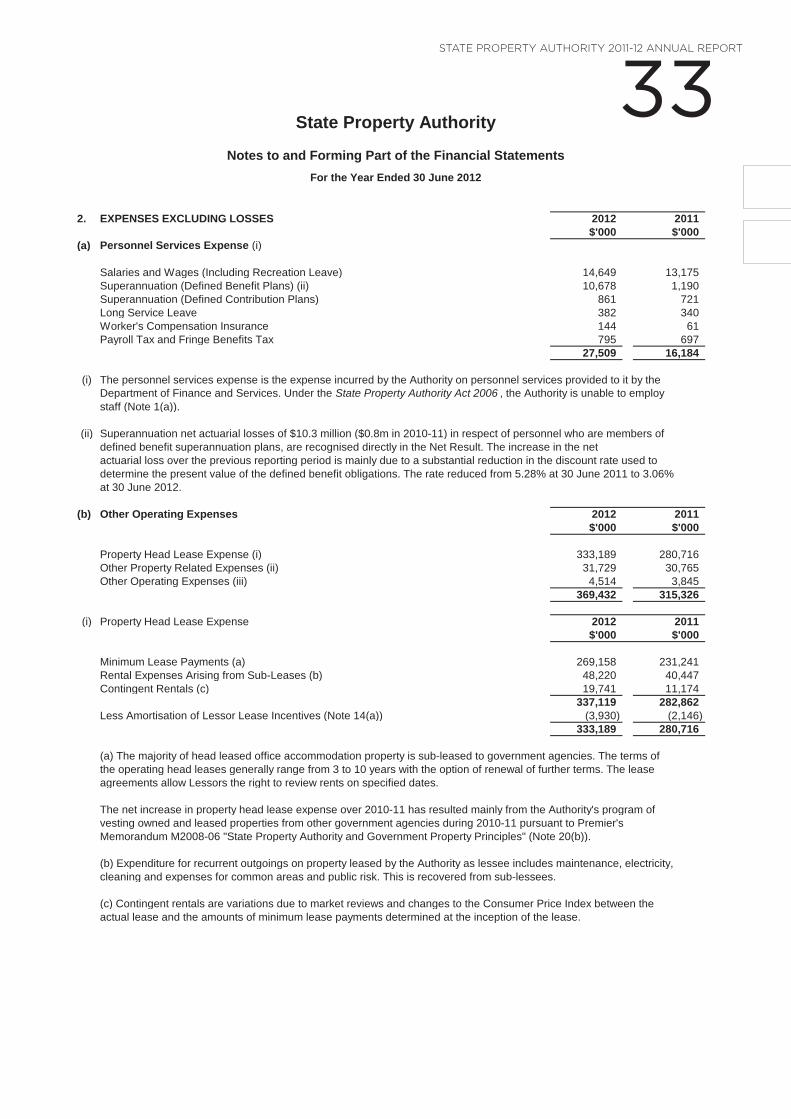
33 State ProPerty authority 2011-12 annual rePort
State Property Authority
Notes to and Forming Part of the Financial StatementsFor the Year Ended 30 June 2012
2. EXPENSES EXCLUDING LOSSES 2012 2011$'000 $'000
(a) Personnel Services Expense (i)
Salaries and Wages (Including Recreation Leave) 14,649 13,175 Superannuation (Defined Benefit Plans) (ii) 10,678 1,190 Superannuation (Defined Contribution Plans) 861 721 Long Service Leave 382 340 Worker's Compensation Insurance 144 61 Payroll Tax and Fringe Benefits Tax 795 697
27,509 16,184
(i) The personnel services expense is the expense incurred by the Authority on personnel services provided to it by theDepartment of Finance and Services. Under the State Property Authority Act 2006 , the Authority is unable to employstaff (Note 1(a)).
(ii) Superannuation net actuarial losses of $10.3 million ($0.8m in 2010-11) in respect of personnel who are members ofdefined benefit superannuation plans, are recognised directly in the Net Result. The increase in the netactuarial loss over the previous reporting period is mainly due to a substantial reduction in the discount rate used todetermine the present value of the defined benefit obligations. The rate reduced from 5.28% at 30 June 2011 to 3.06%at 30 June 2012.
(b) Other Operating Expenses 2012 2011$'000 $'000
Property Head Lease Expense (i) 333,189 280,716 Other Property Related Expenses (ii) 31,729 30,765 Other Operating Expenses (iii) 4,514 3,845
369,432 315,326
(i) Property Head Lease Expense 2012 2011$'000 $'000
Minimum Lease Payments (a) 269,158 231,241 Rental Expenses Arising from Sub-Leases (b) 48,220 40,447 Contingent Rentals (c) 19,741 11,174
337,119 282,862 Less Amortisation of Lessor Lease Incentives (Note 14(a)) (3,930) (2,146)
333,189 280,716
(a) The majority of head leased office accommodation property is sub-leased to government agencies. The terms ofthe operating head leases generally range from 3 to 10 years with the option of renewal of further terms. The leaseagreements allow Lessors the right to review rents on specified dates.
The net increase in property head lease expense over 2010-11 has resulted mainly from the Authority's program ofvesting owned and leased properties from other government agencies during 2010-11 pursuant to Premier'sMemorandum M2008-06 "State Property Authority and Government Property Principles" (Note 20(b)).
(b) Expenditure for recurrent outgoings on property leased by the Authority as lessee includes maintenance, electricity,cleaning and expenses for common areas and public risk. This is recovered from sub-lessees.
(c) Contingent rentals are variations due to market reviews and changes to the Consumer Price Index between theactual lease and the amounts of minimum lease payments determined at the inception of the lease.
- 13 -
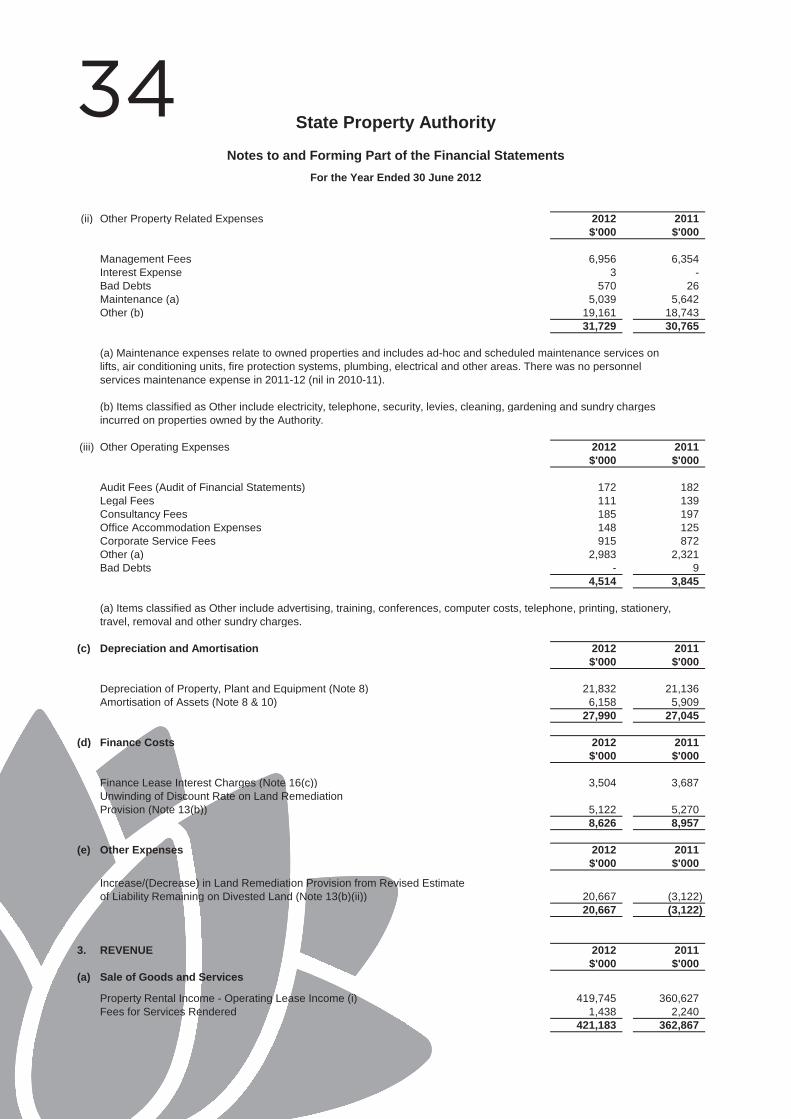
34 State Property Authority
Notes to and Forming Part of the Financial StatementsFor the Year Ended 30 June 2012
(ii) Other Property Related Expenses 2012 2011$'000 $'000
Management Fees 6,956 6,354 Interest Expense 3 - Bad Debts 570 26 Maintenance (a) 5,039 5,642 Other (b) 19,161 18,743
31,729 30,765
(a) Maintenance expenses relate to owned properties and includes ad-hoc and scheduled maintenance services onlifts, air conditioning units, fire protection systems, plumbing, electrical and other areas. There was no personnelservices maintenance expense in 2011-12 (nil in 2010-11).
(b) Items classified as Other include electricity, telephone, security, levies, cleaning, gardening and sundry chargesincurred on properties owned by the Authority.
(iii) Other Operating Expenses 2012 2011$'000 $'000
Audit Fees (Audit of Financial Statements) 172 182 Legal Fees 111 139 Consultancy Fees 185 197 Office Accommodation Expenses 148 125 Corporate Service Fees 915 872 Other (a) 2,983 2,321 Bad Debts - 9
4,514 3,845
(a) Items classified as Other include advertising, training, conferences, computer costs, telephone, printing, stationery,travel, removal and other sundry charges.
(c) Depreciation and Amortisation 2012 2011$'000 $'000
Depreciation of Property, Plant and Equipment (Note 8) 21,832 21,136 Amortisation of Assets (Note 8 & 10) 6,158 5,909
27,990 27,045
(d) Finance Costs 2012 2011$'000 $'000
Finance Lease Interest Charges (Note 16(c)) 3,504 3,687 Unwinding of Discount Rate on Land RemediationProvision (Note 13(b)) 5,122 5,270
8,626 8,957
(e) Other Expenses 2012 2011$'000 $'000
Increase/(Decrease) in Land Remediation Provision from Revised Estimateof Liability Remaining on Divested Land (Note 13(b)(ii)) 20,667 (3,122)
20,667 (3,122)
3. REVENUE 2012 2011$'000 $'000
(a) Sale of Goods and Services
Property Rental Income - Operating Lease Income (i) 419,745 360,627 Fees for Services Rendered 1,438 2,240
421,183 362,867
- 14 -
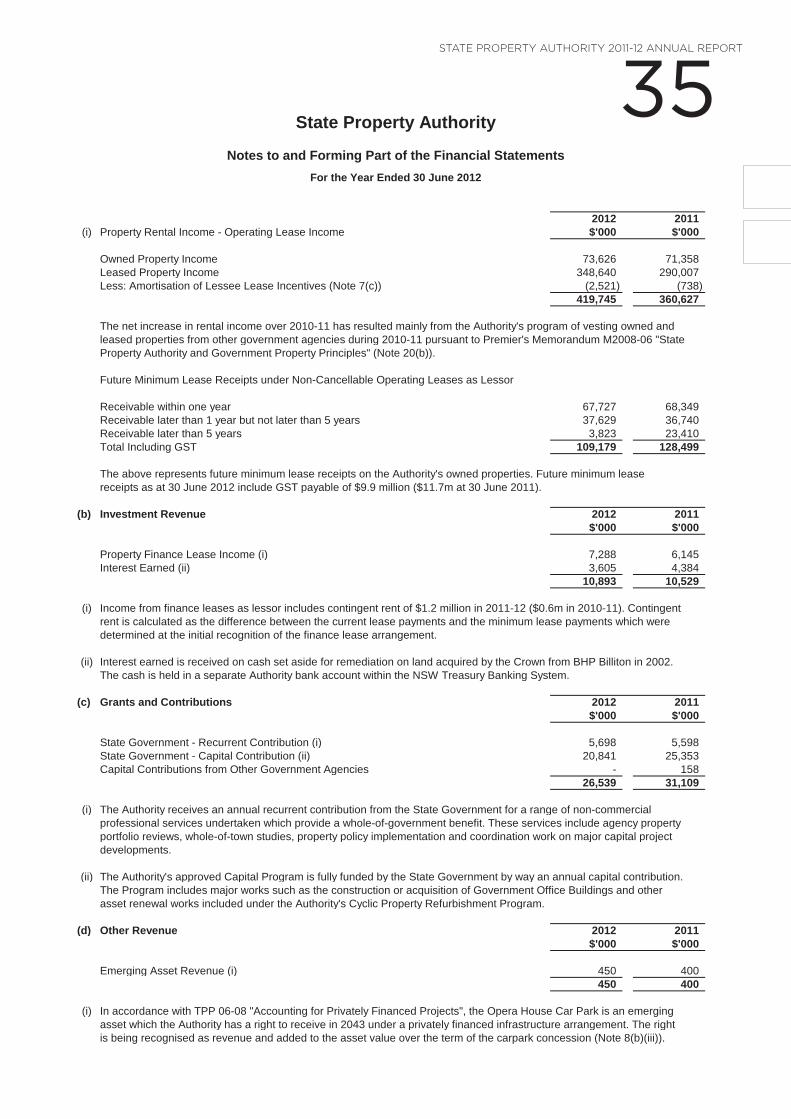
35 State ProPerty authority 2011-12 annual rePort
State Property Authority
Notes to and Forming Part of the Financial StatementsFor the Year Ended 30 June 2012
2012 2011(i) Property Rental Income - Operating Lease Income $'000 $'000
Owned Property Income 73,626 71,358 Leased Property Income 348,640 290,007 Less: Amortisation of Lessee Lease Incentives (Note 7(c)) (2,521) (738)
419,745 360,627
The net increase in rental income over 2010-11 has resulted mainly from the Authority's program of vesting owned andleased properties from other government agencies during 2010-11 pursuant to Premier's Memorandum M2008-06 "StateProperty Authority and Government Property Principles" (Note 20(b)).
Future Minimum Lease Receipts under Non-Cancellable Operating Leases as Lessor
Receivable within one year 67,727 68,349 Receivable later than 1 year but not later than 5 years 37,629 36,740 Receivable later than 5 years 3,823 23,410 Total Including GST 109,179 128,499
The above represents future minimum lease receipts on the Authority's owned properties. Future minimum leasereceipts as at 30 June 2012 include GST payable of $9.9 million ($11.7m at 30 June 2011).
(b) Investment Revenue 2012 2011$'000 $'000
Property Finance Lease Income (i) 7,288 6,145 Interest Earned (ii) 3,605 4,384
10,893 10,529
(i) Income from finance leases as lessor includes contingent rent of $1.2 million in 2011-12 ($0.6m in 2010-11). Contingentrent is calculated as the difference between the current lease payments and the minimum lease payments which weredetermined at the initial recognition of the finance lease arrangement.
(ii) Interest earned is received on cash set aside for remediation on land acquired by the Crown from BHP Billiton in 2002.The cash is held in a separate Authority bank account within the NSW Treasury Banking System.
(c) Grants and Contributions 2012 2011$'000 $'000
State Government - Recurrent Contribution (i) 5,698 5,598 State Government - Capital Contribution (ii) 20,841 25,353 Capital Contributions from Other Government Agencies - 158
26,539 31,109
(i) The Authority receives an annual recurrent contribution from the State Government for a range of non-commercialprofessional services undertaken which provide a whole-of-government benefit. These services include agency propertyportfolio reviews, whole-of-town studies, property policy implementation and coordination work on major capital projectdevelopments.
(ii) The Authority's approved Capital Program is fully funded by the State Government by way an annual capital contribution.The Program includes major works such as the construction or acquisition of Government Office Buildings and otherasset renewal works included under the Authority's Cyclic Property Refurbishment Program.
(d) Other Revenue 2012 2011$'000 $'000
Emerging Asset Revenue (i) 450 400 450 400
(i) In accordance with TPP 06-08 "Accounting for Privately Financed Projects", the Opera House Car Park is an emergingasset which the Authority has a right to receive in 2043 under a privately financed infrastructure arrangement. The rightis being recognised as revenue and added to the asset value over the term of the carpark concession (Note 8(b)(iii)).
- 15 -
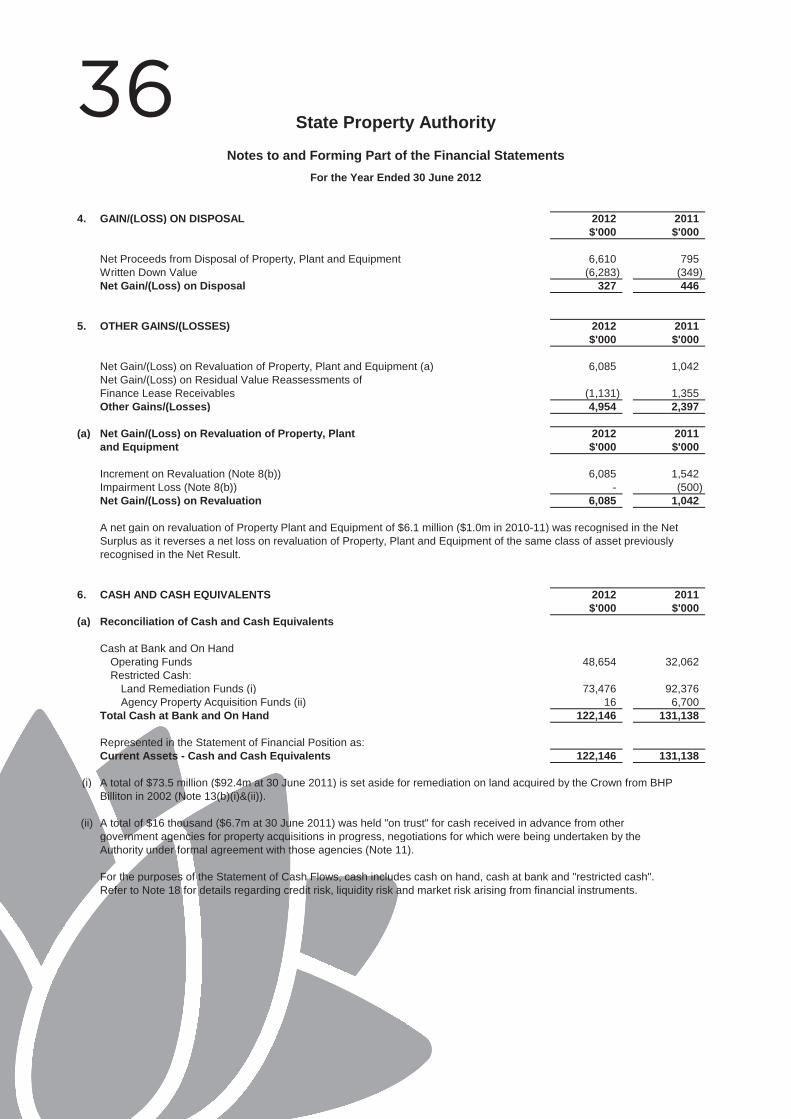
36 State Property Authority
Notes to and Forming Part of the Financial StatementsFor the Year Ended 30 June 2012
4. GAIN/(LOSS) ON DISPOSAL 2012 2011$'000 $'000
Net Proceeds from Disposal of Property, Plant and Equipment 6,610 795 Written Down Value (6,283) (349) Net Gain/(Loss) on Disposal 327 446
5. OTHER GAINS/(LOSSES) 2012 2011$'000 $'000
Net Gain/(Loss) on Revaluation of Property, Plant and Equipment (a) 6,085 1,042 Net Gain/(Loss) on Residual Value Reassessments ofFinance Lease Receivables (1,131) 1,355 Other Gains/(Losses) 4,954 2,397
(a) Net Gain/(Loss) on Revaluation of Property, Plant 2012 2011and Equipment $'000 $'000
Increment on Revaluation (Note 8(b)) 6,085 1,542 Impairment Loss (Note 8(b)) - (500) Net Gain/(Loss) on Revaluation 6,085 1,042
A net gain on revaluation of Property Plant and Equipment of $6.1 million ($1.0m in 2010-11) was recognised in the NetSurplus as it reverses a net loss on revaluation of Property, Plant and Equipment of the same class of asset previouslyrecognised in the Net Result.
6. CASH AND CASH EQUIVALENTS 2012 2011$'000 $'000
(a) Reconciliation of Cash and Cash Equivalents
Cash at Bank and On HandOperating Funds 48,654 32,062 Restricted Cash:
Land Remediation Funds (i) 73,476 92,376 Agency Property Acquisition Funds (ii) 16 6,700
Total Cash at Bank and On Hand 122,146 131,138
Represented in the Statement of Financial Position as:Current Assets - Cash and Cash Equivalents 122,146 131,138
(i) A total of $73.5 million ($92.4m at 30 June 2011) is set aside for remediation on land acquired by the Crown from BHPBilliton in 2002 (Note 13(b)(i)&(ii)).
(ii) A total of $16 thousand ($6.7m at 30 June 2011) was held "on trust" for cash received in advance from othergovernment agencies for property acquisitions in progress, negotiations for which were being undertaken by theAuthority under formal agreement with those agencies (Note 11).
For the purposes of the Statement of Cash Flows, cash includes cash on hand, cash at bank and "restricted cash".Refer to Note 18 for details regarding credit risk, liquidity risk and market risk arising from financial instruments.
- 16 -
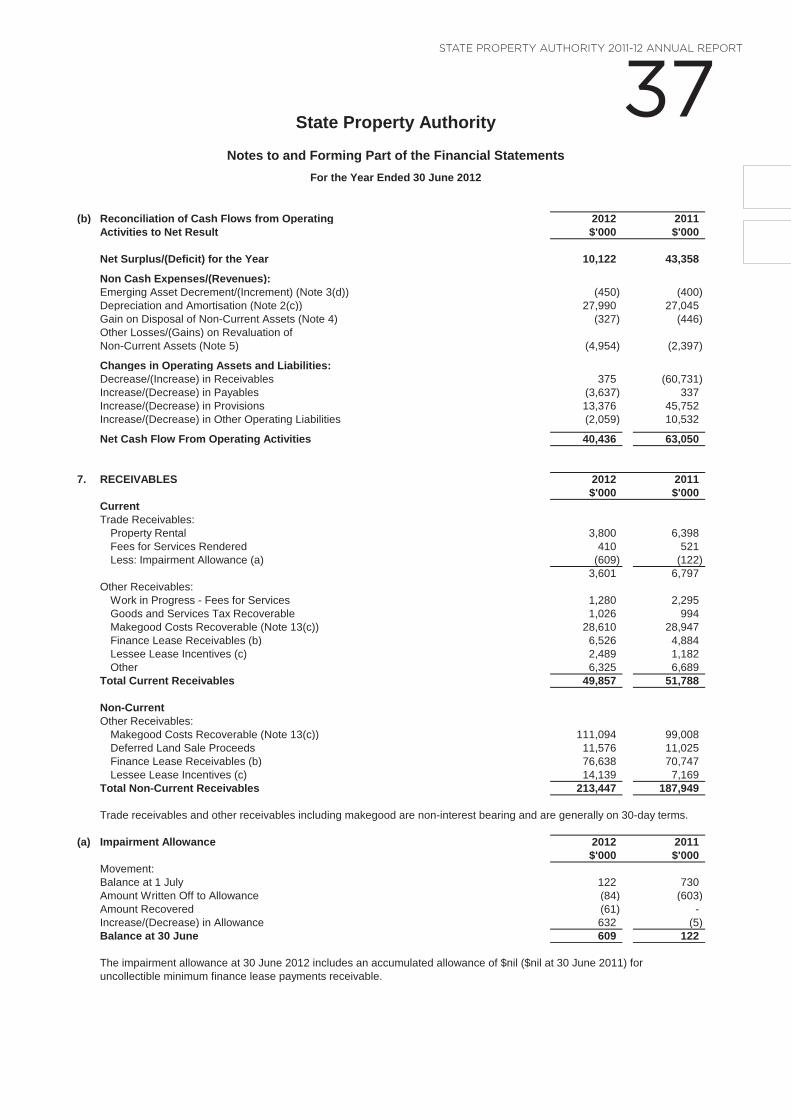
37 State ProPerty authority 2011-12 annual rePort
State Property Authority
Notes to and Forming Part of the Financial StatementsFor the Year Ended 30 June 2012
(b) Reconciliation of Cash Flows from Operating 2012 2011Activities to Net Result $'000 $'000
Net Surplus/(Deficit) for the Year 10,122 43,358
Non Cash Expenses/(Revenues):Emerging Asset Decrement/(Increment) (Note 3(d)) (450) (400) Depreciation and Amortisation (Note 2(c)) 27,990 27,045 Gain on Disposal of Non-Current Assets (Note 4) (327) (446) Other Losses/(Gains) on Revaluation ofNon-Current Assets (Note 5) (4,954) (2,397)
Changes in Operating Assets and Liabilities:Decrease/(Increase) in Receivables 375 (60,731) Increase/(Decrease) in Payables (3,637) 337 Increase/(Decrease) in Provisions 13,376 45,752 Increase/(Decrease) in Other Operating Liabilities (2,059) 10,532
Net Cash Flow From Operating Activities 40,436 63,050
7. RECEIVABLES 2012 2011$'000 $'000
CurrentTrade Receivables:
Property Rental 3,800 6,398 Fees for Services Rendered 410 521 Less: Impairment Allowance (a) (609) (122)
3,601 6,797 Other Receivables:
Work in Progress - Fees for Services 1,280 2,295 Goods and Services Tax Recoverable 1,026 994 Makegood Costs Recoverable (Note 13(c)) 28,610 28,947 Finance Lease Receivables (b) 6,526 4,884 Lessee Lease Incentives (c) 2,489 1,182 Other 6,325 6,689
Total Current Receivables 49,857 51,788
Non-CurrentOther Receivables:
Makegood Costs Recoverable (Note 13(c)) 111,094 99,008 Deferred Land Sale Proceeds 11,576 11,025 Finance Lease Receivables (b) 76,638 70,747 Lessee Lease Incentives (c) 14,139 7,169
Total Non-Current Receivables 213,447 187,949
Trade receivables and other receivables including makegood are non-interest bearing and are generally on 30-day terms.
(a) Impairment Allowance 2012 2011$'000 $'000
Movement:Balance at 1 July 122 730 Amount Written Off to Allowance (84) (603) Amount Recovered (61) - Increase/(Decrease) in Allowance 632 (5) Balance at 30 June 609 122
The impairment allowance at 30 June 2012 includes an accumulated allowance of $nil ($nil at 30 June 2011) foruncollectible minimum finance lease payments receivable.
- 17 -
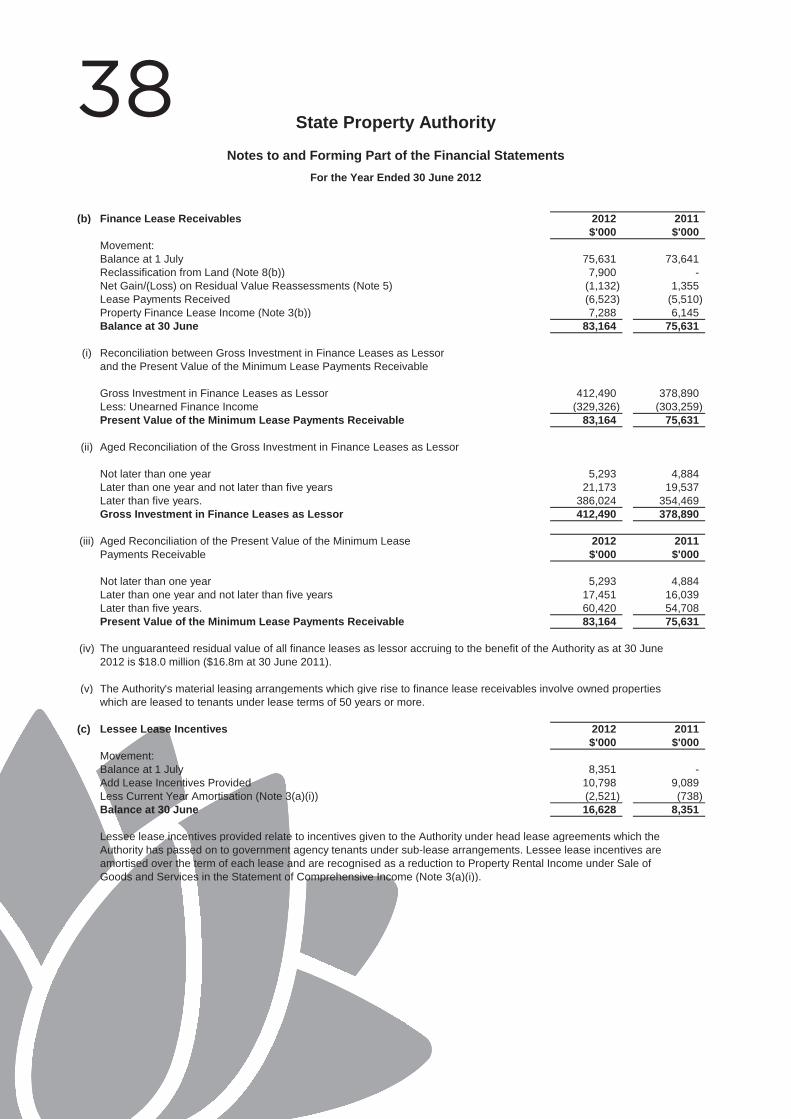
38 State Property Authority
Notes to and Forming Part of the Financial StatementsFor the Year Ended 30 June 2012
(b) Finance Lease Receivables 2012 2011$'000 $'000
Movement:Balance at 1 July 75,631 73,641 Reclassification from Land (Note 8(b)) 7,900 - Net Gain/(Loss) on Residual Value Reassessments (Note 5) (1,132) 1,355 Lease Payments Received (6,523) (5,510) Property Finance Lease Income (Note 3(b)) 7,288 6,145 Balance at 30 June 83,164 75,631
(i) Reconciliation between Gross Investment in Finance Leases as Lessorand the Present Value of the Minimum Lease Payments Receivable
Gross Investment in Finance Leases as Lessor 412,490 378,890 Less: Unearned Finance Income (329,326) (303,259) Present Value of the Minimum Lease Payments Receivable 83,164 75,631
(ii) Aged Reconciliation of the Gross Investment in Finance Leases as Lessor
Not later than one year 5,293 4,884 Later than one year and not later than five years 21,173 19,537 Later than five years. 386,024 354,469 Gross Investment in Finance Leases as Lessor 412,490 378,890
(iii) Aged Reconciliation of the Present Value of the Minimum Lease 2012 2011Payments Receivable $'000 $'000
Not later than one year 5,293 4,884 Later than one year and not later than five years 17,451 16,039 Later than five years. 60,420 54,708 Present Value of the Minimum Lease Payments Receivable 83,164 75,631
(iv) The unguaranteed residual value of all finance leases as lessor accruing to the benefit of the Authority as at 30 June2012 is $18.0 million ($16.8m at 30 June 2011).
(v) The Authority's material leasing arrangements which give rise to finance lease receivables involve owned propertieswhich are leased to tenants under lease terms of 50 years or more.
(c) Lessee Lease Incentives 2012 2011$'000 $'000
Movement:Balance at 1 July 8,351 - Add Lease Incentives Provided 10,798 9,089 Less Current Year Amortisation (Note 3(a)(i)) (2,521) (738) Balance at 30 June 16,628 8,351
Lessee lease incentives provided relate to incentives given to the Authority under head lease agreements which theAuthority has passed on to government agency tenants under sub-lease arrangements. Lessee lease incentives areamortised over the term of each lease and are recognised as a reduction to Property Rental Income under Sale ofGoods and Services in the Statement of Comprehensive Income (Note 3(a)(i)).
- 18 -
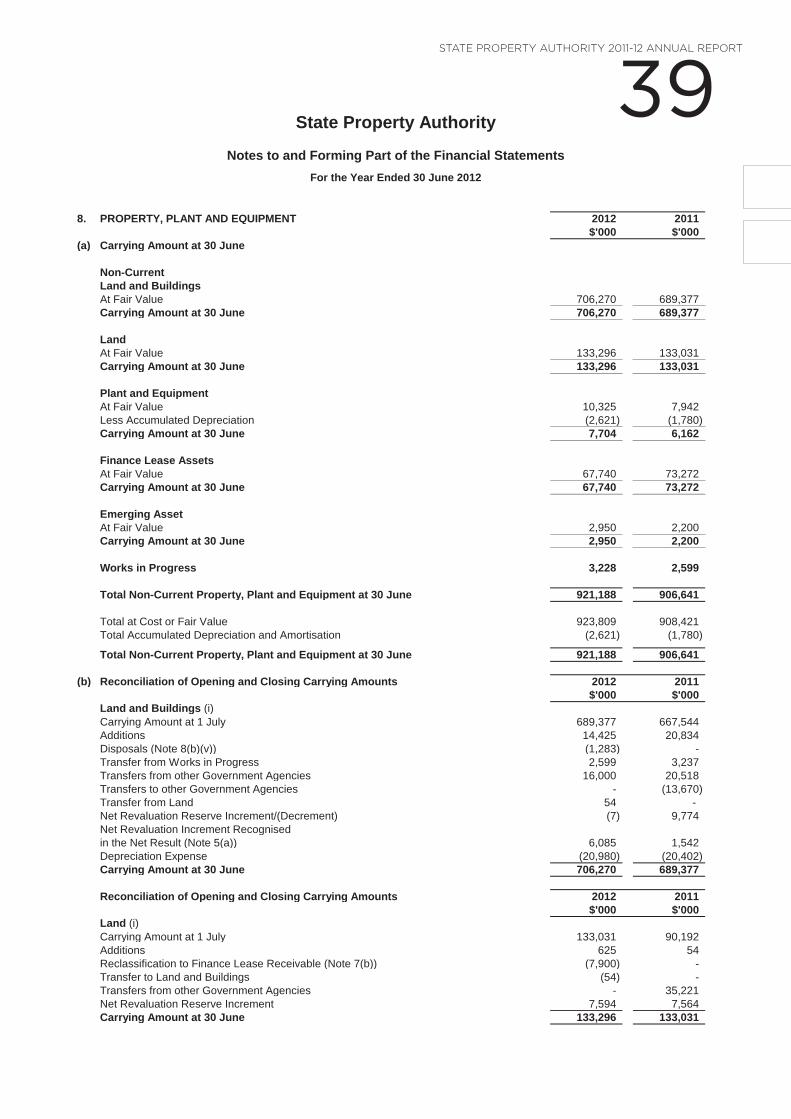
39 State ProPerty authority 2011-12 annual rePort
State Property Authority
Notes to and Forming Part of the Financial StatementsFor the Year Ended 30 June 2012
8. PROPERTY, PLANT AND EQUIPMENT 2012 2011$'000 $'000
(a) Carrying Amount at 30 June
Non-Current Land and BuildingsAt Fair Value 706,270 689,377 Carrying Amount at 30 June 706,270 689,377
LandAt Fair Value 133,296 133,031 Carrying Amount at 30 June 133,296 133,031
Plant and EquipmentAt Fair Value 10,325 7,942 Less Accumulated Depreciation (2,621) (1,780) Carrying Amount at 30 June 7,704 6,162
Finance Lease AssetsAt Fair Value 67,740 73,272 Carrying Amount at 30 June 67,740 73,272
Emerging AssetAt Fair Value 2,950 2,200 Carrying Amount at 30 June 2,950 2,200
Works in Progress 3,228 2,599
Total Non-Current Property, Plant and Equipment at 30 June 921,188 906,641
Total at Cost or Fair Value 923,809 908,421 Total Accumulated Depreciation and Amortisation (2,621) (1,780)
Total Non-Current Property, Plant and Equipment at 30 June 921,188 906,641
(b) Reconciliation of Opening and Closing Carrying Amounts 2012 2011$'000 $'000
Land and Buildings (i)Carrying Amount at 1 July 689,377 667,544 Additions 14,425 20,834 Disposals (Note 8(b)(v)) (1,283) - Transfer from Works in Progress 2,599 3,237 Transfers from other Government Agencies 16,000 20,518 Transfers to other Government Agencies - (13,670) Transfer from Land 54 - Net Revaluation Reserve Increment/(Decrement) (7) 9,774 Net Revaluation Increment Recognisedin the Net Result (Note 5(a)) 6,085 1,542 Depreciation Expense (20,980) (20,402) Carrying Amount at 30 June 706,270 689,377
Reconciliation of Opening and Closing Carrying Amounts 2012 2011$'000 $'000
Land (i)Carrying Amount at 1 July 133,031 90,192 Additions 625 54 Reclassification to Finance Lease Receivable (Note 7(b)) (7,900) - Transfer to Land and Buildings (54) - Transfers from other Government Agencies - 35,221 Net Revaluation Reserve Increment 7,594 7,564 Carrying Amount at 30 June 133,296 133,031
- 19 -
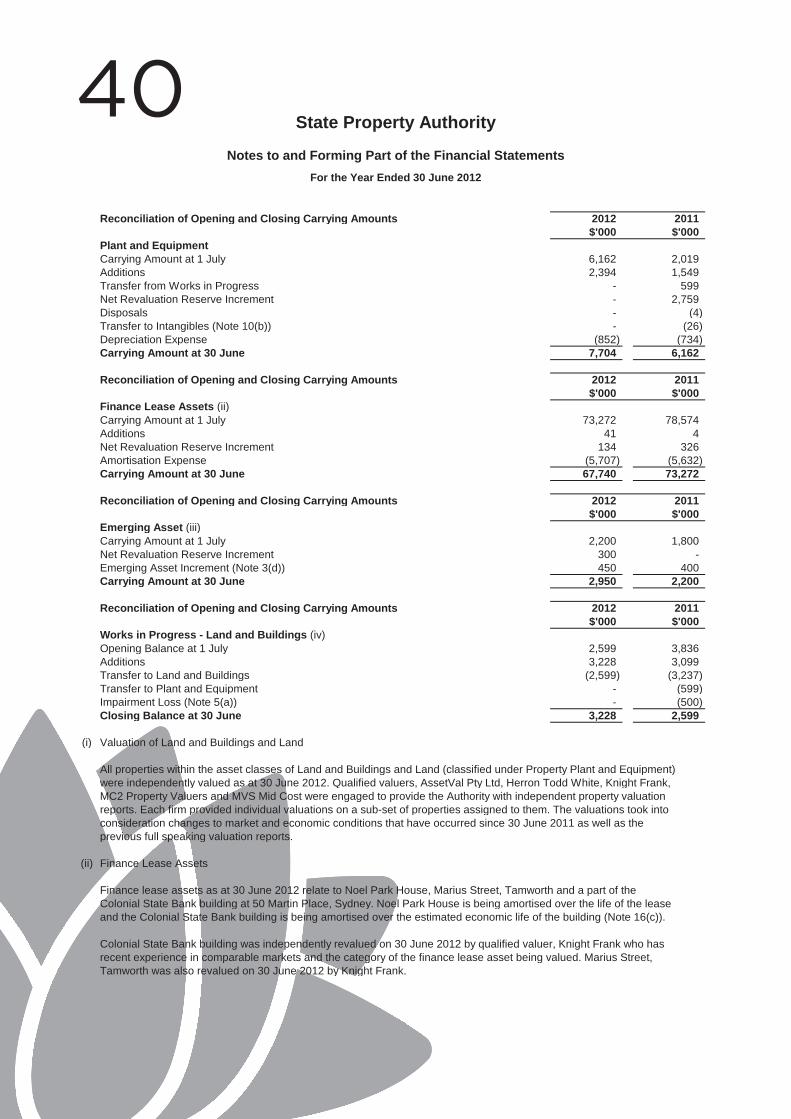
40 State Property Authority
Notes to and Forming Part of the Financial StatementsFor the Year Ended 30 June 2012
Reconciliation of Opening and Closing Carrying Amounts 2012 2011$'000 $'000
Plant and EquipmentCarrying Amount at 1 July 6,162 2,019 Additions 2,394 1,549 Transfer from Works in Progress - 599 Net Revaluation Reserve Increment - 2,759 Disposals - (4) Transfer to Intangibles (Note 10(b)) - (26) Depreciation Expense (852) (734) Carrying Amount at 30 June 7,704 6,162
Reconciliation of Opening and Closing Carrying Amounts 2012 2011$'000 $'000
Finance Lease Assets (ii)Carrying Amount at 1 July 73,272 78,574 Additions 41 4 Net Revaluation Reserve Increment 134 326 Amortisation Expense (5,707) (5,632) Carrying Amount at 30 June 67,740 73,272
Reconciliation of Opening and Closing Carrying Amounts 2012 2011$'000 $'000
Emerging Asset (iii)Carrying Amount at 1 July 2,200 1,800 Net Revaluation Reserve Increment 300 - Emerging Asset Increment (Note 3(d)) 450 400 Carrying Amount at 30 June 2,950 2,200
Reconciliation of Opening and Closing Carrying Amounts 2012 2011$'000 $'000
Works in Progress - Land and Buildings (iv)Opening Balance at 1 July 2,599 3,836 Additions 3,228 3,099 Transfer to Land and Buildings (2,599) (3,237) Transfer to Plant and Equipment - (599) Impairment Loss (Note 5(a)) - (500) Closing Balance at 30 June 3,228 2,599
(i) Valuation of Land and Buildings and Land
All properties within the asset classes of Land and Buildings and Land (classified under Property Plant and Equipment)were independently valued as at 30 June 2012. Qualified valuers, AssetVal Pty Ltd, Herron Todd White, Knight Frank,MC2 Property Valuers and MVS Mid Cost were engaged to provide the Authority with independent property valuationreports. Each firm provided individual valuations on a sub-set of properties assigned to them. The valuations took intoconsideration changes to market and economic conditions that have occurred since 30 June 2011 as well as theprevious full speaking valuation reports.
(ii) Finance Lease Assets
Finance lease assets as at 30 June 2012 relate to Noel Park House, Marius Street, Tamworth and a part of theColonial State Bank building at 50 Martin Place, Sydney. Noel Park House is being amortised over the life of the leaseand the Colonial State Bank building is being amortised over the estimated economic life of the building (Note 16(c)).
Colonial State Bank building was independently revalued on 30 June 2012 by qualified valuer, Knight Frank who hasrecent experience in comparable markets and the category of the finance lease asset being valued. Marius Street,Tamworth was also revalued on 30 June 2012 by Knight Frank.
- 20 -
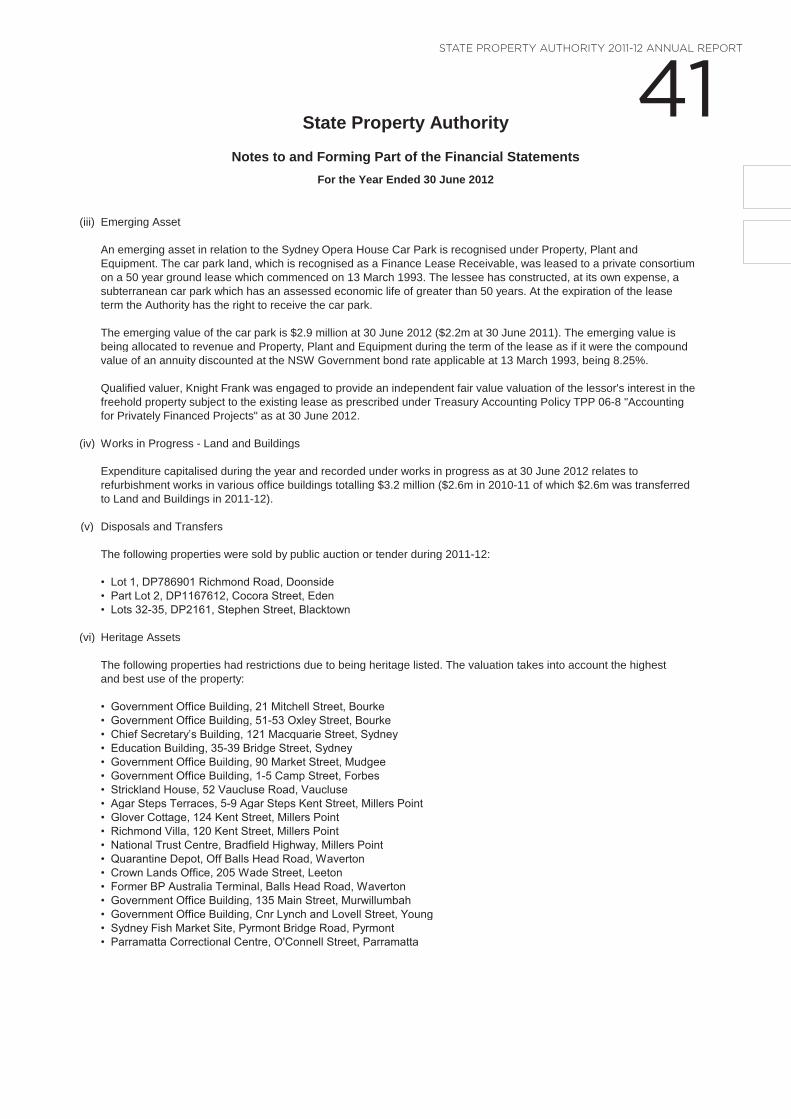
41 State ProPerty authority 2011-12 annual rePort
State Property Authority
Notes to and Forming Part of the Financial StatementsFor the Year Ended 30 June 2012
(iii) Emerging Asset
An emerging asset in relation to the Sydney Opera House Car Park is recognised under Property, Plant andEquipment. The car park land, which is recognised as a Finance Lease Receivable, was leased to a private consortiumon a 50 year ground lease which commenced on 13 March 1993. The lessee has constructed, at its own expense, asubterranean car park which has an assessed economic life of greater than 50 years. At the expiration of the leaseterm the Authority has the right to receive the car park.
The emerging value of the car park is $2.9 million at 30 June 2012 ($2.2m at 30 June 2011). The emerging value isbeing allocated to revenue and Property, Plant and Equipment during the term of the lease as if it were the compoundvalue of an annuity discounted at the NSW Government bond rate applicable at 13 March 1993, being 8.25%.
Qualified valuer, Knight Frank was engaged to provide an independent fair value valuation of the lessor's interest in thefreehold property subject to the existing lease as prescribed under Treasury Accounting Policy TPP 06-8 "Accountingfor Privately Financed Projects" as at 30 June 2012.
(iv) Works in Progress - Land and Buildings
Expenditure capitalised during the year and recorded under works in progress as at 30 June 2012 relates torefurbishment works in various office buildings totalling $3.2 million ($2.6m in 2010-11 of which $2.6m was transferredto Land and Buildings in 2011-12).
(v) Disposals and Transfers
The following properties were sold by public auction or tender during 2011-12:
• Lot 1, DP786901 Richmond Road, Doonside• Part Lot 2, DP1167612, Cocora Street, Eden• Lots 32-35, DP2161, Stephen Street, Blacktown
(vi) Heritage Assets
The following properties had restrictions due to being heritage listed. The valuation takes into account the highestand best use of the property:
• Government Office Building, 21 Mitchell Street, Bourke• Government Office Building, 51-53 Oxley Street, Bourke• Chief Secretary’s Building, 121 Macquarie Street, Sydney• Education Building, 35-39 Bridge Street, Sydney• Government Office Building, 90 Market Street, Mudgee• Government Office Building, 1-5 Camp Street, Forbes• Strickland House, 52 Vaucluse Road, Vaucluse• Agar Steps Terraces, 5-9 Agar Steps Kent Street, Millers Point• Glover Cottage, 124 Kent Street, Millers Point• Richmond Villa, 120 Kent Street, Millers Point• National Trust Centre, Bradfield Highway, Millers Point• Quarantine Depot, Off Balls Head Road, Waverton• Crown Lands Office, 205 Wade Street, Leeton • Former BP Australia Terminal, Balls Head Road, Waverton • Government Office Building, 135 Main Street, Murwillumbah• Government Office Building, Cnr Lynch and Lovell Street, Young• Sydney Fish Market Site, Pyrmont Bridge Road, Pyrmont• Parramatta Correctional Centre, O'Connell Street, Parramatta
- 21 -
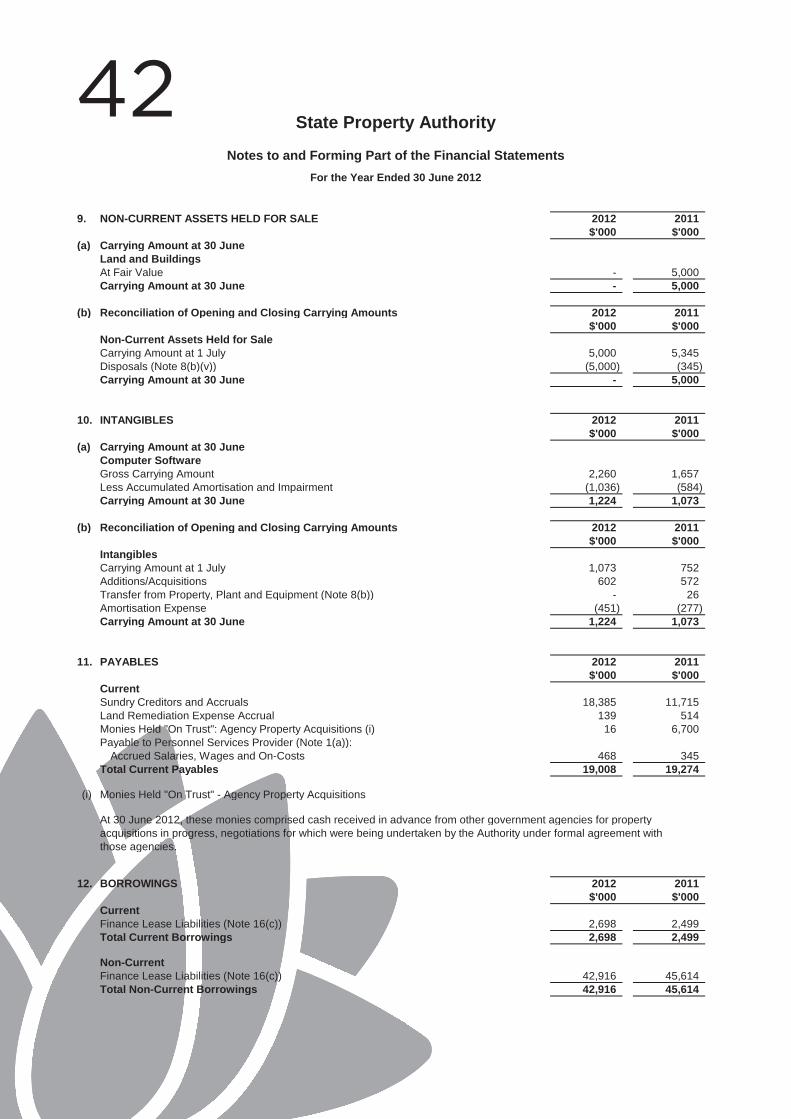
42 State Property Authority
Notes to and Forming Part of the Financial StatementsFor the Year Ended 30 June 2012
9. NON-CURRENT ASSETS HELD FOR SALE 2012 2011$'000 $'000
(a) Carrying Amount at 30 JuneLand and BuildingsAt Fair Value - 5,000 Carrying Amount at 30 June - 5,000
(b) Reconciliation of Opening and Closing Carrying Amounts 2012 2011$'000 $'000
Non-Current Assets Held for SaleCarrying Amount at 1 July 5,000 5,345 Disposals (Note 8(b)(v)) (5,000) (345) Carrying Amount at 30 June - 5,000
10. INTANGIBLES 2012 2011$'000 $'000
(a) Carrying Amount at 30 JuneComputer SoftwareGross Carrying Amount 2,260 1,657 Less Accumulated Amortisation and Impairment (1,036) (584) Carrying Amount at 30 June 1,224 1,073
(b) Reconciliation of Opening and Closing Carrying Amounts 2012 2011$'000 $'000
IntangiblesCarrying Amount at 1 July 1,073 752 Additions/Acquisitions 602 572 Transfer from Property, Plant and Equipment (Note 8(b)) - 26 Amortisation Expense (451) (277) Carrying Amount at 30 June 1,224 1,073
11. PAYABLES 2012 2011$'000 $'000
CurrentSundry Creditors and Accruals 18,385 11,715 Land Remediation Expense Accrual 139 514 Monies Held "On Trust": Agency Property Acquisitions (i) 16 6,700 Payable to Personnel Services Provider (Note 1(a)):
Accrued Salaries, Wages and On-Costs 468 345 Total Current Payables 19,008 19,274
(i) Monies Held "On Trust" - Agency Property Acquisitions
At 30 June 2012, these monies comprised cash received in advance from other government agencies for propertyacquisitions in progress, negotiations for which were being undertaken by the Authority under formal agreement withthose agencies.
12. BORROWINGS 2012 2011$'000 $'000
CurrentFinance Lease Liabilities (Note 16(c)) 2,698 2,499 Total Current Borrowings 2,698 2,499
Non-CurrentFinance Lease Liabilities (Note 16(c)) 42,916 45,614 Total Non-Current Borrowings 42,916 45,614
- 22 -
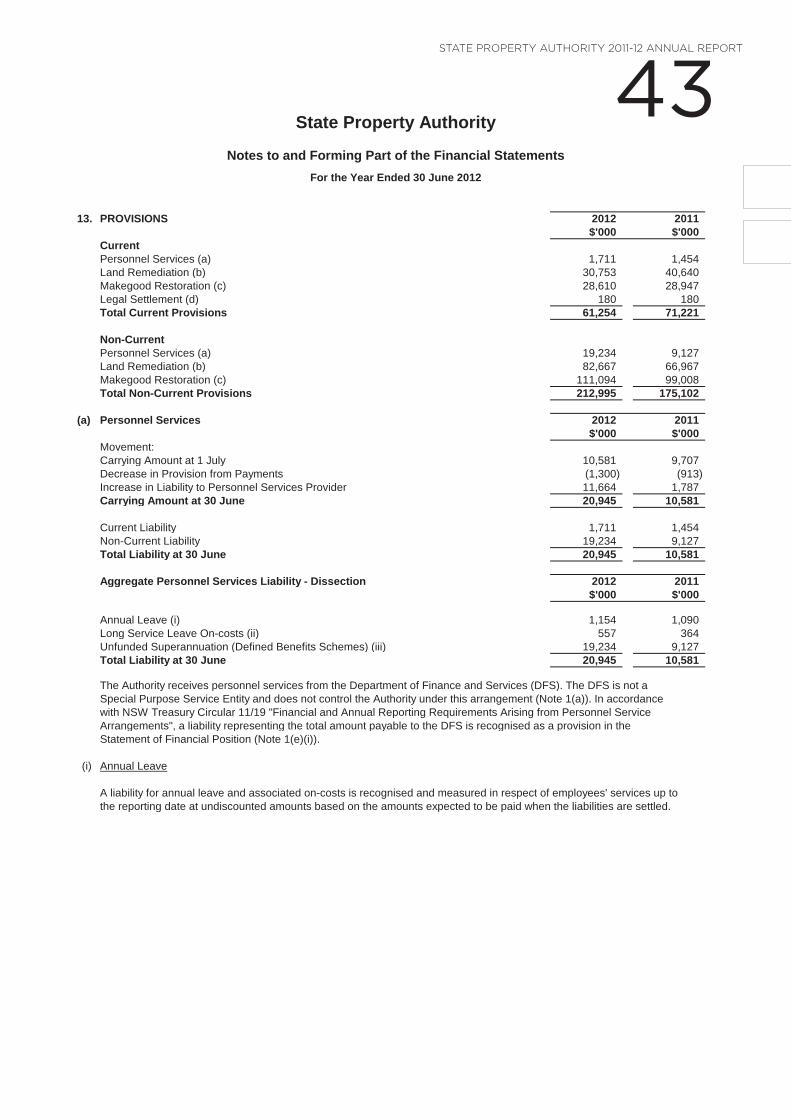
43 State ProPerty authority 2011-12 annual rePort
State Property Authority
Notes to and Forming Part of the Financial StatementsFor the Year Ended 30 June 2012
13. PROVISIONS 2012 2011$'000 $'000
CurrentPersonnel Services (a) 1,711 1,454 Land Remediation (b) 30,753 40,640 Makegood Restoration (c) 28,610 28,947 Legal Settlement (d) 180 180 Total Current Provisions 61,254 71,221
Non-CurrentPersonnel Services (a) 19,234 9,127 Land Remediation (b) 82,667 66,967 Makegood Restoration (c) 111,094 99,008 Total Non-Current Provisions 212,995 175,102
(a) Personnel Services 2012 2011$'000 $'000
Movement:Carrying Amount at 1 July 10,581 9,707 Decrease in Provision from Payments (1,300) (913) Increase in Liability to Personnel Services Provider 11,664 1,787 Carrying Amount at 30 June 20,945 10,581
Current Liability 1,711 1,454 Non-Current Liability 19,234 9,127 Total Liability at 30 June 20,945 10,581
Aggregate Personnel Services Liability - Dissection 2012 2011$'000 $'000
Annual Leave (i) 1,154 1,090 Long Service Leave On-costs (ii) 557 364 Unfunded Superannuation (Defined Benefits Schemes) (iii) 19,234 9,127 Total Liability at 30 June 20,945 10,581
The Authority receives personnel services from the Department of Finance and Services (DFS). The DFS is not aSpecial Purpose Service Entity and does not control the Authority under this arrangement (Note 1(a)). In accordancewith NSW Treasury Circular 11/19 "Financial and Annual Reporting Requirements Arising from Personnel ServiceArrangements", a liability representing the total amount payable to the DFS is recognised as a provision in theStatement of Financial Position (Note 1(e)(i)).
(i) Annual Leave
A liability for annual leave and associated on-costs is recognised and measured in respect of employees' services up tothe reporting date at undiscounted amounts based on the amounts expected to be paid when the liabilities are settled.
- 23 -
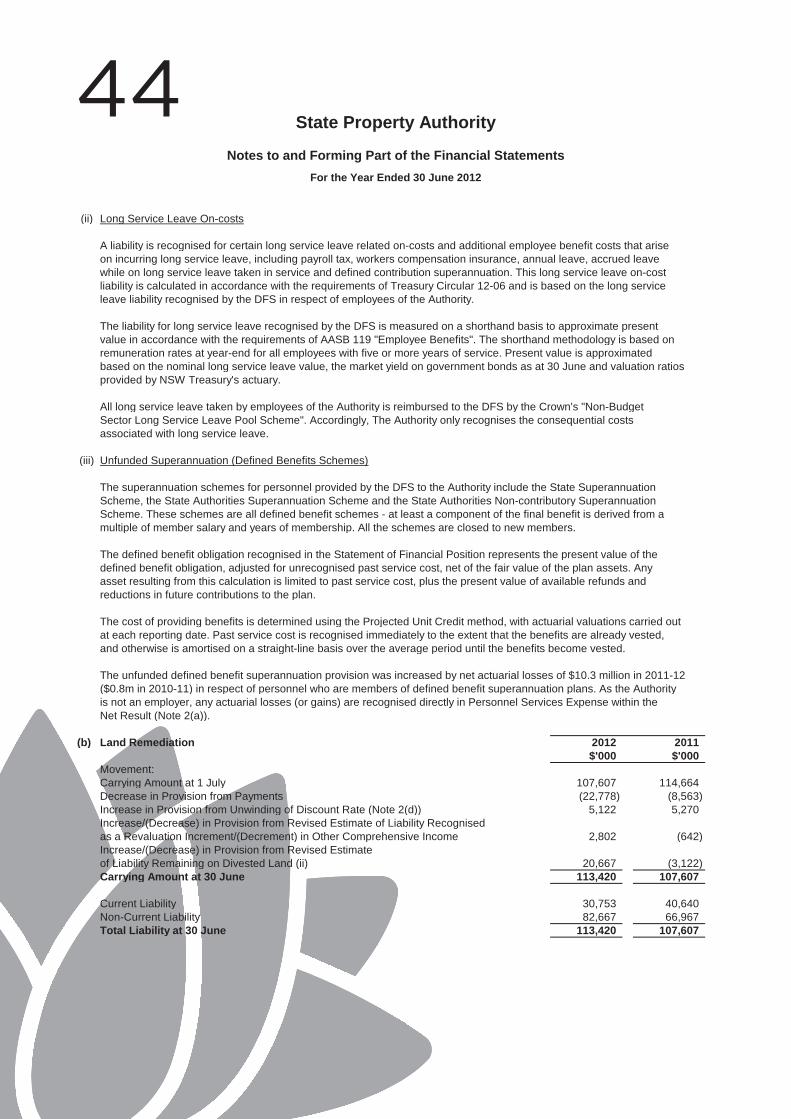
44 State Property Authority
Notes to and Forming Part of the Financial StatementsFor the Year Ended 30 June 2012
(ii) Long Service Leave On-costs
A liability is recognised for certain long service leave related on-costs and additional employee benefit costs that ariseon incurring long service leave, including payroll tax, workers compensation insurance, annual leave, accrued leavewhile on long service leave taken in service and defined contribution superannuation. This long service leave on-costliability is calculated in accordance with the requirements of Treasury Circular 12-06 and is based on the long serviceleave liability recognised by the DFS in respect of employees of the Authority.
The liability for long service leave recognised by the DFS is measured on a shorthand basis to approximate presentvalue in accordance with the requirements of AASB 119 "Employee Benefits". The shorthand methodology is based onremuneration rates at year-end for all employees with five or more years of service. Present value is approximatedbased on the nominal long service leave value, the market yield on government bonds as at 30 June and valuation ratiosprovided by NSW Treasury's actuary.
All long service leave taken by employees of the Authority is reimbursed to the DFS by the Crown's "Non-BudgetSector Long Service Leave Pool Scheme". Accordingly, The Authority only recognises the consequential costsassociated with long service leave.
(iii) Unfunded Superannuation (Defined Benefits Schemes)
The superannuation schemes for personnel provided by the DFS to the Authority include the State SuperannuationScheme, the State Authorities Superannuation Scheme and the State Authorities Non-contributory SuperannuationScheme. These schemes are all defined benefit schemes - at least a component of the final benefit is derived from amultiple of member salary and years of membership. All the schemes are closed to new members.
The defined benefit obligation recognised in the Statement of Financial Position represents the present value of thedefined benefit obligation, adjusted for unrecognised past service cost, net of the fair value of the plan assets. Anyasset resulting from this calculation is limited to past service cost, plus the present value of available refunds andreductions in future contributions to the plan.
The cost of providing benefits is determined using the Projected Unit Credit method, with actuarial valuations carried outat each reporting date. Past service cost is recognised immediately to the extent that the benefits are already vested,and otherwise is amortised on a straight-line basis over the average period until the benefits become vested.
The unfunded defined benefit superannuation provision was increased by net actuarial losses of $10.3 million in 2011-12($0.8m in 2010-11) in respect of personnel who are members of defined benefit superannuation plans. As the Authorityis not an employer, any actuarial losses (or gains) are recognised directly in Personnel Services Expense within theNet Result (Note 2(a)).
(b) Land Remediation 2012 2011$'000 $'000
Movement:Carrying Amount at 1 July 107,607 114,664 Decrease in Provision from Payments (22,778) (8,563) Increase in Provision from Unwinding of Discount Rate (Note 2(d)) 5,122 5,270 Increase/(Decrease) in Provision from Revised Estimate of Liability Recognisedas a Revaluation Increment/(Decrement) in Other Comprehensive Income 2,802 (642) Increase/(Decrease) in Provision from Revised Estimateof Liability Remaining on Divested Land (ii) 20,667 (3,122) Carrying Amount at 30 June 113,420 107,607
Current Liability 30,753 40,640 Non-Current Liability 82,667 66,967 Total Liability at 30 June 113,420 107,607
- 24 -
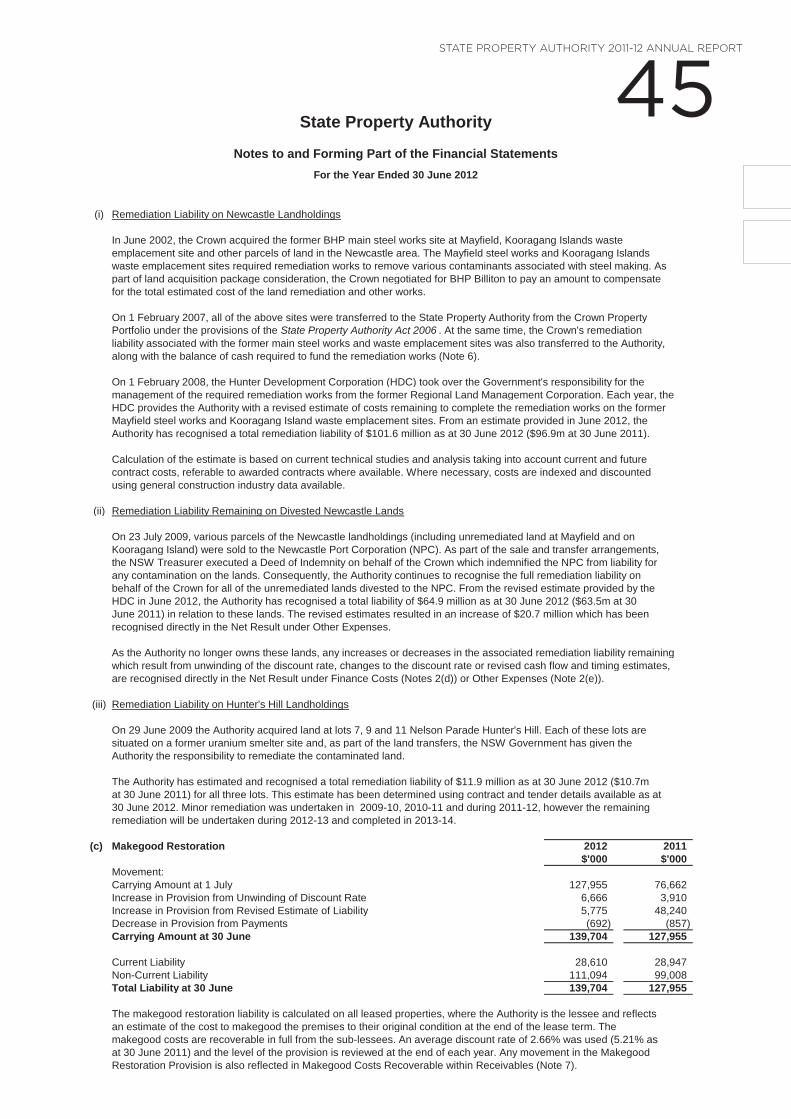
45 State ProPerty authority 2011-12 annual rePort
State Property Authority
Notes to and Forming Part of the Financial StatementsFor the Year Ended 30 June 2012
(i) Remediation Liability on Newcastle Landholdings
In June 2002, the Crown acquired the former BHP main steel works site at Mayfield, Kooragang Islands wasteemplacement site and other parcels of land in the Newcastle area. The Mayfield steel works and Kooragang Islandswaste emplacement sites required remediation works to remove various contaminants associated with steel making. Aspart of land acquisition package consideration, the Crown negotiated for BHP Billiton to pay an amount to compensatefor the total estimated cost of the land remediation and other works.
On 1 February 2007, all of the above sites were transferred to the State Property Authority from the Crown PropertyPortfolio under the provisions of the State Property Authority Act 2006 . At the same time, the Crown's remediationliability associated with the former main steel works and waste emplacement sites was also transferred to the Authority,along with the balance of cash required to fund the remediation works (Note 6).
On 1 February 2008, the Hunter Development Corporation (HDC) took over the Government's responsibility for themanagement of the required remediation works from the former Regional Land Management Corporation. Each year, theHDC provides the Authority with a revised estimate of costs remaining to complete the remediation works on the formerMayfield steel works and Kooragang Island waste emplacement sites. From an estimate provided in June 2012, theAuthority has recognised a total remediation liability of $101.6 million as at 30 June 2012 ($96.9m at 30 June 2011).
Calculation of the estimate is based on current technical studies and analysis taking into account current and futurecontract costs, referable to awarded contracts where available. Where necessary, costs are indexed and discountedusing general construction industry data available.
(ii) Remediation Liability Remaining on Divested Newcastle Lands
On 23 July 2009, various parcels of the Newcastle landholdings (including unremediated land at Mayfield and onKooragang Island) were sold to the Newcastle Port Corporation (NPC). As part of the sale and transfer arrangements,the NSW Treasurer executed a Deed of Indemnity on behalf of the Crown which indemnified the NPC from liability forany contamination on the lands. Consequently, the Authority continues to recognise the full remediation liability onbehalf of the Crown for all of the unremediated lands divested to the NPC. From the revised estimate provided by theHDC in June 2012, the Authority has recognised a total liability of $64.9 million as at 30 June 2012 ($63.5m at 30June 2011) in relation to these lands. The revised estimates resulted in an increase of $20.7 million which has beenrecognised directly in the Net Result under Other Expenses.
As the Authority no longer owns these lands, any increases or decreases in the associated remediation liability remaining which result from unwinding of the discount rate, changes to the discount rate or revised cash flow and timing estimates, are recognised directly in the Net Result under Finance Costs (Notes 2(d)) or Other Expenses (Note 2(e)).
(iii) Remediation Liability on Hunter's Hill Landholdings
On 29 June 2009 the Authority acquired land at lots 7, 9 and 11 Nelson Parade Hunter's Hill. Each of these lots aresituated on a former uranium smelter site and, as part of the land transfers, the NSW Government has given theAuthority the responsibility to remediate the contaminated land.
The Authority has estimated and recognised a total remediation liability of $11.9 million as at 30 June 2012 ($10.7mat 30 June 2011) for all three lots. This estimate has been determined using contract and tender details available as at30 June 2012. Minor remediation was undertaken in 2009-10, 2010-11 and during 2011-12, however the remainingremediation will be undertaken during 2012-13 and completed in 2013-14.
(c) Makegood Restoration 2012 2011$'000 $'000
Movement:Carrying Amount at 1 July 127,955 76,662 Increase in Provision from Unwinding of Discount Rate 6,666 3,910 Increase in Provision from Revised Estimate of Liability 5,775 48,240 Decrease in Provision from Payments (692) (857) Carrying Amount at 30 June 139,704 127,955
Current Liability 28,610 28,947 Non-Current Liability 111,094 99,008 Total Liability at 30 June 139,704 127,955
The makegood restoration liability is calculated on all leased properties, where the Authority is the lessee and reflectsan estimate of the cost to makegood the premises to their original condition at the end of the lease term. Themakegood costs are recoverable in full from the sub-lessees. An average discount rate of 2.66% was used (5.21% asat 30 June 2011) and the level of the provision is reviewed at the end of each year. Any movement in the MakegoodRestoration Provision is also reflected in Makegood Costs Recoverable within Receivables (Note 7).
- 25 -
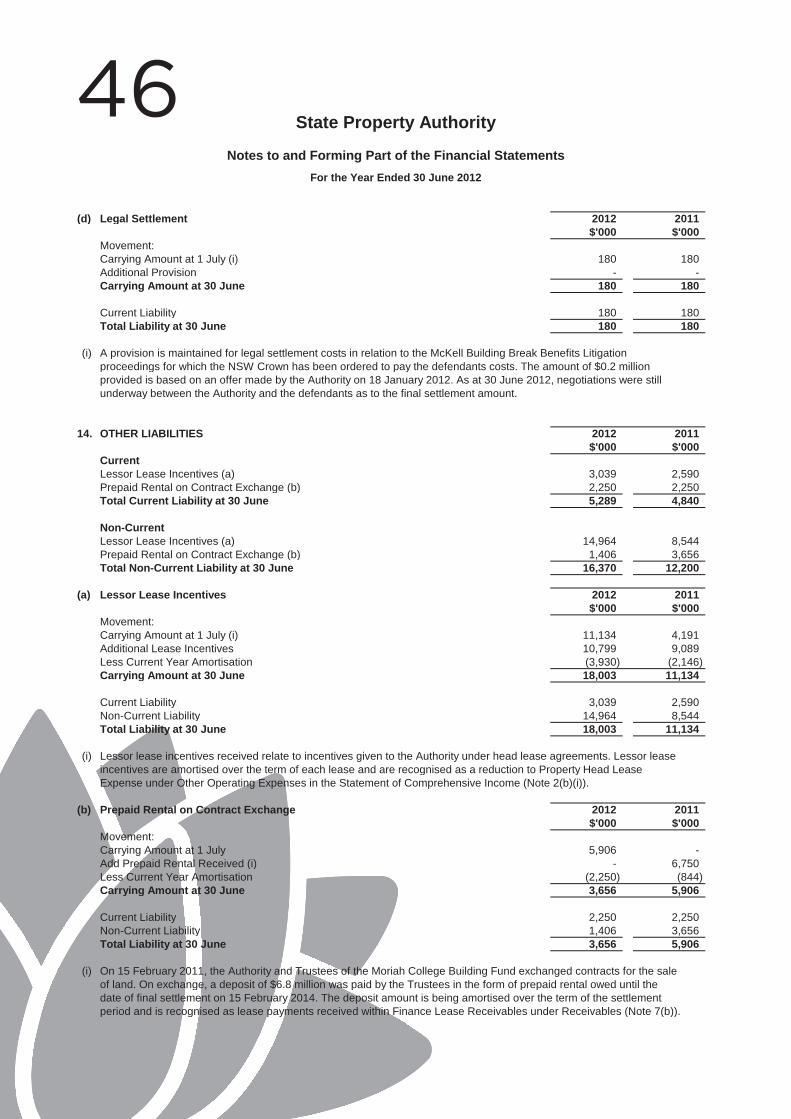
46 State Property Authority
Notes to and Forming Part of the Financial StatementsFor the Year Ended 30 June 2012
(d) Legal Settlement 2012 2011$'000 $'000
Movement:Carrying Amount at 1 July (i) 180 180 Additional Provision - - Carrying Amount at 30 June 180 180
Current Liability 180 180 Total Liability at 30 June 180 180
(i) A provision is maintained for legal settlement costs in relation to the McKell Building Break Benefits Litigationproceedings for which the NSW Crown has been ordered to pay the defendants costs. The amount of $0.2 millionprovided is based on an offer made by the Authority on 18 January 2012. As at 30 June 2012, negotiations were stillunderway between the Authority and the defendants as to the final settlement amount.
14. OTHER LIABILITIES 2012 2011$'000 $'000
CurrentLessor Lease Incentives (a) 3,039 2,590 Prepaid Rental on Contract Exchange (b) 2,250 2,250 Total Current Liability at 30 June 5,289 4,840
Non-CurrentLessor Lease Incentives (a) 14,964 8,544 Prepaid Rental on Contract Exchange (b) 1,406 3,656 Total Non-Current Liability at 30 June 16,370 12,200
(a) Lessor Lease Incentives 2012 2011$'000 $'000
Movement:Carrying Amount at 1 July (i) 11,134 4,191 Additional Lease Incentives 10,799 9,089 Less Current Year Amortisation (3,930) (2,146) Carrying Amount at 30 June 18,003 11,134
Current Liability 3,039 2,590 Non-Current Liability 14,964 8,544 Total Liability at 30 June 18,003 11,134
(i) Lessor lease incentives received relate to incentives given to the Authority under head lease agreements. Lessor leaseincentives are amortised over the term of each lease and are recognised as a reduction to Property Head LeaseExpense under Other Operating Expenses in the Statement of Comprehensive Income (Note 2(b)(i)).
(b) Prepaid Rental on Contract Exchange 2012 2011$'000 $'000
Movement:Carrying Amount at 1 July 5,906 - Add Prepaid Rental Received (i) - 6,750 Less Current Year Amortisation (2,250) (844) Carrying Amount at 30 June 3,656 5,906
Current Liability 2,250 2,250 Non-Current Liability 1,406 3,656 Total Liability at 30 June 3,656 5,906
(i) On 15 February 2011, the Authority and Trustees of the Moriah College Building Fund exchanged contracts for the saleof land. On exchange, a deposit of $6.8 million was paid by the Trustees in the form of prepaid rental owed until thedate of final settlement on 15 February 2014. The deposit amount is being amortised over the term of the settlementperiod and is recognised as lease payments received within Finance Lease Receivables under Receivables (Note 7(b)).
- 26 -
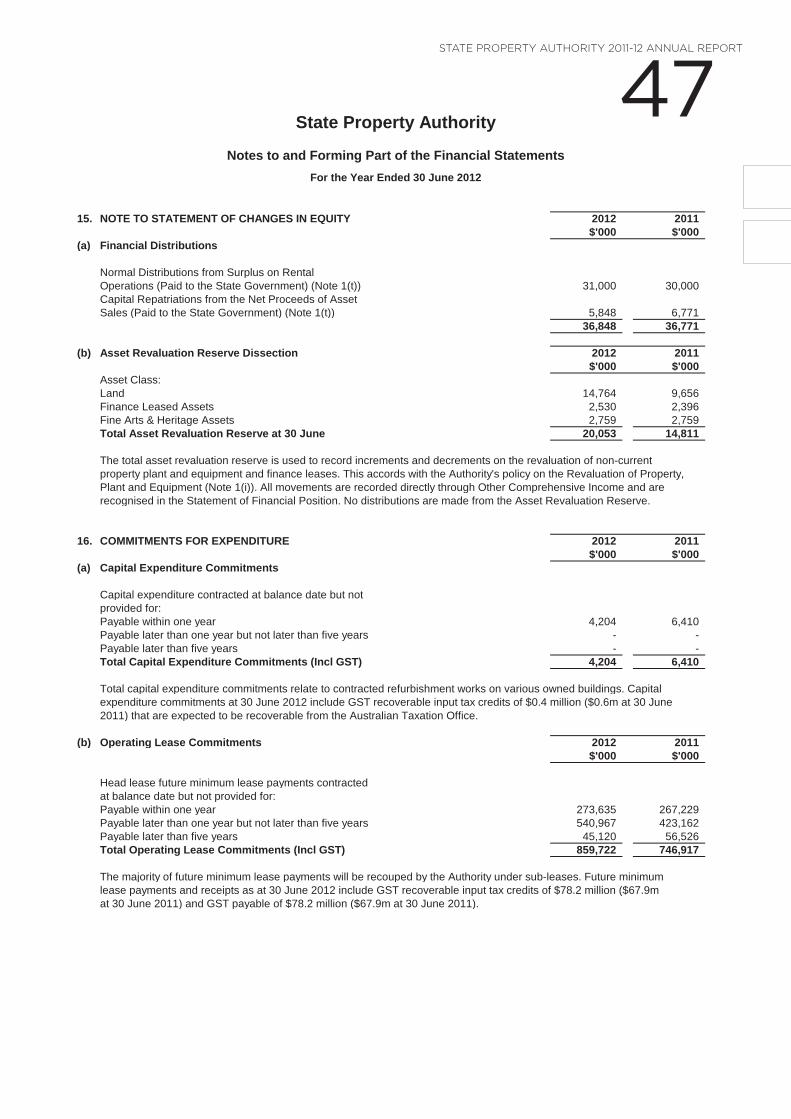
47 State ProPerty authority 2011-12 annual rePort
State Property Authority
Notes to and Forming Part of the Financial StatementsFor the Year Ended 30 June 2012
15. NOTE TO STATEMENT OF CHANGES IN EQUITY 2012 2011$'000 $'000
(a) Financial Distributions
Normal Distributions from Surplus on RentalOperations (Paid to the State Government) (Note 1(t)) 31,000 30,000 Capital Repatriations from the Net Proceeds of AssetSales (Paid to the State Government) (Note 1(t)) 5,848 6,771
36,848 36,771
(b) Asset Revaluation Reserve Dissection 2012 2011$'000 $'000
Asset Class:Land 14,764 9,656 Finance Leased Assets 2,530 2,396 Fine Arts & Heritage Assets 2,759 2,759 Total Asset Revaluation Reserve at 30 June 20,053 14,811
The total asset revaluation reserve is used to record increments and decrements on the revaluation of non-currentproperty plant and equipment and finance leases. This accords with the Authority's policy on the Revaluation of Property,Plant and Equipment (Note 1(i)). All movements are recorded directly through Other Comprehensive Income and arerecognised in the Statement of Financial Position. No distributions are made from the Asset Revaluation Reserve.
16. COMMITMENTS FOR EXPENDITURE 2012 2011$'000 $'000
(a) Capital Expenditure Commitments
Capital expenditure contracted at balance date but notprovided for:Payable within one year 4,204 6,410 Payable later than one year but not later than five years - - Payable later than five years - - Total Capital Expenditure Commitments (Incl GST) 4,204 6,410
Total capital expenditure commitments relate to contracted refurbishment works on various owned buildings. Capitalexpenditure commitments at 30 June 2012 include GST recoverable input tax credits of $0.4 million ($0.6m at 30 June2011) that are expected to be recoverable from the Australian Taxation Office.
(b) Operating Lease Commitments 2012 2011$'000 $'000
Head lease future minimum lease payments contractedat balance date but not provided for:Payable within one year 273,635 267,229 Payable later than one year but not later than five years 540,967 423,162 Payable later than five years 45,120 56,526 Total Operating Lease Commitments (Incl GST) 859,722 746,917
The majority of future minimum lease payments will be recouped by the Authority under sub-leases. Future minimumlease payments and receipts as at 30 June 2012 include GST recoverable input tax credits of $78.2 million ($67.9mat 30 June 2011) and GST payable of $78.2 million ($67.9m at 30 June 2011).
- 27 -
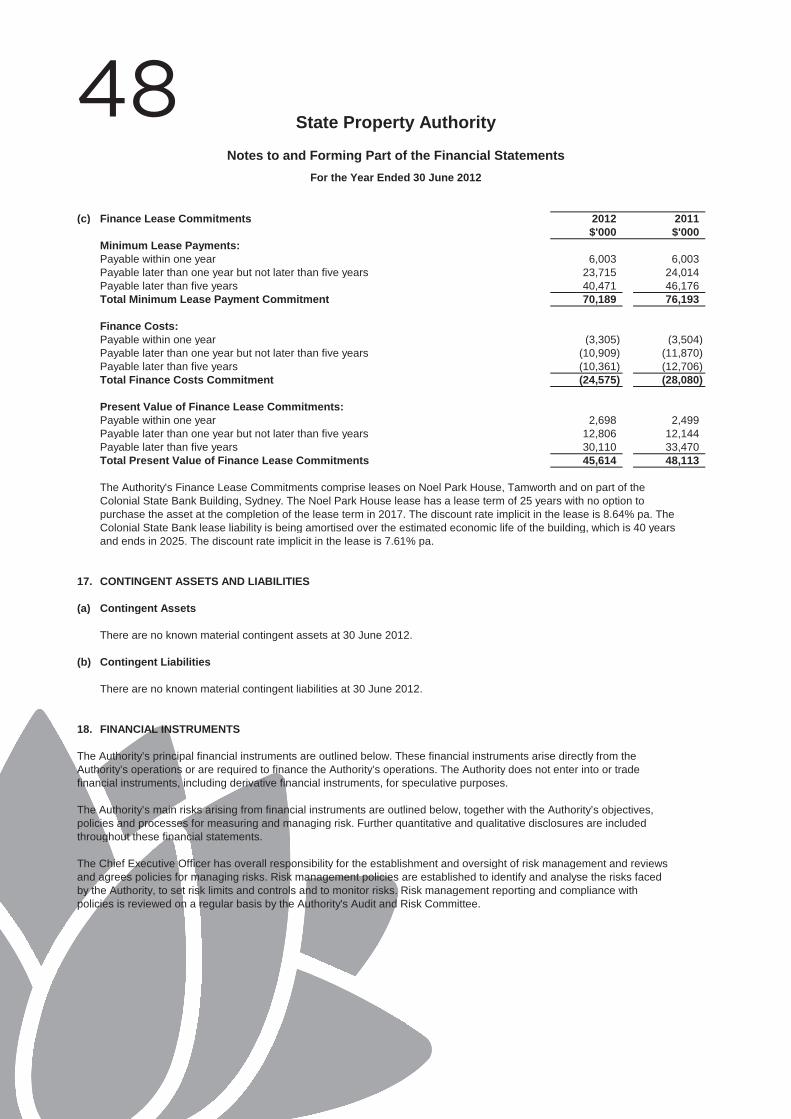
48 State Property Authority
Notes to and Forming Part of the Financial StatementsFor the Year Ended 30 June 2012
(c) Finance Lease Commitments 2012 2011$'000 $'000
Minimum Lease Payments:Payable within one year 6,003 6,003 Payable later than one year but not later than five years 23,715 24,014 Payable later than five years 40,471 46,176 Total Minimum Lease Payment Commitment 70,189 76,193
Finance Costs:Payable within one year (3,305) (3,504) Payable later than one year but not later than five years (10,909) (11,870) Payable later than five years (10,361) (12,706) Total Finance Costs Commitment (24,575) (28,080)
Present Value of Finance Lease Commitments:Payable within one year 2,698 2,499 Payable later than one year but not later than five years 12,806 12,144 Payable later than five years 30,110 33,470 Total Present Value of Finance Lease Commitments 45,614 48,113
The Authority's Finance Lease Commitments comprise leases on Noel Park House, Tamworth and on part of theColonial State Bank Building, Sydney. The Noel Park House lease has a lease term of 25 years with no option topurchase the asset at the completion of the lease term in 2017. The discount rate implicit in the lease is 8.64% pa. TheColonial State Bank lease liability is being amortised over the estimated economic life of the building, which is 40 yearsand ends in 2025. The discount rate implicit in the lease is 7.61% pa.
17. CONTINGENT ASSETS AND LIABILITIES
(a) Contingent Assets
There are no known material contingent assets at 30 June 2012.
(b) Contingent Liabilities
There are no known material contingent liabilities at 30 June 2012.
18. FINANCIAL INSTRUMENTS
The Authority’s principal financial instruments are outlined below. These financial instruments arise directly from theAuthority’s operations or are required to finance the Authority’s operations. The Authority does not enter into or tradefinancial instruments, including derivative financial instruments, for speculative purposes.
The Authority’s main risks arising from financial instruments are outlined below, together with the Authority’s objectives,policies and processes for measuring and managing risk. Further quantitative and qualitative disclosures are includedthroughout these financial statements.
The Chief Executive Officer has overall responsibility for the establishment and oversight of risk management and reviewsand agrees policies for managing risks. Risk management policies are established to identify and analyse the risks facedby the Authority, to set risk limits and controls and to monitor risks. Risk management reporting and compliance withpolicies is reviewed on a regular basis by the Authority's Audit and Risk Committee.
- 28 -
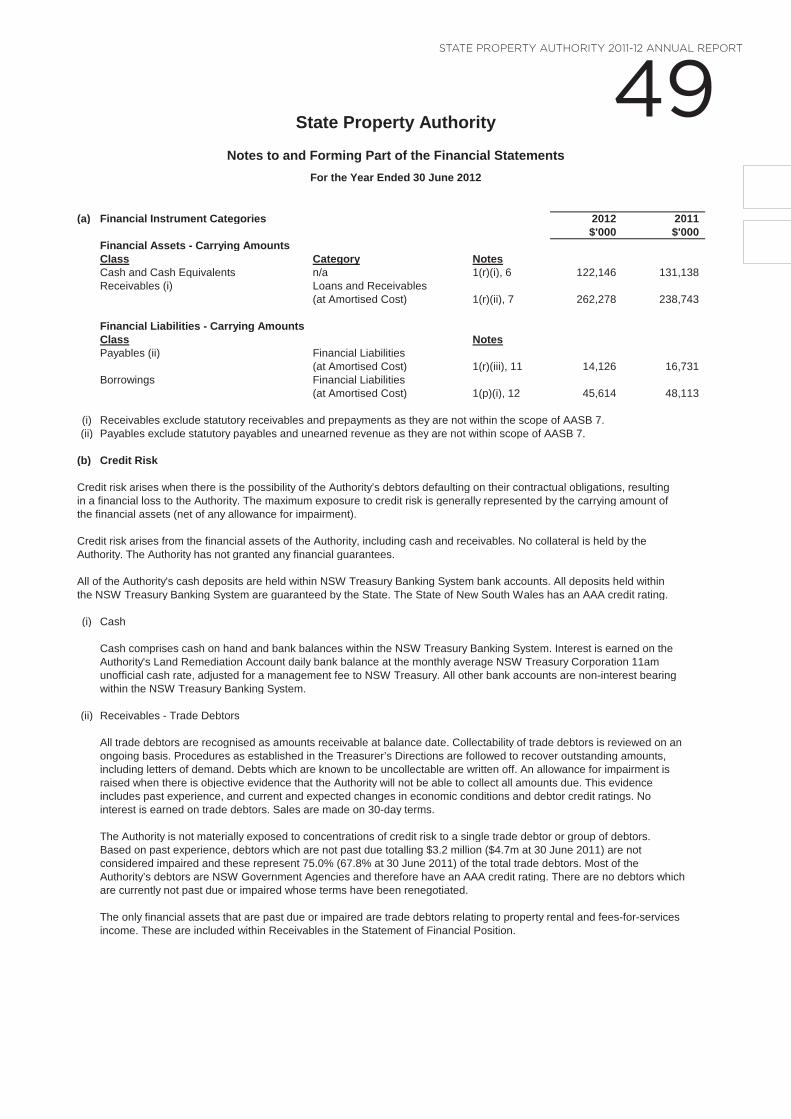
49 State ProPerty authority 2011-12 annual rePort
State Property Authority
Notes to and Forming Part of the Financial StatementsFor the Year Ended 30 June 2012
(a) Financial Instrument Categories 2012 2011$'000 $'000
Financial Assets - Carrying AmountsClass Category NotesCash and Cash Equivalents n/a 1(r)(i), 6 122,146 131,138 Receivables (i) Loans and Receivables
(at Amortised Cost) 1(r)(ii), 7 262,278 238,743
Financial Liabilities - Carrying AmountsClass NotesPayables (ii) Financial Liabilities
(at Amortised Cost) 1(r)(iii), 11 14,126 16,731 Borrowings Financial Liabilities
(at Amortised Cost) 1(p)(i), 12 45,614 48,113
(i) Receivables exclude statutory receivables and prepayments as they are not within the scope of AASB 7.(ii) Payables exclude statutory payables and unearned revenue as they are not within scope of AASB 7.
(b) Credit Risk
Credit risk arises when there is the possibility of the Authority’s debtors defaulting on their contractual obligations, resultingin a financial loss to the Authority. The maximum exposure to credit risk is generally represented by the carrying amount ofthe financial assets (net of any allowance for impairment).
Credit risk arises from the financial assets of the Authority, including cash and receivables. No collateral is held by theAuthority. The Authority has not granted any financial guarantees.
All of the Authority's cash deposits are held within NSW Treasury Banking System bank accounts. All deposits held withinthe NSW Treasury Banking System are guaranteed by the State. The State of New South Wales has an AAA credit rating.
(i) Cash
Cash comprises cash on hand and bank balances within the NSW Treasury Banking System. Interest is earned on theAuthority's Land Remediation Account daily bank balance at the monthly average NSW Treasury Corporation 11amunofficial cash rate, adjusted for a management fee to NSW Treasury. All other bank accounts are non-interest bearingwithin the NSW Treasury Banking System.
(ii) Receivables - Trade Debtors
All trade debtors are recognised as amounts receivable at balance date. Collectability of trade debtors is reviewed on anongoing basis. Procedures as established in the Treasurer’s Directions are followed to recover outstanding amounts,including letters of demand. Debts which are known to be uncollectable are written off. An allowance for impairment israised when there is objective evidence that the Authority will not be able to collect all amounts due. This evidenceincludes past experience, and current and expected changes in economic conditions and debtor credit ratings. Nointerest is earned on trade debtors. Sales are made on 30-day terms.
The Authority is not materially exposed to concentrations of credit risk to a single trade debtor or group of debtors.Based on past experience, debtors which are not past due totalling $3.2 million ($4.7m at 30 June 2011) are notconsidered impaired and these represent 75.0% (67.8% at 30 June 2011) of the total trade debtors. Most of theAuthority’s debtors are NSW Government Agencies and therefore have an AAA credit rating. There are no debtors whichare currently not past due or impaired whose terms have been renegotiated.
The only financial assets that are past due or impaired are trade debtors relating to property rental and fees-for-servicesincome. These are included within Receivables in the Statement of Financial Position.
- 29 -
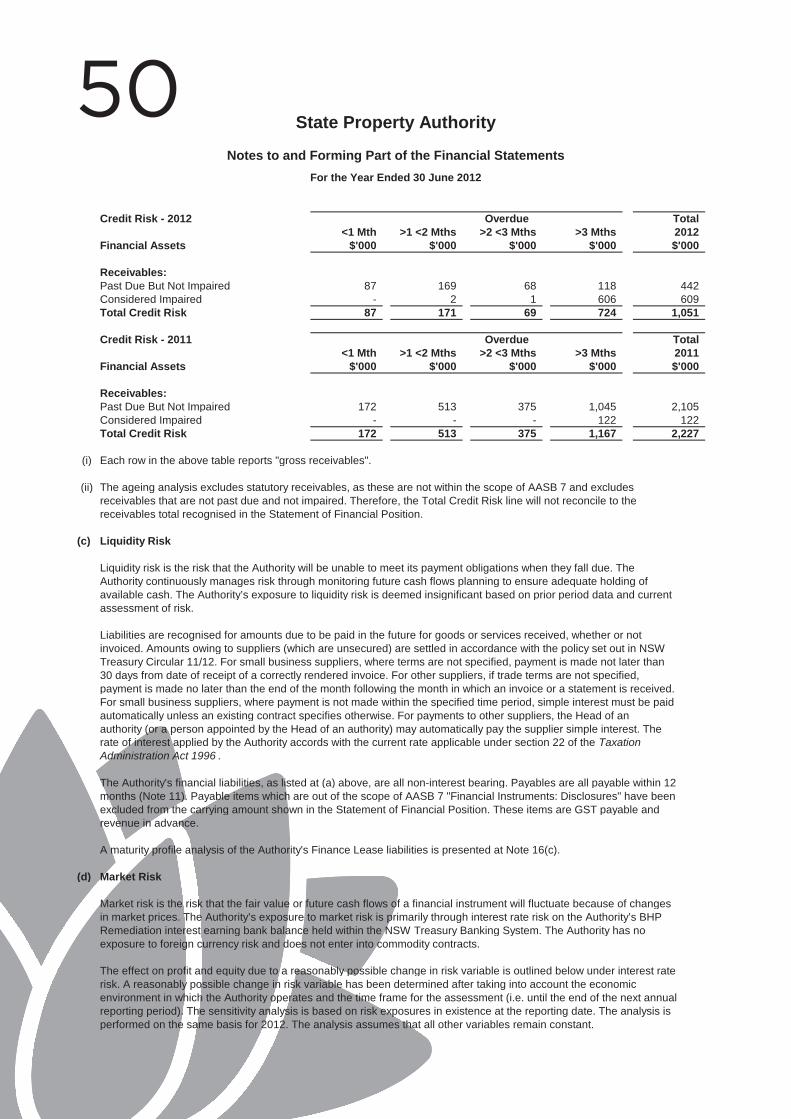
50 State Property Authority
Notes to and Forming Part of the Financial StatementsFor the Year Ended 30 June 2012
Credit Risk - 2012 Total<1 Mth >1 <2 Mths >2 <3 Mths >3 Mths 2012
Financial Assets $'000 $'000 $'000 $'000 $'000
Receivables:Past Due But Not Impaired 87 169 68 118 442 Considered Impaired - 2 1 606 609 Total Credit Risk 87 171 69 724 1,051
Credit Risk - 2011 Total<1 Mth >1 <2 Mths >2 <3 Mths >3 Mths 2011
Financial Assets $'000 $'000 $'000 $'000 $'000
Receivables:Past Due But Not Impaired 172 513 375 1,045 2,105 Considered Impaired - - - 122 122 Total Credit Risk 172 513 375 1,167 2,227
(i) Each row in the above table reports "gross receivables".
(ii) The ageing analysis excludes statutory receivables, as these are not within the scope of AASB 7 and excludes receivables that are not past due and not impaired. Therefore, the Total Credit Risk line will not reconcile to thereceivables total recognised in the Statement of Financial Position.
(c) Liquidity Risk
Liquidity risk is the risk that the Authority will be unable to meet its payment obligations when they fall due. TheAuthority continuously manages risk through monitoring future cash flows planning to ensure adequate holding ofavailable cash. The Authority’s exposure to liquidity risk is deemed insignificant based on prior period data and currentassessment of risk.
Liabilities are recognised for amounts due to be paid in the future for goods or services received, whether or notinvoiced. Amounts owing to suppliers (which are unsecured) are settled in accordance with the policy set out in NSWTreasury Circular 11/12. For small business suppliers, where terms are not specified, payment is made not later than30 days from date of receipt of a correctly rendered invoice. For other suppliers, if trade terms are not specified,payment is made no later than the end of the month following the month in which an invoice or a statement is received.For small business suppliers, where payment is not made within the specified time period, simple interest must be paidautomatically unless an existing contract specifies otherwise. For payments to other suppliers, the Head of anauthority (or a person appointed by the Head of an authority) may automatically pay the supplier simple interest. Therate of interest applied by the Authority accords with the current rate applicable under section 22 of the TaxationAdministration Act 1996 .
The Authority's financial liabilities, as listed at (a) above, are all non-interest bearing. Payables are all payable within 12months (Note 11). Payable items which are out of the scope of AASB 7 "Financial Instruments: Disclosures" have beenexcluded from the carrying amount shown in the Statement of Financial Position. These items are GST payable andrevenue in advance.
A maturity profile analysis of the Authority's Finance Lease liabilities is presented at Note 16(c).
(d) Market Risk
Market risk is the risk that the fair value or future cash flows of a financial instrument will fluctuate because of changesin market prices. The Authority’s exposure to market risk is primarily through interest rate risk on the Authority’s BHPRemediation interest earning bank balance held within the NSW Treasury Banking System. The Authority has noexposure to foreign currency risk and does not enter into commodity contracts.
The effect on profit and equity due to a reasonably possible change in risk variable is outlined below under interest raterisk. A reasonably possible change in risk variable has been determined after taking into account the economicenvironment in which the Authority operates and the time frame for the assessment (i.e. until the end of the next annualreporting period). The sensitivity analysis is based on risk exposures in existence at the reporting date. The analysis isperformed on the same basis for 2012. The analysis assumes that all other variables remain constant.
Overdue
Overdue
- 30 -
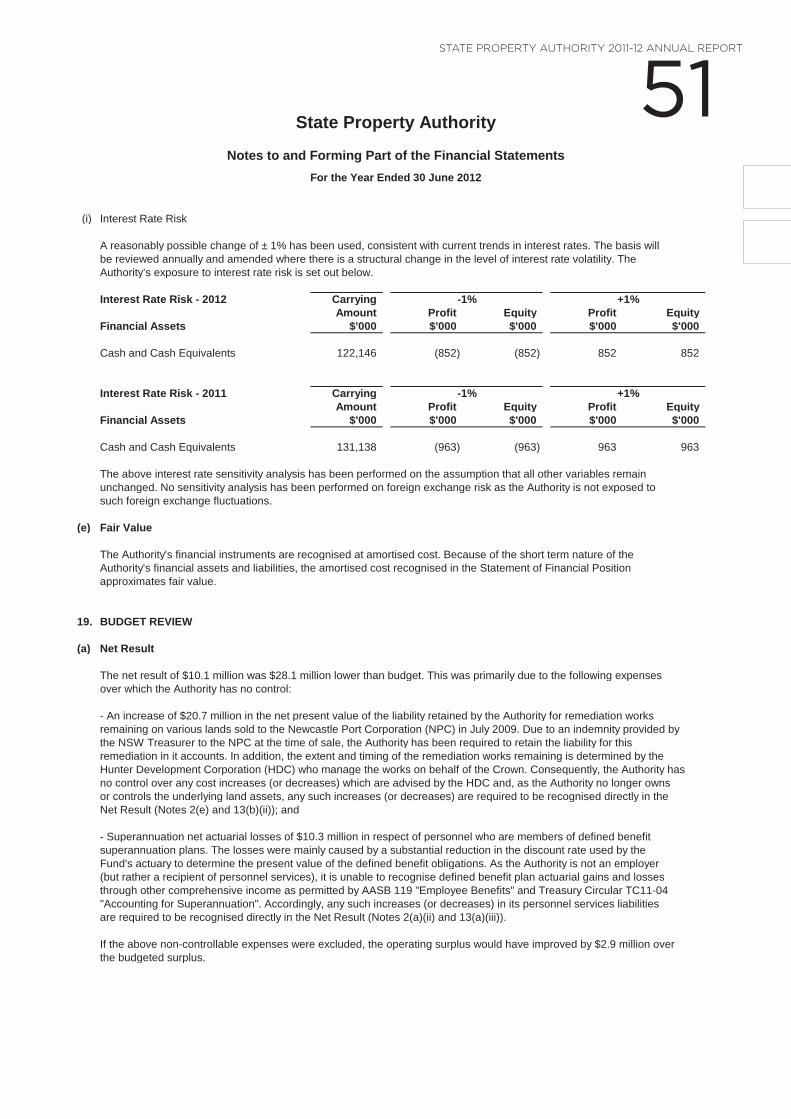
51 State ProPerty authority 2011-12 annual rePort
State Property Authority
Notes to and Forming Part of the Financial StatementsFor the Year Ended 30 June 2012
(i) Interest Rate Risk
A reasonably possible change of ± 1% has been used, consistent with current trends in interest rates. The basis willbe reviewed annually and amended where there is a structural change in the level of interest rate volatility. TheAuthority’s exposure to interest rate risk is set out below.
Interest Rate Risk - 2012 CarryingAmount Profit Equity Profit Equity
Financial Assets $'000 $'000 $'000 $'000 $'000
Cash and Cash Equivalents 122,146 (852) (852) 852 852
Interest Rate Risk - 2011 CarryingAmount Profit Equity Profit Equity
Financial Assets $'000 $'000 $'000 $'000 $'000
Cash and Cash Equivalents 131,138 (963) (963) 963 963
The above interest rate sensitivity analysis has been performed on the assumption that all other variables remainunchanged. No sensitivity analysis has been performed on foreign exchange risk as the Authority is not exposed to such foreign exchange fluctuations.
(e) Fair Value
The Authority's financial instruments are recognised at amortised cost. Because of the short term nature of theAuthority's financial assets and liabilities, the amortised cost recognised in the Statement of Financial Positionapproximates fair value.
19. BUDGET REVIEW
(a) Net Result
The net result of $10.1 million was $28.1 million lower than budget. This was primarily due to the following expensesover which the Authority has no control:
- An increase of $20.7 million in the net present value of the liability retained by the Authority for remediation worksremaining on various lands sold to the Newcastle Port Corporation (NPC) in July 2009. Due to an indemnity provided bythe NSW Treasurer to the NPC at the time of sale, the Authority has been required to retain the liability for thisremediation in it accounts. In addition, the extent and timing of the remediation works remaining is determined by theHunter Development Corporation (HDC) who manage the works on behalf of the Crown. Consequently, the Authority hasno control over any cost increases (or decreases) which are advised by the HDC and, as the Authority no longer ownsor controls the underlying land assets, any such increases (or decreases) are required to be recognised directly in theNet Result (Notes 2(e) and 13(b)(ii)); and
- Superannuation net actuarial losses of $10.3 million in respect of personnel who are members of defined benefitsuperannuation plans. The losses were mainly caused by a substantial reduction in the discount rate used by theFund's actuary to determine the present value of the defined benefit obligations. As the Authority is not an employer(but rather a recipient of personnel services), it is unable to recognise defined benefit plan actuarial gains and lossesthrough other comprehensive income as permitted by AASB 119 "Employee Benefits" and Treasury Circular TC11-04"Accounting for Superannuation". Accordingly, any such increases (or decreases) in its personnel services liabilitiesare required to be recognised directly in the Net Result (Notes 2(a)(ii) and 13(a)(iii)).
If the above non-controllable expenses were excluded, the operating surplus would have improved by $2.9 million overthe budgeted surplus.
-1% +1%
-1% +1%
- 31 -

52 State Property Authority
Notes to and Forming Part of the Financial StatementsFor the Year Ended 30 June 2012
(b) Assets and Liabilities
Total Assets were $76.2 million above budget primarily due to an increase in Cash and Cash Equivalents of $30.8million (Note 19(c)), Property, Plant and Equipment increases of $17.6 million and an aggregated increase of $27.3 million from Makegood Costs Recoverable, Finance Lease Receivables and Lessee Lease Incentives.
Total Liabilities were $84.5 million greater than budget. Included in this was a $41.3 million increase in LandRemediation liabilities due to lower than projected payments during 2011-12 combined with revised estimates advisedby the Hunter Development Corporation in June 2012. Other major liability increases included a $11.2 million increasein Payables, $10.4 million in Personnel Services Liabilities (mainly in unfunded superannuation), $11.7 million inMakegood Restoration and net $6.9 million in Lessor Lease Incentives.
(c) Cash Flows
Closing Cash and Cash Equivalents was $30.8 million greater than budget. This resulted mainly from landremediation payments being $17.5 million lower than the original cash flow estimates provided by the HunterDevelopment Corporation. The balance resulting mainly from lower capital expenditure levels and a higher thanprojected level of operating payables.
20. EVENTS AFTER THE REPORTING PERIOD
(a) Adjusting Events
There are no known events after the reporting period which would give rise to a material impact on the reported results orfinancial position of the Authority as at 30 June 2012.
(b) Non-Adjusting Events
Government Agency Owned and Leased Office Accommodation Property Vesting – Pursuant to Premier’sMemorandum M2008-06, further vesting of Government agency-owned and leased properties is likely to occur inseparate tranches during 2012-13. As the identification and validation of these properties was still in progress at thereporting date, estimates of the financial impact on the Authority's accounts in 2012-13 are not available.
There are no other known non-adjusting events after the reporting period.
End of Audited Financial Statements
- 32 -
53 State ProPerty authority 2011-12 annual rePort
n Chief and senior exeCutive staff
n Chief exeCutive offiCer
michael Coutts-trotter, ba
ses 8 - salary $499,600
michael Coutts-trotter was appointed Chief executive officer of the state Property authority on 4 april 2011 . mr Coutts-trotter is also the director-general of the department of finance and services .
n PerformanCe revieW by minister for finanCe and serviCes
the minister for finance and services is satisfied that the Chief executive officer has met all the performance criteria of the position .
n PerformanCe highLights
as Chief executive officer, mr Coutts-trotter has:
n Provided leadership in the establishment of the government’s Property asset utilisation taskforce to review key asset management bodies across government and develop an integrated and efficient asset management and disposal model .
n directed the resolution of accommodation options for central government, with particular emphasis on options for ministers and their staff, the department of Premier and Cabinet and nsW treasury .
n delivered whole-of-government savings and economic benefits of $38 .5m from the divestment, leasing and improved utilisation of generic property assets .
n Provided the lead role for the department of finance and services in the implementation of the government’s decade of decentralisation strategy .
n overseen the completion of the authority’s program of work for the year including:
1 . the program for the vesting of owned and leased property assets under the government’s policy for the centralised ownership and management of office accommodation .
2 . the program of agency portfolio reviews and regional studies to identify improvements in agencies’ property management outcomes and better alignment of property assets with agencies’ service delivery needs .
3 . the asset sales program, achieving $2 .2 million from the disposal of seven properties .
4 . the $24 .0m capital refurbishment program for 2011-12 .
5 . the Client relationship management strategy and publication of the authority’s first Product and services Catalogue .
n generaL manager
barry douse, emPa, ba (hons), gaiCd .
ses Level 5
total remuneration package: $261,375
Period in position: acting from 16 november 2009 . Permanently appointed 16 july 2010 .
n PerformanCe revieW by Chief exeCutive offiCer
the Chief executive officer is satisfied that the general manager has met all the performance criteria of the position .
n PerformanCe highLights
as general manager, mr douse:
n Provided ongoing strategic advice to the Chief executive officer, minister for finance and services and office of finance on cost effective accommodation options for central government, including nsW treasury and department of Premier and Cabinet .
n Provided strategic advice to government on divestment opportunities across nsW government agencies .
n Coordinated the submission to government of a report on alternative operating and capital funding models for the management of the government’s property assets .
n strengthened the authority’s role to that of a central leading agency in the management of the government’s office assets with control and oversight of agencies’ facilities planning .
n oversaw the authority’s achievement of $38 .5m in savings and economic benefits in 2011-12 .
n statutory and statistiCaL information
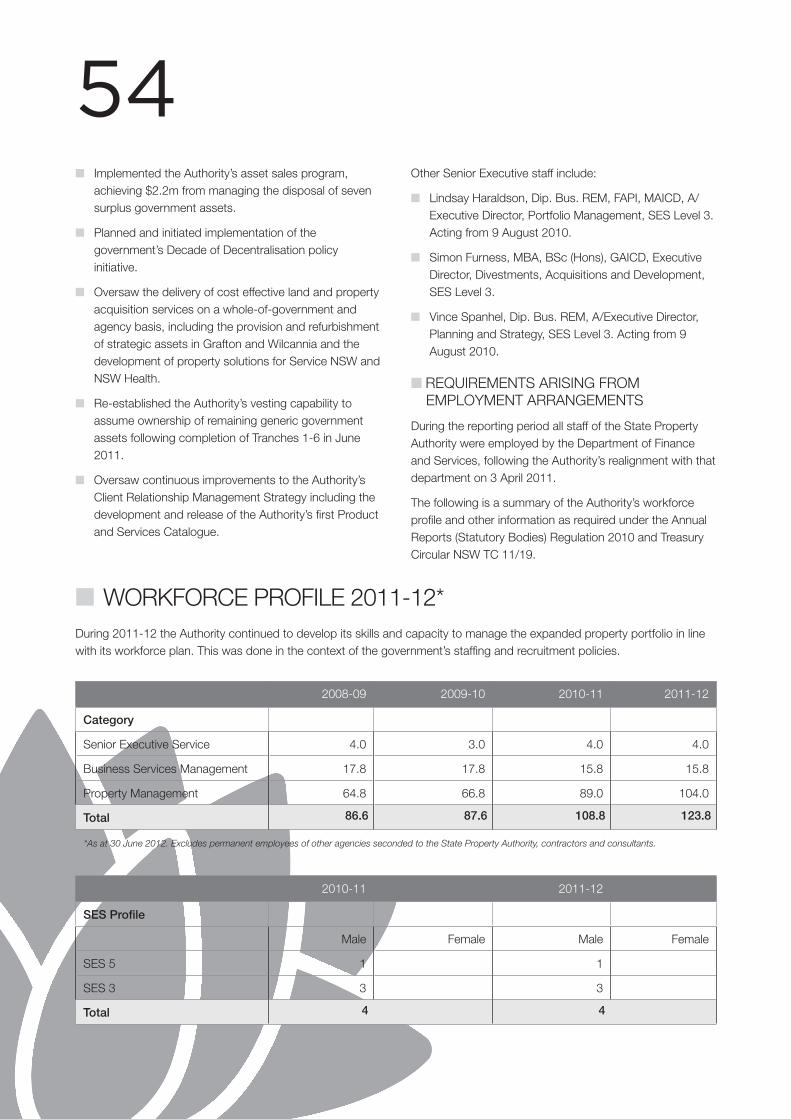
54 n implemented the authority’s asset sales program,
achieving $2 .2m from managing the disposal of seven surplus government assets .
n Planned and initiated implementation of the government’s decade of decentralisation policy initiative .
n oversaw the delivery of cost effective land and property acquisition services on a whole-of-government and agency basis, including the provision and refurbishment of strategic assets in grafton and Wilcannia and the development of property solutions for service nsW and nsW health .
n re-established the authority’s vesting capability to assume ownership of remaining generic government assets following completion of tranches 1-6 in june 2011 .
n oversaw continuous improvements to the authority’s Client relationship management strategy including the development and release of the authority’s first Product and services Catalogue .
other senior executive staff include:
n Lindsay haraldson, dip . bus . rem, faPi, maiCd, a/executive director, Portfolio management, ses Level 3 . acting from 9 august 2010 .
n simon furness, mba, bsc (hons), gaiCd, executive director, divestments, acquisitions and development, ses Level 3 .
n vince spanhel, dip . bus . rem, a/executive director, Planning and strategy, ses Level 3 . acting from 9 august 2010 .
n requirements arising from emPLoyment arrangements
during the reporting period all staff of the state Property authority were employed by the department of finance and services, following the authority’s realignment with that department on 3 april 2011 .
the following is a summary of the authority’s workforce profile and other information as required under the annual reports (statutory bodies) regulation 2010 and treasury Circular nsW tC 11/19 .
n WorKforCe ProfiLe 2011-12*
2008-09 2009-10 2010-11 2011-12
Category
senior executive service 4 .0 3 .0 4 .0 4 .0
business services management 17 .8 17 .8 15 .8 15 .8
Property management 64 .8 66 .8 89 .0 104 .0
Total 86.6 87.6 108.8 123.8
*As at 30 June 2012. Excludes permanent employees of other agencies seconded to the State Property Authority, contractors and consultants.
2010-11 2011-12
SES Profile
male female male female
ses 5 1 1
ses 3 3 3
Total 4 4
during 2011-12 the authority continued to develop its skills and capacity to manage the expanded property portfolio in line with its workforce plan . this was done in the context of the government’s staffing and recruitment policies .
55 State ProPerty authority 2011-12 annual rePort
n exCePtionaL movements in Wages, saLaries or aLLoWanCes
the Crown employees (Public sector – salaries 2008) award was varied on 10 august 2011 to provide for salary increases of 2 .5% effective from the first pay period commencing on or after 1 july 2011 .
the statutory and other offices remuneration tribunal (soort) awarded a 2 .5% increase to the remuneration packages of Chief executive (Ces) and senior executive service (ses) officers effective 1 october 2011 .
n PersonneL PoLiCies and PraCtiCes
no new personnel policies and procedures were developed during 2011-12 as these guidelines are under review following the authority’s realignment with the department of finance and services .
during the reporting period the authority continued to be governed by the policies and procedures of the former Lands and Property management authority along with authority-specific personnel policies . broader department of finance and services policies are being gradually adopted by the authority as they are standardised and rolled out agency-wide .
in 2011-12, the authority’s human resources functions of recruitment, induction, training and development, Payroll and Work health and safety were managed by the department of finance and services to reflect the centralised corporate services model under the agency cluster .
the authority’s migration from the hr KiosK and Chris Payroll systems to the fully integrated system analyse Program (saP) in june 2012 provided employees and managers with a self-service facility which streamlined the processing and management of its timesheets, leave and the payment of claims and allowances; in many cases eliminating the need for paper based transactions .
n industriaL reLations PoLiCies and PraCtiCes
during the financial year the state Property authority was represented on the department of finance and services’ Consultative Committee by a representative of the housing and Property group . the Psa and aPsema are also members of the Committee . meetings were held every two months during the reporting period .
in 2011-12 there were no authority-related industrial disputes or industrial lost time .
n PrinCiPaL governing LegisLation
the state Property authority operates under the following principal legislation:
n state Property authority act 2006
n Public finance and audit act 1983
n Changes in LegisLation state Property authority amendment order 2012 commenced on 23 march 2012 . this order amended schedule 1 of the state Property authority act 2006, transferring 14 land parcels and 43 lease interests to the authority which were previously owned or administered by the following agencies: department of attorney general & justice, department of family & Community services, department of finance & services, fire and rescue nsW, home Care service, department of Premier & Cabinet, office of the director of Public Prosecutions, department of Primary industries (Crown Lands), railCorp, department of trade & investment regional infrastructure & services and WorkCover nsW .
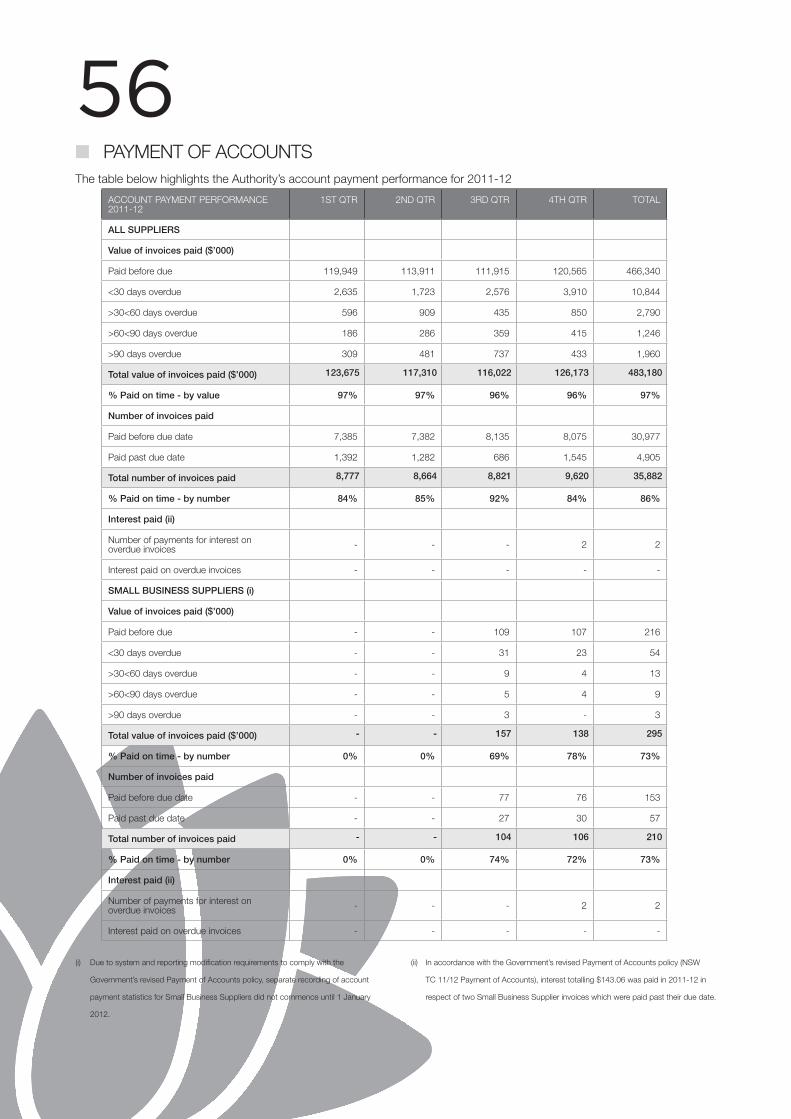
56 n Payment of aCCounts the table below highlights the authority’s account payment performance for 2011-12
aCCount Payment PerformanCe 2011-12
1st qtr
2nd qtr
3rd qtr
4th qtr
totaL
ALL SUPPLIERS
Value of invoices paid ($’000)
Paid before due 119,949 113,911 111,915 120,565 466,340
<30 days overdue 2,635 1,723 2,576 3,910 10,844
>30<60 days overdue 596 909 435 850 2,790
>60<90 days overdue 186 286 359 415 1,246
>90 days overdue 309 481 737 433 1,960
Total value of invoices paid ($’000) 123,675 117,310 116,022 126,173 483,180
% Paid on time - by value 97% 97% 96% 96% 97%
Number of invoices paid
Paid before due date 7,385 7,382 8,135 8,075 30,977
Paid past due date 1,392 1,282 686 1,545 4,905
Total number of invoices paid 8,777 8,664 8,821 9,620 35,882
% Paid on time - by number 84% 85% 92% 84% 86%
Interest paid (ii)
number of payments for interest on overdue invoices - - - 2 2
interest paid on overdue invoices - - - - -
SMALL BUSINESS SUPPLIERS (i)
Value of invoices paid ($’000)
Paid before due - - 109 107 216
<30 days overdue - - 31 23 54
>30<60 days overdue - - 9 4 13
>60<90 days overdue - - 5 4 9
>90 days overdue - - 3 - 3
Total value of invoices paid ($’000) - - 157 138 295
% Paid on time - by number 0% 0% 69% 78% 73%
Number of invoices paid
Paid before due date - - 77 76 153
Paid past due date - - 27 30 57
Total number of invoices paid - - 104 106 210
% Paid on time - by number 0% 0% 74% 72% 73%
Interest paid (ii)
number of payments for interest on overdue invoices - - - 2 2
interest paid on overdue invoices - - - - -
(i) due to system and reporting modification requirements to comply with the
government’s revised Payment of accounts policy, separate recording of account
payment statistics for small business suppliers did not commence until 1 january
2012 .
(ii) in accordance with the government’s revised Payment of accounts policy (nsW
tC 11/12 Payment of accounts), interest totalling $143 .06 was paid in 2011-12 in
respect of two small business supplier invoices which were paid past their due date .
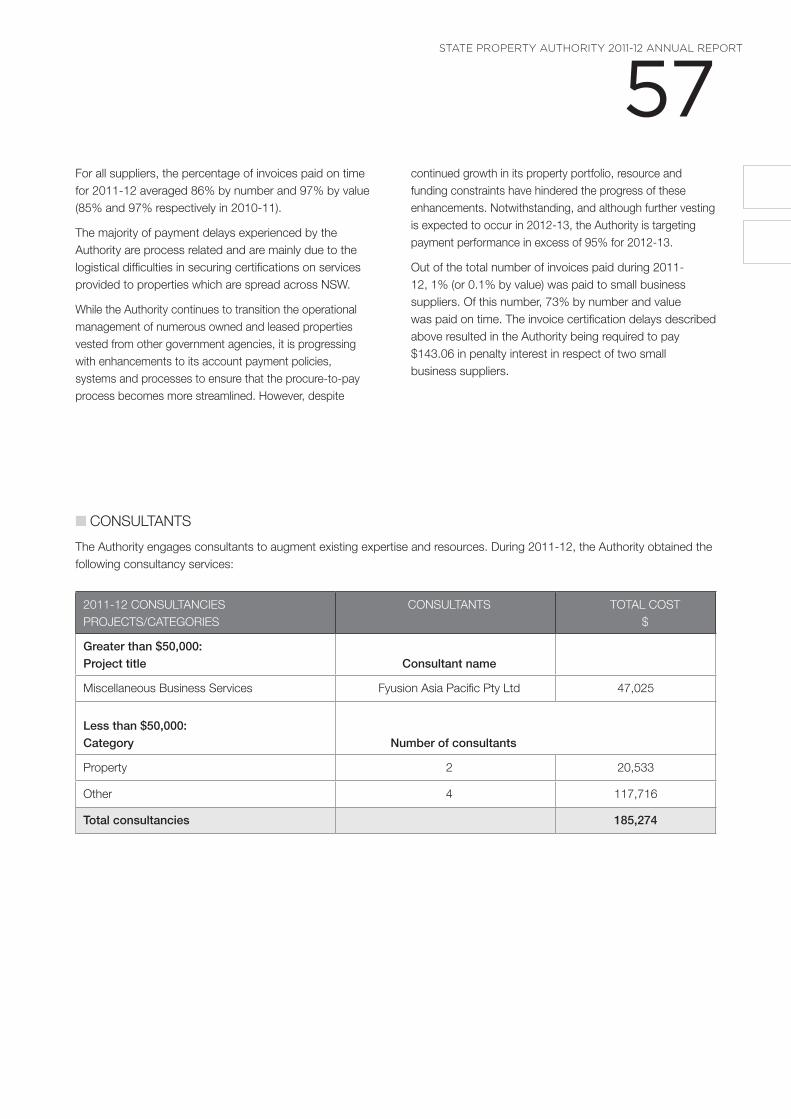
57 State ProPerty authority 2011-12 annual rePort
for all suppliers, the percentage of invoices paid on time for 2011-12 averaged 86% by number and 97% by value (85% and 97% respectively in 2010-11) .
the majority of payment delays experienced by the authority are process related and are mainly due to the logistical difficulties in securing certifications on services provided to properties which are spread across nsW .
While the authority continues to transition the operational management of numerous owned and leased properties vested from other government agencies, it is progressing with enhancements to its account payment policies, systems and processes to ensure that the procure-to-pay process becomes more streamlined . however, despite
continued growth in its property portfolio, resource and funding constraints have hindered the progress of these enhancements . notwithstanding, and although further vesting is expected to occur in 2012-13, the authority is targeting payment performance in excess of 95% for 2012-13 .
out of the total number of invoices paid during 2011-12, 1% (or 0 .1% by value) was paid to small business suppliers . of this number, 73% by number and value was paid on time . the invoice certification delays described above resulted in the authority being required to pay $143 .06 in penalty interest in respect of two small business suppliers .
2011-12 ConsuLtanCies ProjeCts/Categories
ConsuLtants totaL Cost $
Greater than $50,000: Project title
Consultant name
miscellaneous business services fyusion asia Pacific Pty Ltd 47,025
Less than $50,000: Category
Number of consultants
Property 2 20,533
other 4 117,716
Total consultancies 185,274
n ConsuLtants
the authority engages consultants to augment existing expertise and resources . during 2011-12, the authority obtained the following consultancy services:
58 n risK management and insuranCe
in 2011-12 the authority was insured with the treasury managed fund which is managed by the nsW self insurance Corporation .
the authority’s audit and risk Committee was formally reconstituted in the second quarter of 2011-12 following the authority’s realignment with the department of finance and services in april 2011 . during the reporting period, administrative support for the audit and risk Committee was provided by the department of finance and services . the Committee met on three occasions during 2011-12 .
major activities and achievements included:
n review and revision of the authority’s strategic risk register
n completion of a fraud and Corruption risk Profile survey for inclusion in the department of finance and services’ fraud and Corruption Control Plan 2011-13
n development of a risk-based internal audit program .
the authority also fully adopted and communicated the implementation of the department of finance and services’ fraud and Corruption internal reporting Policy, in compliance with the Public interest disclosures act 1994 .
n Credit Cards
in 2011-12 credit card usage within the authority was mainly limited to claimable work-related travel expenses and expenditure for minor purchases where the use of credit cards is a more efficient means of payment .
in accordance with treasurer’s direction 205 .01, credit card usage by officers of the authority during the reporting period was in accordance with relevant government policy, Premier’s memoranda and treasurer’s directions .
the authority has in place a corporate credit card policy that meets nsW treasury guidelines .
n Consumer resPonse
the authority does not deliver front line services to the community . however, mechanisms are in place for its client government agencies to provide feedback via its sPa helpdesk facility as well as online at spafeedback@spa .nsw .gov .au .
in 2011-12 the authority’s sPa helpdesk continued as the central service point for agency property management issues . the authority has ensured that property management issues through this facility are dealt with appropriately and with a high degree of client satisfaction .
the authority also gauges client response to its service delivery through its annual tenant satisfaction survey, aimed at achieving superior customer service and enhancing its service delivery .
n PrivaCy management
the authority’s principal clients are other government agencies . the information collected and retained by the authority generally does not come within the definition of personal information under the Privacy and Personal information Protection act 1998 (PPiP act) . in 2011-12 the authority did not receive any applications for internal review under the PPiP act . the authority’s Privacy statement, Privacy Policy and information on the lodgement of complaints are available on the authority’s website at www .spa .nsw .gov .au .
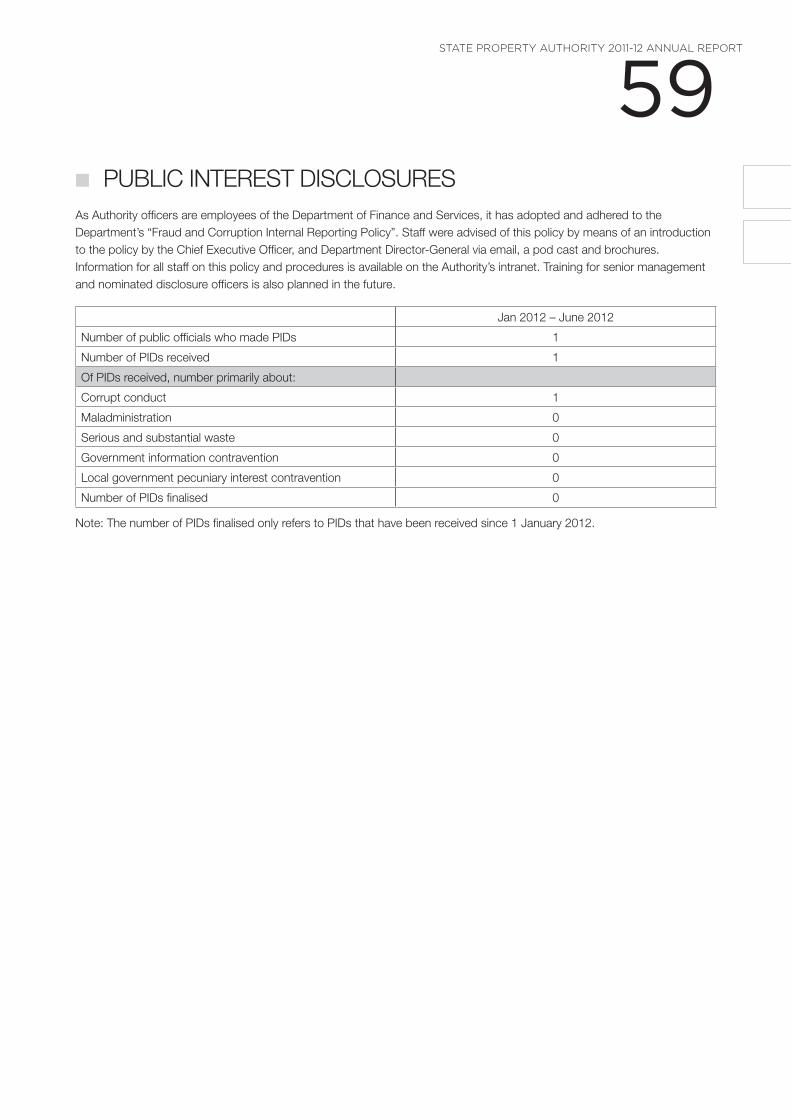
59 State ProPerty authority 2011-12 annual rePort
n PubLiC interest disCLosuresas authority officers are employees of the department of finance and services, it has adopted and adhered to the department’s “fraud and Corruption internal reporting Policy” . staff were advised of this policy by means of an introduction to the policy by the Chief executive officer, and department director-general via email, a pod cast and brochures . information for all staff on this policy and procedures is available on the authority’s intranet . training for senior management and nominated disclosure officers is also planned in the future .
jan 2012 – june 2012
number of public officials who made Pids 1
number of Pids received 1
of Pids received, number primarily about:
Corrupt conduct 1
maladministration 0
serious and substantial waste 0
government information contravention 0
Local government pecuniary interest contravention 0
number of Pids finalised 0
note: the number of Pids finalised only refers to Pids that have been received since 1 january 2012 .
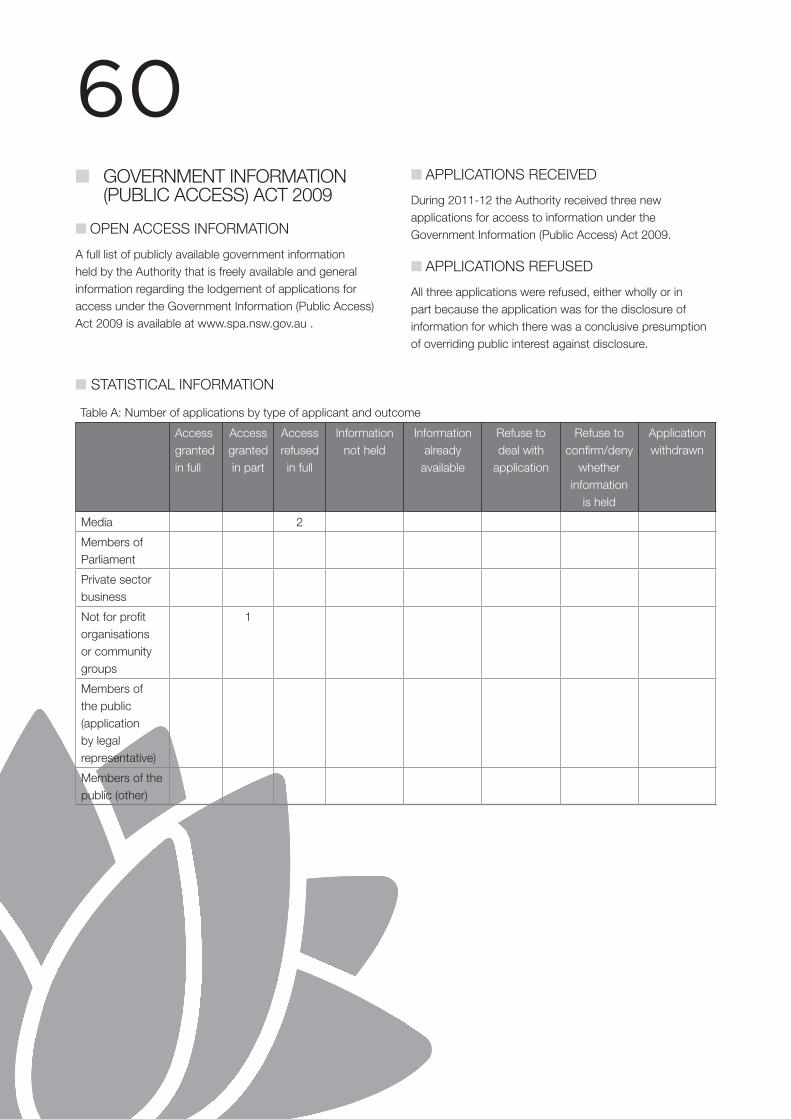
60 n government information
(PubLiC aCCess) aCt 2009
n oPen aCCess information
a full list of publicly available government information held by the authority that is freely available and general information regarding the lodgement of applications for access under the government information (Public access) act 2009 is available at www .spa .nsw .gov .au .
n aPPLiCations reCeived
during 2011-12 the authority received three new applications for access to information under the government information (Public access) act 2009 .
n aPPLiCations refused
all three applications were refused, either wholly or in part because the application was for the disclosure of information for which there was a conclusive presumption of overriding public interest against disclosure .
n statistiCaL information
access granted in full
access granted in part
access refused in full
information not held
information already
available
refuse to deal with
application
refuse to confirm/deny
whether information
is held
application withdrawn
media 2
members of Parliament
Private sector business
not for profit organisations or community groups
1
members of the public (application by legal representative)
members of the public (other)
table a: number of applications by type of applicant and outcome
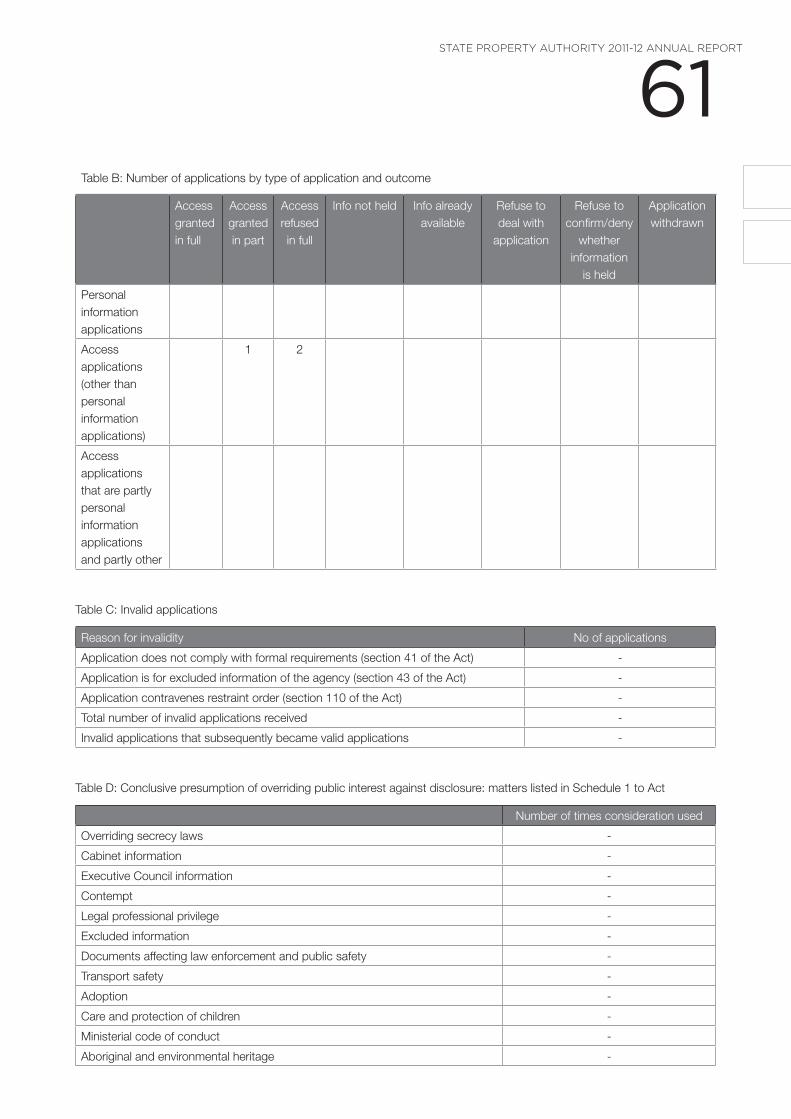
61 State ProPerty authority 2011-12 annual rePort
access granted in full
access granted in part
access refused in full
info not held info already available
refuse to deal with
application
refuse to confirm/deny
whether information
is held
application withdrawn
Personal information applications
access applications (other than personal information applications)
1 2
access applications that are partly personal information applications and partly other
table C: invalid applications
reason for invalidity no of applications
application does not comply with formal requirements (section 41 of the act) -
application is for excluded information of the agency (section 43 of the act) -
application contravenes restraint order (section 110 of the act) -
total number of invalid applications received -
invalid applications that subsequently became valid applications -
table d: Conclusive presumption of overriding public interest against disclosure: matters listed in schedule 1 to act
number of times consideration used
overriding secrecy laws -
Cabinet information -
executive Council information -
Contempt -
Legal professional privilege -
excluded information -
documents affecting law enforcement and public safety -
transport safety -
adoption -
Care and protection of children -
ministerial code of conduct -
aboriginal and environmental heritage -
table b: number of applications by type of application and outcome
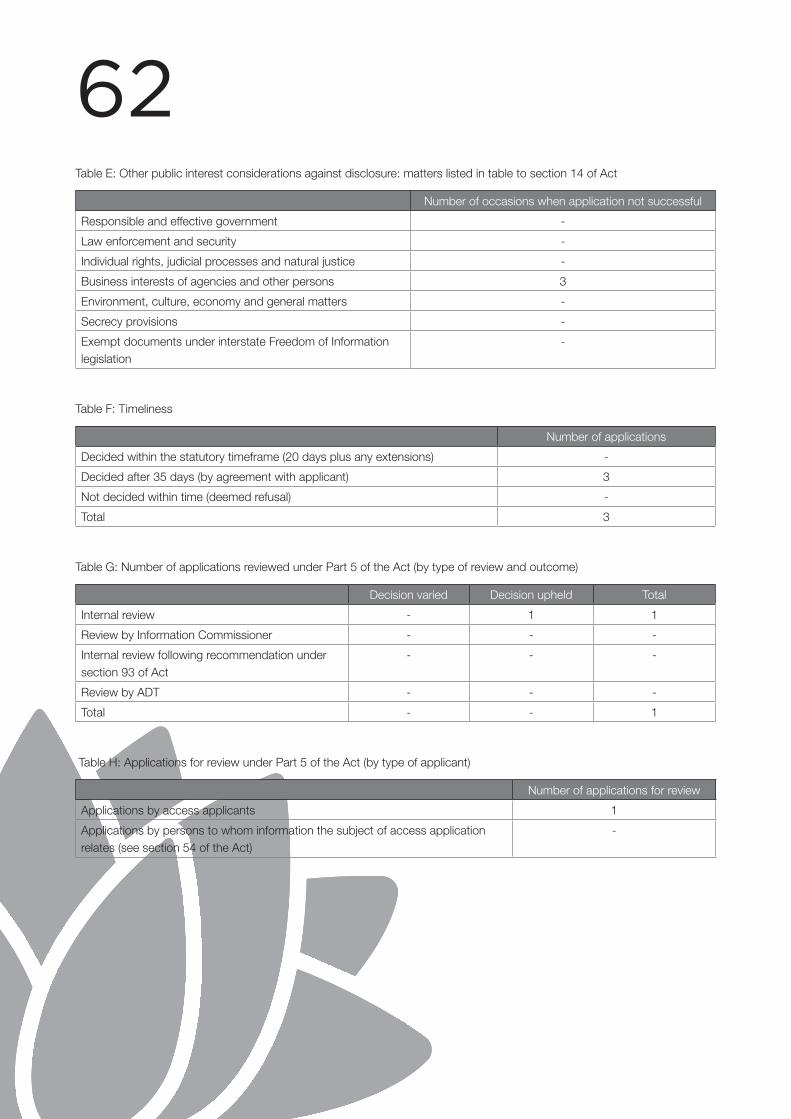
62 table e: other public interest considerations against disclosure: matters listed in table to section 14 of act
number of occasions when application not successful
responsible and effective government -
Law enforcement and security -
individual rights, judicial processes and natural justice -
business interests of agencies and other persons 3
environment, culture, economy and general matters -
secrecy provisions -
exempt documents under interstate freedom of information legislation
-
table f: timeliness
number of applications
decided within the statutory timeframe (20 days plus any extensions) -
decided after 35 days (by agreement with applicant) 3
not decided within time (deemed refusal) -
total 3
table g: number of applications reviewed under Part 5 of the act (by type of review and outcome)
decision varied decision upheld total
internal review - 1 1
review by information Commissioner - - -
internal review following recommendation under section 93 of act
- - -
review by adt - - -
total - - 1
table h: applications for review under Part 5 of the act (by type of applicant)
number of applications for review
applications by access applicants 1
applications by persons to whom information the subject of access application relates (see section 54 of the act)
-
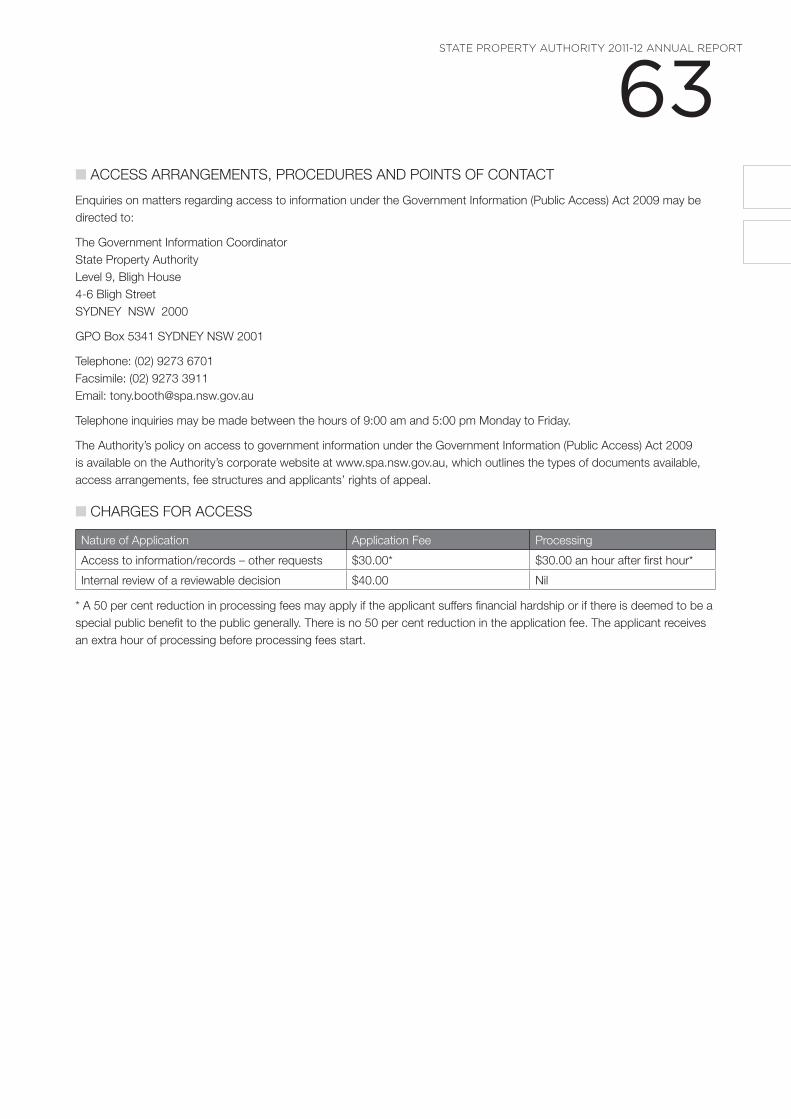
63 State ProPerty authority 2011-12 annual rePort
n aCCess arrangements, ProCedures and Points of ContaCt
enquiries on matters regarding access to information under the government information (Public access) act 2009 may be directed to:
the government information Coordinator state Property authority Level 9, bligh house 4-6 bligh street sydney nsW 2000
gPo box 5341 sydney nsW 2001
telephone: (02) 9273 6701 facsimile: (02) 9273 3911 email: tony .booth@spa .nsw .gov .au
telephone inquiries may be made between the hours of 9:00 am and 5:00 pm monday to friday .
the authority’s policy on access to government information under the government information (Public access) act 2009 is available on the authority’s corporate website at www .spa .nsw .gov .au, which outlines the types of documents available, access arrangements, fee structures and applicants’ rights of appeal .
n Charges for aCCess
nature of application application fee Processing
access to information/records – other requests $30 .00* $30 .00 an hour after first hour*
internal review of a reviewable decision $40 .00 nil
* a 50 per cent reduction in processing fees may apply if the applicant suffers financial hardship or if there is deemed to be a special public benefit to the public generally . there is no 50 per cent reduction in the application fee . the applicant receives an extra hour of processing before processing fees start .
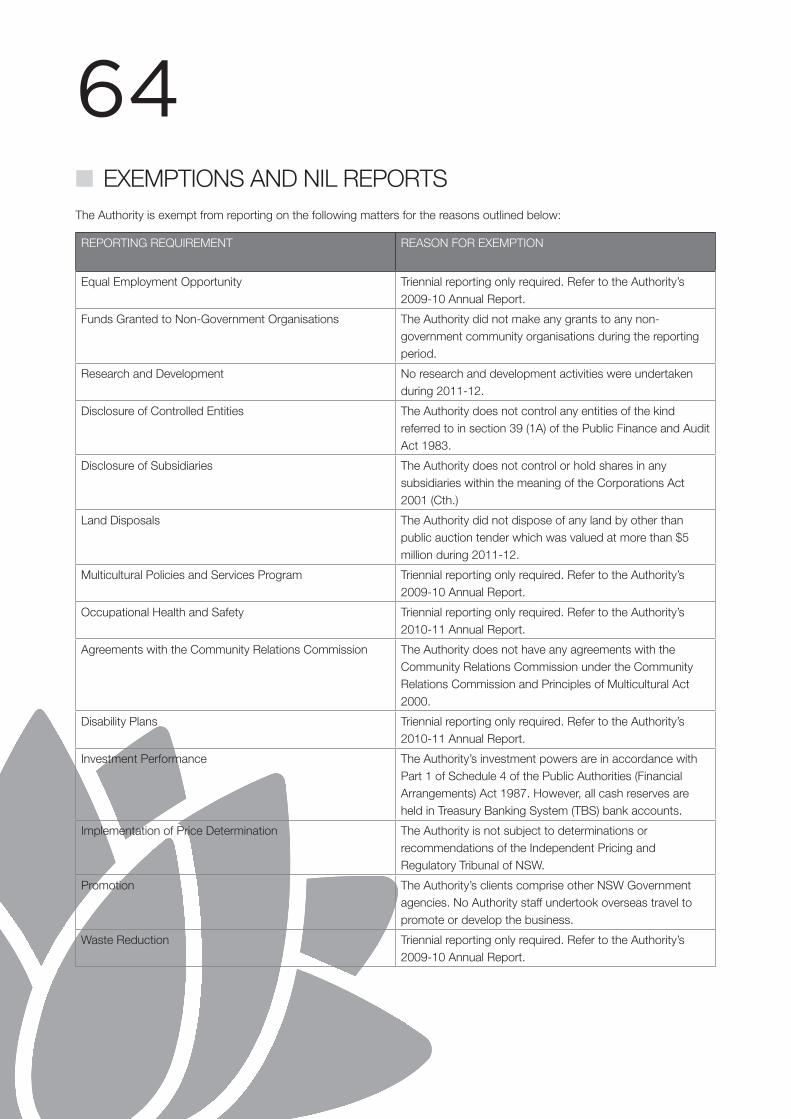
64 n exemPtions and niL rePortsthe authority is exempt from reporting on the following matters for the reasons outlined below:
rePorting requirement reason for exemPtion
equal employment opportunity triennial reporting only required . refer to the authority’s 2009-10 annual report .
funds granted to non-government organisations the authority did not make any grants to any non-government community organisations during the reporting period .
research and development no research and development activities were undertaken during 2011-12 .
disclosure of Controlled entities the authority does not control any entities of the kind referred to in section 39 (1a) of the Public finance and audit act 1983 .
disclosure of subsidiaries the authority does not control or hold shares in any subsidiaries within the meaning of the Corporations act 2001 (Cth .)
Land disposals the authority did not dispose of any land by other than public auction tender which was valued at more than $5 million during 2011-12 .
multicultural Policies and services Program triennial reporting only required . refer to the authority’s 2009-10 annual report .
occupational health and safety triennial reporting only required . refer to the authority’s 2010-11 annual report .
agreements with the Community relations Commission the authority does not have any agreements with the Community relations Commission under the Community relations Commission and Principles of multicultural act 2000 .
disability Plans triennial reporting only required . refer to the authority’s 2010-11 annual report .
investment Performance the authority’s investment powers are in accordance with Part 1 of schedule 4 of the Public authorities (financial arrangements) act 1987 . however, all cash reserves are held in treasury banking system (tbs) bank accounts .
implementation of Price determination the authority is not subject to determinations or recommendations of the independent Pricing and regulatory tribunal of nsW .
Promotion the authority’s clients comprise other nsW government agencies . no authority staff undertook overseas travel to promote or develop the business .
Waste reduction triennial reporting only required . refer to the authority’s 2009-10 annual report .
65 State ProPerty authority 2011-12 annual rePort
n avaiLabiLity of 2011-12 annuaL rePort this annual report is available from the state Property authority in printed format . it is also available on the authority’s web site at www .spa .nsw .gov .au .
n agenCy ContaCts
PostaL address:
gPo box 5341 sydney nsW 2001
street address:
Level 9, bligh house, 4–6 bligh street, sydney nsW 2000
business hours:
9 .00am to 5 .00pm monday to friday
Key ContaCt detaiLs:
switchboard: (02) 9273 3800 fax: (02) 9273 3911 email: spafeedback@spa .nsw .gov .au government information Coordinator: (02) 9273 6701
date of publication 31 october 2012
issn 1835-3983 (Print) or 1839-3985 (online)
n externaL ProduCtion Coststhe total external costs of producing this annual report (including gst) were $1,483 .90 .
66 n index
a
agency contacts (contact details) . . . . . . . . . . . . . . . . . . . . . . . . . . . . . . . . . . . 65
agreements with the Community relations Commission 64
aims and objectives . . . . . . . . . . . . . . . . . . . . . . . . . . . . . . . . . . . . . . . . . . . . . . . . . . . . . . . . 4
audited financial information . . . . . . . . . . . . . . . . . . . . . . . . . . . . . . . . . . . . . . . . . 17
availability of annual report . . . . . . . . . . . . . . . . . . . . . . . . . . . . . . . . . . . . . . . . . . . 65
C
Changes in legislation . . . . . . . . . . . . . . . . . . . . . . . . . . . . . . . . . . . . . . . . . . . . . . . . . . . 55
Charter . . . . . . . . . . . . . . . . . . . . . . . . . . . . . . . . . . . . . . . . . . . . . . . . . . . . . . . . . . . . . . . . . . . . . . . . . . . 4
Chief executive officer’s statement . . . . . . . . . . . . . . . . . . . . . . . . . . . . . . . . 3
Consultants . . . . . . . . . . . . . . . . . . . . . . . . . . . . . . . . . . . . . . . . . . . . . . . . . . . . . . . . . . . . . . . . . . 57
Consumer response . . . . . . . . . . . . . . . . . . . . . . . . . . . . . . . . . . . . . . . . . . . . . . . . . . . . . 58
Contact details . . . . . . . . . . . . . . . . . . . . . . . . . . . . . . . . . . . . . . . . . . . . . . . . . . . . . . . . . . . . . 65
Credit cards . . . . . . . . . . . . . . . . . . . . . . . . . . . . . . . . . . . . . . . . . . . . . . . . . . . . . . . . . . . . . . . . . . 58
d
disability plans . . . . . . . . . . . . . . . . . . . . . . . . . . . . . . . . . . . . . . . . . . . . . . . . . . . . . . . . . . . . . . 64
disclosure of Controlled entities . . . . . . . . . . . . . . . . . . . . . . . . . . . . . . . . . . . . . . 64
disclosure of subsidiaries . . . . . . . . . . . . . . . . . . . . . . . . . . . . . . . . . . . . . . . . . . . . . . . 64
divestments, acquisitions and development group . . . . .5, 10
e
equal employment opportunity . . . . . . . . . . . . . . . . . . . . . . . . . . . . . . . . . . . . . . 64
exemptions . . . . . . . . . . . . . . . . . . . . . . . . . . . . . . . . . . . . . . . . . . . . . . . . . . . . . . . . . . . . . . . . . . 64
external costs of production . . . . . . . . . . . . . . . . . . . . . . . . . . . . . . . . . . . . . . . . . 65
external impacts on performance . . . . . . . . . . . . . . . . . . . . . . . . . . . . . . . . . 11
f
financial performance . . . . . . . . . . . . . . . . . . . . . . . . . . . . . . . . . . . . . . . . . . . . . . . . . . 12
funds granted to non-government organisations . . . . . . . . . 64
g
Government Information (Public Access) Act 2009 . . . . . . . 60
i
implementation of Price determination . . . . . . . . . . . . . . . . . . . . . . . . . . . . 64
independent audit outcome 2011-12 . . . . . . . . . . . . . . . . . . . . . . . . . . . 16
industrial relations policies and practices . . . . . . . . . . . . . . . . . . . . . 55
investment Performance . . . . . . . . . . . . . . . . . . . . . . . . . . . . . . . . . . . . . . . . . . . . . . . . . 64
K
Key performance indicators . . . . . . . . . . . . . . . . . . . . . . . . . . . . . . . . . . . . . . . . . . . . 6
L
Land disposal . . . . . . . . . . . . . . . . . . . . . . . . . . . . . . . . . . . . . . . . . . . . . . . . . . . . . . . . . . . . . . . 64
Legislation . . . . . . . . . . . . . . . . . . . . . . . . . . . . . . . . . . . . . . . . . . . . . . . . . . . . . . . . . . . . . . . . . . . . 55
Letter of submission . . . . . . . . . . . . . . . . . . . . . . . . . . . . . . . . . . . . . . . . . . . . . . . . . . . . . . . 2
m
major works in progress . . . . . . . . . . . . . . . . . . . . . . . . . . . . . . . . . . . . . . . . . . . . . . . 11
management and structure . . . . . . . . . . . . . . . . . . . . . . . . . . . . . . . . . . . . . . . . . . . . . 5
movements in wages, salaries or allowances . . . . . . . . . . . . . . . . 55
multicultural Policies and services Program . . . . . . . . . . . . . . . . . . . . 64
o
occupational health and safety (oh&s) . . . . . . . . . . . . . . . . . . . . . . . 64
operating budget overview 2012-13 . . . . . . . . . . . . . . . . . . . . . . . . . . . . . 15
2011-12 operating result . . . . . . . . . . . . . . . . . . . . . . . . . . . . . . . . . . . . . . . . . . . . . . 14
organisation chart . . . . . . . . . . . . . . . . . . . . . . . . . . . . . . . . . . . . . . . . . . . . . . . . . . . . . . . . . . 5
outcomes and achievements 2011-12 . . . . . . . . . . . . . . . . . . . . . . . . . . . 6
P
Payment of accounts . . . . . . . . . . . . . . . . . . . . . . . . . . . . . . . . . . . . . . . . . . . . . . . . . . . . 56
Personnel policies and practices . . . . . . . . . . . . . . . . . . . . . . . . . . . . . . . . . . . 55
Planning and strategy group . . . . . . . . . . . . . . . . . . . . . . . . . . . . . . . . . . . . . . 5, 8
Portfolio management group . . . . . . . . . . . . . . . . . . . . . . . . . . . . . . . . . . . . . . 5, 8
Principal governing legislation . . . . . . . . . . . . . . . . . . . . . . . . . . . . . . . . . . . . . . . 55
Privacy management . . . . . . . . . . . . . . . . . . . . . . . . . . . . . . . . . . . . . . . . . . . . . . . . . . . . 58
Promotion . . . . . . . . . . . . . . . . . . . . . . . . . . . . . . . . . . . . . . . . . . . . . . . . . . . . . . . . . . . . . . . . . . . . . . . 64
r
requirements arising from employment arrangements . . 54
research and development . . . . . . . . . . . . . . . . . . . . . . . . . . . . . . . . . . . . . . . . . . . . 64
risk management and insurance . . . . . . . . . . . . . . . . . . . . . . . . . . . . . . . . . . 58
s
savings and efficiency outcomes . . . . . . . . . . . . . . . . . . . . . . . . . . . . . . . . . . . . 7
senior executive staff . . . . . . . . . . . . . . . . . . . . . . . . . . . . . . . . . . . . . . . . . . . . . . . . . . . . 53
statutory and statistical information . . . . . . . . . . . . . . . . . . . . . . . . . . . . . . 53
W
Waste reduction . . . . . . . . . . . . . . . . . . . . . . . . . . . . . . . . . . . . . . . . . . . . . . . . . . . . . . . . . . . . 64
Workforce profile . . . . . . . . . . . . . . . . . . . . . . . . . . . . . . . . . . . . . . . . . . . . . . . . . . . . . . . . . . 54