Embed Size (px)
Citation preview

8678 Phys. Chem. Chem. Phys., 2013, 15, 8678--8683 This journal is c the Owner Societies 2013
Cite this: Phys. Chem.Chem.Phys.,2013,15, 8678
A XAS study of the luminescent Eu centers inthiosilicate phosphors
Katleen Korthout, Anthony B. Parmentier, Philippe F. Smet* and Dirk Poelman
Due to its bright yellow-to-red emission, europium doped Ca2SiS4 is a very interesting material for phosphor
converted light emitting diodes. The emission spectrum is highly dependent on the Eu concentration and
can consist of more than one emission band. We combined X-ray absorption fine structure and
photoluminescence measurements to analyze the structure of europium centers in (Ca,Eu)2SiS4 luminescent
powders. This paper provides an explanation for the concentration dependency of the emission spectra. We
find that at low dopant concentrations a large fraction of trivalent europium ions is unexpectedly present
in the powders. These trivalent europium ions tend to form defect clusters in the luminescent powders.
Furthermore we observe a preferential substitution of the europium ions over the two different
substitutional Ca sites, which changes upon increasing the dopant concentration. At high dopant
concentration, the powder crystallizes in the monoclinic Eu2SiS4 structure. Once more a preferential
substitution of the europium ions is observed. Summarizing, the influence of the concentration on the
emission spectrum is explained by a difference in preferential occupation of the Eu ions in the lattice.
Introduction
Recently europium doped alkaline earth thiosilicates have gainedinterest as candidates for use in phosphor converted light emittingdiodes (pc-LEDs), due to their bright yellow-to-red emission.1,2 Theoptical emission spectrum of Eu doped orthorhombic Ca2SiS4
consists of two broad bands, which are caused by 4f65d - 4f7
transitions of the Eu2+ ions, in combination with the presenceof two inequivalent lattice sites for Eu2+. Hereby, the emissionspectrum is strongly dependent on the europium concentration.2
This is due to energy transfer between europium ions at both latticesites, leading to a red shift of the emission spectrum at higherdopant concentrations. Furthermore, the solubility of Eu into theorthorhombic lattice of Ca2SiS4 is limited to about 25% substitu-tion, above which a monoclinic structure, similar to Eu2SiS4, startsto be formed.2 To our knowledge no direct study of the dopantincorporation was performed yet. We performed X-ray absorptionspectroscopy (XAS) measurements to investigate the direct neigh-bourhood of the dopants in the host lattice. Extended X-rayabsorption fine structure measurements3,4 were applied to theeuropium ions incorporated at various concentrations in calciumthiosilicates. Additionally the photoluminescence of the powderswas reviewed. This work reports on the concentration dependencyof the optical emission spectra of europium doped alkaline
earth thiosilicates and discusses the neighbourhood of the Eucenters in these powders. In this paper we show by means ofXAS (X-ray absorption spectroscopy) that Eu-doped phosphorswhich are characterized by broad band emission (typical fordivalent europium) can still show a large fraction of trivalenteuropium, which is however not reflected in the emissionspectrum. Consequently, this can be a direct indication thatthe synthesis conditions, such as the reducing atmosphere,have to be optimized to enhance the incorporation of onlydivalent europium and thus make more efficient use of rareearth resources. In addition, we also show that the presenceof multiple emission bands can clearly be related to the(preferential) occupation of inequivalent lattice sites. Manyphosphor materials have two or more lattice sites where theeuropium ions can substitute for, leading to an often undesiredbroadening of the emission spectrum, or to the presence ofmultiple emission bands.
Although this work specifically treats calcium thiosilicatephosphors, the experimental approach is expected to be straightfor-wardly transferable to other phosphor systems which are currentlydeveloped, for instance for colour conversion in white LEDs.
Experimental setup
Powder samples were prepared by means of a solid statereaction, involving CaS, EuS and Si, with europium concentra-tions ranging from 2% up to 100%. A detailed description of
LumiLab, Department of Solid State Sciences, Ghent University, Krijgslaan 281-S1,
Ghent, 9000, Belgium. E-mail: [email protected]
Received 3rd December 2012,Accepted 11th March 2013
DOI: 10.1039/c3cp44334e
www.rsc.org/pccp
PCCP
PAPER

This journal is c the Owner Societies 2013 Phys. Chem. Chem. Phys., 2013, 15, 8678--8683 8679
the sample preparation can be found in ref. 2 and 5. Dopantconcentrations mentioned in this work are molar concentra-tions, i.e. the percentage of Eu ions that are substitutedfor Ca ions.
X-ray absorption near edge spectroscopy (XANES) measure-ments were performed at the Eu LIII edge at the Dubble beamline(BM26a), EXAFS spectra were collected at the Eu K edge at theSNBL (BM1) and BM23 beamlines, all at the ESRF synchrotronfacility in Grenoble (France). A silicon (111), resp. (311), doublecrystal monochromator was used. The XANES spectra wererecorded in fluorescence mode, while the EXAFS data werecollected in transmission mode. The EXAFS data reductionand analysis were performed by fitting the data to theoreticalstandards generated from the FEFF6 code6 using the Athena andArtemis software by Ravel and Newville.7
The agreement between the model and fit is expressed bythe R-factor, which gives the deviation between experiment andmodel. The photoluminescence emission and excitation spectrawere recorded at room temperature using a FS920 fluorescencespectrometer (Edinburgh Instruments).
Experimental resultsOptical spectra
Fig. 1 shows the typical emission spectra of europium dopedcalcium thiosilicates at different concentrations. At low dopantconcentrations, less than 10%, the emission spectrum consistsof two broad emission bands centered at 564 nm and at660 nm. These two emission bands are caused by the occur-rence of two inequivalent sites in the Ca2SiS4 host lattice.8 TheCa1 (Wyckoff site 4a) and Ca2 (4c) sites are both 6-foldcoordinated, but the Ca1 site has a slightly larger volume. Inref. 9 the peak at 564 nm in the emission spectrum is attributedto the Ca2 site and the peak at 660 nm to the Ca1 site. The Caions at the Ca1 site form chains along the b-axis, the formationof these chains results in a preferential orientation of the
5d orbitals of the europium ions, which lowers the emissionenergy. Since the Ca ions at the Ca2 site do not form such achain, a difference in emission energy occurs.10–12
It is seen from Fig. 1 that an increase in dopant concen-tration, but below 10%, leads to a relative decrease in intensityof the peak at 564 nm.
When the dopant concentration is 50% or higher, i.e. fromCaEuSiS4 up to Eu2SiS4, only a single band is visible thatlinearly shifts from 614 nm to 577 nm.2,5 It was shown inprevious work that these powders crystallize in the monoclinicstructure of Eu2SiS4.13
XAS spectra
XANES. In Fig. 2 the XANES data at the LIII edge of Eu aredisplayed. Eu LIII XANES spectra exhibit a strong white line dueto 2p3/2 - 5d electronic transitions. In all shown spectra two well-resolved edge resonances are visible, indicating the coexistence ofthe two common valence states of the Eu ions (Eu2+ and Eu3+).Since the core electrons in divalent Eu have a lower bindingenergy than in Eu3+, the resonance for divalent europium ions isnearly 8 eV below the trivalent europium resonance.14
In Fig. 3 the XANES part of the Eu K edge XAS spectrum isdepicted. The signal of the reference compounds, EuS andEu2O3, shows that the threshold energies of Eu2+ and Eu3+
differ by 25 eV. The signal coming from a heavily doped samplecoincides with the spectrum of EuS, while the signal of a lightlydoped sample is clearly a combination of both valence states.
EXAFS. In Fig. 4 and 5 the EXAFS data for a lightly doped(7.5%) and a heavily doped (95%) calcium thiosilicate powdersample are shown, together with the fitting results based on thecrystallographic structure of Ca2SiS4,2,8 resp. Eu2SiS4.13 Theexperimental data were extracted from the raw EXAFS dataw(k) multiplied by k2. The EXAFS fits were performed usingmultiple k-weighting, i.e. k1, k2 and k3 weighting.
In this calculation the contributions for both sites in thecrystal structure were used. Since for the heavily doped samples
Fig. 1 Photoluminescent emission spectra of Ca2SiS4 : Eu2+ at different dopantconcentrations at an excitation wavelength of 450 nm; (a) 2%, (b) 10%, (c) 50%and (d) 75%.
Fig. 2 Eu LIII XANES spectra of Ca2SiS4 : Eu2+ at different dopant concentrations.Black line (2%), red (10%), blue (50%) and green (75%). The inset shows theXANES spectra of the used reference materials for divalent Eu, i.e. EuS, andtrivalent Eu, i.e. Eu2O3.
Paper PCCP

8680 Phys. Chem. Chem. Phys., 2013, 15, 8678--8683 This journal is c the Owner Societies 2013
the trivalent valence state is hardly present, only one valencestate was assumed, for the lightly doped samples the twovalence states were taken into account.
During the calculations the energy difference was kept fixedat 25 eV, the energy difference between the threshold energiesof the reference compounds (see Fig. 3).
For the lightly doped samples we firstly performed calcula-tions assuming only a trivalent valence state, but this appearedto be insufficient to reproduce the experimental data.
The Fourier transform is displayed as well, the transformationof the wave vector k into radial distance r. The Fourier transformspectra FT(r) of the lightly doped samples are dominated by apeak arising at 1.8 Å, while this peak appears at a longerdistance for the heavily doped samples.
Discussion(Ca,Eu)SiS4 with low Eu concentration
In earlier work it was reported that the Eu ions in lightly dopedsamples substitute for the Ca ions,2 which is confirmed by theEXAFS data. The ionic radius of Ca2+ in a 6-fold coordination is1.00 Å, which is comparable with the ones for Eu2+ and Eu3+,1.17 Å and 0.947 Å.15
The two optical emission bands are attributed to Eu2+ ionsoccupying two distinct Ca2+ sites. The different intensities of
Fig. 3 Eu K edge XANES spectra of Ca2SiS4 : Eu2+ at different dopant concentrationsand reference compounds. Black line (Eu2O3), red (EuS), blue (Ca1.96Eu0.04SiS4) andgreen (Ca0.1Eu1.9SiS4).
Fig. 4 (a) Solid line: Fourier transform of k2w(k) to radial distance space for a lightlydoped Ca2SiS4 sample, i.e. Ca1.85Eu0.15SiS4. Circles: results of FEFF calculations includingthe two possible substitutional sites, Ca1 and Ca2, and the two possible valence states.The fit parameters can be found in Table 1. The Fourier transforms have beenperformed using a 1.4–7.9 Å�1 Hanning window. (b) Back transformation of thedata in (a) to k-space using a 1.5–5.0 Å Hanning window. The R-factor is 0.0088.
Fig. 5 The same as in Fig. 4 for a heavily doped Ca2SiS4 sample, i.e. Ca0.1Eu1.9SiS4. Thefit parameters can be found in Table 2. The Fourier transforms have been performedusing a 2.0–9.2 Å�1 Hanning window. (b) Back transformation of the data in (a)to k-space using a 1.8–5.4 Å Hanning window. The R-factor is 0.0068.
PCCP Paper
This journal is c the Owner Societies 2013 Phys. Chem. Chem. Phys., 2013, 15, 8678--8683 8681
the two bands have been explained by energy transfer betweenboth sites2 while a preferential substitution by the Eu ions isalso possible. It has to be noted that a large fraction of Eu3+
ions is observed in the XANES spectra, which is not detected inthe photoluminescent spectra (Eu3+ emission is characterizedby narrow 4f6–4f6 emission lines). This observation is notuncommon, it has been encountered in europium dopedCaAl2O4 and SrAl2O4.16–18
A good fit of the EXAFS data is obtained based on the crystalstructure of Ca2SiS4. This model has been introduced based onthe fact that Eu ions substitute for the Ca ions in Ca2SiS4.Choosing the Eu ion at the Ca site as the absorber, the nearest 4groups of atoms, S, Si, Ca and the next S shell, have been takeninto account. The first peak in the spectrum at 1.8 Å arisesmainly from the first sulfur shell; the peak at 2.7 Å is due to thesilicon scatterers and the peak at 3.6 Å can be attributed to thenearby Ca ions and Eu ions (see later) (see Fig. 4). The smallermaxima in the radial distribution function cannot be easilyrelated to certain atomic shells.
The EXAFS results show that the Ca2 site has a higheroccupancy than the Ca1 site (see Table 1) for the Eu3+ ions,while this is opposite for the Eu2+ ions. Upon increasing thedopant concentration from 2% to 10% the relative occupancy ofthe Ca1 site increases. This effect seems to agree well with thephotoluminescence emission spectra: upon increasing thedopant concentration the relative intensity of the emissionband caused by the Ca1 site increases.
Since charge compensation has to occur when a trivalent Eusubstitutes for a divalent Ca ion, some disorder may be presentaround the Eu3+ ions.
If one Ca vacancy is introduced, it can compensate for twoEu3+ ions at a Ca site. This possibility was introduced in theEXAFS data analysis. For this reason new FEFF paths werecalculated for the Ca2SiS4 structure assuming that the absorberis an Eu ion and that the Ca ions in the near neighborhood are
substituted by Eu ions (only the paths describing the scatteringof Eu ions were used). To allow for the occurrence of vacanciesand the substitution of Ca ions by Eu ions, two extra para-meters were added to the amplitude of the scattering paths ofthe Ca ions: a first multiplication with a factor a A [0,1],describing the occurrence of a vacancy (a = 0, means a vacancy;a = 1, no vacancy); secondly a multiplication with b A [0,1] and(1 � b) for the scattering paths of the Eu ions, describing thesubstitution of Ca by Eu.
For the sample with a dopant concentration of 2 molar%, noclustering of Eu ions was seen, nor the occurrence of vacancies.Therefore an equal distribution of the trivalent ions over bothsites was expected, which agrees with the values in Table 1. Forthe higher dopant concentrations, i.e. 7.5% and 10%, theresults showed that there are two possibilities (see Fig. 6):
(a) one trivalent ion at a Ca2 site, and a vacancy and theother ion at Ca1 sites.
(b) Both trivalent ions occupy a Ca2 site, and a vacancyappears at a Ca1 site.
This would mean that the trivalent ions tend to occupy theCa2 sites three times more often than the Ca1 site, whichagrees with the results displayed in Table 1.
Since in Ca2SiS4 all atoms have a similar atomic mass(Si: 28.086 u, S: 32.06 u, Ca: 40.078 u) their Debye–Wallerfactors are expected to be similar. Europium has a much largeratomic mass (Eu: 151.965 u), corresponding to the smallestDebye–Waller factor, this agrees well with the data displayedin Table 1.
An isotropic expansion factor a was used to investigatethe influence of the dopants on its nearest sulfur neighbors(DR = aR). This expansion factor is negative, indicating that thesulfur atoms are located slightly closer to the Eu atoms. For theEu3+ ions this effect can be explained by the fact that the divalentCa ion is replaced by a trivalent Eu ion. Why a similar effect isobserved around the divalent ions is not yet understood.
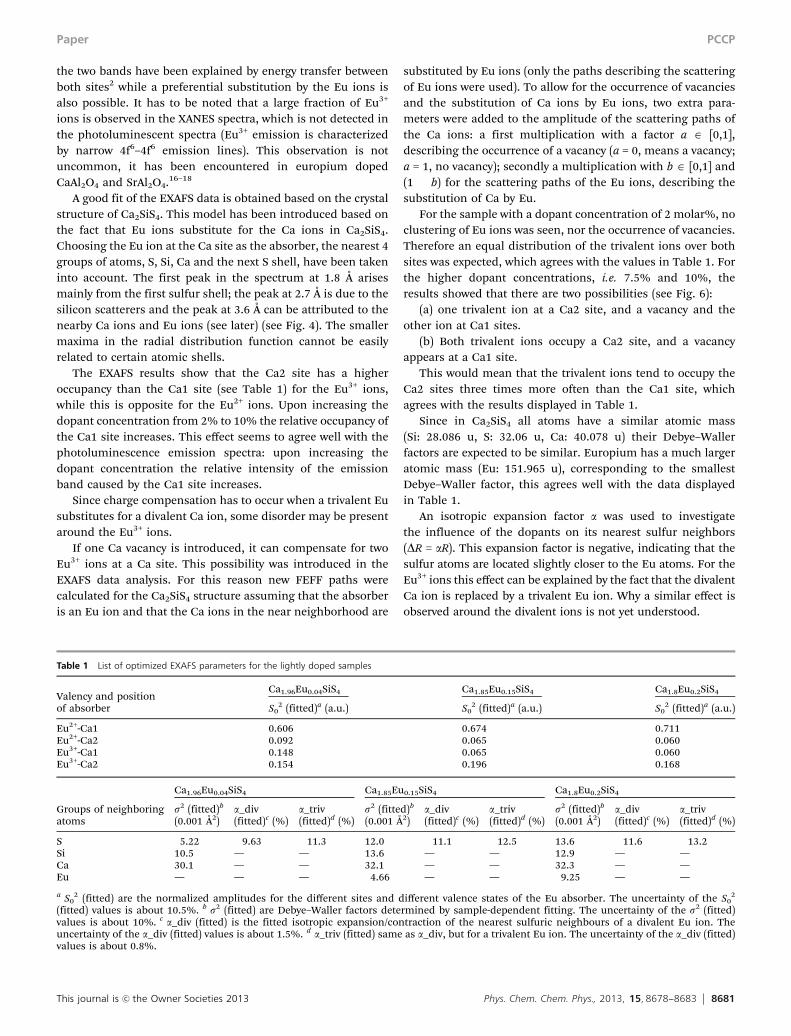
Table 1 List of optimized EXAFS parameters for the lightly doped samples
Valency and positionof absorber
Ca1.96Eu0.04SiS4 Ca1.85Eu0.15SiS4 Ca1.8Eu0.2SiS4
S02 (fitted)a (a.u.) S0
2 (fitted)a (a.u.) S02 (fitted)a (a.u.)
Eu2+-Ca1 0.606 0.674 0.711Eu2+-Ca2 0.092 0.065 0.060Eu3+-Ca1 0.148 0.065 0.060Eu3+-Ca2 0.154 0.196 0.168
Groups of neighboringatoms
Ca1.96Eu0.04SiS4 Ca1.85Eu0.15SiS4 Ca1.8Eu0.2SiS4
s2 (fitted)b
(0.001 Å2)a_div(fitted)c (%)
a_triv(fitted)d (%)
s2 (fitted)b
(0.001 Å2)a_div(fitted)c (%)
a_triv(fitted)d (%)
s2 (fitted)b
(0.001 Å2)a_div(fitted)c (%)
a_triv(fitted)d (%)
S 5.22 �9.63 �11.3 12.0 �11.1 �12.5 13.6 �11.6 �13.2Si 10.5 — — 13.6 — — 12.9 — —Ca 30.1 — — 32.1 — — 32.3 — —Eu — — — 4.66 — — 9.25 — —
a S02 (fitted) are the normalized amplitudes for the different sites and different valence states of the Eu absorber. The uncertainty of the S0
2
(fitted) values is about 10.5%. b s2 (fitted) are Debye–Waller factors determined by sample-dependent fitting. The uncertainty of the s2 (fitted)values is about 10%. c a_div (fitted) is the fitted isotropic expansion/contraction of the nearest sulfuric neighbours of a divalent Eu ion. Theuncertainty of the a_div (fitted) values is about 1.5%. d a_triv (fitted) same as a_div, but for a trivalent Eu ion. The uncertainty of the a_div (fitted)values is about 0.8%.
Paper PCCP

8682 Phys. Chem. Chem. Phys., 2013, 15, 8678--8683 This journal is c the Owner Societies 2013
Bond length distortion was only considered for the nearestsulfur atoms. As such we only used 11 parameters to perform thesimulation, and the Nyquist criterion19,20 was fulfilled, consideringthe used ranges in k-space and R-space for the fitting procedure.
(Ca,Eu)SiS4 with high Eu concentrations
As mentioned before, the crystal structure changes from ortho-rhombic to monoclinic when the dopant concentration is above50%. This is also observed in the XANES and EXAFS spectra(Fig. 2, 4 and 5). The situation can be described as if the Ca ionssubstitute for Eu ions in the Eu2SiS4 host material. In earlierwork it was stated that the Ca ions preferentially occupy the Eu2site in the structure, based on the anisotropic change in the
lattice constants.2 With EXAFS it is possible to investigate theoccupancy of both Eu sites in the crystal structure (see Table 2).
The data were fitted using the theoretical standards for thecrystal structure of Eu2SiS4 generated using FEFF6. We assumedthat the Ca ions substitute for part of the Eu ions in the lattice,albeit some preferential substitution was allowed. As for the lightlydoped samples the Eu ion is the absorber, and the nearest 4 groupsof atoms: S, Si, Eu and the next S shell, have been taken intoaccount. The first sulfur shell causes the peak in the spectrum at2.2 Å; the peak at 3.5 Å is due to the silicon scatterers and the peakat 4.5 Å can be attributed to the nearby Eu ions (see Fig. 5).
From the EXAFS results we can conclude that the Ca ions inheavily doped samples preferentially occupy the Eu2 site in thelattice, since the amplitude for the Eu ions at the Eu1 positionis biggest. The preferential substitution decreases with anincrease of dopant concentration, so we obviously obtain anequal distribution of the Eu ions in Eu2SiS4 (see Fig. 7).
As before we used an isotropic expansion factor a to investigatethe influence of the dopants on the bond distances (DR = aR).
Conclusions
In this paper we provide an explanation for the concentrationdependency of the emission spectra of (Ca, Eu)2SiS4 luminescentpowders. At low Eu concentrations (o10%) the orthorhombic
Fig. 6 In the lightly doped samples (7.5% and 10%), two types of defectclusters are observed. (Top figure) the vacancy occurs at a Ca1 site and theEu3+ ions are at a Ca1 and a Ca2 site. (Bottom figure) both Eu3+ ions occur at aCa2 site and the vacancy at a Ca1 site.
Table 2 List of optimized EXAFS parameters for heavily doped samples
Groups ofneighbouring atoms
CaEuSiS4 Ca0.5Eu1.5SiS4 Ca1.8Eu0.2SiS4 Ca1.9Eu0.1SiS4 Eu2SiS4
s2 (fitted)a
(0.001 Å2)a (fitted)b
(%)s2 (fitted)a
(0.001 Å2)a (fitted)b
(%)s2 (fitted)a
(0.001 Å2)a (fitted)b
(%)s2 (fitted)a
(0.001 Å2)a (fitted)b
(%)s2 (fitted)a
(0.001 Å2)a (fitted)b
(%)
S 11.4 �1.08 12.3 �1.11 12.2 �1.15 11.7 �0.943 11.5 �0.951Si 34.9 — 33.1 — 32.7 — 29.5 — 26.2 —Eu 21.6 — 28.9 — 28.6 — 25.4 — 23.1 —
a s2 (fitted) are Debye–Waller factors determined by sample-dependent fitting. The uncertainty of the s2 (fitted) values is about 6%. b a (fitted) isthe fitted isotropic expansion/contraction of the nearest sulfuric neighbours of the Eu absorber. The uncertainty on this factor is 10% of thedisplayed value.
Fig. 7 Number of Eu ions at each site in the lattice divided by the total numberof Eu ions in the lattice. Open symbols: Eu1 site, filled symbols: Eu2 site.
PCCP Paper

This journal is c the Owner Societies 2013 Phys. Chem. Chem. Phys., 2013, 15, 8678--8683 8683
structure of Ca2SiS4 is found, whereby the dopant ions sub-stitute for the Ca ions at both inequivalent crystallographicsites, albeit that some preferential substitution is observed.At higher concentrations (>40%) the monoclinic Eu2SiS4 struc-ture is observed, whereby the Ca ions occupy both europiumsites. Furthermore an unexpected large fraction of trivalenteuropium ions is found in the XANES spectra of low dopedthiosilicates, although this is not reflected in the photolumi-nescence spectra.
Acknowledgements
KK thanks FWO-Vlaanderen for a PhD grant. This research isfinancially supported by the Dutch-Belgian Beamline project(DUBBLE) funded by the Netherlands Organisation for ScientificResearch (NWO), the Research Foundation Flanders (FWO), andby the UGent Special Research Fund (BOF). The authors aregrateful to Sergey Nikitenko (BM26A, ESRF, Grenoble, France)and Mark A. Newton (BM23, ESRF, Grenoble, France) for theirassistance in the EXAFS experiments and to Katrien Meert forassisting in the data collection.
Notes and references
1 P. F. Smet, K. Korthout, J. E. Van Haecke and D. Poelman,Mater. Sci. Eng., B, 2008, 146, 264–268.
2 P. F. Smet, N. Avci, B. Loos, J. E. Van Haecke andD. Poelman, J. Phys.: Condens. Matter, 2007, 19, 246223.
3 D. C. Koningsberger and R. Prins, X-ray absorption: principles,applications, techniques of EXAFS, SEXAFS, and XANES, Wiley,New York, 1988.
4 B. K. Teo, EXAFS: basic principles and data analysis, Springer-Verlag, 1986.
5 A. B. Parmentier, P. F. Smet, F. Bertram, J. Christen andD. Poelman, J. Phys. D: Appl. Phys., 2010, 43, 085401.
6 J. J. Rehr, R. C. Albers and S. I. Zabinsky, Phys. Rev. Lett.,1992, 69, 3397–3400.
7 B. Ravel and M. Newville, J. Synchrotron Radiat., 2005, 12,537–541.
8 M. Ribes, E. Philippot and M. Maurin, C. R. Seances Acad.Sci., Ser. C, 1970, 270, 716.
9 A. B. Parmentier, P. F. Smet and D. Poelman, Opt. Mater.,2010, 33, 141–144.
10 S. H. M. Poort, W. P. Blokpoel and G. Blasse, Chem. Mater.,1995, 7, 1547–1551.
11 S. H. M. Poort, H. M. Reijnhoudt, H. O. T. van der Kuip andG. Blasse, J. Alloys Compd., 1996, 241, 75–81.
12 S. H. M. Poort, J. W. H. van Krevel, R. Stomphorst, A. P. Vinkand G. Blasse, J. Solid State Chem., 1996, 122, 432–435.
13 I. Hartenbach and T. Schleid, Z. Anorg. Allg. Chem., 2002,628, 1327–1331.
14 G. Wortmann, Hyperfine Interact., 1989, 47–48, 179–202.15 R. D. Shannon, Acta Crystallogr., Sect. A: Cryst. Phys., Diffr.,
Theor. Gen. Cryst., 1976, 32, 751–767.16 N. Avci, K. Korthout, M. A. Newton, P. F. Smet and
D. Poelman, Opt. Mater. Express, 2012, 2, 321–330.17 K. Korthout, K. Van den Eeckhout, J. Botterman,
S. Nikitenko, D. Poelman and P. F. Smet, Phys. Rev. B:Condens. Matter Mater. Phys., 2011, 84, 085140.
18 J. Holsa, T. Laamanen, M. Lastusaari, M. Malkamaki,E. Welter and D. A. Zajac, Spectrochim. Acta, Part B, 2010,65, 301–305.
19 D. C. Koningsberger, B. L. Mojet, G. E. van Dorssen andD. E. Ramaker, Top. Catal., 2000, 10, 143–155.
20 E. A. Stern, Phys. Rev. B: Condens. Matter Mater. Phys., 1993,48, 9825–9827.
Paper PCCP


