Embed Size (px)
Citation preview
Senden et al. Light: Science & Applications (2018) 7:8 Official journal of the CIOMP 2047-7538DOI 10.1038/s41377-018-0013-1 www.nature.com/lsa
ART ICLE Open Ac ce s s
Quenching of the red Mn4+ luminescencein Mn4+-doped fluoride LED phosphorsTim Senden 1, Relinde J.A. van Dijk-Moes2 and Andries Meijerink 1
AbstractRed-emitting Mn4+-doped fluorides are a promising class of materials to improve the color rendering and luminousefficacy of white light-emitting diodes (w-LEDs). For w-LEDs, the luminescence quenching temperature is veryimportant, but surprisingly no systematic research has been conducted to understand the mechanism for thermalquenching in Mn4+-doped fluorides. Furthermore, concentration quenching of the Mn4+ luminescence can be anissue but detailed investigations are lacking. In this work, we study thermal quenching and concentration quenchingin Mn4+-doped fluorides by measuring luminescence spectra and decay curves of K2TiF6:Mn4+ between 4 and 600 Kand for Mn4+ concentrations from 0.01% to 15.7%. Temperature-dependent measurements on K2TiF6:Mn4+ and otherMn4+-doped phosphors show that quenching occurs through thermally activated crossover between the 4T2 excitedstate and 4A2 ground state. The quenching temperature can be optimized by designing host lattices in which Mn4+
has a high 4T2 state energy. Concentration-dependent studies reveal that concentration quenching effects are limitedin K2TiF6:Mn4+ up to 5% Mn4+. This is important, as high Mn4+ concentrations are required for sufficient absorption ofblue LED light in the parity-forbidden Mn4+ d–d transitions. At even higher Mn4+ concentrations (>10%), the quantumefficiency decreases, mostly due to direct energy transfer to quenching sites (defects and impurity ions). Optimizationof the synthesis to reduce quenchers is crucial for developing more efficient highly absorbing Mn4+ phosphors. Thepresent systematic study provides detailed insights into temperature and concentration quenching of Mn4+ emissionand can be used to realize superior narrow-band red Mn4+ phosphors for w-LEDs.
IntroductionWhite light-emitting diodes (w-LEDs) are the next-
generation light sources for display and illumination sys-tems because of their small size, high luminous efficacy,and long operation lifetime1–5. Conventional w-LEDs arecomposed of blue-emitting (In,Ga)N LEDs and green/yellow-emitting and orange/red-emitting phosphors thatconvert part of the blue LED emission5–7. Both phosphorsare necessary to generate warm white light with a highcolor rendering index (CRI > 85). The typical red phos-phors in w-LEDs are Eu2+-doped nitrides (e.g., CaAlSiN3:Eu2+)4,8. These phosphors exhibit high photo-luminescence (PL) quantum efficiencies (QEs > 90%), but
their use also has a serious drawback. The Eu2+ emissionband is broad and extends into the deep red spectralregion (λ > 650 nm) where the eye sensitivity is low. Thiscauses the luminous efficacy of the w-LED to drop(reduced lumen/W output). A worldwide search istherefore aimed at finding efficient narrow-band red-emitting phosphors that can be excited by blue light. Inthis search, Mn4+-doped fluoride phosphors, such asK2SiF6:Mn4+ and K2TiF6:Mn4+, have recently attractedconsiderable attention9–13. Under blue light excitation,Mn4+-doped fluorides show narrow red line emission(λmax ~ 630 nm) with high luminescence QEs13–16. Fur-thermore, they are prepared through low-cost, simplewet-chemical synthesis at room temperature11,17. Theseaspects make Mn4+-doped fluorides very promising red-emitting phosphors for developing energy-efficient highcolor-rendering w-LED systems9.
© The Author(s) 2018OpenAccessThis article is licensedunder aCreativeCommonsAttribution 4.0 International License,whichpermits use, sharing, adaptation, distribution and reproductionin any medium or format, as long as you give appropriate credit to the original author(s) and the source, provide a link to the Creative Commons license, and indicate if
changesweremade. The images or other third partymaterial in this article are included in the article’s Creative Commons license, unless indicated otherwise in a credit line to thematerial. Ifmaterial is not included in the article’s Creative Commons license and your intended use is not permitted by statutory regulation or exceeds the permitted use, you will need to obtainpermission directly from the copyright holder. To view a copy of this license, visit http://creativecommons.org/licenses/by/4.0/.
Correspondence: Tim Senden ([email protected])1Condensed Matter and Interfaces, Debye Institute for Nanomaterials Science,Utrecht University, P.O. Box 80000, 3508 TA Utrecht, The Netherlands2Soft Condensed Matter, Debye Institute for Nanomaterials Science, UtrechtUniversity, P.O. Box 80000, 3508 TA Utrecht, The Netherlands
1234
5678
90():,;
1234
5678
90():,;
1234567890():,;
1234
5678
90():,;
The application of Mn4+-doped fluoride phosphors inw-LEDs may, however, be hampered by thermalquenching of the Mn4+ luminescence. Thermal quench-ing of the phosphor luminescence is a serious issue, as itaffects both the efficacy and color stability of the w-LED.In high-power w-LEDs, the temperature of the on-chipphosphor layer easily reaches 450 K. At these elevatedtemperatures, thermal quenching occurs for Mn4+-dopedfluorides. The luminescence quenching temperature T½,the temperature at which the emission intensity isreduced to half of its maximum, is typically between 400and 500 K15,18,19. Although the temperature dependenceof the emission intensity has been measured for manyMn4+-doped fluorides, the understanding of the thermalquenching behavior is still limited. Most studies do notexplain which process quenches the Mn4+ lumines-cence13,20–23. Moreover, the few reports that do propose aquenching mechanism disagree. Paulusz15 states that theluminescence of Mn4+-doped fluorides is quenched bythermally activated crossing of the Mn4+ 4T2 excited stateand 4A2 ground state. In contrast, Dorenbos24 finds arelation between the quenching temperature and theenergy of the F−→Mn4+ charge-transfer (CT) state andtherefore suggests that quenching involves crossoverbetween the CT state and 4A2 ground state. This CT statecrossover mechanism was also used by Blasse and ourgroup to explain thermal quenching in Mn4+-dopedoxides25–27. Finally, other reports claim that the quench-ing temperature increases if the radius of the cationsubstituted by Mn4+ becomes smaller11,18. A better
understanding of the thermal quenching behavior isessential for developing Mn4+-doped fluoride phosphorswith superior quenching temperatures, and therebyimproving their potential for application in w-LEDs.Besides thermal quenching, concentration quenching is
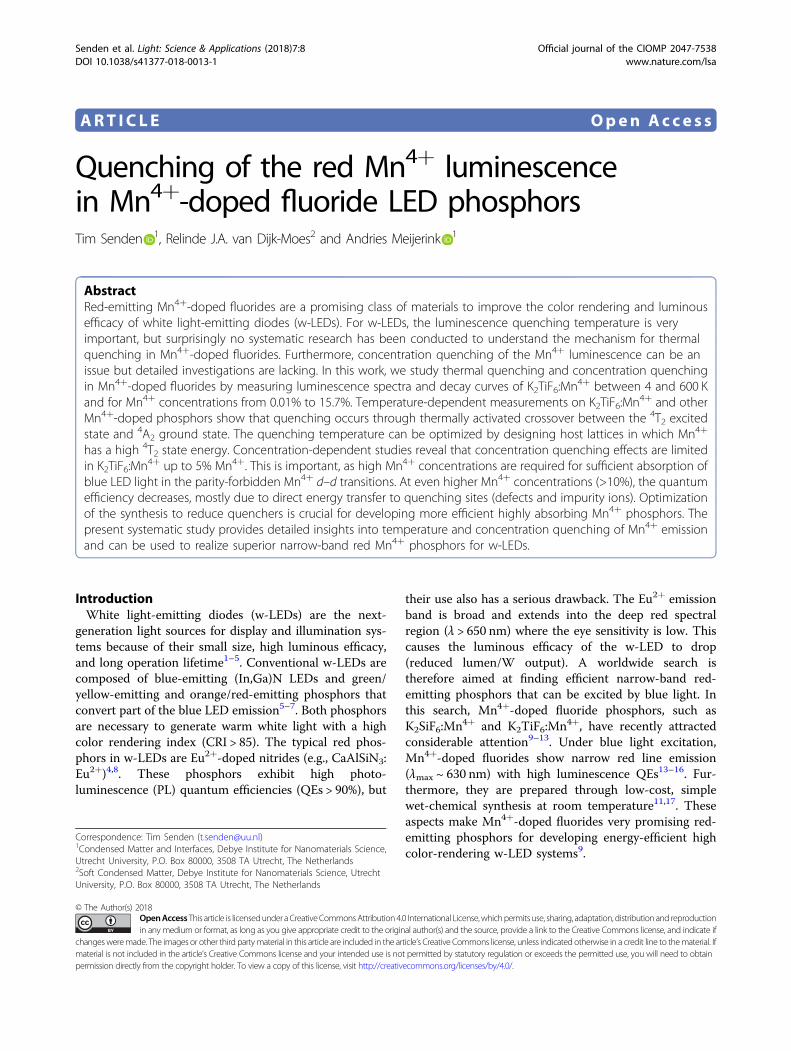
an issue for the application of Mn4+-doped fluorides in w-LEDs. As the Mn4+ d–d transitions are parity-forbidden,high Mn4+ doping concentrations (e.g., 5 mol%) arerequired for sufficient absorption of the blue LED light12.At high dopant concentrations, energy migration amongthe Mn4+ ions can result in concentration quenching26,28,as is illustrated in Fig. 1. If the distance between the Mn4+
ions is small, excitation energy may efficiently migratefrom one Mn4+ ion to another until it reaches aquenching site (defect or impurity ion), where the exci-tation energy is lost non-radiatively (as heat). Studies onconcentration quenching in Mn4+-doped fluorides arelimited. Several works have compared the luminescenceproperties of fluoride phosphors with varying Mn4+
concentrations, but do not measure the actualMn4+ concentration in the phosphors by elemental ana-lysis29–33. Determining the Mn4+ concentration is crucial,as often only a fraction of the Mn4+ ions is incorporatedduring the synthesis19,34. Reports that do perform ele-mental analysis study only a small range of Mn4+ dopingconcentrations and do not provide insight into the role ofconcentration quenching in Mn4+ doped fluorides13,35,36.An in-depth investigation of concentration quenching inMn4+-doped fluorides is thus lacking, despite it being veryimportant for the application of Mn4+-doped fluorides inw-LEDs.In this work, we systematically investigate concentration
quenching and thermal quenching in Mn4+-dopedfluorides. The quenching is studied by measuring lumi-nescence spectra and decay curves in the temperaturerange of 4 to 600 K for K2TiF6:Mn4+ phosphors withMn4+ concentrations ranging from 0.01 to 15.7 mol%(actual Mn4+ concentration). The temperature-dependentluminescence measurements of K2TiF6:Mn4+ and otherMn4+-doped phosphors demonstrate that thermalquenching occurs because of thermally activated cross-over from the 4T2 excited state to the 4A2 ground state.This insight into the quenching mechanism shows thatthe Mn4+ quenching temperature can be raised by findingfluoride hosts that have an increased Mn4+ 4T2 levelenergy. Concentration studies show that the lumines-cence QE of K2TiF6:Mn4+ is high, ~80%, for dopingconcentrations up to 5mol% Mn4+. Concentrationquenching is limited for these relatively high Mn4+
dopant concentrations. At even higher doping con-centrations of >10 mol%, the QE of K2TiF6:Mn4+ fallsbelow 60%. Luminescence decay curves indicatethat the drop in QE can be attributed to an increasedprobability for direct energy transfer to quenching sites
Quenching site
Host cation
Excitation
Mn4+ ion
Energy migration
Radiative emission
Energy transfer to quencher
Fig. 1 Concentration quenching for Mn4+ in crystals. At high Mn4+ doping concentrations the Mn4+ ions (orange) are in closeproximity in the crystal lattice. If the Mn4+ ions are close together,energy transfer between Mn4+ ions (dark blue) causes the excitationto migrate through the crystal. Eventually, it may reach a quenchingsite such as a vacancy or impurity (dashed circle), where the excitationenergy is lost as heat. This process competes with radiative emission(red) and reduces the luminescence efficiency
Senden et al. Light: Science & Applications (2018) 7:8 Page 2 of 13
(e.g., defects, impurity ions, Mn2+, and Mn3+), the con-centration of which increases with the Mn4+ concentra-tion. The present results provide an improvedunderstanding of thermal quenching and concentrationquenching in Mn4+-doped solids and can be used todevelop superior Mn4+-doped fluoride phosphors forw-LEDs.
Materials and methodsSynthesis and characterization of K2TiF6:Mn4+ phosphorsThe K2TiF6:Mn4+ (x%) phosphors were synthesized
according to the method of Zhu et al.13 For the synthesisof K2TiF6:Mn4+ (0.8%), 0.0488 g of K2MnF6 (preparedfollowing refs. 37,38) was dissolved in 2.5 mL of a 40 wt%HF solution (Fluka, 40 wt% HF in water). Next, theobtained yellow-brown solution was mixed with 4.5730 gof K2TiF6 (Sigma-Aldrich, p.a.) and then stirred for 1 h atroom temperature to form K2TiF6:Mn4+ crystals. TheK2TiF6:Mn4+ phosphor was isolated by decanting the HFsolution, washing twice with 15mL of ethanol and thendrying the phosphor for 7 h at 75 °C. The other K2TiF6:Mn4+ (x%) phosphors were prepared following thesame procedure but using other amounts of K2MnF6and K2TiF6 as to obtain different Mn4+ dopingconcentrations.Powder X-ray diffraction (see Supplementary Figure S1)
confirms that the K2TiF6:Mn4+ (x%) phosphors exhibitthe hexagonal crystal structure of K2TiF6 up to the highestdoping concentration of 15.7% Mn4+. Furthermore, noimpurities of K2MnF6 or other crystal phases are observedin the diffraction patterns. Scanning electron microscopy(SEM) images show that most K2TiF6:Mn4+ phosphorparticles are irregularly shaped and have sizes rangingfrom 1 to 200 µm (see Supplementary Figure S2a). Someparticles have a hexagonal shape, in agreement with thehexagonal crystal structure of K2TiF6 (see SupplementaryFigure S2b). Energy-dispersive X-ray (EDX) spectra(see Supplementary Figure S2c) confirm that the phos-phor particles consist of potassium, titanium, fluorine,and manganese ions. The manganese dopant concentra-tions in the K2TiF6:Mn4+ phosphors were determinedwith inductively coupled plasma optical emission spec-troscopy (ICP-OES). The ICP-OES measurements wereperformed on a Perkin-Elmer Optima 8300DV spectro-meter (λem= 257.61 and 259.37 nm). For the ICP-OESanalyses, the K2TiF6:Mn4+ phosphors were dissolved inaqua regia.
Optical spectroscopyPL measurements were performed on an Edinburgh
Instruments FLS920 fluorescence spectrometer, exceptfor the PL decay measurements between 300 and 600 K(see below). For recording excitation and emission spec-tra, we used a 450W Xe lamp as excitation source and a
Hamamatsu R928 photomultiplier tube (PMT) with agrating blazed at 500 nm for detection of emission. For PLdecay measurements, excitation was done with a tunableoptical parametric oscillator (OPO) Opotek Opolette HE355II laser (pulse width 10 ns, repetition rate 10 Hz) andemission was detected with a Hamamatsu H74220–60PMT. The PL decay curves between 300 and 600 K wererecorded on a different setup, which had an Ekspla NT342B OPO laser (pulse width 5 ns, repetition rate 10 Hz)as excitation source and a 0.55 m Triax 550 mono-chromator combined with a Hamamatsu H74220–60PMT for detection of emission. All PL decay curves wereobtained by multi-channel scaling (MCS) with a Pico-Quant TimeHarp 260 computer card. The K2TiF6:Mn4+
phosphors were cooled down to 4 K with an OxfordInstruments liquid helium flow cryostat. For PL mea-surements between 300 and 600 K samples were heated ina Linkam THMS600 temperature controlled stage. ThePL quantum efficiencies of the phosphors were deter-mined with a calibrated home-built setup, which con-sisted of a 65W Xe lamp, excitation monochromator,integrating sphere (Labsphere) and CCD camera (AvantesAvaSpec-2048).
Results and discussionLuminescence of K2TiF6:Mn4+
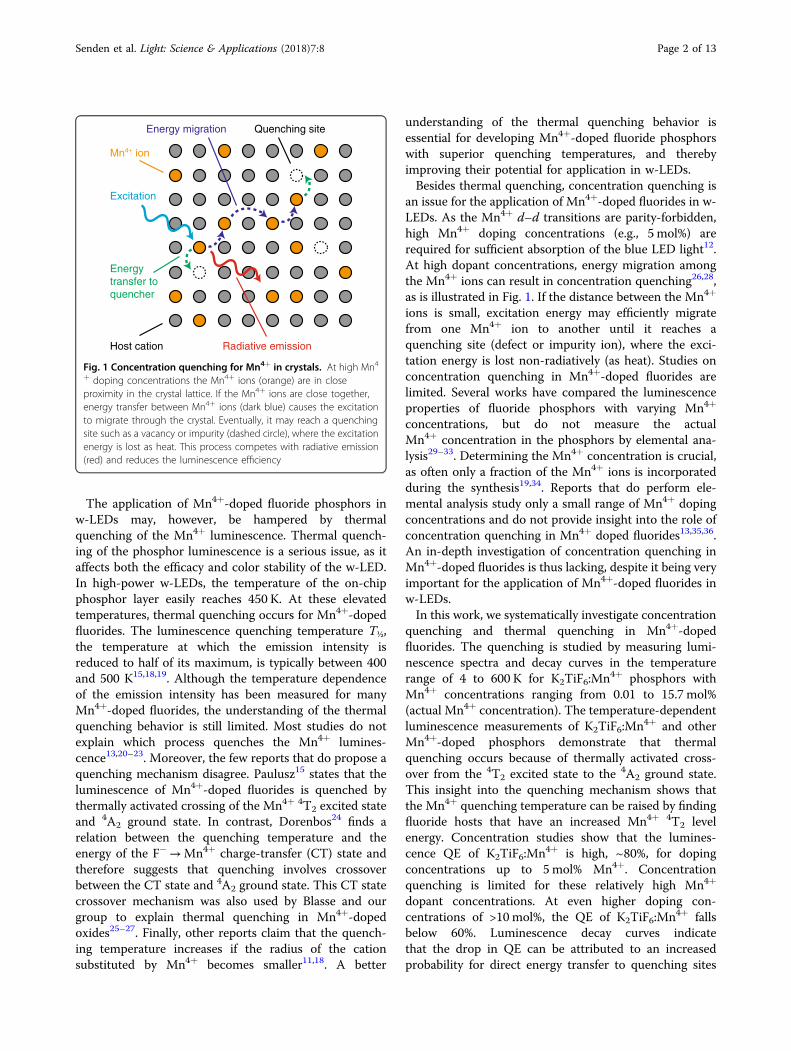
For our quenching studies, we examine the lumines-cence of K2TiF6:Mn4+ phosphors with a wide range ofMn4+ doping concentrations. A photographic image ofthe K2TiF6:Mn4+ (x%) phosphors is displayed in Fig. 2a.The Mn4+ doping concentrations x (molar percentageswith respect to Ti4+) were determined by inductivelycoupled plasma optical emission spectroscopy (ICP-OES).The body color of K2TiF6:Mn4+ becomes more yellowwith increasing Mn4+ concentration as a result ofenhanced absorption in the blue. All of the investigatedK2TiF6:Mn4+ phosphors exhibit bright red Mn4+ lumi-nescence under UV photoexcitation.Figure 2b depicts the Tanabe–Sugano energy level
diagram of Mn4+ (3d3 electron configuration) in anoctahedral crystal field39,40. The diagram gives the d3
energy levels as a function of the crystal field splitting ΔO.Due to its high effective positive charge, Mn4+ experi-ences a strong crystal field and therefore the 2E state is thelowest energy excited state. Hence, the emission spectrumof K2TiF6:Mn4+ (0.8%) is dominated by narrow redemission lines due to spin- and parity-forbidden 2E→ 4A2
transitions, as can be seen in Fig. 2c. The other K2TiF6:Mn4+ (x%) phosphors exhibit similar emission spectra. Asthe potential energy curves of the 2E and 4A2 states are atthe same equilibrium position, the 2E→ 4A2 emission ischaracterized by narrow zero-phonon and vibronicemission lines. The potential energy curves of the 2E and4A2 states are at the same equilibrium position because
Senden et al. Light: Science & Applications (2018) 7:8 Page 3 of 13

the 2E and 4A2 states originate from the same t32g electronconfiguration41.The 2E→ 4A2 emission spectrum consists of a weak
zero-phonon line (ZPL) at ~622 nm and more intenseanti-Stokes and Stokes vibronic emissions (labeled ν3, ν4,and ν6) on the high and low energy sides of the ZPL,respectively13,15. The ZPL is very weak because Mn4+ islocated on a site with inversion symmetry in K2TiF6:Mn4+. Due to the inversion symmetry, there are no odd-paritycrystal field components to admix opposite parity statesinto the 4A2 and 2E states and, as a result, the 2E→ 4A2
transition is electric dipole forbidden. The 2E→ 4A2
transition can become partly allowed, however, by cou-pling with asymmetric vibrations that induce odd-paritycrystal field components. The most intense lines in Fig. 2care assigned to 2E→ 4A2 transitions coupling with theasymmetric ν3, ν4, and ν6 vibrational modes (phonons) ofthe MnF2�
6 group. Thermal population of phonons atroom temperature allows coupling with ν3, ν4, and ν6phonon modes in the 2E excited state (giving rise to theanti-Stokes lines), while transitions to these phononmodes in the 4A2 ground state can occur at all tempera-tures (Stokes lines).
Figure 2d displays the excitation spectrum of the redMn4+ luminescence from K2TiF6:Mn4+. The two broadexcitation bands correspond to spin-allowed 4A2→
4T1
and 4A2→4T2 transitions (violet and blue arrows in
Fig. 2b). In addition, some weak peaks are visible around600 nm. These peaks are assigned to 4A2→
2E and4A2→
2T1 transitions. The 4A2→2T1,
2E transitions arespin-forbidden and therefore low in intensity compared tothe spin-allowed 4A2→
4T1,4T2 transitions.
Temperature dependence of the Mn4+ luminescenceTo study the thermal quenching of the Mn4+ emission,
we measure the PL intensity and Mn4+ emission lifetimeof K2TiF6:Mn4+ (0.01%) as a function of temperaturebetween 4 and 600 K. We use a very low Mn4+ dopingconcentration of 0.01%, as for higher Mn4+ concentra-tions reabsorption of emission and energy transferbetween Mn4+ ions can occur. These processes willinfluence (the temperature dependence of) the Mn4+
luminescence spectra and decay curves6. As a result, witha high concentration of Mn4+ ions, the observations maynot reflect the intrinsic thermal quenching properties ofMn4+.
300 400 500 600Wavelength (nm)
Nor
mal
ized
inte
nsity
0.0
0.2
0.4
0.6
0.8
1.0 4A2
4A2
4A2
4T2
4T1
4A22T1
0.8% Mn
2E
550 600 650 700Wavelength (nm)
Nor
mal
ized
inte
nsity
0.0
0.2
0.4
0.6
0.8
1.0 v6
v6
v4
v4
v3
v3
ZPL
0.8% Mn2E 4A2
StokesAnti-Stokes
a
b
c
d
0.80.10.01 3.81.3 5.4 9.4 15.7Mn4+ concentration (x%)
10 20 30 400Δo/B
10
20
30
40
50
60
4A2
2A12A2
4T2
4T1
4T1
2T2
2T12E
2F
2G4P
4F
E/B
Fig. 2 Mn4+ luminescence of K2TiF6:Mn4+. a Photographic image of K2TiF6:Mn4+ (x%) phosphors with x= 0.01, 0.1, 0.8, 1.3, 3.8, 5.4, 9.4, and 15.7.The phosphors have a white to yellow body color under ambient light (top) and show red Mn4+ luminescence under 365 nm UV illumination(bottom). b Tanabe−Sugano energy level diagram of the d3 electron configuration in an octahedral crystal field. The 4A2→
4T1,4A2→
4T2, and2E→ 4A2 transitions of Mn4+ are indicated by the purple, blue and red arrows, respectively. Note that the excitation transitions are displaced forclarity. For a specific coordination all transitions take place around the same crystal field ΔO. c Emission spectrum of K2TiF6:Mn4+ (0.8%) uponexcitation with blue light (λexc= 450 nm). d Excitation spectrum of the red Mn4+ luminescence (λem= 630 nm) from K2TiF6:Mn4+ (0.8%). Spectra arerecorded at ambient temperature
Senden et al. Light: Science & Applications (2018) 7:8 Page 4 of 13
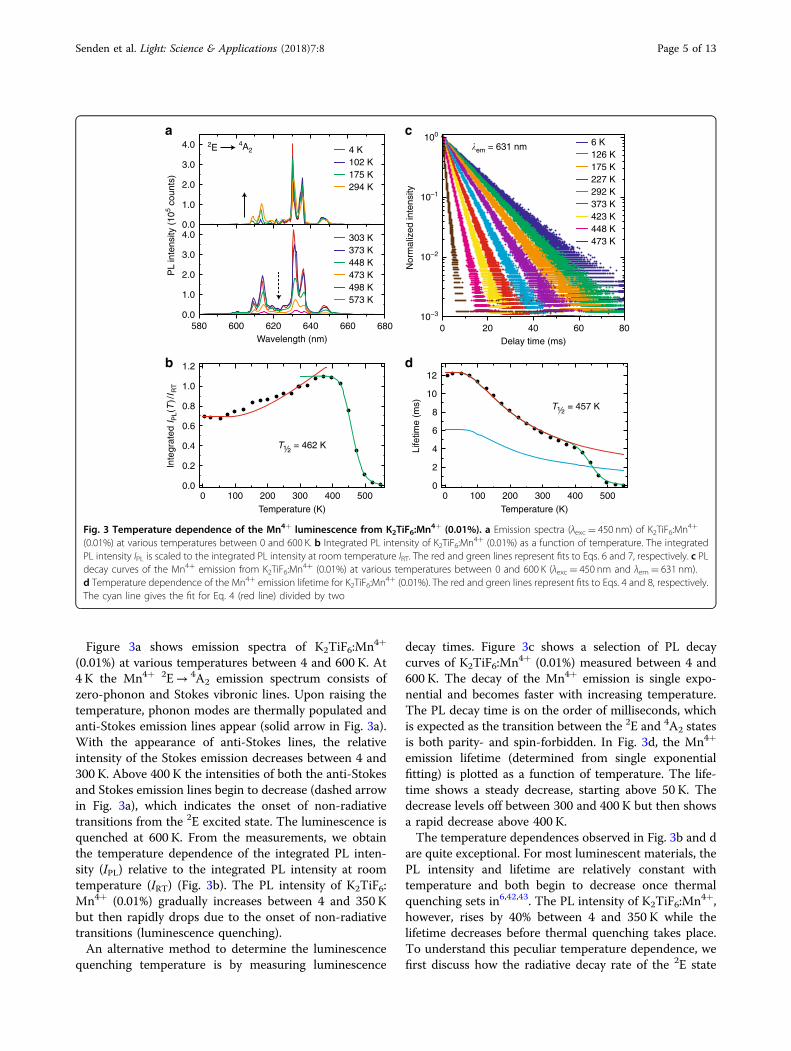
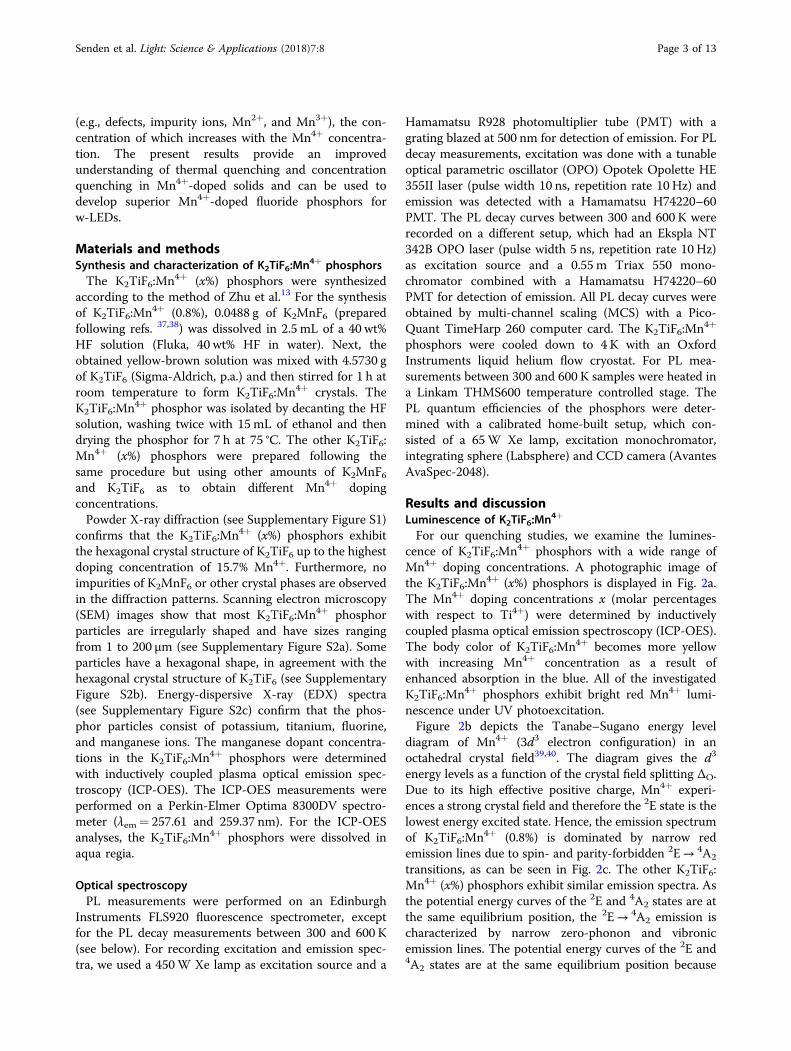
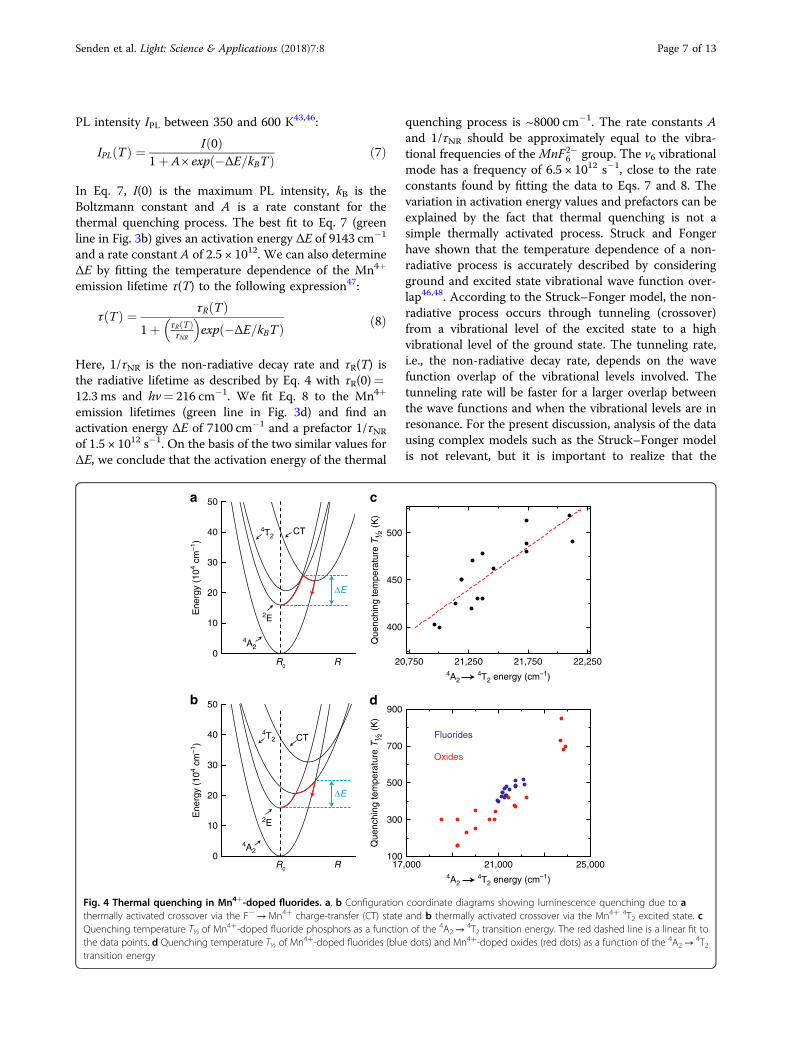
Figure 3a shows emission spectra of K2TiF6:Mn4+
(0.01%) at various temperatures between 4 and 600 K. At4 K the Mn4+ 2E→ 4A2 emission spectrum consists ofzero-phonon and Stokes vibronic lines. Upon raising thetemperature, phonon modes are thermally populated andanti-Stokes emission lines appear (solid arrow in Fig. 3a).With the appearance of anti-Stokes lines, the relativeintensity of the Stokes emission decreases between 4 and300 K. Above 400 K the intensities of both the anti-Stokesand Stokes emission lines begin to decrease (dashed arrowin Fig. 3a), which indicates the onset of non-radiativetransitions from the 2E excited state. The luminescence isquenched at 600 K. From the measurements, we obtainthe temperature dependence of the integrated PL inten-sity (IPL) relative to the integrated PL intensity at roomtemperature (IRT) (Fig. 3b). The PL intensity of K2TiF6:Mn4+ (0.01%) gradually increases between 4 and 350 Kbut then rapidly drops due to the onset of non-radiativetransitions (luminescence quenching).An alternative method to determine the luminescence
quenching temperature is by measuring luminescence
decay times. Figure 3c shows a selection of PL decaycurves of K2TiF6:Mn4+ (0.01%) measured between 4 and600 K. The decay of the Mn4+ emission is single expo-nential and becomes faster with increasing temperature.The PL decay time is on the order of milliseconds, whichis expected as the transition between the 2E and 4A2 statesis both parity- and spin-forbidden. In Fig. 3d, the Mn4+
emission lifetime (determined from single exponentialfitting) is plotted as a function of temperature. The life-time shows a steady decrease, starting above 50 K. Thedecrease levels off between 300 and 400 K but then showsa rapid decrease above 400 K.The temperature dependences observed in Fig. 3b and d
are quite exceptional. For most luminescent materials, thePL intensity and lifetime are relatively constant withtemperature and both begin to decrease once thermalquenching sets in6,42,43. The PL intensity of K2TiF6:Mn4+,however, rises by 40% between 4 and 350 K while thelifetime decreases before thermal quenching takes place.To understand this peculiar temperature dependence, wefirst discuss how the radiative decay rate of the 2E state
0.0
1.0
2.0
3.0
4.0
PL
inte
nsity
(10
5 cou
nts)
620600 640 660 680580Wavelength (nm)
4 K102 K175 K294 K
2E 4A2
303 K373 K448 K473 K498 K573 K
0.0
1.0
2.0
3.0
4.0a c
100
10–1
10−2
10−3
Nor
mal
ized
inte
nsity
Delay time (ms)0 20 40 60 80
�em = 631 nm 6 K126 K175 K227 K292 K373 K423 K448 K473 K
200100 300 400 5000Temperature (K)
Inte
grat
ed I P
L(T
)/I R
T
0.0
0.2
0.4
0.6
0.8
1.0
1.2b d12
10
8
6
4
2
0
Life
time
(ms)
200100 300 400 5000Temperature (K)
T½ = 457 K
T½ = 462 K
Fig. 3 Temperature dependence of the Mn4+ luminescence from K2TiF6:Mn4+ (0.01%). a Emission spectra (λexc= 450 nm) of K2TiF6:Mn4+
(0.01%) at various temperatures between 0 and 600 K. b Integrated PL intensity of K2TiF6:Mn4+ (0.01%) as a function of temperature. The integratedPL intensity IPL is scaled to the integrated PL intensity at room temperature IRT. The red and green lines represent fits to Eqs. 6 and 7, respectively. c PLdecay curves of the Mn4+ emission from K2TiF6:Mn4+ (0.01%) at various temperatures between 0 and 600 K (λexc= 450 nm and λem= 631 nm).d Temperature dependence of the Mn4+ emission lifetime for K2TiF6:Mn4+ (0.01%). The red and green lines represent fits to Eqs. 4 and 8, respectively.The cyan line gives the fit for Eq. 4 (red line) divided by two
Senden et al. Light: Science & Applications (2018) 7:8 Page 5 of 13
changes with temperature. The 2E→ 4A2 emission ofK2TiF6:Mn4+ mainly consists of anti-Stokes and Stokesvibronic emissions (Fig. 2c). Their transition probabilitiesincrease with phonon population. The population ofphonon modes is given by the phonon occupation num-ber n, which increases with temperature according to41:
n ¼ 1exp hv=kBTð Þ � 1
ð1Þ
where kB is the Boltzmann constant and hν is the energyof the phonon coupling to the 2E→ 4A2 transition. Thetransition probabilities PR of the anti-Stokes and Stokesvibronics scale with n by:
Anti� Stokes : PR Tð Þ ¼ PR 0ð Þ n½ � ð2ÞStokes : PR Tð Þ ¼ PR 0ð Þ nþ 1½ � ð3Þ
where PR(0) is the transition probability at T= 0 K. As theradiative lifetime τR is proportional to 1/[PR(anti-Stokes) + PR (Stokes)], it follows from Eqs. 1–3 that:
τR Tð Þ ¼ τR 0ð Þcothðhv=2kBTÞ ð4Þ
Here, τR(0) is the radiative lifetime at T= 0 K. In Fig. 3d,Eq. 4 (red line) has been plotted for τR(0)= 12.3 ms andhν= 216 cm−1 (phonon energy of the intense ν6 modeemission). Equation 4 accurately describes the measuredtemperature dependence of the Mn4+ emission lifetimeup to 375 K, confirming that the decay of the 2E state ismainly radiative up to this temperature. The radiativelifetime of the Mn4+ emission shortens with temperaturedue to thermal population of odd-parity vibrationalmodes at higher temperatures.
Next, we investigate the increase in PL intensitybetween 4 and 350 K. The PL intensity IPL equals theproduct of the PL QE and number of absorbed photons(as IPL scales with the number of absorbed photons, theexcitation wavelength can have a large influence on thetemperature dependence observed for IPL; see Supple-mentary Information). The PL QE η of K2TiF6:Mn4+ canbe expressed as:
η ¼ γRγR þ γNR
ð5Þ
where γR and γNR are the radiative and non-radiativedecay rates of the emitting 2E state, respectively. Theresults in Fig. 3d show that the decay of the 2E state ismainly radiative up to 375 K, so we can assume that γNR isnegligible between 0 and 350 K. The value for η istherefore approximated as a constant close to unitybetween 0 and 350 K. On the other hand, the 4A2→
4T2
absorption will change with temperature. Like the2E→ 4A2 transition, the 4A2→
4T2 transition is electricdipole (parity) forbidden and gains intensity by coupling
with vibrations (for more details on the vibronic structureof the 4A2→
4T2 excitation band, see refs. 15,16,44). As aresult, the PL intensity IPL will scale with temperatureas20,41,45:
IPL Tð Þ ¼ I 0ð Þcoth hv2kBT
� �ð6Þ
with I(0) being the PL intensity at T= 0 K. The results inFig. 3b show that the increase in PL intensity between 4and 350 K follows the temperature dependence given byEq. 6. This confirms that the higher PL intensity at 350 Kis due to a stronger absorption of excitation light. Anincrease in PL intensity between 4 and 350 K due toenhanced absorption is observed for all investigated Mn4+
doping concentrations (see Supplementary Information).Although the temperature dependence of the PL intensityfollows Eq. 6, there is deviation between the fit of Eq. 6and the measured data (see red line in Fig. 3b). The modelof Eq. 6 is simple and does not take into account the shiftand broadening of the 4A2→
4T2 absorption band withtemperature. Both these effects also influence the tem-perature dependence of the PL intensity, and this canexplain the deviation between the model and the experi-mental data. Including the effect of a shift and broadeningof the 4A2→
4T2 band on the absorption strength iscomplex and will not aid a more accurate determinationof T½.
Above 400 K the PL intensity of K2TiF6:Mn4+ (0.01%)begins to decrease due to the onset of non-radiativetransitions (Fig. 3a, b). The non-radiative decay prob-ability rapidly increases with temperature above 400 Kand as a result the luminescence is quenched, with noemission intensity remaining at 600 K. The quenchingtemperature T½ is determined to be 462 K. The Mn4+
emission lifetime also rapidly decreases once thermalquenching sets in (Fig. 3d). Above 400 K the Mn4+
emission lifetime is shorter than the radiative lifetime τRpredicted by Eq. 4 (red line). The lifetime shortensbecause of an additional thermally activated non-radiativecontribution to the decay of the 2E state. From the tem-perature dependence of the lifetime, T½ can be deter-mined by locating the temperature at which the lifetimehas decreased to half of its radiative lifetime value. Toestimate T½, we divide the value from the fit of Eq. 4 for τRby a factor of 2 (Fig. 3d, cyan line). The cyan line crossesthe data points at 457 K. This value for T½ is very close tothe T½ of 462 K obtained from the PL intensitymeasurements.Thermal quenching can be described as a thermally
activated process with an activation energy ΔE. Theactivation energy is obtained by fitting a modifiedArrhenius equation to the temperature dependence of the
Senden et al. Light: Science & Applications (2018) 7:8 Page 6 of 13
PL intensity IPL between 350 and 600 K43,46:
IPL Tð Þ ¼ I 0ð Þ1þ A ´ exp �ΔE=kBTð Þ ð7Þ
In Eq. 7, I(0) is the maximum PL intensity, kB is theBoltzmann constant and A is a rate constant for thethermal quenching process. The best fit to Eq. 7 (greenline in Fig. 3b) gives an activation energy ΔE of 9143 cm−1
and a rate constant A of 2.5 × 10¹². We can also determineΔE by fitting the temperature dependence of the Mn4+
emission lifetime τ(T) to the following expression47:
τ Tð Þ ¼ τR Tð Þ1þ τR Tð Þ
τNR
� �exp �ΔE=kBTð Þ ð8Þ
Here, 1/τNR is the non-radiative decay rate and τR(T) isthe radiative lifetime as described by Eq. 4 with τR(0)=12.3 ms and hν= 216 cm−1. We fit Eq. 8 to the Mn4+
emission lifetimes (green line in Fig. 3d) and find anactivation energy ΔE of 7100 cm−1 and a prefactor 1/τNR
of 1.5 × 10¹² s−1. On the basis of the two similar values forΔE, we conclude that the activation energy of the thermal
quenching process is ~8000 cm−1. The rate constants Aand 1/τNR should be approximately equal to the vibra-tional frequencies of the MnF2�
6 group. The ν6 vibrationalmode has a frequency of 6.5 × 10¹² s−1, close to the rateconstants found by fitting the data to Eqs. 7 and 8. Thevariation in activation energy values and prefactors can beexplained by the fact that thermal quenching is not asimple thermally activated process. Struck and Fongerhave shown that the temperature dependence of a non-radiative process is accurately described by consideringground and excited state vibrational wave function over-lap46,48. According to the Struck–Fonger model, the non-radiative process occurs through tunneling (crossover)from a vibrational level of the excited state to a highvibrational level of the ground state. The tunneling rate,i.e., the non-radiative decay rate, depends on the wavefunction overlap of the vibrational levels involved. Thetunneling rate will be faster for a larger overlap betweenthe wave functions and when the vibrational levels are inresonance. For the present discussion, analysis of the datausing complex models such as the Struck–Fonger modelis not relevant, but it is important to realize that the
20,750 21,250 21,750 22,2504T2 energy (cm–1)4A2
4T2 energy (cm–1)4A2
Que
nchi
ng te
mpe
ratu
re T
½ (
K)
400
450
500
a c
Ene
rgy
(104 c
m–1
) CT
10
20
30
40
0
50
RR0
50
RR0
4A2
4A2
4T2
4T2
2E
2E
CT
ΔE
ΔE
Ene
rgy
(104 c
m–1
)
10
20
30
40
0
b
Que
nchi
ng te
mpe
ratu
re T
½ (
K)
300
100
700
900
17,000 21,000 25,000
Fluorides
Oxides
d
500
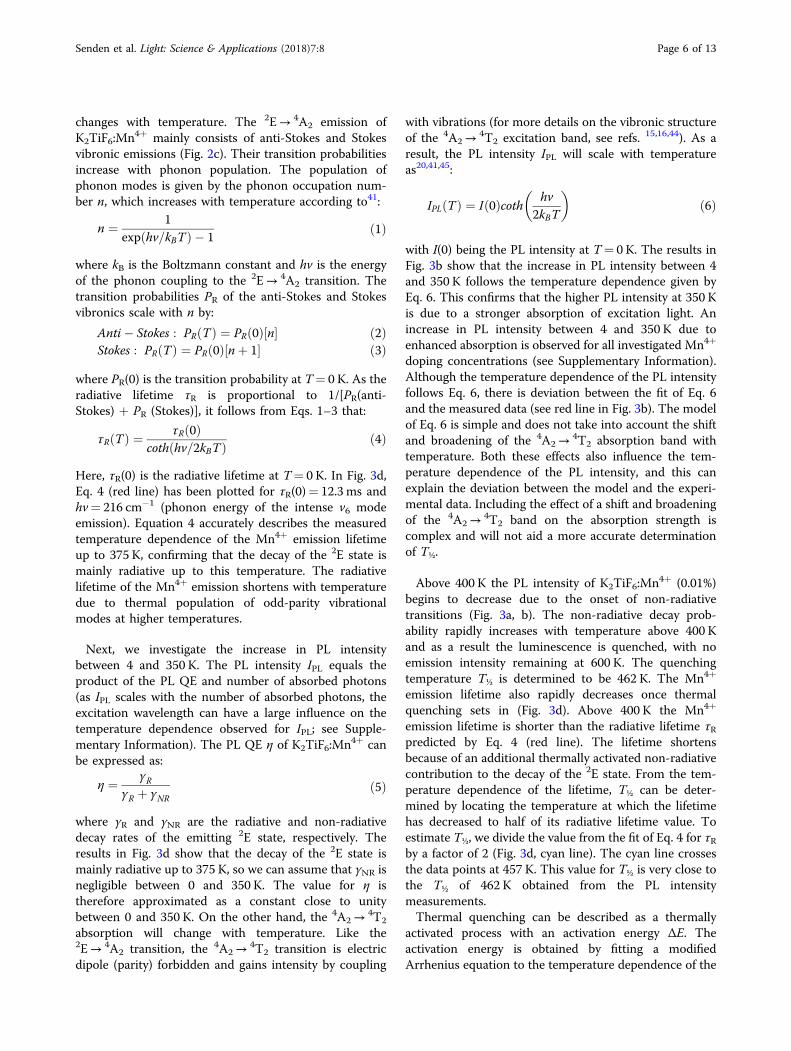
Fig. 4 Thermal quenching in Mn4+-doped fluorides. a, b Configuration coordinate diagrams showing luminescence quenching due to athermally activated crossover via the F−→Mn4+ charge-transfer (CT) state and b thermally activated crossover via the Mn4+ 4T2 excited state. cQuenching temperature T½ of Mn4+-doped fluoride phosphors as a function of the 4A2→
4T2 transition energy. The red dashed line is a linear fit tothe data points. d Quenching temperature T½ of Mn4+-doped fluorides (blue dots) and Mn4+-doped oxides (red dots) as a function of the 4A2→
4T2transition energy
Senden et al. Light: Science & Applications (2018) 7:8 Page 7 of 13
Struck–Fonger model gives a more correct description ofthe actual quenching process.
Thermal quenching in Mn4+-doped fluoridesTo obtain insight into the thermal quenching of Mn4+
luminescence, we will discuss four possible quenchingprocesses: (1) multi-phonon relaxation, (2) thermallyactivated photoionization, (3) thermally activated cross-over via the F−→Mn4+ charge-transfer (CT) state, and(4) thermally activated crossover via the Mn4+ 4T2 excitedstate.In the configurational coordinate diagram, the parabolas
of the Mn4+ 2E and 4A2 states do not cross and lumi-nescence quenching by crossover from the 2E to the 4A2
states is not possible (Fig. 4a). The 4A2 ground state mayhowever be reached by multi-phonon relaxation. In Mn4+-doped fluorides more than 30 phonons of ~500 cm−1
are needed to bridge the energy gap between the 2E and4A2 states
49. For such high numbers of phonons (p > 30),it is unrealistic that non-radiative multi-phonon relaxa-tion is responsible for thermal quenching (see Supple-mentary Information for a more detailed discussion).Alternatively, the thermal quenching can be due to ther-mally activated photoionization of an electron from theMn4+ 2E state to the fluoride host conduction band.Thermally activated photoionization typically quenchesthe emission from a luminescent center if the emittingstate is close in energy to the host conduction band26,50.In density functional theory (DFT) calculations, largeband gaps of around 8 eV have been found for fluoridehosts like K2SiF6 and K2TiF6
51,52. It is therefore expectedthat the Mn4+ 2E state is well below the host conductionband levels. Based on this, we conclude that thermalquenching in Mn4+-doped fluorides is not caused bythermally activated photoionization. However, more evi-dence is necessary to exclude this quenching mechanism.Photoconductivity measurements on Mn4+ phosphors atelevated temperatures need to be performed to provideconvincing evidence for a possible role of photoionizationin the thermal quenching of Mn4+ emission.Thermal quenching in Mn4+-doped fluorides has been
suggested to occur by thermally activated crossover viathe Mn4+ 4T2 state or the F−→Mn4+ charge-transfer(CT) state15,24,26. Both these states are displaced relativeto the potential curve of the 4A2 ground state (Fig. 4a, b).Hence, the 4T2 and CT state parabolas cross the 4A2
ground state parabola. The difference between thepotential curve equilibrium positions is given by the offsetΔR= R0′− R0. By using the energies of the 4A2→
2E,4A2→
4T2 and 4A2→CT transitions in K2TiF6:Mn4+
(Fig. 2d and ref. 13) and assuming specific offsets ΔR forthe 4T2 and CT states, we can construct the diagrams inFig. 4a and b, where non-radiative relaxation occurs eithervia (a) the crossing of the CT and 4A2 states or (b) the
crossing of the 4T2 and 4A2 states. The offset of the CTstate is typically larger than the offset of the 4T2 state.Note that the diagrams in Fig. 4a and b are schematicconfiguration coordinate diagrams to illustrate the dif-ferent quenching mechanisms.In Fig. 4a, the CT state has a larger offset ΔR than the
4T2 state, which causes the CT parabola to cross the 4A2
parabola at lower energies than the 4T2 parabola.Thermal activation over the energy barrier ΔE will allowcrossover from the 2E state into the CT state followed bynon-radiative relaxation to the ground state via thecrossing of the CT and 4A2 parabolas. Alternatively,thermal quenching of the Mn4+ luminescence maybe due to the mechanism depicted in Fig. 4b. Here, the CTstate has a smaller offset ΔR compared to that shown inFig. 4a, and its potential curve is therefore at higherenergies. In addition, the 4T2 state has a slightly largeroffset. As a result, the crossing of the 4T2 and 4A2 para-bolas is now at a lower energy and non-radiative relaxa-tion will proceed via the crossing of the 4T2 and 4A2
parabolas.The activation energies ΔE in the configuration coor-
dinate diagrams are ~8000 cm−1, similar to the ΔE valuesobtained from the temperature-dependent measurements.This indicates that both mechanisms in Fig. 4a, b canexplain the thermal quenching of Mn4+ luminescence. Todetermine which of these two mechanisms is responsiblefor the luminescence quenching, we compare thequenching temperature T½ of K2TiF6:Mn4+ to the T½ ofother Mn4+-doped materials. A relation between thequenching temperature and the energy of either the CT or4T2 state in a variety of hosts will give insight. Ifquenching occurs by crossover from the CT stateto the 4A2 state, T½ will be higher for Mn4+-doped solidswith higher CT transition energies. In K2TiF6:Mn4+ andother Mn4+-doped fluorides the F−→Mn4+ CT transi-tion is at ~40,000 cm−113,15. Mn4+-doped oxides havelower O2−→Mn4+ CT transition energies of30,000–35,000 cm−1 and are therefore expected to havelower T½ values than fluorides if quenching occurs by themechanism in Fig. 4a26,27,53,54. Some Mn4+-doped oxides,however, have much higher quenching temperatures thanMn4+-doped fluorides. For example, Mg4GeO6:Mn4+,Mg28Ge7.5O38F10:Mn4+, and Mg6As2O11:Mn4+ have a T½
of ~700 K55–57, while K2TiF6:Mn4+ and other Mn4+-doped fluorides have a T½ of 400–500 K (see alsoTables 1 and 2). No correlation is found between the Mn4+ luminescence quenching temperature and the energy ofthe CT transition (see Supplementary Information for anoverview and a plot of quenching temperatures and CTenergies). From this we conclude that thermal quenchingin Mn4+-doped fluorides is not caused by thermallyactivated crossover from the F−→Mn4+ CT state to the4A2 ground state.
Senden et al. Light: Science & Applications (2018) 7:8 Page 8 of 13
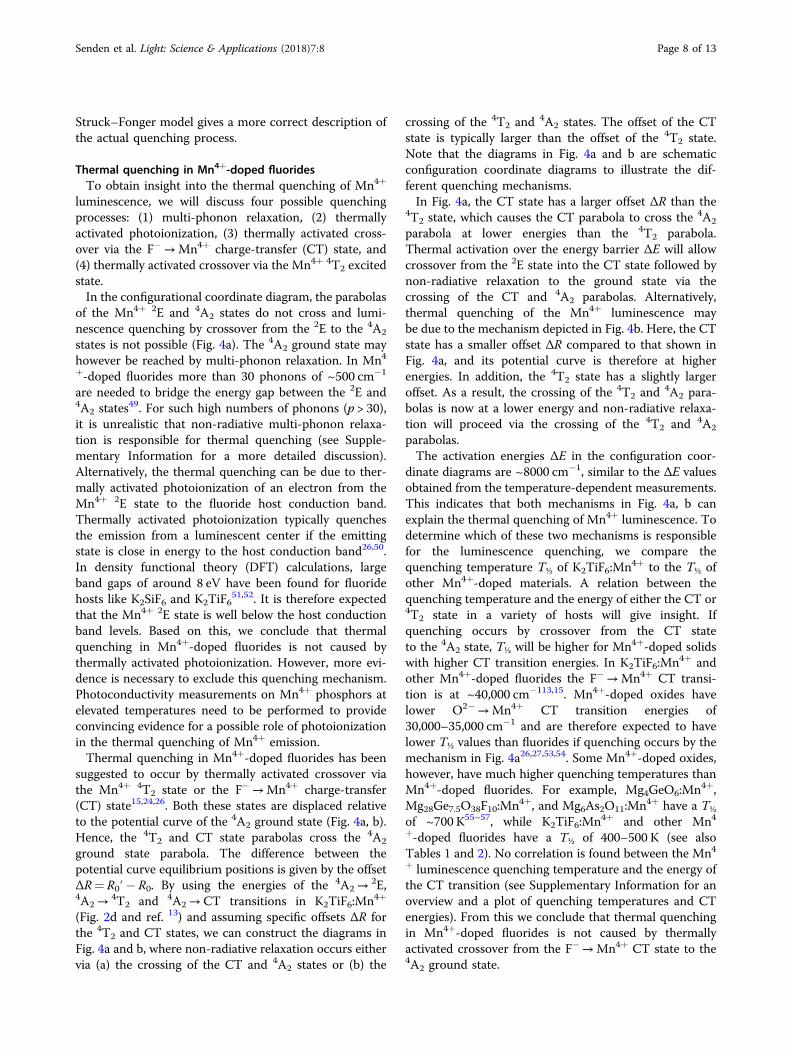
Alternatively, thermal quenching of the Mn4+ lumi-nescence can be caused by thermally activated crossovervia the Mn4+ 4T2 excited state (Fig. 4b). To investigate thevalidity of this mechanism, we compare the T½ and4A2→
4T2 transition energies for K2TiF6:Mn4+ and avariety of other Mn4+-doped fluorides. From the litera-ture and measurements on Mn4+ luminescence we havecollected quenching temperatures and luminescencespectra, preferably for systems with low doping con-centrations. Figures 2d and 3b show that K2TiF6:Mn4+
has a 4A2→4T2 energy of 21,459 cm−1 (maximum of the
excitation band) and a T½ of 462 K. For K2SiF6:Mn4+, wemeasured a 4A2→
4T2 energy of 22,099 cm−1 and a T½ of
518 K (Supplementary Figure S6, K2SiF6:Mn4+ BR301-Ccommercial phosphor from Mitsubishi Chemical, Japan).In Fig. 4c we plot the quenching temperature T½ againstthe 4A2→
4T2 energy for K2TiF6:Mn4+, K2SiF6:Mn4+ andmany other Mn4+-doped fluoride phosphors reported inthe literature (displayed data also listed in Table 1). Thedata show that the T½ increases with the energy of the 4T2
state. The clear trend shows that the thermal quenchingin Mn4+-doped fluorides is due to thermally activatedcrossover from the 4T2 excited state to the 4A2 groundstate. Further confirmation for this quenching mechanismis provided by Mn4+ spectra measured at elevated tem-peratures (see Supplementary Information). Supplemen-tary Figure S7 shows emission spectra of K2SiF6:Mn4+ atT= 573 and 673 K. At 573 K a broad 4T2→
4A2 emissionband is observed, which is almost completely quenched at673 K. The initial rise of the 4T2→
4A2 emission at ele-vated temperatures confirms thermal population of the4T2 level, which eventually leads to thermal quenching ofall Mn4+ emission via this state.To investigate whether thermally activated crossing via
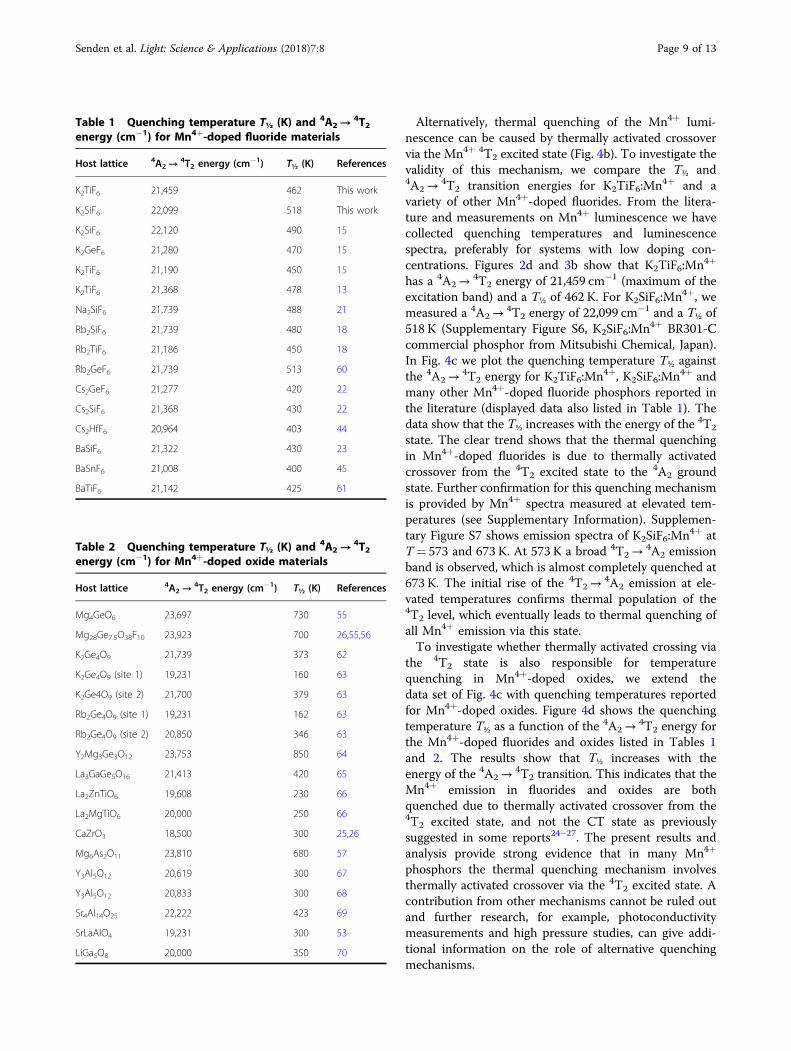
the 4T2 state is also responsible for temperaturequenching in Mn4+-doped oxides, we extend thedata set of Fig. 4c with quenching temperatures reportedfor Mn4+-doped oxides. Figure 4d shows the quenchingtemperature T½ as a function of the 4A2→
4T2 energy forthe Mn4+-doped fluorides and oxides listed in Tables 1and 2. The results show that T½ increases with theenergy of the 4A2→
4T2 transition. This indicates that theMn4+ emission in fluorides and oxides are bothquenched due to thermally activated crossover from the4T2 excited state, and not the CT state as previouslysuggested in some reports24–27. The present results andanalysis provide strong evidence that in many Mn4+
phosphors the thermal quenching mechanism involvesthermally activated crossover via the 4T2 excited state. Acontribution from other mechanisms cannot be ruled outand further research, for example, photoconductivitymeasurements and high pressure studies, can give addi-tional information on the role of alternative quenchingmechanisms.
Table 1 Quenching temperature T½ (K) and 4A2→4T2
energy (cm−1) for Mn4+-doped fluoride materials
Host lattice 4A2→4T2 energy (cm−1) T½ (K) References
K2TiF6 21,459 462 This work
K2SiF6 22,099 518 This work
K2SiF6 22,120 490 15
K2GeF6 21,280 470 15
K2TiF6 21,190 450 15
K2TiF6 21,368 478 13
Na2SiF6 21,739 488 21
Rb2SiF6 21,739 480 18
Rb2TiF6 21,186 450 18
Rb2GeF6 21,739 513 60
Cs2GeF6 21,277 420 22
Cs2SiF6 21,368 430 22
Cs2HfF6 20,964 403 44
BaSiF6 21,322 430 23
BaSnF6 21,008 400 45
BaTiF6 21,142 425 61
Table 2 Quenching temperature T½ (K) and 4A2→4T2
energy (cm−1) for Mn4+-doped oxide materials
Host lattice 4A2→4T2 energy (cm−1) T½ (K) References
Mg4GeO6 23,697 730 55
Mg28Ge7.5O38F10 23,923 700 26,55,56
K2Ge4O9 21,739 373 62
K2Ge4O9 (site 1) 19,231 160 63
K2Ge4O9 (site 2) 21,700 379 63
Rb2Ge4O9 (site 1) 19,231 162 63
Rb2Ge4O9 (site 2) 20,850 346 63
Y2Mg3Ge3O12 23,753 850 64
La3GaGe5O16 21,413 420 65
La2ZnTiO6 19,608 230 66
La2MgTiO6 20,000 250 66
CaZrO3 18,500 300 25,26
Mg6As2O11 23,810 680 57
Y3Al5O12 20,619 300 67
Y3Al5O12 20,833 300 68
Sr4Al14O25 22,222 423 69
SrLaAlO4 19,231 300 53
LiGa5O8 20,000 350 70
Senden et al. Light: Science & Applications (2018) 7:8 Page 9 of 13
As quenching occurs by thermally activated crossovervia the 4T2 excited state, the quenching temperature T½ ofthe Mn4+ luminescence is controlled by the energy of theMn4+ 4T2 state (the dependence of T½ on the energy ofthe 4T2 state is shown in Fig. 4c,d). In addition, the T½ ofthe Mn4+ luminescence depends on the offset ΔRbetween the 4T2 and 4A2 states, as ΔR also determineswhere the 4T2 and 4A2 states cross in the configurationcoordinate diagram (Fig. 4a,b). The horizontal displace-ment of the 4T2 parabola will influence the quenchingtemperature. A variation in ΔR can explain the spreadobserved in the data of Fig. 4c and d. To investigate thevariation in the offset ΔR for Mn4+-doped fluorides, wecompare the bandwidth of the 4A2→
4T2 excitation bandin K2TiF6:Mn4+, K2SiF6:Mn4+ and Cs2HfF6:Mn4+
(see Supplementary Figure S9). The width of the4A2→
4T2 excitation band is controlled by the displace-ment of the 4T2 state and therefore gives a good indicationof ΔR. Comparison of the 4A2→
4T2 bandwidths shows
that there is a variation in ΔR for Mn4+-doped fluorides.The variation in ΔR is small, however, compared to thedifferences in the 4T2 energy, and no correlation isobserved between the spectral width and quenchingtemperatures. This indicates that the 4T2 level energy hasthe largest influence on the quenching temperature ofMn4+-doped fluorides.Finally, in view of applications, it is interesting to see
how we can control the 4T2 level energy (and thereby T½)through the choice of the host lattice. The energy of theMn4+ 4T2 state depends on the crystal field splitting ΔO
(Fig. 2b), where ΔO is typically larger for shorter Mn–Fdistances44,58. For Mn4+-doped fluorides the lumines-cence quenching temperature can therefore be raised byselecting host lattices with short M4+–F− distances(see Supplementary Figure S10a). This is consistent withfindings that T½ increases if the radius of the M4+ hostcation decreases, as expected based on crystal field the-ory11,18. If, however, T½ is plotted against the M4+-ligand
100
10–1
10–3
10–2
Nor
mal
ized
inte
nsity
Delay time (ms)0 20 40
Delay time (ms)0 2.5 5
0.01%0.1%0.8%1.3%3.8%5.4%9.4%15.7%
Mn4+ (x%)
a
db
c
0.0
0.6
0.8
1.0
0.4
0.2
Mn4+ concentration (%)
0 4 8 12 16
Qua
ntum
effi
cien
cy
Life
time
(ms)
5.2
5.4
5.8
5.6
6.0
6.2
Quantum efficiency
0 20 40Delay time (ms)
100
10–1
10–2
Nor
mal
ized
inte
nsity
Res
idua
ls
100
10–1
10–2
Nor
mal
ized
inte
nsity
Res
idua
ls
100
10–1
10–2
Nor
mal
ized
inte
nsity
Res
idua
ls
0.8% Mn4+
T = 298 K
0 20 40Delay time (ms)
0 40 806020Delay time (ms)
�fit = 5.6 ms
15.7% Mn4+
T = 298 K
15.7% Mn4+
T = 4 K
�fit = 5.4 ms �fit = 10.6 ms
e
Emission lifetime
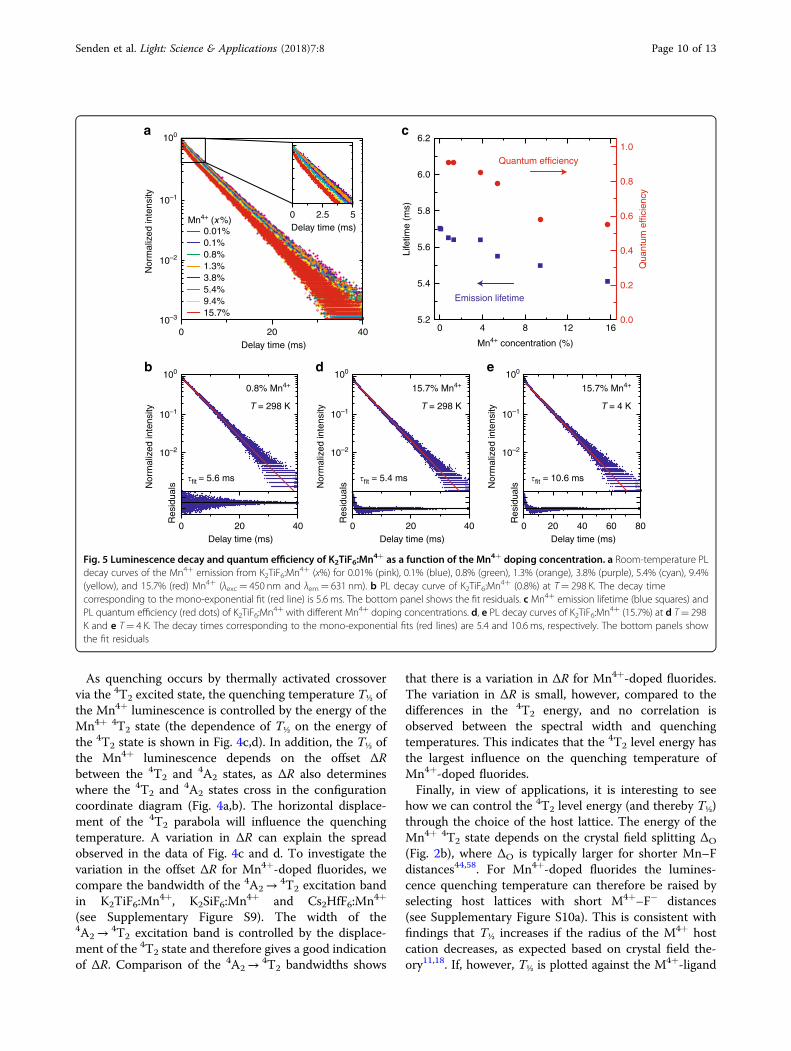
Fig. 5 Luminescence decay and quantum efficiency of K2TiF6:Mn4+ as a function of the Mn4+ doping concentration. a Room-temperature PLdecay curves of the Mn4+ emission from K2TiF6:Mn4+ (x%) for 0.01% (pink), 0.1% (blue), 0.8% (green), 1.3% (orange), 3.8% (purple), 5.4% (cyan), 9.4%(yellow), and 15.7% (red) Mn4+ (λexc= 450 nm and λem= 631 nm). b PL decay curve of K2TiF6:Mn4+ (0.8%) at T= 298 K. The decay timecorresponding to the mono-exponential fit (red line) is 5.6 ms. The bottom panel shows the fit residuals. c Mn4+ emission lifetime (blue squares) andPL quantum efficiency (red dots) of K2TiF6:Mn4+ with different Mn4+ doping concentrations. d, e PL decay curves of K2TiF6:Mn4+ (15.7%) at d T= 298K and e T= 4 K. The decay times corresponding to the mono-exponential fits (red lines) are 5.4 and 10.6 ms, respectively. The bottom panels showthe fit residuals
Senden et al. Light: Science & Applications (2018) 7:8 Page 10 of 13
distance for both Mn4+-doped fluorides and Mn4+-dopedoxides (see Supplementary Figure S10b), no correlationbetween T½ and the M4+-ligand distance is found. Thisshows that the crystal field splitting and 4T2 energy give abetter indication of the quenching temperature for Mn4+-doped phosphors.
Concentration quenchingIn addition to insight into thermal quenching, con-
centration quenching in Mn4+-doped fluorides is impor-tant for application in w-LEDs. The weak parity-forbidden4A2→
4T2 absorption requires that commercial phos-phors have high Mn4+ concentrations. If there is effectiveconcentration quenching, the PL decay time and QE willdecrease when the Mn4+ doping concentration israised26,28. We therefore investigate concentrationquenching in K2TiF6:Mn4+ by measuring the PL decaytimes and QEs of K2TiF6:Mn4+ phosphors with Mn4+
concentrations ranging from 0.01 to 15.7% Mn4+.Figure 5a presents room-temperature PL decay curves
of the Mn4+ emission from K2TiF6:Mn4+ with increasingMn4+ doping concentration x. It can be seen that the PLdecay becomes slightly faster as the Mn4+ concentrationincreases. We analyze the decay dynamics by singleexponential fitting of the PL decay curves. The fit forK2TiF6:Mn4+ (0.8%) is shown in Fig. 5b. The fit residuals(bottom panel) are random and the PL decay thusresembles a single exponential. This indicates that thedecay of the 2E state is mainly radiative. Consequently, theK2TiF6:Mn4+ (0.8%) phosphor has a very high QE of 90%.Figure 5c gives an overview of the fitted decay times (bluesquares) and QEs (red dots) of K2TiF6:Mn4+ with differ-ent Mn4+ concentrations. The emission lifetime barelyshortens if the Mn4+ concentration is increased (5.7 msfor 0.01% Mn4+ to 5.4 ms for 15.7% Mn4+). This suggeststhat energy migration to quenching sites is inefficient inK2TiF6:Mn4+. To verify this, we look at the QE valuesobtained for the K2TiF6:Mn4+ (x%) phosphors. The QEremains above 80% for Mn4+ doping concentrations of 5%or less, which shows that concentration quenching isindeed limited up to a concentration of 5% Mn4+ ions.This result is important for applications in w-LEDs, asthese high Mn4+ doping concentrations (e.g., 5 mol%) arerequired for sufficient absorption of the blue LED light inthe parity-forbidden d–d transitions12.For higher Mn4+ concentrations (x > 10%), non-
radiative decay from the 2E excited state becomes stron-ger, however, and as a result the QE of K2TiF6:Mn4+ fallsbelow 60% (Fig. 5c). The non-radiative decay is also visiblein the PL decay curve of K2TiF6:Mn4+ (15.7%), shown inFig. 5d. The decay is multi-exponential, which proves thatwith 15.7% Mn4+ the 2E state decays both radiatively andnon-radiatively. The faster initial decay indicates thatthere is enhanced quenching by single-step energy
transfer for Mn4+ ions close to a quencher. In case ofenergy migration, a faster decay is also expected for longertimes after the excitation pulse. As this is not observed,the contribution of energy migration via many Mn4+ ionsto quenching sites seems to be small.To further investigate the role of energy migration in
the concentration quenching of the Mn4+ emission, wemeasure a PL decay curve of K2TiF6:Mn4+ (15.7%) at T=4 K, which is displayed in Fig. 5e. At T= 4 K energymigration among the Mn4+ ions (blue arrows in Fig. 1)will be hampered, as there is almost no spectral overlapbetween the Mn4+ 2E→ 4A2 emission and 4A2→
2Eexcitation lines (see Supplementary Figure S11). Hence, at4 K non-radiative decay due to energy migration toquenching sites will be suppressed. The Mn4+ decaydynamics in Fig. 5e, however, show that the non-radiativedecay is not suppressed at 4 K. The deviation from singleexponential behavior is similar to that at 300 K. There isan initial faster decay (single-step energy transfer toquenching sites) followed by an exponential decay with adecay time very close to that measured for Mn4+ at lowdoping concentrations. This suggests that the decrease inQE at higher Mn4+ concentrations is not due to energymigration. The absence of strong concentration quench-ing by energy migration is confirmed by the thermalquenching behavior measured for the different Mn4+
concentrations. In Supplementary Figure S4, it can beseen that the luminescence quenching temperature isapproximately the same for doping concentrations of0.01% and 15.7% Mn4+, which shows that effects due tothermally activated energy migration (i.e., concentrationquenching) are weak. Hence, we conclude that the non-radiative decay at high Mn4+ concentrations is not causedby energy migration. Inefficient energy migration can beunderstood based on the strongly forbidden character ofthe 2E→ 4A2 transition. This allows only Mn4+–Mn4+
energy transfer via short range exchange interaction(see Supplementary Information for details).We instead assign the non-radiative decay to direct
transfer of excitation energy from Mn4+ ions to quench-ers (green arrow in Fig. 1). This process can occur at alltemperatures and becomes more efficient at higher Mn4+
dopant concentrations. With an increasing Mn4+ dopantconcentration, the stress on the K2TiF6 lattice grows andas a result more crystal defects (i.e., quenchers) may beformed. In addition, Mn in different valence states (Mn2+
and Mn3+) may be incorporated at higher Mn4+ con-centrations. Even if a very small fraction of Mn4+ ions hasa different valence state than 4+, effective quenching canoccur via metal-to-metal charge-transfer states or directenergy transfer. Consequently, the probability for energytransfer to quenchers increases, resulting in faster initialPL decay and lower QEs for K2TiF6:Mn4+ at high Mn4+
dopant concentrations. Optimized synthesis procedures
Senden et al. Light: Science & Applications (2018) 7:8 Page 11 of 13
to reduce quenchers (defects and impurity ions) are thuscrucial for obtaining highly luminescent Mn4+-dopedfluoride phosphors (see also recent work of Garcia-Santamaria et al.59 on concentration quenching in K2SiF6:Mn4+).
ConclusionsNarrow-band red-emitting Mn4+ phosphors form an
important new class of materials for LED lighting anddisplays. For these applications, it is important to under-stand and control the luminescence efficiency. We havetherefore investigated quenching of the Mn4+ lumines-cence in Mn4+-doped fluorides by measuring the PLintensity and luminescence lifetimes of K2TiF6:Mn4+
between 4 and 600 K and for Mn4+ concentrations from0.01 to 15.7%. Temperature-dependent measurements ofthe Mn4+ emission intensity and lifetime for K2TiF6:Mn4+
and other Mn4+-doped phosphors show that thermalquenching is caused by thermally activated crossover viathe Mn4+ 4T2 excited state. As a result, the quenchingtemperature is higher in Mn4+-doped materials withhigher 4T2 state energies. These findings can be used toengineer Mn4+-doped fluoride phosphors with higherquenching temperatures for application in high-power w-LEDs.Furthermore, quantum efficiency and luminescence
decay measurements for a wide range of Mn4+ dopingconcentrations show that no concentration quenchingoccurs up to 5% Mn4+ in K2TiF6:Mn4+. This is importantfor the application of Mn4+-doped materials in w-LEDs,as high Mn4+ doping concentrations (e.g., 5 mol%) arerequired for sufficient absorption of the blue LED light inthe parity-forbidden Mn4+ d–d transitions. At very highMn4+ doping concentrations (>10mol%) the quantumefficiency of K2TiF6:Mn4+ decreases due to enhanceddirect energy transfer from Mn4+ to quenching sites.Concentration quenching by Mn4+–Mn4+ energymigration is limited. To optimize the efficiency in highlydoped Mn4+ phosphors, a synthesis procedure aimed atreducing quenching sites (defects, impurity ions, Mn2+,and Mn3+) will be crucial.
AcknowledgementsWe thank Stephan Zevenhuizen and Hans Meeldijk for performing the SEMand EDX measurements. Mart Peeters is acknowledged for measuring the PLquantum efficiencies. Suzanne Verkleij is acknowledged for taking thephotographic images of the K2TiF6:Mn4+ phosphors. This work is financiallysupported by Technologiestichting STW, which is part of the NederlandseOrganisatie voor Wetenschappelijk Onderzoek (NWO).
Author details1Condensed Matter and Interfaces, Debye Institute for Nanomaterials Science,Utrecht University, P.O. Box 80000, 3508 TA Utrecht, The Netherlands. 2SoftCondensed Matter, Debye Institute for Nanomaterials Science, UtrechtUniversity, P.O. Box 80000, 3508 TA Utrecht, The Netherlands
Conflict of interestThe authors declare that they have no conflict of interest.
Supplementary information is available for this paper at https://doi.org/10.1038/s41377-018-0013-1.
Received: 12 October 2017 Revised: 21 February 2018 Accepted: 7 March2018 Accepted article preview online: 13 March 2018
References1. The Economist. Charge of the LED brigade: a global switch to LEDs will
change the lighting business. 20 Aug (2011).2. Krames, M. R. et al. Status and future of high-power light-emitting diodes for
solid-state lighting. J. Disp. Technol. 3, 160–175 (2007).3. Harbers, G., Bierhuizen, S. J. & Krames, M. R. Performance of high power light
emitting diodes in display illumination applications. J. Disp. Technol. 3, 98–109(2007).
4. Setlur, A. A. Phosphors for LED-based solid-state lighting. Electrochem. Soc.Interface 18, 32–36 (2009).
5. Smet, P. F., Parmentier, A. B. & Poelman, D. Selecting conversion phosphors forwhite light-emitting diodes. J. Electrochem. Soc. 158, R37–R54 (2011).
6. Bachmann, V., Ronda, C. & Meijerink, A. Temperature quenching of yellow Ce3+ luminescence in YAG:Ce. Chem. Mater. 21, 2077–2084 (2009).
7. Ye, S., Xiao, F., Pan, Y. X., Ma, Y. Y. & Zhang, Q. Y. Phosphors in phosphor-converted white light-emitting diodes: recent advances in materials, techni-ques and properties. Mater. Sci. Eng. R. Rep. 71, 1–34 (2010).
8. Xie, R. J. & Hirosaki, N. Silicon-based oxynitride and nitride phosphors for whiteLEDs—a review. Sci. Technol. Adv. Mater. 8, 588–600 (2007).
9. Setlur, A. A. et al. Energy-efficient, high color-rendering LED lamps usingoxyfluoride and fluoride phosphors. Chem. Mater. 22, 4076–4082 (2010).
10. Lin, C. C., Meijerink, A. & Liu, R. S. Critical red components for next-generationwhite LEDs. J. Phys. Chem. Lett. 7, 495–503 (2016).
11. Nguyen, H. D. & Liu, R. S. Narrow-band red-emitting Mn4+-doped hexafluoridephosphors: synthesis, optoelectronic properties, and applications in whitelight-emitting diodes. J. Mater. Chem. C 4, 10759–10775 (2016).
12. Radkov, E. V., Grigorov, L. S., Setlur, A. A., & Srivastava, A. M. Red line emittingphosphor materials for use in LED applications: US 7497973B2. 2009-03-03.
13. Zhu, H. et al. Highly efficient non-rare-earth red emitting phosphor for warmwhite light-emitting diodes. Nat. Commun. 5, 4312 (2014).
14. McKittrick, J. & Shea-Rohwer, L. E. Review: down conversion materials for solid-state lighting. J. Am. Ceram. Soc. 97, 1327–1352 (2014).
15. Paulusz, A. G. Efficient Mn(IV) emission in fluorine coordination. J. Electrochem.Soc. 120, 942–947 (1973).
16. Takahashi, T. & Adachi, S. Mn4+-activated red photoluminescence in K2SiF6phosphor. J. Electrochem. Soc. 155, E183–E188 (2008).
17. Wei, L. L. et al. A low-temperature co-precipitation approach to synthesizefluoride phosphors K2MF6:Mn
4+ (M = Ge, Si) for white LED applications. J.Mater. Chem. C 3, 1655–1660 (2015).
18. Sakurai, S., Nakamura, T. & Adachi, S. Rb2SiF6:Mn4+ and Rb2TiF6:Mn4+ red-
emitting phosphors. ECS J. Solid State Sci. Technol. 5, R206–R210 (2016).19. Sijbom, H. F., Joos, J. J., Martin, l. I. D. J., Van den Eeckhout, K. & Poelman, D. et al
Luminescent behavior of the K2SiF6:Mn4+ red phosphor at high fluxes and at
the microscopic level. ECS J. Solid State Sci. Technol. 5, R3040–R3048 (2016).20. Kasa, R. & Adachi, S. Red and deep red emissions from cubic K2SiF6:Mn
4+ andhexagonal K2MnF6 synthesized in HF∕KMnO4∕KHF2∕Si solutions. J. Electrochem.Soc. 159, J89–J95 (2012).
21. Nguyen, H. D., Lin, C. C., Fang, M. H. & Liu, R. S. Synthesis of Na2SiF6:Mn4+ red
phosphors for white LED applications by co-precipitation. J. Mater. Chem. C 2,10268–10272 (2014).
22. Arai, Y. & Adachi, S. Optical transitions and internal vibronic frequencies ofMnF6
2− ions in Cs2SiF6 and Cs2GeF6 red phosphors. J. Electrochem. Soc. 158,J179–J183 (2011).
23. Sekiguchi, D., Nara, J. & Adachi, S. Photoluminescence and Raman scatteringspectroscopies of BaSiF6:Mn
4+ red phosphor. J. Appl. Phys. 113, 183516 (2013).24. Dorenbos, P. Charge transfer bands in optical materials and related defect
level location. Opt. Mater. 69, 8–22 (2017).25. Blasse, G. & de Korte, P. H. M. The luminescence of tetravalent manganese in
CaZrO3:Mn. J. Inorg. Nucl. Chem. 43, 1505–1506 (1981).
Senden et al. Light: Science & Applications (2018) 7:8 Page 12 of 13
26. Blasse, G. & Grabmaier, B. C. Luminescent Materials (Springer-Verlag, Berlin,1994).
27. Senden, T., Broers, F. T. H. & Meijerink, A. Comparative study of the Mn4+ 2E→4A2 luminescence in isostructural RE2Sn2O7:Mn
4+ pyrochlores (RE3+ = Y3+, Lu3+ or Gd3+). Opt. Mater. 60, 431–437 (2016).
28. Dexter, D. L. & Schulman, J. H. Theory of concentration quenching in inorganicphosphors. J. Chem. Phys. 22, 1063–1070 (1954).
29. Zhou, Q. et al. Mn4+-activated BaSiF6 red phosphor: hydrothermal synthesisand dependence of its luminescent properties on reaction conditions. Mater.Chem. Phys. 170, 32–37 (2016).
30. Jiang, X. et al. Hydrothermal synthesis and photoluminescence properties ofred phosphor BaSiF6:Mn
4+ for LED applications. J. Mater. Chem. C 2,2301–2306 (2014).
31. Lv, L., Jiang, X., Huang, S., Chen, X. & Pan, Y. The formation mechanism,improved photoluminescence and LED applications of red phosphor K2SiF6:Mn4+. J. Mater. Chem. C 2, 3879–3884 (2014).
32. Zhong, J. et al. Synthesis and optical performance of a new red-emittingZnTiF6·6H2O:Mn
4+ phosphor for warm white-light-emitting diodes. J. Alloy.Compd. 662, 232–239 (2016).
33. Xi, L. & Pan, Y. Tailored photoluminescence properties of a red phosphorBaSnF6:Mn
4+ synthesized from Sn metal at room temperature and its for-mation mechanism. Mater. Res. Bull. 86, 57–62 (2017).
34. Kim, M., Park, W. B., Bang, B., Kim, C. H. & Sohn, K. S. Radiative and non-radiativedecay rate of K2SiF6:Mn4+ phosphors. J. Mater. Chem. C 3, 5484–5489 (2015).
35. Liao, J., Nie, L., Zhong, L., Gu, Q. & Wang, Q. Co-precipitation synthesis andluminescence properties of K2TiF6:Mn4+ red phosphors for warm white light-emitting diodes. Luminescence 31, 802–807 (2016).
36. Yeo, B. E., Cho, Y. S. & Huh, Y. D. Synthesis and photoluminescence propertiesof a red-emitting phosphor, K2SiF6:Mn
4+, for use in three-band white LEDapplications. Opt. Mater. 51, 50–55 (2016).
37. Bode, H., Jenssen, H. & Bandte, F. Über eine neue darstellung des kalium-hexafluoromanganats(IV). Angew. Chem. 65, 304 (1953).
38. Roesky, H. W. Efficient Preparations of Fluorine Compounds (John Wiley & Sons,Inc, Hoboken, 2012).
39. Tanabe, Y. & Sugano, S. On the absorption spectra of complex ions. I. J. Phys.Soc. Jpn. 9, 753–766 (1954).
40. Tanabe, Y. & Sugano, S. On the absorption spectra of complex ions II. J. Phys.Soc. Jpn. 9, 766–779 (1954).
41. Henderson, B. & Imbusch, G. F. Optical Spectroscopy of Inorganic Solids (OxfordUniversity Press, Oxford, 1989).
42. Ogiegło, J. M. et al. Luminescence and luminescence quenching inGd3(Ga,Al)5O12 scintillators doped with Ce3+. J. Phys. Chem. A 117, 2479–2484(2013).
43. Bachmann, V., Jüstel, T., Meijerink, A., Ronda, C. & Schmidt, P. J. Luminescenceproperties of SrSi2O2N2 doped with divalent rare earth ions. J. Lumin. 121,441–449 (2006).
44. Senden, T., van Harten, E. J. & Meijerink, A. Synthesis and narrow red lumi-nescence of Cs2HfF6:Mn
4+, a new phosphor for warm white LEDs. J. Lumin.194, 131–138 (2018).
45. Hoshino, R., Nakamura, T. & Adachi, S. Synthesis and photoluminescenceproperties of BaSnF6:Mn
4+ red phosphor. ECS J. Solid State Sci. Technol. 5,R37–R43 (2016).
46. Struck, C. W. & Fonger, W. H. Unified model of the temperature quenching ofnarrow-line and broad-band emissions. J. Lumin. 10, 1–30 (1975).
47. Srivastava, A. M. et al. Unusual luminescence of octahedrally coordinateddivalent europium ion in Cs2M
2+P2O7 (M2+ = Ca, Sr). J. Lumin. 129, 919–925
(2009).48. Fonger, W. H. & Struck, C. W. Temperature dependences of Cr3+ radiative and
nonradiative transitions in ruby and emerald. Phys. Rev. B 11, 3251–3260(1975).
49. de Jong, M., Seijo, L., Meijerink, A. & Rabouw, F. T. Resolving the ambiguity inthe relation between Stokes shift and Huang–Rhys parameter. Phys. Chem.Chem. Phys. 17, 16959–16969 (2015).
50. Dorenbos, P. Anomalous luminescence of Eu2+ and Yb2+ in inorganiccompounds. J. Phys. Condens Matter 15, 2645–2665 (2003).
51. Jin, Y. et al. Narrow red emission band fluoride phosphor KNaSiF6:Mn4+ forwarm white light-emitting diodes. ACS Appl. Mater. Interfaces 8, 11194–11203(2016).
52. Brik, M. G. & Srivastava, A. M. Ab initio studies of the structural, electronic, andoptical properties of K2SiF6 single crystals at ambient and elevated hydrostaticpressure. J. Electrochem. Soc. 159, J212–J216 (2012).
53. Zhydachevskii, Y. et al. Spectroscopic properties of Mn4+ ions in SrLaAlO4. Opt.Mater. 35, 1664–1668 (2013).
54. Geschwind, S., Kisliuk, P., Klein, M. P., Remeika, J. P. & Wood, D. L. Sharp-linefluorescence, electron paramagnetic resonance, and thermoluminescence ofMn4+ in α-Al2O3. Phys. Rev. 126, 1684–1686 (1962).
55. Thorington, L. Temperature dependence of the emission of an improvedmanganese-activated magnesium germanate phosphor. J. Opt. Soc. Am. 40,579–583 (1950).
56. Kemeny, G. & Haake, C. H. Activator center in magnesium fluorogermanatephosphors. J. Chem. Phys. 33, 783–789 (1960).
57. Travniçek, M., Kröger, F. A., Botden, T. P. J. & Zalm, P. The luminescence of basicmagnesium arsenate activated by manganese. Physica 18, 33–42 (1952).
58. Srivastava, A. M. & Brik, M. G. The dependence of 10 Dq crystal field parameterfor Mn4+ (3d3 configuration) and the magnitude of 7F1 level splitting for Eu3+
(4f6 configuration) on pyrochlore compositions. Opt. Mater. 35, 196–200(2012).
59. Garcia-Santamaria, F., Murphy, J. E., Setlur, A. A. & Sista, S. P. Concentrationquenching in K2SiF6:Mn
4+ phosphors. ECS J. Solid State Sci. Technol. 7,R3030–R3033 (2018).
60. Wu, W. L. et al. High color rendering index of Rb2GeF6:Mn4+ for light-emitting
diodes. Chem. Mater. 29, 935–939 (2017).61. Mo, G. et al. Deep red BaTiF4:Mn
4+ phosphor: synthesis, optical properties andapplication for warmWLED devices. J. Mater. Sci. Mater. Electron 28, 8155–8159(2017).
62. Li, P., Wondraczek, L., Peng, M. & Zhang, Q. Tuning Mn4+ red photo-luminescence in (K,Rb)2Ge4O9:Mn
4+ solid solutions by partial alkali substitu-tion. J. Am. Ceram. Soc. 99, 3376–3381 (2016).
63. Baur, F. & Jüstel, T. Dependence of the optical properties of Mn4+ activatedA2Ge4O9 (A = K, Rb) on temperature and chemical environment. J. Lumin.177, 354–360 (2016).
64. Jansen, T. et al. Narrow-band deep red photoluminescence of Y2Mg3Ge3O12:Mn4+,Li+ inverse garnet for high power phosphor converted LEDs. ECS J. SolidState Sci. Technol. 7, R3086–R3092 (2018).
65. Zhang, S. et al. Novel La3GaGe5O16:Mn4+ based deep red phosphor: a
potential color converter for warm white light. RSC Adv. 5, 90499–90507(2015).
66. Takeda, Y., Kato, H., Kobayashi, M., Kobayashi, H. & Kakihana, M. Photo-luminescence properties of Mn4+-activated perovskite-type titanates, La2M-TiO6:Mn
4+ (M = Mg and Zn). Chem. Lett. 44, 1541–1543 (2015).67. Chen, D., Zhou, Y. & Zhong, J. A review on Mn4+ activators in solids for warm
white light-emitting diodes. RSC Adv. 6, 86285–86296 (2016).68. Riseberg, L. A. & Weber, M. J. Spectrum and anomalous temperature
dependence of the 2E→ 4A2 emission of Y3Al5O12:Mn4+. Solid State Commun.
9, 791–794 (1971).69. Peng, M., Yin, X., Tanner, P. A., Brik, M. G. & Li, P. Site occupancy preference,
enhancement mechanism, and thermal resistance of Mn4+ red luminescencein Sr4Al14O25:Mn
4+ for warm WLEDs. Chem. Mater. 27, 2938–2945 (2015).70. Da Fonseca, R. J. M. & Abritta, T. Radiative and nonradiative processes in
LiGa5O8:Mn4+. Phys. B Condens Matter 190, 327–332 (1993).
Senden et al. Light: Science & Applications (2018) 7:8 Page 13 of 13


