Embed Size (px)
Citation preview
McFadden et al. BMC Psychiatry 2012, 12:213http://www.biomedcentral.com/1471-244X/12/213
RESEARCH ARTICLE Open Access
Abnormalities in gamma-band responses tolanguage stimuli in first-degree relatives ofchildren with autism spectrum disorder: anMEG studyKristina L McFadden1, Susan Hepburn1,2, Erin Winterrowd3, Gwenda L Schmidt4 and Donald C Rojas1*
Abstract
Background: Synchronous neural oscillatory activity in the gamma range (30–80 Hz) has been shown to beabnormal in individuals with autism spectrum disorders (ASD) and their first-degree relatives in response to simpleauditory stimuli. Gamma-band abnormalities in ASD probands have been seen in response to language stimuli, butthis has not been investigated in first-degree relatives. This is of particular interest given that language impairmentsare a core symptom of ASD and may be part of the broad autism phenotype (BAP) seen in relatives.
Methods: Magnetoencephalography recordings during a continuous word recognition task were obtained for 23parents of a child with ASD (pASD) and 28 adult control participants. Total and evoked gamma-band activity, aswell as inter-trial phase-locking factor (PLF), were measured in response to the task. Beta-band activity was alsomeasured, due to its suggested role in language processing. Participants completed a series of language measuresto assess the relationship between brain activity and language function, and lateralization of task-related activitywas assessed.
Results: The pASD group showed increased evoked gamma and beta activity, while controls had decreasedevoked activity. Additionally, while both groups showed a reduction in total gamma power (commonly seen inlanguage tasks), this reduction was more prominent in the control group. The pASD group demonstratedsignificantly worse performance on a measure of phonology compared to controls. Significant but distinctrelationships were found between gamma/beta activity and language measures within the two groups. In addition,while the overall task generally elicited left lateralized responses, pASD showed greater left lateralization thancontrols in some regions of interest.
Conclusions: Abnormalities in oscillatory responses to language were seen in pASD that are consistent withprevious findings in ASD probands. Gamma-band responses to language stimuli have not previously been assessedin first-degree relatives of ASD probands and these findings are supportive of gamma-band activity as a heritable,neurophysiological biomarker of ASD. The possible relationship seen between language function and neural activityin the current study should be investigated further to assess if oscillatory response abnormalities may contribute tobehavioural manifestations of the BAP.
* Correspondence: [email protected] of Psychiatry at the University of Colorado Denver AnschutzMedical Campus, 13001 E. 17th Place, Aurora, CO 80045, USAFull list of author information is available at the end of the article
© 2012 McFadden et al. This is an Open Access article distributed under the terms of the Creative Commons AttributionLicense (http://creativecommons.org/licenses/by/2.0), which permits unrestricted use, distribution, and reproduction in anymedium, provided the original work is properly cited.
McFadden et al. BMC Psychiatry 2012, 12:213 Page 2 of 18http://www.biomedcentral.com/1471-244X/12/213
BackgroundAutism spectrum disorders (ASD) are characterized bydifficulties in social interaction, communication andrestricted interests [1] and are relatively common in theUnited States, with prevalence rates estimated to be ashigh as 1 in 110 children [2]. As diagnosis of ASD cur-rently relies on behavioral observations and caregiverinterviews alone, the discovery of physiological markers ofASD would provide objective markers of the condition,which would facilitate further research and treatment.Synchronous neural activity in the gamma range
(30–80 Hz) has been implicated as a neurophysiologicalbiomarker in ASD and can be reliably recorded via mag-netoencephalography (MEG). Gamma-band activity iseither phase-locked to the stimulus (evoked responses)or not phase-locked (induced responses); together, evokedand induced power make up total gamma-band power [3],although many researchers consider the phase-locked andnon-phase-locked components together, terming it inducedpower [4]. In this conception, induced power and totalpower are equivalent terms. While the precise role ofgamma-band activity is unclear, it has been implicated in awide range of processes such as attention [5-7], workingmemory [8,9], early processing of sensory information[10,11], language [12-15], and perceptual binding [16,17].This suggests that gamma-band oscillations are producedacross many areas of the cerebral cortex and are sensitiveto a wide variety of task manipulations. This is particularlyrelevant to ASD because many of these processes arethought to be abnormal in this condition [18-24].Grice et al. [25] first reported gamma-band abnormal-
ities in ASD. They found induced gamma activity to begreater to visual presentation of upright faces comparedto inverted faces in adult control participants, but didnot see the gamma-band inversion effect in a group ofadults with ASD. Previous MEG studies have also foundgamma-band abnormalities in response to auditory toneor click-train stimuli in children and adults with ASD[26-28], further implicating it as a biomarker of ASD.Specifically, children with ASD show reduced evokedgamma-band activity [26] and reduced gamma-bandphase-locking to stimuli [28] compared to controls.Adults with ASD also show this reduction in evokedactivity and phase-locking [27]. Braeutigam et al. [29]reported gamma-band activity abnormalities in adultswith ASD during a more complex auditory taskinvolving listening to sentences ending in logical orillogical words. While both groups showed increasedevoked gamma activity, the ASD group demonstrateda more complex pattern of increased activation thatwas stronger and more widespread across the timewindow.The gamma-band abnormalities (i.e., reduced evoked
gamma activity) seen in ASD in response to simple and
steady-state auditory stimuli have also been found inparents of children with ASD (pASD), implicatinggamma-band activity as a potentially heritable ASD bio-marker [27,30]. ASD is thought to be highly heritable, al-though there is inconsistency in heritability estimates.While some have estimated heritability to be as high as90% [31,32], recent work has suggested it could be closerto 38% [33]. Nonetheless, subclinical features of ASD areoften seen in first-degree relatives of those with ASD, aphenomenon referred to as the broad autism phenotype(BAP) [34,35]. Identification of physiological markers ofASD seen as part of the BAP could help in determiningunderlying causes of ASD symptoms, as well as advan-cing ASD research and treatment monitoring.The current study extends previous research by asses-
sing gamma-band abnormalities in pASD in response toauditory language stimuli, which has not previously beeninvestigated. While Braeutigam et al. [29] found increasedevoked gamma-band responses to spoken sentences inadults with ASD, this has not been studied in first-degreerelatives. In previous studies with simpler auditory stimuli(e.g., pure tone and modulated noise stimuli), bothindividuals with ASD [26,27] and pASD [27,30] demon-strated decreases in evoked gamma power compared tocontrols. Previous studies of gamma-band activity duringlanguage stimulation commonly demonstrate event-relateddesynchronization (ERD) in response to language, sug-gested to reflect semantic processing [13,36-38]. As thereare differences between findings using different kinds ofstimulation and experimental paradigms in ASD, it is im-portant to know if findings in pASD are also contextuallyspecific. The current study investigates whether thegamma-band abnormalities seen in pASD in response tolanguage stimuli are similar to those seen in ASD, with thegoal of further understanding and refining the biomarker.To assess this, participants completed an auditorycontinuous word recognition (CWR) task [39] duringMEG recording. By incorporating language into thetask, the gamma-band abnormalities in pASD can beevaluated more thoroughly than has been done previously.In addition, this task is of particular interest in thispopulation because language and communication diffi-culties are a core deficit in ASD [1], and can be seen aspart of the BAP [35,40,41]. Therefore, the current studyalso explored whether gamma-band abnormalities to lan-guage stimuli are related to behavioral measures oflanguage.While much of the research on neural oscillations in
ASD has focused on gamma-band activity, synchronousactivity in the beta band (13–30 Hz) is also relevant tothe current study. Neural oscillations in the beta bandhave been implicated in top-down cognitive control[42,43] and may be involved in language processing[12,37,44,45]. Few studies have investigated beta
McFadden et al. BMC Psychiatry 2012, 12:213 Page 3 of 18http://www.biomedcentral.com/1471-244X/12/213
oscillations in ASD, but increases in beta power havebeen found in children with ASD compared to typicallydeveloping controls [46]. The current study will alsoinvestigate group differences in beta-band activity.In summary, findings from the current study will fur-
ther elucidate gamma-band abnormalities seen in pASD.If these abnormalities are related to simple sensoryaspects of the presented stimuli, results should be con-sistent with those of previous studies using tone andclick-train stimuli, with pASD demonstrating reducedevoked gamma-band activity compared to controls.However, if gamma-band abnormalities are reflective ofhigher order cognitive processes, the pattern of groupdifferences will likely be similar to those seen in Braeutigamet al. [29], with pASD showing a more complex pattern ofincreased evoked gamma activity compared to controls.Group differences in beta-band activity will also beassessed, as beta-band activity may play a role in languageprocessing. Additionally, the current study will investigatethe relationship between behavioral measures of languageand gamma-band activity, assessing a possible link betweenabnormal gamma-band activity and behavioral manifesta-tions of the BAP. This will also be explored for beta-bandactivity. Lastly, the study will examine lateralization of brainactivity during the task, as abnormal lateralization of lan-guage function has been found in ASD [29,47] and theCWR task has previously been used to assess lan-guage lateralization [39]. As previous studies havesuggested that individuals with ASD tend to showright language lateralization rather than the leftlateralization usually seen in typically developing indi-viduals [29,47], we hypothesized that pASD wouldshow less left lateralization than controls.
MethodsParticipant characteristicsTwenty-three parents (8 male, 15 female; mean age =35.84 +/− 9.99 years) of a child with an AutismSpectrum Disorder (ASD) participated in the study. Eachparent had one child meeting DSM-IV criteria for ASD,as determined by consensus of the Autism DiagnosticObservation Schedule (ADOS [48]), the Autism Diag-nostic Interview, Revised (ADI-R [49]) and DSM-IVdiagnosis by a clinical psychologist. Only one parent perfamily participated in the study. Twenty-eight healthyadults (12 male, 16 female; mean age = 38.70 +/− 6.29years) with no personal or family history of developmen-tal disorder participated as a control group. Participantswere recruited via clinical referral (for parents) or fliers/mass email postings (for controls).
ProcedureParticipants provided informed consent and all proce-dures were in accordance with the guidelines of the
Colorado Multiple Institutional Review Board. Followingconsent, demographic measures were collected, includingage, gender, ethnicity, socioeconomic status (as determinedby the Hollingshead Four-Factor Index of Social Status(SES), family weighted total score [50]), and handedness,assessed with the Annett handedness questionnaire [51].To obtain an overall measure of cognitive ability, theWechsler Abbreviated Scale of Intelligence (WASI; Psycho-logical Corporation, 1999) was used to evaluate IQ in bothgroups.
Language measuresTo assess the relationship between language perform-ance and neural activity, participants completed a bat-tery of language measures prior to MEG recording. ThePeabody Picture Vocabulary Test (PPVT-III [52]) wasadministered to capture receptive language, with the Ex-pressive Vocabulary Test (EVT [53]) and the Verbal Flu-ency subtest from the Delis Kaplan Executive FunctionSystem (DK-EFS [54]) used as measures of expressivelanguage. Additionally, the Figurative Language subtestfrom the Test of Language Competence-Expanded Edi-tion (TOLC-E [55]) assessed figurative language, and theNonword Repetition subtest of the Comprehensive Testof Phonological Processing (CTOPP [56]) capturedphonological processing.Independent-samples t-tests were used to assess group
differences (pASD vs. control) in demographic, IQ,and language measures, using SPSS 17.0 (SPSS, Inc.,Chicago, IL). Scores for IQ and language measures werestandardized according to manufacturer recommendationsand the alpha criterion was set at .05 (two-tailed).
Continuous word recognition (CWR) taskTo assess neural activity in response to language stimuli,participants completed the CWR task during MEGrecording. Prior to MEG set-up, participants were givena visual list of target words and instructed to familiarizethemselves with the words so they could recognize themduring the task. During MEG recording, participants lis-tened to the spoken words presented via Eprime version1.3 (Psychology Software Tools, Inc., Pittsburgh, PA)through headphones at 80 dB SPL (with no visual repre-sentation of the words). Prior to recording, all partici-pants demonstrated hearing abilities within normallimits (< 20 dB HL) using the method of constant stim-uli. CWR task stimuli consisted of abstract Englishnouns, with 33 target words and 30 distractor words[39]. A recording of a native English speaker (malevoice) using a flat intonation was used in stimuli presen-tation. The words had a mean duration of 450 ms (range300–750 ms), and were digitized using a sampling rateof 22,500 Hz, with 16-bit resolution. Participants wereinstructed to slightly lift their dominant index finger
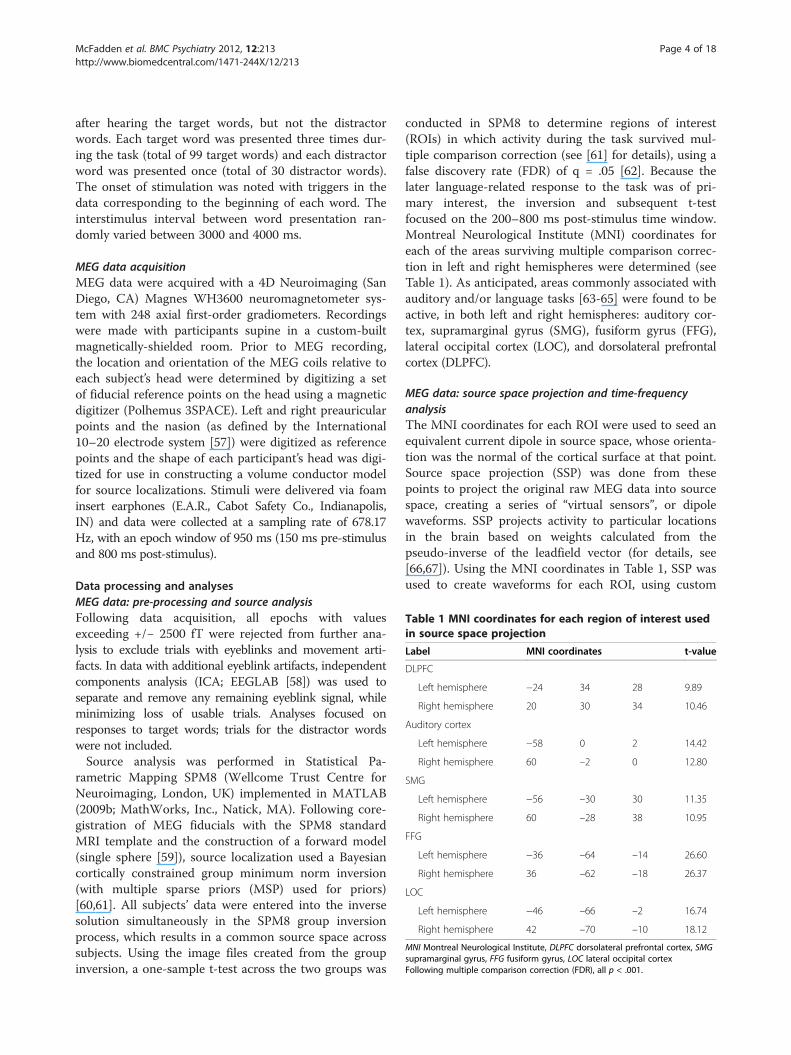
Table 1 MNI coordinates for each region of interest usedin source space projection
Label MNI coordinates t-value
DLPFC
Left hemisphere −24 34 28 9.89
Right hemisphere 20 30 34 10.46
Auditory cortex
Left hemisphere −58 0 2 14.42
Right hemisphere 60 –2 0 12.80
SMG
Left hemisphere −56 –30 30 11.35
Right hemisphere 60 –28 38 10.95
FFG
Left hemisphere −36 –64 –14 26.60
Right hemisphere 36 –62 –18 26.37
LOC
Left hemisphere −46 –66 –2 16.74
Right hemisphere 42 –70 –10 18.12
MNI Montreal Neurological Institute, DLPFC dorsolateral prefrontal cortex, SMGsupramarginal gyrus, FFG fusiform gyrus, LOC lateral occipital cortexFollowing multiple comparison correction (FDR), all p < .001.
McFadden et al. BMC Psychiatry 2012, 12:213 Page 4 of 18http://www.biomedcentral.com/1471-244X/12/213
after hearing the target words, but not the distractorwords. Each target word was presented three times dur-ing the task (total of 99 target words) and each distractorword was presented once (total of 30 distractor words).The onset of stimulation was noted with triggers in thedata corresponding to the beginning of each word. Theinterstimulus interval between word presentation ran-domly varied between 3000 and 4000 ms.
MEG data acquisitionMEG data were acquired with a 4D Neuroimaging (SanDiego, CA) Magnes WH3600 neuromagnetometer sys-tem with 248 axial first-order gradiometers. Recordingswere made with participants supine in a custom-builtmagnetically-shielded room. Prior to MEG recording,the location and orientation of the MEG coils relative toeach subject’s head were determined by digitizing a setof fiducial reference points on the head using a magneticdigitizer (Polhemus 3SPACE). Left and right preauricularpoints and the nasion (as defined by the International10–20 electrode system [57]) were digitized as referencepoints and the shape of each participant’s head was digi-tized for use in constructing a volume conductor modelfor source localizations. Stimuli were delivered via foaminsert earphones (E.A.R., Cabot Safety Co., Indianapolis,IN) and data were collected at a sampling rate of 678.17Hz, with an epoch window of 950 ms (150 ms pre-stimulusand 800 ms post-stimulus).
Data processing and analysesMEG data: pre-processing and source analysisFollowing data acquisition, all epochs with valuesexceeding +/− 2500 fT were rejected from further ana-lysis to exclude trials with eyeblinks and movement arti-facts. In data with additional eyeblink artifacts, independentcomponents analysis (ICA; EEGLAB [58]) was used toseparate and remove any remaining eyeblink signal, whileminimizing loss of usable trials. Analyses focused onresponses to target words; trials for the distractor wordswere not included.Source analysis was performed in Statistical Pa-
rametric Mapping SPM8 (Wellcome Trust Centre forNeuroimaging, London, UK) implemented in MATLAB(2009b; MathWorks, Inc., Natick, MA). Following core-gistration of MEG fiducials with the SPM8 standardMRI template and the construction of a forward model(single sphere [59]), source localization used a Bayesiancortically constrained group minimum norm inversion(with multiple sparse priors (MSP) used for priors)[60,61]. All subjects’ data were entered into the inversesolution simultaneously in the SPM8 group inversionprocess, which results in a common source space acrosssubjects. Using the image files created from the groupinversion, a one-sample t-test across the two groups was
conducted in SPM8 to determine regions of interest(ROIs) in which activity during the task survived mul-tiple comparison correction (see [61] for details), using afalse discovery rate (FDR) of q = .05 [62]. Because thelater language-related response to the task was of pri-mary interest, the inversion and subsequent t-testfocused on the 200–800 ms post-stimulus time window.Montreal Neurological Institute (MNI) coordinates foreach of the areas surviving multiple comparison correc-tion in left and right hemispheres were determined (seeTable 1). As anticipated, areas commonly associated withauditory and/or language tasks [63-65] were found to beactive, in both left and right hemispheres: auditory cor-tex, supramarginal gyrus (SMG), fusiform gyrus (FFG),lateral occipital cortex (LOC), and dorsolateral prefrontalcortex (DLPFC).
MEG data: source space projection and time-frequencyanalysisThe MNI coordinates for each ROI were used to seed anequivalent current dipole in source space, whose orienta-tion was the normal of the cortical surface at that point.Source space projection (SSP) was done from thesepoints to project the original raw MEG data into sourcespace, creating a series of “virtual sensors”, or dipolewaveforms. SSP projects activity to particular locationsin the brain based on weights calculated from thepseudo-inverse of the leadfield vector (for details, see[66,67]). Using the MNI coordinates in Table 1, SSP wasused to create waveforms for each ROI, using custom
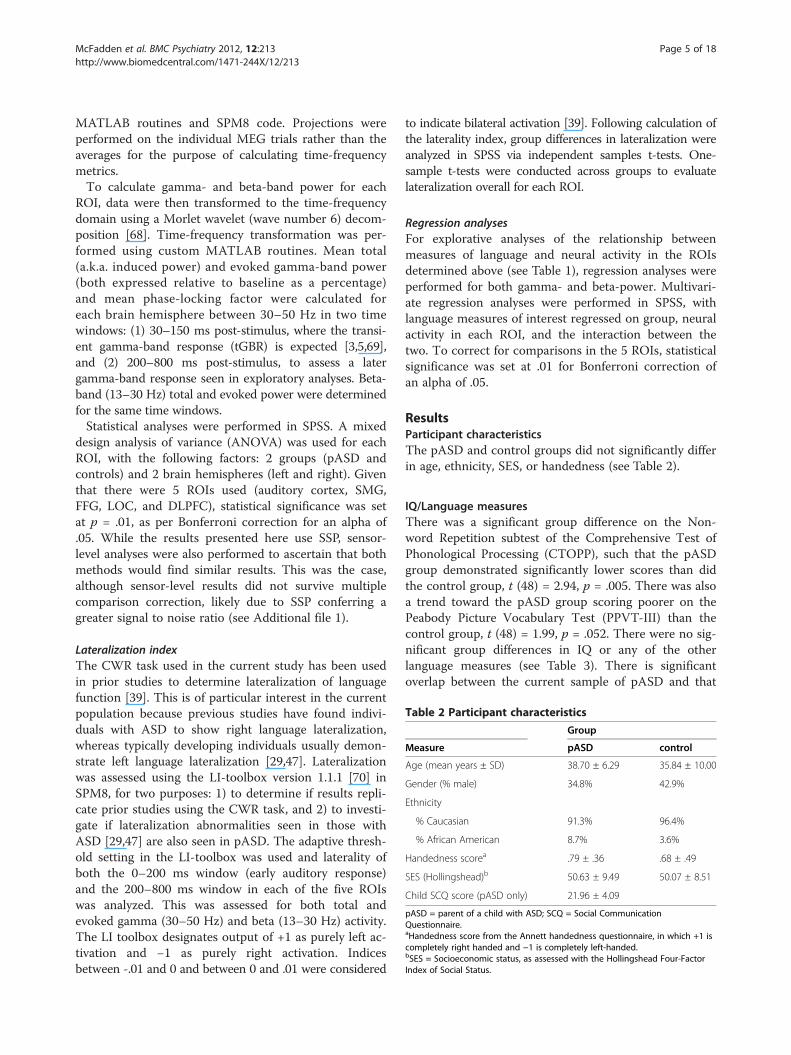
Table 2 Participant characteristics
Group
Measure pASD control
Age (mean years ± SD) 38.70 ± 6.29 35.84 ± 10.00
Gender (% male) 34.8% 42.9%
Ethnicity
% Caucasian 91.3% 96.4%
% African American 8.7% 3.6%
Handedness scorea .79 ± .36 .68 ± .49
SES (Hollingshead)b 50.63 ± 9.49 50.07 ± 8.51
Child SCQ score (pASD only) 21.96 ± 4.09
pASD = parent of a child with ASD; SCQ = Social CommunicationQuestionnaire.aHandedness score from the Annett handedness questionnaire, in which +1 iscompletely right handed and −1 is completely left-handed.bSES = Socioeconomic status, as assessed with the Hollingshead Four-FactorIndex of Social Status.
McFadden et al. BMC Psychiatry 2012, 12:213 Page 5 of 18http://www.biomedcentral.com/1471-244X/12/213
MATLAB routines and SPM8 code. Projections wereperformed on the individual MEG trials rather than theaverages for the purpose of calculating time-frequencymetrics.To calculate gamma- and beta-band power for each
ROI, data were then transformed to the time-frequencydomain using a Morlet wavelet (wave number 6) decom-position [68]. Time-frequency transformation was per-formed using custom MATLAB routines. Mean total(a.k.a. induced power) and evoked gamma-band power(both expressed relative to baseline as a percentage)and mean phase-locking factor were calculated foreach brain hemisphere between 30–50 Hz in two timewindows: (1) 30–150 ms post-stimulus, where the transi-ent gamma-band response (tGBR) is expected [3,5,69],and (2) 200–800 ms post-stimulus, to assess a latergamma-band response seen in exploratory analyses. Beta-band (13–30 Hz) total and evoked power were determinedfor the same time windows.Statistical analyses were performed in SPSS. A mixed
design analysis of variance (ANOVA) was used for eachROI, with the following factors: 2 groups (pASD andcontrols) and 2 brain hemispheres (left and right). Giventhat there were 5 ROIs used (auditory cortex, SMG,FFG, LOC, and DLPFC), statistical significance was setat p = .01, as per Bonferroni correction for an alpha of.05. While the results presented here use SSP, sensor-level analyses were also performed to ascertain that bothmethods would find similar results. This was the case,although sensor-level results did not survive multiplecomparison correction, likely due to SSP conferring agreater signal to noise ratio (see Additional file 1).
Lateralization indexThe CWR task used in the current study has been usedin prior studies to determine lateralization of languagefunction [39]. This is of particular interest in the currentpopulation because previous studies have found indivi-duals with ASD to show right language lateralization,whereas typically developing individuals usually demon-strate left language lateralization [29,47]. Lateralizationwas assessed using the LI-toolbox version 1.1.1 [70] inSPM8, for two purposes: 1) to determine if results repli-cate prior studies using the CWR task, and 2) to investi-gate if lateralization abnormalities seen in those withASD [29,47] are also seen in pASD. The adaptive thresh-old setting in the LI-toolbox was used and laterality ofboth the 0–200 ms window (early auditory response)and the 200–800 ms window in each of the five ROIswas analyzed. This was assessed for both total andevoked gamma (30–50 Hz) and beta (13–30 Hz) activity.The LI toolbox designates output of +1 as purely left ac-tivation and −1 as purely right activation. Indicesbetween -.01 and 0 and between 0 and .01 were considered
to indicate bilateral activation [39]. Following calculation ofthe laterality index, group differences in lateralization wereanalyzed in SPSS via independent samples t-tests. One-sample t-tests were conducted across groups to evaluatelateralization overall for each ROI.
Regression analysesFor explorative analyses of the relationship betweenmeasures of language and neural activity in the ROIsdetermined above (see Table 1), regression analyses wereperformed for both gamma- and beta-power. Multivari-ate regression analyses were performed in SPSS, withlanguage measures of interest regressed on group, neuralactivity in each ROI, and the interaction between thetwo. To correct for comparisons in the 5 ROIs, statisticalsignificance was set at .01 for Bonferroni correction ofan alpha of .05.
ResultsParticipant characteristicsThe pASD and control groups did not significantly differin age, ethnicity, SES, or handedness (see Table 2).
IQ/Language measuresThere was a significant group difference on the Non-word Repetition subtest of the Comprehensive Test ofPhonological Processing (CTOPP), such that the pASDgroup demonstrated significantly lower scores than didthe control group, t (48) = 2.94, p = .005. There was alsoa trend toward the pASD group scoring poorer on thePeabody Picture Vocabulary Test (PPVT-III) than thecontrol group, t (48) = 1.99, p = .052. There were no sig-nificant group differences in IQ or any of the otherlanguage measures (see Table 3). There is significantoverlap between the current sample of pASD and that
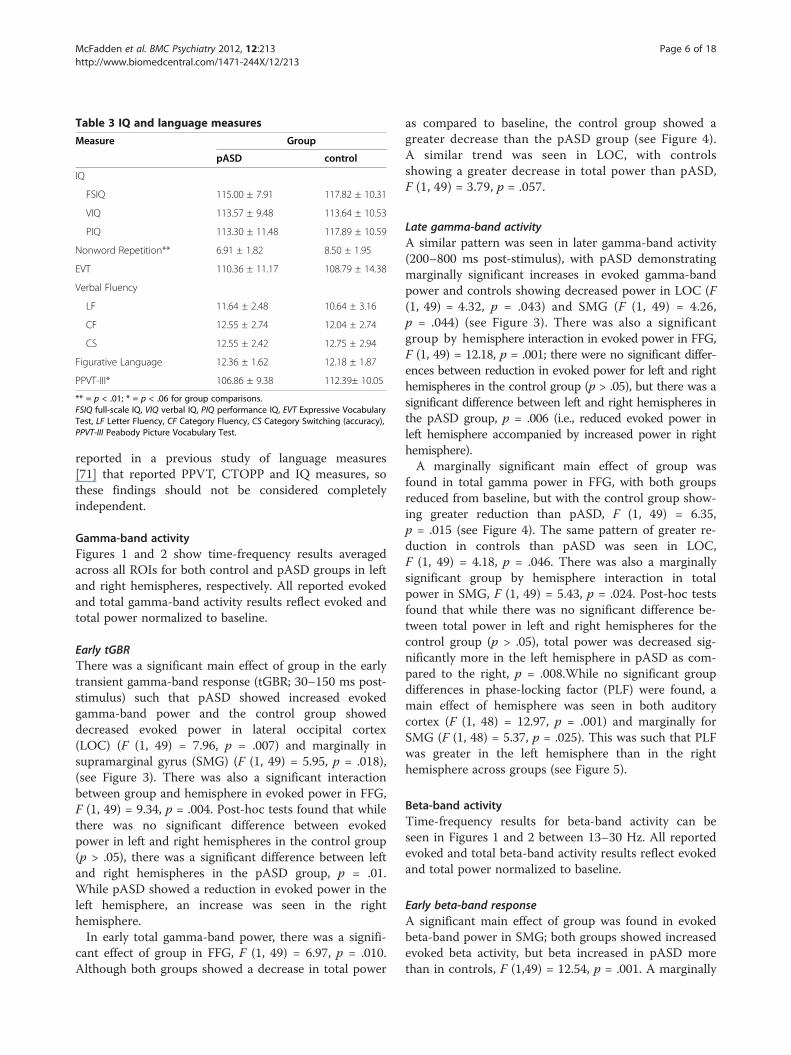
Table 3 IQ and language measures
Measure Group
pASD control
IQ
FSIQ 115.00 ± 7.91 117.82 ± 10.31
VIQ 113.57 ± 9.48 113.64 ± 10.53
PIQ 113.30 ± 11.48 117.89 ± 10.59
Nonword Repetition** 6.91 ± 1.82 8.50 ± 1.95
EVT 110.36 ± 11.17 108.79 ± 14.38
Verbal Fluency
LF 11.64 ± 2.48 10.64 ± 3.16
CF 12.55 ± 2.74 12.04 ± 2.74
CS 12.55 ± 2.42 12.75 ± 2.94
Figurative Language 12.36 ± 1.62 12.18 ± 1.87
PPVT-III* 106.86 ± 9.38 112.39± 10.05
** = p < .01; * = p < .06 for group comparisons.FSIQ full-scale IQ, VIQ verbal IQ, PIQ performance IQ, EVT Expressive VocabularyTest, LF Letter Fluency, CF Category Fluency, CS Category Switching (accuracy),PPVT-III Peabody Picture Vocabulary Test.
McFadden et al. BMC Psychiatry 2012, 12:213 Page 6 of 18http://www.biomedcentral.com/1471-244X/12/213
reported in a previous study of language measures[71] that reported PPVT, CTOPP and IQ measures, sothese findings should not be considered completelyindependent.
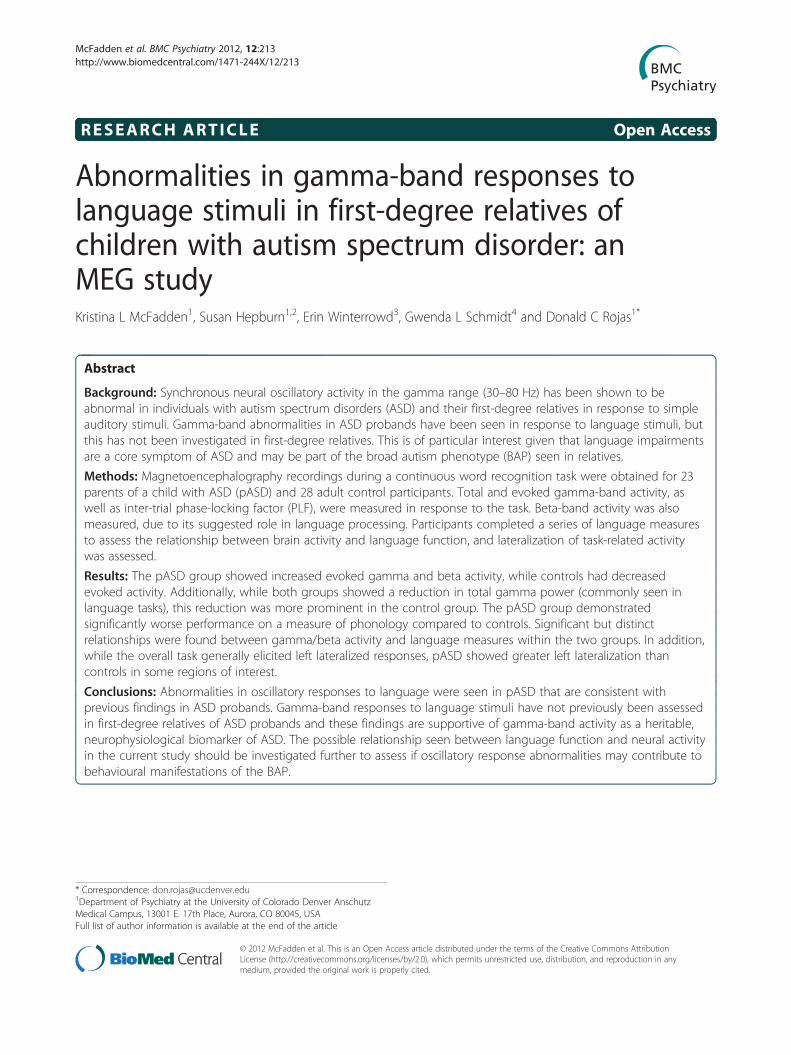
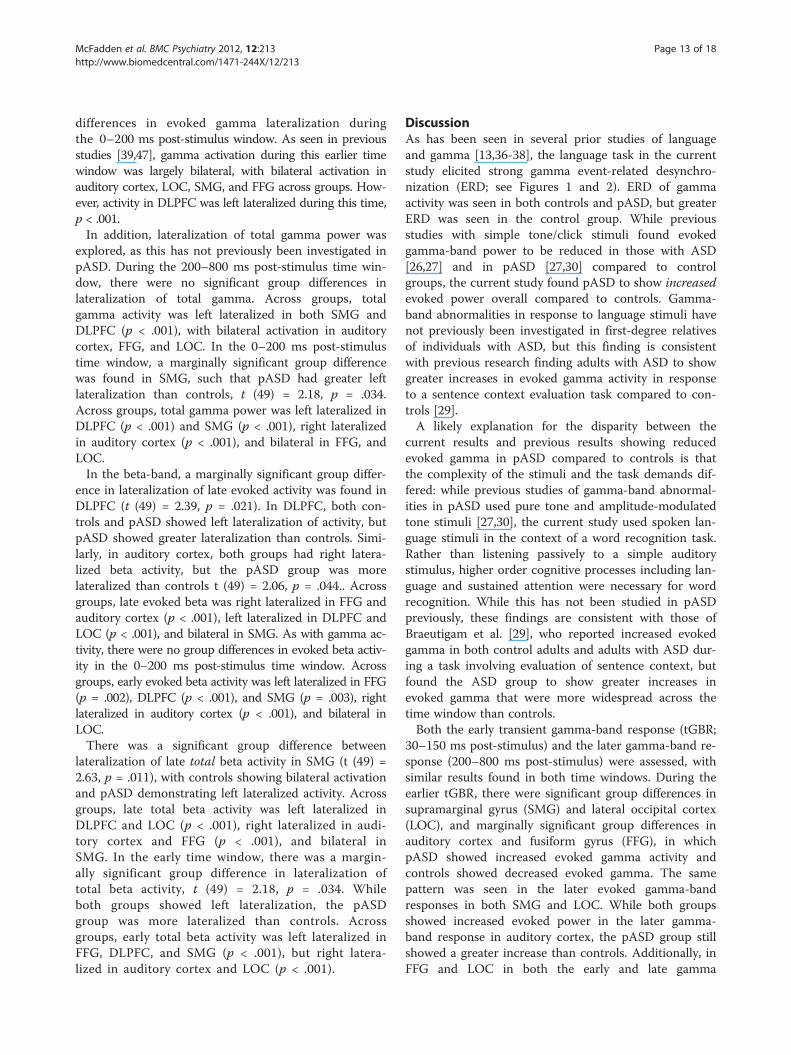
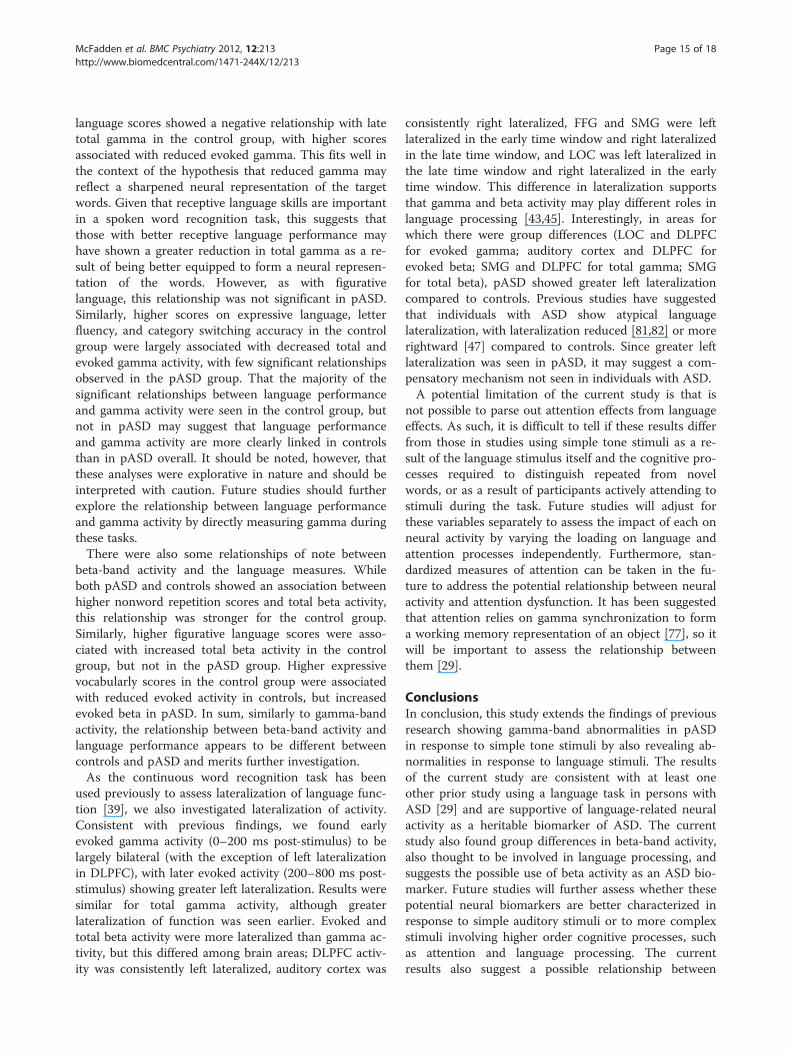
Gamma-band activityFigures 1 and 2 show time-frequency results averagedacross all ROIs for both control and pASD groups in leftand right hemispheres, respectively. All reported evokedand total gamma-band activity results reflect evoked andtotal power normalized to baseline.
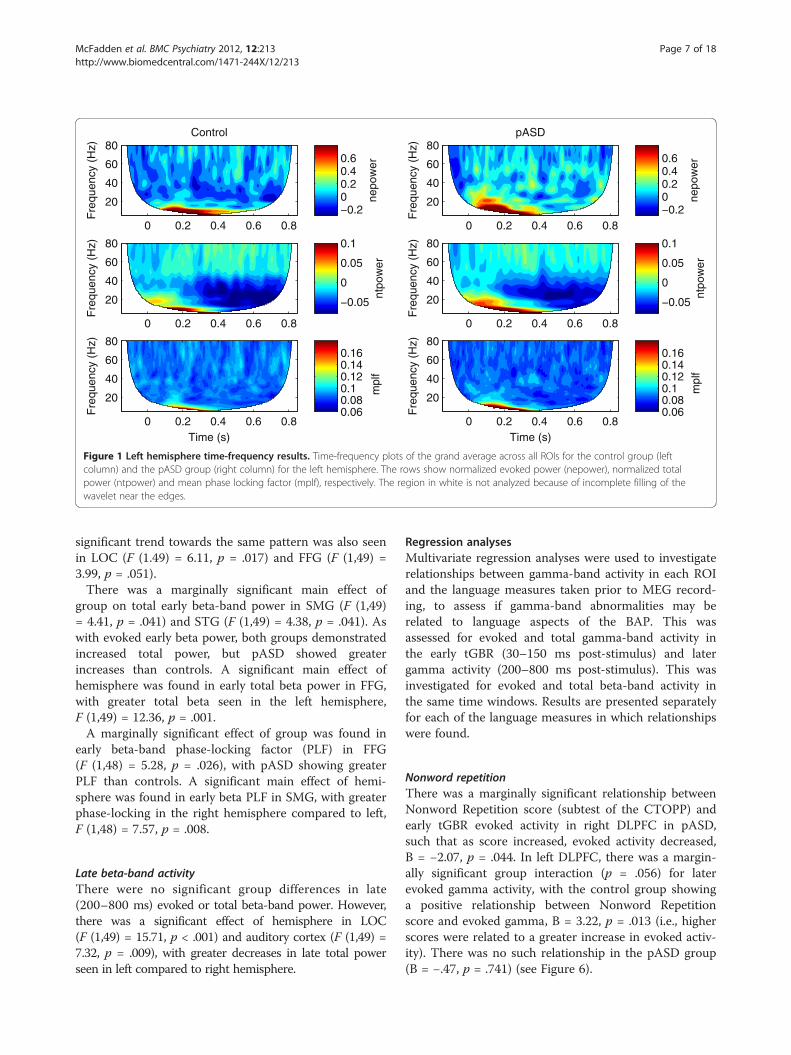
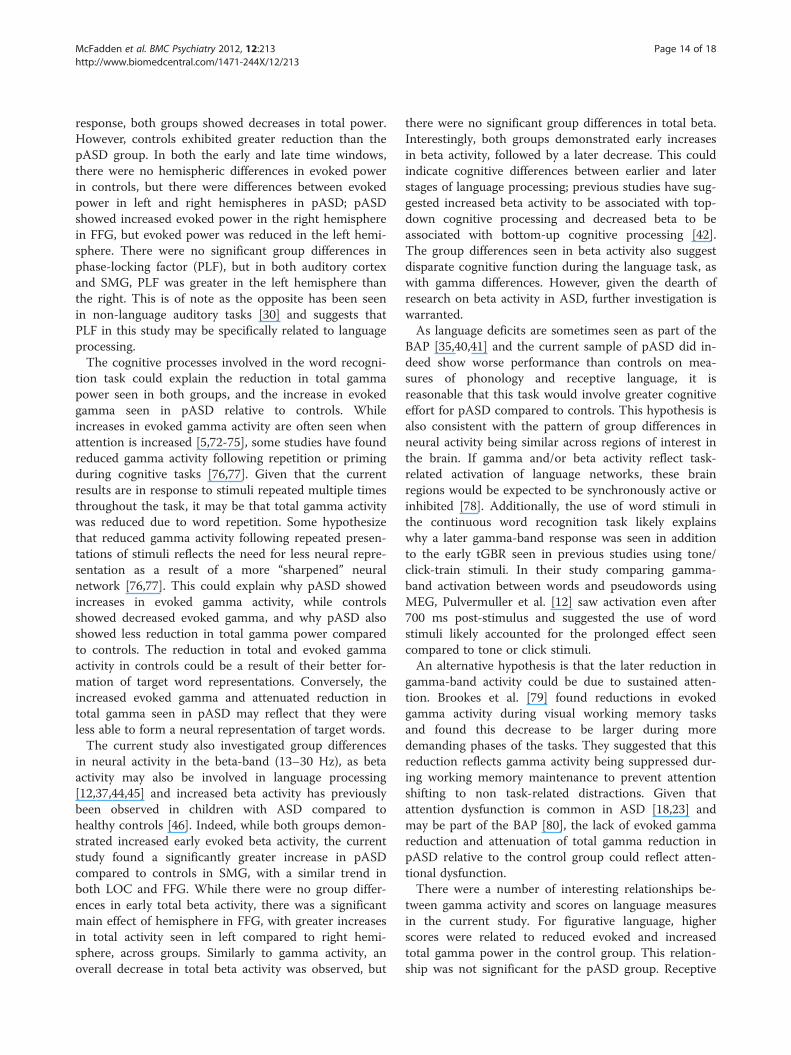
Early tGBRThere was a significant main effect of group in the earlytransient gamma-band response (tGBR; 30–150 ms post-stimulus) such that pASD showed increased evokedgamma-band power and the control group showeddecreased evoked power in lateral occipital cortex(LOC) (F (1, 49) = 7.96, p = .007) and marginally insupramarginal gyrus (SMG) (F (1, 49) = 5.95, p = .018),(see Figure 3). There was also a significant interactionbetween group and hemisphere in evoked power in FFG,F (1, 49) = 9.34, p = .004. Post-hoc tests found that whilethere was no significant difference between evokedpower in left and right hemispheres in the control group(p > .05), there was a significant difference between leftand right hemispheres in the pASD group, p = .01.While pASD showed a reduction in evoked power in theleft hemisphere, an increase was seen in the righthemisphere.In early total gamma-band power, there was a signifi-
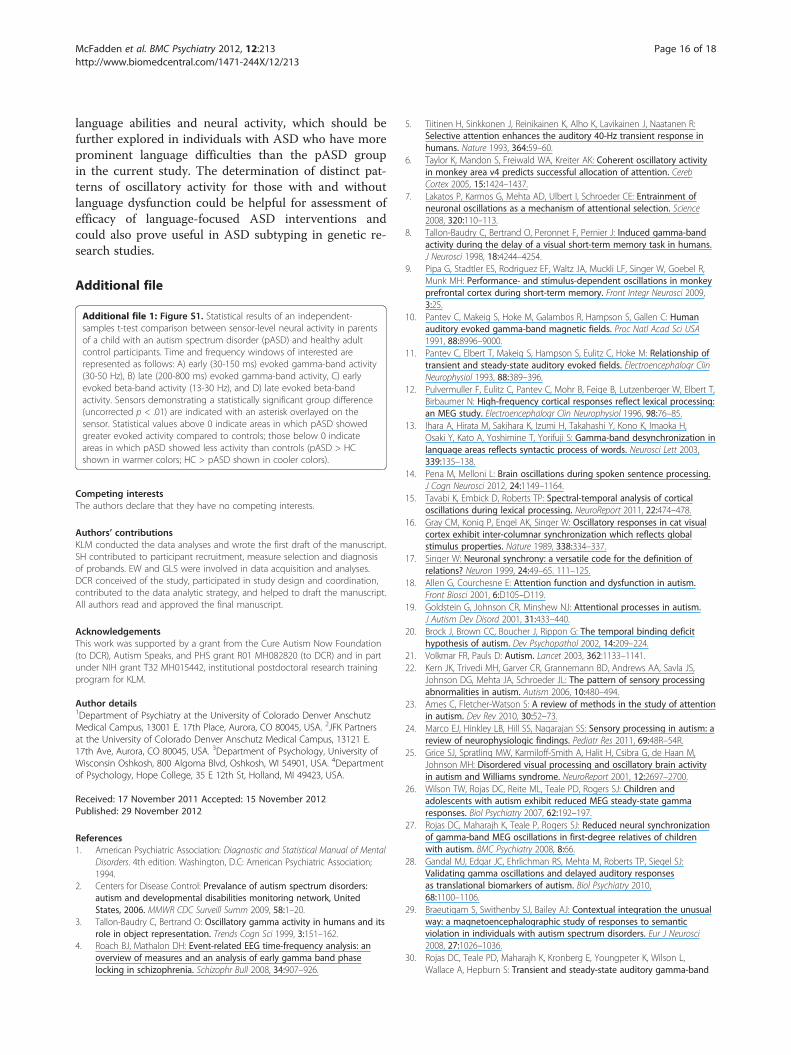
cant effect of group in FFG, F (1, 49) = 6.97, p = .010.Although both groups showed a decrease in total power
as compared to baseline, the control group showed agreater decrease than the pASD group (see Figure 4).A similar trend was seen in LOC, with controlsshowing a greater decrease in total power than pASD,F (1, 49) = 3.79, p = .057.
Late gamma-band activityA similar pattern was seen in later gamma-band activity(200–800 ms post-stimulus), with pASD demonstratingmarginally significant increases in evoked gamma-bandpower and controls showing decreased power in LOC (F(1, 49) = 4.32, p = .043) and SMG (F (1, 49) = 4.26,p = .044) (see Figure 3). There was also a significantgroup by hemisphere interaction in evoked power in FFG,F (1, 49) = 12.18, p = .001; there were no significant differ-ences between reduction in evoked power for left and righthemispheres in the control group (p > .05), but there was asignificant difference between left and right hemispheres inthe pASD group, p = .006 (i.e., reduced evoked power inleft hemisphere accompanied by increased power in righthemisphere).A marginally significant main effect of group was
found in total gamma power in FFG, with both groupsreduced from baseline, but with the control group show-ing greater reduction than pASD, F (1, 49) = 6.35,p = .015 (see Figure 4). The same pattern of greater re-duction in controls than pASD was seen in LOC,F (1, 49) = 4.18, p = .046. There was also a marginallysignificant group by hemisphere interaction in totalpower in SMG, F (1, 49) = 5.43, p = .024. Post-hoc testsfound that while there was no significant difference be-tween total power in left and right hemispheres for thecontrol group (p > .05), total power was decreased sig-nificantly more in the left hemisphere in pASD as com-pared to the right, p = .008.While no significant groupdifferences in phase-locking factor (PLF) were found, amain effect of hemisphere was seen in both auditorycortex (F (1, 48) = 12.97, p = .001) and marginally forSMG (F (1, 48) = 5.37, p = .025). This was such that PLFwas greater in the left hemisphere than in the righthemisphere across groups (see Figure 5).
Beta-band activityTime-frequency results for beta-band activity can beseen in Figures 1 and 2 between 13–30 Hz. All reportedevoked and total beta-band activity results reflect evokedand total power normalized to baseline.
Early beta-band responseA significant main effect of group was found in evokedbeta-band power in SMG; both groups showed increasedevoked beta activity, but beta increased in pASD morethan in controls, F (1,49) = 12.54, p = .001. A marginally
Fre
quen
cy (
Hz)
Control
0 0.2 0.4 0.6 0.8
20
40
60
80
nepo
wer
−0.200.20.40.6
Fre
quen
cy (
Hz)
pASD
0 0.2 0.4 0.6 0.8
20
40
60
80
nepo
wer
−0.200.20.40.6
Fre
quen
cy (
Hz)
0 0.2 0.4 0.6 0.8
20
40
60
80
ntpo
wer
−0.05
0
0.05
0.1
Fre
quen
cy (
Hz)
0 0.2 0.4 0.6 0.8
20
40
60
80
ntpo
wer
−0.05
0
0.05
0.1
Fre
quen
cy (
Hz)
Time (s)0 0.2 0.4 0.6 0.8
20
40
60
80
mpl
f
0.060.080.10.120.140.16
Fre
quen
cy (
Hz)
Time (s)0 0.2 0.4 0.6 0.8
20
40
60
80
mpl
f
0.060.080.10.120.140.16
Figure 1 Left hemisphere time-frequency results. Time-frequency plots of the grand average across all ROIs for the control group (leftcolumn) and the pASD group (right column) for the left hemisphere. The rows show normalized evoked power (nepower), normalized totalpower (ntpower) and mean phase locking factor (mplf), respectively. The region in white is not analyzed because of incomplete filling of thewavelet near the edges.
McFadden et al. BMC Psychiatry 2012, 12:213 Page 7 of 18http://www.biomedcentral.com/1471-244X/12/213
significant trend towards the same pattern was also seenin LOC (F (1.49) = 6.11, p = .017) and FFG (F (1,49) =3.99, p = .051).There was a marginally significant main effect of
group on total early beta-band power in SMG (F (1,49)= 4.41, p = .041) and STG (F (1,49) = 4.38, p = .041). Aswith evoked early beta power, both groups demonstratedincreased total power, but pASD showed greaterincreases than controls. A significant main effect ofhemisphere was found in early total beta power in FFG,with greater total beta seen in the left hemisphere,F (1,49) = 12.36, p = .001.A marginally significant effect of group was found in
early beta-band phase-locking factor (PLF) in FFG(F (1,48) = 5.28, p = .026), with pASD showing greaterPLF than controls. A significant main effect of hemi-sphere was found in early beta PLF in SMG, with greaterphase-locking in the right hemisphere compared to left,F (1,48) = 7.57, p = .008.
Late beta-band activityThere were no significant group differences in late(200–800 ms) evoked or total beta-band power. However,there was a significant effect of hemisphere in LOC(F (1,49) = 15.71, p < .001) and auditory cortex (F (1,49) =7.32, p = .009), with greater decreases in late total powerseen in left compared to right hemisphere.
Regression analysesMultivariate regression analyses were used to investigaterelationships between gamma-band activity in each ROIand the language measures taken prior to MEG record-ing, to assess if gamma-band abnormalities may berelated to language aspects of the BAP. This wasassessed for evoked and total gamma-band activity inthe early tGBR (30–150 ms post-stimulus) and latergamma activity (200–800 ms post-stimulus). This wasinvestigated for evoked and total beta-band activity inthe same time windows. Results are presented separatelyfor each of the language measures in which relationshipswere found.
Nonword repetitionThere was a marginally significant relationship betweenNonword Repetition score (subtest of the CTOPP) andearly tGBR evoked activity in right DLPFC in pASD,such that as score increased, evoked activity decreased,B = −2.07, p = .044. In left DLPFC, there was a margin-ally significant group interaction (p = .056) for laterevoked gamma activity, with the control group showinga positive relationship between Nonword Repetitionscore and evoked gamma, B = 3.22, p = .013 (i.e., higherscores were related to a greater increase in evoked activ-ity). There was no such relationship in the pASD group(B = −.47, p = .741) (see Figure 6).
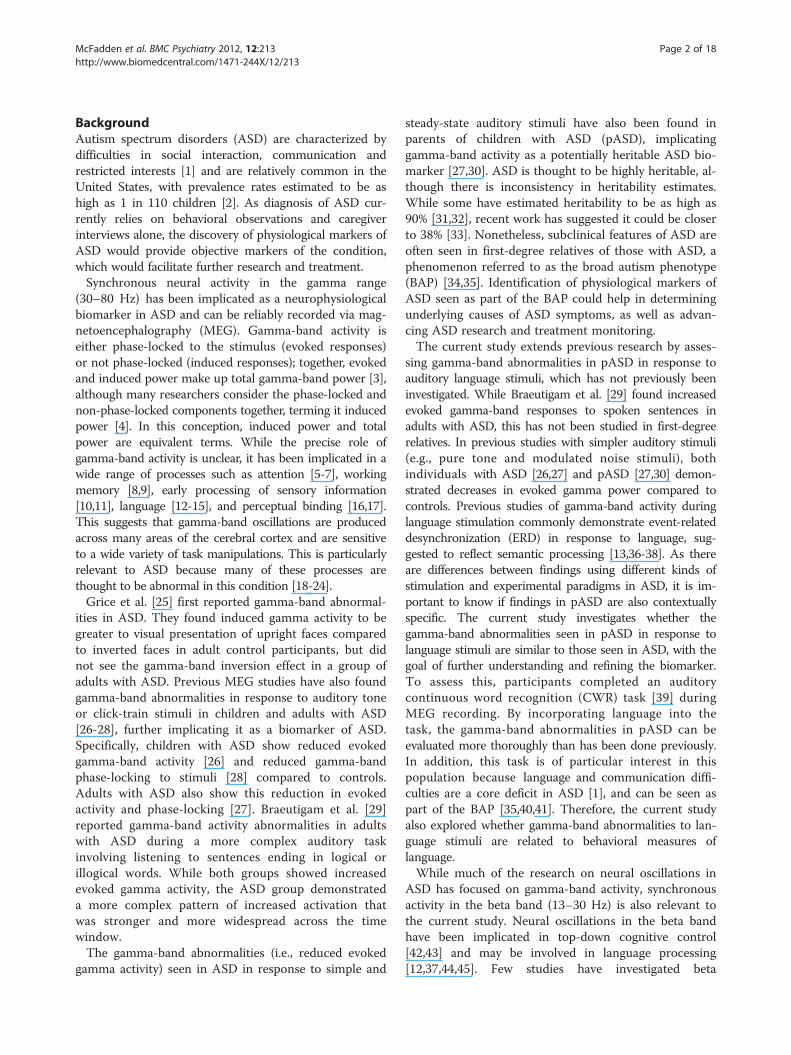
Figure 3 Evoked power results. Mean normalized evoked gamma and beta power (nepower) for A) auditory cortex, B) supramarginal gyrus, C)fusiform gyrus, D) dorsolateral prefrontal cortex, and E) lateral occipital cortex for left and right hemispheres. tr: transient response (30–150 mspost-stimulus), late: late response (200–800 ms post-stimulus).
Fre
quen
cy (
Hz)
Control
0 0.2 0.4 0.6 0.8
20
40
60
80
nepo
wer
−0.200.20.40.6
Fre
quen
cy (
Hz)
pASD
0 0.2 0.4 0.6 0.8
20
40
60
80
nepo
wer
−0.200.20.40.6
Fre
quen
cy (
Hz)
0 0.2 0.4 0.6 0.8
20
40
60
80
ntpo
wer
−0.05
0
0.05
0.1
Fre
quen
cy (
Hz)
0 0.2 0.4 0.6 0.8
20
40
60
80
ntpo
wer
−0.05
0
0.05
0.1
Fre
quen
cy (
Hz)
Time (s)0 0.2 0.4 0.6 0.8
20
40
60
80
mpl
f
0.060.080.10.120.140.16
Fre
quen
cy (
Hz)
Time (s)0 0.2 0.4 0.6 0.8
20
40
60
80
mpl
f
0.060.080.10.120.140.16
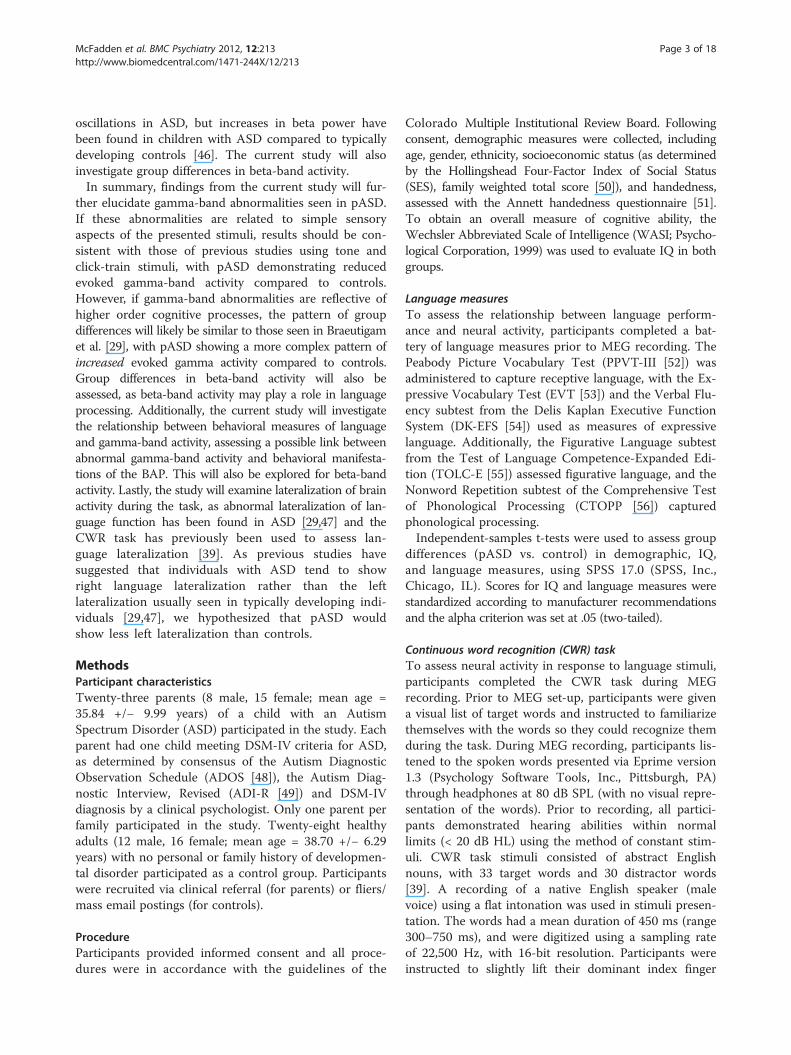
Figure 2 Right hemisphere time-frequency results. Time-frequency plots of the grand average across all ROIs for the control group (leftcolumn) and the pASD group (right column) for the right hemisphere. The rows show normalized evoked power (nepower), normalized totalpower (ntpower) and mean phase locking factor (mplf), respectively. The region in white is not analyzed because of incomplete filling of thewavelet near the edges.
McFadden et al. BMC Psychiatry 2012, 12:213 Page 8 of 18http://www.biomedcentral.com/1471-244X/12/213
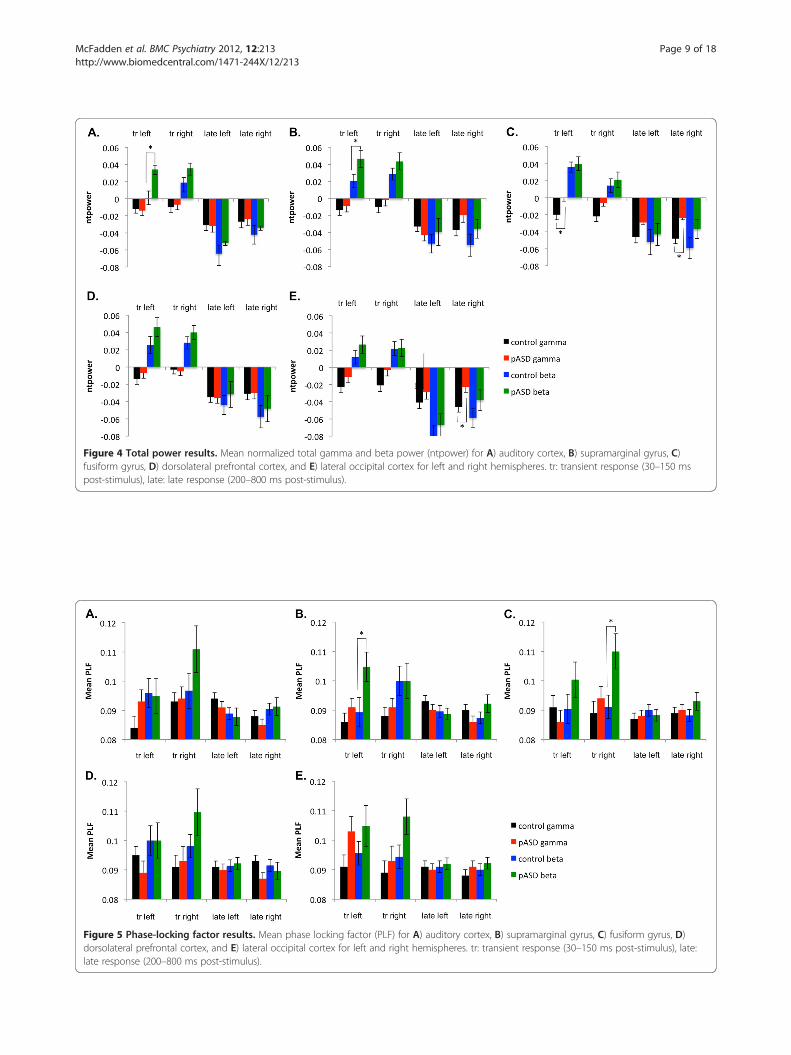
Figure 5 Phase-locking factor results. Mean phase locking factor (PLF) for A) auditory cortex, B) supramarginal gyrus, C) fusiform gyrus, D)dorsolateral prefrontal cortex, and E) lateral occipital cortex for left and right hemispheres. tr: transient response (30–150 ms post-stimulus), late:late response (200–800 ms post-stimulus).
Figure 4 Total power results. Mean normalized total gamma and beta power (ntpower) for A) auditory cortex, B) supramarginal gyrus, C)fusiform gyrus, D) dorsolateral prefrontal cortex, and E) lateral occipital cortex for left and right hemispheres. tr: transient response (30–150 mspost-stimulus), late: late response (200–800 ms post-stimulus).
McFadden et al. BMC Psychiatry 2012, 12:213 Page 9 of 18http://www.biomedcentral.com/1471-244X/12/213
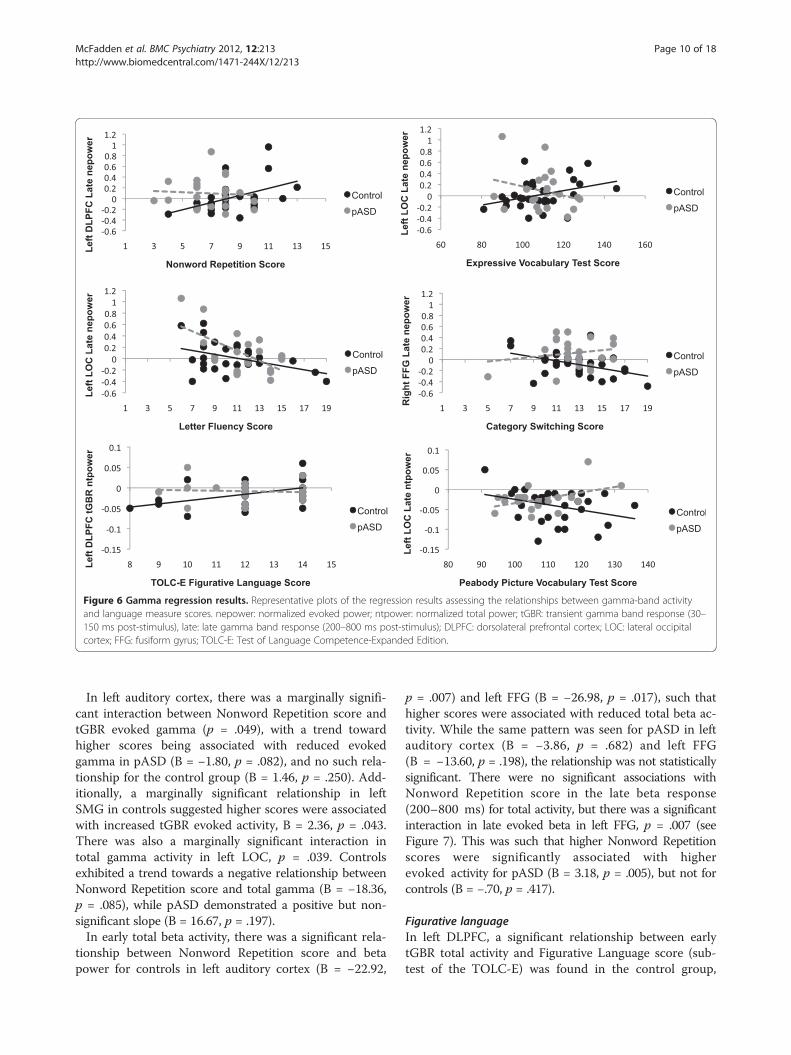
Figure 6 Gamma regression results. Representative plots of the regression results assessing the relationships between gamma-band activityand language measure scores. nepower: normalized evoked power; ntpower: normalized total power; tGBR: transient gamma band response (30–150 ms post-stimulus), late: late gamma band response (200–800 ms post-stimulus); DLPFC: dorsolateral prefrontal cortex; LOC: lateral occipitalcortex; FFG: fusiform gyrus; TOLC-E: Test of Language Competence-Expanded Edition.
McFadden et al. BMC Psychiatry 2012, 12:213 Page 10 of 18http://www.biomedcentral.com/1471-244X/12/213
In left auditory cortex, there was a marginally signifi-cant interaction between Nonword Repetition score andtGBR evoked gamma (p = .049), with a trend towardhigher scores being associated with reduced evokedgamma in pASD (B = −1.80, p = .082), and no such rela-tionship for the control group (B = 1.46, p = .250). Add-itionally, a marginally significant relationship in leftSMG in controls suggested higher scores were associatedwith increased tGBR evoked activity, B = 2.36, p = .043.There was also a marginally significant interaction intotal gamma activity in left LOC, p = .039. Controlsexhibited a trend towards a negative relationship betweenNonword Repetition score and total gamma (B = −18.36,p = .085), while pASD demonstrated a positive but non-significant slope (B = 16.67, p = .197).In early total beta activity, there was a significant rela-
tionship between Nonword Repetition score and betapower for controls in left auditory cortex (B = −22.92,
p = .007) and left FFG (B = −26.98, p = .017), such thathigher scores were associated with reduced total beta ac-tivity. While the same pattern was seen for pASD in leftauditory cortex (B = −3.86, p = .682) and left FFG(B = −13.60, p = .198), the relationship was not statisticallysignificant. There were no significant associations withNonword Repetition score in the late beta response(200–800 ms) for total activity, but there was a significantinteraction in late evoked beta in left FFG, p = .007 (seeFigure 7). This was such that higher Nonword Repetitionscores were significantly associated with higherevoked activity for pASD (B = 3.18, p = .005), but not forcontrols (B = −.70, p = .417).
Figurative languageIn left DLPFC, a significant relationship between earlytGBR total activity and Figurative Language score (sub-test of the TOLC-E) was found in the control group,
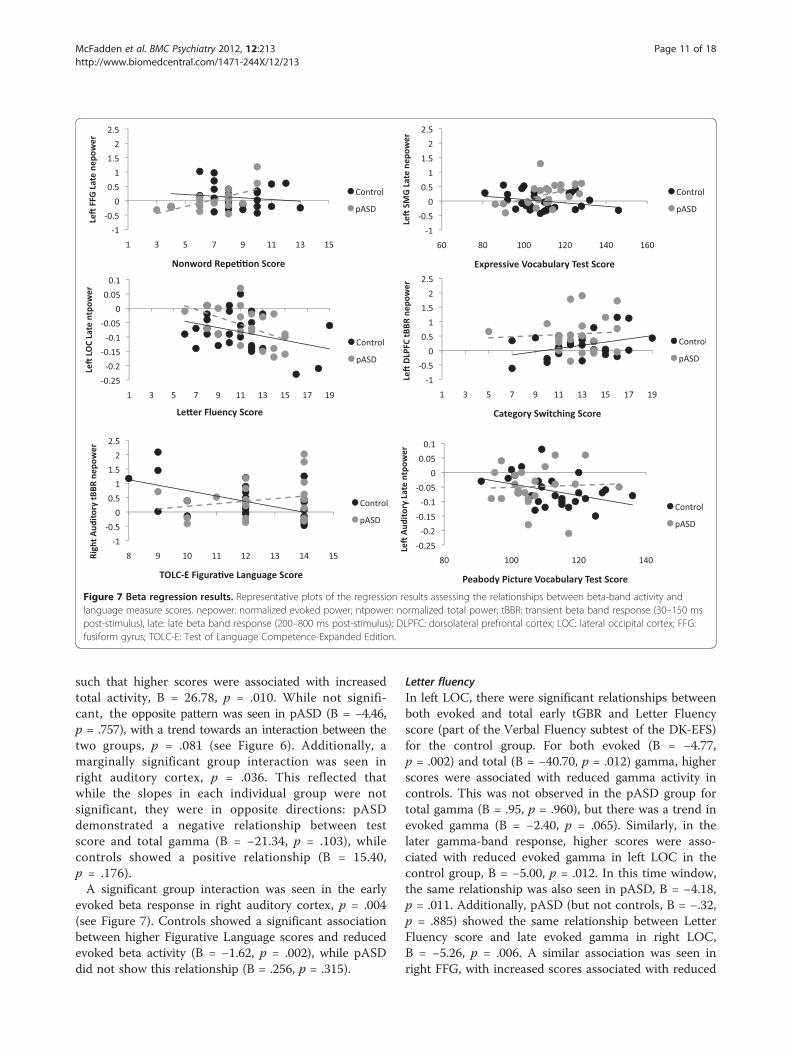
Figure 7 Beta regression results. Representative plots of the regression results assessing the relationships between beta-band activity andlanguage measure scores. nepower: normalized evoked power; ntpower: normalized total power; tBBR: transient beta band response (30–150 mspost-stimulus), late: late beta band response (200–800 ms post-stimulus); DLPFC: dorsolateral prefrontal cortex; LOC: lateral occipital cortex; FFG:fusiform gyrus; TOLC-E: Test of Language Competence-Expanded Edition.
McFadden et al. BMC Psychiatry 2012, 12:213 Page 11 of 18http://www.biomedcentral.com/1471-244X/12/213
such that higher scores were associated with increasedtotal activity, B = 26.78, p = .010. While not signifi-cant, the opposite pattern was seen in pASD (B = −4.46,p = .757), with a trend towards an interaction between thetwo groups, p = .081 (see Figure 6). Additionally, amarginally significant group interaction was seen inright auditory cortex, p = .036. This reflected thatwhile the slopes in each individual group were notsignificant, they were in opposite directions: pASDdemonstrated a negative relationship between testscore and total gamma (B = −21.34, p = .103), whilecontrols showed a positive relationship (B = 15.40,p = .176).A significant group interaction was seen in the early
evoked beta response in right auditory cortex, p = .004(see Figure 7). Controls showed a significant associationbetween higher Figurative Language scores and reducedevoked beta activity (B = −1.62, p = .002), while pASDdid not show this relationship (B = .256, p = .315).
Letter fluencyIn left LOC, there were significant relationships betweenboth evoked and total early tGBR and Letter Fluencyscore (part of the Verbal Fluency subtest of the DK-EFS)for the control group. For both evoked (B = −4.77,p = .002) and total (B = −40.70, p = .012) gamma, higherscores were associated with reduced gamma activity incontrols. This was not observed in the pASD group fortotal gamma (B = .95, p = .960), but there was a trend inevoked gamma (B = −2.40, p = .065). Similarly, in thelater gamma-band response, higher scores were asso-ciated with reduced evoked gamma in left LOC in thecontrol group, B = −5.00, p = .012. In this time window,the same relationship was also seen in pASD, B = −4.18,p = .011. Additionally, pASD (but not controls, B = −.32,p = .885) showed the same relationship between LetterFluency score and late evoked gamma in right LOC,B = −5.26, p = .006. A similar association was seen inright FFG, with increased scores associated with reduced
McFadden et al. BMC Psychiatry 2012, 12:213 Page 12 of 18http://www.biomedcentral.com/1471-244X/12/213
late evoked gamma in the pASD group (B = −5.89, p =.015), but not significantly in the control group (B = −2.87,p = .231). In left FFG, a comparable association was foundfor late total gamma, such that higher scores in both thecontrol (B = −27.90, p = .039) and pASD (B = −45.80, p =.050) groups were associated with decreased total gamma(see Figure 6).In late total beta power, both controls and pASD
showed a similar pattern of higher Letter Fluency scoresbeing associated with reduced total beta power (seeFigure 7). This relationship was significant for controlsin left FFG (B = −18.5, p = 004) and marginally in rightDLPFC (B = −20.35, p = .012), right FFG (B = −17.43,p = .030), left LOC (B = −17.05, p = .035), and rightauditory cortex (B = −18.67, p = .047). The same rela-tionship was marginally significant for pASD in rightFFG (B = −23.96, p = .034) and left LOC (B = −20.11,p = .036), but not for right auditory cortex (B = −22.91,p = .052), left FFG (B = −17.39, p = .069), or rightDLPFC (B = −10.95, p = .182).
Category switchingA negative relationship was seen in the control group inboth right (B = −.606, p = .009) and left (B = −4.33,p = .034) FFG, with greater Category Switching (part ofthe Verbal Fluency subtest of the DK-EFS) accuracy asso-ciated with reduced late evoked gamma activity. This rela-tionship was not seen in pASD in either left (B = −1.34,p = .287) or right FFG (B = 1.84, p = .407), but there was asignificant group interaction in right FFG (p = .015) (seeFigure 6).In the early evoked beta response, a significant group
interaction was seen in left auditory cortex (p = .004).There was a marginally significant relationship betweengreater Category Switching accuracy and reduced evokedbeta activity for pASD (B = −2.32, p = .015), but not forcontrols (B = 2.26, p = .072). Similarly, there was a mar-ginally significant group interaction in left DLPFC (p =.020), with controls showing a marginally significant as-sociation between greater accuracy and higher evokedbeta activity (B = 2.85, p = .022) not seen in pASD (B =−.80, p = .386) (see Figure 7).
Expressive vocabulary testIn left LOC, there was a marginally significant groupinteraction (p = .026), such that while higher expressivevocabulary scores were associated with increased lateevoked gamma in the control group (B = 19.64, p =.041), there was no significant association in the pASDgroup (B = −8.28, p = .291) (see Figure 6). Conversely, inright LOC, higher scores in the control group were asso-ciated with decreased late evoked gamma activity, B =−22.19, p = .036. Again, no such relationship was seen inthe pASD group, B = −4.46, p = .603. The same was seen
in left FFG, with higher scores associated with decreasedlate evoked activity in the control group (B = −22.03,p = .025), but not pASD (B = −9.19, p = .493). A similarrelationship was seen in left DLPFC in late total gammain the control group, with higher scores associated withdecreased gamma, B = −222.31, p = .011. While therewas a marginally significant group interaction (p = .029),there was no significant relationship between expressivevocabulary scores and late total gamma in left DLPFCfor the pASD group, B = 49.77, p = .572.In the late evoked beta response, there was a group
interaction in left SMG, p = .014 (see Figure 7). Higherexpressive vocabulary scores were associated withreduced evoked beta in controls (B = −14.17, p = .091)while higher scores were associated with increasedevoked beta in pASD (B = 13.41, p = .062).
Peabody picture vocabulary test (PPVT-III)Higher PPVT score was marginally associated withreduced early total tGBR in left auditory cortex in thecontrol group, B = −123.94, p = .045. This was not seenin pASD (B = −93.13, p = .263). A significant groupinteraction was found for late total gamma activity in leftDLFPC (p = .015), left LOC (p = .010; see Figure 6) and leftSMG (p = .046). In general, while not all slopes were statis-tically significant, the control group showed a negative rela-tionship between PPVT score and late total gamma(DLPFC: B = −125.41, p = .052; LOC: B = −79.03, p = .071;SMG: B = −70.58, p = .157), while the pASD group showeda positive relationship (DLPFC: B = 104.97, p = .117; LOC:B = 141.13, p = .048; SMG: B = 107.36, p = .141).Higher PPVT scores were marginally associated with
reduced early total beta activity in right DLPFC for bothcontrols (B = −105.97, p = .023) and pASD (B = −107.44,p = .034). Increased late evoked beta activity in left auditorycortex was marginally associated with lower PPVT scoresfor the control group (B = 13.00, p = .036) but not forpASD (B = .969, p = .860) (see Figure 7).
Lateralization indexFor consistency with previous studies investigatinglateralization of the evoked response during a continu-ous word recognition task [39], lateralization of evokedactivity was assessed for both gamma and beta activity ineach ROI during the early (0–200 ms) and late(200–800 ms) post-stimulus time windows. A marginallysignificant group difference in lateralization of late evokedgamma activity was seen in LOC, (t (48) = 2.19, p = .033),with pASD demonstrating greater left lateralization com-pared to controls. Across both groups, significant leftgamma lateralization 200–800 ms post-stimulus was seenin LOC and DLPFC, p < .001, with significant rightlateralization in auditory cortex, p = .001. Bilateral activa-tion was seen in SMG and FFG. There were no group
McFadden et al. BMC Psychiatry 2012, 12:213 Page 13 of 18http://www.biomedcentral.com/1471-244X/12/213
differences in evoked gamma lateralization duringthe 0–200 ms post-stimulus window. As seen in previousstudies [39,47], gamma activation during this earlier timewindow was largely bilateral, with bilateral activation inauditory cortex, LOC, SMG, and FFG across groups. How-ever, activity in DLPFC was left lateralized during this time,p < .001.In addition, lateralization of total gamma power was
explored, as this has not previously been investigated inpASD. During the 200–800 ms post-stimulus time win-dow, there were no significant group differences inlateralization of total gamma. Across groups, totalgamma activity was left lateralized in both SMG andDLPFC (p < .001), with bilateral activation in auditorycortex, FFG, and LOC. In the 0–200 ms post-stimulustime window, a marginally significant group differencewas found in SMG, such that pASD had greater leftlateralization than controls, t (49) = 2.18, p = .034.Across groups, total gamma power was left lateralized inDLPFC (p < .001) and SMG (p < .001), right lateralizedin auditory cortex (p < .001), and bilateral in FFG, andLOC.In the beta-band, a marginally significant group differ-
ence in lateralization of late evoked activity was found inDLPFC (t (49) = 2.39, p = .021). In DLPFC, both con-trols and pASD showed left lateralization of activity, butpASD showed greater lateralization than controls. Simi-larly, in auditory cortex, both groups had right latera-lized beta activity, but the pASD group was morelateralized than controls t (49) = 2.06, p = .044.. Acrossgroups, late evoked beta was right lateralized in FFG andauditory cortex (p < .001), left lateralized in DLPFC andLOC (p < .001), and bilateral in SMG. As with gamma ac-tivity, there were no group differences in evoked beta activ-ity in the 0–200 ms post-stimulus time window. Acrossgroups, early evoked beta activity was left lateralized in FFG(p = .002), DLPFC (p < .001), and SMG (p = .003), rightlateralized in auditory cortex (p < .001), and bilateral inLOC.There was a significant group difference between
lateralization of late total beta activity in SMG (t (49) =2.63, p = .011), with controls showing bilateral activationand pASD demonstrating left lateralized activity. Acrossgroups, late total beta activity was left lateralized inDLPFC and LOC (p < .001), right lateralized in audi-tory cortex and FFG (p < .001), and bilateral inSMG. In the early time window, there was a margin-ally significant group difference in lateralization oftotal beta activity, t (49) = 2.18, p = .034. Whileboth groups showed left lateralization, the pASDgroup was more lateralized than controls. Acrossgroups, early total beta activity was left lateralized inFFG, DLPFC, and SMG (p < .001), but right latera-lized in auditory cortex and LOC (p < .001).
DiscussionAs has been seen in several prior studies of languageand gamma [13,36-38], the language task in the currentstudy elicited strong gamma event-related desynchro-nization (ERD; see Figures 1 and 2). ERD of gammaactivity was seen in both controls and pASD, but greaterERD was seen in the control group. While previousstudies with simple tone/click stimuli found evokedgamma-band power to be reduced in those with ASD[26,27] and in pASD [27,30] compared to controlgroups, the current study found pASD to show increasedevoked power overall compared to controls. Gamma-band abnormalities in response to language stimuli havenot previously been investigated in first-degree relativesof individuals with ASD, but this finding is consistentwith previous research finding adults with ASD to showgreater increases in evoked gamma activity in responseto a sentence context evaluation task compared to con-trols [29].A likely explanation for the disparity between the
current results and previous results showing reducedevoked gamma in pASD compared to controls is thatthe complexity of the stimuli and the task demands dif-fered: while previous studies of gamma-band abnormal-ities in pASD used pure tone and amplitude-modulatedtone stimuli [27,30], the current study used spoken lan-guage stimuli in the context of a word recognition task.Rather than listening passively to a simple auditorystimulus, higher order cognitive processes including lan-guage and sustained attention were necessary for wordrecognition. While this has not been studied in pASDpreviously, these findings are consistent with those ofBraeutigam et al. [29], who reported increased evokedgamma in both control adults and adults with ASD dur-ing a task involving evaluation of sentence context, butfound the ASD group to show greater increases inevoked gamma that were more widespread across thetime window than controls.Both the early transient gamma-band response (tGBR;
30–150 ms post-stimulus) and the later gamma-band re-sponse (200–800 ms post-stimulus) were assessed, withsimilar results found in both time windows. During theearlier tGBR, there were significant group differences insupramarginal gyrus (SMG) and lateral occipital cortex(LOC), and marginally significant group differences inauditory cortex and fusiform gyrus (FFG), in whichpASD showed increased evoked gamma activity andcontrols showed decreased evoked gamma. The samepattern was seen in the later evoked gamma-bandresponses in both SMG and LOC. While both groupsshowed increased evoked power in the later gamma-band response in auditory cortex, the pASD group stillshowed a greater increase than controls. Additionally, inFFG and LOC in both the early and late gamma
McFadden et al. BMC Psychiatry 2012, 12:213 Page 14 of 18http://www.biomedcentral.com/1471-244X/12/213
response, both groups showed decreases in total power.However, controls exhibited greater reduction than thepASD group. In both the early and late time windows,there were no hemispheric differences in evoked powerin controls, but there were differences between evokedpower in left and right hemispheres in pASD; pASDshowed increased evoked power in the right hemispherein FFG, but evoked power was reduced in the left hemi-sphere. There were no significant group differences inphase-locking factor (PLF), but in both auditory cortexand SMG, PLF was greater in the left hemisphere thanthe right. This is of note as the opposite has been seenin non-language auditory tasks [30] and suggests thatPLF in this study may be specifically related to languageprocessing.The cognitive processes involved in the word recogni-
tion task could explain the reduction in total gammapower seen in both groups, and the increase in evokedgamma seen in pASD relative to controls. Whileincreases in evoked gamma activity are often seen whenattention is increased [5,72-75], some studies have foundreduced gamma activity following repetition or primingduring cognitive tasks [76,77]. Given that the currentresults are in response to stimuli repeated multiple timesthroughout the task, it may be that total gamma activitywas reduced due to word repetition. Some hypothesizethat reduced gamma activity following repeated presen-tations of stimuli reflects the need for less neural repre-sentation as a result of a more “sharpened” neuralnetwork [76,77]. This could explain why pASD showedincreases in evoked gamma activity, while controlsshowed decreased evoked gamma, and why pASD alsoshowed less reduction in total gamma power comparedto controls. The reduction in total and evoked gammaactivity in controls could be a result of their better for-mation of target word representations. Conversely, theincreased evoked gamma and attenuated reduction intotal gamma seen in pASD may reflect that they wereless able to form a neural representation of target words.The current study also investigated group differences
in neural activity in the beta-band (13–30 Hz), as betaactivity may also be involved in language processing[12,37,44,45] and increased beta activity has previouslybeen observed in children with ASD compared tohealthy controls [46]. Indeed, while both groups demon-strated increased early evoked beta activity, the currentstudy found a significantly greater increase in pASDcompared to controls in SMG, with a similar trend inboth LOC and FFG. While there were no group differ-ences in early total beta activity, there was a significantmain effect of hemisphere in FFG, with greater increasesin total activity seen in left compared to right hemi-sphere, across groups. Similarly to gamma activity, anoverall decrease in total beta activity was observed, but
there were no significant group differences in total beta.Interestingly, both groups demonstrated early increasesin beta activity, followed by a later decrease. This couldindicate cognitive differences between earlier and laterstages of language processing; previous studies have sug-gested increased beta activity to be associated with top-down cognitive processing and decreased beta to beassociated with bottom-up cognitive processing [42].The group differences seen in beta activity also suggestdisparate cognitive function during the language task, aswith gamma differences. However, given the dearth ofresearch on beta activity in ASD, further investigation iswarranted.As language deficits are sometimes seen as part of the
BAP [35,40,41] and the current sample of pASD did in-deed show worse performance than controls on mea-sures of phonology and receptive language, it isreasonable that this task would involve greater cognitiveeffort for pASD compared to controls. This hypothesis isalso consistent with the pattern of group differences inneural activity being similar across regions of interest inthe brain. If gamma and/or beta activity reflect task-related activation of language networks, these brainregions would be expected to be synchronously active orinhibited [78]. Additionally, the use of word stimuli inthe continuous word recognition task likely explainswhy a later gamma-band response was seen in additionto the early tGBR seen in previous studies using tone/click-train stimuli. In their study comparing gamma-band activation between words and pseudowords usingMEG, Pulvermuller et al. [12] saw activation even after700 ms post-stimulus and suggested the use of wordstimuli likely accounted for the prolonged effect seencompared to tone or click stimuli.An alternative hypothesis is that the later reduction in
gamma-band activity could be due to sustained atten-tion. Brookes et al. [79] found reductions in evokedgamma activity during visual working memory tasksand found this decrease to be larger during moredemanding phases of the tasks. They suggested that thisreduction reflects gamma activity being suppressed dur-ing working memory maintenance to prevent attentionshifting to non task-related distractions. Given thatattention dysfunction is common in ASD [18,23] andmay be part of the BAP [80], the lack of evoked gammareduction and attenuation of total gamma reduction inpASD relative to the control group could reflect atten-tional dysfunction.There were a number of interesting relationships be-
tween gamma activity and scores on language measuresin the current study. For figurative language, higherscores were related to reduced evoked and increasedtotal gamma power in the control group. This relation-ship was not significant for the pASD group. Receptive
McFadden et al. BMC Psychiatry 2012, 12:213 Page 15 of 18http://www.biomedcentral.com/1471-244X/12/213
language scores showed a negative relationship with latetotal gamma in the control group, with higher scoresassociated with reduced evoked gamma. This fits well inthe context of the hypothesis that reduced gamma mayreflect a sharpened neural representation of the targetwords. Given that receptive language skills are importantin a spoken word recognition task, this suggests thatthose with better receptive language performance mayhave shown a greater reduction in total gamma as a re-sult of being better equipped to form a neural represen-tation of the words. However, as with figurativelanguage, this relationship was not significant in pASD.Similarly, higher scores on expressive language, letterfluency, and category switching accuracy in the controlgroup were largely associated with decreased total andevoked gamma activity, with few significant relationshipsobserved in the pASD group. That the majority of thesignificant relationships between language performanceand gamma activity were seen in the control group, butnot in pASD may suggest that language performanceand gamma activity are more clearly linked in controlsthan in pASD overall. It should be noted, however, thatthese analyses were explorative in nature and should beinterpreted with caution. Future studies should furtherexplore the relationship between language performanceand gamma activity by directly measuring gamma duringthese tasks.There were also some relationships of note between
beta-band activity and the language measures. Whileboth pASD and controls showed an association betweenhigher nonword repetition scores and total beta activity,this relationship was stronger for the control group.Similarly, higher figurative language scores were asso-ciated with increased total beta activity in the controlgroup, but not in the pASD group. Higher expressivevocabularly scores in the control group were associatedwith reduced evoked activity in controls, but increasedevoked beta in pASD. In sum, similarly to gamma-bandactivity, the relationship between beta-band activity andlanguage performance appears to be different betweencontrols and pASD and merits further investigation.As the continuous word recognition task has been
used previously to assess lateralization of language func-tion [39], we also investigated lateralization of activity.Consistent with previous findings, we found earlyevoked gamma activity (0–200 ms post-stimulus) to belargely bilateral (with the exception of left lateralizationin DLPFC), with later evoked activity (200–800 ms post-stimulus) showing greater left lateralization. Results weresimilar for total gamma activity, although greaterlateralization of function was seen earlier. Evoked andtotal beta activity were more lateralized than gamma ac-tivity, but this differed among brain areas; DLPFC activ-ity was consistently left lateralized, auditory cortex was
consistently right lateralized, FFG and SMG were leftlateralized in the early time window and right lateralizedin the late time window, and LOC was left lateralized inthe late time window and right lateralized in the earlytime window. This difference in lateralization supportsthat gamma and beta activity may play different roles inlanguage processing [43,45]. Interestingly, in areas forwhich there were group differences (LOC and DLPFCfor evoked gamma; auditory cortex and DLPFC forevoked beta; SMG and DLPFC for total gamma; SMGfor total beta), pASD showed greater left lateralizationcompared to controls. Previous studies have suggestedthat individuals with ASD show atypical languagelateralization, with lateralization reduced [81,82] or morerightward [47] compared to controls. Since greater leftlateralization was seen in pASD, it may suggest a com-pensatory mechanism not seen in individuals with ASD.A potential limitation of the current study is that is
not possible to parse out attention effects from languageeffects. As such, it is difficult to tell if these results differfrom those in studies using simple tone stimuli as a re-sult of the language stimulus itself and the cognitive pro-cesses required to distinguish repeated from novelwords, or as a result of participants actively attending tostimuli during the task. Future studies will adjust forthese variables separately to assess the impact of each onneural activity by varying the loading on language andattention processes independently. Furthermore, stan-dardized measures of attention can be taken in the fu-ture to address the potential relationship between neuralactivity and attention dysfunction. It has been suggestedthat attention relies on gamma synchronization to forma working memory representation of an object [77], so itwill be important to assess the relationship betweenthem [29].
ConclusionsIn conclusion, this study extends the findings of previousresearch showing gamma-band abnormalities in pASDin response to simple tone stimuli by also revealing ab-normalities in response to language stimuli. The resultsof the current study are consistent with at least oneother prior study using a language task in persons withASD [29] and are supportive of language-related neuralactivity as a heritable biomarker of ASD. The currentstudy also found group differences in beta-band activity,also thought to be involved in language processing, andsuggests the possible use of beta activity as an ASD bio-marker. Future studies will further assess whether thesepotential neural biomarkers are better characterized inresponse to simple auditory stimuli or to more complexstimuli involving higher order cognitive processes, suchas attention and language processing. The currentresults also suggest a possible relationship between
McFadden et al. BMC Psychiatry 2012, 12:213 Page 16 of 18http://www.biomedcentral.com/1471-244X/12/213
language abilities and neural activity, which should befurther explored in individuals with ASD who have moreprominent language difficulties than the pASD groupin the current study. The determination of distinct pat-terns of oscillatory activity for those with and withoutlanguage dysfunction could be helpful for assessment ofefficacy of language-focused ASD interventions andcould also prove useful in ASD subtyping in genetic re-search studies.
Additional file
Additional file 1: Figure S1. Statistical results of an independent-samples t-test comparison between sensor-level neural activity in parentsof a child with an autism spectrum disorder (pASD) and healthy adultcontrol participants. Time and frequency windows of interested arerepresented as follows: A) early (30-150 ms) evoked gamma-band activity(30-50 Hz), B) late (200-800 ms) evoked gamma-band activity, C) earlyevoked beta-band activity (13-30 Hz), and D) late evoked beta-bandactivity. Sensors demonstrating a statistically significant group difference(uncorrected p < .01) are indicated with an asterisk overlayed on thesensor. Statistical values above 0 indicate areas in which pASD showedgreater evoked activity compared to controls; those below 0 indicateareas in which pASD showed less activity than controls (pASD > HCshown in warmer colors; HC > pASD shown in cooler colors).
Competing interestsThe authors declare that they have no competing interests.
Authors’ contributionsKLM conducted the data analyses and wrote the first draft of the manuscript.SH contributed to participant recruitment, measure selection and diagnosisof probands. EW and GLS were involved in data acquisition and analyses.DCR conceived of the study, participated in study design and coordination,contributed to the data analytic strategy, and helped to draft the manuscript.All authors read and approved the final manuscript.
AcknowledgementsThis work was supported by a grant from the Cure Autism Now Foundation(to DCR), Autism Speaks, and PHS grant R01 MH082820 (to DCR) and in partunder NIH grant T32 MH015442, institutional postdoctoral research trainingprogram for KLM.
Author details1Department of Psychiatry at the University of Colorado Denver AnschutzMedical Campus, 13001 E. 17th Place, Aurora, CO 80045, USA. 2JFK Partnersat the University of Colorado Denver Anschutz Medical Campus, 13121 E.17th Ave, Aurora, CO 80045, USA. 3Department of Psychology, University ofWisconsin Oshkosh, 800 Algoma Blvd, Oshkosh, WI 54901, USA. 4Departmentof Psychology, Hope College, 35 E 12th St, Holland, MI 49423, USA.
Received: 17 November 2011 Accepted: 15 November 2012Published: 29 November 2012
References1. American Psychiatric Association: Diagnostic and Statistical Manual of Mental
Disorders. 4th edition. Washington, D.C: American Psychiatric Association;1994.
2. Centers for Disease Control: Prevalance of autism spectrum disorders:autism and developmental disabilities monitoring network, UnitedStates, 2006. MMWR CDC Surveill Summ 2009, 58:1–20.
3. Tallon-Baudry C, Bertrand O: Oscillatory gamma activity in humans and itsrole in object representation. Trends Cogn Sci 1999, 3:151–162.
4. Roach BJ, Mathalon DH: Event-related EEG time-frequency analysis: anoverview of measures and an analysis of early gamma band phaselocking in schizophrenia. Schizophr Bull 2008, 34:907–926.
5. Tiitinen H, Sinkkonen J, Reinikainen K, Alho K, Lavikainen J, Naatanen R:Selective attention enhances the auditory 40-Hz transient response inhumans. Nature 1993, 364:59–60.
6. Taylor K, Mandon S, Freiwald WA, Kreiter AK: Coherent oscillatory activityin monkey area v4 predicts successful allocation of attention. CerebCortex 2005, 15:1424–1437.
7. Lakatos P, Karmos G, Mehta AD, Ulbert I, Schroeder CE: Entrainment ofneuronal oscillations as a mechanism of attentional selection. Science2008, 320:110–113.
8. Tallon-Baudry C, Bertrand O, Peronnet F, Pernier J: Induced gamma-bandactivity during the delay of a visual short-term memory task in humans.J Neurosci 1998, 18:4244–4254.
9. Pipa G, Stadtler ES, Rodriguez EF, Waltz JA, Muckli LF, Singer W, Goebel R,Munk MH: Performance- and stimulus-dependent oscillations in monkeyprefrontal cortex during short-term memory. Front Integr Neurosci 2009,3:25.
10. Pantev C, Makeig S, Hoke M, Galambos R, Hampson S, Gallen C: Humanauditory evoked gamma-band magnetic fields. Proc Natl Acad Sci USA1991, 88:8996–9000.
11. Pantev C, Elbert T, Makeig S, Hampson S, Eulitz C, Hoke M: Relationship oftransient and steady-state auditory evoked fields. Electroencephalogr ClinNeurophysiol 1993, 88:389–396.
12. Pulvermuller F, Eulitz C, Pantev C, Mohr B, Feige B, Lutzenberger W, Elbert T,Birbaumer N: High-frequency cortical responses reflect lexical processing:an MEG study. Electroencephalogr Clin Neurophysiol 1996, 98:76–85.
13. Ihara A, Hirata M, Sakihara K, Izumi H, Takahashi Y, Kono K, Imaoka H,Osaki Y, Kato A, Yoshimine T, Yorifuji S: Gamma-band desynchronization inlanguage areas reflects syntactic process of words. Neurosci Lett 2003,339:135–138.
14. Pena M, Melloni L: Brain oscillations during spoken sentence processing.J Cogn Neurosci 2012, 24:1149–1164.
15. Tavabi K, Embick D, Roberts TP: Spectral-temporal analysis of corticaloscillations during lexical processing. NeuroReport 2011, 22:474–478.
16. Gray CM, Konig P, Engel AK, Singer W: Oscillatory responses in cat visualcortex exhibit inter-columnar synchronization which reflects globalstimulus properties. Nature 1989, 338:334–337.
17. Singer W: Neuronal synchrony: a versatile code for the definition ofrelations? Neuron 1999, 24:49–65. 111–125.
18. Allen G, Courchesne E: Attention function and dysfunction in autism.Front Biosci 2001, 6:D105–D119.
19. Goldstein G, Johnson CR, Minshew NJ: Attentional processes in autism.J Autism Dev Disord 2001, 31:433–440.
20. Brock J, Brown CC, Boucher J, Rippon G: The temporal binding deficithypothesis of autism. Dev Psychopathol 2002, 14:209–224.
21. Volkmar FR, Pauls D: Autism. Lancet 2003, 362:1133–1141.22. Kern JK, Trivedi MH, Garver CR, Grannemann BD, Andrews AA, Savla JS,
Johnson DG, Mehta JA, Schroeder JL: The pattern of sensory processingabnormalities in autism. Autism 2006, 10:480–494.
23. Ames C, Fletcher-Watson S: A review of methods in the study of attentionin autism. Dev Rev 2010, 30:52–73.
24. Marco EJ, Hinkley LB, Hill SS, Nagarajan SS: Sensory processing in autism: areview of neurophysiologic findings. Pediatr Res 2011, 69:48R–54R.
25. Grice SJ, Spratling MW, Karmiloff-Smith A, Halit H, Csibra G, de Haan M,Johnson MH: Disordered visual processing and oscillatory brain activityin autism and Williams syndrome. NeuroReport 2001, 12:2697–2700.
26. Wilson TW, Rojas DC, Reite ML, Teale PD, Rogers SJ: Children andadolescents with autism exhibit reduced MEG steady-state gammaresponses. Biol Psychiatry 2007, 62:192–197.
27. Rojas DC, Maharajh K, Teale P, Rogers SJ: Reduced neural synchronizationof gamma-band MEG oscillations in first-degree relatives of childrenwith autism. BMC Psychiatry 2008, 8:66.
28. Gandal MJ, Edgar JC, Ehrlichman RS, Mehta M, Roberts TP, Siegel SJ:Validating gamma oscillations and delayed auditory responsesas translational biomarkers of autism. Biol Psychiatry 2010,68:1100–1106.
29. Braeutigam S, Swithenby SJ, Bailey AJ: Contextual integration the unusualway: a magnetoencephalographic study of responses to semanticviolation in individuals with autism spectrum disorders. Eur J Neurosci2008, 27:1026–1036.
30. Rojas DC, Teale PD, Maharajh K, Kronberg E, Youngpeter K, Wilson L,Wallace A, Hepburn S: Transient and steady-state auditory gamma-band
McFadden et al. BMC Psychiatry 2012, 12:213 Page 17 of 18http://www.biomedcentral.com/1471-244X/12/213
responses in first-degree relatives of people with autism spectrumdisorder. Mol Autism 2011, 2:11.
31. Bailey A, Le Couteur A, Gottesman I, Bolton P, Simonoff E, Yuzda E,Rutter M: Autism as a strongly genetic disorder: evidence from a Britishtwin study. Psychol Med 1995, 25:63–77.
32. Steffenburg S, Gillberg C, Hellgren L, Andersson L, Gillberg IC, Jakobsson G,Bohman M: A twin study of autism in Denmark, Finland, Iceland, Norwayand Sweden. J Child Psychol Psychiatry 1989, 30:405–416.
33. Hallmayer J, Cleveland S, Torres A, Phillips J, Cohen B, Torigoe T, Miller J, Fedele A,Collins J, Smith K, et al: Genetic heritability and shared environmental factorsamong twin pairs with autism. Arch Gen Psychiatry 2011, 68:1095–1102.
34. Piven J, Palmer P: Psychiatric disorder and the broad autism phenotype:evidence from a family study of multiple-incidence autism families. Am JPsychiatry 1999, 156:557–563.
35. Losh M, Childress D, Lam K, Piven J: Defining key features of the broadautism phenotype: a comparison across parents of multiple- andsingle-incidence autism families. Am J Med Genet B Neuropsychiatr Genet2008, 147B:424–433.
36. Xiang J, Wilson D, Otsubo H, Ishii R, Chuang S: Neuromagnetic spectraldistribution of implicit processing of words. NeuroReport 2001,12:3923–3927.
37. Hirata M, Kato A, Taniguchi M, Saitoh Y, Ninomiya H, Ihara A, Kishima H,Oshino S, Baba T, Yorifuji S, Yoshimine T: Determination of languagedominance with synthetic aperture magnetometry: comparison with theWada test. NeuroImage 2004, 23:46–53.
38. Lee SY, Kim JS, Chung CK, Lee SK, Kim WS: Assessment of languagedominance by event-related oscillatory changes in an auditory languagetask: magnetoencephalography study. J Clin Neurophysiol 2010,27:263–269.
39. Papanicolaou AC, Simos PG, Castillo EM, Breier JI, Sarkari S, Pataraia E,Billingsley RL, Buchanan S, Wheless J, Maggio V, Maggio WW:Magnetocephalography: a noninvasive alternative to the Wadaprocedure. J Neurosurg 2004, 100:867–876.
40. Piven J, Palmer P, Landa R, Santangelo S, Jacobi D, Childress D: Personalityand language characteristics in parents from multiple-incidence autismfamilies. Am J Med Genet 1997, 74:398–411.
41. Bailey A, Palferman S, Heavey L, Le Couteur A: Autism: the phenotype inrelatives. J Autism Dev Disord 1998, 28:369–392.
42. Engel AK, Fries P: Beta-band oscillations–signalling the status quo? CurrOpin Neurobiol 2010, 20:156–165.
43. Arnal LH, Wyart V, Giraud AL: Transitions in neural oscillations reflectprediction errors generated in audiovisual speech. Nat Neurosci 2011,14:797–801.
44. Hirata M, Koreeda S, Sakihara K, Kato A, Yoshimine T, Yorifuji S: Effects ofthe emotional connotations in words on the frontal areas–a spatiallyfiltered MEG study. NeuroImage 2007, 35:420–429.
45. Shahin AJ, Picton TW, Miller LM: Brain oscillations during semanticevaluation of speech. Brain Cogn 2009, 70:259–266.
46. Orekhova EV, Stroganova TA, Nygren G, Tsetlin MM, Posikera IN, Gillberg C,Elam M: Excess of high frequency electroencephalogram oscillations inboys with autism. Biol Psychiatry 2007, 62:1022–1029.
47. Flagg EJ, Cardy JE, Roberts W, Roberts TP: Language lateralizationdevelopment in children with autism: insights from the late fieldmagnetoencephalogram. Neurosci Lett 2005, 386:82–87.
48. Lord C, Risi S, Lambrecht L, Cook EH Jr, Leventhal BL, DiLavore PC, Pickles A,Rutter M: The autism diagnostic observation schedule-generic: astandard measure of social and communication deficits associated withthe spectrum of autism. J Autism Dev Disord 2000, 30:205–223.
49. Lord C, Rutter M, Le Couteur A: Autism Diagnostic Interview-Revised: arevised version of a diagnostic interview for caregivers of individualswith possible pervasive developmental disorders. J Autism Dev Disord1994, 24:659–685.
50. Hollingshead A: Four-Factor Index of Social Status. New Haven, CT: YaleUniversity Press; 1975.
51. Annett M: Left, right, hand, and brain: the right shift theory. UK: Hove; 1985.52. Dunn LM, Dunn LM: PPVT-III: Peabody Picture Vocabulary Test-Third Edition.
Circle Pines, MN: American Guidance Service, Inc.; 1997.53. Williams KT: Expressive Vocabulary Test. Circle Pines, MN: American Guidance
Service, Inc.; 1997.54. Delis DC, Kaplan E, Kramer JH: Delis-Kaplan Executive Function System.
San Antonio, TX: The Psychological Corporation; 2001.
55. Wiig EH, Secord WA: Test of Language Competence-Expanded Edition.San Antonio, TX: The Psychological Corporation; 1989.
56. Wagner R, Torgesen J, Rashotte C: Comprehensive Test of PhonologicalProcessing. Austin, TX: PRO-ED; 1999.
57. Jasper HH: The ten-twenty electrode system of the InternationalFederation. Electroencephalogr Clin Neurophysiol 1958, 10:371–375.
58. Delorme A, Makeig S: EEGLAB: an open source toolbox for analysis ofsingle-trial EEG dynamics including independent component analysis.J Neurosci Methods 2004, 134:9–21.
59. Sarvas J: Basic mathematical and electromagnetic concepts of thebiomagnetic inverse problem. Phys Med Biol 1987, 32:11–22.
60. Litvak V, Friston K: Electromagnetic source reconstruction for groupstudies. NeuroImage 2008, 42:1490–1498.
61. Litvak V, Mattout J, Kiebel S, Phillips C, Henson R, Kilner J, Barnes G,Oostenveld R, Daunizeau J, Flandin G, et al: EEG and MEG data analysis inSPM8. Comput Intell Neurosci 2011, 2011:852961.
62. Genovese CR, Lazar NA, Nichols T: Thresholding of statistical maps infunctional neuroimaging using the false discovery rate. NeuroImage 2002,15:870–878.
63. Dronkers N, Pinker S, Damasio A: Language and the aphasias. In Principlesof Neural Science. 4th edition. Edited by Kandel ER, Schwartz JH, Jessell TM.New York, NY: McGraw-Hill; 2000:1169–1187.
64. Hudspeth AJ: Hearing. In Principles of Neural Science. 4th edition. Edited byKandel ER, Schwartz JH, Jessell TM. New York, NY: McGraw-Hill; 2000:590–613.
65. Binder JR, Desai RH, Graves WW, Conant LL: Where is the semanticsystem? A critical review and meta-analysis of 120 functionalneuroimaging studies. Cereb Cortex 2009, 19:2767–2796.
66. Ross B, Borgmann C, Draganova R, Roberts LE, Pantev C: A high-precisionmagnetoencephalographic study of human auditory steady-stateresponses to amplitude-modulated tones. J Acoust Soc Am 2000,108:679–691.
67. Tesche CD, Uusitalo MA, Ilmoniemi RJ, Huotilainen M, Kajola M, Salonen O:Signal-space projections of MEG data characterize both distributed andwell-localized neuronal sources. Electroencephalogr Clin Neurophysiol 1995,95:189–200.
68. Torrence C, Compo GP: A practical guide to wavelet analysis. Bull AmMeteorol Soc 1998, 79:61–78.
69. Herrmann CS, Munk MH, Engel AK: Cognitive functions of gamma-bandactivity: memory match and utilization. Trends Cogn Sci 2004, 8:347–355.
70. Wilke M, Lidzba K: LI-tool: a new toolbox to assess lateralization infunctional MR-data. J Neurosci Methods 2007, 163:128–136.
71. Schmidt GL, Kimel LK, Winterrowd E, Pennington BF, Hepburn SL, Rojas DC:Impairments in phonological processing and nonverbal intellectualfunction in parents of children with autism. J Clin Exp Neuropsychol 2008,30:557–567.
72. Debener S, Herrmann CS, Kranczioch C, Gembris D, Engel AK: Top-downattentional processing enhances auditory evoked gamma band activity.NeuroReport 2003, 14:683–686.
73. Ross B, Picton TW, Herdman AT, Pantev C: The effect of attention on theauditory steady-state response. Neurol Clin Neurophysiol 2004, 2004:22.
74. Skosnik PD, Krishnan GP, O’Donnell BF: The effect of selective attention onthe gamma-band auditory steady-state response. Neurosci Lett 2007,420:223–228.
75. Lenz D, Fischer S, Schadow J, Bogerts B, Herrmann CS: Altered evokedgamma-band responses as a neurophysiological marker ofschizophrenia? Int J Psychophysiol 2010, 79:25–31.
76. Gruber T, Muller MM: Effects of picture repetition on induced gammaband responses, evoked potentials, and phase synchrony in the humanEEG. Brain Res Cogn Brain Res 2002, 13:377–392.
77. Jensen O, Kaiser J, Lachaux JP: Human gamma-frequency oscillationsassociated with attention and memory. Trends Neurosci 2007, 30:317–324.
78. Jerbi K, Ossandon T, Hamame CM, Senova S, Dalal SS, Jung J, Minotti L,Bertrand O, Berthoz A, Kahane P, Lachaux JP: Task-related gamma-banddynamics from an intracerebral perspective: review and implications forsurface EEG and MEG. Hum Brain Mapp 2009, 30:1758–1771.
79. Brookes MJ, Wood JR, Stevenson CM, Zumer JM, White TP, Liddle PF,Morris PG: Changes in brain network activity during working memorytasks: a magnetoencephalography study. NeuroImage 2011, 55:1804–1815.
80. Belmonte MK, Gomot M, Baron-Cohen S: Visual attention in autism families:’unaffected’ sibs share atypical frontal activation. J Child Psychol Psychiatry 2010,51:259–276.
McFadden et al. BMC Psychiatry 2012, 12:213 Page 18 of 18http://www.biomedcentral.com/1471-244X/12/213
81. Bigler ED, Mortensen S, Neeley ES, Ozonoff S, Krasny L, Johnson M, Lu J,Provencal SL, McMahon W, Lainhart JE: Superior temporal gyrus, languagefunction, and autism. Dev Neuropsychol 2007, 31:217–238.
82. Kleinhans NM, Muller RA, Cohen DN, Courchesne E: Atypical functionallateralization of language in autism spectrum disorders. Brain Res 2008,1221:115–125.
doi:10.1186/1471-244X-12-213Cite this article as: McFadden et al.: Abnormalities in gamma-bandresponses to language stimuli in first-degree relatives of children withautism spectrum disorder: an MEG study. BMC Psychiatry 2012 12:213.
Submit your next manuscript to BioMed Centraland take full advantage of:
• Convenient online submission
• Thorough peer review
• No space constraints or color figure charges
• Immediate publication on acceptance
• Inclusion in PubMed, CAS, Scopus and Google Scholar
• Research which is freely available for redistribution
Submit your manuscript at www.biomedcentral.com/submit


