Embed Size (px)
Citation preview
University of Plymouth
PEARL https://pearl.plymouth.ac.uk
04 University of Plymouth Research Theses 01 Research Theses Main Collection
2001
ABSORPTION AND UTILISATION OF
NATURAL AND SYNTHETIC
ASTAXANTHIN FORMS IN SALMONID
NUTRITION
WHITE, DANIEL ALLAN
http://hdl.handle.net/10026.1/2297
University of Plymouth
All content in PEARL is protected by copyright law. Author manuscripts are made available in accordance with
publisher policies. Please cite only the published version using the details provided on the item record or
document. In the absence of an open licence (e.g. Creative Commons), permissions for further reuse of content
should be sought from the publisher or author.
ABSORPTION AND UTILISATION OF NATURAL AND SYNTHETIC
ASTAXANTHIN FORMS IN SALMONID NUTRITION
by
DANIEL ALLAN WHITE
A thesis submitted to the University of Plymouth in partial fulfilment for the degree of
DOCTOR OF PHILOSOPHY
Department of Biological Sciences
Faculty of Science
ln collaboration with
Carotenoid Research Group
Department of Biological sciences
Liverpool John Moores University
Liverpool
October 200 I
11
Item No.
Date 1 8 JAN 2002
LiBRARY STORE
ABSTRACT
Daniel Allan White "The absm·ption and utilisation of natural and synthetic astaxanthin
forms in salmonid nutrition."
Consumer preference for commercially reared fish products that resemble their wild counterparts has resulted in the supplementation of pigments called carotenoids into aquafeeds to promote a pink-red colour in the flesh of salmonid fish. To date synthetic forms of these pigments have been commonly utilised to achieve this desired colouration, with the carotenoid astaxanthin being the regular choice for the feed manufacturer. However, increase in consumer demand for farmed fish products reared on natural feed additives has evoked an interest in natural sources of astaxa·nthin that could be successfully used to pigment salmonid fish efficiently.
In the current study, the microalga Haemalococcus pluvialis has been assessed as a potential feed supplement to pigment the flesh of rainbow trout (Oncorhynchus mykiss). More specifically, those natural characteristics that may well limit the absorption and utilisation of astaxanthin from this source have been assessed individually and discussed from a physiological standpoint. The cell wall of Haematococcus pluvialis when cracked efficiently presents no limitation to the absorption and utilisation ofastaxanthin from this source. Indeed, the cell wall remnants help to prevent oxidation of astaxanthin in the feed compared to cell wall free extracts of carotenoid from the same source. However, esterified astaxanthin (which this algae predominantly contains) is not absorbed as efficiently as unesterified synthetic astaxanthin. Furthermore, the extent of esterification is negatively related to the absorption of astaxanthin. Regional variation in ester hydrolysis along the gastrointestinal tract combined with gut transit time of the ingested feed may explain these limitations. However, despite limitations in absorption, the muscle deposition of astaxanthin supplied as esters does not significantly differ from the unesterified form. The optical purity of astaxanthin esters from this source does not prejudice the final deposition of astaxanthin in fish tissues.
An in vitro model has been developed to assess the absorption of astaxanthin at the intestinal level in salmonid fish in order to define absorption characteristics of carotenoids under different abiotic and biotic conditions. The absorption of astaxanthin seems to occur in a linear passive manner into the intestinal tissue. Although size of the fish does not affect the absorption of astaxanthin, temperature does have a significant effect. Although there were no significant differences in absorption between Atlantic salmon (Salmo salar) and rainbow trout, absorption tended to be greater in the latter species and merits further study.
Ill
LIST OF CONTENTS
TITLE PAGE ........................................................................................................................ ii
ABSTRACT ......................................................................................................................... iii
LIST OF CONTENTS ......................................................................................................... iv
LIST OF FIGURES .............................................................................................................. X
LIST 0 F TABLES .............................................................................................................. XV
ACKNOWLEDGEMENTS .............................................................................................. xvii
AUTHOR'S DECLARATION ........................................................................................ xviii
CHAPTER l.O
GENERAL INTRODUCTION ....................................................................................... I
l.l Salmonid aquaculture and nutritional aspects of pigmentation ......................... I
1.2 Chemistry of carotenoids ...................................................................................... 3
1.3 Carotenoid Function .............................................................................................. 5
1.4 Sources of carotenoid . . . . . . . . . .. . . . . . . . . . . . . . . . . . . . . . . . . . . . . . . . . . . . . . . . . . . . . . . . . . . . . . . . . . . . . . . . . . . . . . . . . . . ... 9
14.1 Crustaceans and by-products .................................................................... 9
1.4.2 Yeast ................................................................................................................ 13
14.3 AJgae .......................................................................................................... 14
1.5 Flesh deposition of carotenoids ....................................................................... 16
1.6 Carotenoid metabolism ....................................................................................... 19
1. 7 Carotenoid digestibility and absorption . . . . . . . . . . . . . . . . . . . . . . . . . . . . . . . . . . . ...................... 22
1.8 Mechanism of carotenoid uptake by the intestine ............................................. 23
1.9 Digestibility and micelle formation ................................................................. 26
1.10 Dietary lipids and carotenoid absorption................... ....... ..... ........ . .............. 27
1.11 Blood transport of carotenoids ........................................................................ 28
IV
1.12 Discrepancies between different carotenoids and their bioavailability ............. 29
1.13 Carotenoid isomers and bioavailability .............................................................. 30
1.14 Synergisticlantagonistic effects between carotenoids on bioavailability ........... 32
1.15 Evidence from in vitro studies ............................................................................. 33
1.16 Aims and Objectives ........................................................................................... 34
CHAPTER2.0
GENERAL MATERIALS AND METHODS .................................................................... 36
2.1 Experimental Diets-composition and analysis .................................................. 36
2.1.1 Preparation of Haematococcus pluvialis feed supplements ................................. 36
2.1.2 Addition of carotenoid to diets (top coating) ...................................................... 37
2.1.3 Protein determination ...................................................................................... 38
2.1.4 Lipid determination ..................................................... ___ ............................ 39
2.1.5 Moisture determination.................................................................... . .... 40
2.1.6 Ash determination ...... -·-·-·· .............................................................................. 40
2.1. 7 Energy determination ....................................................................................... 41
2.1.8 Inert marker analysis ......................................................................................... 42
2.2 Nutrition Trials .................................................................................................... 43
2.2.1 Experimental fish ............................................................................................. 43
2.2.2 Experimental System ......................................................................................... 43
2.2.3 Feeding ...................................................................... -....................................... 44
2.2.4 Faecal Stripping ................................................................................................. 45
2.2.5 Blood Sampling ......................................................................... _ ............. 45
2.3 Assessment of growth and feed utilisation ......................................................... .46
2.3.1 Specific Growth Rate (SGR) .............................. ······--·--········ ..................... _ . 46
2.3.2 Feed Conversion Ratio ....................................................................................... 47
2.4 Carotenoid analyses .......... _ .................................................................................. 4 7
2.4.1 Conventions adopted ....................................................................................... 47
2.4.2 Extraction from Feed and Faeces ................................................................. ___ 48
2.4.3 Extraction from serum ..................................................................................... 50
2.4.4 Extraction from fish muscle ............................................................................ 50
V
2.4.5 Extraction from liver and gastrointestinal tract.. ................................................. 5 I
2.4 .6 Extraction from skin .......................................................................................... 5 I
2.4. 7 Separation of pigments -Thin-Layer Chromatography (TLC} ............................. 52
2.4.8 Preparation of carotenoid standards .................................................................... 54
2.4. 9 Spectrophotometric carotenoid quantification .................................................... 55
2.4.10High Performance Liquid Chromatography (HPLC} Analysis ............................ 56
2.5 Assessment of carotenoid absorption and utilisation ......................................... 58
2.5.1 Apparent Digestibility Coefficient (ADC) .......................................................... 58
2.5.2 Flesh Retention .................................................................................................. 58
2.6 Statistics ............................................................................................................... 59
CHAPTER3.0
THE SPOROPOLLENIN CELL WALL OF HAEMATOCOCCUS PLUVIALIS:
EFFECTS ON ABSORPTION AND DEPOSITION OF ASTAXANTHIN IN RAINBOW
TROUT. ............................................................................................................................... 60
3.1 Introduction ......................................................................................................... 60
3.2 Materials and Methods ........................................................................................ 62
3 .2.1 Experimental design ........................................................................ 62
3.2.2 Basal Diets ....................................................................................................... 62
3. 2. 3 Experimental diets (Experiment I) ..................................................................... 62
3.2.4 Fish, feeding and sampling (Experiment 1) ....................................................... 63
3.2.5 Experimental diets (Experiment 2) .................................................................. 64
3.2.6 Fish, feeding and sampling (Experiment 2) ....................................................... 65
3.2.7 Electron Microscopy .... : .................................................................................... 65
3.2.8 Statistical analysis ............................................................................................. 66
3.2.9 Kinetic modelling .............................................................................................. 66
3.3 Results .................................................................................................................. 67
3.4 Discussion ............................................................................................................. 81
VI
CHAPTER4.0
PHYSIOLOGY OF THE INTESTINE MAY LIMIT THE ABSORPTION OF
ASTAXANTHIN FROM ESTERIFIED SOURCES IN RAINBOW TROUT,
ONCORHYNCHUS MYKISS (W ALBAUM) ...................................................................... 87
4.1 Introduction ......................................................................................................... 87
4.2 Materials and Methods ........................ : ............................................................... 89
4.2.1 Experimental design ........................................................................ 89
4.2.2 Experimental feeds ........................................................................................... 89
4.2.3 Fish and feeding trial .................................................................................... 90
4.2.4 Analysis of feed, digesta, gastrointestinal tract and blood .................................. 91
4.2.5 Statistical analysis .............................................................................................. 92
4.2.6 Kinetic modelling .............................................................................................. 92
4.3 Results .................................................................................................................. 94
4.4 Discussion ........................................................................................................... I 0 I
CHAPTER-5.0
EXTENT OF ESTERIFICATION AND ITS INFLUENCE ON THE UTILISATION OF
(3S,3'S)-ASTAXANTHIN IN RAINBOW TROUT, ONCORHYNCHUS MYKISS
(WALBAUM) .................................................................................................................... IIO
5.1 Introduction ....................................................................................................... 110
5.2 Materials and Methods ..................................................................................... 113
5.2.1 Experimental design................................................... . . . . . . . . . ...... 113
5.2.2 Experimental Diets ................................................................................ 113
5.2.3 Fish feeding and sampling ................................................................... 114
5.2.4 Analysis of astaxanthin chiral forms ........................................................... 115
5.2.5 Statistical analysis ........................................................................................ 116
5.2.6 Kinetic modelling.......... .................. .................. .............. ........ ...... . ...... 116
5.3 Results ............................................................................................................... I 16
5.4 Discussion .......................................................................................................... 128
VII
CHAPTER6.0
EVALUATION OF AN lN VITRO PERFUSION SYSTEM TO ASSESS THE UPTAKE
OF ASTAXANTHIN IN ISOLATED INTESTINE FROM RAINBOW TROUT,
ONCORHYNCHUS MYKISS (WALBAUM) .................................................................... 135
6.1 Introduction ....................................................................................................... 135
6.2 Materials and Methods ...................................................................................... 138
6.2.1 Experimental System ....................................................................................... 138
6.2.2 Preparation of the intestine ............................................................................... 139
6.2.3 Solubilisation of carotenoid ............................................................................. 140
6.2.4 Astaxanthin analysis ........................................................................................ 140
6.2.5 Viability experiments .................................................................................... 141
6.2.5.1 Perfusatejlow ........................... ........................................................... 141
6.2.5.2 Peristaltic contractions .............................................................................. 141
6.2.5.3 Histological examination ............................................................................. 142
6.2.5.4 Uptake vs. perfusate volume plots ................... ............................................ 143
6.2.6 Experiments ..................................................................................................... 143
6.2. 7 Statistical analyses ........................................................................................... 144
6.3 Results ................................................................................................................ 144
6.3.1 Viability ......................................................................................................... 144
6.3.2 Astaxanthin uptake ......................................................................................... 145
6.4 Discussion ........................................................................................................... 161
6.4. I Viability assessment... . .. . .. .. .... .. .... .. .. . .. . . . .. .. . .. .. . . . . . . .. . .. .. . . ........ 161
6.4.2 Solubility of carotenoid ................................................................................ 162
6.4.3 Uptake of astaxanthin ..................................................................................... 164
CHAPTER 7.0
USE OF EVERTED GUT-SACS TO COMPARE THE ABSORPTION OF
ASTAXANTHIN IN SALMONID FISH ......................................................................... 168
7.1 Introduction ....................................................................................................... 168
7.2 Materials and Methods..... .. .. . . . .. .. .... . .. .. .. .. .. . .. .. .. .. .. . .. . .. .. .. ....................... 170
VIII
7.2.1 Experimental system ........................................................................................ 170
7.2.2 Preparation of a micellar solution ................................................................... 171
7.2.3 Preparation of the intestine ............................................................................. 172
7.2.4 Carotenoid extraction from intestine ............................................................. 172
7.2.5 Viability experiments ....................................................................................... 173
7.2.5.1 Peristaltic contractions ................................................................................ 173
7.2.5.2 Tissue Lactate-dehyarodgenase (LDH), potassium and moisture content ..... 173
7.2.6 Statistics .......................................................................................................... 174
7.2.7 Experiment 1: Tissue saturation ....................................................................... 174
7.2.8 Experiment 2: Fish size effects ........................................................................ 175
7. 2. 9 Experiment 3: Temperature effect... ................................................................. 17 5
7.2.10Experiment 4: Species comparison ................................................................. 175
7.3 Results ......................................................................................................... 176
7.3.1 Viability ..................................................................................................... 176
7.3.2 Time saturation ................................................................................................ 177
7.3.3 Size effects ...................................................................................................... 177
7.3.4 Effect oftemperature ...................................................................................... 178
7. 3. 5 Species differences .......................................................................................... 178
7.4 Discussion ........................................................................................................... 187
CHAPTERS.O
GENERAL DISCUSSION.. . .... . . .. .. .. .. .. .. . .. .. .. .. .. . .... .. .. . .. .. . . .. .. .. .... . .. .. . .. .................. 193
8.1 Aplanospore cell wall or Haematococcus pluvialis.......... .... .. .. .. .................. 194
8.2 Astaxanthin esters ............................................................................................. 197
8.3 Chirality or astaxanthin .................................................................................... 200
8.4 Discrepancy between astaxanthin absorption and deposition ......................... 200
8.4 Evidence from in vitro studies on carotenoid absorption ............................... 204
8.5 Additional future experiments ........................................................................ 209
8.6 Conclusions ........................................................................................................ 21 0
REFERENCES .............................................................................................................. 213
IX
LIST OF FIGURES
CHAPTERl.O
Figure 1.1 Structural formula of carotenoids other than astaxanthin mentioned in Utis study (a) lycopenc (b)
~-carotene (c) canlhaxanUtin (d) zeaxanthin (e) lutein. The numbering of carbon atoms used in nomlenculture of
carotenoids is given for ~-carotene ..................................................................................................................... 4
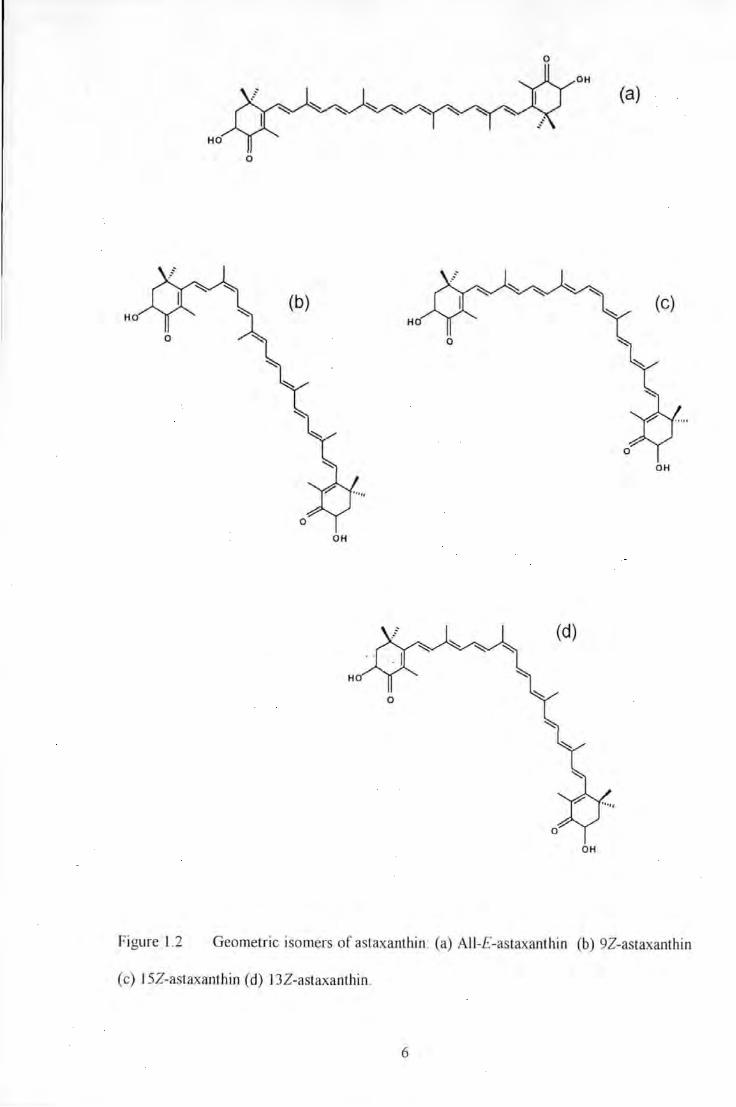
Figure 1.2 Geometric isomers of astaxanlhin: (a) All-E-astaxanthin (b) 92-astaxanUtin (c) 152-astaxanthin
(d) 132-astaxanthin ............................................................................................................................................ 6
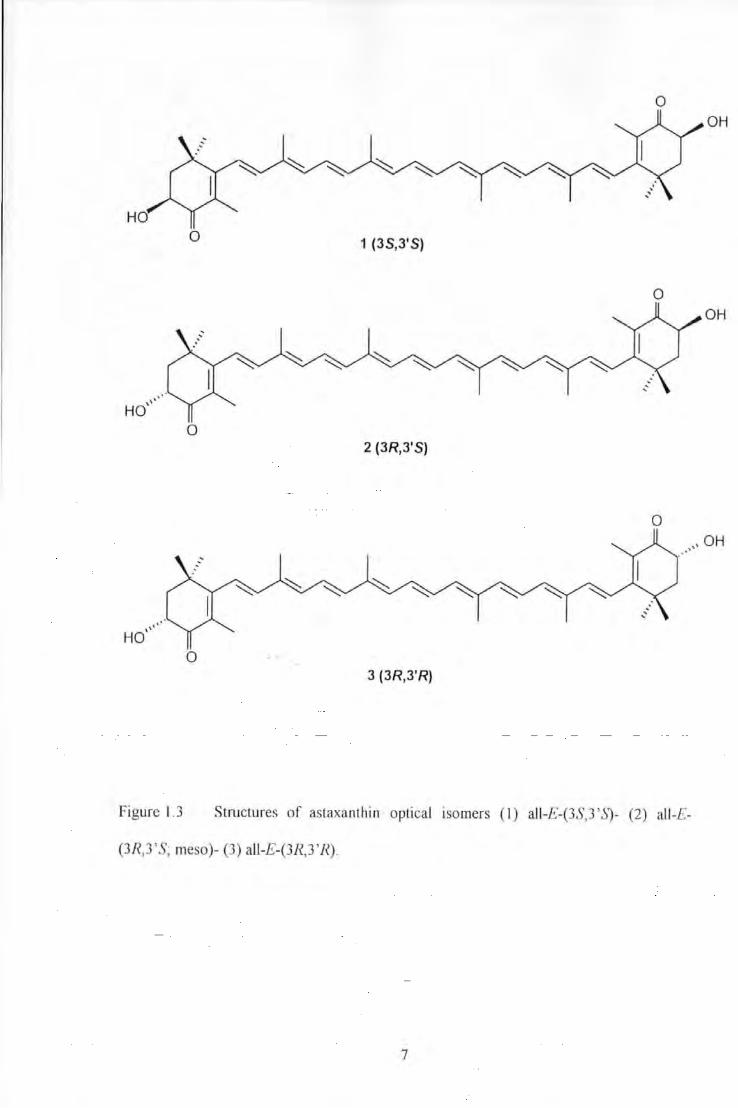
Figure 1.3 Structures of astaxanUtin optical isomers (I) all-£-(3S,3'.S)- (2) all-£-(3R,3'S~ meso)- (3) all-£-
(3R,3 'R) ... ........................................................................................................................ 7
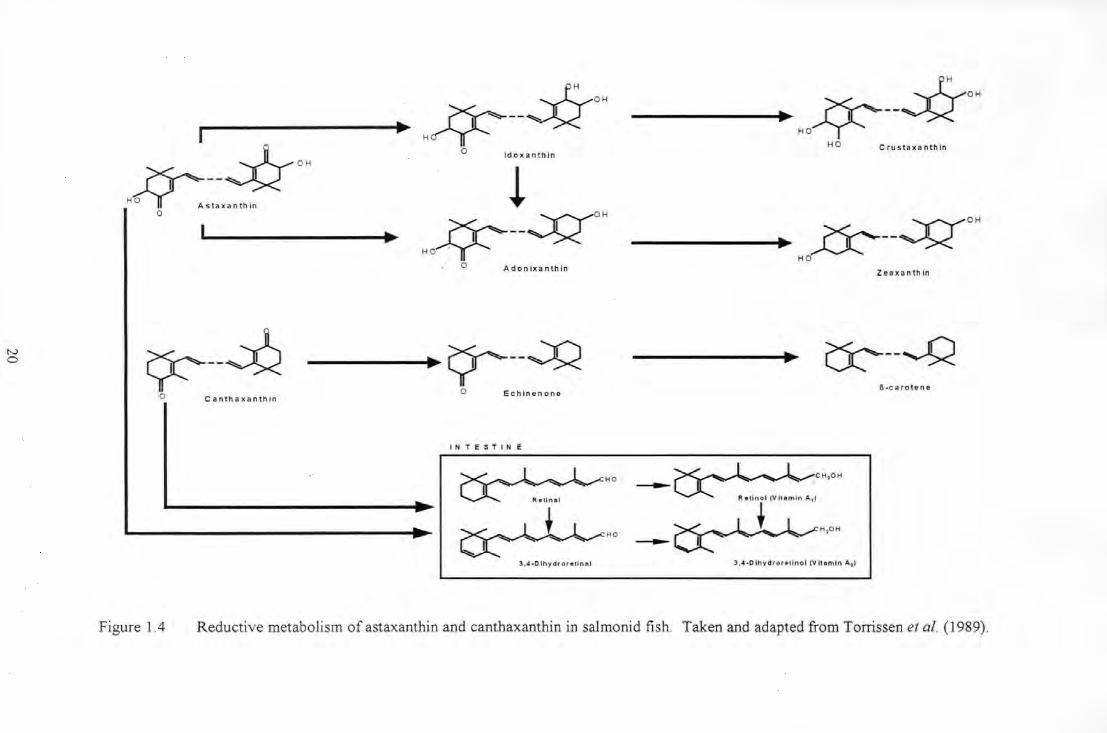
Figure 1.4 Reductive metabolism of astaxanUtin and canUtaXanUtin in sahnonid fish. Taken and adapted from
Torrissen et al. ( 1989) ...................................................................................................................................... 20
Figure 1.5 Proposed uptake of astaxanUtin from lipid nticelles across the unstirred water layer (U. W.L) into
imestinal mucosal cells; possible metabolic events and movement of astaxanthin into lymph and portal
blood .............................................................................................................................. 24
CHAPTER 2.0
Figure 2.1 Typical HPLC chromatogran1s of all-lrans-astaxanthin (standard) on a (a) nitrile (retention time
ea. 7min) and (b) silica colunm (retention time ea. llntin). A typical spectral scan of an astaxanthin st;mdard
().max 470mn) has been included in chromatogram (b)........ ................................... . ....... 57
CHAPTER3.0
Figure 3.1 Scanning electron nticrographs (x 2000) of Haematococcus pluvia/is cells (a) intact cell; (b)
cracked under 5000psi; (c) cracked under 2000psi and (d) NatuRose TM cell cracked using a proprietar\'
process .................... . ....... 76
Figure 3.2 Flesh astaxantltin concentrations (solid bars) ;md Net Apparent Retention values (open bars) for
fish fed diets in Experiment I (A) and Experiment 2 (B). Columns represem means ±SEM (n=3) .................... 77
Figure 3.3 Astaxantltin deposition in Ute flesh of trout fed diets in Experiment I after 4 and 10 weeks of
feeding. Values represent means (n=3, ± SEM) for Diet A <•~ solid line). Diet B <•: short dash) and Diet C (1'~
long dash) ....................................................................................................................... 78
Figure 3.4 Relationship between flesh astaxantl1in concentrations and Sa/moFan™ Score for fish fed diets in
X
Experiment I. Equation for the regression analysis was Sa/moFan™ score~ 22.2366 + 0.767496xflesh
astaxanthin (correlation coefficient~0.80: R'~64.63%). Values represent individual fish sampled at weeks 4 and
10 ..................................................................................................... . ........ 79
Figure 3.5 Post-prandial serum profiles for trout fed a single meal supplemented with either synthetic
unesterified astaxanthin, Diet A (e; solid line); Haematococcus pluvialis, Diet B <•; short dash) or cell free
carotenoid extract, Diet C (T; long dash). Values represent the means of replicates (n~3, ±SEM). Maximum
absorption rates detemlined by multiplying the respective apparent uptake rate constant (k2) by (A + C). Time 0
represents approximately I h after fish were fed ................................................................................................ 80
CHAPTER4.0
Figure 4.1 Representation of the various gastrointestinal regions sampled; region I (stomach), region 2 (ileal
intestine). region 3 (posterior intestine). .... ....... .... ......... .. ............... . ........................ 97
Figure 4.2 A simulated Lime course of serum astaxanthin after ingestion of a single meal. Details of the
kinetic model used are described in the text. The dashed line represents a simulated Lime course using the same
model and parameters except that k3 ~ 0 ........................................................................................................ 98
Figure 4.3 The relative percentage contributions and concentrations of astaxanthin (Ax) forms in the diet and
digesta of fish fed esterified astaxanthin, Diet EST (n~3, ± SEM) ...................... . ························· 99
Figure 4.4 Post-prandial astaxanthin serum profiles for trout fed a single meal supplemented wiU1 eiU1er free
astaxanthin, Diet FR ( -•-) or esterified astaxanthin, Diet EST ( --11--). Values represent the means of replicates
(n~J, ±SEM). Maximum absorption rates of astaxanU1in determined as described in Materials and MeUwds
(kinetic modelling). Time 0 represents approx. I h after fish were fed ........................ . . ....... 100
CHAPTER 5.0
Figure 5.1 Apparent Digestibility Coefficients (ADC) for AstaxanU1in for fish fed U1e experimental diets. 123
Figure 5.2 Post-prandial astaxanUlin serum profiles for trout fed a single meal supplemented with either free
astaxanthin (e; solid line); monoester ( l'; long dash); diester c-; short dash) or Haematococcus pluvial is extract
(+; medium dash). Values represent the means of replicates (n~3, ±SEM). Maximwn absorption rates of
astaxanU1in detennined as described in Materials and Methods (kinetic modelling). Time 0 represents approx. lh
after fish were fed .. . ................................................................................................................... 124
Figure 5.3 AstaxanU1in (JI) and total carotenoid ([]) in white muscle of rainbow trout fed U1e experimental
diets. Values are me<UIS (n~J. ± SEM) ......................................................... . . ..... 125
XI
CHAPTER6.0
Figure 6.1 Everted intestine perfusion system used in the current study .................................................... 148
Figure 6.2 Histological pictures of (a) control intestine (x 20 magnification); (b) control intestine (x 10
magnification); (c) everted intestine sample ( x 20 magnification) and (d) everted intestine ( x 40
magnification) ........................................ .. . .......................................................... 149
Figure 6.3 Cumulative astaxanthin uptake (solid bars) versus cumulative perfusate volume (open bars) at
dose I mg 1"1 in Experiment MIC. Comparison of slopes (linear regression) based on raw data (n= 10) revealed
significant (P=0.0090) differences. Values represent means (n= I 0, ±SEM) .................................................... 150
Figure 6.4 Cumulative astaxanthin uptake (solid bars) versus cumulative perfusate volume (open bars) at
dose 2mg 1"1 in Experiment MIC. Comparison of slopes (linear regression) based on raw data (n=IO) revealed
significant (P=0.0088) differences. Values represent means (n= 10, ±SEM) ..................................................... 151
Figure 6.5 Cumulative astaxanthin uptake (solid bars) versus cumulative perfusate volume (open bars) at
dose 3mg 1" 1 in Experin1ent MIC. Comparison of slopes ·(linear regression) based on raw data (n=4) revealed
significam (P=0.0292) differences. Values represent means (n=4, ±SEM) ....................................................... 152
Figure 6.6 Cumulative astaxanthin uptake (solid bars) versus cumulative perfusate volume (open bars) at
dose 2mg 1"1 in Experin1ent EM Comparison of slopes (linear regression) based on raw data (n=4) revealed
significant (P=0.0202) differences. Values represent means (n=4, ±SEM) ...................................................... 153
Figure 6.7 Cumulative astaxanthin uptake (solid bars) versus cumulative perfusate volume (open bars) at
dose 3mg 1"1 in Experiment EM Comparison of slopes (linear regression) based on raw data (n=4) revealed
significant (P=0.0209) differences. Values represent means (n=4, ±SEM) ....................................................... 154
Figure 6.8 Cumulative astaxanthin uptake (solid bars) versus cumulative perfusate volume (open bars) at
dose 6mg 1"1 in Experiment EM. Comparison of slopes (linear regression) based on raw data (n=4) revealed
significmll (P=0.0202) differences. Values represent mem1s (n=4, ±SEM) ....................................... .. . ....... 155
Figure 6.9 Dose response curve for initial uptake rates of astaxanthin by perfused evened intestines in
Experiment MIC (astaxanthi.J1 solubilise in Tween 20). Open circle symbols represent raw data m1d filled circles
represent means (ling 1"1 and 2mg 1"1 n= 10; 3mg 1" 1 n=4, ±SEM) at intended doses. Regression analysis of raw
data gave the equation: uptake rate= 0.0468937+0.122348xdose (?=0.0021; R2=32.0854%; correlation
coefficient= 0.56644) .................................................................................................................................. 157
Figure 6.10 Dose response curve for initial uptake rates of astaxanthin by perfused everted intestines m
XII
Experiment EM (dispersible beadlets)_ Open circle symbols represent raw data and filled circles represent means
(n=4, ±SEM) at intended doses. Regression analysis of raw data gave the equation: uptake rate= -
0.0362817+0.055410ixdose (?=0.0064; R2=50.5555%; correlation coefficient= 0.711024) .......................... 158
Figure 6.11 Cumulative uptake of astaxanthin in Experiment MIC (Tween 20) by perfused everted intestines at
astaxanthin doses of lmg r1 (-.A.-); 2mg r1 (---)and 3mg r1 (-e-). Plots for Img )'1 and 2mg r 1 dose represent
means of 10 replicates± SEM. Plots for 3mg r• dose represent means of 4 replicates± SEM. ........................ 159
Figure 6.12 Cumulative uptake of astaxanthin in Experiment EM by perfused evened intestines at astaxanthin
doses of2mg 1'1 (-.A.-); 3mg 1'1 (-11-) and 6mg r 1 (-e-). Plots for all doses represent means (n=4, ± SEM) ..... 160
CHAPTER 7.0
Figure 7.1 Tissue LDH activity of control (CNT) and micelle exposed (EXP) ileal and posterior intestine
sections of evened gut sacs from rainbow trout (n=6, ± SEM) ....................................................................... 180
Figure 7.2 Tissue potassiwu concentration of control (CNT) and micelle exposed (EXP) ileal and posterior
intestine sections of everted gut sacs from rainbow trout (n=6, ± SEM). ................. _ .... _ .. _ .. _ .. _ .......... _ .............. 181
Figure 7.3 Tissue moisture content of control (CNT) and micelle exposed (EXP) ileal and posterior intestine
sections of evened gut sacs from rainbow trout (n=6, ± SEM) ...................................................................... 182
Figure 7.4 Uptake of astaxanthin by evened gut sacs of rainbow trout over time. Open bars represent
astaxanthin uptake by the posterior intestine and filled bars represent uptake by the ileal intestine (n=6, ± SEM).
Astaxanthin dose was 5.1 ± 0.2 mg 1'1 at 15 ± I oc_ Uptake at time 0 represents the astaxanthin concentration in
intestinal tissue of control fish- (n~3, ± SEM). Linear regression analysis of raw data gave a significant
relationship (P=0.0045) between time and uptake (R2=66%; correlation coefficient=0.812006;
uptake=O.I00909+0.0421212*time) for the ileal intestine. No such relationship was recorded for the posterior
intestine (P=0.9108) ...................................................................................................................................... 183
Figure 7.5 Astaxanthin uptake by evened gut-sacs of rainbow trout as a function of fish weight. Open circles
and open squares represent astaxanthin uptake by Ute ileal and posterior intestine, respectively. AstaxanUtin dose
was 4.3 ± 0.3 mg 1'1 at IS± l 0 C. Regression analysis ofupwke vs. fish weight for the ileal and posterior intestine
showed non-significant relationships (P>0_05)_ ................................................................................... ___ .. 184
Figure 7.6 Uptake of aswxanthin by evened gut-sacs of rainbow trout under different temperatures_ Open
mtd filled bars represent astaxanUtin uptake by the posterior and ileal intestine, respectively (n=G, ± SEM).
Astaxanthin dose was 3.9 ± 0.1 mg r• ............................................................................................................ 185
Figure 7.7 AstaxanUiin uptake by evened gut sacs of rainbow trout and Atlantic salmon. Open and filled bars
XIII
' ! . - ·_ ..
I''
.iep_fe's~ltt,as~~.tl!inJIJPiake by,:ilie;posierib~ and tiindl intestine, respectivdy1 (n='7, :!'-SE~. AStax;u;tltin• dose
was 4) ± 0:04 ti;g·F\md14!~;± 0,05 rngllii~ for!trotiiandlsalmon respectivel}nat; is ± ii at: .............................. 1!86 I ·, •
XIV
LIST OF TABLES
CHAPTER l.O
Table 1.1 Comparative absorption and deposition of carotenoid from different sources in different salmon id
species ............................................................................................................................. 10
CHAPTER3.0
Table 3.1 Ingredients and formulation of the experimental diets for both experiments ............................. 71
Table 3.2 Astaxanthin forms and inclusion concentration in diets from Experiment I. ............................... 72
Table 3.3 Astaxantll.in forms and inclusion concentrntion in diets from Experiment 2 ............................... 73
Table 3.4 Growth Paran1eters for rainbow trout fed diets in both experiments ........................................... 74
Table 3.5 Apparent Digestibility Coefficients for Astaxanthin in Rainbow Trout Fed the Dietary Treaunents
for Both Experiments ....................................................................................................................................... 75
CHAPTER4.0
Table 4.1 Mean Astaxanthin Concentmtions (1-tg g·' wet weight) in Individual Gastro-lntestinal Regions of
Rainbow Trout Fed Diets Supplemented with Free (Diet FR) or esterified (Diet Esn astaxanthin .................... 96
Table 4. 2 Mean AstaxanU1in Concentrntions in Se nun (Jlg mr' ), Liver and Fish Muscle (llg g·' wet weight)
.. from Rainbow Trout Fed Diets Supplemented wiU1 Free (Diet FR) or esterified (Diet EST) astaxanthin for 56
days .................................................................................................. . ... 96
CHAPTER 5.0
Table 5.1 Ingredients and proxin1ate composition of U1e experimental diets ............................................ 120
Table 5.2 Astaxanthin content and composition of the experimental diets ................................................ 121
Table 5.3 Growth performance and feed utilisation of rainbow trout after eight weeks of feeding U1e diet<U)'
treatments ..... ............................................................................................. In
Table 5.4 Net apparent retention of dietary carotenoid and dietary astaxantllin after 8 weeks of feeding ... 126
Table 5.5 Ch.irality of astaxanU1in in U1e feeds. muscle and skin of rainbow trout at U1e end of the nuuition
XV
itriai... .......... _ ...................................................................................................................... .il27
Table_ 6.'11 'Absorpl.ioniparameters1for perfused everied!iniestines exposedto[differeni doses of-
astaxanthinc ... __ ... __ ......... . . ... 156
XVI
ACKNOWLEDGEMENTS
My sincere thanks to my director of studies Dr. Simon J. Davies for his advice and guidance
during my studies. Thanks also to Dr. A.J. Young for his invaluable efforts during the last
three years. I also wish to thank Dr. J. Moody for his help, encouragement and patience in
reviewing specific chapters of this thesis.
My sincere thanks must go to the sponsors of this study and the financial support they
provided. I would like to personally thank Dr. D. Nickell and Dr. V. Verhlac (Hoffmann la
Roche, Base I, Switzerland) for their contribution to specific areas of this project.
I would like to extend my thanks to those members of staff who have all contributed in their
own way towards this study. In particular, I wish to thank Mr. R. Serwata, Ms. J. Soane, Mrs.
J. Carter, Mr. S. MacMahon, Mr. N. Crocker and Dr. R. Handy. A very special thanks to
Joanne Bowen for her substantial efforts to supply materials used in this study.
A special thanks to my family for their ongoing support through my academic life and to my
friends and colleagues, especially Ash Patel and Greg Page for the amusing stress relief that
they provided.
Lastly, but far from least, my special thanks as always to my partner Nicola.
XVII
AUTHOR'S DECLARATION
At no time during the registration for the degree of Doctor of Philosophy has the author been
registered for any other University award_
This study was financed by the European Framework IV grant (FAIR 97-1518) and in part by
F. Hoffmann-La Roche, Base!, Switzerland_ Work was carried out in collaboration with the
Carotenoid Research Group, Liverpool John Moores University, Liverpool, England
All laboratory and experimental procedures were undertaken in accordance with the Animal
(Scientific Procedures) Act 1986 under the following Home Office Licence details:
Project Licence:
Personal Licence:
PPL 30/1583
PIL 30/4911
Publications accepted and presentations during research period:
White, D.A., Page, G. I., Davies, SJ. (2000) Pigmentation efficacy of alternative sources of
astaxanthin for rainbow trout (Oncorhynchus mykiss)_ Poster presentation; The Ninth
International Symposium on Nutrition & Feeding In Fish Miyazaki, Japan_
Bowen, l, Soutar, C., Serwata, R.D., Lagocki, S., White, D.A., Davies, S.J. & Young, AJ.
(200 I) Utilisation of (3S,3 'S)-astaxanthin acyl esters in pigmentation of rainbow trout
(Oncorhynchus mykiss). Aquaculture Nutrition, 7, 1-10.
XVIII
White, D.A., Page, G. I., Swaile, J., Moody, A.J. & Davies, S.J . (200 I) Effect of esterification
on the absorption of astaxanthin in rainbow trout, Oncorhynchus mykiss (Walbaum).
Aquaculture Research, in press.
Reports submitted to industrial partners:
For F. Hoffmann-La Roche, Base!, Switzerland:
• Pharmacokinetics of astaxanthin through perfused trout intestines in vitro .
• Use of everted salmon id gut sacs to study the uptake of astaxanthin in vitro.
Conferences attended:
The Ninth International Symposium of Feeding and Fish Nutrition, Miyazaki, Japan, May
2000.
External contacts :
Dr. A. Young, Liverpool John Moores University, Liverpool, UK.
Dr. D. Nickell, F-Hoffmann La Roche, Base!, Switzerland.
Dr. V. Yerhlac, F-Hoffmann La Roche, Base!, Switzerland.
Dr. T. Lorenz, Cyanotech corporation, Hawaii.
Signed
Date .11./.l IoA. .....
XIX
CHAPTER 1.0
GENERAL INTRODUCTION
1.1 Salmon id aquaculture and nutritional aspects of pigmentation
As harvest limitations in global fisheries have become increasingly apparent aquaculture
has developed into a rapidly expanding global industry with increasing importance.
Meyers ( 1994) reviewed the status of the global aquaculture industry and its significance
Among the carnivorous finfish species cultured, fifty percent are salmonids with a ratio of
I : 1 salmon and trout. In the period of 1986-1989, increases of I 00-180% occurred in the
production of farmed Atlantic salmon (Salmo salar) and Pacific salmon (Oncorhynchus
spp.), with concurrent increases of around 20-70% for other farmed finfish and
crustaceans. World production of all farmed salmon (in 1999) was estimated to be over
750,000 metric tonnes per annum, with figures expected to approach I million metric
tonnes by the year 2001 and 1.3 million tonnes by the year 2005 (Lorenz & Cysewski
2000). The most prevalent growth has occurred within the Norwegian Atlantic salmon
industry where from 1979 to the early 1990's production expanded from approximately
4,000 to over 150,000 metric tonnes. Bjerkeng (1997) noted that this production of
Atlantic salmon had increased to 220,000 metric tonnes. Chile, the other major producer
of farmed salmonids, increased production of farmed salmon and sea trout from 200,700
metric tonnes in 1998 to 222,900 metric tonnes in 1999, an 11% increase (Egan 2000).
The United Kingdom and Canada U K., also recognised as significant contributors to
world wide salmonid culture, increased production from 115,000 metric tonnes in 1998 to
119,000 metric tonnes in 1999, a 3% increase (Egan 2000).
This growth in the aquaculture industry has been facilitated in part by the parallel
developments that have occurred within the salmonid feed industry, since successful fish
culture is dependent on sound nutrition and feeding regimes {Cho 1990). In this respect,
there has been considerable progress and advances in the last 30 years concerning the
nutritional requirements of fish, particularly salmon and trout. Fish generally have a high
requirement for protein that provides the key essential amino acids needed for growth and
tissue repletion. Additionally, most carnivorous fish including salmonids have the ability
to spare the use of protein for energy purposes by preferentially metabolising lipids and to
a limited extent carbohydrate in the feed (GrisdaleHelland & Helland 1997; Sveier et al.
1999). Lipids also supply the essential fatty acids such as the n-3 and n-6 series that are
important for health and efficient growth performance at all stages of development.
Modern aquafeeds for salmon and trout are formulated to be nutrient dense with respect to
protein and energy. Therefore, it is standard practise to produce diets containing high oil
inclusion (>30%) and based on premium quality fishmeal concentrates and selected
ingredients such as soybean meal and corn glutein. These macro ingredient components
are complemented with vitamin and mineral supplements to provide a completely balanced
feed that satisfies the nutritional requirements of the species in question.
It is essential that farmed fish resemble their wild counterparts in terms of size; shape; taste
and texture. Furthermore, the final colour of fish flesh is an important consideration
(Simpson & Kamata 1978; Goodwin 1986). The consumer prefers red-coloured products
of salmonid fishes (Ostrander et al. 1976; Hatano et al. 1987; Rounds et al. 1992;
Sigurgisladottir et al. 1994; Skonberg et al. 1998). Further to this preference, redness adds
to enjoyment of eating salmonids (Sylvia et al. 1995) and may be an indicator of quality
(Sylvia et al. 1996). Indeed, aquaculture practices that produce high-value salmonid
species employ feeding strategies that result in the development of a pink to red colour in
2
the flesh of fish. This has been achieved in practise by the incorporation of pigments
known as carotenoids, in commercial fish feeds at typical concentrations ranging from 40
to 80 mg kg- 1 (Nickel! & Bromage 1998a). Although these carotenoids are naturally
widespread in nature (primarily in plants), salmonids, amongst other animals, cannot
synthesise these molecules de novo, hence the reason for their dietary inclusion (Hata &
Hata 1973; Simpson & Kamata 1978; Ando et al. 1986b; Ando et al. 1992; Guillou et
al.1992a; Storebakken & No 1992; Blanc & Choubert 1993; Choubert & Storebakken
1996).
ln nature, wild salmonids are pigmented through ingestion of crustaceans which contain
the carotenoid astaxanthin (3,3 '-dihydroxy-~,~-carotene-4,4'dione) (Schiedt et al. 1986;
Skrede & Storebakken 1986), yet synthetical! y manufactured astaxanthin and the
carotenoid canthaxanthin (~,~-carotene-4,4'-dione) are commonly supplemented into
salmonid feed to promote a desired flesh colouration (Schiedt et al. 1986; Bjerkeng 1992;
Bjerkeng et al. 1992; Bell et al. 1998; Akhtar et al. 1999).
1.2 Chemistry of carotenoids
Carotenoids are pigments synthesised by photosynthetic microorganisms and plants, but
not by animals (Furr & Clark 1997). However, animals can modify the structure of
ingested carotenoids through various metabolic routes. These carotenoids represent over
600 compounds in nature and all possess similar chemical features; an polyisoprenoid
structure; a long conjugated series of double bonds within the centre of the molecule
(usually 9-13 double bonds) and near symmetry around the central double bond (Britton
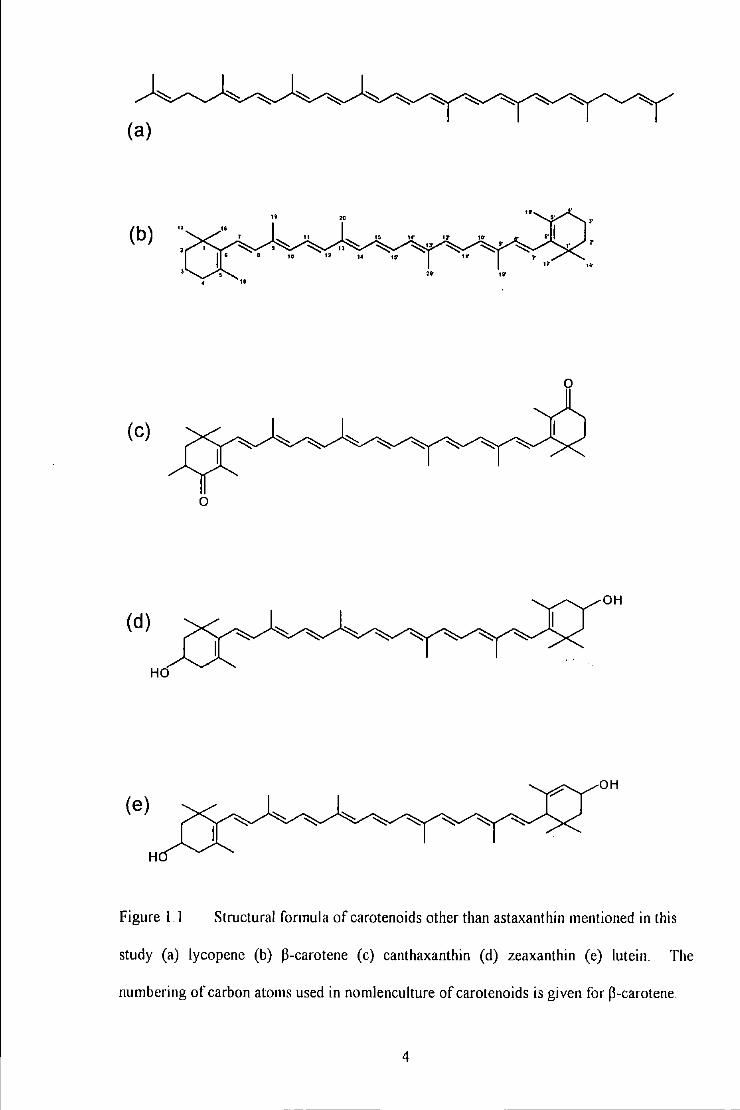
1995; see Figure 1.1 ).
3
(a)
" " ' (b) ,::::,... " ,;:;,.... "
,.. " T
'-':: '-':: '-'::' '-':: " " .. •• "
,. •• "
(c)
0
OH
(d)
OH
(e)
H
Figure 1.1 Structural formula of carotenoids other than astaxanthin mentioned in this
study (a) lycopene (b) P-carotene (c) canthaxanthin (d) zeaxanthin (e) lutein The
numbering of carbon atoms used in nomlenculture of carotenoids is given for P-carotene.
4
The system of alternating single and double bonds that form the central structure of the
carotenoid molecule is known as the chromophore. It is the length and structure of the
chromophore which gives the carotenoids as a group their distinctive molecular shape,
chemical reactivity, and light (ultra violet and/or visible) absorbing properties (Van
Breeman 1996), which ·leads to their colourful appearance (usually yellow to red in
colour). Carotenoids contain 3-11 or more conjugated double bonds and may be present in
numerous cis (Z) isomeric or trans (E) geometric forms (Bjerkeng et al. 1997; see Figure
1.2). The aii-E-isomer is considered to be the predominant native form where Z isomers
are generally artefacts. Furthermore, carotenoids may be present in various optical
configurations i.e. they exist as various enantiomers. Astaxanthin has two chiral centres
giving rise to three optical isomers; an enantiomeric pair and a mesa form; (JS,J 'S);
(3R,3'R) and (3R, 3'S) (Bjerkeng, 1992; see Figure 1.3). Carotenoids that contain one or
more oxygen functions e.g. astaxanthin and canthaxanthin, belong to a group collectively
known as the xanthophylls (Ruban et al. 1993).
1.3 Carotenoid Function
It is believed that carotenoids first emerged in primitive archaebacteria as lipid based
compounds that reinforced cell membranes (Vershinin 1999). However, apart from the
desired colouration that carotenoids impart in salmonid flesh, the functional purpose of
carotenoids in fish species generally remains to be explained fully. lt is well documented
that carotenoids act as precursors for vitamin A in fish (Schiedt et al. 1985; Al-Khalifa &
Simpson 1988; Christiansen et al. 1994; Torrissen & Christiansen 1995; Christiansen &
Torrissen 1996). However, reviewed evidence suggests that these pigments could have a
positive effect in relation to fecundity, fertility and larval development.
5
0
OH
(a)
0
(b) (c) HO
0 0
OH
0
OH
(d)
HO
0
OH
Figure 1.2 Geometric isomers of astaxanthin: (a) All-£-astaxanthin (b) 92-astaxanthin
(c) 15Z-astaxanthin (d) 132-astaxanthin.
6
0 OH
0 1 (3S,3' S)
0 OH
0 2 (3R,3'S)
0
HO' ,. •
0 3 (3R,3'R)
Figure 1.3 Structures of astaxanthin optical tsomers ( 1) all-£-(3S,3 'S)- (2) all-£-
(3R,3 'S; meso)- (3) all-E-(3R,3'R).
7
Positive correlations have been noted between carotenoid supplementation in feeds and
growth rate of fish during the start-feeding period in Atlantic salmon (Christiansen et al.
1994; Torrissen 1984). Dietary astaxanthin has been shown to improve the condition of
broodstock and enhance total egg production in spawning striped jack, Pseudocaranx
dentex (Vassalo-Agius et al. 2001). Indirect evidence has demonstrated that at time of
sexual maturation, deposited pigment in salmonid flesh is mobilised and transferred to the
skin in males and the eggs in females, leading to the hypothesis that they play an important
role during reproduction (Torrissen et al. 1989}. In addition, dietary supplementation with
astaxanthin has been shown to improve liver ultrastructure in some fish species (Segner et
al. 1989). This positive effect may be associated with a carotenoid's singlet-oxygen
quenching ability inhibiting free radical formation (Tacon 1981 ). Several studies have
shown the potential of carotenoids to prevent free radical production and lipid peroxide
production (Miki 1991; Nakano et al. 1995; Kobayashi & Sakamoto 1999; Nakano et al.
1999). Indeed, astaxanthin has been shown to be an excellent antioxidant that perfectly
quenches excited states as well as ground state radicals (Beutner et al. 200 I).
However, in Atlantic salmon, pigmentation of eggs had no effect of on subsequent
fertilisation rates and survival from the eyed stage to hatching (Christiansen & Torrissen
1997) or during the embryonic stage (Torrissen 1984). Choubert et al. ( 1998) found that
feeding diets supplemented with canthaxanthin and astaxanthin to rainbow trout had no
effect on frequency of maturing females; timing of ovulation; relative fecundity; egg
weight; fertilisation rate and fingerling growth. This led the authors to suggest that any
positive effect via dietary supplementation with carotenoids would only be noted under
"abnormally poor" culturing conditions.
8
1.4 Sources of cat·o(enoid
Dietary sources of syntheti: astaxanthin and canthaxanthin have been used extensively for
the pigmentation of salmomd fish species. These sources are incorporated into beadlets
containing a complex mixture of gelatin, carbohydrates starch and antioxidants. Although
canthaxanthin was commercially· available some years prior to astaxanthin, the latter
carotenoid has become the pigment of choice in most salmonid production facilities in
Europe due to the more natural colour it imparts once deposited in salmonid flesh. The
most economically important commercial source of synthetic astaxanthin (CAROPHYLL ®
Pink, Hoffmann-La Roche, Base!, Switzerland; Bjerkeng et al. 1997) consists of a racemic
mixture (1:2:1) of the (3R,3'R), (3R,3'S; meso) and (3S,3'S) isomers, respectively. In
recent years both the consumer and fish farmer have become increasingly wary over the
introduction of chemically synthesised additives into the food chain. This has encouraged
a general trend for using natural sources of feed nutrients (Johnson & An 1991 ). Table I. I
provides a summary of a number of feed trial type studies that have assessed the absorption
and utilisation of carotenoids by salmonids from an array of different carotenoid sources.
I. 4. I Crustaceans and by-products
Crustaceans and crustacean waste produce contain relatively high concentrations of these
pigments and have warranted considerable interest as an alternative natural source of
carotenoids for salmon id feeds (Saito & Regier 1971; Spinelli et al. 1974; Kuo et al. 1976;
Sivtseva & Dubrovin 1982; Choubert & Luquet 1983; Meyers & Thibodeaux 1983;
Tidemann et al. 1983; Arai et al. 1987; Mandeville et al. 1991; Virtue et al. 1995).
9
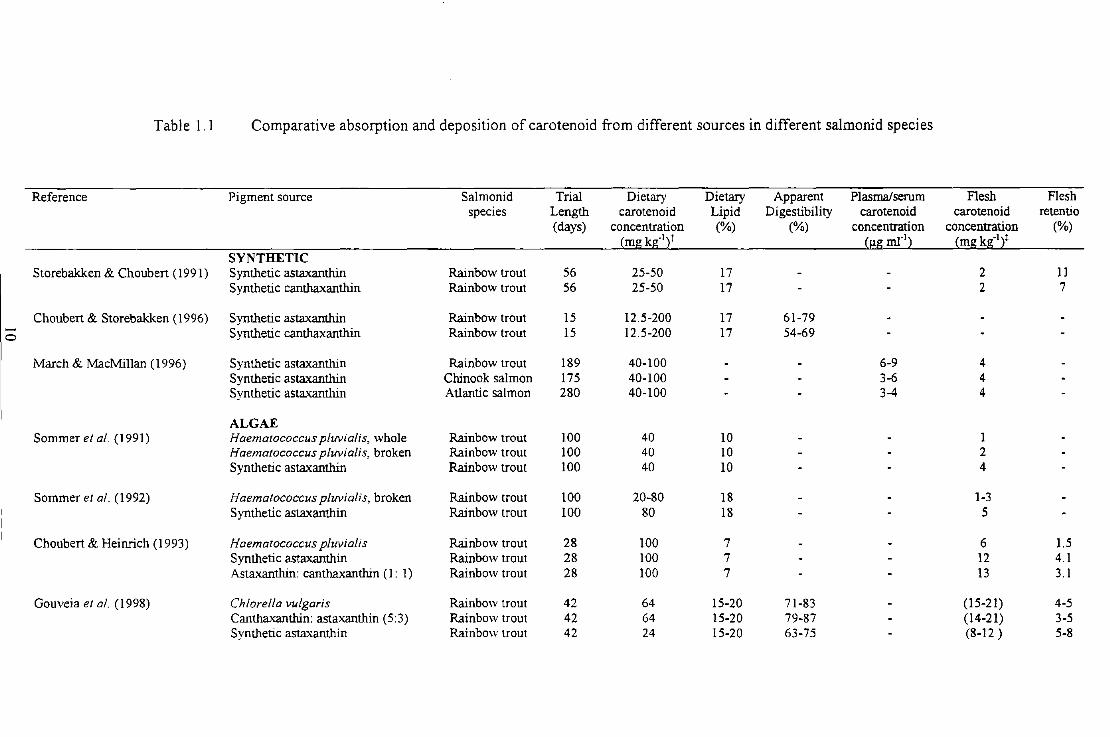
Table I. I Comparative absorption and deposition of carotenoid from different sources in different salmonid species
Reference Pigment source Salmon id Trial Dietary Dietary Apparent Plasma/serum F1esh F1esh species Length carotenoid Lipid Digestibility carotenoid carotenoid retentio
(days) concentration (%) (%) concentration concentration (%) ~mg kg-121 ~J.Lg ml"l2 ~mg kg·Ii
SYNTHETIC Storebakken & Choubert ( 1991) Synthetic astaxanthin Rainbow trout 56 25-50 17 2 11
Synthetic canthaxanthin Rainbow trout 56 25-50 17 2 7
Choubert & Storebakken (1996) Synthetic astaxanthin Rainbow trout 15 12.5-200 17 61-79
0 S yn theti c canthaxanthin Rainbow trout 15 12.5-200 17 54-69
March & MacMillan (1996) Synthetic astaxanthin Rainbow trout 189 40-100 6-9 4 Synthetic astaxanthin Chinook salmon 175 40-100 3-6 4 Synthetic astaxanthin Atlantic salmon 280 40-100 3-4 4
ALGAE Sommer et al. (1991) Haematococcus pluvialis, whole Rainbow trout 100 40 10 1
Haematococcus pluvialis, broken Rainbow trout 100 40 10 2 Synthetic astaxanthin Rainbow trout 100 40 10 4
Sommer et al. (1992) Haematococcus pluvialis, broken Rainbow trout 100 20-80 18 1-3 Synthetic asta.xanthin Rainbow trout lOO 80 18 5
Choubert & Heinrich (1993) Haematococcus pluvialis Rainbow trout 28 100 7 6 1.5 Synthetic astaxanthin Rainbow trout 28 100 7 12 4.1 Asta.xanthin: canthaxanthin (I : 1) Rainbow trout 28 100 7 13 3.1
Gouveia et al. (1998) Chlore/la vulgaris Rainbow trout 42 64 15-20 71-83 (15-21) 4-5 Cantha.xanthin: astaxanthin (5:3) Rainbow trout 42 64 15-20 79-87 (14-21) 3-5 Synthetic asta.xanthin Rainbow trout 42 24 15-20 63-75 (8-12 ) 5-8
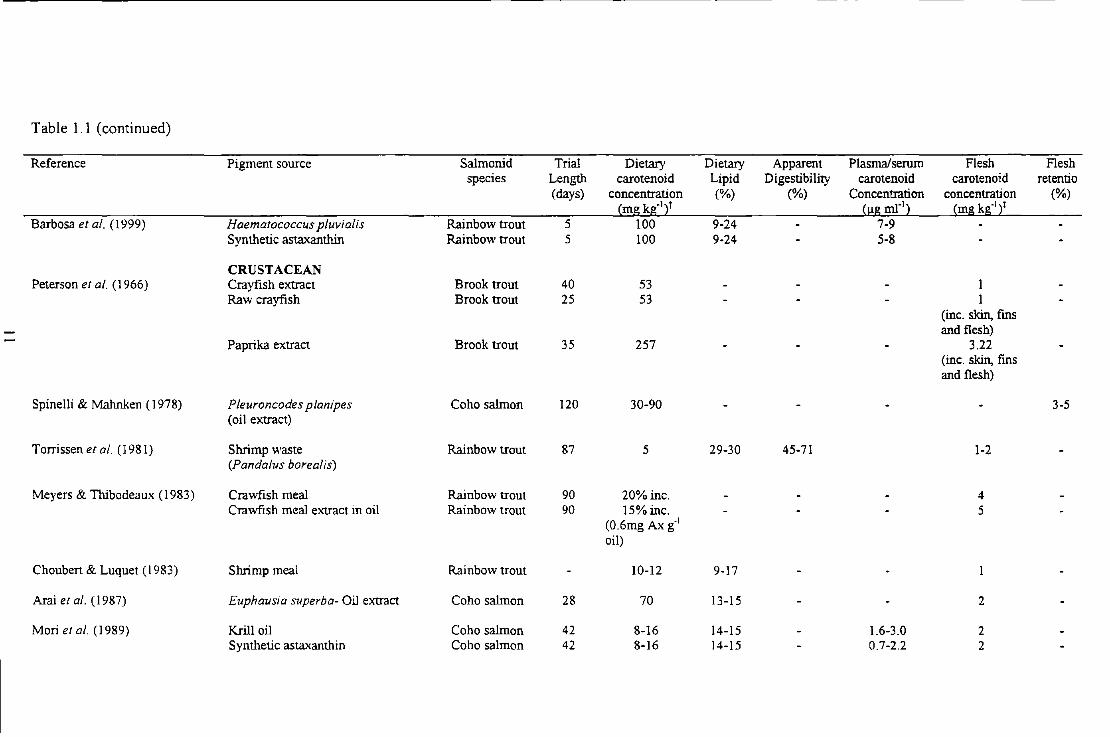
Table 1. 1 (continued)
Reference Pigment source Salmonid Trial Dietary Dietary Apparent Plasma/serum Flesh Flesh species Length carotenoid Lipid Digestibility carotenoid carotenoid retentio
(days) concentration (%) (%) Concentration concentration (%) (mg kg-121 (!,!g ml"l2 (mg kg-121
Barbosa et al. (1999) Haematococcus plwialis Rainbow trout 5 100 9-24 7-9 Synthetic astaxanthin Rainbow trout 5 100 9-24 5-8
CRUSTACEAN Peterson et al. (I 966) Crayfish extract Brook trout 40 53
Raw crayfish Brook trout 25 53 (inc. skin, fms and flesh)
Paprika extract Brook trout 35 257 3.22 (inc. skin, fms and flesh)
Spinelli & Mahnken ( 1978) Pleuroncodes planipes Coho salmon 120 30-90 3-5 (oil extract)
Torrissen er al. ( 1981) Shrimp waste Rainbow trout 87 5 29-30 45-71 1-2 (Panda/us borealis)
Meyers & Thibodea ux (1983) Crawfish meal Rainbow trout 90 20%inc. 4 Crawfish meal extract in oil Rainbow trout 90 15%inc. 5
(0.6mg Ax g·1
oil)
Chouben & Luquet (1983) Shrimp meal Rainbow trout 10-12 9-17
Arai et al. (1987) Euphausia superba- Oil extract Coho salmon 28 70 13-15 2
Mori et al. ( 1989) Krill oil Coho salmon 42 8-16 14-15 1.6-3.0 2 Synthetic astaxanthin Coho salmon 42 8-16 14-15 0.7-2.2 2
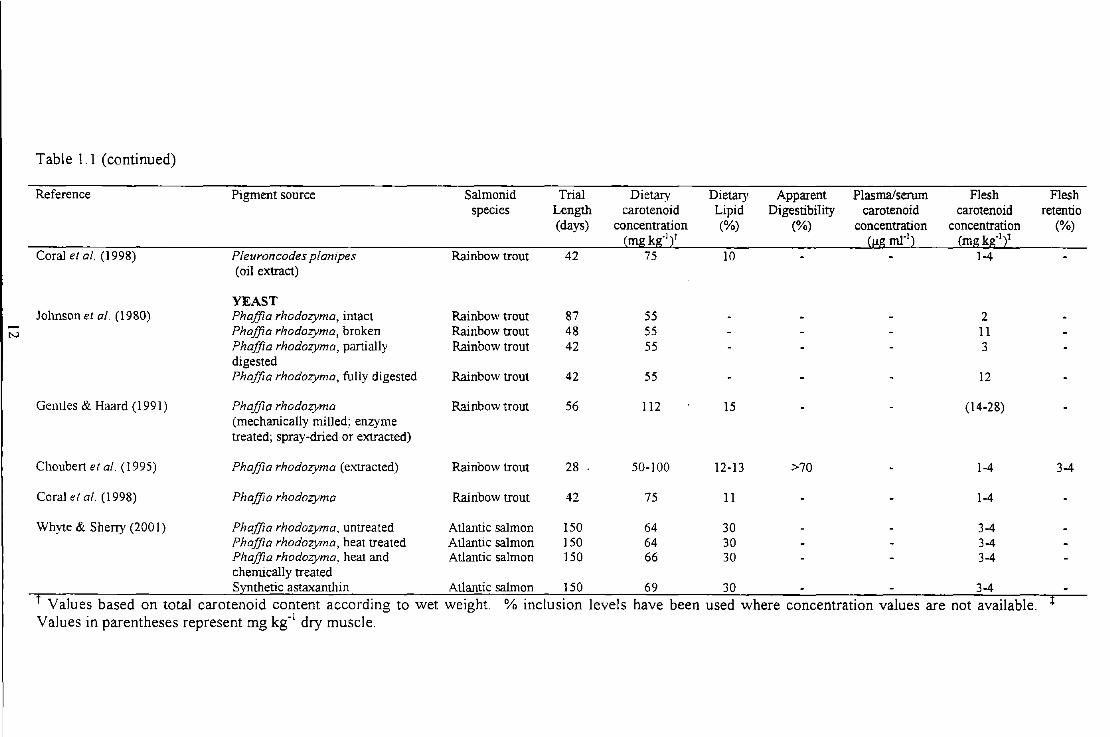
Table 1.1 (continued)
Reference Pigment source Salmonid Trial Dietary Dietary Apparent Plasma/serum Flesh Flesh species Length carotenoid Lipid Digestibility carotenoid carotenoid retentio
(days) concentration (%) (%) concentration concentration (%) (mg kg-')1 (I:!:S ml"') (mgkg·'i
Coral et al. (1998) Pleuroncodes planipes Rainbow trout 42 75 10 1-4 (oil extract)
YEAST Johnson et al. (1980) Phaffia rhodozyma, intact Rainbow trout 87 55 2
N Phoffia rhodozyma, broken Rainbow trout 48 55 11 Phaffia rhodozymo, partially Rainbow trout 42 55 3 digested Phaffia rhodozyma, fully digested Rainbow trout 42 55 12
Gentles & Haard (1991) Phaffia rhodozyma Rainbow trout 56 112 15 (14-28) (mechanically milled; enzyme treated; spray-dried or extracted)
Choubert et al. (1995) Phaffia rhodozyma (extracted) Rainbow trout 28 50-100 12-13 >70 1-4 3-4
Coral et al. (1998) Phaffia rhodozyma Rainbow trout 42 75 11 1-4
Whyte & Sherry (200 I) Phaffia rhodozyma, untreated Atlantic salmon 150 64 30 3-4 Phaffia rhodozyma, heat treated Atlantic salmon 150 64 30 3-4 Phaffia rhodozyma, heat and Atlantic salmon 150 66 30 3-4 chemically treated SY!!thetic astaxanthin Atlantic salmon 150 69 30 3-4
t Values based on total carotenoid content according to wet weight. % inclusion levels have been used where concentration values are not available. t Values in parentheses represent mg kg" 1 dry muscle.
However, further processing of shrimp waste is required to extend this product's short
shelf life and make it economically viable (Torrissen et al. 1981 ). Furthermore, crustacean
meals are low in protein and high in minerals such as chitin and calcium carbonate, which
restrict their use m feed formulations (Meyers & Rutledge 1971 ). Nonetheless,
comparative studies of crustacean by-products and synthetic astaxanthin have
demonstrated that this natural source can produce acceptable pigmentation levels in
salmonids (Mori et al. 1989).
1.4.2 Yeast
Natural microbial sources have been identified as potential pigment sources for salmonids.
For example, the yeast Phaffia rhodozyma has a high nutritional value (>20% protein and
lipid) and contains the carotenoid astaxanthin (Johnson et al. 1977; Sanderson & Jolly
1994; Calo et al. 1995). Choubert et al. ( 1995) compared carotenoid retention in the flesh
of rainbow trout fed diets supplemented with synthetic astaxanthin, Phaffia rhodozyma and
canthaxanthin. Flesh retention, when expressed as a percentage of carotenoid intake, was
' higher for the astaxanthin group compared with the groups fed the yeast preparation.
However, no differences were observed when retention was expressed according to the
Apparent Digestibility Coefficients (ADC) of the astaxanthin sources, demonstrating that
poor carotenoid retention was a result of low digestibility. This poorer digestibility may
have been due to the naturally occurring cell wall that Phaffia rhoduzyma possesses. This
can impede pigment uptake (will reduce carotenoid digestibility) unless sufficient
rupturing of the cell (enzymatic treatment) is undertaken prior to dietary supplementation
(Johnson et al. 1980). However, Atlantic salmon have been shown to deposit astaxanthin
from Phaffia rhodozyma regardless of whether cells had been treated (heat and chemical
13
treatment) in comparison to the synthetic source of astaxanthin (Whyte & Sherry 2001 ).
1.4.3 Algae
Algae are a large and diverse group of organisms that synthesise carotenoids. A number of
studies regarding the use of algal supplements as carotenoid sources have been published
(Ben-Amotz et al. 1989; Stahl et al. 1993 Gouveia et al. 1998).
The microalga Haematococcus pluvialis contains large amounts of astaxanthin (1.5-3.0%
dry weight) although manipulation and production of mutant strains can result in early
enhanced (2 2-3.2 fold) astaxanthin accumulation (Tripathi et al. 2001 ). When strains of
Haematococcus pluvialis are exposed to growth-limiting conditions (nitrogen and
phosphate limitation; addition of NaCI and high temperature or light intensity) vegetative
cells begin producing astaxanthin and concurrently undergo changes in cell morphology
resulting in the formation of large red aplanospores (Boussiba & Vonshak 1991; Harker et
al. 1996a) and the development of a thick sporopollenin cell wall that is resistant to
oxidative degradation (Burczyk 1987). This encysted cell wall may impede absorption of
pigment when used as a carotenoid source in animal diets (Johnson & An 1991 ).
Additional carotenoids produced under these conditions include canthaxanthin, echionene,
adonirubin and ~-carotene, although their contribution usually represents a small
percentage of the total carotenoid (Grung et al. 1992).
Additionally, 95% of the accumulated astaxanthin in this alga source is in an esterified
form primarily consisting of monoesters, as opposed to diesters (Renstrom & Liaaen
Jensen 1981) These esters consist of 16:0, 18:1 and 18:2 fatty acids esterified onto the 3'
14
hydroxyl group of astaxanthin (Lorenz & Cysewski 2000). Furthermore, astaxanthin
synthesised by Haematococcus pluvialis is optically pure, existing as the 3S,3 'S isomer
(Renstmm et al. 1981) compared to the commonly used synthetic source which is a
racemic mixture of isomers.
Gastrointestinal ester hydrolysis is thought to be a pre-requisite to absorption of esterified
carotenoids and vitamins into the systemic blood circulation (Mahadevan et al. 1963;
Muller et al. 1976; Tyczkowski & Hamilton 1986a; Storebakken et al. 1987; Wingerath et
al. 1995; Schweigert 1998). Subsequently, differences in digestibility may exist for
astaxanthin esters compared to the free form since hydrolysis may be a limiting step.
Moreover, reduced digestibility of carotenoid esters may result in poor flesh retention
values for carotenoids in salmonids (Schiedt et al. 1986; Foss et al. 1987; Storebakken et
al. 1987).
Several studies have shown comparatively poorer efficiency in pigmentation of salmonids
when using Haematococcus pluvialis as a source of astaxanthin in comparison to the
synthetic free form of astaxanthin (Sommer et al. 1991; Sommer et al. 1992; Choubert &
Heinrich 1993 ). In all cases it was suggested that poorer pigmentation was a result of
reduced bioavailability of astaxanthin from Haematococcus pluvialis due to encysted cell
wall encapsulation.
However, contradictory evidence was presented by Barbosa et al. (1999) who compared
the serum astaxanthin concentrations in trout fed diets supplemented with two different
sources of astaxanthin (Haematococcus pluvialis and synthetic astaxanthin) at two
different dietary lipid levels (9 and 24%) For the higher energy diet serum astaxanthin
15
concentrations were not significantly different between fish fed the algal and synthetic
sources of astaxanthin. However, when dietary lipid level was low serum astaxanthin
concentrations were significantly higher in fish fed diets supplemented with the algal
source compared to the synthetic form. This su"ggests that differences noted in flesh
retention between these two dietary sources as discussed previously were not a direct result
of reduced bioavailability due to cell wall encapsulation or necessary carotenoid ester
cleavage prior to blood absorption.
Clearly, confounding evidence has been presented concerning the use of Haematococcus
pluvialis as a pigment source for salmonids. If indeed use of this dietary astaxanthin
source results in unfavourable flesh pigmentation compared to the synthetic free form, then
the evidence may suggest that limitations in digestibility and absorption are the cause of
these noted discrepancies.
1.5 Flesh deposition of carotenoids
Salmonids, unlike other fish species, deposit ingested astaxanthin (40-80%) unchanged in
their flesh (Foss et al. 1984; Schiedt et al. 1985; Storebakken et al. 1985; Torrissen el al.
1989; Bjerkeng 1992). Additionally, astaxanthin is deposited in its free form in salmonid
flesh regardless of source (Choubert & Luquet 1983; Henmi et al. 1987). Henmi et al.
(1989) demonstrated that in salmon muscle the carotenoids astaxanthin and or
canthaxanthin binds with one P-ionine ring to a hydrophobic binding site which exists on
the surface of the actomyosin protein within the myofibrils. Astaxanthin has one hydroxyl
group and one carbonyl group on each of the P-ionine rings at opposite ends of its
structure, where canthaxanthin has one carbonyl group on each of it P-ionine rings. These
16
hydroxyl and carbonyl groups form hydrogen bonds with the myofibril proteins.
Subsequently, the strength of the carotenoid-protein association is dependent on the
number of hydrogen bonds. Since astaxanthin can form two hydrogen bonds for each of it
P-ionine rings, it combines more strongly to actomyosin than other carotenoids.
Reported values for astaxanthin in the flesh of farmed salmon are between 4-1 Omg kg" 1
(Torrissen et al. 1989). However, a number of abiotic and biotic factors are thought to
influence the deposition of carotenoids in salrnonids (NickeU & Bromage 1998a) including
size or age (Spinelli & Mahnken 1978; Torrissen et al. 1989; March et al. 1990; Bjerkeng
et al. 1992; Hatlen et al. 199Sa); temperature (Storebakken et al. 1986; March et al. 1990)
and sexual maturation (Crozier 1970; Sivtseva & Dubrovin 1982; Torrissen & Torrissen
1985; Ando et al. 1992).
Several authors have demonstrated a dose response relationship between dietary
astaxanthin and pigmentation in salmonids, whereby a plateau in pigmentation capacity is
reached at a feed astaxanthin concentration of ea. 60mg kg" 1 (Choubert & Storebakken
1989; Torrissen et al. 1989; Storebakken & No 1992; Olsen & Mortensen, 1997).
Consequently, increasing dietary astaxanthin concentration further would be uneconomic.
It has been suggested that variations in the number and size distribution of muscle fibres
may influence astaxanthin deposition (variability in availability of binding sites) thus
limiting flesh retention and causing the plateau effect (Nickel! & Bromage 1998b ).
However, Johnston et al. (2000) found no significant correlation between muscle fibre
density and flesh astaxanthin concentration in Atlantic salmon. Other authors have
explained this dose response effect in part by a limitation in absorption efficiency or
digestibility of the carotenoid (Choubert & Storebakken 1989; Torrissen et al. 1990;
17
Hatleneta/. l99Sb).
Added to an apparent dose response effect, deposition efficiency between carotenoids used
for salmonid pigmentation (cantbaxanthin and astaxanthin) also differs. It has been
repeatedly shown that rainbow trout deposit astaxanthin more efficiently in their flesh than
canthaxanthin (Foss et al. 1984; Torrissen 1986, 1989b; Bjerkeng et al. 1990; Choubert &
Storebakken 1989; No & Storebakken 1992). However, it has been shown more recently
that Atlantic salmon absorb and/or deposit canthaxanthin more favourably in their flesh
compared to astaxanthin (Buttle et al. 200 I). It is plausible that such differences result
from a greater affinity for one carotenoid to bind to the flesh of salmonids in comparison to
the other. However, Henmi et al. (1989, 1991) demonstrated that astaxanthin and
canthaxanthin bound non-specifically to actomyosin in salmon muscle. This suggests that
discrepancies between these carotenoids in terms of deposition do not result from
limitations at the muscle binding sites. Perhaps these differences may be explained in part
by more efficient absorption of astaxanthin compared to canthaxanthin (or visa versa) as
has been suggested for rainbow trout (Torrissen 1986; Guillou et al. 1992a; Choubert et al.
1994a).
Despite evidence to support the notion that absorption of pigments from consumed feed
into the systemic circulation may well be limiting, contradictory findings have been
reported that suggest metabolism of pigments as opposed to absorption is responsible for
poor flesh pigmentation (March et al. 1990). However, March & MacMillan (1996)
presented data (for Atlantic salmon) that again suggested the absorptive capacity of the
intestine limited the amount of astaxanthin that can be advantageously added to salmonid
diets. Nonetheless, interest based on increasing digestibility and/or bioavailability of these
18
carotenoids is at the forefront of current scientific research investigations.
1.6 Ca•·otenoid metabolism
March et al. ( 1990) and March & MacMillan ( 1996) have indicated that rapid metabolism
rather than failing absorption is responsible for poor pigmentation in salmonids, although
no concise quantitative estimates are available on the proportion of absorbed astaxanthin
that is metabolised.
Salmon and rainbow trout differ from goldfish since they cannot oxidise 3,3 '-dihydroxy
carotenoids (e.g. zeaxanthin) to astaxanthin (Hata & Hata 1973). Astaxanthin and
canthaxanthin are reductively metabolised in salmonids (Schiedt et al. 1988ab, 1989;
Bjerkeng et al. 1990, 1992; see Figure 1.4) .. In Arctic charr (Salvelinus alpinus) the
recorded major reductive metabolite of astaxanthin was idoxanthin, comprising 47-75% of
total flesh fillet carotenoids (Aas et al. 1997; Hatlen et al. 1995b). Bjerkeng et al. (1999a)
inferred that this reduction of astaxanthin to idoxanthin predominantly takes place in the
liver of the salmonid fish. This is in agreement with the findings of Hardy et al. ( 1990)
who administered radiolabelled canthaxanthin orally to rainbow trout and noted that the
liver was the major organ that contained reductive metabolites. However, the possibility
exists that concentration of metabolites formed in other tissues and organs may take place
in the liver, as suggested by Metusalach et al. ( 1996).
19
N 0
C rustaxan thln
~ ~--~OH
HO~ · 0 Adonlxanthln
Ze axa nthin
9:'---~ 0 Canth axa nth ln
--.y--...:Q 0 Echlnenone
a -c aroten e
I N TEST IN E
~HO ~CH,OH
~ --~"•0" ~ -- -- -- -- HO - ~ -- -- ~ --
3 , 4 ·0 lhydror•tlna l 3 ,4 - D ihydror•Hnol (VItam in A 1j
Figure 1.4 Reductive metabolism of astaxanthin and canthaxanthin in salmonid fish . Taken and adapted from Torrissen et al. (1989) .
In rainbow trout astaxanthin and canthaxanthin are reductively metabolised into yellow
xanthophylls and carotenes. Astaxanthin is reduced to zeaxanthin (p,p-carotene-3,3 '-diol)
via P-adonixanthin (3,3-dihydroxy-p,p-carotene-4-one) and canthaxanthin is reduced to P
carotene (p,p-carotene) via echionene (Schiedt et al. 1985). Furthermore, rainbow trout
can also convert ketocarotenoids into vitamin A in the intestinal wall, although in vivo this
usually only occurs when the diet is not sufficiently supplemented with vitamin A
(Lambertesen & Braekkan 1969; Schiedt et al. 1985; AI-Khalifa & Simpson 1988). Aas et
al. ( 1999) reported the rapid conversion of astaxanthin into idoxanthin in Atlantic salmon
fed a single dose of radiolabelled astaxanthin. The rapid appearance of idoxanthin in the
blood suggested that the intestine could be an important site for astaxanthin metabolism.
Reductive metabolites of astaxanthin and canthaxanthin are also found in the skin of
rainbow trout (Schiedt et al. 1985; Bjerkeng et al. 1990) although it is not clear whether
reductive metabolism occurs in the skin itself
The cost of synthesised carotenoids and their necessary dietary implementation is high
Approximately I 0-15% of the price of salmon feeds is due to the substantial investment
required for dietary carotenoid inclusion (Torrissen et al. 1989; Hardy et al. 1990). In
Norway, supplementation of synthetic astaxanthin in salmon diets accounts for 15-20% of
the total feed costs (Torrissen & Ingebrigtsen 1992) Furthermore, only up to 15% of
astaxanthin consumed is actually retrieved from fish muscle tissue (Torrissen et al. 1989;
Storebakken & No 1992; Bjerkeng et al. 1999a). Consequently, understanding the
mechanism of carotenoid absorption and the factors that may have an influence on the
process are fundamental for improving flesh pigmentation in salmonids (Nickel! &
Bromage 1998a).
21
1. 7 Carotenoid digestibility and absorption
Of great consideration when formulating and producing fish feeds are the quality of raw
materials and the digestibility of the feed ingredients (Spyradakis et al. 1989; Cho 1990).
Indeed, knowledge of a supplemented carotenoid's digestibility is critical for evaluation of
its pigmentation efficacy (Choubert et al. 1995). The digestibility of a compound after
ingestion is a good primary indicator of absorption efficiency as it indicates the quantity of
compound that has been absorbed from the feed matrix. The current literature shows large
inconsistencies between digestibility and flesh retention values in salmonids which
suggests considerably higher levels of these pigments are absorbed by salmon than are
retained in the flesh. However, carotenoid digestibility values may have been over
estimated due to the degradation of carotenoid in faecal samples (Meyers 1994).
The bioavailability of carotenoids can be expressed as the proportion of carotenoid
ingested that can be absorbed and is available for use and/or storage (Schweigert 1998).
Bioavailability of carotenoids is influenced by a variety of factors. These include species
of carotenoid; molecular linkage; amount of carotenoids consumed; matrix in which the
carotenoid is incorporated; effectors of absorption and bioconversion; nutrient status of the
host; genetic factors; host-related factors and mathematical interactions (Castenmiller &
West 1998}. Furthermore, the efficiency of digestion and gut transit time are likely to
influence the proportion of any micro-nutrient that is absorbed from feed (Jackson 1997).
Bioavailability is considered a pnmary parameter when assessmg the pigmentation
efficiency of a specified carotenoid. Most scientific feed trials employ an initial
assessment of carotenoid absorption by taking digestibility measurements, and/or
measurements of blood concentration in the fishes systemic circulation. Indeed, high
22
correlation has been recorded between dietary carotenoid concentration and carotenoid
levels in the blood (Choubert et al. 1994a; Kiessling et al. 1995 Storebakken & Goswami
1996). This evaluation can be conducted after continuous feeding to ascertain steady state
concentrations of carotenoid in the blood. Alternatively, a post-prandial blood carotenoid
profile can be formed after a single ingested dose of one or more carotenoids (Choubert et
al. 1987; Gobantes et al. 1997). However, caution should be displayed when using blood
concentrations as indicative of bioavailability since they are affected by absorption of
carotenoid; removal of carotenoid from serum for storage/deposition; bioconversion, or
excretion (Castenmiller & West 1998; Van het Hof et al. 2000). Additionally, inherent
heterogeneity of subjects/animals results in large inter-individual variability in
bioavailability assessment (Jackson 1997).
1.8 Mechanism of carotenoid uptake by the intestine
Digestibility values are influenced by the quantity of carotenoid that is absorbed within the
gastrointestinal tract of the animal once ingestion has taken place. According to Torrissen
( 1986) and Al-Khalifa & Simpson (1988) the absorption of carotenoids occurs mainly
along the proximal and mid-intestine of salmonids, although other authors have found little
difference in carotenoid absorption along the entire length of the intestine (Guillou et al.
1992a). In humans, carotenoids appear to be absorbed by duodenal mucosal cells by a
mechanism involving passive diffusion (Parker 1996). The pyloric section of the intestine
in salmonids represents the human duodenal region
The mechanism of carotenoid absorption in humans at the gastrointestinal level has been
extensively reviewed (Erdman et al. 1993; Parker 1996; Furr & Clark 1997; Van den Berg
1999). Figure 1.5 and the following summary is based on these publications.
23
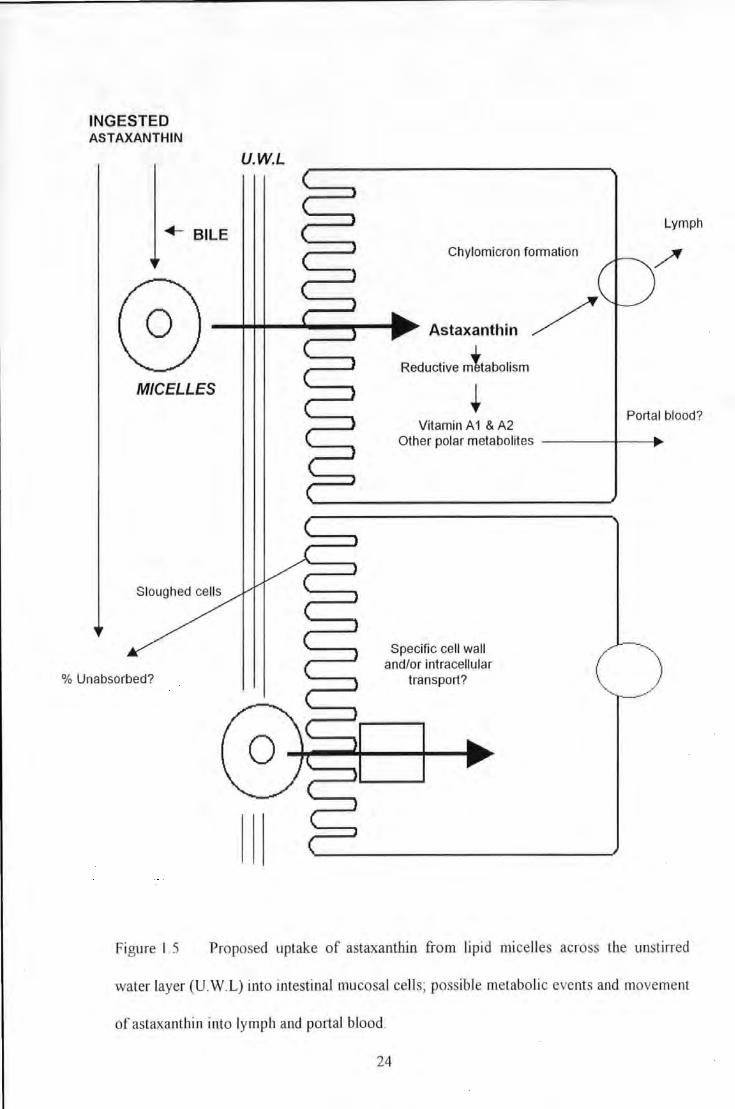
INGESTED ASTAXANTHIN
+ BILE
MICELLES
% Unabsorbed?
U.W.L
Chylomicron formation
Astaxanthin /
Reductive mltabolism
Lymph
Portal blood? Vitamin A1 & A2
Other polar metabolites ------11----~
Specific cell wall and/or intracellular
transport? () -------·
Figure 1.5 Proposed uptake of astaxanthin from lipid micelles across the unstirred
water layer (U.W.L) into intestinal mucosal cells; possible metabolic events and movement
of astaxanthin into lymph and portal blood.
24
Prior to absorption, carotenoids have to be released from the food matrix in which they are
ingested. Initially this is achieved by the action of gastric hydrolysis of dietary proteins
and lipids. Once released, lipophilic carotenoids will naturally dissolve in the oily phase of
lipid droplets produced by gastric hydrolysis. Natural gastric action then renders the lipid
droplets into a fine emulsion that passes into the duodenum region of the gastrointestinal
tract. Solubility of a carotenoid and distribution within the emulsion is determined by
polarity of the pigment, where more polar xanthophylls are located at the surface and the
least polar carotenoids incorporated into the triacylglycerol core. Carotenoid distribution
will affect the transfer of carotenoids into mixed bile salt micelles. This is an essential step
since carotenoid absorption does not take place without micelle formation. Lipid micelles,
whose formation is dependant on bile flow from the gall bladder (stimulated by dietary
fat), are thought to act as a vehicle for carotenoid transfer across the unstirred water layer
(system of water lamellae along the microvillus surface of the intestine). Once this layer is
traversed, carotenoids are absorbed unchanged in a passive manner by mucosal cells.
lt is likely that this passive diffusion process is dependent on the carotenoid concentration
gradient between the micelle and the plasma membrane of the enterocyte. As carotenoids
are hydrophobic in nature, direct contact between the micelle and the cell membrane is
probably required.
If carotenoids are not metabolised in the enterocyte (usually applies to provitamin A
carotenoids) they are packaged into chylomicron like structures and secreted into lymph
and subsequently enter the systemic blood circulation. However, the intracellular
mechanisms controlling these processes are not well understood.
Tyczkowski & Hamilton ( J986b) demonstrated differential absorption for different
carotenoids (zeacarotene and lutein) along the intestinal tract of chickens, suggesting
25
regulatory mechanisms for carotenoid absorption. However, the absorption of carotenoids
in chickens is thought to be independent of lipid absorption since cases of lipid
malabsorption and hypocarotenoidemia are not correlated (Osborne et al. 1982). Non
specific esterases have been found along the intestinal brush border membrane and within
the cytoplasm of enterocytes in Nile tilapia, Oreochromis niloticus (Tengjaroenkul et al.
2000). lf these findings apply to salmonids, this may suggest carotenoid-ester metabolism
may take place intra- and extracellularly.
1.9 Digestibility and micelle formation
Formation of bile salt micelles is thought to be essential for the uptake of fatty acids, or
indeed carotenoids, since they acts as a "shuttle" between the intestinal contents and the
aqueous-microvillus interface of the intestine (Westergaard & Dietschy 1976). Micelles
are thought to penetrate the unstirred water layer, a series of water lamellae adjacent to the
microvillus surface which form a natural barrier to carotenoid uptake (Furr & Clark 1997).
Furthermore, it has been recorded that micelle formation is more important for the
absorption of insoluble non-polar lipids, such as a-tocopherol, compared to polar lipids
such as oleic acid (MacMahon & Thompson 1969; MacMahon & Thompson 1970). In
addition, the presence of polar lipid in micelles enhances the solubility of non-polar lipids
(EI-Gorab & Underwood 1973). These findings imply that the formation of lipid micelles
formed following intraluminal triglyceride lypolysis of the feed matrix is a restricting
factor in the absorption of carotenoids (Bore! et al. 1996).
The degree to which a specific carotenoid is incorporated into micelles may influence its
relative digestibility. Choubert et al. ( 1994a) demonstrated that the clearance rate and
potential absorption mechanism (passive absorption) of canthaxanthin and astaxanthin in
26
the blood of immature trout was similar, yet circulating blood levels of astaxanthin were
2.3 times greater than that of canthaxanthin. Discrepancies in uptake may have been due
to greater solubilisation of astaxanthin compared to canthaxanthin in micelles.
However, it has been demonstrated in vitro that once critical micelle concentration of the
bile salt(s) has been achieved (usually a low value) carotenoid absorption is sufftciently
facilitated (Hollander & Ruble 1978). Moreover, when detergent concentrations are higher
than this critical value, the uptake of P-carotene has been shown to decline sharply (El
Gorab et al. 1975).
1.10 Dietary lipids and carotenoid absorption
Dietary lipid stimulates the production of bile which facilitates intraluminal solubilisation
of carotenoids (micelle formation) prior to absorption, without which apparent carotenoid
absorption is reduced (Erdman et al. 1993; Williams et al. 1998) In fact a number of
studies have found a positive relationship between lipid inclusion and apparent digestibility
of carotenoids (Torrissen et al. 1990; Choubert et al. 1991; Gouveia et al. 1998) and
pigmentation of salmonids (Abdul-Malak et al. 1975). Moreover, it has been shown that
the absorption and deposition of astaxanthin is influenced by the source and composition
of the oil in relation to fatty acid content (Christiansen et al. 1991 ). This may infer that
differences between absorption of different fatty acid classes exist, a feature that has been
recorded in turbot, Scophthalmus maximus (Koven et al. 1994; Koven et al. 1997).
Bjerkeng et al. ( 1999b, 2000) demonstrated that flesh retention of astaxanthin was
significantly higher in salmon fed capelin and Peruvian high PUF A oil compared to
herring and sand eel oiL Salmon fed diets containing Peruvian high PUF A oil also had
27
significantly higher fillet carotenoid content than fish fed the other diets. However, plasma
astaxanthin concentrations were positively related to monounsaturated fatty acids content
and negatively to the content of n-3 fatty acids. There is evidence from analytical studies
that suggests that PUFA's are more effectively absorbed than saturated fatty acids during
lipid digestion in fish (Lie et al. 1987; Koven et al. 1997). In contrast, it has been recorded
that rats absorb astaxanthin to a greater extent from olive oil emulsions compared to corn ·
oil emulsions, suggesting the presence of polyunsaturated fatty acids (PUFA) actually
reduce uptake in mammals (Ciark et al. 2000). Furthermore, contradictory evidence was
presented by Torrissen (I 985) who found no significant differences in pigmentation
between fish fed diets supplemented with capelin oil "high" in free fatty acids and those
fed an oil lower in fatty acids. Nonetheless, differences between the two oil sources may
have not been great enough to promote a noticeable affect.
• l.ll Blood transport of carotenoids
Measurements of blood carotenoid concentration following carotenoid ingestion indicate
the amount of carotenoid that has been absorbed into the systemic circulation and is
potentially available for utilisation. In humans, carotenoids are transported in plasma
exclusively by lipoproteins with the distribution among lipoprotein classes determined
largely by the physical properties of the carotenoid (Erdman et al. 1993; Parker 1996).
The available literature supports the contention that carotenoids must be bound to blood
protein before transport in the blood of salmonids presumably to solubilise the
hydrophobic pigment. For example, in Chum salmon (Oncorhynchus keta) astaxanthin is
mainly bound to high-density lipoprotein (Ando et al. 1985; Nakamura et al. 1985) and
very high-density lipoprotein fractions (Ando et al. 1986b ). Canthaxanthin has been found
in all lipoprotein fractions in immature rainbow trout (Choubert et al. 1992; Chavez et al.
28
1998). In female chum salmon during spawning, appreciable amounts of astaxanthin are
found bound to vitellogenin, a likely carrier of carotenoid from the flesh to the ovaries
(Ando et al. I986c). In Atlantic salmon, astaxanthin in blood plasma is mainly associated
with a protein other than lipoproteins, presumably albumin (Aas et al. 1999). These
findings could suggest that binding of astaxanthin to blood proteins may limit internal
distribution of astaxanthin and deposition in salmonid flesh. However, evidence has been
presented for rainbow trout indicating that the saturation of lipoprotein fractions is not a
limiting factor for transport of carotenoid (Chavez et al. 1998). Similar findings have been
found in humans for the carotenoid P-carotene (Mathews-Roth & Gulbrandsen 1974 ).
1.12 Differences between carotenoids and their bioavailability
A number of different carotenoids may be present in fish feeds due to feed
supplementation with different sources of carotenoid and the origin of other dietary
ingredients. It has been demonstrated that different carotenoids may have different relative
bioavailability (Schiedt et al. 1985; Guillou et al. 1992ab; Clark et al. 2000). In rainbow
trout astaxanthin is more efficiently absorbed into the blood in comparison to
canthaxanthin (Torrissen 1989a; Choubert et al. 1994a), and zeaxanthin (Guillou et al.
1992a).
Some authors have suggested that carotenoid polarity will influence the absorption of these
pigments. For example, astaxanthin (two hydroxyl and ketone groups), is absorbed (blood
plasma values) in rainbow trout to a greater extent than other carotenoids (canthaxanthin,
zeaxanthin, P-cryptoxanthin, P-carotene and lycopene) which are more hydrophobic
(Tyssandier et al. 1998) The authors suggested that less hydrophobic carotenoids are
absorbed more efficiently, or, are cleared from the plasma at a slower rate. Gobantes et al.
29
( 1997) recorded post-prandial serum concentrations of astaxanthin and canthaxanthin in
immature rainbow trout force fed individual doses of one of these carotenoids. The
maximum level of canthaxanthin in serum was 1.6 times lower than that of astaxanthin_ It
was suggested that this finding was due to canthaxanthin being less polar than astaxanthin
and that this might effect an animal's ability to form intestinal micellar solutions with one
carotenoid compared to another. Evidence from in vitro studies supports the theory that
carotenoid polarity affects the solubility of these pigments in aqueous solutions of mixed
micelles (EI-Gorab & Underwood 1973). Additionally, variation in carotenoid polarity
leads to differences in regional distribution of these molecules within the lipid micelle,
where polar and non-polar carotenoids are associated with the surface and the core of the
micelle, respectively (Bore! et al. 1996) Distribution of carotenoids within the lipid
micelle and the effect that this would have on the absorption characteristics of a carotenoid
in fish are not clear.
1.13 Carotenoid isomers and bioavailability
Optical isomers of dietary astaxanthin are utilised equally by salmonids, and no
epimerization occurs once deposited in the flesh (Foss et al. 1984; Storebakken et al. 1985;
Arai et al. 1987). However, there is considerable interest in the bioavailability of different
geometric isomers of carotenoids in various animal models, and the subsequent differences
between them (Stahl et al. 1993; Hebuterne et al. 1995; Stahl et al. 1995; 0sterlie et al.
2000). Bjerkeng et al. (1997) noted that flesh carotenoid concentration in rainbow trout
tended to be higher in those fish fed diets supplemented with ali-E-astaxanthin compared
to those fish fed a diet supplemented with a mixture of isomers. Furthermore, apparent
digestibility coefficients (ADC) of total astaxanthin were higher for trout fed the all-£
astaxanthin diet compared to trout fed a diet supplemented with the stereoisomer mixture.
30
It was suggested that this indicated a competitive mechanism of uptake for the different
stereoisomers. These findings were supported in an extension study where higher total
carotenoid concentrations were found in the blood of trout fed diets supplemented with aii
E-astaxanthin compared to those trout fed diets supplemented with the stereoisomer
mixture (0sterlie et al. 1999). This suggested more efficient intestinal absorption of the
ali-E-isomers compared to the Z-isomers. Similarly, preferential accumulation of all-trans
~-carotene compared to 9-cis-~-carotene in human plasma has been demonstrated (Gaziano
et al. 1995). Furthermore, cis-trans isomerisation has been demonstrated during the
absorption of ~-carotene, resulting in the near absence of post-prandial plasma 9-cis-~
carotene after its oral administration in humans (You et al. 1996).
Selective accumulation of ali-E-astaxanthin has been recorded in the muscle of salmon,
and in blood samples of both salmon and halibut (Bjerkeng & Berge 2000). These
differences may be due to variation in intestinal micellar loading between isomers. Indeed
Bjerkeng & Serge (2000) recorded higher Apparent Digestibility Coefficients for all-£
astaxanthin compared to the 9Z and 13Z isomer for both salmon and halibut
However, contradictory evidence has been presented in humans where it has been shown
that lycopene is isomerized from the trans to cis form pre-absorption in the gastric lumen
(Re et al. 2001). lt was suggested that this might be significant as cis lycopene has greater
bioavailability than the trans form due to increased solubility in micelles. Indeed, cis
isomers of carotenoids are less likely to crystallise/form aggregates than the extended trans
configuration (Britton 1995; Castenmiller & West 1998) which would lead to increased
incorporation into a bile-acid micelle.
31
1.14 Synergistic/antagonistic effects between carotenoids on bioavailability
It is not uncommon practise for feed compames to supplement fish feeds with both
astaxanthin and canthaxanthin. Indeed it has been documented that combined consumption
of astaxanthin and canthaxanthin seems to have a synergistic effect on flesh pigmentation
(Foss et a/ 1987; Torrissen 1989b). However, interaction at the intestinal level
(competition during micellar incorporation, intestinal absorption, lymphatic transport) may
reduce absorption of carotenoids (Van het Hof 2000). Indeed, numerous authors have
suggested combined consumption of one or more carotenoids may inhibit the
uptakelbioavailability of one or both pigments (Gartner et al. 1996; Hageman et al. 1999).
For example, White et al. (1994) investigated the pharmacokinetics of P-carotene and
canthaxanthin after individual and combined doses in the serum of human subjects. These
authors noted that ingestion of a concurrent P-carotene dose reduced the peak serum
canthaxanthin concentration (ea 39%) and the area under the serum canthaxanthin
concentration time curve at twenty four (ea 38%) and seventy two (ea. 34%) hours.
However, this antagonism was not reciprocal, as canthaxanthin did not inhibit the
appearance of P-carotene. Similarly, combined doses of P-carotene and lutein results in
reduced serum area under the curve values for lutein (54-61% of controls) in human
subjects (Kostic et al. 1995). However, lutein reduced the area under the curve value for
P-carotene in some subjects but enhanced it in others, suggesting individual responses can
differ markedly. Results from these studies could suggest that; there are specific
mechanisms for the intestinal carotenoid absorption; there is preferential absorption of
specific carotenoid groups and/or there is competition between carotenoids for mixed
micelles incorporation. Clearly, carotenoids do interact with each other during intestinal
absorption, metabolism and serum clearance. Alternatively, it has been shown in rats that
the absorption of pro-vitamin A carotenoids e.g. P-carotene may be increased due to other
32
carotenoids ( canthaxanthin and zeaxanthin) inhibiting the action of 13-carotene dioxygenase
(Grolier et a/.1991).
Pozo et al. ( 1988) recorded increased deposition of canthaxanthin in the flesh of rainbow
trout when diets were supplemented with both canthaxanthin and vitamin E suggesting that
this was a result of vitamin E reducing oxidative degradation of canthaxanthin in the trout
gut. Similar findings have been shown for astaxanthin and vitamin E in Atlantic salmon
(Christiansen et al. 1991; Bjerkeng, et al. 1999). Bjerkeng et al. ( 1999a) suggested that
vitamin E inhibits the catabolism of astaxanthin, hence sparing the compound for
deposition.
1.15 Evidence from in vitro studies
In vitro applications designed for the study of chemical and solute uptake across animal
intestine have been established for many years (Fisher & Parsons 1949; Darlington &
Quastel 1953; Wilson & Wiseman 1954) and are favoured by some in comparison to in
vivo protocols of absorption assessment on both ethical and technical grounds. The only
work that has been published regarding in vitro salmonid intestinal models and carotenoid
absorption was a brief experiment carried out by AI-Khalifa & Simpson ( 1988). The
authors observed the tissue (pyloric caeca and ileal intestine) conversion of astaxanthin
dispersed in aqueous solution (Tween 20) into vitamin A Although this study indicated
the usefulness of an in vitro approach, no further studies have investigated the potential to
develop similar models for salmonids to assess factors that influence absorption and
subsequently digestibility of astaxanthin. Other in vitro studies that have been published
on carotenoids are focused on the uptake of 13-carotene in mammalian models (Oison 1964;
EI-Gorab et al. 1975; Garret! et al. 1999ab).
33
1.16 Aims and Objectives
The following thesis/project is based on a series of studies and experiments carried out in
order to meet three general objectives:
I. Develop methodology to assess carotenoid absorption in salmonids in order to evaluate
the efficacy of commercially important sources of carotenoid for salmonid
pigmentation.
2. To determine what natural characteristics of the green microalga Haematococcus
pluvia/is (Fiowtow) limit its potential as a dietary source of natural astaxanthin m
salmonid feeds in comparison to other established synthetic forms of this carotenoid.
3. To develop a viable in vitro technique to assess the absorption of carotenoids at the
gastrointestinal level which can then be used to evaluate the influence of abiotic and
biotic factors which could potentially influence the absorption of carotenoids.
The first of these objectives was met m a senes of in vrvo investigations where
measurements of digestibility (Apparent Digestibility Coefficients) and serum (blood)
absorption of carotenoid were taken and determined for different carotenoid sources
Furthermore, novel kinetic strategies were developed for analysis of post-prandial serum
astaxanthin concentrations taken from groups of voluntarily feeding fish. The potential of
this method for a rapid assessment of carotenoid bioavailability is discussed (see General
Discussion).
34
The second of the main objectives was again evaluated in a series of in vivo feed trial
investigations using the rainbow trout as a salmonid model and designed to answer the
following questions:
(a) To what extent does the sporopollenin cell wall of Haematococcus pluvia/is limit
the digestibility and absorption of astaxanthin in rainbow trout? Is rupturing of the
cell wall sufficient to render pigment available or is complete extraction of the
carotenoid necessary prior to feed supplementation?
(b) Is the gastrointestinal tract of rainbow trout effective in the hydrolysis of
astaxanthin esters and subsequent absorption of astaxanthin? Is there regional
variation along the intestine in relation to hydrolytic capacity that may present a
physiological limitation to the use of an esterified source of astaxanthin for the
pigmentation of salmonids?
(c) Does the extent of esterification limit the absorption of astaxanthin?
The final objective was met by evaluating two potential in vitro techniques designed to
either examine solute uptake and translocation across the intestinal barrier (everted gut
perfusions) or solute uptake by intestinal tissue (everted gut sacs).
35
CHAPTER 2.0
GENERAL MATERIALS AND METHODS
2.1 Experimental Diets-composition and analysis
The diets used in the nutrition trials were produced by EWOS Technology Centre
(Livingston, Scotland, U.K.) or Trouw Aquaculture Ltd. (Wincham, U.K.). These basal
diets were formulated to meet the nutritional requirements of rainbow trout. A typical feed
pellet size of 2-Smm was employed depending on the starting weight of fish for successive
experiments. Specific details concerning dietary composition and carotenoid content can
be found in the Materials and Methods sections of respective studies.
2.1.1 Preparation of Haematococcus pluvialis feed supplements
Extraction and isolation of carotenoid fractions i.e. astaxanthin monoesters, diesters or total
carotenoid extracts from Haematococcus pluvialis spores was performed by the Carotenoid
Research Group, Liverpool John Moores University, Liverpool.
A volume (ea. 5ml) of Haematococcus pluvialis culture was centrifuged (MSE Mistral
1000, Sanyo Gallenkamp PLC., Loughborough, Leicestershire, U.K.) at 1200 X g for Smin.
The supernatant was discarded and the cells re-suspended in distilled water. The cells
were then centrifuged ( 1200 X g) again for a further 5min. The supernatant was then
discarded and the cells were re-suspended in re-distilled acetone. Cells were then carefully
transferred to a bijou bottle containing 0.5cm diameter glass beads eh full). To ensure
complete recovery of all cells the centrifuge tube was rinsed with re-distilled acetone into
36
the bijou bottle. The cells were then homogenised for Smin using a tissue homogeniser
(Status X620, Phillip Harris Ltd., Leicestershire, U.K.). Following homogenisation, the
sample was filtered through absorbent cotton fibres to remove cell debris. To ensure all
material was removed, the bijou bottle and the lid were rinsed with re-distilled diethyl
ether, which was then filtered and added to the sample. The filtrate was dried and stored at
-20°C until separation of astax.anthin forms by TLC (see below) and spectrophotometric
quantification of carotenoid content (see below).
2.1.2 Addition of carotenoid to diets (top coating)
Some of the experimental diets utilised in the current studies were supplied as basal feeds
without carotenoid supplementation so that various carotenoid sources could be added in
controlled amounts to meet target levels. In tllis procedure experimental feeds were placed
in 3kg batches into a preheated oven (50°C) for 30min. The required amount of
CAROPHYLL ® Pink (F. Hoffmann-La Roche, Base!, Switzerland) was added to 25ml of
distilled water and warmed to 40°C in a sonicating water bath until the gelatine matrix had
dissolved and the pigment had dispersed homogeneously (ea. 10-JSmin). The dispersed
pigment was then poured into a glass beaker containing the desired quantity of oil
(calculated according to 26% feed inclusion), plus 90ppm of the antioxidant ethoxyquin.
The pigment, oil and water were mixed thoroughly using a magnetic stirrer bar for IOmin
to form an emulsion. Haematococcus pluvialis products were dispersed directly into the
oil without the addition of water owing to the absence of a gelatine matrix. The resulting
emulsion was heated on a magnetic stirrer-hot plate to 40°C and then poured slowly and
continuously onto the warmed experimental feeds whilst being mixed at a steady speed
(Hobart Feed Mixer, Hobart Ltd., Southgate, U.K.). After all oil had been delivered to the
feed, the diets were left to mix for a further 20min to ensure complete absorption of
37
residual oil. Diets were then left to air dry for 12 hours in the dark before being analysed
for carotenoid concentration (see below) and bagged for storage at -20°C.
2.1.3 Protein determination
The protein content of fish feeds was determined by the Kjeldahl method. Typically 50-
IOOmg of ground feed was weighed into borosilicate digestion tube containing I Kjeldahl
catalyst tablet (3g K2S04; lOSmg CuS04.SH20 and IOSmg Ti02; Thompson & Capper
Ltd., Runcorn, Cheshire, U.K.). Concentrated H2S04 (IOml) was then added to each
borosilicate tube prior to the digestion process. Digestion was performed on Gerhardt
Kjeldatherm digestion block (Gerhardt Laboratory Instruments, Bono, Germany) for
30min at 220°C and a further 60min at 380°C. Samples were then removed from the
heating block and allowed to cool to room temperature (ea. 20°C).
Samples were then diluted with distilled water and neutralised with 40% NaOH (Gerhardt
Vapodest Distillation Unit). Following neutralisation, samples were steam distilled and the
ammonia produced was collected in a 250ml conical flask containing 50ml of saturated
orthoboric acid (H3B03) plus BDH 4.5 indicator. The resulting distillate was then titrated
with 0.1M HCL and the percentage protein in the dry sample calculated by using the
following equation:
Crude protein(%)= 100 X (S1- B1
X 0.10 X 14 X 6.25)
w
Where;
S1 = sample titre (ml)
B1 = blank titre (ml)
38
Equation (2.1)
W = sample weight (mg)
0.10 = Molarity ofHCL
14 = relative atomic mass of nitrogen
6.25 = factor describing nitrogen to protein conversion
2.1.4 Lipid determination
Feed lipid content was determined gravimetrically (following pre-treatment of the feed
with acid hydrolysis) essentially according to Bligh & Dyer (1959). Ground feed (ea 2g)
was placed in a polypropylene tube (50ml) and lOml ofHCL (6M) and lOml of methanol
were added. The tubes were then sealed and placed in the oven for 30min at 70°C. After
the samples had cooled to room temperature 18ml of dichloromethane (DCM) was added
before being shaken vigorously and left to stand for a further 60min. The tubes were
shaken again and then centrifuged (I Omin at 20 I 0 x g) An aliquot of the resultant
hypophase (I ml) was removed with a glass syringe and placed into a pre-weighed vial.
The solvent was removed by evaporation under a gentle stream of nitrogen followed by
heating at l05°C for 1 hour. After the samples had cooled to room temperature in a
dessicator, the vials were re-weighed and the lipid content of the sample determined from
the following equation:
Lipid(%)= 100 X ]8 X r i wv -wv Equation (2.2)
w
Where:
wvr = weight of vial final (g)
wvi =weight of vial initial (g)
W =weight of sample (g)
39
2. I. 5 Moisture determination
Determination of moisture m the feed was carried out according to methodology
previously described (A.O.A.C. 1990). Ground feed samples (ca.5-l Og) were fully dried at
105°C to a final constant weight in a fan assisted-exhaust oven (Pickstone E 70F; RE
Pickstone Ltd., Thetford, Norfolk, U.K.). The percentage moisture content was calculated
using the following equation:
Moisture(%)= 100 X Wf
W'
Where:
wr =dried weight of sample (g)
W; = initial weight of sample (g)
2.1.6 Ash determination
Equation (2 3)
Ash content of feed was determined in accordance with A.O.A.C. ( 1990). Ground feed
(0.45-0.Sg) was accurately weighed into a pre-weighed ceramic crucible and ashed at
550°C for 12 hours in a muffie furnace (Carbolite GLM 11/7, Carbolite Furnaces Ltd.,
Bamford, Sheffield, UK.). The crucible and contents were then re-weighed and the
percentage ash content of the sample calculated from the following equation:
Ash(%)= Equation (2.4)
w
40
Where:
er= final weight of crucible and contents (g)
C; = initial weight of crucible (g)
W = sample weight (g)
2.1.7 Energy determination
The energy values of the experimental feeds were determined by bomb calorimetry
according to AOAC. (1990}.
Ground diet (ea. 0.5g) was pressed into a cylindrical pellet attached to a 6cm length of gun
cotton using a vice and stainless steel pellet press. The pellet was then suspended on a
nickel wire (attached to anode and cathode to complete the firing circuit) in an adiabatic
bomb (Gallenkamp and Co. Ltd., Loughborough, U.K). Distilled water (lml) was added
to the bomb to ensure absorption of combustion gases and the bomb was then assembled
and pressurised to 30 bar with 100% oxygen. The bomb was then immersed into a
calorimeter water jacket that inclusive of water weighed 3kg. The initial water temperature
was then measured twice to ensure that there was no ambient temperature variation, before
firing the bomb to ignite the combustion gases. The temperature rise of the water jacket
was accurately recorded every two minutes until a maximum temperature was reached
(most samples had a typical run time of 8mins) and the temperature rise was calculated.
The same procedure was repeated for 0.5g of benzoic acid and 0.5g of a benzoic acid
standard. All analyses were carried out in triplicate. The energy content of the sample was
then calculated according to the following equation:
41
Energy content (kJ g" 1) = Equation (2.5)
Where:
~1S =temperature change induced by combustion of sample
~1B =temperature change induced by combustion ofO.Sg of benzoic acid
E8
=energy value ofO.Sg of benzoic acid standard
W = weight of the sample
2.1.8 Inert marker analysis
Yttrium oxide was included in the fish feed as an inert dietary marker (0.1%) and was
analysed in both feed and faecal samples (following acid digestion) in order to determine
Apparent Digestibility Coefficients.
Approximately IOOmg of finely ground (pestle and mortar) feed or faecal material were
weighed into a closed vessel 120ml teflon RPFA bomb (CEM Instruments, N.C., U.S.A.),
and IOml of concentrated nitric acid (69%) was added. The teflon bomb was then sealed
and placed in a digestion microwave (700W MDS-2000, CEM instruments) for Smin at
lO% power; lmin at 20% power and lOmin at 50% power, followed by a Smin cooling
period. The samples were then removed from the digestion microwave and allowed to
cool to room temperature (ea. 20°C). The acid digests were then decanted into a 25ml
volumetric flask and made to volume with distilled water. Samples were stored in SOml
polypropylene tubes until Induction Coupled Plasma (ICP) analysis for yttrium content.
All digestions were carried out in triplicate.
42
Analysis of yttrium was performed on an ICP emission spectrometer (Varian Liberty 200,
Australia) and calculated on integrated analytical software (ICP AES) by linear correlation
with external standards of known concentration (10, 20, 40 ppm). The content of yttrium
oxide in both the diets and associated faeces was then calculated from the molecular
weight of yttrium oxide and known weight of initial sample. All analyses were carried out
in triplicate.
2.2 Nutrition Trials
2.2.1 Experimental fish
All female, pigment naive rainbow trout (fed non-pigmented diets) were used in the
experimental trials. These were hand-graded and obtained from Hatchland's Trout Farm
(Devon, U.K.). Fish were randomly assigned into groups of 30-40 fish per tank at an
initial mean weight of85-150g (depending on trial and conditions).
Atlantic salmon utilised for in vitro everted gut sac experiments (ea. 400-500g) were
obtained from Lovatt Fisheries (Inverness, Scotland, U.K). Fish were maintained in the
saltwater system described below.
2.2.2 Experimental System
All feed trials were carried out within the aquarium facilities at the University of Plymouth
(Plymouth, Devon, U.K.). The experimental trout systems consisted of six square 4001
fibre-glass tanks supplied with re-circulated fresh water at a flow rate of ea_ I OL min·'
through an external spray bar (maintained unidirectional flow). Outflow and water level
43
were controlled with an internal standpipe. The system was maintained at 15 ± I °C with a
chiller and temperature controller (R & R Electronics, Cornwall, U.K.) and was kept under
a 12 hours light/dark photo period regime using artificial light from fluorescent tubes.
Removable pre-filter media (meshed sponge) was used to trap faecal and other particulate
matter from outflow water and was washed once per week throughout experimental trial
periods to prevent excess nitrogen levels in the ambient water. Following this initial
filtration, water passed through an internal high surface area biofilter consisting of a trickle
plate and plastic bio-spheres which contained denitrifying bacteria to convert toxic
ammonia into nitrites and nitrates. In addition, water circulated through a filtration vessel
containing charcoal filter media in order to maintain optimal water chemistry.
Atlantic salmon were maintained in re-circulating saltwater systems in tanks with 800L
capacity and temperature of 12 ± I °C. Water flow, filtration and biofilter systems were
similar to those described above. Photoperiod was also controlled under artificial light
with a 16-hour light: 8-hour dark regime.
2.2.3 Feeding
Prior to the feeding trial fish were usually acclimated for a minimum of two weeks in
which time they were sparingly fed rations of commercial unpigmented feed (Trouw
Aquaculture, Wincham, U.K).
Typically, each experimental diets was hand fed to triplicate groups of fish one or two
times daily at a feeding ration of 1-2% BW da/ for an 8-12 week period. Alterations to
feed quantity were made daily assuming a feed conversion ratio (FCR) of I 0 with
appropriate adjustments made for mortalities. This feeding ration may have been
44
reassessed for biomass after four weeks (fish were re-weighed) depending on the
experiment in question. Over feeding was minimised by careful observation of fish
feeding behaviour. Specific details concerning feeding strategies can be found in the
Material and Methods sections of respective studies.
2.2.4 Faecal Stripping
In order to determine apparent digestibility coefficients (ADC) for astaxanthin, faecal
material was required from fish. Fish were removed from their respective tanks and
anaesthetised in a 200mg ml" 1 solution ofphenoxy-2-ethanol (Sigma, Poole, Dorset, U.K.)
in domestic mains water. Once sufficiently anaesthetised, faecal samples were stripped
from the fish by applying gentle pressure along the ventral abdominal region according to
Austreng (1978) and collected in metallic trays. Faecal samples for whole groups/tanks of
fish were pooled to provide a sufficient quantity of dried material for carotenoid analysis.
The pooled samples were immediately frozen ( -20°C) for I h before being freeze-dried for
a minimum of 24 hours to remove moisture. Samples in the freeze dryer were shielded
from ambient light by using a black plastic covering_ Once dry, the samples immediately
underwent carotenoid extraction (see below).
2.2.5 Blood Sampling
Serum carotenoid concentrations were routinely used as an indicator of carotenoid
absorption in the nutrition feed trials. Carotenoid concentration was measured in serum in
preference to plasma due to a I 0% increased carotenoid recovery (Nierenberg 1984;
Stacwicz-Sapuntzakis et al. 1987) Fish were first anaesthetised in a 200mg mr1solution
of phenoxy-2-ethanol (Sigma, Poole, Dorset, U.K.) in tap water. Blood was then taken
45
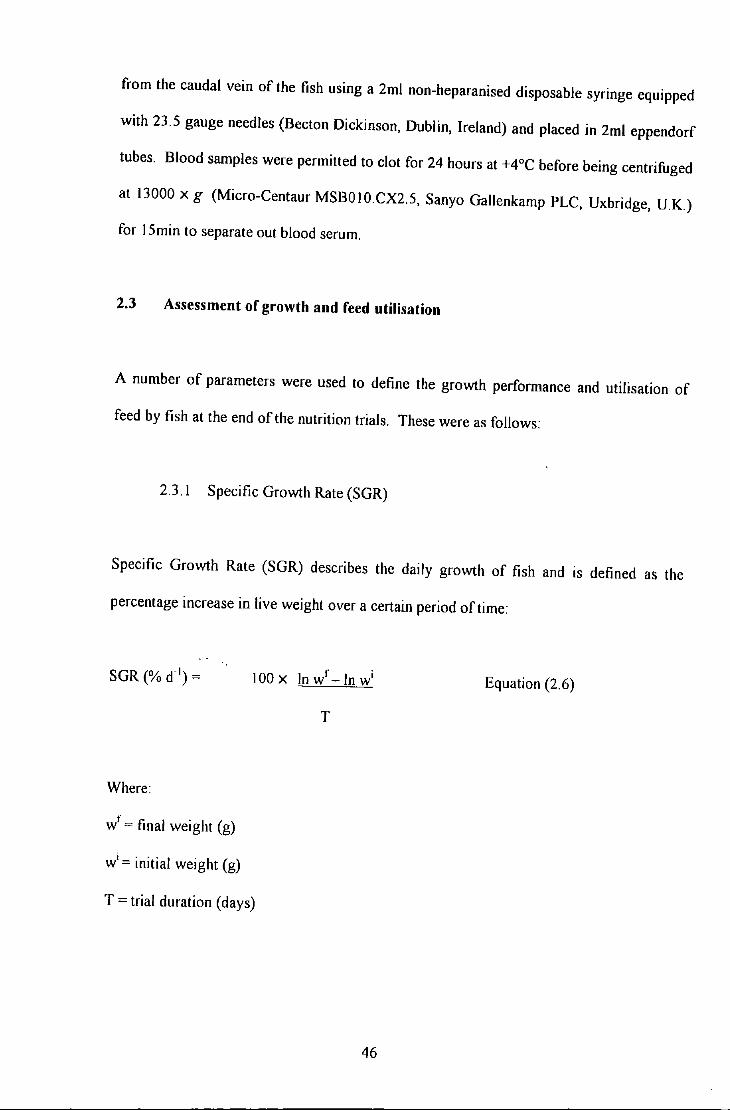
from the caudal vein of the fish using a 2ml non-heparanised disposable syringe equipped
with 23.5 gauge needles (Becton Dickinson, Dublin, Ireland) and placed in 2ml eppendorf
tubes. Blood samples were permitted to clot for 24 hours at +4°C before being centrifuged
at 13000 x g (Micro-Centaur MSB010.CX2.5, Sanyo Gallenkamp PLC, Uxbridge, U.K.)
for 15min to separate out blood serum.
2.3 Assessment of growth and feed utilisation
A number of parameters were used to define the growth performance and utilisation of
feed by fish at the end of the nutrition trials. These were as follows:
2.3.1 Specific Growth Rate (SGR)
Specific Growth Rate (SGR) describes the daily growth of fish and is defined as the
percentage increase in live weight over a certain period of time:
r . I 00 x In w - In w' Equation (2.6)
T
Where:
r w = final weight (g)
w; = initial weight (g)
T =trial duration (days)
46
2.3.2 Feed Conversion Ratio
The feed conversion ratio (FCR) describes the amount of feed consumed that results in live
weight gain. Alternatively, it indicates the extent to which feed is utilised for growth:
FCR= Equation (2. 7)
LW
Where:
Lf= total amount offeed fed
LW = total biomass gain
2.4 Carotenoid analyses
2.4.1 Conventions adopted
Due to the reactive nature of carotenoids a number of precautions as described by Schiedt
& Liaaen-Jensen (1995) were taken to avoid the breakdown of the compounds during
extraction and analysis:
• All procedures were carried out under red/subdued ambient light. Reactions were
carried out in darkness and equipment such as freeze-dryers were covered in a black
lining.
• Since high temperatures promote carotenoid isomerisation, high temperatures and
extreme temperature fluctuation were avoided by carrying out reactions at room
temperature or below. Solvents with low boiling points were used so that
47
concentration of samples in solvent could be performed in water baths with
temperature not exceeding 40°C. Smaller sample volumes were evaporated with a
gentle stream of nitrogen. All dried samples were stored under a blanket of nitrogen at
-20°C.
• Contact of samples with acids and alkalis was avoided by preventing the use of
strongly acidic reagents and alkalis in the laboratory during routine carotenoid
extraction and analyses.
• All solvents used for the quantification and analysis of carotenoids in samples were of
HPLC grade. Other materials used throughout the studies were at least of ANALAR
grade if not higher depending on availability and supply. The addition of antioxidants
i.e. butylated hydroxytoluene (BHT, 2,6-di-t-butyl-p-cresol) to solutions (namely
methanol) during extraction was routine. Dichloromethane was used regularly in place
of chloroform due to the high solubility of carotenoids in this solvent.
• Pipettes and other instrumentation were regularly calibrated before use.
• Carotenoid standards were prepared on a frequent basis to avoid artefact formation
resulting from oxidation or isomerisation.
2.4.2 Extraction from Feed and Faeces
The feed and faeces extraction technique incorporated procedures fi·om the methods of
Weber ( 1988) and Bligh & Dyer ( 1959). Approximately 4g (± 0.2g) of finely ground
(Braun blender, Braun Consumer Service, Isleworth, Middlesex, U.K.) feed was placed in
a 50 m I polypropylene conical tube containing I OOmg of Maxatase (P-3000 encapsulated,
International Biosynthetics, Rijswik, Netherlands). Distilled water ( 15ml) was added to
the sample, which was then vortexed for 30 seconds. The tube and contents were placed in
a preheated (50°C) sonicating water bath for 35min, ensuring that the sample was vortexed
48
vigorously every 5min. The sample was then removed from the heated bath, placed in the
dark, and allowed to cool to ambient temperature (ea. 20°C). Methanol (15ml+500ppm
BHT) and dichloromethane ( 12ml) were added to the sample which was again vortexed.
The sample was then centrifuged (2010 X g) for 15min at 5°C An aliquot (lml) of the
resultant hypophase was pipetted into an amber vial and blown down under a gentle stream
of nitrogen. Feed samples were re-suspended in hexane (4ml), carefully decanted into
sealable eppendorf tubes, and centrifuged (Micro-Centaur MSBOIO.CX2.5, Sanyo
Gallenkamp PLC, Uxbridge, U.K) at 13 000 x g for 5min to precipitate insoluble lipid
prior to carotenoid quantification. Faecal samples were subjected to the following semi
purification process due to the presence oflarge amounts of insoluble matter.
A preparative chromatography column was assembled by filling a disposable pasteur
pipette (15cm) with a slurry ofn-hexane and silica gel (K.eiselgel60 GF254) supported on a
glass wool wad. The pipette was then attached to a glass quick-fit water vacuum assembly,
and filled with n-hexane to further moisten the silica packing. Carotenoid extracts from
faeces were re-suspended in n-hexane (2ml) and transferred to the top of the column with a
pasteur pipette This procedure was repeated several times to ensure all carotenoid had
been transferred to the column. Lipids and beta-carotene were eluted from the extracts by
running 20ml of 6% ether in hexane through the column under vacuum. Insoluble material
present in the faeces precipitated at the top of the column packing. Carotenoids were then
eluted with lOml of 100% ether and collected in a 20ml glass tube. Purified extracts were
blown down under a gentle stream of nitrogen and stored at -20°C in amber vials prior to
analysis.
49
2.4.3 Extraction from serum
500fll of serum was pi petted into a 3ml glass Bijou bottle containing I ml of ethanol
(precipitates protein). After mixing, I ml of diethyl ether and I ml of n-hexane were added
to the sample, which was then mixed again. Samples were sealed and allowed to stand in
the dark for I Omin to ensure efficient carotenoid extraction. The resultant hyperphase was
pipetted (500~-tl) into an amber vial and then evaporated under a gentle stream of nitrogen.
Samples were stored at -20°C prior to analysis by High Performance Liquid
Chromatography (HPLC).
2.4.4 Extraction from fish muscle
The flesh extraction method utilised was a modified version of the procedure described by
Bjerkeng et al. (1997) Rainbow trout fillets were de-skinned and pooled into groups (5
fillets per group) The pools of flesh were then diced and placed in a blender (Waring
blender, Phillip Harris Ltd., Leicestershire, U.K.) and homogenised into a fine paste
consistency. Approximately 5g of this homogenate was placed in a SOml polypropylene
tube to which Sml of distilled water and 5ml of methanol (containing SOOppm BHT) was
added. The contents of the tube were then homogenised (Status X620, Phillip Harris Ltd ,
Leicestershire, U.K.) before the addition of ISml of dichloromethane. The tube and
contents were then mixed vigorously for 30 seconds and placed in the dark for I Omin The
tube and contents were then shaken vigorously for a further 30 seconds and then
centrifuged (20 I 0 X g) at 5°C for IS min. An aliquot of the resultant hypo phase (3 ml) was
withdrawn with a glass syringe and dispensed into a 4ml amber vial before being
evaporated under a gentle stream of nitrogen Samples were then stored at -20°C prior to
HPLC analysis. All analyses were carried out in duplicate.
50
2.4.5 Extraction from liver and gastrointestinal tract
Fish livers were excised from the fish and homogenised whole (Uitra-turrax T8, IKA
Labortechnik, Staufen, Germany) into a slurry from which 2g was used for carotenoid
extraction. Samples of gastrointestinal tract (0.5-I.Sg) were taken according to the
gastrointestinal region represented. All samples were placed in 20ml scalable glass vials
and homogenised (Status X620, Phillip Harris Ltd., Leicestershire, U.K.) with 2ml of
distilled water and 2ml of methanol (+500ppm BHT) for 30 seconds. Dichloromethane
(6ml) was then added to the vial contents, which were then mixed vigorously for a further
30 seconds. Vials were placed in the dark for 1 Omin to ensure complete extraction of
carotenoid. Samples were removed from the dark, vortexed for a further 30 seconds and
then centrifuged at 2010 X g for 15min at 5°C. An aliquot ofthe resultant hypophase (Jml)
was withdrawn with a glass syringe and dispensed into a 4ml amber vial before being
blown down under a gentle stream of nitrogen. Samples were stored at -20°C until HPLC
analysis
2.4.6 Extraction from skin
Extraction of carotenoids from skin was as described by Schiedt et al. ( 1995). Frozen skin
samples (I 00-200g) were cut with scissors and dehydrated with twice the quantity of
anhydrous MgS04 for 30min. The sample was then covered in acetone and homogenised
(Waring blender, Phillip Harris Ltd , Leicestershire, UK.) before filtration through a glass
filter (porosity 2). The skin samples were re-extracted with two more volumes of acetone
to ensure complete carotenoid recovery. The acetone was then evaporated from the sample
using a rotary evaporator to leave a dry lipid-carotenoid residue.
51
The free polar carotenoids were then separated from less polar material (incl. carotenoid
esters and fat) by partition between dimethyl sulphoxide (DMSO) and hexane ( 1: I v/v).
The lipid extract of the skin was dissolved in an appropriate volume of hexane to give a
5% solution (w/v) to which an equal volume of DMSO was added. Free astaxanthin
(100%) partitioned into the DMSO phase and 90-95% of the lipid remained in the hexane
phase that also contained xanthophyll esters. The two phases were then separated and the
hexane phase was washed with water whilst adding small amounts of ethanol to prevent
emulsions forming, before being evaporated. Carotenoids were re-extracted from the
DMSO phase by first adding distilled water, saturated NaCI solution and ethanol to give a
mixture ofDMSO: water: NaCI solution: ethanol of I :0.55: 0.25: I. Carotenoids were then
extracted from the mixture with 2 to 3 volumes of ether/hexane (I : I) until colourless. The
ether/hexane extract was then washed with water before being evaporated to dryness.
2.4.7 Separation of pigments -Thin-Layer Chromatography (TLC)
TLC was carried out to determine the percentage contribution of diesters and monoesters
of astaxanthin as well as free astaxanthin in the Haematococcus pluvialis products, diets
and faeces. TLC on the product itself as well as some diets was performed at Liverpool
John Moores University. TLC identification of carotenoid species in faecal material was
carried out at the University of Plymouth
For semi-preparative work O.Smm thick self-prepared TLC plates were used. Commercial
aluminium backed plates (Merck, Silica gel 60 GF2s4) were used for analytical studies to
ensure high resolution and accurate determination of Rf values for the constituent
carotenoids. Normal-phase silica TLC was used for all analytical and preparative work
52
Semi-preparative plates were prepared by adding 60g of Kieselgel 60 GF254
to 120mi of
distilled water. The mixture was then shaken vigorously to form a slurry (quantity
sufficient for the preparation of five, 20x20cm silica plates)_ Using a plate spreader the
silica slurry was applied to acetone-washed glass plates at a thickness ofO.Smm_ The plates
were then dried at 120°C for at least three hours prior to use. To prevent tailing of
carotenoids plates were acidified with solution of2.S% (w/v) citric acid in methanol. Once
coated the plates were allowed to dry fully before any sample was applied_
To separate pigments and astaxanthin forms an origin line was drawn approximately LScm
above the bottom edge of the plate_ The sample was then re-suspended in a small volume
of re-distilled diethyl ether and then applied to the plate along the origin This was
achieved by using a capillary tube or a drawn-out Pasteur pipette. The TLC plate was then
placed in a developing tank containing acetone in n-hexane (30/70 v/v) and the tank
covered in a dark cloth. Once developed, the plate was removed from the tank and the
solvent front marked. The colour and Rf value of each pigment band was recorded. The Rf
value of each band was calculated using the following equation:
Rf= X I y Equation {2 8)
Where:
x =distance of band from origin
y =distance of solvent front from origin
Where available, appropriate carotenoid standards (kindly donated by Hoffmann La Roche,
Basel, Switzerland) were co-chromatographed with the sample. Rf values were lutein
53
(0.34); free astaxanthin (0.37); astacene (0.43); astaxanthin monoesters (0.47);
canthaxantbin (0.48); astaxanthin diesters (0. 79); J3-carotene (0. 98).
Starting with the lowest Rf value, each band was rapidly scraped off of the plate and
placed in a small glass sinter. Carotenoid was removed from the silica under vacuum by
the addition of a small volume of di-ethyl ether and collected in a 20ml glass tube. The
sample was then decanted into a 4ml amber vial ensuring the glass tube was washed with
small volumes of ether. Samples were then blown down under a gentle stream of nitrogen
and stored at -20°C. Samples were analysed for astaxanthin content
spectrophotometrically (see below).
2.4.8 Preparation of carotenoid standards
To prepare an astaxanthin standard approximately 3mg of crystalline astaxanthin (Sigma,
Poole, Dorset, U.K.) was carefully weighed into a lOOm! amber volumetric flask.
Choloroform (IOml) was then added to the flask and the solution briefly sonicated The
solution was then made to volume with n-hexane and the solution gently everted several
times to ensure homogeneity. An aliquot of this solution (Sml) was then pipetted into a
second I OOml amber volumetric flask containing 4ml of chloroform and was made to
volume with n-hexane (n-hexane: chloroform; 95.5:4.5). This solution was used as the
external standard. The standard was stored at sac prior to concentration determination
when it was brought to room temperature and again sonicated.
To prepare a canthaxanthin standard approximately 3mg of crystalline canthaxanthin
(Sigma, Poole, Dorset, U.K.) was carefully weighed into a I OOml amber volumetric flask.
I Oml of chloroform was then added to the flask and the solution briefly sonicated. The
54
solution was then made to volume with n-hexane and the solution gently everted several
times to ensure homogeneity. An aliquot of this solution (5ml) was then pipetted into a
second amber 100ml volumetric flask containing 4ml of acetone and was made to volume
with n-hexane (n-hexane: chloroform: acetone; 95.5:0.5:4.0). This solution was used as
the external standard. The standard was stored at 5°C prior to concentration determination
when it was brought to room temperature and again sonicated
2.4.9 Spectrophotometric carotenoid quantification
Some samples (namely feed and faecal samples) were assessed for carotenoid
concentration using a UV-Vis spectrophotometer (Helios, UNICAM Ltd., Cambridge,
U.K.). Samples were assessed for astaxanthin (unesterified, monoester or diester) at
M70nm in n-hexane using an El% I cm of 2100 (Britton 1995). Corrections were made for
absorption contributed by carotenoids other than astaxanthin (determined following
separation of carotenoid extracts by TLC). Furthermore, background absorption
contributed by other dietary ingredients was corrected for by carrying out extractions and
quantification on basal feed (non-carotenoid supplemented). HPLC confirmed that basal
feeds did not contain significant quantities of carotenoids (<I ppm).
Astaxanthin and canthaxanthin standards were measured at 470nm (E1% I cm = 21 00) and
466nm (El% I cm= 2260), respectively against suitable blanks. Determination of carotenoid
concentration was carried out using the following formula:
Carotenoid concentration (~tg m!" 1) = Absorbence at A.max x I 0000 Equation (2.9)
55
Where:
A.max = wavelength corresponding to maximum absorption for a carotenoid in a particular
solvent
El% lcm =Extinction coefficient for a specific carotenoid in a particular solvent.
2.4.1 0 High Performance Liquid Chromatography (HPLC) Analysis
Two different HPLC stationary phases were employed for carotenoid analysis throughout
the experimental trials. Blood (serum) and flesh samples were analysed using nitrile and
silica stationary phases, respectively. Figure 2.1 illustrates typical chromatograms
produced using both stationary phases.
The isocratic HPLC system comprised a Spherisorb SS-CN nitrile column (Phenomenex,
Cheshire, U.K.; length 250mm; internal diameter 4.6mm; particle size Sf.!m) with 20%
acetone in hexane as mobile phase (l.Sml min- 1 flow rate). Alternatively, a Lichrosorb 5-
SIL 60A column (Phenomenex, Cheshire, U.K.; length 125mm; internal diameter 4mm;
particle size Sf.!m) with 14% acetone in hexane as mobile phase (1.2ml min- 1 flow rate)
was used. These were coupled with a P332 single channel detector and 325 pump
(Kontron Instruments, Watford, Hertfordshire, U.K.). The detector wavelength was
maintained at 470nm for a 12min run time throughout analysis of all samples, where all-£
astaxanthin exhibited a retention time of ea. 7 or llmin on the nitrile and silica columns,
respectively. Kontron Kroma 2000 software was utilised to integrate samples against
external carotenoid standards.
56
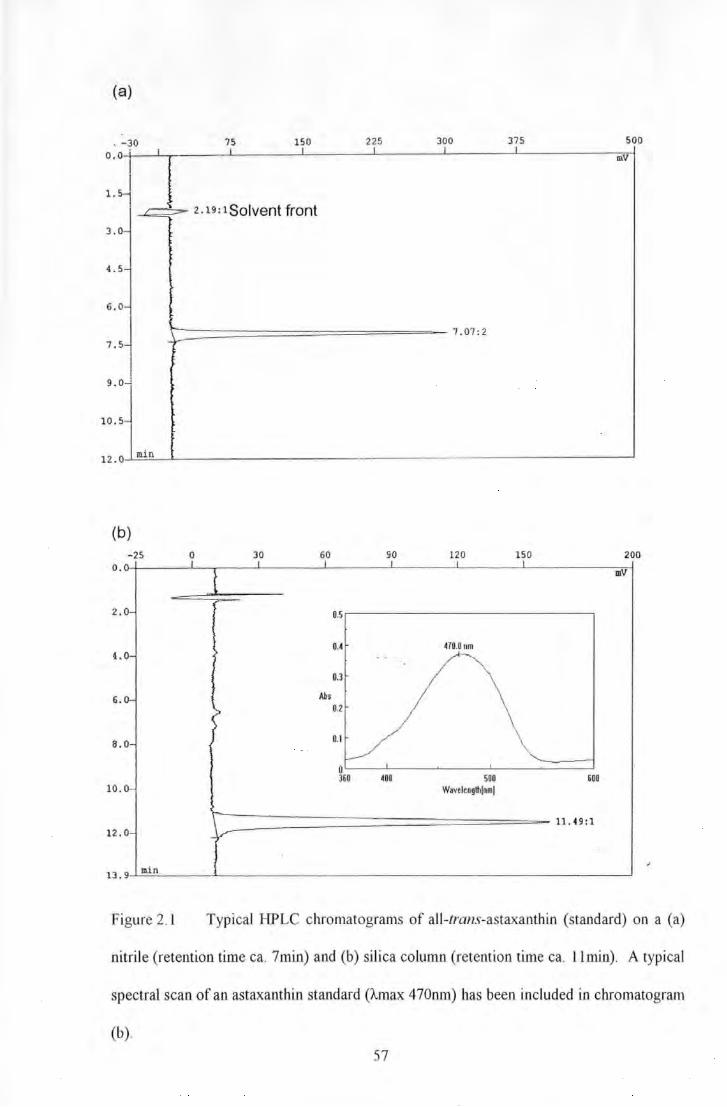
(a)
' -30
o.o I I
l I 1.5l
~
3.0
4.5
6.0-
75 I
150 I
2.19:1 Solvent front
225 300 375 500
m V
7.5-\:=================~- 7.07: 2 r
9 . o-'
10.5-
12 .0 min
(b) -25 0 30 60 90 120 150 200
o. m V
0.5
0.4 470.0 nm 4.
0.3
6. Abs 0.2
0.1
0 360 400 500 600
10 . Waveleng!hjnml
11.49:1
13.9~ru=·n~----~------------------------------------------------~
Figure 2.1 Typical HPLC chromatograms of all-trans-astaxanthin (standard) on a (a)
nitrile (retention time ea. 7min) and (b) silica column (retention time ea. llrnin). A typical
spectral scan of an astaxanthin standard (A.max 470nm) has been included in chromatogram
(b).
57
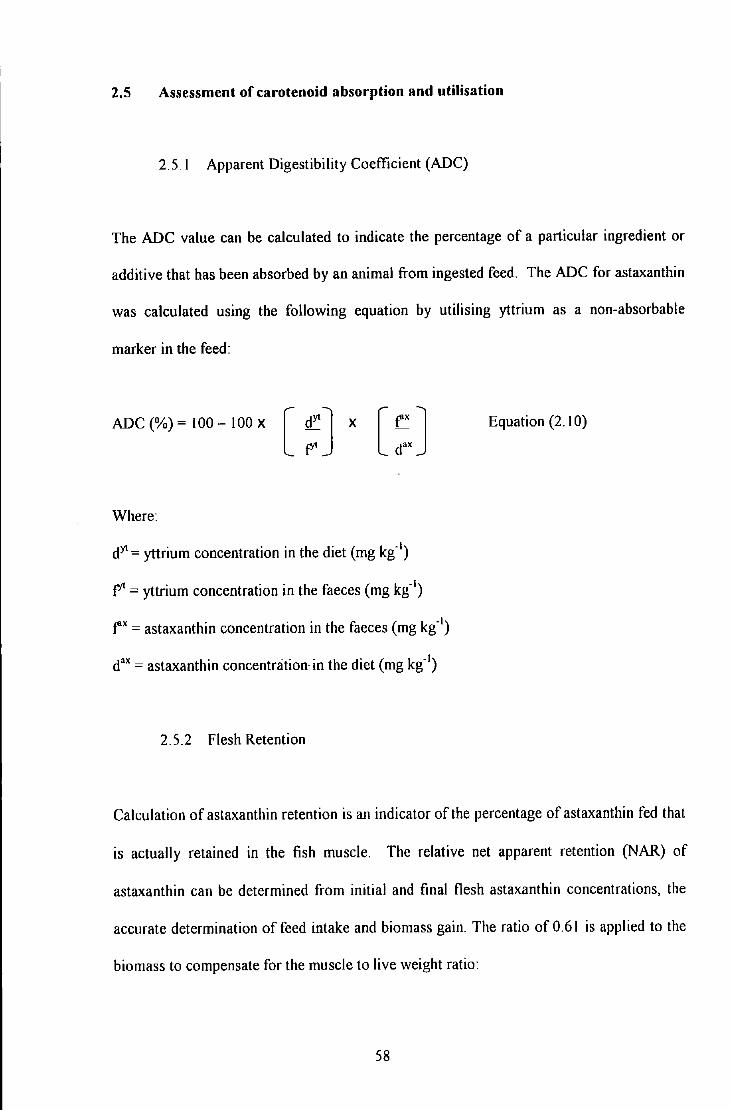
2.5 Assessment of carotenoid absorption and utilisation
2.5.1 Apparent Digestibility Coefficient (ADC)
The ADC value can be calculated to indicate the percentage of a particular ingredient or
additive that has been absorbed by an animal from ingested feed. The ADC for astaxanthin
was calculated using the following equation by utilising yttrium as a non-absorbable
marker in the feed:
ADC(%)= 100- 100 X [ ~ J X [ ::. J Where:
dyt= yttrium concentration in the diet (mg kg-1)
r' =yttrium concentration in the faeces (mg kg- 1)
t'" = astaxanthin concentration in the faeces (mg kg- 1)
dax = astaxanthin concentration· in the diet (mg kg- 1)
2.5.2 Flesh Retention
Equation (2. I 0)
Calculation of astaxanthin retention is an indicator of the percentage of astaxanthin fed that
is actually retained in the fish muscle. The relative net apparent retention (NAR) of
astaxanthin can be determined from initial and final flesh astaxanthin concentrations, the
accurate determination of feed intake and biomass gain_ The ratio of 0.61 is applied to the
biomass to compensate for the muscle to live weight ratio:
58
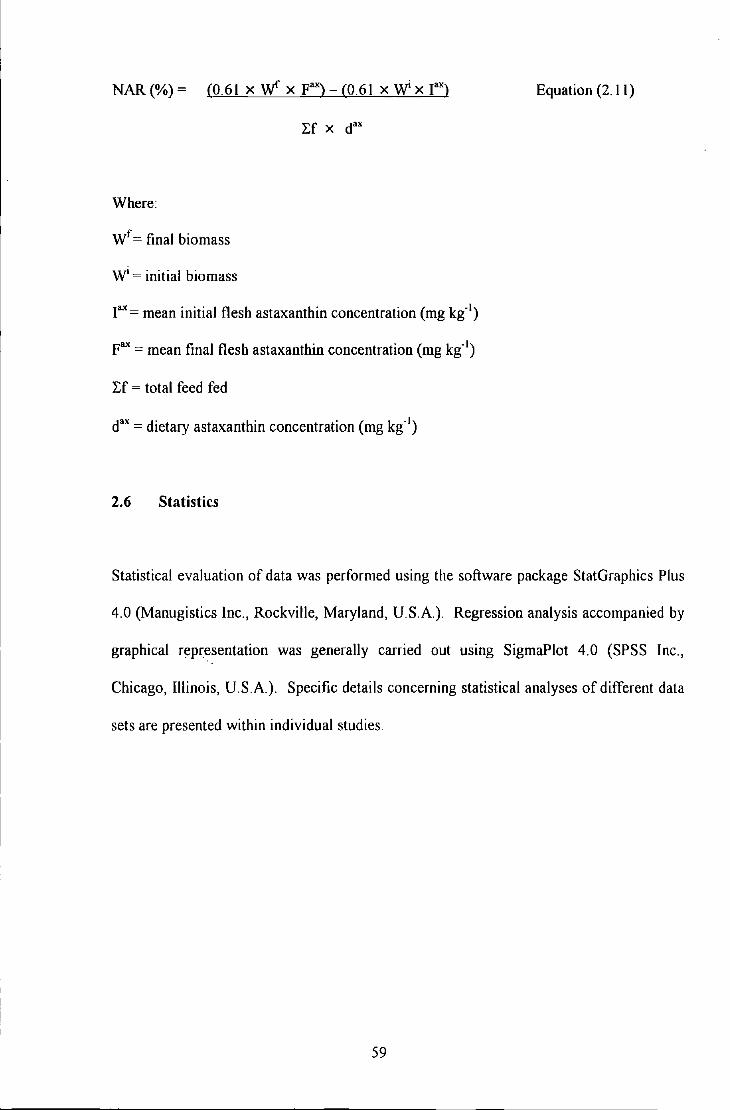
NAR (%) = (0.61 X v/ X Fax)- (0.61 X W X lax)
Where:
wf = final biomass
wi = initial biomass
Lf X d ..
lax= mean initial flesh astaxanthin concentration (mg ki1)
Fax= mean final flesh astaxanthin concentration (mg kg- 1)
Lf = total feed fed
dax =dietary astaxanthin concentration (mg kg- 1)
2.6 Statistics
Equation (2. 11)
Statistical evaluation of data was performed using the software package StatGraphics Plus
4.0 (Manugistics Inc., Rockville, Maryland, US.A.). Regression analysis accompanied by
graphical r~presentation was generally carried out using SigmaPlot 4.0 (SPSS Inc.,
Chicago, Illinois, USA). Specific details concerning statistical analyses of different data
sets are presented within individual studies
59
CHAPTER 3.0
THE SPOROPOLLENIN CELL WALL OF HAEMATOCOCCUS PLUVIALIS:
EFFECTS ON ABSORPTION AND DEPOSITION OF ASTAXANTHIN IN
RAINBOW TROUT.
3.1 Introduction
Distinctive colouration of farmed salmonid flesh owing to the dietary supplementation of
carotenoids in salmonid feeds is critical for consumer acceptance (Torrissen et al. 1990).
Subsequently, salmon farmers strive to achieve the market demand for a fish muscle
astaxanthin concentration of between 6-7 mg kg·1 (Torrissen & Christiansen 1995).
Carotenoid-containing products such as krill (Mori et al. 1989; Torrissen et al. 1989);
shrimp wastes and oil extracts (Saito & Regier 1971; Torrissen et a! 1989); crayfish oil
extracts (Peterson et a! 1966); red crab wastes and oil extracts (Spinelli et a! 1974;
Spinelli & Mahnken 1978) as well as the yeast Pha./fia rhodozyma (Johnson et a! 1977)
have been used successfully as feed supplements to pigment salmonids.
The microalga Haematococcus pluvialis (Flowtow) is also a natural source of astaxanthin.
This algae possesses the ability to accumulate large amounts of carotenoid (Choubert &
Heinrich 1993) typically associated with the formation of aplanospores or cysts when the
algae is subjected to growth limiting conditions e.g. depletion of nitrogen in the growth
medium and/or exposure to high irradiances (Boussiba & Vonshak 1991; Harker et al.
1996a). These cysts are similar to those found in many microalgae and in pollen from
higher plants (VanWinkle Swift & Rickoll 1997) Furthermore, these cysts are surrounded
60
by a tough sporopollenin cell wall that renders them resistant to chemical attack (Good &
Chapman 1979; Burczyk 1987) to KOH and acetolysis, but they can be attacked by
chromic acid. Indeed, resistance to acetolysis is used in part to characterise such cell walls.
Subsequently, these cell walls may impede absorption of carotenoid once ingested by an
animal (Johnson & An 1991). Indeed, several studies have demonstrated comparatively
poorer pigmentation efficiency when using Haemalococcus pluvialis as a source of
astaxanthin with reference to the commercial synthetic source, CAROPHYLL ® Pink
(Sommer et al. 1991; Sommer et al. 1992; Choubert & Heinrich 1993). In all cases poorer
pigmentation was in part explained by reduced bioavailability of carotenoid as a direct
result of the encysted cell wall.
Several methods have been proposed to disrupt algal cells (Farrow and Tabenkin 1966;
Ruane 1977; Nonomura 1987) although most methods are not very efficient for disrupting
the sporopollenin wall of Haematococcus cysts. Methods that have been evaluated include
cryogenic grinding (Burbrick 1991) autoclaving and homogenisation (Mendes-Pinto et al.
200 I) It is important to consider the efficiency of such processing techniques with regards
to homogeneous treatment of the sample and subsequently the bioavailability of
astaxanthin for salmonid pigmentation.
The following study is a description of two experimental feed trials designed to assess the
degree to which cell wall encapsulation affects the digestibility, absorption and final flesh
deposition of astaxanthin in rainbow trout. The first of these was designed to assess
whether removal of the cell wall is necessary prior to feed supplementation in order to
achieve satisfactory absorption and deposition of astaxanthin compared to the synthetic
source. The second experiment investigated the potential of a confidential (patent
61
pending) cell wall cracking procedure at two different levels on the relative bioavailability
of pigment again compared to the synthetic form of astaxanthin.
3.2 Materials and Methods
3.2.1 Experimental design
In the following experiments each dietary treatment was assigned to triplicate tanks
containing groups of fish. Subsequently, each tank is considered as a replicate (n=3).
Following sampling and analysis of individual fish tissues, statistical comparison of results
between treatments was based on mean values from each tank (n=3) to avoid pseudo
replication and false interpretation of results (Morris 1999).
3.2.2 Basal Diets
For both experiments, the basal feeds containing no added carotenoid and formulated to
meet the nutritional requirements of rainbow trout were supplied by Trouw Aquaculture
Ltd. (Wincham, UK). Table 3.1 outlines the dietary ingredients and proximate composition
of the diets.
3.2.3 Experimental diets (Experiment 1)
Three experimental diets were utilised with an astaxanthin concentration target of 60ppm.
Diet A contained the synthetic source of astaxanthin, CAROPHYLL ® Pink (F Hoffmann
La Roche, Base!, Switzerland). Diet B was supplemented with a commercially available
source of Haematococcus pluvialis (NatuRose, Cyanotech Corporation, Kailua-Kona,
62
Hawaii, U.S.A.) and Diet C contained a total carotenoid extract that had been extracted
from Haematococcus pluvialis cells. Mechanical extraction of algal pigments prior to
dietary supplementation was performed as described in Chapter 2 (section 2.1.1 ). Pigment
sources were added to the pre-pelleted feed with additional oil (cod liver oil; Seven Seas
Ltd, Hull, U.K.) in a top coating procedure (section 2. 1.2) to bring the diets to a
commercial level of 26% oil. Carotenoid extraction and analysis of feeds was carried out
as described previously (section 2.4.2). Thin layer chromatography was performed on feed
extracted pigments to determine relative percentage contributions of astaxanthin forms
(monoester, diester, unesterified) according to Kobayashi et al. (1991; see section 2.4 7)
Table 3.2 outlines the astaxanthin composition of each diet.
3.2.4 Fish, feeding and sampling (Experiment I)
Rainbow trout (98.1 ± 0.4g) were obtained from Hatchlands Trout Fisheries (Devon, UK)
and randomly assigned into individual tanks (40 fish per tank), maintained at l5°C under a
12h light/dark photoperiod. Triplicate groups/tanks of fish were fed either experimental
diets in a single morning ration (1.2-1.5% BW da/) for 10 weeks days with alterations
made daily assuming a feed conversion ratio of 1.0. Flesh fillets were taken from trout at
week 4 (5 fish per tank) and at the end of the trial (I 0 fish per tank) for carotenoid analyses
(see section 2.4.4). The perceived colour of these fillets was also determined using the
colour graded SalmoFan™ (F. Hoffmann-La Roche Ltd, Base!, Switzerland). Three
individuals made separate determination for each fillet under artificial ambient light. Fish
were also anaesthetised and stripped of faecal material (Austreng 1978) at week 8 of the
trial. Faeces were pooled per replicate, freeze-dried and analysed for carotenoid and inert
marker concentrations (see sections 2.1.8, 2.4.2 and 2.4. 9).
63
At week I 0, feeding of the experimental diets ceased but fish were fed for a further 4 days
on a non-pigmented diet (same basal formulation as in Table 3.1} to permit blood clearance
of astax:anthin (March et al. 1990}. Fish were then fed a single ration (1.3% BW day"1} of
the respective pigrnented diet and blood samples were taken (see sections 2.2.5) from fish
(5 fish per tank) at five time intervals up to 24h post feeding for carotenoid analyses
(section 2.4.10).
3.2.5 Experimental diets (Experiment 2}
Encysted-astax:anthin rich cells of Haematococcus pluvialis were broken using pressure
treatment (details confidential-patent pending; A J Young pers. Comm). A wet slurry of
freshly harvested cells were exposed to two different pressures (5000 and 20000psi). At
the lower pressure (5000psi) the algal cell wall was ruptured (cell remained largely intact)
and at the higher pressure (20000psi) the cell was fully disrupted with no cell structure
remaining (determined histologically; see below). Ethoxyquin (I OOppm) was carefully
mixed with the cell slurry following cracking and prior to spray drying (Lab Plant SD-05
laboratory spray dryer). Analysis of carotenoid content and composition of the cracked
products (before and after drying) revealed ea. 100% recovery of astaxanthin, with no
detectable formation of astacene (an indicator of oxidised astax:anthin).
Four experimental diets were utilised with an astaxanthin concentration target of 60ppm.
Diet CP contained the synthetic source of astaxanthin, CAROPHYLL ® Pink (F. Hoffmann
La Roche, Basel, Switzerland). Diet 5000 was supplemented with Haematococcus
p/uvialis cracked under low pressure. Diet 20000 contained Haematococcus pluvialis cells
cracked under high pressure and Diet NAT contained a commercially available source of
Haematococcus pluvialis (NatuRose, Cyanotech Corporation, Kailua-Kona, Hawaii,
64
U.S.A.). Addition of pigment sources, carotenoid extraction, TLC and analysis was carried
out as described previously. Table 3.3 outlines the astaxanthin composition of each diet.
3.2.6 Fish, feeding and sampling (Experiment 2)
Rainbow trout (106.2 ± O.lg) were randomly assigned into individual tanks (30 fish per
tank). Triplicate groups of fish were fed experimental diets in a single morning ration (1.2-
1.5% BW da/) for 8 weeks with alterations made daily assuming a feed conversion ratio
of 1.0. On the final day of the trial fish were stripped of faecal material (Austreng 1978)
which was freeze dried and then analysed for carotenoid and inert marker concentrations
(as described previously). Flesh fillets were taken from all fish (30 fish per tank) at the end
of the trial for carotenoid analysis.
3.2.7 Electron Microscopy
Aplanospores of H. pluvialis (produced by a combination of nitrogen-deprivation and
exposure to high irradiances) cracked under different pressures and cells of H. pluvialis
from the NatuRoseTM product were examined by scanning electron microscopy using a
JEOL JSM-840 microscope (Welwyn Garden City, U.K.) at an accelerating voltage ofi-
15KV. The samples were lyophilised (Chris Alpha 1-4, B-Braun Biotech lntl., Epsom,
U.K.) at -52°C, and coated with a thin gold-palladium film (I 0-1 Snm) using a Polaron
E5000 sputter unit (Thermo VG Scientific, East Grinstead, U.K.). Figure 3.1 shows
magnified pictures of the various cracked cells taken using electron microscopy.
65
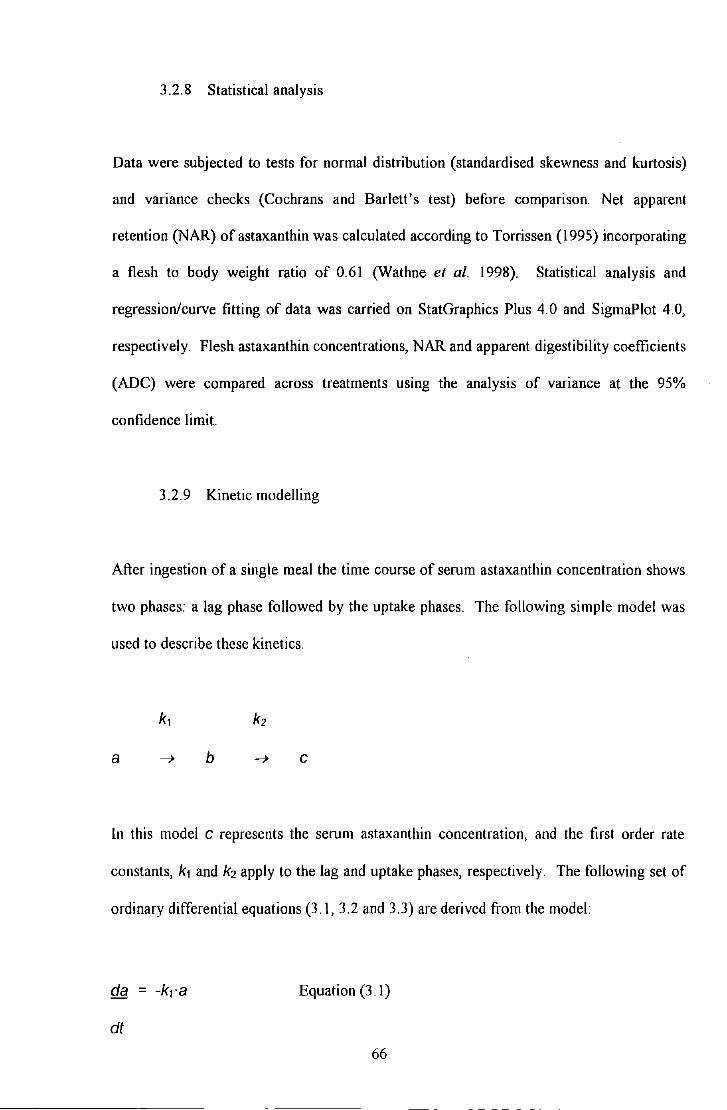
3.2.8 Statistical analysis
Data were subjected to tests for normal distribution (standardised skewness and kurtosis)
and variance checks (Cochrans and Barlett's test) before comparison. Net apparent
retention (NAR) of astaxanthin was calculated according to Torrissen ( 1995) incorporating
a flesh to body weight ratio of 0.61 (Wathne et al. 1998). Statistical analysis and
regression/curve fitting of data was carried on StatGraphics Plus 4.0 and SigmaPlot 4.0,
respectively. Flesh astaxanthin concentrations, NAR and apparent digestibility coefficients
(ADC) were compared across treatments using the analysis of variance at the 95%
confidence limit.
3.2.9 Kinetic modelling
After ingestion of a single meal the time course of serum astaxanthin concentration shows
two phases: a Jag phase followed by the uptake phases. The following simple model was
used to describe these kinetics.
k,
a b c
In this model c represents the serum astaxanthin concentration, and the first order rate
constants, k, and k2 apply to the lag and uptake phases, respectively. The following set of
ordinary differential equations (3.1, 3.2 and 3.3) are derived from the model:
da = -k,·a
dt
Equation (3 .1)
66
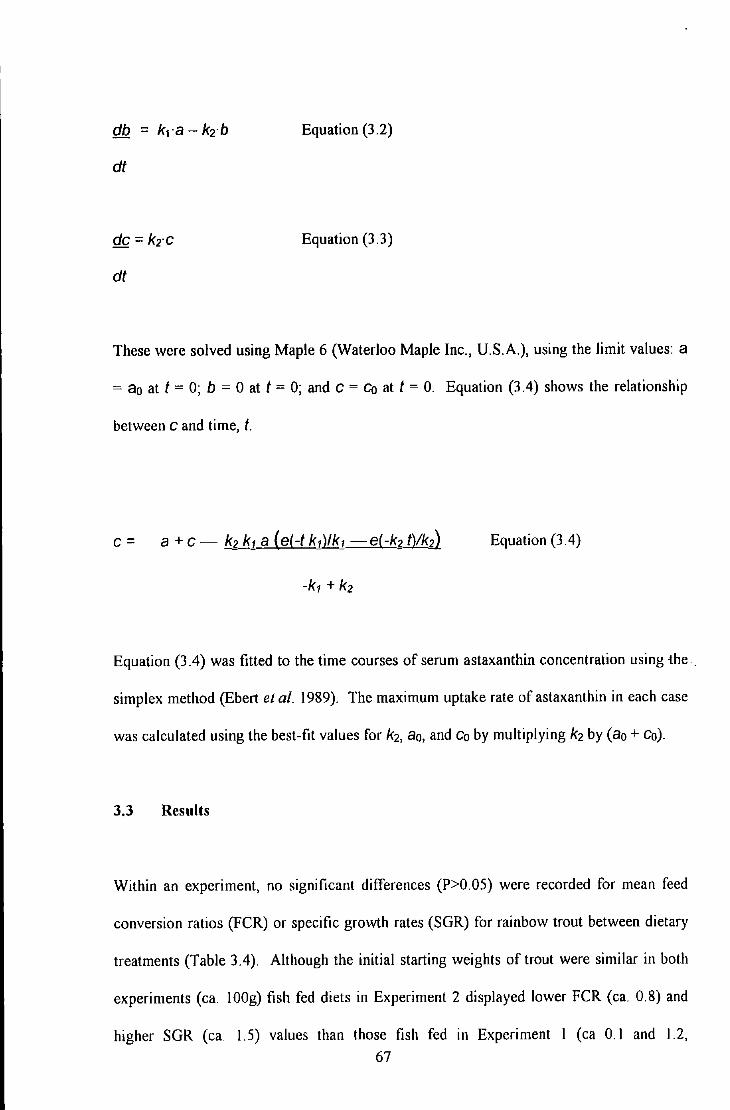
Equation (3.2)
dt
Equation (3.3)
dt
These were solved using Maple 6 (Waterloo Maple Inc., U.S.A.), using the limit values: a
= a 0 at t = 0; b = 0 at t = 0; and c = Co at t = 0. Equation (3.4) shows the relationship
between c and time, f.
c = a+ c- k2 kt a (el-t ktl!.kt -e(-k2 tVk2) Equation (3.4)
Equation (3.4) was fitted to the time courses of serum astaxanthin concentration using 1he .
simplex method (Ebert et al. 1989). The maximum uptake rate of astaxanthin in each case
was calculated using the best-fit values for k2, ao, and eo by multiplying k2 by (ao +eo).
3.3 Results
Within an experiment, no significant differences (P>O.OS) were recorded for mean feed
conversion ratios (FCR) or specific growth rates (SGR) for rainbow trout between dietary
treatments (Table 3.4). Although the initial starting weights of trout were similar in both
experiments (ea. IOOg) fish fed diets in Experiment 2 displayed lower FCR (ea. 0.8) and
higher SGR (ea 1.5) values than those fish fed in Experiment I (ea 0.1 and 12, 67
respectively) suggesting more efficient growth. This is supported by the increase in live
weight of fish over time for fish in Experiment 1 (mean ftnal weight 286.7 ± 2.3g; ea. 29g
week"1) compared to fish in Experiment 2 (mean final weight 265.5 ± 1.8g; ea. 33g week·
1). Furthermore, fish in Experiment 1 grew at a slower rate between weeks 0-4 ( 17.3 ±
0.2g week.1) compared to weeks 4-10 (20.0 ± 0.3g week.1
; n=3, ±SEM) with an average
wet weight of 167.2 ± 0.6g for fish at week 4.
In Experiment I, no significant differences (P>0.05) were noted between mean apparent
digestibility coefficients (ADC) for astaxanthin across dietary treatments (Table 3.5) with
all mean values between 73-75% (n=3). Similarly, no significant differences were
recorded between mean ADC values for astaxanthin across dietary treatments in
Experiment 2 with mean ADC values between 59-70% (n=3). Mean ADC values for
astaxanthin in Experiment I were notably higher than those in Experiment 2 for similar
dietary treatments e.g. Diet A (73.6 ± 0.7) and Diet CP (69.1 ± 4.6) although this
difference was not significant (P>0.05; n=3, ±SEM).
In Experiment 1, no significant differences (P>0.05) were recorded between final muscle
astaxanthin concentrations in rainbow trout fed the diet supplemented with unesterified
astaxanthin, Diet A (6.2 ± 0 611g g" 1), Haematococcus p/uvialis, Diet 8 (6.0 ± 0.51lg g· 1
) or
cell free carotenoid extract, Diet C (5.2 ± O.l11g g"1; n=3, ± SEM) (Figure 3.2) Similarly,
no significant differences (P>0.05) were found between final NAR values for fish fed Diet
A (11.3 ± 1.1%), Diet 8 (10.3 ± 1.3%) or Diet C (9.4 ± 0.6%). However, in Experiment 2
the final mean muscle astaxanthin concentrations in rainbow trout were significantly
higher (P<0.05) in fish fed Diet CP (2.8 ± 0.211g g" 1) compared with those fed Diet 5000
(2.3 ± O.I11g g" 1) and Diet 20000 (2.3 ± 0.111g g"1
), but not significantly higher than those
68
fish fed Diet NAT (2.5 ± 0.2Jlg g-1; n=3, ±SEM). In confirmation of this, the mean NAR
values for Diet CP (7.2 ± 0.4%) were also significantly higher than those noted in fish fed
Diet 5000 (4.2 ± 0.1%) and Diet 20000 (3.9 ± 0.1%), although were not significantly
higher than the mean retention values recorded in fish fed Diet NAT (5.0 ± 0.4%).
Examination of flesh astaxanthin concentrations after 4 and I 0 weeks of feeding in
Experiment I show a positive increase in deposition over time (Figure 3.3). Furthermore,
the rate of astaxanthin deposition was notably greater in the second half of the trial (weeks
4-10) compared to weeks 0-4 where fish fed Diet A, Diet B, and Diet C only deposited I.J
± 0 2Jlg g- 1; I.J ± 0. IJ.!g g- 1 and 1.1 ± 0 04Jlg i 1 of astaxanthin, respectively (n=3, ±SEM).
No significant differences (P>0.05) were perceived in coloration between the fillets of fish
fed the different dietary treatments (assessed using the SalmoFanTM) with a range of 25-31.
Evaluation of the relationship between Sa/moFanTM score and flesh concentrations of
astaxanthin for fish taken at weeks 4 and 10 in Experiment I (Figure 3.4) demonstrated a
significant relationship (P<O.OOI) between the two measurements. However, the
correlation coefficient between the two parameters (0.80) only indicated a moderately
strong association.
Examination of the serum astaxanthin concentrations in fish fed a single meal of either of
the experimental diets (Figure 3. 5) suggested significant quantities of astaxanthin were still
present in the semm of fish at time 0 (ea. 0.8-IJlg mr 1) despite feeding fish non-pigmented
feed for four days. Nevertheless, kinetic assessment of maximum serum astaxanthin
absorption rates showed that the mean absorption rate in fish fed Diet A (0.44 ± 0.07Jlg mr
1h- 1) was numerically but not significantly higher (P>O OS) compared to those in fish fed
Diet 8 (028 ± O.l!Jlg mr 1h-1) and Diet C (0.26 ± 0.02Jlg mr 1h. 1
) Furthermore, at time
69
24h, mean serum astaxanthin concentrations (minus values at time 0) were not
significantly different (P>O.OS) in fish fed Diet A (1.07 ± O.l3f.lg ml"1), Diet B (1.27 ±
0.11 f.lg mr1) or Diet C (1.10 ± 0.25f.lg mr 1
).
70
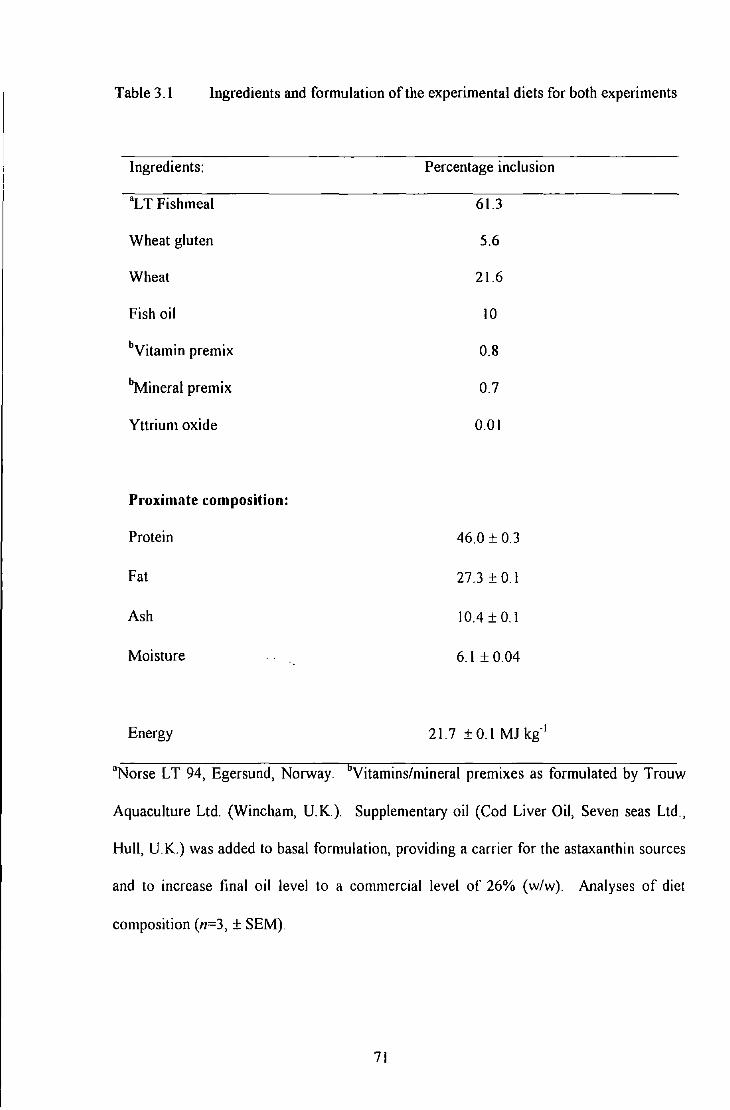
Table 3.1 Ingredients and formulation of the experimental diets for both experiments
Ingredients: Percentage inclusion
"LT Fish meal 61.3
Wheat gluten 5.6
Wheat 21.6
Fish oil 10
bVitamin premix 0.8
bMineral premix 0.7
Yttrium oxide 0.01
Proximate composition:
Protein 46.0 ± 0.3
Fat 27.3 ± 0.1
Ash 10.4 ± 0.1
Moisture 6.1 ± 0.04
Energy 21.7 ± 0.1 MJ kg· 1
"Norse LT 94, Egersund, Norway. Vitamins/mineral premixes as formulated by Trouw
Aquaculture Ltd. (Wincham, U.K.). Supplementary oil (Cod Liver Oil, Seven seas Ltd.,
Hull, U.K.) was added to basal formulation, providing a carrier for the astaxanthin sources
and to increase final oil level to a commercial level of 26% (w/w). Analyses of diet
composition {n=J, ± SEM)
71
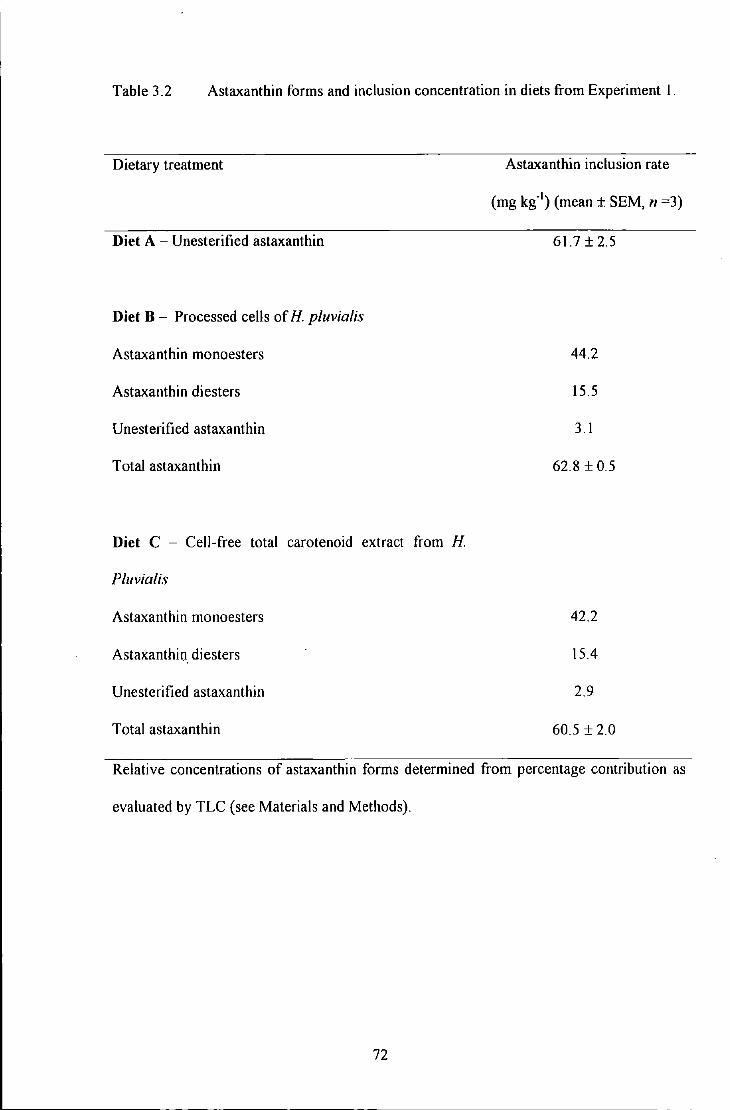
Table 3.2 Astaxanthin forms and inclusion concentration in diets from Experiment I.
Dietary treatment
Diet A - Unesterified astaxanthin
Diet B- Processed cells of H. pluvialis
Astaxanthin monoesters
Astaxanthin diesters
Unesterified astaxanthin
Total astaxanthin
Diet C - Cell-free total carotenoid extract from H.
Pluvialis
Astaxanthin monoesters
Astaxanthin diesters
Unesterified astaxanthin
Total astaxanthin
Astaxanthin inclusion rate
(mg kg.1) (mean± SEM, n =3)
61.7±2.5
44.2
15.5
3 .I
62.8±05
42.2
I 5.4
2.9
60.5 ± 2.0
Relative concentrations of astaxanthin forms determined from percentage contribution as
evaluated by TLC (see Materials and Methods).
72
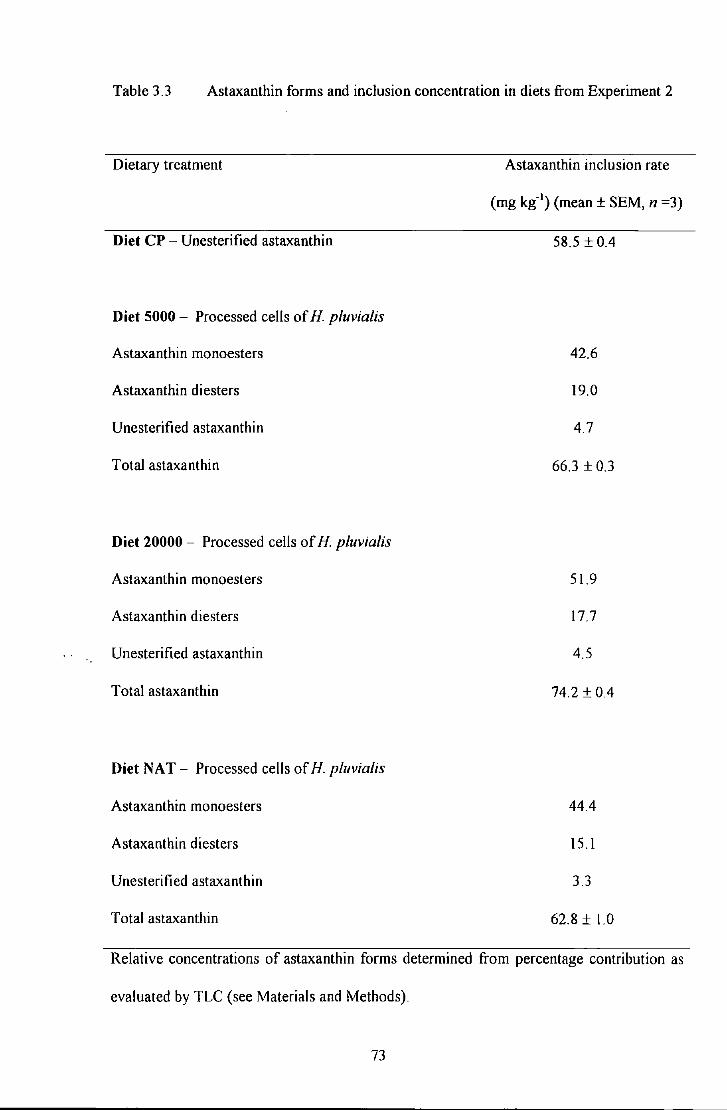
Table 3.3 Astaxanthin forms and inclusion concentration in diets from Experiment 2
Dietary treatment
Diet CP- Unesterified astaxantbin
Diet 5000 - Processed cells of H. pluvialis
Astaxanthin monoesters
Astaxanthin diesters
Unesterified astaxanthin
Total astaxanthin
Diet 20000 - Processed cells of H. pluvia/is
Astaxanthin monoesters
Astaxanthin diesters
Unesterified astaxanthin
Total astaxanthin
Diet NAT- Processed cells of H. pluvialis
Astaxanthin monoesters
Astaxanthin diesters
Unesterified astaxanthin
Total astaxanthin
Astaxanthin inclusion rate
(mg kg-1) (mean± SEM, n =3)
58.5 ± 0.4
42.6
19.0
4.7
66.3 ± 0.3
51.9
17.7
4.5
74.2 ± 0.4
44.4
15.1
3.3
62.8 ± 1.0
Relative concentrations of astaxanthin forms determined from percentage contribution as
evaluated by TLC (see Materials and Methods)_
73
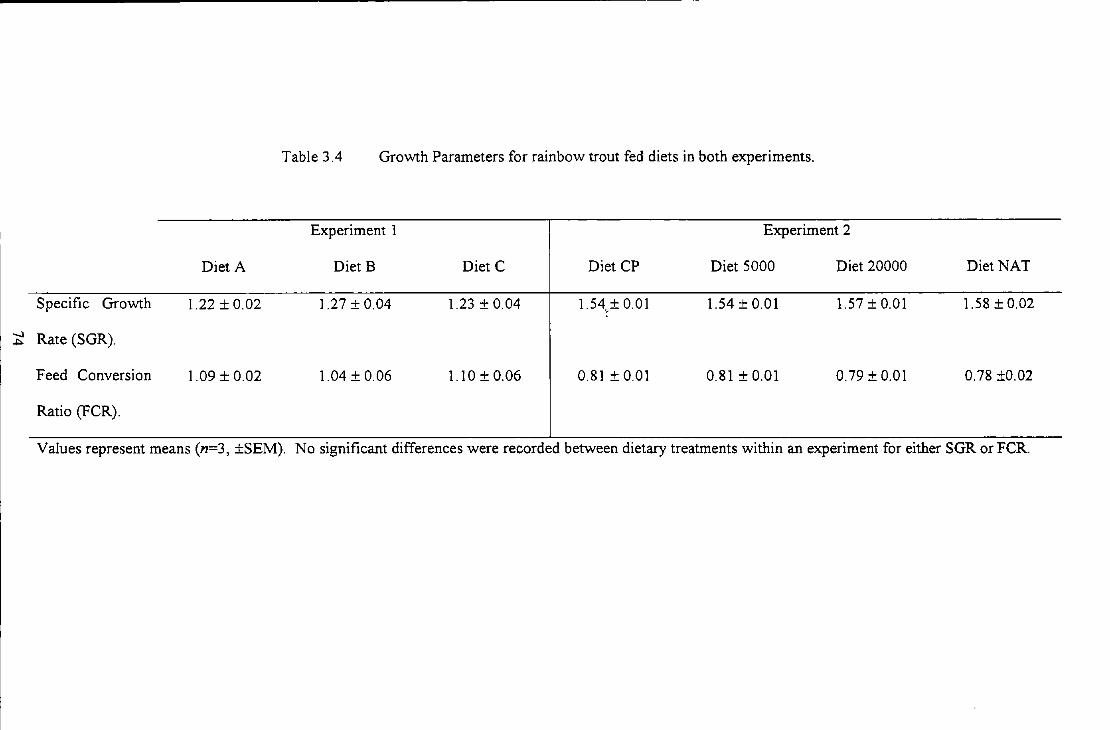
Specific Growth
~ Rate (SGR).
Feed Conversion
Ratio (FCR).
Diet A
1.22 ± 0.02
1.09 ± 0.02
Table 3.4 Growth Parameters for rainbow trout fed diets in both experiments.
Experiment 1
Diet B
1.27 ± 0.04
1.04 ± 0.06
Diet C
1.23 ± 0.04
1.10 ± 0.06
Diet CP
154._± 0.01
0.81 ±0.01
Experiment 2
Diet 5000 Diet 20000
1.54 ± 0.01 1.57 ± 0.01
0.81 ± 0.01 0.79 ± 0.01
Diet NAT
1.58 ± 0.02
0.78 ±0.02
Values represent means (n=3, ±SEM). No significant differences were recorded between dietary treatments within an experiment for either SGR or FCR.
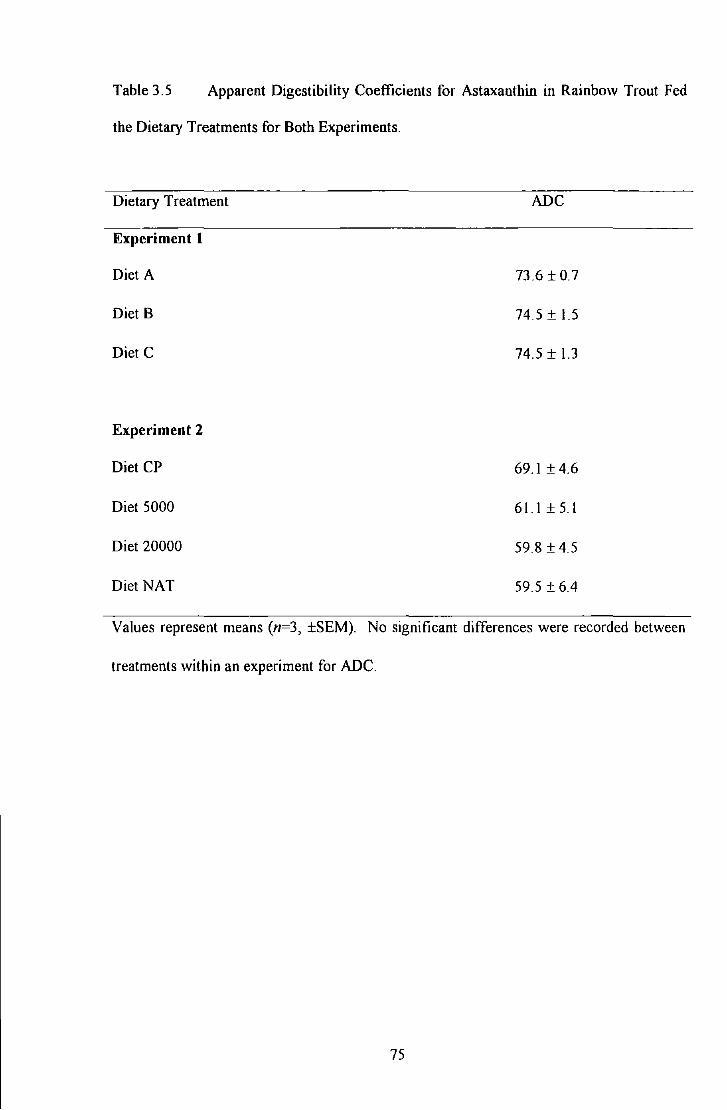
Table 3.5 Apparent Digestibility Coefficients for Astaxanthin in Rainbow Trout Fed
the Dietary Treatments for Both Experiments.
Dietary Treatment
Experiment l
Diet A
Diet B
Diet C
Experiment 2
Diet CP
Diet 5000
Diet 20000
Diet NAT
ADC
73.6 ± 0.1
74 5 ±IS
74.5 ± 1.3
69.1±4.6
61.1 ± 5. I
59.8 ±45
59.5 ± 6.4
Values represent means (n=3, ±SEM). No significant differences were recorded between
treatments within an experiment for ADC.
75
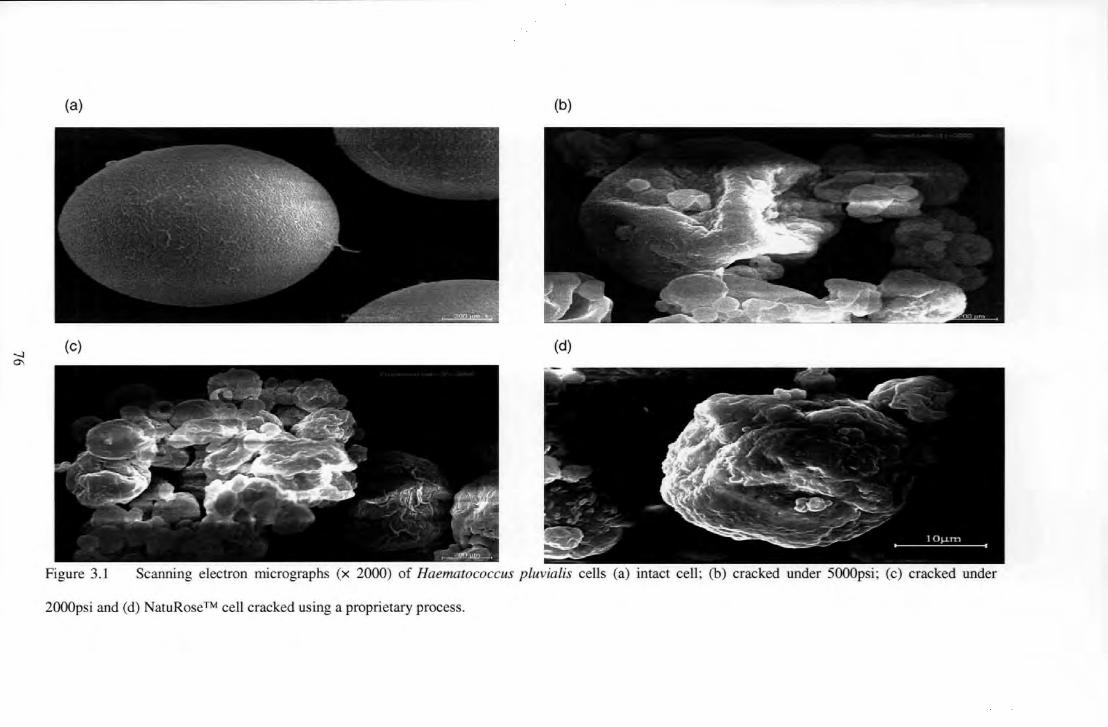
----------------------------------------- .
(a) (b)
(c) (d)
Figure 3.1 Scanning electron micrographs (x 2000) of Haematococcus pluvialis cells (a) intact cell; (b) cracked under 5000psi; (c) cracked under
2000psi and (d) NatuRoseTM cell cracked using a proprietary process.
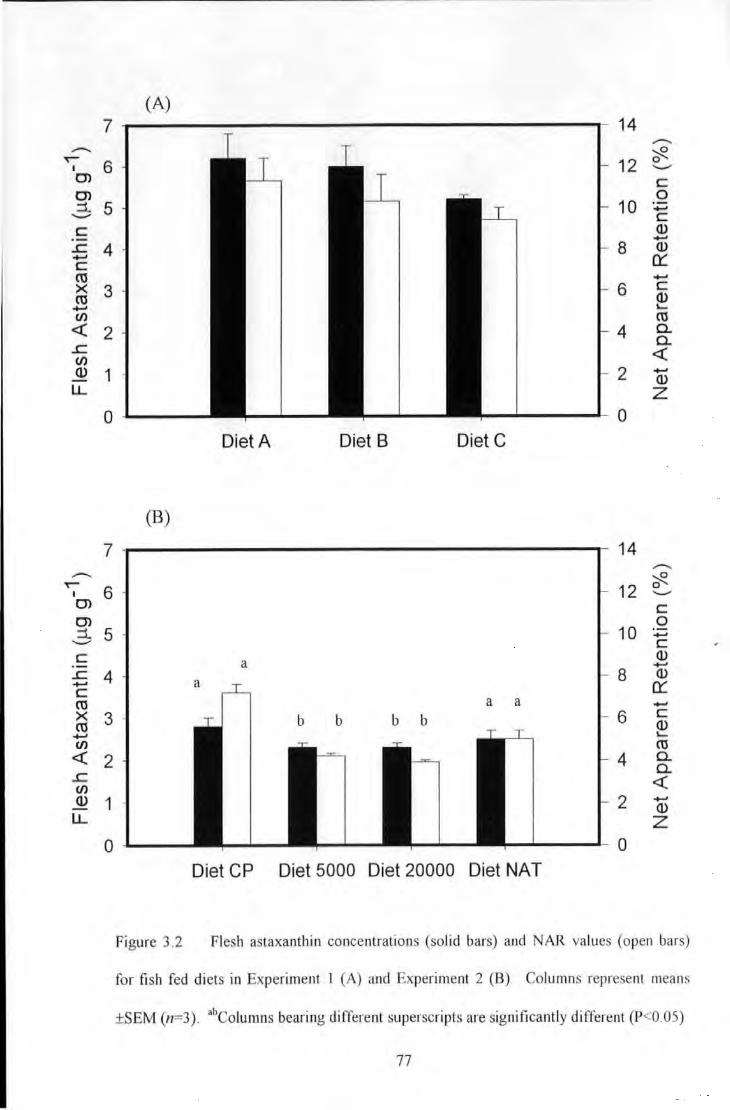
(A) 7 14
....-....- ~ ~
6 12 0 I ...._ 0> c 0> 0 ::i 5 10 ........ ...._ c c Q)
........ ..c 4 8 Q) ........ 0::: c ro ........ >< 3 6 c ro Q)
........ ~
en ro <( 2 4 0.
0. ..c <( en Q) 1 2 ........
Q) LL z
0 0
Diet A Diet B Diet C
(B)
7 14 ....-
....- ~ ~
6 12 0 I
...._ 0> c 0> 0 ::i 5 10 ........ ...._ c c a
Q) ........
..c 4 8 Q) ........ 0::: c ro ........ >< 3 6 c ro Q)
........ ~
en ro <( 2 4 0.
..c 0.
en <( Q) 1 2 ........
Q) LL z
0 0
Diet CP Diet 5000 Diet 20000 Diet NAT
Figure 3.2 Flesh astaxanthin concentrations (solid bars) and NAR values (open bars)
for fi sh fed diets in Experiment I (A) and Experiment 2 (B). Columns represent means
±SEM (n=3). abColumns bearing different superscripts are significantly different (P<O.OS)
77
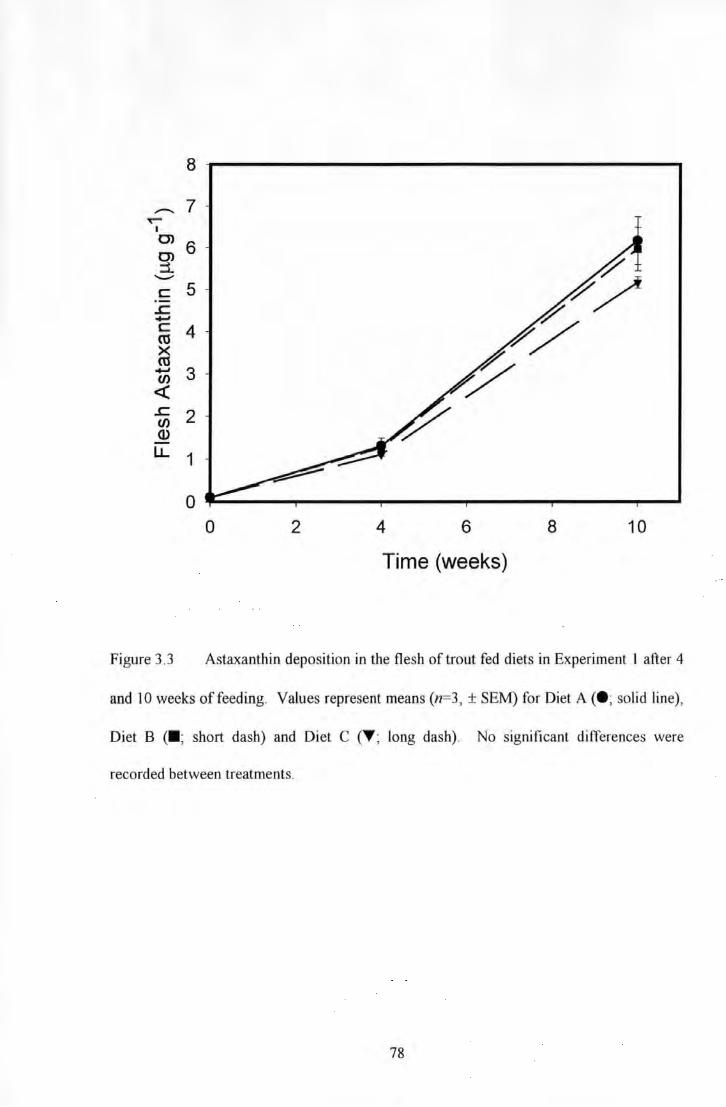
8
-.. 7 ~
I m 6 m ::t ....._... c 5 ~ ...... c 4 CO >< CO ...... 3 en <( .!:: 2 en Q)
u. 1
0 0 2 4 6 8 10
Time (weeks)
Figure 3.3 Astaxanthin deposition in the flesh of trout fed diets in Experiment 1 after 4
and 10 weeks of feeding. Values represent means (n=3 , ± SEM) for Diet A (e ; solid line),
Diet B (11; short dash) and Diet C (Y; long dash). No significant differences were
recorded between treatments.
78
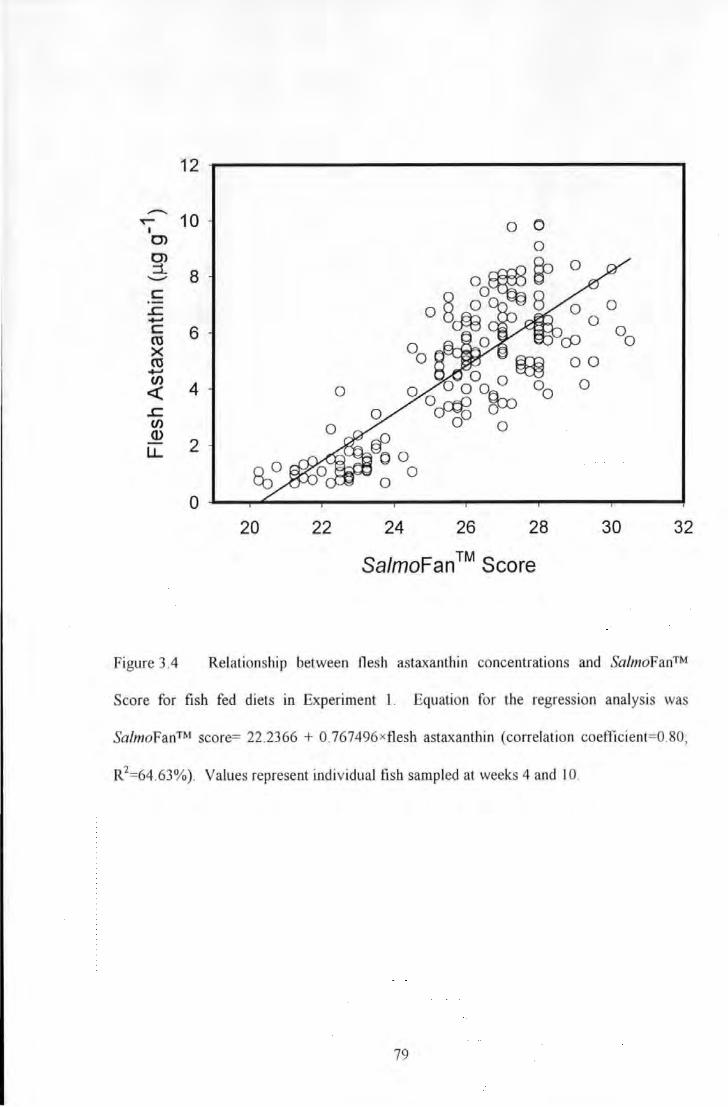
12
-... 10 T""" 0 0 I
0> 0> ::i. 8 ......_., c ·-..c ..... c 6 00 ro 0 ><
0 OQ ro 00 ..... en 4 0 <( 0 o ooo~ oo
..c o~ a en 00 0 Q)
2 u..
0 20 22 24 26 28 30 32
Sa/moF an TM Score
Figure 3.4 Relationship between fl esh astaxanthin concentrations and Sa/moFan™
Score for fish fed diets in Experiment 1. Equation for the regression analysis was
SalmoFanTM score= 22.2366 + 0.767496xflesh astaxanthin (correlation coefficient=0.80;
R2=64.63%). Values represent individual fish sampled at weeks 4 and I 0.
79
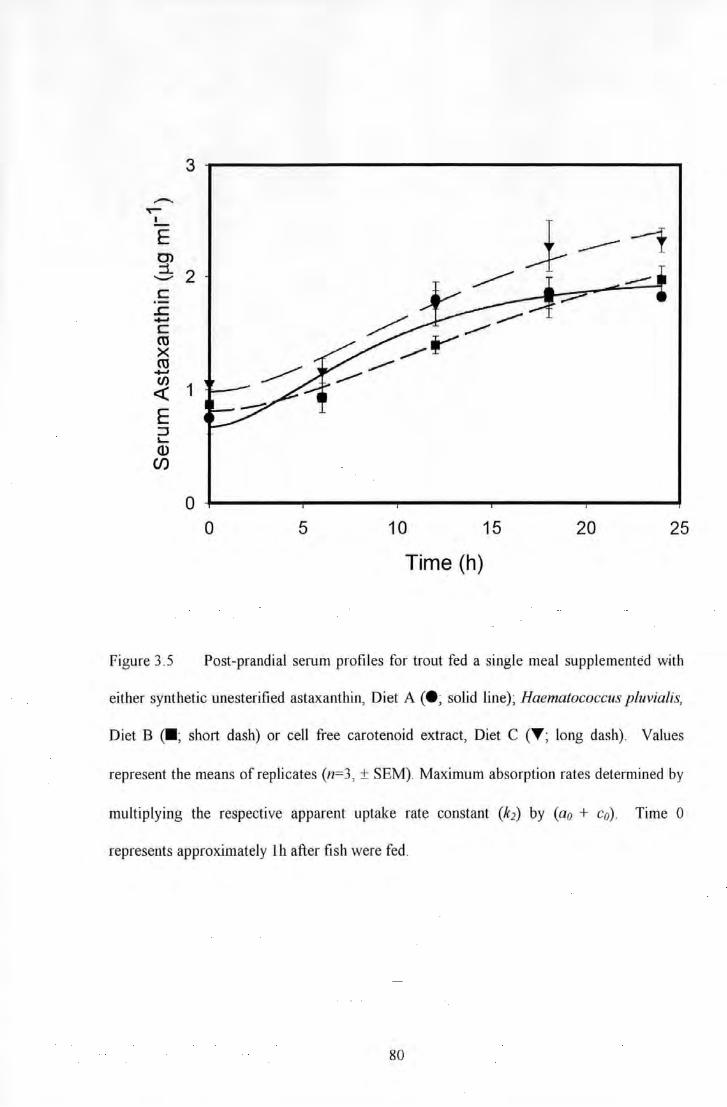
3
...-... ~
I
J------1 E 0> :i 2 _...
~ --c :;:::::;;""' ..c +J c ro >< ro
+J (/)
1 <(
E ::J '-(})
(f)
0 0 5 10 15 20 25
Time (h)
Figure 3.5 Post-prandial serum profiles for trout fed a single meal supplemented with
either synthetic unesterified astaxanthin, Diet A (e; solid line); Haematococcus pluvialis,
Diet B c-; short dash) or cell free carotenoid extract, Diet C (T ; long dash) . Values
represent the means of replicates (n=3, ± SEM). Maximum absorption rates determjned by
multiplying the respective apparent uptake rate constant (k2) by (ao + c0) . Time 0
represents approrimately lh after fish were fed .
80
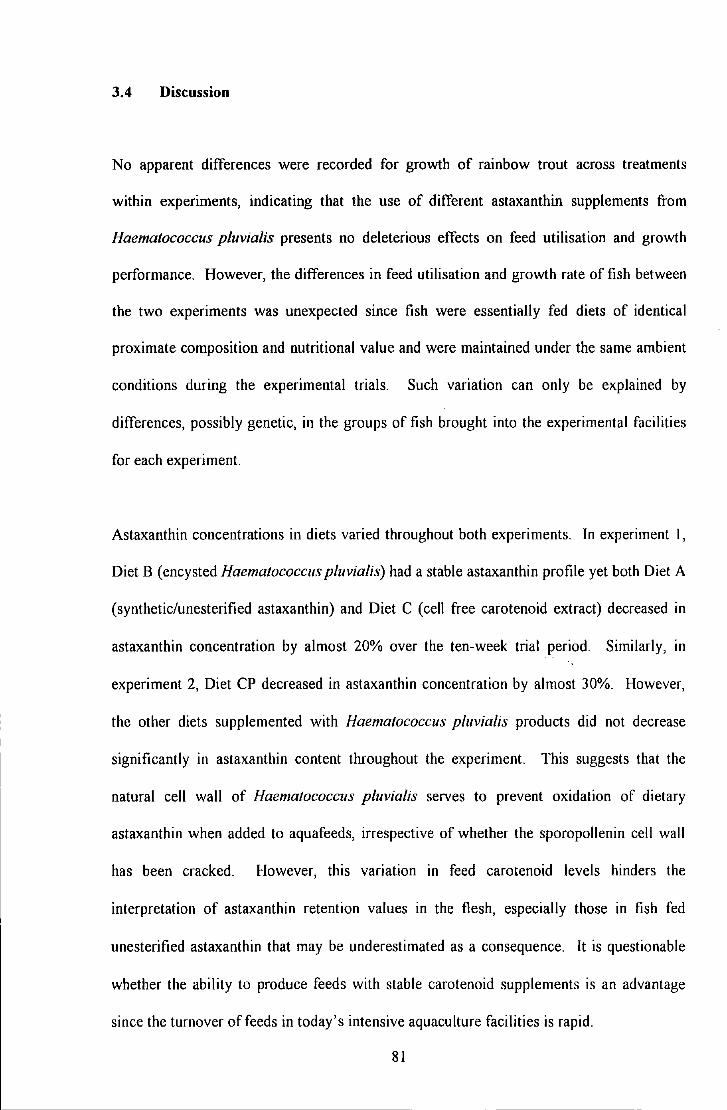
3.4 Discussion
No apparent differences were recorded for growth of rainbow trout across treatments
within experiments, indicating that the use of different astaxanthin supplements from
Haematococcus pluvialis presents no deleterious effects on feed utilisation and growth
performance. However, the differences in feed utilisation and growth rate of fish between
the two experiments was unexpected since fish were essentially fed diets of identical
proximate composition and nutritional value and were maintained under the same ambient
conditions during the experimental trials. Such variation can only be explained by
differences, possibly genetic, in the groups of fish brought into the experimental facilities
for each experiment.
Astaxanthin concentrations in diets varied throughout both experiments. In experiment I,
Diet B (encysted Haematococcus pluvialis) had a stable astaxanthin profile yet both Diet A
(synthetic/unesterified astaxanthin) and Diet C (cell free carotenoid extract) decreased in
astaxanthin concentration by almost 20% over the ten-week trial period Similarly, in
experiment 2, Diet CP decreased in astaxanthin concentration by almost 30%. However,
the other diets supplemented with Haematococcus pluvialis products did not decrease
significantly in astaxanthin content throughout the experiment. This suggests that the
natural cell wall of Haematococcus pluvialis serves to prevent oxidation of dietary
astaxanthin when added to aquafeeds, irrespective of whether the sporopollenin cell wall
has been cracked. However, this variation in feed carotenoid levels hinders the
interpretation of astaxanthin retention values in the flesh, especially those in fish fed
unesterified astaxanthin that may be underestimated as a consequence. lt is questionable
whether the ability to produce feeds with stable carotenoid supplements is an advantage
since the turnover of feeds in today's intensive aquaculture facilities is rapid.
81
The Apparent Digestibility Coefficients (ADC) for astaxanthin in both experiments were in
keeping with previously reported values of between 60-80% (Choubert & Storebakken
1996; Bjerkeng et al. 1997). A lack of significant difference in ADC values between
dietary treatments used in experiment I and experiment 2 suggests that if rupturing of the
cell wall of Haematococcus pluvialis cells is adequate then the intestinal absorption of
astaxanthin is not limited. However, although there were no significant differences in
ADC values in experiment 2, there was a trend for fish fed diets supplemented with
unesterified astaxanthin to have higher ADC values. Similarly, Storebakken et al. (1987)
reported average apparent digestibility values for unesterified astaxanthin in Atlantic
salmon (64%) that were higher than for astaxanthin dipalmitate (47%) although this
difference was not significant. Furthermore, Foss et al. ( 1987) reported higher digestibility
values for unesterified astaxanthin fed to rainbow trout (91-97%) compared to astaxanthin
dipalmitate (42-67%). Variation in results and lack of significant differences may have
been due to factors such as oxidation of pigment in faecal samples, incomplete extraction
of carotenoid and destruction of carotenoids in the intestinal tract.
The significant quantities of astaxanthin remaining in the serum of trout fed on a non
pigmented diet for four days suggests that longer periods of feeding are required to ensure
minimal astaxanthin concentrations. It is not clear whether residual serum astaxanthin
concentrations would have had an effect on uptake rate of astaxanthin into serum.
However, if the concentration gradient between the feed and the serum were an important
factor influencing uptake by passive diffusion (Kiessling et al. 1995), then astaxanthin in
the semm would act to reduce this gradient subsequently reducing the uptake rate.
Nevertheless, observation of the post-prandial astaxanthin serum profiles for the different
trout groups demonstrated that all sources of astaxanthin were absorbed into the blood. In
82
addition, those fish fed synthetic astax:anthin had higher mean serum astax:anthin
absorption rates compared to those fish fed Haematococcus pluvia/is and a cell free extract
from the same alga, although this difference was not significant. This suggests that the
uptake of astax:anthin derived from Haematococcus pluvialis may be rate limited.
However, since the uptake of astax:anthin from the cell free extract was almost identical to
that from the cracked cells, the necessary hydrolysis of astaxanthin esters contained within
this alga may well be the rate-limiting step (Torrissen et al. 1989). However, at 24 hours
after ingestion there was no significant difference in the mean serum astax:anthin
concentrations between fish fed the different astax:anthin sources.
Muscle astax:anthin concentrations at the end of the trial in experiment 2 are in keeping
with values previously reported in other feeding trials of similar duration and feed
carotenoid inclusion level (Sommer et al. 1991; Sommer et al. 1992) although those in
experiment I (5-6J...lg g" 1) were higher. In contrast, Choubert & Heinrich ( 1993) achieved
levels of flesh pigmentation of 6.2mg carotenoid kg-• in rainbow trout fed diets
supplemented with Haematococcus pluvialis, although feed inclusion levels used were
higher (I OOmg kg- 1) than in the current study. The moderate pigmentation levels in
experiment 2 compared to experiment I may be explained in part by the lower ADC values
and the shorter trial duration, although higher values were expected. [n contrast to
previous studies (Sommer et al. 1991; So m mer et al. 1992; Choubert & Heinrich 1993 ), no
significant difference in flesh pigmentation were recorded between fish fed the commercial
synthetic (CAROPHLL ® Pink) and commercial natural (Haematococcus pi.; NatuRose)
sources of astaxanthin. Flesh retention values for astaxanthin showed similar results.
However, pigmentation efficiency for algal cells supplemented into Diet 5000 and Diet
20000 (cracked in a confidential procedure) was significantly lower than the synthetic
source. There were no differences between the contribution of monoesters, diesters and
83
unesterified astaxanthin in the various sources of algal cells. This may suggest inefficiency
in the cracking procedure used on the Haematococcus pluvialis culture supplemented into ·
these two diets, compared to the procedure used to crack the commercial source of algal
cells. However, this does demonstrate the necessity to efficiently crack the sporopollenin
cell wall of Haematococcus pluvialis prior to dietary supplementation in order to achieve
desired levels of flesh pigmentation.
The rate of astaxanthin deposition in the muscle of those fish fed experimental diets in
Experiment I was clearly greater in the second period of the trial (wk 4-1 0) compared to
the first period (wk 0-4). Similarly, the rate of growth for fish was greater in the second
period. Other authors have suggested that salmonids under 150g pigment poorly which is
supported by the current findings (Abdul-Malak et al. 1975; Torrissen 1985; Arai et al.
1987). This suggests that there may be a relationship between the growth or age of fish
and the ability to deposit pigment, maybe due to a physiological constraint in the number
of binding sites within the flesh (Nickell & Bromage 1998b ). However, other authors who
have examined the ~~lationship between muscle fibre density and pigment deposition in
Atlantic salmon have found no relationship (Johnston et al. 2000). Moreover, perhaps
larger fish are able to absorb more pigment from the diet. This potential relationship
between fish size and carotenoid absorption merits further study.
Measurements of carotenoid concentration in the flesh should not be used as criterion of
perceived colour (Little et al. 1979). Comparative measurements of flesh carotenoid
deposition in the whole muscle using a colour fan have been used previously (Little et al.
1979; Skrede et al. 1990; Johnston et al. 2000; Butt le et al. 200 I). Results in the current
experiment suggest a linear relationship between flesh pigment concentration and visual
colour according to the SalmoFan™. The correlation between perceived flesh colour and
84
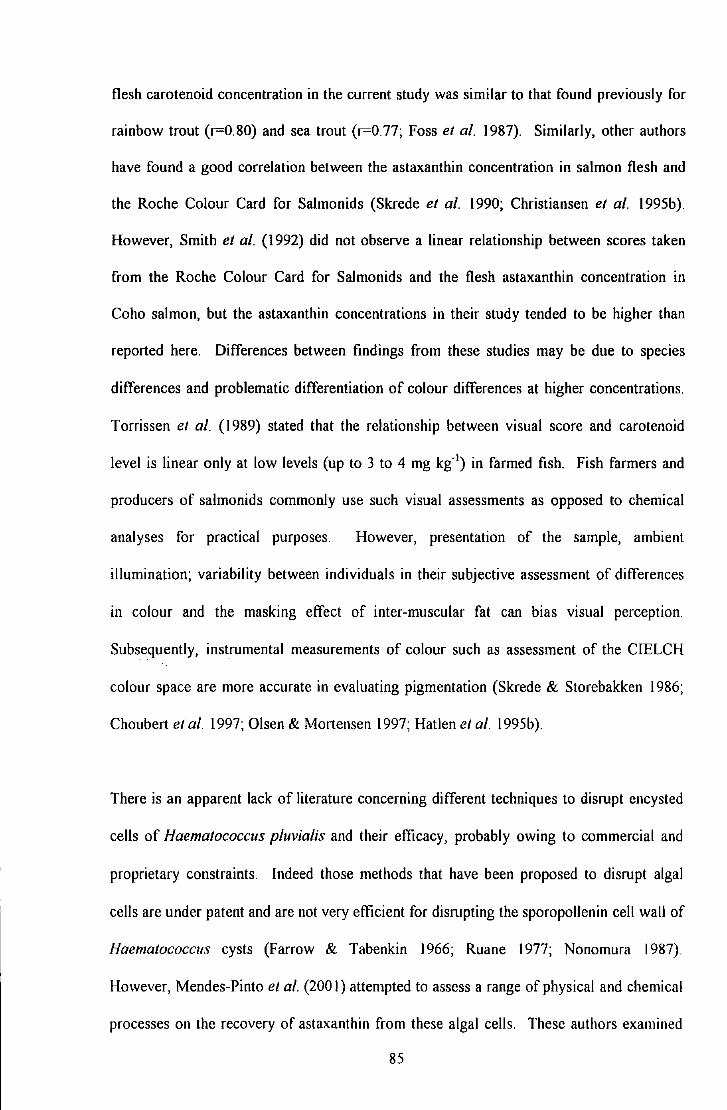
flesh carotenoid concentration in the current study was similar to that found previously for
rainbow trout (r=0.80) and sea trout (r=0.77; Foss et al. 1987). Similarly, other authors
have found a good correlation between the astaxanthin concentration in salmon flesh and
the Roche Colour Card for Salmonids (Skrede et al. 1990; Christiansen et al. 1995b ).
However, Smith et al. (1992) did not observe a linear relationship between scores taken
from the Roche Colour Card for Salmonids and the flesh astaxanthin concentration in
Coho salmon, but the astaxanthin concentrations in their study tended to be higher than
reported here. Differences between findings from these studies may be due to species
differences and problematic differentiation of colour differences at higher concentrations.
Torrissen et al. ( 1989) stated that the relationship between visual score and carotenoid
level is linear only at low levels (up to 3 to 4 mg kg- 1) in farmed fish. Fish farmers and
producers of salmonids commonly use such visual assessments as opposed to chemical
analyses for practical purposes. However, presentation of the sample, ambient
illumination; variability between individuals in their subjective assessment of differences
in colour and the masking effect of inter-muscular fat can bias visual perception.
Subsequently, instrumental measurements of colour such as assessment of the CIELCH
colour space are more accurate in evaluating pigmentation (Skrede & Storebakken 1986;
Choubert et al. 1997; Olsen & Mortensen 1997; Hatlen et al. 1995b).
There is an apparent lack of literature concerning different techniques to disrupt encysted
cells of Haematococcus pluvialis and their efficacy, probably owing to commercial and
proprietary constraints. Indeed those methods that have been proposed to disrupt algal
cells are under patent and are not very efficient for disrupting the sporopollenin cell wall of
Haematococcus cysts (Farrow & Tabenkin 1966; Ruane 1977; Nonomura 1987).
However, Mendes-Pinto et al. (200 I) attempted to assess a range of physical and chemical
processes on the recovery of astaxanthin from these algal cells. These authors examined
85
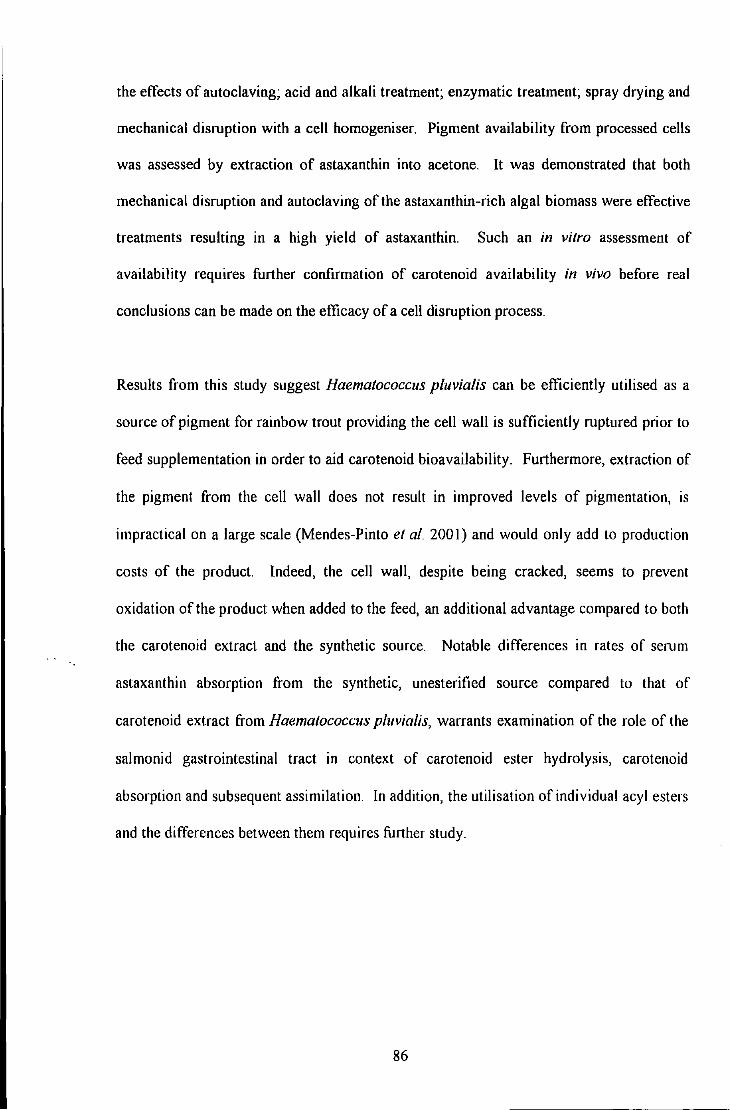
the effects of autoclaving; acid and alkali treatment; enzymatic treatment; spray drying and
mechanical disruption with a cell homogeniser. Pigment availability from processed cells
was assessed by extraction of astaxanthin into acetone. It was demonstrated that both
mechanical disruption and autoclaving of the astaxanthin-rich algal biomass were effective
treatments resulting in a high yield of astaxanthin. Such an in vitro assessment of
availability requires further confirmation of carotenoid availability in vivo before real
conclusions can be made on the efficacy of a cell disruption process.
Results from this study suggest Haematococcus pluvialis can be efficiently utilised as a
source of pigment for rainbow trout providing the cell wall is sufficiently ruptured prior to
feed supplementation in order to aid carotenoid bioavailability. Furthermore, extraction of
the pigment from the cell wall does not result in improved levels of pigmentation, is
impractical on a large scale (Mendes-Pinto et al. 2001) and would only add to production
costs of the product. Indeed, the cell wall, despite being cracked, seems to prevent
oxidation of the product when added to the feed, an additional advantage compared to both
the carotenoid extract and the synthetic source. Notable differences in rates of serum
astaxanthin absorption from the synthetic, unesterified source compared to that of
carotenoid extract from Haematococcus p/uvia/is, warrants examination of the role of the
salmonid gastrointestinal tract in context of carotenoid ester hydrolysis, carotenoid
absorption and subsequent assimilation. In addition, the utilisation of individual acyl esters
and the differences between them requires further study.
86
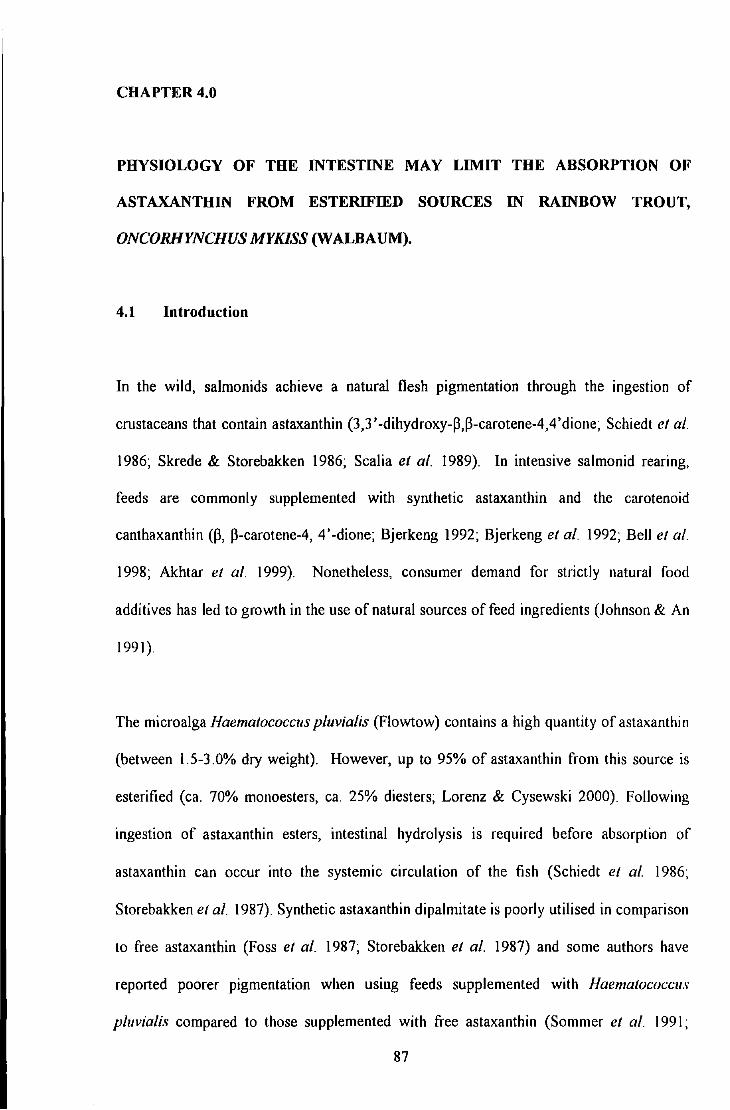
CHAPTER4.0
PHYSIOLOGY OF THE INTESTINE MAY LIMIT THE ABSORPTION OF
ASTAXANTHIN FROM ESTERIFIED SOURCES IN RAINBOW TROUT,
ONCORHYNCHUS MYKISS (WALBAUM).
4.1 Introduction
In the wild, salmonids achieve a natural flesh pigmentation through the ingestion of
crustaceans that contain astaxanthin (3,3'-dihydroxy-~,~-carotene-4,4'dione; Schiedt et al.
1986; Skrede & Storebakken 1986; Scalia et al. 1989). In intensive salmonid rearing,
feeds are commonly supplemented with synthetic astaxanthin and the carotenoid
canthaxanthin (~, ~-carotene-4, 4 '-dione; Bjerkeng 1992; Bjerkeng et al. 1992; Bell et al.
1998; Akhtar et al. 1999). Nonetheless, consumer demand for strictly natural food
additives has led to growth in the use of natural sources of feed ingredients (Johnson & An
1991 ).
The microalga Haematococcus pluvialis (Flowtow) contains a high quantity of astaxanthin
(between 1.5-3.0% dry weight). However, up to 95% of astaxanthin from this source is
esterified (ea. 70% monoesters, ea. 25% diesters; Lorenz & Cysewski 2000). Following
ingestion of astaxanthin esters, intestinal hydrolysis is required before absorption of
astaxanthin can occur into the systemic circulation of the fish (Schiedt et al. 1986;
Storebakken et al. 1987). Synthetic astaxanthin dipalmitate is poorly utilised in comparison
to free astaxanthin (Foss et al. 1987; Storebakken et al. 1987) and some authors have
reported poorer pigmentation when using feeds supplemented with Haematococcus
pluvialis compared to those supplemented with free astaxanthin (Sommer et al. 1991;
87
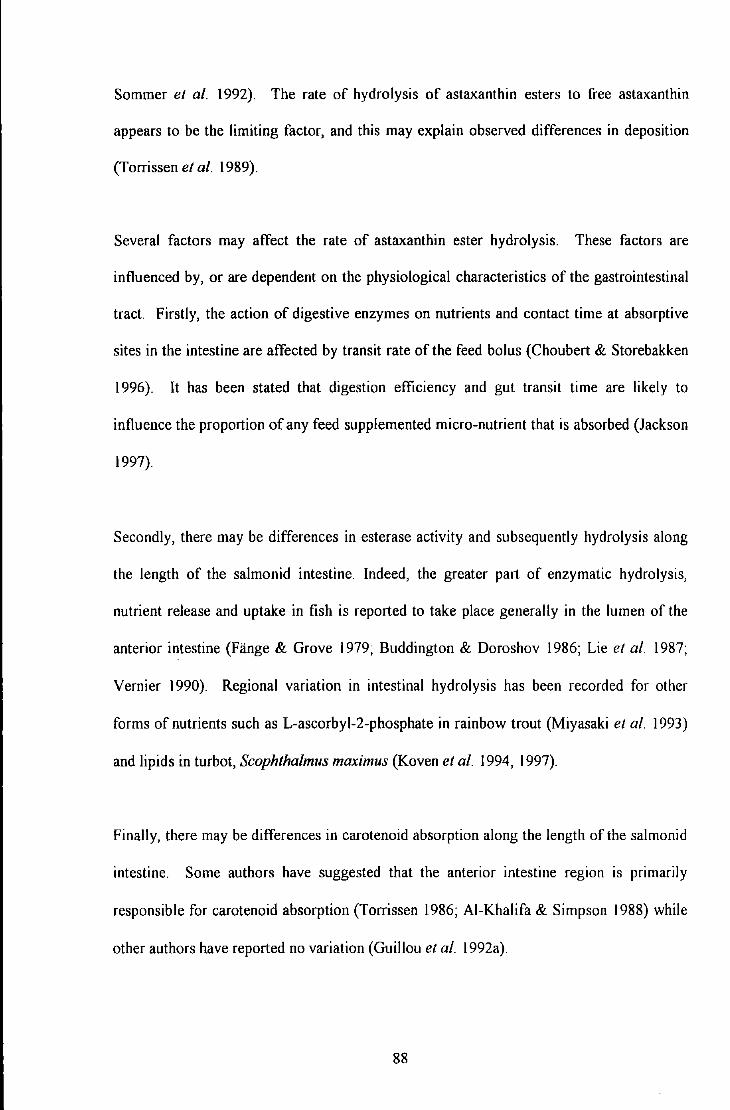
Sommer et al. 1992). The rate of hydrolysis of astaxanthin esters to free astaxanthin
appears to be the limiting factor, and this may explain observed differences in deposition
(Torrissen et al. 1989).
Several factors may affect the rate of astaxanthin ester hydrolysis. These factors are
influenced by, or are dependent on the physiological characteristics of the gastrointestinal
tract Firstly, the action of digestive enzymes on nutrients and contact time at absorptive
sites in the intestine are affected by transit rate of the feed bolus (Choubert & Storebakken
1996). It has been stated that digestion efficiency and gut transit time are likely to
influence the proportion of any feed supplemented micro-nutrient that is absorbed (Jack son
1997).
Secondly, there may be differences in esterase activity and subsequently hydrolysis along
the length of the salmonid intestine. Indeed, the greater part of enzymatic hydrolysis,
nutrient release and uptake in fish is reported to take place generally in the lumen of the
anterior intestine (Fiinge & Grove 1979; Buddington & Doroshov 1986; Lie et a/ 1987;
Vernier 1990). Regional variation in intestinal hydrolysis has been recorded for other
forms of nutrients such as L-ascorbyl-2-phosphate in rainbow trout (Miyasaki et al. 1993)
and lipids in turbot, Scophtha/mus maximus (Koven et a/ 1994, 1997).
Finally, there may be differences in carotenoid absorption along the length of the salmonid
intestine. Some authors have suggested that the anterior intestine region is primarily
responsible for carotenoid absorption (Torrissen 1986; AI-Khalifa & Simpson 1988) while
other authors have reported no variation (Guillou et al. 1992a).
88
The aims of this study were four fold. First, to compare the "steady state" serum
astaxanthin concentrations in rainbow trout, Oncorhynchus mykiss (Walbaum) following
daily feeding with esterified or free astaxanthin to indicate the efficacy of absorption under
standard feeding conditions. Secondly, to quantitatively compare the absorption rates of
astaxanthin in the serum of fish fed a single meal containing each astaxanthin source. It
was envisaged that this would indicate a limitation in absorption as a result of the
requirement for ester hydrolysis. Thirdly, to assess whether there are any differences along
the trout intestine with respect to the hydrolysis of esterified astaxanthin. Finally, to
compare the deposition of astaxanthin from these two sources in the flesh as this is
ultimately the determinant of a product's pigmentation efficacy.
4.2 Materials and Methods
4.2.1 Experimental design
In the following experiment each dietary treatments was assigned to triplicate tanks
containing groups of fish. Subsequently, each tank is considered as a replicate (n=J).
Following sampling and analysis of individual fish tissues, statistical comparison of results
between treatments was based on mean values from each tank (n=3) to avoid pseudo
replication and false interpretation of results (Morris 1999).
4.2.2 Experimental feeds
Experimental diets, prepared at EWOS Technology Centre (Livingston, Scotland, U.K.),
contained either free astaxanthin (Diet FR) added to dry ingredients as water dispersible
beadlets (8% w/v astaxanthin content; CAROPHYLL ® Pink, F Hoffmann-La Roche,
89
Base!, Switzerland), or esterified astaxanthin (Diet EST) added to the feed mixture as a dry
powder form of Haematococcus pluvia/is (NatuRose, Cyanotech Corporation, Kailua
Kona, Hawaii, U.S.A.). Basal dietary ingredients included fishmeal (59%); soya product
(10.5%); wheat (13.5%) and fish oil (17%). Origin of ingredients is proprietary
information. Feeds were analysed in duplicate (at EWOS) for protein by the Kjeldahl
method (EC directive 93/28/EEC), for fat by extraction with petroleum spirit after acid
hydrolysis (EC directive 84/4/EEC) and moisture by oven drying at I 03°C (EC directive
71/393/EEC). Proximate composition of diets was protein (45%); lipid (25%) and dry
matter (93%). Target dietary total carotenoid concentration was 50.6mg kg· 1 and 50.0mg
kg·• for Diet FR and Diet EST, respectively. As a percentage of total astaxanthin in Diet
EST, monoesters (ea. 50%) were predominant compared to diesters (ea. 40%) and
free/unesterified astaxanthin (ea. 10%). This was confirmed by thin layer chromatography
(see section 2.4.7) according to Kobayashi et al. (1991).
4.2.3 Fish and feeding trial
Female rainbow trout (Hatchlands Trout Farm, Devon, U.K.) were held in a re-circulation
system (six 400L glass fibre tanks) maintained at l5°C and exposed to a 12h light/dark
photoperiod (see section 2.2.2). Fish (85 ± 9g) were randomly assigned into groups of 30
per tank.
For determination of the steady state astaxanthin concentrations in the serum of the fish,
test diets were fed in a single morning meal (1.5% BW dai1) for 56 days, with rations
being adjusted assuming a feed conversion ratio (FCR) of 1. 0. Fish in three of the tanks
were fed Diet FR while fish in the other three tanks were fed Diet EST. On the final day
and within I hour of fish being fed, samples of blood (see below); flesh; liver and
90
gastrointestinal tract regions with digesta (Figure 4.1) were taken for astaxanthin analysis
(5 fish per replicate tank).
To determine the time course of serum astaxanthin absorption after a single meal, the
remaining fish were then fed a carotenoid-free diet with the same basal formulation as the
experimental diets at 1.5% BW day" 1 for 14 days in attempt to clear astaxanthin from the
serum. They were then fed a single meal of the respective astaxanthin-supplemented diets
to appetite. Blood samples were taken (3 fish per replicate tank) at eight times up to and
including 72h after the meal (Figure 4.4). The fish were not fed further meals following
this single carotenoid-supplemented meal.
4.2.4 Analysis of feed, digesta, gastrointestinal tract and blood
Carotenoids were extracted from diets (at EWOS Technology Centre, Livingston,
Scotland) essentially according to Schierle & Hardi (1994) In brief, following enzymatic
digestion of the feed (Maxatase P-3000 encapsulated, International Biosynthetics, Rijswik,
Netherlands), carotenoids were extracted with ethanol/dichloromethane (l: l v:v) and
purified on a 4cm glass open-top silica (Silica gel 60) column. Extracts from diets were
analysed spectrophotometrically for total carotenoid content in heptane (Diet FR) or
dimethyl sulfoxide (Diet EST) at 470nrn (El% lcm =1910) or 492nm (E1% lcm =2220),
respectively.
Freeze-dried digesta were pooled on a replicate basis (n=3) and analysed usmg
methodology modified after Weber ( 1988) (see section 2.4.2) Forms of astaxanthin
(monoesters, diesters, and free astaxanthin) were separated by TLC according to
91
------ --- - ------------
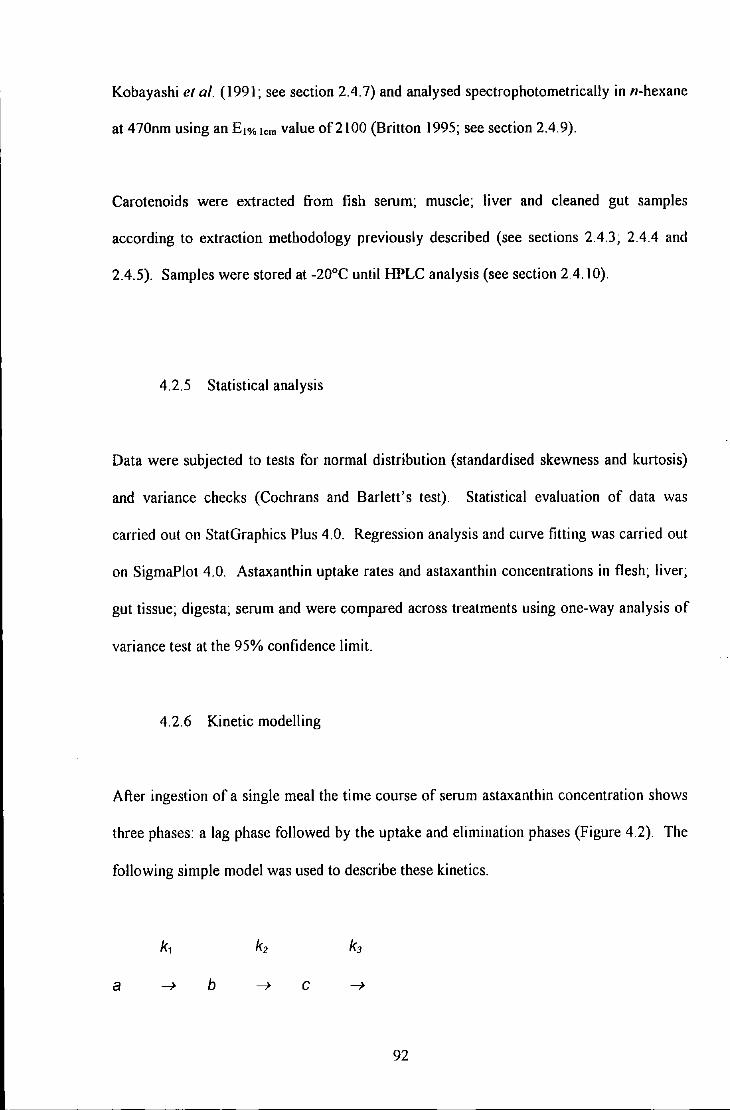
Kobayashi et al. (1991; see section 2.4. 7) and analysed spectrophotometrically in n-hexane
at 470nm using an E 1% tcm value of21 00 (Britton 1995; see section 2.4. 9).
Carotenoids were extracted from fish serum; muscle; liver and cleaned gut samples
according to extraction methodology previously described (see sections 2.4.3; 2.4.4 and
2.4.5). Samples were stored at -20°C until HPLC analysis (see section 2.4.10).
4.2.5 Statistical analysis
Data were subjected to tests for normal distribution (standardised skewness and kurtosis)
and variance checks (Cochrans and Barlett's test). Statistical evaluation of data was
carried out on StatGraphics Plus 4.0. Regression analysis and curve fitting was carried out
on SigmaPlot 4.0. Astaxanthin uptake rates and astaxanthin concentrations in flesh; liver;
gut tissue; digesta; serum and were compared across treatments using one-way analysis of
variance test at the 95% confidence limit.
4.2.6 Kinetic modelling
After ingestion of a single meal the time course of serum astaxanthin concentration shows
three phases: a lag phase followed by the uptake and elimination phases (Figure 4.2). The
following simple model was used to describe these kinetics.
a b c
92
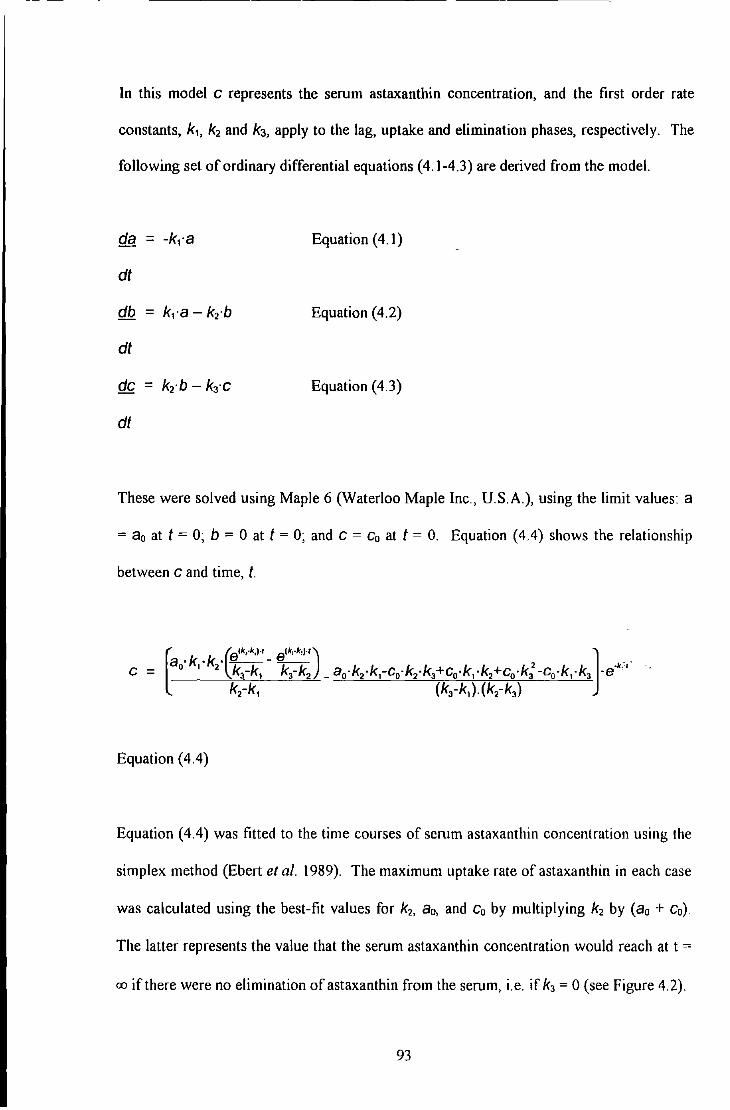
In this model c represents the serum astaxanthin concentration, and the ftrst order rate
constants, k1, k2 and k3, apply to the lag, uptake and elimination phases, respectively. The
following set of ordinary differential equations ( 4.1-4.3) are derived from the model.
da = -kJ"a Equation (4.1)
dt
db = k1·a- k2·b Equation (4.2)
dt
de = k2·b- k3·c Equation (4.3)
dt
These were solved using Maple 6 (Waterloo Maple Inc., U.S.A.), using the limit values: a
= ao at t = 0; b = 0 at t = 0; and c = Co at t = 0. Equation ( 4.4) shows the relationship
between c and time, t.
Equation (4.4)
Equation ( 4.4) was fitted to the time courses of serum astaxanthin concentration using the
simplex method (Ebert et al. 1989). The maximum uptake rate of astaxanthin in each case
was calculated using the best-fit values for k2, 8o, and Co by multiplying k2 by (a0 + Co).
The latter represents the value that the serum astaxanthin concentration would reach at t =
eo if there were no elimination of astaxanthin from the serum, i.e. if kJ = 0 (see Figure 4.2).
93
4.3 Results
There were no significant differences (P>0.05) in growth after 56 days with final weights
of215 ± 3.2g and 219 ± 1.6g (± SEM, n=3) and feed conversion ratios (FCR) of 1.1 ± 0.08
and 1.0 ± 0.03 (± SEM, n=3) for fish fed diets supplemented with free (Diet FR) or
esterified (Diet EST) astaxanthin, respectively.
In both ftsh fed Diet FR or Diet EST the ileal intestine had significantly higher (P<0.05)
mean astaxanthin (unesterified form) concentrations compared to the stomach and
posterior intestine (Table 4.1). No significant differences (P>0.05) were recorded between
fish fed Diet FR or Diet EST for each of the gut sections. HPLC analysis could not
confirm the presence of astaxanthin esters in the gut-tissue samples.
In the digesta of those fish fed Diet EST (Figure 4 3) astaxanthin was detected only in its
free form in the ileal and posterior intestine (post pyloric region). Furthermore, in the ileal
and posterior intestine the digesta contained a higher concentratio1_1 of free astaxanthin (7.1
± 1.9~--tg g- 1 and 5.2 ± 2.9~--tg g- 1, respectively) in comparison to the stomach (2.7 ± 0.6~--tg g·
1; ± SEM, n=3), though the total content of astaxanthin was lower. Astaxanthin forms in
the stomach digesta were representative of the diet with slight increases in monoester (ea.
9%) and corresponding decreases in diester (ea. 7%). Astaxanthin concentrations in the
digesta from the stomach, ileal and posterior intestine were 34.3mg kg- 1, 7.1 mg kg- 1 and
5.2mg kg- 1, respectively, with the most notable reduction in astaxanthin concentration
occurring between the stomach and the ileal intestine.
After 56 days of daily feeding the mean serum astaxanthin concentration of fish fed Diet
FR (2.0 ± 0.3 f.lg mr 1; ± SEM, n=3) was significantly higher to fish fed Diet EST (1.3 ±
94
0.1 ~tg mr1; ± SEM, n=3) at the 90% confidence level (P=0.0582). However, following
ingestion of a single meal the maximum post-prandial serum astaxanthin absorption rates
of rainbow trout (Figure 4.4) were not significantly different (P>O.l) for fish fed Diet FR
(0.8 ± 0.24J.Lg mr1h" 1) or Diet EST (1.02 ± 0.37J.lg mr1h. 1
) (± SEM, n=3). Observation of
regression analysis for post-prandial data shows a peak serum astaxanthin time of ca.l6h
for fish fed either dietary treatment. Comparison of mean serum astaxanthin values at 16h
for those fish fed a single meal of Diet FR (1.7 ± 0.3J.Lg ml" 1) and Diet EST (1.0 ± 0.3J.Lg
ml" 1) revealed no significant differences, P>0.1 (n=3, ± SEM), although mean values were
higher for fish fed Diet FR.
At the end of the trial no significant differences (P>O.OS) were observed in the mean flesh
astaxanthin concentrations (Table 4.2) between trout fed Diet FR (2.1 ± O.SJ.Lg g" 1) or Diet
EST (1.7 ± 0.4J.Lg g" 1). Similarly, no significant differences were recorded between final
mean liver astaxanthin concentrations between trout fed Diet FR (0.5 ± O.OSJ.Lg g"1) or Diet
EST (0.4 ± 0.02J.Lg g· 1; n=3, ±SEM). Flesh concentrations of astaxanthin were notably
higher than astaxanthin concentrations recorded in· the·liver.
95
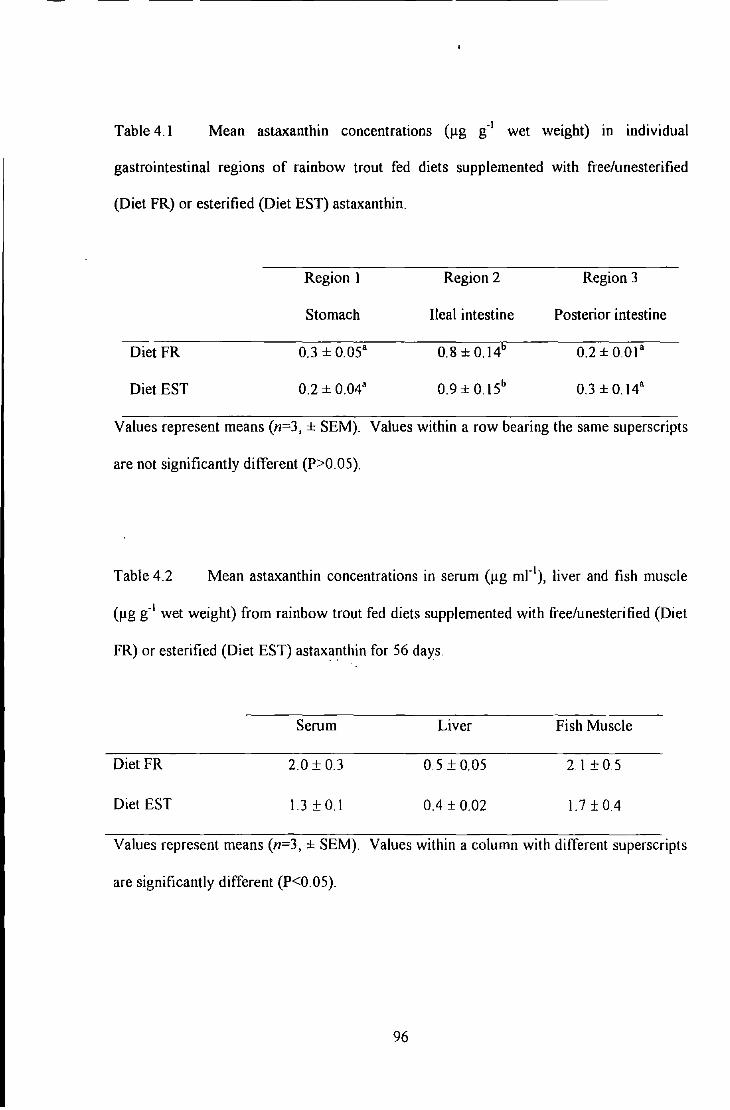
Table 4.1 Mean astaxanthin concentrations (Jlg g-1 wet weight) in individual
gastrointestinal regions of rainbow trout fed diets supplemented with free/unesterified
(Diet FR) or esterified (Diet EST) astaxanthin.
DietFR
Diet EST
Region I
Stomach
o.3 ± o.os•
0.2 ± 0.043
Region 2
Ileal intestine
b 0.8±0.14
0.9 ± O.ISb
Region 3
Posterior intestine
0.2±001"
0.3 ± 0.14"
Values represent means (n=3, ± SEM). Values within a row bearing the same superscripts
are not significantly different (P>O.OS).
Table 4.2 Mean astaxanthin concentrations in serum (Jlg mr\ liver and fish muscle
(Jlg g-1 wet weight) from rainbow trout fed diets supplemented with free/unesterified (Diet
FR) or esterified (Diet EST) astaxanthin for 56 days.
Diet FR
Diet EST
Serum
2.0 ± 0.3
1.3 ± 0.1
Liver
0.5 ± 0.05
0.4 ± 0.02
Fish Muscle
2.1 ±05
1.7 ± 0.4
Values represent means (n=3, ± SEM). Values within a column with different superscripts
are significantly different (P<O.OS).
96
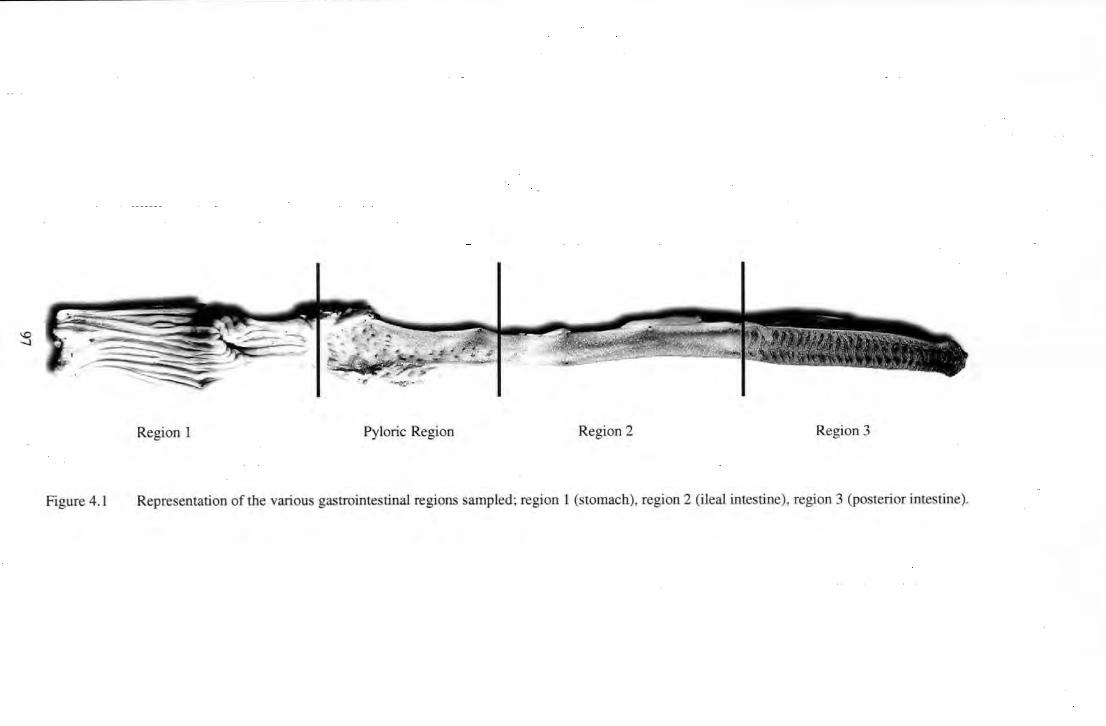
Region 1 Pyloric Region Region 2 Region 3
Figure 4.1 Representation of the various gastrointestinal regions sampled; region 1 (stomach), region 2 (ileal intestine), region 3 (posterior intestine).
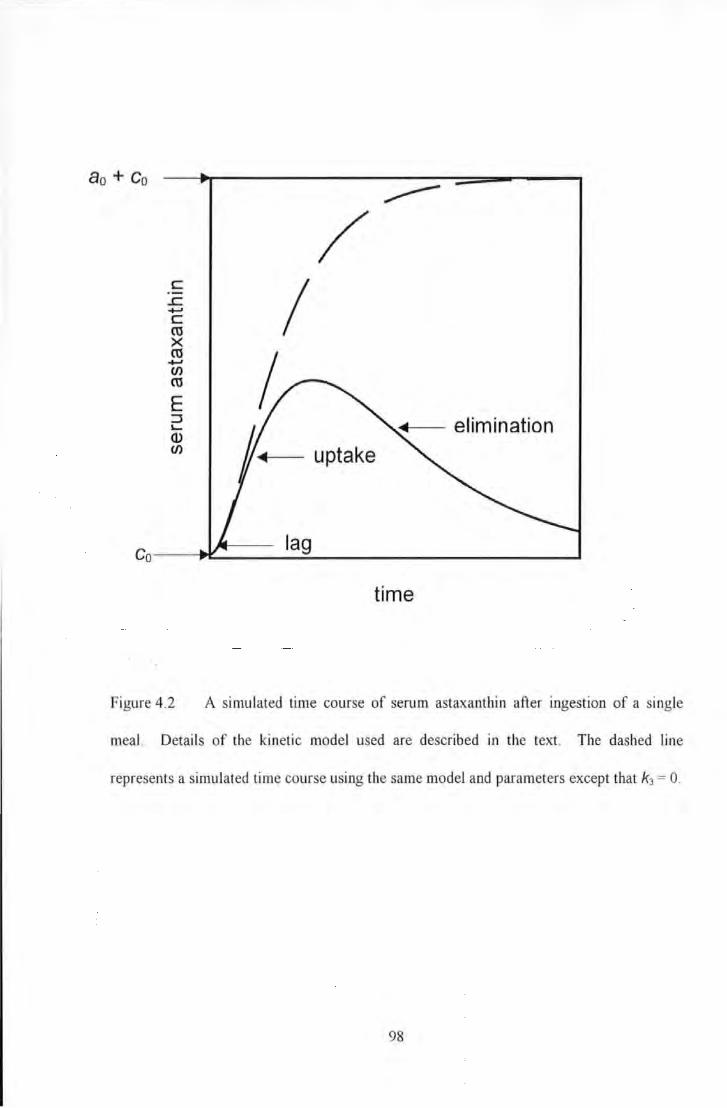
8 o +Go
c ..c ....... c ro X ro ....... en ro E :::J I...
Q) en
Figure 4.2
uptake
time
A simulated time course of serum astaxanthin after ingestion of a single
meaL Details of the kinetic model used are described in the text. The dashed line
represents a simulated time course using the same model and parameters except that k3 = 0.
98
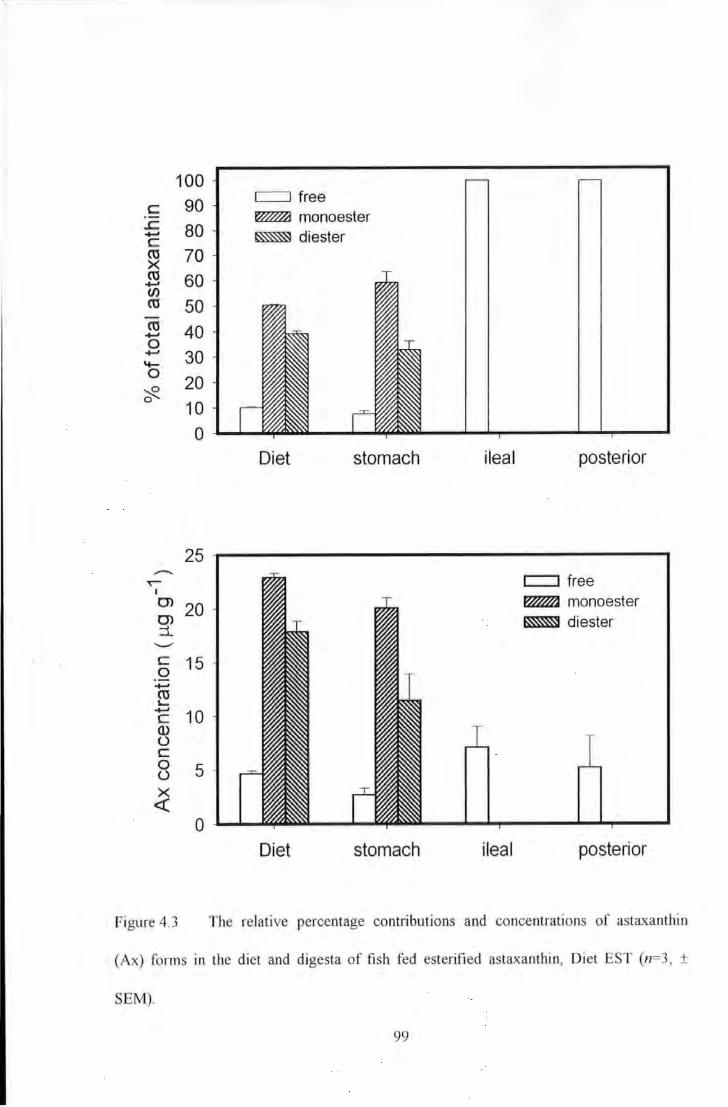
c ..c ...... c ro >< ro ...... (J) ro ro ...... 0 ......
'+-0
~ 0
100 90
80 70
60
50 40 30 20 10
C=:J free ~monoester
~diester
0 ~--~~~--~~~~--_._.~----~~----~
Diet stomach ileal posterior
25 ~----------------------------------~ ----~ I
Ol 20 Ol :::t
c 15 0 ...... ro 1....
c 10 Q) 0 c 0 0 5
0
Figure 4.3
Diet stomach ileal
c:=J free ~monoester
~diester
posterior
The relative percentage contributions and concentrations of astaxanthin
(Ax) forms in the diet and digesta of fi sh fed esterified astaxanthin, Diet EST (n=J, ±
SEM).
99
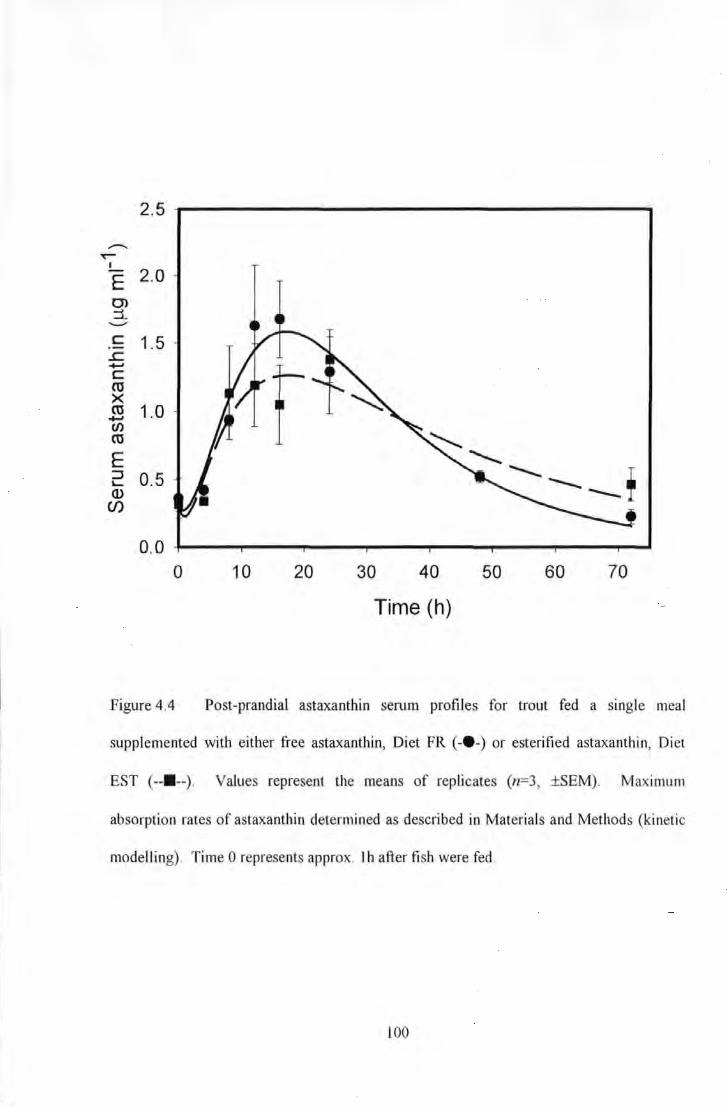
2.5
--. T"""
I
E 2.0 0> :::1. ....._.., c 1.5
.s:::. ....., c ro X ro 1.0 ....., (f) ro E :J 0.5 ,._ Q)
(f)
0.0 0 10 20 30 40 50 60 70
Time (h)
Figure 4.4 Post-prandial astaxanthin serum profiles for trout fed a single meal
supplemented with either free astaxanthin, Diet FR (-e -) or esterified astaxanthin, Diet
EST (--• --). Values represent the means of replicates (n=3, ±SEM). Maximum
absorption rates of astaxanthin determined as described in Materials and Methods (kinetic
modelling). Time 0 represents approx. 1 h after fi sh were fed.
lOO
4.4 Discussion
A number of natural sources of astaxanthin, including crustacean wastes and microalgae
e.g. Haematococcus pluvialis, contain predominantly esterified astaxanthin. This is often a
complex mixture of monoesters and diesters, with unesterified astaxanthin representing a
small percentage of the total carotenoid. Astaxanthin is deposited in a free, unesterified
form in the white muscle of salmonids, but re-esterification takes place (with fatty acids
endogenous to the fish) on deposition in the skin (Schiedt et al. 1985). Consequently,
hydrolysis of these esters within the salmonid gastrointestinal tract prior to absorption may
be an important factor limiting uptake and subsequent deposition of natural astaxanthin
esters (Choubert & Heinrich 1993).
Blood astaxanthin concentration tn the current study displayed expected high inter
individual variation (Guillou et al. 1992a; Gobantes et al. 1997). Attempts to normalise
serum astaxanthin concentrations (following ingestion of a single meal), according to the
amount of astaxanthin fed to each respective tank, resulted in no significant reduction in
standard errors of mean values. This may be due to insufficient data concerning individual
food consumption However, other authors have found weak correlation's with gut
contents and blood astaxanthin concentrations (r=O. 71) in Atlantic salmon (Kiessling et al.
1995). This may suggest that the amount of feed consumed is only partly responsible for
the absorption of astaxanthin. Several approaches could be used and adapted to measure
individual feed consumption by fish. Sequential feeding with different coloured foods has
been used with relative success to define food intake in individual trout (Johnston et al.
1994). Other authors have used more refined means by including radioactive isotopes
within salmonid feeds (Storebakken et al. 1981; Storebakken & Austreng 1988a,b)
I 0 I

The mean steady state serum astaxanthin concentrations recorded after 56 days of feeding
fish in the current trial suggest the absorption of astaxanthin was not as efficient when fed
as a mixture of esters compared to the free form at the 90% confidence level. This
suggests that intestinal hydrolysis of astaxanthin esters probably was limiting under the
regular feeding conditions used in this study. These findings are contrary to those of
Barbosa et al. (1999) who found no significant difference in serum astaxanthin
concentrations between rainbow trout fed for 5 days on diets supplemented with either
Haematococcus pluvialis or synthetic astaxanthin. However, Barbosa et al. (1999) used
higher feed carotenoid concentrations (IOOmg kg-1) than those in the current study (SOmg
kg- 1) which may explain why blood astaxanthin concentrations recorded by those authors
(ea. 5-9J.Ig mr1) were higher than reported here. This, combined with the shorter feeding
period used by these authors, may account for the discrepancy between these authors
findings and our own. Findings in the current study are in keeping with those of other
groups who have demonstrated that synthetic astaxanthin dipalmitate is poorly utilised in
comparison to free, unesterified astaxanthin in salmonids (Foss et al. 1987; Storebakken et
al. 1987). However, since these groups made no direct assessment of absorption of
astaxanthin into serum, direct comparisons with the current study are difficult
Furthermore, the effective utilisation of dietary astaxanthin monoesters and diesters for the
pigmentation of rainbow trout has been demonstrated (Bowen et al. 2001 ).
Kinetics of astaxanthin and canthaxanthin absorption in the serum of immature rainbow
trout fed individual doses of carotenoid has been previously studied (Gobantes et al. 1997).
However, no groups to date have studied the uptake kinetics of astaxanthin derived from
Haematococcus pluvialis. It is important that such kinetics are defined for this source
102
smce the rate of ester hydrolysis, and subsequently the rate at which astaxanthin is
absorbed into the blood, is believed to be the limiting factor in the use of esterified sources
of astaxanthin (Torrissen et al. 1989). The methodology used in this investigation to
observe post-prandial blood astaxanthin concentrations is very similar to that previously
described by Mori et al. ( 1989) who sub sampled fish at timed intervals from a group of
Coho salmon (Oncorhynchus kisutch) fed a pigmented diet to satiation following a period
of starvation. In the current study, analysis of post-prandial serum astaxanthin
concentrations after ingestion of a single meal suggests that the absorption rates of
astaxanthin are similar when supplied as free or esterified astaxanthin, in a single meal.
Similar findings have been noted for Coho salmon (Oncorhynchus kisutch) fed free
astaxanthin and an astaxanthin diester derived from krill (Mori et al. 1989). Results would
suggest that the rate of absorption of astaxanthin into the blood was not limited by the
requirement for hydrolysis when supplied as dietary esters in a single dose. However,
serum peak astaxanthin concentrations (16h) were again higher in fish fed unesterified
astaxanthin compared to those fish fed esterified astaxanthin. A lack of significant
difference in uptake rates may have been due to variability in the data, caused by small
sample sizes and satiation feeding. Certainly, the standard errors on values would support
this. Further uptake rate assessments of this nature should subsequently address these
factors.
Although the pyloric caeca were not examined for astaxanthin concentration because of
difficulties associated with removing feed particulates (Brett & Higgs 1970) our results
support the contention that the anterior/ileal intestine is largely responsible for carotenoid
absorption (Choubert el al. 1987; AI-Khalifa & Simpson 1988; Torrissen et al. 1990).
Indeed, the histological structure of the mid-intestine examined in the current investigation
103
is identical to that of the pyloric caeca but different to that of the posterior intestine (Bergot
et al. 1975). This has lead to the reasoning that pyloric caeca are structures which increase
the intestinal surface area for absorption (Buddington & Diamond 1987). Austreng (1978)
demonstrated that a large proportion of protein and fat absorption took place in the anterior
half of the small intestine, including the caeca. Since carotenoid absorption is thought to
be intrinsically associated with fat absorption (Parker 1996; Furr & Clark 1997), and
positive effects of dietary fat supplementation have been recorded on carotenoid
digestibility (Torrissen et al. 1990; Choubert et al. 1991; Gouveia et al. 1998), it is not
surprising that carotenoids are absorbed in the anterior intestine. However, in vivo studies
that have examined the influence of pyloric caeca have found little relationship between
the number and length of these structures and the digestibility of fat and protein (Ulla &
Gjerdrem 1985) or the digestibility of canthaxanthin (Choubert et al. 1991 ).
Non detectable levels of astaxanthin monoesters and diesters in digesta taken from the ileal
and posterior intestine suggest that the hydrolysis of esters prior to absorption also takes
place in the pyloric region of the gastrointestinal tract. Other authors have investigated site
dependency of esterase activity in animal and human gastrointestinal tract. For example,
Augustijns et al. (1998) examined the distribution of esterase activity along the
gastrointestinal tract of rat and pig by using homogenates of scraped intestinal mucosa
from various parts of small intestine and colon using p-nitrophenyl acetate as a substrate.
Not only did these authors find important interspecies differences with rat intestine
possessing much higher activity than pig intestine, but also both species demonstrated a
gradual decrease of esterase activity along the gut. Rigtrup & Ong ( 1992) demonstrated a
retinyl ester hydrolase activity intrinsic to the brush-border membrane of rat small intestine
as well as an esterase apparently originating from the pancreas. The esterase originating
104
from the pancreas preferentially hydrolysed short-chain retinyl esters and was stimulated
by trihydroxy bile salts. These properties were similar to that of cholesterol ester
hydrolase, known to bind to the brush border of the intestine. The second esterase,
intrinsic to the brush border, preferentially hydrolysed long-chain retinyl esters and was
stimulated by both trihydroxy and dihydroxy bile salts. Furthermore, Mathias et al. (1981)
demonstrated that the majority of tocopheryl esters are hydrolysed in the intestinal lumen
(pancreatic esterase) but some tocopheryl ester is hydrolysed within the enterocyte by a
mucosal esterase associated with the endoplasmic reticulum. Non-specific esterases have
been found along the intestinal brush border membrane and within the cytoplasm of
enterocytes in Nile tilapia, Oreochromis niloticus (Tengjaroenkul et al. 2000). In vitro
studies are required to determine if those esterases responsible for the hydrolysis of
astaxanthin esters are specific and whether they originate from the pancreas of the fish or
are intrinsic to intestinal cells.
Barrowman (1984), who reviewed the hydrolysis of fat-soluble vitamin esters, stated that
there was no evidence for specific vitamin ester bydrolases in pancreatic juice. Rather that
the activity against these esters resides in enzymes of broader specificity such as non
specific lipase and possibly pancreatic lipase. In agreement with this, Harrison ( 1993),
based on evidence from reviewed literature, stated that there were no purified enzymes that
have been demonstrated to be "specific" for long chain retinyl esters or even to hydrolyse
these at a faster rate than other esters. Furthermore, the author went on to state that there
are at least three enzymes that are potentially involved in the hydrolysis of dietary retinyl
esters: pancreatic lipase, pancreatic carboxyl ester lipase and one or more retinyl ester
hydrolases associated with the brush border membrane. Each may play a role according to
their ability to interact with retinyl esters in different physio-chemical forms in which the
105
vitamin may exist in the intestine (emulsions, mixed micelles, liquid-crystalline vesicles).
Since the absorption of fat-soluble vitamins and carotenoids is likely similar owing to their
hydrophobic nature, it is reasonable to assume that carotenoid esters are hydrolysed in the
same manner. Although, the current study suggests that the majority of carotenoid-ester
hydrolysis takes place in the pyloric region of the trout intestine, the capacity of the hind
intestine for esterase activity cannot be ruled out.
Regional differences in astaxanthin ester hydrolysis along the length of the trout intestine
may result in an influence of gut transit rate on the absorption of astaxanthin from an
esterified source. Frequent feeding may increase the gastrointestinal transit rate of the feed
bolus limiting efficient digestion and absorption of nutrients, as has been suggested for dry
matter, protein, lipid and energy (Staples & Nomura 1976; Pedersen 1987; Cho & Kaushik
1990). These findings may account for the disparity in the current study between steady
state astaxanthin concentrations after regular feeding and rate of astaxanthin absorption
after ingestion of a single meal, when supplied as esterified or unesterified astaxanthin.
Furthermore, such effects may account in part for discrepancies between studies on the
utilisation of esterified astaxanthin. For example, in those studies by Storebakken et al.
( 1987) and Foss et al. (1987) which recorded poor utilisation of astaxanthin diester, fish
were fed every 20min for 18h and 24h (to excess) per day, respectively. In comparison,
Bowen et al. (2001) fed a restricted ration (1.3-1.8% BW day"1) and found no differences
in the utilisation of esterified forms of astaxanthin. Although Choubert & Storebakken
( 1996) found that feeding rate did not affect the digestibility of astaxanthin and
canthaxanthin, further research is required on the effects of feeding rate on absorption of
esterified carotenoids. Indeed, viable feeding strategies or feed ingredients that extend the
106
gastrointestinal residence time of feed may enhance the absorption of feed supplemented
esterified astaxanthin.
The final flesh astaxanthin concentrations recorded in the current study were lower than
expected considering the length of the feed trial and the feed astaxanthin concentrations.
In another study, rainbow trout fed diets supplemented with Haematococcus pluvialis
contained final muscle astaxanthin concentrations of 6.2mg kg" 1 after just four weeks of
feeding (Choubert & Heinrich 1993). However, the carotenoid inclusion levels were
higher in that study (1 OOmg kg-1) as was the initial starting weight of fish ( 140g). Starting
weight of fish in the current investigation (ea 85g) may have resulted in initial poor
deposition of pigment since other authors have stated that fish below I 00-ISOg pigment
poorly (Abdul-Malak et al. 1975; Torrissen 1985a). However, final flesh astaxanthin
concentrations in the current study are similar to those reported by Sommer et al. (1992)
following 50 days of feeding with a 60ppm diet (ea l-2J.lg g" 1) and Storebakken &
Choubert ( 1991) who fed rainbow trout diets supplemented with SOppm astaxanthin for
eight weeks.
After 56 days of feeding there was no significant difference in final muscle or liver
astaxanthin concentrations between fish fed diets supplemented with free or esterified
astaxanthin. However, there was a trend for the mean flesh and liver astaxanthin
concentration of those ftsh fed Diet FR to be higher than those of fish fed Diet EST
(similar to the "steady state" blood astaxanthin concentrations). These findings are similar
to those ofBowen et al. (2001) who demonstrated that the isolated Haematococcus mono
and diesters of astaxanthin were as equally well utilised as the synthetic unesterified
astaxanthin in terms of deposition into the white muscle in rainbow trout. Similarly a 'cell-
107
free' total carotenoid extract from Haematococcus was effective in pigmenting rainbow
trout. However, these results contradict the fmdings of Schiedt & Leuenberger ( 1981) and
Schiedt et al. (1985) who reported that synthetic astaxanthin dipalmitate was largely
ineffective in pigmenting salmonids when compared to the unesterified form of the
carotenoid. Furthermore, Choubert & Heinrich (1993) reported very low carotenoid
retention rates (l.5%) for rainbow trout fed with Haematococcus and suggested that
cleavage of the astaxanthin esters may be a limiting step for the deposition of astaxanthin.
Sommer et al. (1991, 1992) also reported a lower efficiency for astaxanthin from cells of
Haematococcus compared to synthetic astaxanthin. In the current study astaxanthin from
both diets was equally utilised, suggesting that esterification per se is not a major factor in
limiting the use of Haematococcus pluvialis as a pigment source. However, it is not clear
whether the difference in mean flesh astaxanthin concentration between fish fed the two
treatments in the current study would have been significant had the trial continued for
longer. The poor deposition of astaxanthin in the liver compared to the flesh in fish fed the
experimental diets suggests that the liver is not a major storage organ for astaxanthin, or,
that the liver metabolises astaxanthin rapidly (Hardy et al. 1990). The presence of
metabolites could not be determined in the current study.
Although the encysted wall of Haematococcus pluvialis used in this study was ruptured
(95% of cells cracked in a proprietary milling process) it may have posed some further
limitation to astaxanthin absorption. Future investigations should be conducted using diets
supplemented with astaxanthin fractions isolated from the encysted algal cells.
Furthermore, astaxanthin from the esterified source used in the current investigation
(Haematococcus pluvialis) was a mixture of mono- and diesters (predominantly mono
esterified). This raises questions concerning the extent of esteriftcation and its effects on
108
·,,.
astaxanthin• absorption arid utilisa:tioitiiri :s-alilloiiids; $t!parate: assessiTi(:jnt_ of111onoester and
c!ies!t!"' fr_actions l!lld ;the' development ofpara:Jieli in vitr:o digestion/hydrolysis: studies will
enhance understanding ,Of caroteiioid-es@ !hydrgiY~ts me<;ll<i!liSm$ 11nd ma~ prove: useful I - -
for prgduct:development and application.
1'09
I '·
CHAPTER 5.0
EXTENT OF ESTERIFICATION AND ITS INFLUENCE ON THE UTILISATION
OF (3S,3'S)-ASTAXANTHIN IN RAINBOW TROUT, ONCORHYNCHUS MYKISS
(WALBAUM).
5.1 Introduction
Accumulation of astaxanthin in Haematococcus pluvia/is is associated with the formation
of aplanospores or cysts (induced by nitrogen limitation, high temperature or light
intensity) where it develops a tough sporopollenin cell wall (Good & Chapman 1979;
Burczyk 1987; Grung et al. 1992). Salmonids appear to lack the digestive enzymes
necessary to break down the Haematococcus sporopollenin wall and intact astaxanthin-rich
aplanospores of Haematococcus do not pigment the white muscle of salmonids (Sommer et
al. 1991; Bowen et al pers. comm.). However, previous work (see Chapter 4) has shown
that efficient cracking of this cell wall renders pigment available for deposition in the flesh
of rainbow trout. Furthermore, this deposition is comparable to that of the synthetic,
unesterified source of astaxanthin (CAROPHYLL Pink; F. Hoffmann La Roche, Basel,
Switzerland) which is commonly used within the aquafeed industry.
Another important factor that distinguishes algal astaxanthin from the synthetic form is the
configuration of the carotenoid. ln this algae, astaxanthin predominantly occurs (>99%) as
the (3S,3' S) form (Renstrom et al. 1981) whilst the synthetic, unesterified, product is a
racemic mixture of the (3R, 3 'R), (3S, 3 '5) and the me so form (3R, 3 'S) in the ratio 11:2
(Bernhard 1990). Foss et al. (1987) demonstrated that all three epimers of unesterified
110
astaxanthin are equally utilised by salmonids, suggesting that rainbow trout would not
discriminate against the algal source of carotenoid according to its enantiomet
composition. However, other feed trials with salmonids have shown discrimination against
dipalmitate ester forms of (3S,3 'S)-astaxanthin with the (3R,3 'R) form deposited in the
flesh to a greater extent (Schiedt et al. 1985; Foss et al. 1987) suggesting that all optical
ester forms of astaxanthin are not utilised equally.
A further characteristic of astaxanthin from Haematococcus is that a very high proportion
(typically >95%) of the astaxanthin exists as a complex mixture of esters, primarily
monoesters rather than diesters (Renstmm & Liaaen-Jensen 1981; Grung et al. 1992;
Hacker et al. 1996b; Lorenz & Cysewski 2000). The carotenoid composition of the
Haematococcus aplanospore is in part dependent upon the age of the culture so that the
ratio of astaxanthin monoesters: diesters decreases with time (Harker et al. l996b ). The
main fatty acid components of the astaxanthin esters from this alga are C1&:J and C2o: 1
(Renstmm & Liaaen-Jensen 1981; Bowen & Young pers. comm.), which are major
components of plant cell membranes.
Esterification of astaxanthin may be an important factor limiting flesh deposition
(Choubert & Heinrich 1993). Indeed the rate of hydrolysis of astaxanthin esters to free
astaxanthin appears to be limited which may explain observed differences in deposition
(Torrissen et al. 1989). It has been shown that synthetic astaxanthin dipalmitate is poorly
utilised in comparison to free astaxanthin in trout and sea trout, and in addition
canthaxanthin in salmon (Foss et al. 1987; Storebakken et a/ 1987). This is contrary to
earlier observations where natural astaxanthin esters have been shown to be more effective
in the pigmentation of rainbow trout compared to the free form of astaxanthin (Simpson &
I 11
Kamata 1979). Furthermore, a study by Mori et al. (1989) demonstrated that there was
practically no difference between an astaxanthin diester from krill and synthesised free
astaxanthin in their absorption and deposition by Coho salmon. Indeed, results from
previous investigations (see Chapter 3 and 4) would agree with the latter examples since
Haematococcus pluvialis products (which contain predominantly esterified astaxanthin)
have been shown to be efficient sources of pigment compared to the synthetic/unesterifted
form. However, some digestibility and rate absorption assessments (into serum) for
astaxanthin from the same studies have suggested that the absorption of esterified
aslaxanthin may well be limited, although not to a significant extent. Furthermore, it is
difficult to interpret the significance of this limitation when astaxanthin esters are supplied
in algal spores where the influence of the cracked cell wall cannot de differentiated from
the limitation presented by the requirement for ester hydrolysis.
Interpretation of the absorption efficiency of astaxanthin esters is confounded when they
are supplied within a complex mixture of carotenoids. Haematococcus pluvialis
commonly contains other carotenoids such as lutein; echionene; canthaxanthin and P
carotene in addition to the various ester forms of astaxanthin (Grung et al. 1992). Bias in
absorption due to interaction between carotenoids at the intestinal level cannot be ruled out
(White et al. 1994; Giirtner et al. 1996; Kostic et al. 1995; Hageman et al. 1999).
Furthermore, it is not clear whether the extent of esterification limits the availability and
deposition of astaxanthin. It is plausible to assume that the hydrolysis of an astaxanthin
monoester to its free form may well be faster relative to the hydrolysis of an astaxanthin
diester. Such differences and their implications have not been assessed previously in in
vivo situations.
112
The following investigation was designed to evaluate whether the extent of esterification
limits the digestibility and absorption of astaxanthin. In addition, to determine whether
(3S,3 'S)-astaxanthin esters from Haematococcus pluvialis are utilised as efficiently as a
racemic astaxanthin mixture. Finally to assess whether the extent of esterification
influences utilisation in comparison to an unesterified synthetic form in pigmenting
rainbow trout.
5.2 Materials and Methods
5.2.1 Experimental design
In the following experiment each dietary treatment was assigned to triplicate tanks
containing groups of fish. Subsequently, each tank is considered as a replicate (n=3).
Following sampling and analysis of individual fish tissues, statistical comparison of results
between treatments was based on mean values from each tank (n=3) to avoid pseudo
replication and false interpretation of results (Morris 1999).
5.2.2 Experimental Diets
The basal feeds containing no added carotenoid and formulated to meet the nutritional
requirements of rainbow trout and were supplied by Trouw Aquaculture Ltd. (Wincham,
UK) Dietary treatments had identical proximate basal composition (Table 5.1) and target
levels of 30ppm astaxanthin. Diet FR contained free astaxanthin (8% w/v dispersible
beadlets; CAROPHYLL ® Pink, F. Hoffman-La Roche); Diet MONO and Diet Dl
contained astaxanthin monoesters and astaxanthin diesters (isolated from Haematococcus
I I 3
pluvialis), respectively. Diet HAEM was supplemented with a cell free carotenoid extract.
Table 5.2 outlines the astaxanthin composition of the experimental diets. Carotenoid
extraction from algal cells and astaxanthin ester isolation was performed as previously
described (see sections 2.1.1 and 2.4.7). Astaxanthin fractions were added to the basal
diets in a top coating procedure (see section 2.1.2) where the fat content of the diet was
increased to a commercially acceptable level of26%.
5.2.3 Fish feeding and sampling
Rainbow trout (I 41 ± 0.6g) were randomly assigned into individual tanks ( 40 fish per tank)
maintained at l5°C under a 12h light/dark photoperiod. Diets were fed in a single morning
ration (1.3-1.8% BW dai 1) to triplicate groups/tanks of fish for 8 weeks, with alterations
to feed quantity made daily assuming a feed conversion ratio (FCR) of 1.0. Faeces were
then stripped from fish (see section 2.2.4) and analysed for astaxanthin (see sections 2.4.2
and 2.4.9) to determine apparent digestibility coefficients (ADC) as described previously
(see sections 2.5.1). In addition, flesh and skin samples were taken from fish (5 fish per
tank; 15 fish per treatment) and analysed for carotenoid by HPLC (see sections 2.4.4; 2.4.6
and 2.4.10); optical isomer content (see below) and evaluation of carotenoid retention (see
section 2.5.2).
Following faecal stripping, fish were fed a carotenoid free diet (same basal formulation as
experimental diets) for 14 days to reduce the level of carotenoid in the serum of fish to a
minimum. Fish were then fed a single ration ( 1.3% BW) of the respective carotenoid
supplemented diet. Blood samples were taken from fish ( 5 fish per tank; 15 fish per
treatment) at six time intervals up to and including 72h for carotenoid analyses.
114
5.2.4 Analysis of astaxanthin chiral forms
Analysis of the various chiral forms of astaxanthin in feeds, fish muscle and skin samples
was performed at Liverpool John Moores University. Analysis was achieved by
derivatization of unesterified (see below) carotenoid to produce their dicarnphanates.
Astaxanthin was dissolved in dry pyridine (0.5rnl) and reacted with 50mg of (-)
camphanoyl chloride (Sigma, Poole, UK) for 1 Ornin at room temperature (ea. 20°C). The
resulting dicamphanates were extracted by partition into diethyl ether.
Analysis of dicamphanates was performed on normal-phase HPLC (Lichrosorb SI60; 250
x 4.6mm; particle size 5J.1m; detection wavelength 49lnm). The solvent system used was
n-hexane/ethyl acetate (75/25 v/v) at a flow rate of 0.5ml min- 1. Retention times for
isomers were; (3R,3'R) 18.5min; (3R,3'S) "meso" 19.8min; (3S,3'S) 21.3min.
As astaxanthin is predominantly esterified in the skin of rainbow trout, anaerobic
saponification was performed on these samples prior to optical isomer analysis. The
method used was based on that originally developed by Schiedt et al. ( 1993). Typically
1 0-IOOJ.Ig of carotenoid esters was dissolved in dichloromethane (maximum 3ml) and
mixed. Sodium methoxide (lml; prepared by dissolving 1.5g of sodium in lOOml of
methanol) per ml of astaxanthin solution was added to a side arm flask and the entire
system flushed with nitrogen to remove all traces of oxygen. The sodium methoxide and
astaxanthin solutions were frozen with liquid nitrogen and placed under vacuum. The
solutions were then thawed at room temperature (ea. 20°C) in order to de-gas them. This
freeze-thaw cycle was repeated at least three times. The sodium methoxide solution was
115
then mixed with the astaxanthin solution under high vacuum and constant stirring for
15min. The mixture was then acidified with 1 ml of 1 N H2S04 ml" 1 of sodium methoxide,
removed and diluted with ethanol and water. Astaxanthin was then extracted with hexane:
diethyl ether (I: I v/v), washed with water and dried under a gentle stream of nitrogen.
5.2.5 Statistical analysis
Data were subjected to tests for normal distribution (standardised skewness and kurtosis)
and variance checks (Cochrans and Barlett's test) before comparison. Net apparent
retention (NAR) of astaxanthin was calculated according to Torrissen (1995) incorporating
a flesh to body weight ratio of 0.61 (Wathne et al. 1998). Statistical analysis and
regression/curve fitting of data was carried on StatGraphics Plus 4.0 and SigmaPiot 4.0,
respectively. Flesh astaxanthin concentrations, NAR and apparent digestibility coefficients
(ADC) were compared across treatments using the analysis of variance at the 95%
confidence limit.
5.2.6 Kinetic modelling
Kinetic determination of serum astaxanthin uptake rates for fish fed the various dietary
treatments was carried out as previously described (see Chapter 4, section 4.2.5).
5.3 Results
No significant differences (P>0.05) were recorded between the mean initial and final
weights of rainbow trout used in this study across dietary treatments (Table 5.3). Fish
116
weight increased by ea. 150g throughout the trial with final fish weights representative of
typical pan-size fish (ea. 250g). Similarly, no significant differences were noted for the
mean feed conversion ratios (FCR) across treatments.
The apparent digestibility coefficients (ADC) for the respective treatments (Figure 5.1)
were Diet FR 65.73 ± 1.33%; Diet MONO 60.51 ± 2.80%; Diet DI 62.63 ± 0.74% and Diet
HAEM 59.69 ± 2.22% (n=3, ±SEM). No significant differences (P>0.05) were recorded
between the ADC values across treatments although there was a trend for higher ADC
values in fish fed diet supplemented with free astaxanthin (Diet FR). However, there was
no obvious difference in ADC values between the other treatments.
Following ingestion of a single ration (Figure 5.2) there were no significant differences
(P>O 05) in the serum-astaxanthin absorption rates between fish fed Diet CP (0.3 5 ±
O.lOJ.Ig mr 1h- 1); Diet MONO (0.24 ± 0.09J.1g mr 1h- 1
); Diet DI (0.19 ± 0.02J.1g mr 1h- 1) or
Diet HAEM (0.23 ± 0.11 J.lg m1" 1h-1). However, the rate of absorption was clearly higher in
fish fed free astaxanthin. Furthermore, there was a trend for fish fed monoesterified
astaxanthin to have higher absorption rates than those fish fed diesterified astaxanthin.
The serum peak times for astaxanthin were similar for all treatment (24-32h). However, at
24h and 32h mean serum astaxanthin concentrations (minus values at time 0) were
significantly higher (P=O.OOI and P=O.Ol8, respectively) in fish fed Diet FR (166 ±
0.05J.Ig mr 1 and 1.61 ± 0.06J.1g mr 1, respectively) and Diet MONO ( 1.43 ± 0.20J.1g mr 1 and
154 ± O.IOJ.ig mr 1, respectively) compared to fish fed Diet 01 (0.92 ± 0.07J.1g mr 1 and
0.99 ± 0.07J.1g mr 1, respectively) and Diet HAEM (0.65 ± 0.09J.1g mr 1 and 113 ± 0.20J.1g
mr 1, respectively)(n=3, ±SEM)
117
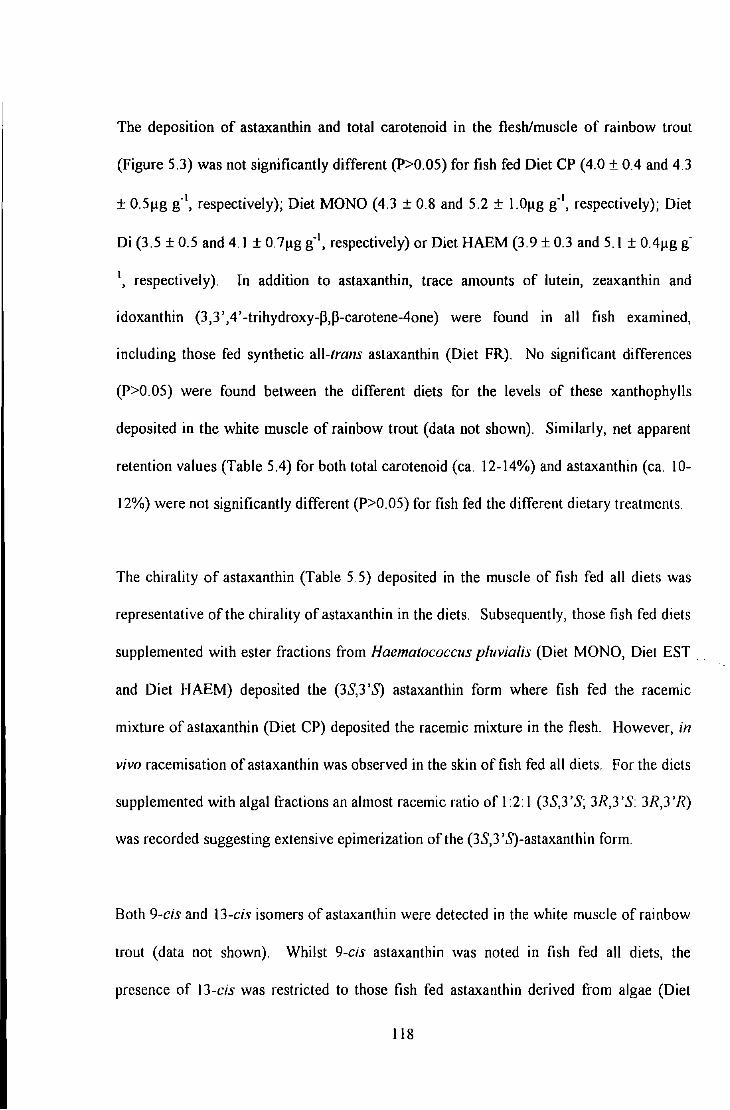
The deposition of astaxanthin and total carotenoid in the flesh/muscle of rainbow trout
(Figure 5.3) was not significantly different {P>0.05) for fish fed Diet CP (4.0 ± 0.4 and 4.3
± 0.5f.lg g·\ respectively); Diet MONO (4.3 ± 0.8 and 5.2 ± l.Of.lg g·1, respectively); Diet
Di (3.5 ± 0.5 and 4.1 ± 0.7f.lg g"1, respectively) or Diet HAEM (3.9 ± 0.3 and 5.1 ± 0.4f.lg g·
1, respectively). In addition to astaxanthin, trace amounts of lutein, zeaxanthin and
idoxanthin (3,3 ',4' -trihydroxy-~,~-carotene-4one) were found in all fish examined,
including those fed synthetic all-trans astaxanthin (Diet FR). No significant differences
(P>0.05) were found between the different diets for the levels of these xanthophylls
deposited in the white muscle of rainbow trout (data not shown). Similarly, net apparent
retention values (Table 5.4) for both total carotenoid (ea. 12-14%) and astaxanthin (ea. 10-
12%) were not significantly different (P>0.05) for fish fed the different dietary treatments.
The chirality of astaxanthin (Table 5.5) deposited in the muscle of fish fed all diets was
representative of the chirality of astaxanthin in the diets. Subsequently, those fish fed diets
supplemented with ester fractions from Haematococcus pluvialis (Diet MONO, Diet EST ..
and Diet HAEM) deposited the (3S,3 'S) astaxanthin form where fish fed the racemic
mixture of astaxanthin (Diet CP) deposited the racemic mixture in the flesh. However, in
vivo racemisation of astaxanthin was observed in the skin of fish fed all diets. For the diets
supplemented with algal fractions an almost racemic ratio of I :2: I (3S,3 'S; 3R,3 'S: 3R,3 'R)
was recorded suggesting extensive epimerization of the (3S,3 'S)-astaxanthin form.
Both 9-cis and 13-cis isomers of astaxanthin were detected in the white muscle of rainbow
trout (data not shown). Whilst 9-cis astaxanthin was noted in fish fed all diets, the
presence of 13-cis was restricted to those fish fed astaxanthin derived from algae (Diet
118
.tMONQ; 1f!>ie1 m andi DieLHAEM). Levei~ ofrthese isomersrwas' small I and,orilt accounted
f_qr.Jess 'thanA%. qf;thl! tota:t .carotenoid .recorded 'in_ ~he muscle ~( t<}inbowArout ,J3oih .of
these isoriters were foundi natunilly;in;all.diets,ifollowing carotenoidtextraction.
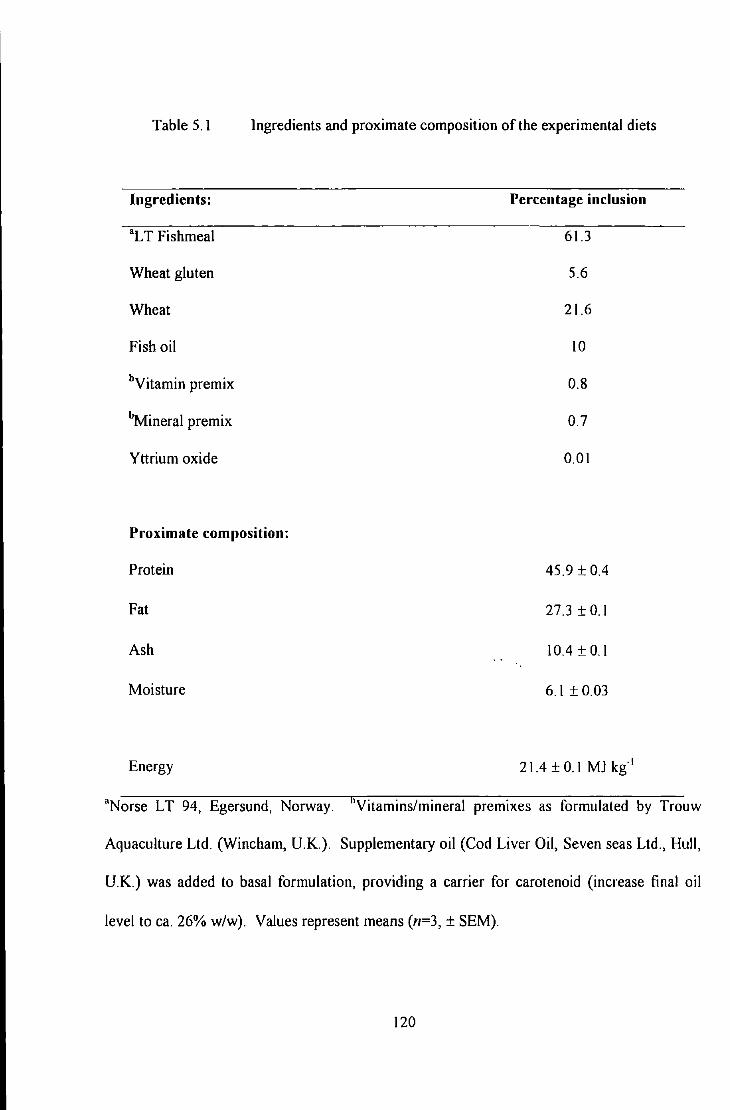
Table 5.1 Ingredients and proximate composition of the experimental diets
Ingredients: Percentage inclusion
•L T Fishmeal 61.3
Wheat gluten 5.6
Wheat 21.6
Fish oil 10
bVitamin premix 0.8
"Mineral premix 0.7
Yttrium oxide 0.01
Proximate composition:
Protein 45.9 ± 0.4
Fat 27.3 ± 0.1
Ash I 0.4 ± 0.1
Moisture 6.1 ± 0.03
Energy 21.4 ± 0.1 MJ kg- 1
•Norse LT 94, Egersund, Norway. Vitamins/mineral premixes as formulated by Trouw
Aquaculture Ltd. (Wincham, U.K). Supplementary oil (Cod Liver Oil, Seven seas Ltd., Hull,
U.K.) was added to basal formulation, providing a carrier for carotenoid (increase final oil
level to ea. 26% w/w). Values represent means (n=3, ± SEM).
120
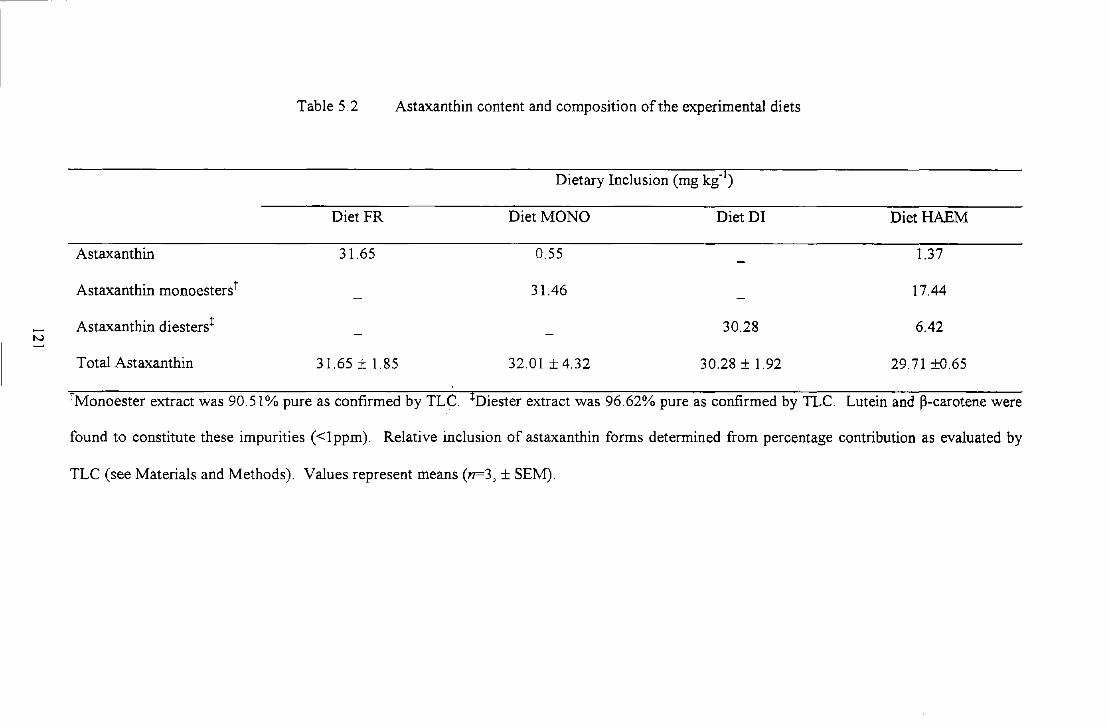
N
Table 5.2 Astaxanthin content and composition of the experimental diets
Dietary Inclusion (mg kg- )
Diet FR Diet MONO Diet DI
Astaxanthin 31.65 0.55
Astaxanthin monoesterst 31.46
Astaxanthin diesters! 30.28
Total Astaxanthin 31.65 ± 1.85 32.01 ± 4.32 30.28 ± 1.92
Diet HAEM
1.37
17.44
6.42
29.71 ±0.65
tMonoester extract was 90.51% pure as confirmed by TLC. tDiester extract was 96.62% pure as confirmed by TLC. Lutein and ~-carotene were
found to constitute these impurities (<I ppm). Relative inclusion of astaxanthin forms determined from percentage contribution as evaluated by
TLC (see Materials and Methods). Values represent means (n=3, ± SEM).
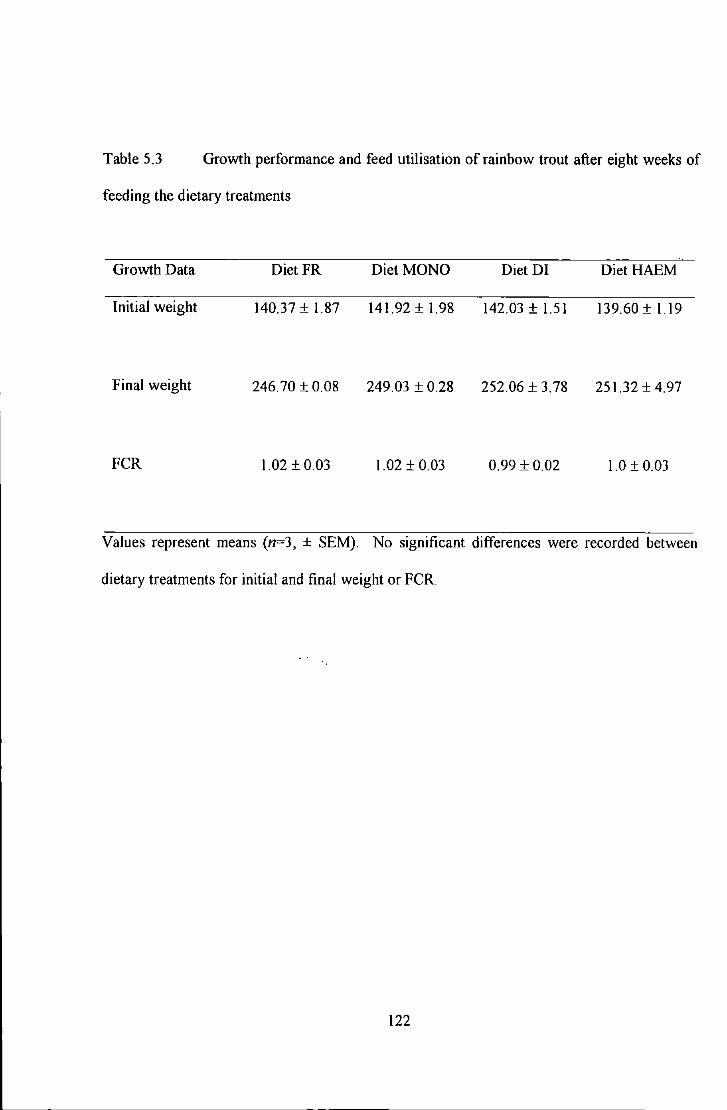
Table 5.3 Growth performance and feed utilisation of rainbow trout after eight weeks of
feeding the dietary treatments
Growth Data Diet FR Diet MONO Diet DI Diet HAEM
Initial weight 140.37 ± 1.87 141.92 ± 1.98 142.03 ± l.SI 139.60 ± l.l9
Final weight 246.70 ± 0.08 249.03 ± 0.28 252.06 ± 3.78 251.32 ± 4.97
FCR 1.02 ± 0.03 1.02 ± 0.03 0.99 ± 0.02 1.0 ± 0.03
Values represent means (n=3, ± SEM). No significant differences were recorded between
dietary treatments for initial and final weight or FCR.
122
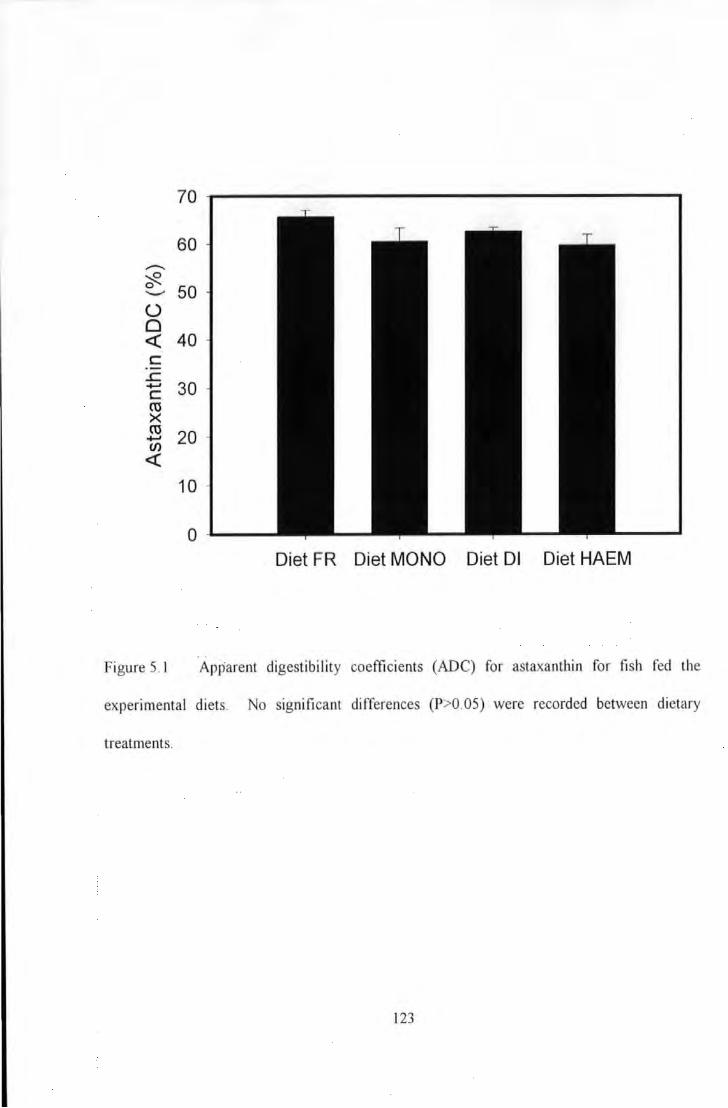
70
60 ...-... :::R 0
50 ..._.,
0 0 <( 40 c
..c ....., 30 c ro X ro 20 ....., Cl) <(
10
0 Diet FR Diet MONO Diet Dl Diet HAEM
.. Figure 5.1 Apparent digestibility coeffi cients (ADC) for astaxanthin for fish fed the
experimental diets. No significant differences (P>O.OS) were recorded between dietary
treatments.
123
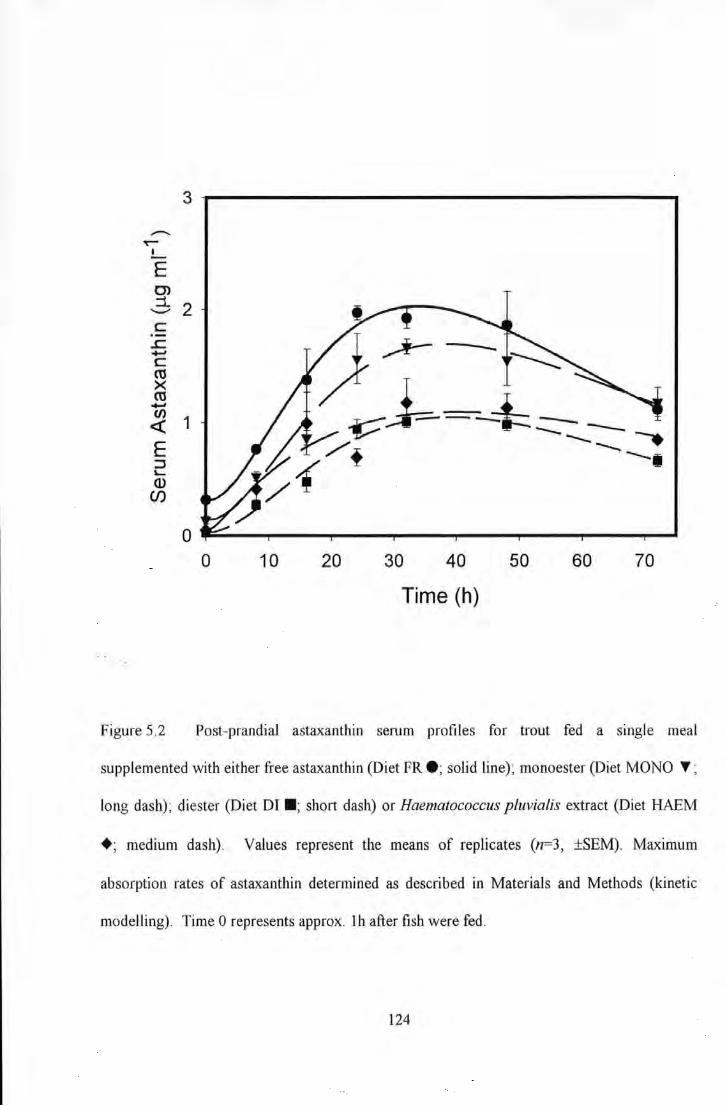
3
--T""" I
E 0> =l 2 .._ c ·-..c ......, c ro X ro ......, (/)
1 <(
E :::J L.. Q)
(/')
0 0 10 20 30 40 50 60 70
Time (h)
Figure 5.2 Post-prandial astaxanthin serum profiles for trout fed a single meal
supplemented with either free astaxanthin (Diet FR e; solid line); monoester (Diet MONO T ;
long dash) ; diester (Diet DI • ; short dash) or Haematococcus pluvialis extract (Diet HAEM
+; medium dash) . Values represent the means of replicates (n=3 , ±SEM). Maximum
absorption rates of astaxanthin determined as described in Materials and Methods (kinetic
modelling). Time 0 represents approx. l h after fish were fed.
124
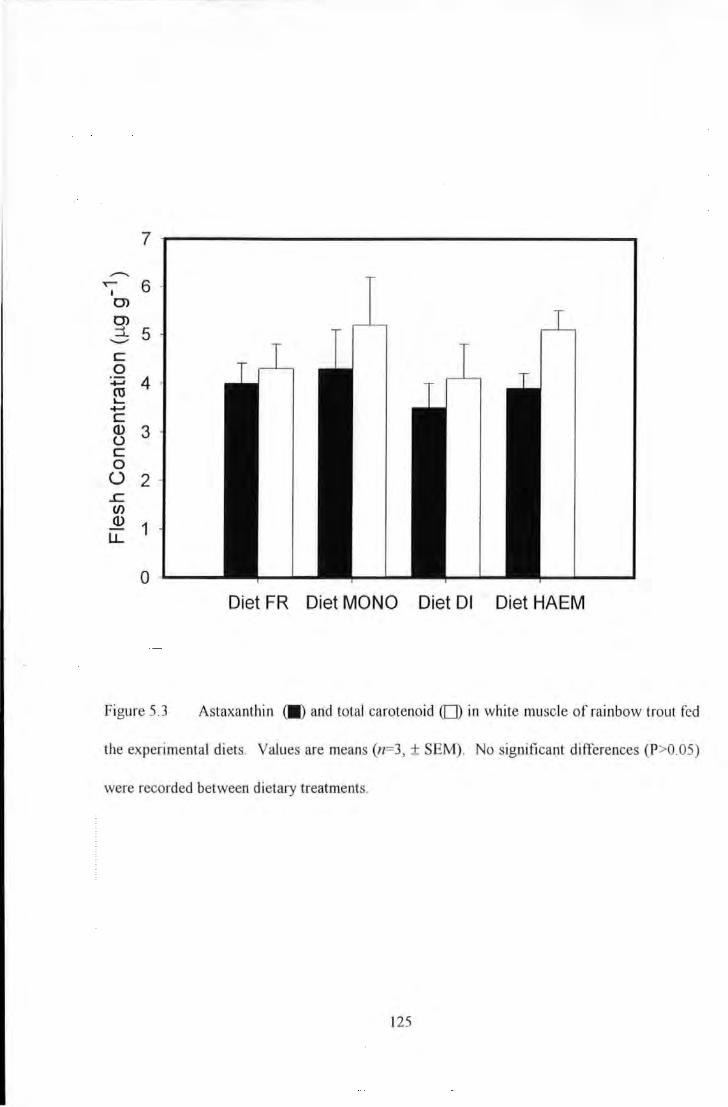
7
...--... T""" 6 I
0> 0> :::L 5 _...
c 0
-f.J 4 rn ..._ -f.J
c Q) 3 (.) c 0 () 2 ..c (/) Q)
1 LL
0
Diet FR Diet MONO Diet Dl Diet HAEM
Figure 5.3 Astaxanthin (11) and total carotenoid (D) in white muscle of rainbow trout fed
the experimental diets. Values are means (n=3, ± SEM). No significant differences (P>0.05)
were recorded between dietary treatments.
125
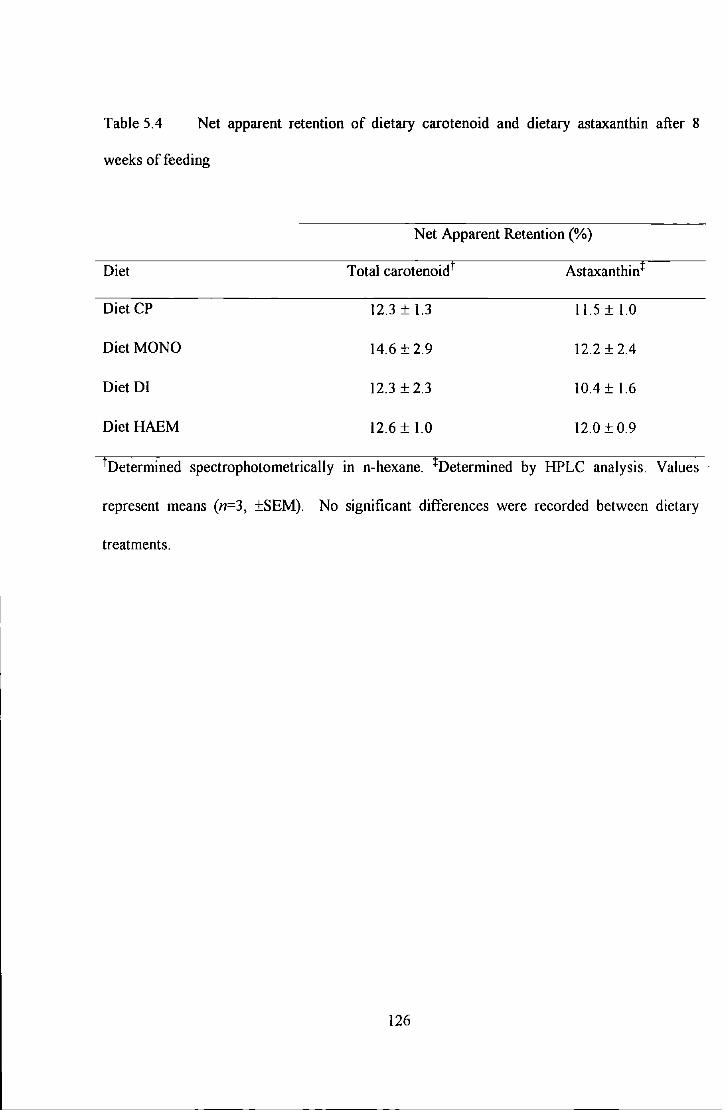
Table 5.4 Net apparent retention of dietary carotenoid and dietary astaxanthin after 8
weeks of feeding
Diet
Diet CP
Diet MONO
Diet Dl
Diet HAEM
Net Apparent Retention(%)
Total carotenoidt
12.3 ± 1.3
14.6 ± 2.9
12.3 ± 2.3
12.6 ± 1.0
Astaxanthint
11.5±1.0
12.2 ± 2.4
10.4±1.6
12.0 ± 0.9
fDetermined spectrophotometrically in n-hexane. !Determined by HPLC analysis. Values
represent means (n=3, ±SEM). No significant differences were recorded between dietary
treatments.
126
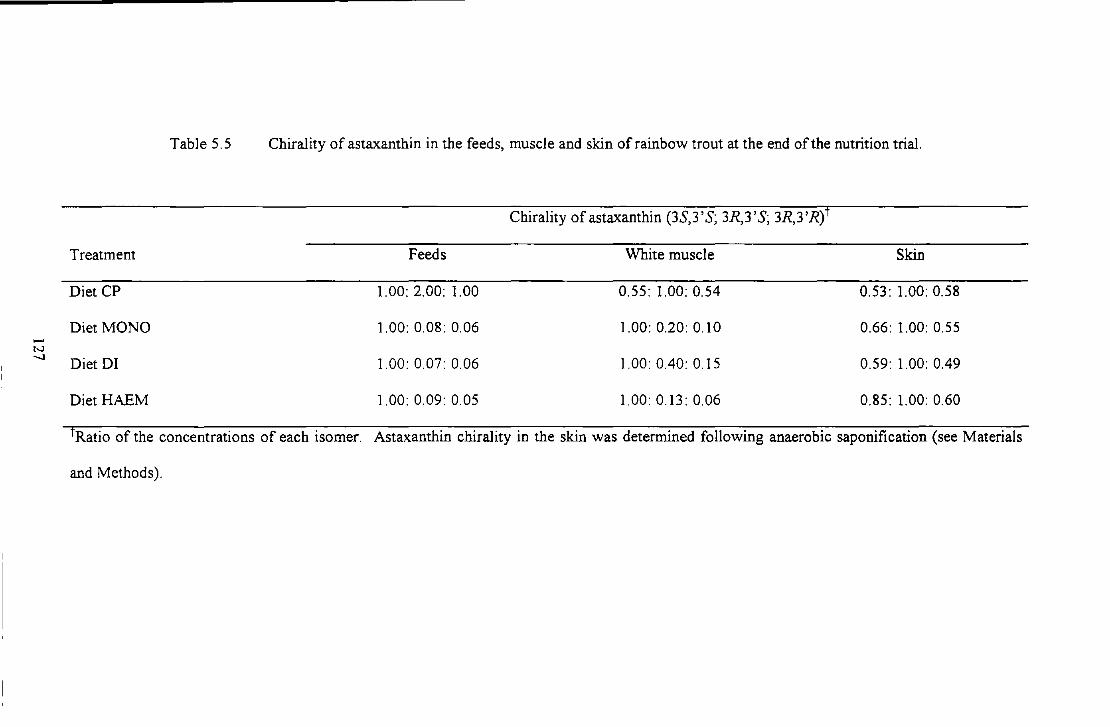
N -.1
Table 5.5 Chirality ofastaxanthin in the feeds, muscle and skin ofrainbow trout at the end ofthe nutrition trial.
Chirality of astaxanthin (3S,3 'S; 3R,3 'S; 3R,3 'R)f
Treatment Feeds White muscle Skin
Diet CP 1.00: 2.00: 1.00 0.55: 1.00: 0.54 0.53: 1.00: 0.58
Diet MONO 1.00: 0.08: 0.06 1.00: 0.20: 0.10 0.66: 1.00: 0.55
Diet Dl 1.00: 0.07: 0.06 1.00: 0.40: 0.15 0.59: 1.00: 0.49
Diet HAEM 1.00: 0.09: 0.05 1.00: 0.13: 0.06 0.85: 1.00: 0.60
fRatio of the concentrations of each isomer. Astaxanthin chirality in the skin was determined following anaerobic saponification (see Materials
and Methods).
5.4 Discussion
No apparent differences were witnessed in growth of rainbow trout across treatments,
indicating that the use of different astaxanthin supplements from Haematococcus pluvia/is
presents no deleterious effects on feed utilisation and growth performance. This confirms the
fmdings of previous trials in this study.
The ADC values recorded for astaxanthin in this trial are in keeping with values previously
reported in the literature for rainbow trout of 50-70% (Foss et al. 1987; No & Storebakken
1991; Bjerkeng et al. 1997). The ADC for free astaxanthin in this study (ea. 65%) was similar
to that found by Bjerkeng et al. ( 1997) for trout fed a stereo isomer mixture of free astaxanthin
(64%), and for free astaxanthin in diets fed to Atlantic salmon of ea. 59-64% (Storebakken et
al. 1987; Bjerkeng & Berge 2000). However, the average ADC found for astaxanthin diesters
in the current investigation (ea. 63%) was higher than that found for a synthetic astaxanthin
dipalmitate fed to Atlantic salmon (47%; Storebakken et al. 1987) yet within the range for
astaxanthin dipalmitate fed to rainbow trout ( 42-67%; Foss et al. 1987). The lack of
significant differences between ADC values in the present study suggests that the hydrolysis
of astaxanthin esters and subsequent absorption by intestinal mucosal cells presents no
limitation to the use of esterified astaxanthin as a source of pigment in salmonid feeds. These
findings are similar to those of Storebakken et al. ( 1987) who found no significant differences
in digestibility between astaxanthin and astaxanthin dipalmitate. Furthermore, the degree of
esterification i.e. mono- or diesters does not significantly influence the digestibility of
astaxanthin, suggesting efficient ester hydrolysis at the gastrointestinal level under the feeding
conditions applied. However, although there were no significant differences in ADC values,
128
there was a trend for fish fed diets supplemented with free astaxanthin to have higher ADC
values.
Analysis of post-prandial serum astaxanthin concentrations following ingestion of a single
meal show that the absorption rate of free astaxanthin (Diet FR) tended to be higher than that
of esterified astaxanthin, although not significantly. This could suggest that the requirement
for intestinal ester hydrolysis before absorption into the blood is a limiting factor and may
merit further study. This fmding agrees in part with the ADC value for Diet FR in this study
which was higher than the other treatments but not significantly. The serum absorption rate of
astaxanthin in fish fed diets supplemented with diesters was lower than that of fish fed
astaxanthin monoesters. This suggests that the degree of esterification of astaxanthin may
well limit the absorption of this carotenoid into the blood. Very similar uptake rates for Diet
MONO and Diet HAEM may be expected since the cell free carotenoid extract was composed
mainly of astaxanthin monoesters. Although the rates of uptake were not significantly
different, the differences between them did result in significant differences m serum
astaxanthin concentration between treatments at the peak serum time of 24 to 32 hours.
Clearly, the extent of esterification of the astaxanthin molecule was negatively related to
absorption of astaxanthin into trout serum.
A lack of significant differences in digestibility coupled with significant differences in serum
astaxanthin concentrations may suggest that intestinal cells absorb astaxanthin esters intact
followed by intracellular hydrolysis prior to blood transport. Indeed, non-specific esterases
have been found along the intestinal brush border membrane and within the cytoplasm of
enterocytes in Nile tilapia, Oreochromis niloticus (Tengjaroenkul et al. 2000). Alternatively,
129
variations m sensitivity between the two assessments may account for the differences.
Digestibility values may be overestimated due to carotenoid degradation in faecal samples
(Meyers 1994). Absorption, as well as removal from the serum for storage; bioconversion and
excretion influence blood carotenoid concentrations (Castenmiller & West 1998; Van het Hof
et al. 2000).
This study revealed that isolated monoesters and diesters of astaxanthin as well as a mixture of
both in a total carotenoid extract, were utilised as efficiently as the free synthetic form of
astaxanthin in pigmenting rainbow trout under these trial conditions. These results are
contradictory to those of other groups who have showed that synthetic astaxanthin dipalmitate
was largely ineffective in pigmenting salmonids in comparison to the free, unesterified form of
this carotenoid (Schiedt & Leuenberger 1981; Schiedt et al. 1985; Foss et al. 1987;
Storebakken et al. 1987). Comparison between these studies and the current investigation are
confounded by variations in trial duration and feeding conditions; dietary carotenoid levels
and choice of salmonid species. Nonetheless, moderate levels of pigmentation and relatively
short trial duration in the current study may have negated development of significant
differences between treatments. However, Torrissen et al. ( 1989) indicated that farmed
salmonids should have at least 3-4~g g·1 of total carotenoid to be marketable, a level that was
achieved for all treatments. Net apparent retention values for astaxanthin and total carotenoid
in the current study (10-12%) were lower than the 18% reported by Torrissen & Braekkan
( 1979) but in keeping with the 7-11% reported by Foss et al. ( 1987). Choubert & Storebakken
(1989) obtained a retention coefficient of 12.5% for rainbow trout fed for six weeks on diets
supplemented with astaxanthin. Direct comparison is however complicated by differences in
calculation and carotenoid content of feeds.
130
Pigmentation results from this study are consistent with those findings of Mori et al. (1989)
who found no difference between the deposition of a krill astax:anthin diester and synthetic
free astax:anthin in juvenile Coho salmon (Oncorhynchus kisutch)_ Moreover, Simpson and
Kamata ( 1979) reported higher levels of pigmentation when using an esterified source of
astaxanthin in comparison to the free form. Choubert & Heinrich (1993) reported very low
carotenoid retention levels (1.5%) in rainbow trout fed diets supplemented with
Haematococcus and suggested that the requirement for ester hydrolysis may be a limiting step
in the deposition of astax:anthin. Results from the present study suggest that this is not the
case and that the cell wall of Haematococcus may be the main limiting factor (Johnson & An
1991). Indeed, algal cells used in the study by Choubert & Heinrich (1993) were not
homogenised/disrupted prior to addition to the feed thus limiting carotenoid bioavailability
Enantiomers of astaxanthin in wild Salmo and Oncorhynchus species are typically found in the
ratio 78-85: 2-6: 12-17 (3S,J'S): (JR,J'S): (JR,J'R) (Schiedt 1998). However, synthetic
astaxanthin (CAROPHYLL ® Pink) has a ratio of I :2: I (i.e. a ratio of I: I for the racemate
forms: Bernhard 1990). When salmonids deposit astaxanthin in their muscle, they do not
discriminate between the three enantiomers of unesterified astaxanthin (Foss et al. 1984).
This is in agreement with findings in the current study since both racemic (synthetic
astaxanthin) and (3S,3 'S)-astax:anthin were deposited unchanged. However, it has been
reported that astaxanthin esters are utilised differently from the unesterified carotenoid
(Schiedt et al. 1985) where astaxanthin dipalmitate was utilised in the order racemic >
(JR,J 'R) > (JS,J 'S). Indeed, rainbow trout and sea trout (Salmo lmtta. L.) fed a synthetic
mixture of astax:anthin dipalmitate enantiomers deposited (JR,J 'R) astaxanthin in their flesh to
131
a greater extent than (3S,3 'S)-astaxanthin (Foss et al. 1987). This may be due to stereo
selective attack by ester hydrolases in the intestinal lumen of the fish and requires further
study.
When astaxanthin is deposited in the skin of salmonids it is re-esterified with fatty acids
(namely 20:5 and 18:1) although this re-esterification has been found to be unspecific in
relation to the enantiomeric form of the carotenoid molecule (Schiedt et al. 1985). In the
present investigation, whilst no epimerization of astaxanthin in the muscle was recorded,
deposition of astaxanthin from algal sources in the skin was accompanied with epimerization
of (3S,3 'S)-astaxanthin, with both the (3R,3 'S) and (3R,3 'R) forms being deposited. Specific
enrichment ofthe (3R,3'R) form in the skin ofsalmonids has been recorded when dipalmitates
of these enantiomers have been used. Racemic astaxanthin dipalmitate was deposited in the
ratio 0.4: 1.0:1.0 (3S,3 'S): (3R,3 'S): (3R,3 'R) suggesting discrimination against the (3S,3 'S)
form (Schiedt et al. 1985, Schiedt 1998). In vivo racemisation of 3H-(3S,3 'S)-astaxanthin has
also been observed in the shrimp Penaeus japonicus although it could not be determined
whether this occurred during or after absorption (Schiedt et al. 199 I, I 993 ).
The presence of geometrical isomers of astaxanthin in the white muscle of salmonids is in
agreement with previous findings. The 9-cis, 13-cis and I 5-cis forms of astaxanthin have been
detected in the white muscle of rainbow trout fed with synthetic astaxanthin (Bjerkeng et al.
I 997). Furthermore these authors demonstrated that the ADC' s were significantly higher for
all-trans astaxanthin compared to a mixture of cis/trans isomers. More recently, selective
distribution of geometrical isomers of astaxanthin in the faeces, blood, liver and muscle of
rainbow trout has been demonstrated (0sterlie et al. 1999). Since isomerisation of all-trans
132
astaxanthin may take place in the gastrointestinal tract and also following uptake (Bjerkeng et
al. 1997) it is plausible that intestinal hydrolysis of astaxanthin esters might promote trans-cis
isomerisation. However, the presence of cis isomers was minimal and did not seem to have
any affect on deposition or retention.
The presence of idoxanthin in the muscle of fish fed unesterified astaxanthin, astaxanthin
esters or total carotenoid extract confirms other observations in rainbow trout (Bjerkeng et al.
1997) and Atlantic salmon (Schiedt et al. 1988a). Since idoxanthin was not found in the feed
it is plausible that this carotenoid may represent a reductive metabolite of astaxanthin. Indeed,
in Arctic charr (Salvelinus alpinus) the recorded major reductive metabolite of astaxanthin was
idoxanthin, comprising 47-75% of total fillet carotenoids (Aas et a/_ 1997; Hatlen et al.
1995a).
Data from the present investigation demonstrates that natural fatty acid astaxanthin esters
(extracted from Haematococcus) are as efficiently utilised as a free synthetic form in the
pigmentation of rainbow trout. These results have implications for the use of other natural
sources of astaxanthin esters e.g. shrimps and krill wastes that contain esterified astaxanthin
In addition, the degree of astaxanthin esterification has no significant influence on the
apparent digestibility of carotenoid. However, this study does provide evidence that the extent
of esterification of astaxanthin does influence the rate of astaxanthin absorption into the blood
that results in significant differences in peak serum concentrations of astaxanthin. This may
suggest that hydrolysis may occur intracellularly within the enterocyte post absorption by the
intestine and requires further study. The use of younger cultures of this algal may be
133
recommended since the ratio of monoesters: diesters have been shown to decrease with time
(Harker et al. 1996b ).
Clearly, a more refined understanding concerning the intraluminal digestive and absorptive
processes within the salmonid intestine in relation to astaxanthin and its various forms is
required. Although in vivo feed trials are an excellent indicator of the limitations associated
with absorption, complex combinations of physiological events that occur in the living animal
and which as yet are not understood, confound detailed assessment. Furthermore, the relative
significance of each event e.g. absorption as opposed to metabolism, can not be strictly
determined in live animal investigations. Consequently, it is essential to develop in vitro
models that isolate and enable examination of carotenoid absorption at the gastrointestinal
level.
134
CHAPTER 6.0
EVALUATION OF AN IN VITRO PERFUSION SYSTEM TO ASSESS THE UPTAKE
OF ASTAXANTHIN IN ISOLATED INTESTINE FROM RAINBOW TROUT,
ONCORHYNCHUS MYKISS (W ALBAUM).
6.1 Introduction
Astaxanthin is an important carotenoid that is commonly used as a feed supplement to pigment
cultured salmonid fish (Torrissen 1989a; Nickell & Bromage 1998a) and due to its wide
distribution in the animal kingdom must constitute part of the human diet (0sterlie et al
2000). Astaxanthin has been documented as a potential antioxidant in salmonids (Christiansen
et al. 1995a). In addition, when used as a feed supplement improvements in growth of
Atlantic salmon (Salmo salar) fry (Torrissen 1984) and growth and survival during the start
feeding period (Christiansen et al. 1994) have been recorded. Subsequently, there is great
interest in the absorption and metabolism of this carotenoid in the context of promoting fish
health and production.
The mechanism of carotenoid absorption in humans and mammals at the gastrointestinallevel
has been extensively reviewed (Erdman et al. 1993; Parker 1996; Furr & Clark 1997; Van den
Berg 1999) yet there is an apparent lack of knowledge relating to similar processes in
salmonids. In mammals, once released from the food matrix (gastric hydrolysis), carotenoids
dissolve into a fine emulsion that passes into the duodenum region of the gastrointestinal tract.
Carotenoids are then incorporated into lipid micelles (formation is dependent on bile flow
135
from the gall bladder) which act as a vehicle for carotenoid transfer across the unstirred water
layer. Carotenoids are then passively absorbed by mucosal cells before being packaged into
chylomicron like structures, secreted into lymph and subsequently into the systemic blood
circulation. There is a disparity of information concerning those intracellular events that result
in the formation of these chylomicrons.
A majority of carotenoid absorption studies in both humans and in fish have been assessed
primarily through monitoring rise and decline of the carotenoid in the blood of subjects
following acute or chronic administration (White et al. 1994; Gobantes et al. 1997; Van den
Berg 1998; 0sterlie et al. 2000). However, although this approach is informative it does not
quantify the amount of carotenoid that is absorbed (Garret! et al. 1999a). Furthermore,
carotenoid levels in the blood are affected by metabolism and excretion as well as absorption
(Castenmiller & West 1998; Van het Hof et al. 2000). Digestibility studies have been utilised
to indicate the absorption of carotenoid at the intestinal level in salmonids (Torrissen et al.
1990; Choubert & Storebakken 1996; Bjerkeng & Berge 2000). However, such measurements
are often subject to overestimation due to oxidation of carotenoids in faecal samples (Meyers
1994)
In vitro assessment of intestinal nutrient absorption has been carried out following a number of
approaches each with their own advantages and disadvantages. One of the earliest in vitro
preparations designed to monitor intestinal solute uptake was a section of intestine, circularly
perfused on its luminal side, with samples being drawn from both the luminal and serosal
reservoirs (Fisher & Parsons 1949). This method was later replaced with the established
everted sac technique (Wilson & Wiseman 1954) which incorporated an everted segment of
136
intestine filled with media, sealed at both ends (serosal compartment) and suspended in a
luminal reservoir containing the solute of interest. However, this preparation is limited by the
inability to oxygenate and sample the serosal compartment throughout the experimental
period. Studies where anaesthetised (Sawchuk & Awni 1986; Peres del Castillo et al. 1997;
Wang et al. 1997) and non anaesthetised animals (Saunders & Dawson 1963; Simmonds et al.
1968; Thompson et al. 1969; Clark et al. 1998) are chronically catheterised are believed to be
most physiologically representative. Such methods involve surgical procedures that are
difficult and often impractical where fish are the subject of investigation, although in situ
catfish intestinal preparations have been recently described (Kleinow et al. 1998; Doi et al.
2000). A modern system described by Carmona (1998) used non-recirculating serosally
perfused everted segments of intestine that were placed in large volume incubation chambers
which avoid large changes in luminal concentration. The continuous flow of perfusate
(serosal compartment) avoids accumulation of solutes in the tissue phase and tissue viability is
kept optimal by oxygen delivery to both the luminal and serosal media. In addition continuous
collection of serosal perfusate fractions allows the determination of translocation kinetics and
monitoring of a steady state.
The objectives of the current study were to assess the potential of an intestine perfusion
system to monitor and describe the uptake kinetics of astaxanthin in two potential
vectors/solubilising agents. Secondly, to assess the viability of intestinal tissue when used in
an in vitro perfusion system.
137
6.2 Materials and Methods
6.2.1 Experimental System
The isolated gut perfusion preparation used throughout the investigations was based on
methodology described by Carmona (1998) and Ando et al. (1986a). A diagramatic
representation of the system can be seen in Figure 6.1. Everted intestines were mounted in a
gassed (95% 02; 5% C02) luminal reservoir ( !5cm x 11 cm) containing physiological saline
(450ml) of composition (g r1): NaCI 7.37g; KCL 0.31g; CaC~ 0.17g; MgS04 0.14g; KH2P04
0.46g; Na2H2P04 2.02g; 0.3% Tween 20; 0.1% glucose (pH 7.3} (AI-Khalifa & Simpson
1988). The preparation was perfused with saline using a peristaltic pump (Gilson Miniplus 3,
Villiers le Bel, France) at a set flow rate of I ml min- 1 to mimic the blood flow of fish in vivo
(Barron et al. 1987). A 250ml glass Erlenmeyer flask was used as a perfusion reservoir and
was also gassed (95 % 0 2; 5% C02) to ensure preparation viability. The intestines were
mounted on a polythene mesh support (15cm x 8cm) above a magnetic flea, rotated using a
magnetic stirrer (HI l90M, HANN A Instruments, UK). This ensured efficient flow of the
saline across the intestinal mucosa. Both the luminal and perfusate reservoirs were chilled
with circulating water (Maxicool 14, lMl Cornelius, U.K.) to ensure the preparation was
maintained at a desired temperature below that of ambient, ea. 20°C (typically at I5°C ± I 0 C).
No inserts were necessary to sustain luminal space along the intestine owing to inherent
musculature of the organ.
138
6.2.2 Preparation of the intestine
Rainbow trout (250-400g) were taken from the aquarium system (see section 2.2.2) and
immediately culled via a blow to the cranium followed by destruction of the brain. Fish
weight was recorded. The gastrointestinal tract was promptly dissected from the fish and the
stomach and pyloric region (from the pyloric sphincter to the last pyloric diverticular)
separated from that of the remaining intestine, and discarded. The remaining intestine was
immediately placed in lOOm! glass beaker containing both chilled (5°C) and gassed (95% 0 2)
physiological saline for an initial period of recovery. Any fat deposits adhering to the intestine
were gently removed from the organ using tweezers and a scalpel taking care not to tear or
puncture the organ. The intestine section was then everted on a stainless steel everting rod
(300mm x 2mm) and placed in the luminal reservoir containing 450ml of the physiological
saline and dissolved solute (carotenoid). The anterior end of the intestine was supplied with
saline from the perfusate reservoir, via the peristaltic pump and PVC tubing (0.63 mm internal
diameter) containing a 1.5cm stainless steel insert at its out flow (lml min- 1). The intestine
was attached to the tubing with surgical suture. The distal end of the preparation was attached
directly to similar tubing leading to a rack containing six 20ml pre-weighed glass vials that
acted as fraction collectors (!Omin fractions) throughout the experimental period (60min).
The preparation was then back-filled with chilled physiological saline and observed for leaks
An initial period (5 min) ofperistaltic flow (lml min- 1) was then sustained (elute discarded) to
observe preparation viability, and ensure residual carotenoid that may have entered the lumen
of the organ during initial transfer would not influence uptake data.
139
------------------------ -----
6.2.3 Solubilisation of carotenoid
Two different methods of solubilisation were employed in the current study. In Experiment
MIC, astaxanthin was dispersed in a non-ionic surfactant (Tween 20, BDH Supplies, Poole,
England) which was added to the luminal reservoir saline at 0.3% (v/v) (AJ-Khalifa &
Simpson 1988). The surfactant was included at an amount higher than its micellar
concentration (59 J.IM) and it was subsequently assumed that carotenoid was incorporated into
these micelles. The saline was filtered (Whatman No. I) before use to remove crystalline
carotenoid that was not dispersed. Due to the limited solubility of astaxanthin in this solution,
a second experiment (Experiment EM) was carried out using water miscible beadlets
containing 4.6% astaxanthin (CAROPHYLL ®Pink; Roche Ltd., Basel). These were dispersed
into saline (in addition to 0.3% v/v Tween 20) by mixing at 40°C. In both experiments Tween
20 was also added (0.3% v/v) to the serosal perfusate to act as a solubilising agent for
translocated carotenoid (Loran & Althausen 1969}.
6.2.4 Astaxanthin analysis
At the end of the experimental period 2ml of methanol ( +SOOppm BHT) was added to each
perfusate fraction followed by rapid vortexing. Dichloromethane (6ml) was then added to
each fraction, followed again by vortexing and a I Omin extraction period in darkness. Each
fraction was then given a final vortex and then centrifuged at 3000 X g for I 0 m in at I5°C. An
aliquot of the resulting hypophase (3ml) was extracted (Sml glass syringe; Hamilton, Reno,
Nevada}, filtered (0.2J.1m), blown down under a gentle stream of nitrogen and stored at -20°C
140
until analysis. Samples were re-suspended in lOOJ!I of dichloromethane, before injection into
the HPLC system for carotenoid quantification (see section 2.4.10)
6.2.5 Viability experiments
A number of parameters were assessed throughout the investigations to ensure the viability of
the preparation and the subsequent value of the data obtained. During the perfusion period the
observation of normal peristaltic contractions and constant perfusate out flow were the most
efficient indicators of viability. Those preparations that conformed to these parameters were
subjected to histological examination and were compared against tissues taken from normal
healthy animals.
6.2.5.1 Perfusate outflow
This was measured by subtracting the initial weight of the fraction collector (pre-weighed vial)
from the final weight of the vial with perfusate If results varied considerably from one
fraction to another e.g. a dramatic drop in serosal perfusate volume, the preparation was
deemed non-viable and the data dismissed from further analysis. Tears, leakage and
blockages were factors that may have been responsible for variation in flow
6.2.5.2 Peristaltic contractions
Observations of sudden and spontaneous contractions are normal for intestine preparations and
were taken as an indicator of physiological viability. Only when contracture was severe and
141
lasted over long periods was this considered as an indicator of decreased viability and the data·
was duly disregarded.
6.2.5.3 Histological examination
Approximately 2cm of the everted intestine sample was typically used for ultrastructure
examination and confirmation of preparation viability. The sample was placed in a 20ml glass
vial filled with 5% buffered formal saline and left for a minimum of 24 hours. The formal
saline was then discarded and the sample washed and stored in 70% alcohol for 3 hours,
followed by washing and storage in 90% alcohol for 2 hours. The sample was then washed
and kept in absolute alcohol (100%) for a minimum of 12 hours. The alcohol was then
decantered and the sample washed and placed in xylene for 2 hours with an intermittent
transfer into fresh xylene after 1 hour. Following removal of the xylene the sample was set
into a wax block mould.
Sectioning was carried out on a rotary microtome with a typical section thickness of 8j.!m.
Samples were then stained using the Mallory's Trichrome procedure. The slide with specimen
was placed in haematoxylin for 20min, followed by washing with water. The specimen was
briefly placed in a lithium carbonate solution; differentiated in I% acid alcohol, and then
placed back into the lithium carbonate solution for a few seconds. The specimen was then
washed thoroughly in distilled water. The si ide was then placed in acid fuchin solution for I 0
seconds and again washed in distilled water. Following washing, the slide was placed in
Mallory's stain for 10 seconds; washed with distilled water; placed in 90% alcohol for 5
142
seconds and I 00% alcohol 2 min. The sample was then placed in xylene for 2 min and then
mounted with a coverslip using DPX.
6.2.5.4 Uptake vs. perfusate volume plots
Regression analysis and comparison was carried out on cumulative uptake of astaxanthin and
cumulative perfusate volume data. Differences in the slopes of regressions between plots
suggest uptake is independent of perfusate tlow and that uptake is not a factor of solvent drag.
Comparisons between total perfusate volume (total perfusate in each time fractions at the end
of the perfusion period) at each astaxanthin dose were carried out to determine differences in
apparent net water tlux.
6.2.6 Experiments
Experiment MIC and Experiment EM were carried out as preliminary dose response
investigations. Doses of carotenoid were chosen according to representation of physiological
concentrations, solubility restrictions and detection limits (see discussion). Uptake rates of
astaxanthin were measured as a function of the amount of astaxanthin in the perfusate
fractions and normalised for wet weight of the intestinal preparation. Initial uptake rates of
astaxanthin were based on the amount of astaxanthin absorbed in the first IOmin fraction
where overall uptake rates were calculated according to the total amount of astaxanthin taken
up over the 60min perfusion period. Absorption coefficients were calculated according to:
143
100 X total amount of astaxanthin in perfusate after 60min (I! g)
total amount of astaxanthin in luminal reservoir (Jlg)
Those doses of astaxanthin which generated cumulative uptake data showing typical saturation
over time was subjected to Michaelis-Menten kinetic fittings to identify Vmax which
represented a theoretical maximum tissue astaxanthin concentration.
6.2.7 Statistical analyses
All statistical comparisons were carried out on StatGraphics Plus (2) for Windows. All data
sets were subjected to tests for normal distribution and variance checks before comparison
with parametric or non-parametric (Kruskall Wallis) tests. Curve fitting and regression
analysis of cumulative uptake, initial uptake rates and cumulative volume was performed
using SigmaPiot 4.0. Uptake rates, absorption coefficients and Vmax values were compared
across treatments using a one-way analysis of variance at the 95% confidence level.
Regression analysis of cumulative uptake and volume data generated slope values that were
compared using the Kruskal Wallis test at the 95% confidence limit.
6.3 Results
6.3.1 Viability
Viability assessments demonstrated that greater than 95% of the intestinal preparations were
viable over the 60min perfusion period. Preparations mainly failed (<7%) due to tears in the
144
tissue that occurred during excision from the fish. These were quickly noticed due to erratic
variations in perfusate volume. Histological examination of the tissue (Figure 6.2) revealed a
thinning of the lamina propria within the epithelial tissue cells which occurred in greater than
95% of the samples (as compared to controls).
Comparison of regression line slopes for cumulative uptake and perfusate volume revealed
that significant differences (P<0.05) existed between plots and that astaxanthin absorption was
not influenced by "solvent drag" (see Figures 6.3-6.8). However, the total perfusate volume
(Table 6.1) at the end of the perfusion period did vary between astaxanthin doses in both
experiments where a general trend of decreasing volume with increasing dose was recorded.
In Experiment l\1.IC, the total perfusate volume at astaxanthin dose l mg 1" 1 was significantly
higher (P=0.0247) than the perfusate volumes at doses of2 and 3mg rl Furthermore, the total
perfusate volume at dose 6mg 1" 1 in Experiment EM was significantly lower (P=O 0 162) than
the perfusate volume at doses 2 and 3 mg 1" 1.
6.3.2 Astaxanthin uptake
In both experiments there was a significant (P<0.01) positive relationship between initial
uptake rate (based on the first I Omin fraction) and dose of astaxanthin (Figures 6. 9-6.1 0) with
P-values of 0.0021 and 0.0064 for Experiment l\1.IC and Experiment EM, respectively.
However, variability in the raw data resulted in moderate R2 and correlation coefficients for
both Experiment MIC (R2=321%; correlation coefficient=0.56644) and Experiment EM
(R2=50.6%; correlation coefftcient=O. 711 024). In Experiment MIC, the initial uptake rate at
doses of 2mg r 1 (0.30 ± 0.04 11g g"1h"1; n=1 0~ ±SEM) and 3mg 1" 1 (0.40 ± 0.12 11g g" 1h" 1
; n=4,
145
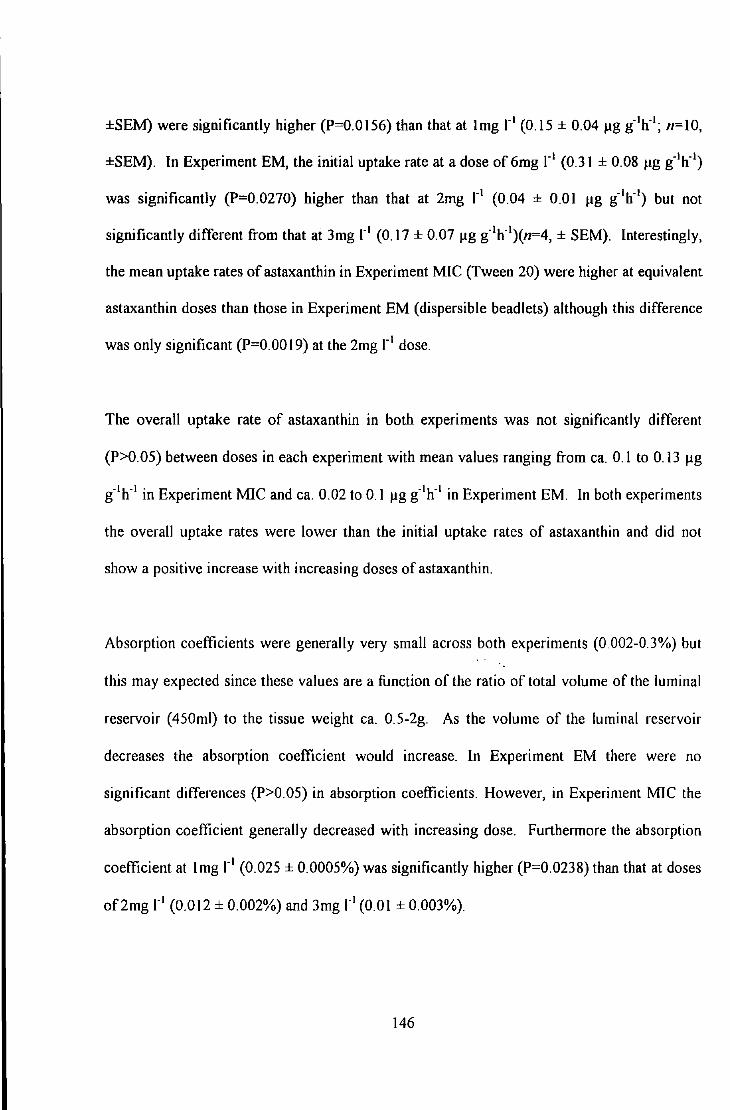
±SEM) were significantly higher (P=0.0156) than that at 1mg r 1 (0.15 ± 0.04 J.lg g" 1h"1; n=IO,
±SEM). In Experiment EM, the initial uptake rate at a dose of 6mg r1 (0.31 ± 0.08 J.lg g"1h- 1)
was significantly (P=0.0270) higher than that at 2mg r1 (0.04 ± 0.01 j.lg g" 1h" 1) but not
significantly different from that at 3mg r 1 (0.17 ± 0.07 J.lg g" 1h- 1)(n=4, ± SEM). Interestingly,
the mean uptake rates of astaxanthin in Experiment MIC (Tween 20) were higher at equivalent
astaxanthin doses than those in Experiment EM (dispersible beadlets) although this difference
was only significant (P=O.OO 19) at the 2mg r1 dose.
The overall uptake rate of astaxanthin in both experiments was not significantly different
(P>0.05) between doses in each experiment with mean values ranging from ea. 0.1 to 0.13 J.lg
g"1h- 1 in Experiment MIC and ea. 0.02 to 0.1 J.lg g" 1h- 1 in Experiment EM. In both experiments
the overall uptake rates were lower than the initial uptake rates of astaxanthin and did not
show a positive increase with increasing doses of astaxanthin.
Absorption coefficients were generally very small across both experiments (0 002-0.3%) but
this may expected since these values are a function of the ratio of total volume of the luminal
reservoir (450ml) to the tissue weight ea. 0.5-2g. As the volume of the luminal reservoir
decreases the absorption coefficient would increase. ln Experiment EM there were no
significant differences (P>0.05) in absorption coefficients. However, in Experiment MlC the
absorption coefficient generally decreased with increasing dose. Furthermore the absorption
coefficient at lmg 1" 1 (0.025 ± 0.0005%) was significantly higher (P=0.0238) than that at doses
of2mg 1" 1 (0.012 ± 0.002%) and 3mg 1" 1 (0.01 ± 0.003%).
146
The Vmax values for those doses that generated typical time saturation kinetics (see Figures
6. 11-6.12) in the cumulative uptake data (Doses 2 and 3mg r1 in Experiment MIC and 3 and
6mg r1 in Experiment EM) were not significantly different and typically ranged from ea. 0. I to
0.3 Jlg g-1.
147
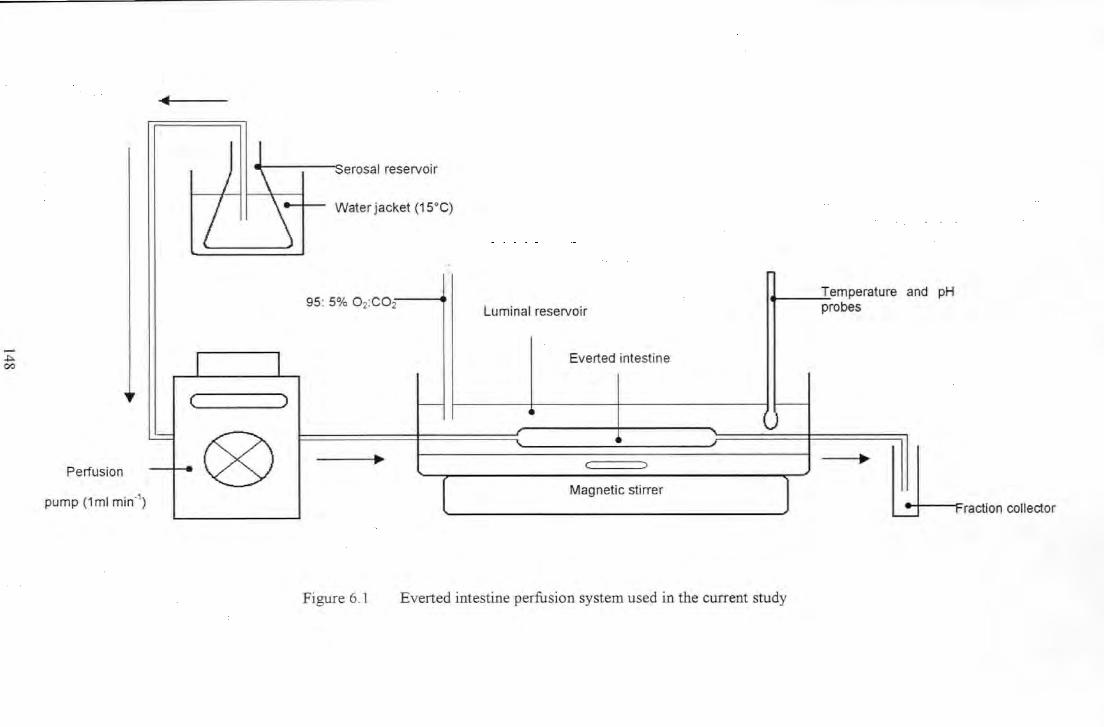
J ~erosal reservoir
~ j
I \ Water jacket (15°C)
Temperature 95: 5% 0 2:C02
Luminal reservoir probes and pH
-~ 00
Everted intestine I I ( ) f-- -
L
Perfusion
pump (1 ml min-1)
'=
Q9 I ... ...
Magnetic stirrer Lraction collector
Figure 6.1 Everted intestine perfusion system used in the current study
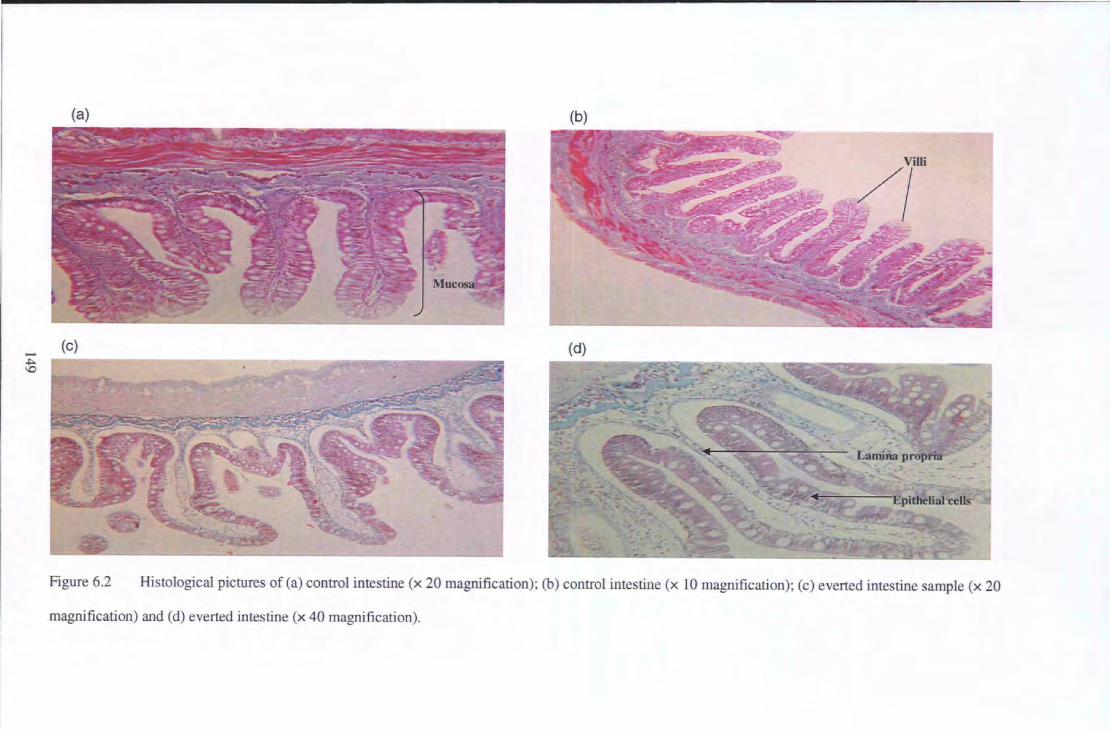
(a) (b)
(c) (d)
Figure 6.2 Histological pictures of (a) control intestine (x 20 magnification); (b) control intestine (x 10 magnification); (c) everted intestine sample (x 20
magnification) and (d) everted intestine (x 40 magnification).
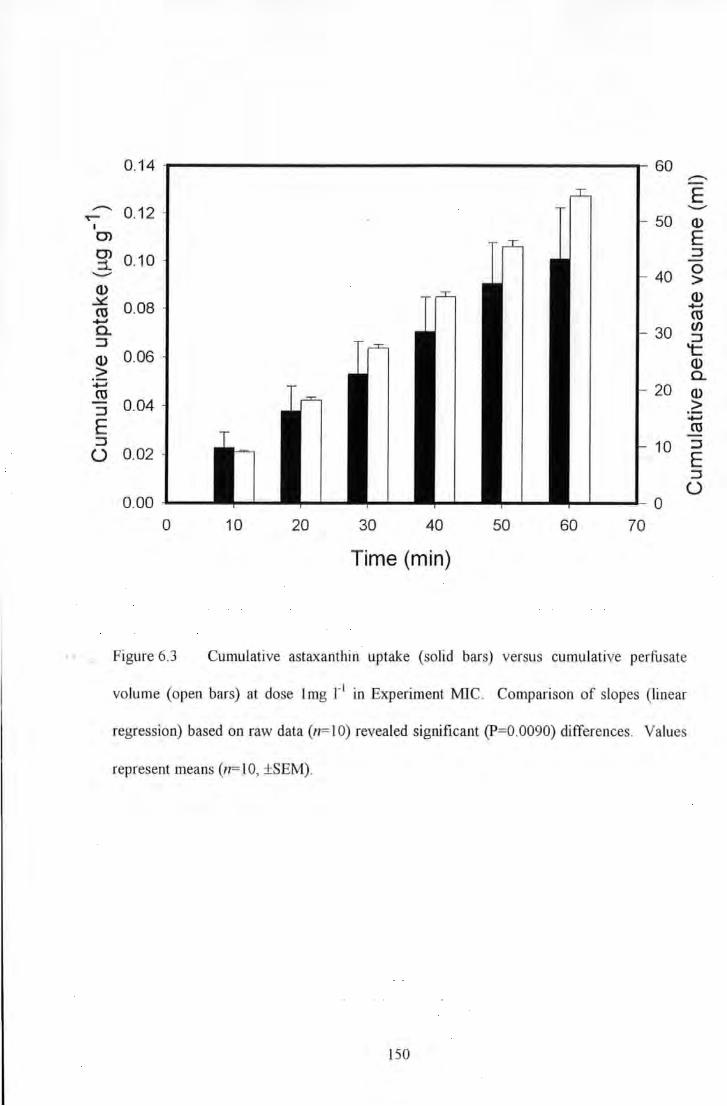
0.14 60 ...-E ...- 0.12
......_.. T""" 50 Q) I
0> E 0> 0.10
::J :::1.. -
0 ......_.. 40 > Q)
Q) ~ 0.08 +J m m +J (/) a. 30 ::J ::J 't: Q) 0.06 Q) > a. +J 20 Q) m ::J 0.04 >
+J
E m ::J 10 ::J
0 0.02 E ::J 0
0.00 0 0 10 20 30 40 50 60 70
Time (min)
Figure 6.3 Cumulative astaxanthin uptake (solid bars) versus cumulative perfusate
volume (open bars) at dose lmg r1 in Experiment MJC. Comparison of slopes (linear
regression) based on raw data (n=lO) revealed significant (P=0.0090) differences. Values
represent means (n= 10, ±SEM).
150
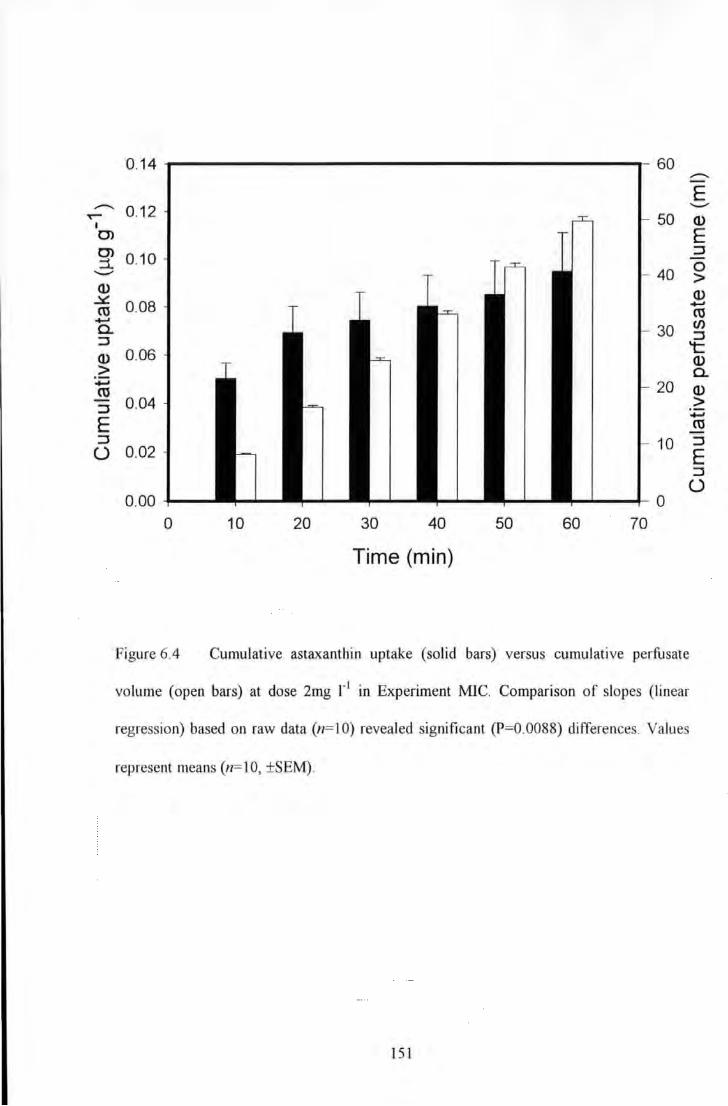
0.14 60 -... E -... 0.12 _...
~ 50 Q.) I
0> E 0> 0.10
:J :::t 0 _... 40 > Q.)
Q.) .::£ 0.08 ~ ro ro ~ Cl) c.. 30 :J :J 't: Q.) 0.06 Q.) > c.. ~ 20 Q.) ro :J 0.04 >
~
E ro :J 10 :J 0 0.02 E
:J 0
0.00 0
0 10 20 30 40 50 60 70
Time (min)
Figure 6.4 Cumulative astaxanthin uptake (solid bars) versus cumulative perfusate
volume (open bars) at dose 2mg r 1 in Experiment MlC. Comparison of slopes (linear
regression) based on raw data (n= IO) revealed significant (P=0.0088) differences. Values
represent means (n= I 0, ±SEM).
151
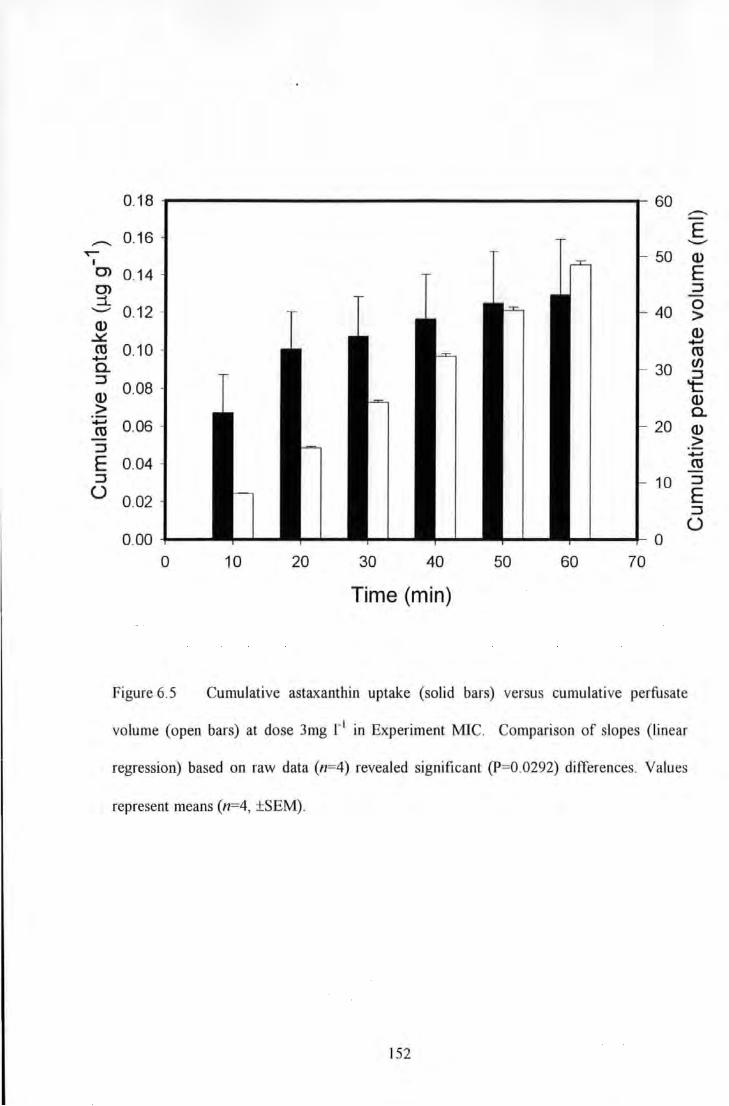
0.18 60 .............
0.16 E ............. ..._... ~ 50 <1> I
0> 0.14 E 0> ::3 ::t -
0.12 0 ..._... 40 >
<1> <1> ~ +J ro 0.10 ro +J en 0.. 30 ::3 ::3
0.08 't: Q) <1> .> 0.. +J 0.06 20 <1> ro ::3 >
+J
E 0.04 CO ::3 10 ::3 0 0.02 E
::3
0 0.00 0
0 10 20 30 40 50 60 70
Time (min)
Figure 6.5 Cumulative astaxanthin uptake (solid bars) versus cumulative perfusate
volume (open bars) at dose 3mg r 1 in Experiment MIC. Comparison of slopes (linear
regression) based on raw data (n=4) revealed significant (P=0.0292) differences. Values
represent means (n=4, ±SEM).
152
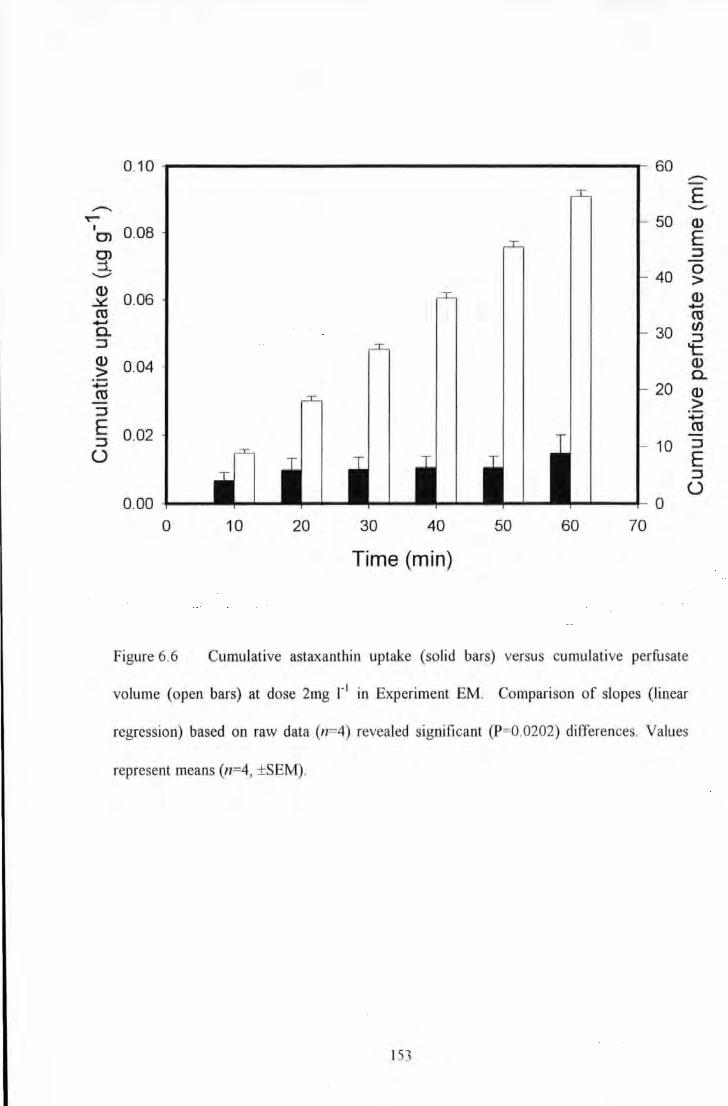
0.10 60 ...-E ...- .._...
oor- 50 Q) I 0.08 Cl E Cl :::J :::t 0 .._... 40 > Q)
0.06 Q) ::£ ..... ro ro ..... (}) 0. 30 :::J :::J
't: Q) 0.04 Q) > 0. ..... 20 ro Q)
:::J > ..... E 0.02
ro :::J 10 :::J 0 E
:::J 0
0.00 0
0 10 20 30 40 50 60 70
Time (min)
Figure 6.6 Cumulative astaxanthin uptake (solid bars) versus cumulative perfusate
volume (open bars) at dose 2mg r1 in Experiment EM. Comparison of slopes (linear
regression) based on raw data (n=4) revealed significant (P=0.0202) differences. Values
represent means (n=4, ±SEM).
153
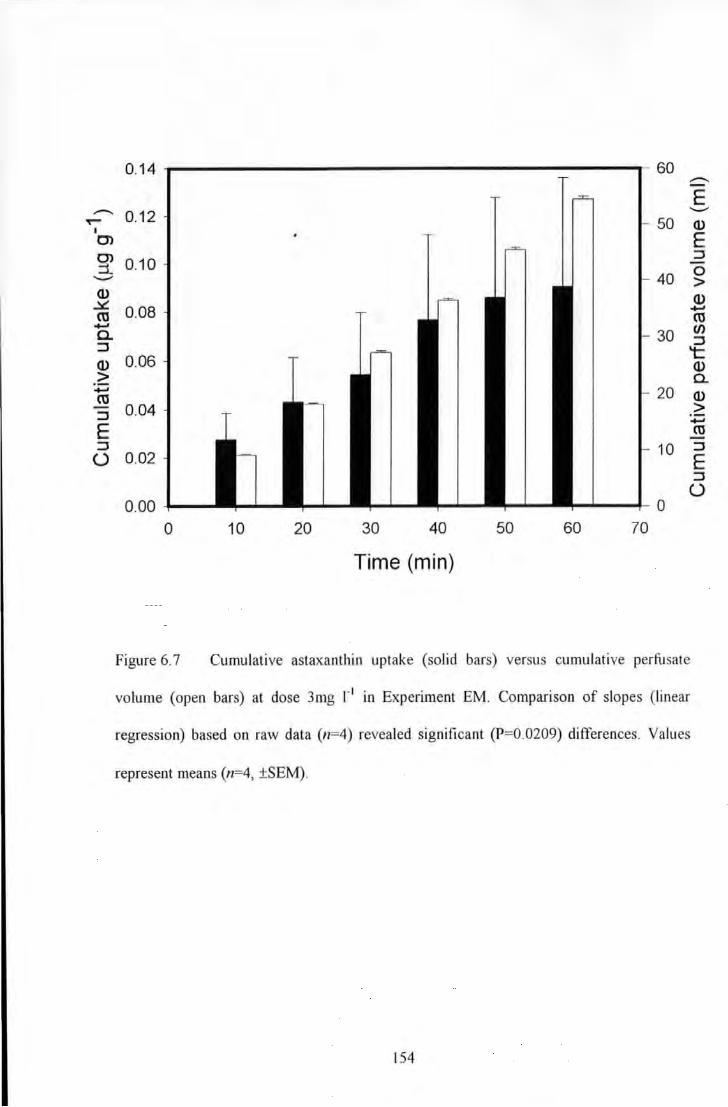
0.14 60 ---E --.. 0.12 .._...
~ 50 Q) I
0> E 0> 0.10
::J :i. 0 .._... 40 > Q) Q) ~ 0.08 ...... ro ro ...... en a. 30 ::J ::J
0.06 't: Q) Q) > a. ...... 20 Q) ro ::J 0.04 > ...... E rn ::J 10 ::J
0 0.02 E ::J 0
0.00 0
0 10 20 30 40 50 60 70
Time (min)
Figure 6.7 Cumulative astaxanthin uptake (solid bars) versus cumulative perfusate
volume (open bars) at dose 3mg r1 in Experiment EM. Comparison of slopes (linear
regression) based on raw data (n=4) revealed significant (P=0.0209) differences. Values
represent means (n=4, ±SEM).
154
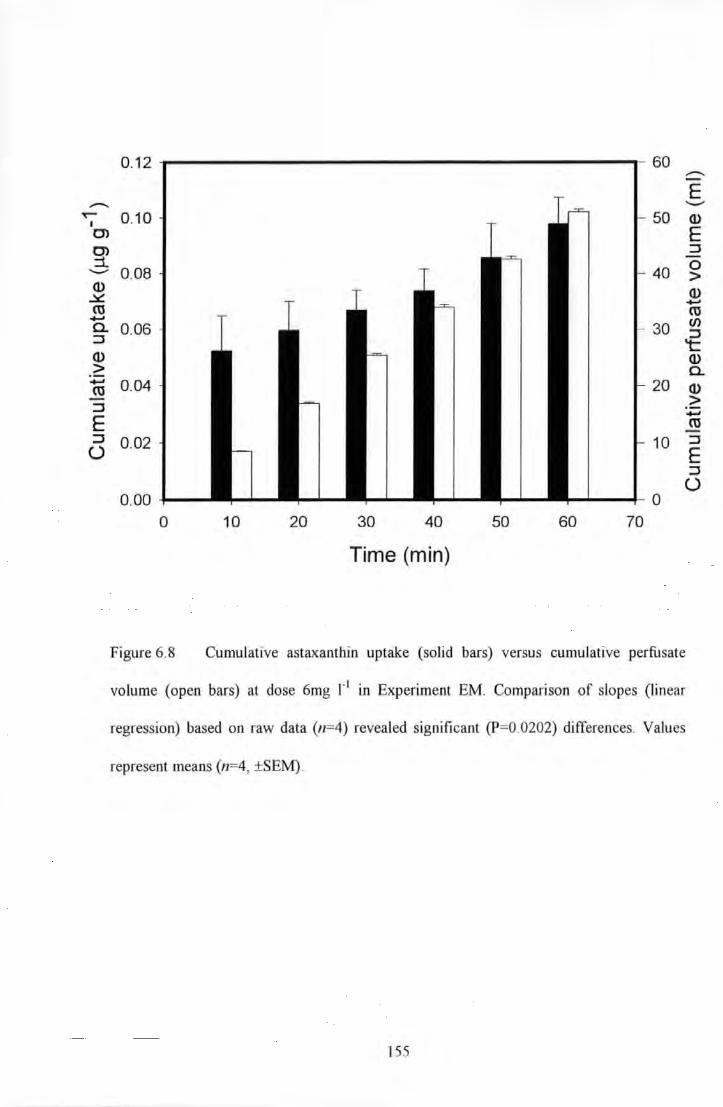
0.12 60 ..-
E - ..._ T""" 0.10 50 Q)
I C) E C) :J :i.
40 0 ..._ 0.08 > Q)
Q) ..X:: +-' ro ro +-' Cl) a. 0.06 30 :J :J 't: Q) Q) .> a. +-' 0.04 20 Q) ro :J >
+-'
E ro ::J 0.02 10 :J
(.) E ::J u
0.00 0
0 10 20 30 40 50 60 70
Time (min)
Figure 6.8 Cumulative astaxanthin uptake (solid bars) versus cumulative perfusate
volume (open bars) at dose 6mg r1 in Experiment EM. Compari son of slopes (linear
regression) based on raw data (n=4) revealed significant (P=0.0202) differences. Values
represent means (n=4, ±SEM).
155
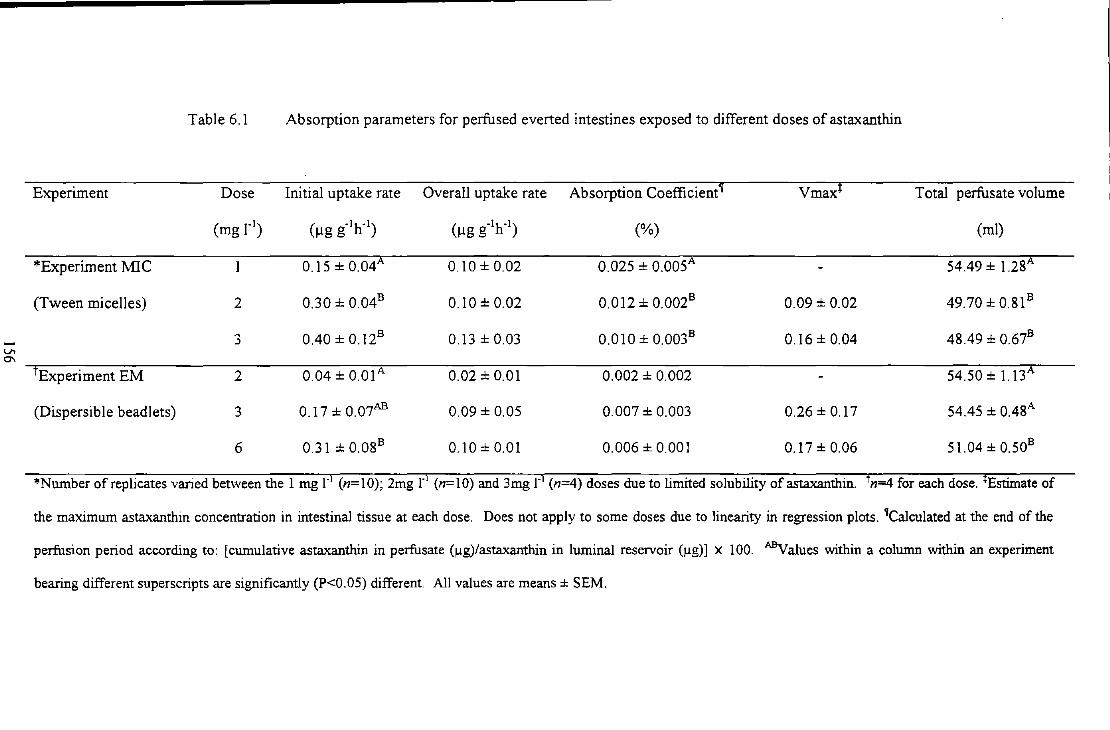
Table 6.1 Absorption parameters for perfused everted intestines exposed to different doses of astaxanthin
Experiment Dose Initial uptake rate Overall uptake rate Absorption Coefficient'~ Vmaxt Total perfusate volume
(mg 1"1) (!lg g"1h-1) (!lg g"1h-1) (%) (ml)
*Experiment MJC 0.15 ± 0.04 0.10 ± 0.02 0.025 ± 0.005 54.49 ± 1.28
(Tween micelles) 2 0.30 ± 0.048 0.10 ± 0.02 0.012 ± 0.0028 0.09 ± 0.02 49.70 ± 0.81 8
3 0.40 ± 0.128 0.13 ± 0.03 0.010 ± 0.0038 0.16±0.04 48.49 ± 0.678
V> 0\
fExperiment EM 2 0.04 ± 0.01A 0.02 ± 0.01 0.002 ± 0.002 54.50 ± l.l3A
(Dispersible beadlets) 3 0.17 ± 0.07AB 0.09 ± 0.05 0.007 ± 0.003 0.26 ± 0.17 54.45 ± 0.48A
6 0.31 ± 0.088 0.10±0.01 0.006 ± 0.001 0.17±0.06 51.04 ± 0.508
*Number of replicates varied between the I mg r1 (n= 1 0); 2mg r1 (n=l 0) and 3mg r1 (n=4) doses due to limited solubility of astaxanthin. f n=4 for each dose. tEstirnate of
the maximum astaxanthin concentration in intestinal tissue at each dose. Does not apply to some doses due to linearity in regression plots. ~Calculated at the end of the
perfusion period according to: [cumulative astaxanthin in perfusate (!lg)/astaxanthin in luminal reservoir (!lg)] X 100. ABvalues within a column within an experiment
bearing different superscripts are significantly (P<0.05) different. All values are means± SEM.
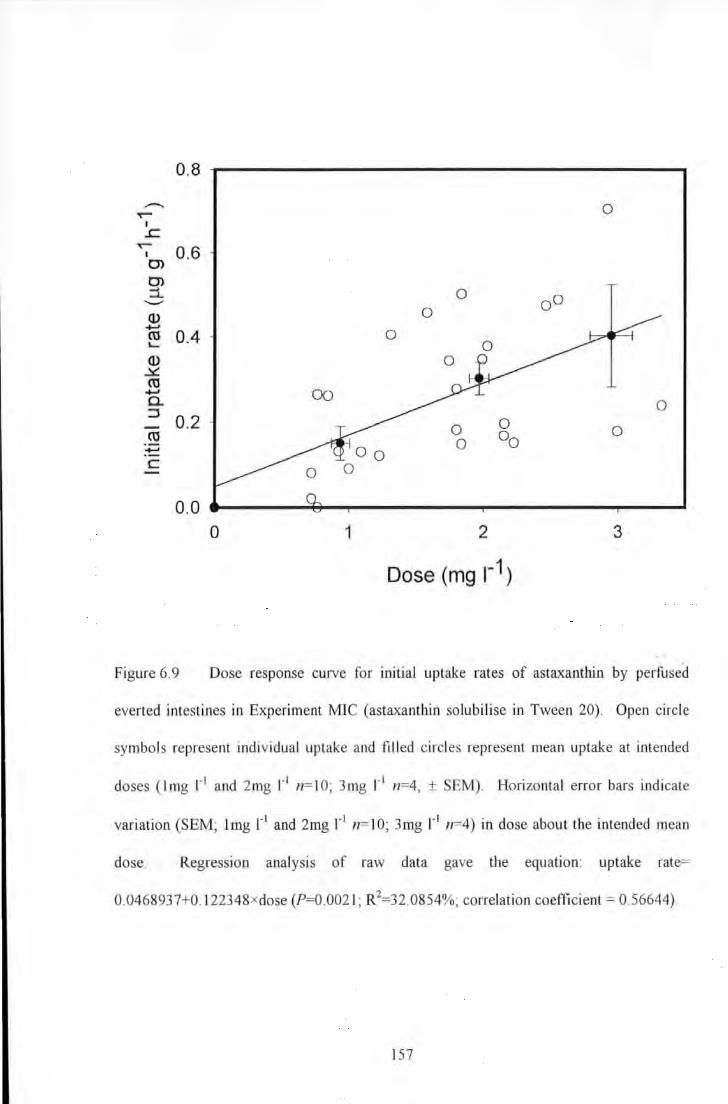
0.8
...- 0 T'"" I ..c.
T'"" 0.6 I
0> 0> :i. 0 oO ..._.... Q.) 0
........ ro 0.4 0 '-Q.) 0 ~ ro ........ 00 0. :J 0
0.2 0 0 0 ro oo ........ 0 c
0.0 0 1 2 3
Dose (mg r1)
Figure 6.9 Dose response curve for initial uptake rates of astaxanthin by perfused
everted intestines in Experiment MJC (astaxanthin so lubilise in Tween 20). Open circle
symbols represent individual uptake and filled ci rcl es represent mean uptake at intended
doses (Jmg r1 and 2mg r1 n= IO; 3mg r1 n=4, ± SEM). Horizontal error bars indicate
variation (SEM; lmg l"1 and 2mg r 1 n= IO; 3mg r 1 n=4) in dose about the intended mean
dose. Regression analysis of raw data gave the equation: uptake rate=
0.0468937+0.122348xdose (P=0 .0021 ; R2=32.0854%; correlation coefficient = 0.56644).
157
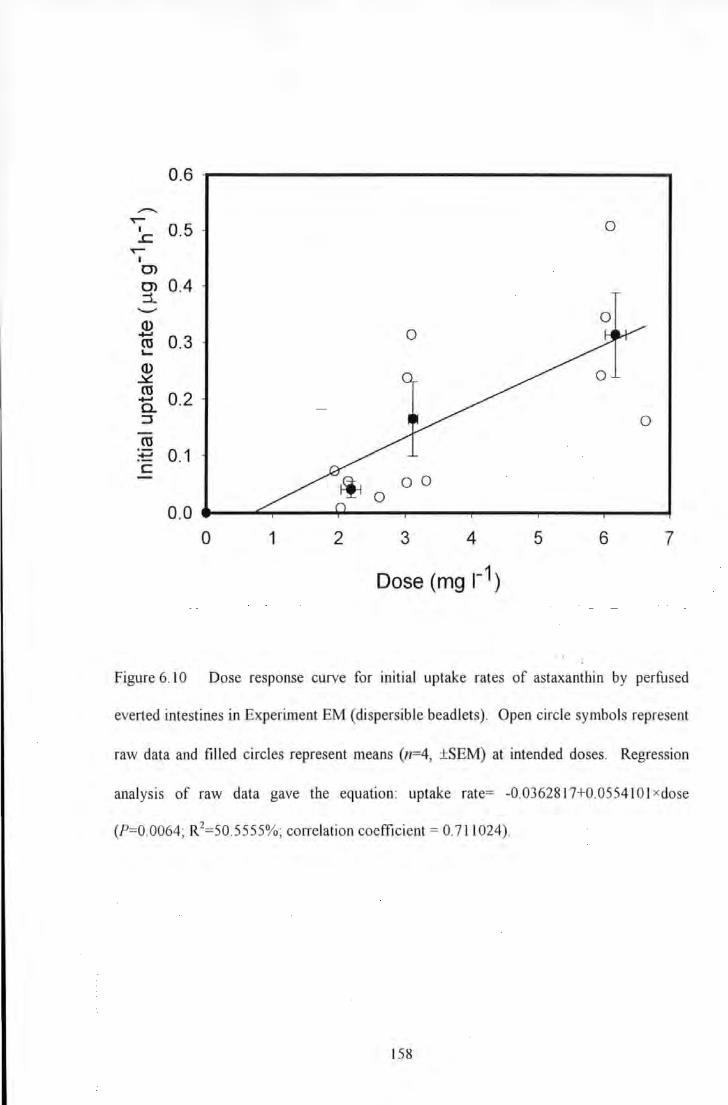
0.6
...-... ~ 0 I 0.5 ..c ~
I
0> 0> :i.
0.4 ..._...
0 Q)
+"" 0.3 ro I....
Q) ~ ro 0.2 +"" a. ::J
ro +"" 0.1 c
0.0 0 1 2 3 4 5 6 7
Dose (mg r1)
Figure 6. I 0 Dose response curve for initial uptake rates of astaxanthin by perfused
everted intestines in Experiment EM (dispersible beadlets). Open circle symbols represent
raw data and fi lled circles represent means (n=4, ±SEM) at intended doses. Regression
analysis of raw data gave the equation: uptake rate= -0.0362817+0.0554 I 0 I xdose
(?=0.0064; R2=50.5555%; co1Telation coefficient = 0.711 024).
I 58
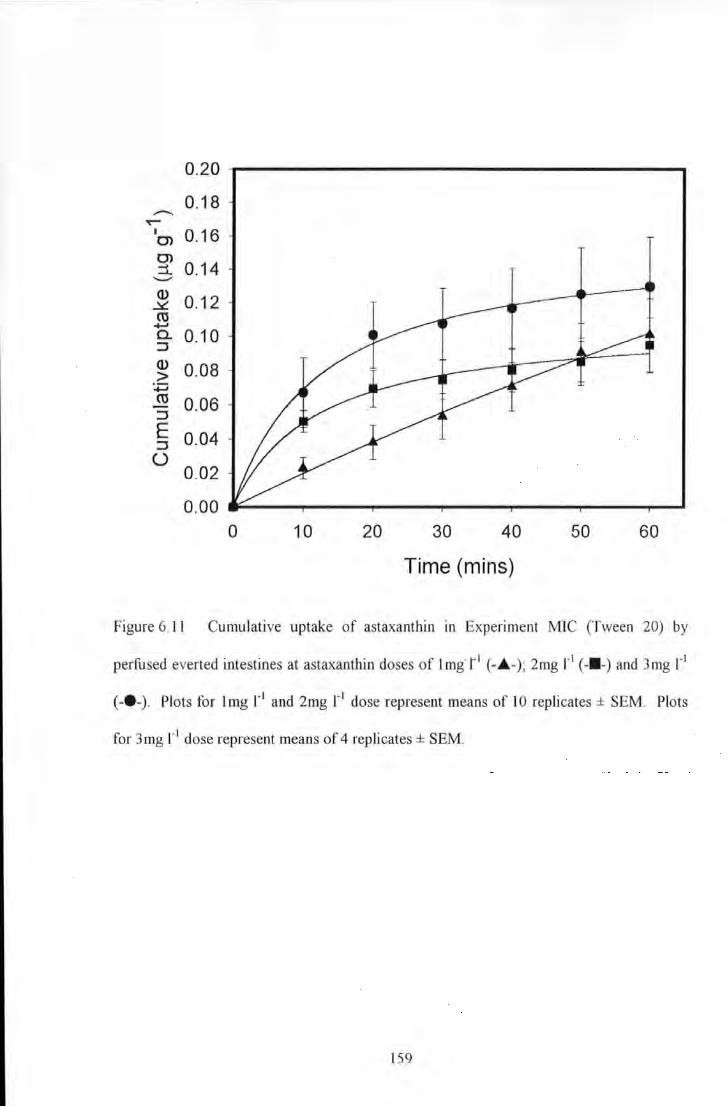
0.20 -.--------------------
0.18 --. T"""
'rn 0.16 CJ) :i 0.14 _.... Q)
.Y. 0.12 ro ...... 0.. ::J Q)
> ......
0.10
0.08
~ 0.06
E ::J 0.04 u
0.02
0.00 .... --or----~--,....---~--.,--__,.--0 10 20 30 40 50 60
Time (mins)
Figure 6.11 Cumulative uptake of astaxanthin in Experiment MIC (Tween 20) by
perfused everted intestines at astaxanthin doses of 1mg·r 1 (-.... -) ; 2mg r1 c-•-) and 3mg 1"1
(-e-). Plots for lmg r 1 and 2mg r t dose represent means of 10 replicates ± SEM. Plots
for 3 mg r1 dose represent means of 4 replicates ± SEM.
159
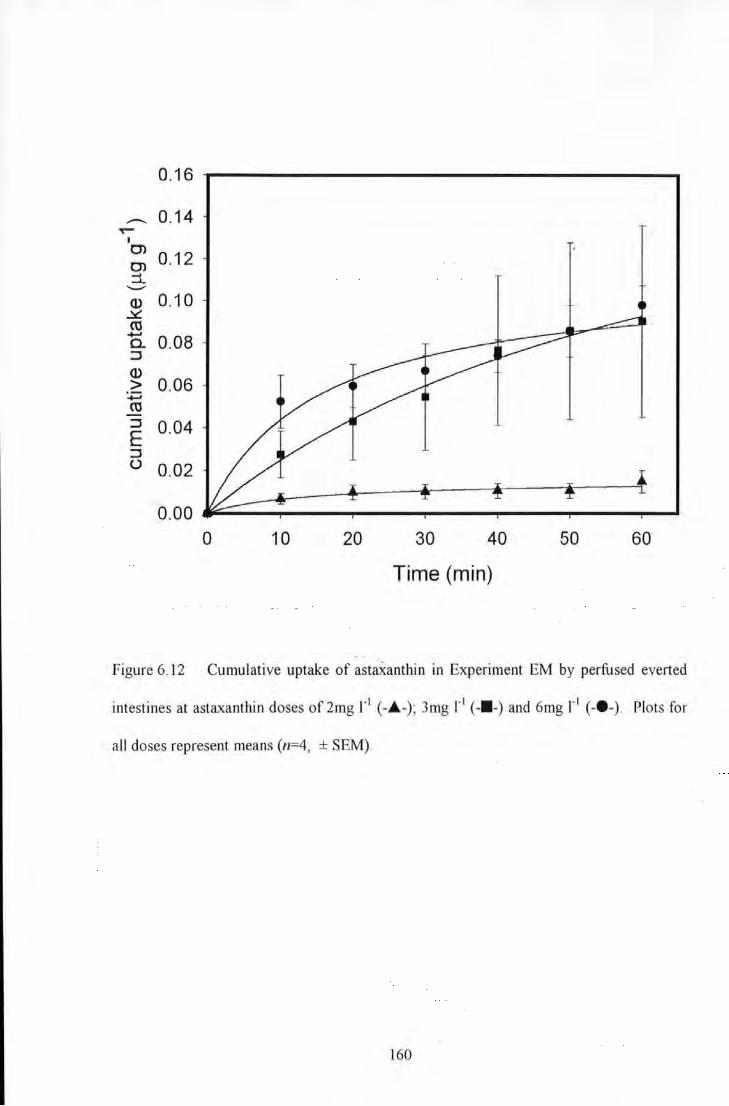
0.16
--- 0.14 ~
I 0>
0.12 0> :::t. ..._.,. Q) 0.10 ~ ro ......
0.08 a. ::J Q)
0.06 > ...... ro ::J 0.04 E ::J () 0.02
0.00 0 10 20 30 40 50 60
Time (min)
Figure 6.12 Cumulative uptake of astaxanthin in Experiment EM by perfused everted
intestines at astaxanthin doses of2mg 1"1 (-• -) ; 3mg r 1 (-· -)and 6mg r1 (-e-). Plots for
all doses represent means (n=4, ± SEM).
160
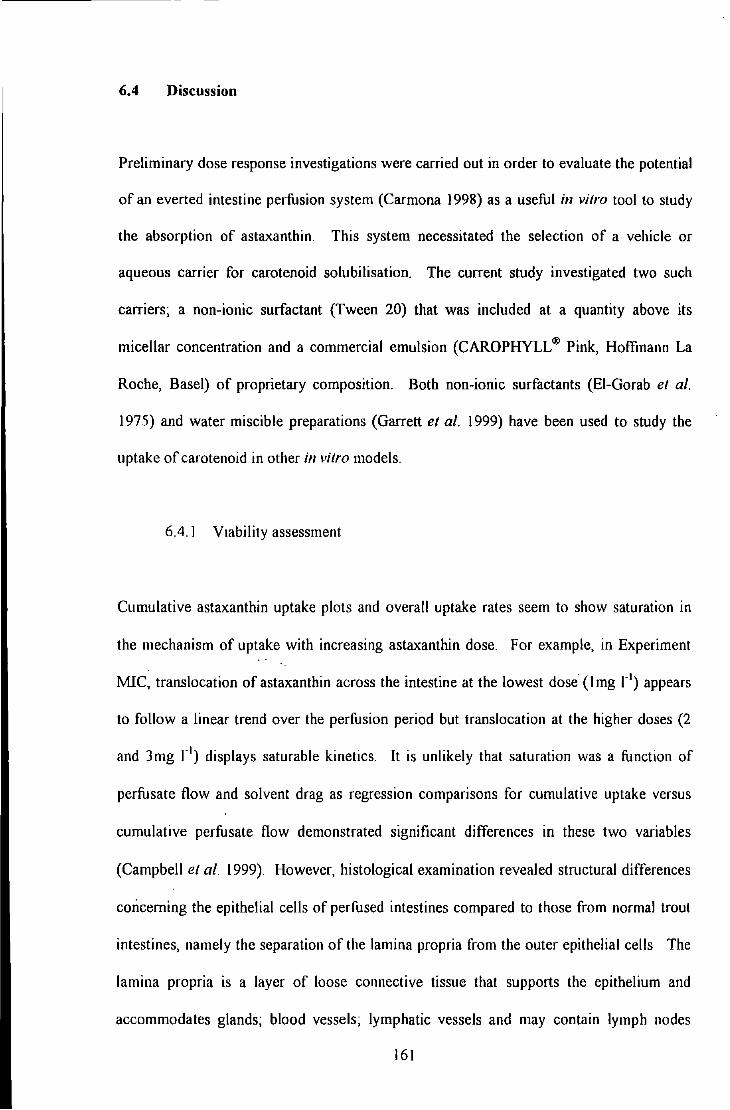
6.4 Discussion
Preliminary dose response investigations were carried out in order to evaluate the potential
of an everted intestine perfusion system (Carmona 1998) as a useful in vitro tool to study
the absorption of astaxanthin. This system necessitated the selection of a vehicle or
aqueous carrier for carotenoid solubilisation. The current study investigated two such
carriers; a non-ionic surfactant (Tween 20) that was included at a quantity above its
micellar concentration and a commercial emulsion (CAROPHYLL ® Pink, Hoffmann La
Roche, Base!) of proprietary composition. Both non-ionic surfactants (El-Gorab et al.
1975) and water miscible preparations (Garrett et al. 1999) have been used to study the
uptake of carotenoid in other in vitro models.
6.4.1 Vmbility assessment
Cumulative astaxanthin uptake plots and overall uptake rates seem to show saturation in
the mechanism of uptake with increasing astaxanthin dose. For example, in Experiment
MIC: translocation of astaxanthin across the intestine at the lowest dose· (I mg r•) appears
to follow a linear trend over the perfusion period but translocation at the higher doses (2
and Jmg l"1) displays saturable kinetics. It is unlikely that saturation was a function of
perfusate flow and solvent drag as regression comparisons for cumulative uptake versus
cumulative perfusate flow demonstrated significant differences in these two variables
(Campbell et al. !999). However, histological examination revealed structural differences
concerning the epithelial cells of perfused intestines compared to those from normal trout
intestines, namely the separation of the lamina propria from the outer epithelial cells The
lamina propria is a layer of loose connective tissue that supports the epithelium and
accommodates glands; blood vessels; lymphatic vessels and may contain lymph nodes
161
(Freeman & Bracegirdle 1967). This separation can often be a function of histological
procedures, however intact structure of epithelia and sub-muscular layers suggest that this
separation may have been caused by a constituents within the luminal reservoir saline.
Detergents or surfactants such as Tween 20 may solubilise tight junction within epithelial
cells causing layers to separate on fixation and sectioning during histological procedures.
Since this phenomenon was recorded in all cells and to the same extent at each astaxanthin
dose (determined from cell counts) it is unlikely that this result was due to astaxanthin
movement into lymphatics. Solubilisation of tight junctions would plausibly lead to
progressive increases in permeability with exposure time. Schep et al. (1998) investigated
the permeability of salmon (Oncorhynchus tshawytscha) posterior intestine to two
hydrophilic markers in the presence and absence of the bile salt sodium deoxycholate
(SDA) whose detergent action would mimic that of non-ionic surfactants. Not only did the
presence of the bile salt increase the permeability of the markers, but also histological
examination seemed to show the same separation of the lamina propria, although the
authors made no comment on this. Other authors have found no significant effects of bile
salt micelles on the permeability of intestinal preparations (Sallee et al. 1972) Indeed,
cumulative uptake plots for astaxanthin in the current investigation show rapid initial
uptake followed by saturation indicating uptake was independent of this effect.
Nevertheless, such changes induced in epithelia raise concerns over the use of surfactants
in in vitro studies.
6.4.2 Solubility of carotenoid
Solubility of astaxanthin was limited when dispersed with the surfactant (Tween 20) with
maxi mal concentration not exceeding 3. 5 mg r 1• Furthermore, desired carotenoid
concentration could not consistently be achieved due to unreliability in solubility.
162
Combination of these factors resulted in a dose response cuiVe over a narrow range of
concentrations with variability in averaged doses. However, based on the size range of fish
used in these studies (250-400g) and feed consumption (2% BW feed; 50mglkg carotenoid
inclusion) the maximum intake of carotenoid (ea. 0.4mg) is similar to the range of doses
investigated {0.45-1.35mg; based on luminal reseiVoir volume and astaxanthin
concentration). Due to the limited solubility of astaxanthin in Experiment MIC, attempts
were made to examine the uptake of astaxanthin at higher doses by using water miscible
beadlets containing astaxanthin (Experiment EM). The surfactant (Tween 20) was also
included in the medium to prevent bias in tissue viability. However, inconsistency in
uptake results between different stock solutions prevented extensive use of this method of
solubility (results presented for Experiment EM originate from one batch of stock
solution). A reason for inconsistency in uptake between stock solutions in this way may be
due to varied incorporation of astaxanthin from the emulsion into the included surfactant
(Tween 20) although possible partitioning was not determined. Similarly, Garrett et al.
(1999) found that almost one third of P-carotene from water miscible beadlets had failed to
incorporate into micelles when an attempt was made to make a solution of higher P
carotene concentration than could be achieved with micelles alone.
Discrepancies in uptake rates at similar doses between Experiment MIC (Tween 20) and
Experiment EM (water miscible beadlets) may be a result of differences in absorption of
astaxanthin from the two different vectors. This phenomenon has been recorded by several
groups that have used different vectors to study uptake of carotenoids in vitro (EI-Gorab et
al. 1975; Garrett et al. 1999b) and in vivo (MacMahon & Thompson 1969; Bi:ihm & Bitsch
1999). These findings may suggest that absorption of carotenoid can be influenced by the
use of different solubilising agents, yet whether this effect is biochemical and/or
physiological remains to be validated. Such variation calls for methods of solubilisation
163
that are more physiologically representative e.g. bile salt micelles, before extrapolation of
findings can take place from in vitro to in vivo situations.
6.4.3 Uptake of astaxantbin
Dose response curves for initial uptake rates of astaxantbin in both experiments showed a
significant proportional increase in uptake rate witb increasing astaxanthin dose. This
would agree with findings in vivo where blood carotenoid concentration have been
positively related to the carotenoid concentration of feed consumed (Choubert et al. 1994a;
Storebak.ken & Goswami 1996) and would tend to agree with the hypothesis that the
absorption of carotenoid occurs passively at those doses examined. Indeed, Kiessling et al.
(1995) stated that the concentration gradient for astaxanthin between intestinal contents
and blood of Atlantic salmon (Salmo salar) was influential on the uptake of this
carotenoid.
The process by which astaxanthin transfers from the mucosal medium to the serosal
perfusate is not clear from this model. However, in mammals in vivo it is believed that
once absorbed by the intestinal enterocyte (believed to be a passive process), carotenoids
are incorporated into chylomicrons before being secreted into the lymph for blood
transport (Fur & Clark 1997; Van den Berg 1999). Tbe assembly of chylomicrons is
dependent on absorption of lipids by the enterocyte; cellular lipid (re)synthesis and
translocation of cellular lipid pools; synthesis and post-translational modification of
various apolipoproteins and the assembly of lipid and lipoprotein components into a
chylomicron (V an Greevenbroeck & de Bruin 1998). Complex intracellular events such as
these could plausibly become saturated at various stages resulting in reduced astaxanthin
uptake. Hollander ( 1973) attempted to measure the translocation of a fat-soluble vitamin
164
(Vitamin K) across the intestine into the serosal fluid of mammalian (Sprague-Dawley rats)
everted gut sacs. Results from this study suggested that uptake (determined from tissue
concentrations) of this vitamin was via an active or facilitated transport system (saturable).
Furthermore, translocation of the vitamin into the serosal fluid was minimal which may
explain the saturable kinetics witnessed in the cumulative uptake plots from the current
study. Csaky (1984) indicated that studies of lipid absorption with in vitro intestine
systems are of limited usefulness as the epithelium rapidly accumulates the lipid and
cannot transport it out of the absorptive cell. Because many lipids of biological importance
are metabolised and incorporated into specific lipoproteins within the cell the rate of
appearance of these particles at the serosal surface does not reflect the rate of absorption of
the constitutive lipids across the intestinal brush border (Sallee et al. 1972). However,
earlier studies (Loran et al. 1961; Loran & Althausen 1969) did demonstrate the transport
of a fat-soluble vitamin across the intestine into serosal medium by including a solubilising
agent (Tween 80) in the serosal medium. In the current study, Tween 20 was included in
the serosal medium at a similar percentage to that in the luminal reservoir (0.3%).
Percentage inclusion of this solubilising agent was not increased so as to avoid differences
in osmotic gradient and technical difficulties associated with HPLC analysis.
There is evidence in the literature to suggest that lipid absorption in rainbow trout is quite
different to that in mammals. Analysis of blood following force feeding with radiolabelled
palmitic acid suggested that fish are incapable of delivering triglyceride to its circulation in
the usual way and that most of the lipid is absorbed as free fatty acids, probably via the
portal system (Robinson & Mead 1973). Indeed other authors have presented evidence
that suggests fish do not have true lymphatics (Vogel & Claviez 1981; Vogel 1985).
However Sire et al. ( 1981) demonstrated that fatty acids are re-esterified in the trout
intestine mucosal cells and transported m very low density lipoprotein like structures.
165
Furthermore, later studies have isolated chylomicrons from fish serum (Rogie & Skinner
1981; Fremont et al. 1981; Sheridan et al. 1985). Sheridan et al. ( 1985) suggested that
lipid absorption in fish may be a two-step process whereby soluble short chain fatty acids
and carrier bound fatty acids are absorbed directly and a slower system where
triacylglycerol (TAG) rich lipoprotein particles are formed. Since carotenoids and lipid
absorption are associated, this potential route for absorption of carotenoids and its
importance requires clarification.
It is interesting to note that the predicted Vmax values for tissue saturation of astaxanthin
(0.1-0.3 11g g" 1) are similar to findings for intestinal tissue astaxanthin concentrations stated
in a previous study by the author (Chapter 3; 0.2-0.91-lg g" 1). However, data from that
study suggested that there were significant differences between the ileal and hind intestine
in terms of astaxanthin absorption. The current model used preparations that comprised
both these regions and normalisation of data was based on total weight of the two. This
may in part explain the large variation between replicates. As such future perfusion
investigations should be carried out with isolated regions of intestine i.e. ileal and hind
intestine to distinguish potential differences.
The perfusion system used in this investigation has been used successfully to describe the
cumulative translocation of astaxanthin across the intestine of rainbow trout and determine
initial uptake rates for this carotenoid. Limitations associated with tissue viability;
solubility of the carotenoid in aqueous media and issues of variability in uptake between
solubilising agents prevented more detailed interpretation of dose response investigations.
Those processes that influence translocation of carotenoid across the intestine are
obviously complex and difficult to interpret with the current model. As such future
developments with similar in vitro models should be focussed on the use of preparations
166
I'
[,
'that permifdireet and. r11pi~ as§es~ment cif carotenoid! 'absorpti()il: by.. iritesti~.iil ~Issue e:g. ·-
evertel.il gut sacs, and the use .cit:1rii6re IPhysi()logically representative niearui ofcarqte,noid
soJubllisatiOil such !lSibiJ(!"Salt micelles:
167
CHAPTER 7.0
USE OF EVERTED GUT-SACS TO COMPARE THE ABSORPTION OF
ASTAXANTHIN IN SALMONID FISH.
7.1 Introduction
The producers of high value salmonid species are in no doubt that the use of salmonids
feeds which contain carotenoids and ultimately result in the red colouration of fish flesh is
a vital asset to the market value of these fish. Indeed, feeding of pigments is regarded as
the most important management practise for marketing of farmed salmon (Moe 1990).
Furthermore, Torrissen & Christiansen (1995) have suggested that astaxanthin should be
regarded as a vitamin for fish and should be included in feed to ensure the health of the
animal. However, astaxanthin may account for 15-20% of the total feed cost or 6-8% of
the total production cost of Atlantic salmon (Torrissen 1995). Consequently, knowledge of
those factors that may affect the pigmentation is at the forefront of carotenoid research. A
variety of biotic and environmental factors may influence the utilisation of carotenoids by
salmonids. However, it is not well understood which factors, if not all, influence the
absorption of carotenoids at the gastrointestinal level.
Changes in intestinal permeability and properties of the unstirred water layer are known to
occur with ageing and will influence absorption of lipid-soluble nutrients (Hollander &
Tarnawski 1984). Bjerkeng et al. (1992) studied the pigmentation of rainbow trout from
start feeding to sexual maturation and found body redistribution of carotenoids coinciding
with smoltification and sexual maturation. These authors suggested that these findings
could be explained by changes in carotenoid absorption; transport capacity; affinity for
carotenoid in various tissues or to catabolism. In mammalian models, size or age has been
168
shown to be an influential factor in the intestinal absorption of vitamin D (Hollander &
Tarnawski 1984) yet has no influence on the absorption of vitamin A (Hollander &
Morgan 1979). Studies have shown that rainbow trout below an average weight of ea.
1 50g do not efficiently deposit pigment in their flesh (Abdul-Malak et al. 1975; Torrissen
1985a). Similarly, juvenile Coho salmon (Oncorhynchus kisutch) of ea. 80g weight are
virtually unable to assimilate astaxanthin from the diet and deposit it in the flesh when
raised in fresh water (Arai et al. 1987).
Water temperature significantly influences growth and metabolism in fish (reviewed by
Smith 1989) As fish are poikilotherms, their metabolism and nutrient utilisation are likely
reduced at low temperatures. Commercial salmonid culture in outdoor ponds/lakes is
subject to both regional and temporal fluctuations in ambient temperature. A reduction in
environmental temperature increases the gastrointestinal holding time (Fange & Grove
1979; Fauconneau et al. 1983) leaving more time for efficient digestion and potentially
counteracting reduced digestive enzyme activity. Indeed, the rate of gastric digestion in
fingerling sockeye salmon (Oncorhynchus nerka) expresses an optimum at ea I 5°C (Brett
& Higgs 1970) However, in salmonids, some studies have reported lower apparent
digestibility coefficients (ADC) of nutrients with decreases in temperature (Atherton &
Aitken 1970; Brauge et al. 1995; Olsen & Ring0 1998; Medale et al. 1999) while others
have found no influence (Windell et al. 1978). A key study by No & Storebakken (1991)
recorded that rainbow trout kept at two different temperatures (1 5°C and 5°C) and fed
dietary astaxanthin tended to absorb astaxanthin (according to digestibility values) more
efficiently at the higher temperature, although pigmentation was not significantly different.
Genetic differences associated with intestinal uptake of fatty acids have been demonstrated
in mice (Keelan et al. 2000). Previous studies have demonstrated interspecific differences
169
between rainbow trout and Atlantic salmon in their ability to utilise and efficiently deposit
ingested pigment (Foss et al. 1984; Storebakken et al. 1985; Storebakken et al. 1986;).
Furthermore, compared with rainbow trout, Atlantic salmon have been shown to
demonstrate more constant plasma astaxanthin concentrations regardless of dietary
astaxanthin levels, indicating that the absorptive capacity of the salmon intestine may limit
the amount of astaxanthin that can be advantageously added to their diet (March &
MacMillan 1996).
The following study presents a series of experiments carried out to examine the effects of
environmental (temperature) and biotic (size and species comparison) factors on uptake of
astaxanthin in vitro by everted intestine sacs taken from rainbow trout (Oncorhynchus
mykiss) and Atlantic salmon (Salmo salar).
7.2 Materials and Methods
7.2.1 Experimental system
The everted gut-sac preparation used throughout the investigations was based on
methodology of Wilson & Wiseman ( 1954). Everted intestines were mounted in a gassed
(95% 02; 5% C02) bath or luminal reservoir (15cm x llcm) containing a physiological
saline designed for trout (AI-Khalifa and Simpson, 1988) of composition (g 1"1): NaCI
7.37g; KCL 0.31g; CaC~ O.l7g; MgS04 O.l4g; KH2P04 0.46g; Na2HP04 2.02g; 0.1%
glucose (pH 7. 3). When Atlantic salmon intestine was used, the NaCI content of the saline
was increased to 8.77g 1" 1 (Nordrum et al. 2000}. The everted intestines were laid on a
polythene mesh support ( 15cm x 8cm) above a magnetic flea, rotated using a magnetic
stirrer (HI 190M, HANNA Instruments, U.K.) to ensure efficient flow of oxygenated
170
saline across the intestinal mucosa. The preparation was maintained at a desired
temperature (commonly 1 5 ± 1 aq below that of ambient (if required) by circulating
chilled water around the luminal reservoir.
7.2.2 Preparation of a micellar solution
Simple micelles of sodium salt and carotenoid were prepared according to simplified
methodology of Canfield et al. ( 1990). Approximately 30mg of crystalline astaxanthin
were dissolved in lOOm! of dichloromethane containing 25mg of BHT. The solvent was
then evaporated in a 250ml round bottom flask almost to dryness (remaining wet film).
lOOm! of sodium taurocholate solution (0.1 M) were then added to the flask and the
contents shaken vigorously. The turbid solution was then placed in a sonicating water bath
at 50°C for 2hrs with occasional shaking whilst maintained within a fume hood. On
completion of sonication the solution was made to a final volume of 1 litre by adding
physiological saline. The mixture was then transferred to ultra centrifuge tubes and
centrifuged at 4°C for 4hrs at 50,000 X g. Post centrifugation the clear micelle solution
was additionally filtered (Whatman no.1).
The micellar solution (filtrate) was then analysed immediately for astaxanthin by adding
2ml of solution to 2ml of methanol and 6ml of dichloromethane in a 20ml glass vial. The
contents were then vortexed for 30 seconds and placed in the darkness for a 10min
extraction period. The samples were then centrifuged at 20 I 0 X g for 1 Omin and 3 mls of
the resultant hypophase extracted and blown down under a gentle stream of nitrogen.
Samples were either re-suspended in hexane and analysed by HPLC (see section 2.4.10),
or, stored at -20°C prior to analysis. All analyses were performed in triplicate. Micelle
171
solutions were used within 24hrs to ensure stability. Observations to support micellar
incorporation were as described by Garrett et al. ( 1999).
7.2.3 Preparation of the intestine
Fish were taken from the holding facility (see sections 2.2.2) and immediately culled via a
blow to the cranium followed by destruction of the brain (Schedule I, Home Office
Procedures). Fish weight was recorded The gastrointestinal tract was promptly dissected
from the fish and the stomach and pyloric region (indicated by the first pyloric diverticular)
separated from that of the remaining intestine (ileal and posterior region), and discarded.
The remaining intestine was immediately placed in l OOml glass beaker containing both
chilled (5°C) and gassed (95% oxygen, 5% C02) physiological saline for an initial period
of recovery. Fat deposits adhering to the intestine were carefully removed from the organ
using tweezers and a scalpel. The intestine section was then everted on a stainless steel rod
(300mm x 2mm) by securing the ileal end (suture) and rolling the proximal region over it.
Once removed from the rod, the proximal end of the intestine was closed with suture and
the anterior end secured to a syringe containing chilled physiological saline. The intestine
was then filled with saline until distended and removed from the syringe whilst securing
tightly. The preparation was then placed in the luminal reservoir containing 450ml of the
micellar solution containing astaxanthin for a typical exposure period of 50 min.
7.2.4 Carotenoid extraction from intestine
Following the exposure period intestinal sacs were removed from the micellar solution and
thoroughly washed in a beaker containing saline and sodium taurocholate (I OmM). The
secured suture was then cut away and the serosal fluid drained and discarded, ensuring the
172
tissue was washed in saline simultaneously to avoid contamination. A section of ileal and
posterior intestine were then separated; blotted dry; weighed separately and placed in 20ml
glass vials. Methanol (2ml) and distilled water (2ml) was then added to the vials, and the
contents homogenised. Dichloromethane (6ml) was then added to each fraction, followed
by vortexing and a l Omin extraction period in darkness. Vial contents were then given a
fmal vortex and centrifuged at 20 l 0 X g for lO m in at 5°C. An aliquot of the resultant
hypophase (3ml) was then blown down under a gentle stream of nitrogen and stored at -
20°C until analysis. Samples were re-suspended in 250J.tl of n-hexane before injection into
the HPLC system for carotenoid quantification (see section 2.4.1 0).
7.2.5 Viability experiments
A number of parameters were assessed throughout the investigations to ensure the viability
of the preparation and the subsequent value of the data obtained.
7.2.5.1 Peristaltic contractions
Observations of sudden and spontaneous contractions are normal for intestine preparations
and are usually taken as an indicator of physiological viability. Only when contracture was
severe and prolonged was this considered as an indicator of decreased viability and the
data was duly disregarded.
7.2.5.2 Tissue lactate-dehydrodgenase (LDH), potassium and moisture content
Measurements of lactate dehydrogenase (LDH) and potassium content of normal (initial)
and micelle exposed ileal and posterior intestines were compared (n=6). Briefly, ea. 0 5g
173
of tissue was homogenised in 8ml of distilled water. The homogenates were then
centrifuged at 50, 000 X g for 30min. The supernatant was then assessed for potassium
concentration using a flame photometer {CORNING 480). A 1 in 10 dilution was
performed on the supernatant before assessment of LDH was carried out. A significant
decrease in this cytosolic enzyme in tissue preparations would indicate tissue damage and
reduced viability. The LDH assay was based on the kinetic pyruvate reduction method that
detects the disappearance of NADH at 340nm (Sigma diagnostics DG1340-K, Poole,
U.K.)
Moisture analysis of tissue samples was carried out by drying tissue samples as previously
described (see sections 2.1.5)
7.2.6 Statistics
All data was analysed using StatGraphics Plus for windows (version 4.0). Data were
subjected to tests for normality before carrying out statistical tests. A one-way ANOV A
was used to compare the uptake of astaxanthin at different temperatures, between species
and tissue viability measurements between control and exposed intestine. Regression
analysis of astaxanthin uptake over time and uptake vs. fish weight was performed using
Sigma Plot 4.0.
7.2.7 Experiment I: Tissue saturation
In order to define a suitable experimental exposure period (within linear uptake range) an
experiment was carried out to determine the uptake of an above average physiological dose
(5.1 ± 0.2mg 1" 1) of dietary astaxanthin over a I hour exposure period with tissue uptake
174
assessment carried out after 30min and 60min. Six individual tissue preparations were
analysed at both time points with both the ileal and posterior intestine assessed for
astaxanthin content.
7.2.8 Experiment 2: Fish size effects
An experiment was carried out to determine whether rainbow trout from two different size
classes (204-302g and 802-1689g) displayed differences in intestinal uptake capabilities
for astaxanthin. Six preparations from each size class were exposed to a micelle solution
ofastaxanthin (4.3 ± O.Jmg 1"1) for a 50min period. Both ileal and posterior intestine were
analysed for tissue accumulation of carotenoid
7.2.9 Experiment 3: Temperature effect
The effect of temperature on intestinal uptake of carotenoid was examined at three
exposl\re temperatures (8°C, l5°C and 20°C) that may represent typical aquaculture
rearing conditions through both temporal and spatial variation Six intestinal preparations
from rainbow trout were examined at each temperature with an exposure dose of 3.9 ±
O.lmg 1" 1 for a period of50min.
7.2.10 Experiment 4: Species comparison
ln order to determine whether inter-specific differences in intestinal uptake of carotenoid
exist between salmonid species, a comparison was made between rainbow trout and
Atlantic salmon (Salmo salar). Seven intestinal preparations from each species were
exposed to a micelle solution of astaxanthin for a period of 50min of concentration 4.3 ±
175
0.04mg r1 and 4.3 ± 0.05mg r1 for trout and salmon, respectively, after which they were
assessed for tissue accumulation of astaxanthin.
7.3 Results
7.3.1 Viability
Assessment of viability criteria revealed that the gut-sac preparation remained
physiologically viable throughout the 50min exposure period. LDH activity (Figure 7.1)
was significantly higher (P<0.05) in the posterior intestine (ca.ll6-120 U g- 1) compared to
the ileal intestine (ea. 74-79 U g-1), regardless of whether the tissue had been exposed to
the micelle medium (P=0.0037), or not (P=O.OOOI). However, no significant differences
(P>0.05) were noted between micelle exposed and control intestinal samples from either
the ileal (78.47 ± 9.92 and 73.79 ± 5.07 U g- 1, respectively) or posterior (119.54 ± 4.53 and
116 ± 4.00 U g- 1, respectively) region (n=6, ± SEM).
Interestingly, potassium concentration (Figure 7.2) was also significantly higher in the
posterior region (ea. 57-64 IJmol g-1) compared to the ileal intestine (ea. 51-53 11mol g-1
) in
both micelle exposed (P=O.OOOI) and control tissues (P=0.0254). Furthermore, potassium
concentration in the exposed posterior intestine (63.58 ± 0.64 j.lmol g- 1) was significantly
higher (P=O.OOOI) than in the control samples of posterior intestine tissue (57.48 ± 0.67
IJmol g-1). However, no significant differences (P>0.05) were recorded between the
potassium content of the control (53.34 ± 1.43 IJillOI g- 1) and exposed (5174 ± 1.53 IJillOI
g- 1) ileal intestine.
176
No significant differences (P>O.OS) were recorded for moisture content (Figure 7.3)
between the ileal and posterior intestine region. Moreover, no significant differences
(P>O.OS) in moisture content were noted between control and exposed ileal (80.24 ± 0.30
and 81.33 ± 0.30 %, respectively) and posterior (79.52 ± 0.27 and 78.88 ± 0.27 %,
respectively) regions {n=6, ±SEM).
7.3.2 Time saturation
In experiment 1, tissue astaxanthin concentration m the ileal and posterior intestine
increased from time 0 {0.15 ± 0.12 and 0 !lg g-1, respectively) to 60min (2.64 ± 0.42 and
0.09 ± 0.02 !lg g- 1, respectively; n=S, ± SEM) when exposed to astaxanthin micelles
(Figure 7.4) The result of fitting linear regressions to the time saturation data suggests
that uptake of astaxanthin by the ileal intestinal tissue followed a significant positive
relationship (P=0.0045) over the 60 ruin period at the dose investigated (5.1 ± 0.2 mg r1).
Interestingly, uptake of astaxanthin by the posterior intestine showed no similar significant
trend (P>0.05). Furthermore, tissue astaxanthin concentrations in the posterior intestine
were significantly lower compared to the ileal intestine at 30min (P=0.0001) and at 60min
(P=0.001). For experiments 2-4 doses of astaxanthin were kept below 5mg 1" 1 (-4mg 1" 1)
and exposure time was limited to SOmin (all results recalculated to express uptake over
60min). This ensured astaxanthin uptake would be compared within the linear phase
according to the results from experiment 1.
7.3.3 Size effects
Comparisons of intestinal uptake by two different size classes of rainbow trout in
experiment 2 (Figure 7.5) revealed no significant relationships between fish weight and
177
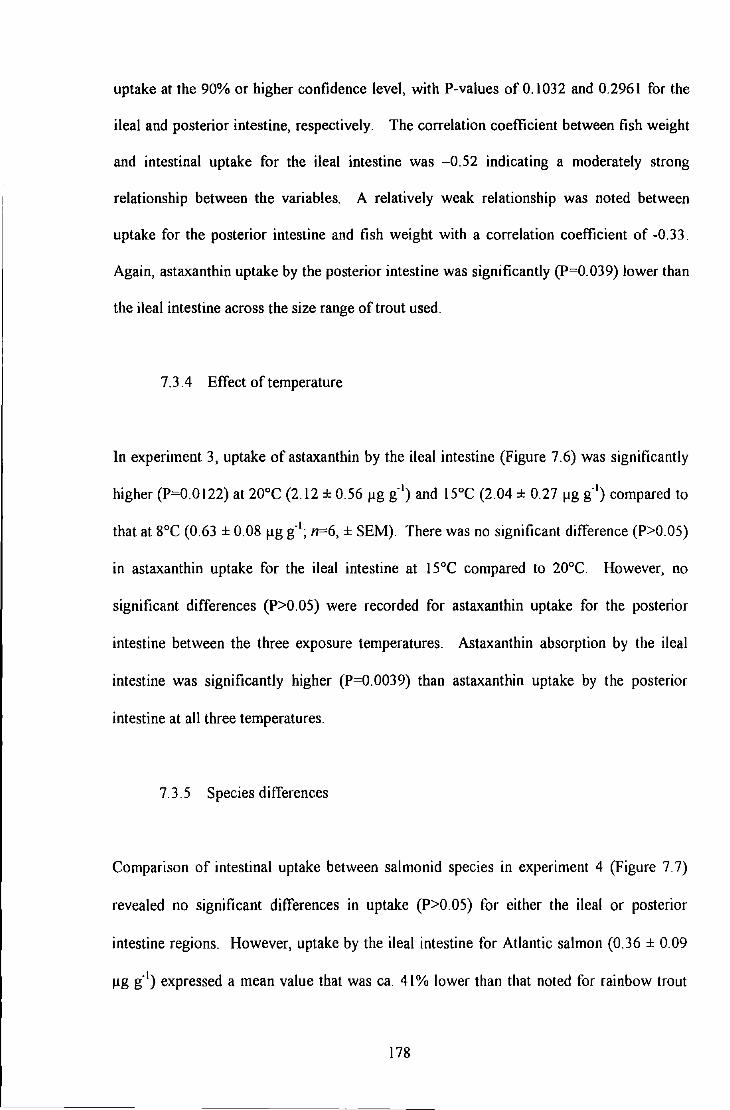
uptake at the 90% or higher confidence level, with P-values of 0.1032 and 0.2961 for the
ileal and posterior intestine, respectively. The correlation coefficient between fish weight
and intestinal uptake for the ileal intestine was -0.52 indicating a moderately strong
relationship between the variables. A relatively weak relationship was noted between
uptake for the posterior intestine and fish weight with a correlation coefficient of -0.33.
Again, astaxanthin uptake by the posterior intestine was significantly (P=0.039) lower than
the ileal intestine across the size range of trout used.
7.3.4 Effect of temperature
In experiment 3, uptake of astaxanthin by the ileal intestine (Figure 7.6) was significantly
higher (P=O.O 122) at 20°C (2.12 ± 0.56 llg g·1) and I5°C (2.04 ± 0.27 llg g·1
) compared to
that at 8°C (0.63 ± 0.08 llg g·1; n=6, ± SEM) There was no significant difference {P>O OS)
in astaxanthin uptake for the ileal intestine at I5°C compared to 20°C. However, no
significant differences (P>O.OS) were recorded for astaxanthin uptake for the posterior
intestine between the three exposure temperatures. Astaxanthin absorption by the ileal
intestine was significantly higher (P=0.0039) than astaxanthin uptake by the posterior
intestine at all three temperatures.
7.3.5 Species differences
Comparison of intestinal uptake between salmonid species in experiment 4 (Figure 7. 7)
revealed no significant differences in uptake (P>O.OS) for either the ileal or posterior
intestine regions. However, uptake by the ileal intestine for Atlantic salmon (0.36 ± 0.09
llg g" 1) expressed a mean value that was ea. 41% lower than that noted for rainbow trout
178
,• '• ·. "
t(b:62 ±;.0!091 J.1Kg{1~ .. \!Jp!ake ,·by, tlie ~posterior intestine, wlls !lg!li.o ,signif!<:~tndy IQw~r~than . . .
itha._tof,the ilealiregion,fmtboth,trout (P"'Or.0064)iandi salmon (P=O.O,l104).
{79
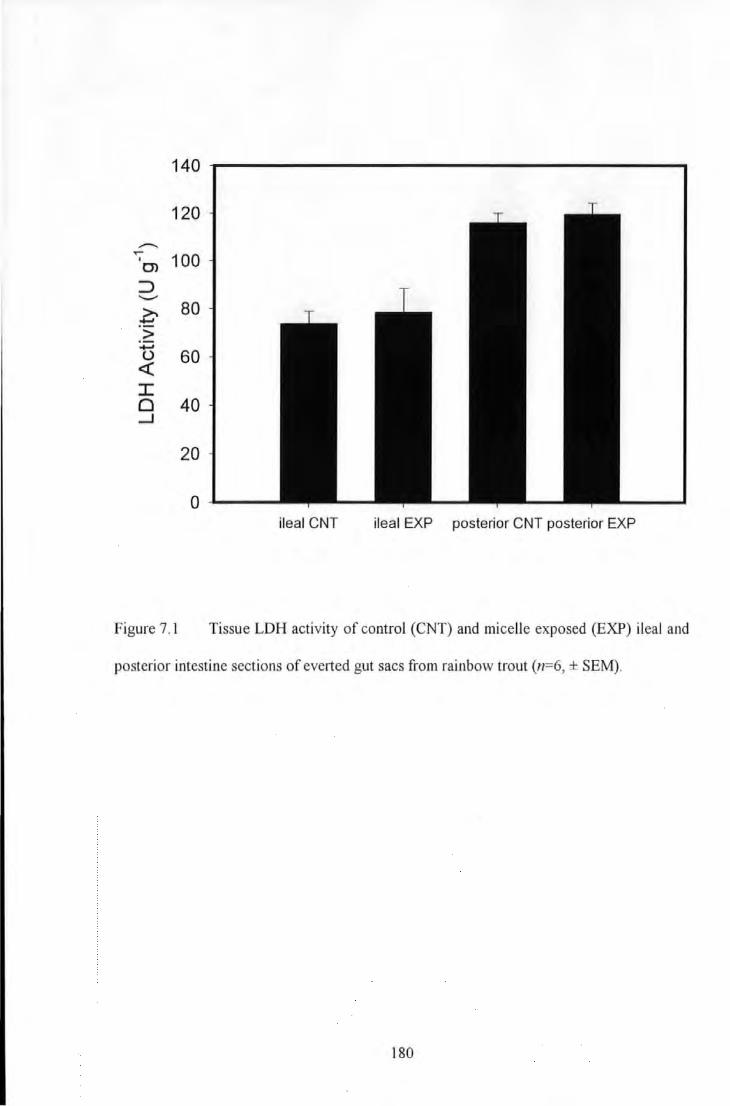
140
120
---..-100 I
0>
:::> ..._.... >.
:t= 80
> ....., () 60 <(
I 0 40 _J
20
0 ileal CNT ileal EXP posterior CNT posterior EXP
Figure 7.1 Tissue LDH activity of control (CNT) and micelle exposed (EXP) ileal and
posterior intestine sections of everted gut sacs from rainbow trout (n=6, ± SEM).
180
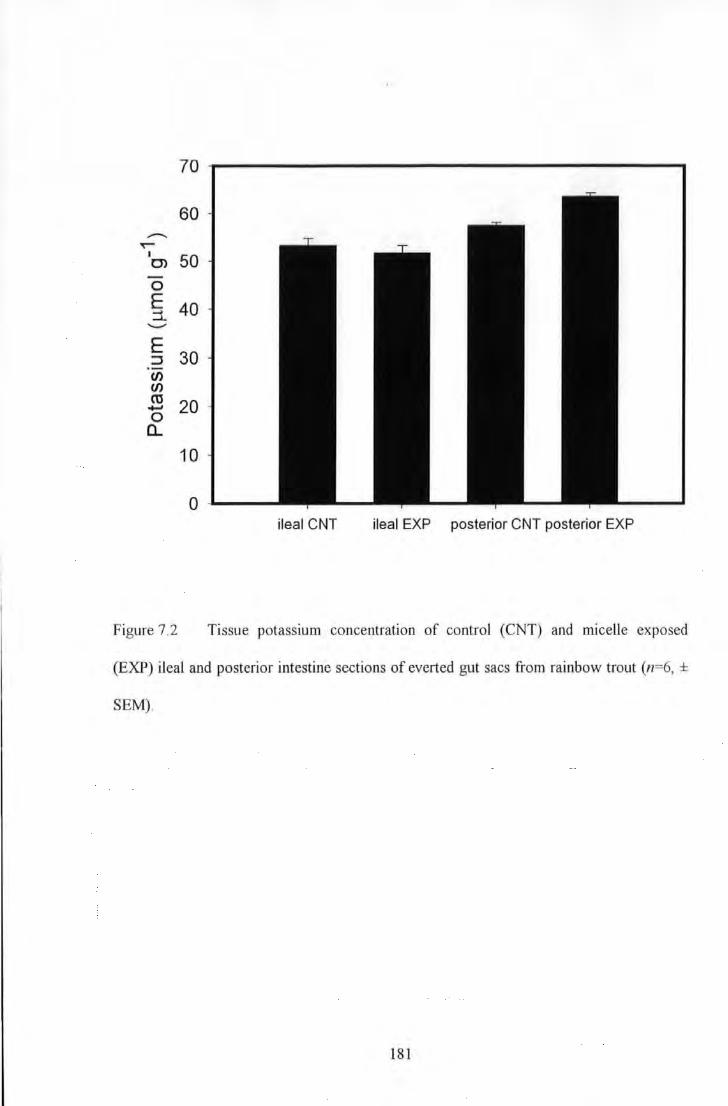
70
60 --. ~
I 50 0>
0 E 40 ::i ..._
E 30 :::J
en en ro 20 ....... 0
a.. 10
0 ileal CNT ileal EXP posterior CNT posterior EXP
Figure 7 .2 Tissue potassium concentration of control (CNT) and micelle exposed
(EXP) ileal and posterior intestine sections of everted gut sacs from rainbow trout (n=6, ±
SEM).
181
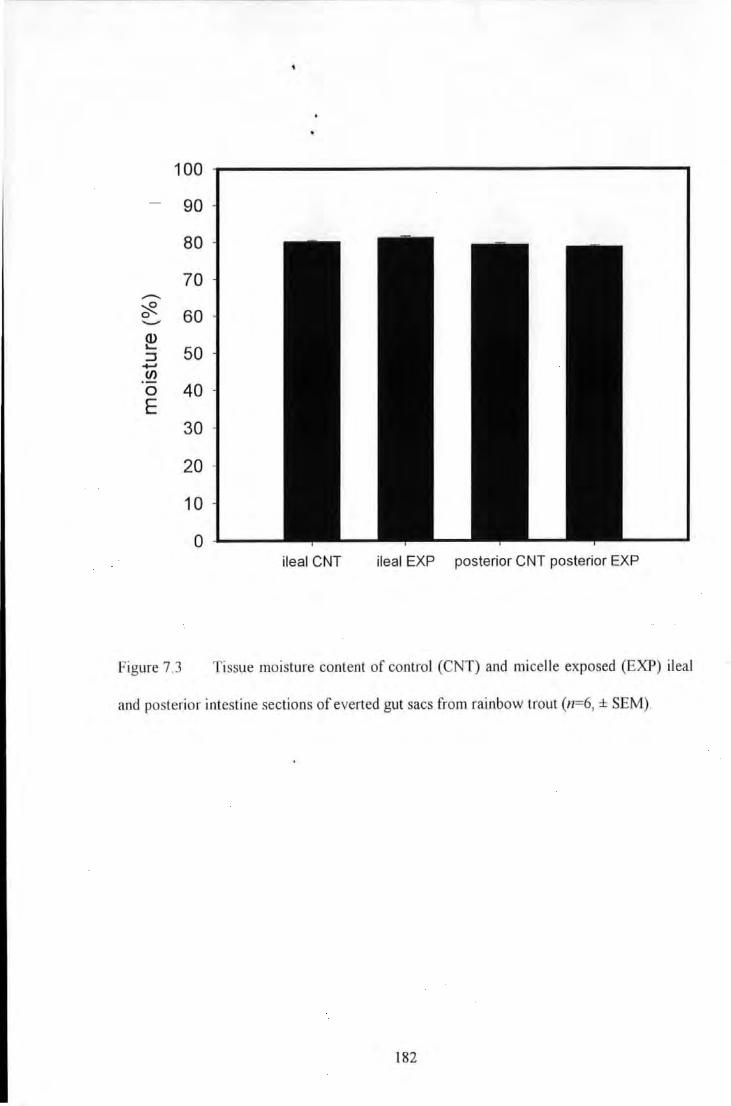
100
90
80
70 ...-~ 60 0 ..._... Q) '- 50 ::I ...... Cf)
0 40 E
30
20
10
0 ileal CNT ileal EXP posterior CNT posterior EXP
Figure 7.3 Tissue moisture content of control (CNT) and micelle exposed (EXP) ileal
and posterior intestine sections of everted gut sacs from rainbow trout (n=6, ± SEM).
182
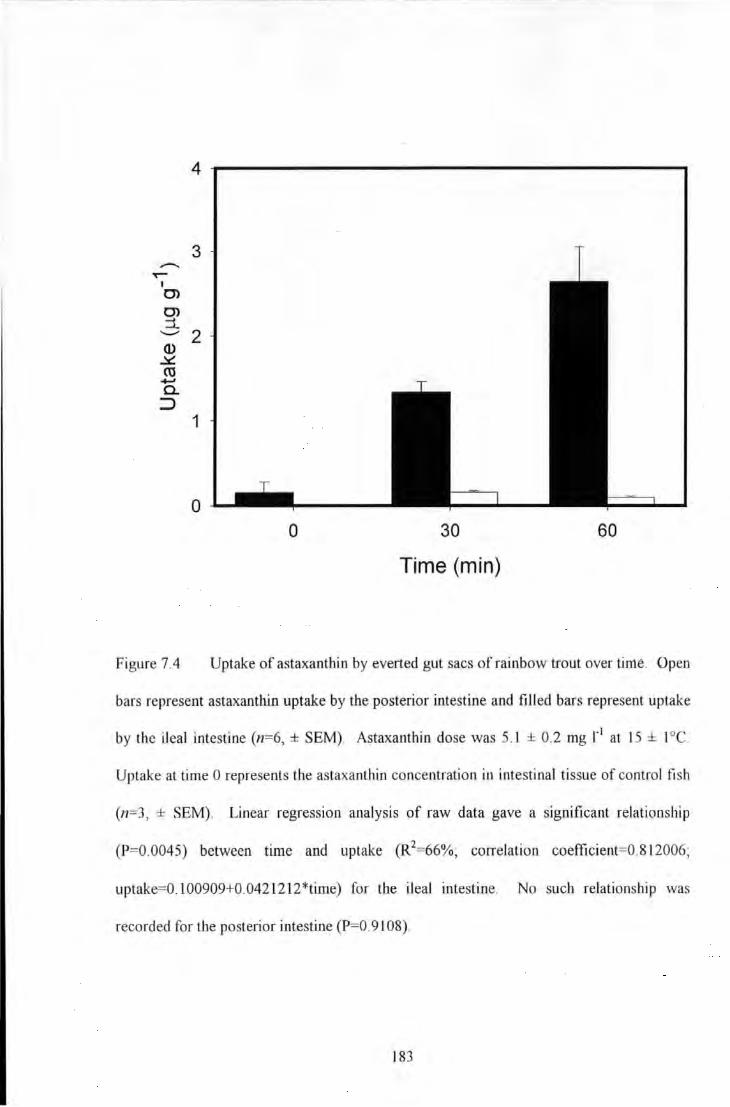
,..-..... "'t'""""
I C)
C) :::L ....._... ()) ~ ro -tJ
0.. ::>
Figure 7.4
4
3
2
1
0 0 30
Time (min)
60
Uptake of astaxanthin by everted gut sacs of rainbow trout over time. Open
bars represent astaxanthin uptake by the posterior intestine and filled bars represent uptake
by the ileal intestine (n=6, ± SEM). Astaxanthin dose was 5.1 ± 0.2 mg r1 at 15 ± I oc.
Uptake at time 0 represents the astaxanthin concentration in intestinal tissue of control fi sh
(n=3, ± SEM). Linear regression analysis of raw data gave a significant relationship
(P=0.0045) between time and uptake (R2=66%; correlation coefficient=0.812006;
uptake=O. l00909+0.042 l2 l2*time) for the ileal intestine. No such relationship was
recorded for the posterior intestine (P=0.91 08).
183
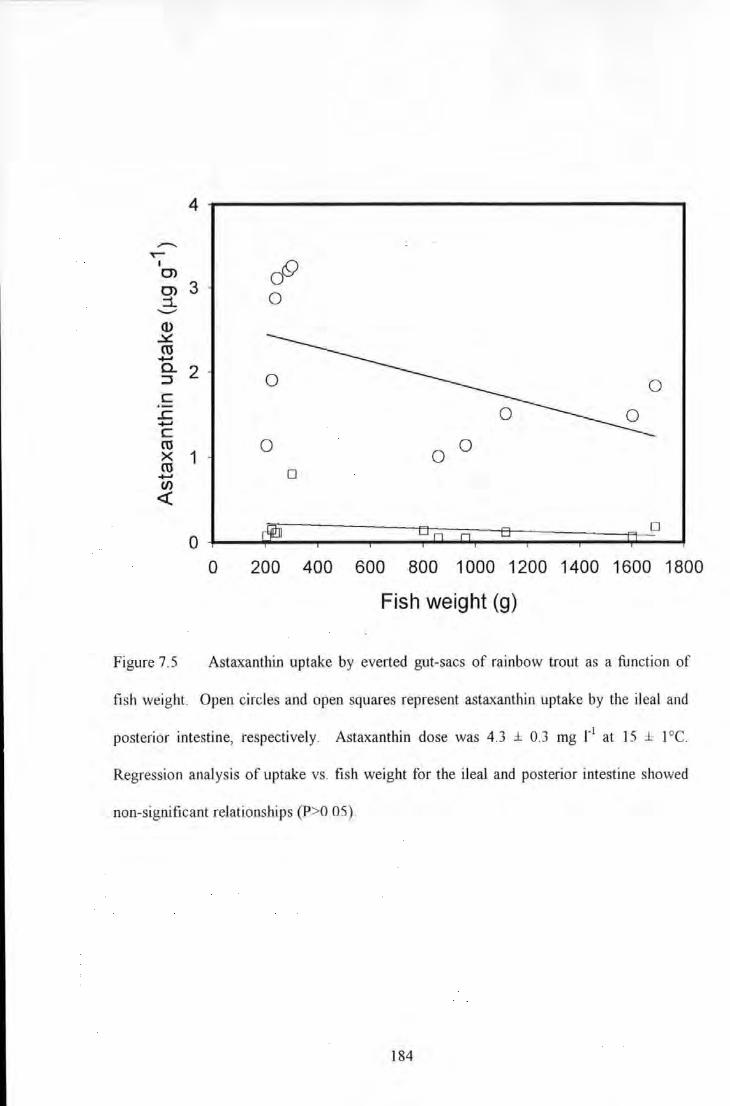
4
-.. 'r"
I
OQ CJ)
CJ) 3 0 ::t __.. Q) ~ ro -.. 0. 2 :J c
..r: -.. c ro 0 0 0 >< 1 ro 0 -.. en <(
0
0 0 200 400 600 800 1000 1200 1400 1600 1800
Fish weight (g)
Figure 7.5 Astaxanthin uptake by everted gut-sacs of rainbow trout as a function of
fish weight. Open circles and open squares represent astaxanthin uptake by the ileal and
posterior intestine, respectively. Astaxantbi_n dose was 4.3 ± 0.3 mg r1 at 15 ± 1 °C.
Regression analysis of uptake vs. fish weight for the ileal and posterior intestine showed
non-significant relationships (P>0.05).
184
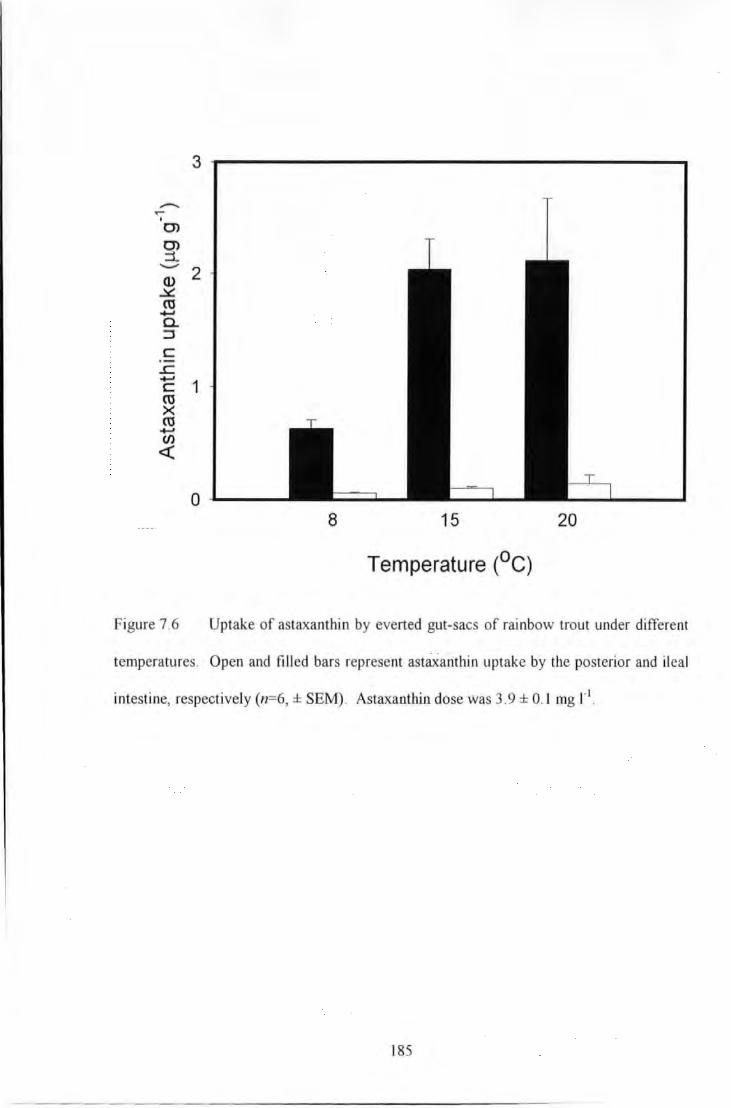
3
-.--' C)
C) :::l --- 2 <L> ~ ro ....... c. :::J
c ...c .......
1 c ro >< ro ....... en <(
0 8 15 20
Temperature (°C)
Figure 7.6 Uptake of astaxanthin by everted gut-sacs of rainbow trout under different
temperatures. Open and filled bars represent astaxanthin uptake by the posterior and ileal
intestine, respectively (n=6, ± SEM). Astaxanthin dose was 3. 9 ± 0.1 mg 1"1.
185
- ---- -------- ----------------
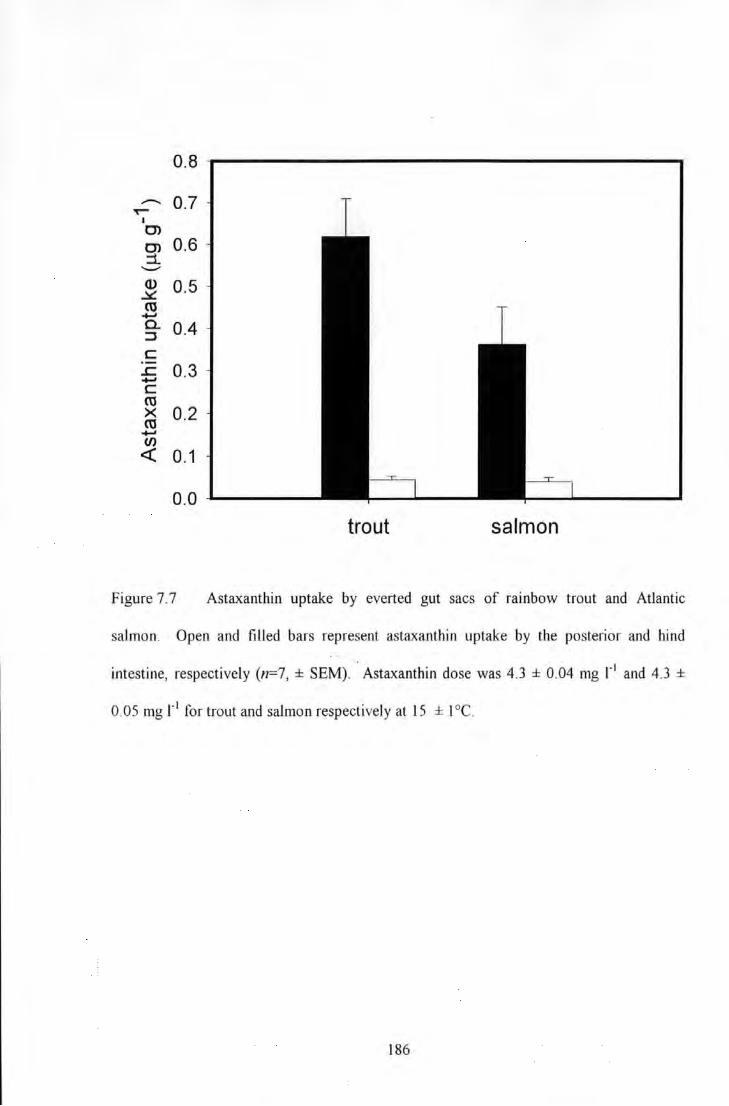
0.8
..-... 0.7 T'""
I Cl Cl :::t
0.6 _...
<1> 0.5 ~ ro ...... a. 0.4 :J
c ..r: 0.3 ...... c ro >< 0.2 ro ...... (/)
<( 0.1
0.0
trout salmon
Figure 7.7 Astaxanthin uptake by everted gut sacs of rainbow trout and Atlantic
salmon. Open and filled bars represent astaxanthin uptake by the posterior and hind
intestine, respectively (n=7, ± SEM) . . Astaxanthin dose was 4.3 ± 0.04 mg 1"1 and 4.3 ±
0.05 mg r1 for trout and salmon respectively at I 5 ± I oc.
186
7.4 Discussion
In the current study a senes of experiments was carried out in order to evaluate the
potential of an in vitro gut sac technique to monitor the absorption of astaxanthin.
Previous efforts with an everted gut perfusion system were limited due to an inability to
effectively evaluate the translocation of carotenoid across the intestinal barrier.
Furthermore, efforts have been made in the current study to solubilise astaxanthin in a near
physiologically representative medium, namely bile salt micelles. Micelles were not
formulated to incorporate additional fatty acids (mixed micelles) as information relating to
typical fatty acid compositions of digesta from salmonids, is lacking.
Measurements of LDH activity have been used previously in other in vitro models as an
assessment of cellular integrity (Campbell et al. 1999; Pfitzner et al. 2000). Similarly,
damaged intestinal tissue will leak potassium down an electrochemical gradient into the
surrounding medium and is a function of anatomical position along the length of the gut
(reflecting potassium absorption: Loretz 1995). However, other authors have shown that in
African catfish (Clarias gariepinus) tissue potassium concentration was not position
dependent and therefore provides a better overall marker of potassium loss (Handy et al.
2000). A measurement of water content in the tissue will indicate a net flux ofwater if the
tissue is not in osmotic balance within the medium it is contained. However, these tissue
viability assays carried out in this investigation showed no significant deleterious effects of
exposing the intestine to the micelle medium within the experimental period (50min)
suggesting uptake of astaxanthin into tissue occurred under nominal conditions.
The uptake of astaxanthin over a 60min period (Figure 7.4) seemed to follow a linear trend
at a higher than average physiological dose (-5 mg 1" 1). This may suggest a passive
187
diffusion process of uptake. However, use of active uptake inhibitors is required before
conclusions can be drawn as to the uptake mechanism of carotenoids at the gastrointestinal
level. For the purposes of this study, this experiment served to identify an appropriate
exposure period and suitable astaxanthin concentration for comparative uptake
measurements within the linear range. An exposure period of 50min and dose of 4mg r 1
was chosen to ensure linearity in uptake data for comparative purposes.
Tissue concentrations of astaxanthin in this study were recorded above 2J.1g g·1 which are
higher than findings in vivo (see Chapter 4). This may be partly due to the high
"bioavailability" of astaxanthin in micelle media used in the present investigation,
compared to in vivo where only a fraction of ingested astaxanthin may well be solubilised
into micelles (data unavailable). Alternatively, after incubation in the astaxanthin micelle
medium, astaxanthin may have been strongly bound to the mucosal cells of the ileal
intestine. However, extensive washing with saline containing bile salts did not release
significant amounts of astaxanthin. Other authors have found that a percentage of
carotenoid presented in this way is surface bound rather than intracellular (EI-Gorab et al.
1975). Refinements to the current method to distinguish between surface adherent and
available substrate include washing with solvents (EI-Gorab et al. 1975) and use of non
absorbable markers (Salle et al. 1972). However, since radiolabelled astaxanthin is
difficult to obtain the solvent extraction techniques and forms of analysis (HPLC) used in
the current investigation would restrict the choice of an appropriate marker.
Throughout this study a clear discrepancy was recorded between the uptake capacity of the
ileal and posterior region of intestine for astaxanthin. Evidence from these in vitro
experiments suggests that the ileal intestine has a greater affinity for astaxanthin uptake
compared to that of the hind or posterior intestine. Indeed, this is supported by the view of
188
Torrissen (1986) and Al-Khalifa and Simpson (1988) and the current study (see Chapter 4)
that absorption of carotenoids occurs mainJy along the proximal and mid-intestine of
salmonids. This variation in nutrient uptake along intestinal regions is not limited to
carotenoids and has been recorded for the amino acids in rainbow trout and Coho salmon,
Oncorhynchus kisz1tch (Marcotte & de la Noiie 1984; Collie 1985). Discrepancies in
absorptive capacity for astaxanthin along the length of the intestine, necessitates
consideration of those factors associated with salmonid feeding practises that influence gut
transit time. The feeding level and composition of the diet is a major determinant
influencing digestion rate and thereby indirectly affecting absorption efficiency (Jobling
1986).
No significant relationship was recorded between fish weight and uptake of astaxanthin for
either the ileal or posterior intestine regions. Uptake values were expressed per gram of
intestinal tissue (wet weight) suggesting that there is no physiological change in the
intestine associated with astaxanthin absorption, with development and maturation in the
rainbow trout. A study that investigated the pigmentation of two size groups of Arctic
charr (Salvelinus alpinus L.) using dietary canthaxanthin found that those fish which
started at a smaller weight (17g), deposited relatively less pigment than those fish starting
at a larger weight of 125g (Christiansen & Wallace 1988). Furthermore, the apparent
digestibilities of canthaxanthin were 17.9% and 3 8. 7% for the small and large fish,
respectively. This suggested that the poorer pigmentation of the smaller size class was a
result of reduced digestibility of carotenoid. Similarly, Hollander & Dadufalza ( 1989)
measured the uptake of vitamin E into the lymph and bile of young (4 months), middle
aged ( 14 months) and old (24 months) Sprague-Dawley rats in vivo. These authors
recorded increased absorption ofthis vitamin in old (16,467pmol 5hr"1) compared to young
(5912pmol 5k1) rats. However, these findings may be due to a direct increase in
189
intestinal length (and surface area) with increasing size of the animal. In contrast, vitamin
A absorption has been shown to increase linearly with age in rats but changes in the
absorptive surface area of the intestine were ruled out (Hollander & Morgan 1979).
Instead, the authors suggested that a decrease in the unstirred water layer thickness with
ageing may have resulted in greater efficiency of absorption associated with age, a
phenomenon found with vitamin D (Hollander & Tarnawski 1984). Indeed, Wilson et al.
(I 971) suggested that the unstirred water layer is rate limiting for intestinal absorption of
lipids from micellar solutions. Results from the current study suggest that there is no
difference in the uptake capacity of the trout intestine for astaxanthin between size classes
and it is not clear whether the unstirred water layer is as influential in the absorption of
carotenoids, in fish. However, only two size classes of rainbow trout were examined in the
current study. Since Torrissen et al. (1989) suggest that rainbow trout under 90g pigment
poorly, fish within this size range could be examined to define whether the poor
pigmentation is associated with an inability to absorb astaxanthin at the gastrointestinal
level.
Uptake of astaxanthin was significantly higher for intestines (ileal region) maintained at
zooe and l5°e compared to those at 8°e. These findings are supported from evidence in
vivo where nutrient absorption has been shown to be greater at higher temperatures. For
example, Medale et al. (1999) studied the utilisation of a carbohydrate-rich diet by
common carp reared at 18 and 25°C. These authors noted that the apparent digestibility
coefficients of energy and nutrients including starch were higher at 25°C. Olsen and Ring0
(1998) demonstrated that the digestibility of protein, carbohydrate, lipid and dry matter
was lower in Arctic charr kept at 0.6°e compared to woe suggesting that increased
gastrointestinal holding time following low temperature adaptation does not fully
compensate for lower digestive/absorptive metabolism Maintaining the fish at 0.6°e also
190
significantly reduced the ADC of saturated fatty acids, while the monounsaturated and
polyunsaturated fatty acids were not influence by environmental temperature. The
absorption of the fat-soluble vitamin K in vitro is influenced by temperature (Hollander
1973). However, the latter study demonstrated that this temperature effect was due to the
requirement of an energy requiring process for vitamin uptake. Available evidence
suggests the absorption of carotenoid is via a passive process (Choubert et al. 1994a;
Kiessling et al. 1995; Storebakken & Goswami 1996). This suggests that the effect noted
in the current investigation may be due to the well-established Q10 effect that may well
affect transporters, much like enzymes. However, speculations concerning the process of
astaxanthin uptake are unfounded until in vitro experiments, in the presence of oxygen free
environments and with active inhibitors, are carried out.
Although no significant differences were found between intestinal uptake of astaxanthin
between rainbow trout and Atlantic salmon, mean uptake was notably higher for rainbow
trout (41%). Clearly, the use of a larger sample number (n>7) is required to define any
differences that exist. Indeed, March and MacMillan (1996) suggested that the absorptive
capacity of the Atlantic salmon intestine limited the amount of astaxanthin that could be
advantageously added to their diet. Similarly, Storebakken et al. (1986) found that salmon
utilised canthaxanthin less efficiently in comparison to rainbow trout. Torrissen et al.
( 1989) on the basis of reviewed evidence stated that the digestibility of astaxanthin was
greater in rainbow trout (91-97%) compared to Atlantic salmon ( 45-74%). Indeed,
findings from our own laboratory suggest that the digestibility of astaxanthin is higher in
rainbow trout (ea. 96%) compared to Atlantic salmon (ea. 35%; G. Page pers. comm.).
Certainly, the current findings suggest that there is greater scope for the examination of
carotenoid uptake between species using the current model and established in vivo
protocols.
191
The use of everted gut sacs is favourable for the study of astaxanthin uptake compared to
isolated intestinal perfusion studies owing to a number of advantages. The uptake of
astaxanthin can be measured directly from tissue accumulation, which presents a
significant quantity for reliable HPLC analysis (although samples do have to be
concentrated). Samples can be re-suspended in hexane without precipitation from a
solubilising agent, plus numerous preparations can be analysed within a comparatively
shorter space of time. The advantageous characteristics of this in vitro model have allowed
the successful examination of astaxanthin uptake at the intestinal level, under varying
abiotic (temperature) and biotic (fish size and species) conditions.
192
CHAPTER8.0
GENERAL DISCUSSION
This study has encompassed a large number of themes related to the absorption and
utilisation of astaxanthin forms in artificial feeds for salmonids, as demonstrated for trout
and salmon. More specifically, the evaluation of a microalgae source of astaxanthin,
namely Haematococcus pluvialis, has been undertaken. Scientific examination and
assessment of those biological features of the algae and indeed physiological factors
related to the gastrointestinal system of the rainbow trout that may limit the efficacy of this
pigment source have been addressed. Furthermore, owing to limitations associated with in
vivo measurements of digestibility and absorption, efforts have been made to develop an in
vitro model suitable for studying the absorption of carotenoids at the gastrointestinal level
in salmonids.
The following discussion begins by individually considering those factors (both biological
and physiological) that have been shown to limit the use of Haemalococcus pluvialis as a
source of pigment in salmon id feeds; their relative importance and potential strategies to
further improve or validate this carotenoid source. Secondly, the value of in vitro models
to evaluate the absorption of carotenoids and the current findings from their use are
discussed. Possible future experiments and their importance to commercial pigmentation
strategies are proposed throughout.
193
8.1 Aplanospore cell wall of Haematococcus pluvialis.
There is a general consensus that the aplanospore cell wall of Haematococcus pluvial is is a
major limiting factor in the utilisation of this algal source of astaxanthin (Johnson & An
1991; Choubert & Heinrich 1993; Sommer et al. 1991, 1992; Bowen et al. pers. comm.).
Subsequently, techniques that can be applied to fracture or crack the cell wall need to be
used before the alga is supplemented into animal feeds. Such techniques might include
milling, enzyme treatment, homogenisation, or pressure treatment as was examined in
Chapter 3. However, a dearth of published information regarding this topic, due to patent
and commercial obligations, prevents comparisons being made on the efficiency of these
techniques.
Some investigations that have examined the utilisation of carotenoid from Haematococcus
pluvialis in salmonids have made efforts to crack this cell wall before feed
supplementation, where others have not. For example, Sommer et al. (1991) used a
confidential homogenisation step on part of a concentrated biomass of algal spores and
found with microscopic cell counts that ea. 60% of the cells were completely disrupted.
Sommer et al. ( 1992) homogenised the total algal spore biomass prior to feed
supplementation but failed to report the level of cell disruption with similar evidence from
cell counts. However, Choubert & Heinrich ( 1993 ), in a feed trial with rainbow trout, used
algal spores that had not been homogenised. All of these studies reported poorer levels of
pigmentation and flesh retention when using the algae source in comparison to the
synthetic source of astaxanthin. However, Barbosa et al. (1999) tested an algal biomass
that was mechanically ground in a ball grinder for Smin to disrupt the cell wall and
assessed grinding efficiency by microscopic observation. These authors noted that the
absorption of astaxanthin into serum of rainbow trout was similar for the algal and a
194
synthetic source at a higher dietary lipid level but was better for the algal source at a lower
dietary lipid level.
Data from the current investigations suggest that "efficient" cracking of the cell wall
renders contained pigment bioavailable to the fish. Furthermore, the degree of flesh
pigmentation when the algal source is used in feed for rainbow trout is comparable to that
of the synthetic source of astaxanthin (providing the cell wall is cracked efficiently).
Indeed, use of an alga carotenoid extract (removed from the aplanospore) does not result in
improved levels of absorption or pigmentation in comparison to the efficiently cracked cell
when used in salmonid feeds. Moreover, the presence of a cell wall, although cracked
prevents oxidation of contained pigment once supplemented into the feed. This ensures
that salmonid feeds exhibit a stable astaxanthin profile over prolonged storage periods
prior to use. Furthermore, methodology utilised in the current study to extract the
carotenoid from the aplanospores (solvent extraction) would be impractical and
uneconomic on a commercial scale.
In the current study, the commercial source of Haematococcus pluvialis (NatuRose,
Cyanotech, Hawaii; 95% of cells cracked) proved a more efficient pigment source than the
algal cells disrupted by pressure treatment (confidential process), in comparison to the
commonly used synthetic source of astaxanthin. This was despite electron microscopic
examination having been utilised to assess efficacy of cell wall cracking. Although,
microscopic examination can reveal the extent to which cells have been ruptured, it is not a
real measure of bioavailability. Feeding trials and measurements of pigmentation, such as
the ones employed in the current investigations, are costly, time consuming and
confounded by physiological and metabolic processes that as yet are not understood.
Subsequently, a rapid screening approach is required that measures the relative
195
bioavailability of pigment from a biomass of cracked cells and that would give greater
biological meaning to how "efficient" a cracking technique is. Leaching measurements
into polar solvents such as acetone have been used previously to assess the relative
bioavailability of carotenoid from aplanospores (Mendes-Pinto et al. 200 I). This
technique has been used to quantitatively estimate the amount of pigment that is potentially
bioavailable. However, whether such an approach is physiologically representative is
highly questionable. Other authors have assessed carotenoid bioavailability from meals by
using in vitro digestion methods (Garrett et al. I 999a; Garrett et al. 2000; Ferruzzi et al.
200I). In these studies, natural food items containing carotenoids e.g. carrots and tomato
pastes are incubated under those conditions experienced in the stomach and small intestine
of adult humans, consecutively. This involves sequential treatments with different
enzymes and varying pH that simulate the digestion process. The aqueous fraction that
contains micelles is then separated from the digesta by ultracentrifugation and the amount
of micellar incorporated carotenoid quantified by HPLC. Further to this, the carotenoid
containing micelles can then be exposed to human intestinal cell lines for a relative
measurement of absorption. Such techniques could be readily adapted to mimic the
digestive processes in fish. Indeed, previous efforts have been made to simulate, in vitro,
the conditions found in the alimentary tracts of rainbow trout and carp to study the
digestibility of proteins of broad bean and soya bean feed supplements (Grabner & Ho fer
I 985). It is envisaged that these in vitro digestion techniques could be used to measure the
bioavailability of carotenoid from Haematococcus pluvialis aplanospores, thus presenting a
physiologically representative technique to evaluate the efficiency of a cell cracking
procedure.
I96
8.2 Astaxanthin esters
The current investigations have generally shown that the use of dietary astaxanthin esters
does limit astaxanthin absorption into the serum of rainbow trout compared to the
unesterified form. This is supported by findings from both steady state serum astaxanthin
concentrations and rates of absorption. This supports the suggestion that the requirement
for intestinal hydrolysis of astaxanthin esters probably is a limiting factor in the absorption
of astaxanthin. Moreover, the degree of esterification is negatively related to the serum
absorption of astaxanthin so that astaxanthin from monoesters is absorbed more efficiently
than from diesters. This may be an important observation when attempting to compare
findings from different studies and when evaluating natural sources of astaxanthin.
Although it has been reported that astaxanthin in Haematococcus pluvialis is primarily
monoesterified (Renstrom & Liaaen-Jensen 1981) Choubert & Heinrich (I 993) reported a
higher astaxanthin diester (ea. 29%) compared to monoester (ea. 12%) content in the algal
biomass they used. Moreover, crustacean sources of astaxanthin have been shown to
predominantly contain astaxanthin diesters (Torrissen et al. 1981; Arai et al. 1987; Mori et
al. 1989). Other authors have examined the utilisation of astaxanthin dipalmitate (diester)
and have drawn conclusions regarding the efficacy of astaxanthin esters per se in the
pigmentation of salmonids (Storebakken et al. 1987; Foss et al. 1987). Certainly there is
potential, at least for Haematococcus pluvialis, to be manipulated at the culture stage to
increase the astaxanthin monoester content in comparison to the diesterified form. For
example, other authors have stated that the monoester: diester ratio in Haematococcus
pluvialis is a function of the age of the culture (Harker et al. 1996b) whereby younger
cultures have a relatively higher monoester content.
197
Apparent digestibility coefficients (ADC) for astaxanthin esters and unesterified
astaxanthin in the current investigation also seem to suggest that the absorption of
unesterified astaxanthin is more etftcient. Furthermore, generally the trends in ADC
seemed to correlate with the findings in the serum. However, evidence suggests that a
combination of both measurements is required to avoid misleading conclusions regarding
absorption.
These combined findings would generally suggest that the hydrolysis of astaxanthin esters
likely occurs in the lumen of the intestine prior to absorption into the blood. The pancreas
and or the intestinal mucosa are the likely sources of this hydrolytic activity (Mathias et al.
1981; Rigtrup & Ong 1992; Tengjaroenkul et al. 2000). Erlanson & Borgstrom (1968)
demonstrated through gel filtration of rat pancreatic juice that pancreatic lipase was active
in hydrolysing vitamin A palmitate. Similarly, fractions that contained esterolytic activity
against a variety of water soluble vitamins also hydrolysed bile salt solutions of vitamin A
palmitate. The latter enzyme was a carboxyl ester hydrolase of broad specificity which
encompasses the activity of "cholesterol esterase", otherwise known as "non-specific
lipase". Indeed, non-specific esterase is used in some methodologies to hydrolyse
carotenoid esters prior to analysis (Jacobs et al. 1982). This raises the potential to use a
non-specific esterase as a feed additive when using esterified forms of astaxanthin in order
to facilitate the intraluminal hydrolysis of astaxanthin esters. However, the cost and
viability of such a strategy might out-way the benefits of using the natural source of
esterified astaxanthin compared to the synthetic unesterified form. Therefore, future
scientific assessment of this strategy is required.
Added to the requirement for intestinal hydrolysis of astaxanthin esters prior to absorption
into the blood the current investigations have shown a clear regional disparity in esterolytic
198
activity along the gastrointestinal tract of the rainbow trout. Evidence suggests that the
majority of astaxanthin ester hydrolysis take place in the pyloric region of the trout
gastrointestinal tract. This physiological finding may in part limit further the absorption of
astaxanthin from an esterified source depending on gut transit rate of the feed bolus as has
been suggested for other nutrients (Staples & Nomura 1976; Pedersen 1987; Cho &
Kaushik 1990). Consequently, efforts need to be made to determine the relative kinetics of
ester hydrolysis for both monoester and diester forms within the salmonid intestine to
establish optimum residence times for the carotenoid supplemented feed bolus.
Practically, an in vitro approach incorporating intestinal homogenates from various regions
of the gastrointestinal tract would be the first step (Koven et al. 1994, 1997). Additionally
this would confirm the role and comparative importance of the various gastrointestinal
regions in ester hydrolysis.
Various factors are known to influence the gut transit time of ingested food including
temperature (Brett & Higgs 1970); dietary lipid (Jobling 1986) and feeding frequency (Cho
& Kaushik 1990). Plausibly, such factors could be manipulated in feed trials to prolong
the residence time of any given feed bolus and subsequently maximise the time available
for carotenoid ester hydrolysis. However, it is important not to maximise carotenoid ester
hydrolysis at the expense of salmonid growth or final carcass composition. For example,
reduced temperatures result in poorer growth rates in salmonids (Azevedo et al. 1998) and
dietary lipid has obvious consequences in relation to consumer acceptance. However,
manipulations of feeding frequency might offer a suitable strategy to maximise the
absorption of astaxanthin when supplied in an esterified form. Rather than feeding little
and often, one larger single meal may be more effective in this respect. This approach
requires evaluation in a series of feeding studies with suitably sized fish.
199
8.3 Chirality of astaxanthin
Haematococcus pluvialis contains optically pure astaxanthin (3S,3 'S; Renstr111m et al.
1981) unlike synthetic astaxanthin which is a racemic mixture of optical isomers. The
current study has noted that the optical purity of astaxanthin esters does not significantly
influence the deposition of astaxanthin in the muscle of rainbow trout in comparison to the
synthetic unesterified product (CAROPHYLL © Pink; F. Hoffmann La Roche, Base!,
Switzerland). This suggests that evaluation of a novel astaxanthin source need not require
analysis of enantiomer composition since optical isomers are deposited in the flesh in
approximately the same ratio as they are found in the feed. However, some authors have
suggested possible stereo-selectivity of ester hydrolysing enzymes within the intestine of
the salmonid which do not favour the (3S,3 'S) form (Foss et al. 1987). Data from the
current study does not support this suggestion although direct examination of such
selectivity was not carried out. Either way, this suggestion is an interesting concept that
could be ultimately examined in the future using the in vitro digestion model discussed
previously.
8.4 Discrepancy between astaxanthin absorption and deposition
Despite differences in measurements of absorption between astaxanthin supplied as dietary
esters or in its free form, no obvious differences were recorded between flesh pigmentation
in trout fed diets supplemented with Haematococcus pluvialis and synthetic unesterified
astaxanthin. The one exception to this was fish fed diets supplemented with cells cracked
under different pressures (see Chapter 3) although this is likely due to an inefficiency in
the cracking technique as the commercial source of Haematococcus pluvialis proved
200
effective. This raises obvious questions regarding measurements of absorption and their
value in predicting the efficacy of a source of pigment.
Choubert et al. ( 1994a) has shown positive linear correlations between plasma astaxanthin
concentration and dietary astaxanthin concentration up to 200mg kg"1 in rainbow trout.
Indeed, Storebakken & Goswami (1996) have demonstrated that measurements of plasma
carotenoid (astaxanthin) concentrations were highly correlated with dietary astaxanthin
concentration (r = 0.90) in Atlantic salmon. This suggests that plasma concentrations are
good indicators of dietary astaxanthin content. Indeed, Storebakken & Goswami (1996)
also demonstrated that plasma astaxanthin concentrations were highly correlated with the
amount of astaxanthin retained in the flesh per kg of body weight (r = 0.92) and flesh
carotenoid level (r = 0.95). This suggested that plasma astaxanthin concentration can be
used as a useful indicator of astaxanthin availability and flesh deposition in salmon and
thus can serve as a rapid screening test for different carotenoid sources. However, Wathne
et al. ( 1998) found that the total carotenoid content in the blood plasma was not a useful
indicator of final muscle astaxanthin concentration. However, these authors fed alternate
meals with and without astaxanthin that may have resulted in fluctuating levels of blood
plasma astaxanthin.
Several authors have suggested that there is a limit or saturation level for the deposition of
astaxanthin in trout muscle (Torrissen 1989b; Storebakken et al. 1987; Nickel! & Bromage
1998b ). Moreover, several groups have reported a dose response effect with dietary
carotenoid and deposition whereby there is a plateau reached when feed inclusion levels
are ea. 60mg kg- 1 (Choubert & Storebakken 1989; Bjerkeng et al. 1990; Torrissen 1995;
March & MacMillan 1996).
201
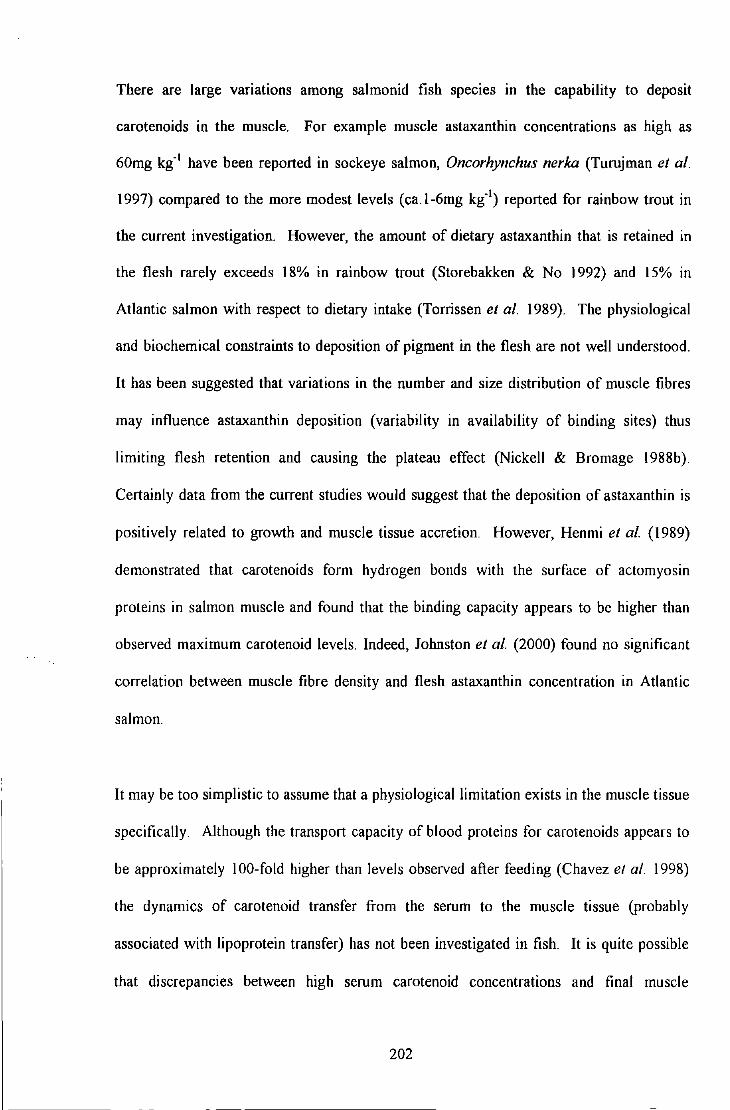
There are large variations among salmonid fish spectes m the capability to deposit
carotenoids in the muscle. For example muscle astaxanthin concentrations as high as
60mg kg-1 have been reported in sockeye salmon, Oncorhynchus nerka (Turujman et al.
1997) compared to the more modest levels (ca.1-6mg kg-1) reported for rainbow trout in
the current investigation. However, the amount of dietary astaxanthin that is retained in
the flesh rarely exceeds 18% in rainbow trout (Storebakken & No 1992) and I 5% in
Atlantic salmon with respect to dietary intake (Torrissen et al. 1989). The physiological
and biochemical constraints to deposition of pigment in the flesh are not well understood.
It has been suggested that variations in the number and size distribution of muscle fibres
may influence astaxanthin deposition (variability in availability of binding sites) thus
limiting flesh retention and causing the plateau effect (Nickell & Bromage 1988b).
Certainly data from the current studies would suggest that the deposition of astaxanthin is
positively related to growth and muscle tissue accretion However, Henmi et al. (1989)
demonstrated that carotenoids form hydrogen bonds with the surface of actomyosin
proteins in salmon muscle and found that the binding capacity appears to be higher than
observed maximum carotenoid levels. Indeed, Johnston et al. (2000) found no significant
correlation between muscle fibre density and flesh astaxanthin concentration in Atlantic
salmon.
It may be too simplistic to assume that a physiological limitation exists in the muscle tissue
specifically Although the transport capacity of blood proteins for carotenoids appears to
be approximately I 00-fold higher than levels observed after feeding (Chavez et al. 1998)
the dynamics of carotenoid transfer from the serum to the muscle tissue (probably
associated with lipoprotein transfer) has not been investigated in fish. It is quite possible
that discrepancies between high serum carotenoid concentrations and final muscle
202
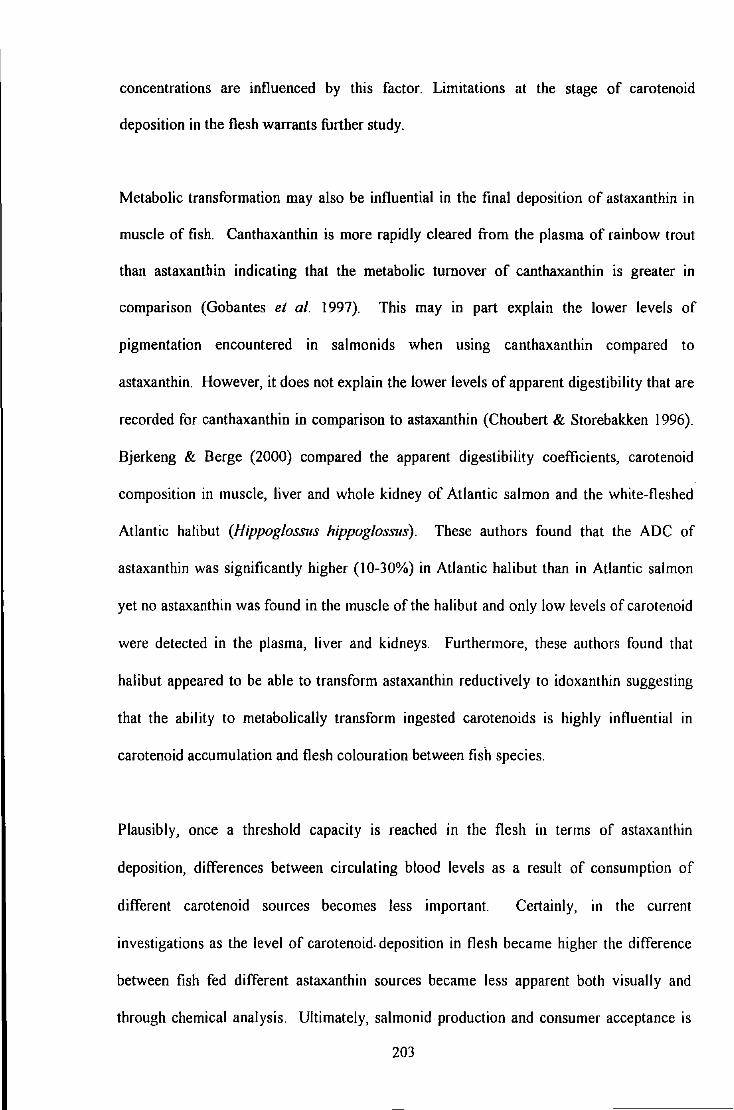
concentrations are influenced by this factor. Limitations at the stage of carotenoid
deposition in the flesh warrants further study.
Metabolic transformation may also be influential in the final deposition of astaxanthin in
muscle of fish. Canthaxanthin is more rapidly cleared from the plasma of rainbow trout
than astaxanthin indicating that the metabolic turnover of canthaxanthin is greater in
comparison (Gobantes et al. 1997). This may in part explain the lower levels of
pigmentation encountered in salmonids when using canthaxanthin compared to
astaxanthin. However, it does not explain the lower levels of apparent digestibility that are
recorded for canthaxanthin in comparison to astaxanthin (Choubert & Storebakken 1996).
Bjerkeng & Berge (2000) compared the apparent digestibility coefficients, carotenoid
composition in muscle, liver and whole kidney of Atlantic salmon and the white-fleshed
Atlantic halibut (Hippoglossus hippoglosSlls). These authors found that the ADC of
astaxanthin was significantly higher (10-30%) in Atlantic halibut than in Atlantic salmon
yet no astaxanthin was found in the muscle of the halibut and only low levels of carotenoid
were detected in the plasma, liver and kidneys Furthermore, these authors found that
halibut appeared to be able to transform astaxanthin reductively to idoxanthin suggesting
that the ability to metabolically transform ingested carotenoids is highly influential in
carotenoid accumulation and flesh colouration between fish species.
Plausibly, once a threshold capacity is reached in the flesh in terms of astaxanthin
deposition, differences between circulating blood levels as a result of consumption of
different carotenoid sources becomes less important. Certainly, in the current
investigations as the level of carotenoid. deposition in flesh became higher the difference
between fish fed different astaxanthin sources became less apparent both visually and
through chemical analysis. Ultimately, salmonid production and consumer acceptance is
203
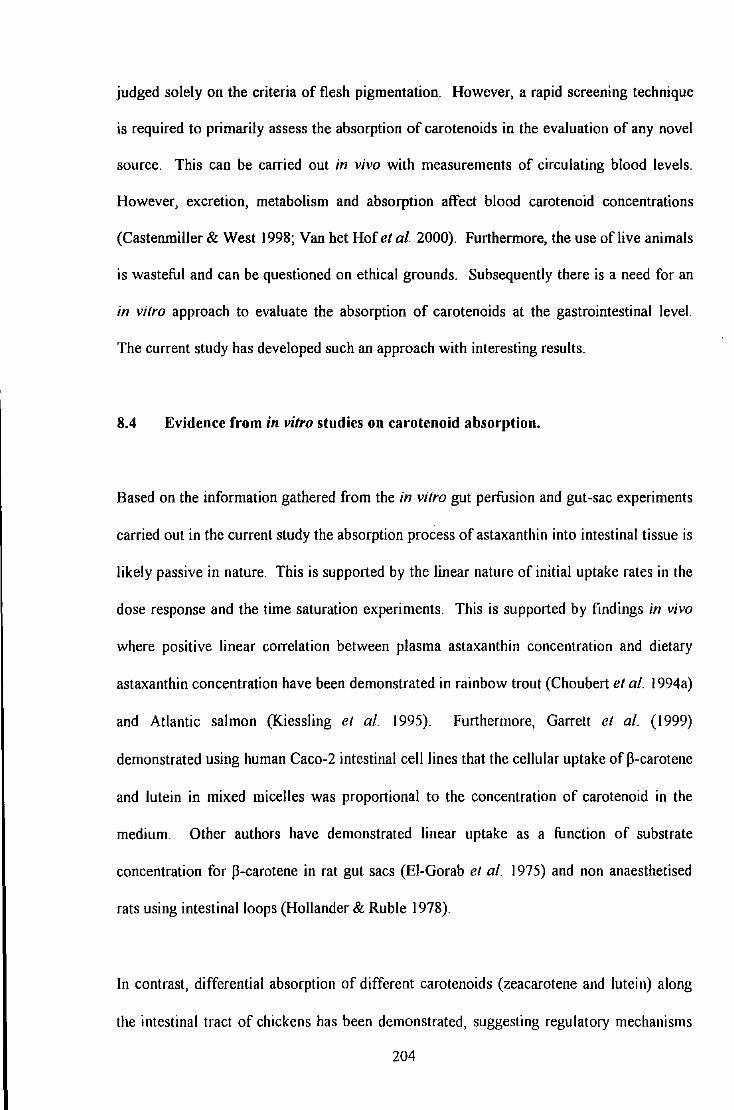
judged solely on the criteria of flesh pigmentation. However, a rapid screening technique
is required to primarily assess the absorption of carotenoids in the evaluation of any novel
source. This can be carried out in vivo with measurements of circulating blood levels.
However, excretion, metabolism and absorption affect blood carotenoid concentrations
(Castenmiller & West 1998; Van het Hof et al. 2000). Furthermore, the use of live animals
is wasteful and can be questioned on ethical grounds. Subsequently there is a need for an
in vitro approach to evaluate the absorption of carotenoids at the gastrointestinal level.
The current study has developed such an approach with interesting results.
8.4 Evidence from in vitro studies on carotenoid absorption.
Based on the information gathered from the in vitro gut perfusion and gut-sac experiments
carried out in the current study the absorption process of astaxanthin into intestinal tissue is
likely passive in nature. This is supported by the linear nature of initial uptake rates in the
dose response and the time saturation experiments. This is supported by findings in vivo
where positive linear correlation between plasma astaxanthin concentration and dietary
astaxanthin concentration have been demonstrated in rainbow trout (Choubert et al. 1994a)
and Atlantic salmon (Kiessling et al. 1995). Furthermore, Garrett et al. (1999)
demonstrated using human Caco-2 intestinal cell lines that the cellular uptake of P-carotene
and lutein in mixed micelles was proportional to the concentration of carotenoid in the
medium. Other authors have demonstrated linear uptake as a function of substrate
concentration for P-carotene in rat gut sacs (El-Gorab et al. 1975) and non anaesthetised
rats using intestinal loops (Hollander & Ruble 1978).
In contrast, differential absorption of different carotenoids (zeacarotene and lutein) along
the intestinal tract of chickens has been demonstrated, suggesting regulatory mechanisms
204
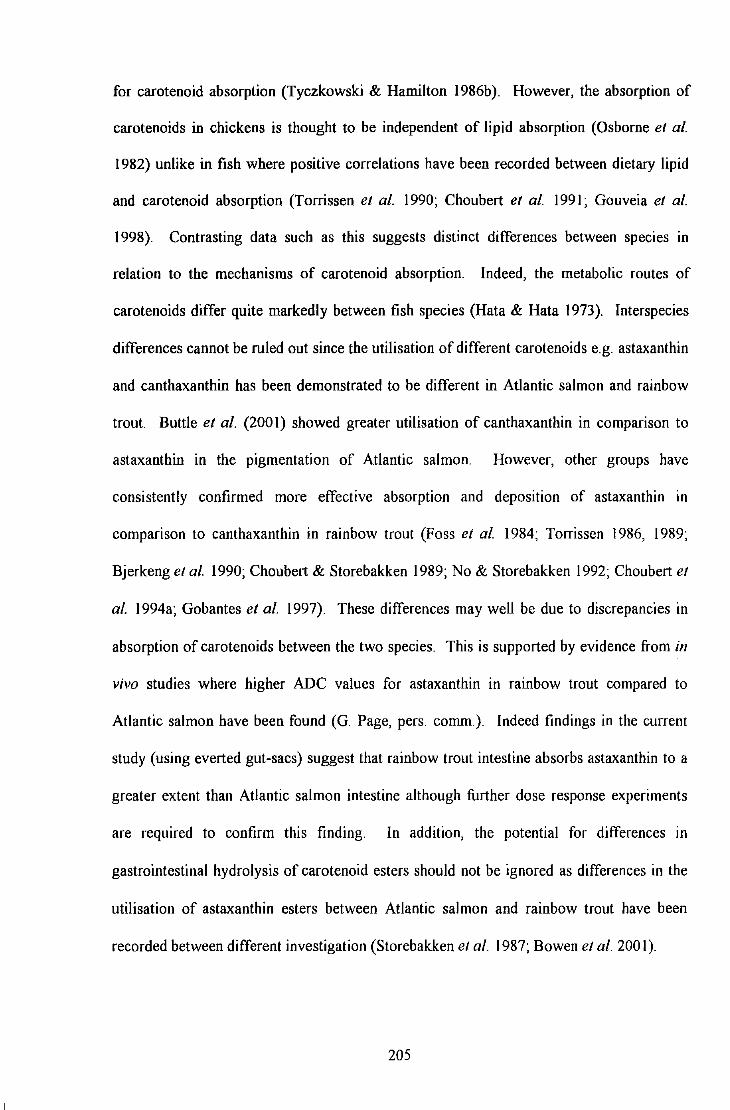
for carotenoid absorption (Tyczkowski & Hamilton l986b). However, the absorption of
carotenoids in chickens is thought to be independent of lipid absorption (Osborne et al.
1982) unlike in fish where positive correlations have been recorded between dietary lipid
and carotenoid absorption (Torrissen et al. 1990; Choubert et al. 1991; Gouveia et al.
1998). Contrasting data such as this suggests distinct differences between species in
relation to the mechanisms of carotenoid absorption. Indeed, the metabolic routes of
carotenoids differ quite markedly between fish species (Hata & Hata 1973). Interspecies
differences cannot be ruled out since the utilisation of different carotenoids e.g. astaxanthin
and canthaxanthin has been demonstrated to be different in Atlantic salmon and rainbow
trout. Buttle et al. (200 I) showed greater utilisation of canthaxanthin in comparison to
astaxanthin in the pigmentation of Atlantic salmon. However, other groups have
consistently confirmed more effective absorption and deposition of astaxanthin in
comparison to canthaxanthin in rainbow trout (Foss et al. 1984; Torrissen 1986, 1989;
Bjerkeng et al. 1990; Choubert & Storebakken 1989; No & Storebakken 1992; Choubert et
al. 1994a; Gobantes et al. 1997). These differences may well be due to discrepancies in
absorption of carotenoids between the two species. This is supported by evidence from in
vivo studies where higher ADC values for astaxanthin in rainbow trout compared to
Atlantic salmon have been found (G. Page, pers. comm ). Indeed findings in the current
study (using everted gut-sacs) suggest that rainbow trout intestine absorbs astaxanthin to a
greater extent than Atlantic salmon intestine although further dose response experiments
are required to confirm this finding. In addition, the potential for differences in
gastrointestinal hydrolysis of carotenoid esters should not be ignored as differences in the
utilisation of astaxanthin esters between Atlantic salmon and rainbow trout have been
recorded between different investigation (Storebakken et al. 1987; Bowen et al. 200 I).
205
A passive carotenoid absorption process might suggest that the pigmentation of salmonids
could be achieved more rapidly by simply increasing the dietary carotenoid content.
However, as discussed earlier, dose response flesh pigmentation investigations have shown
a non-linear response (Torrissen 1989b; Storebakken et a!_ 1987). Furthermore, Apparent
Digestibility Coefficients (ADC) for astaxanthin in the current study (ea. 60-75%) suggest
that the absorption process is not highly efficient, especially when considering that ADC
values are likely elevated due to the oxidation of carotenoids in faeces. Regional variation
in carotenoid absorption along the gastrointestinal tract (as demonstrated in Chapter 4)
coupled with the effects of gut transit rate may in part account for a reduced digestibility.
Alternatively, there may be other stages in the intestinal absorption process that limit the
absorption of astaxanthin.
According to the current study, once a carotenoid has been suitably solubilised the
absorption of carotenoid by the intestine is a passive process and is not limiting when a
concentration gradient is maintained. Subsequently, it seems that the solubilisation stage is
more likely influential in the absorption of carotenoid.
In mammals, once released from the feed matrix carotenoids are solubilised in mixed bile
salt micelles (Erdman et al. 1993; Parker 1996; Furr & Clark 1997; Van den Berg 1999). It
is interesting to note that the formation of micelles is dependent on the production of bile
that is itself stimulated by dietary fat. It remains to be shown whether the increased
absorption of carotenoids with increasing dietary fat in salmonids (Torrissen et al. 1990;
Choubert et al. 1991; Gouveia et al. 1998) is a result of this phenomenon or simply a
coincidence. Formation of these micelles is critical to ensure solubilisation and high
concentrations of the highly hydrophobic carotenoids in aqueous solution that allows them
to cross the unstirred water layer adjacent to the intestinal mucosa. Similarly, in rats it has
206
been demonstrated that the absorption of the lipophillic vitamin E requires bile salts in the
intestine (Pearson & Legge 1972; MacMahon & Thompson 1970). The latter authors
showed that although a polar lipid (oleic acid) was absorbed equally from an emulsion or
micellar solution, a-tocopherol was absorbed to a lesser extent from the emulsion
compared to the micellar solution. This indicates the greater importance of micellar
solubilisation ofless-polar lipids. In the current study the uptake rates of astaxanthin have
been shown to be different when using alternative solubilising strategies. Since the use of
non-ionic surfactants above their CMC resulted in the formation of micelles and higher
uptake rates compared to an emulsion (dispersible beadlets), the current study supports the
contention that micelle incorporation is important in the absorption of hydrophobic
carotenoids in salmonids.
It is possible that differences in micellar incorporation owing to differences in polarity may
account for the more efficient absorption of astaxanthin compared to canthaxanthin
(Choubert et al. 1994a) Astaxanthin is more polar than canthaxanthin and may well
partition into bile salt micelles more readily. In support of this, EI-Gorab & Underwood
(1973) have shown that retinol is almost ten times more readily dissolved in micelles than
P-carotene and exhibits a greater polarity. Furthermore, retinol may partition into the more
polar peripheral region of the bile salt-micelle where P-carotene is probably solubilised in
the hydrophobic core and its solubility may be enhanced by expansion of the micelle with
polar lipids (there was no competition between the two for micellar solubilisation). An
enhancement of solubilisation such as this could account for the synergistic affects
witnessed when both astaxanthin and canthaxanthin are included in salmonid feeds in
terms of flesh pigmentation (Foss et al. 1987; Torrissen 1989b ). The techniques used in
the current study to form micelles could be readily utilised to determine potential
differences of micelle incorporation for these two commercially important carotenoids.
207
Further to their role in the solubilisation of unesterified carotenoids, bile salts are likely
necessary for the hydrolysis of astaxanthin esters .. Lombardo & Guy (1980) have stated
that bile-salts are also involved in providing a suitable substrate (micellar solution of the
fat-soluble vitamin esters) for the hydrolytic activity of the carboxyl ester hydrolase of
pancreatic juice with the activity of this enzyme enhanced by the trihydroxy bile acids.
However, the hydrolysis of vitamin A esters by rat intestine in vitro has been demonstrated
in the presence of other synthetic solubilising agents (Mahadaven et al. 1963).
Other studies have shown that the bile salts are necessary for the metabolism of P-carotene
within the intestinal mucosa (El-Gorab et al. 1975). The formation of metabolites of
astaxanthin in the intestine has not been assessed in the current investigation due to a lack
ofradiolabelled compound, appropriate standards and analytical equipment However, it is
plausible that measurements of astaxanthin absorption in everted gut-sacs may have been
underestimated due to the rapid metabolism and formation of unidentifiable compounds.
Indeed other authors have used everted gut sacs of trout intestine exposed to aqueous
solutions of astaxanthin (H3 -radiolabelled) and have demonstrated the formation of retinol
(AI-Khalifa & Simpson 1988). These authors noted that after 60min exposure 3% of
astaxanthin absorbed was converted to retinol in the ileum where up to 12% was converted
in the pyloric caeca, although this was probably a function of surface area. Since the ileal
portion of the intestine was used in the current study it may be assumed that conversion
was minimal (ea. 3%). Furthermore, findings presented by AI-Khalifa & Simpson (1988)
suggest that bile salts are not necessary for the metabolism of astaxanthin to retinol since
they used a synthetic detergent to solubilise the carotenoid. Nevertheless, it is envisaged
that the everted-gut sac system could be used to study the metabolism of astaxanthin at the
208
intestinal level and the factors that influence this process. For example, the system could
be used to compare the metabolism of astaxanthin esters, geometric and optical isomers.
8.5 Additional future experiments
Due to the focussed nature of the current study not all of the influential factors that have
been published concerning the absorption of astaxanthin have been evaluated. However,
the everted gut sac methodology used in the current investigations could be applied to
assess some of these factors and consequently they require brief discussion. For example,
the comparative absorption of astaxanthin stereoisomers (trans- and cis-astaxanthin) has
not been evaluated. Bjerkeng et al. (1997) recorded significantly higher apparent
digestibility coefficients for astaxanthin for rainbow trout fed aii-E-astaxanthin (79%)
compared to trout fed a stereoisomer mixture (64%) and indicated a competitive
mechanism of uptake of the different stereoisomers. It is envisaged that the current
methodology could be utilised to compare micellar incorporation and intestinal absorption
for the different isomers thus confirming a potential competitive mechanism at the
intestinal level. In addition there is some evidence that the fatty acid composition of
dietary oils may influence the absorption of astaxanthin (Bjerkeng et al. 1999b ). Micelle
preparations used in the current study could be formulated to incorporate an array of
different fatty acid classes representative of the proftle of various sources of dietary oil and
examine their effects on micellar incorporation and intestinal absorption of astaxanthin.
209
8.6 Conclusions
Several general conclusions can be put forward based on findings from the current study
that are relevant to the salmonid feed industry and pigmentation strategies that are utilised
in salmonid production.
The microalgae Haematococcus pluvialis can be used as a viable source of pigment in
salmonid feeds for the production of rainbow trout providing the cell wall structure is
efficiently fractured to ensure bioavailability of pigment. Furthermore the presence of a
cell wall in a fractured state ensures minimum oxidation of pigment and stable feed
astaxanthin profiles.
The extent of esterification does negatively influence the absorption of astaxanthin.
However, these differences do not significantly influence the deposition of esterified
astaxanthin in the muscle of rainbow trout. This has several implications. Firstly, the
extent of esterification should be used as a consideration when choosing and evaluating
other novel sources of carotenoid. Secondly, future assessment of natural carotenoid
sources that contain esterified astaxanthin should make efforts to report the monoester:
diester ratio as this may ultimately affect the findings and conclusions drawn from these
studies. Thirdly, with reference to Haematococcus pluvialis, efforts should be made to
maintain a higher monoester: diester ratio to ensure maximum absorption of astaxanthin
(Hark er et al. l996b)
The gastrointestinal absorption of astaxanthin and hydrolysis of astaxanthin esters takes
place mainly in the pyloric and ileal region of the intestinal system as demonstrated in vivo
and in vitro for rainbow trout and in vitro for Atlantic salmon. Such regional variation in
210
carotenoid-ester hydrolysis and astaxanthin absorption has implications related to feeding
practises and their influence on gut transit rate.
The absorption of astaxanthin by the intestine appears to be a passive linear process. The
size of the fish does not appear to influence the uptake capacity of intestinal tissue in
rainbow trout. However, increases in temperature (within a range found under typical
culture conditions) result in positive increases in absorption of astaxanthin by trout
intestine.
The intestinal absorption of astaxanthin is not significantly different in rainbow trout
compared to Atlantic salmon, although it appears to be higher. Subsequently, differences
in intestinal absorption between these two salmonid species cannot be ruled out.
Clearly, the role of pigmentation in the intensive culture of salmonid species in today's
aquaculture industry is an important one. Consequently, there is still a demand for
scientific research into this field in a continuing drive to increase the utilisation of different
carotenoid sources from feeds, and subsequently reduce the substantial cost of this micro
supplement. Ongoing changes in the manufacture of feeds with respect to macro
ingredients and the demand for alternatives, especially with respect to lipid sources, will
undoubtedly necessitate further studies in relation to pigmentation efficiency. The
increasing production of a larger array of salmonid species will necessitate an
understanding of those genetic strains and potential selection programmes of those fish
groups that have a higher capacity for the absorption and utilisation of carotenoids. Future
research into carotenoids should as a whole encompass factors relating to husbandry and
feeding practises in addition to dietary. composition. It is essential that this research is
211
•. ~·
i, , -·~ I • •J _carried •OUt· :Withi a: marriage of well -defined: in vitr.o. :anfl,r. in VlVQ iiJfOto:~::cM tllat .\\iill
• I I ' ~
significantly"benefii the:aqyafeed. inQl!Stl)' ip• relation to· feed! pigment supplementation, . ' I . - ....
-.·-.. ,_
2l2
REFERENCES
Aas, G.H., Bjerkeng, B., Hatlen, B. & Storebakken, T. (1997) Idoxanthin, a major carotenoid in the flesh of Arctic charr (Salvelinus alpinus) fed diets containing astaxanthin. Aquaculture. 150, 135-142.
Aas, G.H., Bjerkeng, B., Storebakken, T. & Ruyter, B. (1999) Blood appearance, metabolic transformation and plasma transport proteins of 14C-astaxanthin in Atlantic salmon (Salmo salar L.). Fish Physiology and Biochemistry. 21, 325-334.
Abdul-Malak, N.A, Zwingelstein, G., Jouanneteau, J. & Koenig, J. (1975) Influence de certains facteurs nutritionels sur la pigmentation de la truite arc-en-ciel par la canthaxanthine. Annales de la Nutrition et de l'Aiimentation. 29, 459-457.
Akhtar, P., Gray, J.I., Cooper, T.H., Garling, D.L. & Booren, A. M. ( 1999) Dietary pigmentation and deposition of a-tocopherol and carotenoids in rainbow trout muscle and liver tissue. Journal of Food Science. 64, 234-239.
Al-Khalifa, A.S. & Simpson, K.L. (1988) Metabolism of astaxanthin in the rainbow trout (Salmo gairdneri). Comparative Biochemistry and Physiology. 918, 563-568.
Ando, M., Sasaki, H. & Huang, K.C. (1986a) A new technique for measuring water transport across the seawater eel intestine. Journal of Experimental Biology. 122, 257-268.
An do, S., Takeyama, T. & Hatano, M. ( 1986b) Isolation and characterisation of a carotenoid-carrying lipoprotein in the serum of Chum salmon (Oncorhynchus keta) during spawning migration. Agricultural and Biological Chemistry. 50, 907-914.
Ando, S., Takeyama, T., Hatano, M. & Zama, K. (1985) Carotenoid-carrying lipoproteins in the serum of chum salmon (Oncorhynchus keta) associated with migration. Agricultural and Biological Chemistry. 49, 2185-2187.
Ando, S., Tetsushige, T. & Hatano, M. (1986c) Transport associated with serum vitellogenin of carotenoid in Chum salmon (Oncorhynchus keta). Agricultural and Biological Chemistry. 50, 557-563.
Ando, S., Yamauchi, H., Hatano, M. & Heard, W.R. (1992) Comparison of muscle compositions between red- and white-fleshed chinook salmon (Oncorhynchus tshawytscha). Aquaculture. 103, 359-365.
A.O.AC (1990) Official Methods of Analysis, 15'h edition (Helrich, K. ed.). Arlington, Virginia, U.S.A.
Arai, S., Mori, T., Miki, W., Yamaguchi, K., Konosu, S., Satake, M. & Fujita, T. (1987) Pigmentation of juvenile Coho salmon with carotenoid oil extracted from Antarctic krill. Aquaculture. 66, 255-264.
Atherton, W.D. & Aitken, A. (1970) Growth, nitrogen metabolism and fat metabolism in Salmo gaidneri, Rich. Comparative Biochemistry and Physiology. 36, 719-747.
213
Augustijns, P., Annart, P., Heylen, P., Van den Mooter, G. & Kinget, R. ( 1998) Drug absorption studies of prodrug esters using the Caco-2 model: evaluation of ester hydrolysis and transepithelial transport. International Journal of Pharmaceutics. 166, 45-53.
Austreng, E. (1978) Digestibility determination in fish using chromic oxide marking and analysis of contents from different segments of the gastrointestinal tract. Aquaculture. 13, 265-272.
Azevedo, P.A., Cho, C.Y., Leeson, S. & Bureau, D.P. (1998) Effects of feeding level and water temperature on growth, nutrient and energy utilisation and waste outputs of rainbow trout (Oncorhynchus mykiss). Aquatic Living Resources. 11, 227-238.
Barbosa, M.J., Morais, R. & Choubert, G. (1999) Effect of carotenoid source and dietary lipid content on blood astaxanthin concentration in rainbow trout (Oncorhynchus mykiss). Aquaculture. 176, 331-341.
Barron, M.G., Tarr, B.D. & Hayton, W.L. (1987) Temperature dependence of cardiac output and regional blood flow in rainbow trout, Salmo gairdneri Richardson. Journal of Fish Biology. 31, 735-744.
Barrowman, J.A. ( 1984) Intestinal absorption of the fat-soluble vitamins: physiology and pharmacology. In Pharmacology of Intestinal Permeation I (Csa.ky, T.Z. ed.), Vol.70/I, pp. 647-689. Springer-Verlag, New York
Bell, J.G., McEvoy, J., Webster, J.L., McGhee, F., Millar, R.M. & Sargent, J.R. (1998) Flesh lipid and carotenoid composition of Scottish farmed Atlantic salmon (Salmo salar). Journal of Agricultural Food Chemistry. 46, 119-127.
Ben-Amotz, A., Mokaday, S., Edelstein, S. & Avron, M. (1989) Bioavailability of a natural isomer mixture as compared with synthetic all-trans-P-carotene in rats and chicks. Journal of Nutrition. 119, I 013-1019. .
Bergot, P., Solari, A & Luquet, P. ( 1975) Comparison des surfaces absorbantes des caeca pyloriques et de l'intestin chez la truite arc-en-ciel (Salmo gairdneri Rich.). Annales d'Hydrohiologie. 6, 27-43.
Bernhard, K. ( 1990) Synthetic astaxanthin. The route of a carotenoid from research to commercialisation. ln Carotenoids. Chemistry and Biology (Krinsky, N.I., MathewsRoth, M.M. & Taylor, R.F. eds.), pp. 337-364. Plenum Press, New York
Beutner, S., Bloedorn, B., Frixel, S., Blanco, I.H., Hoffmann, T., Martin, H.D., Mayer, B., Noack, P., Ruck, C., Schmidt, M., Schulke, I., Sell, S., Ernst, H., Haremza, S., Seybold, G., Sies, H., Stahl, W. & Walsh, R. (200 I) Quantitative assessment of antioxidant properties of natural colorants and phytochemicals: carotenoids, flavonoids, phenols and indigoids. The role of P-carotene in antioxidant functions. Journal of the Science of Food and Agriculture. 81, 559-568.
Bjerkeng, B. ( 1992) Analysis of carotenoids in salmonids. In Quality Assurance in the Fish Indust1y (Huss, H.H., Jakobsen, M. & Liston, J. eds.), pp. 417-424. Elsevier Science Publishers B.Y.
214
Bjerkeng, B. (1997) Chromatographic analysis of synthesised astaxanthin- a handy tool for the ecologist and the forensic chemist? The Progressive Fish-Culturist. 59, 129-140.
Bjerkeng, B. & Berge, G.M. (2000) Apparent digestibility coefficients and accumulation of astaxanthin EIZ isomers in Atlantic salmon (Salmo salar L.) and Atlantic halibut (Hippoglossus hippoglossus L.). Comparative Biochemistry and Physiology. 127, 423-432.
Bjerkeng, B., Foiling, M., Lagocki, S., Storebakken, T., Olli, J.J. & Alsted, N. (1997) Bioavailability of all-E-astaxanthin and Z-isomers of astaxanthin in rainbow trout (Oncorhynchus mykiss). Aquaculture. 157, 63-82.
Bjerkeng, B., Hamre, K., Hatlen, B. & Wathne, E. (1999a) Astaxanthin deposition in fillets of Atlantic salmon Salmo salar L. fed two dietary levels of astaxanthin in combination with three levels of a-tocopheryl acetate. Aquaculture Research. 30, 637-646.
Bjerkeng, B., Hatlen, B. & Wathne, E. (2000) Corrigendum to "Deposition of astaxanthin in fillets of Atlantic salmon (Salmo salar) fed diets with herring, capelin, sandeel, or Peruvian high PUF A oils" [Aquaculture 180, 307-319]. Aquaculture. 189, 389-390.
Bjerkeng, B., Hatlen, B. & Wathne, E. (1999b) Deposition of astaxanthin in fillets of Atlantic salmon (Salmo salar) fed diets with herring, capelin, sandeel, or Peruvian high PUFA oils. Aquaculture. 180, 307-319.
Bjerkeng, B., Storebakken, T. & Liaaen-Jensen, S. (1990) Response to carotenoids by rainbow trout in the sea. Resorption and metabolism of dietary astaxanthin and canthaxanthin. Aquaculture. 91, 153-162.
Bjerkeng, B., Storebakken, T. & Liaaen-Jensen, S. (1992) Pigmentation of rainbow trout from start feeding to sexual maturation. Aquaculture. 108, 333-346.
Blanc, J.M. & Choubert, G. (1993) Genetic variation of flesh colour in pan-size rainbow trout fed astaxanthin. Journal of Applied Aquaculture. 2, 115-123.
Bligh, E.G. & Dyer, W.J. (1959) A rapid method of total lipid extraction and purification. Canadian Journal of Biochemistry and Physiology. 37, 911-917.
Bi:ihm, V. & Bitsch, R. (1999) Intestinal absorption of lycopene from different matrices and interactions to other carotenoids, the lipid status, and the antioxidant capacity of human plasma. European Journal of Nutrition. 38, 118-125.
Bore!, P., Grolier, P., Armand, M., Partier, A., Lafont, H., Lairon, D. & Azais-Braesco, V. (1996) Carotenoids in biological emulsions: solubility, surface-to-core distribution, and release from lipid droplets. Journal of Lipid Research. 37, 250-261.
Boussiba, S. & Vonshak, A (1991) Astaxanthin accumulation m the green alga Haematococcus piu via/is. Plant Cell Physiology. 32, I 077-1082.
Bowen, 1., Soutar, C., Serwata, R.D., Lagocki, S., White, D.A., Davies, S.J. & Young, A.J. (2001) Utilisation of (3S,3'S)-astaxanthin acyl esters in pigmentation of rainbow trout (Oncorhynchus mykiss). Aquaculture Nutrition. 7, 1-10.
215
Brauge, C., Corraze, G. & Medale, F. {1995) Effect of dietary levels of lipid and carbohydrate on growth performance, body composition, nitrogen excretion and plasma glucose levels in rainbow trout reared at 8 or I8°C. Reproduction Nutrition Development. 35, 277-290.
Brett, J.R. & Higgs, D.A. (1970) Effect of temperature on the rate of gastric digestion in fingerling sockeye salmon, Oncorhynchus nerka. Journal of the Fisheries Research Board Canada. 21, 1767-1779.
Britton, G. ( 1995) Structure and properties of carotenoids in relation to function. FASEB. 9, 1551-1558.
Buddington, R.K. & Diamond, J.M. (1987) Pyloric ceca of fish: a "new" absorptive organ. American Journal of Physiology. 252, G65-G76.
Buddington, R.K. & Doroshov, S.I. (1986) Digestive enzyme complement of white sturgeon (Acipenser transmontanus). Comparative Biochemistry and Physiology. 83A, 561-567.
Burbrick, P. (1991) Production of astaxanthin from Haematococcus. Bioresource Technology. 38, 237-239.
Burczyk, J. ( 1987) Biogenetic relationships between ketocarotenoids and sporopollenins in green algae. Phytochemistry. 26, 113-119.
Buttle, L.G., Crampton, V.O. & Williams, P.D. (2001) The effect of feed pigment type on flesh pigment deposition and colour in farmed Atlantic salmon, Salmo salar L. Aquaculture Research. 32, I 03-111.
Calo, P., Velazquez, J.B., Sieiro, C., Blanco, P., Longo, E. & Villa, T.G. (1995) Analysis of astaxanthin and other carotenoids from several Phaffia rhodozyma Mutants. Journal of Agricultural Food Chemistry. 43, 1396-1399.
Campbell, 1-IA, Handy, R.D. & Nimmo, M. (1999) Copper uptake kinetics across the gills of rainbow trout (Oncorhynchus mykiss) measured using an improved isolated perfused head technique. Aquatic toxicology. 46, 177-190.
Canfield, L.M., Fritz, TA & Tarara, T.E. (1990) Incorporation of P-carotene into mixed micelles. Methods in Enzymology. 189, 418-422.
Carmona, A. ( 1998) A simple in vitro perfusion system to measure intestinal nutrient uptake. Journal of Nutritional Biochemistry. 9, 52-57.
Castenmiller, J.J.M. & West, C.E. (1998) Bioavailability and bioconversion ofcarotenoids. Annual Reviews in Nutrition. 18, 19-38.
Chavez, P.R.G., Rengal, D., Gomez, R., Choubert, G. & Milicua, J.C.G. (1998) Canthaxanthin saturation of serum lipoproteins from immature rainbow trout (Oncorhynchus mykiss). Comparative Biochemistry and Physiology. 121, 129-134.
216
Chen, B.H. & Yang, S.H. (1992) An improved analytical method for the determination of carotenes and xanthophylls in dried plant materials and mixed feeds. Food Chemistry. 44, 61-66.
Cho, C.Y. (1990) Fish nutrition, feeds, and feeding: with special emphasis on salmonid aquaculture. Food Review International. 6, 333-357.
Cho, C.Y. & Kaushik, S.J. (1990) Nutritional energetics in fish: energy and protein utilisation in rainbow trout (Salmo gairdneri). World Review of Nutrition and Dietetics 61, 132-172.
Choubert, G., Blanc, J.M. & Poisson, H. (1998) effects of dietary keto-carotenoids (canthaxanthin and astaxanthin) on the reproductive performance of female rainbow trout Oncorhynchus mykiss (Walbaum). Aquaculture Nutrition. 4, 249-254.
Choubert, G., Blanc, J.M. & Vallee, F. (1997) Colour measurement, using the CIELCH colour space, of muscle of rainbow trout, Oncorhynchus mykiss (Walbaum), fed astaxanthin: effects offamily, ploidy, sex, and location of reading. Aquaculture Research. 28, 15-22.
Choubert, G., De la Noue, J. & Blanc, J.M. (1991) Apparent digestibility of canthaxanthin in rainbow trout: Effect of dietary fat level, antibotics and number of pyloric caeca. Aquaculture. 99, 323-329.
Choubert, G., Gomez, R. & Milicua, 1. G. ( 1994a) Response of serum carotenoid levels to dietary astaxanthin and canthaxanthin in immature rainbow trout Oncorhynchus mykiss. Comparative Biochemistry and Physiology. 109A, I 001-1006.
Choubert, G., Guillou, A. & Fauconneau, B. (1987) Absorption and fate of labelled canthaxanthin 15, I S'-3H2 in rainbow trout (Salmo gairdneri Rich.). Comparative Biochemistry and Physiology. 87 A, 717-720.
Choubert, G. & Heinrich, 0. (1993) Carotenoid pigments of the green alga Haematococcus pluvialis: assay on rainbow trout, Oncorhynchus mykiss, pigmentation in comparison with synthetic astaxanthin and canthaxanthin. Aquaculture. 112, 217-226.
Choubert, G. & Luquet, P. (1983) Utilisation of shrimp meal for rainbow trout (Salmo gairdneri Rich.) pigmentation. Influence of fat content of the diet. Aquaculture. 32, 19-26.
Choubert, G., Milicua, J.C.G., Martinez, R.G. & Sance, S. (1992) Distribution of canthaxanthin in immature rainbow trout Oncorhynchus mykiss serum. Comparative Biochemistry and Physiology. 103A, 403-405.
Choubert, G., Milicua, J.G. & Gomez, R. (1994b) The transport ofastaxanthin in immature rainbow trout Oncorhynchus mykiss serum. Comparative Biochemistry and Physiology. 108A, 245-248.
Choubert, G., Milicua, J.G., Gomez, R., Sance, S., Petit, H., Negre-Sadargues, G., Castillo, R. & Trilles, 1. (I 995) Utilisation of carotenoids from various sources by rainbow trout:
217
muscle colour, carotenoid digestibility and retention. Aquaculture International. 3, 205-216.
Choubert, G. & Storebakken, T. ( 1989) Dose response to astaxanthin and canthaxanthin pigmentation of rainbow trout fed various dietary carotenoid concentrations. Aquaculture. 81, 69-77.
Choubert, G. & Storebakken, T. (1996) Digestibility of astaxanthin and canthaxanthin in rainbow trout as affected by dietary concentration, feeding rate and water salinity. Annates de Zootechnie. 45, 445-453.
Christiansen, J.S. & Wallace, J.C. (1988) Deposition ofcanthaxanthin and muscle lipid in two size groups of Arctic charr, Salvelinus alpinus (L.). Aquaculture. 69, 69-78.
Christiansen, R., Glette, J., Lie, 0., Torrissen, O.J. & Wagabo, R. (1995a) Antioxidant status and immunity in Atlantic salmon, Salmo salar L., fed semi-purified diets with and without astaxanthin supplementation. Journal of Fish Disease. 18, 317-328.
Christiansen, R., Lie, 0. & Torrissen, O.J. ( 1994) Effect of astaxanthin and vitamin A on growth and survival during first feeding of Atlantic salmon, Salmo salar L. Aquaculture and Fisheries Management. 25, 903-914.
Christiansen, R., Sruksnaes, G., Estermann, R. & Torrissen, 0.1. (1995b) Assessment of flesh colour in Atlantic salmon, Salmo salar L. Aquaculture Research. 26, 311-321.
Christiansen, R. & Torrissen, O.J. ( 1996) Growth and survival of Atlantic salmon, Salmo salar L. fed different dietary levels of astaxanthin. Juveniles. Aquaculture Nutrition. 2, 55-62.
Christiansen, R. & Torrissen, 0.1. (1997) Effects of dietary astaxanthin supplementation on fertilization and egg survival in Atlantic salmon (Salmo salar L.). Aquaculture. 153, 51-62.
Christiansen, R., Wagabo, R. & Torrissen, O.J. (1991) Effects of polyunsaturated fatty acids and vitamin E on flesh pigmentation in Atlantic salmon (Salmo salar) ln Fish Nutrition in Practise (INRA, P. ed.), No.6, pp. 339-343. Les Colloques, Paris.
Clark, R.M., Yao, L., She, L. & Furr, H.C. (1998) A comparison of lycopene and canthaxanthin absorption: using the rat to study the absorption of non-provitamin A carotenoids. Lipids. 33, 159-163.
Clark, R.M., Yao, L., She, L. & Furr, H.C. (2000) A comparison of lycopene and astaxanthin absorption from corn oil and olive oil emulsions. Lipids. 35, 803-806.
Collie, N.L. (1985) Intestinal nutrient transport in Coho salmon (Oncorhynchus kisutch) and the effect of development, starvation, and seawater adaptation. Journal of Comparative Physiology B. 156, 163-174.
Coral, G., Huberman, A., De la Lanza, G. & Monroy-Ruiz, J. (1998) Muscle pigmentation of rainbow trout (Oncorhynchus mykiss) fed on oil-extracted pigment from Langostilla
218
(Pieuroncodes planipes) compared with two commercial sources of astaxanthin. Journal of Aquatic Food Product Technology. 7, 31-45.
Crozier, G.F. ( 1970) Tissue carotenoids in pre-spawning and spawning Sockeye salmon (Oncorhynchus nerka). Journal Fisheries Research Board of Canada. 27, 973-975.
Csaky, T.Z. ( 1984) Methods for investigation of intestinal permeability. In Pharmacology of Intestinal Permeation (Csaky, T.Z. ed.), pp. 91-111. Springer Verlag, New York.
Darlington, W.A. & Quastel, J.H. (1953) Absorption of sugars from isolated surviving intestine. Archives of Biochemistry and Biophysics. 43, 194-207.
Doi, AM., Lou, Z., Holmes, E., Li, C.L.J., Venugopal, C.S., James, M.O. & Kleinow, K.M. (2000) Effect of micelle fatty acid composition and 3,4,3',4'-tetrachlorobiphenyl (TCB) exposure on intestinal [14C]-TCB bioavailability and biotransformation channel catfish in situ preparations. Toxicological Sciences. 55, 85-96.
Ebert, K., Ederer, H. & Isenhour, T.L. (1989) Computer applications in chemistry. pp. 390. VCH Publishers, New York.
Egan, D. (2000) Salmon Farming Overview 1999. Presentation to the B.C. Salmon Farmers Association Annual General Meeting. Vancouver, B. C., June 15
EI-Gorab, M. & Underwood, B.A. (1973) Solubilisation of ~-carotene and retinol into aqueous solutions of mixed micelles. Biochimica et Biophysica Acta. 306, 58-66.
El-Gorab, M., Underwood, B.A. & Loerch, J.D. (1975) The roles of bile salts in the uptake of ~-carotene and retinol by rat everted gut sacs. Biochimica et Biophysica Acta. 401, 265-277.
Erdman, J.W., Bierer, T.L. & Gugger, E.T. (1993) Absorption and transport of carotenoids. Annals. New York Academy of Sciences. 691, 76-85.
Erlanson, C. & Borgstrom, B. ( 1968) The identity of vitamin A esterase activity of rat pancreatic juice. Biochimica et Biophysica Acta. 141, 629-631.
Fiinge, R. & Grove, D. ( 1979) Digestion. Ln Fish Physiology (Fiinge, R. & Grove, D. eds.), VIII, pp. 161-261. Academic Press, New York.
Farrow, W.M. & Tabenkin, B. (1966) Process for the preparation of lutein. US. Paten/ no. 3 280 502.
Fauconneau, B., Choubert, G., Blanc, D., Breque, 1. & Luquet, P. (1983) Influence of environmental temperature on flow rate of foodstuffs through the gastrointestinal tract of rainbow trout. Aquaculture. 34, 27-39.
Ferruzzi, M.G., Failla, M.L. & Schwartz, S.J. (2001) Assessment of degradation and intestinal cell uptake of carotenoids and chlorophyll derivatives from spinach puree using an in vitro digestion and caco-2 human cell model. Journal of Agricultural and Food Chemistry. 49, 2082-2089.
219
Fisher, R.B. & Parsons, D.S. (1949) A preparation of surviving small intestine for the study of absorption. Journal of Physiology. 110, 36-46.
Foss, P., Storebakken, T., Austreng, E. & Liaaen-Jensen, S. (1987) Carotenoids in diets for salmonids V. Pigmentation of rainbow trout and sea trout with astaxanthin and astaxanthin dipalmitate in comparison with canthaxanthin. Aquacu/ture. 65, 293-305.
Foss, P., Storebakken, T., Schiedt, K., Liaaen-Jensen, S., Austreng, E. & Streiff, K. (1984) Carotenoids in diets for salmonids I. Pigmentation of rainbow trout with the individual optical isomers of astaxanthin in comparison with canthaxanthin. Aquacu/ture. 41, 213-226.
Freeman, W.H. & Bracegirdle, B. (1967) An atlas of histology. Heinemann Education Books Ltd., London
Fremont, L., Leger, C., Boudon, M. & Gozzelino, M.T. (1981) Fatty acid composition of lipids in trout II. Fractionation and analysis of plasma lipoproteins. Comparative Biochemistry and Physiology. 698, 107-113.
Furr, H.C. & Clark, R.M. (1997) Intestinal absorption and tissue distribution of carotenoids. Nutritional Biochemistry. 8, 364-377.
Garrett, D.A., Failla, M.L. & Sarama, R.J. (1999a) Development of an in vitro digestion method to assess carotenoid bioavailability from meals. Journal of Agricultural and Food Chemistry. 47, 4301-4309.
Garrett, D.A., Failla, M.L. & Sarama, RJ. (2000) Estimation of carotenoid bioavailability from fresh stir-fried vegetables using an in vitro digestion/caco-2 cell culture model. Journal of Nutritional Biochemist1y. 11, 574-580.
Garrett, D.A., Failla, M.L., Sarama, RJ. & Craft, N. (1999b) Accumulation and retention of micellar P-carotene and lutein by Caco-2 human intestinal cells. Journal of Nutritional Biochemist1y. 10, 573-581.
Gartner, C., Stahl, W. & Sies, H. ( 1996) Preferential increase in chylomicron levels of the xanthophylls lutein and zeaxanthin compared to P-carotene in the human. International Journal of Vitamin Nutritional Research. 66, 119-125.
Gaziano, J.M., Johnson, E.J., Russell, R.M., Manson, J.E., Stampfer, M.J., Ridker, P.M., Frei, B., Hennekens, C.H. & Krinsky, N.I. (1995) Discrimination in absorption or transport of P-carotene isomers after oral supplementation with either all-trans- or 9-cis-P-carotene American Journal of Clinical Nutrition. 61, 1248-1252.
Gentles, A. & Haard, N.F. (1991) Pigmentation of rainbow trout with enzyme-treated and spray-dried Phaffia rhodozyma. The Progressive Fish Culturist. 53, 1-6.
Gobantes, 1., Choubert, G., Laurentie, M., Milicua, J.C.G. & Gomez, R. (1997) Astaxanthin and canthaxanthin kinetics after ingestion of individual doses by immature rainbow trout Oncorhynchus mykiss. Journal of Agricultural and Food Chemistry. 45, 454-458.
220
Good, B.H. & Chapman, R.L. (1979) A comparison between the walls of Haematococcus cysts and the loricas of Dysmorphoccus and the possible presence of sporopollenin. Journal ofphycology. 15, 17.
Goodwin, T.W. (1986) Metabolism, nutrition, and function of carotenoids. Annual Review of Nutrition. 6, 273-297.
Gouveia, L., Choubert, G., Gomez, E., Rema, P. & Empis, J. (1998) Use of Ch/orella vulgaris as a carotenoid source for rainbow trout: effect of dietary lipid content on pigmentation, digestibility and retention in the muscle tissue. Aquaculture International. 6, 269-279.
Grabner, M. & Hofer, R. (1985) The digestibility of the proteins of broad bean (Viciafaba) and soy bean (Glycine max) under in vitro conditions simulating the alimentary tracts of rainbow trout (Salmo gairdneri) and carp (Cyprinus carpio). Aquaculture. 48, lll-122.
GrisdaleHelland, B. & Helland, S.J. (1997) Replacement of protein by fat and carbohydrate in diets for Atlantic salmon (Salmo salar) at the end of the freshwater stage. Aquaculture. 152, 167-180.
Grolier, P., Duszka, C., Bore!, P., Alexandre-Gouabau, M.-C. & Azais-Braesco, V. (1997) In vitro and in vivo inhibition of P-carotene dioxygenase activity by canthaxanthin in rat intestine. Archives of Biochemistry and Biophysics. 348, 233-238.
Grung, M., D'Souza, F.M.L., Borowitzka, M. & Liaaen-Jensen, S (1992) Algal carotenoids 51. Secondary carotenoids 2. Haematococcus pluvialis aplanospores as a source of (3S, 3'S)-astaxanthin esters. Journal of Applied Phycology. 4, 165-171.
Guillou, A., Choubert, G. & De La Noue, J. (1992a) Absorption and blood clearance of labelled carotenoids ([ 14C]astaxanthin, [3H]canthaxanthin and [3H]zeaxanthin) in mature female rainbow trout (Oncorhynchus mykiss). Comparative Biochemistry and Physiology. 103A, 301-306.
Guillou, A., Choubert, G. & De la Noue, J. (1992b) Comparative accumulations of labelled carotenoids C4C-astaxanthin, 3H-canthaxanthin and 3H-zeaxanthin) and their metabolic conversions in mature female rainbow trout (Oncorhynchus mykiss). Comparative Biochemistry and Physiology. 1028, 61-65.
Hageman, S.H., She, L., Furr, H.C. & Clark, R.M. (1999) Excess vitamin E decreases canthaxanthin absorption in the rat. Lipids. 34, 627-631.
Handy, R.D., Musonda, M.M., Phillips, C. & Falla, S.J. (2000) Mechanisms of gastrointestinal copper absorption in the African walking catfish: copper dose-effects and a novel anion-dependent pathway in the intestine. The Journal of Experimental Biology. 203, 2365-2377.
Hardy, RW, Torrissen, 0.1. & Scott, TM. (1990) Absorption and distribution of 14Clabeled canthaxanthin in rainbow trout (Oncorhynchus mykiss). Aquaculture. 87, 331-340.
221
Harker, M., Tsavalos, A.J. & Young, A.J. (1996a) Factors responsible for astaxanthin formation in the chlorophyte Haematococcus pluvialis. Bioresource technology. 55, 207-214.
Harker, M., Tsavalos, A.J. & Young, A.J. (1996b) Autotrophic growth and carotenoid production of Haematococcus pluvialis in a 30 litre air lift bioreactor. Journal of Fermentation and Bioengineering. 82, 113-118.
Harrison, E.H. (1993) Enzymes catalysing the hydrolysis of retinyl esters. Biochemica et BiophysicaActa. 1170, 99-108.
Hata, M. & Hata, M. (1973) Studies on astaxanthin formation in some fresh-water fishes. Tohoku Journal of Agricultural Research. 24, 192-195.
Hatano, M., Takahashi, K., Takama, S. & Nakajima, S. (1987) Sensory evaluation of the flesh quality of fall chum salmon. Bulletin. Faculty of Fisheries Hokkaido University. 38, 311-321.
Hatlen, B., Aas, G.H, Jorgensen, E.H., Storebakken, T. & Goswami, U.C. (1995a) Pigmentation of 1, 2 and 3 year old arctic charr (Salvelinus alpinus) fed two different dietary astaxanthin concentrations. Aquaculture. 138, 303-312.
Hatlen, B., Jobling, M. & Bjerkeng, B. (1995b) Relationships between carotenoid concentration and colour of fillets of arctic charr, Salvelinus alpinus (L.), fed astaxanthin. Aquaculture Research. 29, 191-202.
Hebuterne, X., Wang, X.-D., Johnson, E.J., Krinsky, N.I. & Russell, R.M. (1995) Intestinal absorption and metabolism of 9-cis-~-carotene in vivo: biosynthesis of 9-cis-retinoic acid. Journal of Lipid Research. 36, 1264-1273.
Henrni, H, Hata, M. & Hata, M. (1989) Astaxanthin and/ or canthaxanthin -actomyosin complex in salmon muscle. Nippon Suisan Gakkaishi. 55, I 583-1589. · · ·
Henmi, H., Hata, M. & Takeuchi, M. (1991) Studies on the carotenoids in the muscle of salmon V. Combination of astaxanthin and canthaxanthin with bovine serum albumin and egg albumin. Comparative Biochemistry and Physiology. 99B, 609-612.
Henmi, H., Iwata, T. & Hata, M. (1987) Studies on the carotenoids in the muscle of salmons I. Intracellular distribution of carotenoids in the muscle. Tohoku Journal of Agricultural Research. 37, 101-111.
Hollander, D. (1973) Vitamin K1 absorption by everted intestinal sacs of the rat. American Journal of Physiology. 225, 360-364.
Hollander, D. & Dadufalza, V. (1989) Lymphatic and portal absorption of vitamin E in ageing rats. Digestive Diseases and Sciences 34, 768-772.
Hollander, D. & Morgan, D. (1979) Ageing: its influence on vitamin A intestinal absorption in vivo by the rat. Experimental Gerontology. 14, 301-305.
222
Hollander, D. & Ruble, P.E. (1978) P-carotene intestinal absorption: bile, fatty acid, pH, and flow rate effects on transport. American Journal of Physiology. 235, E686-E691.
Hollander, D. & Tarnawski, H. (1984) Influence of ageing on vitamin D absorption and unstirred water layer dimensions in the rat. Journal of Laboratory and Clinical Medicine. 103, 462-469.
Jackson, M.J. (1997) The assessment of bioavailability of micronutrients: Introduction. European Journal of Clinical Nutrition. 51, S 1-S2.
Jacobs, P.B., LeBoeuf, R.D., McCommas, S.A. & Tauber, J.D. (1982) The cleavage of carotenoid esters by cholesterol esterase. Comparative Biochemistry and Physiology. 72B, 157-160.
Job ling, M ( 1986) Gastrointestinal overload-a problem with formulated feeds? Aquaculture. 51, 257-263.
Johnson, E.A. & An, G.H. (1991) Astaxanthin from microbial sources. Critical Reviews in Biotechnology. ll, 297-326.
Johnson, E.A., Conklin, D.E. & Lewis, M.J. (1977) The yeast Phaffia rhodozyma as a dietary source for salmonids and crustaceans. Journal Fisheries Research Board Canada. 34, 2417-2421.
Johnson, E.A., Villa, T.G. & Lewis, M.J. (1980) Phaffia rhodozyma as an astaxanthin source in salmonid diets. Aquaculture. 20, 123-134.
Johnston, I.A., Alderson, R., Sandham, C., Dingwall, A., Mitchell, D., Selkirk, C., Nickell, · D., Baker, R., Robertson, B., Whyte, D. & Springate, J. (2000) Muscle fibre density in relation to the colour and texture of smoked Atlantic salmon (Salmo salar L.). Aquaculture 189, 335-349.
Keelan, M., Hui, D.Y., Wild, G., Clandinin, M.T. & Thomson, A.B.R. (2000) Variability of the intestinal uptake oflipids is genetically determined in mice. Lipids. 35, 833-837.
Kiessling, A., Dosanjh, B., Higgs, D., Deacon, G. & Rowshandeli, N. (1995) Dorsal aorta cannulation: a method to monitor changes in blood levels of astaxanthin in voluntarily feeding Atlantic salmon, Salmo salar L. Aquaculture Nutrition. 1, 43-50.
Kleinow, K.M., lames, M.O., Tong, Z. & Venugopalan, C.S (1998) Bioavailability and biotransformation of Bezo(a)pyrene in an isolated perfused in situ catfish intestinal preparation. l!.:nvironmental Health Per!>pectives. 106, 155-166.
Kobayashi, M., Kakizono, T. & Nagai, S. (1991) Astaxanthin production by a green alga, Haematococcus pluvialis accompanied with morphological changes in acetate media. Journal of Fermentation and Bioengineering. 71, 335-339.
Kobayashi, M. & Sakamoto, Y (1999) Singlet oxygen quenching ability of astaxanthin esters from the green alga Haematococcus pluvialis. Biotechnology Letters. 21, 265-269.
223
Kostic, D., White, W.S. & Olson, J.A. (l99S) Intestinal absorption, serum clearance, and interactions between lutein and P-carotene when administered to human adults in separate or combined oral doses. American Journal of Clinical Nutrition. 62, 604-610.
Koven, W.M., Henderson, R.J. & Sargent, J.R. (1994) Lipid digestion in turbot (Scophthalmus maximus). 1: lipid class and fatty acid composition of digesta from different segments of the digestive tract. Fish Physiology and Biochemistry. 13, 69-79.
Koven, W. M., Henderson, R.J. & Sargent, J.R. ( 1997) Lipid digestion in turbot (Scopthalmus maximus): in vivo and in vitro studies of the lipolytic activity in various segments ofthe digestive tract. Aquaculture. 151, 1SS-171.
Kuo, H.C., Lee, T.C., Kamata, T. & Simpson, K.L. (1976) Red crab processing waste as a carotenoid source for rainbow trout. Alimenta. 15, 47-S I.
Lambertsen, G. & Braekkan, O.R. (1969) In vivo conversion of vitamin A1 to vitamin A2. Acta Chemica Scandinavica. 23, 1063-1064.
Lie, 0., Lied, E. & Lambertsen, G. (1987) Lipid digestion m cod (Gadus morhua). Comparative Biochemistry and Physiology. 88B, 697-700.
Little, A.C., Martinsen, C. & Sceurman, L. (1979) Colour assessment of experimentally pigmented rainbow trout. Colour Research and Application 4, 92-9S.
Lombardo, D. & Guy, 0. (1980) Studies on the substrate specificity of a caroboxyl ester hydrolase from human pancreatic juice. II Action on cholesterol esters and lipid-soluble vitamin esters. Biochimica et Biophysica Acta. 611, 147-1 SS.
Loran, M.R & Althausen, T.L. ( 1969) Transport of vitamin A in vitro across normal isolated rat intestine and intestine subjected to "partial" resection. American Journal of Physiology. 197, 1333-1336.
Loran, M.R., Althausen, T.L., Spicer, F.W. & Goldstein, W.l. (1961) Transport of vitamin A across human intestine in vitro. Journal of Laboratory and Clinical Medicine. 58, 622-626.
Lorenz, T.R. & Cysewski, G.R. (2000) Commercial potential for Haematococcus microalgae as a natural source of astaxanthin. Trends in Biotechnology. 18, 160-167.
Loretz, C. A. (I 99S) Electrophysiology of ion transport in teleost intestinal cells. In Cellular and molecular approaches to fish ionic regulation. (Wood, C. M. & Shuttleworth, T.J. eds.), pp. 2S-S6. Academic Press, London.
MacMahon, M.T. & Thompson, G.R. ( 1969) Comparison of absorption of a polar and nonpolar lipid from micellar solutions and emulsions. Gut. 10, I 054.
MacMahon, M.T. & Thompson, G.R. ( 1970) Comparison of the absorption of a polar lipid, oleic acid, and a non-polar lipid, a-tocopherol from mixed micellar solutions and emulsions. European Journal of Clinical Investigation. l, 161-166.
224
Mahadeven, S., Seshadri Sastri, P. & Ganguly, J. (1963) Studies on metabolism of vitamin A. 4. Studies on the mode of absorption of vitamin A by rat intestine in vitro. Biochemistry. 88, 534-539.
Mandeville, S., Yaylayan, V., Simpson, B. & Ramaswamy, H. (1991) Isolation and identification of carotenoid pigments, lipids and flavour active components from raw commercial shrimp waste. Food Biotechnology. 5, 185-195.
March, B.E., Hajen, W.E., Deacon, G., MacMillan, C. & Walsh, M.G. (1990) Intestinal absorption of astaxanthin, plasma astaxanthin concentration, body weight, and metabolic rate as determinants of flesh pigmentation in salmonid fish. Aquacu/ture. 90, 313-322.
March, B.E. & MacMillan, C. (1996) Muscle pigmentation and plasma concentrations of astaxanthin in rainbow trout, chinook salmon, and Atlantic salmon in response to different dietary levels of astaxanthin. The Progressive Fish Culturisl. 58, 178-186.
Marcotte, G. & De la Ntiue, J. (1984) In vitro intestinal absorption of glycine and Lalanine by rainbow trout, Salmo gairdneri, Rich. Comparative Biochemistry and Physiology. 79A, 209-213.
Mathews-Roth, M.M. & Gulbrandsen, C.L. (I 974) Transport of beta carotene in serum of individuals with Carotenemia. Clinical Chemistry. 20, 1578-1579.
Mathias, P.M., Harries, J.T., Peters, T.J. & Muller, D.P.R. (1981) Studies on the in vivo absorption of micellar solutions of tocopherol and tocopheryl acetate in the rat: demonstration and partial characterisation of a mucosal esterase localised to the endoplasmic reticulum of the enterocyte. Journal of Lipid Research. 22, 829-837.
Medale, F., Poli, J.-M., Vallee, F. & Blanc, D. (1999) Comparison del'utilisation digestive et metaboliqe d'un regime riche en glucides par la carpe a 18°C et 25°C. Cybium. 23, 139-152.
Mendes-Pinto, M. M., Raposo, M F.l, Bowen, J., Young, A.J. & Morais, R. (2001) Evaluation of different cell disruption processes on encysted cells of Haema/ococcus pluvialis: effects on astaxanthin recovery and implications for bio-availability. Journal of Applied Phycology. 13, 19-24.
Metusalach, Synowiecki, J., Brown, J. & Shahidi, F. (1996) Deposition and metabolism of dietary canthaxanthin in different organs of Arctic charr (Salvelinus alpinus L.). Aquaculture. 142, 99-106.
Meyers, S.P. (I 994) Developments in world aquaculture, feed formulations, and role of carotenoids. Pure and Aplplied Chemistry. 66, I 069-1076.
Meyers, S.P. & Rutledge, J.E. (1971) Economic utilisation of crustacean meals. Feedstuffs. 43, 46.
Meyers, S.P. & Thibodeaux, P. ( 1983) Crawfish wastes and extracted astaxanthin as pigmentation sources in aquatic diets. Journal of Aquariculture & Aquatic Sciences. 3, 64-70.
225
Miki, W. (1991) Biological functions and activities of animal carotenoids. Pure and Applied Chemistry. 63, 141-146.
Miyasaki, T., Sato, M., Yoshinaka, R. & Sakaguchi, M. (1993) Intestinal absorption and the activity of enzymatic hydrolysis of ascorbyl-2-phosphate in rainbow trout. Nippon Suisan Gakkaishi. 59, 2059-2064.
Moe, N.H. ( 1990) Key factors in marketing farmed salmon. Proceedings of the Nutritional Society New Zealand. 15, 16-22.
Mori, T., Makabe, K., Yamaguchi, K., Konosu, S. & Arai, S. (1989) Comparison between krill astaxanthin diester and synthesised free astaxanthin supplemented to diets in their absorption and deposition by juvenile Coho salmon (Oncorhynchus kisutch). Comparative Biochemistry and Physiology. 93B, 255-258.
Morris, T.R. (1999) Pens and Paddocks. In Experimental Design and Analysis in Animal Sciences, pp. 53-61. CABI Publishing, UK.
Muller, D.P.R., Manning, J.A., Mathias, P.M. & Harries, J.T. (1976) Studies on the intestinal hydrolysis of tocopherol esters. International Journal of Vitamin and Nutritional Research. 46, 207-21 0.
Nakamura, K., Hata, M. & Hata, M. (1985) a study on astaxanthin in salmon Oncorhynchus keta serum. Bulletin of the Japanese Society of Scientific Fisheries. 51, 979-983.
Nakano, T., Kanmuri, T., Sato, M. & Takeuchi, M. (I 999) Effect of astaxanthin rich red yeast (Phaffia rhodozyma) on oxidative stress in rainbow trout. Biochimica et Biophysica Acta. 1426, 119-125.
Nakano, T., Tosa, M. & Takeuchi, M. (1995) Improvement of biochemical features in fish health by ted yeast and synthetic astaxanthin. Journal of Agricultural and Food Chemistry. 43, I 570-1573.
Nickell, D. & Bromage, N. ( 1998a) Problems of pigmentation in rainbow trout. Trout News. 26, 26-30.
Nickell, D.C. & Bromage, N.R. (1998b) The effect of dietary lipid level on variation of flesh pigmentation in rainbow trout (Oncorhynchus mykiss). Aquaculture. 161, 237-25 I.
Nierenberg, D.W. (1984) Determinations of serum and plasma concentrations of retinol using high performance liquid chromatography. Journal of Chromatography. 311, 239-248.
No, H.K. & Storebakken, T. ( 1991) Pigmentation of rainbow trout with astaxanthin at different water temperatures. Aquaculture. 97, 203-216.
No, H.K. & Storebakken, T. (1992) Pigmentation of rainbow trout with astaxanthin and canthaxanthin in freshwater and saltwater. Aquaculture. 101, 123-134.
226
Nonomura, A.M. (1987) Process for producing a naturally-derived carotene/oil composition by direct extraction from algae. U.S. Patent no. 4 680 314.
Nordrum, S., Bakke-McKellep, A.M., Krogdahl, A. & Buddington, R.K. (2000) Effects of soybean meal and salinity on intestinal transport of nutrients in Atlantic salmon (Salmo salar L.) and rainbow trout (Oncorhynchus mykiss). Comparative Biochemistry and Physiology. 125, 317-335.
Olsen, R. E. & Mortensen, A. ( 1997) The influence of dietary astaxanthin and temperature on flesh colour in Arctic charr Salvelinus alpinus L. Aquaculture Research. 28, 51-58.
Olsen, R.E. & Ringo, E. (1998) The influence of temperature on the apparent nutrient and fatty acid digestibility of Arctic charr, Salvelinus alpinus L. Aquaculture Research. 29, 695-701.
Olson, J.A. (1964) The effect of bile and bile salts on the uptake and cleavage of Pcarotene into retinol ester (vitamin A ester) by intestinal slices. Journal of Lipid Research. 5, 402-408.
Osborne, D.J., Huff, W.E., Hamilton, P.B. & Burmeister, H.R. (1982) Comparison of ochratoxin, aflotoxin, and T-2 toxin for their effects on selected parameters related to digestion and evidence for specific metabolism of carotenoids in chickens. Poultry Science. 67, 1646-1652.
0sterlie, M , Bjerkeng, B. & Liaaen-Jensen, S. ( 1999) Accumulation of astaxanthin all-£, 9Z and 13Z geometrical isomers and 3 and 3' RS optical isomers in rainbow trout (Oncorhynchus mykiss) is selective. Journal of Nutrition. 129, 391-398.
0sterlie, M., Bjerkeng, B. & Liaaen-Jensen, S. (2000) Plasma appearance and distribution of astaxanthin Ell and RIS isomers in plasma lipoproteins of men after single dose administration of astaxanthin. Journal of Nutritional Biochemistry. 11, 482-490.
Ostrander, J., Martinsen, C., Liston, J. & McCullough, J. (1976) Sensory testing of penreared salmon and trout. Journal of Food Science. 41, 386-390.
Parker, R.S. (1996) Absorption, metabolism, and transport of carotenoids FASEB Journal. 10, 542-551.
Pearson, C.K. & Legge, A.M. (1972) Uptake of vitamin E by rat small-intestinal slices. Biochemistry Journal. 129, 16P-17P.
Pedersen, C.L. ( 1987) Energy budgets for juvenile rainbow trout at vanous oxygen concentrations. Aquaculture. 97, 203-216.
Perez del Castillo, M.M., Lostao, M.P., Barber, A. & Ponz, F. (1997) Some technical precisions to a method for in vivo intestinal absorption studies. Journal of Physiology and Biochemist1y. 53, 281-288.
Peterson, D.H., lager, H.K. & Savage, G.M. (1966) Natural coloration of trout usmg xanthophylls. Transactions. American Fisheries Society. 35, 408-414.
227
Pfitzner, 1., Francz, P.I. & Biesalki, H.K. (2000) Carotenoid:methyl-P-cyclodextrin formulations: an improved method for supplementation of cultured cells. Biochemica et Biophysica Acta. 1474, 163-168.
Pozo, R., Lavety, J. & Love, R.M. (1988) The role of dietary a-tocopherol (vitamin E) in stabilising the canthaxanthin and lipids of rainbow trout muscle. Aquaculture. 73, 165-175.
Re, R., Fraser, P.D., Long, M., Bramley, P.M. & Rice-Evans, C. (2001) Isomerisation of lycopene in the gastric milieu. Biochemical and Biophysical Research Communications. 281, 576-581.
Renstmm, B., Borch, G., Skulberg, O.M. & Liaaen-Jensen, S. (1981) Optical purity of(3S, 3'S)-astaxanthin from Haematococcus pluvialis. Phytochemistry_ 20, 2561-2564.
Renstmm, B. & Liaaen-Jensen, S. (198\) Fatty acid composition of some esterified carotenols. Comparative Biochemistry and Physiology. 69B, 625-627.
Rigtrup, K.M. & Ong, D.E. (1992) A retinyl ester hydrolase activity intrinsic to the brush border membrane of rat small intestine. Biochemistry. 31, 2920-2926.
Robinson, J.S. & Mead, J.F. (1973) Lipid absorption and deposition in rainbow trout (Salmo gairdnerii). Canadian Journal of Biochemistry. 51, I 050-1058.
Rogie, A. & Skinner, E.R. (1981) Some aspects of lipid transport in the rainbow trout Biochemistry Society. Transactions. 9, 59.
Rounds, R.C., Glenn, C.L. & Bush, A.O. (1992) Consumer acceptance of brown trout (Sa/mo trutta) as an alternative to rainbow trout (Salmo gairdneri). Journal of Food Science. 57, 572-574.
Ruane, M ( 1977) Extraction of caroteniferous materials from algae. Auastralian Patent no. 72 395 74.
Ruban, A. V., Horton, P. & Young, A.J. (1993) Aggregation of higher plant xanthophylls: differences in absorption spectra and in the dependency on solvent polarity. Journal of Photochemistry and Photbiology B: Biology. 21, 229-234.
Saito, A. & Regier, L.W. (1971) Pigmentation of brook trout (Salvelinus fontinalis) by feeding dried crustacean waste. Journal Fisheries Research Board of Canada. 28, 509-512.
Sallee, V.L., Wilson, F.A. & Dietschy, J.M. (1972) Determination of unidirectional uptake rates for lipids across the intestinal brush border. Journal of Lipid Research. 13, 184-192.
Sanderson, G.W. & Jolly, S.O. (1994) The value of Phaffia yeast as a feed ingredient for salmonid fish. Aquaculture. 124, \93-200.
Saunders, D.R. & Dawson, AM. (1963) The absorption of oleic acid in the bile fistula rat. Gut. 4, 254-260.
228
Sawchuk, R.J. & Awni, W.M. (1986) Absorption of cyclosporine from rabbit small intestine in situ. Journal of Pharmaceutical Sciences. 75, 1151-1156.
Scalia, S., lsaksen, M. & Francis G. W. ( 1989) Carotenoids of the Arctic charr, Salvelinus alpinus (L.). Journal of Fish Biology 34, 969-970.
Schep, L.J., Tucker, I.G., Young, G., Ledger, R. & Butt, A.G. (1998) Permeability of the salmon (Oncorhynchus tshawytscha) posterior intestine in vivo to two hydrophilic markers. Journal of Comparative Physiology. 168, 562-568.
Schiedt, K. (1998) Absorption and metabolism of carotenoids in birds, fish and crustaceans. In Carotenoids, Biosynthesis and Metabolism (Britton, G., Liaaen-Jensen, S. & Pfander, H. eds.), Vol. 3, pp. 285-358. Birkhailser Verlag, Base!, Switzerland.
Schiedt, K., Bischoff, S. & Glinz, E. (1991) Recent progress on carotenoid metabolism in animals. Pure and Applied Chemistry. 63, 89-100.
Schiedt, K., Bischoff, S. & Glinz, E. ( 1993) Metabolism of carotenoids and in vivo racemization of (3S,3'S)-astaxanthin in the crustacean Penaeus. Methods in Enzymo/ogy. 214, 148-168.
Schiedt, K., Bischoff, S. & Glinz, E. (I 995) Isolation of astaxanthin and its metabolites from skin of Atlantic salmon (Salmo salar). In Carotenoids Volume lA: isolation and analysis. (Britton, G., Liaaen-Jensen, S. & Pfander, P. eds.), pp. 243-252. Birkhauser Verlag,Basel.
Schiedt, K., Foss, P., Storebakken, T. & Liaaen-Jensen, S. (1989) Metabolism of carotenoids in salmonids-1. Idoxanthin, a metabolite of astaxanthin in the flesh of Atlantic salmon (Salmo salar, L.) under varying external conditions. Comparative Biochemistry and Physiology. 928,277-281.
Schiedt, K. & Leuenberger, F.J. ( 1981) Retention, distribution and metabolism of astaxanthin in rainbow trout (Salmo gairdneri). Abstract. 6th International Symposium on Carotenoids, Liverpool, U.K.
Schiedt, K., Leuenberger, F.J., Vecchi, M. & Glinz, E. (I 985) Absorption, retention and metabolic transformations of carotenoid in rainbow trout, salmon and chicken. Pure & Applied Chemistry. 57, 685-692.
Schiedt, K. & Liaaen-Jensen, S. (1995) Isolation and Analysis. In Carotenoids Volume lA: Isolation and Analysis (Britton, G., Liaaen-Jensen, S. & Pfander, H. eds), pp. 81-108 Birkhauser Verlag, Base!.
Schiedt, K., Mayer, H., Vecchi, M., Glinz, E. & Storebakken, T. ( 1988a) I 00. Metabolism of carotenoids in salmonids. 11. Distribution and absoloute configuration of idoxanthin in various organs and tissues of one Atlantic salmon (Salmo salar, L.) fed with astaxanthin. Helvelica Chi mica Acta. 71, 881-886.
Schiedt , K., Vecchi, M. & Glinz, E. (1986) Astaxanthin and its metabolites in wild rainbow trout (Salmo gairdneri R.). Comparative Biochemistry and Physiology. 838, 9-12.
229
Schiedt, K., Vecchi, M., Glinz, E. & Storebakken, T. (1988b) 101. Metabolism of carotenoids in salmonids. Ill. Metabolites of astaxanthin and canthaxanthin in the skin of Atlantic salmon (Salmo salar, L.). Helvetica Chimica Acta. 71, 887-896.
Schierle, J. & Hiirdi, W. (1994) Determination of stabilized astaxanthin in CAROPHYLL ®
Pink, premixes and fish feeds. In: Analytical Methods for Vitamins and Carotenoids in Feeds (.Hofmann, P., Keller, H.E., Schierle, J. & Schiiep, W. eds), pp. 1-5. Department of Vitamin Research and Development, Roche, Base!.
Schumann, K. & Hunder, G. (1997) A modified device for the differentiated study of intestinal transfer in isolated intestinal segments from mice and suckling rats in vitro. Journal of Pharmacological and Toxicological Methods. 36, 211-217.
Schweigert, F.J. (1998) Metabolism of carotenoids in mammals. In Carotenoids Volume 3: Biosynthesis and Metabolism. (Britton, G., Liaaen-Jensen, S., Pfander, H. eds.), pp. 250-284. Birkhauser Verlag, Base!.
Segner, H., Arend, P., Poeppinghausen, K.V. & Schmidt, H. (1989) The effect of feeding astaxanthin to Oreochromis niloticus and Colisa labiosa on the histology of the liver. Aquaculture. 19, 381-390.
Sheridan, M .A., Friedlander, JKL. & Alien, W.V. ( 1985) Chylomicra in the serum of prostprandial steelhead trout (Salmo gairdnerii). Comparative Biochemistry and Physiology. SIB, 281-284.
Sigurgisladottir, S., Parrish, C.C., Lall, S.P. & Ackman, R.G. (1994) Effects of feeding natural tocopherols and astaxanthin on Atlantic salmon (Salmo salar) fillet quality. Food Research International. 27, 23-32.
Simmonds, W.J., Redgrave, T.G. & Willix, R.L.S. (1968) Absorption of oleic and palmitic acids from emulsions and micellar solutions. The Journal of Clinical investigation. 41, 1015-1025.
Sirnpson, K.L. & Kamata, T. (1979). Use of carotenoids in fish feeds. Proceeding of the World Symposium on Finfish Nutrition and Fishfeed Technology, Hamberg.
Sire, M. F., Lutton, C. & Vernier, J.M. (1981) New views on intestinal absorption of lipids in teleostean fishes: an ultrastructural and biochemical study in the rainbow trout. Journal of Lipid Research. 22, 81-94.
Sivtseva, LV. & Dubrovin, V.N. (1982) Some patterns in the quantitative distribution of carotenoid pigments in the body of rainbow trout, Salmo gairdneri. Journal of lcthyology. 22, 96-100.
Skonberg, D.I., Hardy, R.W., Barrows, F.T. & Dong, F.M. (1998) Colour and flavour analyses of fillets from farm-raised rainbow trout (Oncorhynchus mykiss) fed lowphosphorous feeds containing corn or wheat gluten. Aquaculture. 166, 269-277.
Skrede, G., Risvik, E., Huber, M., Enersen, G. & Bliimlein, L. (1990) Developing a colour card for raw flesh of astaxanthin-fed salmon. Journal of Food Science. 55, 361-363.
230
Skrede, G. & Storebakken, T. (1986) Instrumental colour analysis of farmed and wild Atlantic salmon when raw, baked and smoked. Aquaculture. 53, 279-286.
Smith, B.E., Hardy, R.W. & Torrissen, O.J. (1992) Synthetic astaxanthin deposition in pan-size Coho salmon (Oncorhynchus kisutch). Aquaculture. 104, 105-119.
Smith, R.R. (1989) Nutritional energetics. In Fish Nutrition (Halver, I.E. ed), pp. 1-29. Academic Press, New York.
Sommer, T.R., D'Souza, F.M.L. & Morrissy, N.M. (1992) Pigmentation of adult rainbow trout, Oncorhynchus mykiss, using the green alga Haematococcus pluvialis. Aquaculture. 106, 63-74.
Sommer, T.R., Potts, W.T. & Morrissy, N.M. (1991) Utilisation of microalgal astaxanthin by rainbow trout (Oncorhynchus mykiss). Aquaculture. 94, 79-88.
Spinelli, J., Lehman, L. & Wieg, D. (1974) Composition, processing and utilisation of red crab (Pleuroncodes planipes) as an aquaculture feed ingredient. Journal Fisheries Research Board of Canada. 31, I 025-l 029.
Spinelli, J. & Mahnken, C. (1978) Carotenoid deposition in pen-reared salmonids fed diets containing oil extracts of red crab (Pleuroncodes planipes). Aquaculture. 13, 213-223.
Spyradakis, P., Metailler, R., Gabaudan, 1. & Riaza, A. (1989) Studies on nutrient digestibility in European sea bass (Dicentrarchus labrax) I. Methodological aspects concerning faeces collection. Aquaculture. 77, 61-70.
Stacwicz-Sapuntzakis, M., Bowen, P.E., Kinkendall, J.W. & Burgess, M. (1987) Simultaneous determination of serum retinol and various carotenoids: their distribution in middle-aged men and women. Journal of Micronutrient Analysis. 3, 27-45.
Stahl, W., Schwarz, W. & Sies, H. ( 1993) Human serum concentrations of all-trans P- and a.-carotene but not 9-cis P-carotene increases upon ingestion of a natural isomer mixture obtained from Dunaliella salina (Betatene). Journal of Nutrition. 123, 847-851.
Staples, DJ. & Nomura, M. (1976) Influence of body size and food ration on the energy budget of rainbow trout Salmo gairdneri Richardson. Journal of Fish Biology. 9, 29-43.
Storebakken, T. & Austreng, E. (1988a) Feed intake measurements in fish using radioactive isotopes. I. Experiments with rainbow trout in freshwater. Aquaculture. 70, 269-276.
Storebakken, T. & Austreng, E. ( 1988b) Feed intake measurements in fish using radioactive isotopes. II. Experiments with Atlantic salmon and rainbow trout in sea-pens. Aquaculture. 70, 277-288.
Storebakken, T. & Choubert, G. ( 1991) Flesh pigmentation of rainbow trout fed astaxanthin or canthaxanthin at different feeding rates in freshwater and saltwater. Aquaculture. 95, 289-295.
231
Storebakken, T., Erland, A & Steenberg, K. (1981) A method for determination of feed intake in salmonid using radioactive isotopes. Aquaculture. 24, 133-142.
Storebak.ken, T., Foss, P., Austreng, E. & Liaaen-Jensen, S. (1985) Carotenoids in diets for sa1monids. II. Epimerization studies with astaxanthin in Atlantic salmon. Aquaculture. 44, 259-269.
Storebakken, T., Foss, P., Ruse, 1., Wandsvik, A & Lea, T.B. (1986) Carotenoids in diets for salmonids. Ill. Utilisation of canthaxanthin from dry and wet diets by Atlantic salmon, rainbow trout and sea trout. Aquaculture. 51, 245-255.
Storebakken, T., Foss, P., Schiedt, K., Austreng, E., Liaaen-Jensen, S. & Manz, U. (1987) Carotenoids in diets for salmonids IV. Pigmentation of Atlantic salmon with astaxanthin, astaxanthin dipalmitate and canthaxanthin. Aquaculture. 65, 279-292.
Storebakken, T. & Go swami, U. C. ( 1996) Plasma carotenoid concentration indicates the availability of dietary astaxanthin for Atlantic salmon, Salmo salar. Aquacullure. 146, 147-153.
Storebakken, T. & No, H.K. (1992) Pigmentation of rainbow trout. Aquaculture. 100, 209-229.
Sveier, H., Wathne, E. & Lied, E. (1999) Growth, feed and nutrient utilisation and gastrointestinal evacuation time in Atlantic salmon (Salmo salar L.): the effect of dietary fish meal particle size and protein concentration. Aquaculture. 180, 265-282.
Sylvia, G., Morrissey, M.T., Graham, T. & Garcia, S. (1995) Organoleptic qualities of farmed and wild salmon. Journal of Aquatic Food Production Technology. 4, 51-64.
Sylvia, G., Morrissey, M.T., Graham, T. & Garcia, S. (1996) Changing trends in seafood markets: the case of farmed and wild salmon. Journal of Food Production and Marketing 3, 49-63.
Tacon, G.J. (1981) Speculative review of possible carotenoid function in fish. Progressive Fish Culture. 43, 205-208.
Tengjaroenkul, B., Smith, B.J., Caceci, T. & Smith, S.A. (2000) Distribution of intestinal enzyme activities along the intestinal tract of cultured Nile tilapia, Oreochromis niloticus L. Aquacuflure. 182, 317-327.
Thompson, G.R., Ockner, R.K. & Isselbacher, K.J. (1969) Effect of mixed micellar lipid on the absorption of cholesterol and vitamin D3 into lymph. The Journal of Clinical Investigation. 48, 87-95.
Tidemann, E., Raa, J., Stormo, B. & Torrissen, 0. (1983). Processing and Utilisation of Shrimp Waste. Third International Congress on Engineering and Food, Trinity College, Dublin, Ireland. Elsevier Applied Science Publishers.
Torrissen, O.J. (1984) Pigmentation ofsalmonids. Effects ofcarotenoids in eggs and startfeeding diet on survival and growth rate. Aquacu/ture. 43, 185-193.
232
-------
Torrissen, O.J. (1985) Pigmentation of salmonids: factors affecting carotenoid deposition in rainbow trout (Salmo gairdneri). Aquaculture. 46, 133-142.
Torrissen, O.J. (1986) Pigmentation of salmonids-a comparison of astaxanthin and canthaxanthin as pigment sources for rainbow trout. Aquaculture. 53, 271-278.
Torrissen, O.J. (1989a). Biological activities ofcarotenoids in fishes. The Current status of Finfish Nutrition in Aquaculture. Proceedings of the Third International Symposium on Feeding and Nutrition in Fish, Toba, Japan.
Torrissen, O.J. (1989b) Pigmentation of salmonids: interactions of astaxanthin and canthaxanthin on pigment deposition in rainbow trout. Aquaculture. 79, 363-374.
Torrissen, 0.1. ( 1995) Strategies for salmonid pigmentation Journal of Applied Icthyology. 11, 276-281.
Torrissen, 0.1. & Braekkan, O.R. (1979) The utilisation of astaxanthin forms by rainbow trout (Salmo gairdneri). In Finfish Nutrition and Fishfeed Technology (Halver, J.E. & Tiews, K. eds.), Vol. 11, pp. 377-382. Heeneman, Berlin.
Torrissen, 0.1. & Christiansen, R. (1995) Requirements for carotenoids m fish diets. Journal of Applied Ichthyology. 11, 225-230.
Torrissen, 0.1, Hardy, R W. & Shearer, K.D. (1989) Pigmentation of salmonidscarotenoid deposition and metabolism. CRC Critical Reviews in Aquatic Sciences. I, 209-225.
Torrissen, O.J., Hardy, R.W., Shearer, K.D., Scott, T.M. & Stone, F.E. (1990) Effects of dietary canthaxanthin level and lipid level on apparent digestibility coefficients for canthaxanthin in rainbow trout (Oncorhynchus mykiss). Aquaculture. 88, 3 51-362.
Torrissen, O.J. & lngebrigtsen, K. (1992) Tissue distribution of 14C-astaxanthin in the Atlantic salmon (Salmo salar). Aquaculture. 108, 381-386.
Torrissen, OJ., Tidemann, E., Hansen, F. & Raa, J. (1981) Ensiling in acid-a method to stabilise astaxanthin in shrimp processing by-products and improve uptake of this pigment by rainbow trout (Salmo gairdneri). Aquaculture. 26, 77-83.
Torrissen, K.R. & Torrissen, O.J. (1985) Protease activities and carotenoid levels during the sexual maturation of Atlantic salmon (Salmo salar). Aquaculture. 50, 113-122.
Tripathi, U., Venkateshwaran, G., Sarada, R. & Ravishankar, G.A. (2001) Studies on Haematococcus pluvialis for improved production of astaxanthin by mutagenesis. World Journal of Microbiology & Biotechnology. 17, 143-148.
Turujman, S.A., Wamer, W.G., Wei, R.R. & Albert, R.H. (1997) Rapid liquid chromatographic method to distinguish wild salmon from aquacultured salmon fed synthetic astaxanthin. Journal. Association of Official Analytical Chemists. International. 80, 622-632.
233
Tyczkowski, J.K. & Hamilton, P.B. ( 1986a) Absorption, transport, and deposition in chickens of lutein diester, a carotenoid extracted from marigold (Tagetes erecta) petals. Poultry Science. 65, I 526-1531.
Tyczkowski, J.K. & Hamilton, P.B. (1986b) Evidence for differential absorption of zeacarotene, cryptoxanthin, and lutein, in young broiler chickens. Poultry Science. 65, 1137-1140.
Tyssandier, V., Bore!, P., Choubert, G., Grolier, P., Alexandre-Gouabau, M.C. & AzaisBraesco, V. (1998) The bioavailability of carotenoids is positively related to their polarity. Scienza de/J'A/imentazione. 18, 324.
Ulla, 0. & Gjedrem, T. (1985) Number and length of pyloric caeca and their relationship to fat and protein digestibility in rainbow trout. Aquaculture. 47, 105-111.
Van Breeman, R.B. (1996) Innovations in carotenoid analysis using LC/MS. Analytical Chemistry News & Features. 299A-304A.
Van den Berg, H. (1998) Effect of lutein on Beta-carotene absorption and cleavage. International Journal of Vitamin and Nutrition Research. 68, 360-365.
Van den Berg, H. (1999) Carotenoid interactions. Nutritional Reviews. 57, 1-10.
Van Greevenbroek, M.M.J. & de Bruin, T.W.A. (1998) Chylomicron synthesis by intestinal cells in vitro and in vivo. Antherosc/erosis. 141, S9-S 16.
Van het Hof, K.H., West, C.E., Weststrate, J.A. & Hautvast, J.G.A.J. (2000) Dietary factors that affect the bioavailability of carotenoids. Journal of Nutrition. 130, 503-506.
VanWinkle Swift, K.P. & Rickoll, W.L. (1997) The zygospore wall of Chlamydomonas monoica (Chlorophyceae): Morphogenesis and evidence for the presence of sporopollenin. Journal of Phyco/ogy. 33, 655-665.
Vassallo-Agius, R., Imaizumi, H., Watanabe, T., Yamazaki, T., Satoh, S. & Kiron, V. (200 I) The influence of astaxanthin supplemented dry pellets on spawning of striped jack Fisheries Science. 67, 260-270.
Vernier, J.M. (1990) Intestine ultrastructure in relation to lipid and protein absorpton in teleost fish. Comparative Biochemistry and Physiology. 5, 166-175.
Vershinin, A. (1999) Biological functions of carotenoids-diversity and evolution. Biofactors. l 0, 99-104.
Virtue, P., Johannes, R.E., Nichols, P.D. & Young, J.W. (1995) Biochemical composition of Nyctiphanes australis and its possible use as an aquaculture feed source: lipids, pigments and fluoride content. Marine Biology. 122, 121-128.
Vogel, W.O.P. (1985) The caudal heart of fish; Not a lymph heart. Acta Anatomica. 121, 41-45.
234
Vogel, W.O.P. & Claviez, M. (1981) Vascular specialization in fish, but no evidence for lymphatics. Zeitschriftfuer Naturforschung. 36C, 490-492.
Wang, Y., Aun, R. & Tse, F.L.S. (1997) Absorption ofD-glucose in the rat studied using in situ intestinal perfusion: a permeability-index approach. Pharmaceutical Research. 14, 1563-1567.
Wathne, E., Bjerkeng, B., Storebakken, T., Vassvik, V. & Odland, AB. (1998) Pigmentation of Atlantic salmon (Salmo salar) fed astaxanthin in all meals or in alternating meals. Aquaculture. 159, 217-231.
Weber, S. (1988) Determination of stabilised, added astaxanthin in fish feeds and premixes with HPLC. In : Analytical Methods for Vitamins and Carotenoids in Feed (Keller, H. E. ed.), Index no. 2101. 59-61. Hoffmann-La roche, Base!, Switzerland.
Westergaard, H. & Dietschy, J.M. (1976) The mechanism whereby bile acid micelles increase the rate of fatty acid and cholesterol uptake into the intestinal mucosal cell. The Journal of Clinical Investigation. 58, 97-108.
White, W.S., Sapuntzakis, M.S., Erdman, J.W. & Bowen, P.E. (1994) Pharmokinetics ofPcarotene and canthaxanthin after ingestion of individual and combined doses by human subjects. Journal of the American College of Nutrition. 13, 665-671.
Whyte, J.N.C. & Sherry, K.L. (2001) Pigmentation and composition of flesh of Atlantic salmon fed diets supplemented with the yeast Phaffia rhodozyma. North American Journal of Aquaculture. 63, 52-57.
Williams, A.W., BoiJeau, T.W.M. & Erdman, J.W. (1998) Factors influencing the uptake and absorption of carotenoids. Proceedings of the Society for Experimental Biology and Medicine. 218, 106-108.
Wilson, F.A., Sallee, V.L. & Dietschy, J.M. (1971) Unstirred water layers in intestine: rate determinant of fatty acid absorption from micellar solutions. Science. 174, I 031-1033.
Wilson, T.H. & Wiseman, G. (1954) The use of sacs of everted small intestine for the study of the transference of substances from the mucosal to the serosal surface. Journal of Physiology. 123, 116-125.
Windell, J.T., Foltz, J.W. & Saroken, J.A. (1978) Effect of fish size, temperature, and amount fed on nutrient digestibility of a pelleted diet by rainbow trout, Salmo gairdneri. Transactions of the American Fisheries Society. 107, 613-616.
Wingerath, T., Stahl, W & Sies, H. ( 1995) P-cryptoxanthin selectively increases in human chylomicrons upon ingestion of tangerine concentrate rich in P-cryptoxanthin esters. Archives of Biochemistry and Biophysics. 324, 385-390.
You, C.S., Parker, R.S., Goodman, K.J., Swanson, J.E. & Corso, T.N. (1996) Evidence of cis-trans isomerization of 9-cis-P-carotene during absorption in humans. American Journal ofClincal Nutrition. 64, 177-183.
235
This copy of this thesis has been supplied on condition that anyone who consults it is
understood to recognise that its copyright rests with its author and that no quotation from the
thesis and no information derived from it may be published without the author's prior writ/en
consent.
©Daniel A. White 200 I


