Embed Size (px)
Citation preview
Intensive Care Medicine
Supplement 2, Volume 39
October 2013
Abstracts
ESICM LIVES 201326th Annual Congress
Paris, France5–9 October
This supplement issue of the official ESICM/ESPNIC journal Intensive Care Medicine contains abstracts of scientific
papers presented at the 26th Annual Congress of the European Society of Intensive Care Medicine.
The abstracts appear in order of presentation from Monday 7 October to Wednesday 9 October 2013.
The same abstract numbering is used in the Congress Final Programme.
This supplement was not sponsored by outside commercial interests; it was funded entirely by the society’s own resources.
DOI:10.1007/s00134-013-3095-5
123
26th ANNUAL CONGRESS—PARIS, FRANCE—5–9 OCTOBER 2013
26th ANNUAL CONGRESS—PARIS, FRANCE—5–9 OCTOBER 2013
www.esicm.org
RESEARCH AT ESICM A JOINT EFFORT!
ESICM aims to foster collaborative research among its members and to promote European Intensive Care Research
• We establish networks of investigators and research teams
• We provide forums for discussion of research projects
• We develop and implement clinical trials• We provide access to methodological help
(e.g. meta-analysis group - SRG)• We offer opportunities for education and
collegial support for emerging investigators
• We foster communication within the ICU research community
• We provide several awards to support research projects
GET INVOLVED!
JOIN US_
Join our Trials Group and give more visibility to your research projects
Join on-going research projects or submit proposals for collaborative studies
To learn more, go to www.esicm.org and visit the Research section
The intensive connection for…
Cutting-edge Research_
TO BE CONTINUED >
26th ANNUAL CONGRESS—PARIS, FRANCE—5–9 OCTOBER 2013

26th ANNUAL CONGRESS—PARIS, FRANCE—5–9 OCTOBER 2013
CONGRESS COMMITTEECHAIRMAN
Giuseppe Citerio, Monza, Italy
ACUTE KIDNEY INJURY
Michael Joannidis, Innsbruck, Austria
ACUTE RESPIRATORY FAILURE
Antonio Pesenti, Monza, Italy
CARDIOVASCULAR DYNAMICS
Maurizio Cecconi, London, United Kingdom
ETHICS
Jozef Kesecioglu, Utrecht, Netherlands
HEALTH SERVICES RESEARCH AND OUTCOMES
Andreas Valentin, Vienna, Austria
INFECTION
Jean-François Timsit, Grenoble, France
METABOLISM, ENDOCRINOLOGY & NUTRITION
Michael Hiesmayr, Vienna, Austria
NEURO-INTENSIVE CARE
Pedro Navarrete Navarro, Granada, Spain
PERI-OPERATIVE INTENSIVE CARE
Rupert Pearse, London, United Kingdom
SYSTEM INFLAMMATION AND SEPSIS
Claude Martin, Marseille, France
TRAUMA & EMERGENCY MEDICINE
Jacques Duranteau, Kremlin-Bicêtre, France
NURSES AND ALLIED HEALTHCARE PROFESSIONALS
Stijn Blot, Gent, Belgium
RESEARCH COMMITTEE
CHAIRMAN
Richard Beale, London, United Kingdom
EDUCATION AND TRAINING COMMITTEECHAIRMAN
Marco Maggiorini, Zurich, Switzerland
26th ANNUAL CONGRESS—PARIS, FRANCE—5–9 OCTOBER 2013
26th ESICM ANNUAL CONGRESS — PARIS, FRANCE — 5–9 OCTOBER 2013
Table of Contents
Monday 07 October 2013
Oral sessions
Non-invasive ventilation: indication, optimization,
outcome . . . . . . . . . . . . . . . . . . . . . . . . . . . . . 0001–0005
Bench to bedside: frontiers in ARDS . . . . . . . . . 0006–0010
Old and new management strategies in sepsis . . . 0011–0015
Management and outcome of acute kidney injury 0016–0020
Monitoring the brain: not an easy task . . . . . . . . 0021–0025
Trauma, bleeding and coagulopathy . . . . . . . . . . 0026–0030
Optimisation of antimicrobial use in ICU. . . . . . 0031–0035
New findings on cardiac arrest survivors . . . . . . 0036–0040
Information technology, quality improvement
and cost saving. . . . . . . . . . . . . . . . . . . . . . . . . 0041–0045
Planning for care and aiding with coping . . . . . . 0046–0050
Poster Sessions
Organising safer intensive care. . . . . . . . . . . . . . 0051–0064
Epidemiology of sepsis . . . . . . . . . . . . . . . . . . . 0065–0078
Haemodynamic monitoring. . . . . . . . . . . . . . . . 0079–0092
Sepsis: insights from the bench . . . . . . . . . . . . . 0093–0106
Special nutrients and metabolic control . . . . . . . 0107–0120
Acute coronary syndromes... . . . . . . . . . . . . . . . 0121–0134
Mechanical ventilation: current practice and
novel ideas. . . . . . . . . . . . . . . . . . . . . . . . . . . . 0135–0148
Airway management.. . . . . . . . . . . . . . . . . . . . . 0149–0162
Traumatic brain injury . . . . . . . . . . . . . . . . . . . 0163–0176
Acute kidney injury . . . . . . . . . . . . . . . . . . . . . 0177–0190
Quality issues and ICU economics . . . . . . . . . . . 0191–0204
Update on antibacterial therapies . . . . . . . . . . . . 0205–0218
Metabolic issues in the ICU. . . . . . . . . . . . . . . . 0219–0232
Biomarkers in sepsis . . . . . . . . . . . . . . . . . . . . . 0233–0246
Patient-centred outcomes . . . . . . . . . . . . . . . . . 0247–0260
Cardiac arrest & therapeutic hypothermia. . . . . . 0261–0274
Arrhythmias, thrombosis & cardiovascular
infections.. . . . . . . . . . . . . . . . . . . . . . . . . . . . . 0275–0288
Fluid management in perioperative intensive care 0289–0301
Liver injury and intestinal failure . . . . . . . . . . . . 0302–0315
ECMO update . . . . . . . . . . . . . . . . . . . . . . . . . 0316–0329
ARDS management & VILI . . . . . . . . . . . . . . . . 0330–0343
Diagnosis and treatment of VAP & CAP . . . . . . 0344–0357
Emergency medicine & resuscitation . . . . . . . . . 0358–0371
Practical issues in CRRT . . . . . . . . . . . . . . . . . . 0372–0385
Linking sepsis pathophysiology to outcomes . . . . 0386–0399
Focus on our patients: cancer & the elderly . . . . 0400–0413
Limitation of therapy . . . . . . . . . . . . . . . . . . . . 0414–0427
Bloodstream infections . . . . . . . . . . . . . . . . . . . 0428–0441
Tuesday 08 October 2013
Oral Sessions
Abstract Award Session . . . . . . . . . . . . . . . . . . . 0442–0445
Mechanical ventilation settings: from optimal
to individualized? . . . . . . . . . . . . . . . . . . . . . . . 0446–0450
Cardiac Issues in ICU . . . . . . . . . . . . . . . . . . . . 0451–0455
Prognostic biomarkers in sepsis . . . . . . . . . . . . . 0456–0460
Haemodynamic assessment: what’s new at
the bedside? . . . . . . . . . . . . . . . . . . . . . . . . . . . 0461–0465
Different measures of daily intensive care practice:
does it matter? . . . . . . . . . . . . . . . . . . . . . . . . . 0466–0470
Intestinal failure challenges . . . . . . . . . . . . . . . . 0471–0475
Post-operative complications: management and
impact on outcome . . . . . . . . . . . . . . . . . . . . . 0476–0480
Advances in nursing and physiotherapy . . . . . . . 0481–0485
Poster Sessions
Stroke in intensive care . . . . . . . . . . . . . . . . . . . 0486–0499
New trends in non-invasive ventilation. . . . . . . . 0500–0513
Glucose monitoring & control . . . . . . . . . . . . . . 0514–0527
Heart failure: diagnosis & management . . . . . . . 0528–0541
Post-operative intensive care . . . . . . . . . . . . . . . 0542–0555
Stratification of ARDS severity: still a challenge. . 0556–0569
Ventilation in the critically ill: from physiology
to technology . . . . . . . . . . . . . . . . . . . . . . . . . . 0570–0582
CAP, VAP & nosocomial infections . . . . . . . . . . 0583–0596
Coagulation and transfusion . . . . . . . . . . . . . . . 0597–0610
Evaluation of renal function . . . . . . . . . . . . . . . 0611–0624
Echocardiography and haemodynamic
monitoring . . . . . . . . . . . . . . . . . . . . . . . . . . . 0625–0638
26th ESICM ANNUAL CONGRESS — PARIS, FRANCE — 5–9 OCTOBER 2013

26th ESICM ANNUAL CONGRESS — PARIS, FRANCE — 5–9 OCTOBER 2013
Fungal infections . . . . . . . . . . . . . . . . . . . . . . . 0639–0651
Surviving intensive care. . . . . . . . . . . . . . . . . . . 0652–0665
Nursing care and practices . . . . . . . . . . . . . . . . 0666–0679
Artificial airway: instrumentation and ventilatory
management . . . . . . . . . . . . . . . . . . . . . . . . . . 0680–0693
Management of sepsis . . . . . . . . . . . . . . . . . . . . 0694–0707
Cardiac surgical intensive care. . . . . . . . . . . . . . 0708–0721
Sedation and delirium. . . . . . . . . . . . . . . . . . . . 0722–0735
Nutrition performance . . . . . . . . . . . . . . . . . . . 0736–0749
Weaning: a perfect recipe?. . . . . . . . . . . . . . . . . 0750–0762
Brain dysfunction and brain death . . . . . . . . . . . 0763–0776
VAP: prediction, prevention, outcomes . . . . . . . 0777–0790
Severe trauma . . . . . . . . . . . . . . . . . . . . . . . . . 0791–0804
Renal replacement therapies. . . . . . . . . . . . . . . . 0805–0818
Care of the ventilated patient: a global view.. . . . 0819–0832
Outcome prediction: what’s up?. . . . . . . . . . . . . 0833–0846
Pathophysiology of sepsis . . . . . . . . . . . . . . . . . 0847–0858
Rehabilitation and nursing outcomes . . . . . . . . . 0859–0872
Wednesday 09 October 2013
Oral Sessions
Nosocomial infection and immunoparalysis
of severe ICU patients. . . . . . . . . . . . . . . . . . . . 0873–0877
New etiological aspects of acute kidney injury. . . 0878–0882
Improving outcomes of prolonged mechanical
ventilation . . . . . . . . . . . . . . . . . . . . . . . . . . . . 0883–0887
Perfusion: assessment and manipulation . . . . . . . 0888–0892
Can we improve ICU outcome? . . . . . . . . . . . . . 0893–0897
Ventilator associated prenumonia: new insights. . 0898–0902
Neurointensive care: outcome prediction . . . . . . 0903–0907
Improving knowledge on sedation and delirium . 0908–0912
Poster Sessions
Technology in ICU . . . . . . . . . . . . . . . . . . . . . . 0913–0926
Out-of-hospital cardiac arrest: ICU management. 0927–0940
Haemodynamic management of sepsis . . . . . . . . 0941–0954
Perfusion and the microcirculation . . . . . . . . . . 0955–0968
Nursing education & management . . . . . . . . . . . 0969–0982
ALI & ARDS: mechanistic insights . . . . . . . . . . . 0983–0995
Imaging to understand lung disease & guide
therapy . . . . . . . . . . . . . . . . . . . . . . . . . . . . . . 0996–1009
Sepsis: experimental models. . . . . . . . . . . . . . . . 1010–1021
Predicting long-term outcome . . . . . . . . . . . . . . 1022–1035
Salt, water and acidosis . . . . . . . . . . . . . . . . . . . 1036–1049
Special patients + special places = special
problems . . . . . . . . . . . . . . . . . . . . . . . . . . . . . 1050–1061
Fighting multidrug resistant pathogens . . . . . . . . 1062–1075
Prognosis of sepsis . . . . . . . . . . . . . . . . . . . . . . 1076–1089
ICU policies and strategies . . . . . . . . . . . . . . . . 1090–1102
Author Index
Abstract submitted and selected under label ECCRN. Displayed as
e-poster on dedicated screen at ESICM booth for whole duration
of congress (ICC, Lobby Level).
Abstract selected for the Abstract Award Winning
Session.
26th ESICM ANNUAL CONGRESS — PARIS, FRANCE — 5–9 OCTOBER 2013
Monday 07 October 2013
Oral SessionsNon-invasive ventilation: indication, optimization,outcome: 0001–00050001UNDERSTANDING NONINVASIVE MECHANICAL VENTILATION SUCCESS INFRENCH AND BELGIAN ICUS
A. Demoule1, S. Chevret2, A. Kouatchet3, S. Jaber4, F. Meziani5, M. Schmitt6, D. Schnell2,C. Clergue7, J. Aboab8, A. Rabbat9, D. Lambert10, C. Guérin11, H. Georges12, B. Zuber13,J. Dellamonica14, P. Depuydt15, L. Brochard16, É. Azoulay2, The oVNI Study Group1Groupe Hospitalier Pitié-Salpêtrière, Pneumolgie et Réanimation Médicale, Paris, France,2Hôpital Saint-Louis, Paris, France, 3CHRU, Angers, France, 4Hôpital Saint-Eloi,Montpellier, France, 5Hôpital Civil, Strasbourg, France, 6Groupe Hospitalier Pitié-Salpêtrière, Paris, France, 7Centre Hospitalier, Evry, France, 8Hôpital Raymond Poincaré,Garches, France, 9Hôtel Dieu, Paris, France, 10Hopital La Timone, Marseille, France,11Hôpital de la Croix Rousse, Lyon, France, 12Centre Hospitalier, Tourcoing, France,13Hôpital Cochin, Paris, France, 14Centre Hospitalier, Nice, France, 15University Hospital,Ghent, Belgium, 16Hôpitaux Universitaires, Genève, SwitzerlandINTRODUCTION. Over the last two decades, non-invasive ventilation (NIV) has becomethe cornerstone therapy of acute respiratory failure (ARF) in the intensive care unit (ICU).Two prospective French surveys performed in 1997 and 2002 have shown a steady rate ofNIV success.OBJECTIVES. We performed a survey to reevaluate NIV tolerance, success rate and riskfactors for NIV failure.METHODS. Over a 2 months period (2010–2011), 54 ICUs in France and Belgium par-ticipated to the oVNI study. A case-report form was completed for all patients requiring anyform of ventilatory support, until ICU discharge. Demographics, clinical history, institutionof mechanical ventilation, and follow-up were recorded.RESULTS. 2,367 patients receiving either NIV (n = 582) or EIT (n = 1,785) were pro-spectively included. The conditions precipitating ARF (and corresponding NIV prevalence)were: acute on chronic respiratory failure in 21 % (NIV 68 %), non-hyperbaric coma in30 % (no NIV), cardiogenic pulmonary edema in 8 % (NIV 53 %), and ‘‘de novo’’ ARF in41 % (NIV 16 %). NIV was first attempted in 23 % of all patients. Overall, nurses reportedpoor NIV tolerance in 29 % of patients. Patients self-reported on anxiety in 24 % of thecases, and 9 % complained of an important nose and mouth dryness. Conjunctivitis, noseskin ulcerations or gastric distension were found in 6 % of patients. Nurses ranked sleepquality as poor in 32 % of patients. NIV success was 69 % overall (95 % CI 65–73 %),showing significant increased as compared to 2002 (56 %, 95 % CI 50–62 %, p = 0.0003).Multivariate analysis identified that independent risk factors for NIV success were ‘‘denovo’’ ARF as the precipitating factor (OR = 0.43, 95 % CI 0.23–0.84), severity of organdysfunction defined as an elevated SOFA (OR = 0.82, 95 % CI 0.71–0.95), severity uponadmission defined as an elevated SAPS II (OR = 0.97, 95 % CI 0.94–1.00) and a shortsleep time assessed by nurses (OR = 1.30, 95 % CI 1.13–1.48). In the IRA-IRC subset,SOFA (OR = 0.74, 95 % CI 0.61–0.90) and sleep time (OR = 1.32, 95 % CI 1.07–1.62)were jointly associated with NIV success. In the subset of de novo ARF patients, only SOFAwas retained in the multivariable model (OR = 0.75, 95 % CI 0.66–0.85).CONCLUSIONS. In this prospective multicentre study recruiting 2,367 patients from 54 ICUS,NIV was used in more than half the COPD or cardiac patients and in only 16 % of those with ‘‘denovo’’ ARF depicting ongoing controversies. NIV side effects affected up to one third of thepatients. Compared to 1997 and 2002, NIV success rate increased significantly. Organ dys-function, physiological severity upon ICU admission, ‘‘de novo’’ ARF and a short total sleep timewere predictors of NIV failure. The impact of NIV failure on subsequent long term survival andhealth-related quality of life are being analyzed in each subgroup of comorbidities.
0002NON-INVASIVE MECHANICAL VENTILATION IN PATIENTS WITH ACUTERESPIRATORY FAILURE: TRENDS IN USE AND OUTCOMES
D. Schnell1, J.-F. Timsit2,3, M. Darmon4, A. Vesin3, D. Goldgran-Toledano5,A.-S. Dumenil6, M. Garrouste-Orgeas3,7, C. Adrie8, L. Bouadma9, B. Planquette10,Y. Cohen11, C. Schwebel2, L. Soufir7, S. Jamali12, B. Souweine13, E. Azoulay1,3
1Saint Louis University Hospital, Paris, France, 2CHU de Grenoble, Grenoble, France,3Integrated Research Center U823-Albert Bonniot Institute, Team 11: Outcome ofRespiratory Cancers and Mechanically Ventilated Patients, La Tronche, France, 4CHU deSaint-Etienne, Saint Priest en Jarez, France, 5CHG de Gonesse, Gonesse, France, 6CHUAntoine Beclère, Clamart, France, 7Groupe Hospitalier St Joseph, Paris, France, 8Hôpital deSaint Denis, Saint Denis, France, 9CHU Bichat, Paris, France, 10Hôpital André Mignot, LeChesnay, France, 11CHU Avicenne, Bobigny, France, 12Centre Hospitalier Simone Veil,Eaubonne, France, 13CHU Gabriel Montpied, Clermont-Ferrand, FranceINTRODUCTION. Benefits from non-invasive mechanical ventilation (NIV) have beenreported from clinical trials in selected patients admitted to centers with extensive experi-ence [1]. Whether these benefits are generalizable is an important issue to assess.OBJECTIVES. This multicenter longitudinal study was designed to assess the trends in use andsuccess of NIV over a 15-year period in 14 French intensive care units (ICUs). Also, the netimpact of NIV on mortality in a pseudo-population mimicking randomisation was assessed.METHODS. Critically ill patients admitted for acute respiratory failure (ARF) from 1997 to2011 and requiring ventilatory support were included. The first-line ventilatory supportmodality was recorded. Acute respiratory failure etiologies were classified into three groups:acute on chronic respiratory failure, cardiogenic pulmonary oedema, and de novo respira-tory failure (i.e. hypoxemic ARF in patients immunocompromised or not). The trends in useof and outcomes associated with NIV were examined in the whole study cohort and for eachstudy group. The impact of first-line NIV on mortality was evaluated by a marginalstructural model for longitudinal data [2]. Follow-up was censored at day 60.RESULTS. Among the 3,163 ARF patients, 1,232 (39 %) patients received NIV. Over thestudy period, NIV use and success rate increased from 29 to 42 %, and from 69 to 84 %,respectively. By the marginal structural model analysis, NIV was shown to decrease mor-tality (adjusted HR 0.83, 95 % CI [0.75–0.92]; p = 0.0004). This protective effect wasobserved in patients with acute on chronic respiratory failure (adjusted HR 0.7, 95 % CI[0.56–0.88]; p = 0.003) and in immunocompromised patients with hypoxemic ARF(adjusted HR 0.76, 95 % CI [0.6–0.97]; p = 0.026), but not in patients with cardiogenicpulmonary oedema (adjusted HR 1.11, 95 % CI [0.93–1.33]; p = 0.25) and in non-
immunocompromised patients with de novo ARF (adjusted HR 1.28, 95 % CI [0.96–1.7];p = 0.095). Non-invasive mechanical ventilation failure was an independent time-depen-dent risk factor of mortality (adjusted HR 4.4, 95 % CI [2.9–6.6]; p \ 0.0001).CONCLUSIONS. The use of NIV increased steadily over the last 15 years and resulted inreduced mortality. Survival benefits from NIV are obvious in patients with chronic respi-ratory failure and those who are immunocompromised. However, no benefit could beidentified in other subset of patients. Moreover, NIV failure remained an independent riskfactor of hospital mortality. Further studies are warranted to better understand early pre-dictors of NIV failure that should guide timely intubation.REFERENCES. 1. Brochard L. Noninvasive ventilation for acute respiratory failure.JAMA. 2002;288(8):932–5. 2. Cole SR, Hernan MA. Constructing inverse probabilityweights for marginal structural models. Am J Epidemiol. 2008;168(6):656–64.GRANT ACKNOWLEDGMENT. This study received no financial support.
0003IS IMMUNOSUPPRESSION A RISK FACTOR OF MORTALITY FOR ACUTERESPIRATORY FAILURE PATIENTS RECEIVING NON INVASIVEVENTILATION (NIV)?
A. Kouatchet1, S. Chevret2, A. Demoule3, S. Jaber4, A. Rabbat5, F. Meziani6, D. Schnell6,S. Mortaza7, E. Guerot8, J. Mayaux9, S. Legriel10, L. Papazian11, A.-P. Meert12,L. Brochard13, A. Mercat7, E. Azoulay14
1CHU d’Angers, Angers, France, 2CHU Saint Louis, Département de Biostatistique etInformatique Médicale, Paris, France, 3CHU Pitie Salpétrière, Service de Pneumologie etRéanimation Médicale, Paris, France, 4CHU Saint-Eloi, Département d’Anesthésie etRéanimation, Montpellier, France, 5CHU Hotel Dieu, Service de Pneumologie etRéanimation, Paris, France, 6CHU de Strasbourg, Hôpital Civil, Service de RéanimationMédicale, Strasbourg, France, 7CHU d’Angers, Service de Réanimation Médicale etMédecine Hyperbare, Angers, France, 8Hôpital Européen Georges Pompidou (HEGP),Service de Réanimation Médicale, Paris, France, 9CHU La Pitié-Salpêtrière, Service dePneumologie et Réanimation, Paris, France, 10CH de Versailles, Site André Mignot, Servicede Réanimation Médico-Chirurgicale, Le Chesnay Cedex, France, 11CHU de Marseille,Hôpital Nord, Service de Réanimation des Détresses Respiratoires et Infections Sévères,Marseille, France, 12Institut Jules Bordet, Bruxelles, Belgium, 13Hôpitaux Universitaires deGenève, Service de Soins Intensifs, Genève, Switzerland, 14CHU Saint Louis, Service deRéanimation Médicale, Paris, FranceINTRODUCTION. Several cohort studies underlined the profit of NIV for immunosuppressedpatients (ID) admitted for hypoxemic acute respiratory failure (ARF). Elements explaining thisprofit hold in the frequent complications and the greater mortality of the invasive ventilation inthis indication. Today, in immunosuppressed ARF patients, NIV is the object of internationalrecommendations. In the present study, we estimated the impact of ID on mortality of the patientsadmitted in intensive care unit for hypoxemic ARF and treated with NIV.METHODS. It is a secondary analysis of the ‘‘oVNI’’ cohort having included 1450 acuterespiratory patients among which 780 received NIV. We realized a study exposed/non-exposed in ID. A comparison of the ID and Non-id was realized after exclusion of COPD,cardiac failure but also patients with therapeutic limitation. The exposed group includes theID patients (malignant hemopathies, long-term steroids or immunosuppressive treatment)treated by NIV. The unexposed group includes Non-ID patients treated by VNI. The closestneighbour method is used for the matching of exposed and unexposed. Assessment criteriawere the rate of success of the VNI and the hospital mortality. Finally, the analysis of theeffect of ID on the mortality was adjusted on a propensity score to be immunosuppressed.RESULTS. Among the 1450 ARF patients admitted in ICU, 191 ID and 494 Non-IDreceived NIV. The ID patients were younger (p = 0.0007), the less frequently with cardiacinsufficiency (p = 0.002), patients with arterial hypertension (p = 0.005) and the morefrequently carrier of systemic disease (p = 0.0001). Their admission in ICU was delayed inas compared to that of the others (p = 0.0003), and their severity score and SOFA and IGSII were higher (respectively p = 0.014; p = 0.010).We thus derived a propensity score of being immunosuppressed, based on the following 11variables: age, cardiac failure, HTA, COPD, systemic disease, renal failure, SOFA, PaCO2,pH, and time from hospital admission to intensive care unit. We also introduced severehepatitis (trend towards prognostic effect), as well as mechanical ventilation.Based on the score, 102 (84 %) patients with ID were matched to a control. A multivariateanalysis of factors associated to the hospital mortality, adjusted on the propensity score to beID, was realized. In an interesting way, this analysis does not identify the immunosup-pression as a factor of mortality for patients with hypoxemic ARF receiving NIV(OR = 1.26 (95 % CI 0.58–2.71); p = 0.56).CONCLUSIONS. For patients admitted in ICU for hypoxemic acute respiratory failure andreceiving NIV, the immunosuppression is not a risk factor of hospital mortality.
0004IMMEDIATE INTUBATION VS. INTUBATION DELAYED BY A NON-INVASIVEVENTILATION TRIAL IN COPD PATIENTS WITH ACUTE RESPIRATORYFAILURE: A NATIONWIDE OBSERVATIONAL COHORT STUDY OF LONGTERM SURVIVAL
J. von Walter1, J. Berkius2,3, C.-J. Wickerts4, S.M. Walther2, on behalf of the SwedishIntensive Care Registry1Nyköping Hospital, Dept of Anaesthesia and Intensive Care, Nyköping, Sweden,2Linköping University, Dept of Medicine and Health, Div of Cardiovascular Medicine,Linköping, Sweden, 3Västervik Hospital, Dept of Anaesthesia and Intensive Care,Västervik, Sweden, 4Danderyd Hospital and Karolinska Institutet, Div of Anaesthesia andIntensive Care and Dept of Clinical Sciences, Stockholm, SwedenINTRODUCTION. Non-invasive ventilation (NIV) is a first line treatment in the care ofCOPD patients with an acute exacerbation (AECOPD). Many opportunities to use NIV aremissed; some probably of concern that a trial of NIV followed by delayed intubation wouldincrease the risk of death.OBJECTIVES. To compare long-term survival after immediate and delayed intubation inpatients with AECOPD.METHODS. Admissions in the Swedish Intensive Care Registry (http://www.icuregswe.org) during 2008–2012 were examined. Patients admitted with AECOPD wereidentified by the principal diagnosis at discharge from ICU. Age, gender, illness severity(SAPS3) and length of ICU-stay were analyzed per treatment group (immediate vs. NIV-trial groups). Survival was examined using Cox’s proportional hazards regression.
26th ESICM ANNUAL CONGRESS — PARIS, FRANCE — 5–9 OCTOBER 2013
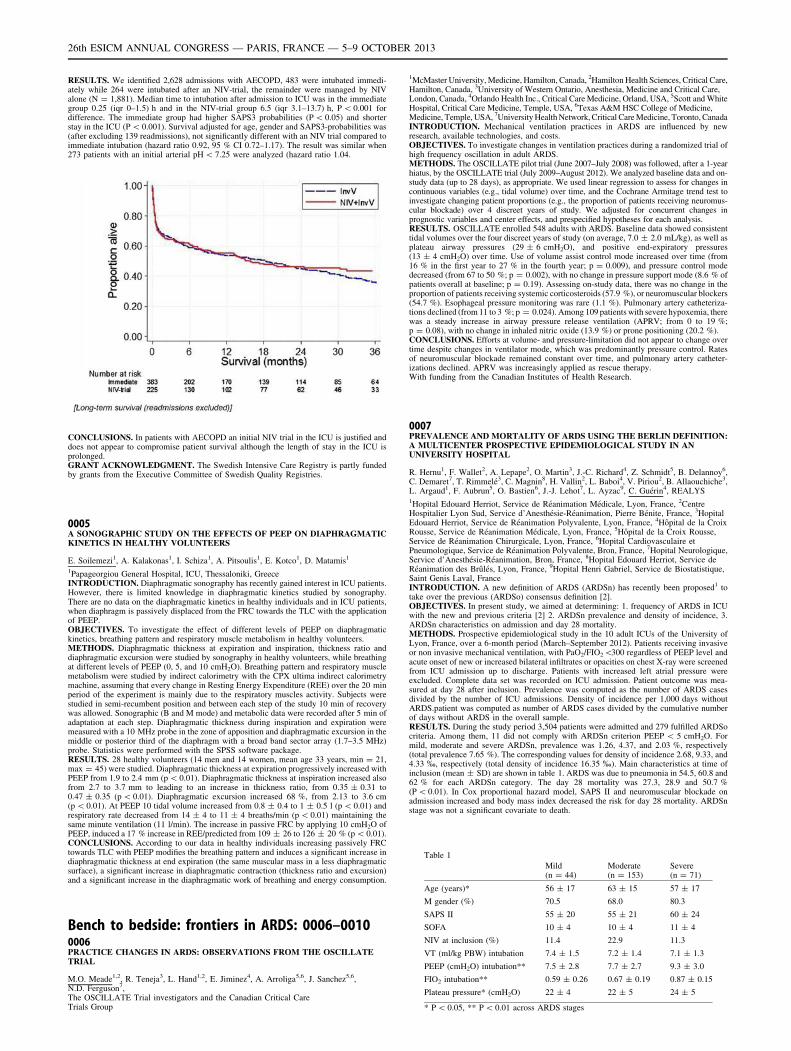
RESULTS. We identified 2,628 admissions with AECOPD, 483 were intubated immedi-ately while 264 were intubated after an NIV-trial, the remainder were managed by NIValone (N = 1,881). Median time to intubation after admission to ICU was in the immediategroup 0.25 (iqr 0–1.5) h and in the NIV-trial group 6.5 (iqr 3.1–13.7) h, P \ 0.001 fordifference. The immediate group had higher SAPS3 probabilities (P \ 0.05) and shorterstay in the ICU (P \ 0.001). Survival adjusted for age, gender and SAPS3-probabilities was(after excluding 139 readmissions), not significantly different with an NIV trial compared toimmediate intubation (hazard ratio 0.92, 95 % CI 0.72–1.17). The result was similar when273 patients with an initial arterial pH \ 7.25 were analyzed (hazard ratio 1.04.
CONCLUSIONS. In patients with AECOPD an initial NIV trial in the ICU is justified anddoes not appear to compromise patient survival although the length of stay in the ICU isprolonged.GRANT ACKNOWLEDGMENT. The Swedish Intensive Care Registry is partly fundedby grants from the Executive Committee of Swedish Quality Registries.
0005A SONOGRAPHIC STUDY ON THE EFFECTS OF PEEP ON DIAPHRAGMATICKINETICS IN HEALTHY VOLUNTEERS
E. Soilemezi1, A. Kalakonas1, I. Schiza1, A. Pitsoulis1, E. Kotco1, D. Matamis1
1Papageorgiou General Hospital, ICU, Thessaloniki, GreeceINTRODUCTION. Diaphragmatic sonography has recently gained interest in ICU patients.However, there is limited knowledge in diaphragmatic kinetics studied by sonography.There are no data on the diaphragmatic kinetics in healthy individuals and in ICU patients,when diaphragm is passively displaced from the FRC towards the TLC with the applicationof PEEP.OBJECTIVES. To investigate the effect of different levels of PEEP on diaphragmatickinetics, breathing pattern and respiratory muscle metabolism in healthy volunteers.METHODS. Diaphragmatic thickness at expiration and inspiration, thickness ratio anddiaphragmatic excursion were studied by sonography in healthy volunteers, while breathingat different levels of PEEP (0, 5, and 10 cmH2O). Breathing pattern and respiratory musclemetabolism were studied by indirect calorimetry with the CPX ultima indirect calorimetrymachine, assuming that every change in Resting Energy Expenditure (REE) over the 20 minperiod of the experiment is mainly due to the respiratory muscles activity. Subjects werestudied in semi-recumbent position and between each step of the study 10 min of recoverywas allowed. Sonographic (B and M mode) and metabolic data were recorded after 5 min ofadaptation at each step. Diaphragmatic thickness during inspiration and expiration weremeasured with a 10 MHz probe in the zone of apposition and diaphragmatic excursion in themiddle or posterior third of the diaphragm with a broad band sector array (1.7–3.5 MHz)probe. Statistics were performed with the SPSS software package.RESULTS. 28 healthy volunteers (14 men and 14 women, mean age 33 years, min = 21,max = 45) were studied. Diaphragmatic thickness at expiration progressively increased withPEEP from 1.9 to 2.4 mm (p \ 0.01). Diaphragmatic thickness at inspiration increased alsofrom 2.7 to 3.7 mm to leading to an increase in thickness ratio, from 0.35 ± 0.31 to0.47 ± 0.35 (p \ 0.01). Diaphragmatic excursion increased 68 %, from 2.13 to 3.6 cm(p \ 0.01). At PEEP 10 tidal volume increased from 0.8 ± 0.4 to 1 ± 0.5 l (p \ 0.01) andrespiratory rate decreased from 14 ± 4 to 11 ± 4 breaths/min (p \ 0.01) maintaining thesame minute ventilation (11 l/min). The increase in passive FRC by applying 10 cmH2O ofPEEP, induced a 17 % increase in REE/predicted from 109 ± 26 to 126 ± 20 % (p \ 0.01).CONCLUSIONS. According to our data in healthy individuals increasing passively FRCtowards TLC with PEEP modifies the breathing pattern and induces a significant increase indiaphragmatic thickness at end expiration (the same muscular mass in a less diaphragmaticsurface), a significant increase in diaphragmatic contraction (thickness ratio and excursion)and a significant increase in the diaphragmatic work of breathing and energy consumption.
Bench to bedside: frontiers in ARDS: 0006–00100006PRACTICE CHANGES IN ARDS: OBSERVATIONS FROM THE OSCILLATETRIAL
M.O. Meade1,2, R. Teneja3, L. Hand1,2, E. Jiminez4, A. Arroliga5,6, J. Sanchez5,6,N.D. Ferguson7,The OSCILLATE Trial investigators and the Canadian Critical CareTrials Group
1McMaster University, Medicine, Hamilton, Canada, 2Hamilton Health Sciences, Critical Care,Hamilton, Canada, 3University of Western Ontario, Anesthesia, Medicine and Critical Care,London, Canada, 4Orlando Health Inc., Critical Care Medicine, Orland, USA, 5Scott and WhiteHospital, Critical Care Medicine, Temple, USA, 6Texas A&M HSC College of Medicine,Medicine, Temple, USA, 7University Health Network, Critical Care Medicine, Toronto, CanadaINTRODUCTION. Mechanical ventilation practices in ARDS are influenced by newresearch, available technologies, and costs.OBJECTIVES. To investigate changes in ventilation practices during a randomized trial ofhigh frequency oscillation in adult ARDS.METHODS. The OSCILLATE pilot trial (June 2007–July 2008) was followed, after a 1-yearhiatus, by the OSCILLATE trial (July 2009–August 2012). We analyzed baseline data and on-study data (up to 28 days), as appropriate. We used linear regression to assess for changes incontinuous variables (e.g., tidal volume) over time, and the Cochrane Armitage trend test toinvestigate changing patient proportions (e.g., the proportion of patients receiving neuromus-cular blockade) over 4 discreet years of study. We adjusted for concurrent changes inprognostic variables and center effects, and prespecified hypotheses for each analysis.RESULTS. OSCILLATE enrolled 548 adults with ARDS. Baseline data showed consistenttidal volumes over the four discreet years of study (on average, 7.0 ± 2.0 mL/kg), as well asplateau airway pressures (29 ± 6 cmH2O), and positive end-expiratory pressures(13 ± 4 cmH2O) over time. Use of volume assist control mode increased over time (from16 % in the first year to 27 % in the fourth year; p = 0.009), and pressure control modedecreased (from 67 to 50 %; p = 0.002), with no change in pressure support mode (8.6 % ofpatients overall at baseline; p = 0.19). Assessing on-study data, there was no change in theproportion of patients receiving systemic corticosteroids (57.9 %), or neuromuscular blockers(54.7 %). Esophageal pressure monitoring was rare (1.1 %). Pulmonary artery catheteriza-tions declined (from 11 to 3 %; p = 0.024). Among 109 patients with severe hypoxemia, therewas a steady increase in airway pressure release ventilation (APRV; from 0 to 19 %;p = 0.08), with no change in inhaled nitric oxide (13.9 %) or prone positioning (20.2 %).CONCLUSIONS. Efforts at volume- and pressure-limitation did not appear to change overtime despite changes in ventilator mode, which was predominantly pressure control. Ratesof neuromuscular blockade remained constant over time, and pulmonary artery catheter-izations declined. APRV was increasingly applied as rescue therapy.With funding from the Canadian Institutes of Health Research.
0007PREVALENCE AND MORTALITY OF ARDS USING THE BERLIN DEFINITION:A MULTICENTER PROSPECTIVE EPIDEMIOLOGICAL STUDY IN ANUNIVERSITY HOSPITAL
R. Hernu1, F. Wallet2, A. Lepape2, O. Martin3, J.-C. Richard4, Z. Schmidt5, B. Delannoy6,C. Demaret7, T. Rimmelé3, C. Magnin8, H. Vallin2, L. Baboi4, V. Piriou2, B. Allaouchiche3,L. Argaud1, F. Aubrun5, O. Bastien6, J.-J. Lehot7, L. Ayzac9, C. Guérin4, REALYS1Hopital Edouard Herriot, Service de Réanimation Médicale, Lyon, France, 2CentreHospitalier Lyon Sud, Service d’Anesthésie-Réanimation, Pierre Bénite, France, 3HopitalEdouard Herriot, Service de Réanimation Polyvalente, Lyon, France, 4Hôpital de la CroixRousse, Service de Réanimation Médicale, Lyon, France, 5Hôpital de la Croix Rousse,Service de Réanimation Chirurgicale, Lyon, France, 6Hopital Cardiovasculaire etPneumologique, Service de Réanimation Polyvalente, Bron, France, 7Hopital Neurologique,Service d’Anesthésie-Réanimation, Bron, France, 8Hopital Edouard Herriot, Service deRéanimation des Brûlés, Lyon, France, 9Hopital Henri Gabriel, Service de Biostatistique,Saint Genis Laval, FranceINTRODUCTION. A new definition of ARDS (ARDSn) has recently been proposed1 totake over the previous (ARDSo) consensus definition [2].OBJECTIVES. In present study, we aimed at determining: 1. frequency of ARDS in ICUwith the new and previous criteria [2] 2. ARDSn prevalence and density of incidence, 3.ARDSn characteristics on admission and day 28 mortality.METHODS. Prospective epidemiological study in the 10 adult ICUs of the University ofLyon, France, over a 6-month period (March–September 2012). Patients receiving invasiveor non invasive mechanical ventilation, with PaO2/FIO2\300 regardless of PEEP level andacute onset of new or increased bilateral infiltrates or opacities on chest X-ray were screenedfrom ICU admission up to discharge. Patients with increased left atrial pressure wereexcluded. Complete data set was recorded on ICU admission. Patient outcome was mea-sured at day 28 after inclusion. Prevalence was computed as the number of ARDS casesdivided by the number of ICU admissions. Density of incidence per 1,000 days withoutARDS.patient was computed as number of ARDS cases divided by the cumulative numberof days without ARDS in the overall sample.RESULTS. During the study period 3,504 patients were admitted and 279 fulfilled ARDSocriteria. Among them, 11 did not comply with ARDSn criterion PEEP \ 5 cmH2O. Formild, moderate and severe ARDSn, prevalence was 1.26, 4.37, and 2.03 %, respectively(total prevalence 7.65 %). The corresponding values for density of incidence 2.68, 9.33, and4.33 %, respectively (total density of incidence 16.35 %). Main characteristics at time ofinclusion (mean ± SD) are shown in table 1. ARDS was due to pneumonia in 54.5, 60.8 and62 % for each ARDSn category. The day 28 mortality was 27.3, 28.9 and 50.7 %(P \ 0.01). In Cox proportional hazard model, SAPS II and neuromuscular blockade onadmission increased and body mass index decreased the risk for day 28 mortality. ARDSnstage was not a significant covariate to death.
Table 1
Mild(n = 44)
Moderate(n = 153)
Severe(n = 71)
Age (years)* 56 ± 17 63 ± 15 57 ± 17
M gender (%) 70.5 68.0 80.3
SAPS II 55 ± 20 55 ± 21 60 ± 24
SOFA 10 ± 4 10 ± 4 11 ± 4
NIV at inclusion (%) 11.4 22.9 11.3
VT (ml/kg PBW) intubation 7.4 ± 1.5 7.2 ± 1.4 7.1 ± 1.3
PEEP (cmH2O) intubation** 7.5 ± 2.8 7.7 ± 2.7 9.3 ± 3.0
FIO2 intubation** 0.59 ± 0.26 0.67 ± 0.19 0.87 ± 0.15
Plateau pressure* (cmH2O) 22 ± 4 22 ± 5 24 ± 5
* P \ 0.05, ** P \ 0.01 across ARDS stages
26th ESICM ANNUAL CONGRESS — PARIS, FRANCE — 5–9 OCTOBER 2013
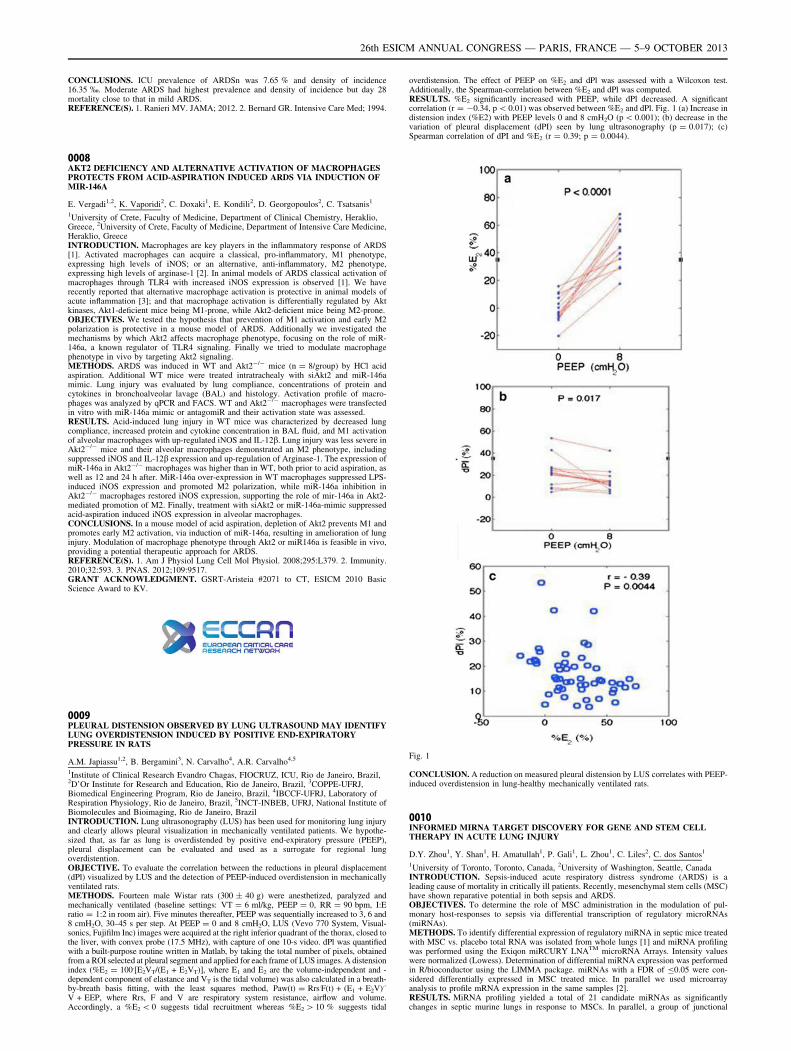
CONCLUSIONS. ICU prevalence of ARDSn was 7.65 % and density of incidence16.35 %. Moderate ARDS had highest prevalence and density of incidence but day 28mortality close to that in mild ARDS.REFERENCE(S). 1. Ranieri MV. JAMA; 2012. 2. Bernard GR. Intensive Care Med; 1994.
0008AKT2 DEFICIENCY AND ALTERNATIVE ACTIVATION OF MACROPHAGESPROTECTS FROM ACID-ASPIRATION INDUCED ARDS VIA INDUCTION OFMIR-146A
E. Vergadi1,2, K. Vaporidi2, C. Doxaki1, E. Kondili2, D. Georgopoulos2, C. Tsatsanis1
1University of Crete, Faculty of Medicine, Department of Clinical Chemistry, Heraklio,Greece, 2University of Crete, Faculty of Medicine, Department of Intensive Care Medicine,Heraklio, GreeceINTRODUCTION. Macrophages are key players in the inflammatory response of ARDS[1]. Activated macrophages can acquire a classical, pro-inflammatory, M1 phenotype,expressing high levels of iNOS; or an alternative, anti-inflammatory, M2 phenotype,expressing high levels of arginase-1 [2]. In animal models of ARDS classical activation ofmacrophages through TLR4 with increased iNOS expression is observed [1]. We haverecently reported that alternative macrophage activation is protective in animal models ofacute inflammation [3]; and that macrophage activation is differentially regulated by Aktkinases, Akt1-deficient mice being M1-prone, while Akt2-deficient mice being M2-prone.OBJECTIVES. We tested the hypothesis that prevention of M1 activation and early M2polarization is protective in a mouse model of ARDS. Additionally we investigated themechanisms by which Akt2 affects macrophage phenotype, focusing on the role of miR-146a, a known regulator of TLR4 signaling. Finally we tried to modulate macrophagephenotype in vivo by targeting Akt2 signaling.METHODS. ARDS was induced in WT and Akt2-/- mice (n = 8/group) by HCl acidaspiration. Additional WT mice were treated intratrachealy with siAkt2 and miR-146amimic. Lung injury was evaluated by lung compliance, concentrations of protein andcytokines in bronchoalveolar lavage (BAL) and histology. Activation profile of macro-phages was analyzed by qPCR and FACS. WT and Akt2-/- macrophages were transfectedin vitro with miR-146a mimic or antagomiR and their activation state was assessed.RESULTS. Acid-induced lung injury in WT mice was characterized by decreased lungcompliance, increased protein and cytokine concentration in BAL fluid, and M1 activationof alveolar macrophages with up-regulated iNOS and IL-12b. Lung injury was less severe inAkt2-/- mice and their alveolar macrophages demonstrated an M2 phenotype, includingsuppressed iNOS and IL-12b expression and up-regulation of Arginase-1. The expression ofmiR-146a in Akt2-/- macrophages was higher than in WT, both prior to acid aspiration, aswell as 12 and 24 h after. MiR-146a over-expression in WT macrophages suppressed LPS-induced iNOS expression and promoted M2 polarization, while miR-146a inhibition inAkt2-/- macrophages restored iNOS expression, supporting the role of mir-146a in Akt2-mediated promotion of M2. Finally, treatment with siAkt2 or miR-146a-mimic suppressedacid-aspiration induced iNOS expression in alveolar macrophages.CONCLUSIONS. In a mouse model of acid aspiration, depletion of Akt2 prevents M1 andpromotes early M2 activation, via induction of miR-146a, resulting in amelioration of lunginjury. Modulation of macrophage phenotype through Akt2 or miR146a is feasible in vivo,providing a potential therapeutic approach for ARDS.REFERENCE(S). 1. Am J Physiol Lung Cell Mol Physiol. 2008;295:L379. 2. Immunity.2010;32:593. 3. PNAS. 2012;109:9517.GRANT ACKNOWLEDGMENT. GSRT-Aristeia #2071 to CT, ESICM 2010 BasicScience Award to KV.
0009PLEURAL DISTENSION OBSERVED BY LUNG ULTRASOUND MAY IDENTIFYLUNG OVERDISTENSION INDUCED BY POSITIVE END-EXPIRATORYPRESSURE IN RATS
A.M. Japiassu1,2, B. Bergamini3, N. Carvalho4, A.R. Carvalho4,5
1Institute of Clinical Research Evandro Chagas, FIOCRUZ, ICU, Rio de Janeiro, Brazil,2D’Or Institute for Research and Education, Rio de Janeiro, Brazil, 3COPPE-UFRJ,Biomedical Engineering Program, Rio de Janeiro, Brazil, 4IBCCF-UFRJ, Laboratory ofRespiration Physiology, Rio de Janeiro, Brazil, 5INCT-INBEB, UFRJ, National Institute ofBiomolecules and Bioimaging, Rio de Janeiro, BrazilINTRODUCTION. Lung ultrasonography (LUS) has been used for monitoring lung injuryand clearly allows pleural visualization in mechanically ventilated patients. We hypothe-sized that, as far as lung is overdistended by positive end-expiratory pressure (PEEP),pleural displacement can be evaluated and used as a surrogate for regional lungoverdistention.OBJECTIVE. To evaluate the correlation between the reductions in pleural displacement(dPl) visualized by LUS and the detection of PEEP-induced overdistension in mechanicallyventilated rats.METHODS. Fourteen male Wistar rats (300 ± 40 g) were anesthetized, paralyzed andmechanically ventilated (baseline settings: VT = 6 ml/kg, PEEP = 0, RR = 90 bpm, I:Eratio = 1:2 in room air). Five minutes thereafter, PEEP was sequentially increased to 3, 6 and8 cmH2O, 30–45 s per step. At PEEP = 0 and 8 cmH2O, LUS (Vevo 770 System, Visual-sonics, Fujifilm Inc) images were acquired at the right inferior quadrant of the thorax, closed tothe liver, with convex probe (17.5 MHz), with capture of one 10-s video. dPl was quantifiedwith a built-purpose routine written in Matlab, by taking the total number of pixels, obtainedfrom a ROI selected at pleural segment and applied for each frame of LUS images. A distensionindex (%E2 = 100.[E2
. VT/(E1 + E2. VT)], where E1 and E2 are the volume-independent and -
dependent component of elastance and VT is the tidal volume) was also calculated in a breath-by-breath basis fitting, with the least squares method, Paw(t) = Rrs.F(t) + (E1 + E2
. V).-
V + EEP, where Rrs, F and V are respiratory system resistance, airflow and volume.Accordingly, a %E2 \ 0 suggests tidal recruitment whereas %E2 [ 10 % suggests tidal
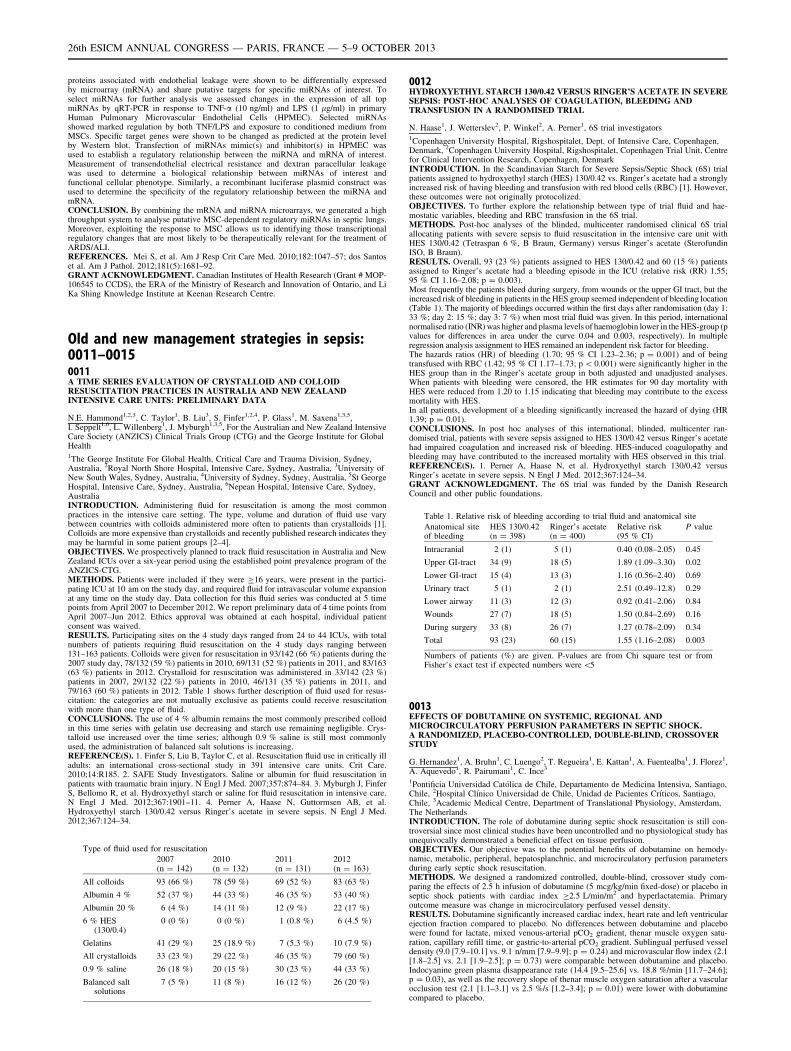
overdistension. The effect of PEEP on %E2 and dPl was assessed with a Wilcoxon test.Additionally, the Spearman-correlation between %E2 and dPl was computed.RESULTS. %E2 significantly increased with PEEP, while dPl decreased. A significantcorrelation (r = -0.34, p \ 0.01) was observed between %E2 and dPl. Fig. 1 (a) Increase indistension index (%E2) with PEEP levels 0 and 8 cmH2O (p \ 0.001); (b) decrease in thevariation of pleural displacement (dPI) seen by lung ultrasonography (p = 0.017); (c)Spearman correlation of dPI and %E2 (r = 0.39; p = 0.0044).
Fig. 1
CONCLUSION. A reduction on measured pleural distension by LUS correlates with PEEP-induced overdistension in lung-healthy mechanically ventilated rats.
0010INFORMED MIRNA TARGET DISCOVERY FOR GENE AND STEM CELLTHERAPY IN ACUTE LUNG INJURY
D.Y. Zhou1, Y. Shan1, H. Amatullah1, P. Gali1, L. Zhou1, C. Liles2, C. dos Santos1
1University of Toronto, Toronto, Canada, 2University of Washington, Seattle, CanadaINTRODUCTION. Sepsis-induced acute respiratory distress syndrome (ARDS) is aleading cause of mortality in critically ill patients. Recently, mesenchymal stem cells (MSC)have shown reparative potential in both sepsis and ARDS.OBJECTIVES. To determine the role of MSC administration in the modulation of pul-monary host-responses to sepsis via differential transcription of regulatory microRNAs(miRNAs).METHODS. To identify differential expression of regulatory miRNA in septic mice treatedwith MSC vs. placebo total RNA was isolated from whole lungs [1] and miRNA profilingwas performed using the Exiqon miRCURY LNATM microRNA Arrays. Intensity valueswere normalized (Lowess). Determination of differential miRNA expression was performedin R/bioconductor using the LIMMA package. miRNAs with a FDR of B0.05 were con-sidered differentially expressed in MSC treated mice. In parallel we used microarrayanalysis to profile mRNA expression in the same samples [2].RESULTS. MiRNA profiling yielded a total of 21 candidate miRNAs as significantlychanges in septic murine lungs in response to MSCs. In parallel, a group of junctional
26th ESICM ANNUAL CONGRESS — PARIS, FRANCE — 5–9 OCTOBER 2013
proteins associated with endothelial leakage were shown to be differentially expressedby microarray (mRNA) and share putative targets for specific miRNAs of interest. Toselect miRNAs for further analysis we assessed changes in the expression of all topmiRNAs by qRT-PCR in response to TNF-a (10 ng/ml) and LPS (1 lg/ml) in primaryHuman Pulmonary Microvascular Endothelial Cells (HPMEC). Selected miRNAsshowed marked regulation by both TNF/LPS and exposure to conditioned medium fromMSCs. Specific target genes were shown to be changed as predicted at the protein levelby Western blot. Transfection of miRNAs mimic(s) and inhibitor(s) in HPMEC wasused to establish a regulatory relationship between the miRNA and mRNA of interest.Measurement of transendothelial electrical resistance and dextran paracellular leakagewas used to determine a biological relationship between miRNAs of interest andfunctional cellular phenotype. Similarly, a recombinant luciferase plasmid construct wasused to determine the specificity of the regulatory relationship between the miRNA andmRNA.CONCLUSION. By combining the mRNA and miRNA microarrays, we generated a highthroughput system to analyse putative MSC-dependent regulatory miRNAs in septic lungs.Moreover, exploiting the response to MSC allows us to identifying those transcriptionalregulatory changes that are most likely to be therapeutically relevant for the treatment ofARDS/ALI.REFERENCES. Mei S, et al. Am J Resp Crit Care Med. 2010;182:1047–57; dos Santoset al. Am J Pathol. 2012;181(5):1681–92.GRANT ACKNOWLEDGMENT. Canadian Institutes of Health Research (Grant # MOP-106545 to CCDS), the ERA of the Ministry of Research and Innovation of Ontario, and LiKa Shing Knowledge Institute at Keenan Research Centre.
Old and new management strategies in sepsis:0011–00150011A TIME SERIES EVALUATION OF CRYSTALLOID AND COLLOIDRESUSCITATION PRACTICES IN AUSTRALIA AND NEW ZEALANDINTENSIVE CARE UNITS: PRELIMINARY DATA
N.E. Hammond1,2,3, C. Taylor1, B. Liu3, S. Finfer1,2,4, P. Glass1, M. Saxena1,3,5,I. Seppelt1,6, L. Willenberg1, J. Myburgh1,3,5, For the Australian and New Zealand IntensiveCare Society (ANZICS) Clinical Trials Group (CTG) and the George Institute for GlobalHealth1The George Institute For Global Health, Critical Care and Trauma Division, Sydney,Australia, 2Royal North Shore Hospital, Intensive Care, Sydney, Australia, 3University ofNew South Wales, Sydney, Australia, 4University of Sydney, Sydney, Australia, 5St GeorgeHospital, Intensive Care, Sydney, Australia, 6Nepean Hospital, Intensive Care, Sydney,AustraliaINTRODUCTION. Administering fluid for resuscitation is among the most commonpractices in the intensive care setting. The type, volume and duration of fluid use varybetween countries with colloids administered more often to patients than crystalloids [1].Colloids are more expensive than crystalloids and recently published research indicates theymay be harmful in some patient groups [2–4].OBJECTIVES. We prospectively planned to track fluid resuscitation in Australia and NewZealand ICUs over a six-year period using the established point prevalence program of theANZICS-CTG.METHODS. Patients were included if they were C16 years, were present in the partici-pating ICU at 10 am on the study day, and required fluid for intravascular volume expansionat any time on the study day. Data collection for this fluid series was conducted at 5 timepoints from April 2007 to December 2012. We report preliminary data of 4 time points fromApril 2007–Jun 2012. Ethics approval was obtained at each hospital, individual patientconsent was waived.RESULTS. Participating sites on the 4 study days ranged from 24 to 44 ICUs, with totalnumbers of patients requiring fluid resuscitation on the 4 study days ranging between131–163 patients. Colloids were given for resuscitation in 93/142 (66 %) patients during the2007 study day, 78/132 (59 %) patients in 2010, 69/131 (52 %) patients in 2011, and 83/163(63 %) patients in 2012. Crystalloid for resuscitation was administered in 33/142 (23 %)patients in 2007, 29/132 (22 %) patients in 2010, 46/131 (35 %) patients in 2011, and79/163 (60 %) patients in 2012. Table 1 shows further description of fluid used for resus-citation: the categories are not mutually exclusive as patients could receive resuscitationwith more than one type of fluid.CONCLUSIONS. The use of 4 % albumin remains the most commonly prescribed colloidin this time series with gelatin use decreasing and starch use remaining negligible. Crys-talloid use increased over the time series; although 0.9 % saline is still most commonlyused, the administration of balanced salt solutions is increasing.REFERENCE(S). 1. Finfer S, Liu B, Taylor C, et al. Resuscitation fluid use in critically illadults: an international cross-sectional study in 391 intensive care units. Crit Care.2010;14:R185. 2. SAFE Study Investigators. Saline or albumin for fluid resuscitation inpatients with traumatic brain injury. N Engl J Med. 2007;357:874–84. 3. Myburgh J, FinferS, Bellomo R, et al. Hydroxyethyl starch or saline for fluid resuscitation in intensive care.N Engl J Med. 2012;367:1901–11. 4. Perner A, Haase N, Guttormsen AB, et al.Hydroxyethyl starch 130/0.42 versus Ringer’s acetate in severe sepsis. N Engl J Med.2012;367:124–34.
Type of fluid used for resuscitation
2007(n = 142)
2010(n = 132)
2011(n = 131)
2012(n = 163)
All colloids 93 (66 %) 78 (59 %) 69 (52 %) 83 (63 %)
Albumin 4 % 52 (37 %) 44 (33 %) 46 (35 %) 53 (40 %)
Albumin 20 % 6 (4 %) 14 (11 %) 12 (9 %) 22 (17 %)
6 % HES(130/0.4)
0 (0 %) 0 (0 %) 1 (0.8 %) 6 (4.5 %)
Gelatins 41 (29 %) 25 (18.9 %) 7 (5.3 %) 10 (7.9 %)
All crystalloids 33 (23 %) 29 (22 %) 46 (35 %) 79 (60 %)
0.9 % saline 26 (18 %) 20 (15 %) 30 (23 %) 44 (33 %)
Balanced saltsolutions
7 (5 %) 11 (8 %) 16 (12 %) 26 (20 %)
0012HYDROXYETHYL STARCH 130/0.42 VERSUS RINGER’S ACETATE IN SEVERESEPSIS: POST-HOC ANALYSES OF COAGULATION, BLEEDING ANDTRANSFUSION IN A RANDOMISED TRIAL
N. Haase1, J. Wetterslev2, P. Winkel2, A. Perner1, 6S trial investigators1Copenhagen University Hospital, Rigshospitalet, Dept. of Intensive Care, Copenhagen,Denmark, 2Copenhagen University Hospital, Rigshospitalet, Copenhagen Trial Unit, Centrefor Clinical Intervention Research, Copenhagen, DenmarkINTRODUCTION. In the Scandinavian Starch for Severe Sepsis/Septic Shock (6S) trialpatients assigned to hydroxyethyl starch (HES) 130/0.42 vs. Ringer’s acetate had a stronglyincreased risk of having bleeding and transfusion with red blood cells (RBC) [1]. However,these outcomes were not originally protocolized.OBJECTIVES. To further explore the relationship between type of trial fluid and hae-mostatic variables, bleeding and RBC transfusion in the 6S trial.METHODS. Post-hoc analyses of the blinded, multicenter randomised clinical 6S trialallocating patients with severe sepsis to fluid resuscitation in the intensive care unit withHES 130/0.42 (Tetraspan 6 %, B Braun, Germany) versus Ringer’s acetate (SterofundinISO, B Braun).RESULTS. Overall, 93 (23 %) patients assigned to HES 130/0.42 and 60 (15 %) patientsassigned to Ringer’s acetate had a bleeding episode in the ICU (relative risk (RR) 1.55;95 % CI 1.16–2.08; p = 0.003).Most frequently the patients bleed during surgery, from wounds or the upper GI tract, but theincreased risk of bleeding in patients in the HES group seemed independent of bleeding location(Table 1). The majority of bleedings occurred within the first days after randomisation (day 1:33 %; day 2: 15 %; day 3: 7 %) when most trial fluid was given. In this period, internationalnormalised ratio (INR) was higher and plasma levels of haemoglobin lower in the HES-group (pvalues for differences in area under the curve 0.04 and 0.003, respectively). In multipleregression analysis assignment to HES remained an independent risk factor for bleeding.The hazards ratios (HR) of bleeding (1.70; 95 % CI 1.23–2.36; p = 0.001) and of beingtransfused with RBC (1.42; 95 % CI 1.17–1.73; p \ 0.001) were significantly higher in theHES group than in the Ringer’s acetate group in both adjusted and unadjusted analyses.When patients with bleeding were censored, the HR estimates for 90 day mortality withHES were reduced from 1.20 to 1.15 indicating that bleeding may contribute to the excessmortality with HES.In all patients, development of a bleeding significantly increased the hazard of dying (HR1.39; p = 0.01).CONCLUSIONS. In post hoc analyses of this international, blinded, multicenter ran-domised trial, patients with severe sepsis assigned to HES 130/0.42 versus Ringer’s acetatehad impaired coagulation and increased risk of bleeding. HES-induced coagulopathy andbleeding may have contributed to the increased mortality with HES observed in this trial.REFERENCE(S). 1. Perner A, Haase N, et al. Hydroxyethyl starch 130/0.42 versusRinger’s acetate in severe sepsis. N Engl J Med. 2012;367:124–34.GRANT ACKNOWLEDGMENT. The 6S trial was funded by the Danish ResearchCouncil and other public foundations.
Table 1. Relative risk of bleeding according to trial fluid and anatomical site
Anatomical siteof bleeding
HES 130/0.42(n = 398)
Ringer’s acetate(n = 400)
Relative risk(95 % CI)
P value
Intracranial 2 (1) 5 (1) 0.40 (0.08–2.05) 0.45
Upper GI-tract 34 (9) 18 (5) 1.89 (1.09–3.30) 0.02
Lower GI-tract 15 (4) 13 (3) 1.16 (0.56–2.40) 0.69
Urinary tract 5 (1) 2 (1) 2.51 (0.49–12.8) 0.29
Lower airway 11 (3) 12 (3) 0.92 (0.41–2.06) 0.84
Wounds 27 (7) 18 (5) 1.50 (0.84–2.69) 0.16
During surgery 33 (8) 26 (7) 1.27 (0.78–2.09) 0.34
Total 93 (23) 60 (15) 1.55 (1.16–2.08) 0.003
Numbers of patients (%) are given. P-values are from Chi square test or fromFisher’s exact test if expected numbers were \5
0013EFFECTS OF DOBUTAMINE ON SYSTEMIC, REGIONAL ANDMICROCIRCULATORY PERFUSION PARAMETERS IN SEPTIC SHOCK.A RANDOMIZED, PLACEBO-CONTROLLED, DOUBLE-BLIND, CROSSOVERSTUDY
G. Hernandez1, A. Bruhn1, C. Luengo2, T. Regueira1, E. Kattan1, A. Fuentealba1, J. Florez1,A. Aquevedo1, R. Pairumani1, C. Ince3
1Pontificia Universidad Católica de Chile, Departamento de Medicina Intensiva, Santiago,Chile, 2Hospital Clı́nico Universidad de Chile, Unidad de Pacientes Crı́ticos, Santiago,Chile, 3Academic Medical Centre, Department of Translational Physiology, Amsterdam,The NetherlandsINTRODUCTION. The role of dobutamine during septic shock resuscitation is still con-troversial since most clinical studies have been uncontrolled and no physiological study hasunequivocally demonstrated a beneficial effect on tissue perfusion.OBJECTIVES. Our objective was to the potential benefits of dobutamine on hemody-namic, metabolic, peripheral, hepatosplanchnic, and microcirculatory perfusion parametersduring early septic shock resuscitation.METHODS. We designed a randomized controlled, double-blind, crossover study com-paring the effects of 2.5 h infusion of dobutamine (5 mcg/kg/min fixed-dose) or placebo inseptic shock patients with cardiac index C2.5 L/min/m2 and hyperlactatemia. Primaryoutcome measure was change in microcirculatory perfused vessel density.RESULTS. Dobutamine significantly increased cardiac index, heart rate and left ventricularejection fraction compared to placebo. No differences between dobutamine and placebowere found for lactate, mixed venous-arterial pCO2 gradient, thenar muscle oxygen satu-ration, capillary refill time, or gastric-to-arterial pCO2 gradient. Sublingual perfused vesseldensity (9.0 [7.9–10.1] vs. 9.1 n/mm [7.9–9.9]; p = 0.24) and microvascular flow index (2.1[1.8–2.5] vs. 2.1 [1.9–2.5]; p = 0.73) were comparable between dobutamine and placebo.Indocyanine green plasma disappearance rate (14.4 [9.5–25.6] vs. 18.8 %/min [11.7–24.6];p = 0.03), as well as the recovery slope of thenar muscle oxygen saturation after a vascularocclusion test (2.1 [1.1–3.1] vs 2.5 %/s [1.2–3.4]; p = 0.01) were lower with dobutaminecompared to placebo.
26th ESICM ANNUAL CONGRESS — PARIS, FRANCE — 5–9 OCTOBER 2013

CONCLUSIONS. Dobutamine failed to improve sublingual microcirculatory, metabolic,hepatosplanchnic or peripheral perfusion parameters despite inducing a significant increasein systemic hemodynamic variables in septic shock patients without low cardiac output butwith persistent hypoperfusion.GRANT ACKNOWLEDGMENT. FONDECYT Chile, Project 1100610.
0014FLUID BALANCE IN PATIENTS WITH SEVERE SEPSIS AND/OR SEPTICSHOCK
A. Rodriguez1, C. De Haro1, C. Teixido1, E. Torrents1, C. Espinal1, A. Artigas1
1Critical Care Unit. CIBER Respiratory Diseases. Hospital de Sabadell. CorporacióSanitària i Universitària Parc Taulı́ (CSPT), Universitat Autònoma de Barcelona (UAB),Tauli Hospital, Barcelona, SpainINTRODUCTION. Fluid administration is essential for the initial resuscitation of sepsis.Once the initial resuscitation phase is done, a liberal fluid administration therapy could bedeleterious.OBJECTIVES. To evaluate the effect of fluid balance (FB) in the resolution of septic shockand organ dysfunction, as well as the fulfillment of initial resuscitation goals of the Sur-viving Sepsis Campaign. To evaluate the effect of negative versus positive FB after thesecond day of sepsis evolution.METHODS. Retrospective observational study (November2010–November 2011). Weincluded patients with severe sepsis and/or septic shock admitted in a polyvalent ICU. Weanalyzed clinical variables, cumulative FB in the first 4 days of sepsis and administratedtreatment. Patients were classified into two groups regarding if they had positive or negativebalance after the second day. Data were analyzed with t-student and Pearson correlation, andwere presented as mean ± standard deviation, percentage and Pearson correlationcoefficient.RESULTS. We included 99 patients (58.6 % male), mean age was 66.68 ± 14 years oldand the APACHE II at admission was 18.52 ± 7 points. 59.6 % of patients wereadmitted from the emergency department, 31.3 % from hospitalization ward and 8.1 %from the ICU. The source of sepsis was 40.4 % abdominal, 26.3 % respiratory and17.2 % urinary tract. The average fluid balance inputs were 11,072.39 ± 4,110 mL andoutputs 6,171.98 ± 2,894 mL. Both groups were comparable at baseline. FB was cor-related with the initial resuscitation goals of MAP of 65 mmHg (r = 0.29, p \ 0.01) andvasoactive treatment duration (r = 0.36, p \ 0.01) but not with CVP [8 mmHg or SvO2
C70 %. There is a correlation between FB and the SOFA score (r = 0.54, p \ 0.01).Patients with positive FB from the second day had a worse evolution of SOFA score andmore renal failure with more renal replacement therapy requirements (25.5 vs 0 %,p \ 0.01). Positive FB was associated with increased plasma transfusion (18.2 vs 4.5 %,p \ 0.05) and platelets transfusion (14.5 vs 2.3 %, p \ 0.05. Positive FB group wasassociated with more days of mechanical ventilation (9.63 ± 3.10 vs 5.59 ± 9.56,p \ 0.05) and a trend toward to increase ICU stay (16.96 ± 15.38 vs 11.88 ± 12.72,p = 0.085). There is a trend to higher mortality in the positive fluid balance group (35.3vs 18.6 %, p = 0.072).
Evolutive SOFA as positive or negative FB
Positive fluidbalance
Negative fluidbalance
SOFA day 2 8.49 ± 3.31 5.57 ± 2.68
SOFA day 3 8 ± 3.55 4.28 ± 2.52
SOFA day 4 6.98 ± 3.97 3.50 ± 2.49
Renal failure as positive or negative FB
Positive fluidbalance
Negativefluid balance
Day 2 (%) 34.5 9.1
Day 3 (%) 20 4.7
Day 4 (%) 15.1 0
CONCLUSIONS. In our patients there is a correlation between the FB and the goalof resuscitation of MAP of 65 mmHg and the vasoactive treatment duration. Patients withpositive FB from the second day of sepsis had worst daily SOFA, increased renal failure,more days of mechanical ventilation and a trend to more ICU stay and higher in-hospitalmortality.REFERENCE(S). 1. Boyd JH, et al. Fluid resuscitation in septic shock: a positive fluidbalance and elevated central venous pressure are associated with increased mortality. CCM.2011;39:259–65. 2. Murphy CV, et al. The importance of fluid management in ALI sec-ondary to septic shock. Chest. 2009;136:102–9.
0015EXTRACORPOREAL CYTOKINE HEMOADSORPTION IN SEVERELY SEPTICPATIENTS: A MULTICENTER RANDOMIZED CONTROLLED TRIAL
D. Schädler1, C. Porzilius2, J. Brederlau3, A. Jörres4, G. Marx5, A. Meier-Hellmann6,C. Putensen7, M. Quintel8, C.D. Spies4, C. Engel2, J. Kellum9, N. Weiler10,M.K. Kuhlmann11, Cytosorb European Sepsis Trial Group1University Medical Center Schleswig–Holstein, Campus Kiel, Anaesthesiology andIntensive Care Medicine, Kiel, Germany, 2University of Leipzig, Leipzig, Germany, 3HeliosHospital Berlin-Buch, Berlin, Germany, 4Charité University Medicine Berlin, Berlin,Germany, 5RWTH University Hospital Aachen, Aachen, Germany, 6Helios Hospital Erfurt,Erfurt, Germany, 7University of Bonn, Bonn, Germany, 8University Hospital Göttingen,Göttingen, Germany, 9University of Pittsburgh, Pittsburgh, USA, 10University MedicalCenter Schleswig–Holstein, Campus Kiel, Kiel, Germany, 11Vivantes HospitalFriedrichshain, Berlin, Germany
INTRODUCTION. A novel sorbent hemoadsorption device for cytokine removal (Cyto-Sorb�, CytoSorbents Corporation, USA) was developed and successfully tested in twodifferent animal models of sepsis [1, 2]. The experience in the clinical setting is still limitedto case reports.OBJECTIVES. In this first clinical trial, we tested the hypothesis that treatment withsorbent hemoadsorption could safely and effectively reduce cytokines in septic patients withacute lung injury (ALI).METHODS. Ventilated patients fulfilling the criteria for severe sepsis and ALI wereenrolled in this multicenter randomized, controlled, open-label study comparing standard ofcare with or without hemoperfusion treatment. Primary endpoints were safety and IL-6reduction. Treated patients were anti-coagulated with either regional citrate or systemicheparin and underwent hemoperfusion at flow rates of *200–300 ml/min for 6 h per dayfor 7 consecutive days. The overall mean reduction in individual plasma cytokines for thecontrol and treatment groups during the treatment period was calculated using a generalizedlinear model.RESULTS. 43 patients (18 treated, 25 control) completed the study and were furtheranalyzed. Incidence of organ dysfunction at enrollment (treatment vs. control) was: septicshock (94 vs. 100 %, p = 0.42), acute respiratory distress syndrome (67 vs. 56 %,p = 0.33), and renal failure (39 vs. 24 %, p = 0.54). During 115 treatments no seriousdevice related adverse events occurred. On average, there were no changes in hematologyand other blood parameters except for a modest reduction in platelet count (\10 %) andalbumin (\5 %) with treatment. Hemoperfusion decreased IL-6 blood concentration sig-nificantly (-49.1 %, p = 0.01), with similar reductions of MCP-1 (-49.5 %, p = 0.002),IL-1ra (-36.5 %, p = 0.001), and IL-8 (-30.2 %, p = 0.002). 28-day (28 vs. 24 % control,p = 0.84) and 60-day mortality (39 vs. 32 % control, p = 0.75) did not differ significantlybetween the two studied groups.CONCLUSIONS. In this first clinical study of a novel sorbent hemoadsorption device inpatients with severe sepsis and ALI, the device appeared to be safe and decreased theblood concentration of several cytokines. Further research is needed to study the effectof the device on the clinical outcome of septic patients (clinicaltrials.gov IDNCT00559130).REFERENCE(S). 1. Kellum JA, et al. Crit Care Med. 2004;32:801–5. 2. Peng Z-Y, et al.Crit Care Med. 2008;36:1573–7.GRANT ACKNOWLEDGMENT. The study was supported by CytoSorbents Corporation,USA.
Management and outcome of acute kidney injury:0016–00200016SURVIVAL AND QUALITY OF LIFE AT 6 MONTHS IN CRITICALLY ILLPATIENTS WITH ACUTE KIDNEY INJURY
S. Nisula1, S. Vaara1, K.-M. Kaukonen1,2, M. Reinikainen3, M. Poukkanen4, V. Pettilä1,5,A.-M. Korhonen1, The FINNAKI Study Group1Helsinki University Central Hospital, Intensive Care Units, Division of Anaesthesia andIntensive Care Medicine, Department of Surgery, Helsinki, Finland, 2Monash University,Australian and New Zealand Intensive Care Research Centre, Department of Epidemiologyand Preventive Medicine, Melbourne, Australia, 3North Karelia Central Hospital,Department of Intensive Care, Joensuu, Finland, 4Lapland Central Hospital, Department ofAnesthesia and Intensive Care Medicine, Rovaniemi, Finland, 5University of Helsinki,Institute of Clinical Medicine, Helsinki, FinlandINTRODUCTION. Acute kidney injury (AKI) has high incidence among the critically illand associates with dismal outcome [1]. Not only the long-term survival, but also the qualityof life (QOL) of patients with AKI is relevant due to substantial burden of care regardingthese patients.OBJECTIVES. To study the long-term outcome and quality of life of patients with AKItreated in intensive care units (ICUs).METHODS. We conducted a 6-month follow-up of ICU patients from a prospective,observational, multi-centre FINNAKI study [2]. We included study centres with over 70 %follow-up rate. We acquired mortality data and evaluated QOL of survivors with the Eu-roQol (EQ-5D) questionnaire [3].RESULTS. Of the 1568 study patients, 635 [40.5 %, 95 % confidence interval (CI)38.0–43.0 %] had AKI (Kidney Disease Improving Global Outcomes, KDIGO criteria),and 181 (11.5 %) received renal replacement therapy (RRT). 35.3 % (95 % CI31.5–39.0 %) of the AKI patients, compared to 16.5 % (95 % CI 14.1–19.0 %) ofpatients without AKI, died within 6 months. The 6-month mortality for patients withRRT was 39.2 %.80.6 % of the survivors (959/1,190) answered the EQ-5D questionnaire at 6 months. Theresponders’ severity-of-illness scores (interquartile range, IQR) were slightly higher thanthose of the non-responders [SAPS II 39 (30–48) vs. 35 (25–46), SOFA (day 1) 8 (6–10) vs.7 (5–9)], otherwise the groups were comparable.The median (IQR) EQ-5D index at 6 months was 0.690 (0.533–1.00), as compared to 0.845(0.812–0.882) for the age and sex-matched general population. The EQ-5D was comparablein patients with AKI of any stage and in RRT-treated patients: 0.676 (0.520–1.00) vs. 0.676(0.489–1.00), respectively.The admission EQ-5D was available for 774/1,190 (65 %) patients. Mean increases of 0.017(no AKI) and 0.024 (AKI) in the EQ-5D index were observed after the critical illness andfollow-up period.CONCLUSIONS. Over 35 % of patients with AKI die within 6 months after ICUadmission. The QOL of surviving AKI patients is significantly lower compared to thegeneral population already at ICU admission. This level is preserved, however, throughcritical illness and is comparable to patients without AKI.REFERENCE(S). 1. Bagshaw SM, et al. Changes in the incidence and outcome forearly acute kidney injury in a cohort of Australian intensive care units. Crit Care.2007;11(3):R68. 2. Nisula S, et al. Incidence, risk factors and 90-day mortality ofpatients with acute kidney injury in Finnish intensive care units: the FINNAKI study.Intensive Care Med. 2013;39(3):420–8. 3. Brooks R. EuroQol: the current state of play.Health Policy. 1996;37(1):53–72.GRANT ACKNOWLEDGMENT. Clinical Research funding from Helsinki UniversityHospital, and a grant from the Finnish Society of Intensive Care, and a grant from theAcademy of Finland.
26th ESICM ANNUAL CONGRESS — PARIS, FRANCE — 5–9 OCTOBER 2013
0017VALIDATION OF A CONTINUOUS INFUSION OF VERY LOW DOSE IOHEXOL(CIVLDI) TO MEASURE GLOMERULAR FILTRATION RATE (GFR): A NEWGOLD STANDARD FOR AKI?
J.J. Dixon1, K. Lane1, R.N. Dalton2, C. Turner2, R.M. Grounds1, I.A.M. MacPhee3,B.J. Philips1, Acute Kidney Injury Research Group1St George’s Healthcare NHS Trust and St George’s University of London, GeneralIntensive Care, London, UK, 2Guy’s and St Thomas’ NHS Foundation Trust, PaediatricBiochemistry, London, UK, 3St. George’s Healthcare NHS Trust and St George’s Universityof London, Renal Medicine, London, UKINTRODUCTION. There is currently no accurate method of measuring GFR in patientswith AKI. Current definitions are based upon [50 % change in serum Creatinineconcentration (SCr) and reduced urine output [1], however, these criteria have limita-tions in patients with AKI and diagnosis may be delayed if using these criteria alone.We have designed a method of continuous measurement of GFR with the intention ofapplying it in patients with AKI. The purpose of this crossover trial was to prove theconcept and safety in volunteers over a range of GFR from normal to \30 mL/min/1.73 m2.OBJECTIVES. 1. Validate a method of measuring Glomerular Filtration Rate (GFR) thatwe will eventually use to measure Acute Kidney injury (AKI); 2. Determine the intra-individual variation in GFR in people with stable renal function and the minimum changeour method can measure.METHODS. The trial was registered with the European Clinical Trials Database. 17 vol-unteers were allocated, via block randomisation, to measurement of GFR, either bymeasuring the plasma clearance of a single intravenous injection of Iohexol or by measuringthe plasma and renal clearance of a continuous infusion of very low dose Iohexol (CIVLDI;0.5 mL/h for 12 h). GFR was then measured by the other method after a washout period of4-28 days. Iohexol was measured by HPLC–MS/MS at 10 time points. The time to steadystate was determined, along with intra-individual variation in GFR (99 % confidenceintervals).RESULTS. Accuracy: There were no crossover effects (P = 0.43). There was no differencein GFR between the two methods (P = 0.82). Correlation between the methods was 0.98(P \ 0.0001); Bland–Altman comparison revealed a bias of 2.2 mL (3.5 %) with limits ofagreement -2 to 12.6 mL/min/1.73 m2 when GFR was measured by CIVLDI. Plasmaclearance overestimated renal clearance by 5.5 ± 7.3 mL/min/1.73 m2. Time to plasmasteady state concentration was 155 ± 84 min in subjects with GFR [60 mL/min/1.73 m2
and 487 ± 127 min in subjects with GFR \60 mL/min/1.73 m2.Precision: Intra-individual variation in GFR was 8.8 % (P \ 0.01). Changes [8.8 % rep-resent a true change in GFR.CONCLUSIONS. CIVLDI appears to be accurate and precise. Once the time to steady statehas elapsed, changes[8.8 % represent a true change in GFR. This is less than the changesrequired in SCr to define AKI. In future, we aim to apply this method in patients with AKI.We predict CIVLDI will augment research into suitable AKI biomarkers because smallerchanges in GFR can potentially be detected at an earlier stage than with conventionalcriteria.REFERENCES. 1. Kidney Disease Improving Global Outcomes work group. KDIGOClinical Practice Guidelines for Acute Kidney Injury. Kidney Int Suppl. 2012;2(1):1–138.GRANT ACKNOWLEDGMENT. St. George’s Hospital Charity.
0018THE ATTRIBUTABLE MORTALITY OF ACUTE KIDNEY INJURY:A SEQUENTIALLY MATCHED ANALYSIS
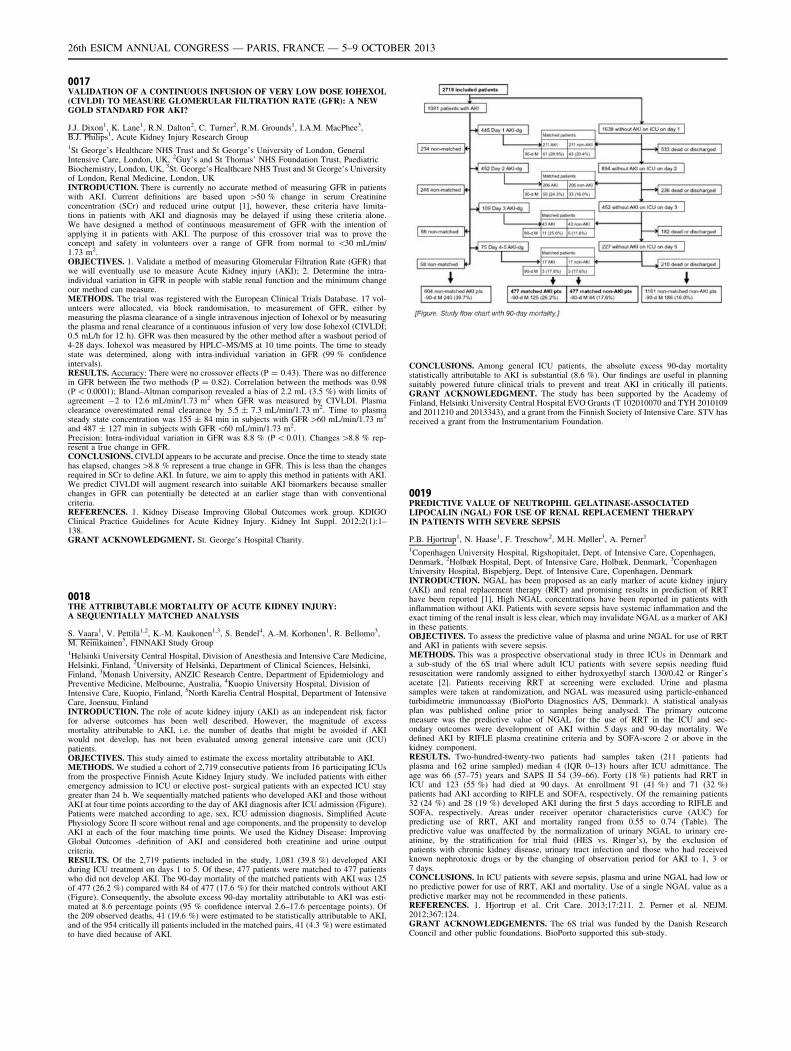
S. Vaara1, V. Pettilä1,2, K.-M. Kaukonen1,3, S. Bendel4, A.-M. Korhonen1, R. Bellomo3,M. Reinikainen5, FINNAKI Study Group1Helsinki University Central Hospital, Division of Anesthesia and Intensive Care Medicine,Helsinki, Finland, 2University of Helsinki, Department of Clinical Sciences, Helsinki,Finland, 3Monash University, ANZIC Research Centre, Department of Epidemiology andPreventive Medicine, Melbourne, Australia, 4Kuopio University Hospital, Division ofIntensive Care, Kuopio, Finland, 5North Karelia Central Hospital, Department of IntensiveCare, Joensuu, FinlandINTRODUCTION. The role of acute kidney injury (AKI) as an independent risk factorfor adverse outcomes has been well described. However, the magnitude of excessmortality attributable to AKI, i.e. the number of deaths that might be avoided if AKIwould not develop, has not been evaluated among general intensive care unit (ICU)patients.OBJECTIVES. This study aimed to estimate the excess mortality attributable to AKI.METHODS. We studied a cohort of 2,719 consecutive patients from 16 participating ICUsfrom the prospective Finnish Acute Kidney Injury study. We included patients with eitheremergency admission to ICU or elective post- surgical patients with an expected ICU staygreater than 24 h. We sequentially matched patients who developed AKI and those withoutAKI at four time points according to the day of AKI diagnosis after ICU admission (Figure).Patients were matched according to age, sex, ICU admission diagnosis, Simplified AcutePhysiology Score II score without renal and age components, and the propensity to developAKI at each of the four matching time points. We used the Kidney Disease: ImprovingGlobal Outcomes -definition of AKI and considered both creatinine and urine outputcriteria.RESULTS. Of the 2,719 patients included in the study, 1,081 (39.8 %) developed AKIduring ICU treatment on days 1 to 5. Of these, 477 patients were matched to 477 patientswho did not develop AKI. The 90-day mortality of the matched patients with AKI was 125of 477 (26.2 %) compared with 84 of 477 (17.6 %) for their matched controls without AKI(Figure). Consequently, the absolute excess 90-day mortality attributable to AKI was esti-mated at 8.6 percentage points (95 % confidence interval 2.6–17.6 percentage points). Ofthe 209 observed deaths, 41 (19.6 %) were estimated to be statistically attributable to AKI,and of the 954 critically ill patients included in the matched pairs, 41 (4.3 %) were estimatedto have died because of AKI.
CONCLUSIONS. Among general ICU patients, the absolute excess 90-day mortalitystatistically attributable to AKI is substantial (8.6 %). Our findings are useful in planningsuitably powered future clinical trials to prevent and treat AKI in critically ill patients.GRANT ACKNOWLEDGMENT. The study has been supported by the Academy ofFinland, Helsinki University Central Hospital EVO Grants (T 102010070 and TYH 2010109and 2011210 and 2013343), and a grant from the Finnish Society of Intensive Care. STV hasreceived a grant from the Instrumentarium Foundation.
0019PREDICTIVE VALUE OF NEUTROPHIL GELATINASE-ASSOCIATEDLIPOCALIN (NGAL) FOR USE OF RENAL REPLACEMENT THERAPYIN PATIENTS WITH SEVERE SEPSIS
P.B. Hjortrup1, N. Haase1, F. Treschow2, M.H. Møller3, A. Perner1
1Copenhagen University Hospital, Rigshopitalet, Dept. of Intensive Care, Copenhagen,Denmark, 2Holbæk Hospital, Dept. of Intensive Care, Holbæk, Denmark, 3CopenhagenUniversity Hospital, Bispebjerg, Dept. of Intensive Care, Copenhagen, DenmarkINTRODUCTION. NGAL has been proposed as an early marker of acute kidney injury(AKI) and renal replacement therapy (RRT) and promising results in prediction of RRThave been reported [1]. High NGAL concentrations have been reported in patients withinflammation without AKI. Patients with severe sepsis have systemic inflammation and theexact timing of the renal insult is less clear, which may invalidate NGAL as a marker of AKIin these patients.OBJECTIVES. To assess the predictive value of plasma and urine NGAL for use of RRTand AKI in patients with severe sepsis.METHODS. This was a prospective observational study in three ICUs in Denmark anda sub-study of the 6S trial where adult ICU patients with severe sepsis needing fluidresuscitation were randomly assigned to either hydroxyethyl starch 130/0.42 or Ringer’sacetate [2]. Patients receiving RRT at screening were excluded. Urine and plasmasamples were taken at randomization, and NGAL was measured using particle-enhancedturbidimetric immunoassay (BioPorto Diagnostics A/S, Denmark). A statistical analysisplan was published online prior to samples being analysed. The primary outcomemeasure was the predictive value of NGAL for the use of RRT in the ICU and sec-ondary outcomes were development of AKI within 5 days and 90-day mortality. Wedefined AKI by RIFLE plasma creatinine criteria and by SOFA-score 2 or above in thekidney component.RESULTS. Two-hundred-twenty-two patients had samples taken (211 patients hadplasma and 162 urine sampled) median 4 (IQR 0–13) hours after ICU admittance. Theage was 66 (57–75) years and SAPS II 54 (39–66). Forty (18 %) patients had RRT inICU and 123 (55 %) had died at 90 days. At enrollment 91 (41 %) and 71 (32 %)patients had AKI according to RIFLE and SOFA, respectively. Of the remaining patients32 (24 %) and 28 (19 %) developed AKI during the first 5 days according to RIFLE andSOFA, respectively. Areas under receiver operator characteristics curve (AUC) forpredicting use of RRT, AKI and mortality ranged from 0.55 to 0.74 (Table). Thepredictive value was unaffected by the normalization of urinary NGAL to urinary cre-atinine, by the stratification for trial fluid (HES vs. Ringer’s), by the exclusion ofpatients with chronic kidney disease, urinary tract infection and those who had receivedknown nephrotoxic drugs or by the changing of observation period for AKI to 1, 3 or7 days.CONCLUSIONS. In ICU patients with severe sepsis, plasma and urine NGAL had low orno predictive power for use of RRT, AKI and mortality. Use of a single NGAL value as apredictive marker may not be recommended in these patients.REFERENCES. 1. Hjortrup et al. Crit Care. 2013;17:211. 2. Perner et al. NEJM.2012;367:124.GRANT ACKNOWLEDGEMENTS. The 6S trial was funded by the Danish ResearchCouncil and other public foundations. BioPorto supported this sub-study.
26th ESICM ANNUAL CONGRESS — PARIS, FRANCE — 5–9 OCTOBER 2013
Prediction of NGAL for RRT, AKI and mortality
AUC(95 % CI)
Cutoff Sensitivity Specificity PPV NPV
RRT(pNGAL)
0.70(0.61–0.78)
641 ng/mL 0.69 0.64 0.30 0.90
RRT(uNGAL)
0.62(0.51–0.73)
1,832 ng/mL 0.46 0.77 0.28 0.88
RRT(creatinine)
0.74(0.67–0.82)
166 lmol/L 0.63 0.75 0.36 0.90
AKIRIFLE(pNGAL)
0.67(0.56–0.78)
559 ng/mL 0.58 0.76 0.45 0.85
AKIRIFLE(uNGAL)
0.70(0.58–0.83)
737 ng/mL 0.56 0.83 0.52 0.85
AKI SOFA(pNGAL)
0.65(0.55–0.76)
324 ng/mL 0.85 0.46 0.26 0.93
AKI SOFA(uNGAL)
0.74(0.62–0.85)
799 ng/mL 0.70 0.74 0.36 0.92
Mortality(pNGAL)
0.55(0.47–0.63)
641 ng/mL 0.46 0.63 0.60 0.49
Mortality(uNGAL)
0.61(0.53–0.70)
1,687 ng/mL 0.37 0.82 0.69 0.56
0020CLINICAL AND ECONOMIC IMPACTS OF A SWITCH FROM A HIGH TO LOWINTENSITY CONTINUOUS RENAL REPLACEMENT THERAPY IN PATIENTSWITH ACUTE KIDNEY INJURY
A.L. Paterson1, A.J. Johnston1, R. Gokhale1, D. Kingston1, R. Mahroof1
1John Farman Intensive Care Unit, Addenbrooke’s Hospital, Cambridge, UKINTRODUCTION. High intensity continuous renal replacement therapy (RRT) in patientswith acute kidney injury (AKI) on intensive care units (ICU) has failed to show an improve-ment in patient mortality compared to lower intensity protocols [1, 2]. In Sept 2011 thestandard RRT protocol used on our unit was switched from high, 30-35, to low, 20 mL kg-
1 h-1, intensity dose ultrafiltration. Our unit admits all general ICU patients including trans-plant (liver, multi-visceral), haem-oncology, tertiary hepatology and interventional radiology.Our Unit does not admit cardio-thoracic surgery and neuro-surgical patients.OBJECTIVES. We explored the effect of the protocol switch on: (a) patient mortality, lengthof ICU stay and duration of organ support; (b) the unit’s expenditure on RRT disposables.METHODS. All patients receiving RRT for 12 months on either side of the switch in RRTdose were investigated. Patients on long-term dialysis prior to admission and inter-hospitalICU to ICU transfers were excluded. Chi squared, Mann–Whitney U and T-test(s) were usedto assess statistical significance.RESULTS. Demographics of patients in cohort 1 (PRE) (high dose RRT, n = 187) andcohort 2 (POST) (low dose RRT, n = 179) were comparable (see Table), except for a higherincidence of chronic kidney disease (CKD) stage 3–5 at baseline in the POST group, 50 vs31 %, p = 0.001. There were no differences in mean APACHE II, 21.8 vs 22.0 p = 0.78;and ICNARC scores, 28.9 vs 27.9 p = 0.20; between the PRE and POST groups respectively.
Cohort demographics
Parameter Cohort 1 Cohort 2 p value
Age—median (IQR) 64 (51–74) 66 (54–77) 0.14
Sex—male 105 (56 %) 118 (66 %) 0.08
No. organs supported 0.68
RRT only 22 (11 %) 26 (14 %)
2 organs 45 (23 %) 44 (23 %)
3 organs 131 (66 %) 118 (63 %)
No difference in in-hospital mortality, 41 vs 42 %, p = 0.92; or ICU mortality, 29 vs 34 %,p = 0.40, was seen between the two cohorts. Patients in the POST group who survived toICU discharge, had a shorter median ICU length of stay than the PRE group, 8 days(interquartile range (IQR) 4–16) vs 12 days (IQR 6–22), p = 0.05; with a trend towards ashorter duration of RRT, median 4 days (IQR 2–6) vs 4 days (IQR 3–7), p = 0.07.There was a comparable duration of invasive ventilatory support, median 7 days (IQR 4–16)vs 11 days (IQR 4–22), p = 0.13; and inotrope support, median 4 days (IQR 2–5) vs 3 days(IQR 2–5), p = 0.89; between the two cohorts. The percentage change (mean ± standarddeviation) in eGFR from the patient’s pre-admission baseline to hospital discharge was alsoequivalent, PRE -1 ± 36 % vs POST 4 ± 44 %, p = 0.47.A 25 % reduction in dialysis/replacement fluid usage per day of RRT was observed with thenew protocol, equating to a cost saving of over £27,000 (€31,500) per annum.CONCLUSIONS. A switch from high to low intensity continuous haemodiafiltration hadminimal effects on clinical outcomes and resulted in marked cost-savings.REFERENCES. 1. Palevsky PM, Zhang JH, O0Connor TZ, et al. Intensity of renal supportin critically ill patients with acute kidney injury. NEJM. 2008;359:7–20. 2. Bellomo R, CassA, Cole L, et al. Intensity of continuous renal-replacement therapy in critically ill patients.NEJM. 2009;361:1627–38.
Monitoring the brain: not an easy task: 0021–00250021BRAIN THERMOMAPPING DURING STROKE
A. Butrov1, D. Cheboksarov1, O. Shevelev2, M. Shevelev3
1Peoples’ Friendship University of Russia, Department of Anesthesiology and IntensiveCare, Moscow, Russian Federation, 2Peoples’ Friendship University of Russia,
Pathophysiology, Moscow, Russian Federation, 3Moscow State Technical University namedafter N.E. Bauman, Moscow, Russian FederationINTRODUCTION. Development of the technique of expeditious monitoring in patientssuffering from stroke at the early stages of hospitalization (2–24 h from the beginning of thedisease).OBJECTIVES. Definition of the diagnostic opportunities of noninvasive thermomapping incerebral stroke.METHODS. Measurement of the cerebral temperature with thermomapping creation car-ried out by registration of electromagnetic radiation from a brain in the decimeter rangedevice RTM-01. 20 patients with ischemic stroke, confirmed by CT scan (54–81 ages) weresurveyed. In a control group healthy people were investigated.RESULTS. Temperature of healthy peoples’ hemispheres lacks noticeable thermo-hetero-geneity in normal conditions of the environment (Tair = 25 �C, Patm = 750 mmHg).Healthy brain temperature on the average was 36.7 ± 0.01 �C with a range deviationsranging from 35 to 38 �C (KK Pearson’s 0.899 (p \ 0.001). Brain temperature in strokepatients is on average 37.2 ± 0.02 �C. In the injured brain section and the ‘‘penumbra’’, thetemperature of the cortex reached 39–42 �C. The temperature increase range in the injuredhemisphere reached about 7–9 �C and showed high level of thermo-heterogeneity of thebrain (Pearson’s-0,151 KK, p [ 0.1).CONCLUSIONS. The obtained data considers thermomapping of the cerebral hemispheresby registration of electromagnetic radiation as a perspective technique of expeditiousmonitoring of patients with an ischemic stroke.
0022CEREBRAL PERFUSION PRESSURE IS LOWER IN PATIENTS WITHMYOCARDIAL INJURY AFTER SUBARACHNOID HEMORRHAGE
M. Hravnak1, Y. Chang2, T.J. Price Jr.1, E. Crago1, B. Jankowitz2, R.M. Friedlander2
1University of Pittsburgh, School of Nursing, Pittsburgh, USA, 2University of Pittsburgh,School of Medicine, Dept. Neurosurgery, Pittsburgh, USAINTRODUCTION. Patients with aneurysmal subarachnoid hemorrhage (aSAH) who alsodisplay accompanying myocardial injury (SAHMI) are known to experience poorer out-comes than patients with no SAHMI. Although we have determined that the systemicperfusion impairment associated with SAHMI can be subtle and transient, we still suspectthat such systemic perfusion impairment could contribute to a cerebral perfusion shortfall.OBJECTIVES. We sought to test the hypothesis that patients with SAHMI, manifested byelevated cardiac troponin I (cTnI) and myocardial wall motion abnormality (WMA), woulddisplay lower dynamic cerebral perfusion pressure (CPP) than patients with no SAHMI inthe immediate post injury period (days 0–3), even when the severity of aSAH is taken intoaccount.METHODS. Convenience sample of 44 patients diagnosed with aSAH. Twenty-twopatients with cTnI C0.3 ng/ml and WMA by echocardiographic determination were mat-ched to 22 patients with cTnI = 0 and no WMA. Match criteria were age ± 5 years,gender, race, Fisher grade and Hunt/Hess score (HH). Intracranial (ICP) and CPP (deter-mined as MAP-ICP) were measured every 2 h from admission to day 3 post-aSAH, alongwith measures of systemic perfusion (heart rate [HR], systolic [SBP], diastolic [DBP] meanarterial [MAP], and central venous pressures [CVP]). SAHMI cases and no-SAHMI controlsperfusion parameters across days 0–3 were compared with generalized estimating equations(GEE) to fit a repeated measure linear regression.RESULTS. The sample was primarily female (86 %) and white race (86 %) with mean age56 ± 10 years. SAHMI case patients peak mean cTnI was 8.9 ± 9.6 ng/ml. SAHMI casesexhibited significantly lower CPP than controls across days 0–3 (b = -7.9, p = 0.007).Although SAHMI cases and controls had similar ICP (b = -0.87, p = 0.262), the SAHMIcases displayed lower MAP (b = -7.06, p = 0.002) and SBP (b = -14.42, p \ 0.001), buthigher HR (b = 7.27, p = 0.013) and CVP (b = 2.42, p = 0.02).CONCLUSIONS. Patients with SAHMI have lower CPP across days 0–3 after aneurysmalsubarachnoid hemorrhage than patients with no SAHMI, even when the severity of hem-orrhage is taken into account. Since ICP remains similar between the groups, it appears thatlower MAP in the SAHMI group is responsible for the lower CPP. Further study is needed todetermine if the demonstrated lower CPP is accompanied by cerebral tissue hypoxia andpoorer neuropsychologic function.GRANT ACKNOWLEDGMENT. Funding U.S. National Institutes of Health. NHLBIR01HL074316.
0023CEREBRAL NEAR-INFRARED SPECTROSCOPY IN ADULTS ON VENO-ARTERIAL EXTRACORPOREAL MEMBRANE OXYGENATION
S. Cristallini1, D. Fagnoul1, B. Rondelet1, S. Scolletta1, K. Donadello1, J.-L. Vincent1,D. De Backer1, F.S. Taccone1
1Hopital Erasme, Bruxelles, BelgiumINTRODUCTION. Veno-arterial extracorporeal membrane oxygenation (VA-ECMO) isincreasingly used for cardiovascular support in critically ill patients but it can result inthromboembolic complications or brain hypoperfusion in some cases.OBJECTIVES. Continuous monitoring of cerebral oximetry (rSO2) can be helpful to detectbrain hypoperfusion or cerebrovascular accident (CVA) during VA-ECMO therapy.METHODS. Of the 53 patients treated with VA-ECMO over from October 2011 to April2013, 16 patients (median age 53 years; 11 males) were monitored with cerebral near-infrared spectroscopy (NIRS, Foresight, CAS Medical System Inc., Branford, CT), placedon patients’ forehead. Patients were analyzed for: baseline (rSO2); the percentage of timespent below the rSO2 threshold of 60, 55 or 50 % (%T \60, 55, 50 %); the maximumdifferential in right-left rSO2 values. Also, rSO2 findings were recorded, analyzed, andcorrelated with clinical events. VA-ECMO was initiated by percutaneous femo-femoral orcentral thoracic cannulation in 14 and 2 patients, respectively.RESULTS. The median duration on VA-ECMO in the 16 patients was 5 (range 2–18) days;the median duration of NIRS monitoring was 4 (2–8) days. Overall ICU mortality was 50 %.Initial rSO2 was 62 [52–67] %. Thirteen (81 %) patients presented with rSO2 \60 % for atleast 5 % of the time of monitoring. Therapeutic interventions, including increasing meanarterial pressure and/or ECMO flow, decreased PaCO2 and red blood cells transfusion,corrected these values to[60 % in 10 patients; in three patients, persistent decreased rSO2
below 50 % finally resulted in brain death diagnosis. In the four patients having a maximumdifferential right-left side rSO2 values exceeding 10 % for more than 15 min, cerebral CT-scan eventually yielded large ischemic CVA. Patients without encephalopathy at ICU
26th ESICM ANNUAL CONGRESS — PARIS, FRANCE — 5–9 OCTOBER 2013
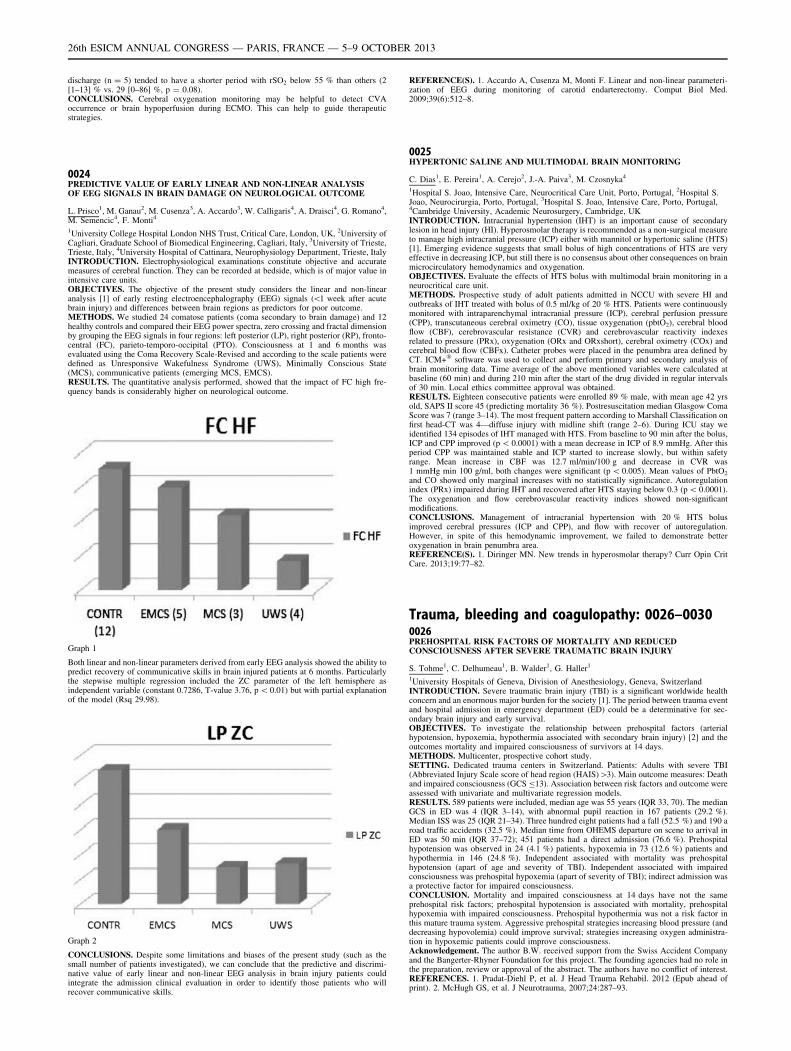
discharge (n = 5) tended to have a shorter period with rSO2 below 55 % than others (2[1–13] % vs. 29 [0–86] %, p = 0.08).CONCLUSIONS. Cerebral oxygenation monitoring may be helpful to detect CVAoccurrence or brain hypoperfusion during ECMO. This can help to guide therapeuticstrategies.
0024PREDICTIVE VALUE OF EARLY LINEAR AND NON-LINEAR ANALYSISOF EEG SIGNALS IN BRAIN DAMAGE ON NEUROLOGICAL OUTCOME
L. Prisco1, M. Ganau2, M. Cusenza3, A. Accardo3, W. Calligaris4, A. Draisci4, G. Romano4,M. Semencic4, F. Monti4
1University College Hospital London NHS Trust, Critical Care, London, UK, 2University ofCagliari, Graduate School of Biomedical Engineering, Cagliari, Italy, 3University of Trieste,Trieste, Italy, 4University Hospital of Cattinara, Neurophysiology Department, Trieste, ItalyINTRODUCTION. Electrophysiological examinations constitute objective and accuratemeasures of cerebral function. They can be recorded at bedside, which is of major value inintensive care units.OBJECTIVES. The objective of the present study considers the linear and non-linearanalysis [1] of early resting electroencephalography (EEG) signals (\1 week after acutebrain injury) and differences between brain regions as predictors for poor outcome.METHODS. We studied 24 comatose patients (coma secondary to brain damage) and 12healthy controls and compared their EEG power spectra, zero crossing and fractal dimensionby grouping the EEG signals in four regions: left posterior (LP), right posterior (RP), fronto-central (FC), parieto-temporo-occipital (PTO). Consciousness at 1 and 6 months wasevaluated using the Coma Recovery Scale-Revised and according to the scale patients weredefined as Unresponsive Wakefulness Syndrome (UWS), Minimally Conscious State(MCS), communicative patients (emerging MCS, EMCS).RESULTS. The quantitative analysis performed, showed that the impact of FC high fre-quency bands is considerably higher on neurological outcome.
Graph 1
Both linear and non-linear parameters derived from early EEG analysis showed the ability topredict recovery of communicative skills in brain injured patients at 6 months. Particularlythe stepwise multiple regression included the ZC parameter of the left hemisphere asindependent variable (constant 0.7286, T-value 3.76, p \ 0.01) but with partial explanationof the model (Rsq 29.98).
Graph 2
CONCLUSIONS. Despite some limitations and biases of the present study (such as thesmall number of patients investigated), we can conclude that the predictive and discrimi-native value of early linear and non-linear EEG analysis in brain injury patients couldintegrate the admission clinical evaluation in order to identify those patients who willrecover communicative skills.
REFERENCE(S). 1. Accardo A, Cusenza M, Monti F. Linear and non-linear parameteri-zation of EEG during monitoring of carotid endarterectomy. Comput Biol Med.2009;39(6):512–8.
0025HYPERTONIC SALINE AND MULTIMODAL BRAIN MONITORING
C. Dias1, E. Pereira1, A. Cerejo2, J.-A. Paiva3, M. Czosnyka4
1Hospital S. Joao, Intensive Care, Neurocritical Care Unit, Porto, Portugal, 2Hospital S.Joao, Neurocirurgia, Porto, Portugal, 3Hospital S. Joao, Intensive Care, Porto, Portugal,4Cambridge University, Academic Neurosurgery, Cambridge, UKINTRODUCTION. Intracranial hypertension (IHT) is an important cause of secondarylesion in head injury (HI). Hyperosmolar therapy is recommended as a non-surgical measureto manage high intracranial pressure (ICP) either with mannitol or hypertonic saline (HTS)[1]. Emerging evidence suggests that small bolus of high concentrations of HTS are veryeffective in decreasing ICP, but still there is no consensus about other consequences on brainmicrocirculatory hemodynamics and oxygenation.OBJECTIVES. Evaluate the effects of HTS bolus with multimodal brain monitoring in aneurocritical care unit.METHODS. Prospective study of adult patients admitted in NCCU with severe HI andoutbreaks of IHT treated with bolus of 0.5 ml/kg of 20 % HTS. Patients were continuouslymonitored with intraparenchymal intracranial pressure (ICP), cerebral perfusion pressure(CPP), transcutaneous cerebral oximetry (CO), tissue oxygenation (pbtO2), cerebral bloodflow (CBF), cerebrovascular resistance (CVR) and cerebrovascular reactivity indexesrelated to pressure (PRx), oxygenation (ORx and ORxshort), cerebral oximetry (COx) andcerebral blood flow (CBFx). Catheter probes were placed in the penumbra area defined byCT. ICM+� software was used to collect and perform primary and secondary analysis ofbrain monitoring data. Time average of the above mentioned variables were calculated atbaseline (60 min) and during 210 min after the start of the drug divided in regular intervalsof 30 min. Local ethics committee approval was obtained.RESULTS. Eighteen consecutive patients were enrolled 89 % male, with mean age 42 yrsold, SAPS II score 45 (predicting mortality 36 %). Postresuscitation median Glasgow ComaScore was 7 (range 3–14). The most frequent pattern according to Marshall Classification onfirst head-CT was 4—diffuse injury with midline shift (range 2–6). During ICU stay weidentified 134 episodes of IHT managed with HTS. From baseline to 90 min after the bolus,ICP and CPP improved (p \ 0.0001) with a mean decrease in ICP of 8.9 mmHg. After thisperiod CPP was maintained stable and ICP started to increase slowly, but within safetyrange. Mean increase in CBF was 12.7 ml/min/100 g and decrease in CVR was1 mmHg min 100 g/ml, both changes were significant (p \ 0.005). Mean values of PbtO2
and CO showed only marginal increases with no statistically significance. Autoregulationindex (PRx) impaired during IHT and recovered after HTS staying below 0.3 (p \ 0.0001).The oxygenation and flow cerebrovascular reactivity indices showed non-significantmodifications.CONCLUSIONS. Management of intracranial hypertension with 20 % HTS bolusimproved cerebral pressures (ICP and CPP), and flow with recover of autoregulation.However, in spite of this hemodynamic improvement, we failed to demonstrate betteroxygenation in brain penumbra area.REFERENCE(S). 1. Diringer MN. New trends in hyperosmolar therapy? Curr Opin CritCare. 2013;19:77–82.
Trauma, bleeding and coagulopathy: 0026–00300026PREHOSPITAL RISK FACTORS OF MORTALITY AND REDUCEDCONSCIOUSNESS AFTER SEVERE TRAUMATIC BRAIN INJURY
S. Tohme1, C. Delhumeau1, B. Walder1, G. Haller1
1University Hospitals of Geneva, Division of Anesthesiology, Geneva, SwitzerlandINTRODUCTION. Severe traumatic brain injury (TBI) is a significant worldwide healthconcern and an enormous major burden for the society [1]. The period between trauma eventand hospital admission in emergency department (ED) could be a determinative for sec-ondary brain injury and early survival.OBJECTIVES. To investigate the relationship between prehospital factors (arterialhypotension, hypoxemia, hypothermia associated with secondary brain injury) [2] and theoutcomes mortality and impaired consciousness of survivors at 14 days.METHODS. Multicenter, prospective cohort study.SETTING. Dedicated trauma centers in Switzerland. Patients: Adults with severe TBI(Abbreviated Injury Scale score of head region (HAIS)[3). Main outcome measures: Deathand impaired consciousness (GCS B13). Association between risk factors and outcome wereassessed with univariate and multivariate regression models.RESULTS. 589 patients were included, median age was 55 years (IQR 33, 70). The medianGCS in ED was 4 (IQR 3–14), with abnormal pupil reaction in 167 patients (29.2 %).Median ISS was 25 (IQR 21–34). Three hundred eight patients had a fall (52.5 %) and 190 aroad traffic accidents (32.5 %). Median time from OHEMS departure on scene to arrival inED was 50 min (IQR 37–72); 451 patients had a direct admission (76.6 %). Prehospitalhypotension was observed in 24 (4.1 %) patients, hypoxemia in 73 (12.6 %) patients andhypothermia in 146 (24.8 %). Independent associated with mortality was prehospitalhypotension (apart of age and severity of TBI). Independent associated with impairedconsciousness was prehospital hypoxemia (apart of severity of TBI); indirect admission wasa protective factor for impaired consciousness.CONCLUSION. Mortality and impaired consciousness at 14 days have not the sameprehospital risk factors; prehospital hypotension is associated with mortality, prehospitalhypoxemia with impaired consciousness. Prehospital hypothermia was not a risk factor inthis mature trauma system. Aggressive prehospital strategies increasing blood pressure (anddecreasing hypovolemia) could improve survival; strategies increasing oxygen administra-tion in hypoxemic patients could improve consciousness.Acknowledgement. The author B.W. received support from the Swiss Accident Companyand the Bangerter-Rhyner Foundation for this project. The founding agencies had no role inthe preparation, review or approval of the abstract. The authors have no conflict of interest.REFERENCES. 1. Pradat-Diehl P, et al. J Head Trauma Rehabil. 2012 (Epub ahead ofprint). 2. McHugh GS, et al. J Neurotrauma, 2007;24:287–93.
26th ESICM ANNUAL CONGRESS — PARIS, FRANCE — 5–9 OCTOBER 2013
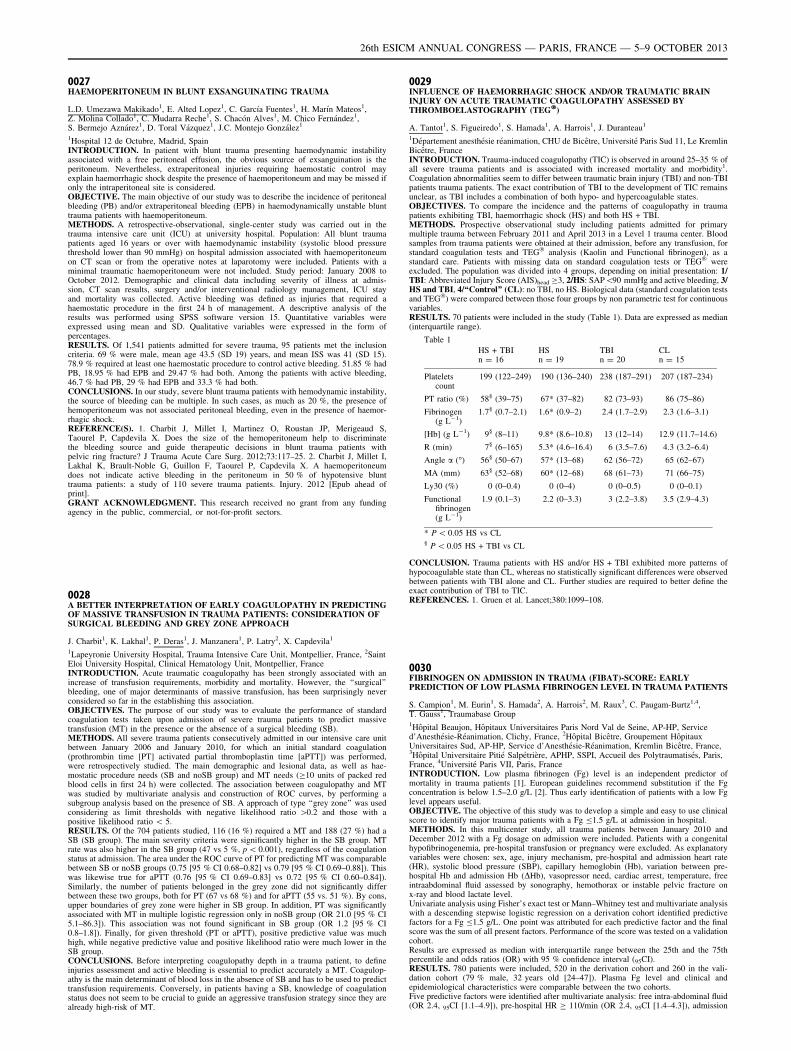
0027HAEMOPERITONEUM IN BLUNT EXSANGUINATING TRAUMA
L.D. Umezawa Makikado1, E. Alted Lopez1, C. Garcı́a Fuentes1, H. Marı́n Mateos1,Z. Molina Collado1, C. Mudarra Reche1, S. Chacón Alves1, M. Chico Fernández1,S. Bermejo Aznárez1, D. Toral Vázquez1, J.C. Montejo González1
1Hospital 12 de Octubre, Madrid, SpainINTRODUCTION. In patient with blunt trauma presenting haemodynamic instabilityassociated with a free peritoneal effusion, the obvious source of exsanguination is theperitoneum. Nevertheless, extraperitoneal injuries requiring haemostatic control mayexplain haemorrhagic shock despite the presence of haemoperitoneum and may be missed ifonly the intraperitoneal site is considered.OBJECTIVE. The main objective of our study was to describe the incidence of peritonealbleeding (PB) and/or extraperitoneal bleeding (EPB) in haemodynamically unstable blunttrauma patients with haemoperitoneum.METHODS. A retrospective-observational, single-center study was carried out in thetrauma intensive care unit (ICU) at university hospital. Population: All blunt traumapatients aged 16 years or over with haemodynamic instability (systolic blood pressurethreshold lower than 90 mmHg) on hospital admission associated with haemoperitoneumon CT scan or from the operative notes at laparotomy were included. Patients with aminimal traumatic haemoperitoneum were not included. Study period: January 2008 toOctober 2012. Demographic and clinical data including severity of illness at admis-sion, CT scan results, surgery and/or interventional radiology management, ICU stayand mortality was collected. Active bleeding was defined as injuries that required ahaemostatic procedure in the first 24 h of management. A descriptive analysis of theresults was performed using SPSS software version 15. Quantitative variables wereexpressed using mean and SD. Qualitative variables were expressed in the form ofpercentages.RESULTS. Of 1,541 patients admitted for severe trauma, 95 patients met the inclusioncriteria. 69 % were male, mean age 43.5 (SD 19) years, and mean ISS was 41 (SD 15).78.9 % required at least one haemostatic procedure to control active bleeding. 51.85 % hadPB, 18.95 % had EPB and 29.47 % had both. Among the patients with active bleeding,46.7 % had PB, 29 % had EPB and 33.3 % had both.CONCLUSIONS. In our study, severe blunt trauma patients with hemodynamic instability,the source of bleeding can be multiple. In such cases, as much as 20 %, the presence ofhemoperitoneum was not associated peritoneal bleeding, even in the presence of haemor-rhagic shock.REFERENCE(S). 1. Charbit J, Millet I, Martinez O, Roustan JP, Merigeaud S,Taourel P, Capdevila X. Does the size of the hemoperitoneum help to discriminatethe bleeding source and guide therapeutic decisions in blunt trauma patients withpelvic ring fracture? J Trauma Acute Care Surg. 2012;73:117–25. 2. Charbit J, Millet I,Lakhal K, Brault-Noble G, Guillon F, Taourel P, Capdevila X. A haemoperitoneumdoes not indicate active bleeding in the peritoneum in 50 % of hypotensive blunttrauma patients: a study of 110 severe trauma patients. Injury. 2012 [Epub ahead ofprint].GRANT ACKNOWLEDGMENT. This research received no grant from any fundingagency in the public, commercial, or not-for-profit sectors.
0028A BETTER INTERPRETATION OF EARLY COAGULOPATHY IN PREDICTINGOF MASSIVE TRANSFUSION IN TRAUMA PATIENTS: CONSIDERATION OFSURGICAL BLEEDING AND GREY ZONE APPROACH
J. Charbit1, K. Lakhal1, P. Deras1, J. Manzanera1, P. Latry2, X. Capdevila1
1Lapeyronie University Hospital, Trauma Intensive Care Unit, Montpellier, France, 2SaintEloi University Hospital, Clinical Hematology Unit, Montpellier, FranceINTRODUCTION. Acute traumatic coagulopathy has been strongly associated with anincrease of transfusion requirements, morbidity and mortality. However, the ‘‘surgical’’bleeding, one of major determinants of massive transfusion, has been surprisingly neverconsidered so far in the establishing this association.OBJECTIVES. The purpose of our study was to evaluate the performance of standardcoagulation tests taken upon admission of severe trauma patients to predict massivetransfusion (MT) in the presence or the absence of a surgical bleeding (SB).METHODS. All severe trauma patients consecutively admitted in our intensive care unitbetween January 2006 and January 2010, for which an initial standard coagulation(prothrombin time [PT] activated partial thromboplastin time [aPTT]) was performed,were retrospectively studied. The main demographic and lesional data, as well as hae-mostatic procedure needs (SB and noSB group) and MT needs (C10 units of packed redblood cells in first 24 h) were collected. The association between coagulopathy and MTwas studied by multivariate analysis and construction of ROC curves, by performing asubgroup analysis based on the presence of SB. A approach of type ‘‘grey zone’’ was usedconsidering as limit thresholds with negative likelihood ratio [0.2 and those with apositive likelihood ratio \ 5.RESULTS. Of the 704 patients studied, 116 (16 %) required a MT and 188 (27 %) had aSB (SB group). The main severity criteria were significantly higher in the SB group. MTrate was also higher in the SB group (47 vs 5 %, p \ 0.001), regardless of the coagulationstatus at admission. The area under the ROC curve of PT for predicting MT was comparablebetween SB or noSB groups (0.75 [95 % CI 0.68–0.82] vs 0.79 [95 % CI 0.69–0.88]). Thiswas likewise true for aPTT (0.76 [95 % CI 0.69–0.83] vs 0.72 [95 % CI 0.60–0.84]).Similarly, the number of patients belonged in the grey zone did not significantly differbetween these two groups, both for PT (67 vs 68 %) and for aPTT (55 vs. 51 %). By cons,upper boundaries of grey zone were higher in SB group. In addition, PT was significantlyassociated with MT in multiple logistic regression only in noSB group (OR 21.0 [95 % CI5.1–86.3]). This association was not found significant in SB group (OR 1.2 [95 % CI0.8–1.8]). Finally, for given threshold (PT or aPTT), positive predictive value was muchhigh, while negative predictive value and positive likelihood ratio were much lower in theSB group.CONCLUSIONS. Before interpreting coagulopathy depth in a trauma patient, to defineinjuries assessment and active bleeding is essential to predict accurately a MT. Coagulop-athy is the main determinant of blood loss in the absence of SB and has to be used to predicttransfusion requirements. Conversely, in patients having a SB, knowledge of coagulationstatus does not seem to be crucial to guide an aggressive transfusion strategy since they arealready high-risk of MT.
0029INFLUENCE OF HAEMORRHAGIC SHOCK AND/OR TRAUMATIC BRAININJURY ON ACUTE TRAUMATIC COAGULOPATHY ASSESSED BYTHROMBOELASTOGRAPHY (TEG�)
A. Tantot1, S. Figueiredo1, S. Hamada1, A. Harrois1, J. Duranteau1
1Département anesthésie réanimation, CHU de Bicêtre, Université Paris Sud 11, Le KremlinBicêtre, FranceINTRODUCTION. Trauma-induced coagulopathy (TIC) is observed in around 25–35 % ofall severe trauma patients and is associated with increased mortality and morbidity1.Coagulation abnormalities seem to differ between traumatic brain injury (TBI) and non-TBIpatients trauma patients. The exact contribution of TBI to the development of TIC remainsunclear, as TBI includes a combination of both hypo- and hypercoagulable states.OBJECTIVES. To compare the incidence and the patterns of coagulopathy in traumapatients exhibiting TBI, haemorrhagic shock (HS) and both HS + TBI.METHODS. Prospective observational study including patients admitted for primarymultiple trauma between February 2011 and April 2013 in a Level 1 trauma center. Bloodsamples from trauma patients were obtained at their admission, before any transfusion, forstandard coagulation tests and TEG� analysis (Kaolin and Functional fibrinogen), as astandard care. Patients with missing data on standard coagulation tests or TEG� wereexcluded. The population was divided into 4 groups, depending on initial presentation: 1/TBI: Abbreviated Injury Score (AIS)head C3, 2/HS: SAP\90 mmHg and active bleeding, 3/HS and TBI, 4/‘‘Control’’ (CL): no TBI, no HS. Biological data (standard coagulation testsand TEG�) were compared between those four groups by non parametric test for continuousvariables.RESULTS. 70 patients were included in the study (Table 1). Data are expressed as median(interquartile range).
Table 1
HS + TBIn = 16
HSn = 19
TBIn = 20
CLn = 15
Plateletscount
199 (122–249) 190 (136–240) 238 (187–291) 207 (187–234)
PT ratio (%) 58§ (39–75) 67* (37–82) 82 (73–93) 86 (75–86)
Fibrinogen(g L-1)
1.7§ (0.7–2.1) 1.6* (0.9–2) 2.4 (1.7–2.9) 2.3 (1.6–3.1)
[Hb] (g L-1) 9§ (8–11) 9.8* (8.6–10.8) 13 (12–14) 12.9 (11.7–14.6)
R (min) 7§ (6–165) 5.3* (4.6–16.4) 6 (3.5–7.6) 4.3 (3.2–6.4)
Angle a (�) 56§ (50–67) 57* (13–68) 62 (56–72) 65 (62–67)
MA (mm) 63§ (52–68) 60* (12–68) 68 (61–73) 71 (66–75)
Ly30 (%) 0 (0–0.4) 0 (0–4) 0 (0–0.5) 0 (0–0.1)
Functionalfibrinogen(g L-1)
1.9 (0.1–3) 2.2 (0–3.3) 3 (2.2–3.8) 3.5 (2.9–4.3)
* P \ 0.05 HS vs CL§ P \ 0.05 HS + TBI vs CL
CONCLUSION. Trauma patients with HS and/or HS + TBI exhibited more patterns ofhypocoagulable state than CL, whereas no statistically significant differences were observedbetween patients with TBI alone and CL. Further studies are required to better define theexact contribution of TBI to TIC.REFERENCES. 1. Gruen et al. Lancet;380:1099–108.
0030FIBRINOGEN ON ADMISSION IN TRAUMA (FIBAT)-SCORE: EARLYPREDICTION OF LOW PLASMA FIBRINOGEN LEVEL IN TRAUMA PATIENTS
S. Campion1, M. Eurin1, S. Hamada2, A. Harrois2, M. Raux3, C. Paugam-Burtz1,4,T. Gauss1, Traumabase Group1Hôpital Beaujon, Hôpitaux Universitaires Paris Nord Val de Seine, AP-HP, Serviced’Anesthésie-Réanimation, Clichy, France, 2Hôpital Bicêtre, Groupement HôpitauxUniversitaires Sud, AP-HP, Service d’Anesthésie-Réanimation, Kremlin Bicêtre, France,3Hôpital Universitaire Pitié Salpétrière, APHP, SSPI, Accueil des Polytraumatisés, Paris,France, 4Université Paris VII, Paris, FranceINTRODUCTION. Low plasma fibrinogen (Fg) level is an independent predictor ofmortality in trauma patients [1]. European guidelines recommend substitution if the Fgconcentration is below 1.5–2.0 g/L [2]. Thus early identification of patients with a low Fglevel appears useful.OBJECTIVE. The objective of this study was to develop a simple and easy to use clinicalscore to identify major trauma patients with a Fg B1.5 g/L at admission in hospital.METHODS. In this multicenter study, all trauma patients between January 2010 andDecember 2012 with a Fg dosage on admission were included. Patients with a congenitalhypofibrinogenemia, pre-hospital transfusion or pregnancy were excluded. As explanatoryvariables were chosen: sex, age, injury mechanism, pre-hospital and admission heart rate(HR), systolic blood pressure (SBP), capillary hemoglobin (Hb), variation between pre-hospital Hb and admission Hb (DHb), vasopressor need, cardiac arrest, temperature, freeintraabdominal fluid assessed by sonography, hemothorax or instable pelvic fracture onx-ray and blood lactate level.Univariate analysis using Fisher’s exact test or Mann–Whitney test and multivariate analysiswith a descending stepwise logistic regression on a derivation cohort identified predictivefactors for a Fg B1.5 g/L. One point was attributed for each predictive factor and the finalscore was the sum of all present factors. Performance of the score was tested on a validationcohort.Results are expressed as median with interquartile range between the 25th and the 75thpercentile and odds ratios (OR) with 95 % confidence interval (95CI).RESULTS. 780 patients were included, 520 in the derivation cohort and 260 in the vali-dation cohort (79 % male, 32 years old [24–47]). Plasma Fg level and clinical andepidemiological characteristics were comparable between the two cohorts.Five predictive factors were identified after multivariate analysis: free intra-abdominal fluid(OR 2.4, 95CI [1.1–4.9]), pre-hospital HR C 110/min (OR 2.4, 95CI [1.4–4.3]), admission
26th ESICM ANNUAL CONGRESS — PARIS, FRANCE — 5–9 OCTOBER 2013
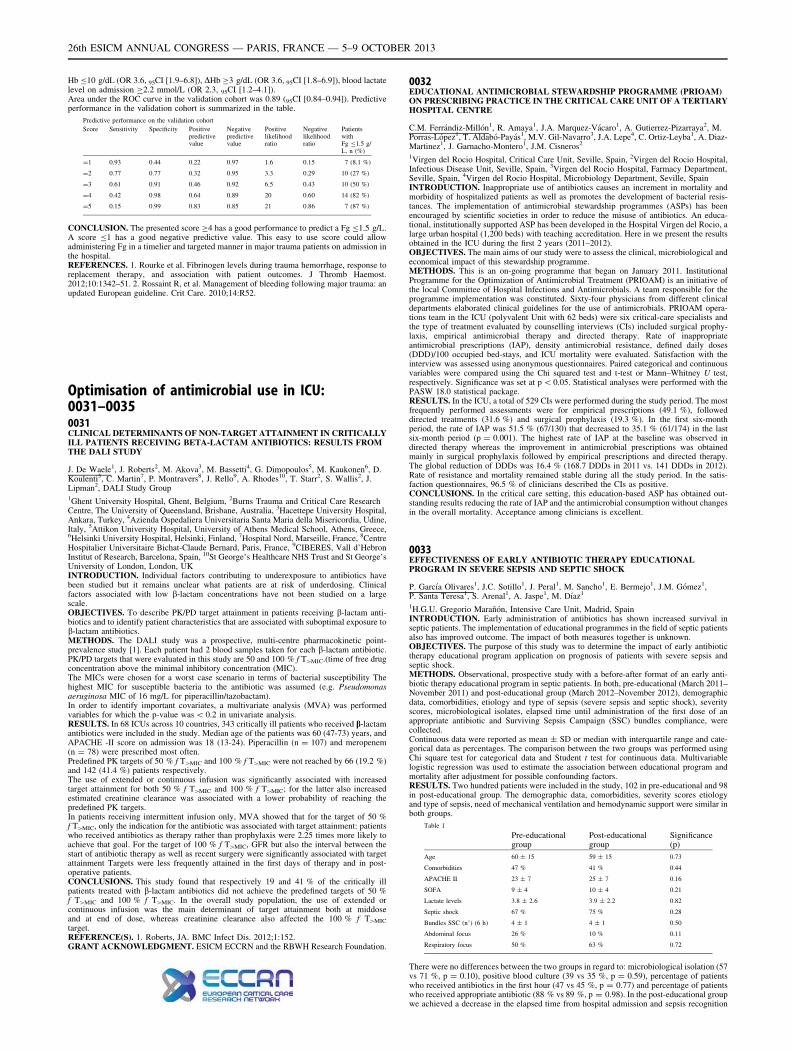
Hb B10 g/dL (OR 3.6, 95CI [1.9–6.8]), DHb C3 g/dL (OR 3.6, 95CI [1.8–6.9]), blood lactatelevel on admission C2.2 mmol/L (OR 2.3, 95CI [1.2–4.1]).Area under the ROC curve in the validation cohort was 0.89 (95CI [0.84–0.94]). Predictiveperformance in the validation cohort is summarized in the table.
Predictive performance on the validation cohort
Score Sensitivity Specificity Positivepredictivevalue
Negativepredictivevalue
Positivelikelihoodratio
Negativelikelihoodratio
PatientswithFg B1.5 g/L, n (%)
=1 0.93 0.44 0.22 0.97 1.6 0.15 7 (8.1 %)
=2 0.77 0.77 0.32 0.95 3.3 0.29 10 (27 %)
=3 0.61 0.91 0.46 0.92 6.5 0.43 10 (50 %)
=4 0.42 0.98 0.64 0.89 20 0.60 14 (82 %)
=5 0.15 0.99 0.83 0.85 21 0.86 7 (87 %)
CONCLUSION. The presented score C4 has a good performance to predict a Fg B1.5 g/L.A score B1 has a good negative predictive value. This easy to use score could allowadministering Fg in a timelier and targeted manner in major trauma patients on admission inthe hospital.REFERENCES. 1. Rourke et al. Fibrinogen levels during trauma hemorrhage, response toreplacement therapy, and association with patient outcomes. J Thromb Haemost.2012;10:1342–51. 2. Rossaint R, et al. Management of bleeding following major trauma: anupdated European guideline. Crit Care. 2010;14:R52.
Optimisation of antimicrobial use in ICU:0031–00350031CLINICAL DETERMINANTS OF NON-TARGET ATTAINMENT IN CRITICALLYILL PATIENTS RECEIVING BETA-LACTAM ANTIBIOTICS: RESULTS FROMTHE DALI STUDY
J. De Waele1, J. Roberts2, M. Akova3, M. Bassetti4, G. Dimopoulos5, M. Kaukonen6, D.Koulenti5, C. Martin7, P. Montravers8, J. Rello9, A. Rhodes10, T. Starr2, S. Wallis2, J.Lipman2, DALI Study Group1Ghent University Hospital, Ghent, Belgium, 2Burns Trauma and Critical Care ResearchCentre, The University of Queensland, Brisbane, Australia, 3Hacettepe University Hospital,Ankara, Turkey, 4Azienda Ospedaliera Universitaria Santa Maria della Misericordia, Udine,Italy, 5Attikon University Hospital, University of Athens Medical School, Athens, Greece,6Helsinki University Hospital, Helsinki, Finland, 7Hospital Nord, Marseille, France, 8CentreHospitalier Universitaire Bichat-Claude Bernard, Paris, France, 9CIBERES, Vall d’HebronInstitut of Research, Barcelona, Spain, 10St George’s Healthcare NHS Trust and St George’sUniversity of London, London, UKINTRODUCTION. Individual factors contributing to underexposure to antibiotics havebeen studied but it remains unclear what patients are at risk of underdosing. Clinicalfactors associated with low b-lactam concentrations have not been studied on a largescale.OBJECTIVES. To describe PK/PD target attainment in patients receiving b-lactam anti-biotics and to identify patient characteristics that are associated with suboptimal exposure tob-lactam antibiotics.METHODS. The DALI study was a prospective, multi-centre pharmacokinetic point-prevalence study [1]. Each patient had 2 blood samples taken for each b-lactam antibiotic.PK/PD targets that were evaluated in this study are 50 and 100 % f T[MIC.(time of free drugconcentration above the minimal inhibitory concentration (MIC).The MICs were chosen for a worst case scenario in terms of bacterial susceptibility Thehighest MIC for susceptible bacteria to the antibiotic was assumed (e.g. Pseudomonasaeruginosa MIC of 16 mg/L for piperacillin/tazobactam).In order to identify important covariates, a multivariate analysis (MVA) was performedvariables for which the p-value was \ 0.2 in univariate analysis.RESULTS. In 68 ICUs across 10 countries, 343 critically ill patients who received b-lactamantibiotics were included in the study. Median age of the patients was 60 (47-73) years, andAPACHE -II score on admission was 18 (13-24). Piperacillin (n = 107) and meropenem(n = 78) were prescribed most often.Predefined PK targets of 50 % f T[MIC and 100 % f T[MIC were not reached by 66 (19.2 %)and 142 (41.4 %) patients respectively.The use of extended or continuous infusion was significantly associated with increasedtarget attainment for both 50 % f T[MIC and 100 % f T[MIC; for the latter also increasedestimated creatinine clearance was associated with a lower probability of reaching thepredefined PK targets.In patients receiving intermittent infusion only, MVA showed that for the target of 50 %f T[MIC, only the indication for the antibiotic was associated with target attainment: patientswho received antibiotics as therapy rather than prophylaxis were 2.25 times more likely toachieve that goal. For the target of 100 % f T[MIC, GFR but also the interval between thestart of antibiotic therapy as well as recent surgery were significantly associated with targetattainment Targets were less frequently attained in the first days of therapy and in post-operative patients.CONCLUSIONS. This study found that respectively 19 and 41 % of the critically illpatients treated with b-lactam antibiotics did not achieve the predefined targets of 50 %f T[MIC and 100 % f T[MIC. In the overall study population, the use of extended orcontinuous infusion was the main determinant of target attainment both at middoseand at end of dose, whereas creatinine clearance also affected the 100 % f T[MIC
target.REFERENCE(S). 1. Roberts, JA. BMC Infect Dis. 2012;1:152.GRANT ACKNOWLEDGMENT. ESICM ECCRN and the RBWH Research Foundation.
0032EDUCATIONAL ANTIMICROBIAL STEWARDSHIP PROGRAMME (PRIOAM)ON PRESCRIBING PRACTICE IN THE CRITICAL CARE UNIT OF A TERTIARYHOSPITAL CENTRE
C.M. Ferrándiz-Millón1, R. Amaya1, J.A. Marquez-Vácaro1, A. Gutierrez-Pizarraya2, M.Porras-López1, T. Aldabó-Payás1, M.V. Gil-Navarro3, J.A. Lepe4, C. Ortiz-Leyba1, A. Diaz-Martinez1, J. Garnacho-Montero1, J.M. Cisneros2
1Virgen del Rocio Hospital, Critical Care Unit, Seville, Spain, 2Virgen del Rocio Hospital,Infectious Disease Unit, Seville, Spain, 3Virgen del Rocio Hospital, Farmacy Department,Seville, Spain, 4Virgen del Rocio Hospital, Microbiology Department, Seville, SpainINTRODUCTION. Inappropriate use of antibiotics causes an increment in mortality andmorbidity of hospitalized patients as well as promotes the development of bacterial resis-tances. The implementation of antimicrobial stewardship programmes (ASPs) has beenencouraged by scientific societies in order to reduce the misuse of antibiotics. An educa-tional, institutionally supported ASP has been developed in the Hospital Virgen del Rocio, alarge urban hospital (1,200 beds) with teaching accreditation. Here in we present the resultsobtained in the ICU during the first 2 years (2011–2012).OBJECTIVES. The main aims of our study were to assess the clinical, microbiological andeconomical impact of this stewardship programme.METHODS. This is an on-going programme that began on January 2011. InstitutionalProgramme for the Optimization of Antimicrobial Treatment (PRIOAM) is an initiative ofthe local Committee of Hospital Infections and Antimicrobials. A team responsible for theprogramme implementation was constituted. Sixty-four physicians from different clinicaldepartments elaborated clinical guidelines for the use of antimicrobials. PRIOAM opera-tions team in the ICU (polyvalent Unit with 62 beds) were six critical-care specialists andthe type of treatment evaluated by counselling interviews (CIs) included surgical prophy-laxis, empirical antimicrobial therapy and directed therapy. Rate of inappropriateantimicrobial prescriptions (IAP), density antimicrobial resistance, defined daily doses(DDD)/100 occupied bed-stays, and ICU mortality were evaluated. Satisfaction with theinterview was assessed using anonymous questionnaires. Paired categorical and continuousvariables were compared using the Chi squared test and t-test or Mann–Whitney U test,respectively. Significance was set at p \ 0.05. Statistical analyses were performed with thePASW 18.0 statistical package.RESULTS. In the ICU, a total of 529 CIs were performed during the study period. The mostfrequently performed assessments were for empirical prescriptions (49.1 %), followeddirected treatments (31.6 %) and surgical prophylaxis (19.3 %). In the first six-monthperiod, the rate of IAP was 51.5 % (67/130) that decreased to 35.1 % (61/174) in the lastsix-month period (p = 0.001). The highest rate of IAP at the baseline was observed indirected therapy whereas the improvement in antimicrobial prescriptions was obtainedmainly in surgical prophylaxis followed by empirical prescriptions and directed therapy.The global reduction of DDDs was 16.4 % (168.7 DDDs in 2011 vs. 141 DDDs in 2012).Rate of resistance and mortality remained stable during all the study period. In the satis-faction questionnaires, 96.5 % of clinicians described the CIs as positive.CONCLUSIONS. In the critical care setting, this education-based ASP has obtained out-standing results reducing the rate of IAP and the antimicrobial consumption without changesin the overall mortality. Acceptance among clinicians is excellent.
0033EFFECTIVENESS OF EARLY ANTIBIOTIC THERAPY EDUCATIONALPROGRAM IN SEVERE SEPSIS AND SEPTIC SHOCK
P. Garcı́a Olivares1, J.C. Sotillo1, J. Peral1, M. Sancho1, E. Bermejo1, J.M. Gómez1,P. Santa Teresa1, S. Arenal1, A. Jaspe1, M. Dı́az1
1H.G.U. Gregorio Marañón, Intensive Care Unit, Madrid, SpainINTRODUCTION. Early administration of antibiotics has shown increased survival inseptic patients. The implementation of educational programmes in the field of septic patientsalso has improved outcome. The impact of both measures together is unknown.OBJECTIVES. The purpose of this study was to determine the impact of early antibiotictherapy educational program application on prognosis of patients with severe sepsis andseptic shock.METHODS. Observational, prospective study with a before-after format of an early anti-biotic therapy educational program in septic patients. In both, pre-educational (March 2011–November 2011) and post-educational group (March 2012–November 2012), demographicdata, comorbidities, etiology and type of sepsis (severe sepsis and septic shock), severityscores, microbiological isolates, elapsed time until administration of the first dose of anappropriate antibiotic and Surviving Sepsis Campaign (SSC) bundles compliance, werecollected.Continuous data were reported as mean ± SD or median with interquartile range and cate-gorical data as percentages. The comparison between the two groups was performed usingChi square test for categorical data and Student t test for continuous data. Multivariablelogistic regression was used to estimate the association between educational program andmortality after adjustment for possible confounding factors.RESULTS. Two hundred patients were included in the study, 102 in pre-educational and 98in post-educational group. The demographic data, comorbidities, severity scores etiologyand type of sepsis, need of mechanical ventilation and hemodynamic support were similar inboth groups.
Table 1
Pre-educationalgroup
Post-educationalgroup
Significance(p)
Age 60 ± 15 59 ± 15 0.73
Comorbidities 47 % 41 % 0.44
APACHE II 23 ± 7 25 ± 7 0.16
SOFA 9 ± 4 10 ± 4 0.21
Lactate levels 3.8 ± 2.6 3.9 ± 2.2 0.82
Septic shock 67 % 75 % 0.28
Bundles SSC (n8) (6 h) 4 ± 1 4 ± 1 0.50
Abdominal focus 26 % 10 % 0.11
Respiratory focus 50 % 63 % 0.72
There were no differences between the two groups in regard to: microbiological isolation (57vs 71 %, p = 0.10), positive blood culture (39 vs 35 %, p = 0.59), percentage of patientswho received antibiotics in the first hour (47 vs 45 %, p = 0.77) and percentage of patientswho received appropriate antibiotic (88 % vs 89 %, p = 0.98). In the post-educational groupwe achieved a decrease in the elapsed time from hospital admission and sepsis recognition
26th ESICM ANNUAL CONGRESS — PARIS, FRANCE — 5–9 OCTOBER 2013
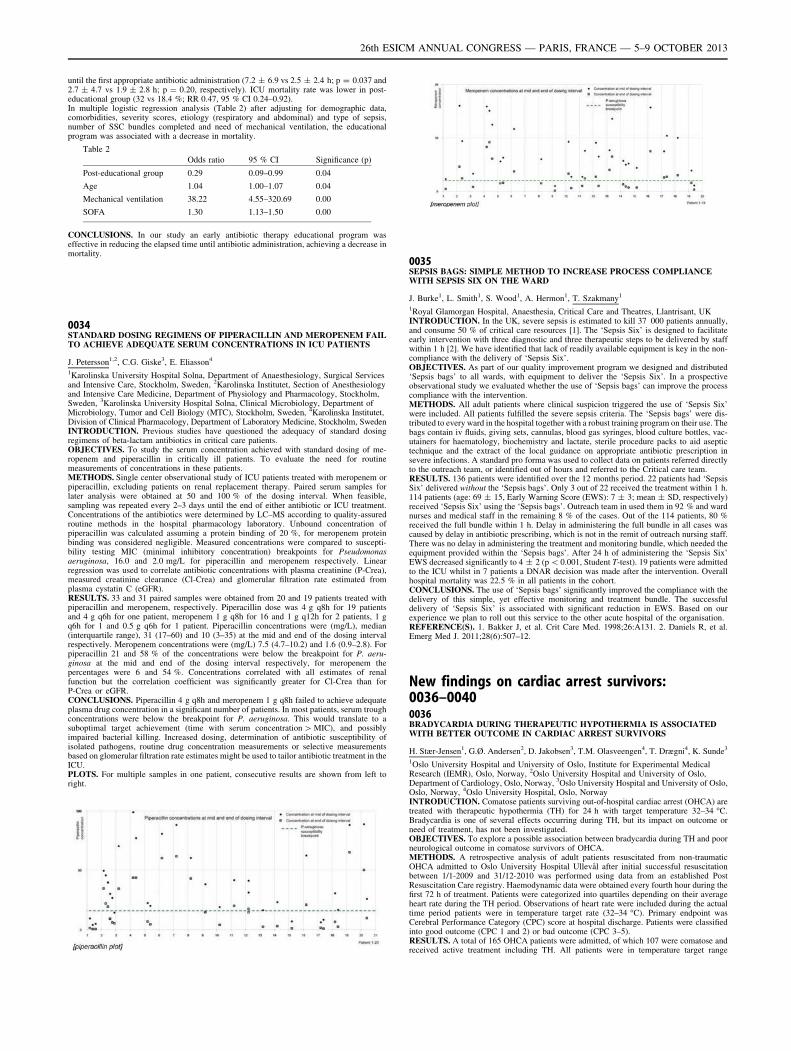
until the first appropriate antibiotic administration (7.2 ± 6.9 vs 2.5 ± 2.4 h; p = 0.037 and2.7 ± 4.7 vs 1.9 ± 2.8 h; p = 0.20, respectively). ICU mortality rate was lower in post-educational group (32 vs 18.4 %; RR 0.47, 95 % CI 0.24–0.92).In multiple logistic regression analysis (Table 2) after adjusting for demographic data,comorbidities, severity scores, etiology (respiratory and abdominal) and type of sepsis,number of SSC bundles completed and need of mechanical ventilation, the educationalprogram was associated with a decrease in mortality.
Table 2
Odds ratio 95 % CI Significance (p)
Post-educational group 0.29 0.09–0.99 0.04
Age 1.04 1.00–1.07 0.04
Mechanical ventilation 38.22 4.55–320.69 0.00
SOFA 1.30 1.13–1.50 0.00
CONCLUSIONS. In our study an early antibiotic therapy educational program waseffective in reducing the elapsed time until antibiotic administration, achieving a decrease inmortality.
0034STANDARD DOSING REGIMENS OF PIPERACILLIN AND MEROPENEM FAILTO ACHIEVE ADEQUATE SERUM CONCENTRATIONS IN ICU PATIENTS
J. Petersson1,2, C.G. Giske3, E. Eliasson4
1Karolinska University Hospital Solna, Department of Anaesthesiology, Surgical Servicesand Intensive Care, Stockholm, Sweden, 2Karolinska Institutet, Section of Anesthesiologyand Intensive Care Medicine, Department of Physiology and Pharmacology, Stockholm,Sweden, 3Karolinska University Hospital Solna, Clinical Microbiology, Department ofMicrobiology, Tumor and Cell Biology (MTC), Stockholm, Sweden, 4Karolinska Institutet,Division of Clinical Pharmacology, Department of Laboratory Medicine, Stockholm, SwedenINTRODUCTION. Previous studies have questioned the adequacy of standard dosingregimens of beta-lactam antibiotics in critical care patients.OBJECTIVES. To study the serum concentration achieved with standard dosing of me-ropenem and piperacillin in critically ill patients. To evaluate the need for routinemeasurements of concentrations in these patients.METHODS. Single center observational study of ICU patients treated with meropenem orpiperacillin, excluding patients on renal replacement therapy. Paired serum samples forlater analysis were obtained at 50 and 100 % of the dosing interval. When feasible,sampling was repeated every 2–3 days until the end of either antibiotic or ICU treatment.Concentrations of the antibiotics were determined by LC–MS according to quality-assuredroutine methods in the hospital pharmacology laboratory. Unbound concentration ofpiperacillin was calculated assuming a protein binding of 20 %, for meropenem proteinbinding was considered negligible. Measured concentrations were compared to suscepti-bility testing MIC (minimal inhibitory concentration) breakpoints for Pseudomonasaeruginosa, 16.0 and 2.0 mg/L for piperacillin and meropenem respectively. Linearregression was used to correlate antibiotic concentrations with plasma creatinine (P-Crea),measured creatinine clearance (Cl-Crea) and glomerular filtration rate estimated fromplasma cystatin C (eGFR).RESULTS. 33 and 31 paired samples were obtained from 20 and 19 patients treated withpiperacillin and meropenem, respectively. Piperacillin dose was 4 g q8h for 19 patientsand 4 g q6h for one patient, meropenem 1 g q8h for 16 and 1 g q12h for 2 patients, 1 gq6h for 1 and 0.5 g q6h for 1 patient. Piperacillin concentrations were (mg/L), median(interquartile range), 31 (17–60) and 10 (3–35) at the mid and end of the dosing intervalrespectively. Meropenem concentrations were (mg/L) 7.5 (4.7–10.2) and 1.6 (0.9–2.8). Forpiperacillin 21 and 58 % of the concentrations were below the breakpoint for P. aeru-ginosa at the mid and end of the dosing interval respectively, for meropenem thepercentages were 6 and 54 %. Concentrations correlated with all estimates of renalfunction but the correlation coefficient was significantly greater for Cl-Crea than forP-Crea or eGFR.CONCLUSIONS. Piperacillin 4 g q8h and meropenem 1 g q8h failed to achieve adequateplasma drug concentration in a significant number of patients. In most patients, serum troughconcentrations were below the breakpoint for P. aeruginosa. This would translate to asuboptimal target achievement (time with serum concentration [ MIC), and possiblyimpaired bacterial killing. Increased dosing, determination of antibiotic susceptibility ofisolated pathogens, routine drug concentration measurements or selective measurementsbased on glomerular filtration rate estimates might be used to tailor antibiotic treatment in theICU.PLOTS. For multiple samples in one patient, consecutive results are shown from left toright.
0035SEPSIS BAGS: SIMPLE METHOD TO INCREASE PROCESS COMPLIANCEWITH SEPSIS SIX ON THE WARD
J. Burke1, L. Smith1, S. Wood1, A. Hermon1, T. Szakmany1
1Royal Glamorgan Hospital, Anaesthesia, Critical Care and Theatres, Llantrisant, UKINTRODUCTION. In the UK, severe sepsis is estimated to kill 37 000 patients annually,and consume 50 % of critical care resources [1]. The ‘Sepsis Six’ is designed to facilitateearly intervention with three diagnostic and three therapeutic steps to be delivered by staffwithin 1 h [2]. We have identified that lack of readily available equipment is key in the non-compliance with the delivery of ‘Sepsis Six’.OBJECTIVES. As part of our quality improvement program we designed and distributed‘Sepsis bags’ to all wards, with equipment to deliver the ‘Sepsis Six’. In a prospectiveobservational study we evaluated whether the use of ‘Sepsis bags’ can improve the processcompliance with the intervention.METHODS. All adult patients where clinical suspicion triggered the use of ‘Sepsis Six’were included. All patients fulfilled the severe sepsis criteria. The ‘Sepsis bags’ were dis-tributed to every ward in the hospital together with a robust training program on their use. Thebags contain iv fluids, giving sets, cannulas, blood gas syringes, blood culture bottles, vac-utainers for haematology, biochemistry and lactate, sterile procedure packs to aid aseptictechnique and the extract of the local guidance on appropriate antibiotic prescription insevere infections. A standard pro forma was used to collect data on patients referred directlyto the outreach team, or identified out of hours and referred to the Critical care team.RESULTS. 136 patients were identified over the 12 months period. 22 patients had ‘SepsisSix’ delivered without the ‘Sepsis bags’. Only 3 out of 22 received the treatment within 1 h.114 patients (age: 69 ± 15, Early Warning Score (EWS): 7 ± 3; mean ± SD, respectively)received ‘Sepsis Six’ using the ‘Sepsis bags’. Outreach team in used them in 92 % and wardnurses and medical staff in the remaining 8 % of the cases. Out of the 114 patients, 80 %received the full bundle within 1 h. Delay in administering the full bundle in all cases wascaused by delay in antibiotic prescribing, which is not in the remit of outreach nursing staff.There was no delay in administering the treatment and monitoring bundle, which needed theequipment provided within the ‘Sepsis bags’. After 24 h of administering the ‘Sepsis Six’EWS decreased significantly to 4 ± 2 (p \ 0.001, Student T-test). 19 patients were admittedto the ICU whilst in 7 patients a DNAR decision was made after the intervention. Overallhospital mortality was 22.5 % in all patients in the cohort.CONCLUSIONS. The use of ‘Sepsis bags’ significantly improved the compliance with thedelivery of this simple, yet effective monitoring and treatment bundle. The successfuldelivery of ‘Sepsis Six’ is associated with significant reduction in EWS. Based on ourexperience we plan to roll out this service to the other acute hospital of the organisation.REFERENCE(S). 1. Bakker J, et al. Crit Care Med. 1998;26:A131. 2. Daniels R, et al.Emerg Med J. 2011;28(6):507–12.
New findings on cardiac arrest survivors:0036–00400036BRADYCARDIA DURING THERAPEUTIC HYPOTHERMIA IS ASSOCIATEDWITH BETTER OUTCOME IN CARDIAC ARREST SURVIVORS
H. Stær-Jensen1, G.Ø. Andersen2, D. Jakobsen3, T.M. Olasveengen4, T. Drægni4, K. Sunde3
1Oslo University Hospital and University of Oslo, Institute for Experimental MedicalResearch (IEMR), Oslo, Norway, 2Oslo University Hospital and University of Oslo,Department of Cardiology, Oslo, Norway, 3Oslo University Hospital and University of Oslo,Oslo, Norway, 4Oslo University Hospital, Oslo, NorwayINTRODUCTION. Comatose patients surviving out-of-hospital cardiac arrest (OHCA) aretreated with therapeutic hypothermia (TH) for 24 h with target temperature 32–34 �C.Bradycardia is one of several effects occurring during TH, but its impact on outcome orneed of treatment, has not been investigated.OBJECTIVES. To explore a possible association between bradycardia during TH and poorneurological outcome in comatose survivors of OHCA.METHODS. A retrospective analysis of adult patients resuscitated from non-traumaticOHCA admitted to Oslo University Hospital Ullevål after initial successful resuscitationbetween 1/1-2009 and 31/12-2010 was performed using data from an established PostResuscitation Care registry. Haemodynamic data were obtained every fourth hour during thefirst 72 h of treatment. Patients were categorized into quartiles depending on their averageheart rate during the TH period. Observations of heart rate were included during the actualtime period patients were in temperature target rate (32–34 �C). Primary endpoint wasCerebral Performance Category (CPC) score at hospital discharge. Patients were classifiedinto good outcome (CPC 1 and 2) or bad outcome (CPC 3–5).RESULTS. A total of 165 OHCA patients were admitted, of which 107 were comatose andreceived active treatment including TH. All patients were in temperature target range
26th ESICM ANNUAL CONGRESS — PARIS, FRANCE — 5–9 OCTOBER 2013
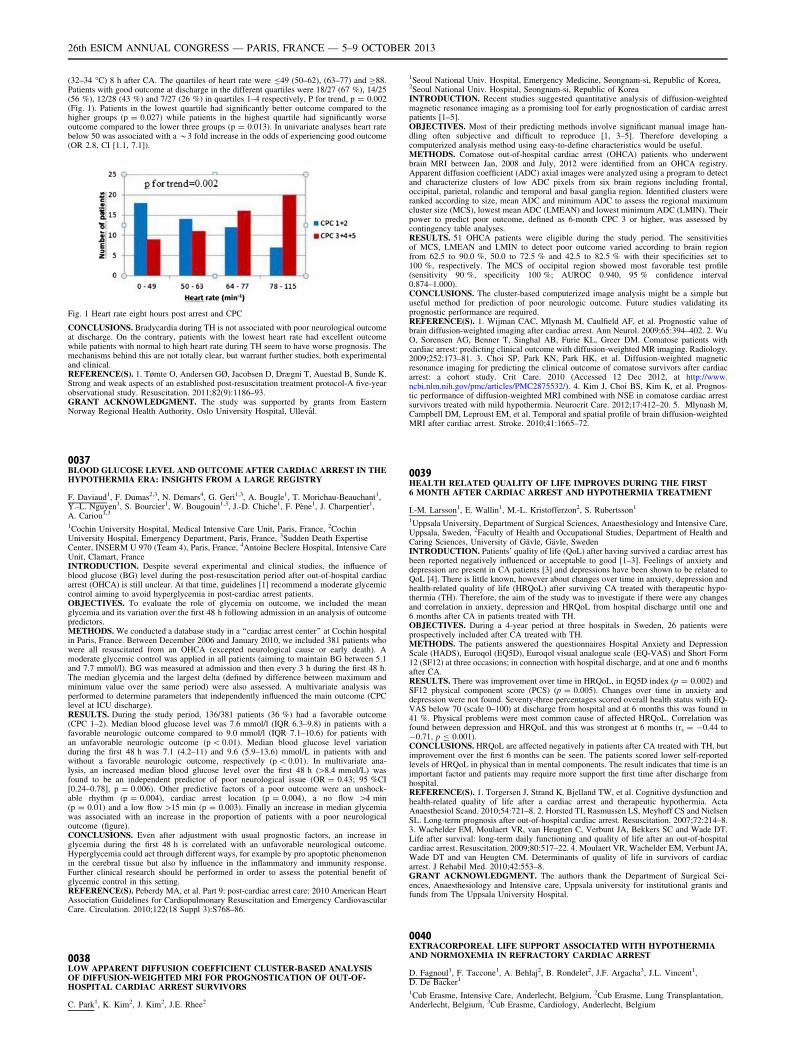
(32–34 �C) 8 h after CA. The quartiles of heart rate were B49 (50–62), (63–77) and C88.Patients with good outcome at discharge in the different quartiles were 18/27 (67 %), 14/25(56 %), 12/28 (43 %) and 7/27 (26 %) in quartiles 1–4 respectively, P for trend, p = 0.002(Fig. 1). Patients in the lowest quartile had significantly better outcome compared to thehigher groups (p = 0.027) while patients in the highest quartile had significantly worseoutcome compared to the lower three groups (p = 0.013). In univariate analyses heart ratebelow 50 was associated with a *3 fold increase in the odds of experiencing good outcome(OR 2.8, CI [1.1, 7.1]).
Fig. 1 Heart rate eight hours post arrest and CPC
CONCLUSIONS. Bradycardia during TH is not associated with poor neurological outcomeat discharge. On the contrary, patients with the lowest heart rate had excellent outcomewhile patients with normal to high heart rate during TH seem to have worse prognosis. Themechanisms behind this are not totally clear, but warrant further studies, both experimentaland clinical.REFERENCE(S). 1. Tømte O, Andersen GØ, Jacobsen D, Drægni T, Auestad B, Sunde K.Strong and weak aspects of an established post-resuscitation treatment protocol-A five-yearobservational study. Resuscitation. 2011;82(9):1186–93.GRANT ACKNOWLEDGMENT. The study was supported by grants from EasternNorway Regional Health Authority, Oslo University Hospital, Ullevål.
0037BLOOD GLUCOSE LEVEL AND OUTCOME AFTER CARDIAC ARREST IN THEHYPOTHERMIA ERA: INSIGHTS FROM A LARGE REGISTRY
F. Daviaud1, F. Dumas2,3, N. Demars4, G. Geri1,3, A. Bougle1, T. Morichau-Beauchant1,Y.-L. Nguyen1, S. Bourcier1, W. Bougouin1,3, J.-D. Chiche1, F. Pène1, J. Charpentier1,A. Cariou1,3
1Cochin University Hospital, Medical Intensive Care Unit, Paris, France, 2CochinUniversity Hospital, Emergency Department, Paris, France, 3Sudden Death ExpertiseCenter, INSERM U 970 (Team 4), Paris, France, 4Antoine Beclere Hospital, Intensive CareUnit, Clamart, FranceINTRODUCTION. Despite several experimental and clinical studies, the influence ofblood glucose (BG) level during the post-resuscitation period after out-of-hospital cardiacarrest (OHCA) is still unclear. At that time, guidelines [1] recommend a moderate glycemiccontrol aiming to avoid hyperglycemia in post-cardiac arrest patients.OBJECTIVES. To evaluate the role of glycemia on outcome, we included the meanglycemia and its variation over the first 48 h following admission in an analysis of outcomepredictors.METHODS. We conducted a database study in a ‘‘cardiac arrest center’’ at Cochin hospitalin Paris, France. Between December 2006 and January 2010, we included 381 patients whowere all resuscitated from an OHCA (excepted neurological cause or early death). Amoderate glycemic control was applied in all patients (aiming to maintain BG between 5.1and 7.7 mmol/l). BG was measured at admission and then every 3 h during the first 48 h.The median glycemia and the largest delta (defined by difference between maximum andminimum value over the same period) were also assessed. A multivariate analysis wasperformed to determine parameters that independently influenced the main outcome (CPClevel at ICU discharge).RESULTS. During the study period, 136/381 patients (36 %) had a favorable outcome(CPC 1–2). Median blood glucose level was 7.6 mmol/l (IQR 6.3–9.8) in patients with afavorable neurologic outcome compared to 9.0 mmol/l (IQR 7.1–10.6) for patients withan unfavorable neurologic outcome (p \ 0.01). Median blood glucose level variationduring the first 48 h was 7.1 (4.2–11) and 9.6 (5.9–13.6) mmol/L in patients with andwithout a favorable neurologic outcome, respectively (p \ 0.01). In multivariate ana-lysis, an increased median blood glucose level over the first 48 h ([8.4 mmol/L) wasfound to be an independent predictor of poor neurological issue (OR = 0.43; 95 %CI[0.24–0.78], p = 0.006). Other predictive factors of a poor outcome were an unshock-able rhythm (p = 0.004), cardiac arrest location (p = 0.004), a no flow [4 min(p = 0.01) and a low flow [15 min (p = 0.003). Finally an increase in median glycemiawas associated with an increase in the proportion of patients with a poor neurologicaloutcome (figure).CONCLUSIONS. Even after adjustment with usual prognostic factors, an increase inglycemia during the first 48 h is correlated with an unfavorable neurological outcome.Hyperglycemia could act through different ways, for example by pro apoptotic phenomenonin the cerebral tissue but also by influence in the inflammatory and immunity response.Further clinical research should be performed in order to assess the potential benefit ofglycemic control in this setting.REFERENCE(S). Peberdy MA, et al. Part 9: post-cardiac arrest care: 2010 American HeartAssociation Guidelines for Cardiopulmonary Resuscitation and Emergency CardiovascularCare. Circulation. 2010;122(18 Suppl 3):S768–86.
0038LOW APPARENT DIFFUSION COEFFICIENT CLUSTER-BASED ANALYSISOF DIFFUSION-WEIGHTED MRI FOR PROGNOSTICATION OF OUT-OF-HOSPITAL CARDIAC ARREST SURVIVORS
C. Park1, K. Kim2, J. Kim2, J.E. Rhee2
1Seoul National Univ. Hospital, Emergency Medicine, Seongnam-si, Republic of Korea,2Seoul National Univ. Hospital, Seongnam-si, Republic of KoreaINTRODUCTION. Recent studies suggested quantitative analysis of diffusion-weightedmagnetic resonance imaging as a promising tool for early prognostication of cardiac arrestpatients [1–5].OBJECTIVES. Most of their predicting methods involve significant manual image han-dling often subjective and difficult to reproduce [1, 3–5]. Therefore developing acomputerized analysis method using easy-to-define characteristics would be useful.METHODS. Comatose out-of-hospital cardiac arrest (OHCA) patients who underwentbrain MRI between Jan, 2008 and July, 2012 were identified from an OHCA registry.Apparent diffusion coefficient (ADC) axial images were analyzed using a program to detectand characterize clusters of low ADC pixels from six brain regions including frontal,occipital, parietal, rolandic and temporal and basal ganglia region. Identified clusters wereranked according to size, mean ADC and minimum ADC to assess the regional maximumcluster size (MCS), lowest mean ADC (LMEAN) and lowest minimum ADC (LMIN). Theirpower to predict poor outcome, defined as 6-month CPC 3 or higher, was assessed bycontingency table analyses.RESULTS. 51 OHCA patients were eligible during the study period. The sensitivitiesof MCS, LMEAN and LMIN to detect poor outcome varied according to brain regionfrom 62.5 to 90.0 %, 50.0 to 72.5 % and 42.5 to 82.5 % with their specificities set to100 %, respectively. The MCS of occipital region showed most favorable test profile(sensitivity 90 %, specificity 100 %; AUROC 0.940, 95 % confidence interval0.874–1.000).CONCLUSIONS. The cluster-based computerized image analysis might be a simple butuseful method for prediction of poor neurologic outcome. Future studies validating itsprognostic performance are required.REFERENCE(S). 1. Wijman CAC, Mlynash M, Caulfield AF, et al. Prognostic value ofbrain diffusion-weighted imaging after cardiac arrest. Ann Neurol. 2009;65:394–402. 2. WuO, Sorensen AG, Benner T, Singhal AB, Furie KL, Greer DM. Comatose patients withcardiac arrest: predicting clinical outcome with diffusion-weighted MR imaging. Radiology.2009;252:173–81. 3. Choi SP, Park KN, Park HK, et al. Diffusion-weighted magneticresonance imaging for predicting the clinical outcome of comatose survivors after cardiacarrest: a cohort study. Crit Care. 2010 (Accessed 12 Dec 2012, at http://www.ncbi.nlm.nih.gov/pmc/articles/PMC2875532/). 4. Kim J, Choi BS, Kim K, et al. Prognos-tic performance of diffusion-weighted MRI combined with NSE in comatose cardiac arrestsurvivors treated with mild hypothermia. Neurocrit Care. 2012;17:412–20. 5. Mlynash M,Campbell DM, Leproust EM, et al. Temporal and spatial profile of brain diffusion-weightedMRI after cardiac arrest. Stroke. 2010;41:1665–72.
0039HEALTH RELATED QUALITY OF LIFE IMPROVES DURING THE FIRST6 MONTH AFTER CARDIAC ARREST AND HYPOTHERMIA TREATMENT
I.-M. Larsson1, E. Wallin1, M.-L. Kristofferzon2, S. Rubertsson1
1Uppsala University, Department of Surgical Sciences, Anaesthesiology and Intensive Care,Uppsala, Sweden, 2Faculty of Health and Occupational Studies, Department of Health andCaring Sciences, University of Gävle, Gävle, SwedenINTRODUCTION. Patients’ quality of life (QoL) after having survived a cardiac arrest hasbeen reported negatively influenced or acceptable to good [1–3]. Feelings of anxiety anddepression are present in CA patients [3] and depressions have been shown to be related toQoL [4]. There is little known, however about changes over time in anxiety, depression andhealth-related quality of life (HRQoL) after surviving CA treated with therapeutic hypo-thermia (TH). Therefore, the aim of the study was to investigate if there were any changesand correlation in anxiety, depression and HRQoL from hospital discharge until one and6 months after CA in patients treated with TH.OBJECTIVES. During a 4-year period at three hospitals in Sweden, 26 patients wereprospectively included after CA treated with TH.METHODS. The patients answered the questionnaires Hospital Anxiety and DepressionScale (HADS), Euroqol (EQ5D), Euroqol visual analogue scale (EQ-VAS) and Short Form12 (SF12) at three occasions; in connection with hospital discharge, and at one and 6 monthsafter CA.RESULTS. There was improvement over time in HRQoL, in EQ5D index (p = 0.002) andSF12 physical component score (PCS) (p = 0.005). Changes over time in anxiety anddepression were not found. Seventy-three percentages scored overall health status with EQ-VAS below 70 (scale 0–100) at discharge from hospital and at 6 months this was found in41 %. Physical problems were most common cause of affected HRQoL. Correlation wasfound between depression and HRQoL and this was strongest at 6 months (rs = -0.44 to-0.71, p B 0.001).CONCLUSIONS. HRQoL are affected negatively in patients after CA treated with TH, butimprovement over the first 6 months can be seen. The patients scored lower self-reportedlevels of HRQoL in physical than in mental components. The result indicates that time is animportant factor and patients may require more support the first time after discharge fromhospital.REFERENCE(S). 1. Torgersen J, Strand K, Bjelland TW, et al. Cognitive dysfunction andhealth-related quality of life after a cardiac arrest and therapeutic hypothermia. ActaAnaesthesiol Scand. 2010;54:721–8. 2. Horsted TI, Rasmussen LS, Meyhoff CS and NielsenSL. Long-term prognosis after out-of-hospital cardiac arrest. Resuscitation. 2007;72:214–8.3. Wachelder EM, Moulaert VR, van Heugten C, Verbunt JA, Bekkers SC and Wade DT.Life after survival: long-term daily functioning and quality of life after an out-of-hospitalcardiac arrest. Resuscitation. 2009;80:517–22. 4. Moulaert VR, Wachelder EM, Verbunt JA,Wade DT and van Heugten CM. Determinants of quality of life in survivors of cardiacarrest. J Rehabil Med. 2010;42:553–8.GRANT ACKNOWLEDGMENT. The authors thank the Department of Surgical Sci-ences, Anaesthesiology and Intensive care, Uppsala university for institutional grants andfunds from The Uppsala University Hospital.
0040EXTRACORPOREAL LIFE SUPPORT ASSOCIATED WITH HYPOTHERMIAAND NORMOXEMIA IN REFRACTORY CARDIAC ARREST
D. Fagnoul1, F. Taccone1, A. Behlaj2, B. Rondelet2, J.F. Argacha3, J.L. Vincent1,D. De Backer1
1Cub Erasme, Intensive Care, Anderlecht, Belgium, 2Cub Erasme, Lung Transplantation,Anderlecht, Belgium, 3Cub Erasme, Cardiology, Anderlecht, Belgium
26th ESICM ANNUAL CONGRESS — PARIS, FRANCE — 5–9 OCTOBER 2013
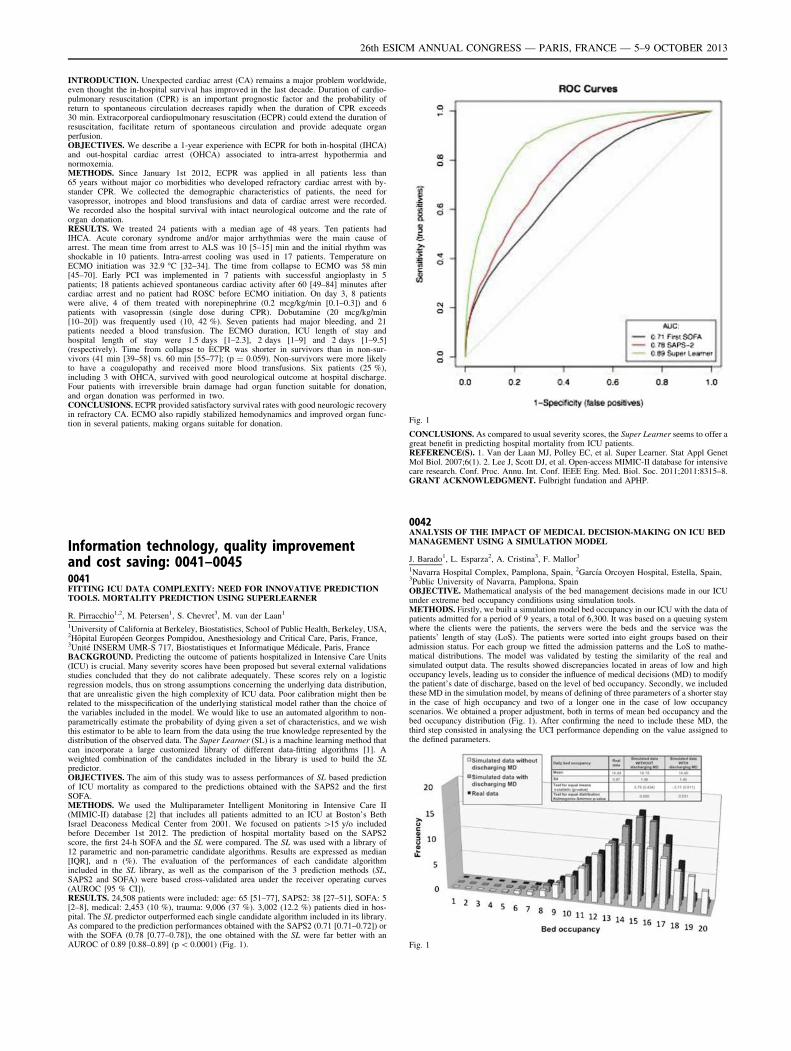
INTRODUCTION. Unexpected cardiac arrest (CA) remains a major problem worldwide,even thought the in-hospital survival has improved in the last decade. Duration of cardio-pulmonary resuscitation (CPR) is an important prognostic factor and the probability ofreturn to spontaneous circulation decreases rapidly when the duration of CPR exceeds30 min. Extracorporeal cardiopulmonary resuscitation (ECPR) could extend the duration ofresuscitation, facilitate return of spontaneous circulation and provide adequate organperfusion.OBJECTIVES. We describe a 1-year experience with ECPR for both in-hospital (IHCA)and out-hospital cardiac arrest (OHCA) associated to intra-arrest hypothermia andnormoxemia.METHODS. Since January 1st 2012, ECPR was applied in all patients less than65 years without major co morbidities who developed refractory cardiac arrest with by-stander CPR. We collected the demographic characteristics of patients, the need forvasopressor, inotropes and blood transfusions and data of cardiac arrest were recorded.We recorded also the hospital survival with intact neurological outcome and the rate oforgan donation.RESULTS. We treated 24 patients with a median age of 48 years. Ten patients hadIHCA. Acute coronary syndrome and/or major arrhythmias were the main cause ofarrest. The mean time from arrest to ALS was 10 [5–15] min and the initial rhythm wasshockable in 10 patients. Intra-arrest cooling was used in 17 patients. Temperature onECMO initiation was 32.9 �C [32–34]. The time from collapse to ECMO was 58 min[45–70]. Early PCI was implemented in 7 patients with successful angioplasty in 5patients; 18 patients achieved spontaneous cardiac activity after 60 [49–84] minutes aftercardiac arrest and no patient had ROSC before ECMO initiation. On day 3, 8 patientswere alive, 4 of them treated with norepinephrine (0.2 mcg/kg/min [0.1–0.3]) and 6patients with vasopressin (single dose during CPR). Dobutamine (20 mcg/kg/min[10–20]) was frequently used (10, 42 %). Seven patients had major bleeding, and 21patients needed a blood transfusion. The ECMO duration, ICU length of stay andhospital length of stay were 1.5 days [1–2.3], 2 days [1–9] and 2 days [1–9.5](respectively). Time from collapse to ECPR was shorter in survivors than in non-sur-vivors (41 min [39–58] vs. 60 min [55–77]; (p = 0.059). Non-survivors were more likelyto have a coagulopathy and received more blood transfusions. Six patients (25 %),including 3 with OHCA, survived with good neurological outcome at hospital discharge.Four patients with irreversible brain damage had organ function suitable for donation,and organ donation was performed in two.CONCLUSIONS. ECPR provided satisfactory survival rates with good neurologic recoveryin refractory CA. ECMO also rapidly stabilized hemodynamics and improved organ func-tion in several patients, making organs suitable for donation.
Information technology, quality improvementand cost saving: 0041–00450041FITTING ICU DATA COMPLEXITY: NEED FOR INNOVATIVE PREDICTIONTOOLS. MORTALITY PREDICTION USING SUPERLEARNER
R. Pirracchio1,2, M. Petersen1, S. Chevret3, M. van der Laan1
1University of California at Berkeley, Biostatistics, School of Public Health, Berkeley, USA,2Hôpital Européen Georges Pompidou, Anesthesiology and Critical Care, Paris, France,3Unité INSERM UMR-S 717, Biostatistiques et Informatique Médicale, Paris, FranceBACKGROUND. Predicting the outcome of patients hospitalized in Intensive Care Units(ICU) is crucial. Many severity scores have been proposed but several external validationsstudies concluded that they do not calibrate adequately. These scores rely on a logisticregression models, thus on strong assumptions concerning the underlying data distribution,that are unrealistic given the high complexity of ICU data. Poor calibration might then berelated to the misspecification of the underlying statistical model rather than the choice ofthe variables included in the model. We would like to use an automated algorithm to non-parametrically estimate the probability of dying given a set of characteristics, and we wishthis estimator to be able to learn from the data using the true knowledge represented by thedistribution of the observed data. The Super Learner (SL) is a machine learning method thatcan incorporate a large customized library of different data-fitting algorithms [1]. Aweighted combination of the candidates included in the library is used to build the SLpredictor.OBJECTIVES. The aim of this study was to assess performances of SL based predictionof ICU mortality as compared to the predictions obtained with the SAPS2 and the firstSOFA.METHODS. We used the Multiparameter Intelligent Monitoring in Intensive Care II(MIMIC-II) database [2] that includes all patients admitted to an ICU at Boston’s BethIsrael Deaconess Medical Center from 2001. We focused on patients [15 y/o includedbefore December 1st 2012. The prediction of hospital mortality based on the SAPS2score, the first 24-h SOFA and the SL were compared. The SL was used with a library of12 parametric and non-parametric candidate algorithms. Results are expressed as median[IQR], and n (%). The evaluation of the performances of each candidate algorithmincluded in the SL library, as well as the comparison of the 3 prediction methods (SL,SAPS2 and SOFA) were based cross-validated area under the receiver operating curves(AUROC [95 % CI]).RESULTS. 24,508 patients were included: age: 65 [51–77], SAPS2: 38 [27–51], SOFA: 5[2–8], medical: 2,453 (10 %), trauma: 9,006 (37 %). 3,002 (12.2 %) patients died in hos-pital. The SL predictor outperformed each single candidate algorithm included in its library.As compared to the prediction performances obtained with the SAPS2 (0.71 [0.71–0.72]) orwith the SOFA (0.78 [0.77–0.78]), the one obtained with the SL were far better with anAUROC of 0.89 [0.88–0.89] (p \ 0.0001) (Fig. 1).
Fig. 1
CONCLUSIONS. As compared to usual severity scores, the Super Learner seems to offer agreat benefit in predicting hospital mortality from ICU patients.REFERENCE(S). 1. Van der Laan MJ, Polley EC, et al. Super Learner. Stat Appl GenetMol Biol. 2007;6(1). 2. Lee J, Scott DJ, et al. Open-access MIMIC-II database for intensivecare research. Conf. Proc. Annu. Int. Conf. IEEE Eng. Med. Biol. Soc. 2011;2011:8315–8.GRANT ACKNOWLEDGMENT. Fulbright fundation and APHP.
0042ANALYSIS OF THE IMPACT OF MEDICAL DECISION-MAKING ON ICU BEDMANAGEMENT USING A SIMULATION MODEL
J. Barado1, L. Esparza2, A. Cristina3, F. Mallor3
1Navarra Hospital Complex, Pamplona, Spain, 2Garcı́a Orcoyen Hospital, Estella, Spain,3Public University of Navarra, Pamplona, SpainOBJECTIVE. Mathematical analysis of the bed management decisions made in our ICUunder extreme bed occupancy conditions using simulation tools.METHODS. Firstly, we built a simulation model bed occupancy in our ICU with the data ofpatients admitted for a period of 9 years, a total of 6,300. It was based on a queuing systemwhere the clients were the patients, the servers were the beds and the service was thepatients’ length of stay (LoS). The patients were sorted into eight groups based on theiradmission status. For each group we fitted the admission patterns and the LoS to mathe-matical distributions. The model was validated by testing the similarity of the real andsimulated output data. The results showed discrepancies located in areas of low and highoccupancy levels, leading us to consider the influence of medical decisions (MD) to modifythe patient’s date of discharge, based on the level of bed occupancy. Secondly, we includedthese MD in the simulation model, by means of defining of three parameters of a shorter stayin the case of high occupancy and two of a longer one in the case of low occupancyscenarios. We obtained a proper adjustment, both in terms of mean bed occupancy and thebed occupancy distribution (Fig. 1). After confirming the need to include these MD, thethird step consisted in analysing the UCI performance depending on the value assigned tothe defined parameters.
Fig. 1
26th ESICM ANNUAL CONGRESS — PARIS, FRANCE — 5–9 OCTOBER 2013
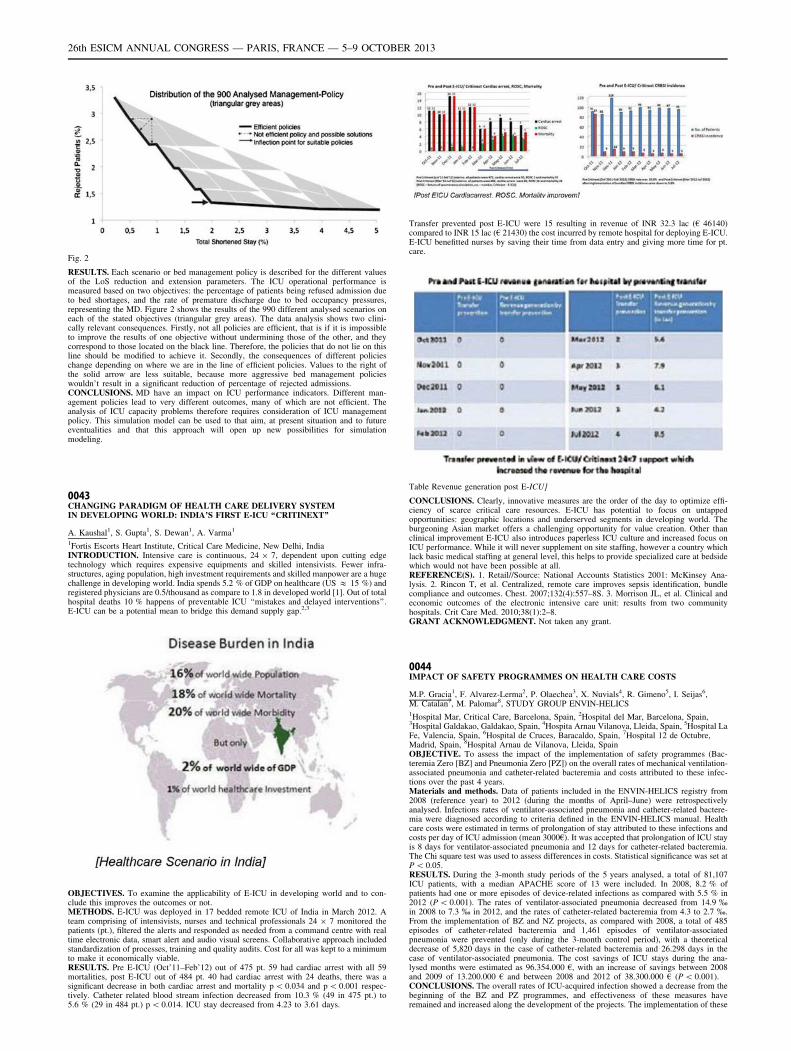
Fig. 2
RESULTS. Each scenario or bed management policy is described for the different valuesof the LoS reduction and extension parameters. The ICU operational performance ismeasured based on two objectives: the percentage of patients being refused admission dueto bed shortages, and the rate of premature discharge due to bed occupancy pressures,representing the MD. Figure 2 shows the results of the 990 different analysed scenarios oneach of the stated objectives (triangular grey areas). The data analysis shows two clini-cally relevant consequences. Firstly, not all policies are efficient, that is if it is impossibleto improve the results of one objective without undermining those of the other, and theycorrespond to those located on the black line. Therefore, the policies that do not lie on thisline should be modified to achieve it. Secondly, the consequences of different policieschange depending on where we are in the line of efficient policies. Values to the right ofthe solid arrow are less suitable, because more aggressive bed management policieswouldn’t result in a significant reduction of percentage of rejected admissions.CONCLUSIONS. MD have an impact on ICU performance indicators. Different man-agement policies lead to very different outcomes, many of which are not efficient. Theanalysis of ICU capacity problems therefore requires consideration of ICU managementpolicy. This simulation model can be used to that aim, at present situation and to futureeventualities and that this approach will open up new possibilities for simulationmodeling.
0043CHANGING PARADIGM OF HEALTH CARE DELIVERY SYSTEMIN DEVELOPING WORLD: INDIA’S FIRST E-ICU ‘‘CRITINEXT’’
A. Kaushal1, S. Gupta1, S. Dewan1, A. Varma1
1Fortis Escorts Heart Institute, Critical Care Medicine, New Delhi, IndiaINTRODUCTION. Intensive care is continuous, 24 9 7, dependent upon cutting edgetechnology which requires expensive equipments and skilled intensivists. Fewer infra-structures, aging population, high investment requirements and skilled manpower are a hugechallenge in developing world. India spends 5.2 % of GDP on healthcare (US & 15 %) andregistered physicians are 0.5/thousand as compare to 1.8 in developed world [1]. Out of totalhospital deaths 10 % happens of preventable ICU ‘‘mistakes and delayed interventions’’.E-ICU can be a potential mean to bridge this demand supply gap.2,3
OBJECTIVES. To examine the applicability of E-ICU in developing world and to con-clude this improves the outcomes or not.METHODS. E-ICU was deployed in 17 bedded remote ICU of India in March 2012. Ateam comprising of intensivists, nurses and technical professionals 24 9 7 monitored thepatients (pt.), filtered the alerts and responded as needed from a command centre with realtime electronic data, smart alert and audio visual screens. Collaborative approach includedstandardization of processes, training and quality audits. Cost for all was kept to a minimumto make it economically viable.RESULTS. Pre E-ICU (Oct’11–Feb’12) out of 475 pt. 59 had cardiac arrest with all 59mortalities, post E-ICU out of 484 pt. 40 had cardiac arrest with 24 deaths, there was asignificant decrease in both cardiac arrest and mortality p \ 0.034 and p \ 0.001 respec-tively. Catheter related blood stream infection decreased from 10.3 % (49 in 475 pt.) to5.6 % (29 in 484 pt.) p \ 0.014. ICU stay decreased from 4.23 to 3.61 days.
Transfer prevented post E-ICU were 15 resulting in revenue of INR 32.3 lac (€ 46140)compared to INR 15 lac (€ 21430) the cost incurred by remote hospital for deploying E-ICU.E-ICU benefitted nurses by saving their time from data entry and giving more time for pt.care.
Table Revenue generation post E-ICU]
CONCLUSIONS. Clearly, innovative measures are the order of the day to optimize effi-ciency of scarce critical care resources. E-ICU has potential to focus on untappedopportunities: geographic locations and underserved segments in developing world. Theburgeoning Asian market offers a challenging opportunity for value creation. Other thanclinical improvement E-ICU also introduces paperless ICU culture and increased focus onICU performance. While it will never supplement on site staffing, however a country whichlack basic medical staffing at general level, this helps to provide specialized care at bedsidewhich would not have been possible at all.REFERENCE(S). 1. Retail//Source: National Accounts Statistics 2001: McKinsey Ana-lysis. 2. Rincon T, et al. Centralized, remote care improves sepsis identification, bundlecompliance and outcomes. Chest. 2007;132(4):557–8S. 3. Morrison JL, et al. Clinical andeconomic outcomes of the electronic intensive care unit: results from two communityhospitals. Crit Care Med. 2010;38(1):2–8.GRANT ACKNOWLEDGMENT. Not taken any grant.
0044IMPACT OF SAFETY PROGRAMMES ON HEALTH CARE COSTS
M.P. Gracia1, F. Alvarez-Lerma2, P. Olaechea3, X. Nuvials4, R. Gimeno5, I. Seijas6,M. Catalan7, M. Palomar8, STUDY GROUP ENVIN-HELICS1Hospital Mar, Critical Care, Barcelona, Spain, 2Hospital del Mar, Barcelona, Spain,3Hospital Galdakao, Galdakao, Spain, 4Hospita Arnau Vilanova, Lleida, Spain, 5Hospital LaFe, Valencia, Spain, 6Hospital de Cruces, Baracaldo, Spain, 7Hospital 12 de Octubre,Madrid, Spain, 8Hospital Arnau de Vilanova, Lleida, SpainOBJECTIVE. To assess the impact of the implementation of safety programmes (Bac-teremia Zero [BZ] and Pneumonia Zero [PZ]) on the overall rates of mechanical ventilation-associated pneumonia and catheter-related bacteremia and costs attributed to these infec-tions over the past 4 years.Materials and methods. Data of patients included in the ENVIN-HELICS registry from2008 (reference year) to 2012 (during the months of April–June) were retrospectivelyanalysed. Infections rates of ventilator-associated pneumonia and catheter-related bactere-mia were diagnosed according to criteria defined in the ENVIN-HELICS manual. Healthcare costs were estimated in terms of prolongation of stay attributed to these infections andcosts per day of ICU admission (mean 3000€). It was accepted that prolongation of ICU stayis 8 days for ventilator-associated pneumonia and 12 days for catheter-related bacteremia.The Chi square test was used to assess differences in costs. Statistical significance was set atP \ 0.05.RESULTS. During the 3-month study periods of the 5 years analysed, a total of 81,107ICU patients, with a median APACHE score of 13 were included. In 2008, 8.2 % ofpatients had one or more episodes of device-related infections as compared with 5.5 % in2012 (P \ 0.001). The rates of ventilator-associated pneumonia decreased from 14.9 %in 2008 to 7.3 % in 2012, and the rates of catheter-related bacteremia from 4.3 to 2.7 %.From the implementation of BZ and NZ projects, as compared with 2008, a total of 485episodes of catheter-related bacteremia and 1,461 episodes of ventilator-associatedpneumonia were prevented (only during the 3-month control period), with a theoreticaldecrease of 5,820 days in the case of catheter-related bacteremia and 26.298 days in thecase of ventilator-associated pneumonia. The cost savings of ICU stays during the ana-lysed months were estimated as 96.354.000 €, with an increase of savings between 2008and 2009 of 13.200.000 € and between 2008 and 2012 of 38.300.000 € (P \ 0.001).CONCLUSIONS. The overall rates of ICU-acquired infection showed a decrease from thebeginning of the BZ and PZ programmes, and effectiveness of these measures haveremained and increased along the development of the projects. The implementation of these
26th ESICM ANNUAL CONGRESS — PARIS, FRANCE — 5–9 OCTOBER 2013
programmes has been associated with important economic savings to the Spanish healthcare system that increases each year.
0045DEVELOPMENT OF A TRIGGER-BASED AUTOMATED NOSOCOMIALINFECTION SURVEILLANCE
A.-M. Kaiser1, S. Evelein-Brugman2, A. Beishuizen2, J. Peppink2,C. Vandenbroucke-Grauls1, A. Girbes2
1University Hospital VU Medical Centre, Department of Medical Microbiology andInfection Control, Amsterdam, The Netherlands, 2University Hospital VU Medical Centre,Department of Intensive Care, Amsterdam, The NetherlandsINTRODUCTION. Results of nosocomial infection surveillance are important indicatorsof quality of care. However, continuous registration is laborious. The availability of aPatient Data Management System (PDMS) has created opportunities for a trigger-basedelectronic surveillance system (ESS).OBJECTIVES. To develop a trigger-based ESS for ventilator-associated pneumonia (VAP)and catheter-related sepsis (CRS).METHODS. Prospective comparison of VAP/and CRS surveillance based on electronicdata collection and manual daily assessment of VAP and CRS in all patients with sur-veillance based on electronic data collection and assessment of VAP and CRS in patientsupon a trigger signal from the ESS. Slightly amended CDC infection criteria were used. Thetrigger consisted of components of the VAP/CRS criteria which were available and updatedby ESS each day. The components were: the use of specific antibiotic, the presence ofventilation/catheter and the presence of relevant clinical symptoms. Assessment of thepresence of VAP or CRS was only performed for those patients with a positive trigger signalfrom the ESS. This assessment involved the evaluation of chest radiographs and of theresults of microbiology cultures. The assessment was performed by an infection controlpractitioner together with an intensive care physician.RESULTS. A total of 555 patients was screened for VAP and CRS. The incidence of VAPwas 3.3/1,000 ventilation days, of CRS 1.7/1,000 catheter days. For VAP, the trigger-basedscreening had a sensitivity of 92.3 % and a negative predictive value of 99.8 % compared tomanual screening of all patients. For CRP this sensitivity was 91.3 % and the negativepredictive value was 99.6 %. For both CRS and VAP screening, the trigger-based screeningreduced labour time by 84 %: from 4.4 h per week without trigger to 42 min per week forscreening with trigger.CONCLUSIONS. In an environment with PDMS, surveillance of VAP and CRS with atrigger-based screening system for patients fulfilling part of the VAP or CRS criteria isfeasible, has a high sensitivity and negative predictive value, and diminishes workload.
Planning for care and aiding with coping:0046–00500046ADVANCE CARE PLANNING IN MAJOR SURGERY: PREVALENCE ANDCONCORDANCE IN PATIENTS AND THEIR RELATIVES
F. Gigon1,2, P. Merlani2,3, B. Ricou1,2
1University Hospitals of Geneva, APSI, Intensive Care Unit, Geneva, Switzerland,2University of Geneva, Medicine, Geneva, Switzerland, 3Ospedale Regionale di Lugano,Intensive Care Unit, Lugano, SwitzerlandINTRODUCTION. Patients who undergo major cardiovascular surgery experience ajourney in ICU. Intensivists may have to take important decisions when such patients aretemporarily incompetent. Advance Directives (AD) were developed to respect the patients’autonomy in such cases. The alternative way is to address the patient’s wishes through thehealth care surrogate decision maker (HCS).OBJECTIVES. To investigate the prevalence of AD and HCS in patients planned for majorcardiovascular surgery and their attitudes towards these approaches. To investigate rela-tives’ views for patients on the same topics.METHODS. Patients and their relatives were met separately before or after surgery. Thestudy was lead by structured interviews according to a questionnaire. Patients’ character-istics were extracted from their charts.RESULTS. Out of 405 eligible patients, 361 (89 %) patients, 256 (71 %) with relatives and105 (29 %) without relatives answered the interview. Male patients: 256 (71 %). Age(mean ± SD): 68 ± 15 years. 215 (60 %) patients underwent valvular replacement, 92(25 %) coronary bypass and 54 (15 %) other major cardiovascular surgeries. SAPS II(mean ± SD): 33 ± 15; ASA (mean ± SD): 3 ± 0.5.16 (4 %) had AD, 8 (2 %) a HCS. At the end of the interview, 60 (17 %) were interested inAD, 50 (14 %) in HCS, and 19 (5 %) in actually writing AD. AD or HCS were consideredvery useful theoretically but not of interest for themselves, maybe for others. Discomfort orreluctance towards participation in the study was surprisingly rarely noted by the investi-gators despite such sensitive topics. Only 5 (1 %) patients had a DNR order in their chartwhereas they had no AD.When the data from the 256 patients and from their relatives were compared, 9 (4 %)patients had AD, 6 (3 %) a HCS whereas 4 (2 %) relatives said the patient had AD, 2 (1 %)a HCS, but they were often wrong. At the end of the interview, 48 (19 %) patients wereinterested in AD, 41 (16 %) in HCS, and 12 (5 %) in actually writing AD. 63 (25 %) and 49(19 %) relatives said the patient would have an interest in AD and HCS respectively butwere wrong in 73 (29 %, p = 0.008) and 64 (25 %, p = 0.03) cases.7 (7 %) patients without relatives had AD, 2 (2 %) a HCS. At the end of the interview, 12(12 %) patients were interested in AD, 9 (9 %) in HCS, and 7 (7 %) in actually writing AD.There was no significant difference compared to data from patients with relatives.CONCLUSIONS. In our study, very few patients had AD or HCS even when planned toundergo a major surgery. Interest to have AD or a HCS was not higher than 17 % and only5 % actually wrote AD. The reasons of the discrepancy between the expressed usefulness ofAD and HCS and the reality towards such approaches need to be further analysed. Relativesweren’t always aware their beloved having AD or a HCS.GRANT ACKNOWLEDGMENT. This study is sustained by the FNRS (CR31I3_127135/1).
0047REDUCTION OF UNWANTED SYMPTOMS IN DUTCH CRITICALLY ILL ICUPATIENTS AFTER WITHDRAWAL OF LIFE SUSTAINING THERAPY BYINTRODUCTION OF A SIMPLE DIRECTIVE; THE RESULTS OF A 2-YEARPROSPECTIVE OBSERVATIONAL STUDY
J.L. Epker1, E.J.O. Kompanje1
1Erasmus Medical Centre (ErasmusMC), Intensive Care, Rotterdam, The NetherlandsINTRODUCTION. In end-of-life management, various ethical and practical issues arerelevant. One of the most disturbing events after treatment withdrawal is the occurrence ofunwanted symptoms like death rattle stridor and terminal restlessness. The presence of thesesymptoms is often distressful for the family and should therefore be anticipated if possible[1]. Necessary decisions are sometimes ironically paradoxical. Detubation after ventilationcessation improves family satisfaction with the treatment withdrawal process, however itincreases the chance on stridor and death rattle.OBJECTIVES. To describe and analyze the change in incidence of unwanted symptomsin relation to treatment withdrawal in critically ill Dutch ICU patients in the before andafter an educational intervention, focussing on sedation level, medication use andsymptom severity.METHODS. A prospective interventional study in 2 non-academic hospitals for twonon-consecutive years, including all patients in whom ventilation and/or vaso-activemedication was withdrawn. In the in-between period the nurses and doctors in bothhospitals were instructed how to use simple flow diagrams. Rass and Ramsey scaleswere used to measure sedation levels. Unwanted symptoms as death rattle, stridor andterminal restlessness, were scored using a 5- scale scoring system. ICU research nursestook care of patient inclusion and data collection. Analyses were made using IBM SPSSstatistics 19.0.RESULTS. Respectively 139 and 102 patients were included. There were no statisticaldifferences in the two populations in age, sex, disease severity, level of sedation, dosages ofmidazolam or opioids and the incidence of ventilation withdrawal. However the incidenceof detubation was statistically significant higher in the intervention year (p = 0.001).Moreover the mean dosage of propofol was significantly lower in that same year. In theintervention year the use of buscopan for death rattle prevention was noted 8 times. In thetotal population (n = 241) severe stridor (scale 4–5) was reported in 8 patients, moderatestridor (scale 3) in 17 patients, severe death rattle was observed in 10 patients, moderatedeath rattle in 31 patients and severe terminal restlessness was observed in only 11 patientswhile moderate restlessness was seen in 7 patients. There was no statistical difference in theincidence of unwanted symptoms between the observational year and the interventionperiod.CONCLUSIONS. Although unwanted symptoms after treatment withdrawal are experi-enced as distressing and may therefor keep doctors from full treatment withdrawal, theincidence of severe symptoms is relatively low. With the introduction of practical andcompact flow-diagram cards based on the national approved withdrawal of treatment pro-tocol, the incidence of patient extubation increased without compromising patient andfamily comfort.REFERENCE(S). 1. Kompanje EJ. The death rattle. Neurocrit Care. 2005;3:107–10.
0048WHEN EOL DECISIONS IN ICU ARE MADE, WHAT THEN? FAMILYMEMBERS’ EXPERIENCES OF THE WITHDRAWAL OF TREATMENT
R. Lind1, P. Nortvedt2,3
1University Hospital of Northern Norway, Opin-Clinic, Tromsø, Norway, 2University ofOslo, Section for Medical Ethics, Oslo, Norway, 3Akershus University College of AppliedSciences, Nursing, Oslo, NorwayINTRODUCTION. End-of-life decisions for terminally ill ICU patients are common inICUs [1]. These processes are thoroughly described in research from the perspectives ofboth ICU staff and the patients’ family [2, 3]. However, little is known about how familiesexperience treatment withdrawal in the final hours after the end-of-life decision-makingprocess.OBJECTIVES. In this study the objective was to analyse the families’ experiences of theprocess of treatment withdrawal after the end-of-life decision.METHODS. A constructivist interpretive approach to the grounded theory method ofqualitative research was employed with interviews of 27 bereaved family members offormer ICU patients 3–12 months after the patient’s death.RESULTS. The core finding is that facing the final hours of the patient’s life is aprocess in several stages where the family needs support and guidance, and appreciatebeing cared for by nurses and doctors they have met before. The first experiential stageis about temporal dimensions, either experienced as rushing into death as if to ‘‘get itover’’ or as using more time in the process. The next stage involves understanding howthe ‘‘turning off moment’’ will take place and how it was actually carried out. This wasdone in three ways: extubation; decreased oxygen and increased morphine; turning offequipment. Despite advance information, several participants were anxious about thepatient’s reaction, such as signs of struggling from suffocating. This stage was followedby strong sense impressions of facing the death of a loved one. Spirituality and beingable to bid farewell was the last official ICU stage for the families. However, this wasfollowed by emptiness when leaving the dead body in the ICU, feeling unable to go onwith life. In this phase several participants longed for more support, care and follow upfrom the ICU staff.CONCLUSIONS. Families need to be guided through all the stages they experience in thewithdrawal situation. More attention should be paid to communication of how health carepersonnel assume that the process will progress and thereby try to prepare the families forthe many strong impressions which follow treatment termination. We also suggest thatclinicians should be more sensitive of the moment when families leave the ICU, and perhapsoffer a follow-up talk some weeks later.REFERENCE(S). 1. Cohen S, Sprung C, Sjøkvist P, et al. Communication of end-of-lifedecisions in European intensive care units. Int Care Med. 2005;31:1215–21. 2. Halvorsen K,Førde R, Nortvedt P. Value choices and considerations when limiting intensive care treat-ment: a qualitative study. Acta Anaesthesiol Scand. 2009;53:10–7. 3. Lind R, Lorem GF,Nortvedt P, Hevrøy O. Family members’ experiences of ‘‘wait and see’’ as a communicationstrategy in end-of-life decisions. Int Care Med. 2011;37:1143–50.GRANT ACKNOWLEDGMENT. Funded by the University Hospital of North Norway.
26th ESICM ANNUAL CONGRESS — PARIS, FRANCE — 5–9 OCTOBER 2013
0049RISK FACTORS FOR POST-TRAUMATIC STRESS, ANXIETY ANDDEPRESSION IN RELATIVES OF ICU PATIENTS WITH SEVERE SEPSIS ANDEND-OF-LIFE DECISIONS
C.S. Hartog1,2, D. Schwarzkopf1, H. Skupin2, B. Kabisch2, R. Pfeifer3, A. Guenther4,K. Reinhart2
1Jena University Hospital, Center for Sepsis Control and Care, Jena, Germany, 2JenaUniversity Hospital, Department of Anesthesiology and Intensive Care, Jena, Germany,3Jena University Hospital, Department of Internal Medicine I, Jena, Germany, 4JenaUniversity Hospital, Department of Neurology, Jena, GermanyINTRODUCTION. Severe sepsis is the main cause of death in the ICU. Care of dyingpatients puts relatives at risk for developing psychologic symptoms like posttraumatic stressdisorder (PTSD) or anxiety and depression, especially if relatives are involved in end-of-lifedecisions (EOLD) to limit life-sustaining therapy [1]. This investigation was part of a studyto improve quality of end-of-life care in the ICU (trial registration NCT01247792).OBJECTIVES. To predict emotional burden of relatives at 90 days after the patient’s deathor discharge.METHODS. Prospective study on 4 ICUs of one university hospital. Patients with severesepsis and EOLD were included and followed till death or discharge. The attending ICUphysician initiated most EOLD and was therefore questioned about each decision-makingprocess. At 90 days, the main relative was asked to participate in a standardized interviewcontaining the Impact of Event Scale (IES) to measure risk for PTSD, the Hospital Anxietyand Depression Scale (HADS) to measure risk for anxiety and depression and questions onsatisfaction with the ICU experience (i.e. 6 items about satisfaction with medical care andcommunication with ICU physicians). Multiple regression models were used to identifypredictors for risk of PTSD, anxiety and depression. Beside patient and relatives charac-teristics and overall satisfaction, the set of predictors included characteristics of thedecision-making process.RESULTS. 145 patients with EOLD were included, 118 patients (81 %) died in the ICU,93 % of patients died within 90 days. For 23 % of patients, EOLD were perceived to bedelayed. Surgeons were involved in the care of 80.7 % of patients. Of 121 relatives whocould be contacted, 84 agreed to participate (70 %); 22 relatives (26 %) were male, medianage was 57 years. Overall satisfaction was very high with the ICU experience (median of 9on a scale from 1 to 10). 51 % of relatives had a risk for PTSD, 48 % for anxiety and 33 %for depression. IES rates were lower if relatives were male (p = 0.024). IES and HADSdepression rates were higher for spouses compared to children (p = 0.038, p \ 0.001,respectively).Relatives’ satisfaction with the ICU experience predicted lower anxiety (p = 0.025). Anxietyand depression were also reduced if the EOLD was judged to be delayed (p = 0.002,p = 0.024). Surgeon involvement tended to predict increased anxiety (p = 0.095).CONCLUSIONS. The rate of PTSD in relatives of patients who died after EOLD is similarto that previously assessed by a French group [1]. Apart from perceived high-qualitymedical care, satisfactory communication by ICU physicians reduces the relatives’ anxietyand depression. Interestingly, having more time to accept the fatality of death may supportrelatives to cope psychologically.REFERENCE(S). 1. Azoulay et al. Am J Respir Crit Care Med. 2005;171(9):987–94.GRANT ACKNOWLEDGEMENT. Funded by the German Ministry of Education andResearch, grant no. 01 E0 1002.
0050END OF LIFE IN NEONATAL AND PAEDIATRIC INTENSIVE CARE: THECOMPLEX DEMANDS OF PATIENT AND FAMILY CARE. A QUALITATIVEEXPLORATORY STUDY
M.J. Bloomer1, R. Endacott1,2, B. Copnell3, M. O’Connor1
1Monash University, School of Nursing and Midwifery, Frankston, Australia, 2University ofPlymouth, Faculty of Health, Education and Society, Plymouth, UK, 3Monash University,School of Nursing and Midwifery, Clayton, AustraliaINTRODUCTION. Death in childhood is rare in developed countries. In Australia most in-hospital childhood deaths occur in Neonatal and Paediatric Intensive Care (NICU/PICU)settings (Copnell 2005), where family care is a critical component of clinicians’ work(Bloomer et al. 2013).OBJECTIVES. The objectives of this study were to: (1) describe how NICU/PICU nursescare for families before and after a death; and (2) explore the nurses’ perspectives on theirpreparedness/ability to provide family care, whilst caring for the child/infant.
METHODS. Focus group and individual interviews were conducted with registered nursesworking in NICU/PICU (n = 23), who have cared for a dying infant/child, in two majorpaediatric centres in Australia.RESULTS. Qualitative content analysis of transcripts identified 4 processes that influ-enced care management: (1) Medical influence on the dying process. The medicalisationof NICU/PICU care sometimes resulted in continued aggressive intervention and treat-ment, despite acknowledgement that death was likely. (2) Navigating communicationchallenges. Effective communication with families required interprofessional collabora-tion, with doctors leading end of life discussions. Understanding family dynamics, historyand culture was imperative for effective communication and reaching consensus aboutdeath. Nurse continuity enabled rapport and facilitated family support before and afterdeath. (3) Preparing for death. Making family memories was a nursing priority. Nursesavoided a ‘universal’ approach, instead prioritising cultural, religious and social needs ofthe family prior to the death. Nurses perceived that the best outcomes occurred whenfamilies had a high degree of control in deciding when, where and how death occurred.(4) Coming back the next day. After the death, nurses relied on informal peer support tocope with a death, often rationalising the death versus the certainty of ongoing sufferingassociated with ongoing ICU care. Nurses accepted that death was part of the job, buteach death still had an impact.
CONCLUSIONS. This research demonstrates the psychological/emotional, workload andenvironmental challenges faced by NICU/PICU nurses in caring for a dying baby/childbefore/after death. More importantly, how nurses manage these challenges and continued toprovide individualised care to the patient and family is explored, identifying the uniquenessof this aspect of nursing care.REFERENCE(S). 1. Bloomer M, Morphet J, O0Connor M, Lee S, Griffiths D. Nursing careof the family before and after death in the ICU—an exploratory pilot study. Aust Crit Care.2013;26(1):23–8. 2. Copnell B. Death in the pediatric ICU: caring for the children andfamilies at the End of Life. Crit Care Clin North Am. 2005;17(4):349–60.GRANT ACKNOWLEDGMENT. We acknowledge the Australian College of Nursing forthe award of a NBVLL Major Research Grant.
Monday 07 October 2013
Poster SessionsOrganising safer intensive care: 0051–00640051REFERRALS MADE TO CRITICAL CARE; A PROSPECTIVE SERVICEEVALUATION
T. Astles1, T. Cope1, S. Nagaraja1
1University Hospital Aintree, Department of Intensive Care Medicine, Liverpool, UKINTRODUCTION. Data about patients admitted to Intensive Therapy Units (ITUs) inEngland are collected and analysed in detail by the Intensive Care National Audit andResearch Centre (ICNARC). Detailed reports are then produced giving valuable informationabout workload and performance of individual departments.Another important area, which contributes significantly to the day-to-day workload of adepartment and its staff, is the total number of referrals to ITU—a number of whom may notneed admission. These referrals are not captured by ICNARC and so the workload theyproduce is difficult to quantify.OBJECTIVES. To measure the workload generated by referrals to ITU especially forpatients referred who do not require admission. To quantify the number of patients thatwould be appropriate for admission to ITU but can’t be admitted due to lack of capacity.METHODS. We prospectively collected data on all non-elective referrals made to the ITUteam from July 2012–February 2013.Demographic data, time of referral and one of the following four outcomes of the referralwas recorded:
Outcome of referral
Outcome
Accepted and admitted (for level 2 or 3 care)
Accepted but no bed available (plan for patient’s ongoing care recorded)
Declined—doesn’t require ITU
Declined—admission to ITU not appropriate
RESULTS. There were 1,105 referrals captured over 203 days (40 days missing), anaverage of 5.4 referrals per 24-h. The number of referrals per 24-h ranged from 0–15.419 (38.5 %) patients were admitted, 302 (27.8 %) were felt not need admission to ITU, andin 298 (27.4 %) cases admission to ITU was felt to be inappropriate. There were 69occasions when a patient was accepted for ITU treatment but it was not possible to admitthem due to a lack of beds.In total, 14.1 % of appropriate referrals were not admitted to the ITU due to lack ofavailable beds. On a monthly basis this ranged from 0 to 29.7 % of appropriate referrals.CONCLUSIONS. There are two very important conclusions from this study.Firstly, we have found that over half of the referrals to ITU either do not need ITU treatmentor it is felt that ITU admission would not be in the patient’s best interest and is thereforeinappropriate. Although the decision of whether or not to admit a patient to ITU is part ofthe Intensivist’s role, there are a number of examples where admission was clearly notappropriate. Referrals such as these provide a significant workload for the ITU team whooften have to review the patient and sometimes then engage in difficult conversations withboth the patient and their family. There is a place for improving the awareness of the role ofITU within the hospital and improving the decision making process about when and who torefer for ITU treatment.The second conclusion surrounds the number of patients that it is not possible to admit dueto lack of beds. There are UK guidelines that state it should be possible to admit 95 % ofappropriate referrals to ITU. The finding that we are unable to admit 14 % of appropriatereferrals has provided us with useful evidence that we need to expand the number of beds wehave in our department.
0052PHYSICIANS’ CLINICAL PRACTICE AND BEHAVIOR CHANGE AFTERPARTICIPATION IN HANDS-ON RESPIRATORY MANAGEMENT WORKSHOPIN JAPAN. FROM THE PERSPECTIVE OF QUALITY IN RESPIRATORYMANAGEMENT PRACTICE
K. Hasegawa1, R. Tanaka2, N. Kaneko3
1Kameda Medical Center, Critical Care Medicine, Kamogawa, Japan, 2LDS Hospital,Pulmonary and Critical Care Medicine, Salt Lake City, USA, 3Kameda Medical Center,Pulmonary, Kamogawa, JapanINTRODUCTION. Mechanical ventilation is an essential technique in critical patients.Specific methods of mechanical ventilator management can improve mortality and decreasethe duration of mechanical ventilation [1]. Despite the need for systemic mechanical ven-tilation management education to acquire specific knowledge and skills for patients’ care,there is no respiratory management education either in medical school or in training pro-grams in Japan. The quality of respiratory management practice or its education remains as abig issue to be solved.OBJECTIVES. The Respiratory Management Hands-on Workshop for Physicians(RMWP) began in November 2010 to respond the demands of systemic mechanical ven-tilation management education. Over 300 physicians all over Japan have participated in theworkshop. We investigated the impacts of RMWP on physician including educationalactivity and quality of patient care in respiratory management.METHODS. The preliminary survey and the pre-test were conducted via web. The post-testand the anonymous questionnaire were conducted during the workshop. The post-survey ofthe past participants, more than 160 physicians participated the workshop of throughNovember 2011 to January 2013, was conducted in March 2013 via web (�Survey Monkey).RESULTS. In the preliminary survey revealed that the large number of participantsselected SIMV (Synchronized Intermittent Mandatory Ventilation) and PCV (PressureControlled Ventilation) as initial mechanical ventilator setting in their practice, in contrast,knowledge about SIMV and PCV were low in the pre-test. Those scores were significantlyimproved in the post-test. In regard to the post-survey, a total of the 64 % (105 out of165) answered and revealed the physicians’ behavioral change. The initial setting ofmechanical ventilation was significantly changed and it was consistent with previous post-survey [2]. In addition, 25 % (26 out of 105) physicians held lectures and/or hands-onworkshop of respiratory management in their facility after participation in RMWP.
26th ESICM ANNUAL CONGRESS — PARIS, FRANCE — 5–9 OCTOBER 2013
CONCLUSIONS. Physician’s experiences of mechanical ventilation were not necessarya guarantee of their knowledge requiring for respiratory management. In terms ofquality of patient care, WMRP is valuable because it consistently improved physicians’understandings and changed their clinical practice of respiratory management. In addi-tion, their educational activity would lead to further quality improvement of patientcare.REFERENCES. 1. Acute Respiratory Distress Syndrome Network. Ventilation with lowertidal volumes as compared with traditional tidal volumes for acute lung injury and the acuterespiratory distress syndrome. N Engl J Med. 2000;342(18):1301–8. 2. Hasegawa K, TanakaR, Kaneko N. Impact of hands-on respiratory management for physicians and its futureperspective. Presented at the annual meeting of American College of Chest Physicians,Atlanta; 2012.
0053INTRODUCTION OF A CARE PATHWAY FOR PATIENTS UNDERGOINGEMERGENCY LAPAROTOMY: THE IMPACT ON MORTALITY ANDINTENSIVE CARE UNIT COSTS
C.M. Chalmers1, P. Carvalho1, S. Huddart1, M. Dickinson1, Y. Soon2, J. Kirk-Bayley1,M. Zuleika1
1Royal Surrey County Hospital, Department of Anaesthetics and Intensive Care, Guildford,UK, 2Royal Surrey County Hospital, Department of Surgery, Guildford, UKINTRODUCTION. Patients undergoing emergency laparotomy in the United Kingdomhave a high mortality rate, yet many are never admitted to an intensive care unit (ICU)0 [1,2]. In line with recent guidance [2, 3], our hospital introduced an ‘emergency laparotomypathway’ (ELP). This document uses checklists to prompt best practice from admission intothe post-operative period. The ELP mandates post-operative admission of all patients to theICU (an 18-bed, mixed level 2/3 facility). Prior to this the need for ICU admission wasdecided on a case-by-case basis, with some patients cared for in lower dependency areas.OBJECTIVES. To determine the impact of the ELP on mortality and cost of ICU stay forpatients admitted following emergency laparotomy.METHODS. From a prospectively collected database, data were analysed for all patientsadmitted to ICU following emergency laparotomy 3 months pre- and post-ELP introduction.Variables included APACHE II score, and length of stay (LOS) and mortality in ICU and inhospital. The cost of patients’ ICU stay, as charged to their funding Primary Care Trust, wasobtained from financial records. All variables were compared pre- and post-ELP using theMann–Whitney U test, except mortality (Fisher’s exact test); p values \0.05 were consid-ered statistically significant.RESULTS. Thirty patients were identified before and 31 after introduction of the ELP. Asshown in the table below, hospital mortality was significantly reduced (RR 0.54, 95 % CI0.35–0.84) after introduction of the ELP. Total cost for the groups dropped from £355,891pre-ELP to £290,934 post-ELP; however there was no significant difference in median costper patient. There was no significant difference between the groups in cost of ICU stay,APACHE II score, ICU and hospital LOS or ICU mortality.
Comparison of variables pre-/post-ELP introduction
Variable [median(interquartile range),except mortality]
Pre-ELP Post-ELP p value
APACHE II score 14.5 (13–17.8) 13 (10–16.5) 0.1
ICU LOS (days)—all 3 (2–8) 4 (3–9) 0.89
ICU LOS (days)—survivors
3 (2–5) 4 (3–8) 0.54
Hospital LOS(days)—all
19 (10.3–30.8) 18 (13.5–52.5) 0.26
Hospital LOS(days)—survivors
15.5 (10.3–30.8) 25 (14–55) 0.24
ICU mortality (%) 13 6 0.42
Hospital mortality (%) 27 6 0.02*
Cost of ICU stay(£ per patient)
£4,519 (£3,045–£10,114)
£6,025 (£,3142–£11,491)
0.83
CONCLUSIONS. Introduction of a care pathway in our hospital has, by enabling best-practice, significantly reduced the mortality of patients undergoing emergency laparotomy,without increasing ICU cost.REFERENCE(S). 1. Saunders DJ, Murray D, Pichel AC, et al. Variations in mortality afteremergency laparotomy: the first report of the UK emergency Laparotomy Network. BJA.2012;109:268–75. 2. Royal College of surgeons of England and Department of Health. Thehigher risk general surgical patient: towards improved care for a forgotten group. [Online]2011. http://www.rcseng.ac.uk/publications/docs/higher-risk-surgical-patient (Accessed 11Apr 2013). 3. National Confidential Enquiry into Patient Outcome and Death. Knowing therisk: a review of the peri-operative care of surgical patients. [Online] 2011. http://www.ncepod.org.uk/2011report2/downloads/POC_fullreport.pdf (Accessed 11 Apr 2013).
0054A PROSPECTIVE OBSERVATIONAL STUDY ON THE IMPACT OFA STRUCTURED MECHANICAL VENTILATION WORKSHOP ON PRETESTAND POST TEST ASSESSMENT
S. Jakkinaboina1, S.P. Haranath2, T. Mohan Maharaj3
1Apollo Health City, Critical Care Medicine, Hyderabad, India, 2Apollo Health City,Pulmonary and Critical Care Medicine, Hyderabad, India, 3CARE Hospitals,Anesthesiology and Critical Care Medicine, Vishakapatnam, IndiaINTRODUCTION. Continuing medical education is required for all physicians to remainabreast of the rapid advances in medicine. Intensive care medicine practitioners need to havea thorough working knowledge of mechanical ventilation. We conducted an evidence basedand hands-on workshop on mechanical ventilation with evaluation of participants.OBJECTIVES. To determine the impact on knowledge retention and practical applicationof attending the mechanical ventilation educational activity among various categories ofparticipants.
METHODS. A prospective observational study was done in Sept 2011 as part of AP-CRITICON (Andhra Pradesh Critical Care Conference) at Visakhapatnam, Andhra Pradesh,India. 70 participants comprised of consultants, post graduates, registrars, ICU and non ICUdoctors and respiratory therapists were included. The total program duration was 9 hincluding lectures and workshop sessions. Pre-test was conducted just before the programand post test was conducted after completion of the workshop. The fifteen questions on thetest were the same before after the test. Feedback forms were given to all delegates onregistration and they were asked to mark their evaluation once each talk or workshop wasdone. Participants were grouped as Consultants, Post Graduates (MD) with no ICU expe-rience, MD with less than 1 year ICU experience, MD with more than 1 year ICUexperience and respiratory therapists. The data was analyzed using standard statisticalmethods.RESULTS. Complete data was available for 64 participants. The total number of marks was960. The cumulative pretest marks was 558 and post test 774. The percentage increase inpost test was 22 % but the absolute increase was 37.93 %. In the Consultants group, PostMD doctors with no ICU experience, Post MD doctors with \1 year ICU experience, PostMD doctors with [1 year ICU experience, Post graduate doctors, Respiratory techniciansthe absolute increases were 87.8, 32.26, 26.78, 58.16, 30.27, 40 % respectively. Consultantsgot the least marks in the pretest and they improved to the highest with an absolute increaseof 89 %.The post MD doctors without ICU experience scored highest in the pretest and the absoluteincrease was only 40 %. Also, they got highest marks post test at 91 %, but the absoluteincrease was less as they got highest marks. Post MD doctors with\1 year ICU experiencegot the least absolute increase at 26.78 % but they got a good score pretest and post test theabsolute rise was less.
Pre and post test results of the group
Group Totalnumber
Pre testmarks/totalmarks
Pretest %
Post testmarks/totalmarks
Posttest %
%Increase
Consultant 6 41/90 45.6 77/90 85.6 87.8
Respiratorytechnician
3 20/45 44.45 28/45 62.22 40
Post MD no ICUexperience
3 31/45 69 41/45 91 32.26
Post graduate 20 185/300 61.7 241/300 80.3 30.27
Post graduate\1 year ICUexperience
19 183/285 64.21 232/285 81.4 26.78
Post graduate[1 year ICUexperience
13 98/195 50.2 155/195 79.48 58.16
Pre and post test results of the whole group
Pre test/total marks
Pre test % Post test/total marks
Post test % % Increase
558/960 58.12 774/960 80.62 37.93
CONCLUSIONS. CME improved knowledge base for all participants. The more senior theparticipant, the greater the benefit. Absolute scores increased less for juniors likely becauseof pre-existing high baseline. The cumulative increase in scores can be used to assess theoverall impact of the educational program. Evidence based training is mandatory foreveryone working in the ICU to improve knowledge and improve outcomes for the patients.
0055EVALUATION AND IMPACT OF IMPLEMENTATION OF AN EARLYWARNING SCORING SYSTEM (EWS)/MEDICAL EMERGENCY TEAM (MET)
M. Prchalova1, M. Donnelly1, N. Hayes1, A.-M. Barnes1, E. Kidney1
1The Adelaide and Meath Hospital, Incorporating the National Children’s Hospital,Anaesthesia and Intensive Care, Dublin, IrelandINTRODUCTION. A National Early Warning Score is being implemented nation-wide inIrish Acute Hospitals. EWS/MET was implemented in our hospital (a 500 bed tertiary centrewith 9 ICU beds only) over a 1 year period.OBJECTIVES AND METHODS. ICU and Hospital databases and ICU referral bookswere retrospectively reviewed from August 2012 until December 2012. We collected: totalnumber of inpatient admissions, rate of MET calls and their outcome, MET and non-METreferrals, time spent by ICU registrars outside ICU. Hospital deaths and cardiac arrest callsfor 3 years spanning MEWS introduction were reviewed.RESULTS. Between August 1st and December 31st 2012 there were 6,927 hospitaladmissions and 247 referrals to the ICU team. 85 = 12.3/1,000 inpatients (34 %) were METreferrals and 162 were non MET referrals (87 direct referrals from A&E, 48 direct teamreferrals of ward patients and 27 cardiac arrest calls). One month after implementation (9/61) 14 % of all ICU referrals were via MET activation. This increased to (23/53) 43 % bythe fifth month (p = 0.0008). The MET call rate peaked in October (17.7/1,000). Thismonth also recorded the highest number of patients on wards with ViEWS score seven andabove. Of the 85 MET calls, 33 (38 %) were admitted to ICU. Of the non-MET referrals 27(36 %) of ward calls including crash calls and 48 (55 %) of A&E referrals were admitted toICU. The median ViEWS score of MET call patients admitted to ICU was 9 (7-10), similarto the median ViEWS score 9 (8–19) of MET call patients who remained on the ward(p = 0.5). Of those patients who remained on the ward, 50 % were discharged home and theother 50 % were either palliated made NFR or died suddenly. 6 % were referred back toMET again.Of the re-referrals to the MET, one patient was discharged and died at home (4 ERT calls).One patient was admitted to ICU and later discharged home, and one patient was palliatedafter 4 re-referrals.Median time spent with MET call patients admitted to ICU was 80 vs 30 min with patientsnot admitted to ICU. Median ICU transfer time was 4 h, 25 % were delayed more then 7 h,primarily due to lack of bed capacity. During the study period ICU occupancy was 100 %.There was a consistent drop in cardiac arrests and a trend towards decrease in hospitalmortality over the 3 years spanning introduction of ViEWS-ERT 2010-2012 (p = 0.0512and p = 0.0557 respectively).
26th ESICM ANNUAL CONGRESS — PARIS, FRANCE — 5–9 OCTOBER 2013
CONCLUSION. Since full implementation of the EWS there was a significant increase inMET calls over the 5-month period. There was no significant difference in the VieWS scorebetween patients who were admitted to the ICU and those who were not. This may be linkedto shortage of ICU beds or triage decisions that have not yet been made. There is a trendtowards decrease in cardiac arrests and hospital mortality. Further work is required toestablish mortality benefit and its association with EWS/MET implementation especially inthe setting of restricted resources.
0056FACTORS AFFECTING THE THRESHOLD TRANSFER OF SICKPARTURIENTS TO HIGHER LEVELS OF CARE
A. James1, R. Endacott1,2, E. Stenhouse1
1Plymouth University, School of Nursing and Midwifery, Plymouth, UK, 2MonashUniversity, School of Nursing and Midwifery, Melbourne, AustraliaINTRODUCTION. Current maternal mortality rate directly or indirectly due to pregnancyin the United Kingdom currently stands at 11.39 per 100,000 maternities (CMACE, 2011)and suboptimal care is frequently identified as a contributing factor in these deaths. Theappropriate and timely escalation of care for maternity patients is vital in order to ensurethey receive the appropriate level of care and have safe clinical outcomes (CMACE, 2011).This may include the need for maternity high dependency care (MHDC), transfer to anintensive care unit (ICU) or other specialist unit. The thresholds at which transfers to higherlevels of care happen appear variable (Maternal Critical Care Working Group, 2011).OBJECTIVES. The aim of the research was to determine what constitutes high dependencycare in the maternity unit setting.Research questions: 1. How do clinicians define MHDC? 2. Is there any difference in thedefinition of MHDC between professional groups? 3. Does the size and type of hospital/maternity unit influence the definition of MHDC?METHODS. A three-round Delphi study was used to seek consensus across experts cur-rently involved either directly/indirectly in the provision of/transfer to MHDC. Participantswere drawn from seven maternity units in the UK, birth rates ranging from 1,700 to 5,000.Sixty-seven doctors and midwives completed all 3 rounds. Responses to a question aboutwhat constitutes MHDC (Round 1) were grouped into themes and participants ratedagreement on a 5 point Likert scale (Round 2). Statements that didn’t achieve consensuswere presented again in Round 3, and participants were also asked if they were familiar withthe UK Intensive Care Society levels of care.RESULTS. Four themes were identified in R1 (conditions, vigilance, interventions andservice delivery), common across anaesthetists, obstetricians and midwives. However,midwives were more likely than doctors to request ICU admission for continuous ECGmonitoring (63.3 vs. 36.4 %) and arterial line monitoring (73.5 vs. 53.1 %). Smallermaternity units were less likely to provide MHDC and had a more liberal policy of trans-ferring women to ICU. Qualitative comments indicated that a lack of necessary equipment,facilities and skilled midwifery staff were contributing factors. The extent of familiaritywith the ICS levels of care (14.3–57.1 % familiarity) tended to correspond with the size ofUnit (1,700–4,500 birth rate).CONCLUSIONS. Whilst it may be seen as accountable and safe practice, this ‘early’escalation of care to intensive care or HDC has workload implications for ICUs and mayalso impact on the bonding process between the mother and her baby.REFERENCE(S). 1. CMACE. Saving Mothers’ Lives: reviewing maternal deaths to makemotherhood safe 2006–2008. BJOG. 2011;118(suppl. 1):1–203. Maternal Critical CareWorking Group. Providing equity of critical and maternity care for the critically ill pregnantor recently pregnant woman. London: RCA; 2011.
0057HOW TO ORGANIZE A HDU FACILITY TO SUPPORT YOUR INTENSIVE CAREUNIT
R. Stui1, T. van Galen1, J.J. Spijkstra1
1VU University Medical Center, Intensive Care, Amsterdam, The NetherlandsINTRODUCTION. There is a huge gap between ICU and regular ward care. This gap can bebridged by a high dependency unit (HDU) [1]. It is to be expected that there will be an increaseddemand for HDU capacity to relieve ICU capacity and increase cost effectiveness [2]. In contraryto accepted ICU standards there is no clear standard how to organize and establish a highperformance HDU. Especially concerning nurse patient ratio which is the biggest cost driver.METHODS. At VUmc, the 9 bed HDU is integrated in the ICU care and managementorganization. The HDU is intensivist led and patient logistics are fully integrated with theICU logistic system. Educational and quality programs are shared or combined. Main dif-ference in delivered care: HDU patients are treated for mono-organ or accidental doubleorgan failure, excluding invasive ventilation. HDU distinctive nursing care includes NIV andCPAP, ICP measurement, tracheotomy care, treatment with high dose vaso-active medica-tion and intensive revalidation. HDU management objectives: Annual up to 2,500 patientdays. Expected occupancy rate is 90 %. Staffing characteristics HDU: Available for directpatient care 2.5–2.7 (ICU 3.4–3.7) full time equivalent (Fte) per bed. Workload is measuredwith the Nursing activity score (NAS) [3]. HDU location lay out is similar to the ICU facility.RESULTS. HDU 2012 management data: 950 admitted patients with an average LOS of2.2 days and 2,350 patient days in total. Effective occupancy rate 80 %. Case mix origin:50 % General surgery, 25 % Neurosurgical and 25 % miscellaneous. Post ICU inflow: 191patients, average LOS of 7 days. Non post ICU inflow: 759 patients, average LOS 1.6 days.This means that 57 % of our population amounts post ICU patients.Out of 9 (or sometimes less patients), there are 5 post ICU inflow patients. HDU nursingworkload is almost equal to ICU workload (HDU NAS 46.2 vs ICU 48.5). HDU operationaland consumption costs are €1.234 per patient day vs ICU €2.070.CONCLUSIONS. We are convinced that at VUmc our HDU contributes strongly tooptimal, safe and integrated patient care, reduced unnecessary use of ICU capacity withlower annual costs. Main HDU advantage is the continuity of medical and nursing care andthe integrated logistic system. N/P ratio is high and comparable to low level ICU staffingstandards. This allows us to provide optimal care for both step-up and step-down patientcare. The comparable nursing workload for ICU and HDU patients justifies comparablestaffing standards between both departments. An unsolved current (Dutch) problem is lackof funding. There is no additional funding for HDU care which can lead to inappropriate useof costlier ICU capacity.REFERENCE(S). 1. Lucena et al. Retrospective study of intermediate care. J Hosp Med.2012. 2. vd Steen et al. Inventory round Medium Care in the Netherlands, NJCC; 2008. 3.NAS ‘Nursing Activities Score’: Miranda, D. Crit Med Care. 2003;31:328–374.
0058VITALPAC EARLY WARNING SCORE SYSTEM (VIEWS): A 2-MONTHEVALUATION IN BEAUMONT HOSPITAL
C. Black1, G. Rufli1, M. Flynn1, P. O’Kelly1, K. Costelloe1, C. Walshe1
1Beaumont Hospital, Anaesthesia and Intensive Care, Dublin, IrelandINTRODUCTION. ViEWS uses physiological vital signs to detect the deterioratingpatient, facilitating timely intervention. Of all early warning score systems, the ViEWS isthe most sensitive for predicting mortality [1]. The system has been in place in BeaumontHospital since May 2012.Beaumont Hospital has modified the ViEWS trigger points to match our current resources(where interns are the most junior doctor) to read:ViEWS score 4–6 to be reviewed by intern or senior house officer within 30 minViEWS score C7 to be reviewed by registrar or consultant immediately.OBJECTIVES. To review efficacy and compliance with the Beaumont ViEWS system.METHODS. Gillian Rufli and Mary Flynn collected data from wards, over a 2-monthperiod, on every ViEWS score that resulted in a patient review by a doctor. Data included 3stems—patient demographics, ViEWS details and details of the review itself. Statisticalanalysis was by means of Pearson Chi squared tests.RESULTS. Results were categorized based on timing of review, review scores and level ofdoctor reviewing the patient.There were 380 separate reviews as a result of ViEWS triggers in 205 patients (average age78, 83 male, 122 female). 228 reviews were of medical patients, 127 surgical and 25 notdocumented. The average score requiring review was 6.63. In the study period, there were11 cardiac arrests on the wards, although only 2 had required review according to ViEWS.Four patients required ICU admission following review.Among our initial key findings: 1. 250/380 (66 %) of calls for review occurred out ofworking hours 2. Out of hours, patients with a ViEWS C7 are more likely to be reviewed byan intern in the first instance (p \ 0.05) 3. Patients requiring repeat reviews, with at leastone trigger C7, were more likely to be reviewed by interns 44/51 (86 %), compared to thosepatients requiring single review, with a trigger C7, 24/42 (57 %).
CONCLUSIONS. Our initial results demonstrate that the majority of these calls are out ofhours when staffing levels are low. Frequently, patients with high scores are seen by interns,particularly out of working hours. This may be, in part, due to patients requiring repeatedreview for high scores being patients with high baseline scores, and this may be impactingexcessively on the workload of NCHDs out of hours. This is supported by the low incidenceof ICU admission and cardiac arrests during the study period.This project is ongoing. Following completion, we hope to determine if a ‘rapid response’ICU outreach team is required in our institution to effectively manage deteriorating patientson the ward.REFERENCE(S). 1. ViEWS—towards a national early warning score for detecting adultinpatient deterioration. Resuscitation. 2010;81(8):932–7.
0059DAILY EVALUATION OF FASHTUG PROTOCOL AND SHORT-TERMOUTCOMES
E. Curiel-Balsera1, C. Joya-Montosa1, M.C. Martinez-Gonzalez1, E. Trujillo-Garcı́a1,H. Molina-Diaz1, J. Mora-Ordoñez1, G. Quesada-Garcia1
1Carlos Haya Regional Hospital, Intensive Care, Málaga, SpainINTRODUCTION AND OBJECTIVES. Evaluating the degree of routinely fulfilment ofmanagement protocols and its relation to short-term outcomes.METHODS. Observational, prospective and unicentric study. The FASHTUG protocol wasanalysed daily for a month in all ICU-admitted patients with [48 h stays. Evaluation wascompleted without the physicians in charge of these patients were aware of study com-pletion, so as not to modify their daily working routine. The scores of seriousness upon ICU-admission, clinical-demographic variables and death rate upon ICU-discharge. Square Chiand Student’s T-test, as well as binary logistic regression for multivariate analysis, wereused. Maximum error alpha was set at 5 %.RESULTS. 95 patients (49 males) with average APACHE II score 17.68 ± 9.1 uponadmission and average stay of 4 ± 2 days. Crude death rate was 14.5 %, and the ratio offulfilment of the different items was high—ranging from 73.6 ± 37.7 % in glycemic controlto 100 % in stress ulcer prophylaxis. Indeed, 100 % fulfilment was reached in all items andall days of admissions in 27.3 % of the cases. These 100 %-fulfilment patients had shorteraverage stays (p = 0.014).The least fulfilled item, as previously commented, was glycemic control (73.6 %). Glycemiccontrol was analysed according to the fact that patients were diabetic or not. Differenceswere observed, as fulfilment was 92.6 ± 14.3 and 61.9 ± 42.8 % in diabetic and nondia-betic patients, respectively (p = 0.0001).Death rate was related to seriousness upon admission due to either APACHE II (0.002) orSAPS III (0.0001). Separate or joint fulfilment of any item was not related to betterprognosis.CONCLUSIONS. Most of the items that shape FASHTUG have been tested in differentstudies, proving to lead to better results and less complications. The high fulfilment levelobserved in the present study hinders proving these results with such a reduced numberof patients. Greater adherence to glycemic control in nondiabetic patients is desirable.REFERENCE(S). 1. Vincent JL. Give your patient a fast hug (at least) once a day. CritCare Med. 2005;33:1225–9.
0060PREDICT: PREDICTION OF READMISSION
B.A.B. Ligtenberg1, L.M. Dijkema1, W. Dieperink1, J.J.M. Ligtenberg1, J.G. Zijlstra1
1Univeristy Medical Centre Groningen, CAPE Research Institute, Groningen,The NetherlandsINTRODUCTION. Readmission to the ICU is associated with increased hospital mortality.Therefore identifying patients at risk for readmission is important. The aim of the first studyis to determine the clinical characteristics of patients at risk for readmission from routinelycollected data. We combined these parameters with the clinical view of the ICU physiciansand nurses in a second study.METHODS. We analysed prospectively collected data from our MediScore ICU databaseover two periods of respectively 19 and 12 months at the 47 bed ICU of our universityhospital. Measurements were conducted on demographic, diagnostic, physiological and
26th ESICM ANNUAL CONGRESS — PARIS, FRANCE — 5–9 OCTOBER 2013
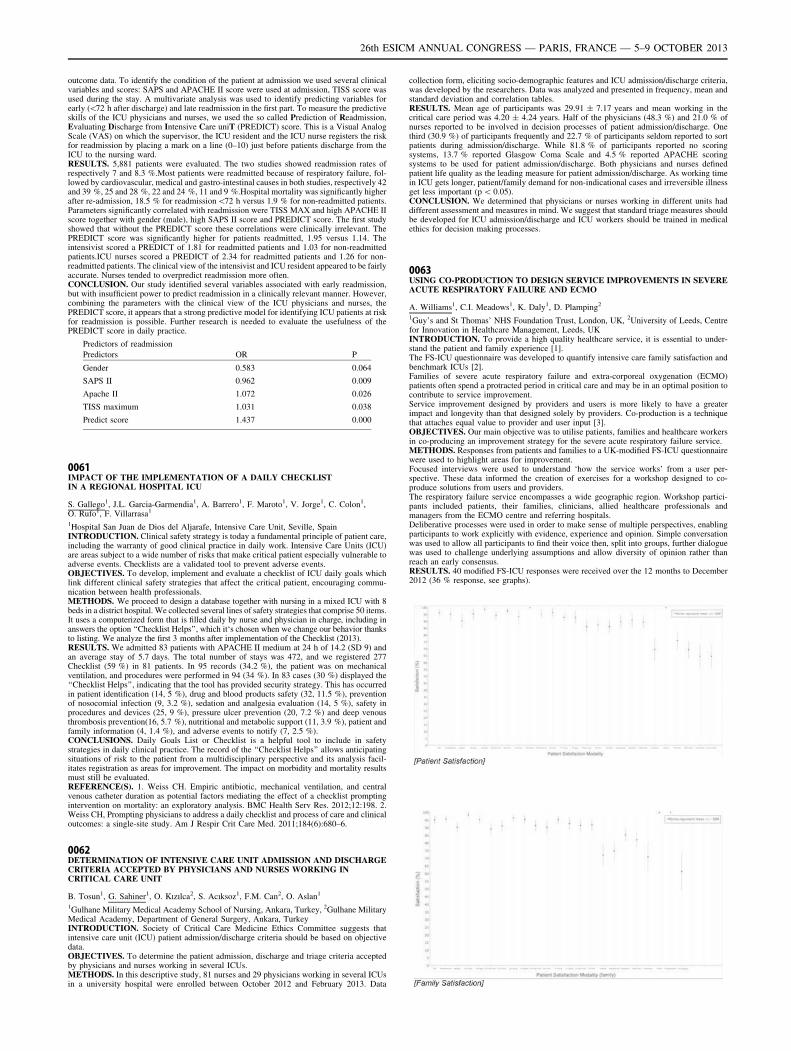
outcome data. To identify the condition of the patient at admission we used several clinicalvariables and scores: SAPS and APACHE II score were used at admission, TISS score wasused during the stay. A multivariate analysis was used to identify predicting variables forearly (\72 h after discharge) and late readmission in the first part. To measure the predictiveskills of the ICU physicians and nurses, we used the so called Prediction of Readmission,Evaluating Discharge from Intensive Care uniT (PREDICT) score. This is a Visual AnalogScale (VAS) on which the supervisor, the ICU resident and the ICU nurse registers the riskfor readmission by placing a mark on a line (0–10) just before patients discharge from theICU to the nursing ward.RESULTS. 5,881 patients were evaluated. The two studies showed readmission rates ofrespectively 7 and 8.3 %.Most patients were readmitted because of respiratory failure, fol-lowed by cardiovascular, medical and gastro-intestinal causes in both studies, respectively 42and 39 %, 25 and 28 %, 22 and 24 %, 11 and 9 %.Hospital mortality was significantly higherafter re-admission, 18.5 % for readmission\72 h versus 1.9 % for non-readmitted patients.Parameters significantly correlated with readmission were TISS MAX and high APACHE IIscore together with gender (male), high SAPS II score and PREDICT score. The first studyshowed that without the PREDICT score these correlations were clinically irrelevant. ThePREDICT score was significantly higher for patients readmitted, 1.95 versus 1.14. Theintensivist scored a PREDICT of 1.81 for readmitted patients and 1.03 for non-readmittedpatients.ICU nurses scored a PREDICT of 2.34 for readmitted patients and 1.26 for non-readmitted patients. The clinical view of the intensivist and ICU resident appeared to be fairlyaccurate. Nurses tended to overpredict readmission more often.CONCLUSION. Our study identified several variables associated with early readmission,but with insufficient power to predict readmission in a clinically relevant manner. However,combining the parameters with the clinical view of the ICU physicians and nurses, thePREDICT score, it appears that a strong predictive model for identifying ICU patients at riskfor readmission is possible. Further research is needed to evaluate the usefulness of thePREDICT score in daily practice.
Predictors of readmission
Predictors OR P
Gender 0.583 0.064
SAPS II 0.962 0.009
Apache II 1.072 0.026
TISS maximum 1.031 0.038
Predict score 1.437 0.000
0061IMPACT OF THE IMPLEMENTATION OF A DAILY CHECKLISTIN A REGIONAL HOSPITAL ICU
S. Gallego1, J.L. Garcia-Garmendia1, A. Barrero1, F. Maroto1, V. Jorge1, C. Colon1,O. Rufo1, F. Villarrasa1
1Hospital San Juan de Dios del Aljarafe, Intensive Care Unit, Seville, SpainINTRODUCTION. Clinical safety strategy is today a fundamental principle of patient care,including the warranty of good clinical practice in daily work. Intensive Care Units (ICU)are areas subject to a wide number of risks that make critical patient especially vulnerable toadverse events. Checklists are a validated tool to prevent adverse events.OBJECTIVES. To develop, implement and evaluate a checklist of ICU daily goals whichlink different clinical safety strategies that affect the critical patient, encouraging commu-nication between health professionals.METHODS. We proceed to design a database together with nursing in a mixed ICU with 8beds in a district hospital. We collected several lines of safety strategies that comprise 50 items.It uses a computerized form that is filled daily by nurse and physician in charge, including inanswers the option ‘‘Checklist Helps’’, which it‘s chosen when we change our behavior thanksto listing. We analyze the first 3 months after implementation of the Checklist (2013).RESULTS. We admitted 83 patients with APACHE II medium at 24 h of 14.2 (SD 9) andan average stay of 5.7 days. The total number of stays was 472, and we registered 277Checklist (59 %) in 81 patients. In 95 records (34.2 %), the patient was on mechanicalventilation, and procedures were performed in 94 (34 %). In 83 cases (30 %) displayed the‘‘Checklist Helps’’, indicating that the tool has provided security strategy. This has occurredin patient identification (14, 5 %), drug and blood products safety (32, 11.5 %), preventionof nosocomial infection (9, 3.2 %), sedation and analgesia evaluation (14, 5 %), safety inprocedures and devices (25, 9 %), pressure ulcer prevention (20, 7.2 %) and deep venousthrombosis prevention(16, 5.7 %), nutritional and metabolic support (11, 3.9 %), patient andfamily information (4, 1.4 %), and adverse events to notify (7, 2.5 %).CONCLUSIONS. Daily Goals List or Checklist is a helpful tool to include in safetystrategies in daily clinical practice. The record of the ‘‘Checklist Helps’’ allows anticipatingsituations of risk to the patient from a multidisciplinary perspective and its analysis facil-itates registration as areas for improvement. The impact on morbidity and mortality resultsmust still be evaluated.REFERENCE(S). 1. Weiss CH. Empiric antibiotic, mechanical ventilation, and centralvenous catheter duration as potential factors mediating the effect of a checklist promptingintervention on mortality: an exploratory analysis. BMC Health Serv Res. 2012;12:198. 2.Weiss CH, Prompting physicians to address a daily checklist and process of care and clinicaloutcomes: a single-site study. Am J Respir Crit Care Med. 2011;184(6):680–6.
0062DETERMINATION OF INTENSIVE CARE UNIT ADMISSION AND DISCHARGECRITERIA ACCEPTED BY PHYSICIANS AND NURSES WORKING INCRITICAL CARE UNIT
B. Tosun1, G. Sahiner1, O. Kızılca2, S. Acıksoz1, F.M. Can2, O. Aslan1
1Gulhane Military Medical Academy School of Nursing, Ankara, Turkey, 2Gulhane MilitaryMedical Academy, Department of General Surgery, Ankara, TurkeyINTRODUCTION. Society of Critical Care Medicine Ethics Committee suggests thatintensive care unit (ICU) patient admission/discharge criteria should be based on objectivedata.OBJECTIVES. To determine the patient admission, discharge and triage criteria acceptedby physicians and nurses working in several ICUs.METHODS. In this descriptive study, 81 nurses and 29 physicians working in several ICUsin a university hospital were enrolled between October 2012 and February 2013. Data
collection form, eliciting socio-demographic features and ICU admission/discharge criteria,was developed by the researchers. Data was analyzed and presented in frequency, mean andstandard deviation and correlation tables.RESULTS. Mean age of participants was 29.91 ± 7.17 years and mean working in thecritical care period was 4.20 ± 4.24 years. Half of the physicians (48.3 %) and 21.0 % ofnurses reported to be involved in decision processes of patient admission/discharge. Onethird (30.9 %) of participants frequently and 22.7 % of participants seldom reported to sortpatients during admission/discharge. While 81.8 % of participants reported no scoringsystems, 13.7 % reported Glasgow Coma Scale and 4.5 % reported APACHE scoringsystems to be used for patient admission/discharge. Both physicians and nurses definedpatient life quality as the leading measure for patient admission/discharge. As working timein ICU gets longer, patient/family demand for non-indicational cases and irreversible illnessget less important (p \ 0.05).CONCLUSION. We determined that physicians or nurses working in different units haddifferent assessment and measures in mind. We suggest that standard triage measures shouldbe developed for ICU admission/discharge and ICU workers should be trained in medicalethics for decision making processes.
0063USING CO-PRODUCTION TO DESIGN SERVICE IMPROVEMENTS IN SEVEREACUTE RESPIRATORY FAILURE AND ECMO
A. Williams1, C.I. Meadows1, K. Daly1, D. Plamping2
1Guy’s and St Thomas’ NHS Foundation Trust, London, UK, 2University of Leeds, Centrefor Innovation in Healthcare Management, Leeds, UKINTRODUCTION. To provide a high quality healthcare service, it is essential to under-stand the patient and family experience [1].The FS-ICU questionnaire was developed to quantify intensive care family satisfaction andbenchmark ICUs [2].Families of severe acute respiratory failure and extra-corporeal oxygenation (ECMO)patients often spend a protracted period in critical care and may be in an optimal position tocontribute to service improvement.Service improvement designed by providers and users is more likely to have a greaterimpact and longevity than that designed solely by providers. Co-production is a techniquethat attaches equal value to provider and user input [3].OBJECTIVES. Our main objective was to utilise patients, families and healthcare workersin co-producing an improvement strategy for the severe acute respiratory failure service.METHODS. Responses from patients and families to a UK-modified FS-ICU questionnairewere used to highlight areas for improvement.Focused interviews were used to understand ‘how the service works’ from a user per-spective. These data informed the creation of exercises for a workshop designed to co-produce solutions from users and providers.The respiratory failure service encompasses a wide geographic region. Workshop partici-pants included patients, their families, clinicians, allied healthcare professionals andmanagers from the ECMO centre and referring hospitals.Deliberative processes were used in order to make sense of multiple perspectives, enablingparticipants to work explicitly with evidence, experience and opinion. Simple conversationwas used to allow all participants to find their voice then, split into groups, further dialoguewas used to challenge underlying assumptions and allow diversity of opinion rather thanreach an early consensus.RESULTS. 40 modified FS-ICU responses were received over the 12 months to December2012 (36 % response, see graphs).
26th ESICM ANNUAL CONGRESS — PARIS, FRANCE — 5–9 OCTOBER 2013
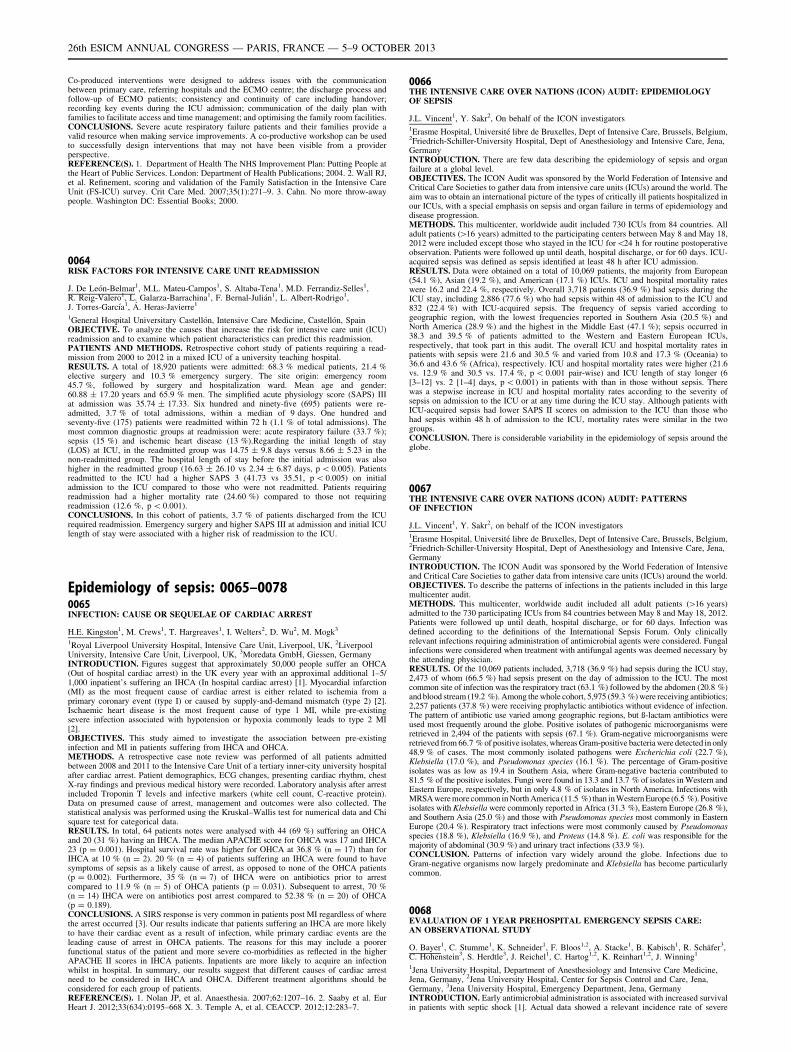
Co-produced interventions were designed to address issues with the communicationbetween primary care, referring hospitals and the ECMO centre; the discharge process andfollow-up of ECMO patients; consistency and continuity of care including handover;recording key events during the ICU admission; communication of the daily plan withfamilies to facilitate access and time management; and optimising the family room facilities.CONCLUSIONS. Severe acute respiratory failure patients and their families provide avalid resource when making service improvements. A co-productive workshop can be usedto successfully design interventions that may not have been visible from a providerperspective.REFERENCE(S). 1. Department of Health The NHS Improvement Plan: Putting People atthe Heart of Public Services. London: Department of Health Publications; 2004. 2. Wall RJ,et al. Refinement, scoring and validation of the Family Satisfaction in the Intensive CareUnit (FS-ICU) survey. Crit Care Med. 2007;35(1):271–9. 3. Cahn. No more throw-awaypeople. Washington DC: Essential Books; 2000.
0064RISK FACTORS FOR INTENSIVE CARE UNIT READMISSION
J. De León-Belmar1, M.L. Mateu-Campos1, S. Altaba-Tena1, M.D. Ferrandiz-Selles1,R. Reig-Valero1, L. Galarza-Barrachina1, F. Bernal-Julián1, L. Albert-Rodrigo1,J. Torres-Garcı́a1, Á. Heras-Javierre1
1General Hospital Universitary Castellón, Intensive Care Medicine, Castellón, SpainOBJECTIVE. To analyze the causes that increase the risk for intensive care unit (ICU)readmission and to examine which patient characteristics can predict this readmission.PATIENTS AND METHODS. Retrospective cohort study of patients requiring a read-mission from 2000 to 2012 in a mixed ICU of a university teaching hospital.RESULTS. A total of 18,920 patients were admitted: 68.3 % medical patients, 21.4 %elective surgery and 10.3 % emergency surgery. The site origin: emergency room45.7 %, followed by surgery and hospitalization ward. Mean age and gender:60.88 ± 17.20 years and 65.9 % men. The simplified acute physiology score (SAPS) IIIat admission was 35.74 ± 17.33. Six hundred and ninety-five (695) patients were re-admitted, 3.7 % of total admissions, within a median of 9 days. One hundred andseventy-five (175) patients were readmitted within 72 h (1.1 % of total admissions). Themost common diagnostic groups at readmission were: acute respiratory failure (33.7 %);sepsis (15 %) and ischemic heart disease (13 %).Regarding the initial length of stay(LOS) at ICU, in the readmitted group was 14.75 ± 9.8 days versus 8.66 ± 5.23 in thenon-readmitted group. The hospital length of stay before the initial admission was alsohigher in the readmitted group (16.63 ± 26.10 vs 2.34 ± 6.87 days, p \ 0.005). Patientsreadmitted to the ICU had a higher SAPS 3 (41.73 vs 35.51, p \ 0.005) on initialadmission to the ICU compared to those who were not readmitted. Patients requiringreadmission had a higher mortality rate (24.60 %) compared to those not requiringreadmission (12.6 %, p \ 0.001).CONCLUSIONS. In this cohort of patients, 3.7 % of patients discharged from the ICUrequired readmission. Emergency surgery and higher SAPS III at admission and initial ICUlength of stay were associated with a higher risk of readmission to the ICU.
Epidemiology of sepsis: 0065–00780065INFECTION: CAUSE OR SEQUELAE OF CARDIAC ARREST
H.E. Kingston1, M. Crews1, T. Hargreaves1, I. Welters2, D. Wu2, M. Mogk3
1Royal Liverpool University Hospital, Intensive Care Unit, Liverpool, UK, 2LiverpoolUniversity, Intensive Care Unit, Liverpool, UK, 3Moredata GmbH, Giessen, GermanyINTRODUCTION. Figures suggest that approximately 50,000 people suffer an OHCA(Out of hospital cardiac arrest) in the UK every year with an approximal additional 1–5/1,000 inpatient’s suffering an IHCA (In hospital cardiac arrest) [1]. Myocardial infarction(MI) as the most frequent cause of cardiac arrest is either related to ischemia from aprimary coronary event (type I) or caused by supply-and-demand mismatch (type 2) [2].Ischaemic heart disease is the most frequent cause of type 1 MI, while pre-existingsevere infection associated with hypotension or hypoxia commonly leads to type 2 MI[2].OBJECTIVES. This study aimed to investigate the association between pre-existinginfection and MI in patients suffering from IHCA and OHCA.METHODS. A retrospective case note review was performed of all patients admittedbetween 2008 and 2011 to the Intensive Care Unit of a tertiary inner-city university hospitalafter cardiac arrest. Patient demographics, ECG changes, presenting cardiac rhythm, chestX-ray findings and previous medical history were recorded. Laboratory analysis after arrestincluded Troponin T levels and infective markers (white cell count, C-reactive protein).Data on presumed cause of arrest, management and outcomes were also collected. Thestatistical analysis was performed using the Kruskal–Wallis test for numerical data and Chisquare test for categorical data.RESULTS. In total, 64 patients notes were analysed with 44 (69 %) suffering an OHCAand 20 (31 %) having an IHCA. The median APACHE score for OHCA was 17 and IHCA23 (p = 0.001). Hospital survival rate was higher for OHCA at 36.8 % (n = 17) than forIHCA at 10 % (n = 2). 20 % (n = 4) of patients suffering an IHCA were found to havesymptoms of sepsis as a likely cause of arrest, as opposed to none of the OHCA patients(p = 0.002). Furthermore, 35 % (n = 7) of IHCA were on antibiotics prior to arrestcompared to 11.9 % (n = 5) of OHCA patients (p = 0.031). Subsequent to arrest, 70 %(n = 14) IHCA were on antibiotics post arrest compared to 52.38 % (n = 20) of OHCA(p = 0.189).CONCLUSIONS. A SIRS response is very common in patients post MI regardless of wherethe arrest occurred [3]. Our results indicate that patients suffering an IHCA are more likelyto have their cardiac event as a result of infection, while primary cardiac events are theleading cause of arrest in OHCA patients. The reasons for this may include a poorerfunctional status of the patient and more severe co-morbidities as reflected in the higherAPACHE II scores in IHCA patients. Inpatients are more likely to acquire an infectionwhilst in hospital. In summary, our results suggest that different causes of cardiac arrestneed to be considered in IHCA and OHCA. Different treatment algorithms should beconsidered for each group of patients.REFERENCE(S). 1. Nolan JP, et al. Anaesthesia. 2007;62:1207–16. 2. Saaby et al. EurHeart J. 2012;33(634):0195–668 X. 3. Temple A, et al. CEACCP. 2012;12:283–7.
0066THE INTENSIVE CARE OVER NATIONS (ICON) AUDIT: EPIDEMIOLOGYOF SEPSIS
J.L. Vincent1, Y. Sakr2, On behalf of the ICON investigators1Erasme Hospital, Université libre de Bruxelles, Dept of Intensive Care, Brussels, Belgium,2Friedrich-Schiller-University Hospital, Dept of Anesthesiology and Intensive Care, Jena,GermanyINTRODUCTION. There are few data describing the epidemiology of sepsis and organfailure at a global level.OBJECTIVES. The ICON Audit was sponsored by the World Federation of Intensive andCritical Care Societies to gather data from intensive care units (ICUs) around the world. Theaim was to obtain an international picture of the types of critically ill patients hospitalized inour ICUs, with a special emphasis on sepsis and organ failure in terms of epidemiology anddisease progression.METHODS. This multicenter, worldwide audit included 730 ICUs from 84 countries. Alladult patients ([16 years) admitted to the participating centers between May 8 and May 18,2012 were included except those who stayed in the ICU for\24 h for routine postoperativeobservation. Patients were followed up until death, hospital discharge, or for 60 days. ICU-acquired sepsis was defined as sepsis identified at least 48 h after ICU admission.RESULTS. Data were obtained on a total of 10,069 patients, the majority from European(54.1 %), Asian (19.2 %), and American (17.1 %) ICUs. ICU and hospital mortality rateswere 16.2 and 22.4 %, respectively. Overall 3,718 patients (36.9 %) had sepsis during theICU stay, including 2,886 (77.6 %) who had sepsis within 48 of admission to the ICU and832 (22.4 %) with ICU-acquired sepsis. The frequency of sepsis varied according togeographic region, with the lowest frequencies reported in Southern Asia (20.5 %) andNorth America (28.9 %) and the highest in the Middle East (47.1 %); sepsis occurred in38.3 and 39.5 % of patients admitted to the Western and Eastern European ICUs,respectively, that took part in this audit. The overall ICU and hospital mortality rates inpatients with sepsis were 21.6 and 30.5 % and varied from 10.8 and 17.3 % (Oceania) to36.6 and 43.6 % (Africa), respectively. ICU and hospital mortality rates were higher (21.6vs. 12.9 % and 30.5 vs. 17.4 %, p \ 0.001 pair-wise) and ICU length of stay longer (6[3–12] vs. 2 [1–4] days, p \ 0.001) in patients with than in those without sepsis. Therewas a stepwise increase in ICU and hospital mortality rates according to the severity ofsepsis on admission to the ICU or at any time during the ICU stay. Although patients withICU-acquired sepsis had lower SAPS II scores on admission to the ICU than those whohad sepsis within 48 h of admission to the ICU, mortality rates were similar in the twogroups.CONCLUSION. There is considerable variability in the epidemiology of sepsis around theglobe.
0067THE INTENSIVE CARE OVER NATIONS (ICON) AUDIT: PATTERNSOF INFECTION
J.L. Vincent1, Y. Sakr2, on behalf of the ICON investigators1Erasme Hospital, Université libre de Bruxelles, Dept of Intensive Care, Brussels, Belgium,2Friedrich-Schiller-University Hospital, Dept of Anesthesiology and Intensive Care, Jena,GermanyINTRODUCTION. The ICON Audit was sponsored by the World Federation of Intensiveand Critical Care Societies to gather data from intensive care units (ICUs) around the world.OBJECTIVES. To describe the patterns of infections in the patients included in this largemulticenter audit.METHODS. This multicenter, worldwide audit included all adult patients ([16 years)admitted to the 730 participating ICUs from 84 countries between May 8 and May 18, 2012.Patients were followed up until death, hospital discharge, or for 60 days. Infection wasdefined according to the definitions of the International Sepsis Forum. Only clinicallyrelevant infections requiring administration of antimicrobial agents were considered. Fungalinfections were considered when treatment with antifungal agents was deemed necessary bythe attending physician.RESULTS. Of the 10,069 patients included, 3,718 (36.9 %) had sepsis during the ICU stay,2,473 of whom (66.5 %) had sepsis present on the day of admission to the ICU. The mostcommon site of infection was the respiratory tract (63.1 %) followed by the abdomen (20.8 %)and blood stream (19.2 %). Among the whole cohort, 5,975 (59.3 %) were receiving antibiotics;2,257 patients (37.8 %) were receiving prophylactic antibiotics without evidence of infection.The pattern of antibiotic use varied among geographic regions, but ß-lactam antibiotics wereused most frequently around the globe. Positive isolates of pathogenic microorganisms wereretrieved in 2,494 of the patients with sepsis (67.1 %). Gram-negative microorganisms wereretrieved from 66.7 % of positive isolates, whereas Gram-positive bacteria were detected in only48.9 % of cases. The most commonly isolated pathogens were Escherichia coli (22.7 %),Klebsiella (17.0 %), and Pseudomonas species (16.1 %). The percentage of Gram-positiveisolates was as low as 19.4 in Southern Asia, where Gram-negative bacteria contributed to81.5 % of the positive isolates. Fungi were found in 13.3 and 13.7 % of isolates in Western andEastern Europe, respectively, but in only 4.8 % of isolates in North America. Infections withMRSA were more common in North America (11.5 %) than in Western Europe (6.5 %). Positiveisolates with Klebsiella were commonly reported in Africa (31.3 %), Eastern Europe (26.8 %),and Southern Asia (25.0 %) and those with Pseudomonas species most commonly in EasternEurope (20.4 %). Respiratory tract infections were most commonly caused by Pseudomonasspecies (18.8 %), Klebsiella (16.9 %), and Proteus (14.8 %). E. coli was responsible for themajority of abdominal (30.9 %) and urinary tract infections (33.9 %).CONCLUSION. Patterns of infection vary widely around the globe. Infections due toGram-negative organisms now largely predominate and Klebsiella has become particularlycommon.
0068EVALUATION OF 1 YEAR PREHOSPITAL EMERGENCY SEPSIS CARE:AN OBSERVATIONAL STUDY
O. Bayer1, C. Stumme1, K. Schneider1, F. Bloos1,2, A. Stacke1, B. Kabisch1, R. Schäfer3,C. Hohenstein3, S. Herdtle3, J. Reichel1, C. Hartog1,2, K. Reinhart1,2, J. Winning1
1Jena University Hospital, Department of Anesthesiology and Intensive Care Medicine,Jena, Germany, 2Jena University Hospital, Center for Sepsis Control and Care, Jena,Germany, 3Jena University Hospital, Emergency Department, Jena, GermanyINTRODUCTION. Early antimicrobial administration is associated with increased survivalin patients with septic shock [1]. Actual data showed a relevant incidence rate of severe
26th ESICM ANNUAL CONGRESS — PARIS, FRANCE — 5–9 OCTOBER 2013
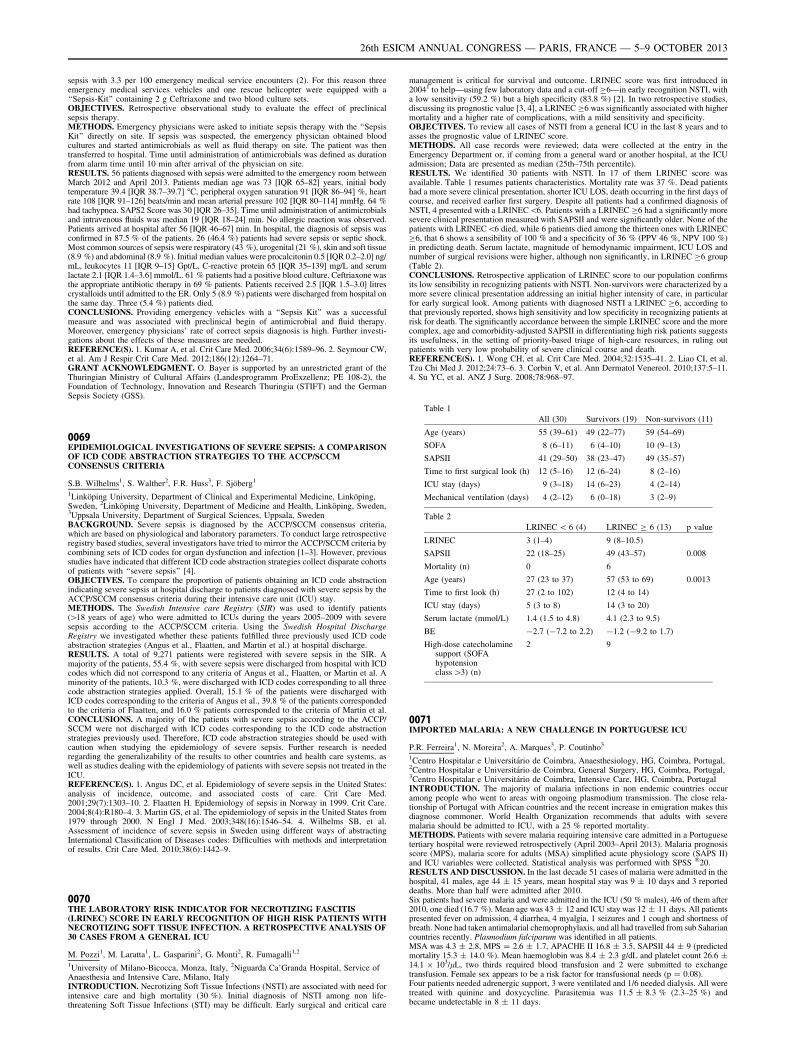
sepsis with 3.3 per 100 emergency medical service encounters (2). For this reason threeemergency medical services vehicles and one rescue helicopter were equipped with a‘‘Sepsis-Kit’’ containing 2 g Ceftriaxone and two blood culture sets.OBJECTIVES. Retrospective observational study to evaluate the effect of preclinicalsepsis therapy.METHODS. Emergency physicians were asked to initiate sepsis therapy with the ‘‘SepsisKit’’ directly on site. If sepsis was suspected, the emergency physician obtained bloodcultures and started antimicrobials as well as fluid therapy on site. The patient was thentransferred to hospital. Time until administration of antimicrobials was defined as durationfrom alarm time until 10 min after arrival of the physician on site.RESULTS. 56 patients diagnosed with sepsis were admitted to the emergency room betweenMarch 2012 and April 2013. Patients median age was 73 [IQR 65–82] years, initial bodytemperature 39.4 [IQR 38.7–39.7] �C, peripheral oxygen saturation 91 [IQR 86–94] %, heartrate 108 [IQR 91–126] beats/min and mean arterial pressure 102 [IQR 80–114] mmHg. 64 %had tachypnea. SAPS2 Score was 30 [IQR 26–35]. Time until administration of antimicrobialsand intravenous fluids was median 19 [IQR 18–24] min. No allergic reaction was observed.Patients arrived at hospital after 56 [IQR 46–67] min. In hospital, the diagnosis of sepsis wasconfirmed in 87.5 % of the patients. 26 (46.4 %) patients had severe sepsis or septic shock.Most common sources of sepsis were respiratory (43 %), urogenital (21 %), skin and soft tissue(8.9 %) and abdominal (8.9 %). Initial median values were procalcitonin 0.5 [IQR 0.2–2.0] ng/mL, leukocytes 11 [IQR 9–15] Gpt/L, C-reactive protein 65 [IQR 35–139] mg/L and serumlactate 2.1 [IQR 1.4–3.6] mmol/L. 61 % patients had a positive blood culture. Ceftriaxone wasthe appropriate antibiotic therapy in 69 % patients. Patients received 2.5 [IQR 1.5–3.0] litrescrystalloids until admitted to the ER. Only 5 (8.9 %) patients were discharged from hospital onthe same day. Three (5.4 %) patients died.CONCLUSIONS. Providing emergency vehicles with a ‘‘Sepsis Kit’’ was a successfulmeasure and was associated with preclinical begin of antimicrobial and fluid therapy.Moreover, emergency physicians’ rate of correct sepsis diagnosis is high. Further investi-gations about the effects of these measures are needed.REFERENCE(S). 1. Kumar A, et al. Crit Care Med. 2006;34(6):1589–96. 2. Seymour CW,et al. Am J Respir Crit Care Med. 2012;186(12):1264–71.GRANT ACKNOWLEDGMENT. O. Bayer is supported by an unrestricted grant of theThuringian Ministry of Cultural Affairs (Landesprogramm ProExzellenz; PE 108-2), theFoundation of Technology, Innovation and Research Thuringia (STIFT) and the GermanSepsis Society (GSS).
0069EPIDEMIOLOGICAL INVESTIGATIONS OF SEVERE SEPSIS: A COMPARISONOF ICD CODE ABSTRACTION STRATEGIES TO THE ACCP/SCCMCONSENSUS CRITERIA
S.B. Wilhelms1, S. Walther2, F.R. Huss3, F. Sjöberg1
1Linköping University, Department of Clinical and Experimental Medicine, Linköping,Sweden, 2Linköping University, Department of Medicine and Health, Linköping, Sweden,3Uppsala University, Department of Surgical Sciences, Uppsala, SwedenBACKGROUND. Severe sepsis is diagnosed by the ACCP/SCCM consensus criteria,which are based on physiological and laboratory parameters. To conduct large retrospectiveregistry based studies, several investigators have tried to mirror the ACCP/SCCM criteria bycombining sets of ICD codes for organ dysfunction and infection [1–3]. However, previousstudies have indicated that different ICD code abstraction strategies collect disparate cohortsof patients with ‘‘severe sepsis’’ [4].OBJECTIVES. To compare the proportion of patients obtaining an ICD code abstractionindicating severe sepsis at hospital discharge to patients diagnosed with severe sepsis by theACCP/SCCM consensus criteria during their intensive care unit (ICU) stay.METHODS. The Swedish Intensive care Registry (SIR) was used to identify patients([18 years of age) who were admitted to ICUs during the years 2005–2009 with severesepsis according to the ACCP/SCCM criteria. Using the Swedish Hospital DischargeRegistry we investigated whether these patients fulfilled three previously used ICD codeabstraction strategies (Angus et al., Flaatten, and Martin et al.) at hospital discharge.RESULTS. A total of 9,271 patients were registered with severe sepsis in the SIR. Amajority of the patients, 55.4 %, with severe sepsis were discharged from hospital with ICDcodes which did not correspond to any criteria of Angus et al., Flaatten, or Martin et al. Aminority of the patients, 10.3 %, were discharged with ICD codes corresponding to all threecode abstraction strategies applied. Overall, 15.1 % of the patients were discharged withICD codes corresponding to the criteria of Angus et al., 39.8 % of the patients correspondedto the criteria of Flaatten, and 16.0 % patients corresponded to the criteria of Martin et al.CONCLUSIONS. A majority of the patients with severe sepsis according to the ACCP/SCCM were not discharged with ICD codes corresponding to the ICD code abstractionstrategies previously used. Therefore, ICD code abstraction strategies should be used withcaution when studying the epidemiology of severe sepsis. Further research is neededregarding the generalizability of the results to other countries and health care systems, aswell as studies dealing with the epidemiology of patients with severe sepsis not treated in theICU.REFERENCE(S). 1. Angus DC, et al. Epidemiology of severe sepsis in the United States:analysis of incidence, outcome, and associated costs of care. Crit Care Med.2001;29(7):1303–10. 2. Flaatten H. Epidemiology of sepsis in Norway in 1999. Crit Care.2004;8(4):R180–4. 3. Martin GS, et al. The epidemiology of sepsis in the United States from1979 through 2000. N Engl J Med. 2003;348(16):1546–54. 4. Wilhelms SB, et al.Assessment of incidence of severe sepsis in Sweden using different ways of abstractingInternational Classification of Diseases codes: Difficulties with methods and interpretationof results. Crit Care Med. 2010;38(6):1442–9.
0070THE LABORATORY RISK INDICATOR FOR NECROTIZING FASCITIS(LRINEC) SCORE IN EARLY RECOGNITION OF HIGH RISK PATIENTS WITHNECROTIZING SOFT TISSUE INFECTION. A RETROSPECTIVE ANALYSIS OF30 CASES FROM A GENERAL ICU
M. Pozzi1, M. Laratta1, L. Gasparini2, G. Monti2, R. Fumagalli1,2
1University of Milano-Bicocca, Monza, Italy, 2Niguarda Ca’Granda Hospital, Service ofAnaesthesia and Intensive Care, Milano, ItalyINTRODUCTION. Necrotizing Soft Tissue Infections (NSTI) are associated with need forintensive care and high mortality (30 %). Initial diagnosis of NSTI among non life-threatening Soft Tissue Infections (STI) may be difficult. Early surgical and critical care
management is critical for survival and outcome. LRINEC score was first introduced in20041 to help—using few laboratory data and a cut-off C6—in early recognition NSTI, witha low sensitivity (59.2 %) but a high specificity (83.8 %) [2]. In two retrospective studies,discussing its prognostic value [3, 4], a LRINEC C6 was significantly associated with highermortality and a higher rate of complications, with a mild sensitivity and specificity.OBJECTIVES. To review all cases of NSTI from a general ICU in the last 8 years and toasses the prognostic value of LRINEC score.METHODS. All case records were reviewed; data were collected at the entry in theEmergency Department or, if coming from a general ward or another hospital, at the ICUadmission; Data are presented as median (25th–75th percentile).RESULTS. We identified 30 patients with NSTI. In 17 of them LRINEC score wasavailable. Table 1 resumes patients characteristics. Mortality rate was 37 %. Dead patientshad a more severe clinical presentation, shorter ICU LOS, death occurring in the first days ofcourse, and received earlier first surgery. Despite all patients had a confirmed diagnosis ofNSTI, 4 presented with a LRINEC\6. Patients with a LRINEC C6 had a significantly moresevere clinical presentation measured with SAPSII and were significantly older. None of thepatients with LRINEC\6 died, while 6 patients died among the thirteen ones with LRINECC6, that 6 shows a sensibility of 100 % and a specificity of 36 % (PPV 46 %, NPV 100 %)in predicting death. Serum lactate, magnitude of hemodynamic impairment, ICU LOS andnumber of surgical revisions were higher, although non significantly, in LRINEC C6 group(Table 2).CONCLUSIONS. Retrospective application of LRINEC score to our population confirmsits low sensibility in recognizing patients with NSTI. Non-survivors were characterized by amore severe clinical presentation addressing an initial higher intensity of care, in particularfor early surgical look. Among patients with diagnosed NSTI a LRINEC C6, according tothat previously reported, shows high sensitivity and low specificity in recognizing patients atrisk for death. The significantly accordance between the simple LRINEC score and the morecomplex, age and comorbidity-adjusted SAPSII in differentiating high risk patients suggestsits usefulness, in the setting of priority-based triage of high-care resources, in ruling outpatients with very low probability of severe clinical course and death.REFERENCE(S). 1. Wong CH, et al. Crit Care Med. 2004;32:1535–41. 2. Liao CI, et al.Tzu Chi Med J. 2012;24:73–6. 3. Corbin V, et al. Ann Dermatol Venereol. 2010;137:5–11.4. Su YC, et al. ANZ J Surg. 2008;78:968–97.
Table 1
All (30) Survivors (19) Non-survivors (11)
Age (years) 55 (39–61) 49 (22–77) 59 (54–69)
SOFA 8 (6–11) 6 (4–10) 10 (9–13)
SAPSII 41 (29–50) 38 (23–47) 49 (35–57)
Time to first surgical look (h) 12 (5–16) 12 (6–24) 8 (2–16)
ICU stay (days) 9 (3–18) 14 (6–23) 4 (2–14)
Mechanical ventilation (days) 4 (2–12) 6 (0–18) 3 (2–9)
Table 2
LRINEC \ 6 (4) LRINEC C 6 (13) p value
LRINEC 3 (1–4) 9 (8–10.5)
SAPSII 22 (18–25) 49 (43–57) 0.008
Mortality (n) 0 6
Age (years) 27 (23 to 37) 57 (53 to 69) 0.0013
Time to first look (h) 27 (2 to 102) 12 (4 to 14)
ICU stay (days) 5 (3 to 8) 14 (3 to 20)
Serum lactate (mmol/L) 1.4 (1.5 to 4.8) 4.1 (2.3 to 9.5)
BE -2.7 (-7.2 to 2.2) -1.2 (-9.2 to 1.7)
High-dose catecholaminesupport (SOFAhypotensionclass [3) (n)
2 9
0071IMPORTED MALARIA: A NEW CHALLENGE IN PORTUGUESE ICU
P.R. Ferreira1, N. Moreira2, A. Marques3, P. Coutinho3
1Centro Hospitalar e Universitário de Coimbra, Anaesthesiology, HG, Coimbra, Portugal,2Centro Hospitalar e Universitário de Coimbra, General Surgery, HG, Coimbra, Portugal,3Centro Hospitalar e Universitário de Coimbra, Intensive Care, HG, Coimbra, PortugalINTRODUCTION. The majority of malaria infections in non endemic countries occuramong people who went to areas with ongoing plasmodium transmission. The close rela-tionship of Portugal with African countries and the recent increase in emigration makes thisdiagnose commoner. World Health Organization recommends that adults with severemalaria should be admitted to ICU, with a 25 % reported mortality.METHODS. Patients with severe malaria requiring intensive care admitted in a Portuguesetertiary hospital were reviewed retrospectively (April 2003–April 2013). Malaria prognosisscore (MPS), malaria score for adults (MSA) simplified acute physiology score (SAPS II)and ICU variables were collected. Statistical analysis was performed with SPSS �20.RESULTS AND DISCUSSION. In the last decade 51 cases of malaria were admitted in thehospital, 41 males, age 44 ± 15 years, mean hospital stay was 9 ± 10 days and 3 reporteddeaths. More than half were admitted after 2010.Six patients had severe malaria and were admitted in the ICU (50 % males), 4/6 of them after2010, one died (16.7 %). Mean age was 43 ± 12 and ICU stay was 12 ± 11 days. All patientspresented fever on admission, 4 diarrhea, 4 myalgia, 1 seizures and 1 cough and shortness ofbreath. None had taken antimalarial chemoprophylaxis, and all had travelled from sub Sahariancountries recently. Plasmodium falciparum was identified in all patients.MSA was 4.3 ± 2.8, MPS = 2.6 ± 1.7, APACHE II 16.8 ± 3.5, SAPSII 44 ± 9 (predictedmortality 15.3 ± 14.0 %). Mean haemoglobin was 8.4 ± 2.3 g/dL and platelet count 26.6 ±14.1 9 103/lL, two thirds required blood transfusion and 2 were submitted to exchangetransfusion. Female sex appears to be a risk factor for transfusional needs (p = 0.08).Four patients needed adrenergic support, 3 were ventilated and 1/6 needed dialysis. All weretreated with quinine and doxycycline. Parasitemia was 11.5 ± 8.3 % (2.3–25 %) andbecame undetectable in 8 ± 11 days.
26th ESICM ANNUAL CONGRESS — PARIS, FRANCE — 5–9 OCTOBER 2013
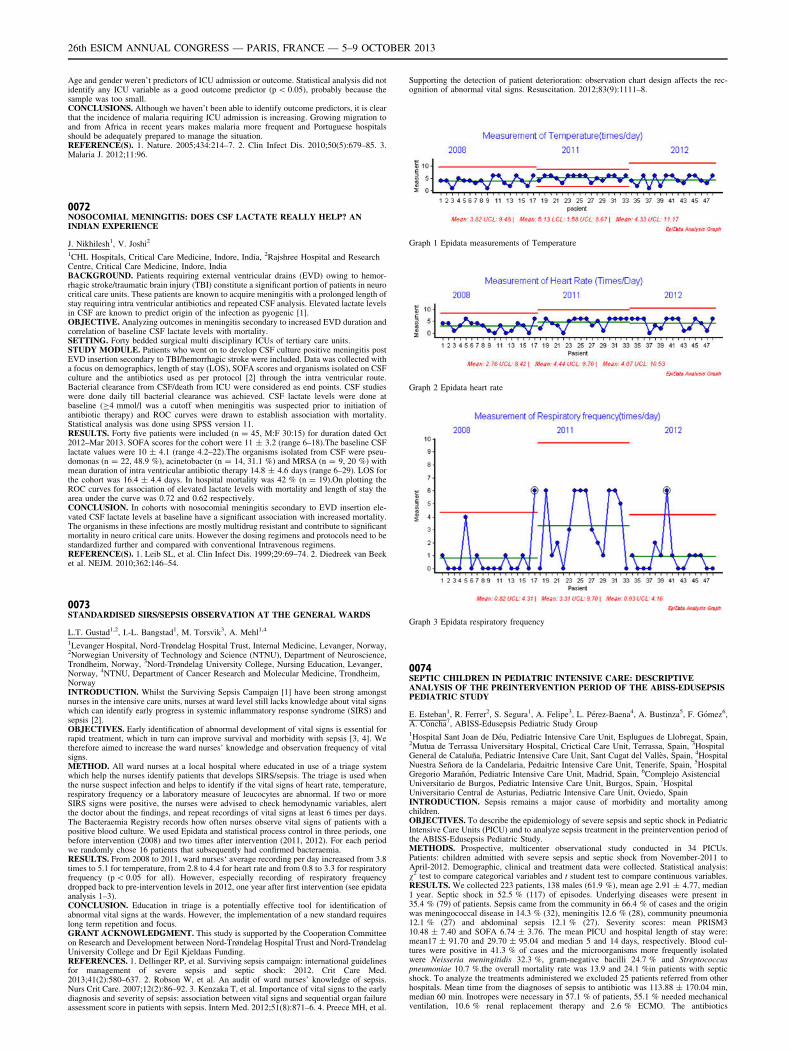
Age and gender weren’t predictors of ICU admission or outcome. Statistical analysis did notidentify any ICU variable as a good outcome predictor (p \ 0.05), probably because thesample was too small.CONCLUSIONS. Although we haven’t been able to identify outcome predictors, it is clearthat the incidence of malaria requiring ICU admission is increasing. Growing migration toand from Africa in recent years makes malaria more frequent and Portuguese hospitalsshould be adequately prepared to manage the situation.REFERENCE(S). 1. Nature. 2005;434:214–7. 2. Clin Infect Dis. 2010;50(5):679–85. 3.Malaria J. 2012;11:96.
0072NOSOCOMIAL MENINGITIS: DOES CSF LACTATE REALLY HELP? ANINDIAN EXPERIENCE
J. Nikhilesh1, V. Joshi2
1CHL Hospitals, Critical Care Medicine, Indore, India, 2Rajshree Hospital and ResearchCentre, Critical Care Medicine, Indore, IndiaBACKGROUND. Patients requiring external ventricular drains (EVD) owing to hemor-rhagic stroke/traumatic brain injury (TBI) constitute a significant portion of patients in neurocritical care units. These patients are known to acquire meningitis with a prolonged length ofstay requiring intra ventricular antibiotics and repeated CSF analysis. Elevated lactate levelsin CSF are known to predict origin of the infection as pyogenic [1].OBJECTIVE. Analyzing outcomes in meningitis secondary to increased EVD duration andcorrelation of baseline CSF lactate levels with mortality.SETTING. Forty bedded surgical multi disciplinary ICUs of tertiary care units.STUDY MODULE. Patients who went on to develop CSF culture positive meningitis postEVD insertion secondary to TBI/hemorrhagic stroke were included. Data was collected witha focus on demographics, length of stay (LOS), SOFA scores and organisms isolated on CSFculture and the antibiotics used as per protocol [2] through the intra ventricular route.Bacterial clearance from CSF/death from ICU were considered as end points. CSF studieswere done daily till bacterial clearance was achieved. CSF lactate levels were done atbaseline (C4 mmol/l was a cutoff when meningitis was suspected prior to initiation ofantibiotic therapy) and ROC curves were drawn to establish association with mortality.Statistical analysis was done using SPSS version 11.RESULTS. Forty five patients were included (n = 45, M:F 30:15) for duration dated Oct2012–Mar 2013. SOFA scores for the cohort were 11 ± 3.2 (range 6–18).The baseline CSFlactate values were 10 ± 4.1 (range 4.2–22).The organisms isolated from CSF were pseu-domonas (n = 22, 48.9 %), acinetobacter (n = 14, 31.1 %) and MRSA (n = 9, 20 %) withmean duration of intra ventricular antibiotic therapy 14.8 ± 4.6 days (range 6–29). LOS forthe cohort was 16.4 ± 4.4 days. In hospital mortality was 42 % (n = 19).On plotting theROC curves for association of elevated lactate levels with mortality and length of stay thearea under the curve was 0.72 and 0.62 respectively.CONCLUSION. In cohorts with nosocomial meningitis secondary to EVD insertion ele-vated CSF lactate levels at baseline have a significant association with increased mortality.The organisms in these infections are mostly multidrug resistant and contribute to significantmortality in neuro critical care units. However the dosing regimens and protocols need to bestandardized further and compared with conventional Intravenous regimens.REFERENCE(S). 1. Leib SL, et al. Clin Infect Dis. 1999;29:69–74. 2. Diedreek van Beeket al. NEJM. 2010;362:146–54.
0073STANDARDISED SIRS/SEPSIS OBSERVATION AT THE GENERAL WARDS
L.T. Gustad1,2, I.-L. Bangstad1, M. Torsvik3, A. Mehl1,4
1Levanger Hospital, Nord-Trøndelag Hospital Trust, Internal Medicine, Levanger, Norway,2Norwegian University of Technology and Science (NTNU), Department of Neuroscience,Trondheim, Norway, 3Nord-Trøndelag University College, Nursing Education, Levanger,Norway, 4NTNU, Department of Cancer Research and Molecular Medicine, Trondheim,NorwayINTRODUCTION. Whilst the Surviving Sepsis Campaign [1] have been strong amongstnurses in the intensive care units, nurses at ward level still lacks knowledge about vital signswhich can identify early progress in systemic inflammatory response syndrome (SIRS) andsepsis [2].OBJECTIVES. Early identification of abnormal development of vital signs is essential forrapid treatment, which in turn can improve survival and morbidity with sepsis [3, 4]. Wetherefore aimed to increase the ward nurses’ knowledge and observation frequency of vitalsigns.METHOD. All ward nurses at a local hospital where educated in use of a triage systemwhich help the nurses identify patients that develops SIRS/sepsis. The triage is used whenthe nurse suspect infection and helps to identify if the vital signs of heart rate, temperature,respiratory frequency or a laboratory measure of leucocytes are abnormal. If two or moreSIRS signs were positive, the nurses were advised to check hemodynamic variables, alertthe doctor about the findings, and repeat recordings of vital signs at least 6 times per days.The Bacteraemia Registry records how often nurses observe vital signs of patients with apositive blood culture. We used Epidata and statistical process control in three periods, onebefore intervention (2008) and two times after intervention (2011, 2012). For each periodwe randomly chose 16 patients that subsequently had confirmed bacteraemia.RESULTS. From 2008 to 2011, ward nurses‘ average recording per day increased from 3.8times to 5.1 for temperature, from 2.8 to 4.4 for heart rate and from 0.8 to 3.3 for respiratoryfrequency (p \ 0.05 for all). However, especially recording of respiratory frequencydropped back to pre-intervention levels in 2012, one year after first intervention (see epidataanalysis 1–3).CONCLUSION. Education in triage is a potentially effective tool for identification ofabnormal vital signs at the wards. However, the implementation of a new standard requireslong term repetition and focus.GRANT ACKNOWLEDGMENT. This study is supported by the Cooperation Committeeon Research and Development between Nord-Trøndelag Hospital Trust and Nord-TrøndelagUniversity College and Dr Egil Kjeldaas Funding.REFERENCES. 1. Dellinger RP, et al. Surviving sepsis campaign: international guidelinesfor management of severe sepsis and septic shock: 2012. Crit Care Med.2013;41(2):580–637. 2. Robson W, et al. An audit of ward nurses’ knowledge of sepsis.Nurs Crit Care. 2007;12(2):86–92. 3. Kenzaka T, et al. Importance of vital signs to the earlydiagnosis and severity of sepsis: association between vital signs and sequential organ failureassessment score in patients with sepsis. Intern Med. 2012;51(8):871–6. 4. Preece MH, et al.
Supporting the detection of patient deterioration: observation chart design affects the rec-ognition of abnormal vital signs. Resuscitation. 2012;83(9):1111–8.
Graph 1 Epidata measurements of Temperature
Graph 2 Epidata heart rate
Graph 3 Epidata respiratory frequency
0074SEPTIC CHILDREN IN PEDIATRIC INTENSIVE CARE: DESCRIPTIVEANALYSIS OF THE PREINTERVENTION PERIOD OF THE ABISS-EDUSEPSISPEDIATRIC STUDY
E. Esteban1, R. Ferrer2, S. Segura1, A. Felipe3, L. Pérez-Baena4, A. Bustinza5, F. Gómez6,A. Concha7, ABISS-Edusepsis Pediatric Study Group1Hospital Sant Joan de Déu, Pediatric Intensive Care Unit, Esplugues de Llobregat, Spain,2Mutua de Terrassa Universitary Hospital, Crictical Care Unit, Terrassa, Spain, 3HospitalGeneral de Cataluña, Pediatric Intensive Care Unit, Sant Cugat del Vallès, Spain, 4HospitalNuestra Señora de la Candelaria, Pedaitric Intensive Care Unit, Tenerife, Spain, 5HospitalGregorio Marañón, Pediatric Intensive Care Unit, Madrid, Spain, 6Complejo AsistencialUniversitario de Burgos, Pediatric Intensive Care Unit, Burgos, Spain, 7HospitalUniversitario Central de Asturias, Pediatric Intensive Care Unit, Oviedo, SpainINTRODUCTION. Sepsis remains a major cause of morbidity and mortality amongchildren.OBJECTIVES. To describe the epidemiology of severe sepsis and septic shock in PediatricIntensive Care Units (PICU) and to analyze sepsis treatment in the preintervention period ofthe ABISS-Edusepsis Pediatric Study.METHODS. Prospective, multicenter observational study conducted in 34 PICUs.Patients: children admitted with severe sepsis and septic shock from November-2011 toApril-2012. Demographic, clinical and treatment data were collected. Statistical analysis:v2 test to compare categorical variables and t student test to compare continuous variables.RESULTS. We collected 223 patients, 138 males (61.9 %), mean age 2.91 ± 4.77, median1 year. Septic shock in 52.5 % (117) of episodes. Underlying diseases were present in35.4 % (79) of patients. Sepsis came from the community in 66.4 % of cases and the originwas meningococcal disease in 14.3 % (32), meningitis 12.6 % (28), community pneumonia12.1 % (27) and abdominal sepsis 12.1 % (27). Severity scores: mean PRISM310.48 ± 7.40 and SOFA 6.74 ± 3.76. The mean PICU and hospital length of stay were:mean17 ± 91.70 and 29.70 ± 95.04 and median 5 and 14 days, respectively. Blood cul-tures were positive in 41.3 % of cases and the microorganisms more frequently isolatedwere Neisseria meningitidis 32.3 %, gram-negative bacilli 24.7 % and Streptococcuspneumoniae 10.7 %.the overall mortality rate was 13.9 and 24.1 %in patients with septicshock. To analyze the treatments administered we excluded 25 patients referred from otherhospitals. Mean time from the diagnoses of sepsis to antibiotic was 113.88 ± 170.04 min,median 60 min. Inotropes were necessary in 57.1 % of patients, 55.1 % needed mechanicalventilation, 10.6 % renal replacement therapy and 2.6 % ECMO. The antibiotics
26th ESICM ANNUAL CONGRESS — PARIS, FRANCE — 5–9 OCTOBER 2013
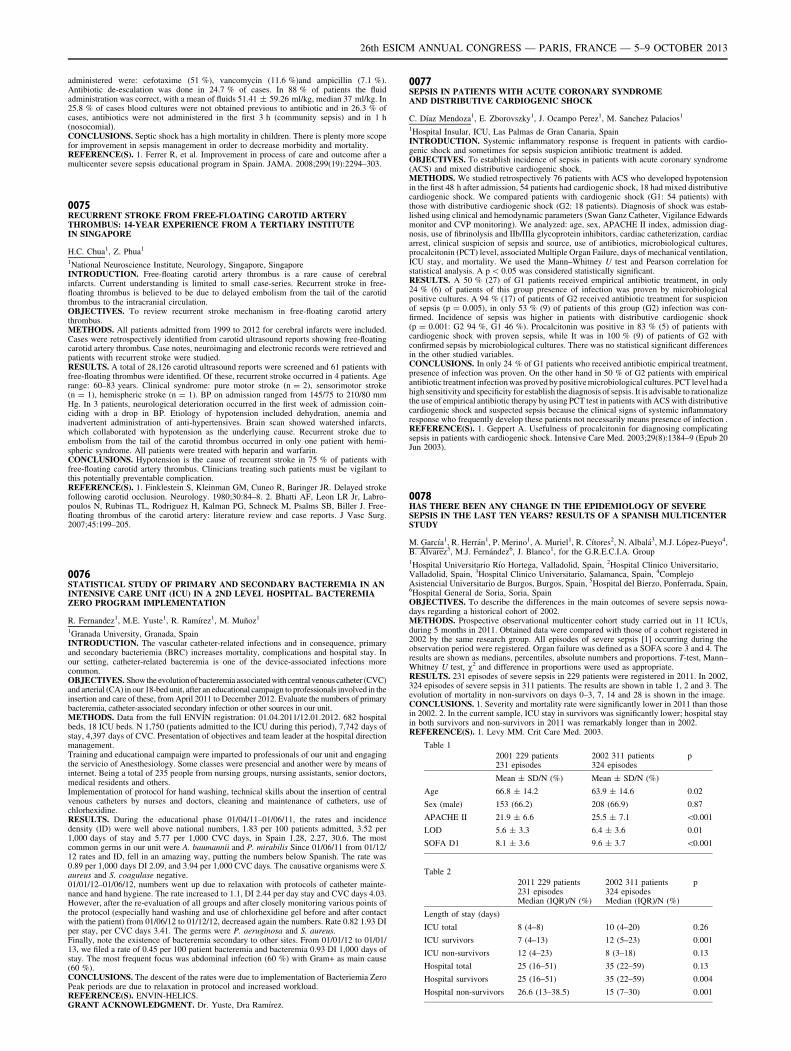
administered were: cefotaxime (51 %), vancomycin (11.6 %)and ampicillin (7.1 %).Antibiotic de-escalation was done in 24.7 % of cases. In 88 % of patients the fluidadministration was correct, with a mean of fluids 51.41 ± 59.26 ml/kg, median 37 ml/kg. In25.8 % of cases blood cultures were not obtained previous to antibiotic and in 26.3 % ofcases, antibiotics were not administered in the first 3 h (community sepsis) and in 1 h(nosocomial).CONCLUSIONS. Septic shock has a high mortality in children. There is plenty more scopefor improvement in sepsis management in order to decrease morbidity and mortality.REFERENCE(S). 1. Ferrer R, et al. Improvement in process of care and outcome after amulticenter severe sepsis educational program in Spain. JAMA. 2008;299(19):2294–303.
0075RECURRENT STROKE FROM FREE-FLOATING CAROTID ARTERYTHROMBUS: 14-YEAR EXPERIENCE FROM A TERTIARY INSTITUTEIN SINGAPORE
H.C. Chua1, Z. Phua1
1National Neuroscience Institute, Neurology, Singapore, SingaporeINTRODUCTION. Free-floating carotid artery thrombus is a rare cause of cerebralinfarcts. Current understanding is limited to small case-series. Recurrent stroke in free-floating thrombus is believed to be due to delayed embolism from the tail of the carotidthrombus to the intracranial circulation.OBJECTIVES. To review recurrent stroke mechanism in free-floating carotid arterythrombus.METHODS. All patients admitted from 1999 to 2012 for cerebral infarcts were included.Cases were retrospectively identified from carotid ultrasound reports showing free-floatingcarotid artery thrombus. Case notes, neuroimaging and electronic records were retrieved andpatients with recurrent stroke were studied.RESULTS. A total of 28,126 carotid ultrasound reports were screened and 61 patients withfree-floating thrombus were identified. Of these, recurrent stroke occurred in 4 patients. Agerange: 60–83 years. Clinical syndrome: pure motor stroke (n = 2), sensorimotor stroke(n = 1), hemispheric stroke (n = 1). BP on admission ranged from 145/75 to 210/80 mmHg. In 3 patients, neurological deterioration occurred in the first week of admission coin-ciding with a drop in BP. Etiology of hypotension included dehydration, anemia andinadvertent administration of anti-hypertensives. Brain scan showed watershed infarcts,which collaborated with hypotension as the underlying cause. Recurrent stroke due toembolism from the tail of the carotid thrombus occurred in only one patient with hemi-spheric syndrome. All patients were treated with heparin and warfarin.CONCLUSIONS. Hypotension is the cause of recurrent stroke in 75 % of patients withfree-floating carotid artery thrombus. Clinicians treating such patients must be vigilant tothis potentially preventable complication.REFERENCE(S). 1. Finklestein S, Kleinman GM, Cuneo R, Baringer JR. Delayed strokefollowing carotid occlusion. Neurology. 1980;30:84–8. 2. Bhatti AF, Leon LR Jr, Labro-poulos N, Rubinas TL, Rodriguez H, Kalman PG, Schneck M, Psalms SB, Biller J. Free-floating thrombus of the carotid artery: literature review and case reports. J Vasc Surg.2007;45:199–205.
0076STATISTICAL STUDY OF PRIMARY AND SECONDARY BACTEREMIA IN ANINTENSIVE CARE UNIT (ICU) IN A 2ND LEVEL HOSPITAL. BACTEREMIAZERO PROGRAM IMPLEMENTATION
R. Fernandez1, M.E. Yuste1, R. Ramı́rez1, M. Muñoz1
1Granada University, Granada, SpainINTRODUCTION. The vascular catheter-related infections and in consequence, primaryand secondary bacteriemia (BRC) increases mortality, complications and hospital stay. Inour setting, catheter-related bacteremia is one of the device-associated infections morecommon.OBJECTIVES. Show the evolution of bacteremia associated with central venous catheter (CVC)and arterial (CA) in our 18-bed unit, after an educational campaign to professionals involved in theinsertion and care of these, from April 2011 to December 2012. Evaluate the numbers of primarybacteremia, catheter-associated secondary infection or other sources in our unit.METHODS. Data from the full ENVIN registration: 01.04.2011/12.01.2012. 682 hospitalbeds, 18 ICU beds. N 1,750 (patients admitted to the ICU during this period), 7,742 days ofstay, 4,397 days of CVC. Presentation of objectives and team leader at the hospital directionmanagement.Training and educational campaign were imparted to professionals of our unit and engagingthe servicio of Anesthesiology. Some classes were presencial and another were by means ofinternet. Being a total of 235 people from nursing groups, nursing assistants, senior doctors,medical residents and others.Implementation of protocol for hand washing, technical skills about the insertion of centralvenous catheters by nurses and doctors, cleaning and maintenance of catheters, use ofchlorhexidine.RESULTS. During the educational phase 01/04/11–01/06/11, the rates and incidencedensity (ID) were well above national numbers, 1.83 per 100 patients admitted, 3.52 per1,000 days of stay and 5.77 per 1,000 CVC days, in Spain 1.28, 2.27, 30.6. The mostcommon germs in our unit were A. baumannii and P. mirabilis Since 01/06/11 from 01/12/12 rates and ID, fell in an amazing way, putting the numbers below Spanish. The rate was0.89 per 1,000 days DI 2.09, and 3.94 per 1,000 CVC days. The causative organisms were S.aureus and S. coagulase negative.01/01/12–01/06/12, numbers went up due to relaxation with protocols of catheter mainte-nance and hand hygiene. The rate increased to 1.1, DI 2.44 per day stay and CVC days 4.03.However, after the re-evaluation of all groups and after closely monitoring various points ofthe protocol (especially hand washing and use of chlorhexidine gel before and after contactwith the patient) from 01/06/12 to 01/12/12, decreased again the numbers. Rate 0.82 1.93 DIper stay, per CVC days 3.41. The germs were P. aeruginosa and S. aureus.Finally, note the existence of bacteremia secondary to other sites. From 01/01/12 to 01/01/13, we filed a rate of 0.45 per 100 patient bacteremia and bacteremia 0.93 DI 1,000 days ofstay. The most frequent focus was abdominal infection (60 %) with Gram+ as main cause(60 %).CONCLUSIONS. The descent of the rates were due to implementation of Bacteriemia ZeroPeak periods are due to relaxation in protocol and increased workload.REFERENCE(S). ENVIN-HELICS.GRANT ACKNOWLEDGMENT. Dr. Yuste, Dra Ramı́rez.
0077SEPSIS IN PATIENTS WITH ACUTE CORONARY SYNDROMEAND DISTRIBUTIVE CARDIOGENIC SHOCK
C. Dı́az Mendoza1, E. Zborovszky1, J. Ocampo Perez1, M. Sanchez Palacios1
1Hospital Insular, ICU, Las Palmas de Gran Canaria, SpainINTRODUCTION. Systemic inflammatory response is frequent in patients with cardio-genic shock and sometimes for sepsis suspicion antibiotic treatment is added.OBJECTIVES. To establish incidence of sepsis in patients with acute coronary syndrome(ACS) and mixed distributive cardiogenic shock.METHODS. We studied retrospectively 76 patients with ACS who developed hypotensionin the first 48 h after admission, 54 patients had cardiogenic shock, 18 had mixed distributivecardiogenic shock. We compared patients with cardiogenic shock (G1: 54 patients) withthose with distributive cardiogenic shock (G2: 18 patients). Diagnosis of shock was estab-lished using clinical and hemodynamic parameters (Swan Ganz Catheter, Vigilance Edwardsmonitor and CVP monitoring). We analyzed: age, sex, APACHE II index, admission diag-nosis, use of fibrinolysis and IIb/IIIa glycoprotein inhibitors, cardiac catheterization, cardiacarrest, clinical suspicion of sepsis and source, use of antibiotics, microbiological cultures,procalcitonin (PCT) level, associated Multiple Organ Failure, days of mechanical ventilation,ICU stay, and mortality. We used the Mann–Whitney U test and Pearson correlation forstatistical analysis. A p \ 0.05 was considered statistically significant.RESULTS. A 50 % (27) of G1 patients received empirical antibiotic treatment, in only24 % (6) of patients of this group presence of infection was proven by microbiologicalpositive cultures. A 94 % (17) of patients of G2 received antibiotic treatment for suspicionof sepsis (p = 0.005), in only 53 % (9) of patients of this group (G2) infection was con-firmed. Incidence of sepsis was higher in patients with distributive cardiogenic shock(p = 0.001: G2 94 %, G1 46 %). Procalcitonin was positive in 83 % (5) of patients withcardiogenic shock with proven sepsis, while It was in 100 % (9) of patients of G2 withconfirmed sepsis by microbiological cultures. There was no statistical significant differencesin the other studied variables.CONCLUSIONS. In only 24 % of G1 patients who received antibiotic empirical treatment,presence of infection was proven. On the other hand in 50 % of G2 patients with empiricalantibiotic treatment infection was proved by positive microbiological cultures. PCT level had ahigh sensitivity and specificity for establish the diagnosis of sepsis. It is advisable to rationalizethe use of empirical antibiotic therapy by using PCT test in patients with ACS with distributivecardiogenic shock and suspected sepsis because the clinical signs of systemic inflammatoryresponse who frequently develop these patients not necessarily means presence of infection .REFERENCE(S). 1. Geppert A. Usefulness of procalcitonin for diagnosing complicatingsepsis in patients with cardiogenic shock. Intensive Care Med. 2003;29(8):1384–9 (Epub 20Jun 2003).
0078HAS THERE BEEN ANY CHANGE IN THE EPIDEMIOLOGY OF SEVERESEPSIS IN THE LAST TEN YEARS? RESULTS OF A SPANISH MULTICENTERSTUDY
M. Garcı́a1, R. Herrán1, P. Merino1, A. Muriel1, R. Cı́tores2, N. Albalá3, M.J. López-Pueyo4,B. Álvarez5, M.J. Fernández6, J. Blanco1, for the G.R.E.C.I.A. Group1Hospital Universitario Rı́o Hortega, Valladolid, Spain, 2Hospital Clinico Universitario,Valladolid, Spain, 3Hospital Clinico Universitario, Salamanca, Spain, 4ComplejoAsistencial Universitario de Burgos, Burgos, Spain, 5Hospital del Bierzo, Ponferrada, Spain,6Hospital General de Soria, Soria, SpainOBJECTIVES. To describe the differences in the main outcomes of severe sepsis nowa-days regarding a historical cohort of 2002.METHODS. Prospective observational multicenter cohort study carried out in 11 ICUs,during 5 months in 2011. Obtained data were compared with those of a cohort registered in2002 by the same research group. All episodes of severe sepsis [1] occurring during theobservation period were registered. Organ failure was defined as a SOFA score 3 and 4. Theresults are shown as medians, percentiles, absolute numbers and proportions. T-test, Mann–Whitney U test, v2 and difference in proportions were used as appropriate.RESULTS. 231 episodes of severe sepsis in 229 patients were registered in 2011. In 2002,324 episodes of severe sepsis in 311 patients. The results are shown in table 1, 2 and 3. Theevolution of mortality in non-survivors on days 0–3, 7, 14 and 28 is shown in the image.CONCLUSIONS. 1. Severity and mortality rate were significantly lower in 2011 than thosein 2002. 2. In the current sample, ICU stay in survivors was significantly lower; hospital stayin both survivors and non-survivors in 2011 was remarkably longer than in 2002.REFERENCE(S). 1. Levy MM. Crit Care Med. 2003.
Table 1
2001 229 patients231 episodes
2002 311 patients324 episodes
p
Mean ± SD/N (%) Mean ± SD/N (%)
Age 66.8 ± 14.2 63.9 ± 14.6 0.02
Sex (male) 153 (66.2) 208 (66.9) 0.87
APACHE II 21.9 ± 6.6 25.5 ± 7.1 \0.001
LOD 5.6 ± 3.3 6.4 ± 3.6 0.01
SOFA D1 8.1 ± 3.6 9.6 ± 3.7 \0.001
Table 2
2011 229 patients231 episodes
2002 311 patients324 episodes
p
Median (IQR)/N (%) Median (IQR)/N (%)
Length of stay (days)
ICU total 8 (4–8) 10 (4–20) 0.26
ICU survivors 7 (4–13) 12 (5–23) 0.001
ICU non-survivors 12 (4–23) 8 (3–18) 0.13
Hospital total 25 (16–51) 35 (22–59) 0.13
Hospital survivors 25 (16–51) 35 (22–59) 0.004
Hospital non-survivors 26.6 (13–38.5) 15 (7–30) 0.001
26th ESICM ANNUAL CONGRESS — PARIS, FRANCE — 5–9 OCTOBER 2013
Table 3
2011 229 patients231 episodes
2002 311 patients324 episodes
p
Median (IQR)/N (%) Median (IQR)/N (%)
Mortality day 0 2 (0.87) 13 (4.2) 0.02
Mortality day 1 12 (5.2) 29 (9.3) 0.07
Mortality day 3 29 (9.5) 60 (19.3) 0.02
Mortality day 7 28 (12.1) 86 (27.6) \0.001
Mortality day 14 43 (18.6) 118 (37.9) \0.001
Mortality day 28 65 (28.1) 149 (47.9) \0.001
ICU mortality 62 (27.2) 150 (48.2) \0.001
Overall mortality 83 (36.4) 169 (54.3) \0.001
Cumulative Mortality (%) in non-survivors
Haemodynamic monitoring: 0079–00920079FLUID RESPONSIVENESS PREDICTED BY ELEVATION OF PEEPIN PATIENTS WITH SEPTIC SHOCK
E. Wilkman1, A. Kuitunen1,2, V. Pettilä1,3, M. Varpula1,4
1Helsinki University Central Hospital, Department of Surgery, Division of Anaesthesia andIntensive Care Medicine, Helsinki, Finland, 2Tampere University Hospital, Tampere, Finland,3University of Helsinki, Department of Clinical Sciences, Helsinki, Finland, 4Heart and LungCentre, Helsinki University Central Hospital, Department of Cardiology, Helsinki, FinlandINTRODUCTION. Achievement of optimal preload is important in the treatment of cir-culatory failure. There is also evolving evidence that a positive fluid balance is associatedwith increased mortality in critically ill patients. Static filling pressures are inadequateindicators of fluid responsiveness in critically ill patients. Dynamic indices may be unre-liable in clinical practise, due to arrhythmias or spontaneous breathing efforts. Thehaemodynamic effects caused by positive end-expiratory pressure (PEEP) resemble thosecaused by positive pressure ventilation. Elevation of PEEP causes cardiorespiratory inter-actions, which may pronounce signs of hypovolemia.OBJECTIVES. Our aim was to assess whether haemodynamic changes during a shortelevation of PEEP would predict fluid responsiveness in patients with septic shock.METHODS. We performed a prospective observational study of 20 patients with septicshock on mechanical ventilation. We assessed changes (D) in mean arterial pressure (MAP),systolic arterial pressure (SAP), pulse pressure, central venous pressure (CVP) and pul-monary artery occlusion pressure (PAOP). We also assessed changes in left ventricular enddiastolic area (LVEDA) and aortic velocity time integral (VTIAo) by transesophagealechocardiography. We performed all assessments at PEEP 10 cmH2O and after elevation ofPEEP from 10 to 20 cmH2O. We defined fluid responsiveness as an increase in cardiacoutput, measured by thermodilution, of C15 % in response to fluid challenge. We assessedthe predictive value for fluid responsiveness of the measured variables by receiver operatingcharacteristic (ROC) analysis. We determined the cut-off point of the best predictivevariables with Youden Index. We assessed the best clinical cut-off value as the point withthe highest negative predictive value (NPV).RESULTS. The best predictive variables for fluid responsiveness were DMAP and DSAP(p = 0.003 and p = 0.03). We detected no association between fluid responsiveness andDLVEDA (p = 0.44), DVTIAo, (p = 0.91), baseline CVP (p = 0.30) or PAOP (p = 0.077),DCVP (p = 0.84) or DPAOP (p = 0.78). In the ROC analysis, the areas under the curve(AUCs, 95 % CIs) for DMAP and DSAP were 0.91 (0.77–1.0) and 0.82 (0.64–1.0). The bestcut-off value for DMAP was -10 % (CI 95 % 0.77–1.00, p = 0.005) yielding the sensi-tivity of 83 % and specificity of 86 %. The best clinical cut-off value for DMAP was - 8 %with a negative predictive value and sensitivity of 100 %.CONCLUSIONS. In patients with septic shock on mechanical ventilation, absence ofdecrease in MAP during elevation of PEEP may be used to identify patients who will notincrease their cardiac output in response to fluid challenge.REFERENCE(S). 1. Luecke T, Pelosi P. Clinical review: Positive end-expiratory pressureand cardiac output. Crit Care. 2005;9(6):607–21.GRANT ACKNOWLEDGMENT. Helsinki University Hospital EVO-grant T102010070.
0080DYNAMIC ARTERIAL ELASTANCE IS A PREDICTOR OF ARTERIALPRESSURE CHANGES TO VOLUME ADMINISTRATION IN FLUID-RESPONDER PATIENTS
M.I. Monge Garcia1,2, M. Gracia Romero1, A. Gil Cano1, A. Rhodes2, R.M. Grounds2,C. Maurizio2
1Hospital del SAS de Jerez, Servicio de Cuidados Crı́ticos y Urgencias, Jerez de la Frontera,Spain, 2St. George’s Healthcare NHS Trust and St George’s University of London,Department of Intensive Care Medicine, London, UKINTRODUCTION. In a previous study, we demonstrated that dynamic arterial elastance(Eadyn), defined as ratio between pulse-pressure variation (PPV) and stroke volume variation
(SVV), allowed to predict the arterial pressure response to volume expansion (VE) inhypotensive preload-dependent patients [1]. A Eadyn value C0.89 predicted a significantincrease in MAP after VE with high sensitivity and specificity. However, since SVV wasobtained from the arterial pressure-derived monitoring system (Vigileo), a mathematicalcoupling factor could not be excluded.OBJECTIVES. We designed this study to assess whether Eadyn, defined as the ratiobetween PPV and SVV, obtained from an esophageal Doppler, could predict the arterialpressure response in preload-dependent patients.METHODS. We included mechanically ventilated patients monitored with an indwellingarterial catheter and an esophageal Doppler (CardioQ-CombiTM, Deltex Medical, Chich-ester, UK). This monitor combined a standard Doppler monitor together with the arterialpressure analysis from the invasive arterial waveform. The decision to give fluids was takenaccording to the presence of hypoperfusion and preload-dependence condition (increaseC10 % of cardiac output (CO) during a 2-min passive leg raising maneuver). VE consistedof 500 mL of crystalloid administered over 30 min. We evaluated different aspects of thearterial load: systemic vascular resistance (SVR = MAP/CO), net arterial compliance(C = stroke volume/arterial pulse pressure), and effective arterial elastance (Ea = 90 % ofsystolic arterial pressure/stroke volume). Dynamic arterial elastance (Eadyn) was calculatedas the ratio between PPV (from the arterial line) and SVV (from the Doppler system), bothparameters were calculated and recorded simultaneously by the Doppler monitor.RESULTS. Twenty-five patients were included. CO increased from 5.5 to 6.7 L/min(P \ 0.0001) and MAP from 70 ± 16 to 78 ± 18 (P = 0.0001). Thirteen patients (52 %)increased their MAP values C15 % (pressure-responders). Only Eadyn allowed detecting aVE-induced increase in MAP C15 % (AUC 0.85; 95 % CI 0.65–0.96; P = 0.0001). Apreinfusion Eadyn value C0.70 discriminate pressure-responders patients with a 85 % ofsensitivity and 92 % of specificity.CONCLUSIONS. Our preliminary results confirm that the assessment of dynamic arterialelastance, defined as the PVV to SVV ratio, obtained from two independent signals, allowpredicting the arterial pressure response in mechanically ventilated, preload-dependent patients.REFERENCES. 1. Monge Garcia MI, Gil Cano A, Gracia Romero M: Dynamic arterialelastance to predict arterial pressure response to volume loading in preload-dependentpatients. Crit Care. 2011;15(1):R15.
0081MEASUREMENT OF HEART–LUNG INTERACTIONS BY ELECTRICALIMPEDANCE TOMOGRAPHY
C.J.C. Trepte1, C. Phillips2, J. Solà i Caros3, A. Adler4, M. Rapin4, S.H. Bohm5,D.A. Reuter1
1University Medical Center Hamburg-Eppendorf, Anesthesiology and Intensive CareMedicine, Hamburg, Germany, 2Oregon Health and Science University, Pulmonary andCritical Care, Portland, USA, 3Centre Suisse d’Electronique et de Microtechnique (CSEM),Neuchâtel, Switzerland, 4Carleton University, Department of Systems and ComputerEngineering, Ottawa, Canada, 5Swisstom AG, Landquart, SwitzerlandINTRODUCTION. Goal-directed fluid therapy has been shown to improve outcome incritically ill patients. For guidance of fluid therapy dynamic indices of cardiac preload havebeen shown to be superior in comparison to static or volumetric parameters. While deter-mination of dynamic preload indices from peripheral pulse signals is rather easy to acquire,unfortunately it is highly unreliable in critically-ill patients. In this aspect functionalimaging using electrical impedance tomography (EIT) that allows estimation of a centralhemodynamic signal may represent a useful alternative.OBJECTIVES. Non-invasive functional imaging of central hemodynamic signals fromwithin the thorax by means of EIT has been shown to hold promise as an alternative way toassess fluid responsiveness. In an earlier publication 1 EIT-based approach to stroke volumevariations (SVVEIT) was presented. However this novel method has not been validated in anindependent study. Hence, aim of this study was to validate SVVEIT against SVVPC frompulse contour analysis in an experimental animal model.METHODS. In a prospective animal study measurements were carried out in 30 anes-thetized pigs, ventilated with tidal volumes of 8 ml/kg bodyweight. PEEP of 10 cmH2O anda respiratory rate of 18/min were applied. SVVEIT was calculated automatically analysingheart–lung interactions in a set of pixels representing the aorta. For the first time suchanalysis was carried out in an unsupervised way using predefined frequency domain algo-rithms that had not previously been trained in the study population. Independent assessmentof stroke volume variation from calibrated pulse contour analysis was used as experimentalreference and for calculation of correlation analysis.RESULTS. A total of 129 measurements of SVVEIT were acquired. Correlation analysisrevealed highly significant correlations for SVV and stroke volume variation by pulsecontour analysis (r = 0.71; p \ 0.0019).CONCLUSION. Estimation of stroke volume variation by electrical impedance tomogra-phy does hold the potential to become a reliable non-invasive means to assess heart–lunginteractions and dynamic indices of preload by analyzing a central hemodynamic signalwithin the thorax.REFERENCE(S). 1. Maisch S, Bohm SH, Sola J, Goepfert M, Kubitz JC, Richter H,Ridder J, Goetz A, Reuter D. Heart–lung interactions measured by electrical impedancetomography. Crit Care Med. 2011.GRANT ACKNOWLEDGMENT. Else Kröner-Fresenius Stiftung.
0082COMPARISON BETWEEN INVASIVE AND NON-INVASIVE ASSESSMENTOF DP/DT-MAX OBTAINED WITH TWO PULSE WAVE ANALYSIS DEVICES
F. Franchi1, P. Mongelli1, M. Nocci1, K. Donadello2, F.S. Taccone2, C. Ragozzino1,B. Biagioli1, S. Scolletta1
1University of Siena, Siena, Italy, 2Erasme University Hospital, Brussels, BelgiumINTRODUCTION. Left ventricular (LV) function is often assessed with echocardiographyin critically ill patients. Unfortunately, this technique requires an experienced operator and itcannot provide a beat-by-beat evaluation of LV function. Some pulse wave analysis (PWA)systems allow evaluating LV performance on a beat-by-beat basis with an indirect esti-mation of ‘‘dP/dt-max’’ (maximum rate of pressure change in the left ventricle). Amongthese PWA systems, SphygmoCor (AtCor Medical, Australia) offers semi-continuously,non-invasively, but operator-dependently, dP/dt-max. Conversely, MostCare (Vygon, Pad-ua, Italy) has the main advantage of being an operator-independent technique that providescontinuously, but invasively, dP/dt-max.OBJECTIVES. Our aim was to compare dP/dt-max obtained by SphygmoCor (Sphy-dP/dt-max) and by MostCare (MC-dP/dt-max) in critically ill patients.
26th ESICM ANNUAL CONGRESS — PARIS, FRANCE — 5–9 OCTOBER 2013
METHODS. We studies 20 heterogeneous patients (age 55 ± 10 years, 15 male, 5female) admitted to Intensive Care Unit (ICU) who were equipped with a radial arterycatheter. Exclusion criteria were: age \18 years, pathologies that could affect the reli-ability of the arterial signal (e.g., aortic valve and ascending aorta pathologies, cardiacarrhythmias). dP/dt-max was estimated after ICU admission from the analysis of the leftor right radial artery during haemodynamic stability, defined as no more than a 5 %variation in heart rate and mean systemic arterial pressure during the time needed forSphygmoCor measurements. Sphy-dP/dt-max was assessed applying the tonometer at theopposite site of the radial artery catheter. MC-dP/dt-max values were averaged over thetime needed for each Sphy-dP/dt-max measurement. Linear correlation and Bland–Altmananalysis were applied.RESULTS. The mean Sphy-dP/dt-max was 982 ± 328 (range 506–1452 mmHg/ms). MeanMC-dP/dt-max was 1013 ± 375 mmHg/ms (range 548–1500 mmHg/ms). The correlationbetween Sphy-dP/dt-max and MC-dp/dt-max was 0.82 (95 % CI 0.76–0.88; p \ 0.001). Themean bias between dP/dt obtained with the two systems was 30.3 mmHg/msec (Limits ofagreement from -313 to 374 mmHg/ms).CONCLUSIONS. There is a good agreement between dP/dt-max obtained with Sphyg-moCor and MostCare. These two methods show similar capability of providing anevaluation of LV function in critically ill patients.
0083NON-INVASIVE, AUTOCALIBRATED CARDIAC OUTPUT DETERMINATIONBASED ON THE ANALYSIS OF AN ARTERIAL PRESSURE WAVEFORMRECORDED WITH RADIAL ARTERY APPLANATION TONOMETRY: A PROOFOF CONCEPT PILOT ANALYSIS
B. Saugel1, A.S. Meidert1, N. Langwieser2, J.Y. Wagner3, F. Fassio1, W. Huber1,A. Hapfelmeier4, R.M. Schmid1, O. Gödje5
1II. Medizinische Klinik und Poliklinik, Klinikum rechts der Isar der TechnischenUniversität München, Munich, Germany, 2I. Medizinische Klinik, Klinikum rechts der Isarder Technischen Universität München, Munich, Germany, 3III. Medizinische Klinik,Klinikum rechts der Isar der Technischen Universität München, Munich, Germany, 4Institutfür Medizinische Statistik und Epidemiologie, Klinikum rechts der Isar der TechnischenUniversität München, Munich, Germany, 5University Ulm, Global Restructuring Advisors,Ulm, GermanyINTRODUCTION. In critical care, cardiac output (CO) as a determinant for oxygendelivery is a hemodynamic variable of crucial importance in the evaluation of a patient’shemodynamic state. A non-invasive technology for the assessment of a continuous arterialpressure (AP) waveform is radial artery applanation tonometry (AT). So far, AT using theT-Line system (Tensys Medical Inc., San Diego, CA, USA) did not provide CO values inaddition to AP values. Recently, an autocalibrating CO algorithm for the determination ofCO based on the analysis of an AP waveform recorded using AT has been developed.OBJECTIVES. In this proof of concept analysis we aimed to describe and evaluate anautocalibrated algorithm for the determination of cardiac output (CO) based on the analysisof an AP waveform recorded using radial artery applanation tonometry (AT) in a continuousnon-invasive manner.METHODS. To be able to exemplarily describe and evaluate the algorithm for COdetermination, we deliberately selected 22 patients with impeccable AP waveforms from adatabase including AP data obtained with AT using the T-Line system (Tensys Medical Inc.,San Diego, CA, USA) in intensive care unit (ICU) patients. When recording AP data for thisprospectively maintained database, we had simultaneously noted CO measurementsobtained from just calibrated pulse contour analysis (PiCCO system; Pulsion MedicalSystems, Feldkirchen, Germany) every minute. We applied the autocalibrating CO-algo-rithm to the AT-derived AP waveforms and noted the computed CO value every minuteduring a total of 15 min of data recordings per patient (3 9 5 min intervals). These 330 AT-derived CO (AT-CO) values were then statistically compared to the corresponding pulsecontour CO (PC-CO) values.RESULTS. Mean ± standard deviation for PC-CO and AT-CO was 7.0 ± 2.0 and6.9 ± 2.1 L/min, respectively. The coefficient of variation for PC-CO and AT-CO was 28.0and 29.9 %, respectively. Bland–Altman analysis demonstrated a mean difference of+0.1 L/min with a standard deviation of 0.8 L/min and 95 % limits of agreement of -1.5 to1.7 L/min. The percentage error was 23 %.CONCLUSIONS. Autocalibrating CO can be computed based on the analysis of the APwaveform recorded with AT. In the selected patients included in this pilot analysis, apercentage error of 23 % indicates clinically acceptable agreement between AT-CO and justcalibrated pulse contour CO.GRANT ACKNOWLEDGMENT. BS and ASM received research grants from TensysMedical Inc. (San Diego, CA, USA). BS and WH collaborate with Pulsion Medical Systems(Feldkirchen, Germany) as members of the medical advisory board. OG consults for TensysMedical Inc. as medical advisor.
0084STROKE VOLUME VARIATION GUIDED FLUID THERAPY IN SEVERE SEPTICSHOCK: WHEN TO STOP CHASING HIGH SVV?
S. Jog1, S. Sable1, D. Patel1, P. Rajhans1, P. Akole1, B. Pawar1, B. Bhurke1, M. Kothari1
1Deenanath Mangeshkar Hospital, Department of Intensive Care Medicine, Pune, IndiaINTRODUCTION. In septic shock recent guidelines recommend [1] fluid challengetechnique to be applied based on dynamic parameter like Stroke Volume Variation (SVV),as static parameter like Central Venous Pressure (CVP) has poor correlation with fluidresponsiveness. But excessive fluid therapy has been shown to increase mortality duringseptic shock and to prolong mechanical ventilation.OBJECTIVES. In patients who are RELATIVELY FLUID OPTIMISED guided by CVPmonitoring, we studied the effect further fluid therapy guided by SVV on the outcome ofsevere septic shock.METHODS. This was retrospective study conducted in a 55 bedded tertiary level mixedICU in Pune, India. Inclusion criteria were: 1. Septic shock patients who had receivedminimum of 30 ml/kg volume expansion before vasopressor therapy. 2. NorepinephrineC0.1 mcg/kg/min. 3. CVP C12 mmHg. 4. Mechanical ventilation under deep sedation.Exclusion criteria were arrhythmias, spontaneous mode of ventilation, needing ContinuousRenal Replacement Therapy (CRRT) during study period. During the 24 h study period,SVV was continuously monitored with Third Generation Flotrac-Vigileo system (version
3.02). Intravenous fluids either crystalloids or colloids were given in bolus form to keep SVV\12 % throughout the study period. Vasopressors and ionotrope infusions were titrated tokeep Mean Arterial Pressure (MAP) C65 mm Hg. Positive End Expiratory Pressure (PEEP)and tidal volume (8 ml/kg) were kept constant throughout the study period. Diuresis wasavoided.RESULTS. Consecutive 45 patients with severe septic shock in whom SVV guided fluidtherapy was instituted were studied. Average dose of Norepinephrine was 0.19 ± 0.01 mcg/kg/min at baseline. Additionally 22 patients were on Dopamine, 8 patients were onDobutamine or Epinephrine for ionotropy and 10 patients were on vasopressin as thirdvasopressor agent. Average amount of SVV guided fluids infused was 4.84 ± 0.91 liters in24 h. 33.33 % (15/45) patients survived till hospital discharge (Survivors) and 66.66 % (30/45) patients died in the ICU/hospital (Non survivors). Table 1 shows the comparison ofSurvivors and Non survivors at baseline i.e. before starting SVV guided fluid therapy. Boththe groups were comparable.
Comparison of baseline variables
Variable Survivor Non survivor p value
MAP (mmHg) 70.13 ± 8.01 70.63 ± 7.51 0.84
CVP (mmHg) 12.93 ± 3.08 13.83 ± 3.08 0.36
Lactates (mmol/l) 3.07 ± 3.77 4.13 ± 3.48 0.35
Urine (ml/h) 33.33 ± 29.50 35.33 ± 40.51 0.87
ScvO2 (%0 67.57 ± 4.94 65.72 ± 3.53 0.57
LVEF (%) 50.33 ± 10.08 65.72 ± 3.53 0.57
P/F ratio 261.33 ± 100.94 211.31 ± 131.80 0.21
SVV (%) 20.80 ± 5.26 17.87 ± 3.80 0.07
Table 2 shows predictors of mortality by logistic regression analysis at 24 h of study period.CVP, urine output in ml/hr, arterial lactates, amount of fluids received in 24 h had no corelation with mortality whereas worsening of PO2/FiO2 ratio (p = 0.01) and SVV persis-tently above 12 % (p = 0.01) were independently and significantly related with themortality.
Predictors of mortality on regression analysis
Variable at 24 h B value SE p value Odds ratio (CI)
CVP (mmHg) -0.13 0.25 0.60 0.88 (0.95–1.06)
Urine (ml/h) 0.09 0.01 0.55 1.01 (0.98–1.04)
Lactate (mmol/l) -0.70 0.47 0.13 0.49 (0.20–1.23)
Fluid volume received (l) 0.27 0.40 0.50 1.31 (0.60–2.88)
P/F ratio 0.01 0.01 0.01 1.01 (1.01–1.02)
SVV \12 % = 1
SVV C12 % = 2
2.65 1.06 0.01 14.20 (1.78–113.23)
CONCLUSIONS. Worsening of oxygenation and persistent higher SVV (C12 %) at 24 hof SVV guided fluid resuscitation are predictors of mortality in severe septic shock.REFERENCE(S). 1. Surviving Sepsis Campaign: International Guidelines for Managementof Severe Sepsis and Septic Shock, 2012. Intensive Care Med. 2013;39:165–228.
0085OSCILLATION OF CONTINUOUS CARDIAC OUTPUT MEASUREMENTCAUSED BY INTERMITTENT PNEUMATIC COMPRESSION OF FOOT
H. Mima1, K. Yunoki1, H. Ueta1, T. Shimozono1, K. Arakawa2, K. Yamazaki1
1Kobe City Medical Center General Hospital, Anesthesia and Critical Care, Kobe, Japan,2Okayama University Graduate School of Medicine, Anesthesiology and Resuscitology,Okayama, JapanINTRODUCTION. Cardiac output (CO) measurement with pulmonary artery catheter(PAC) is still valuable in postoperative management in cardiac surgery, but some recentreports have revealed that intermittent pneumatic compression devises (IPC) have potentialsto cause serious errors in CO measurement. In continuous mode, calculation of arithmeticmean of CO for several minutes seemed to offset the artifacts by IPC, but we previouslyreported the novel phenomena which displayed the rhythmic fluctuation of continuouscardiac output (CCO) during the IPC working. Those phenomena mimic sine wave-likecurves, so now we rename and call them CCO oscillations. In several cases, stopping theIPCs seemed to abolish the oscillations completely, which suggested that IPC is the mostpossible candidate for the artifact of CCO.OBJECTIVES. The aim of this study is to confirm the hypothesis that IPC is the maincause of CCO oscillations. We will also demonstrate the method to obtain the true value ofthe oscillating CCO, which is crucial to our daily clinical practices.METHODS. We reviewed the ICU records of consecutive 32 patients from May 2012 toJune 2012 retrospectively. All patients admitted to ICU after cardiac surgeries with PACinserted at operation theatre. Continuous cardiac index (CCI: CCO/body surface area)curves were obtained, calculated and plotted on the Vigilance II (Edwards Lifesciences,Irvine, CA, USA). We mounted and started the IPC (Venostream, Terumo, Japan) afteradmission to ICU, but sometimes stopped the IPC transiently (\2 h), observing the CCIcurve, and tried to define the true value of CI (cardiac index: CO/body surface area).Inflation cycle of IPC was about once/55 s regularly. Oscillation is defined to be positivewhen the CCO curve is alternating current-like appearance and the difference between CImax and CI min exceeds 0.5L/min/m2. Here we describe how often the phenomenaoccurred, and elicit the amplitude and frequency of oscillations. We also selected the IPCstop test-performed cases, and evaluated its effectiveness and true value of CI. All data areshown as mean ± SD.RESULTS. Of 32 patients, 31patients were displaying oscillations. In oscillation-positivepatients, CI max, CI min, and mean amplitudes (= CI max - CI min) were 3.44 ± 0.83,2.26 ± 0.6, 1.19 ± 0.65, respectively. Mean frequency was 2.76 ± 0.95 cycles/h. 16 stoptests were performed, and in all cases oscillations disappeared or extremely diminished.True value of CI were 2.38 ± 0.55, and can be expressed as CI min + (0.26 ± 0.19), that is,true values were estimated to be in the range of lower half of oscillations.CONCLUSIONS. IPC is the main cause of prominent oscillation of CCO measured withPAC. True value of CO can be elicited by IPC stop test and estimated to be in the lower halfof oscillations. We also found out wide discrepancy between inflation cycle of IPC and CCOoscillation frequency.
26th ESICM ANNUAL CONGRESS — PARIS, FRANCE — 5–9 OCTOBER 2013
0086A NOVEL CO2 BASED METHOD FOR CONTINUOUS NON-INVASIVE CARDIACOUTPUT MONITORING
C. Hällsjö Sander1, F. Suarez Sipmann2, M. Hallbäck3, M. Wallin3, A. Oldner1,A. Larsson2, J. Batista Borges2, H. Björne1
1Karolinska University Hospital Solna, Department of Anaesthesia, Surgical Services andIntensive Care, Solna, Sweden, 2Uppsala University/Surgical Sciences, HedenstiernaLaboratory, Uppsala, Sweden, 3Maquet Critical Care AB, Solna, SwedenINTRODUCTION. We present a novel non-invasive continuous method to estimate car-diac output by measuring effective pulmonary blood flow (EPBF) based on the analysis ofexpired CO2.OBJECTIVES. To evaluate a novel continuous non-invasive measurement of EPBF basedon a capnodynamic method in a porcine experimental model.METHODS. The EPBF method is based on the analysis of changes in expired CO2 and CO2
elimination through an optimal fitting procedure between a mathematical model of a singlecompartment lung and measured data. The required alveolar CO2 changes, between 0.1 to1 kPa, are induced by introducing a variable ventilation sequence by alternating 5 shorterbreaths without an inspiratory pause with 5 longer breaths increasing the inspiratory time byadding a 60 % inspiratory pause while maintaining the same expiratory time. By updatingdata breath by breath we obtained a continuous measurement method.Experimental procedures: 10 anesthetized and muscle relaxed pigs (24–30 kg) were ven-tilated in a volume-controlled mode using a Servo-i ventilator (Maquet Critical Care) andexpired CO2 was analyzed using a standard mainstream capnometer. Reference cardiacoutput measurements were performed by a Transonic pulmonary flow probe placed at themain pulmonary artery. Cardiac output was decreased 30–50 % by brief inflations of aninferior vena cava balloon and increased 30–50 % by infusion of dobutamine in healthylung conditions and after inducing lung injury by repeated lung lavages. Arterial and mixedvenous blood gases were obtained at each protocol step. We evaluated the performance atdifferent shunt conditions by studying two different PEEP levels: 5 and 12 cmH2O.RESULTS. For PEEP 5 and 12 cmH2O shunt levels were 0.16 (0.06–0.29) (median, range)and 0.1 (0.04–0.23) prelavage and 0.31 (0.11–0.52) and 0.12 (0.06–0.23) in lavaged ani-mals. Correlations between the two cardiac output measurement methods were r = 0.92 andr = 0.79 for prelavaged animals and r = 0.67 and r = 0.71 for lavaged animals at PEEP 5and 12 cmH2O respectively. When analyzing data according to shunt levels, grouped asshunt \0.15, 0.15–0.30 and [0.3 the obtained correlations were 0.78, 0.82 and 0.37respectively.CONCLUSION. The presented novel non-invasive, continuous method to measure EPBFprovided good estimates of cardiac output in the experimental conditions studied whenshunt levels B0.3. Whether some correction algorithms can further improve cardiac outputestimations based on EPBF remains to be established.GRANT ACKNOWLEDGMENT. This study was supported by Maquet Critical Care AB.
0087VENTRICULO-ARTERIAL COUPLING IN SEPTIC SHOCK PATIENTS
B. Ferro1, P. Bertini1, R. Baldassarri1, L. Doroni1, F. Guarracino1
1Azienda Ospedaliero Universitaria Pisana, Cardiothoracic Department, Pisa, ItalyINTRODUCTION. Cardiac dysfunction often occurs in patients with septic shock and cansignificantly affect outcome [1]. The systematic evaluation of patients in septic shock for thepresence of cardiac dysfunction is complexed by the associated peripheral vasodilationwhich often masks cardiac impairment. One physiologic approach to unravel the interactionbetween the heart and the circulation when both are affected is to examine ventriculo-arterial coupling [2].OBJECTIVES. To evaluate ventriculo-arterial coupling in septic shock patients noninva-sively [3].METHODS. We measured routine hemodynamics using indwelling arterial and pulmonaryarterial catheters and a transthoracic echocardiogram in 20 septic patients upon ICUadmission. End-systolic elastance (Ees) was measured by echocardiographic single-beatmethod (Ees[SB]). Arterial elastance (Ea) was calculated as 0.9 systolic arterial pressure/stroke volume and the Ea/Ees ratio was calculated (normal 0.5–1.36) [2].RESULTS. Ea/Ees was [1.36 (uncoupled) in fifteen patients, and B1.36 in 5 patients. Nocorrelation was found between Ees(SB) and either cardiac output or left ventricular ejectionfraction.CONCLUSIONS. Septic shock patients on presentation have a high prevalence of ven-triculo-arterial decoupling (Ea/Ees [1.36), which is associated with impaired LVperformance. Since Ea/Ees decoupling is an index of cardiovascular inefficiency and adeterminant of cardiac energetic, we speculate that decoupled septic patients may benefitfrom therapy aimed at normalizing Ea/Ees.REFERENCES. 1. Vieillard-Baron A. Septic cardiomyopathy. Ann Intensive Care.2011;1(1):6. 2. Starling MR. Left ventricular-arterial coupling relations in the normal humanheart. Am Heart J. 1993;125:1659. 3. Chen CH, Fetics B, Nevo E, Rochitte CE, Chiou KR,Ding PA, Kawaguchi M, Kass DA. Noninvasive single-beat determination of left ventricularend-systolic elastance in humans. J Am Coll Cardiol. 2001;38(7):2028–34.
0088RELIABILITY OF NON-INVASIVE CARDIAC SYSTEM (NICAS�)BIOIMPEDANCE AS CARDIAC OUTPUT MONITORING IN CARDIOTHORACICINTENSIVE CARE
G. Tavazzi1, Y. Mebrate2, M. White3, S. Price3
1University and Foundation Policlinico San Matteo IRCCS, Intensive Care Dept 1, Pavia,Italy, 2Royal Brompton Hospital, Clinical Engineering, London, UK, 3Royal BromptonHospital, Adult Intensive Care, London, UKINTRODUCTION. Hemodynamic monitoring plays a central role in the management ofcritical ill patients. In the last several years, aiming at a monitoring less invasive as possible,numerous devices have been proposed and studied. One of them is the continuous Non-Invasive Cardiac System (NICaS�) utilizing whole body bioimpedance cardiography withelectrodes placed on one wrist and on the contralateral ankle [1].OBJECTIVES. We examine the use of NICaS� as CO monitoring in cardiothoracicintensive care patients.
METHODS. We performed 27 CO measurements on 18 patients (one patient had 5 andanother 6 measurements) using NICaS� and echocardiography.The two measurement methods were carried out simultaneously on the same patient. Twoexperienced physician sonographers have performed the echocardiography.12 patients were male and 6 female; 1 patient was on veno-arterial extracorporeal supportand intraaortic balloon pump (IABP); another one had IABP; 2 patients had septic shock, 2underwent pacemaker optimization, 11 were post cardiac surgery patients and 1 had a trans-catheter aortic valve implantation. 16 were on positive pressure ventilation (mean peakpressure 18 ± 5 cmH2O); the mean systolic pressure was 79 ± 11 mmHg.RESULTS. We found significant difference between the values measured using the twomethods, paired T-test shows mean difference of SV 61 ml using US method against42.5 ml of NICAS (p = 0.000128) (Graph 1, Graph 3) and mean difference of CO 5.66 L/min (CI 3.12 L/min/m2) using US method against 3.92 L/min (CI 2.18 L/min/m2) of NI-CAS (p = 0.000131) (Graph 2, Graph 3).
Graph 1
Graph 2
Graph 3
CONCLUSIONS. NICaS� has been shown to perform well on heart failure patients for COmonitoring [1], however, our results have shown that the reliability of the NICaS itself andcompared to echocardiography to measure CO and to track the CO changes in ICU patientswas not clinically acceptable.REFERENCE(S). 1. Marina Leitman, et al. Eur J Heart Failure 2006;8:136–40.
0089ARE WE STILL PERFORMING PULMONARY ARTERY CATHETERIZATIONSIN THE 21ST CENTURY?
S. Appavu1
1University of Illinois, Rockford, IL, USAINTRODUCTION. The use of pulmonary artery catheter (PAC) in the monitory of thecritically ill patient has fallen into disfavor. Connors [1] showed that the use of PAC wasassociated with increased mortality, ICU length of stay and health care cost. Bernard et al.[2] reporting on the National Heart, Lung and Blood Institute workshop called for furtherclinical studies on the use of PAC. In a presentation at the International Symposium onIntensive Care and Emergency Medicine in Brussels, Belgium in 2005, we showed a sta-tistically significant decline in the use of the PAC between the years of 2000 and 2001.Several newer modalities of hemodynamic monitoring have also been clinically introducedin the last decade.OBJECTIVES. Because of all of the above, it is unknown whether or not pulmonary arterycatheters are still being clinically used and if so, how often and for what indications.Therefore, we performed the following study.METHODS. We studied the use of PAC within the state of Illinois, USA. The major citieswithin the state include Chicago, Aurora, Rockford and Peoria. All the hospitals within thestate of Illinois report diagnosis related group (DRG) data including ICD9 9 diagnostic andprocedure codes to the Illinois health care cost containment council database throughouteach year. We searched this database for pulmonary artery pressure monitoring and pul-monary artery wedge pressure monitoring using the corresponding codes. Then we analyzedthe data to find the total number of cases of PAC use, the age and gender of patients and theindications for PAC use.
26th ESICM ANNUAL CONGRESS — PARIS, FRANCE — 5–9 OCTOBER 2013
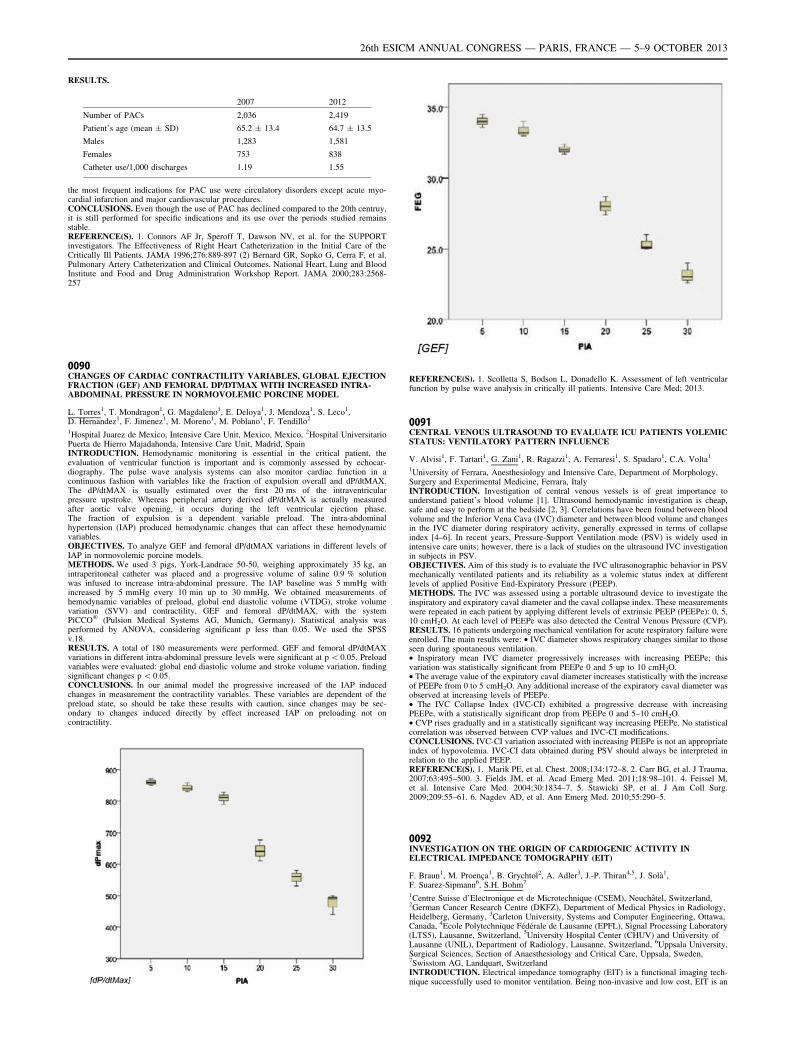
RESULTS.
2007 2012
Number of PACs 2,036 2,419
Patient’s age (mean ± SD) 65.2 ± 13.4 64.7 ± 13.5
Males 1,283 1,581
Females 753 838
Catheter use/1,000 discharges 1.19 1.55
the most frequent indications for PAC use were circulatory disorders except acute myo-cardial infarction and major cardiovascular procedures.CONCLUSIONS. Even though the use of PAC has declined compared to the 20th centruy,it is still performed for specific indications and its use over the periods studied remainsstable.REFERENCE(S). 1. Connors AF Jr, Speroff T, Dawson NV, et al. for the SUPPORTinvestigators. The Effectiveness of Right Heart Catheterization in the Initial Care of theCritically Ill Patients. JAMA 1996;276:889-897 (2) Bernard GR, Sopko G, Cerra F, et al.Pulmonary Artery Catheterization and Clinical Outcomes. National Heart, Lung and BloodInstitute and Food and Drug Administration Workshop Report. JAMA 2000;283:2568-257
0090CHANGES OF CARDIAC CONTRACTILITY VARIABLES, GLOBAL EJECTIONFRACTION (GEF) AND FEMORAL DP/DTMAX WITH INCREASED INTRA-ABDOMINAL PRESSURE IN NORMOVOLEMIC PORCINE MODEL
L. Torres1, T. Mondragon1, G. Magdaleno1, E. Deloya1, J. Mendoza1, S. Leco1,D. Hernandez1, F. Jimenez1, M. Moreno1, M. Poblano1, F. Tendillo2
1Hospital Juarez de Mexico, Intensive Care Unit, Mexico, Mexico, 2Hospital UniversitarioPuerta de Hierro Majadahonda, Intensive Care Unit, Madrid, SpainINTRODUCTION. Hemodynamic monitoring is essential in the critical patient, theevaluation of ventricular function is important and is commonly assessed by echocar-diography. The pulse wave analysis systems can also monitor cardiac function in acontinuous fashion with variables like the fraction of expulsion overall and dP/dtMAX.The dP/dtMAX is usually estimated over the first 20 ms of the intraventricularpressure upstroke. Whereas peripheral artery derived dP/dtMAX is actually measuredafter aortic valve opening, it occurs during the left ventricular ejection phase.The fraction of expulsion is a dependent variable preload. The intra-abdominalhypertension (IAP) produced hemodynamic changes that can affect these hemodynamicvariables.OBJECTIVES. To analyze GEF and femoral dP/dtMAX variations in different levels ofIAP in normovolemic porcine models.METHODS. We used 3 pigs, York-Landrace 50-50, weighing approximately 35 kg, anintraperitoneal catheter was placed and a progressive volume of saline 0.9 % solutionwas infused to increase intra-abdominal pressure. The IAP baseline was 5 mmHg withincreased by 5 mmHg every 10 min up to 30 mmHg. We obtained measurements ofhemodynamic variables of preload, global end diastolic volume (VTDG), stroke volumevariation (SVV) and contractility, GEF and femoral dP/dtMAX, with the systemPiCCO� (Pulsion Medical Systems AG, Munich, Germany). Statistical analysis wasperformed by ANOVA, considering significant p less than 0.05. We used the SPSSv.18.RESULTS. A total of 180 measurements were performed. GEF and femoral dP/dtMAXvariations in different intra-abdominal pressure levels were significant at p \ 0.05. Preloadvariables were evaluated: global end diastolic volume and stroke volume variation, findingsignificant changes p \ 0.05.CONCLUSIONS. In our animal model the progressive increased of the IAP inducedchanges in measurement the contractility variables. These variables are dependent of thepreload state, so should be take these results with caution, since changes may be sec-ondary to changes induced directly by effect increased IAP on preloading not oncontractility.
REFERENCE(S). 1. Scolletta S, Bodson L, Donadello K. Assessment of left ventricularfunction by pulse wave analysis in critically ill patients. Intensive Care Med; 2013.
0091CENTRAL VENOUS ULTRASOUND TO EVALUATE ICU PATIENTS VOLEMICSTATUS: VENTILATORY PATTERN INFLUENCE
V. Alvisi1, F. Tartari1, G. Zani1, R. Ragazzi1, A. Ferraresi1, S. Spadaro1, C.A. Volta1
1University of Ferrara, Anesthesiology and Intensive Care, Department of Morphology,Surgery and Experimental Medicine, Ferrara, ItalyINTRODUCTION. Investigation of central venous vessels is of great importance tounderstand patient’s blood volume [1]. Ultrasound hemodynamic investigation is cheap,safe and easy to perform at the bedside [2, 3]. Correlations have been found between bloodvolume and the Inferior Vena Cava (IVC) diameter and between blood volume and changesin the IVC diameter during respiratory activity, generally expressed in terms of collapseindex [4–6]. In recent years, Pressure-Support Ventilation mode (PSV) is widely used inintensive care units; however, there is a lack of studies on the ultrasound IVC investigationin subjects in PSV.OBJECTIVES. Aim of this study is to evaluate the IVC ultrasonographic behavior in PSVmechanically ventilated patients and its reliability as a volemic status index at differentlevels of applied Positive End-Expiratory Pressure (PEEP).METHODS. The IVC was assessed using a portable ultrasound device to investigate theinspiratory and expiratory caval diameter and the caval collapse index. These measurementswere repeated in each patient by applying different levels of extrinsic PEEP (PEEPe): 0, 5,10 cmH2O. At each level of PEEPe was also detected the Central Venous Pressure (CVP).RESULTS. 16 patients undergoing mechanical ventilation for acute respiratory failure wereenrolled. The main results were: • IVC diameter shows respiratory changes similar to thoseseen during spontaneous ventilation.• Inspiratory mean IVC diameter progressively increases with increasing PEEPe; thisvariation was statistically significant from PEEPe 0 and 5 up to 10 cmH2O.• The average value of the expiratory caval diameter increases statistically with the increaseof PEEPe from 0 to 5 cmH2O. Any additional increase of the expiratory caval diameter wasobserved at increasing levels of PEEPe.• The IVC Collapse Index (IVC-CI) exhibited a progressive decrease with increasingPEEPe, with a statistically significant drop from PEEPe 0 and 5–10 cmH2O.• CVP rises gradually and in a statistically significant way increasing PEEPe. No statisticalcorrelation was observed between CVP values and IVC-CI modifications.CONCLUSIONS. IVC-CI variation associated with increasing PEEPe is not an appropriateindex of hypovolemia. IVC-CI data obtained during PSV should always be interpreted inrelation to the applied PEEP.REFERENCE(S). 1. Marik PE, et al. Chest. 2008;134:172–8. 2. Carr BG, et al. J Trauma.2007;63:495–500. 3. Fields JM, et al. Acad Emerg Med. 2011;18:98–101. 4. Feissel M,et al. Intensive Care Med. 2004;30:1834–7. 5. Stawicki SP, et al. J Am Coll Surg.2009;209:55–61. 6. Nagdev AD, et al. Ann Emerg Med. 2010;55:290–5.
0092INVESTIGATION ON THE ORIGIN OF CARDIOGENIC ACTIVITY INELECTRICAL IMPEDANCE TOMOGRAPHY (EIT)
F. Braun1, M. Proença1, B. Grychtol2, A. Adler3, J.-P. Thiran4,5, J. Solà1,F. Suarez-Sipmann6, S.H. Bohm7
1Centre Suisse d’Electronique et de Microtechnique (CSEM), Neuchâtel, Switzerland,2German Cancer Research Centre (DKFZ), Department of Medical Physics in Radiology,Heidelberg, Germany, 3Carleton University, Systems and Computer Engineering, Ottawa,Canada, 4Ecole Polytechnique Fédérale de Lausanne (EPFL), Signal Processing Laboratory(LTS5), Lausanne, Switzerland, 5University Hospital Center (CHUV) and University ofLausanne (UNIL), Department of Radiology, Lausanne, Switzerland, 6Uppsala University,Surgical Sciences, Section of Anaesthesiology and Critical Care, Uppsala, Sweden,7Swisstom AG, Landquart, SwitzerlandINTRODUCTION. Electrical impedance tomography (EIT) is a functional imaging tech-nique successfully used to monitor ventilation. Being non-invasive and low cost, EIT is an
26th ESICM ANNUAL CONGRESS — PARIS, FRANCE — 5–9 OCTOBER 2013
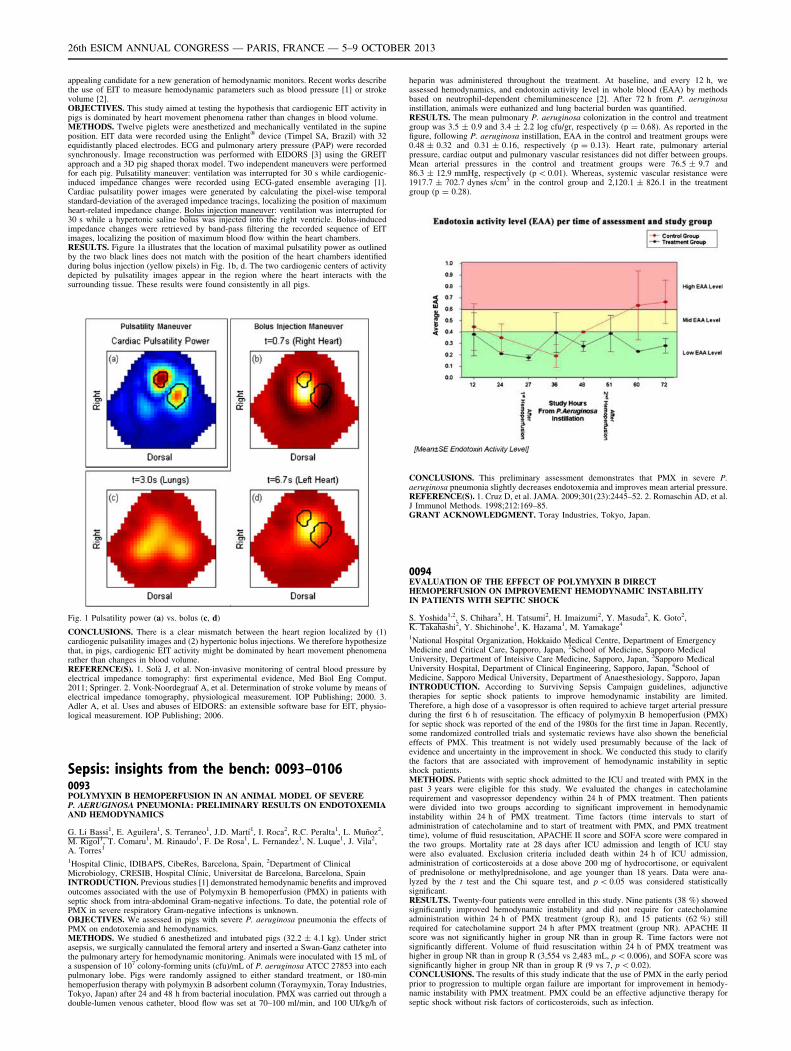
appealing candidate for a new generation of hemodynamic monitors. Recent works describethe use of EIT to measure hemodynamic parameters such as blood pressure [1] or strokevolume [2].OBJECTIVES. This study aimed at testing the hypothesis that cardiogenic EIT activity inpigs is dominated by heart movement phenomena rather than changes in blood volume.METHODS. Twelve piglets were anesthetized and mechanically ventilated in the supineposition. EIT data were recorded using the Enlight� device (Timpel SA, Brazil) with 32equidistantly placed electrodes. ECG and pulmonary artery pressure (PAP) were recordedsynchronously. Image reconstruction was performed with EIDORS [3] using the GREITapproach and a 3D pig shaped thorax model. Two independent maneuvers were performedfor each pig. Pulsatility maneuver: ventilation was interrupted for 30 s while cardiogenic-induced impedance changes were recorded using ECG-gated ensemble averaging [1].Cardiac pulsatility power images were generated by calculating the pixel-wise temporalstandard-deviation of the averaged impedance tracings, localizing the position of maximumheart-related impedance change. Bolus injection maneuver: ventilation was interrupted for30 s while a hypertonic saline bolus was injected into the right ventricle. Bolus-inducedimpedance changes were retrieved by band-pass filtering the recorded sequence of EITimages, localizing the position of maximum blood flow within the heart chambers.RESULTS. Figure 1a illustrates that the location of maximal pulsatility power as outlinedby the two black lines does not match with the position of the heart chambers identifiedduring bolus injection (yellow pixels) in Fig. 1b, d. The two cardiogenic centers of activitydepicted by pulsatility images appear in the region where the heart interacts with thesurrounding tissue. These results were found consistently in all pigs.
Fig. 1 Pulsatility power (a) vs. bolus (c, d)
CONCLUSIONS. There is a clear mismatch between the heart region localized by (1)cardiogenic pulsatility images and (2) hypertonic bolus injections. We therefore hypothesizethat, in pigs, cardiogenic EIT activity might be dominated by heart movement phenomenarather than changes in blood volume.REFERENCE(S). 1. Solà J, et al. Non-invasive monitoring of central blood pressure byelectrical impedance tomography: first experimental evidence, Med Biol Eng Comput.2011; Springer. 2. Vonk-Noordegraaf A, et al. Determination of stroke volume by means ofelectrical impedance tomography, physiological measurement. IOP Publishing; 2000. 3.Adler A, et al. Uses and abuses of EIDORS: an extensible software base for EIT, physio-logical measurement. IOP Publishing; 2006.
Sepsis: insights from the bench: 0093–01060093POLYMYXIN B HEMOPERFUSION IN AN ANIMAL MODEL OF SEVEREP. AERUGINOSA PNEUMONIA: PRELIMINARY RESULTS ON ENDOTOXEMIAAND HEMODYNAMICS
G. Li Bassi1, E. Aguilera1, S. Terraneo1, J.D. Martı́1, I. Roca2, R.C. Peralta1, L. Muñoz2,M. Rigol1, T. Comaru1, M. Rinaudo1, F. De Rosa1, L. Fernandez1, N. Luque1, J. Vila2,A. Torres1
1Hospital Clinic, IDIBAPS, CibeRes, Barcelona, Spain, 2Department of ClinicalMicrobiology, CRESIB, Hospital Clı́nic, Universitat de Barcelona, Barcelona, SpainINTRODUCTION. Previous studies [1] demonstrated hemodynamic benefits and improvedoutcomes associated with the use of Polymyxin B hemoperfusion (PMX) in patients withseptic shock from intra-abdominal Gram-negative infections. To date, the potential role ofPMX in severe respiratory Gram-negative infections is unknown.OBJECTIVES. We assessed in pigs with severe P. aeruginosa pneumonia the effects ofPMX on endotoxemia and hemodynamics.METHODS. We studied 6 anesthetized and intubated pigs (32.2 ± 4.1 kg). Under strictasepsis, we surgically cannulated the femoral artery and inserted a Swan-Ganz catheter intothe pulmonary artery for hemodynamic monitoring. Animals were inoculated with 15 mL ofa suspension of 107 colony-forming units (cfu)/mL of P. aeruginosa ATCC 27853 into eachpulmonary lobe. Pigs were randomly assigned to either standard treatment, or 180-minhemoperfusion therapy with polymyxin B adsorbent column (Toraymyxin, Toray Industries,Tokyo, Japan) after 24 and 48 h from bacterial inoculation. PMX was carried out through adouble-lumen venous catheter, blood flow was set at 70–100 ml/min, and 100 UI/kg/h of
heparin was administered throughout the treatment. At baseline, and every 12 h, weassessed hemodynamics, and endotoxin activity level in whole blood (EAA) by methodsbased on neutrophil-dependent chemiluminescence [2]. After 72 h from P. aeruginosainstillation, animals were euthanized and lung bacterial burden was quantified.RESULTS. The mean pulmonary P. aeruginosa colonization in the control and treatmentgroup was 3.5 ± 0.9 and 3.4 ± 2.2 log cfu/gr, respectively (p = 0.68). As reported in thefigure, following P. aeruginosa instillation, EAA in the control and treatment groups were0.48 ± 0.32 and 0.31 ± 0.16, respectively (p = 0.13). Heart rate, pulmonary arterialpressure, cardiac output and pulmonary vascular resistances did not differ between groups.Mean arterial pressures in the control and treatment groups were 76.5 ± 9.7 and86.3 ± 12.9 mmHg, respectively (p \ 0.01). Whereas, systemic vascular resistance were1917.7 ± 702.7 dynes s/cm5 in the control group and 2,120.1 ± 826.1 in the treatmentgroup (p = 0.28).
CONCLUSIONS. This preliminary assessment demonstrates that PMX in severe P.aeruginosa pneumonia slightly decreases endotoxemia and improves mean arterial pressure.REFERENCE(S). 1. Cruz D, et al. JAMA. 2009;301(23):2445–52. 2. Romaschin AD, et al.J Immunol Methods. 1998;212:169–85.GRANT ACKNOWLEDGMENT. Toray Industries, Tokyo, Japan.
0094EVALUATION OF THE EFFECT OF POLYMYXIN B DIRECTHEMOPERFUSION ON IMPROVEMENT HEMODYNAMIC INSTABILITYIN PATIENTS WITH SEPTIC SHOCK
S. Yoshida1,2, S. Chihara3, H. Tatsumi2, H. Imaizumi2, Y. Masuda2, K. Goto2,K. Takahashi2, Y. Shichinohe1, K. Hazama1, M. Yamakage4
1National Hospital Organization, Hokkaido Medical Centre, Department of EmergencyMedicine and Critical Care, Sapporo, Japan, 2School of Medicine, Sapporo MedicalUniversity, Department of Inteisive Care Medicine, Sapporo, Japan, 3Sapporo MedicalUniversity Hospital, Department of Clinical Engineering, Sapporo, Japan, 4School ofMedicine, Sapporo Medical University, Department of Anaesthesiology, Sapporo, JapanINTRODUCTION. According to Surviving Sepsis Campaign guidelines, adjunctivetherapies for septic shock patients to improve hemodynamic instability are limited.Therefore, a high dose of a vasopressor is often required to achieve target arterial pressureduring the first 6 h of resuscitation. The efficacy of polymyxin B hemoperfusion (PMX)for septic shock was reported of the end of the 1980s for the first time in Japan. Recently,some randomized controlled trials and systematic reviews have also shown the beneficialeffects of PMX. This treatment is not widely used presumably because of the lack ofevidence and uncertainty in the improvement in shock. We conducted this study to clarifythe factors that are associated with improvement of hemodynamic instability in septicshock patients.METHODS. Patients with septic shock admitted to the ICU and treated with PMX in thepast 3 years were eligible for this study. We evaluated the changes in catecholaminerequirement and vasopressor dependency within 24 h of PMX treatment. Then patientswere divided into two groups according to significant improvement in hemodynamicinstability within 24 h of PMX treatment. Time factors (time intervals to start ofadministration of catecholamine and to start of treatment with PMX, and PMX treatmenttime), volume of fluid resuscitation, APACHE II score and SOFA score were compared inthe two groups. Mortality rate at 28 days after ICU admission and length of ICU staywere also evaluated. Exclusion criteria included death within 24 h of ICU admission,administration of corticosteroids at a dose above 200 mg of hydrocortisone, or equivalentof prednisolone or methylprednisolone, and age younger than 18 years. Data were ana-lyzed by the t test and the Chi square test, and p \ 0.05 was considered statisticallysignificant.RESULTS. Twenty-four patients were enrolled in this study. Nine patients (38 %) showedsignificantly improved hemodynamic instability and did not require for catecholamineadministration within 24 h of PMX treatment (group R), and 15 patients (62 %) stillrequired for catecholamine support 24 h after PMX treatment (group NR). APACHE IIscore was not significantly higher in group NR than in group R. Time factors were notsignificantly different. Volume of fluid resuscitation within 24 h of PMX treatment washigher in group NR than in group R (3,554 vs 2,483 mL, p \ 0.006), and SOFA score wassignificantly higher in group NR than in group R (9 vs 7, p \ 0.02).CONCLUSIONS. The results of this study indicate that the use of PMX in the early periodprior to progression to multiple organ failure are important for improvement in hemody-namic instability with PMX treatment. PMX could be an effective adjunctive therapy forseptic shock without risk factors of corticosteroids, such as infection.
26th ESICM ANNUAL CONGRESS — PARIS, FRANCE — 5–9 OCTOBER 2013
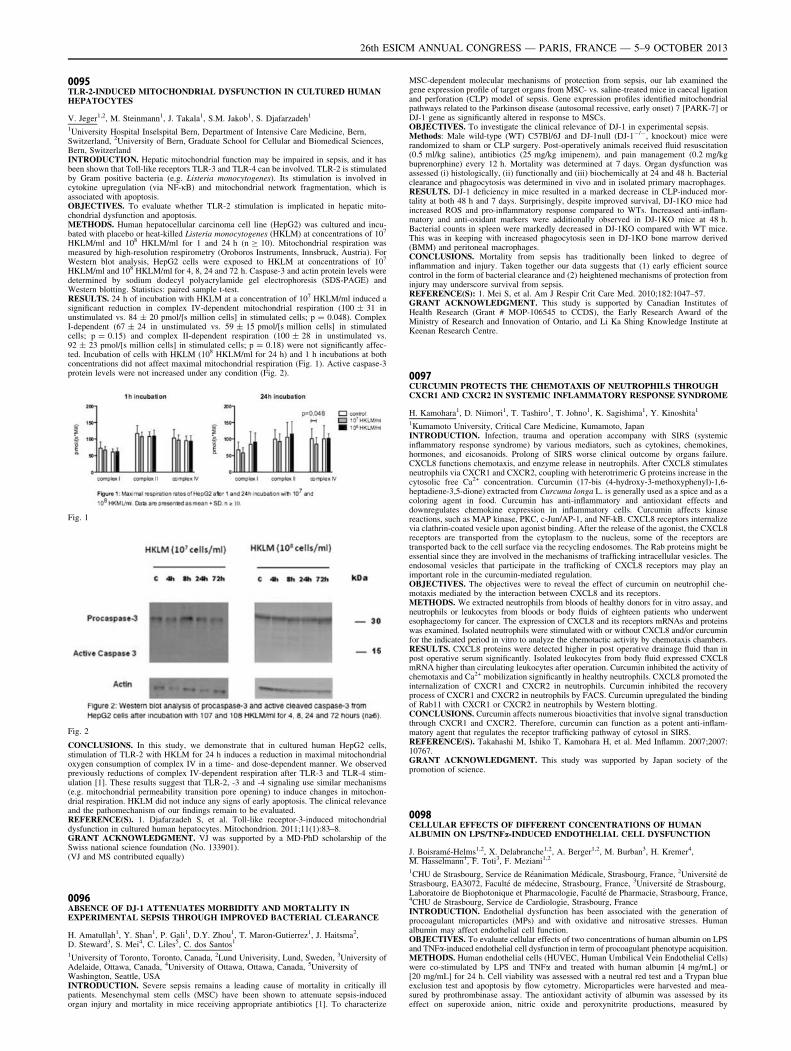
0095TLR-2-INDUCED MITOCHONDRIAL DYSFUNCTION IN CULTURED HUMANHEPATOCYTES
V. Jeger1,2, M. Steinmann1, J. Takala1, S.M. Jakob1, S. Djafarzadeh1
1University Hospital Inselspital Bern, Department of Intensive Care Medicine, Bern,Switzerland, 2University of Bern, Graduate School for Cellular and Biomedical Sciences,Bern, SwitzerlandINTRODUCTION. Hepatic mitochondrial function may be impaired in sepsis, and it hasbeen shown that Toll-like receptors TLR-3 and TLR-4 can be involved. TLR-2 is stimulatedby Gram positive bacteria (e.g. Listeria monocytogenes). Its stimulation is involved incytokine upregulation (via NF-jB) and mitochondrial network fragmentation, which isassociated with apoptosis.OBJECTIVES. To evaluate whether TLR-2 stimulation is implicated in hepatic mito-chondrial dysfunction and apoptosis.METHODS. Human hepatocellular carcinoma cell line (HepG2) was cultured and incu-bated with placebo or heat-killed Listeria monocytogenes (HKLM) at concentrations of 107
HKLM/ml and 108 HKLM/ml for 1 and 24 h (n C 10). Mitochondrial respiration wasmeasured by high-resolution respirometry (Oroboros Instruments, Innsbruck, Austria). ForWestern blot analysis, HepG2 cells were exposed to HKLM at concentrations of 107
HKLM/ml and 108 HKLM/ml for 4, 8, 24 and 72 h. Caspase-3 and actin protein levels weredetermined by sodium dodecyl polyacrylamide gel electrophoresis (SDS-PAGE) andWestern blotting. Statistics: paired sample t-test.RESULTS. 24 h of incubation with HKLM at a concentration of 107 HKLM/ml induced asignificant reduction in complex IV-dependent mitochondrial respiration (100 ± 31 inunstimulated vs. 84 ± 20 pmol/[s million cells] in stimulated cells; p = 0.048). ComplexI-dependent (67 ± 24 in unstimulated vs. 59 ± 15 pmol/[s million cells] in stimulatedcells; p = 0.15) and complex II-dependent respiration (100 ± 28 in unstimulated vs.92 ± 23 pmol/[s million cells] in stimulated cells; p = 0.18) were not significantly affec-ted. Incubation of cells with HKLM (108 HKLM/ml for 24 h) and 1 h incubations at bothconcentrations did not affect maximal mitochondrial respiration (Fig. 1). Active caspase-3protein levels were not increased under any condition (Fig. 2).
Fig. 1
Fig. 2
CONCLUSIONS. In this study, we demonstrate that in cultured human HepG2 cells,stimulation of TLR-2 with HKLM for 24 h induces a reduction in maximal mitochondrialoxygen consumption of complex IV in a time- and dose-dependent manner. We observedpreviously reductions of complex IV-dependent respiration after TLR-3 and TLR-4 stim-ulation [1]. These results suggest that TLR-2, -3 and -4 signaling use similar mechanisms(e.g. mitochondrial permeability transition pore opening) to induce changes in mitochon-drial respiration. HKLM did not induce any signs of early apoptosis. The clinical relevanceand the pathomechanism of our findings remain to be evaluated.REFERENCE(S). 1. Djafarzadeh S, et al. Toll-like receptor-3-induced mitochondrialdysfunction in cultured human hepatocytes. Mitochondrion. 2011;11(1):83–8.GRANT ACKNOWLEDGMENT. VJ was supported by a MD-PhD scholarship of theSwiss national science foundation (No. 133901).(VJ and MS contributed equally)
0096ABSENCE OF DJ-1 ATTENUATES MORBIDITY AND MORTALITY INEXPERIMENTAL SEPSIS THROUGH IMPROVED BACTERIAL CLEARANCE
H. Amatullah1, Y. Shan1, P. Gali1, D.Y. Zhou1, T. Maron-Gutierrez1, J. Haitsma2,D. Steward3, S. Mei4, C. Liles5, C. dos Santos1
1University of Toronto, Toronto, Canada, 2Lund Univerisity, Lund, Sweden, 3University ofAdelaide, Ottawa, Canada, 4University of Ottawa, Ottawa, Canada, 5University ofWashington, Seattle, USAINTRODUCTION. Severe sepsis remains a leading cause of mortality in critically illpatients. Mesenchymal stem cells (MSC) have been shown to attenuate sepsis-inducedorgan injury and mortality in mice receiving appropriate antibiotics [1]. To characterize
MSC-dependent molecular mechanisms of protection from sepsis, our lab examined thegene expression profile of target organs from MSC- vs. saline-treated mice in caecal ligationand perforation (CLP) model of sepsis. Gene expression profiles identified mitochondrialpathways related to the Parkinson disease (autosomal recessive, early onset) 7 [PARK-7] orDJ-1 gene as significantly altered in response to MSCs.OBJECTIVES. To investigate the clinical relevance of DJ-1 in experimental sepsis.Methods: Male wild-type (WT) C57Bl/6J and DJ-1null (DJ-1-/-, knockout) mice wererandomized to sham or CLP surgery. Post-operatively animals received fluid resuscitation(0.5 ml/kg saline), antibiotics (25 mg/kg imipenem), and pain management (0.2 mg/kgbuprenorphine) every 12 h. Mortality was determined at 7 days. Organ dysfunction wasassessed (i) histologically, (ii) functionally and (iii) biochemically at 24 and 48 h. Bacterialclearance and phagocytosis was determined in vivo and in isolated primary macrophages.RESULTS. DJ-1 deficiency in mice resulted in a marked decrease in CLP-induced mor-tality at both 48 h and 7 days. Surprisingly, despite improved survival, DJ-1KO mice hadincreased ROS and pro-inflammatory response compared to WTs. Increased anti-inflam-matory and anti-oxidant markers were additionally observed in DJ-1KO mice at 48 h.Bacterial counts in spleen were markedly decreased in DJ-1KO compared with WT mice.This was in keeping with increased phagocytosis seen in DJ-1KO bone marrow derived(BMM) and peritoneal macrophages.CONCLUSIONS. Mortality from sepsis has traditionally been linked to degree ofinflammation and injury. Taken together our data suggests that (1) early efficient sourcecontrol in the form of bacterial clearance and (2) heightened mechanisms of protection frominjury may underscore survival from sepsis.REFERENCE(S): 1. Mei S, et al. Am J Respir Crit Care Med. 2010;182:1047–57.GRANT ACKNOWLEDGMENT. This study is supported by Canadian Institutes ofHealth Research (Grant # MOP-106545 to CCDS), the Early Research Award of theMinistry of Research and Innovation of Ontario, and Li Ka Shing Knowledge Institute atKeenan Research Centre.
0097CURCUMIN PROTECTS THE CHEMOTAXIS OF NEUTROPHILS THROUGHCXCR1 AND CXCR2 IN SYSTEMIC INFLAMMATORY RESPONSE SYNDROME
H. Kamohara1, D. Niimori1, T. Tashiro1, T. Johno1, K. Sagishima1, Y. Kinoshita1
1Kumamoto University, Critical Care Medicine, Kumamoto, JapanINTRODUCTION. Infection, trauma and operation accompany with SIRS (systemicinflammatory response syndrome) by various mediators, such as cytokines, chemokines,hormones, and eicosanoids. Prolong of SIRS worse clinical outcome by organs failure.CXCL8 functions chemotaxis, and enzyme release in neutrophils. After CXCL8 stimulatesneutrophils via CXCR1 and CXCR2, coupling with heterotrimeric G proteins increase in thecytosolic free Ca2+ concentration. Curcumin (17-bis (4-hydroxy-3-methoxyphenyl)-1,6-heptadiene-3,5-dione) extracted from Curcuma longa L. is generally used as a spice and as acoloring agent in food. Curcumin has anti-inflammatory and antioxidant effects anddownregulates chemokine expression in inflammatory cells. Curcumin affects kinasereactions, such as MAP kinase, PKC, c-Jun/AP-1, and NF-kB. CXCL8 receptors internalizevia clathrin-coated vesicle upon agonist binding. After the release of the agonist, the CXCL8receptors are transported from the cytoplasm to the nucleus, some of the receptors aretransported back to the cell surface via the recycling endosomes. The Rab proteins might beessential since they are involved in the mechanisms of trafficking intracellular vesicles. Theendosomal vesicles that participate in the trafficking of CXCL8 receptors may play animportant role in the curcumin-mediated regulation.OBJECTIVES. The objectives were to reveal the effect of curcumin on neutrophil che-motaxis mediated by the interaction between CXCL8 and its receptors.METHODS. We extracted neutrophils from bloods of healthy donors for in vitro assay, andneutrophils or leukocytes from bloods or body fluids of eighteen patients who underwentesophagectomy for cancer. The expression of CXCL8 and its receptors mRNAs and proteinswas examined. Isolated neutrophils were stimulated with or without CXCL8 and/or curcuminfor the indicated period in vitro to analyze the chemotactic activity by chemotaxis chambers.RESULTS. CXCL8 proteins were detected higher in post operative drainage fluid than inpost operative serum significantly. Isolated leukocytes from body fluid expressed CXCL8mRNA higher than circulating leukocytes after operation. Curcumin inhibited the activity ofchemotaxis and Ca2+ mobilization significantly in healthy neutrophils. CXCL8 promoted theinternalization of CXCR1 and CXCR2 in neutrophils. Curcumin inhibited the recoveryprocess of CXCR1 and CXCR2 in neutrophils by FACS. Curcumin upregulated the bindingof Rab11 with CXCR1 or CXCR2 in neutrophils by Western blotting.CONCLUSIONS. Curcumin affects numerous bioactivities that involve signal transductionthrough CXCR1 and CXCR2. Therefore, curcumin can function as a potent anti-inflam-matory agent that regulates the receptor trafficking pathway of cytosol in SIRS.REFERENCE(S). Takahashi M, Ishiko T, Kamohara H, et al. Med Inflamm. 2007;2007:10767.GRANT ACKNOWLEDGMENT. This study was supported by Japan society of thepromotion of science.
0098CELLULAR EFFECTS OF DIFFERENT CONCENTRATIONS OF HUMANALBUMIN ON LPS/TNFa-INDUCED ENDOTHELIAL CELL DYSFUNCTION
J. Boisramé-Helms1,2, X. Delabranche1,2, A. Berger1,2, M. Burban3, H. Kremer4,M. Hasselmann1, F. Toti3, F. Meziani1,2
1CHU de Strasbourg, Service de Réanimation Médicale, Strasbourg, France, 2Université deStrasbourg, EA3072, Faculté de médecine, Strasbourg, France, 3Université de Strasbourg,Laboratoire de Biophotonique et Pharmacologie, Faculté de Pharmacie, Strasbourg, France,4CHU de Strasbourg, Service de Cardiologie, Strasbourg, FranceINTRODUCTION. Endothelial dysfunction has been associated with the generation ofprocoagulant microparticles (MPs) and with oxidative and nitrosative stresses. Humanalbumin may affect endothelial cell function.OBJECTIVES. To evaluate cellular effects of two concentrations of human albumin on LPSand TNFa-induced endothelial cell dysfunction in term of procoagulant phenotype acquisition.METHODS. Human endothelial cells (HUVEC, Human Umbilical Vein Endothelial Cells)were co-stimulated by LPS and TNFa and treated with human albumin [4 mg/mL] or[20 mg/mL] for 24 h. Cell viability was assessed with a neutral red test and a Trypan blueexclusion test and apoptosis by flow cytometry. Microparticles were harvested and mea-sured by prothrombinase assay. The antioxidant activity of albumin was assessed by itseffect on superoxide anion, nitric oxide and peroxynitrite productions, measured by
26th ESICM ANNUAL CONGRESS — PARIS, FRANCE — 5–9 OCTOBER 2013
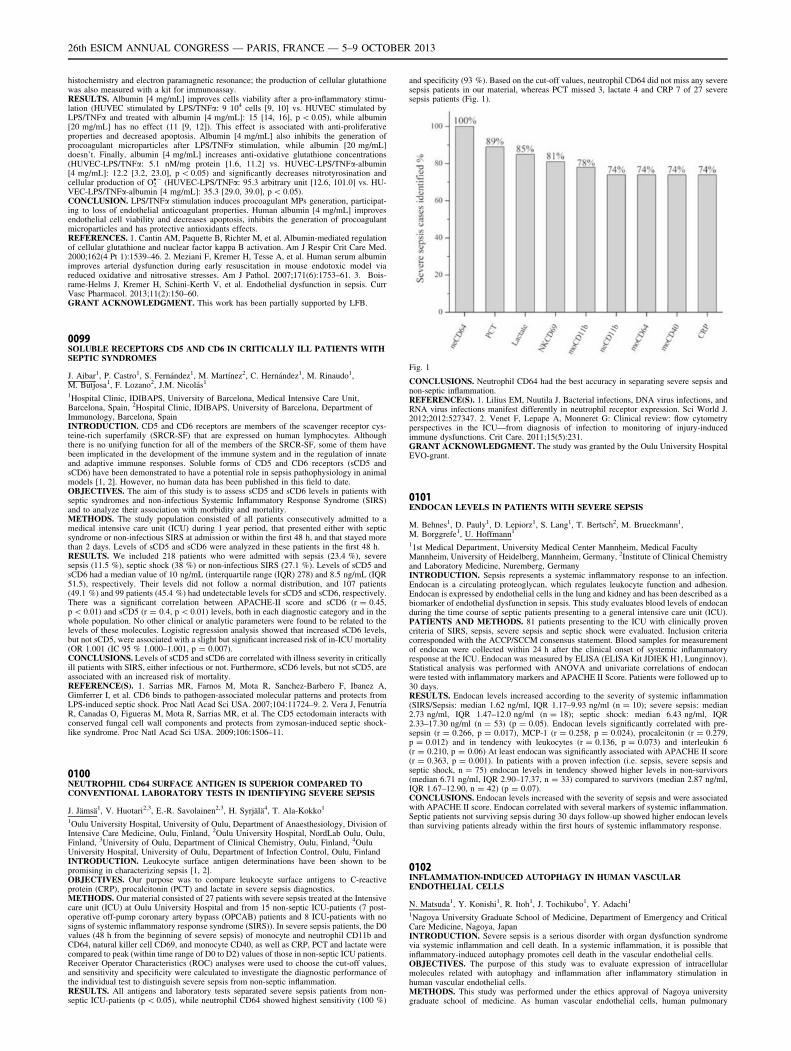
histochemistry and electron paramagnetic resonance; the production of cellular glutathionewas also measured with a kit for immunoassay.RESULTS. Albumin [4 mg/mL] improves cells viability after a pro-inflammatory stimu-lation (HUVEC stimulated by LPS/TNFa: 9 104 cells [9, 10] vs. HUVEC stimulated byLPS/TNFa and treated with albumin [4 mg/mL]: 15 [14, 16], p \ 0.05), while albumin[20 mg/mL] has no effect (11 [9, 12]). This effect is associated with anti-proliferativeproperties and decreased apoptosis. Albumin [4 mg/mL] also inhibits the generation ofprocoagulant microparticles after LPS/TNFa stimulation, while albumin [20 mg/mL]doesn’t. Finally, albumin [4 mg/mL] increases anti-oxidative glutathione concentrations(HUVEC-LPS/TNFa: 5.1 nM/mg protein [1.6, 11.2] vs. HUVEC-LPS/TNFa-albumin[4 mg/mL]: 12.2 [3.2, 23.0], p \ 0.05) and significantly decreases nitrotyrosination andcellular production of O2
•- (HUVEC-LPS/TNFa: 95.3 arbitrary unit [12.6, 101.0] vs. HU-VEC-LPS/TNFa-albumin [4 mg/mL]: 35.3 [29.0, 39.0], p \ 0.05).CONCLUSION. LPS/TNFa stimulation induces procoagulant MPs generation, participat-ing to loss of endothelial anticoagulant properties. Human albumin [4 mg/mL] improvesendothelial cell viability and decreases apoptosis, inhibits the generation of procoagulantmicroparticles and has protective antioxidants effects.REFERENCES. 1. Cantin AM, Paquette B, Richter M, et al. Albumin-mediated regulationof cellular glutathione and nuclear factor kappa B activation. Am J Respir Crit Care Med.2000;162(4 Pt 1):1539–46. 2. Meziani F, Kremer H, Tesse A, et al. Human serum albuminimproves arterial dysfunction during early resuscitation in mouse endotoxic model viareduced oxidative and nitrosative stresses. Am J Pathol. 2007;171(6):1753–61. 3. Bois-rame-Helms J, Kremer H, Schini-Kerth V, et al. Endothelial dysfunction in sepsis. CurrVasc Pharmacol. 2013;11(2):150–60.GRANT ACKNOWLEDGMENT. This work has been partially supported by LFB.
0099SOLUBLE RECEPTORS CD5 AND CD6 IN CRITICALLY ILL PATIENTS WITHSEPTIC SYNDROMES
J. Aibar1, P. Castro1, S. Fernández1, M. Martı́nez2, C. Hernández1, M. Rinaudo1,M. Butjosa1, F. Lozano2, J.M. Nicolás1
1Hospital Clinic, IDIBAPS, University of Barcelona, Medical Intensive Care Unit,Barcelona, Spain, 2Hospital Clinic, IDIBAPS, University of Barcelona, Department ofImmunology, Barcelona, SpainINTRODUCTION. CD5 and CD6 receptors are members of the scavenger receptor cys-teine-rich superfamily (SRCR-SF) that are expressed on human lymphocytes. Althoughthere is no unifying function for all of the members of the SRCR-SF, some of them havebeen implicated in the development of the immune system and in the regulation of innateand adaptive immune responses. Soluble forms of CD5 and CD6 receptors (sCD5 andsCD6) have been demonstrated to have a potential role in sepsis pathophysiology in animalmodels [1, 2]. However, no human data has been published in this field to date.OBJECTIVES. The aim of this study is to assess sCD5 and sCD6 levels in patients withseptic syndromes and non-infectious Systemic Inflammatory Response Syndrome (SIRS)and to analyze their association with morbidity and mortality.METHODS. The study population consisted of all patients consecutively admitted to amedical intensive care unit (ICU) during 1 year period, that presented either with septicsyndrome or non-infectious SIRS at admission or within the first 48 h, and that stayed morethan 2 days. Levels of sCD5 and sCD6 were analyzed in these patients in the first 48 h.RESULTS. We included 218 patients who were admitted with sepsis (23.4 %), severesepsis (11.5 %), septic shock (38 %) or non-infectious SIRS (27.1 %). Levels of sCD5 andsCD6 had a median value of 10 ng/mL (interquartile range (IQR) 278) and 8.5 ng/mL (IQR51.5), respectively. Their levels did not follow a normal distribution, and 107 patients(49.1 %) and 99 patients (45.4 %) had undetectable levels for sCD5 and sCD6, respectively.There was a significant correlation between APACHE-II score and sCD6 (r = 0.45,p \ 0.01) and sCD5 (r = 0.4, p \ 0.01) levels, both in each diagnostic category and in thewhole population. No other clinical or analytic parameters were found to be related to thelevels of these molecules. Logistic regression analysis showed that increased sCD6 levels,but not sCD5, were associated with a slight but significant increased risk of in-ICU mortality(OR 1.001 (IC 95 % 1.000–1.001, p = 0.007).CONCLUSIONS. Levels of sCD5 and sCD6 are correlated with illness severity in criticallyill patients with SIRS, either infectious or not. Furthermore, sCD6 levels, but not sCD5, areassociated with an increased risk of mortality.REFERENCE(S). 1. Sarrias MR, Farnos M, Mota R, Sanchez-Barbero F, Ibanez A,Gimferrer I, et al. CD6 binds to pathogen-associated molecular patterns and protects fromLPS-induced septic shock. Proc Natl Acad Sci USA. 2007;104:11724–9. 2. Vera J, FenutriaR, Canadas O, Figueras M, Mota R, Sarrias MR, et al. The CD5 ectodomain interacts withconserved fungal cell wall components and protects from zymosan-induced septic shock-like syndrome. Proc Natl Acad Sci USA. 2009;106:1506–11.
0100NEUTROPHIL CD64 SURFACE ANTIGEN IS SUPERIOR COMPARED TOCONVENTIONAL LABORATORY TESTS IN IDENTIFYING SEVERE SEPSIS
J. Jämsä1, V. Huotari2,3, E.-R. Savolainen2,3, H. Syrjälä4, T. Ala-Kokko1
1Oulu University Hospital, University of Oulu, Department of Anaesthesiology, Division ofIntensive Care Medicine, Oulu, Finland, 2Oulu University Hospital, NordLab Oulu, Oulu,Finland, 3University of Oulu, Department of Clinical Chemistry, Oulu, Finland, 4OuluUniversity Hospital, University of Oulu, Department of Infection Control, Oulu, FinlandINTRODUCTION. Leukocyte surface antigen determinations have been shown to bepromising in characterizing sepsis [1, 2].OBJECTIVES. Our purpose was to compare leukocyte surface antigens to C-reactiveprotein (CRP), procalcitonin (PCT) and lactate in severe sepsis diagnostics.METHODS. Our material consisted of 27 patients with severe sepsis treated at the Intensivecare unit (ICU) at Oulu University Hospital and from 15 non-septic ICU-patients (7 post-operative off-pump coronary artery bypass (OPCAB) patients and 8 ICU-patients with nosigns of systemic inflammatory response syndrome (SIRS)). In severe sepsis patients, the D0values (48 h from the beginning of severe sepsis) of monocyte and neutrophil CD11b andCD64, natural killer cell CD69, and monocyte CD40, as well as CRP, PCT and lactate werecompared to peak (within time range of D0 to D2) values of those in non-septic ICU patients.Receiver Operator Characteristics (ROC) analyses were used to choose the cut-off values,and sensitivity and specificity were calculated to investigate the diagnostic performance ofthe individual test to distinguish severe sepsis from non-septic inflammation.RESULTS. All antigens and laboratory tests separated severe sepsis patients from non-septic ICU-patients (p \ 0.05), while neutrophil CD64 showed highest sensitivity (100 %)
and specificity (93 %). Based on the cut-off values, neutrophil CD64 did not miss any severesepsis patients in our material, whereas PCT missed 3, lactate 4 and CRP 7 of 27 severesepsis patients (Fig. 1).
Fig. 1
CONCLUSIONS. Neutrophil CD64 had the best accuracy in separating severe sepsis andnon-septic inflammation.REFERENCE(S). 1. Lilius EM, Nuutila J. Bacterial infections, DNA virus infections, andRNA virus infections manifest differently in neutrophil receptor expression. Sci World J.2012;2012:527347. 2. Venet F, Lepape A, Monneret G: Clinical review: flow cytometryperspectives in the ICU—from diagnosis of infection to monitoring of injury-inducedimmune dysfunctions. Crit Care. 2011;15(5):231.GRANT ACKNOWLEDGMENT. The study was granted by the Oulu University HospitalEVO-grant.
0101ENDOCAN LEVELS IN PATIENTS WITH SEVERE SEPSIS
M. Behnes1, D. Pauly1, D. Lepiorz1, S. Lang1, T. Bertsch2, M. Brueckmann1,M. Borggrefe1, U. Hoffmann1
11st Medical Department, University Medical Center Mannheim, Medical FacultyMannheim, University of Heidelberg, Mannheim, Germany, 2Institute of Clinical Chemistryand Laboratory Medicine, Nuremberg, GermanyINTRODUCTION. Sepsis represents a systemic inflammatory response to an infection.Endocan is a circulating proteoglycan, which regulates leukocyte function and adhesion.Endocan is expressed by endothelial cells in the lung and kidney and has been described as abiomarker of endothelial dysfunction in sepsis. This study evaluates blood levels of endocanduring the time course of septic patients presenting to a general intensive care unit (ICU).PATIENTS AND METHODS. 81 patients presenting to the ICU with clinically provencriteria of SIRS, sepsis, severe sepsis and septic shock were evaluated. Inclusion criteriacorresponded with the ACCP/SCCM consensus statement. Blood samples for measurementof endocan were collected within 24 h after the clinical onset of systemic inflammatoryresponse at the ICU. Endocan was measured by ELISA (ELISA Kit JDIEK H1, Lunginnov).Statistical analysis was performed with ANOVA and univariate correlations of endocanwere tested with inflammatory markers and APACHE II Score. Patients were followed up to30 days.RESULTS. Endocan levels increased according to the severity of systemic inflammation(SIRS/Sepsis: median 1.62 ng/ml, IQR 1.17–9.93 ng/ml (n = 10); severe sepsis: median2.73 ng/ml, IQR 1.47–12.0 ng/ml (n = 18); septic shock: median 6.43 ng/ml, IQR2.33–17.30 ng/ml (n = 53) (p = 0.05). Endocan levels significantly correlated with pre-sepsin (r = 0.266, p = 0.017), MCP-1 (r = 0.258, p = 0.024), procalcitonin (r = 0.279,p = 0.012) and in tendency with leukocytes (r = 0.136, p = 0.073) and interleukin 6(r = 0.210, p = 0.06) At least endocan was significantly associated with APACHE II score(r = 0.363, p = 0.001). In patients with a proven infection (i.e. sepsis, severe sepsis andseptic shock, n = 75) endocan levels in tendency showed higher levels in non-survivors(median 6.71 ng/ml, IQR 2.90–17.37, n = 33) compared to survivors (median 2.87 ng/ml,IQR 1.67–12.90, n = 42) (p = 0.07).CONCLUSIONS. Endocan levels increased with the severity of sepsis and were associatedwith APACHE II score. Endocan correlated with several markers of systemic inflammation.Septic patients not surviving sepsis during 30 days follow-up showed higher endocan levelsthan surviving patients already within the first hours of systemic inflammatory response.
0102INFLAMMATION-INDUCED AUTOPHAGY IN HUMAN VASCULARENDOTHELIAL CELLS
N. Matsuda1, Y. Konishi1, R. Itoh1, J. Tochikubo1, Y. Adachi1
1Nagoya University Graduate School of Medicine, Department of Emergency and CriticalCare Medicine, Nagoya, JapanINTRODUCTION. Severe sepsis is a serious disorder with organ dysfunction syndromevia systemic inflammation and cell death. In a systemic inflammation, it is possible thatinflammatory-induced autophagy promotes cell death in the vascular endothelial cells.OBJECTIVES. The purpose of this study was to evaluate expression of intracellularmolecules related with autophagy and inflammation after inflammatory stimulation inhuman vascular endothelial cells.METHODS. This study was performed under the ethics approval of Nagoya universitygraduate school of medicine. As human vascular endothelial cells, human pulmonary
26th ESICM ANNUAL CONGRESS — PARIS, FRANCE — 5–9 OCTOBER 2013
endothelial cells (HPAEC) and human umbilical vein endothelial cells (HUVEC) wereseparately stimulated with tumor necrosis factor-a (TNFa; 10–100 ng/mL) or lipopoly-saccharide (LPS; 10–100 lg/mL) for 15, 30, 60 min and 4 h. The cells were evaluated byquantitative PCR and electron microscope imaging. The densitometric comparisons weremade using one-way analysis of variance followed by Tukey’s multiple comparison test.Differences were considered significant when P values were \0.05.RESULTS. In HPAEC culture, autophagy-related gene transcription especially in ATG5,ATG12 and LC3 was time-dependently and significantly increased by 2.07 ± 0.28,3.02 ± 0.52, 6.30 ± 0.50-fold, respectively, after stimulation of 100 lg/mL LPS. MyD88,p38 and FADD in inflammation-related gene significantly increased transcriptional activityby 1.87 ± 0.28, 2.67 ± 0.46, 2.94 ± 0.20-fold at 15 min after 100 lg/mL LPS stimulation,respectively. On the other hand, 100 ng/mL TNFa stimulation increased the transcription ofTNFR1, MyD88, FOS and c-JUN by 125.23 ± 4.95, 2.15 ± 0.26, 316.02 ± 60.16,12.5 ± 0.86-fold, respectively. Weibel–Palade bodies which could promote hypercoagula-tion in injured vascular endothelium was increased in HPAEC at 4 h after the TNFastimulation. Electron microscope imaging revealed the increased number of autophagosomeand Weibel–Palade body in HPAEC. Inflammatory and autophagy-related moleculesshowed the same expression pattern after LPS and TNFa stimulation in HUVEC culture.CONCLUSIONS. This study showed that inflammatory stimulation such as LPS and TNFacould induce transcriptional activation of autophagy-related gene family including ATG5,ATG12 and LC3 in human vascular endothelial cells. Inflammation could induce auto-phagosome formation in vascular endothelial cells, which might induce amino acidtransformation for the translation of mRNA. We concluded that inflammation-inducedautophagy could occur in human vascular endothelial cells.
0103HEAT SHOCK PROTEIN 72 AND 90 INTRACELLULAR MONOCYTEEXPRESSION IN PATIENTS WITH SEPSIS OR SIRS. PRELIMINARY DATA*
K.T. Apostolou1, K. Psara2, E. Briassouli1, K. Vardas1, T. Tavladaki3, E. Mageira1,C. Routsi1, S. Nanas1, G. Briassoulis3
1National and Kapodistrian University of Athens, First Critical Care Department, Athens,Greece, 2Evangelismos General Hospital, Immunology-Histocompatibility Department,Athens, Greece, 3University of Crete/University Hospital, Pediatric Intensive Care Unit,Heraklion, GreeceINTRODUCTION. Heat shock proteins (HSP) have intracellular cytoprotective actions,while they act extracellularly as inducers of cytokines and stimulants for immune cellsduring stress. HSP72 is a cytosolic stress protein that is highly inducible by severe sepsis(SS). HSP90 assists in the activation of a wide range of client proteins, including manyinvolved in signaling and transcription by a mechanism dependent on its ability to bind andhydrolyze ATP.OBJECTIVES. So determine the intracellular levels of HSP72 and HSP90 in monocytes ofpatients with SS or systemic inflammatory response syndrome (SIRS) admitted to a generalintensive care unit (ICU), compared to those of healthy individuals; to correlate theirexpression with demographics and severity of illness.METHODS. Sixteen consecutively admitted patients with SS, 13 with SIRS, and 13 healthycontrol subjects (H) were enrolled in the study. Patients’ demographic characteristics,laboratory exams, Acute Physiology And Chronic Health Evaluation (APACHE) II and theSequential Organ Failure Assessment (SOFA) scores were recorded on admission. HSPslevels were determined after staining with surface antigens CD33- PE/Cy5 and CD45 PE/Cy7 followed by either HSP72-FITC or HSP90a-PE intracellular staining (4-colour FlowCytometry). Mean Fluorescence Intensity (MFI) values for each HSP were noted andanalyzed.RESULTS. Neither gender nor age affected the HSPs’ expression. Intracellular HSP72 MFIdiffered significantly among groups (p \ 0.04, Kruskal–Wallis), being higher in patientswith SIRS (26.7 ± 5) as compared to H group (15.4 ± 2) or SS patients (16.2 ± 2,p = 0.05 Mann–Whitney). HSP90 showed a non-significant higher trend in the SIRS(34 ± 8 pg/ml) compared to SS (21.6 ± 6) or H groups (17.6 ± 3). The HSP72 meanfluorescence intensity decreased in patients with high APACHE II scores (r = -0.446,p = 0.015).CONCLUSIONS. SIRS increased HSP72 and 90 expressions in monocytes, indicating aprotective function of HSP in monocytes during the acute phase of stress. The down-regulation of HSP-positive cells in patients with severe sepsis seems to be a result ofadaptation mechanisms to severity of illness.GRANT ACKNOWLEDGEMENT: This research has been co-financed by the EuropeanUnion (European Social Fund (ESF)) and Greek national funds through the OperationalProgram ‘‘Education and Lifelong Learning’’ of the National Strategic Reference Frame-work (NSRF)-Research Funding Program: THALES.*Part of the study ‘‘Heat shock proteins and glutamine alterations related to hormonal,immunological, inflammatory and molecular response to sepsis: A combined clinical andexperimental study’’.
0104HIGH FLUORESCENCE LYMPHOCYTES AND IMMATURE GRANULOCYTESAS EARLY MARKERS OF SEPSIS IN CRITICALLY ILL PATIENTS
B. Arneth1, K. Hommel2, S. Gehrisch3, G. Siegert3, M. Ragaller2
1University Hospital Dresden, Clinical Chemistry and Laboratory Medicine, Dresden,Germany, 2University Hospital Dresden, Anaesthesiology and Intensive Care Medicine,Dresden, Germany, 3University Hospital Dresden, Dresden, GermanyOBJECTIVES. The latest-generation XE5000 hematology analyzer records mature andrelated immature cell populations, such as neutrophils, immature granulocytes (IGs), andhigh fluorescence lymphocytes (HFLCs). In this study, the value of these new parameterswas examined with regard to the detection of immature cells in patients with sepsis in anintensive care unit.METHODS. In 38 patients of an anesthesiological/surgical intensive care unit, the newmarkers were measured in early morning whole blood samples using a XE5000 (SYSMEXEurope, Norderstedt).RESULTS. Twenty of 38 patients developed sepsis during their intensive care unit stay, 10patients developed a local infection. The numbers of IGs and HFLCs were significantlyhigher in patients with sepsis and infection versus those without evidence of infection(HFLC 0.021 ± 0.01 vs. 0.01 ± 0.01 Gpt/l, p \ 0.05; IG 0.45 ± 0.2 vs 0.018 ± 0.01 Gpt/l,p \ 0.01). Absolute IG value was a better measure of the severity of the infection or sepsis
than the relative value and the absolute value of HFLCs. ROC curves for the detection ofsepsis using IGs and/or HFLCs were generated. The highest AUC was found for absolute IGcounts (0.94).CONCLUSION. Absolute IG number has potential as marker for the early diagnosis ofsepsis in critically ill patients in the intensive care unit.Currently sepsis is usually diagnosed by biochemical markers rather lately. Using the newIG marker, sepsis patients might potentially be treated earlier and more effectively.
0105ENDOTHELIAL PROTEIN C RECEPTOR POLYMORPHISMS AND RISKOF SEVERE SEPSIS/SEPTIC SHOCK IN CRITICALLY-ILL PATIENTS
A. Vassiliou1, A. Kotanidou1,2, N.A. Maniatis1,3, M. Kallergi2, F. Karystinaki2, E. Letsiou1,C. Glynos1,2, E. Kourti2, P. Kopterides3, D. Vassiliadi3, N. Nikitas3, I. Dimopoulou1,3,A. Armaganidis1,3, S.E. Orfanos1,3
1Medical School of Athens University, Evangelismos Hospital, 1st Department of CriticalCare Medicine and Pulmonary Services, GP Livanos and M Simou Laboratories, Athens,Greece, 2Medical School of Athens University, Evangelismos Hospital, 1st Department ofCritical Care Medicine and Pulmonary Services, Athens, Greece, 3Medical School of AthensUniversity, Attikon Hospital, 2nd Dept. of Critical Care, Athens, GreeceINTRODUCTION. Severe sepsis and septic shock are major healthcare problems,affecting millions of people around the world each year, with a mortality of more than 25 %[1]. The endothelial protein C receptor (EPCR) is involved in the regulation of the cyto-protective and anticoagulant pathways of protein C. The human EPCR genotypes can bedivided into 4 haplotypes, H1, H2, H3 and the very rare H4, three of which (H1, H3 and H4)contain one or more haplotype-specific single nucleotide polymorphisms (htSNPs). Onehaplotype (H2) consists of the common alleles of all haplotype-tagging (ht)SNPs [2–3]. Thefunctional importance of these mutations has been investigated in various diseases, but theirrole in severe sepsis or septic shock is unknown.OBJECTIVES. We assessed whether haplotypes in the EPCR gene, notably H1 andH3, modify the risk of severe sepsis and/or septic shock development in critically-illpatients.METHODS. Three polymorphisms in the EPCR gene were genotyped in 389 Caucasiancritically-ill patients, hospitalized in the intensive care units of two major hospitals inAthens, Greece. Multivariate logistic regression analysis controlling for age, APACHE IIand SOFA scores, sex and diagnosis was performed to determine the effect of haplo-types H1 and H3 in the EPCR gene on the development of severe sepsis and/or septicshock.RESULTS. Severe sepsis and/or septic shock occurred in 38.8 % of the critically-illpatients carrying minor alleles belonging to both H1 and H3 haplotypes, in 58.0 % of the H1carriers, 64.3 % of the H3 carriers and 65.2 % of the patients carrying all common alleles(H2). Compared to H2 carriers, the odds ratios (OR) for developing severe sepsis and/orseptic shock were 0.34 (95 % confidence interval (CI) 0.16–0.76, p = 0.008) for the H1 andH3 carriers; 0.65 (95 % CI 0.37–1.13, p = 0.123) for the H1 carriers; and 0.82 (95 % CI0.39–1.70, p = 0.590) for the H3 carriers.Conclusion: Our results indicate that carriers of minor alleles belonging to the H1 and H3haplotypes are at a reduced risk of developing severe sepsis and/or septic shock in thiscohort of critically-ill patients.REFERENCES. 1. Dellinger RP, et al. Surviving sepsis campaign: international guidelinesfor management of severe sepsis and septic shock. Intensive Care Med. 2013;39:165–228. 2.Saposnik B, et al. A haplotype of the EPCR gene is associated with increased plasma levelsof sEPCR and is a candidate risk factor for thrombosis. Blood. 2004;103:1311–8. 3. Uitte deWillige S, et al. Haplotypes of the EPCR gene, plasma sEPCR levels and the risk of deepvenous thrombosis. J Thromb Haemost 2004;2:1305–10.GRANT ACKNOWLEDGMENT. The project was funded by the non-profit organizationThorax Research Centre for Intensive and Emergency Thoracic Medicine.
0106EXPRESSION OF INTRACELLULAR HSPS IN NEUTROPHIL AND MONOCYTESUBSETS DURING ACUTE PHASE OF STRESS IN CRITICALLY ILL PATIENTS.PRELIMINARY DATA*
T. Tavladaki1, A.M. Spanaki1, H. Dimitriou2, E. Kondili3, I. Plati4, K. Apostolou5,D. Georgopoulos3, G. Briassoulis1
1PICU, University of Crete/University Hospital, Heraklion, Greece, 2PaediatricHaematology Oncology, University of Crete, Medical School, Heraklion, Greece, 3ICU,University of Crete/University Hospital, Heraklion, Greece, 4Department of ClinicalBiochemistry, University of Crete, Medical School, Heraklion, Greece, 5National andKapodistrian University of Athens, First Critical Care Department, Athens, GreeceINTRODUCTION. Intracellular expression of heat-shock-proteins (HSPs) arises early instress as a tool to protect cellular homeostasis. HSP72-expression is induced by a widevariety of stimuli including Systemic Inflammatory Response Syndrome (SIRS) and SevereSepsis (SS). HSP90a exerts its chaperone function to ensure the proteolytic turnover of arange of proteins that are involved in cell growth, differentiation and survival.OBJECTIVES. To investigate the HSP72 and 90a expression in the neutrophils andmonocytes of critically ill patients with SS, SIRS (trauma), and healthy blood donors duringthe early phase of stress as well as longitudinally (days 3 and 5); to correlate their expressionwith energy expenditure and respiratory quotient (RQ) and outcome.METHODS. Eight consecutively admitted patients with trauma (19 HSP measurements),6 with SS (12 measurements), and 8 healthy control subjects (H) were enrolled in thestudy. Patients’ demographic characteristics, laboratory exams, energy expenditure andRQ were obtained using 30-min indirect calorimetry by E-COVX. Acute Physiology AndChronic Health Evaluation II (APACHE II) and the Sequential Organ Failure Assessment(SOFA) scores were measured and documented each time. HSPs levels were determinedafter staining with surface antigens CD33-PE/Cy5 and CD45 PE/Cy7 followed by HSP72-FITC and HSP90a-PE intracellular staining. Results are expressed as the Mean Fluores-cence Intensity (MFI) value for each HSP in the monocyte and neutrophil subpopulations.RESULTS. Energy expenditure and RQ did not differ between groups and time series andwere not related to HSPs levels. Neutrophil HSP72 MFI was negatively related to the SOFAand APACHE II (r2 = -0. 60, -0.067, p \ 0.001). HSPs expression was lower in the non-survivors compared to survivors (neutrophil HSP72, p = 0.001). Intracellular HSP72 dif-fered significantly among groups in both monocytes (SIRS 24.8 ± 9 vs. SS 15.9 ± 7,p \ 0.006) and neutrophils (SIRS 43.3 ± 14 vs. SS 26.8 ± 20, p = 0.03). Longitudinally,monocyte HSP72 showed a trend to decrease (16 ± 7 day 1 vs. 11 ± 8 day 5) in contrast to
26th ESICM ANNUAL CONGRESS — PARIS, FRANCE — 5–9 OCTOBER 2013
HSP90a showing an increasing trend (23 ± 7 and 37 ± 23, respectively) among patientswith SS.CONCLUSIONS. HSP response in the critically ill may confer protection if induced in theearly phase of stress. HSP72 and 90a monocyte expressions follow different longitudinalcourses in severe sepsis, not related to the metabolic response to stress.GRANT ACKNOWLEDGMENT. This research has been co-financed by the EuropeanUnion (European Social Fund (ESF)) and Greek national funds through the OperationalProgram ‘‘Education and Lifelong Learning’’ of the National Strategic Reference Frame-work (NSRF)-Research Funding Program: THALES.*Part of the study ‘‘Heat shock proteins and glutamine alterations related to hormonal,immunological, inflammatory and molecular response to sepsis: A combined clinical andexperimental study’’.
Special nutrients and metabolic control: 0107–01200107ROLE OF GLYCEMIC STATUS IN THE DEVELOPMENT OF INFECTIOUSCOMPLICATIONS IN VICTIMS WITH SEVERE COMBINED TRAUMA
O. Iegorov1, Y. Nalapko1, O. Peicheva1
1Lugansk State Medical University, Anesthesiology, Intensive Care and Emergency Medic,Lugansk, UkraineINTRODUCTION. The human body is programmed to maintain a constant homeostasis ofall body systems through the complex relationship of neuroendocrine and vegetative sys-tems. Severe trauma violates this phenomenon homeostasis through autonomic and cytokinehyperactivity. Insulin metabolism varies among the first. Develops as a consequence ofhyperglycemia, which in these patients is stressful genesis.OBJECTIVES. To determine the relationship between starting glycemic status and theincidence of infectious complications in patients with severe combined trauma (SCT).METHODS. The study involved 123 patients with SCT (ISS[26) who were treated in ICU.We’re formed two study groups-62 patients who did not differ significantly from each otherin age, sex and severity of the condition. Group I included 32 patients who subsequently hada favorable outcome of the current injury. Group II included 30 patients who later died. Thedegree of injury ISS score in both groups was 32.4 ± 3.5 points and isn’t statisticallydifferent between groups. Nosocomial complications were fixed in accordance with thecriteria of CDC[1].RESULTS. I stage of the research—analysis of the structure and comparison of compli-cations between the groups. In Group I, infectious complications were 16 patients (50.0 %),and they did not lead to death. In group II patients, who later died, infection had all 30patients (100.0 %).In Group I, the average number of events per one patient was 0.72, including infectiouscomplications was 73.3 % (0.56 to 1 patient).Group II—4.22 complications, which is 5.9 times more than in the I group. The number ofinfectious complications in Group II was 79 (2.63 by 1 patient).Phase II study—identifying ceiling starting glycemia above which infection rates signifi-cantly increased. In the first 2 days after the injury level of blood sugar in all patients greaterthan 6.1 mmol/l. According to the correlation analysis showed that the critical level is theconcentration of glucose 8.3 mmol/l.Hyperglycemia is more than 8.3 mmol/l was recorded in 42 patients (67.7 %), of whom 30were all victims of group II, who later developed a fatal traumatic disease. Blood glucoselevel above 11.0 mmol/l was observed only in group II (24 victims—80.0 %), and above14.2 mmol/l in 19 (63.3 %).CONCLUSIONS. Infectious complications of SCT are an independent predictor of thedevelopment of multiple organ failure and adverse outcome of trauma. Victims with SCT in67.7 % of cases have a predisposition to the development of stress hyperglycemia above8.3 mmol/l. Blood plasma glucose level at admission above 11.0 mmol/l is associated withthe development of infectious complications and adverse outcome of traumatic disease in100 % of the victims.REFERENCE(S). 1. Horan TC, et al. CDC/NHSN surveillance definition of health care-associated infection and criteria for specific types of infections in the acute care setting. AmJ Infect Control. 2008;36:309–32.
0108SEPSIS IN DIABETES: ARE RBS AND HBA1C SIMILAR?
J. Nikhilesh1, V. Joshi2, B. Pranay2
1CHL Hospitals, Critical Care Medicine, Indore, India, 2Rajshree Hospital and ResearchCentre, Critical Care Medicine, Indore, IndiaBACKGROUND. Stress related hyperglycemia is known to occur in sepsis. However, thereare gaps in our knowledge levels on sepsis behavior in diabetics pertaining to significance ofrandom blood sugar (RBS) levels v/s HbA1C levels (glycosylated Hemoglobin).OBJECTIVE. To analyze outcomes in sepsis cohorts with diabetes and look for compar-isons of outcomes differentiating on RBS vis-à-vis Hba1C levels at baseline.SETTING. Two medical-surgical ICUs (40 bedded) of tertiary care units.STUDY MODULE: Consecutive diabetic patients with documented history of being on oralhypoglycemic agents/insulin were included. All the patients were compared for variablessuch as demographics, SOFA scores, requirement of pressors, requirement of ventilatorysupport(MV), requirement of dialysis (RRT) and length of stay (LOS) in days. Death/dis-charge from CCU were considered as end points. Two groups were made differentiating onbasis of RBS and HbA1C levels. Statistical analysis was done using SPSS version 11.RESULTS. Forty patients were included (n = 40, M:F 27:13) in the study duration (Oct2012–Mar 2012).Mean age of the cohort was 51.1 ± 14.4 years (22–75 years) and SOFAscores were 13 ± 2.8 (8–18).
Cohort characteristics
RBS (mg/dl) 282 ± 85 (160–550)
HbA1C 7 ± 0.9 (5.2–8.9)
MV 16 (40 %)
RRT 11 (27.5 %)
Pressor requirement 11 (27.5 %)
LOS for the cohort was 2.8 ± 2 days (range 1–8 days).In hospital mortality was 32.5 %(n = 13). On statistical analysis likelihood of dialysis was more in patients with elevated
HbA1C (p = 0.02S) whereas likelihood of pressor requirement, increased LOS and venti-lator requirement was more with elevated RBS (p = 0.01, 0.02 and p = 0.01S) group. Onplotting a ROC curve the likelihood of mortality was more for patients with elevatedHbA1C vis-à-vis RBS (AUC 0.59 and 0.36 respectively).CONCLUSION. Elevated HbA1C levels have a stronger association with mortality vis-à-vis elevated RBS levels in diabetic patients getting admitted with sepsis. Similar resultswere documented in requirement of RRT but vice versa was noted in terms of ventilatorrequirement and pressors. However, the sample size is small and we shall need interventionbased and follow up trials to formulate definitive strategies for sepsis in diabetic patients.
0109NORMALIZING GLUTAMINE CONCENTRATION UNCOUPLESRESPIRATORY CHAIN FROM ATP SYNTHESIS IN AN IN VITRO MODELOF HUMAN SKELETAL MUSCLE. A POTENTIAL MOLECULARMECHANISM FOR THE HARM CAUSED BY AGGRESSIVE GLUTAMINESUPPLEMENTATION?
A. Krajcova1, J. Ziak1, K. Jiroutkova1, V. Dzupa2, M. Fric3, F. Duska1,4
13rd Medical Faculty, Dept of Biochemistry and Molecular Biology, Prague, CzechRepublic, 2Kralovske Vinohrady University Hospital, Dept. of Orthopaedic Surgery, Prague,Czech Republic, 3Kralovske Vinohrady University Hospital, Dept. of Anaesthesia andIntensive Care Medicine, Prague, Czech Republic, 4Nottingham University Hospitals NHSTrust, AICU, Nottingham, UKINTRODUCTION. Skeletal muscle contains myoblasts. These undifferentiated cells arecrucial for muscle regeneration as they can proliferate and differentiate into myotubes,which then fuse with muscle fibres. Myoblasts and myotubes can be cultured and used as anin vitro model of skeletal muscle. Rapidly dividing cells use glutamine as an energy sub-strate [1].OBJECTIVES. To assess the influence of glutamine concentration on the rate of prolif-eration of human myoblasts and on skeletal muscle energy metabolism in vitro.METHODS. Myoblasts were isolated [2] from muscle biopsy samples obtained from 5volunteers during elective hip surgery. Cells were cultured in triplicates in glutamineconcentrations of 0, 0.1, 0.2, 0.3, 0.5 and 5 mM for 20 days. Every 5th day cells weretrypsinized and manually counted. Before the end of exposure, half of the cells were allowedto differentiate into myotubes. After 20 days of exposure to various glutamine concentrationwe assessed the energy metabolism by extracellular flux analysis XF-24 (Seahorse Bio-sciences) of both myoblasts and myotubes [3]. We measured in tri-or tetraplicates oxygenconsumption rate (OCR) at baseline and after addition of (a) ATPase inhibitor oligomycine,(b) mitochondrial uncoupler FCCP, and (c) complex III inhibitor antimycine A. Thisallowed us to calculate baseline OCR, ATP turnover rate, proton leak through inner mito-chondrial membrane and respiratory chain capacity (uncoupled respiration). The lattervalues are express as % of baseline OCR.RESULTS. Myoblast proliferation rate was maximal and exponential at 0.3 mM of glu-tamine, OCR at baseline was unaffected by glutamine concentration in both myoblasts andmyotubes (Table 1). In myotubes, proton leak through inner mitochondrial membrane waslowest with 0.2–0.3 mM of glutamine, whilst lower or higher concentrations caused mito-chondrial uncoupling (p = 0.04) and tended to decrease ATP production (p = 0.05).Similarly, respiratory chain spare capacity was maximal at 0.2 mM and decreased in bothextremes of glutamine concentrations (p = 0.03).
Table 1 Energy metabolism in myotubes (medians)
Glutamineconcentration(mM)
0 0.1 0.2 0.3 0.5 5.0 p (Kruskal–Wallis)
Myoblastdoublingtime(days)
1.68 1.39 1.32 1.14 1.15 1.16 N/A
OCR atbaseline(pmol/min)
54 (IQR46–57)
71 (IQR21–100)
44 (IQR 25–47) 52 (IQR45–102)
65 (IQR 54–72) 87 (IQR71–103)
0.293
Leak(% OCRatbaseline)
24 (IQR 11–50) 22 (IQR17–26)
8 (IQR 0–17) 17 (IQR13–36)
36 (IQR 32–40) 49 (IQR39–51)
0.041
ATP turnover(% OCRatbaseline)
76 (IQR 50–98) 78 (IQR74–83)
92 (IQR 83–100) 83 (IQR74–87)
65 (IQR 62–72) 51 (IQR49–61)
0.053
Resp.capacity(%baseline)
176 (IQR132–196)
315 (IQR164–338)
317 (IQR276–520)
202 (IQR187–207)
255 (IQR183–345)
159 (150–174) 0.031
In myoblasts we saw similar trends which did not reach statistical significance.CONCLUSIONS. Hypoglutaminaemia in a range seen in critically ill patients(0.2–0.3 mM) brings about optimal conditions for the proliferation of human myoblasts andfor ATP production in an in vitro model of human skeletal muscle. Glutamine concentra-tions above and below this range cause mitochondrial uncoupling and decrease respiratorychain spare capacity. This generates hypothesis that glutamine effect on mitochondrialmetabolism may have contributed to disappointing clinical outcomes seen with aggressiveglutamine supplementation [4, 5].REFERENCE(S). 1. Parry-Billings, et al. Lancet. 1990;336(8714):523–5. 2. Thompson,et al. J Clin Invest. 1996;98(10):2346–50. 3. Auger, et al. PLoS One. 2011;6(12):e28536. 4.Heyland, et al. NEJM. 2013;368:1489–97. 5. Andrews, et al. BMJ. 2011;342:d1542.GRANT ACKNOWLEDGMENT. Supported by IGA NT 12319.
0110METABOLIC AND INFECTIOUS CONTROL WITH A SPECIFIC ENTERALFORMULA FOR DIABETES IN HYPERGLYCAEMIC CRITICALLY ILLPATIENTS UNDER MECHANICAL VENTILATION. PROSPECTIVE,RANDOMIZED AND MULTICENTRE STUDY
C. Vaquerizo1, A. Mesejo2, J.C. Montejo3, G. Lobo4, M. Zabarte5, I. Herrero6, J. Acosta7,A. Blesa8, F. Martı́nez-Lozano9
1Hospital de Fuenlabrada, Madrid, Spain, 2Hospital Clı́nico, Valencia, Spain, 3Hospital 12de Octubre, Madrid, Spain, 4Hospital Virgen de las Nieves, Granada, Spain, 5HospitalDonostia, San Sebastián, Spain, 6Hospital de Bellvitge, Barcelona, Spain, 7Hospital General,Alicante, Spain, 8Hospital Clı́nico San Carlos, Madrid, Spain, 9Hospital Reina Sofı́a,Murcia, SpainOBJECTIVE. Metabolic and infectious control is a priority in critically-ill patients. Ourprimary endpoint is to evaluate if the administration of a new diabetes-specific diet achieves
26th ESICM ANNUAL CONGRESS — PARIS, FRANCE — 5–9 OCTOBER 2013
a better glycaemic control and reduces infectious complications in critically ill patientsunder mechanical ventilation compared to a different composition diabetes-specific diet andto a conventional high-protein diet.METHODS. Nine University Hospitals Intensive Care Units involved in Spain. 160patients were estimated to achieve, assuming an alpha risk of 0.05 and a beta risk of 0.2, a20 % reduction in insulin requirements. Three groups: A: new diabetes-specific diet (T-Dietplus diabet IR�), B: high-protein diet (Isosource protein�), C: diabetes-specific diet(Glucerna select�).Informed consent. Eligibility criteria: age C18 years, enteral nutrition C5 days, mechanicalventilation, basal hyperglycaemia (fasting) [126 mg/dL. Exclusion criteria: contraindica-tion for enteral nutrition, BMI C35, kidney or liver failure, APACHE II score B10, type 1diabetes. Diet randomization was blind and web-based. Glycaemic target 110–150 mg/dl(perfusion insulin protocol). Calorie calculation: 25 kcal/kg/day. Volume ratio, metabolic,gastro-intestinal and infectious complications control. The daily mean capillary glucoselevel and the morning plasma glucose level were evaluated. Intention-to-treat analysis(descriptive statistics, Chi square, ANOVA, Student t test, Kruskal–Wallis).RESULTS. Communication with 157 cases (A = 52, B = 53, C = 52). Male 75 %; age 56(SD 16); BMI 26.6 (SD 3). On admission, the groups were homogenous, without statisticallysignificant differences in APACHE II, SOFA, plasma glucose level, capillary glucose level,HbA1c and HOMA. During ICU stay, there were no differences in caloric and proteinintake, volume ratio, days of enteral nutrition, ICU length of stay, days of mechanicalventilation and mortality. Metabolic data in Table 1. Infectious data in Table 2.
Table 1
Table 2
CONCLUSIONS. 1. Glycaemic targets are met in the three groups, with a greater need forinsulin in group B. 2. There is a non-significant trend for lower capillary glucose level andlower plasma glucose level with diet of group A. 3. Capillary glucose and plasma glycaemiadelta is better with diet A and glycaemic lability index is lower with specific formulas, withstatistical significance. 4. There are significant differences in infectious complications withboth specific formulas.
0111ROOT CAUSE ANALYSIS OF DIABETIC KETOACIDOSIS AND ITSCOMPLICATIONS: A DEVELOPING COUNTRY EXPERIENCE
M. Jayashree1, S. Rohit1, S. Singhi1
1Postgraduate Institute of Medical Education and Research, Advanced Pediatrics Centre,Chandigarh, IndiaINTRODUCTION. Diabetic ketoacidosis (DKA)related morbidity and mortality indeveloping economies is high due to putative reasons such as delay in seeking medicalattention, delayed diagnosis and high rate of co-morbidities like infections and undernu-trition. However data related to above is scarce.OBJECTIVES. To evaluate system based contributory factors for occurrence of DKA andits complications with emphasis on level of awareness among parents and treating physi-cians and issues in pre-referral management of DKA.METHODS. A retrospective observational Root Cause Analysis (RCA) was conducted forall cases of DKA presenting to Pediatric Emergency of a tertiary care referral hospital inIndia from July 2010 to June 2011. Possible contributors to poor outcome were discussed apriori by investigators using RCA guidelines and questionnaires were prepared for infor-mation retrieval through direct interview or field observations. RCA was initiated andcompleted for each patient within 7 and 45 days respectively looking into pre-hospital,health care system, referral and continuum of care related factors. Direct interview ofparents and referring physician(s) was conducted at admission and over the next 45 daysrespectively. Data were compiled; time frame of events and causal factor tree was made foreach case of DKA.RESULTS. Of the 30 patients enrolled 26 (86.6 %) were referrals; 16 (61.5 %) from first, 7(26.9 %) from second and 3 (11.5 %) from third health care facility. More than half (60 %)had new onset diabetes and belonged to poor socioeconomic strata. Twenty two children(73.3 %) had some complication at time of admission like shock (63.3 %), hypokalemia
(36 %) and cerebral edema (10 %). Majority of parents were ignorant of symptoms ofdiabetes or DKA. The median (range) duration of symptoms before seeking medical carewas 10 (1–60) days. In known diabetes 49.3 % were noncompliant with insulin, 41.7 % oninappropriate treatment and only 25 % on regular at least once a day blood glucose mon-itoring. Nearly half of cases (n = 11) remained undiagnosed after first health care facilitycontact, more so for new onset compared to known diabetes (9/18 vs 2/8; p = 0.022). Evenafter diagnosis, none received standard recommended treatment. The referring hospitals hadlimited facilities for blood glucose estimation (40 %), blood gas analysis (20 %)and insulininfusion. Only one third of the physicians were trained pediatricians. Univariate analysisrevealed that patients with missed/delayed diagnosis presented more often as severe DKAwith higher incidence of complications like shock, cerebral edema and renal failure.CONCLUSION. Parental ignorance, poor socioeconomic status, treatment non-compliance,missed or delayed diagnosis due to lack of clinical expertise and limited primary health carefacilities for optimum management were the root causes for severe and complicated DKA.Parent and physician education regarding symptomatology, complications, early recognitionand treatment is the key to improving DKA related outcome.
0112LIPID METABOLISM IN CRITICALLY ILL SEPTIC PATIENTS STUDIEDBY ADIPOSE TISSUE MICRODIALYSIS (MD)
M. Theodorakopoulou1, F. Frantzeskaki1, S.E. Orfanos1, N. Nikitas1, P. Kopterides1,S. Karambi1, P. Papadopoulos1, A. Antonopoulou1, A. Diamantakis1, A. Armaganidis1,I. Dimopoulou1
1University Hospital Attikon Athens Greece, 2nd Critical Care Department, Chaidari,GreeceINTRODUCTION. Microdialysis (MD) is a bedside in vivo sampling technique thatpermits continuous analysis of a patient’s interstitial fluid chemistry without consumingblood. As the interstitial fluid bathes the cells, its composition reflects the local metabolicactivity of those cells thus reflecting intracellular metabolic changes and disorders. In vivoMD is performed by implanting a commercially available catheter that mimics a bloodcapillary at the site of interest. In addition, it has been shown that, low cholesterol and lowHDL levels as well as high triglyceride levels are related to the progression to sepsis and/orseptic shock.OBJECTIVES. In this study, we used MD to assess the metabolic changes of lipids inintensive care unit patients with sepsis. To this end, a MD probe was inserted into thesubcutaneous adipose tissue of the upper thigh.METHODS. A total of 65 (38 men) mechanically ventilated septic patients having amedian age of 69 ± 19 years were studied. All patients met the ACCP/SCCM consensuscriteria for sepsis. Upon sepsis onset a microdialysis catheter (CMA60, CMA, Solna,Sweden) was inserted into the subcutaneous adipose tissue of the upper thigh. The dialysatesamples were collected in microvials and were analyzed immediately for glycerol using amobile CMA ISCUS analyzer. Measurements were performed 6 times per day during thefirst 6 days from sepsis onset. The daily mean values of MD measurements were calculatedfor each patient. Blood samples were collected from these patients upon sepsis onset and onday 6 and were analyzed for total cholesterol, high density lipoprotein (HDL), low densitylipoprotein (LDL), triglycerides, glycerol and free fatty acids (FFA). Results are expressedas mean ± SD.RESULTS. Sixty five (38 men) critically ill septic patients with a mean (SD) age of69 ± 19 years were studied. APACHE II and SOFA at study entry were 20 ± 4 and 8 ± 4,respectively. Sepsis was related to SIRS (n = 7), severe sepsis (n = 17) and septic shock(n = 41). Mortality was 39 %. Serum cholesterol (79 ± 46 mg/l) along with HDL(14 ± 15 mg/dl) and LDL (67 ± 32 mg/dl) were low. Serum triglycerides (149 ± 88 mg/dl) and free fatty acids (FFA, 0.39 ± 0.24 mmol/l) were within normal limits. Serumglycerol was 25 ± 18 lmol/l. Interstitial glycerol was elevated (324 ± 185 lmol/l). SerumFFA correlated with both serum (r = 0.41, p = 0.008) and interstitial (r = 0.32, p = 0.04)glycerol.CONCLUSIONS. Critical sepsis is characterized by an increase in serum and tissueglycerol and preserved FFA levels, indicating enhanced lipolysis and an increase FFAuptake by peripheral tissues. Serum or interstitial glycerol are better indices of lipidmobilization than serum FFA levels in mechanically ventilated septic patients.
0113EFFECTS OF RIKKUNSHITO (TRADITIONAL JAPANESE MEDICINE KAMPO)ON ENTERAL FEEDING AND PLASMA GHRELIN CONCENTRATIONIN CRITICALLY ILL PATIENTS: A DOUBLE-BLIND, RANDOMIZED,CONTROLLED TRIAL
Y. Yanagida1, M. Hayakawa1, H. Yamamoto1, T. Wada1, M. Sugano1, A. Sawamura1,S. Gando1
1Hokkaido University Hospital, Emergency and Critical Care Center, Sapporo, JapanINTRODUCTION. Rikkunshito is one of traditional Japanese medicines (Kampo), and hasbeen widely prescribed for patients with various gastrointestinal symptoms. Recently, theprokinetic function of Rikkunshito for several diseases attracts in Japan.OBJECTIVES. The aim of the present study was to investigate the effect of Rikkunshito onthe intragastric enteral feeding and the plasma levels of ghrelin in critically ill patients.METHODS. The study population consisted of critically ill patients who were guessed tobe received intragastric tube feeding more than 7 days. Patients were prospectively assignedto two treatment groups, and randomized to receive either Rikkunshito or metoclopramide.All patients were received standard enteral nutrition. The patients in both two groups werestarted continuous intragastric tube feeding according to our protocol. Observational periodwas defined until gastric feeding was no longer required or 10 days after the enrollment. Theprimary end point of our study was the rate of success in the enteral feeding. The secondaryend points were the changes of the plasma levels of active ghrelin and desacyl ghrelin (non-active ghrelin).RESULTS. Thirteen patients were assigned to the metoclopramide group and 10 were to theRikkunshito group. All patients were performed with mechanical ventilation on theenrollment. The proportions of success in the enteral feeding were not different between thetwo groups. The increase of active ghrelin concentration after the treatment in the Ri-kkunshito group was larger than that in the metoclopramide group (P = 0.023). The changesof desacyl ghrelin concentrations were not different between the two groups.CONCLUSIONS. Rikkunshito administration increased the plasma levels of active ghrelin,and resulted in the prokinetic effects as same as metoclopramide in the critically ill patients.REFERENCE(S). 1. MacLaren R, Kuhl DA, Gervasio JM, Brown RO, Dickerson RN,Livingston TN, Swift K, Headley S, Kudsk KA, Lima JJ. Sequential single doses of
26th ESICM ANNUAL CONGRESS — PARIS, FRANCE — 5–9 OCTOBER 2013
cisapride, erythromycin, and metoclopramide in critically ill patients intolerant to enteralnutrition: a randomized, placebo-controlled, crossover study. Crit Care Med.2000;28:438–44. 2. Arai M, Matsumura T, Tsuchiya N, Sadakane C, Inami R, Suzuki T,Yoshikawa M, Imazeki F, Yokosuka O. Rikkunshito improves the symptoms in patientswith functional dyspepsia, accompanied by an increase in the level of plasma ghrelin.Hepatogastroenterology. 2012;59:62–6.
0114COMPLIANCE REGARDING THE USE OF EICOSAPENTAENOIC ACID (EPA)AND GAMMA-LINOLENIC ACID (GLA) IN THE TREATMENT OF PATIENTSWITH ARDS: RESULTS FROM THE PARIS STUDY: A ONE-DAY PREVALENCEMULTICENTER OBSERVATIONAL STUDY
A.P. Magalhães-Júnior1, A. Pontes-Arruda1, V.D.A. do Ceará1, A.P. Lima1, D. Guimarães1,H.P. Moreira1, F.E. Mendonça-Neto1, B. Furtado-Lima1, L.G. de Castro1, J.H. Militão1,H. Monte-Coelho Neto1, M.F. Colares2, M. Martins2, I.S. Bonfim3
1Christus University Center, School of Medicine, Fortaleza, Brazil, 2Hospital FernandesTávora, Fortaleza, Brazil, 3Hospital Regional do Cariri, Juazeiro do Norte, BrazilINTRODUCTION. The use of enteral diets with an anti-inflammatory lipid profile, enri-ched with eicosapentaenoic acid (EPA) and gamma-linolenic acid (GLA) has beenrecommended by international nutrition guidelines as an important adjuvant therapy in thetreatment of patients with impaired lung conditions, especially those suffering from acuterespiratory distress syndrome (ARDS). However, there is few data available evaluating ifsuch nutrition intervention has been incorporated in the daily routine of ICU physicians aspart of the ARDS standard of care.OBJECTIVES. To conduct a multicenter one-day prevalence study in ICU’s to evaluate theincidence ARDS in the Intensive Care Units and compliance regarding the use of enteralnutrition enriched with anti-inflammatory lipids in this population of patients as recom-mended by international guidelines.METHODS. After institutional review board approval was obtained data from all ICUpatients in 30 ICU’s in 15 Brazilian hospitals were collected during a single day in April2012. All relevant parameters were collected in loco using patients’ original medicalrecords. ARDS was diagnosed using the Berlin definitions [1]. The use of EPA/GLA as partof the ARDS treatment was also audited at the bedside. Categorical variables were com-pared between the two groups using the v2 test or Fisher’s exact test as appropriate.Quantitative normally distributed variables between the groups were compared using anunpaired two-sample t-test. For quantitative non-normally distributed data, the nonpara-metric Wilcoxon rank-sum test was used. Normality was assessed by using the Shapiro–Wilk test.RESULTS. Data from 207 patients were collected. A total of 51 patients were consideringas having ARDS in accordance with the Berlin definitions. The use of enteral diet with ananti-inflammatory lipid profile (EPA/GLA) was considered extremely low in this populationof patients. Only 3 patients were in use of an EPA/GLA diet as part of their ARDS treatment(none of them identified as suffering from severe ARDS).CONCLUSIONS. Although the incidence of ARDS was considered high (24 % of theevaluated patients) and despite the fact that current international guidelines are recom-mending the use of an enteral nutrition with EPA/GLA as an important part of the treatment(Grade A recommendation from the ASPEN/SCCM guidelines for nutrition in critically ill),few patients are in fact using this nutrition intervention.REFERENCE(S). (1) The ARDS Definition Task Force. Acute Respiratory DistressSyndrome The Berlin Definition. JAMA. 2012;307(23). doi:10.1001/jama.2012.5669
0115TO EVALUATE THE SAFETY AND EFFICACY OF A FISH OIL-ENRICHEDPARENTERAL NUTRITION REGIMEN IN TRAUMA AND BURN PATIENTS
P. Soni1
1Amandeep Hospital, Critical Care, Amritsar, Punjab, IndiaINTRODUCTION. Previous studies and a meta-analysis in surgical patients indicate thatsupplementing parenteral nutrition regimens with n-3 polyunsaturated fatty acids (PUFAs)is associated with improved laboratory and clinical outcomes in the setting of hyper-inflammatory conditions. Fish oil (FO) is rich in x-3 FA, which is highly bioactive com-pared with MCT and OO. This FO-based IVFE not only is a nutrient and an alternate sourceof energy but also has anti-inflammatory properties and possesses potentially importantpharmacological benefits.OBJECTIVES. The objective of the present meta-analysis was to evaluate the benefit ofn-3 PUFA-enriched parenteral nutrition regimens in trauma and burns (ICU) patients.METHODS. Prospective, randomized, parallel group study carried out at the IntensiveMedicine, Department of Critical Care, Amandeep Hospital, Amritsar, India. Patients weredivided into two groups, Group A: omega-3 fatty acid-enriched lipid emulsion were given.Group B: placebo. The patients with polytrauma and burns more then 30 % were included inthe study. Omega-3 fatty started after the 24 h in group A.RESULTS. The combined analysis showed that a fish oil-enriched parenteral nutritionregimen had a positive treatment effect on length of hospital stay (weighed mean differ-ence = -2.98, P \ 0.001), length of intensive care unit stay, postoperative infection rate(odds ratio = 0.56, P = 0.04), and serum levels of Lactate level day 0, 1, 5 days, in thesepatients. The significant differences were found between the 2 groups in postoperativemortality; incidence of postoperative cardiac complications; serum levels of bilirubin, tri-glyceride. No serious adverse events related to fish oil treatment were reported.CONCLUSIONS. Based on the analysis, fish oil-supplemented parenteral nutrition wassafe, improved clinical outcomes in trauma and burn patients. More laboratory parametersshould be considered in future meta-analyses. The use of n-3 PUFA-enriched parenteralnutrition is safe and effective in reducing the infection rate and hospital/ICU stay.REFERENCE(S). 1. Chen B, Zhou Y, Yang P, Wan HW, Wu XT. Safety and efficacy offish oil-enriched parenteral nutrition regimen on postoperative patients undergoing majorabdominal surgery: a meta-analysis of randomized controlled trials. JPEN. 2010;34:387–94.2. Barbosa VM, Miles EA, Calhau C, Lafuente E, Calder PC. Effects of a fish oil containinglipid emulsion on plasma phospholipid fatty acids, inflammatory markers, and clinicaloutcomes in septic patients: a randomized, controlled clinical trial. Crit Care. 2010;14:R5. 3.Morlion BJ, Torwesten E, Lessire H, Sturm G, Peskar BM, Fürst P, Puchstein C. The effectof parenteral fish oil on leukocyte membrane fatty acid composition and leukotriene-syn-thesizing capacity in patients with postoperative trauma. Metabolism. 1996;45:1208–13.GRANT ACKNOWLEDGMENT. I have not received any grant from any source.
0116VITAMIN D DEFICIENCY IN CRITICALLY ILL PATIENTS
A. Zapatero1, J. Nolla1, S. Valles1, F. Solsona1, M.P. Gracia1, Y. Diaz1, I. Dot1
1Hospital del Mar, Intensive Care, Barcelona, SpainINTRODUCTION. The incidence of vitamin D deficiency in critically ill patients has beenreported to range from as low as 17 % to as high as 79 %. Data regarding the relationshipbetween 25-hydroxyvitamin D levels and outcomes in the medical intensive care unit arescarce.OBJETIVE: The objective of the study was to evaluate the prevalence of 25-hydroxyvi-tamin D deficiency in the intensive care unit and its relationship with prognosis.METHOD. This was an observational prospective study of all patients admitted to the ICUbetween February 2011 to November 2011 at a 14-bed closed unit in a university-affiliatedhospital. Exclusion criteria were: readmission to ICU, pregnancy, coronary artery disease,non-Caucasian patients, primary hyperparathyroidism, chronic renal failure, patients withmalabsorption syndrome and which were under treatment with Vitamin D or drugs thatinterfere with bone metabolism. Baseline demographics, comorbidities, admission diagnosisand treatment administered were collected as well as severity index (SOFA and APACHE IIscores determined from the worst values obtained within 24 h of ICU admission). Serum25(OH)D concentrations were assayed at ICU admission by liquid chromatography-tandemmass spectrometry. In our study we used 25(OH)D cutoff level of less than 30 ng/dL todefine 25(OH)D deficiency. This group was classified into 3 categories: insufficiency\30 to[20 ng/mL; moderate deficiency £ 20 to [10 ng/mL; severe deficiency £ 10 ng/mL. ICUlength of stay, and hospital mortality were analyzed.RESULTS. 135 patients were included [66 % male and 46 female, age 59 (46–74) years].Admission diagnosis were neurological pathology in 50 patients (37 %); cardiorespiratorypathology in 31 cases (22.9 %); polytrauma in 20 patients (14.8 %); metabolic disease in18 cases (13.3 %); and sepsis in 16 patients (11.9 %). APACHE II score at ICU admissionwas 17 (10–23) and SOFA score at ICU admission was 5 (3–8). Global mortality was18.5 % (25 patients). Mean serum 25(OH)D level was 11 (7–19.78) ng/mL. In 122(90.4 %) patients low serum 25(OH)D was identified [22 (16.3 %) insufficiency; 42(31.1 %) moderate deficiency; 58 (43 % severe deficiency); 25(OH)D mean levels in thesegroups were 23.5 (2.5–25.4), 12.4 (11.05–16.03), 6 (4–8.01)]. Hospital mortality washigher in patients with 25(OH)D severe deficiency (25.9 vs. 13 %, p = 0.05). Severevitamin D deficiency was associated with higher APACHE-II and SOFA scores on ICUadmission [APACHE-II (19 vs. 16, p = 0.002); SOFA (7 vs. 4), p = 0.001]. An asso-ciation between severe 25(OH)D deficiency and acute renal failure was demonstrated(29.3 vs. 13 %, p = 0.02).CONCLUSION. Low level of 25(OH) is a common finding in the intensive care unit andsevere deficiency is associated with increased risk for hospital mortality. Further studies areneeded to determine whether correction of 25(OH)D deficiency is associated with improvedoutcomes for ICU patients.
0117SEVERE VITAMIN D DEFICIENCY AND A PROGRESSIVE DECREASEIS ASSOCIATED TO MORTALITY AMONG CRITICALLY ILL PATIENTS
R.B. Moraes1,2, G. Friedman3,4,5, Y.W. Christmann4, F.M. Nagel4, T.C. Lisboa4,L. Marques4, L. Bonzanini4, M.M. Marimon2, L.M. Burin2, H.T. Schroeder6,M.V. Rodrigues6, M.A. Czepielewski4,7
1Hospital de Clı́nicas de Porto Alegre, Intensive Care Unit, Porto Alegre, Brazil,2Universidade Federal do Rio Grande do Sul, Porto Alegre, Brazil, 3Universidade Federaldo Rio Grande do Sul, Intensive Care Unit, Porto Alegre, Brazil, 4Hospital de Clı́nicas dePorto Alegre, Porto Alegre, Brazil, 5Universidade Federal de Ciências da Saúde de PortoAlegre, Intensive Care Unit, Porto Alegre, Brazil, 6Universidade Federal de Ciências daSaúde de Porto Alegre, Porto Alegre, Brazil, 7Universidade Federal do Rio Grande do Sul,Department of Endocrinology, Porto Alegre, BrazilINTRODUCTION. Despite the effects of vitamin D (VITD) on bone metabolism, there isinsufficient data on the impact of VITD deficiency in critically ill patients. Trials havereported high prevalence of VITD deficiency and an association with mortality. Severalissues remain: 1. what values of VITD relate to morbidity and mortality, 2. VITD cineticand ICU clinical outcomes.OBJECTIVES. To identify correlation between baseline VITD, its cinetic and mortality ormorbidity.METHODS. From March to November 2012 we prospectively allocated 135 ICU patientsin southern Brazil (30�050S). We included patients with length of hospital stay prior to ICU\3 days. Exclusion criteria: \18 years; cardiac or elective surgeries; chronic renal failurerequiring dialysis or creatinine [2 mg/dL; expected ICU stay \3 days, expecting death\24 h; pregnant women, patients with tuberculosis, sarcoidosis, hypo/hyperparathyroidism.Demographic and laboratory data were collected: APACHE II, SOFA, lactate, parathyroidhormone (PTH) and serum 25[OH]D3 on admission and weekly until discharge from ICU.Outcomes: mortality, need for mechanical ventilation, length of stay, infections and posi-tivity of cultures.RESULTS. Median VITD = 13.3 [8.1–20] ng/mL. 75 % of patients had VITD \20 ng/mL. Women = 47.4 %; Caucasians = 78 %; age = 56 ± 16 y; APACHE = 18 [13–24];SOFA = 5 [2–8]; PTH = 124 [58–217]). Area under ROC curve of VITD for hospitalmortality was 0.61 (95 % CI 0.495–0.73). The point of 11.9 ng/mL had a sensitivity of62 % and specificity of 65 %. Patients with VITD levels\12 ng/mL had a higher hospitalmortality (32.2 % 9 13.2 %, p = 0.014), but no differences in duration of mechanicalventilation, length of ICU or hospital stay, positivity of cultures or infections. The cutoff of20 ng/mL shows no difference for any of the outcomes. Non-survivors showed a decrease inVITD levels after 2 weeks of ICU stay.CONCLUSIONS. Severe VITD deficiency (VITD levels \12 ng/mL) as well as VITDdecrease throughout ICU stay (1) is associated with increased mortality; and (2) mayconstitute a level to define VITD supplementation in critically ill patients.REFERENCE(S). 1. Holick MF, Binkley NC, Bischoff-Ferrari HA, et al. Evaluation,treatment, and prevention of vitamin D deficiency: an Endocrine Society clinical practiceguideline. J Clin Endocrinol Metab. 2011;96:1911–30. 2. Lee P, Nair P, Eisman JA, CenterJR. Vitamin D deficiency in the intensive care unit: an invisible accomplice to morbidity andmortality? Intensive Care Med. 2009;35(12):2028–32. 3. Braun A, Chang D, MahadevappaK, Gibbons FK, Liu Y, Giovannucci E, Christopher KB. Association of low serum25-hydroxyvitamin D levels and mortality in the critically ill. Crit Care Med.2011;39:671–7.GRANT ACKNOWLEDGMENT. Financial Support: FIPE-HCPA and PPG-Endocrinol-ogy-UFRGS.
26th ESICM ANNUAL CONGRESS — PARIS, FRANCE — 5–9 OCTOBER 2013
0118LOW DOSE (0.05 U/KG/H) VERSUS STANDARD DOSE (0.1 U/KG/H) INSULININFUSION IN PEDIATRIC DIABETIC KETOACIDOSIS: A RANDOMIZEDCONTROLLED STUDY
K. Nallasamy1, M. Jayashree1, S. Singhi1
1PGIMER, Dept. of Pediatrics, Chandigarh, IndiaINTRODUCTION. The recommended insulin dose (0.1 U/kg/h) in current DKA guide-lines is not based on strong clinical evidence. Physiological dose–effect studies showed thateven lower doses (0.03 and 0.05 U/kg/h) could adequately normalize the raised ketones.Recent retrospective studies observed a dose of 0.05 U/kg/h to be as effective as standarddose in correcting acidosis. Given the possible association of rapid glucose fall followingstart of insulin and risk for cerebral edema, lower insulin doses may potentially be safer.Also, using low dose could minimize therapy related complications like hypokalemia andhypoglycemia.OBJECTIVES. To compare the efficacy and safety of low dose (0.05 U/kg/h) with stan-dard dose (0.1 U/kg/h) insulin in pediatric DKA.PRIMARY. Rate of fall in blood glucose (BG) till it reaches to B250 mg/dl.SECONDARY. Rate of resolution of acidosis, incidence of cerebral edema, hypokalemiaand hypoglycemia.DESIGN. Open-labeled Randomized Controlled Trial.SETTING. Pediatric Emergency and Intensive care Units of a tertiary care hospital.SUBJECTS. Children B12 years with DKA between July 2011 and December 2012.INTERVENTIONS. Fifty children were randomized to receive either low dose (n = 25) orstandard dose (n = 25) insulin. A uniform fluid correction (6.5 %) over 36 h with additionalinitial bolus to correct shock was administered in both groups.RESULTS. Mean (SD) age of study population (n = 50) was 6.9 (3.7)years. New onsetTIDM presenting as DKA was seen in 29 (58 %). Two thirds (n = 34; 68 %) had severeDKA at enrollment. Baseline clinical and biochemical (pH, HCO3, BG) variables werecomparable between two groups. The time taken for BG to reach B250 mg/dL in low vs.standard dose group, was similar [(6.0 vs 6.2 h) and mean ± SD rate of BG fall tillB250 mg/dL (45.7 ± 18 vs 51.4 ± 24 mg/dL/h) were similar. However the first hour BGfall was significantly higher in standard as compared to low dose (63.2 vs 39.1 mg/dL;p = 0.01), with 4 (16 %) children in the former compared to none in the latter showing aBG fall [100 mg/dL. Duration for resolution of acidosis (low vs. standard dose: 16.5 vs17.2 h; p = 0.73) and rate of resolution were similar in both. Incidence of hypokalemia wassignificantly higher with standard dose (48 vs. 20 %; p = 0.04); the difference being morein malnourished (88 vs. 28 %; p = 0.02). Five (20 %) and 1 (4 %) with standard and lowdose infusion (p = 0.08) respectively developed hypoglycemia. One child in standard dosegroup developed cerebral edema and there were no deaths.CONCLUSIONS. Low dose is as effective as standard dose insulin in children with DKA.However it may be preferred in malnourished children and in situations warranting a gentlerfall in BG.REFERENCE(S). 1. Wolfsdorf J. Pediatric Diabetes. 2009;10(s12):118–33. 2. Noyes KJ.Pediatr Diabetes. 2007;8:150–56. 3. Puttha R. Pediatr Diabetes. 2010;11:12–7. 4. Al HanshiS. Pediatr Crit Care Med. 2011;12:137–40. 5. Bradley P. Am J Ther. 2007;14:265–8.
0119MACRONUTRIENTS UTILIZATION AND BALANCES DURING THE FIRSTWEEK OF HOSPITALITION IN VENTILATED CRITICALLY ILL CHILDREN
C. Moullet1, C. Jotterand1, J. Depeyre1, M.-H. Perez2, J. Cotting2
1University of Applied Sciences Western Switzerland (HES-SO), Nutrition and DieteticsDepartment, Geneva, Switzerland, 2University Hospital (CHUV), Pediatric Intensive CareUnit, Lausanne, SwitzerlandINTRODUCTION. In critically ill children, adequate nutritional support is associated withdecreased mortality and morbidity. Nutritional needs may be influenced by the metabolicstress, treatments, fever, etc. which makes difficult the acute determination of macronutri-ents needs. If energy needs have been documented, substrate utilization during the stayremains unknown.OBJECTIVE. The aim of this study was to determine macronutrients utilization and bal-ances during the first week of hospitalization in ventilated critically ill children.METHODS. Children with expected mechanical ventilation C72 h and a FiO2 B60 % wereconsecutively included. Energy expenditure, respiratory quotient (RQ) and substrate utiliza-tion were calculated from the values of oxygen consumption and carbon dioxide productionmeasured by indirect calorimetry and from total urinary nitrogen measured by chemolumi-nescence daily. A total of 328 measurements were performed. Macronutrients intakes wererecorded using a computerized information system (MetaVision, Imdsoft). Macronutrientsbalances were then calculated as the difference between oxidation and intakes. The RQ wasalso compared with the RQ of the macronutrients administered (RQmacr).RESULTS. We included 63 children, 34 boys and 29 girls with a median age (IQR) of 21(0–103) months. Energy, protein and lipids balances remained negative during the first weekof hospitalization while carbohydrates balance was positive from the first day. On average,energy expenditure was 54 ± 10 kcal/kg/d and energy balance was -9 ± 16 kcal/kg/d.Protein, lipids and carbohydrate oxidation were 1.4 ± 0.4, 3.1 ± 1.5 and 5.1 ± 2.8 g/kg/d,respectively. The mean balance was -0.4 ± 0.6 g/kg/d for proteins, -1.9 ± 1.8 g/kg/d forlipids and +1.8 ± 3.1 g/kg/d for carbohydrates. RQ measured was lower than RQmacrcalculated (0.81 ± 0.06 versus 0.92 ± 0.05).CONCLUSION. In our group of ventilated critically ill children, we observed a slightlipolysis and catabolism during the first week of hospitalization. The carbohydrate oxidationwas insufficient, probably due to a reduced oxidation capacity and insulin resistance inmetabolic stress conditions.
0120THE USE OF ANTI-INFLAMMATORY LIPIDS FOR THE TREATMENTOF CRITICALLY ILL PATIENTS WITH SYSTEMIC INFLAMMATION:A META ANALYSIS OF OUTCOMES DATA
H.P. Moreira1, A. Pontes-Arruda1, F.E. Mendonça-Neto1, B. Furtado-Lima1,
L.G. de Castro1, J.H. Militão1, V.D.A. do Ceará1, H. Monte-Coelho Neto1, A.P. Lima1,A.P. Magalhães-Júnior1, D. Guimarães1
1Christus University Center, School of Medicine, Fortaleza, BrazilINTRODUCTION. Several studies have reported the effects of anti-inflammatory lipids inthe treatment of critically ill patients suffering from systemic inflammatory diseases such as
ALI, ARDS and sepsis. Several trials reported the effect of this approach but they are notunanimous in their findings [1–7]. Although some trials demonstrated improve in severaloutcomes such as intensive care days, mechanical ventilation days, reduction in thedevelopment of new organ dysfunctions and reduction in the 28-days all-cause mortality,others were unable to demonstrate such benefits. In such situation a meta-analysis of theavailable evidence is of pivotal importance to determine the possible benefits of using anti-inflammatory lipids in the critically ill population of patients.OBJECTIVES. To perform a meta-analysis trials comparing evaluating the use of anti-inflammatory lipids to determine the effectiveness of this approach in critically ill patients.METHODS. Searches of MEDLINE, EMBASE, Cochrane, and NIH databases were per-formed. Outcome measures included 28-days mortality, ventilator and ICU-free days, anddevelopment of new organ failures. Effects were calculated using a random effects model.Results were analyzed combining studies using anti inflammatory-lipids either deliveredusing enteral route as part of a total enteral nutrition regimen or as a supplement (deliveredin bolus).RESULTS. Seven studies were included in this meta-analysis (n = 1,048 patients). Overallresults demonstrated reduction in the risk of developing new organ failures (OR = 0.25;95 % CI 0.15–0.43; p \ 0.0001), time on mechanical ventilation (SMD = 0.35; 95 % CI0.06–0.64; p = 0.01) but not ICU stay (SMD = 0.02; 95 % CI -0.28 to 0.34; p = 0.86).Analysis of mortality of all seven studies using RR was associated with reduction in the28-days all-cause mortality (RR = 0.78; 95 % CI 0.61–1.00, p = 0.05).CONCLUSIONS. This evaluation showed that when comparing studies regardless of themethodology or trial design, the use of anti-inflammatory lipids is associated with reductionin the 28-days all-cause mortality as evaluated by relative risk, reduction in the time spendusing mechanical ventilation, and reduction in the development of new organ dysfunctions,but not with time spend at the ICU.REFERENCE(S). 1. Gadek J, et al. Crit Care Med. 1999;27:1409–20. 2. Singer P, et al.Crit Care Med. 2006;34:1033–8. 3. Pontes-Arruda A, et al. Crit Care Med. 2006;34:2325–3.4. Grau-Carmona T, et al. Clin Nutr. 2011;30:578–84. 5. Pontes-Arruda, et al. Crit Care.2011;15:R144–R158. 6. Stapleton RD, et al. Crit Care Med. 2011;39:1655–62. 7. Rice TW,et al. JAMA. 2011;306:1574–81.
Acute coronary syndromes: 0121–01330121XENON INHALATIONS IN COMPLEX ANTIANGINAL TREATMENTOF PATIENTS WITH ACUTE CORONARY SYNDROME: A PILOT STUDY
I.V. Molchanov1, V.I. Potievskaya1, E.H. Shebzuhova1
1Russian Medical Academy of Postgraduate Education, Anaesthesiology and Resuscitation,Moscow, Russian FederationINTRODUCTION. Xenon is one of the most promising gas anesthetics, similar in itsproperties to the ideal anesthetic. It possesses also analgetic, neotropic, neuroprotective,antihypoxic, antiinflammatory, sedative effects. The main clinical symptom of ACS isanginal status, the treatment of which involves the use of narcotic analgesics, which have anumber of side effects. We conducted a prospective study to investigate the efficiency ofcomplex intensive therapy of ACS by including xenon—oxygen inhalations.OBJECTIVES. 50 patients admitted to cardiological intensive care unit with ACS weretreated according to the recommendations of ESC. Xenon was included in the treatment of30 patients. 20 patients received only conventional therapy.METHODS. Xenon therapy was performed by inhalations of gas mixture containing from25 to 50 % xenon and from 40 to 70 % oxygen. The number of sessions ranged from 3 to 5.Monitoring BP, heart rate, oxygen saturation, transcutaneous PO2 and PCO2 in arterialblood, parameters of systemic hemodynamics was conducted in all the patients. Throm-boelastography was performed before and after the session of xenon inhalation. Laboratorymethods for the study included myocardial necrosis markers (cardiac troponin I, creatinekinase MB).RESULTS. Xenon provided fast pain relief and a positive dynamics of clinical status. Nosignificant changes in HR and BP were observed during inhalations of xenon–oxygenmixture. The study demonstrated increase in stroke volume from 64.75 ± 2.75 to71.00 ± 3.31 ml (p \ 0.05), cardiac index from 3.07 ± 0.22 to 3.48 ± 0.14 l/min/m2
(p \ 0.05) and reduction in system vessel resistance from 1,494.75 ± 42.17 to1,397.75 ± 39.28 din sm m2 (p \ 0.05) after the session of xenon breathing. PCO2 inarterial blood did not change significantly. The obtained data showed reduction of coagu-lation potential in patients with ACS after xenon treatment. The analysis of markers ofmyocardial necrosis level demonstrated significant decrease to the third day of observation.In the control group only a tendency to reduce the level of troponin I was observed.CONCLUSIONS. In this pilot study we revealed a positive effect of xenon in patients withACS: xenon causes fast chest pain relief, has no adverse effects on monitoring parameters,induces favourable changes in systemic hemodynamics, reduces hypercoagulation andprovides faster dynamics of necrosis markers. Further studies needed to determine the placeof xenon in ACS treatment.REFERENCE(S). 1. Burov NE, Potapov VN, Makeev GN. Xenon in anesthesiology; 2000.2. Burov NE, Molchanov IV, Nikolaev LL, Potapov VN. Technical support of xenonanesthesia. Clin Anesthesiol Resuscitation. 2005;2:27–32. 3. Pagel PS. Cardioprotection bynoble gases. J Cardiothorac Vasc Anesth. 2010;24(1):143–63 (Epub 20 May 2009).
0122REPERFUSION INJURY ACCORDING TO REPERFUSION STRATEGYAFTER ST-ELEVATION MYOCARDIAL INFARCTION: ASSESSMENTWITH CARDIOVASCULAR MAGNETIC RESONANCE
L. Palacios Gamir1, R. Oltra1, V. Bodi2, R.C. Huerta1, F.J. Chorro2
1Clinic Hospital of Valencia, ICU, Valencia, Spain, 2Clinic Hospital of Valencia,Cardiology, Valencia, SpainINTRODUCTION. In ST-segment elevation myocardial infarction (STEMI) timelyreperfusion is the primary therapeutic goal but may cause reperfusion injury (RI) includingmicrovascular obstruction (MVO) and intramyocardial hemorrhage (IMH). Differentreperfusion strategies exist for achieving reperfusion and some patients do not undergotimely reperfusion. Cardiovascular magnetic resonance (CMR) allows for detection of bothMVO and IMH. Data on the incidence of RI assessed with CMR according to reperfusionstrategy is scarce.
26th ESICM ANNUAL CONGRESS — PARIS, FRANCE — 5–9 OCTOBER 2013
OBJECTIVES. To assess reperfusion injury according to reperfusion strategy after ST-elevation myocardial infarction through cardiovascular magnetic resonance.METHODS. We stratified STEMI patients according to reperfusion therapy: no reperfusionwithin 12 h after symptom onset, primary PCI (percutaneous coronary intervention),thrombolysis plus early PCI and rescue PCI. Using CMR, the incidence RI (frequency ofIMH and MVO in [1 segment) was determined in T2 and late enhancement sequences.RESULTS. 379 patients were included in the study. Reperfusion mode was: no reperfusion,n = 44, pPCI, n = 147, thrombolysis, n = 142 and rescue PCI, n = 46. Overall incidenceof both IMH and MVO was 34 %. In the ‘‘no reperfusion’’ group, the incidence of RI wassignificantly lower compared to all other groups, while the contrary was the case for rescuePCI. There was a non-significant trend towards less RI in patients treated with thrombolysiscompared to primary PCI.CONCLUSIONS. RI in a non-selected STEMI population occurs frequently in relationshipwith reperfusion therapies. Using CMR we found that RI is most frequent in patientsundergoing rescue PCI while patients who do not receive reperfusion within the first 12 hdisplayed the lowest incidence. There was a non-significant trend towards a lower incidenceof RI in patients with successful thrombolysis compared to primary PCI. Additional ther-apies to minimize RI are needed.REFERENCE(S). 1. Turer AT, et al. Pathogenesis of myocardial ischemia–reperfusioninjury and rationale for therapy. Am J Cardiol (Author manuscript; available in PMC 2011August 1). 2. Thiele H, et al. Prognostic value of intramyocardial hemorrhage detected bycardiac magnetic resonance imaging in acute reperfused ST-elevation myocardial infarction.3. Hombach V, et al. Sequelae of acute myocardial infarction regarding cardiac structureand function and their prognostic significance as assessed by magnetic resonance imaging.Eur Heart J. 2005;26(6):549–57 (Epub 15 Feb 2005).
0123RISK FACTORS ASSOCIATED WITH MORTALITY IN ACUTE MYOCARDIALINFARCTION IN ELDERLY PATIENTS
F. Garcı́a1, J.A. Ortega1, J.M. Lebron1, S. Arrabal1, S. Vitaller1
1Marbella Hospital, Intensive Care Unit, Marbella, SpainINTRODUCTION. Due to increased life expectancy, more and more elderly patients aretreated in hospital in serious diseases, including ischemic heart disease. The objective of thisstudy is to find the possible risk factors higher hospital mortality in patients with acutemyocardial infarction in patients over 70 years.METHODS. We conducted a study with retrospective data collection, we selected allpatients with a diagnosis of acute myocardial infarction (electrical and analytical criteria)admitted between January 2008 and December 2012. We selected patients over 70 years ascases. The variables analyzed as possible risk factors included age, sex, presence ofhypertension, diabetes mellitus, smoke, dyslipidemia, ischemic heart disease, GRACEscore, revascularization technique, Killip class, use of IABP, presence of acute renal failure,postinfarction angina, reinfarction, stroke, mechanical complications, cardiogenic shock.Descriptive study was conducted initial and subsequent analysis by logistic regression usingas dependent variable mortality over 70 years.RESULTS. Among patients hospitalized for acute myocardial infarction (515), 167(32.4 %) were older than 70 years, 70.7 % were men, the most frequent location ofinfarction was inferior (37.7 %), postinfarction hospital mortality in this group was 8.4 %(14 patients). In multivariate logistic regression analysis showed risk factors for hospitalmortality: Killip class [1 (OR 3.2, 95 % CI 1.033–9.95), GRACE score [210 (OR 4.4,95 % CI 1.18–16.99), need for IABP (OR 13.43, 95 % CI 1.44–125.05); Occurrence ofacute renal failure (OR 4.64, 95 % CI 1.30–16.48). In all other variables were not statis-tically significant. Hospital mortality in this group was significantly higher (OR 3.09, 95 %CI 1.34–7.11) for mortality under 70 years (2.87 %).CONCLUSIONS. Among patients older than 70 years, admitted to the ICU for acutemyocardial infarction, the risk factors for hospital mortality are above, consistent withthose published in the literature and similar to younger patients. Also, in-hospital mortalityin this group was significantly higher than the mortality in patients below 70 years in oursample.REFERENCES. 1. Alexander KP, Newby LK, Cannon CP, Armstrong PW, et al. Acutecoronary care in the elderly, part I non-ST-segment-elevation acute coronary syndromes. 2.Avezum A, Makdisse M, Spencer F, Gore JM, Fox KA, Montalescot G, Eagle KA, White K,Mehta RH, Knobel E, Collet JP; GRACE Investigators. Impact of age on management andoutcome of acute coronary syndrome: observations from the Global Registry of AcuteCoronary Events (GRACE). Am Heart J. 2005;149:67–73. 3. Rathore SS, Mehta RH, WangY, Radford MJ, Krumholz HM. Effects of age on the quality of care provided to olderpatients with acute myocardial infarction. Am J Med. 2003;114:307–15.
0124EVALUATION OF GRADE 3 ISCHAEMIA AS A PROGNOSTIC FACTOR FORMORTALITY IN PATIENTS WITH ST-ELEVATION ACUTE CORONARYSYNDROME
M. Arias-Verdú1, T. Garcı́a-Paredes1, R. Rivera-López2, E. Aguilar-Alonso3,
J. Arboleda-Sánchez1, J. Gómez-Martı́n4, G. Quesada-Garcia1, R. Rivera-Fernández1
1Hospital Carlos Haya, Intensive Care Unit, Málaga, Spain, 2Hospital Virgen de las Nieves,Cardiologia, Granada, Spain, 3Hospital Infanta Margarita, Intensive Care Unit, Córdoba,Spain, 4Universidad de Granada, Facultad de Medicina, Granada, SpainOBJECTIVE. To analyze in patients with ST elevation acute coronary syndrome (STEMI),the relation between mortality and Grade 3 ischaemia evaluated by ECG.METHODS. We undertook a nested case–control study in a cohort (N = 524) of patientswith STEMI admitted to Carlos Haya hospital, Malaga, Spain between 2008–2010. Thecases comprised the patients who died in the hospital (n = 38) and the controls (n = 81)were composed of a random sample of patients who survived (1 in each 6). We analyzedage, sex, Killip on admission, TIMI, APACHE II and mortality. We also analyzed the ECGon admission to the hospital and after the repermeabilization (fibrinolysis or primaryangioplasty) and examined the presence of Grade 3 ischaemia (J point above 50 % of thevoltage of the R wave in inferior infarctions and absence of S wave in at least two of theV1–V3 leads in anterior infarctions). Statistical analysis was done with the Student t test, v2
and multiple logistic regression.RESULTS. A total of 38 (7.25 %) patients died in the hospital. A first ECG was availablefor 104 patients, and Grade 3 ischaemia could be assessed in 101 cases, 31 of the 38 whodied and 70 of the 81 controls. Those who died were older (75.66 ± 8.20 vs.
64.48 ± 13.61 years; p \ 0.001), and had a higher APACHE-II (19.11 ± 7.37 vs.10.32 ± 3.28; p \ 0.001) and TIMI (7.39 ± 2.94 vs. 3.62 ± 2.31; p \ 0.001).The Killipin those who died was I (26.3 %), II (21.2 %), III (13.2 %), and IV (39.5 %); andin the controls it was I (75.3 %), II (13.6 %), III (7.4 %), and IV (3.7 %); (p \ 0.001).Of the 31 who died, 17 (54.8 %) had Grade 3 ischaemia and 22 (31.4 %) of the 70 survivors(p = 0.028). 97 patients underwent reperfusion procedures. We classified the patientsaccording to the ECG information after reperfusion, or if absent the ECG on admission, andfound that Grade 3 ischaemia was present in 41.9 % of the 31 who died and 18.3 % of the71 survivors (p = 0.012).Logistic regression showed that Grade 3 ischaemia after the reperfusion procedure (or ifabsent using the information from the admission ECG) complemented the Killip classifi-cation; with the OR for Grade 3 ischaemia 3.51 (1.11–11.08) and for Killip-I OR: 1; Killip-II OR: 3.83 (1.11–11.08); Killip-III OR: 2.56 (0.39–16.5) and Killip-IV OR: 53.23(9.79–289.58). The discrimination of this model, evaluated with the area under the ROCcurve, was 0.84 (0.74–0.93) and for the Killip classification 0.80 (0.69–0.90). Grade 3ischaemia did not complement the TIMI or the APACHE II classification.CONCLUSIONS. In patients with STEMI, Grade 3 ischaemia as evaluated with the ECGafter the repermeabilization procedure and on hospital admission was related with mortality,complementing the Killip classification, though it added no further information to thecommonly used prognostic indices TIMI and APACHEII.
0125LEVOSIMENDAN INFUSION IN ACUTE HEART FAILUREDUE TO MYOCARDIAL INFARCTION
C. Gutu-Bahov1,2, T. Dumitras3, V. Cojocaru1, S. Matcovschi3, N. Gurschi1, C. Talmaci3
1State University of Medicine and Pharmacy ‘Nicolae Testemitanu’, Chair ofAnaesthesiology and Reanimatology Nr. 2, Chisinau, Moldova, 2Clinical MunicipalHospital ‘Sfanta Treime’, Critical Care Unit, Chisinau, Moldova, 3State University ofMedicine and Pharmacy ‘Nicolae Testemitanu’, Department of Internal Medicine, Chisinau,MoldovaINTRODUCTION. There is still a controversy about the complications and survivalbenefits of levosimendan infusion without using bolus doses.OBJECTIVES. To assess the efficacy, and 5 days survival of patients with myocardialinfarction complicated by acute heart failure, receiving levosimendan infusion versusdobutamine infusion.METHODS. We retrospectively analyzed 36 case histories of patients hospitalized withmyocardial infarction (MI) in Critical Care Unit of Clinical Municipal Hospital ‘‘SfantaTreime’’ in 2010–2012. The inclusion criteria were MI with Q wave on ECG, clinical signsof acute heart failure (AHF), echocardiography with left ventricle ejection fraction (LVEF)\40 %, signs of pulmonary edema on chest radiography, brain natriuretic peptide (BNP)[400 g/ml, systolic blood pressure (BP)[85 mmHg. Changes in clinical symptoms, LVEF,BNP were measured after 24-h infusion and at day 5. The treatment was supplied bydopamine infusion.RESULTS. Retrospectively the patients were divided into two groups: group I (26 patients)received continuous 24-h infusion of levosimendan at a dose of 0.05–0.1 mg/kg/min infu-sion, without bolus, and group II (10 patients) received continuous dobutamine infusion at adose of 2.5–5 mg/kg/min for 24 h. In group I, infusion of levosimendan in 23 patients led toa decrease of dyspnea and number of lung rales and positive radiological dynamic. Duringinfusion of levosimendan in 8 (31.7 %) patients different arrhythmias were recorded. Fataloutcome occurred in 2 patients (7.7 %). After infusion of levosimendan BNP’s leveldecreased 2-fold in 16–24 h and mean LVEF fraction increased from 29.8 ± 3.5 % to39.6 ± 2.27 % in 24–48 h, p \ 0.05. After 24 h of completion of dobutamine infusion heartrate and diastolic BP did not differ from the original, systolic BP decreased, the number ofpulmonary rales decreased and a positive radiological dynamic was registered. Episodes ofarrhythmias were detected in 9 patients, mean LVEF before the infusion constituted33.7 ± 1.7 and 34.3 ± 1.9 %, 24–48 h after infusion, and BNP dynamic was absent. Fataloutcome in the dobutamine group was 40 % (4 patients).CONCLUSIONS. In patients with acute heart failure due to myocardial infarction, treat-ment with levosimendan infusion contributed to a more pronounced beneficial effect onhemodynamics, with rapid resolution of heart failure and more increased left ventricularejection fraction, as well as lower rate of complications and higher 5 days survival, thanwith dobutamine infusion.REFERENCE(S). 1. Moiseyev VS, et al. Safety and efficacy of novel calcium sensitizer,levosimendan, in patients with left ventricular failure due to an acute myocardial infarction.A randomized, placebo-controlled, double-blind study (RUSSLAN). Eur Heart J.2002;23(18):1422–32.
0126THE ASSOCIATION BETWEEN CIRCULATING PLASMINOGEN ACTIVATORINHIBITOR TYPE 1 (PAI-1) LEVELS, THE PAI-1 4G/5G POLYMORPHISM ANDINCIDENT MYOCARDIAL INFARCTION
I. Tsangaris1, G. Tsaknis1, G. Nikolopoulos2, S. Bonovas2, P. Bagos3, A. Tsantes4,
P. Kopterides1, E. Vrigkou1, D. Konstantonis1, A. Armaganidis1
12nd Department of Critical Care Medicine, ‘‘Attiko’’ University Hospital, Medical School,University of Athens, Athens, Greece, 2Hellenic Centre for Disease Control and Prevention,Athens, Greece, 3Department of Computer Science and Biomedical Informatics, Universityof Central Greece, Athens, Greece, 4Department of Hematology and Blood Bank Unit,‘‘Attiko’’ University Hospital, Medical School, University of Athens, Athens, GreeceINTRODUCTION. Circulating levels of Plasminogen Activator Inhibitor type 1 (PAI-1)are increased in individuals carrying the 4G allele at position -675 of the PAI-1 gene. Inturn, overexpression of PAI-1 has been found to affect both atheroma and thrombosis.However, the association between PAI-1 levels and the incidence of Myocardial Infarction(MI) is complicated by the potentially confounding effect of well-known cardiovascular riskfactors.OBJECTIVES. The current study tried to investigate in parallel the association of PAI-1activity with the PAI-1 4G/5G polymorphism, MI, and components of Metabolic Syndrome(MetS).METHODS. The current meta-analysis was conducted according to the MOOSE guidelinesand the PRISMA statement. The methodology was pre-specified and documented in aprotocol. A comprehensive electronic search of PubMed and Scopus was conducted up untilMay 2010. The following keywords or combination of them were used: ‘‘Plasminogenactivator inhibitor’’, ‘‘PAI-1’’, and ‘‘Myocardial infarction’’. After an initial screening oftitles and abstracts, only relevant studies remained. Subsequently, full text articles were
26th ESICM ANNUAL CONGRESS — PARIS, FRANCE — 5–9 OCTOBER 2013
critically evaluated for eligibility and their reference lists were manually scanned to identifyfurther studies for inclusion. Furthermore, in an effort to limit the effect of ‘‘grey literature’’-related bias, 25 studies published in conference proceedings or as short abstracts were alsoconsidered (if found). Using meta-analytical Mendelian randomization approaches, geno-type-disease and genotype-phenotype associations were modeled simultaneously.RESULTS. According to the recessive model of inheritance, which was supported from thedata, the MI-related odd ratio for the 4G/4G individuals was 1.136 with 95 % confidenceinterval (CI) 0.995, 1.297. Moreover, the 4G homozygotes had, on average, higher PAI-1activity by 1.926 units compared to 5G carriers (95 % CI 1.132, 2.720). The meta-regressionanalyses showed that increased levels of triglycerides (p \ 10-4), cholesterol (p \ 10-4) andPAI-1 (p = 0.020) in controls were associated with reduced MI risk for 4G homozygotes.Finally, cholesterol (p \ 10-4) and triglyceride (p \ 10-4) levels were positively related tothe mean genotype difference of PAI-1 activity in controls.CONCLUSIONS. Mendelian randomization approaches suggested that PAI-1 could lie inthe etiological pathway to MI. However, the meta-regression analyses compromised thisevidence. Although meta-regression methods are prone to biases, further research is neededon the kind of association, if any, between PAI-1 levels and some components of MetS.REFERENCES. Tsangaris I, Tsantes A, Bonovas S, Lignos M, Kopterides P, Gialeraki A,Rapti E, Orfanos S, Dimopoulou I, Travlou A, Armaganidis A. The impact of the PAI-1 4G/5G polymorphism on the outcome of patients with ALI/ARDS. Thromb Res.2009;123(6):832–6.GRANT ACKNOWLEDGMENT. Greek Ministry of Health and Social Solidarity (Grant70/3/10260 to Dr I. Tsangaris).
0127IS THERE AGREEMENT AMONG INTERVENTIONAL CARDIOLOGISTSIN THE TREATMENT OF INTERMEDIATE CORONARY STENOSIS?
M.A. Ramirez-Marrero1, M. Cano-Garcia1, J.L. Delgado-Prieto1, M. Jimenez-Navarro2,M. de Mora-Martin3
1Hospital Carlos Haya, Cardiology, Malaga, Spain, 2Hospital Clinico Virgen de la Victoria,Cardiology, Malaga, Spain, 3Hospital Carlos Haya, Malaga, SpainINTRODUCTION. An intermediate coronary lesion was defined as a stenosis between C40and B70 %. The fractional flow reserve (FFR) by pressure guidewire is indicated to assessthe hemodynamic significance of moderate stenosis in the absence of functional informa-tion. The aim of this study is to analyze the interobserver variability in visual assessment ofangiographically intermediate coronary lesions by interventional cardiologist experts, andtheir comparison with the functional severity by pressure guide.MATERIALS AND METHODS. Analysis of patients with intermediate coronary lesionsundergoing coronary angiography between January 2008 and March 2011 admitted forACS. Guide pressure was performed in all cases. Lesions were considered significant if FFRwas B0.75. All lesions were visualized independently by three expert interventional car-diologists with at least 5 years of experience, who rated the coronary lesions in ‘‘severe’’and ‘‘severe.’’ The degree of agreement was measured using the kappa statistic.RESULTS. We included 93 intermediate lesions belonging to 79 patients. The 73.4 % weremen, mean age 61 ± 9 years. The most common reason for admission was unstable angina.All lesions with positive pressure wire were revascularized, except in one case due totechnical difficulties. Lesions with negative pressure wire were not revascularized. Of the 93lesions, 19 (20.4 %) lesions were considered responsible for coronary event. The overallkappa between observers was 0.263 (95 % CI 0.124–0.402, p = 0.0001) and betweenobservers and assessing FFR in 0153 (95 % CI 0.049–0.258, p = 0.0003). No significantdifference between the percentage of total agreement between observers when the lesionwas functionally significant versus when the pressure wire was negative (35.4 vs 48.5 %,p = 0.189). The visual assessment tends to overestimate the severity of lesions comparedwith FFR, existing over 21.5 % classified as severe injuries by the Observer-1, 23.7 % bythe Observer-2 and 17.2 % for the Observer-3.CONCLUSIONS. There is great variability in the visual assessment of intermediate cor-onary lesions. This means that in clinical practice could be treated functionally non-significant coronary lesions unnecessarily, which could result in possible complications forthe patient. The use of FFR is limited by the additional time needed and the current facilityfor the treatment of these coronary lesions, which favors to be treated even in a time lessthan that required for evaluation, or to defer the decision to clinically evaluate its impact,revascularization postponing for a second time, resulting in the need for a new procedure,the greater number of days of hospitalization, higher complication rate and higher economiccosts.
0128CLINICAL IMPACT OF INTRA-AORTIC BALLOON PUMP DURINGPERCUTANEOUS CARDIOPULMONARY SUPPORT IN PATIENTS WITHACUTE MYOCARDIAL INFARCTION COMPLICATED BY CARDIOGENICSHOCK
J.H. Yang1, T.K. Park1, C.R. Chung1, C.-M. Park1, K. Jeon1, G.Y. Suh1, S.-H. Choi1
1Samsung Medical Center, Sungkyunkwan University School of Medicine, Seoul, Republicof KoreaINTRODUCTION. While on percutaneous cardiopulmonary support (PCPS), the leftventricle (LV) is only partially unloaded and LV afterload may be high. Intra-aortic balloonpump (IABP) has been considered as being one of the options to optimize hemodynamicstatus in patients with LV distension.OBJECTIVES. We investigated whether IABP support, combined with PCPS, improvesin-hospital survival in patients with acute myocardial infarction (AMI) complicated bycardiogenic shock.METHODS. Using a retrospective, single-center registry between January 2004 andDecember 2011, we analyzed 96 consecutive Korean patients with cardiogenic shockcomplicating AMI assisted by a PCPS system. The primary outcome was in-hospitalmortality. The secondary outcome was the success rate of weaning from PCPS and thelactate clearance for 48 h (%).RESULTS. Combination of IABP and PCPS was performed in 41 (42.7 %) patients. In-hospital mortality occurred in 51 patients (PCPS with IABP versus PCPS alone; 51.2 vs.54.5 %, P = 0.747). The success rate of weaning from PCPS was also similar (63.4 vs.58.2 %, P = 0.604). Complications such as ischemia of lower extremity or bleeding ofPCPS insertion site did not increase in PCPS with IABP (P = 0.521 and P = 0.667,respectively). Among survivors for 24 h more, lactate clearance was not significantly dif-ferent between the PCPS alone and PCPS with IABP (P = 0.918).
CONCLUSIONS. The combined use of PCPS and IABP could not improve in-hospitalsurvival.REFERENCE(S). 1. Phillips SJ, Zeff RH, Kongtahworn C, Grignon A, Barker L, IannoneLA, Tannenbaum M, Verhey MH, Wickemeyer WJ, Ghali MG, et al. Benefits of combinedballoon pumping and percutaneous cardiopulmonary bypass. Ann Thorac Surg.1992;54(5):908–10. 2. Sung K, Lee YT, Park PW, Park KH, Jun TG, Yang JH, Ha YK.Improved survival after cardiac arrest using emergent autopriming percutaneous cardio-pulmonary support. Ann Thorac Surg. 2006;82(2):651–6. 3. Madershahian N, LiakopoulosOJ, Wippermann J, Salehi-Gilani S, Wittwer T, Choi YH, Naraghi H, Wahlers T. Theimpact of intraaortic balloon counterpulsation on bypass graft flow in patients withperipheral ECMO. J Card Surg. 2009;24(3):265–8. 4. Sauren LD, Reesink KD, Selder JL,Beghi C, van der Veen FH, Maessen JG. The acute effect of intra-aortic balloon counter-pulsation during extracorporeal life support: an experimental study. Artif Organs.2007;31(1):31–8.
0129GENDER IMPACT ON COMPLICATIONS IN ST-ELEVATION ACUTECORONARY SYNDROME
J. Muñoz-Bono1, E. Trujillo-Garcı́a1, J.A. Arboleda-Sánchez1, R. Rivera-Fernández1,M.D. Fernández-Zamora1, T. Garcı́a-Paredes1
1Carlos Haya Regional University Hospital, Intensive Care Unit, Málaga, SpainINTRODUCTION. The main death cause in industrial countries is ischemic cardiopathy.Gender-related differences in death rate have been reported by some studies. Thus, high andshort-time hospital death-rate is observed in females who suffer acute coronary syndrome(ACS).OBJECTIVES. Describe gender impact on complications in ICU-admitted, st-elevationacute coronary syndrome patients.METHODS. An observational and prospective study on ST-elevation ACS patients fromJanuary 2002 to January 2012 in our Intensive Care Unit, and collected in the ARIAM-Andalucı́a database. Cardiovascular complications are analysed throughout hospitalization.Pearson’s Chi squared test was used as statistical method for comparison purposes—thelevel of significance was set at 95 %—and binary logistic regression was used for multi-variate analysis.RESULTS. A total number of 569 patients were included in this study (78.9 % were males).Complications were right cardiac failure (3.2 %), cardiac tamponade (0.7 %), hypertension(6.7 %), cardiac shock (6.3 %), complete AV block (13.7 %), cardiac arrest (11.1 %), VF(4 %), pulseless VT (5.1 %), mechanical defects (1.8 %), and CVA (1.1 %). The tablebelow shows complication analysis by gender:
Complications
Male (%) Female (%) p
Right ventricular failure 3.1 3.3 ns
Tamponade 0.7 0.85 ns
Cardiogenic shock 4.9 11.7 0.009
Ventricular arrhythmias 9.1 9.1 ns
AV blocks 7.6 6.7 ns
Mechanical defects 1.8 1.7 ns
CVA 1.1 0.8 ns
Renal failure 5.3 6.7 ns
Adjusting seriousness (by Killip and Grace scale), reperfusion delay and infarct localizationby age, ‘‘female’’ is an independent predictor in cardiac-failure patients (p = 0.049, OR12.5; IC 95 %).CONCLUSIONS. Female gender involves higher possibility of cardiac failure with nodifferences regarding other complications.GRANT ACKNOWLEDGMENT. Ariam researchers.
0130HEAD-TO-HEAD COMPARISON OF 1 WEEK VERSUS 6 MONTHS CMR-DERIVED INFARCT SIZE FOR PREDICTION LATE EVENTS AFTER STEMI
L. Palacios Gamir1, R. Oltra1, V. Bodi2, R.C. Huerta1, F.J. Chorro2
1Clinic Hospital of Valencia, ICU, Valencia, Spain, 2Clinic Hospital of Valencia,Cardiology, Valencia, SpainINTRODUCTION. Infarct size (IS) diminishes during the first months after ST-elevationmyocardial infarction (STEMI). The incremental prognostic value of IS regression and offinal IS at 6 months is unknown.OBJECTIVE. To compare cardiovascular magnetic resonance (CMR)-derived IS at 1 weekand 6 months after MI for predicting late major adverse cardiac events (MACE).METHODS. 250 patients underwent CMR at 1 week and 6 months after MI. IS wasdetermined as % of left ventricular mass (%LV) and the extent of segments with transmuralnecrosis (in [50 % of wall thickness, ETN). During 163 weeks, 23 late MACE (cardiacdeath, MI or readmission for heart failure after 6 months) occurred.RESULTS. Patients with MACE had a larger IS than those without MACE: at 1 week(%LV 32 ± 17 vs. 21 ± 14, p = 0.001, ETN 6 [4–9] vs. 3 [1–5], p \ 0.0001) and at6 months (%LV 28 ± 15 vs. 17 ± 13, p \ 0.001, ETN 5 [2–6] vs. 3 [1–5], p = 0.005).Late MACE rates in IS[median were higher at 1 week (%LV 14 vs. 5 %, p = 0.02, ETN14 vs. 4 %, p = 0.007) and 6 months (%LV 14 vs. 5 %, p = 0.02, ETN 12 vs. 5 %,p = 0.053). The C-statistic for predicting late MACE of CMR at 1 week and 6 months wascomparable (0.720 vs. 0.746, p = 0.1). Only ETN at 1 week (HR 1.31, 95 % CI[1.14–1.52], p \ 0.0001, per segment) independently predicted late MACE.CONCLUSIONS. CMR-derived IS at 6 months does not offer prognostic value beyond ISat 1 week after MI. The strongest predictor of late MACE is ETN at 1 week.REFERENCE(S). 1. Marra MP, et al. MRI in acute myocardial infarction. Eur Heart J.2011;32(3):284–93. doi:10.1093/eurheartj/ehq409. 2. Mandapaka S, et al. Does late gado-linium enhancement predict cardiac events in patients with ischemic cardiomyopathy?Circulation. 2006;113:2676–8. 3. Hombach V, et al. Sequelae of acute myocardial infarctionregarding cardiac structure and function and their prognostic significance as assessed bymagnetic resonance imaging. Eur Heart J. 2005;26(6):549–57 (Epub 15 Feb 2005).
26th ESICM ANNUAL CONGRESS — PARIS, FRANCE — 5–9 OCTOBER 2013
0131REPERCUSSION OF COMPLETE PERCUTANEOUS CORONARYREVASCULARIZATION ON PROGNOSIS OF ELDERLY PATIENTS
M.A. Ramirez-Marrero1, M.A. Roldan-Jimenez1, J.L. Delgado-Prieto1,
M. Jimenez-Navarro2, M. de Mora-Martin1
1Hospital Carlos Haya, Cardiology, Malaga, Spain, 2Hospital Clinico Virgen de la Victoria,Cardiology, Malaga, SpainINTRODUCTION AND OBJECTIVES. Prevalence of ischemic heart disease isincreasing due to progressive population ageing. Our aim was to analyze the baselinecharacteristics of elderly patients undergoing percutaneous coronary revascularization andthe impact of the anatomic revascularization in their long term survival.MATERIALS AND METHODS. Retrospective study of all elderly patients (over 75 yearsold) consecutively admitted for acute coronary syndrome between January 2008 andDecember 2009. Complete revascularization was defined according to anatomical criteria,i.e. when no stenosis was greater than 70 % in epicardial coronary arteries or branches ofmore than 2 mm, assessing their impact on cardiovascular mortality. An average follow-upof 35.4 ± 14 months was performed, being such follow-up completed in 98.6 % of thecases.RESULTS. A total of 146 patients, with a mean age of 78.22 ± 2.70 years, were included.90 (62.9 %) were male, 113 (79 %) hypertensive, 66 (46.2 %) had diabetes and dyslipi-demia, 78 (54.5 %) showed prior history of angina and 45 (31.5 %) of acute myocardialinfarction. Multivessel coronary heart disease was present in 63.6 % of the patients.Revascularization was incomplete in 80 (53.8 %) patients which, compared to patients withcomplete revascularization, presented a larger number of stenosed vessels (2.44 ± 0.69 vs.1.32 ± 0.61, p = 0.0001), and a greater history of prior myocardial infarction (23.1 vs.8.4 %, p = 0.002) and comorbidity (Charlson comorbidity index 19 ± 1.13 vs.0.80 ± 1.02, p = 0.03). After the follow-up, 18 patients had died of cardiovascular causes,with a predominance of those who had received incomplete coronary revascularization (10.2vs. 2.9 %, p = 0.03). After adjustment, complete revascularization predicted lower risk ofcardiovascular mortality (OR 0.32; 95 % CI 1.05–1.08). On the contrary, the presence ofhyperlipidemia and a highest score of Charlson index related to higher cardiovascularmortality (OR 3.02; 95 % CI 1.2–9.2 and OR 1.72, 95 % CI 1.09–2.71, respectively).CONCLUSIONS. Complete coronary revascularization improves the long-term prognosisin terms of cardiovascular mortality in elderly patients undergoing percutaneous coronaryintervention.
0132PATIENTS ADMITTED WITH DIAGNOSIS OF STABLE ANGINA PECTORIS:CLINICAL PROFILE AND OUTCOME
B. Pérez Villardón1, A.M. Garcia Bellon2, A.M. Gonzalez Gonzalez2, D. Gaitan Roman2,M. Ramirez Marrero2, J. Cano Nieto2, R. Vivancos Delgado2, M. De Mora Martin2
1Hospital Carlos Haya/Hospital Comarcal Axarquı́a, Servicio de Cardiologia, Málaga,Spain, 2Hospital Carlos Haya, Servicio de Cardiologia, Malaga, SpainINTRODUCTION. Stable angina is a clinical syndrome attributed to myocardial ischae-mia; usually the pathological substrate is the atheromatous narrowing the coronary arteries.The aim of this study is to assess the clinical characteristics of patients (p) referred forcoronary angiography with the diagnosis of stable angina.METHODS. We identified 198p referred for coronary angiography from January 2011–November 2011 with stable angina pectoris as indication. The cardiovascular risk factors(CVRF) were recorded at the time of inclusion, the canadian cardiovascular society func-tional classification of angina (CCS class) and left ventricular ejection fraction (LVEF). Wealso evaluated the ischaemia tests performed, the treatment, the results of the coronaryangiography, and the short-term outcome.RESULTS. A total of 198p were included, with a slight predominance of males (61.6 %)mean age of 65 ± 10.4 years. CVRF: 81.8 % high blood pressure, 66.2 % dyslipidemia,47.5 % current/former smokers, 33.8 % diabetes mellitus, 35.9 % menopause, 11.1 %family history of ischemic disease. Treatment for a depressive disorder was present in13.6 %. The body mass index was 30.1 ± 4.6 kg/m2. The average creatinine was1.1 ± 0.7 mg/dl, 9.6 % had kidney failure and 1.5 % needed dialysis. Peripheral vasculardisease history was present in 7.6 %, and previous stroke in 5.6 %.CCS class: II in 57.6 %, III in 41.9 % and IV in 0.5 %. The LVEF was \50 % in 5.6 %.Sinus rhythm was present in 95 %, mean heart rate 69.8 ± 11.1 bpm.A previous ischaemia test was performed in 65.6 %: exercise test (22.7 %), cardiac gam-magraphy (28.3 %), stress echo (1 %), cardiac-CT (5 %), C2 tests (8.6 %). These tests wereconclusive in 85.4 % and concordant with the coronariography results in 61 %. The radialartery access was used in 70.7 %. The coronariography results were: normal coronaryarteries (26.3 %), diffuse non-obstructive disease (14.6 %), slow flow (3 %), milking (1 %),1-vessel disease in 30.8 %, 2-vessel in 11.6 %, 3-vessel or left main stenosis in 12.1 %. Theleft anterior descending coronary artery was the most frequent involved (31.4 %). A per-cutaneous coronary intervention was performed in 41.4 %, and coronary artery bypassgrafting in 8 %. The revascularization was complete in 79.6 %; in 54.8 % were used drugeluting stents. During the in-hospital stay, 10p (5.1 %) had any complication: 1p nosocomialurinary tract infection, 2p haematomas that required an imaging test, 2p atrial arrhythmias, 3acute myocardial infarction post-procedure, 1 coronary dissection, 1 cardiogenic shock.During the follow-up, 21p (10.6 %) suffered any MACE, and in 19p (9.6 %) a new coro-nariography was performed: 13p had no changes, 4p had bare metal stent restenosis, 2p hadcoronary artery spasm.CONCLUSIONS. Patients suspected of stable angina pectoris have a high comorbidity.Frequently they have non-obstructive coronary artery disease (45.4 %). The coronariogra-phy is a safety procedure with a low rate of complications.
0133NON INVASIVE CORONARY ANGIOGRAPHY BY 64-SLICE COMPUTEDTOMOGRAPHY: PREVALENCE OF OBSTRUCTIVE CORONARY DISEASE
M.A. Ramirez Marrero1, A.M. Garcia Bellon1, B. Perez Villardon1,
A.M. Gonzalez Gonzalez1, D. Gaitan Roman1, M. De Mora Martin1
1Hospital Carlos Haya, Servicio de Cardiologia, Malaga, SpainINTRODUCTION. Coronary computed tomography of 64 slices (CT 64) has shown a highnegative predictive value. The aim of this study is to evaluate the presence of obstructivecoronary artery disease in patients without a history of known coronary artery disease(CAD) undergoing CT 64.
MATERIALS AND METHODS. We evaluated 80 patients undergoing CT 64 fromSeptember 2008–September 2011. We excluded patients with previous CAD, acutecoronary syndrome, typical clinical for ischemic heart disease, severe renal insuffi-ciency and patients with a history of allergic reactions to iodinated contrast. We used aPhilips Brilliance CT 64 scanner. We used contrast of low osmolarity. In patientswith high heart rate we used esmolol iv. In all procedures sublingual nitroglycerin wasused.RESULTS. We analyzed 80 patients, with a slight predominance of males (58.8 %), meanage 57.9 years. Regarding cardiovascular risk factors, highlights: 66.3 % were hypertensive,58.8 % had dyslipidemia, 50 % were diabetics, 41.3 % were overweight, 26.3 %wereobese, 28.8 % were active smokers, 31.3 % were former smokers. 35 % had a family historyof ischemic heart disease. Reason for request CT: 41.3 % atypical chest pain, 16.3 %unexplained dyspnea, 22.5 % pathological ECG, 2.5 % prior to start vigorous exercise,17.5 % prior to non cardiac surgery. 41.2 % had previously performed another test ofischemia: 25 % scintigraphy, 8.8 % wall motion abnormalities on echocardiogram, 7.5 %non-conclusive stress test.Agatston Score was \10 in 27.5 %, 11–100 in 38.8 %, 101–400 in 22.5 %, 401–1,000 in8.8 %,[1,000 in 2.5 %. Coronary lesions were found in 59 p (73.8 %): 30 % fibrocalcifiedplate, 18.8 % calcified plaque, 18.8 % fibrofatty plate, 5 % ulcerated plaque, 1.3 %thrombotic lesion. We found significant lesions in 20 p (25 %): 6.3 % in DA, 6.3 % in CD,2.5 % in Cx, 1.3 % LM lesion, 2.5 % two-vessel disease, 6.3 % 3-vessel disease.CONCLUSIONS. The presence of obstructive lesions was observed in 25 %. Thus, the useof TC 64 for the evaluation of patients with suspected CAD and ischemia induction studiesnegative or non-conclusive significantly helps in the actual characterization of coronarydisease.
Mechanical ventilation: current practice and novelideas: 0135–01480135EFFECTS OF INHALED NITROGLYCERIN COMPARED WITH INHALEDILOPROST IN PATIENTS WITH HYPOXEMIC ACUTE RESPIRATORYDISTRESS SYNDROME
K. Trongtrakul1, A. Wongsa1, K. Piyawechvirutana1
1Pramongkutkloa Hospital, Division of Pulmonary and Critical Care Medicine, Departmentof Internal Medicine, Bangkok, ThailandINTRODUCTION. Nitric oxide and iloprost have been used to improve oxygenation asinhaled pulmonary vasodilators for improving V/Q mismatch, one mechanism of hypoxemiain ARDS. Although there are quite costly and some requires sophisticated machine. Weassumed nitroglycerin, a nitric oxide donor, was comparable with iloprost for treatinghypoxemia in ARDS.OBJECTIVES. To investigate the effects of inhaled nitroglycerin versus inhaled iloproston improving oxygenation in hypoxemic ARDS patients.METHODS. We conducted a prospective randomized crossover study within patientscomparison in ten ARDS patients, 15 treatment episodes with moderate to severe ARDS, atMICUs of Pramongkutklao Hospital. The ARDS patients were randomized to received15 min nebulization of nitroglycerin (10 mcg/kg) or iloprost (5 mcg) as an initial medica-tion followed by a crossover to other agent after 60 min. Hemodynamic, lung mechanic andoxygenation variables was measured before (minute-0), immediately after (minute-15) and30 min (minute-45). Both medications were nebulized using ultrasonic nebulizer. Primaryoutcome was comparative effects of nebulized nitroglycerin versus iloprost to oxygenvariables. Secondary outcome was the adverse effect of nitroglycerin measured by methe-moglobin level before and after nebulization.RESULTS. Ten ARDS patients had mean age of 67 ± 16 years old, body weight of56 ± 10 kg. Pneumonia was the most common causes of ARDS. Nine were moderate andone was severe ARDS classified by ARDS Berlin Definition 2012. Average baselineparameters of 15 treatment episodes in ten ARDS patients include tidal volume of 8 ± 2 ml/kg PBW, PEEP of 13 ± 3 cmH2O, PF ratio of 157 ± 41 and respiratory compliance of24 ± 7 ml/cmH2O. The primary outcome showed that the mean difference in oxygenationvariables between baseline and minute-15 after received inhaled nitroglycerin or iloprost asmonitored by PaO2, SaO2, and PF ratio were 0.2 ± 1.8 versus 4.3 ± 2.6 mmHg, -0.3 ± 0.3 versus 0.4 ± 0.3 percent, and 0.7 ± 3.5 versus 8.3 ± 5.1, respectively. The meandifferences in oxygenation variables, when compared between inhaled nitroglycerin andiloprost indicated that inhaled iloprost resulted in more change in PaO2, SaO2, and PF ratio,but were not significant (4.1 ± 3.6 mmHg, p = 0.28; 0.7 ± 0.4 percent, p = 0.80; and7.6 ± 6.79, p = 0.28, respectively). In regards to adverse effects, methemoglobin level wasmeasured before, minute-15, and minute-45 after inhale nitroglycerin. The levels measuredat the three points of time were 0.18 ± 0.12, 0.24 ± 0.13, and 0.21 ± 0.08 percent,respectively but the difference was not statistically significant (p = 0.44).CONCLUSIONS. Among hypoxemic ARDS patients using ultrasonic nebulizer for inhalediloprost 5 mcg has a better trend of oxygenation detected by PaO2, SpO2, and PF ratio, ascompared to inhaled nitroglycerin 10 mcg/kg but were not statistically significant.GRANT ACKNOWLEDGMENT. The Thai Society of Critical Care Medicine.
0136SPONTANEOUS EFFORT CAUSES OCCULT PENDELLUFT DURINGMECHANICAL VENTILATION
T. Yoshida1,2, V. Torsani2, S. Gomes2, R.R.D.S. Santiago2, M. Beraldo2, M.R. Tucci2,
W.A. Zin3, B.P. Kavanagh4, M.B.P. Amato2
1Osaka University Graduate School of Medicine, Department of Anesthesiology andIntensive Care Medicine, Suita, Japan, 2Hospital das Clı́nicas da Faculdade de Medicina daUniversidade de São Paulo, Heart Institute (InCor), São Paulo, Brazil, 3UniversidadeFederal do Rio de Janeiro, Instituto de Biofı́sica Carlos Chagas Filho, Rio de Janeiro, Brazil,4University of Toronto, Hospital for Sick Children, Departments of Critical Care Medicineand Anesthesia, Toronto, CanadaINTRODUCTION. Traditionally, we assume that diaphragmatic contraction uniformlylowers pleural pressure (Ppl) by the same amount at all points on the lung surface, creating auniform increase in transpulmonary pressure [1, 2]. This assumption (i.e. the fluid-likebehavior of normal lungs) has been the basis of the use of esophageal pressures, alsoexplaining why spontaneous breathing augments ventilation and gas exchange. However, ina typical patient with injured lungs, we recently observed a Pendelluft phenomenon:
26th ESICM ANNUAL CONGRESS — PARIS, FRANCE — 5–9 OCTOBER 2013
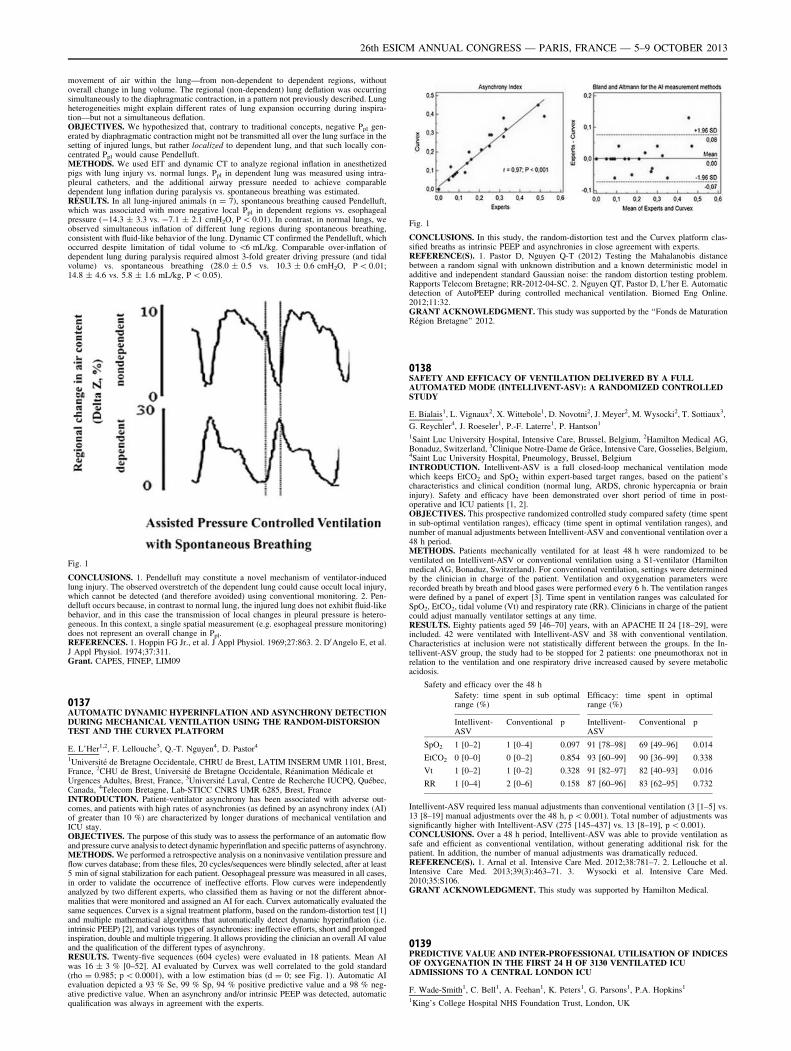
movement of air within the lung—from non-dependent to dependent regions, withoutoverall change in lung volume. The regional (non-dependent) lung deflation was occurringsimultaneously to the diaphragmatic contraction, in a pattern not previously described. Lungheterogeneities might explain different rates of lung expansion occurring during inspira-tion—but not a simultaneous deflation.OBJECTIVES. We hypothesized that, contrary to traditional concepts, negative Ppl gen-erated by diaphragmatic contraction might not be transmitted all over the lung surface in thesetting of injured lungs, but rather localized to dependent lung, and that such locally con-centrated Ppl would cause Pendelluft.METHODS. We used EIT and dynamic CT to analyze regional inflation in anesthetizedpigs with lung injury vs. normal lungs. Ppl in dependent lung was measured using intra-pleural catheters, and the additional airway pressure needed to achieve comparabledependent lung inflation during paralysis vs. spontaneous breathing was estimated.RESULTS. In all lung-injured animals (n = 7), spontaneous breathing caused Pendelluft,which was associated with more negative local Ppl in dependent regions vs. esophagealpressure (-14.3 ± 3.3 vs. -7.1 ± 2.1 cmH2O, P \ 0.01). In contrast, in normal lungs, weobserved simultaneous inflation of different lung regions during spontaneous breathing,consistent with fluid-like behavior of the lung. Dynamic CT confirmed the Pendelluft, whichoccurred despite limitation of tidal volume to \6 mL/kg. Comparable over-inflation ofdependent lung during paralysis required almost 3-fold greater driving pressure (and tidalvolume) vs. spontaneous breathing (28.0 ± 0.5 vs. 10.3 ± 0.6 cmH2O, P \ 0.01;14.8 ± 4.6 vs. 5.8 ± 1.6 mL/kg, P \ 0.05).
Fig. 1
CONCLUSIONS. 1. Pendelluft may constitute a novel mechanism of ventilator-inducedlung injury. The observed overstretch of the dependent lung could cause occult local injury,which cannot be detected (and therefore avoided) using conventional monitoring. 2. Pen-delluft occurs because, in contrast to normal lung, the injured lung does not exhibit fluid-likebehavior, and in this case the transmission of local changes in pleural pressure is hetero-geneous. In this context, a single spatial measurement (e.g. esophageal pressure monitoring)does not represent an overall change in Ppl.REFERENCES. 1. Hoppin FG Jr., et al. J Appl Physiol. 1969;27:863. 2. D0Angelo E, et al.J Appl Physiol. 1974;37:311.Grant. CAPES, FINEP, LIM09
0137AUTOMATIC DYNAMIC HYPERINFLATION AND ASYNCHRONY DETECTIONDURING MECHANICAL VENTILATION USING THE RANDOM-DISTORSIONTEST AND THE CURVEX PLATFORM
E. L’Her1,2, F. Lellouche3, Q.-T. Nguyen4, D. Pastor4
1Université de Bretagne Occidentale, CHRU de Brest, LATIM INSERM UMR 1101, Brest,France, 2CHU de Brest, Université de Bretagne Occidentale, Réanimation Médicale etUrgences Adultes, Brest, France, 3Université Laval, Centre de Recherche IUCPQ, Québec,Canada, 4Telecom Bretagne, Lab-STICC CNRS UMR 6285, Brest, FranceINTRODUCTION. Patient-ventilator asynchrony has been associated with adverse out-comes, and patients with high rates of asynchronies (as defined by an asynchrony index (AI)of greater than 10 %) are characterized by longer durations of mechanical ventilation andICU stay.OBJECTIVES. The purpose of this study was to assess the performance of an automatic flowand pressure curve analysis to detect dynamic hyperinflation and specific patterns of asynchrony.METHODS. We performed a retrospective analysis on a noninvasive ventilation pressure andflow curves database; from these files, 20 cycles/sequences were blindly selected, after at least5 min of signal stabilization for each patient. Oesophageal pressure was measured in all cases,in order to validate the occurrence of ineffective efforts. Flow curves were independentlyanalyzed by two different experts, who classified them as having or not the different abnor-malities that were monitored and assigned an AI for each. Curvex automatically evaluated thesame sequences. Curvex is a signal treatment platform, based on the random-distortion test [1]and multiple mathematical algorithms that automatically detect dynamic hyperinflation (i.e.intrinsic PEEP) [2], and various types of asynchronies: ineffective efforts, short and prolongedinspiration, double and multiple triggering. It allows providing the clinician an overall AI valueand the qualification of the different types of asynchrony.RESULTS. Twenty-five sequences (604 cycles) were evaluated in 18 patients. Mean AIwas 16 ± 3 % [0–52]. AI evaluated by Curvex was well correlated to the gold standard(rho = 0.985; p \ 0.0001), with a low estimation bias (d = 0; see Fig. 1). Automatic AIevaluation depicted a 93 % Se, 99 % Sp, 94 % positive predictive value and a 98 % neg-ative predictive value. When an asynchrony and/or intrinsic PEEP was detected, automaticqualification was always in agreement with the experts.
Fig. 1
CONCLUSIONS. In this study, the random-distortion test and the Curvex platform clas-sified breaths as intrinsic PEEP and asynchronies in close agreement with experts.REFERENCE(S). 1. Pastor D, Nguyen Q-T (2012) Testing the Mahalanobis distancebetween a random signal with unknown distribution and a known deterministic model inadditive and independent standard Gaussian noise: the random distortion testing problem.Rapports Telecom Bretagne; RR-2012-04-SC. 2. Nguyen QT, Pastor D, L0her E. Automaticdetection of AutoPEEP during controlled mechanical ventilation. Biomed Eng Online.2012;11:32.GRANT ACKNOWLEDGMENT. This study was supported by the ‘‘Fonds de MaturationRégion Bretagne’’ 2012.
0138SAFETY AND EFFICACY OF VENTILATION DELIVERED BY A FULLAUTOMATED MODE (INTELLIVENT-ASV): A RANDOMIZED CONTROLLEDSTUDY
E. Bialais1, L. Vignaux2, X. Wittebole1, D. Novotni2, J. Meyer2, M. Wysocki2, T. Sottiaux3,
G. Reychler4, J. Roeseler1, P.-F. Laterre1, P. Hantson1
1Saint Luc University Hospital, Intensive Care, Brussel, Belgium, 2Hamilton Medical AG,Bonaduz, Switzerland, 3Clinique Notre-Dame de Grâce, Intensive Care, Gosselies, Belgium,4Saint Luc University Hospital, Pneumology, Brussel, BelgiumINTRODUCTION. Intellivent-ASV is a full closed-loop mechanical ventilation modewhich keeps EtCO2 and SpO2 within expert-based target ranges, based on the patient’scharacteristics and clinical condition (normal lung, ARDS, chronic hypercapnia or braininjury). Safety and efficacy have been demonstrated over short period of time in post-operative and ICU patients [1, 2].OBJECTIVES. This prospective randomized controlled study compared safety (time spentin sub-optimal ventilation ranges), efficacy (time spent in optimal ventilation ranges), andnumber of manual adjustments between Intellivent-ASV and conventional ventilation over a48 h period.METHODS. Patients mechanically ventilated for at least 48 h were randomized to beventilated on Intellivent-ASV or conventional ventilation using a S1-ventilator (Hamiltonmedical AG, Bonaduz, Switzerland). For conventional ventilation, settings were determinedby the clinician in charge of the patient. Ventilation and oxygenation parameters wererecorded breath by breath and blood gases were performed every 6 h. The ventilation rangeswere defined by a panel of expert [3]. Time spent in ventilation ranges was calculated forSpO2, EtCO2, tidal volume (Vt) and respiratory rate (RR). Clinicians in charge of the patientcould adjust manually ventilator settings at any time.RESULTS. Eighty patients aged 59 [46–70] years, with an APACHE II 24 [18–29], wereincluded. 42 were ventilated with Intellivent-ASV and 38 with conventional ventilation.Characteristics at inclusion were not statistically different between the groups. In the In-tellivent-ASV group, the study had to be stopped for 2 patients: one pneumothorax not inrelation to the ventilation and one respiratory drive increased caused by severe metabolicacidosis.
Safety and efficacy over the 48 h
Safety: time spent in sub optimalrange (%)
Efficacy: time spent in optimalrange (%)
Intellivent-ASV
Conventional p Intellivent-ASV
Conventional p
SpO2 1 [0–2] 1 [0–4] 0.097 91 [78–98] 69 [49–96] 0.014
EtCO2 0 [0–0] 0 [0–2] 0.854 93 [60–99] 90 [36–99] 0.338
Vt 1 [0–2] 1 [0–2] 0.328 91 [82–97] 82 [40–93] 0.016
RR 1 [0–4] 2 [0–6] 0.158 87 [60–96] 83 [62–95] 0.732
Intellivent-ASV required less manual adjustments than conventional ventilation (3 [1–5] vs.13 [8–19] manual adjustments over the 48 h, p \ 0.001). Total number of adjustments wassignificantly higher with Intellivent-ASV (275 [145–437] vs. 13 [8–19], p \ 0.001).CONCLUSIONS. Over a 48 h period, Intellivent-ASV was able to provide ventilation assafe and efficient as conventional ventilation, without generating additional risk for thepatient. In addition, the number of manual adjustments was dramatically reduced.REFERENCE(S). 1. Arnal et al. Intensive Care Med. 2012;38:781–7. 2. Lellouche et al.Intensive Care Med. 2013;39(3):463–71. 3. Wysocki et al. Intensive Care Med.2010;35:S106.GRANT ACKNOWLEDGMENT. This study was supported by Hamilton Medical.
0139PREDICTIVE VALUE AND INTER-PROFESSIONAL UTILISATION OF INDICESOF OXYGENATION IN THE FIRST 24 H OF 3130 VENTILATED ICUADMISSIONS TO A CENTRAL LONDON ICU
F. Wade-Smith1, C. Bell1, A. Feehan1, K. Peters1, G. Parsons1, P.A. Hopkins1
1King’s College Hospital NHS Foundation Trust, London, UK
26th ESICM ANNUAL CONGRESS — PARIS, FRANCE — 5–9 OCTOBER 2013
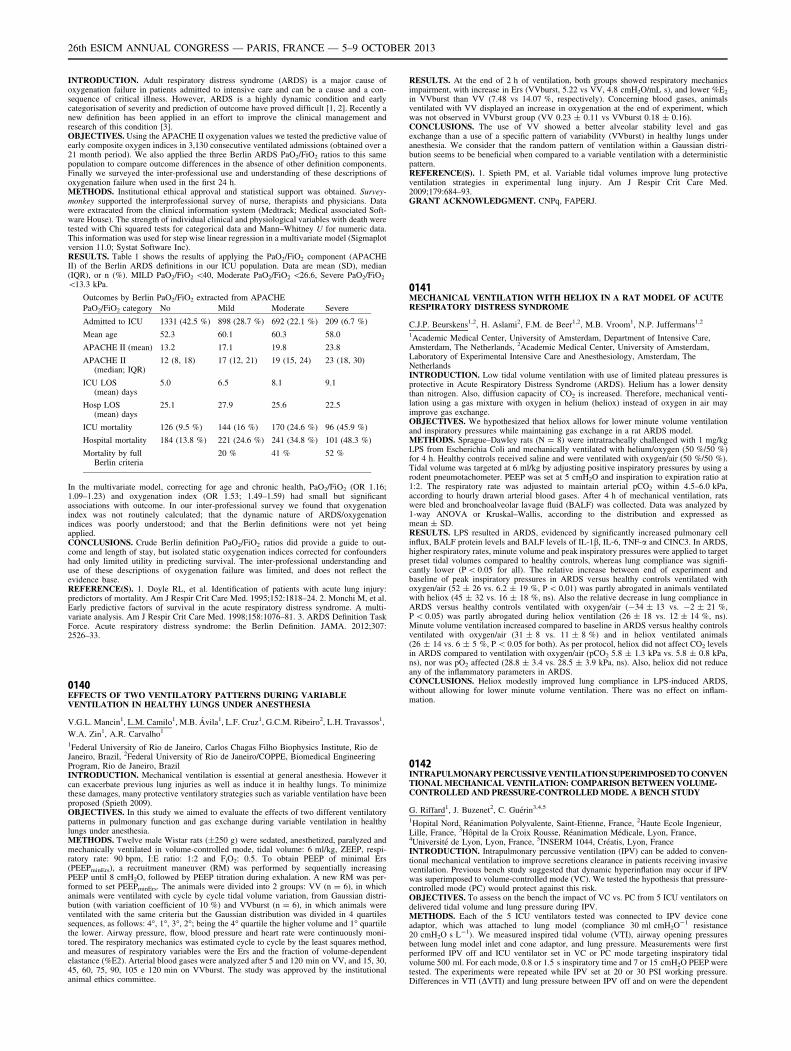
INTRODUCTION. Adult respiratory distress syndrome (ARDS) is a major cause ofoxygenation failure in patients admitted to intensive care and can be a cause and a con-sequence of critical illness. However, ARDS is a highly dynamic condition and earlycategorisation of severity and prediction of outcome have proved difficult [1, 2]. Recently anew definition has been applied in an effort to improve the clinical management andresearch of this condition [3].OBJECTIVES. Using the APACHE II oxygenation values we tested the predictive value ofearly composite oxygen indices in 3,130 consecutive ventilated admissions (obtained over a21 month period). We also applied the three Berlin ARDS PaO2/FiO2 ratios to this samepopulation to compare outcome differences in the absence of other definition components.Finally we surveyed the inter-professional use and understanding of these descriptions ofoxygenation failure when used in the first 24 h.METHODS. Institutional ethical approval and statistical support was obtained. Survey-monkey supported the interprofessional survey of nurse, therapists and physicians. Datawere extracated from the clinical information system (Medtrack; Medical associated Soft-ware House). The strength of individual clinical and physiological variables with death weretested with Chi squared tests for categorical data and Mann–Whitney U for numeric data.This information was used for step wise linear regression in a multivariate model (Sigmaplotversion 11.0; Systat Software Inc).RESULTS. Table 1 shows the results of applying the PaO2/FiO2 component (APACHEII) of the Berlin ARDS definitions in our ICU population. Data are mean (SD), median(IQR), or n (%). MILD PaO2/FiO2 \40, Moderate PaO2/FiO2 \26.6, Severe PaO2/FiO2
\13.3 kPa.
Outcomes by Berlin PaO2/FiO2 extracted from APACHE
PaO2/FiO2 category No Mild Moderate Severe
Admitted to ICU 1331 (42.5 %) 898 (28.7 %) 692 (22.1 %) 209 (6.7 %)
Mean age 52.3 60.1 60.3 58.0
APACHE II (mean) 13.2 17.1 19.8 23.8
APACHE II(median; IQR)
12 (8, 18) 17 (12, 21) 19 (15, 24) 23 (18, 30)
ICU LOS(mean) days
5.0 6.5 8.1 9.1
Hosp LOS(mean) days
25.1 27.9 25.6 22.5
ICU mortality 126 (9.5 %) 144 (16 %) 170 (24.6 %) 96 (45.9 %)
Hospital mortality 184 (13.8 %) 221 (24.6 %) 241 (34.8 %) 101 (48.3 %)
Mortality by fullBerlin criteria
20 % 41 % 52 %
In the multivariate model, correcting for age and chronic health, PaO2/FiO2 (OR 1.16;1.09–1.23) and oxygenation index (OR 1.53; 1.49–1.59) had small but significantassociations with outcome. In our inter-professional survey we found that oxygenationindex was not routinely calculated; that the dynamic nature of ARDS/oxygenationindices was poorly understood; and that the Berlin definitions were not yet beingapplied.CONCLUSIONS. Crude Berlin definition PaO2/FiO2 ratios did provide a guide to out-come and length of stay, but isolated static oxygenation indices corrected for confoundershad only limited utility in predicting survival. The inter-professional understanding anduse of these descriptions of oxygenation failure was limited, and does not reflect theevidence base.REFERENCE(S). 1. Doyle RL, et al. Identification of patients with acute lung injury:predictors of mortality. Am J Respir Crit Care Med. 1995;152:1818–24. 2. Monchi M, et al.Early predictive factors of survival in the acute respiratory distress syndrome. A multi-variate analysis. Am J Respir Crit Care Med. 1998;158:1076–81. 3. ARDS Definition TaskForce. Acute respiratory distress syndrome: the Berlin Definition. JAMA. 2012;307:2526–33.
0140EFFECTS OF TWO VENTILATORY PATTERNS DURING VARIABLEVENTILATION IN HEALTHY LUNGS UNDER ANESTHESIA
V.G.L. Mancin1, L.M. Camilo1, M.B. Ávila1, L.F. Cruz1, G.C.M. Ribeiro2, L.H. Travassos1,
W.A. Zin1, A.R. Carvalho1
1Federal University of Rio de Janeiro, Carlos Chagas Filho Biophysics Institute, Rio deJaneiro, Brazil, 2Federal University of Rio de Janeiro/COPPE, Biomedical EngineeringProgram, Rio de Janeiro, BrazilINTRODUCTION. Mechanical ventilation is essential at general anesthesia. However itcan exacerbate previous lung injuries as well as induce it in healthy lungs. To minimizethese damages, many protective ventilatory strategies such as variable ventilation have beenproposed (Spieth 2009).OBJECTIVES. In this study we aimed to evaluate the effects of two different ventilatorypatterns in pulmonary function and gas exchange during variable ventilation in healthylungs under anesthesia.METHODS. Twelve male Wistar rats (±250 g) were sedated, anesthetized, paralyzed andmechanically ventilated in volume-controlled mode, tidal volume: 6 ml/kg, ZEEP, respi-ratory rate: 90 bpm, I:E ratio: 1:2 and FiO2: 0.5. To obtain PEEP of minimal Ers(PEEPminErs), a recruitment maneuver (RM) was performed by sequentially increasingPEEP until 8 cmH2O, followed by PEEP titration during exhalation. A new RM was per-formed to set PEEPminErs. The animals were divided into 2 groups: VV (n = 6), in whichanimals were ventilated with cycle by cycle tidal volume variation, from Gaussian distri-bution (with variation coefficient of 10 %) and VVburst (n = 6), in which animals wereventilated with the same criteria but the Gaussian distribution was divided in 4 quartilessequences, as follows: 4�, 1�, 3�, 2�; being the 4� quartile the higher volume and 1� quartilethe lower. Airway pressure, flow, blood pressure and heart rate were continuously moni-tored. The respiratory mechanics was estimated cycle to cycle by the least squares method,and measures of respiratory variables were the Ers and the fraction of volume-dependentelastance (%E2). Arterial blood gases were analyzed after 5 and 120 min on VV, and 15, 30,45, 60, 75, 90, 105 e 120 min on VVburst. The study was approved by the institutionalanimal ethics committee.
RESULTS. At the end of 2 h of ventilation, both groups showed respiratory mechanicsimpairment, with increase in Ers (VVburst, 5.22 vs VV, 4.8 cmH2O/mL s), and lower %E2
in VVburst than VV (7.48 vs 14.07 %, respectively). Concerning blood gases, animalsventilated with VV displayed an increase in oxygenation at the end of experiment, whichwas not observed in VVburst group (VV 0.23 ± 0.11 vs VVburst 0.18 ± 0.16).CONCLUSIONS. The use of VV showed a better alveolar stability level and gasexchange than a use of a specific pattern of variability (VVburst) in healthy lungs underanesthesia. We consider that the random pattern of ventilation within a Gaussian distri-bution seems to be beneficial when compared to a variable ventilation with a deterministicpattern.REFERENCE(S). 1. Spieth PM, et al. Variable tidal volumes improve lung protectiveventilation strategies in experimental lung injury. Am J Respir Crit Care Med.2009;179:684–93.GRANT ACKNOWLEDGMENT. CNPq, FAPERJ.
0141MECHANICAL VENTILATION WITH HELIOX IN A RAT MODEL OF ACUTERESPIRATORY DISTRESS SYNDROME
C.J.P. Beurskens1,2, H. Aslami2, F.M. de Beer1,2, M.B. Vroom1, N.P. Juffermans1,2
1Academic Medical Center, University of Amsterdam, Department of Intensive Care,Amsterdam, The Netherlands, 2Academic Medical Center, University of Amsterdam,Laboratory of Experimental Intensive Care and Anesthesiology, Amsterdam, TheNetherlandsINTRODUCTION. Low tidal volume ventilation with use of limited plateau pressures isprotective in Acute Respiratory Distress Syndrome (ARDS). Helium has a lower densitythan nitrogen. Also, diffusion capacity of CO2 is increased. Therefore, mechanical venti-lation using a gas mixture with oxygen in helium (heliox) instead of oxygen in air mayimprove gas exchange.OBJECTIVES. We hypothesized that heliox allows for lower minute volume ventilationand inspiratory pressures while maintaining gas exchange in a rat ARDS model.METHODS. Sprague–Dawley rats (N = 8) were intratracheally challenged with 1 mg/kgLPS from Escherichia Coli and mechanically ventilated with helium/oxygen (50 %/50 %)for 4 h. Healthy controls received saline and were ventilated with oxygen/air (50 %/50 %).Tidal volume was targeted at 6 ml/kg by adjusting positive inspiratory pressures by using arodent pneumotachometer. PEEP was set at 5 cmH2O and inspiration to expiration ratio at1:2. The respiratory rate was adjusted to maintain arterial pCO2 within 4.5–6.0 kPa,according to hourly drawn arterial blood gases. After 4 h of mechanical ventilation, ratswere bled and bronchoalveolar lavage fluid (BALF) was collected. Data was analyzed by1-way ANOVA or Kruskal–Wallis, according to the distribution and expressed asmean ± SD.RESULTS. LPS resulted in ARDS, evidenced by significantly increased pulmonary cellinflux, BALF protein levels and BALF levels of IL-1b, IL-6, TNF-a and CINC3. In ARDS,higher respiratory rates, minute volume and peak inspiratory pressures were applied to targetpreset tidal volumes compared to healthy controls, whereas lung compliance was signifi-cantly lower (P \ 0.05 for all). The relative increase between end of experiment andbaseline of peak inspiratory pressures in ARDS versus healthy controls ventilated withoxygen/air (52 ± 26 vs. 6.2 ± 19 %, P \ 0.01) was partly abrogated in animals ventilatedwith heliox (45 ± 32 vs. 16 ± 18 %, ns). Also the relative decrease in lung compliance inARDS versus healthy controls ventilated with oxygen/air (-34 ± 13 vs. -2 ± 21 %,P \ 0.05) was partly abrogated during heliox ventilation (26 ± 18 vs. 12 ± 14 %, ns).Minute volume ventilation increased compared to baseline in ARDS versus healthy controlsventilated with oxygen/air (31 ± 8 vs. 11 ± 8 %) and in heliox ventilated animals(26 ± 14 vs. 6 ± 5 %, P \ 0.05 for both). As per protocol, heliox did not affect CO2 levelsin ARDS compared to ventilation with oxygen/air (pCO2 5.8 ± 1.3 kPa vs. 5.8 ± 0.8 kPa,ns), nor was pO2 affected (28.8 ± 3.4 vs. 28.5 ± 3.9 kPa, ns). Also, heliox did not reduceany of the inflammatory parameters in ARDS.CONCLUSIONS. Heliox modestly improved lung compliance in LPS-induced ARDS,without allowing for lower minute volume ventilation. There was no effect on inflam-mation.
0142INTRAPULMONARY PERCUSSIVE VENTILATION SUPERIMPOSED TO CONVENTIONAL MECHANICAL VENTILATION: COMPARISON BETWEEN VOLUME-CONTROLLED AND PRESSURE-CONTROLLED MODE. A BENCH STUDY
G. Riffard1, J. Buzenet2, C. Guérin3,4,5
1Hopital Nord, Réanimation Polyvalente, Saint-Etienne, France, 2Haute Ecole Ingenieur,Lille, France, 3Hôpital de la Croix Rousse, Réanimation Médicale, Lyon, France,4Université de Lyon, Lyon, France, 5INSERM 1044, Créatis, Lyon, FranceINTRODUCTION. Intrapulmonary percussive ventilation (IPV) can be added to conven-tional mechanical ventilation to improve secretions clearance in patients receiving invasiveventilation. Previous bench study suggested that dynamic hyperinflation may occur if IPVwas superimposed to volume-controlled mode (VC). We tested the hypothesis that pressure-controlled mode (PC) would protect against this risk.OBJECTIVES. To assess on the bench the impact of VC vs. PC from 5 ICU ventilators ondelivered tidal volume and lung pressure during IPV.METHODS. Each of the 5 ICU ventilators tested was connected to IPV device coneadaptor, which was attached to lung model (compliance 30 ml cmH2O-1 resistance20 cmH2O s L-1). We measured inspired tidal volume (VTI), airway opening pressuresbetween lung model inlet and cone adaptor, and lung pressure. Measurements were firstperformed IPV off and ICU ventilator set in VC or PC mode targeting inspiratory tidalvolume 500 ml. For each mode, 0.8 or 1.5 s inspiratory time and 7 or 15 cmH2O PEEP weretested. The experiments were repeated while IPV set at 20 or 30 PSI working pressure.Differences in VTI (DVTI) and lung pressure between IPV off and on were the dependent
26th ESICM ANNUAL CONGRESS — PARIS, FRANCE — 5–9 OCTOBER 2013
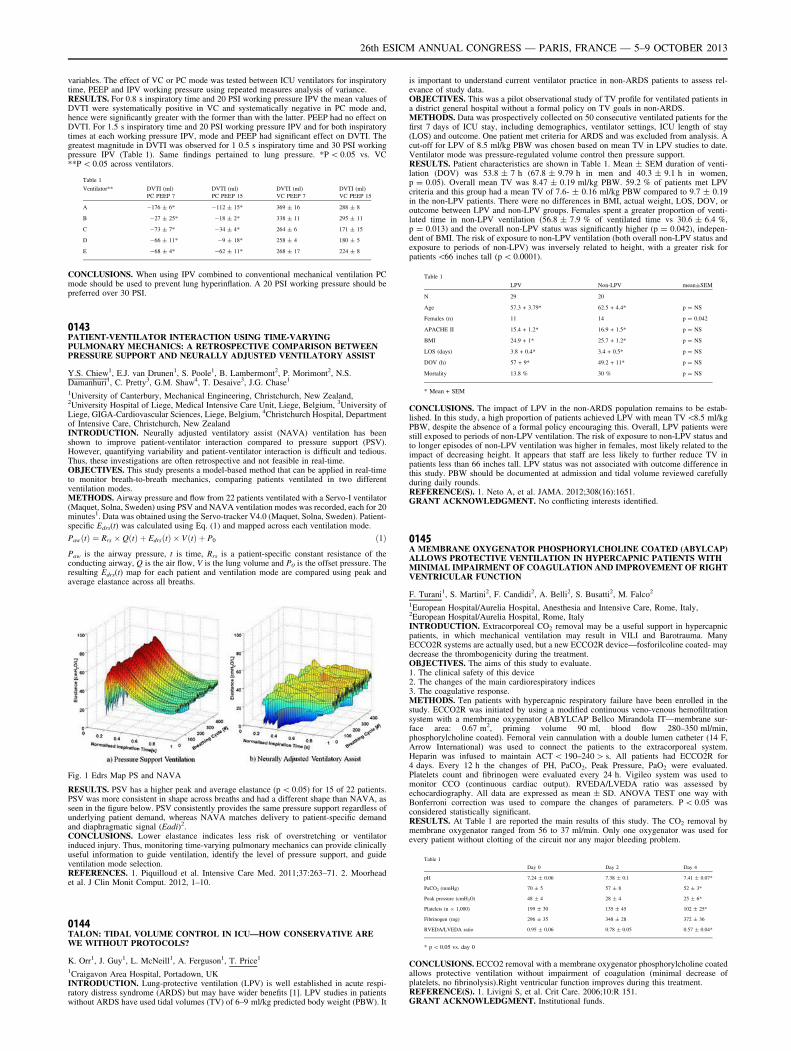
variables. The effect of VC or PC mode was tested between ICU ventilators for inspiratorytime, PEEP and IPV working pressure using repeated measures analysis of variance.RESULTS. For 0.8 s inspiratory time and 20 PSI working pressure IPV the mean values ofDVTI were systematically positive in VC and systematically negative in PC mode and,hence were significantly greater with the former than with the latter. PEEP had no effect onDVTI. For 1.5 s inspiratory time and 20 PSI working pressure IPV and for both inspiratorytimes at each working pressure IPV, mode and PEEP had significant effect on DVTI. Thegreatest magnitude in DVTI was observed for 1 0.5 s inspiratory time and 30 PSI workingpressure IPV (Table 1). Same findings pertained to lung pressure. *P \ 0.05 vs. VC**P \ 0.05 across ventilators.
Table 1
Ventilator** DVTI (ml)
PC PEEP 7
DVTI (ml)
PC PEEP 15
DVTI (ml)
VC PEEP 7
DVTI (ml)
VC PEEP 15
A -176 ± 6* -112 ± 15* 369 ± 16 288 ± 8
B -27 ± 25* -18 ± 2* 338 ± 11 295 ± 11
C -73 ± 7* -34 ± 4* 264 ± 6 171 ± 15
D -66 ± 11* -9 ± 18* 258 ± 4 180 ± 5
E -68 ± 4* -62 ± 11* 268 ± 17 224 ± 8
CONCLUSIONS. When using IPV combined to conventional mechanical ventilation PCmode should be used to prevent lung hyperinflation. A 20 PSI working pressure should bepreferred over 30 PSI.
0143PATIENT-VENTILATOR INTERACTION USING TIME-VARYINGPULMONARY MECHANICS: A RETROSPECTIVE COMPARISON BETWEENPRESSURE SUPPORT AND NEURALLY ADJUSTED VENTILATORY ASSIST
Y.S. Chiew1, E.J. van Drunen1, S. Poole1, B. Lambermont2, P. Morimont2, N.S.Damanhuri1, C. Pretty3, G.M. Shaw4, T. Desaive3, J.G. Chase1
1University of Canterbury, Mechanical Engineering, Christchurch, New Zealand,2University Hospital of Liege, Medical Intensive Care Unit, Liege, Belgium, 3University ofLiege, GIGA-Cardiovascular Sciences, Liege, Belgium, 4Christchurch Hospital, Departmentof Intensive Care, Christchurch, New ZealandINTRODUCTION. Neurally adjusted ventilatory assist (NAVA) ventilation has beenshown to improve patient-ventilator interaction compared to pressure support (PSV).However, quantifying variability and patient-ventilator interaction is difficult and tedious.Thus, these investigations are often retrospective and not feasible in real-time.OBJECTIVES. This study presents a model-based method that can be applied in real-timeto monitor breath-to-breath mechanics, comparing patients ventilated in two differentventilation modes.METHODS. Airway pressure and flow from 22 patients ventilated with a Servo-I ventilator(Maquet, Solna, Sweden) using PSV and NAVA ventilation modes was recorded, each for 20minutes1. Data was obtained using the Servo-tracker V4.0 (Maquet, Solna, Sweden). Patient-specific Edrs(t) was calculated using Eq. (1) and mapped across each ventilation mode.
Paw tð Þ ¼ Rrs � Q tð Þ þ Edrs tð Þ � V tð Þ þ P0 ð1Þ
Paw is the airway pressure, t is time, Rrs is a patient-specific constant resistance of theconducting airway, Q is the air flow, V is the lung volume and P0 is the offset pressure. Theresulting Edrs(t) map for each patient and ventilation mode are compared using peak andaverage elastance across all breaths.
Fig. 1 Edrs Map PS and NAVA
RESULTS. PSV has a higher peak and average elastance (p \ 0.05) for 15 of 22 patients.PSV was more consistent in shape across breaths and had a different shape than NAVA, asseen in the figure below. PSV consistently provides the same pressure support regardless ofunderlying patient demand, whereas NAVA matches delivery to patient-specific demandand diaphragmatic signal (Eadi)2.CONCLUSIONS. Lower elastance indicates less risk of overstretching or ventilatorinduced injury. Thus, monitoring time-varying pulmonary mechanics can provide clinicallyuseful information to guide ventilation, identify the level of pressure support, and guideventilation mode selection.REFERENCES. 1. Piquilloud et al. Intensive Care Med. 2011;37:263–71. 2. Moorheadet al. J Clin Monit Comput. 2012, 1–10.
0144TALON: TIDAL VOLUME CONTROL IN ICU—HOW CONSERVATIVE AREWE WITHOUT PROTOCOLS?
K. Orr1, J. Guy1, L. McNeill1, A. Ferguson1, T. Price1
1Craigavon Area Hospital, Portadown, UKINTRODUCTION. Lung-protective ventilation (LPV) is well established in acute respi-ratory distress syndrome (ARDS) but may have wider benefits [1]. LPV studies in patientswithout ARDS have used tidal volumes (TV) of 6–9 ml/kg predicted body weight (PBW). It
is important to understand current ventilator practice in non-ARDS patients to assess rel-evance of study data.OBJECTIVES. This was a pilot observational study of TV profile for ventilated patients ina district general hospital without a formal policy on TV goals in non-ARDS.METHODS. Data was prospectively collected on 50 consecutive ventilated patients for thefirst 7 days of ICU stay, including demographics, ventilator settings, ICU length of stay(LOS) and outcome. One patient met criteria for ARDS and was excluded from analysis. Acut-off for LPV of 8.5 ml/kg PBW was chosen based on mean TV in LPV studies to date.Ventilator mode was pressure-regulated volume control then pressure support.RESULTS. Patient characteristics are shown in Table 1. Mean ± SEM duration of venti-lation (DOV) was 53.8 ± 7 h (67.8 ± 9.79 h in men and 40.3 ± 9.1 h in women,p = 0.05). Overall mean TV was 8.47 ± 0.19 ml/kg PBW. 59.2 % of patients met LPVcriteria and this group had a mean TV of 7.6- ± 0.16 ml/kg PBW compared to 9.7 ± 0.19in the non-LPV patients. There were no differences in BMI, actual weight, LOS, DOV, oroutcome between LPV and non-LPV groups. Females spent a greater proportion of venti-lated time in non-LPV ventilation (56.8 ± 7.9 % of ventilated time vs 30.6 ± 6.4 %,p = 0.013) and the overall non-LPV status was significantly higher (p = 0.042), indepen-dent of BMI. The risk of exposure to non-LPV ventilation (both overall non-LPV status andexposure to periods of non-LPV) was inversely related to height, with a greater risk forpatients \66 inches tall (p \ 0.0001).
Table 1
LPV Non-LPV mean±SEM
N 29 20
Age 57.3 + 3.79* 62.5 + 4.4* p = NS
Females (n) 11 14 p = 0.042
APACHE II 15.4 + 1.2* 16.9 + 1.5* p = NS
BMI 24.9 + 1* 25.7 + 1.2* p = NS
LOS (days) 3.8 + 0.4* 3.4 + 0.5* p = NS
DOV (h) 57 + 9* 49.2 + 11* p = NS
Mortality 13.8 % 30 % p = NS
* Mean + SEM
CONCLUSIONS. The impact of LPV in the non-ARDS population remains to be estab-lished. In this study, a high proportion of patients achieved LPV with mean TV\8.5 ml/kgPBW, despite the absence of a formal policy encouraging this. Overall, LPV patients werestill exposed to periods of non-LPV ventilation. The risk of exposure to non-LPV status andto longer episodes of non-LPV ventilation was higher in females, most likely related to theimpact of decreasing height. It appears that staff are less likely to further reduce TV inpatients less than 66 inches tall. LPV status was not associated with outcome difference inthis study. PBW should be documented at admission and tidal volume reviewed carefullyduring daily rounds.REFERENCE(S). 1. Neto A, et al. JAMA. 2012;308(16):1651.GRANT ACKNOWLEDGMENT. No conflicting interests identified.
0145A MEMBRANE OXYGENATOR PHOSPHORYLCHOLINE COATED (ABYLCAP)ALLOWS PROTECTIVE VENTILATION IN HYPERCAPNIC PATIENTS WITHMINIMAL IMPAIRMENT OF COAGULATION AND IMPROVEMENT OF RIGHTVENTRICULAR FUNCTION
F. Turani1, S. Martini2, F. Candidi2, A. Belli2, S. Busatti2, M. Falco2
1European Hospital/Aurelia Hospital, Anesthesia and Intensive Care, Rome, Italy,2European Hospital/Aurelia Hospital, Rome, ItalyINTRODUCTION. Extracorporeal CO2 removal may be a useful support in hypercapnicpatients, in which mechanical ventilation may result in VILI and Barotrauma. ManyECCO2R systems are actually used, but a new ECCO2R device—fosforilcoline coated- maydecrease the thrombogenicity during the treatment.OBJECTIVES. The aims of this study to evaluate.1. The clinical safety of this device2. The changes of the main cardiorespiratory indices3. The coagulative response.METHODS. Ten patients with hypercapnic respiratory failure have been enrolled in thestudy. ECCO2R was initiated by using a modified continuous veno-venous hemofiltrationsystem with a membrane oxygenator (ABYLCAP Bellco Mirandola IT—membrane sur-face area: 0.67 m2, priming volume 90 ml, blood flow 280–350 ml/min,phosphorylcholine coated). Femoral vein cannulation with a double lumen catheter (14 F,Arrow International) was used to connect the patients to the extracorporeal system.Heparin was infused to maintain ACT \ 190–240 [ s. All patients had ECCO2R for4 days. Every 12 h the changes of PH, PaCO2, Peak Pressure, PaO2 were evaluated.Platelets count and fibrinogen were evaluated every 24 h. Vigileo system was used tomonitor CCO (continuous cardiac output). RVEDA/LVEDA ratio was assessed byechocardiography. All data are expressed as mean ± SD. ANOVA TEST one way withBonferroni correction was used to compare the changes of parameters. P \ 0.05 wasconsidered statistically significant.RESULTS. At Table 1 are reported the main results of this study. The CO2 removal bymembrane oxygenator ranged from 56 to 37 ml/min. Only one oxygenator was used forevery patient without clotting of the circuit nor any major bleeding problem.
Table 1
Day 0 Day 2 Day 4
pH 7.24 ± 0.06 7.38 ± 0.1 7.41 ± 0.07*
PaCO2 (mmHg) 70 ± 5 57 ± 8 52 ± 3*
Peak pressure (cmH2O) 48 ± 4 28 ± 4 25 ± 6*
Platelets (n 9 1,000) 199 ± 30 135 ± 45 102 ± 25*
Fibrinogen (mg) 296 ± 35 348 ± 28 372 ± 36
RVEDA/LVEDA ratio 0.95 ± 0.06 0.78 ± 0.05 0.57 ± 0.04*
* p \ 0.05 vs. day 0
CONCLUSIONS. ECCO2 removal with a membrane oxygenator phosphorylcholine coatedallows protective ventilation without impairment of coagulation (minimal decrease ofplatelets, no fibrinolysis).Right ventricular function improves during this treatment.REFERENCE(S). 1. Livigni S, et al. Crit Care. 2006;10:R 151.GRANT ACKNOWLEDGMENT. Institutional funds.
26th ESICM ANNUAL CONGRESS — PARIS, FRANCE — 5–9 OCTOBER 2013
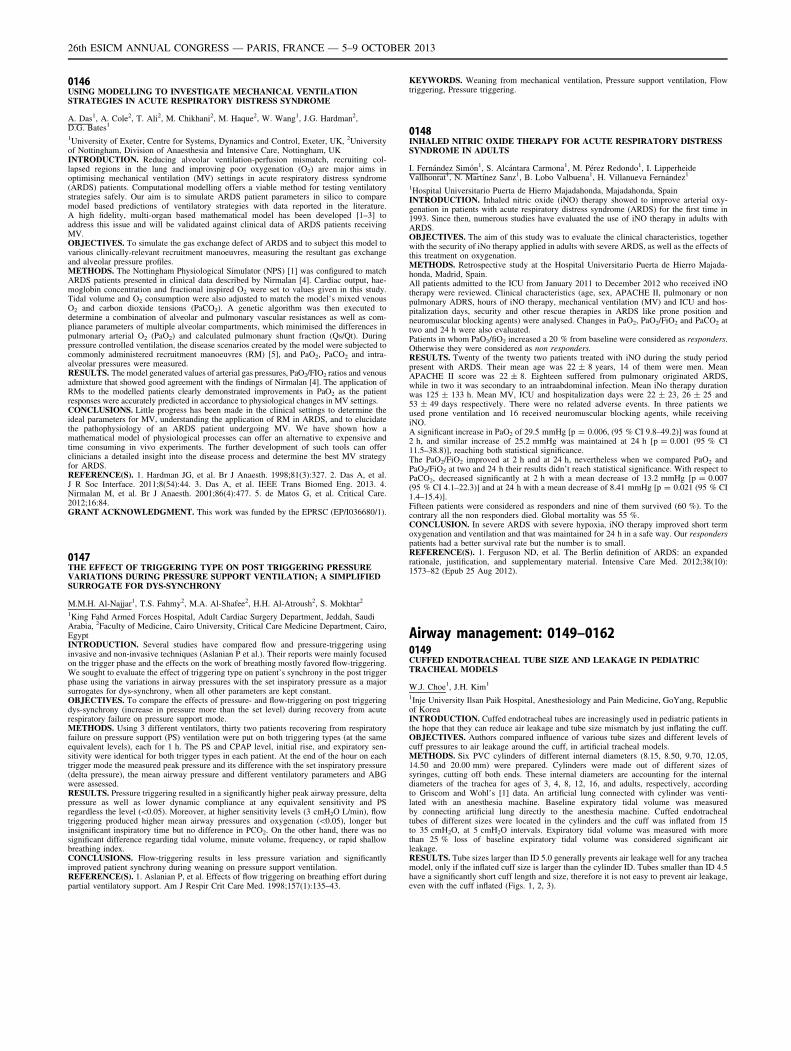
0146USING MODELLING TO INVESTIGATE MECHANICAL VENTILATIONSTRATEGIES IN ACUTE RESPIRATORY DISTRESS SYNDROME
A. Das1, A. Cole2, T. Ali2, M. Chikhani2, M. Haque2, W. Wang1, J.G. Hardman2,D.G. Bates1
1University of Exeter, Centre for Systems, Dynamics and Control, Exeter, UK, 2Universityof Nottingham, Division of Anaesthesia and Intensive Care, Nottingham, UKINTRODUCTION. Reducing alveolar ventilation-perfusion mismatch, recruiting col-lapsed regions in the lung and improving poor oxygenation (O2) are major aims inoptimising mechanical ventilation (MV) settings in acute respiratory distress syndrome(ARDS) patients. Computational modelling offers a viable method for testing ventilatorystrategies safely. Our aim is to simulate ARDS patient parameters in silico to comparemodel based predictions of ventilatory strategies with data reported in the literature.A high fidelity, multi-organ based mathematical model has been developed [1–3] toaddress this issue and will be validated against clinical data of ARDS patients receivingMV.OBJECTIVES. To simulate the gas exchange defect of ARDS and to subject this model tovarious clinically-relevant recruitment manoeuvres, measuring the resultant gas exchangeand alveolar pressure profiles.METHODS. The Nottingham Physiological Simulator (NPS) [1] was configured to matchARDS patients presented in clinical data described by Nirmalan [4]. Cardiac output, hae-moglobin concentration and fractional inspired O2 were set to values given in this study.Tidal volume and O2 consumption were also adjusted to match the model’s mixed venousO2 and carbon dioxide tensions (PaCO2). A genetic algorithm was then executed todetermine a combination of alveolar and pulmonary vascular resistances as well as com-pliance parameters of multiple alveolar compartments, which minimised the differences inpulmonary arterial O2 (PaO2) and calculated pulmonary shunt fraction (Qs/Qt). Duringpressure controlled ventilation, the disease scenarios created by the model were subjected tocommonly administered recruitment manoeuvres (RM) [5], and PaO2, PaCO2 and intra-alveolar pressures were measured.RESULTS. The model generated values of arterial gas pressures, PaO2/FIO2 ratios and venousadmixture that showed good agreement with the findings of Nirmalan [4]. The application ofRMs to the modelled patients clearly demonstrated improvements in PaO2 as the patientresponses were accurately predicted in accordance to physiological changes in MV settings.CONCLUSIONS. Little progress has been made in the clinical settings to determine theideal parameters for MV, understanding the application of RM in ARDS, and to elucidatethe pathophysiology of an ARDS patient undergoing MV. We have shown how amathematical model of physiological processes can offer an alternative to expensive andtime consuming in vivo experiments. The further development of such tools can offerclinicians a detailed insight into the disease process and determine the best MV strategyfor ARDS.REFERENCE(S). 1. Hardman JG, et al. Br J Anaesth. 1998;81(3):327. 2. Das A, et al.J R Soc Interface. 2011;8(54):44. 3. Das A, et al. IEEE Trans Biomed Eng. 2013. 4.Nirmalan M, et al. Br J Anaesth. 2001;86(4):477. 5. de Matos G, et al. Critical Care.2012;16:84.GRANT ACKNOWLEDGMENT. This work was funded by the EPRSC (EP/I036680/1).
0147THE EFFECT OF TRIGGERING TYPE ON POST TRIGGERING PRESSUREVARIATIONS DURING PRESSURE SUPPORT VENTILATION; A SIMPLIFIEDSURROGATE FOR DYS-SYNCHRONY
M.M.H. Al-Najjar1, T.S. Fahmy2, M.A. Al-Shafee2, H.H. Al-Atroush2, S. Mokhtar2
1King Fahd Armed Forces Hospital, Adult Cardiac Surgery Department, Jeddah, SaudiArabia, 2Faculty of Medicine, Cairo University, Critical Care Medicine Department, Cairo,EgyptINTRODUCTION. Several studies have compared flow and pressure-triggering usinginvasive and non-invasive techniques (Aslanian P et al.). Their reports were mainly focusedon the trigger phase and the effects on the work of breathing mostly favored flow-triggering.We sought to evaluate the effect of triggering type on patient’s synchrony in the post triggerphase using the variations in airway pressures with the set inspiratory pressure as a majorsurrogates for dys-synchrony, when all other parameters are kept constant.OBJECTIVES. To compare the effects of pressure- and flow-triggering on post triggeringdys-synchrony (increase in pressure more than the set level) during recovery from acuterespiratory failure on pressure support mode.METHODS. Using 3 different ventilators, thirty two patients recovering from respiratoryfailure on pressure support (PS) ventilation were put on both triggering types (at the sameequivalent levels), each for 1 h. The PS and CPAP level, initial rise, and expiratory sen-sitivity were identical for both trigger types in each patient. At the end of the hour on eachtrigger mode the measured peak pressure and its difference with the set inspiratory pressure(delta pressure), the mean airway pressure and different ventilatory parameters and ABGwere assessed.RESULTS. Pressure triggering resulted in a significantly higher peak airway pressure, deltapressure as well as lower dynamic compliance at any equivalent sensitivity and PSregardless the level (\0.05). Moreover, at higher sensitivity levels (3 cmH2O L/min), flowtriggering produced higher mean airway pressures and oxygenation (\0.05), longer butinsignificant inspiratory time but no difference in PCO2. On the other hand, there was nosignificant difference regarding tidal volume, minute volume, frequency, or rapid shallowbreathing index.CONCLUSIONS. Flow-triggering results in less pressure variation and significantlyimproved patient synchrony during weaning on pressure support ventilation.REFERENCE(S). 1. Aslanian P, et al. Effects of flow triggering on breathing effort duringpartial ventilatory support. Am J Respir Crit Care Med. 1998;157(1):135–43.
KEYWORDS. Weaning from mechanical ventilation, Pressure support ventilation, Flowtriggering, Pressure triggering.
0148INHALED NITRIC OXIDE THERAPY FOR ACUTE RESPIRATORY DISTRESSSYNDROME IN ADULTS
I. Fernández Simón1, S. Alcántara Carmona1, M. Pérez Redondo1, I. LipperheideVallhonrat1, N. Martı́nez Sanz1, B. Lobo Valbuena1, H. Villanueva Fernández1
1Hospital Universitario Puerta de Hierro Majadahonda, Majadahonda, SpainINTRODUCTION. Inhaled nitric oxide (iNO) therapy showed to improve arterial oxy-genation in patients with acute respiratory distress syndrome (ARDS) for the first time in1993. Since then, numerous studies have evaluated the use of iNO therapy in adults withARDS.OBJECTIVES. The aim of this study was to evaluate the clinical characteristics, togetherwith the security of iNo therapy applied in adults with severe ARDS, as well as the effects ofthis treatment on oxygenation.METHODS. Retrospective study at the Hospital Universitario Puerta de Hierro Majada-honda, Madrid, Spain.All patients admitted to the ICU from January 2011 to December 2012 who received iNOtherapy were reviewed. Clinical characteristics (age, sex, APACHE II, pulmonary or nonpulmonary ADRS, hours of iNO therapy, mechanical ventilation (MV) and ICU and hos-pitalization days, security and other rescue therapies in ARDS like prone position andneuromuscular blocking agents) were analysed. Changes in PaO2, PaO2/FiO2 and PaCO2 attwo and 24 h were also evaluated.Patients in whom PaO2/fiO2 increased a 20 % from baseline were considered as responders.Otherwise they were considered as non responders.RESULTS. Twenty of the twenty two patients treated with iNO during the study periodpresent with ARDS. Their mean age was 22 ± 8 years, 14 of them were men. MeanAPACHE II score was 22 ± 8. Eighteen suffered from pulmonary originated ARDS,while in two it was secondary to an intraabdominal infection. Mean iNo therapy durationwas 125 ± 133 h. Mean MV, ICU and hospitalization days were 22 ± 23, 26 ± 25 and53 ± 49 days respectively. There were no related adverse events. In three patients weused prone ventilation and 16 received neuromuscular blocking agents, while receivingiNO.A significant increase in PaO2 of 29.5 mmHg [p = 0.006, (95 % CI 9.8–49.2)] was found at2 h, and similar increase of 25.2 mmHg was maintained at 24 h [p = 0.001 (95 % CI11.5–38.8)], reaching both statistical significance.The PaO2/FiO2 improved at 2 h and at 24 h, nevertheless when we compared PaO2 andPaO2/FiO2 at two and 24 h their results didn’t reach statistical significance. With respect toPaCO2, decreased significantly at 2 h with a mean decrease of 13.2 mmHg [p = 0.007(95 % CI 4.1–22.3)] and at 24 h with a mean decrease of 8.41 mmHg [p = 0.021 (95 % CI1.4–15.4)].Fifteen patients were considered as responders and nine of them survived (60 %). To thecontrary all the non responders died. Global mortality was 55 %.CONCLUSION. In severe ARDS with severe hypoxia, iNO therapy improved short termoxygenation and ventilation and that was maintained for 24 h in a safe way. Our responderspatients had a better survival rate but the number is to small.REFERENCE(S). 1. Ferguson ND, et al. The Berlin definition of ARDS: an expandedrationale, justification, and supplementary material. Intensive Care Med. 2012;38(10):1573–82 (Epub 25 Aug 2012).
Airway management: 0149–01620149CUFFED ENDOTRACHEAL TUBE SIZE AND LEAKAGE IN PEDIATRICTRACHEAL MODELS
W.J. Choe1, J.H. Kim1
1Inje University Ilsan Paik Hospital, Anesthesiology and Pain Medicine, GoYang, Republicof KoreaINTRODUCTION. Cuffed endotracheal tubes are increasingly used in pediatric patients inthe hope that they can reduce air leakage and tube size mismatch by just inflating the cuff.OBJECTIVES. Authors compared influence of various tube sizes and different levels ofcuff pressures to air leakage around the cuff, in artificial tracheal models.METHODS. Six PVC cylinders of different internal diameters (8.15, 8.50, 9.70, 12.05,14.50 and 20.00 mm) were prepared. Cylinders were made out of different sizes ofsyringes, cutting off both ends. These internal diameters are accounting for the internaldiameters of the trachea for ages of 3, 4, 8, 12, 16, and adults, respectively, accordingto Griscom and Wohl’s [1] data. An artificial lung connected with cylinder was venti-lated with an anesthesia machine. Baseline expiratory tidal volume was measuredby connecting artificial lung directly to the anesthesia machine. Cuffed endotrachealtubes of different sizes were located in the cylinders and the cuff was inflated from 15to 35 cmH2O, at 5 cmH2O intervals. Expiratory tidal volume was measured with morethan 25 % loss of baseline expiratory tidal volume was considered significant airleakage.RESULTS. Tube sizes larger than ID 5.0 generally prevents air leakage well for any tracheamodel, only if the inflated cuff size is larger than the cylinder ID. Tubes smaller than ID 4.5have a significantly short cuff length and size, therefore it is not easy to prevent air leakage,even with the cuff inflated (Figs. 1, 2, 3).
26th ESICM ANNUAL CONGRESS — PARIS, FRANCE — 5–9 OCTOBER 2013
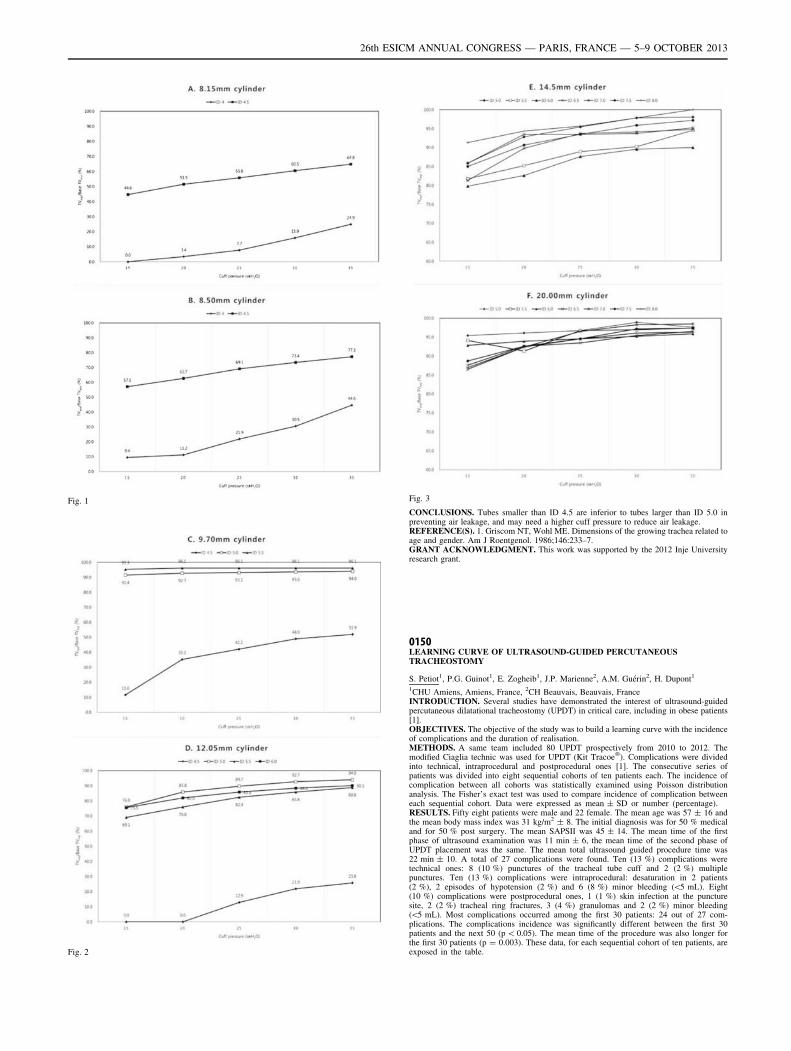
Fig. 1
Fig. 2
Fig. 3
CONCLUSIONS. Tubes smaller than ID 4.5 are inferior to tubes larger than ID 5.0 inpreventing air leakage, and may need a higher cuff pressure to reduce air leakage.REFERENCE(S). 1. Griscom NT, Wohl ME. Dimensions of the growing trachea related toage and gender. Am J Roentgenol. 1986;146:233–7.GRANT ACKNOWLEDGMENT. This work was supported by the 2012 Inje Universityresearch grant.
0150LEARNING CURVE OF ULTRASOUND-GUIDED PERCUTANEOUSTRACHEOSTOMY
S. Petiot1, P.G. Guinot1, E. Zogheib1, J.P. Marienne2, A.M. Guérin2, H. Dupont1
1CHU Amiens, Amiens, France, 2CH Beauvais, Beauvais, FranceINTRODUCTION. Several studies have demonstrated the interest of ultrasound-guidedpercutaneous dilatational tracheostomy (UPDT) in critical care, including in obese patients[1].OBJECTIVES. The objective of the study was to build a learning curve with the incidenceof complications and the duration of realisation.METHODS. A same team included 80 UPDT prospectively from 2010 to 2012. Themodified Ciaglia technic was used for UPDT (Kit Tracoe�). Complications were dividedinto technical, intraprocedural and postprocedural ones [1]. The consecutive series ofpatients was divided into eight sequential cohorts of ten patients each. The incidence ofcomplication between all cohorts was statistically examined using Poisson distributionanalysis. The Fisher’s exact test was used to compare incidence of complication betweeneach sequential cohort. Data were expressed as mean ± SD or number (percentage).RESULTS. Fifty eight patients were male and 22 female. The mean age was 57 ± 16 andthe mean body mass index was 31 kg/m2 ± 8. The initial diagnosis was for 50 % medicaland for 50 % post surgery. The mean SAPSII was 45 ± 14. The mean time of the firstphase of ultrasound examination was 11 min ± 6, the mean time of the second phase ofUPDT placement was the same. The mean total ultrasound guided procedure time was22 min ± 10. A total of 27 complications were found. Ten (13 %) complications weretechnical ones: 8 (10 %) punctures of the tracheal tube cuff and 2 (2 %) multiplepunctures. Ten (13 %) complications were intraprocedural: desaturation in 2 patients(2 %), 2 episodes of hypotension (2 %) and 6 (8 %) minor bleeding (\5 mL). Eight(10 %) complications were postprocedural ones, 1 (1 %) skin infection at the puncturesite, 2 (2 %) tracheal ring fractures, 3 (4 %) granulomas and 2 (2 %) minor bleeding(\5 mL). Most complications occurred among the first 30 patients: 24 out of 27 com-plications. The complications incidence was significantly different between the first 30patients and the next 50 (p \ 0.05). The mean time of the procedure was also longer forthe first 30 patients (p = 0.003). These data, for each sequential cohort of ten patients, areexposed in the table.
26th ESICM ANNUAL CONGRESS — PARIS, FRANCE — 5–9 OCTOBER 2013
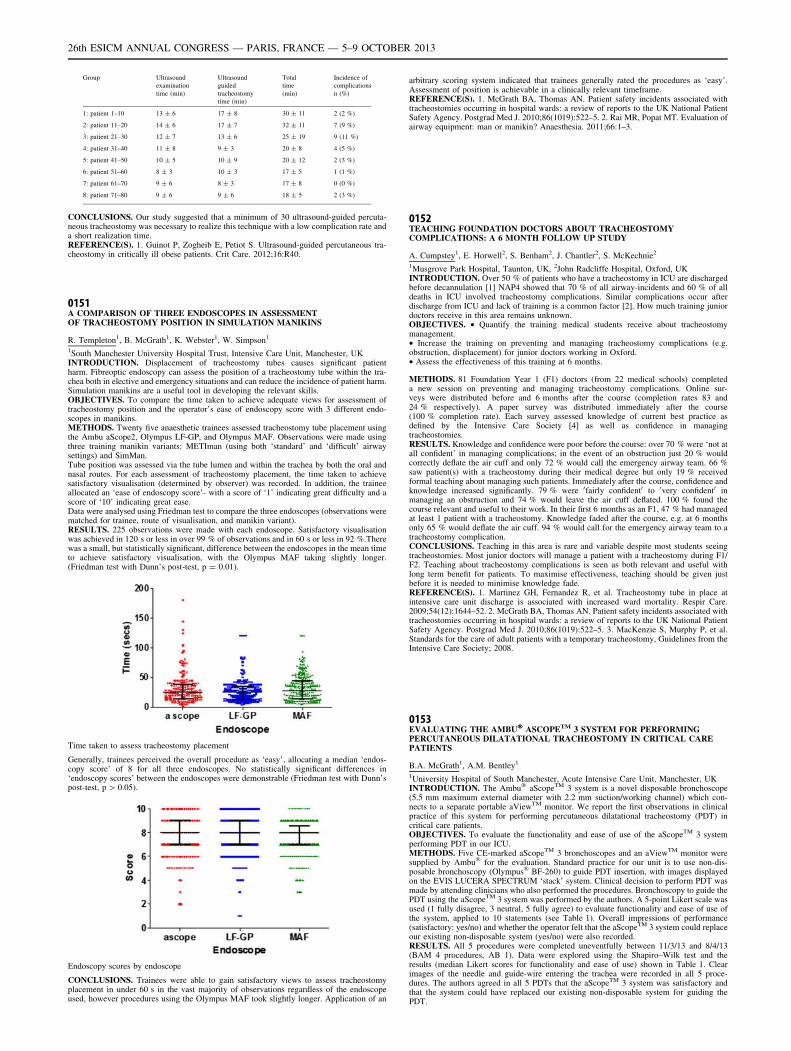
Group Ultrasound
examination
time (min)
Ultrasound
guided
tracheostomy
time (min)
Total
time
(min)
Incidence of
complications
n (%)
1: patient 1–10 13 ± 6 17 ± 8 30 ± 11 2 (2 %)
2: patient 11–20 14 ± 6 17 ± 7 32 ± 11 7 (9 %)
3: patient 21–30 12 ± 7 13 ± 6 25 ± 19 9 (11 %)
4: patient 31–40 11 ± 8 9 ± 3 20 ± 8 4 (5 %)
5: patient 41–50 10 ± 5 10 ± 9 20 ± 12 2 (3 %)
6: patient 51–60 8 ± 3 10 ± 3 17 ± 5 1 (1 %)
7: patient 61–70 9 ± 6 8 ± 3 17 ± 8 0 (0 %)
8: patient 71–80 9 ± 6 9 ± 6 18 ± 5 2 (3 %)
CONCLUSIONS. Our study suggested that a minimum of 30 ultrasound-guided percuta-neous tracheostomy was necessary to realize this technique with a low complication rate anda short realization time.REFERENCE(S). 1. Guinot P, Zogheib E, Petiot S. Ultrasound-guided percutaneous tra-cheostomy in critically ill obese patients. Crit Care. 2012;16:R40.
0151A COMPARISON OF THREE ENDOSCOPES IN ASSESSMENTOF TRACHEOSTOMY POSITION IN SIMULATION MANIKINS
R. Templeton1, B. McGrath1, K. Webster1, W. Simpson1
1South Manchester University Hospital Trust, Intensive Care Unit, Manchester, UKINTRODUCTION. Displacement of tracheostomy tubes causes significant patientharm. Fibreoptic endoscopy can assess the position of a tracheostomy tube within the tra-chea both in elective and emergency situations and can reduce the incidence of patient harm.Simulation manikins are a useful tool in developing the relevant skills.OBJECTIVES. To compare the time taken to achieve adequate views for assessment oftracheostomy position and the operator’s ease of endoscopy score with 3 different endo-scopes in manikins.METHODS. Twenty five anaesthetic trainees assessed tracheostomy tube placement usingthe Ambu aScope2, Olympus LF-GP, and Olympus MAF. Observations were made usingthree training manikin variants: METIman (using both ‘standard’ and ‘difficult’ airwaysettings) and SimMan.Tube position was assessed via the tube lumen and within the trachea by both the oral andnasal routes. For each assessment of tracheostomy placement, the time taken to achievesatisfactory visualisation (determined by observer) was recorded. In addition, the traineeallocated an ‘ease of endoscopy score’- with a score of ‘1’ indicating great difficulty and ascore of ‘10’ indicating great ease.Data were analysed using Friedman test to compare the three endoscopes (observations werematched for trainee, route of visualisation, and manikin variant).RESULTS. 225 observations were made with each endoscope. Satisfactory visualisationwas achieved in 120 s or less in over 99 % of observations and in 60 s or less in 92 %.Therewas a small, but statistically significant, difference between the endoscopes in the mean timeto achieve satisfactory visualisation, with the Olympus MAF taking slightly longer.(Friedman test with Dunn’s post-test, p = 0.01).
Time taken to assess tracheostomy placement
Generally, trainees perceived the overall procedure as ‘easy’, allocating a median ‘endos-copy score’ of 8 for all three endoscopes. No statistically significant differences in‘endoscopy scores’ between the endoscopes were demonstrable (Friedman test with Dunn’spost-test, p [ 0.05).
Endoscopy scores by endoscope
CONCLUSIONS. Trainees were able to gain satisfactory views to assess tracheostomyplacement in under 60 s in the vast majority of observations regardless of the endoscopeused, however procedures using the Olympus MAF took slightly longer. Application of an
arbitrary scoring system indicated that trainees generally rated the procedures as ‘easy’.Assessment of position is achievable in a clinically relevant timeframe.REFERENCE(S). 1. McGrath BA, Thomas AN. Patient safety incidents associated withtracheostomies occurring in hospital wards: a review of reports to the UK National PatientSafety Agency. Postgrad Med J. 2010;86(1019):522–5. 2. Rai MR, Popat MT. Evaluation ofairway equipment: man or manikin? Anaesthesia. 2011;66:1–3.
0152TEACHING FOUNDATION DOCTORS ABOUT TRACHEOSTOMYCOMPLICATIONS: A 6 MONTH FOLLOW UP STUDY
A. Cumpstey1, E. Horwell2, S. Benham2, J. Chantler2, S. McKechnie2
1Musgrove Park Hospital, Taunton, UK, 2John Radcliffe Hospital, Oxford, UKINTRODUCTION. Over 50 % of patients who have a tracheostomy in ICU are dischargedbefore decannulation [1] NAP4 showed that 70 % of all airway-incidents and 60 % of alldeaths in ICU involved tracheostomy complications. Similar complications occur afterdischarge from ICU and lack of training is a common factor [2]. How much training juniordoctors receive in this area remains unknown.OBJECTIVES. • Quantify the training medical students receive about tracheostomymanagement.• Increase the training on preventing and managing tracheostomy complications (e.g.obstruction, displacement) for junior doctors working in Oxford.• Assess the effectiveness of this training at 6 months.
METHODS. 81 Foundation Year 1 (F1) doctors (from 22 medical schools) completeda new session on preventing and managing tracheostomy complications. Online sur-veys were distributed before and 6 months after the course (completion rates 83 and24 % respectively). A paper survey was distributed immediately after the course(100 % completion rate). Each survey assessed knowledge of current best practice asdefined by the Intensive Care Society [4] as well as confidence in managingtracheostomies.RESULTS. Knowledge and confidence were poor before the course: over 70 % were ‘not atall confident’ in managing complications; in the event of an obstruction just 20 % wouldcorrectly deflate the air cuff and only 72 % would call the emergency airway team. 66 %saw patient(s) with a tracheostomy during their medical degree but only 19 % receivedformal teaching about managing such patients. Immediately after the course, confidence andknowledge increased significantly. 79 % were 0fairly confident0 to 0very confident0 inmanaging an obstruction and 74 % would leave the air cuff deflated. 100 % found thecourse relevant and useful to their work. In their first 6 months as an F1, 47 % had managedat least 1 patient with a tracheostomy. Knowledge faded after the course, e.g. at 6 monthsonly 65 % would deflate the air cuff. 94 % would call for the emergency airway team to atracheostomy complication.CONCLUSIONS. Teaching in this area is rare and variable despite most students seeingtracheostomies. Most junior doctors will manage a patient with a tracheostomy during F1/F2. Teaching about tracheostomy complications is seen as both relevant and useful withlong term benefit for patients. To maximise effectiveness, teaching should be given justbefore it is needed to minimise knowledge fade.REFERENCE(S). 1. Martinez GH, Fernandez R, et al. Tracheostomy tube in place atintensive care unit discharge is associated with increased ward mortality. Respir Care.2009;54(12):1644–52. 2. McGrath BA, Thomas AN. Patient safety incidents associated withtracheostomies occurring in hospital wards: a review of reports to the UK National PatientSafety Agency. Postgrad Med J. 2010;86(1019):522–5. 3. MacKenzie S, Murphy P, et al.Standards for the care of adult patients with a temporary tracheostomy, Guidelines from theIntensive Care Society; 2008.
0153EVALUATING THE AMBU� ASCOPETM 3 SYSTEM FOR PERFORMINGPERCUTANEOUS DILATATIONAL TRACHEOSTOMY IN CRITICAL CAREPATIENTS
B.A. McGrath1, A.M. Bentley1
1University Hospital of South Manchester, Acute Intensive Care Unit, Manchester, UKINTRODUCTION. The Ambu� aScopeTM 3 system is a novel disposable bronchoscope(5.5 mm maximum external diameter with 2.2 mm suction/working channel) which con-nects to a separate portable aViewTM monitor. We report the first observations in clinicalpractice of this system for performing percutaneous dilatational tracheostomy (PDT) incritical care patients.OBJECTIVES. To evaluate the functionality and ease of use of the aScopeTM 3 systemperforming PDT in our ICU.METHODS. Five CE-marked aScopeTM 3 bronchoscopes and an aViewTM monitor weresupplied by Ambu� for the evaluation. Standard practice for our unit is to use non-dis-posable bronchoscopy (Olympus� BF-260) to guide PDT insertion, with images displayedon the EVIS LUCERA SPECTRUM ‘stack’ system. Clinical decision to perform PDT wasmade by attending clinicians who also performed the procedures. Bronchoscopy to guide thePDT using the aScopeTM 3 system was performed by the authors. A 5-point Likert scale wasused (1 fully disagree, 3 neutral, 5 fully agree) to evaluate functionality and ease of use ofthe system, applied to 10 statements (see Table 1). Overall impressions of performance(satisfactory: yes/no) and whether the operator felt that the aScopeTM 3 system could replaceour existing non-disposable system (yes/no) were also recorded.RESULTS. All 5 procedures were completed uneventfully between 11/3/13 and 8/4/13(BAM 4 procedures, AB 1). Data were explored using the Shapiro–Wilk test and theresults (median Likert scores for functionality and ease of use) shown in Table 1. Clearimages of the needle and guide-wire entering the trachea were recorded in all 5 proce-dures. The authors agreed in all 5 PDTs that the aScopeTM 3 system was satisfactory andthat the system could have replaced our existing non-disposable system for guiding thePDT.
26th ESICM ANNUAL CONGRESS — PARIS, FRANCE — 5–9 OCTOBER 2013
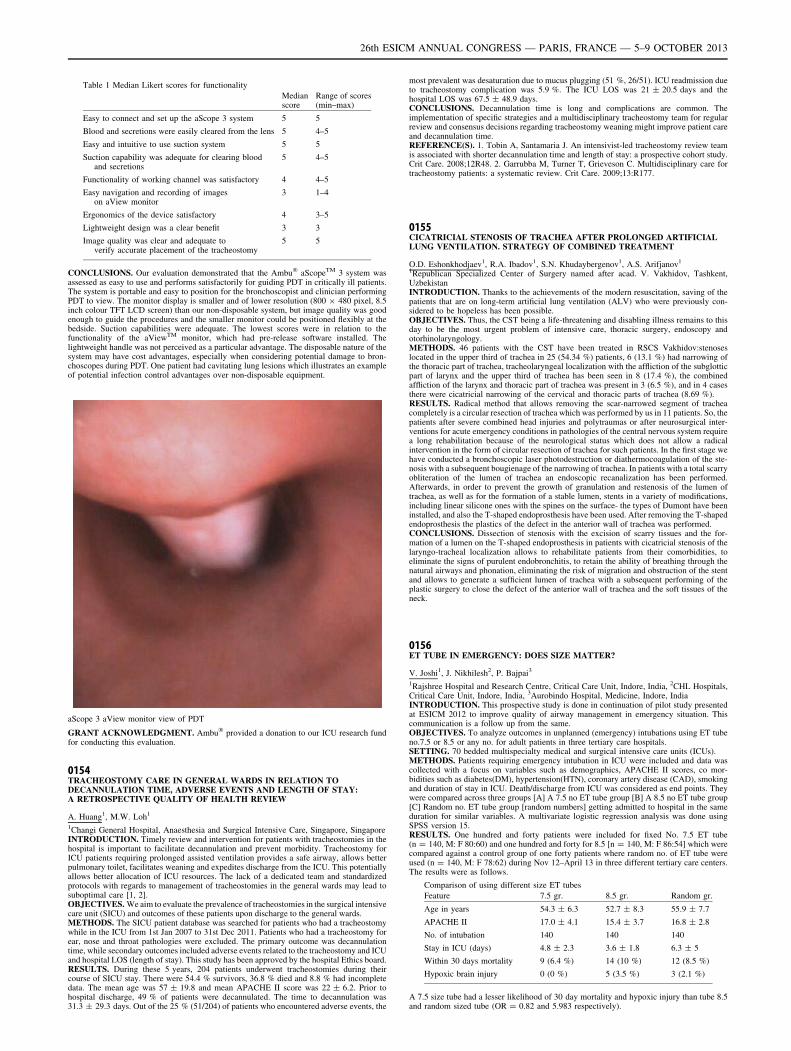
Table 1 Median Likert scores for functionality
Medianscore
Range of scores(min–max)
Easy to connect and set up the aScope 3 system 5 5
Blood and secretions were easily cleared from the lens 5 4–5
Easy and intuitive to use suction system 5 5
Suction capability was adequate for clearing bloodand secretions
5 4–5
Functionality of working channel was satisfactory 4 4–5
Easy navigation and recording of imageson aView monitor
3 1–4
Ergonomics of the device satisfactory 4 3–5
Lightweight design was a clear benefit 3 3
Image quality was clear and adequate toverify accurate placement of the tracheostomy
5 5
CONCLUSIONS. Our evaluation demonstrated that the Ambu� aScopeTM 3 system wasassessed as easy to use and performs satisfactorily for guiding PDT in critically ill patients.The system is portable and easy to position for the bronchoscopist and clinician performingPDT to view. The monitor display is smaller and of lower resolution (800 9 480 pixel, 8.5inch colour TFT LCD screen) than our non-disposable system, but image quality was goodenough to guide the procedures and the smaller monitor could be positioned flexibly at thebedside. Suction capabilities were adequate. The lowest scores were in relation to thefunctionality of the aViewTM monitor, which had pre-release software installed. Thelightweight handle was not perceived as a particular advantage. The disposable nature of thesystem may have cost advantages, especially when considering potential damage to bron-choscopes during PDT. One patient had cavitating lung lesions which illustrates an exampleof potential infection control advantages over non-disposable equipment.
aScope 3 aView monitor view of PDT
GRANT ACKNOWLEDGMENT. Ambu� provided a donation to our ICU research fundfor conducting this evaluation.
0154TRACHEOSTOMY CARE IN GENERAL WARDS IN RELATION TODECANNULATION TIME, ADVERSE EVENTS AND LENGTH OF STAY:A RETROSPECTIVE QUALITY OF HEALTH REVIEW
A. Huang1, M.W. Loh1
1Changi General Hospital, Anaesthesia and Surgical Intensive Care, Singapore, SingaporeINTRODUCTION. Timely review and intervention for patients with tracheostomies in thehospital is important to facilitate decannulation and prevent morbidity. Tracheostomy forICU patients requiring prolonged assisted ventilation provides a safe airway, allows betterpulmonary toilet, facilitates weaning and expedites discharge from the ICU. This potentiallyallows better allocation of ICU resources. The lack of a dedicated team and standardizedprotocols with regards to management of tracheostomies in the general wards may lead tosuboptimal care [1, 2].OBJECTIVES. We aim to evaluate the prevalence of tracheostomies in the surgical intensivecare unit (SICU) and outcomes of these patients upon discharge to the general wards.METHODS. The SICU patient database was searched for patients who had a tracheostomywhile in the ICU from 1st Jan 2007 to 31st Dec 2011. Patients who had a tracheostomy forear, nose and throat pathologies were excluded. The primary outcome was decannulationtime, while secondary outcomes included adverse events related to the tracheostomy and ICUand hospital LOS (length of stay). This study has been approved by the hospital Ethics board.RESULTS. During these 5 years, 204 patients underwent tracheostomies during theircourse of SICU stay. There were 54.4 % survivors, 36.8 % died and 8.8 % had incompletedata. The mean age was 57 ± 19.8 and mean APACHE II score was 22 ± 6.2. Prior tohospital discharge, 49 % of patients were decannulated. The time to decannulation was31.3 ± 29.3 days. Out of the 25 % (51/204) of patients who encountered adverse events, the
most prevalent was desaturation due to mucus plugging (51 %, 26/51). ICU readmission dueto tracheostomy complication was 5.9 %. The ICU LOS was 21 ± 20.5 days and thehospital LOS was 67.5 ± 48.9 days.CONCLUSIONS. Decannulation time is long and complications are common. Theimplementation of specific strategies and a multidisciplinary tracheostomy team for regularreview and consensus decisions regarding tracheostomy weaning might improve patient careand decannulation time.REFERENCE(S). 1. Tobin A, Santamaria J. An intensivist-led tracheostomy review teamis associated with shorter decannulation time and length of stay: a prospective cohort study.Crit Care. 2008;12R48. 2. Garrubba M, Turner T, Grieveson C. Multidisciplinary care fortracheostomy patients: a systematic review. Crit Care. 2009;13:R177.
0155CICATRICIAL STENOSIS OF TRACHEA AFTER PROLONGED ARTIFICIALLUNG VENTILATION. STRATEGY OF COMBINED TREATMENT
O.D. Eshonkhodjaev1, R.A. Ibadov1, S.N. Khudaybergenov1, A.S. Arifjanov1
1Republican Specialized Center of Surgery named after acad. V. Vakhidov, Tashkent,UzbekistanINTRODUCTION. Thanks to the achievements of the modern resuscitation, saving of thepatients that are on long-term artificial lung ventilation (ALV) who were previously con-sidered to be hopeless has been possible.OBJECTIVES. Thus, the CST being a life-threatening and disabling illness remains to thisday to be the most urgent problem of intensive care, thoracic surgery, endoscopy andotorhinolaryngology.METHODS. 46 patients with the CST have been treated in RSCS Vakhidov:stenoseslocated in the upper third of trachea in 25 (54.34 %) patients, 6 (13.1 %) had narrowing ofthe thoracic part of trachea, tracheolaryngeal localization with the affliction of the subglotticpart of larynx and the upper third of trachea has been seen in 8 (17.4 %), the combinedaffliction of the larynx and thoracic part of trachea was present in 3 (6.5 %), and in 4 casesthere were cicatricial narrowing of the cervical and thoracic parts of trachea (8.69 %).RESULTS. Radical method that allows removing the scar-narrowed segment of tracheacompletely is a circular resection of trachea which was performed by us in 11 patients. So, thepatients after severe combined head injuries and polytraumas or after neurosurgical inter-ventions for acute emergency conditions in pathologies of the central nervous system requirea long rehabilitation because of the neurological status which does not allow a radicalintervention in the form of circular resection of trachea for such patients. In the first stage wehave conducted a bronchoscopic laser photodestruction or diathermocoagulation of the ste-nosis with a subsequent bougienage of the narrowing of trachea. In patients with a total scarryobliteration of the lumen of trachea an endoscopic recanalization has been performed.Afterwards, in order to prevent the growth of granulation and restenosis of the lumen oftrachea, as well as for the formation of a stable lumen, stents in a variety of modifications,including linear silicone ones with the spines on the surface- the types of Dumont have beeninstalled, and also the T-shaped endoprosthesis have been used. After removing the T-shapedendoprosthesis the plastics of the defect in the anterior wall of trachea was performed.CONCLUSIONS. Dissection of stenosis with the excision of scarry tissues and the for-mation of a lumen on the T-shaped endoprosthesis in patients with cicatricial stenosis of thelaryngo-tracheal localization allows to rehabilitate patients from their comorbidities, toeliminate the signs of purulent endobronchitis, to retain the ability of breathing through thenatural airways and phonation, eliminating the risk of migration and obstruction of the stentand allows to generate a sufficient lumen of trachea with a subsequent performing of theplastic surgery to close the defect of the anterior wall of trachea and the soft tissues of theneck.
0156ET TUBE IN EMERGENCY: DOES SIZE MATTER?
V. Joshi1, J. Nikhilesh2, P. Bajpai3
1Rajshree Hospital and Research Centre, Critical Care Unit, Indore, India, 2CHL Hospitals,Critical Care Unit, Indore, India, 3Aurobindo Hospital, Medicine, Indore, IndiaINTRODUCTION. This prospective study is done in continuation of pilot study presentedat ESICM 2012 to improve quality of airway management in emergency situation. Thiscommunication is a follow up from the same.OBJECTIVES. To analyze outcomes in unplanned (emergency) intubations using ET tubeno.7.5 or 8.5 or any no. for adult patients in three tertiary care hospitals.SETTING. 70 bedded multispecialty medical and surgical intensive care units (ICUs).METHODS. Patients requiring emergency intubation in ICU were included and data wascollected with a focus on variables such as demographics, APACHE II scores, co mor-bidities such as diabetes(DM), hypertension(HTN), coronary artery disease (CAD), smokingand duration of stay in ICU. Death/discharge from ICU was considered as end points. Theywere compared across three groups [A] A 7.5 no ET tube group [B] A 8.5 no ET tube group[C] Random no. ET tube group [random numbers] getting admitted to hospital in the sameduration for similar variables. A multivariate logistic regression analysis was done usingSPSS version 15.RESULTS. One hundred and forty patients were included for fixed No. 7.5 ET tube(n = 140, M: F 80:60) and one hundred and forty for 8.5 [n = 140, M: F 86:54] which werecompared against a control group of one forty patients where random no. of ET tube wereused (n = 140, M: F 78:62) during Nov 12–April 13 in three different tertiary care centers.The results were as follows.
Comparison of using different size ET tubes
Feature 7.5 gr. 8.5 gr. Random gr.
Age in years 54.3 ± 6.3 52.7 ± 8.3 55.9 ± 7.7
APACHE II 17.0 ± 4.1 15.4 ± 3.7 16.8 ± 2.8
No. of intubation 140 140 140
Stay in ICU (days) 4.8 ± 2.3 3.6 ± 1.8 6.3 ± 5
Within 30 days mortality 9 (6.4 %) 14 (10 %) 12 (8.5 %)
Hypoxic brain injury 0 (0 %) 5 (3.5 %) 3 (2.1 %)
A 7.5 size tube had a lesser likelihood of 30 day mortality and hypoxic injury than tube 8.5and random sized tube (OR = 0.82 and 5.983 respectively).
26th ESICM ANNUAL CONGRESS — PARIS, FRANCE — 5–9 OCTOBER 2013
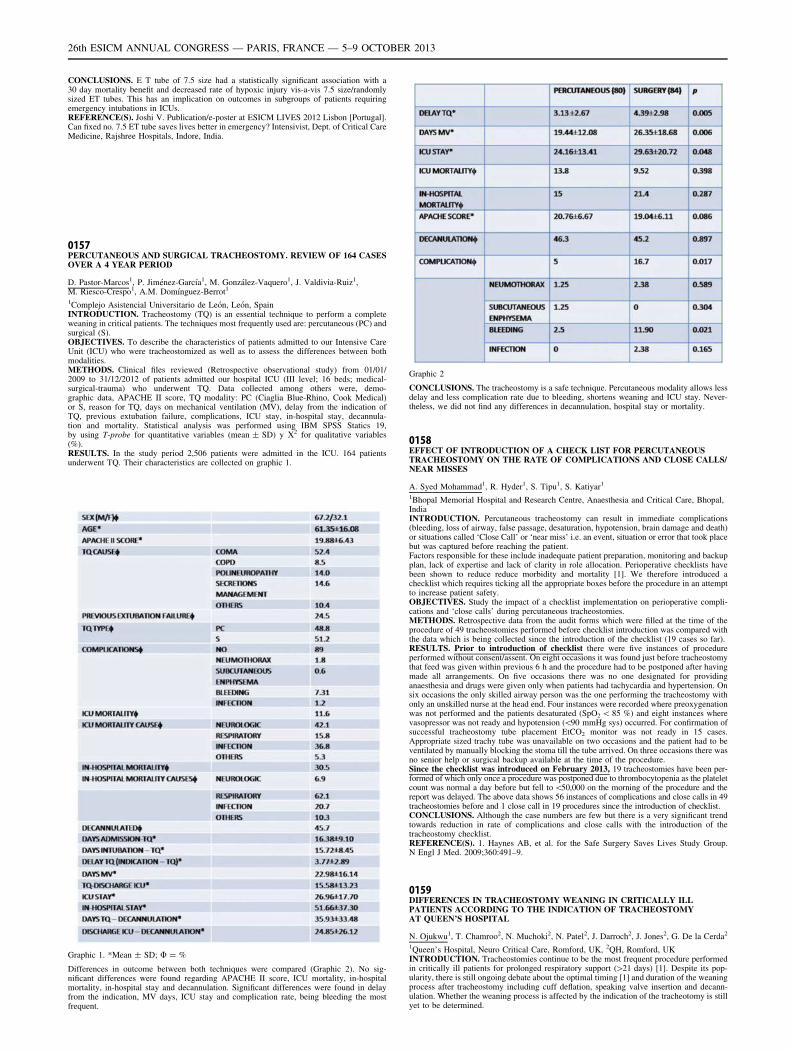
CONCLUSIONS. E T tube of 7.5 size had a statistically significant association with a30 day mortality benefit and decreased rate of hypoxic injury vis-a-vis 7.5 size/randomlysized ET tubes. This has an implication on outcomes in subgroups of patients requiringemergency intubations in ICUs.REFERENCE(S). Joshi V. Publication/e-poster at ESICM LIVES 2012 Lisbon [Portugal].Can fixed no. 7.5 ET tube saves lives better in emergency? Intensivist, Dept. of Critical CareMedicine, Rajshree Hospitals, Indore, India.
0157PERCUTANEOUS AND SURGICAL TRACHEOSTOMY. REVIEW OF 164 CASESOVER A 4 YEAR PERIOD
D. Pastor-Marcos1, P. Jiménez-Garcı́a1, M. González-Vaquero1, J. Valdivia-Ruiz1,M. Riesco-Crespo1, A.M. Domı́nguez-Berrot1
1Complejo Asistencial Universitario de León, León, SpainINTRODUCTION. Tracheostomy (TQ) is an essential technique to perform a completeweaning in critical patients. The techniques most frequently used are: percutaneous (PC) andsurgical (S).OBJECTIVES. To describe the characteristics of patients admitted to our Intensive CareUnit (ICU) who were tracheostomized as well as to assess the differences between bothmodalities.METHODS. Clinical files reviewed (Retrospective observational study) from 01/01/2009 to 31/12/2012 of patients admitted our hospital ICU (III level; 16 beds; medical-surgical-trauma) who underwent TQ. Data collected among others were, demo-graphic data, APACHE II score, TQ modality: PC (Ciaglia Blue-Rhino, Cook Medical)or S, reason for TQ, days on mechanical ventilation (MV), delay from the indication ofTQ, previous extubation failure, complications, ICU stay, in-hospital stay, decannula-tion and mortality. Statistical analysis was performed using IBM SPSS Statics 19,by using T-probe for quantitative variables (mean ± SD) y V2 for qualitative variables(%).RESULTS. In the study period 2,506 patients were admitted in the ICU. 164 patientsunderwent TQ. Their characteristics are collected on graphic 1.
Graphic 1. *Mean ± SD; U = %
Differences in outcome between both techniques were compared (Graphic 2). No sig-nificant differences were found regarding APACHE II score, ICU mortality, in-hospitalmortality, in-hospital stay and decannulation. Significant differences were found in delayfrom the indication, MV days, ICU stay and complication rate, being bleeding the mostfrequent.
Graphic 2
CONCLUSIONS. The tracheostomy is a safe technique. Percutaneous modality allows lessdelay and less complication rate due to bleeding, shortens weaning and ICU stay. Never-theless, we did not find any differences in decannulation, hospital stay or mortality.
0158EFFECT OF INTRODUCTION OF A CHECK LIST FOR PERCUTANEOUSTRACHEOSTOMY ON THE RATE OF COMPLICATIONS AND CLOSE CALLS/NEAR MISSES
A. Syed Mohammad1, R. Hyder1, S. Tipu1, S. Katiyar1
1Bhopal Memorial Hospital and Research Centre, Anaesthesia and Critical Care, Bhopal,IndiaINTRODUCTION. Percutaneous tracheostomy can result in immediate complications(bleeding, loss of airway, false passage, desaturation, hypotension, brain damage and death)or situations called ‘Close Call’ or ‘near miss’ i.e. an event, situation or error that took placebut was captured before reaching the patient.Factors responsible for these include inadequate patient preparation, monitoring and backupplan, lack of expertise and lack of clarity in role allocation. Perioperative checklists havebeen shown to reduce reduce morbidity and mortality [1]. We therefore introduced achecklist which requires ticking all the appropriate boxes before the procedure in an attemptto increase patient safety.OBJECTIVES. Study the impact of a checklist implementation on perioperative compli-cations and ‘close calls’ during percutaneous tracheostomies.METHODS. Retrospective data from the audit forms which were filled at the time of theprocedure of 49 tracheostomies performed before checklist introduction was compared withthe data which is being collected since the introduction of the checklist (19 cases so far).RESULTS. Prior to introduction of checklist there were five instances of procedureperformed without consent/assent. On eight occasions it was found just before tracheostomythat feed was given within previous 6 h and the procedure had to be postponed after havingmade all arrangements. On five occasions there was no one designated for providinganaesthesia and drugs were given only when patients had tachycardia and hypertension. Onsix occasions the only skilled airway person was the one performing the tracheostomy withonly an unskilled nurse at the head end. Four instances were recorded where preoxygenationwas not performed and the patients desaturated (SpO2 \ 85 %) and eight instances wherevasopressor was not ready and hypotension (\90 mmHg sys) occurred. For confirmation ofsuccessful tracheostomy tube placement EtCO2 monitor was not ready in 15 cases.Appropriate sized trachy tube was unavailable on two occasions and the patient had to beventilated by manually blocking the stoma till the tube arrived. On three occasions there wasno senior help or surgical backup available at the time of the procedure.Since the checklist was introduced on February 2013, 19 tracheostomies have been per-formed of which only once a procedure was postponed due to thrombocytopenia as the plateletcount was normal a day before but fell to\50,000 on the morning of the procedure and thereport was delayed. The above data shows 56 instances of complications and close calls in 49tracheostomies before and 1 close call in 19 procedures since the introduction of checklist.CONCLUSIONS. Although the case numbers are few but there is a very significant trendtowards reduction in rate of complications and close calls with the introduction of thetracheostomy checklist.REFERENCE(S). 1. Haynes AB, et al. for the Safe Surgery Saves Lives Study Group.N Engl J Med. 2009;360:491–9.
0159DIFFERENCES IN TRACHEOSTOMY WEANING IN CRITICALLY ILLPATIENTS ACCORDING TO THE INDICATION OF TRACHEOSTOMYAT QUEEN’S HOSPITAL
N. Ojukwu1, T. Chamroo2, N. Muchoki2, N. Patel2, J. Darroch2, J. Jones2, G. De la Cerda2
1Queen’s Hospital, Neuro Critical Care, Romford, UK, 2QH, Romford, UKINTRODUCTION. Tracheostomies continue to be the most frequent procedure performedin critically ill patients for prolonged respiratory support ([21 days) [1]. Despite its pop-ularity, there is still ongoing debate about the optimal timing [1] and duration of the weaningprocess after tracheostomy including cuff deflation, speaking valve insertion and decann-ulation. Whether the weaning process is affected by the indication of the tracheotomy is stillyet to be determined.
26th ESICM ANNUAL CONGRESS — PARIS, FRANCE — 5–9 OCTOBER 2013
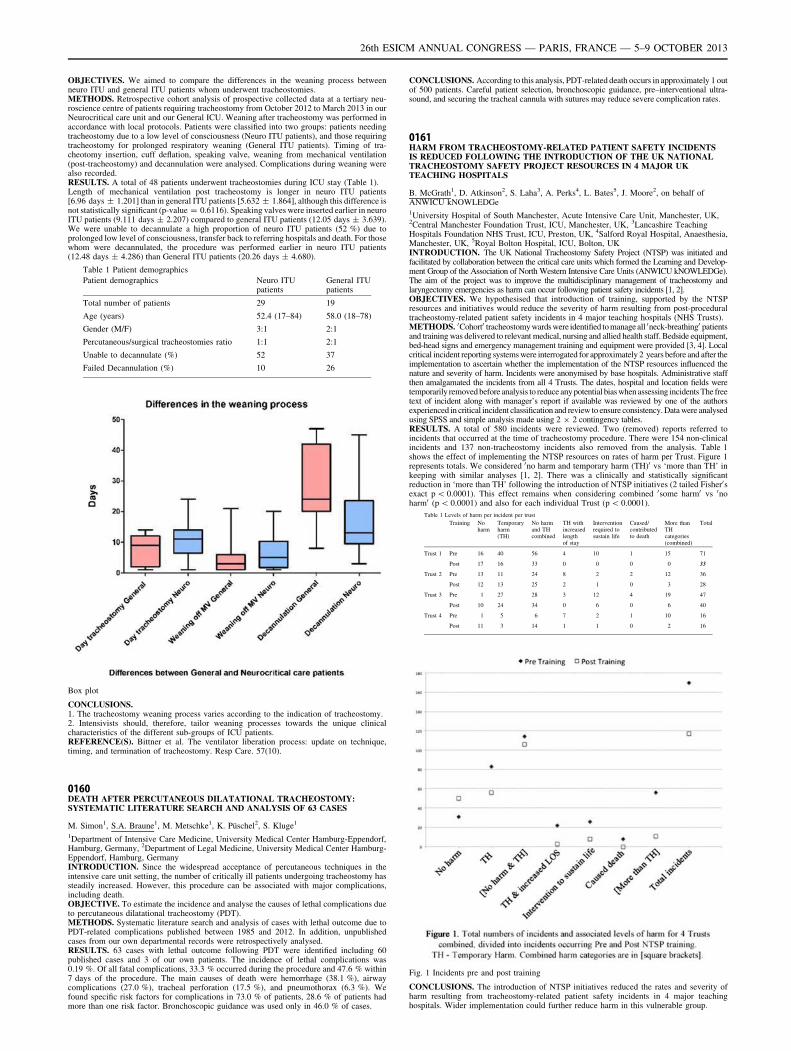
OBJECTIVES. We aimed to compare the differences in the weaning process betweenneuro ITU and general ITU patients whom underwent tracheostomies.METHODS. Retrospective cohort analysis of prospective collected data at a tertiary neu-roscience centre of patients requiring tracheostomy from October 2012 to March 2013 in ourNeurocritical care unit and our General ICU. Weaning after tracheostomy was performed inaccordance with local protocols. Patients were classified into two groups: patients needingtracheostomy due to a low level of consciousness (Neuro ITU patients), and those requiringtracheostomy for prolonged respiratory weaning (General ITU patients). Timing of tra-cheotomy insertion, cuff deflation, speaking valve, weaning from mechanical ventilation(post-tracheostomy) and decannulation were analysed. Complications during weaning werealso recorded.RESULTS. A total of 48 patients underwent tracheostomies during ICU stay (Table 1).Length of mechanical ventilation post tracheostomy is longer in neuro ITU patients[6.96 days ± 1.201] than in general ITU patients [5.632 ± 1.864], although this difference isnot statistically significant (p-value = 0.6116). Speaking valves were inserted earlier in neuroITU patients (9.111 days ± 2.207) compared to general ITU patients (12.05 days ± 3.639).We were unable to decannulate a high proportion of neuro ITU patients (52 %) due toprolonged low level of consciousness, transfer back to referring hospitals and death. For thosewhom were decannulated, the procedure was performed earlier in neuro ITU patients(12.48 days ± 4.286) than General ITU patients (20.26 days ± 4.680).
Table 1 Patient demographics
Patient demographics Neuro ITUpatients
General ITUpatients
Total number of patients 29 19
Age (years) 52.4 (17–84) 58.0 (18–78)
Gender (M/F) 3:1 2:1
Percutaneous/surgical tracheostomies ratio 1:1 2:1
Unable to decannulate (%) 52 37
Failed Decannulation (%) 10 26
Box plot
CONCLUSIONS.1. The tracheostomy weaning process varies according to the indication of tracheostomy.2. Intensivists should, therefore, tailor weaning processes towards the unique clinicalcharacteristics of the different sub-groups of ICU patients.REFERENCE(S). Bittner et al. The ventilator liberation process: update on technique,timing, and termination of tracheostomy. Resp Care. 57(10).
0160DEATH AFTER PERCUTANEOUS DILATATIONAL TRACHEOSTOMY:SYSTEMATIC LITERATURE SEARCH AND ANALYSIS OF 63 CASES
M. Simon1, S.A. Braune1, M. Metschke1, K. Püschel2, S. Kluge1
1Department of Intensive Care Medicine, University Medical Center Hamburg-Eppendorf,Hamburg, Germany, 2Department of Legal Medicine, University Medical Center Hamburg-Eppendorf, Hamburg, GermanyINTRODUCTION. Since the widespread acceptance of percutaneous techniques in theintensive care unit setting, the number of critically ill patients undergoing tracheostomy hassteadily increased. However, this procedure can be associated with major complications,including death.OBJECTIVE. To estimate the incidence and analyse the causes of lethal complications dueto percutaneous dilatational tracheostomy (PDT).METHODS. Systematic literature search and analysis of cases with lethal outcome due toPDT-related complications published between 1985 and 2012. In addition, unpublishedcases from our own departmental records were retrospectively analysed.RESULTS. 63 cases with lethal outcome following PDT were identified including 60published cases and 3 of our own patients. The incidence of lethal complications was0.19 %. Of all fatal complications, 33.3 % occurred during the procedure and 47.6 % within7 days of the procedure. The main causes of death were hemorrhage (38.1 %), airwaycomplications (27.0 %), tracheal perforation (17.5 %), and pneumothorax (6.3 %). Wefound specific risk factors for complications in 73.0 % of patients, 28.6 % of patients hadmore than one risk factor. Bronchoscopic guidance was used only in 46.0 % of cases.
CONCLUSIONS. According to this analysis, PDT-related death occurs in approximately 1 outof 500 patients. Careful patient selection, bronchoscopic guidance, pre–interventional ultra-sound, and securing the tracheal cannula with sutures may reduce severe complication rates.
0161HARM FROM TRACHEOSTOMY-RELATED PATIENT SAFETY INCIDENTSIS REDUCED FOLLOWING THE INTRODUCTION OF THE UK NATIONALTRACHEOSTOMY SAFETY PROJECT RESOURCES IN 4 MAJOR UKTEACHING HOSPITALS
B. McGrath1, D. Atkinson2, S. Laha3, A. Perks4, L. Bates5, J. Moore2, on behalf ofANWICU kNOWLEDGe1University Hospital of South Manchester, Acute Intensive Care Unit, Manchester, UK,2Central Manchester Foundation Trust, ICU, Manchester, UK, 3Lancashire TeachingHospitals Foundation NHS Trust, ICU, Preston, UK, 4Salford Royal Hospital, Anaesthesia,Manchester, UK, 5Royal Bolton Hospital, ICU, Bolton, UKINTRODUCTION. The UK National Tracheostomy Safety Project (NTSP) was initiated andfacilitated by collaboration between the critical care units which formed the Learning and Develop-ment Group of the Association of North Western Intensive Care Units (ANWICU kNOWLEDGe).The aim of the project was to improve the multidisciplinary management of tracheostomy andlaryngectomy emergencies as harm can occur following patient safety incidents [1, 2].OBJECTIVES. We hypothesised that introduction of training, supported by the NTSPresources and initiatives would reduce the severity of harm resulting from post-proceduraltracheostomy-related patient safety incidents in 4 major teaching hospitals (NHS Trusts).METHODS. 0Cohort0 tracheostomy wards were identified to manage all 0neck-breathing0 patientsand training was delivered to relevant medical, nursing and allied health staff. Bedside equipment,bed-head signs and emergency management training and equipment were provided [3, 4]. Localcritical incident reporting systems were interrogated for approximately 2 years before and after theimplementation to ascertain whether the implementation of the NTSP resources influenced thenature and severity of harm. Incidents were anonymised by base hospitals. Administrative staffthen amalgamated the incidents from all 4 Trusts. The dates, hospital and location fields weretemporarily removed before analysis to reduce any potential bias when assessing incidents The freetext of incident along with manager’s report if available was reviewed by one of the authorsexperienced in critical incident classification and review to ensure consistency. Data were analysedusing SPSS and simple analysis made using 2 9 2 contingency tables.RESULTS. A total of 580 incidents were reviewed. Two (removed) reports referred toincidents that occurred at the time of tracheostomy procedure. There were 154 non-clinicalincidents and 137 non-tracheostomy incidents also removed from the analysis. Table 1shows the effect of implementing the NTSP resources on rates of harm per Trust. Figure 1represents totals. We considered 0no harm and temporary harm (TH)0 vs ‘more than TH’ inkeeping with similar analyses [1, 2]. There was a clinically and statistically significantreduction in ‘more than TH’ following the introduction of NTSP initiatives (2 tailed Fisher0sexact p \ 0.0001). This effect remains when considering combined 0some harm0 vs 0noharm0 (p \ 0.0001) and also for each individual Trust (p \ 0.0001).
Table 1 Levels of harm per incident per trust
Training Noharm
Temporaryharm(TH)
No harmand THcombined
TH withincreasedlengthof stay
Interventionrequired tosustain life
Caused/contributedto death
More thanTHcategories(combined)
Total
Trust 1 Pre 16 40 56 4 10 1 15 71
Post 17 16 33 0 0 0 0 33
Trust 2 Pre 13 11 24 8 2 2 12 36
Post 12 13 25 2 1 0 3 28
Trust 3 Pre 1 27 28 3 12 4 19 47
Post 10 24 34 0 6 0 6 40
Trust 4 Pre 1 5 6 7 2 1 10 16
Post 11 3 14 1 1 0 2 16
Fig. 1 Incidents pre and post training
CONCLUSIONS. The introduction of NTSP initiatives reduced the rates and severity ofharm resulting from tracheostomy-related patient safety incidents in 4 major teachinghospitals. Wider implementation could further reduce harm in this vulnerable group.
26th ESICM ANNUAL CONGRESS — PARIS, FRANCE — 5–9 OCTOBER 2013
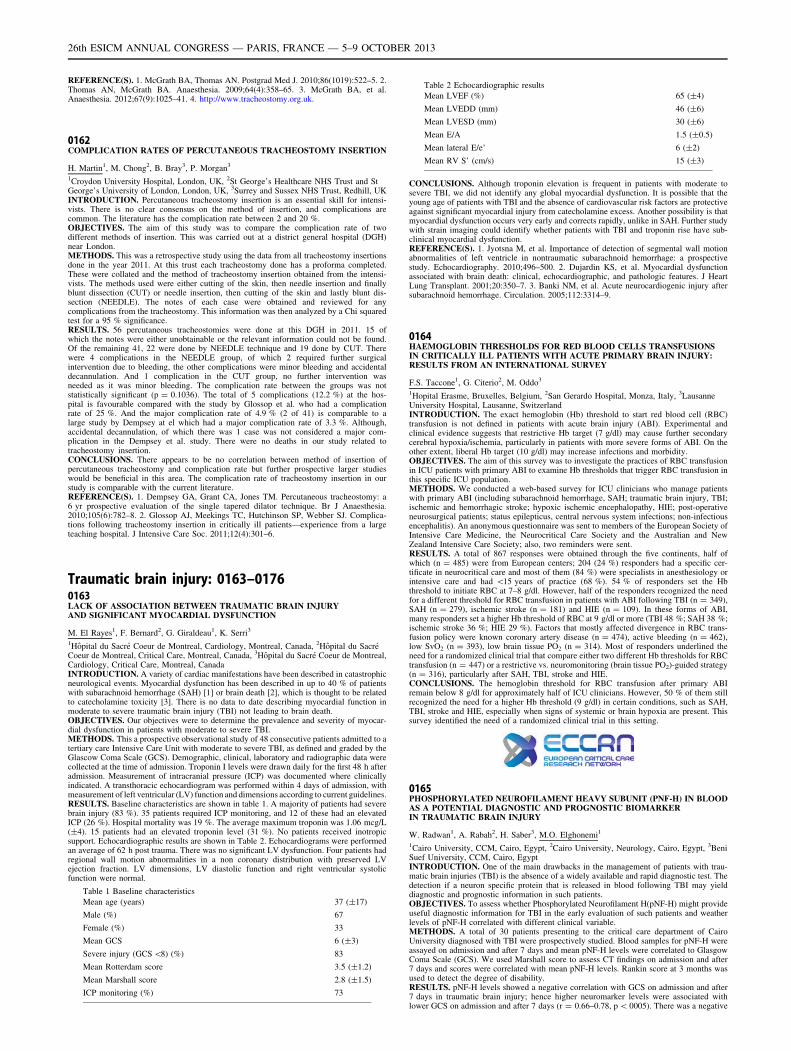
REFERENCE(S). 1. McGrath BA, Thomas AN. Postgrad Med J. 2010;86(1019):522–5. 2.Thomas AN, McGrath BA. Anaesthesia. 2009;64(4):358–65. 3. McGrath BA, et al.Anaesthesia. 2012;67(9):1025–41. 4. http://www.tracheostomy.org.uk.
0162COMPLICATION RATES OF PERCUTANEOUS TRACHEOSTOMY INSERTION
H. Martin1, M. Chong2, B. Bray3, P. Morgan3
1Croydon University Hospital, London, UK, 2St George’s Healthcare NHS Trust and StGeorge’s University of London, London, UK, 3Surrey and Sussex NHS Trust, Redhill, UKINTRODUCTION. Percutaneous tracheostomy insertion is an essential skill for intensi-vists. There is no clear consensus on the method of insertion, and complications arecommon. The literature has the complication rate between 2 and 20 %.OBJECTIVES. The aim of this study was to compare the complication rate of twodifferent methods of insertion. This was carried out at a district general hospital (DGH)near London.METHODS. This was a retrospective study using the data from all tracheostomy insertionsdone in the year 2011. At this trust each tracheostomy done has a proforma completed.These were collated and the method of tracheostomy insertion obtained from the intensi-vists. The methods used were either cutting of the skin, then needle insertion and finallyblunt dissection (CUT) or needle insertion, then cutting of the skin and lastly blunt dis-section (NEEDLE). The notes of each case were obtained and reviewed for anycomplications from the tracheostomy. This information was then analyzed by a Chi squaredtest for a 95 % significance.RESULTS. 56 percutaneous tracheostomies were done at this DGH in 2011. 15 ofwhich the notes were either unobtainable or the relevant information could not be found.Of the remaining 41, 22 were done by NEEDLE technique and 19 done by CUT. Therewere 4 complications in the NEEDLE group, of which 2 required further surgicalintervention due to bleeding, the other complications were minor bleeding and accidentaldecannulation. And 1 complication in the CUT group, no further intervention wasneeded as it was minor bleeding. The complication rate between the groups was notstatistically significant (p = 0.1036). The total of 5 complications (12.2 %) at the hos-pital is favourable compared with the study by Glossop et al. who had a complicationrate of 25 %. And the major complication rate of 4.9 % (2 of 41) is comparable to alarge study by Dempsey at el which had a major complication rate of 3.3 %. Although,accidental decannulation, of which there was 1 case was not considered a major com-plication in the Dempsey et al. study. There were no deaths in our study related totracheostomy insertion.CONCLUSIONS. There appears to be no correlation between method of insertion ofpercutaneous tracheostomy and complication rate but further prospective larger studieswould be beneficial in this area. The complication rate of tracheostomy insertion in ourstudy is comparable with the current literature.REFERENCE(S). 1. Dempsey GA, Grant CA, Jones TM. Percutaneous tracheostomy: a6 yr prospective evaluation of the single tapered dilator technique. Br J Anaesthesia.2010;105(6):782–8. 2. Glossop AJ, Meekings TC, Hutchinson SP, Webber SJ. Complica-tions following tracheostomy insertion in critically ill patients—experience from a largeteaching hospital. J Intensive Care Soc. 2011;12(4):301–6.
Traumatic brain injury: 0163–01760163LACK OF ASSOCIATION BETWEEN TRAUMATIC BRAIN INJURYAND SIGNIFICANT MYOCARDIAL DYSFUNCTION
M. El Rayes1, F. Bernard2, G. Giraldeau1, K. Serri3
1Hôpital du Sacré Coeur de Montreal, Cardiology, Montreal, Canada, 2Hôpital du SacréCoeur de Montreal, Critical Care, Montreal, Canada, 3Hôpital du Sacré Coeur de Montreal,Cardiology, Critical Care, Montreal, CanadaINTRODUCTION. A variety of cardiac manifestations have been described in catastrophicneurological events. Myocardial dysfunction has been described in up to 40 % of patientswith subarachnoid hemorrhage (SAH) [1] or brain death [2], which is thought to be relatedto catecholamine toxicity [3]. There is no data to date describing myocardial function inmoderate to severe traumatic brain injury (TBI) not leading to brain death.OBJECTIVES. Our objectives were to determine the prevalence and severity of myocar-dial dysfunction in patients with moderate to severe TBI.METHODS. This a prospective observational study of 48 consecutive patients admitted to atertiary care Intensive Care Unit with moderate to severe TBI, as defined and graded by theGlascow Coma Scale (GCS). Demographic, clinical, laboratory and radiographic data werecollected at the time of admission. Troponin I levels were drawn daily for the first 48 h afteradmission. Measurement of intracranial pressure (ICP) was documented where clinicallyindicated. A transthoracic echocardiogram was performed within 4 days of admission, withmeasurement of left ventricular (LV) function and dimensions according to current guidelines.RESULTS. Baseline characteristics are shown in table 1. A majority of patients had severebrain injury (83 %). 35 patients required ICP monitoring, and 12 of these had an elevatedICP (26 %). Hospital mortality was 19 %. The average maximum troponin was 1.06 mcg/L(±4). 15 patients had an elevated troponin level (31 %). No patients received inotropicsupport. Echocardiographic results are shown in Table 2. Echocardiograms were performedan average of 62 h post trauma. There was no significant LV dysfunction. Four patients hadregional wall motion abnormalities in a non coronary distribution with preserved LVejection fraction. LV dimensions, LV diastolic function and right ventricular systolicfunction were normal.
Table 1 Baseline characteristics
Mean age (years) 37 (±17)
Male (%) 67
Female (%) 33
Mean GCS 6 (±3)
Severe injury (GCS \8) (%) 83
Mean Rotterdam score 3.5 (±1.2)
Mean Marshall score 2.8 (±1.5)
ICP monitoring (%) 73
Table 2 Echocardiographic results
Mean LVEF (%) 65 (±4)
Mean LVEDD (mm) 46 (±6)
Mean LVESD (mm) 30 (±6)
Mean E/A 1.5 (±0.5)
Mean lateral E/e’ 6 (±2)
Mean RV S’ (cm/s) 15 (±3)
CONCLUSIONS. Although troponin elevation is frequent in patients with moderate tosevere TBI, we did not identify any global myocardial dysfunction. It is possible that theyoung age of patients with TBI and the absence of cardiovascular risk factors are protectiveagainst significant myocardial injury from catecholamine excess. Another possibility is thatmyocardial dysfunction occurs very early and corrects rapidly, unlike in SAH. Further studywith strain imaging could identify whether patients with TBI and troponin rise have sub-clinical myocardial dysfunction.REFERENCE(S). 1. Jyotsna M, et al. Importance of detection of segmental wall motionabnormalities of left ventricle in nontraumatic subarachnoid hemorrhage: a prospectivestudy. Echocardiography. 2010;496–500. 2. Dujardin KS, et al. Myocardial dysfunctionassociated with brain death: clinical, echocardiographic, and pathologic features. J HeartLung Transplant. 2001;20:350–7. 3. Banki NM, et al. Acute neurocardiogenic injury aftersubarachnoid hemorrhage. Circulation. 2005;112:3314–9.
0164HAEMOGLOBIN THRESHOLDS FOR RED BLOOD CELLS TRANSFUSIONSIN CRITICALLY ILL PATIENTS WITH ACUTE PRIMARY BRAIN INJURY:RESULTS FROM AN INTERNATIONAL SURVEY
F.S. Taccone1, G. Citerio2, M. Oddo3
1Hopital Erasme, Bruxelles, Belgium, 2San Gerardo Hospital, Monza, Italy, 3LausanneUniversity Hospital, Lausanne, SwitzerlandINTRODUCTION. The exact hemoglobin (Hb) threshold to start red blood cell (RBC)transfusion is not defined in patients with acute brain injury (ABI). Experimental andclinical evidence suggests that restrictive Hb target (7 g/dl) may cause further secondarycerebral hypoxia/ischemia, particularly in patients with more severe forms of ABI. On theother extent, liberal Hb target (10 g/dl) may increase infections and morbidity.OBJECTIVES. The aim of this survey was to investigate the practices of RBC transfusionin ICU patients with primary ABI to examine Hb thresholds that trigger RBC transfusion inthis specific ICU population.METHODS. We conducted a web-based survey for ICU clinicians who manage patientswith primary ABI (including subarachnoid hemorrhage, SAH; traumatic brain injury, TBI;ischemic and hemorrhagic stroke; hypoxic ischemic encephalopathy, HIE; post-operativeneurosurgical patients; status epilepticus, central nervous system infections; non-infectiousencephalitis). An anonymous questionnaire was sent to members of the European Society ofIntensive Care Medicine, the Neurocritical Care Society and the Australian and NewZealand Intensive Care Society; also, two reminders were sent.RESULTS. A total of 867 responses were obtained through the five continents, half ofwhich (n = 485) were from European centers; 204 (24 %) responders had a specific cer-tificate in neurocritical care and most of them (84 %) were specialists in anesthesiology orintensive care and had \15 years of practice (68 %). 54 % of responders set the Hbthreshold to initiate RBC at 7–8 g/dl. However, half of the responders recognized the needfor a different threshold for RBC transfusion in patients with ABI following TBI (n = 349),SAH (n = 279), ischemic stroke (n = 181) and HIE (n = 109). In these forms of ABI,many responders set a higher Hb threshold of RBC at 9 g/dl or more (TBI 48 %; SAH 38 %;ischemic stroke 36 %; HIE 29 %). Factors that mostly affected divergence in RBC trans-fusion policy were known coronary artery disease (n = 474), active bleeding (n = 462),low SvO2 (n = 393), low brain tissue PO2 (n = 314). Most of responders underlined theneed for a randomized clinical trial that compare either two different Hb thresholds for RBCtransfusion (n = 447) or a restrictive vs. neuromonitoring (brain tissue PO2)-guided strategy(n = 316), particularly after SAH, TBI, stroke and HIE.CONCLUSIONS. The hemoglobin threshold for RBC transfusion after primary ABIremain below 8 g/dl for approximately half of ICU clinicians. However, 50 % of them stillrecognized the need for a higher Hb threshold (9 g/dl) in certain conditions, such as SAH,TBI, stroke and HIE, especially when signs of systemic or brain hypoxia are present. Thissurvey identified the need of a randomized clinical trial in this setting.
0165PHOSPHORYLATED NEUROFILAMENT HEAVY SUBUNIT (PNF-H) IN BLOODAS A POTENTIAL DIAGNOSTIC AND PROGNOSTIC BIOMARKERIN TRAUMATIC BRAIN INJURY
W. Radwan1, A. Rabah2, H. Saber3, M.O. Elghonemi1
1Cairo University, CCM, Cairo, Egypt, 2Cairo University, Neurology, Cairo, Egypt, 3BeniSuef University, CCM, Cairo, EgyptINTRODUCTION. One of the main drawbacks in the management of patients with trau-matic brain injuries (TBI) is the absence of a widely available and rapid diagnostic test. Thedetection if a neuron specific protein that is released in blood following TBI may yielddiagnostic and prognostic information in such patients.OBJECTIVES. To assess whether Phosphorylated Neurofilament H(pNF-H) might provideuseful diagnostic information for TBI in the early evaluation of such patients and weatherlevels of pNF-H correlated with different clinical variable.METHODS. A total of 30 patients presenting to the critical care department of CairoUniversity diagnosed with TBI were prospectively studied. Blood samples for pNF-H wereassayed on admission and after 7 days and mean pNF-H levels were correlated to GlasgowComa Scale (GCS). We used Marshall score to assess CT findings on admission and after7 days and scores were correlated with mean pNF-H levels. Rankin score at 3 months wasused to detect the degree of disability.RESULTS. pNF-H levels showed a negative correlation with GCS on admission and after7 days in traumatic brain injury; hence higher neuromarker levels were associated withlower GCS on admission and after 7 days (r = 0.66–0.78, p \ 0005). There was a negative
26th ESICM ANNUAL CONGRESS — PARIS, FRANCE — 5–9 OCTOBER 2013
correlation between neurofilament levels and Marshall CT scores on admission and after7 days (r = 0.56–0.0.4, p \ 0.005) hence higher pNF-H levels correlated with worse CTfindings. Patients who died or had the greatest (Rankin 6 and 5) after 3 months had thehighest levels of pNF-H on admission and after 7 days. The cut off level of Neurofilament todetect death and disability was 35 pg/ml on admission (sensitivity 82 %, specificity 78 %)and was 11 pg/ml after 7 days (sensitivity 87 %,specificity 92 %, p \ 0.005).CONCLUSIONS. Plasma levels of pNF-H were measurable is patients with TBI. Levels ofpNF-H were significantly higher in patients who had lower GCS and more extensive CTfinding, Patients with worst outcomes had significantly higher levels of pNF-H than thosewith better outcome. Cut off levels to detect death or severe disability were 35 pg/ml onadmission and 111 pg/ml after 7 days. More extensive studies will be needed with higherpatient population before the routine use of pNF-H in TBI.REFERENCES. 1. Petzold A. Neurofilament phosphoforms: surrogate markers for axomalinjury, degeneration and loss. J Neurol Sci. 2005;233:183–98. 2. Ingebrigtsen T, et al.Traumatic brain damage in minor head injury: relation of serum S-100 protein measure-ments to magnetic resonance imaging and neurobehavioral outcome. Neurosurgery.1999;45(3):468–76. 3. Anderson RE, et al. High serum S100B levels for trauma patientswithout head injuries. Neurosurgery. 2001;48:1255–60. 4. Anderson KJ, et al. The phos-phorylated axonal form of the neurofilament subunit NF-H (pNF-H) as a blood biomarker oftraumatic brain injury.GRANT ACKNOWLEDGMENT. This study was supported by University of Cairo.
0166THIOPENTAL COMA IN PATIENTS WITH INCREASED CRANIAL PRESSUREREFRACTORY TO STANDARD TREATMENT
N. Shaikh1, Y. Hanssens2, M.P. Sujith1, G.S. Al Sulaiti3
1Hamad General Hospital, Anesthesia and Intensive Care, Doha, Qatar, 2Hamad GeneralHospital, Clinical Pharmacy Services, Doha, Qatar, 3Hamad General Hospital,Neurosurgery, Doha, QatarINTRODUCTION. Secondary brain injury causing refractory intracranial hypertension isusually fatal. Barbiturate coma is the recommended therapy in this desperate clinical con-dition. Due to its adverse effects however, it is reserved for patients refractory to first linetherapy such as mannitol and hypertonic saline.OBJECTIVES. To evaluate the efficacy and safety profile in patients with secondary braininjury requiring thiopental coma for the control of refractory intracranial hypertension.METHODS. All patients who were admitted to the intensive care unit (ICU) of HamadGeneral Hospital, a tertiary hospital, requiring thiopental coma to control refractory intra-cranial hypertension were enrolled in this study.Patients with hepatic and/or renal impairment were excluded.Patients’ demographic data, diagnosis, post resuscitation Glasgow coma score (GCS),neurosurgical intervention, intracranial pressure (ICP) before, during and after thiopentalcoma, duration of thiopental coma, use of vasopressors, occurrence of pneumonia, hepaticand/or renal impairment, septic shock, ICU stay and Glasgow Outcome Score (GOS) wererecorded. Dosage of thiopental was as follows: 20 mg/kg/h during the first hour, 10 mg/kg/hfor the next 3 h followed by a continuous infusion of 3 mg/kg/h. During the thiopentalcoma, continuous bispectral index (BIS�) monitoring was applied.RESULTS. A total 58 patients were enrolled during the 5-year study period. The majoritywere male (95 %) and suffered traumatic brain injury (86.5 %). Average age was 32 years.There was a significant reduction in ICP following thiopental coma (from 47 ± 12 to18.5 ± 3.4 mmHg; p \ 0.001). Mean GCS upon admission was 5.63 (SD = 2.5), durationof thiopental coma was 3.03 days (SD = 1.5), ICU stay was 20.68 days (SD = 22.2) andGCS upon transfer to the ward was 10.6 (SD = 3.06). All patients required vasopressors,43.1 % had pneumonia, 95 % had dyskalemia and 50 % suffered renal impairment duringthiopental coma, 49 % of these patients had liver impairment, 23 % suffered septic shock,and 9 % had enteral feed intolerance. Eleven percent of the patients treated with thiopentalcoma recovered completely while 5.2 % had mild to moderate functional disabilities. Agedid not seem to influence survival. Usage of more than one vasopressor, hypokalemia,hypernatremia and renal impairment were significantly associated with mortality(P \ 0.005).CONCLUSION. Thiopental coma significantly reduces raised ICP. Decompressive crani-ectomy in combination with thiopental coma did not show any survival benefits while agedid not influence survival.Usage of more than one vasopressor, hypokalemia, hypernatremia and renal impairmentwere the risk factors for increased mortality in thiopental coma patients treated in ourinstitution.
0167A NOVEL HYPERTONIC SALINE INFUSION REGIME FOR THE TREATMENTOF INTRACRANIAL HYPERTENSION FOLLOWING TRAUMATIC BRAININJURY
T. Ali1, A. Monkhouse1, H. Madder1
1John Radcliffe Hospital, Neurosciences Intensive Care Unit, Oxford, UKINTRODUCTION. Traumatic brain injury (TBI) is a major cause of morbidity andmortality. The key in managing TBI on the intensive care unit (ICU) is to preventsecondary brain injury resulting from intracranial hypertension as this is associated withpoor outcome [1]. Various methods of controlling intracranial pressure (ICP) are utilisedon ICU, however the two main agents used are mannitol and hypertonic saline (HTS).HTS has been shown to have a better side effect and safety profile than mannitol [2] anddemonstrates more effective reduction of ICP both as boluses and as infusions [3].OBJECTIVES. To establish the safety of a local protocol on the use of 2.7 % HTSfor treatment of resistant intracranial hypertension. The protocol commenced a 48 hinfusion at 0.5 ml/kg/h with 0.2 ml/kg/h adjustments 4 hourly in response to serumsodium. It targets a serum sodium of 145–155 mmol/l and serum osmolality of300–320 mOsmol/l.METHODS. A single centre retrospective study in 30 consecutive unselected patients onNeurosciences ICU (NICU) at the John Radcliffe Hospital. Patient notes, charts and elec-tronic results were utilised for data collection. The collected data included ICP, serumsodium and osmolality, and adverse effects.RESULTS. Thirty patients were analysed for day 1 and 27 patients for day 2. Loss ofthree patients0 data was due to early discontinuation, death and treatment withdrawal.Improvement in ICP, defined as a fall below 20 mmHg from direct measurement,
occurred in 23/30 (76 %) patients. No improvement, described by ICP greater than20 mmHg, occurred in 7/30 (23 %) patients. Mean rise in serum sodium on day 1 was 2.3and 4.6 mmol/l on day 2. The mean rise in serum osmolality at the end of the infusion(48 h) was 12.5 mOsmol/l. Overshoot in serum sodium, defined as greater than 155 mmol/l, occurred in 7/30 (23 %) patients however no adverse effects occurred. Adverse effectssought included renal impairment, electrolyte disturbances and dilutional coagulopathy.CONCLUSIONS. The local protocol for use of 2.7 % saline is safe, effective andeasily administered. It significantly decreased ICP in majority of patients with noadverse effects. Sustained hypernatremia occurred in 23 % of patients and was safelytolerated. Further larger controlled trials are required before recommendation forwidespread use.REFERENCE(S). 1. Forsyth LL, Liu-DeRyke X, Parker D Jr, Rhoney DH. Role ofhypertonic saline for the management of intracranial hypertension after stroke and traumaticbrain injury. Pharmacotherapy. 2008;28:469–84. 2. Battison C, Andrews PJ, Graham C,Petty T. Randomized, controlled trial on the effect of a 20 % mannitol solution and a 7.5 %saline/6 % dextran solution on increased intracranial pressure after brain injury. CCM.2005;33:196–202. 3. Larive LL, Rhoney DH, Parker D Jr, Coplin WM, Carhuapoma JR.Introducing hypertonic saline for cerebral edema: an academic center experience. NeurocritCare. 2004;1:435–40.
0168SUCCESSFUL WEANING AFTER CERVICAL SPINAL CORD INJURY.PRELIMINARY RESULTS IN 34 TETRAPLEGIC PATIENTS
U. Hamsen1, T. Ramczykowski1, O. Kuhs1, M. Aach1, T.A. Schildhauer1, J. Swol1
1BG University Hospital Bergmannsheil, Department of General and Trauma Surgery,Bochum, GermanyINTRODUCTION. Cervical spinal cord injury with tetraplegia lead to respiratory failureand long-term invasive ventilation. Due to the spinal shock the mucosal clearance isreduced. There is a high risk of ventilator-associated pneumonia. The swallow disability isoften present. The paralysis of the intercostal musculature leads to dependence ofrespirator.METHODS. All patients suffered from acute spinal cord injury with tetraplegia. Injury,clinical course and outcome data was extracted retrospectively using the ICU database. Toevaluate predictors for successful weaning we assessed 34 consecutive patients (31 male,3 female; age 60.7 ± 17.3 years) treated in our center between 1.10.2010 and 1.12.2011.RESULTS. 32 of 34 patients were discharged from hospital, 2 patients died within hospitalstay. 33 patients received tracheostoma for weaning. Mean days ventilated before performedtracheostomy was 9.6 ± 8.7. 28 patients left hospital weaned from ventilator (88 %). 13 of28 patients left hospital without tracheostoma. Mean duration of ventilation was30.1 ± 24.7 days.CONCLUSIONS. Tetraplegic patients are often at an advanced age ([50 years old), whichis an unfavorable situation for weaning. Percutaneous tracheostomy simplifies phoniationbecause the stoma is better sealed. Percutaneous gastrostomy prevents microaspiration andrecurrent pneumonia. Weaning from mechanical ventilation is possible and should be aimedonce the patient has adapted to the new situation of tetraplegia after resolution of spinalshock.REFERENCE(S). Call MS, Kutcher ME, Izenberg RA, Singh T, Cohen MJ. Spinal cordinjury: outcomes of ventilatory weaning and extubation. J Trauma. 2011;71(6):1673–9.GRANT ACKNOWLEDGMENT. Conflict of interests: None to declare.
0169NEFOPAM IN THE STRUCTURE OF POST-OPERATIVE PAIN RELIEF AFTERNEUROSURGICAL OPERATIONS
A. Kondratyev1, R. Nazarov1, R. Rutkovskii1
1Russian Neurosurgical Institute after A.L. Polenov, Saint Petersburg, Russian FederationINTRODUCTION. The issue of safe and effective pain management in the early post-operative period is still very actual.OBJECTIVES. The aim of the study was to compare the results of using of centrally actingnon-opioid analgetic Nefopam and NSAIDs Ketoprofen. To evaluate the possibility to useNefopam for postoperative analgesia in neurosurgical patients.METHODS. In our study we enrolled 147 patients with brain tumors, intracranial vascularpathologies mass lesions and spinal cord who underwent elective neurosurgical treatment.All patients were divided into two groups: in the first group (44 patients) the postoperativepain management was provided by using ketoprofen (100 mg). The patients of the secondgroup (103) received Nefopam 20 mg. Patients in both groups were comparable in age,weight, sex, somatic pathology (physical status by ASA). Randomization was achieved bythe introduction of Acupan on the odd days and Ketonal—on the even days. The first dose ofthe drug was administered during the final stages of the operation intravenously (Nefopam20 mg as an infusion over 15–30 min, Ketoprofen—100 mg as a bolus). The administrationof the next doses of the drugs was based on the assessment of pain intensity. The maincriterion for evaluating the effectiveness of pain management in our study was the sub-jective report of the patient about the quality of analgesia in the first postoperative day (allpatients were transferred to the surgical department on the second day after surgery).Checkpoints pain assessment: after waking the patient/after transportation to the ICU, and in21-00 on the first postoperative day, 8-00 on the second day after surgery. The perception ofpain was assessed by a visual analog scale (10-point) or verbal numeric scale (10-point),depending on patient preference.RESULTS. In the first group (Ketoprofen) in 34 % of cases patients required an additionalinjection of the drug, in the second group (Nefopan)—39.8 % of patients needed theaddition analgesia. The average score when assessing the intensity of acute post-operativepain using a visual analog scale (10-point) or verbal numeric scale (10-point) was1.05 ± 0.41 in patients of Group I and 1.4 ± 0.49 in group II. This result suggests that thetraditional NSAID analgesic has the comparable effect with nefopam. Effect on the clottingability of the blood was assessed indirectly by quantifying the amount of the hemorrhagicdischarge from subcutaneous drainage in the first postoperative day. Application of Ketonalled to a more significant bleeding: group I—240 ± 78 ml, group II—189 ± 93 ml.CONCLUSIONS. Thus, on the basis of these data we can assume that Nefopam can besuccessfully used for the relief of acute pain in the postoperative period in neurosurgicalpatients. In some clinical cases (intraoperative problems with haemostasis, allergy onNSAIDs, aspirin asthma, ulceration in the digestive tract) the use of nefopam may be morepreferable.
26th ESICM ANNUAL CONGRESS — PARIS, FRANCE — 5–9 OCTOBER 2013
0170EARLY DETECTION OF ANTIPITUITARY ANTIBODIES AND PITUITARYDYSFUNCTION IN PATIENTS WITH SEVERE TRAUMATIC BRAIN INJURY
A.T. Mazzeo1, F. Guaraldi2, M. Parasiliti Caprino2, A. Berton2, G. Mengozzi3,M. Lucchiari3, F. Borelli1, V. Fanelli1, F. Civiletti1, A. Sollazzo1, L. Costa1, S. Tosetto1,S. Cavallo4, M. Berardino4, C. Capisani1, I. Mastromauro1, C. Filippini1, A. Ducati5,S. Grottoli2, E. Ghigo2, L. Mascia1
1University of Turin, Anesthesia and Intensive Care, Turin, Italy, 2University of Turin,Endocrinology, Turin, Italy, 3University of Turin, Biochemical Clinic, Turin, Italy,4Ospedale CTO Torino, Anesthesia and Intensive Care, Turin, Italy, 5University of Turin,Neurosurgery, Turin, ItalyINTRODUCTION. Hypopituitarism is a common complication affecting late recoveryafter traumatic brain injury (TBI) but data on neuroendocrine dysfunction in the very earlyphase after injury are scanty. Recent studies showed the presence of antipituitary antibodies(APA) associated with hypopituitarism in TBI patients 3 years after trauma. Systemicinflammation has been proposed among the possible mechanisms involved in the patho-genesis of endocrine dysfunction in critically ill patients.OBJECTIVES. Aim of this study was to investigate incidence of pituitary dysfunction,presence of APA, and their relationship with systemic inflammation during the early phaseof TBI.METHODS. Severe TBI patients consecutively admitted to the ICU were prospectivelyincluded. Patients with history of endocrine dysfunction or autoimmune disorders wereexcluded. Demographic data, severity indexes on admission and physiological variableswere recorded. Blood samples were obtained on day 1, 2 and 4 to measure TSH, fT3, fT4,prolactin, ACTH, cortisol, GH and IGF1, osmolality, sodium concentration and interleukin(IL)-6 (ELISA). Presence and title of APA were evaluated by indirect immunofluorescenceperformed on cryostat section of monkey anterior and posterior pituitary gland (Euroimmun,Germany), using an optimized IFI method (secondary Ab: FITC conjugated goat anti-humanIgA, IgM, IgG: dilution 1:200). Data are expressed as mean ± SD. Anova for repeatedmeasurements and unpaired t test were applied.RESULTS. Twenty-five patients were included, 21 male, mean age 41 ± 19, median GCS4 (range 3–13), median GCSm 2, APACHE II 18 ± 12, ISS 34 ± 9. fT4 and fT3 signifi-cantly decreased from day 1 becoming below the physiologic range on day 4 (10.84 ± 2.7,10.57 ± 3.03, 7.47 ± 1.64, p = 0.0005 and 2.45 ± 0.61, 2 ± 0.5, 1.7 ± 0.36, p \ 0.001respectively). TSH and prolactin levels remained within the physiological range over time.Prolactin (p \ 0.0001) and TSH (p = 0.02) levels were significantly reduced when patientsreceived dopamine infusion. Diabetes insipidus was detected in 20 % of patients. Theremaining hormonal dosage are under evaluation.On day 1, 2 and 4 anti cytoplasmic Abs (anterior and posterior pituitary) were detected in43, 53 and 35 % of patients with 1:10 dilution, 43, 47 and 29 % with 1:20 dilution, and 19, 5and 6 % with 1:40 dilution respectively; Anti nuclear Abs (1:40 dilution) were positive in 9,10 and 18 % of patients. FT4 was low in 86 % of patients on day 4 and in 38 % of thisgroup APA were positive.Patients with positive APA showed IL6 levels higher than those without APA (p = 0.039).Early pituitary dysfunction and presence of APA were not related to severity indexes onadmission.CONCLUSIONS. This study demonstrates that the dysfunction of pituitary axis is alreadypresent in the very early phase after severe TBI. The presence of APA, showed for the firsttime in the early phase after TBI, was associated with a systemic inflammatory reaction.
0171AUDIT OF INTRACRANIAL PRESSURE MONITORING IN TRAUMATIC BRAININJURY
N. Pathmanathan1, G. Purushothaman1, S. Long1, E. Balakumar1
1Hull and East Yorkshire Hospitals, Intensive Care Unit, Hull, UKINTRODUCTION. A recent randomized controlled trial has brought into question theeffectiveness of intracranial pressure (ICP) monitoring and the threshold for maintainingICP below 20 mmHg [1]. However, ICP monitoring remains the current standard forpatients with severe traumatic brain injury (TBI) who are admitted to the neuro-intensivecare units of most developed countries. The 3rd edition of the Guidelines for the Man-agement of Severe Traumatic Brain Injury [2] from the Brain Trauma Foundation outlines alevel II recommendation that ‘ICP should be monitored in all salvageable patients with asevere TBI (GCS 3–8 after resuscitation)’.OBJECTIVES.
• To review insertion rates of ICP monitoring for TBI and compare against currentguidelines• Evaluation of 30 day mortalityMETHODS. We conducted a retrospective review of admissions over 1 year from Januaryto December 2011. All adult patients admitted to the neuro-intensive care unit with TBIwere included. Baseline demographics, mechanism of injury, severity of head injury,insertion of ICP monitor and outcome at 30 days were collected. Patients admitted to theneuro-high dependency unit were excluded.RESULTS. 36 patients were admitted with TBI. Five were excluded due to initial GCS notbeing clearly documented. 31 patients were included in the analysis. Mean age was 39;81 % were male. The majority of TBI was secondary to falls (18), followed by road trafficcollisions (11) and assaults (2).All patients with ICP monitoring had a subdural bolt sited.
Table 1 Outcome by severity of TBI
Grade Number 30 day mortality (%)
Mild (GCS 14–15) 2 0 (0)
Moderate (GCS 9–13) 11 2 (18.2)
Severe (GCS 14–15) 23 7 (30.4)
Table 2 ICP monitoring rates
Grade ICP monitored (%) No ICP monitoring (%)
Mild (GCS 14–15) 0 (0) 2 (100)
Moderate (GCS 9–13) 6 (54.5) 5 (45.5)
Severe (GCS 3–8) 14 (60.9) 9 (39.1)
Table 3 Outcome by severity and presence of ICP m
Grade ICP monitoring Number 30 day mortality (%)
Moderate (GCS 9–13) No 5 1 (20.0)
Moderate (GCS 9–13) Yes 6 1 (16.7)
Severe (GCS 3–8) No 9 5 (55.6)
Severe (GCS 3–8) Yes 14 2 (14.3)
There were no recorded complications from ICP monitors.CONCLUSIONS. Insertion rates for ICP monitoring of severe TBI are significantly lowerthan the currently recommended standard.There was a large difference in mortality rates for patients with severe TBI who were treatedwith or without an ICP monitor. Although overall numbers are small, this suggests weshould implement ICP monitoring routinely in severe TBI. Further work will focus onlonger term survival and neurological outcome.REFERENCE(S).1. Chesnut RM, Temkin N, Carney N, et al. A trial of intracranial-pressure monitoring in traumatic brain injury. N Engl J Med. 2012;367(26):2471–81. 2.Guidelines for the management of severe traumatic brain injury. 3rd edition. 2007. Braintrauma foundation.
0172FEVER, LEUKOCYTOSIS AND C-REACTIVE PROTEIN IN NEUROCRITICALCARE
M.J. Ferreira da Silva1, A. Lages1, P. Silveira2, L. Lencastre2
1Hospital de Braga, Internal Medicine Department, Braga, Portugal, 2Hospital de Braga,Intensive Care Unit, Braga, PortugalINTRODUCTION. Fever is a common finding in patients with brain injury, which can berelated to a multiplicity of causes. Its presence may complicate up to 70 % of all IntensiveCare Unit (ICU) admissions, with direct impact in short and long-term mortality. One of themost challenging questions is whether its presence is infectious or due to neuronal lesion,leading to significantly differences in treatment approaches.OBJECTIVES. To evaluate the incidence of fever in acute neurological/neurosurgicalpatients in ICU, and to relate it to C-reactive protein (CRP) and leukocytes values.METHODS. Retrospective study of 106 patients admitted in our ICU to neurointensivecare measures, during 2011. Using SPSS 20.0, following data was analysed: demo-graphics; type of admission (planned or emergent traumatic/medical); admissionGlasgow Coma Scale (GCS); Acute Physiology and Chronic Health Evaluation(APACHE) II score; body temperature; CRP and leukocytes values; subarachnoidhaemorrhage (SAH); invasive procedures (intracranial pressure sensor (ICPS), cranialdrainage and external ventricular drains (EVD)), craniotomy and mortality. Fever wasdefined by body temperature [38.3 �C, at least documented on one measurement for2 days in a row.RESULTS. The majority of patients (43.4 %) were admitted after traumatic brain injury(TBI). Admission GCS was lower than 6 in 43 patients. The mean APACHE II score was19.26 (±7.6). Fifty-four patients (50.9 %) developed fever, in which 65.6 % were admittedafter emergency surgery, and 54.3 % had TBI. Admission type and presence of fever werestatistically significant (p = 0.003). Fever was also associated with SAH (p = 0.02) andICPS (p \ 0.0001). Cranial fracture, craniotomy, cranial drainage and EVD didn’t showsignificant relation with fever onset. More than 70 % of patients had leukocyte count above10,000/lL, but no direct relation to fever was found. In opposition, values of CRP superiorto 50 mg/L were associated with a higher incidence of fever showing a statistically sig-nificant result (p \ 0.001). Fever as an independent variable was not associated with ahigher ICU mortality (p = 0.06).CONCLUSIONS. As observed in other studies, elevated body temperature is frequentlyencountered in patients with brain injury and appears to be related with both medical andtraumatic causes. Fever can be caused by exogenous or endogenous pyrogens, which arereleased after neuronal insult. SAH and ICPS appear to have an important role in feveronset. Elevated CRP may be more significant than leukocytosis as a predictor of fever inneurocritical patients. Its role to distinguish infectious/non-infectious causes remainsunknown and requires further studies with other biological markers. We believe this is astarting point to future prospective studies that may help set new references in cut-off valuesof well-known biomarkers.REFERENCE(S). 1. Neurobiol Dis. 2003;12:163–73.
0173PUPILLARY ALTERATIONS AND OTHER PROGNOSTIC FACTORSIN PATIENTS WITH STRUCTURAL BRAIN LESION WHO UNDERGODECOMPRESSIVE CRANIECTOMY
M. Arias-Verdú1, M. Delgado-Amaya1, R. Gutiérrez-Rodriguez1, A. Muñoz-López1,
S. Fernández-Jimenez1, G. Jiménez-Pérez1, R. Rivera-Fernández1, A. Pérez-Rielo1
1Hospital Carlos Haya, Intensive Care Unit, Málaga, SpainOBJECTIVE. To analyze in patients admitted to the ICU by structural brain lesion whoundergo decompressive craniectomy (DC) the relation between mortality and the clinicalcharacteristics of the patient in an attempt to define modifiable risk factors.METHODS. The prospective study included all those patients with structural brain damage(spontaneous subarachnoid haemorrhage (SAH) secondary to aneurysm rupture, spontane-ous intracerebral haemorrhagic (SIH), ischaemic stroke and traumatic brain injury (TBI))requiring decompressive craniectomy at some time during their ICU stay, between2006–2012. Data were recorded on age, sex, Glasgow coma scale, abnormal pupils,admission diagnosis, reason for DC, time of DC, administration of pentotal, mortality (ICUand hospital), cranial tomography characteristics, etc. The statistical analyses were donewith the Student test, Chi squared test and logistic regression.RESULTS. The sample included 62 patients, 19 with SAH secondary to aneurysm rupture,5 with SIH, 6 with ischaemic stroke, and 32 with TBI. Their age was 73 ± 48.22 years, thedepth of coma on admission, assessed with GCS, was 9.35 ± 68, and APACHE II21.57 ± 5.87. Prior to surgery 28 patients (45.2 %) had isochoric pupils, 32 (51.6 %) hadanisocoria and 2 (3.2 %) had bilateral nonreactive mydriasis. ICU mortality was 29 % andhospital mortality 40.3 %. Those patients who died in the hospital presented no significantdifferences concerning age and Glasgow coma scale. The mortality in 34 patients with
26th ESICM ANNUAL CONGRESS — PARIS, FRANCE — 5–9 OCTOBER 2013
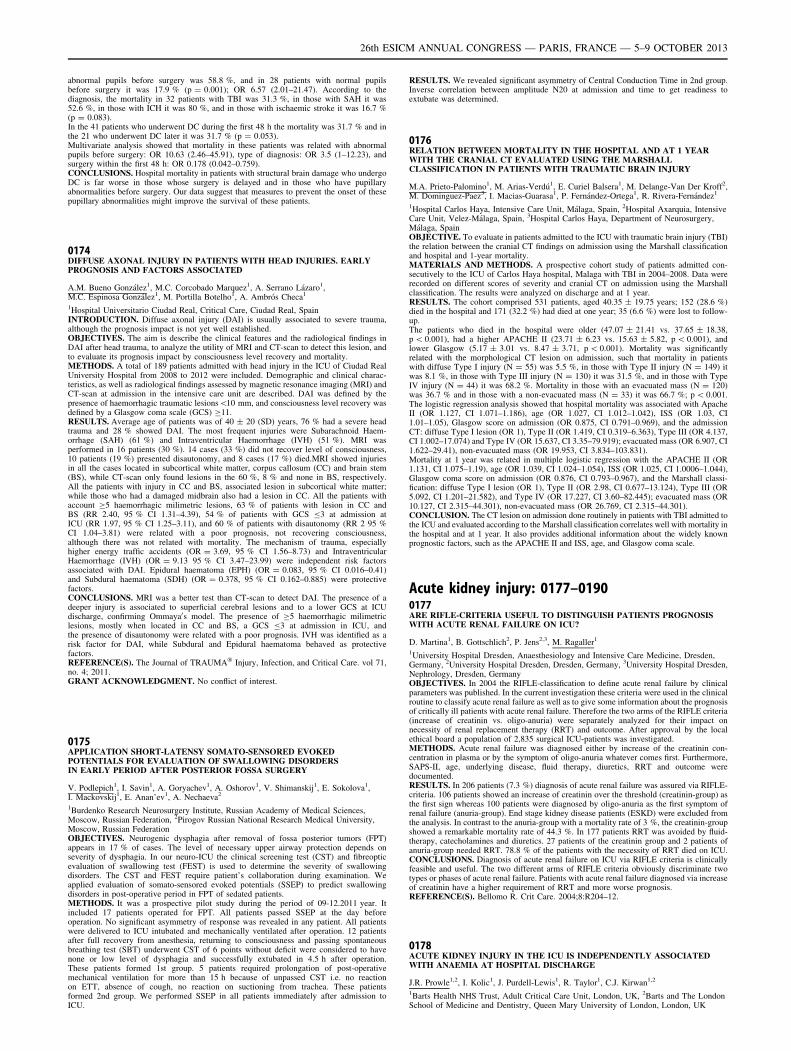
abnormal pupils before surgery was 58.8 %, and in 28 patients with normal pupilsbefore surgery it was 17.9 % (p = 0.001); OR 6.57 (2.01–21.47). According to thediagnosis, the mortality in 32 patients with TBI was 31.3 %, in those with SAH it was52.6 %, in those with ICH it was 80 %, and in those with ischaemic stroke it was 16.7 %(p = 0.083).In the 41 patients who underwent DC during the first 48 h the mortality was 31.7 % and inthe 21 who underwent DC later it was 31.7 % (p = 0.053).Multivariate analysis showed that mortality in these patients was related with abnormalpupils before surgery: OR 10.63 (2.46–45.91), type of diagnosis: OR 3.5 (1–12.23), andsurgery within the first 48 h: OR 0.178 (0.042–0.759).CONCLUSIONS. Hospital mortality in patients with structural brain damage who undergoDC is far worse in those whose surgery is delayed and in those who have pupillaryabnormalities before surgery. Our data suggest that measures to prevent the onset of thesepupillary abnormalities might improve the survival of these patients.
0174DIFFUSE AXONAL INJURY IN PATIENTS WITH HEAD INJURIES. EARLYPROGNOSIS AND FACTORS ASSOCIATED
A.M. Bueno González1, M.C. Corcobado Marquez1, A. Serrano Lázaro1,M.C. Espinosa González1, M. Portilla Botelho1, A. Ambrós Checa1
1Hospital Universitario Ciudad Real, Critical Care, Ciudad Real, SpainINTRODUCTION. Diffuse axonal injury (DAI) is usually associated to severe trauma,although the prognosis impact is not yet well established.OBJECTIVES. The aim is describe the clinical features and the radiological findings inDAI after head trauma, to analyze the utility of MRI and CT-scan to detect this lesion, andto evaluate its prognosis impact by consciousness level recovery and mortality.METHODS. A total of 189 patients admitted with head injury in the ICU of Ciudad RealUniversity Hospital from 2008 to 2012 were included. Demographic and clinical charac-teristics, as well as radiological findings assessed by magnetic resonance imaging (MRI) andCT-scan at admission in the intensive care unit are described. DAI was defined by thepresence of haemorrhagic traumatic lesions\10 mm, and consciousness level recovery wasdefined by a Glasgow coma scale (GCS) C11.RESULTS. Average age of patients was of 40 ± 20 (SD) years, 76 % had a severe headtrauma and 28 % showed DAI. The most frequent injuries were Subarachnoid Haem-orrhage (SAH) (61 %) and Intraventricular Haemorrhage (IVH) (51 %). MRI wasperformed in 16 patients (30 %). 14 cases (33 %) did not recover level of consciousness,10 patients (19 %) presented disautonomy, and 8 cases (17 %) died.MRI showed injuriesin all the cases located in subcortical white matter, corpus callosum (CC) and brain stem(BS), while CT-scan only found lesions in the 60 %, 8 % and none in BS, respectively.All the patients with injury in CC and BS, associated lesion in subcortical white matter;while those who had a damaged midbrain also had a lesion in CC. All the patients withaccount C5 haemorrhagic milimetric lesions, 63 % of patients with lesion in CC andBS (RR 2.40, 95 % CI 1.31–4.39), 54 % of patients with GCS B3 at admission atICU (RR 1.97, 95 % CI 1.25–3.11), and 60 % of patients with disautonomy (RR 2 95 %CI 1.04–3.81) were related with a poor prognosis, not recovering consciousness,although there was not related with mortality. The mechanism of trauma, especiallyhigher energy traffic accidents (OR = 3.69, 95 % CI 1.56–8.73) and IntraventricularHaemorrhage (IVH) (OR = 9.13 95 % CI 3.47–23.99) were independent risk factorsassociated with DAI. Epidural haematoma (EPH) (OR = 0.083, 95 % CI 0.016–0.41)and Subdural haematoma (SDH) (OR = 0.378, 95 % CI 0.162–0.885) were protectivefactors.CONCLUSIONS. MRI was a better test than CT-scan to detect DAI. The presence of adeeper injury is associated to superficial cerebral lesions and to a lower GCS at ICUdischarge, confirming Ommaya0s model. The presence of C5 haemorrhagic milimetriclesions, mostly when located in CC and BS, a GCS B3 at admission in ICU, andthe presence of disautonomy were related with a poor prognosis. IVH was identified as arisk factor for DAI, while Subdural and Epidural haematoma behaved as protectivefactors.REFERENCE(S). The Journal of TRAUMA� Injury, Infection, and Critical Care. vol 71,no. 4; 2011.GRANT ACKNOWLEDGMENT. No conflict of interest.
0175APPLICATION SHORT-LATENSY SOMATO-SENSORED EVOKEDPOTENTIALS FOR EVALUATION OF SWALLOWING DISORDERSIN EARLY PERIOD AFTER POSTERIOR FOSSA SURGERY
V. Podlepich1, I. Savin1, A. Goryachev1, A. Oshorov1, V. Shimanskij1, E. Sokolova1,I. Mackovskij1, E. Anan’ev1, A. Nechaeva2
1Burdenko Research Neurosurgery Institute, Russian Academy of Medical Sciences,Moscow, Russian Federation, 2Pirogov Russian National Research Medical University,Moscow, Russian FederationOBJECTIVES. Neurogenic dysphagia after removal of fossa posterior tumors (FPT)appears in 17 % of cases. The level of necessary upper airway protection depends onseverity of dysphagia. In our neuro-ICU the clinical screening test (CST) and fibreopticevaluation of swallowing test (FEST) is used to determine the severity of swallowingdisorders. The CST and FEST require patient’s collaboration during examination. Weapplied evaluation of somato-sensored evoked potentials (SSEP) to predict swallowingdisorders in post-operative period in FPT of sedated patients.METHODS. It was a prospective pilot study during the period of 09-12.2011 year. Itincluded 17 patients operated for FPT. All patients passed SSEP at the day beforeoperation. No significant asymmetry of response was revealed in any patient. All patientswere delivered to ICU intubated and mechanically ventilated after operation. 12 patientsafter full recovery from anesthesia, returning to consciousness and passing spontaneousbreathing test (SBT) underwent CST of 6 points without deficit were considered to havenone or low level of dysphagia and successfully extubated in 4.5 h after operation.These patients formed 1st group. 5 patients required prolongation of post-operativemechanical ventilation for more than 15 h because of unpassed CST i.e. no reactionon ETT, absence of cough, no reaction on suctioning from trachea. These patientsformed 2nd group. We performed SSEP in all patients immediately after admission toICU.
RESULTS. We revealed significant asymmetry of Central Conduction Time in 2nd group.Inverse correlation between amplitude N20 at admission and time to get readiness toextubate was determined.
0176RELATION BETWEEN MORTALITY IN THE HOSPITAL AND AT 1 YEARWITH THE CRANIAL CT EVALUATED USING THE MARSHALLCLASSIFICATION IN PATIENTS WITH TRAUMATIC BRAIN INJURY
M.A. Prieto-Palomino1, M. Arias-Verdú1, E. Curiel Balsera1, M. Delange-Van Der Kroff2,M. Dominguez-Paez3, I. Macias-Guarasa1, P. Fernández-Ortega1, R. Rivera-Fernández1
1Hospital Carlos Haya, Intensive Care Unit, Málaga, Spain, 2Hospital Axarquia, IntensiveCare Unit, Velez-Málaga, Spain, 3Hospital Carlos Haya, Department of Neurosurgery,Málaga, SpainOBJECTIVE. To evaluate in patients admitted to the ICU with traumatic brain injury (TBI)the relation between the cranial CT findings on admission using the Marshall classificationand hospital and 1-year mortality.MATERIALS AND METHODS. A prospective cohort study of patients admitted con-secutively to the ICU of Carlos Haya hospital, Malaga with TBI in 2004–2008. Data wererecorded on different scores of severity and cranial CT on admission using the Marshallclassification. The results were analyzed on discharge and at 1 year.RESULTS. The cohort comprised 531 patients, aged 40.35 ± 19.75 years; 152 (28.6 %)died in the hospital and 171 (32.2 %) had died at one year; 35 (6.6 %) were lost to follow-up.The patients who died in the hospital were older (47.07 ± 21.41 vs. 37.65 ± 18.38,p \ 0.001), had a higher APACHE II (23.71 ± 6.23 vs. 15.63 ± 5.82, p \ 0.001), andlower Glasgow (5.17 ± 3.01 vs. 8.47 ± 3.71, p \ 0.001). Mortality was significantlyrelated with the morphological CT lesion on admission, such that mortality in patientswith diffuse Type I injury (N = 55) was 5.5 %, in those with Type II injury (N = 149) itwas 8.1 %, in those with Type III injury (N = 130) it was 31.5 %, and in those with TypeIV injury (N = 44) it was 68.2 %. Mortality in those with an evacuated mass (N = 120)was 36.7 % and in those with a non-evacuated mass (N = 33) it was 66.7 %; p \ 0.001.The logistic regression analysis showed that hospital mortality was associated with ApacheII (OR 1.127, CI 1.071–1.186), age (OR 1.027, CI 1.012–1.042), ISS (OR 1.03, CI1.01–1.05), Glasgow score on admission (OR 0.875, CI 0.791–0.969), and the admissionCT: diffuse Type I lesion (OR 1), Type II (OR 1.419, CI 0.319–6.363), Type III (OR 4.137,CI 1.002–17.074) and Type IV (OR 15.637, CI 3.35–79.919); evacuated mass (OR 6.907, CI1.622–29.41), non-evacuated mass (OR 19.953, CI 3.834–103.831).Mortality at 1 year was related in multiple logistic regression with the APACHE II (OR1.131, CI 1.075–1.19), age (OR 1.039, CI 1.024–1.054), ISS (OR 1.025, CI 1.0006–1.044),Glasgow coma score on admission (OR 0.876, CI 0.793–0.967), and the Marshall classi-fication: diffuse Type I lesion (OR 1), Type II (OR 2.98, CI 0.677–13.124), Type III (OR5.092, CI 1.201–21.582), and Type IV (OR 17.227, CI 3.60–82.445); evacuated mass (OR10.127, CI 2.315–44.301), non-evacuated mass (OR 26.769, CI 2.315–44.301).CONCLUSION. The CT lesion on admission done routinely in patients with TBI admitted tothe ICU and evaluated according to the Marshall classification correlates well with mortality inthe hospital and at 1 year. It also provides additional information about the widely knownprognostic factors, such as the APACHE II and ISS, age, and Glasgow coma scale.
Acute kidney injury: 0177–01900177ARE RIFLE-CRITERIA USEFUL TO DISTINGUISH PATIENTS PROGNOSISWITH ACUTE RENAL FAILURE ON ICU?
D. Martina1, B. Gottschlich2, P. Jens2,3, M. Ragaller1
1University Hospital Dresden, Anaesthesiology and Intensive Care Medicine, Dresden,Germany, 2University Hospital Dresden, Dresden, Germany, 3University Hospital Dresden,Nephrology, Dresden, GermanyOBJECTIVES. In 2004 the RIFLE-classification to define acute renal failure by clinicalparameters was published. In the current investigation these criteria were used in the clinicalroutine to classify acute renal failure as well as to give some information about the prognosisof critically ill patients with acute renal failure. Therefore the two arms of the RIFLE criteria(increase of creatinin vs. oligo-anuria) were separately analyzed for their impact onnecessity of renal replacement therapy (RRT) and outcome. After approval by the localethical board a population of 2,835 surgical ICU-patients was investigated.METHODS. Acute renal failure was diagnosed either by increase of the creatinin con-centration in plasma or by the symptom of oligo-anuria whatever comes first. Furthermore,SAPS-II, age, underlying disease, fluid therapy, diuretics, RRT and outcome weredocumented.RESULTS. In 206 patients (7.3 %) diagnosis of acute renal failure was assured via RIFLE-criteria. 106 patients showed an increase of creatinin over the threshold (creatinin-group) asthe first sign whereas 100 patients were diagnosed by oligo-anuria as the first symptom ofrenal failure (anuria-group). End stage kidney disease patients (ESKD) were excluded fromthe analysis. In contrast to the anuria-group with a mortality rate of 3 %, the creatinin-groupshowed a remarkable mortality rate of 44.3 %. In 177 patients RRT was avoided by fluid-therapy, catecholamines and diuretics. 27 patients of the creatinin group and 2 patients ofanuria-group needed RRT. 78.8 % of the patients with the necessity of RRT died on ICU.CONCLUSIONS. Diagnosis of acute renal failure on ICU via RIFLE criteria is clinicallyfeasible and useful. The two different arms of RIFLE criteria obviously discriminate twotypes or phases of acute renal failure. Patients with acute renal failure diagnosed via increaseof creatinin have a higher requirement of RRT and more worse prognosis.REFERENCE(S). Bellomo R. Crit Care. 2004;8:R204–12.
0178ACUTE KIDNEY INJURY IN THE ICU IS INDEPENDENTLY ASSOCIATEDWITH ANAEMIA AT HOSPITAL DISCHARGE
J.R. Prowle1,2, I. Kolic1, J. Purdell-Lewis1, R. Taylor1, C.J. Kirwan1,2
1Barts Health NHS Trust, Adult Critical Care Unit, London, UK, 2Barts and The LondonSchool of Medicine and Dentistry, Queen Mary University of London, London, UK
26th ESICM ANNUAL CONGRESS — PARIS, FRANCE — 5–9 OCTOBER 2013
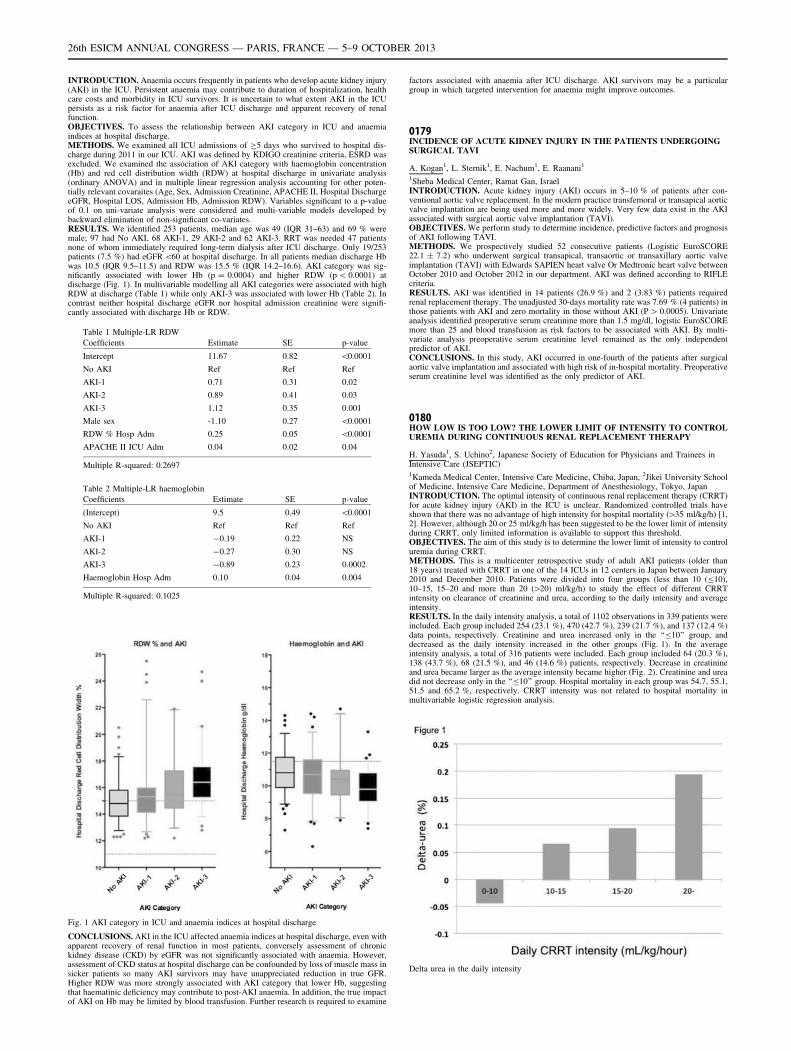
INTRODUCTION. Anaemia occurs frequently in patients who develop acute kidney injury(AKI) in the ICU. Persistent anaemia may contribute to duration of hospitalization, healthcare costs and morbidity in ICU survivors. It is uncertain to what extent AKI in the ICUpersists as a risk factor for anaemia after ICU discharge and apparent recovery of renalfunction.OBJECTIVES. To assess the relationship between AKI category in ICU and anaemiaindices at hospital discharge.METHODS. We examined all ICU admissions of C5 days who survived to hospital dis-charge during 2011 in our ICU. AKI was defined by KDIGO creatinine criteria, ESRD wasexcluded. We examined the association of AKI category with haemoglobin concentration(Hb) and red cell distribution width (RDW) at hospital discharge in univariate analysis(ordinary ANOVA) and in multiple linear regression analysis accounting for other poten-tially relevant covaraites (Age, Sex, Admission Creatinine, APACHE II, Hospital DischargeeGFR, Hospital LOS, Admission Hb, Admission RDW). Variables significant to a p-valueof 0.1 on uni-variate analysis were considered and multi-variable models developed bybackward elimination of non-significant co-variates.RESULTS. We identified 253 patients, median age was 49 (IQR 31–63) and 69 % weremale; 97 had No AKI, 68 AKI-1, 29 AKI-2 and 62 AKI-3. RRT was needed 47 patientsnone of whom immediately required long-term dialysis after ICU discharge. Only 19/253patients (7.5 %) had eGFR \60 at hospital discharge. In all patients median discharge Hbwas 10.5 (IQR 9.5–11.5) and RDW was 15.5 % (IQR 14.2–16.6). AKI category was sig-nificantly associated with lower Hb (p = 0.0004) and higher RDW (p \ 0.0001) atdischarge (Fig. 1). In multivariable modelling all AKI categories were associated with highRDW at discharge (Table 1) while only AKI-3 was associated with lower Hb (Table 2). Incontrast neither hospital discharge eGFR nor hospital admission creatinine were signifi-cantly associated with discharge Hb or RDW.
Table 1 Multiple-LR RDW
Coefficients Estimate SE p-value
Intercept 11.67 0.82 \0.0001
No AKI Ref Ref Ref
AKI-1 0.71 0.31 0.02
AKI-2 0.89 0.41 0.03
AKI-3 1.12 0.35 0.001
Male sex -1.10 0.27 \0.0001
RDW % Hosp Adm 0.25 0.05 \0.0001
APACHE II ICU Adm 0.04 0.02 0.04
Multiple R-squared: 0.2697
Table 2 Multiple-LR haemoglobin
Coefficients Estimate SE p-value
(Intercept) 9.5 0.49 \0.0001
No AKI Ref Ref Ref
AKI-1 -0.19 0.22 NS
AKI-2 -0.27 0.30 NS
AKI-3 -0.89 0.23 0.0002
Haemoglobin Hosp Adm 0.10 0.04 0.004
Multiple R-squared: 0.1025
Fig. 1 AKI category in ICU and anaemia indices at hospital discharge
CONCLUSIONS. AKI in the ICU affected anaemia indices at hospital discharge, even withapparent recovery of renal function in most patients, conversely assessment of chronickidney disease (CKD) by eGFR was not significantly associated with anaemia. However,assessment of CKD status at hospital discharge can be confounded by loss of muscle mass insicker patients so many AKI survivors may have unappreciated reduction in true GFR.Higher RDW was more strongly associated with AKI category that lower Hb, suggestingthat haematinic deficiency may contribute to post-AKI anaemia. In addition, the true impactof AKI on Hb may be limited by blood transfusion. Further research is required to examine
factors associated with anaemia after ICU discharge. AKI survivors may be a particulargroup in which targeted intervention for anaemia might improve outcomes.
0179INCIDENCE OF ACUTE KIDNEY INJURY IN THE PATIENTS UNDERGOINGSURGICAL TAVI
A. Kogan1, L. Sternik1, E. Nachum1, E. Raanani1
1Sheba Medical Center, Ramat Gan, IsraelINTRODUCTION. Acute kidney injury (AKI) occurs in 5–10 % of patients after con-ventional aortic valve replacement. In the modern practice transfemoral or transapical aorticvalve implantation are being used more and more widely. Very few data exist in the AKIassociated with surgical aortic valve implantation (TAVI).OBJECTIVES. We perform study to determine incidence, predictive factors and prognosisof AKI following TAVI.METHODS. We prospectively studied 52 consecutive patients (Logistic EuroSCORE22.1 ± 7.2) who underwent surgical transapical, transaortic or transaxillary aortic valveimplantation (TAVI) with Edwards SAPIEN heart valve Or Medtronic heart valve betweenOctober 2010 and October 2012 in our department. AKI was defined according to RIFLEcriteria.RESULTS. AKI was identified in 14 patients (26.9 %) and 2 (3.83 %) patients requiredrenal replacement therapy. The unadjusted 30-days mortality rate was 7.69 % (4 patients) inthose patients with AKI and zero mortality in those without AKI (P [ 0.0005). Univariateanalysis identified preoperative serum creatinine more than 1.5 mg/dl, logistic EuroSCOREmore than 25 and blood transfusion as risk factors to be associated with AKI. By multi-variate analysis preoperative serum creatinine level remained as the only independentpredictor of AKI.CONCLUSIONS. In this study, AKI occurred in one-fourth of the patients after surgicalaortic valve implantation and associated with high risk of in-hospital mortality. Preoperativeserum creatinine level was identified as the only predictor of AKI.
0180HOW LOW IS TOO LOW? THE LOWER LIMIT OF INTENSITY TO CONTROLUREMIA DURING CONTINUOUS RENAL REPLACEMENT THERAPY
H. Yasuda1, S. Uchino2, Japanese Society of Education for Physicians and Trainees inIntensive Care (JSEPTIC)1Kameda Medical Center, Intensive Care Medicine, Chiba, Japan, 2Jikei University Schoolof Medicine, Intensive Care Medicine, Department of Anesthesiology, Tokyo, JapanINTRODUCTION. The optimal intensity of continuous renal replacement therapy (CRRT)for acute kidney injury (AKI) in the ICU is unclear. Randomized controlled trials haveshown that there was no advantage of high intensity for hospital mortality ([35 ml/kg/h) [1,2]. However, although 20 or 25 ml/kg/h has been suggested to be the lower limit of intensityduring CRRT, only limited information is available to support this threshold.OBJECTIVES. The aim of this study is to determine the lower limit of intensity to controluremia during CRRT.METHODS. This is a multicenter retrospective study of adult AKI patients (older than18 years) treated with CRRT in one of the 14 ICUs in 12 centers in Japan between January2010 and December 2010. Patients were divided into four groups (less than 10 (B10),10–15, 15–20 and more than 20 ([20) ml/kg/h) to study the effect of different CRRTintensity on clearance of creatinine and urea, according to the daily intensity and averageintensity.RESULTS. In the daily intensity analysis, a total of 1102 observations in 339 patients wereincluded. Each group included 254 (23.1 %), 470 (42.7 %), 239 (21.7 %), and 137 (12.4 %)data points, respectively. Creatinine and urea increased only in the ‘‘B10’’ group, anddecreased as the daily intensity increased in the other groups (Fig. 1). In the averageintensity analysis, a total of 316 patients were included. Each group included 64 (20.3 %),138 (43.7 %), 68 (21.5 %), and 46 (14.6 %) patients, respectively. Decrease in creatinineand urea became larger as the average intensity became higher (Fig. 2). Creatinine and ureadid not decrease only in the ‘‘B10’’ group. Hospital mortality in each group was 54.7, 55.1,51.5 and 65.2 %, respectively. CRRT intensity was not related to hospital mortality inmultivariable logistic regression analysis.
Delta urea in the daily intensity
26th ESICM ANNUAL CONGRESS — PARIS, FRANCE — 5–9 OCTOBER 2013
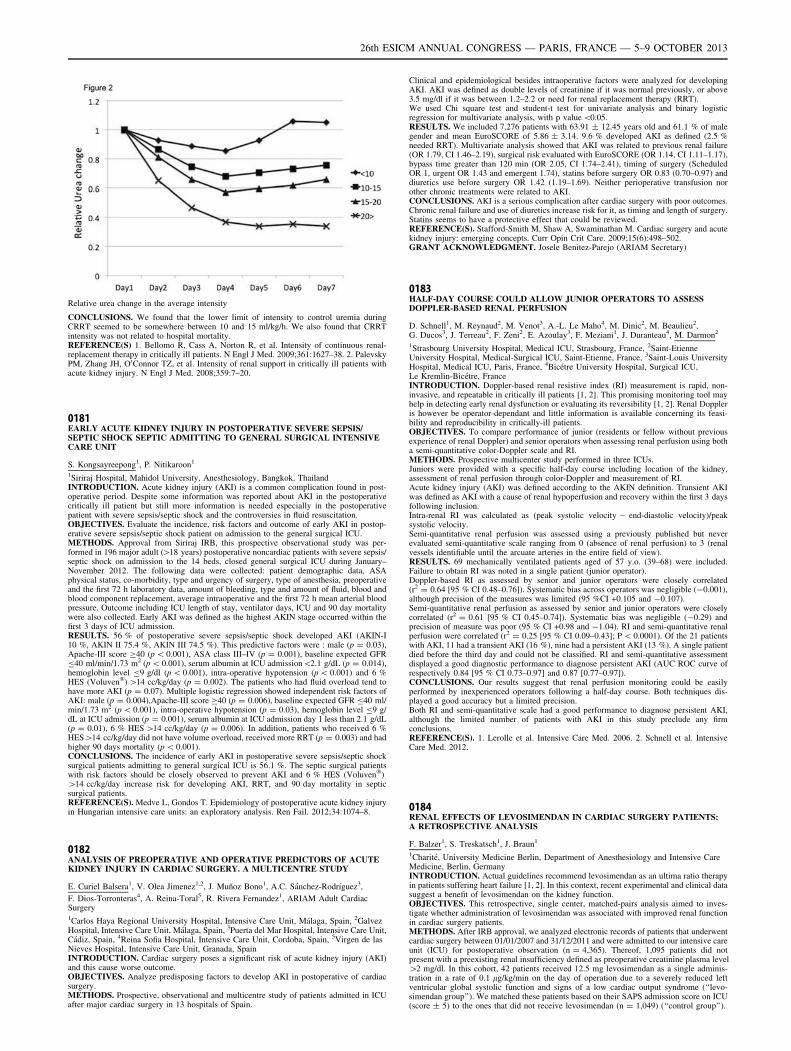
Relative urea change in the average intensity
CONCLUSIONS. We found that the lower limit of intensity to control uremia duringCRRT seemed to be somewhere between 10 and 15 ml/kg/h. We also found that CRRTintensity was not related to hospital mortality.REFERENCE(S) 1. Bellomo R, Cass A, Norton R, et al. Intensity of continuous renal-replacement therapy in critically ill patients. N Engl J Med. 2009;361:1627–38. 2. PalevskyPM, Zhang JH, O0Connor TZ, et al. Intensity of renal support in critically ill patients withacute kidney injury. N Engl J Med. 2008;359:7–20.
0181EARLY ACUTE KIDNEY INJURY IN POSTOPERATIVE SEVERE SEPSIS/SEPTIC SHOCK SEPTIC ADMITTING TO GENERAL SURGICAL INTENSIVECARE UNIT
S. Kongsayreepong1, P. Nitikaroon1
1Siriraj Hospital, Mahidol University, Anesthesiology, Bangkok, ThailandINTRODUCTION. Acute kidney injury (AKI) is a common complication found in post-operative period. Despite some information was reported about AKI in the postoperativecritically ill patient but still more information is needed especially in the postoperativepatient with severe sepsis/septic shock and the controversies in fluid resuscitation.OBJECTIVES. Evaluate the incidence, risk factors and outcome of early AKI in postop-erative severe sepsis/septic shock patient on admission to the general surgical ICU.METHODS. Approval from Siriraj IRB, this prospective observational study was per-formed in 196 major adult ([18 years) postoperative noncardiac patients with severe sepsis/septic shock on admission to the 14 beds, closed general surgical ICU during January–November 2012. The following data were collected: patient demographic data, ASAphysical status, co-morbidity, type and urgency of surgery, type of anesthesia, preoperativeand the first 72 h laboratory data, amount of bleeding, type and amount of fluid, blood andblood component replacement, average intraoperative and the first 72 h mean arterial bloodpressure. Outcome including ICU length of stay, ventilator days, ICU and 90 day mortalitywere also collected. Early AKI was defined as the highest AKIN stage occurred within thefirst 3 days of ICU admission.RESULTS. 56 % of postoperative severe sepsis/septic shock developed AKI (AKIN-I10 %, AKIN II 75.4 %, AKIN III 74.5 %). This predictive factors were : male (p = 0.03),Apache-III score C40 (p \ 0.001), ASA class III–IV (p = 0.001), baseline expected GFRB40 ml/min/1.73 m2 (p \ 0.001), serum albumin at ICU admission\2.1 g/dL (p = 0.014),hemoglobin level B9 g/dl (p \ 0.001), intra-operative hypotension (p \ 0.001) and 6 %HES (Voluven�) [14 cc/kg/day (p = 0.002). The patients who had fluid overload tend tohave more AKI (p = 0.07). Multiple logistic regression showed independent risk factors ofAKI: male (p = 0.004),Apache-III score C40 (p = 0.006), baseline expected GFR B40 ml/min/1.73 m2 (p \ 0.001), intra-operative hypotension (p = 0.03), hemoglobin level B9 g/dL at ICU admission (p = 0.001), serum albumin at ICU admission day 1 less than 2.1 g/dL(p = 0.01), 6 % HES [14 cc/kg/day (p = 0.006). In addition, patients who received 6 %HES[14 cc/kg/day did not have volume overload, received more RRT (p = 0.003) and hadhigher 90 days mortality (p \ 0.001).CONCLUSIONS. The incidence of early AKI in postoperative severe sepsis/septic shocksurgical patients admitting to general surgical ICU is 56.1 %. The septic surgical patientswith risk factors should be closely observed to prevent AKI and 6 % HES (Voluven�)[14 cc/kg/day increase risk for developing AKI, RRT, and 90 day mortality in septicsurgical patients.REFERENCE(S). Medve L, Gondos T. Epidemiology of postoperative acute kidney injuryin Hungarian intensive care units: an exploratory analysis. Ren Fail. 2012;34:1074–8.
0182ANALYSIS OF PREOPERATIVE AND OPERATIVE PREDICTORS OF ACUTEKIDNEY INJURY IN CARDIAC SURGERY. A MULTICENTRE STUDY
E. Curiel Balsera1, V. Olea Jimenez1,2, J. Muñoz Bono1, A.C. Sánchez-Rodrı́guez3,
F. Dios-Torronteras4, A. Reina-Toral5, R. Rivera Fernandez1, ARIAM Adult CardiacSurgery1Carlos Haya Regional University Hospital, Intensive Care Unit, Málaga, Spain, 2GalvezHospital, Intensive Care Unit, Málaga, Spain, 3Puerta del Mar Hospital, Intensive Care Unit,Cádiz, Spain, 4Reina Sofia Hospital, Intensive Care Unit, Cordoba, Spain, 5Virgen de lasNieves Hospital, Intensive Care Unit, Granada, SpainINTRODUCTION. Cardiac surgery poses a significant risk of acute kidney injury (AKI)and this cause worse outcome.OBJECTIVES. Analyze predisposing factors to develop AKI in postoperative of cardiacsurgery.METHODS. Prospective, observational and multicentre study of patients admitted in ICUafter major cardiac surgery in 13 hospitals of Spain.
Clinical and epidemiological besides intraoperative factors were analyzed for developingAKI. AKI was defined as double levels of creatinine if it was normal previously, or above3.5 mg/dl if it was between 1.2–2.2 or need for renal replacement therapy (RRT).We used Chi square test and student-t test for univariate analysis and binary logisticregression for multivariate analysis, with p value \0.05.RESULTS. We included 7,276 patients with 63.91 ± 12.45 years old and 61.1 % of malegender and mean EuroSCORE of 5.86 ± 3.14. 9.6 % developed AKI as defined (2.5 %needed RRT). Multivariate analysis showed that AKI was related to previous renal failure(OR 1.79, CI 1.46–2.19), surgical risk evaluated with EuroSCORE (OR 1.14, CI 1.11–1.17),bypass time greater than 120 min (OR 2.05, CI 1.74–2.41), timing of surgery (ScheduledOR 1, urgent OR 1.43 and emergent 1.74), statins before surgery OR 0.83 (0.70–0.97) anddiuretics use before surgery OR 1.42 (1.19–1.69). Neither perioperative transfusion norother chronic treatments were related to AKI.CONCLUSIONS. AKI is a serious complication after cardiac surgery with poor outcomes.Chronic renal failure and use of diuretics increase risk for it, as timing and length of surgery.Statins seems to have a protective effect that could be reviewed.REFERENCE(S). Stafford-Smith M, Shaw A, Swaminathan M. Cardiac surgery and acutekidney injury: emerging concepts. Curr Opin Crit Care. 2009;15(6):498–502.GRANT ACKNOWLEDGMENT. Josele Benitez-Parejo (ARIAM Secretary)
0183HALF-DAY COURSE COULD ALLOW JUNIOR OPERATORS TO ASSESSDOPPLER-BASED RENAL PERFUSION
D. Schnell1, M. Reynaud2, M. Venot3, A.-L. Le Maho4, M. Dinic2, M. Beaulieu2,G. Ducos3, J. Terreau2, F. Zeni2, E. Azoulay3, F. Meziani1, J. Duranteau4, M. Darmon2
1Strasbourg University Hospital, Medical ICU, Strasbourg, France, 2Saint-EtienneUniversity Hospital, Medical-Surgical ICU, Saint-Etienne, France, 3Saint-Louis UniversityHospital, Medical ICU, Paris, France, 4Bicétre University Hospital, Surgical ICU,Le Kremlin-Bicétre, FranceINTRODUCTION. Doppler-based renal resistive index (RI) measurement is rapid, non-invasive, and repeatable in critically ill patients [1, 2]. This promising monitoring tool mayhelp in detecting early renal dysfunction or evaluating its reversibility [1, 2]. Renal Doppleris however be operator-dependant and little information is available concerning its feasi-bility and reproducibility in critically-ill patients.OBJECTIVES. To compare performance of junior (residents or fellow without previousexperience of renal Doppler) and senior operators when assessing renal perfusion using botha semi-quantitative color-Doppler scale and RI.METHODS. Prospective multicenter study performed in three ICUs.Juniors were provided with a specific half-day course including location of the kidney,assessment of renal perfusion through color-Doppler and measurement of RI.Acute kidney injury (AKI) was defined according to the AKIN definition. Transient AKIwas defined as AKI with a cause of renal hypoperfusion and recovery within the first 3 daysfollowing inclusion.Intra-renal RI was calculated as (peak systolic velocity - end-diastolic velocity)/peaksystolic velocity.Semi-quantitative renal perfusion was assessed using a previously published but neverevaluated semi-quantitative scale ranging from 0 (absence of renal perfusion) to 3 (renalvessels identifiable until the arcuate arteries in the entire field of view).RESULTS. 69 mechanically ventilated patients aged of 57 y.o. (39–68) were included.Failure to obtain RI was noted in a single patient (junior operator).Doppler-based RI as assessed by senior and junior operators were closely correlated(r2 = 0.64 [95 % CI 0.48–0.76]). Systematic bias across operators was negligible (-0.001),although precision of the measures was limited (95 %CI +0.105 and -0.107).Semi-quantitative renal perfusion as assessed by senior and junior operators were closelycorrelated (r2 = 0.61 [95 % CI 0.45–0.74]). Systematic bias was negligible (-0.29) andprecision of measure was poor (95 % CI +0.98 and -1.04). RI and semi-quantitative renalperfusion were correlated (r2 = 0.25 [95 % CI 0.09–0.43]; P \ 0.0001). Of the 21 patientswith AKI, 11 had a transient AKI (16 %), nine had a persistent AKI (13 %). A single patientdied before the third day and could not be classified. RI and semi-quantitative assessmentdisplayed a good diagnostic performance to diagnose persistent AKI (AUC ROC curve ofrespectively 0.84 [95 % CI 0.73–0.97] and 0.87 [0.77–0.97]).CONCLUSIONS. Our results suggest that renal perfusion monitoring could be easilyperformed by inexperienced operators following a half-day course. Both techniques dis-played a good accuracy but a limited precision.Both RI and semi-quantitative scale had a good performance to diagnose persistent AKI,although the limited number of patients with AKI in this study preclude any firmconclusions.REFERENCE(S). 1. Lerolle et al. Intensive Care Med. 2006. 2. Schnell et al. IntensiveCare Med. 2012.
0184RENAL EFFECTS OF LEVOSIMENDAN IN CARDIAC SURGERY PATIENTS:A RETROSPECTIVE ANALYSIS
F. Balzer1, S. Treskatsch1, J. Braun1
1Charité, University Medicine Berlin, Department of Anesthesiology and Intensive CareMedicine, Berlin, GermanyINTRODUCTION. Actual guidelines recommend levosimendan as an ultima ratio therapyin patients suffering heart failure [1, 2]. In this context, recent experimental and clinical datasuggest a benefit of levosimendan on the kidney function.OBJECTIVES. This retrospective, single center, matched-pairs analysis aimed to inves-tigate whether administration of levosimendan was associated with improved renal functionin cardiac surgery patients.METHODS. After IRB approval, we analyzed electronic records of patients that underwentcardiac surgery between 01/01/2007 and 31/12/2011 and were admitted to our intensive careunit (ICU) for postoperative observation (n = 4,365). Thereof, 1,095 patients did notpresent with a preexisting renal insufficiency defined as preoperative creatinine plasma level[2 mg/dl. In this cohort, 42 patients received 12.5 mg levosimendan as a single adminis-tration in a rate of 0.1 lg/kg/min on the day of operation due to a severely reduced leftventricular global systolic function and signs of a low cardiac output syndrome (‘‘levo-simendan group’’). We matched these patients based on their SAPS admission score on ICU(score ± 5) to the ones that did not receive levosimendan (n = 1,049) (‘‘control group’’).
26th ESICM ANNUAL CONGRESS — PARIS, FRANCE — 5–9 OCTOBER 2013
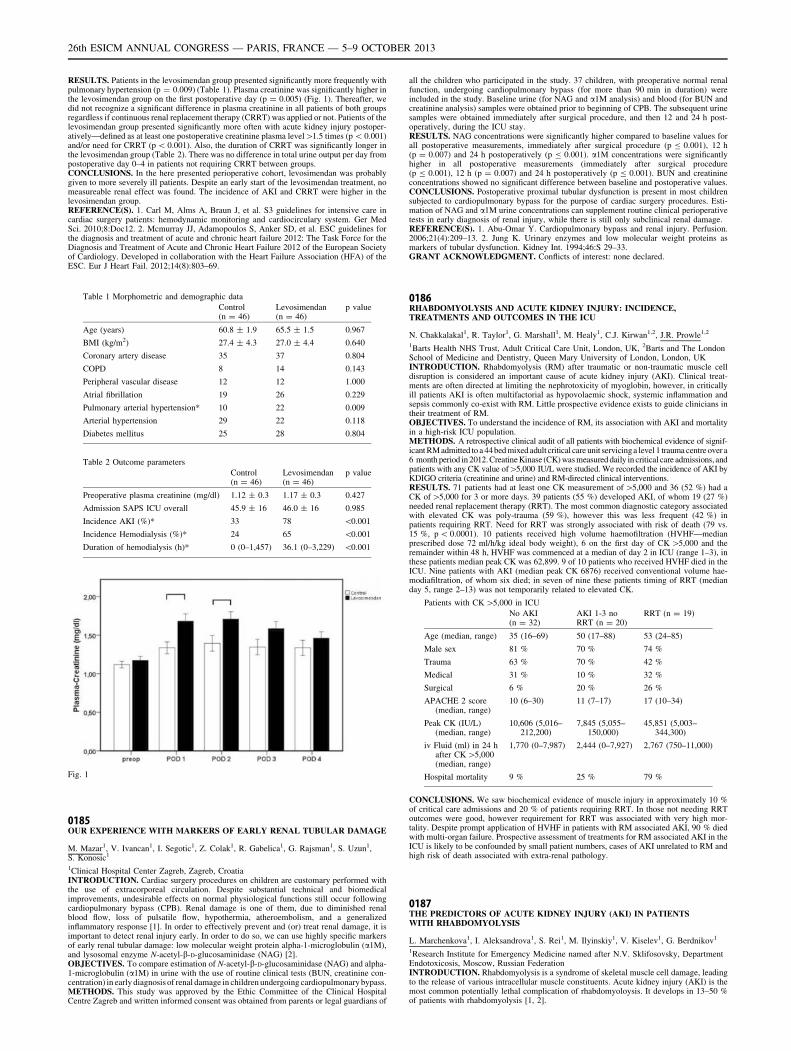
RESULTS. Patients in the levosimendan group presented significantly more frequently withpulmonary hypertension (p = 0.009) (Table 1). Plasma creatinine was significantly higher inthe levosimendan group on the first postoperative day (p = 0.005) (Fig. 1). Thereafter, wedid not recognize a significant difference in plasma creatinine in all patients of both groupsregardless if continuous renal replacement therapy (CRRT) was applied or not. Patients of thelevosimendan group presented significantly more often with acute kidney injury postoper-atively—defined as at least one postoperative creatinine plasma level[1.5 times (p \ 0.001)and/or need for CRRT (p \ 0.001). Also, the duration of CRRT was significantly longer inthe levosimendan group (Table 2). There was no difference in total urine output per day frompostoperative day 0–4 in patients not requiring CRRT between groups.CONCLUSIONS. In the here presented perioperative cohort, levosimendan was probablygiven to more severely ill patients. Despite an early start of the levosimendan treatment, nomeasureable renal effect was found. The incidence of AKI and CRRT were higher in thelevosimendan group.REFERENCE(S). 1. Carl M, Alms A, Braun J, et al. S3 guidelines for intensive care incardiac surgery patients: hemodynamic monitoring and cardiocirculary system. Ger MedSci. 2010;8:Doc12. 2. Mcmurray JJ, Adamopoulos S, Anker SD, et al. ESC guidelines forthe diagnosis and treatment of acute and chronic heart failure 2012: The Task Force for theDiagnosis and Treatment of Acute and Chronic Heart Failure 2012 of the European Societyof Cardiology. Developed in collaboration with the Heart Failure Association (HFA) of theESC. Eur J Heart Fail. 2012;14(8):803–69.
Table 1 Morphometric and demographic data
Control(n = 46)
Levosimendan(n = 46)
p value
Age (years) 60.8 ± 1.9 65.5 ± 1.5 0.967
BMI (kg/m2) 27.4 ± 4.3 27.0 ± 4.4 0.640
Coronary artery disease 35 37 0.804
COPD 8 14 0.143
Peripheral vascular disease 12 12 1.000
Atrial fibrillation 19 26 0.229
Pulmonary arterial hypertension* 10 22 0.009
Arterial hypertension 29 22 0.118
Diabetes mellitus 25 28 0.804
Table 2 Outcome parameters
Control(n = 46)
Levosimendan(n = 46)
p value
Preoperative plasma creatinine (mg/dl) 1.12 ± 0.3 1.17 ± 0.3 0.427
Admission SAPS ICU overall 45.9 ± 16 46.0 ± 16 0.985
Incidence AKI (%)* 33 78 \0.001
Incidence Hemodialysis (%)* 24 65 \0.001
Duration of hemodialysis (h)* 0 (0–1,457) 36.1 (0–3,229) \0.001
Fig. 1
0185OUR EXPERIENCE WITH MARKERS OF EARLY RENAL TUBULAR DAMAGE
M. Mazar1, V. Ivancan1, I. Segotic1, Z. Colak1, R. Gabelica1, G. Rajsman1, S. Uzun1,S. Konosic1
1Clinical Hospital Center Zagreb, Zagreb, CroatiaINTRODUCTION. Cardiac surgery procedures on children are customary performed withthe use of extracorporeal circulation. Despite substantial technical and biomedicalimprovements, undesirable effects on normal physiological functions still occur followingcardiopulmonary bypass (CPB). Renal damage is one of them, due to diminished renalblood flow, loss of pulsatile flow, hypothermia, atheroembolism, and a generalizedinflammatory response [1]. In order to effectively prevent and (or) treat renal damage, it isimportant to detect renal injury early. In order to do so, we can use highly specific markersof early renal tubular damage: low molecular weight protein alpha-1-microglobulin (a1M),and lysosomal enzyme N-acetyl-b-D-glucosaminidase (NAG) [2].OBJECTIVES. To compare estimation of N-acetyl-b-D-glucosaminidase (NAG) and alpha-1-microglobulin (a1M) in urine with the use of routine clinical tests (BUN, creatinine con-centration) in early diagnosis of renal damage in children undergoing cardiopulmonary bypass.METHODS. This study was approved by the Ethic Committee of the Clinical HospitalCentre Zagreb and written informed consent was obtained from parents or legal guardians of
all the children who participated in the study. 37 children, with preoperative normal renalfunction, undergoing cardiopulmonary bypass (for more than 90 min in duration) wereincluded in the study. Baseline urine (for NAG and a1M analysis) and blood (for BUN andcreatinine analysis) samples were obtained prior to beginning of CPB. The subsequent urinesamples were obtained immediately after surgical procedure, and then 12 and 24 h post-operatively, during the ICU stay.RESULTS. NAG concentrations were significantly higher compared to baseline values forall postoperative measurements, immediately after surgical procedure (p B 0.001), 12 h(p = 0.007) and 24 h postoperatively (p B 0.001). a1M concentrations were significantlyhigher in all postoperative measurements (immediately after surgical procedure(p B 0.001), 12 h (p = 0.007) and 24 h postoperatively (p B 0.001). BUN and creatinineconcentrations showed no significant difference between baseline and postoperative values.CONCLUSIONS. Postoperative proximal tubular dysfunction is present in most childrensubjected to cardiopulmonary bypass for the purpose of cardiac surgery procedures. Esti-mation of NAG and a1M urine concentrations can supplement routine clinical perioperativetests in early diagnosis of renal injury, while there is still only subclinical renal damage.REFERENCE(S). 1. Abu-Omar Y. Cardiopulmonary bypass and renal injury. Perfusion.2006;21(4):209–13. 2. Jung K. Urinary enzymes and low molecular weight proteins asmarkers of tubular dysfunction. Kidney Int. 1994;46:S 29–33.GRANT ACKNOWLEDGMENT. Conflicts of interest: none declared.
0186RHABDOMYOLYSIS AND ACUTE KIDNEY INJURY: INCIDENCE,TREATMENTS AND OUTCOMES IN THE ICU
N. Chakkalakal1, R. Taylor1, G. Marshall1, M. Healy1, C.J. Kirwan1,2, J.R. Prowle1,2
1Barts Health NHS Trust, Adult Critical Care Unit, London, UK, 2Barts and The LondonSchool of Medicine and Dentistry, Queen Mary University of London, London, UKINTRODUCTION. Rhabdomyolysis (RM) after traumatic or non-traumatic muscle celldisruption is considered an important cause of acute kidney injury (AKI). Clinical treat-ments are often directed at limiting the nephrotoxicity of myoglobin, however, in criticallyill patients AKI is often multifactorial as hypovolaemic shock, systemic inflammation andsepsis commonly co-exist with RM. Little prospective evidence exists to guide clinicians intheir treatment of RM.OBJECTIVES. To understand the incidence of RM, its association with AKI and mortalityin a high-risk ICU population.METHODS. A retrospective clinical audit of all patients with biochemical evidence of signif-icant RM admitted to a 44bed mixed adult critical care unit servicinga level 1 trauma centre over a6 month period in 2012.Creatine Kinase (CK) was measured daily in critical care admissions, andpatients with any CK value of[5,000 IU/L were studied. We recorded the incidence of AKI byKDIGO criteria (creatinine and urine) and RM-directed clinical interventions.RESULTS. 71 patients had at least one CK measurement of [5,000 and 36 (52 %) had aCK of[5,000 for 3 or more days. 39 patients (55 %) developed AKI, of whom 19 (27 %)needed renal replacement therapy (RRT). The most common diagnostic category associatedwith elevated CK was poly-trauma (59 %), however this was less frequent (42 %) inpatients requiring RRT. Need for RRT was strongly associated with risk of death (79 vs.15 %, p \ 0.0001). 10 patients received high volume haemofiltration (HVHF—medianprescribed dose 72 ml/h/kg ideal body weight), 6 on the first day of CK [5,000 and theremainder within 48 h, HVHF was commenced at a median of day 2 in ICU (range 1–3), inthese patients median peak CK was 62,899. 9 of 10 patients who received HVHF died in theICU. Nine patients with AKI (median peak CK 6876) received conventional volume hae-modiafiltration, of whom six died; in seven of nine these patients timing of RRT (medianday 5, range 2–13) was not temporarily related to elevated CK.
Patients with CK [5,000 in ICU
No AKI(n = 32)
AKI 1-3 noRRT (n = 20)
RRT (n = 19)
Age (median, range) 35 (16–69) 50 (17–88) 53 (24–85)
Male sex 81 % 70 % 74 %
Trauma 63 % 70 % 42 %
Medical 31 % 10 % 32 %
Surgical 6 % 20 % 26 %
APACHE 2 score(median, range)
10 (6–30) 11 (7–17) 17 (10–34)
Peak CK (IU/L)(median, range)
10,606 (5,016–212,200)
7,845 (5,055–150,000)
45,851 (5,003–344,300)
iv Fluid (ml) in 24 hafter CK [5,000(median, range)
1,770 (0–7,987) 2,444 (0–7,927) 2,767 (750–11,000)
Hospital mortality 9 % 25 % 79 %
CONCLUSIONS. We saw biochemical evidence of muscle injury in approximately 10 %of critical care admissions and 20 % of patients requiring RRT. In those not needing RRToutcomes were good, however requirement for RRT was associated with very high mor-tality. Despite prompt application of HVHF in patients with RM associated AKI, 90 % diedwith multi-organ failure. Prospective assessment of treatments for RM associated AKI in theICU is likely to be confounded by small patient numbers, cases of AKI unrelated to RM andhigh risk of death associated with extra-renal pathology.
0187THE PREDICTORS OF ACUTE KIDNEY INJURY (AKI) IN PATIENTSWITH RHABDOMYOLYSIS
L. Marchenkova1, I. Aleksandrova1, S. Rei1, M. Ilyinskiy1, V. Kiselev1, G. Berdnikov1
1Research Institute for Emergency Medicine named after N.V. Sklifosovsky, DepartmentEndotoxicosis, Moscow, Russian FederationINTRODUCTION. Rhabdomyolysis is a syndrome of skeletal muscle cell damage, leadingto the release of various intracellular muscle constituents. Acute kidney injury (AKI) is themost common potentially lethal complication of rhabdomyoloysis. It develops in 13–50 %of patients with rhabdomyolysis [1, 2].
26th ESICM ANNUAL CONGRESS — PARIS, FRANCE — 5–9 OCTOBER 2013
OBJECTIVES. The aim of the study was to retrospectively determine the predictors ofacute kidney injury in patients with rhabdomyolysis.METHODS. 213 patients (17 F, 196 M) with rhabdomyolysis admitted to the ICU ofour institute between 2002 and 2009 were evaluated. Mean age was 38.5 ± 14.1 years(range 17–74 years). The median time interval between the onset of injury and admis-sion was 2.0 (1.0; 4.0) days. Area of soft tissue injury ranged from 5 to 50 % of bodysurface, on average 19.0 ± 8.8 %. The serum concentration of myoglobin on admissionwas 1,958.0 (449.2; 11,078.0) ng/ml. The serum creatinine level was 408.0 (180.0;629.9) lmol/l.RESULTS. One hundred seventy-nine patients (84 %) were diagnosed with AKI. A sig-nificant correlation was found between AKI and the area of soft tissue injury (r = 0.414,p = 0.000) as well as serum myoglobin (r = 0.204, p = 0.001).Optimum cutoff levels (by ROC curve analysis) were of area of soft tissue injury C12 %(sensitivity 0.827; 1-specificity 0.294), and serum myoglobin level C1,000 ng/ml (sensi-tivity 0.702; 1-specificity 0.267). Areas under the curves (AUC) are shown in table.
Area under the curve for AKI diagnosis
Variable Area under curve Standard error 95 % CI
Area of soft tissue injury 0.795 0.042 0.712–0.878
Myoglobin level 0.788 0.054 0.693–0.904
CONCLUSIONS. The area of soft tissue injury and myoglobin level could be used topredict the development of acute kidney injury in patients with rhabdomyolysis.REFERENCE(S). 1. Bosch X, Poch E, Grau JM. Rhabdomyolysis and acute kidney injury.N Engl J Med. 2009;361(1):62–72. 2. Khan FY. Rhabdomyolysis: a review of the literature.Neth J Med. 2009;67(9):272–83.
0188IMPLEMENTATION OF A PROTOCOL-DRIVEN TARGETED RESUSCITATIONBUNDLE IN PEDIATRIC SHOCK DECREASES ACUTE KIDNEY INJURYAND IMPROVES OUTCOMES
A. Akcan Arikan1, E.A. Williams2, J.M. Graf2, C.E. Kennedy2, B. Patel3, A.T. Cruz3
1Baylor College of Medicine, Sections of Pediatric Critical Care Medicine and Renal,Houston, USA, 2Baylor College of Medicine, Section of Pediatric Critical Care Medicine,Houston, USA, 3Baylor College of Medicine, Section of Pediatric Emergency Medicine,Houston, USAINTRODUCTION. Acute kidney injury (AKI) is very common in critically ill pediatricpatients (pts) and increases morbidity and mortality. Recent advances in the standardizeddefinition and stratification of AKI and modalities of renal support have not improvedpatient outcomes. 30 % of pediatric patients in cardiorespiratory failure have AKI on ICUadmission, emphasizing the need for early identification and timely intervention. Sepsis withassociated hemodynamic instability causes nearly 50 % of all ICU AKI. Early goal directedresuscitation has improved sepsis outcomes in both adults and children.OBJECTIVES. We investigated the incidence of AKI before and after institution of aprotocol- driven resuscitation bundle (‘‘shock protocol’’(SP)) in the emergency department(ED) [1].METHODS. Retrospective review of children with clinical sepsis and hemodynamicinstability admitted to ICU from ED before (2009 (PRE)) and after (2010 (POST))implementation of SP at a tertiary care children’s hospital. AKI was defined by pRIFLEcreatinine criteria [2].RESULTS. 202 patients (PRE n = 98, POST n = 104) were included, 53 % males, meanage 7.7 ± 5.6 years, mean PELOD 8.9 ± 12.7, mean PRISM 5.3 ± 13.9. There were nodifferences in age, gender, presence of preexisting conditions, PRISM or PELOD scoresbetween PRE and POST groups. 41 % (n = 83) of all patients had AKI. AKI decreasedafter SP implementation (54 % in PRE vs 29 % in POST, p \ 0.001). Gentamicin (G) waspart of the SP; however, less AKI was seen in the gentamicin group (G 31 % vs no G 52 %,p = 0.003). Four patients in PRE had renal replacement therapy (RRT) vs none in POST(p = 0.04); 10 pts (10 %) in PRE died vs 3 (3 %) in POST. SP was independently asso-ciated with decreased AKI when controlled for age, gender, gentamicin use, and PELOD(OR 0.27, 95 % CI 0.13 - 0 0.56). POST pts had shorter ICU and hospital LOS (1.9 ± 2.3 vs4.5 ± 7.6, p \ 0.01, 6.3 ± 5.1 vs 15.3 ± 16.9, p \ 0.001). In multivariate analyses, SP wasindependently associated with shorter ICU and hospital LOS when controlled for AKI andPELOD (p = 0.02, p \ 0.001, respectively).CONCLUSIONS. Implementation of a protocol-driven targeted resuscitation bundle in theED decreased AKI and need for RRT, as well as ICU and hospital LOS and mortality.REFERENCE(S). 1. Cruz AT, Perry AM, Williams EA, Graf JM, Wuestner ER, Patel B.Implementation of goal-directed therapy for children with suspected sepsis in the emergencydepartment. Pediatrics. 2011;127(3):758–66. 2. Akcan Arikan A, Zappitelli M, Loftis LL,Washburn KK, Jefferson LS, Goldstein SL. Modified RIFLE criteria in critically ill childrenwith acute kidney injury. Kidney Int. 2007;71(10):1028–35.
0190WORSENING OF RENAL FUNCTION FOLLOWING HEART SURGERYFOR ACTIVE INFECTIVE ENDOCARDITIS: INCIDENCE, RISK FACTORSAND PREDICTION BASED ON SUPER LEARNING
R. Pirracchio1,2,3, M. Legrand4,5, M. Petersen3, M. van der Laan3, J.N. Fabiani6,
B. Cholley1, J.L. Mainardi7
1Hôpital Européen Georges Pompidou, Anesthesiology and Critical Care, Paris, France,2Unité INSERM UMR-S 717, Biostatistiques et Informatique Médicale, Paris, France,3University of California at Berkeley, Biostatistics, School of Public Health, Berkeley, USA,4Hôpital Lariboisière, Anesthesiology and Critical Care, Paris, France, 5Unité INSERMUMR-S 942, Hôpital Lariboisière, Paris, France, 6Hôpital Européen Georges Pompidou,Cardiovascular Surgery, Paris, France, 7Hôpital Européen Georges Pompidou,Microbiology, Paris, FranceINTRODUCTION. Cardiac surgery is frequently needed in patients with infective endo-carditis (IE). Acute kidney injury (AKI) is frequent in this setting and is associated with pooroutcomes.OBJECTIVES. The purpose of the study was to determine the risk factors for post-oper-ative AKI in patients who underwent cardiac surgery for IE.
METHODS. Retrospective, non-interventional study of prospectively collected data(2000–2010) including the patients with IE and cardiac surgery with cardio-pulmonarybypass. The primary outcome was the development or the progression of AKI in the post-operative period based on the AKIN definition. We used an ensemble machine learning(‘‘Super Learning’’) to develop a predictor of AKI based on 36 standard risk factors andevaluated its performance using cross-validated Areas Under the Receiver Operating Curve(AUROC). The SuperLearner (SL) algorithm uses a cross-validation procedure to combine auser-specified set of candidate prediction algorithms. We estimated adjusted variableimportance measures for each of a candidate set of risk factors using Targeted MaximumLikelihood Estimation (TMLE).RESULTS. Two-hundred and two patients were included, of which 91 (45 %) experienceda worsening in their renal function after surgery. Sixty-five (32.2 %) patients presented anAKI before surgery while 120 (59.4 %) patients presented an AKI in the postoperativeperiod. Twenty patients (9.9 %) required a renal replacement therapy during the post-operative ICU stay and 30 (14.8 %) died during their hospital stay. The Super Learnerweighted estimator achieved the best prediction performances with estimated AUROC of0.760 [0.694–0.826]. The following variables were found to be significantly associated withrenal function impairment, after adjustment for other risk factors: multiple surgery (OR4.16, 95 % CI 2.98–5.80, p \ 0.001), pre-operative anemia (OR 1.89, 95 % CI 1.34–2.66,p \ 0.001), transfusion requirement during surgery (OR 2.38, 95 % CI 1.55–3.63,p \ 0.001), and the use of a nephrotoxic agent: vancomycin (OR 2.63, 95 % CI 2.07–3.34,p \ 0.001), aminoglycosides (OR 1.44, 95 % CI 1.13–1.83, p = 0.004) or contrast iodine(OR 1.70, 95 % CI 1.37–2.12, p \ 0.001). Age over 65 y/o was found to be associated withless impairment in the renal function (OR 0.41, 95 % CI 0.30–0.57, p \ 0.001). Postop-erative but not preoperative AKI was associated with hospital mortality.CONCLUSION. The Super Learner succeeded in finding the optimal combination ofprediction algorithms, that maximized the prediction performances. In association withTMLE, it helped to identify multiple surgery, anemia, transfusion and nephrotoxic agents asmajor risk factors for worsening of renal function after cardiac surgery for acuteendocarditis.
Quality issues and ICU economics: 0191–02040191TRAINEE DELIVERED EDUCATION: MEETING THE NEEDS OF TODAY’SNOVICE INTENSIVISTS
M. Armstrong1, J. Gross1, M. Barenco2, N. Arul2, P. Nandabalan1, D. Walker1
1University College London Hospital, London, UK, 2University College London,London, UKINTRODUCTION. Early recognition, assessment and appropriate management of criti-cally ill patients is essential to improve clinical outcomes. However, variation exists injunior doctors0 approach to acutely unwell patients and their understanding of ICU practice[1]. The Temple report [2] makes several recommendations to ensure service environmentbased training is both safe and of high quality. These include the use of simulation andtechnologies, where patients are not at risk, to accelerate learning. At our institution, a one-day lecture and practical based introductory course is held bi-annually that aims to addressthese issues guiding new doctors in core aspects of intensive care practice.OBJECTIVES. To assess impact of an introductory ICU course, designed to increaseknowledge and understanding of critical illness and insight into intensive care practice.METHODS. Junior doctors who attended the most recent course completed pre and postcourse MCQ papers each of 15 questions. Half the course were asked to complete paper Aand the remaining half paper B before the course. Papers were then switched over for thepost course MCQs, which were completed at the end of the day.Feedback was obtained at the end of the day and via a follow-up questionnaire sent out6 weeks later to evaluate the course’s impact on approach to managing acutely unwellpatients and ICU practice.RESULTS. Mean scores for paper A pre and post course were 12.70 (37) and 13.11 (45)respectively (p = 0.08).For paper B, pre and post course mean scores were 11.95 (44) and 12.64 (37) respectively(p = 0.01), showing a 4.6 % increase.Overall there was a 4 % improvement in scores of all the candidates between the start of theday and the end (p = 0.002).On the day feedback scored good or excellent overall in 83 % of cases. 6 weeks later,response rate was 47 %. Of those who responded, 95 % thought the course had helped themin their approach to managing acutely unwell patients and was either moderately or veryuseful to their clinical practice. Furthermore, 97 % thought that the course gave themmoderate or very useful insight into ICU.CONCLUSIONS. Providing a one-day introductory course for newly qualified doctors withlittle or no ICU experience improves their knowledge and approach to managing acutelyunwell patients and gives them a useful insight into intensive care, which was sustained6 weeks post course. Improvement in knowledge was demonstrated although further scopeexists to increase discriminatory power of the validation tool and include questions with awider range of difficulty.REFERENCES. 1. Kelly D. Knowledge of medical students and newly qualified doctorsconcerning the specialty of intensive care medicine. J Intensive Care Soc. 2011;12:98–106.2. Time for training—a review of the impact of the European Working Time Directive onthe quality of training Professor John Temple; 2010. http://www.mee.nhs.uk/PDF/14274%20Bookmark%20Web%20Version.pdf
0192LISTENING TO THE WARNING: DOES DELAY IN ACTIVATION OF CRITICALCARE OUTREACH TEAMS IMPACT PATIENT CARE?
B. Tillmann1, M. Klingel2, S. McLeod2, S. Anderson1, W. Haddara3, N. Parry4
1London Health Sciences Centre, Department of Medicine, Division of EmergencyMedicine, London, Canada, 2London Health Sciences Centre, Division of EmergencyMedicine, London, Canada, 3London Health Sciences Centre, Department of Medicine,London, Canada, 4London Health Sciences Centre, Department of Surgery, London, Canada
26th ESICM ANNUAL CONGRESS — PARIS, FRANCE — 5–9 OCTOBER 2013
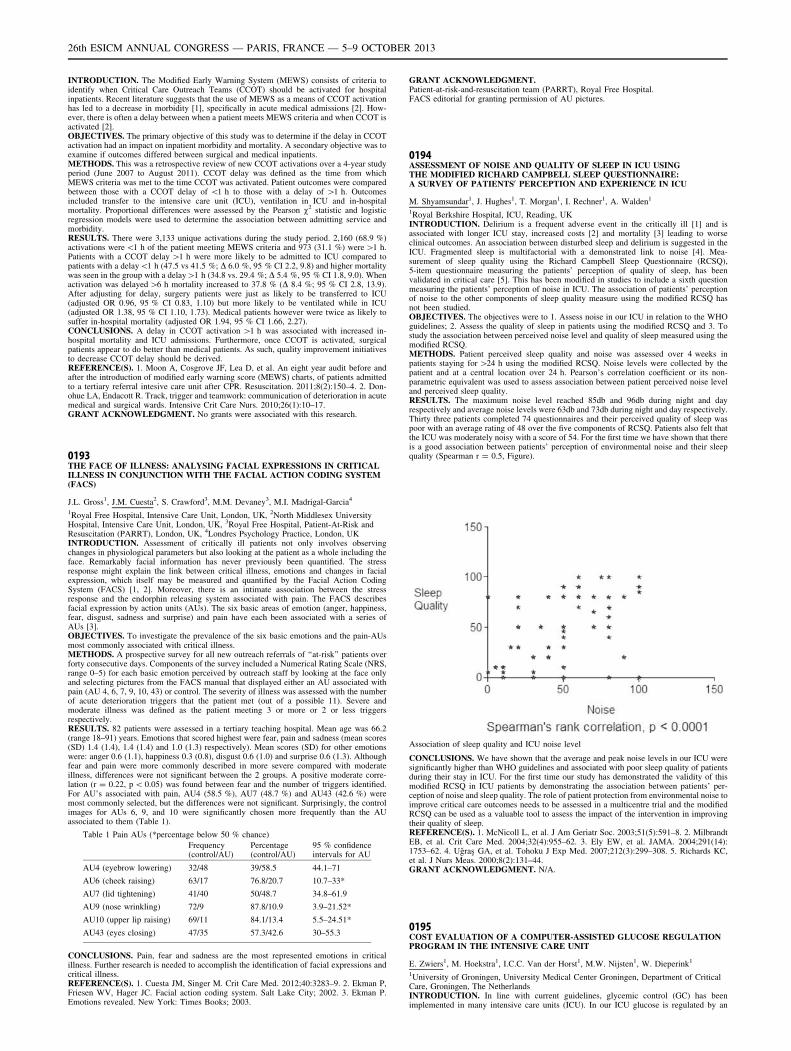
INTRODUCTION. The Modified Early Warning System (MEWS) consists of criteria toidentify when Critical Care Outreach Teams (CCOT) should be activated for hospitalinpatients. Recent literature suggests that the use of MEWS as a means of CCOT activationhas led to a decrease in morbidity [1], specifically in acute medical admissions [2]. How-ever, there is often a delay between when a patient meets MEWS criteria and when CCOT isactivated [2].OBJECTIVES. The primary objective of this study was to determine if the delay in CCOTactivation had an impact on inpatient morbidity and mortality. A secondary objective was toexamine if outcomes differed between surgical and medical inpatients.METHODS. This was a retrospective review of new CCOT activations over a 4-year studyperiod (June 2007 to August 2011). CCOT delay was defined as the time from whichMEWS criteria was met to the time CCOT was activated. Patient outcomes were comparedbetween those with a CCOT delay of \1 h to those with a delay of [1 h. Outcomesincluded transfer to the intensive care unit (ICU), ventilation in ICU and in-hospitalmortality. Proportional differences were assessed by the Pearson v2 statistic and logisticregression models were used to determine the association between admitting service andmorbidity.RESULTS. There were 3,133 unique activations during the study period. 2,160 (68.9 %)activations were \1 h of the patient meeting MEWS criteria and 973 (31.1 %) were [1 h.Patients with a CCOT delay [1 h were more likely to be admitted to ICU compared topatients with a delay\1 h (47.5 vs 41.5 %; D 6.0 %, 95 % CI 2.2, 9.8) and higher mortalitywas seen in the group with a delay[1 h (34.8 vs. 29.4 %; D 5.4 %, 95 % CI 1.8, 9.0). Whenactivation was delayed [6 h mortality increased to 37.8 % (D 8.4 %; 95 % CI 2.8, 13.9).After adjusting for delay, surgery patients were just as likely to be transferred to ICU(adjusted OR 0.96, 95 % CI 0.83, 1.10) but more likely to be ventilated while in ICU(adjusted OR 1.38, 95 % CI 1.10, 1.73). Medical patients however were twice as likely tosuffer in-hospital mortality (adjusted OR 1.94, 95 % CI 1.66, 2.27).CONCLUSIONS. A delay in CCOT activation [1 h was associated with increased in-hospital mortality and ICU admissions. Furthermore, once CCOT is activated, surgicalpatients appear to do better than medical patients. As such, quality improvement initiativesto decrease CCOT delay should be derived.REFERENCE(S). 1. Moon A, Cosgrove JF, Lea D, et al. An eight year audit before andafter the introduction of modified early warning score (MEWS) charts, of patients admittedto a tertiary referral intesive care unit after CPR. Resuscitation. 2011;8(2):150–4. 2. Don-ohue LA, Endacott R. Track, trigger and teamwork: communication of deterioration in acutemedical and surgical wards. Intensive Crit Care Nurs. 2010;26(1):10–17.GRANT ACKNOWLEDGMENT. No grants were associated with this research.
0193THE FACE OF ILLNESS: ANALYSING FACIAL EXPRESSIONS IN CRITICALILLNESS IN CONJUNCTION WITH THE FACIAL ACTION CODING SYSTEM(FACS)
J.L. Gross1, J.M. Cuesta2, S. Crawford3, M.M. Devaney3, M.I. Madrigal-Garcia4
1Royal Free Hospital, Intensive Care Unit, London, UK, 2North Middlesex UniversityHospital, Intensive Care Unit, London, UK, 3Royal Free Hospital, Patient-At-Risk andResuscitation (PARRT), London, UK, 4Londres Psychology Practice, London, UKINTRODUCTION. Assessment of critically ill patients not only involves observingchanges in physiological parameters but also looking at the patient as a whole including theface. Remarkably facial information has never previously been quantified. The stressresponse might explain the link between critical illness, emotions and changes in facialexpression, which itself may be measured and quantified by the Facial Action CodingSystem (FACS) [1, 2]. Moreover, there is an intimate association between the stressresponse and the endorphin releasing system associated with pain. The FACS describesfacial expression by action units (AUs). The six basic areas of emotion (anger, happiness,fear, disgust, sadness and surprise) and pain have each been associated with a series ofAUs [3].OBJECTIVES. To investigate the prevalence of the six basic emotions and the pain-AUsmost commonly associated with critical illness.METHODS. A prospective survey for all new outreach referrals of ‘‘at-risk’’ patients overforty consecutive days. Components of the survey included a Numerical Rating Scale (NRS,range 0–5) for each basic emotion perceived by outreach staff by looking at the face onlyand selecting pictures from the FACS manual that displayed either an AU associated withpain (AU 4, 6, 7, 9, 10, 43) or control. The severity of illness was assessed with the numberof acute deterioration triggers that the patient met (out of a possible 11). Severe andmoderate illness was defined as the patient meeting 3 or more or 2 or less triggersrespectively.RESULTS. 82 patients were assessed in a tertiary teaching hospital. Mean age was 66.2(range 18–91) years. Emotions that scored highest were fear, pain and sadness (mean scores(SD) 1.4 (1.4), 1.4 (1.4) and 1.0 (1.3) respectively). Mean scores (SD) for other emotionswere: anger 0.6 (1.1), happiness 0.3 (0.8), disgust 0.6 (1.0) and surprise 0.6 (1.3). Althoughfear and pain were more commonly described in more severe compared with moderateillness, differences were not significant between the 2 groups. A positive moderate corre-lation (r = 0.22, p \ 0.05) was found between fear and the number of triggers identified.For AU’s associated with pain, AU4 (58.5 %), AU7 (48.7 %) and AU43 (42.6 %) weremost commonly selected, but the differences were not significant. Surprisingly, the controlimages for AUs 6, 9, and 10 were significantly chosen more frequently than the AUassociated to them (Table 1).
Table 1 Pain AUs (*percentage below 50 % chance)
Frequency(control/AU)
Percentage(control/AU)
95 % confidenceintervals for AU
AU4 (eyebrow lowering) 32/48 39/58.5 44.1–71
AU6 (cheek raising) 63/17 76.8/20.7 10.7–33*
AU7 (lid tightening) 41/40 50/48.7 34.8–61.9
AU9 (nose wrinkling) 72/9 87.8/10.9 3.9–21.52*
AU10 (upper lip raising) 69/11 84.1/13.4 5.5–24.51*
AU43 (eyes closing) 47/35 57.3/42.6 30–55.3
CONCLUSIONS. Pain, fear and sadness are the most represented emotions in criticalillness. Further research is needed to accomplish the identification of facial expressions andcritical illness.REFERENCE(S). 1. Cuesta JM, Singer M. Crit Care Med. 2012;40:3283–9. 2. Ekman P,Friesen WV, Hager JC. Facial action coding system. Salt Lake City; 2002. 3. Ekman P.Emotions revealed. New York: Times Books; 2003.
GRANT ACKNOWLEDGMENT.Patient-at-risk-and-resuscitation team (PARRT), Royal Free Hospital.FACS editorial for granting permission of AU pictures.
0194ASSESSMENT OF NOISE AND QUALITY OF SLEEP IN ICU USINGTHE MODIFIED RICHARD CAMPBELL SLEEP QUESTIONNAIRE:A SURVEY OF PATIENTS0 PERCEPTION AND EXPERIENCE IN ICU
M. Shyamsundar1, J. Hughes1, T. Morgan1, I. Rechner1, A. Walden1
1Royal Berkshire Hospital, ICU, Reading, UKINTRODUCTION. Delirium is a frequent adverse event in the critically ill [1] and isassociated with longer ICU stay, increased costs [2] and mortality [3] leading to worseclinical outcomes. An association between disturbed sleep and delirium is suggested in theICU. Fragmented sleep is multifactorial with a demonstrated link to noise [4]. Mea-surement of sleep quality using the Richard Campbell Sleep Questionnaire (RCSQ),5-item questionnaire measuring the patients’ perception of quality of sleep, has beenvalidated in critical care [5]. This has been modified in studies to include a sixth questionmeasuring the patients’ perception of noise in ICU. The association of patients’ perceptionof noise to the other components of sleep quality measure using the modified RCSQ hasnot been studied.OBJECTIVES. The objectives were to 1. Assess noise in our ICU in relation to the WHOguidelines; 2. Assess the quality of sleep in patients using the modified RCSQ and 3. Tostudy the association between perceived noise level and quality of sleep measured using themodified RCSQ.METHODS. Patient perceived sleep quality and noise was assessed over 4 weeks inpatients staying for [24 h using the modified RCSQ. Noise levels were collected by thepatient and at a central location over 24 h. Pearson’s correlation coefficient or its non-parametric equivalent was used to assess association between patient perceived noise leveland perceived sleep quality.RESULTS. The maximum noise level reached 85db and 96db during night and dayrespectively and average noise levels were 63db and 73db during night and day respectively.Thirty three patients completed 74 questionnaires and their perceived quality of sleep waspoor with an average rating of 48 over the five components of RCSQ. Patients also felt thatthe ICU was moderately noisy with a score of 54. For the first time we have shown that thereis a good association between patients’ perception of environmental noise and their sleepquality (Spearman r = 0.5, Figure).
Association of sleep quality and ICU noise level
CONCLUSIONS. We have shown that the average and peak noise levels in our ICU weresignificantly higher than WHO guidelines and associated with poor sleep quality of patientsduring their stay in ICU. For the first time our study has demonstrated the validity of thismodified RCSQ in ICU patients by demonstrating the association between patients’ per-ception of noise and sleep quality. The role of patient protection from environmental noise toimprove critical care outcomes needs to be assessed in a multicentre trial and the modifiedRCSQ can be used as a valuable tool to assess the impact of the intervention in improvingtheir quality of sleep.REFERENCE(S). 1. McNicoll L, et al. J Am Geriatr Soc. 2003;51(5):591–8. 2. MilbrandtEB, et al. Crit Care Med. 2004;32(4):955–62. 3. Ely EW, et al. JAMA. 2004;291(14):1753–62. 4. Uğraş GA, et al. Tohoku J Exp Med. 2007;212(3):299–308. 5. Richards KC,et al. J Nurs Meas. 2000;8(2):131–44.GRANT ACKNOWLEDGMENT. N/A.
0195COST EVALUATION OF A COMPUTER-ASSISTED GLUCOSE REGULATIONPROGRAM IN THE INTENSIVE CARE UNIT
E. Zwiers1, M. Hoekstra1, I.C.C. Van der Horst1, M.W. Nijsten1, W. Dieperink1
1University of Groningen, University Medical Center Groningen, Department of CriticalCare, Groningen, The NetherlandsINTRODUCTION. In line with current guidelines, glycemic control (GC) has beenimplemented in many intensive care units (ICU). In our ICU glucose is regulated by an
26th ESICM ANNUAL CONGRESS — PARIS, FRANCE — 5–9 OCTOBER 2013
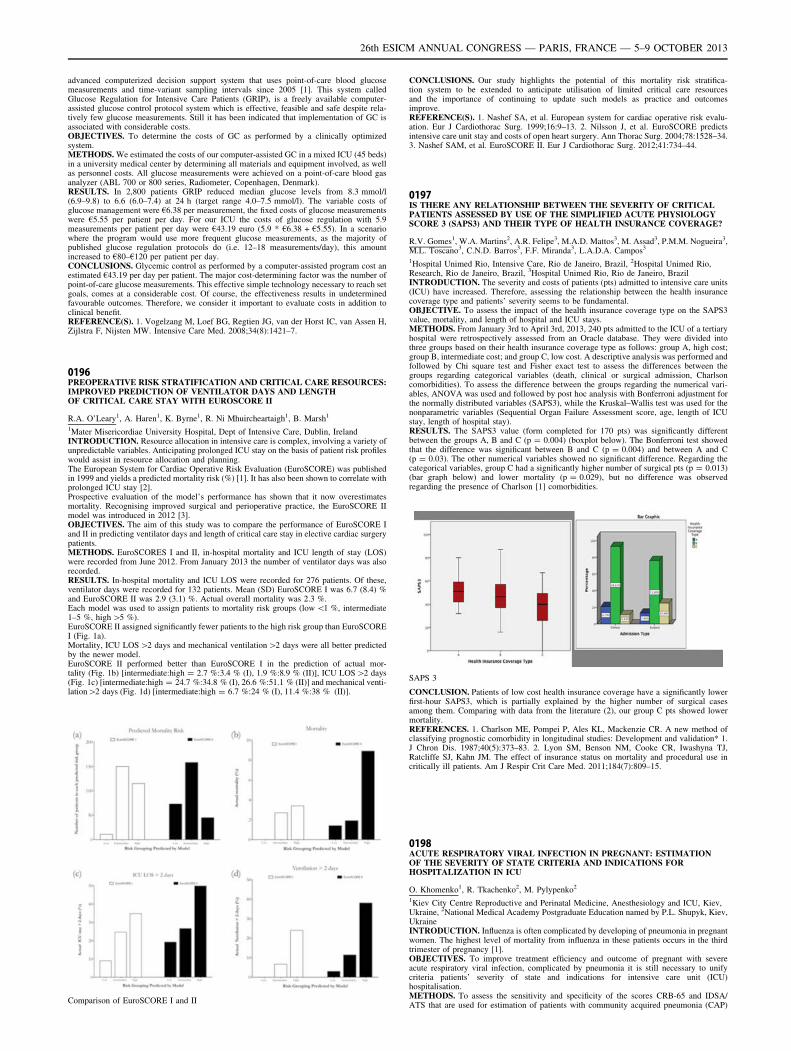
advanced computerized decision support system that uses point-of-care blood glucosemeasurements and time-variant sampling intervals since 2005 [1]. This system calledGlucose Regulation for Intensive Care Patients (GRIP), is a freely available computer-assisted glucose control protocol system which is effective, feasible and safe despite rela-tively few glucose measurements. Still it has been indicated that implementation of GC isassociated with considerable costs.OBJECTIVES. To determine the costs of GC as performed by a clinically optimizedsystem.METHODS. We estimated the costs of our computer-assisted GC in a mixed ICU (45 beds)in a university medical center by determining all materials and equipment involved, as wellas personnel costs. All glucose measurements were achieved on a point-of-care blood gasanalyzer (ABL 700 or 800 series, Radiometer, Copenhagen, Denmark).RESULTS. In 2,800 patients GRIP reduced median glucose levels from 8.3 mmol/l(6.9–9.8) to 6.6 (6.0–7.4) at 24 h (target range 4.0–7.5 mmol/l). The variable costs ofglucose management were €6.38 per measurement, the fixed costs of glucose measurementswere €5.55 per patient per day. For our ICU the costs of glucose regulation with 5.9measurements per patient per day were €43.19 euro (5.9 * €6.38 + €5.55). In a scenariowhere the program would use more frequent glucose measurements, as the majority ofpublished glucose regulation protocols do (i.e. 12–18 measurements/day), this amountincreased to €80–€120 per patient per day.CONCLUSIONS. Glycemic control as performed by a computer-assisted program cost anestimated €43.19 per day per patient. The major cost-determining factor was the number ofpoint-of-care glucose measurements. This effective simple technology necessary to reach setgoals, comes at a considerable cost. Of course, the effectiveness results in undeterminedfavourable outcomes. Therefore, we consider it important to evaluate costs in addition toclinical benefit.REFERENCE(S). 1. Vogelzang M, Loef BG, Regtien JG, van der Horst IC, van Assen H,Zijlstra F, Nijsten MW. Intensive Care Med. 2008;34(8):1421–7.
0196PREOPERATIVE RISK STRATIFICATION AND CRITICAL CARE RESOURCES:IMPROVED PREDICTION OF VENTILATOR DAYS AND LENGTHOF CRITICAL CARE STAY WITH EUROSCORE II
R.A. O’Leary1, A. Haren1, K. Byrne1, R. Ni Mhuircheartaigh1, B. Marsh1
1Mater Misericordiae University Hospital, Dept of Intensive Care, Dublin, IrelandINTRODUCTION. Resource allocation in intensive care is complex, involving a variety ofunpredictable variables. Anticipating prolonged ICU stay on the basis of patient risk profileswould assist in resource allocation and planning.The European System for Cardiac Operative Risk Evaluation (EuroSCORE) was publishedin 1999 and yields a predicted mortality risk (%) [1]. It has also been shown to correlate withprolonged ICU stay [2].Prospective evaluation of the model’s performance has shown that it now overestimatesmortality. Recognising improved surgical and perioperative practice, the EuroSCORE IImodel was introduced in 2012 [3].OBJECTIVES. The aim of this study was to compare the performance of EuroSCORE Iand II in predicting ventilator days and length of critical care stay in elective cardiac surgerypatients.METHODS. EuroSCORES I and II, in-hospital mortality and ICU length of stay (LOS)were recorded from June 2012. From January 2013 the number of ventilator days was alsorecorded.RESULTS. In-hospital mortality and ICU LOS were recorded for 276 patients. Of these,ventilator days were recorded for 132 patients. Mean (SD) EuroSCORE I was 6.7 (8.4) %and EuroSCORE II was 2.9 (3.1) %. Actual overall mortality was 2.3 %.Each model was used to assign patients to mortality risk groups (low \1 %, intermediate1–5 %, high [5 %).EuroSCORE II assigned significantly fewer patients to the high risk group than EuroSCOREI (Fig. 1a).Mortality, ICU LOS[2 days and mechanical ventilation[2 days were all better predictedby the newer model.EuroSCORE II performed better than EuroSCORE I in the prediction of actual mor-tality (Fig. 1b) [intermediate:high = 2.7 %:3.4 % (I), 1.9 %:8.9 % (II)], ICU LOS[2 days(Fig. 1c) [intermediate:high = 24.7 %:34.8 % (I), 26.6 %:51.1 % (II)] and mechanical venti-lation[2 days (Fig. 1d) [intermediate:high = 6.7 %:24 % (I), 11.4 %:38 % (II)].
Comparison of EuroSCORE I and II
CONCLUSIONS. Our study highlights the potential of this mortality risk stratifica-tion system to be extended to anticipate utilisation of limited critical care resourcesand the importance of continuing to update such models as practice and outcomesimprove.REFERENCE(S). 1. Nashef SA, et al. European system for cardiac operative risk evalu-ation. Eur J Cardiothorac Surg. 1999;16:9–13. 2. Nilsson J, et al. EuroSCORE predictsintensive care unit stay and costs of open heart surgery. Ann Thorac Surg. 2004;78:1528–34.3. Nashef SAM, et al. EuroSCORE II. Eur J Cardiothorac Surg. 2012;41:734–44.
0197IS THERE ANY RELATIONSHIP BETWEEN THE SEVERITY OF CRITICALPATIENTS ASSESSED BY USE OF THE SIMPLIFIED ACUTE PHYSIOLOGYSCORE 3 (SAPS3) AND THEIR TYPE OF HEALTH INSURANCE COVERAGE?
R.V. Gomes1, W.A. Martins2, A.R. Felipe3, M.A.D. Mattos3, M. Assad3, P.M.M. Nogueira3,M.L. Toscano3, C.N.D. Barros3, F.F. Miranda3, L.A.D.A. Campos3
1Hospital Unimed Rio, Intensive Care, Rio de Janeiro, Brazil, 2Hospital Unimed Rio,Research, Rio de Janeiro, Brazil, 3Hospital Unimed Rio, Rio de Janeiro, BrazilINTRODUCTION. The severity and costs of patients (pts) admitted to intensive care units(ICU) have increased. Therefore, assessing the relationship between the health insurancecoverage type and patients’ severity seems to be fundamental.OBJECTIVE. To assess the impact of the health insurance coverage type on the SAPS3value, mortality, and length of hospital and ICU stays.METHODS. From January 3rd to April 3rd, 2013, 240 pts admitted to the ICU of a tertiaryhospital were retrospectively assessed from an Oracle database. They were divided intothree groups based on their health insurance coverage type as follows: group A, high cost;group B, intermediate cost; and group C, low cost. A descriptive analysis was performed andfollowed by Chi square test and Fisher exact test to assess the differences between thegroups regarding categorical variables (death, clinical or surgical admission, Charlsoncomorbidities). To assess the difference between the groups regarding the numerical vari-ables, ANOVA was used and followed by post hoc analysis with Bonferroni adjustment forthe normally distributed variables (SAPS3), while the Kruskal–Wallis test was used for thenonparametric variables (Sequential Organ Failure Assessment score, age, length of ICUstay, length of hospital stay).RESULTS. The SAPS3 value (form completed for 170 pts) was significantly differentbetween the groups A, B and C (p = 0.004) (boxplot below). The Bonferroni test showedthat the difference was significant between B and C (p = 0.004) and between A and C(p = 0.03). The other numerical variables showed no significant difference. Regarding thecategorical variables, group C had a significantly higher number of surgical pts (p = 0.013)(bar graph below) and lower mortality (p = 0.029), but no difference was observedregarding the presence of Charlson [1] comorbidities.
SAPS 3
CONCLUSION. Patients of low cost health insurance coverage have a significantly lowerfirst-hour SAPS3, which is partially explained by the higher number of surgical casesamong them. Comparing with data from the literature (2), our group C pts showed lowermortality.REFERENCES. 1. Charlson ME, Pompei P, Ales KL, Mackenzie CR. A new method ofclassifying prognostic comorbidity in longitudinal studies: Development and validation* 1.J Chron Dis. 1987;40(5):373–83. 2. Lyon SM, Benson NM, Cooke CR, Iwashyna TJ,Ratcliffe SJ, Kahn JM. The effect of insurance status on mortality and procedural use incritically ill patients. Am J Respir Crit Care Med. 2011;184(7):809–15.
0198ACUTE RESPIRATORY VIRAL INFECTION IN PREGNANT: ESTIMATIONOF THE SEVERITY OF STATE CRITERIA AND INDICATIONS FORHOSPITALIZATION IN ICU
O. Khomenko1, R. Tkachenko2, M. Pylypenko2
1Kiev City Centre Reproductive and Perinatal Medicine, Anesthesiology and ICU, Kiev,Ukraine, 2National Medical Academy Postgraduate Education named by P.L. Shupyk, Kiev,UkraineINTRODUCTION. Influenza is often complicated by developing of pneumonia in pregnantwomen. The highest level of mortality from influenza in these patients occurs in the thirdtrimester of pregnancy [1].OBJECTIVES. To improve treatment efficiency and outcome of pregnant with severeacute respiratory viral infection, complicated by pneumonia it is still necessary to unifycriteria patients’ severity of state and indications for intensive care unit (ICU)hospitalisation.METHODS. To assess the sensitivity and specificity of the scores CRB-65 and IDSA/ATS that are used for estimation of patients with community acquired pneumonia (CAP)
26th ESICM ANNUAL CONGRESS — PARIS, FRANCE — 5–9 OCTOBER 2013
[2, 3] we have retrospectively analyzed medical histories of 3 groups of pregnant andpostpartum women with severe influenza A H1N1. Group 1 was 49 patients from all overUkraine who died during the influenza A H1N1 epidemy (2009–2010); group 2 wasmatched 22 survived patients who were treated in the ICU in the Kiev City CentreReproductive and Perinatal Medicine during 2009–2013; group 3–70 hospitalized patientswho didn’t required admission in ICU. In some cases the blood gases analysis were notavailable and PaO2 we calculated from the data of SpO2 by the algorithm introduced by ofKelman [4].RESULTS. Among all 139 patients CRB-65 score has shown low sensitivity in mortalityprognosis (4 % on the day of hospitalization and 6 % on the day admission to the ICU) buthigh specificity according mortality (100 % during hospitalization and 91 % specificityduring admission to the ICU). The sensitivity of the presents of the ‘‘big and small’’ criteriaof IDSA/ATS score in prediction of mortality was higher—34 % during hospitalization and66 % during admitting to the ICU and its specificity—97 % during hospitalization and 68 %during admission to the ICU.CONCLUSIONS. Our data suggest that the ‘‘big and small’’ criteria of IDSA/ATS areinformative and should be used for estimation of the severity of state and evaluation ofindications for hospitalization in ICU during an all period of the disease. The simplerscale CRB-65 could be used for screening patients at the outpatient and admission room.The sensitivity of CAP scale for determining the severity state and criteria for ICUtransferring is found to be unsatisfied and future research in this area has to beconducted.REFERENCE(S). 1. Torres A. Pandemic influenza caused by A(H1N1) in pregnantwomen. Gynecol Obstet Mex. 2010;78(2):121–7. 2. Liapikou A, Ferrer M, Polverino E,et al. Severe community-acquired pneumonia: validation of the infectious Diseases Societyof America/American Thoracic Society Guidelines to Predict Intensive Care Unit Admis-sion. Clin Infect Dis. 2009;48:377–85. 3. Fine M, Auble T, Yealy D, et al. A prediction ruleto identify low-risk patients with community-acquired pneumonia. N Engl J Med.1997;336:43–50. 4. Kelman G. JAP. 1966;21(4):1375.
0199LONG-TERM ADMISSION TO THE INTENSIVE CARE UNIT: A DESCRIPTIVEANALYSIS OF COSTS AND OUTCOMES
S. Rodriguez Villar1, R. Barrientos Vega2, R. Barrientos Yuste3, O. Rice1
1Queen’s Elizabeth Hospital, Critical Care Medicine, London, UK, 2Hospital Virgen de laSalud, Critical Care Medicine, Toledo, Spain, 3Madrid Care Centre for the Disabled,Madrid, SpainINTRODUCTION. The quality of resources that are nowadays available to Intensive CareServices, allows the healing and survival of patients suffering more and more serious andcomplex health state. However, the main diagnosis together with the failure of other organs,often prolong the stay of patients in our units and, as a result, increase morbidity andmortality, as well as they generate higher involved cost level.OBJECTIVE. To assess outcomes in long-term patients at a multi-purpose ICU (IntensiveCare Unit), with follow-ups carried out at one-year post-discharge, with a view to calcu-lating the costs incurred by the hospital in relation to the benefits gained.MATERIALS AND METHODS. Of 3,639 patients consecutively admitted over the courseof 3 years to ICU, 235 (6.5 %) were assessed for the purposes of the study, having spent aperiod exceeding 20 days in intensive care. The survey tool used was a Minimum Data Set(MDS) designed in the ICU in which the study was carried out. The length of ICU stay andhospital stay following discharge from ICU were calculated and, 1 year post-discharge, thepatient/next of kin was contacted in order to carry out a follow-up survey regarding thepatient’s survival and functional status (according to GOS-E scale). Co-morbidity wasassessed according to the Charlson score.RESULTS. The 235 patients under study had an mean length of stay of 37 days, occupied34 % of the ICU beds available and used up 29 % of the ICU’s economic resources(10,992,500 €). Their stay on hospital wards was of a mean of 33 days. Mortality in ICU andon hospital wards was 40 % higher amongst patients of greater age, APACHE II score andCharlson index. Mortality rates were triple in neurosurgical patients. In those dischargedfrom hospital, at the one-year follow-up, there was a mortality rate of 25 %. Only 21 %recovered an acceptable functional status.CONCLUSIONS. Mortality rates in long-term ICU patients are high, both during theirhospital stay and in the first year post-discharge. They do not exhibit a good level ofrecovery and use up a large proportion of economic resources. The development ofassessment scales and protocols which would adjust expenditure according to probableoutcome should perhaps be taken into consideration.REFERENCES. 1. Friedrich J, Wilson G, Chant C. Long-term outcomes and clinicalpredictors of hospital mortality in very long stay intensive care unit patients: a cohort study.Crit Care. 2006;10:R594. 2. Sricker KH, Cavegen R, Takala J. Does ICU length of stayinfluence quality of life? Acta Anaesthesiol Scand. 2005;49:975–36. 3. Heyland DK,Konopad E, Noseworthy TW. Is it ‘‘Worthwhile’’ to continue treating patients with aprolonged stay (\14 days) in de ICU? Chest. 1998;114:192–8.Financial support, including any institutional departmental funds, was not sought for thisstudy.
0200STS RISK SCORE: DOES IT REALLY WORK IN OUR PATIENTES?
M. Perez Cheng1, J. Gonzalez Robledo1, P. Vazquez Paredes1, L. Sanchez Montori1,V. Sagredo Meneses1, J.J. Marin Salazar1, J.M. Gonzalez Santos1, A. Rodriguez Encinas1
1Complejo Asistencial Universitario de Salamanca, Salamanca, SpainINTRODUCTION. The STS score was developed within the largest clinical cardiac sur-gery data registry in the world and tries to asses not only the mortality risk but also majormorbidity endpoints.OBJECTIVES. This study is aimed to validate different endpoints of the STS score:prolonged ventilation greater than 48 h, renal dysfunction or failure requiring dialysis, anycardiac surgery, prolonged hospitalization more than 14 days and operative mortality.METHODS. Data for all patients undergone heart surgery at the University Hospital ofSalamanca, Spain, between 2008 and 2011 were retrospectively collected. We includedthose interventions which meet the criteria of the STS, and collected data from days ofmechanical ventilation, renal failure, reoperation, length of stay and mortality. Data wereanalyzed with SPSS v17.0.RESULTS. We retrospectively analyzed the records of 826 patients who underwent cardiacsurgery. The median age was 73 ± 9.88 (range 23–87 years). Most patients were men (78.1 %).
A valve procedure without coronary artery bypass was performed in 33 % of the cases, acoronary artery bypass grafting-only operation in 46 % and valve procedure with CABG in19 %. Patients had a median ICU stay of 4.73 ± 3 days and 0.3 ± 5.47 days of mechanicalventilation. The incidence of renal failure was 8.1 %, of re-operation 3.8 %, and mortality 6.1 %.The discriminatory power of STS score was analyzed by ROC curves. There were nosignificant statistics differences in the need of re-operation with an AUC of 0.46 (95 %confidence interval 0.36–0.58). The best results were in predicting renal failure, with anAUC of 0.8 (95 % confidence interval 0.75–0.85), and prolonged mechanical ventilationwith an AUC of 0.77 (95 % confidence interval 0.71–0.82). In terms of mortality, the AUCwas 0.75 (95 % confidence interval 0.68–0.82) and prolonged length of stay AUC 0.73(95 % confidence interval, 0.67–0.68).CONCLUSIONS. The STS scale seems an attractive model because it not only predictssurgical risk for mortality, but also takes into account other relevant end-points in post-operative cardiac surgery. However we found certain limitation in the fact that it can’t beused in ascending aorta procedures, tricuspid valve and multiple valve replacements. As forits performance in the end-points we have analyzed, it has had acceptable results, especiallyin terms of prolonged mechanical ventilation and renal failure, but not significant in pre-dicting the need of reoperation.REFERENCE. 1. Caceres M, et al. A short history of the society of thoracic surgeonsnational cardiac database: perceptions of a practicing surgeon. Ann Thorac Surg.2010;89:332–9.
0201FREQUENT ATTENDANCE AT OUR EMERGENCY DEPARTMENT:OVERCONSUMPTION?
I. Brümmer1, J.J.M. Ligtenberg2, J.C. ter Maaten2, CAPE Research Institute, UMCG1UMCG, Emergency Department, Groningen, The Netherlands, 2UMCG, Emergency andInternal Medicine, Groningen, The NetherlandsINTRODUCTION. In previous studies, Emergency Department (ED) frequent users weredefined as visiting the ED[4 to[10 times per year. In these studies frequent attendance wasassociated with poor access to quality primary care, poor socioeconomic background,psychosocial, psychiatric or chronic illness, increased mortality, overall high health serviceuse and high admission rates. Suggested solutions were to improve living standards andcoping mechanisms of these patients.This is the first study regarding frequent ED users in The Netherlands. The study is per-formed at the ED of the University Medical Center Groningen (UMCG), where most EDpatients are referred by a primary care physician, ambulance or specialist. We were inter-ested to know if the above findings are applicable to our situation.OBJECTIVES. To investigate the incidence and characteristics of frequent users of the EDof the UMCG.METHODS. Using the ED computer registration database, all patients were identifiedpresenting to the hospital ED more than 4 times in a one-year period from the 1st of Januaryto the 31st of December 2010. Medical records were reviewed to determine the reason forrepeated ED visits.RESULTS. In 2010 a total of 32665 visits were made to the ED, of which 1,503 visits by254 frequent users. Most of the frequent users visited the ED five times, only ten patientsvisited the ED more than ten times. The mean age of frequent users was 50.6 years, of allED-patients 42.1 years, both with a standard deviation of ±20 years. Frequent users wereself-referred less frequently than other ED-visitors (P \ 0.001) and were more oftenadmitted to hospital (P \ 0.001). Top reasons for frequent attendance were: abdominal pain(14.7 %); dyspnea (10.9 %); collapse/palpitations (10.7 %); extremity problem (8.6 %);infection/abscess (7.7 %); and chestpain (7.3 %).CONCLUSIONS. Frequent users of the ED of the UMCG tend to be older, come less oftenunreferred and are more often admitted to the hospital than the average ED visitor. Very fewpatients are admitted to the ED more than ten times a year. Our group of frequent ED-usersdiffers from those in hospitals and countries where most patients are self-referred. Frequentattendance in our population is not due to overconsumption and poor access to good qualityprimary care but is often related to a chronic illness, e.g. chronic abdominal conditions,COPD, atrial fibrillation, and coronary heart disease. Our frequent users need a differentapproach from those in most previous studies.
0202UNPLANNED INTENSIVE CARE UNIT ADMISSIONS: ARE WE ADHERENTTO GUIDELINES?
V. Metaxa1,2, D. Garcia-Rodriguez1, I. Carrasco1, D. Mateo1
1Newham University Hospital, London, UK, 2King’s College Hospital NHS FoundationTrust, London, UKINTRODUCTION. Recognizing acutely deteriorating patients in hospital wards is oftendelayed or managed inappropriately, resulting in late referral to critical care, avoidableintensive care unit (ICU) admissions and unnecessary patient deaths. These patients oftenshow deteriorating vital signs for several hours before experiencing a serious adverse event.Local implementation of ‘track and trigger’ systems, early involvement of an outreach team,as well as daily review by a consultant are some of the measures proposed by the NationalInstitute of Clinical Excellence and the Academy of Medical Royal Colleges, in an attemptto increase patient safety and provide high quality of care [1, 2].OBJECTIVES. We aimed to estimate the adherence of hospital staff to national guidelinesand ascertain whether it influenced admission severity scores and clinical outcome.METHODS. We retrospectively reviewed all unplanned ICU admissions from August 2011to September 2012 in our unit. Data on demographics, admission diagnosis, Acute Physi-ology and Chronic Health Evaluation (APACHE) II and Modified Early Warning (MEWS)score, physician and outreach team involvement, and outcome were collected.RESULTS. The mean age of admitted patients was 64 years/age with median APACHE andMEWS scores 17 and 4 respectively. The most common reasons for admission were post-operative complications (26 %), circulatory collapse (24 %) and respiratory failure (23 %).Only 16 % and 21 % of the patients have been reviewed by the ward consultant 6 and 24 hprior to ICU admission respectively. Almost half (46 %) of the acutely deteriorating patientswere not seen by the outreach team 6 h prior to admission and 36 % of them were neverreferred to ICU. ICU and hospital mortality were 19 and 11 % respectively. No statisticallysignificant difference was found in admission severity scores and clinical outcome betweenpatients with timely and delayed review by outreach services and senior physicians (p\ 0.05).CONCLUSIONS. Despite clear national standards for in-hospital patient care, we found a lowcompliance with published guidelines. Further implementation strategies, continuous educationand reinforcement are necessary both for medical and nursing staff in order to recognize thedeteriorating patients and timely refer them to outreach teams and senior physicians.
26th ESICM ANNUAL CONGRESS — PARIS, FRANCE — 5–9 OCTOBER 2013
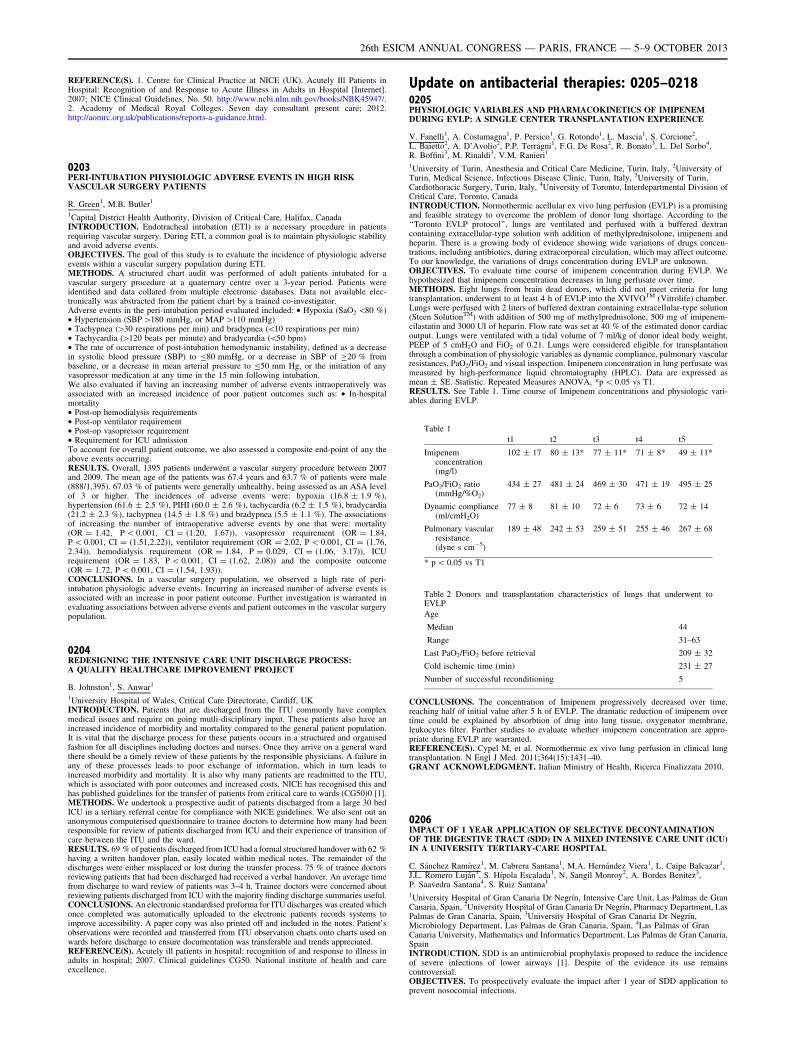
REFERENCE(S). 1. Centre for Clinical Practice at NICE (UK). Acutely Ill Patients inHospital: Recognition of and Response to Acute Illness in Adults in Hospital [Internet].2007; NICE Clinical Guidelines, No. 50. http://www.ncbi.nlm.nih.gov/books/NBK45947/.2. Academy of Medical Royal Colleges. Seven day consultant present care; 2012.http://aomrc.org.uk/publications/reports-a-guidance.html.
0203PERI-INTUBATION PHYSIOLOGIC ADVERSE EVENTS IN HIGH RISKVASCULAR SURGERY PATIENTS
R. Green1, M.B. Butler1
1Capital District Health Authority, Division of Critical Care, Halifax, CanadaINTRODUCTION. Endotracheal intubation (ETI) is a necessary procedure in patientsrequiring vascular surgery. During ETI, a common goal is to maintain physiologic stabilityand avoid adverse events.OBJECTIVES. The goal of this study is to evaluate the incidence of physiologic adverseevents within a vascular surgery population during ETI.METHODS. A structured chart audit was performed of adult patients intubated for avascular surgery procedure at a quaternary centre over a 3-year period. Patients wereidentified and data collated from multiple electronic databases. Data not available elec-tronically was abstracted from the patient chart by a trained co-investigator.Adverse events in the peri-intubation period evaluated included: • Hypoxia (SaO2 \80 %)• Hypertension (SBP [180 mmHg, or MAP [110 mmHg)• Tachypnea ([30 respirations per min) and bradypnea (\10 respirations per min)• Tachycardia ([120 beats per minute) and bradycardia (\50 bpm)• The rate of occurrence of post-intubation hemodynamic instability, defined as a decreasein systolic blood pressure (SBP) to B80 mmHg, or a decrease in SBP of C20 % frombaseline, or a decrease in mean arterial pressure to B50 mm Hg, or the initiation of anyvasopressor medication at any time in the 15 min following intubation.We also evaluated if having an increasing number of adverse events intraoperatively wasassociated with an increased incidence of poor patient outcomes such as: • In-hospitalmortality• Post-op hemodialysis requirements• Post-op ventilator requirement• Post-op vasopressor requirement• Requirement for ICU admissionTo account for overall patient outcome, we also assessed a composite end-point of any theabove events occurring.RESULTS. Overall, 1395 patients underwent a vascular surgery procedure between 2007and 2009. The mean age of the patients was 67.4 years and 63.7 % of patients were male(888/1,395). 67.03 % of patients were generally unhealthy, being assessed as an ASA levelof 3 or higher. The incidences of adverse events were: hypoxia (16.8 ± 1.9 %),hypertension (61.6 ± 2.5 %), PIHI (60.0 ± 2.6 %), tachycardia (6.2 ± 1.5 %), bradycardia(21.2 ± 2.3 %), tachypnea (14.5 ± 1.8 %) and bradypnea (5.5 ± 1.1 %). The associationsof increasing the number of intraoperative adverse events by one that were: mortality(OR = 1.42, P \ 0.001, CI = (1.20, 1.67)), vasopressor requirement (OR = 1.84,P \ 0.001, CI = (1.51,2.22)), ventilator requirement (OR = 2.02, P \ 0.001, CI = (1.76,2.34)), hemodialysis requirement (OR = 1.84, P = 0.029, CI = (1.06, 3.17)), ICUrequirement (OR = 1.83, P \ 0.001, CI = (1.62, 2.08)) and the composite outcome(OR = 1.72, P \ 0.001, CI = (1.54, 1.93)).CONCLUSIONS. In a vascular surgery population, we observed a high rate of peri-intubation physiologic adverse events. Incurring an increased number of adverse events isassociated with an increase in poor patient outcome. Further investigation is warranted inevaluating associations between adverse events and patient outcomes in the vascular surgerypopulation.
0204REDESIGNING THE INTENSIVE CARE UNIT DISCHARGE PROCESS:A QUALITY HEALTHCARE IMPROVEMENT PROJECT
B. Johnston1, S. Anwar1
1University Hospital of Wales, Critical Care Directorate, Cardiff, UKINTRODUCTION. Patients that are discharged from the ITU commonly have complexmedical issues and require on going mutli-disciplinary input. These patients also have anincreased incidence of morbidity and mortality compared to the general patient population.It is vital that the discharge process for these patients occurs in a structured and organisedfashion for all disciplines including doctors and nurses. Once they arrive on a general wardthere should be a timely review of these patients by the responsible physicians. A failure inany of these processes leads to poor exchange of information, which in turn leads toincreased morbidity and mortality. It is also why many patients are readmitted to the ITU,which is associated with poor outcomes and increased costs. NICE has recognised this andhas published guidelines for the transfer of patients from critical care to wards (CG50)0 [1].METHODS. We undertook a prospective audit of patients discharged from a large 30 bedICU in a tertiary referral centre for compliance with NICE guidelines. We also sent out ananonymous computerised questionnaire to trainee doctors to determine how many had beenresponsible for review of patients discharged from ICU and their experience of transition ofcare between the ITU and the ward.RESULTS. 69 % of patients discharged from ICU had a formal structured handover with 62 %having a written handover plan, easily located within medical notes. The remainder of thedischarges were either misplaced or lost during the transfer process. 75 % of trainee doctorsreviewing patients that had been discharged had received a verbal handover. An average timefrom discharge to ward review of patients was 3–4 h. Trainee doctors were concerned aboutreviewing patients discharged from ICU with the majority finding discharge summaries useful.CONCLUSIONS. An electronic standardised proforma for ITU discharges was created whichonce completed was automatically uploaded to the electronic patients records systems toimprove accessibility. A paper copy was also printed off and included in the notes. Patient’sobservations were recorded and transferred from ITU observation charts onto charts used onwards before discharge to ensure documentation was transferable and trends appreciated.REFERENCE(S). Acutely ill patients in hospital: recognition of and response to illness inadults in hospital; 2007. Clinical guidelines CG50. National institute of health and careexcellence.
Update on antibacterial therapies: 0205–02180205PHYSIOLOGIC VARIABLES AND PHARMACOKINETICS OF IMIPENEMDURING EVLP: A SINGLE CENTER TRANSPLANTATION EXPERIENCE
V. Fanelli1, A. Costamagna1, P. Persico1, G. Rotondo1, L. Mascia1, S. Corcione2,L. Baietto2, A. D’Avolio2, P.P. Terragni1, F.G. De Rosa2, R. Bonato3, L. Del Sorbo4,R. Boffini3, M. Rinaldi3, V.M. Ranieri1
1University of Turin, Anesthesia and Critical Care Medicine, Turin, Italy, 2University ofTurin, Medical Science, Infectious Disease Clinic, Turin, Italy, 3University of Turin,Cardiothoracic Surgery, Turin, Italy, 4University of Toronto, Interdepartmental Division ofCritical Care, Toronto, CanadaINTRODUCTION. Normothermic acellular ex vivo lung perfusion (EVLP) is a promisingand feasible strategy to overcome the problem of donor lung shortage. According to the‘‘Toronto EVLP protocol’’, lungs are ventilated and perfused with a buffered dextrancontaining extracellular-type solution with addition of methylprednisolone, imipenem andheparin. There is a growing body of evidence showing wide variations of drugs concen-trations, including antibiotics, during extracorporeal circulation, which may affect outcome.To our knowledge, the variations of drugs concentration during EVLP are unknown.OBJECTIVES. To evaluate time course of imipenem concentration during EVLP. Wehypothesized that imipenem concentration decreases in lung perfusate over time.METHODS. Eight lungs from brain dead donors, which did not meet criteria for lungtransplantation, underwent to at least 4 h of EVLP into the XVIVOTM (Vitrolife) chamber.Lungs were perfused with 2 liters of buffered dextran containing extracellular-type solution(Steen SolutionTM) with addition of 500 mg of methylprednisolone, 500 mg of imipenem-cilastatin and 3000 UI of heparin. Flow rate was set at 40 % of the estimated donor cardiacoutput. Lungs were ventilated with a tidal volume of 7 ml/kg of donor ideal body weight,PEEP of 5 cmH2O and FiO2 of 0.21. Lungs were considered eligible for transplantationthrough a combination of physiologic variables as dynamic compliance, pulmonary vascularresistances, PaO2/FiO2 and visual inspection. Imipenem concentration in lung perfusate wasmeasured by high-performance liquid chromatography (HPLC). Data are expressed asmean ± SE. Statistic. Repeated Measures ANOVA, *p \ 0.05 vs T1.RESULTS. See Table 1. Time course of Imipenem concentrations and physiologic vari-ables during EVLP.
Table 1
t1 t2 t3 t4 t5
Imipenemconcentration(mg/l)
102 ± 17 80 ± 13* 77 ± 11* 71 ± 8* 49 ± 11*
PaO2/FiO2 ratio(mmHg/%O2)
434 ± 27 481 ± 24 469 ± 30 471 ± 19 495 ± 25
Dynamic compliance(ml/cmH2O)
77 ± 8 81 ± 10 72 ± 6 73 ± 6 72 ± 14
Pulmonary vascularresistance(dyne s cm-5)
189 ± 48 242 ± 53 259 ± 51 255 ± 46 267 ± 68
* p \ 0.05 vs T1
Table 2 Donors and transplantation characteristics of lungs that underwent toEVLP
Age
Median 44
Range 31–63
Last PaO2/FiO2 before retrieval 209 ± 32
Cold ischemic time (min) 231 ± 27
Number of successful reconditioning 5
CONCLUSIONS. The concentration of Imipenem progressively decreased over time,reaching half of initial value after 5 h of EVLP. The dramatic reduction of imipenem overtime could be explained by absorbtion of drug into lung tissue, oxygenator membrane,leukocytes filter. Further studies to evaluate whether imipenem concentration are appro-priate during EVLP are warranted.REFERENCE(S). Cypel M, et al. Normothermic ex vivo lung perfusion in clinical lungtransplantation. N Engl J Med. 2011;364(15):1431–40.GRANT ACKNOWLEDGMENT. Italian Ministry of Health, Ricerca Finalizzata 2010.
0206IMPACT OF 1 YEAR APPLICATION OF SELECTIVE DECONTAMINATIONOF THE DIGESTIVE TRACT (SDD) IN A MIXED INTENSIVE CARE UNIT (ICU)IN A UNIVERSITY TERTIARY-CARE HOSPITAL
C. Sánchez Ramı́rez1, M. Cabrera Santana1, M.A. Hernández Viera1, L. Caipe Balcazar1,J.L. Romero Luján1, S. Hı́pola Escalada1, N. Sangil Monroy2, A. Bordes Benitez3,P. Saavedra Santana4, S. Ruiz Santana1
1University Hospital of Gran Canaria Dr Negrı́n, Intensive Care Unit, Las Palmas de GranCanaria, Spain, 2University Hospital of Gran Canaria Dr Negrı́n, Pharmacy Department, LasPalmas de Gran Canaria, Spain, 3University Hospital of Gran Canaria Dr Negrı́n,Microbiology Department, Las Palmas de Gran Canaria, Spain, 4Las Palmas of GranCanaria University, Mathematics and Informatics Department, Las Palmas de Gran Canaria,SpainINTRODUCTION. SDD is an antimicrobial prophylaxis proposed to reduce the incidenceof severe infections of lower airways [1]. Despite of the evidence its use remainscontroversial.OBJECTIVES. To prospectively evaluate the impact after 1 year of SDD application toprevent nosocomial infections.
26th ESICM ANNUAL CONGRESS — PARIS, FRANCE — 5–9 OCTOBER 2013
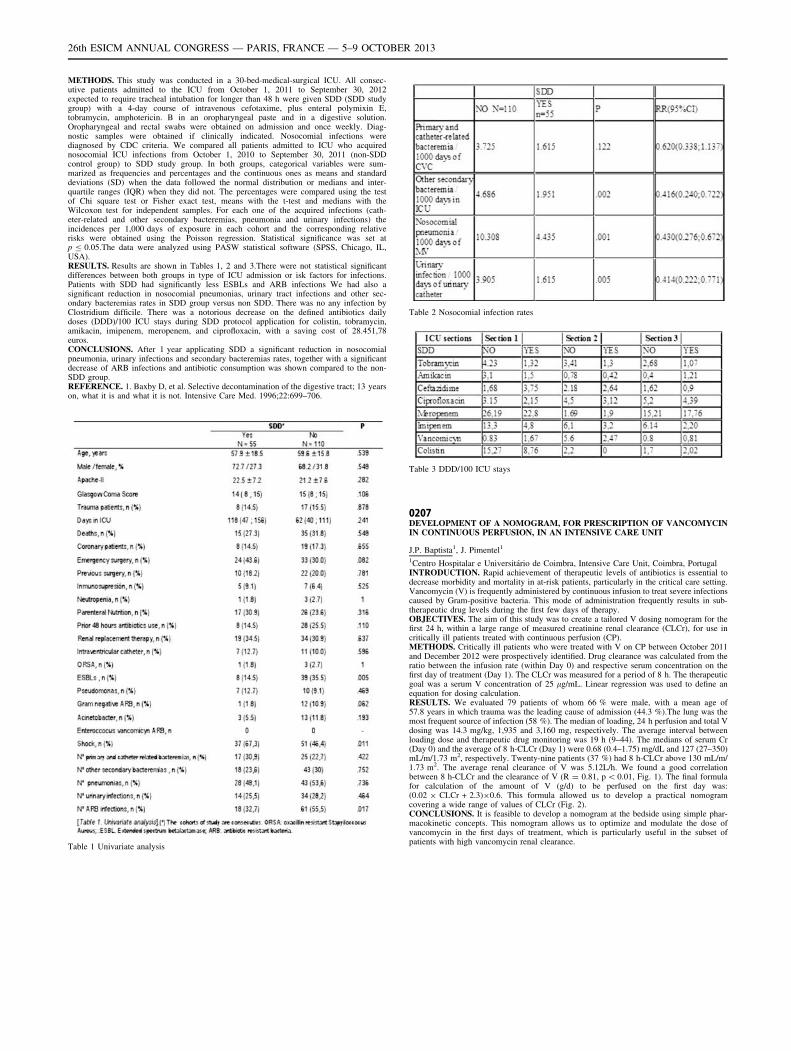
METHODS. This study was conducted in a 30-bed-medical-surgical ICU. All consec-utive patients admitted to the ICU from October 1, 2011 to September 30, 2012expected to require tracheal intubation for longer than 48 h were given SDD (SDD studygroup) with a 4-day course of intravenous cefotaxime, plus enteral polymixin E,tobramycin, amphotericin. B in an oropharyngeal paste and in a digestive solution.Oropharyngeal and rectal swabs were obtained on admission and once weekly. Diag-nostic samples were obtained if clinically indicated. Nosocomial infections werediagnosed by CDC criteria. We compared all patients admitted to ICU who acquirednosocomial ICU infections from October 1, 2010 to September 30, 2011 (non-SDDcontrol group) to SDD study group. In both groups, categorical variables were sum-marized as frequencies and percentages and the continuous ones as means and standarddeviations (SD) when the data followed the normal distribution or medians and inter-quartile ranges (IQR) when they did not. The percentages were compared using the testof Chi square test or Fisher exact test, means with the t-test and medians with theWilcoxon test for independent samples. For each one of the acquired infections (cath-eter-related and other secondary bacteremias, pneumonia and urinary infections) theincidences per 1,000 days of exposure in each cohort and the corresponding relativerisks were obtained using the Poisson regression. Statistical significance was set atp B 0.05.The data were analyzed using PASW statistical software (SPSS, Chicago, IL,USA).RESULTS. Results are shown in Tables 1, 2 and 3.There were not statistical significantdifferences between both groups in type of ICU admission or isk factors for infections.Patients with SDD had significantly less ESBLs and ARB infections We had also asignificant reduction in nosocomial pneumonias, urinary tract infections and other sec-ondary bacteremias rates in SDD group versus non SDD. There was no any infection byClostridium difficile. There was a notorious decrease on the defined antibiotics dailydoses (DDD)/100 ICU stays during SDD protocol application for colistin, tobramycin,amikacin, imipenem, meropenem, and ciprofloxacin, with a saving cost of 28.451,78euros.CONCLUSIONS. After 1 year applicating SDD a significant reduction in nosocomialpneumonia, urinary infections and secondary bacteremias rates, together with a significantdecrease of ARB infections and antibiotic consumption was shown compared to the non-SDD group.REFERENCE. 1. Baxby D, et al. Selective decontamination of the digestive tract; 13 yearson, what it is and what it is not. Intensive Care Med. 1996;22:699–706.
Table 1 Univariate analysis
Table 2 Nosocomial infection rates
Table 3 DDD/100 ICU stays
0207DEVELOPMENT OF A NOMOGRAM, FOR PRESCRIPTION OF VANCOMYCININ CONTINUOUS PERFUSION, IN AN INTENSIVE CARE UNIT
J.P. Baptista1, J. Pimentel1
1Centro Hospitalar e Universitário de Coimbra, Intensive Care Unit, Coimbra, PortugalINTRODUCTION. Rapid achievement of therapeutic levels of antibiotics is essential todecrease morbidity and mortality in at-risk patients, particularly in the critical care setting.Vancomycin (V) is frequently administered by continuous infusion to treat severe infectionscaused by Gram-positive bacteria. This mode of administration frequently results in sub-therapeutic drug levels during the first few days of therapy.OBJECTIVES. The aim of this study was to create a tailored V dosing nomogram for thefirst 24 h, within a large range of measured creatinine renal clearance (CLCr), for use incritically ill patients treated with continuous perfusion (CP).METHODS. Critically ill patients who were treated with V on CP between October 2011and December 2012 were prospectively identified. Drug clearance was calculated from theratio between the infusion rate (within Day 0) and respective serum concentration on thefirst day of treatment (Day 1). The CLCr was measured for a period of 8 h. The therapeuticgoal was a serum V concentration of 25 lg/mL. Linear regression was used to define anequation for dosing calculation.RESULTS. We evaluated 79 patients of whom 66 % were male, with a mean age of57.8 years in which trauma was the leading cause of admission (44.3 %).The lung was themost frequent source of infection (58 %). The median of loading, 24 h perfusion and total Vdosing was 14.3 mg/kg, 1,935 and 3,160 mg, respectively. The average interval betweenloading dose and therapeutic drug monitoring was 19 h (9–44). The medians of serum Cr(Day 0) and the average of 8 h-CLCr (Day 1) were 0.68 (0.4–1.75) mg/dL and 127 (27–350)mL/m/1.73 m2, respectively. Twenty-nine patients (37 %) had 8 h-CLCr above 130 mL/m/1.73 m2. The average renal clearance of V was 5.12L/h. We found a good correlationbetween 8 h-CLCr and the clearance of V (R = 0.81, p \ 0.01, Fig. 1). The final formulafor calculation of the amount of V (g/d) to be perfused on the first day was:(0.02 9 CLCr + 2.3)90.6. This formula allowed us to develop a practical nomogramcovering a wide range of values of CLCr (Fig. 2).CONCLUSIONS. It is feasible to develop a nomogram at the bedside using simple phar-macokinetic concepts. This nomogram allows us to optimize and modulate the dose ofvancomycin in the first days of treatment, which is particularly useful in the subset ofpatients with high vancomycin renal clearance.
26th ESICM ANNUAL CONGRESS — PARIS, FRANCE — 5–9 OCTOBER 2013
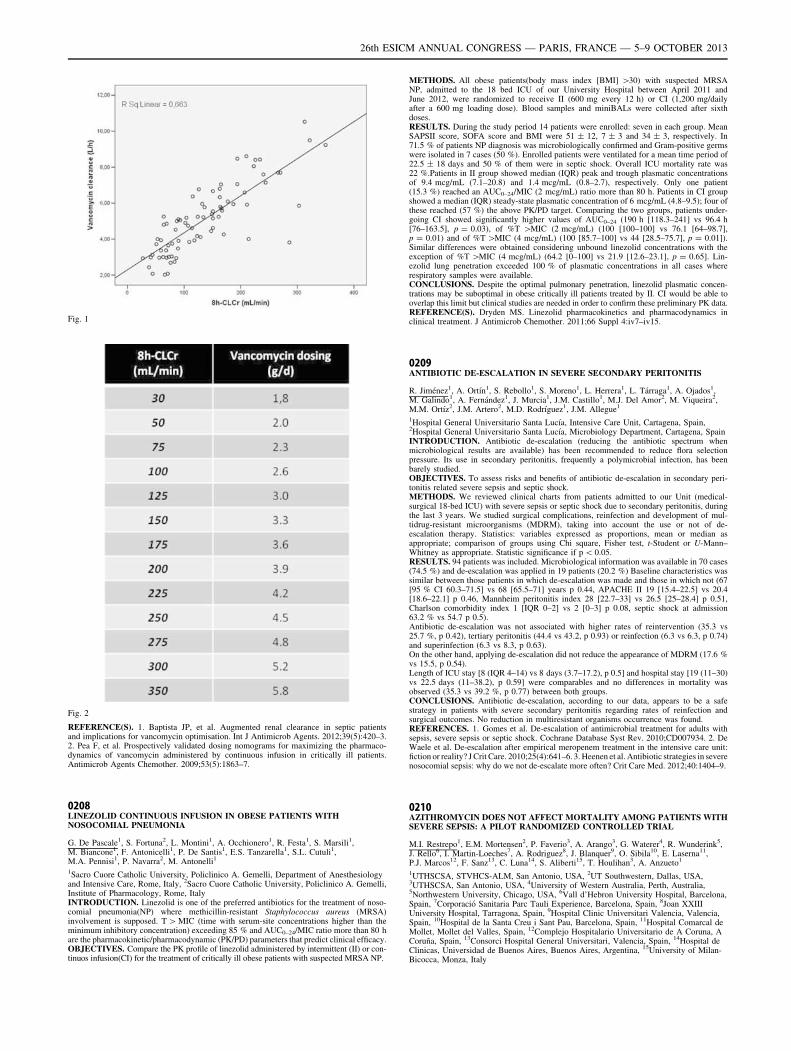
Fig. 1
Fig. 2
REFERENCE(S). 1. Baptista JP, et al. Augmented renal clearance in septic patientsand implications for vancomycin optimisation. Int J Antimicrob Agents. 2012;39(5):420–3.2. Pea F, et al. Prospectively validated dosing nomograms for maximizing the pharmaco-dynamics of vancomycin administered by continuous infusion in critically ill patients.Antimicrob Agents Chemother. 2009;53(5):1863–7.
0208LINEZOLID CONTINUOUS INFUSION IN OBESE PATIENTS WITHNOSOCOMIAL PNEUMONIA
G. De Pascale1, S. Fortuna2, L. Montini1, A. Occhionero1, R. Festa1, S. Marsili1,M. Biancone1, F. Antonicelli1, P. De Santis1, E.S. Tanzarella1, S.L. Cutuli1,M.A. Pennisi1, P. Navarra2, M. Antonelli1
1Sacro Cuore Catholic University, Policlinico A. Gemelli, Department of Anesthesiologyand Intensive Care, Rome, Italy, 2Sacro Cuore Catholic University, Policlinico A. Gemelli,Institute of Pharmacology, Rome, ItalyINTRODUCTION. Linezolid is one of the preferred antibiotics for the treatment of noso-comial pneumonia(NP) where methicillin-resistant Staphylococcus aureus (MRSA)involvement is supposed. T [ MIC (time with serum-site concentrations higher than theminimum inhibitory concentration) exceeding 85 % and AUC0–24/MIC ratio more than 80 hare the pharmacokinetic/pharmacodynamic (PK/PD) parameters that predict clinical efficacy.OBJECTIVES. Compare the PK profile of linezolid administered by intermittent (II) or con-tinuos infusion(CI) for the treatment of critically ill obese patients with suspected MRSA NP.
METHODS. All obese patients(body mass index [BMI] [30) with suspected MRSANP, admitted to the 18 bed ICU of our University Hospital between April 2011 andJune 2012, were randomized to receive II (600 mg every 12 h) or CI (1,200 mg/dailyafter a 600 mg loading dose). Blood samples and miniBALs were collected after sixthdoses.RESULTS. During the study period 14 patients were enrolled: seven in each group. MeanSAPSII score, SOFA score and BMI were 51 ± 12, 7 ± 3 and 34 ± 3, respectively. In71.5 % of patients NP diagnosis was microbiologically confirmed and Gram-positive germswere isolated in 7 cases (50 %). Enrolled patients were ventilated for a mean time period of22.5 ± 18 days and 50 % of them were in septic shock. Overall ICU mortality rate was22 %.Patients in II group showed median (IQR) peak and trough plasmatic concentrationsof 9.4 mcg/mL (7.1–20.8) and 1.4 mcg/mL (0.8–2.7), respectively. Only one patient(15.3 %) reached an AUC0–24/MIC (2 mcg/mL) ratio more than 80 h. Patients in CI groupshowed a median (IQR) steady-state plasmatic concentration of 6 mcg/mL (4.8–9.5); four ofthese reached (57 %) the above PK/PD target. Comparing the two groups, patients under-going CI showed significantly higher values of AUC0–24 (190 h [118.3–241] vs 96.4 h[76–163.5], p = 0.03), of %T [MIC (2 mcg/mL) (100 [100–100] vs 76.1 [64–98.7],p = 0.01) and of %T [MIC (4 mcg/mL) (100 [85.7–100] vs 44 [28.5–75.7], p = 0.01]).Similar differences were obtained considering unbound linezolid concentrations with theexception of %T [MIC (4 mcg/mL) (64.2 [0–100] vs 21.9 [12.6–23.1], p = 0.65]. Lin-ezolid lung penetration exceeded 100 % of plasmatic concentrations in all cases whererespiratory samples were available.CONCLUSIONS. Despite the optimal pulmonary penetration, linezolid plasmatic concen-trations may be suboptimal in obese critically ill patients treated by II. CI would be able tooverlap this limit but clinical studies are needed in order to confirm these preliminary PK data.REFERENCE(S). Dryden MS. Linezolid pharmacokinetics and pharmacodynamics inclinical treatment. J Antimicrob Chemother. 2011;66 Suppl 4:iv7–iv15.
0209ANTIBIOTIC DE-ESCALATION IN SEVERE SECONDARY PERITONITIS
R. Jiménez1, A. Ortı́n1, S. Rebollo1, S. Moreno1, L. Herrera1, L. Tárraga1, A. Ojados1,M. Galindo1, A. Fernández1, J. Murcia1, J.M. Castillo1, M.J. Del Amor2, M. Viqueira2,M.M. Ortı́z2, J.M. Artero2, M.D. Rodrı́guez1, J.M. Allegue1
1Hospital General Universitario Santa Lucı́a, Intensive Care Unit, Cartagena, Spain,2Hospital General Universitario Santa Lucı́a, Microbiology Department, Cartagena, SpainINTRODUCTION. Antibiotic de-escalation (reducing the antibiotic spectrum whenmicrobiological results are available) has been recommended to reduce flora selectionpressure. Its use in secondary peritonitis, frequently a polymicrobial infection, has beenbarely studied.OBJECTIVES. To assess risks and benefits of antibiotic de-escalation in secondary peri-tonitis related severe sepsis and septic shock.METHODS. We reviewed clinical charts from patients admitted to our Unit (medical-surgical 18-bed ICU) with severe sepsis or septic shock due to secondary peritonitis, duringthe last 3 years. We studied surgical complications, reinfection and development of mul-tidrug-resistant microorganisms (MDRM), taking into account the use or not of de-escalation therapy. Statistics: variables expressed as proportions, mean or median asappropriate; comparison of groups using Chi square, Fisher test, t-Student or U-Mann–Whitney as appropriate. Statistic significance if p \ 0.05.RESULTS. 94 patients was included. Microbiological information was available in 70 cases(74.5 %) and de-escalation was applied in 19 patients (20.2 %) Baseline characteristics wassimilar between those patients in which de-escalation was made and those in which not (67[95 % CI 60.3–71.5] vs 68 [65.5–71] years p 0.44, APACHE II 19 [15.4–22.5] vs 20.4[18.6–22.1] p 0.46, Mannheim peritonitis index 28 [22.7–33] vs 26.5 [25–28.4] p 0.51,Charlson comorbidity index 1 [IQR 0–2] vs 2 [0–3] p 0.08, septic shock at admission63.2 % vs 54.7 p 0.5).Antibiotic de-escalation was not associated with higher rates of reintervention (35.3 vs25.7 %, p 0.42), tertiary peritonitis (44.4 vs 43.2, p 0.93) or reinfection (6.3 vs 6.3, p 0.74)and superinfection (6.3 vs 8.3, p 0.63).On the other hand, applying de-escalation did not reduce the appearance of MDRM (17.6 %vs 15.5, p 0.54).Length of ICU stay [8 (IQR 4–14) vs 8 days (3.7–17.2), p 0.5] and hospital stay [19 (11–30)vs 22.5 days (11–38.2), p 0.59] were comparables and no differences in mortality wasobserved (35.3 vs 39.2 %, p 0.77) between both groups.CONCLUSIONS. Antibiotic de-escalation, according to our data, appears to be a safestrategy in patients with severe secondary peritonitis regarding rates of reinfection andsurgical outcomes. No reduction in multiresistant organisms occurrence was found.REFERENCES. 1. Gomes et al. De-escalation of antimicrobial treatment for adults withsepsis, severe sepsis or septic shock. Cochrane Database Syst Rev. 2010;CD007934. 2. DeWaele et al. De-escalation after empirical meropenem treatment in the intensive care unit:fiction or reality? J Crit Care. 2010;25(4):641–6. 3. Heenen et al. Antibiotic strategies in severenosocomial sepsis: why do we not de-escalate more often? Crit Care Med. 2012;40:1404–9.
0210AZITHROMYCIN DOES NOT AFFECT MORTALITY AMONG PATIENTS WITHSEVERE SEPSIS: A PILOT RANDOMIZED CONTROLLED TRIAL
M.I. Restrepo1, E.M. Mortensen2, P. Faverio3, A. Arango3, G. Waterer4, R. Wunderink5,J. Rello6, I. Martin-Loeches7, A. Rodriguez8, J. Blanquer9, O. Sibila10, E. Laserna11,P.J. Marcos12, F. Sanz13, C. Luna14, S. Aliberti15, T. Houlihan3, A. Anzueto1
1UTHSCSA, STVHCS-ALM, San Antonio, USA, 2UT Southwestern, Dallas, USA,3UTHSCSA, San Antonio, USA, 4University of Western Australia, Perth, Australia,5Northwestern University, Chicago, USA, 6Vall d’Hebron University Hospital, Barcelona,Spain, 7Corporació Sanitaria Parc Tauli Experience, Barcelona, Spain, 8Joan XXIIIUniversity Hospital, Tarragona, Spain, 9Hospital Clinic Universitari Valencia, Valencia,Spain, 10Hospital de la Santa Creu i Sant Pau, Barcelona, Spain, 11Hospital Comarcal deMollet, Mollet del Valles, Spain, 12Complejo Hospitalario Universitario de A Coruna, ACoruña, Spain, 13Consorci Hospital General Universitari, Valencia, Spain, 14Hospital deClinicas, Universidad de Buenos Aires, Buenos Aires, Argentina, 15University of Milan-Bicocca, Monza, Italy
26th ESICM ANNUAL CONGRESS — PARIS, FRANCE — 5–9 OCTOBER 2013
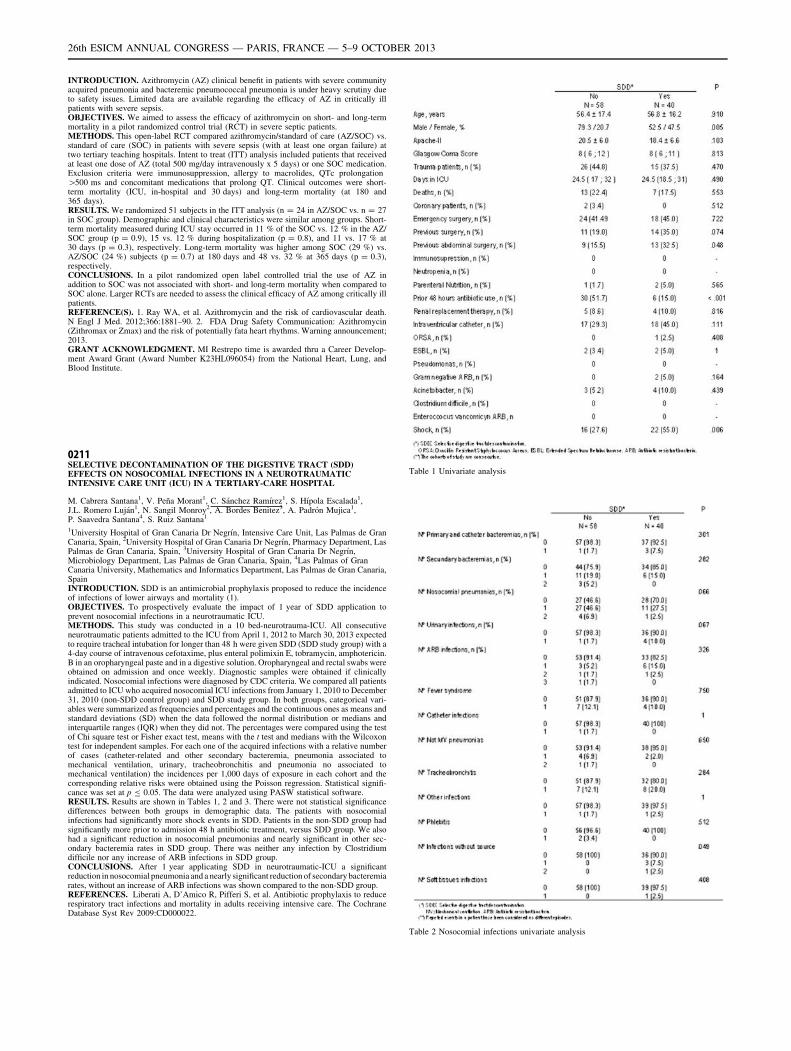
INTRODUCTION. Azithromycin (AZ) clinical benefit in patients with severe communityacquired pneumonia and bacteremic pneumococcal pneumonia is under heavy scrutiny dueto safety issues. Limited data are available regarding the efficacy of AZ in critically illpatients with severe sepsis.OBJECTIVES. We aimed to assess the efficacy of azithromycin on short- and long-termmortality in a pilot randomized control trial (RCT) in severe septic patients.METHODS. This open-label RCT compared azithromycin/standard of care (AZ/SOC) vs.standard of care (SOC) in patients with severe sepsis (with at least one organ failure) attwo tertiary teaching hospitals. Intent to treat (ITT) analysis included patients that receivedat least one dose of AZ (total 500 mg/day intravenously x 5 days) or one SOC medication.Exclusion criteria were immunosuppression, allergy to macrolides, QTc prolongation[500 ms and concomitant medications that prolong QT. Clinical outcomes were short-term mortality (ICU, in-hospital and 30 days) and long-term mortality (at 180 and365 days).RESULTS. We randomized 51 subjects in the ITT analysis (n = 24 in AZ/SOC vs. n = 27in SOC group). Demographic and clinical characteristics were similar among groups. Short-term mortality measured during ICU stay occurred in 11 % of the SOC vs. 12 % in the AZ/SOC group (p = 0.9), 15 vs. 12 % during hospitalization (p = 0.8), and 11 vs. 17 % at30 days (p = 0.3), respectively. Long-term mortality was higher among SOC (29 %) vs.AZ/SOC (24 %) subjects (p = 0.7) at 180 days and 48 vs. 32 % at 365 days (p = 0.3),respectively.CONCLUSIONS. In a pilot randomized open label controlled trial the use of AZ inaddition to SOC was not associated with short- and long-term mortality when compared toSOC alone. Larger RCTs are needed to assess the clinical efficacy of AZ among critically illpatients.REFERENCE(S). 1. Ray WA, et al. Azithromycin and the risk of cardiovascular death.N Engl J Med. 2012;366:1881–90. 2. FDA Drug Safety Communication: Azithromycin(Zithromax or Zmax) and the risk of potentially fata heart rhythms. Warning announcement;2013.GRANT ACKNOWLEDGMENT. MI Restrepo time is awarded thru a Career Develop-ment Award Grant (Award Number K23HL096054) from the National Heart, Lung, andBlood Institute.
0211SELECTIVE DECONTAMINATION OF THE DIGESTIVE TRACT (SDD)EFFECTS ON NOSOCOMIAL INFECTIONS IN A NEUROTRAUMATICINTENSIVE CARE UNIT (ICU) IN A TERTIARY-CARE HOSPITAL
M. Cabrera Santana1, V. Peña Morant1, C. Sánchez Ramı́rez1, S. Hı́pola Escalada1,J.L. Romero Luján1, N. Sangil Monroy2, A. Bordes Benitez3, A. Padrón Mujica1,P. Saavedra Santana4, S. Ruiz Santana1
1University Hospital of Gran Canaria Dr Negrı́n, Intensive Care Unit, Las Palmas de GranCanaria, Spain, 2University Hospital of Gran Canaria Dr Negrı́n, Pharmacy Department, LasPalmas de Gran Canaria, Spain, 3University Hospital of Gran Canaria Dr Negrı́n,Microbiology Department, Las Palmas de Gran Canaria, Spain, 4Las Palmas of GranCanaria University, Mathematics and Informatics Department, Las Palmas de Gran Canaria,SpainINTRODUCTION. SDD is an antimicrobial prophylaxis proposed to reduce the incidenceof infections of lower airways and mortality (1).OBJECTIVES. To prospectively evaluate the impact of 1 year of SDD application toprevent nosocomial infections in a neurotraumatic ICU.METHODS. This study was conducted in a 10 bed-neurotrauma-ICU. All consecutiveneurotraumatic patients admitted to the ICU from April 1, 2012 to March 30, 2013 expectedto require tracheal intubation for longer than 48 h were given SDD (SDD study group) with a4-day course of intravenous cefotaxime, plus enteral polimixin E, tobramycin, amphotericin.B in an oropharyngeal paste and in a digestive solution. Oropharyngeal and rectal swabs wereobtained on admission and once weekly. Diagnostic samples were obtained if clinicallyindicated. Nosocomial infections were diagnosed by CDC criteria. We compared all patientsadmitted to ICU who acquired nosocomial ICU infections from January 1, 2010 to December31, 2010 (non-SDD control group) and SDD study group. In both groups, categorical vari-ables were summarized as frequencies and percentages and the continuous ones as means andstandard deviations (SD) when the data followed the normal distribution or medians andinterquartile ranges (IQR) when they did not. The percentages were compared using the testof Chi square test or Fisher exact test, means with the t test and medians with the Wilcoxontest for independent samples. For each one of the acquired infections with a relative numberof cases (catheter-related and other secondary bacteremia, pneumonia associated tomechanical ventilation, urinary, tracheobronchitis and pneumonia no associated tomechanical ventilation) the incidences per 1,000 days of exposure in each cohort and thecorresponding relative risks were obtained using the Poisson regression. Statistical signifi-cance was set at p B 0.05. The data were analyzed using PASW statistical software.RESULTS. Results are shown in Tables 1, 2 and 3. There were not statistical significancedifferences between both groups in demographic data. The patients with nosocomialinfections had significantly more shock events in SDD. Patients in the non-SDD group hadsignificantly more prior to admission 48 h antibiotic treatment, versus SDD group. We alsohad a significant reduction in nosocomial pneumonias and nearly significant in other sec-ondary bacteremia rates in SDD group. There was neither any infection by Clostridiumdifficile nor any increase of ARB infections in SDD group.CONCLUSIONS. After 1 year applicating SDD in neurotraumatic-ICU a significantreduction in nosocomial pneumonia and a nearly significant reduction of secondary bacteremiarates, without an increase of ARB infections was shown compared to the non-SDD group.REFERENCES. Liberati A, D’Amico R, Pifferi S, et al. Antibiotic prophylaxis to reducerespiratory tract infections and mortality in adults receiving intensive care. The CochraneDatabase Syst Rev 2009:CD000022.
Table 1 Univariate analysis
Table 2 Nosocomial infections univariate analysis
26th ESICM ANNUAL CONGRESS — PARIS, FRANCE — 5–9 OCTOBER 2013
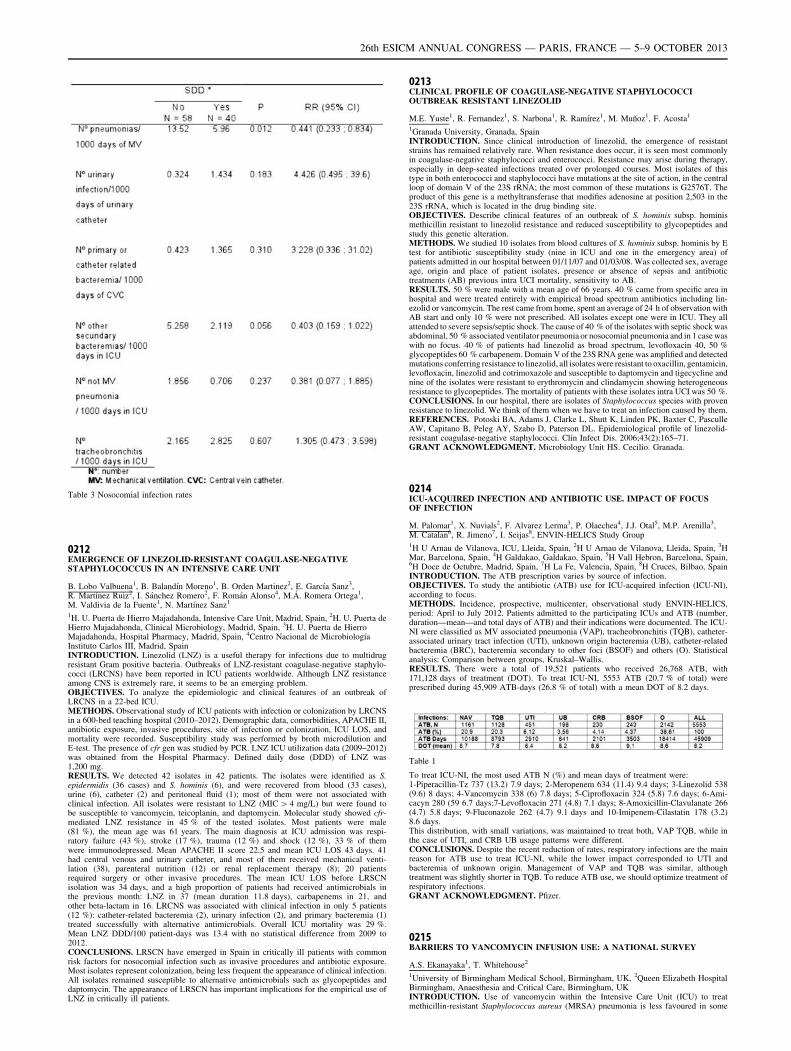
Table 3 Nosocomial infection rates
0212EMERGENCE OF LINEZOLID-RESISTANT COAGULASE-NEGATIVESTAPHYLOCOCCUS IN AN INTENSIVE CARE UNIT
B. Lobo Valbuena1, B. Balandı́n Moreno1, B. Orden Martinez2, E. Garcı́a Sanz3,R. Martı́nez Ruiz2, I. Sánchez Romero2, F. Román Alonso4, M.Á. Romera Ortega1,M. Valdivia de la Fuente1, N. Martı́nez Sanz1
1H. U. Puerta de Hierro Majadahonda, Intensive Care Unit, Madrid, Spain, 2H. U. Puerta deHierro Majadahonda, Clinical Microbiology, Madrid, Spain, 3H. U. Puerta de HierroMajadahonda, Hospital Pharmacy, Madrid, Spain, 4Centro Nacional de Microbiologı́aInstituto Carlos III, Madrid, SpainINTRODUCTION. Linezolid (LNZ) is a useful therapy for infections due to multidrugresistant Gram positive bacteria. Outbreaks of LNZ-resistant coagulase-negative staphylo-cocci (LRCNS) have been reported in ICU patients worldwide. Although LNZ resistanceamong CNS is extremely rare, it seems to be an emerging problem.OBJECTIVES. To analyze the epidemiologic and clinical features of an outbreak ofLRCNS in a 22-bed ICU.METHODS. Observational study of ICU patients with infection or colonization by LRCNSin a 600-bed teaching hospital (2010–2012). Demographic data, comorbidities, APACHE II,antibiotic exposure, invasive procedures, site of infection or colonization, ICU LOS, andmortality were recorded. Susceptibility study was performed by broth microdilution andE-test. The presence of cfr gen was studied by PCR. LNZ ICU utilization data (2009–2012)was obtained from the Hospital Pharmacy. Defined daily dose (DDD) of LNZ was1,200 mg.RESULTS. We detected 42 isolates in 42 patients. The isolates were identified as S.epidermidis (36 cases) and S. hominis (6), and were recovered from blood (33 cases),urine (6), catheter (2) and peritoneal fluid (1); most of them were not associated withclinical infection. All isolates were resistant to LNZ (MIC [ 4 mg/L) but were found tobe susceptible to vancomycin, teicoplanin, and daptomycin. Molecular study showed cfr-mediated LNZ resistance in 45 % of the tested isolates. Most patients were male(81 %), the mean age was 61 years. The main diagnosis at ICU admission was respi-ratory failure (43 %), stroke (17 %), trauma (12 %) and shock (12 %), 33 % of themwere immunodepressed. Mean APACHE II score 22.5 and mean ICU LOS 43 days. 41had central venous and urinary catheter, and most of them received mechanical venti-lation (38), parenteral nutrition (12) or renal replacement therapy (8); 20 patientsrequired surgery or other invasive procedures. The mean ICU LOS before LRSCNisolation was 34 days, and a high proportion of patients had received antimicrobials inthe previous month: LNZ in 37 (mean duration 11.8 days), carbapenems in 21, andother beta-lactam in 16. LRCNS was associated with clinical infection in only 5 patients(12 %): catheter-related bacteremia (2), urinary infection (2), and primary bacteremia (1)treated successfully with alternative antimicrobials. Overall ICU mortality was 29 %.Mean LNZ DDD/100 patient-days was 13.4 with no statistical difference from 2009 to2012.CONCLUSIONS. LRSCN have emerged in Spain in critically ill patients with commonrisk factors for nosocomial infection such as invasive procedures and antibiotic exposure.Most isolates represent colonization, being less frequent the appearance of clinical infection.All isolates remained susceptible to alternative antimicrobials such as glycopeptides anddaptomycin. The appearance of LRSCN has important implications for the empirical use ofLNZ in critically ill patients.
0213CLINICAL PROFILE OF COAGULASE-NEGATIVE STAPHYLOCOCCIOUTBREAK RESISTANT LINEZOLID
M.E. Yuste1, R. Fernandez1, S. Narbona1, R. Ramı́rez1, M. Muñoz1, F. Acosta1
1Granada University, Granada, SpainINTRODUCTION. Since clinical introduction of linezolid, the emergence of resistantstrains has remained relatively rare. When resistance does occur, it is seen most commonlyin coagulase-negative staphylococci and enterococci. Resistance may arise during therapy,especially in deep-seated infections treated over prolonged courses. Most isolates of thistype in both enterococci and staphylococci have mutations at the site of action, in the centralloop of domain V of the 23S rRNA; the most common of these mutations is G2576T. Theproduct of this gene is a methyltransferase that modifies adenosine at position 2,503 in the23S rRNA, which is located in the drug binding site.OBJECTIVES. Describe clinical features of an outbreak of S. hominis subsp. hominismethicillin resistant to linezolid resistance and reduced susceptibility to glycopeptides andstudy this genetic alteration.METHODS. We studied 10 isolates from blood cultures of S. hominis subsp. hominis by Etest for antibiotic susceptibility study (nine in ICU and one in the emergency area) ofpatients admitted in our hospital between 01/11/07 and 01/03/08. Was collected sex, averageage, origin and place of patient isolates, presence or absence of sepsis and antibiotictreatments (AB) previous intra UCI mortality, sensitivity to AB.RESULTS. 50 % were male with a mean age of 66 years. 40 % came from specific area inhospital and were treated entirely with empirical broad spectrum antibiotics including lin-ezolid or vancomycin. The rest came from home, spent an average of 24 h of observation withAB start and only 10 % were not prescribed. All isolates except one were in ICU. They allattended to severe sepsis/septic shock. The cause of 40 % of the isolates with septic shock wasabdominal, 50 % associated ventilator pneumonia or nosocomial pneumonia and in 1 case waswith no focus. 40 % of patients had linezolid as broad spectrum, levofloxacin 40, 50 %glycopeptides 60 % carbapenem. Domain V of the 23S RNA gene was amplified and detectedmutations conferring resistance to linezolid, all isolates were resistant to oxacillin, gentamicin,levofloxacin, linezolid and cotrimoxazole and susceptible to daptomycin and tigecycline andnine of the isolates were resistant to erythromycin and clindamycin showing heterogeneousresistance to glycopeptides. The mortality of patients with these isolates intra UCI was 50 %.CONCLUSIONS. In our hospital, there are isolates of Staphylococcus species with provenresistance to linezolid. We think of them when we have to treat an infection caused by them.REFERENCES. Potoski BA, Adams J, Clarke L, Shutt K, Linden PK, Baxter C, PasculleAW, Capitano B, Peleg AY, Szabo D, Paterson DL. Epidemiological profile of linezolid-resistant coagulase-negative staphylococci. Clin Infect Dis. 2006;43(2):165–71.GRANT ACKNOWLEDGMENT. Microbiology Unit HS. Cecilio. Granada.
0214ICU-ACQUIRED INFECTION AND ANTIBIOTIC USE. IMPACT OF FOCUSOF INFECTION
M. Palomar1, X. Nuvials2, F. Alvarez Lerma3, P. Olaechea4, J.J. Otal5, M.P. Arenilla3,M. Catalan6, R. Jimeno7, I. Seijas8, ENVIN-HELICS Study Group1H U Arnau de Vilanova, ICU, Lleida, Spain, 2H U Arnau de Vilanova, Lleida, Spain, 3HMar, Barcelona, Spain, 4H Galdakao, Galdakao, Spain, 5H Vall Hebron, Barcelona, Spain,6H Doce de Octubre, Madrid, Spain, 7H La Fe, Valencia, Spain, 8H Cruces, Bilbao, SpainINTRODUCTION. The ATB prescription varies by source of infection.OBJECTIVES. To study the antibiotic (ATB) use for ICU-acquired infection (ICU-NI),according to focus.METHODS. Incidence, prospective, multicenter, observational study ENVIN-HELICS,period: April to July 2012. Patients admitted to the participating ICUs and ATB (number,duration—mean—and total days of ATB) and their indications were documented. The ICU-NI were classified as MV associated pneumonia (VAP), tracheobronchitis (TQB), catheter-associated urinary tract infection (UTI), unknown origin bacteremia (UB), catheter-relatedbacteremia (BRC), bacteremia secondary to other foci (BSOF) and others (O). Statisticalanalysis: Comparison between groups, Kruskal–Wallis.RESULTS. There were a total of 19,521 patients who received 26,768 ATB, with171,128 days of treatment (DOT). To treat ICU-NI, 5553 ATB (20.7 % of total) wereprescribed during 45,909 ATB-days (26.8 % of total) with a mean DOT of 8.2 days.
Table 1
To treat ICU-NI, the most used ATB N (%) and mean days of treatment were:1-Piperacillin-Tz 737 (13.2) 7.9 days; 2-Meropenem 634 (11.4) 9.4 days; 3-Linezolid 538(9.6) 8 days; 4-Vancomycin 338 (6) 7.8 days; 5-Ciprofloxacin 324 (5.8) 7.6 days; 6-Ami-cacyn 280 (59 6.7 days;7-Levofloxacin 271 (4.8) 7.1 days; 8-Amoxicillin-Clavulanate 266(4.7) 5.8 days; 9-Fluconazole 262 (4.7) 9.1 days and 10-Imipenem-Cilastatin 178 (3.2)8.6 days.This distribution, with small variations, was maintained to treat both, VAP TQB, while inthe case of UTI, and CRB UB usage patterns were different.CONCLUSIONS. Despite the recent reduction of rates, respiratory infections are the mainreason for ATB use to treat ICU-NI, while the lower impact corresponded to UTI andbacteremia of unknown origin. Management of VAP and TQB was similar, althoughtreatment was slightly shorter in TQB. To reduce ATB use, we should optimize treatment ofrespiratory infections.GRANT ACKNOWLEDGMENT. Pfizer.
0215BARRIERS TO VANCOMYCIN INFUSION USE: A NATIONAL SURVEY
A.S. Ekanayaka1, T. Whitehouse2
1University of Birmingham Medical School, Birmingham, UK, 2Queen Elizabeth HospitalBirmingham, Anaesthesia and Critical Care, Birmingham, UKINTRODUCTION. Use of vancomycin within the Intensive Care Unit (ICU) to treatmethicillin-resistant Staphylococcus aureus (MRSA) pneumonia is less favoured in some
26th ESICM ANNUAL CONGRESS — PARIS, FRANCE — 5–9 OCTOBER 2013
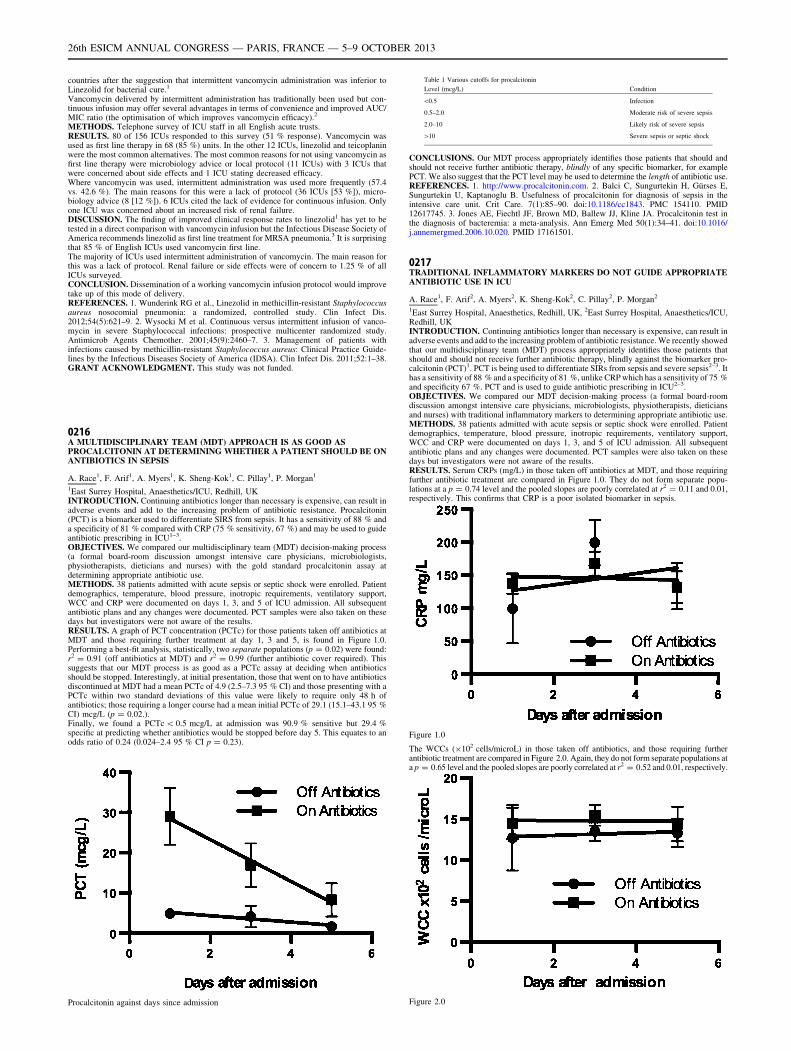
countries after the suggestion that intermittent vancomycin administration was inferior toLinezolid for bacterial cure.1
Vancomycin delivered by intermittent administration has traditionally been used but con-tinuous infusion may offer several advantages in terms of convenience and improved AUC/MIC ratio (the optimisation of which improves vancomycin efficacy).2
METHODS. Telephone survey of ICU staff in all English acute trusts.RESULTS. 80 of 156 ICUs responded to this survey (51 % response). Vancomycin wasused as first line therapy in 68 (85 %) units. In the other 12 ICUs, linezolid and teicoplaninwere the most common alternatives. The most common reasons for not using vancomycin asfirst line therapy were microbiology advice or local protocol (11 ICUs) with 3 ICUs thatwere concerned about side effects and 1 ICU stating decreased efficacy.Where vancomycin was used, intermittent administration was used more frequently (57.4vs. 42.6 %). The main reasons for this were a lack of protocol (36 ICUs [53 %]), micro-biology advice (8 [12 %]). 6 ICUs cited the lack of evidence for continuous infusion. Onlyone ICU was concerned about an increased risk of renal failure.DISCUSSION. The finding of improved clinical response rates to linezolid1 has yet to betested in a direct comparison with vancomycin infusion but the Infectious Disease Society ofAmerica recommends linezolid as first line treatment for MRSA pneumonia.3 It is surprisingthat 85 % of English ICUs used vancomycin first line.The majority of ICUs used intermittent administration of vancomycin. The main reason forthis was a lack of protocol. Renal failure or side effects were of concern to 1.25 % of allICUs surveyed.CONCLUSION. Dissemination of a working vancomycin infusion protocol would improvetake up of this mode of delivery.REFERENCES. 1. Wunderink RG et al., Linezolid in methicillin-resistant Staphylococcusaureus nosocomial pneumonia: a randomized, controlled study. Clin Infect Dis.2012;54(5):621–9. 2. Wysocki M et al. Continuous versus intermittent infusion of vanco-mycin in severe Staphylococcal infections: prospective multicenter randomized study.Antimicrob Agents Chemother. 2001;45(9):2460–7. 3. Management of patients withinfections caused by methicillin-resistant Staphylococcus aureus: Clinical Practice Guide-lines by the Infectious Diseases Society of America (IDSA). Clin Infect Dis. 2011;52:1–38.GRANT ACKNOWLEDGMENT. This study was not funded.
0216A MULTIDISCIPLINARY TEAM (MDT) APPROACH IS AS GOOD ASPROCALCITONIN AT DETERMINING WHETHER A PATIENT SHOULD BE ONANTIBIOTICS IN SEPSIS
A. Race1, F. Arif1, A. Myers1, K. Sheng-Kok1, C. Pillay1, P. Morgan1
1East Surrey Hospital, Anaesthetics/ICU, Redhill, UKINTRODUCTION. Continuing antibiotics longer than necessary is expensive, can result inadverse events and add to the increasing problem of antibiotic resistance. Procalcitonin(PCT) is a biomarker used to differentiate SIRS from sepsis. It has a sensitivity of 88 % anda specificity of 81 % compared with CRP (75 % sensitivity, 67 %) and may be used to guideantibiotic prescribing in ICU1–3.OBJECTIVES. We compared our multidisciplinary team (MDT) decision-making process(a formal board-room discussion amongst intensive care physicians, microbiologists,physiotherapists, dieticians and nurses) with the gold standard procalcitonin assay atdetermining appropriate antibiotic use.METHODS. 38 patients admitted with acute sepsis or septic shock were enrolled. Patientdemographics, temperature, blood pressure, inotropic requirements, ventilatory support,WCC and CRP were documented on days 1, 3, and 5 of ICU admission. All subsequentantibiotic plans and any changes were documented. PCT samples were also taken on thesedays but investigators were not aware of the results.RESULTS. A graph of PCT concentration (PCTc) for those patients taken off antibiotics atMDT and those requiring further treatment at day 1, 3 and 5, is found in Figure 1.0.Performing a best-fit analysis, statistically, two separate populations (p = 0.02) were found:r2 = 0.91 (off antibiotics at MDT) and r2 = 0.99 (further antibiotic cover required). Thissuggests that our MDT process is as good as a PCTc assay at deciding when antibioticsshould be stopped. Interestingly, at initial presentation, those that went on to have antibioticsdiscontinued at MDT had a mean PCTc of 4.9 (2.5–7.3 95 % CI) and those presenting with aPCTc within two standard deviations of this value were likely to require only 48 h ofantibiotics; those requiring a longer course had a mean initial PCTc of 29.1 (15.1–43.1 95 %CI) mcg/L (p = 0.02.).Finally, we found a PCTc \ 0.5 mcg/L at admission was 90.9 % sensitive but 29.4 %specific at predicting whether antibiotics would be stopped before day 5. This equates to anodds ratio of 0.24 (0.024–2.4 95 % CI p = 0.23).
Procalcitonin against days since admission
Table 1 Various cutoffs for procalcitonin
Level (mcg/L) Condition
\0.5 Infection
0.5–2.0 Moderate risk of severe sepsis
2.0–10 Likely risk of severe sepsis
[10 Severe sepsis or septic shock
CONCLUSIONS. Our MDT process appropriately identifies those patients that should andshould not receive further antibiotic therapy, blindly of any specific biomarker, for examplePCT. We also suggest that the PCT level may be used to determine the length of antibiotic use.REFERENCES. 1. http://www.procalcitonin.com. 2. Balci C, Sungurtekin H, Gürses E,Sungurtekin U, Kaptanoglu B. Usefulness of procalcitonin for diagnosis of sepsis in theintensive care unit. Crit Care. 7(1):85–90. doi:10.1186/cc1843. PMC 154110. PMID12617745. 3. Jones AE, Fiechtl JF, Brown MD, Ballew JJ, Kline JA. Procalcitonin test inthe diagnosis of bacteremia: a meta-analysis. Ann Emerg Med 50(1):34–41. doi:10.1016/j.annemergmed.2006.10.020. PMID 17161501.
0217TRADITIONAL INFLAMMATORY MARKERS DO NOT GUIDE APPROPRIATEANTIBIOTIC USE IN ICU
A. Race1, F. Arif2, A. Myers2, K. Sheng-Kok2, C. Pillay2, P. Morgan2
1East Surrey Hospital, Anaesthetics, Redhill, UK, 2East Surrey Hospital, Anaesthetics/ICU,Redhill, UKINTRODUCTION. Continuing antibiotics longer than necessary is expensive, can result inadverse events and add to the increasing problem of antibiotic resistance. We recently showedthat our multidisciplinary team (MDT) process appropriately identifies those patients thatshould and should not receive further antibiotic therapy, blindly against the biomarker pro-calcitonin (PCT)1. PCT is being used to differentiate SIRs from sepsis and severe sepsis2–3. Ithas a sensitivity of 88 % and a specificity of 81 %, unlike CRP which has a sensitivity of 75 %and specificity 67 %. PCT and is used to guide antibiotic prescribing in ICU2–3.OBJECTIVES. We compared our MDT decision-making process (a formal board-roomdiscussion amongst intensive care physicians, microbiologists, physiotherapists, dieticiansand nurses) with traditional inflammatory markers to determining appropriate antibiotic use.METHODS. 38 patients admitted with acute sepsis or septic shock were enrolled. Patientdemographics, temperature, blood pressure, inotropic requirements, ventilatory support,WCC and CRP were documented on days 1, 3, and 5 of ICU admission. All subsequentantibiotic plans and any changes were documented. PCT samples were also taken on thesedays but investigators were not aware of the results.RESULTS. Serum CRPs (mg/L) in those taken off antibiotics at MDT, and those requiringfurther antibiotic treatment are compared in Figure 1.0. They do not form separate popu-lations at a p = 0.74 level and the pooled slopes are poorly correlated at r2 = 0.11 and 0.01,respectively. This confirms that CRP is a poor isolated biomarker in sepsis.
Figure 1.0
The WCCs (9102 cells/microL) in those taken off antibiotics, and those requiring furtherantibiotic treatment are compared in Figure 2.0. Again, they do not form separate populations ata p = 0.65 level and the pooled slopes are poorly correlated at r2 = 0.52 and 0.01, respectively.
Figure 2.0
26th ESICM ANNUAL CONGRESS — PARIS, FRANCE — 5–9 OCTOBER 2013
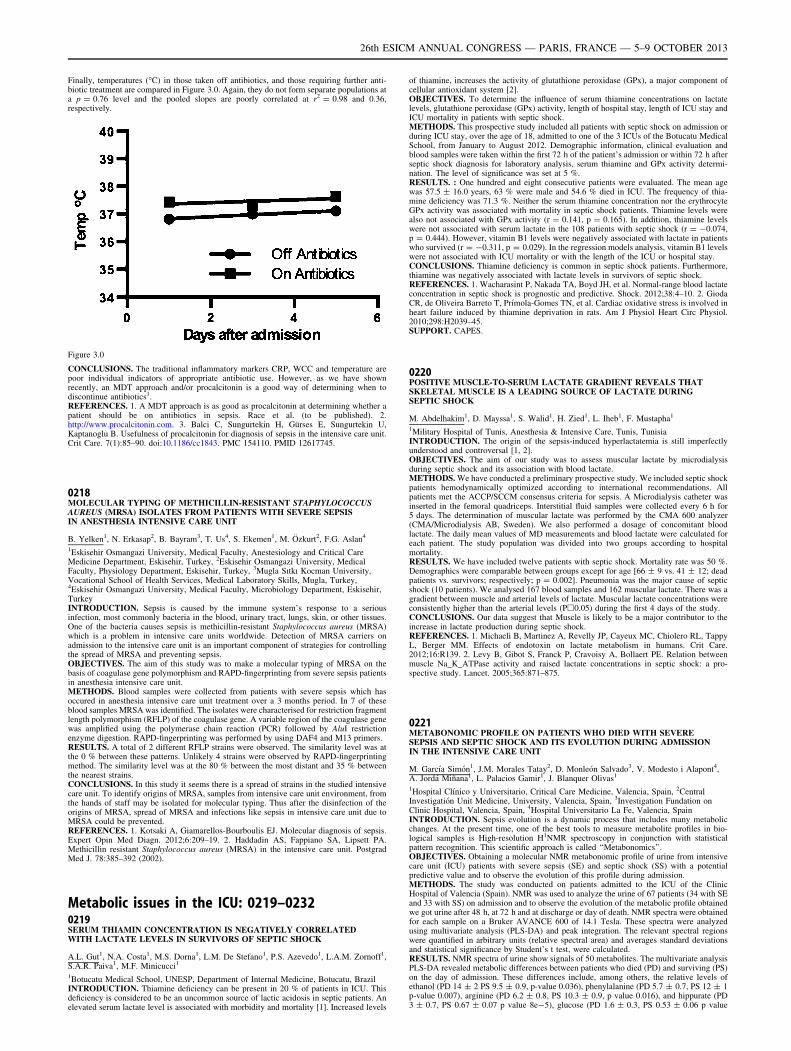
Finally, temperatures (�C) in those taken off antibiotics, and those requiring further anti-biotic treatment are compared in Figure 3.0. Again, they do not form separate populations ata p = 0.76 level and the pooled slopes are poorly correlated at r2 = 0.98 and 0.36,respectively.
Figure 3.0
CONCLUSIONS. The traditional inflammatory markers CRP, WCC and temperature arepoor individual indicators of appropriate antibiotic use. However, as we have shownrecently, an MDT approach and/or procalcitonin is a good way of determining when todiscontinue antibiotics1.REFERENCES. 1. A MDT approach is as good as procalcitonin at determining whether apatient should be on antibiotics in sepsis. Race et al. (to be published). 2.http://www.procalcitonin.com. 3. Balci C, Sungurtekin H, Gürses E, Sungurtekin U,Kaptanoglu B. Usefulness of procalcitonin for diagnosis of sepsis in the intensive care unit.Crit Care. 7(1):85–90. doi:10.1186/cc1843. PMC 154110. PMID 12617745.
0218MOLECULAR TYPING OF METHICILLIN-RESISTANT STAPHYLOCOCCUSAUREUS (MRSA) ISOLATES FROM PATIENTS WITH SEVERE SEPSISIN ANESTHESIA INTENSIVE CARE UNIT
B. Yelken1, N. Erkasap2, B. Bayram3, T. Us4, S. Ekemen1, M. Özkurt2, F.G. Aslan4
1Eskisehir Osmangazi University, Medical Faculty, Anestesiology and Critical CareMedicine Department, Eskisehir, Turkey, 2Eskisehir Osmangazi University, MedicalFaculty, Physiology Department, Eskisehir, Turkey, 3Mugla Sıtkı Kocman University,Vocational School of Health Services, Medical Laboratory Skills, Mugla, Turkey,4Eskisehir Osmangazi University, Medical Faculty, Microbiology Department, Eskisehir,TurkeyINTRODUCTION. Sepsis is caused by the immune system’s response to a seriousinfection, most commonly bacteria in the blood, urinary tract, lungs, skin, or other tissues.One of the bacteria causes sepsis is methicillin-resistant Staphylococcus aureus (MRSA)which is a problem in intensive care units worldwide. Detection of MRSA carriers onadmission to the intensive care unit is an important component of strategies for controllingthe spread of MRSA and preventing sepsis.OBJECTIVES. The aim of this study was to make a molecular typing of MRSA on thebasis of coagulase gene polymorphism and RAPD-fingerprinting from severe sepsis patientsin anesthesia intensive care unit.METHODS. Blood samples were collected from patients with severe sepsis which hasoccured in anesthesia intensive care unit treatment over a 3 months period. In 7 of theseblood samples MRSA was identified. The isolates were characterised for restriction fragmentlength polymorphism (RFLP) of the coagulase gene. A variable region of the coagulase genewas amplified using the polymerase chain reaction (PCR) followed by AluI restrictionenzyme digestion. RAPD-fingerprinting was performed by using DAF4 and M13 primers.RESULTS. A total of 2 different RFLP strains were observed. The similarity level was atthe 0 % between these patterns. Unlikely 4 strains were observed by RAPD-fingerprintingmethod. The similarity level was at the 80 % between the most distant and 35 % betweenthe nearest strains.CONCLUSIONS. In this study it seems there is a spread of strains in the studied intensivecare unit. To identify origins of MRSA, samples from intensive care unit environment, fromthe hands of staff may be isolated for molecular typing. Thus after the disinfection of theorigins of MRSA, spread of MRSA and infections like sepsis in intensive care unit due toMRSA could be prevented.REFERENCES. 1. Kotsaki A, Giamarellos-Bourboulis EJ. Molecular diagnosis of sepsis.Expert Opin Med Diagn. 2012;6:209–19. 2. Haddadin AS, Fappiano SA, Lipsett PA.Methicillin resistant Staphylococcus aureus (MRSA) in the intensive care unit. PostgradMed J. 78:385–392 (2002).
Metabolic issues in the ICU: 0219–02320219SERUM THIAMIN CONCENTRATION IS NEGATIVELY CORRELATEDWITH LACTATE LEVELS IN SURVIVORS OF SEPTIC SHOCK
A.L. Gut1, N.A. Costa1, M.S. Dorna1, L.M. De Stefano1, P.S. Azevedo1, L.A.M. Zornoff1,S.A.R. Paiva1, M.F. Minicucci1
1Botucatu Medical School, UNESP, Department of Internal Medicine, Botucatu, BrazilINTRODUCTION. Thiamine deficiency can be present in 20 % of patients in ICU. Thisdeficiency is considered to be an uncommon source of lactic acidosis in septic patients. Anelevated serum lactate level is associated with morbidity and mortality [1]. Increased levels
of thiamine, increases the activity of glutathione peroxidase (GPx), a major component ofcellular antioxidant system [2].OBJECTIVES. To determine the influence of serum thiamine concentrations on lactatelevels, glutathione peroxidase (GPx) activity, length of hospital stay, length of ICU stay andICU mortality in patients with septic shock.METHODS. This prospective study included all patients with septic shock on admission orduring ICU stay, over the age of 18, admitted to one of the 3 ICUs of the Botucatu MedicalSchool, from January to August 2012. Demographic information, clinical evaluation andblood samples were taken within the first 72 h of the patient’s admission or within 72 h afterseptic shock diagnosis for laboratory analysis, serum thiamine and GPx activity determi-nation. The level of significance was set at 5 %.RESULTS. : One hundred and eight consecutive patients were evaluated. The mean agewas 57.5 ± 16.0 years, 63 % were male and 54.6 % died in ICU. The frequency of thia-mine deficiency was 71.3 %. Neither the serum thiamine concentration nor the erythrocyteGPx activity was associated with mortality in septic shock patients. Thiamine levels werealso not associated with GPx activity (r = 0.141, p = 0.165). In addition, thiamine levelswere not associated with serum lactate in the 108 patients with septic shock (r = -0.074,p = 0.444). However, vitamin B1 levels were negatively associated with lactate in patientswho survived (r = -0.311, p = 0.029). In the regression models analysis, vitamin B1 levelswere not associated with ICU mortality or with the length of the ICU or hospital stay.CONCLUSIONS. Thiamine deficiency is common in septic shock patients. Furthermore,thiamine was negatively associated with lactate levels in survivors of septic shock.REFERENCES. 1. Wacharasint P, Nakada TA, Boyd JH, et al. Normal-range blood lactateconcentration in septic shock is prognostic and predictive. Shock. 2012;38:4–10. 2. GiodaCR, de Oliveira Barreto T, Prı́mola-Gomes TN, et al. Cardiac oxidative stress is involved inheart failure induced by thiamine deprivation in rats. Am J Physiol Heart Circ Physiol.2010;298:H2039–45.SUPPORT. CAPES.
0220POSITIVE MUSCLE-TO-SERUM LACTATE GRADIENT REVEALS THATSKELETAL MUSCLE IS A LEADING SOURCE OF LACTATE DURINGSEPTIC SHOCK
M. Abdelhakim1, D. Mayssa1, S. Walid1, H. Zied1, L. Iheb1, F. Mustapha1
1Military Hospital of Tunis, Anesthesia & Intensive Care, Tunis, TunisiaINTRODUCTION. The origin of the sepsis-induced hyperlactatemia is still imperfectlyunderstood and controversal [1, 2].OBJECTIVES. The aim of our study was to assess muscular lactate by microdialysisduring septic shock and its association with blood lactate.METHODS. We have conducted a preliminary prospective study. We included septic shockpatients hemodynamically optimized according to international recommendations. Allpatients met the ACCP/SCCM consensus criteria for sepsis. A Microdialysis catheter wasinserted in the femoral quadriceps. Interstitial fluid samples were collected every 6 h for5 days. The determination of muscular lactate was performed by the CMA 600 analyzer(CMA/Microdialysis AB, Sweden). We also performed a dosage of concomitant bloodlactate. The daily mean values of MD measurements and blood lactate were calculated foreach patient. The study population was divided into two groups according to hospitalmortality.RESULTS. We have included twelve patients with septic shock. Mortality rate was 50 %.Demographics were comparable between groups except for age [66 ± 9 vs. 41 ± 12; deadpatients vs. survivors; respectively; p = 0.002]. Pneumonia was the major cause of septicshock (10 patients). We analysed 167 blood samples and 162 muscular lactate. There was agradient between muscle and arterial levels of lactate. Muscular lactate concentrations wereconsistently higher than the arterial levels (Ph0.05) during the first 4 days of the study.CONCLUSIONS. Our data suggest that Muscle is likely to be a major contributor to theincrease in lactate production during septic shock.REFERENCES. 1. Michaeli B, Martinez A, Revelly JP, Cayeux MC, Chiolero RL, TappyL, Berger MM. Effects of endotoxin on lactate metabolism in humans. Crit Care.2012;16:R139. 2. Levy B, Gibot S, Franck P, Cravoisy A, Bollaert PE. Relation betweenmuscle Na_K_ATPase activity and raised lactate concentrations in septic shock: a pro-spective study. Lancet. 2005;365:871–875.
0221METABONOMIC PROFILE ON PATIENTS WHO DIED WITH SEVERESEPSIS AND SEPTIC SHOCK AND ITS EVOLUTION DURING ADMISSIONIN THE INTENSIVE CARE UNIT
M. Garcı́a Simón1, J.M. Morales Tatay2, D. Monleón Salvado3, V. Modesto i Alapont4,A. Jordá Miñana1, L. Palacios Gamir1, J. Blanquer Olivas1
1Hospital Clı́nico y Universitario, Critical Care Medicine, Valencia, Spain, 2CentralInvestigatión Unit Medicine, University, Valencia, Spain, 3Investigation Fundation onClinic Hospital, Valencia, Spain, 4Hospital Universitario La Fe, Valencia, SpainINTRODUCTION. Sepsis evolution is a dynamic process that includes many metabolicchanges. At the present time, one of the best tools to measure metabolite profiles in bio-logical samples is High-resolution H1NMR spectroscopy in conjunction with statisticalpattern recognition. This scientific approach is called ‘‘Metabonomics’’.OBJECTIVES. Obtaining a molecular NMR metabonomic profile of urine from intensivecare unit (ICU) patients with severe sepsis (SE) and septic shock (SS) with a potentialpredictive value and to observe the evolution of this profile during admission.METHODS. The study was conducted on patients admitted to the ICU of the ClinicHospital of Valencia (Spain). NMR was used to analyze the urine of 67 patients (34 with SEand 33 with SS) on admission and to observe the evolution of the metabolic profile obtainedwe got urine after 48 h, at 72 h and at discharge or day of death. NMR spectra were obtainedfor each sample on a Bruker AVANCE 600 of 14.1 Tesla. These spectra were analyzedusing multivariate analysis (PLS-DA) and peak integration. The relevant spectral regionswere quantified in arbitrary units (relative spectral area) and averages standard deviationsand statistical significance by Student’s t test, were calculated.RESULTS. NMR spectra of urine show signals of 50 metabolites. The multivariate analysisPLS-DA revealed metabolic differences between patients who died (PD) and surviving (PS)on the day of admission. These differences include, among others, the relative levels ofethanol (PD 14 ± 2 PS 9.5 ± 0.9, p-value 0.036), phenylalanine (PD 5.7 ± 0.7, PS 12 ± 1p-value 0.007), arginine (PD 6.2 ± 0.8, PS 10.3 ± 0.9, p value 0.016), and hippurate (PD3 ± 0.7, PS 0.67 ± 0.07 p value 8e-5), glucose (PD 1.6 ± 0.3, PS 0.53 ± 0.06 p value
26th ESICM ANNUAL CONGRESS — PARIS, FRANCE — 5–9 OCTOBER 2013
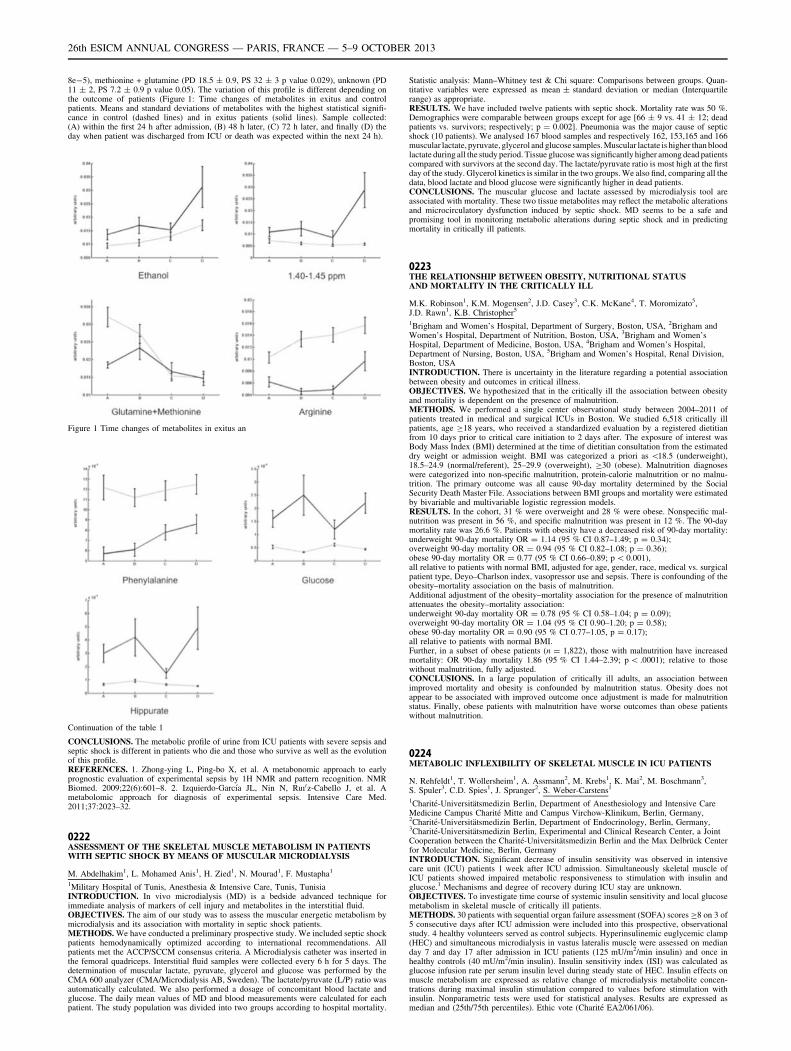
8e-5), methionine + glutamine (PD 18.5 ± 0.9, PS 32 ± 3 p value 0.029), unknown (PD11 ± 2, PS 7.2 ± 0.9 p value 0.05). The variation of this profile is different depending onthe outcome of patients (Figure 1: Time changes of metabolites in exitus and controlpatients. Means and standard deviations of metabolites with the highest statistical signifi-cance in control (dashed lines) and in exitus patients (solid lines). Sample collected:(A) within the first 24 h after admission, (B) 48 h later, (C) 72 h later, and finally (D) theday when patient was discharged from ICU or death was expected within the next 24 h).
Figure 1 Time changes of metabolites in exitus an
Continuation of the table 1
CONCLUSIONS. The metabolic profile of urine from ICU patients with severe sepsis andseptic shock is different in patients who die and those who survive as well as the evolutionof this profile.REFERENCES. 1. Zhong-ying L, Ping-bo X, et al. A metabonomic approach to earlyprognostic evaluation of experimental sepsis by 1H NMR and pattern recognition. NMRBiomed. 2009;22(6):601–8. 2. Izquierdo-Garcı́a JL, Nin N, Ruı0z-Cabello J, et al. Ametabolomic approach for diagnosis of experimental sepsis. Intensive Care Med.2011;37:2023–32.
0222ASSESSMENT OF THE SKELETAL MUSCLE METABOLISM IN PATIENTSWITH SEPTIC SHOCK BY MEANS OF MUSCULAR MICRODIALYSIS
M. Abdelhakim1, L. Mohamed Anis1, H. Zied1, N. Mourad1, F. Mustapha1
1Military Hospital of Tunis, Anesthesia & Intensive Care, Tunis, TunisiaINTRODUCTION. In vivo microdialysis (MD) is a bedside advanced technique forimmediate analysis of markers of cell injury and metabolites in the interstitial fluid.OBJECTIVES. The aim of our study was to assess the muscular energetic metabolism bymicrodialysis and its association with mortality in septic shock patients.METHODS. We have conducted a preliminary prospective study. We included septic shockpatients hemodynamically optimized according to international recommendations. Allpatients met the ACCP/SCCM consensus criteria. A Microdialysis catheter was inserted inthe femoral quadriceps. Interstitial fluid samples were collected every 6 h for 5 days. Thedetermination of muscular lactate, pyruvate, glycerol and glucose was performed by theCMA 600 analyzer (CMA/Microdialysis AB, Sweden). The lactate/pyruvate (L/P) ratio wasautomatically calculated. We also performed a dosage of concomitant blood lactate andglucose. The daily mean values of MD and blood measurements were calculated for eachpatient. The study population was divided into two groups according to hospital mortality.
Statistic analysis: Mann–Whitney test & Chi square: Comparisons between groups. Quan-titative variables were expressed as mean ± standard deviation or median (Interquartilerange) as appropriate.RESULTS. We have included twelve patients with septic shock. Mortality rate was 50 %.Demographics were comparable between groups except for age [66 ± 9 vs. 41 ± 12; deadpatients vs. survivors; respectively; p = 0.002]. Pneumonia was the major cause of septicshock (10 patients). We analysed 167 blood samples and respectively 162, 153,165 and 166muscular lactate, pyruvate, glycerol and glucose samples. Muscular lactate is higher than bloodlactate during all the study period. Tissue glucose was significantly higher among dead patientscompared with survivors at the second day. The lactate/pyruvate ratio is most high at the firstday of the study. Glycerol kinetics is similar in the two groups. We also find, comparing all thedata, blood lactate and blood glucose were significantly higher in dead patients.CONCLUSIONS. The muscular glucose and lactate assessed by microdialysis tool areassociated with mortality. These two tissue metabolites may reflect the metabolic alterationsand microcirculatory dysfunction induced by septic shock. MD seems to be a safe andpromising tool in monitoring metabolic alterations during septic shock and in predictingmortality in critically ill patients.
0223THE RELATIONSHIP BETWEEN OBESITY, NUTRITIONAL STATUSAND MORTALITY IN THE CRITICALLY ILL
M.K. Robinson1, K.M. Mogensen2, J.D. Casey3, C.K. McKane4, T. Moromizato5,J.D. Rawn1, K.B. Christopher5
1Brigham and Women’s Hospital, Department of Surgery, Boston, USA, 2Brigham andWomen’s Hospital, Department of Nutrition, Boston, USA, 3Brigham and Women’sHospital, Department of Medicine, Boston, USA, 4Brigham and Women’s Hospital,Department of Nursing, Boston, USA, 5Brigham and Women’s Hospital, Renal Division,Boston, USAINTRODUCTION. There is uncertainty in the literature regarding a potential associationbetween obesity and outcomes in critical illness.OBJECTIVES. We hypothesized that in the critically ill the association between obesityand mortality is dependent on the presence of malnutrition.METHODS. We performed a single center observational study between 2004–2011 ofpatients treated in medical and surgical ICUs in Boston. We studied 6,518 critically illpatients, age C18 years, who received a standardized evaluation by a registered dietitianfrom 10 days prior to critical care initiation to 2 days after. The exposure of interest wasBody Mass Index (BMI) determined at the time of dietitian consultation from the estimateddry weight or admission weight. BMI was categorized a priori as \18.5 (underweight),18.5–24.9 (normal/referent), 25–29.9 (overweight), C30 (obese). Malnutrition diagnoseswere categorized into non-specific malnutrition, protein-calorie malnutrition or no malnu-trition. The primary outcome was all cause 90-day mortality determined by the SocialSecurity Death Master File. Associations between BMI groups and mortality were estimatedby bivariable and multivariable logistic regression models.RESULTS. In the cohort, 31 % were overweight and 28 % were obese. Nonspecific mal-nutrition was present in 56 %, and specific malnutrition was present in 12 %. The 90-daymortality rate was 26.6 %. Patients with obesity have a decreased risk of 90-day mortality:underweight 90-day mortality OR = 1.14 (95 % CI 0.87–1.49; p = 0.34);overweight 90-day mortality OR = 0.94 (95 % CI 0.82–1.08; p = 0.36);obese 90-day mortality OR = 0.77 (95 % CI 0.66–0.89; p \ 0.001),all relative to patients with normal BMI, adjusted for age, gender, race, medical vs. surgicalpatient type, Deyo–Charlson index, vasopressor use and sepsis. There is confounding of theobesity–mortality association on the basis of malnutrition.Additional adjustment of the obesity–mortality association for the presence of malnutritionattenuates the obesity–mortality association:underweight 90-day mortality OR = 0.78 (95 % CI 0.58–1.04; p = 0.09);overweight 90-day mortality OR = 1.04 (95 % CI 0.90–1.20; p = 0.58);obese 90-day mortality OR = 0.90 (95 % CI 0.77–1.05, p = 0.17);all relative to patients with normal BMI.Further, in a subset of obese patients (n = 1,822), those with malnutrition have increasedmortality: OR 90-day mortality 1.86 (95 % CI 1.44–2.39; p \ .0001); relative to thosewithout malnutrition, fully adjusted.CONCLUSIONS. In a large population of critically ill adults, an association betweenimproved mortality and obesity is confounded by malnutrition status. Obesity does notappear to be associated with improved outcome once adjustment is made for malnutritionstatus. Finally, obese patients with malnutrition have worse outcomes than obese patientswithout malnutrition.
0224METABOLIC INFLEXIBILITY OF SKELETAL MUSCLE IN ICU PATIENTS
N. Rehfeldt1, T. Wollersheim1, A. Assmann2, M. Krebs1, K. Mai2, M. Boschmann3,S. Spuler3, C.D. Spies1, J. Spranger2, S. Weber-Carstens1
1Charité-Universitätsmedizin Berlin, Department of Anesthesiology and Intensive CareMedicine Campus Charité Mitte and Campus Virchow-Klinikum, Berlin, Germany,2Charité-Universitätsmedizin Berlin, Department of Endocrinology, Berlin, Germany,3Charité-Universitätsmedizin Berlin, Experimental and Clinical Research Center, a JointCooperation between the Charité-Universitätsmedizin Berlin and the Max Delbrück Centerfor Molecular Medicine, Berlin, GermanyINTRODUCTION. Significant decrease of insulin sensitivity was observed in intensivecare unit (ICU) patients 1 week after ICU admission. Simultaneously skeletal muscle ofICU patients showed impaired metabolic responsiveness to stimulation with insulin andglucose.1 Mechanisms and degree of recovery during ICU stay are unknown.OBJECTIVES. To investigate time course of systemic insulin sensitivity and local glucosemetabolism in skeletal muscle of critically ill patients.METHODS. 30 patients with sequential organ failure assessment (SOFA) scores C8 on 3 of5 consecutive days after ICU admission were included into this prospective, observationalstudy. 4 healthy volunteers served as control subjects. Hyperinsulinemic euglycemic clamp(HEC) and simultaneous microdialysis in vastus lateralis muscle were assessed on medianday 7 and day 17 after admission in ICU patients (125 mU/m2/min insulin) and once inhealthy controls (40 mU/m2/min insulin). Insulin sensitivity index (ISI) was calculated asglucose infusion rate per serum insulin level during steady state of HEC. Insulin effects onmuscle metabolism are expressed as relative change of microdialysis metabolite concen-trations during maximal insulin stimulation compared to values before stimulation withinsulin. Nonparametric tests were used for statistical analyses. Results are expressed asmedian and (25th/75th percentiles). Ethic vote (Charité EA2/061/06).
26th ESICM ANNUAL CONGRESS — PARIS, FRANCE — 5–9 OCTOBER 2013
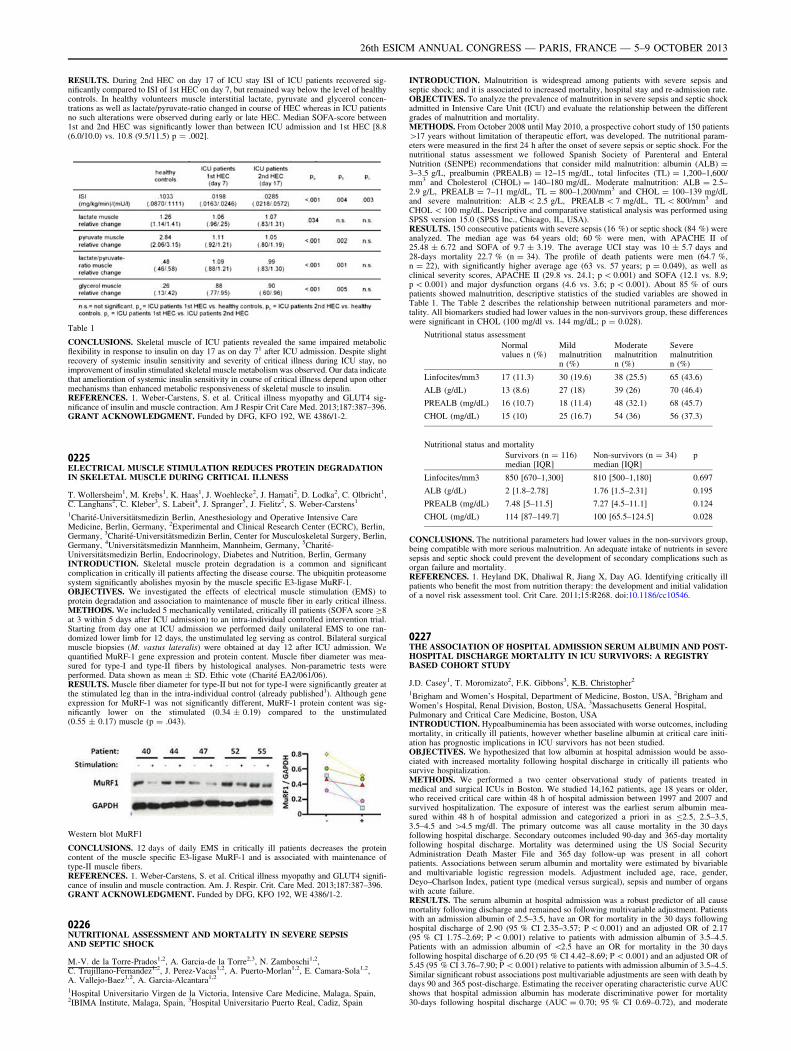
RESULTS. During 2nd HEC on day 17 of ICU stay ISI of ICU patients recovered sig-nificantly compared to ISI of 1st HEC on day 7, but remained way below the level of healthycontrols. In healthy volunteers muscle interstitial lactate, pyruvate and glycerol concen-trations as well as lactate/pyruvate-ratio changed in course of HEC whereas in ICU patientsno such alterations were observed during early or late HEC. Median SOFA-score between1st and 2nd HEC was significantly lower than between ICU admission and 1st HEC [8.8(6.0/10.0) vs. 10.8 (9.5/11.5) p = .002].
Table 1
CONCLUSIONS. Skeletal muscle of ICU patients revealed the same impaired metabolicflexibility in response to insulin on day 17 as on day 71 after ICU admission. Despite slightrecovery of systemic insulin sensitivity and severity of critical illness during ICU stay, noimprovement of insulin stimulated skeletal muscle metabolism was observed. Our data indicatethat amelioration of systemic insulin sensitivity in course of critical illness depend upon othermechanisms than enhanced metabolic responsiveness of skeletal muscle to insulin.REFERENCES. 1. Weber-Carstens, S. et al. Critical illness myopathy and GLUT4 sig-nificance of insulin and muscle contraction. Am J Respir Crit Care Med. 2013;187:387–396.GRANT ACKNOWLEDGMENT. Funded by DFG, KFO 192, WE 4386/1-2.
0225ELECTRICAL MUSCLE STIMULATION REDUCES PROTEIN DEGRADATIONIN SKELETAL MUSCLE DURING CRITICAL ILLNESS
T. Wollersheim1, M. Krebs1, K. Haas1, J. Woehlecke2, J. Hamati2, D. Lodka2, C. Olbricht1,C. Langhans2, C. Kleber3, S. Labeit4, J. Spranger5, J. Fielitz2, S. Weber-Carstens1
1Charité-Universitätsmedizin Berlin, Anesthesiology and Operative Intensive CareMedicine, Berlin, Germany, 2Experimental and Clinical Research Center (ECRC), Berlin,Germany, 3Charité-Universitätsmedizin Berlin, Center for Musculoskeletal Surgery, Berlin,Germany, 4Universitätsmedizin Mannheim, Mannheim, Germany, 5Charité-Universitätsmedizin Berlin, Endocrinology, Diabetes and Nutrition, Berlin, GermanyINTRODUCTION. Skeletal muscle protein degradation is a common and significantcomplication in critically ill patients affecting the disease course. The ubiquitin proteasomesystem significantly abolishes myosin by the muscle specific E3-ligase MuRF-1.OBJECTIVES. We investigated the effects of electrical muscle stimulation (EMS) toprotein degradation and association to maintenance of muscle fiber in early critical illness.METHODS. We included 5 mechanically ventilated, critically ill patients (SOFA score C8at 3 within 5 days after ICU admission) to an intra-individual controlled intervention trial.Starting from day one at ICU admission we performed daily unilateral EMS to one ran-domized lower limb for 12 days, the unstimulated leg serving as control. Bilateral surgicalmuscle biopsies (M. vastus lateralis) were obtained at day 12 after ICU admission. Wequantified MuRF-1 gene expression and protein content. Muscle fiber diameter was mea-sured for type-I and type-II fibers by histological analyses. Non-parametric tests wereperformed. Data shown as mean ± SD. Ethic vote (Charité EA2/061/06).RESULTS. Muscle fiber diameter for type-II but not for type-I were significantly greater atthe stimulated leg than in the intra-individual control (already published1). Although geneexpression for MuRF-1 was not significantly different, MuRF-1 protein content was sig-nificantly lower on the stimulated (0.34 ± 0.19) compared to the unstimulated(0.55 ± 0.17) muscle (p = .043).
Western blot MuRF1
CONCLUSIONS. 12 days of daily EMS in critically ill patients decreases the proteincontent of the muscle specific E3-ligase MuRF-1 and is associated with maintenance oftype-II muscle fibers.REFERENCES. 1. Weber-Carstens, S. et al. Critical illness myopathy and GLUT4 signifi-cance of insulin and muscle contraction. Am. J. Respir. Crit. Care Med. 2013;187:387–396.GRANT ACKNOWLEDGMENT. Funded by DFG, KFO 192, WE 4386/1-2.
0226NUTRITIONAL ASSESSMENT AND MORTALITY IN SEVERE SEPSISAND SEPTIC SHOCK
M.-V. de la Torre-Prados1,2, A. Garcia-de la Torre2,3, N. Zamboschi1,2,C. Trujillano-Fernandez1,2, J. Perez-Vacas1,2, A. Puerto-Morlan1,2, E. Camara-Sola1,2,A. Vallejo-Baez1,2, A. Garcia-Alcantara1,2
1Hospital Universitario Virgen de la Victoria, Intensive Care Medicine, Malaga, Spain,2IBIMA Institute, Malaga, Spain, 3Hospital Universitario Puerto Real, Cadiz, Spain
INTRODUCTION. Malnutrition is widespread among patients with severe sepsis andseptic shock; and it is associated to increased mortality, hospital stay and re-admission rate.OBJECTIVES. To analyze the prevalence of malnutrition in severe sepsis and septic shockadmitted in Intensive Care Unit (ICU) and evaluate the relationship between the differentgrades of malnutrition and mortality.METHODS. From October 2008 until May 2010, a prospective cohort study of 150 patients[17 years without limitation of therapeutic effort, was developed. The nutritional param-eters were measured in the first 24 h after the onset of severe sepsis or septic shock. For thenutritional status assessment we followed Spanish Society of Parenteral and EnteralNutrition (SENPE) recommendations that consider mild malnutrition: albumin (ALB) =3–3.5 g/L, prealbumin (PREALB) = 12–15 mg/dL, total linfocites (TL) = 1,200–1,600/mm3 and Cholesterol (CHOL) = 140–180 mg/dL. Moderate malnutrition: ALB = 2.5–2.9 g/L, PREALB = 7–11 mg/dL, TL = 800–1,200/mm3 and CHOL = 100–139 mg/dLand severe malnutrition: ALB \ 2.5 g/L, PREALB \ 7 mg/dL, TL \ 800/mm3 andCHOL \ 100 mg/dL. Descriptive and comparative statistical analysis was performed usingSPSS version 15.0 (SPSS Inc., Chicago, IL, USA).RESULTS. 150 consecutive patients with severe sepsis (16 %) or septic shock (84 %) wereanalyzed. The median age was 64 years old; 60 % were men, with APACHE II of25.48 ± 6.72 and SOFA of 9.7 ± 3.19. The average UCI stay was 10 ± 5.7 days and28-days mortality 22.7 % (n = 34). The profile of death patients were men (64.7 %,n = 22), with significantly higher average age (63 vs. 57 years; p = 0.049), as well asclinical severity scores, APACHE II (29.8 vs. 24.1; p \ 0.001) and SOFA (12.1 vs. 8.9;p \ 0.001) and major dysfunction organs (4.6 vs. 3.6; p \ 0.001). About 85 % of ourspatients showed malnutrition, descriptive statistics of the studied variables are showed inTable 1. The Table 2 describes the relationship between nutritional parameters and mor-tality. All biomarkers studied had lower values in the non-survivors group, these differenceswere significant in CHOL (100 mg/dl vs. 144 mg/dL; p = 0.028).
Nutritional status assessment
Normalvalues n (%)
Mildmalnutritionn (%)
Moderatemalnutritionn (%)
Severemalnutritionn (%)
Linfocites/mm3 17 (11.3) 30 (19.6) 38 (25.5) 65 (43.6)
ALB (g/dL) 13 (8.6) 27 (18) 39 (26) 70 (46.4)
PREALB (mg/dL) 16 (10.7) 18 (11.4) 48 (32.1) 68 (45.7)
CHOL (mg/dL) 15 (10) 25 (16.7) 54 (36) 56 (37.3)
Nutritional status and mortality
Survivors (n = 116)median [IQR]
Non-survivors (n = 34)median [IQR]
p
Linfocites/mm3 850 [670–1,300] 810 [500–1,180] 0.697
ALB (g/dL) 2 [1.8–2.78] 1.76 [1.5–2.31] 0.195
PREALB (mg/dL) 7.48 [5–11.5] 7.27 [4.5–11.1] 0.124
CHOL (mg/dL) 114 [87–149.7] 100 [65.5–124.5] 0.028
CONCLUSIONS. The nutritional parameters had lower values in the non-survivors group,being compatible with more serious malnutrition. An adequate intake of nutrients in severesepsis and septic shock could prevent the development of secondary complications such asorgan failure and mortality.REFERENCES. 1. Heyland DK, Dhaliwal R, Jiang X, Day AG. Identifying critically illpatients who benefit the most from nutrition therapy: the development and initial validationof a novel risk assessment tool. Crit Care. 2011;15:R268. doi:10.1186/cc10546.
0227THE ASSOCIATION OF HOSPITAL ADMISSION SERUM ALBUMIN AND POST-HOSPITAL DISCHARGE MORTALITY IN ICU SURVIVORS: A REGISTRYBASED COHORT STUDY
J.D. Casey1, T. Moromizato2, F.K. Gibbons3, K.B. Christopher2
1Brigham and Women’s Hospital, Department of Medicine, Boston, USA, 2Brigham andWomen’s Hospital, Renal Division, Boston, USA, 3Massachusetts General Hospital,Pulmonary and Critical Care Medicine, Boston, USAINTRODUCTION. Hypoalbuminemia has been associated with worse outcomes, includingmortality, in critically ill patients, however whether baseline albumin at critical care initi-ation has prognostic implications in ICU survivors has not been studied.OBJECTIVES. We hypothesized that low albumin at hospital admission would be asso-ciated with increased mortality following hospital discharge in critically ill patients whosurvive hospitalization.METHODS. We performed a two center observational study of patients treated inmedical and surgical ICUs in Boston. We studied 14,162 patients, age 18 years or older,who received critical care within 48 h of hospital admission between 1997 and 2007 andsurvived hospitalization. The exposure of interest was the earliest serum albumin mea-sured within 48 h of hospital admission and categorized a priori in as B2.5, 2.5–3.5,3.5–4.5 and [4.5 mg/dl. The primary outcome was all cause mortality in the 30 daysfollowing hospital discharge. Secondary outcomes included 90-day and 365-day mortalityfollowing hospital discharge. Mortality was determined using the US Social SecurityAdministration Death Master File and 365 day follow-up was present in all cohortpatients. Associations between serum albumin and mortality were estimated by bivariableand multivariable logistic regression models. Adjustment included age, race, gender,Deyo–Charlson Index, patient type (medical versus surgical), sepsis and number of organswith acute failure.RESULTS. The serum albumin at hospital admission was a robust predictor of all causemortality following discharge and remained so following multivariable adjustment. Patientswith an admission albumin of 2.5–3.5, have an OR for mortality in the 30 days followinghospital discharge of 2.90 (95 % CI 2.35–3.57; P \ 0.001) and an adjusted OR of 2.17(95 % CI 1.75–2.69; P \ 0.001) relative to patients with admission albumin of 3.5–4.5.Patients with an admission albumin of \2.5 have an OR for mortality in the 30 daysfollowing hospital discharge of 6.20 (95 % CI 4.42–8.69; P \ 0.001) and an adjusted OR of5.45 (95 % CI 3.76–7.90; P \ 0.001) relative to patients with admission albumin of 3.5–4.5.Similar significant robust associations post multivariable adjustments are seen with death bydays 90 and 365 post-discharge. Estimating the receiver operating characteristic curve AUCshows that hospital admission albumin has moderate discriminative power for mortality30-days following hospital discharge (AUC = 0.70; 95 % CI 0.69–0.72), and moderate
26th ESICM ANNUAL CONGRESS — PARIS, FRANCE — 5–9 OCTOBER 2013
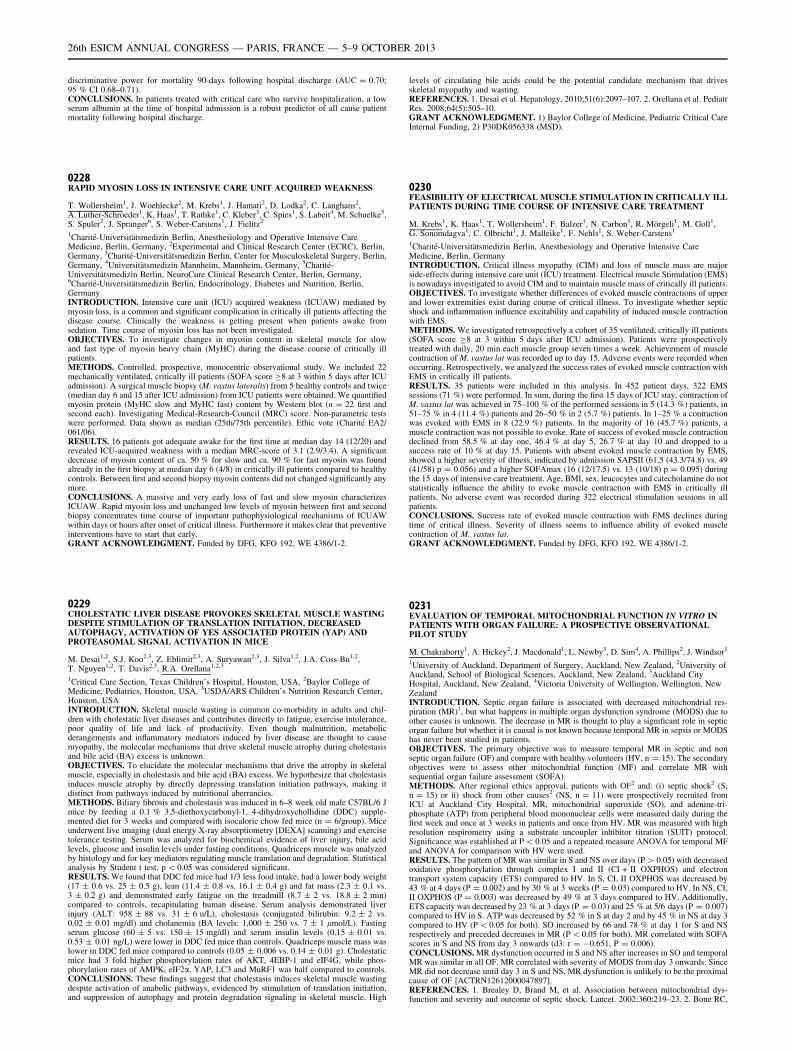
discriminative power for mortality 90-days following hospital discharge (AUC = 0.70;95 % CI 0.68–0.71).CONCLUSIONS. In patients treated with critical care who survive hospitalization, a lowserum albumin at the time of hospital admission is a robust predictor of all cause patientmortality following hospital discharge.
0228RAPID MYOSIN LOSS IN INTENSIVE CARE UNIT ACQUIRED WEAKNESS
T. Wollersheim1, J. Woehlecke2, M. Krebs1, J. Hamati2, D. Lodka2, C. Langhans2,A. Luther-Schroeder1, K. Haas1, T. Rathke1, C. Kleber3, C. Spies1, S. Labeit4, M. Schuelke5,S. Spuler2, J. Spranger6, S. Weber-Carstens1, J. Fielitz2
1Charité-Universitätsmedizin Berlin, Anesthesiology and Operative Intensive CareMedicine, Berlin, Germany, 2Experimental and Clinical Research Center (ECRC), Berlin,Germany, 3Charité-Universitätsmedizin Berlin, Center for Musculoskeletal Surgery, Berlin,Germany, 4Universitätsmedizin Mannheim, Mannheim, Germany, 5Charité-Universitätsmedizin Berlin, NeuroCure Clinical Research Center, Berlin, Germany,6Charité-Universitätsmedizin Berlin, Endocrinology, Diabetes and Nutrition, Berlin,GermanyINTRODUCTION. Intensive care unit (ICU) acquired weakness (ICUAW) mediated bymyosin loss, is a common and significant complication in critically ill patients affecting thedisease course. Clinically the weakness is getting present when patients awake fromsedation. Time course of myosin loss has not been investigated.OBJECTIVES. To investigate changes in myosin content in skeletal muscle for slowand fast type of myosin heavy chain (MyHC) during the disease course of critically illpatients.METHODS. Controlled, prospective, monocentric observational study. We included 22mechanically ventilated, critically ill patients (SOFA score C8 at 3 within 5 days after ICUadmission). A surgical muscle biopsy (M. vastus lateralis) from 5 healthy controls and twice(median day 6 and 15 after ICU admission) from ICU patients were obtained. We quantifiedmyosin protein (MyHC slow and MyHC fast) content by Western blot (n = 22 first andsecond each). Investigating Medical-Research-Council (MRC) score. Non-parametric testswere performed. Data shown as median (25th/75th percentile). Ethic vote (Charité EA2/061/06).RESULTS. 16 patients got adequate awake for the first time at median day 14 (12/20) andrevealed ICU-acquired weakness with a median MRC-score of 3.1 (2.9/3.4). A significantdecrease of myosin content of ca. 50 % for slow and ca. 90 % for fast myosin was foundalready in the first biopsy at median day 6 (4/8) in critically ill patients compared to healthycontrols. Between first and second biopsy myosin contents did not changed significantly anymore.CONCLUSIONS. A massive and very early loss of fast and slow myosin characterizesICUAW. Rapid myosin loss and unchanged low levels of myosin between first and secondbiopsy concentrates time course of important pathophysiological mechanisms of ICUAWwithin days or hours after onset of critical illness. Furthermore it makes clear that preventiveinterventions have to start that early.GRANT ACKNOWLEDGMENT. Funded by DFG, KFO 192, WE 4386/1-2.
0229CHOLESTATIC LIVER DISEASE PROVOKES SKELETAL MUSCLE WASTINGDESPITE STIMULATION OF TRANSLATION INITIATION, DECREASEDAUTOPHAGY, ACTIVATION OF YES ASSOCIATED PROTEIN (YAP) ANDPROTEASOMAL SIGNAL ACTIVATION IN MICE
M. Desai1,2, S.J. Koo2,3, Z. Eblimit2,3, A. Suryawan2,3, J. Silva1,2, J.A. Coss-Bu1,2,T. Nguyen1,2, T. Davis2,3, R.A. Orellana1,2,3
1Critical Care Section, Texas Children’s Hospital, Houston, USA, 2Baylor College ofMedicine, Pediatrics, Houston, USA, 3USDA/ARS Children’s Nutrition Research Center,Houston, USAINTRODUCTION. Skeletal muscle wasting is common co-morbidity in adults and chil-dren with cholestatic liver diseases and contributes directly to fatigue, exercise intolerance,poor quality of life and lack of productivity. Even though malnutrition, metabolicderangements and inflammatory mediators induced by liver disease are thought to causemyopathy, the molecular mechanisms that drive skeletal muscle atrophy during cholestasisand bile acid (BA) excess is unknown.OBJECTIVES. To elucidate the molecular mechanisms that drive the atrophy in skeletalmuscle, especially in cholestasis and bile acid (BA) excess. We hypothesize that cholestasisinduces muscle atrophy by directly depressing translation initiation pathways, making itdistinct from pathways induced by nutritional aberrancies.METHODS. Biliary fibrosis and cholestasis was induced in 6–8 week old male C57BL/6 Jmice by feeding a 0.1 % 3,5-diethoxycarbonyl-1, 4-dihydroxychollidine (DDC) supple-mented diet for 3 weeks and compared with isocaloric chow fed mice (n = 6/group). Miceunderwent live imaging (dual energy X-ray absorptiometry [DEXA] scanning) and exercisetolerance testing. Serum was analyzed for biochemical evidence of liver injury, bile acidlevels, glucose and insulin levels under fasting conditions. Quadriceps muscle was analyzedby histology and for key mediators regulating muscle translation and degradation. Statisticalanalysis by Student t test, p \ 0.05 was considered significant.RESULTS. We found that DDC fed mice had 1/3 less food intake, had a lower body weight(17 ± 0.6 vs. 25 ± 0.5 g), lean (11.4 ± 0.8 vs. 16.1 ± 0.4 g) and fat mass (2.3 ± 0.1 vs.3 ± 0.2 g) and demonstrated early fatigue on the treadmill (8.7 ± 2 vs. 18.8 ± 2 min)compared to controls, recapitulating human disease. Serum analysis demonstrated liverinjury (ALT: 958 ± 88 vs. 31 ± 6 u/L), cholestasis (conjugated bilirubin: 9.2 ± 2 vs.0.02 ± 0.01 mg/dl) and cholanemia (BA levels: 1,000 ± 250 vs. 7 ± 1 lmol/L). Fastingserum glucose (60 ± 5 vs. 150 ± 15 mg/dl) and serum insulin levels (0.15 ± 0.01 vs.0.53 ± 0.01 ng/L) were lower in DDC fed mice than controls. Quadriceps muscle mass waslower in DDC fed mice compared to controls (0.05 ± 0.006 vs. 0.14 ± 0.01 g). Cholestaticmice had 3 fold higher phosphorylation rates of AKT, 4EBP-1 and eIF4G, while phos-phorylation rates of AMPK, eIF2a, YAP, LC3 and MuRF1 was half compared to controls.CONCLUSIONS. These findings suggest that cholestasis induces skeletal muscle wastingdespite activation of anabolic pathways, evidenced by stimulation of translation initiation,and suppression of autophagy and protein degradation signaling in skeletal muscle. High
levels of circulating bile acids could be the potential candidate mechanism that drivesskeletal myopathy and wasting.REFERENCES. 1. Desai et al. Hepatology. 2010;51(6):2097–107. 2. Orellana et al. PediatrRes. 2008;64(5):505–10.GRANT ACKNOWLEDGMENT. 1) Baylor College of Medicine, Pediatric Critical CareInternal Funding, 2) P30DK056338 (MSD).
0230FEASIBILITY OF ELECTRICAL MUSCLE STIMULATION IN CRITICALLY ILLPATIENTS DURING TIME COURSE OF INTENSIVE CARE TREATMENT
M. Krebs1, K. Haas1, T. Wollersheim1, F. Balzer1, N. Carbon1, R. Mörgeli1, M. Goll1,G. Sonomdagva1, C. Olbricht1, J. Malleike1, F. Nehls1, S. Weber-Carstens1
1Charité-Universitätsmedizin Berlin, Anesthesiology and Operative Intensive CareMedicine, Berlin, GermanyINTRODUCTION. Critical illness myopathy (CIM) and loss of muscle mass are majorside-effects during intensive care unit (ICU) treatment. Electrical muscle Stimulation (EMS)is nowadays investigated to avoid CIM and to maintain muscle mass of critically ill patients.OBJECTIVES. To investigate whether differences of evoked muscle contractions of upperand lower extremities exist during course of critical illness. To investigate whether septicshock and inflammation influence excitability and capability of induced muscle contractionwith EMS.METHODS. We investigated retrospectively a cohort of 35 ventilated, critically ill patients(SOFA score C8 at 3 within 5 days after ICU admission). Patients were prospectivelytreated with daily, 20 min each muscle group seven times a week. Achievement of musclecontraction of M. vastus lat was recorded up to day 15. Adverse events were recorded whenoccurring. Retrospectively, we analyzed the success rates of evoked muscle contraction withEMS in critically ill patients.RESULTS. 35 patients were included in this analysis. In 452 patient days, 322 EMSsessions (71 %) were performed. In sum, during the first 15 days of ICU stay, contraction ofM. vastus lat was achieved in 75–100 % of the performed sessions in 5 (14.3 %) patients, in51–75 % in 4 (11.4 %) patients and 26–50 % in 2 (5.7 %) patients. In 1–25 % a contractionwas evoked with EMS in 8 (22.9 %) patients. In the majority of 16 (45.7 %) patients, amuscle contraction was not possible to evoke. Rate of success of evoked muscle contractiondeclined from 58.5 % at day one, 46.4 % at day 5, 26.7 % at day 10 and dropped to asuccess rate of 10 % at day 15. Patients with absent evoked muscle contraction by EMS,showed a higher severity of illness, indicated by admission SAPSII (61.5 (43.3/74.8) vs. 49(41/58) p = 0.056) and a higher SOFAmax (16 (12/17.5) vs. 13 (10/18) p = 0.095) duringthe 15 days of intensive care treatment. Age, BMI, sex, leucocytes and catecholamine do notstatistically influence the ability to evoke muscle contraction with EMS in critically illpatients. No adverse event was recorded during 322 electrical stimulation sessions in allpatients.CONCLUSIONS. Success rate of evoked muscle contraction with EMS declines duringtime of critical illness. Severity of illness seems to influence ability of evoked musclecontraction of M. vastus lat.GRANT ACKNOWLEDGMENT. Funded by DFG, KFO 192, WE 4386/1-2.
0231EVALUATION OF TEMPORAL MITOCHONDRIAL FUNCTION IN VITRO INPATIENTS WITH ORGAN FAILURE: A PROSPECTIVE OBSERVATIONALPILOT STUDY
M. Chakraborty1, A. Hickey2, J. Macdonald1, L. Newby3, D. Sim4, A. Phillips2, J. Windsor1
1University of Auckland, Department of Surgery, Auckland, New Zealand, 2University ofAuckland, School of Biological Sciences, Auckland, New Zealand, 3Auckland CityHospital, Auckland, New Zealand, 4Victoria University of Wellington, Wellington, NewZealandINTRODUCTION. Septic organ failure is associated with decreased mitochondrial res-piration (MR)1, but what happens in multiple organ dysfunction syndrome (MODS) due toother causes is unknown. The decrease in MR is thought to play a significant role in septicorgan failure but whether it is causal is not known because temporal MR in sepsis or MODShas never been studied in patients.OBJECTIVES. The primary objective was to measure temporal MR in septic and nonseptic organ failure (OF) and compare with healthy volunteers (HV, n = 15). The secondaryobjectives were to assess other mitochondrial function (MF) and correlate MR withsequential organ failure assessment (SOFA).METHODS. After regional ethics approval, patients with OF2 and: (i) septic shock2 (S,n = 15) or ii) shock from other causes2 (NS, n = 11) were prospectively recruited fromICU at Auckland City Hospital. MR, mitochondrial superoxide (SO), and adenine-tri-phosphate (ATP) from peripheral blood mononuclear cells were measured daily during thefirst week and once at 3 weeks in patients and once from HV. MR was measured with highresolution respirometry using a substrate uncoupler inhibitor titration (SUIT) protocol.Significance was established at P \ 0.05 and a repeated measure ANOVA for temporal MFand ANOVA for comparison with HV were used.RESULTS. The pattern of MR was similar in S and NS over days (P [ 0.05) with decreasedoxidative phosphorylation through complex I and II (CI + II OXPHOS) and electrontransport system capacity (ETS) compared to HV. In S, CI, II OXPHOS was decreased by43 % at 4 days (P = 0.002) and by 30 % at 3 weeks (P = 0.03) compared to HV. In NS, CI,II OXPHOS (P = 0.003) was decreased by 49 % at 3 days compared to HV. Additionally,ETS capacity was decreased by 23 % at 3 days (P = 0.03) and 25 % at 5/6 days (P = 0.007)compared to HV in S. ATP was decreased by 52 % in S at day 2 and by 45 % in NS at day 3compared to HV (P \ 0.05 for both). SO increased by 66 and 78 % at day 1 for S and NSrespectively and preceded decreases in MR (P \ 0.05 for both). MR correlated with SOFAscores in S and NS from day 3 onwards (d3: r = -0.651, P = 0.006).CONCLUSIONS. MR dysfunction occurred in S and NS after increases in SO and temporalMR was similar in all OF. MR correlated with severity of MODS from day 3 onwards. SinceMR did not decrease until day 3 in S and NS, MR dysfunction is unlikely to be the proximalcause of OF [ACTRN12612000047897].REFERENCES. 1. Brealey D, Brand M, et al. Association between mitochondrial dys-function and severity and outcome of septic shock. Lancet. 2002;360:219–23. 2. Bone RC,
26th ESICM ANNUAL CONGRESS — PARIS, FRANCE — 5–9 OCTOBER 2013
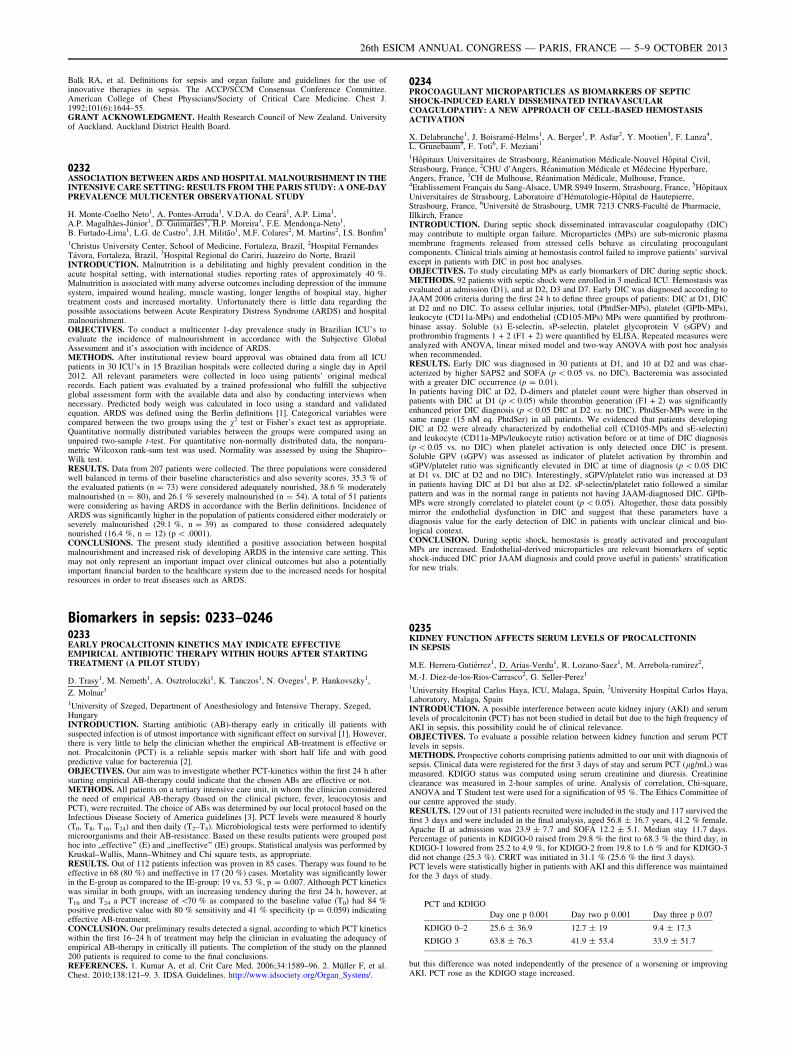
Balk RA, et al. Definitions for sepsis and organ failure and guidelines for the use ofinnovative therapies in sepsis. The ACCP/SCCM Consensus Conference Committee.American College of Chest Physicians/Society of Critical Care Medicine. Chest J.1992;101(6):1644–55.GRANT ACKNOWLEDGMENT. Health Research Council of New Zealand. Universityof Auckland. Auckland District Health Board.
0232ASSOCIATION BETWEEN ARDS AND HOSPITAL MALNOURISHMENT IN THEINTENSIVE CARE SETTING: RESULTS FROM THE PARIS STUDY: A ONE-DAYPREVALENCE MULTICENTER OBSERVATIONAL STUDY
H. Monte-Coelho Neto1, A. Pontes-Arruda1, V.D.A. do Ceará1, A.P. Lima1,A.P. Magalhães-Júnior1, D. Guimarães1, H.P. Moreira1, F.E. Mendonça-Neto1,B. Furtado-Lima1, L.G. de Castro1, J.H. Militão1, M.F. Colares2, M. Martins2, I.S. Bonfim3
1Christus University Center, School of Medicine, Fortaleza, Brazil, 2Hospital FernandesTávora, Fortaleza, Brazil, 3Hospital Regional do Cariri, Juazeiro do Norte, BrazilINTRODUCTION. Malnutrition is a debilitating and highly prevalent condition in theacute hospital setting, with international studies reporting rates of approximately 40 %.Malnutrition is associated with many adverse outcomes including depression of the immunesystem, impaired wound healing, muscle wasting, longer lengths of hospital stay, highertreatment costs and increased mortality. Unfortunately there is little data regarding thepossible associations between Acute Respiratory Distress Syndrome (ARDS) and hospitalmalnourishment.OBJECTIVES. To conduct a multicenter 1-day prevalence study in Brazilian ICU’s toevaluate the incidence of malnourishment in accordance with the Subjective GlobalAssessment and it’s association with incidence of ARDS.METHODS. After institutional review board approval was obtained data from all ICUpatients in 30 ICU’s in 15 Brazilian hospitals were collected during a single day in April2012. All relevant parameters were collected in loco using patients’ original medicalrecords. Each patient was evaluated by a trained professional who fulfill the subjectiveglobal assessment form with the available data and also by conducting interviews whennecessary. Predicted body weigh was calculated in loco using a standard and validatedequation. ARDS was defined using the Berlin definitions [1]. Categorical variables werecompared between the two groups using the v2 test or Fisher’s exact test as appropriate.Quantitative normally distributed variables between the groups were compared using anunpaired two-sample t-test. For quantitative non-normally distributed data, the nonpara-metric Wilcoxon rank-sum test was used. Normality was assessed by using the Shapiro–Wilk test.RESULTS. Data from 207 patients were collected. The three populations were consideredwell balanced in terms of their baseline characteristics and also severity scores. 35.3 % ofthe evaluated patients (n = 73) were considered adequately nourished, 38.6 % moderatelymalnourished (n = 80), and 26.1 % severely malnourished (n = 54). A total of 51 patientswere considering as having ARDS in accordance with the Berlin definitions. Incidence ofARDS was significantly higher in the population of patients considered either moderately orseverely malnourished (29.1 %, n = 39) as compared to those considered adequatelynourished (16.4 %, n = 12) (p \ .0001).CONCLUSIONS. The present study identified a positive association between hospitalmalnourishment and increased risk of developing ARDS in the intensive care setting. Thismay not only represent an important impact over clinical outcomes but also a potentiallyimportant financial burden to the healthcare system due to the increased needs for hospitalresources in order to treat diseases such as ARDS.
Biomarkers in sepsis: 0233–02460233EARLY PROCALCITONIN KINETICS MAY INDICATE EFFECTIVEEMPIRICAL ANTIBIOTIC THERAPY WITHIN HOURS AFTER STARTINGTREATMENT (A PILOT STUDY)
D. Trasy1, M. Nemeth1, A. Osztroluczki1, K. Tanczos1, N. Oveges1, P. Hankovszky1,
Z. Molnar1
1University of Szeged, Department of Anesthesiology and Intensive Therapy, Szeged,HungaryINTRODUCTION. Starting antibiotic (AB)-therapy early in critically ill patients withsuspected infection is of utmost importance with significant effect on survival [1]. However,there is very little to help the clinician whether the empirical AB-treatment is effective ornot. Procalcitonin (PCT) is a reliable sepsis marker with short half life and with goodpredictive value for bacteremia [2].OBJECTIVES. Our aim was to investigate whether PCT-kinetics within the first 24 h afterstarting empirical AB-therapy could indicate that the chosen ABs are effective or not.METHODS. All patients on a tertiary intensive care unit, in whom the clinician consideredthe need of empirical AB-therapy (based on the clinical picture, fever, leucocytosis andPCT), were recruited. The choice of ABs was determined by our local protocol based on theInfectious Disease Society of America guidelines [3]. PCT levels were measured 8 hourly(T0, T8, T16, T24) and then daily (T2–T5). Microbiological tests were performed to identifymicroorganisms and their AB-resistance. Based on these results patients were grouped posthoc into ,,effective’’ (E) and ,,ineffective’’ (IE) groups. Statistical analysis was performed byKruskal–Wallis, Mann–Whitney and Chi square tests, as appropriate.RESULTS. Out of 112 patients infection was proven in 85 cases. Therapy was found to beeffective in 68 (80 %) and ineffective in 17 (20 %) cases. Mortality was significantly lowerin the E-group as compared to the IE-group: 19 vs. 53 %, p = 0.007. Although PCT kineticswas similar in both groups, with an increasing tendency during the first 24 h, however, atT16 and T24 a PCT increase of \70 % as compared to the baseline value (T0) had 84 %positive predictive value with 80 % sensitivity and 41 % specificity (p = 0.059) indicatingeffective AB-treatment.CONCLUSION. Our preliminary results detected a signal, according to which PCT kineticswithin the first 16–24 h of treatment may help the clinician in evaluating the adequacy ofempirical AB-therapy in critically ill patients. The completion of the study on the planned200 patients is required to come to the final conclusions.REFERENCES. 1. Kumar A, et al. Crit Care Med. 2006;34:1589–96. 2. Müller F, et al.Chest. 2010;138:121–9. 3. IDSA Guidelines. http://www.idsociety.org/Organ_System/.
0234PROCOAGULANT MICROPARTICLES AS BIOMARKERS OF SEPTICSHOCK-INDUCED EARLY DISSEMINATED INTRAVASCULARCOAGULOPATHY: A NEW APPROACH OF CELL-BASED HEMOSTASISACTIVATION
X. Delabranche1, J. Boisramé-Helms1, A. Berger1, P. Asfar2, Y. Mootien3, F. Lanza4,L. Grunebaum5, F. Toti6, F. Meziani1
1Hôpitaux Universitaires de Strasbourg, Réanimation Médicale-Nouvel Hôpital Civil,Strasbourg, France, 2CHU d’Angers, Réanimation Médicale et Médecine Hyperbare,Angers, France, 3CH de Mulhouse, Réanimation Médicale, Mulhouse, France,4Etablissement Français du Sang-Alsace, UMR S949 Inserm, Strasbourg, France, 5HôpitauxUniversitaires de Strasbourg, Laboratoire d’Hématologie-Hôpital de Hautepierre,Strasbourg, France, 6Université de Strasbourg, UMR 7213 CNRS-Faculté de Pharmacie,Illkirch, FranceINTRODUCTION. During septic shock disseminated intravascular coagulopathy (DIC)may contribute to multiple organ failure. Microparticles (MPs) are sub-micronic plasmamembrane fragments released from stressed cells behave as circulating procoagulantcomponents. Clinical trials aiming at hemostasis control failed to improve patients’ survivalexcept in patients with DIC in post hoc analyses.OBJECTIVES. To study circulating MPs as early biomarkers of DIC during septic shock.METHODS. 92 patients with septic shock were enrolled in 3 medical ICU. Hemostasis wasevaluated at admission (D1), and at D2, D3 and D7. Early DIC was diagnosed according toJAAM 2006 criteria during the first 24 h to define three groups of patients: DIC at D1, DICat D2 and no DIC. To assess cellular injuries, total (PhtdSer-MPs), platelet (GPIb-MPs),leukocyte (CD11a-MPs) and endothelial (CD105-MPs) MPs were quantified by prothrom-binase assay. Soluble (s) E-selectin, sP-selectin, platelet glycoprotein V (sGPV) andprothrombin fragments 1 + 2 (F1 + 2) were quantified by ELISA. Repeated measures wereanalyzed with ANOVA, linear mixed model and two-way ANOVA with post hoc analysiswhen recommended.RESULTS. Early DIC was diagnosed in 30 patients at D1, and 10 at D2 and was char-acterized by higher SAPS2 and SOFA (p \ 0.05 vs. no DIC). Bacteremia was associatedwith a greater DIC occurrence (p = 0.01).In patients having DIC at D2, D-dimers and platelet count were higher than observed inpatients with DIC at D1 (p \ 0.05) while thrombin generation (F1 + 2) was significantlyenhanced prior DIC diagnosis (p \ 0.05 DIC at D2 vs. no DIC). PhtdSer-MPs were in thesame range (15 nM eq. PhtdSer) in all patients. We evidenced that patients developingDIC at D2 were already characterized by endothelial cell (CD105-MPs and sE-selectin)and leukocyte (CD11a-MPs/leukocyte ratio) activation before or at time of DIC diagnosis(p \ 0.05 vs. no DIC) when platelet activation is only detected once DIC is present.Soluble GPV (sGPV) was assessed as indicator of platelet activation by thrombin andsGPV/platelet ratio was significantly elevated in DIC at time of diagnosis (p \ 0.05 DICat D1 vs. DIC at D2 and no DIC). Interestingly, sGPV/platelet ratio was increased at D3in patients having DIC at D1 but also at D2. sP-selectin/platelet ratio followed a similarpattern and was in the normal range in patients not having JAAM-diagnosed DIC. GPIb-MPs were strongly correlated to platelet count (p \ 0.05). Altogether, these data possiblymirror the endothelial dysfunction in DIC and suggest that these parameters have adiagnosis value for the early detection of DIC in patients with unclear clinical and bio-logical context.CONCLUSION. During septic shock, hemostasis is greatly activated and procoagulantMPs are increased. Endothelial-derived microparticles are relevant biomarkers of septicshock-induced DIC prior JAAM diagnosis and could prove useful in patients’ stratificationfor new trials.
0235KIDNEY FUNCTION AFFECTS SERUM LEVELS OF PROCALCITONININ SEPSIS
M.E. Herrera-Gutiérrez1, D. Arias-Verdu1, R. Lozano-Saez1, M. Arrebola-ramirez2,
M.-J. Diez-de-los-Rios-Carrasco2, G. Seller-Perez1
1University Hospital Carlos Haya, ICU, Malaga, Spain, 2University Hospital Carlos Haya,Laboratory, Malaga, SpainINTRODUCTION. A possible interference between acute kidney injury (AKI) and serumlevels of procalcitonin (PCT) has not been studied in detail but due to the high frequency ofAKI in sepsis, this possibility could be of clinical relevance.OBJECTIVES. To evaluate a possible relation between kidney function and serum PCTlevels in sepsis.METHODS. Prospective cohorts comprising patients admitted to our unit with diagnosis ofsepsis. Clinical data were registered for the first 3 days of stay and serum PCT (lg/mL) wasmeasured. KDIGO status was computed using serum creatinine and diuresis. Creatinineclearance was measured in 2-hour samples of urine. Analysis of correlation, Chi-square,ANOVA and T Student test were used for a signification of 95 %. The Ethics Committee ofour centre approved the study.RESULTS. 129 out of 131 patients recruited were included in the study and 117 survived thefirst 3 days and were included in the final analysis, aged 56.8 ± 16.7 years, 41.2 % female.Apache II at admission was 23.9 ± 7.7 and SOFA 12.2 ± 5.1. Median stay 11.7 days.Percentage of patients in KDIGO-0 raised from 29.8 % the first to 68.3 % the third day, inKDIGO-1 lowered from 25.2 to 4.9 %, for KDIGO-2 from 19.8 to 1.6 % and for KDIGO-3did not change (25.3 %). CRRT was initiated in 31.1 % (25.6 % the first 3 days).PCT levels were statistically higher in patients with AKI and this difference was maintainedfor the 3 days of study.
PCT and KDIGO
Day one p 0.001 Day two p 0.001 Day three p 0.07
KDIGO 0–2 25.6 ± 36.9 12.7 ± 19 9.4 ± 17.3
KDIGO 3 63.8 ± 76.3 41.9 ± 53.4 33.9 ± 51.7
but this difference was noted independently of the presence of a worsening or improvingAKI. PCT rose as the KDIGO stage increased.
26th ESICM ANNUAL CONGRESS — PARIS, FRANCE — 5–9 OCTOBER 2013
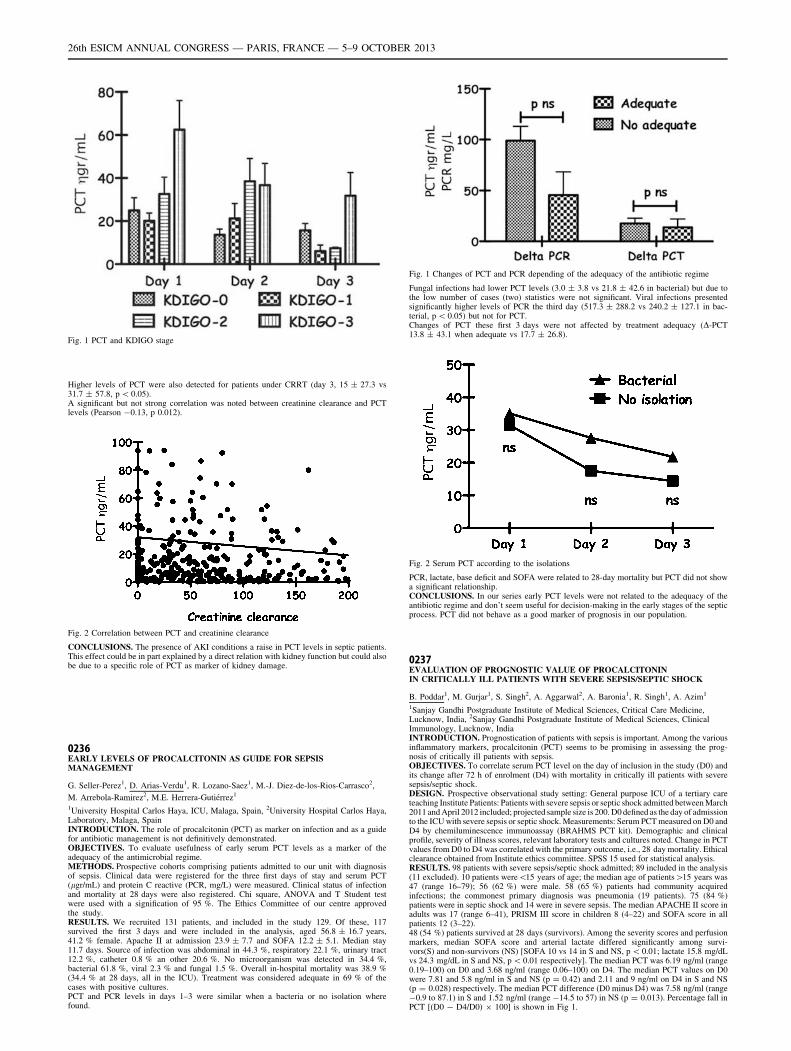
Fig. 1 PCT and KDIGO stage
Higher levels of PCT were also detected for patients under CRRT (day 3, 15 ± 27.3 vs31.7 ± 57.8, p \ 0.05).A significant but not strong correlation was noted between creatinine clearance and PCTlevels (Pearson -0.13, p 0.012).
Fig. 2 Correlation between PCT and creatinine clearance
CONCLUSIONS. The presence of AKI conditions a raise in PCT levels in septic patients.This effect could be in part explained by a direct relation with kidney function but could alsobe due to a specific role of PCT as marker of kidney damage.
0236EARLY LEVELS OF PROCALCITONIN AS GUIDE FOR SEPSISMANAGEMENT
G. Seller-Perez1, D. Arias-Verdu1, R. Lozano-Saez1, M.-J. Diez-de-los-Rios-Carrasco2,
M. Arrebola-Ramirez2, M.E. Herrera-Gutiérrez1
1University Hospital Carlos Haya, ICU, Malaga, Spain, 2University Hospital Carlos Haya,Laboratory, Malaga, SpainINTRODUCTION. The role of procalcitonin (PCT) as marker on infection and as a guidefor antibiotic management is not definitively demonstrated.OBJECTIVES. To evaluate usefulness of early serum PCT levels as a marker of theadequacy of the antimicrobial regime.METHODS. Prospective cohorts comprising patients admitted to our unit with diagnosisof sepsis. Clinical data were registered for the three first days of stay and serum PCT(lgr/mL) and protein C reactive (PCR, mg/L) were measured. Clinical status of infectionand mortality at 28 days were also registered. Chi square, ANOVA and T Student testwere used with a signification of 95 %. The Ethics Committee of our centre approvedthe study.RESULTS. We recruited 131 patients, and included in the study 129. Of these, 117survived the first 3 days and were included in the analysis, aged 56.8 ± 16.7 years,41.2 % female. Apache II at admission 23.9 ± 7.7 and SOFA 12.2 ± 5.1. Median stay11.7 days. Source of infection was abdominal in 44.3 %, respiratory 22.1 %, urinary tract12.2 %, catheter 0.8 % an other 20.6 %. No microorganism was detected in 34.4 %,bacterial 61.8 %, viral 2.3 % and fungal 1.5 %. Overall in-hospital mortality was 38.9 %(34.4 % at 28 days, all in the ICU). Treatment was considered adequate in 69 % of thecases with positive cultures.PCT and PCR levels in days 1–3 were similar when a bacteria or no isolation wherefound.
Fig. 1 Changes of PCT and PCR depending of the adequacy of the antibiotic regime
Fungal infections had lower PCT levels (3.0 ± 3.8 vs 21.8 ± 42.6 in bacterial) but due tothe low number of cases (two) statistics were not significant. Viral infections presentedsignificantly higher levels of PCR the third day (517.3 ± 288.2 vs 240.2 ± 127.1 in bac-terial, p \ 0.05) but not for PCT.Changes of PCT these first 3 days were not affected by treatment adequacy (D-PCT13.8 ± 43.1 when adequate vs 17.7 ± 26.8).
Fig. 2 Serum PCT according to the isolations
PCR, lactate, base deficit and SOFA were related to 28-day mortality but PCT did not showa significant relationship.CONCLUSIONS. In our series early PCT levels were not related to the adequacy of theantibiotic regime and don’t seem useful for decision-making in the early stages of the septicprocess. PCT did not behave as a good marker of prognosis in our population.
0237EVALUATION OF PROGNOSTIC VALUE OF PROCALCITONININ CRITICALLY ILL PATIENTS WITH SEVERE SEPSIS/SEPTIC SHOCK
B. Poddar1, M. Gurjar1, S. Singh2, A. Aggarwal2, A. Baronia1, R. Singh1, A. Azim1
1Sanjay Gandhi Postgraduate Institute of Medical Sciences, Critical Care Medicine,Lucknow, India, 2Sanjay Gandhi Postgraduate Institute of Medical Sciences, ClinicalImmunology, Lucknow, IndiaINTRODUCTION. Prognostication of patients with sepsis is important. Among the variousinflammatory markers, procalcitonin (PCT) seems to be promising in assessing the prog-nosis of critically ill patients with sepsis.OBJECTIVES. To correlate serum PCT level on the day of inclusion in the study (D0) andits change after 72 h of enrolment (D4) with mortality in critically ill patients with severesepsis/septic shock.DESIGN. Prospective observational study setting: General purpose ICU of a tertiary careteaching Institute Patients: Patients with severe sepsis or septic shock admitted between March2011 and April 2012 included; projected sample size is 200. D0 defined as the day of admissionto the ICU with severe sepsis or septic shock. Measurements: Serum PCT measured on D0 andD4 by chemiluminescence immunoassay (BRAHMS PCT kit). Demographic and clinicalprofile, severity of illness scores, relevant laboratory tests and cultures noted. Change in PCTvalues from D0 to D4 was correlated with the primary outcome, i.e., 28 day mortality. Ethicalclearance obtained from Institute ethics committee. SPSS 15 used for statistical analysis.RESULTS. 98 patients with severe sepsis/septic shock admitted; 89 included in the analysis(11 excluded). 10 patients were\15 years of age; the median age of patients[15 years was47 (range 16–79); 56 (62 %) were male. 58 (65 %) patients had community acquiredinfections; the commonest primary diagnosis was pneumonia (19 patients). 75 (84 %)patients were in septic shock and 14 were in severe sepsis. The median APACHE II score inadults was 17 (range 6–41), PRISM III score in children 8 (4–22) and SOFA score in allpatients 12 (3–22).48 (54 %) patients survived at 28 days (survivors). Among the severity scores and perfusionmarkers, median SOFA score and arterial lactate differed significantly among survi-vors(S) and non-survivors (NS) [SOFA 10 vs 14 in S and NS, p \ 0.01; lactate 15.8 mg/dLvs 24.3 mg/dL in S and NS, p \ 0.01 respectively]. The median PCT was 6.19 ng/ml (range0.19–100) on D0 and 3.68 ng/ml (range 0.06–100) on D4. The median PCT values on D0were 7.81 and 5.8 ng/ml in S and NS (p = 0.42) and 2.11 and 9 ng/ml on D4 in S and NS(p = 0.028) respectively. The median PCT difference (D0 minus D4) was 7.58 ng/ml (range-0.9 to 87.1) in S and 1.52 ng/ml (range -14.5 to 57) in NS (p = 0.013). Percentage fall inPCT [(D0 - D4/D0) 9 100] is shown in Fig 1.
26th ESICM ANNUAL CONGRESS — PARIS, FRANCE — 5–9 OCTOBER 2013
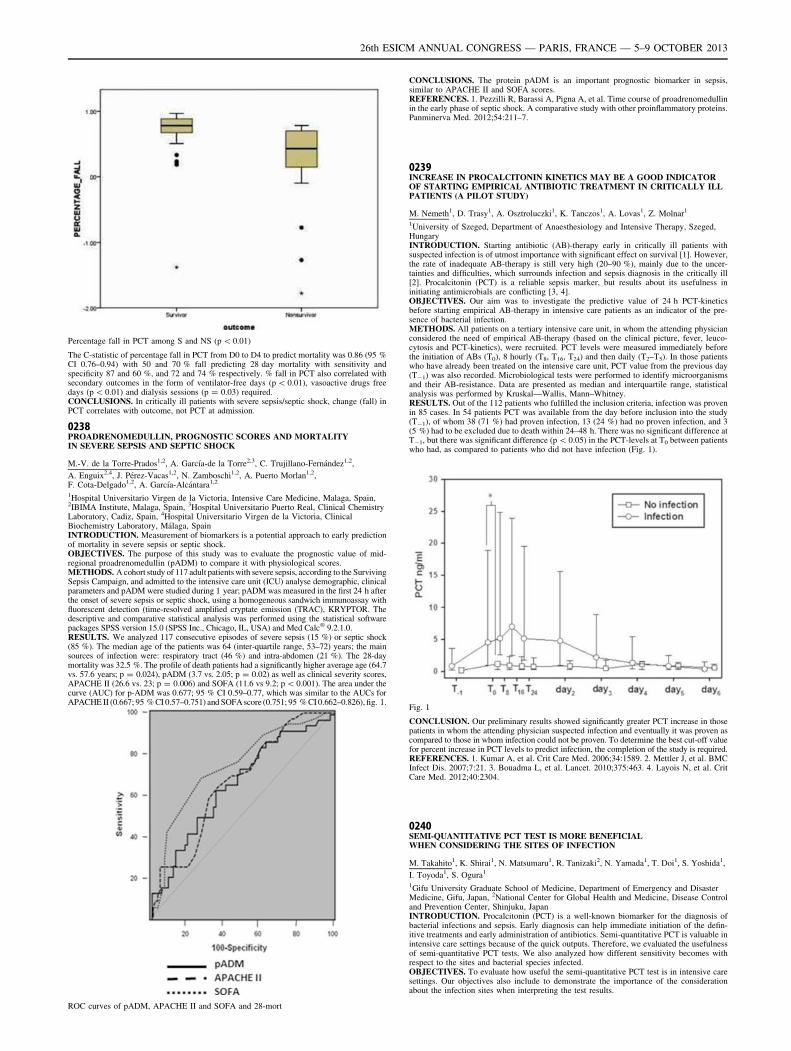
Percentage fall in PCT among S and NS (p \ 0.01)
The C-statistic of percentage fall in PCT from D0 to D4 to predict mortality was 0.86 (95 %CI 0.76–0.94) with 50 and 70 % fall predicting 28 day mortality with sensitivity andspecificity 87 and 60 %, and 72 and 74 % respectively. % fall in PCT also correlated withsecondary outcomes in the form of ventilator-free days (p \ 0.01), vasoactive drugs freedays (p \ 0.01) and dialysis sessions (p = 0.03) required.CONCLUSIONS. In critically ill patients with severe sepsis/septic shock, change (fall) inPCT correlates with outcome, not PCT at admission.
0238PROADRENOMEDULLIN, PROGNOSTIC SCORES AND MORTALITYIN SEVERE SEPSIS AND SEPTIC SHOCK
M.-V. de la Torre-Prados1,2, A. Garcı́a-de la Torre2,3, C. Trujillano-Fernández1,2,
A. Enguix2,4, J. Pérez-Vacas1,2, N. Zamboschi1,2, A. Puerto Morlan1,2,F. Cota-Delgado1,2, A. Garcı́a-Alcántara1,2
1Hospital Universitario Virgen de la Victoria, Intensive Care Medicine, Malaga, Spain,2IBIMA Institute, Malaga, Spain, 3Hospital Universitario Puerto Real, Clinical ChemistryLaboratory, Cadiz, Spain, 4Hospital Universitario Virgen de la Victoria, ClinicalBiochemistry Laboratory, Málaga, SpainINTRODUCTION. Measurement of biomarkers is a potential approach to early predictionof mortality in severe sepsis or septic shock.OBJECTIVES. The purpose of this study was to evaluate the prognostic value of mid-regional proadrenomedullin (pADM) to compare it with physiological scores.METHODS. A cohort study of 117 adult patients with severe sepsis, according to the SurvivingSepsis Campaign, and admitted to the intensive care unit (ICU) analyse demographic, clinicalparameters and pADM were studied during 1 year; pADM was measured in the first 24 h afterthe onset of severe sepsis or septic shock, using a homogeneous sandwich immunoassay withfluorescent detection (time-resolved amplified cryptate emission (TRAC), KRYPTOR. Thedescriptive and comparative statistical analysis was performed using the statistical softwarepackages SPSS version 15.0 (SPSS Inc., Chicago, IL, USA) and Med Calc� 9.2.1.0.RESULTS. We analyzed 117 consecutive episodes of severe sepsis (15 %) or septic shock(85 %). The median age of the patients was 64 (inter-quartile range, 53–72) years; the mainsources of infection were: respiratory tract (46 %) and intra-abdomen (21 %). The 28-daymortality was 32.5 %. The profile of death patients had a significantly higher average age (64.7vs. 57.6 years; p = 0.024), pADM (3.7 vs. 2.05; p = 0.02) as well as clinical severity scores,APACHE II (26.6 vs. 23; p = 0.006) and SOFA (11.6 vs 9.2; p \ 0.001). The area under thecurve (AUC) for p-ADM was 0.677; 95 % CI 0.59–0.77, which was similar to the AUCs forAPACHE II (0.667; 95 % CI 0.57–0.751) and SOFA score (0.751; 95 % CI 0.662–0.826), fig. 1.
ROC curves of pADM, APACHE II and SOFA and 28-mort
CONCLUSIONS. The protein pADM is an important prognostic biomarker in sepsis,similar to APACHE II and SOFA scores.REFERENCES. 1. Pezzilli R, Barassi A, Pigna A, et al. Time course of proadrenomedullinin the early phase of septic shock. A comparative study with other proinflammatory proteins.Panminerva Med. 2012;54:211–7.
0239INCREASE IN PROCALCITONIN KINETICS MAY BE A GOOD INDICATOROF STARTING EMPIRICAL ANTIBIOTIC TREATMENT IN CRITICALLY ILLPATIENTS (A PILOT STUDY)
M. Nemeth1, D. Trasy1, A. Osztroluczki1, K. Tanczos1, A. Lovas1, Z. Molnar1
1University of Szeged, Department of Anaesthesiology and Intensive Therapy, Szeged,HungaryINTRODUCTION. Starting antibiotic (AB)-therapy early in critically ill patients withsuspected infection is of utmost importance with significant effect on survival [1]. However,the rate of inadequate AB-therapy is still very high (20–90 %), mainly due to the uncer-tainties and difficulties, which surrounds infection and sepsis diagnosis in the critically ill[2]. Procalcitonin (PCT) is a reliable sepsis marker, but results about its usefulness ininitiating antimicrobials are conflicting [3, 4].OBJECTIVES. Our aim was to investigate the predictive value of 24 h PCT-kineticsbefore starting empirical AB-therapy in intensive care patients as an indicator of the pre-sence of bacterial infection.METHODS. All patients on a tertiary intensive care unit, in whom the attending physicianconsidered the need of empirical AB-therapy (based on the clinical picture, fever, leuco-cytosis and PCT-kinetics), were recruited. PCT levels were measured immediately beforethe initiation of ABs (T0), 8 hourly (T8, T16, T24) and then daily (T2–T5). In those patientswho have already been treated on the intensive care unit, PCT value from the previous day(T-1) was also recorded. Microbiological tests were performed to identify microorganismsand their AB-resistance. Data are presented as median and interquartile range, statisticalanalysis was performed by Kruskal––Wallis, Mann–Whitney.RESULTS. Out of the 112 patients who fulfilled the inclusion criteria, infection was provenin 85 cases. In 54 patients PCT was available from the day before inclusion into the study(T-1), of whom 38 (71 %) had proven infection, 13 (24 %) had no proven infection, and 3(5 %) had to be excluded due to death within 24–48 h. There was no significant difference atT-1, but there was significant difference (p \ 0.05) in the PCT-levels at T0 between patientswho had, as compared to patients who did not have infection (Fig. 1).
Fig. 1
CONCLUSION. Our preliminary results showed significantly greater PCT increase in thosepatients in whom the attending physician suspected infection and eventually it was proven ascompared to those in whom infection could not be proven. To determine the best cut-off valuefor percent increase in PCT levels to predict infection, the completion of the study is required.REFERENCES. 1. Kumar A, et al. Crit Care Med. 2006;34:1589. 2. Mettler J, et al. BMCInfect Dis. 2007;7:21. 3. Bouadma L, et al. Lancet. 2010;375:463. 4. Layois N, et al. CritCare Med. 2012;40:2304.
0240SEMI-QUANTITATIVE PCT TEST IS MORE BENEFICIALWHEN CONSIDERING THE SITES OF INFECTION
M. Takahito1, K. Shirai1, N. Matsumaru1, R. Tanizaki2, N. Yamada1, T. Doi1, S. Yoshida1,
I. Toyoda1, S. Ogura1
1Gifu University Graduate School of Medicine, Department of Emergency and DisasterMedicine, Gifu, Japan, 2National Center for Global Health and Medicine, Disease Controland Prevention Center, Shinjuku, JapanINTRODUCTION. Procalcitonin (PCT) is a well-known biomarker for the diagnosis ofbacterial infections and sepsis. Early diagnosis can help immediate initiation of the defin-itive treatments and early administration of antibiotics. Semi-quantitative PCT is valuable inintensive care settings because of the quick outputs. Therefore, we evaluated the usefulnessof semi-quantitative PCT tests. We also analyzed how different sensitivity becomes withrespect to the sites and bacterial species infected.OBJECTIVES. To evaluate how useful the semi-quantitative PCT test is in intensive caresettings. Our objectives also include to demonstrate the importance of the considerationabout the infection sites when interpreting the test results.
26th ESICM ANNUAL CONGRESS — PARIS, FRANCE — 5–9 OCTOBER 2013
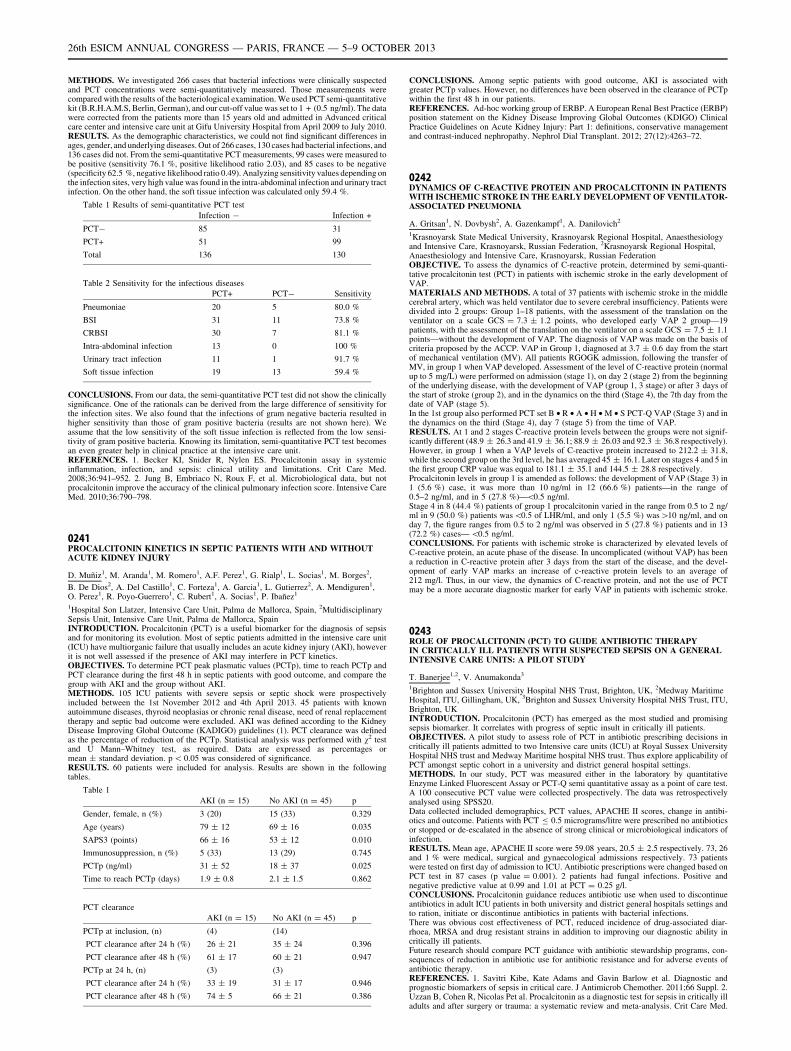
METHODS. We investigated 266 cases that bacterial infections were clinically suspectedand PCT concentrations were semi-quantitatively measured. Those measurements werecompared with the results of the bacteriological examination. We used PCT semi-quantitativekit (B.R.H.A.M.S, Berlin, German), and our cut-off value was set to 1 + (0.5 ng/ml). The datawere corrected from the patients more than 15 years old and admitted in Advanced criticalcare center and intensive care unit at Gifu University Hospital from April 2009 to July 2010.RESULTS. As the demographic characteristics, we could not find significant differences inages, gender, and underlying diseases. Out of 266 cases, 130 cases had bacterial infections, and136 cases did not. From the semi-quantitative PCT measurements, 99 cases were measured tobe positive (sensitivity 76.1 %, positive likelihood ratio 2.03), and 85 cases to be negative(specificity 62.5 %, negative likelihood ratio 0.49). Analyzing sensitivity values depending onthe infection sites, very high value was found in the intra-abdominal infection and urinary tractinfection. On the other hand, the soft tissue infection was calculated only 59.4 %.
Table 1 Results of semi-quantitative PCT test
Infection - Infection +
PCT- 85 31
PCT+ 51 99
Total 136 130
Table 2 Sensitivity for the infectious diseases
PCT+ PCT- Sensitivity
Pneumoniae 20 5 80.0 %
BSI 31 11 73.8 %
CRBSI 30 7 81.1 %
Intra-abdominal infection 13 0 100 %
Urinary tract infection 11 1 91.7 %
Soft tissue infection 19 13 59.4 %
CONCLUSIONS. From our data, the semi-quantitative PCT test did not show the clinicallysignificance. One of the rationals can be derived from the large difference of sensitivity forthe infection sites. We also found that the infections of gram negative bacteria resulted inhigher sensitivity than those of gram positive bacteria (results are not shown here). Weassume that the low sensitivity of the soft tissue infection is reflected from the low sensi-tivity of gram positive bacteria. Knowing its limitation, semi-quantitative PCT test becomesan even greater help in clinical practice at the intensive care unit.REFERENCES. 1. Becker KI, Snider R, Nylen ES. Procalcitonin assay in systemicinflammation, infection, and sepsis: clinical utility and limitations. Crit Care Med.2008;36:941–952. 2. Jung B, Embriaco N, Roux F, et al. Microbiological data, but notprocalcitonin improve the accuracy of the clinical pulmonary infection score. Intensive CareMed. 2010;36:790–798.
0241PROCALCITONIN KINETICS IN SEPTIC PATIENTS WITH AND WITHOUTACUTE KIDNEY INJURY
D. Muñiz1, M. Aranda1, M. Romero1, A.F. Perez1, G. Rialp1, L. Socias1, M. Borges2,
B. De Dios2, A. Del Castillo1, C. Forteza1, A. Garcia1, L. Gutierrez2, A. Mendiguren1,O. Perez1, R. Poyo-Guerrero1, C. Rubert1, A. Socias1, P. Ibañez1
1Hospital Son Llatzer, Intensive Care Unit, Palma de Mallorca, Spain, 2MultidisciplinarySepsis Unit, Intensive Care Unit, Palma de Mallorca, SpainINTRODUCTION. Procalcitonin (PCT) is a useful biomarker for the diagnosis of sepsisand for monitoring its evolution. Most of septic patients admitted in the intensive care unit(ICU) have multiorganic failure that usually includes an acute kidney injury (AKI), howeverit is not well assessed if the presence of AKI may interfere in PCT kinetics.OBJECTIVES. To determine PCT peak plasmatic values (PCTp), time to reach PCTp andPCT clearance during the first 48 h in septic patients with good outcome, and compare thegroup with AKI and the group without AKI.METHODS. 105 ICU patients with severe sepsis or septic shock were prospectivelyincluded between the 1st November 2012 and 4th April 2013. 45 patients with knownautoimmune diseases, thyroid neoplasias or chronic renal disease, need of renal replacementtherapy and septic bad outcome were excluded. AKI was defined according to the KidneyDisease Improving Global Outcome (KADIGO) guidelines (1). PCT clearance was definedas the percentage of reduction of the PCTp. Statistical analysis was performed with v2 testand U Mann–Whitney test, as required. Data are expressed as percentages ormean ± standard deviation. p \ 0.05 was considered of significance.RESULTS. 60 patients were included for analysis. Results are shown in the followingtables.
Table 1
AKI (n = 15) No AKI (n = 45) p
Gender, female, n (%) 3 (20) 15 (33) 0.329
Age (years) 79 ± 12 69 ± 16 0.035
SAPS3 (points) 66 ± 16 53 ± 12 0.010
Immunosuppression, n (%) 5 (33) 13 (29) 0.745
PCTp (ng/ml) 31 ± 52 18 ± 37 0.025
Time to reach PCTp (days) 1.9 ± 0.8 2.1 ± 1.5 0.862
PCT clearance
AKI (n = 15) No AKI (n = 45) p
PCTp at inclusion, (n) (4) (14)
PCT clearance after 24 h (%) 26 ± 21 35 ± 24 0.396
PCT clearance after 48 h (%) 61 ± 17 60 ± 21 0.947
PCTp at 24 h, (n) (3) (3)
PCT clearance after 24 h (%) 33 ± 19 31 ± 17 0.946
PCT clearance after 48 h (%) 74 ± 5 66 ± 21 0.386
CONCLUSIONS. Among septic patients with good outcome, AKI is associated withgreater PCTp values. However, no differences have been observed in the clearance of PCTpwithin the first 48 h in our patients.REFERENCES. Ad-hoc working group of ERBP. A European Renal Best Practice (ERBP)position statement on the Kidney Disease Improving Global Outcomes (KDIGO) ClinicalPractice Guidelines on Acute Kidney Injury: Part 1: definitions, conservative managementand contrast-induced nephropathy. Nephrol Dial Transplant. 2012; 27(12):4263–72.
0242DYNAMICS OF C-REACTIVE PROTEIN AND PROCALCITONIN IN PATIENTSWITH ISCHEMIC STROKE IN THE EARLY DEVELOPMENT OF VENTILATOR-ASSOCIATED PNEUMONIA
A. Gritsan1, N. Dovbysh2, A. Gazenkampf1, A. Danilovich2
1Krasnoyarsk State Medical University, Krasnoyarsk Regional Hospital, Anaesthesiologyand Intensive Care, Krasnoyarsk, Russian Federation, 2Krasnoyarsk Regional Hospital,Anaesthesiology and Intensive Care, Krasnoyarsk, Russian FederationOBJECTIVE. To assess the dynamics of C-reactive protein, determined by semi-quanti-tative procalcitonin test (PCT) in patients with ischemic stroke in the early development ofVAP.MATERIALS AND METHODS. A total of 37 patients with ischemic stroke in the middlecerebral artery, which was held ventilator due to severe cerebral insufficiency. Patients weredivided into 2 groups: Group 1–18 patients, with the assessment of the translation on theventilator on a scale GCS = 7.3 ± 1.2 points, who developed early VAP 2 group—19patients, with the assessment of the translation on the ventilator on a scale GCS = 7.5 ± 1.1points—without the development of VAP. The diagnosis of VAP was made on the basis ofcriteria proposed by the ACCP. VAP in Group 1, diagnosed at 3.7 ± 0.6 day from the startof mechanical ventilation (MV). All patients RGOGK admission, following the transfer ofMV, in group 1 when VAP developed. Assessment of the level of C-reactive protein (normalup to 5 mg/L) were performed on admission (stage 1), on day 2 (stage 2) from the beginningof the underlying disease, with the development of VAP (group 1, 3 stage) or after 3 days ofthe start of stroke (group 2), and in the dynamics on the third (Stage 4), the 7th day from thedate of VAP (stage 5).In the 1st group also performed PCT set B • R • A • H • M • S PCT-Q VAP (Stage 3) and inthe dynamics on the third (Stage 4), day 7 (stage 5) from the time of VAP.RESULTS. At 1 and 2 stages C-reactive protein levels between the groups were not signif-icantly different (48.9 ± 26.3 and 41.9 ± 36.1; 88.9 ± 26.03 and 92.3 ± 36.8 respectively).However, in group 1 when a VAP levels of C-reactive protein increased to 212.2 ± 31.8,while the second group on the 3rd level, he has averaged 45 ± 16.1. Later on stages 4 and 5 inthe first group CRP value was equal to 181.1 ± 35.1 and 144.5 ± 28.8 respectively.Procalcitonin levels in group 1 is amended as follows: the development of VAP (Stage 3) in1 (5.6 %) case, it was more than 10 ng/ml in 12 (66.6 %) patients—in the range of0.5–2 ng/ml, and in 5 (27.8 %)—\0.5 ng/ml.Stage 4 in 8 (44.4 %) patients of group 1 procalcitonin varied in the range from 0.5 to 2 ng/ml in 9 (50.0 %) patients was\0.5 of LHR/ml, and only 1 (5.5 %) was[10 ng/ml, and onday 7, the figure ranges from 0.5 to 2 ng/ml was observed in 5 (27.8 %) patients and in 13(72.2 %) cases— \0.5 ng/ml.CONCLUSIONS. For patients with ischemic stroke is characterized by elevated levels ofC-reactive protein, an acute phase of the disease. In uncomplicated (without VAP) has beena reduction in C-reactive protein after 3 days from the start of the disease, and the devel-opment of early VAP marks an increase of c-reactive protein levels to an average of212 mg/l. Thus, in our view, the dynamics of C-reactive protein, and not the use of PCTmay be a more accurate diagnostic marker for early VAP in patients with ischemic stroke.
0243ROLE OF PROCALCITONIN (PCT) TO GUIDE ANTIBIOTIC THERAPYIN CRITICALLY ILL PATIENTS WITH SUSPECTED SEPSIS ON A GENERALINTENSIVE CARE UNITS: A PILOT STUDY
T. Banerjee1,2, V. Anumakonda3
1Brighton and Sussex University Hospital NHS Trust, Brighton, UK, 2Medway MaritimeHospital, ITU, Gillingham, UK, 3Brighton and Sussex University Hospital NHS Trust, ITU,Brighton, UKINTRODUCTION. Procalcitonin (PCT) has emerged as the most studied and promisingsepsis biomarker. It correlates with progress of septic insult in critically ill patients.OBJECTIVES. A pilot study to assess role of PCT in antibiotic prescribing decisions incritically ill patients admitted to two Intensive care units (ICU) at Royal Sussex UniversityHospital NHS trust and Medway Maritime hospital NHS trust. Thus explore applicability ofPCT amongst septic cohort in a university and district general hospital settings.METHODS. In our study, PCT was measured either in the laboratory by quantitativeEnzyme Linked Fluorescent Assay or PCT-Q semi quantitative assay as a point of care test.A 100 consecutive PCT value were collected prospectively. The data was retrospectivelyanalysed using SPSS20.Data collected included demographics, PCT values, APACHE II scores, change in antibi-otics and outcome. Patients with PCT B 0.5 micrograms/litre were prescribed no antibioticsor stopped or de-escalated in the absence of strong clinical or microbiological indicators ofinfection.RESULTS. Mean age, APACHE II score were 59.08 years, 20.5 ± 2.5 respectively. 73, 26and 1 % were medical, surgical and gynaecological admissions respectively. 73 patientswere tested on first day of admission to ICU. Antibiotic prescriptions were changed based onPCT test in 87 cases (p value = 0.001). 2 patients had fungal infections. Positive andnegative predictive value at 0.99 and 1.01 at PCT = 0.25 g/l.CONCLUSIONS. Procalcitonin guidance reduces antibiotic use when used to discontinueantibiotics in adult ICU patients in both university and district general hospitals settings andto ration, initiate or discontinue antibiotics in patients with bacterial infections.There was obvious cost effectiveness of PCT, reduced incidence of drug-associated diar-rhoea, MRSA and drug resistant strains in addition to improving our diagnostic ability incritically ill patients.Future research should compare PCT guidance with antibiotic stewardship programs, con-sequences of reduction in antibiotic use for antibiotic resistance and for adverse events ofantibiotic therapy.REFERENCES. 1. Savitri Kibe, Kate Adams and Gavin Barlow et al. Diagnostic andprognostic biomarkers of sepsis in critical care. J Antimicrob Chemother. 2011;66 Suppl. 2.Uzzan B, Cohen R, Nicolas Pet al. Procalcitonin as a diagnostic test for sepsis in critically illadults and after surgery or trauma: a systematic review and meta-analysis. Crit Care Med.
26th ESICM ANNUAL CONGRESS — PARIS, FRANCE — 5–9 OCTOBER 2013
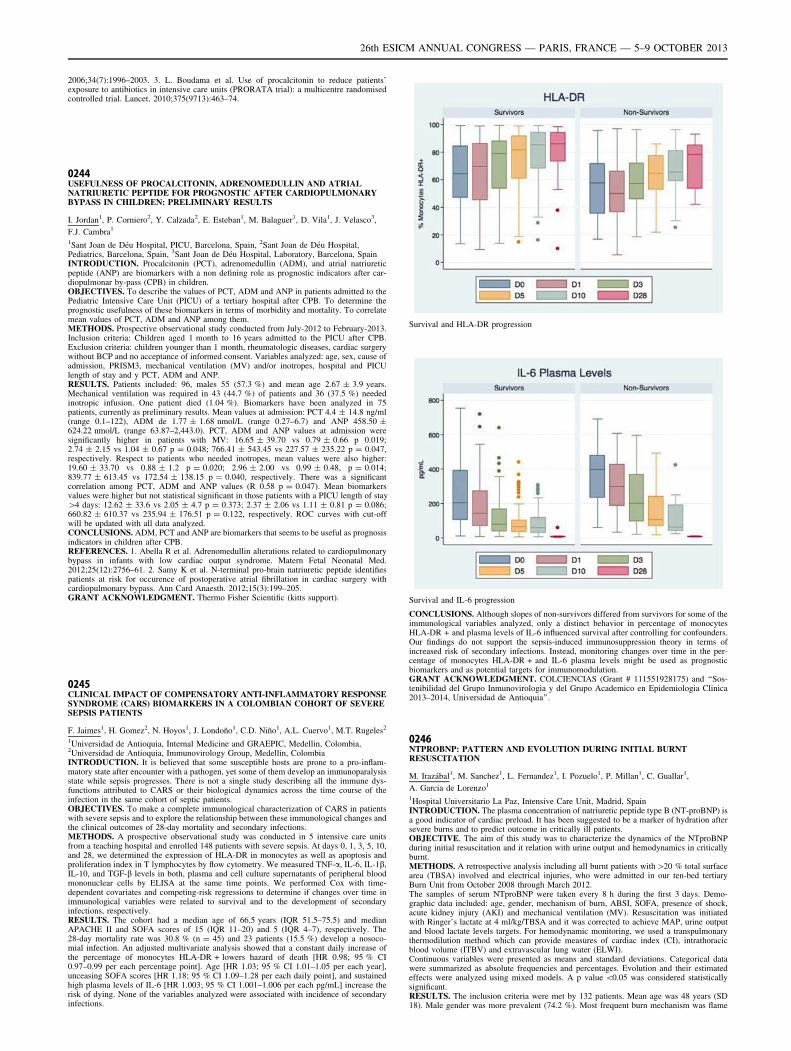
2006;34(7):1996–2003. 3. L. Boudama et al. Use of procalcitonin to reduce patients’exposure to antibiotics in intensive care units (PRORATA trial): a multicentre randomisedcontrolled trial. Lancet. 2010;375(9713):463–74.
0244USEFULNESS OF PROCALCITONIN, ADRENOMEDULLIN AND ATRIALNATRIURETIC PEPTIDE FOR PROGNOSTIC AFTER CARDIOPULMONARYBYPASS IN CHILDREN: PRELIMINARY RESULTS
I. Jordan1, P. Corniero2, Y. Calzada2, E. Esteban1, M. Balaguer1, D. Vila1, J. Velasco3,
F.J. Cambra1
1Sant Joan de Déu Hospital, PICU, Barcelona, Spain, 2Sant Joan de Déu Hospital,Pediatrics, Barcelona, Spain, 3Sant Joan de Déu Hospital, Laboratory, Barcelona, SpainINTRODUCTION. Procalcitonin (PCT), adrenomedullin (ADM), and atrial natriureticpeptide (ANP) are biomarkers with a non defining role as prognostic indicators after car-diopulmonar by-pass (CPB) in children.OBJECTIVES. To describe the values of PCT, ADM and ANP in patients admitted to thePediatric Intensive Care Unit (PICU) of a tertiary hospital after CPB. To determine theprognostic usefulness of these biomarkers in terms of morbidity and mortality. To correlatemean values of PCT, ADM and ANP among them.METHODS. Prospective observational study conducted from July-2012 to February-2013.Inclusion criteria: Children aged 1 month to 16 years admitted to the PICU after CPB.Exclusion criteria: children younger than 1 month, rheumatologic diseases, cardiac surgerywithout BCP and no acceptance of informed consent. Variables analyzed: age, sex, cause ofadmission, PRISM3, mechanical ventilation (MV) and/or inotropes, hospital and PICUlength of stay and y PCT, ADM and ANP.RESULTS. Patients included: 96, males 55 (57.3 %) and mean age 2.67 ± 3.9 years.Mechanical ventilation was required in 43 (44.7 %) of patients and 36 (37.5 %) neededinotropic infusion. One patient died (1.04 %). Biomarkers have been analyzed in 75patients, currently as preliminary results. Mean values at admission: PCT 4.4 ± 14.8 ng/ml(range 0.1–122), ADM de 1.77 ± 1.68 nmol/L (range 0.27–6.7) and ANP 458.50 ±624.22 nmol/L (range 63.87–2,443.0). PCT, ADM and ANP values at admission weresignificantly higher in patients with MV: 16.65 ± 39.70 vs 0.79 ± 0.66 p 0.019;2.74 ± 2.15 vs 1.04 ± 0.67 p = 0.048; 766.41 ± 543.45 vs 227.57 ± 235.22 p = 0.047,respectively. Respect to patients who needed inotropes, mean values were also higher:19.60 ± 33.70 vs 0.88 ± 1.2 p = 0.020; 2.96 ± 2.00 vs 0.99 ± 0.48, p = 0.014;839.77 ± 613.45 vs 172.54 ± 138.15 p = 0.040, respectively. There was a significantcorrelation among PCT, ADM and ANP values (R 0.58 p = 0.047). Mean biomarkersvalues were higher but not statistical significant in those patients with a PICU length of stay[4 days: 12.62 ± 33.6 vs 2.05 ± 4.7 p = 0.373; 2.37 ± 2.06 vs 1.11 ± 0.81 p = 0.086;660.82 ± 610.37 vs 235.94 ± 176.51 p = 0.122, respectively. ROC curves with cut-offwill be updated with all data analyzed.CONCLUSIONS. ADM, PCT and ANP are biomarkers that seems to be useful as prognosisindicators in children after CPB.REFERENCES. 1. Abella R et al. Adrenomedullin alterations related to cardiopulmonarybypass in infants with low cardiac output syndrome. Matern Fetal Neonatal Med.2012;25(12):2756–61. 2. Samy K et al. N-terminal pro-brain natriuretic peptide identifiespatients at risk for occurence of postoperative atrial fibrillation in cardiac surgery withcardiopulmonary bypass. Ann Card Anaesth. 2012;15(3):199–205.GRANT ACKNOWLEDGMENT. Thermo Fisher Scientific (kitts support).
0245CLINICAL IMPACT OF COMPENSATORY ANTI-INFLAMMATORY RESPONSESYNDROME (CARS) BIOMARKERS IN A COLOMBIAN COHORT OF SEVERESEPSIS PATIENTS
F. Jaimes1, H. Gomez2, N. Hoyos1, J. Londoño1, C.D. Niño1, A.L. Cuervo1, M.T. Rugeles2
1Universidad de Antioquia, Internal Medicine and GRAEPIC, Medellin, Colombia,2Universidad de Antioquia, Immunovirology Group, Medellin, ColombiaINTRODUCTION. It is believed that some susceptible hosts are prone to a pro-inflam-matory state after encounter with a pathogen, yet some of them develop an immunoparalysisstate while sepsis progresses. There is not a single study describing all the immune dys-functions attributed to CARS or their biological dynamics across the time course of theinfection in the same cohort of septic patients.OBJECTIVES. To make a complete immunological characterization of CARS in patientswith severe sepsis and to explore the relationship between these immunological changes andthe clinical outcomes of 28-day mortality and secondary infections.METHODS. A prospective observational study was conducted in 5 intensive care unitsfrom a teaching hospital and enrolled 148 patients with severe sepsis. At days 0, 1, 3, 5, 10,and 28, we determined the expression of HLA-DR in monocytes as well as apoptosis andproliferation index in T lymphocytes by flow cytometry. We measured TNF-a, IL-6, IL-1b,IL-10, and TGF-b levels in both, plasma and cell culture supernatants of peripheral bloodmononuclear cells by ELISA at the same time points. We performed Cox with time-dependent covariates and competing-risk regressions to determine if changes over time inimmunological variables were related to survival and to the development of secondaryinfections, respectively.RESULTS. The cohort had a median age of 66.5 years (IQR 51.5–75.5) and medianAPACHE II and SOFA scores of 15 (IQR 11–20) and 5 (IQR 4–7), respectively. The28-day mortality rate was 30.8 % (n = 45) and 23 patients (15.5 %) develop a nosoco-mial infection. An adjusted multivariate analysis showed that a constant daily increase ofthe percentage of monocytes HLA-DR + lowers hazard of death [HR 0.98; 95 % CI0.97–0.99 per each percentage point]. Age [HR 1.03; 95 % CI 1.01–1.05 per each year],unceasing SOFA scores [HR 1.18; 95 % CI 1.09–1.28 per each daily point], and sustainedhigh plasma levels of IL-6 [HR 1.003; 95 % CI 1.001–1.006 per each pg/mL] increase therisk of dying. None of the variables analyzed were associated with incidence of secondaryinfections.
Survival and HLA-DR progression
Survival and IL-6 progression
CONCLUSIONS. Although slopes of non-survivors differed from survivors for some of theimmunological variables analyzed, only a distinct behavior in percentage of monocytesHLA-DR + and plasma levels of IL-6 influenced survival after controlling for confounders.Our findings do not support the sepsis-induced immunosuppression theory in terms ofincreased risk of secondary infections. Instead, monitoring changes over time in the per-centage of monocytes HLA-DR + and IL-6 plasma levels might be used as prognosticbiomarkers and as potential targets for immunomodulation.GRANT ACKNOWLEDGMENT. COLCIENCIAS (Grant # 111551928175) and ‘‘Sos-tenibilidad del Grupo Inmunovirologia y del Grupo Academico en Epidemiologia Clinica2013–2014, Universidad de Antioquia’’.
0246NTPROBNP: PATTERN AND EVOLUTION DURING INITIAL BURNTRESUSCITATION
M. Irazábal1, M. Sanchez1, L. Fernandez1, I. Pozuelo1, P. Millan1, C. Guallar1,
A. Garcia de Lorenzo1
1Hospital Universitario La Paz, Intensive Care Unit, Madrid, SpainINTRODUCTION. The plasma concentration of natriuretic peptide type B (NT-proBNP) isa good indicator of cardiac preload. It has been suggested to be a marker of hydration aftersevere burns and to predict outcome in critically ill patients.OBJECTIVE. The aim of this study was to characterize the dynamics of the NTproBNPduring initial resuscitation and it relation with urine output and hemodynamics in criticallyburnt.METHODS. A retrospective analysis including all burnt patients with[20 % total surfacearea (TBSA) involved and electrical injuries, who were admitted in our ten-bed tertiaryBurn Unit from October 2008 through March 2012.The samples of serum NTproBNP were taken every 8 h during the first 3 days. Demo-graphic data included: age, gender, mechanism of burn, ABSI, SOFA, presence of shock,acute kidney injury (AKI) and mechanical ventilation (MV). Resuscitation was initiatedwith Ringer’s lactate at 4 ml/kg/TBSA and it was corrected to achieve MAP, urine outputand blood lactate levels targets. For hemodynamic monitoring, we used a transpulmonarythermodilution method which can provide measures of cardiac index (CI), intrathoracicblood volume (ITBV) and extravascular lung water (ELWI).Continuous variables were presented as means and standard deviations. Categorical datawere summarized as absolute frequencies and percentages. Evolution and their estimatedeffects were analyzed using mixed models. A p value \0.05 was considered statisticallysignificant.RESULTS. The inclusion criteria were met by 132 patients. Mean age was 48 years (SD18). Male gender was more prevalent (74.2 %). Most frequent burn mechanism was flame
26th ESICM ANNUAL CONGRESS — PARIS, FRANCE — 5–9 OCTOBER 2013
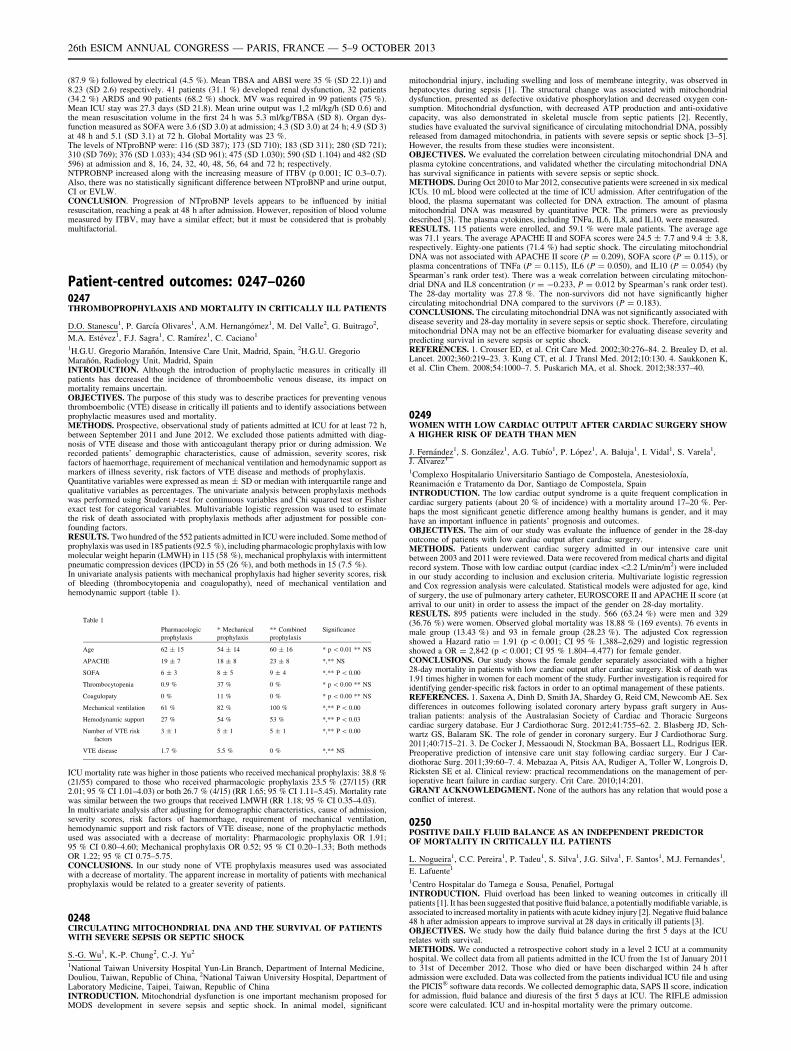
(87.9 %) followed by electrical (4.5 %). Mean TBSA and ABSI were 35 % (SD 22.1)) and8.23 (SD 2.6) respectively. 41 patients (31.1 %) developed renal dysfunction, 32 patients(34.2 %) ARDS and 90 patients (68.2 %) shock. MV was required in 99 patients (75 %).Mean ICU stay was 27.3 days (SD 21.8). Mean urine output was 1,2 ml/kg/h (SD 0.6) andthe mean resuscitation volume in the first 24 h was 5.3 ml/kg/TBSA (SD 8). Organ dys-function measured as SOFA were 3.6 (SD 3.0) at admission; 4.3 (SD 3.0) at 24 h; 4.9 (SD 3)at 48 h and 5.1 (SD 3.1) at 72 h. Global Mortality was 23 %.The levels of NTproBNP were: 116 (SD 387); 173 (SD 710); 183 (SD 311); 280 (SD 721);310 (SD 769); 376 (SD 1.033); 434 (SD 961); 475 (SD 1.030); 590 (SD 1.104) and 482 (SD596) at admission and 8, 16, 24, 32, 40, 48, 56, 64 and 72 h; respectively.NTPROBNP increased along with the increasing measure of ITBV (p 0.001; IC 0.3–0.7).Also, there was no statistically significant difference between NTproBNP and urine output,CI or EVLW.CONCLUSION. Progression of NTproBNP levels appears to be influenced by initialresuscitation, reaching a peak at 48 h after admission. However, reposition of blood volumemeasured by ITBV, may have a similar effect; but it must be considered that is probablymultifactorial.
Patient-centred outcomes: 0247–02600247THROMBOPROPHYLAXIS AND MORTALITY IN CRITICALLY ILL PATIENTS
D.O. Stanescu1, P. Garcı́a Olivares1, A.M. Hernangómez1, M. Del Valle2, G. Buitrago2,
M.A. Estévez1, F.J. Sagra1, C. Ramı́rez1, C. Caciano1
1H.G.U. Gregorio Marañón, Intensive Care Unit, Madrid, Spain, 2H.G.U. GregorioMarañón, Radiology Unit, Madrid, SpainINTRODUCTION. Although the introduction of prophylactic measures in critically illpatients has decreased the incidence of thromboembolic venous disease, its impact onmortality remains uncertain.OBJECTIVES. The purpose of this study was to describe practices for preventing venousthromboembolic (VTE) disease in critically ill patients and to identify associations betweenprophylactic measures used and mortality.METHODS. Prospective, observational study of patients admitted at ICU for at least 72 h,between September 2011 and June 2012. We excluded those patients admitted with diag-nosis of VTE disease and those with anticoagulant therapy prior or during admission. Werecorded patients’ demographic characteristics, cause of admission, severity scores, riskfactors of haemorrhage, requirement of mechanical ventilation and hemodynamic support asmarkers of illness severity, risk factors of VTE disease and methods of prophylaxis.Quantitative variables were expressed as mean ± SD or median with interquartile range andqualitative variables as percentages. The univariate analysis between prophylaxis methodswas performed using Student t-test for continuous variables and Chi squared test or Fisherexact test for categorical variables. Multivariable logistic regression was used to estimatethe risk of death associated with prophylaxis methods after adjustment for possible con-founding factors.RESULTS. Two hundred of the 552 patients admitted in ICU were included. Some method ofprophylaxis was used in 185 patients (92.5 %), including pharmacologic prophylaxis with lowmolecular weight heparin (LMWH) in 115 (58 %), mechanical prophylaxis with intermittentpneumatic compression devices (IPCD) in 55 (26 %), and both methods in 15 (7.5 %).In univariate analysis patients with mechanical prophylaxis had higher severity scores, riskof bleeding (thrombocytopenia and coagulopathy), need of mechanical ventilation andhemodynamic support (table 1).
Table 1
Pharmacologic
prophylaxis
* Mechanical
prophylaxis
** Combined
prophylaxis
Significance
Age 62 ± 15 54 ± 14 60 ± 16 * p \ 0.01 ** NS
APACHE 19 ± 7 18 ± 8 23 ± 8 *,** NS
SOFA 6 ± 3 8 ± 5 9 ± 4 *.** P \ 0.00
Thrombocytopenia 0.9 % 37 % 0 % * p \ 0.00 ** NS
Coagulopaty 0 % 11 % 0 % * p \ 0.00 ** NS
Mechanical ventilation 61 % 82 % 100 % *,** P \ 0.00
Hemodynamic support 27 % 54 % 53 % *,** P \ 0.03
Number of VTE risk
factors
3 ± 1 5 ± 1 5 ± 1 *,** P \ 0.00
VTE disease 1.7 % 5.5 % 0 % *,** NS
ICU mortality rate was higher in those patients who received mechanical prophylaxis: 38.8 %(21/55) compared to those who received pharmacologic prophylaxis 23.5 % (27/115) (RR2.01; 95 % CI 1.01–4.03) or both 26.7 % (4/15) (RR 1.65; 95 % CI 1.11–5.45). Mortality ratewas similar between the two groups that received LMWH (RR 1.18; 95 % CI 0.35–4.03).In multivariate analysis after adjusting for demographic characteristics, cause of admission,severity scores, risk factors of haemorrhage, requirement of mechanical ventilation,hemodynamic support and risk factors of VTE disease, none of the prophylactic methodsused was associated with a decrease of mortality: Pharmacologic prophylaxis OR 1.91;95 % CI 0.80–4.60; Mechanical prophylaxis OR 0.52; 95 % CI 0.20–1.33; Both methodsOR 1.22; 95 % CI 0.75–5.75.CONCLUSIONS. In our study none of VTE prophylaxis measures used was associatedwith a decrease of mortality. The apparent increase in mortality of patients with mechanicalprophylaxis would be related to a greater severity of patients.
0248CIRCULATING MITOCHONDRIAL DNA AND THE SURVIVAL OF PATIENTSWITH SEVERE SEPSIS OR SEPTIC SHOCK
S.-G. Wu1, K.-P. Chung2, C.-J. Yu2
1National Taiwan University Hospital Yun-Lin Branch, Department of Internal Medicine,Douliou, Taiwan, Republic of China, 2National Taiwan University Hospital, Department ofLaboratory Medicine, Taipei, Taiwan, Republic of ChinaINTRODUCTION. Mitochondrial dysfunction is one important mechanism proposed forMODS development in severe sepsis and septic shock. In animal model, significant
mitochondrial injury, including swelling and loss of membrane integrity, was observed inhepatocytes during sepsis [1]. The structural change was associated with mitochondrialdysfunction, presented as defective oxidative phosphorylation and decreased oxygen con-sumption. Mitochondrial dysfunction, with decreased ATP production and anti-oxidativecapacity, was also demonstrated in skeletal muscle from septic patients [2]. Recently,studies have evaluated the survival significance of circulating mitochondrial DNA, possiblyreleased from damaged mitochondria, in patients with severe sepsis or septic shock [3–5].However, the results from these studies were inconsistent.OBJECTIVES. We evaluated the correlation between circulating mitochondrial DNA andplasma cytokine concentrations, and validated whether the circulating mitochondrial DNAhas survival significance in patients with severe sepsis or septic shock.METHODS. During Oct 2010 to Mar 2012, consecutive patients were screened in six medicalICUs. 10 mL blood were collected at the time of ICU admission. After centrifugation of theblood, the plasma supernatant was collected for DNA extraction. The amount of plasmamitochondrial DNA was measured by quantitative PCR. The primers were as previouslydescribed [3]. The plasma cytokines, including TNFa, IL6, IL8, and IL10, were measured.RESULTS. 115 patients were enrolled, and 59.1 % were male patients. The average agewas 71.1 years. The average APACHE II and SOFA scores were 24.5 ± 7.7 and 9.4 ± 3.8,respectively. Eighty-one patients (71.4 %) had septic shock. The circulating mitochondrialDNA was not associated with APACHE II score (P = 0.209), SOFA score (P = 0.115), orplasma concentrations of TNFa (P = 0.115), IL6 (P = 0.050), and IL10 (P = 0.054) (bySpearman’s rank order test). There was a weak correlation between circulating mitochon-drial DNA and IL8 concentration (r = -0.233, P = 0.012 by Spearman’s rank order test).The 28-day mortality was 27.8 %. The non-survivors did not have significantly highercirculating mitochondrial DNA compared to the survivors (P = 0.183).CONCLUSIONS. The circulating mitochondrial DNA was not significantly associated withdisease severity and 28-day mortality in severe sepsis or septic shock. Therefore, circulatingmitochondrial DNA may not be an effective biomarker for evaluating disease severity andpredicting survival in severe sepsis or septic shock.REFERENCES. 1. Crouser ED, et al. Crit Care Med. 2002;30:276–84. 2. Brealey D, et al.Lancet. 2002;360:219–23. 3. Kung CT, et al. J Transl Med. 2012;10:130. 4. Saukkonen K,et al. Clin Chem. 2008;54:1000–7. 5. Puskarich MA, et al. Shock. 2012;38:337–40.
0249WOMEN WITH LOW CARDIAC OUTPUT AFTER CARDIAC SURGERY SHOWA HIGHER RISK OF DEATH THAN MEN
J. Fernández1, S. González1, A.G. Tubı́o1, P. López1, A. Baluja1, I. Vidal1, S. Varela1,J. Álvarez1
1Complexo Hospitalario Universitario Santiago de Compostela, Anestesioloxı́a,Reanimación e Tratamento da Dor, Santiago de Compostela, SpainINTRODUCTION. The low cardiac output syndrome is a quite frequent complication incardiac surgery patients (about 20 % of incidence) with a mortality around 17–20 %. Per-haps the most significant genetic difference among healthy humans is gender, and it mayhave an important influence in patients’ prognosis and outcomes.OBJECTIVES. The aim of our study was evaluate the influence of gender in the 28-dayoutcome of patients with low cardiac output after cardiac surgery.METHODS. Patients underwent cardiac surgery admitted in our intensive care unitbetween 2003 and 2011 were reviewed. Data were recovered from medical charts and digitalrecord system. Those with low cardiac output (cardiac index\2.2 L/min/m2) were includedin our study according to inclusion and exclusion criteria. Multivariate logistic regressionand Cox regression analysis were calculated. Statistical models were adjusted for age, kindof surgery, the use of pulmonary artery catheter, EUROSCORE II and APACHE II score (atarrival to our unit) in order to assess the impact of the gender on 28-day mortality.RESULTS. 895 patients were included in the study. 566 (63.24 %) were men and 329(36.76 %) were women. Observed global mortality was 18.88 % (169 events). 76 events inmale group (13.43 %) and 93 in female group (28.23 %). The adjusted Cox regressionshowed a Hazard ratio = 1.91 (p \ 0.001; CI 95 % 1,388–2,629) and logistic regressionshowed a OR = 2,842 (p \ 0.001; CI 95 % 1.804–4.477) for female gender.CONCLUSIONS. Our study shows the female gender separately associated with a higher28-day mortality in patients with low cardiac output after cardiac surgery. Risk of death was1.91 times higher in women for each moment of the study. Further investigation is required foridentifying gender-specific risk factors in order to an optimal management of these patients.REFERENCES. 1. Saxena A, Dinh D, Smith JA, Shardey G, Reid CM, Newcomb AE. Sexdifferences in outcomes following isolated coronary artery bypass graft surgery in Aus-tralian patients: analysis of the Australasian Society of Cardiac and Thoracic Surgeonscardiac surgery database. Eur J Cardiothorac Surg. 2012;41:755–62. 2. Blasberg JD, Sch-wartz GS, Balaram SK. The role of gender in coronary surgery. Eur J Cardiothorac Surg.2011;40:715–21. 3. De Cocker J, Messaoudi N, Stockman BA, Bossaert LL, Rodrigus IER.Preoperative prediction of intensive care unit stay following cardiac surgery. Eur J Car-diothorac Surg. 2011;39:60–7. 4. Mebazaa A, Pitsis AA, Rudiger A, Toller W, Longrois D,Ricksten SE et al. Clinical review: practical recommendations on the management of per-ioperative heart failure in cardiac surgery. Crit Care. 2010;14:201.GRANT ACKNOWLEDGMENT. None of the authors has any relation that would pose aconflict of interest.
0250POSITIVE DAILY FLUID BALANCE AS AN INDEPENDENT PREDICTOROF MORTALITY IN CRITICALLY ILL PATIENTS
L. Nogueira1, C.C. Pereira1, P. Tadeu1, S. Silva1, J.G. Silva1, F. Santos1, M.J. Fernandes1,
E. Lafuente1
1Centro Hospitalar do Tamega e Sousa, Penafiel, PortugalINTRODUCTION. Fluid overload has been linked to weaning outcomes in critically illpatients [1]. It has been suggested that positive fluid balance, a potentially modifiable variable, isassociated to increased mortality in patients with acute kidney injury [2]. Negative fluid balance48 h after admission appears to improve survival at 28 days in critically ill patients [3].OBJECTIVES. We study how the daily fluid balance during the first 5 days at the ICUrelates with survival.METHODS. We conducted a retrospective cohort study in a level 2 ICU at a communityhospital. We collect data from all patients admitted in the ICU from the 1st of January 2011to 31st of December 2012. Those who died or have been discharged within 24 h afteradmission were excluded. Data was collected from the patients individual ICU file and usingthe PICIS� software data records. We collected demographic data, SAPS II score, indicationfor admission, fluid balance and diuresis of the first 5 days at ICU. The RIFLE admissionscore were calculated. ICU and in-hospital mortality were the primary outcome.
26th ESICM ANNUAL CONGRESS — PARIS, FRANCE — 5–9 OCTOBER 2013
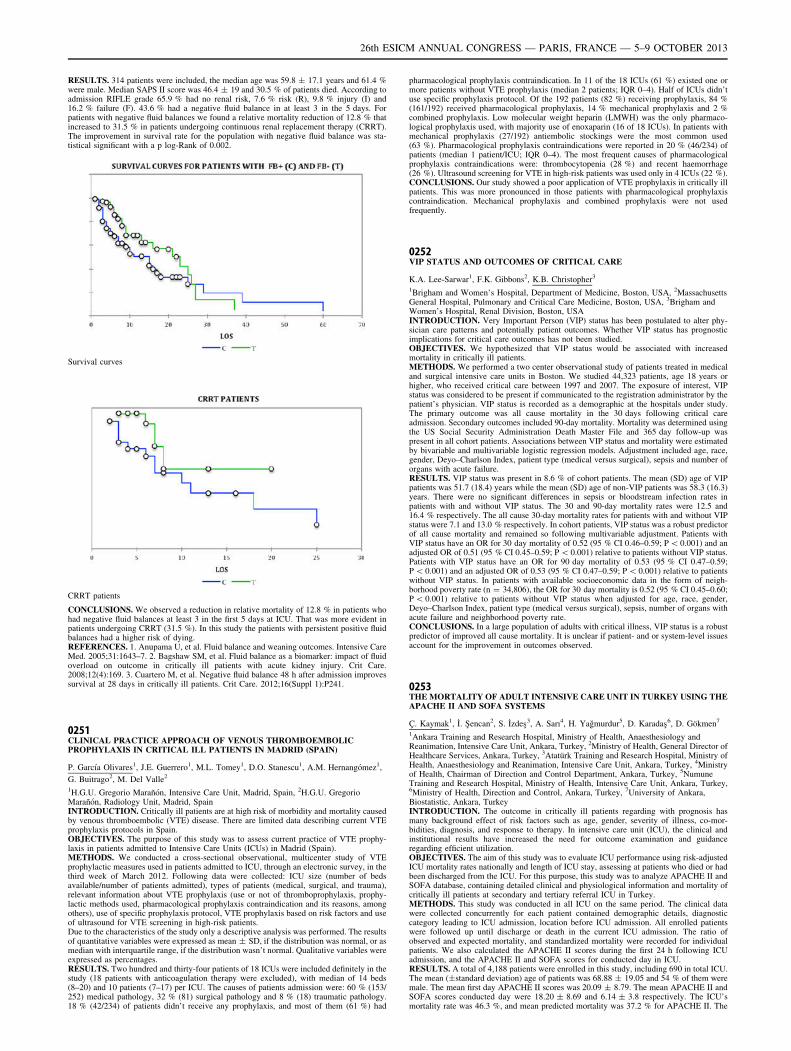
RESULTS. 314 patients were included, the median age was 59.8 ± 17.1 years and 61.4 %were male. Median SAPS II score was 46.4 ± 19 and 30.5 % of patients died. According toadmission RIFLE grade 65.9 % had no renal risk, 7.6 % risk (R), 9.8 % injury (I) and16.2 % failure (F). 43.6 % had a negative fluid balance in at least 3 in the 5 days. Forpatients with negative fluid balances we found a relative mortality reduction of 12.8 % thatincreased to 31.5 % in patients undergoing continuous renal replacement therapy (CRRT).The improvement in survival rate for the population with negative fluid balance was sta-tistical significant with a p log-Rank of 0.002.
Survival curves
CRRT patients
CONCLUSIONS. We observed a reduction in relative mortality of 12.8 % in patients whohad negative fluid balances at least 3 in the first 5 days at ICU. That was more evident inpatients undergoing CRRT (31.5 %). In this study the patients with persistent positive fluidbalances had a higher risk of dying.REFERENCES. 1. Anupama U, et al. Fluid balance and weaning outcomes. Intensive CareMed. 2005;31:1643–7. 2. Bagshaw SM, et al. Fluid balance as a biomarker: impact of fluidoverload on outcome in critically ill patients with acute kidney injury. Crit Care.2008;12(4):169. 3. Cuartero M, et al. Negative fluid balance 48 h after admission improvessurvival at 28 days in critically ill patients. Crit Care. 2012;16(Suppl 1):P241.
0251CLINICAL PRACTICE APPROACH OF VENOUS THROMBOEMBOLICPROPHYLAXIS IN CRITICAL ILL PATIENTS IN MADRID (SPAIN)
P. Garcı́a Olivares1, J.E. Guerrero1, M.L. Tomey1, D.O. Stanescu1, A.M. Hernangómez1,
G. Buitrago2, M. Del Valle2
1H.G.U. Gregorio Marañón, Intensive Care Unit, Madrid, Spain, 2H.G.U. GregorioMarañón, Radiology Unit, Madrid, SpainINTRODUCTION. Critically ill patients are at high risk of morbidity and mortality causedby venous thromboembolic (VTE) disease. There are limited data describing current VTEprophylaxis protocols in Spain.OBJECTIVES. The purpose of this study was to assess current practice of VTE prophy-laxis in patients admitted to Intensive Care Units (ICUs) in Madrid (Spain).METHODS. We conducted a cross-sectional observational, multicenter study of VTEprophylactic measures used in patients admitted to ICU, through an electronic survey, in thethird week of March 2012. Following data were collected: ICU size (number of bedsavailable/number of patients admitted), types of patients (medical, surgical, and trauma),relevant information about VTE prophylaxis (use or not of thromboprophylaxis, prophy-lactic methods used, pharmacological prophylaxis contraindication and its reasons, amongothers), use of specific prophylaxis protocol, VTE prophylaxis based on risk factors and useof ultrasound for VTE screening in high-risk patients.Due to the characteristics of the study only a descriptive analysis was performed. The resultsof quantitative variables were expressed as mean ± SD, if the distribution was normal, or asmedian with interquartile range, if the distribution wasn’t normal. Qualitative variables wereexpressed as percentages.RESULTS. Two hundred and thirty-four patients of 18 ICUs were included definitely in thestudy (18 patients with anticoagulation therapy were excluded), with median of 14 beds(8–20) and 10 patients (7–17) per ICU. The causes of patients admission were: 60 % (153/252) medical pathology, 32 % (81) surgical pathology and 8 % (18) traumatic pathology.18 % (42/234) of patients didn’t receive any prophylaxis, and most of them (61 %) had
pharmacological prophylaxis contraindication. In 11 of the 18 ICUs (61 %) existed one ormore patients without VTE prophylaxis (median 2 patients; IQR 0–4). Half of ICUs didn’tuse specific prophylaxis protocol. Of the 192 patients (82 %) receiving prophylaxis, 84 %(161/192) received pharmacological prophylaxis, 14 % mechanical prophylaxis and 2 %combined prophylaxis. Low molecular weight heparin (LMWH) was the only pharmaco-logical prophylaxis used, with majority use of enoxaparin (16 of 18 ICUs). In patients withmechanical prophylaxis (27/192) antiembolic stockings were the most common used(63 %). Pharmacological prophylaxis contraindications were reported in 20 % (46/234) ofpatients (median 1 patient/ICU; IQR 0–4). The most frequent causes of pharmacologicalprophylaxis contraindications were: thrombocytopenia (28 %) and recent haemorrhage(26 %). Ultrasound screening for VTE in high-risk patients was used only in 4 ICUs (22 %).CONCLUSIONS. Our study showed a poor application of VTE prophylaxis in critically illpatients. This was more pronounced in those patients with pharmacological prophylaxiscontraindication. Mechanical prophylaxis and combined prophylaxis were not usedfrequently.
0252VIP STATUS AND OUTCOMES OF CRITICAL CARE
K.A. Lee-Sarwar1, F.K. Gibbons2, K.B. Christopher3
1Brigham and Women’s Hospital, Department of Medicine, Boston, USA, 2MassachusettsGeneral Hospital, Pulmonary and Critical Care Medicine, Boston, USA, 3Brigham andWomen’s Hospital, Renal Division, Boston, USAINTRODUCTION. Very Important Person (VIP) status has been postulated to alter phy-sician care patterns and potentially patient outcomes. Whether VIP status has prognosticimplications for critical care outcomes has not been studied.OBJECTIVES. We hypothesized that VIP status would be associated with increasedmortality in critically ill patients.METHODS. We performed a two center observational study of patients treated in medicaland surgical intensive care units in Boston. We studied 44,323 patients, age 18 years orhigher, who received critical care between 1997 and 2007. The exposure of interest, VIPstatus was considered to be present if communicated to the registration administrator by thepatient’s physician. VIP status is recorded as a demographic at the hospitals under study.The primary outcome was all cause mortality in the 30 days following critical careadmission. Secondary outcomes included 90-day mortality. Mortality was determined usingthe US Social Security Administration Death Master File and 365 day follow-up waspresent in all cohort patients. Associations between VIP status and mortality were estimatedby bivariable and multivariable logistic regression models. Adjustment included age, race,gender, Deyo–Charlson Index, patient type (medical versus surgical), sepsis and number oforgans with acute failure.RESULTS. VIP status was present in 8.6 % of cohort patients. The mean (SD) age of VIPpatients was 51.7 (18.4) years while the mean (SD) age of non-VIP patients was 58.3 (16.3)years. There were no significant differences in sepsis or bloodstream infection rates inpatients with and without VIP status. The 30 and 90-day mortality rates were 12.5 and16.4 % respectively. The all cause 30-day mortality rates for patients with and without VIPstatus were 7.1 and 13.0 % respectively. In cohort patients, VIP status was a robust predictorof all cause mortality and remained so following multivariable adjustment. Patients withVIP status have an OR for 30 day mortality of 0.52 (95 % CI 0.46–0.59; P \ 0.001) and anadjusted OR of 0.51 (95 % CI 0.45–0.59; P \ 0.001) relative to patients without VIP status.Patients with VIP status have an OR for 90 day mortality of 0.53 (95 % CI 0.47–0.59;P \ 0.001) and an adjusted OR of 0.53 (95 % CI 0.47–0.59; P \ 0.001) relative to patientswithout VIP status. In patients with available socioeconomic data in the form of neigh-borhood poverty rate (n = 34,806), the OR for 30 day mortality is 0.52 (95 % CI 0.45–0.60;P \ 0.001) relative to patients without VIP status when adjusted for age, race, gender,Deyo–Charlson Index, patient type (medical versus surgical), sepsis, number of organs withacute failure and neighborhood poverty rate.CONCLUSIONS. In a large population of adults with critical illness, VIP status is a robustpredictor of improved all cause mortality. It is unclear if patient- and or system-level issuesaccount for the improvement in outcomes observed.
0253THE MORTALITY OF ADULT INTENSIVE CARE UNIT IN TURKEY USING THEAPACHE II AND SOFA SYSTEMS
Ç. Kaymak1, İ. Şencan2, S. İzdeş3, A. Sarı4, H. Yağmurdur5, D. Karadaş6, D. Gökmen7
1Ankara Training and Research Hospital, Ministry of Health, Anaesthesiology andReanimation, Intensive Care Unit, Ankara, Turkey, 2Ministry of Health, General Director ofHealthcare Services, Ankara, Turkey, 3Atatürk Training and Research Hospital, Ministry ofHealth, Anaesthesiology and Reanimation, Intensive Care Unit, Ankara, Turkey, 4Ministryof Health, Chairman of Direction and Control Department, Ankara, Turkey, 5NumuneTraining and Research Hospital, Ministry of Health, Intensive Care Unit, Ankara, Turkey,6Ministry of Health, Direction and Control, Ankara, Turkey, 7University of Ankara,Biostatistic, Ankara, TurkeyINTRODUCTION. The outcome in critically ill patients regarding with prognosis hasmany background effect of risk factors such as age, gender, severity of illness, co-mor-bidities, diagnosis, and response to therapy. In intensive care unit (ICU), the clinical andinstitutional results have increased the need for outcome examination and guidanceregarding efficient utilization.OBJECTIVES. The aim of this study was to evaluate ICU performance using risk-adjustedICU mortality rates nationally and length of ICU stay, assessing at patients who died or hadbeen discharged from the ICU. For this purpose, this study was to analyze APACHE II andSOFA database, containing detailed clinical and physiological information and mortality ofcritically ill patients at secondary and tertiary referral ICU in Turkey.METHODS. This study was conducted in all ICU on the same period. The clinical datawere collected concurrently for each patient contained demographic details, diagnosticcategory leading to ICU admission, location before ICU admission. All enrolled patientswere followed up until discharge or death in the current ICU admission. The ratio ofobserved and expected mortality, and standardized mortality were recorded for individualpatients. We also calculated the APACHE II scores during the first 24 h following ICUadmission, and the APACHE II and SOFA scores for conducted day in ICU.RESULTS. A total of 4,188 patients were enrolled in this study, including 690 in total ICU.The mean (±standard deviation) age of patients was 68.88 ± 19.05 and 54 % of them weremale. The mean first day APACHE II scores was 20.09 ± 8.79. The mean APACHE II andSOFA scores conducted day were 18.20 ± 8.69 and 6.14 ± 3.8 respectively. The ICU’smortality rate was 46.3 %, and mean predicted mortality was 37.2 % for APACHE II. The
26th ESICM ANNUAL CONGRESS — PARIS, FRANCE — 5–9 OCTOBER 2013
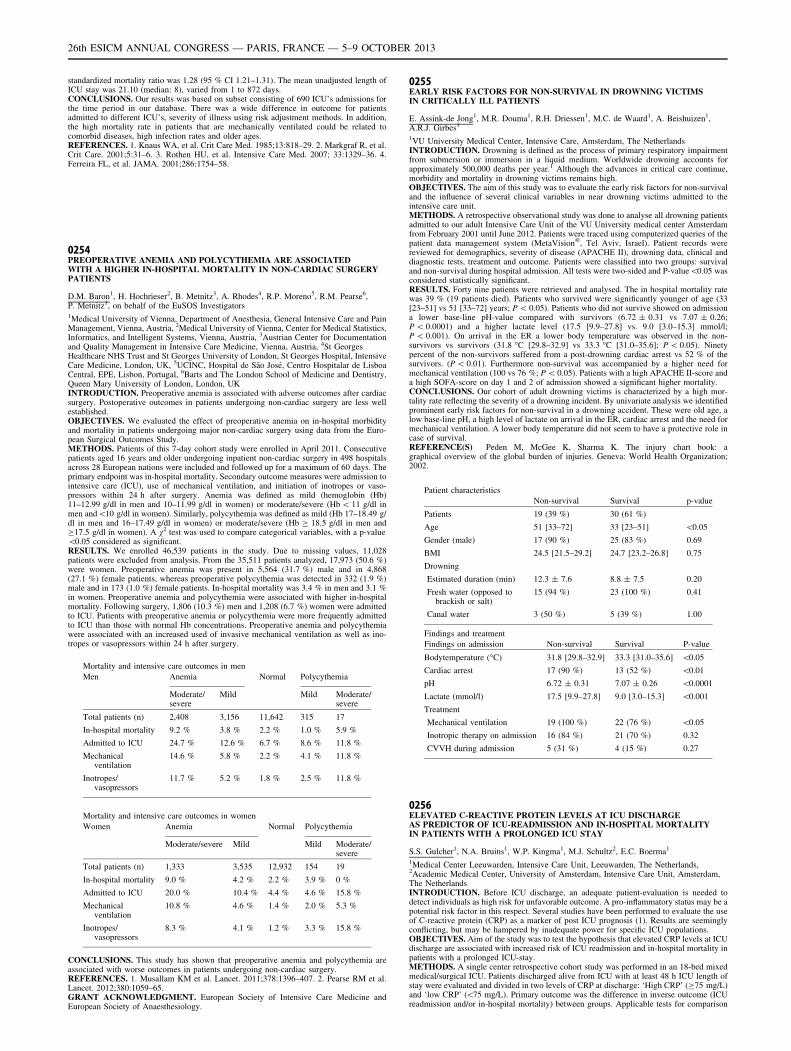
standardized mortality ratio was 1.28 (95 % CI 1.21–1.31). The mean unadjusted length ofICU stay was 21.10 (median: 8), varied from 1 to 872 days.CONCLUSIONS. Our results was based on subset consisting of 690 ICU’s admissions forthe time period in our database. There was a wide difference in outcome for patientsadmitted to different ICU’s, severity of illness using risk adjustment methods. In addition,the high mortality rate in patients that are mechanically ventilated could be related tocomorbid diseases, high infection rates and older ages.REFERENCES. 1. Knaus WA, et al. Crit Care Med. 1985;13:818–29. 2. Markgraf R, et al.Crit Care. 2001;5:31–6. 3. Rothen HU, et al. Intensive Care Med. 2007; 33:1329–36. 4.Ferreira FL, et al. JAMA. 2001;286:1754–58.
0254PREOPERATIVE ANEMIA AND POLYCYTHEMIA ARE ASSOCIATEDWITH A HIGHER IN-HOSPITAL MORTALITY IN NON-CARDIAC SURGERYPATIENTS
D.M. Baron1, H. Hochrieser2, B. Metnitz3, A. Rhodes4, R.P. Moreno5, R.M. Pearse6,P. Metnitz1, on behalf of the EuSOS Investigators1Medical University of Vienna, Department of Anesthesia, General Intensive Care and PainManagement, Vienna, Austria, 2Medical University of Vienna, Center for Medical Statistics,Informatics, and Intelligent Systems, Vienna, Austria, 3Austrian Center for Documentationand Quality Management in Intensive Care Medicine, Vienna, Austria, 4St GeorgesHealthcare NHS Trust and St Georges University of London, St Georges Hospital, IntensiveCare Medicine, London, UK, 5UCINC, Hospital de São José, Centro Hospitalar de LisboaCentral, EPE, Lisbon, Portugal, 6Barts and The London School of Medicine and Dentistry,Queen Mary University of London, London, UKINTRODUCTION. Preoperative anemia is associated with adverse outcomes after cardiacsurgery. Postoperative outcomes in patients undergoing non-cardiac surgery are less wellestablished.OBJECTIVES. We evaluated the effect of preoperative anemia on in-hospital morbidityand mortality in patients undergoing major non-cardiac surgery using data from the Euro-pean Surgical Outcomes Study.METHODS. Patients of this 7-day cohort study were enrolled in April 2011. Consecutivepatients aged 16 years and older undergoing inpatient non-cardiac surgery in 498 hospitalsacross 28 European nations were included and followed up for a maximum of 60 days. Theprimary endpoint was in-hospital mortality. Secondary outcome measures were admission tointensive care (ICU), use of mechanical ventilation, and initiation of inotropes or vaso-pressors within 24 h after surgery. Anemia was defined as mild (hemoglobin (Hb)11–12.99 g/dl in men and 10–11.99 g/dl in women) or moderate/severe (Hb \ 11 g/dl inmen and\10 g/dl in women). Similarly, polycythemia was defined as mild (Hb 17–18.49 g/dl in men and 16–17.49 g/dl in women) or moderate/severe (Hb C 18.5 g/dl in men andC17.5 g/dl in women). A v2 test was used to compare categorical variables, with a p-value\0.05 considered as significant.RESULTS. We enrolled 46,539 patients in the study. Due to missing values, 11,028patients were excluded from analysis. From the 35,511 patients analyzed, 17,973 (50.6 %)were women. Preoperative anemia was present in 5,564 (31.7 %) male and in 4,868(27.1 %) female patients, whereas preoperative polycythemia was detected in 332 (1.9 %)male and in 173 (1.0 %) female patients. In-hospital mortality was 3.4 % in men and 3.1 %in women. Preoperative anemia and polycythemia were associated with higher in-hospitalmortality. Following surgery, 1,806 (10.3 %) men and 1,208 (6.7 %) women were admittedto ICU. Patients with preoperative anemia or polycythemia were more frequently admittedto ICU than those with normal Hb concentrations. Preoperative anemia and polycythemiawere associated with an increased used of invasive mechanical ventilation as well as ino-tropes or vasopressors within 24 h after surgery.
Mortality and intensive care outcomes in men
Men Anemia Normal Polycythemia
Moderate/severe
Mild Mild Moderate/severe
Total patients (n) 2,408 3,156 11,642 315 17
In-hospital mortality 9.2 % 3.8 % 2.2 % 1.0 % 5.9 %
Admitted to ICU 24.7 % 12.6 % 6.7 % 8.6 % 11.8 %
Mechanicalventilation
14.6 % 5.8 % 2.2 % 4.1 % 11.8 %
Inotropes/vasopressors
11.7 % 5.2 % 1.8 % 2.5 % 11.8 %
Mortality and intensive care outcomes in women
Women Anemia Normal Polycythemia
Moderate/severe Mild Mild Moderate/severe
Total patients (n) 1,333 3,535 12,932 154 19
In-hospital mortality 9.0 % 4.2 % 2.2 % 3.9 % 0 %
Admitted to ICU 20.0 % 10.4 % 4.4 % 4.6 % 15.8 %
Mechanicalventilation
10.8 % 4.6 % 1.4 % 2.0 % 5.3 %
Inotropes/vasopressors
8.3 % 4.1 % 1.2 % 3.3 % 15.8 %
CONCLUSIONS. This study has shown that preoperative anemia and polycythemia areassociated with worse outcomes in patients undergoing non-cardiac surgery.REFERENCES. 1. Musallam KM et al. Lancet. 2011;378:1396–407. 2. Pearse RM et al.Lancet. 2012;380:1059–65.GRANT ACKNOWLEDGMENT. European Society of Intensive Care Medicine andEuropean Society of Anaesthesiology.
0255EARLY RISK FACTORS FOR NON-SURVIVAL IN DROWNING VICTIMSIN CRITICALLY ILL PATIENTS
E. Assink-de Jong1, M.R. Douma1, R.H. Driessen1, M.C. de Waard1, A. Beishuizen1,A.R.J. Girbes1
1VU University Medical Center, Intensive Care, Amsterdam, The NetherlandsINTRODUCTION. Drowning is defined as the process of primary respiratory impairmentfrom submersion or immersion in a liquid medium. Worldwide drowning accounts forapproximately 500,000 deaths per year.1 Although the advances in critical care continue,morbidity and mortality in drowning victims remains high.OBJECTIVES. The aim of this study was to evaluate the early risk factors for non-survivaland the influence of several clinical variables in near drowning victims admitted to theintensive care unit.METHODS. A retrospective observational study was done to analyse all drowning patientsadmitted to our adult Intensive Care Unit of the VU University medical center Amsterdamfrom February 2001 until June 2012. Patients were traced using computerized queries of thepatient data management system (MetaVision�, Tel Aviv, Israel). Patient records werereviewed for demographics, severity of disease (APACHE II), drowning data, clinical anddiagnostic tests, treatment and outcome. Patients were classified into two groups: survivaland non-survival during hospital admission. All tests were two-sided and P-value\0.05 wasconsidered statistically significant.RESULTS. Forty nine patients were retrieved and analysed. The in hospital mortality ratewas 39 % (19 patients died). Patients who survived were significantly younger of age (33[23–51] vs 51 [33–72] years; P \ 0.05). Patients who did not survive showed on admissiona lower base-line pH-value compared with survivors (6.72 ± 0.31 vs 7.07 ± 0.26;P \ 0.0001) and a higher lactate level (17.5 [9.9–27.8] vs. 9.0 [3.0–15.3] mmol/l;P \ 0.001). On arrival in the ER a lower body temperature was observed in the non-survivors vs survivors (31.8 �C [29.8–32.9] vs 33.3 �C [31.0–35.6]; P \ 0.05). Ninetypercent of the non-survivors suffered from a post-drowning cardiac arrest vs 52 % of thesurvivors. (P \ 0.01). Furthermore non-survival was accompanied by a higher need formechanical ventilation (100 vs 76 %; P \ 0.05). Patients with a high APACHE II-score anda high SOFA-score on day 1 and 2 of admission showed a significant higher mortality.CONCLUSIONS. Our cohort of adult drowning victims is characterized by a high mor-tality rate reflecting the severity of a drowning incident. By univariate analysis we identifiedprominent early risk factors for non-survival in a drowning accident. These were old age, alow base-line pH, a high level of lactate on arrival in the ER, cardiac arrest and the need formechanical ventilation. A lower body temperature did not seem to have a protective role incase of survival.REFERENCE(S) Peden M, McGee K, Sharma K. The injury chart book: agraphical overview of the global burden of injuries. Geneva: World Health Organization;2002.
Patient characteristics
Non-survival Survival p-value
Patients 19 (39 %) 30 (61 %)
Age 51 [33–72] 33 [23–51] \0.05
Gender (male) 17 (90 %) 25 (83 %) 0.69
BMI 24.5 [21.5–29.2] 24.7 [23.2–26.8] 0.75
Drowning
Estimated duration (min) 12.3 ± 7.6 8.8 ± 7.5 0.20
Fresh water (opposed tobrackish or salt)
15 (94 %) 23 (100 %) 0.41
Canal water 3 (50 %) 5 (39 %) 1.00
Findings and treatment
Findings on admission Non-survival Survival P-value
Bodytemperature (�C) 31.8 [29.8–32.9] 33.3 [31.0–35.6] \0.05
Cardiac arrest 17 (90 %) 13 (52 %) \0.01
pH 6.72 ± 0.31 7.07 ± 0.26 \0.0001
Lactate (mmol/l) 17.5 [9.9–27.8] 9.0 [3.0–15.3] \0.001
Treatment
Mechanical ventilation 19 (100 %) 22 (76 %) \0.05
Inotropic therapy on admission 16 (84 %) 21 (70 %) 0.32
CVVH during admission 5 (31 %) 4 (15 %) 0.27
0256ELEVATED C-REACTIVE PROTEIN LEVELS AT ICU DISCHARGEAS PREDICTOR OF ICU-READMISSION AND IN-HOSPITAL MORTALITYIN PATIENTS WITH A PROLONGED ICU STAY
S.S. Gulcher1, N.A. Bruins1, W.P. Kingma1, M.J. Schultz2, E.C. Boerma1
1Medical Center Leeuwarden, Intensive Care Unit, Leeuwarden, The Netherlands,2Academic Medical Center, University of Amsterdam, Intensive Care Unit, Amsterdam,The NetherlandsINTRODUCTION. Before ICU discharge, an adequate patient-evaluation is needed todetect individuals as high risk for unfavorable outcome. A pro-inflammatory status may be apotential risk factor in this respect. Several studies have been performed to evaluate the useof C-reactive protein (CRP) as a marker of post ICU prognosis (1). Results are seeminglyconflicting, but may be hampered by inadequate power for specific ICU populations.OBJECTIVES. Aim of the study was to test the hypothesis that elevated CRP levels at ICUdischarge are associated with increased risk of ICU readmission and in-hospital mortality inpatients with a prolonged ICU-stay.METHODS. A single center retrospective cohort study was performed in an 18-bed mixedmedical/surgical ICU. Patients discharged alive from ICU with at least 48 h ICU length ofstay were evaluated and divided in two levels of CRP at discharge: ‘High CRP’ (C75 mg/L)and ‘low CRP’ (\75 mg/L). Primary outcome was the difference in inverse outcome (ICUreadmission and/or in-hospital mortality) between groups. Applicable tests for comparison
26th ESICM ANNUAL CONGRESS — PARIS, FRANCE — 5–9 OCTOBER 2013
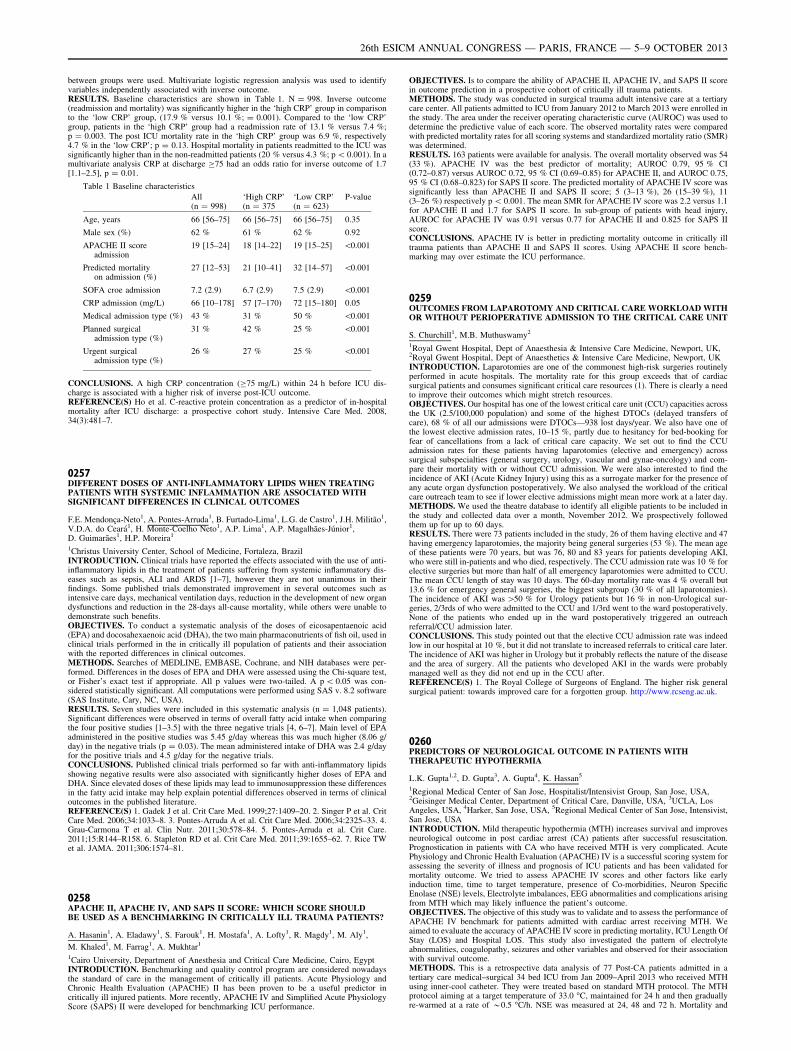
between groups were used. Multivariate logistic regression analysis was used to identifyvariables independently associated with inverse outcome.RESULTS. Baseline characteristics are shown in Table 1. N = 998. Inverse outcome(readmission and mortality) was significantly higher in the ‘high CRP’ group in comparisonto the ‘low CRP’ group, (17.9 % versus 10.1 %; = 0.001). Compared to the ‘low CRP’group, patients in the ‘high CRP’ group had a readmission rate of 13.1 % versus 7.4 %;p = 0.003. The post ICU mortality rate in the ‘high CRP’ group was 6.9 %, respectively4.7 % in the ‘low CRP’; p = 0.13. Hospital mortality in patients readmitted to the ICU wassignificantly higher than in the non-readmitted patients (20 % versus 4.3 %; p \ 0.001). In amultivariate analysis CRP at discharge C75 had an odds ratio for inverse outcome of 1.7[1.1–2.5], p = 0.01.
Table 1 Baseline characteristics
All(n = 998)
‘High CRP’(n = 375
‘Low CRP’(n = 623)
P-value
Age, years 66 [56–75] 66 [56–75] 66 [56–75] 0.35
Male sex (%) 62 % 61 % 62 % 0.92
APACHE II scoreadmission
19 [15–24] 18 [14–22] 19 [15–25] \0.001
Predicted mortalityon admission (%)
27 [12–53] 21 [10–41] 32 [14–57] \0.001
SOFA croe admission 7.2 (2.9) 6.7 (2.9) 7.5 (2.9) \0.001
CRP admission (mg/L) 66 [10–178] 57 [7–170) 72 [15–180] 0.05
Medical admission type (%) 43 % 31 % 50 % \0.001
Planned surgicaladmission type (%)
31 % 42 % 25 % \0.001
Urgent surgicaladmission type (%)
26 % 27 % 25 % \0.001
CONCLUSIONS. A high CRP concentration (C75 mg/L) within 24 h before ICU dis-charge is associated with a higher risk of inverse post-ICU outcome.REFERENCE(S) Ho et al. C-reactive protein concentration as a predictor of in-hospitalmortality after ICU discharge: a prospective cohort study. Intensive Care Med. 2008,34(3):481–7.
0257DIFFERENT DOSES OF ANTI-INFLAMMATORY LIPIDS WHEN TREATINGPATIENTS WITH SYSTEMIC INFLAMMATION ARE ASSOCIATED WITHSIGNIFICANT DIFFERENCES IN CLINICAL OUTCOMES
F.E. Mendonça-Neto1, A. Pontes-Arruda1, B. Furtado-Lima1, L.G. de Castro1, J.H. Militão1,V.D.A. do Ceará1, H. Monte-Coelho Neto1, A.P. Lima1, A.P. Magalhães-Júnior1,D. Guimarães1, H.P. Moreira1
1Christus University Center, School of Medicine, Fortaleza, BrazilINTRODUCTION. Clinical trials have reported the effects associated with the use of anti-inflammatory lipids in the treatment of patients suffering from systemic inflammatory dis-eases such as sepsis, ALI and ARDS [1–7], however they are not unanimous in theirfindings. Some published trials demonstrated improvement in several outcomes such asintensive care days, mechanical ventilation days, reduction in the development of new organdysfunctions and reduction in the 28-days all-cause mortality, while others were unable todemonstrate such benefits.OBJECTIVES. To conduct a systematic analysis of the doses of eicosapentaenoic acid(EPA) and docosahexaenoic acid (DHA), the two main pharmaconutrients of fish oil, used inclinical trials performed in the in critically ill population of patients and their associationwith the reported differences in clinical outcomes.METHODS. Searches of MEDLINE, EMBASE, Cochrane, and NIH databases were per-formed. Differences in the doses of EPA and DHA were assessed using the Chi-square test,or Fisher’s exact test if appropriate. All p values were two-tailed. A p \ 0.05 was con-sidered statistically significant. All computations were performed using SAS v. 8.2 software(SAS Institute, Cary, NC, USA).RESULTS. Seven studies were included in this systematic analysis (n = 1,048 patients).Significant differences were observed in terms of overall fatty acid intake when comparingthe four positive studies [1–3.5] with the three negative trials [4, 6–7]. Main level of EPAadministered in the positive studies was 5.45 g/day whereas this was much higher (8.06 g/day) in the negative trials (p = 0.03). The mean administered intake of DHA was 2.4 g/dayfor the positive trials and 4.5 g/day for the negative trials.CONCLUSIONS. Published clinical trials performed so far with anti-inflammatory lipidsshowing negative results were also associated with significantly higher doses of EPA andDHA. Since elevated doses of these lipids may lead to immunosuppression these differencesin the fatty acid intake may help explain potential differences observed in terms of clinicaloutcomes in the published literature.REFERENCE(S) 1. Gadek J et al. Crit Care Med. 1999;27:1409–20. 2. Singer P et al. CritCare Med. 2006;34:1033–8. 3. Pontes-Arruda A et al. Crit Care Med. 2006;34:2325–33. 4.Grau-Carmona T et al. Clin Nutr. 2011;30:578–84. 5. Pontes-Arruda et al. Crit Care.2011;15:R144–R158. 6. Stapleton RD et al. Crit Care Med. 2011;39:1655–62. 7. Rice TWet al. JAMA. 2011;306:1574–81.
0258APACHE II, APACHE IV, AND SAPS II SCORE: WHICH SCORE SHOULDBE USED AS A BENCHMARKING IN CRITICALLY ILL TRAUMA PATIENTS?
A. Hasanin1, A. Eladawy1, S. Farouk1, H. Mostafa1, A. Lofty1, R. Magdy1, M. Aly1,
M. Khaled1, M. Farrag1, A. Mukhtar1
1Cairo University, Department of Anesthesia and Critical Care Medicine, Cairo, EgyptINTRODUCTION. Benchmarking and quality control program are considered nowadaysthe standard of care in the management of critically ill patients. Acute Physiology andChronic Health Evaluation (APACHE) II has been proven to be a useful predictor incritically ill injured patients. More recently, APACHE IV and Simplified Acute PhysiologyScore (SAPS) II were developed for benchmarking ICU performance.
OBJECTIVES. Is to compare the ability of APACHE II, APACHE IV, and SAPS II scorein outcome prediction in a prospective cohort of critically ill trauma patients.METHODS. The study was conducted in surgical trauma adult intensive care at a tertiarycare center. All patients admitted to ICU from January 2012 to March 2013 were enrolled inthe study. The area under the receiver operating characteristic curve (AUROC) was used todetermine the predictive value of each score. The observed mortality rates were comparedwith predicted mortality rates for all scoring systems and standardized mortality ratio (SMR)was determined.RESULTS. 163 patients were available for analysis. The overall mortality observed was 54(33 %). APACHE IV was the best predictor of mortality; AUROC 0.79, 95 % CI(0.72–0.87) versus AUROC 0.72, 95 % CI (0.69–0.85) for APACHE II, and AUROC 0.75,95 % CI (0.68–0.823) for SAPS II score. The predicted mortality of APACHE IV score wassignificantly less than APACHE II and SAPS II score; 5 (3–13 %), 26 (15–39 %), 11(3–26 %) respectively p \ 0.001. The mean SMR for APACHE IV score was 2.2 versus 1.1for APACHE II and 1.7 for SAPS II score. In sub-group of patients with head injury,AUROC for APACHE IV was 0.91 versus 0.77 for APACHE II and 0.825 for SAPS IIscore.CONCLUSIONS. APACHE IV is better in predicting mortality outcome in critically illtrauma patients than APACHE II and SAPS II scores. Using APACHE II score bench-marking may over estimate the ICU performance.
0259OUTCOMES FROM LAPAROTOMY AND CRITICAL CARE WORKLOAD WITHOR WITHOUT PERIOPERATIVE ADMISSION TO THE CRITICAL CARE UNIT
S. Churchill1, M.B. Muthuswamy2
1Royal Gwent Hospital, Dept of Anaesthesia & Intensive Care Medicine, Newport, UK,2Royal Gwent Hospital, Dept of Anaesthetics & Intensive Care Medicine, Newport, UKINTRODUCTION. Laparotomies are one of the commonest high-risk surgeries routinelyperformed in acute hospitals. The mortality rate for this group exceeds that of cardiacsurgical patients and consumes significant critical care resources (1). There is clearly a needto improve their outcomes which might stretch resources.OBJECTIVES. Our hospital has one of the lowest critical care unit (CCU) capacities acrossthe UK (2.5/100,000 population) and some of the highest DTOCs (delayed transfers ofcare), 68 % of all our admissions were DTOCs—938 lost days/year. We also have one ofthe lowest elective admission rates, 10–15 %, partly due to hesitancy for bed-booking forfear of cancellations from a lack of critical care capacity. We set out to find the CCUadmission rates for these patients having laparotomies (elective and emergency) acrosssurgical subspecialties (general surgery, urology, vascular and gynae-oncology) and com-pare their mortality with or without CCU admission. We were also interested to find theincidence of AKI (Acute Kidney Injury) using this as a surrogate marker for the presence ofany acute organ dysfunction postoperatively. We also analysed the workload of the criticalcare outreach team to see if lower elective admissions might mean more work at a later day.METHODS. We used the theatre database to identify all eligible patients to be included inthe study and collected data over a month, November 2012. We prospectively followedthem up for up to 60 days.RESULTS. There were 73 patients included in the study, 26 of them having elective and 47having emergency laparotomies, the majority being general surgeries (53 %). The mean ageof these patients were 70 years, but was 76, 80 and 83 years for patients developing AKI,who were still in-patients and who died, respectively. The CCU admission rate was 10 % forelective surgeries but more than half of all emergency laparotomies were admitted to CCU.The mean CCU length of stay was 10 days. The 60-day mortality rate was 4 % overall but13.6 % for emergency general surgeries, the biggest subgroup (30 % of all laparotomies).The incidence of AKI was [50 % for Urology patients but 16 % in non-Urological sur-geries, 2/3rds of who were admitted to the CCU and 1/3rd went to the ward postoperatively.None of the patients who ended up in the ward postoperatively triggered an outreachreferral/CCU admission later.CONCLUSIONS. This study pointed out that the elective CCU admission rate was indeedlow in our hospital at 10 %, but it did not translate to increased referrals to critical care later.The incidence of AKI was higher in Urology but it probably reflects the nature of the diseaseand the area of surgery. All the patients who developed AKI in the wards were probablymanaged well as they did not end up in the CCU after.REFERENCE(S) 1. The Royal College of Surgeons of England. The higher risk generalsurgical patient: towards improved care for a forgotten group. http://www.rcseng.ac.uk.
0260PREDICTORS OF NEUROLOGICAL OUTCOME IN PATIENTS WITHTHERAPEUTIC HYPOTHERMIA
L.K. Gupta1,2, D. Gupta3, A. Gupta4, K. Hassan5
1Regional Medical Center of San Jose, Hospitalist/Intensivist Group, San Jose, USA,2Geisinger Medical Center, Department of Critical Care, Danville, USA, 3UCLA, LosAngeles, USA, 4Harker, San Jose, USA, 5Regional Medical Center of San Jose, Intensivist,San Jose, USAINTRODUCTION. Mild therapeutic hypothermia (MTH) increases survival and improvesneurological outcome in post cardiac arrest (CA) patients after successful resuscitation.Prognostication in patients with CA who have received MTH is very complicated. AcutePhysiology and Chronic Health Evaluation (APACHE) IV is a successful scoring system forassessing the severity of illness and prognosis of ICU patients and has been validated formortality outcome. We tried to assess APACHE IV scores and other factors like earlyinduction time, time to target temperature, presence of Co-morbidities, Neuron SpecificEnolase (NSE) levels, Electrolyte imbalances, EEG abnormalities and complications arisingfrom MTH which may likely influence the patient’s outcome.OBJECTIVES. The objective of this study was to validate and to assess the performance ofAPACHE IV benchmark for patients admitted with cardiac arrest receiving MTH. Weaimed to evaluate the accuracy of APACHE IV score in predicting mortality, ICU Length OfStay (LOS) and Hospital LOS. This study also investigated the pattern of electrolyteabnormalities, coagulopathy, seizures and other variables and observed for their associationwith survival outcome.METHODS. This is a retrospective data analysis of 77 Post-CA patients admitted in atertiary care medical–surgical 34 bed ICU from Jan 2009–April 2013 who received MTHusing inner-cool catheter. They were treated based on standard MTH protocol. The MTHprotocol aiming at a target temperature of 33.0 �C, maintained for 24 h and then graduallyre-warmed at a rate of *0.5 �C/h. NSE was measured at 24, 48 and 72 h. Mortality and
26th ESICM ANNUAL CONGRESS — PARIS, FRANCE — 5–9 OCTOBER 2013
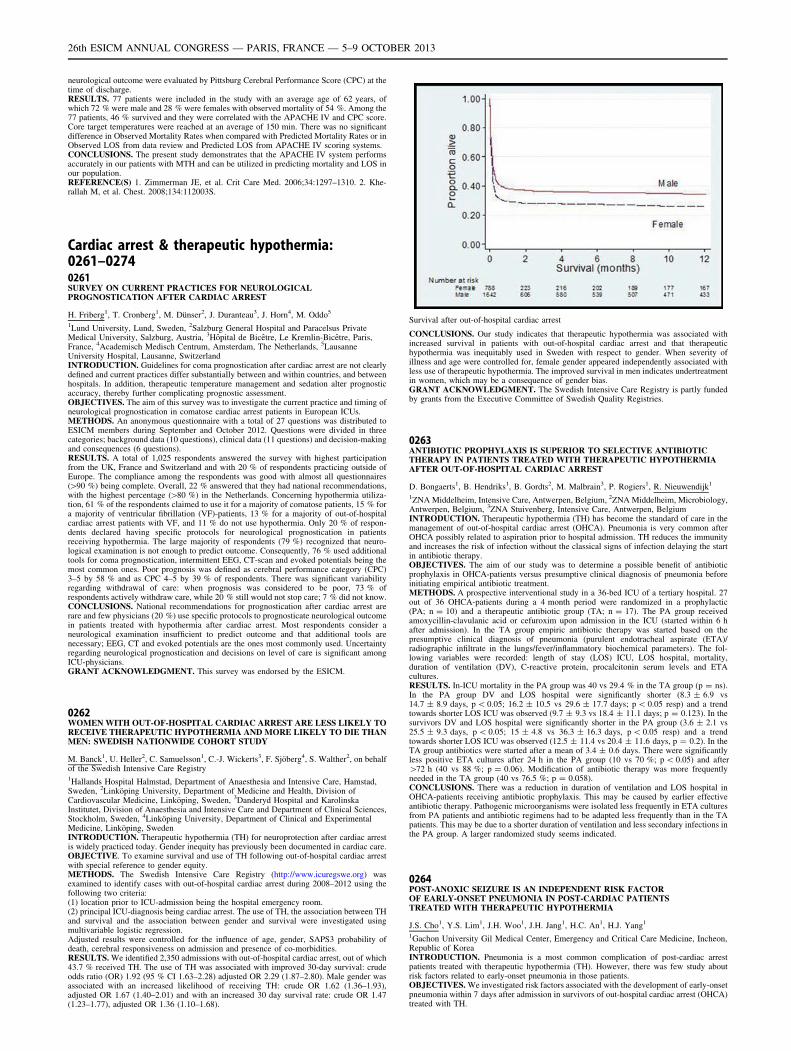
neurological outcome were evaluated by Pittsburg Cerebral Performance Score (CPC) at thetime of discharge.RESULTS. 77 patients were included in the study with an average age of 62 years, ofwhich 72 % were male and 28 % were females with observed mortality of 54 %. Among the77 patients, 46 % survived and they were correlated with the APACHE IV and CPC score.Core target temperatures were reached at an average of 150 min. There was no significantdifference in Observed Mortality Rates when compared with Predicted Mortality Rates or inObserved LOS from data review and Predicted LOS from APACHE IV scoring systems.CONCLUSIONS. The present study demonstrates that the APACHE IV system performsaccurately in our patients with MTH and can be utilized in predicting mortality and LOS inour population.REFERENCE(S) 1. Zimmerman JE, et al. Crit Care Med. 2006;34:1297–1310. 2. Khe-rallah M, et al. Chest. 2008;134:112003S.
Cardiac arrest & therapeutic hypothermia:0261–02740261SURVEY ON CURRENT PRACTICES FOR NEUROLOGICALPROGNOSTICATION AFTER CARDIAC ARREST
H. Friberg1, T. Cronberg1, M. Dünser2, J. Duranteau3, J. Horn4, M. Oddo5
1Lund University, Lund, Sweden, 2Salzburg General Hospital and Paracelsus PrivateMedical University, Salzburg, Austria, 3Hôpital de Bicêtre, Le Kremlin-Bicêtre, Paris,France, 4Academisch Medisch Centrum, Amsterdam, The Netherlands, 5LausanneUniversity Hospital, Lausanne, SwitzerlandINTRODUCTION. Guidelines for coma prognostication after cardiac arrest are not clearlydefined and current practices differ substantially between and within countries, and betweenhospitals. In addition, therapeutic temperature management and sedation alter prognosticaccuracy, thereby further complicating prognostic assessment.OBJECTIVES. The aim of this survey was to investigate the current practice and timing ofneurological prognostication in comatose cardiac arrest patients in European ICUs.METHODS. An anonymous questionnaire with a total of 27 questions was distributed toESICM members during September and October 2012. Questions were divided in threecategories; background data (10 questions), clinical data (11 questions) and decision-makingand consequences (6 questions).RESULTS. A total of 1,025 respondents answered the survey with highest participationfrom the UK, France and Switzerland and with 20 % of respondents practicing outside ofEurope. The compliance among the respondents was good with almost all questionnaires([90 %) being complete. Overall, 22 % answered that they had national recommendations,with the highest percentage ([80 %) in the Netherlands. Concerning hypothermia utiliza-tion, 61 % of the respondents claimed to use it for a majority of comatose patients, 15 % fora majority of ventricular fibrillation (VF)-patients, 13 % for a majority of out-of-hospitalcardiac arrest patients with VF, and 11 % do not use hypothermia. Only 20 % of respon-dents declared having specific protocols for neurological prognostication in patientsreceiving hypothermia. The large majority of respondents (79 %) recognized that neuro-logical examination is not enough to predict outcome. Consequently, 76 % used additionaltools for coma prognostication, intermittent EEG, CT-scan and evoked potentials being themost common ones. Poor prognosis was defined as cerebral performance category (CPC)3–5 by 58 % and as CPC 4–5 by 39 % of respondents. There was significant variabilityregarding withdrawal of care: when prognosis was considered to be poor, 73 % ofrespondents actively withdraw care, while 20 % still would not stop care; 7 % did not know.CONCLUSIONS. National recommendations for prognostication after cardiac arrest arerare and few physicians (20 %) use specific protocols to prognosticate neurological outcomein patients treated with hypothermia after cardiac arrest. Most respondents consider aneurological examination insufficient to predict outcome and that additional tools arenecessary; EEG, CT and evoked potentials are the ones most commonly used. Uncertaintyregarding neurological prognostication and decisions on level of care is significant amongICU-physicians.GRANT ACKNOWLEDGMENT. This survey was endorsed by the ESICM.
0262WOMEN WITH OUT-OF-HOSPITAL CARDIAC ARREST ARE LESS LIKELY TORECEIVE THERAPEUTIC HYPOTHERMIA AND MORE LIKELY TO DIE THANMEN: SWEDISH NATIONWIDE COHORT STUDY
M. Banck1, U. Heller2, C. Samuelsson1, C.-J. Wickerts3, F. Sjöberg4, S. Walther2, on behalfof the Swedish Intensive Care Registry1Hallands Hospital Halmstad, Department of Anaesthesia and Intensive Care, Hamstad,Sweden, 2Linköping University, Department of Medicine and Health, Division ofCardiovascular Medicine, Linköping, Sweden, 3Danderyd Hospital and KarolinskaInstitutet, Division of Anaesthesia and Intensive Care and Department of Clinical Sciences,Stockholm, Sweden, 4Linköping University, Department of Clinical and ExperimentalMedicine, Linköping, SwedenINTRODUCTION. Therapeutic hypothermia (TH) for neuroprotection after cardiac arrestis widely practiced today. Gender inequity has previously been documented in cardiac care.OBJECTIVE. To examine survival and use of TH following out-of-hospital cardiac arrestwith special reference to gender equity.METHODS. The Swedish Intensive Care Registry (http://www.icuregswe.org) wasexamined to identify cases with out-of-hospital cardiac arrest during 2008–2012 using thefollowing two criteria:(1) location prior to ICU-admission being the hospital emergency room.(2) principal ICU-diagnosis being cardiac arrest. The use of TH, the association between THand survival and the association between gender and survival were investigated usingmultivariable logistic regression.Adjusted results were controlled for the influence of age, gender, SAPS3 probability ofdeath, cerebral responsiveness on admission and presence of co-morbidities.RESULTS. We identified 2,350 admissions with out-of-hospital cardiac arrest, out of which43.7 % received TH. The use of TH was associated with improved 30-day survival: crudeodds ratio (OR) 1.92 (95 % CI 1.63–2.28) adjusted OR 2.29 (1.87–2.80). Male gender wasassociated with an increased likelihood of receiving TH: crude OR 1.62 (1.36–1.93),adjusted OR 1.67 (1.40–2.01) and with an increased 30 day survival rate: crude OR 1.47(1.23–1.77), adjusted OR 1.36 (1.10–1.68).
Survival after out-of-hospital cardiac arrest
CONCLUSIONS. Our study indicates that therapeutic hypothermia was associated withincreased survival in patients with out-of-hospital cardiac arrest and that therapeutichypothermia was inequitably used in Sweden with respect to gender. When severity ofillness and age were controlled for, female gender appeared independently associated withless use of therapeutic hypothermia. The improved survival in men indicates undertreatmentin women, which may be a consequence of gender bias.GRANT ACKNOWLEDGMENT. The Swedish Intensive Care Registry is partly fundedby grants from the Executive Committee of Swedish Quality Registries.
0263ANTIBIOTIC PROPHYLAXIS IS SUPERIOR TO SELECTIVE ANTIBIOTICTHERAPY IN PATIENTS TREATED WITH THERAPEUTIC HYPOTHERMIAAFTER OUT-OF-HOSPITAL CARDIAC ARREST
D. Bongaerts1, B. Hendriks1, B. Gordts2, M. Malbrain3, P. Rogiers1, R. Nieuwendijk1
1ZNA Middelheim, Intensive Care, Antwerpen, Belgium, 2ZNA Middelheim, Microbiology,Antwerpen, Belgium, 3ZNA Stuivenberg, Intensive Care, Antwerpen, BelgiumINTRODUCTION. Therapeutic hypothermia (TH) has become the standard of care in themanagement of out-of-hospital cardiac arrest (OHCA). Pneumonia is very common afterOHCA possibly related to aspiration prior to hospital admission. TH reduces the immunityand increases the risk of infection without the classical signs of infection delaying the startin antibiotic therapy.OBJECTIVES. The aim of our study was to determine a possible benefit of antibioticprophylaxis in OHCA-patients versus presumptive clinical diagnosis of pneumonia beforeinitiating empirical antibiotic treatment.METHODS. A prospective interventional study in a 36-bed ICU of a tertiary hospital. 27out of 36 OHCA-patients during a 4 month period were randomized in a prophylactic(PA; n = 10) and a therapeutic antibiotic group (TA; n = 17). The PA group receivedamoxycillin-clavulanic acid or cefuroxim upon admission in the ICU (started within 6 hafter admission). In the TA group empiric antibiotic therapy was started based on thepresumptive clinical diagnosis of pneumonia (purulent endotracheal aspirate (ETA)/radiographic infiltrate in the lungs/fever/inflammatory biochemical parameters). The fol-lowing variables were recorded: length of stay (LOS) ICU, LOS hospital, mortality,duration of ventilation (DV), C-reactive protein, procalcitonin serum levels and ETAcultures.RESULTS. In-ICU mortality in the PA group was 40 vs 29.4 % in the TA group (p = ns).In the PA group DV and LOS hospital were significantly shorter (8.3 ± 6.9 vs14.7 ± 8.9 days, p \ 0.05; 16.2 ± 10.5 vs 29.6 ± 17.7 days; p \ 0.05 resp) and a trendtowards shorter LOS ICU was observed (9.7 ± 9.3 vs 18.4 ± 11.1 days; p = 0.123). In thesurvivors DV and LOS hospital were significantly shorter in the PA group (3.6 ± 2.1 vs25.5 ± 9.3 days, p \ 0.05; 15 ± 4.8 vs 36.3 ± 16.3 days, p \ 0.05 resp) and a trendtowards shorter LOS ICU was observed (12.5 ± 11.4 vs 20.4 ± 11.6 days, p = 0.2). In theTA group antibiotics were started after a mean of 3.4 ± 0.6 days. There were significantlyless positive ETA cultures after 24 h in the PA group (10 vs 70 %; p \ 0.05) and after[72 h (40 vs 88 %; p = 0.06). Modification of antibiotic therapy was more frequentlyneeded in the TA group (40 vs 76.5 %; p = 0.058).CONCLUSIONS. There was a reduction in duration of ventilation and LOS hospital inOHCA-patients receiving antibiotic prophylaxis. This may be caused by earlier effectiveantibiotic therapy. Pathogenic microorganisms were isolated less frequently in ETA culturesfrom PA patients and antibiotic regimens had to be adapted less frequently than in the TApatients. This may be due to a shorter duration of ventilation and less secondary infections inthe PA group. A larger randomized study seems indicated.
0264POST-ANOXIC SEIZURE IS AN INDEPENDENT RISK FACTOROF EARLY-ONSET PNEUMONIA IN POST-CARDIAC PATIENTSTREATED WITH THERAPEUTIC HYPOTHERMIA
J.S. Cho1, Y.S. Lim1, J.H. Woo1, J.H. Jang1, H.C. An1, H.J. Yang1
1Gachon University Gil Medical Center, Emergency and Critical Care Medicine, Incheon,Republic of KoreaINTRODUCTION. Pneumonia is a most common complication of post-cardiac arrestpatients treated with therapeutic hypothermia (TH). However, there was few study aboutrisk factors related to early-onset pneumonia in those patients.OBJECTIVES. We investigated risk factors associated with the development of early-onsetpneumonia within 7 days after admission in survivors of out-hospital cardiac arrest (OHCA)treated with TH.
26th ESICM ANNUAL CONGRESS — PARIS, FRANCE — 5–9 OCTOBER 2013
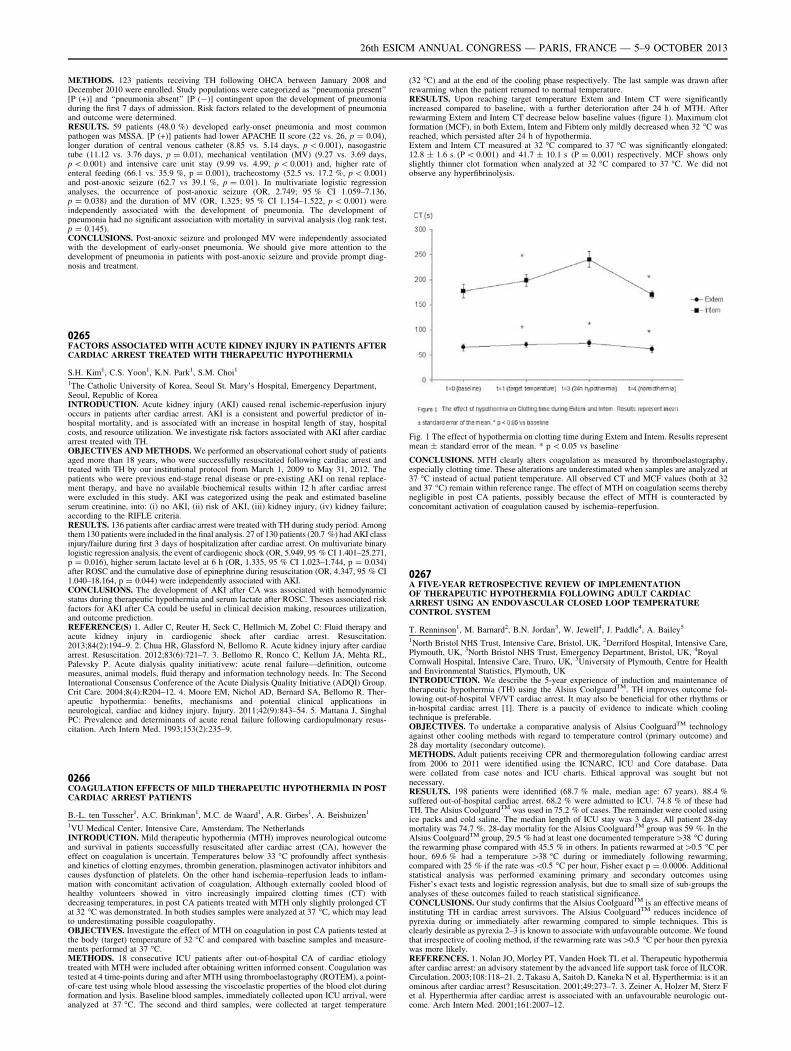
METHODS. 123 patients receiving TH following OHCA between January 2008 andDecember 2010 were enrolled. Study populations were categorized as ‘‘pneumonia present’’[P (+)] and ‘‘pneumonia absent’’ [P (-)] contingent upon the development of pneumoniaduring the first 7 days of admission. Risk factors related to the development of pneumoniaand outcome were determined.RESULTS. 59 patients (48.0 %) developed early-onset pneumonia and most commonpathogen was MSSA. [P (+)] patients had lower APACHE II score (22 vs. 26, p = 0.04),longer duration of central venous catheter (8.85 vs. 5.14 days, p \ 0.001), nasogastrictube (11.12 vs. 3.76 days, p = 0.01), mechanical ventilation (MV) (9.27 vs. 3.69 days,p \ 0.001) and intensive care unit stay (9.99 vs. 4.99, p \ 0.001) and, higher rate ofenteral feeding (66.1 vs. 35.9 %, p = 0.001), tracheostomy (52.5 vs. 17.2 %, p \ 0.001)and post-anoxic seizure (62.7 vs 39.1 %, p = 0.01). In multivariate logistic regressionanalyses, the occurrence of post-anoxic seizure (OR, 2.749; 95 % CI 1.059–7.136,p = 0.038) and the duration of MV (OR, 1.325; 95 % CI 1.154–1.522, p \ 0.001) wereindependently associated with the development of pneumonia. The development ofpneumonia had no significant association with mortality in survival analysis (log rank test,p = 0.145).CONCLUSIONS. Post-anoxic seizure and prolonged MV were independently associatedwith the development of early-onset pneumonia. We should give more attention to thedevelopment of pneumonia in patients with post-anoxic seizure and provide prompt diag-nosis and treatment.
0265FACTORS ASSOCIATED WITH ACUTE KIDNEY INJURY IN PATIENTS AFTERCARDIAC ARREST TREATED WITH THERAPEUTIC HYPOTHERMIA
S.H. Kim1, C.S. Yoon1, K.N. Park1, S.M. Choi1
1The Catholic University of Korea, Seoul St. Mary’s Hospital, Emergency Department,Seoul, Republic of KoreaINTRODUCTION. Acute kidney injury (AKI) caused renal ischemic-reperfusion injuryoccurs in patients after cardiac arrest. AKI is a consistent and powerful predictor of in-hospital mortality, and is associated with an increase in hospital length of stay, hospitalcosts, and resource utilization. We investigate risk factors associated with AKI after cardiacarrest treated with TH.OBJECTIVES AND METHODS. We performed an observational cohort study of patientsaged more than 18 years, who were successfully resuscitated following cardiac arrest andtreated with TH by our institutional protocol from March 1, 2009 to May 31, 2012. Thepatients who were previous end-stage renal disease or pre-existing AKI on renal replace-ment therapy, and have no available biochemical results within 12 h after cardiac arrestwere excluded in this study. AKI was categorized using the peak and estimated baselineserum creatinine, into: (i) no AKI, (ii) risk of AKI, (iii) kidney injury, (iv) kidney failure;according to the RIFLE criteria.RESULTS. 136 patients after cardiac arrest were treated with TH during study period. Amongthem 130 patients were included in the final analysis. 27 of 130 patients (20.7 %) had AKI classinjury/failure during first 3 days of hospitalization after cardiac arrest. On multivariate binarylogistic regression analysis, the event of cardiogenic shock (OR, 5.949, 95 % CI 1.401–25.271,p = 0.016), higher serum lactate level at 6 h (OR, 1.335, 95 % CI 1.023–1.744, p = 0.034)after ROSC and the cumulative dose of epinephrine during resuscitation (OR, 4.347, 95 % CI1.040–18.164, p = 0.044) were independently associated with AKI.CONCLUSIONS. The development of AKI after CA was associated with hemodynamicstatus during therapeutic hypothermia and serum lactate after ROSC. Theses associated riskfactors for AKI after CA could be useful in clinical decision making, resources utilization,and outcome prediction.REFERENCE(S) 1. Adler C, Reuter H, Seck C, Hellmich M, Zobel C: Fluid therapy andacute kidney injury in cardiogenic shock after cardiac arrest. Resuscitation.2013;84(2):194–9. 2. Chua HR, Glassford N, Bellomo R. Acute kidney injury after cardiacarrest. Resuscitation. 2012;83(6):721–7. 3. Bellomo R, Ronco C, Kellum JA, Mehta RL,Palevsky P. Acute dialysis quality initiativew: acute renal failure—definition, outcomemeasures, animal models, fluid therapy and information technology needs. In: The SecondInternational Consensus Conference of the Acute Dialysis Quality Initiative (ADQI) Group.Crit Care. 2004;8(4):R204–12. 4. Moore EM, Nichol AD, Bernard SA, Bellomo R. Ther-apeutic hypothermia: benefits, mechanisms and potential clinical applications inneurological, cardiac and kidney injury. Injury. 2011;42(9):843–54. 5. Mattana J, SinghalPC: Prevalence and determinants of acute renal failure following cardiopulmonary resus-citation. Arch Intern Med. 1993;153(2):235–9.
0266COAGULATION EFFECTS OF MILD THERAPEUTIC HYPOTHERMIA IN POSTCARDIAC ARREST PATIENTS
B.-L. ten Tusscher1, A.C. Brinkman1, M.C. de Waard1, A.R. Girbes1, A. Beishuizen1
1VU Medical Center, Intensive Care, Amsterdam, The NetherlandsINTRODUCTION. Mild therapeutic hypothermia (MTH) improves neurological outcomeand survival in patients successfully resuscitated after cardiac arrest (CA), however theeffect on coagulation is uncertain. Temperatures below 33 �C profoundly affect synthesisand kinetics of clotting enzymes, thrombin generation, plasminogen activator inhibitors andcauses dysfunction of platelets. On the other hand ischemia–reperfusion leads to inflam-mation with concomitant activation of coagulation. Although externally cooled blood ofhealthy volunteers showed in vitro increasingly impaired clotting times (CT) withdecreasing temperatures, in post CA patients treated with MTH only slightly prolonged CTat 32 �C was demonstrated. In both studies samples were analyzed at 37 �C, which may leadto underestimating possible coagulopathy.OBJECTIVES. Investigate the effect of MTH on coagulation in post CA patients tested atthe body (target) temperature of 32 �C and compared with baseline samples and measure-ments performed at 37 �C.METHODS. 18 consecutive ICU patients after out-of-hospital CA of cardiac etiologytreated with MTH were included after obtaining written informed consent. Coagulation wastested at 4 time-points during and after MTH using thromboelastography (ROTEM), a point-of-care test using whole blood assessing the viscoelastic properties of the blood clot duringformation and lysis. Baseline blood samples, immediately collected upon ICU arrival, wereanalyzed at 37 �C. The second and third samples, were collected at target temperature
(32 �C) and at the end of the cooling phase respectively. The last sample was drawn afterrewarming when the patient returned to normal temperature.RESULTS. Upon reaching target temperature Extem and Intem CT were significantlyincreased compared to baseline, with a further deterioration after 24 h of MTH. Afterrewarming Extem and Intem CT decrease below baseline values (figure 1). Maximum clotformation (MCF), in both Extem, Intem and Fibtem only mildly decreased when 32 �C wasreached, which persisted after 24 h of hypothermia.Extem and Intem CT measured at 32 �C compared to 37 �C was significantly elongated:12.8 ± 1.6 s (P \ 0.001) and 41.7 ± 10.1 s (P = 0.001) respectively. MCF shows onlyslightly thinner clot formation when analyzed at 32 �C compared to 37 �C. We did notobserve any hyperfibrinolysis.
Fig. 1 The effect of hypothermia on clotting time during Extem and Intem. Results representmean ± standard error of the mean. * p \ 0.05 vs baseline
CONCLUSIONS. MTH clearly alters coagulation as measured by thromboelastography,especially clotting time. These alterations are underestimated when samples are analyzed at37 �C instead of actual patient temperature. All observed CT and MCF values (both at 32and 37 �C) remain within reference range. The effect of MTH on coagulation seems therebynegligible in post CA patients, possibly because the effect of MTH is counteracted byconcomitant activation of coagulation caused by ischemia–reperfusion.
0267A FIVE-YEAR RETROSPECTIVE REVIEW OF IMPLEMENTATIONOF THERAPEUTIC HYPOTHERMIA FOLLOWING ADULT CARDIACARREST USING AN ENDOVASCULAR CLOSED LOOP TEMPERATURECONTROL SYSTEM
T. Renninson1, M. Barnard2, B.N. Jordan3, W. Jewell4, J. Paddle4, A. Bailey5
1North Bristol NHS Trust, Intensive Care, Bristol, UK, 2Derriford Hospital, Intensive Care,Plymouth, UK, 3North Bristol NHS Trust, Emergency Department, Bristol, UK, 4RoyalCornwall Hospital, Intensive Care, Truro, UK, 5University of Plymouth, Centre for Healthand Environmental Statistics, Plymouth, UKINTRODUCTION. We describe the 5-year experience of induction and maintenance oftherapeutic hypothermia (TH) using the Alsius CoolguardTM. TH improves outcome fol-lowing out-of-hospital VF/VT cardiac arrest. It may also be beneficial for other rhythms orin-hospital cardiac arrest [1]. There is a paucity of evidence to indicate which coolingtechnique is preferable.OBJECTIVES. To undertake a comparative analysis of Alsius CoolguardTM technologyagainst other cooling methods with regard to temperature control (primary outcome) and28 day mortality (secondary outcome).METHODS. Adult patients receiving CPR and thermoregulation following cardiac arrestfrom 2006 to 2011 were identified using the ICNARC, ICU and Core database. Datawere collated from case notes and ICU charts. Ethical approval was sought but notnecessary.RESULTS. 198 patients were identified (68.7 % male, median age: 67 years). 88.4 %suffered out-of-hospital cardiac arrest. 68.2 % were admitted to ICU. 74.8 % of these hadTH. The Alsius CoolguardTM was used in 75.2 % of cases. The remainder were cooled usingice packs and cold saline. The median length of ICU stay was 3 days. All patient 28-daymortality was 74.7 %. 28-day mortality for the Alsius CoolguardTM group was 59 %. In theAlsius CoolguardTM group, 29.5 % had at least one documented temperature[38 �C duringthe rewarming phase compared with 45.5 % in others. In patients rewarmed at[0.5 �C perhour, 69.6 % had a temperature [38 �C during or immediately following rewarming,compared with 25 % if the rate was\0.5 �C per hour, Fisher exact p = 0.0006. Additionalstatistical analysis was performed examining primary and secondary outcomes usingFisher’s exact tests and logistic regression analysis, but due to small size of sub-groups theanalyses of these outcomes failed to reach statistical significance.CONCLUSIONS. Our study confirms that the Alsius CoolguardTM is an effective means ofinstituting TH in cardiac arrest survivors. The Alsius CoolguardTM reduces incidence ofpyrexia during or immediately after rewarming compared to simple techniques. This isclearly desirable as pyrexia 2–3 is known to associate with unfavourable outcome. We foundthat irrespective of cooling method, if the rewarming rate was[0.5 �C per hour then pyrexiawas more likely.REFERENCES. 1. Nolan JO, Morley PT, Vanden Hoek TL et al. Therapeutic hypothermiaafter cardiac arrest: an advisory statement by the advanced life support task force of ILCOR.Circulation. 2003;108:118–21. 2. Takasu A, Saitoh D, Kaneka N et al. Hyperthermia: is it anominous after cardiac arrest? Resuscitation. 2001;49:273–7. 3. Zeiner A, Holzer M, Sterz Fet al. Hyperthermia after cardiac arrest is associated with an unfavourable neurologic out-come. Arch Intern Med. 2001;161:2007–12.
26th ESICM ANNUAL CONGRESS — PARIS, FRANCE — 5–9 OCTOBER 2013
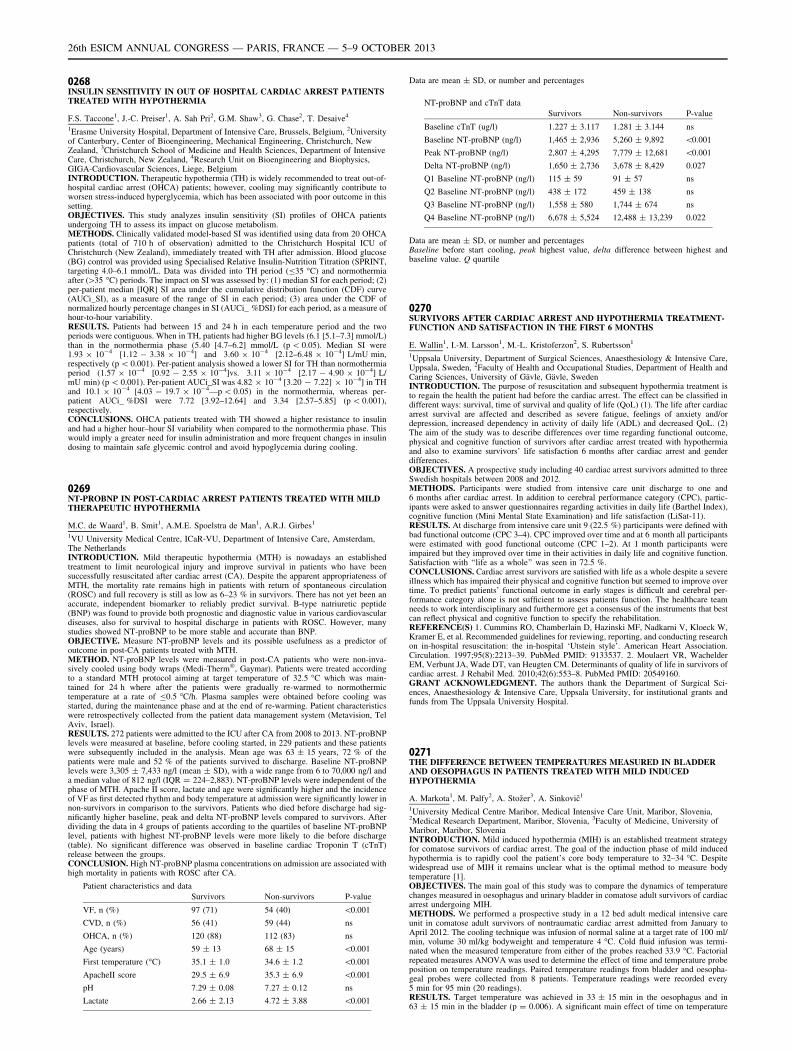
0268INSULIN SENSITIVITY IN OUT OF HOSPITAL CARDIAC ARREST PATIENTSTREATED WITH HYPOTHERMIA
F.S. Taccone1, J.-C. Preiser1, A. Sah Pri2, G.M. Shaw3, G. Chase2, T. Desaive4
1Erasme University Hospital, Department of Intensive Care, Brussels, Belgium, 2Universityof Canterbury, Center of Bioengineering, Mechanical Engineering, Christchurch, NewZealand, 3Christchurch School of Medicine and Health Sciences, Department of IntensiveCare, Christchurch, New Zealand, 4Research Unit on Bioengineering and Biophysics,GIGA-Cardiovascular Sciences, Liege, BelgiumINTRODUCTION. Therapeutic hypothermia (TH) is widely recommended to treat out-of-hospital cardiac arrest (OHCA) patients; however, cooling may significantly contribute toworsen stress-induced hyperglycemia, which has been associated with poor outcome in thissetting.OBJECTIVES. This study analyzes insulin sensitivity (SI) profiles of OHCA patientsundergoing TH to assess its impact on glucose metabolism.METHODS. Clinically validated model-based SI was identified using data from 20 OHCApatients (total of 710 h of observation) admitted to the Christchurch Hospital ICU ofChristchurch (New Zealand), immediately treated with TH after admission. Blood glucose(BG) control was provided using Specialised Relative Insulin-Nutrition Titration (SPRINT,targeting 4.0–6.1 mmol/L. Data was divided into TH period (B35 �C) and normothermiaafter ([35 �C) periods. The impact on SI was assessed by: (1) median SI for each period; (2)per-patient median [IQR] SI area under the cumulative distribution function (CDF) curve(AUCi_SI), as a measure of the range of SI in each period; (3) area under the CDF ofnormalized hourly percentage changes in SI (AUCi_ %DSI) for each period, as a measure ofhour-to-hour variability.RESULTS. Patients had between 15 and 24 h in each temperature period and the twoperiods were contiguous. When in TH, patients had higher BG levels (6.1 [5.1–7.3] mmol/L)than in the normothermia phase (5.40 [4.7–6.2] mmol/L (p \ 0.05). Median SI were1.93 9 10-4 [1.12 - 3.38 9 10-4] and 3.60 9 10-4 [2.12–6.48 9 10-4] L/mU min,respectively (p \ 0.001). Per-patient analysis showed a lower SI for TH than normothermiaperiod (1.57 9 10-4 [0.92 - 2.55 9 10-4]vs. 3.11 9 10-4 [2.17 - 4.90 9 10-4] L/mU min) (p \ 0.001). Per-patient AUCi_SI was 4.82 9 10-4 [3.20 - 7.22] 9 10-4] in THand 10.1 9 10-4 [4.03 - 19.7 9 10-4—p \ 0.05) in the normothermia, whereas per-patient AUCi_ %DSI were 7.72 [3.92–12.64] and 3.34 [2.57–5.85] (p \ 0.001),respectively.CONCLUSIONS. OHCA patients treated with TH showed a higher resistance to insulinand had a higher hour–hour SI variability when compared to the normothermia phase. Thiswould imply a greater need for insulin administration and more frequent changes in insulindosing to maintain safe glycemic control and avoid hypoglycemia during cooling.
0269NT-PROBNP IN POST-CARDIAC ARREST PATIENTS TREATED WITH MILDTHERAPEUTIC HYPOTHERMIA
M.C. de Waard1, B. Smit1, A.M.E. Spoelstra de Man1, A.R.J. Girbes1
1VU University Medical Centre, ICaR-VU, Department of Intensive Care, Amsterdam,The NetherlandsINTRODUCTION. Mild therapeutic hypothermia (MTH) is nowadays an establishedtreatment to limit neurological injury and improve survival in patients who have beensuccessfully resuscitated after cardiac arrest (CA). Despite the apparent appropriateness ofMTH, the mortality rate remains high in patients with return of spontaneous circulation(ROSC) and full recovery is still as low as 6–23 % in survivors. There has not yet been anaccurate, independent biomarker to reliably predict survival. B-type natriuretic peptide(BNP) was found to provide both prognostic and diagnostic value in various cardiovasculardiseases, also for survival to hospital discharge in patients with ROSC. However, manystudies showed NT-proBNP to be more stable and accurate than BNP.OBJECTIVE. Measure NT-proBNP levels and its possible usefulness as a predictor ofoutcome in post-CA patients treated with MTH.METHOD. NT-proBNP levels were measured in post-CA patients who were non-inva-sively cooled using body wraps (Medi-Therm�, Gaymar). Patients were treated accordingto a standard MTH protocol aiming at target temperature of 32.5 �C which was main-tained for 24 h where after the patients were gradually re-warmed to normothermictemperature at a rate of B0.5 �C/h. Plasma samples were obtained before cooling wasstarted, during the maintenance phase and at the end of re-warming. Patient characteristicswere retrospectively collected from the patient data management system (Metavision, TelAviv, Israel).RESULTS. 272 patients were admitted to the ICU after CA from 2008 to 2013. NT-proBNPlevels were measured at baseline, before cooling started, in 229 patients and these patientswere subsequently included in the analysis. Mean age was 63 ± 15 years, 72 % of thepatients were male and 52 % of the patients survived to discharge. Baseline NT-proBNPlevels were 3,305 ± 7,433 ng/l (mean ± SD), with a wide range from 6 to 70,000 ng/l anda median value of 812 ng/l (IQR = 224–2,883). NT-proBNP levels were independent of thephase of MTH. Apache II score, lactate and age were significantly higher and the incidenceof VF as first detected rhythm and body temperature at admission were significantly lower innon-survivors in comparison to the survivors. Patients who died before discharge had sig-nificantly higher baseline, peak and delta NT-proBNP levels compared to survivors. Afterdividing the data in 4 groups of patients according to the quartiles of baseline NT-proBNPlevel, patients with highest NT-proBNP levels were more likely to die before discharge(table). No significant difference was observed in baseline cardiac Troponin T (cTnT)release between the groups.CONCLUSION. High NT-proBNP plasma concentrations on admission are associated withhigh mortality in patients with ROSC after CA.
Patient characteristics and data
Survivors Non-survivors P-value
VF, n (%) 97 (71) 54 (40) \0.001
CVD, n (%) 56 (41) 59 (44) ns
OHCA, n (%) 120 (88) 112 (83) ns
Age (years) 59 ± 13 68 ± 15 \0.001
First temperature (�C) 35.1 ± 1.0 34.6 ± 1.2 \0.001
ApacheII score 29.5 ± 6.9 35.3 ± 6.9 \0.001
pH 7.29 ± 0.08 7.27 ± 0.12 ns
Lactate 2.66 ± 2.13 4.72 ± 3.88 \0.001
Data are mean ± SD, or number and percentages
NT-proBNP and cTnT data
Survivors Non-survivors P-value
Baseline cTnT (ug/l) 1.227 ± 3.117 1.281 ± 3.144 ns
Baseline NT-proBNP (ng/l) 1,465 ± 2,936 5,260 ± 9,892 \0.001
Peak NT-proBNP (ng/l) 2,807 ± 4,295 7,779 ± 12,681 \0.001
Delta NT-proBNP (ng/l) 1,650 ± 2,736 3,678 ± 8,429 0.027
Q1 Baseline NT-proBNP (ng/l) 115 ± 59 91 ± 57 ns
Q2 Baseline NT-proBNP (ng/l) 438 ± 172 459 ± 138 ns
Q3 Baseline NT-proBNP (ng/l) 1,558 ± 580 1,744 ± 674 ns
Q4 Baseline NT-proBNP (ng/l) 6,678 ± 5,524 12,488 ± 13,239 0.022
Data are mean ± SD, or number and percentagesBaseline before start cooling, peak highest value, delta difference between highest andbaseline value. Q quartile
0270SURVIVORS AFTER CARDIAC ARREST AND HYPOTHERMIA TREATMENT-FUNCTION AND SATISFACTION IN THE FIRST 6 MONTHS
E. Wallin1, I.-M. Larsson1, M.-L. Kristoferzon2, S. Rubertsson1
1Uppsala University, Department of Surgical Sciences, Anaesthesiology & Intensive Care,Uppsala, Sweden, 2Faculty of Health and Occupational Studies, Department of Health andCaring Sciences, University of Gävle, Gävle, SwedenINTRODUCTION. The purpose of resuscitation and subsequent hypothermia treatment isto regain the health the patient had before the cardiac arrest. The effect can be classified indifferent ways: survival, time of survival and quality of life (QoL) (1). The life after cardiacarrest survival are affected and described as severe fatigue, feelings of anxiety and/ordepression, increased dependency in activity of daily life (ADL) and decreased QoL. (2)The aim of the study was to describe differences over time regarding functional outcome,physical and cognitive function of survivors after cardiac arrest treated with hypothermiaand also to examine survivors’ life satisfaction 6 months after cardiac arrest and genderdifferences.OBJECTIVES. A prospective study including 40 cardiac arrest survivors admitted to threeSwedish hospitals between 2008 and 2012.METHODS. Participants were studied from intensive care unit discharge to one and6 months after cardiac arrest. In addition to cerebral performance category (CPC), partic-ipants were asked to answer questionnaires regarding activities in daily life (Barthel Index),cognitive function (Mini Mental State Examination) and life satisfaction (LiSat-11).RESULTS. At discharge from intensive care unit 9 (22.5 %) participants were defined withbad functional outcome (CPC 3–4). CPC improved over time and at 6 month all participantswere estimated with good functional outcome (CPC 1–2). At 1 month participants wereimpaired but they improved over time in their activities in daily life and cognitive function.Satisfaction with ‘‘life as a whole’’ was seen in 72.5 %.CONCLUSIONS. Cardiac arrest survivors are satisfied with life as a whole despite a severeillness which has impaired their physical and cognitive function but seemed to improve overtime. To predict patients’ functional outcome in early stages is difficult and cerebral per-formance category alone is not sufficient to assess patients function. The healthcare teamneeds to work interdisciplinary and furthermore get a consensus of the instruments that bestcan reflect physical and cognitive function to specify the rehabilitation.REFERENCE(S) 1. Cummins RO, Chamberlain D, Hazinski MF, Nadkarni V, Kloeck W,Kramer E, et al. Recommended guidelines for reviewing, reporting, and conducting researchon in-hospital resuscitation: the in-hospital ‘Utstein style’. American Heart Association.Circulation. 1997;95(8):2213–39. PubMed PMID: 9133537. 2. Moulaert VR, WachelderEM, Verbunt JA, Wade DT, van Heugten CM. Determinants of quality of life in survivors ofcardiac arrest. J Rehabil Med. 2010;42(6):553–8. PubMed PMID: 20549160.GRANT ACKNOWLEDGMENT. The authors thank the Department of Surgical Sci-ences, Anaesthesiology & Intensive Care, Uppsala University, for institutional grants andfunds from The Uppsala University Hospital.
0271THE DIFFERENCE BETWEEN TEMPERATURES MEASURED IN BLADDERAND OESOPHAGUS IN PATIENTS TREATED WITH MILD INDUCEDHYPOTHERMIA
A. Markota1, M. Palfy2, A. Stožer3, A. Sinkovič1
1University Medical Centre Maribor, Medical Intensive Care Unit, Maribor, Slovenia,2Medical Research Department, Maribor, Slovenia, 3Faculty of Medicine, University ofMaribor, Maribor, SloveniaINTRODUCTION. Mild induced hypothermia (MIH) is an established treatment strategyfor comatose survivors of cardiac arrest. The goal of the induction phase of mild inducedhypothermia is to rapidly cool the patient’s core body temperature to 32–34 �C. Despitewidespread use of MIH it remains unclear what is the optimal method to measure bodytemperature [1].OBJECTIVES. The main goal of this study was to compare the dynamics of temperaturechanges measured in oesophagus and urinary bladder in comatose adult survivors of cardiacarrest undergoing MIH.METHODS. We performed a prospective study in a 12 bed adult medical intensive careunit in comatose adult survivors of nontraumatic cardiac arrest admitted from January toApril 2012. The cooling technique was infusion of normal saline at a target rate of 100 ml/min, volume 30 ml/kg bodyweight and temperature 4 �C. Cold fluid infusion was termi-nated when the measured temperature from either of the probes reached 33.9 �C. Factorialrepeated measures ANOVA was used to determine the effect of time and temperature probeposition on temperature readings. Paired temperature readings from bladder and oesopha-geal probes were collected from 8 patients. Temperature readings were recorded every5 min for 95 min (20 readings).RESULTS. Target temperature was achieved in 33 ± 15 min in the oesophagus and in63 ± 15 min in the bladder (p = 0.006). A significant main effect of time on temperature
26th ESICM ANNUAL CONGRESS — PARIS, FRANCE — 5–9 OCTOBER 2013
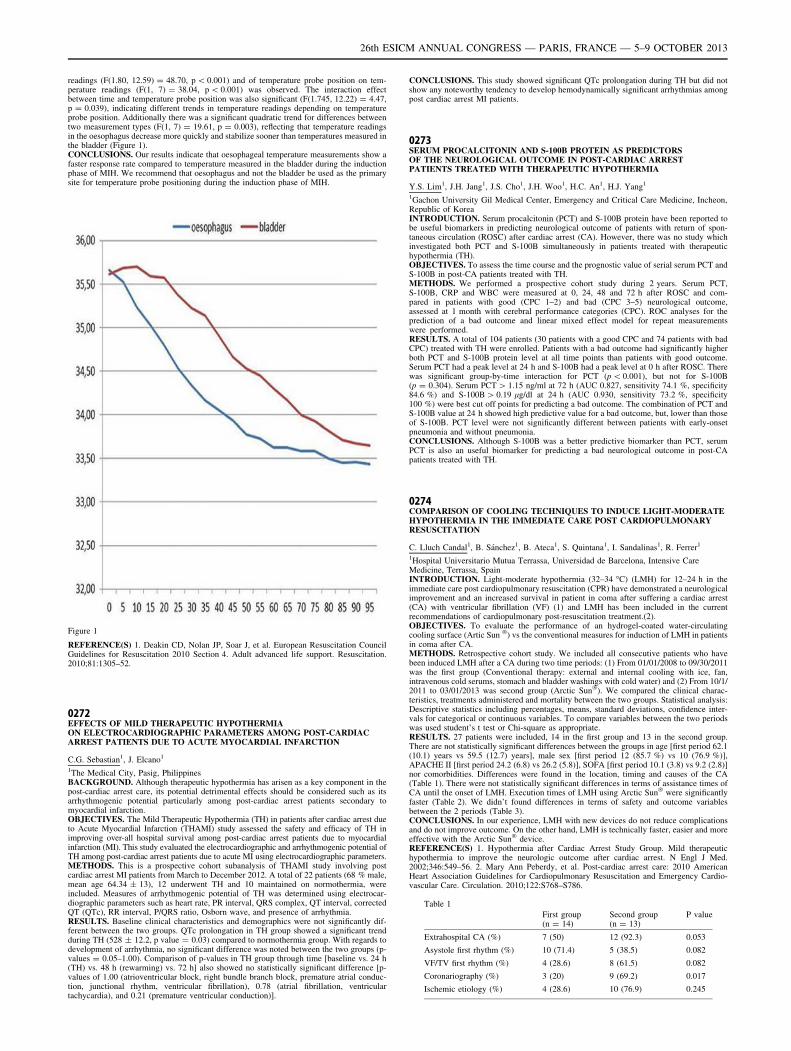
readings (F(1.80, 12.59) = 48.70, p \ 0.001) and of temperature probe position on tem-perature readings (F(1, 7) = 38.04, p \ 0.001) was observed. The interaction effectbetween time and temperature probe position was also significant (F(1.745, 12.22) = 4.47,p = 0.039), indicating different trends in temperature readings depending on temperatureprobe position. Additionally there was a significant quadratic trend for differences betweentwo measurement types (F(1, 7) = 19.61, p = 0.003), reflecting that temperature readingsin the oesophagus decrease more quickly and stabilize sooner than temperatures measured inthe bladder (Figure 1).CONCLUSIONS. Our results indicate that oesophageal temperature measurements show afaster response rate compared to temperature measured in the bladder during the inductionphase of MIH. We recommend that oesophagus and not the bladder be used as the primarysite for temperature probe positioning during the induction phase of MIH.
Figure 1
REFERENCE(S) 1. Deakin CD, Nolan JP, Soar J, et al. European Resuscitation CouncilGuidelines for Resuscitation 2010 Section 4. Adult advanced life support. Resuscitation.2010;81:1305–52.
0272EFFECTS OF MILD THERAPEUTIC HYPOTHERMIAON ELECTROCARDIOGRAPHIC PARAMETERS AMONG POST-CARDIACARREST PATIENTS DUE TO ACUTE MYOCARDIAL INFARCTION
C.G. Sebastian1, J. Elcano1
1The Medical City, Pasig, PhilippinesBACKGROUND. Although therapeutic hypothermia has arisen as a key component in thepost-cardiac arrest care, its potential detrimental effects should be considered such as itsarrhythmogenic potential particularly among post-cardiac arrest patients secondary tomyocardial infarction.OBJECTIVES. The Mild Therapeutic Hypothermia (TH) in patients after cardiac arrest dueto Acute Myocardial Infarction (THAMI) study assessed the safety and efficacy of TH inimproving over-all hospital survival among post-cardiac arrest patients due to myocardialinfarction (MI). This study evaluated the electrocardiographic and arrhythmogenic potential ofTH among post-cardiac arrest patients due to acute MI using electrocardiographic parameters.METHODS. This is a prospective cohort subanalysis of THAMI study involving postcardiac arrest MI patients from March to December 2012. A total of 22 patients (68 % male,mean age 64.34 ± 13), 12 underwent TH and 10 maintained on normothermia, wereincluded. Measures of arrhythmogenic potential of TH was determined using electrocar-diographic parameters such as heart rate, PR interval, QRS complex, QT interval, correctedQT (QTc), RR interval, P/QRS ratio, Osborn wave, and presence of arrhythmia.RESULTS. Baseline clinical characteristics and demographics were not significantly dif-ferent between the two groups. QTc prolongation in TH group showed a significant trendduring TH (528 ± 12.2, p value = 0.03) compared to normothermia group. With regards todevelopment of arrhythmia, no significant difference was noted between the two groups (p-values = 0.05–1.00). Comparison of p-values in TH group through time [baseline vs. 24 h(TH) vs. 48 h (rewarming) vs. 72 h] also showed no statistically significant difference [p-values of 1.00 (atrioventricular block, right bundle branch block, premature atrial conduc-tion, junctional rhythm, ventricular fibrillation), 0.78 (atrial fibrillation, ventriculartachycardia), and 0.21 (premature ventricular conduction)].
CONCLUSIONS. This study showed significant QTc prolongation during TH but did notshow any noteworthy tendency to develop hemodynamically significant arrhythmias amongpost cardiac arrest MI patients.
0273SERUM PROCALCITONIN AND S-100B PROTEIN AS PREDICTORSOF THE NEUROLOGICAL OUTCOME IN POST-CARDIAC ARRESTPATIENTS TREATED WITH THERAPEUTIC HYPOTHERMIA
Y.S. Lim1, J.H. Jang1, J.S. Cho1, J.H. Woo1, H.C. An1, H.J. Yang1
1Gachon University Gil Medical Center, Emergency and Critical Care Medicine, Incheon,Republic of KoreaINTRODUCTION. Serum procalcitonin (PCT) and S-100B protein have been reported tobe useful biomarkers in predicting neurological outcome of patients with return of spon-taneous circulation (ROSC) after cardiac arrest (CA). However, there was no study whichinvestigated both PCT and S-100B simultaneously in patients treated with therapeutichypothermia (TH).OBJECTIVES. To assess the time course and the prognostic value of serial serum PCT andS-100B in post-CA patients treated with TH.METHODS. We performed a prospective cohort study during 2 years. Serum PCT,S-100B, CRP and WBC were measured at 0, 24, 48 and 72 h after ROSC and com-pared in patients with good (CPC 1–2) and bad (CPC 3–5) neurological outcome,assessed at 1 month with cerebral performance categories (CPC). ROC analyses for theprediction of a bad outcome and linear mixed effect model for repeat measurementswere performed.RESULTS. A total of 104 patients (30 patients with a good CPC and 74 patients with badCPC) treated with TH were enrolled. Patients with a bad outcome had significantly higherboth PCT and S-100B protein level at all time points than patients with good outcome.Serum PCT had a peak level at 24 h and S-100B had a peak level at 0 h after ROSC. Therewas significant group-by-time interaction for PCT (p \ 0.001), but not for S-100B(p = 0.304). Serum PCT [ 1.15 ng/ml at 72 h (AUC 0.827, sensitivity 74.1 %, specificity84.6 %) and S-100B [ 0.19 lg/dl at 24 h (AUC 0.930, sensitivity 73.2 %, specificity100 %) were best cut off points for predicting a bad outcome. The combination of PCT andS-100B value at 24 h showed high predictive value for a bad outcome, but, lower than thoseof S-100B. PCT level were not significantly different between patients with early-onsetpneumonia and without pneumonia.CONCLUSIONS. Although S-100B was a better predictive biomarker than PCT, serumPCT is also an useful biomarker for predicting a bad neurological outcome in post-CApatients treated with TH.
0274COMPARISON OF COOLING TECHNIQUES TO INDUCE LIGHT-MODERATEHYPOTHERMIA IN THE IMMEDIATE CARE POST CARDIOPULMONARYRESUSCITATION
C. Lluch Candal1, B. Sánchez1, B. Ateca1, S. Quintana1, I. Sandalinas1, R. Ferrer1
1Hospital Universitario Mutua Terrassa, Universidad de Barcelona, Intensive CareMedicine, Terrassa, SpainINTRODUCTION. Light-moderate hypothermia (32–34 �C) (LMH) for 12–24 h in theimmediate care post cardiopulmonary resuscitation (CPR) have demonstrated a neurologicalimprovement and an increased survival in patient in coma after suffering a cardiac arrest(CA) with ventricular fibrillation (VF) (1) and LMH has been included in the currentrecommendations of cardiopulmonary post-resuscitation treatment.(2).OBJECTIVES. To evaluate the performance of an hydrogel-coated water-circulatingcooling surface (Artic Sun �) vs the conventional measures for induction of LMH in patientsin coma after CA.METHODS. Retrospective cohort study. We included all consecutive patients who havebeen induced LMH after a CA during two time periods: (1) From 01/01/2008 to 09/30/2011was the first group (Conventional therapy: external and internal cooling with ice, fan,intravenous cold serums, stomach and bladder washings with cold water) and (2) From 10/1/2011 to 03/01/2013 was second group (Arctic Sun�). We compared the clinical charac-teristics, treatments administered and mortality between the two groups. Statistical analysis:Descriptive statistics including percentages, means, standard deviations, confidence inter-vals for categorical or continuous variables. To compare variables between the two periodswas used student’s t test or Chi-square as appropriate.RESULTS. 27 patients were included, 14 in the first group and 13 in the second group.There are not statistically significant differences between the groups in age [first period 62.1(10.1) years vs 59.5 (12.7) years], male sex [first period 12 (85.7 %) vs 10 (76.9 %)],APACHE II [first period 24.2 (6.8) vs 26.2 (5.8)], SOFA [first period 10.1 (3.8) vs 9.2 (2.8)]nor comorbidities. Differences were found in the location, timing and causes of the CA(Table 1). There were not statistically significant differences in terms of assistance times ofCA until the onset of LMH. Execution times of LMH using Arctic Sun� were significantlyfaster (Table 2). We didn’t found differences in terms of safety and outcome variablesbetween the 2 periods (Table 3).CONCLUSIONS. In our experience, LMH with new devices do not reduce complicationsand do not improve outcome. On the other hand, LMH is technically faster, easier and moreeffective with the Arctic Sun� device.REFERENCE(S) 1. Hypothermia after Cardiac Arrest Study Group. Mild therapeutichypothermia to improve the neurologic outcome after cardiac arrest. N Engl J Med.2002;346:549–56. 2. Mary Ann Peberdy, et al. Post-cardiac arrest care: 2010 AmericanHeart Association Guidelines for Cardiopulmonary Resuscitation and Emergency Cardio-vascular Care. Circulation. 2010;122:S768–S786.
Table 1
First group(n = 14)
Second group(n = 13)
P value
Extrahospital CA (%) 7 (50) 12 (92.3) 0.053
Asystole first rhythm (%) 10 (71.4) 5 (38.5) 0.082
VF/TV first rhythm (%) 4 (28.6) 8 (61.5) 0.082
Coronariography (%) 3 (20) 9 (69.2) 0.017
Ischemic etiology (%) 4 (28.6) 10 (76.9) 0.245
26th ESICM ANNUAL CONGRESS — PARIS, FRANCE — 5–9 OCTOBER 2013
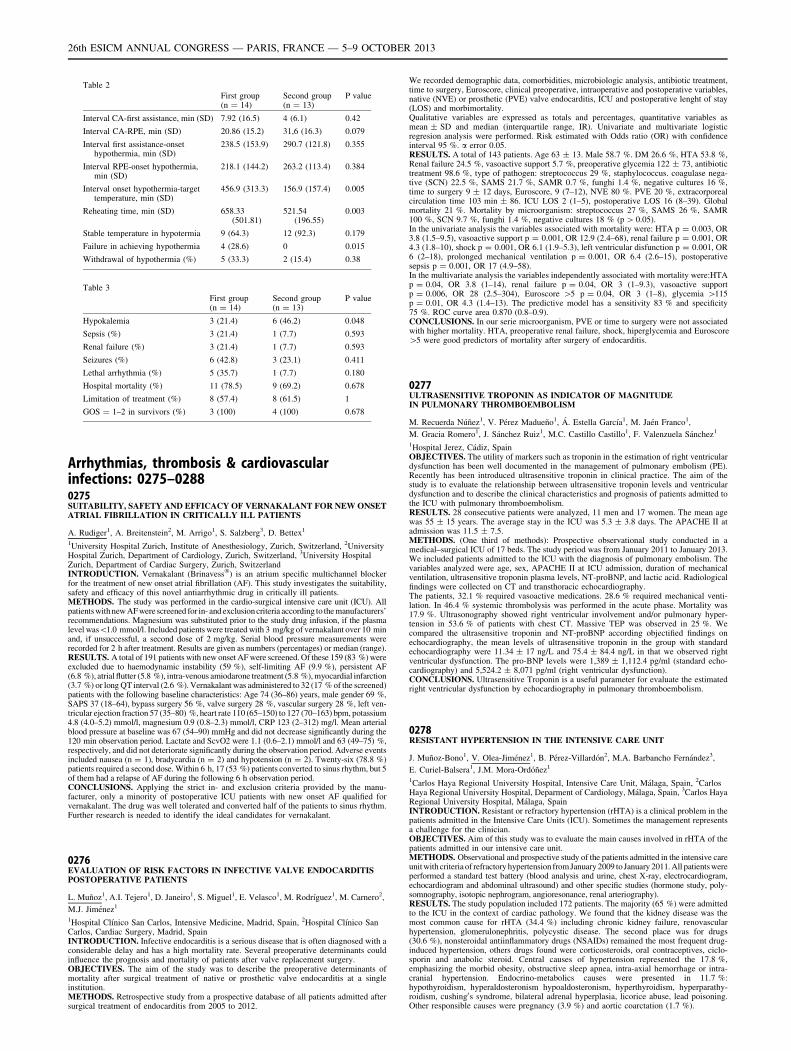
Table 2
First group(n = 14)
Second group(n = 13)
P value
Interval CA-first assistance, min (SD) 7.92 (16.5) 4 (6.1) 0.42
Interval CA-RPE, min (SD) 20.86 (15.2) 31,6 (16.3) 0.079
Interval first assistance-onsethypothermia, min (SD)
238.5 (153.9) 290.7 (121.8) 0.355
Interval RPE-onset hypothermia,min (SD)
218.1 (144.2) 263.2 (113.4) 0.384
Interval onset hypothermia-targettemperature, min (SD)
456.9 (313.3) 156.9 (157.4) 0.005
Reheating time, min (SD) 658.33(501.81)
521.54(196.55)
0.003
Stable temperature in hypotermia 9 (64.3) 12 (92.3) 0.179
Failure in achieving hypothermia 4 (28.6) 0 0.015
Withdrawal of hypothermia (%) 5 (33.3) 2 (15.4) 0.38
Table 3
First group(n = 14)
Second group(n = 13)
P value
Hypokalemia 3 (21.4) 6 (46.2) 0.048
Sepsis (%) 3 (21.4) 1 (7.7) 0.593
Renal failure (%) 3 (21.4) 1 (7.7) 0.593
Seizures (%) 6 (42.8) 3 (23.1) 0.411
Lethal arrhythmia (%) 5 (35.7) 1 (7.7) 0.180
Hospital mortality (%) 11 (78.5) 9 (69.2) 0.678
Limitation of treatment (%) 8 (57.4) 8 (61.5) 1
GOS = 1–2 in survivors (%) 3 (100) 4 (100) 0.678
Arrhythmias, thrombosis & cardiovascularinfections: 0275–02880275SUITABILITY, SAFETY AND EFFICACY OF VERNAKALANT FOR NEW ONSETATRIAL FIBRILLATION IN CRITICALLY ILL PATIENTS
A. Rudiger1, A. Breitenstein2, M. Arrigo1, S. Salzberg3, D. Bettex1
1University Hospital Zurich, Institute of Anesthesiology, Zurich, Switzerland, 2UniversityHospital Zurich, Department of Cardiology, Zurich, Switzerland, 3University HospitalZurich, Department of Cardiac Surgery, Zurich, SwitzerlandINTRODUCTION. Vernakalant (Brinavess�) is an atrium specific multichannel blockerfor the treatment of new onset atrial fibrillation (AF). This study investigates the suitability,safety and efficacy of this novel antiarrhythmic drug in critically ill patients.METHODS. The study was performed in the cardio-surgical intensive care unit (ICU). Allpatients with new AF were screened for in- and exclusion criteria according to the manufacturers’recommendations. Magnesium was substituted prior to the study drug infusion, if the plasmalevel was\1.0 mmol/l. Included patients were treated with 3 mg/kg of vernakalant over 10 minand, if unsuccessful, a second dose of 2 mg/kg. Serial blood pressure measurements wererecorded for 2 h after treatment. Results are given as numbers (percentages) or median (range).RESULTS. A total of 191 patients with new onset AF were screened. Of these 159 (83 %) wereexcluded due to haemodynamic instability (59 %), self-limiting AF (9.9 %), persistent AF(6.8 %), atrial flutter (5.8 %), intra-venous amiodarone treatment (5.8 %), myocardial infarction(3.7 %) or long QT interval (2.6 %). Vernakalant was administered to 32 (17 % of the screened)patients with the following baseline characteristics: Age 74 (36–86) years, male gender 69 %,SAPS 37 (18–64), bypass surgery 56 %, valve surgery 28 %, vascular surgery 28 %, left ven-tricular ejection fraction 57 (35–80) %, heart rate 110 (65–150) to 127 (70–163) bpm, potassium4.8 (4.0–5.2) mmol/l, magnesium 0.9 (0.8–2.3) mmol/l, CRP 123 (2–312) mg/l. Mean arterialblood pressure at baseline was 67 (54–90) mmHg and did not decrease significantly during the120 min observation period. Lactate and ScvO2 were 1.1 (0.6–2.1) mmol/l and 63 (49–75) %,respectively, and did not deteriorate significantly during the observation period. Adverse eventsincluded nausea (n = 1), bradycardia (n = 2) and hypotension (n = 2). Twenty-six (78.8 %)patients required a second dose. Within 6 h, 17 (53 %) patients converted to sinus rhythm, but 5of them had a relapse of AF during the following 6 h observation period.CONCLUSIONS. Applying the strict in- and exclusion criteria provided by the manu-facturer, only a minority of postoperative ICU patients with new onset AF qualified forvernakalant. The drug was well tolerated and converted half of the patients to sinus rhythm.Further research is needed to identify the ideal candidates for vernakalant.
0276EVALUATION OF RISK FACTORS IN INFECTIVE VALVE ENDOCARDITISPOSTOPERATIVE PATIENTS
L. Muñoz1, A.I. Tejero1, D. Janeiro1, S. Miguel1, E. Velasco1, M. Rodrı́guez1, M. Carnero2,
M.J. Jiménez1
1Hospital Clı́nico San Carlos, Intensive Medicine, Madrid, Spain, 2Hospital Clı́nico SanCarlos, Cardiac Surgery, Madrid, SpainINTRODUCTION. Infective endocarditis is a serious disease that is often diagnosed with aconsiderable delay and has a high mortality rate. Several preoperative determinants couldinfluence the prognosis and mortality of patients after valve replacement surgery.OBJECTIVES. The aim of the study was to describe the preoperative determinants ofmortality after surgical treatment of native or prosthetic valve endocarditis at a singleinstitution.METHODS. Retrospective study from a prospective database of all patients admitted aftersurgical treatment of endocarditis from 2005 to 2012.
We recorded demographic data, comorbidities, microbiologic analysis, antibiotic treatment,time to surgery, Euroscore, clinical preoperative, intraoperative and postoperative variables,native (NVE) or prosthetic (PVE) valve endocarditis, ICU and postoperative lenght of stay(LOS) and morbimortality.Qualitative variables are expressed as totals and percentages, quantitative variables asmean ± SD and median (interquartile range, IR). Univariate and multivariate logisticregresion analysis were performed. Risk estimated with Odds ratio (OR) with confidenceinterval 95 %. a error 0.05.RESULTS. A total of 143 patients. Age 63 ± 13. Male 58.7 %. DM 26.6 %, HTA 53.8 %,Renal failure 24.5 %, vasoactive support 5.7 %, preoperative glycemia 122 ± 73, antibiotictreatment 98.6 %, type of pathogen: streptococcus 29 %, staphylococcus. coagulase nega-tive (SCN) 22.5 %, SAMS 21.7 %, SAMR 0.7 %, funghi 1.4 %, negative cultures 16 %,time to surgery 9 ± 12 days, Euroscore, 9 (7–12), NVE 80 %. PVE 20 %, extracorporealcirculation time 103 min ± 86. ICU LOS 2 (1–5), postoperative LOS 16 (8–39). Globalmortality 21 %. Mortality by microorganism: streptococcus 27 %, SAMS 26 %, SAMR100 %, SCN 9.7 %, funghi 1.4 %, negative cultures 18 % (p [ 0.05).In the univariate analysis the variables associated with mortality were: HTA p = 0.003, OR3.8 (1.5–9.5), vasoactive support p = 0.001, OR 12.9 (2.4–68), renal failure p = 0.001, OR4.3 (1.8–10), shock p = 0.001, OR 6.1 (1.9–5.3), left ventricular disfunction p = 0.001, OR6 (2–18), prolonged mechanical ventilation p = 0.001, OR 6.4 (2.6–15), postoperativesepsis p = 0.001, OR 17 (4.9–58).In the multivariate analysis the variables independently associated with mortality were:HTAp = 0.04, OR 3.8 (1–14), renal failure p = 0.04, OR 3 (1–9.3), vasoactive supportp = 0.006, OR 28 (2.5–304), Euroscore [5 p = 0.04, OR 3 (1–8), glycemia [115p = 0.01, OR 4.3 (1.4–13). The predictive model has a sensitivity 83 % and specificity75 %. ROC curve area 0.870 (0.8–0.9).CONCLUSIONS. In our serie microorganism, PVE or time to surgery were not associatedwith higher mortality. HTA, preoperative renal failure, shock, hiperglycemia and Euroscore[5 were good predictors of mortality after surgery of endocarditis.
0277ULTRASENSITIVE TROPONIN AS INDICATOR OF MAGNITUDEIN PULMONARY THROMBOEMBOLISM
M. Recuerda Núñez1, V. Pérez Madueño1, Á. Estella Garcı́a1, M. Jaén Franco1,
M. Gracia Romero1, J. Sánchez Ruiz1, M.C. Castillo Castillo1, F. Valenzuela Sánchez1
1Hospital Jerez, Cádiz, SpainOBJECTIVES. The utility of markers such as troponin in the estimation of right ventriculardysfunction has been well documented in the management of pulmonary embolism (PE).Recently has been introduced ultrasensitive troponin in clinical practice. The aim of thestudy is to evaluate the relationship between ultrasensitive troponin levels and ventriculardysfunction and to describe the clinical characteristics and prognosis of patients admitted tothe ICU with pulmonary thromboembolism.RESULTS. 28 consecutive patients were analyzed, 11 men and 17 women. The mean agewas 55 ± 15 years. The average stay in the ICU was 5.3 ± 3.8 days. The APACHE II atadmission was 11.5 ± 7.5.METHODS. (One third of methods): Prospective observational study conducted in amedical–surgical ICU of 17 beds. The study period was from January 2011 to January 2013.We included patients admitted to the ICU with the diagnosis of pulmonary embolism. Thevariables analyzed were age, sex, APACHE II at ICU admission, duration of mechanicalventilation, ultrasensitive troponin plasma levels, NT-proBNP, and lactic acid. Radiologicalfindings were collected on CT and transthoracic echocardiography.The patients, 32.1 % required vasoactive medications. 28.6 % required mechanical venti-lation. In 46.4 % systemic thrombolysis was performed in the acute phase. Mortality was17.9 %. Ultrasonography showed right ventricular involvement and/or pulmonary hyper-tension in 53.6 % of patients with chest CT. Massive TEP was observed in 25 %. Wecompared the ultrasensitive troponin and NT-proBNP according objectified findings onechocardiography, the mean levels of ultrasensitive troponin in the group with standardechocardiography were 11.34 ± 17 ng/L and 75.4 ± 84.4 ng/L in that we observed rightventricular dysfunction. The pro-BNP levels were 1,389 ± 1,112.4 pg/ml (standard echo-cardiography) and 5,524.2 ± 8,071 pg/ml (right ventricular dysfunction).CONCLUSIONS. Ultrasensitive Troponin is a useful parameter for evaluate the estimatedright ventricular dysfunction by echocardiography in pulmonary thromboembolism.
0278RESISTANT HYPERTENSION IN THE INTENSIVE CARE UNIT
J. Muñoz-Bono1, V. Olea-Jiménez1, B. Pérez-Villardón2, M.A. Barbancho Fernández3,
E. Curiel-Balsera1, J.M. Mora-Ordóñez1
1Carlos Haya Regional University Hospital, Intensive Care Unit, Málaga, Spain, 2CarlosHaya Regional University Hospital, Deparment of Cardiology, Málaga, Spain, 3Carlos HayaRegional University Hospital, Málaga, SpainINTRODUCTION. Resistant or refractory hypertension (rHTA) is a clinical problem in thepatients admitted in the Intensive Care Units (ICU). Sometimes the management representsa challenge for the clinician.OBJECTIVES. Aim of this study was to evaluate the main causes involved in rHTA of thepatients admitted in our intensive care unit.METHODS. Observational and prospective study of the patients admitted in the intensive careunit with criteria of refractory hypertension from January 2009 to January 2011. All patients wereperformed a standard test battery (blood analysis and urine, chest X-ray, electrocardiogram,echocardiogram and abdominal ultrasound) and other specific studies (hormone study, poly-somnography, isotopic nephrogram, angioresonance, renal arteriography).RESULTS. The study population included 172 patients. The majority (65 %) were admittedto the ICU in the context of cardiac pathology. We found that the kidney disease was themost common cause for rHTA (34.4 %) including chronic kidney failure, renovascularhypertension, glomerulonephritis, polycystic disease. The second place was for drugs(30.6 %), nonsteroidal antiinflammatory drugs (NSAIDs) remained the most frequent drug-induced hypertension, others drugs found were corticosteroids, oral contraceptives, ciclo-sporin and anabolic steroid. Central causes of hypertension represented the 17.8 %,emphasizing the morbid obesity, obstructive sleep apnea, intra-axial hemorrhage or intra-cranial hypertension. Endocrino-metabolics causes were presented in 11.7 %:hypothyroidism, hyperaldosteronism hypoaldosteronism, hyperthyroidism, hyperparathy-roidism, cushing0s syndrome, bilateral adrenal hyperplasia, licorice abuse, lead poisoning.Other responsible causes were pregnancy (3.9 %) and aortic coarctation (1.7 %).
26th ESICM ANNUAL CONGRESS — PARIS, FRANCE — 5–9 OCTOBER 2013
CONCLUSIONS. In the most of the case the rHTA has a specific etiology but specializedstudies are needed. We propose a model of a multidisciplinary team envolved in thediagnosis because it provides an early diagnosis, allows the start of an appropriate treatmentand can also help to identify the factors of decompensation.
0279IS AUTOMATED BRACHIAL CUFF MEASUREMENT OF ARTERIALPRESSURE LESS ACCURATE IN CASE OF ARRHYTHMIA?
F. Reminiac1, S. Faiz2, M. Martin3, A.-S. Crouzet3, S. Ehrmann1,4, R. Cinotti3,
X. Capdevila5, K. Asehnoune6, Y. Blanloeil3, B. Rozec3, T. Boulain2, K. Lakhal3
1CHRU de Tours, Service de Réanimation Polyvalente, Tours, France, 2Hôpital de laSource, Centre Hospitalier Régional d’Orléans, Réanimation Médicale Polyvalente,Orléans, France, 3CHU Laënnec, Réanimation Chirurgicale Polyvalente, Nantes, France,4Inserm UMR 955, Equipe de Biomécanique Cellulaire et Respiratoire, Créteil, France,5CHU Lapeyronie, Réanimation Médico-Chirurgicale, Montpellier, France, 6CHU HôtelDieu, Réanimation Chirurgicale, Nantes, FranceINTRODUCTION. In case of arrhythmia, the beat-to-beat variation of arterial pressure mayimpair the accuracy of automated cuff measurements. Indeed, this oscillometric device relies onthe detection of arterial wall oscillations. Despite its widespread use in intensive care units, evenin arrhythmic patients, the accuracy of automated brachial cuff measurements is unknown.OBJECTIVES. To determine, in critically ill patients, whether brachial cuff measurementsare really less reliable in case of arrhythmia as compared to regular rhythm to detecthypotension or response to cardiovascular therapy.METHODS. Consecutive patients with arrhythmia and carrying an arterial catheter were pro-spectively included in this multicenter study. After each arrhythmic inclusion, a regular rhythmpatient was included. A 2nd inclusion was possible in case of change in the cardiac rhythm.Three pairs of invasive and brachial cuff (Philips� MP70) measurements of mean arterialpressure (MAP) were averaged. Some patients underwent a 2nd set of measurements, after acardiovascular intervention (passive leg raising, volume expansion, initiation of/increase incatecholamine infusion: per attending physician) allowing the assessment of MAP changes.RESULTS. Brachial cuff measurement of blood pressure never failed among the 193inclusions in 173 patients. Arrhythmic patients (n = 96) [atrial fibrillation 87 %] weresimilar to patients in regular rhythm (n = 97) for MAP (median 74 [IQR 67–83] vs 77[70–87] mmHg), SAPSII (44 [30–58] vs 47 [26–59]), arm circumference (30 [27–33] vs 30[27–33] cm), mechanical ventilation (79 vs 83 %), site of arterial catheter (radial: 84 vs87 %) [all p [ 0.05]. However, arrhythmic patients differed from regular rhythm patientsfor characteristics that may affect oscillometric measurements accuracy: body mass index(28 [24–31] vs 26 [22–29] kg/m2), age (69 [60–77] vs 62 [52–71] years) and the presence ofacute circulatory failure (n = 70 [73 %] vs n = 51 [53 %]) [all p \ 0.01].Agreement between invasive and brachial cuff measurements of MAP was similar inarrhythmic and regular rhythm patients: mean bias 0 ± 7 [limits of agreement -14/14]mmHg vs. 3 ± 7 [-12/18] mmHg, respectively (Bland–Altman analysis).Hypotension: the detection of patients with an invasive MAP \ 65 mmHg was reliable withbrachial cuff during arrhythmia: AUC = 0.91 (0.84–0.96). In patients with a regular ry-thme, AUC was 0.98 (0.93–0.99).Response to therapy ([10 % increase in invasive MAP among patients with acute circu-latory failure) was also accurately detected with the brachial cuff during arrhythmia:AUC = 0.91 (0.77–0.98). In patients with a regular rhythm, AUC was 0.99 (0.87–1).CONCLUSIONS. These preliminary results suggest that 1) arrhythmia does not impair theagreement of automated cuff measurements of MAP with invasive measurements and 2) thatit allows identifying patients with a MAP \ 65 mmHg or change in MAP [ 10 % afterhemodynamic intervention, with a clinically relevant performance.
0280INCIDENCE AND RISK FACTORS OF NEW ONSET ATRIAL FIBRILLATIONIN NON-CARDIAC INTENSIVE CARE UNIT PATIENTS
A. Margariti1, S.S. Makrygiannis1, D. Rizikou1, M. Labakis1, D. Mermigkis1, K. Katsifa1,
I. Laspiti1, A. Prekates1
1Tzanio General Hospital of Pireas, ICU, Pireas, GreeceINTRODUCTION. Atrial fibrillation (AF) is thought to be a relatively common arrhythmiain the setting of non-cardiac intensive care unit (ICU). However, data concerning AFderiving from such populations are scarce. Additionally, it is unclear which of the widespectrum of AF risk factors are relevant to the ICU setting.OBJECTIVES. The aim of our study was to evaluate the incidence of new-onset AF andinvestigate the factors that contribute to its occurrence in ICU patients.METHODS. We prospectively studied all patients admitted to our ICU for an 1-yearperiod. Patients admitted for brief postoperative monitoring, patients with chronic orintermittent AF and AF present upon admission, were excluded. A number of conditionsincriminated as AF risk factors from demographics, medical history, present disease, cardiacechocardiography as well as circumstances of AF onset, were recorded.RESULTS. The study population consisted of 139 patients (92 male). AF was observed in14,4 % of them. Thirty percent of septic patients manifested AF. Age (p \ 0.001), arterialhypertension (p = 0.047), systemic inflammatory response syndrome (p \ 0.001), sepsis(p \ 0.001), left atrial size (p = 0.04) and diastolic dysfunction (p = 0.043) were signifi-cantly associated with the occurence of AF. Patients manifesting AF were frequentlyhypovolaemic (30 %), had electrolyte disorders (40 %) as well as elevated and rising serumC-Reactive Protein (70 %).CONCLUSIONS. A significant fraction of ICU patients manifest AF. The risk-factors ofinterest for the ICU patients might be considerably different than those of the generalpopulation and other subgroups.
0281VENOUS THROMBOEMBOLIC DISEASE IN CRITICAL ILL PATIENTS
A.M. Hernangómez1, P. Garcı́a Olivares1, D.O. Stanescu1, M. Del Valle2, G. Buitrago2,
C. Bocanegra1, M. Dı́az1, L. Tang1, I.A. De Sousa1
1H.G.U. Gregorio Marañón, Intensive Care Unit, Madrid, Spain, 2H.G.U. GregorioMarañón, Radiology Unit, Madrid, SpainINTRODUCTION. Critically ill patients have an increased risk of venous thromboembolic(VTE) disease. There are few studies to evaluate the risks and benefits of a VTEprophylaxis.
OBJECTIVES. The purpose of this study was to determine the incidence of venousthromboembolic disease (VTE) in critical patients and to analyze its relationship withprophylactic methods used.METHODS. Prospective, observational study conducted between September 2011–June2012. All patients admitted to ICU [ 72 h were included. Patients with prior VTE andanticoagulant therapy were excluded. A bilateral lower extremity compression ultrasoundstudy was made in common femoral, proximal deep femoral and popliteal veins, within first48 h of ICU admission, twice weekly, and whenever VTE was clinically suspected. A chestCT scan was performed in patients with deep vein thrombosis (DVT) and suspected pul-monary embolism (PE). VTE prophylaxis methods used were: low molecular weight heparin(LMWH), intermittent pneumatic compression devices (IPCD) and combined prophylaxis(CP). Demographic data, severity scores, risk factors for DVT, DVT prophylactic methods,development of DVT and PE, and outcome were collected. Categorical data was presented aspercentages and continuous data as mean ± SD or median (interquartile range). The rela-tionship between prophylactic methods and VTE disease was analyzed using Fisher exact test.RESULTS. Two hundred patients were included. 61 % were male. The mean age was 60years (45–75), with Charlson Index 1 (1–3). Severity scores: APACHE II 19 ± 8, SOFA7 ± 4. Patology of ICU admission: infectious (35 %), neurological (28.5 %) and respiratory(16.5 %). 64 % of patients required mechanical ventilation (11 days; 5–21) and 39 %vasopressor therapy (3 days; 2–6). ICU stay was 10 days (10–21) and hospital stay 27 days(15–59). ICU mortality was 27 % and hospital mortality 34 %.The median Number of VTE risk factors prior to ICU admision was 3 (1–4): age (68 %),high blood pressure (47 %), chronic obstructive pulmonary disease (21 %) and neoplasia(15 %). The median number of VTE risk factors associated with ICU was 4 (3–5):immobility (96 %), sedation and mechanical ventilation (68 %), neuromuscular blockade(17 %) and femoral catheter (9 %). Median of ultrasound studies made was 2 (1–4).VTE prophylactic methods used were: LMWH 58 %, IPCD 27 % and CP 8 %. Incidence ofDVT was1.5 % (3/200), all cases were in common femoral vein, with one related tocatheter. Incidence of PE was 1.5 % (3/200), only one association with DVT. Overallincidence of VTE was 2.5 % (5/200).There were no differences in the incidence of VTE disease related to prophylactic methodused: LMWH vs. IPCD 1.7 vs. 4.3 % (RR 0.39; CI 0.06–2.39); LMWH vs. CP 1.7 vs. 0 %(RR 0.98; CI 0.96–1.01); IPCD vs. CP 4.3 vs. 0 % (RR 0.94; CI 0.88–1.01).CONCLUSIONS. In our study we found a low incidence of VTE disease with the pro-phylactic methods used. None of prophylactic methods used was related to a higherincidence of VTE disease.
0282RELAPSE AND THROMBOTIC COMPLICATIONS OF ATRIAL FIBRILLATIONIN INTENSIVE CARE UNIT PATIENTS. CLINICAL ANDECHOCARDIOGRAPHIC CORRELATES
D. Rizikou1, M. Labakis1, A. Margariti1, S. Vangelis1, S. Makrygiannis1, K. Sakellaridis1,
I. Laspiti1, A. Prekates1
1Tzanio General Hospital of Pireas, ICU, Pireas, GreeceINTRODUCTION. Atrial fibrillation (AF) is a common arrhythmia also observed in criticallyill patients. Though, it has not been thoroughly investigated in non-cardiac intensive care units(ICU). There is reason to believe that AF epidemiology might be different in ICU patients. Inthis context, there are scant data concerning the frequency of occurrence, relapse and com-plications of AF in these patients, and their clinical significance has not been clarified.OBJECTIVES. By this study, we aimed to investigate AF relapse and complicationsespecially in relation to a number of clinical factors as well as echocardiographic findings.METHODS. We prospectively studied all patients admitted to a single ICU for a period of12 months. Patients admitted for brief postoperative monitoring, patients with chronic,intermittent AF and AF present upon admission, were excluded. A wide spectrum of clinicalfactors known to cause or trigger AF were recorded. Echocardiographic study was per-formed in all cases. Death during hospitalization in ICU was reported for all patients.RESULTS. The study population consisted of 139 patients (92 male). Twenty of themmanifested AF. In two cases AF caused hemodynamic instability. Successful cardioversion wasachieved in all of the patients. A 50 % of patients relapsed within the period of their stay inICU. Relapse was observed in a median time of 48 h. However, failure to maintain sinusrhythm was not related to increased ICU mortality (p = 0.6). Thrombotic complications wereobserved in 5 % of patients, where low molecular weight heparin could not be administereddue to clinical condition. Diastolic dysfunction as estimated by echocardiographic study beforethe index AF episode was the most potent predictor of relapse (p = 0.02).CONCLUSIONS. Relapse of AF seems to be quite frequent and occurs rather shortlyfollowing the first event, in ICU patients. Nevertheless, it doesn0t seem to bear prognosticinformation regarding short-term clinical outcome. Thrombotic complications are fairly rareprobably due to the widespread use of prophylactic anticoagulation in ICUs.
0283DETECTION OF ATRIAL FIBRILLATION IN PACEMAKER CLINICAND IMPROVEMENT ANTITHROMBOTIC THERAPY
C. Salazar Ramirez1, F. Cota Delgado1, M. Carballo Ruiz1, L. Ruiz del Fresno1,
A. Garcia Alcantara1, M.V. De la Torre Prados1
1Hospital Virgen de la Victoria, Intensive Care Unit, Malaga, SpainINTRODUCTION. Pacemakers are implanted for intensivist who provide care for patientwho have these devices. The prevalence of atrial fibrillation in patient with pacemaker ishigh and studies in patients with little or no awareness of their arrhythmia condition indicatethat unrecognized and untreated AF may cause congestive heart failure, increased risk ofcerebrovascular accident and increased mortality.OBJECTIVES. To identify the clinical characteristics of patients with atrial fibrillation inpatients with pacemakers.METHODS. Were included all patients seen in pacemaker clinic during the year 2012 inthis prospective study, assessing the risk of stroke in patient with non-rheumatic atrialfibrillation by CHADS2 scale or CHA2DS2VASc, risk of bleeding (HAS-BLED), indicationfor anticoagulation and contraindications.RESULTS. Of the 273 patients who came to the center for a pacemaker checkup over thecourse of the year 2012, 71 (26 %) had displayed atrial flutter or AF at some point duringfollow-up with a median monitoring period of 6 years. Of these, 27 (38 %) already has adocumented history of AF at the time of implant. In the 44 (62 %) who developed AF afterpacemaker implantation, arrhythmia was detected using electrocardiogram and by detectionof mode-switching episodes. The pacemaker was implanted in response to atrioventricular
26th ESICM ANNUAL CONGRESS — PARIS, FRANCE — 5–9 OCTOBER 2013
block in 55 %, sinus node disease in 8 % and slow AF in 38 %. In 52 patients (73 %) a VVI/R pacemaker was initially implanted, while the remaining 19 (26 %) recieved a type ofpacemaker that maintains AV synchrony (DDD/R) CHADS2 score were calculated for 71patients which showed that a high percentage of patients were at high risk of embolism(85 % CHADS2 C 2). Patients with CHADS2 \ 2 were analysed with CHA2DS2VASc.All patients with CHADS2 C 2, 48 % were under anticoagulation, 32 % were taking an-tiplatelets and 20 % without antithrombotic therapy.CONCLUSIONS. of the most relevant observations in this study is the high proportion ofpatients with permanent pacemakers, who developed atrial flutter or AF during follow-up,26 %. More than 85 % had a CHADDS2 score C2, however only 32 % of them receiveanticoagulant treatment. Age was a negative factor for the decision of anticoagulation.Clinical profile were the pacing mode (VVI/R, hypertension and age).CONCLUSIONS. Pacemaker-detected AF is very common and clinic is an excellentopportunity to conduct appropiate treatment as has been suggested clinical practiceguidelines.REFERENCE(S) Cabrera et al. Pacemaker clinic: an opportunity to detect silent atrialfibrillation and improve antithrombotic treatment. Europace. 2011;13(11).
0284PROLONGED BRADYCARDIA AND ASYSTOLE IN HIGH SPINAL CORDINJURY PATIENTS: RISK FACTORS AND MANAGEMENT
N. Shaikh1, A. Raza2, Y. Hanssens3, M.F. Malmstrom1
1Hamad General Hospital, Anesthesia and Intensive Care, Doha, Qatar, 2Hamad GeneralHospital, Neurosurgery, Doha, Qatar, 3Hamad General Hospital, Clinical PharmacyServices, Doha, QatarINTRODUCTION. High spinal cord injury (HSCI) is one of the devastating traumaticinjuries. Eighty percent of these patients are young male, and 93 % of them will have majorneurological disabilities having great financial impact on patient0s family as well as thehealth care system. There is paucity of literature about prolonged bradycardia in HSCIpatients.OBJECTIVES. To evalaute the prevalence, duration, risk factors, precipitating factors forprolonged bradycardia, and its association with pneumonia, positioning or endotrachealsuction in the HSCI patients.METHODS. All patients who were admitted to the intensive care unit (ICU) of HamadGeneral Hospital, a tertiary hospital, with spinal cord injury above level of dorsal (D4) wereenrolled in this study. Data collected include: patient’s demographic data, mechanism, leveland type of spinal injury, associated injuries, injury severity score (ISS), spinal shock,vasopressors used, time of occurrence of bradycardia, treatment of bradycardia, chest X-rayfinding at the occurrence of bradycardia, relation of bradycardia with endotracheal suc-tioning or position of the patient, ICU stay, tracheostomy, any other complications andoutcome.RESULTS. During the study period (from January 2004 through December 2009), 138patients were admitted to the ICU with HSCI. The majority of patients were male (96 %).The most frequently associated injury in these patients was skeletal fractures (38.4 %) andmost common complication was pneumonia 56 (41 %). Forty five patients (33 %) hadprolonged bradycardia; 87 % of these patients had pneumonia when bradycardia occurred,53.4 % of them had asystole, 77.8 % required tracheostomy. 40 (29 %) of total HSCIpatients had spinal shock at admission, 29 (21 %) patients of them had bradycardia at thetime of endotracheal suctioning whereas 27 (20 %) patients developed bradycardia at thetime of position. Majority of the patients were managed conservatively. Those HSCIpatients who developed prolonged bradycardia, their ISS score was statistically highercompared to the HSCI patients without prolonged bradycardia (43.5 ± 14 vs 34.4 ± 16.6,p = 0.02). ICU stay (38.8 ± 29 vs 9.6 ± 11.9, p = 0.001) and hospital stay (63 ± 55 vs27 ± 34, p = 0.002) were also found significantly higher compared with those HSCIpatient without prolonged bradycardia. Multivariate analysis showed that hypotension onadmission (OR = 10.66, 95 % C.I. 2.8–40.6, p = 0.001), pneumonia (OR = 3.5, 95 % CI0.9–14.0, P = 0.05) and tracheostomy (OR = 6.3, 95 % C.I. 1.67–23.5, p = 0.006) werethe risk factors for the development of prolonged bradycardia in HSCI patients.CONCLUSIONS. Prolonged bradycardia was significantly associated with higher inci-dence of asystole. Endotracheal suctioning and positioning of HSCI patients were significantprovocative factors for prolonged bradycardia whereas, hypotension on admission, pneu-monia and tracheostomy played major role for the development of prolonged bradycardia inthese patients.
0285YEARS OF MYOPERICARDITIS. FOLLOW-UP AT 50 MONTHS
M. Recuerda Núñez1, S. Gamaza Chulian1, J. León Jiménez1, V. Pérez Madueño1,
Á. Estella Garcı́a1, L. Pérez-Bello Fontaina1, M. Jaén Franco1, J. Sánchez Ruiz1
1Hospital Jerez, Cádiz, SpainOBJECTIVES. The pericarditis represent 5 % of emergency visits and 0.1 % of patientshospitalized for ischemic chest pain. Between 15 and 35 % have elevated cardiac bio-markers (myopericarditis). Our aim was to analyze the characteristics and outcomes ofpatients hospitalized for myopericarditis.METHODS. We included patients admitted to our hospital with acute myopericarditis viralor idiopathic between January 2001 and December 2011, excluding those of traumaticorigin, and postoperative infarction. We recorded clinical, electrocardiographic, echocar-diographic and evolution.RESULTS. A total of 66 patients (95 % male, mean age 29.8 ± 9.7 years) were included,with 40.9 % of smokers. The main symptom was chest pain in 98.5 % of cases, fever wasdetected in 48.5 % and pericardial rub in 3 %. Electrocardiographic abnormalities wereobserved in 98.5 %, the most frequent was diffuse ST segment elevation (93.9 %). Theechocardiographic pericardial effusion rate was 13.8 %, with only one case of massivepericardial effusion. 92.4 % of patients were treated with NSAIDs, and only one patient wastreated with corticosteroids. After a mean follow-up of 50 months, the recurrence rate was10.3 %, without objectifying any case of dilated cardiomyopathy or constrictive. Onepatient had cardiac tamponade and only one recorded case of hospital cardiac death, noother deaths in monitoring.CONCLUSIONS. The myopericarditis is a frequent condition, which predominantly affectsyoung males. His long-term prognosis is excellent, with recurrent pericarditis the mostcommon complication.
0286PREDICTORS OF PACEMAKER IMPLANTATION IN PATIENTS EVALUATEDAT A SYNCOPE UNIT
M.A. Ramirez-Marrero1, M.A. Roldan-Jimenez1, M. Cano-Garcia1, I. Vegas-Vegas1,D. Gaitan-Roman1, J.A. de la Chica-Sanchez1, M. de Mora-Martin2
1Hospital Carlos Haya, Cardiology, Malaga, Spain, 2Hospital Carlos Haya, Malaga, SpainINTRODUCTION AND OBJECTIVES. Syncope is a common clinical entity in emer-gencies. It requires early prognostic stratification, as it might be a life-threatening situationand for this reason, syncope units are created (S.U.). Our goal is to evaluate the factorsassociated with its cardiogenic origin and its need for pacemaker implantation.MATERIALS AND METHODS. A prospective analysis of all patients consecutivelyevaluated at a S.U., from June 2009 to April 2012 was performed. Clinical and epidemi-ological variables, performed diagnostic tests, etiological diagnostic of the syncopal episodeand the need for pacemaker implantation were studied. A follow-up with a mean of8 months in all patients was completed.RESULTS. We included 401 patients, mean age 56.6 ± 20.7 years, 206 (48.6 %) males. 17(6.2 %) patients required permanent pacemaker implantation for cardiogenic syncope epi-sodes. These patients compared to those with non-cardiogenic syncope showed an older age(72.2 ± 12.4 vs. 55.6 ± 20.7 years, p = 0.001), male gender predominance (70.6 vs.29.4 %, p = 0.06), higher comorbidity (1.5 ± 0.7 vs. 0.6 ± 1.2, p = 0.03), higher per-centage of pathological baseline EKG (82.3 vs. 17.7 %, p = 0.0001) and lower frequency ofprevious prodromes (5.9 vs. 94.1 %, p = 0.0001). After adjustment, male sex and a path-ological baseline EKG predicted the cardiogenic origin and the need of pacemakerimplantation in these patients (OR 1.7, 95 % CI 0.97–4.9 and OR 8.55, 95 % CI,2.19–12.34, respectively), while the existence of prior prodromes turned out to be a pro-tective factor instead (OR 0.03, CI 95 %, from 0.004 to 0.25).CONCLUSIONS. Syncope units allow risk stratification of patients who have suffered anearly syncopal episode. The cardiogenic origin of this entity is not negligible. The need forpermanent pacemaker implantation was associated with a pathological baseline EKG andwith male gender, being more rare with the onset of prior prodromes.
0287STEMI AND YOUNG PEOPLE. ANALYSIS OF RISK FACTORS
J. Muñoz-Bono1, G. Jiménez-Pérez1, E. Curiel-Balsera1, M.D. Fernández-Zamora1,
M.J. Chaparro-Sánchez2, G. Quesada-Garcı́a1
1Carlos Haya Regional University Hospital, Intensive Care Unit, Málaga, Spain, 2CarlosHaya Regional Hospital, Intensive Care Unit, Málaga, SpainINTRODUCTION. Recently has been analyzed the epidemiology of acute myocardialinfarction (AMI) among different population groups. In young adults may be characteristicsthat could be different from those of older population. It is unknown whether having an AMIat an early age implies a worse long-term prognosis and whether clinical managementshould be different from that used in older patients.OBJECTIVES. Aim of this study was to evaluate the influence of the cardiovascular riskfactors in young patients admitted in the intensive care unit with STEMI and if there is anydifference with patients older than 45 years.METHODS. Prospective multicenter study of risk factors of patients with STEMI includedin the database ARIAM-Andalusia from 1-January-2008 to 31-December-2012. We com-pared these risk factors in patients older and younger than 45 years. To compare thepercentages we used the Chi square and the significance level was established at 95 %.RESULTS. We included a total of 11,575 patients, of whom 10.1 % were younger than45 years. Analysis of risk factors shows these results:
Cardiovascular risk factors
\45 años [45 años p
Hypertension 294 (25 %) 5,454 (52.4 %) \0.0001
Diabetes Mellitus 84 (7.1 %) 2,838 (27.3 %) \0.0001
Dyslipidemia 421 (35.8 %) 4,294 (41.3 %) \0.0001
Smoker 896 (76.2 %) 4,073 (39.2 %) \0.0001
Obesity 250 (21.3 %) 1,895 (18.2 %) 0.012
After analyze the risk factors by sex, males \45 years admitted with STEMI are moresmokers (72 vs39 % p \ 0.001), suffer less hypertension (27 vs 54.3 % p \ 0.0001) andless diabetes (7.8 vs. 29.1 % p \ 0.001). In case of women\45 years also are more smokers(62.5 vs 12.6 % p \ 0.0001) and suffer less dyslipidemia (23.2 vs 46.5 %, p \ 0.0001).CONCLUSIONS. Smoking appears to be the risk factor more related to the incidence ofSTEMI in ‘‘young patients under 45 years’’.REFERENCE(S) 1. Awad HH, McManus DD, Anderson FA Jr, Gore JM, Goldberg RJ.Young patients hospitalizad with an acute coronary syndrome. Coron Artery Dis.2013;24(1):54–60. 2. Pellaton C, Monney P, Ludman AJ, Schwitter J, Eeckhout E, Hugli O,Muller O. Clinical features of myocardial infarction and myocarditis in young adults: aretrospective study. BMJ Open. 2012;2(6): e001571.
GRANT ACKNOWLEDGMENT. ARIAM database researchers.
0288TRENDS IN CARDIOVASCULAR RISK FACTORS AND AGE OF FIRSTCORONARY EVENT PRESENTATION. AN ICU EPIDEMIOLOGICAL STUDY
J. Cebrián1, J. Ruı́z2, E. Villarreal1, K. Vacacela1, E. Parreño1, J. Bonastre1
1Hospital Universitario y Politécnico La Fe, ICU, Valencia, Spain, 2Hospital General deCastellón, ICU, Cartellón, SpainINTRODUCTION. In spite of the fact the roughly only a half of coronary artery syndromes(CAS) are admitted in ICU, this remains, in our country, a good place to study trends andchanges in age of presentation and coronary risk factors (CRF) associated.OBJECTIVES. Our aim is to compare the prevalence of the main CRF and age of firstcoronary event (FCE) presentation between years 2002 and 2012.METHODS. We compared all FCE event admitted in our ICU in two different periods(years 2002 and 2012). We analyse the prevalence of the main CRF (hypertension, di-slipemia, smoking habit, diabetes and peripheral artheriopathy) and the age of presentation.Diagnosis was made by using simple clinical criteria recorded in medical files. Descriptivestatistics uses percents (qualitative variables) and medians and interquartil range for
26th ESICM ANNUAL CONGRESS — PARIS, FRANCE — 5–9 OCTOBER 2013
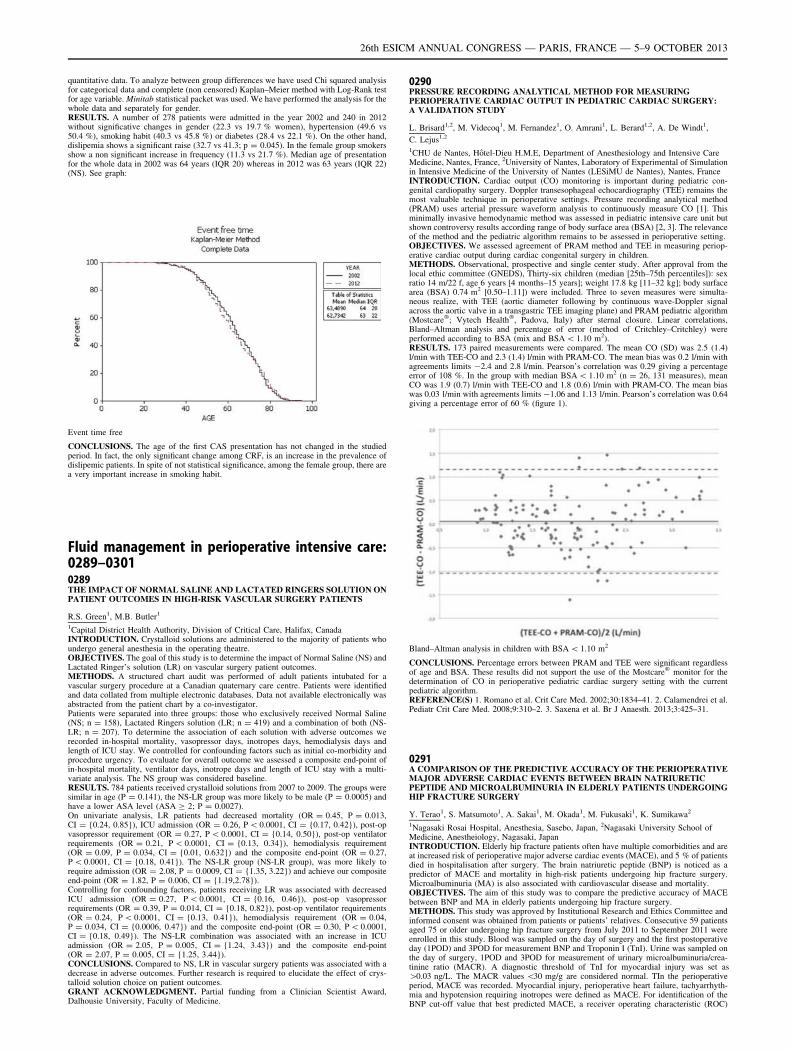
quantitative data. To analyze between group differences we have used Chi squared analysisfor categorical data and complete (non censored) Kaplan–Meier method with Log-Rank testfor age variable. Minitab statistical packet was used. We have performed the analysis for thewhole data and separately for gender.RESULTS. A number of 278 patients were admitted in the year 2002 and 240 in 2012without significative changes in gender (22.3 vs 19.7 % women), hypertension (49.6 vs50.4 %), smoking habit (40.3 vs 45.8 %) or diabetes (28.4 vs 22.1 %). On the other hand,dislipemia shows a significant raise (32.7 vs 41.3; p = 0.045). In the female group smokersshow a non significant increase in frequency (11.3 vs 21.7 %). Median age of presentationfor the whole data in 2002 was 64 years (IQR 20) whereas in 2012 was 63 years (IQR 22)(NS). See graph:
Event time free
CONCLUSIONS. The age of the first CAS presentation has not changed in the studiedperiod. In fact, the only significant change among CRF, is an increase in the prevalence ofdislipemic patients. In spite of not statistical significance, among the female group, there area very important increase in smoking habit.
Fluid management in perioperative intensive care:0289–03010289THE IMPACT OF NORMAL SALINE AND LACTATED RINGERS SOLUTION ONPATIENT OUTCOMES IN HIGH-RISK VASCULAR SURGERY PATIENTS
R.S. Green1, M.B. Butler1
1Capital District Health Authority, Division of Critical Care, Halifax, CanadaINTRODUCTION. Crystalloid solutions are administered to the majority of patients whoundergo general anesthesia in the operating theatre.OBJECTIVES. The goal of this study is to determine the impact of Normal Saline (NS) andLactated Ringer’s solution (LR) on vascular surgery patient outcomes.METHODS. A structured chart audit was performed of adult patients intubated for avascular surgery procedure at a Canadian quaternary care centre. Patients were identifiedand data collated from multiple electronic databases. Data not available electronically wasabstracted from the patient chart by a co-investigator.Patients were separated into three groups: those who exclusively received Normal Saline(NS; n = 158), Lactated Ringers solution (LR; n = 419) and a combination of both (NS-LR; n = 207). To determine the association of each solution with adverse outcomes werecorded in-hospital mortality, vasopressor days, inotropes days, hemodialysis days andlength of ICU stay. We controlled for confounding factors such as initial co-morbidity andprocedure urgency. To evaluate for overall outcome we assessed a composite end-point ofin-hospital mortality, ventilator days, inotrope days and length of ICU stay with a multi-variate analysis. The NS group was considered baseline.RESULTS. 784 patients received crystalloid solutions from 2007 to 2009. The groups weresimilar in age (P = 0.141), the NS-LR group was more likely to be male (P = 0.0005) andhave a lower ASA level (ASA C 2; P = 0.0027).On univariate analysis, LR patients had decreased mortality (OR = 0.45, P = 0.013,CI = {0.24, 0.85}), ICU admission (OR = 0.26, P \ 0.0001, CI = {0.17, 0.42}), post-opvasopressor requirement (OR = 0.27, P \ 0.0001, CI = {0.14, 0.50}), post-op ventilatorrequirements (OR = 0.21, P \ 0.0001, CI = {0.13, 0.34}), hemodialysis requirement(OR = 0.09, P = 0.034, CI = {0.01, 0.632}) and the composite end-point (OR = 0.27,P \ 0.0001, CI = {0.18, 0.41}). The NS-LR group (NS-LR group), was more likely torequire admission (OR = 2.08, P = 0.0009, CI = {1.35, 3.22}) and achieve our compositeend-point (OR = 1.82, P = 0.006, CI = {1.19,2.78}).Controlling for confounding factors, patients receiving LR was associated with decreasedICU admission (OR = 0.27, P \ 0.0001, CI = {0.16, 0.46}), post-op vasopressorrequirements (OR = 0.39, P = 0.014, CI = {0.18, 0.82}), post-op ventilator requirements(OR = 0.24, P \ 0.0001, CI = {0.13, 0.41}), hemodialysis requirement (OR = 0.04,P = 0.034, CI = {0.0006, 0.47}) and the composite end-point (OR = 0.30, P \ 0.0001,CI = {0.18, 0.49}). The NS-LR combination was associated with an increase in ICUadmission (OR = 2.05, P = 0.005, CI = {1.24, 3.43}) and the composite end-point(OR = 2.07, P = 0.005, CI = {1.25, 3.44}).CONCLUSIONS. Compared to NS, LR in vascular surgery patients was associated with adecrease in adverse outcomes. Further research is required to elucidate the effect of crys-talloid solution choice on patient outcomes.GRANT ACKNOWLEDGMENT. Partial funding from a Clinician Scientist Award,Dalhousie University, Faculty of Medicine.
0290PRESSURE RECORDING ANALYTICAL METHOD FOR MEASURINGPERIOPERATIVE CARDIAC OUTPUT IN PEDIATRIC CARDIAC SURGERY:A VALIDATION STUDY
L. Brisard1,2, M. Videcoq1, M. Fernandez1, O. Amrani1, L. Berard1,2, A. De Windt1,
C. Lejus1,2
1CHU de Nantes, Hôtel-Dieu H.M.E, Department of Anesthesiology and Intensive CareMedicine, Nantes, France, 2University of Nantes, Laboratory of Experimental of Simulationin Intensive Medicine of the University of Nantes (LESiMU de Nantes), Nantes, FranceINTRODUCTION. Cardiac output (CO) monitoring is important during pediatric con-genital cardiopathy surgery. Doppler transesophageal echocardiography (TEE) remains themost valuable technique in perioperative settings. Pressure recording analytical method(PRAM) uses arterial pressure waveform analysis to continuously measure CO [1]. Thisminimally invasive hemodynamic method was assessed in pediatric intensive care unit butshown controversy results according range of body surface area (BSA) [2, 3]. The relevanceof the method and the pediatric algorithm remains to be assessed in perioperative setting.OBJECTIVES. We assessed agreement of PRAM method and TEE in measuring periop-erative cardiac output during cardiac congenital surgery in children.METHODS. Observational, prospective and single center study. After approval from thelocal ethic committee (GNEDS), Thirty-six children (median [25th–75th percentiles]): sexratio 14 m/22 f, age 6 years [4 months–15 years]; weight 17.8 kg [11–32 kg]; body surfacearea (BSA) 0.74 m2 [0.50–1.11]) were included. Three to seven measures were simulta-neous realize, with TEE (aortic diameter following by continuous wave-Doppler signalacross the aortic valve in a transgastric TEE imaging plane) and PRAM pediatric algorithm(Mostcare�; Vytech Health�, Padova, Italy) after sternal closure. Linear correlations,Bland–Altman analysis and percentage of error (method of Critchley–Critchley) wereperformed according to BSA (mix and BSA \ 1.10 m2).RESULTS. 173 paired measurements were compared. The mean CO (SD) was 2.5 (1.4)l/min with TEE-CO and 2.3 (1.4) l/min with PRAM-CO. The mean bias was 0.2 l/min withagreements limits -2.4 and 2.8 l/min. Pearson’s correlation was 0.29 giving a percentageerror of 108 %. In the group with median BSA \ 1.10 m2 (n = 26, 131 measures), meanCO was 1.9 (0.7) l/min with TEE-CO and 1.8 (0.6) l/min with PRAM-CO. The mean biaswas 0.03 l/min with agreements limits -1.06 and 1.13 l/min. Pearson’s correlation was 0.64giving a percentage error of 60 % (figure 1).
Bland–Altman analysis in children with BSA \ 1.10 m2
CONCLUSIONS. Percentage errors between PRAM and TEE were significant regardlessof age and BSA. These results did not support the use of the Mostcare� monitor for thedetermination of CO in perioperative pediatric cardiac surgery setting with the currentpediatric algorithm.REFERENCE(S) 1. Romano et al. Crit Care Med. 2002;30:1834–41. 2. Calamendrei et al.Pediatr Crit Care Med. 2008;9:310–2. 3. Saxena et al. Br J Anaesth. 2013;3:425–31.
0291A COMPARISON OF THE PREDICTIVE ACCURACY OF THE PERIOPERATIVEMAJOR ADVERSE CARDIAC EVENTS BETWEEN BRAIN NATRIURETICPEPTIDE AND MICROALBUMINURIA IN ELDERLY PATIENTS UNDERGOINGHIP FRACTURE SURGERY
Y. Terao1, S. Matsumoto1, A. Sakai1, M. Okada1, M. Fukusaki1, K. Sumikawa2
1Nagasaki Rosai Hospital, Anesthesia, Sasebo, Japan, 2Nagasaki University School ofMedicine, Anestheiology, Nagasaki, JapanINTRODUCTION. Elderly hip fracture patients often have multiple comorbidities and areat increased risk of perioperative major adverse cardiac events (MACE), and 5 % of patientsdied in hospitalisation after surgery. The brain natriuretic peptide (BNP) is noticed as apredictor of MACE and mortality in high-risk patients undergoing hip fracture surgery.Microalbuminuria (MA) is also associated with cardiovascular disease and mortality.OBJECTIVES. The aim of this study was to compare the predictive accuracy of MACEbetween BNP and MA in elderly patients undergoing hip fracture surgery.METHODS. This study was approved by Institutional Research and Ethics Committee andinformed consent was obtained from patients or patients’ relatives. Consecutive 59 patientsaged 75 or older undergoing hip fracture surgery from July 2011 to September 2011 wereenrolled in this study. Blood was sampled on the day of surgery and the first postoperativeday (1POD) and 3POD for measurement BNP and Troponin I (TnI). Urine was sampled onthe day of surgery, 1POD and 3POD for measurement of urinary microalbuminuria/crea-tinine ratio (MACR). A diagnostic threshold of TnI for myocardial injury was set as[0.03 ng/L. The MACR values \30 mg/g are considered normal. TIn the perioperativeperiod, MACE was recorded. Myocardial injury, perioperative heart failure, tachyarrhyth-mia and hypotension requiring inotropes were defined as MACE. For identification of theBNP cut-off value that best predicted MACE, a receiver operating characteristic (ROC)
26th ESICM ANNUAL CONGRESS — PARIS, FRANCE — 5–9 OCTOBER 2013
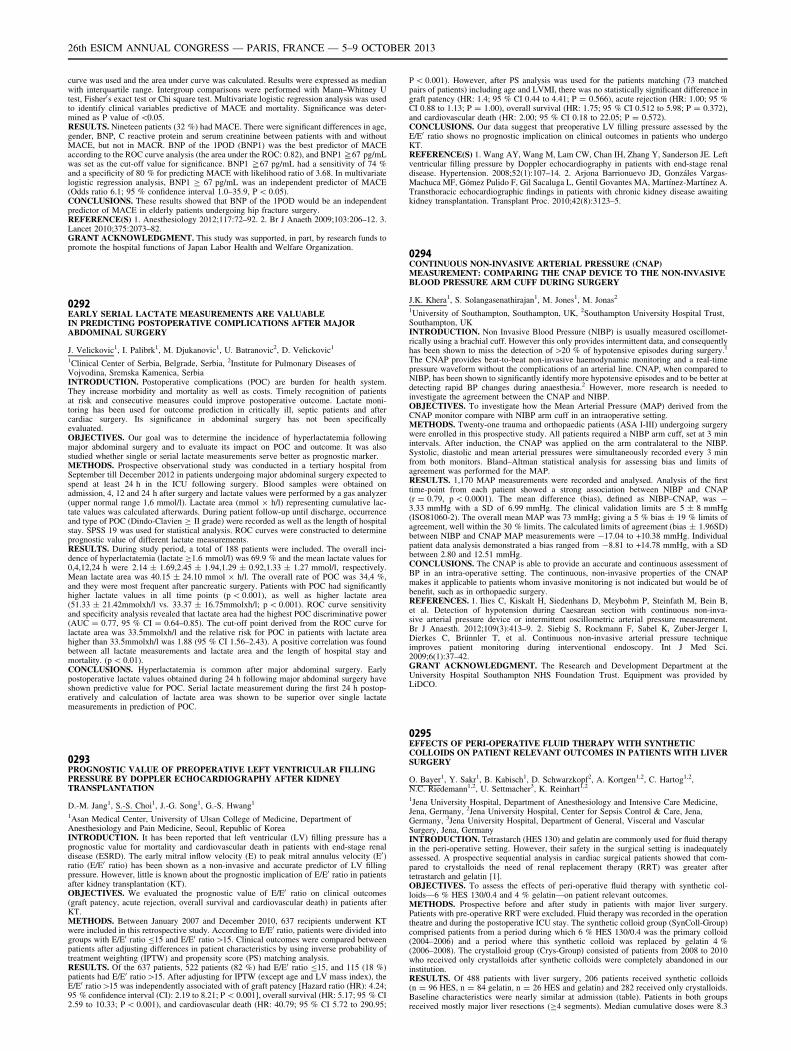
curve was used and the area under curve was calculated. Results were expressed as medianwith interquartile range. Intergroup comparisons were performed with Mann–Whitney Utest, Fisher0s exact test or Chi square test. Multivariate logistic regression analysis was usedto identify clinical variables predictive of MACE and mortality. Significance was deter-mined as P value of \0.05.RESULTS. Nineteen patients (32 %) had MACE. There were significant differences in age,gender, BNP, C reactive protein and serum creatinine between patients with and withoutMACE, but not in MACR. BNP of the 1POD (BNP1) was the best predictor of MACEaccording to the ROC curve analysis (the area under the ROC: 0.82), and BNP1 ]67 pg/mLwas set as the cut-off value for significance. BNP1 ]67 pg/mL had a sensitivity of 74 %and a specificity of 80 % for predicting MACE with likelihood ratio of 3.68. In multivariatelogistic regression analysis, BNP1 C 67 pg/mL was an independent predictor of MACE(Odds ratio 6.1; 95 % confidence interval 1.0–35.9, P \ 0.05).CONCLUSIONS. These results showed that BNP of the 1POD would be an independentpredictor of MACE in elderly patients undergoing hip fracture surgery.REFERENCE(S) 1. Anesthesiology 2012;117:72–92. 2. Br J Anaeth 2009;103:206–12. 3.Lancet 2010;375:2073–82.GRANT ACKNOWLEDGMENT. This study was supported, in part, by research funds topromote the hospital functions of Japan Labor Health and Welfare Organization.
0292EARLY SERIAL LACTATE MEASUREMENTS ARE VALUABLEIN PREDICTING POSTOPERATIVE COMPLICATIONS AFTER MAJORABDOMINAL SURGERY
J. Velickovic1, I. Palibrk1, M. Djukanovic1, U. Batranovic2, D. Velickovic1
1Clinical Center of Serbia, Belgrade, Serbia, 2Institute for Pulmonary Diseases ofVojvodina, Sremska Kamenica, SerbiaINTRODUCTION. Postoperative complications (POC) are burden for health system.They increase morbidity and mortality as well as costs. Timely recognition of patientsat risk and consecutive measures could improve postoperative outcome. Lactate moni-toring has been used for outcome prediction in critically ill, septic patients and aftercardiac surgery. Its significance in abdominal surgery has not been specificallyevaluated.OBJECTIVES. Our goal was to determine the incidence of hyperlactatemia followingmajor abdominal surgery and to evaluate its impact on POC and outcome. It was alsostudied whether single or serial lactate measurements serve better as prognostic marker.METHODS. Prospective observational study was conducted in a tertiary hospital fromSeptember till December 2012 in patients undergoing major abdominal surgery expected tospend at least 24 h in the ICU following surgery. Blood samples were obtained onadmission, 4, 12 and 24 h after surgery and lactate values were performed by a gas analyzer(upper normal range 1,6 mmol/l). Lactate area (mmol 9 h/l) representing cumulative lac-tate values was calculated afterwards. During patient follow-up until discharge, occurrenceand type of POC (Dindo-Clavien C II grade) were recorded as well as the length of hospitalstay. SPSS 19 was used for statistical analysis. ROC curves were constructed to determineprognostic value of different lactate measurements.RESULTS. During study period, a total of 188 patients were included. The overall inci-dence of hyperlactatemia (lactate C1.6 mmol/l) was 69.9 % and the mean lactate values for0,4,12,24 h were 2.14 ± 1.69,2.45 ± 1.94,1.29 ± 0.92,1.33 ± 1.27 mmol/l, respectively.Mean lactate area was 40.15 ± 24.10 mmol 9 h/l. The overall rate of POC was 34,4 %,and they were most frequent after pancreatic surgery. Patients with POC had significantlyhigher lactate values in all time points (p \ 0.001), as well as higher lactate area(51.33 ± 21.42mmolxh/l vs. 33.37 ± 16.75mmolxh/l; p \ 0.001). ROC curve sensitivityand specificity analysis revealed that lactate area had the highest POC discriminative power(AUC = 0.77, 95 % CI = 0.64–0.85). The cut-off point derived from the ROC curve forlactate area was 33.5mmolxh/l and the relative risk for POC in patients with lactate areahigher than 33.5mmolxh/l was 1.88 (95 % CI 1.56–2.43). A positive correlation was foundbetween all lactate measurements and lactate area and the length of hospital stay andmortality. (p \ 0.01).CONCLUSIONS. Hyperlactatemia is common after major abdominal surgery. Earlypostoperative lactate values obtained during 24 h following major abdominal surgery haveshown predictive value for POC. Serial lactate measurement during the first 24 h postop-eratively and calculation of lactate area was shown to be superior over single lactatemeasurements in prediction of POC.
0293PROGNOSTIC VALUE OF PREOPERATIVE LEFT VENTRICULAR FILLINGPRESSURE BY DOPPLER ECHOCARDIOGRAPHY AFTER KIDNEYTRANSPLANTATION
D.-M. Jang1, S.-S. Choi1, J.-G. Song1, G.-S. Hwang1
1Asan Medical Center, University of Ulsan College of Medicine, Department ofAnesthesiology and Pain Medicine, Seoul, Republic of KoreaINTRODUCTION. It has been reported that left ventricular (LV) filling pressure has aprognostic value for mortality and cardiovascular death in patients with end-stage renaldisease (ESRD). The early mitral inflow velocity (E) to peak mitral annulus velocity (E0)ratio (E/E0 ratio) has been shown as a non-invasive and accurate predictor of LV fillingpressure. However, little is known about the prognostic implication of E/E0 ratio in patientsafter kidney transplantation (KT).OBJECTIVES. We evaluated the prognostic value of E/E0 ratio on clinical outcomes(graft patency, acute rejection, overall survival and cardiovascular death) in patients afterKT.METHODS. Between January 2007 and December 2010, 637 recipients underwent KTwere included in this retrospective study. According to E/E0 ratio, patients were divided intogroups with E/E0 ratio B15 and E/E0 ratio[15. Clinical outcomes were compared betweenpatients after adjusting differences in patient characteristics by using inverse probability oftreatment weighting (IPTW) and propensity score (PS) matching analysis.RESULTS. Of the 637 patients, 522 patients (82 %) had E/E0 ratio B15, and 115 (18 %)patients had E/E0 ratio[15. After adjusting for IPTW (except age and LV mass index), theE/E0 ratio[15 was independently associated with of graft patency [Hazard ratio (HR): 4.24;95 % confidence interval (CI): 2.19 to 8.21; P \ 0.001], overall survival (HR: 5.17; 95 % CI2.59 to 10.33; P \ 0.001), and cardiovascular death (HR: 40.79; 95 % CI 5.72 to 290.95;
P \ 0.001). However, after PS analysis was used for the patients matching (73 matchedpairs of patients) including age and LVMI, there was no statistically significant difference ingraft patency (HR: 1.4; 95 % CI 0.44 to 4.41; P = 0.566), acute rejection (HR: 1.00; 95 %CI 0.88 to 1.13; P = 1.00), overall survival (HR: 1.75; 95 % CI 0.512 to 5.98; P = 0.372),and cardiovascular death (HR: 2.00; 95 % CI 0.18 to 22.05; P = 0.572).CONCLUSIONS. Our data suggest that preoperative LV filling pressure assessed by theE/E0 ratio shows no prognostic implication on clinical outcomes in patients who undergoKT.REFERENCE(S) 1. Wang AY, Wang M, Lam CW, Chan IH, Zhang Y, Sanderson JE. Leftventricular filling pressure by Doppler echocardiography in patients with end-stage renaldisease. Hypertension. 2008;52(1):107–14. 2. Arjona Barrionuevo JD, Gonzáles Vargas-Machuca MF, Gómez Pulido F, Gil Sacaluga L, Gentil Govantes MA, Martı́nez-Martı́nez A.Transthoracic echocardiographic findings in patients with chronic kidney disease awaitingkidney transplantation. Transplant Proc. 2010;42(8):3123–5.
0294CONTINUOUS NON-INVASIVE ARTERIAL PRESSURE (CNAP)MEASUREMENT: COMPARING THE CNAP DEVICE TO THE NON-INVASIVEBLOOD PRESSURE ARM CUFF DURING SURGERY
J.K. Khera1, S. Solangasenathirajan1, M. Jones1, M. Jonas2
1University of Southampton, Southampton, UK, 2Southampton University Hospital Trust,Southampton, UKINTRODUCTION. Non Invasive Blood Pressure (NIBP) is usually measured oscillomet-rically using a brachial cuff. However this only provides intermittent data, and consequentlyhas been shown to miss the detection of [20 % of hypotensive episodes during surgery.1
The CNAP provides beat-to-beat non-invasive haemodynamic monitoring and a real-timepressure waveform without the complications of an arterial line. CNAP, when compared toNIBP, has been shown to significantly identify more hypotensive episodes and to be better atdetecting rapid BP changes during anaesthesia.2 However, more research is needed toinvestigate the agreement between the CNAP and NIBP.OBJECTIVES. To investigate how the Mean Arterial Pressure (MAP) derived from theCNAP monitor compare with NIBP arm cuff in an intraoperative setting.METHODS. Twenty-one trauma and orthopaedic patients (ASA I-III) undergoing surgerywere enrolled in this prospective study. All patients required a NIBP arm cuff, set at 3 minintervals. After induction, the CNAP was applied on the arm contralateral to the NIBP.Systolic, diastolic and mean arterial pressures were simultaneously recorded every 3 minfrom both monitors. Bland–Altman statistical analysis for assessing bias and limits ofagreement was performed for the MAP.RESULTS. 1,170 MAP measurements were recorded and analysed. Analysis of the firsttime-point from each patient showed a strong association between NIBP and CNAP(r = 0.79, p \ 0.0001). The mean difference (bias), defined as NIBP–CNAP, was -3.33 mmHg with a SD of 6.99 mmHg. The clinical validation limits are 5 ± 8 mmHg(ISO81060-2). The overall mean MAP was 73 mmHg; giving a 5 % bias ± 19 % limits ofagreement, well within the 30 % limits. The calculated limits of agreement (bias ± 1.96SD)between NIBP and CNAP MAP measurements were -17.04 to +10.38 mmHg. Individualpatient data analysis demonstrated a bias ranged from -8.81 to +14.78 mmHg, with a SDbetween 2.80 and 12.51 mmHg.CONCLUSIONS. The CNAP is able to provide an accurate and continuous assessment ofBP in an intra-operative setting. The continuous, non-invasive properties of the CNAPmakes it applicable to patients whom invasive monitoring is not indicated but would be ofbenefit, such as in orthopaedic surgery.REFERENCES. 1. Ilies C, Kiskalt H, Siedenhans D, Meybohm P, Steinfath M, Bein B,et al. Detection of hypotension during Caesarean section with continuous non-inva-sive arterial pressure device or intermittent oscillometric arterial pressure measurement.Br J Anaesth. 2012;109(3):413–9. 2. Siebig S, Rockmann F, Sabel K, Zuber-Jerger I,Dierkes C, Brünnler T, et al. Continuous non-invasive arterial pressure techniqueimproves patient monitoring during interventional endoscopy. Int J Med Sci.2009;6(1):37–42.GRANT ACKNOWLEDGMENT. The Research and Development Department at theUniversity Hospital Southampton NHS Foundation Trust. Equipment was provided byLiDCO.
0295EFFECTS OF PERI-OPERATIVE FLUID THERAPY WITH SYNTHETICCOLLOIDS ON PATIENT RELEVANT OUTCOMES IN PATIENTS WITH LIVERSURGERY
O. Bayer1, Y. Sakr1, B. Kabisch1, D. Schwarzkopf2, A. Kortgen1,2, C. Hartog1,2,N.C. Riedemann1,2, U. Settmacher3, K. Reinhart1,2
1Jena University Hospital, Department of Anesthesiology and Intensive Care Medicine,Jena, Germany, 2Jena University Hospital, Center for Sepsis Control & Care, Jena,Germany, 3Jena University Hospital, Department of General, Visceral and VascularSurgery, Jena, GermanyINTRODUCTION. Tetrastarch (HES 130) and gelatin are commonly used for fluid therapyin the peri-operative setting. However, their safety in the surgical setting is inadequatelyassessed. A prospective sequential analysis in cardiac surgical patients showed that com-pared to crystalloids the need of renal replacement therapy (RRT) was greater aftertetrastarch and gelatin [1].OBJECTIVES. To assess the effects of peri-operative fluid therapy with synthetic col-loids—6 % HES 130/0.4 and 4 % gelatin—on patient relevant outcomes.METHODS. Prospective before and after study in patients with major liver surgery.Patients with pre-operative RRT were excluded. Fluid therapy was recorded in the operationtheatre and during the postoperative ICU stay. The synthetic colloid group (SynColl-Group)comprised patients from a period during which 6 % HES 130/0.4 was the primary colloid(2004–2006) and a period where this synthetic colloid was replaced by gelatin 4 %(2006–2008). The crystalloid group (Crys-Group) consisted of patients from 2008 to 2010who received only crystalloids after synthetic colloids were completely abandoned in ourinstitution.RESULTS. Of 488 patients with liver surgery, 206 patients received synthetic colloids(n = 96 HES, n = 84 gelatin, n = 26 HES and gelatin) and 282 received only crystalloids.Baseline characteristics were nearly similar at admission (table). Patients in both groupsreceived mostly major liver resections (C4 segments). Median cumulative doses were 8.3
26th ESICM ANNUAL CONGRESS — PARIS, FRANCE — 5–9 OCTOBER 2013
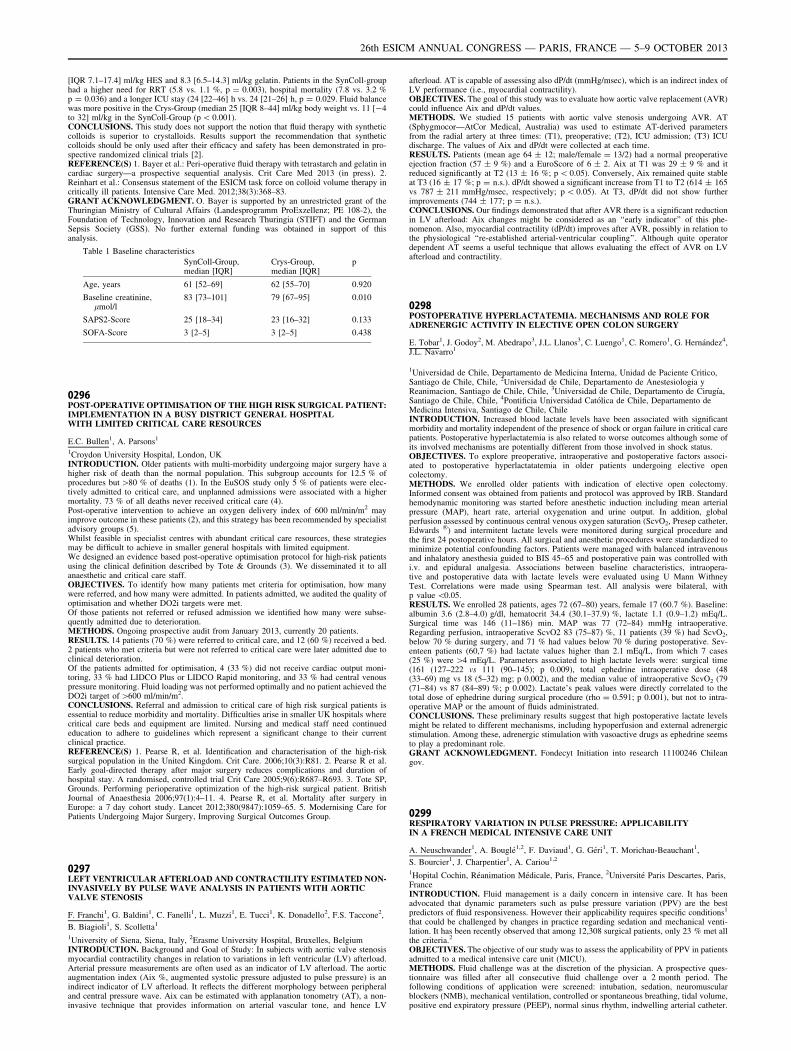
[IQR 7.1–17.4] ml/kg HES and 8.3 [6.5–14.3] ml/kg gelatin. Patients in the SynColl-grouphad a higher need for RRT (5.8 vs. 1.1 %, p = 0.003), hospital mortality (7.8 vs. 3.2 %p = 0.036) and a longer ICU stay (24 [22–46] h vs. 24 [21–26] h, p = 0.029. Fluid balancewas more positive in the Crys-Group (median 25 [IQR 8–44] ml/kg body weight vs. 11 [-4to 32] ml/kg in the SynColl-Group (p \ 0.001).CONCLUSIONS. This study does not support the notion that fluid therapy with syntheticcolloids is superior to crystalloids. Results support the recommendation that syntheticcolloids should be only used after their efficacy and safety has been demonstrated in pro-spective randomized clinical trials [2].REFERENCE(S) 1. Bayer et al.: Peri-operative fluid therapy with tetrastarch and gelatin incardiac surgery—a prospective sequential analysis. Crit Care Med 2013 (in press). 2.Reinhart et al.: Consensus statement of the ESICM task force on colloid volume therapy incritically ill patients. Intensive Care Med. 2012;38(3):368–83.GRANT ACKNOWLEDGMENT. O. Bayer is supported by an unrestricted grant of theThuringian Ministry of Cultural Affairs (Landesprogramm ProExzellenz; PE 108-2), theFoundation of Technology, Innovation and Research Thuringia (STIFT) and the GermanSepsis Society (GSS). No further external funding was obtained in support of thisanalysis.
Table 1 Baseline characteristics
SynColl-Group,median [IQR]
Crys-Group,median [IQR]
p
Age, years 61 [52–69] 62 [55–70] 0.920
Baseline creatinine,lmol/l
83 [73–101] 79 [67–95] 0.010
SAPS2-Score 25 [18–34] 23 [16–32] 0.133
SOFA-Score 3 [2–5] 3 [2–5] 0.438
0296POST-OPERATIVE OPTIMISATION OF THE HIGH RISK SURGICAL PATIENT:IMPLEMENTATION IN A BUSY DISTRICT GENERAL HOSPITALWITH LIMITED CRITICAL CARE RESOURCES
E.C. Bullen1, A. Parsons1
1Croydon University Hospital, London, UKINTRODUCTION. Older patients with multi-morbidity undergoing major surgery have ahigher risk of death than the normal population. This subgroup accounts for 12.5 % ofprocedures but [80 % of deaths (1). In the EuSOS study only 5 % of patients were elec-tively admitted to critical care, and unplanned admissions were associated with a highermortality. 73 % of all deaths never received critical care (4).Post-operative intervention to achieve an oxygen delivery index of 600 ml/min/m2 mayimprove outcome in these patients (2), and this strategy has been recommended by specialistadvisory groups (5).Whilst feasible in specialist centres with abundant critical care resources, these strategiesmay be difficult to achieve in smaller general hospitals with limited equipment.We designed an evidence based post-operative optimisation protocol for high-risk patientsusing the clinical definition described by Tote & Grounds (3). We disseminated it to allanaesthetic and critical care staff.OBJECTIVES. To identify how many patients met criteria for optimisation, how manywere referred, and how many were admitted. In patients admitted, we audited the quality ofoptimisation and whether DO2i targets were met.Of those patients not referred or refused admission we identified how many were subse-quently admitted due to deterioration.METHODS. Ongoing prospective audit from January 2013, currently 20 patients.RESULTS. 14 patients (70 %) were referred to critical care, and 12 (60 %) received a bed.2 patients who met criteria but were not referred to critical care were later admitted due toclinical deterioration.Of the patients admitted for optimisation, 4 (33 %) did not receive cardiac output moni-toring, 33 % had LIDCO Plus or LIDCO Rapid monitoring, and 33 % had central venouspressure monitoring. Fluid loading was not performed optimally and no patient achieved theDO2i target of [600 ml/min/m2.CONCLUSIONS. Referral and admission to critical care of high risk surgical patients isessential to reduce morbidity and mortality. Difficulties arise in smaller UK hospitals wherecritical care beds and equipment are limited. Nursing and medical staff need continuededucation to adhere to guidelines which represent a significant change to their currentclinical practice.REFERENCE(S) 1. Pearse R, et al. Identification and characterisation of the high-risksurgical population in the United Kingdom. Crit Care. 2006;10(3):R81. 2. Pearse R et al.Early goal-directed therapy after major surgery reduces complications and duration ofhospital stay. A randomised, controlled trial Crit Care 2005;9(6):R687–R693. 3. Tote SP,Grounds. Performing perioperative optimization of the high-risk surgical patient. BritishJournal of Anaesthesia 2006;97(1):4–11. 4. Pearse R, et al. Mortality after surgery inEurope: a 7 day cohort study. Lancet 2012;380(9847):1059–65. 5. Modernising Care forPatients Undergoing Major Surgery, Improving Surgical Outcomes Group.
0297LEFT VENTRICULAR AFTERLOAD AND CONTRACTILITY ESTIMATED NON-INVASIVELY BY PULSE WAVE ANALYSIS IN PATIENTS WITH AORTICVALVE STENOSIS
F. Franchi1, G. Baldini1, C. Fanelli1, L. Muzzi1, E. Tucci1, K. Donadello2, F.S. Taccone2,
B. Biagioli1, S. Scolletta1
1University of Siena, Siena, Italy, 2Erasme University Hospital, Bruxelles, BelgiumINTRODUCTION. Background and Goal of Study: In subjects with aortic valve stenosismyocardial contractility changes in relation to variations in left ventricular (LV) afterload.Arterial pressure measurements are often used as an indicator of LV afterload. The aorticaugmentation index (Aix %, augmented systolic pressure adjusted to pulse pressure) is anindirect indicator of LV afterload. It reflects the different morphology between peripheraland central pressure wave. Aix can be estimated with applanation tonometry (AT), a non-invasive technique that provides information on arterial vascular tone, and hence LV
afterload. AT is capable of assessing also dP/dt (mmHg/msec), which is an indirect index ofLV performance (i.e., myocardial contractility).OBJECTIVES. The goal of this study was to evaluate how aortic valve replacement (AVR)could influence Aix and dP/dt values.METHODS. We studied 15 patients with aortic valve stenosis undergoing AVR. AT(Sphygmocor—AtCor Medical, Australia) was used to estimate AT-derived parametersfrom the radial artery at three times: (T1), preoperative; (T2), ICU admission; (T3) ICUdischarge. The values of Aix and dP/dt were collected at each time.RESULTS. Patients (mean age 64 ± 12; male/female = 13/2) had a normal preoperativeejection fraction (57 ± 9 %) and a EuroScore of 6 ± 2. Aix at T1 was 29 ± 9 % and itreduced significantly at T2 (13 ± 16 %; p \ 0.05). Conversely, Aix remained quite stableat T3 (16 ± 17 %; p = n.s.). dP/dt showed a significant increase from T1 to T2 (614 ± 165vs 787 ± 211 mmHg/msec, respectively; p \ 0.05). At T3, dP/dt did not show furtherimprovements (744 ± 177; p = n.s.).CONCLUSIONS. Our findings demonstrated that after AVR there is a significant reductionin LV afterload: Aix changes might be considered as an ‘‘early indicator’’ of this phe-nomenon. Also, myocardial contractility (dP/dt) improves after AVR, possibly in relation tothe physiological ‘‘re-established arterial-ventricular coupling’’. Although quite operatordependent AT seems a useful technique that allows evaluating the effect of AVR on LVafterload and contractility.
0298POSTOPERATIVE HYPERLACTATEMIA. MECHANISMS AND ROLE FORADRENERGIC ACTIVITY IN ELECTIVE OPEN COLON SURGERY
E. Tobar1, J. Godoy2, M. Abedrapo3, J.L. Llanos3, C. Luengo1, C. Romero1, G. Hernández4,J.L. Navarro1
1Universidad de Chile, Departamento de Medicina Interna, Unidad de Paciente Critico,Santiago de Chile, Chile, 2Universidad de Chile, Departamento de Anestesiologia yReanimacion, Santiago de Chile, Chile, 3Universidad de Chile, Departamento de Cirugı́a,Santiago de Chile, Chile, 4Pontificia Universidad Católica de Chile, Departamento deMedicina Intensiva, Santiago de Chile, ChileINTRODUCTION. Increased blood lactate levels have been associated with significantmorbidity and mortality independent of the presence of shock or organ failure in critical carepatients. Postoperative hyperlactatemia is also related to worse outcomes although some ofits involved mechanisms are potentially different from those involved in shock status.OBJECTIVES. To explore preoperative, intraoperative and postoperative factors associ-ated to postoperative hyperlactatatemia in older patients undergoing elective opencolectomy.METHODS. We enrolled older patients with indication of elective open colectomy.Informed consent was obtained from patients and protocol was approved by IRB. Standardhemodynamic monitoring was started before anesthetic induction including mean arterialpressure (MAP), heart rate, arterial oxygenation and urine output. In addition, globalperfusion assessed by continuous central venous oxygen saturation (ScvO2, Presep catheter,Edwards �) and intermitent lactate levels were monitored during surgical procedure andthe first 24 postoperative hours. All surgical and anesthetic procedures were standardized tominimize potential confounding factors. Patients were managed with balanced intravenousand inhalatory anesthesia guided to BIS 45–65 and postoperative pain was controlled withi.v. and epidural analgesia. Associations between baseline characteristics, intraopera-tive and postoperative data with lactate levels were evaluated using U Mann WithneyTest. Correlations were made using Spearman test. All analysis were bilateral, withp value \0.05.RESULTS. We enrolled 28 patients, ages 72 (67–80) years, female 17 (60.7 %). Baseline:albumin 3.6 (2.8–4.0) g/dl, hematocrit 34.4 (30.1–37.9) %, lactate 1.1 (0.9–1.2) mEq/L.Surgical time was 146 (11–186) min. MAP was 77 (72–84) mmHg intraoperative.Regarding perfusion, intraoperative ScvO2 83 (75–87) %, 11 patients (39 %) had ScvO2,below 70 % during surgery, and 71 % had values below 70 % during postoperative. Sev-enteen patients (60,7 %) had lactate values higher than 2.1 mEq/L, from which 7 cases(25 %) were [4 mEq/L. Parameters associated to high lactate levels were: surgical time(161 (127–222 vs 111 (90–145); p 0.009), total ephedrine intraoperative dose (48(33–69) mg vs 18 (5–32) mg; p 0.002), and the median value of intraoperative ScvO2 (79(71–84) vs 87 (84–89) %; p 0.002). Lactate’s peak values were directly correlated to thetotal dose of ephedrine during surgical procedure (rho = 0.591; p 0.001), but not to intra-operative MAP or the amount of fluids administrated.CONCLUSIONS. These preliminary results suggest that high postoperative lactate levelsmight be related to different mechanisms, including hypoperfusion and external adrenergicstimulation. Among these, adrenergic stimulation with vasoactive drugs as ephedrine seemsto play a predominant role.GRANT ACKNOWLEDGMENT. Fondecyt Initiation into research 11100246 Chileangov.
0299RESPIRATORY VARIATION IN PULSE PRESSURE: APPLICABILITYIN A FRENCH MEDICAL INTENSIVE CARE UNIT
A. Neuschwander1, A. Bouglé1,2, F. Daviaud1, G. Géri1, T. Morichau-Beauchant1,
S. Bourcier1, J. Charpentier1, A. Cariou1,2
1Hopital Cochin, Réanimation Médicale, Paris, France, 2Université Paris Descartes, Paris,FranceINTRODUCTION. Fluid management is a daily concern in intensive care. It has beenadvocated that dynamic parameters such as pulse pressure variation (PPV) are the bestpredictors of fluid responsiveness. However their applicability requires specific conditions1
that could be challenged by changes in practice regarding sedation and mechanical venti-lation. It has been recently observed that among 12,308 surgical patients, only 23 % met allthe criteria.2
OBJECTIVES. The objective of our study was to assess the applicability of PPV in patientsadmitted to a medical intensive care unit (MICU).METHODS. Fluid challenge was at the discretion of the physician. A prospective ques-tionnaire was filled after all consecutive fluid challenge over a 2 month period. Thefollowing conditions of application were screened: intubation, sedation, neuromuscularblockers (NMB), mechanical ventilation, controlled or spontaneous breathing, tidal volume,positive end expiratory pressure (PEEP), normal sinus rhythm, indwelling arterial catheter.
26th ESICM ANNUAL CONGRESS — PARIS, FRANCE — 5–9 OCTOBER 2013
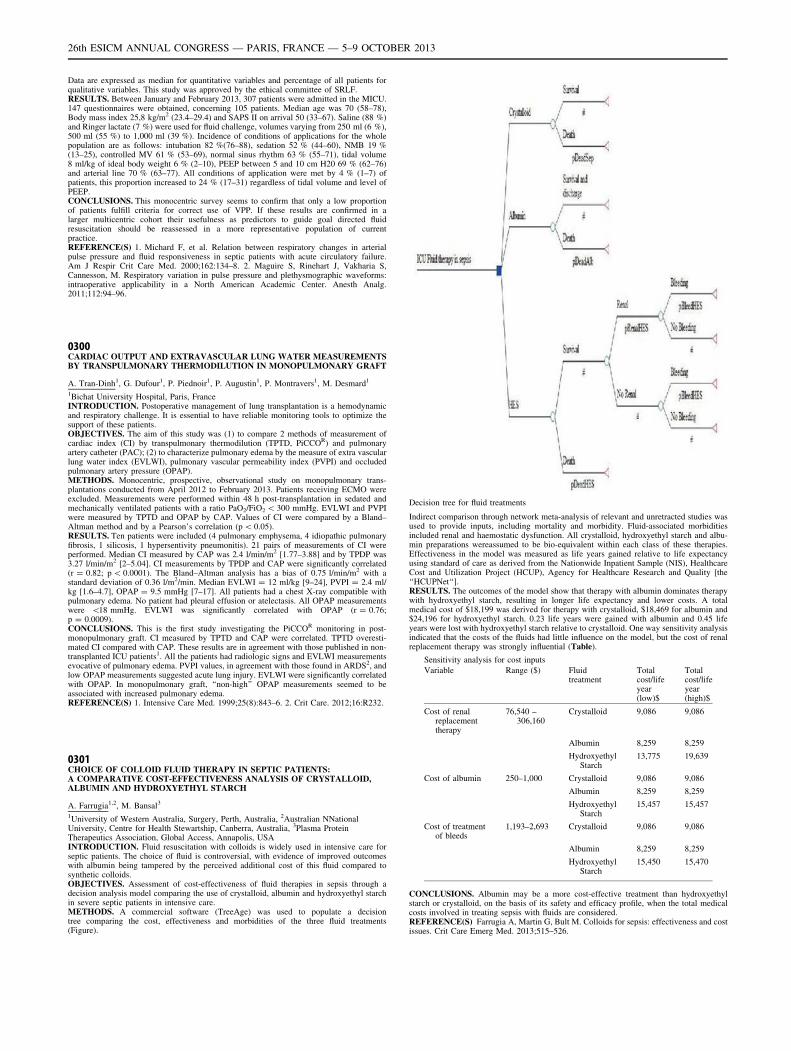
Data are expressed as median for quantitative variables and percentage of all patients forqualitative variables. This study was approved by the ethical committee of SRLF.RESULTS. Between January and February 2013, 307 patients were admitted in the MICU.147 questionnaires were obtained, concerning 105 patients. Median age was 70 (58–78),Body mass index 25,8 kg/m2 (23.4–29.4) and SAPS II on arrival 50 (33–67). Saline (88 %)and Ringer lactate (7 %) were used for fluid challenge, volumes varying from 250 ml (6 %),500 ml (55 %) to 1,000 ml (39 %). Incidence of conditions of applications for the wholepopulation are as follows: intubation 82 %(76–88), sedation 52 % (44–60), NMB 19 %(13–25), controlled MV 61 % (53–69), normal sinus rhythm 63 % (55–71), tidal volume8 ml/kg of ideal body weight 6 % (2–10), PEEP between 5 and 10 cm H20 69 % (62–76)and arterial line 70 % (63–77). All conditions of application were met by 4 % (1–7) ofpatients, this proportion increased to 24 % (17–31) regardless of tidal volume and level ofPEEP.CONCLUSIONS. This monocentric survey seems to confirm that only a low proportionof patients fulfill criteria for correct use of VPP. If these results are confirmed in alarger multicentric cohort their usefulness as predictors to guide goal directed fluidresuscitation should be reassessed in a more representative population of currentpractice.REFERENCE(S) 1. Michard F, et al. Relation between respiratory changes in arterialpulse pressure and fluid responsiveness in septic patients with acute circulatory failure.Am J Respir Crit Care Med. 2000;162:134–8. 2. Maguire S, Rinehart J, Vakharia S,Cannesson, M. Respiratory variation in pulse pressure and plethysmographic waveforms:intraoperative applicability in a North American Academic Center. Anesth Analg.2011;112:94–96.
0300CARDIAC OUTPUT AND EXTRAVASCULAR LUNG WATER MEASUREMENTSBY TRANSPULMONARY THERMODILUTION IN MONOPULMONARY GRAFT
A. Tran-Dinh1, G. Dufour1, P. Piednoir1, P. Augustin1, P. Montravers1, M. Desmard1
1Bichat University Hospital, Paris, FranceINTRODUCTION. Postoperative management of lung transplantation is a hemodynamicand respiratory challenge. It is essential to have reliable monitoring tools to optimize thesupport of these patients.OBJECTIVES. The aim of this study was (1) to compare 2 methods of measurement ofcardiac index (CI) by transpulmonary thermodilution (TPTD, PiCCOR) and pulmonaryartery catheter (PAC); (2) to characterize pulmonary edema by the measure of extra vascularlung water index (EVLWI), pulmonary vascular permeability index (PVPI) and occludedpulmonary artery pressure (OPAP).METHODS. Monocentric, prospective, observational study on monopulmonary trans-plantations conducted from April 2012 to February 2013. Patients receiving ECMO wereexcluded. Measurements were performed within 48 h post-transplantation in sedated andmechanically ventilated patients with a ratio PaO2/FiO2 \ 300 mmHg. EVLWI and PVPIwere measured by TPTD and OPAP by CAP. Values of CI were compared by a Bland–Altman method and by a Pearson’s correlation (p \ 0.05).RESULTS. Ten patients were included (4 pulmonary emphysema, 4 idiopathic pulmonaryfibrosis, 1 silicosis, 1 hypersentivity pneumonitis). 21 pairs of measurements of CI wereperformed. Median CI measured by CAP was 2.4 l/min/m2 [1.77–3.88] and by TPDP was3.27 l/min/m2 [2–5.04]. CI measurements by TPDP and CAP were significantly correlated(r = 0.82; p \ 0.0001). The Bland–Altman analysis has a bias of 0.75 l/min/m2 with astandard deviation of 0.36 l/m2/min. Median EVLWI = 12 ml/kg [9–24], PVPI = 2.4 ml/kg [1.6–4.7], OPAP = 9.5 mmHg [7–17]. All patients had a chest X-ray compatible withpulmonary edema. No patient had pleural effusion or atelectasis. All OPAP measurementswere \18 mmHg. EVLWI was significantly correlated with OPAP (r = 0.76;p = 0.0009).CONCLUSIONS. This is the first study investigating the PiCCOR monitoring in post-monopulmonary graft. CI measured by TPTD and CAP were correlated. TPTD overesti-mated CI compared with CAP. These results are in agreement with those published in non-transplanted ICU patients1. All the patients had radiologic signs and EVLWI measurementsevocative of pulmonary edema. PVPI values, in agreement with those found in ARDS2, andlow OPAP measurements suggested acute lung injury. EVLWI were significantly correlatedwith OPAP. In monopulmonary graft, ‘‘non-high’’ OPAP measurements seemed to beassociated with increased pulmonary edema.REFERENCE(S) 1. Intensive Care Med. 1999;25(8):843–6. 2. Crit Care. 2012;16:R232.
0301CHOICE OF COLLOID FLUID THERAPY IN SEPTIC PATIENTS:A COMPARATIVE COST-EFFECTIVENESS ANALYSIS OF CRYSTALLOID,ALBUMIN AND HYDROXYETHYL STARCH
A. Farrugia1,2, M. Bansal3
1University of Western Australia, Surgery, Perth, Australia, 2Australian NNationalUniversity, Centre for Health Stewartship, Canberra, Australia, 3Plasma ProteinTherapeutics Association, Global Access, Annapolis, USAINTRODUCTION. Fluid resuscitation with colloids is widely used in intensive care forseptic patients. The choice of fluid is controversial, with evidence of improved outcomeswith albumin being tampered by the perceived additional cost of this fluid compared tosynthetic colloids.OBJECTIVES. Assessment of cost-effectiveness of fluid therapies in sepsis through adecision analysis model comparing the use of crystalloid, albumin and hydroxyethyl starchin severe septic patients in intensive care.METHODS. A commercial software (TreeAge) was used to populate a decisiontree comparing the cost, effectiveness and morbidities of the three fluid treatments(Figure).
Decision tree for fluid treatments
Indirect comparison through network meta-analysis of relevant and unretracted studies wasused to provide inputs, including mortality and morbidity. Fluid-associated morbiditiesincluded renal and haemostatic dysfunction. All crystalloid, hydroxyethyl starch and albu-min preparations wereassumed to be bio-equivalent within each class of these therapies.Effectiveness in the model was measured as life years gained relative to life expectancyusing standard of care as derived from the Nationwide Inpatient Sample (NIS), HealthcareCost and Utilization Project (HCUP), Agency for Healthcare Research and Quality [the‘‘HCUPNet‘‘].RESULTS. The outcomes of the model show that therapy with albumin dominates therapywith hydroxyethyl starch, resulting in longer life expectancy and lower costs. A totalmedical cost of $18,199 was derived for therapy with crystalloid, $18,469 for albumin and$24,196 for hydroxyethyl starch. 0.23 life years were gained with albumin and 0.45 lifeyears were lost with hydroxyethyl starch relative to crystalloid. One way sensitivity analysisindicated that the costs of the fluids had little influence on the model, but the cost of renalreplacement therapy was strongly influential (Table).
Sensitivity analysis for cost inputs
Variable Range ($) Fluidtreatment
Totalcost/lifeyear(low)$
Totalcost/lifeyear(high)$
Cost of renalreplacementtherapy
76,540 –306,160
Crystalloid 9,086 9,086
Albumin 8,259 8,259
HydroxyethylStarch
13,775 19,639
Cost of albumin 250–1,000 Crystalloid 9,086 9,086
Albumin 8,259 8,259
HydroxyethylStarch
15,457 15,457
Cost of treatmentof bleeds
1,193–2,693 Crystalloid 9,086 9,086
Albumin 8,259 8,259
HydroxyethylStarch
15,450 15,470
CONCLUSIONS. Albumin may be a more cost-effective treatment than hydroxyethylstarch or crystalloid, on the basis of its safety and efficacy profile, when the total medicalcosts involved in treating sepsis with fluids are considered.REFERENCE(S) Farrugia A, Martin G, Bult M. Colloids for sepsis: effectiveness and costissues. Crit Care Emerg Med. 2013;515–526.
26th ESICM ANNUAL CONGRESS — PARIS, FRANCE — 5–9 OCTOBER 2013
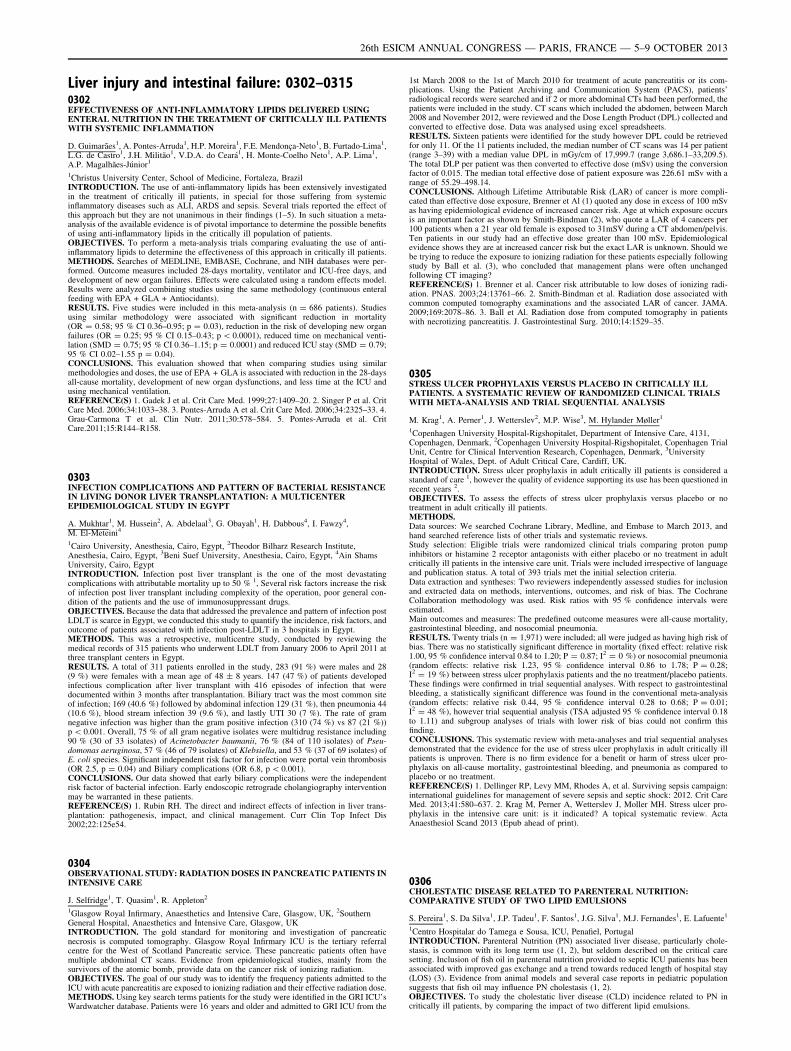
Liver injury and intestinal failure: 0302–03150302EFFECTIVENESS OF ANTI-INFLAMMATORY LIPIDS DELIVERED USINGENTERAL NUTRITION IN THE TREATMENT OF CRITICALLY ILL PATIENTSWITH SYSTEMIC INFLAMMATION
D. Guimarães1, A. Pontes-Arruda1, H.P. Moreira1, F.E. Mendonça-Neto1, B. Furtado-Lima1,L.G. de Castro1, J.H. Militão1, V.D.A. do Ceará1, H. Monte-Coelho Neto1, A.P. Lima1,A.P. Magalhães-Júnior1
1Christus University Center, School of Medicine, Fortaleza, BrazilINTRODUCTION. The use of anti-inflammatory lipids has been extensively investigatedin the treatment of critically ill patients, in special for those suffering from systemicinflammatory diseases such as ALI, ARDS and sepsis. Several trials reported the effect ofthis approach but they are not unanimous in their findings (1–5). In such situation a meta-analysis of the available evidence is of pivotal importance to determine the possible benefitsof using anti-inflammatory lipids in the critically ill population of patients.OBJECTIVES. To perform a meta-analysis trials comparing evaluating the use of anti-inflammatory lipids to determine the effectiveness of this approach in critically ill patients.METHODS. Searches of MEDLINE, EMBASE, Cochrane, and NIH databases were per-formed. Outcome measures included 28-days mortality, ventilator and ICU-free days, anddevelopment of new organ failures. Effects were calculated using a random effects model.Results were analyzed combining studies using the same methodology (continuous enteralfeeding with EPA + GLA + Antiocidants).RESULTS. Five studies were included in this meta-analysis (n = 686 patients). Studiesusing similar methodology were associated with significant reduction in mortality(OR = 0.58; 95 % CI 0.36–0.95; p = 0.03), reduction in the risk of developing new organfailures (OR = 0.25; 95 % CI 0.15–0.43; p \ 0.0001), reduced time on mechanical venti-lation (SMD = 0.75; 95 % CI 0.36–1.15; p = 0.0001) and reduced ICU stay (SMD = 0.79;95 % CI 0.02–1.55 p = 0.04).CONCLUSIONS. This evaluation showed that when comparing studies using similarmethodologies and doses, the use of EPA + GLA is associated with reduction in the 28-daysall-cause mortality, development of new organ dysfunctions, and less time at the ICU andusing mechanical ventilation.REFERENCE(S) 1. Gadek J et al. Crit Care Med. 1999;27:1409–20. 2. Singer P et al. CritCare Med. 2006;34:1033–38. 3. Pontes-Arruda A et al. Crit Care Med. 2006;34:2325–33. 4.Grau-Carmona T et al. Clin Nutr. 2011;30:578–584. 5. Pontes-Arruda et al. CritCare.2011;15:R144–R158.
0303INFECTION COMPLICATIONS AND PATTERN OF BACTERIAL RESISTANCEIN LIVING DONOR LIVER TRANSPLANTATION: A MULTICENTEREPIDEMIOLOGICAL STUDY IN EGYPT
A. Mukhtar1, M. Hussein2, A. Abdelaal3, G. Obayah1, H. Dabbous4, I. Fawzy4,M. El-Meteini4
1Cairo University, Anesthesia, Cairo, Egypt, 2Theodor Bilharz Research Institute,Anesthesia, Cairo, Egypt, 3Beni Suef University, Anesthesia, Cairo, Egypt, 4Ain ShamsUniversity, Cairo, EgyptINTRODUCTION. Infection post liver transplant is the one of the most devastatingcomplications with attributable mortality up to 50 % 1, Several risk factors increase the riskof infection post liver transplant including complexity of the operation, poor general con-dition of the patients and the use of immunosuppressant drugs.OBJECTIVES. Because the data that addressed the prevalence and pattern of infection postLDLT is scarce in Egypt, we conducted this study to quantify the incidence, risk factors, andoutcome of patients associated with infection post-LDLT in 3 hospitals in Egypt.METHODS. This was a retrospective, multicentre study, conducted by reviewing themedical records of 315 patients who underwent LDLT from January 2006 to April 2011 atthree transplant centers in Egypt.RESULTS. A total of 311 patients enrolled in the study, 283 (91 %) were males and 28(9 %) were females with a mean age of 48 ± 8 years. 147 (47 %) of patients developedinfectious complication after liver transplant with 416 episodes of infection that weredocumented within 3 months after transplantation. Biliary tract was the most common siteof infection; 169 (40.6 %) followed by abdominal infection 129 (31 %), then pneumonia 44(10.6 %), blood stream infection 39 (9.6 %), and lastly UTI 30 (7 %). The rate of gramnegative infection was higher than the gram positive infection (310 (74 %) vs 87 (21 %))p \ 0.001. Overall, 75 % of all gram negative isolates were multidrug resistance including90 % (30 of 33 isolates) of Acinetobacter baumanii, 76 % (84 of 110 isolates) of Pseu-domonas aeruginosa, 57 % (46 of 79 isolates) of Klebsiella, and 53 % (37 of 69 isolates) ofE. coli species. Significant independent risk factor for infection were portal vein thrombosis(OR 2.5, p = 0.04) and Biliary complications (OR 6.8, p \ 0.001).CONCLUSIONS. Our data showed that early biliary complications were the independentrisk factor of bacterial infection. Early endoscopic retrograde cholangiography interventionmay be warranted in these patients.REFERENCE(S) 1. Rubin RH. The direct and indirect effects of infection in liver trans-plantation: pathogenesis, impact, and clinical management. Curr Clin Top Infect Dis2002;22:125e54.
0304OBSERVATIONAL STUDY: RADIATION DOSES IN PANCREATIC PATIENTS ININTENSIVE CARE
J. Selfridge1, T. Quasim1, R. Appleton2
1Glasgow Royal Infirmary, Anaesthetics and Intensive Care, Glasgow, UK, 2SouthernGeneral Hospital, Anaesthetics and Intensive Care, Glasgow, UKINTRODUCTION. The gold standard for monitoring and investigation of pancreaticnecrosis is computed tomography. Glasgow Royal Infirmary ICU is the tertiary referralcentre for the West of Scotland Pancreatic service. These pancreatic patients often havemultiple abdominal CT scans. Evidence from epidemiological studies, mainly from thesurvivors of the atomic bomb, provide data on the cancer risk of ionizing radiation.OBJECTIVES. The goal of our study was to identify the frequency patients admitted to theICU with acute pancreatitis are exposed to ionizing radiation and their effective radiation dose.METHODS. Using key search terms patients for the study were identified in the GRI ICU’sWardwatcher database. Patients were 16 years and older and admitted to GRI ICU from the
1st March 2008 to the 1st of March 2010 for treatment of acute pancreatitis or its com-plications. Using the Patient Archiving and Communication System (PACS), patients’radiological records were searched and if 2 or more abdominal CTs had been performed, thepatients were included in the study. CT scans which included the abdomen, between March2008 and November 2012, were reviewed and the Dose Length Product (DPL) collected andconverted to effective dose. Data was analysed using excel spreadsheets.RESULTS. Sixteen patients were identified for the study however DPL could be retrievedfor only 11. Of the 11 patients included, the median number of CT scans was 14 per patient(range 3–39) with a median value DPL in mGy/cm of 17,999.7 (range 3,686.1–33,209.5).The total DLP per patient was then converted to effective dose (mSv) using the conversionfactor of 0.015. The median total effective dose of patient exposure was 226.61 mSv with arange of 55.29–498.14.CONCLUSIONS. Although Lifetime Attributable Risk (LAR) of cancer is more compli-cated than effective dose exposure, Brenner et Al (1) quoted any dose in excess of 100 mSvas having epidemiological evidence of increased cancer risk. Age at which exposure occursis an important factor as shown by Smith-Bindman (2), who quote a LAR of 4 cancers per100 patients when a 21 year old female is exposed to 31mSV during a CT abdomen/pelvis.Ten patients in our study had an effective dose greater than 100 mSv. Epidemiologicalevidence shows they are at increased cancer risk but the exact LAR is unknown. Should webe trying to reduce the exposure to ionizing radiation for these patients especially followingstudy by Ball et al. (3), who concluded that management plans were often unchangedfollowing CT imaging?REFERENCE(S) 1. Brenner et al. Cancer risk attributable to low doses of ionizing radi-ation. PNAS. 2003;24:13761–66. 2. Smith-Bindman et al. Radiation dose associated withcommon computed tomography examinations and the associated LAR of cancer. JAMA.2009;169:2078–86. 3. Ball et Al. Radiation dose from computed tomography in patientswith necrotizing pancreatitis. J. Gastrointestinal Surg. 2010;14:1529–35.
0305STRESS ULCER PROPHYLAXIS VERSUS PLACEBO IN CRITICALLY ILLPATIENTS. A SYSTEMATIC REVIEW OF RANDOMIZED CLINICAL TRIALSWITH META-ANALYSIS AND TRIAL SEQUENTIAL ANALYSIS
M. Krag1, A. Perner1, J. Wetterslev2, M.P. Wise3, M. Hylander Møller1
1Copenhagen University Hospital-Rigshopitalet, Department of Intensive Care, 4131,Copenhagen, Denmark, 2Copenhagen University Hospital-Rigshopitalet, Copenhagen TrialUnit, Centre for Clinical Intervention Research, Copenhagen, Denmark, 3UniversityHospital of Wales, Dept. of Adult Critical Care, Cardiff, UK.INTRODUCTION. Stress ulcer prophylaxis in adult critically ill patients is considered astandard of care 1, however the quality of evidence supporting its use has been questioned inrecent years 2.OBJECTIVES. To assess the effects of stress ulcer prophylaxis versus placebo or notreatment in adult critically ill patients.METHODS.Data sources: We searched Cochrane Library, Medline, and Embase to March 2013, andhand searched reference lists of other trials and systematic reviews.Study selection: Eligible trials were randomized clinical trials comparing proton pumpinhibitors or histamine 2 receptor antagonists with either placebo or no treatment in adultcritically ill patients in the intensive care unit. Trials were included irrespective of languageand publication status. A total of 393 trials met the initial selection criteria.Data extraction and syntheses: Two reviewers independently assessed studies for inclusionand extracted data on methods, interventions, outcomes, and risk of bias. The CochraneCollaboration methodology was used. Risk ratios with 95 % confidence intervals wereestimated.Main outcomes and measures: The predefined outcome measures were all-cause mortality,gastrointestinal bleeding, and nosocomial pneumonia.RESULTS. Twenty trials (n = 1,971) were included; all were judged as having high risk ofbias. There was no statistically significant difference in mortality (fixed effect: relative risk1.00, 95 % confidence interval 0.84 to 1.20; P = 0.87; I2 = 0 %) or nosocomial pneumonia(random effects: relative risk 1.23, 95 % confidence interval 0.86 to 1.78; P = 0.28;I2 = 19 %) between stress ulcer prophylaxis patients and the no treatment/placebo patients.These findings were confirmed in trial sequential analyses. With respect to gastrointestinalbleeding, a statistically significant difference was found in the conventional meta-analysis(random effects: relative risk 0.44, 95 % confidence interval 0.28 to 0.68; P = 0.01;I2 = 48 %), however trial sequential analysis (TSA adjusted 95 % confidence interval 0.18to 1.11) and subgroup analyses of trials with lower risk of bias could not confirm thisfinding.CONCLUSIONS. This systematic review with meta-analyses and trial sequential analysesdemonstrated that the evidence for the use of stress ulcer prophylaxis in adult critically illpatients is unproven. There is no firm evidence for a benefit or harm of stress ulcer pro-phylaxis on all-cause mortality, gastrointestinal bleeding, and pneumonia as compared toplacebo or no treatment.REFERENCE(S) 1. Dellinger RP, Levy MM, Rhodes A, et al. Surviving sepsis campaign:international guidelines for management of severe sepsis and septic shock: 2012. Crit CareMed. 2013;41:580–637. 2. Krag M, Perner A, Wetterslev J, Moller MH. Stress ulcer pro-phylaxis in the intensive care unit: is it indicated? A topical systematic review. ActaAnaesthesiol Scand 2013 (Epub ahead of print).
0306CHOLESTATIC DISEASE RELATED TO PARENTERAL NUTRITION:COMPARATIVE STUDY OF TWO LIPID EMULSIONS
S. Pereira1, S. Da Silva1, J.P. Tadeu1, F. Santos1, J.G. Silva1, M.J. Fernandes1, E. Lafuente1
1Centro Hospitalar do Tamega e Sousa, ICU, Penafiel, PortugalINTRODUCTION. Parenteral Nutrition (PN) associated liver disease, particularly chole-stasis, is common with its long term use (1, 2), but seldom described on the critical caresetting. Inclusion of fish oil in parenteral nutrition provided to septic ICU patients has beenassociated with improved gas exchange and a trend towards reduced length of hospital stay(LOS) (3). Evidence from animal models and several case reports in pediatric populationsuggests that fish oil may influence PN cholestasis (1, 2).OBJECTIVES. To study the cholestatic liver disease (CLD) incidence related to PN incritically ill patients, by comparing the impact of two different lipid emulsions.
26th ESICM ANNUAL CONGRESS — PARIS, FRANCE — 5–9 OCTOBER 2013
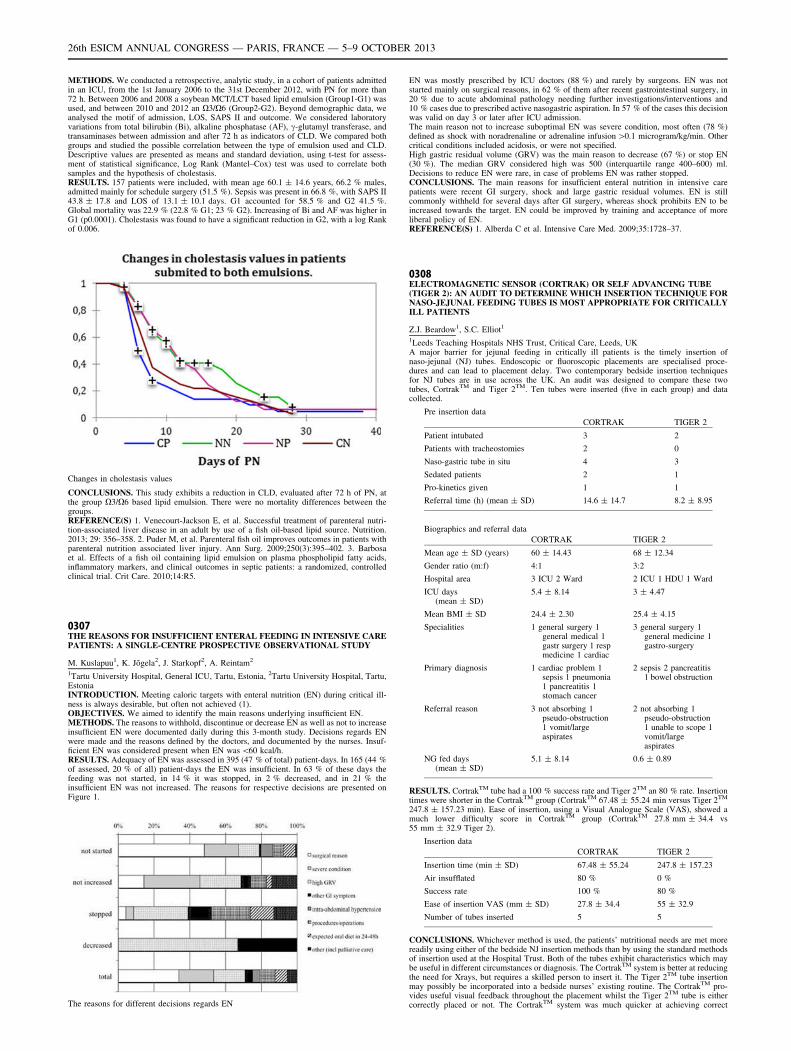
METHODS. We conducted a retrospective, analytic study, in a cohort of patients admittedin an ICU, from the 1st January 2006 to the 31st December 2012, with PN for more than72 h. Between 2006 and 2008 a soybean MCT/LCT based lipid emulsion (Group1-G1) wasused, and between 2010 and 2012 an X3/X6 (Group2-G2). Beyond demographic data, weanalysed the motif of admission, LOS, SAPS II and outcome. We considered laboratoryvariations from total bilirubin (Bi), alkaline phosphatase (AF), c-glutamyl transferase, andtransaminases between admission and after 72 h as indicators of CLD. We compared bothgroups and studied the possible correlation between the type of emulsion used and CLD.Descriptive values are presented as means and standard deviation, using t-test for assess-ment of statistical significance, Log Rank (Mantel–Cox) test was used to correlate bothsamples and the hypothesis of cholestasis.RESULTS. 157 patients were included, with mean age 60.1 ± 14.6 years, 66.2 % males,admitted mainly for schedule surgery (51.5 %). Sepsis was present in 66.8 %, with SAPS II43.8 ± 17.8 and LOS of 13.1 ± 10.1 days. G1 accounted for 58.5 % and G2 41.5 %.Global mortality was 22.9 % (22.8 % G1; 23 % G2). Increasing of Bi and AF was higher inG1 (p0.0001). Cholestasis was found to have a significant reduction in G2, with a log Rankof 0.006.
Changes in cholestasis values
CONCLUSIONS. This study exhibits a reduction in CLD, evaluated after 72 h of PN, atthe group X3/X6 based lipid emulsion. There were no mortality differences between thegroups.REFERENCE(S) 1. Venecourt-Jackson E, et al. Successful treatment of parenteral nutri-tion-associated liver disease in an adult by use of a fish oil-based lipid source. Nutrition.2013; 29: 356–358. 2. Puder M, et al. Parenteral fish oil improves outcomes in patients withparenteral nutrition associated liver injury. Ann Surg. 2009;250(3):395–402. 3. Barbosaet al. Effects of a fish oil containing lipid emulsion on plasma phospholipid fatty acids,inflammatory markers, and clinical outcomes in septic patients: a randomized, controlledclinical trial. Crit Care. 2010;14:R5.
0307THE REASONS FOR INSUFFICIENT ENTERAL FEEDING IN INTENSIVE CAREPATIENTS: A SINGLE-CENTRE PROSPECTIVE OBSERVATIONAL STUDY
M. Kuslapuu1, K. Jõgela2, J. Starkopf2, A. Reintam2
1Tartu University Hospital, General ICU, Tartu, Estonia, 2Tartu University Hospital, Tartu,EstoniaINTRODUCTION. Meeting caloric targets with enteral nutrition (EN) during critical ill-ness is always desirable, but often not achieved (1).OBJECTIVES. We aimed to identify the main reasons underlying insufficient EN.METHODS. The reasons to withhold, discontinue or decrease EN as well as not to increaseinsufficient EN were documented daily during this 3-month study. Decisions regards ENwere made and the reasons defined by the doctors, and documented by the nurses. Insuf-ficient EN was considered present when EN was \60 kcal/h.RESULTS. Adequacy of EN was assessed in 395 (47 % of total) patient-days. In 165 (44 %of assessed, 20 % of all) patient-days the EN was insufficient. In 63 % of these days thefeeding was not started, in 14 % it was stopped, in 2 % decreased, and in 21 % theinsufficient EN was not increased. The reasons for respective decisions are presented onFigure 1.
The reasons for different decisions regards EN
EN was mostly prescribed by ICU doctors (88 %) and rarely by surgeons. EN was notstarted mainly on surgical reasons, in 62 % of them after recent gastrointestinal surgery, in20 % due to acute abdominal pathology needing further investigations/interventions and10 % cases due to prescribed active nasogastric aspiration. In 57 % of the cases this decisionwas valid on day 3 or later after ICU admission.The main reason not to increase suboptimal EN was severe condition, most often (78 %)defined as shock with noradrenaline or adrenaline infusion [0.1 microgram/kg/min. Othercritical conditions included acidosis, or were not specified.High gastric residual volume (GRV) was the main reason to decrease (67 %) or stop EN(30 %). The median GRV considered high was 500 (interquartile range 400–600) ml.Decisions to reduce EN were rare, in case of problems EN was rather stopped.CONCLUSIONS. The main reasons for insufficient enteral nutrition in intensive carepatients were recent GI surgery, shock and large gastric residual volumes. EN is stillcommonly withheld for several days after GI surgery, whereas shock prohibits EN to beincreased towards the target. EN could be improved by training and acceptance of moreliberal policy of EN.REFERENCE(S) 1. Alberda C et al. Intensive Care Med. 2009;35:1728–37.
0308ELECTROMAGNETIC SENSOR (CORTRAK) OR SELF ADVANCING TUBE(TIGER 2): AN AUDIT TO DETERMINE WHICH INSERTION TECHNIQUE FORNASO-JEJUNAL FEEDING TUBES IS MOST APPROPRIATE FOR CRITICALLYILL PATIENTS
Z.J. Beardow1, S.C. Elliot1
1Leeds Teaching Hospitals NHS Trust, Critical Care, Leeds, UKA major barrier for jejunal feeding in critically ill patients is the timely insertion ofnaso-jejunal (NJ) tubes. Endoscopic or fluoroscopic placements are specialised proce-dures and can lead to placement delay. Two contemporary bedside insertion techniquesfor NJ tubes are in use across the UK. An audit was designed to compare these twotubes, CortrakTM and Tiger 2TM. Ten tubes were inserted (five in each group) and datacollected.
Pre insertion data
CORTRAK TIGER 2
Patient intubated 3 2
Patients with tracheostomies 2 0
Naso-gastric tube in situ 4 3
Sedated patients 2 1
Pro-kinetics given 1 1
Referral time (h) (mean ± SD) 14.6 ± 14.7 8.2 ± 8.95
Biographics and referral data
CORTRAK TIGER 2
Mean age ± SD (years) 60 ± 14.43 68 ± 12.34
Gender ratio (m:f) 4:1 3:2
Hospital area 3 ICU 2 Ward 2 ICU 1 HDU 1 Ward
ICU days(mean ± SD)
5.4 ± 8.14 3 ± 4.47
Mean BMI ± SD 24.4 ± 2.30 25.4 ± 4.15
Specialities 1 general surgery 1general medical 1gastr surgery 1 respmedicine 1 cardiac
3 general surgery 1general medicine 1gastro-surgery
Primary diagnosis 1 cardiac problem 1sepsis 1 pneumonia1 pancreatitis 1stomach cancer
2 sepsis 2 pancreatitis1 bowel obstruction
Referral reason 3 not absorbing 1pseudo-obstruction1 vomit/largeaspirates
2 not absorbing 1pseudo-obstruction1 unable to scope 1vomit/largeaspirates
NG fed days(mean ± SD)
5.1 ± 8.14 0.6 ± 0.89
RESULTS. CortrakTM tube had a 100 % success rate and Tiger 2TM an 80 % rate. Insertiontimes were shorter in the CortrakTM group (CortrakTM 67.48 ± 55.24 min versus Tiger 2TM
247.8 ± 157.23 min). Ease of insertion, using a Visual Analogue Scale (VAS), showed amuch lower difficulty score in CortrakTM group (CortrakTM 27.8 mm ± 34.4 vs55 mm ± 32.9 Tiger 2).
Insertion data
CORTRAK TIGER 2
Insertion time (min ± SD) 67.48 ± 55.24 247.8 ± 157.23
Air insufflated 80 % 0 %
Success rate 100 % 80 %
Ease of insertion VAS (mm ± SD) 27.8 ± 34.4 55 ± 32.9
Number of tubes inserted 5 5
CONCLUSIONS. Whichever method is used, the patients’ nutritional needs are met morereadily using either of the bedside NJ insertion methods than by using the standard methodsof insertion used at the Hospital Trust. Both of the tubes exhibit characteristics which maybe useful in different circumstances or diagnosis. The CortrakTM system is better at reducingthe need for Xrays, but requires a skilled person to insert it. The Tiger 2TM tube insertionmay possibly be incorporated into a bedside nurses’ existing routine. The CortrakTM pro-vides useful visual feedback throughout the placement whilst the Tiger 2TM tube is eithercorrectly placed or not. The CortrakTM system was much quicker at achieving correct
26th ESICM ANNUAL CONGRESS — PARIS, FRANCE — 5–9 OCTOBER 2013
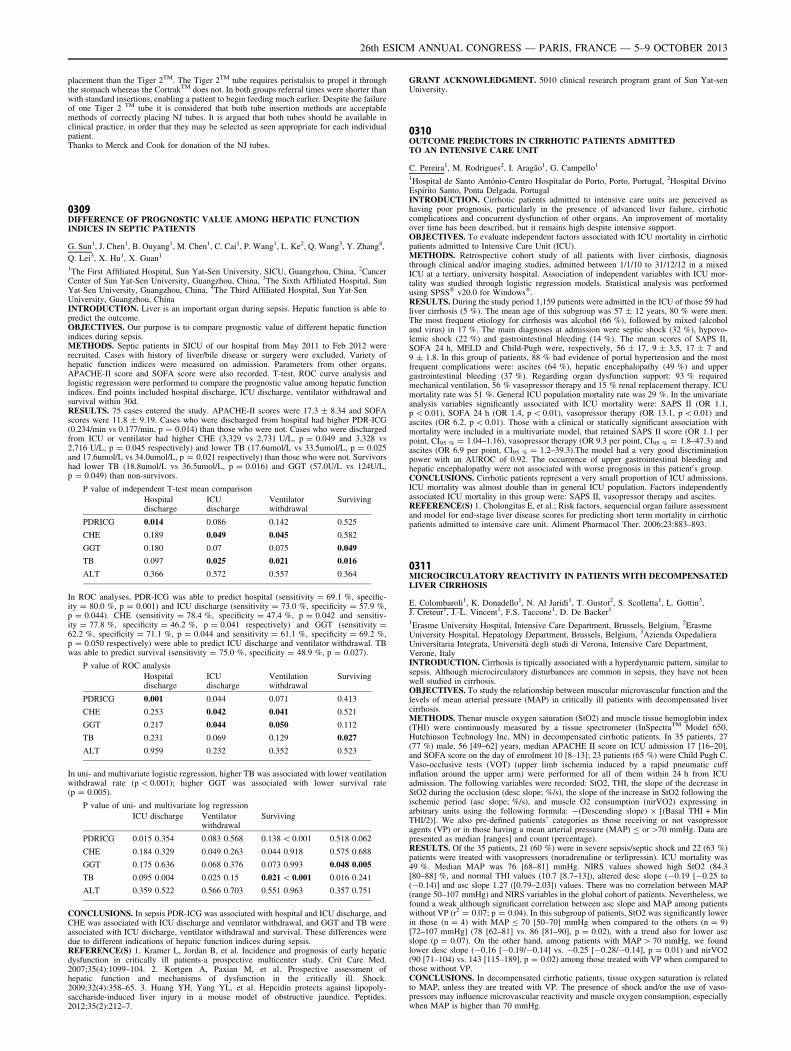
placement than the Tiger 2TM. The Tiger 2TM tube requires peristalsis to propel it throughthe stomach whereas the CortrakTM does not. In both groups referral times were shorter thanwith standard insertions, enabling a patient to begin feeding much earlier. Despite the failureof one Tiger 2 TM tube it is considered that both tube insertion methods are acceptablemethods of correctly placing NJ tubes. It is argued that both tubes should be available inclinical practice, in order that they may be selected as seen appropriate for each individualpatient.Thanks to Merck and Cook for donation of the NJ tubes.
0309DIFFERENCE OF PROGNOSTIC VALUE AMONG HEPATIC FUNCTIONINDICES IN SEPTIC PATIENTS
G. Sun1, J. Chen1, B. Ouyang1, M. Chen1, C. Cai1, P. Wang1, L. Ke2, Q. Wang3, Y. Zhang4,
Q. Lei3, X. Hu1, X. Guan1
1The First Affiliated Hospital, Sun Yat-Sen University, SICU, Guangzhou, China, 2CancerCenter of Sun Yat-Sen University, Guangzhou, China, 3The Sixth Affiliated Hospital, SunYat-Sen University, Guangzhou, China, 4The Third Affiliated Hospital, Sun Yat-SenUniversity, Guangzhou, ChinaINTRODUCTION. Liver is an important organ during sepsis. Hepatic function is able topredict the outcome.OBJECTIVES. Our purpose is to compare prognostic value of different hepatic functionindices during sepsis.METHODS. Septic patients in SICU of our hospital from May 2011 to Feb 2012 wererecruited. Cases with history of liver/bile disease or surgery were excluded. Variety ofhepatic function indices were measured on admission. Parameters from other organs,APACHE-II score and SOFA score were also recorded. T-test, ROC curve analysis andlogistic regression were performed to compare the prognostic value among hepatic functionindices. End points included hospital discharge, ICU discharge, ventilator withdrawal andsurvival within 30d.RESULTS. 75 cases entered the study. APACHE-II scores were 17.3 ± 8.34 and SOFAscores were 11.8 ± 9.19. Cases who were discharged from hospital had higher PDR-ICG(0.234/min vs 0.177/min, p = 0.014) than those who were not. Cases who were dischargedfrom ICU or ventilator had higher CHE (3,329 vs 2,731 U/L, p = 0.049 and 3,328 vs2,716 U/L, p = 0.045 respectively) and lower TB (17.6umol/L vs 33.5umol/L, p = 0.025and 17.6umol/L vs 34.0umol/L, p = 0.021 respectively) than those who were not. Survivorshad lower TB (18.8umol/L vs 36.5umol/L, p = 0.016) and GGT (57.0U/L vs 124U/L,p = 0.049) than non-survivors.
P value of independent T-test mean comparison
Hospitaldischarge
ICUdischarge
Ventilatorwithdrawal
Surviving
PDRICG 0.014 0.086 0.142 0.525
CHE 0.189 0.049 0.045 0.582
GGT 0.180 0.07 0.075 0.049
TB 0.097 0.025 0.021 0.016
ALT 0.366 0.572 0.557 0.364
In ROC analyses, PDR-ICG was able to predict hospital (sensitivity = 69.1 %, specific-ity = 80.0 %, p = 0.001) and ICU discharge (sensitivity = 73.0 %, specificity = 57.9 %,p = 0.044). CHE (sensitivity = 78.4 %, specificity = 47.4 %, p = 0.042 and sensitiv-ity = 77.8 %, specificity = 46.2 %, p = 0.041 respectively) and GGT (sensitivity =62.2 %, specificity = 71.1 %, p = 0.044 and sensitivity = 61.1 %, specificity = 69.2 %,p = 0.050 respectively) were able to predict ICU discharge and ventilator withdrawal. TBwas able to predict survival (sensitivity = 75.0 %, specificity = 48.9 %, p = 0.027).
P value of ROC analysis
Hospitaldischarge
ICUdischarge
Ventilationwithdrawal
Surviving
PDRICG 0.001 0.044 0.071 0.413
CHE 0.253 0.042 0.041 0.521
GGT 0.217 0.044 0.050 0.112
TB 0.231 0.069 0.129 0.027
ALT 0.959 0.232 0.352 0.523
In uni- and multivariate logistic regression, higher TB was associated with lower ventilationwithdrawal rate (p \ 0.001); higher GGT was associated with lower survival rate(p = 0.005).
P value of uni- and multivariate log regression
ICU discharge Ventilatorwithdrawal
Surviving
PDRICG 0.015 0.354 0.083 0.568 0.138 \ 0.001 0.518 0.062
CHE 0.184 0.329 0.049 0.263 0.044 0.918 0.575 0.688
GGT 0.175 0.636 0.068 0.376 0.073 0.993 0.048 0.005
TB 0.095 0.004 0.025 0.15 0.021 \ 0.001 0.016 0.241
ALT 0.359 0.522 0.566 0.703 0.551 0.963 0.357 0.751
CONCLUSIONS. In sepsis PDR-ICG was associated with hospital and ICU discharge, andCHE was associated with ICU discharge and ventilator withdrawal, and GGT and TB wereassociated with ICU discharge, ventilator withdrawal and survival. These differences weredue to different indications of hepatic function indices during sepsis.REFERENCE(S) 1. Kramer L, Jordan B, et al. Incidence and prognosis of early hepaticdysfunction in critically ill patients-a prospective multicenter study. Crit Care Med.2007;35(4):1099–104. 2. Kortgen A, Paxian M, et al. Prospective assessment ofhepatic function and mechanisms of dysfunction in the critically ill. Shock.2009;32(4):358–65. 3. Huang YH, Yang YL, et al. Hepcidin protects against lipopoly-saccharide-induced liver injury in a mouse model of obstructive jaundice. Peptides.2012;35(2):212–7.
GRANT ACKNOWLEDGMENT. 5010 clinical research program grant of Sun Yat-senUniversity.
0310OUTCOME PREDICTORS IN CIRRHOTIC PATIENTS ADMITTEDTO AN INTENSIVE CARE UNIT
C. Pereira1, M. Rodrigues2, I. Aragão1, G. Campello1
1Hospital de Santo António-Centro Hospitalar do Porto, Porto, Portugal, 2Hospital DivinoEspı́rito Santo, Ponta Delgada, PortugalINTRODUCTION. Cirrhotic patients admitted to intensive care units are perceived ashaving poor prognosis, particularly in the presence of advanced liver failure, cirrhoticcomplications and concurrent dysfunction of other organs. An improvement of mortalityover time has been described, but it remains high despite intensive support.OBJECTIVES. To evaluate independent factors associated with ICU mortality in cirrhoticpatients admitted to Intensive Care Unit (ICU).METHODS. Retrospective cohort study of all patients with liver cirrhosis, diagnosisthrough clinical and/or imaging studies, admitted between 1/1/10 to 31/12/12 in a mixedICU at a tertiary, university hospital. Association of independent variables with ICU mor-tality was studied through logistic regression models. Statistical analysis was performedusing SPSS� v20.0 for Windows�.RESULTS. During the study period 1,159 patients were admitted in the ICU of those 59 hadliver cirrhosis (5 %). The mean age of this subgroup was 57 ± 12 years, 80 % were men.The most frequent etiology for cirrhosis was alcohol (66 %), followed by mixed (alcoholand virus) in 17 %. The main diagnoses at admission were septic shock (32 %), hypovo-lemic shock (22 %) and gastrointestinal bleeding (14 %). The mean scores of SAPS II,SOFA 24 h, MELD and Child-Pugh were, respectively, 56 ± 17, 9 ± 3.5, 17 ± 7 and9 ± 1.8. In this group of patients, 88 % had evidence of portal hypertension and the mostfrequent complications were: ascites (64 %), hepatic encephalopathy (49 %) and uppergastrointestinal bleeding (37 %). Regarding organ dysfunction support: 93 % requiredmechanical ventilation, 56 % vasopressor therapy and 15 % renal replacement therapy. ICUmortality rate was 51 %. General ICU population mortality rate was 29 %. In the univariateanalysis variables significantly associated with ICU mortality were: SAPS II (OR 1.1,p \ 0.01), SOFA 24 h (OR 1.4, p \ 0.01), vasopressor therapy (OR 13.1, p \ 0.01) andascites (OR 6.2, p \ 0.01). Those with a clinical or statically significant association withmortality were included in a multivariate model, that retained SAPS II score (OR 1.1 perpoint, CI95 % = 1.04–1.16), vasopressor therapy (OR 9.3 per point, CI95 % = 1.8–47.3) andascites (OR 6.9 per point, CI95 % = 1.2–39.3).The model had a very good discriminationpower with an AUROC of 0.92. The occurrence of upper gastrointestinal bleeding andhepatic encephalopathy were not associated with worse prognosis in this patient0s group.CONCLUSIONS. Cirrhotic patients represent a very small proportion of ICU admissions.ICU mortality was almost double than in general ICU population. Factors independentlyassociated ICU mortality in this group were: SAPS II, vasopressor therapy and ascites.REFERENCE(S) 1. Cholongitas E, et al.; Risk factors, sequencial organ failure assessmentand model for end-stage liver disease scores for predicting short term mortality in cirrhoticpatients admitted to intensive care unit. Aliment Pharmacol Ther. 2006;23:883–893.
0311MICROCIRCULATORY REACTIVITY IN PATIENTS WITH DECOMPENSATEDLIVER CIRRHOSIS
E. Colombaroli1, K. Donadello1, N. Al Jaridi1, T. Gustot2, S. Scolletta1, L. Gottin3,J. Creteur1, J.-L. Vincent1, F.S. Taccone1, D. De Backer1
1Erasme University Hospital, Intensive Care Department, Brussels, Belgium, 2ErasmeUniversity Hospital, Hepatology Department, Brussels, Belgium, 3Azienda OspedalieraUniversitaria Integrata, Università degli studi di Verona, Intensive Care Department,Verone, ItalyINTRODUCTION. Cirrhosis is tipically associated with a hyperdynamic pattern, similar tosepsis. Although microcirculatory disturbances are common in sepsis, they have not beenwell studied in cirrhosis.OBJECTIVES. To study the relationship between muscular microvascular function and thelevels of mean arterial pressure (MAP) in critically ill patients with decompensated livercirrhosis.METHODS. Thenar muscle oxygen saturation (StO2) and muscle tissue hemoglobin index(THI) were continuously measured by a tissue spectrometer (InSpectraTM Model 650,Hutchinson Technology Inc, MN) in decompensated cirrhotic patients. In 35 patients, 27(77 %) male, 56 [49–62] years, median APACHE II score on ICU admission 17 [16–20],and SOFA score on the day of enrolment 10 [8–13]; 23 patients (65 %) were Child Pugh C.Vaso-occlusive tests (VOT) (upper limb ischemia induced by a rapid pneumatic cuffinflation around the upper arm) were performed for all of them within 24 h from ICUadmission. The following variables were recorded: StO2, THI, the slope of the decrease inStO2 during the occlusion (desc slope; %/s), the slope of the increase in StO2 following theischemic period (asc slope; %/s), and muscle O2 consumption (nirVO2) expressing inarbitrary units using the following formula: -(Descending slope) 9 [(Basal THI + MinTHI/2)]. We also pre-defined patients’ categories as those receiving or not vasopressoragents (VP) or in those having a mean arterial pressure (MAP) B or [70 mmHg. Data arepresented as median [ranges] and count (percentage).RESULTS. Of the 35 patients, 21 (60 %) were in severe sepsis/septic shock and 22 (63 %)patients were treated with vasopressors (noradrenaline or terlipressin). ICU mortality was49 %. Median MAP was 76 [68–81] mmHg. NIRS values showed high StO2 (84.3[80–88] %, and normal THI values (10.7 [8.7–13]), altered desc slope (-0.19 [-0.25 to(-0.14)] and asc slope 1.27 ([0.79–2.03]) values. There was no correlation between MAP(range 50–107 mmHg) and NIRS variables in the global cohort of patients. Nevertheless, wefound a weak although significant correlation between asc slope and MAP among patientswithout VP (r2 = 0.07; p = 0.04). In this subgroup of patients, StO2 was significantly lowerin those (n = 4) with MAP B 70 [50–70] mmHg when compared to the others (n = 9)[72–107 mmHg] (78 [62–81] vs. 86 [81–90], p = 0.02), with a trend also for lower ascslope (p = 0.07). On the other hand, among patients with MAP [ 70 mmHg, we foundlower desc slope (-0.16 [-0.19/-0.14] vs. -0.25 [-0.28/-0.14], p = 0.01) and nirVO2(90 [71–104) vs. 143 [115–189], p = 0.02) among those treated with VP when compared tothose without VP.CONCLUSIONS. In decompensated cirrhotic patients, tissue oxygen saturation is relatedto MAP, unless they are treated with VP. The presence of shock and/or the use of vaso-pressors may influence microvascular reactivity and muscle oxygen consumption, especiallywhen MAP is higher than 70 mmHg.
26th ESICM ANNUAL CONGRESS — PARIS, FRANCE — 5–9 OCTOBER 2013
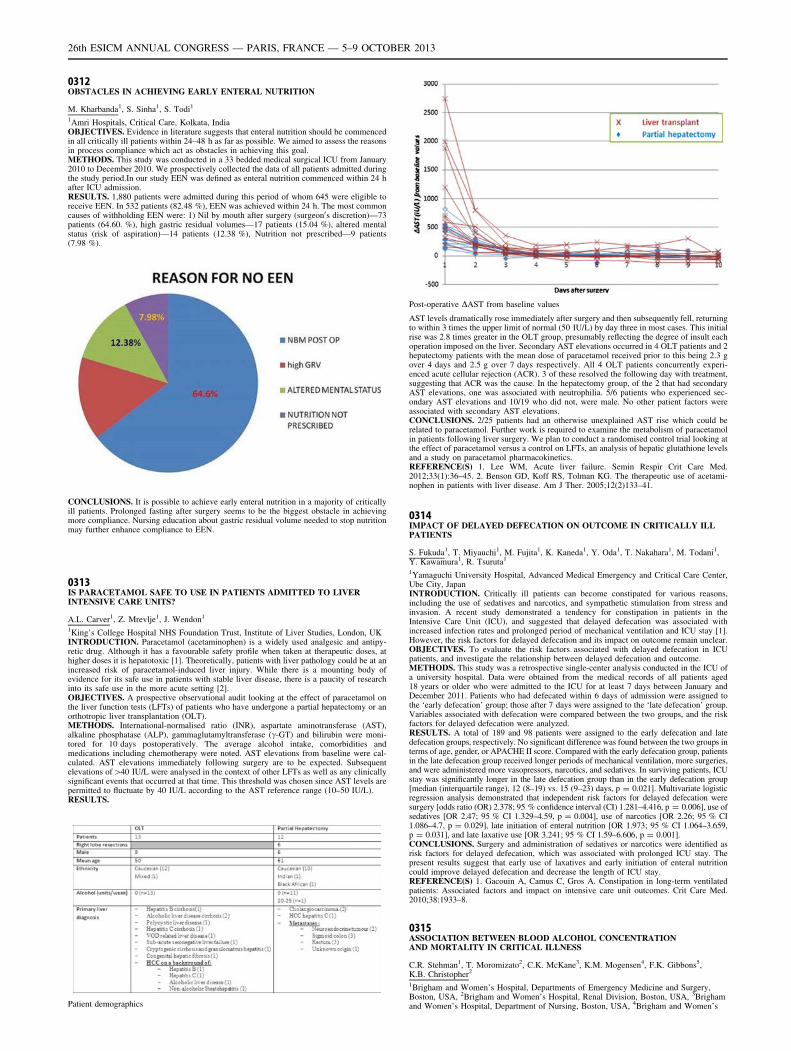
0312OBSTACLES IN ACHIEVING EARLY ENTERAL NUTRITION
M. Kharbanda1, S. Sinha1, S. Todi1
1Amri Hospitals, Critical Care, Kolkata, IndiaOBJECTIVES. Evidence in literature suggests that enteral nutrition should be commencedin all critically ill patients within 24–48 h as far as possible. We aimed to assess the reasonsin process compliance which act as obstacles in achieving this goal.METHODS. This study was conducted in a 33 bedded medical surgical ICU from January2010 to December 2010. We prospectively collected the data of all patients admitted duringthe study period.In our study EEN was defined as enteral nutrition commenced within 24 hafter ICU admission.RESULTS. 1,880 patients were admitted during this period of whom 645 were eligible toreceive EEN. In 532 patients (82.48 %), EEN was achieved within 24 h. The most commoncauses of withholding EEN were: 1) Nil by mouth after surgery (surgeon0s discretion)—73patients (64.60. %), high gastric residual volumes—17 patients (15.04 %), altered mentalstatus (risk of aspiration)—14 patients (12.38 %), Nutrition not prescribed—9 patients(7.98 %).
CONCLUSIONS. It is possible to achieve early enteral nutrition in a majority of criticallyill patients. Prolonged fasting after surgery seems to be the biggest obstacle in achievingmore compliance. Nursing education about gastric residual volume needed to stop nutritionmay further enhance compliance to EEN.
0313IS PARACETAMOL SAFE TO USE IN PATIENTS ADMITTED TO LIVERINTENSIVE CARE UNITS?
A.L. Carver1, Z. Mrevlje1, J. Wendon1
1King’s College Hospital NHS Foundation Trust, Institute of Liver Studies, London, UKINTRODUCTION. Paracetamol (acetaminophen) is a widely used analgesic and antipy-retic drug. Although it has a favourable safety profile when taken at therapeutic doses, athigher doses it is hepatotoxic [1]. Theoretically, patients with liver pathology could be at anincreased risk of paracetamol-induced liver injury. While there is a mounting body ofevidence for its safe use in patients with stable liver disease, there is a paucity of researchinto its safe use in the more acute setting [2].OBJECTIVES. A prospective observational audit looking at the effect of paracetamol onthe liver function tests (LFTs) of patients who have undergone a partial hepatectomy or anorthotropic liver transplantation (OLT).METHODS. International-normalised ratio (INR), aspartate aminotransferase (AST),alkaline phosphatase (ALP), gammaglutamyltransferase (c-GT) and bilirubin were moni-tored for 10 days postoperatively. The average alcohol intake, comorbidities andmedications including chemotherapy were noted. AST elevations from baseline were cal-culated. AST elevations immediately following surgery are to be expected. Subsequentelevations of[40 IU/L were analysed in the context of other LFTs as well as any clinicallysignificant events that occurred at that time. This threshold was chosen since AST levels arepermitted to fluctuate by 40 IU/L according to the AST reference range (10–50 IU/L).RESULTS.
Patient demographics
Post-operative DAST from baseline values
AST levels dramatically rose immediately after surgery and then subsequently fell, returningto within 3 times the upper limit of normal (50 IU/L) by day three in most cases. This initialrise was 2.8 times greater in the OLT group, presumably reflecting the degree of insult eachoperation imposed on the liver. Secondary AST elevations occurred in 4 OLT patients and 2hepatectomy patients with the mean dose of paracetamol received prior to this being 2.3 gover 4 days and 2.5 g over 7 days respectively. All 4 OLT patients concurrently experi-enced acute cellular rejection (ACR). 3 of these resolved the following day with treatment,suggesting that ACR was the cause. In the hepatectomy group, of the 2 that had secondaryAST elevations, one was associated with neutrophilia. 5/6 patients who experienced sec-ondary AST elevations and 10/19 who did not, were male. No other patient factors wereassociated with secondary AST elevations.CONCLUSIONS. 2/25 patients had an otherwise unexplained AST rise which could berelated to paracetamol. Further work is required to examine the metabolism of paracetamolin patients following liver surgery. We plan to conduct a randomised control trial looking atthe effect of paracetamol versus a control on LFTs, an analysis of hepatic glutathione levelsand a study on paracetamol pharmacokinetics.REFERENCE(S) 1. Lee WM, Acute liver failure. Semin Respir Crit Care Med.2012;33(1):36–45. 2. Benson GD, Koff RS, Tolman KG. The therapeutic use of acetami-nophen in patients with liver disease. Am J Ther. 2005;12(2)133–41.
0314IMPACT OF DELAYED DEFECATION ON OUTCOME IN CRITICALLY ILLPATIENTS
S. Fukuda1, T. Miyauchi1, M. Fujita1, K. Kaneda1, Y. Oda1, T. Nakahara1, M. Todani1,Y. Kawamura1, R. Tsuruta1
1Yamaguchi University Hospital, Advanced Medical Emergency and Critical Care Center,Ube City, JapanINTRODUCTION. Critically ill patients can become constipated for various reasons,including the use of sedatives and narcotics, and sympathetic stimulation from stress andinvasion. A recent study demonstrated a tendency for constipation in patients in theIntensive Care Unit (ICU), and suggested that delayed defecation was associated withincreased infection rates and prolonged period of mechanical ventilation and ICU stay [1].However, the risk factors for delayed defecation and its impact on outcome remain unclear.OBJECTIVES. To evaluate the risk factors associated with delayed defecation in ICUpatients, and investigate the relationship between delayed defecation and outcome.METHODS. This study was a retrospective single-center analysis conducted in the ICU ofa university hospital. Data were obtained from the medical records of all patients aged18 years or older who were admitted to the ICU for at least 7 days between January andDecember 2011. Patients who had defecated within 6 days of admission were assigned tothe ‘early defecation’ group; those after 7 days were assigned to the ‘late defecation’ group.Variables associated with defecation were compared between the two groups, and the riskfactors for delayed defecation were analyzed.RESULTS. A total of 189 and 98 patients were assigned to the early defecation and latedefecation groups, respectively. No significant difference was found between the two groups interms of age, gender, or APACHE II score. Compared with the early defecation group, patientsin the late defecation group received longer periods of mechanical ventilation, more surgeries,and were administered more vasopressors, narcotics, and sedatives. In surviving patients, ICUstay was significantly longer in the late defecation group than in the early defecation group[median (interquartile range), 12 (8–19) vs. 15 (9–23) days, p = 0.021]. Multivariate logisticregression analysis demonstrated that independent risk factors for delayed defecation weresurgery [odds ratio (OR) 2.378; 95 % confidence interval (CI) 1.281–4.416, p = 0.006], use ofsedatives [OR 2.47; 95 % CI 1.329–4.59, p = 0.004], use of narcotics [OR 2.26; 95 % CI1.086–4.7, p = 0.029], late initiation of enteral nutrition [OR 1.973; 95 % CI 1.064–3.659,p = 0.031], and late laxative use [OR 3.241; 95 % CI 1.59–6.606, p = 0.001].CONCLUSIONS. Surgery and administration of sedatives or narcotics were identified asrisk factors for delayed defecation, which was associated with prolonged ICU stay. Thepresent results suggest that early use of laxatives and early initiation of enteral nutritioncould improve delayed defecation and decrease the length of ICU stay.REFERENCE(S) 1. Gacouin A, Camus C, Gros A. Constipation in long-term ventilatedpatients: Associated factors and impact on intensive care unit outcomes. Crit Care Med.2010;38:1933–8.
0315ASSOCIATION BETWEEN BLOOD ALCOHOL CONCENTRATIONAND MORTALITY IN CRITICAL ILLNESS
C.R. Stehman1, T. Moromizato2, C.K. McKane3, K.M. Mogensen4, F.K. Gibbons5,K.B. Christopher2
1Brigham and Women’s Hospital, Departments of Emergency Medicine and Surgery,Boston, USA, 2Brigham and Women’s Hospital, Renal Division, Boston, USA, 3Brighamand Women’s Hospital, Department of Nursing, Boston, USA, 4Brigham and Women’s
26th ESICM ANNUAL CONGRESS — PARIS, FRANCE — 5–9 OCTOBER 2013
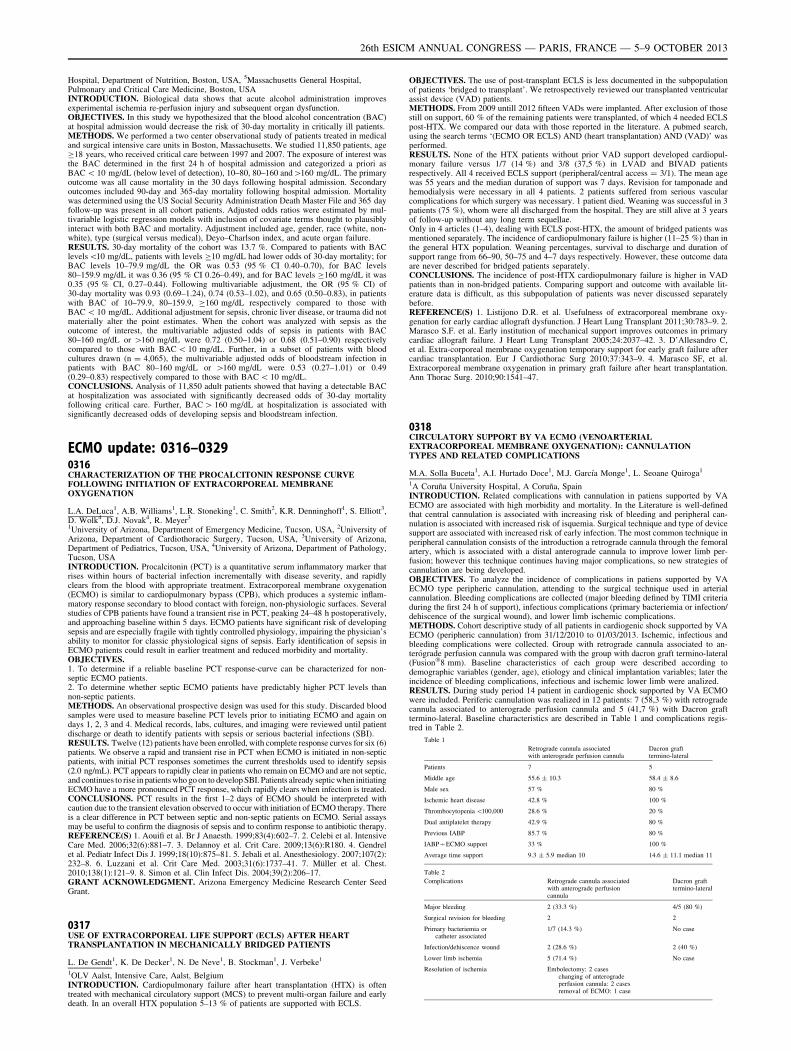
Hospital, Department of Nutrition, Boston, USA, 5Massachusetts General Hospital,Pulmonary and Critical Care Medicine, Boston, USAINTRODUCTION. Biological data shows that acute alcohol administration improvesexperimental ischemia re-perfusion injury and subsequent organ dysfunction.OBJECTIVES. In this study we hypothesized that the blood alcohol concentration (BAC)at hospital admission would decrease the risk of 30-day mortality in critically ill patients.METHODS. We performed a two center observational study of patients treated in medicaland surgical intensive care units in Boston, Massachusetts. We studied 11,850 patients, ageC18 years, who received critical care between 1997 and 2007. The exposure of interest wasthe BAC determined in the first 24 h of hospital admission and categorized a priori asBAC \ 10 mg/dL (below level of detection), 10–80, 80–160 and[160 mg/dL. The primaryoutcome was all cause mortality in the 30 days following hospital admission. Secondaryoutcomes included 90-day and 365-day mortality following hospital admission. Mortalitywas determined using the US Social Security Administration Death Master File and 365 dayfollow-up was present in all cohort patients. Adjusted odds ratios were estimated by mul-tivariable logistic regression models with inclusion of covariate terms thought to plausiblyinteract with both BAC and mortality. Adjustment included age, gender, race (white, non-white), type (surgical versus medical), Deyo–Charlson index, and acute organ failure.RESULTS. 30-day mortality of the cohort was 13.7 %. Compared to patients with BAClevels\10 mg/dL, patients with levels C10 mg/dL had lower odds of 30-day mortality; forBAC levels 10–79.9 mg/dL the OR was 0.53 (95 % CI 0.40–0.70), for BAC levels80–159.9 mg/dL it was 0.36 (95 % CI 0.26–0.49), and for BAC levels C160 mg/dL it was0.35 (95 % CI, 0.27–0.44). Following multivariable adjustment, the OR (95 % CI) of30-day mortality was 0.93 (0.69–1.24), 0.74 (0.53–1.02), and 0.65 (0.50–0.83), in patientswith BAC of 10–79.9, 80–159.9, C160 mg/dL respectively compared to those withBAC \ 10 mg/dL. Additional adjustment for sepsis, chronic liver disease, or trauma did notmaterially alter the point estimates. When the cohort was analyzed with sepsis as theoutcome of interest, the multivariable adjusted odds of sepsis in patients with BAC80–160 mg/dL or [160 mg/dL were 0.72 (0.50–1.04) or 0.68 (0.51–0.90) respectivelycompared to those with BAC \ 10 mg/dL. Further, in a subset of patients with bloodcultures drawn (n = 4,065), the multivariable adjusted odds of bloodstream infection inpatients with BAC 80–160 mg/dL or [160 mg/dL were 0.53 (0.27–1.01) or 0.49(0.29–0.83) respectively compared to those with BAC \ 10 mg/dL.CONCLUSIONS. Analysis of 11,850 adult patients showed that having a detectable BACat hospitalization was associated with significantly decreased odds of 30-day mortalityfollowing critical care. Further, BAC [ 160 mg/dL at hospitalization is associated withsignificantly decreased odds of developing sepsis and bloodstream infection.
ECMO update: 0316–03290316CHARACTERIZATION OF THE PROCALCITONIN RESPONSE CURVEFOLLOWING INITIATION OF EXTRACORPOREAL MEMBRANEOXYGENATION
L.A. DeLuca1, A.B. Williams1, L.R. Stoneking1, C. Smith2, K.R. Denninghoff1, S. Elliott3,D. Wolk4, D.J. Novak4, R. Meyer3
1University of Arizona, Department of Emergency Medicine, Tucson, USA, 2University ofArizona, Department of Cardiothoracic Surgery, Tucson, USA, 3University of Arizona,Department of Pediatrics, Tucson, USA, 4University of Arizona, Department of Pathology,Tucson, USAINTRODUCTION. Procalcitonin (PCT) is a quantitative serum inflammatory marker thatrises within hours of bacterial infection incrementally with disease severity, and rapidlyclears from the blood with appropriate treatment. Extracorporeal membrane oxygenation(ECMO) is similar to cardiopulmonary bypass (CPB), which produces a systemic inflam-matory response secondary to blood contact with foreign, non-physiologic surfaces. Severalstudies of CPB patients have found a transient rise in PCT, peaking 24–48 h postoperatively,and approaching baseline within 5 days. ECMO patients have significant risk of developingsepsis and are especially fragile with tightly controlled physiology, impairing the physician’sability to monitor for classic physiological signs of sepsis. Early identification of sepsis inECMO patients could result in earlier treatment and reduced morbidity and mortality.OBJECTIVES.1. To determine if a reliable baseline PCT response-curve can be characterized for non-septic ECMO patients.2. To determine whether septic ECMO patients have predictably higher PCT levels thannon-septic patients.METHODS. An observational prospective design was used for this study. Discarded bloodsamples were used to measure baseline PCT levels prior to initiating ECMO and again ondays 1, 2, 3 and 4. Medical records, labs, cultures, and imaging were reviewed until patientdischarge or death to identify patients with sepsis or serious bacterial infections (SBI).RESULTS. Twelve (12) patients have been enrolled, with complete response curves for six (6)patients. We observe a rapid and transient rise in PCT when ECMO is initiated in non-septicpatients, with initial PCT responses sometimes the current thresholds used to identify sepsis(2.0 ng/mL). PCT appears to rapidly clear in patients who remain on ECMO and are not septic,and continues to rise in patients who go on to develop SBI. Patients already septic when initiatingECMO have a more pronounced PCT response, which rapidly clears when infection is treated.CONCLUSIONS. PCT results in the first 1–2 days of ECMO should be interpreted withcaution due to the transient elevation observed to occur with initiation of ECMO therapy. Thereis a clear difference in PCT between septic and non-septic patients on ECMO. Serial assaysmay be useful to confirm the diagnosis of sepsis and to confirm response to antibiotic therapy.REFERENCE(S) 1. Aouifi et al. Br J Anaesth. 1999;83(4):602–7. 2. Celebi et al. IntensiveCare Med. 2006;32(6):881–7. 3. Delannoy et al. Crit Care. 2009;13(6):R180. 4. Gendrelet al. Pediatr Infect Dis J. 1999;18(10):875–81. 5. Jebali et al. Anesthesiology. 2007;107(2):232–8. 6. Luzzani et al. Crit Care Med. 2003;31(6):1737–41. 7. Müller et al. Chest.2010;138(1):121–9. 8. Simon et al. Clin Infect Dis. 2004;39(2):206–17.GRANT ACKNOWLEDGMENT. Arizona Emergency Medicine Research Center SeedGrant.
0317USE OF EXTRACORPOREAL LIFE SUPPORT (ECLS) AFTER HEARTTRANSPLANTATION IN MECHANICALLY BRIDGED PATIENTS
L. De Gendt1, K. De Decker1, N. De Neve1, B. Stockman1, J. Verbeke1
1OLV Aalst, Intensive Care, Aalst, BelgiumINTRODUCTION. Cardiopulmonary failure after heart transplantation (HTX) is oftentreated with mechanical circulatory support (MCS) to prevent multi-organ failure and earlydeath. In an overall HTX population 5–13 % of patients are supported with ECLS.
OBJECTIVES. The use of post-transplant ECLS is less documented in the subpopulationof patients ‘bridged to transplant’. We retrospectively reviewed our transplanted ventricularassist device (VAD) patients.METHODS. From 2009 untill 2012 fifteen VADs were implanted. After exclusion of thosestill on support, 60 % of the remaining patients were transplanted, of which 4 needed ECLSpost-HTX. We compared our data with those reported in the literature. A pubmed search,using the search terms ‘(ECMO OR ECLS) AND (heart transplantation) AND (VAD)’ wasperformed.RESULTS. None of the HTX patients without prior VAD support developed cardiopul-monary failure versus 1/7 (14 %) and 3/8 (37,5 %) in LVAD and BIVAD patientsrespectively. All 4 received ECLS support (peripheral/central access = 3/1). The mean agewas 55 years and the median duration of support was 7 days. Revision for tamponade andhemodialysis were necessary in all 4 patients. 2 patients suffered from serious vascularcomplications for which surgery was necessary. 1 patient died. Weaning was successful in 3patients (75 %), whom were all discharged from the hospital. They are still alive at 3 yearsof follow-up without any long term sequellae.Only in 4 articles (1–4), dealing with ECLS post-HTX, the amount of bridged patients wasmentioned separately. The incidence of cardiopulmonary failure is higher (11–25 %) than inthe general HTX population. Weaning percentages, survival to discharge and duration ofsupport range from 66–90, 50–75 and 4–7 days respectively. However, these outcome dataare never described for bridged patients separately.CONCLUSIONS. The incidence of post-HTX cardiopulmonary failure is higher in VADpatients than in non-bridged patients. Comparing support and outcome with available lit-erature data is difficult, as this subpopulation of patients was never discussed separatelybefore.REFERENCE(S) 1. Listijono D.R. et al. Usefulness of extracorporeal membrane oxy-genation for early cardiac allograft dysfunction. J Heart Lung Transplant 2011;30:783–9. 2.Marasco S.F. et al. Early institution of mechanical support improves outcomes in primarycardiac allograft failure. J Heart Lung Transplant 2005;24:2037–42. 3. D’Allesandro C,et al. Extra-corporeal membrane oxygenation temporary support for early graft failure aftercardiac transplantation. Eur J Cardiothorac Surg 2010;37:343–9. 4. Marasco SF, et al.Extracorporeal membrane oxygenation in primary graft failure after heart transplantation.Ann Thorac Surg. 2010;90:1541–47.
0318CIRCULATORY SUPPORT BY VA ECMO (VENOARTERIALEXTRACORPOREAL MEMBRANE OXYGENATION): CANNULATIONTYPES AND RELATED COMPLICATIONS
M.A. Solla Buceta1, A.I. Hurtado Doce1, M.J. Garcı́a Monge1, L. Seoane Quiroga1
1A Coruña University Hospital, A Coruña, SpainINTRODUCTION. Related complications with cannulation in patiens supported by VAECMO are associated with high morbidity and mortality. In the Literature is well-definedthat central cannulation is associated with increasing risk of bleeding and peripheral can-nulation is associated with increased risk of isquemia. Surgical technique and type of devicesupport are associated with increased risk of early infection. The most common technique inperipheral cannulation consists of the introduction a retrograde cannula through the femoralartery, which is associated with a distal anterograde cannula to improve lower limb per-fusion; however this technique continues having major complications, so new strategies ofcannulation are being developed.OBJECTIVES. To analyze the incidence of complications in patiens supported by VAECMO type peripheric cannulation, attending to the surgical technique used in arterialcannulation. Bleeding complications are collected (major bleeding defined by TIMI criteriaduring the first 24 h of support), infectious complications (primary bacteriemia or infection/dehiscence of the surgical wound), and lower limb ischemic complications.METHODS. Cohort descriptive study of all patients in cardiogenic shock supported by VAECMO (peripheric cannulation) from 31/12/2010 to 01/03/2013. Ischemic, infectious andbleeding complications were collected. Group with retrograde cannula associated to an-terógrade perfusion cannula was compared with the group with dacron graft termino-lateral(Fusion�8 mm). Baseline characteristics of each group were described according todemographic variables (gender, age), etiology and clinical implantation variables; later theincidence of bleeding complications, infectious and ischemic lower limb were analized.RESULTS. During study period 14 patient in cardiogenic shock supported by VA ECMOwere included. Periferic cannulation was realized in 12 patients: 7 (58,3 %) with retrogradecannula associated to anterograde perfusion cannula and 5 (41,7 %) with Dacron grafttermino-lateral. Baseline characteristics are described in Table 1 and complications regis-tred in Table 2.
Table 1
Retrograde cannula associatedwith anterograde perfusion cannula
Dacron grafttermino-lateral
Patients 7 5
Middle age 55.6 ± 10.3 58.4 ± 8.6
Male sex 57 % 80 %
Ischemic heart disease 42.8 % 100 %
Thrombocytopenia \100,000 28.6 % 20 %
Dual antiplatelet therapy 42.9 % 80 %
Previous IABP 85.7 % 80 %
IABP7ECMO support 33 % 100 %
Average time support 9.3 ± 5.9 median 10 14.6 ± 11.1 median 11
Table 2
Complications Retrograde cannula associatedwith anterograde perfusioncannula
Dacron grafttermino-lateral
Major bleeding 2 (33.3 %) 4/5 (80 %)
Surgical revision for bleeding 2 2
Primary bacteriemia orcatheter associated
1/7 (14.3 %) No case
Infection/dehiscence wound 2 (28.6 %) 2 (40 %)
Lower limb ischemia 5 (71.4 %) No case
Resolution of ischemia Embolectomy: 2 caseschanging of anterogradeperfusion cannula: 2 casesremoval of ECMO: 1 case
26th ESICM ANNUAL CONGRESS — PARIS, FRANCE — 5–9 OCTOBER 2013
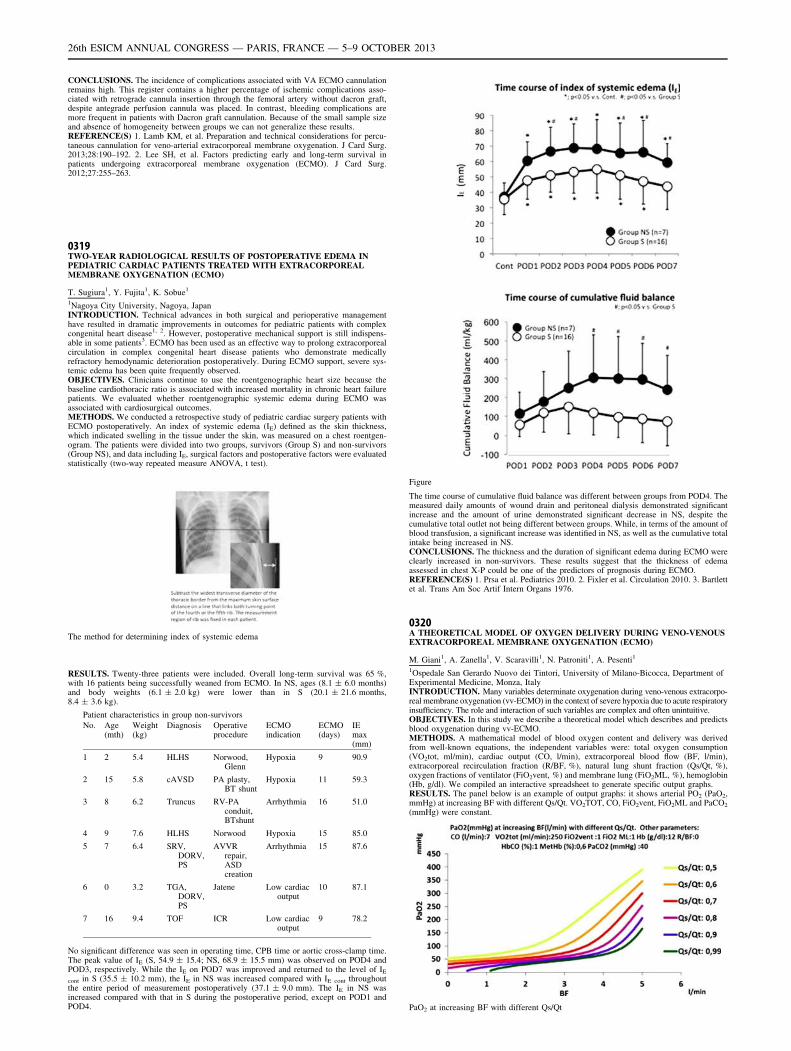
CONCLUSIONS. The incidence of complications associated with VA ECMO cannulationremains high. This register contains a higher percentage of ischemic complications asso-ciated with retrograde cannula insertion through the femoral artery without dacron graft,despite antegrade perfusion cannula was placed. In contrast, bleeding complications aremore frequent in patients with Dacron graft cannulation. Because of the small sample sizeand absence of homogeneity between groups we can not generalize these results.REFERENCE(S) 1. Lamb KM, et al. Preparation and technical considerations for percu-taneous cannulation for veno-arterial extracorporeal membrane oxygenation. J Card Surg.2013;28:190–192. 2. Lee SH, et al. Factors predicting early and long-term survival inpatients undergoing extracorporeal membrane oxygenation (ECMO). J Card Surg.2012;27:255–263.
0319TWO-YEAR RADIOLOGICAL RESULTS OF POSTOPERATIVE EDEMA INPEDIATRIC CARDIAC PATIENTS TREATED WITH EXTRACORPOREALMEMBRANE OXYGENATION (ECMO)
T. Sugiura1, Y. Fujita1, K. Sobue1
1Nagoya City University, Nagoya, JapanINTRODUCTION. Technical advances in both surgical and perioperative managementhave resulted in dramatic improvements in outcomes for pediatric patients with complexcongenital heart disease1, 2. However, postoperative mechanical support is still indispens-able in some patients3. ECMO has been used as an effective way to prolong extracorporealcirculation in complex congenital heart disease patients who demonstrate medicallyrefractory hemodynamic deterioration postoperatively. During ECMO support, severe sys-temic edema has been quite frequently observed.OBJECTIVES. Clinicians continue to use the roentgenographic heart size because thebaseline cardiothoracic ratio is associated with increased mortality in chronic heart failurepatients. We evaluated whether roentgenographic systemic edema during ECMO wasassociated with cardiosurgical outcomes.METHODS. We conducted a retrospective study of pediatric cardiac surgery patients withECMO postoperatively. An index of systemic edema (IE) defined as the skin thickness,which indicated swelling in the tissue under the skin, was measured on a chest roentgen-ogram. The patients were divided into two groups, survivors (Group S) and non-survivors(Group NS), and data including IE, surgical factors and postoperative factors were evaluatedstatistically (two-way repeated measure ANOVA, t test).
The method for determining index of systemic edema
RESULTS. Twenty-three patients were included. Overall long-term survival was 65 %,with 16 patients being successfully weaned from ECMO. In NS, ages (8.1 ± 6.0 months)and body weights (6.1 ± 2.0 kg) were lower than in S (20.1 ± 21.6 months,8.4 ± 3.6 kg).
Patient characteristics in group non-survivors
No. Age(mth)
Weight(kg)
Diagnosis Operativeprocedure
ECMOindication
ECMO(days)
IEmax(mm)
1 2 5.4 HLHS Norwood,Glenn
Hypoxia 9 90.9
2 15 5.8 cAVSD PA plasty,BT shunt
Hypoxia 11 59.3
3 8 6.2 Truncus RV-PAconduit,BTshunt
Arrhythmia 16 51.0
4 9 7.6 HLHS Norwood Hypoxia 15 85.0
5 7 6.4 SRV,DORV,PS
AVVRrepair,ASDcreation
Arrhythmia 15 87.6
6 0 3.2 TGA,DORV,PS
Jatene Low cardiacoutput
10 87.1
7 16 9.4 TOF ICR Low cardiacoutput
9 78.2
No significant difference was seen in operating time, CPB time or aortic cross-clamp time.The peak value of IE (S, 54.9 ± 15.4; NS, 68.9 ± 15.5 mm) was observed on POD4 andPOD3, respectively. While the IE on POD7 was improved and returned to the level of IE
cont in S (35.5 ± 10.2 mm), the IE in NS was increased compared with IE cont throughoutthe entire period of measurement postoperatively (37.1 ± 9.0 mm). The IE in NS wasincreased compared with that in S during the postoperative period, except on POD1 andPOD4.
Figure
The time course of cumulative fluid balance was different between groups from POD4. Themeasured daily amounts of wound drain and peritoneal dialysis demonstrated significantincrease and the amount of urine demonstrated significant decrease in NS, despite thecumulative total outlet not being different between groups. While, in terms of the amount ofblood transfusion, a significant increase was identified in NS, as well as the cumulative totalintake being increased in NS.CONCLUSIONS. The thickness and the duration of significant edema during ECMO wereclearly increased in non-survivors. These results suggest that the thickness of edemaassessed in chest X-P could be one of the predictors of prognosis during ECMO.REFERENCE(S) 1. Prsa et al. Pediatrics 2010. 2. Fixler et al. Circulation 2010. 3. Bartlettet al. Trans Am Soc Artif Intern Organs 1976.
0320A THEORETICAL MODEL OF OXYGEN DELIVERY DURING VENO-VENOUSEXTRACORPOREAL MEMBRANE OXYGENATION (ECMO)
M. Giani1, A. Zanella1, V. Scaravilli1, N. Patroniti1, A. Pesenti1
1Ospedale San Gerardo Nuovo dei Tintori, University of Milano-Bicocca, Department ofExperimental Medicine, Monza, ItalyINTRODUCTION. Many variables determinate oxygenation during veno-venous extracorpo-real membrane oxygenation (vv-ECMO) in the context of severe hypoxia due to acute respiratoryinsufficiency. The role and interaction of such variables are complex and often unintuitive.OBJECTIVES. In this study we describe a theoretical model which describes and predictsblood oxygenation during vv-ECMO.METHODS. A mathematical model of blood oxygen content and delivery was derivedfrom well-known equations, the independent variables were: total oxygen consumption(VO2tot, ml/min), cardiac output (CO, l/min), extracorporeal blood flow (BF, l/min),extracorporeal recirculation fraction (R/BF, %), natural lung shunt fraction (Qs/Qt, %),oxygen fractions of ventilator (FiO2vent, %) and membrane lung (FiO2ML, %), hemoglobin(Hb, g/dl). We compiled an interactive spreadsheet to generate specific output graphs.RESULTS. The panel below is an example of output graphs: it shows arterial PO2 (PaO2,mmHg) at increasing BF with different Qs/Qt. VO2TOT, CO, FiO2vent, FiO2ML and PaCO2
(mmHg) were constant.
PaO2 at increasing BF with different Qs/Qt
26th ESICM ANNUAL CONGRESS — PARIS, FRANCE — 5–9 OCTOBER 2013
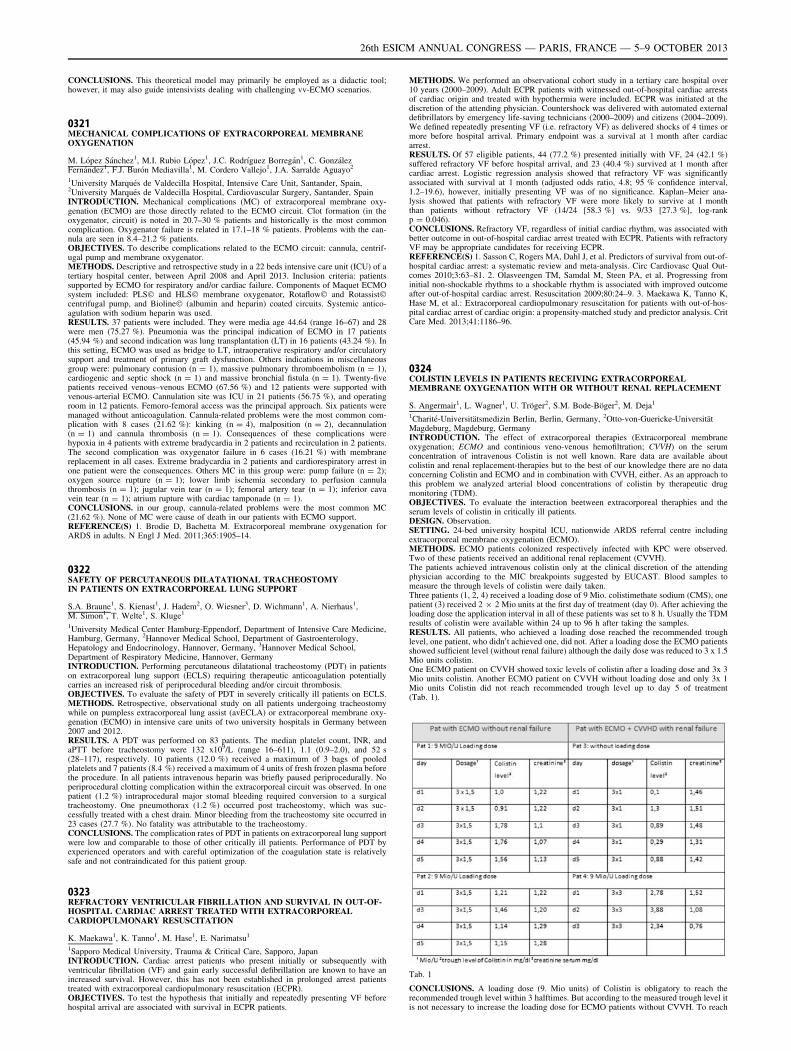
CONCLUSIONS. This theoretical model may primarily be employed as a didactic tool;however, it may also guide intensivists dealing with challenging vv-ECMO scenarios.
0321MECHANICAL COMPLICATIONS OF EXTRACORPOREAL MEMBRANEOXYGENATION
M. López Sánchez1, M.I. Rubio López1, J.C. Rodrı́guez Borregán1, C. GonzálezFernández1, F.J. Burón Mediavilla1, M. Cordero Vallejo1, J.A. Sarralde Aguayo2
1University Marqués de Valdecilla Hospital, Intensive Care Unit, Santander, Spain,2University Marqués de Valdecilla Hospital, Cardiovascular Surgery, Santander, SpainINTRODUCTION. Mechanical complications (MC) of extracorporeal membrane oxy-genation (ECMO) are those directly related to the ECMO circuit. Clot formation (in theoxygenator, circuit) is noted in 20.7–30 % patients and historically is the most commoncomplication. Oxygenator failure is related in 17.1–18 % patients. Problems with the can-nula are seen in 8.4–21.2 % patients.OBJECTIVES. To describe complications related to the ECMO circuit: cannula, centrif-ugal pump and membrane oxygenator.METHODS. Descriptive and retrospective study in a 22 beds intensive care unit (ICU) of atertiary hospital center, between April 2008 and April 2013. Inclusion criteria: patientssupported by ECMO for respiratory and/or cardiac failure. Components of Maquet ECMOsystem included: PLS� and HLS� membrane oxygenator, Rotaflow� and Rotassist�centrifugal pump, and Bioline� (albumin and heparin) coated circuits. Systemic antico-agulation with sodium heparin was used.RESULTS. 37 patients were included. They were media age 44.64 (range 16–67) and 28were men (75.27 %). Pneumonia was the principal indication of ECMO in 17 patients(45.94 %) and second indication was lung transplantation (LT) in 16 patients (43.24 %). Inthis setting, ECMO was used as bridge to LT, intraoperative respiratory and/or circulatorysupport and treatment of primary graft dysfunction. Others indications in miscellaneousgroup were: pulmonary contusion (n = 1), massive pulmonary thromboembolism (n = 1),cardiogenic and septic shock (n = 1) and massive bronchial fistula (n = 1). Twenty-fivepatients received venous–venous ECMO (67.56 %) and 12 patients were supported withvenous-arterial ECMO. Cannulation site was ICU in 21 patients (56.75 %), and operatingroom in 12 patients. Femoro-femoral access was the principal approach. Six patients weremanaged without anticoagulation. Cannula-related problems were the most common com-plication with 8 cases (21.62 %): kinking (n = 4), malposition (n = 2), decannulation(n = 1) and cannula thrombosis (n = 1). Consequences of these complications werehypoxia in 4 patients with extreme bradycardia in 2 patients and recirculation in 2 patients.The second complication was oxygenator failure in 6 cases (16.21 %) with membranereplacement in all cases. Extreme bradycardia in 2 patients and cardiorespiratory arrest inone patient were the consequences. Others MC in this group were: pump failure (n = 2);oxygen source rupture (n = 1); lower limb ischemia secondary to perfusion cannulathrombosis (n = 1); jugular vein tear (n = 1); femoral artery tear (n = 1); inferior cavavein tear (n = 1); atrium rupture with cardiac tamponade (n = 1).CONCLUSIONS. in our group, cannula-related problems were the most common MC(21.62 %). None of MC were cause of death in our patients with ECMO support.REFERENCE(S) 1. Brodie D, Bachetta M. Extracorporeal membrane oxygenation forARDS in adults. N Engl J Med. 2011;365:1905–14.
0322SAFETY OF PERCUTANEOUS DILATATIONAL TRACHEOSTOMYIN PATIENTS ON EXTRACORPOREAL LUNG SUPPORT
S.A. Braune1, S. Kienast1, J. Hadem2, O. Wiesner3, D. Wichmann1, A. Nierhaus1,M. Simon1, T. Welte1, S. Kluge1
1University Medical Center Hamburg-Eppendorf, Department of Intensive Care Medicine,Hamburg, Germany, 2Hannover Medical School, Department of Gastroenterology,Hepatology and Endocrinology, Hannover, Germany, 3Hannover Medical School,Department of Respiratory Medicine, Hannover, GermanyINTRODUCTION. Performing percutaneous dilatational tracheostomy (PDT) in patientson extracorporeal lung support (ECLS) requiring therapeutic anticoagulation potentiallycarries an increased risk of periprocedural bleeding and/or circuit thrombosis.OBJECTIVES. To evaluate the safety of PDT in severely critically ill patients on ECLS.METHODS. Retrospective, observational study on all patients undergoing tracheostomywhile on pumpless extracorporeal lung assist (avECLA) or extracorporeal membrane oxy-genation (ECMO) in intensive care units of two university hospitals in Germany between2007 and 2012.RESULTS. A PDT was performed on 83 patients. The median platelet count, INR, andaPTT before tracheostomy were 132 x109/L (range 16–611), 1.1 (0.9–2.0), and 52 s(28–117), respectively. 10 patients (12.0 %) received a maximum of 3 bags of pooledplatelets and 7 patients (8.4 %) received a maximum of 4 units of fresh frozen plasma beforethe procedure. In all patients intravenous heparin was briefly paused periprocedurally. Noperiprocedural clotting complication within the extracorporeal circuit was observed. In onepatient (1.2 %) intraprocedural major stomal bleeding required conversion to a surgicaltracheostomy. One pneumothorax (1.2 %) occurred post tracheostomy, which was suc-cessfully treated with a chest drain. Minor bleeding from the tracheostomy site occurred in23 cases (27.7 %). No fatality was attributable to the tracheostomy.CONCLUSIONS. The complication rates of PDT in patients on extracorporeal lung supportwere low and comparable to those of other critically ill patients. Performance of PDT byexperienced operators and with careful optimization of the coagulation state is relativelysafe and not contraindicated for this patient group.
0323REFRACTORY VENTRICULAR FIBRILLATION AND SURVIVAL IN OUT-OF-HOSPITAL CARDIAC ARREST TREATED WITH EXTRACORPOREALCARDIOPULMONARY RESUSCITATION
K. Maekawa1, K. Tanno1, M. Hase1, E. Narimatsu1
1Sapporo Medical University, Trauma & Critical Care, Sapporo, JapanINTRODUCTION. Cardiac arrest patients who present initially or subsequently withventricular fibrillation (VF) and gain early successful defibrillation are known to have anincreased survival. However, this has not been established in prolonged arrest patientstreated with extracorporeal cardiopulmonary resuscitation (ECPR).OBJECTIVES. To test the hypothesis that initially and repeatedly presenting VF beforehospital arrival are associated with survival in ECPR patients.
METHODS. We performed an observational cohort study in a tertiary care hospital over10 years (2000–2009). Adult ECPR patients with witnessed out-of-hospital cardiac arrestsof cardiac origin and treated with hypothermia were included. ECPR was initiated at thediscretion of the attending physician. Countershock was delivered with automated externaldefibrillators by emergency life-saving technicians (2000–2009) and citizens (2004–2009).We defined repeatedly presenting VF (i.e. refractory VF) as delivered shocks of 4 times ormore before hospital arrival. Primary endpoint was a survival at 1 month after cardiacarrest.RESULTS. Of 57 eligible patients, 44 (77.2 %) presented initially with VF, 24 (42.1 %)suffered refractory VF before hospital arrival, and 23 (40.4 %) survived at 1 month aftercardiac arrest. Logistic regression analysis showed that refractory VF was significantlyassociated with survival at 1 month (adjusted odds ratio, 4.8; 95 % confidence interval,1.2–19.6), however, initially presenting VF was of no significance. Kaplan–Meier ana-lysis showed that patients with refractory VF were more likely to survive at 1 monththan patients without refractory VF (14/24 [58.3 %] vs. 9/33 [27.3 %], log-rankp = 0.046).CONCLUSIONS. Refractory VF, regardless of initial cardiac rhythm, was associated withbetter outcome in out-of-hospital cardiac arrest treated with ECPR. Patients with refractoryVF may be appropriate candidates for receiving ECPR.REFERENCE(S) 1. Sasson C, Rogers MA, Dahl J, et al. Predictors of survival from out-of-hospital cardiac arrest: a systematic review and meta-analysis. Circ Cardiovasc Qual Out-comes 2010;3:63–81. 2. Olasveengen TM, Samdal M, Steen PA, et al. Progressing frominitial non-shockable rhythms to a shockable rhythm is associated with improved outcomeafter out-of-hospital cardiac arrest. Resuscitation 2009;80:24–9. 3. Maekawa K, Tanno K,Hase M, et al.: Extracorporeal cardiopulmonary resuscitation for patients with out-of-hos-pital cardiac arrest of cardiac origin: a propensity-matched study and predictor analysis. CritCare Med. 2013;41:1186–96.
0324COLISTIN LEVELS IN PATIENTS RECEIVING EXTRACORPOREALMEMBRANE OXYGENATION WITH OR WITHOUT RENAL REPLACEMENT
S. Angermair1, L. Wagner1, U. Tröger2, S.M. Bode-Böger2, M. Deja1
1Charité-Universitätsmedizin Berlin, Berlin, Germany, 2Otto-von-Guericke-UniversitätMagdeburg, Magdeburg, GermanyINTRODUCTION. The effect of extracorporeal therapies (Extracorporeal membraneoxygenation; ECMO and continious veno-venous hemofiltration; CVVH) on the serumconcentration of intravenous Colistin is not well known. Rare data are available aboutcolistin and renal replacement-therapies but to the best of our knowledge there are no dataconcerning Colistin and ECMO and in combination with CVVH, either. As an approach tothis problem we analyzed arterial blood concentrations of colistin by therapeutic drugmonitoring (TDM).OBJECTIVES. To evaluate the interaction beetween extracorporeal theraphies and theserum levels of colistin in critically ill patients.DESIGN. Observation.SETTING. 24-bed university hospital ICU, nationwide ARDS referral centre includingextracorporeal membrane oxygenation (ECMO).METHODS. ECMO patients colonized respectively infected with KPC were observed.Two of these patients received an additional renal replacement (CVVH).The patients achieved intravenous colistin only at the clinical discretion of the attendingphysician according to the MIC breakpoints suggested by EUCAST. Blood samples tomeasure the through levels of colistin were daily taken.Three patients (1, 2, 4) received a loading dose of 9 Mio. colistimethate sodium (CMS), onepatient (3) received 2 9 2 Mio units at the first day of treatment (day 0). After achieving theloading dose the application interval in all of these patients was set to 8 h. Usually the TDMresults of colistin were available within 24 up to 96 h after taking the samples.RESULTS. All patients, who achieved a loading dose reached the recommended troughlevel, one patient, who didn0t achieved one, did not. After a loading dose the ECMO patientsshowed sufficient level (without renal failure) although the daily dose was reduced to 3 x 1.5Mio units colistin.One ECMO patient on CVVH showed toxic levels of colistin after a loading dose and 3x 3Mio units colistin. Another ECMO patient on CVVH without loading dose and only 3x 1Mio units Colistin did not reach recommended trough level up to day 5 of treatment(Tab. 1).
Tab. 1
CONCLUSIONS. A loading dose (9. Mio units) of Colistin is obligatory to reach therecommended trough level within 3 halftimes. But according to the measured trough level itis not necessary to increase the loading dose for ECMO patients without CVVH. To reach
26th ESICM ANNUAL CONGRESS — PARIS, FRANCE — 5–9 OCTOBER 2013
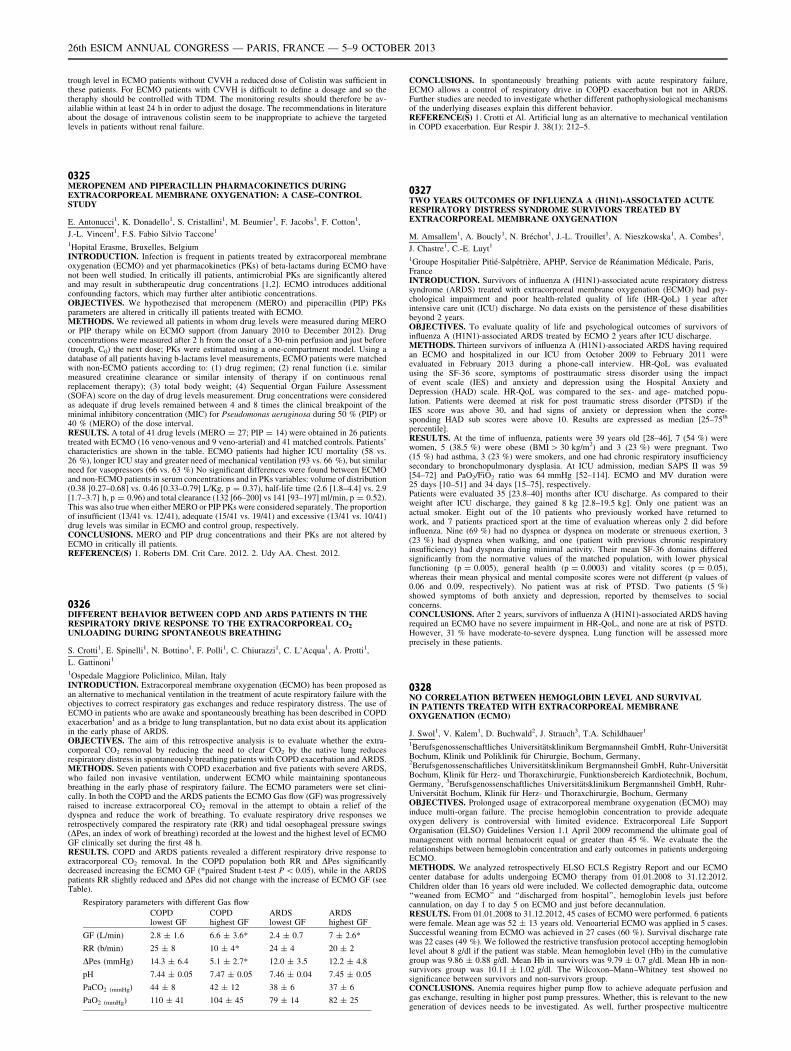
trough level in ECMO patients without CVVH a reduced dose of Colistin was sufficient inthese patients. For ECMO patients with CVVH is difficult to define a dosage and so thetheraphy should be controlled with TDM. The monitoring results should therefore be av-ailablie within at least 24 h in order to adjust the dosage. The recommendations in literatureabout the dosage of intravenous colistin seem to be inappropriate to achieve the targetedlevels in patients without renal failure.
0325MEROPENEM AND PIPERACILLIN PHARMACOKINETICS DURINGEXTRACORPOREAL MEMBRANE OXYGENATION: A CASE–CONTROLSTUDY
E. Antonucci1, K. Donadello1, S. Cristallini1, M. Beumier1, F. Jacobs1, F. Cotton1,
J.-L. Vincent1, F.S. Fabio Silvio Taccone1
1Hopital Erasme, Bruxelles, BelgiumINTRODUCTION. Infection is frequent in patients treated by extracorporeal membraneoxygenation (ECMO) and yet pharmacokinetics (PKs) of beta-lactams during ECMO havenot been well studied. In critically ill patients, antimicrobial PKs are significantly alteredand may result in subtherapeutic drug concentrations [1,2]. ECMO introduces additionalconfounding factors, which may further alter antibiotic concentrations.OBJECTIVES. We hypothezised that meropenem (MERO) and piperacillin (PIP) PKsparameters are altered in critically ill patients treated with ECMO.METHODS. We reviewed all patients in whom drug levels were measured during MEROor PIP therapy while on ECMO support (from January 2010 to December 2012). Drugconcentrations were measured after 2 h from the onset of a 30-min perfusion and just before(trough, C0) the next dose; PKs were estimated using a one-compartment model. Using adatabase of all patients having b-lactams level measurements, ECMO patients were matchedwith non-ECMO patients according to: (1) drug regimen; (2) renal function (i.e. similarmeasured creatinine clearance or similar intensity of therapy if on continuous renalreplacement therapy); (3) total body weight; (4) Sequential Organ Failure Assessment(SOFA) score on the day of drug levels measurement. Drug concentrations were consideredas adequate if drug levels remained between 4 and 8 times the clinical breakpoint of theminimal inhibitory concentration (MIC) for Pseudomonas aeruginosa during 50 % (PIP) or40 % (MERO) of the dose interval.RESULTS. A total of 41 drug levels (MERO = 27; PIP = 14) were obtained in 26 patientstreated with ECMO (16 veno-venous and 9 veno-arterial) and 41 matched controls. Patients’characteristics are shown in the table. ECMO patients had higher ICU mortality (58 vs.26 %), longer ICU stay and greater need of mechanical ventilation (93 vs. 66 %), but similarneed for vasopressors (66 vs. 63 %) No significant differences were found between ECMOand non-ECMO patients in serum concentrations and in PKs variables: volume of distribution(0.38 [0.27–0.68] vs. 0.46 [0.33–0.79] L/Kg, p = 0.37), half-life time (2.6 [1.8–4.4] vs. 2.9[1.7–3.7] h, p = 0.96) and total clearance (132 [66–200] vs 141 [93–197] ml/min, p = 0.52).This was also true when either MERO or PIP PKs were considered separately. The proportionof insufficient (13/41 vs. 12/41), adequate (15/41 vs. 19/41) and excessive (13/41 vs. 10/41)drug levels was similar in ECMO and control group, respectively.CONCLUSIONS. MERO and PIP drug concentrations and their PKs are not altered byECMO in critically ill patients.REFERENCE(S) 1. Roberts DM. Crit Care. 2012. 2. Udy AA. Chest. 2012.
0326DIFFERENT BEHAVIOR BETWEEN COPD AND ARDS PATIENTS IN THERESPIRATORY DRIVE RESPONSE TO THE EXTRACORPOREAL CO2
UNLOADING DURING SPONTANEOUS BREATHING
S. Crotti1, E. Spinelli1, N. Bottino1, F. Polli1, C. Chiurazzi1, C. L’Acqua1, A. Protti1,
L. Gattinoni1
1Ospedale Maggiore Policlinico, Milan, ItalyINTRODUCTION. Extracorporeal membrane oxygenation (ECMO) has been proposed asan alternative to mechanical ventilation in the treatment of acute respiratory failure with theobjectives to correct respiratory gas exchanges and reduce respiratory distress. The use ofECMO in patients who are awake and spontaneously breathing has been described in COPDexacerbation1 and as a bridge to lung transplantation, but no data exist about its applicationin the early phase of ARDS.OBJECTIVES. The aim of this retrospective analysis is to evaluate whether the extra-corporeal CO2 removal by reducing the need to clear CO2 by the native lung reducesrespiratory distress in spontaneously breathing patients with COPD exacerbation and ARDS.METHODS. Seven patients with COPD exacerbation and five patients with severe ARDS,who failed non invasive ventilation, underwent ECMO while maintaining spontaneousbreathing in the early phase of respiratory failure. The ECMO parameters were set clini-cally. In both the COPD and the ARDS patients the ECMO Gas flow (GF) was progressivelyraised to increase extracorporeal CO2 removal in the attempt to obtain a relief of thedyspnea and reduce the work of breathing. To evaluate respiratory drive responses weretrospectively compared the respiratory rate (RR) and tidal oesophageal pressure swings(DPes, an index of work of breathing) recorded at the lowest and the highest level of ECMOGF clinically set during the first 48 h.RESULTS. COPD and ARDS patients revealed a different respiratory drive response toextracorporeal CO2 removal. In the COPD population both RR and DPes significantlydecreased increasing the ECMO GF (*paired Student t-test P \ 0.05), while in the ARDSpatients RR slightly reduced and DPes did not change with the increase of ECMO GF (seeTable).
Respiratory parameters with different Gas flow
COPDlowest GF
COPDhighest GF
ARDSlowest GF
ARDShighest GF
GF (L/min) 2.8 ± 1.6 6.6 ± 3.6* 2.4 ± 0.7 7 ± 2.6*
RR (b/min) 25 ± 8 10 ± 4* 24 ± 4 20 ± 2
DPes (mmHg) 14.3 ± 6.4 5.1 ± 2.7* 12.0 ± 3.5 12.2 ± 4.8
pH 7.44 ± 0.05 7.47 ± 0.05 7.46 ± 0.04 7.45 ± 0.05
PaCO2 (mmHg) 44 ± 8 42 ± 12 38 ± 6 37 ± 6
PaO2 (mmHg) 110 ± 41 104 ± 45 79 ± 14 82 ± 25
CONCLUSIONS. In spontaneously breathing patients with acute respiratory failure,ECMO allows a control of respiratory drive in COPD exacerbation but not in ARDS.Further studies are needed to investigate whether different pathophysiological mechanismsof the underlying diseases explain this different behavior.REFERENCE(S) 1. Crotti et Al. Artificial lung as an alternative to mechanical ventilationin COPD exacerbation. Eur Respir J. 38(1): 212–5.
0327TWO YEARS OUTCOMES OF INFLUENZA A (H1N1)-ASSOCIATED ACUTERESPIRATORY DISTRESS SYNDROME SURVIVORS TREATED BYEXTRACORPOREAL MEMBRANE OXYGENATION
M. Amsallem1, A. Boucly1, N. Bréchot1, J.-L. Trouillet1, A. Nieszkowska1, A. Combes1,
J. Chastre1, C.-E. Luyt1
1Groupe Hospitalier Pitié-Salpêtrière, APHP, Service de Réanimation Médicale, Paris,FranceINTRODUCTION. Survivors of influenza A (H1N1)-associated acute respiratory distresssyndrome (ARDS) treated with extracorporeal membrane oxygenation (ECMO) had psy-chological impairment and poor health-related quality of life (HR-QoL) 1 year afterintensive care unit (ICU) discharge. No data exists on the persistence of these disabilitiesbeyond 2 years.OBJECTIVES. To evaluate quality of life and psychological outcomes of survivors ofinfluenza A (H1N1)-associated ARDS treated by ECMO 2 years after ICU discharge.METHODS. Thirteen survivors of influenza A (H1N1)-associated ARDS having requiredan ECMO and hospitalized in our ICU from October 2009 to February 2011 wereevaluated in February 2013 during a phone-call interview. HR-QoL was evaluatedusing the SF-36 score, symptoms of posttraumatic stress disorder using the impactof event scale (IES) and anxiety and depression using the Hospital Anxiety andDepression (HAD) scale. HR-QoL was compared to the sex- and age- matched popu-lation. Patients were deemed at risk for post traumatic stress disorder (PTSD) if theIES score was above 30, and had signs of anxiety or depression when the corre-sponding HAD sub scores were above 10. Results are expressed as median [25–75th
percentile].RESULTS. At the time of influenza, patients were 39 years old [28–46], 7 (54 %) werewomen, 5 (38.5 %) were obese (BMI [ 30 kg/m2) and 3 (23 %) were pregnant. Two(15 %) had asthma, 3 (23 %) were smokers, and one had chronic respiratory insufficiencysecondary to bronchopulmonary dysplasia. At ICU admission, median SAPS II was 59[54–72] and PaO2/FiO2 ratio was 64 mmHg [52–114]. ECMO and MV duration were25 days [10–51] and 34 days [15–75], respectively.Patients were evaluated 35 [23.8–40] months after ICU discharge. As compared to theirweight after ICU discharge, they gained 8 kg [2.8–19.5 kg]. Only one patient was anactual smoker. Eight out of the 10 patients who previously worked have returned towork, and 7 patients practiced sport at the time of evaluation whereas only 2 did beforeinfluenza. Nine (69 %) had no dyspnea or dyspnea on moderate or strenuous exertion, 3(23 %) had dyspnea when walking, and one (patient with previous chronic respiratoryinsufficiency) had dyspnea during minimal activity. Their mean SF-36 domains differedsignificantly from the normative values of the matched population, with lower physicalfunctioning (p = 0.005), general health (p = 0.0003) and vitality scores (p = 0.05),whereas their mean physical and mental composite scores were not different (p values of0.06 and 0.09, respectively). No patient was at risk of PTSD. Two patients (5 %)showed symptoms of both anxiety and depression, reported by themselves to socialconcerns.CONCLUSIONS. After 2 years, survivors of influenza A (H1N1)-associated ARDS havingrequired an ECMO have no severe impairment in HR-QoL, and none are at risk of PSTD.However, 31 % have moderate-to-severe dyspnea. Lung function will be assessed moreprecisely in these patients.
0328NO CORRELATION BETWEEN HEMOGLOBIN LEVEL AND SURVIVALIN PATIENTS TREATED WITH EXTRACORPOREAL MEMBRANEOXYGENATION (ECMO)
J. Swol1, V. Kalem1, D. Buchwald2, J. Strauch3, T.A. Schildhauer1
1Berufsgenossenschaftliches Universitätsklinikum Bergmannsheil GmbH, Ruhr-UniversitätBochum, Klinik und Poliklinik für Chirurgie, Bochum, Germany,2Berufsgenossenschaftliches Universitätsklinikum Bergmannsheil GmbH, Ruhr-UniversitätBochum, Klinik für Herz- und Thoraxchirurgie, Funktionsbereich Kardiotechnik, Bochum,Germany, 3Berufsgenossenschaftliches Universitätsklinikum Bergmannsheil GmbH, Ruhr-Universität Bochum, Klinik für Herz- und Thoraxchirurgie, Bochum, GermanyOBJECTIVES. Prolonged usage of extracorporeal membrane oxygenation (ECMO) mayinduce multi-organ failure. The precise hemoglobin concentration to provide adequateoxygen delivery is controversial with limited evidence. Extracorporeal Life SupportOrganisation (ELSO) Guidelines Version 1.1 April 2009 recommend the ultimate goal ofmanagement with normal hematocrit equal or greater than 45 %. We evaluate the therelationships between hemoglobin concentration and early outcomes in patients undergoingECMO.METHODS. We analyzed retrospectively ELSO ECLS Registry Report and our ECMOcenter database for adults undergoing ECMO therapy from 01.01.2008 to 31.12.2012.Children older than 16 years old were included. We collected demographic data, outcome‘‘weaned from ECMO’’ and ‘‘discharged from hospital’’, hemoglobin levels just beforecannulation, on day 1 to day 5 on ECMO and just before decannulation.RESULTS. From 01.01.2008 to 31.12.2012, 45 cases of ECMO were performed. 6 patientswere female. Mean age was 52 ± 13 years old. Venoarterial ECMO was applied in 5 cases.Successful weaning from ECMO was achieved in 27 cases (60 %). Survival discharge ratewas 22 cases (49 %). We followed the restrictive transfusion protocol accepting hemoglobinlevel about 8 g/dl if the patient was stable. Mean hemoglobin level (Hb) in the cumulativegroup was 9.86 ± 0.88 g/dl. Mean Hb in survivors was 9.79 ± 0.7 g/dl. Mean Hb in non-survivors group was 10.11 ± 1.02 g/dl. The Wilcoxon–Mann–Whitney test showed nosignificance between survivors and non-survivors group.CONCLUSIONS. Anemia requires higher pump flow to achieve adequate perfusion andgas exchange, resulting in higher post pump pressures. Whether, this is relevant to the newgeneration of devices needs to be investigated. As well, further prospective multicentre
26th ESICM ANNUAL CONGRESS — PARIS, FRANCE — 5–9 OCTOBER 2013
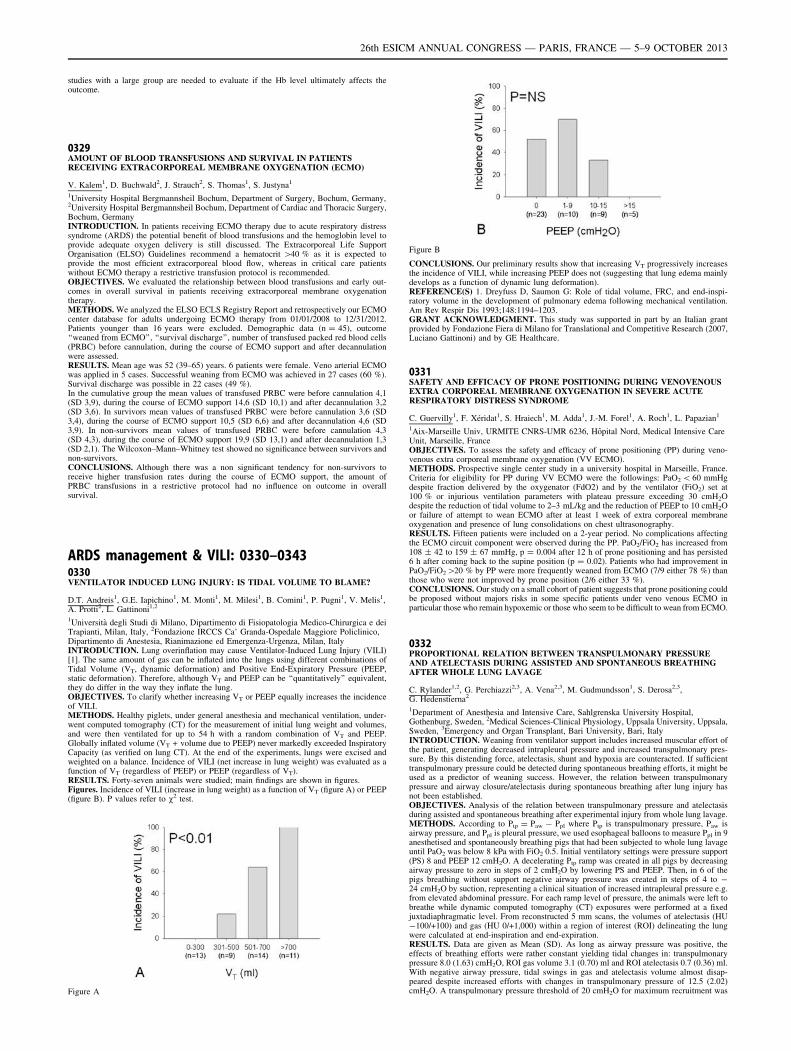
studies with a large group are needed to evaluate if the Hb level ultimately affects theoutcome.
0329AMOUNT OF BLOOD TRANSFUSIONS AND SURVIVAL IN PATIENTSRECEIVING EXTRACORPOREAL MEMBRANE OXYGENATION (ECMO)
V. Kalem1, D. Buchwald2, J. Strauch2, S. Thomas1, S. Justyna1
1University Hospital Bergmannsheil Bochum, Department of Surgery, Bochum, Germany,2University Hospital Bergmannsheil Bochum, Department of Cardiac and Thoracic Surgery,Bochum, GermanyINTRODUCTION. In patients receiving ECMO therapy due to acute respiratory distresssyndrome (ARDS) the potential benefit of blood transfusions and the hemoglobin level toprovide adequate oxygen delivery is still discussed. The Extracorporeal Life SupportOrganisation (ELSO) Guidelines recommend a hematocrit [40 % as it is expected toprovide the most efficient extracorporeal blood flow, whereas in critical care patientswithout ECMO therapy a restrictive transfusion protocol is recommended.OBJECTIVES. We evaluated the relationship between blood transfusions and early out-comes in overall survival in patients receiving extracorporeal membrane oxygenationtherapy.METHODS. We analyzed the ELSO ECLS Registry Report and retrospectively our ECMOcenter database for adults undergoing ECMO therapy from 01/01/2008 to 12/31/2012.Patients younger than 16 years were excluded. Demographic data (n = 45), outcome‘‘weaned from ECMO’’, ‘‘survival discharge’’, number of transfused packed red blood cells(PRBC) before cannulation, during the course of ECMO support and after decannulationwere assessed.RESULTS. Mean age was 52 (39–65) years. 6 patients were female. Veno arterial ECMOwas applied in 5 cases. Successful weaning from ECMO was achieved in 27 cases (60 %).Survival discharge was possible in 22 cases (49 %).In the cumulative group the mean values of transfused PRBC were before cannulation 4,1(SD 3,9), during the course of ECMO support 14,6 (SD 10,1) and after decannulation 3,2(SD 3,6). In survivors mean values of transfused PRBC were before cannulation 3,6 (SD3,4), during the course of ECMO support 10,5 (SD 6,6) and after decannulation 4,6 (SD3,9). In non-survivors mean values of transfused PRBC were before cannulation 4,3(SD 4,3), during the course of ECMO support 19,9 (SD 13,1) and after decannulation 1,3(SD 2,1). The Wilcoxon–Mann–Whitney test showed no significance between survivors andnon-survivors.CONCLUSIONS. Although there was a non significant tendency for non-survivors toreceive higher transfusion rates during the course of ECMO support, the amount ofPRBC transfusions in a restrictive protocol had no influence on outcome in overallsurvival.
ARDS management & VILI: 0330–03430330VENTILATOR INDUCED LUNG INJURY: IS TIDAL VOLUME TO BLAME?
D.T. Andreis1, G.E. Iapichino1, M. Monti1, M. Milesi1, B. Comini1, P. Pugni1, V. Melis1,A. Protti2, L. Gattinoni1,2
1Università degli Studi di Milano, Dipartimento di Fisiopatologia Medico-Chirurgica e deiTrapianti, Milan, Italy, 2Fondazione IRCCS Ca’ Granda-Ospedale Maggiore Policlinico,Dipartimento di Anestesia, Rianimazione ed Emergenza-Urgenza, Milan, ItalyINTRODUCTION. Lung overinflation may cause Ventilator-Induced Lung Injury (VILI)[1]. The same amount of gas can be inflated into the lungs using different combinations ofTidal Volume (VT, dynamic deformation) and Positive End-Expiratory Pressure (PEEP,static deformation). Therefore, although VT and PEEP can be ‘‘quantitatively’’ equivalent,they do differ in the way they inflate the lung.OBJECTIVES. To clarify whether increasing VT or PEEP equally increases the incidenceof VILI.METHODS. Healthy piglets, under general anesthesia and mechanical ventilation, under-went computed tomography (CT) for the measurement of initial lung weight and volumes,and were then ventilated for up to 54 h with a random combination of VT and PEEP.Globally inflated volume (VT + volume due to PEEP) never markedly exceeded InspiratoryCapacity (as verified on lung CT). At the end of the experiments, lungs were excised andweighted on a balance. Incidence of VILI (net increase in lung weight) was evaluated as afunction of VT (regardless of PEEP) or PEEP (regardless of VT).RESULTS. Forty-seven animals were studied; main findings are shown in figures.Figures. Incidence of VILI (increase in lung weight) as a function of VT (figure A) or PEEP(figure B). P values refer to v2 test.
Figure A
Figure B
CONCLUSIONS. Our preliminary results show that increasing VT progressively increasesthe incidence of VILI, while increasing PEEP does not (suggesting that lung edema mainlydevelops as a function of dynamic lung deformation).REFERENCE(S) 1. Dreyfuss D, Saumon G: Role of tidal volume, FRC, and end-inspi-ratory volume in the development of pulmonary edema following mechanical ventilation.Am Rev Respir Dis 1993;148:1194–1203.GRANT ACKNOWLEDGMENT. This study was supported in part by an Italian grantprovided by Fondazione Fiera di Milano for Translational and Competitive Research (2007,Luciano Gattinoni) and by GE Healthcare.
0331SAFETY AND EFFICACY OF PRONE POSITIONING DURING VENOVENOUSEXTRA CORPOREAL MEMBRANE OXYGENATION IN SEVERE ACUTERESPIRATORY DISTRESS SYNDROME
C. Guervilly1, F. Xéridat1, S. Hraiech1, M. Adda1, J.-M. Forel1, A. Roch1, L. Papazian1
1Aix-Marseille Univ, URMITE CNRS-UMR 6236, Hôpital Nord, Medical Intensive CareUnit, Marseille, FranceOBJECTIVES. To assess the safety and efficacy of prone positioning (PP) during veno-venous extra corporeal membrane oxygenation (VV ECMO).METHODS. Prospective single center study in a university hospital in Marseille, France.Criteria for eligibility for PP during VV ECMO were the followings: PaO2 \ 60 mmHgdespite fraction delivered by the oxygenator (FdO2) and by the ventilator (FiO2) set at100 % or injurious ventilation parameters with plateau pressure exceeding 30 cmH2Odespite the reduction of tidal volume to 2–3 mL/kg and the reduction of PEEP to 10 cmH2Oor failure of attempt to wean ECMO after at least 1 week of extra corporeal membraneoxygenation and presence of lung consolidations on chest ultrasonography.RESULTS. Fifteen patients were included on a 2-year period. No complications affectingthe ECMO circuit component were observed during the PP. PaO2/FiO2 has increased from108 ± 42 to 159 ± 67 mmHg, p = 0.004 after 12 h of prone positioning and has persisted6 h after coming back to the supine position (p = 0.02). Patients who had improvement inPaO2/FiO2[20 % by PP were more frequently weaned from ECMO (7/9 either 78 %) thanthose who were not improved by prone position (2/6 either 33 %).CONCLUSIONS. Our study on a small cohort of patient suggests that prone positioning couldbe proposed without majors risks in some specific patients under veno venous ECMO inparticular those who remain hypoxemic or those who seem to be difficult to wean from ECMO.
0332PROPORTIONAL RELATION BETWEEN TRANSPULMONARY PRESSUREAND ATELECTASIS DURING ASSISTED AND SPONTANEOUS BREATHINGAFTER WHOLE LUNG LAVAGE
C. Rylander1,2, G. Perchiazzi2,3, A. Vena2,3, M. Gudmundsson1, S. Derosa2,3,G. Hedenstierna2
1Department of Anesthesia and Intensive Care, Sahlgrenska University Hospital,Gothenburg, Sweden, 2Medical Sciences-Clinical Physiology, Uppsala University, Uppsala,Sweden, 3Emergency and Organ Transplant, Bari University, Bari, ItalyINTRODUCTION. Weaning from ventilator support includes increased muscular effort ofthe patient, generating decreased intrapleural pressure and increased transpulmonary pres-sure. By this distending force, atelectasis, shunt and hypoxia are counteracted. If sufficienttranspulmonary pressure could be detected during spontaneous breathing efforts, it might beused as a predictor of weaning success. However, the relation between transpulmonarypressure and airway closure/atelectasis during spontaneous breathing after lung injury hasnot been established.OBJECTIVES. Analysis of the relation between transpulmonary pressure and atelectasisduring assisted and spontaneous breathing after experimental injury from whole lung lavage.METHODS. According to Ptp = Paw - Ppl where Ptp is transpulmonary pressure, Paw isairway pressure, and Ppl is pleural pressure, we used esophageal balloons to measure Ppl in 9anesthetised and spontaneously breathing pigs that had been subjected to whole lung lavageuntil PaO2 was below 8 kPa with FiO2 0.5. Initial ventilatory settings were pressure support(PS) 8 and PEEP 12 cmH2O. A decelerating Ptp ramp was created in all pigs by decreasingairway pressure to zero in steps of 2 cmH2O by lowering PS and PEEP. Then, in 6 of thepigs breathing without support negative airway pressure was created in steps of 4 to -24 cmH2O by suction, representing a clinical situation of increased intrapleural pressure e.g.from elevated abdominal pressure. For each ramp level of pressure, the animals were left tobreathe while dynamic computed tomography (CT) exposures were performed at a fixedjuxtadiaphragmatic level. From reconstructed 5 mm scans, the volumes of atelectasis (HU-100/+100) and gas (HU 0/+1,000) within a region of interest (ROI) delineating the lungwere calculated at end-inspiration and end-expiration.RESULTS. Data are given as Mean (SD). As long as airway pressure was positive, theeffects of breathing efforts were rather constant yielding tidal changes in: transpulmonarypressure 8.0 (1.63) cmH2O, ROI gas volume 3.1 (0.70) ml and ROI atelectasis 0.7 (0.36) ml.With negative airway pressure, tidal swings in gas and atelectasis volume almost disap-peared despite increased efforts with changes in transpulmonary pressure of 12.5 (2.02)cmH2O. A transpulmonary pressure threshold of 20 cmH2O for maximum recruitment was
26th ESICM ANNUAL CONGRESS — PARIS, FRANCE — 5–9 OCTOBER 2013
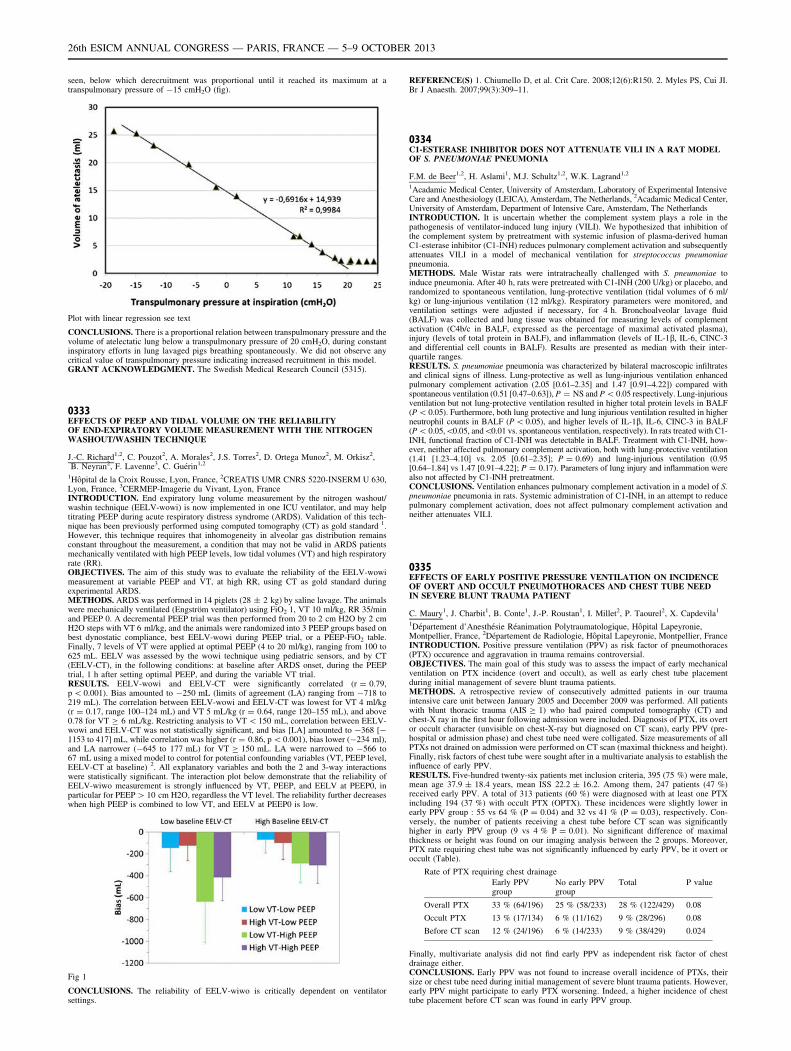
seen, below which derecruitment was proportional until it reached its maximum at atranspulmonary pressure of -15 cmH2O (fig).
Plot with linear regression see text
CONCLUSIONS. There is a proportional relation between transpulmonary pressure and thevolume of atelectatic lung below a transpulmonary pressure of 20 cmH2O, during constantinspiratory efforts in lung lavaged pigs breathing spontaneously. We did not observe anycritical value of transpulmonary pressure indicating increased recruitment in this model.GRANT ACKNOWLEDGMENT. The Swedish Medical Research Council (5315).
0333EFFECTS OF PEEP AND TIDAL VOLUME ON THE RELIABILITYOF END-EXPIRATORY VOLUME MEASUREMENT WITH THE NITROGENWASHOUT/WASHIN TECHNIQUE
J.-C. Richard1,2, C. Pouzot2, A. Morales2, J.S. Torres2, D. Ortega Munoz2, M. Orkisz2,B. Neyran2, F. Lavenne3, C. Guérin1,2
1Hôpital de la Croix Rousse, Lyon, France, 2CREATIS UMR CNRS 5220-INSERM U 630,Lyon, France, 3CERMEP-Imagerie du Vivant, Lyon, FranceINTRODUCTION. End expiratory lung volume measurement by the nitrogen washout/washin technique (EELV-wowi) is now implemented in one ICU ventilator, and may helptitrating PEEP during acute respiratory distress syndrome (ARDS). Validation of this tech-nique has been previously performed using computed tomography (CT) as gold standard 1.However, this technique requires that inhomogeneity in alveolar gas distribution remainsconstant throughout the measurement, a condition that may not be valid in ARDS patientsmechanically ventilated with high PEEP levels, low tidal volumes (VT) and high respiratoryrate (RR).OBJECTIVES. The aim of this study was to evaluate the reliability of the EELV-wowimeasurement at variable PEEP and VT, at high RR, using CT as gold standard duringexperimental ARDS.METHODS. ARDS was performed in 14 piglets (28 ± 2 kg) by saline lavage. The animalswere mechanically ventilated (Engström ventilator) using FiO2 1, VT 10 ml/kg, RR 35/minand PEEP 0. A decremental PEEP trial was then performed from 20 to 2 cm H2O by 2 cmH2O steps with VT 6 ml/kg, and the animals were randomized into 3 PEEP groups based onbest dynostatic compliance, best EELV-wowi during PEEP trial, or a PEEP-FiO2 table.Finally, 7 levels of VT were applied at optimal PEEP (4 to 20 ml/kg), ranging from 100 to625 mL. EELV was assessed by the wowi technique using pediatric sensors, and by CT(EELV-CT), in the following conditions: at baseline after ARDS onset, during the PEEPtrial, 1 h after setting optimal PEEP, and during the variable VT trial.RESULTS. EELV-wowi and EELV-CT were significantly correlated (r = 0.79,p \ 0.001). Bias amounted to -250 mL (limits of agreement (LA) ranging from -718 to219 mL). The correlation between EELV-wowi and EELV-CT was lowest for VT 4 ml/kg(r = 0.17, range 100–124 mL) and VT 5 mL/kg (r = 0.64, range 120–155 mL), and above0.78 for VT C 6 mL/kg. Restricting analysis to VT \ 150 mL, correlation between EELV-wowi and EELV-CT was not statistically significant, and bias [LA] amounted to -368 [-1153 to 417] mL, while correlation was higher (r = 0.86, p \ 0.001), bias lower (-234 ml),and LA narrower (-645 to 177 mL) for VT C 150 mL. LA were narrowed to -566 to67 mL using a mixed model to control for potential confounding variables (VT, PEEP level,EELV-CT at baseline) 2. All explanatory variables and both the 2 and 3-way interactionswere statistically significant. The interaction plot below demonstrate that the reliability ofEELV-wiwo measurement is strongly influenced by VT, PEEP, and EELV at PEEP0, inparticular for PEEP [ 10 cm H2O, regardless the VT level. The reliability further decreaseswhen high PEEP is combined to low VT, and EELV at PEEP0 is low.
Fig 1
CONCLUSIONS. The reliability of EELV-wiwo is critically dependent on ventilatorsettings.
REFERENCE(S) 1. Chiumello D, et al. Crit Care. 2008;12(6):R150. 2. Myles PS, Cui JI.Br J Anaesth. 2007;99(3):309–11.
0334C1-ESTERASE INHIBITOR DOES NOT ATTENUATE VILI IN A RAT MODELOF S. PNEUMONIAE PNEUMONIA
F.M. de Beer1,2, H. Aslami1, M.J. Schultz1,2, W.K. Lagrand1,2
1Acadamic Medical Center, University of Amsterdam, Laboratory of Experimental IntensiveCare and Anesthesiology (LEICA), Amsterdam, The Netherlands, 2Acadamic Medical Center,University of Amsterdam, Department of Intensive Care, Amsterdam, The NetherlandsINTRODUCTION. It is uncertain whether the complement system plays a role in thepathogenesis of ventilator-induced lung injury (VILI). We hypothesized that inhibition ofthe complement system by pretreatment with systemic infusion of plasma-derived humanC1-esterase inhibitor (C1-INH) reduces pulmonary complement activation and subsequentlyattenuates VILI in a model of mechanical ventilation for streptococcus pneumoniaepneumonia.METHODS. Male Wistar rats were intratracheally challenged with S. pneumoniae toinduce pneumonia. After 40 h, rats were pretreated with C1-INH (200 U/kg) or placebo, andrandomized to spontaneous ventilation, lung-protective ventilation (tidal volumes of 6 ml/kg) or lung-injurious ventilation (12 ml/kg). Respiratory parameters were monitored, andventilation settings were adjusted if necessary, for 4 h. Bronchoalveolar lavage fluid(BALF) was collected and lung tissue was obtained for measuring levels of complementactivation (C4b/c in BALF, expressed as the percentage of maximal activated plasma),injury (levels of total protein in BALF), and inflammation (levels of IL-1b, IL-6, CINC-3and differential cell counts in BALF). Results are presented as median with their inter-quartile ranges.RESULTS. S. pneumoniae pneumonia was characterized by bilateral macroscopic infiltratesand clinical signs of illness. Lung-protective as well as lung-injurious ventilation enhancedpulmonary complement activation (2.05 [0.61–2.35] and 1.47 [0.91–4.22]) compared withspontaneous ventilation (0.51 [0.47–0.63]), P = NS and P \ 0.05 respectively. Lung-injuriousventilation but not lung-protective ventilation resulted in higher total protein levels in BALF(P \ 0.05). Furthermore, both lung protective and lung injurious ventilation resulted in higherneutrophil counts in BALF (P \ 0.05), and higher levels of IL-1b, IL-6, CINC-3 in BALF(P \ 0.05,\0.05, and\0.01 vs. spontaneous ventilation, respectively). In rats treated with C1-INH, functional fraction of C1-INH was detectable in BALF. Treatment with C1-INH, how-ever, neither affected pulmonary complement activation, both with lung-protective ventilation(1.41 [1.23–4.10] vs. 2.05 [0.61–2.35]; P = 0.69) and lung-injurious ventilation (0.95[0.64–1.84] vs 1.47 [0.91–4.22]; P = 0.17). Parameters of lung injury and inflammation werealso not affected by C1-INH pretreatment.CONCLUSIONS. Ventilation enhances pulmonary complement activation in a model of S.pneumoniae pneumonia in rats. Systemic administration of C1-INH, in an attempt to reducepulmonary complement activation, does not affect pulmonary complement activation andneither attenuates VILI.
0335EFFECTS OF EARLY POSITIVE PRESSURE VENTILATION ON INCIDENCEOF OVERT AND OCCULT PNEUMOTHORACES AND CHEST TUBE NEEDIN SEVERE BLUNT TRAUMA PATIENT
C. Maury1, J. Charbit1, B. Conte1, J.-P. Roustan1, I. Millet2, P. Taourel2, X. Capdevila1
1Département d’Anesthésie Réanimation Polytraumatologique, Hôpital Lapeyronie,Montpellier, France, 2Département de Radiologie, Hôpital Lapeyronie, Montpellier, FranceINTRODUCTION. Positive pressure ventilation (PPV) as risk factor of pneumothoraces(PTX) occurence and aggravation in trauma remains controversial.OBJECTIVES. The main goal of this study was to assess the impact of early mechanicalventilation on PTX incidence (overt and occult), as well as early chest tube placementduring initial management of severe blunt trauma patients.METHODS. A retrospective review of consecutively admitted patients in our traumaintensive care unit between January 2005 and December 2009 was performed. All patientswith blunt thoracic trauma (AIS C 1) who had paired computed tomography (CT) andchest-X ray in the first hour following admission were included. Diagnosis of PTX, its overtor occult character (unvisible on chest-X-ray but diagnosed on CT scan), early PPV (pre-hospital or admission phase) and chest tube need were colligated. Size measurements of allPTXs not drained on admission were performed on CT scan (maximal thickness and height).Finally, risk factors of chest tube were sought after in a multivariate analysis to establish theinfluence of early PPV.RESULTS. Five-hundred twenty-six patients met inclusion criteria, 395 (75 %) were male,mean age 37.9 ± 18.4 years, mean ISS 22.2 ± 16.2. Among them, 247 patients (47 %)received early PPV. A total of 313 patients (60 %) were diagnosed with at least one PTXincluding 194 (37 %) with occult PTX (OPTX). These incidences were slightly lower inearly PPV group : 55 vs 64 % (P = 0.04) and 32 vs 41 % (P = 0.03), respectively. Con-versely, the number of patients receiving a chest tube before CT scan was significantlyhigher in early PPV group (9 vs 4 % P = 0.01). No significant difference of maximalthickness or height was found on our imaging analysis between the 2 groups. Moreover,PTX rate requiring chest tube was not significantly influenced by early PPV, be it overt oroccult (Table).
Rate of PTX requiring chest drainage
Early PPVgroup
No early PPVgroup
Total P value
Overall PTX 33 % (64/196) 25 % (58/233) 28 % (122/429) 0.08
Occult PTX 13 % (17/134) 6 % (11/162) 9 % (28/296) 0.08
Before CT scan 12 % (24/196) 6 % (14/233) 9 % (38/429) 0.024
Finally, multivariate analysis did not find early PPV as independent risk factor of chestdrainage either.CONCLUSIONS. Early PPV was not found to increase overall incidence of PTXs, theirsize or chest tube need during initial management of severe blunt trauma patients. However,early PPV might participate to early PTX worsening. Indeed, a higher incidence of chesttube placement before CT scan was found in early PPV group.
26th ESICM ANNUAL CONGRESS — PARIS, FRANCE — 5–9 OCTOBER 2013
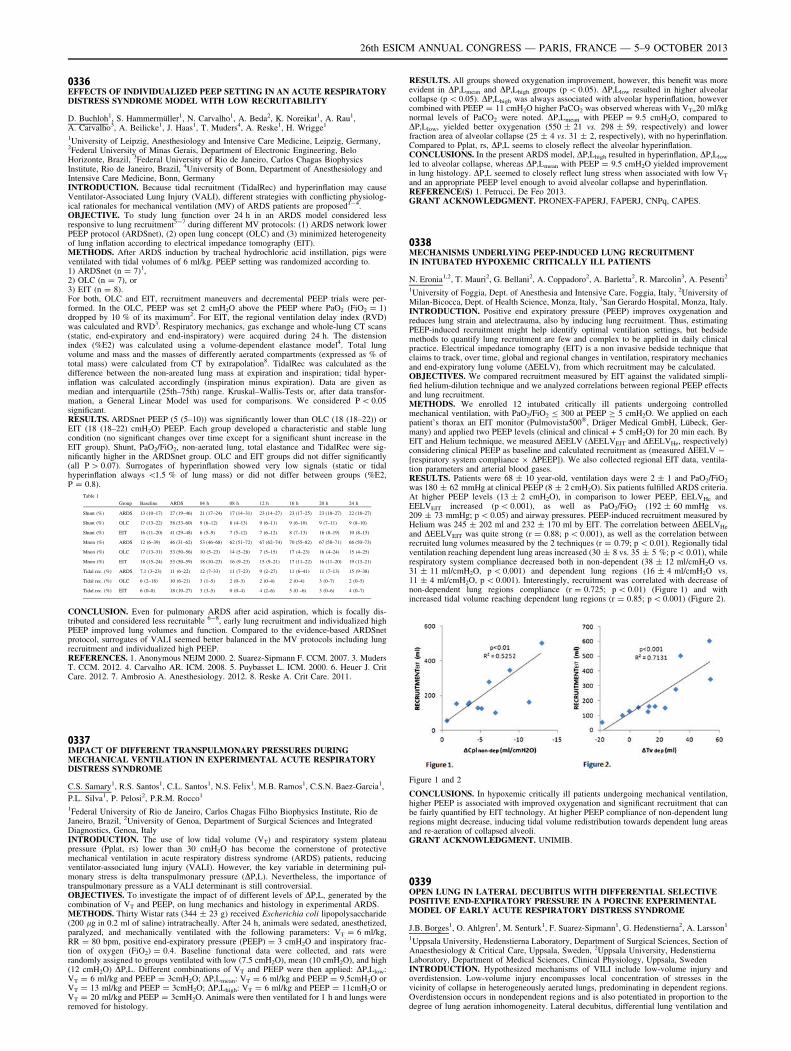
0336EFFECTS OF INDIVIDUALIZED PEEP SETTING IN AN ACUTE RESPIRATORYDISTRESS SYNDROME MODEL WITH LOW RECRUITABILITY
D. Buchloh1, S. Hammermüller1, N. Carvalho1, A. Beda2, K. Noreikat1, A. Rau1,A. Carvalho3, A. Beilicke1, J. Haas1, T. Muders4, A. Reske1, H. Wrigge1
1University of Leipzig, Anesthesiology and Intensive Care Medicine, Leipzig, Germany,2Federal University of Minas Gerais, Department of Electronic Engineering, BeloHorizonte, Brazil, 3Federal University of Rio de Janeiro, Carlos Chagas BiophysicsInstitute, Rio de Janeiro, Brazil, 4University of Bonn, Department of Anesthesiology andIntensive Care Medicine, Bonn, GermanyINTRODUCTION. Because tidal recruitment (TidalRec) and hyperinflation may causeVentilator-Associated Lung Injury (VALI), different strategies with conflicting physiolog-ical rationales for mechanical ventilation (MV) of ARDS patients are proposed1-4.OBJECTIVE. To study lung function over 24 h in an ARDS model considered lessresponsive to lung recruitment5-7 during different MV protocols: (1) ARDS network lowerPEEP protocol (ARDSnet), (2) open lung concept (OLC) and (3) minimized heterogeneityof lung inflation according to electrical impedance tomography (EIT).METHODS. After ARDS induction by tracheal hydrochloric acid instillation, pigs wereventilated with tidal volumes of 6 ml/kg. PEEP setting was randomized according to.1) ARDSnet (n = 7)1,2) OLC (n = 7), or3) EIT (n = 8).For both, OLC and EIT, recruitment maneuvers and decremental PEEP trials were per-formed. In the OLC, PEEP was set 2 cmH2O above the PEEP where PaO2 (FiO2 = 1)dropped by 10 % of its maximum2. For EIT, the regional ventilation delay index (RVD)was calculated and RVD3. Respiratory mechanics, gas exchange and whole-lung CT scans(static, end-expiratory and end-inspiratory) were acquired during 24 h. The distensionindex (%E2) was calculated using a volume-dependent elastance model4. Total lungvolume and mass and the masses of differently aerated compartments (expressed as % oftotal mass) were calculated from CT by extrapolation8. TidalRec was calculated as thedifference between the non-areated lung mass at expiration and inspiration; tidal hyper-inflation was calculated accordingly (inspiration minus expiration). Data are given asmedian and interquartile (25th–75th) range. Kruskal–Wallis-Tests or, after data transfor-mation, a General Linear Model was used for comparisons. We considered P \ 0.05significant.RESULTS. ARDSnet PEEP (5 (5–10)) was significantly lower than OLC (18 (18–22)) orEIT (18 (18–22) cmH2O) PEEP. Each group developed a characteristic and stable lungcondition (no significant changes over time except for a significant shunt increase in theEIT group). Shunt, PaO2/FiO2, non-aerated lung, total elastance and TidalRec were sig-nificantly higher in the ARDSnet group. OLC and EIT groups did not differ significantly(all P [ 0.07). Surrogates of hyperinflation showed very low signals (static or tidalhyperinflation always \1.5 % of lung mass) or did not differ between groups (%E2,P = 0.8).
Table 1
Group Baseline ARDS 04 h 08 h 12 h 16 h 20 h 24 h
Shunt (%) ARDS 13 (10–17) 27 (19–46) 21 (17–24) 17 (14–31) 23 (14–27) 23 (17–25) 23 (18–27) 22 (18–27)
Shunt (%) OLC 17 (13–22) 58 (33–60) 9 (6–12) 8 (4–13) 9 (6–11) 9 (6–10) 9 (7–11) 9 (8–10)
Shunt (%) EIT 16 (11–20) 41 (29–48) 6 (5–9) 7 (5–12) 7 (6–12) 8 (7–13) 16 (8–19) 10 (8–15)
Mnon (%) ARDS 12 (6–39) 46 (31–62) 53 (46–68) 62 (51–72) 67 (62–74) 70 (55–82) 67 (58–71) 66 (50–73)
Mnon (%) OLC 17 (13–31) 53 (50–56) 10 (5–23) 14 (5–28) 7 (5–15) 17 (4–23) 16 (4–24) 15 (4–25)
Mnon (%) EIT 18 (15–24) 53 (50–59) 18 (10–23) 16 (9–23) 15 (9–21) 17 (11–22) 16 (11–20) 19 (13–21)
Tidal rec. (%) ARDS 7.1 (3–23) 11 (6–22) 12 (7–33) 11 (7–23) 9 (2–27) 11 (6–41) 11 (7–13) 15 (9–38)
Tidal rec. (%) OLC 6 (2–18) 10 (6–21) 3 (1–5) 2 (0–3) 2 (0–4) 2 (0–4) 3 (0–7) 2 (0–5)
Tidal rec. (%) EIT 6 (0–8) 18 (10–27) 3 (3–5) 0 (0–4) 4 (2–6) 5 (0 –6) 3 (0–6) 4 (0–7)
CONCLUSION. Even for pulmonary ARDS after acid aspiration, which is focally dis-tributed and considered less recruitable 6-8, early lung recruitment and individualized highPEEP improved lung volumes and function. Compared to the evidence-based ARDSnetprotocol, surrogates of VALI seemed better balanced in the MV protocols including lungrecruitment and individualized high PEEP.REFERENCES. 1. Anonymous NEJM 2000. 2. Suarez-Sipmann F. CCM. 2007. 3. MudersT. CCM. 2012. 4. Carvalho AR. ICM. 2008. 5. Puybasset L. ICM. 2000. 6. Heuer J. CritCare. 2012. 7. Ambrosio A. Anesthesiology. 2012. 8. Reske A. Crit Care. 2011.
0337IMPACT OF DIFFERENT TRANSPULMONARY PRESSURES DURINGMECHANICAL VENTILATION IN EXPERIMENTAL ACUTE RESPIRATORYDISTRESS SYNDROME
C.S. Samary1, R.S. Santos1, C.L. Santos1, N.S. Felix1, M.B. Ramos1, C.S.N. Baez-Garcia1,
P.L. Silva1, P. Pelosi2, P.R.M. Rocco1
1Federal University of Rio de Janeiro, Carlos Chagas Filho Biophysics Institute, Rio deJaneiro, Brazil, 2University of Genoa, Department of Surgical Sciences and IntegratedDiagnostics, Genoa, ItalyINTRODUCTION. The use of low tidal volume (VT) and respiratory system plateaupressure (Pplat, rs) lower than 30 cmH2O has become the cornerstone of protectivemechanical ventilation in acute respiratory distress syndrome (ARDS) patients, reducingventilator-associated lung injury (VALI). However, the key variable in determining pul-monary stress is delta transpulmonary pressure (DP,L). Nevertheless, the importance oftranspulmonary pressure as a VALI determinant is still controversial.OBJECTIVES. To investigate the impact of of different levels of DP,L, generated by thecombination of VT and PEEP, on lung mechanics and histology in experimental ARDS.METHODS. Thirty Wistar rats (344 ± 23 g) received Escherichia coli lipopolysaccharide(200 lg in 0.2 ml of saline) intratracheally. After 24 h, animals were sedated, anesthetized,paralyzed, and mechanically ventilated with the following parameters: VT = 6 ml/kg,RR = 80 bpm, positive end-expiratory pressure (PEEP) = 3 cmH2O and inspiratory frac-tion of oxygen (FiO2) = 0.4. Baseline functional data were collected, and rats wererandomly assigned to groups ventilated with low (7.5 cmH2O), mean (10 cmH2O), and high(12 cmH2O) DP,L. Different combinations of VT and PEEP were then applied: DP,Llow:VT = 6 ml/kg and PEEP = 3cmH2O; DP,Lmean: VT = 6 ml/kg and PEEP = 9.5cmH2O orVT = 13 ml/kg and PEEP = 3cmH2O; DP,Lhigh: VT = 6 ml/kg and PEEP = 11cmH2O orVT = 20 ml/kg and PEEP = 3cmH2O. Animals were then ventilated for 1 h and lungs wereremoved for histology.
RESULTS. All groups showed oxygenation improvement, however, this benefit was moreevident in DP,Lmean and DP,Lhigh groups (p \ 0.05). DP,Llow resulted in higher alveolarcollapse (p \ 0.05). DP,Lhigh was always associated with alveolar hyperinflation, howevercombined with PEEP = 11 cmH2O higher PaCO2 was observed whereas with VT=20 ml/kgnormal levels of PaCO2 were noted. DP,Lmean with PEEP = 9.5 cmH2O, compared toDP,Llow, yielded better oxygenation (550 ± 21 vs. 298 ± 59, respectively) and lowerfraction area of alveolar collapse (25 ± 4 vs. 31 ± 2, respectively), with no hyperinflation.Compared to Pplat, rs, DP,L seems to closely reflect the alveolar hyperinflation.CONCLUSIONS. In the present ARDS model, DP,Lhigh resulted in hyperinflation, DP,Llow
led to alveolar collapse, whereas DP,Lmean with PEEP = 9.5 cmH2O yielded improvementin lung histology. DP,L seemed to closely reflect lung stress when associated with low VT
and an appropriate PEEP level enough to avoid alveolar collapse and hyperinflation.REFERENCE(S) 1. Petrucci, De Feo 2013.GRANT ACKNOWLEDGMENT. PRONEX-FAPERJ, FAPERJ, CNPq, CAPES.
0338MECHANISMS UNDERLYING PEEP-INDUCED LUNG RECRUITMENTIN INTUBATED HYPOXEMIC CRITICALLY ILL PATIENTS
N. Eronia1,2, T. Mauri2, G. Bellani2, A. Coppadoro2, A. Barletta2, R. Marcolin3, A. Pesenti2
1University of Foggia, Dept. of Anesthesia and Intensive Care, Foggia, Italy, 2University ofMilan-Bicocca, Dept. of Health Science, Monza, Italy, 3San Gerardo Hospital, Monza, Italy.INTRODUCTION. Positive end expiratory pressure (PEEP) improves oxygenation andreduces lung strain and atelectrauma, also by inducing lung recruitment. Thus, estimatingPEEP-induced recruitment might help identify optimal ventilation settings, but bedsidemethods to quantify lung recruitment are few and complex to be applied in daily clinicalpractice. Electrical impedance tomography (EIT) is a non invasive bedside technique thatclaims to track, over time, global and regional changes in ventilation, respiratory mechanicsand end-expiratory lung volume (DEELV), from which recruitment may be calculated.OBJECTIVES. We compared recruitment measured by EIT against the validated simpli-fied helium-dilution technique and we analyzed correlations between regional PEEP effectsand lung recruitment.METHODS. We enrolled 12 intubated critically ill patients undergoing controlledmechanical ventilation, with PaO2/FiO2 B 300 at PEEP C 5 cmH2O. We applied on eachpatient’s thorax an EIT monitor (Pulmovista500�, Dräger Medical GmbH, Lübeck, Ger-many) and applied two PEEP levels (clinical and clinical + 5 cmH2O) for 20 min each. ByEIT and Helium technique, we measured DEELV (DEELVEIT and DEELVHe, respectively)considering clinical PEEP as baseline and calculated recruitment as (measured DEELV -[respiratory system compliance 9 DPEEP]). We also collected regional EIT data, ventila-tion parameters and arterial blood gases.RESULTS. Patients were 68 ± 10 year-old, ventilation days were 2 ± 1 and PaO2/FiO2
was 180 ± 62 mmHg at clinical PEEP (8 ± 2 cmH2O). Six patients fulfilled ARDS criteria.At higher PEEP levels (13 ± 2 cmH2O), in comparison to lower PEEP, EELVHe andEELVEIT increased (p \ 0.001), as well as PaO2/FiO2 (192 ± 60 mmHg vs.209 ± 73 mmHg; p \ 0.05) and airway pressures. PEEP-induced recruitment measured byHelium was 245 ± 202 ml and 232 ± 170 ml by EIT. The correlation between DEELVHe
and DEELVEIT was quite strong (r = 0.88; p \ 0.001), as well as the correlation betweenrecruited lung volumes measured by the 2 techniques (r = 0.79; p \ 0.01). Regionally tidalventilation reaching dependent lung areas increased (30 ± 8 vs. 35 ± 5 %; p \ 0.01), whilerespiratory system compliance decreased both in non-dependent (38 ± 12 ml/cmH2O vs.31 ± 11 ml/cmH2O, p \ 0.001) and dependent lung regions (16 ± 4 ml/cmH2O vs.11 ± 4 ml/cmH2O, p \ 0.001). Interestingly, recruitment was correlated with decrease ofnon-dependent lung regions compliance (r = 0.725; p \ 0.01) (Figure 1) and withincreased tidal volume reaching dependent lung regions (r = 0.85; p \ 0.001) (Figure 2).
Figure 1 and 2
CONCLUSIONS. In hypoxemic critically ill patients undergoing mechanical ventilation,higher PEEP is associated with improved oxygenation and significant recruitment that canbe fairly quantified by EIT technology. At higher PEEP compliance of non-dependent lungregions might decrease, inducing tidal volume redistribution towards dependent lung areasand re-aeration of collapsed alveoli.GRANT ACKNOWLEDGMENT. UNIMIB.
0339OPEN LUNG IN LATERAL DECUBITUS WITH DIFFERENTIAL SELECTIVEPOSITIVE END-EXPIRATORY PRESSURE IN A PORCINE EXPERIMENTALMODEL OF EARLY ACUTE RESPIRATORY DISTRESS SYNDROME
J.B. Borges1, O. Ahlgren1, M. Senturk1, F. Suarez-Sipmann1, G. Hedenstierna2, A. Larsson1
1Uppsala University, Hedenstierna Laboratory, Department of Surgical Sciences, Section ofAnaesthesiology & Critical Care, Uppsala, Sweden, 2Uppsala University, HedenstiernaLaboratory, Department of Medical Sciences, Clinical Physiology, Uppsala, SwedenINTRODUCTION. Hypothesized mechanisms of VILI include low-volume injury andoverdistension. Low-volume injury encompasses local concentration of stresses in thevicinity of collapse in heterogeneously aerated lungs, predominating in dependent regions.Overdistension occurs in nondependent regions and is also potentiated in proportion to thedegree of lung aeration inhomogeneity. Lateral decubitus, differential lung ventilation and
26th ESICM ANNUAL CONGRESS — PARIS, FRANCE — 5–9 OCTOBER 2013
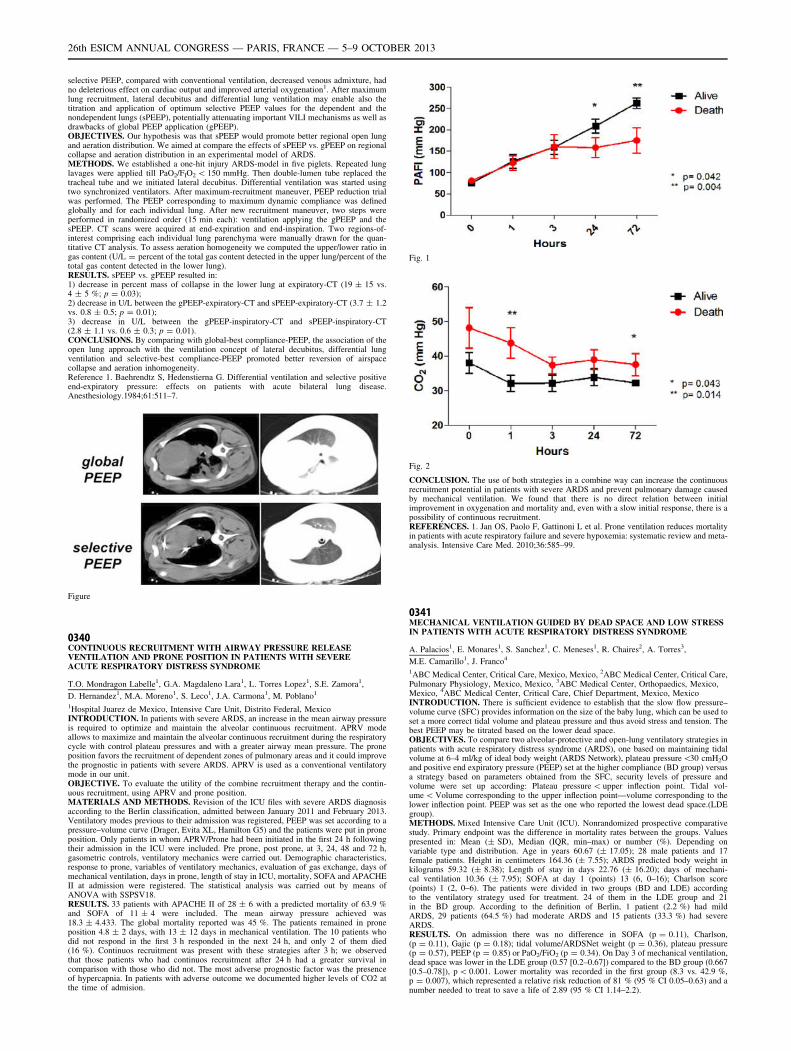
selective PEEP, compared with conventional ventilation, decreased venous admixture, hadno deleterious effect on cardiac output and improved arterial oxygenation1. After maximumlung recruitment, lateral decubitus and differential lung ventilation may enable also thetitration and application of optimum selective PEEP values for the dependent and thenondependent lungs (sPEEP), potentially attenuating important VILI mechanisms as well asdrawbacks of global PEEP application (gPEEP).OBJECTIVES. Our hypothesis was that sPEEP would promote better regional open lungand aeration distribution. We aimed at compare the effects of sPEEP vs. gPEEP on regionalcollapse and aeration distribution in an experimental model of ARDS.METHODS. We established a one-hit injury ARDS-model in five piglets. Repeated lunglavages were applied till PaO2/FIO2 \ 150 mmHg. Then double-lumen tube replaced thetracheal tube and we initiated lateral decubitus. Differential ventilation was started usingtwo synchronized ventilators. After maximum-recruitment maneuver, PEEP reduction trialwas performed. The PEEP corresponding to maximum dynamic compliance was definedglobally and for each individual lung. After new recruitment maneuver, two steps wereperformed in randomized order (15 min each): ventilation applying the gPEEP and thesPEEP. CT scans were acquired at end-expiration and end-inspiration. Two regions-of-interest comprising each individual lung parenchyma were manually drawn for the quan-titative CT analysis. To assess aeration homogeneity we computed the upper/lower ratio ingas content (U/L = percent of the total gas content detected in the upper lung/percent of thetotal gas content detected in the lower lung).RESULTS. sPEEP vs. gPEEP resulted in:1) decrease in percent mass of collapse in the lower lung at expiratory-CT (19 ± 15 vs.4 ± 5 %; p = 0.03);2) decrease in U/L between the gPEEP-expiratory-CT and sPEEP-expiratory-CT (3.7 ± 1.2vs. 0.8 ± 0.5; p = 0.01);3) decrease in U/L between the gPEEP-inspiratory-CT and sPEEP-inspiratory-CT(2.8 ± 1.1 vs. 0.6 ± 0.3; p = 0.01).CONCLUSIONS. By comparing with global-best compliance-PEEP, the association of theopen lung approach with the ventilation concept of lateral decubitus, differential lungventilation and selective-best compliance-PEEP promoted better reversion of airspacecollapse and aeration inhomogeneity.Reference 1. Baehrendtz S, Hedenstierna G. Differential ventilation and selective positiveend-expiratory pressure: effects on patients with acute bilateral lung disease.Anesthesiology.1984;61:511–7.
Figure
0340CONTINUOUS RECRUITMENT WITH AIRWAY PRESSURE RELEASEVENTILATION AND PRONE POSITION IN PATIENTS WITH SEVEREACUTE RESPIRATORY DISTRESS SYNDROME
T.O. Mondragon Labelle1, G.A. Magdaleno Lara1, L. Torres Lopez1, S.E. Zamora1,
D. Hernandez1, M.A. Moreno1, S. Leco1, J.A. Carmona1, M. Poblano1
1Hospital Juarez de Mexico, Intensive Care Unit, Distrito Federal, MexicoINTRODUCTION. In patients with severe ARDS, an increase in the mean airway pressureis required to optimize and maintain the alveolar continuous recruitment. APRV modeallows to maximize and maintain the alveolar continuous recruitment during the respiratorycycle with control plateau pressures and with a greater airway mean pressure. The proneposition favors the recruitment of dependent zones of pulmonary areas and it could improvethe prognostic in patients with severe ARDS. APRV is used as a conventional ventilatorymode in our unit.OBJECTIVE. To evaluate the utility of the combine recruitment therapy and the contin-uous recruitment, using APRV and prone position.MATERIALS AND METHODS. Revision of the ICU files with severe ARDS diagnosisaccording to the Berlin classification, admitted between January 2011 and February 2013.Ventilatory modes previous to their admission was registered, PEEP was set according to apressure–volume curve (Drager, Evita XL, Hamilton G5) and the patients were put in proneposition. Only patients in whom APRV/Prone had been initiated in the first 24 h followingtheir admission in the ICU were included. Pre prone, post prone, at 3, 24, 48 and 72 h,gasometric controls, ventilatory mechanics were carried out. Demographic characteristics,response to prone, variables of ventilatory mechanics, evaluation of gas exchange, days ofmechanical ventilation, days in prone, length of stay in ICU, mortality, SOFA and APACHEII at admission were registered. The statistical analysis was carried out by means ofANOVA with SSPSV18.RESULTS. 33 patients with APACHE II of 28 ± 6 with a predicted mortality of 63.9 %and SOFA of 11 ± 4 were included. The mean airway pressure achieved was18.3 ± 4.433. The global mortality reported was 45 %. The patients remained in proneposition 4.8 ± 2 days, with 13 ± 12 days in mechanical ventilation. The 10 patients whodid not respond in the first 3 h responded in the next 24 h, and only 2 of them died(16 %). Continuos recruitment was present with these strategies after 3 h; we observedthat those patients who had continuos recruitment after 24 h had a greater survival incomparison with those who did not. The most adverse prognostic factor was the presenceof hypercapnia. In patients with adverse outcome we documented higher levels of CO2 atthe time of admision.
Fig. 1
Fig. 2
CONCLUSION. The use of both strategies in a combine way can increase the continuousrecruitment potential in patients with severe ARDS and prevent pulmonary damage causedby mechanical ventilation. We found that there is no direct relation between initialimprovement in oxygenation and mortality and, even with a slow initial response, there is apossibility of continuous recruitment.REFERENCES. 1. Jan OS, Paolo F, Gattinoni L et al. Prone ventilation reduces mortalityin patients with acute respiratory failure and severe hypoxemia: systematic review and meta-analysis. Intensive Care Med. 2010;36:585–99.
0341MECHANICAL VENTILATION GUIDED BY DEAD SPACE AND LOW STRESSIN PATIENTS WITH ACUTE RESPIRATORY DISTRESS SYNDROME
A. Palacios1, E. Monares1, S. Sanchez1, C. Meneses1, R. Chaires2, A. Torres3,
M.E. Camarillo1, J. Franco4
1ABC Medical Center, Critical Care, Mexico, Mexico, 2ABC Medical Center, Critical Care,Pulmonary Physiology, Mexico, Mexico, 3ABC Medical Center, Orthopaedics, Mexico,Mexico, 4ABC Medical Center, Critical Care, Chief Department, Mexico, MexicoINTRODUCTION. There is sufficient evidence to establish that the slow flow pressure–volume curve (SFC) provides information on the size of the baby lung, which can be used toset a more correct tidal volume and plateau pressure and thus avoid stress and tension. Thebest PEEP may be titrated based on the lower dead space.OBJECTIVES. To compare two alveolar-protective and open-lung ventilatory strategies inpatients with acute respiratory distress syndrome (ARDS), one based on maintaining tidalvolume at 6–4 ml/kg of ideal body weight (ARDS Network), plateau pressure\30 cmH2Oand positive end expiratory pressure (PEEP) set at the higher compliance (BD group) versusa strategy based on parameters obtained from the SFC, security levels of pressure andvolume were set up according: Plateau pressure \ upper inflection point. Tidal vol-ume \ Volume corresponding to the upper inflection point—volume corresponding to thelower inflection point. PEEP was set as the one who reported the lowest dead space.(LDEgroup).METHODS. Mixed Intensive Care Unit (ICU). Nonrandomized prospective comparativestudy. Primary endpoint was the difference in mortality rates between the groups. Valuespresented in: Mean (± SD), Median (IQR, min–max) or number (%). Depending onvariable type and distribution. Age in years 60.67 (± 17.05); 28 male patients and 17female patients. Height in centimeters 164.36 (± 7.55); ARDS predicted body weight inkilograms 59.32 (± 8.38); Length of stay in days 22.76 (± 16.20); days of mechani-cal ventilation 10.36 (± 7.95); SOFA at day 1 (points) 13 (6, 0–16); Charlson score(points) 1 (2, 0–6). The patients were divided in two groups (BD and LDE) accordingto the ventilatory strategy used for treatment. 24 of them in the LDE group and 21in the BD group. According to the definition of Berlin, 1 patient (2.2 %) had mildARDS, 29 patients (64.5 %) had moderate ARDS and 15 patients (33.3 %) had severeARDS.RESULTS. On admission there was no difference in SOFA (p = 0.11), Charlson,(p = 0.11), Gajic (p = 0.18); tidal volume/ARDSNet weight (p = 0.36), plateau pressure(p = 0.57), PEEP (p = 0.85) or PaO2/FiO2 (p = 0.34). On Day 3 of mechanical ventilation,dead space was lower in the LDE group (0.57 [0.2–0.67]) compared to the BD group (0.667[0.5–0.78]), p \ 0.001. Lower mortality was recorded in the first group (8.3 vs. 42.9 %,p = 0.007), which represented a relative risk reduction of 81 % (95 % CI 0.05–0.63) and anumber needed to treat to save a life of 2.89 (95 % CI 1.14–2.2).
26th ESICM ANNUAL CONGRESS — PARIS, FRANCE — 5–9 OCTOBER 2013
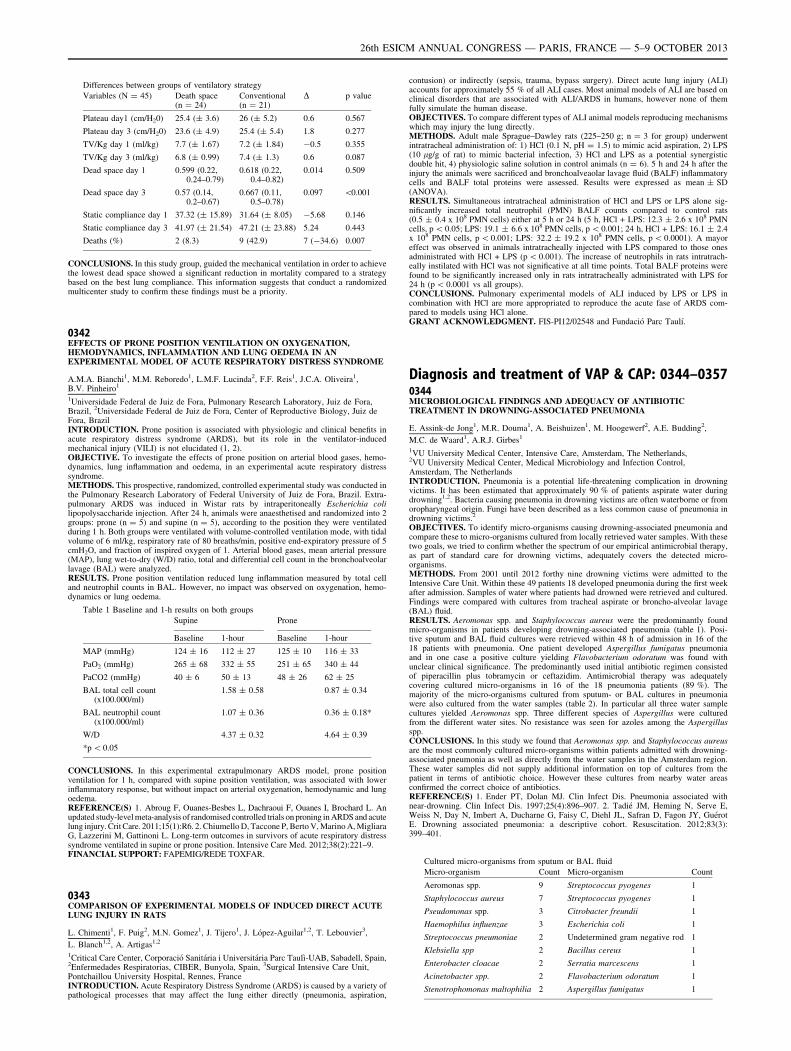
Differences between groups of ventilatory strategy
Variables (N = 45) Death space(n = 24)
Conventional(n = 21)
D p value
Plateau day1 (cm/H20) 25.4 (± 3.6) 26 (± 5.2) 0.6 0.567
Plateau day 3 (cm/H20) 23.6 (± 4.9) 25.4 (± 5.4) 1.8 0.277
TV/Kg day 1 (ml/kg) 7.7 (± 1.67) 7.2 (± 1.84) -0.5 0.355
TV/Kg day 3 (ml/kg) 6.8 (± 0.99) 7.4 (± 1.3) 0.6 0.087
Dead space day 1 0.599 (0.22,0.24–0.79)
0.618 (0.22,0.4–0.82)
0.014 0.509
Dead space day 3 0.57 (0.14,0.2–0.67)
0.667 (0.11,0.5–0.78)
0.097 \0.001
Static compliance day 1 37.32 (± 15.89) 31.64 (± 8.05) -5.68 0.146
Static compliance day 3 41.97 (± 21.54) 47.21 (± 23.88) 5.24 0.443
Deaths (%) 2 (8.3) 9 (42.9) 7 (-34.6) 0.007
CONCLUSIONS. In this study group, guided the mechanical ventilation in order to achievethe lowest dead space showed a significant reduction in mortality compared to a strategybased on the best lung compliance. This information suggests that conduct a randomizedmulticenter study to confirm these findings must be a priority.
0342EFFECTS OF PRONE POSITION VENTILATION ON OXYGENATION,HEMODYNAMICS, INFLAMMATION AND LUNG OEDEMA IN ANEXPERIMENTAL MODEL OF ACUTE RESPIRATORY DISTRESS SYNDROME
A.M.A. Bianchi1, M.M. Reboredo1, L.M.F. Lucinda2, F.F. Reis1, J.C.A. Oliveira1,B.V. Pinheiro1
1Universidade Federal de Juiz de Fora, Pulmonary Research Laboratory, Juiz de Fora,Brazil, 2Universidade Federal de Juiz de Fora, Center of Reproductive Biology, Juiz deFora, BrazilINTRODUCTION. Prone position is associated with physiologic and clinical benefits inacute respiratory distress syndrome (ARDS), but its role in the ventilator-inducedmechanical injury (VILI) is not elucidated (1, 2).OBJECTIVE. To investigate the effects of prone position on arterial blood gases, hemo-dynamics, lung inflammation and oedema, in an experimental acute respiratory distresssyndrome.METHODS. This prospective, randomized, controlled experimental study was conducted inthe Pulmonary Research Laboratory of Federal University of Juiz de Fora, Brazil. Extra-pulmonary ARDS was induced in Wistar rats by intraperitoneally Escherichia colilipopolysaccharide injection. After 24 h, animals were anaesthetised and randomized into 2groups: prone (n = 5) and supine (n = 5), according to the position they were ventilatedduring 1 h. Both groups were ventilated with volume-controlled ventilation mode, with tidalvolume of 6 ml/kg, respiratory rate of 80 breaths/min, positive end-expiratory pressure of 5cmH2O, and fraction of inspired oxygen of 1. Arterial blood gases, mean arterial pressure(MAP), lung wet-to-dry (W/D) ratio, total and differential cell count in the bronchoalveolarlavage (BAL) were analyzed.RESULTS. Prone position ventilation reduced lung inflammation measured by total celland neutrophil counts in BAL. However, no impact was observed on oxygenation, hemo-dynamics or lung oedema.
Table 1 Baseline and 1-h results on both groups
Supine Prone
Baseline 1-hour Baseline 1-hour
MAP (mmHg) 124 ± 16 112 ± 27 125 ± 10 116 ± 33
PaO2 (mmHg) 265 ± 68 332 ± 55 251 ± 65 340 ± 44
PaCO2 (mmHg) 40 ± 6 50 ± 13 48 ± 26 62 ± 25
BAL total cell count(x100.000/ml)
1.58 ± 0.58 0.87 ± 0.34
BAL neutrophil count(x100.000/ml)
1.07 ± 0.36 0.36 ± 0.18*
W/D 4.37 ± 0.32 4.64 ± 0.39
*p \ 0.05
CONCLUSIONS. In this experimental extrapulmonary ARDS model, prone positionventilation for 1 h, compared with supine position ventilation, was associated with lowerinflammatory response, but without impact on arterial oxygenation, hemodynamic and lungoedema.REFERENCE(S) 1. Abroug F, Ouanes-Besbes L, Dachraoui F, Ouanes I, Brochard L. Anupdated study-level meta-analysis of randomised controlled trials on proning in ARDS and acutelung injury. Crit Care. 2011;15(1):R6. 2. Chiumello D, Taccone P, Berto V, Marino A, MigliaraG, Lazzerini M, Gattinoni L. Long-term outcomes in survivors of acute respiratory distresssyndrome ventilated in supine or prone position. Intensive Care Med. 2012;38(2):221–9.FINANCIAL SUPPORT: FAPEMIG/REDE TOXFAR.
0343COMPARISON OF EXPERIMENTAL MODELS OF INDUCED DIRECT ACUTELUNG INJURY IN RATS
L. Chimenti1, F. Puig2, M.N. Gomez1, J. Tijero1, J. López-Aguilar1,2, T. Lebouvier3,
L. Blanch1,2, A. Artigas1,2
1Critical Care Center, Corporació Sanitária i Universitária Parc Taulı̀-UAB, Sabadell, Spain,2Enfermedades Respiratorias, CIBER, Bunyola, Spain, 3Surgical Intensive Care Unit,Pontchaillou University Hospital, Rennes, FranceINTRODUCTION. Acute Respiratory Distress Syndrome (ARDS) is caused by a variety ofpathological processes that may affect the lung either directly (pneumonia, aspiration,
contusion) or indirectly (sepsis, trauma, bypass surgery). Direct acute lung injury (ALI)accounts for approximately 55 % of all ALI cases. Most animal models of ALI are based onclinical disorders that are associated with ALI/ARDS in humans, however none of themfully simulate the human disease.OBJECTIVES. To compare different types of ALI animal models reproducing mechanismswhich may injury the lung directly.METHODS. Adult male Sprague–Dawley rats (225–250 g; n = 3 for group) underwentintratracheal administration of: 1) HCl (0.1 N, pH = 1.5) to mimic acid aspiration, 2) LPS(10 lg/g of rat) to mimic bacterial infection, 3) HCl and LPS as a potential synergisticdouble hit, 4) physiologic saline solution in control animals (n = 6). 5 h and 24 h after theinjury the animals were sacrificed and bronchoalveaolar lavage fluid (BALF) inflammatorycells and BALF total proteins were assessed. Results were expressed as mean ± SD(ANOVA).RESULTS. Simultaneous intratracheal administration of HCl and LPS or LPS alone sig-nificantly increased total neutrophil (PMN) BALF counts compared to control rats(0.5 ± 0.4 x 10⁸ PMN cells) either at 5 h or 24 h (5 h, HCl + LPS: 12.3 ± 2.6 x 10⁸ PMNcells, p \ 0.05; LPS: 19.1 ± 6.6 x 10⁸ PMN cells, p \ 0.001; 24 h, HCl + LPS: 16.1 ± 2.4x 10⁸ PMN cells, p \ 0.001; LPS: 32.2 ± 19.2 x 10⁸ PMN cells, p \ 0.0001). A mayoreffect was observed in animals intratracheally injected with LPS compared to those onesadministrated with HCl + LPS (p \ 0.001). The increase of neutrophils in rats intratrach-eally instilated with HCl was not significative at all time points. Total BALF proteins werefound to be significantly increased only in rats intratracheally administrated with LPS for24 h (p \ 0.0001 vs all groups).CONCLUSIONS. Pulmonary experimental models of ALI induced by LPS or LPS incombination with HCl are more appropriated to reproduce the acute fase of ARDS com-pared to models using HCl alone.GRANT ACKNOWLEDGMENT. FIS-PI12/02548 and Fundació Parc Taulı́.
Diagnosis and treatment of VAP & CAP: 0344–03570344MICROBIOLOGICAL FINDINGS AND ADEQUACY OF ANTIBIOTICTREATMENT IN DROWNING-ASSOCIATED PNEUMONIA
E. Assink-de Jong1, M.R. Douma1, A. Beishuizen1, M. Hoogewerf2, A.E. Budding2,
M.C. de Waard1, A.R.J. Girbes1
1VU University Medical Center, Intensive Care, Amsterdam, The Netherlands,2VU University Medical Center, Medical Microbiology and Infection Control,Amsterdam, The NetherlandsINTRODUCTION. Pneumonia is a potential life-threatening complication in drowningvictims. It has been estimated that approximately 90 % of patients aspirate water duringdrowning1,2. Bacteria causing pneumonia in drowning victims are often waterborne or fromoropharyngeal origin. Fungi have been described as a less common cause of pneumonia indrowning victims.2
OBJECTIVES. To identify micro-organisms causing drowning-associated pneumonia andcompare these to micro-organisms cultured from locally retrieved water samples. With thesetwo goals, we tried to confirm whether the spectrum of our empirical antimicrobial therapy,as part of standard care for drowning victims, adequately covers the detected micro-organisms.METHODS. From 2001 until 2012 forthy nine drowning victims were admitted to theIntensive Care Unit. Within these 49 patients 18 developed pneumonia during the first weekafter admission. Samples of water where patients had drowned were retrieved and cultured.Findings were compared with cultures from tracheal aspirate or broncho-alveolar lavage(BAL) fluid.RESULTS. Aeromonas spp. and Staphylococcus aureus were the predominantly foundmicro-organisms in patients developing drowning-associated pneumonia (table 1). Posi-tive sputum and BAL fluid cultures were retrieved within 48 h of admission in 16 of the18 patients with pneumonia. One patient developed Aspergillus fumigatus pneumoniaand in one case a positive culture yielding Flavobacterium odoratum was found withunclear clinical significance. The predominantly used initial antibiotic regimen consistedof piperacillin plus tobramycin or ceftazidim. Antimicrobial therapy was adequatelycovering cultured micro-organisms in 16 of the 18 pneumonia patients (89 %). Themajority of the micro-organisms cultured from sputum- or BAL cultures in pneumoniawere also cultured from the water samples (table 2). In particular all three water samplecultures yielded Aeromonas spp. Three different species of Aspergillus were culturedfrom the different water sites. No resistance was seen for azoles among the Aspergillusspp.CONCLUSIONS. In this study we found that Aeromonas spp. and Staphylococcus aureusare the most commonly cultured micro-organisms within patients admitted with drowning-associated pneumonia as well as directly from the water samples in the Amsterdam region.These water samples did not supply additional information on top of cultures from thepatient in terms of antibiotic choice. However these cultures from nearby water areasconfirmed the correct choice of antibiotics.REFERENCE(S) 1. Ender PT, Dolan MJ. Clin Infect Dis. Pneumonia associated withnear-drowning. Clin Infect Dis. 1997;25(4):896–907. 2. Tadié JM, Heming N, Serve E,Weiss N, Day N, Imbert A, Ducharne G, Faisy C, Diehl JL, Safran D, Fagon JY, GuérotE. Drowning associated pneumonia: a descriptive cohort. Resuscitation. 2012;83(3):399–401.
Cultured micro-organisms from sputum or BAL fluid
Micro-organism Count Micro-organism Count
Aeromonas spp. 9 Streptococcus pyogenes 1
Staphylococcus aureus 7 Streptococcus pyogenes 1
Pseudomonas spp. 3 Citrobacter freundii 1
Haemophilus influenzae 3 Escherichia coli 1
Streptococcus pneumoniae 2 Undetermined gram negative rod 1
Klebsiella spp 2 Bacillus cereus 1
Enterobacter cloacae 2 Serratia marcescens 1
Acinetobacter spp. 2 Flavobacterium odoratum 1
Stenotrophomonas maltophilia 2 Aspergillus fumigatus 1
26th ESICM ANNUAL CONGRESS — PARIS, FRANCE — 5–9 OCTOBER 2013
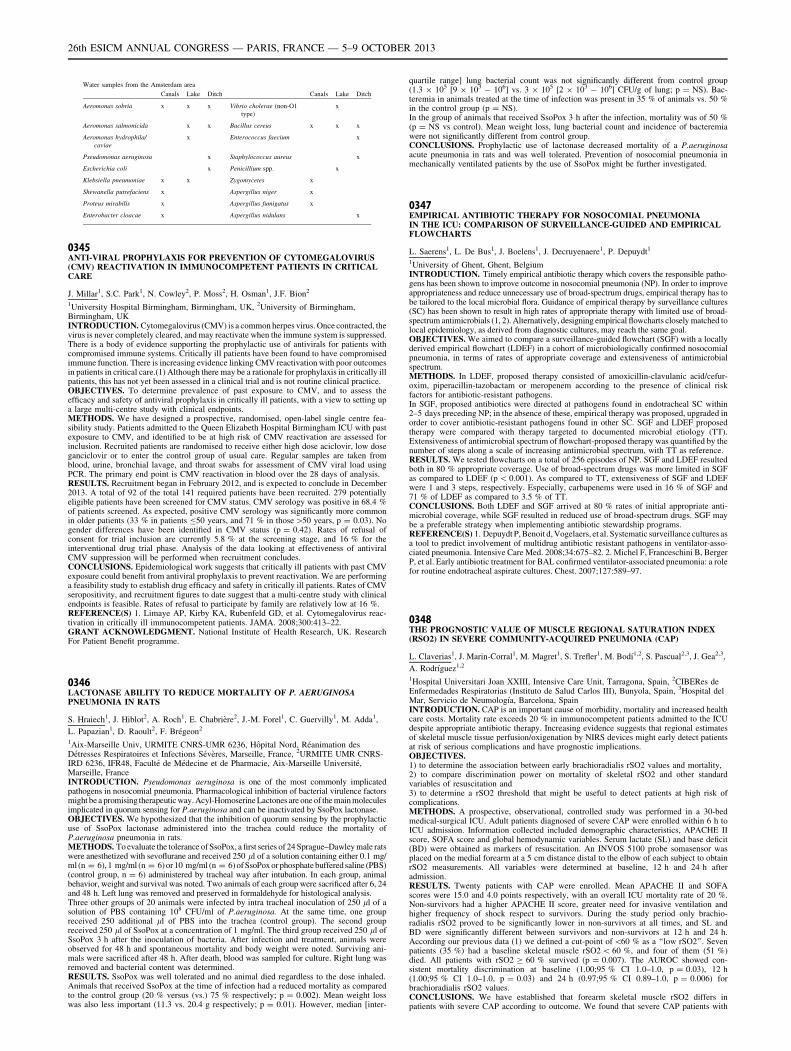
Water samples from the Amsterdam area
Canals Lake Ditch Canals Lake Ditch
Aeromonas sobria x x x Vibrio cholerae (non-O1
type)
x
Aeromonas salmonicida x x Bacillus cereus x x x
Aeromonas hydrophila/
caviae
x Enterococcus faecium x
Pseudomonas aeruginosa x Staphylococcus aureus x
Escherichia coli x Penicillium spp. x
Klebsiella pneumoniae x x Zygomycetes x
Shewanella putrefaciens x Aspergillus niger x
Proteus mirabilis x Aspergillus fumigatus x
Enterobacter cloacae x Aspergillus nidulans x
0345ANTI-VIRAL PROPHYLAXIS FOR PREVENTION OF CYTOMEGALOVIRUS(CMV) REACTIVATION IN IMMUNOCOMPETENT PATIENTS IN CRITICALCARE
J. Millar1, S.C. Park1, N. Cowley2, P. Moss2, H. Osman1, J.F. Bion2
1University Hospital Birmingham, Birmingham, UK, 2University of Birmingham,Birmingham, UKINTRODUCTION. Cytomegalovirus (CMV) is a common herpes virus. Once contracted, thevirus is never completely cleared, and may reactivate when the immune system is suppressed.There is a body of evidence supporting the prophylactic use of antivirals for patients withcompromised immune systems. Critically ill patients have been found to have compromisedimmune function. There is increasing evidence linking CMV reactivation with poor outcomesin patients in critical care.(1) Although there may be a rationale for prophylaxis in critically illpatients, this has not yet been assessed in a clinical trial and is not routine clinical practice.OBJECTIVES. To determine prevalence of past exposure to CMV, and to assess theefficacy and safety of antiviral prophylaxis in critically ill patients, with a view to setting upa large multi-centre study with clinical endpoints.METHODS. We have designed a prospective, randomised, open-label single centre fea-sibility study. Patients admitted to the Queen Elizabeth Hospital Birmingham ICU with pastexposure to CMV, and identified to be at high risk of CMV reactivation are assessed forinclusion. Recruited patients are randomised to receive either high dose aciclovir, low doseganciclovir or to enter the control group of usual care. Regular samples are taken fromblood, urine, bronchial lavage, and throat swabs for assessment of CMV viral load usingPCR. The primary end point is CMV reactivation in blood over the 28 days of analysis.RESULTS. Recruitment began in February 2012, and is expected to conclude in December2013. A total of 92 of the total 141 required patients have been recruited. 279 potentiallyeligible patients have been screened for CMV status. CMV serology was positive in 68.4 %of patients screened. As expected, positive CMV serology was significantly more commonin older patients (33 % in patients B50 years, and 71 % in those[50 years, p = 0.03). Nogender differences have been identified in CMV status (p = 0.42). Rates of refusal ofconsent for trial inclusion are currently 5.8 % at the screening stage, and 16 % for theinterventional drug trial phase. Analysis of the data looking at effectiveness of antiviralCMV suppression will be performed when recruitment concludes.CONCLUSIONS. Epidemiological work suggests that critically ill patients with past CMVexposure could benefit from antiviral prophylaxis to prevent reactivation. We are performinga feasibility study to establish drug efficacy and safety in critically ill patients. Rates of CMVseropositivity, and recruitment figures to date suggest that a multi-centre study with clinicalendpoints is feasible. Rates of refusal to participate by family are relatively low at 16 %.REFERENCE(S) 1. Limaye AP, Kirby KA, Rubenfeld GD, et al. Cytomegalovirus reac-tivation in critically ill immunocompetent patients. JAMA. 2008;300:413–22.GRANT ACKNOWLEDGMENT. National Institute of Health Research, UK. ResearchFor Patient Benefit programme.
0346LACTONASE ABILITY TO REDUCE MORTALITY OF P. AERUGINOSAPNEUMONIA IN RATS
S. Hraiech1, J. Hiblot2, A. Roch1, E. Chabrière2, J.-M. Forel1, C. Guervilly1, M. Adda1,
L. Papazian1, D. Raoult2, F. Brégeon2
1Aix-Marseille Univ, URMITE CNRS-UMR 6236, Hôpital Nord, Réanimation desDétresses Respiratoires et Infections Sévères, Marseille, France, 2URMITE UMR CNRS-IRD 6236, IFR48, Faculté de Médecine et de Pharmacie, Aix-Marseille Université,Marseille, FranceINTRODUCTION. Pseudomonas aeruginosa is one of the most commonly implicatedpathogens in nosocomial pneumonia. Pharmacological inhibition of bacterial virulence factorsmight be a promising therapeutic way. Acyl-Homoserine Lactones are one of the main moleculesimplicated in quorum sensing for P.aeruginosa and can be inactivated by SsoPox lactonase.OBJECTIVES. We hypothesized that the inhibition of quorum sensing by the prophylacticuse of SsoPox lactonase administered into the trachea could reduce the mortality ofP.aeruginosa pneumonia in rats.METHODS. To evaluate the tolerance of SsoPox, a first series of 24 Sprague–Dawley male ratswere anesthetized with sevoflurane and received 250 ll of a solution containing either 0.1 mg/ml (n = 6), 1 mg/ml (n = 6) or 10 mg/ml (n = 6) of SsoPox or phosphate buffered saline (PBS)(control group, n = 6) administered by tracheal way after intubation. In each group, animalbehavior, weight and survival was noted. Two animals of each group were sacrificed after 6, 24and 48 h. Left lung was removed and preserved in formaldehyde for histological analysis.Three other groups of 20 animals were infected by intra tracheal inoculation of 250 ll of asolution of PBS containing 108 CFU/ml of P.aeruginosa. At the same time, one groupreceived 250 additional ll of PBS into the trachea (control group). The second groupreceived 250 ll of SsoPox at a concentration of 1 mg/ml. The third group received 250 ll ofSsoPox 3 h after the inoculation of bacteria. After infection and treatment, animals wereobserved for 48 h and spontaneous mortality and body weight were noted. Surviving ani-mals were sacrificed after 48 h. After death, blood was sampled for culture. Right lung wasremoved and bacterial content was determined.RESULTS. SsoPox was well tolerated and no animal died regardless to the dose inhaled.Animals that received SsoPox at the time of infection had a reduced mortality as comparedto the control group (20 % versus (vs.) 75 % respectively; p = 0.002). Mean weight losswas also less important (11.3 vs. 20.4 g respectively; p = 0.01). However, median [inter-
quartile range] lung bacterial count was not significantly different from control group(1.3 9 105 [9 9 103 - 106] vs. 3 9 105 [2 9 103 - 106] CFU/g of lung; p = NS). Bac-teremia in animals treated at the time of infection was present in 35 % of animals vs. 50 %in the control group (p = NS).In the group of animals that received SsoPox 3 h after the infection, mortality was of 50 %(p = NS vs control). Mean weight loss, lung bacterial count and incidence of bacteremiawere not significantly different from control group.CONCLUSIONS. Prophylactic use of lactonase decreased mortality of a P.aeruginosaacute pneumonia in rats and was well tolerated. Prevention of nosocomial pneumonia inmechanically ventilated patients by the use of SsoPox might be further investigated.
0347EMPIRICAL ANTIBIOTIC THERAPY FOR NOSOCOMIAL PNEUMONIAIN THE ICU: COMPARISON OF SURVEILLANCE-GUIDED AND EMPIRICALFLOWCHARTS
L. Saerens1, L. De Bus1, J. Boelens1, J. Decruyenaere1, P. Depuydt1
1University of Ghent, Ghent, BelgiumINTRODUCTION. Timely empirical antibiotic therapy which covers the responsible patho-gens has been shown to improve outcome in nosocomial pneumonia (NP). In order to improveappropriateness and reduce unnecessary use of broad-spectrum drugs, empirical therapy has tobe tailored to the local microbial flora. Guidance of empirical therapy by surveillance cultures(SC) has been shown to result in high rates of appropriate therapy with limited use of broad-spectrum antimicrobials (1, 2). Alternatively, designing empirical flowcharts closely matched tolocal epidemiology, as derived from diagnostic cultures, may reach the same goal.OBJECTIVES. We aimed to compare a surveillance-guided flowchart (SGF) with a locallyderived empirical flowchart (LDEF) in a cohort of microbiologically confirmed nosocomialpneumonia, in terms of rates of appropriate coverage and extensiveness of antimicrobialspectrum.METHODS. In LDEF, proposed therapy consisted of amoxicillin-clavulanic acid/cefur-oxim, piperacillin-tazobactam or meropenem according to the presence of clinical riskfactors for antibiotic-resistant pathogens.In SGF, proposed antibiotics were directed at pathogens found in endotracheal SC within2–5 days preceding NP; in the absence of these, empirical therapy was proposed, upgraded inorder to cover antibiotic-resistant pathogens found in other SC. SGF and LDEF proposedtherapy were compared with therapy targeted to documented microbial etiology (TT).Extensiveness of antimicrobial spectrum of flowchart-proposed therapy was quantified by thenumber of steps along a scale of increasing antimicrobial spectrum, with TT as reference.RESULTS. We tested flowcharts on a total of 256 episodes of NP. SGF and LDEF resultedboth in 80 % appropriate coverage. Use of broad-spectrum drugs was more limited in SGFas compared to LDEF (p \ 0.001). As compared to TT, extensiveness of SGF and LDEFwere 1 and 3 steps, respectively. Especially, carbapenems were used in 16 % of SGF and71 % of LDEF as compared to 3.5 % of TT.CONCLUSIONS. Both LDEF and SGF arrived at 80 % rates of initial appropriate anti-microbial coverage, while SGF resulted in reduced use of broad-spectrum drugs. SGF maybe a preferable strategy when implementing antibiotic stewardship programs.REFERENCE(S) 1. Depuydt P, Benoit d, Vogelaers, et al. Systematic surveillance cultures asa tool to predict involvement of multidrug antibiotic resistant pathogens in ventilator-asso-ciated pneumonia. Intensive Care Med. 2008;34:675–82. 2. Michel F, Franceschini B, BergerP, et al. Early antibiotic treatment for BAL confirmed ventilator-associated pneumonia: a rolefor routine endotracheal aspirate cultures. Chest. 2007;127:589–97.
0348THE PROGNOSTIC VALUE OF MUSCLE REGIONAL SATURATION INDEX(RSO2) IN SEVERE COMMUNITY-ACQUIRED PNEUMONIA (CAP)
L. Claverias1, J. Marin-Corral1, M. Magret1, S. Trefler1, M. Bodı́1,2, S. Pascual2,3, J. Gea2,3,
A. Rodrı́guez1,2
1Hospital Universitari Joan XXIII, Intensive Care Unit, Tarragona, Spain, 2CIBERes deEnfermedades Respiratorias (Instituto de Salud Carlos III), Bunyola, Spain, 3Hospital delMar, Servicio de Neumologı́a, Barcelona, SpainINTRODUCTION. CAP is an important cause of morbidity, mortality and increased healthcare costs. Mortality rate exceeds 20 % in immunocompetent patients admitted to the ICUdespite appropriate antibiotic therapy. Increasing evidence suggests that regional estimatesof skeletal muscle tissue perfusion/oxigenation by NIRS devices might early detect patientsat risk of serious complications and have prognostic implications.OBJECTIVES.1) to determine the association between early brachioradialis rSO2 values and mortality,2) to compare discrimination power on mortality of skeletal rSO2 and other standardvariables of resuscitation and3) to determine a rSO2 threshold that might be useful to detect patients at high risk ofcomplications.METHODS. A prospective, observational, controlled study was performed in a 30-bedmedical-surgical ICU. Adult patients diagnosed of severe CAP were enrolled within 6 h toICU admission. Information collected included demographic characteristics, APACHE IIscore, SOFA score and global hemodynamic variables. Serum lactate (SL) and base deficit(BD) were obtained as markers of resuscitation. An INVOS 5100 probe somasensor wasplaced on the medial forearm at a 5 cm distance distal to the elbow of each subject to obtainrSO2 measurements. All variables were determined at baseline, 12 h and 24 h afteradmission.RESULTS. Twenty patients with CAP were enrolled. Mean APACHE II and SOFAscores were 15.0 and 4.0 points respectively, with an overall ICU mortality rate of 20 %.Non-survivors had a higher APACHE II score, greater need for invasive ventilation andhigher frequency of shock respect to survivors. During the study period only brachio-radialis rSO2 proved to be significantly lower in non-survivors at all times, and SL andBD were significantly different between survivors and non-survivors at 12 h and 24 h.According our previous data (1) we defined a cut-point of \60 % as a ‘‘low rSO2’’. Sevenpatients (35 %) had a baseline skeletal muscle rSO2 \ 60 %, and four of them (51 %)died. All patients with rSO2 C 60 % survived (p = 0.007). The AUROC showed con-sistent mortality discrimination at baseline (1.00;95 % CI 1.0–1.0, p = 0.03), 12 h(1.00;95 % CI 1.0–1.0, p = 0.03) and 24 h (0.97;95 % CI 0.89–1.0, p = 0.006) forbrachioradialis rSO2 values.CONCLUSIONS. We have established that forearm skeletal muscle rSO2 differs inpatients with severe CAP according to outcome. We found that severe CAP patients with
26th ESICM ANNUAL CONGRESS — PARIS, FRANCE — 5–9 OCTOBER 2013
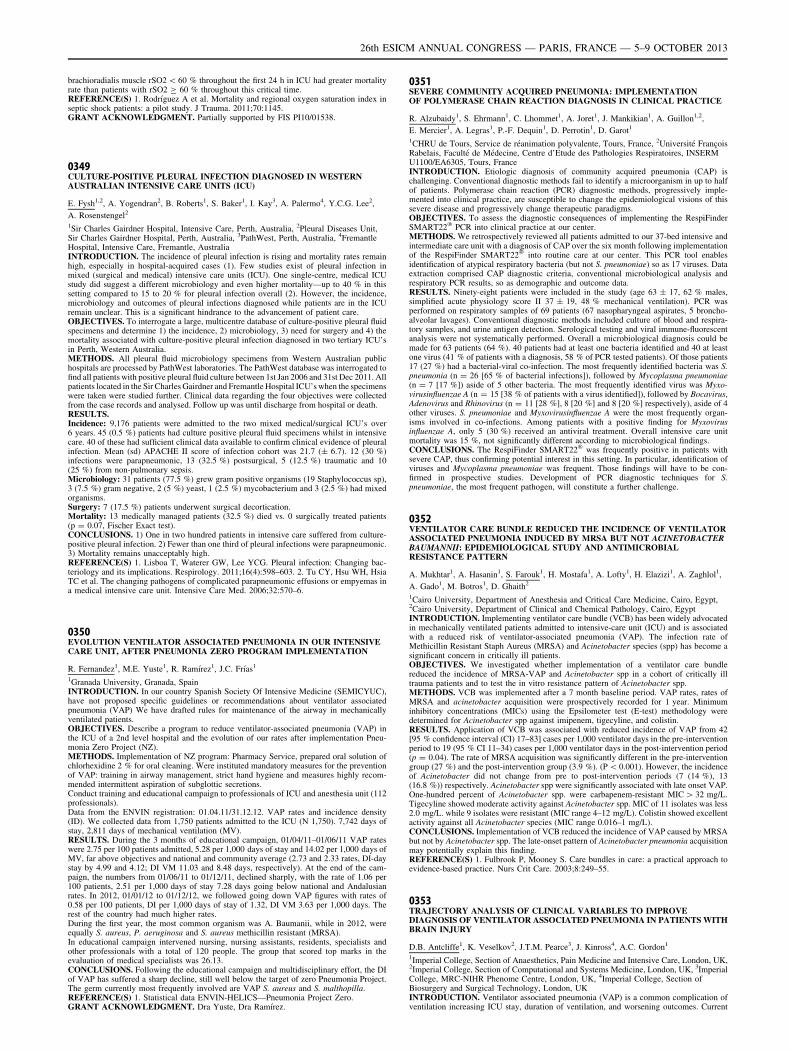
brachioradialis muscle rSO2 \ 60 % throughout the first 24 h in ICU had greater mortalityrate than patients with rSO2 C 60 % throughout this critical time.REFERENCE(S) 1. Rodrı́guez A et al. Mortality and regional oxygen saturation index inseptic shock patients: a pilot study. J Trauma. 2011;70:1145.GRANT ACKNOWLEDGMENT. Partially supported by FIS PI10/01538.
0349CULTURE-POSITIVE PLEURAL INFECTION DIAGNOSED IN WESTERNAUSTRALIAN INTENSIVE CARE UNITS (ICU)
E. Fysh1,2, A. Yogendran2, B. Roberts1, S. Baker1, I. Kay3, A. Palermo4, Y.C.G. Lee2,
A. Rosenstengel2
1Sir Charles Gairdner Hospital, Intensive Care, Perth, Australia, 2Pleural Diseases Unit,Sir Charles Gairdner Hospital, Perth, Australia, 3PathWest, Perth, Australia, 4FremantleHospital, Intensive Care, Fremantle, AustraliaINTRODUCTION. The incidence of pleural infection is rising and mortality rates remainhigh, especially in hospital-acquired cases (1). Few studies exist of pleural infection inmixed (surgical and medical) intensive care units (ICU). One single-centre, medical ICUstudy did suggest a different microbiology and even higher mortality—up to 40 % in thissetting compared to 15 to 20 % for pleural infection overall (2). However, the incidence,microbiology and outcomes of pleural infections diagnosed while patients are in the ICUremain unclear. This is a significant hindrance to the advancement of patient care.OBJECTIVES. To interrogate a large, multicentre database of culture-positive pleural fluidspecimens and determine 1) the incidence, 2) microbiology, 3) need for surgery and 4) themortality associated with culture-positive pleural infection diagnosed in two tertiary ICU’sin Perth, Western Australia.METHODS. All pleural fluid microbiology specimens from Western Australian publichospitals are processed by PathWest laboratories. The PathWest database was interrogated tofind all patients with positive pleural fluid culture between 1st Jan 2006 and 31st Dec 2011. Allpatients located in the Sir Charles Gairdner and Fremantle Hospital ICU’s when the specimenswere taken were studied further. Clinical data regarding the four objectives were collectedfrom the case records and analysed. Follow up was until discharge from hospital or death.RESULTS.Incidence: 9,176 patients were admitted to the two mixed medical/surgical ICU’s over6 years. 45 (0.5 %) patients had culture positive pleural fluid specimens whilst in intensivecare. 40 of these had sufficient clinical data available to confirm clinical evidence of pleuralinfection. Mean (sd) APACHE II score of infection cohort was 21.7 (± 6.7). 12 (30 %)infections were parapneumonic, 13 (32.5 %) postsurgical, 5 (12.5 %) traumatic and 10(25 %) from non-pulmonary sepsis.Microbiology: 31 patients (77.5 %) grew gram positive organisms (19 Staphylococcus sp),3 (7.5 %) gram negative, 2 (5 %) yeast, 1 (2.5 %) mycobacterium and 3 (2.5 %) had mixedorganisms.Surgery: 7 (17.5 %) patients underwent surgical decortication.Mortality: 13 medically managed patients (32.5 %) died vs. 0 surgically treated patients(p = 0.07, Fischer Exact test).CONCLUSIONS. 1) One in two hundred patients in intensive care suffered from culture-positive pleural infection. 2) Fewer than one third of pleural infections were parapneumonic.3) Mortality remains unacceptably high.REFERENCE(S) 1. Lisboa T, Waterer GW, Lee YCG. Pleural infection: Changing bac-teriology and its implications. Respirology. 2011;16(4):598–603. 2. Tu CY, Hsu WH, HsiaTC et al. The changing pathogens of complicated parapneumonic effusions or empyemas ina medical intensive care unit. Intensive Care Med. 2006;32:570–6.
0350EVOLUTION VENTILATOR ASSOCIATED PNEUMONIA IN OUR INTENSIVECARE UNIT, AFTER PNEUMONIA ZERO PROGRAM IMPLEMENTATION
R. Fernandez1, M.E. Yuste1, R. Ramı́rez1, J.C. Frı́as1
1Granada University, Granada, SpainINTRODUCTION. In our country Spanish Society Of Intensive Medicine (SEMICYUC),have not proposed specific guidelines or recommendations about ventilator associatedpneumonia (VAP) We have drafted rules for maintenance of the airway in mechanicallyventilated patients.OBJECTIVES. Describe a program to reduce ventilator-associated pneumonia (VAP) inthe ICU of a 2nd level hospital and the evolution of our rates after implementation Pneu-monia Zero Project (NZ).METHODS. Implementation of NZ program: Pharmacy Service, prepared oral solution ofchlorhexidine 2 % for oral cleaning. Were instituted mandatory measures for the preventionof VAP: training in airway management, strict hand hygiene and measures highly recom-mended intermittent aspiration of subglottic secretions.Conduct training and educational campaign to professionals of ICU and anesthesia unit (112professionals).Data from the ENVIN registration: 01.04.11/31.12.12. VAP rates and incidence density(ID). We collected data from 1,750 patients admitted to the ICU (N 1,750). 7,742 days ofstay, 2,811 days of mechanical ventilation (MV).RESULTS. During the 3 months of educational campaign, 01/04/11–01/06/11 VAP rateswere 2.75 per 100 patients admitted, 5.28 per 1,000 days of stay and 14.02 per 1,000 days ofMV, far above objectives and national and community average (2.73 and 2.33 rates, DI-daystay by 4.99 and 4.12; DI VM 11.03 and 8.48 days, respectively). At the end of the cam-paign, the numbers from 01/06/11 to 01/12/11, declined sharply, with the rate of 1.06 per100 patients, 2.51 per 1,000 days of stay 7.28 days going below national and Andalusianrates. In 2012, 01/01/12 to 01/12/12, we followed going down VAP figures with rates of0.58 per 100 patients, DI per 1,000 days of stay of 1.32, DI VM 3.63 per 1,000 days. Therest of the country had much higher rates.During the first year, the most common organism was A. Baumanii, while in 2012, wereequally S. aureus, P. aeruginosa and S. aureus methicillin resistant (MRSA).In educational campaign intervened nursing, nursing assistants, residents, specialists andother professionals with a total of 120 people. The group that scored top marks in theevaluation of medical specialists was 26.13.CONCLUSIONS. Following the educational campaign and multidisciplinary effort, the DIof VAP has suffered a sharp decline, still well below the target of zero Pneumonia Project.The germ currently most frequently involved are VAP S. aureus and S. malthopilla.REFERENCE(S) 1. Statistical data ENVIN-HELICS—Pneumonia Project Zero.GRANT ACKNOWLEDGMENT. Dra Yuste, Dra Ramı́rez.
0351SEVERE COMMUNITY ACQUIRED PNEUMONIA: IMPLEMENTATIONOF POLYMERASE CHAIN REACTION DIAGNOSIS IN CLINICAL PRACTICE
R. Alzubaidy1, S. Ehrmann1, C. Lhommet1, A. Joret1, J. Mankikian1, A. Guillon1,2,
E. Mercier1, A. Legras1, P.-F. Dequin1, D. Perrotin1, D. Garot1
1CHRU de Tours, Service de réanimation polyvalente, Tours, France, 2Université FrançoisRabelais, Faculté de Médecine, Centre d’Etude des Pathologies Respiratoires, INSERMU1100/EA6305, Tours, FranceINTRODUCTION. Etiologic diagnosis of community acquired pneumonia (CAP) ischallenging. Conventional diagnostic methods fail to identify a microorganism in up to halfof patients. Polymerase chain reaction (PCR) diagnostic methods, progressively imple-mented into clinical practice, are susceptible to change the epidemiological visions of thissevere disease and progressively change therapeutic paradigms.OBJECTIVES. To assess the diagnostic consequences of implementing the RespiFinderSMART22� PCR into clinical practice at our center.METHODS. We retrospectively reviewed all patients admitted to our 37-bed intensive andintermediate care unit with a diagnosis of CAP over the six month following implementationof the RespiFinder SMART22� into routine care at our center. This PCR tool enablesidentification of atypical respiratory bacteria (but not S. pneumoniae) so as 17 viruses. Dataextraction comprised CAP diagnostic criteria, conventional microbiological analysis andrespiratory PCR results, so as demographic and outcome data.RESULTS. Ninety-eight patients were included in the study (age 63 ± 17, 62 % males,simplified acute physiology score II 37 ± 19, 48 % mechanical ventilation). PCR wasperformed on respiratory samples of 69 patients (67 nasopharyngeal aspirates, 5 broncho-alveolar lavages). Conventional diagnostic methods included culture of blood and respira-tory samples, and urine antigen detection. Serological testing and viral immune-fluorescentanalysis were not systematically performed. Overall a microbiological diagnosis could bemade for 63 patients (64 %). 40 patients had at least one bacteria identified and 40 at leastone virus (41 % of patients with a diagnosis, 58 % of PCR tested patients). Of those patients17 (27 %) had a bacterial-viral co-infection. The most frequently identified bacteria was S.pneumonia (n = 26 [65 % of bacterial infections]), followed by Mycoplasma pneumoniae(n = 7 [17 %]) aside of 5 other bacteria. The most frequently identified virus was Myxo-virusinfluenzae A (n = 15 [38 % of patients with a virus identified]), followed by Bocavirus,Adenovirus and Rhinovirus (n = 11 [28 %], 8 [20 %] and 8 [20 %] respectively), aside of 4other viruses. S. pneumoniae and Myxovirusinfluenzae A were the most frequently organ-isms involved in co-infections. Among patients with a positive finding for Myxovirusinfluenzae A, only 5 (30 %) received an antiviral treatment. Overall intensive care unitmortality was 15 %, not significantly different according to microbiological findings.CONCLUSIONS. The RespiFinder SMART22� was frequently positive in patients withsevere CAP, thus confirming potential interest in this setting. In particular, identification ofviruses and Mycoplasma pneumoniae was frequent. Those findings will have to be con-firmed in prospective studies. Development of PCR diagnostic techniques for S.pneumoniae, the most frequent pathogen, will constitute a further challenge.
0352VENTILATOR CARE BUNDLE REDUCED THE INCIDENCE OF VENTILATORASSOCIATED PNEUMONIA INDUCED BY MRSA BUT NOT ACINETOBACTERBAUMANNII: EPIDEMIOLOGICAL STUDY AND ANTIMICROBIALRESISTANCE PATTERN
A. Mukhtar1, A. Hasanin1, S. Farouk1, H. Mostafa1, A. Lofty1, H. Elazizi1, A. Zaghlol1,
A. Gado1, M. Botros1, D. Ghaith2
1Cairo University, Department of Anesthesia and Critical Care Medicine, Cairo, Egypt,2Cairo University, Department of Clinical and Chemical Pathology, Cairo, EgyptINTRODUCTION. Implementing ventilator care bundle (VCB) has been widely advocatedin mechanically ventilated patients admitted to intensive-care unit (ICU) and is associatedwith a reduced risk of ventilator-associated pneumonia (VAP). The infection rate ofMethicillin Resistant Staph Aureus (MRSA) and Acinetobacter species (spp) has become asignificant concern in critically ill patients.OBJECTIVES. We investigated whether implementation of a ventilator care bundlereduced the incidence of MRSA-VAP and Acinetobacter spp in a cohort of critically illtrauma patients and to test the in vitro resistance pattern of Acinetobacter spp.METHODS. VCB was implemented after a 7 month baseline period. VAP rates, rates ofMRSA and acinetobacter acquisition were prospectively recorded for 1 year. Minimuminhibitory concentrations (MICs) using the Epsilometer test (E-test) methodology weredetermined for Acinetobacter spp against imipenem, tigecyline, and colistin.RESULTS. Application of VCB was associated with reduced incidence of VAP from 42[95 % confidence interval (CI) 17–83] cases per 1,000 ventilator days in the pre-interventionperiod to 19 (95 % CI 11–34) cases per 1,000 ventilator days in the post-intervention period(p = 0.04). The rate of MRSA acquisition was significantly different in the pre-interventiongroup (27 %) and the post-intervention group (3.9 %). (P \ 0.001). However, the incidenceof Acinetobacter did not change from pre to post-intervention periods (7 (14 %), 13(16.8 %)) respectively. Acinetobacter spp were significantly associated with late onset VAP.One-hundred percent of Acinetobacter spp. were carbapenem-resistant MIC [ 32 mg/L.Tigecyline showed moderate activity against Acinetobacter spp. MIC of 11 isolates was less2.0 mg/L. while 9 isolates were resistant (MIC range 4–12 mg/L). Colistin showed excellentactivity against all Acinetobacter species (MIC range 0.016–1 mg/L).CONCLUSIONS. Implementation of VCB reduced the incidence of VAP caused by MRSAbut not by Acinetobacter spp. The late-onset pattern of Acinetobacter pneumonia acquisitionmay potentially explain this finding.REFERENCE(S) 1. Fulbrook P, Mooney S. Care bundles in care: a practical approach toevidence-based practice. Nurs Crit Care. 2003;8:249–55.
0353TRAJECTORY ANALYSIS OF CLINICAL VARIABLES TO IMPROVEDIAGNOSIS OF VENTILATOR ASSOCIATED PNEUMONIA IN PATIENTS WITHBRAIN INJURY
D.B. Antcliffe1, K. Veselkov2, J.T.M. Pearce3, J. Kinross4, A.C. Gordon1
1Imperial College, Section of Anaesthetics, Pain Medicine and Intensive Care, London, UK,2Imperial College, Section of Computational and Systems Medicine, London, UK, 3ImperialCollege, MRC-NIHR Phenome Centre, London, UK, 4Imperial College, Section ofBiosurgery and Surgical Technology, London, UKINTRODUCTION. Ventilator associated pneumonia (VAP) is a common complication ofventilation increasing ICU stay, duration of ventilation, and worsening outcomes. Current
26th ESICM ANNUAL CONGRESS — PARIS, FRANCE — 5–9 OCTOBER 2013
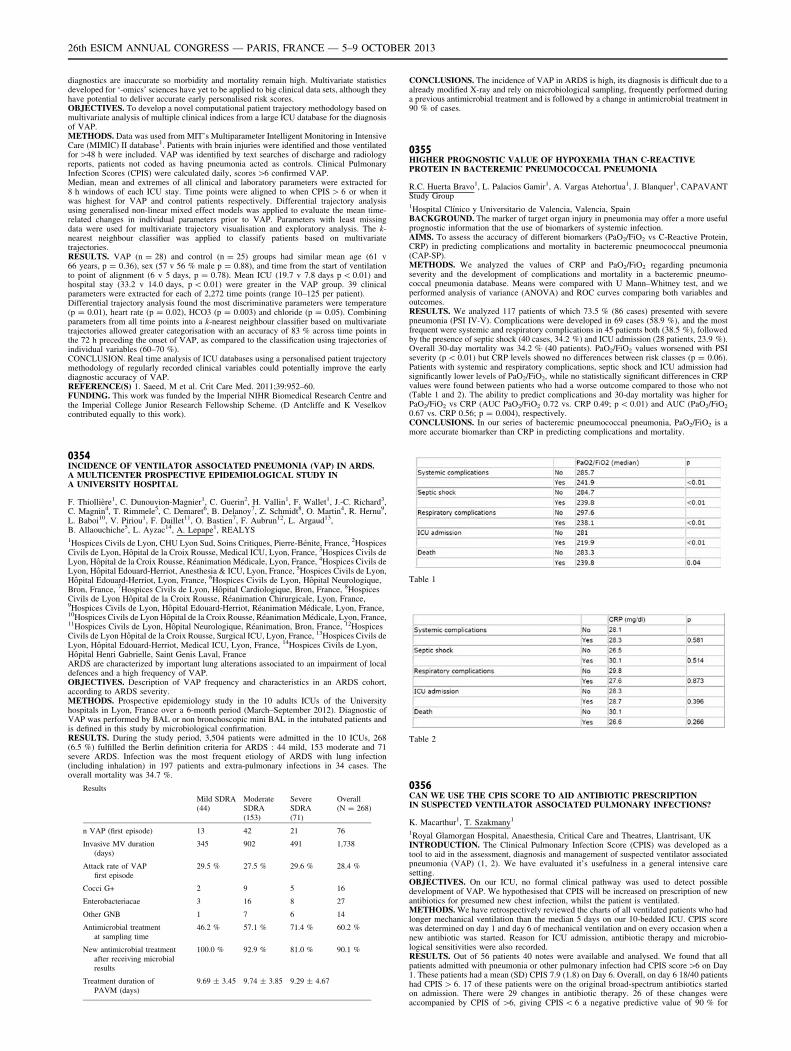
diagnostics are inaccurate so morbidity and mortality remain high. Multivariate statisticsdeveloped for ‘-omics’ sciences have yet to be applied to big clinical data sets, although theyhave potential to deliver accurate early personalised risk scores.OBJECTIVES. To develop a novel computational patient trajectory methodology based onmultivariate analysis of multiple clinical indices from a large ICU database for the diagnosisof VAP.METHODS. Data was used from MIT’s Multiparameter Intelligent Monitoring in IntensiveCare (MIMIC) II database1. Patients with brain injuries were identified and those ventilatedfor [48 h were included. VAP was identified by text searches of discharge and radiologyreports, patients not coded as having pneumonia acted as controls. Clinical PulmonaryInfection Scores (CPIS) were calculated daily, scores [6 confirmed VAP.Median, mean and extremes of all clinical and laboratory parameters were extracted for8 h windows of each ICU stay. Time points were aligned to when CPIS [ 6 or when itwas highest for VAP and control patients respectively. Differential trajectory analysisusing generalised non-linear mixed effect models was applied to evaluate the mean time-related changes in individual parameters prior to VAP. Parameters with least missingdata were used for multivariate trajectory visualisation and exploratory analysis. The k-nearest neighbour classifier was applied to classify patients based on multivariatetrajectories.RESULTS. VAP (n = 28) and control (n = 25) groups had similar mean age (61 v66 years, p = 0.36), sex (57 v 56 % male p = 0.88), and time from the start of ventilationto point of alignment (6 v 5 days, p = 0.78). Mean ICU (19.7 v 7.8 days p \ 0.01) andhospital stay (33.2 v 14.0 days, p \ 0.01) were greater in the VAP group. 39 clinicalparameters were extracted for each of 2,272 time points (range 10–125 per patient).Differential trajectory analysis found the most discriminative parameters were temperature(p = 0.01), heart rate (p = 0.02), HCO3 (p = 0.003) and chloride (p = 0.05). Combiningparameters from all time points into a k-nearest neighbour classifier based on multivariatetrajectories allowed greater categorisation with an accuracy of 83 % across time points inthe 72 h preceding the onset of VAP, as compared to the classification using trajectories ofindividual variables (60–70 %).CONCLUSION. Real time analysis of ICU databases using a personalised patient trajectorymethodology of regularly recorded clinical variables could potentially improve the earlydiagnostic accuracy of VAP.REFERENCE(S) 1. Saeed, M et al. Crit Care Med. 2011;39:952–60.FUNDING. This work was funded by the Imperial NIHR Biomedical Research Centre andthe Imperial College Junior Research Fellowship Scheme. (D Antcliffe and K Veselkovcontributed equally to this work).
0354INCIDENCE OF VENTILATOR ASSOCIATED PNEUMONIA (VAP) IN ARDS.A MULTICENTER PROSPECTIVE EPIDEMIOLOGICAL STUDY INA UNIVERSITY HOSPITAL
F. Thiollière1, C. Dunouvion-Magnier1, C. Guerin2, H. Vallin1, F. Wallet1, J.-C. Richard3,C. Magnin4, T. Rimmele5, C. Demaret6, B. Delanoy7, Z. Schmidt8, O. Martin4, R. Hernu9,L. Baboi10, V. Piriou1, F. Daillet11, O. Bastien7, F. Aubrun12, L. Argaud13,B. Allaouchiche5, L. Ayzac14, A. Lepape1, REALYS1Hospices Civils de Lyon, CHU Lyon Sud, Soins Critiques, Pierre-Bénite, France, 2HospicesCivils de Lyon, Hôpital de la Croix Rousse, Medical ICU, Lyon, France, 3Hospices Civils deLyon, Hôpital de la Croix Rousse, Réanimation Médicale, Lyon, France, 4Hospices Civils deLyon, Hôpital Edouard-Herriot, Anesthesia & ICU, Lyon, France, 5Hospices Civils de Lyon,Hôpital Edouard-Herriot, Lyon, France, 6Hospices Civils de Lyon, Hôpital Neurologique,Bron, France, 7Hospices Civils de Lyon, Hôpital Cardiologique, Bron, France, 8HospicesCivils de Lyon Hôpital de la Croix Rousse, Réanimation Chirurgicale, Lyon, France,9Hospices Civils de Lyon, Hôpital Edouard-Herriot, Réanimation Médicale, Lyon, France,10Hospices Civils de Lyon Hôpital de la Croix Rousse, Réanimation Médicale, Lyon, France,11Hospices Civils de Lyon, Hôpital Neurologique, Réanimation, Bron, France, 12HospicesCivils de Lyon Hôpital de la Croix Rousse, Surgical ICU, Lyon, France, 13Hospices Civils deLyon, Hôpital Edouard-Herriot, Medical ICU, Lyon, France, 14Hospices Civils de Lyon,Hôpital Henri Gabrielle, Saint Genis Laval, FranceARDS are characterized by important lung alterations associated to an impairment of localdefences and a high frequency of VAP.OBJECTIVES. Description of VAP frequency and characteristics in an ARDS cohort,according to ARDS severity.METHODS. Prospective epidemiology study in the 10 adults ICUs of the Universityhospitals in Lyon, France over a 6-month period (March–September 2012). Diagnostic ofVAP was performed by BAL or non bronchoscopic mini BAL in the intubated patients andis defined in this study by microbiological confirmation.RESULTS. During the study period, 3,504 patients were admitted in the 10 ICUs, 268(6.5 %) fulfilled the Berlin definition criteria for ARDS : 44 mild, 153 moderate and 71severe ARDS. Infection was the most frequent etiology of ARDS with lung infection(including inhalation) in 197 patients and extra-pulmonary infections in 34 cases. Theoverall mortality was 34.7 %.
Results
Mild SDRA(44)
ModerateSDRA(153)
SevereSDRA(71)
Overall(N = 268)
n VAP (first episode) 13 42 21 76
Invasive MV duration(days)
345 902 491 1,738
Attack rate of VAPfirst episode
29.5 % 27.5 % 29.6 % 28.4 %
Cocci G+ 2 9 5 16
Enterobacteriacae 3 16 8 27
Other GNB 1 7 6 14
Antimicrobial treatmentat sampling time
46.2 % 57.1 % 71.4 % 60.2 %
New antimicrobial treatmentafter receiving microbialresults
100.0 % 92.9 % 81.0 % 90.1 %
Treatment duration ofPAVM (days)
9.69 ± 3.45 9.74 ± 3.85 9.29 ± 4.67
CONCLUSIONS. The incidence of VAP in ARDS is high, its diagnosis is difficult due to aalready modified X-ray and rely on microbiological sampling, frequently performed duringa previous antimicrobial treatment and is followed by a change in antimicrobial treatment in90 % of cases.
0355HIGHER PROGNOSTIC VALUE OF HYPOXEMIA THAN C-REACTIVEPROTEIN IN BACTEREMIC PNEUMOCOCCAL PNEUMONIA
R.C. Huerta Bravo1, L. Palacios Gamir1, A. Vargas Atehortua1, J. Blanquer1, CAPAVANTStudy Group1Hospital Clı́nico y Universitario de Valencia, Valencia, SpainBACKGROUND. The marker of target organ injury in pneumonia may offer a more usefulprognostic information that the use of biomarkers of systemic infection.AIMS. To assess the accuracy of different biomarkers (PaO2/FiO2 vs C-Reactive Protein,CRP) in predicting complications and mortality in bacteremic pneumococcal pneumonia(CAP-SP).METHODS. We analyzed the values of CRP and PaO2/FiO2 regarding pneumoniaseverity and the development of complications and mortality in a bacteremic pneumo-coccal pneumonia database. Means were compared with U Mann–Whitney test, and weperformed analysis of variance (ANOVA) and ROC curves comparing both variables andoutcomes.RESULTS. We analyzed 117 patients of which 73.5 % (86 cases) presented with severepneumonia (PSI IV-V). Complications were developed in 69 cases (58.9 %), and the mostfrequent were systemic and respiratory complications in 45 patients both (38.5 %), followedby the presence of septic shock (40 cases, 34.2 %) and ICU admission (28 patients, 23.9 %).Overall 30-day mortality was 34.2 % (40 patients). PaO2/FiO2 values worsened with PSIseverity (p \ 0.01) but CRP levels showed no differences between risk classes (p = 0.06).Patients with systemic and respiratory complications, septic shock and ICU admission hadsignificantly lower levels of PaO2/FiO2, while no statistically significant differences in CRPvalues were found between patients who had a worse outcome compared to those who not(Table 1 and 2). The ability to predict complications and 30-day mortality was higher forPaO2/FiO2 vs CRP (AUC PaO2/FiO2 0.72 vs. CRP 0.49; p \ 0.01) and AUC (PaO2/FiO2
0.67 vs. CRP 0.56; p = 0.004), respectively.CONCLUSIONS. In our series of bacteremic pneumococcal pneumonia, PaO2/FiO2 is amore accurate biomarker than CRP in predicting complications and mortality.
Table 1
Table 2
0356CAN WE USE THE CPIS SCORE TO AID ANTIBIOTIC PRESCRIPTIONIN SUSPECTED VENTILATOR ASSOCIATED PULMONARY INFECTIONS?
K. Macarthur1, T. Szakmany1
1Royal Glamorgan Hospital, Anaesthesia, Critical Care and Theatres, Llantrisant, UKINTRODUCTION. The Clinical Pulmonary Infection Score (CPIS) was developed as atool to aid in the assessment, diagnosis and management of suspected ventilator associatedpneumonia (VAP) (1, 2). We have evaluated it’s usefulness in a general intensive caresetting.OBJECTIVES. On our ICU, no formal clinical pathway was used to detect possibledevelopment of VAP. We hypothesised that CPIS will be increased on prescription of newantibiotics for presumed new chest infection, whilst the patient is ventilated.METHODS. We have retrospectively reviewed the charts of all ventilated patients who hadlonger mechanical ventilation than the median 5 days on our 10-bedded ICU. CPIS scorewas determined on day 1 and day 6 of mechanical ventilation and on every occasion when anew antibiotic was started. Reason for ICU admission, antibiotic therapy and microbio-logical sensitivities were also recorded.RESULTS. Out of 56 patients 40 notes were available and analysed. We found that allpatients admitted with pneumonia or other pulmonary infection had CPIS score[6 on Day1. These patients had a mean (SD) CPIS 7.9 (1.8) on Day 6. Overall, on day 6 18/40 patientshad CPIS [ 6. 17 of these patients were on the original broad-spectrum antibiotics startedon admission. There were 29 changes in antibiotic therapy. 26 of these changes wereaccompanied by CPIS of [6, giving CPIS \ 6 a negative predictive value of 90 % for
26th ESICM ANNUAL CONGRESS — PARIS, FRANCE — 5–9 OCTOBER 2013
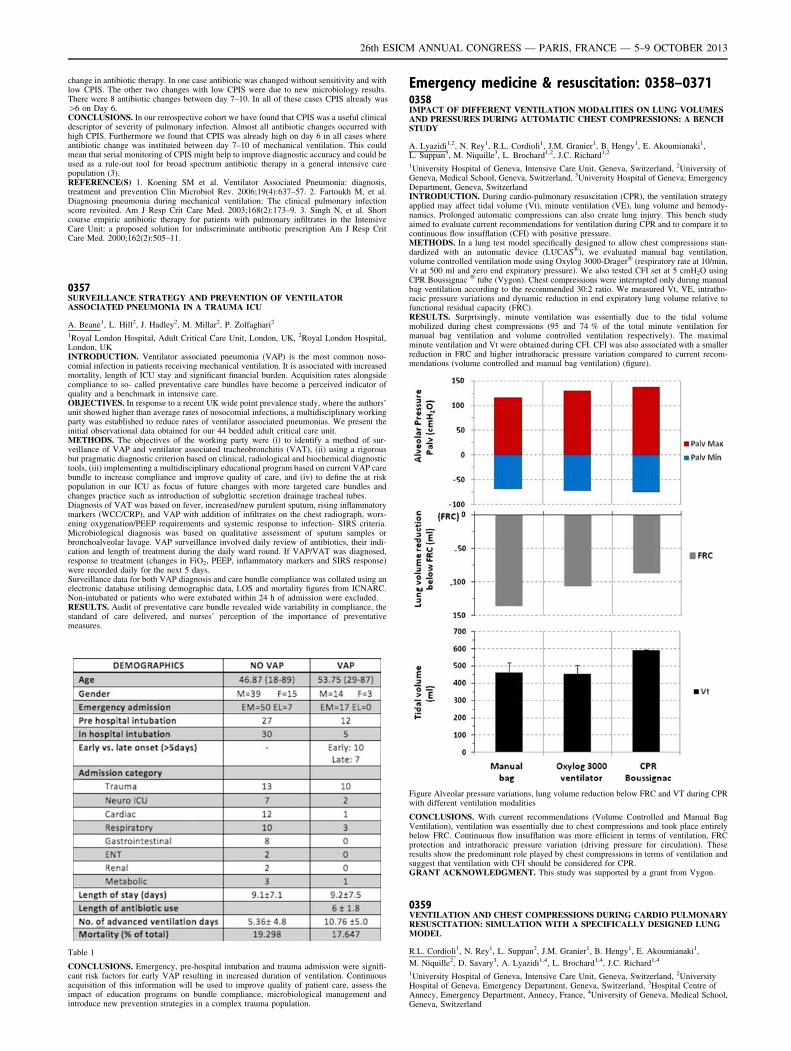
change in antibiotic therapy. In one case antibiotic was changed without sensitivity and withlow CPIS. The other two changes with low CPIS were due to new microbiology results.There were 8 antibiotic changes between day 7–10. In all of these cases CPIS already was[6 on Day 6.CONCLUSIONS. In our retrospective cohort we have found that CPIS was a useful clinicaldescriptor of severity of pulmonary infection. Almost all antibiotic changes occurred withhigh CPIS. Furthermore we found that CPIS was already high on day 6 in all cases whereantibiotic change was instituted between day 7–10 of mechanical ventilation. This couldmean that serial monitoring of CPIS might help to improve diagnostic accuracy and could beused as a rule-out tool for broad spectrum antibiotic therapy in a general intensive carepopulation (3).REFERENCE(S) 1. Koening SM et al. Ventilator Associated Pneumonia: diagnosis,treatment and prevention Clin Microbiol Rev. 2006;19(4):637–57. 2. Fartoukh M, et al.Diagnosing pneumonia during mechanical ventilation: The clinical pulmonary infectionscore revisited. Am J Resp Crit Care Med. 2003;168(2):173–9. 3. Singh N, et al. Shortcourse empiric antibiotic therapy for patients with pulmonary infiltrates in the IntensiveCare Unit: a proposed solution for indiscriminate antibiotic prescription Am J Resp CritCare Med. 2000;162(2):505–11.
0357SURVEILLANCE STRATEGY AND PREVENTION OF VENTILATORASSOCIATED PNEUMONIA IN A TRAUMA ICU
A. Beane1, L. Hill2, J. Hadley2, M. Millar2, P. Zolfaghari2
1Royal London Hospital, Adult Critical Care Unit, London, UK, 2Royal London Hospital,London, UKINTRODUCTION. Ventilator associated pneumonia (VAP) is the most common noso-comial infection in patients receiving mechanical ventilation. It is associated with increasedmortality, length of ICU stay and significant financial burden. Acquisition rates alongsidecompliance to so- called preventative care bundles have become a perceived indicator ofquality and a benchmark in intensive care.OBJECTIVES. In response to a recent UK wide point prevalence study, where the authors’unit showed higher than average rates of nosocomial infections, a multidisciplinary workingparty was established to reduce rates of ventilator associated pneumonias. We present theinitial observational data obtained for our 44 bedded adult critical care unit.METHODS. The objectives of the working party were (i) to identify a method of sur-veillance of VAP and ventilator associated tracheobronchitis (VAT), (ii) using a rigorousbut pragmatic diagnostic criterion based on clinical, radiological and biochemical diagnostictools, (iii) implementing a multidisciplinary educational program based on current VAP carebundle to increase compliance and improve quality of care, and (iv) to define the at riskpopulation in our ICU as focus of future changes with more targeted care bundles andchanges practice such as introduction of subglottic secretion drainage tracheal tubes.Diagnosis of VAT was based on fever, increased/new purulent sputum, rising inflammatorymarkers (WCC/CRP), and VAP with addition of infiltrates on the chest radiograph, wors-ening oxygenation/PEEP requirements and systemic response to infection- SIRS criteria.Microbiological diagnosis was based on qualitative assessment of sputum samples orbronchoalveolar lavage. VAP surveillance involved daily review of antibiotics, their indi-cation and length of treatment during the daily ward round. If VAP/VAT was diagnosed,response to treatment (changes in FiO2, PEEP, inflammatory markers and SIRS response)were recorded daily for the next 5 days.Surveillance data for both VAP diagnosis and care bundle compliance was collated using anelectronic database utilising demographic data, LOS and mortality figures from ICNARC.Non-intubated or patients who were extubated within 24 h of admission were excluded.RESULTS. Audit of preventative care bundle revealed wide variability in compliance, thestandard of care delivered, and nurses’ perception of the importance of preventativemeasures.
Table 1
CONCLUSIONS. Emergency, pre-hospital intubation and trauma admission were signifi-cant risk factors for early VAP resulting in increased duration of ventilation. Continuousacquisition of this information will be used to improve quality of patient care, assess theimpact of education programs on bundle compliance, microbiological management andintroduce new prevention strategies in a complex trauma population.
Emergency medicine & resuscitation: 0358–03710358IMPACT OF DIFFERENT VENTILATION MODALITIES ON LUNG VOLUMESAND PRESSURES DURING AUTOMATIC CHEST COMPRESSIONS: A BENCHSTUDY
A. Lyazidi1,2, N. Rey1, R.L. Cordioli1, J.M. Granier1, B. Hengy1, E. Akoumianaki1,L. Suppan3, M. Niquille3, L. Brochard1,2, J.C. Richard1,2
1University Hospital of Geneva, Intensive Care Unit, Geneva, Switzerland, 2University ofGeneva, Medical School, Geneva, Switzerland, 3University Hospital of Geneva, EmergencyDepartment, Geneva, SwitzerlandINTRODUCTION. During cardio-pulmonary resuscitation (CPR), the ventilation strategyapplied may affect tidal volume (Vt), minute ventilation (VE), lung volume and hemody-namics. Prolonged automatic compressions can also create lung injury. This bench studyaimed to evaluate current recommendations for ventilation during CPR and to compare it tocontinuous flow insufflation (CFI) with positive pressure.METHODS. In a lung test model specifically designed to allow chest compressions stan-dardized with an automatic device (LUCAS�), we evaluated manual bag ventilation,volume controlled ventilation mode using Oxylog 3000-Drager� (respiratory rate at 10/min,Vt at 500 ml and zero end expiratory pressure). We also tested CFI set at 5 cmH2O usingCPR Boussignac � tube (Vygon). Chest compressions were interrupted only during manualbag ventilation according to the recommended 30:2 ratio. We measured Vt, VE, intratho-racic pressure variations and dynamic reduction in end expiratory lung volume relative tofunctional residual capacity (FRC).RESULTS. Surprisingly, minute ventilation was essentially due to the tidal volumemobilized during chest compressions (95 and 74 % of the total minute ventilation formanual bag ventilation and volume controlled ventilation respectively). The maximalminute ventilation and Vt were obtained during CFI. CFI was also associated with a smallerreduction in FRC and higher intrathoracic pressure variation compared to current recom-mendations (volume controlled and manual bag ventilation) (figure).
Figure Alveolar pressure variations, lung volume reduction below FRC and VT during CPRwith different ventilation modalities
CONCLUSIONS. With current recommendations (Volume Controlled and Manual BagVentilation), ventilation was essentially due to chest compressions and took place entirelybelow FRC. Continuous flow insufflation was more efficient in terms of ventilation, FRCprotection and intrathoracic pressure variation (driving pressure for circulation). Theseresults show the predominant role played by chest compressions in terms of ventilation andsuggest that ventilation with CFI should be considered for CPR.GRANT ACKNOWLEDGMENT. This study was supported by a grant from Vygon.
0359VENTILATION AND CHEST COMPRESSIONS DURING CARDIO PULMONARYRESUSCITATION: SIMULATION WITH A SPECIFICALLY DESIGNED LUNGMODEL
R.L. Cordioli1, N. Rey1, L. Suppan2, J.M. Granier1, B. Hengy1, E. Akoumianaki1,
M. Niquille2, D. Savary3, A. Lyazidi1,4, L. Brochard1,4, J.C. Richard1,4
1University Hospital of Geneva, Intensive Care Unit, Geneva, Switzerland, 2UniversityHospital of Geneva, Emergency Department, Geneva, Switzerland, 3Hospital Centre ofAnnecy, Emergency Department, Annecy, France, 4University of Geneva, Medical School,Geneva, Switzerland
26th ESICM ANNUAL CONGRESS — PARIS, FRANCE — 5–9 OCTOBER 2013
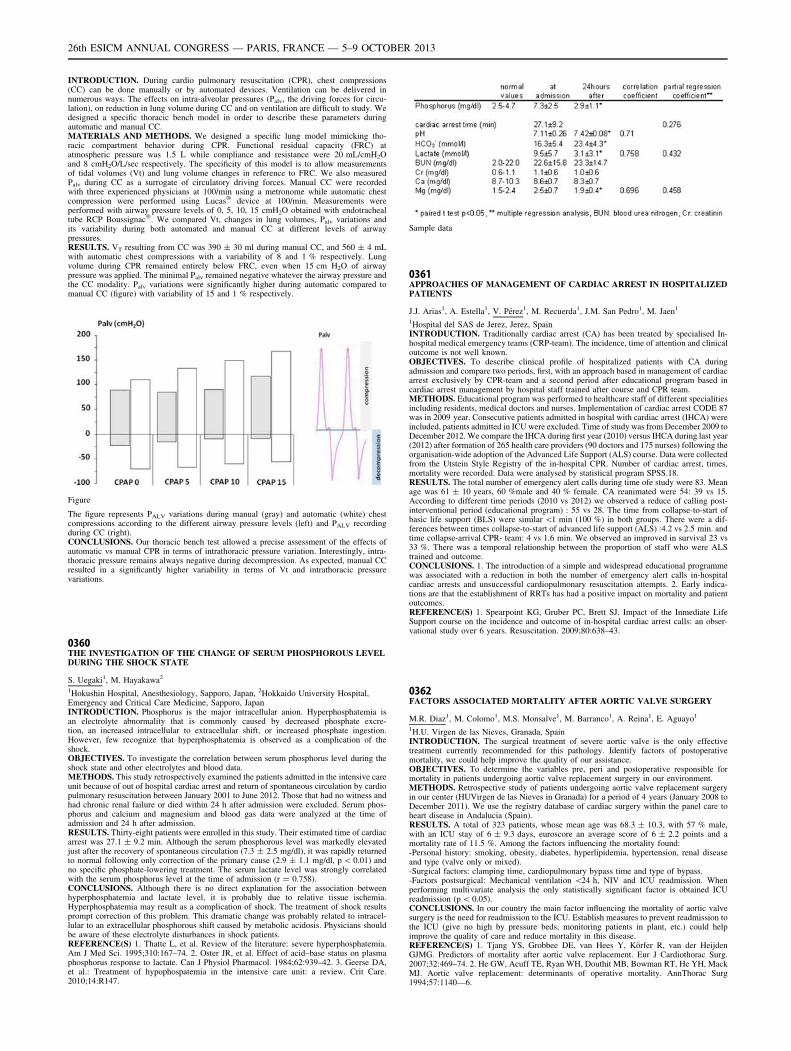
INTRODUCTION. During cardio pulmonary resuscitation (CPR), chest compressions(CC) can be done manually or by automated devices. Ventilation can be delivered innumerous ways. The effects on intra-alveolar pressures (Palv, the driving forces for circu-lation), on reduction in lung volume during CC and on ventilation are difficult to study. Wedesigned a specific thoracic bench model in order to describe these parameters duringautomatic and manual CC.MATERIALS AND METHODS. We designed a specific lung model mimicking tho-racic compartment behavior during CPR. Functional residual capacity (FRC) atatmospheric pressure was 1.5 L while compliance and resistance were 20 mL/cmH2Oand 8 cmH2O/L/sec respectively. The specificity of this model is to allow measurementsof tidal volumes (Vt) and lung volume changes in reference to FRC. We also measuredPalv during CC as a surrogate of circulatory driving forces. Manual CC were recordedwith three experienced physicians at 100/min using a metronome while automatic chestcompression were performed using Lucas� device at 100/min. Measurements wereperformed with airway pressure levels of 0, 5, 10, 15 cmH2O obtained with endotrachealtube RCP Boussignac�. We compared Vt, changes in lung volumes, Palv variations andits variability during both automated and manual CC at different levels of airwaypressures.RESULTS. VT resulting from CC was 390 ± 30 ml during manual CC, and 560 ± 4 mLwith automatic chest compressions with a variability of 8 and 1 % respectively. Lungvolume during CPR remained entirely below FRC, even when 15 cm H2O of airwaypressure was applied. The minimal Palv remained negative whatever the airway pressure andthe CC modality. Palv variations were significantly higher during automatic compared tomanual CC (figure) with variability of 15 and 1 % respectively.
Figure
The figure represents PALV variations during manual (gray) and automatic (white) chestcompressions according to the different airway pressure levels (left) and PALV recordingduring CC (right).CONCLUSIONS. Our thoracic bench test allowed a precise assessment of the effects ofautomatic vs manual CPR in terms of intrathoracic pressure variation. Interestingly, intra-thoracic pressure remains always negative during decompression. As expected, manual CCresulted in a significantly higher variability in terms of Vt and intrathoracic pressurevariations.
0360THE INVESTIGATION OF THE CHANGE OF SERUM PHOSPHOROUS LEVELDURING THE SHOCK STATE
S. Uegaki1, M. Hayakawa2
1Hokushin Hospital, Anesthesiology, Sapporo, Japan, 2Hokkaido University Hospital,Emergency and Critical Care Medicine, Sapporo, JapanINTRODUCTION. Phosphorus is the major intracellular anion. Hyperphosphatemia isan electrolyte abnormality that is commonly caused by decreased phosphate excre-tion, an increased intracellular to extracellular shift, or increased phosphate ingestion.However, few recognize that hyperphosphatemia is observed as a complication of theshock.OBJECTIVES. To investigate the correlation between serum phosphorus level during theshock state and other electrolytes and blood data.METHODS. This study retrospectively examined the patients admitted in the intensive careunit because of out of hospital cardiac arrest and return of spontaneous circulation by cardiopulmonary resuscitation between January 2001 to June 2012. Those that had no witness andhad chronic renal failure or died within 24 h after admission were excluded. Serum phos-phorus and calcium and magnesium and blood gas data were analyzed at the time ofadmission and 24 h after admission.RESULTS. Thirty-eight patients were enrolled in this study. Their estimated time of cardiacarrest was 27.1 ± 9.2 min. Although the serum phosphorous level was markedly elevatedjust after the recovery of spontaneous circulation (7.3 ± 2.5 mg/dl), it was rapidly returnedto normal following only correction of the primary cause (2.9 ± 1.1 mg/dl, p \ 0.01) andno specific phosphate-lowering treatment. The serum lactate level was strongly correlatedwith the serum phosphorus level at the time of admission (r = 0.758).CONCLUSIONS. Although there is no direct explanation for the association betweenhyperphosphatemia and lactate level, it is probably due to relative tissue ischemia.Hyperphosphatemia may result as a complication of shock. The treatment of shock resultsprompt correction of this problem. This dramatic change was probably related to intracel-lular to an extracellular phosphorous shift caused by metabolic acidosis. Physicians shouldbe aware of these electrolyte disturbances in shock patients.REFERENCE(S) 1. Thatte L, et al. Review of the literature: severe hyperphosphatemia.Am J Med Sci. 1995;310:167–74. 2. Oster JR, et al. Effect of acid–base status on plasmaphosphorus response to lactate. Can J Physiol Pharmacol. 1984;62:939–42. 3. Geerse DA,et al.: Treatment of hypophospatemia in the intensive care unit: a review. Crit Care.2010;14:R147.
Sample data
0361APPROACHES OF MANAGEMENT OF CARDIAC ARREST IN HOSPITALIZEDPATIENTS
J.J. Arias1, A. Estella1, V. Pérez1, M. Recuerda1, J.M. San Pedro1, M. Jaen1
1Hospital del SAS de Jerez, Jerez, SpainINTRODUCTION. Traditionally cardiac arrest (CA) has been treated by specialised In-hospital medical emergency teams (CRP-team). The incidence, time of attention and clinicaloutcome is not well known.OBJECTIVES. To describe clinical profile of hospitalized patients with CA duringadmission and compare two periods, first, with an approach based in management of cardiacarrest exclusively by CPR-team and a second period after educational program based incardiac arrest management by hospital staff trained after course and CPR team.METHODS. Educational program was performed to healthcare staff of different specialitiesincluding residents, medical doctors and nurses. Implementation of cardiac arrest CODE 87was in 2009 year. Consecutive patients admitted in hospital with cardiac arrest (IHCA) wereincluded, patients admitted in ICU were excluded. Time of study was from December 2009 toDecember 2012. We compare the IHCA during first year (2010) versus IHCA during last year(2012) after formation of 265 health care providers (90 doctors and 175 nurses) following theorganisation-wide adoption of the Advanced Life Support (ALS) course. Data were collectedfrom the Utstein Style Registry of the in-hospital CPR. Number of cardiac arrest, times,mortality were recorded. Data were analysed by statistical program SPSS.18.RESULTS. The total number of emergency alert calls during time ofe study were 83. Meanage was 61 ± 10 years, 60 %male and 40 % female. CA reanimated were 54: 39 vs 15.According to different time periods (2010 vs 2012) we observed a reduce of calling post-interventional period (educational program) : 55 vs 28. The time from collapse-to-start ofbasic life support (BLS) were similar \1 min (100 %) in both groups. There were a dif-ferences between times collapse-to-start of advanced life support (ALS) :4.2 vs 2.5 min. andtime collapse-arrival CPR- team: 4 vs 1.6 min. We observed an improved in survival 23 vs33 %. There was a temporal relationship between the proportion of staff who were ALStrained and outcome.CONCLUSIONS. 1. The introduction of a simple and widespread educational programmewas associated with a reduction in both the number of emergency alert calls in-hospitalcardiac arrests and unsuccessful cardiopulmonary resuscitation attempts. 2. Early indica-tions are that the establishment of RRTs has had a positive impact on mortality and patientoutcomes.REFERENCE(S) 1. Spearpoint KG, Gruber PC, Brett SJ. Impact of the Inmediate LifeSupport course on the incidence and outcome of in-hospital cardiac arrest calls: an obser-vational study over 6 years. Resuscitation. 2009;80:638–43.
0362FACTORS ASSOCIATED MORTALITY AFTER AORTIC VALVE SURGERY
M.R. Diaz1, M. Colomo1, M.S. Monsalve1, M. Barranco1, A. Reina1, E. Aguayo1
1H.U. Virgen de las Nieves, Granada, SpainINTRODUCTION. The surgical treatment of severe aortic valve is the only effectivetreatment currently recommended for this pathology. Identify factors of postoperativemortality, we could help improve the quality of our assistance.OBJECTIVES. To determine the variables pre, peri and postoperative responsible formortality in patients undergoing aortic valve replacement surgery in our environment.METHODS. Retrospective study of patients undergoing aortic valve replacement surgeryin our center (HUVirgen de las Nieves in Granada) for a period of 4 years (January 2008 toDecember 2011). We use the registry database of cardiac surgery within the panel care toheart disease in Andalucia (Spain).RESULTS. A total of 323 patients, whose mean age was 68.3 ± 10.3, with 57 % male,with an ICU stay of 6 ± 9.3 days, euroscore an average score of 6 ± 2.2 points and amortality rate of 11.5 %. Among the factors influencing the mortality found:-Personal history: smoking, obesity, diabetes, hyperlipidemia, hypertension, renal diseaseand type (valve only or mixed).-Surgical factors: clamping time, cardiopulmonary bypass time and type of bypass.-Factors postsurgical: Mechanical ventilation \24 h, NIV and ICU readmission. Whenperforming multivariate analysis the only statistically significant factor is obtained ICUreadmission (p \ 0.05).CONCLUSIONS. In our country the main factor influencing the mortality of aortic valvesurgery is the need for readmission to the ICU. Establish measures to prevent readmission tothe ICU (give no high by pressure beds, monitoring patients in plant, etc.) could helpimprove the quality of care and reduce mortality in this disease.REFERENCE(S) 1. Tjang YS, Grobbee DE, van Hees Y, Körfer R, van der HeijdenGJMG. Predictors of mortality after aortic valve replacement. Eur J Cardiothorac Surg.2007;32:469–74. 2. He GW, Acuff TE, Ryan WH, Douthit MB, Bowman RT, He YH, MackMJ. Aortic valve replacement: determinants of operative mortality. AnnThorac Surg1994;57:1140—6.
26th ESICM ANNUAL CONGRESS — PARIS, FRANCE — 5–9 OCTOBER 2013
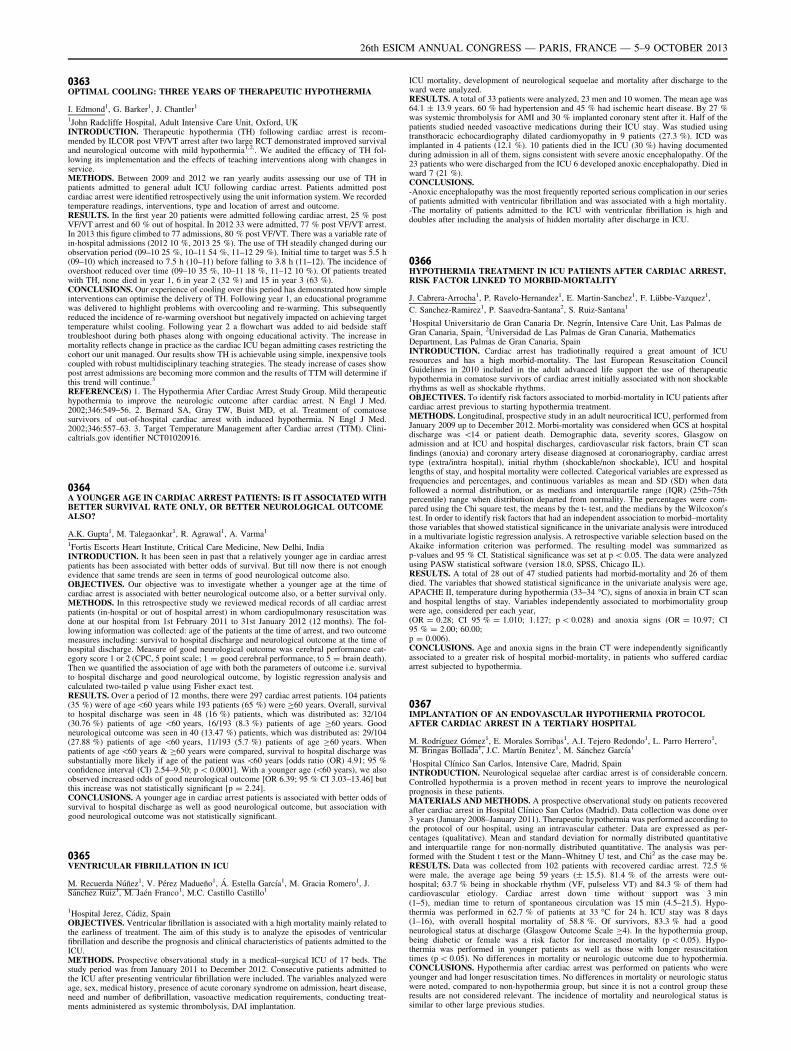
0363OPTIMAL COOLING: THREE YEARS OF THERAPEUTIC HYPOTHERMIA
I. Edmond1, G. Barker1, J. Chantler1
1John Radcliffe Hospital, Adult Intensive Care Unit, Oxford, UKINTRODUCTION. Therapeutic hypothermia (TH) following cardiac arrest is recom-mended by ILCOR post VF/VT arrest after two large RCT demonstrated improved survivaland neurological outcome with mild hypothermia1,2,. We audited the efficacy of TH fol-lowing its implementation and the effects of teaching interventions along with changes inservice.METHODS. Between 2009 and 2012 we ran yearly audits assessing our use of TH inpatients admitted to general adult ICU following cardiac arrest. Patients admitted postcardiac arrest were identified retrospectively using the unit information system. We recordedtemperature readings, interventions, type and location of arrest and outcome.RESULTS. In the first year 20 patients were admitted following cardiac arrest, 25 % postVF/VT arrest and 60 % out of hospital. In 2012 33 were admitted, 77 % post VF/VT arrest.In 2013 this figure climbed to 77 admissions, 80 % post VF/VT. There was a variable rate ofin-hospital admissions (2012 10 %, 2013 25 %). The use of TH steadily changed during ourobservation period (09–10 25 %, 10–11 54 %, 11–12 29 %). Initial time to target was 5.5 h(09–10) which increased to 7.5 h (10–11) before falling to 3.8 h (11–12). The incidence ofovershoot reduced over time (09–10 35 %, 10–11 18 %, 11–12 10 %). Of patients treatedwith TH, none died in year 1, 6 in year 2 (32 %) and 15 in year 3 (63 %).CONCLUSIONS. Our experience of cooling over this period has demonstrated how simpleinterventions can optimise the delivery of TH. Following year 1, an educational programmewas delivered to highlight problems with overcooling and re-warming. This subsequentlyreduced the incidence of re-warming overshoot but negatively impacted on achieving targettemperature whilst cooling. Following year 2 a flowchart was added to aid bedside stafftroubleshoot during both phases along with ongoing educational activity. The increase inmortality reflects change in practice as the cardiac ICU began admitting cases restricting thecohort our unit managed. Our results show TH is achievable using simple, inexpensive toolscoupled with robust multidisciplinary teaching strategies. The steady increase of cases showpost arrest admissions are becoming more common and the results of TTM will determine ifthis trend will continue.3
REFERENCE(S) 1. The Hypothermia After Cardiac Arrest Study Group. Mild therapeutichypothermia to improve the neurologic outcome after cardiac arrest. N Engl J Med.2002;346:549–56. 2. Bernard SA, Gray TW, Buist MD, et al. Treatment of comatosesurvivors of out-of-hospital cardiac arrest with induced hypothermia. N Engl J Med.2002;346:557–63. 3. Target Temperature Management after Cardiac arrest (TTM). Clini-caltrials.gov identifier NCT01020916.
0364A YOUNGER AGE IN CARDIAC ARREST PATIENTS: IS IT ASSOCIATED WITHBETTER SURVIVAL RATE ONLY, OR BETTER NEUROLOGICAL OUTCOMEALSO?
A.K. Gupta1, M. Talegaonkar1, R. Agrawal1, A. Varma1
1Fortis Escorts Heart Institute, Critical Care Medicine, New Delhi, IndiaINTRODUCTION. It has been seen in past that a relatively younger age in cardiac arrestpatients has been associated with better odds of survival. But till now there is not enoughevidence that same trends are seen in terms of good neurological outcome also.OBJECTIVES. Our objective was to investigate whether a younger age at the time ofcardiac arrest is associated with better neurological outcome also, or a better survival only.METHODS. In this retrospective study we reviewed medical records of all cardiac arrestpatients (in-hospital or out of hospital arrest) in whom cardiopulmonary resuscitation wasdone at our hospital from 1st February 2011 to 31st January 2012 (12 months). The fol-lowing information was collected: age of the patients at the time of arrest, and two outcomemeasures including: survival to hospital discharge and neurological outcome at the time ofhospital discharge. Measure of good neurological outcome was cerebral performance cat-egory score 1 or 2 (CPC, 5 point scale; 1 = good cerebral performance, to 5 = brain death).Then we quantified the association of age with both the parameters of outcome i.e. survivalto hospital discharge and good neurological outcome, by logistic regression analysis andcalculated two-tailed p value using Fisher exact test.RESULTS. Over a period of 12 months, there were 297 cardiac arrest patients. 104 patients(35 %) were of age\60 years while 193 patients (65 %) were C60 years. Overall, survivalto hospital discharge was seen in 48 (16 %) patients, which was distributed as: 32/104(30.76 %) patients of age \60 years, 16/193 (8.3 %) patients of age C60 years. Goodneurological outcome was seen in 40 (13.47 %) patients, which was distributed as: 29/104(27.88 %) patients of age \60 years, 11/193 (5.7 %) patients of age C60 years. Whenpatients of age \60 years & C60 years were compared, survival to hospital discharge wassubstantially more likely if age of the patient was \60 years [odds ratio (OR) 4.91; 95 %confidence interval (CI) 2.54–9.50; p \ 0.0001]. With a younger age (\60 years), we alsoobserved increased odds of good neurological outcome [OR 6.39; 95 % CI 3.03–13.46] butthis increase was not statistically significant [p = 2.24].CONCLUSIONS. A younger age in cardiac arrest patients is associated with better odds ofsurvival to hospital discharge as well as good neurological outcome, but association withgood neurological outcome was not statistically significant.
0365VENTRICULAR FIBRILLATION IN ICU
M. Recuerda Núñez1, V. Pérez Madueño1, Á. Estella Garcı́a1, M. Gracia Romero1, J.Sánchez Ruiz1, M. Jaén Franco1, M.C. Castillo Castillo1
1Hospital Jerez, Cádiz, SpainOBJECTIVES. Ventricular fibrillation is associated with a high mortality mainly related tothe earliness of treatment. The aim of this study is to analyze the episodes of ventricularfibrillation and describe the prognosis and clinical characteristics of patients admitted to theICU.METHODS. Prospective observational study in a medical–surgical ICU of 17 beds. Thestudy period was from January 2011 to December 2012. Consecutive patients admitted tothe ICU after presenting ventricular fibrillation were included. The variables analyzed wereage, sex, medical history, presence of acute coronary syndrome on admission, heart disease,need and number of defibrillation, vasoactive medication requirements, conducting treat-ments administered as systemic thrombolysis, DAI implantation.
ICU mortality, development of neurological sequelae and mortality after discharge to theward were analyzed.RESULTS. A total of 33 patients were analyzed, 23 men and 10 women. The mean age was64.1 ± 13.9 years. 60 % had hypertension and 45 % had ischemic heart disease. By 27 %was systemic thrombolysis for AMI and 30 % implanted coronary stent after it. Half of thepatients studied needed vasoactive medications during their ICU stay. Was studied usingtransthoracic echocardiography dilated cardiomyopathy in 9 patients (27.3 %). ICD wasimplanted in 4 patients (12.1 %). 10 patients died in the ICU (30 %) having documentedduring admission in all of them, signs consistent with severe anoxic encephalopathy. Of the23 patients who were discharged from the ICU 6 developed anoxic encephalopathy. Died inward 7 (21 %).CONCLUSIONS.-Anoxic encephalopathy was the most frequently reported serious complication in our seriesof patients admitted with ventricular fibrillation and was associated with a high mortality.-The mortality of patients admitted to the ICU with ventricular fibrillation is high anddoubles after including the analysis of hidden mortality after discharge in ICU.
0366HYPOTHERMIA TREATMENT IN ICU PATIENTS AFTER CARDIAC ARREST,RISK FACTOR LINKED TO MORBID-MORTALITY
J. Cabrera-Arrocha1, P. Ravelo-Hernandez1, E. Martin-Sanchez1, F. Lübbe-Vazquez1,
C. Sanchez-Ramirez1, P. Saavedra-Santana2, S. Ruiz-Santana1
1Hospital Universitario de Gran Canaria Dr. Negrı́n, Intensive Care Unit, Las Palmas deGran Canaria, Spain, 2Universidad de Las Palmas de Gran Canaria, MathematicsDepartment, Las Palmas de Gran Canaria, SpainINTRODUCTION. Cardiac arrest has tradiotinally required a great amount of ICUresources and has a high morbid-mortality. The last European Resuscitation CouncilGuidelines in 2010 included in the adult advanced life support the use of therapeutichypothermia in comatose survivors of cardiac arrest initially associated with non shockablerhythms as well as shockable rhythms.OBJECTIVES. To identify risk factors associated to morbid-mortality in ICU patients aftercardiac arrest previous to starting hypothermia treatment.METHODS. Longitudinal, prospective study in an adult neurocritical ICU, performed fromJanuary 2009 up to December 2012. Morbi-mortality was considered when GCS at hospitaldischarge was \14 or patient death. Demographic data, severity scores, Glasgow onadmission and at ICU and hospital discharges, cardiovascular risk factors, brain CT scanfindings (anoxia) and coronary artery disease diagnosed at coronariography, cardiac arresttype (extra/intra hospital), initial rhythm (shockable/non shockable), ICU and hospitallengths of stay, and hospital mortality were collected. Categorical variables are expressed asfrequencies and percentages, and continuous variables as mean and SD (SD) when datafollowed a normal distribution, or as medians and interquartile range (IQR) (25th–75thpercentile) range when distribution departed from normality. The percentages were com-pared using the Chi square test, the means by the t- test, and the medians by the Wilcoxon0stest. In order to identify risk factors that had an independent association to morbid–mortalitythose variables that showed statistical significance in the univariate analysis were introducedin a multivariate logistic regression analysis. A retrospective variable selection based on theAkaike information criterion was performed. The resulting model was summarized asp-values and 95 % CI. Statistical significance was set at p \ 0.05. The data were analyzedusing PASW statistical software (version 18.0, SPSS, Chicago IL).RESULTS. A total of 28 out of 47 studied patients had morbid-mortality and 26 of themdied. The variables that showed statistical significance in the univariate analysis were age,APACHE II, temperature during hypothermia (33–34 �C), signs of anoxia in brain CT scanand hospital lengths of stay. Variables independently associated to morbimortality groupwere age, considered per each year,(OR = 0.28; CI 95 % = 1.010; 1.127; p \ 0.028) and anoxia signs (OR = 10.97; CI95 % = 2.00; 60.00;p = 0.006).CONCLUSIONS. Age and anoxia signs in the brain CT were independently significantlyassociated to a greater risk of hospital morbid-mortality, in patients who suffered cardiacarrest subjected to hypothermia.
0367IMPLANTATION OF AN ENDOVASCULAR HYPOTHERMIA PROTOCOLAFTER CARDIAC ARREST IN A TERTIARY HOSPITAL
M. Rodrı́guez Gómez1, E. Morales Sorribas1, A.I. Tejero Redondo1, L. Parro Herrero1,M. Bringas Bollada1, J.C. Martı́n Benitez1, M. Sánchez Garcı́a1
1Hospital Clı́nico San Carlos, Intensive Care, Madrid, SpainINTRODUCTION. Neurological sequelae after cardiac arrest is of considerable concern.Controlled hypothermia is a proven method in recent years to improve the neurologicalprognosis in these patients.MATERIALS AND METHODS. A prospective observational study on patients recoveredafter cardiac arrest in Hospital Clı́nico San Carlos (Madrid). Data collection was done over3 years (January 2008–January 2011). Therapeutic hypothermia was performed according tothe protocol of our hospital, using an intravascular catheter. Data are expressed as per-centages (qualitative). Mean and standard deviation for normally distributed quantitativeand interquartile range for non-normally distributed quantitative. The analysis was per-formed with the Student t test or the Mann–Whitney U test, and Chi2 as the case may be.RESULTS. Data was collected from 102 patients with recovered cardiac arrest. 72.5 %were male, the average age being 59 years (± 15.5). 81.4 % of the arrests were out-hospital; 63.7 % being in shockable rhythm (VF, pulseless VT) and 84.3 % of them hadcardiovascular etiology. Cardiac arrest down time without support was 3 min(1–5), median time to return of spontaneous circulation was 15 min (4.5–21.5). Hypo-thermia was performed in 62.7 % of patients at 33 �C for 24 h. ICU stay was 8 days(1–16), with overall hospital mortality of 58.8 %. Of survivors, 83.3 % had a goodneurological status at discharge (Glasgow Outcome Scale C4). In the hypothermia group,being diabetic or female was a risk factor for increased mortality (p \ 0.05). Hypo-thermia was performed in younger patients as well as those with longer resuscitationtimes (p \ 0.05). No differences in mortality or neurologic outcome due to hypothermia.CONCLUSIONS. Hypothermia after cardiac arrest was performed on patients who wereyounger and had longer resuscitation times. No differences in mortality or neurologic statuswere noted, compared to non-hypothermia group, but since it is not a control group theseresults are not considered relevant. The incidence of mortality and neurological status issimilar to other large previous studies.
26th ESICM ANNUAL CONGRESS — PARIS, FRANCE — 5–9 OCTOBER 2013
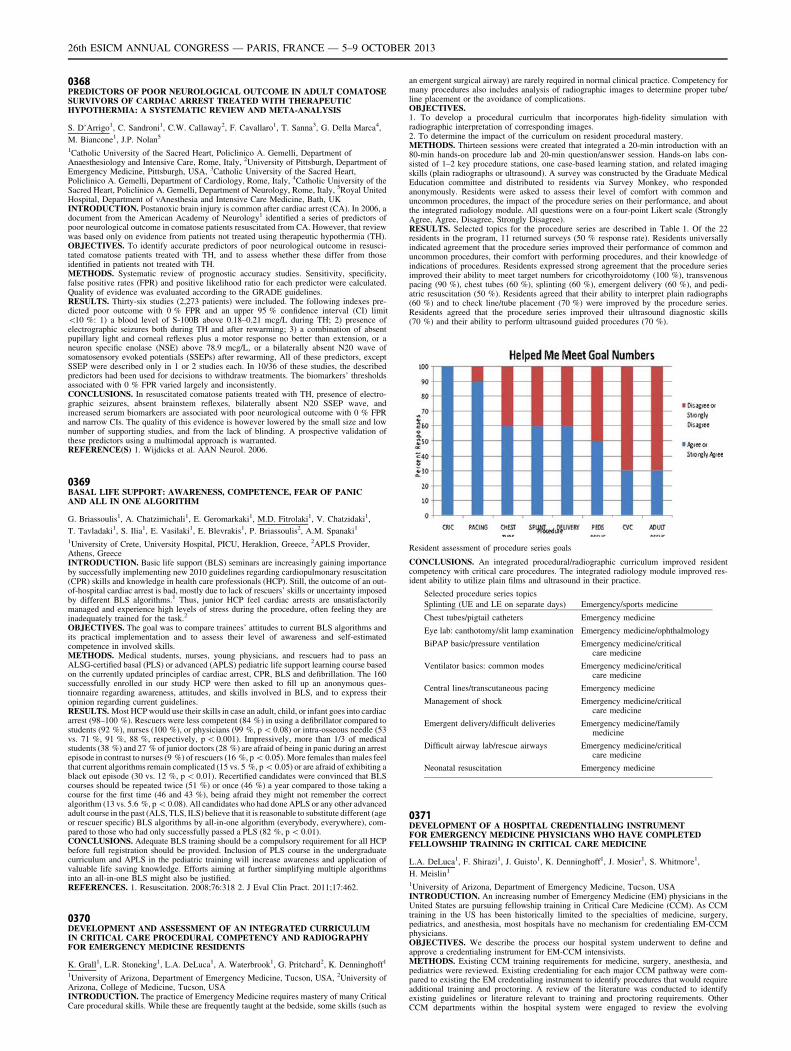
0368PREDICTORS OF POOR NEUROLOGICAL OUTCOME IN ADULT COMATOSESURVIVORS OF CARDIAC ARREST TREATED WITH THERAPEUTICHYPOTHERMIA: A SYSTEMATIC REVIEW AND META-ANALYSIS
S. D’Arrigo1, C. Sandroni1, C.W. Callaway2, F. Cavallaro1, T. Sanna3, G. Della Marca4,
M. Biancone1, J.P. Nolan5
1Catholic University of the Sacred Heart, Policlinico A. Gemelli, Department ofAnaesthesiology and Intensive Care, Rome, Italy, 2University of Pittsburgh, Department ofEmergency Medicine, Pittsburgh, USA, 3Catholic University of the Sacred Heart,Policlinico A. Gemelli, Department of Cardiology, Rome, Italy, 4Catholic University of theSacred Heart, Policlinico A. Gemelli, Department of Neurology, Rome, Italy, 5Royal UnitedHospital, Department of mAnesthesia and Intensive Care Medicine, Bath, UKINTRODUCTION. Postanoxic brain injury is common after cardiac arrest (CA). In 2006, adocument from the American Academy of Neurology1 identified a series of predictors ofpoor neurological outcome in comatose patients resuscitated from CA. However, that reviewwas based only on evidence from patients not treated using therapeutic hypothermia (TH).OBJECTIVES. To identify accurate predictors of poor neurological outcome in resusci-tated comatose patients treated with TH, and to assess whether these differ from thoseidentified in patients not treated with TH.METHODS. Systematic review of prognostic accuracy studies. Sensitivity, specificity,false positive rates (FPR) and positive likelihood ratio for each predictor were calculated.Quality of evidence was evaluated according to the GRADE guidelines.RESULTS. Thirty-six studies (2,273 patients) were included. The following indexes pre-dicted poor outcome with 0 % FPR and an upper 95 % confidence interval (CI) limit\10 %: 1) a blood level of S-100B above 0.18–0.21 mcg/L during TH; 2) presence ofelectrographic seizures both during TH and after rewarming; 3) a combination of absentpupillary light and corneal reflexes plus a motor response no better than extension, or aneuron specific enolase (NSE) above 78.9 mcg/L, or a bilaterally absent N20 wave ofsomatosensory evoked potentials (SSEPs) after rewarming, All of these predictors, exceptSSEP were described only in 1 or 2 studies each. In 10/36 of these studies, the describedpredictors had been used for decisions to withdraw treatments. The biomarkers’ thresholdsassociated with 0 % FPR varied largely and inconsistently.CONCLUSIONS. In resuscitated comatose patients treated with TH, presence of electro-graphic seizures, absent brainstem reflexes, bilaterally absent N20 SSEP wave, andincreased serum biomarkers are associated with poor neurological outcome with 0 % FPRand narrow CIs. The quality of this evidence is however lowered by the small size and lownumber of supporting studies, and from the lack of blinding. A prospective validation ofthese predictors using a multimodal approach is warranted.REFERENCE(S) 1. Wijdicks et al. AAN Neurol. 2006.
0369BASAL LIFE SUPPORT: AWARENESS, COMPETENCE, FEAR OF PANICAND ALL IN ONE ALGORITHM
G. Briassoulis1, A. Chatzimichali1, E. Geromarkaki1, M.D. Fitrolaki1, V. Chatzidaki1,
T. Tavladaki1, S. Ilia1, E. Vasilaki1, E. Blevrakis1, P. Briassoulis2, A.M. Spanaki1
1University of Crete, University Hospital, PICU, Heraklion, Greece, 2APLS Provider,Athens, GreeceINTRODUCTION. Basic life support (BLS) seminars are increasingly gaining importanceby successfully implementing new 2010 guidelines regarding cardiopulmonary resuscitation(CPR) skills and knowledge in health care professionals (HCP). Still, the outcome of an out-of-hospital cardiac arrest is bad, mostly due to lack of rescuers’ skills or uncertainty imposedby different BLS algorithms.1 Thus, junior HCP feel cardiac arrests are unsatisfactorilymanaged and experience high levels of stress during the procedure, often feeling they areinadequately trained for the task.2
OBJECTIVES. The goal was to compare trainees’ attitudes to current BLS algorithms andits practical implementation and to assess their level of awareness and self-estimatedcompetence in involved skills.METHODS. Medical students, nurses, young physicians, and rescuers had to pass anALSG-certified basal (PLS) or advanced (APLS) pediatric life support learning course basedon the currently updated principles of cardiac arrest, CPR, BLS and defibrillation. The 160successfully enrolled in our study HCP were then asked to fill up an anonymous ques-tionnaire regarding awareness, attitudes, and skills involved in BLS, and to express theiropinion regarding current guidelines.RESULTS. Most HCP would use their skills in case an adult, child, or infant goes into cardiacarrest (98–100 %). Rescuers were less competent (84 %) in using a defibrillator compared tostudents (92 %), nurses (100 %), or physicians (99 %, p \ 0.08) or intra-osseous needle (53vs. 71 %, 91 %, 88 %, respectively, p \ 0.001). Impressively, more than 1/3 of medicalstudents (38 %) and 27 % of junior doctors (28 %) are afraid of being in panic during an arrestepisode in contrast to nurses (9 %) of rescuers (16 %, p \ 0.05). More females than males feelthat current algorithms remain complicated (15 vs. 5 %, p \ 0.05) or are afraid of exhibiting ablack out episode (30 vs. 12 %, p \ 0.01). Recertified candidates were convinced that BLScourses should be repeated twice (51 %) or once (46 %) a year compared to those taking acourse for the first time (46 and 43 %), being afraid they might not remember the correctalgorithm (13 vs. 5.6 %, p \ 0.08). All candidates who had done APLS or any other advancedadult course in the past (ALS, TLS, ILS) believe that it is reasonable to substitute different (ageor rescuer specific) BLS algorithms by all-in-one algorithm (everybody, everywhere), com-pared to those who had only successfully passed a PLS (82 %, p \ 0.01).CONCLUSIONS. Adequate BLS training should be a compulsory requirement for all HCPbefore full registration should be provided. Inclusion of PLS course in the undergraduatecurriculum and APLS in the pediatric training will increase awareness and application ofvaluable life saving knowledge. Efforts aiming at further simplifying multiple algorithmsinto an all-in-one BLS might also be justified.REFERENCES. 1. Resuscitation. 2008;76:318 2. J Eval Clin Pract. 2011;17:462.
0370DEVELOPMENT AND ASSESSMENT OF AN INTEGRATED CURRICULUMIN CRITICAL CARE PROCEDURAL COMPETENCY AND RADIOGRAPHYFOR EMERGENCY MEDICINE RESIDENTS
K. Grall1, L.R. Stoneking1, L.A. DeLuca1, A. Waterbrook1, G. Pritchard2, K. Denninghoff1
1University of Arizona, Department of Emergency Medicine, Tucson, USA, 2University ofArizona, College of Medicine, Tucson, USAINTRODUCTION. The practice of Emergency Medicine requires mastery of many CriticalCare procedural skills. While these are frequently taught at the bedside, some skills (such as
an emergent surgical airway) are rarely required in normal clinical practice. Competency formany procedures also includes analysis of radiographic images to determine proper tube/line placement or the avoidance of complications.OBJECTIVES.1. To develop a procedural curriculm that incorporates high-fidelity simulation withradiographic interpretation of corresponding images.2. To determine the impact of the curriculum on resident procedural mastery.METHODS. Thirteen sessions were created that integrated a 20-min introduction with an80-min hands-on procedure lab and 20-min question/answer session. Hands-on labs con-sisted of 1–2 key procedure stations, one case-based learning station, and related imagingskills (plain radiographs or ultrasound). A survey was constructed by the Graduate MedicalEducation committee and distributed to residents via Survey Monkey, who respondedanonymously. Residents were asked to assess their level of comfort with common anduncommon procedures, the impact of the procedure series on their performance, and aboutthe integrated radiology module. All questions were on a four-point Likert scale (StronglyAgree, Agree, Disagree, Strongly Disagree).RESULTS. Selected topics for the procedure series are described in Table 1. Of the 22residents in the program, 11 returned surveys (50 % response rate). Residents universallyindicated agreement that the procedure series improved their performance of common anduncommon procedures, their comfort with performing procedures, and their knowledge ofindications of procedures. Residents expressed strong agreement that the procedure seriesimproved their ability to meet target numbers for cricothyroidotomy (100 %), transvenouspacing (90 %), chest tubes (60 %), splinting (60 %), emergent delivery (60 %), and pedi-atric resuscitation (50 %). Residents agreed that their ability to interpret plain radiographs(60 %) and to check line/tube placement (70 %) were improved by the procedure series.Residents agreed that the procedure series improved their ultrasound diagnostic skills(70 %) and their ability to perform ultrasound guided procedures (70 %).
Resident assessment of procedure series goals
CONCLUSIONS. An integrated procedural/radiographic curriculum improved residentcompetency with critical care procedures. The integrated radiology module improved res-ident ability to utilize plain films and ultrasound in their practice.
Selected procedure series topics
Splinting (UE and LE on separate days) Emergency/sports medicine
Chest tubes/pigtail catheters Emergency medicine
Eye lab: canthotomy/slit lamp examination Emergency medicine/ophthalmology
BiPAP basic/pressure ventilation Emergency medicine/criticalcare medicine
Ventilator basics: common modes Emergency medicine/criticalcare medicine
Central lines/transcutaneous pacing Emergency medicine
Management of shock Emergency medicine/criticalcare medicine
Emergent delivery/difficult deliveries Emergency medicine/familymedicine
Difficult airway lab/rescue airways Emergency medicine/criticalcare medicine
Neonatal resuscitation Emergency medicine
0371DEVELOPMENT OF A HOSPITAL CREDENTIALING INSTRUMENTFOR EMERGENCY MEDICINE PHYSICIANS WHO HAVE COMPLETEDFELLOWSHIP TRAINING IN CRITICAL CARE MEDICINE
L.A. DeLuca1, F. Shirazi1, J. Guisto1, K. Denninghoff1, J. Mosier1, S. Whitmore1,
H. Meislin1
1University of Arizona, Department of Emergency Medicine, Tucson, USAINTRODUCTION. An increasing number of Emergency Medicine (EM) physicians in theUnited States are pursuing fellowship training in Critical Care Medicine (CCM). As CCMtraining in the US has been historically limited to the specialties of medicine, surgery,pediatrics, and anesthesia, most hospitals have no mechanism for credentialing EM-CCMphysicians.OBJECTIVES. We describe the process our hospital system underwent to define andapprove a credentialing instrument for EM-CCM intensivists.METHODS. Existing CCM training requirements for medicine, surgery, anesthesia, andpediatrics were reviewed. Existing credentialing for each major CCM pathway were com-pared to existing the EM credentialing instrument to identify procedures that would requireadditional training and proctoring. A review of the literature was conducted to identifyexisting guidelines or literature relevant to training and proctoring requirements. OtherCCM departments within the hospital system were engaged to review the evolving
26th ESICM ANNUAL CONGRESS — PARIS, FRANCE — 5–9 OCTOBER 2013
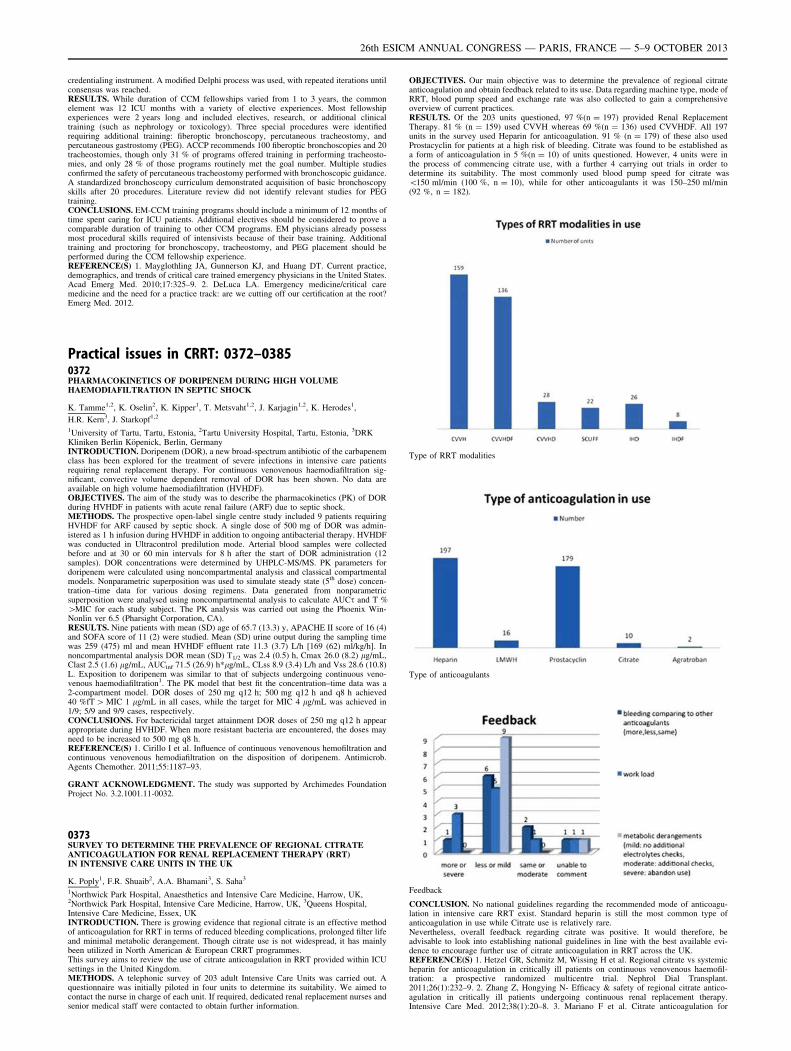
credentialing instrument. A modified Delphi process was used, with repeated iterations untilconsensus was reached.RESULTS. While duration of CCM fellowships varied from 1 to 3 years, the commonelement was 12 ICU months with a variety of elective experiences. Most fellowshipexperiences were 2 years long and included electives, research, or additional clinicaltraining (such as nephrology or toxicology). Three special procedures were identifiedrequiring additional training: fiberoptic bronchoscopy, percutaneous tracheostomy, andpercutaneous gastrostomy (PEG). ACCP recommends 100 fiberoptic bronchoscopies and 20tracheostomies, though only 31 % of programs offered training in performing tracheosto-mies, and only 28 % of those programs routinely met the goal number. Multiple studiesconfirmed the safety of percutaneous tracheostomy performed with bronchoscopic guidance.A standardized bronchoscopy curriculum demonstrated acquisition of basic bronchoscopyskills after 20 procedures. Literature review did not identify relevant studies for PEGtraining.CONCLUSIONS. EM-CCM training programs should include a minimum of 12 months oftime spent caring for ICU patients. Additional electives should be considered to prove acomparable duration of training to other CCM programs. EM physicians already possessmost procedural skills required of intensivists because of their base training. Additionaltraining and proctoring for bronchoscopy, tracheostomy, and PEG placement should beperformed during the CCM fellowship experience.REFERENCE(S) 1. Mayglothling JA, Gunnerson KJ, and Huang DT. Current practice,demographics, and trends of critical care trained emergency physicians in the United States.Acad Emerg Med. 2010;17:325–9. 2. DeLuca LA. Emergency medicine/critical caremedicine and the need for a practice track: are we cutting off our certification at the root?Emerg Med. 2012.
Practical issues in CRRT: 0372–03850372PHARMACOKINETICS OF DORIPENEM DURING HIGH VOLUMEHAEMODIAFILTRATION IN SEPTIC SHOCK
K. Tamme1,2, K. Oselin2, K. Kipper1, T. Metsvaht1,2, J. Karjagin1,2, K. Herodes1,
H.R. Kern3, J. Starkopf1,2
1University of Tartu, Tartu, Estonia, 2Tartu University Hospital, Tartu, Estonia, 3DRKKliniken Berlin Köpenick, Berlin, GermanyINTRODUCTION. Doripenem (DOR), a new broad-spectrum antibiotic of the carbapenemclass has been explored for the treatment of severe infections in intensive care patientsrequiring renal replacement therapy. For continuous venovenous haemodiafiltration sig-nificant, convective volume dependent removal of DOR has been shown. No data areavailable on high volume haemodiafiltration (HVHDF).OBJECTIVES. The aim of the study was to describe the pharmacokinetics (PK) of DORduring HVHDF in patients with acute renal failure (ARF) due to septic shock.METHODS. The prospective open-label single centre study included 9 patients requiringHVHDF for ARF caused by septic shock. A single dose of 500 mg of DOR was admin-istered as 1 h infusion during HVHDF in addition to ongoing antibacterial therapy. HVHDFwas conducted in Ultracontrol predilution mode. Arterial blood samples were collectedbefore and at 30 or 60 min intervals for 8 h after the start of DOR administration (12samples). DOR concentrations were determined by UHPLC-MS/MS. PK parameters fordoripenem were calculated using noncompartmental analysis and classical compartmentalmodels. Nonparametric superposition was used to simulate steady state (5th dose) concen-tration–time data for various dosing regimens. Data generated from nonparametricsuperposition were analysed using noncompartmental analysis to calculate AUCs and T %[MIC for each study subject. The PK analysis was carried out using the Phoenix Win-Nonlin ver 6.5 (Pharsight Corporation, CA).RESULTS. Nine patients with mean (SD) age of 65.7 (13.3) y, APACHE II score of 16 (4)and SOFA score of 11 (2) were studied. Mean (SD) urine output during the sampling timewas 259 (475) ml and mean HVHDF effluent rate 11.3 (3.7) L/h [169 (62) ml/kg/h]. Innoncompartmental analysis DOR mean (SD) T1/2 was 2.4 (0.5) h, Cmax 26.0 (8.2) lg/mL,Clast 2.5 (1.6) lg/mL, AUCinf 71.5 (26.9) h*lg/mL, CLss 8.9 (3.4) L/h and Vss 28.6 (10.8)L. Exposition to doripenem was similar to that of subjects undergoing continuous veno-venous haemodiafiltration1. The PK model that best fit the concentration–time data was a2-compartment model. DOR doses of 250 mg q12 h; 500 mg q12 h and q8 h achieved40 %fT [ MIC 1 lg/mL in all cases, while the target for MIC 4 lg/mL was achieved in1/9; 5/9 and 9/9 cases, respectively.CONCLUSIONS. For bactericidal target attainment DOR doses of 250 mg q12 h appearappropriate during HVHDF. When more resistant bacteria are encountered, the doses mayneed to be increased to 500 mg q8 h.REFERENCE(S) 1. Cirillo I et al. Influence of continuous venovenous hemofiltration andcontinuous venovenous hemodiafiltration on the disposition of doripenem. Antimicrob.Agents Chemother. 2011;55:1187–93.
GRANT ACKNOWLEDGMENT. The study was supported by Archimedes FoundationProject No. 3.2.1001.11-0032.
0373SURVEY TO DETERMINE THE PREVALENCE OF REGIONAL CITRATEANTICOAGULATION FOR RENAL REPLACEMENT THERAPY (RRT)IN INTENSIVE CARE UNITS IN THE UK
K. Poply1, F.R. Shuaib2, A.A. Bhamani3, S. Saha3
1Northwick Park Hospital, Anaesthetics and Intensive Care Medicine, Harrow, UK,2Northwick Park Hospital, Intensive Care Medicine, Harrow, UK, 3Queens Hospital,Intensive Care Medicine, Essex, UKINTRODUCTION. There is growing evidence that regional citrate is an effective methodof anticoagulation for RRT in terms of reduced bleeding complications, prolonged filter lifeand minimal metabolic derangement. Though citrate use is not widespread, it has mainlybeen utilized in North American & European CRRT programmes.This survey aims to review the use of citrate anticoagulation in RRT provided within ICUsettings in the United Kingdom.METHODS. A telephonic survey of 203 adult Intensive Care Units was carried out. Aquestionnaire was initially piloted in four units to determine its suitability. We aimed tocontact the nurse in charge of each unit. If required, dedicated renal replacement nurses andsenior medical staff were contacted to obtain further information.
OBJECTIVES. Our main objective was to determine the prevalence of regional citrateanticoagulation and obtain feedback related to its use. Data regarding machine type, mode ofRRT, blood pump speed and exchange rate was also collected to gain a comprehensiveoverview of current practices.RESULTS. Of the 203 units questioned, 97 %(n = 197) provided Renal ReplacementTherapy. 81 % (n = 159) used CVVH whereas 69 %(n = 136) used CVVHDF. All 197units in the survey used Heparin for anticoagulation. 91 % (n = 179) of these also usedProstacyclin for patients at a high risk of bleeding. Citrate was found to be established asa form of anticoagulation in 5 %(n = 10) of units questioned. However, 4 units were inthe process of commencing citrate use, with a further 4 carrying out trials in order todetermine its suitability. The most commonly used blood pump speed for citrate was\150 ml/min (100 %, n = 10), while for other anticoagulants it was 150–250 ml/min(92 %, n = 182).
Type of RRT modalities
Type of anticoagulants
Feedback
CONCLUSION. No national guidelines regarding the recommended mode of anticoagu-lation in intensive care RRT exist. Standard heparin is still the most common type ofanticoagulation in use while Citrate use is relatively rare.Nevertheless, overall feedback regarding citrate was positive. It would therefore, beadvisable to look into establishing national guidelines in line with the best available evi-dence to encourage further use of citrate anticoagulation in RRT across the UK.REFERENCE(S) 1. Hetzel GR, Schmitz M, Wissing H et al. Regional citrate vs systemicheparin for anticoagulation in critically ill patients on continuous venovenous haemofil-tration: a prospective randomized multicentre trial. Nephrol Dial Transplant.2011;26(1):232–9. 2. Zhang Z, Hongying N- Efficacy & safety of regional citrate antico-agulation in critically ill patients undergoing continuous renal replacement therapy.Intensive Care Med. 2012;38(1):20–8. 3. Mariano F et al. Citrate anticoagulation for
26th ESICM ANNUAL CONGRESS — PARIS, FRANCE — 5–9 OCTOBER 2013
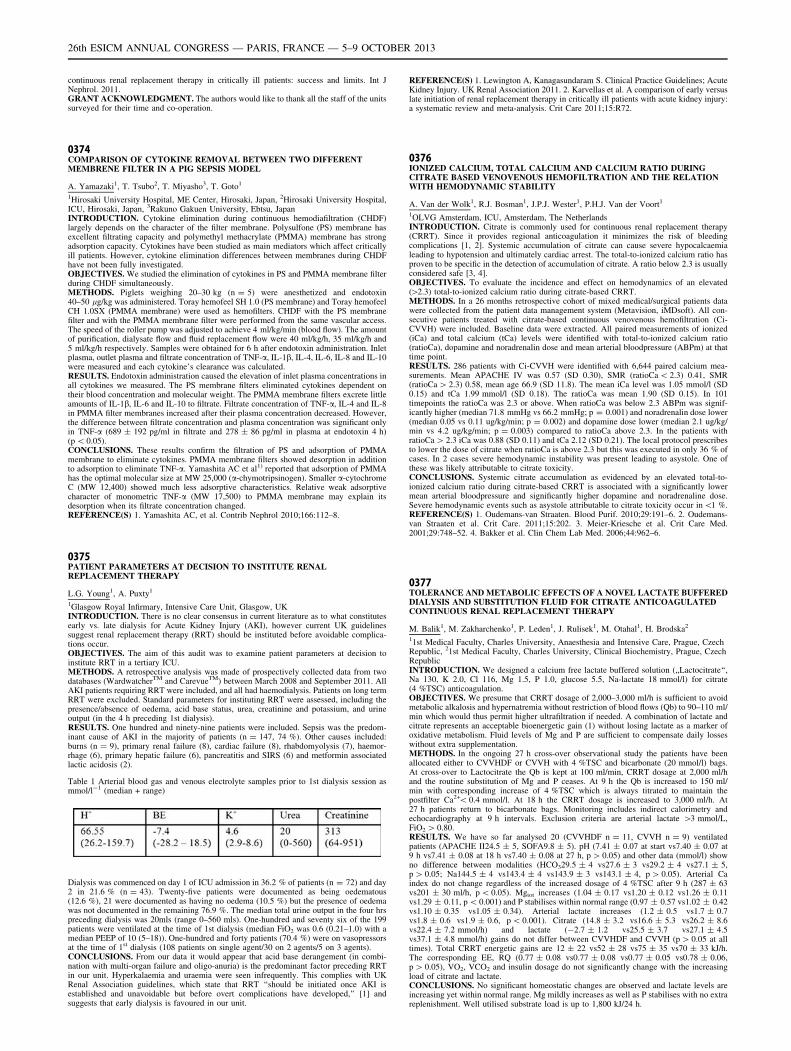
continuous renal replacement therapy in critically ill patients: success and limits. Int JNephrol. 2011.GRANT ACKNOWLEDGMENT. The authors would like to thank all the staff of the unitssurveyed for their time and co-operation.
0374COMPARISON OF CYTOKINE REMOVAL BETWEEN TWO DIFFERENTMEMBRENE FILTER IN A PIG SEPSIS MODEL
A. Yamazaki1, T. Tsubo2, T. Miyasho3, T. Goto1
1Hirosaki University Hospital, ME Center, Hirosaki, Japan, 2Hirosaki University Hospital,ICU, Hirosaki, Japan, 3Rakuno Gakuen University, Ebtsu, JapanINTRODUCTION. Cytokine elimination during continuous hemodiafiltration (CHDF)largely depends on the character of the filter membrane. Polysulfone (PS) membrane hasexcellent filtrating capacity and polymethyl methacrylate (PMMA) membrane has strongadsorption capacity. Cytokines have been studied as main mediators which affect criticallyill patients. However, cytokine elimination differences between membranes during CHDFhave not been fully investigated.OBJECTIVES. We studied the elimination of cytokines in PS and PMMA membrane filterduring CHDF simultaneously.METHODS. Piglets weighing 20–30 kg (n = 5) were anesthetized and endotoxin40–50 lg/kg was administered. Toray hemofeel SH 1.0 (PS membrane) and Toray hemofeelCH 1.0SX (PMMA membrane) were used as hemofilters. CHDF with the PS membranefilter and with the PMMA membrane filter were performed from the same vascular access.The speed of the roller pump was adjusted to achieve 4 ml/kg/min (blood flow). The amountof purification, dialysate flow and fluid replacement flow were 40 ml/kg/h, 35 ml/kg/h and5 ml/kg/h respectively. Samples were obtained for 6 h after endotoxin administration. Inletplasma, outlet plasma and filtrate concentration of TNF-a, IL-1b, IL-4, IL-6, IL-8 and IL-10were measured and each cytokine’s clearance was calculated.RESULTS. Endotoxin administration caused the elevation of inlet plasma concentrations inall cytokines we measured. The PS membrane filters eliminated cytokines dependent ontheir blood concentration and molecular weight. The PMMA membrane filters excrete littleamounts of IL-1b, IL-6 and IL-10 to filtrate. Filtrate concentration of TNF-a, IL-4 and IL-8in PMMA filter membranes increased after their plasma concentration decreased. However,the difference between filtrate concentration and plasma concentration was significant onlyin TNF-a (689 ± 192 pg/ml in filtrate and 278 ± 86 pg/ml in plasma at endotoxin 4 h)(p \ 0.05).CONCLUSIONS. These results confirm the filtration of PS and adsorption of PMMAmembrane to eliminate cytokines. PMMA membrane filters showed desorption in additionto adsorption to eliminate TNF-a. Yamashita AC et al1) reported that adsorption of PMMAhas the optimal molecular size at MW 25,000 (a-chymotripsinogen). Smaller a-cytochromeC (MW 12,400) showed much less adsorptive characteristics. Relative weak adsorptivecharacter of monometric TNF-a (MW 17,500) to PMMA membrane may explain itsdesorption when its filtrate concentration changed.REFERENCE(S) 1. Yamashita AC, et al. Contrib Nephrol 2010;166:112–8.
0375PATIENT PARAMETERS AT DECISION TO INSTITUTE RENALREPLACEMENT THERAPY
L.G. Young1, A. Puxty1
1Glasgow Royal Infirmary, Intensive Care Unit, Glasgow, UKINTRODUCTION. There is no clear consensus in current literature as to what constitutesearly vs. late dialysis for Acute Kidney Injury (AKI), however current UK guidelinessuggest renal replacement therapy (RRT) should be instituted before avoidable complica-tions occur.OBJECTIVES. The aim of this audit was to examine patient parameters at decision toinstitute RRT in a tertiary ICU.METHODS. A retrospective analysis was made of prospectively collected data from twodatabases (WardwatcherTM and CarevueTM) between March 2008 and September 2011. AllAKI patients requiring RRT were included, and all had haemodialysis. Patients on long termRRT were excluded. Standard parameters for instituting RRT were assessed, including thepresence/absence of oedema, acid base status, urea, creatinine and potassium, and urineoutput (in the 4 h preceding 1st dialysis).RESULTS. One hundred and ninety-nine patients were included. Sepsis was the predom-inant cause of AKI in the majority of patients (n = 147, 74 %). Other causes included:burns (n = 9), primary renal failure (8), cardiac failure (8), rhabdomyolysis (7), haemor-rhage (6), primary hepatic failure (6), pancreatitis and SIRS (6) and metformin associatedlactic acidosis (2).
Table 1 Arterial blood gas and venous electrolyte samples prior to 1st dialysis session asmmol/l-1 (median + range)
Dialysis was commenced on day 1 of ICU admission in 36.2 % of patients (n = 72) and day2 in 21.6 % (n = 43). Twenty-five patients were documented as being oedematous(12.6 %), 21 were documented as having no oedema (10.5 %) but the presence of oedemawas not documented in the remaining 76.9 %. The median total urine output in the four hrspreceding dialysis was 20mls (range 0–560 mls). One-hundred and seventy six of the 199patients were ventilated at the time of 1st dialysis (median FiO2 was 0.6 (0.21–1.0) with amedian PEEP of 10 (5–18)). One-hundred and forty patients (70.4 %) were on vasopressorsat the time of 1st dialysis (108 patients on single agent/30 on 2 agents/5 on 3 agents).CONCLUSIONS. From our data it would appear that acid base derangement (in combi-nation with multi-organ failure and oligo-anuria) is the predominant factor preceding RRTin our unit. Hyperkalaemia and uraemia were seen infrequently. This complies with UKRenal Association guidelines, which state that RRT ‘‘should be initiated once AKI isestablished and unavoidable but before overt complications have developed,’’ [1] andsuggests that early dialysis is favoured in our unit.
REFERENCE(S) 1. Lewington A, Kanagasundaram S. Clinical Practice Guidelines; AcuteKidney Injury. UK Renal Association 2011. 2. Karvellas et al. A comparison of early versuslate initiation of renal replacement therapy in critically ill patients with acute kidney injury:a systematic review and meta-analysis. Crit Care 2011;15:R72.
0376IONIZED CALCIUM, TOTAL CALCIUM AND CALCIUM RATIO DURINGCITRATE BASED VENOVENOUS HEMOFILTRATION AND THE RELATIONWITH HEMODYNAMIC STABILITY
A. Van der Wolk1, R.J. Bosman1, J.P.J. Wester1, P.H.J. Van der Voort1
1OLVG Amsterdam, ICU, Amsterdam, The NetherlandsINTRODUCTION. Citrate is commonly used for continuous renal replacement therapy(CRRT). Since it provides regional anticoagulation it minimizes the risk of bleedingcomplications [1, 2]. Systemic accumulation of citrate can cause severe hypocalcaemialeading to hypotension and ultimately cardiac arrest. The total-to-ionized calcium ratio hasproven to be specific in the detection of accumulation of citrate. A ratio below 2.3 is usuallyconsidered safe [3, 4].OBJECTIVES. To evaluate the incidence and effect on hemodynamics of an elevated([2.3) total-to-ionized calcium ratio during citrate-based CRRT.METHODS. In a 26 months retrospective cohort of mixed medical/surgical patients datawere collected from the patient data management system (Metavision, iMDsoft). All con-secutive patients treated with citrate-based continuous venovenous hemofiltration (Ci-CVVH) were included. Baseline data were extracted. All paired measurements of ionized(iCa) and total calcium (tCa) levels were identified with total-to-ionized calcium ratio(ratioCa), dopamine and noradrenalin dose and mean arterial bloodpressure (ABPm) at thattime point.RESULTS. 286 patients with Ci-CVVH were identified with 6,644 paired calcium mea-surements. Mean APACHE IV was 0.57 (SD 0.30), SMR (ratioCa \ 2.3) 0.41, SMR(ratioCa [ 2.3) 0.58, mean age 66.9 (SD 11.8). The mean iCa level was 1.05 mmol/l (SD0.15) and tCa 1.99 mmol/l (SD 0.18). The ratioCa was mean 1.90 (SD 0.15). In 101timepoints the ratioCa was 2.3 or above. When ratioCa was below 2.3 ABPm was signif-icantly higher (median 71.8 mmHg vs 66.2 mmHg; p = 0.001) and noradrenalin dose lower(median 0.05 vs 0.11 ug/kg/min; p = 0.002) and dopamine dose lower (median 2.1 ug/kg/min vs 4.2 ug/kg/min; p = 0.003) compared to ratioCa above 2.3. In the patients withratioCa [ 2.3 iCa was 0.88 (SD 0.11) and tCa 2.12 (SD 0.21). The local protocol prescribesto lower the dose of citrate when ratioCa is above 2.3 but this was executed in only 36 % ofcases. In 2 cases severe hemodynamic instability was present leading to asystole. One ofthese was likely attributable to citrate toxicity.CONCLUSIONS. Systemic citrate accumulation as evidenced by an elevated total-to-ionized calcium ratio during citrate-based CRRT is associated with a significantly lowermean arterial bloodpressure and significantly higher dopamine and noradrenaline dose.Severe hemodynamic events such as asystole attributable to citrate toxicity occur in\1 %.REFERENCE(S) 1. Oudemans-van Straaten. Blood Purif. 2010;29:191–6. 2. Oudemans-van Straaten et al. Crit Care. 2011;15:202. 3. Meier-Kriesche et al. Crit Care Med.2001;29:748–52. 4. Bakker et al. Clin Chem Lab Med. 2006;44:962–6.
0377TOLERANCE AND METABOLIC EFFECTS OF A NOVEL LACTATE BUFFEREDDIALYSIS AND SUBSTITUTION FLUID FOR CITRATE ANTICOAGULATEDCONTINUOUS RENAL REPLACEMENT THERAPY
M. Balik1, M. Zakharchenko1, P. Leden1, J. Rulisek1, M. Otahal1, H. Brodska2
11st Medical Faculty, Charles University, Anaesthesia and Intensive Care, Prague, CzechRepublic, 21st Medical Faculty, Charles University, Clinical Biochemistry, Prague, CzechRepublicINTRODUCTION. We designed a calcium free lactate buffered solution (,,Lactocitrate‘‘,Na 130, K 2.0, Cl 116, Mg 1.5, P 1.0, glucose 5.5, Na-lactate 18 mmol/l) for citrate(4 %TSC) anticoagulation.OBJECTIVES. We presume that CRRT dosage of 2,000–3,000 ml/h is sufficient to avoidmetabolic alkalosis and hypernatremia without restriction of blood flows (Qb) to 90–110 ml/min which would thus permit higher ultrafiltration if needed. A combination of lactate andcitrate represents an acceptable bioenergetic gain (1) without losing lactate as a marker ofoxidative metabolism. Fluid levels of Mg and P are sufficient to compensate daily losseswithout extra supplementation.METHODS. In the ongoing 27 h cross-over observational study the patients have beenallocated either to CVVHDF or CVVH with 4 %TSC and bicarbonate (20 mmol/l) bags.At cross-over to Lactocitrate the Qb is kept at 100 ml/min, CRRT dosage at 2,000 ml/hand the routine substitution of Mg and P ceases. At 9 h the Qb is increased to 150 ml/min with corresponding increase of 4 %TSC which is always titrated to maintain thepostfilter Ca2+\ 0.4 mmol/l. At 18 h the CRRT dosage is increased to 3,000 ml/h. At27 h patients return to bicarbonate bags. Monitoring includes indirect calorimetry andechocardiography at 9 h intervals. Exclusion criteria are arterial lactate [3 mmol/L,FiO2 [ 0.80.RESULTS. We have so far analysed 20 (CVVHDF n = 11, CVVH n = 9) ventilatedpatients (APACHE II24.5 ± 5, SOFA9.8 ± 5). pH (7.41 ± 0.07 at start vs7.40 ± 0.07 at9 h vs7.41 ± 0.08 at 18 h vs7.40 ± 0.08 at 27 h, p [ 0.05) and other data (mmol/l) showno difference between modalities (HCO329.5 ± 4 vs27.6 ± 3 vs29.2 ± 4 vs27.1 ± 5,p [ 0.05; Na144.5 ± 4 vs143.4 ± 4 vs143.9 ± 3 vs143.1 ± 4, p [ 0.05). Arterial Caindex do not change regardless of the increased dosage of 4 %TSC after 9 h (287 ± 63vs201 ± 30 ml/h, p \ 0.05). Mgtot increases (1.04 ± 0.17 vs1.20 ± 0.12 vs1.26 ± 0.11vs1.29 ± 0.11, p \ 0.001) and P stabilises within normal range (0.97 ± 0.57 vs1.02 ± 0.42vs1.10 ± 0.35 vs1.05 ± 0.34). Arterial lactate increases (1.2 ± 0.5 vs1.7 ± 0.7vs1.8 ± 0.6 vs1.9 ± 0.6, p \ 0.001). Citrate (14.8 ± 3.2 vs16.6 ± 5.3 vs26.2 ± 8.6vs22.4 ± 7.2 mmol/h) and lactate (-2.7 ± 1.2 vs25.5 ± 3.7 vs27.1 ± 4.5vs37.1 ± 4.8 mmol/h) gains do not differ between CVVHDF and CVVH (p [ 0.05 at alltimes). Total CRRT energetic gains are 12 ± 22 vs52 ± 28 vs75 ± 35 vs70 ± 33 kJ/h.The corresponding EE, RQ (0.77 ± 0.08 vs0.77 ± 0.08 vs0.77 ± 0.05 vs0.78 ± 0.06,p [ 0.05), VO2, VCO2 and insulin dosage do not significantly change with the increasingload of citrate and lactate.CONCLUSIONS. No significant homeostatic changes are observed and lactate levels areincreasing yet within normal range. Mg mildly increases as well as P stabilises with no extrareplenishment. Well utilised substrate load is up to 1,800 kJ/24 h.
26th ESICM ANNUAL CONGRESS — PARIS, FRANCE — 5–9 OCTOBER 2013
REFERENCES. 1. Balik M, Zakharchenko M, Leden P, et al. Bioenergetic gain of citrateanticoagulated continuous hemodiafiltration—a comparison between two citrate modalitiesand unfractionated heparin, J Crit Care. 2013;28:87–95.ACKNOWLEDGMENT. Supported from ESICM Stoutenbeek Award 2012.
0378HEPARIN FOR CIRCUIT LONGEVITY IN CONTINUOUS RENALREPLACEMENT THERAPY: ARE WE GETTING IT RIGHT?
J. Peh1, M. Sarabia1, R. Ondoy1, M. Singh1, B. Abifarin1, J. Ball2
1St George’s Healthcare NHS Trust, London, UK, 2St George’s Healthcare NHS Trust andSt George’s University of London, London, UKINTRODUCTION. Unfractionated heparin (UFH) is commonly used as an anticoagulantto prolong the extracorporeal circuit life during continuous renal replacement therapy(CRRT). Length of time reported varies between 20 to 40 h when UFH is used (1, 3).Variations in guidelines differ across ICUs from the amount of UFH used to prime afilter, use of a bolus dose, dilution for continuous infusions and dosing algorithm toachieve a target range for activated partial thromboplastin time ratio (aPTTr). Algorithmshave allowed a more efficient approach to empower nursing staff to lead the manage-ment of heparin infusions (1, 2). At our hospital, the management of UFH in CRRT wasstandardised in 2010 with local guidelines implemented across two ICUs (General andCardiothoracic). Filter sets are usually changed every 72 h based on its licensed use.OBJECTIVES. To review practice reflected through circuit longevity (72 h per filter) usingUFH and observe the rate of over and under-anticoagulation based on a target aPTTr of1.5–2.0.METHODS. For 3 months in 2011 (April to June) and 2012 (October to December),patients on CRRT with heparin only were included in the audit. We did not review anypatients who were on CRRT with no anticoagulation or on alternative anticoagulation suchas epoprostenol. aPTTr values including sampling times were recorded. Time of a filterclotting was also recorded. Results of the first audit were analyzed. One recurrent issuenoted was that a large number of patients only had one to two aPTTr readings in 24 h.Changes were made to the guidelines to emphasize sampling times and review of levels. Anupdated guideline was implemented in June 2012. Adherence was re-audited four monthslater.RESULTS. There were 22 patients in each audit period. aPTTr values were recorded for allfilters when UFH was used including when electively discontinued.
aPTTr values
2011 2012
aPTTr interquartile range(min–max)
1.22–2.09 (0.7–4.28) 1.17–2.13 (0.8–[6)
aPTTr interquartile range priorto filter clotting (min–max)
1.01–1.38 (0.85–3.11) 1.02–1.87 (0.85–3.35)
No. aPTTr readings per 24 h (=155) (=252)
1 12 (=12) 21 (=21)
2 27 (=54) 29 (=58)
3 16 (=48) 28 (=84)
4 5 (=20) 16 (=64)
5 3 (=15) 5 (=25)
6 1 (=6) 0
In both audit periods, 28 % of readings were below target with 45 % above target. Meancircuit life was 42 h in 2011 with a longer circuit life of 50 h in 2012.CONCLUSIONS. Clarity on sampling and review times in the guideline did not show areduction in the incidence of over and under-anticoagulation but longer circuit life wasnoted in the second audit period. We conclude circuit longevity in our ICUs is on average45 h. The guideline’s algorithm was not adhered to. In practice the process of sending andreviewing blood results from the laboratory is not compatible with the timeliness of heparindosing. Availability of near patient testing of blood samples can help improve efficiency indosing. We are investigating the possibility of utilising thromboelastography to guide dosingof UFH (4).REFERENCE(S) 1. Ostermann et al. Crit Care 2010;14:419. 2. Baldwin I, Fealy N. SeminDial. 2009;22:189–93. 3. Brophy PD, Somers MJ et al. Nephrol Dial Transpl.2005;20(7):1416–21. 4. Panigada et al. Crit Care. 2013;17(Suppl 2):P126.
0379CITRATE-BASED ANTICOAGULATION IN PATIENTS WITH AKI IN THEINTENSIVE CARE UNIT: A SAFE AND EFFICACIOUS METHOD
F. Stucker1, J. Pugin2, J. Tattaw1, B. Ponte1, L. Brochard2, P.-Y. Martin1, P. Saudan1
1HUG, Nephrology, Geneva, Switzerland, 2HUG, Intensive Care, Geneva, SwitzerlandINTRODUCTION. A systemic anticoagulation is often required to prevent clotting of filterand extracorporeal circulation in ICU patients undergoing continuous renal replacementtherapy (CRRT). A regional citrate-based anticoagulation (RCA) does not induce a systemicanticoagulation and prolongs the filter lifespan. Nevertheless metabolic side-effects havebeen associated with this therapy.OBJECTIVES. We are conducting a randomized controlled trial with patients requiringCRRT to determine whether a RCA is more effective than heparin in terms of renalreplacement delivered dose and safety profile.METHODS. Patients: included if they are aged [18 years and have an AKI requiringCRRT. The exclusion criteria are: active hemorrhagic disorder, pregnancy, history ofheparin-induced thrombopenia, consent form not obtained.Randomized to either CRRT with RCA (Prismocitrate, Gambro) or classical heparin anti-coagulation. Treatment is performed with Prismaflex machines (hemodiafiltration mode,overall RRT dose 30 ml/kg/h and filter change every 72 h). Primary endpoints: effectivedaily RRT dose (% of prescribed RRT dose) and filter lifespan. Secondary endpoints:survival at 28 days, number of hemorrhagical events requiring blood transfusions, severemetabolic complications (metabolic alcalosis with pH [ 7.55, metabolic acidosis withpH \ 7.25) hypocalcaemia (ionized calcium \1 mmol/l).
RESULTS. From October 2010 up to the end of March 2013, 206 patients were treated withCRRT, of whom 85 patients (41 %) were randomized. Exclusion criteria for those notincluded in this trial were active hemorrhagic disorders or severe thrombocytopenia (21 %),terminal liver failure (9 %), chronic maintenance dialysis (25 %) or others (45 %). Meanage was 62 ± 9 years, and 64.9 % were of male gender. Etiology of AKIs were medical(77 %), surgical (12 %) and posttraumatic (11 %). Mean CRRT duration was 5 ± 5 days.Effective daily RRT dose was 97 ± 8 % in the RCA group and 91 ± 12 % in the heparingroup (p = 0.009). 28-days mortality was 23.8 % in the RCA group and 24.3 % in theheparin group. Electrolytes and acid–base disturbances were uncommon and transient inpatients treated with RCA.CONCLUSIONS. These preliminary results show that RCA in terms of effective dailydelivered RRT dose is superior to heparin-based anticoagulation, which however does nottranslate into a 28-day survival improvement.
0380DO INTENSIVE CARE PATIENTS REQUIRING RENAL REPLACEMENTTHERAPY RECEIVE AN ADEQUATE DELIVERED DOSE? A TERTIARYCENTRE EXPERIENCE
C. Richardson1, B. Tunnicliffe1
1Queen Elizabeth Hospital, Intensive Care, Birmingham, UKINTRODUCTION. Acute Kidney injury (AKI) requiring renal replacement therapy (RRT)in intensive care is a frequent problem with high mortality. Effective RRT relies, amongstother things, on good vascular access and an extracorporeal circuit that functions correctly.Recent trials have demonstrated no added benefit in mortality outcomes with augmentedversus standard prescribed doses for RRT1, 2. Evidence suggests a minimum prescribed doseof 25 ml/kg/h3 aiming for a delivered dose of 20 ml/kg/h. This allows for operationaldifficulties and medical interventions. Despite this, prescribing the correct dose does notalways ensure an adequate delivered dose potentially leading to sub-optimal RRT.OBJECTIVES. A prospective observational audit was conducted to assess the prescribedand delivered dose in patients receiving haemofiltration in the intensive care units of a largetertiary hospital.METHODS. Data was collected daily on patient demographics, RRT indication, RRTprescription and anticoagulation over a 2-week period during July 2012. Twenty-twopatients received haemofiltration with 104 filtration days available for analysis. Analysiswas carried out using SPSS. T-test was used for continuous parametric variables and Chisquare for categorical variables.RESULTS.
Demographic data
N = 22 Range
Sex M = 68 % F = 32 %
Age in years ± SD 61 ± 16.26 20–82
APACHE II* score ± SD 16.7 ± 7.97 6–36
Pre-morbid mean GFR ml/min** ± SD 63.2 ± 20.9 35–90
* Out of 22 patients, 11 APACHE scores available** Data available for 13 (59 %) patients.Most of the ITU admissions were secondary to elective operations or sepsis. AKI was themain indication for RRT.
RRT prescription/delivered dose
Mean + SD Range
Prescribed dose 22.59 ml/kg/h ± 12.28 10.8–80 ml/kg/h
% of prescribed dose achieved 83 % ± 22.23 % 4–100 %
Delivered dose 18.70 ± 11.76 ml/kg/h 0.6–80 ml/kg/h
Upon further analysis of the mean delivered dose, out of 93 RRT days: 39 % receivedC20 ml/kg/h8 % received 15–20 ml/kg/h37 % received 10–14.9 ml/kg/h16 % received \10 ml/kg/h
There was no difference in the percentage of prescribed dose achieved whether anticoag-ulation was used or not (p = 0.995). However, the mean percentage of prescribed doseachieved was lower when filter clotting problems existed as opposed to not (74 vs.89.49 %). This difference was statistically significant (p = 0.002). Interestingly there wasno association between filter clotting problems and not receiving anticoagulation in our dataset (p = 0.291).CONCLUSIONS. The percentage of prescribed dose achieved in our centre was suboptimalwith a large variation in range. The actual delivered dose was also suboptimal with asizeable proportion of filtration days having a very low delivered dose.It is crucial for intensive care units to adopt RRT prescription protocols based on idealpatient body weight as well as undertake regular audit to monitor that the actual delivereddose is adequate.REFERENCE(S) 1. The RENAL Replacement Therapy Study Investigators. N Engl J Med.2009;361:1627–38. 2. The VA/NIH Acute Renal Failure Trial Network. N Engl J Med.2008;359:7–20. 3. KDIGO clinical practice guidelines for acute kidney injury. Kidney IntSuppl. 2012;2(1).
0381REGIONAL CITRATE ANTICOAGULATION FOR CONTINUOUSVENOVENOUS HEMOFILTRATION AND HEMODIAFILTRATION USINGLACTATE AS BUFFER AND CALCIUM-CONTAINING DIALYSATE ANDREPLACEMENT FLUID. EXPERIENCE IN 21 PATIENTS
R. Avila1, E. Romero2, N. Carrizo1, J. Fuentes2, V. Cordini1, G. Bongiorni2
1Hospital Cullen, Santa Fe, Argentina, 2Hospital Privado Centro Medico de Cordoba,Cordoba, Argentina
26th ESICM ANNUAL CONGRESS — PARIS, FRANCE — 5–9 OCTOBER 2013
INTRODUCTION. Regional anticoagulation with citrate is an effective alternative toheparin in patients at high risk for bleeding. However, existing protocols require the use ofcalcium free solutions. To get adequate solutions in a developing country is a big challenge.OBJECTIVES. To evaluate the citrate anticoagulation during CVVH and CVVHDF usingan anticoagulant Citrate Dextrose Formula A (ACD-A) solution along with calcium con-taining dialysate and replacement fluid. Also to register the most frequently foundcomplications during the procedures.METHODS. We retrospectively reviewed the medical records of 21 patients at an intensivecare unit of two tertiary-care institutions who had undergone citrate-based CVVHDF andCVVH using a dialysate and a replacement fluid both containing calcium. We used an ACD-A solution to perform anticoagulation and a SOLUFLEX-3075 solution (Na 140 mEq/l, Cl109.5 mEq/l, Ca 3.5 mEq/l, Mg 1 mEq/l, Na lactate 35 mEq/l) for dialysate and replace-ment fluid. We evaluated the frequency of hemofilter clotting, hypocalcemia, metabolicalkalosis, metabolic acidosis, hyperlactatemia and citrate toxicity.RESULTS. Continuous venovenous hemodiafiltration and CVVH were performed for atotal of 76 days using 28 filters. Weighting mean hemofilter life span was 95.35 h (SD 58.5).No patients experienced symptomatic hypocalcemia and/or signs and symptoms of citratetoxicity. Twelve patients developed metabolic alkalosis; mean lactate was 5.32 (SD 5.77)mean total/iCa concentration 2.16 (SD 0.24).CONCLUSIONS. In our research the citrate anticoagulation using calcium-containingsolutions is not associated with increased hemofilter clotting. Due to higher doses of citrateused to keep the level of post-filter iCa and the content of lactate in the solutions the patientstended to develop metabolic alkalosis rapidly. The limited availability of suitable solutionsin our country (only one) makes it difficult to avoid some complications during CRRT.REFERENCE(S) 1. Gupta M, Wadhwa NK, Bukovsky R. Regional citrate anticoagulationfor continuous venovenous hemodiafiltration using calcium-containing dialysate. Am JKidney Dis. 2004;43:67–73. 2. Bellomo R: Bench-to-bedside review: Lactate and thekidney. Crit Care 2002;6:322–6.
0382DIALYTRAUMA INCIDENCE IN PATIENTS TREATED WITH CONTINUOUSRENAL REPLACEMENT THERAPY
S.N. Capela1, N.A. Velez1, S. Pereira1, P. Tadeu1, S. Silva1, M.J. Fernandes1, J.G. Silva1,
F. Santos1, A. Ferreira1, E.M. Lafuente1
1Centro Hospitalar do Tamega e Sousa, UCIP, Penafiel, PortugalINTRODUCTION. Continuous Renal Replacement Therapy (CRRT) is considered safeand effective (1). Its use is limited to critically and unstable patients. Dialytrauma is aconcept used to describe the adverse effects of CRRT (1, 2).OBJECTIVE. To analyse the operational characteristics of the CRRT identifying theevents that contributed the most for the dialytrauma.METHODS. Retrospective, quantitative and analytic study of the patients submitted toCRRT in the Intensive Care Unit (ICU) between 2005 and 2011. We analysed demographicdata, reason for admission, length of stay, SAPSII, SOFA and condition at discharge fromICU. To study dialytrauma incidence we considered the type of technique, reason andduration, type and quantity of membranes used per patient, hypocoagulant, fluids and buffer,prescribed and effective dose in mL/Kg/h, fluid balance, diuresis and hypothermia related tothe CRRT. We analysed the course of plasma markers: urea, creatinine, phosphorus, mag-nesium, total and ionized calcium, sodium, potassium, pH, bicarbonate, lactate, hematocrit,platelets, activated partial tromboplastin time and glucose. We assessed their relative weightfor the incidence of dialytrauma using Student T Test, ANOVA and Logistic Regression.RESULTS. We studied 237 patients, age 60.6 ± 14.4 years, 60.6 % male and length ofstay of 12.8 ± 12.4 days in the ICU. Had surgical pathology 27 %, 70 % medical and 3 %trauma. SAPSII was 55.4 ± 18.5 and mortality in the ICU was 50.6 %. CVVHDF was usedin 71.8 % and CVVHF in 28.2 %. The membrane ST150� was used in 95 %, the Oxiris� in2 % and the Septex� in 3 %.Each patient used in average 2.3 membranes and 92.3 h of treatment. Heparin was used in45.5 %, citrate in 15.3 % and none in 39.2 %. The buffer was bicarbonate in 99.2 %,Hemosol BO� in 49.5 %, Prismasol� 4 in 36.5 % and Prisma 0 cal� in 24 %. The meanprescribed dosage was 38 mL/Kg/h. Hypothermia was present in 56.4 %. The dialytraumarelated events that have shown statistical significance were: the reductions of phosphorus,pH, platelets and calcium. Negative fluid balance, maintenance of spontaneous diuresis andcreatinine reduction were the data that appeared to have a positive effect on the final results.CONCLUSIONS. Dialytrauma occurs quite often in the first hours of CRRT. In this studywe found significant variations for some ions, even though none of them appeared to haveinfluenced mortality. The results suggest that negative fluid balance and the maintenance ofspontaneous diuresis contribute for better prognosis.REFERENCES. 1. Moliner JM, Honore PM, Riera SI, Gutiérrez ME, Spapen HD: Han-dling continuous renal replacement therapy-related adverse effects in intensive care unitpatients: the dialytrauma concept. Blood Purif. 2012;34:177–185. 2. Tomas E, Veigas E,Filipe E, Lafuente E: Electrolyte disturbances (Dialytrauma) of continuous renal replace-ment therapy: a 6 years retrospective study. Intensive Care Med. 2011;S1:S129.
0383A NOVEL CALCULATOR IMPROVES HAEMODIAFILTRATION DELIVERY
D. Cottle1, S. Mousdale2, J. Overend2
1Lancashire Teaching Hospitals Foundation NHS Trust, Critical Care, Preston, UK, 2EastLancashire Hospitals Trust, Critical Care, Blackburn, UKINTRODUCTION. The optimal delivery of renal replacement therapy has been shown toimprove survival in critical care patients. The optimal mode of delivery of delivery is lessclear and the different machines available increase variations in practice. Therefore a dailyprescription for patients who require RRT is an important marker of good clinical practice.OBJECTIVES. To design an Excel spreadsheet that would:• Be easy to use for the medical staff and present the nursing staff a series of values to enteron the haemofiltration machine (Prismaflex, Gambro ltd).• Deliver consistent, accurate, evidence based haemodiafiltration.• Deliver a filtration fraction (FF) \0.2.• Improve the filter lifespan.
METHODS. We designed a calculator in an Excel spreadsheet based upon equationsdeveloped by Pisitkun et al. (1) and validated by Ricci et al. (2). These were rearranged and,in addition to some of our own calculations, give parameters for optimal haemodiafiltration.
The doctor enters the patient’s weight, haematocrit and the hourly fluid removal. There is afixed blood flow rate of 160 ml min-1, filtration fraction of 0.2 and predilution 500 ml h-1.The calculator then gives the optimal convection and dialysate flow rates that ensure totalclearance was 35 ml kg-1 h-1.Data was collected retrospectively from the Prismaflex data cards. Control data was col-lected in January 2012, and the data after the introduction of the calculator was collected inSeptember 2012.RESULTS. There were 14 filters used in January 2012 and 11 used in September 2012. Themean filter life increased from 15.2 h to 19.6 h. There was a marked reduction in thevariation of dosing delivered (see Table 1). The January dose range was 6.3–67.1 ml kg-
1 h-1 (mean 36.4 ml kg-1 h-1), the September dose range was 24.8–48.3 ml kg-1 h-1
(mean 35.4 ml kg-1 h-1). The number of patients with FF \ 0.2 reduced from 43 to 9 %.
Comparison of January and September data
Parameter January 2012 September 2012
Mean filter life (ml/h) 15.2 19.6
Min dose (ml/kg/h) 6.3 24.8
Max dose (ml/kg/h) 67.1 48.3
Mean dose (ml/kg/h) 36.4 35.4
FF [ 0.2 43 % 9 %
CONCLUSIONS. We have improved and standardized RRT on our unit, ensuring theaccurate delivery of a given dose and therefore adequate clearance. Filter life has improvedas a result of reducing the FF and it has been well received by both medical and nursingstaff. There is much less variation in delivery which can improve further as uptake of theprescription improves. A future reduction in delivery to 25 ml kg-1 h-1 can easily beincorporated into the calculations resulting in an immediate change in practice on the unit.REFERENCE(S) 1. Pisitkun T, Tiranathanagul K, Poulin S, Bonello M, Salvatori G,D’Intini V, Ricci Z, Bellomo R, Ronco C. A practical tool for determining the adequacy ofrenal replacement therapy in acute renal failure patients. Contrib Nephrol.2004;144:329–49. 2. Ricci Z, Salvatori G, Bonello M, Pisitkun T, Bolgan I, D’Amico G,Dan M, Piccinni P, Ronco C. In vivo validation of the adequacy calculator for continuousrenal replacement therapies. Crit Care. 2005;9:R266–73.
0384A PROSPECTIVE STUDY OF THE USE OF PRISMOCITRATE 18/0 SOLUTIONFOR CONTINUOUS VENOVEONOUS HEMODIAFILTRATION IN CRITICALLYILL PATIENTS
M.M.S. Lui1, N.Y.Y. Leung2, M.F. Lam3, W.M. Chan2
1Queen Mary Hospital, Medicine, AICU, Hong Kong, Hong Kong, 2Queen Mary Hospital,AICU, Hong Kong, Hong Kong, 3Queen Mary Hospital, Medicine, Hong Kong, Hong KongINTRODUCTION. Regional citrate anticoagulation (RCA) is effective in prolonging filterfunction, and confers less risk of bleeding.(1) Commercial preparation of citrate pre-dilutionsolution facilitates wider use of RCA in critically ill patients. Previous studies usingPrismocitrate 10/2 (Gambro) have reported the requirement of additional bicarbonateinfusion to achieve better acid–base profile.OBJECTIVES. To assess the safety of a protocol using Prismocitrate 18/0, a new for-mulation with altered citrate/citric acid content, as pre-dilution replacement solutioncoupled with calcium-free dialysate (Prism0 cal B22) for continuous venovenous hemo-diafiltration in patients admitted to the Adult Intensive Care Unit (AICU).METHODS. Asian medical patients admitted to the AICU of Queen Mary Hospital who areindicated for continuous renal replacement therapy were invited. Those with significant liverimpairment or refractory septic shock, are excluded. The protocol adopted fixed flow ratesof blood and Prismocitrate 18/0 (pre-dilution replacement) at 120 ml/min and 1,000 ml/minrespectively. Dialysate (Prism0 cal B22) flow rate is adjusted according to body weight toachieve the recommended ultrafiltration dose of 30–35 ml/kg/h. Normal saline ran at100 ml/h as the post-dilution solution. CVVHDF was performed using Prismaflex� machinewith high flux filter (ST100, Gambro). Post-filter calcium levels targeted between0.3–0.5 mmol/l. Calcium chloride 10 % was infused to keep serum ionized calcium level1.0–1.0 mmol/l using a sliding scale. CVVHDF was stopped if pre-defined clinical targetwas achieved, or the filter clotted.RESULTS. 31 subjects (16 males, 15 females, age 26–85) were recruited. The post-filterionized calcium were consistent between 0.3–0.5 mmol/l. 23 of them completed theCVVHDF therapy without filter clotting, and the filter last 7–72 h. Filter clotting wasreported in 3 subjects, after CVVHDF for 26, 38, 53 h respectively. Catheter malfunctionwere found in 2 of the cases with filter clotted. 5 subjects were withdrawn from the studyafter CVVHDF for 5, 12, 21 h, subsequent to clinical deterioration with the development ofcontraindications for citrate infusion. Among the cohort, no disturbance in sodium level orcitrate accumulation was reported. No adverse events related to hypocalcemia, hypophos-phatemia or hypomagnesemia were reported. Mild hypophosphatemia and hypomagnesemiadeveloped mainly after prolonged CVVHDF ([24 h). No bleeding episodes were foundduring CVVHDF. No additional bicarbonate infusion was not required in all subject com-pleted CVVHDF (n = 26).CONCLUSIONS. The current CVVHDF protocol using Prismocitrate 18/0 as replacementsolution is feasible and safe.REFERENCE(S) 1. Zhang Z, Hongying N. Efficacy and safety of regional citrate anti-coagulation in critically ill patients undergoing continuous renal replacement therapy.Intensive Care Med. 2012;38(1):20–8.
0385CONTINUOUS RENAL REPLACEMENT THERAPY IMPLEMENTATIONIN A CRITICAL CARE UNIT
Y. Diaz1, A. Vázquez1, M.P. Gracia1, A. Zapatero1, I. Dot1, A.F. Villasboa1, M. Basas1,F.D. Vasco1, S. Valles1
1Parc de Salut Mar, Hospital del Mar, Critical Care, Barcelona, SpainINTRODUCTION. We can not say that the Continuous Renal Replacement Theraphy(CRRT) are better at inttermitent. In certain clinical situations, such as unstable criticalpatient, offer a number of advantages for its better hemodynamic tolerance, greater ability toremove fluids and immunomodulatory effect in septic patients.
26th ESICM ANNUAL CONGRESS — PARIS, FRANCE — 5–9 OCTOBER 2013
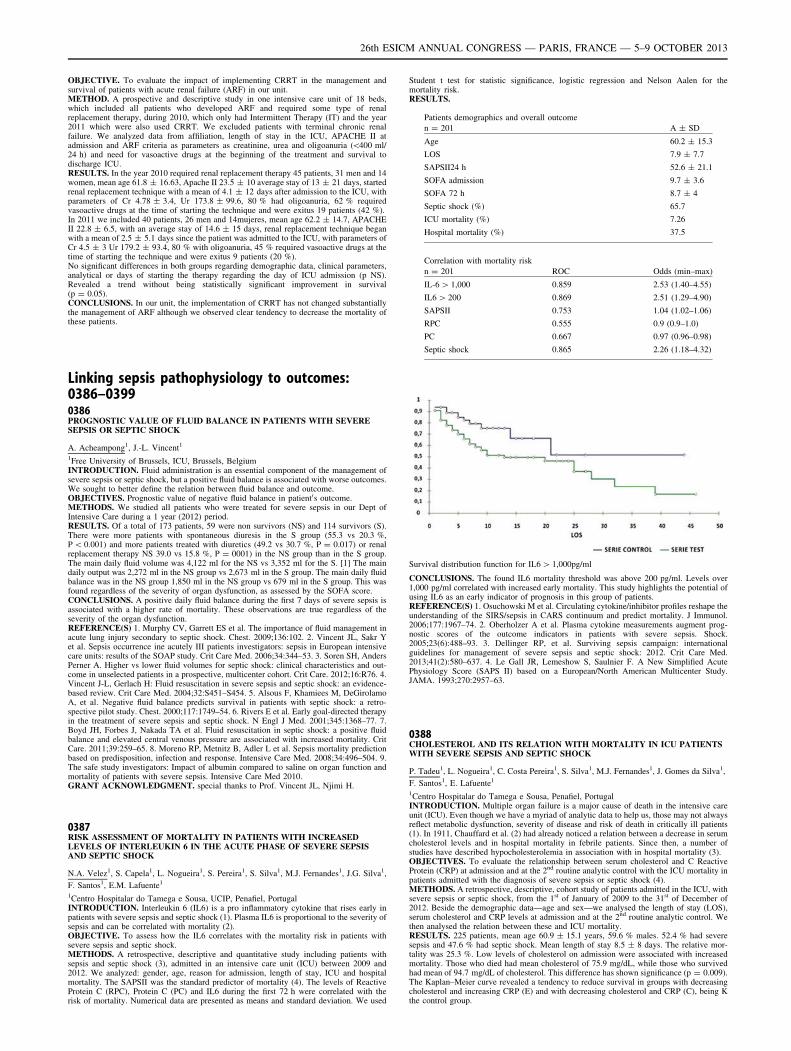
OBJECTIVE. To evaluate the impact of implementing CRRT in the management andsurvival of patients with acute renal failure (ARF) in our unit.METHOD. A prospective and descriptive study in one intensive care unit of 18 beds,which included all patients who developed ARF and required some type of renalreplacement therapy, during 2010, which only had Intermittent Therapy (IT) and the year2011 which were also used CRRT. We excluded patients with terminal chronic renalfailure. We analyzed data from affiliation, length of stay in the ICU, APACHE II atadmission and ARF criteria as parameters as creatinine, urea and oligoanuria (\400 ml/24 h) and need for vasoactive drugs at the beginning of the treatment and survival todischarge ICU.RESULTS. In the year 2010 required renal replacement therapy 45 patients, 31 men and 14women, mean age 61.8 ± 16.63, Apache II 23.5 ± 10 average stay of 13 ± 21 days, startedrenal replacement technique with a mean of 4.1 ± 12 days after admission to the ICU, withparameters of Cr 4.78 ± 3.4, Ur 173.8 ± 99.6, 80 % had oligoanuria, 62 % requiredvasoactive drugs at the time of starting the technique and were exitus 19 patients (42 %).In 2011 we included 40 patients, 26 men and 14mujeres, mean age 62.2 ± 14.7, APACHEII 22.8 ± 6.5, with an average stay of 14.6 ± 15 days, renal replacement technique beganwith a mean of 2.5 ± 5.1 days since the patient was admitted to the ICU, with parameters ofCr 4.5 ± 3 Ur 179.2 ± 93.4, 80 % with oligoanuria, 45 % required vasoactive drugs at thetime of starting the technique and were exitus 9 patients (20 %).No significant differences in both groups regarding demographic data, clinical parameters,analytical or days of starting the therapy regarding the day of ICU admission (p NS).Revealed a trend without being statistically significant improvement in survival(p = 0.05).CONCLUSIONS. In our unit, the implementation of CRRT has not changed substantiallythe management of ARF although we observed clear tendency to decrease the mortality ofthese patients.
Linking sepsis pathophysiology to outcomes:0386–03990386PROGNOSTIC VALUE OF FLUID BALANCE IN PATIENTS WITH SEVERESEPSIS OR SEPTIC SHOCK
A. Acheampong1, J.-L. Vincent1
1Free University of Brussels, ICU, Brussels, BelgiumINTRODUCTION. Fluid administration is an essential component of the management ofsevere sepsis or septic shock, but a positive fluid balance is associated with worse outcomes.We sought to better define the relation between fluid balance and outcome.OBJECTIVES. Prognostic value of negative fluid balance in patient0s outcome.METHODS. We studied all patients who were treated for severe sepsis in our Dept ofIntensive Care during a 1 year (2012) period.RESULTS. Of a total of 173 patients, 59 were non survivors (NS) and 114 survivors (S).There were more patients with spontaneous diuresis in the S group (55.3 vs 20.3 %,P \ 0.001) and more patients treated with diuretics (49.2 vs 30.7 %, P = 0.017) or renalreplacement therapy NS 39.0 vs 15.8 %, P = 0001) in the NS group than in the S group.The main daily fluid volume was 4,122 ml for the NS vs 3,352 ml for the S. [1] The maindaily output was 2,272 ml in the NS group vs 2,673 ml in the S group. The main daily fluidbalance was in the NS group 1,850 ml in the NS group vs 679 ml in the S group. This wasfound regardless of the severity of organ dysfunction, as assessed by the SOFA score.CONCLUSIONS. A positive daily fluid balance during the first 7 days of severe sepsis isassociated with a higher rate of mortality. These observations are true regardless of theseverity of the organ dysfunction.REFERENCE(S) 1. Murphy CV, Garrett ES et al. The importance of fluid management inacute lung injury secondary to septic shock. Chest. 2009;136:102. 2. Vincent JL, Sakr Yet al. Sepsis occurrence ine acutely III patients investigators: sepsis in European intensivecare units: results of the SOAP study. Crit Care Med. 2006;34:344–53. 3. Soren SH, AndersPerner A. Higher vs lower fluid volumes for septic shock: clinical characteristics and out-come in unselected patients in a prospective, multicenter cohort. Crit Care. 2012;16:R76. 4.Vincent J-L, Gerlach H: Fluid resuscitation in severe sepsis and septic shock: an evidence-based review. Crit Care Med. 2004;32:S451–S454. 5. Alsous F, Khamiees M, DeGirolamoA, et al. Negative fluid balance predicts survival in patients with septic shock: a retro-spective pilot study. Chest. 2000;117:1749–54. 6. Rivers E et al. Early goal-directed therapyin the treatment of severe sepsis and septic shock. N Engl J Med. 2001;345:1368–77. 7.Boyd JH, Forbes J, Nakada TA et al. Fluid resuscitation in septic shock: a positive fluidbalance and elevated central venous pressure are associated with increased mortality. CritCare. 2011;39:259–65. 8. Moreno RP, Metnitz B, Adler L et al. Sepsis mortality predictionbased on predisposition, infection and response. Intensive Care Med. 2008;34:496–504. 9.The safe study investigators: Impact of albumin compared to saline on organ function andmortality of patients with severe sepsis. Intensive Care Med 2010.GRANT ACKNOWLEDGMENT. special thanks to Prof. Vincent JL, Njimi H.
0387RISK ASSESSMENT OF MORTALITY IN PATIENTS WITH INCREASEDLEVELS OF INTERLEUKIN 6 IN THE ACUTE PHASE OF SEVERE SEPSISAND SEPTIC SHOCK
N.A. Velez1, S. Capela1, L. Nogueira1, S. Pereira1, S. Silva1, M.J. Fernandes1, J.G. Silva1,
F. Santos1, E.M. Lafuente1
1Centro Hospitalar do Tamega e Sousa, UCIP, Penafiel, PortugalINTRODUCTION. Interleukin 6 (IL6) is a pro inflammatory cytokine that rises early inpatients with severe sepsis and septic shock (1). Plasma IL6 is proportional to the severity ofsepsis and can be correlated with mortality (2).OBJECTIVE. To assess how the IL6 correlates with the mortality risk in patients withsevere sepsis and septic shock.METHODS. A retrospective, descriptive and quantitative study including patients withsepsis and septic shock (3), admitted in an intensive care unit (ICU) between 2009 and2012. We analyzed: gender, age, reason for admission, length of stay, ICU and hospitalmortality. The SAPSII was the standard predictor of mortality (4). The levels of ReactiveProtein C (RPC), Protein C (PC) and IL6 during the first 72 h were correlated with therisk of mortality. Numerical data are presented as means and standard deviation. We used
Student t test for statistic significance, logistic regression and Nelson Aalen for themortality risk.RESULTS.
Patients demographics and overall outcome
n = 201 A ± SD
Age 60.2 ± 15.3
LOS 7.9 ± 7.7
SAPSII24 h 52.6 ± 21.1
SOFA admission 9.7 ± 3.6
SOFA 72 h 8.7 ± 4
Septic shock (%) 65.7
ICU mortality (%) 7.26
Hospital mortality (%) 37.5
Correlation with mortality risk
n = 201 ROC Odds (min–max)
IL-6 [ 1,000 0.859 2.53 (1.40–4.55)
IL6 [ 200 0.869 2.51 (1.29–4.90)
SAPSII 0.753 1.04 (1.02–1.06)
RPC 0.555 0.9 (0.9–1.0)
PC 0.667 0.97 (0.96–0.98)
Septic shock 0.865 2.26 (1.18–4.32)
Survival distribution function for IL6 [ 1,000pg/ml
CONCLUSIONS. The found IL6 mortality threshold was above 200 pg/ml. Levels over1,000 pg/ml correlated with increased early mortality. This study highlights the potential ofusing IL6 as an early indicator of prognosis in this group of patients.REFERENCE(S) 1. Osuchowski M et al. Circulating cytokine/inhibitor profiles reshape theunderstanding of the SIRS/sepsis in CARS continuum and predict mortality. J Immunol.2006;177:1967–74. 2. Oberholzer A et al. Plasma cytokine measurements augment prog-nostic scores of the outcome indicators in patients with severe sepsis. Shock.2005;23(6):488–93. 3. Dellinger RP, et al. Surviving sepsis campaign: internationalguidelines for management of severe sepsis and septic shock: 2012. Crit Care Med.2013;41(2):580–637. 4. Le Gall JR, Lemeshow S, Saulnier F. A New Simplified AcutePhysiology Score (SAPS II) based on a European/North American Multicenter Study.JAMA. 1993;270:2957–63.
0388CHOLESTEROL AND ITS RELATION WITH MORTALITY IN ICU PATIENTSWITH SEVERE SEPSIS AND SEPTIC SHOCK
P. Tadeu1, L. Nogueira1, C. Costa Pereira1, S. Silva1, M.J. Fernandes1, J. Gomes da Silva1,
F. Santos1, E. Lafuente1
1Centro Hospitalar do Tamega e Sousa, Penafiel, PortugalINTRODUCTION. Multiple organ failure is a major cause of death in the intensive careunit (ICU). Even though we have a myriad of analytic data to help us, those may not alwaysreflect metabolic dysfunction, severity of disease and risk of death in critically ill patients(1). In 1911, Chauffard et al. (2) had already noticed a relation between a decrease in serumcholesterol levels and in hospital mortality in febrile patients. Since then, a number ofstudies have described hypocholesterolemia in association with in hospital mortality (3).OBJECTIVES. To evaluate the relationship between serum cholesterol and C ReactiveProtein (CRP) at admission and at the 2nd routine analytic control with the ICU mortality inpatients admitted with the diagnosis of severe sepsis or septic shock (4).METHODS. A retrospective, descriptive, cohort study of patients admitted in the ICU, withsevere sepsis or septic shock, from the 1st of January of 2009 to the 31st of December of2012. Beside the demographic data—age and sex—we analysed the length of stay (LOS),serum cholesterol and CRP levels at admission and at the 2nd routine analytic control. Wethen analysed the relation between these and ICU mortality.RESULTS. 225 patients, mean age 60.9 ± 15.1 years, 59.6 % males. 52.4 % had severesepsis and 47.6 % had septic shock. Mean length of stay 8.5 ± 8 days. The relative mor-tality was 25.3 %. Low levels of cholesterol on admission were associated with increasedmortality. Those who died had mean cholesterol of 75.9 mg/dL, while those who survivedhad mean of 94.7 mg/dL of cholesterol. This difference has shown significance (p = 0.009).The Kaplan–Meier curve revealed a tendency to reduce survival in groups with decreasingcholesterol and increasing CRP (E) and with decreasing cholesterol and CRP (C), being Kthe control group.
26th ESICM ANNUAL CONGRESS — PARIS, FRANCE — 5–9 OCTOBER 2013
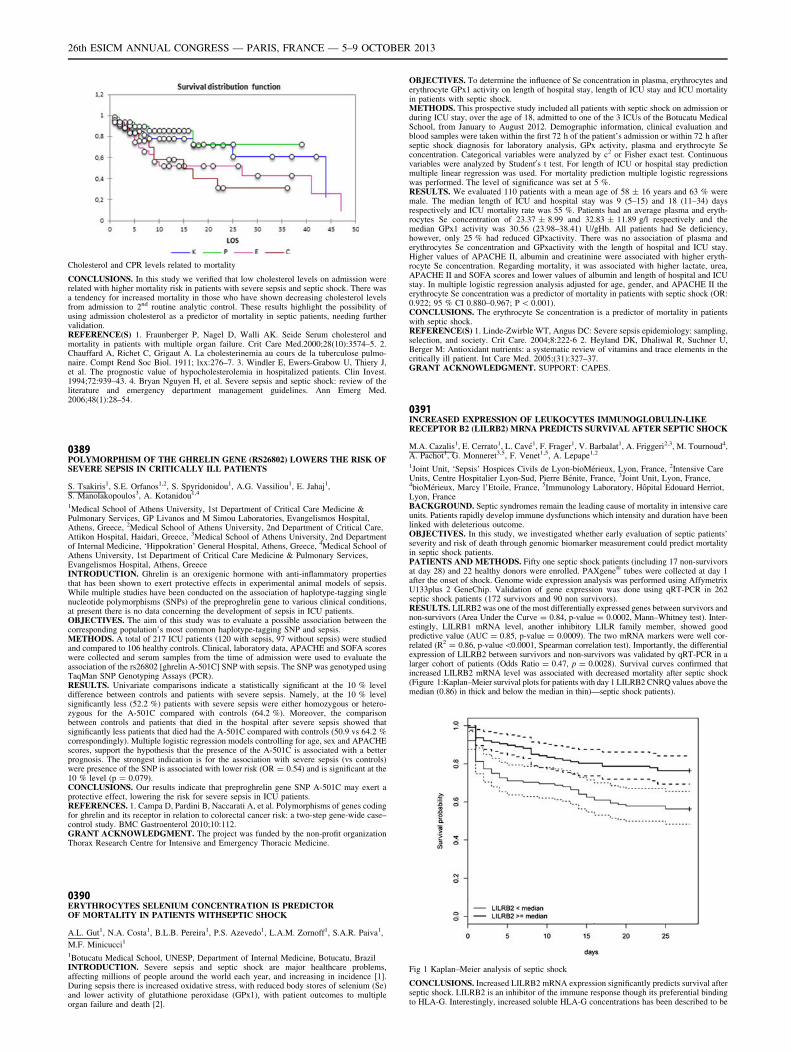
Cholesterol and CPR levels related to mortality
CONCLUSIONS. In this study we verified that low cholesterol levels on admission wererelated with higher mortality risk in patients with severe sepsis and septic shock. There wasa tendency for increased mortality in those who have shown decreasing cholesterol levelsfrom admission to 2nd routine analytic control. These results highlight the possibility ofusing admission cholesterol as a predictor of mortality in septic patients, needing furthervalidation.REFERENCE(S) 1. Fraunberger P, Nagel D, Walli AK. Seide Serum cholesterol andmortality in patients with multiple organ failure. Crit Care Med.2000;28(10):3574–5. 2.Chauffard A, Richet C, Grigaut A. La cholesterinemia au cours de la tuberculose pulmo-naire. Compt Rend Soc Biol. 1911; lxx:276–7. 3. Windler E, Ewers-Grabow U, Thiery J,et al. The prognostic value of hypocholesterolemia in hospitalized patients. Clin Invest.1994;72:939–43. 4. Bryan Nguyen H, et al. Severe sepsis and septic shock: review of theliterature and emergency department management guidelines. Ann Emerg Med.2006;48(1):28–54.
0389POLYMORPHISM OF THE GHRELIN GENE (RS26802) LOWERS THE RISK OFSEVERE SEPSIS IN CRITICALLY ILL PATIENTS
S. Tsakiris1, S.E. Orfanos1,2, S. Spyridonidou1, A.G. Vassiliou1, E. Jahaj1,S. Manolakopoulos3, A. Kotanidou1,4
1Medical School of Athens University, 1st Department of Critical Care Medicine &Pulmonary Services, GP Livanos and M Simou Laboratories, Evangelismos Hospital,Athens, Greece, 2Medical School of Athens University, 2nd Department of Critical Care,Attikon Hospital, Haidari, Greece, 3Medical School of Athens University, 2nd Departmentof Internal Medicine, ‘Hippokration’ General Hospital, Athens, Greece, 4Medical School ofAthens University, 1st Department of Critical Care Medicine & Pulmonary Services,Evangelismos Hospital, Athens, GreeceINTRODUCTION. Ghrelin is an orexigenic hormone with anti-inflammatory propertiesthat has been shown to exert protective effects in experimental animal models of sepsis.While multiple studies have been conducted on the association of haplotype-tagging singlenucleotide polymorphisms (SNPs) of the preproghrelin gene to various clinical conditions,at present there is no data concerning the development of sepsis in ICU patients.OBJECTIVES. The aim of this study was to evaluate a possible association between thecorresponding population’s most common haplotype-tagging SNP and sepsis.METHODS. A total of 217 ICU patients (120 with sepsis, 97 without sepsis) were studiedand compared to 106 healthy controls. Clinical, laboratory data, APACHE and SOFA scoreswere collected and serum samples from the time of admission were used to evaluate theassociation of the rs26802 [ghrelin A-501C] SNP with sepsis. The SNP was genotyped usingTaqMan SNP Genotyping Assays (PCR).RESULTS. Univariate comparisons indicate a statistically significant at the 10 % leveldifference between controls and patients with severe sepsis. Namely, at the 10 % levelsignificantly less (52.2 %) patients with severe sepsis were either homozygous or hetero-zygous for the A-501C compared with controls (64.2 %). Moreover, the comparisonbetween controls and patients that died in the hospital after severe sepsis showed thatsignificantly less patients that died had the A-501C compared with controls (50.9 vs 64.2 %correspondingly). Multiple logistic regression models controlling for age, sex and APACHEscores, support the hypothesis that the presence of the A-501C is associated with a betterprognosis. The strongest indication is for the association with severe sepsis (vs controls)were presence of the SNP is associated with lower risk (OR = 0.54) and is significant at the10 % level (p = 0.079).CONCLUSIONS. Our results indicate that preproghrelin gene SNP A-501C may exert aprotective effect, lowering the risk for severe sepsis in ICU patients.REFERENCES. 1. Campa D, Pardini B, Naccarati A, et al. Polymorphisms of genes codingfor ghrelin and its receptor in relation to colorectal cancer risk: a two-step gene-wide case–control study. BMC Gastroenterol 2010;10:112.GRANT ACKNOWLEDGMENT. The project was funded by the non-profit organizationThorax Research Centre for Intensive and Emergency Thoracic Medicine.
0390ERYTHROCYTES SELENIUM CONCENTRATION IS PREDICTOROF MORTALITY IN PATIENTS WITHSEPTIC SHOCK
A.L. Gut1, N.A. Costa1, B.L.B. Pereira1, P.S. Azevedo1, L.A.M. Zornoff1, S.A.R. Paiva1,
M.F. Minicucci1
1Botucatu Medical School, UNESP, Department of Internal Medicine, Botucatu, BrazilINTRODUCTION. Severe sepsis and septic shock are major healthcare problems,affecting millions of people around the world each year, and increasing in incidence [1].During sepsis there is increased oxidative stress, with reduced body stores of selenium (Se)and lower activity of glutathione peroxidase (GPx1), with patient outcomes to multipleorgan failure and death [2].
OBJECTIVES. To determine the influence of Se concentration in plasma, erythrocytes anderythrocyte GPx1 activity on length of hospital stay, length of ICU stay and ICU mortalityin patients with septic shock.METHODS. This prospective study included all patients with septic shock on admission orduring ICU stay, over the age of 18, admitted to one of the 3 ICUs of the Botucatu MedicalSchool, from January to August 2012. Demographic information, clinical evaluation andblood samples were taken within the first 72 h of the patient’s admission or within 72 h afterseptic shock diagnosis for laboratory analysis, GPx activity, plasma and erythrocyte Seconcentration. Categorical variables were analyzed by c2 or Fisher exact test. Continuousvariables were analyzed by Student0s t test. For length of ICU or hospital stay predictionmultiple linear regression was used. For mortality prediction multiple logistic regressionswas performed. The level of significance was set at 5 %.RESULTS. We evaluated 110 patients with a mean age of 58 ± 16 years and 63 % weremale. The median length of ICU and hospital stay was 9 (5–15) and 18 (11–34) daysrespectively and ICU mortality rate was 55 %. Patients had an average plasma and eryth-rocytes Se concentration of 23.37 ± 8.99 and 32.83 ± 11.89 g/l respectively and themedian GPx1 activity was 30.56 (23.98–38.41) U/gHb. All patients had Se deficiency,however, only 25 % had reduced GPxactivity. There was no association of plasma anderythrocytes Se concentration and GPxactivity with the length of hospital and ICU stay.Higher values of APACHE II, albumin and creatinine were associated with higher eryth-rocyte Se concentration. Regarding mortality, it was associated with higher lactate, urea,APACHE II and SOFA scores and lower values of albumin and length of hospital and ICUstay. In multiple logistic regression analysis adjusted for age, gender, and APACHE II theerythrocyte Se concentration was a predictor of mortality in patients with septic shock (OR:0.922; 95 % CI 0.880–0.967; P \ 0.001).CONCLUSIONS. The erythrocyte Se concentration is a predictor of mortality in patientswith septic shock.REFERENCE(S) 1. Linde-Zwirble WT, Angus DC: Severe sepsis epidemiology: sampling,selection, and society. Crit Care. 2004;8:222-6 2. Heyland DK, Dhaliwal R, Suchner U,Berger M: Antioxidant nutrients: a systematic review of vitamins and trace elements in thecritically ill patient. Int Care Med. 2005;(31):327–37.GRANT ACKNOWLEDGMENT. SUPPORT: CAPES.
0391INCREASED EXPRESSION OF LEUKOCYTES IMMUNOGLOBULIN-LIKERECEPTOR B2 (LILRB2) MRNA PREDICTS SURVIVAL AFTER SEPTIC SHOCK
M.A. Cazalis1, E. Cerrato1, L. Cavé1, F. Frager1, V. Barbalat1, A. Friggeri2,3, M. Tournoud4,A. Pachot1, G. Monneret3,5, F. Venet1,5, A. Lepape1,2
1Joint Unit, ‘Sepsis’ Hospices Civils de Lyon-bioMérieux, Lyon, France, 2Intensive CareUnits, Centre Hospitalier Lyon-Sud, Pierre Bénite, France, 3Joint Unit, Lyon, France,4bioMérieux, Marcy l’Etoile, France, 5Immunology Laboratory, Hôpital Edouard Herriot,Lyon, FranceBACKGROUND. Septic syndromes remain the leading cause of mortality in intensive careunits. Patients rapidly develop immune dysfunctions which intensity and duration have beenlinked with deleterious outcome.OBJECTIVES. In this study, we investigated whether early evaluation of septic patients’severity and risk of death through genomic biomarker measurement could predict mortalityin septic shock patients.PATIENTS AND METHODS. Fifty one septic shock patients (including 17 non-survivorsat day 28) and 22 healthy donors were enrolled. PAXgene� tubes were collected at day 1after the onset of shock. Genome wide expression analysis was performed using AffymetrixU133plus 2 GeneChip. Validation of gene expression was done using qRT-PCR in 262septic shock patients (172 survivors and 90 non survivors).RESULTS. LILRB2 was one of the most differentially expressed genes between survivors andnon-survivors (Area Under the Curve = 0.84, p-value = 0.0002, Mann–Whitney test). Inter-estingly, LILRB1 mRNA level, another inhibitory LILR family member, showed goodpredictive value (AUC = 0.85, p-value = 0.0009). The two mRNA markers were well cor-related (R2 = 0.86, p-value\0.0001, Spearman correlation test). Importantly, the differentialexpression of LILRB2 between survivors and non-survivors was validated by qRT-PCR in alarger cohort of patients (Odds Ratio = 0.47, p = 0.0028). Survival curves confirmed thatincreased LILRB2 mRNA level was associated with decreased mortality after septic shock(Figure 1:Kaplan–Meier survival plots for patients with day 1 LILRB2 CNRQ values above themedian (0.86) in thick and below the median in thin)—septic shock patients).
Fig 1 Kaplan–Meier analysis of septic shock
CONCLUSIONS. Increased LILRB2 mRNA expression significantly predicts survival afterseptic shock. LILRB2 is an inhibitor of the immune response though its preferential bindingto HLA-G. Interestingly, increased soluble HLA-G concentrations has been described to be
26th ESICM ANNUAL CONGRESS — PARIS, FRANCE — 5–9 OCTOBER 2013
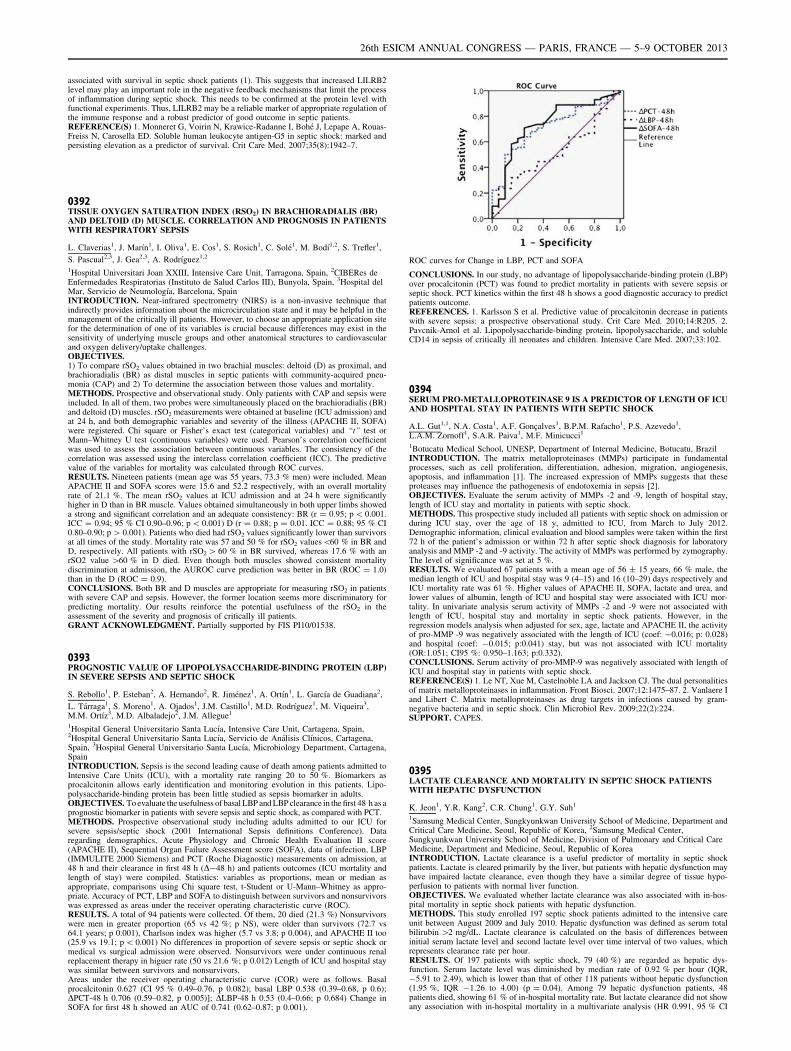
associated with survival in septic shock patients (1). This suggests that increased LILRB2level may play an important role in the negative feedback mechanisms that limit the processof inflammation during septic shock. This needs to be confirmed at the protein level withfunctional experiments. Thus, LILRB2 may be a reliable marker of appropriate regulation ofthe immune response and a robust predictor of good outcome in septic patients.REFERENCE(S) 1. Monneret G, Voirin N, Krawice-Radanne I, Bohé J, Lepape A, Rouas-Freiss N, Carosella ED. Soluble human leukocyte antigen-G5 in septic shock: marked andpersisting elevation as a predictor of survival. Crit Care Med. 2007;35(8):1942–7.
0392TISSUE OXYGEN SATURATION INDEX (RSO2) IN BRACHIORADIALIS (BR)AND DELTOID (D) MUSCLE. CORRELATION AND PROGNOSIS IN PATIENTSWITH RESPIRATORY SEPSIS
L. Claverias1, J. Marı́n1, I. Oliva1, E. Cos1, S. Rosich1, C. Solé1, M. Bodı́1,2, S. Trefler1,
S. Pascual2,3, J. Gea2,3, A. Rodrı́guez1,2
1Hospital Universitari Joan XXIII, Intensive Care Unit, Tarragona, Spain, 2CIBERes deEnfermedades Respiratorias (Instituto de Salud Carlos III), Bunyola, Spain, 3Hospital delMar, Servicio de Neumologı́a, Barcelona, SpainINTRODUCTION. Near-infrared spectrometry (NIRS) is a non-invasive technique thatindirectly provides information about the microcirculation state and it may be helpful in themanagement of the critically ill patients. However, to choose an appropriate application sitefor the determination of one of its variables is crucial because differences may exist in thesensitivity of underlying muscle groups and other anatomical structures to cardiovascularand oxygen delivery/uptake challenges.OBJECTIVES.1) To compare rSO2 values obtained in two brachial muscles: deltoid (D) as proximal, andbrachioradialis (BR) as distal muscles in septic patients with community-acquired pneu-monia (CAP) and 2) To determine the association between those values and mortality.METHODS. Prospective and observational study. Only patients with CAP and sepsis wereincluded. In all of them, two probes were simultaneously placed on the brachioradialis (BR)and deltoid (D) muscles. rSO2 measurements were obtained at baseline (ICU admission) andat 24 h, and both demographic variables and severity of the illness (APACHE II, SOFA)were registered. Chi square or Fisher’s exact test (categorical variables) and ‘‘t’’ test orMann–Whitney U test (continuous variables) were used. Pearson’s correlation coefficientwas used to assess the association between continuous variables. The consistency of thecorrelation was assessed using the interclass correlation coefficient (ICC). The predictivevalue of the variables for mortality was calculated through ROC curves.RESULTS. Nineteen patients (mean age was 55 years, 73.3 % men) were included. MeanAPACHE II and SOFA scores were 15.6 and 52.2 respectively, with an overall mortalityrate of 21.1 %. The mean rSO2 values at ICU admission and at 24 h were significantlyhigher in D than in BR muscle. Values obtained simultaneously in both upper limbs showeda strong and significant correlation and an adequate consistency: BR (r = 0.95; p \ 0.001.ICC = 0.94; 95 % CI 0.90–0.96; p \ 0.001) D (r = 0.88; p = 0.01. ICC = 0.88; 95 % CI0.80–0.90; p [ 0.001). Patients who died had rSO2 values significantly lower than survivorsat all times of the study. Mortality rate was 57 and 50 % for rSO2 values\60 % in BR andD, respectively. All patients with rSO2 [ 60 % in BR survived, whereas 17.6 % with anrSO2 value [60 % in D died. Even though both muscles showed consistent mortalitydiscrimination at admission, the AUROC curve prediction was better in BR (ROC = 1.0)than in the D (ROC = 0.9).CONCLUSIONS. Both BR and D muscles are appropriate for measuring rSO2 in patientswith severe CAP and sepsis. However, the former location seems more discriminatory forpredicting mortality. Our results reinforce the potential usefulness of the rSO2 in theassessment of the severity and prognosis of critically ill patients.GRANT ACKNOWLEDGMENT. Partially supported by FIS PI10/01538.
0393PROGNOSTIC VALUE OF LIPOPOLYSACCHARIDE-BINDING PROTEIN (LBP)IN SEVERE SEPSIS AND SEPTIC SHOCK
S. Rebollo1, P. Esteban2, A. Hernando2, R. Jiménez1, A. Ortı́n1, L. Garcı́a de Guadiana2,
L. Tárraga1, S. Moreno1, A. Ojados1, J.M. Castillo1, M.D. Rodrı́guez1, M. Viqueira3,M.M. Ortı́z3, M.D. Albaladejo2, J.M. Allegue1
1Hospital General Universitario Santa Lucı́a, Intensive Care Unit, Cartagena, Spain,2Hospital General Universitario Santa Lucı́a, Servicio de Análisis Clı́nicos, Cartagena,Spain, 3Hospital General Universitario Santa Lucı́a, Microbiology Department, Cartagena,SpainINTRODUCTION. Sepsis is the second leading cause of death among patients admitted toIntensive Care Units (ICU), with a mortality rate ranging 20 to 50 %. Biomarkers asprocalcitonin allows early identification and monitoring evolution in this patients. Lipo-polysaccharide-binding protein has been little studied as sepsis biomarker in adults.OBJECTIVES. To evaluate the usefulness of basal LBP and LBP clearance in the first 48 h as aprognostic biomarker in patients with severe sepsis and septic shock, as compared with PCT.METHODS. Prospective observational study including adults admitted to our ICU forsevere sepsis/septic shock (2001 International Sepsis definitions Conference). Dataregarding demographics, Acute Physiology and Chronic Health Evaluation II score(APACHE II), Sequential Organ Failure Assessment score (SOFA), data of infection, LBP(IMMULITE 2000 Siemens) and PCT (Roche Diagnostic) measurements on admission, at48 h and their clearance in first 48 h (D-48 h) and patients outcomes (ICU mortality andlength of stay) were compiled. Statistics: variables as proportions, mean or median asappropriate, comparisons using Chi square test, t-Student or U-Mann–Whitney as appro-priate. Accuracy of PCT, LBP and SOFA to distinguish between survivors and nonsurvivorswas expressed as areas under the receiver operating characteristic curve (ROC).RESULTS. A total of 94 patients were collected. Of them, 20 died (21.3 %) Nonsurvivorswere men in greater proportion (65 vs 42 %; p NS), were older than survivors (72.7 vs64.1 years; p 0.001), Charlson index was higher (5.7 vs 3.8; p 0.004), and APACHE II too(25.9 vs 19.1; p \ 0.001) No differences in proportion of severe sepsis or septic shock ormedical vs surgical admission were observed. Nonsurvivors were under continuous renalreplacement therapy in higuer rate (50 vs 21.6 %; p 0.012) Length of ICU and hospital staywas similar between survivors and nonsurvivors.Areas under the receiver operating characteristic curve (COR) were as follows. Basalprocalcitonin 0.627 (CI 95 % 0.49–0.76, p 0.082); basal LBP 0.538 (0.39–0.68, p 0.6);DPCT-48 h 0.706 (0.59–0.82, p 0.005)]; DLBP-48 h 0.53 (0.4–0.66; p 0.684) Change inSOFA for first 48 h showed an AUC of 0.741 (0.62–0.87; p 0.001).
ROC curves for Change in LBP, PCT and SOFA
CONCLUSIONS. In our study, no advantage of lipopolysaccharide-binding protein (LBP)over procalcitonin (PCT) was found to predict mortality in patients with severe sepsis orseptic shock. PCT kinetics within the first 48 h shows a good diagnostic accuracy to predictpatients outcome.REFERENCES. 1. Karlsson S et al. Predictive value of procalcitonin decrease in patientswith severe sepsis: a prospective observational study. Crit Care Med. 2010;14:R205. 2.Pavcnik-Arnol et al. Lipopolysaccharide-binding protein, lipopolysaccharide, and solubleCD14 in sepsis of critically ill neonates and children. Intensive Care Med. 2007;33:102.
0394SERUM PRO-METALLOPROTEINASE 9 IS A PREDICTOR OF LENGTH OF ICUAND HOSPITAL STAY IN PATIENTS WITH SEPTIC SHOCK
A.L. Gut1,1, N.A. Costa1, A.F. Gonçalves1, B.P.M. Rafacho1, P.S. Azevedo1,L.A.M. Zornoff1, S.A.R. Paiva1, M.F. Minicucci1
1Botucatu Medical School, UNESP, Department of Internal Medicine, Botucatu, BrazilINTRODUCTION. The matrix metalloproteinases (MMPs) participate in fundamentalprocesses, such as cell proliferation, differentiation, adhesion, migration, angiogenesis,apoptosis, and inflammation [1]. The increased expression of MMPs suggests that theseproteases may influence the pathogenesis of endotoxemia in sepsis [2].OBJECTIVES. Evaluate the serum activity of MMPs -2 and -9, length of hospital stay,length of ICU stay and mortality in patients with septic shock.METHODS. This prospective study included all patients with septic shock on admission orduring ICU stay, over the age of 18 y, admitted to ICU, from March to July 2012.Demographic information, clinical evaluation and blood samples were taken within the first72 h of the patient’s admission or within 72 h after septic shock diagnosis for laboratoryanalysis and MMP -2 and -9 activity. The activity of MMPs was performed by zymography.The level of significance was set at 5 %.RESULTS. We evaluated 67 patients with a mean age of 56 ± 15 years, 66 % male, themedian length of ICU and hospital stay was 9 (4–15) and 16 (10–29) days respectively andICU mortality rate was 61 %. Higher values of APACHE II, SOFA, lactate and urea, andlower values of albumin, length of ICU and hospital stay were associated with ICU mor-tality. In univariate analysis serum activity of MMPs -2 and -9 were not associated withlength of ICU, hospital stay and mortality in septic shock patients. However, in theregression models analysis when adjusted for sex, age, lactate and APACHE II, the activityof pro-MMP -9 was negatively associated with the length of ICU (coef: -0.016; p: 0.028)and hospital (coef: -0.015; p:0.041) stay, but was not associated with ICU mortality(OR:1.051; CI95 %: 0.950–1.163; p:0.332).CONCLUSIONS. Serum activity of pro-MMP-9 was negatively associated with length ofICU and hospital stay in patients with septic shock.REFERENCE(S) 1. Le NT, Xue M, Castelnoble LA and Jackson CJ. The dual personalitiesof matrix metalloproteinases in inflammation. Front Biosci. 2007;12:1475–87. 2. Vanlaere Iand Libert C. Matrix metalloproteinases as drug targets in infections caused by gram-negative bacteria and in septic shock. Clin Microbiol Rev. 2009;22(2):224.SUPPORT. CAPES.
0395LACTATE CLEARANCE AND MORTALITY IN SEPTIC SHOCK PATIENTSWITH HEPATIC DYSFUNCTION
K. Jeon1, Y.R. Kang2, C.R. Chung1, G.Y. Suh1
1Samsung Medical Center, Sungkyunkwan University School of Medicine, Department andCritical Care Medicine, Seoul, Republic of Korea, 2Samsung Medical Center,Sungkyunkwan University School of Medicine, Division of Pulmonary and Critical CareMedicine, Department and Medicine, Seoul, Republic of KoreaINTRODUCTION. Lactate clearance is a useful predictor of mortality in septic shockpatients. Lactate is cleared primarily by the liver, but patients with hepatic dysfunction mayhave impaired lactate clearance, even though they have a similar degree of tissue hypo-perfusion to patients with normal liver function.OBJECTIVES. We evaluated whether lactate clearance was also associated with in-hos-pital mortality in septic shock patients with hepatic dysfunction.METHODS. This study enrolled 197 septic shock patients admitted to the intensive careunit between August 2009 and July 2010. Hepatic dysfunction was defined as serum totalbilirubin [2 mg/dL. Lactate clearance is calculated on the basis of differences betweeninitial serum lactate level and second lactate level over time interval of two values, whichrepresents clearance rate per hour.RESULTS. Of 197 patients with septic shock, 79 (40 %) are regarded as hepatic dys-function. Serum lactate level was diminished by median rate of 0.92 % per hour (IQR,-5.91 to 2.49), which is lower than that of other 118 patients without hepatic dysfunction(1.95 %, IQR -1.26 to 4.00) (p = 0.04). Among 79 hepatic dysfunction patients, 48patients died, showing 61 % of in-hospital mortality rate. But lactate clearance did not showany association with in-hospital mortality in a multivariate analysis (HR 0.991, 95 % CI
26th ESICM ANNUAL CONGRESS — PARIS, FRANCE — 5–9 OCTOBER 2013
0.949–1.035, p = 0.69). Even after adjusting for the potential confounding factors, it stillfailed to show association with in-hospital mortality.CONCLUSIONS. Lactate clearance could not be used as a predictor of in-hospital mor-tality in septic shock patients with hepatic dysfunction.
0396IMMATURE GRANULOCYTES IN MICROBIAL INFECTIONAND ITS ADVERSE SEQUALE IN THE INTENSIVE CARE UNIT
P.J. van der Geest1, M. Mohseni1, R. Brouwer2, B. van den Hoven1, A.B.J. Groeneveld1
1Erasmus Medical Center, Intensive Care, Rotterdam, The Netherlands, 2Erasmus MedicalCenter, Clinical Chemistry, Rotterdam, The NetherlandsINTRODUCTION. Severe leukocytosis and the so called leftward shift with increasingband and immature neutrophils versus polymorphonuclear segmented cells are classicalhallmarks of microbial infection. However, the predictive and diagnostic value of leuko-cytosis in patients in the intensive care unit (ICU) is poor, so that the search for betterbiomarkers is ongoing. One of those markers could be the IG percentage (percentage ofimmature granulocytes of the total white blood cells). The marker has been studied aspredictor of microbial infection. However these data are limited and only a few studiesevaluated this marker in critically ill patients in the ICU setting.OBJECTIVES. To evaluate the predictive value of automated immature (vs mature)granulocyte count (IG percentage) in comparison with white blood cell counts (WBC) andC-reactive protein (CRP), for microbial infection, its invasiveness and severity, in theintensive care unit (ICU).METHODS. In 46 patients admitted into the ICU, blood samples were collected at the day (0)of a clinical suspicion of microbial infection and at day 1 and 3 thereafter. The WBC, manualdifferential counts, IG percentage and CRP were determined. We defined microbial infections,blood stream infection and septic shock within 7 days after enrolment using the criteria definedat the International Sepsis Forum Consensus Conference on definitions of infection in the ICU.RESULTS. Of the 46 patients, 31 patients had a confirmed infection by microbiologicalculture, 12 patients developed a bloodstream infection and 13 patients developed septic shock.The 28-day mortality was 48 % among the patients suffering from infection versus 28 % in thepatients without having an infection, P = 0.16. The IG percentage and CRP increases with theinvasiveness of confirmed microbial infection on day 0, 1 and 3. In patients with septic shockthe values of IG percentage are higher for each day, compared with the IG percentage values inpatients with infection. Receiver operating characteristic analysis for the prediction ofmicrobial infection showed an AUC of 0.73 (P = 0.02) for IG percentage versus 0.74(P = 0.01) for CRP and 0.66 (P = 0.10) for WBC. Combining the WBC, CRP and IG per-centage for the prediction of microbial infection yielded an AUC of 0.93 (P \ 0.01).CONCLUSION. The IG percentage which can be collected routinely at no additional costs, isa useful adjunctive predictor of microbial infection, its invasiveness and severity in the ICU.
0397VITAMIN D LEVELS AND ORGAN DYSFUNCTION IN PATIENTSWITH SEVERE SEPSIS AND SEPTIC SHOCK
F. Alves1, L. Azevedo1, F. Machado1
1Federal University of Sao Paulo, São Paulo, BrazilINTRODUCTION. Several studies revealed that vitamin D is important in immunomod-ulation and regulation of inflammatory response. Nevertheless, vitamin D deficiency israrely considered in critically ill patients.OBJECTIVE. To compare the plasma levels of 25-hydroxy vitamin D [25 (OH) D] inseptic and non-septic critically ill patients and correlate these levels with the severity oforgan dysfunction.METHODS. We carried out a prospective observational study in critically ill patients withsevere sepsis or septic shock within B48 h of organ dysfunction. Critically ill non-septicpatients served as a control group. Plasma 25 (OH) D, ionized calcium and magnesium weremeasured within the first 48 h (D0) and after 7 days (D7) of septic organ dysfunction onsetor at ICU admission in the control group. We determined the Sequential Organ FailureAssessment (SOFA) score, ventilator, inotropic and vasopressor-free days at 28 days, ICUand hospital mortality. We categorized the concentrations of 25(OH) as deficiency (B20 ng/mL) and undetectable (B10 ng/mL).22 The correlation between baseline levels and SOFAscore was assessed using Spearman correlation test. We also compared the levels obtained atD0 and D7 in patients with improvement or worsened SOFA score between these timepoints. A p value \0.05 was considered significant.RESULTS. Thirty-four patients were enrolled with a median age of 51 years, being 28 %with severe sepsis and 72 % with septic shock and 18 % died. The prevalence of vitamin Ddeficiency was 89 %, with a median level of 7.9 ng/mL [25–75 percentile %] at D0 and9.2 ng/mL [25–75 percentile %] at D7. About 68 % of patients with undetectable value ofvitamin D at D0 were septic (p = 0.016). There was no statistical difference in the values ofvitamin D between those who improved or not the SOFA score at D7, either in septic orcontrol group. Nevertheless, lower 25 (OH) D levels at DO was significantly but weaklycorrelated with higher SOFA scores at baseline (r = 0.353; p = 0.04).CONCLUSION. Vitamin D deficiency is highly prevalent in critically ill patients. Althoughlower levels were correlated with the degree of organ dysfunction we could not demonstrateany relationship with the progression of organ dysfunction in patients with severe sepsis orseptic shock.REFERENCES. 1. Braun A, Chang D, Mahadevappa K, Gibbons FK. Association of lowserum 25-hydroxyvitamin D levels and mortality in the critically ill. Crit Care Med.2011;39(4):671–7. 2. Watkins RR, Yamshchikov AV. The role of vitamin D deficiency insepsis and potential therapeutic implications. J Infect. 2011. 3. Michael F. Holick, Neil C.Binkley, Heike A. Evaluation, treatment, and prevention of vitamin D deficiency: an endo-crine society clinical practice guideline. J Clin Endocrinol Metab. 2011;96(7):0000–0000.GRANT ACKNOWLEDGMENT. This research received no specific grant from anyfunding agency in the public, commercial, or not-for-profit sectors.
0398MUSCULAR GLUCOSE ASSESSED BY MICRODIALYSIS AND BLOODGLUCOSE CAN PREDICT MORTALITY IN SEPTIC SHOCK
M. Abdelhakim1, H. Zied1, N. Imen1, R. Chihebeddine1, L. Iheb1, F. Mustapha1
1Military Hospital of Tunis, Anesthesia & Intensive Care, Tunis, TunisiaOBJECTIVES. The aim of our study was to assess the muscular glucose by microdialysisand its association with mortality in septic shock patients.
METHODS. We have conducted a preliminary prospective study. We included septic shockpatients hemodynamically optimized according to international recommendations.Allpatients met the ACCP/SCCM consensus. A Microdialysis catheter was inserted in thefemoral quadriceps. Interstitial fluid samples were collected every 6 h for 5 days. Thedetermination of muscular glucose was performed by the CMA 600 analyzer (CMA/Microdialysis AB, Sweden). We also performed a dosage of concomitant blood glucose.The study population was divided into two groups according to hospital mortality. Statisticanalysis: Mann–Whitney test & Chi-square: Comparisons between groups. Quantitativevariables were expressed as mean ± standard deviation or median (Interquartile range) asappropriate.RESULTS. We have included twelve patients with septic shock. Mortality rate was 50 %.Demographics were comparable between groups except for age [66 ± 9 vs. 41 ± 12; deadpatients vs. survivors; respectively; p = 0.002]. Pneumonia was the major cause of septicshock (10 patients). We analysed 167 blood samples and 166 muscular glucose samples. Wefound a positive association between muscular glucose, blood glucose and mortality. Tissueglucose was significantly higher among dead patients compared with survivors at the 54thhour. Comparing all data, muscular glucose (p = 0.02) and blood glucose (p = 0.007) weresignificantly higher in dead patients.CONCLUSIONS. Our data suggest that muscular glucose assessed by microdialysis andblood glucose are associated with mortality in septic shock patients. Therefore, muscularglucose may reflect the metabolic alterations and microcirculatory dysfunction induced byseptic shock.
0399VALIDATION OF IMMATURE GRANULOCYTE AS A PREDICTOR FOR THE 28DAY MORTALITY IN PATIENTS WITH SEVERE SEPSIS AND SEPTIC SHOCK
S.O. Ha1, S.B. Hong2, S.H. Park3, S. Jang3
1University of Ulsan College of Medicine and Asan Medical Center, Emergency Medicine,Seoul, Republic of Korea, 2University of Ulsan College of Medicine and Asan MedicalCenter, Pulmonary and Critical Care Medicine, Seoul, Republic of Korea, 3University ofUlsan College of Medicine and Asan Medical Center, Laboratory Medicine, Seoul, Republicof KoreaINTRODUCTION. Recently, several studies for immature granulocyte (IG) in patientswith sepsis revealed that IG was related with the severity of sepsis.OBJECTIVES. In this study, we evaluated IG as a predictive marker in patients with severesepsis or septic shock.METHODS. This was a retrospective study for patients with severe sepsis and septic shockwho admitted to medical intensive care unit of a tertiary care hospital for 4 months. The IGmeasured by Sysmex XE-2100 and other inflammatory markers such as C-reactive protein,lactate and procalcitonin were evaluated and compared for the 28 day mortality.RESULTS. 85 patients with septic shock and 45 patients with severe sepsis were enrolled.In non-survivors group (n = 32, 24.6 %), APACHE II score (p = 0.017), use of continuousrenal replacement therapy (CRRT) (p = 0.002) and septic shock (p = 0.009) were statis-tically higher than survivors group. APACHE II score (OR 1.099, p = 0.008) and IG(C0.5 %) (OR 3.568, p = 0.036) predicted the 28 day mortality independently afteradjusting septic shock, SOFA score, disseminated intravascular coagulopathy, use of CRRTand gender. However, IG (C0.5 %) had low specificity 33.7 % and positive predicted value30.1 % for mortality.CONCLUSIONS. IG was more useful as a marker for the prediction of the 28 day mor-tality than other inflammatory markers in patients with severe sepsis or septic shock. But thewell-designed additional prospective research is needed to decide the relevance of IG as apredictor for the 28 day mortality.REFERENCE(S) 1. Tschaikowsky K, Hedwig-Geissing M, Braun GG, Radespiel-Troe-ger M. Predictive value of procalcitonin, interleukin-6, and C-reactive protein forsurvival in postoperative patients with severe sepsis. J Crit Care. 2011;26:54–64. 2.Nahm CH, Choi JW, Lee J. Delta neutrophil index in automated immature granulocytecounts for assessing disease severity of patients with sepsis. Ann Clin Lab Sci.2008;38:241–6. 3. Park BH, Kang YA, Park MS, Jung WJ, Lee SH, Lee SK, et al. Deltaneutrophil index as an early marker of disease severity in critically ill patients withsepsis. Bmc Infect Dis. 2011;11. 4. Seok Y, Choi JR, Kim J, Kim YK, Lee J, Song J,et al. Delta neutrophil index: a promising diagnostic and prognostic marker for sepsis.Shock. 2012;37:242–6. 5. Nierhaus A, Klatte S, Linssen J, Eismann NM, Wichmann D,Hedke J, et al. Revisiting the white blood cell count: immature granulocytes count as adiagnostic marker to discriminate between SIRS and sepsis—a prospective, observationalstudy. BMC Immunol. 2013;14:8.
Focus on our patients: cancer & the elderly:0400–04130400ADMITTING VERY OLD PEOPLE (‡80 YEARS) IN ICU
C.E.G. Quintaneiro1,2, C. Ferrão2,3, C.C. Dias4, I. Aragão2, T. Cardoso2
1Hospital Distrital da Figueira da Foz, Internal Medicine, Figueira da Foz, Portugal,2Hospital de Santo António-Centro Hospitalar do Porto, Unidade de Cuidados IntensivosPolivalentes, Porto, Portugal, 3Hospital de Santo António-Centro Hospitalar do Porto,Internal Medicine, Porto, Portugal, 4Faculty of Medicine, University of Porto, Departmentof Health Information and Decision Sciences, Center for Research and Health Technologysand Information Systems (CINTESIS), Porto, PortugalINTRODUCTION. Ongoing population aging creates a new and growing problem con-cerning ICU admission and resource management. There are not clear and consensualrecommendations regarding the management of patients over 80 years old. Disagreementamong medical teams on ICU admission is common related to patient age. Neverthelessthere are several studies involving very old patients showing favorable outcomes at hospitaldischarge.OBJECTIVES. To characterize very old population admitted in a mixed ICU along withthe invasive therapeutics and long term outcome. Explore the relevance of age over themortality in these patients.METHODS. Retrospective cohort of all patients aged 80 or more admitted to ICU betweenJanuary 2006 and October 2012. Variables associated with hospital mortality were studiedin this population; those with a clear association in the univariate analysis (p-value \0.1)were selected for the multivariable analysis. The results of the multivariable models are
26th ESICM ANNUAL CONGRESS — PARIS, FRANCE — 5–9 OCTOBER 2013
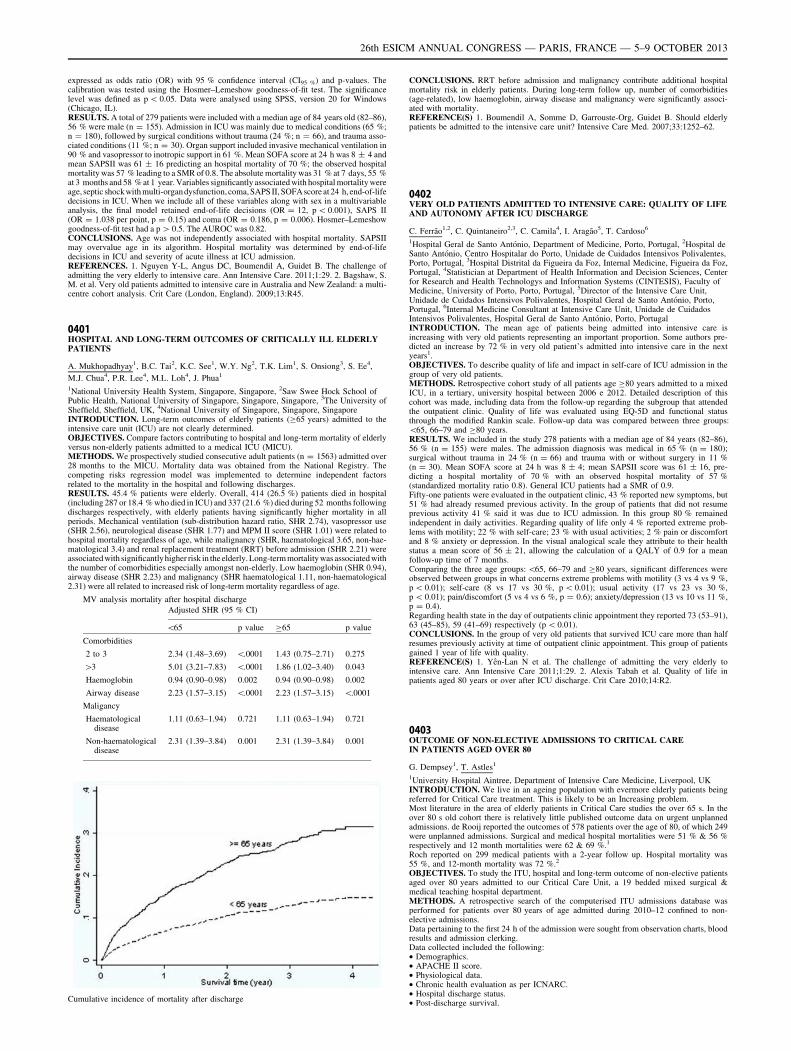
expressed as odds ratio (OR) with 95 % confidence interval (CI95 %) and p-values. Thecalibration was tested using the Hosmer–Lemeshow goodness-of-fit test. The significancelevel was defined as p \ 0.05. Data were analysed using SPSS, version 20 for Windows(Chicago, IL).RESULTS. A total of 279 patients were included with a median age of 84 years old (82–86),56 % were male (n = 155). Admission in ICU was mainly due to medical conditions (65 %;n = 180), followed by surgical conditions without trauma (24 %; n = 66), and trauma asso-ciated conditions (11 %; n = 30). Organ support included invasive mechanical ventilation in90 % and vasopressor to inotropic support in 61 %. Mean SOFA score at 24 h was 8 ± 4 andmean SAPSII was 61 ± 16 predicting an hospital mortality of 70 %; the observed hospitalmortality was 57 % leading to a SMR of 0.8. The absolute mortality was 31 % at 7 days, 55 %at 3 months and 58 % at 1 year. Variables significantly associated with hospital mortality wereage, septic shock with multi-organdysfunction, coma, SAPS II, SOFA score at 24 h, end-of-lifedecisions in ICU. When we include all of these variables along with sex in a multivariableanalysis, the final model retained end-of-life decisions (OR = 12, p \ 0.001), SAPS II(OR = 1.038 per point, p = 0.15) and coma (OR = 0.186, p = 0.006). Hosmer–Lemeshowgoodness-of-fit test had a p [ 0.5. The AUROC was 0.82.CONCLUSIONS. Age was not independently associated with hospital mortality. SAPSIImay overvalue age in its algorithm. Hospital mortality was determined by end-of-lifedecisions in ICU and severity of acute illness at ICU admission.REFERENCES. 1. Nguyen Y-L, Angus DC, Boumendil A, Guidet B. The challenge ofadmitting the very elderly to intensive care. Ann Intensive Care. 2011;1:29. 2. Bagshaw, S.M. et al. Very old patients admitted to intensive care in Australia and New Zealand: a multi-centre cohort analysis. Crit Care (London, England). 2009;13:R45.
0401HOSPITAL AND LONG-TERM OUTCOMES OF CRITICALLY ILL ELDERLYPATIENTS
A. Mukhopadhyay1, B.C. Tai2, K.C. See1, W.Y. Ng2, T.K. Lim1, S. Onsiong3, S. Ee4,
M.J. Chua4, P.R. Lee4, M.L. Loh4, J. Phua1
1National University Health System, Singapore, Singapore, 2Saw Swee Hock School ofPublic Health, National University of Singapore, Singapore, Singapore, 3The University ofSheffield, Sheffield, UK, 4National University of Singapore, Singapore, SingaporeINTRODUCTION. Long-term outcomes of elderly patients (C65 years) admitted to theintensive care unit (ICU) are not clearly determined.OBJECTIVES. Compare factors contributing to hospital and long-term mortality of elderlyversus non-elderly patients admitted to a medical ICU (MICU).METHODS. We prospectively studied consecutive adult patients (n = 1563) admitted over28 months to the MICU. Mortality data was obtained from the National Registry. Thecompeting risks regression model was implemented to determine independent factorsrelated to the mortality in the hospital and following discharges.RESULTS. 45.4 % patients were elderly. Overall, 414 (26.5 %) patients died in hospital(including 287 or 18.4 % who died in ICU) and 337 (21.6 %) died during 52 months followingdischarges respectively, with elderly patients having significantly higher mortality in allperiods. Mechanical ventilation (sub-distribution hazard ratio, SHR 2.74), vasopressor use(SHR 2.56), neurological disease (SHR 1.77) and MPM II score (SHR 1.01) were related tohospital mortality regardless of age, while malignancy (SHR, haematological 3.65, non-hae-matological 3.4) and renal replacement treatment (RRT) before admission (SHR 2.21) wereassociated with significantlyhigher risk in the elderly. Long-term mortality was associated withthe number of comorbidities especially amongst non-elderly. Low haemoglobin (SHR 0.94),airway disease (SHR 2.23) and malignancy (SHR haematological 1.11, non-haematological2.31) were all related to increased risk of long-term mortality regardless of age.
MV analysis mortality after hospital discharge
Adjusted SHR (95 % CI)
\65 p value C65 p value
Comorbidities
2 to 3 2.34 (1.48–3.69) \.0001 1.43 (0.75–2.71) 0.275
[3 5.01 (3.21–7.83) \.0001 1.86 (1.02–3.40) 0.043
Haemoglobin 0.94 (0.90–0.98) 0.002 0.94 (0.90–0.98) 0.002
Airway disease 2.23 (1.57–3.15) \.0001 2.23 (1.57–3.15) \.0001
Maligancy
Haematologicaldisease
1.11 (0.63–1.94) 0.721 1.11 (0.63–1.94) 0.721
Non-haematologicaldisease
2.31 (1.39–3.84) 0.001 2.31 (1.39–3.84) 0.001
Cumulative incidence of mortality after discharge
CONCLUSIONS. RRT before admission and malignancy contribute additional hospitalmortality risk in elderly patients. During long-term follow up, number of comorbidities(age-related), low haemoglobin, airway disease and malignancy were significantly associ-ated with mortality.REFERENCE(S) 1. Boumendil A, Somme D, Garrouste-Org, Guidet B. Should elderlypatients be admitted to the intensive care unit? Intensive Care Med. 2007;33:1252–62.
0402VERY OLD PATIENTS ADMITTED TO INTENSIVE CARE: QUALITY OF LIFEAND AUTONOMY AFTER ICU DISCHARGE
C. Ferrão1,2, C. Quintaneiro2,3, C. Camila4, I. Aragão5, T. Cardoso6
1Hospital Geral de Santo António, Department of Medicine, Porto, Portugal, 2Hospital deSanto António, Centro Hospitalar do Porto, Unidade de Cuidados Intensivos Polivalentes,Porto, Portugal, 3Hospital Distrital da Figueira da Foz, Internal Medicine, Figueira da Foz,Portugal, 4Statistician at Department of Health Information and Decision Sciences, Centerfor Research and Health Technologys and Information Systems (CINTESIS), Faculty ofMedicine, University of Porto, Porto, Portugal, 5Director of the Intensive Care Unit,Unidade de Cuidados Intensivos Polivalentes, Hospital Geral de Santo António, Porto,Portugal, 6Internal Medicine Consultant at Intensive Care Unit, Unidade de CuidadosIntensivos Polivalentes, Hospital Geral de Santo António, Porto, PortugalINTRODUCTION. The mean age of patients being admitted into intensive care isincreasing with very old patients representing an important proportion. Some authors pre-dicted an increase by 72 % in very old patient’s admitted into intensive care in the nextyears1.OBJECTIVES. To describe quality of life and impact in self-care of ICU admission in thegroup of very old patients.METHODS. Retrospective cohort study of all patients age C80 years admitted to a mixedICU, in a tertiary, university hospital between 2006 e 2012. Detailed description of thiscohort was made, including data from the follow-up regarding the subgroup that attendedthe outpatient clinic. Quality of life was evaluated using EQ-5D and functional statusthrough the modified Rankin scale. Follow-up data was compared between three groups:\65, 66–79 and C80 years.RESULTS. We included in the study 278 patients with a median age of 84 years (82–86),56 % (n = 155) were males. The admission diagnosis was medical in 65 % (n = 180);surgical without trauma in 24 % (n = 66) and trauma with or without surgery in 11 %(n = 30). Mean SOFA score at 24 h was 8 ± 4; mean SAPSII score was 61 ± 16, pre-dicting a hospital mortality of 70 % with an observed hospital mortality of 57 %(standardized mortality ratio 0.8). General ICU patients had a SMR of 0.9.Fifty-one patients were evaluated in the outpatient clinic, 43 % reported new symptoms, but51 % had already resumed previous activity. In the group of patients that did not resumeprevious activity 41 % said it was due to ICU admission. In this group 80 % remainedindependent in daily activities. Regarding quality of life only 4 % reported extreme prob-lems with motility; 22 % with self-care; 23 % with usual activities; 2 % pain or discomfortand 8 % anxiety or depression. In the visual analogical scale they attribute to their healthstatus a mean score of 56 ± 21, allowing the calculation of a QALY of 0.9 for a meanfollow-up time of 7 months.Comparing the three age groups: \65, 66–79 and C80 years, significant differences wereobserved between groups in what concerns extreme problems with motility (3 vs 4 vs 9 %,p \ 0.01); self-care (8 vs 17 vs 30 %, p \ 0.01); usual activity (17 vs 23 vs 30 %,p \ 0.01); pain/discomfort (5 vs 4 vs 6 %, p = 0.6); anxiety/depression (13 vs 10 vs 11 %,p = 0.4).Regarding health state in the day of outpatients clinic appointment they reported 73 (53–91),63 (45–85), 59 (41–69) respectively (p \ 0.01).CONCLUSIONS. In the group of very old patients that survived ICU care more than halfresumes previously activity at time of outpatient clinic appointment. This group of patientsgained 1 year of life with quality.REFERENCE(S) 1. Yên-Lan N et al. The challenge of admitting the very elderly tointensive care. Ann Intensive Care 2011;1:29. 2. Alexis Tabah et al. Quality of life inpatients aged 80 years or over after ICU discharge. Crit Care 2010;14:R2.
0403OUTCOME OF NON-ELECTIVE ADMISSIONS TO CRITICAL CAREIN PATIENTS AGED OVER 80
G. Dempsey1, T. Astles1
1University Hospital Aintree, Department of Intensive Care Medicine, Liverpool, UKINTRODUCTION. We live in an ageing population with evermore elderly patients beingreferred for Critical Care treatment. This is likely to be an Increasing problem.Most literature in the area of elderly patients in Critical Care studies the over 65 s. In theover 80 s old cohort there is relatively little published outcome data on urgent unplannedadmissions. de Rooij reported the outcomes of 578 patients over the age of 80, of which 249were unplanned admissions. Surgical and medical hospital mortalities were 51 % & 56 %respectively and 12 month mortalities were 62 & 69 %.1
Roch reported on 299 medical patients with a 2-year follow up. Hospital mortality was55 %, and 12-month mortality was 72 %.2
OBJECTIVES. To study the ITU, hospital and long-term outcome of non-elective patientsaged over 80 years admitted to our Critical Care Unit, a 19 bedded mixed surgical &medical teaching hospital department.METHODS. A retrospective search of the computerised ITU admissions database wasperformed for patients over 80 years of age admitted during 2010–12 confined to non-elective admissions.Data pertaining to the first 24 h of the admission were sought from observation charts, bloodresults and admission clerking.Data collected included the following:• Demographics.• APACHE II score.• Physiological data.• Chronic health evaluation as per ICNARC.• Hospital discharge status.• Post-discharge survival.
26th ESICM ANNUAL CONGRESS — PARIS, FRANCE — 5–9 OCTOBER 2013
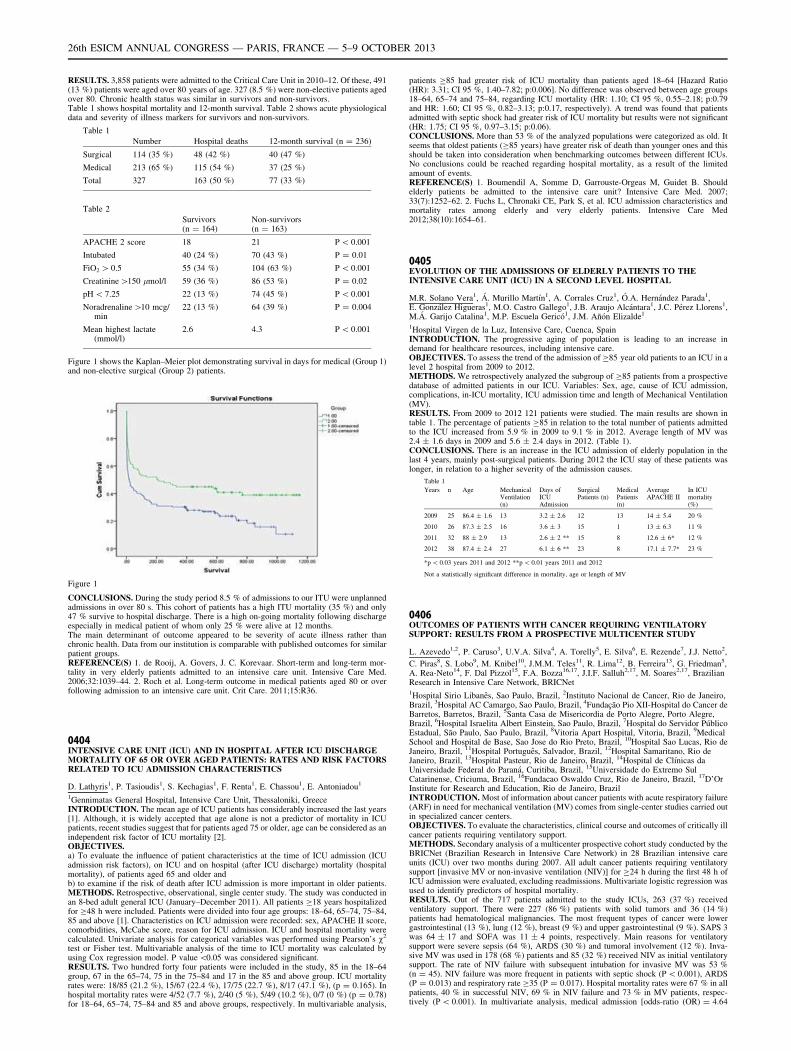
RESULTS. 3,858 patients were admitted to the Critical Care Unit in 2010–12. Of these, 491(13 %) patients were aged over 80 years of age. 327 (8.5 %) were non-elective patients agedover 80. Chronic health status was similar in survivors and non-survivors.Table 1 shows hospital mortality and 12-month survival. Table 2 shows acute physiologicaldata and severity of illness markers for survivors and non-survivors.
Table 1
Number Hospital deaths 12-month survival (n = 236)
Surgical 114 (35 %) 48 (42 %) 40 (47 %)
Medical 213 (65 %) 115 (54 %) 37 (25 %)
Total 327 163 (50 %) 77 (33 %)
Table 2
Survivors(n = 164)
Non-survivors(n = 163)
APACHE 2 score 18 21 P \ 0.001
Intubated 40 (24 %) 70 (43 %) P = 0.01
FiO2 [ 0.5 55 (34 %) 104 (63 %) P \ 0.001
Creatinine [150 lmol/l 59 (36 %) 86 (53 %) P = 0.02
pH \ 7.25 22 (13 %) 74 (45 %) P \ 0.001
Noradrenaline [10 mcg/min
22 (13 %) 64 (39 %) P = 0.004
Mean highest lactate(mmol/l)
2.6 4.3 P \ 0.001
Figure 1 shows the Kaplan–Meier plot demonstrating survival in days for medical (Group 1)and non-elective surgical (Group 2) patients.
Figure 1
CONCLUSIONS. During the study period 8.5 % of admissions to our ITU were unplannedadmissions in over 80 s. This cohort of patients has a high ITU mortality (35 %) and only47 % survive to hospital discharge. There is a high on-going mortality following dischargeespecially in medical patient of whom only 25 % were alive at 12 months.The main determinant of outcome appeared to be severity of acute illness rather thanchronic health. Data from our institution is comparable with published outcomes for similarpatient groups.REFERENCE(S) 1. de Rooij, A. Govers, J. C. Korevaar. Short-term and long-term mor-tality in very elderly patients admitted to an intensive care unit. Intensive Care Med.2006;32:1039–44. 2. Roch et al. Long-term outcome in medical patients aged 80 or overfollowing admission to an intensive care unit. Crit Care. 2011;15:R36.
0404INTENSIVE CARE UNIT (ICU) AND IN HOSPITAL AFTER ICU DISCHARGEMORTALITY OF 65 OR OVER AGED PATIENTS: RATES AND RISK FACTORSRELATED TO ICU ADMISSION CHARACTERISTICS
D. Lathyris1, P. Tasioudis1, S. Kechagias1, F. Renta1, E. Chassou1, E. Antoniadou1
1Gennimatas General Hospital, Intensive Care Unit, Thessaloniki, GreeceINTRODUCTION. The mean age of ICU patients has considerably increased the last years[1]. Although, it is widely accepted that age alone is not a predictor of mortality in ICUpatients, recent studies suggest that for patients aged 75 or older, age can be considered as anindependent risk factor of ICU mortality [2].OBJECTIVES.a) To evaluate the influence of patient characteristics at the time of ICU admission (ICUadmission risk factors), on ICU and on hospital (after ICU discharge) mortality (hospitalmortality), of patients aged 65 and older andb) to examine if the risk of death after ICU admission is more important in older patients.METHODS. Retrospective, observational, single center study. The study was conducted inan 8-bed adult general ICU (January–December 2011). All patients C18 years hospitalizedfor C48 h were included. Patients were divided into four age groups: 18–64, 65–74, 75–84,85 and above [1]. Characteristics on ICU admission were recorded: sex, APACHE II score,comorbidities, McCabe score, reason for ICU admission. ICU and hospital mortality werecalculated. Univariate analysis for categorical variables was performed using Pearson’s v2
test or Fisher test. Multivariable analysis of the time to ICU mortality was calculated byusing Cox regression model. P value \0.05 was considered significant.RESULTS. Two hundred forty four patients were included in the study, 85 in the 18–64group, 67 in the 65–74, 75 in the 75–84 and 17 in the 85 and above group. ICU mortalityrates were: 18/85 (21.2 %), 15/67 (22.4 %), 17/75 (22.7 %), 8/17 (47.1 %), (p = 0.165). Inhospital mortality rates were 4/52 (7.7 %), 2/40 (5 %), 5/49 (10.2 %), 0/7 (0 %) (p = 0.78)for 18–64, 65–74, 75–84 and 85 and above groups, respectively. In multivariable analysis,
patients C85 had greater risk of ICU mortality than patients aged 18–64 [Hazard Ratio(HR): 3.31; CI 95 %, 1.40–7.82; p:0.006]. No difference was observed between age groups18–64, 65–74 and 75–84, regarding ICU mortality (HR: 1.10; CI 95 %, 0.55–2.18; p:0.79and HR: 1.60; CI 95 %, 0.82–3.13; p:0.17, respectively). A trend was found that patientsadmitted with septic shock had greater risk of ICU mortality but results were not significant(HR: 1.75; CI 95 %, 0.97–3.15; p:0.06).CONCLUSIONS. More than 53 % of the analyzed populations were categorized as old. Itseems that oldest patients (C85 years) have greater risk of death than younger ones and thisshould be taken into consideration when benchmarking outcomes between different ICUs.No conclusions could be reached regarding hospital mortality, as a result of the limitedamount of events.REFERENCE(S) 1. Boumendil A, Somme D, Garrouste-Orgeas M, Guidet B. Shouldelderly patients be admitted to the intensive care unit? Intensive Care Med. 2007;33(7):1252–62. 2. Fuchs L, Chronaki CE, Park S, et al. ICU admission characteristics andmortality rates among elderly and very elderly patients. Intensive Care Med2012;38(10):1654–61.
0405EVOLUTION OF THE ADMISSIONS OF ELDERLY PATIENTS TO THEINTENSIVE CARE UNIT (ICU) IN A SECOND LEVEL HOSPITAL
M.R. Solano Vera1, Á. Murillo Martı́n1, A. Corrales Cruz1, Ó.A. Hernández Parada1,E. González Higueras1, M.O. Castro Gallego1, J.B. Araujo Alcántara1, J.C. Pérez Llorens1,M.Á. Garijo Catalina1, M.P. Escuela Gericó1, J.M. Añón Elizalde1
1Hospital Virgen de la Luz, Intensive Care, Cuenca, SpainINTRODUCTION. The progressive aging of population is leading to an increase indemand for healthcare resources, including intensive care.OBJECTIVES. To assess the trend of the admission of C85 year old patients to an ICU in alevel 2 hospital from 2009 to 2012.METHODS. We retrospectively analyzed the subgroup of C85 patients from a prospectivedatabase of admitted patients in our ICU. Variables: Sex, age, cause of ICU admission,complications, in-ICU mortality, ICU admission time and length of Mechanical Ventilation(MV).RESULTS. From 2009 to 2012 121 patients were studied. The main results are shown intable 1. The percentage of patients C85 in relation to the total number of patients admittedto the ICU increased from 5.9 % in 2009 to 9.1 % in 2012. Average length of MV was2.4 ± 1.6 days in 2009 and 5.6 ± 2.4 days in 2012. (Table 1).CONCLUSIONS. There is an increase in the ICU admission of elderly population in thelast 4 years, mainly post-surgical patients. During 2012 the ICU stay of these patients waslonger, in relation to a higher severity of the admission causes.
Table 1
Years n Age MechanicalVentilation(n)
Days ofICUAdmission
SurgicalPatients (n)
MedicalPatients(n)
AverageAPACHE II
In ICUmortality(%)
2009 25 86.4 ± 1.6 13 3.2 ± 2.6 12 13 14 ± 5.4 20 %
2010 26 87.3 ± 2.5 16 3.6 ± 3 15 1 13 ± 6.3 11 %
2011 32 88 ± 2.9 13 2.6 ± 2 ** 15 8 12.6 ± 6* 12 %
2012 38 87.4 ± 2.4 27 6.1 ± 6 ** 23 8 17.1 ± 7.7* 23 %
*p \ 0.03 years 2011 and 2012 **p \ 0.01 years 2011 and 2012
Not a statistically significant difference in mortality, age or length of MV
0406OUTCOMES OF PATIENTS WITH CANCER REQUIRING VENTILATORYSUPPORT: RESULTS FROM A PROSPECTIVE MULTICENTER STUDY
L. Azevedo1,2, P. Caruso3, U.V.A. Silva4, A. Torelly5, E. Silva6, E. Rezende7, J.J. Netto2,
C. Piras8, S. Lobo9, M. Knibel10, J.M.M. Teles11, R. Lima12, B. Ferreira13, G. Friedman5,A. Rea-Neto14, F. Dal Pizzol15, F.A. Bozza16,17, J.I.F. Salluh2,17, M. Soares2,17, BrazilianResearch in Intensive Care Network, BRICNet1Hospital Sirio Libanês, Sao Paulo, Brazil, 2Instituto Nacional de Cancer, Rio de Janeiro,Brazil, 3Hospital AC Camargo, Sao Paulo, Brazil, 4Fundação Pio XII-Hospital do Cancer deBarretos, Barretos, Brazil, 5Santa Casa de Misericordia de Porto Alegre, Porto Alegre,Brazil, 6Hospital Israelita Albert Einstein, Sao Paulo, Brazil, 7Hospital do Servidor PúblicoEstadual, São Paulo, Sao Paulo, Brazil, 8Vitoria Apart Hospital, Vitoria, Brazil, 9MedicalSchool and Hospital de Base, Sao Jose do Rio Preto, Brazil, 10Hospital Sao Lucas, Rio deJaneiro, Brazil, 11Hospital Português, Salvador, Brazil, 12Hospital Samaritano, Rio deJaneiro, Brazil, 13Hospital Pasteur, Rio de Janeiro, Brazil, 14Hospital de Clı́nicas daUniversidade Federal do Paraná, Curitiba, Brazil, 15Universidade do Extremo SulCatarinense, Criciuma, Brazil, 16Fundacao Oswaldo Cruz, Rio de Janeiro, Brazil, 17D’OrInstitute for Research and Education, Rio de Janeiro, BrazilINTRODUCTION. Most of information about cancer patients with acute respiratory failure(ARF) in need for mechanical ventilation (MV) comes from single-center studies carried outin specialized cancer centers.OBJECTIVES. To evaluate the characteristics, clinical course and outcomes of critically illcancer patients requiring ventilatory support.METHODS. Secondary analysis of a multicenter prospective cohort study conducted by theBRICNet (Brazilian Research in Intensive Care Network) in 28 Brazilian intensive careunits (ICU) over two months during 2007. All adult cancer patients requiring ventilatorysupport [invasive MV or non-invasive ventilation (NIV)] for C24 h during the first 48 h ofICU admission were evaluated, excluding readmissions. Multivariate logistic regression wasused to identify predictors of hospital mortality.RESULTS. Out of the 717 patients admitted to the study ICUs, 263 (37 %) receivedventilatory support. There were 227 (86 %) patients with solid tumors and 36 (14 %)patients had hematological malignancies. The most frequent types of cancer were lowergastrointestinal (13 %), lung (12 %), breast (9 %) and upper gastrointestinal (9 %). SAPS 3was 64 ± 17 and SOFA was 11 ± 4 points, respectively. Main reasons for ventilatorysupport were severe sepsis (64 %), ARDS (30 %) and tumoral involvement (12 %). Inva-sive MV was used in 178 (68 %) patients and 85 (32 %) received NIV as initial ventilatorysupport. The rate of NIV failure with subsequent intubation for invasive MV was 53 %(n = 45). NIV failure was more frequent in patients with septic shock (P \ 0.001), ARDS(P = 0.013) and respiratory rate C35 (P = 0.017). Hospital mortality rates were 67 % in allpatients, 40 % in successful NIV, 69 % in NIV failure and 73 % in MV patients, respec-tively (P \ 0.001). In multivariate analysis, medical admission [odds-ratio (OR) = 4.64
26th ESICM ANNUAL CONGRESS — PARIS, FRANCE — 5–9 OCTOBER 2013
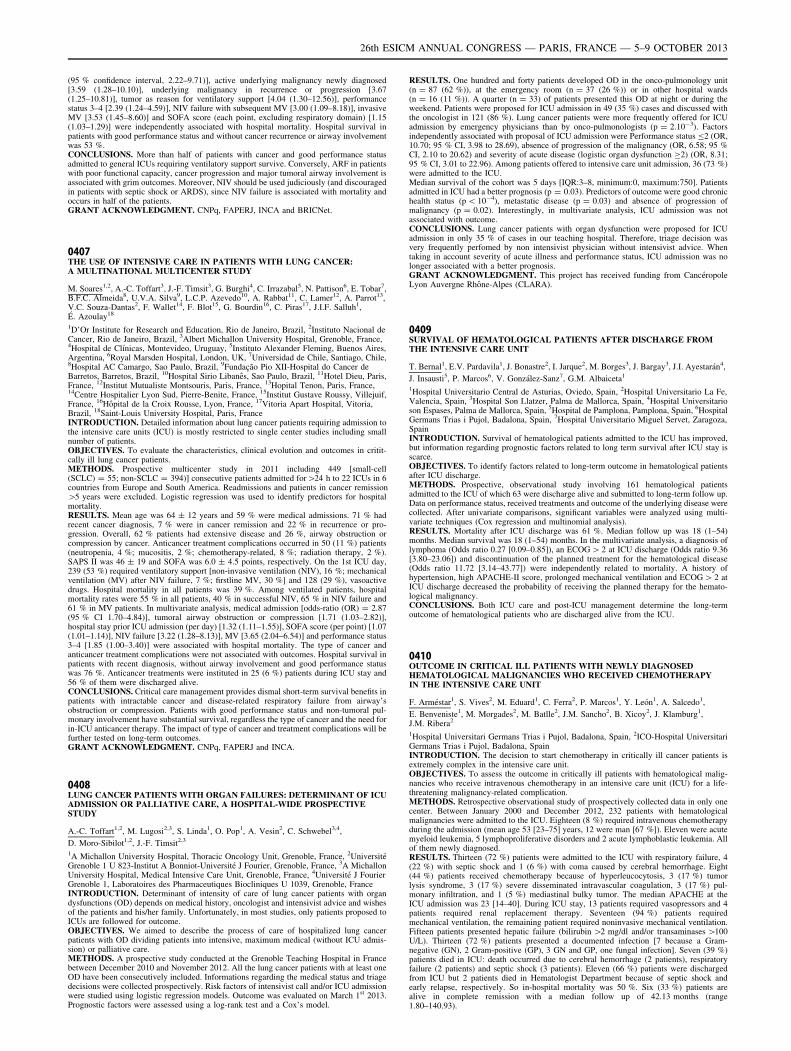
(95 % confidence interval, 2.22–9.71)], active underlying malignancy newly diagnosed[3.59 (1.28–10.10)], underlying malignancy in recurrence or progression [3.67(1.25–10.81)], tumor as reason for ventilatory support [4.04 (1.30–12.56)], performancestatus 3–4 [2.39 (1.24–4.59)], NIV failure with subsequent MV [3.00 (1.09–8.18)], invasiveMV [3.53 (1.45–8.60)] and SOFA score (each point, excluding respiratory domain) [1.15(1.03–1.29)] were independently associated with hospital mortality. Hospital survival inpatients with good performance status and without cancer recurrence or airway involvementwas 53 %.CONCLUSIONS. More than half of patients with cancer and good performance statusadmitted to general ICUs requiring ventilatory support survive. Conversely, ARF in patientswith poor functional capacity, cancer progression and major tumoral airway involvement isassociated with grim outcomes. Moreover, NIV should be used judiciously (and discouragedin patients with septic shock or ARDS), since NIV failure is associated with mortality andoccurs in half of the patients.GRANT ACKNOWLEDGMENT. CNPq, FAPERJ, INCA and BRICNet.
0407THE USE OF INTENSIVE CARE IN PATIENTS WITH LUNG CANCER:A MULTINATIONAL MULTICENTER STUDY
M. Soares1,2, A.-C. Toffart3, J.-F. Timsit3, G. Burghi4, C. Irrazabal5, N. Pattison6, E. Tobar7,B.F.C. Almeida8, U.V.A. Silva9, L.C.P. Azevedo10, A. Rabbat11, C. Lamer12, A. Parrot13,V.C. Souza-Dantas2, F. Wallet14, F. Blot15, G. Bourdin16, C. Piras17, J.I.F. Salluh1,É. Azoulay18
1D’Or Institute for Research and Education, Rio de Janeiro, Brazil, 2Instituto Nacional deCancer, Rio de Janeiro, Brazil, 3Albert Michallon University Hospital, Grenoble, France,4Hospital de Clı́nicas, Montevideo, Uruguay, 5Instituto Alexander Fleming, Buenos Aires,Argentina, 6Royal Marsden Hospital, London, UK, 7Universidad de Chile, Santiago, Chile,8Hospital AC Camargo, Sao Paulo, Brazil, 9Fundação Pio XII-Hospital do Cancer deBarretos, Barretos, Brazil, 10Hospital Sirio Libanês, Sao Paulo, Brazil, 11Hotel Dieu, Paris,France, 12Institut Mutualiste Montsouris, Paris, France, 13Hopital Tenon, Paris, France,14Centre Hospitalier Lyon Sud, Pierre-Benite, France, 15Institut Gustave Roussy, Villejuif,France, 16Hôpital de la Croix Rousse, Lyon, France, 17Vitoria Apart Hospital, Vitoria,Brazil, 18Saint-Louis University Hospital, Paris, FranceINTRODUCTION. Detailed information about lung cancer patients requiring admission tothe intensive care units (ICU) is mostly restricted to single center studies including smallnumber of patients.OBJECTIVES. To evaluate the characteristics, clinical evolution and outcomes in critit-cally ill lung cancer patients.METHODS. Prospective multicenter study in 2011 including 449 [small-cell(SCLC) = 55; non-SCLC = 394)] consecutive patients admitted for[24 h to 22 ICUs in 6countries from Europe and South America. Readmissions and patients in cancer remission[5 years were excluded. Logistic regression was used to identify predictors for hospitalmortality.RESULTS. Mean age was 64 ± 12 years and 59 % were medical admissions. 71 % hadrecent cancer diagnosis, 7 % were in cancer remission and 22 % in recurrence or pro-gression. Overall, 62 % patients had extensive disease and 26 %, airway obstruction orcompression by cancer. Anticancer treatment complications occurred in 50 (11 %) patients(neutropenia, 4 %; mucositis, 2 %; chemotherapy-related, 8 %; radiation therapy, 2 %).SAPS II was 46 ± 19 and SOFA was 6.0 ± 4.5 points, respectively. On the 1st ICU day,239 (53 %) required ventilatory support [non-invasive ventilation (NIV), 16 %; mechanicalventilation (MV) after NIV failure, 7 %; firstline MV, 30 %] and 128 (29 %), vasoactivedrugs. Hospital mortality in all patients was 39 %. Among ventilated patients, hospitalmortality rates were 55 % in all patients, 40 % in successful NIV, 65 % in NIV failure and61 % in MV patients. In multivariate analysis, medical admission [odds-ratio (OR) = 2.87(95 % CI 1.70–4.84)], tumoral airway obstruction or compression [1.71 (1.03–2.82)],hospital stay prior ICU admission (per day) [1.32 (1.11–1.55)], SOFA score (per point) [1.07(1.01–1.14)], NIV failure [3.22 (1.28–8.13)], MV [3.65 (2.04–6.54)] and performance status3–4 [1.85 (1.00–3.40)] were associated with hospital mortality. The type of cancer andanticancer treatment complications were not associated with outcomes. Hospital survival inpatients with recent diagnosis, without airway involvement and good performance statuswas 76 %. Anticancer treatments were instituted in 25 (6 %) patients during ICU stay and56 % of them were discharged alive.CONCLUSIONS. Critical care management provides dismal short-term survival benefits inpatients with intractable cancer and disease-related respiratory failure from airway’sobstruction or compression. Patients with good performance status and non-tumoral pul-monary involvement have substantial survival, regardless the type of cancer and the need forin-ICU anticancer therapy. The impact of type of cancer and treatment complications will befurther tested on long-term outcomes.GRANT ACKNOWLEDGMENT. CNPq, FAPERJ and INCA.
0408LUNG CANCER PATIENTS WITH ORGAN FAILURES: DETERMINANT OF ICUADMISSION OR PALLIATIVE CARE, A HOSPITAL-WIDE PROSPECTIVESTUDY
A.-C. Toffart1,2, M. Lugosi2,3, S. Linda1, O. Pop1, A. Vesin2, C. Schwebel3,4,
D. Moro-Sibilot1,2, J.-F. Timsit2,3
1A Michallon University Hospital, Thoracic Oncology Unit, Grenoble, France, 2UniversitéGrenoble 1 U 823-Institut A Bonniot-Université J Fourier, Grenoble, France, 3A MichallonUniversity Hospital, Medical Intensive Care Unit, Grenoble, France, 4Université J FourierGrenoble 1, Laboratoires des Pharmaceutiques Biocliniques U 1039, Grenoble, FranceINTRODUCTION. Determinant of intensity of care of lung cancer patients with organdysfunctions (OD) depends on medical history, oncologist and intensivist advice and wishesof the patients and his/her family. Unfortunately, in most studies, only patients proposed toICUs are followed for outcome.OBJECTIVES. We aimed to describe the process of care of hospitalized lung cancerpatients with OD dividing patients into intensive, maximum medical (without ICU admis-sion) or palliative care.METHODS. A prospective study conducted at the Grenoble Teaching Hospital in Francebetween December 2010 and November 2012. All the lung cancer patients with at least oneOD have been consecutively included. Informations regarding the medical status and triagedecisions were collected prospectively. Risk factors of intensivist call and/or ICU admissionwere studied using logistic regression models. Outcome was evaluated on March 1st 2013.Prognostic factors were assessed using a log-rank test and a Cox’s model.
RESULTS. One hundred and forty patients developed OD in the onco-pulmonology unit(n = 87 (62 %)), at the emergency room (n = 37 (26 %)) or in other hospital wards(n = 16 (11 %)). A quarter (n = 33) of patients presented this OD at night or during theweekend. Patients were proposed for ICU admission in 49 (35 %) cases and discussed withthe oncologist in 121 (86 %). Lung cancer patients were more frequently offered for ICUadmission by emergency physicians than by onco-pulmonologists (p = 2.10-3). Factorsindependently associated with proposal of ICU admission were Performance status B2 (OR,10.70; 95 % CI, 3.98 to 28.69), absence of progression of the malignancy (OR, 6.58; 95 %CI, 2.10 to 20.62) and severity of acute disease (logistic organ dysfunction C2) (OR, 8.31;95 % CI, 3.01 to 22.96). Among patients offered to intensive care unit admission, 36 (73 %)were admitted to the ICU.Median survival of the cohort was 5 days [IQR:3–8, minimum:0, maximum:750]. Patientsadmitted in ICU had a better prognosis (p = 0.03). Predictors of outcome were good chronichealth status (p \ 10-4), metastatic disease (p = 0.03) and absence of progression ofmalignancy (p = 0.02). Interestingly, in multivariate analysis, ICU admission was notassociated with outcome.CONCLUSIONS. Lung cancer patients with organ dysfunction were proposed for ICUadmission in only 35 % of cases in our teaching hospital. Therefore, triage decision wasvery frequently perfomed by non intensivist physician without intensivist advice. Whentaking in account severity of acute illness and performance status, ICU admission was nolonger associated with a better prognosis.GRANT ACKNOWLEDGMENT. This project has received funding from CancéropoleLyon Auvergne Rhône-Alpes (CLARA).
0409SURVIVAL OF HEMATOLOGICAL PATIENTS AFTER DISCHARGE FROMTHE INTENSIVE CARE UNIT
T. Bernal1, E.V. Pardavila1, J. Bonastre2, I. Jarque2, M. Borges3, J. Bargay3, J.I. Ayestarán4,
J. Insausti5, P. Marcos6, V. González-Sanz7, G.M. Albaiceta1
1Hospital Universitario Central de Asturias, Oviedo, Spain, 2Hospital Universitario La Fe,Valencia, Spain, 3Hospital Son Llatzer, Palma de Mallorca, Spain, 4Hospital Universitarioson Espases, Palma de Mallorca, Spain, 5Hospital de Pamplona, Pamplona, Spain, 6HospitalGermans Trias i Pujol, Badalona, Spain, 7Hospital Universitario Miguel Servet, Zaragoza,SpainINTRODUCTION. Survival of hematological patients admitted to the ICU has improved,but information regarding prognostic factors related to long term survival after ICU stay isscarce.OBJECTIVES. To identify factors related to long-term outcome in hematological patientsafter ICU discharge.METHODS. Prospective, observational study involving 161 hematological patientsadmitted to the ICU of which 63 were discharge alive and submitted to long-term follow up.Data on performance status, received treatments and outcome of the underlying disease werecollected. After univariate comparisons, significant variables were analyzed using multi-variate techniques (Cox regression and multinomial analysis).RESULTS. Mortality after ICU discharge was 61 %. Median follow up was 18 (1–54)months. Median survival was 18 (1–54) months. In the multivariate analysis, a diagnosis oflymphoma (Odds ratio 0.27 [0.09–0.85]), an ECOG [ 2 at ICU discharge (Odds ratio 9.36[3.80–23.06]) and discontinuation of the planned treatment for the hematological disease(Odds ratio 11.72 [3.14–43.77]) were independently related to mortality. A history ofhypertension, high APACHE-II score, prolonged mechanical ventilation and ECOG [ 2 atICU discharge decreased the probability of receiving the planned therapy for the hemato-logical malignancy.CONCLUSIONS. Both ICU care and post-ICU management determine the long-termoutcome of hematological patients who are discharged alive from the ICU.
0410OUTCOME IN CRITICAL ILL PATIENTS WITH NEWLY DIAGNOSEDHEMATOLOGICAL MALIGNANCIES WHO RECEIVED CHEMOTHERAPYIN THE INTENSIVE CARE UNIT
F. Arméstar1, S. Vives2, M. Eduard1, C. Ferra2, P. Marcos1, Y. León1, A. Salcedo1,
E. Benveniste1, M. Morgades2, M. Batlle2, J.M. Sancho2, B. Xicoy2, J. Klamburg1,J.M. Ribera2
1Hospital Universitari Germans Trias i Pujol, Badalona, Spain, 2ICO-Hospital UniversitariGermans Trias i Pujol, Badalona, SpainINTRODUCTION. The decision to start chemotherapy in critically ill cancer patients isextremely complex in the intensive care unit.OBJECTIVES. To assess the outcome in critically ill patients with hematological malig-nancies who receive intravenous chemotherapy in an intensive care unit (ICU) for a life-threatening malignancy-related complication.METHODS. Retrospective observational study of prospectively collected data in only onecenter. Between January 2000 and December 2012, 232 patients with hematologicalmalignancies were admitted to the ICU. Eighteen (8 %) required intravenous chemotherapyduring the admission (mean age 53 [23–75] years, 12 were man [67 %]). Eleven were acutemyeloid leukemia, 5 lymphoproliferative disorders and 2 acute lymphoblastic leukemia. Allof them newly diagnosed.RESULTS. Thirteen (72 %) patients were admitted to the ICU with respiratory failure, 4(22 %) with septic shock and 1 (6 %) with coma caused by cerebral hemorrhage. Eight(44 %) patients received chemotherapy because of hyperleucocytosis, 3 (17 %) tumorlysis syndrome, 3 (17 %) severe disseminated intravascular coagulation, 3 (17 %) pul-monary infiltration, and 1 (5 %) mediastinal bulky tumor. The median APACHE at theICU admission was 23 [14–40]. During ICU stay, 13 patients required vasopressors and 4patients required renal replacement therapy. Seventeen (94 %) patients requiredmechanical ventilation, the remaining patient required noninvasive mechanical ventilation.Fifteen patients presented hepatic failure (bilirubin [2 mg/dl and/or transaminases [100U/L). Thirteen (72 %) patients presented a documented infection [7 because a Gram-negative (GN), 2 Gram-positive (GP), 3 GN and GP, one fungal infection]. Seven (39 %)patients died in ICU: death occurred due to cerebral hemorrhage (2 patients), respiratoryfailure (2 patients) and septic shock (3 patients). Eleven (66 %) patients were dischargedfrom ICU but 2 patients died in Hematologist Department because of septic shock andearly relapse, respectively. So in-hospital mortality was 50 %. Six (33 %) patients arealive in complete remission with a median follow up of 42.13 months (range1.80–140.93).
26th ESICM ANNUAL CONGRESS — PARIS, FRANCE — 5–9 OCTOBER 2013
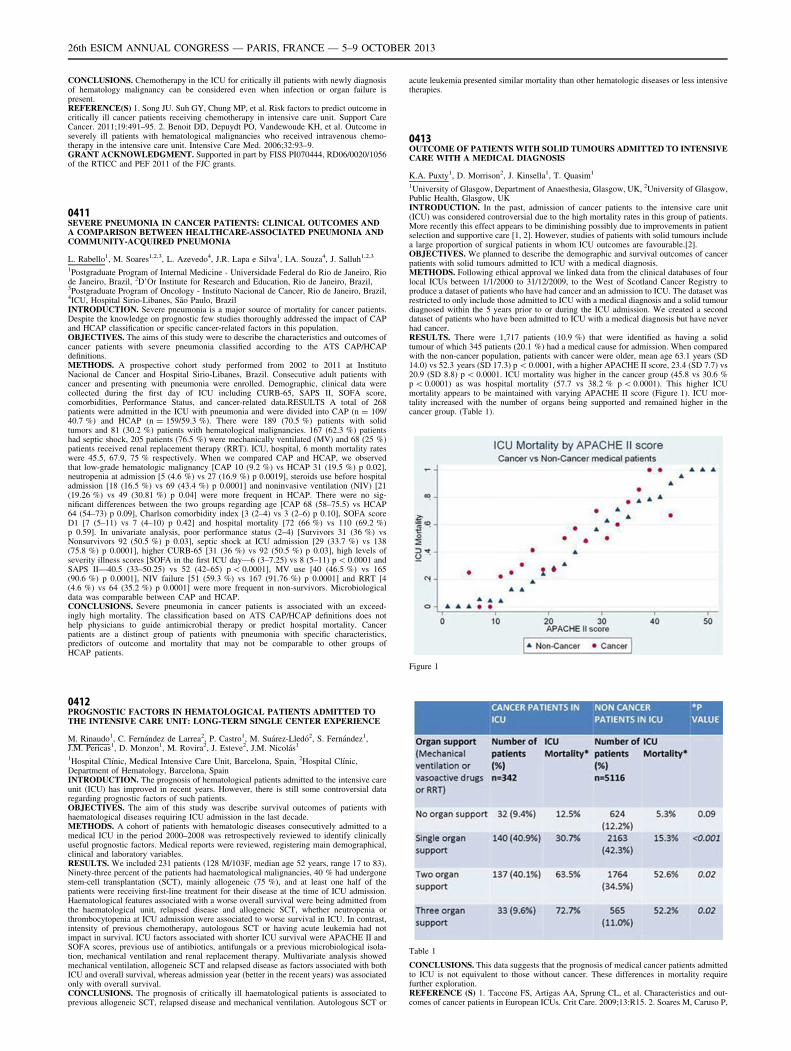
CONCLUSIONS. Chemotherapy in the ICU for critically ill patients with newly diagnosisof hematology malignancy can be considered even when infection or organ failure ispresent.REFERENCE(S) 1. Song JU. Suh GY, Chung MP, et al. Risk factors to predict outcome incritically ill cancer patients receiving chemotherapy in intensive care unit. Support CareCancer. 2011;19:491–95. 2. Benoit DD, Depuydt PO, Vandewoude KH, et al. Outcome inseverely ill patients with hematological malignancies who received intravenous chemo-therapy in the intensive care unit. Intensive Care Med. 2006;32:93–9.GRANT ACKNOWLEDGMENT. Supported in part by FISS PI070444, RD06/0020/1056of the RTICC and PEF 2011 of the FJC grants.
0411SEVERE PNEUMONIA IN CANCER PATIENTS: CLINICAL OUTCOMES ANDA COMPARISON BETWEEN HEALTHCARE-ASSOCIATED PNEUMONIA ANDCOMMUNITY-ACQUIRED PNEUMONIA
L. Rabello1, M. Soares1,2,3, L. Azevedo4, J.R. Lapa e Silva1, I.A. Souza4, J. Salluh1,2,3
1Postgraduate Program of Internal Medicine - Universidade Federal do Rio de Janeiro, Riode Janeiro, Brazil, 2D’Or Institute for Research and Education, Rio de Janeiro, Brazil,3Postgraduate Program of Oncology - Instituto Nacional de Cancer, Rio de Janeiro, Brazil,4ICU, Hospital Sirio-Libanes, São Paulo, BrazilINTRODUCTION. Severe pneumonia is a major source of mortality for cancer patients.Despite the knowledge on prognostic few studies thoroughly addressed the impact of CAPand HCAP classification or specific cancer-related factors in this population.OBJECTIVES. The aims of this study were to describe the characteristics and outcomes ofcancer patients with severe pneumonia classified according to the ATS CAP/HCAPdefinitions.METHODS. A prospective cohort study performed from 2002 to 2011 at InstitutoNacional de Cancer and Hospital Sirio-Libanes, Brazil. Consecutive adult patients withcancer and presenting with pneumonia were enrolled. Demographic, clinical data werecollected during the first day of ICU including CURB-65, SAPS II, SOFA score,comorbidities, Performance Status, and cancer-related data.RESULTS A total of 268patients were admitted in the ICU with pneumonia and were divided into CAP (n = 109/40.7 %) and HCAP (n = 159/59.3 %). There were 189 (70.5 %) patients with solidtumors and 81 (30.2 %) patients with hematological malignancies. 167 (62.3 %) patientshad septic shock, 205 patients (76.5 %) were mechanically ventilated (MV) and 68 (25 %)patients received renal replacement therapy (RRT). ICU, hospital, 6 month mortality rateswere 45.5, 67.9, 75 % respectively. When we compared CAP and HCAP, we observedthat low-grade hematologic malignancy [CAP 10 (9.2 %) vs HCAP 31 (19.5 %) p 0.02],neutropenia at admission [5 (4.6 %) vs 27 (16.9 %) p 0.0019], steroids use before hospitaladmission [18 (16.5 %) vs 69 (43.4 %) p 0.0001] and noninvasive ventilation (NIV) [21(19.26 %) vs 49 (30.81 %) p 0.04] were more frequent in HCAP. There were no sig-nificant differences between the two groups regarding age [CAP 68 (58–75.5) vs HCAP64 (54–73) p 0.09], Charlson comorbidity index [3 (2–4) vs 3 (2–6) p 0.10], SOFA scoreD1 [7 (5–11) vs 7 (4–10) p 0.42] and hospital mortality [72 (66 %) vs 110 (69.2 %)p 0.59]. In univariate analysis, poor performance status (2–4) [Survivors 31 (36 %) vsNonsurvivors 92 (50.5 %) p 0.03], septic shock at ICU admission [29 (33.7 %) vs 138(75.8 %) p 0.0001], higher CURB-65 [31 (36 %) vs 92 (50.5 %) p 0.03], high levels ofseverity illness scores [SOFA in the first ICU day—6 (3–7.25) vs 8 (5–11) p \ 0.0001 andSAPS II—40.5 (33–50.25) vs 52 (42–65) p \ 0.0001], MV use [40 (46.5 %) vs 165(90.6 %) p 0.0001], NIV failure [51 (59.3 %) vs 167 (91.76 %) p 0.0001] and RRT [4(4.6 %) vs 64 (35.2 %) p 0.0001] were more frequent in non-survivors. Microbiologicaldata was comparable between CAP and HCAP.CONCLUSIONS. Severe pneumonia in cancer patients is associated with an exceed-ingly high mortality. The classification based on ATS CAP/HCAP definitions does nothelp physicians to guide antimicrobial therapy or predict hospital mortality. Cancerpatients are a distinct group of patients with pneumonia with specific characteristics,predictors of outcome and mortality that may not be comparable to other groups ofHCAP patients.
0412PROGNOSTIC FACTORS IN HEMATOLOGICAL PATIENTS ADMITTED TOTHE INTENSIVE CARE UNIT: LONG-TERM SINGLE CENTER EXPERIENCE
M. Rinaudo1, C. Fernández de Larrea2, P. Castro1, M. Suárez-Lledó2, S. Fernández1,J.M. Pericas1, D. Monzon1, M. Rovira2, J. Esteve2, J.M. Nicolás1
1Hospital Clı́nic, Medical Intensive Care Unit, Barcelona, Spain, 2Hospital Clı́nic,Department of Hematology, Barcelona, SpainINTRODUCTION. The prognosis of hematological patients admitted to the intensive careunit (ICU) has improved in recent years. However, there is still some controversial dataregarding prognostic factors of such patients.OBJECTIVES. The aim of this study was describe survival outcomes of patients withhaematological diseases requiring ICU admission in the last decade.METHODS. A cohort of patients with hematologic diseases consecutively admitted to amedical ICU in the period 2000–2008 was retrospectively reviewed to identify clinicallyuseful prognostic factors. Medical reports were reviewed, registering main demographical,clinical and laboratory variables.RESULTS. We included 231 patients (128 M/103F, median age 52 years, range 17 to 83).Ninety-three percent of the patients had haematological malignancies, 40 % had undergonestem-cell transplantation (SCT), mainly allogeneic (75 %), and at least one half of thepatients were receiving first-line treatment for their disease at the time of ICU admission.Haematological features associated with a worse overall survival were being admitted fromthe haematological unit, relapsed disease and allogeneic SCT, whether neutropenia orthrombocytopenia at ICU admission were associated to worse survival in ICU. In contrast,intensity of previous chemotherapy, autologous SCT or having acute leukemia had notimpact in survival. ICU factors associated with shorter ICU survival were APACHE II andSOFA scores, previous use of antibiotics, antifungals or a previous microbiological isola-tion, mechanical ventilation and renal replacement therapy. Multivariate analysis showedmechanical ventilation, allogeneic SCT and relapsed disease as factors associated with bothICU and overall survival, whereas admission year (better in the recent years) was associatedonly with overall survival.CONCLUSIONS. The prognosis of critically ill haematological patients is associated toprevious allogeneic SCT, relapsed disease and mechanical ventilation. Autologous SCT or
acute leukemia presented similar mortality than other hematologic diseases or less intensivetherapies.
0413OUTCOME OF PATIENTS WITH SOLID TUMOURS ADMITTED TO INTENSIVECARE WITH A MEDICAL DIAGNOSIS
K.A. Puxty1, D. Morrison2, J. Kinsella1, T. Quasim1
1University of Glasgow, Department of Anaesthesia, Glasgow, UK, 2University of Glasgow,Public Health, Glasgow, UKINTRODUCTION. In the past, admission of cancer patients to the intensive care unit(ICU) was considered controversial due to the high mortality rates in this group of patients.More recently this effect appears to be diminishing possibly due to improvements in patientselection and supportive care [1, 2]. However, studies of patients with solid tumours includea large proportion of surgical patients in whom ICU outcomes are favourable.[2].OBJECTIVES. We planned to describe the demographic and survival outcomes of cancerpatients with solid tumours admitted to ICU with a medical diagnosis.METHODS. Following ethical approval we linked data from the clinical databases of fourlocal ICUs between 1/1/2000 to 31/12/2009, to the West of Scotland Cancer Registry toproduce a dataset of patients who have had cancer and an admission to ICU. The dataset wasrestricted to only include those admitted to ICU with a medical diagnosis and a solid tumourdiagnosed within the 5 years prior to or during the ICU admission. We created a seconddataset of patients who have been admitted to ICU with a medical diagnosis but have neverhad cancer.RESULTS. There were 1,717 patients (10.9 %) that were identified as having a solidtumour of which 345 patients (20.1 %) had a medical cause for admission. When comparedwith the non-cancer population, patients with cancer were older, mean age 63.1 years (SD14.0) vs 52.3 years (SD 17.3) p \ 0.0001, with a higher APACHE II score, 23.4 (SD 7.7) vs20.9 (SD 8.8) p \ 0.0001. ICU mortality was higher in the cancer group (45.8 vs 30.6 %p \ 0.0001) as was hospital mortality (57.7 vs 38.2 % p \ 0.0001). This higher ICUmortality appears to be maintained with varying APACHE II score (Figure 1). ICU mor-tality increased with the number of organs being supported and remained higher in thecancer group. (Table 1).
Figure 1
Table 1
CONCLUSIONS. This data suggests that the prognosis of medical cancer patients admittedto ICU is not equivalent to those without cancer. These differences in mortality requirefurther exploration.REFERENCE (S) 1. Taccone FS, Artigas AA, Sprung CL, et al. Characteristics and out-comes of cancer patients in European ICUs. Crit Care. 2009;13:R15. 2. Soares M, Caruso P,
26th ESICM ANNUAL CONGRESS — PARIS, FRANCE — 5–9 OCTOBER 2013
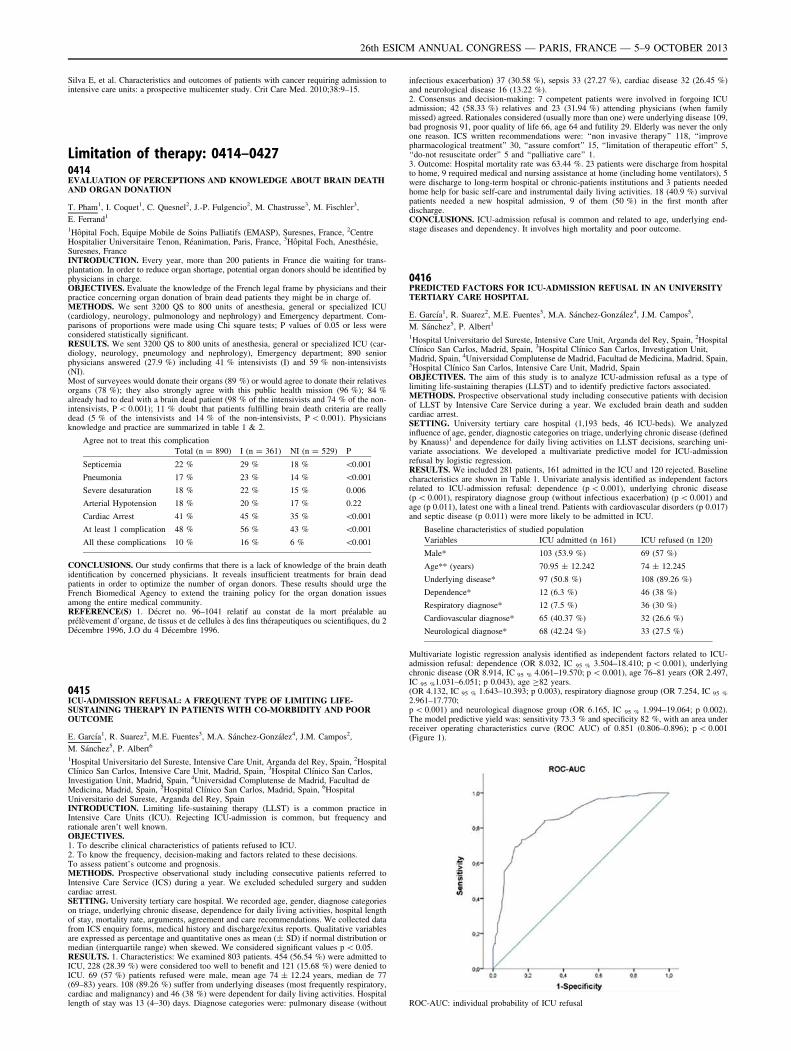
Silva E, et al. Characteristics and outcomes of patients with cancer requiring admission tointensive care units: a prospective multicenter study. Crit Care Med. 2010;38:9–15.
Limitation of therapy: 0414–04270414EVALUATION OF PERCEPTIONS AND KNOWLEDGE ABOUT BRAIN DEATHAND ORGAN DONATION
T. Pham1, I. Coquet1, C. Quesnel2, J.-P. Fulgencio2, M. Chastrusse3, M. Fischler3,
E. Ferrand1
1Hôpital Foch, Equipe Mobile de Soins Palliatifs (EMASP), Suresnes, France, 2CentreHospitalier Universitaire Tenon, Réanimation, Paris, France, 3Hôpital Foch, Anesthésie,Suresnes, FranceINTRODUCTION. Every year, more than 200 patients in France die waiting for trans-plantation. In order to reduce organ shortage, potential organ donors should be identified byphysicians in charge.OBJECTIVES. Evaluate the knowledge of the French legal frame by physicians and theirpractice concerning organ donation of brain dead patients they might be in charge of.METHODS. We sent 3200 QS to 800 units of anesthesia, general or specialized ICU(cardiology, neurology, pulmonology and nephrology) and Emergency department. Com-parisons of proportions were made using Chi square tests; P values of 0.05 or less wereconsidered statistically significant.RESULTS. We sent 3200 QS to 800 units of anesthesia, general or specialized ICU (car-diology, neurology, pneumology and nephrology), Emergency department; 890 seniorphysicians answered (27.9 %) including 41 % intensivists (I) and 59 % non-intensivists(NI).Most of surveyees would donate their organs (89 %) or would agree to donate their relativesorgans (78 %); they also strongly agree with this public health mission (96 %); 84 %already had to deal with a brain dead patient (98 % of the intensivists and 74 % of the non-intensivists, P \ 0.001); 11 % doubt that patients fulfilling brain death criteria are reallydead (5 % of the intensivists and 14 % of the non-intensivists, P \ 0.001). Physiciansknowledge and practice are summarized in table 1 & 2.
Agree not to treat this complication
Total (n = 890) I (n = 361) NI (n = 529) P
Septicemia 22 % 29 % 18 % \0.001
Pneumonia 17 % 23 % 14 % \0.001
Severe desaturation 18 % 22 % 15 % 0.006
Arterial Hypotension 18 % 20 % 17 % 0.22
Cardiac Arrest 41 % 45 % 35 % \0.001
At least 1 complication 48 % 56 % 43 % \0.001
All these complications 10 % 16 % 6 % \0.001
CONCLUSIONS. Our study confirms that there is a lack of knowledge of the brain deathidentification by concerned physicians. It reveals insufficient treatments for brain deadpatients in order to optimize the number of organ donors. These results should urge theFrench Biomedical Agency to extend the training policy for the organ donation issuesamong the entire medical community.REFERENCE(S) 1. Décret no. 96–1041 relatif au constat de la mort préalable auprélèvement d’organe, de tissus et de cellules à des fins thérapeutiques ou scientifiques, du 2Décembre 1996, J.O du 4 Décembre 1996.
0415ICU-ADMISSION REFUSAL: A FREQUENT TYPE OF LIMITING LIFE-SUSTAINING THERAPY IN PATIENTS WITH CO-MORBIDITY AND POOROUTCOME
E. Garcı́a1, R. Suarez2, M.E. Fuentes3, M.A. Sánchez-González4, J.M. Campos2,
M. Sánchez5, P. Albert6
1Hospital Universitario del Sureste, Intensive Care Unit, Arganda del Rey, Spain, 2HospitalClı́nico San Carlos, Intensive Care Unit, Madrid, Spain, 3Hospital Clı́nico San Carlos,Investigation Unit, Madrid, Spain, 4Universidad Complutense de Madrid, Facultad deMedicina, Madrid, Spain, 5Hospital Clı́nico San Carlos, Madrid, Spain, 6HospitalUniversitario del Sureste, Arganda del Rey, SpainINTRODUCTION. Limiting life-sustaining therapy (LLST) is a common practice inIntensive Care Units (ICU). Rejecting ICU-admission is common, but frequency andrationale aren’t well known.OBJECTIVES.1. To describe clinical characteristics of patients refused to ICU.2. To know the frequency, decision-making and factors related to these decisions.To assess patient’s outcome and prognosis.METHODS. Prospective observational study including consecutive patients referred toIntensive Care Service (ICS) during a year. We excluded scheduled surgery and suddencardiac arrest.SETTING. University tertiary care hospital. We recorded age, gender, diagnose categorieson triage, underlying chronic disease, dependence for daily living activities, hospital lengthof stay, mortality rate, arguments, agreement and care recommendations. We collected datafrom ICS enquiry forms, medical history and discharge/exitus reports. Qualitative variablesare expressed as percentage and quantitative ones as mean (± SD) if normal distribution ormedian (interquartile range) when skewed. We considered significant values p \ 0.05.RESULTS. 1. Characteristics: We examined 803 patients. 454 (56.54 %) were admitted toICU, 228 (28.39 %) were considered too well to benefit and 121 (15.68 %) were denied toICU. 69 (57 %) patients refused were male, mean age 74 ± 12.24 years, median de 77(69–83) years. 108 (89.26 %) suffer from underlying diseases (most frequently respiratory,cardiac and malignancy) and 46 (38 %) were dependent for daily living activities. Hospitallength of stay was 13 (4–30) days. Diagnose categories were: pulmonary disease (without
infectious exacerbation) 37 (30.58 %), sepsis 33 (27.27 %), cardiac disease 32 (26.45 %)and neurological disease 16 (13.22 %).2. Consensus and decision-making: 7 competent patients were involved in forgoing ICUadmission; 42 (58.33 %) relatives and 23 (31.94 %) attending physicians (when familymissed) agreed. Rationales considered (usually more than one) were underlying disease 109,bad prognosis 91, poor quality of life 66, age 64 and futility 29. Elderly was never the onlyone reason. ICS written recommendations were: ‘‘non invasive therapy’’ 118, ‘‘improvepharmacological treatment’’ 30, ‘‘assure comfort’’ 15, ‘‘limitation of therapeutic effort’’ 5,‘‘do-not resuscitate order’’ 5 and ‘‘palliative care’’ 1.3. Outcome: Hospital mortality rate was 63.44 %. 23 patients were discharge from hospitalto home, 9 required medical and nursing assistance at home (including home ventilators), 5were discharge to long-term hospital or chronic-patients institutions and 3 patients neededhome help for basic self-care and instrumental daily living activities. 18 (40.9 %) survivalpatients needed a new hospital admission, 9 of them (50 %) in the first month afterdischarge.CONCLUSIONS. ICU-admission refusal is common and related to age, underlying end-stage diseases and dependency. It involves high mortality and poor outcome.
0416PREDICTED FACTORS FOR ICU-ADMISSION REFUSAL IN AN UNIVERSITYTERTIARY CARE HOSPITAL
E. Garcı́a1, R. Suarez2, M.E. Fuentes3, M.A. Sánchez-González4, J.M. Campos5,
M. Sánchez5, P. Albert1
1Hospital Universitario del Sureste, Intensive Care Unit, Arganda del Rey, Spain, 2HospitalClı́nico San Carlos, Madrid, Spain, 3Hospital Clı́nico San Carlos, Investigation Unit,Madrid, Spain, 4Universidad Complutense de Madrid, Facultad de Medicina, Madrid, Spain,5Hospital Clı́nico San Carlos, Intensive Care Unit, Madrid, SpainOBJECTIVES. The aim of this study is to analyze ICU-admission refusal as a type oflimiting life-sustaining therapies (LLST) and to identify predictive factors associated.METHODS. Prospective observational study including consecutive patients with decisionof LLST by Intensive Care Service during a year. We excluded brain death and suddencardiac arrest.SETTING. University tertiary care hospital (1,193 beds, 46 ICU-beds). We analyzedinfluence of age, gender, diagnostic categories on triage, underlying chronic disease (definedby Knauss)1 and dependence for daily living activities on LLST decisions, searching uni-variate associations. We developed a multivariate predictive model for ICU-admissionrefusal by logistic regression.RESULTS. We included 281 patients, 161 admitted in the ICU and 120 rejected. Baselinecharacteristics are shown in Table 1. Univariate analysis identified as independent factorsrelated to ICU-admission refusal: dependence (p \ 0.001), underlying chronic disease(p \ 0.001), respiratory diagnose group (without infectious exacerbation) (p \ 0.001) andage (p 0.011), latest one with a lineal trend. Patients with cardiovascular disorders (p 0.017)and septic disease (p 0.011) were more likely to be admitted in ICU.
Baseline characteristics of studied population
Variables ICU admitted (n 161) ICU refused (n 120)
Male* 103 (53.9 %) 69 (57 %)
Age** (years) 70.95 ± 12.242 74 ± 12.245
Underlying disease* 97 (50.8 %) 108 (89.26 %)
Dependence* 12 (6.3 %) 46 (38 %)
Respiratory diagnose* 12 (7.5 %) 36 (30 %)
Cardiovascular diagnose* 65 (40.37 %) 32 (26.6 %)
Neurological diagnose* 68 (42.24 %) 33 (27.5 %)
Multivariate logistic regression analysis identified as independent factors related to ICU-admission refusal: dependence (OR 8.032, IC 95 % 3.504–18.410; p \ 0.001), underlyingchronic disease (OR 8.914, IC 95 % 4.061–19.570; p \ 0.001), age 76–81 years (OR 2.497,IC 95 %1.031–6.051; p 0.043), age C82 years.(OR 4.132, IC 95 % 1.643–10.393; p 0.003), respiratory diagnose group (OR 7.254, IC 95 %
2.961–17.770;p \ 0.001) and neurological diagnose group (OR 6.165, IC 95 % 1.994–19.064; p 0.002).The model predictive yield was: sensitivity 73.3 % and specificity 82 %, with an area underreceiver operating characteristics curve (ROC AUC) of 0.851 (0.806–0.896); p \ 0.001(Figure 1).
ROC-AUC: individual probability of ICU refusal
26th ESICM ANNUAL CONGRESS — PARIS, FRANCE — 5–9 OCTOBER 2013
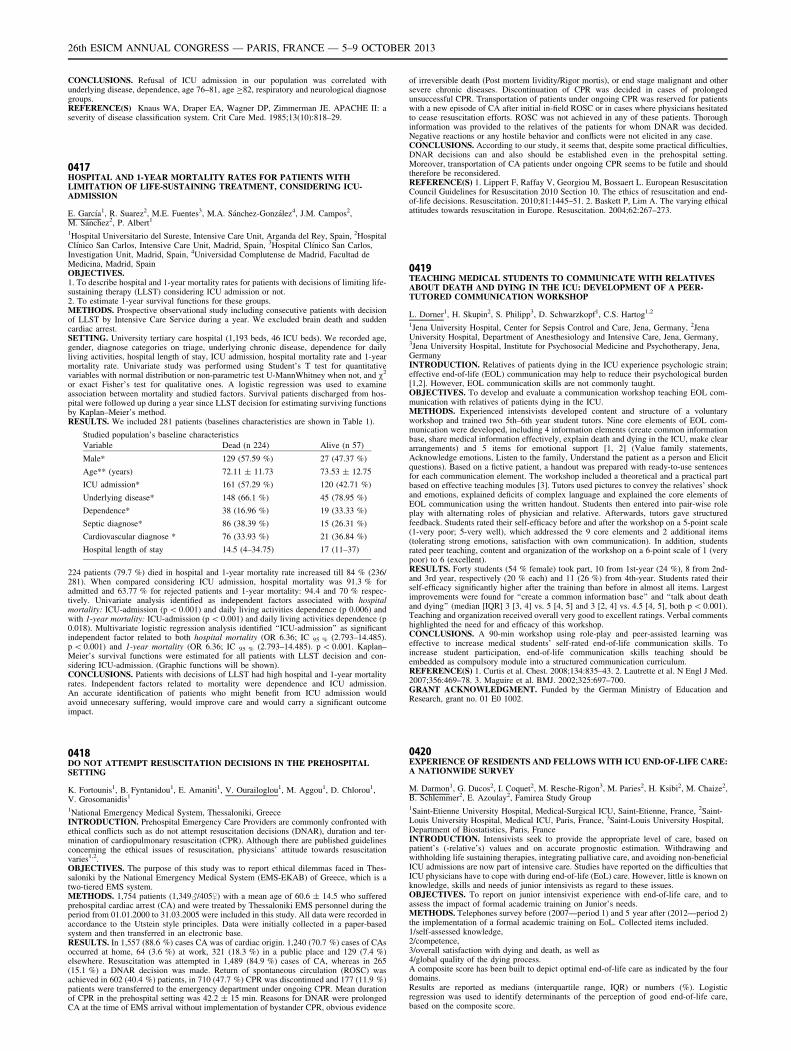
CONCLUSIONS. Refusal of ICU admission in our population was correlated withunderlying disease, dependence, age 76–81, age C82, respiratory and neurological diagnosegroups.REFERENCE(S) Knaus WA, Draper EA, Wagner DP, Zimmerman JE. APACHE II: aseverity of disease classification system. Crit Care Med. 1985;13(10):818–29.
0417HOSPITAL AND 1-YEAR MORTALITY RATES FOR PATIENTS WITHLIMITATION OF LIFE-SUSTAINING TREATMENT, CONSIDERING ICU-ADMISSION
E. Garcı́a1, R. Suarez2, M.E. Fuentes3, M.A. Sánchez-González4, J.M. Campos2,M. Sánchez2, P. Albert1
1Hospital Universitario del Sureste, Intensive Care Unit, Arganda del Rey, Spain, 2HospitalClı́nico San Carlos, Intensive Care Unit, Madrid, Spain, 3Hospital Clı́nico San Carlos,Investigation Unit, Madrid, Spain, 4Universidad Complutense de Madrid, Facultad deMedicina, Madrid, SpainOBJECTIVES.1. To describe hospital and 1-year mortality rates for patients with decisions of limiting life-sustaining therapy (LLST) considering ICU admission or not.2. To estimate 1-year survival functions for these groups.METHODS. Prospective observational study including consecutive patients with decisionof LLST by Intensive Care Service during a year. We excluded brain death and suddencardiac arrest.SETTING. University tertiary care hospital (1,193 beds, 46 ICU beds). We recorded age,gender, diagnose categories on triage, underlying chronic disease, dependence for dailyliving activities, hospital length of stay, ICU admission, hospital mortality rate and 1-yearmortality rate. Univariate study was performed using Student’s T test for quantitativevariables with normal distribution or non-parametric test U-MannWhitney when not, and v2
or exact Fisher’s test for qualitative ones. A logistic regression was used to examineassociation between mortality and studied factors. Survival patients discharged from hos-pital were followed up during a year since LLST decision for estimating surviving functionsby Kaplan–Meier’s method.RESULTS. We included 281 patients (baselines characteristics are shown in Table 1).
Studied population’s baseline characteristics
Variable Dead (n 224) Alive (n 57)
Male* 129 (57.59 %) 27 (47.37 %)
Age** (years) 72.11 ± 11.73 73.53 ± 12.75
ICU admission* 161 (57.29 %) 120 (42.71 %)
Underlying disease* 148 (66.1 %) 45 (78.95 %)
Dependence* 38 (16.96 %) 19 (33.33 %)
Septic diagnose* 86 (38.39 %) 15 (26.31 %)
Cardiovascular diagnose * 76 (33.93 %) 21 (36.84 %)
Hospital length of stay 14.5 (4–34.75) 17 (11–37)
224 patients (79.7 %) died in hospital and 1-year mortality rate increased till 84 % (236/281). When compared considering ICU admission, hospital mortality was 91.3 % foradmitted and 63.77 % for rejected patients and 1-year mortality: 94.4 and 70 % respec-tively. Univariate analysis identified as independent factors associated with hospitalmortality: ICU-admission (p \ 0.001) and daily living activities dependence (p 0.006) andwith 1-year mortality: ICU-admission (p \ 0.001) and daily living activities dependence (p0.018). Multivariate logistic regression analysis identified ‘‘ICU-admission’’ as significantindependent factor related to both hospital mortality (OR 6.36; IC 95 % (2.793–14.485).p \ 0.001) and 1-year mortality (OR 6.36; IC 95 % (2.793–14.485). p \ 0.001. Kaplan–Meier’s survival functions were estimated for all patients with LLST decision and con-sidering ICU-admission. (Graphic functions will be shown).CONCLUSIONS. Patients with decisions of LLST had high hospital and 1-year mortalityrates. Independent factors related to mortality were dependence and ICU admission.An accurate identification of patients who might benefit from ICU admission wouldavoid unnecesary suffering, would improve care and would carry a significant outcomeimpact.
0418DO NOT ATTEMPT RESUSCITATION DECISIONS IN THE PREHOSPITALSETTING
K. Fortounis1, B. Fyntanidou1, E. Amaniti1, V. Ourailoglou1, M. Aggou1, D. Chlorou1,V. Grosomanidis1
1National Emergency Medical System, Thessaloniki, GreeceINTRODUCTION. Prehospital Emergency Care Providers are commonly confronted withethical conflicts such as do not attempt resuscitation decisions (DNAR), duration and ter-mination of cardiopulmonary resuscitation (CPR). Although there are published guidelinesconcerning the ethical issues of resuscitation, physicians’ attitude towards resuscitationvaries1,2.OBJECTIVES. The purpose of this study was to report ethical dilemmas faced in Thes-saloniki by the National Emergency Medical System (EMS-EKAB) of Greece, which is atwo-tiered EMS system.METHODS. 1,754 patients (1,349#/405$) with a mean age of 60.6 ± 14.5 who sufferedprehospital cardiac arrest (CA) and were treated by Thessaloniki EMS personnel during theperiod from 01.01.2000 to 31.03.2005 were included in this study. All data were recorded inaccordance to the Utstein style principles. Data were initially collected in a paper-basedsystem and then transferred in an electronic base.RESULTS. In 1,557 (88.6 %) cases CA was of cardiac origin. 1,240 (70.7 %) cases of CAsoccurred at home, 64 (3.6 %) at work, 321 (18.3 %) in a public place and 129 (7.4 %)elsewhere. Resuscitation was attempted in 1,489 (84.9 %) cases of CA, whereas in 265(15.1 %) a DNAR decision was made. Return of spontaneous circulation (ROSC) wasachieved in 602 (40.4 %) patients, in 710 (47.7 %) CPR was discontinued and 177 (11.9 %)patients were transferred to the emergency department under ongoing CPR. Mean durationof CPR in the prehospital setting was 42.2 ± 15 min. Reasons for DNAR were prolongedCA at the time of EMS arrival without implementation of bystander CPR, obvious evidence
of irreversible death (Post mortem lividity/Rigor mortis), or end stage malignant and othersevere chronic diseases. Discontinuation of CPR was decided in cases of prolongedunsuccessful CPR. Transportation of patients under ongoing CPR was reserved for patientswith a new episode of CA after initial in-field ROSC or in cases where physicians hesitatedto cease resuscitation efforts. ROSC was not achieved in any of these patients. Thoroughinformation was provided to the relatives of the patients for whom DNAR was decided.Negative reactions or any hostile behavior and conflicts were not elicited in any case.CONCLUSIONS. According to our study, it seems that, despite some practical difficulties,DNAR decisions can and also should be established even in the prehospital setting.Moreover, transportation of CA patients under ongoing CPR seems to be futile and shouldtherefore be reconsidered.REFERENCE(S) 1. Lippert F, Raffay V, Georgiou M, Bossaert L. European ResuscitationCouncil Guidelines for Resuscitation 2010 Section 10. The ethics of resuscitation and end-of-life decisions. Resuscitation. 2010;81:1445–51. 2. Baskett P, Lim A. The varying ethicalattitudes towards resuscitation in Europe. Resuscitation. 2004;62:267–273.
0419TEACHING MEDICAL STUDENTS TO COMMUNICATE WITH RELATIVESABOUT DEATH AND DYING IN THE ICU: DEVELOPMENT OF A PEER-TUTORED COMMUNICATION WORKSHOP
L. Dorner1, H. Skupin2, S. Philipp3, D. Schwarzkopf1, C.S. Hartog1,2
1Jena University Hospital, Center for Sepsis Control and Care, Jena, Germany, 2JenaUniversity Hospital, Department of Anesthesiology and Intensive Care, Jena, Germany,3Jena University Hospital, Institute for Psychosocial Medicine and Psychotherapy, Jena,GermanyINTRODUCTION. Relatives of patients dying in the ICU experience psychologic strain;effective end-of-life (EOL) communication may help to reduce their psychological burden[1,2]. However, EOL communication skills are not commonly taught.OBJECTIVES. To develop and evaluate a communication workshop teaching EOL com-munication with relatives of patients dying in the ICU.METHODS. Experienced intensivists developed content and structure of a voluntaryworkshop and trained two 5th–6th year student tutors. Nine core elements of EOL com-munication were developed, including 4 information elements (create common informationbase, share medical information effectively, explain death and dying in the ICU, make cleararrangements) and 5 items for emotional support [1, 2] (Value family statements,Acknowledge emotions, Listen to the family, Understand the patient as a person and Elicitquestions). Based on a fictive patient, a handout was prepared with ready-to-use sentencesfor each communication element. The workshop included a theoretical and a practical partbased on effective teaching modules [3]. Tutors used pictures to convey the relatives’ shockand emotions, explained deficits of complex language and explained the core elements ofEOL communication using the written handout. Students then entered into pair-wise roleplay with alternating roles of physician and relative. Afterwards, tutors gave structuredfeedback. Students rated their self-efficacy before and after the workshop on a 5-point scale(1-very poor; 5-very well), which addressed the 9 core elements and 2 additional items(tolerating strong emotions, satisfaction with own communication). In addition, studentsrated peer teaching, content and organization of the workshop on a 6-point scale of 1 (verypoor) to 6 (excellent).RESULTS. Forty students (54 % female) took part, 10 from 1st-year (24 %), 8 from 2nd-and 3rd year, respectively (20 % each) and 11 (26 %) from 4th-year. Students rated theirself-efficacy significantly higher after the training than before in almost all items. Largestimprovements were found for ‘‘create a common information base’’ and ‘‘talk about deathand dying’’ (median [IQR] 3 [3, 4] vs. 5 [4, 5] and 3 [2, 4] vs. 4.5 [4, 5], both p \ 0.001).Teaching and organization received overall very good to excellent ratings. Verbal commentshighlighted the need for and efficacy of this workshop.CONCLUSIONS. A 90-min workshop using role-play and peer-assisted learning waseffective to increase medical students’ self-rated end-of-life communication skills. Toincrease student participation, end-of-life communication skills teaching should beembedded as compulsory module into a structured communication curriculum.REFERENCE(S) 1. Curtis et al. Chest. 2008;134:835–43. 2. Lautrette et al. N Engl J Med.2007;356:469–78. 3. Maguire et al. BMJ. 2002;325:697–700.GRANT ACKNOWLEDGMENT. Funded by the German Ministry of Education andResearch, grant no. 01 E0 1002.
0420EXPERIENCE OF RESIDENTS AND FELLOWS WITH ICU END-OF-LIFE CARE:A NATIONWIDE SURVEY
M. Darmon1, G. Ducos2, I. Coquet2, M. Resche-Rigon3, M. Paries2, H. Ksibi2, M. Chaize2,B. Schlemmer2, E. Azoulay2, Famirea Study Group1Saint-Etienne University Hospital, Medical-Surgical ICU, Saint-Etienne, France, 2Saint-Louis University Hospital, Medical ICU, Paris, France, 3Saint-Louis University Hospital,Department of Biostatistics, Paris, FranceINTRODUCTION. Intensivists seek to provide the appropriate level of care, based onpatient’s (-relative’s) values and on accurate prognostic estimation. Withdrawing andwithholding life sustaining therapies, integrating palliative care, and avoiding non-beneficialICU admissions are now part of intensive care. Studies have reported on the difficulties thatICU physicians have to cope with during end-of-life (EoL) care. However, little is known onknowledge, skills and needs of junior intensivists as regard to these issues.OBJECTIVES. To report on junior intensivist experience with end-of-life care, and toassess the impact of formal academic training on Junior’s needs.METHODS. Telephones survey before (2007—period 1) and 5 year after (2012—period 2)the implementation of a formal academic training on EoL. Collected items included.1/self-assessed knowledge,2/competence,3/overall satisfaction with dying and death, as well as4/global quality of the dying process.A composite score has been built to depict optimal end-of-life care as indicated by the fourdomains.Results are reported as medians (interquartile range, IQR) or numbers (%). Logisticregression was used to identify determinants of the perception of good end-of-life care,based on the composite score.
26th ESICM ANNUAL CONGRESS — PARIS, FRANCE — 5–9 OCTOBER 2013
RESULTS. 429 junior intensivists were surveyed, 299 during period 1 (109 ICUs) and 130during period 2 (49 ICUS). Most of the responders were residents (74.7 %), aged of28 years (27–30). Respondents were of male gender more frequently during period 1 (64.5vs. 50 % in period 2, p = 0.002).Respondents reported more frequently having received a dedicated formation regarding EoLdecision or triage during period 2 (38.5 vs. 17.3 % during period 1, p \ 0.0001).During period 2 respondents reported being less uncomfortable or having uncertaintyregarding the EOL or triage process (17.7 vs. 38.9 % in period 1 [P \ 0.0001] and 48.5vs.69.4 % in period 1 [P \ 0.0001] respectively). Self-assessed knowledge and skills withend-of-life care (likert scale from 0 to 10), were respectively lower and higher during period2 [5 (4–6) vs. 6 (5–6), P = 0.006 and 6 (5–7) vs. 5 (5–6), P = 0.05].Factors independently associated with good perception of the dying process (logisticregression) were age (OR 1.19 per year; 95 % CI 1.09–1.25) and male gender (OR 1.61;95 % CI 1.05–2.47). Conversely, previous conflict with family members (OR 0.58; 95 % CI0.0.37–0.87) and absence of formal training (OR 0.29; 95 % CI 0.17–0.50) were associatedwith a poor perception of this process.CONCLUSIONS. This study adds information as regard to junior’s experience with ICUEoLcare. Implementation of formal academic training and courses dedicated to EoL care isassociated with a better perception of the dying process, may decrease uncertainty andincrease junior’s comfort. Studies assessing proactive training program are needed as well asqualitative data to understand which aspects of end-of-life care deserve specific skills.
0421KNOWLEDGE AND PERCEPTIONS ABOUT THE COLLEGIAL PROCESSIN DECISIONS TO WITHHOLD/WITHDRAW LIFE SUSTAININGTREATMENTS AMONG FRENCH PHYSICIANS
T. Pham1, I. Coquet1, C. Quesnel2, J.-P. Fulgencio2, M. Chastrusse3, M. Fischler3,E. Ferrand1
1Hôpital Foch, Equipe Mobile de Soins Palliatifs (EMASP), Suresnes, France, 2CentreHospitalier Universitaire Tenon, Réanimation, Paris, France, 3Hôpital Foch, Anesthésie,Suresnes, FranceINTRODUCTION. Decisions to withdraw or withhold life sustaining treatments avoidtherapeutic obstinacy. In France since 2005 a specific Law (the Leonetti Act) regulates thesedecisions when the patient is unable to express himself and the healthcare team must followa collegial process with an interdisciplinary approach.OBJECTIVES. The aim of this study was to evaluate what is the current knowledge of thecollegial process in decision making among concerned physicians 7 years after the LeonettiAct.METHODS. Multicenter observational study based on an anonymous questionnaire (QS)proposed to senior hospital physicians who might treat patients concerned by withdrawingor withholding decisions. The QS dealt with their knowledge, feelings and practice con-cerning withdrawing and withholding process. Comparisons of proportions were made usingChi square test, P values of 0.05 or less were considered statistically significant.RESULTS. We sent 3,200 QS to 800 units of anaesthesia, general or specialized ICU(cardiology, neurology, pneumology and nephrology) and Emergency department; 890senior physicians responded (27.9 %) including 41 % intensivists (I) and 59 % non in-tensivists (NI).The collegial process criteria were declared to be known by 45 %, but only 25 % knew howto describe it; 28 % thought decision making could lead to conflict. Knowledge, actualpractice and perceptions of the process are summarized in Table 1.
Table 1 Knowledge and respect of the collegial process
Total(n = 890)(%)
I(n = 361)(%)
NI(n = 529)(%)
P
Declared to know the process 45 70 28 \0.001
Actual knowledge 25 27 6 \0.001
Consults the nurse 56 66 50 \0.001
Consults the relatives 47 67 34 \0.001
Know the surrogate part 57 69 49 \0.001
Advice of an external consultant 42 56 32 \0.001
Process traceability 65 83 54 \0.001
Strict observance of the process 28 35 24 0.001
Observance of the process exceptthe advice of an externalconsultant
68 78 59 \0.001
CONCLUSIONS. Our study confirms that there is a lack of knowledge of the legalrequirement of withdrawal/withholding decisions by concerned physicians. The impact ofthis ignorance appears to be subdued in practice, especially in ICU, except when an externalconsultant is involved, which seems to be a specific issue. A lot has to be done in order toensure that laws are implemented.REFERENCE(S). Journal Officiel 23 Avril 2005, ‘Loi no 2005-370 du 22 avril 2005relative aux droits des malades et à la fin de vie’.
0422THE EXPERT-ICU STUDY: A FRENCH MULTICENTER STUDY OF ICUPHYSICIAN-BASED DETERMINANTS OF LIFE-SUSTAINING THERAPYDURING NIGHT AND WEEK-END SHIFTS
M. Ben-Rehouma1, J.-F. Timsit2,3,4, S. Ruckly4, M. Darmon3,5, C. Clec’h3,6, C. Adrie7,A. Tabah1, E. Azoulay3,8, M. Garrouste-Orgeas1,3, Outcomerea Research Group1Saint Joseph Hospital Network, Medical-Surgical ICU, Paris, France, 2Albert MichallonUniversity Hospital, Medical ICU, Grenoble, France, 3Joseph Fourier University, AlbertBonniot Institute, La Tronche, France, 4Outcomerea, Department of Statistics, La Tronche,France, 5Saint-Etienne University Hospital, Medical ICU, Saint-Priest en Jarez, France,6Avicenne University Hospital, Medical ICU, Bobigny, France, 7Cochin UniversityHospital, Department of Physiology, Paris, France, 8Saint Louis University Hospital,Medical ICU, Paris, France
INTRODUCTION. Few studies of physician-related factors, experience, specialty, reli-gion, ethnicity, and nationality exploring intensity of care were available.OBJECTIVES. To describe patient’s characteristics admitted during the night and week-end shift, to assess the physician-based determinants life sustaining treatments of patientsadmitted while adjusting on center effects.METHODS. An observational study (2001–2009) was performed in six ICUs. The patient’scharacteristics were extracted from the prospective database Rhea (Outcomerea group). InSeptember 2012, physicians answered a questionnaire on line exploring the following: age,gender, religion and religiosity, ICU experience, specialty, belonging to the staff or not. Weused hierarchical mixed models to adjust on center and physician random effects.RESULTS. Of the 9,627 ICU stays 2,181 (22 %) were deleted (lack of admission hour). Ofthe 166 physicians who participated in duties, 156 (93 %) physicians were contacted. Theresponse rate was 119/156 (76 %). The ICU physicians were men (70 %), 41 ± 7.8 yearsold, catholic (51.3 %), with a background of 50 duties and over in 40 % of them before thefirst duty in the study center. Patients admitted during duties vs those outside the dutyrespectively had significantly less hematologic diseases and metastatic cancer (229/4,398;5.2 % vs 261/4,230; 6.2 %) and (247/4,398; 5.6 % vs 269/4,230; 6.4 %; p = 0.05) orrespiratory chronic diseases (p \ 0.001). They were less mechanically ventilated (1,852/4,398; 42.3 % vs 1,952/4,230; 46.1 %, p = 0.0004), had less central catheter (1,859/4,398;42.3 % vs 1,083/4,230; 48.1 %; p \ 0.0001) or arterial catheters (1,313/4,398; 29.9 % vs1,430/4,230; 33.8 %, p \ 0.0001). ICU and hospital mortality were not different. Whenadjusted on center and physician random effects, SAPS II score was higher for ICU patientsaccepted by women [median (25–75 %)] [42 (29–58) vs 40 (28–54); p = 0.004] andphysician without religion [42 (29–56) vs 39 (28–54); p = 0.02]. Similarly, during the first48 h, physicians aged \35 years used more vasopressors (OR 1.15, 95 % CI 1.08–1.22,p \ 0.0001), start renal replacement therapy (OR 1.04, 95 % CI 1.07–1.19, p = 0.04).Physicians with emergency care as primary specialty used invasive mechanical ventilationmore frequently (OR 1.14, 95 %CI 1.04–1.24, p = 0.004). Physicians’ religiosity wasassociated with more non-invasive mechanical ventilation (NIV) (OR 1.05, 95 % CI1.01–1.09, p = 0.008) whereas, experience ([20 years of duty) was associated with lessNIV (OR 0.91, 95 % CI 0.85–0.98, p = 0.008). At day 3–4, the only physicians’ charac-teristic associated with withholding or withdrawing treatment was the admission by aphysician who did not belong to the staff.CONCLUSIONS. Patients admitted during the duty period had less comorbidities andreceived less intensity of treatment. Physicians-based determinants influencing life-sus-taining treatments were age, religion, specialty, experience and not belonging to the ICUcenter team.
0423TIMING, CONTENT AND IMPACT OF END OF LIFE DISCUSSIONSWITH PATIENTS AND FAMILIES IN ICU: PERSPECTIVES FROM ISRAELAND THE UK
R. Endacott1,2, F. de Keyser Ganz3, J. Benbenishty4, M. Ben Nunn5, H. Ryan6,W. Chamberlain7, C. Boulanger8, C. Boyer1
1Plymouth University, School of Nursing & Midwifery, Plymouth, United Kingdom,2Monash University, School of Nursing & Midwifery, Melbourne, Australia, 3HadassahHebrew University, School of Nursing & Midwifery, Jerusalem, Israel, 4Hadassah HebrewUniversity Medical Center, ICU, Jerusalem, Israel, 5Kaplan Medical Centre, ICU, Rehovot,Israel, 6Yeovil District Hospital NHS Foundation Trust, ICU, Yeovil, United Kingdom,7Taunton & Somerset NHS Foundation Trust, ICU, Taunton, United Kingdom, 8RoyalDevon & Exeter Hospital NHS Foundation Trust, ICU, Exeter, United KingdomINTRODUCTION. Preferences and processes for ICU end of life care vary across coun-tries [1] and public and clinician expectations of outcome do not always match [2].Identifying opportunities and appropriate content for end of life discussions with ICUpatients and families is an area where learning across country boundaries can be fruitful.OBJECTIVES. 1. To identify factors perceived by ICU nurses to contribute to the qualityof dying in Israel and the UK. 2. To compare the emotional content of discussions betweenICU nurses about end of life care in Israel and the UK.METHODS. Focus group and individual interviews were conducted with nurses (n = 55)in four ICUs in Israel and three ICUs in the UK. Data were analysed using qualitativethematic analysis and quantitative Linguistic Inquiry and Word Count (LIWC) software toexamine the amount and content of emotional talk.RESULTS. The dominant factors identified by participants across units and countries werethe timing and content of end of life communication. Participants also identified similarcritical junctures, such as the first visit of the family to ICU, where the quality of com-munication influenced the quality of end of life care. The individual responses toapproaching death by clinicians and families could be accommodated when communicationwas effective. The amount of emotional talk used by participants when recounting end oflife narratives varied by Unit and by country.CONCLUSIONS. Findings suggest that individual ICU culture may influence communi-cation processes when talking about end of life care with patients and families. The criticaljunctures identified by participants may provide a useful framework for guiding end of lifediscussions in ICU.REFERENCE(S). 1. Sprung CL, Woodcock T, Sjokvist P, Ricou B, Bulow HH, Lippert D,et al. Reason, considerations, difficulties and documentation of end-of-life decisions inEuropean intensive care units: the ETHICUS study. Intensive Care Med. 2008;34:271–277.2. Endacott R, Boyer C. Preparing for the unavoidable: public and clinician expectations ofdeath. Nurs Crit Care. 2013; in press.GRANT ACKNOWLEDGMENT. Isaiah Berlin Academic Study Group.
0424DISCUSSION AND DOCUMENTATION OF DO NOT ATTEMPTRESUSCITATION (DNAR) DECISIONS IN A DGH
M. Toynbee1,2, O. Nicholas1, D. Dutta3
1Princess Alexandra Hospital NHS Trust, Harlow, United Kingdom, 2Homerton UniversityHospital NHS Foundation Trust, London, United Kingdom, 3Princess Alexandra HospitalNHS Trust, Intensive Care Unit, Harlow, United KingdomINTRODUCTION. Decisions relating to resuscitation are emotive, topical and imperativeto patient-centred care. There is increasing consensus on the importance of early discussionand decision-making, with clear unambiguous documentation of this process and outcomefor all acute admissions [1]. The recent National Confidential Enquiry into Patient Outcomeand Death (NCEPOD) publication ‘CAP: Time to Intervene’ [2] highlights the inadequacynationally of consideration and documentation.
26th ESICM ANNUAL CONGRESS — PARIS, FRANCE — 5–9 OCTOBER 2013
OBJECTIVES. Our hospital, Princess Alexandra3, adopted the new East of England NHSDNR documentation pro-forma in early 2012. The NCEPOD report concluded that 85 % ofinpatient CPR attempts were futile and that the majority of these failed attempts wereclinically predictable, highlighting the inadequacies of decision-making and documentation.We aimed to look at the completion rates of this new document on our medical wards tocompare this with regional and national rates and improve this as necessary.METHODS. We undertook a complete survey of all medical inpatients notes on four wards(n = 96) on a single day; recording the completion rates, completeness of documentationand record of outcome of DNAR decisions. Having analysed our results we communicatedour findings and suggestions for improvement to the trust: This included a trust-widemeeting and dissemination of the new targets electronically. Given that this area of hospitalpractice is most important in acute medical admissions, we focused on staff in this area byadditionally following-up on understanding and suitability of the new pro-forma with care-providers on a one-to-one basis. We then repeated the survey 3 months later.RESULTS. Our initial rates of documentation were in line with national averages (25 %compared to 22 % nationally) but below local trust policy and national guidelines (both100 %). By re-audit we had almost doubled this to 48 %. A similar improvement was seenin rates of consultant involvement in decision-making. We also saw greatly improved ratesof discussion with both patients and their families, an issue that is becoming increasinglyimportant.CONCLUSIONS. Locally and nationally DNAR decisions are inadequately discussed anddocumented. This results in significant distress for patients, their families and healthcareproviders. Whilst the ethical and financial implications of predictably futile CPR attemptsare important to raise throughout a hospital trust, we have shown that significantimprovements can be made by focusing discussions and setting targets.REFERENCE(S). 1. Decisions relating to cardiopulmonary resuscitation-joint statementfrom BMA, Resuscitation Council (UK) and Royal College of Nursing-Oct 2007. 2. Time toIntervene? NCEPOD report 2012. 3. Resuscitation Policy, PAH NHS Trust, January 2012.
0425A REVIEW OF THE METHODS OF WITHDRAWAL OF LIFE SUSTAININGCARE IN INTENSIVE CARE
L.G. Young1, J. Cuthill1
1Glasgow Royal Infirmary, Intensive Care Unit, Glasgow, United KingdomINTRODUCTION. No specific UK guidelines currently exist as to how life-sustaininginterventions, in particular ventilation, should be withdrawn in the ICU. Some cliniciansprefer immediate terminal extubation, whilst others prefer rapid terminal weaning ofventilation.OBJECTIVES. The aim of this audit was to examine the specific unit practice with regardto withdrawal of life sustaining care in intensive care patients over a 1 year period.METHODS. All patients who died in our intensive care unit in the year 2012 plus thosedischarged for ‘palliative care’ were found by searching the Wardwatcher database. Medicaland nursing notes of these patients were retrospectively reviewed via the CareVue electronicpatient record system.RESULTS. Glasgow Royal Infirmary is a 20-bedded unit consisting of 12 level 3 and 8level 2 beds. It provides tertiary services for burns and pancreatitis. In 2012 our unitadmitted 947 patients of which 135 (14.3 %) died. Life sustaining care was activelywithdrawn in eighty-four level 3 patients. Eighty of these died within the unit, three furtherpatients were discharged to the ward for ongoing palliative care and one was dischargedhome for palliation. Of the 80 patients who died in the unit following withdrawal, themedian age was 67 years (range 17–84). The median time from admission to the decision towithdraw was 5 days (range 1–124). 26 % patients were extubated, 29 % were converted toa swedish nose and 2 % to a T-piece, and 17 % had rapid terminal weaning of ventilationwithout extubation (remaining 26 % unclear). Fifty-six patients were prescribed vasopressoragents at the time of decision to withdraw which were discontinued in 38 patients (68 %),continued in 2 patients, and the management was unclear in the remaining 16. Median timefrom withdrawal of therapy to death was 39 min (range 10 min–18 h 54 min) in theextubated patients versus 42 min (range 6 min–11 h 30 min) (p = 0.14) in all other patients.CONCLUSIONS. Significant variation in practice exists within our unit, with the mode ofwithdrawal being decided by the consultant in charge on a specific day.Our unit adopted a critical care end of life pathway in February 2013. This includesreminders to ensure that there is a ‘Do Not Attempt Resuscitation’ form completed, familymembers have been made aware and that all inappropriate tests and monitoring have beendiscontinued. It also covers spiritual care and consideration of organ donation. We plan torepeat this audit in 6 months to assess the impact this pathway has had on our practice.REFERENCE(S). 1. Campbell ML. How to withdraw mechanical ventilation. AACN AdvCrit Care. 2007;18(4):397–403. 2. Truog et al. Recommendations for end-of-life care in theintensive care unit: a consensus statement by the American College of Critical CareMedicine. Crit Care Med. 2008;36(3):953–63.
0426LIVE SUPPORT THERAPY LIMITATION PRACTICES IN A SPANISHPOLIVALENT ICU
M. Llauradó1,2, A. Sandiumenge1,2,3, P. López4, J. Twose4, E. Cos3, V. Blázquez3,
M. Bodı́1,2,3
1Institut d’Investigació Sanitària Pere Virgili, Intensive Care Unit-University Hospital JoanXXIII, Tarragona, Spain, 2Universitat Rovira i Virgili, Tarragona, Spain, 3UniversityHospital Joan XXIII, Intensive Care Unit, Tarragona, Spain, 4Catalan TransplantOrganization, Barcelona, SpainINTRODUCTION. Many patients admitted in the ICU are under some kind of live supporttherapy limitation (LSTL). These practices vary depending on the geographical region aswell as its cultural patterns. However, LSTL practices have changed in the last years.OBJECTIVES. To describe LSTL practices in a polivalent ICU and to compare charac-teristics of dead patients according to the application or not of LTSL.METHODS. Prospective, observational, 9-month study of all patients who died and/orunderwent LSTL in a 30-bed adult polivalent ICU.First LTSL action (F-LSTL) and the last or definitive action (D-LSTL) were registered. TheD-LSTL was defined as the LSTL action that preceded patient’s death in ICU.Patient’s characteristics and F-LSTL and/or D-LSTL actions were described.A total of 604 patients were admitted in the ICU, with a mortality rate of 20.4 % (n = 122).RESULTS. In the study period, 123 (20.5 %) underwent LSTL, of whom 39 patients(31.7 %) survived the ICU and 31 (25.2 %) of them were alive at hospital discharge.Patients undergoing LSTL were 59.0 % male; 68.8 ± 14.0 years old; APACHEII
20.5 ± 6.8; 72.1 % medical, 21.3 % surgical, 5.7 % trauma, and 23.8 % neurocritical. Nodifferences were found in demographic characteristics of patients who died after LTSV withrespect to those dying without LTSV.Main reasons for F-LSTL and D-LSTL were comorbidity (44.0 and 58.0 % respectively)and therapy futility (42.9 and 40.5 % respectively).First and definitive LSTL actions were taken 8 days and 4.5 h ± 11 days and 22 h, 8 daysand 10 h ± 10 days and 18 h after admission respectively. LSTL decisions agreementamong medical staff and with family was reached in 100 and 76 % respectively. 73.1 % ofthe LSTL actions were recorded in the medical history.Witholding measures (81.3 %) was the most frequent measure taken in the F-LTSL (36.5 %mechanical ventilation, 28.6 % do not ressucitate) followed by 14.5 % conditioned inten-sive therapy and 2.2 % withdrawing measures, whereas whithdrawing was the mostcommon action in D-LSTL (82.4 %) followed by withdolding (17.6 %). When measureswere withdrawn, 22 actions involved vasoactive support and/or 24 mechanical ventilation.Of those patients who died, time to death when measures were withhold was 2 days and4 h ± 2 days and 6.5 h and when measures were withdrawn was 6 h and 9 min ± 8 h and30 min (p \ 0.05).CONCLUSIONS. Despite LTSL is a frequent practice in the ICU, one out of four patientsundergoing this action survive hospital stay. Time to death is shorter in patients whomeasures are withdrawn than in those who undergo withholding.
0427AUDIT OF CARE WITHDRAWALS IN OUR INTENSIVE CARE UNIT
D. Dutta1, D. Ragavan1,2, E. Sweeney3, H. Tufton4
1The Princess Alexandra Hospital NHS Trust, Anaesthesia & Critical Care, Harlow, UnitedKingdom, 2Barnet Hospital NHS Trust, London, United Kingdom, 3Princess AlexandraHospital NHS Trust, Harlow, United Kingdom, 4The Princess Alexandra Hospital NHSTrust, Harlow, United KingdomINTRODUCTION. Withdrawal of active care is regularly practiced in critical care units.However, the spirits of BMA guidance [1] encompass Human Rights Act offering dignity andtransparent decision. The Intensive Care Society, UK laid down principles [2] towards everywithdrawal decisions. General Medical Council, UK gives a very broad based guidance to theprocess by offering examples of decision making models [3]. There is, however, no availableguidance on assessment of therapeutic futility given the diversity of cases. The purpose ofthis prospective study was to identify current patterns in withdrawal of care.OBJECTIVES. To assess the various factors surrounding withdrawal of care from patientsadmitted to a single ITU/HDU unit in the UK.METHODS. Prospective single centre study lasting 7.5 months with a 34 % inclusion rateof all candidates. Dates & Times recorded for each patient: on admission to ITU; onwithdrawal of care; at patient death. Data recorded on: admitting reason, co-morbidities,members of staff involved in decision, reasons for decision; organ donation decisions.RESULTS. 27/74 potential patients admitted to audit. Average age at admission 72.74 years(range 44–91 years; SD 11.71), Average time to withdrawal of care 4.25 days (0-21 days; SD4.95), Average time from withdrawal to death 318 min (0–1,870 min; SD 395 min). Con-sultants were involved in all withdrawal decisions, without any disagreement from staff orpatients. 26 patients (96.2 %) had care withdrawn on clinical grounds of futility. In 6 (22.2 %)of the 27 cases relatives expressed the wishes of the patients to discontinue life supportmeasures. Quality of life was taken into consideration in 4 (14.8 %) patients. No advancedecisions/directives were identified in any of the patients. 4 (14.8 %) patients were consideredfor organ donation while referral to organ donation team was made in three (11.1 %) cases.CONCLUSIONS. There was a wide variety in the demographics of patients & their co-morbidities. In most cases withdrawal led to a quick death indirectly indicating appropri-ateness. We observed a low incidence of consideration for organ donation. This could bebecause the patients were very sick to begin with and were in advanced stages of organfailure evidenced by the timing of the death. It is evident that clinical judgement of ther-apeutic futility plays a major role in decision making. It is also evident that despite increasepublic awareness, advance decisions of treatment refusals are not so common. We haverevised our ‘Liverpool Care Pathway’ for critical care unit to ensure organ donations areconsidered in all cases of treatment withdrawals.REFERENCE(S). 1. BMA Booklet (2nd Edition) on withholding and withdrawing lifeprolonging treatment. October 2000. 2. Guidelines for limitation of treatment. ICS, UK2003. 3. Good practice in decision making, GMC 2010.
Bloodstream infections: 0428–04410428IMPACT OF QUALITY IMPROVEMENT STRATEGIES FOR THE PREVENTIONOF CENTRAL LINE-ASSOCIATED BLOODSTREAM INFECTIONS:A SYSTEMATIC REVIEW AND META-ANALYSIS
K. Blot1, J. Bergs2, S. Blot1, J. Hellings2, D. Vandijck1,2,3
1Ghent University, Faculty of Medicine & Health Sciences, Ghent, Belgium, 2HasseltUniversity, Health Economics & Patient Safety, Diepenbeek, Belgium, 3Ghent UniversityHospital, General Internal Medicine & Infectious Diseases, Ghent, BelgiumINTRODUCTION. Nosocomial central line-associated bloodstream infections (CLABSI)are an important economic burden and cause of impaired patient outcomes. Qualityimprovement strategies may increase adherence to infection prevention processes, whichlowers the CLABSI rate.OBJECTIVES. To assess the impact of quality improvement interventions on the rates ofCLABSI in adult ICUs.METHODS. The MEDLINE database was systematically searched for relevant articles fromJanuary 1995 to June 2012. Studies were assessed by their methodological quality using theDowns and Black tool. A meta-analysis was performed (random effects model with DerSi-monian-Laird estimator), and mixed-effects modelling was used to compare qualityimprovement intervention studies that did or did not use a bundle or checklist strategy.RESULTS. The systematic review identified 46 before-after, 11 interrupted time series, and3 controlled before-after studies of quality improvement strategies. A meta-analysis of 41trials involving 560 adult, 11 neonatal, and 9 paediatric ICUs showed a decrease in CLABSIrates [odds ratio (OR) 0.39; 95 % confidence interval (CI) 0.33–0.46; P \ 0.001; Fig. 1). Alarge amount of statistical heterogeneity was found between studies (I2 = 85.4 %,s2 = 0.1617, P \ 0.001).Subgroup analyses demonstrated CLABSI rate reductions for trials without a bundle orchecklist (22 trials; OR 0.45, 95 % CI 0.36–0.55) and those with a bundle and/or checklist
26th ESICM ANNUAL CONGRESS — PARIS, FRANCE — 5–9 OCTOBER 2013
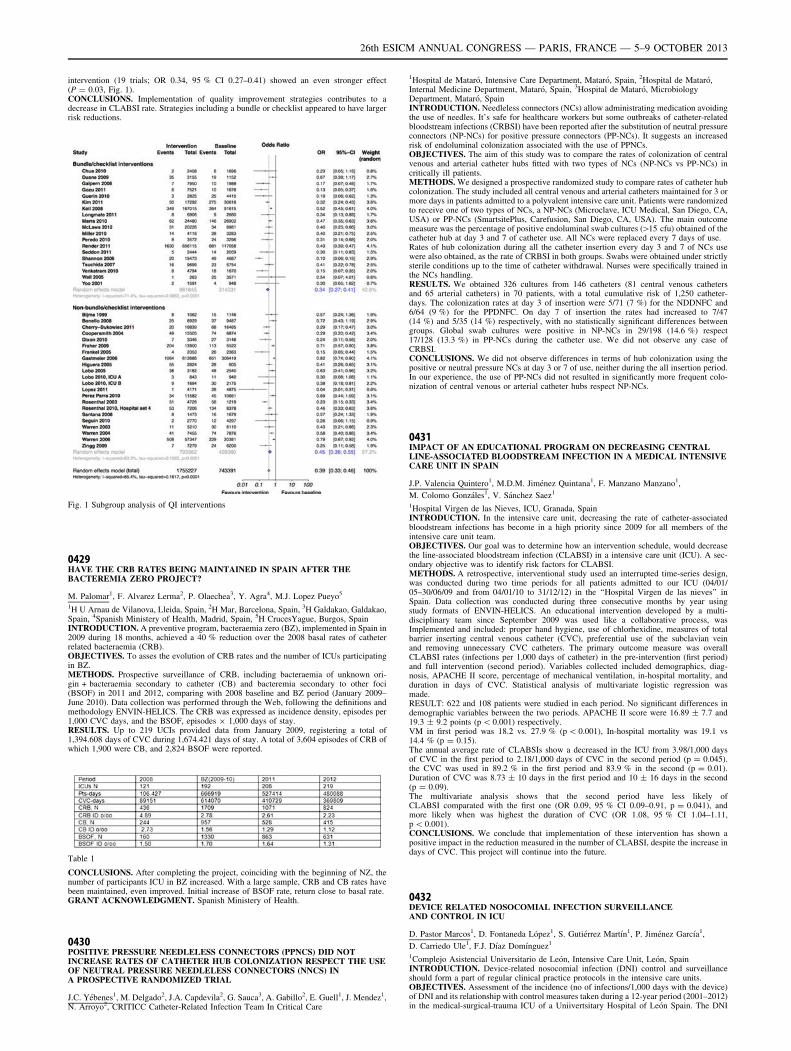
intervention (19 trials; OR 0.34, 95 % CI 0.27–0.41) showed an even stronger effect(P = 0.03, Fig. 1).CONCLUSIONS. Implementation of quality improvement strategies contributes to adecrease in CLABSI rate. Strategies including a bundle or checklist appeared to have largerrisk reductions.
Fig. 1 Subgroup analysis of QI interventions
0429HAVE THE CRB RATES BEING MAINTAINED IN SPAIN AFTER THEBACTEREMIA ZERO PROJECT?
M. Palomar1, F. Alvarez Lerma2, P. Olaechea3, Y. Agra4, M.J. Lopez Pueyo5
1H U Arnau de Vilanova, Lleida, Spain, 2H Mar, Barcelona, Spain, 3H Galdakao, Galdakao,Spain, 4Spanish Ministery of Health, Madrid, Spain, 5H CrucesYague, Burgos, SpainINTRODUCTION. A preventive program, bacteraemia zero (BZ), implemented in Spain in2009 during 18 months, achieved a 40 % reduction over the 2008 basal rates of catheterrelated bacteraemia (CRB).OBJECTIVES. To asses the evolution of CRB rates and the number of ICUs participatingin BZ.METHODS. Prospective surveillance of CRB, including bacteraemia of unknown ori-gin + bacteraemia secondary to catheter (CB) and bacteremia secondary to other foci(BSOF) in 2011 and 2012, comparing with 2008 baseline and BZ period (January 2009–June 2010). Data collection was performed through the Web, following the definitions andmethodology ENVIN-HELICS. The CRB was expressed as incidence density, episodes per1,000 CVC days, and the BSOF, episodes 9 1,000 days of stay.RESULTS. Up to 219 UCIs provided data from January 2009, registering a total of1,394.608 days of CVC during 1,674.421 days of stay. A total of 3,604 episodes of CRB ofwhich 1,900 were CB, and 2,824 BSOF were reported.
Table 1
CONCLUSIONS. After completing the project, coinciding with the beginning of NZ, thenumber of participants ICU in BZ increased. With a large sample, CRB and CB rates havebeen maintained, even improved. Initial increase of BSOF rate, return close to basal rate.GRANT ACKNOWLEDGMENT. Spanish Ministery of Health.
0430POSITIVE PRESSURE NEEDLELESS CONNECTORS (PPNCS) DID NOTINCREASE RATES OF CATHETER HUB COLONIZATION RESPECT THE USEOF NEUTRAL PRESSURE NEEDLELESS CONNECTORS (NNCS) INA PROSPECTIVE RANDOMIZED TRIAL
J.C. Yébenes1, M. Delgado2, J.A. Capdevila2, G. Sauca3, A. Gabillo2, E. Guell1, J. Mendez1,N. Arroyo2, CRITICC Catheter-Related Infection Team In Critical Care
1Hospital de Mataró, Intensive Care Department, Mataró, Spain, 2Hospital de Mataró,Internal Medicine Department, Mataró, Spain, 3Hospital de Mataró, MicrobiologyDepartment, Mataró, SpainINTRODUCTION. Needleless connectors (NCs) allow administrating medication avoidingthe use of needles. It’s safe for healthcare workers but some outbreaks of catheter-relatedbloodstream infections (CRBSI) have been reported after the substitution of neutral pressureconnectors (NP-NCs) for positive pressure connectors (PP-NCs). It suggests an increasedrisk of endoluminal colonization associated with the use of PPNCs.OBJECTIVES. The aim of this study was to compare the rates of colonization of centralvenous and arterial catheter hubs fitted with two types of NCs (NP-NCs vs PP-NCs) incritically ill patients.METHODS. We designed a prospective randomized study to compare rates of catheter hubcolonization. The study included all central venous and arterial catheters maintained for 3 ormore days in patients admitted to a polyvalent intensive care unit. Patients were randomizedto receive one of two types of NCs, a NP-NCs (Microclave, ICU Medical, San Diego, CA,USA) or PP-NCs (SmartsitePlus, Carefusion, San Diego, CA, USA). The main outcomemeasure was the percentage of positive endoluminal swab cultures ([15 cfu) obtained of thecatheter hub at day 3 and 7 of catheter use. All NCs were replaced every 7 days of use.Rates of hub colonization during all the catheter insertion every day 3 and 7 of NCs usewere also obtained, as the rate of CRBSI in both groups. Swabs were obtained under strictlysterile conditions up to the time of catheter withdrawal. Nurses were specifically trained inthe NCs handling.RESULTS. We obtained 326 cultures from 146 catheters (81 central venous cathetersand 65 arterial catheters) in 70 patients, with a total cumulative risk of 1,250 catheter-days. The colonization rates at day 3 of insertion were 5/71 (7 %) for the NDDNFC and6/64 (9 %) for the PPDNFC. On day 7 of insertion the rates had increased to 7/47(14 %) and 5/35 (14 %) respectively, with no statistically significant differences betweengroups. Global swab cultures were positive in NP-NCs in 29/198 (14.6 %) respect17/128 (13.3 %) in PP-NCs during the catheter use. We did not observe any case ofCRBSI.CONCLUSIONS. We did not observe differences in terms of hub colonization using thepositive or neutral pressure NCs at day 3 or 7 of use, neither during the all insertion period.In our experience, the use of PP-NCs did not resulted in significantly more frequent colo-nization of central venous or arterial catheter hubs respect NP-NCs.
0431IMPACT OF AN EDUCATIONAL PROGRAM ON DECREASING CENTRALLINE-ASSOCIATED BLOODSTREAM INFECTION IN A MEDICAL INTENSIVECARE UNIT IN SPAIN
J.P. Valencia Quintero1, M.D.M. Jiménez Quintana1, F. Manzano Manzano1,
M. Colomo Gonzáles1, V. Sánchez Saez1
1Hospital Virgen de las Nieves, ICU, Granada, SpainINTRODUCTION. In the intensive care unit, decreasing the rate of catheter-associatedbloodstream infections has become in a high priority since 2009 for all members of theintensive care unit team.OBJECTIVES. Our goal was to determine how an intervention schedule, would decreasethe line-associated bloodstream infection (CLABSI) in a intensive care unit (ICU). A sec-ondary objective was to identify risk factors for CLABSI.METHODS. A retrospective, interventional study used an interrupted time-series design,was conducted during two time periods for all patients admitted to our ICU (04/01/05–30/06/09 and from 04/01/10 to 31/12/12) in the ‘‘Hospital Virgen de las nieves’’ inSpain. Data collection was conducted during three consecutive months by year usingstudy formats of ENVIN-HELICS. An educational intervention developed by a multi-disciplinary team since September 2009 was used like a collaborative process, wasImplemented and included: proper hand hygiene, use of chlorhexidine, measures of totalbarrier inserting central venous catheter (CVC), preferential use of the subclavian veinand removing unnecessary CVC catheters. The primary outcome measure was overallCLABSI rates (infections per 1,000 days of catheter) in the pre-intervention (first period)and full intervention (second period). Variables collected included demographics, diag-nosis, APACHE II score, percentage of mechanical ventilation, in-hospital mortality, andduration in days of CVC. Statistical analysis of multivariate logistic regression wasmade.RESULT: 622 and 108 patients were studied in each period. No significant differences indemographic variables between the two periods. APACHE II score were 16.89 ± 7.7 and19.3 ± 9.2 points (p \ 0.001) respectively.VM in first period was 18.2 vs. 27.9 % (p \ 0.001), In-hospital mortality was 19.1 vs14.4 % (p = 0.15).The annual average rate of CLABSIs show a decreased in the ICU from 3.98/1,000 daysof CVC in the first period to 2.18/1,000 days of CVC in the second period (p = 0.045).the CVC was used in 89.2 % in the first period and 83.9 % in the second (p = 0.01).Duration of CVC was 8.73 ± 10 days in the first period and 10 ± 16 days in the second(p = 0.09).The multivariate analysis shows that the second period have less likely ofCLABSI comparated with the first one (OR 0.09, 95 % CI 0.09–0.91, p = 0.041), andmore likely when was highest the duration of CVC (OR 1.08, 95 % CI 1.04–1.11,p \ 0.001).CONCLUSIONS. We conclude that implementation of these intervention has shown apositive impact in the reduction measured in the number of CLABSI, despite the increase indays of CVC. This project will continue into the future.
0432DEVICE RELATED NOSOCOMIAL INFECTION SURVEILLANCEAND CONTROL IN ICU
D. Pastor Marcos1, D. Fontaneda López1, S. Gutiérrez Martı́n1, P. Jiménez Garcı́a1,
D. Carriedo Ule1, F.J. Dı́az Domı́nguez1
1Complejo Asistencial Universitario de León, Intensive Care Unit, León, SpainINTRODUCTION. Device-related nosocomial infection (DNI) control and surveillanceshould form a part of regular clinical practice protocols in the intensive care units.OBJECTIVES. Assessment of the incidence (no of infections/1,000 days with the device)of DNI and its relationship with control measures taken during a 12-year period (2001–2012)in the medical-surgical-trauma ICU of a Uniivertsitary Hospital of León Spain. The DNI
26th ESICM ANNUAL CONGRESS — PARIS, FRANCE — 5–9 OCTOBER 2013
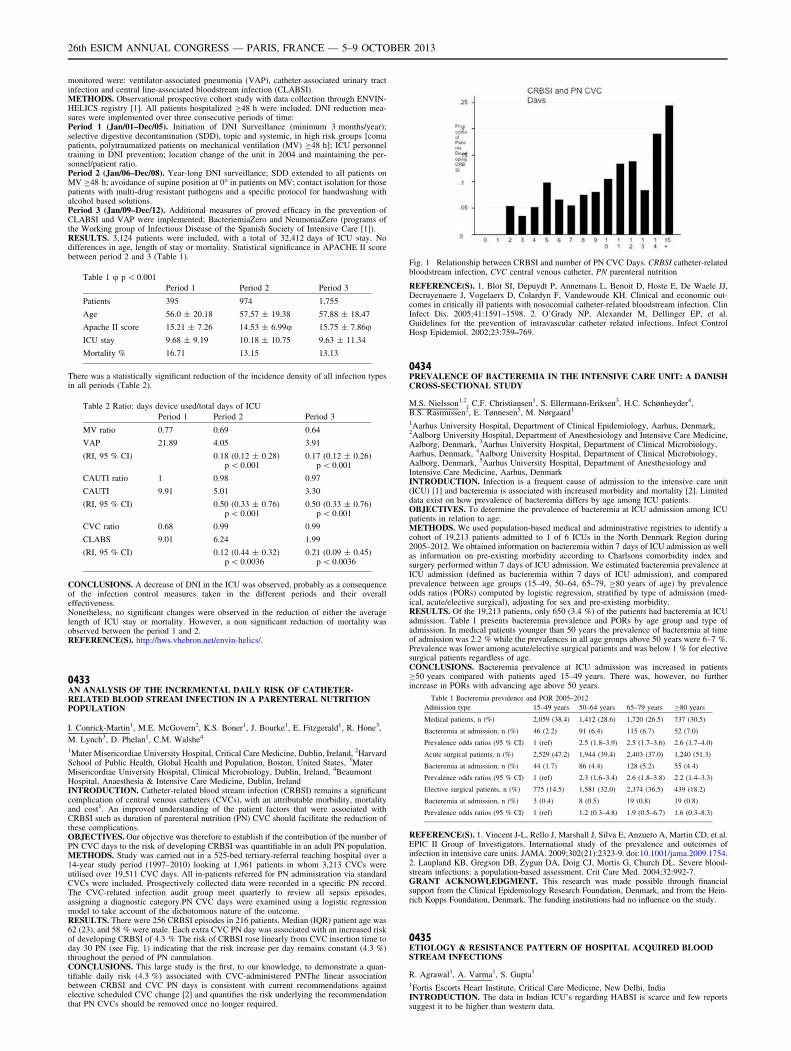
monitored were: ventilator-associated pneumonia (VAP), catheter-associated urinary tractinfection and central line-associated bloodstream infection (CLABSI).METHODS. Observational prospective cohort study with data collection through ENVIN-HELICS registry [1]. All patients hospitalized C48 h were included. DNI reduction mea-sures were implemented over three consecutive periods of time:Period 1 (Jan/01–Dec/05). Initiation of DNI Surveillance (minimum 3 months/year);selective digestive decontamination (SDD), topic and systemic, in high risk groups [comapatients, polytraumatized patients on mechanical ventilation (MV) C48 h]; ICU personneltraining in DNI prevention; location change of the unit in 2004 and maintaining the per-sonnel/patient ratio.Period 2 (Jan/06–Dec/08). Year-long DNI surveillance; SDD extended to all patients onMV C48 h; avoidance of supine position at 0� in patients on MV; contact isolation for thosepatients with multi-drug resistant pathogens and a specific protocol for handwashing withalcohol based solutions.Period 3 (Jan/09–Dec/12). Additional measures of proved efficacy in the prevention ofCLABSI and VAP were implemented; BacteriemiaZero and NeumoniaZero (programs ofthe Working group of Infectious Disease of the Spanish Society of Intensive Care [1]).RESULTS. 3,124 patients were included, with a total of 32,412 days of ICU stay. Nodifferences in age, length of stay or mortality. Statistical significance in APACHE II scorebetween period 2 and 3 (Table 1).
Table 1 u p \ 0.001
Period 1 Period 2 Period 3
Patients 395 974 1,755
Age 56.0 ± 20.18 57.57 ± 19.38 57.88 ± 18.47
Apache II score 15.21 ± 7.26 14.53 ± 6.99u 15.75 ± 7.86u
ICU stay 9.68 ± 9.19 10.18 ± 10.75 9.63 ± 11.34
Mortality % 16.71 13.15 13.13
There was a statistically significant reduction of the incidence density of all infection typesin all periods (Table 2).
Table 2 Ratio: days device used/total days of ICU
Period 1 Period 2 Period 3
MV ratio 0.77 0.69 0.64
VAP 21.89 4.05 3.91
(RI, 95 % CI) 0.18 (0.12 ± 0.28)p \ 0.001
0.17 (0.12 ± 0.26)p \ 0.001
CAUTI ratio 1 0.98 0.97
CAUTI 9.91 5.01 3.30
(RI, 95 % CI) 0.50 (0.33 ± 0.76)p \ 0.001
0.50 (0.33 ± 0.76)p \ 0.001
CVC ratio 0.68 0.99 0.99
CLABS 9.01 6.24 1.99
(RI, 95 % CI) 0.12 (0.44 ± 0.32)p \ 0.0036
0.21 (0.09 ± 0.45)p \ 0.0036
CONCLUSIONS. A decrease of DNI in the ICU was observed, probably as a consequenceof the infection control measures taken in the different periods and their overalleffectiveness.Nonetheless, no significant changes were observed in the reduction of either the averagelength of ICU stay or mortality. However, a non significant reduction of mortality wasobserved between the period 1 and 2.REFERENCE(S). http://hws.vhebron.net/envin-helics/.
0433AN ANALYSIS OF THE INCREMENTAL DAILY RISK OF CATHETER-RELATED BLOOD STREAM INFECTION IN A PARENTERAL NUTRITIONPOPULATION
I. Conrick-Martin1, M.E. McGovern2, K.S. Boner1, J. Bourke1, E. Fitzgerald1, R. Hone3,
M. Lynch3, D. Phelan1, C.M. Walshe4
1Mater Misericordiae University Hospital, Critical Care Medicine, Dublin, Ireland, 2HarvardSchool of Public Health, Global Health and Population, Boston, United States, 3MaterMisericordiae University Hospital, Clinical Microbiology, Dublin, Ireland, 4BeaumontHospital, Anaesthesia & Intensive Care Medicine, Dublin, IrelandINTRODUCTION. Catheter-related blood stream infection (CRBSI) remains a significantcomplication of central venous catheters (CVCs), with an attributable morbidity, mortalityand cost1. An improved understanding of the patient factors that were associated withCRBSI such as duration of parenteral nutrition (PN) CVC should facilitate the reduction ofthese complications.OBJECTIVES. Our objective was therefore to establish if the contribution of the number ofPN CVC days to the risk of developing CRBSI was quantifiable in an adult PN population.METHODS. Study was carried out in a 525-bed tertiary-referral teaching hospital over a14-year study period (1997–2010) looking at 1,961 patients in whom 3,213 CVCs wereutilised over 19,511 CVC days. All in-patients referred for PN administration via standardCVCs were included. Prospectively collected data were recorded in a specific PN record.The CVC-related infection audit group meet quarterly to review all sepsis episodes,assigning a diagnostic category.PN CVC days were examined using a logistic regressionmodel to take account of the dichotomous nature of the outcome.RESULTS. There were 256 CRBSI episodes in 216 patients. Median (IQR) patient age was62 (23), and 58 % were male. Each extra CVC PN day was associated with an increased riskof developing CRBSI of 4.3 % The risk of CRBSI rose linearly from CVC insertion time today 30 PN (see Fig. 1) indicating that the risk increase per day remains constant (4.3 %)throughout the period of PN cannulation.CONCLUSIONS. This large study is the first, to our knowledge, to demonstrate a quan-tifiable daily risk (4.3 %) associated with CVC-administered PNThe linear associationbetween CRBSI and CVC PN days is consistent with current recommendations againstelective scheduled CVC change [2] and quantifies the risk underlying the recommendationthat PN CVCs should be removed once no longer required.
Fig. 1 Relationship between CRBSI and number of PN CVC Days. CRBSI catheter-relatedbloodstream infection, CVC central venous catheter, PN parenteral nutrition
REFERENCE(S). 1. Blot SI, Depuydt P, Annemans L, Benoit D, Hoste E, De Waele JJ,Decruyenaere J, Vogelaers D, Colardyn F, Vandewoude KH. Clinical and economic out-comes in critically ill patients with nosocomial catheter-related bloodstream infection. ClinInfect Dis. 2005;41:1591–1598. 2. O’Grady NP, Alexander M, Dellinger EP, et al.Guidelines for the prevention of intravascular catheter related infections. Infect ControlHosp Epidemiol. 2002;23:759–769.
0434PREVALENCE OF BACTEREMIA IN THE INTENSIVE CARE UNIT: A DANISHCROSS-SECTIONAL STUDY
M.S. Nielsson1,2, C.F. Christiansen1, S. Ellermann-Eriksen3, H.C. Schønheyder4,B.S. Rasmussen2, E. Tønnesen5, M. Nørgaard1
1Aarhus University Hospital, Department of Clinical Epidemiology, Aarhus, Denmark,2Aalborg University Hospital, Department of Anesthesiology and Intensive Care Medicine,Aalborg, Denmark, 3Aarhus University Hospital, Department of Clinical Microbiology,Aarhus, Denmark, 4Aalborg University Hospital, Department of Clinical Microbiology,Aalborg, Denmark, 5Aarhus University Hospital, Department of Anesthesiology andIntensive Care Medicine, Aarhus, DenmarkINTRODUCTION. Infection is a frequent cause of admission to the intensive care unit(ICU) [1] and bacteremia is associated with increased morbidity and mortality [2]. Limiteddata exist on how prevalence of bacteremia differs by age among ICU patients.OBJECTIVES. To determine the prevalence of bacteremia at ICU admission among ICUpatients in relation to age.METHODS. We used population-based medical and administrative registries to identify acohort of 19,213 patients admitted to 1 of 6 ICUs in the North Denmark Region during2005–2012. We obtained information on bacteremia within 7 days of ICU admission as wellas information on pre-existing morbidity according to Charlsons comorbidity index andsurgery performed within 7 days of ICU admission. We estimated bacteremia prevalence atICU admission (defined as bacteremia within 7 days of ICU admission), and comparedprevalence between age groups (15–49, 50–64, 65–79, C80 years of age) by prevalenceodds ratios (PORs) computed by logistic regression, stratified by type of admission (med-ical, acute/elective surgical), adjusting for sex and pre-existing morbidity.RESULTS. Of the 19,213 patients, only 650 (3.4 %) of the patients had bacteremia at ICUadmission. Table 1 presents bacteremia prevalence and PORs by age group and type ofadmission. In medical patients younger than 50 years the prevalence of bacteremia at timeof admission was 2.2 % while the prevalences in all age groups above 50 years were 6–7 %.Prevalence was lower among acute/elective surgical patients and was below 1 % for electivesurgical patients regardless of age.CONCLUSIONS. Bacteremia prevalence at ICU admission was increased in patientsC50 years compared with patients aged 15–49 years. There was, however, no furtherincrease in PORs with advancing age above 50 years.
Table 1 Bacteremia prevalence and POR 2005–2012
Admission type 15–49 years 50–64 years 65–79 years C80 years
Medical patients, n (%) 2,059 (38.4) 1,412 (28.6) 1,720 (26.5) 737 (30.5)
Bacteremia at admission, n (%) 46 (2.2) 91 (6.4) 115 (6.7) 52 (7.0)
Prevalence odds ratios (95 % CI) 1 (ref) 2.5 (1.8–3.9) 2.5 (1.7–3.6) 2.6 (1.7–4.0)
Acute surgical patients, n (%) 2,529 (47.2) 1,944 (39.4) 2,403 (37.0) 1,240 (51.3)
Bacteremia at admission, n (%) 44 (1.7) 86 (4.4) 128 (5.2) 55 (4.4)
Prevalence odds ratios (95 % CI) 1 (ref) 2.3 (1.6–3.4) 2.6 (1.8–3.8) 2.2 (1.4–3.3)
Elective surgical patients, n (%) 775 (14.5) 1,581 (32.0) 2,374 (36.5) 439 (18.2)
Bacteremia at admission, n (%) 3 (0.4) 8 (0.5) 19 (0.8) 19 (0.8)
Prevalence odds ratios (95 % CI) 1 (ref) 1.2 (0.3–4.8) 1.9 (0.5–6.7) 1.6 (0.3–8.3)
REFERENCE(S). 1. Vincent J-L, Rello J, Marshall J, Silva E, Anzueto A, Martin CD, et al.EPIC II Group of Investigators. International study of the prevalence and outcomes ofinfection in intensive care units. JAMA. 2009;302(21):2323-9. doi:10.1001/jama.2009.1754.2. Laupland KB, Gregson DB, Zygun DA, Doig CJ, Mortis G, Church DL. Severe blood-stream infections: a population-based assessment. Crit Care Med. 2004;32:992-7.GRANT ACKNOWLEDGMENT. This research was made possible through financialsupport from the Clinical Epidemiology Research Foundation, Denmark, and from the Hein-rich Kopps Foundation, Denmark. The funding institutions had no influence on the study.
0435ETIOLOGY & RESISTANCE PATTERN OF HOSPITAL ACQUIRED BLOODSTREAM INFECTIONS
R. Agrawal1, A. Varma1, S. Gupta1
1Fortis Escorts Heart Institute, Critical Care Medicine, New Delhi, IndiaINTRODUCTION. The data in Indian ICU’s regarding HABSI is scarce and few reportssuggest it to be higher than western data.
26th ESICM ANNUAL CONGRESS — PARIS, FRANCE — 5–9 OCTOBER 2013
OBJECTIVES. To determine the incidence,etiology and resistance pattern of HABSI inIndian context.METHODS. It was a single center study in 35 bed ICU over 1 year period. HABSI wasdefined according to current CDC guidelines [1]. HCAP, CAUTI and skin related infectionscausing BSI were defined according to recent guidelines and analysed.RESULTS. Out of 332 positive samples 90 samples (n = 45) were HABSI. The micro-biological analysis showed 60 % were Gram negative, 27 % were Gram positive bacteriaand 6 % were candida. CRBSI was the most common etiology of blood stream infec-tions.HCAP and CAUTI caused 9.5 % of infections respectively.
Table 1 Etiology of HABSI
Source Total (%)
CRBSI 69
HCAP 9.5
CAUTI 9.5
Skin 7
Devices 5
The resistance pattern analysis showed 69 % isolates were ESBL. Of ESBL isolates 25 %were XDR (sensitive only to colistin methionate).
Table 2 Resistance pattern in ESBL isolates
ESBL types n (%)
MDR 17 (65
XDR(carbapenem resistant) 7 (25)
PDR(pan Drug resistant) 3 (10)
HABSI hospital Acquired blood stream infection, CRBSI catheter relatedblood stream infection, HCAP healthcare associated pneumonia, XDRextreme drug resistant, ESBL extended spectrum beta lactamases
CONCLUSIONS. In our study the incidence of HABSI was 27 %, CRBSI was found to bethe most common etiology.Gram negative infections were most common unlike westerndata where Gram positive are more prevalent [2]. About two-third of Gram negatives wereESBL isolates.Our study highlights need for stringent guidelines for CRBSI prevention andoptimal antimicrobial usage to minimize resistance.REFERENCE(S). 1. Richard P, et al. Crit care Med. 1999;27:887–892. 2. WisplinghoffClin Infect Dis. 2004;39:309–317. 3. Garrouste M, et al. Clin Infect Dis. 2006;42:1118–1126. 4. Valles J, et al. J Infect. 2008;56:27–34.
0436INVESTIGATION OF PROCALCITONIN, WBC, CRP AND SOFA SCOREKINETICS DURING THE FIRST DAYS OF CATHETER-RELATEDBLOODSTREAM INFECTIONS: RELATIONSHIP WITH THE CONTROLOF THERAPY
V. Theodorou1, V.E. Papaioannou1, G.A. Tripsianis2, E.K. Christophoridis1,
G.A. Kouliatsis1, I.A. Pneumatikos1
1University Hospital of Alexandroupolis, Department of Intensive Care Unit,Alexandroupolis, Greece, 2University Hospital of Alexandroupolis, Department of MedicalStatistics, Alexandroupolis, GreeceINTRODUCTION. Using diagnostic biomarkers to assist early clinical decisions duringthe management of bacteremia could be helpful.OBJECTIVES. The potential role of PCT, WBC, CRP, SOFA score, and their kinetics as away to early monitor the efficacy of therapy of intravascular catheter-related bloodstreaminfections (CRBSI) in intensive care unit (ICU) was assessed in the present study.METHODS. Twenty-six patients presented with CRBSI during their ICU stay wereincluded in the study. They were divided in two groups according to clinical and micro-biological control of bactereamia, 72 h upon onset of therapy (controlled, n = 16 vs non-controlled, n = 10). Serum PCT, WBC and CRP levels and SOFA scores, along with theirvariations over time, were measured during the first 5 days of therapy and comparedbetween and within patients. A logistic regression was also performed for assessing prog-nostic accuracy of measured variables upon infection control.RESULTS. A significant reduction of PCT concentration on D1 (day 1 of treatment)compared to D0 (onset of clinically suspicious infection) was observed in both groups ofpatients. However, both its serum levels and SOFA scores tended to further decrease sig-nificantly in patients with controlled CRBSI, but remained stable in the non-controlledgroup. In addition, on D3 PCT was found significantly reduced in the controlled comparedwith the non-controlled group [0.55 (0.50–3.10) vs 2.60 (0.75–5.12), respectively;p = 0.047], whereas SOFA was found significantly decreased on D2 in the same group ofpatients (5.37 vs 7.70, p = 0.033). Neither WBC threshold values nor their kinetics werefound to differ between and within patients, whereas non-controlled group exhibited sig-nificantly higher CRP levels on D5 (p = 0.0046). SOFA score higher than 5.5 during D2and PCT values higher than 1.5 ng/ml on D3 were found to predict therapy control (OR10.11, 95 % CI 1.60–64.00, p = 0.009).CONCLUSIONS. We suggest that daily measurements of PCT serum levels and SOFAscores can be of significant value for monitoring and predicting therapeutic efficiency duringCRBSI.REFERENCE(S). Charles PE, Tinel C, Barbar S, Aho S, Prin S, Doise JM, Olsson NO,Blettery B, Quenot JP. Procalcitonin kinetics within the first days of sepsis: relationship withthe appropriateness of antibiotic therapy and the outcome. Crit Care. 2009;13:R38.
0437INCIDENCE AND RISK FACTORS FOR CENTRAL VASCULAR CATHETER-RELATED BACTEREMIA IN A MEDICAL INTENSIVE CARE UNIT
Z. Hajjej1, E. Abbessi1, M. Nasri1, W. Sallemi1, H. Gharsallah1, M. Ferjani1
1Military Hospital of Tunis, Intensive Care Unit, Tunis, TunisiaINTRODUCTION. Central venous catheters (CVCs) are commonly used in the ICU. Up to80 % of ICU patients may require central venous catheterization [1]. Catheter-relatedinfections (CRI) and especially catheter-related bacteremia (CRB) are the most common
complications associated with CVCs, responsible for additional morbidity and mortality, alonger length of stay and increased hospital costs [2].OBJECTIVES. The aims of our study were to determine the incidence, microbiologicalprofile and risk factors for CRI in a Tunisia medical intensive care unit.METHODS. Over eight months (1 January 2012–30 August 2012) a prospective, obser-vational study was performed. Patients who required central venous catheter (CVC)placement for duration greater than 48 h were included in the study. The definitions ofcatheter colonization (CC) and CRB published by IDSA were used [3]. Patients with CRBwere designated as group A, patients with CC were designated as group B. Continuousvariables are expressed as mean ± standard deviation, while categorical variables areexpressed with absolute and relative frequencies.RESULTS. During the study period, a total of 260 patients, with a total of 482 CVCs wereenrolled. The ratio of exposure to CVC was 77 % and the mean duration of catheterizationwas 33 days. CVC insertion sites included the subclavian (58 %), the internal jugular(33 %) or the femoral vein (9 %).Overall, 25 (5.1 %) patients were classified as havingCRB (group A), 90 (18.6 %) patients as having CC (group B). CRB incidence was 5 per1,000 catheter days, whereas CC incidence was 19 per 1,000 catheter days. Risk factorsindependently for CC were prolonged duration of catheterization, use of parenteral nutritionand changing the CVC dressing at intervals of 48 h or more. The predominant microor-ganisms isolated from CRB episodes were Gram-negative bacilli (Pseudomonas aeruginosaand Klebsiella pneumonia).CONCLUSIONS. The incidence of CC and CRB was high. Use of CVC for the shortesttime possible, good hand hygiene and change of CVC dressing at intervals of less than 48 hare infection prevention practices that need to be followed.REFERENCE(S). 1. Vincent JL, et al. JAMA. 1995;274:639–44. 2. Renaud B, et al. Am JRespir Crit Care Med. 2001;163:1584–90. 3. Mermel LA, et al. IDSA. 2009.
0438POSTOPERATIVE BACTEREMIAS IN HEART TRANSPLANTATION
P. Fernandez Ugidos1, R. Gomez Lopez1, P. Vidal Cortes1, M.J. Paniagua Martin2,
E. Barge Caballero2, J. Muñiz3, M.T. Bouza Vieiro4, A.V. Aller Fernandez4,V. Rodriguez Lopez4, A.I. Suarez Freire4, S. Fojon Polanco4, M.G. Crespo Leiro2
1Complexo Hospitalario Universitario Ourense, ICU, Ourense, Spain, 2ComplexoHospitalario Universitario A Coruña, Cardiologia, A Coruña, Spain, 3ComplexoHospitalario Universitario A Coruña, UDC, A Coruña, Spain, 4Complexo HospitalarioUniversitario A Coruña, ICU, A Coruña, SpainINTRODUCTION. Infection is a major complication after heart transplantation (HT).Among nosocomial infections, bloodstream infections are of particular importance, espe-cially those related to catheters, because of its high morbi-mortality and its potentiallyprevention.OBJECTIVES. To determine the incidence and clinical and microbiological characteristicsof patients that suffer a bacteremia during the immediate postoperative period, beforehospital discharge.METHODS. Historical prospective cohort study of all patients undergoing HT in a singlecenter of Northern Spain during 18 years. Define nosocomial infections, sepsis and multipleorgan dysfunction according to CDC criteria, SSC and SOFA score, respectively. In thisgroup of patients were selected for analysis those with diagnostic of bacteremia.RESULTS. In 594 HT, we found 97 infection episodes in 75 patients. 31 % werebacteremia (the second infection cause, only behind pneumonia). 76.5 % was associatedwith catheters (BAC) and 23.5 % primary. 80.6 % of patients are male, with a mean age51.54 years 29 %. 41.9 % of patients required hospitalization before HT (mean stay inICU 4.03 days) and 29 % of cases were transplanted in emergencies 0.35 % requiredpretransplant circulatory assistance. 25.8 % required mechanical ventilation (MV) pre-transplant. 29 % cases had, already in preoperative period, central venous catheter(CVC). Respect postoperative time: Patients with bacteremia required MV during a meanof 24 days. All of them carried at least one CVC (mean of 2.96, median 2), for anaverage of 42.44 days. Perioperative shock was suffered by 61.3 % (mainly, for primarygraft failure). Acute renal failure (ARF) appeared in 58.1 %, needing extra-renal tech-niques (TDER) 41.9 % of patients. 19.4 % of cases suffered a rejection episode. Feverappeared in 80.6 % and leukocytosis in 93.1 %. The most common causative agent wasStafilococcus negative coagulase (31.91 %), followed by enterococci (14.89 %) andE. coli (12.6 %) 0.423 % were treated with broad espectrum antibioterapy. 69.23 % ofcases were localized infections, 5.13 % severe sepsis and 25.64 % of patients sufferedseptic shock. Multiorgan failure appears in 16.3 % of cases (mean SOFA 14.9 points,range 8–19). The mean stay at ICU was 39.41 days. The hospital mortality rate was16.1 %.CONCLUSIONS. In our series, the incidence of bloodstream infection after HT was5.23 %. These patients had long ICU stay, long MV time and their mortality was 16.1 %. Aquarter of patients suffer septic shock with high incidencia of ARF. The first causal agentwas negative coagulase stafilococci.
0439HYPOTHERMIA AND INFECTION PREVENTION SURVEY
I. Voigt1, C.K. Naber1
1Elisabeth-Krankenhaus Essen, Heart and Vascular Center, Essen, GermanyINTRODUCTION. The ILCOR-Guidelines [1] recommend mild therapeutic hypothermia(MTH) in unconscious adult patients after return of spontaneous circulation from out-of-hospital cardiac arrest. Even though mortality rates decrease and patients present betterneurologic outcomes, postresuscitation care is becoming more important in this group ofpatients. Besides rhythm disturbance, bleeding and cardiodepression another challenge areinfections. The incidence of pneumonia was reported up to 40 % in post-cardiac arrestpatients treated with MTH.OBJECTIVES. The objective of this survey was to evaluate infection prevention strategiesused during MTH.METHODS. During April and May 2012 we sent an e-mail invitation to 105 correspondingauthors of articles concerning mild therapeutic hypothermia. Responses submitted between5 April and 30 June 2012 were collected into a central database and analysed.RESULTS. 68 (65 %) physicians submitted valuable data. Average rate of hypothermiapatients was 32.7/year. MTH standard operation procedures are available in 58 (83 %) units.Our results implicate inflammatory biomarkers like CRP, WBC, Procalcitonin or IL-6 to beless useful in the participating intensivist’s opinion. In contrast pulmonary infiltrates onchest x-ray, positive microbiological cultures or clinical signs are thought to have biggerinfluence on antibiotic treatment initiation. Among the responding physicians most used
26th ESICM ANNUAL CONGRESS — PARIS, FRANCE — 5–9 OCTOBER 2013
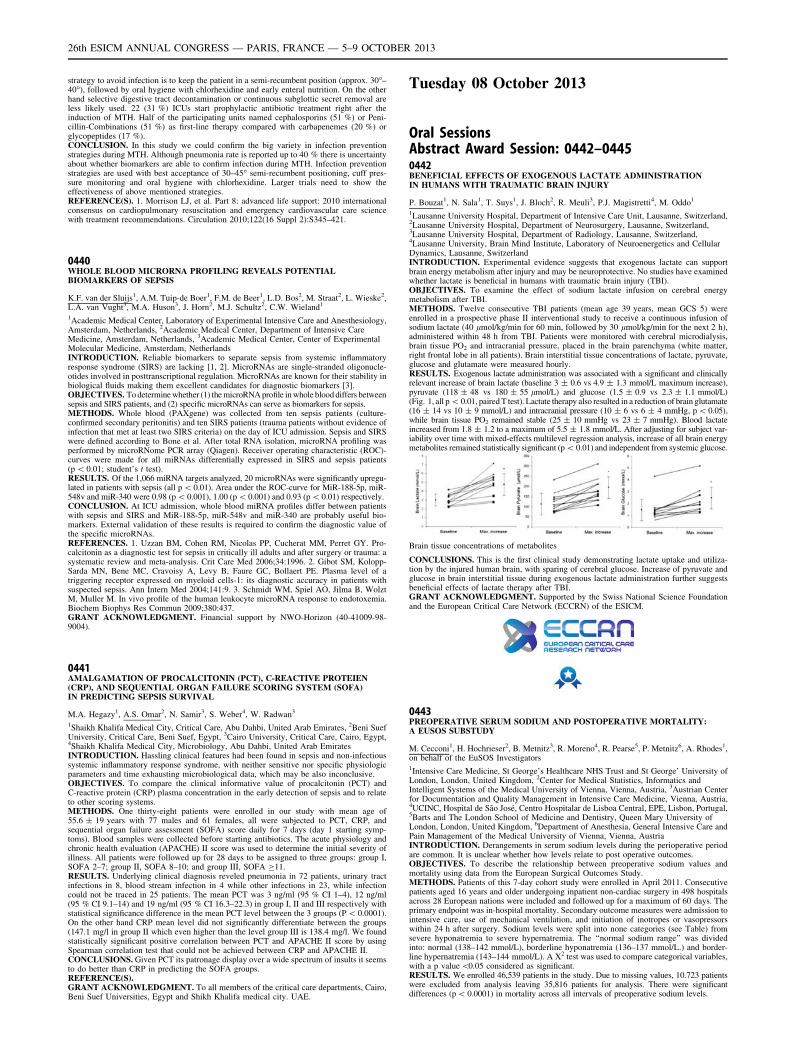
strategy to avoid infection is to keep the patient in a semi-recumbent position (approx. 30�–40�), followed by oral hygiene with chlorhexidine and early enteral nutrition. On the otherhand selective digestive tract decontamination or continuous subglottic secret removal areless likely used. 22 (31 %) ICUs start prophylactic antibiotic treatment right after theinduction of MTH. Half of the participating units named cephalosporins (51 %) or Peni-cillin-Combinations (51 %) as first-line therapy compared with carbapenemes (20 %) orglycopeptides (17 %).CONCLUSION. In this study we could confirm the big variety in infection preventionstrategies during MTH. Although pneumonia rate is reported up to 40 % there is uncertaintyabout whether biomarkers are able to confirm infection during MTH. Infection preventionstrategies are used with best acceptance of 30–45� semi-recumbent positioning, cuff pres-sure monitoring and oral hygiene with chlorhexidine. Larger trials need to show theeffectiveness of above mentioned strategies.REFERENCE(S). 1. Morrison LJ, et al. Part 8: advanced life support: 2010 internationalconsensus on cardiopulmonary resuscitation and emergency cardiovascular care sciencewith treatment recommendations. Circulation 2010;122(16 Suppl 2):S345–421.
0440WHOLE BLOOD MICRORNA PROFILING REVEALS POTENTIALBIOMARKERS OF SEPSIS
K.F. van der Sluijs1, A.M. Tuip-de Boer1, F.M. de Beer1, L.D. Bos2, M. Straat2, L. Wieske2,L.A. van Vught3, M.A. Huson3, J. Horn2, M.J. Schultz2, C.W. Wieland1
1Academic Medical Center, Laboratory of Experimental Intensive Care and Anesthesiology,Amsterdam, Netherlands, 2Academic Medical Center, Department of Intensive CareMedicine, Amsterdam, Netherlands, 3Academic Medical Center, Center of ExperimentalMolecular Medicine, Amsterdam, NetherlandsINTRODUCTION. Reliable biomarkers to separate sepsis from systemic inflammatoryresponse syndrome (SIRS) are lacking [1, 2]. MicroRNAs are single-stranded oligonucle-otides involved in posttranscriptional regulation. MicroRNAs are known for their stability inbiological fluids making them excellent candidates for diagnostic biomarkers [3].OBJECTIVES. To determine whether (1) the microRNA profile in whole blood differs betweensepsis and SIRS patients, and (2) specific microRNAs can serve as biomarkers for sepsis.METHODS. Whole blood (PAXgene) was collected from ten sepsis patients (culture-confirmed secondary peritonitis) and ten SIRS patients (trauma patients without evidence ofinfection that met at least two SIRS criteria) on the day of ICU admission. Sepsis and SIRSwere defined according to Bone et al. After total RNA isolation, microRNA profiling wasperformed by microRNome PCR array (Qiagen). Receiver operating characteristic (ROC)-curves were made for all miRNAs differentially expressed in SIRS and sepsis patients(p \ 0.01; student’s t test).RESULTS. Of the 1,066 miRNA targets analyzed, 20 microRNAs were significantly upregu-lated in patients with sepsis (all p \ 0.01). Area under the ROC-curve for MiR-188-5p, miR-548v and miR-340 were 0.98 (p \ 0.001), 1.00 (p \ 0.001) and 0.93 (p\ 0.01) respectively.CONCLUSION. At ICU admission, whole blood miRNA profiles differ between patientswith sepsis and SIRS and MiR-188-5p, miR-548v and miR-340 are probably useful bio-markers. External validation of these results is required to confirm the diagnostic value ofthe specific microRNAs.REFERENCES. 1. Uzzan BM, Cohen RM, Nicolas PP, Cucherat MM, Perret GY. Pro-calcitonin as a diagnostic test for sepsis in critically ill adults and after surgery or trauma: asystematic review and meta-analysis. Crit Care Med 2006;34:1996. 2. Gibot SM, Kolopp-Sarda MN, Bene MC, Cravoisy A, Levy B, Faure GC, Bollaert PE. Plasma level of atriggering receptor expressed on myeloid cells-1: its diagnostic accuracy in patients withsuspected sepsis. Ann Intern Med 2004;141:9. 3. Schmidt WM, Spiel AO, Jilma B, WolztM, Muller M. In vivo profile of the human leukocyte microRNA response to endotoxemia.Biochem Biophys Res Commun 2009;380:437.GRANT ACKNOWLEDGMENT. Financial support by NWO-Horizon (40-41009-98-9004).
0441AMALGAMATION OF PROCALCITONIN (PCT), C-REACTIVE PROTEIEN(CRP), AND SEQUENTIAL ORGAN FAILURE SCORING SYSTEM (SOFA)IN PREDICTING SEPSIS SURVIVAL
M.A. Hegazy1, A.S. Omar2, N. Samir3, S. Weber4, W. Radwan3
1Shaikh Khalifa Medical City, Critical Care, Abu Dahbi, United Arab Emirates, 2Beni SuefUniversity, Critical Care, Beni Suef, Egypt, 3Cairo University, Critical Care, Cairo, Egypt,4Shaikh Khalifa Medical City, Microbiology, Abu Dahbi, United Arab EmiratesINTRODUCTION. Hassling clinical features had been found in sepsis and non-infectioussystemic inflammatory response syndrome, with neither sensitive nor specific physiologicparameters and time exhausting microbiological data, which may be also inconclusive.OBJECTIVES. To compare the clinical informative value of procalcitonin (PCT) andC-reactive protein (CRP) plasma concentration in the early detection of sepsis and to relateto other scoring systems.METHODS. One thirty-eight patients were enrolled in our study with mean age of55.6 ± 19 years with 77 males and 61 females, all were subjected to PCT, CRP, andsequential organ failure assessment (SOFA) score daily for 7 days (day 1 starting symp-toms). Blood samples were collected before starting antibiotics. The acute physiology andchronic health evaluation (APACHE) II score was used to determine the initial severity ofillness. All patients were followed up for 28 days to be assigned to three groups: group I,SOFA 2–7; group II, SOFA 8–10; and group III, SOFA C11.RESULTS. Underlying clinical diagnosis reveled pneumonia in 72 patients, urinary tractinfections in 8, blood stream infection in 4 while other infections in 23, while infectioncould not be traced in 25 patients. The mean PCT was 3 ng/ml (95 % CI 1–4), 12 ng/ml(95 % CI 9.1–14) and 19 ng/ml (95 % CI 16.3–22.3) in group I, II and III respectively withstatistical significance difference in the mean PCT level between the 3 groups (P \ 0.0001).On the other hand CRP mean level did not significantly differentiate between the groups(147.1 mg/l in group II which even higher than the level group III is 138.4 mg/l. We foundstatistically significant positive correlation between PCT and APACHE II score by usingSpearman correlation test that could not be achieved between CRP and APACHE II.CONCLUSIONS. Given PCT its patronage display over a wide spectrum of insults it seemsto do better than CRP in predicting the SOFA groups.REFERENCE(S).GRANT ACKNOWLEDGMENT. To all members of the critical care departments, Cairo,Beni Suef Universities, Egypt and Shikh Khalifa medical city. UAE.
Tuesday 08 October 2013
Oral SessionsAbstract Award Session: 0442–04450442BENEFICIAL EFFECTS OF EXOGENOUS LACTATE ADMINISTRATIONIN HUMANS WITH TRAUMATIC BRAIN INJURY
P. Bouzat1, N. Sala1, T. Suys1, J. Bloch2, R. Meuli3, P.J. Magistretti4, M. Oddo1
1Lausanne University Hospital, Department of Intensive Care Unit, Lausanne, Switzerland,2Lausanne University Hospital, Department of Neurosurgery, Lausanne, Switzerland,3Lausanne University Hospital, Department of Radiology, Lausanne, Switzerland,4Lausanne University, Brain Mind Institute, Laboratory of Neuroenergetics and CellularDynamics, Lausanne, SwitzerlandINTRODUCTION. Experimental evidence suggests that exogenous lactate can supportbrain energy metabolism after injury and may be neuroprotective. No studies have examinedwhether lactate is beneficial in humans with traumatic brain injury (TBI).OBJECTIVES. To examine the effect of sodium lactate infusion on cerebral energymetabolism after TBI.METHODS. Twelve consecutive TBI patients (mean age 39 years, mean GCS 5) wereenrolled in a prospective phase II interventional study to receive a continuous infusion ofsodium lactate (40 lmol/kg/min for 60 min, followed by 30 lmol/kg/min for the next 2 h),administered within 48 h from TBI. Patients were monitored with cerebral microdialysis,brain tissue PO2 and intracranial pressure, placed in the brain parenchyma (white matter,right frontal lobe in all patients). Brain interstitial tissue concentrations of lactate, pyruvate,glucose and glutamate were measured hourly.RESULTS. Exogenous lactate administration was associated with a significant and clinicallyrelevant increase of brain lactate (baseline 3 ± 0.6 vs 4.9 ± 1.3 mmol/L maximum increase),pyruvate (118 ± 48 vs 180 ± 55 lmol/L) and glucose (1.5 ± 0.9 vs 2.3 ± 1.1 mmol/L)(Fig. 1, all p \ 0.01, paired T test). Lactate therapy also resulted in a reduction of brain glutamate(16 ± 14 vs 10 ± 9 mmol/L) and intracranial pressure (10 ± 6 vs 6 ± 4 mmHg, p \ 0.05),while brain tissue PO2 remained stable (25 ± 10 mmHg vs 23 ± 7 mmHg). Blood lactateincreased from 1.8 ± 1.2 to a maximum of 5.5 ± 1.8 mmol/L. After adjusting for subject var-iability over time with mixed-effects multilevel regression analysis, increase of all brain energymetabolites remained statistically significant (p \ 0.01) and independent from systemic glucose.
Brain tissue concentrations of metabolites
CONCLUSIONS. This is the first clinical study demonstrating lactate uptake and utiliza-tion by the injured human brain, with sparing of cerebral glucose. Increase of pyruvate andglucose in brain interstitial tissue during exogenous lactate administration further suggestsbeneficial effects of lactate therapy after TBI.GRANT ACKNOWLEDGMENT. Supported by the Swiss National Science Foundationand the European Critical Care Network (ECCRN) of the ESICM.
0443PREOPERATIVE SERUM SODIUM AND POSTOPERATIVE MORTALITY:A EUSOS SUBSTUDY
M. Cecconi1, H. Hochrieser2, B. Metnitz3, R. Moreno4, R. Pearse5, P. Metnitz6, A. Rhodes1,on behalf of the EuSOS Investigators1Intensive Care Medicine, St George’s Healthcare NHS Trust and St George’ University ofLondon, London, United Kingdom, 2Center for Medical Statistics, Informatics andIntelligent Systems of the Medical University of Vienna, Vienna, Austria, 3Austrian Centerfor Documentation and Quality Management in Intensive Care Medicine, Vienna, Austria,4UCINC, Hospital de São José, Centro Hospitalar de Lisboa Central, EPE, Lisbon, Portugal,5Barts and The London School of Medicine and Dentistry, Queen Mary University ofLondon, London, United Kingdom, 6Department of Anesthesia, General Intensive Care andPain Management of the Medical University of Vienna, Vienna, AustriaINTRODUCTION. Derangements in serum sodium levels during the perioperative periodare common. It is unclear whether how levels relate to post operative outcomes.OBJECTIVES. To describe the relationship between preoperative sodium values andmortality using data from the European Surgical Outcomes Study.METHODS. Patients of this 7-day cohort study were enrolled in April 2011. Consecutivepatients aged 16 years and older undergoing inpatient non-cardiac surgery in 498 hospitalsacross 28 European nations were included and followed up for a maximum of 60 days. Theprimary endpoint was in-hospital mortality. Secondary outcome measures were admission tointensive care, use of mechanical ventilation, and initiation of inotropes or vasopressorswithin 24 h after surgery. Sodium levels were split into none categories (see Table) fromsevere hyponatremia to severe hypernatremia. The ‘‘normal sodium range’’ was dividedinto: normal (138–142 mmol/L), borderline hyponatremia (136–137 mmol/L.) and border-line hypernatremia (143–144 mmol/L). A V2 test was used to compare categorical variables,with a p value \0.05 considered as significant.RESULTS. We enrolled 46,539 patients in the study. Due to missing values, 10.723 patientswere excluded from analysis leaving 35,816 patients for analysis. There were significantdifferences (p\ 0.0001) in mortality across all intervals of preoperative sodium levels.
26th ESICM ANNUAL CONGRESS — PARIS, FRANCE — 5–9 OCTOBER 2013
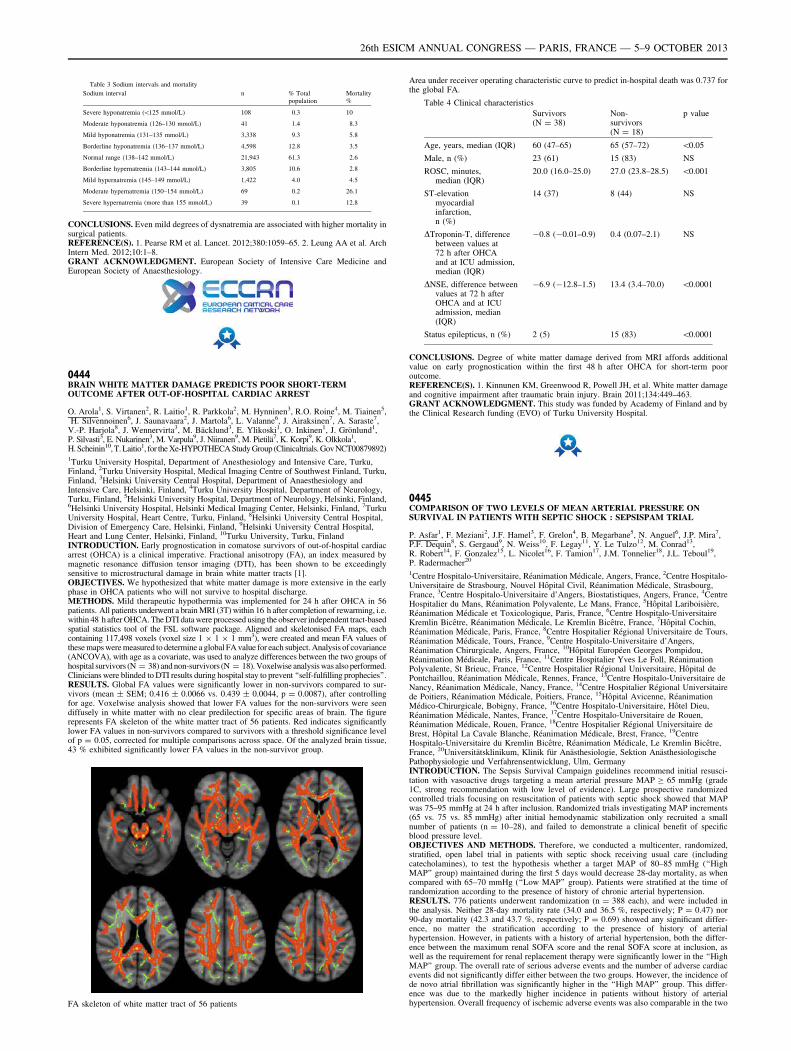
Table 3 Sodium intervals and mortality
Sodium interval n % Totalpopulation
Mortality%
Severe hyponatremia (\125 mmol/L) 108 0.3 10
Moderate hyponatremia (126–130 mmol/L) 41 1.4 8.3
Mild hyponatremia (131–135 mmol/L) 3,338 9.3 5.8
Borderline hyponatremia (136–137 mmol/L) 4,598 12.8 3.5
Normal range (138–142 mmol/L) 21,943 61.3 2.6
Borderline hypernatremia (143–144 mmol/L) 3,805 10.6 2.8
Mild hypernatremia (145–149 mmol/L) 1,422 4.0 4.5
Moderate hypernatremia (150–154 mmol/L) 69 0.2 26.1
Severe hypernatremia (more than 155 mmol/L) 39 0.1 12.8
CONCLUSIONS. Even mild degrees of dysnatremia are associated with higher mortality insurgical patients.REFERENCE(S). 1. Pearse RM et al. Lancet. 2012;380:1059–65. 2. Leung AA et al. ArchIntern Med. 2012;10:1–8.GRANT ACKNOWLEDGMENT. European Society of Intensive Care Medicine andEuropean Society of Anaesthesiology.
0444BRAIN WHITE MATTER DAMAGE PREDICTS POOR SHORT-TERMOUTCOME AFTER OUT-OF-HOSPITAL CARDIAC ARREST
O. Arola1, S. Virtanen2, R. Laitio1, R. Parkkola2, M. Hynninen3, R.O. Roine4, M. Tiainen5,H. Silvennoinen6, J. Saunavaara2, J. Martola6, L. Valanne6, J. Airaksinen7, A. Saraste7,
V.-P. Harjola8, J. Wennervirta3, M. Bäcklund3, E. Ylikoski1, O. Inkinen1, J. Grönlund1,P. Silvasti3, E. Nukarinen3, M. Varpula9, J. Niiranen9, M. Pietilä7, K. Korpi9, K. Olkkola1,H. Scheinin10, T. Laitio1, for the Xe-HYPOTHECA Study Group (Clinicaltrials. Gov NCT00879892)1Turku University Hospital, Department of Anesthesiology and Intensive Care, Turku,Finland, 2Turku University Hospital, Medical Imaging Centre of Southwest Finland, Turku,Finland, 3Helsinki University Central Hospital, Department of Anaesthesiology andIntensive Care, Helsinki, Finland, 4Turku University Hospital, Department of Neurology,Turku, Finland, 5Helsinki University Hospital, Department of Neurology, Helsinki, Finland,6Helsinki University Hospital, Helsinki Medical Imaging Center, Helsinki, Finland, 7TurkuUniversity Hospital, Heart Centre, Turku, Finland, 8Helsinki University Central Hospital,Division of Emergency Care, Helsinki, Finland, 9Helsinki University Central Hospital,Heart and Lung Center, Helsinki, Finland, 10Turku University, Turku, FinlandINTRODUCTION. Early prognostication in comatose survivors of out-of-hospital cardiacarrest (OHCA) is a clinical imperative. Fractional anisotropy (FA), an index measured bymagnetic resonance diffusion tensor imaging (DTI), has been shown to be exceedinglysensitive to microstructural damage in brain white matter tracts [1].OBJECTIVES. We hypothesized that white matter damage is more extensive in the earlyphase in OHCA patients who will not survive to hospital discharge.METHODS. Mild therapeutic hypothermia was implemented for 24 h after OHCA in 56patients. All patients underwent a brain MRI (3T) within 16 h after completion of rewarming, i.e.within 48 h after OHCA. The DTI data were processed using the observer independent tract-basedspatial statistics tool of the FSL software package. Aligned and skeletonised FA maps, eachcontaining 117,498 voxels (voxel size 1 9 1 9 1 mm3), were created and mean FA values ofthese maps were measured to determine a global FA value for each subject. Analysis of covariance(ANCOVA), with age as a covariate, was used to analyze differences between the two groups ofhospital survivors (N = 38) and non-survivors (N = 18). Voxelwise analysis was also performed.Clinicians were blinded to DTI results during hospital stay to prevent ‘‘self-fulfilling prophecies’’.RESULTS. Global FA values were significantly lower in non-survivors compared to sur-vivors (mean ± SEM; 0.416 ± 0.0066 vs. 0.439 ± 0.0044, p = 0.0087), after controllingfor age. Voxelwise analysis showed that lower FA values for the non-survivors were seendiffusely in white matter with no clear predilection for specific areas of brain. The figurerepresents FA skeleton of the white matter tract of 56 patients. Red indicates significantlylower FA values in non-survivors compared to survivors with a threshold significance levelof p = 0.05, corrected for multiple comparisons across space. Of the analyzed brain tissue,43 % exhibited significantly lower FA values in the non-survivor group.
FA skeleton of white matter tract of 56 patients
Area under receiver operating characteristic curve to predict in-hospital death was 0.737 forthe global FA.
Table 4 Clinical characteristics
Survivors(N = 38)
Non-survivors(N = 18)
p value
Age, years, median (IQR) 60 (47–65) 65 (57–72) \0.05
Male, n (%) 23 (61) 15 (83) NS
ROSC, minutes,median (IQR)
20.0 (16.0–25.0) 27.0 (23.8–28.5) \0.001
ST-elevationmyocardialinfarction,n (%)
14 (37) 8 (44) NS
DTroponin-T, differencebetween values at72 h after OHCAand at ICU admission,median (IQR)
-0.8 (-0.01–0.9) 0.4 (0.07–2.1) NS
DNSE, difference betweenvalues at 72 h afterOHCA and at ICUadmission, median(IQR)
-6.9 (-12.8–1.5) 13.4 (3.4–70.0) \0.0001
Status epilepticus, n (%) 2 (5) 15 (83) \0.0001
CONCLUSIONS. Degree of white matter damage derived from MRI affords additionalvalue on early prognostication within the first 48 h after OHCA for short-term pooroutcome.REFERENCE(S). 1. Kinnunen KM, Greenwood R, Powell JH, et al. White matter damageand cognitive impairment after traumatic brain injury. Brain 2011;134:449–463.GRANT ACKNOWLEDGMENT. This study was funded by Academy of Finland and bythe Clinical Research funding (EVO) of Turku University Hospital.
0445COMPARISON OF TWO LEVELS OF MEAN ARTERIAL PRESSURE ONSURVIVAL IN PATIENTS WITH SEPTIC SHOCK : SEPSISPAM TRIAL
P. Asfar1, F. Meziani2, J.F. Hamel3, F. Grelon4, B. Megarbane5, N. Anguel6, J.P. Mira7,P.F. Dequin8, S. Gergaud9, N. Weiss10, F. Legay11, Y. Le Tulzo12, M. Conrad13,R. Robert14, F. Gonzalez15, L. Nicolet16, F. Tamion17, J.M. Tonnelier18, J.L. Teboul19,P. Radermacher20
1Centre Hospitalo-Universitaire, Réanimation Médicale, Angers, France, 2Centre Hospitalo-Universitaire de Strasbourg, Nouvel Hôpital Civil, Réanimation Médicale, Strasbourg,France, 3Centre Hospitalo-Universitaire d’Angers, Biostatistiques, Angers, France, 4CentreHospitalier du Mans, Réanimation Polyvalente, Le Mans, France, 5Hôpital Lariboisière,Réanimation Médicale et Toxicologique, Paris, France, 6Centre Hospitalo-UniversitaireKremlin Bicêtre, Réanimation Médicale, Le Kremlin Bicêtre, France, 7Hôpital Cochin,Réanimation Médicale, Paris, France, 8Centre Hospitalier Régional Universitaire de Tours,Réanimation Médicale, Tours, France, 9Centre Hospitalo-Universitaire d’Angers,Réanimation Chirurgicale, Angers, France, 10Hôpital Européen Georges Pompidou,Réanimation Médicale, Paris, France, 11Centre Hospitalier Yves Le Foll, RéanimationPolyvalente, St Brieuc, France, 12Centre Hospitalier Régional Universitaire, Hôpital dePontchaillou, Réanimation Médicale, Rennes, France, 13Centre Hospitalo-Universitaire deNancy, Réanimation Médicale, Nancy, France, 14Centre Hospitalier Régional Universitairede Poitiers, Réanimation Médicale, Poitiers, France, 15Hôpital Avicenne, RéanimationMédico-Chirurgicale, Bobigny, France, 16Centre Hospitalo-Universitaire, Hôtel Dieu,Réanimation Médicale, Nantes, France, 17Centre Hospitalo-Universitaire de Rouen,Réanimation Médicale, Rouen, France, 18Centre Hospitalier Régional Universitaire deBrest, Hôpital La Cavale Blanche, Réanimation Médicale, Brest, France, 19CentreHospitalo-Universitaire du Kremlin Bicêtre, Réanimation Médicale, Le Kremlin Bicêtre,France, 20Universitätsklinikum, Klinik für Anästhesiologie, Sektion AnästhesiologischePathophysiologie und Verfahrensentwicklung, Ulm, GermanyINTRODUCTION. The Sepsis Survival Campaign guidelines recommend initial resusci-tation with vasoactive drugs targeting a mean arterial pressure MAP C 65 mmHg (grade1C, strong recommendation with low level of evidence). Large prospective randomizedcontrolled trials focusing on resuscitation of patients with septic shock showed that MAPwas 75–95 mmHg at 24 h after inclusion. Randomized trials investigating MAP increments(65 vs. 75 vs. 85 mmHg) after initial hemodynamic stabilization only recruited a smallnumber of patients (n = 10–28), and failed to demonstrate a clinical benefit of specificblood pressure level.OBJECTIVES AND METHODS. Therefore, we conducted a multicenter, randomized,stratified, open label trial in patients with septic shock receiving usual care (includingcatecholamines), to test the hypothesis whether a target MAP of 80–85 mmHg (‘‘HighMAP’’ group) maintained during the first 5 days would decrease 28-day mortality, as whencompared with 65–70 mmHg (‘‘Low MAP’’ group). Patients were stratified at the time ofrandomization according to the presence of history of chronic arterial hypertension.RESULTS. 776 patients underwent randomization (n = 388 each), and were included inthe analysis. Neither 28-day mortality rate (34.0 and 36.5 %, respectively; P = 0.47) nor90-day mortality (42.3 and 43.7 %, respectively; P = 0.69) showed any significant differ-ence, no matter the stratification according to the presence of history of arterialhypertension. However, in patients with a history of arterial hypertension, both the differ-ence between the maximum renal SOFA score and the renal SOFA score at inclusion, aswell as the requirement for renal replacement therapy were significantly lower in the ‘‘HighMAP’’ group. The overall rate of serious adverse events and the number of adverse cardiacevents did not significantly differ either between the two groups. However, the incidence ofde novo atrial fibrillation was significantly higher in the ‘‘High MAP’’ group. This differ-ence was due to the markedly higher incidence in patients without history of arterialhypertension. Overall frequency of ischemic adverse events was also comparable in the two
26th ESICM ANNUAL CONGRESS — PARIS, FRANCE — 5–9 OCTOBER 2013
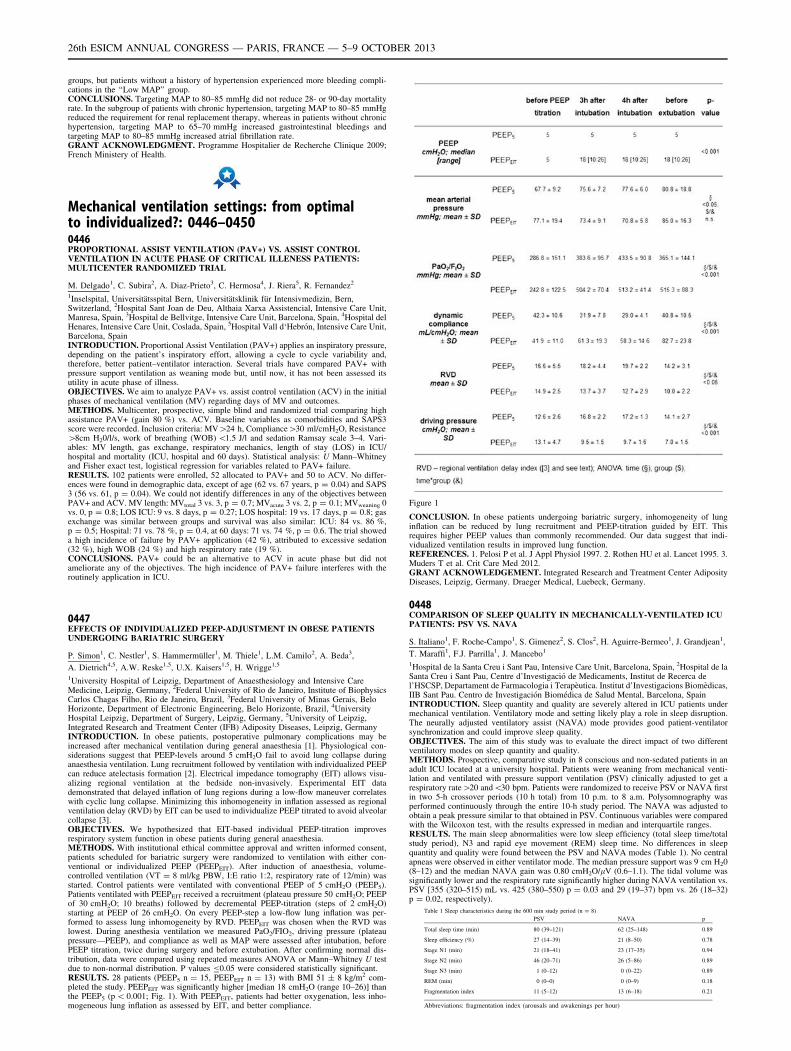
groups, but patients without a history of hypertension experienced more bleeding compli-cations in the ‘‘Low MAP’’ group.CONCLUSIONS. Targeting MAP to 80–85 mmHg did not reduce 28- or 90-day mortalityrate. In the subgroup of patients with chronic hypertension, targeting MAP to 80–85 mmHgreduced the requirement for renal replacement therapy, whereas in patients without chronichypertension, targeting MAP to 65–70 mmHg increased gastrointestinal bleedings andtargeting MAP to 80–85 mmHg increased atrial fibrillation rate.GRANT ACKNOWLEDGMENT. Programme Hospitalier de Recherche Clinique 2009;French Ministery of Health.
Mechanical ventilation settings: from optimalto individualized?: 0446–04500446PROPORTIONAL ASSIST VENTILATION (PAV+) VS. ASSIST CONTROLVENTILATION IN ACUTE PHASE OF CRITICAL ILLENESS PATIENTS:MULTICENTER RANDOMIZED TRIAL
M. Delgado1, C. Subira2, A. Diaz-Prieto3, C. Hermosa4, J. Riera5, R. Fernandez2
1Inselspital, Universitätsspital Bern, Universitätsklinik für Intensivmedizin, Bern,Switzerland, 2Hospital Sant Joan de Deu, Althaia Xarxa Assistencial, Intensive Care Unit,Manresa, Spain, 3Hospital de Bellvitge, Intensive Care Unit, Barcelona, Spain, 4Hospital delHenares, Intensive Care Unit, Coslada, Spain, 5Hospital Vall d‘Hebrón, Intensive Care Unit,Barcelona, SpainINTRODUCTION. Proportional Assist Ventilation (PAV+) applies an inspiratory pressure,depending on the patient’s inspiratory effort, allowing a cycle to cycle variability and,therefore, better patient–ventilator interaction. Several trials have compared PAV+ withpressure support ventilation as weaning mode but, until now, it has not been assessed itsutility in acute phase of illness.OBJECTIVES. We aim to analyze PAV+ vs. assist control ventilation (ACV) in the initialphases of mechanical ventilation (MV) regarding days of MV and outcomes.METHODS. Multicenter, prospective, simple blind and randomized trial comparing highassistance PAV+ (gain 80 %) vs. ACV. Baseline variables as comorbidities and SAPS3score were recorded. Inclusion criteria: MV[24 h, Compliance[30 ml/cmH2O, Resistance[8cm H20/l/s, work of breathing (WOB) \1.5 J/l and sedation Ramsay scale 3–4. Vari-ables: MV length, gas exchange, respiratory mechanics, length of stay (LOS) in ICU/hospital and mortality (ICU, hospital and 60 days). Statistical analysis: U Mann–Whitneyand Fisher exact test, logistical regression for variables related to PAV+ failure.RESULTS. 102 patients were enrolled, 52 allocated to PAV+ and 50 to ACV. No differ-ences were found in demographic data, except of age (62 vs. 67 years, p = 0.04) and SAPS3 (56 vs. 61, p = 0.04). We could not identify differences in any of the objectives betweenPAV+ and ACV. MV length: MVtotal 3 vs. 3, p = 0.7; MVacute 3 vs. 2, p = 0.1; MVweaning 0vs. 0, p = 0.8; LOS ICU: 9 vs. 8 days, p = 0.27; LOS hospital: 19 vs. 17 days, p = 0.8; gasexchange was similar between groups and survival was also similar: ICU: 84 vs. 86 %,p = 0.5; Hospital: 71 vs. 78 %, p = 0.4, at 60 days: 71 vs. 74 %, p = 0.6. The trial showeda high incidence of failure by PAV+ application (42 %), attributed to excessive sedation(32 %), high WOB (24 %) and high respiratory rate (19 %).CONCLUSIONS. PAV+ could be an alternative to ACV in acute phase but did notameliorate any of the objectives. The high incidence of PAV+ failure interferes with theroutinely application in ICU.
0447EFFECTS OF INDIVIDUALIZED PEEP-ADJUSTMENT IN OBESE PATIENTSUNDERGOING BARIATRIC SURGERY
P. Simon1, C. Nestler1, S. Hammermüller1, M. Thiele1, L.M. Camilo2, A. Beda3,
A. Dietrich4,5, A.W. Reske1,5, U.X. Kaisers1,5, H. Wrigge1,5
1University Hospital of Leipzig, Department of Anaesthesiology and Intensive CareMedicine, Leipzig, Germany, 2Federal University of Rio de Janeiro, Institute of BiophysicsCarlos Chagas Filho, Rio de Janeiro, Brazil, 3Federal University of Minas Gerais, BeloHorizonte, Department of Electronic Engineering, Belo Horizonte, Brazil, 4UniversityHospital Leipzig, Department of Surgery, Leipzig, Germany, 5University of Leipzig,Integrated Research and Treatment Center (IFB) Adiposity Diseases, Leipzig, GermanyINTRODUCTION. In obese patients, postoperative pulmonary complications may beincreased after mechanical ventilation during general anaesthesia [1]. Physiological con-siderations suggest that PEEP-levels around 5 cmH2O fail to avoid lung collapse duringanaesthesia ventilation. Lung recruitment followed by ventilation with individualized PEEPcan reduce atelectasis formation [2]. Electrical impedance tomography (EIT) allows visu-alizing regional ventilation at the bedside non-invasively. Experimental EIT datademonstrated that delayed inflation of lung regions during a low-flow maneuver correlateswith cyclic lung collapse. Minimizing this inhomogeneity in inflation assessed as regionalventilation delay (RVD) by EIT can be used to individualize PEEP titrated to avoid alveolarcollapse [3].OBJECTIVES. We hypothesized that EIT-based individual PEEP-titration improvesrespiratory system function in obese patients during general anaesthesia.METHODS. With institutional ethical committee approval and written informed consent,patients scheduled for bariatric surgery were randomized to ventilation with either con-ventional or individualized PEEP (PEEPEIT). After induction of anaesthesia, volume-controlled ventilation (VT = 8 ml/kg PBW, I:E ratio 1:2, respiratory rate of 12/min) wasstarted. Control patients were ventilated with conventional PEEP of 5 cmH2O (PEEP5).Patients ventilated with PEEPEIT received a recruitment (plateau pressure 50 cmH2O; PEEPof 30 cmH2O; 10 breaths) followed by decremental PEEP-titration (steps of 2 cmH2O)starting at PEEP of 26 cmH2O. On every PEEP-step a low-flow lung inflation was per-formed to assess lung inhomogeneity by RVD. PEEPEIT was chosen when the RVD waslowest. During anesthesia ventilation we measured PaO2/FIO2, driving pressure (plateaupressure—PEEP), and compliance as well as MAP were assessed after intubation, beforePEEP titration, twice during surgery and before extubation. After confirming normal dis-tribution, data were compared using repeated measures ANOVA or Mann–Whitney U testdue to non-normal distribution. P values B0.05 were considered statistically significant.RESULTS. 28 patients (PEEP5 n = 15, PEEPEIT n = 13) with BMI 51 ± 8 kg/m2 com-pleted the study. PEEPEIT was significantly higher [median 18 cmH2O (range 10–26)] thanthe PEEP5 (p \ 0.001; Fig. 1). With PEEPEIT, patients had better oxygenation, less inho-mogeneous lung inflation as assessed by EIT, and better compliance.
Figure 1
CONCLUSION. In obese patients undergoing bariatric surgery, inhomogeneity of lunginflation can be reduced by lung recruitment and PEEP-titration guided by EIT. Thisrequires higher PEEP values than commonly recommended. Our data suggest that indi-vidualized ventilation results in improved lung function.REFERENCES. 1. Pelosi P et al. J Appl Physiol 1997. 2. Rothen HU et al. Lancet 1995. 3.Muders T et al. Crit Care Med 2012.GRANT ACKNOWLEDGEMENT. Integrated Research and Treatment Center AdiposityDiseases, Leipzig, Germany. Draeger Medical, Luebeck, Germany.
0448COMPARISON OF SLEEP QUALITY IN MECHANICALLY-VENTILATED ICUPATIENTS: PSV VS. NAVA
S. Italiano1, F. Roche-Campo1, S. Gimenez2, S. Clos2, H. Aguirre-Bermeo1, J. Grandjean1,
T. Maraffi1, F.J. Parrilla1, J. Mancebo1
1Hospital de la Santa Creu i Sant Pau, Intensive Care Unit, Barcelona, Spain, 2Hospital de laSanta Creu i Sant Pau, Centre d’Investigació de Medicaments, Institut de Recerca del’HSCSP, Departament de Farmacologia i Terapèutica. Institut d’Investigacions Biomèdicas,IIB Sant Pau. Centro de Investigación Biomédica de Salud Mental, Barcelona, SpainINTRODUCTION. Sleep quantity and quality are severely altered in ICU patients undermechanical ventilation. Ventilatory mode and setting likely play a role in sleep disruption.The neurally adjusted ventilatory assist (NAVA) mode provides good patient-ventilatorsynchronization and could improve sleep quality.OBJECTIVES. The aim of this study was to evaluate the direct impact of two differentventilatory modes on sleep quantity and quality.METHODS. Prospective, comparative study in 8 conscious and non-sedated patients in anadult ICU located at a university hospital. Patients were weaning from mechanical venti-lation and ventilated with pressure support ventilation (PSV) clinically adjusted to get arespiratory rate[20 and\30 bpm. Patients were randomized to receive PSV or NAVA firstin two 5-h crossover periods (10 h total) from 10 p.m. to 8 a.m. Polysomnography wasperformed continuously through the entire 10-h study period. The NAVA was adjusted toobtain a peak pressure similar to that obtained in PSV. Continuous variables were comparedwith the Wilcoxon test, with the results expressed in median and interquartile ranges.RESULTS. The main sleep abnormalities were low sleep efficiency (total sleep time/totalstudy period), N3 and rapid eye movement (REM) sleep time. No differences in sleepquantity and quality were found between the PSV and NAVA modes (Table 1). No centralapneas were observed in either ventilator mode. The median pressure support was 9 cm H20(8–12) and the median NAVA gain was 0.80 cmH2O/lV (0.6–1.1). The tidal volume wassignificantly lower and the respiratory rate significantly higher during NAVA ventilation vs.PSV [355 (320–515) mL vs. 425 (380–550) p = 0.03 and 29 (19–37) bpm vs. 26 (18–32)p = 0.02, respectively).
Table 1 Sleep characteristics during the 600 min study period (n = 8)
PSV NAVA p
Total sleep time (min) 80 (39–121) 62 (25–148) 0.89
Sleep efficiency (%) 27 (14–39) 21 (8–50) 0.78
Stage N1 (min) 21 (18–41) 23 (17–35) 0.94
Stage N2 (min) 46 (20–71) 26 (5–86) 0.89
Stage N3 (min) 1 (0–12) 0 (0–22) 0.89
REM (min) 0 (0–0) 0 (0–9) 0.18
Fragmentation index 11 (5–12) 13 (6–18) 0.21
Abbreviations: fragmentation index (arousals and awakenings per hour)
26th ESICM ANNUAL CONGRESS — PARIS, FRANCE — 5–9 OCTOBER 2013
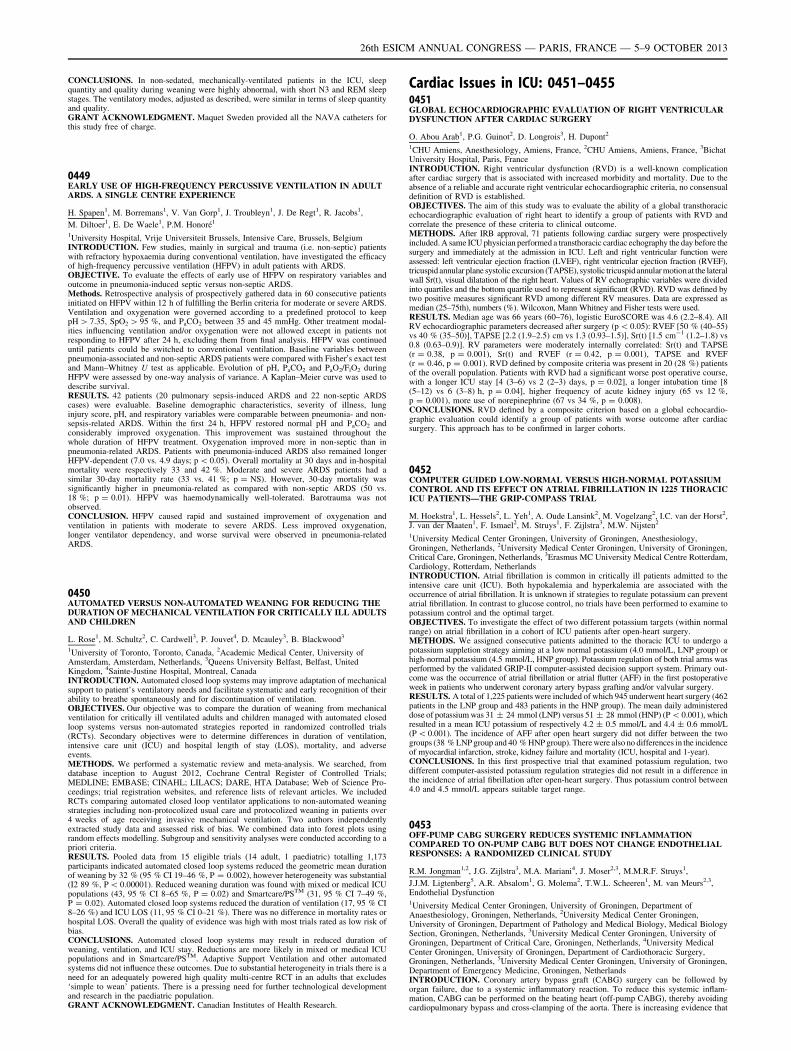
CONCLUSIONS. In non-sedated, mechanically-ventilated patients in the ICU, sleepquantity and quality during weaning were highly abnormal, with short N3 and REM sleepstages. The ventilatory modes, adjusted as described, were similar in terms of sleep quantityand quality.GRANT ACKNOWLEDGMENT. Maquet Sweden provided all the NAVA catheters forthis study free of charge.
0449EARLY USE OF HIGH-FREQUENCY PERCUSSIVE VENTILATION IN ADULTARDS. A SINGLE CENTRE EXPERIENCE
H. Spapen1, M. Borremans1, V. Van Gorp1, J. Troubleyn1, J. De Regt1, R. Jacobs1,
M. Diltoer1, E. De Waele1, P.M. Honoré1
1University Hospital, Vrije Universiteit Brussels, Intensive Care, Brussels, BelgiumINTRODUCTION. Few studies, mainly in surgical and trauma (i.e. non-septic) patientswith refractory hypoxaemia during conventional ventilation, have investigated the efficacyof high-frequency percussive ventilation (HFPV) in adult patients with ARDS.OBJECTIVE. To evaluate the effects of early use of HFPV on respiratory variables andoutcome in pneumonia-induced septic versus non-septic ARDS.Methods. Retrospective analysis of prospectively gathered data in 60 consecutive patientsinitiated on HFPV within 12 h of fulfilling the Berlin criteria for moderate or severe ARDS.Ventilation and oxygenation were governed according to a predefined protocol to keeppH [ 7.35, SpO2 [ 95 %, and PaCO2 between 35 and 45 mmHg. Other treatment modal-ities influencing ventilation and/or oxygenation were not allowed except in patients notresponding to HFPV after 24 h, excluding them from final analysis. HFPV was continueduntil patients could be switched to conventional ventilation. Baseline variables betweenpneumonia-associated and non-septic ARDS patients were compared with Fisher0s exact testand Mann–Whitney U test as applicable. Evolution of pH, PaCO2 and PaO2/FiO2 duringHFPV were assessed by one-way analysis of variance. A Kaplan–Meier curve was used todescribe survival.RESULTS. 42 patients (20 pulmonary sepsis-induced ARDS and 22 non-septic ARDScases) were evaluable. Baseline demographic characteristics, severity of illness, lunginjury score, pH, and respiratory variables were comparable between pneumonia- and non-sepsis-related ARDS. Within the first 24 h, HFPV restored normal pH and PaCO2 andconsiderably improved oxygenation. This improvement was sustained throughout thewhole duration of HFPV treatment. Oxygenation improved more in non-septic than inpneumonia-related ARDS. Patients with pneumonia-induced ARDS also remained longerHFPV-dependent (7.0 vs. 4.9 days; p \ 0.05). Overall mortality at 30 days and in-hospitalmortality were respectively 33 and 42 %. Moderate and severe ARDS patients had asimilar 30-day mortality rate (33 vs. 41 %; p = NS). However, 30-day mortality wassignificantly higher in pneumonia-related as compared with non-septic ARDS (50 vs.18 %; p = 0.01). HFPV was haemodynamically well-tolerated. Barotrauma was notobserved.CONCLUSION. HFPV caused rapid and sustained improvement of oxygenation andventilation in patients with moderate to severe ARDS. Less improved oxygenation,longer ventilator dependency, and worse survival were observed in pneumonia-relatedARDS.
0450AUTOMATED VERSUS NON-AUTOMATED WEANING FOR REDUCING THEDURATION OF MECHANICAL VENTILATION FOR CRITICALLY ILL ADULTSAND CHILDREN
L. Rose1, M. Schultz2, C. Cardwell3, P. Jouvet4, D. Mcauley3, B. Blackwood3
1University of Toronto, Toronto, Canada, 2Academic Medical Center, University ofAmsterdam, Amsterdam, Netherlands, 3Queens University Belfast, Belfast, UnitedKingdom, 4Sainte-Justine Hospital, Montreal, CanadaINTRODUCTION. Automated closed loop systems may improve adaptation of mechanicalsupport to patient’s ventilatory needs and facilitate systematic and early recognition of theirability to breathe spontaneously and for discontinuation of ventilation.OBJECTIVES. Our objective was to compare the duration of weaning from mechanicalventilation for critically ill ventilated adults and children managed with automated closedloop systems versus non-automated strategies reported in randomized controlled trials(RCTs). Secondary objectives were to determine differences in duration of ventilation,intensive care unit (ICU) and hospital length of stay (LOS), mortality, and adverseevents.METHODS. We performed a systematic review and meta-analysis. We searched, fromdatabase inception to August 2012, Cochrane Central Register of Controlled Trials;MEDLINE; EMBASE; CINAHL; LILACS; DARE, HTA Database; Web of Science Pro-ceedings; trial registration websites, and reference lists of relevant articles. We includedRCTs comparing automated closed loop ventilator applications to non-automated weaningstrategies including non-protocolized usual care and protocolized weaning in patients over4 weeks of age receiving invasive mechanical ventilation. Two authors independentlyextracted study data and assessed risk of bias. We combined data into forest plots usingrandom effects modelling. Subgroup and sensitivity analyses were conducted according to apriori criteria.RESULTS. Pooled data from 15 eligible trials (14 adult, 1 paediatric) totalling 1,173participants indicated automated closed loop systems reduced the geometric mean durationof weaning by 32 % (95 % CI 19–46 %, P = 0.002), however heterogeneity was substantial(I2 89 %, P \ 0.00001). Reduced weaning duration was found with mixed or medical ICUpopulations (43, 95 % CI 8–65 %, P = 0.02) and Smartcare/PSTM (31, 95 % CI 7–49 %,P = 0.02). Automated closed loop systems reduced the duration of ventilation (17, 95 % CI8–26 %) and ICU LOS (11, 95 % CI 0–21 %). There was no difference in mortality rates orhospital LOS. Overall the quality of evidence was high with most trials rated as low risk ofbias.CONCLUSIONS. Automated closed loop systems may result in reduced duration ofweaning, ventilation, and ICU stay. Reductions are more likely in mixed or medical ICUpopulations and in Smartcare/PSTM. Adaptive Support Ventilation and other automatedsystems did not influence these outcomes. Due to substantial heterogeneity in trials there is aneed for an adequately powered high quality multi-centre RCT in an adults that excludes‘simple to wean’ patients. There is a pressing need for further technological developmentand research in the paediatric population.GRANT ACKNOWLEDGMENT. Canadian Institutes of Health Research.
Cardiac Issues in ICU: 0451–04550451GLOBAL ECHOCARDIOGRAPHIC EVALUATION OF RIGHT VENTRICULARDYSFUNCTION AFTER CARDIAC SURGERY
O. Abou Arab1, P.G. Guinot2, D. Longrois3, H. Dupont2
1CHU Amiens, Anesthesiology, Amiens, France, 2CHU Amiens, Amiens, France, 3BichatUniversity Hospital, Paris, FranceINTRODUCTION. Right ventricular dysfunction (RVD) is a well-known complicationafter cardiac surgery that is associated with increased morbidity and mortality. Due to theabsence of a reliable and accurate right ventricular echocardiographic criteria, no consensualdefinition of RVD is established.OBJECTIVES. The aim of this study was to evaluate the ability of a global transthoracicechocardiographic evaluation of right heart to identify a group of patients with RVD andcorrelate the presence of these criteria to clinical outcome.METHODS. After IRB approval, 71 patients following cardiac surgery were prospectivelyincluded. A same ICU physician performed a transthoracic cardiac echography the day before thesurgery and immediately at the admission in ICU. Left and right ventricular function wereassessed: left ventricular ejection fraction (LVEF), right ventricular ejection fraction (RVEF),tricuspid annular plane systolic excursion (TAPSE), systolic tricuspidannular motionat the lateralwall Sr(t), visual dilatation of the right heart. Values of RV echographic variables were dividedinto quartiles and the bottom quartile used to represent significant (RVD). RVD was defined bytwo positive measures significant RVD among different RV measures. Data are expressed asmedian (25–75th), numbers (%). Wilcoxon, Mann Whitney and Fisher tests were used.RESULTS. Median age was 66 years (60–76), logistic EuroSCORE was 4.6 (2.2–8.4). AllRV echocardiographic parameters decreased after surgery (p \ 0.05): RVEF [50 % (40–55)vs 40 % (35–50)], TAPSE [2.2 (1.9–2.5) cm vs 1.3 (0.93–1.5)], Sr(t) [1.5 cm-1 (1.2–1.8) vs0.8 (0.63–0.9)]. RV parameters were moderately internally correlated: Sr(t) and TAPSE(r = 0.38, p = 0.001), Sr(t) and RVEF (r = 0.42, p = 0.001), TAPSE and RVEF(r = 0.46, p = 0.001). RVD defined by composite criteria was present in 20 (28 %) patientsof the overall population. Patients with RVD had a significant worse post operative course,with a longer ICU stay [4 (3–6) vs 2 (2–3) days, p = 0.02], a longer intubation time [8(5–12) vs 6 (3–8) h, p = 0.04], higher frequency of acute kidney injury (65 vs 12 %,p = 0.001), more use of norepinephrine (67 vs 34 %, p = 0.008).CONCLUSIONS. RVD defined by a composite criterion based on a global echocardio-graphic evaluation could identify a group of patients with worse outcome after cardiacsurgery. This approach has to be confirmed in larger cohorts.
0452COMPUTER GUIDED LOW-NORMAL VERSUS HIGH-NORMAL POTASSIUMCONTROL AND ITS EFFECT ON ATRIAL FIBRILLATION IN 1225 THORACICICU PATIENTS—THE GRIP-COMPASS TRIAL
M. Hoekstra1, L. Hessels2, L. Yeh1, A. Oude Lansink2, M. Vogelzang2, I.C. van der Horst2,J. van der Maaten1, F. Ismael2, M. Struys1, F. Zijlstra3, M.W. Nijsten2
1University Medical Center Groningen, University of Groningen, Anesthesiology,Groningen, Netherlands, 2University Medical Center Groningen, University of Groningen,Critical Care, Groningen, Netherlands, 3Erasmus MC University Medical Centre Rotterdam,Cardiology, Rotterdam, NetherlandsINTRODUCTION. Atrial fibrillation is common in critically ill patients admitted to theintensive care unit (ICU). Both hypokalemia and hyperkalemia are associated with theoccurrence of atrial fibrillation. It is unknown if strategies to regulate potassium can preventatrial fibrillation. In contrast to glucose control, no trials have been performed to examine topotassium control and the optimal target.OBJECTIVES. To investigate the effect of two different potassium targets (within normalrange) on atrial fibrillation in a cohort of ICU patients after open-heart surgery.METHODS. We assigned consecutive patients admitted to the thoracic ICU to undergo apotassium suppletion strategy aiming at a low normal potassium (4.0 mmol/L, LNP group) orhigh-normal potassium (4.5 mmol/L, HNP group). Potassium regulation of both trial arms wasperformed by the validated GRIP-II computer-assisted decision support system. Primary out-come was the occurrence of atrial fibrillation or atrial flutter (AFF) in the first postoperativeweek in patients who underwent coronary artery bypass grafting and/or valvular surgery.RESULTS. A total of 1,225 patients were included of which 945 underwent heart surgery (462patients in the LNP group and 483 patients in the HNP group). The mean daily administereddose of potassium was 31 ± 24 mmol (LNP) versus 51 ± 28 mmol (HNP) (P \ 0.001), whichresulted in a mean ICU potassium of respectively 4.2 ± 0.5 mmol/L and 4.4 ± 0.6 mmol/L(P\ 0.001). The incidence of AFF after open heart surgery did not differ between the twogroups (38 % LNP group and 40 % HNP group). There were also no differences in the incidenceof myocardial infarction, stroke, kidney failure and mortality (ICU, hospital and 1-year).CONCLUSIONS. In this first prospective trial that examined potassium regulation, twodifferent computer-assisted potassium regulation strategies did not result in a difference inthe incidence of atrial fibrillation after open-heart surgery. Thus potassium control between4.0 and 4.5 mmol/L appears suitable target range.
0453OFF-PUMP CABG SURGERY REDUCES SYSTEMIC INFLAMMATIONCOMPARED TO ON-PUMP CABG BUT DOES NOT CHANGE ENDOTHELIALRESPONSES: A RANDOMIZED CLINICAL STUDY
R.M. Jongman1,2, J.G. Zijlstra3, M.A. Mariani4, J. Moser2,3, M.M.R.F. Struys1,
J.J.M. Ligtenberg5, A.R. Absalom1, G. Molema2, T.W.L. Scheeren1, M. van Meurs2,3,Endothelial Dysfunction1University Medical Center Groningen, University of Groningen, Department ofAnaesthesiology, Groningen, Netherlands, 2University Medical Center Groningen,University of Groningen, Department of Pathology and Medical Biology, Medical BiologySection, Groningen, Netherlands, 3University Medical Center Groningen, University ofGroningen, Department of Critical Care, Groningen, Netherlands, 4University MedicalCenter Groningen, University of Groningen, Department of Cardiothoracic Surgery,Groningen, Netherlands, 5University Medical Center Groningen, University of Groningen,Department of Emergency Medicine, Groningen, NetherlandsINTRODUCTION. Coronary artery bypass graft (CABG) surgery can be followed byorgan failure, due to a systemic inflammatory reaction. To reduce this systemic inflam-mation, CABG can be performed on the beating heart (off-pump CABG), thereby avoidingcardiopulmonary bypass and cross-clamping of the aorta. There is increasing evidence that
26th ESICM ANNUAL CONGRESS — PARIS, FRANCE — 5–9 OCTOBER 2013
the endothelium plays an important role in the pathophysiology of organ failure post CABG.When the endothelium becomes activated, it starts to express adhesion molecules andsecretes pro inflammatory cytokines [1]. The Angiopoietin (Ang)/Tie2 receptor system andthe VEGF/VEGF receptor system are involved in endothelial activation in organ failure [2].Endothelial activation can be studied by measuring systemic levels of soluble adhesionmolecules, and angiogenic and vascular leakage related factors in the plasma [3].OBJECTIVES. To study the effects of off-pump versus on-pump CABG surgery on sys-temic inflammation and endothelial activation.METHODS. In this prospective, randomized, observational study, 60 patients who werescheduled for elective CABG surgery were randomized to have surgery for on-pump or off-pump CABG. One patient was excluded from the study because off-pump CABG wasperformed, whereas the patient was randomized for on-pump CABG. Blood was collected atfour time points: at start of the procedure, at the end, 6, and 24 h postoperatively. Levels ofinflammatory cytokines [IL-6, TNF-a, IL-10, and myeloperoxidase (MPO)], soluble adhe-sion molecules (E-selectin, VCAM-1, and ICAM-1), and angiogenic factors and theirreceptors (Ang-1, Ang-2, sTie2, VEGF, sFlt-1, and KDR) were measured in the plasma.RESULTS. There was no difference in pre-operative characteristics between the patientgroups. The inflammatory cytokines TNFa, IL-10 and MPO, but not IL-6, were moreincreased after the procedure in the on-pump group compared with the off-pump CABGgroup. The soluble endothelial adhesion molecules E-selectin, VCAM-1, and ICAM-1showed a similar release pattern in the plasma during and after CABG in on-pump and off-pump and were not elevated. Ang-2 was only increased 24 h after surgery, and was notdifferent between on-pump and off-pump group. Higher levels of sFlt-1 were found at theend of the procedure in off-pump CABG compared to on-pump CABG.CONCLUSIONS. Our study showed that avoiding cardiopulmonary bypass and aorticcross-clamping in CABG surgery reduces the systemic inflammatory response. On-pumpCABG does not lead to a higher release of soluble endothelial adhesion molecules in thesystem compared to off-pump CABG. The systemic levels of angiogenic and vascularleakage related molecules of the endothelial Ang/Tie2 and the VEGF/VEGF receptor sys-tem were more deranged from start values in on-pump than in off-pump CABG.REFERENCE(S). 1. Aird WC. Crit Care Med 2003;31(4 Suppl):S221–30. 2. van Meurs Met al. Crit Care 2009;13(2):207. 3. de Pablo R et al. Eur J Intern Med 2013;24(2):132–138.
0454STUDY OF FOCUSSED ASSESSMENT OF TRANSTHORACICECHOCARDIOGRAPHY(FATE) PROTOCOL IN ADULT POSTCARDIOTHORACIC SURGERY PATIENTS
S.N. Veerappa1, R. Gupta1, Adult Post Operative Cardiothoracic Surgery Patients1Narayana Hrudayalaya, Critical Care Medicine, Bangalore, Karnataka, IndiaINTRODUCTION. • Echo in the ICU has commonly been used as a diagnostic tool-worthwhile using it for monitoring and hemodynamic assessment.• FATE is a quick, goal oriented cardiac and pleura imaging protocol designed for use inICU• Involves basic echo in four standard transthoracic acoustic windows
OBJECTIVES. To evaluate the utility of focused assessment of transthoracic echo (FATE)protocol in decision making in adult post cardiothoracic surgery patients in intensive therapyunit.METHODS. • Inclusion criteria: adult patients undergoing cardiac surgeries with indica-tions for echo in the post op period like-pre-load assessment, increased need for inotropes,drop in hematocrit, respiratory insufficiency, hemodynamic instability in the immediate postop period were included in the study.• Exclusion criteria: pre-operative patients requiring stay in AITU were excluded, pediatricpatients and patients\18 years of age undergoing surgery for congenital heart diseases wereexcluded.• 366 patients among the 1,024 adult patients undergoing cardiothoracic surgery includingvalve repairs and replacements, bypass grafting and aortic aneurysm repairs were studiedover a period of 4 months.• FATE protocol was followed when there was clinical indication for echocardiography inthe immediate postoperative (\12 h).• 4 views-apical, parasternal, sub-xiphoid, and pleural views, were examined by a seniorconsultant intensivist using a standard GE VIVID 3 ECHO machine using the 3 Hz probe• Assessment of usefulness of FATE was made in 4 categories-1. Poor window/no information 2. Support of existing information 3. Added new infor-
mation 4. Added decisive information • Tabulated results where subjected to paired andunpaired ‘t’ tests for parametric and non-parametric data as applicable and CHI square testapplied for usefulness of FATE. Test results were significant when p value was \0.05RESULTS. • A total of 366 patients were studied, of whom 290 (79.23 %) were males and76 (20.76 %) were females.• A total of 283 (77.32 %) patients were on ventilator at the time of examination. Mean age52.91 ± 26.12 years. Mean BMI 24.53 ± 8.12• Decisive information was obtained using FATE in 246 (67.21 %).• New information was obtained in 32 (8.74 %).• 86 (23.49 %) FATE supported already existing information.• 2 (0.66 %) patients had very poor ECHO window.• Of the 246 (67.21 %) patients that FATE helped obtaining decisive information. In 234(95.12 %) patients, medical management was directly influenced by FATE findings, 50(20.32 %) patients were extubated aiding in early transfer out of the ITU.• In 80 (32.52 %) patients, FATE aided in decision making, in terms of requirement ofsurgical intervention-inter costal drain (ICD) insertion in 47 (19.10 %) and re-exploration in33 (13.41 %).
CONCLUSIONS. Decisive information obtained using FATE in 246 (67.21 %) was foundto be statistically significant with a p value \0.0001.REFERENCE(S). http://www.fate.org
0455INFLUENCE OF GOAL-DIRECTED HEMODYNAMIC OPTIMIZATION ONCLINICAL PARAMETERS OF PATIENTS UNDERGOING TRANSCATHETERAORTIC VALVE IMPLANTATION (TAVI) - A RETROSPECTIVE ANALYSIS
V. Mezger1, M. Habicher1, F. Balzer1, G. Fucini1, K. Stangl2, M. Sander1
1Charité—University Medicine Berlin, Anesthesiology and Intensive Care Medicine, Berlin,Germany, 2Charité—University Medicine Berlin, Department of Cardiology and Angiology,Berlin, Germany
INTRODUCTION. TAVI has become a potential option for patients with aortic valvestenosis. As this patient population according to age and cardiovascular condition is con-sidered as ‘‘high risk’’ the intraoperative anesthetic management and especiallyhemodynamic stability maintaining preload and avoiding tachycardia is essential (1).OBJECTIVES. The aim of this study was to investigate the influence of a standardizedgoal-directed hemodynamic optimization during TAVI on clinical parameters.METHODS. 40 Patients receiving TAVI whether through transfemoral or transapicalapproach received a standardized volume management intraoperatively according to Pearseet al. (group 1). Therefore, 250 ml of Hydroxyethyl starch (HES) were infused afterinduction controlling the effect via SV-monitoring. Responders (dSV [ 10 %) receivedadditional volume boluses until dSV was \10 %. After valve implantation infusion of250 ml HES was performed again. Responders (dSV [ 10 %) received additional volumeboluses until dSV was \10 % [2]. Data of another 40 patients who underwent TAVI withfluid management according to the attending anesthesiologist (group 2) was analyzed ret-rospectively and compared to data above.RESULTS. During this study data of 80 patients was analyzed. One patient was excludedbecause of missing data. There was no difference between the two groups according sex andage. Group 1 obtained significantly more HES 6 % (726 ± 261l vs. 295 ± 319 ml;p \ 0,01), group 2 significantly more cristalloids compared to group 1 (731 ± 300l vs.363 ± 271 ml; p \ 0,01) with no variation in cumulative administration of volume intra-operatively. In addition there was no difference in number of intraoperative transfusions ordose of noradrenaline. Beyond significant decrease in length of anesthesia but not significantreduction of surgery time were observed in group 1 (126.7 ± 46.3 vs. 163.3 ± 75.3 min;p = 0,002 and 81 ± 40.2 vs. 98.3 + 68.1 min; p = 0,057). Interestingly, a significantdecrease in number of days staying at ICU (4.55 ± 4.89 vs. 6.62 + 6; p \ 0,05) contem-poraneous not changing length of hospital stay could be found in the group that underwent agoal-directed hemodynamic optimization.CONCLUSIONS. Goal-directed volume management after transcatheter aortic valveimplantation led to reduced use of cristalloids and increased use of colloids during theprocedure and resulted in a shorter ICU stay. Further investigations regarding postoperativecomplications will help to elucidate the reduced length of ICU treatment in the group withgoal-directed hemodynamic management.REFERENCE(S). 1. Habicher M, Perrino A Jr, Sander M et al. Contemporary fluidmanagement in cardiac anesthesia. J Cardiothorac Vasc Anesth 2011;25:1141–53. 2. PearseR, Dawson D, Bennett ED et al.: Early goal-directed therapy after major surgery reducescomplications and duration of hospital stay. A randomised, controlled trial. Crit Care2010;9:R687–93.GRANT ACKNOWLEDGMENT. Institutionally.
Prognostic biomarkers in sepsis: 0456–04600456PROCALCITONIN, C-REACTIVE PROTEIN AND LACTATE AS PROGNOSTICMARKERS OF MORTALITY IN PATIENTS WITH COMPLICATED INTRA-ABDOMINAL INFECTION ADMITTED TO THE ICU
A. Suarez de la Rica1, E. Maseda1, V. Anillo1, C. Hernandez Gancedo1, A. Lopez-Tofiño1,
F. Gilsanz1
1Hospital Universitario La Paz, Anaesthesiology and Surgical Critical Care, Madrid, SpainINTRODUCTION. Biomarkers are increasingly used to facilitate early diagnosis andmanagement of sepsis, and they can also help the clinician in prognostication.OBJECTIVES. The aim of the study was to compare the prognostic utility of procalcitonin(PCT), C-reactive protein (CRP) and lactate with each other and with clinical severityscores.METHODS. Patients with complicated intra-abdominal infection admitted to ICU aftersource control surgery between January 2010 and January 2013 were studied. PCT, CRP andlactate were measured at admission and daily on the first 3 days. Initial severity wasassessed by simplified acute physiology score II (SAPS II) and sequential organ failureassessment (SOFA) score. Severity was reassessed after 3 days by SOFA score. ICUmortality and 28-day mortality were evaluated.RESULTS. A total of 91 patients were included. 10 patients (10.9 %) died in the ICU, and14 (15.3 %) in the first 28 days after ICU admission. On day 28, SAPS II, SOFA score atadmission and on day 3 were different between non survivors and survivors (59 vs. 37, 9 vs.4 and 8 vs 4; p \ 0.001). CRP on day 1, on day 2 and CRP peak values were also higher innon-survivors (247 vs. 112 mg/l, p = 0.001; 266 vs. 101, p \ 0.001; 302 vs. 213,p = 0.006). Lactate on day 1 was higher in non-survivors (2.1 vs. 0.9 mmol/l; p = 0.002).PCT peak values tended to be higher in non-survivors, without reaching significance (77 vs.18 ng/ml; p = 0.053). SOFA score on day 3 was the best predictor of 28-day mortality(AUC 0.85), followed by CRP on day 2 (AUC 0.82), lactate on day 1 (AUC 0.81), CRP onday 1 (AUC 0.79) and SAPS II (AUC 0.79). At logistic regression analysis SOFA score onday 3 and CRP on day 2 were the only independent predictors of 28-day mortality (OR 1.5,CI 95 % 1.09–2.07, p = 0.013; OR 1.01, CI 95 % 1.002–1.023). ICU non-survivors hadhigher CRP on day 1 and 2 (263 vs. 118 mg/l, p = 0.004; 232 vs. 114, p = 0.013), higherlactate at admission and on day 1 and 2 (3.3 vs. 2 mmol/l, p = 0.021; 2.5 vs. 0.9, p = 0.001;1.4 vs. 0.3, p = 0.043) and higher peak PCT values (64 vs. 22.6 ng/ml, p = 0.015).CONCLUSIONS. CRP is a good prognostic biomarker, better than PCT and lactate inpostsurgical patients with complicated intra-abdominal infection, mainly on day 2 after ICUadmission. Prognostic value of SOFA score on day 3 is superior to that of SAPS II, SOFAscore at admission, PCT, CRP and lactate.REFERENCE(S). 1. Krüger S, Ewig S, Giersdorf S et al. Cardiovascular and inflammatorybiomarkers to predict short and long term survival in community-acquired pneumonia. Am JRespir Crit Care Med 2010;182:1426–1434. 2. Menedez R, Martinez R, Reyes S et al.Biomarkers improve mortality prediction by prognostic scales in community-acquiredpneumonia. Thorax 2009;64:587–591.
0457CLEARANCE LACTATE LEVELS IN EARLY GOAL DIRECTED THERAPYIN SEVERE SEPSIS AND SEPTIC SHOCK PATIENTS
P. Garcı́a Olivares1, I.A. De Sousa1, L. Tang1, M. Dı́az1, E. Keough1, M. Dalorzo1,
M.A. Estévez1, C. Caciano1, C. Ramı́rez1, C. Bocanegra1
1H.G.U. Gregorio Marañón, Intensive Care Unit, Madrid, SpainINTRODUCTION. Lactate clearance in the first 6 h is associated with outcome in septicpatients and it has been proposed to guide treatment.
26th ESICM ANNUAL CONGRESS — PARIS, FRANCE — 5–9 OCTOBER 2013
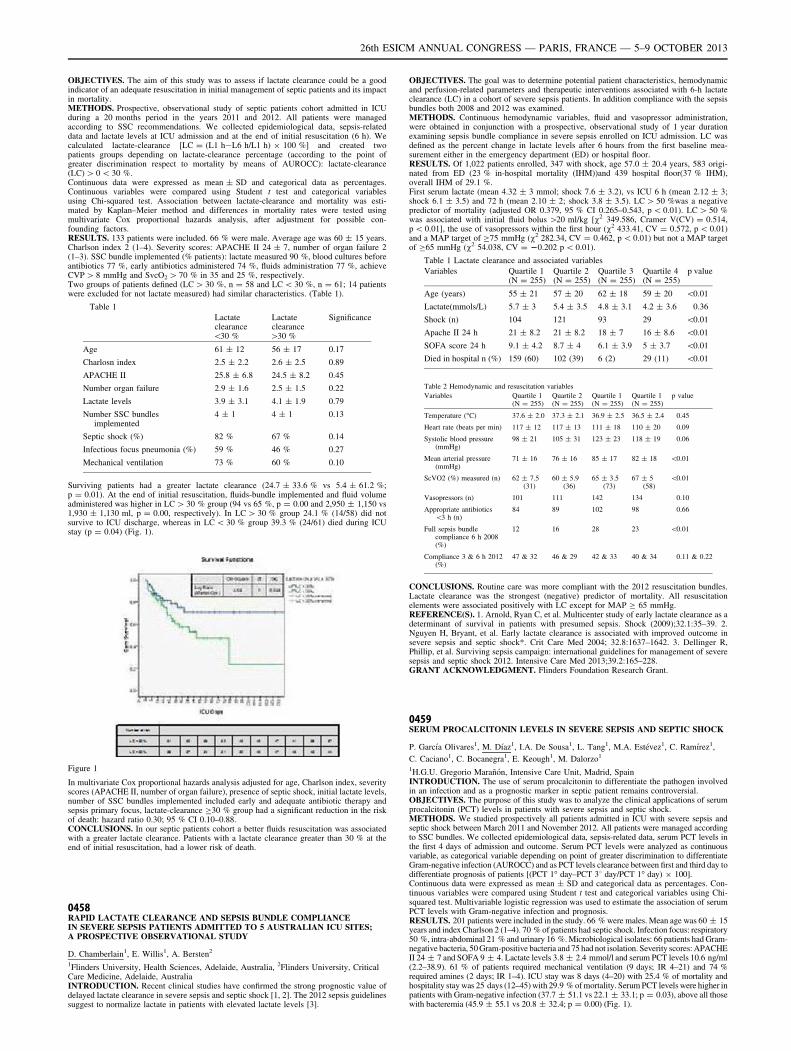
OBJECTIVES. The aim of this study was to assess if lactate clearance could be a goodindicator of an adequate resuscitation in initial management of septic patients and its impactin mortality.METHODS. Prospective, observational study of septic patients cohort admitted in ICUduring a 20 months period in the years 2011 and 2012. All patients were managedaccording to SSC recommendations. We collected epidemiological data, sepsis-relateddata and lactate levels at ICU admission and at the end of initial resuscitation (6 h). Wecalculated lactate-clearance [LC = (L1 h-L6 h/L1 h) 9 100 %] and created twopatients groups depending on lactate-clearance percentage (according to the point ofgreater discrimination respect to mortality by means of AUROCC): lactate-clearance(LC) [ 0 \ 30 %.Continuous data were expressed as mean ± SD and categorical data as percentages.Continuous variables were compared using Student t test and categorical variablesusing Chi-squared test. Association between lactate-clearance and mortality was esti-mated by Kaplan–Meier method and differences in mortality rates were tested usingmultivariate Cox proportional hazards analysis, after adjustment for possible con-founding factors.RESULTS. 133 patients were included. 66 % were male. Average age was 60 ± 15 years.Charlson index 2 (1–4). Severity scores: APACHE II 24 ± 7, number of organ failure 2(1–3). SSC bundle implemented (% patients): lactate measured 90 %, blood cultures beforeantibiotics 77 %, early antibiotics administered 74 %, fluids administration 77 %, achieveCVP [ 8 mmHg and SvcO2 [ 70 % in 35 and 25 %, respectively.Two groups of patients defined (LC [ 30 %, n = 58 and LC \ 30 %, n = 61; 14 patientswere excluded for not lactate measured) had similar characteristics. (Table 1).
Table 1
Lactateclearance\30 %
Lactateclearance[30 %
Significance
Age 61 ± 12 56 ± 17 0.17
Charlosn index 2.5 ± 2.2 2.6 ± 2.5 0.89
APACHE II 25.8 ± 6.8 24.5 ± 8.2 0.45
Number organ failure 2.9 ± 1.6 2.5 ± 1.5 0.22
Lactate levels 3.9 ± 3.1 4.1 ± 1.9 0.79
Number SSC bundlesimplemented
4 ± 1 4 ± 1 0.13
Septic shock (%) 82 % 67 % 0.14
Infectious focus pneumonia (%) 59 % 46 % 0.27
Mechanical ventilation 73 % 60 % 0.10
Surviving patients had a greater lactate clearance (24.7 ± 33.6 % vs 5.4 ± 61.2 %;p = 0.01). At the end of initial resuscitation, fluids-bundle implemented and fluid volumeadministered was higher in LC [ 30 % group (94 vs 65 %, p = 0.00 and 2,950 ± 1,150 vs1,930 ± 1,130 ml, p = 0.00, respectively). In LC [ 30 % group 24.1 % (14/58) did notsurvive to ICU discharge, whereas in LC \ 30 % group 39.3 % (24/61) died during ICUstay (p = 0.04) (Fig. 1).
Figure 1
In multivariate Cox proportional hazards analysis adjusted for age, Charlson index, severityscores (APACHE II, number of organ failure), presence of septic shock, initial lactate levels,number of SSC bundles implemented included early and adequate antibiotic therapy andsepsis primary focus, lactate-clearance C30 % group had a significant reduction in the riskof death: hazard ratio 0.30; 95 % CI 0.10–0.88.CONCLUSIONS. In our septic patients cohort a better fluids resuscitation was associatedwith a greater lactate clearance. Patients with a lactate clearance greater than 30 % at theend of initial resuscitation, had a lower risk of death.
0458RAPID LACTATE CLEARANCE AND SEPSIS BUNDLE COMPLIANCEIN SEVERE SEPSIS PATIENTS ADMITTED TO 5 AUSTRALIAN ICU SITES;A PROSPECTIVE OBSERVATIONAL STUDY
D. Chamberlain1, E. Willis1, A. Bersten2
1Flinders University, Health Sciences, Adelaide, Australia, 2Flinders University, CriticalCare Medicine, Adelaide, AustraliaINTRODUCTION. Recent clinical studies have confirmed the strong prognostic value ofdelayed lactate clearance in severe sepsis and septic shock [1, 2]. The 2012 sepsis guidelinessuggest to normalize lactate in patients with elevated lactate levels [3].
OBJECTIVES. The goal was to determine potential patient characteristics, hemodynamicand perfusion-related parameters and therapeutic interventions associated with 6-h lactateclearance (LC) in a cohort of severe sepsis patients. In addition compliance with the sepsisbundles both 2008 and 2012 was examined.METHODS. Continuous hemodynamic variables, fluid and vasopressor administration,were obtained in conjunction with a prospective, observational study of 1 year durationexamining sepsis bundle compliance in severe sepsis enrolled on ICU admission. LC wasdefined as the percent change in lactate levels after 6 hours from the first baseline mea-surement either in the emergency department (ED) or hospital floor.RESULTS. Of 1,022 patients enrolled, 347 with shock, age 57.0 ± 20.4 years, 583 origi-nated from ED (23 % in-hospital mortality (IHM))and 439 hospital floor(37 % IHM),overall IHM of 29.1 %.First serum lactate (mean 4.32 ± 3 mmol; shock 7.6 ± 3.2), vs ICU 6 h (mean 2.12 ± 3;shock 6.1 ± 3.5) and 72 h (mean 2.10 ± 2; shock 3.8 ± 3.5). LC [ 50 %was a negativepredictor of mortality (adjusted OR 0.379, 95 % CI 0.265–0.543, p \ 0.01). LC [ 50 %was associated with initial fluid bolus [20 ml/kg [v2 349.586, Cramer V(CV) = 0.514,p \ 0.01], the use of vasopressors within the first hour (v2 433.41, CV = 0.572, p \ 0.01)and a MAP target of C75 mmHg (v2 282.34, CV = 0.462, p \ 0.01) but not a MAP targetof C65 mmHg (v2 54.038, CV = 20.202 p \ 0.01).
Table 1 Lactate clearance and associated variables
Variables Quartile 1(N = 255)
Quartile 2(N = 255)
Quartile 3(N = 255)
Quartile 4(N = 255)
p value
Age (years) 55 ± 21 57 ± 20 62 ± 18 59 ± 20 \0.01
Lactate(mmols/L) 5.7 ± 3 5.4 ± 3.5 4.8 ± 3.1 4.2 ± 3.6 0.36
Shock (n) 104 121 93 29 \0.01
Apache II 24 h 21 ± 8.2 21 ± 8.2 18 ± 7 16 ± 8.6 \0.01
SOFA score 24 h 9.1 ± 4.2 8.7 ± 4 6.1 ± 3.9 5 ± 3.7 \0.01
Died in hospital n (%) 159 (60) 102 (39) 6 (2) 29 (11) \0.01
Table 2 Hemodynamic and resuscitation variables
Variables Quartile 1(N = 255)
Quartile 2(N = 255)
Quartile 1(N = 255)
Quartile 1(N = 255)
p value
Temperature (�C) 37.6 ± 2.0 37.3 ± 2.1 36.9 ± 2.5 36.5 ± 2.4 0.45
Heart rate (beats per min) 117 ± 12 117 ± 13 111 ± 18 110 ± 20 0.09
Systolic blood pressure(mmHg)
98 ± 21 105 ± 31 123 ± 23 118 ± 19 0.06
Mean arterial pressure(mmHg)
71 ± 16 76 ± 16 85 ± 17 82 ± 18 \0.01
ScVO2 (%) measured (n) 62 ± 7.5(31)
60 ± 5.9(36)
65 ± 3.5(73)
67 ± 5(58)
\0.01
Vasopressors (n) 101 111 142 134 0.10
Appropriate antibiotics\3 h (n)
84 89 102 98 0.66
Full sepsis bundlecompliance 6 h 2008(%)
12 16 28 23 \0.01
Compliance 3 & 6 h 2012(%)
47 & 32 46 & 29 42 & 33 40 & 34 0.11 & 0.22
CONCLUSIONS. Routine care was more compliant with the 2012 resuscitation bundles.Lactate clearance was the strongest (negative) predictor of mortality. All resuscitationelements were associated positively with LC except for MAP C 65 mmHg.REFERENCE(S). 1. Arnold, Ryan C, et al. Multicenter study of early lactate clearance as adeterminant of survival in patients with presumed sepsis. Shock (2009);32.1:35–39. 2.Nguyen H, Bryant, et al. Early lactate clearance is associated with improved outcome insevere sepsis and septic shock*. Crit Care Med 2004; 32.8:1637–1642. 3. Dellinger R,Phillip, et al. Surviving sepsis campaign: international guidelines for management of severesepsis and septic shock 2012. Intensive Care Med 2013;39.2:165–228.GRANT ACKNOWLEDGMENT. Flinders Foundation Research Grant.
0459SERUM PROCALCITONIN LEVELS IN SEVERE SEPSIS AND SEPTIC SHOCK
P. Garcı́a Olivares1, M. Dı́az1, I.A. De Sousa1, L. Tang1, M.A. Estévez1, C. Ramı́rez1,
C. Caciano1, C. Bocanegra1, E. Keough1, M. Dalorzo1
1H.G.U. Gregorio Marañón, Intensive Care Unit, Madrid, SpainINTRODUCTION. The use of serum procalcitonin to differentiate the pathogen involvedin an infection and as a prognostic marker in septic patient remains controversial.OBJECTIVES. The purpose of this study was to analyze the clinical applications of serumprocalcitonin (PCT) levels in patients with severe sepsis and septic shock.METHODS. We studied prospectively all patients admitted in ICU with severe sepsis andseptic shock between March 2011 and November 2012. All patients were managed accordingto SSC bundles. We collected epidemiological data, sepsis-related data, serum PCT levels inthe first 4 days of admission and outcome. Serum PCT levels were analyzed as continuousvariable, as categorical variable depending on point of greater discrimination to differentiateGram-negative infection (AUROCC) and as PCT levels clearance between first and third day todifferentiate prognosis of patients [(PCT 1� day–PCT 38 day/PCT 1� day) 9 100].Continuous data were expressed as mean ± SD and categorical data as percentages. Con-tinuous variables were compared using Student t test and categorical variables using Chi-squared test. Multivariable logistic regression was used to estimate the association of serumPCT levels with Gram-negative infection and prognosis.RESULTS. 201 patients were included in the study. 66 % were males. Mean age was 60 ± 15years and index Charlson 2 (1–4). 70 % of patients had septic shock. Infection focus: respiratory50 %, intra-abdominal 21 % and urinary 16 %. Microbiological isolates: 66 patients had Gram-negative bacteria, 50 Gram-positive bacteria and 75 had not isolation. Severity scores: APACHEII 24 ± 7 and SOFA 9 ± 4. Lactate levels 3.8 ± 2.4 mmol/l and serum PCT levels 10.6 ng/ml(2.2–38.9). 61 % of patients required mechanical ventilation (9 days; IR 4–21) and 74 %required amines (2 days; IR 1–4). ICU stay was 8 days (4–20) with 25.4 % of mortality andhospitality stay was 25 days (12–45) with 29.9 % of mortality. Serum PCT levels were higher inpatients with Gram-negative infection (37.7 ± 51.1 vs 22.1 ± 33.1; p = 0.03), above all thosewith bacteremia (45.9 ± 55.1 vs 20.8 ± 32.4; p = 0.00) (Fig. 1).
26th ESICM ANNUAL CONGRESS — PARIS, FRANCE — 5–9 OCTOBER 2013
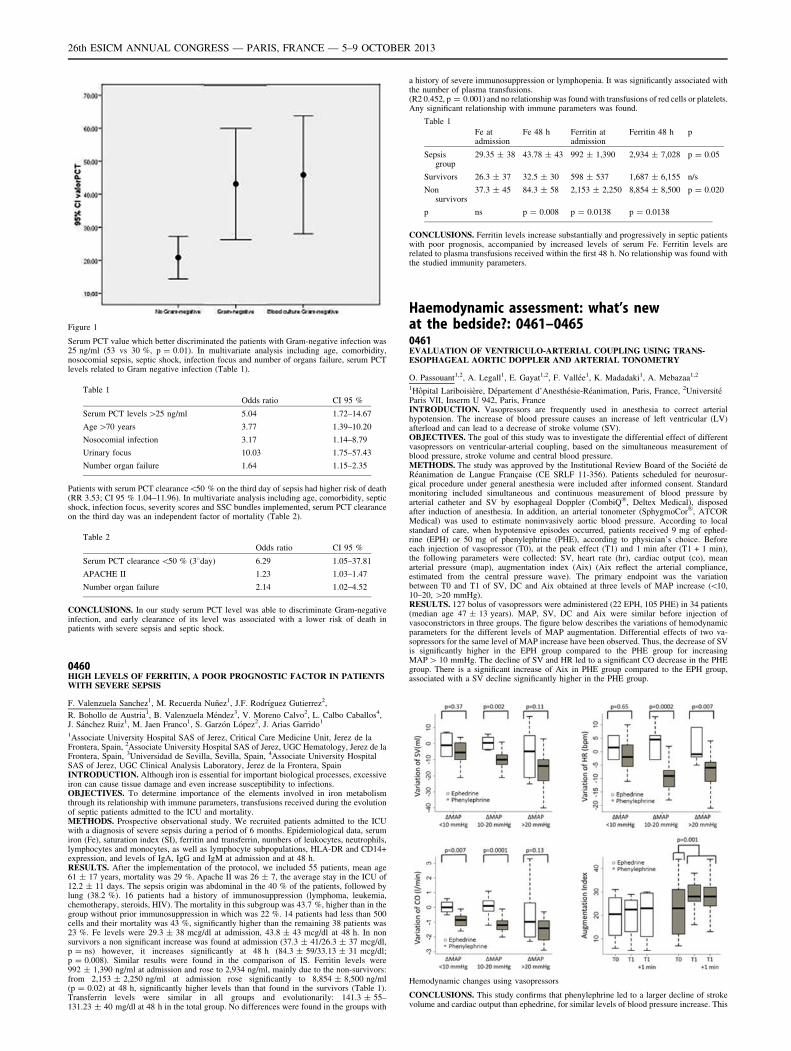
Figure 1
Serum PCT value which better discriminated the patients with Gram-negative infection was25 ng/ml (53 vs 30 %, p = 0.01). In multivariate analysis including age, comorbidity,nosocomial sepsis, septic shock, infection focus and number of organs failure, serum PCTlevels related to Gram negative infection (Table 1).
Table 1
Odds ratio CI 95 %
Serum PCT levels [25 ng/ml 5.04 1.72–14.67
Age [70 years 3.77 1.39–10.20
Nosocomial infection 3.17 1.14–8.79
Urinary focus 10.03 1.75–57.43
Number organ failure 1.64 1.15–2.35
Patients with serum PCT clearance\50 % on the third day of sepsis had higher risk of death(RR 3.53; CI 95 % 1.04–11.96). In multivariate analysis including age, comorbidity, septicshock, infection focus, severity scores and SSC bundles implemented, serum PCT clearanceon the third day was an independent factor of mortality (Table 2).
Table 2
Odds ratio CI 95 %
Serum PCT clearance \50 % (38day) 6.29 1.05–37.81
APACHE II 1.23 1.03–1.47
Number organ failure 2.14 1.02–4.52
CONCLUSIONS. In our study serum PCT level was able to discriminate Gram-negativeinfection, and early clearance of its level was associated with a lower risk of death inpatients with severe sepsis and septic shock.
0460HIGH LEVELS OF FERRITIN, A POOR PROGNOSTIC FACTOR IN PATIENTSWITH SEVERE SEPSIS
F. Valenzuela Sanchez1, M. Recuerda Nuñez1, J.F. Rodrı́guez Gutierrez2,
R. Bohollo de Austria1, B. Valenzuela Méndez3, V. Moreno Calvo2, L. Calbo Caballos4,J. Sánchez Ruiz1, M. Jaen Franco1, S. Garzón López2, J. Arias Garrido1
1Associate University Hospital SAS of Jerez, Critical Care Medicine Unit, Jerez de laFrontera, Spain, 2Associate University Hospital SAS of Jerez, UGC Hematology, Jerez de laFrontera, Spain, 3Universidad de Sevilla, Sevilla, Spain, 4Associate University HospitalSAS of Jerez, UGC Clinical Analysis Laboratory, Jerez de la Frontera, SpainINTRODUCTION. Although iron is essential for important biological processes, excessiveiron can cause tissue damage and even increase susceptibility to infections.OBJECTIVES. To determine importance of the elements involved in iron metabolismthrough its relationship with immune parameters, transfusions received during the evolutionof septic patients admitted to the ICU and mortality.METHODS. Prospective observational study. We recruited patients admitted to the ICUwith a diagnosis of severe sepsis during a period of 6 months. Epidemiological data, serumiron (Fe), saturation index (SI), ferritin and transferrin, numbers of leukocytes, neutrophils,lymphocytes and monocytes, as well as lymphocyte subpopulations, HLA-DR and CD14+expression, and levels of IgA, IgG and IgM at admission and at 48 h.RESULTS. After the implementation of the protocol, we included 55 patients, mean age61 ± 17 years, mortality was 29 %. Apache II was 26 ± 7, the average stay in the ICU of12.2 ± 11 days. The sepsis origin was abdominal in the 40 % of the patients, followed bylung (38.2 %). 16 patients had a history of immunosuppression (lymphoma, leukemia,chemotherapy, steroids, HIV). The mortality in this subgroup was 43.7 %, higher than in thegroup without prior immunosuppression in which was 22 %. 14 patients had less than 500cells and their mortality was 43 %, significantly higher than the remaining 38 patients was23 %. Fe levels were 29.3 ± 38 mcg/dl at admission, 43.8 ± 43 mcg/dl at 48 h. In nonsurvivors a non significant increase was found at admission (37.3 ± 41/26.3 ± 37 mcg/dl,p = ns) however, it increases significantly at 48 h (84.3 ± 59/33.13 ± 31 mcg/dl;p = 0.008). Similar results were found in the comparison of IS. Ferritin levels were992 ± 1,390 ng/ml at admission and rose to 2,934 ng/ml, mainly due to the non-survivors:from 2,153 ± 2,250 ng/ml at admission rose significantly to 8,854 ± 8,500 ng/ml(p = 0.02) at 48 h, significantly higher levels than that found in the survivors (Table 1).Transferrin levels were similar in all groups and evolutionarily: 141.3 ± 55–131.23 ± 40 mg/dl at 48 h in the total group. No differences were found in the groups with
a history of severe immunosuppression or lymphopenia. It was significantly associated withthe number of plasma transfusions.(R2 0.452, p = 0.001) and no relationship was found with transfusions of red cells or platelets.Any significant relationship with immune parameters was found.
Table 1
Fe atadmission
Fe 48 h Ferritin atadmission
Ferritin 48 h p
Sepsisgroup
29.35 ± 38 43.78 ± 43 992 ± 1,390 2,934 ± 7,028 p = 0.05
Survivors 26.3 ± 37 32.5 ± 30 598 ± 537 1,687 ± 6,155 n/s
Nonsurvivors
37.3 ± 45 84.3 ± 58 2,153 ± 2,250 8,854 ± 8,500 p = 0.020
p ns p = 0.008 p = 0.0138 p = 0.0138
CONCLUSIONS. Ferritin levels increase substantially and progressively in septic patientswith poor prognosis, accompanied by increased levels of serum Fe. Ferritin levels arerelated to plasma transfusions received within the first 48 h. No relationship was found withthe studied immunity parameters.
Haemodynamic assessment: what’s newat the bedside?: 0461–04650461EVALUATION OF VENTRICULO-ARTERIAL COUPLING USING TRANS-ESOPHAGEAL AORTIC DOPPLER AND ARTERIAL TONOMETRY
O. Passouant1,2, A. Legall1, E. Gayat1,2, F. Vallée1, K. Madadaki1, A. Mebazaa1,2
1Hôpital Lariboisière, Département d’Anesthésie-Réanimation, Paris, France, 2UniversitéParis VII, Inserm U 942, Paris, FranceINTRODUCTION. Vasopressors are frequently used in anesthesia to correct arterialhypotension. The increase of blood pressure causes an increase of left ventricular (LV)afterload and can lead to a decrease of stroke volume (SV).OBJECTIVES. The goal of this study was to investigate the differential effect of differentvasopressors on ventricular-arterial coupling, based on the simultaneous measurement ofblood pressure, stroke volume and central blood pressure.METHODS. The study was approved by the Institutional Review Board of the Société deRéanimation de Langue Française (CE SRLF 11-356). Patients scheduled for neurosur-gical procedure under general anesthesia were included after informed consent. Standardmonitoring included simultaneous and continuous measurement of blood pressure byarterial catheter and SV by esophageal Doppler (CombiQ�, Deltex Medical), disposedafter induction of anesthesia. In addition, an arterial tonometer (SphygmoCor�, ATCORMedical) was used to estimate noninvasively aortic blood pressure. According to localstandard of care, when hypotensive episodes occurred, patients received 9 mg of ephed-rine (EPH) or 50 mg of phenylephrine (PHE), according to physician’s choice. Beforeeach injection of vasopressor (T0), at the peak effect (T1) and 1 min after (T1 + 1 min),the following parameters were collected: SV, heart rate (hr), cardiac output (co), meanarterial pressure (map), augmentation index (Aix) (Aix reflect the arterial compliance,estimated from the central pressure wave). The primary endpoint was the variationbetween T0 and T1 of SV, DC and Aix obtained at three levels of MAP increase (\10,10–20, [20 mmHg).RESULTS. 127 bolus of vasopressors were administered (22 EPH, 105 PHE) in 34 patients(median age 47 ± 13 years). MAP, SV, DC and Aix were similar before injection ofvasoconstrictors in three groups. The figure below describes the variations of hemodynamicparameters for the different levels of MAP augmentation. Differential effects of two va-sopressors for the same level of MAP increase have been observed. Thus, the decrease of SVis significantly higher in the EPH group compared to the PHE group for increasingMAP [ 10 mmHg. The decline of SV and HR led to a significant CO decrease in the PHEgroup. There is a significant increase of Aix in PHE group compared to the EPH group,associated with a SV decline significantly higher in the PHE group.
Hemodynamic changes using vasopressors
CONCLUSIONS. This study confirms that phenylephrine led to a larger decline of strokevolume and cardiac output than ephedrine, for similar levels of blood pressure increase. This
26th ESICM ANNUAL CONGRESS — PARIS, FRANCE — 5–9 OCTOBER 2013
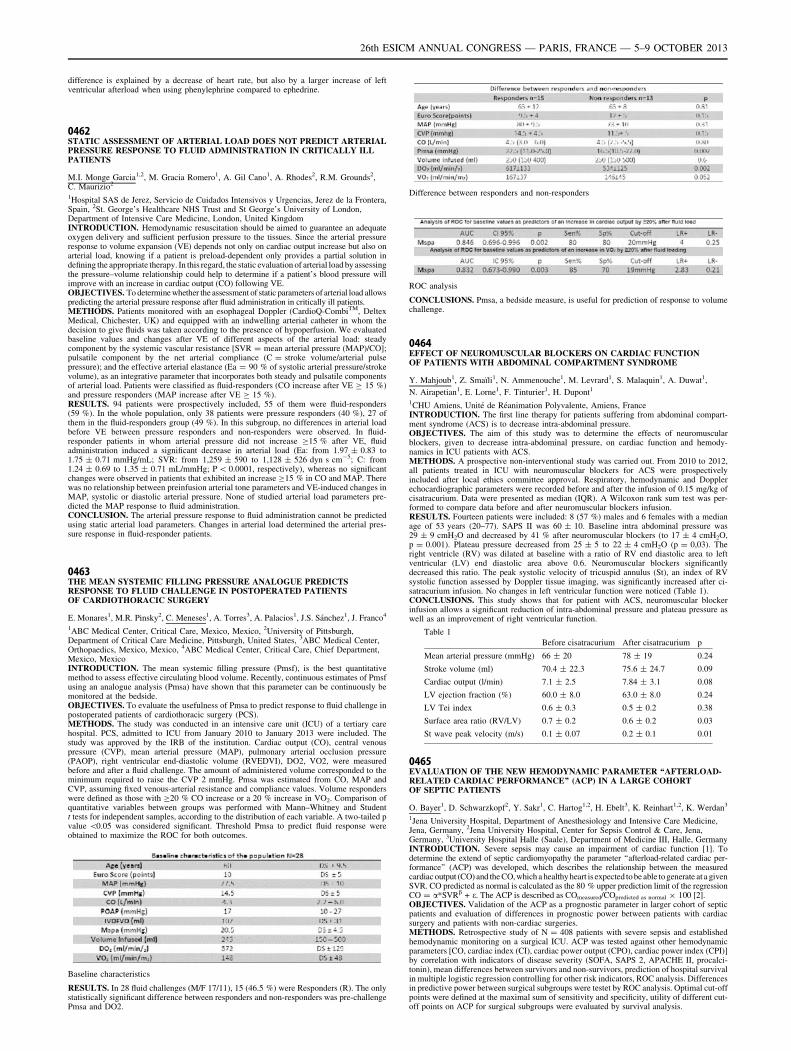
difference is explained by a decrease of heart rate, but also by a larger increase of leftventricular afterload when using phenylephrine compared to ephedrine.
0462STATIC ASSESSMENT OF ARTERIAL LOAD DOES NOT PREDICT ARTERIALPRESSURE RESPONSE TO FLUID ADMINISTRATION IN CRITICALLY ILLPATIENTS
M.I. Monge Garcia1,2, M. Gracia Romero1, A. Gil Cano1, A. Rhodes2, R.M. Grounds2,C. Maurizio2
1Hospital SAS de Jerez, Servicio de Cuidados Intensivos y Urgencias, Jerez de la Frontera,Spain, 2St. George’s Healthcare NHS Trust and St George’s University of London,Department of Intensive Care Medicine, London, United KingdomINTRODUCTION. Hemodynamic resuscitation should be aimed to guarantee an adequateoxygen delivery and sufficient perfusion pressure to the tissues. Since the arterial pressureresponse to volume expansion (VE) depends not only on cardiac output increase but also onarterial load, knowing if a patient is preload-dependent only provides a partial solution indefining the appropriate therapy. In this regard, the static evaluation of arterial load by assessingthe pressure–volume relationship could help to determine if a patient’s blood pressure willimprove with an increase in cardiac output (CO) following VE.OBJECTIVES. To determine whether the assessment of static parameters of arterial load allowspredicting the arterial pressure response after fluid administration in critically ill patients.METHODS. Patients monitored with an esophageal Doppler (CardioQ-CombiTM, DeltexMedical, Chichester, UK) and equipped with an indwelling arterial catheter in whom thedecision to give fluids was taken according to the presence of hypoperfusion. We evaluatedbaseline values and changes after VE of different aspects of the arterial load: steadycomponent by the systemic vascular resistance [SVR = mean arterial pressure (MAP)/CO];pulsatile component by the net arterial compliance (C = stroke volume/arterial pulsepressure); and the effective arterial elastance (Ea = 90 % of systolic arterial pressure/strokevolume), as an integrative parameter that incorporates both steady and pulsatile componentsof arterial load. Patients were classified as fluid-responders (CO increase after VE C 15 %)and pressure responders (MAP increase after VE C 15 %).RESULTS. 94 patients were prospectively included, 55 of them were fluid-responders(59 %). In the whole population, only 38 patients were pressure responders (40 %), 27 ofthem in the fluid-responders group (49 %). In this subgroup, no differences in arterial loadbefore VE between pressure responders and non-responders were observed. In fluid-responder patients in whom arterial pressure did not increase C15 % after VE, fluidadministration induced a significant decrease in arterial load (Ea: from 1.97 ± 0.83 to1.75 ± 0.71 mmHg/mL; SVR: from 1,259 ± 590 to 1,128 ± 526 dyn s cm-5; C: from1.24 ± 0.69 to 1.35 ± 0.71 mL/mmHg; P \ 0.0001, respectively), whereas no significantchanges were observed in patients that exhibited an increase C15 % in CO and MAP. Therewas no relationship between preinfusion arterial tone parameters and VE-induced changes inMAP, systolic or diastolic arterial pressure. None of studied arterial load parameters pre-dicted the MAP response to fluid administration.CONCLUSION. The arterial pressure response to fluid administration cannot be predictedusing static arterial load parameters. Changes in arterial load determined the arterial pres-sure response in fluid-responder patients.
0463THE MEAN SYSTEMIC FILLING PRESSURE ANALOGUE PREDICTSRESPONSE TO FLUID CHALLENGE IN POSTOPERATED PATIENTSOF CARDIOTHORACIC SURGERY
E. Monares1, M.R. Pinsky2, C. Meneses1, A. Torres3, A. Palacios1, J.S. Sánchez1, J. Franco4
1ABC Medical Center, Critical Care, Mexico, Mexico, 2University of Pittsburgh,Department of Critical Care Medicine, Pittsburgh, United States, 3ABC Medical Center,Orthopaedics, Mexico, Mexico, 4ABC Medical Center, Critical Care, Chief Department,Mexico, MexicoINTRODUCTION. The mean systemic filling pressure (Pmsf), is the best quantitativemethod to assess effective circulating blood volume. Recently, continuous estimates of Pmsfusing an analogue analysis (Pmsa) have shown that this parameter can be continuously bemonitored at the bedside.OBJECTIVES. To evaluate the usefulness of Pmsa to predict response to fluid challenge inpostoperated patients of cardiothoracic surgery (PCS).METHODS. The study was conducted in an intensive care unit (ICU) of a tertiary carehospital. PCS, admitted to ICU from January 2010 to January 2013 were included. Thestudy was approved by the IRB of the institution. Cardiac output (CO), central venouspressure (CVP), mean arterial pressure (MAP), pulmonary arterial occlusion pressure(PAOP), right ventricular end-diastolic volume (RVEDVI), DO2, VO2, were measuredbefore and after a fluid challenge. The amount of administered volume corresponded to theminimum required to raise the CVP 2 mmHg. Pmsa was estimated from CO, MAP andCVP, assuming fixed venous-arterial resistance and compliance values. Volume responderswere defined as those with C20 % CO increase or a 20 % increase in VO2. Comparison ofquantitative variables between groups was performed with Mann–Whitney and Studentt tests for independent samples, according to the distribution of each variable. A two-tailed pvalue \0.05 was considered significant. Threshold Pmsa to predict fluid response wereobtained to maximize the ROC for both outcomes.
Baseline characteristics
RESULTS. In 28 fluid challenges (M/F 17/11), 15 (46.5 %) were Responders (R). The onlystatistically significant difference between responders and non-responders was pre-challengePmsa and DO2.
Difference between responders and non-responders
ROC analysis
CONCLUSIONS. Pmsa, a bedside measure, is useful for prediction of response to volumechallenge.
0464EFFECT OF NEUROMUSCULAR BLOCKERS ON CARDIAC FUNCTIONOF PATIENTS WITH ABDOMINAL COMPARTMENT SYNDROME
Y. Mahjoub1, Z. Smaı̈li1, N. Ammenouche1, M. Levrard1, S. Malaquin1, A. Duwat1,
N. Airapetian1, E. Lorne1, F. Tinturier1, H. Dupont1
1CHU Amiens, Unité de Réanimation Polyvalente, Amiens, FranceINTRODUCTION. The first line therapy for patients suffering from abdominal compart-ment syndrome (ACS) is to decrease intra-abdominal pressure.OBJECTIVES. The aim of this study was to determine the effects of neuromuscularblockers, given to decrease intra-abdominal pressure, on cardiac function and hemody-namics in ICU patients with ACS.METHODS. A prospective non-interventional study was carried out. From 2010 to 2012,all patients treated in ICU with neuromuscular blockers for ACS were prospectivelyincluded after local ethics committee approval. Respiratory, hemodynamic and Dopplerechocardiographic parameters were recorded before and after the infusion of 0.15 mg/kg ofcisatracurium. Data were presented as median (IQR). A Wilcoxon rank sum test was per-formed to compare data before and after neuromuscular blockers infusion.RESULTS. Fourteen patients were included: 8 (57 %) males and 6 females with a medianage of 53 years (20–77). SAPS II was 60 ± 10. Baseline intra abdominal pressure was29 ± 9 cmH2O and decreased by 41 % after neuromuscular blockers (to 17 ± 4 cmH2O,p = 0.001). Plateau pressure decreased from 25 ± 5 to 22 ± 4 cmH2O (p = 0,03). Theright ventricle (RV) was dilated at baseline with a ratio of RV end diastolic area to leftventricular (LV) end diastolic area above 0.6. Neuromuscular blockers significantlydecreased this ratio. The peak systolic velocity of tricuspid annulus (St), an index of RVsystolic function assessed by Doppler tissue imaging, was significantly increased after ci-satracurium infusion. No changes in left ventricular function were noticed (Table 1).CONCLUSIONS. This study shows that for patient with ACS, neuromuscular blockerinfusion allows a significant reduction of intra-abdominal pressure and plateau pressure aswell as an improvement of right ventricular function.
Table 1
Before cisatracurium After cisatracurium p
Mean arterial pressure (mmHg) 66 ± 20 78 ± 19 0.24
Stroke volume (ml) 70.4 ± 22.3 75.6 ± 24.7 0.09
Cardiac output (l/min) 7.1 ± 2.5 7.84 ± 3.1 0.08
LV ejection fraction (%) 60.0 ± 8.0 63.0 ± 8.0 0.24
LV Tei index 0.6 ± 0.3 0.5 ± 0.2 0.38
Surface area ratio (RV/LV) 0.7 ± 0.2 0.6 ± 0.2 0.03
St wave peak velocity (m/s) 0.1 ± 0.07 0.2 ± 0.1 0.01
0465EVALUATION OF THE NEW HEMODYNAMIC PARAMETER ‘‘AFTERLOAD-RELATED CARDIAC PERFORMANCE’’ (ACP) IN A LARGE COHORTOF SEPTIC PATIENTS
O. Bayer1, D. Schwarzkopf2, Y. Sakr1, C. Hartog1,2, H. Ebelt3, K. Reinhart1,2, K. Werdan3
1Jena University Hospital, Department of Anesthesiology and Intensive Care Medicine,Jena, Germany, 2Jena University Hospital, Center for Sepsis Control & Care, Jena,Germany, 3University Hospital Halle (Saale), Department of Medicine III, Halle, GermanyINTRODUCTION. Severe sepsis may cause an impairment of cardiac function [1]. Todetermine the extend of septic cardiomyopathy the parameter ‘‘afterload-related cardiac per-formance’’ (ACP) was developed, which describes the relationship between the measuredcardiac output (CO) and the CO, which a healthy heart is expected to be able to generate at a givenSVR. CO predicted as normal is calculated as the 80 % upper prediction limit of the regressionCO = a*SVRb + e. The ACP is described as COmeasured/COpredicted as normal 9 100 [2].OBJECTIVES. Validation of the ACP as a prognostic parameter in larger cohort of septicpatients and evaluation of differences in prognostic power between patients with cardiacsurgery and patients with non-cardiac surgeries.METHODS. Retrospective study of N = 408 patients with severe sepsis and establishedhemodynamic monitoring on a surgical ICU. ACP was tested against other hemodynamicparameters [CO, cardiac index (CI), cardiac power output (CPO), cardiac power index (CPI)]by correlation with indicators of disease severity (SOFA, SAPS 2, APACHE II, procalci-tonin), mean differences between survivors and non-survivors, prediction of hospital survivalin multiple logistic regression controlling for other risk indicators, ROC analysis. Differencesin predictive power between surgical subgroups were testet by ROC analysis. Optimal cut-offpoints were defined at the maximal sum of sensitivity and specificity, utility of different cut-off points on ACP for surgical subgroups were evaluated by survival analysis.
26th ESICM ANNUAL CONGRESS — PARIS, FRANCE — 5–9 OCTOBER 2013
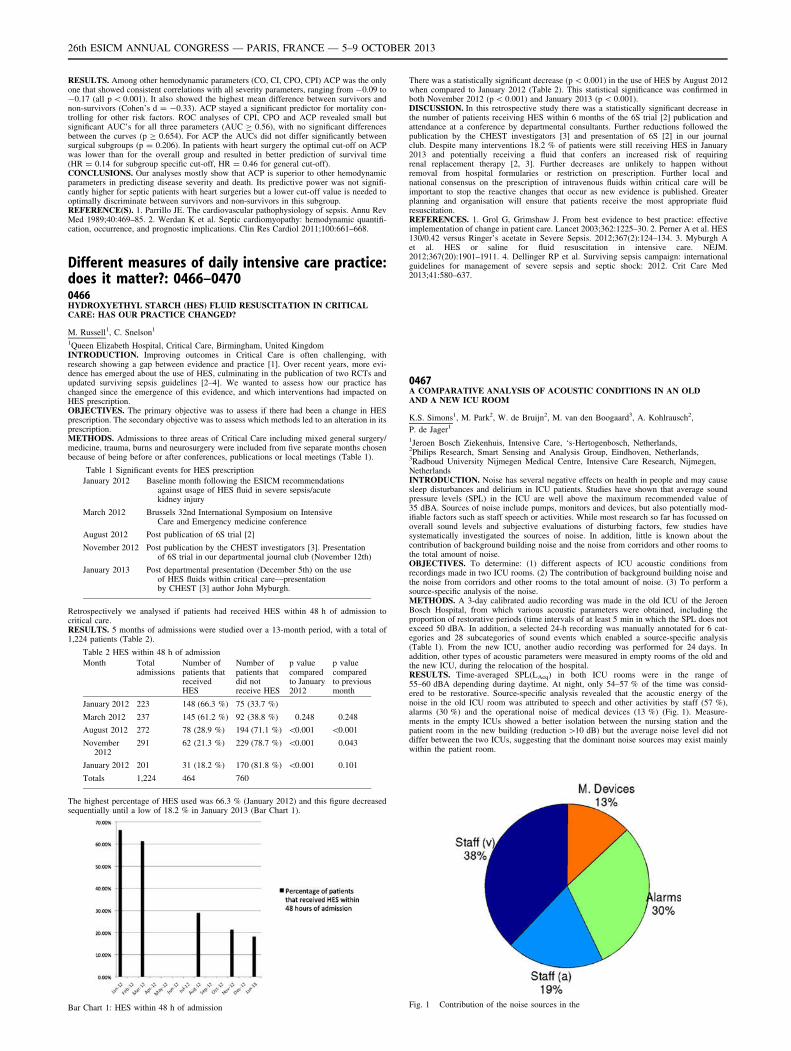
RESULTS. Among other hemodynamic parameters (CO, CI, CPO, CPI) ACP was the onlyone that showed consistent correlations with all severity parameters, ranging from -0.09 to-0.17 (all p \ 0.001). It also showed the highest mean difference between survivors andnon-survivors (Cohen’s d = -0.33). ACP stayed a significant predictor for mortality con-trolling for other risk factors. ROC analyses of CPI, CPO and ACP revealed small butsignificant AUC’s for all three parameters (AUC C 0.56), with no significant differencesbetween the curves (p C 0.654). For ACP the AUCs did not differ significantly betweensurgical subgroups (p = 0.206). In patients with heart surgery the optimal cut-off on ACPwas lower than for the overall group and resulted in better prediction of survival time(HR = 0.14 for subgroup specific cut-off, HR = 0.46 for general cut-off).CONCLUSIONS. Our analyses mostly show that ACP is superior to other hemodynamicparameters in predicting disease severity and death. Its predictive power was not signifi-cantly higher for septic patients with heart surgeries but a lower cut-off value is needed tooptimally discriminate between survivors and non-survivors in this subgroup.REFERENCE(S). 1. Parrillo JE. The cardiovascular pathophysiology of sepsis. Annu RevMed 1989;40:469–85. 2. Werdan K et al. Septic cardiomyopathy: hemodynamic quantifi-cation, occurrence, and prognostic implications. Clin Res Cardiol 2011;100:661–668.
Different measures of daily intensive care practice:does it matter?: 0466–04700466HYDROXYETHYL STARCH (HES) FLUID RESUSCITATION IN CRITICALCARE: HAS OUR PRACTICE CHANGED?
M. Russell1, C. Snelson1
1Queen Elizabeth Hospital, Critical Care, Birmingham, United KingdomINTRODUCTION. Improving outcomes in Critical Care is often challenging, withresearch showing a gap between evidence and practice [1]. Over recent years, more evi-dence has emerged about the use of HES, culminating in the publication of two RCTs andupdated surviving sepsis guidelines [2–4]. We wanted to assess how our practice haschanged since the emergence of this evidence, and which interventions had impacted onHES prescription.OBJECTIVES. The primary objective was to assess if there had been a change in HESprescription. The secondary objective was to assess which methods led to an alteration in itsprescription.METHODS. Admissions to three areas of Critical Care including mixed general surgery/medicine, trauma, burns and neurosurgery were included from five separate months chosenbecause of being before or after conferences, publications or local meetings (Table 1).
Table 1 Significant events for HES prescription
January 2012 Baseline month following the ESICM recommendationsagainst usage of HES fluid in severe sepsis/acutekidney injury
March 2012 Brussels 32nd International Symposium on IntensiveCare and Emergency medicine conference
August 2012 Post publication of 6S trial [2]
November 2012 Post publication by the CHEST investigators [3]. Presentationof 6S trial in our departmental journal club (November 12th)
January 2013 Post departmental presentation (December 5th) on the useof HES fluids within critical care—presentationby CHEST [3] author John Myburgh.
Retrospectively we analysed if patients had received HES within 48 h of admission tocritical care.RESULTS. 5 months of admissions were studied over a 13-month period, with a total of1,224 patients (Table 2).
Table 2 HES within 48 h of admission
Month Totaladmissions
Number ofpatients thatreceivedHES
Number ofpatients thatdid notreceive HES
p valuecomparedto January2012
p valuecomparedto previousmonth
January 2012 223 148 (66.3 %) 75 (33.7 %)
March 2012 237 145 (61.2 %) 92 (38.8 %) 0.248 0.248
August 2012 272 78 (28.9 %) 194 (71.1 %) \0.001 \0.001
November2012
291 62 (21.3 %) 229 (78.7 %) \0.001 0.043
January 2012 201 31 (18.2 %) 170 (81.8 %) \0.001 0.101
Totals 1,224 464 760
The highest percentage of HES used was 66.3 % (January 2012) and this figure decreasedsequentially until a low of 18.2 % in January 2013 (Bar Chart 1).
Bar Chart 1: HES within 48 h of admission
There was a statistically significant decrease (p \ 0.001) in the use of HES by August 2012when compared to January 2012 (Table 2). This statistical significance was confirmed inboth November 2012 (p \ 0.001) and January 2013 (p \ 0.001).DISCUSSION. In this retrospective study there was a statistically significant decrease inthe number of patients receiving HES within 6 months of the 6S trial [2] publication andattendance at a conference by departmental consultants. Further reductions followed thepublication by the CHEST investigators [3] and presentation of 6S [2] in our journalclub. Despite many interventions 18.2 % of patients were still receiving HES in January2013 and potentially receiving a fluid that confers an increased risk of requiringrenal replacement therapy [2, 3]. Further decreases are unlikely to happen withoutremoval from hospital formularies or restriction on prescription. Further local andnational consensus on the prescription of intravenous fluids within critical care will beimportant to stop the reactive changes that occur as new evidence is published. Greaterplanning and organisation will ensure that patients receive the most appropriate fluidresuscitation.REFERENCES. 1. Grol G, Grimshaw J. From best evidence to best practice: effectiveimplementation of change in patient care. Lancet 2003;362:1225–30. 2. Perner A et al. HES130/0.42 versus Ringer’s acetate in Severe Sepsis. 2012;367(2):124–134. 3. Myburgh Aet al. HES or saline for fluid resuscitation in intensive care. NEJM.2012;367(20):1901–1911. 4. Dellinger RP et al. Surviving sepsis campaign: internationalguidelines for management of severe sepsis and septic shock: 2012. Crit Care Med2013;41:580–637.
0467A COMPARATIVE ANALYSIS OF ACOUSTIC CONDITIONS IN AN OLDAND A NEW ICU ROOM
K.S. Simons1, M. Park2, W. de Bruijn2, M. van den Boogaard3, A. Kohlrausch2,
P. de Jager1
1Jeroen Bosch Ziekenhuis, Intensive Care, ‘s-Hertogenbosch, Netherlands,2Philips Research, Smart Sensing and Analysis Group, Eindhoven, Netherlands,3Radboud University Nijmegen Medical Centre, Intensive Care Research, Nijmegen,NetherlandsINTRODUCTION. Noise has several negative effects on health in people and may causesleep disturbances and delirium in ICU patients. Studies have shown that average soundpressure levels (SPL) in the ICU are well above the maximum recommended value of35 dBA. Sources of noise include pumps, monitors and devices, but also potentially mod-ifiable factors such as staff speech or activities. While most research so far has focussed onoverall sound levels and subjective evaluations of disturbing factors, few studies havesystematically investigated the sources of noise. In addition, little is known about thecontribution of background building noise and the noise from corridors and other rooms tothe total amount of noise.OBJECTIVES. To determine: (1) different aspects of ICU acoustic conditions fromrecordings made in two ICU rooms. (2) The contribution of background building noise andthe noise from corridors and other rooms to the total amount of noise. (3) To perform asource-specific analysis of the noise.METHODS. A 3-day calibrated audio recording was made in the old ICU of the JeroenBosch Hospital, from which various acoustic parameters were obtained, including theproportion of restorative periods (time intervals of at least 5 min in which the SPL does notexceed 50 dBA. In addition, a selected 24-h recording was manually annotated for 6 cat-egories and 28 subcategories of sound events which enabled a source-specific analysis(Table 1). From the new ICU, another audio recording was performed for 24 days. Inaddition, other types of acoustic parameters were measured in empty rooms of the old andthe new ICU, during the relocation of the hospital.RESULTS. Time-averaged SPL(LAeq) in both ICU rooms were in the range of55–60 dBA depending during daytime. At night, only 54–57 % of the time was consid-ered to be restorative. Source-specific analysis revealed that the acoustic energy of thenoise in the old ICU room was attributed to speech and other activities by staff (57 %),alarms (30 %) and the operational noise of medical devices (13 %) (Fig. 1). Measure-ments in the empty ICUs showed a better isolation between the nursing station and thepatient room in the new building (reduction [10 dB) but the average noise level did notdiffer between the two ICUs, suggesting that the dominant noise sources may exist mainlywithin the patient room.
Fig. 1 Contribution of the noise sources in the
26th ESICM ANNUAL CONGRESS — PARIS, FRANCE — 5–9 OCTOBER 2013
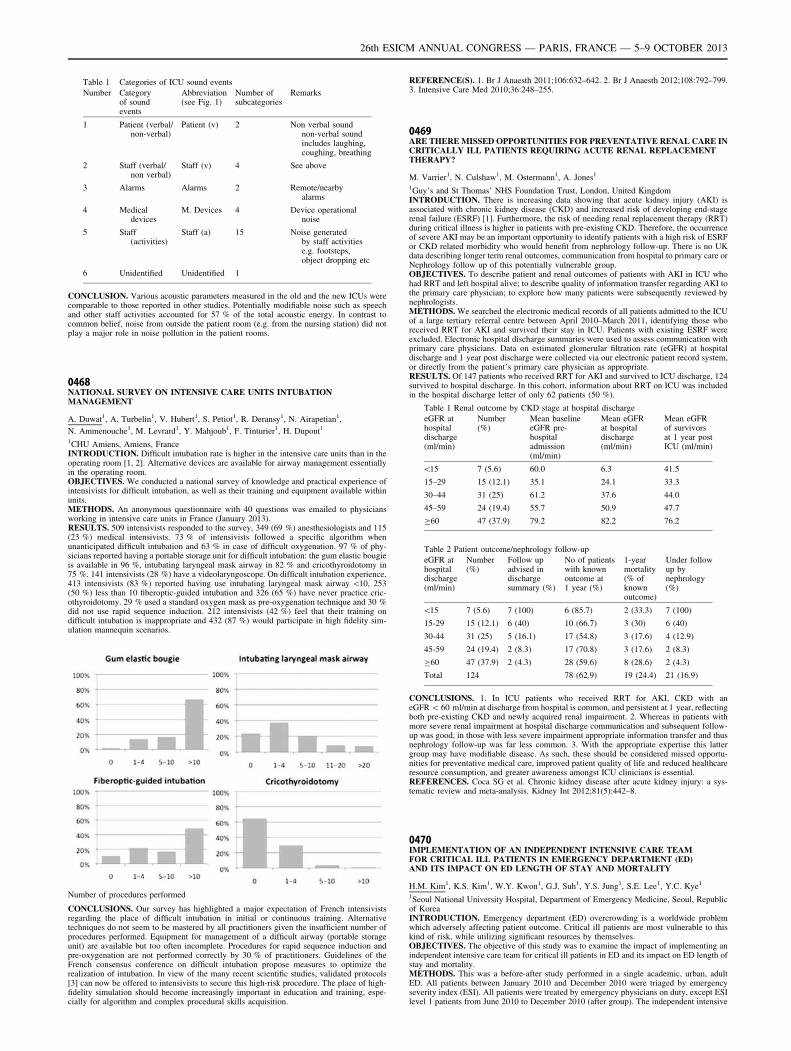
Table 1 Categories of ICU sound events
Number Categoryof soundevents
Abbreviation(see Fig. 1)
Number ofsubcategories
Remarks
1 Patient (verbal/non-verbal)
Patient (v) 2 Non verbal soundnon-verbal soundincludes laughing,coughing, breathing
2 Staff (verbal/non verbal)
Staff (v) 4 See above
3 Alarms Alarms 2 Remote/nearbyalarms
4 Medicaldevices
M. Devices 4 Device operationalnoise
5 Staff(activities)
Staff (a) 15 Noise generatedby staff activitiese.g. footsteps,object dropping etc
6 Unidentified Unidentified 1
CONCLUSION. Various acoustic parameters measured in the old and the new ICUs werecomparable to those reported in other studies. Potentially modifiable noise such as speechand other staff activities accounted for 57 % of the total acoustic energy. In contrast tocommon belief, noise from outside the patient room (e.g. from the nursing station) did notplay a major role in noise pollution in the patient rooms.
0468NATIONAL SURVEY ON INTENSIVE CARE UNITS INTUBATIONMANAGEMENT
A. Duwat1, A. Turbelin1, V. Hubert1, S. Petiot1, R. Deransy1, N. Airapetian1,
N. Ammenouche1, M. Levrard1, Y. Mahjoub1, F. Tinturier1, H. Dupont1
1CHU Amiens, Amiens, FranceINTRODUCTION. Difficult intubation rate is higher in the intensive care units than in theoperating room [1, 2]. Alternative devices are available for airway management essentiallyin the operating room.OBJECTIVES. We conducted a national survey of knowledge and practical experience ofintensivists for difficult intubation, as well as their training and equipment available withinunits.METHODS. An anonymous questionnaire with 40 questions was emailed to physiciansworking in intensive care units in France (January 2013).RESULTS. 509 intensivists responded to the survey, 349 (69 %) anesthesiologists and 115(23 %) medical intensivists. 73 % of intensivists followed a specific algorithm whenunanticipated difficult intubation and 63 % in case of difficult oxygenation. 97 % of phy-sicians reported having a portable storage unit for difficult intubation: the gum elastic bougieis available in 96 %, intubating laryngeal mask airway in 82 % and cricothyroidotomy in75 %. 141 intensivists (28 %) have a videolaryngoscope. On difficult intubation experience,413 intensivists (83 %) reported having use intubating laryngeal mask airway \10, 253(50 %) less than 10 fiberoptic-guided intubation and 326 (65 %) have never practice cric-othyroidotomy. 29 % used a standard oxygen mask as pre-oxygenation technique and 30 %did not use rapid sequence induction. 212 intensivists (42 %) feel that their training ondifficult intubation is inappropriate and 432 (87 %) would participate in high fidelity sim-ulation mannequin scenarios.
Number of procedures performed
CONCLUSIONS. Our survey has highlighted a major expectation of French intensivistsregarding the place of difficult intubation in initial or continuous training. Alternativetechniques do not seem to be mastered by all practitioners given the insufficient number ofprocedures performed. Equipment for management of a difficult airway (portable storageunit) are available but too often incomplete. Procedures for rapid sequence induction andpre-oxygenation are not performed correctly by 30 % of practitioners. Guidelines of theFrench consensus conference on difficult intubation propose measures to optimize therealization of intubation. In view of the many recent scientific studies, validated protocols[3] can now be offered to intensivists to secure this high-risk procedure. The place of high-fidelity simulation should become increasingly important in education and training, espe-cially for algorithm and complex procedural skills acquisition.
REFERENCE(S). 1. Br J Anaesth 2011;106:632–642. 2. Br J Anaesth 2012;108:792–799.3. Intensive Care Med 2010;36:248–255.
0469ARE THERE MISSED OPPORTUNITIES FOR PREVENTATIVE RENAL CARE INCRITICALLY ILL PATIENTS REQUIRING ACUTE RENAL REPLACEMENTTHERAPY?
M. Varrier1, N. Culshaw1, M. Ostermann1, A. Jones1
1Guy’s and St Thomas’ NHS Foundation Trust, London, United KingdomINTRODUCTION. There is increasing data showing that acute kidney injury (AKI) isassociated with chronic kidney disease (CKD) and increased risk of developing end-stagerenal failure (ESRF) [1]. Furthermore, the risk of needing renal replacement therapy (RRT)during critical illness is higher in patients with pre-existing CKD. Therefore, the occurrenceof severe AKI may be an important opportunity to identify patients with a high risk of ESRFor CKD related morbidity who would benefit from nephrology follow-up. There is no UKdata describing longer term renal outcomes, communication from hospital to primary care orNephrology follow up of this potentially vulnerable group.OBJECTIVES. To describe patient and renal outcomes of patients with AKI in ICU whohad RRT and left hospital alive; to describe quality of information transfer regarding AKI tothe primary care physician; to explore how many patients were subsequently reviewed bynephrologists.METHODS. We searched the electronic medical records of all patients admitted to the ICUof a large tertiary referral centre between April 2010–March 2011, identifying those whoreceived RRT for AKI and survived their stay in ICU. Patients with existing ESRF wereexcluded. Electronic hospital discharge summaries were used to assess communication withprimary care physicians. Data on estimated glomerular filtration rate (eGFR) at hospitaldischarge and 1 year post discharge were collected via our electronic patient record system,or directly from the patient’s primary care physician as appropriate.RESULTS. Of 147 patients who received RRT for AKI and survived to ICU discharge, 124survived to hospital discharge. In this cohort, information about RRT on ICU was includedin the hospital discharge letter of only 62 patients (50 %).
Table 1 Renal outcome by CKD stage at hospital discharge
eGFR athospitaldischarge(ml/min)
Number(%)
Mean baselineeGFR pre-hospitaladmission(ml/min)
Mean eGFRat hospitaldischarge(ml/min)
Mean eGFRof survivorsat 1 year postICU (ml/min)
\15 7 (5.6) 60.0 6.3 41.5
15–29 15 (12.1) 35.1 24.1 33.3
30–44 31 (25) 61.2 37.6 44.0
45–59 24 (19.4) 55.7 50.9 47.7
C60 47 (37.9) 79.2 82.2 76.2
Table 2 Patient outcome/nephrology follow-up
eGFR athospitaldischarge(ml/min)
Number(%)
Follow upadvised indischargesummary (%)
No of patientswith knownoutcome at1 year (%)
1-yearmortality(% ofknownoutcome)
Under followup bynephrology(%)
\15 7 (5.6) 7 (100) 6 (85.7) 2 (33.3) 7 (100)
15-29 15 (12.1) 6 (40) 10 (66.7) 3 (30) 6 (40)
30-44 31 (25) 5 (16.1) 17 (54.8) 3 (17.6) 4 (12.9)
45-59 24 (19.4) 2 (8.3) 17 (70.8) 3 (17.6) 2 (8.3)
C60 47 (37.9) 2 (4.3) 28 (59.6) 8 (28.6) 2 (4.3)
Total 124 78 (62.9) 19 (24.4) 21 (16.9)
CONCLUSIONS. 1. In ICU patients who received RRT for AKI, CKD with aneGFR \ 60 ml/min at discharge from hospital is common, and persistent at 1 year, reflectingboth pre-existing CKD and newly acquired renal impairment. 2. Whereas in patients withmore severe renal impairment at hospital discharge communication and subsequent follow-up was good, in those with less severe impairment appropriate information transfer and thusnephrology follow-up was far less common. 3. With the appropriate expertise this lattergroup may have modifiable disease. As such, these should be considered missed opportu-nities for preventative medical care, improved patient quality of life and reduced healthcareresource consumption, and greater awareness amongst ICU clinicians is essential.REFERENCES. Coca SG et al. Chronic kidney disease after acute kidney injury: a sys-tematic review and meta-analysis. Kidney Int 2012;81(5):442–8.
0470IMPLEMENTATION OF AN INDEPENDENT INTENSIVE CARE TEAMFOR CRITICAL ILL PATIENTS IN EMERGENCY DEPARTMENT (ED)AND ITS IMPACT ON ED LENGTH OF STAY AND MORTALITY
H.M. Kim1, K.S. Kim1, W.Y. Kwon1, G.J. Suh1, Y.S. Jung1, S.E. Lee1, Y.C. Kye1
1Seoul National University Hospital, Department of Emergency Medicine, Seoul, Republicof KoreaINTRODUCTION. Emergency department (ED) overcrowding is a worldwide problemwhich adversely affecting patient outcome. Critical ill patients are most vulnerable to thiskind of risk, while utilizing significant resources by themselves.OBJECTIVES. The objective of this study was to examine the impact of implementing anindependent intensive care team for critical ill patients in ED and its impact on ED length ofstay and mortality.METHODS. This was a before-after study performed in a single academic, urban, adultED. All patients between January 2010 and December 2010 were triaged by emergencyseverity index (ESI). All patients were treated by emergency physicians on duty, except ESIlevel 1 patients from June 2010 to December 2010 (after group). The independent intensive
26th ESICM ANNUAL CONGRESS — PARIS, FRANCE — 5–9 OCTOBER 2013
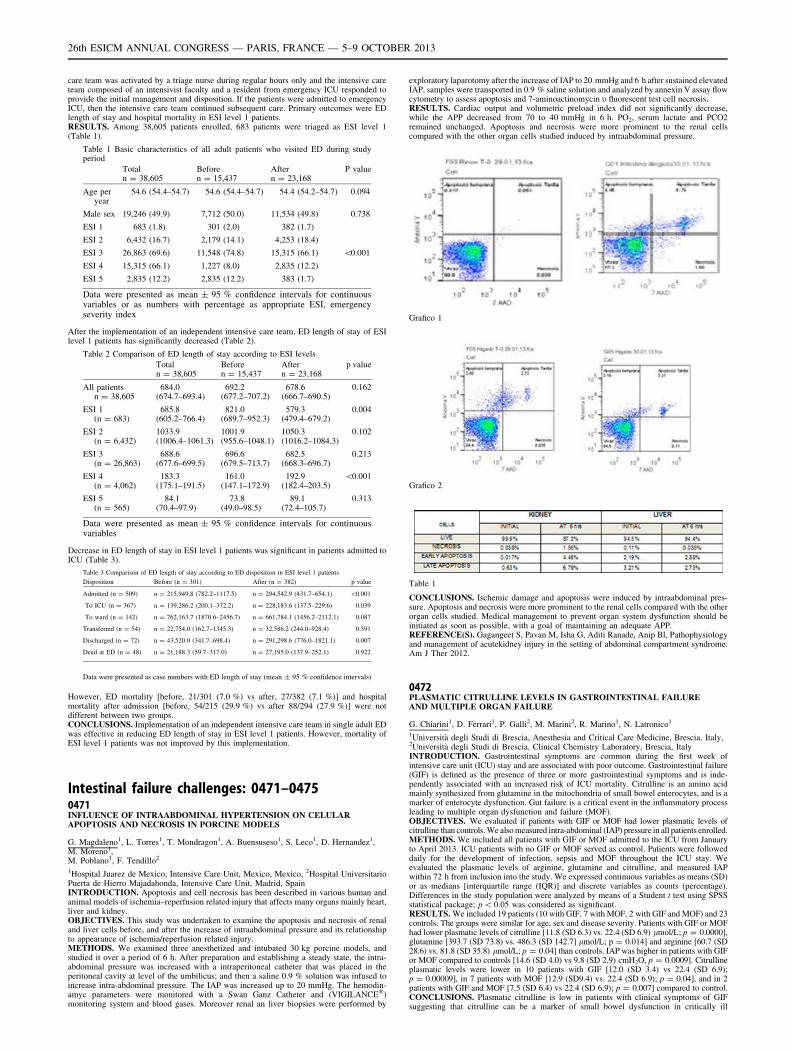
care team was activated by a triage nurse during regular hours only and the intensive careteam composed of an intensivist faculty and a resident from emergency ICU responded toprovide the initial management and disposition. If the patients were admitted to emergencyICU, then the intensive care team continued subsequent care. Primary outcomes were EDlength of stay and hospital mortality in ESI level 1 patients.RESULTS. Among 38,605 patients enrolled, 683 patients were triaged as ESI level 1(Table 1).
Table 1 Basic characteristics of all adult patients who visited ED during studyperiod
Totaln = 38,605
Beforen = 15,437
Aftern = 23,168
P value
Age peryear
54.6 (54.4–54.7) 54.6 (54.4–54.7) 54.4 (54.2–54.7) 0.094
Male sex 19,246 (49.9) 7,712 (50.0) 11,534 (49.8) 0.738
ESI 1 683 (1.8) 301 (2.0) 382 (1.7)
ESI 2 6,432 (16.7) 2,179 (14.1) 4,253 (18.4)
ESI 3 26,863 (69.6) 11,548 (74.8) 15,315 (66.1) \0.001
ESI 4 15,315 (66.1) 1,227 (8.0) 2,835 (12.2)
ESI 5 2,835 (12.2) 2,835 (12.2) 383 (1.7)
Data were presented as mean ± 95 % confidence intervals for continuousvariables or as numbers with percentage as appropriate ESI, emergencyseverity index
After the implementation of an independent intensive care team, ED length of stay of ESIlevel 1 patients has significantly decreased (Table 2).
Table 2 Comparison of ED length of stay according to ESI levels
Totaln = 38,605
Beforen = 15,437
Aftern = 23,168
p value
All patientsn = 38,605
684.0(674.7–693.4)
692.2(677.2–707.2)
678.6(666.7–690.5)
0.162
ESI 1(n = 683)
685.8(605.2–766.4)
821.0(689.7–952.3)
579.3(479.4–679.2)
0.004
ESI 2(n = 6,432)
1033.9(1006.4–1061.3)
1001.9(955.6–1048.1)
1050.3(1016.2–1084.3)
0.102
ESI 3(n = 26,863)
688.6(677.6–699.5)
696.6(679.5–713.7)
682.5(668.3–696.7)
0.213
ESI 4(n = 4,062)
183.3(175.1–191.5)
161.0(147.1–172.9)
192.9(182.4–203.5)
\0.001
ESI 5(n = 565)
84.1(70.4–97.9)
73.8(49.0–98.5)
89.1(72.4–105.7)
0.313
Data were presented as mean ± 95 % confidence intervals for continuousvariables
Decrease in ED length of stay in ESI level 1 patients was significant in patients admitted toICU (Table 3).
Table 3 Comparison of ED length of stay according to ED disposition in ESI level 1 patients
Disposition Before (n = 301) After (n = 382) p value
Admitted (n = 509) n = 215,949.8 (782.2–1117.5) n = 294,542.9 (431.7–654.1) \0.001
To ICU (n = 367) n = 139,286.2 (200.1–372.2) n = 228,183.6 (137.5–229.6) 0.039
To ward (n = 142) n = 762,163.7 (1870.6–2456.7) n = 661,784.1 (1456.2–2112.1) 0.087
Transferred (n = 54) n = 22,754.0 (162.7–1345.3) n = 32,586.2 (244.0–928.4) 0.591
Discharged (n = 72) n = 43,520.0 (341.7–698.4) n = 291,298.6 (776.0–1821.1) 0.007
Dead at ED (n = 48) n = 21,188.3 (59.7–317.0) n = 27,195.0 (137.9–252.1) 0.922
Data were presented as case numbers with ED length of stay (mean ± 95 % confidence intervals)
However, ED mortality [before, 21/301 (7.0 %) vs after, 27/382 (7.1 %)] and hospitalmortality after admission [before, 54/215 (29.9 %) vs after 88/294 (27.9 %)] were notdifferent between two groups.CONCLUSIONS. Implementation of an independent intensive care team in single adult EDwas effective in reducing ED length of stay in ESI level 1 patients. However, mortality ofESI level 1 patients was not improved by this implementation.
Intestinal failure challenges: 0471–04750471INFLUENCE OF INTRAABDOMINAL HYPERTENSION ON CELULARAPOPTOSIS AND NECROSIS IN PORCINE MODELS
G. Magdaleno1, L. Torres1, T. Mondragon1, A. Buensuseso1, S. Leco1, D. Hernandez1,M. Moreno1,M. Poblano1, F. Tendillo2
1Hospital Juarez de Mexico, Intensive Care Unit, Mexico, Mexico, 2Hospital UniversitarioPuerta de Hierro Majadahonda, Intensive Care Unit, Madrid, SpainINTRODUCTION. Apoptosis and cell necrosis has been described in various human andanimal models of ischemia–reperfusion related injury that affects many organs mainly heart,liver and kidney.OBJECTIVES. This study was undertaken to examine the apoptosis and necrosis of renaland liver cells before, and after the increase of intraabdominal pressure and its relationshipto appearance of ischemia/reperfusion related injury.METHODS. We examined three anesthetized and intubated 30 kg porcine models, andstudied it over a period of 6 h. After preparation and establishing a steady state, the intra-abdominal pressure was increased with a intraperitoneal catheter that was placed in theperitoneal cavity at level of the umbilicus; and then a saline 0.9 % solution was infused toincrease intra-abdominal pressure. The IAP was increased up to 20 mmHg. The hemodin-amyc parameters were monitored with a Swan Ganz Catheter and (VIGILANCE�)monitoring system and blood gases. Moreover renal an liver biopsies were performed by
exploratory laparotomy after the increase of IAP to 20 mmHg and 6 h after sustained elevatedIAP, samples were transported in 0.9 % saline solution and analyzed by annexin V assay flowcytometry to assess apoptosis and 7-aminoactinomycin D fluorescent test cell necrosis.RESULTS. Cardiac output and volumetric preload index did not significantly decrease,while the APP decreased from 70 to 40 mmHg in 6 h. PO2, serum lactate and PCO2remained unchanged. Apoptosis and necrosis were more prominent to the renal cellscompared with the other organ cells studied induced by intraabdominal pressure.
Grafico 1
Grafico 2
Table 1
CONCLUSIONS. Ischemic damage and apoptosis were induced by intraabdominal pres-sure. Apoptosis and necrosis were more prominent to the renal cells compared with the otherorgan cells studied. Medical management to prevent organ system dysfunction should beinitiated as soon as possible, with a goal of maintaining an adequate APP.REFERENCE(S). Gagangeet S, Pavan M, Isha G, Aditi Ranade, Anip Bl, Pathophysiologyand management of acutekidney injury in the setting of abdominal compartment syndrome.Am J Ther 2012.
0472PLASMATIC CITRULLINE LEVELS IN GASTROINTESTINAL FAILUREAND MULTIPLE ORGAN FAILURE
G. Chiarini1, D. Ferrari1, P. Galli2, M. Marini2, R. Marino1, N. Latronico1
1Università degli Studi di Brescia, Anesthesia and Critical Care Medicine, Brescia, Italy,2Università degli Studi di Brescia, Clinical Chemistry Laboratory, Brescia, ItalyINTRODUCTION. Gastrointestinal symptoms are common during the first week ofintensive care unit (ICU) stay and are associated with poor outcome. Gastrointestinal failure(GIF) is defined as the presence of three or more gastrointestinal symptoms and is inde-pendently associated with an increased risk of ICU mortality. Citrulline is an amino acidmainly synthesized from glutamine in the mitochondria of small bowel enterocytes, and is amarker of enterocyte dysfunction. Gut failure is a critical event in the inflammatory processleading to multiple organ dysfunction and failure (MOF).OBJECTIVES. We evaluated if patients with GIF or MOF had lower plasmatic levels ofcitrulline than controls. We also measured intra-abdominal (IAP) pressure in all patients enrolled.METHODS. We included all patients with GIF or MOF admitted to the ICU from Januaryto April 2013. ICU patients with no GIF or MOF served as control. Patients were followeddaily for the development of infection, sepsis and MOF throughout the ICU stay. Weevaluated the plasmatic levels of arginine, glutamine and citrulline, and measured IAPwithin 72 h from inclusion into the study. We expressed continuous variables as means (SD)or as medians [interquartile range (IQR)] and discrete variables as counts (percentage).Differences in the study population were analyzed by means of a Student t test using SPSSstatistical package; p \ 0.05 was considered as significant.RESULTS. We included 19 patients (10 with GIF, 7 with MOF, 2 with GIF and MOF) and 23controls. The groups were similar for age, sex and disease severity. Patients with GIF or MOFhad lower plasmatic levels of citrulline [11.8 (SD 6.3) vs. 22.4 (SD 6.9) lmol/L; p = 0.0000],glutamine [393.7 (SD 73.8) vs. 486.3 (SD 142.7] lmol/L; p = 0.014] and arginine [60.7 (SD28.6) vs. 81.8 (SD 35.8) lmol/L; p = 0.04] than controls. IAP was higher in patients with GIFor MOF compared to controls [14.6 (SD 4.0) vs 9.8 (SD 2.9) cmH2O, p = 0.0009]. Citrullineplasmatic levels were lower in 10 patients with GIF [12.0 (SD 3.4) vs 22.4 (SD 6.9);p = 0.00009], in 7 patients with MOF [12.9 (SD9.4) vs. 22.4 (SD 6.9); p = 0.04], and in 2patients with GIF and MOF [7.5 (SD 6.4) vs 22.4 (SD 6.9); p = 0.007] compared to control.CONCLUSIONS. Plasmatic citrulline is low in patients with clinical symptoms of GIFsuggesting that citrulline can be a marker of small bowel dysfunction in critically ill
26th ESICM ANNUAL CONGRESS — PARIS, FRANCE — 5–9 OCTOBER 2013
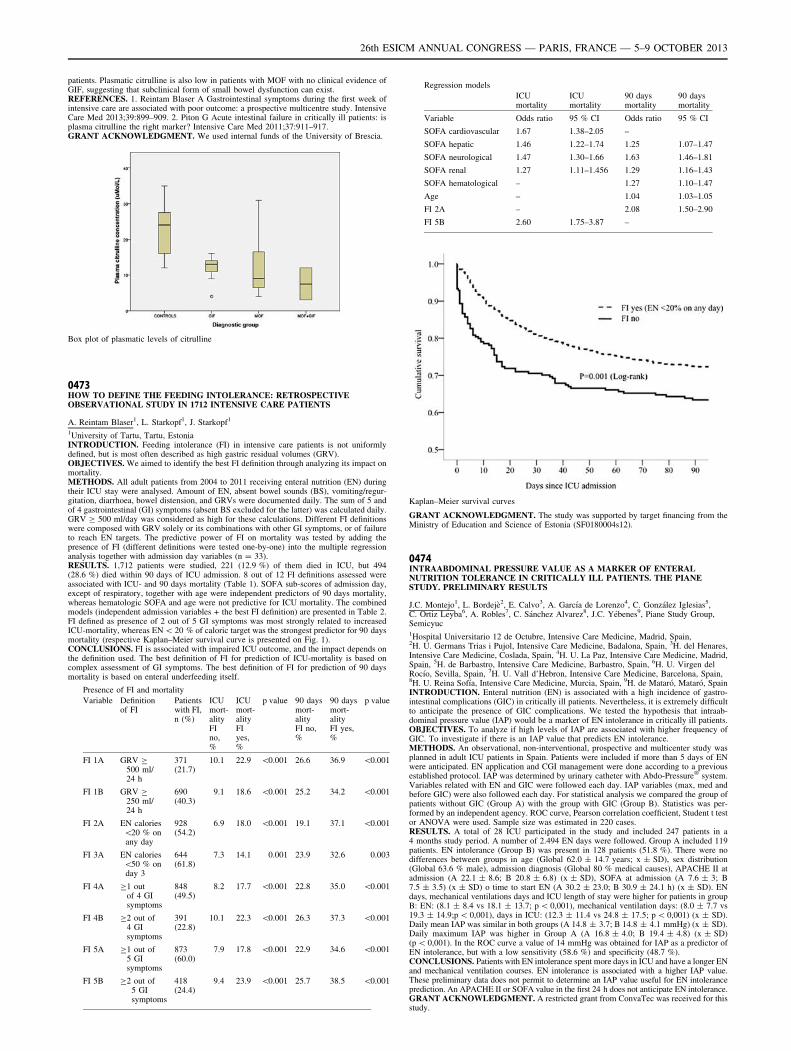
patients. Plasmatic citrulline is also low in patients with MOF with no clinical evidence ofGIF, suggesting that subclinical form of small bowel dysfunction can exist.REFERENCES. 1. Reintam Blaser A Gastrointestinal symptoms during the first week ofintensive care are associated with poor outcome: a prospective multicentre study. IntensiveCare Med 2013;39:899–909. 2. Piton G Acute intestinal failure in critically ill patients: isplasma citrulline the right marker? Intensive Care Med 2011;37:911–917.GRANT ACKNOWLEDGMENT. We used internal funds of the University of Brescia.
Box plot of plasmatic levels of citrulline
0473HOW TO DEFINE THE FEEDING INTOLERANCE: RETROSPECTIVEOBSERVATIONAL STUDY IN 1712 INTENSIVE CARE PATIENTS
A. Reintam Blaser1, L. Starkopf1, J. Starkopf1
1University of Tartu, Tartu, EstoniaINTRODUCTION. Feeding intolerance (FI) in intensive care patients is not uniformlydefined, but is most often described as high gastric residual volumes (GRV).OBJECTIVES. We aimed to identify the best FI definition through analyzing its impact onmortality.METHODS. All adult patients from 2004 to 2011 receiving enteral nutrition (EN) duringtheir ICU stay were analysed. Amount of EN, absent bowel sounds (BS), vomiting/regur-gitation, diarrhoea, bowel distension, and GRVs were documented daily. The sum of 5 andof 4 gastrointestinal (GI) symptoms (absent BS excluded for the latter) was calculated daily.GRV C 500 ml/day was considered as high for these calculations. Different FI definitionswere composed with GRV solely or its combinations with other GI symptoms, or of failureto reach EN targets. The predictive power of FI on mortality was tested by adding thepresence of FI (different definitions were tested one-by-one) into the multiple regressionanalysis together with admission day variables (n = 33).RESULTS. 1,712 patients were studied, 221 (12.9 %) of them died in ICU, but 494(28.6 %) died within 90 days of ICU admission. 8 out of 12 FI definitions assessed wereassociated with ICU- and 90 days mortality (Table 1). SOFA sub-scores of admission day,except of respiratory, together with age were independent predictors of 90 days mortality,whereas hematologic SOFA and age were not predictive for ICU mortality. The combinedmodels (independent admission variables + the best FI definition) are presented in Table 2.FI defined as presence of 2 out of 5 GI symptoms was most strongly related to increasedICU-mortality, whereas EN \ 20 % of caloric target was the strongest predictor for 90 daysmortality (respective Kaplan–Meier survival curve is presented on Fig. 1).CONCLUSIONS. FI is associated with impaired ICU outcome, and the impact depends onthe definition used. The best definition of FI for prediction of ICU-mortality is based oncomplex assessment of GI symptoms. The best definition of FI for prediction of 90 daysmortality is based on enteral underfeeding itself.
Presence of FI and mortality
Variable Definitionof FI
Patientswith FI,n (%)
ICUmort-alityFIno,%
ICUmort-alityFIyes,%
p value 90 daysmort-alityFI no,%
90 daysmort-alityFI yes,%
p value
FI 1A GRV C500 ml/24 h
371(21.7)
10.1 22.9 \0.001 26.6 36.9 \0.001
FI 1B GRV C250 ml/24 h
690(40.3)
9.1 18.6 \0.001 25.2 34.2 \0.001
FI 2A EN calories\20 % onany day
928(54.2)
6.9 18.0 \0.001 19.1 37.1 \0.001
FI 3A EN calories\50 % onday 3
644(61.8)
7.3 14.1 0.001 23.9 32.6 0.003
FI 4A C1 outof 4 GIsymptoms
848(49.5)
8.2 17.7 \0.001 22.8 35.0 \0.001
FI 4B C2 out of4 GIsymptoms
391(22.8)
10.1 22.3 \0.001 26.3 37.3 \0.001
FI 5A C1 out of5 GIsymptoms
873(60.0)
7.9 17.8 \0.001 22.9 34.6 \0.001
FI 5B C2 out of5 GIsymptoms
418(24.4)
9.4 23.9 \0.001 25.7 38.5 \0.001
Regression models
ICUmortality
ICUmortality
90 daysmortality
90 daysmortality
Variable Odds ratio 95 % CI Odds ratio 95 % CI
SOFA cardiovascular 1.67 1.38–2.05 –
SOFA hepatic 1.46 1.22–1.74 1.25 1.07–1.47
SOFA neurological 1.47 1.30–1.66 1.63 1.46–1.81
SOFA renal 1.27 1.11–1.456 1.29 1.16–1.43
SOFA hematological – 1.27 1.10–1.47
Age – 1.04 1.03–1.05
FI 2A – 2.08 1.50–2.90
FI 5B 2.60 1.75–3.87 –
Kaplan–Meier survival curves
GRANT ACKNOWLEDGMENT. The study was supported by target financing from theMinistry of Education and Science of Estonia (SF0180004s12).
0474INTRAABDOMINAL PRESSURE VALUE AS A MARKER OF ENTERALNUTRITION TOLERANCE IN CRITICALLY ILL PATIENTS. THE PIANESTUDY. PRELIMINARY RESULTS
J.C. Montejo1, L. Bordejè2, E. Calvo3, A. Garcı́a de Lorenzo4, C. González Iglesias5,C. Ortiz Leyba6, A. Robles7, C. Sánchez Alvarez8, J.C. Yébenes9, Piane Study Group,Semicyuc1Hospital Universitario 12 de Octubre, Intensive Care Medicine, Madrid, Spain,2H. U. Germans Trias i Pujol, Intensive Care Medicine, Badalona, Spain, 3H. del Henares,Intensive Care Medicine, Coslada, Spain, 4H. U. La Paz, Intensive Care Medicine, Madrid,Spain, 5H. de Barbastro, Intensive Care Medicine, Barbastro, Spain, 6H. U. Virgen delRocı́o, Sevilla, Spain, 7H. U. Vall d’Hebron, Intensive Care Medicine, Barcelona, Spain,8H. U. Reina Sofı́a, Intensive Care Medicine, Murcia, Spain, 9H. de Mataró, Mataró, SpainINTRODUCTION. Enteral nutrition (EN) is associated with a high incidence of gastro-intestinal complications (GIC) in critically ill patients. Nevertheless, it is extremely difficultto anticipate the presence of GIC complications. We tested the hypothesis that intraab-dominal pressure value (IAP) would be a marker of EN intolerance in critically ill patients.OBJECTIVES. To analyze if high levels of IAP are associated with higher frequency ofGIC. To investigate if there is an IAP value that predicts EN intolerance.METHODS. An observational, non-interventional, prospective and multicenter study wasplanned in adult ICU patients in Spain. Patients were included if more than 5 days of ENwere anticipated. EN application and CGI management were done according to a previousestablished protocol. IAP was determined by urinary catheter with Abdo-Pressure� system.Variables related with EN and GIC were followed each day. IAP variables (max, med andbefore GIC) were also followed each day. For statistical analysis we compared the group ofpatients without GIC (Group A) with the group with GIC (Group B). Statistics was per-formed by an independent agency. ROC curve, Pearson correlation coefficient, Student t testor ANOVA were used. Sample size was estimated in 220 cases.RESULTS. A total of 28 ICU participated in the study and included 247 patients in a4 months study period. A number of 2.494 EN days were followed. Group A included 119patients. EN intolerance (Group B) was present in 128 patients (51.8 %). There were nodifferences between groups in age (Global 62.0 ± 14.7 years; x ± SD), sex distribution(Global 63.6 % male), admission diagnosis (Global 80 % medical causes), APACHE II atadmission (A 22.1 ± 8.6; B 20.8 ± 6.8) (x ± SD), SOFA at admission (A 7.6 ± 3; B7.5 ± 3.5) (x ± SD) o time to start EN (A 30.2 ± 23.0; B 30.9 ± 24.1 h) (x ± SD). ENdays, mechanical ventilations days and ICU length of stay were higher for patients in groupB: EN: (8.1 ± 8.4 vs 18.1 ± 13.7; p \ 0,001), mechanical ventilation days: (8.0 ± 7.7 vs19.3 ± 14.9;p \ 0,001), days in ICU: (12.3 ± 11.4 vs 24.8 ± 17.5; p \ 0,001) (x ± SD).Daily mean IAP was similar in both groups (A 14.8 ± 3.7; B 14.8 ± 4.1 mmHg) (x ± SD).Daily maximum IAP was higher in Group A (A 16.8 ± 4.0; B 19.4 ± 4.8) (x ± SD)(p \ 0,001). In the ROC curve a value of 14 mmHg was obtained for IAP as a predictor ofEN intolerance, but with a low sensitivity (58.6 %) and specificity (48.7 %).CONCLUSIONS. Patients with EN intolerance spent more days in ICU and have a longer ENand mechanical ventilation courses. EN intolerance is associated with a higher IAP value.These preliminary data does not permit to determine an IAP value useful for EN intoleranceprediction. An APACHE II or SOFA value in the first 24 h does not anticipate EN intolerance.GRANT ACKNOWLEDGMENT. A restricted grant from ConvaTec was received for thisstudy.
26th ESICM ANNUAL CONGRESS — PARIS, FRANCE — 5–9 OCTOBER 2013
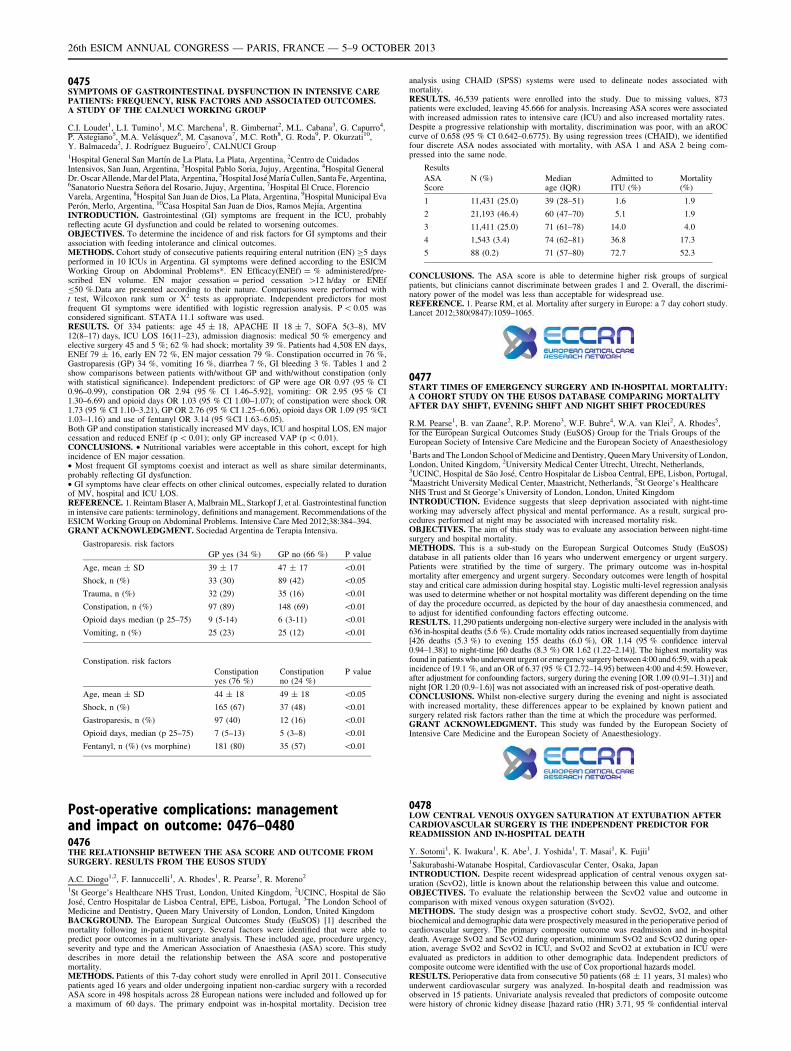
0475SYMPTOMS OF GASTROINTESTINAL DYSFUNCTION IN INTENSIVE CAREPATIENTS: FREQUENCY, RISK FACTORS AND ASSOCIATED OUTCOMES.A STUDY OF THE CALNUCI WORKING GROUP
C.I. Loudet1, L.I. Tumino1, M.C. Marchena1, R. Gimbernat2, M.L. Cabana3, G. Capurro4,P. Astegiano5, M.A. Velásquez6, M. Casanova7, M.C. Roth8, G. Roda9, P. Okurzati10,Y. Balmaceda2, J. Rodrı́guez Bugueiro7, CALNUCI Group1Hospital General San Martı́n de La Plata, La Plata, Argentina, 2Centro de CuidadosIntensivos, San Juan, Argentina, 3Hospital Pablo Soria, Jujuy, Argentina, 4Hospital GeneralDr. Oscar Allende, Mar del Plata, Argentina, 5Hospital José Marı́a Cullen, Santa Fe, Argentina,6Sanatorio Nuestra Señora del Rosario, Jujuy, Argentina, 7Hospital El Cruce, FlorencioVarela, Argentina, 8Hospital San Juan de Dios, La Plata, Argentina, 9Hospital Municipal EvaPerón, Merlo, Argentina, 10Casa Hospital San Juan de Dios, Ramos Mejı́a, ArgentinaINTRODUCTION. Gastrointestinal (GI) symptoms are frequent in the ICU, probablyreflecting acute GI dysfunction and could be related to worsening outcomes.OBJECTIVES. To determine the incidence of and risk factors for GI symptoms and theirassociation with feeding intolerance and clinical outcomes.METHODS. Cohort study of consecutive patients requiring enteral nutrition (EN) C5 daysperformed in 10 ICUs in Argentina. GI symptoms were defined according to the ESICMWorking Group on Abdominal Problems*. EN Efficacy(ENEf) = % administered/pre-scribed EN volume. EN major cessation = period cessation [12 h/day or ENEfB50 %.Data are presented according to their nature. Comparisons were performed witht test, Wilcoxon rank sum or X2 tests as appropriate. Independent predictors for mostfrequent GI symptoms were identified with logistic regression analysis. P \ 0.05 wasconsidered significant. STATA 11.1 software was used.RESULTS. Of 334 patients: age 45 ± 18, APACHE II 18 ± 7, SOFA 5(3–8), MV12(8–17) days, ICU LOS 16(11–23), admission diagnosis: medical 50 % emergency andelective surgery 45 and 5 %; 62 % had shock; mortality 39 %. Patients had 4,508 EN days,ENEf 79 ± 16, early EN 72 %, EN major cessation 79 %. Constipation occurred in 76 %,Gastroparesis (GP) 34 %, vomiting 16 %, diarrhea 7 %, GI bleeding 3 %. Tables 1 and 2show comparisons between patients with/without GP and with/without constipation (onlywith statistical significance). Independent predictors: of GP were age OR 0.97 (95 % CI0.96–0.99), constipation OR 2.94 (95 % CI 1.46–5.92], vomiting: OR 2.95 (95 % CI1.30–6.69) and opioid days OR 1.03 (95 % CI 1.00–1.07); of constipation were shock OR1.73 (95 % CI 1.10–3.21), GP OR 2.76 (95 % CI 1.25–6.06), opioid days OR 1.09 (95 %CI1.03–1.16) and use of fentanyl OR 3.14 (95 %CI 1.63–6.05).Both GP and constipation statistically increased MV days, ICU and hospital LOS, EN majorcessation and reduced ENEf (p \ 0.01); only GP increased VAP (p \ 0.01).CONCLUSIONS. • Nutritional variables were acceptable in this cohort, except for highincidence of EN major cessation.• Most frequent GI symptoms coexist and interact as well as share similar determinants,probably reflecting GI dysfunction.• GI symptoms have clear effects on other clinical outcomes, especially related to durationof MV, hospital and ICU LOS.REFERENCE. 1. Reintam Blaser A, Malbrain ML, Starkopf J, et al. Gastrointestinal functionin intensive care patients: terminology, definitions and management. Recommendations of theESICM Working Group on Abdominal Problems. Intensive Care Med 2012;38:384–394.GRANT ACKNOWLEDGMENT. Sociedad Argentina de Terapia Intensiva.
Gastroparesis. risk factors
GP yes (34 %) GP no (66 %) P value
Age, mean ± SD 39 ± 17 47 ± 17 \0.01
Shock, n (%) 33 (30) 89 (42) \0.05
Trauma, n (%) 32 (29) 35 (16) \0.01
Constipation, n (%) 97 (89) 148 (69) \0.01
Opioid days median (p 25–75) 9 (5-14) 6 (3-11) \0.01
Vomiting, n (%) 25 (23) 25 (12) \0.01
Constipation. risk factors
Constipationyes (76 %)
Constipationno (24 %)
P value
Age, mean ± SD 44 ± 18 49 ± 18 \0.05
Shock, n (%) 165 (67) 37 (48) \0.01
Gastroparesis, n (%) 97 (40) 12 (16) \0.01
Opioid days, median (p 25–75) 7 (5–13) 5 (3–8) \0.01
Fentanyl, n (%) (vs morphine) 181 (80) 35 (57) \0.01
Post-operative complications: managementand impact on outcome: 0476–04800476THE RELATIONSHIP BETWEEN THE ASA SCORE AND OUTCOME FROMSURGERY. RESULTS FROM THE EUSOS STUDY
A.C. Diogo1,2, F. Iannuccelli1, A. Rhodes1, R. Pearse3, R. Moreno2
1St George’s Healthcare NHS Trust, London, United Kingdom, 2UCINC, Hospital de SãoJosé, Centro Hospitalar de Lisboa Central, EPE, Lisboa, Portugal, 3The London School ofMedicine and Dentistry, Queen Mary University of London, London, United KingdomBACKGROUND. The European Surgical Outcomes Study (EuSOS) [1] described themortality following in-patient surgery. Several factors were identified that were able topredict poor outcomes in a multivariate analysis. These included age, procedure urgency,severity and type and the American Association of Anaesthesia (ASA) score. This studydescribes in more detail the relationship between the ASA score and postoperativemortality.METHODS. Patients of this 7-day cohort study were enrolled in April 2011. Consecutivepatients aged 16 years and older undergoing inpatient non-cardiac surgery with a recordedASA score in 498 hospitals across 28 European nations were included and followed up fora maximum of 60 days. The primary endpoint was in-hospital mortality. Decision tree
analysis using CHAID (SPSS) systems were used to delineate nodes associated withmortality.RESULTS. 46,539 patients were enrolled into the study. Due to missing values, 873patients were excluded, leaving 45.666 for analysis. Increasing ASA scores were associatedwith increased admission rates to intensive care (ICU) and also increased mortality rates.Despite a progressive relationship with mortality, discrimination was poor, with an aROCcurve of 0.658 (95 % CI 0.642–0.6775). By using regression trees (CHAID), we identifiedfour discrete ASA nodes associated with mortality, with ASA 1 and ASA 2 being com-pressed into the same node.
Results
ASAScore
N (%) Medianage (IQR)
Admitted toITU (%)
Mortality(%)
1 11,431 (25.0) 39 (28–51) 1.6 1.9
2 21,193 (46.4) 60 (47–70) 5.1 1.9
3 11,411 (25.0) 71 (61–78) 14.0 4.0
4 1,543 (3.4) 74 (62–81) 36.8 17.3
5 88 (0.2) 71 (57–80) 72.7 52.3
CONCLUSIONS. The ASA score is able to determine higher risk groups of surgicalpatients, but clinicians cannot discriminate between grades 1 and 2. Overall, the discrimi-natory power of the model was less than acceptable for widespread use.REFERENCE. 1. Pearse RM, et al. Mortality after surgery in Europe: a 7 day cohort study.Lancet 2012;380(9847):1059–1065.
0477START TIMES OF EMERGENCY SURGERY AND IN-HOSPITAL MORTALITY:A COHORT STUDY ON THE EUSOS DATABASE COMPARING MORTALITYAFTER DAY SHIFT, EVENING SHIFT AND NIGHT SHIFT PROCEDURES
R.M. Pearse1, B. van Zaane2, R.P. Moreno3, W.F. Buhre4, W.A. van Klei2, A. Rhodes5,for the European Surgical Outcomes Study (EuSOS) Group for the Trials Groups of theEuropean Society of Intensive Care Medicine and the European Society of Anaesthesiology1Barts and The London School of Medicine and Dentistry, Queen Mary University of London,London, United Kingdom, 2University Medical Center Utrecht, Utrecht, Netherlands,3UCINC, Hospital de São José, Centro Hospitalar de Lisboa Central, EPE, Lisbon, Portugal,4Maastricht University Medical Center, Maastricht, Netherlands, 5St George’s HealthcareNHS Trust and St George’s University of London, London, United KingdomINTRODUCTION. Evidence suggests that sleep deprivation associated with night-timeworking may adversely affect physical and mental performance. As a result, surgical pro-cedures performed at night may be associated with increased mortality risk.OBJECTIVES. The aim of this study was to evaluate any association between night-timesurgery and hospital mortality.METHODS. This is a sub-study on the European Surgical Outcomes Study (EuSOS)database in all patients older than 16 years who underwent emergency or urgent surgery.Patients were stratified by the time of surgery. The primary outcome was in-hospitalmortality after emergency and urgent surgery. Secondary outcomes were length of hospitalstay and critical care admission during hospital stay. Logistic multi-level regression analysiswas used to determine whether or not hospital mortality was different depending on the timeof day the procedure occurred, as depicted by the hour of day anaesthesia commenced, andto adjust for identified confounding factors effecting outcome.RESULTS. 11,290 patients undergoing non-elective surgery were included in the analysis with636 in-hospital deaths (5.6 %). Crude mortality odds ratios increased sequentially from daytime[426 deaths (5.3 %) to evening 155 deaths (6.0 %), OR 1.14 (95 % confidence interval0.94–1.38)] to night-time [60 deaths (8.3 %) OR 1.62 (1.22–2.14)]. The highest mortality wasfound in patients who underwent urgent or emergency surgery between 4:00 and 6:59, with a peakincidence of 19.1 %, and an OR of 6.37 (95 % CI 2.72–14.95) between 4:00 and 4:59. However,after adjustment for confounding factors, surgery during the evening [OR 1.09 (0.91–1.31)] andnight [OR 1.20 (0.9–1.6)] was not associated with an increased risk of post-operative death.CONCLUSIONS. Whilst non-elective surgery during the evening and night is associatedwith increased mortality, these differences appear to be explained by known patient andsurgery related risk factors rather than the time at which the procedure was performed.GRANT ACKNOWLEDGMENT. This study was funded by the European Society ofIntensive Care Medicine and the European Society of Anaesthesiology.
0478LOW CENTRAL VENOUS OXYGEN SATURATION AT EXTUBATION AFTERCARDIOVASCULAR SURGERY IS THE INDEPENDENT PREDICTOR FORREADMISSION AND IN-HOSPITAL DEATH
Y. Sotomi1, K. Iwakura1, K. Abe1, J. Yoshida1, T. Masai1, K. Fujii1
1Sakurabashi-Watanabe Hospital, Cardiovascular Center, Osaka, JapanINTRODUCTION. Despite recent widespread application of central venous oxygen sat-uration (ScvO2), little is known about the relationship between this value and outcome.OBJECTIVES. To evaluate the relationship between the ScvO2 value and outcome incomparison with mixed venous oxygen saturation (SvO2).METHODS. The study design was a prospective cohort study. ScvO2, SvO2, and otherbiochemical and demographic data were prospectively measured in the perioperative period ofcardiovascular surgery. The primary composite outcome was readmission and in-hospitaldeath. Average SvO2 and ScvO2 during operation, minimum SvO2 and ScvO2 during oper-ation, average SvO2 and ScvO2 in ICU, and SvO2 and ScvO2 at extubation in ICU wereevaluated as predictors in addition to other demographic data. Independent predictors ofcomposite outcome were identified with the use of Cox proportional hazards model.RESULTS. Perioperative data from consecutive 50 patients (68 ± 11 years, 31 males) whounderwent cardiovascular surgery was analyzed. In-hospital death and readmission wasobserved in 15 patients. Univariate analysis revealed that predictors of composite outcomewere history of chronic kidney disease [hazard ratio (HR) 3.71, 95 % confidential interval
26th ESICM ANNUAL CONGRESS — PARIS, FRANCE — 5–9 OCTOBER 2013
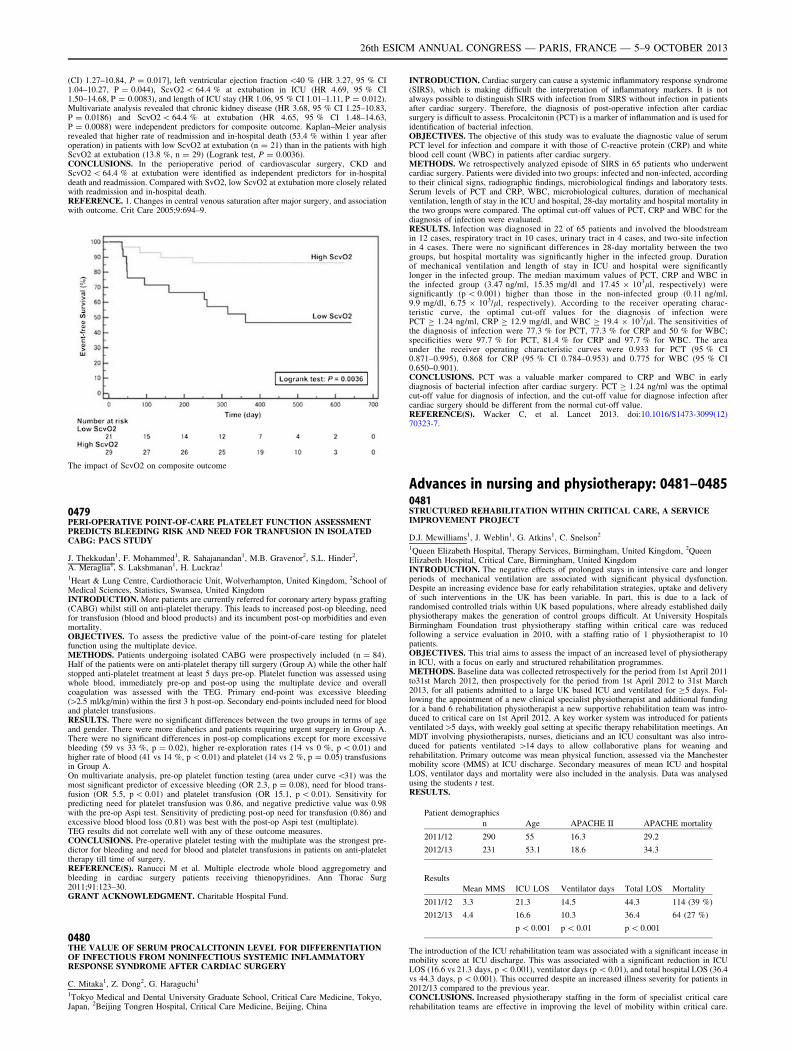
(CI) 1.27–10.84, P = 0.017], left ventricular ejection fraction \40 % (HR 3.27, 95 % CI1.04–10.27, P = 0.044), ScvO2 \ 64.4 % at extubation in ICU (HR 4.69, 95 % CI1.50–14.68, P = 0.0083), and length of ICU stay (HR 1.06, 95 % CI 1.01–1.11, P = 0.012).Multivariate analysis revealed that chronic kidney disease (HR 3.68, 95 % CI 1.25–10.83,P = 0.0186) and ScvO2 \ 64.4 % at extubation (HR 4.65, 95 % CI 1.48–14.63,P = 0.0088) were independent predictors for composite outcome. Kaplan–Meier analysisrevealed that higher rate of readmission and in-hospital death (53.4 % within 1 year afteroperation) in patients with low ScvO2 at extubation (n = 21) than in the patients with highScvO2 at extubation (13.8 %, n = 29) (Logrank test, P = 0.0036).CONCLUSIONS. In the perioperative period of cardiovascular surgery, CKD andScvO2 \ 64.4 % at extubation were identified as independent predictors for in-hospitaldeath and readmission. Compared with SvO2, low ScvO2 at extubation more closely relatedwith readmission and in-hospital death.REFERENCE. 1. Changes in central venous saturation after major surgery, and associationwith outcome. Crit Care 2005;9:694–9.
The impact of ScvO2 on composite outcome
0479PERI-OPERATIVE POINT-OF-CARE PLATELET FUNCTION ASSESSMENTPREDICTS BLEEDING RISK AND NEED FOR TRANFUSION IN ISOLATEDCABG: PACS STUDY
J. Thekkudan1, F. Mohammed1, R. Sahajanandan1, M.B. Gravenor2, S.L. Hinder2,A. Meraglia1, S. Lakshmanan1, H. Luckraz1
1Heart & Lung Centre, Cardiothoracic Unit, Wolverhampton, United Kingdom, 2School ofMedical Sciences, Statistics, Swansea, United KingdomINTRODUCTION. More patients are currently referred for coronary artery bypass grafting(CABG) whilst still on anti-platelet therapy. This leads to increased post-op bleeding, needfor transfusion (blood and blood products) and its incumbent post-op morbidities and evenmortality.OBJECTIVES. To assess the predictive value of the point-of-care testing for plateletfunction using the multiplate device.METHODS. Patients undergoing isolated CABG were prospectively included (n = 84).Half of the patients were on anti-platelet therapy till surgery (Group A) while the other halfstopped anti-platelet treatment at least 5 days pre-op. Platelet function was assessed usingwhole blood, immediately pre-op and post-op using the multiplate device and overallcoagulation was assessed with the TEG. Primary end-point was excessive bleeding([2.5 ml/kg/min) within the first 3 h post-op. Secondary end-points included need for bloodand platelet transfusions.RESULTS. There were no significant differences between the two groups in terms of ageand gender. There were more diabetics and patients requiring urgent surgery in Group A.There were no significant differences in post-op complications except for more excessivebleeding (59 vs 33 %, p = 0.02), higher re-exploration rates (14 vs 0 %, p \ 0.01) andhigher rate of blood (41 vs 14 %, p \ 0.01) and platelet (14 vs 2 %, p = 0.05) transfusionsin Group A.On multivariate analysis, pre-op platelet function testing (area under curve \31) was themost significant predictor of excessive bleeding (OR 2.3, p = 0.08), need for blood trans-fusion (OR 5.5, p \ 0.01) and platelet transfusion (OR 15.1, p \ 0.01). Sensitivity forpredicting need for platelet transfusion was 0.86, and negative predictive value was 0.98with the pre-op Aspi test. Sensitivity of predicting post-op need for transfusion (0.86) andexcessive blood blood loss (0.81) was best with the post-op Aspi test (multiplate).TEG results did not correlate well with any of these outcome measures.CONCLUSIONS. Pre-operative platelet testing with the multiplate was the strongest pre-dictor for bleeding and need for blood and platelet transfusions in patients on anti-platelettherapy till time of surgery.REFERENCE(S). Ranucci M et al. Multiple electrode whole blood aggregometry andbleeding in cardiac surgery patients receiving thienopyridines. Ann Thorac Surg2011;91:123–30.GRANT ACKNOWLEDGMENT. Charitable Hospital Fund.
0480THE VALUE OF SERUM PROCALCITONIN LEVEL FOR DIFFERENTIATIONOF INFECTIOUS FROM NONINFECTIOUS SYSTEMIC INFLAMMATORYRESPONSE SYNDROME AFTER CARDIAC SURGERY
C. Mitaka1, Z. Dong2, G. Haraguchi1
1Tokyo Medical and Dental University Graduate School, Critical Care Medicine, Tokyo,Japan, 2Beijing Tongren Hospital, Critical Care Medicine, Beijing, China
INTRODUCTION. Cardiac surgery can cause a systemic inflammatory response syndrome(SIRS), which is making difficult the interpretation of inflammatory markers. It is notalways possible to distinguish SIRS with infection from SIRS without infection in patientsafter cardiac surgery. Therefore, the diagnosis of post-operative infection after cardiacsurgery is difficult to assess. Procalcitonin (PCT) is a marker of inflammation and is used foridentification of bacterial infection.OBJECTIVES. The objective of this study was to evaluate the diagnostic value of serumPCT level for infection and compare it with those of C-reactive protein (CRP) and whiteblood cell count (WBC) in patients after cardiac surgery.METHODS. We retrospectively analyzed episode of SIRS in 65 patients who underwentcardiac surgery. Patients were divided into two groups: infected and non-infected, accordingto their clinical signs, radiographic findings, microbiological findings and laboratory tests.Serum levels of PCT and CRP, WBC, microbiological cultures, duration of mechanicalventilation, length of stay in the ICU and hospital, 28-day mortality and hospital mortality inthe two groups were compared. The optimal cut-off values of PCT, CRP and WBC for thediagnosis of infection were evaluated.RESULTS. Infection was diagnosed in 22 of 65 patients and involved the bloodstreamin 12 cases, respiratory tract in 10 cases, urinary tract in 4 cases, and two-site infectionin 4 cases. There were no significant differences in 28-day mortality between the twogroups, but hospital mortality was significantly higher in the infected group. Durationof mechanical ventilation and length of stay in ICU and hospital were significantlylonger in the infected group. The median maximum values of PCT, CRP and WBC inthe infected group (3.47 ng/ml, 15.35 mg/dl and 17.45 9 103ll, respectively) weresignificantly (p \ 0.001) higher than those in the non-infected group (0.11 ng/ml,9.9 mg/dl, 6.75 9 103/ll, respectively). According to the receiver operating charac-teristic curve, the optimal cut-off values for the diagnosis of infection werePCT C 1.24 ng/ml, CRP C 12.9 mg/dl, and WBC C 19.4 9 103/ll. The sensitivities ofthe diagnosis of infection were 77.3 % for PCT, 77.3 % for CRP and 50 % for WBC;specificities were 97.7 % for PCT, 81.4 % for CRP and 97.7 % for WBC. The areaunder the receiver operating characteristic curves were 0.933 for PCT (95 % CI0.871–0.995), 0.868 for CRP (95 % CI 0.784–0.953) and 0.775 for WBC (95 % CI0.650–0.901).CONCLUSIONS. PCT was a valuable marker compared to CRP and WBC in earlydiagnosis of bacterial infection after cardiac surgery. PCT C 1.24 ng/ml was the optimalcut-off value for diagnosis of infection, and the cut-off value for diagnose infection aftercardiac surgery should be different from the normal cut-off value.REFERENCE(S). Wacker C, et al. Lancet 2013. doi:10.1016/S1473-3099(12)70323-7.
Advances in nursing and physiotherapy: 0481–04850481STRUCTURED REHABILITATION WITHIN CRITICAL CARE, A SERVICEIMPROVEMENT PROJECT
D.J. Mcwilliams1, J. Weblin1, G. Atkins1, C. Snelson2
1Queen Elizabeth Hospital, Therapy Services, Birmingham, United Kingdom, 2QueenElizabeth Hospital, Critical Care, Birmingham, United KingdomINTRODUCTION. The negative effects of prolonged stays in intensive care and longerperiods of mechanical ventilation are associated with significant physical dysfunction.Despite an increasing evidence base for early rehabilitation strategies, uptake and deliveryof such interventions in the UK has been variable. In part, this is due to a lack ofrandomised controlled trials within UK based populations, where already established dailyphysiotherapy makes the generation of control groups difficult. At University HospitalsBirmingham Foundation trust physiotherapy staffing within critical care was reducedfollowing a service evaluation in 2010, with a staffing ratio of 1 physiotherapist to 10patients.OBJECTIVES. This trial aims to assess the impact of an increased level of physiotherapyin ICU, with a focus on early and structured rehabilitation programmes.METHODS. Baseline data was collected retrospectively for the period from 1st April 2011to31st March 2012, then prospectively for the period from 1st April 2012 to 31st March2013, for all patients admitted to a large UK based ICU and ventilated for C5 days. Fol-lowing the appointment of a new clinical specialist physiotherapist and additional fundingfor a band 6 rehabilitation physiotherapist a new supportive rehabilitation team was intro-duced to critical care on 1st April 2012. A key worker system was introduced for patientsventilated[5 days, with weekly goal setting at specific therapy rehabilitation meetings. AnMDT involving physiotherapists, nurses, dieticians and an ICU consultant was also intro-duced for patients ventilated [14 days to allow collaborative plans for weaning andrehabilitation. Primary outcome was mean physical function, assessed via the Manchestermobility score (MMS) at ICU discharge. Secondary measures of mean ICU and hospitalLOS, ventilator days and mortality were also included in the analysis. Data was analysedusing the students t test.RESULTS.
Patient demographics
n Age APACHE II APACHE mortality
2011/12 290 55 16.3 29.2
2012/13 231 53.1 18.6 34.3
Results
Mean MMS ICU LOS Ventilator days Total LOS Mortality
2011/12 3.3 21.3 14.5 44.3 114 (39 %)
2012/13 4.4 16.6 10.3 36.4 64 (27 %)
p \ 0.001 p \ 0.01 p \ 0.001
The introduction of the ICU rehabilitation team was associated with a significant incease inmobility score at ICU discharge. This was associated with a significant reduction in ICULOS (16.6 vs 21.3 days, p \ 0.001), ventilator days (p \ 0.01), and total hospital LOS (36.4vs 44.3 days, p \ 0.001). This occurred despite an increased illness severity for patients in2012/13 compared to the previous year.CONCLUSIONS. Increased physiotherapy staffing in the form of specialist critical carerehabilitation teams are effective in improving the level of mobility within critical care.
26th ESICM ANNUAL CONGRESS — PARIS, FRANCE — 5–9 OCTOBER 2013
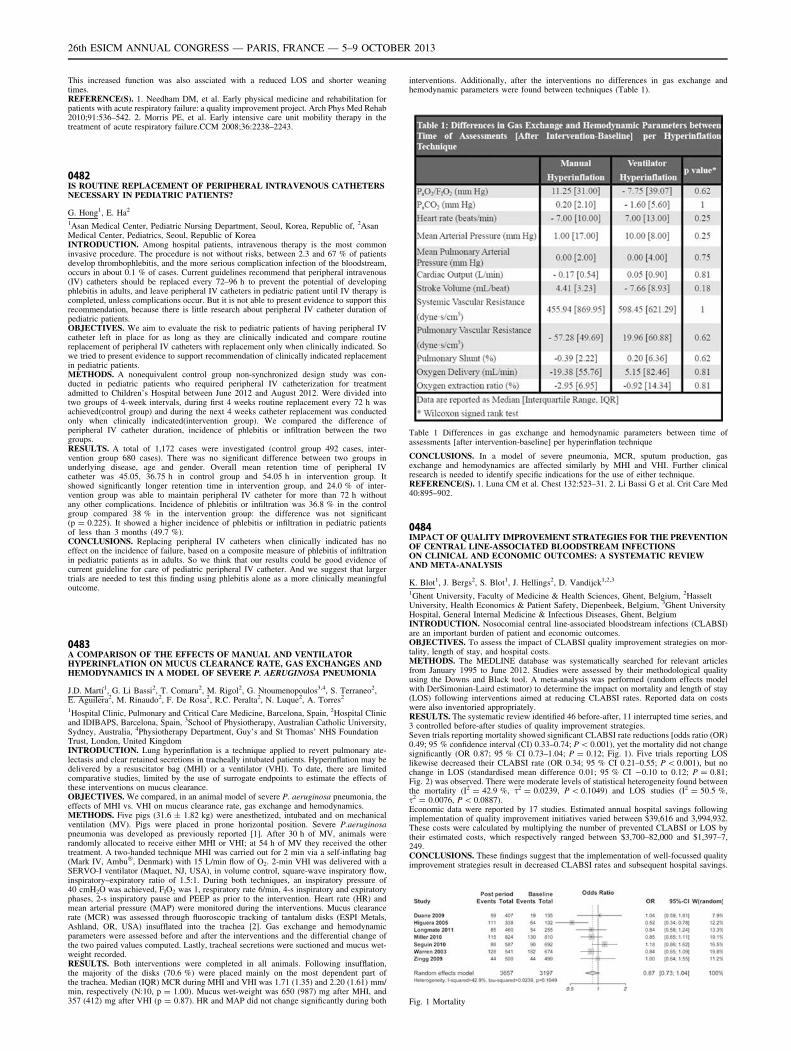
This increased function was also assciated with a reduced LOS and shorter weaningtimes.REFERENCE(S). 1. Needham DM, et al. Early physical medicine and rehabilitation forpatients with acute respiratory failure: a quality improvement project. Arch Phys Med Rehab2010;91:536–542. 2. Morris PE, et al. Early intensive care unit mobility therapy in thetreatment of acute respiratory failure.CCM 2008;36:2238–2243.
0482IS ROUTINE REPLACEMENT OF PERIPHERAL INTRAVENOUS CATHETERSNECESSARY IN PEDIATRIC PATIENTS?
G. Hong1, E. Ha2
1Asan Medical Center, Pediatric Nursing Department, Seoul, Korea, Republic of, 2AsanMedical Center, Pediatrics, Seoul, Republic of KoreaINTRODUCTION. Among hospital patients, intravenous therapy is the most commoninvasive procedure. The procedure is not without risks, between 2.3 and 67 % of patientsdevelop thrombophlebitis, and the more serious complication infection of the bloodstream,occurs in about 0.1 % of cases. Current guidelines recommend that peripheral intravenous(IV) catheters should be replaced every 72–96 h to prevent the potential of developingphlebitis in adults, and leave peripheral IV catheters in pediatric patient until IV therapy iscompleted, unless complications occur. But it is not able to present evidence to support thisrecommendation, because there is little research about peripheral IV catheter duration ofpediatric patients.OBJECTIVES. We aim to evaluate the risk to pediatric patients of having peripheral IVcatheter left in place for as long as they are clinically indicated and compare routinereplacement of peripheral IV catheters with replacement only when clinically indicated. Sowe tried to present evidence to support recommendation of clinically indicated replacementin pediatric patients.METHODS. A nonequivalent control group non-synchronized design study was con-ducted in pediatric patients who required peripheral IV catheterization for treatmentadmitted to Children’s Hospital between June 2012 and August 2012. Were divided intotwo groups of 4-week intervals, during first 4 weeks routine replacement every 72 h wasachieved(control group) and during the next 4 weeks catheter replacement was conductedonly when clinically indicated(intervention group). We compared the difference ofperipheral IV catheter duration, incidence of phlebitis or infiltration between the twogroups.RESULTS. A total of 1,172 cases were investigated (control group 492 cases, inter-vention group 680 cases). There was no significant difference between two groups inunderlying disease, age and gender. Overall mean retention time of peripheral IVcatheter was 45.05, 36.75 h in control group and 54.05 h in intervention group. Itshowed significantly longer retention time in intervention group, and 24.0 % of inter-vention group was able to maintain peripheral IV catheter for more than 72 h withoutany other complications. Incidence of phlebitis or infiltration was 36.8 % in the controlgroup compared 38 % in the intervention group: the difference was not significant(p = 0.225). It showed a higher incidence of phlebitis or infiltration in pediatric patientsof less than 3 months (49.7 %).CONCLUSIONS. Replacing peripheral IV catheters when clinically indicated has noeffect on the incidence of failure, based on a composite measure of phlebitis of infiltrationin pediatric patients as in adults. So we think that our results could be good evidence ofcurrent guideline for care of pediatric peripheral IV catheter. And we suggest that largertrials are needed to test this finding using phlebitis alone as a more clinically meaningfuloutcome.
0483A COMPARISON OF THE EFFECTS OF MANUAL AND VENTILATORHYPERINFLATION ON MUCUS CLEARANCE RATE, GAS EXCHANGES ANDHEMODYNAMICS IN A MODEL OF SEVERE P. AERUGINOSA PNEUMONIA
J.D. Martı́1, G. Li Bassi2, T. Comaru2, M. Rigol2, G. Ntoumenopoulos3,4, S. Terraneo2,E. Aguilera2, M. Rinaudo2, F. De Rosa2, R.C. Peralta2, N. Luque2, A. Torres2
1Hospital Clinic, Pulmonary and Critical Care Medicine, Barcelona, Spain, 2Hospital Clinicand IDIBAPS, Barcelona, Spain, 3School of Physiotherapy, Australian Catholic University,Sydney, Australia, 4Physiotherapy Department, Guy’s and St Thomas’ NHS FoundationTrust, London, United KingdomINTRODUCTION. Lung hyperinflation is a technique applied to revert pulmonary ate-lectasis and clear retained secretions in tracheally intubated patients. Hyperinflation may bedelivered by a resuscitator bag (MHI) or a ventilator (VHI). To date, there are limitedcomparative studies, limited by the use of surrogate endpoints to estimate the effects ofthese interventions on mucus clearance.OBJECTIVES. We compared, in an animal model of severe P. aeruginosa pneumonia, theeffects of MHI vs. VHI on mucus clearance rate, gas exchange and hemodynamics.METHODS. Five pigs (31.6 ± 1.82 kg) were anesthetized, intubated and on mechanicalventilation (MV). Pigs were placed in prone horizontal position. Severe P.aeruginosapneumonia was developed as previously reported [1]. After 30 h of MV, animals wererandomly allocated to receive either MHI or VHI; at 54 h of MV they received the othertreatment. A two-handed technique MHI was carried out for 2 min via a self-inflating bag(Mark IV, Ambu�, Denmark) with 15 L/min flow of O2. 2-min VHI was delivered with aSERVO-I ventilator (Maquet, NJ, USA), in volume control, square-wave inspiratory flow,inspiratory–expiratory ratio of 1.5:1. During both techniques, an inspiratory pressure of40 cmH2O was achieved, FIO2 was 1, respiratory rate 6/min, 4-s inspiratory and expiratoryphases, 2-s inspiratory pause and PEEP as prior to the intervention. Heart rate (HR) andmean arterial pressure (MAP) were monitored during the interventions. Mucus clearancerate (MCR) was assessed through fluoroscopic tracking of tantalum disks (ESPI Metals,Ashland, OR, USA) insufflated into the trachea [2]. Gas exchange and hemodynamicparameters were assessed before and after the interventions and the differential change ofthe two paired values computed. Lastly, tracheal secretions were suctioned and mucus wet-weight recorded.RESULTS. Both interventions were completed in all animals. Following insufflation,the majority of the disks (70.6 %) were placed mainly on the most dependent part ofthe trachea. Median (IQR) MCR during MHI and VHI was 1.71 (1.35) and 2.20 (1.61) mm/min, respectively (N:10, p = 1.00). Mucus wet-weight was 650 (987) mg after MHI, and357 (412) mg after VHI (p = 0.87). HR and MAP did not change significantly during both
interventions. Additionally, after the interventions no differences in gas exchange andhemodynamic parameters were found between techniques (Table 1).
Table 1 Differences in gas exchange and hemodynamic parameters between time ofassessments [after intervention-baseline] per hyperinflation technique
CONCLUSIONS. In a model of severe pneumonia, MCR, sputum production, gasexchange and hemodynamics are affected similarly by MHI and VHI. Further clinicalresearch is needed to identify specific indications for the use of either technique.REFERENCE(S). 1. Luna CM et al. Chest 132:523–31. 2. Li Bassi G et al. Crit Care Med40:895–902.
0484IMPACT OF QUALITY IMPROVEMENT STRATEGIES FOR THE PREVENTIONOF CENTRAL LINE-ASSOCIATED BLOODSTREAM INFECTIONSON CLINICAL AND ECONOMIC OUTCOMES: A SYSTEMATIC REVIEWAND META-ANALYSIS
K. Blot1, J. Bergs2, S. Blot1, J. Hellings2, D. Vandijck1,2,3
1Ghent University, Faculty of Medicine & Health Sciences, Ghent, Belgium, 2HasseltUniversity, Health Economics & Patient Safety, Diepenbeek, Belgium, 3Ghent UniversityHospital, General Internal Medicine & Infectious Diseases, Ghent, BelgiumINTRODUCTION. Nosocomial central line-associated bloodstream infections (CLABSI)are an important burden of patient and economic outcomes.OBJECTIVES. To assess the impact of CLABSI quality improvement strategies on mor-tality, length of stay, and hospital costs.METHODS. The MEDLINE database was systematically searched for relevant articlesfrom January 1995 to June 2012. Studies were assessed by their methodological qualityusing the Downs and Black tool. A meta-analysis was performed (random effects modelwith DerSimonian-Laird estimator) to determine the impact on mortality and length of stay(LOS) following interventions aimed at reducing CLABSI rates. Reported data on costswere also inventoried appropriately.RESULTS. The systematic review identified 46 before-after, 11 interrupted time series, and3 controlled before-after studies of quality improvement strategies.Seven trials reporting mortality showed significant CLABSI rate reductions [odds ratio (OR)0.49; 95 % confidence interval (CI) 0.33–0.74; P \ 0.001), yet the mortality did not changesignificantly (OR 0.87; 95 % CI 0.73–1.04; P = 0.12; Fig. 1). Five trials reporting LOSlikewise decreased their CLABSI rate (OR 0.34; 95 % CI 0.21–0.55; P \ 0.001), but nochange in LOS (standardised mean difference 0.01; 95 % CI -0.10 to 0.12; P = 0.81;Fig. 2) was observed. There were moderate levels of statistical heterogeneity found betweenthe mortality (I2 = 42.9 %, s2 = 0.0239, P \ 0.1049) and LOS studies (I2 = 50.5 %,s2 = 0.0076, P \ 0.0887).Economic data were reported by 17 studies. Estimated annual hospital savings followingimplementation of quality improvement initiatives varied between $39,616 and 3,994,932.These costs were calculated by multiplying the number of prevented CLABSI or LOS bytheir estimated costs, which respectively ranged between $3,700–82,000 and $1,397–7,249.CONCLUSIONS. These findings suggest that the implementation of well-focussed qualityimprovement strategies result in decreased CLABSI rates and subsequent hospital savings.
Fig. 1 Mortality
26th ESICM ANNUAL CONGRESS — PARIS, FRANCE — 5–9 OCTOBER 2013
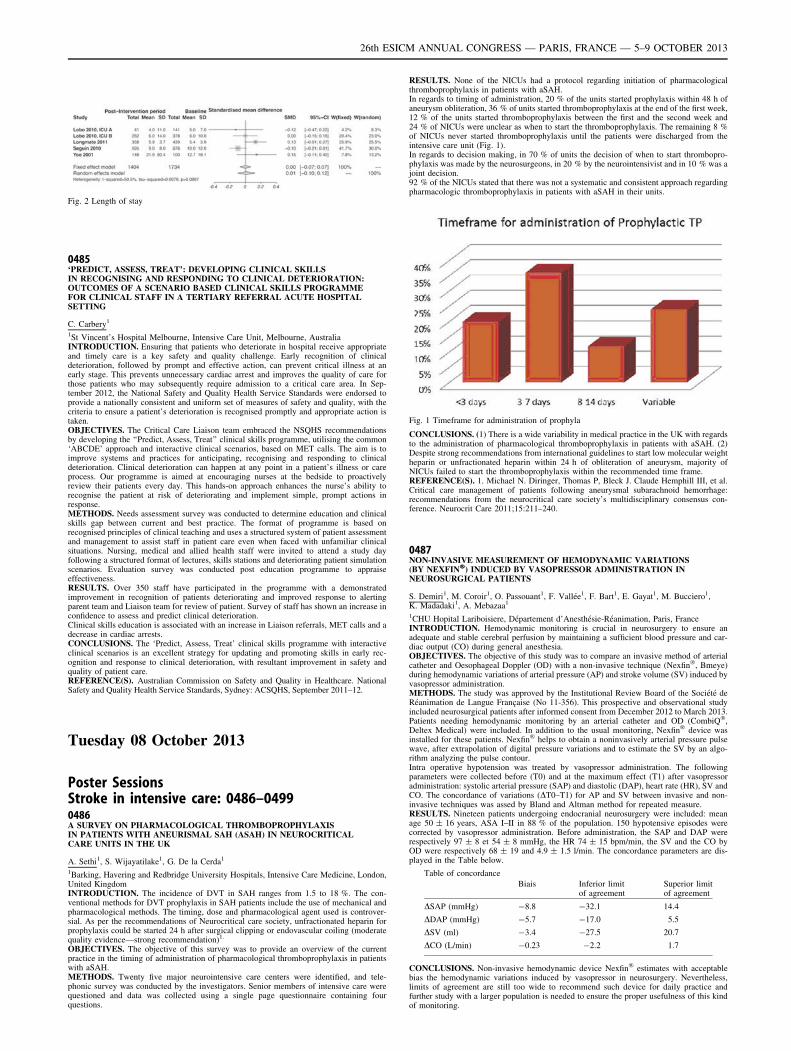
Fig. 2 Length of stay
0485‘PREDICT, ASSESS, TREAT’: DEVELOPING CLINICAL SKILLSIN RECOGNISING AND RESPONDING TO CLINICAL DETERIORATION:OUTCOMES OF A SCENARIO BASED CLINICAL SKILLS PROGRAMMEFOR CLINICAL STAFF IN A TERTIARY REFERRAL ACUTE HOSPITALSETTING
C. Carbery1
1St Vincent’s Hospital Melbourne, Intensive Care Unit, Melbourne, AustraliaINTRODUCTION. Ensuring that patients who deteriorate in hospital receive appropriateand timely care is a key safety and quality challenge. Early recognition of clinicaldeterioration, followed by prompt and effective action, can prevent critical illness at anearly stage. This prevents unnecessary cardiac arrest and improves the quality of care forthose patients who may subsequently require admission to a critical care area. In Sep-tember 2012, the National Safety and Quality Health Service Standards were endorsed toprovide a nationally consistent and uniform set of measures of safety and quality, with thecriteria to ensure a patient’s deterioration is recognised promptly and appropriate action istaken.OBJECTIVES. The Critical Care Liaison team embraced the NSQHS recommendationsby developing the ‘‘Predict, Assess, Treat’’ clinical skills programme, utilising the common‘ABCDE’ approach and interactive clinical scenarios, based on MET calls. The aim is toimprove systems and practices for anticipating, recognising and responding to clinicaldeterioration. Clinical deterioration can happen at any point in a patient’s illness or careprocess. Our programme is aimed at encouraging nurses at the bedside to proactivelyreview their patients every day. This hands-on approach enhances the nurse’s ability torecognise the patient at risk of deteriorating and implement simple, prompt actions inresponse.METHODS. Needs assessment survey was conducted to determine education and clinicalskills gap between current and best practice. The format of programme is based onrecognised principles of clinical teaching and uses a structured system of patient assessmentand management to assist staff in patient care even when faced with unfamiliar clinicalsituations. Nursing, medical and allied health staff were invited to attend a study dayfollowing a structured format of lectures, skills stations and deteriorating patient simulationscenarios. Evaluation survey was conducted post education programme to appraiseeffectiveness.RESULTS. Over 350 staff have participated in the programme with a demonstratedimprovement in recognition of patients deteriorating and improved response to alertingparent team and Liaison team for review of patient. Survey of staff has shown an increase inconfidence to assess and predict clinical deterioration.Clinical skills education is associated with an increase in Liaison referrals, MET calls and adecrease in cardiac arrests.CONCLUSIONS. The ‘Predict, Assess, Treat’ clinical skills programme with interactiveclinical scenarios is an excellent strategy for updating and promoting skills in early rec-ognition and response to clinical deterioration, with resultant improvement in safety andquality of patient care.REFERENCE(S). Australian Commission on Safety and Quality in Healthcare. NationalSafety and Quality Health Service Standards, Sydney: ACSQHS, September 2011–12.
Tuesday 08 October 2013
Poster SessionsStroke in intensive care: 0486–04990486A SURVEY ON PHARMACOLOGICAL THROMBOPROPHYLAXISIN PATIENTS WITH ANEURISMAL SAH (ASAH) IN NEUROCRITICALCARE UNITS IN THE UK
A. Sethi1, S. Wijayatilake1, G. De la Cerda1
1Barking, Havering and Redbridge University Hospitals, Intensive Care Medicine, London,United KingdomINTRODUCTION. The incidence of DVT in SAH ranges from 1.5 to 18 %. The con-ventional methods for DVT prophylaxis in SAH patients include the use of mechanical andpharmacological methods. The timing, dose and pharmacological agent used is controver-sial. As per the recommendations of Neurocritical care society, unfractionated heparin forprophylaxis could be started 24 h after surgical clipping or endovascular coiling (moderatequality evidence—strong recommendation)1.
OBJECTIVES. The objective of this survey was to provide an overview of the currentpractice in the timing of administration of pharmacological thromboprophylaxis in patientswith aSAH.METHODS. Twenty five major neurointensive care centers were identified, and tele-phonic survey was conducted by the investigators. Senior members of intensive care werequestioned and data was collected using a single page questionnaire containing fourquestions.
RESULTS. None of the NICUs had a protocol regarding initiation of pharmacologicalthromboprophylaxis in patients with aSAH.In regards to timing of administration, 20 % of the units started prophylaxis within 48 h ofaneurysm obliteration, 36 % of units started thromboprophylaxis at the end of the first week,12 % of the units started thromboprophylaxis between the first and the second week and24 % of NICUs were unclear as when to start the thromboprophylaxis. The remaining 8 %of NICUs never started thromboprophylaxis until the patients were discharged from theintensive care unit (Fig. 1).In regards to decision making, in 70 % of units the decision of when to start thrombopro-phylaxis was made by the neurosurgeons, in 20 % by the neurointensivist and in 10 % was ajoint decision.92 % of the NICUs stated that there was not a systematic and consistent approach regardingpharmacologic thromboprophylaxis in patients with aSAH in their units.
Fig. 1 Timeframe for administration of prophyla
CONCLUSIONS. (1) There is a wide variability in medical practice in the UK with regardsto the administration of pharmacological thromboprophylaxis in patients with aSAH. (2)Despite strong recommendations from international guidelines to start low molecular weightheparin or unfractionated heparin within 24 h of obliteration of aneurysm, majority ofNICUs failed to start the thromboprophylaxis within the recommended time frame.REFERENCE(S). 1. Michael N. Diringer, Thomas P, Bleck J. Claude Hemphill III, et al.Critical care management of patients following aneurysmal subarachnoid hemorrhage:recommendations from the neurocritical care society’s multidisciplinary consensus con-ference. Neurocrit Care 2011;15:211–240.
0487NON-INVASIVE MEASUREMENT OF HEMODYNAMIC VARIATIONS(BY NEXFIN�) INDUCED BY VASOPRESSOR ADMINISTRATION INNEUROSURGICAL PATIENTS
S. Demiri1, M. Coroir1, O. Passouant1, F. Vallée1, F. Bart1, E. Gayat1, M. Bucciero1,K. Madadaki1, A. Mebazaa1
1CHU Hopital Lariboisiere, Département d’Anesthésie-Réanimation, Paris, FranceINTRODUCTION. Hemodynamic monitoring is crucial in neurosurgery to ensure anadequate and stable cerebral perfusion by maintaining a sufficient blood pressure and car-diac output (CO) during general anesthesia.OBJECTIVES. The objective of this study was to compare an invasive method of arterialcatheter and Oesophageal Doppler (OD) with a non-invasive technique (Nexfin�, Bmeye)during hemodynamic variations of arterial pressure (AP) and stroke volume (SV) induced byvasopressor administration.METHODS. The study was approved by the Institutional Review Board of the Société deRéanimation de Langue Française (No 11-356). This prospective and observational studyincluded neurosurgical patients after informed consent from December 2012 to March 2013.Patients needing hemodynamic monitoring by an arterial catheter and OD (CombiQ�,Deltex Medical) were included. In addition to the usual monitoring, Nexfin� device wasinstalled for these patients. Nexfin� helps to obtain a noninvasively arterial pressure pulsewave, after extrapolation of digital pressure variations and to estimate the SV by an algo-rithm analyzing the pulse contour.Intra operative hypotension was treated by vasopressor administration. The followingparameters were collected before (T0) and at the maximum effect (T1) after vasopressoradministration: systolic arterial pressure (SAP) and diastolic (DAP), heart rate (HR), SV andCO. The concordance of variations (DT0–T1) for AP and SV between invasive and non-invasive techniques was assed by Bland and Altman method for repeated measure.RESULTS. Nineteen patients undergoing endocranial neurosurgery were included: meanage 50 ± 16 years, ASA I–II in 88 % of the population. 150 hypotensive episodes werecorrected by vasopressor administration. Before administration, the SAP and DAP wererespectively 97 ± 8 et 54 ± 8 mmHg, the HR 74 ± 15 bpm/min, the SV and the CO byOD were respectively 68 ± 19 and 4.9 ± 1.5 l/min. The concordance parameters are dis-played in the Table below.
Table of concordance
Biais Inferior limitof agreement
Superior limitof agreement
DSAP (mmHg) -8.8 -32.1 14.4
DDAP (mmHg) -5.7 -17.0 5.5
DSV (ml) -3.4 -27.5 20.7
DCO (L/min) -0.23 -2.2 1.7
CONCLUSIONS. Non-invasive hemodynamic device Nexfin� estimates with acceptablebias the hemodynamic variations induced by vasopressor in neurosurgery. Nevertheless,limits of agreement are still too wide to recommend such device for daily practice andfurther study with a larger population is needed to ensure the proper usefulness of this kindof monitoring.
26th ESICM ANNUAL CONGRESS — PARIS, FRANCE — 5–9 OCTOBER 2013
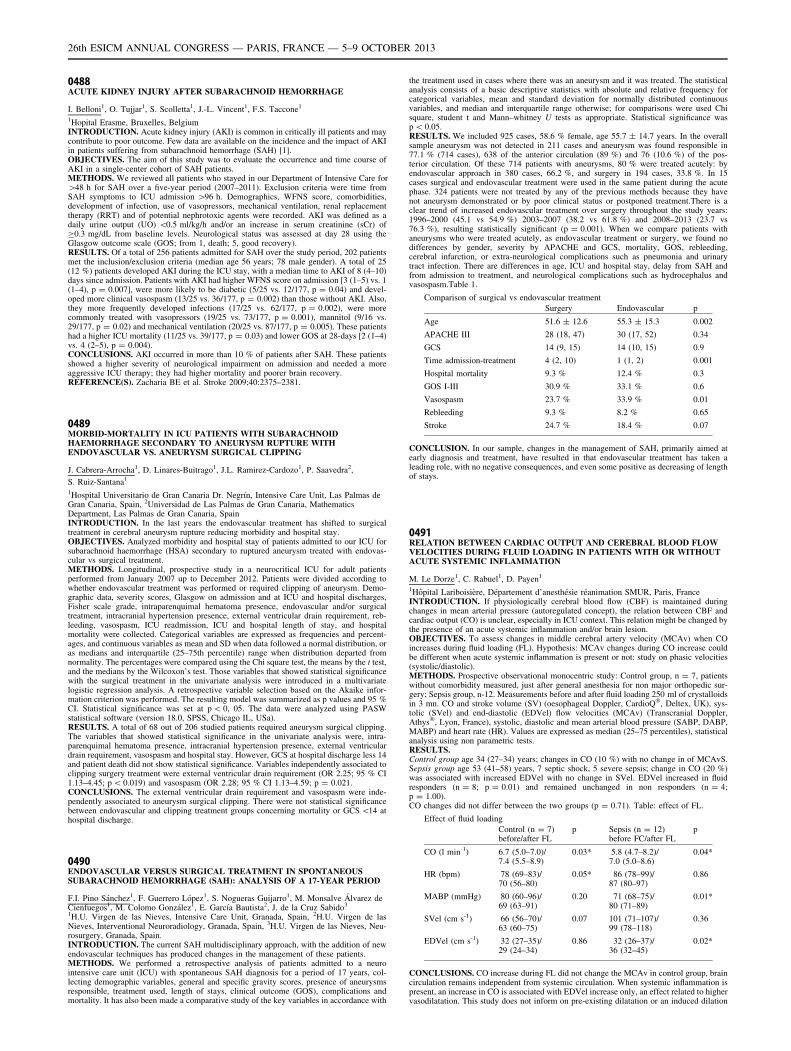
0488ACUTE KIDNEY INJURY AFTER SUBARACHNOID HEMORRHAGE
I. Belloni1, O. Tujjar1, S. Scolletta1, J.-L. Vincent1, F.S. Taccone1
1Hopital Erasme, Bruxelles, BelgiumINTRODUCTION. Acute kidney injury (AKI) is common in critically ill patients and maycontribute to poor outcome. Few data are available on the incidence and the impact of AKIin patients suffering from subarachnoid hemorrhage (SAH) [1].OBJECTIVES. The aim of this study was to evaluate the occurrence and time course ofAKI in a single-center cohort of SAH patients.METHODS. We reviewed all patients who stayed in our Department of Intensive Care for[48 h for SAH over a five-year period (2007–2011). Exclusion criteria were time fromSAH symptoms to ICU admission [96 h. Demographics, WFNS score, comorbidities,development of infection, use of vasopressors, mechanical ventilation, renal replacementtherapy (RRT) and of potential nephrotoxic agents were recorded. AKI was defined as adaily urine output (UO) \0.5 ml/kg/h and/or an increase in serum creatinine (sCr) ofC0.3 mg/dL from baseline levels. Neurological status was assessed at day 28 using theGlasgow outcome scale (GOS; from 1, death; 5, good recovery).RESULTS. Of a total of 256 patients admitted for SAH over the study period, 202 patientsmet the inclusion/exclusion criteria (median age 56 years; 78 male gender). A total of 25(12 %) patients developed AKI during the ICU stay, with a median time to AKI of 8 (4–10)days since admission. Patients with AKI had higher WFNS score on admission [3 (1–5) vs. 1(1–4), p = 0.007], were more likely to be diabetic (5/25 vs. 12/177, p = 0.04) and devel-oped more clinical vasospasm (13/25 vs. 36/177, p = 0.002) than those without AKI. Also,they more frequently developed infections (17/25 vs. 62/177, p = 0.002), were morecommonly treated with vasopressors (19/25 vs. 73/177, p = 0.001), mannitol (9/16 vs.29/177, p = 0.02) and mechanical ventilation (20/25 vs. 87/177, p = 0.005). These patientshad a higher ICU mortality (11/25 vs. 39/177, p = 0.03) and lower GOS at 28-days [2 (1–4)vs. 4 (2–5), p = 0.004).CONCLUSIONS. AKI occurred in more than 10 % of patients after SAH. These patientsshowed a higher severity of neurological impairment on admission and needed a moreaggressive ICU therapy; they had higher mortality and poorer brain recovery.REFERENCE(S). Zacharia BE et al. Stroke 2009;40:2375–2381.
0489MORBID-MORTALITY IN ICU PATIENTS WITH SUBARACHNOIDHAEMORRHAGE SECONDARY TO ANEURYSM RUPTURE WITHENDOVASCULAR VS. ANEURYSM SURGICAL CLIPPING
J. Cabrera-Arrocha1, D. Linares-Buitrago1, J.L. Ramirez-Cardozo1, P. Saavedra2,
S. Ruiz-Santana1
1Hospital Universitario de Gran Canaria Dr. Negrı́n, Intensive Care Unit, Las Palmas deGran Canaria, Spain, 2Universidad de Las Palmas de Gran Canaria, MathematicsDepartment, Las Palmas de Gran Canaria, SpainINTRODUCTION. In the last years the endovascular treatment has shifted to surgicaltreatment in cerebral aneurysm rupture reducing morbidity and hospital stay.OBJECTIVES. Analyzed morbidity and hospital stay of patients admitted to our ICU forsubarachnoid haemorrhage (HSA) secondary to ruptured aneurysm treated with endovas-cular vs surgical treatment.METHODS. Longitudinal, prospective study in a neurocritical ICU for adult patientsperformed from January 2007 up to December 2012. Patients were divided according towhether endovascular treatment was performed or required clipping of aneurysm. Demo-graphic data, severity scores, Glasgow on admission and at ICU and hospital discharges,Fisher scale grade, intraparenquimal hematoma presence, endovascular and/or surgicaltreatment, intracranial hypertension presence, external ventricular drain requirement, reb-leeding, vasospasm, ICU readmission, ICU and hospital length of stay, and hospitalmortality were collected. Categorical variables are expressed as frequencies and percent-ages, and continuous variables as mean and SD when data followed a normal distribution, oras medians and interquartile (25–75th percentile) range when distribution departed fromnormality. The percentages were compared using the Chi square test, the means by the t test,and the medians by the Wilcoxon’s test. Those variables that showed statistical significancewith the surgical treatment in the univariate analysis were introduced in a multivariatelogistic regression analysis. A retrospective variable selection based on the Akaike infor-mation criterion was performed. The resulting model was summarized as p values and 95 %CI. Statistical significance was set at p \ 0, 05. The data were analyzed using PASWstatistical software (version 18.0, SPSS, Chicago IL, USa).RESULTS. A total of 68 out of 206 studied patients required aneurysm surgical clipping.The variables that showed statistical significance in the univariate analysis were, intra-parenquimal hematoma presence, intracranial hypertension presence, external ventriculardrain requirement, vasospasm and hospital stay. However, GCS at hospital discharge less 14and patient death did not show statistical significance. Variables independently associated toclipping surgery treatment were external ventricular drain requirement (OR 2.25; 95 % CI1.13–4.45; p \ 0.019) and vasospasm (OR 2.28; 95 % CI 1.13–4.59; p = 0.021.CONCLUSIONS. The external ventricular drain requirement and vasospasm were inde-pendently associated to aneurysm surgical clipping. There were not statistical significancebetween endovascular and clipping treatment groups concerning mortality or GCS \14 athospital discharge.
0490ENDOVASCULAR VERSUS SURGICAL TREATMENT IN SPONTANEOUSSUBARACHNOID HEMORRHAGE (SAH): ANALYSIS OF A 17-YEAR PERIOD
F.I. Pino Sánchez1, F. Guerrero López1, S. Nogueras Guijarro1, M. Monsalve Álvarez deCienfuegos1, M. Colomo González1, E. Garcı́a Bautista2, J. de la Cruz Sabido3
1H.U. Virgen de las Nieves, Intensive Care Unit, Granada, Spain, 2H.U. Virgen de lasNieves, Interventional Neuroradiology, Granada, Spain, 3H.U. Virgen de las Nieves, Neu-rosurgery, Granada, Spain.INTRODUCTION. The current SAH multidisciplinary approach, with the addition of newendovascular techniques has produced changes in the management of these patients.METHODS. We performed a retrospective analysis of patients admitted to a neurointensive care unit (ICU) with spontaneous SAH diagnosis for a period of 17 years, col-lecting demographic variables, general and specific gravity scores, presence of aneurysmsresponsible, treatment used, length of stays, clinical outcome (GOS), complications andmortality. It has also been made a comparative study of the key variables in accordance with
the treatment used in cases where there was an aneurysm and it was treated. The statisticalanalysis consists of a basic descriptive statistics with absolute and relative frequency forcategorical variables, mean and standard deviation for normally distributed continuousvariables, and median and interquartile range otherwise; for comparisons were used Chisquare, student t and Mann–whitney U tests as appropriate. Statistical significance wasp \ 0.05.RESULTS. We included 925 cases, 58.6 % female, age 55.7 ± 14.7 years. In the overallsample aneurysm was not detected in 211 cases and aneurysm was found responsible in77.1 % (714 cases), 638 of the anterior circulation (89 %) and 76 (10.6 %) of the pos-terior circulation. Of these 714 patients with aneurysms, 80 % were treated acutely: byendovascular approach in 380 cases, 66.2 %, and surgery in 194 cases, 33.8 %. In 15cases surgical and endovascular treatment were used in the same patient during the acutephase. 324 patients were not treated by any of the previous methods because they havenot aneurysm demonstrated or by poor clinical status or postponed treatment.There is aclear trend of increased endovascular treatment over surgery throughout the study years:1996–2000 (45.1 vs 54.9 %) 2003–2007 (38.2 vs 61.8 %) and 2008–2013 (23.7 vs76.3 %), resulting statistically significant (p = 0.001). When we compare patients withaneurysms who were treated acutely, as endovascular treatment or surgery, we found nodifferences by gender, severity by APACHE and GCS, mortality, GOS, rebleeding,cerebral infarction, or extra-neurological complications such as pneumonia and urinarytract infection. There are differences in age, ICU and hospital stay, delay from SAH andfrom admission to treatment, and neurological complications such as hydrocephalus andvasospasm.Table 1.
Comparison of surgical vs endovascular treatment
Surgery Endovascular p
Age 51.6 ± 12.6 55.3 ± 15.3 0.002
APACHE III 28 (18, 47) 30 (17, 52) 0.34
GCS 14 (9, 15) 14 (10, 15) 0.9
Time admission-treatment 4 (2, 10) 1 (1, 2) 0.001
Hospital mortality 9.3 % 12.4 % 0.3
GOS I-III 30.9 % 33.1 % 0.6
Vasospasm 23.7 % 33.9 % 0.01
Rebleeding 9.3 % 8.2 % 0.65
Stroke 24.7 % 18.4 % 0.07
CONCLUSION. In our sample, changes in the management of SAH, primarily aimed atearly diagnosis and treatment, have resulted in that endovascular treatment has taken aleading role, with no negative consequences, and even some positive as decreasing of lengthof stays.
0491RELATION BETWEEN CARDIAC OUTPUT AND CEREBRAL BLOOD FLOWVELOCITIES DURING FLUID LOADING IN PATIENTS WITH OR WITHOUTACUTE SYSTEMIC INFLAMMATION
M. Le Dorze1, C. Rabuel1, D. Payen1
1Hôpital Lariboisière, Département d’anesthésie réanimation SMUR, Paris, FranceINTRODUCTION. If physiologically cerebral blood flow (CBF) is maintained duringchanges in mean arterial pressure (autoregulated concept), the relation between CBF andcardiac output (CO) is unclear, especially in ICU context. This relation might be changed bythe presence of an acute systemic inflammation and/or brain lesion.OBJECTIVES. To assess changes in middle cerebral artery velocity (MCAv) when COincreases during fluid loading (FL). Hypothesis: MCAv changes during CO increase couldbe different when acute systemic inflammation is present or not: study on phasic velocities(systolic/diastolic).METHODS. Prospective observational monocentric study: Control group, n = 7, patientswithout comorbidity measured, just after general anesthesia for non major orthopedic sur-gery; Sepsis group, n-12. Measurements before and after fluid loading 250 ml of crystalloidsin 3 mn. CO and stroke volume (SV) (oesophageal Doppler, CardioQ�, Deltex, UK), sys-tolic (SVel) and end-diastolic (EDVel) flow velocities (MCAv) (Transcranial Doppler,Athys�, Lyon, France), systolic, diastolic and mean arterial blood pressure (SABP, DABP,MABP) and heart rate (HR). Values are expressed as median (25–75 percentiles), statisticalanalysis using non parametric tests.RESULTS.Control group age 34 (27–34) years; changes in CO (10 %) with no change in of MCAvS.Sepsis group age 53 (41–58) years, 7 septic shock, 5 severe sepsis; change in CO (20 %)was associated with increased EDVel with no change in SVel. EDVel increased in fluidresponders (n = 8; p = 0.01) and remained unchanged in non responders (n = 4;p = 1.00).CO changes did not differ between the two groups (p = 0.71). Table: effect of FL.
Effect of fluid loading
Control (n = 7)before/after FL
p Sepsis (n = 12)before FC/after FL
p
CO (l min-1) 6.7 (5.0–7.0)/7.4 (5.5–8.9)
0.03* 5.8 (4.7–8.2)/7.0 (5.0–8.6)
0.04*
HR (bpm) 78 (69–83)/70 (56–80)
0.05* 86 (78–99)/87 (80–97)
0.86
MABP (mmHg) 80 (60–96)/69 (63–91)
0.20 71 (68–75)/80 (71–89)
0.01*
SVel (cm s-1) 66 (56–70)/63 (60–75)
0.07 101 (71–107)/99 (78–118)
0.36
EDVel (cm s-1) 32 (27–35)/29 (24–34)
0.86 32 (26–37)/36 (32–45)
0.02*
CONCLUSIONS. CO increase during FL did not change the MCAv in control group, braincirculation remains independent from systemic circulation. When systemic inflammation ispresent, an increase in CO is associated with EDVel increase only, an effect related to highervasodilatation. This study does not inform on pre-existing dilatation or an induced dilation
26th ESICM ANNUAL CONGRESS — PARIS, FRANCE — 5–9 OCTOBER 2013
by CO increase. These results suggest that acute inflammation puts brain circulation insystemic hemodynamic dependence.REFERENCE(S). 1. J Appl Physiol 2010;109:1424–1431. 2. Neurocrit Care 2010;12:35–42. 3. Am J Physiol Regul Integr Comp Physiol 2012;303:1127–1135.GRANT ACKNOWLEDGMENT. This work was supported in part by University Paris 7Plan Quadrienal grant.
0492ADRENOMEDULLIN, A NEW PROGNOSTIC MARKER IN THENEUROCRITICAL PATIENT. A PRELIMINARY STUDY
M.P. Gracia1, A. Ois2, C. Soriano2, J. Roquer2, Y. Diaz2, A. Zapatero2, I. Dot2,F. Alvarez-Lerma2
1Hospital Mar, Critical Care, Barcelona, Spain, 2Hospital del Mar, Barcelona, SpainAdrenomedullin (ADM) is a 52 amino acid vasoactive peptide expressed by endothelialcells which increases in cellular stress conditions. It has been shown its usefulness inpatients with cardiovascular disease and sepsis.OBJECTIVE. To assess the usefulness of plasma MRproADM levels for predicting the riskof death in patients with severe neurocritical disorders.METHODS. Prospective and observational study in patients with severe neurocriticaldiseases admitted to the ICU and/or stroke units between 2010 and 2012. On admission tothe hospital, plasma stable fragments of pro-ADM (MRproADM) were measured by anautomated immunoflurescence test (Thermo Scientific BRAHMS MR-proADM KRYPTORImmunoassay, Germany). Samples were centrifuged and supernatants frozen at -70 �Cuntil analysis. Univariate and multivariate analyses adjusted by risk factors were performed.Statistical significance was set at P \ 0.05.RESULTS. The study population included 104 patients, 57 with subarachnoid haemorrhage(54.8 %), 40 with stroke (38.5 %), and 7 with head injury (6.7 %), with a mean (SD) age of62 (15.7) years, and a 90-day mortality rate of 30.8 % (n = 32). The median (25–75thpercentile) MRproADM level was 0.70 (0.55–1.86) nmol/L. Levels of MRproADM weresignificantly associated with 90-day mortality rate in the univariate analysis 0.67(0.49–0.78) nmol/L vs. 0.87 (0.67–1.35) nmol/L (P \ 0.001). The percentage of mortalityfor each quartile was 11.5, 25.9, 25, and 65.2 %, respectively (P \ 0.001). In the multi-variate analysis adjusted by age, sex, and cardiovascular risk factors, plasma levels ofMRproADM were significantly associated with mortality (odds ratio 2.72, 95 % confidenceinterval 1.60–4.73, P \ 0.001).CONCLUSION. Plasma levels of MRproADM may be a useful predictor of the risk ofdeath in patients with severe cerebral diseases.
0493OUTCOME OF PATIENTS WITH ACUTE STROKE REQUIRING MECHANICALVENTILATION
P. Bouvet1, B. Pons2, S. Guyomarc’h1, P. Gery1, D. Page1, M. Coudrot3, E. Diconne1,F. Zeni1, M. Darmon1
1Saint-Etienne University Hospital, Medical-Surgical ICU, Saint-Etienne, France, 2Pointe-à-Pitre University Hospital, Medical Surgical ICU, Pointe-à-Pitre, France, 3Saint-EtienneUniversity Hospital, Saint-Etienne, FranceINTRODUCTION. Prognosis of patients with acute stroke and requiring mechanicalventilation remains controversial [1, 2].OBJECTIVES. The main objective of this study was to assess ICU outcome of thesepatients. Secondary objectives were to assess temporal trend in survival and the prognosticfactors.METHODS. Monocenter retrospective cohort study conducted in our ICU between January1994 and December 2008. Every adult patient requiring ICU admission and mechanicalventilation at the early phase (\7 days) of strokes were included in this study.Results are reported as median (IQR) or n (%). Factors associated with ICU mortality wereassessed using a backward conditional logistic regression model.RESULTS. 274 patients were included in this study, including 61 patients (22.3 %) withischemic stroke, 57 patients (20.8 %) intracerebral hemorrhage and 156 patients (56.9 %)subarachnoid hemorrhage (SAH). Median age was 55 years (45–66) and 157 patients wereof male gender (57.4 %). Severity at ICU admission was assessed by SAPSII score was of45 (36–55). Coma was the main reason for mechanical ventilation (n = 195; 71.4 %).Vasopressors were required in 143 (52.2 %) and renal replacement therapy in 6 (2.2 %).Twelve patients had ischemic stroke of embolic origin and 107 patients (68.6 %) with SAHhad a Fischer score IV. Of patients with ischemic stroke, fibrinolysis was performed inseven. Endovascular treatment of SAH was performed in 74 patients. Decompressive cra-niectomy was performed in three patients.ICU mortality was 48.2 % (n = 132). ICU mortality according to the type of stroke was of49.2, 61.4 and 42.9 % in ischemic stroke, hemorrhagic stroke and SAH respectively(P = 0.06).Factors independently associated with ICU mortality are reported in Table 1.
Factors independently associated with ICU death
OR (95 % CI)
Sepsis at admission 0.34 (0.15–0.77)
IGSII (/point) 1.09 (1.06–1.11)
ARDS 6.01 (1.50–24.1)
Cerebral edema 2.91 (1.52–5.58)
Anisocoria at admission 6.73 (2.05–22.08)
When forced in the final model, neither mechanism of stroke nor admission period (\1999,1999–2004,[2004) were associated with outcome. These variables did not change the finalmodel.Hospital and 1 year mortality and functional prognosis are currently being evaluated.CONCLUSIONS. Survival of critically-ill patients requiring mechanical ventilation at theearly phase of stroke remains meaningful. Aetiology or admission period had no influence ofoutcome after adjustment for confounders.REFERENCE(S). 1. Navarrete-Navarro P et al. Intensive Care Med 2003. 2. Berrouschot Jet al. Crit Care Med 2000.
0494ANALYSIS OF HOSPITAL MORTALITY OF PATIENTS ADMITTEDTO THE INTENSIVE CARE UNIT (ICU) FOR SPONTANEOUSINTRACEREBRAL HEMORRHAGE
F. Guerrero-López1, F.I. Pino-Sánchez2, M. Colomo González2, R. Lara Rosales2,P. Navarrete-Navarro2, E.A. Fernández-Mondéjar2
1H.U. Virgen de las Nieves, Critical Care, Granada, Spain, 2H.U. Virgen de las Nieves,Granada, Spain.INTRODUCTION. Intracerebral hemorrhage (ICH) is associated with the highest mortalityof all strokes. Knowing mortality predictors can help clinicians in decision making.OBJECTIVES. To analyze hospital mortality of patients admitted to the neuro intensivecare unit (NICU) for nontraumatic ICH confirmed by brain imaging (CT or MRI) andpredictors of hospital mortality.METHODS. Single-center cohort study of ICH patients admitted consecutively to the12-bed NICU of a tertiary hospital in the period from 1996 to 2012. Variables were col-lected on sex, age, history of hypertension, previous antithrombotic treatment, GlasgowComa Score (GCS), blood glucose, blood pressure, APACHE III score on admission,location of hematoma, need for mechanical ventilation, surgery for hematoma evacuation,other medical and surgical treatments, year of admission (for periods 1996–2000,2001–2004, 2005–2008, 2009–2012), length of stay in ICU and hospital, and hospitalmortality. Results are expressed as mean ± standard deviation, median and interquartylerange and absolute and relative frequencies. Comparisons between variables were madeusing Student t, Mann–Whitney U and Pearson v2 tests. The relationship between theindependent variables and in-hospital mortality was assessed by multivariate logisticregression analysis. p \ 0.05 was considered to indicate statistical significance.RESULTS. Between 1996 and 2012 we admitted to ICU 1,006 patients with ICH; thehospital mortality was 52.1 % (95 % CI 49–55.2 %) and the ICU mortality was 46.4 %(95 % CI 43.3–49.5 %). Patients who died were older (62.5 ± 13.8 vs 53.9 ± 16.5 years),had higher APACHE III score (86.9 ± 23.9 vs 49.1 ± 25.1), glycemia (198 ± 84 vs162 ± 61), systolic blood pressure (188 ± 44 vs 178 ± 39), and lower scores of GCS [4(3.5) vs 9 (7.13)] (p \ 0.001 for all the comparisons); more often had a history hypertension(57.4 vs 50.2 %, p = 0.02), prior antithrombotic therapy (22.7 vs 15.1 %, p = 0.002), theyneeded more often mechanical ventilation (MV) (92.7 vs 62 %, p \ 0.001), and less fre-quently subjected to surgical hematoma evacuation (14.3 vs 31.3 %, p \ 0.001). Survivorshad longer ICU and hospital stay [6 (3.14) vs 2 (1.6) days and 31 (14.63) vs 2 (1.8) days,respectively, p \ 0.001]. Patients admitted in the last 4 years had a lower mortality(43.7 %) that in previous periods (50, 59.9 and 55.8 % respectively), p = 0.002. There wasno difference in mortality by sex or location of the hematoma. Table shows the results of thelogistic regression analysis.
Logistic regression for hospital mortality
Variable p Odds ratio 95 % CI OR
Age (years) \0.01 1.02 1.01–1.03
APACHE III \0.001 1.04 1.03–1.05
GCS 3–5 \0.001 1
GCS 6–8 0.5 0.31–0.8
GCS 9–12 0.44 0.25–0.78
GCS 13–15 0.27 0.12–0.58
MV \0.001 2.56 1.44–4.52
Surgery \0.001 0.35 0.23–0.53
Period (2009–2012) \0.05 0.56 0.34–0.83
CONCLUSIONS. The hospital mortality of patients with intracerebral hemorrhage whorequired ICU admission remains high, depending on the of admissions and dischargespolicies. This mortality increases with increasing age and baseline severity (GCS,APACHE). The need for mechanical ventilation increases the risk of death and surgery(hematoma evacuation) reduces it. Mortality has decreased in recent years, probably inrelation to the best general care.
0495PRE-OPERATIVE MALNUTRITION IN PATIENTS OPERATED ELECTIVELYFOR RESECTION OF BRAIN TUMORS IS ASSOCIATED TO A HIGHERMORBIDITY IN NEUROINTENSIVE CARE UNIT (NICU) AND TO A LONGERSTAY IN HOSPITAL AND IN NICU
E.M. Olivares-Durán1, B.B. Lozano-Moreno2, P. Vargas-Rocha3
1El Bajı́o Regional High Specialty Hospital (HRAEB), NICU & Adult ICU, León, Mexico,2University of the Valley of Atemajac, León, Mexico, 3University of Guanajuato,Department of Nursing and Obstetrics, Campus León, León, MexicoINTRODUCTION. Patients that will be operated for resection of brain tumors have highrisk of malnutrition, but there is not enough information about potential impact of pre-operative malnutrition in the postoperative course of this group of patients in NICU.OBJECTIVES. To compare, in a series of patients admitted consecutively to the NICU forelective resection of brain tumors, the rate of postoperative complications, the time ofmechanical ventilation, and the length of stay in hospital and in NICU, observed in thegroup of malnourished patients versus those observed in the group without malnutrition.METHODS. Prospectively, during a 15-month period, patients that were admitted to theHRAEB for elective resection of brain tumors were nutritionally evaluated by means of thesubjective global assessment of nutritional status (SGA-NS) scale. All the patients wereadmitted to NICU during their postoperative period, where postoperative complications, time ofmechanical ventilation, length of stay (LOS) in NICU and total LOS in hospital were registered.In this research, the differences between the group of malnourished patients versus the group ofpatients without malnutrition are reported. Either Student’s t test or Chi square test was used, asit corresponded. Values of p lower than 0.05 were considered significant.RESULTS. 52 patients were included in this report (2 more patients were operated for resectionof brain tumor, but they were excluded since SGA-NS was not totally completed). From the 52patients, 31 (59.6 %) were qualified by SGA-NS as status A (well nourished), and 21 asmalnourished (40.3 %): 18 patients (34.6 %) in status B (moderately malnourished malnutri-tion) and 3 more (5.7 %) in the status C (severely malnourished).On Table 1, five significant differences are shown, which document higher rates of diversepostoperative complications (including higher incidence of infectious complications and/or
26th ESICM ANNUAL CONGRESS — PARIS, FRANCE — 5–9 OCTOBER 2013
extended mechanical ventilation), as well as longer LOS in hospital and in NICU, in thegroup of patients with malnutrition with regard to the group without malnutrition. Relativerisk (RR) for complications potentially associated to malnutrition (infectious complicationsand/or extended mechanical ventilation) was 7.93. The rate of hospital mortality in thegroup without malnutrition was of 0 versus 9.5 % (2/21) in the group of malnourishedpatients (non-significant p values).CONCLUSIONS. In this series of patients undergone to elective resection of brain tumors,the prevalence of preoperative malnutrition was 40.3 %. In the NICU, the group ofundernourished patients showed times of mechanical ventilation, LOS in the NICU and inthe hospital, as well as rates of morbidity significantly higher than those observed in thegroup of patients without malnutrition.REFERENCE(S). Detsky A, McLaughlin J, Baker J, et al. What is subjective globalassessment of nutritional status. JPEN J Parenter Enteral Nutr 1987;11:8–13.
Significant differences between the groups
Variable Group withmalnutrition
Group withoutmalnutrition
p
Number of patients with all kind ofcomplications
17 (81.0 %) 6 (19.3 %) \0.001
Number of patients with complicationspotentially associated to malnutrition
16 (76.2 %) 3 (9.6 %) \0.001
Number of patients with mechanicalventilation [72 h
10 (47.6 %) 1 (3.2 %) \0.001
LOS-NICU (average ± standarddeviation)
5.1 ± 3.7 1.54 ± 1.06 \0.005
Total LOS-hospital (average ± standarddeviation)
12.4 ± 7.4 7.8 ± 6.5 \0.01
0496ELEVATED INTRACRANIAL PRESSURE IN SUBARACHNOID HEMORRHAGE.RISK FACTORS AND MANAGEMENT
A. Vázquez González1, M. Mourelo Fariña1, B. Besteiro Grandı́o2, I. Astola Hidalgo1,
Y. López Curbeira3, V. Aller Fernández1, R. Galeiras Vázquez1, D. Freire Moar1
1CHUAC, ICU, A Coruña, Spain, 2Saint James’s University Hospital, ICU, Leeds, UnitedKingdom, 3CHUF, Ferrol, SpainINTRODUCTION. Subarachnoid hemorrhage (SAH) is associated to significant morbidityand mortality in young people. The first secondary brain injury mechanisms contribute to thepoor outcome. Elevation of intracranial pressure (ICP) is one of the most important factors.OBJECTIVES. To analyze the characteristics and management of patients with SAHadmitted to the ICU.METHODS. We collected patients admitted to the ICU (2004–2009) with diagnosis ofSAH. We described age, sex, treatment of ICP, ICU stay, hospital stay and mortality.Univariate analysis was performed with t-test and Chi square test, considering significantp \ 0.05.RESULTS. We entered 287 patients diagnosed of SAH, 51 of them suffered ICP. The agewas 58-year-old (SD 13.71). 68.6 % of these patients were women. 78 % of these patientsdied.The severity scales were: Fisher 3.57 (SD 0.83), APACHE II 18.35 (SD 4.84), SAPSII 42.92 (SD 12.92), SOFA 6.55 (SD 3.03), Glasgow (GCS) 10.2 (SD 4.31), GCS to 24 h6.67 (SD 4.55), GCS at discharge 1.82 (DE) and Glasgow outcome scale (GOS) 3 months1.69 (SD 1.17) at 3 months RANKIN 5.35 (SD 1.31). Exitus were associated to APACHEII (P 0.04) and SOFA (P0.02).The most frequent antecedent was hypertension 52.9 %,followed by 33.3 % toxic habits, dyslipidemia 17.6, 13.7 % diabetes mellitus, heart dis-ease and oral anticoagulants with 9.8 % each. Only antededent of ischemic heart diseaseand use of oral anticoagulants were more common in men (25 %) versus women (2.9 %),with statistical significance. Isquemic heart disease and hypertension were both associatedto age, with an average age of patients with heart disease about 69-year-old and patientswithout heart disease about 59-year-old (p = 0.04), and the average age of hypertensivespatients was 61.4-year-old while patients without hypertension was 52.6-year-old, withstatistical significance(p = 0.02).The most frequent aneurysm territories were middlecerebral artery in 31.4 % of cases, followed by 11.8 % in anterior cerebral artery and7.8 % in anterior communicating artery.ICU stay was not correlated to age or GCS,APACHE, SAPSII or SOFA.In the treatment of ICP, sedation was the first option in74.5 % relaxation was used as 2nd option in 52.9 %, the hypertonic saline and mannitolwere used as 3rd option in 23.5 and 37.3 % each. External ventricular derivation andhyperventilation were used as 4th option in 11.8 and 3.9 % of cases. Decompressivesurgery and barbiturates were both used as 5th option in 5.9 %. No correlation was foundbetween exitus and treatments.CONCLUSIONS. SAH associated to ICP, affects young patients,predominantly womenwithout a significant difference and it has high death rate.The most affected area by theaneurysm is the middle cerebral artery. Only hypertension and ischemic heart disease aremore associated to males and age with significant differences. There are not significantdifferences about ICU stay or treatments used, although these outcomes could be because ofthe number of patients included.
0497EVALUATION OF NEUROMONITORING PARAMETERS DURINGVENTILATION, CONTROLLED VOLUME AND PRESSURE, IN PATIENTSWITH HEMORRHAGIC STROKE
A. Gritsan1, N. Dovbysh2, A. Gazenkampf1, G. Gritsan3
1Krasnoyarsk State Medical University, Krasnoyarsk Regional Hospital, Anaesthesiologyand Intensive Care, Krasnoyarsk, Russian Federation, 2Krasnoyarsk Regional Hospital,Anaesthesiology and Intensive Care, Krasnoyarsk, Russian Federation, 3Krasnoyarsk StateMedical University, Anaesthesiology and Intensive Care, Krasnoyarsk, Russian FederationOBJECTIVE. To study the parameters of neuromonitoring during artificial ventila-tion (AV), controlled by volume (VC) and pressure (PC) in patients with hemorrhagicstroke.MATERIALS AND METHODS. A prospective study on the comparative performanceevaluation of neuromonitoring during mechanical ventilation, 75 patients with hemor-rhagic stroke, which were divided into 2 groups: Group 1, 39; Group 2, 36 patients which
held MV by VC and PC mode respectively. In 71.8 % (28) of cases in the first group andin 61.1 % (22) in the second group, patients underwent surgery. All patients receivedstandardized therapy based on Guidelines for the Management of Spontaneous Intrace-rebral Hemorrhage in Adults. Neuromonitoring was carried out in the following amounts:control ICP and CPP (20 patients) apparatus Spiegelberg brain-pressure monitor in the‘‘on-line’’ mode, the definition of linear flow velocity in the middle cerebral artery (Vmca)on both sides (48 patients), the definition SrO2 (26 people) unit Somanetics invosoximetercerebral/somatic/continuously and level SvjO2 (45). To measure SvjO2 chosen dominantjugular Vienna, determined during the ultrasound. The study was conducted at the fol-lowing stages: Stage 1—1 day the patient is in the hospital, or the beginning ofmechanical ventilation, Stage 2—3 day, 3 phase—day 5, Stage 4—7 days and 5 stage—the 10th day of respiratory support.RESULTS. SrO2 value on the affected side on the 2nd phase of the study in the first group was5.9 % lower (p \ 0,05), than in group 2, and the most significant differences were found in the4th stage of the study, when the difference between treatment groups on average reached 14.7 %(64.0 and 75.0 % respectively). In this case, on the intact side by 2–4 stages of the study thedifferences in SrO2 ranged from 11.4 to 12.8 %. At the same time, the group 2 value SvjO2already on one phase of the study the average was higher by 8.2 % (p \ 0,05), than in those ofthe first group, and the maximum statistically significant difference was detected at 4 and 5stages study (10.1 and 8.2 %, respectively).ICP level in the second group at all-time points, except for the 3 days of mechanicalventilation (stage 2), higher than in group 1, with the greatest difference (23.6 %) on the 4thstage of the study (23.8 ± 1.1 and 18.2 ± 0.8 mmHg, respectively).CPP at all stages, the last one (step 5), in the group with ventilation in VC mode, the averagewas higher than in the group with ventilation mode PC. The maximum statistically sig-nificant difference was determined at the second stage and was 16.9 % (91.1 ± 2.6 and77.9 ± 2.2 mmHg, respectively).CONCLUSIONS. (1) In patients with hemorrhagic stroke, during mechanical ventilation tocontrol the volume (VC), in comparison with the control pressure mechanical ventilation(PC), supported by better performance SrO2 and SvjO2. (2) Mode of respiratory support(VC and PC) has no significant effect on the level of ICP.
0498HUNT AND HESS SCALE AS A PREDICTOR OF OUTCOME INSUBARACHNOID HAEMORRHAGE
P. Ferreira1, A. Marques2, S. Beirão2, P. Coutinho2
1Centro Hospitalar e Universitário de Coimbra, Anaesthesiology—HG, Coimbra, Portugal,2Centro Hospitalar e Universitário de Coimbra, Intensive Care—HG, Coimbra, PortugalINTRODUCTION. The severity of clinical presentation is the strongest prognostic indi-cator in spontaneous subarachnoid haemorrhage (SAH). Many complications can occurduring SAH management (rebleeding, vasospasm) and are major predictors of poor out-come. Despite difficulties in accurately predict the prognosis of SAH patients, Hunt andHess is one of the most widely used scales to assess clinical severity at hospital admission.OBJECTIVES. To evaluate Hunt and Hess scale as a predictor of outcome in patientsadmitted to our ICU with SAH.METHODS. All 54 SAH patients admitted to our 9-bed mixed intensive care unit (ICU) ina 5-year period (January 2008–January 2012) were retrospectively evaluated. Demographicdata, severity scores, Hunt and Hess and Glasgow coma scales, length of stay, duration ofmechanical ventilation support, complications, mortality and patients status 6 months afterhospital discharge were collected.RESULTS. The average age was 51.7 ± 13.1 years; 35 (64.8 %) patients were female.Severity scores on admission: APACHE II 19.4 ± 8.8, SAPS II 40.3 ± 17.2, SOFA9.9 ± 11.7, Glasgow coma scale 6.9 ± 3.1 (3–14) and Hunt–Hess scale 4.2 ± 0.7 (3–5).Average ICU length of stay (LOS) was 9.1 ± 5.7 (1–28) days and hospital LOS30.3 ± 36.1 (2–190) days. Most patients (51 = 94.4 %) needed mechanical ventilation,with an average duration of 6.5 ± 4.7 days. At least one aneurysm was identified in 49(90.7 %) patients, an arteriovenous malformation in 2 (3.2 %) and absence of vascularlesions in 3 (5.6 %). Intra-cranial complications included: brain edema 34 (63 %), hydro-cephalus 26 (48.1 %), cerebral ischemia 22 (40.7 %), vasospasm 20 (37 %) and re-bleeding11 (20.4 %). ICU mortality was 31.5 %, hospital mortality 38.9 % and 6 months afterdischarge mortality 59.3 %. Analysing global mortality, most deaths (90.6 %) occurred inpatients with Hunt–Hess 4 and 5.The 22 survivors were observed approximately 6 monthsafter hospital discharge: 13 individuals presented with neurological deficits (Hunt–Hessgrade 3 n = 2; grade 4 n = 6; grade 5 n = 5) and 9 without deficits (Hunt–Hess grade 3n = 4; grade 4 n = 4; grade 5 n = 1).CONCLUSIONS. The majority of patients in our study were poor-grade SAH (Hunt andHess 4 and 5) and this group was clearly associated with high mortality rate and permanentneurological deficits in survivors. Nevertheless, 16 patients (29.6 %) initially classified aspoor-grade SAH actually survived, and 5 (9.2 %) of them without neurological deficits.Aggressive treatment even in poor-grade SAH patients can result in more favourable long-term outcomes than predicted by Hunt and Hess scale.REFERENCE(S). 1. Stroke. 2012;43:1711–1737. 2. Curr Opin Crit Care 2011;17:85–93.
0499INCIDENCE AND PROGNOSTIC SIGNIFICANCE OF HYPERGLYCEMIAIN ACUTE PERIOD OF ANTERIOR PART CIRCLE OF WILLIS CEREBRALANEURYSM RUPTURE
J.V. Titova1, E.A. Karapetyan1, A.A. Solodov1, S.S. Petrikov1, V.V. Krylov1
1Medical Emergency Scientific Research Institute n.a.N.V. Sklifosovsky, Moscow,Russian FederationINTRODUCTION. Hyperglycemia (HG) is a risk factor of poor-grade outcome in patients(pts) with subarachnoid hemorrhage (SAH) due to cerebral aneurysm rupture. But theincidence of HG in pts with SAH is not defined.OBJECTIVES. To determine the incidence and prognostic significance of HG in acuteperiod of anterior part circle of Willis cerebral aneurysm rupture.METHODS. Medical reports retrospective analysis of 165 pts (age 48.9 ± 11; male/female—75/90) with SAH due to anterior circle of Willis aneurysm rupture was presented.Diabetes mellitus was exclusion criteria. Hunt and Hess (H–H) scale severity grading was:II-in 26.1 % pts, III-in 59.4 % pts, IV-in 12.1 % pts and V-in 2.4 % pts. Fisher SAHcomputed tomography (CT) grading scale was: 1-in 10.9 % pts, 2-in 1.2 % pts, 3-in 21.2 %pts, 4-in 66.7 % pts. The localization of aneurysm ruptured was: middle cerebral artery(MCA)-in 24.2 % pts, anterior cerebral artery-anterior communicating artery (ACA-ACoA)-
26th ESICM ANNUAL CONGRESS — PARIS, FRANCE — 5–9 OCTOBER 2013
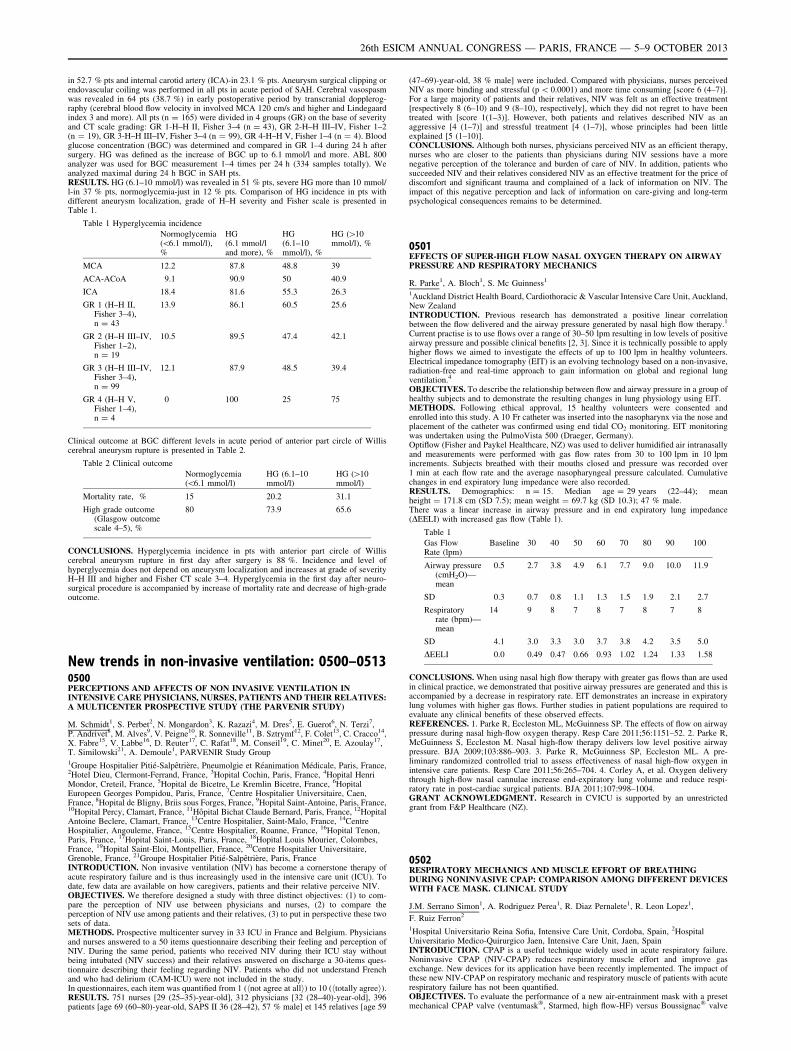
in 52.7 % pts and internal carotid artery (ICA)-in 23.1 % pts. Aneurysm surgical clipping orendovascular coiling was performed in all pts in acute period of SAH. Cerebral vasospasmwas revealed in 64 pts (38.7 %) in early postoperative period by transcranial dopplerog-raphy (cerebral blood flow velocity in involved MCA 120 cm/s and higher and Lindegaardindex 3 and more). All pts (n = 165) were divided in 4 groups (GR) on the base of severityand CT scale grading: GR 1-H–H II, Fisher 3–4 (n = 43), GR 2-H–H III–IV, Fisher 1–2(n = 19), GR 3-H–H III–IV, Fisher 3–4 (n = 99), GR 4-H–H V, Fisher 1–4 (n = 4). Bloodglucose concentration (BGC) was determined and compared in GR 1–4 during 24 h aftersurgery. HG was defined as the increase of BGC up to 6.1 mmol/l and more. ABL 800analyzer was used for BGC measurement 1–4 times per 24 h (334 samples totally). Weanalyzed maximal during 24 h BGC in SAH pts.RESULTS. HG (6.1–10 mmol/l) was revealed in 51 % pts, severe HG more than 10 mmol/l-in 37 % pts, normoglycemia-just in 12 % pts. Comparison of HG incidence in pts withdifferent aneurysm localization, grade of H–H severity and Fisher scale is presented inTable 1.
Table 1 Hyperglycemia incidence
Normoglycemia(\6.1 mmol/l),%
HG(6.1 mmol/land more), %
HG(6.1–10mmol/l), %
HG ([10mmol/l), %
MCA 12.2 87.8 48.8 39
ACA-ACoA 9.1 90.9 50 40.9
ICA 18.4 81.6 55.3 26.3
GR 1 (H–H II,Fisher 3–4),n = 43
13.9 86.1 60.5 25.6
GR 2 (H–H III–IV,Fisher 1–2),n = 19
10.5 89.5 47.4 42.1
GR 3 (H–H III–IV,Fisher 3–4),n = 99
12.1 87.9 48.5 39.4
GR 4 (H–H V,Fisher 1–4),n = 4
0 100 25 75
Clinical outcome at BGC different levels in acute period of anterior part circle of Williscerebral aneurysm rupture is presented in Table 2.
Table 2 Clinical outcome
Normoglycemia(\6.1 mmol/l)
HG (6.1–10mmol/l)
HG ([10mmol/l)
Mortality rate, % 15 20.2 31.1
High grade outcome(Glasgow outcomescale 4–5), %
80 73.9 65.6
CONCLUSIONS. Hyperglycemia incidence in pts with anterior part circle of Williscerebral aneurysm rupture in first day after surgery is 88 %. Incidence and level ofhyperglycemia does not depend on aneurysm localization and increases at grade of severityH–H III and higher and Fisher CT scale 3–4. Hyperglycemia in the first day after neuro-surgical procedure is accompanied by increase of mortality rate and decrease of high-gradeoutcome.
New trends in non-invasive ventilation: 0500–05130500PERCEPTIONS AND AFFECTS OF NON INVASIVE VENTILATION ININTENSIVE CARE PHYSICIANS, NURSES, PATIENTS AND THEIR RELATIVES:A MULTICENTER PROSPECTIVE STUDY (THE PARVENIR STUDY)
M. Schmidt1, S. Perbet2, N. Mongardon3, K. Razazi4, M. Dres5, E. Guerot6, N. Terzi7,P. Andrivet8, M. Alves9, V. Peigne10, R. Sonneville11, B. Sztrymf12, F. Colet13, C. Cracco14,X. Fabre15, V. Labbe16, D. Reuter17, C. Rafat18, M. Conseil19, C. Minet20, E. Azoulay17,T. Similowski21, A. Demoule1, PARVENIR Study Group1Groupe Hospitalier Pitié-Salpêtrière, Pneumolgie et Réanimation Médicale, Paris, France,2Hotel Dieu, Clermont-Ferrand, France, 3Hopital Cochin, Paris, France, 4Hopital HenriMondor, Creteil, France, 5Hopital de Bicetre, Le Kremlin Bicetre, France, 6HopitalEuropeen Georges Pompidou, Paris, France, 7Centre Hospitalier Universitaire, Caen,France, 8Hopital de Bligny, Briis sous Forges, France, 9Hopital Saint-Antoine, Paris, France,10Hopital Percy, Clamart, France, 11Hôpital Bichat Claude Bernard, Paris, France, 12HopitalAntoine Beclere, Clamart, France, 13Centre Hospitalier, Saint-Malo, France, 14CentreHospitalier, Angouleme, France, 15Centre Hospitalier, Roanne, France, 16Hopital Tenon,Paris, France, 17Hopital Saint-Louis, Paris, France, 18Hopital Louis Mourier, Colombes,France, 19Hopital Saint-Eloi, Montpellier, France, 20Centre Hospitalier Universitaire,Grenoble, France, 21Groupe Hospitalier Pitié-Salpêtrière, Paris, FranceINTRODUCTION. Non invasive ventilation (NIV) has become a cornerstone therapy ofacute respiratory failure and is thus increasingly used in the intensive care unit (ICU). Todate, few data are available on how caregivers, patients and their relative perceive NIV.OBJECTIVES. We therefore designed a study with three distinct objectives: (1) to com-pare the perception of NIV use between physicians and nurses, (2) to compare theperception of NIV use among patients and their relatives, (3) to put in perspective these twosets of data.METHODS. Prospective multicenter survey in 33 ICU in France and Belgium. Physiciansand nurses answered to a 50 items questionnaire describing their feeling and perception ofNIV. During the same period, patients who received NIV during their ICU stay withoutbeing intubated (NIV success) and their relatives answered on discharge a 30-items ques-tionnaire describing their feeling regarding NIV. Patients who did not understand Frenchand who had delirium (CAM-ICU) were not included in the study.In questionnaires, each item was quantified from 1 (hnot agree at alli) to 10 (htotally agreei).RESULTS. 751 nurses [29 (25–35)-year-old], 312 physicians [32 (28–40)-year-old], 396patients [age 69 (60–80)-year-old, SAPS II 36 (28–42), 57 % male] et 145 relatives [age 59
(47–69)-year-old, 38 % male] were included. Compared with physicians, nurses perceivedNIV as more binding and stressful (p \ 0.0001) and more time consuming [score 6 (4–7)].For a large majority of patients and their relatives, NIV was felt as an effective treatment[respectively 8 (6–10) and 9 (8–10), respectively], which they did not regret to have beentreated with [score 1(1–3)]. However, both patients and relatives described NIV as anaggressive [4 (1–7)] and stressful treatment [4 (1–7)], whose principles had been littleexplained [5 (1–10)].CONCLUSIONS. Although both nurses, physicians perceived NIV as an efficient therapy,nurses who are closer to the patients than physicians during NIV sessions have a morenegative perception of the tolerance and burden of care of NIV. In addition, patients whosucceeded NIV and their relatives considered NIV as an effective treatment for the price ofdiscomfort and significant trauma and complained of a lack of information on NIV. Theimpact of this negative perception and lack of information on care-giving and long-termpsychological consequences remains to be determined.
0501EFFECTS OF SUPER-HIGH FLOW NASAL OXYGEN THERAPY ON AIRWAYPRESSURE AND RESPIRATORY MECHANICS
R. Parke1, A. Bloch1, S. Mc Guinness1
1Auckland District Health Board, Cardiothoracic & Vascular Intensive Care Unit, Auckland,New ZealandINTRODUCTION. Previous research has demonstrated a positive linear correlationbetween the flow delivered and the airway pressure generated by nasal high flow therapy.1
Current practise is to use flows over a range of 30–50 lpm resulting in low levels of positiveairway pressure and possible clinical benefits [2, 3]. Since it is technically possible to applyhigher flows we aimed to investigate the effects of up to 100 lpm in healthy volunteers.Electrical impedance tomography (EIT) is an evolving technology based on a non-invasive,radiation-free and real-time approach to gain information on global and regional lungventilation.4
OBJECTIVES. To describe the relationship between flow and airway pressure in a group ofhealthy subjects and to demonstrate the resulting changes in lung physiology using EIT.METHODS. Following ethical approval, 15 healthy volunteers were consented andenrolled into this study. A 10 Fr catheter was inserted into the nasopharynx via the nose andplacement of the catheter was confirmed using end tidal CO2 monitoring. EIT monitoringwas undertaken using the PulmoVista 500 (Draeger, Germany).Optiflow (Fisher and Paykel Healthcare, NZ) was used to deliver humidified air intranasallyand measurements were performed with gas flow rates from 30 to 100 lpm in 10 lpmincrements. Subjects breathed with their mouths closed and pressure was recorded over1 min at each flow rate and the average nasopharyngeal pressure calculated. Cumulativechanges in end expiratory lung impedance were also recorded.RESULTS. Demographics: n = 15. Median age = 29 years (22–44); meanheight = 171.8 cm (SD 7.5); mean weight = 69.7 kg (SD 10.3); 47 % male.There was a linear increase in airway pressure and in end expiratory lung impedance(DEELI) with increased gas flow (Table 1).
Table 1
Gas FlowRate (lpm)
Baseline 30 40 50 60 70 80 90 100
Airway pressure(cmH2O)—mean
0.5 2.7 3.8 4.9 6.1 7.7 9.0 10.0 11.9
SD 0.3 0.7 0.8 1.1 1.3 1.5 1.9 2.1 2.7
Respiratoryrate (bpm)—mean
14 9 8 7 8 7 8 7 8
SD 4.1 3.0 3.3 3.0 3.7 3.8 4.2 3.5 5.0
DEELI 0.0 0.49 0.47 0.66 0.93 1.02 1.24 1.33 1.58
CONCLUSIONS. When using nasal high flow therapy with greater gas flows than are usedin clinical practice, we demonstrated that positive airway pressures are generated and this isaccompanied by a decrease in respiratory rate. EIT demonstrates an increase in expiratorylung volumes with higher gas flows. Further studies in patient populations are required toevaluate any clinical benefits of these observed effects.REFERENCES. 1. Parke R, Eccleston ML, McGuinness SP. The effects of flow on airwaypressure during nasal high-flow oxygen therapy. Resp Care 2011;56:1151–52. 2. Parke R,McGuinness S, Eccleston M. Nasal high-flow therapy delivers low level positive airwaypressure. BJA 2009;103:886–903. 3. Parke R, McGuinness SP, Eccleston ML. A pre-liminary randomized controlled trial to assess effectiveness of nasal high-flow oxygen inintensive care patients. Resp Care 2011;56:265–704. 4. Corley A, et al. Oxygen deliverythrough high-flow nasal cannulae increase end-expiratory lung volume and reduce respi-ratory rate in post-cardiac surgical patients. BJA 2011;107:998–1004.GRANT ACKNOWLEDGMENT. Research in CVICU is supported by an unrestrictedgrant from F&P Healthcare (NZ).
0502RESPIRATORY MECHANICS AND MUSCLE EFFORT OF BREATHINGDURING NONINVASIVE CPAP: COMPARISON AMONG DIFFERENT DEVICESWITH FACE MASK. CLINICAL STUDY
J.M. Serrano Simon1, A. Rodriguez Perea1, R. Diaz Pernalete1, R. Leon Lopez1,
F. Ruiz Ferron2
1Hospital Universitario Reina Sofia, Intensive Care Unit, Cordoba, Spain, 2HospitalUniversitario Medico-Quirurgico Jaen, Intensive Care Unit, Jaen, SpainINTRODUCTION. CPAP is a useful technique widely used in acute respiratory failure.Noninvasive CPAP (NIV-CPAP) reduces respiratory muscle effort and improve gasexchange. New devices for its application have been recently implemented. The impact ofthese new NIV-CPAP on respiratory mechanic and respiratory muscle of patients with acuterespiratory failure has not been quantified.OBJECTIVES. To evaluate the performance of a new air-entrainment mask with a presetmechanical CPAP valve (ventumask�, Starmed, high flow-HF) versus Boussignac� valve
26th ESICM ANNUAL CONGRESS — PARIS, FRANCE — 5–9 OCTOBER 2013
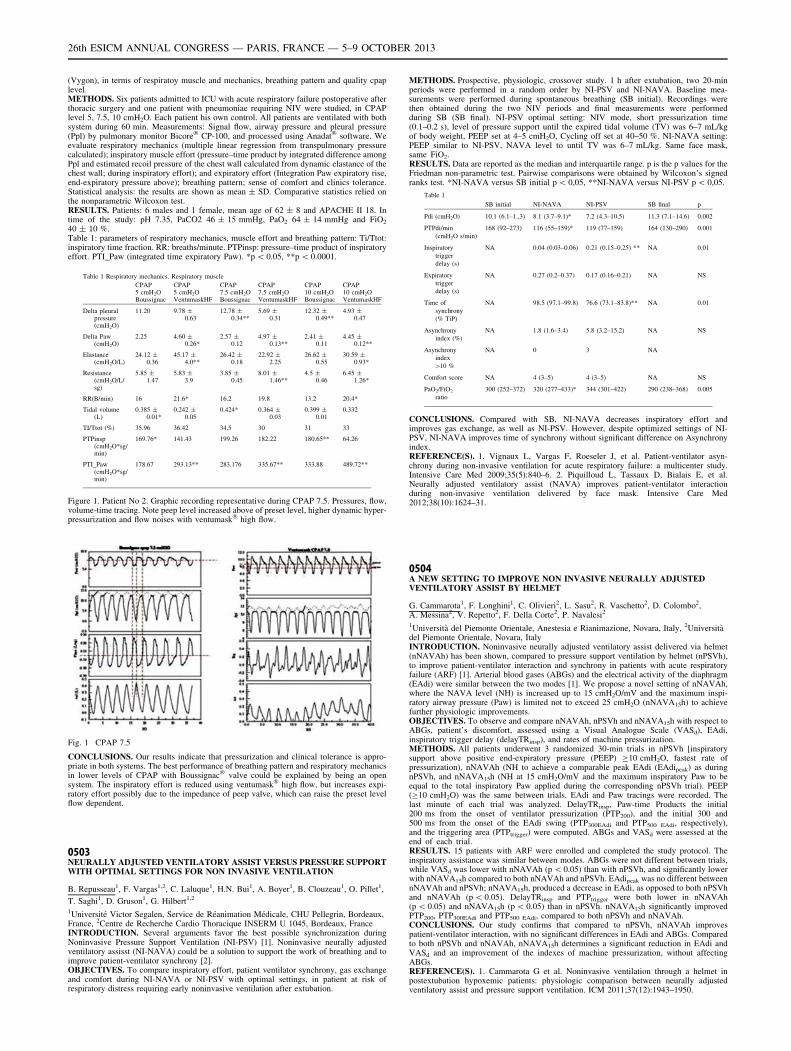
(Vygon), in terms of respiratoy muscle and mechanics, breathing pattern and quality cpaplevel.METHODS. Six patients admitted to ICU with acute respiratory failure postoperative afterthoracic surgery and one patient with pneumoniae requiring NIV were studied, in CPAPlevel 5, 7.5, 10 cmH2O. Each patient his own control. All patients are ventilated with bothsystem during 60 min. Measurements: Signal flow, airway pressure and pleural pressure(Ppl) by pulmonary monitor Bicore� CP-100, and processed using Anadat� software. Weevaluate respiratory mechanics (multiple linear regression from transpulmonary pressurecalculated); inspiratory muscle effort (pressure–time product by integrated difference amongPpl and estimated recoil pressure of the chest wall calculated from dynamic elastance of thechest wall; during inspiratory effort); and expiratory effort (Integration Paw expiratory rise,end-expiratory pressure above); breathing pattern; sense of comfort and clinics tolerance.Statistical analysis: the results are shown as mean ± SD. Comparative statistics relied onthe nonparametric Wilcoxon test.RESULTS. Patients: 6 males and 1 female, mean age of 62 ± 8 and APACHE II 18. Intime of the study: pH 7.35, PaCO2 46 ± 15 mmHg, PaO2 64 ± 14 mmHg and FiO2
40 ± 10 %.Table 1: parameters of respiratory mechanics, muscle effort and breathing pattern: Ti/Ttot:inspiratory time fraction. RR: breaths/minute. PTPinsp: pressure–time product of inspiratoryeffort. PTI_Paw (integrated time expiratory Paw). *p \ 0.05, **p \ 0.0001.
Table 1 Respiratory mechanics. Respiratory muscle
CPAP5 cmH2OBoussignac
CPAP5 cmH2OVentumaskHF
CPAP7.5 cmH2OBoussignac
CPAP7.5 cmH2OVentumaskHF
CPAP10 cmH2OBoussignac
CPAP10 cmH2OVentumaskHF
Delta pleuralpressure(cmH2O)
11.20 9.78 ±0.63
12.78 ±0.34**
5.69 ±0.31
12.32 ±0.49**
4.93 ±0.47
Delta Paw(cmH2O)
2.25 4.60 ±0.26*
2.57 ±0.12
4.97 ±0.13**
2.41 ±0.11
4.45 ±0.12**
Elastance(cmH2O/L)
24.12 ±0.36
45.17 ±4.0**
26.42 ±0.18
22.92 ±2.25
26.62 ±0.55
30.59 ±0.93*
Resistance(cmH2O/L/sg)
5.85 ±1.47
5.83 ±3.9
3.85 ±0.45
8.01 ±1.46**
4.5 ±0.46
6.45 ±1.26*
RR(B/min) 16 21.6* 16.2 19.8 13.2 20.4*
Tidal volume(L)
0.385 ±0.01*
0.242 ±0.05
0.424* 0.364 ±0.03
0.399 ±0.01
0.332
TI/Ttot (%) 35.96 36.42 34,5 30 31 33
PTPinsp(cmH2O*sg/min)
169.76* 141.43 199.26 182.22 180.65** 64.26
PTI_Paw(cmH2O*sg/min)
178.67 293.13** 283.176 335.67** 333.88 489.72**
Figure 1. Patient No 2. Graphic recording representative during CPAP 7.5. Pressures, flow,volume-time tracing. Note peep level increased above of preset level, higher dynamic hyper-pressurization and flow noises with ventumask� high flow.
Fig. 1 CPAP 7.5
CONCLUSIONS. Our results indicate that pressurization and clinical tolerance is appro-priate in both systems. The best performance of breathing pattern and respiratory mechanicsin lower levels of CPAP with Boussignac� valve could be explained by being an opensystem. The inspiratory effort is reduced using ventumask� high flow, but increases expi-ratory effort possibly due to the impedance of peep valve, which can raise the preset levelflow dependent.
0503NEURALLY ADJUSTED VENTILATORY ASSIST VERSUS PRESSURE SUPPORTWITH OPTIMAL SETTINGS FOR NON INVASIVE VENTILATION
B. Repusseau1, F. Vargas1,2, C. Laluque1, H.N. Bui1, A. Boyer1, B. Clouzeau1, O. Pillet1,
T. Saghi1, D. Gruson1, G. Hilbert1,2
1Université Victor Segalen, Service de Réanimation Médicale, CHU Pellegrin, Bordeaux,France, 2Centre de Recherche Cardio Thoracique INSERM U 1045, Bordeaux, FranceINTRODUCTION. Several arguments favor the best possible synchronization duringNoninvasive Pressure Support Ventilation (NI-PSV) [1]. Noninvasive neurally adjustedventilatory assisst (NI-NAVA) could be a solution to support the work of breathing and toimprove patient-ventilator synchrony [2].OBJECTIVES. To compare inspiratory effort, patient ventilator synchrony, gas exchangeand comfort during NI-NAVA or NI-PSV with optimal settings, in patient at risk ofrespiratory distress requiring early noninvasive ventilation after extubation.
METHODS. Prospective, physiologic, crossover study. 1 h after extubation, two 20-minperiods were performed in a random order by NI-PSV and NI-NAVA. Baseline mea-surements were performed during spontaneous breathing (SB initial). Recordings werethen obtained during the two NIV periods and final measurements were performedduring SB (SB final). NI-PSV optimal setting: NIV mode, short pressurization time(0.1–0.2 s), level of pressure support until the expired tidal volume (TV) was 6–7 mL/kgof body weight, PEEP set at 4–5 cmH2O, Cycling off set at 40–50 %. NI-NAVA setting:PEEP similar to NI-PSV, NAVA level to until TV was 6–7 mL/kg. Same face mask,same FiO2.RESULTS. Data are reported as the median and interquartile range. p is the p values for theFriedman non-parametric test. Pairwise comparisons were obtained by Wilcoxon’s signedranks test. *NI-NAVA versus SB initial p \ 0,05, **NI-NAVA versus NI-PSV p \ 0,05.
Table 1
SB initial NI-NAVA NI-PSV SB final p
Pdi (cmH2O) 10.1 (6.1–1.,3) 8.1 (3.7–9.1)* 7.2 (4.3–10.5) 11.3 (7.1–14.6) 0.002
PTPdi/min
(cmH2O s/min)
168 (92–273) 116 (55–159)* 119 (77–159) 164 (130–290) 0.001
Inspiratory
trigger
delay (s)
NA 0.04 (0.03–0.06) 0.21 (0.15–0.25) ** NA 0.01
Expiratory
trigger
delay (s)
NA 0.27 (0.2–0.37) 0.17 (0.16–0.21) NA NS
Time of
synchrony
(% TiP)
NA 98.5 (97.1–99.8) 76.6 (73.1–83.8)** NA 0.01
Asynchrony
index (%)
NA 1.8 (1.6–3.4) 5.8 (3.2–15.2) NA NS
Asynchrony
index
[10 %
NA 0 3 NA
Comfort score NA 4 (3–5) 4 (3–5) NA NS
PaO2/FiO2
ratio
300 (252–372) 320 (277–433)* 344 (301–422) 290 (238–368) 0.005
CONCLUSIONS. Compared with SB, NI-NAVA decreases inspiratory effort andimproves gas exchange, as well as NI-PSV. However, despite optimized settings of NI-PSV, NI-NAVA improves time of synchrony without significant difference on Asynchronyindex.REFERENCE(S). 1. Vignaux L, Vargas F, Roeseler J, et al. Patient-ventilator asyn-chrony during non-invasive ventilation for acute respiratory failure: a multicenter study.Intensive Care Med 2009;35(5):840–6. 2. Piquilloud L, Tassaux D, Bialais E, et al.Neurally adjusted ventilatory assist (NAVA) improves patient-ventilator interactionduring non-invasive ventilation delivered by face mask. Intensive Care Med2012;38(10):1624–31.
0504A NEW SETTING TO IMPROVE NON INVASIVE NEURALLY ADJUSTEDVENTILATORY ASSIST BY HELMET
G. Cammarota1, F. Longhini1, C. Olivieri2, L. Sasu2, R. Vaschetto2, D. Colombo2,A. Messina2, V. Repetto2, F. Della Corte2, P. Navalesi2
1Università del Piemonte Orientale, Anestesia e Rianimazione, Novara, Italy, 2Universitàdel Piemonte Orientale, Novara, ItalyINTRODUCTION. Noninvasive neurally adjusted ventilatory assist delivered via helmet(nNAVAh) has been shown, compared to pressure support ventilation by helmet (nPSVh),to improve patient-ventilator interaction and synchrony in patients with acute respiratoryfailure (ARF) [1]. Arterial blood gases (ABGs) and the electrical activity of the diaphragm(EAdi) were similar between the two modes [1]. We propose a novel setting of nNAVAh,where the NAVA level (NH) is increased up to 15 cmH2O/mV and the maximum inspi-ratory airway pressure (Paw) is limited not to exceed 25 cmH2O (nNAVA15h) to achievefurther physiologic improvements.OBJECTIVES. To observe and compare nNAVAh, nPSVh and nNAVA15h with respect toABGs, patient’s discomfort, assessed using a Visual Analogue Scale (VASd), EAdi,inspiratory trigger delay (delayTRinsp), and rates of machine pressurization.METHODS. All patients underwent 3 randomized 30-min trials in nPSVh [inspiratorysupport above positive end-expiratory pressure (PEEP) C10 cmH2O, fastest rate ofpressurization), nNAVAh (NH to achieve a comparable peak EAdi (EAdipeak) as duringnPSVh, and nNAVA15h (NH at 15 cmH2O/mV and the maximum inspiratory Paw to beequal to the total inspiratory Paw applied during the corresponding nPSVh trial). PEEP(C10 cmH2O) was the same between trials. EAdi and Paw tracings were recorded. Thelast minute of each trial was analyzed. DelayTRinsp, Paw-time Products the initial200 ms from the onset of ventilator pressurization (PTP200), and the initial 300 and500 ms from the onset of the EAdi swing (PTP300EAdi and PTP500 EAdi, respectively),and the triggering area (PTPtrigger) were computed. ABGs and VASd were assessed at theend of each trial.RESULTS. 15 patients with ARF were enrolled and completed the study protocol. Theinspiratory assistance was similar between modes. ABGs were not different between trials,while VASd was lower with nNAVAh (p \ 0.05) than with nPSVh, and significantly lowerwith nNAVA15h compared to both nNAVAh and nPSVh. EAdipeak was no different betweennNAVAh and nPSVh; nNAVA15h, produced a decrease in EAdi, as opposed to both nPSVhand nNAVAh (p \ 0.05). DelayTRinsp and PTPtrigger were both lower in nNAVAh(p \ 0.05) and nNAVA15h (p \ 0.05) than in nPSVh. nNAVA15h significantly improvedPTP200, PTP300EAdi and PTP500 EAdi, compared to both nPSVh and nNAVAh.CONCLUSIONS. Our study confirms that compared to nPSVh, nNAVAh improvespatient-ventilator interaction, with no significant differences in EAdi and ABGs. Comparedto both nPSVh and nNAVAh, nNAVA15h determines a significant reduction in EAdi andVASd and an improvement of the indexes of machine pressurization, without affectingABGs.REFERENCE(S). 1. Cammarota G et al. Noninvasive ventilation through a helmet inpostextubation hypoxemic patients: physiologic comparison between neurally adjustedventilatory assist and pressure support ventilation. ICM 2011;37(12):1943–1950.
26th ESICM ANNUAL CONGRESS — PARIS, FRANCE — 5–9 OCTOBER 2013
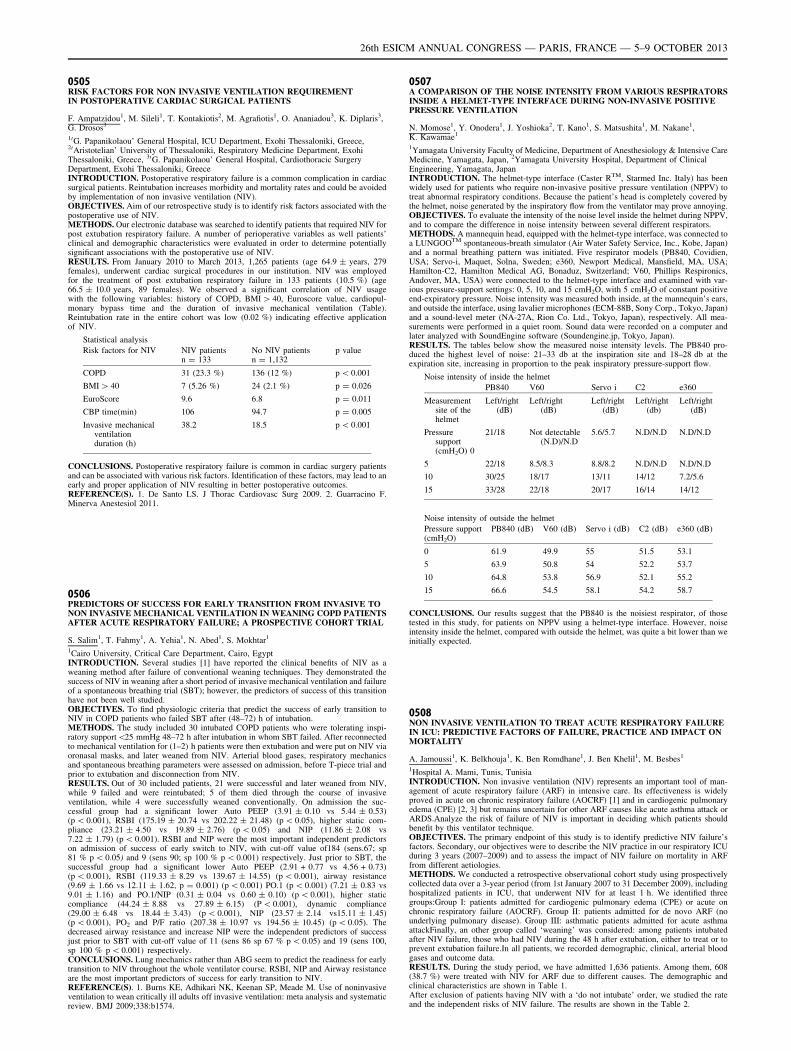
0505RISK FACTORS FOR NON INVASIVE VENTILATION REQUIREMENTIN POSTOPERATIVE CARDIAC SURGICAL PATIENTS
F. Ampatzidou1, M. Sileli1, T. Kontakiotis2, M. Agrafiotis1, O. Ananiadou3, K. Diplaris3,G. Drosos3
10G. Papanikolaou’ General Hospital, ICU Department, Exohi Thessaloniki, Greece,20Aristotelian’ University of Thessaloniki, Respiratory Medicine Department, ExohiThessaloniki, Greece, 30G. Papanikolaou’ General Hospital, Cardiothoracic SurgeryDepartment, Exohi Thessaloniki, GreeceINTRODUCTION. Postoperative respiratory failure is a common complication in cardiacsurgical patients. Reintubation increases morbidity and mortality rates and could be avoidedby implementation of non invasive ventilation (NIV).OBJECTIVES. Aim of our retrospective study is to identify risk factors associated with thepostoperative use of NIV.METHODS. Our electronic database was searched to identify patients that required NIV forpost extubation respiratory failure. A number of perioperative variables as well patients’clinical and demographic characteristics were evaluated in order to determine potentiallysignificant associations with the postoperative use of NIV.RESULTS. From January 2010 to March 2013, 1,265 patients (age 64.9 ± years, 279females), underwent cardiac surgical procedures in our institution. NIV was employedfor the treatment of post extubation respiratory failure in 133 patients (10.5 %) (age66.5 ± 10.0 years, 89 females). We observed a significant correlation of NIV usagewith the following variables: history of COPD, BMI [ 40, Euroscore value, cardiopul-monary bypass time and the duration of invasive mechanical ventilation (Table).Reintubation rate in the entire cohort was low (0.02 %) indicating effective applicationof NIV.
Statistical analysis
Risk factors for NIV NIV patientsn = 133
No NIV patientsn = 1,132
p value
COPD 31 (23.3 %) 136 (12 %) p \ 0.001
BMI [ 40 7 (5.26 %) 24 (2.1 %) p = 0.026
EuroScore 9.6 6.8 p = 0.011
CBP time(min) 106 94.7 p = 0.005
Invasive mechanicalventilationduration (h)
38.2 18.5 p \ 0.001
CONCLUSIONS. Postoperative respiratory failure is common in cardiac surgery patientsand can be associated with various risk factors. Identification of these factors, may lead to anearly and proper application of NIV resulting in better postoperative outcomes.REFERENCE(S). 1. De Santo LS. J Thorac Cardiovasc Surg 2009. 2. Guarracino F.Minerva Anestesiol 2011.
0506PREDICTORS OF SUCCESS FOR EARLY TRANSITION FROM INVASIVE TONON INVASIVE MECHANICAL VENTILATION IN WEANING COPD PATIENTSAFTER ACUTE RESPIRATORY FAILURE; A PROSPECTIVE COHORT TRIAL
S. Salim1, T. Fahmy1, A. Yehia1, N. Abed1, S. Mokhtar1
1Cairo University, Critical Care Department, Cairo, EgyptINTRODUCTION. Several studies [1] have reported the clinical benefits of NIV as aweaning method after failure of conventional weaning techniques. They demonstrated thesuccess of NIV in weaning after a short period of invasive mechanical ventilation and failureof a spontaneous breathing trial (SBT); however, the predictors of success of this transitionhave not been well studied.OBJECTIVES. To find physiologic criteria that predict the success of early transition toNIV in COPD patients who failed SBT after (48–72) h of intubation.METHODS. The study included 30 intubated COPD patients who were tolerating inspi-ratory support\25 mmHg 48–72 h after intubation in whom SBT failed. After reconnectedto mechanical ventilation for (1–2) h patients were then extubation and were put on NIV viaoronasal masks, and later weaned from NIV. Arterial blood gases, respiratory mechanicsand spontaneous breathing parameters were assessed on admission, before T-piece trial andprior to extubation and disconnection from NIV.RESULTS. Out of 30 included patients, 21 were successful and later weaned from NIV,while 9 failed and were reintubated; 5 of them died through the course of invasiveventilation, while 4 were successfully weaned conventionally. On admission the suc-cessful group had a significant lower Auto PEEP (3.91 ± 0.10 vs 5.44 ± 0.53)(p \ 0.001), RSBI (175.19 ± 20.74 vs 202.22 ± 21.48) (p \ 0.05), higher static com-pliance (23.21 ± 4.50 vs 19.89 ± 2.76) (p \ 0.05) and NIP (11.86 ± 2.08 vs7.22 ± 1.79) (p \ 0.001). RSBI and NIP were the most important independent predictorson admission of success of early switch to NIV, with cut-off value of184 (sens.67; sp81 % p \ 0.05) and 9 (sens 90; sp 100 % p \ 0.001) respectively. Just prior to SBT, thesuccessful group had a significant lower Auto PEEP (2.91 + 0.77 vs 4.56 + 0.73)(p \ 0.001), RSBI (119.33 ± 8.29 vs 139.67 ± 14.55) (p \ 0.001), airway resistance(9.69 ± 1.66 vs 12.11 ± 1.62, p = 0.001) (p \ 0.001) PO.1 (p \ 0.001) (7.21 ± 0.83 vs9.01 ± 1.16) and PO.1/NIP (0.31 ± 0.04 vs 0.60 ± 0.10) (p \ 0.001), higher staticcompliance (44.24 ± 8.88 vs 27.89 ± 6.15) (P \ 0.001), dynamic compliance(29.00 ± 6.48 vs 18.44 ± 3.43) (p \ 0.001), NIP (23.57 ± 2.14 vs15.11 ± 1.45)(p \ 0.001), PO2 and P/F ratio (207.38 ± 10.97 vs 194.56 ± 10.45) (p \ 0.05). Thedecreased airway resistance and increase NIP were the independent predictors of successjust prior to SBT with cut-off value of 11 (sens 86 sp 67 % p \ 0.05) and 19 (sens 100,sp 100 % p \ 0.001) respectively.CONCLUSIONS. Lung mechanics rather than ABG seem to predict the readiness for earlytransition to NIV throughout the whole ventilator course. RSBI, NIP and Airway resistanceare the most important predictors of success for early transition to NIV.REFERENCE(S). 1. Burns KE, Adhikari NK, Keenan SP, Meade M. Use of noninvasiveventilation to wean critically ill adults off invasive ventilation: meta analysis and systematicreview. BMJ 2009;338:b1574.
0507A COMPARISON OF THE NOISE INTENSITY FROM VARIOUS RESPIRATORSINSIDE A HELMET-TYPE INTERFACE DURING NON-INVASIVE POSITIVEPRESSURE VENTILATION
N. Momose1, Y. Onodera1, J. Yoshioka2, T. Kano1, S. Matsushita1, M. Nakane1,K. Kawamae1
1Yamagata University Faculty of Medicine, Department of Anesthesiology & Intensive CareMedicine, Yamagata, Japan, 2Yamagata University Hospital, Department of ClinicalEngineering, Yamagata, JapanINTRODUCTION. The helmet-type interface (Caster RTM, Starmed Inc. Italy) has beenwidely used for patients who require non-invasive positive pressure ventilation (NPPV) totreat abnormal respiratory conditions. Because the patient’s head is completely covered bythe helmet, noise generated by the inspiratory flow from the ventilator may prove annoying.OBJECTIVES. To evaluate the intensity of the noise level inside the helmet during NPPV,and to compare the difference in noise intensity between several different respirators.METHODS. A mannequin head, equipped with the helmet-type interface, was connected toa LUNGOOTM spontaneous-breath simulator (Air Water Safety Service, Inc., Kobe, Japan)and a normal breathing pattern was initiated. Five respirator models (PB840, Covidien,USA; Servo-i, Maquet, Solna, Sweden; e360, Newport Medical, Mansfield, MA, USA;Hamilton-C2, Hamilton Medical AG, Bonaduz, Switzerland; V60, Phillips Respironics,Andover, MA, USA) were connected to the helmet-type interface and examined with var-ious pressure-support settings: 0, 5, 10, and 15 cmH2O, with 5 cmH2O of constant positiveend-expiratory pressure. Noise intensity was measured both inside, at the mannequin’s ears,and outside the interface, using lavalier microphones (ECM-88B, Sony Corp., Tokyo, Japan)and a sound-level meter (NA-27A, Rion Co. Ltd., Tokyo, Japan), respectively. All mea-surements were performed in a quiet room. Sound data were recorded on a computer andlater analyzed with SoundEngine software (Soundengine.jp, Tokyo, Japan).RESULTS. The tables below show the measured noise intensity levels. The PB840 pro-duced the highest level of noise: 21–33 db at the inspiration site and 18–28 db at theexpiration site, increasing in proportion to the peak inspiratory pressure-support flow.
Noise intensity of inside the helmet
PB840 V60 Servo i C2 e360
Measurementsite of thehelmet
Left/right(dB)
Left/right(dB)
Left/right(dB)
Left/right(db)
Left/right(dB)
Pressuresupport(cmH2O) 0
21/18 Not detectable(N.D)/N.D
5.6/5.7 N.D/N.D N.D/N.D
5 22/18 8.5/8.3 8.8/8.2 N.D/N.D N.D/N.D
10 30/25 18/17 13/11 14/12 7.2/5.6
15 33/28 22/18 20/17 16/14 14/12
Noise intensity of outside the helmet
Pressure support(cmH2O)
PB840 (dB) V60 (dB) Servo i (dB) C2 (dB) e360 (dB)
0 61.9 49.9 55 51.5 53.1
5 63.9 50.8 54 52.2 53.7
10 64.8 53.8 56.9 52.1 55.2
15 66.6 54.5 58.1 54.2 58.7
CONCLUSIONS. Our results suggest that the PB840 is the noisiest respirator, of thosetested in this study, for patients on NPPV using a helmet-type interface. However, noiseintensity inside the helmet, compared with outside the helmet, was quite a bit lower than weinitially expected.
0508NON INVASIVE VENTILATION TO TREAT ACUTE RESPIRATORY FAILUREIN ICU: PREDICTIVE FACTORS OF FAILURE, PRACTICE AND IMPACT ONMORTALITY
A. Jamoussi1, K. Belkhouja1, K. Ben Romdhane1, J. Ben Khelil1, M. Besbes1
1Hospital A. Mami, Tunis, TunisiaINTRODUCTION. Non invasive ventilation (NIV) represents an important tool of man-agement of acute respiratory failure (ARF) in intensive care. Its effectiveness is widelyproved in acute on chronic respiratory failure (AOCRF) [1] and in cardiogenic pulmonaryedema (CPE) [2, 3] but remains uncertain for other ARF causes like acute asthma attack orARDS.Analyze the risk of failure of NIV is important in deciding which patients shouldbenefit by this ventilator technique.OBJECTIVES. The primary endpoint of this study is to identify predictive NIV failure’sfactors. Secondary, our objectives were to describe the NIV practice in our respiratory ICUduring 3 years (2007–2009) and to assess the impact of NIV failure on mortality in ARFfrom different aetiologies.METHODS. We conducted a retrospective observational cohort study using prospectivelycollected data over a 3-year period (from 1st January 2007 to 31 December 2009), includinghospitalized patients in ICU, that underwent NIV for at least 1 h. We identified threegroups:Group I: patients admitted for cardiogenic pulmonary edema (CPE) or acute onchronic respiratory failure (AOCRF). Group II: patients admitted for de novo ARF (nounderlying pulmonary disease). Group III: asthmatic patients admitted for acute asthmaattackFinally, an other group called ‘weaning’ was considered: among patients intubatedafter NIV failure, those who had NIV during the 48 h after extubation, either to treat or toprevent extubation failure.In all patients, we recorded demographic, clinical, arterial bloodgases and outcome data.RESULTS. During the study period, we have admitted 1,636 patients. Among them, 608(38.7 %) were treated with NIV for ARF due to different causes. The demographic andclinical characteristics are shown in Table 1.After exclusion of patients having NIV with a ‘do not intubate’ order, we studied the rateand the independent risks of NIV failure. The results are shown in the Table 2.
26th ESICM ANNUAL CONGRESS — PARIS, FRANCE — 5–9 OCTOBER 2013
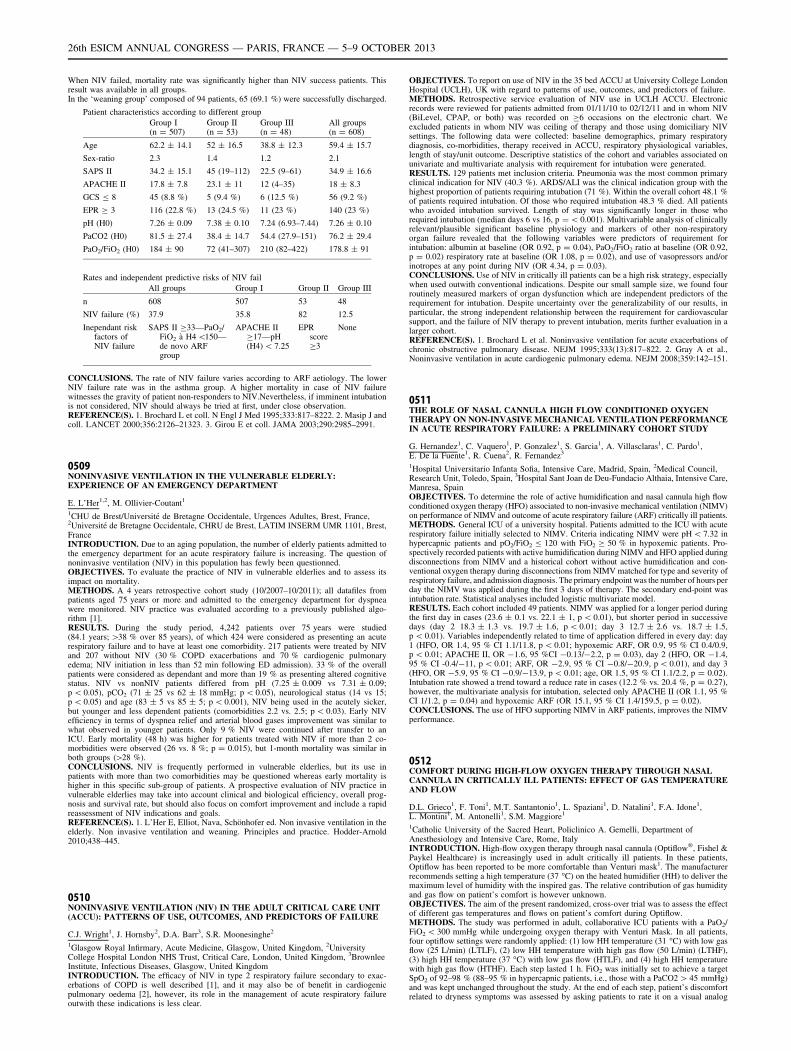
When NIV failed, mortality rate was significantly higher than NIV success patients. Thisresult was available in all groups.In the ‘weaning group’ composed of 94 patients, 65 (69.1 %) were successfully discharged.
Patient characteristics according to different group
Group I(n = 507)
Group II(n = 53)
Group III(n = 48)
All groups(n = 608)
Age 62.2 ± 14.1 52 ± 16.5 38.8 ± 12.3 59.4 ± 15.7
Sex-ratio 2.3 1.4 1.2 2.1
SAPS II 34.2 ± 15.1 45 (19–112) 22.5 (9–61) 34.9 ± 16.6
APACHE II 17.8 ± 7.8 23.1 ± 11 12 (4–35) 18 ± 8.3
GCS B 8 45 (8.8 %) 5 (9.4 %) 6 (12.5 %) 56 (9.2 %)
EPR C 3 116 (22.8 %) 13 (24.5 %) 11 (23 %) 140 (23 %)
pH (H0) 7.26 ± 0.09 7.38 ± 0.10 7.24 (6.93–7.44) 7.26 ± 0.10
PaCO2 (H0) 81.5 ± 27.4 38.4 ± 14.7 54.4 (27.9–151) 76.2 ± 29.4
PaO2/FiO2 (H0) 184 ± 90 72 (41–307) 210 (82–422) 178.8 ± 91
Rates and independent predictive risks of NIV fail
All groups Group I Group II Group III
n 608 507 53 48
NIV failure (%) 37.9 35.8 82 12.5
Inependant riskfactors ofNIV failure
SAPS II C33—PaO2/FiO2 à H4 \150—de novo ARFgroup
APACHE IIC17—pH(H4) \ 7.25
EPRscoreC3
None
CONCLUSIONS. The rate of NIV failure varies according to ARF aetiology. The lowerNIV failure rate was in the asthma group. A higher mortality in case of NIV failurewitnesses the gravity of patient non-responders to NIV.Nevertheless, if imminent intubationis not considered, NIV should always be tried at first, under close observation.REFERENCE(S). 1. Brochard L et coll. N Engl J Med 1995;333:817–8222. 2. Masip J andcoll. LANCET 2000;356:2126–21323. 3. Girou E et coll. JAMA 2003;290:2985–2991.
0509NONINVASIVE VENTILATION IN THE VULNERABLE ELDERLY:EXPERIENCE OF AN EMERGENCY DEPARTMENT
E. L’Her1,2, M. Ollivier-Coutant1
1CHU de Brest/Université de Bretagne Occidentale, Urgences Adultes, Brest, France,2Université de Bretagne Occidentale, CHRU de Brest, LATIM INSERM UMR 1101, Brest,FranceINTRODUCTION. Due to an aging population, the number of elderly patients admitted tothe emergency department for an acute respiratory failure is increasing. The question ofnoninvasive ventilation (NIV) in this population has fewly been questionned.OBJECTIVES. To evaluate the practice of NIV in vulnerable elderlies and to assess itsimpact on mortality.METHODS. A 4 years retrospective cohort study (10/2007–10/2011); all datafiles frompatients aged 75 years or more and admitted to the emergency department for dyspneawere monitored. NIV practice was evaluated according to a previously published algo-rithm [1].RESULTS. During the study period, 4,242 patients over 75 years were studied(84.1 years; [38 % over 85 years), of which 424 were considered as presenting an acuterespiratory failure and to have at least one comorbidity. 217 patients were treated by NIVand 207 without NIV (30 % COPD exacerbations and 70 % cardiogenic pulmonaryedema; NIV initiation in less than 52 min following ED admission). 33 % of the overallpatients were considered as dependant and more than 19 % as presenting altered cognitivestatus. NIV vs nonNIV patients differed from pH (7.25 ± 0.009 vs 7.31 ± 0.09;p \ 0.05), pCO2 (71 ± 25 vs 62 ± 18 mmHg; p \ 0.05), neurological status (14 vs 15;p \ 0.05) and age (83 ± 5 vs 85 ± 5; p \ 0.001), NIV being used in the acutely sicker,but younger and less dependent patients (comorbidities 2.2 vs. 2.5; p \ 0.03). Early NIVefficiency in terms of dyspnea relief and arterial blood gases improvement was similar towhat observed in younger patients. Only 9 % NIV were continued after transfer to anICU. Early mortality (48 h) was higher for patients treated with NIV if more than 2 co-morbidities were observed (26 vs. 8 %; p = 0.015), but 1-month mortality was similar inboth groups ([28 %).CONCLUSIONS. NIV is frequently performed in vulnerable elderlies, but its use inpatients with more than two comorbidities may be questioned whereas early mortality ishigher in this specific sub-group of patients. A prospective evaluation of NIV practice invulnerable elderlies may take into account clinical and biological efficiency, overall prog-nosis and survival rate, but should also focus on comfort improvement and include a rapidreassessment of NIV indications and goals.REFERENCE(S). 1. L’Her E, Elliot, Nava, Schönhofer ed. Non invasive ventilation in theelderly. Non invasive ventilation and weaning. Principles and practice. Hodder-Arnold2010;438–445.
0510NONINVASIVE VENTILATION (NIV) IN THE ADULT CRITICAL CARE UNIT(ACCU): PATTERNS OF USE, OUTCOMES, AND PREDICTORS OF FAILURE
C.J. Wright1, J. Hornsby2, D.A. Barr3, S.R. Moonesinghe2
1Glasgow Royal Infirmary, Acute Medicine, Glasgow, United Kingdom, 2UniversityCollege Hospital London NHS Trust, Critical Care, London, United Kingdom, 3BrownleeInstitute, Infectious Diseases, Glasgow, United KingdomINTRODUCTION. The efficacy of NIV in type 2 respiratory failure secondary to exac-erbations of COPD is well described [1], and it may also be of benefit in cardiogenicpulmonary oedema [2], however, its role in the management of acute respiratory failureoutwith these indications is less clear.
OBJECTIVES. To report on use of NIV in the 35 bed ACCU at University College LondonHospital (UCLH), UK with regard to patterns of use, outcomes, and predictors of failure.METHODS. Retrospective service evaluation of NIV use in UCLH ACCU. Electronicrecords were reviewed for patients admitted from 01/11/10 to 02/12/11 and in whom NIV(BiLevel, CPAP, or both) was recorded on C6 occasions on the electronic chart. Weexcluded patients in whom NIV was ceiling of therapy and those using domiciliary NIVsettings. The following data were collected: baseline demographics, primary respiratorydiagnosis, co-morbidities, therapy received in ACCU, respiratory physiological variables,length of stay/unit outcome. Descriptive statistics of the cohort and variables associated onunivariate and multivariate analysis with requirement for intubation were generated.RESULTS. 129 patients met inclusion criteria. Pneumonia was the most common primaryclinical indication for NIV (40.3 %). ARDS/ALI was the clinical indication group with thehighest proportion of patients requiring intubation (71 %). Within the overall cohort 48.1 %of patients required intubation. Of those who required intubation 48.3 % died. All patientswho avoided intubation survived. Length of stay was significantly longer in those whorequired intubation (median days 6 vs 16, p = \ 0.001). Multivariable analysis of clinicallyrelevant/plausible significant baseline physiology and markers of other non-respiratoryorgan failure revealed that the following variables were predictors of requirement forintubation: albumin at baseline (OR 0.92, p = 0.04), PaO2/FiO2 ratio at baseline (OR 0.92,p = 0.02) respiratory rate at baseline (OR 1.08, p = 0.02), and use of vasopressors and/orinotropes at any point during NIV (OR 4.34, p = 0.03).CONCLUSIONS. Use of NIV in critically ill patients can be a high risk strategy, especiallywhen used outwith conventional indications. Despite our small sample size, we found fourroutinely measured markers of organ dysfunction which are independent predictors of therequirement for intubation. Despite uncertainty over the generalizability of our results, inparticular, the strong independent relationship between the requirement for cardiovascularsupport, and the failure of NIV therapy to prevent intubation, merits further evaluation in alarger cohort.REFERENCE(S). 1. Brochard L et al. Noninvasive ventilation for acute exacerbations ofchronic obstructive pulmonary disease. NEJM 1995;333(13):817–822. 2. Gray A et al.,Noninvasive ventilation in acute cardiogenic pulmonary edema. NEJM 2008;359:142–151.
0511THE ROLE OF NASAL CANNULA HIGH FLOW CONDITIONED OXYGENTHERAPY ON NON-INVASIVE MECHANICAL VENTILATION PERFORMANCEIN ACUTE RESPIRATORY FAILURE: A PRELIMINARY COHORT STUDY
G. Hernandez1, C. Vaquero1, P. Gonzalez1, S. Garcia1, A. Villasclaras1, C. Pardo1,E. De la Fuente1, R. Cuena2, R. Fernandez3
1Hospital Universitario Infanta Sofia, Intensive Care, Madrid, Spain, 2Medical Council,Research Unit, Toledo, Spain, 3Hospital Sant Joan de Deu-Fundacio Althaia, Intensive Care,Manresa, SpainOBJECTIVES. To determine the role of active humidification and nasal cannula high flowconditioned oxygen therapy (HFO) associated to non-invasive mechanical ventilation (NIMV)on performance of NIMV and outcome of acute respiratory failure (ARF) critically ill patients.METHODS. General ICU of a university hospital. Patients admitted to the ICU with acuterespiratory failure initially selected to NIMV. Criteria indicating NIMV were pH \ 7.32 inhypercapnic patients and pO2/FiO2 B 120 with FiO2 C 50 % in hypoxemic patients. Pro-spectively recorded patients with active humidification during NIMV and HFO applied duringdisconnections from NIMV and a historical cohort without active humidification and con-ventional oxygen therapy during disconnections from NIMV matched for type and severity ofrespiratory failure, and admission diagnosis. The primary endpoint was the number of hours perday the NIMV was applied during the first 3 days of therapy. The secondary end-point wasintubation rate. Statistical analyses included logistic multivariate model.RESULTS. Each cohort included 49 patients. NIMV was applied for a longer period duringthe first day in cases (23.6 ± 0.1 vs. 22.1 ± 1, p \ 0.01), but shorter period in successivedays (day 2 18.3 ± 1.3 vs. 19.7 ± 1.6, p \ 0.01; day 3 12.7 ± 2.6 vs. 18.7 ± 1.5,p \ 0.01). Variables independently related to time of application differed in every day: day1 (HFO, OR 1.4, 95 % CI 1.1/11.8, p \ 0.01; hypoxemic ARF, OR 0.9, 95 % CI 0.4/0.9,p \ 0.01; APACHE II, OR -1.6, 95 %CI -0.13/-2.2, p = 0.03), day 2 (HFO, OR -1.4,95 % CI -0.4/-11, p \ 0.01; ARF, OR -2.9, 95 % CI -0.8/-20.9, p \ 0.01), and day 3(HFO, OR -5.9, 95 % CI -0.9/-13.9, p \ 0.01; age, OR 1.5, 95 % CI 1.1/2.2, p = 0.02).Intubation rate showed a trend toward a reduce rate in cases (12.2 % vs. 20.4 %, p = 0.27),however, the multivariate analysis for intubation, selected only APACHE II (OR 1.1, 95 %CI 1/1.2, p = 0.04) and hypoxemic ARF (OR 15.1, 95 % CI 1.4/159.5, p = 0.02).CONCLUSIONS. The use of HFO supporting NIMV in ARF patients, improves the NIMVperformance.
0512COMFORT DURING HIGH-FLOW OXYGEN THERAPY THROUGH NASALCANNULA IN CRITICALLY ILL PATIENTS: EFFECT OF GAS TEMPERATUREAND FLOW
D.L. Grieco1, F. Toni1, M.T. Santantonio1, L. Spaziani1, D. Natalini1, F.A. Idone1,L. Montini1, M. Antonelli1, S.M. Maggiore1
1Catholic University of the Sacred Heart, Policlinico A. Gemelli, Department ofAnesthesiology and Intensive Care, Rome, ItalyINTRODUCTION. High-flow oxygen therapy through nasal cannula (Optiflow�, Fishel &Paykel Healthcare) is increasingly used in adult critically ill patients. In these patients,Optiflow has been reported to be more comfortable than Venturi mask1. The manufacturerrecommends setting a high temperature (37 �C) on the heated humidifier (HH) to deliver themaximum level of humidity with the inspired gas. The relative contribution of gas humidityand gas flow on patient’s comfort is however unknown.OBJECTIVES. The aim of the present randomized, cross-over trial was to assess the effectof different gas temperatures and flows on patient’s comfort during Optiflow.METHODS. The study was performed in adult, collaborative ICU patients with a PaO2/FiO2 \ 300 mmHg while undergoing oxygen therapy with Venturi Mask. In all patients,four optiflow settings were randomly applied: (1) low HH temperature (31 �C) with low gasflow (25 L/min) (LTLF), (2) low HH temperature with high gas flow (50 L/min) (LTHF),(3) high HH temperature (37 �C) with low gas flow (HTLF), and (4) high HH temperaturewith high gas flow (HTHF). Each step lasted 1 h. FiO2 was initially set to achieve a targetSpO2 of 92–98 % (88–95 % in hypercapnic patients, i.e., those with a PaCO2 [ 45 mmHg)and was kept unchanged throughout the study. At the end of each step, patient’s discomfortrelated to dryness symptoms was assessed by asking patients to rate it on a visual analog
26th ESICM ANNUAL CONGRESS — PARIS, FRANCE — 5–9 OCTOBER 2013
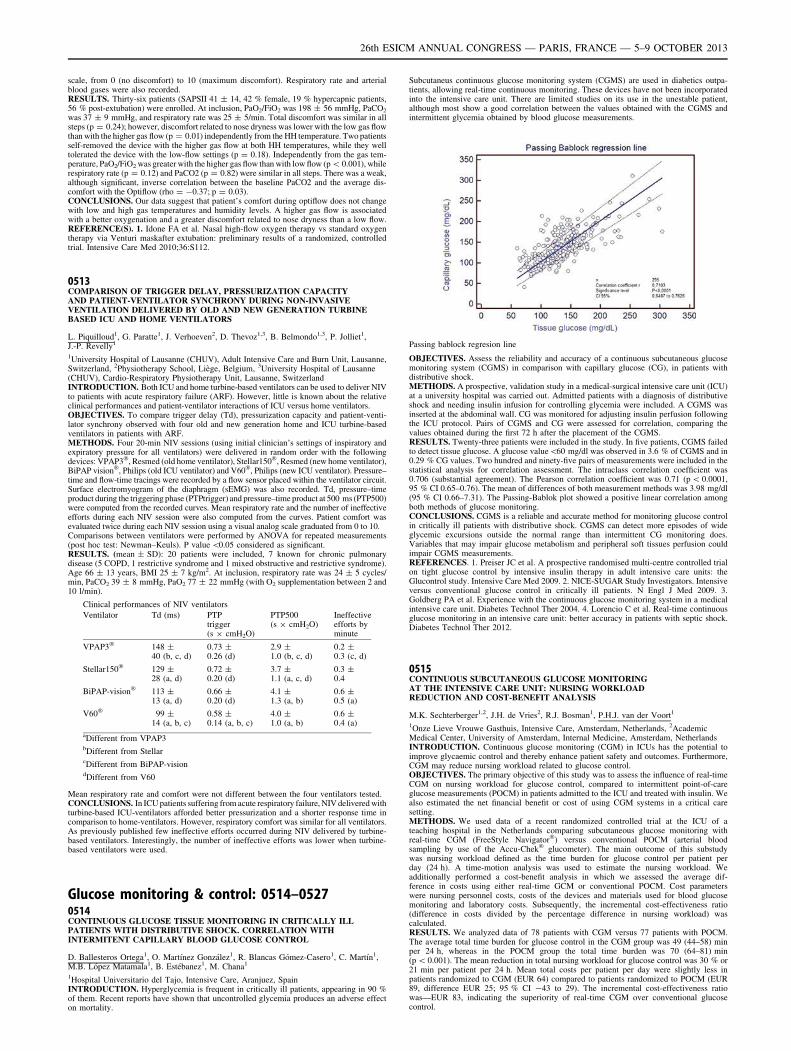
scale, from 0 (no discomfort) to 10 (maximum discomfort). Respiratory rate and arterialblood gases were also recorded.RESULTS. Thirty-six patients (SAPSII 41 ± 14, 42 % female, 19 % hypercapnic patients,56 % post-extubation) were enrolled. At inclusion, PaO2/FiO2 was 198 ± 56 mmHg, PaCO2
was 37 ± 9 mmHg, and respiratory rate was 25 ± 5/min. Total discomfort was similar in allsteps (p = 0.24); however, discomfort related to nose dryness was lower with the low gas flowthan with the higher gas flow (p = 0.01) independently from the HH temperature. Two patientsself-removed the device with the higher gas flow at both HH temperatures, while they welltolerated the device with the low-flow settings (p = 0.18). Independently from the gas tem-perature, PaO2/FiO2 was greater with the higher gas flow than with low flow (p \ 0.001), whilerespiratory rate (p = 0.12) and PaCO2 (p = 0.82) were similar in all steps. There was a weak,although significant, inverse correlation between the baseline PaCO2 and the average dis-comfort with the Optiflow (rho = -0.37; p = 0.03).CONCLUSIONS. Our data suggest that patient’s comfort during optiflow does not changewith low and high gas temperatures and humidity levels. A higher gas flow is associatedwith a better oxygenation and a greater discomfort related to nose dryness than a low flow.REFERENCE(S). 1. Idone FA et al. Nasal high-flow oxygen therapy vs standard oxygentherapy via Venturi maskafter extubation: preliminary results of a randomized, controlledtrial. Intensive Care Med 2010;36:S112.
0513COMPARISON OF TRIGGER DELAY, PRESSURIZATION CAPACITYAND PATIENT-VENTILATOR SYNCHRONY DURING NON-INVASIVEVENTILATION DELIVERED BY OLD AND NEW GENERATION TURBINEBASED ICU AND HOME VENTILATORS
L. Piquilloud1, G. Paratte1, J. Verhoeven2, D. Thevoz1,3, B. Belmondo1,3, P. Jolliet1,J.-P. Revelly1
1University Hospital of Lausanne (CHUV), Adult Intensive Care and Burn Unit, Lausanne,Switzerland, 2Physiotherapy School, Liège, Belgium, 3University Hospital of Lausanne(CHUV), Cardio-Respiratory Physiotherapy Unit, Lausanne, SwitzerlandINTRODUCTION. Both ICU and home turbine-based ventilators can be used to deliver NIVto patients with acute respiratory failure (ARF). However, little is known about the relativeclinical performances and patient-ventilator interactions of ICU versus home ventilators.OBJECTIVES. To compare trigger delay (Td), pressurization capacity and patient-venti-lator synchrony observed with four old and new generation home and ICU turbine-basedventilators in patients with ARF.METHODS. Four 20-min NIV sessions (using initial clinician’s settings of inspiratory andexpiratory pressure for all ventilators) were delivered in random order with the followingdevices: VPAP3�, Resmed (old home ventilator), Stellar150�, Resmed (new home ventilator),BiPAP vision�, Philips (old ICU ventilator) and V60�, Philips (new ICU ventilator). Pressure–time and flow-time tracings were recorded by a flow sensor placed within the ventilator circuit.Surface electromyogram of the diaphragm (sEMG) was also recorded. Td, pressure–timeproduct during the triggering phase (PTPtrigger) and pressure–time product at 500 ms (PTP500)were computed from the recorded curves. Mean respiratory rate and the number of ineffectiveefforts during each NIV session were also computed from the curves. Patient comfort wasevaluated twice during each NIV session using a visual analog scale graduated from 0 to 10.Comparisons between ventilators were performed by ANOVA for repeated measurements(post hoc test: Newman–Keuls). P value \0.05 considered as significant.RESULTS. (mean ± SD): 20 patients were included, 7 known for chronic pulmonarydisease (5 COPD, 1 restrictive syndrome and 1 mixed obstructive and restrictive syndrome).Age 66 ± 13 years, BMI 25 ± 7 kg/m2. At inclusion, respiratory rate was 24 ± 5 cycles/min, PaCO2 39 ± 8 mmHg, PaO2 77 ± 22 mmHg (with O2 supplementation between 2 and10 l/min).
Clinical performances of NIV ventilators
Ventilator Td (ms) PTPtrigger(s 9 cmH2O)
PTP500(s 9 cmH2O)
Ineffectiveefforts byminute
VPAP3� 148 ±40 (b, c, d)
0.73 ±0.26 (d)
2.9 ±1.0 (b, c, d)
0.2 ±0.3 (c, d)
Stellar150� 129 ±28 (a, d)
0.72 ±0.20 (d)
3.7 ±1.1 (a, c, d)
0.3 ±0.4
BiPAP-vision� 113 ±13 (a, d)
0.66 ±0.20 (d)
4.1 ±1.3 (a, b)
0.6 ±0.5 (a)
V60� 99 ±14 (a, b, c)
0.58 ±0.14 (a, b, c)
4.0 ±1.0 (a, b)
0.6 ±0.4 (a)
aDifferent from VPAP3bDifferent from StellarcDifferent from BiPAP-visiondDifferent from V60
Mean respiratory rate and comfort were not different between the four ventilators tested.CONCLUSIONS. In ICU patients suffering from acute respiratory failure, NIV delivered withturbine-based ICU-ventilators afforded better pressurization and a shorter response time incomparison to home-ventilators. However, respiratory comfort was similar for all ventilators.As previously published few ineffective efforts occurred during NIV delivered by turbine-based ventilators. Interestingly, the number of ineffective efforts was lower when turbine-based ventilators were used.
Glucose monitoring & control: 0514–05270514CONTINUOUS GLUCOSE TISSUE MONITORING IN CRITICALLY ILLPATIENTS WITH DISTRIBUTIVE SHOCK. CORRELATION WITHINTERMITENT CAPILLARY BLOOD GLUCOSE CONTROL
D. Ballesteros Ortega1, O. Martı́nez González1, R. Blancas Gómez-Casero1, C. Martı́n1,M.B. López Matamala1, B. Estébanez1, M. Chana1
1Hospital Universitario del Tajo, Intensive Care, Aranjuez, SpainINTRODUCTION. Hyperglycemia is frequent in critically ill patients, appearing in 90 %of them. Recent reports have shown that uncontrolled glycemia produces an adverse effecton mortality.
Subcutaneus continuous glucose monitoring system (CGMS) are used in diabetics outpa-tients, allowing real-time continuous monitoring. These devices have not been incorporatedinto the intensive care unit. There are limited studies on its use in the unestable patient,although most show a good correlation between the values obtained with the CGMS andintermittent glycemia obtained by blood glucose measurements.
Passing bablock regresion line
OBJECTIVES. Assess the reliability and accuracy of a continuous subcutaneous glucosemonitoring system (CGMS) in comparison with capillary glucose (CG), in patients withdistributive shock.METHODS. A prospective, validation study in a medical-surgical intensive care unit (ICU)at a university hospital was carried out. Admitted patients with a diagnosis of distributiveshock and needing insulin infusion for controlling glycemia were included. A CGMS wasinserted at the abdominal wall. CG was monitored for adjusting insulin perfusion followingthe ICU protocol. Pairs of CGMS and CG were assessed for correlation, comparing thevalues obtained during the first 72 h after the placement of the CGMS.RESULTS. Twenty-three patients were included in the study. In five patients, CGMS failedto detect tissue glucose. A glucose value\60 mg/dl was observed in 3.6 % of CGMS and in0.29 % CG values. Two hundred and ninety-five pairs of measurements were included in thestatistical analysis for correlation assessment. The intraclass correlation coefficient was0.706 (substantial agreement). The Pearson correlation coefficient was 0.71 (p \ 0.0001,95 % CI 0.65–0.76). The mean of differences of both measurement methods was 3.98 mg/dl(95 % CI 0.66–7.31). The Passing-Bablok plot showed a positive linear correlation amongboth methods of glucose monitoring.CONCLUSIONS. CGMS is a reliable and accurate method for monitoring glucose controlin critically ill patients with distributive shock. CGMS can detect more episodes of wideglycemic excursions outside the normal range than intermittent CG monitoring does.Variables that may impair glucose metabolism and peripheral soft tissues perfusion couldimpair CGMS measurements.REFERENCES. 1. Preiser JC et al. A prospective randomised multi-centre controlled trialon tight glucose control by intensive insulin therapy in adult intensive care units: theGlucontrol study. Intensive Care Med 2009. 2. NICE-SUGAR Study Investigators. Intensiveversus conventional glucose control in critically ill patients. N Engl J Med 2009. 3.Goldberg PA et al. Experience with the continuous glucose monitoring system in a medicalintensive care unit. Diabetes Technol Ther 2004. 4. Lorencio C et al. Real-time continuousglucose monitoring in an intensive care unit: better accuracy in patients with septic shock.Diabetes Technol Ther 2012.
0515CONTINUOUS SUBCUTANEOUS GLUCOSE MONITORINGAT THE INTENSIVE CARE UNIT: NURSING WORKLOADREDUCTION AND COST-BENEFIT ANALYSIS
M.K. Sechterberger1,2, J.H. de Vries2, R.J. Bosman1, P.H.J. van der Voort1
1Onze Lieve Vrouwe Gasthuis, Intensive Care, Amsterdam, Netherlands, 2AcademicMedical Center, University of Amsterdam, Internal Medicine, Amsterdam, NetherlandsINTRODUCTION. Continuous glucose monitoring (CGM) in ICUs has the potential toimprove glycaemic control and thereby enhance patient safety and outcomes. Furthermore,CGM may reduce nursing workload related to glucose control.OBJECTIVES. The primary objective of this study was to assess the influence of real-timeCGM on nursing workload for glucose control, compared to intermittent point-of-careglucose measurements (POCM) in patients admitted to the ICU and treated with insulin. Wealso estimated the net financial benefit or cost of using CGM systems in a critical caresetting.METHODS. We used data of a recent randomized controlled trial at the ICU of ateaching hospital in the Netherlands comparing subcutaneous glucose monitoring withreal-time CGM (FreeStyle Navigator�) versus conventional POCM (arterial bloodsampling by use of the Accu-Chek� glucometer). The main outcome of this substudywas nursing workload defined as the time burden for glucose control per patient perday (24 h). A time-motion analysis was used to estimate the nursing workload. Weadditionally performed a cost-benefit analysis in which we assessed the average dif-ference in costs using either real-time GCM or conventional POCM. Cost parameterswere nursing personnel costs, costs of the devices and materials used for blood glucosemonitoring and laboratory costs. Subsequently, the incremental cost-effectiveness ratio(difference in costs divided by the percentage difference in nursing workload) wascalculated.RESULTS. We analyzed data of 78 patients with CGM versus 77 patients with POCM.The average total time burden for glucose control in the CGM group was 49 (44–58) minper 24 h, whereas in the POCM group the total time burden was 70 (64–81) min(p \ 0.001). The mean reduction in total nursing workload for glucose control was 30 % or21 min per patient per 24 h. Mean total costs per patient per day were slightly less inpatients randomized to CGM (EUR 64) compared to patients randomized to POCM (EUR89, difference EUR 25; 95 % CI -43 to 29). The incremental cost-effectiveness ratiowas—EUR 83, indicating the superiority of real-time CGM over conventional glucosecontrol.
26th ESICM ANNUAL CONGRESS — PARIS, FRANCE — 5–9 OCTOBER 2013
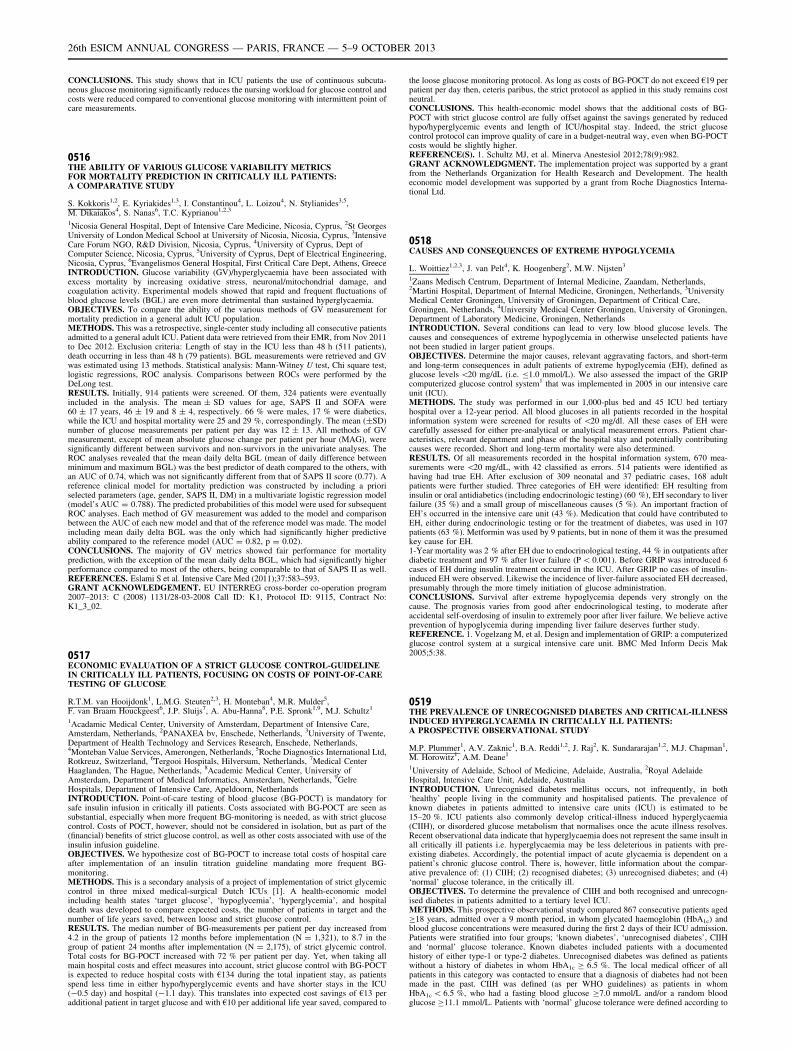
CONCLUSIONS. This study shows that in ICU patients the use of continuous subcuta-neous glucose monitoring significantly reduces the nursing workload for glucose control andcosts were reduced compared to conventional glucose monitoring with intermittent point ofcare measurements.
0516THE ABILITY OF VARIOUS GLUCOSE VARIABILITY METRICSFOR MORTALITY PREDICTION IN CRITICALLY ILL PATIENTS:A COMPARATIVE STUDY
S. Kokkoris1,2, E. Kyriakides1,3, I. Constantinou4, L. Loizou4, N. Stylianides3,5,M. Dikaiakos4, S. Nanas6, T.C. Kyprianou1,2,3
1Nicosia General Hospital, Dept of Intensive Care Medicine, Nicosia, Cyprus, 2St GeorgesUniversity of London Medical School at University of Nicosia, Nicosia, Cyprus, 3IntensiveCare Forum NGO, R&D Division, Nicosia, Cyprus, 4University of Cyprus, Dept ofComputer Science, Nicosia, Cyprus, 5University of Cyprus, Dept of Electrical Engineering,Nicosia, Cyprus, 6Evangelismos General Hospital, First Critical Care Dept, Athens, GreeceINTRODUCTION. Glucose variability (GV)/hyperglycaemia have been associated withexcess mortality by increasing oxidative stress, neuronal/mitochondrial damage, andcoagulation activity. Experimental models showed that rapid and frequent fluctuations ofblood glucose levels (BGL) are even more detrimental than sustained hyperglycaemia.OBJECTIVES. To compare the ability of the various methods of GV measurement formortality prediction in a general adult ICU population.METHODS. This was a retrospective, single-center study including all consecutive patientsadmitted to a general adult ICU. Patient data were retrieved from their EMR, from Nov 2011to Dec 2012. Exclusion criteria: Length of stay in the ICU less than 48 h (511 patients),death occurring in less than 48 h (79 patients). BGL measurements were retrieved and GVwas estimated using 13 methods. Statistical analysis: Mann-Witney U test, Chi square test,logistic regressions, ROC analysis. Comparisons between ROCs were performed by theDeLong test.RESULTS. Initially, 914 patients were screened. Of them, 324 patients were eventuallyincluded in the analysis. The mean ± SD values for age, SAPS II and SOFA were60 ± 17 years, 46 ± 19 and 8 ± 4, respectively. 66 % were males, 17 % were diabetics,while the ICU and hospital mortality were 25 and 29 %, correspondingly. The mean (±SD)number of glucose measurements per patient per day was 12 ± 13. All methods of GVmeasurement, except of mean absolute glucose change per patient per hour (MAG), weresignificantly different between survivors and non-survivors in the univariate analyses. TheROC analyses revealed that the mean daily delta BGL (mean of daily difference betweenminimum and maximum BGL) was the best predictor of death compared to the others, withan AUC of 0.74, which was not significantly different from that of SAPS II score (0.77). Areference clinical model for mortality prediction was constructed by including a prioriselected parameters (age, gender, SAPS II, DM) in a multivariate logistic regression model(model’s AUC = 0.788). The predicted probabilities of this model were used for subsequentROC analyses. Each method of GV measurement was added to the model and comparisonbetween the AUC of each new model and that of the reference model was made. The modelincluding mean daily delta BGL was the only which had significantly higher predictiveability compared to the reference model (AUC = 0.82, p = 0.02).CONCLUSIONS. The majority of GV metrics showed fair performance for mortalityprediction, with the exception of the mean daily delta BGL, which had significantly higherperformance compared to most of the others, being comparable to that of SAPS II as well.REFERENCES. Eslami S et al. Intensive Care Med (2011);37:583–593.GRANT ACKNOWLEDGEMENT. EU INTERREG cross-border co-operation program2007–2013: C (2008) 1131/28-03-2008 Call ID: J1, Protocol ID: 9115, Contract No:K1_3_02.
0517ECONOMIC EVALUATION OF A STRICT GLUCOSE CONTROL-GUIDELINEIN CRITICALLY ILL PATIENTS, FOCUSING ON COSTS OF POINT-OF-CARETESTING OF GLUCOSE
R.T.M. van Hooijdonk1, L.M.G. Steuten2,3, H. Monteban4, M.R. Mulder5,F. van Braam Houckgeest6, J.P. Sluijs7, A. Abu-Hanna8, P.E. Spronk1,9, M.J. Schultz1
1Acadamic Medical Center, University of Amsterdam, Department of Intensive Care,Amsterdam, Netherlands, 2PANAXEA bv, Enschede, Netherlands, 3University of Twente,Department of Health Technology and Services Research, Enschede, Netherlands,4Monteban Value Services, Amerongen, Netherlands, 5Roche Diagnostics International Ltd,Rotkreuz, Switzerland, 6Tergooi Hospitals, Hilversum, Netherlands, 7Medical CenterHaaglanden, The Hague, Netherlands, 8Academic Medical Center, University ofAmsterdam, Department of Medical Informatics, Amsterdam, Netherlands, 9GelreHospitals, Department of Intensive Care, Apeldoorn, NetherlandsINTRODUCTION. Point-of-care testing of blood glucose (BG-POCT) is mandatory forsafe insulin infusion in critically ill patients. Costs associated with BG-POCT are seen assubstantial, especially when more frequent BG-monitoring is needed, as with strict glucosecontrol. Costs of POCT, however, should not be considered in isolation, but as part of the(financial) benefits of strict glucose control, as well as other costs associated with use of theinsulin infusion guideline.OBJECTIVES. We hypothesize cost of BG-POCT to increase total costs of hospital careafter implementation of an insulin titration guideline mandating more frequent BG-monitoring.METHODS. This is a secondary analysis of a project of implementation of strict glycemiccontrol in three mixed medical-surgical Dutch ICUs [1]. A health-economic modelincluding health states ‘target glucose’, ‘hypoglycemia’, ‘hyperglycemia’, and hospitaldeath was developed to compare expected costs, the number of patients in target and thenumber of life years saved, between loose and strict glucose control.RESULTS. The median number of BG-measurements per patient per day increased from4.2 in the group of patients 12 months before implementation (N = 1,321), to 8.7 in thegroup of patient 24 months after implementation (N = 2,175), of strict glycemic control.Total costs for BG-POCT increased with 72 % per patient per day. Yet, when taking allmain hospital costs and effect measures into account, strict glucose control with BG-POCTis expected to reduce hospital costs with €134 during the total inpatient stay, as patientsspend less time in either hypo/hyperglycemic events and have shorter stays in the ICU(-0.5 day) and hospital (-1.1 day). This translates into expected cost savings of €13 peradditional patient in target glucose and with €10 per additional life year saved, compared to
the loose glucose monitoring protocol. As long as costs of BG-POCT do not exceed €19 perpatient per day then, ceteris paribus, the strict protocol as applied in this study remains costneutral.CONCLUSIONS. This health-economic model shows that the additional costs of BG-POCT with strict glucose control are fully offset against the savings generated by reducedhypo/hyperglycemic events and length of ICU/hospital stay. Indeed, the strict glucosecontrol protocol can improve quality of care in a budget-neutral way, even when BG-POCTcosts would be slightly higher.REFERENCE(S). 1. Schultz MJ, et al. Minerva Anestesiol 2012;78(9):982.GRANT ACKNOWLEDGMENT. The implementation project was supported by a grantfrom the Netherlands Organization for Health Research and Development. The healtheconomic model development was supported by a grant from Roche Diagnostics Interna-tional Ltd.
0518CAUSES AND CONSEQUENCES OF EXTREME HYPOGLYCEMIA
L. Woittiez1,2,3, J. van Pelt4, K. Hoogenberg2, M.W. Nijsten3
1Zaans Medisch Centrum, Department of Internal Medicine, Zaandam, Netherlands,2Martini Hospital, Department of Internal Medicine, Groningen, Netherlands, 3UniversityMedical Center Groningen, University of Groningen, Department of Critical Care,Groningen, Netherlands, 4University Medical Center Groningen, University of Groningen,Department of Laboratory Medicine, Groningen, NetherlandsINTRODUCTION. Several conditions can lead to very low blood glucose levels. Thecauses and consequences of extreme hypoglycemia in otherwise unselected patients havenot been studied in larger patient groups.OBJECTIVES. Determine the major causes, relevant aggravating factors, and short-termand long-term consequences in adult patients of extreme hypoglycemia (EH), defined asglucose levels \20 mg/dL (i.e. B1.0 mmol/L). We also assessed the impact of the GRIPcomputerized glucose control system1 that was implemented in 2005 in our intensive careunit (ICU).METHODS. The study was performed in our 1,000-plus bed and 45 ICU bed tertiaryhospital over a 12-year period. All blood glucoses in all patients recorded in the hospitalinformation system were screened for results of \20 mg/dl. All these cases of EH werecarefully assessed for either pre-analytical or analytical measurement errors. Patient char-acteristics, relevant department and phase of the hospital stay and potentially contributingcauses were recorded. Short and long-term mortality were also determined.RESULTS. Of all measurements recorded in the hospital information system, 670 mea-surements were \20 mg/dL, with 42 classified as errors. 514 patients were identified ashaving had true EH. After exclusion of 309 neonatal and 37 pediatric cases, 168 adultpatients were further studied. Three categories of EH were identified: EH resulting frominsulin or oral antidiabetics (including endocrinologic testing) (60 %), EH secondary to liverfailure (35 %) and a small group of miscellaneous causes (5 %). An important fraction ofEH’s occurred in the intensive care unit (43 %). Medication that could have contributed toEH, either during endocrinologic testing or for the treatment of diabetes, was used in 107patients (63 %). Metformin was used by 9 patients, but in none of them it was the presumedkey cause for EH.1-Year mortality was 2 % after EH due to endocrinological testing, 44 % in outpatients afterdiabetic treatment and 97 % after liver failure (P \ 0.001). Before GRIP was introduced 6cases of EH during insulin treatment occurred in the ICU. After GRIP no cases of insulin-induced EH were observed. Likewise the incidence of liver-failure associated EH decreased,presumably through the more timely initiation of glucose administration.CONCLUSIONS. Survival after extreme hypoglycemia depends very strongly on thecause. The prognosis varies from good after endocrinological testing, to moderate afteraccidental self-overdosing of insulin to extremely poor after liver failure. We believe activeprevention of hypoglycemia during impending liver failure deserves further study.REFERENCE. 1. Vogelzang M, et al. Design and implementation of GRIP: a computerizedglucose control system at a surgical intensive care unit. BMC Med Inform Decis Mak2005;5:38.
0519THE PREVALENCE OF UNRECOGNISED DIABETES AND CRITICAL-ILLNESSINDUCED HYPERGLYCAEMIA IN CRITICALLY ILL PATIENTS:A PROSPECTIVE OBSERVATIONAL STUDY
M.P. Plummer1, A.V. Zaknic1, B.A. Reddi1,2, J. Raj2, K. Sundararajan1,2, M.J. Chapman1,M. Horowitz1, A.M. Deane1
1University of Adelaide, School of Medicine, Adelaide, Australia, 2Royal AdelaideHospital, Intensive Care Unit, Adelaide, AustraliaINTRODUCTION. Unrecognised diabetes mellitus occurs, not infrequently, in both‘healthy’ people living in the community and hospitalised patients. The prevalence ofknown diabetes in patients admitted to intensive care units (ICU) is estimated to be15–20 %. ICU patients also commonly develop critical-illness induced hyperglycaemia(CIIH), or disordered glucose metabolism that normalises once the acute illness resolves.Recent observational data indicate that hyperglycaemia does not represent the same insult inall critically ill patients i.e. hyperglycaemia may be less deleterious in patients with pre-existing diabetes. Accordingly, the potential impact of acute glycaemia is dependent on apatient’s chronic glucose control. There is, however, little information about the compar-ative prevalence of: (1) CIIH; (2) recognised diabetes; (3) unrecognised diabetes; and (4)‘normal’ glucose tolerance, in the critically ill.OBJECTIVES. To determine the prevalence of CIIH and both recognised and unrecogn-ised diabetes in patients admitted to a tertiary level ICU.METHODS. This prospective observational study compared 867 consecutive patients agedC18 years, admitted over a 9 month period, in whom glycated haemoglobin (HbA1c) andblood glucose concentrations were measured during the first 2 days of their ICU admission.Patients were stratified into four groups; ‘known diabetes’, ‘unrecognised diabetes’, CIIHand ‘normal’ glucose tolerance. Known diabetes included patients with a documentedhistory of either type-1 or type-2 diabetes. Unrecognised diabetes was defined as patientswithout a history of diabetes in whom HbA1c C 6.5 %. The local medical officer of allpatients in this category was contacted to ensure that a diagnosis of diabetes had not beenmade in the past. CIIH was defined (as per WHO guidelines) as patients in whomHbA1c \ 6.5 %, who had a fasting blood glucose C7.0 mmol/L and/or a random bloodglucose C11.1 mmol/L. Patients with ‘normal’ glucose tolerance were defined according to
26th ESICM ANNUAL CONGRESS — PARIS, FRANCE — 5–9 OCTOBER 2013
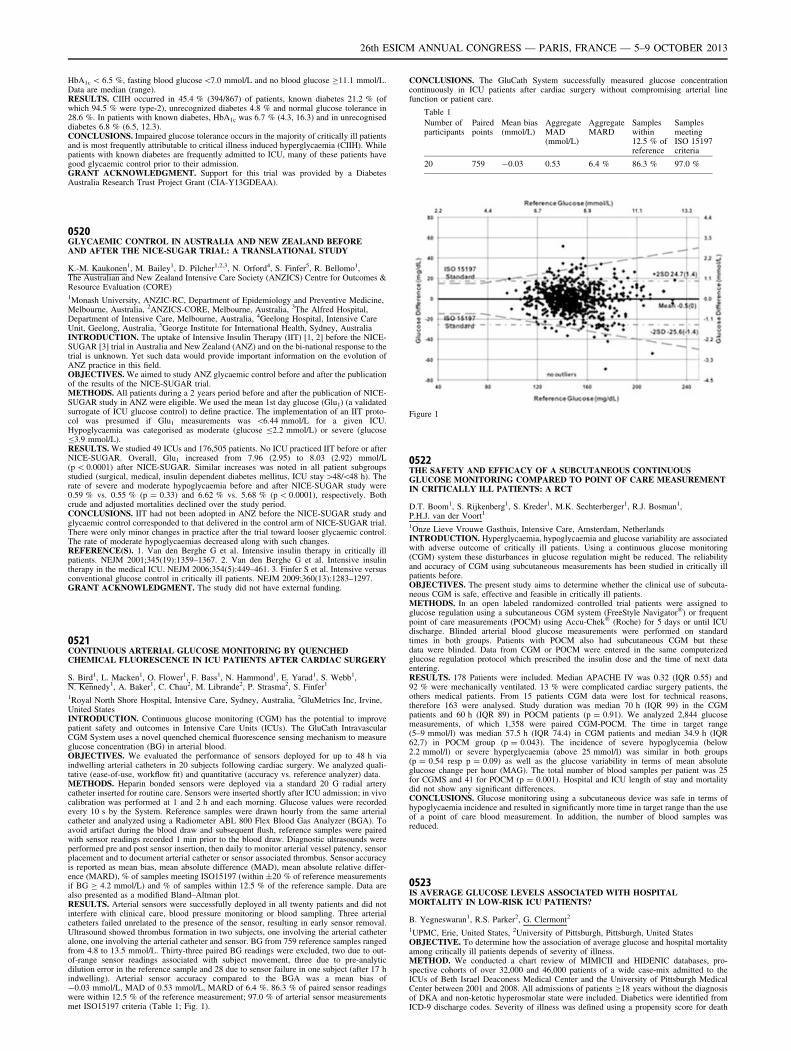
HbA1c \ 6.5 %, fasting blood glucose\7.0 mmol/L and no blood glucose C11.1 mmol/L.Data are median (range).RESULTS. CIIH occurred in 45.4 % (394/867) of patients, known diabetes 21.2 % (ofwhich 94.5 % were type-2), unrecognized diabetes 4.8 % and normal glucose tolerance in28.6 %. In patients with known diabetes, HbA1c was 6.7 % (4.3, 16.3) and in unrecogniseddiabetes 6.8 % (6.5, 12.3).CONCLUSIONS. Impaired glucose tolerance occurs in the majority of critically ill patientsand is most frequently attributable to critical illness induced hyperglycaemia (CIIH). Whilepatients with known diabetes are frequently admitted to ICU, many of these patients havegood glycaemic control prior to their admission.GRANT ACKNOWLEDGMENT. Support for this trial was provided by a DiabetesAustralia Research Trust Project Grant (CIA-Y13GDEAA).
0520GLYCAEMIC CONTROL IN AUSTRALIA AND NEW ZEALAND BEFOREAND AFTER THE NICE-SUGAR TRIAL: A TRANSLATIONAL STUDY
K.-M. Kaukonen1, M. Bailey1, D. Pilcher1,2,3, N. Orford4, S. Finfer5, R. Bellomo1,The Australian and New Zealand Intensive Care Society (ANZICS) Centre for Outcomes &Resource Evaluation (CORE)1Monash University, ANZIC-RC, Department of Epidemiology and Preventive Medicine,Melbourne, Australia, 2ANZICS-CORE, Melbourne, Australia, 3The Alfred Hospital,Department of Intensive Care, Melbourne, Australia, 4Geelong Hospital, Intensive CareUnit, Geelong, Australia, 5George Institute for International Health, Sydney, AustraliaINTRODUCTION. The uptake of Intensive Insulin Therapy (IIT) [1, 2] before the NICE-SUGAR [3] trial in Australia and New Zealand (ANZ) and on the bi-national response to thetrial is unknown. Yet such data would provide important information on the evolution ofANZ practice in this field.OBJECTIVES. We aimed to study ANZ glycaemic control before and after the publicationof the results of the NICE-SUGAR trial.METHODS. All patients during a 2 years period before and after the publication of NICE-SUGAR study in ANZ were eligible. We used the mean 1st day glucose (Glu1) (a validatedsurrogate of ICU glucose control) to define practice. The implementation of an IIT proto-col was presumed if Glu1 measurements was \6.44 mmol/L for a given ICU.Hypoglycaemia was categorised as moderate (glucose B2.2 mmol/L) or severe (glucoseB3.9 mmol/L).RESULTS. We studied 49 ICUs and 176,505 patients. No ICU practiced IIT before or afterNICE-SUGAR. Overall, Glu1 increased from 7.96 (2.95) to 8.03 (2.92) mmol/L(p \ 0.0001) after NICE-SUGAR. Similar increases was noted in all patient subgroupsstudied (surgical, medical, insulin dependent diabetes mellitus, ICU stay [48/\48 h). Therate of severe and moderate hypoglycaemia before and after NICE-SUGAR study were0.59 % vs. 0.55 % (p = 0.33) and 6.62 % vs. 5.68 % (p \ 0.0001), respectively. Bothcrude and adjusted mortalities declined over the study period.CONCLUSIONS. IIT had not been adopted in ANZ before the NICE-SUGAR study andglycaemic control corresponded to that delivered in the control arm of NICE-SUGAR trial.There were only minor changes in practice after the trial toward looser glycaemic control.The rate of moderate hypoglycaemias decreased along with such changes.REFERENCE(S). 1. Van den Berghe G et al. Intensive insulin therapy in critically illpatients. NEJM 2001;345(19):1359–1367. 2. Van den Berghe G et al. Intensive insulintherapy in the medical ICU. NEJM 2006;354(5):449–461. 3. Finfer S et al. Intensive versusconventional glucose control in critically ill patients. NEJM 2009;360(13):1283–1297.GRANT ACKNOWLEDGMENT. The study did not have external funding.
0521CONTINUOUS ARTERIAL GLUCOSE MONITORING BY QUENCHEDCHEMICAL FLUORESCENCE IN ICU PATIENTS AFTER CARDIAC SURGERY
S. Bird1, L. Macken1, O. Flower1, F. Bass1, N. Hammond1, E. Yarad1, S. Webb1,N. Kennedy1, A. Baker1, C. Chau2, M. Librande2, P. Strasma2, S. Finfer1
1Royal North Shore Hospital, Intensive Care, Sydney, Australia, 2GluMetrics Inc, Irvine,United StatesINTRODUCTION. Continuous glucose monitoring (CGM) has the potential to improvepatient safety and outcomes in Intensive Care Units (ICUs). The GluCath IntravascularCGM System uses a novel quenched chemical fluorescence sensing mechanism to measureglucose concentration (BG) in arterial blood.OBJECTIVES. We evaluated the performance of sensors deployed for up to 48 h viaindwelling arterial catheters in 20 subjects following cardiac surgery. We analyzed quali-tative (ease-of-use, workflow fit) and quantitative (accuracy vs. reference analyzer) data.METHODS. Heparin bonded sensors were deployed via a standard 20 G radial arterycatheter inserted for routine care. Sensors were inserted shortly after ICU admission; in vivocalibration was performed at 1 and 2 h and each morning. Glucose values were recordedevery 10 s by the System. Reference samples were drawn hourly from the same arterialcatheter and analyzed using a Radiometer ABL 800 Flex Blood Gas Analyzer (BGA). Toavoid artifact during the blood draw and subsequent flush, reference samples were pairedwith sensor readings recorded 1 min prior to the blood draw. Diagnostic ultrasounds wereperformed pre and post sensor insertion, then daily to monitor arterial vessel patency, sensorplacement and to document arterial catheter or sensor associated thrombus. Sensor accuracyis reported as mean bias, mean absolute difference (MAD), mean absolute relative differ-ence (MARD), % of samples meeting ISO15197 (within ±20 % of reference measurementsif BG C 4.2 mmol/L) and % of samples within 12.5 % of the reference sample. Data arealso presented as a modified Bland–Altman plot.RESULTS. Arterial sensors were successfully deployed in all twenty patients and did notinterfere with clinical care, blood pressure monitoring or blood sampling. Three arterialcatheters failed unrelated to the presence of the sensor, resulting in early sensor removal.Ultrasound showed thrombus formation in two subjects, one involving the arterial catheteralone, one involving the arterial catheter and sensor. BG from 759 reference samples rangedfrom 4.8 to 13.5 mmol/L. Thirty-three paired BG readings were excluded, two due to out-of-range sensor readings associated with subject movement, three due to pre-analyticdilution error in the reference sample and 28 due to sensor failure in one subject (after 17 hindwelling). Arterial sensor accuracy compared to the BGA was a mean bias of-0.03 mmol/L, MAD of 0.53 mmol/L, MARD of 6.4 %. 86.3 % of paired sensor readingswere within 12.5 % of the reference measurement; 97.0 % of arterial sensor measurementsmet ISO15197 criteria (Table 1; Fig. 1).
CONCLUSIONS. The GluCath System successfully measured glucose concentrationcontinuously in ICU patients after cardiac surgery without compromising arterial linefunction or patient care.
Table 1
Number ofparticipants
Pairedpoints
Mean bias(mmol/L)
AggregateMAD(mmol/L)
AggregateMARD
Sampleswithin12.5 % ofreference
SamplesmeetingISO 15197criteria
20 759 -0.03 0.53 6.4 % 86.3 % 97.0 %
Figure 1
0522THE SAFETY AND EFFICACY OF A SUBCUTANEOUS CONTINUOUSGLUCOSE MONITORING COMPARED TO POINT OF CARE MEASUREMENTIN CRITICALLY ILL PATIENTS: A RCT
D.T. Boom1, S. Rijkenberg1, S. Kreder1, M.K. Sechterberger1, R.J. Bosman1,P.H.J. van der Voort1
1Onze Lieve Vrouwe Gasthuis, Intensive Care, Amsterdam, NetherlandsINTRODUCTION. Hyperglycaemia, hypoglycaemia and glucose variability are associatedwith adverse outcome of critically ill patients. Using a continuous glucose monitoring(CGM) system these disturbances in glucose regulation might be reduced. The reliabilityand accuracy of CGM using subcutaneous measurements has been studied in critically illpatients before.OBJECTIVES. The present study aims to determine whether the clinical use of subcuta-neous CGM is safe, effective and feasible in critically ill patients.METHODS. In an open labeled randomized controlled trial patients were assigned toglucose regulation using a subcutaneous CGM system (FreeStyle Navigator�) or frequentpoint of care measurements (POCM) using Accu-Chek� (Roche) for 5 days or until ICUdischarge. Blinded arterial blood glucose measurements were performed on standardtimes in both groups. Patients with POCM also had subcutaneous CGM but thesedata were blinded. Data from CGM or POCM were entered in the same computerizedglucose regulation protocol which prescribed the insulin dose and the time of next dataentering.RESULTS. 178 Patients were included. Median APACHE IV was 0.32 (IQR 0.55) and92 % were mechanically ventilated. 13 % were complicated cardiac surgery patients, theothers medical patients. From 15 patients CGM data were lost for technical reasons,therefore 163 were analysed. Study duration was median 70 h (IQR 99) in the CGMpatients and 60 h (IQR 89) in POCM patients (p = 0.91). We analyzed 2,844 glucosemeasurements, of which 1,358 were paired CGM-POCM. The time in target range(5–9 mmol/l) was median 57.5 h (IQR 74.4) in CGM patients and median 34.9 h (IQR62.7) in POCM group (p = 0.043). The incidence of severe hypoglycemia (below2.2 mmol/l) or severe hyperglycaemia (above 25 mmol/l) was similar in both groups(p = 0.54 resp p = 0.09) as well as the glucose variability in terms of mean absoluteglucose change per hour (MAG). The total number of blood samples per patient was 25for CGMS and 41 for POCM (p = 0.001). Hospital and ICU length of stay and mortalitydid not show any significant differences.CONCLUSIONS. Glucose monitoring using a subcutaneous device was safe in terms ofhypoglycaemia incidence and resulted in significantly more time in target range than the useof a point of care blood measurement. In addition, the number of blood samples wasreduced.
0523IS AVERAGE GLUCOSE LEVELS ASSOCIATED WITH HOSPITALMORTALITY IN LOW-RISK ICU PATIENTS?
B. Yegneswaran1, R.S. Parker2, G. Clermont2
1UPMC, Erie, United States, 2University of Pittsburgh, Pittsburgh, United StatesOBJECTIVE. To determine how the association of average glucose and hospital mortalityamong critically ill patients depends of severity of illness.METHOD. We conducted a chart review of MIMICII and HIDENIC databases, pro-spective cohorts of over 32,000 and 46,000 patients of a wide case-mix admitted to theICUs of Beth Israel Deaconess Medical Center and the University of Pittsburgh MedicalCenter between 2001 and 2008. All admissions of patients C18 years without the diagnosisof DKA and non-ketotic hyperosmolar state were included. Diabetics were identified fromICD-9 discharge codes. Severity of illness was defined using a propensity score for death
26th ESICM ANNUAL CONGRESS — PARIS, FRANCE — 5–9 OCTOBER 2013
(pDead) computed as the predicted hospital death from either SAPSI (MIMICII) orAPACHEIII(HIDENIC) scores on the day of ICU admission. Average glucose (AVG) wascomputed as the area under the glucose curve throughout ICU admission. Hypoglycemiawas defined as AVG B60 mg/dl. A patient was defined as low-risk if her pDEAD was lessthan the median. Patients were binned according to their AVG in bins of 10 mg/dl andcrude mortality rates computed within bins and statistically significant mortality betweenadjacent bins was ascertained, following Bonferroni correction. Patients are low-risk andhigh-risk were analyzed separately. A multivariate model including AVG was alsoconstructed.RESULTS. MIMICII database 21,209 admissions met inclusion criteria. Mean age:62.5 ± 16.4 years; female: 9,070 (42.8 %); diabetes 5,496 (25.9 %); mean admission SAP1score: 13.8 ± 5.2; mean LOS: 9 days (IQR-6, 15); hospital mortality: 10.3 %. HIDENICdatabase 38,872 admissions met inclusion criteria. Mean age: 59.4 ± 17.3 years; female16,675 (42.9 %); diabetes 11,326 (29.1 %); mean admission APACHEIII score: 80.2 ± 14;mean LOS: 11 days (IQR-7, 22); Hospital mortality: 14.3 %.In both low-risk and high-riskgroups, there was a bathtub-like association between hospital mortality and AVG, with nadirmortality being flat between 80 and 130 mg/dl. Low & increased average glucose areassociated with mortality. Mean pDead was 0.06 and the percentage of death was 6.6 %among low risk ICU patients, compared to 0.20 and 19.4 % in high-risk patients. Vaso-pressor, infection status, ventilator use, age of patients, glucose variability, average andmaximum glucose levels where all significantly associated with mortality while diabetes hada protective effect in multivariate analysis.CONCLUSION. In a large observational cohort, there is a strong relationship betweenaverage blood glucose and mortality in low-risk ICU patients, after adjustment for severityand process of care.GRANT SUPPORT. Supported by National Institutes of Health (R21-DK-92813).
0524EXPANDING ANALYTICS TO ASSESS GLYCEMIC CONTROL IN CRITICALCARE
M.R. Rigby1, T. Leong2, C. Rider1, T. Szakmany3,4
1Indiana University School of Medicine, Department of Pediatrics, Indianapolis, UnitedStates, 2Emory University School of Medicine, Rollins School of Public Health, Atlanta,United States, 3Royal Glamorgan Hospital, Anaesthesia, Critical Care and Theatres,Llantrisant, United Kingdom, 4Cardiff University, Department of Anaesthesia, IntensiveCare and Pain Medicine, Cardiff, United KingdomINTRODUCTION. Over the past decade glycemic control has become accepted care incritically ill patients. Although original studies suggested that targeting blood glucose (BG)in the 4.4–6.1 mmol/L range were optimal, subsequent studies and recommendations havesuggested a more liberal upper limit, i.e. 8.3–10 mmol/L [1]. These recommendations arebased on clinical studies that have assessed glycemic management based on averaging BGreadings with little appreciation for the frequency of reading or ICU course.OBJECTIVES. In order to better understand how outcome may correlate with BG readingsover the course of an ICU stay, we developed an approach to assess and compare BGreadings, time and area in and out of recommended ranges in ICU patients.METHODS. We assessed BG readings, demographics and outcome of mechanically ven-tilated patients who were admitted to the Royal Glamorgan Hospital ICU, had a length ofstay greater than 1 day and at least 5 blood glucose readings in 2011–2012. Timed BGreadings were entered into proprietary software in which output includes average BG, BGstandard deviation, and allows assessment of the number and percent of readings in definedBG ranges. In addition to number of readings, output includes time and area (time9BGlevel) in and out of preselected range of 4.4–8.3 mmol/L [1].RESULTS. Out of the 203 eligible patients 185 were analysed. In 18 patients full outcomedate was not available. Of the 185 patients 157 (77.3 %) survived. While gender did notdiffer between survivors (S) and non survivors (N/S) (p [ 0.05), age (59 vs 67 years) wassignificantly different between groups (p = 0.0039). Although the average LOS for S waslonger than for N/S (9.8 vs 8.3 days) (p = 0.0002), there were only 36 % more BG checksin the S vs N/S groups (49 vs 36). The average and standard deviation of all BG mea-surement for the S and N/S groups were 7.7 ± 1.6 and 8.3 ± 2 mmol/L (p [ 0.05). Whenanalyzing the BG results with our new method, the S and N/S were in range on average 85and 72 % of the area, respectively (p = 0.0134). The average % area above the preselectedrange (8.3 mmol/L) in N/S was 25.7 % in contrast to 15.2 % for the S (p = 0.0375).There was not a statistical difference between mortality groups and average % area under4.4 mmol/L 0.13 S vs 2 % N/S, p = 0.1228).CONCLUSIONS. One of the limitations of previous studies in ICU glycemic control maybe the approaches used to quantify glycemic control, which may be influenced by thenumber and timing of BG levels. Our approach to assess use time and area weightedassessments and may assist in determining optimal therapeutic ranges and help in real-timeassessments. The average % area within the normal range appears to be a more sensitiveparameter to objectively measure the quality of glucose control on the ICU.REFERENCE(S). Crit Care Med 2013;41:580–637.
0525INCIDENCE, CAUSES AND CONSEQUENCES OF EARLY HYPOGLYCEMIAIN SEVERE TRAUMA PATIENTS
M. Wouters1,2, R.A. Posma1, L. van der Weerd1, T.S. van Putten1, K.W. Wendt2,M.W. Nijsten1
1University Medical Center Groningen, University of Groningen, Department of CriticalCare, Groningen, Netherlands, 2University Medical Center Groningen, University ofGroningen, Department of Surgery, Groningen, NetherlandsINTRODUCTION. Multiple trauma patients have increased energy needs caused by theinjury and the subsequent systemic responses. Even in normally nourished persons glycogenstores may become inadequate after prolonged stress. Whether early hypoglycemia due toexhaustion might occur in trauma patients not been studied before.OBJECTIVES. To determine the incidence and risk factors of hypoglycemia in multipletrauma patients and relate this to potential contributing factors and subsequent outcomes.METHODS. A retrospective database review was conducted on all adult trauma patients(age C16 years) seen at our emergency department (ED) and subsequently admitted to theintensive care unit (ICU) between 1992 and 2011. The lowest glucose in the first 48 h afterthe time of the accident was determined for all patients. Age, diabetes status, alcohol use,interval between accident and treatment at the emergency department, injury severity score(ISS), transfusion requirements and core temperature at the ED and ICU were recorded.
Outcome measures including hospital mortality were also recorded, to determine the relationbetween glucose and mortality. We subsequently selected patients with an episode ofhypoglycemia defined as any glucose B4.5 mmol/L in the first 48 h after the accident. Thesecases were then matched on age, sex and year of admission with an equal number ofcontrols. Cases and controls were studied in detail. We also recorded if any calorie-con-taining infusions or feeding were administered.RESULTS. A total of 2,326 adult patients with mean ± SD lowest glucose of6.0 ± 2.0 mmol/L and a hospital mortality of 22 % were studied. Multivariable logisticregression analysis showed that glucose, age, ISS and transfusion requirements were allsignificantly related to hospital mortality. Moreover glucose also displayed a significantU-shaped relation with outcome (P \ 0.001), thus underscoring that low early glucoselevels are associated with mortality. 247 patients had a lowest glucose of B4.5 mmol/L andwere matched with another 247 control patients. Diabetes status was univariately associatedwith low glucose levels (P = 0.02) and alcohol use showed a trend towards low glucoselevels (P = 0.05). The interval between accident and ED-admission was not related withhypoglycemia, but core temperature measured at the ED and later at the ICU was signifi-cantly lower in hypoglycemic cases versus controls: 35.8 ± 1.7 versus 36.3 ± 0.9 �C(P = 0.002). Upon multivariable analysis, a lower core temperature remained associatedwith hypoglycemia (P = 0.015).CONCLUSIONS. Early hypoglycemia can occur in severe trauma patients and is associ-ated with increased mortality. The association of a low body temperature withhypoglycemia suggests insufficient metabolism as a common mechanism. Whether earlyadministration of larger amounts glucose to selected trauma patients might provide benefit,deserves further study.
0526PROSPECTIVE STUDY EXPLORING PREDICTIVE VALUE IN BLOODGLUCOSE CONCENTRATION AND BLOOD GLUCOSE VARIABILITYTO PROGNOSIS IN PATIENTS WITH SEVERE ABDOMINAL INFECTIONS
L. Xiaoyue1, C. Li-Hua1
1Dongguan People’s Hospital, Department of Critical Care Medicine, Dongguan, ChinaOBJECTIVES. To investigate the predictive value in blood glucose concentration andblood glucose variability to prognosis in patients with severe abdominal infections.METHODS. A prospective study was conducted. Blood glucose monitoring and prognosisobservation were performed for the adult nondiabetic patients with severe abdominalinfections admitted in ICU from July 2012 to Feb 2013. Blood monitoring terminal was 24 hafter admitted in ICU. Prognosis observation terminal was 7 days after admitted in ICU. Theblood glucose concentration admitted in ICU, the maximum and minimum values of bloodglucose were recorded. Acute physiology and chronic health evaluationII(APACHEII)scores, sequential organ failure assessment (SOFA), differential value of blood glu-cose(GLUdif), average value of blood glucose (GLUave) and standard deviation (GLUsd),coefficient of blood glucose (GLUcv), mean absolute blood glucose fluctuation amplitude(MAGE) were calculated. Patients were divided into good prognosis group and bad prog-nosis group.RESULTS. Forty-two patients were divided into good prognosis group (n = 24) and badprognosis group (n = 18). There were no significantly differences in age, sex, primarydisease, blood glucose concentration on admission, acute physiology and chronic healthevaluation and sequential organ failure assessment between two groups (P [ 0.05). GLU-
max, GLUdif, MAGE in good prognosis group were significantly lower than those in badprognosis group (P \ 0.05). Area under ROC of MAGE, GLUmax and GLUdif were 0.806,0.787 and 0.769. With a cut-off value of 15.4 mmol L-1, GLUmax had a sensitivity of77.8 % and a specificity of 83.3 %.CONCLUSIONS. High blood glucose concentration and high blood glucose variability areimportant factors to bad prognosis in patients with severe abdominal infections. GLUmax
during 24 h admission to ICU is a good index to predict prognosis for patients with severeabdominal infections. The cut-off value of GLUmax was 15.4 mmol L-1.REFERENCE(S). 1. Van den Berghe G, Wouters P, Weekers F, et al. Intensive insulintherapy in the critically ill patients. N Engl J Med 2001;345(19):1359–1367. 2. The NICE-SUGAR study investigators: Intensive versus conventional glucose control in critically illpatients. N Engl J Med 2009;360:1283–1297. 3. Levy MM, Fink MP, Marshall JC, et al.2001 SCCM/ESICM/ACCP/ATS/SIS international sepsis definitions conference. Crit CareMed 2003;31(4):1250–1256. 4. Phillip Dellinger R., Mitchell M. Levy, Andrew Rhodes,et al. Surviving Sepsis campaign: international guidelines for management of severe sepsisand septic shock: 2012. Crit Care Med 2013;41(2):580–637. 5. Jacka MJ, Torok-Both CJ,Bagshaw SM. Blood glocose control among critically ill patients with brain injury. Can JNeurol Sci 2009;36(4):436–442.
0527GLUCOSE DISORDERS IN CRITICALLY ILL CHILDREN IN A TERTIARYCARE INDIAN ICU
K. Naranje1, B. Poddar1, R. Lal2, A. Baronia1
1Sanjay Gandhi Postgraduate Institute of Medical Sciences, Critical Care Medicine,Lucknow, India, 2Sanjay Gandhi Postgraduate Institute of Medical Sciences, PediatricSurgery, Lucknow, IndiaINTRODUCTION. Glucose disorders in the form of hyperglycemia, hypoglycemia andvariability of blood glucose (BG) levels have been associated with adverse outcomes incritically ill children. Few studies are reported from developing countries.OBJECTIVES. To study the incidence of hyperglycemia (BG C 126 mg/dl), hypoglyce-mia (BG B 60 mg/dl) and glucose variability in critically ill children in the first week ofICU stay and their association with mortality, length of ICU stay and organ dysfunction.METHODS. Retrospective study of children (B18 years) admitted to a combined adult andpediatric ICU of a tertiary care teaching hospital in India over a period of 9 years (March2003–April 2012). Data was retrieved from the patient records and included demographicand clinical profile, severity of illness, indications for ICU admission and outcome. Max-imum and minimum BG levels, insulin and steroid usage, and ICU interventions for first7 days of ICU stay were noted. BG variability was defined as occurrence of hypoglycemiaand hyperglycemia on the same day. Data was analysed using SPSS statistics version 17.0.RESULTS. 391 children were admitted during this period; data is presented for 102patients. The median age was 6 years (range 10 days to 18 years); 72 (70.5 %) weremales.The median PRISM III score on day 1 was 9 (IQR 5–13.5). The median length of ICUstay was 4 days (IQR 2–6 days) and 33 (32.3 %) patients died during the ICU stay; majority31 (93.9 %) were with medical conditions. Figure 1 shows median maximun and minimumBG levels in the first 7 days.
26th ESICM ANNUAL CONGRESS — PARIS, FRANCE — 5–9 OCTOBER 2013
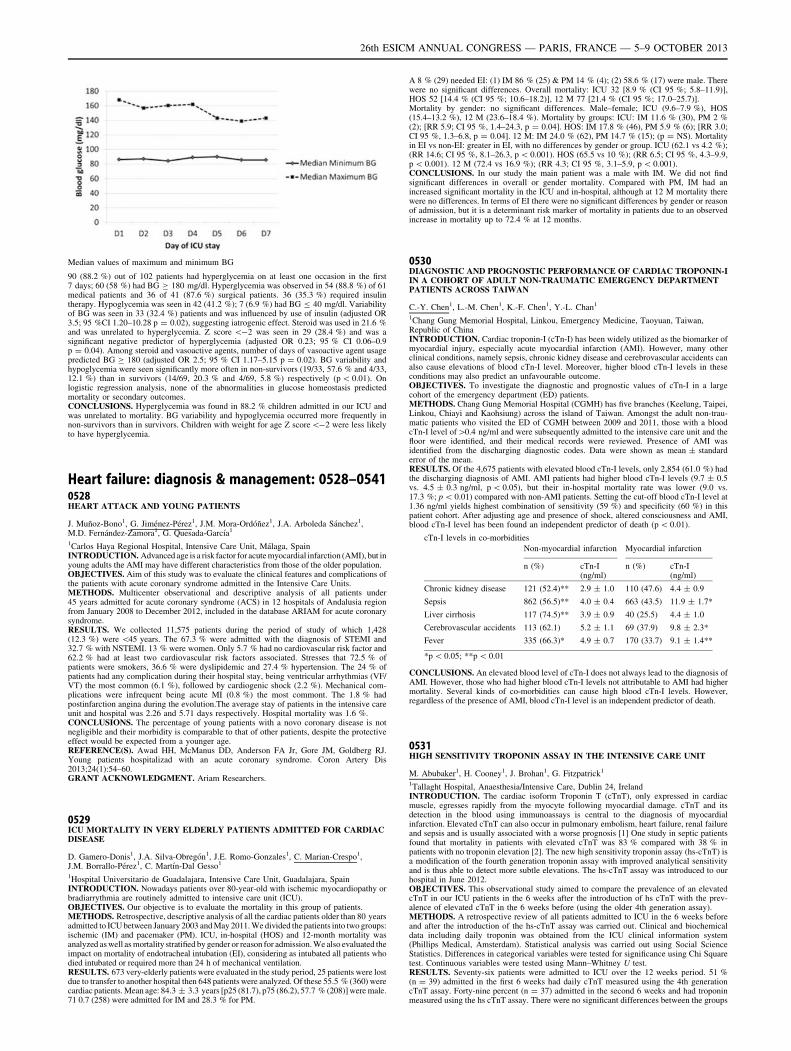
Median values of maximum and minimum BG
90 (88.2 %) out of 102 patients had hyperglycemia on at least one occasion in the first7 days; 60 (58 %) had BG C 180 mg/dl. Hyperglycemia was observed in 54 (88.8 %) of 61medical patients and 36 of 41 (87.6 %) surgical patients. 36 (35.3 %) required insulintherapy. Hypoglycemia was seen in 42 (41.2 %); 7 (6.9 %) had BG B 40 mg/dl. Variabilityof BG was seen in 33 (32.4 %) patients and was influenced by use of insulin (adjusted OR3.5; 95 %CI 1.20–10.28 p = 0.02), suggesting iatrogenic effect. Steroid was used in 21.6 %and was unrelated to hyperglycemia. Z score \-2 was seen in 29 (28.4 %) and was asignificant negative predictor of hyperglycemia (adjusted OR 0.23; 95 % CI 0.06–0.9p = 0.04). Among steroid and vasoactive agents, number of days of vasoactive agent usagepredicted BG C 180 (adjusted OR 2.5; 95 % CI 1.17–5.15 p = 0.02). BG variability andhypoglycemia were seen significantly more often in non-survivors (19/33, 57.6 % and 4/33,12.1 %) than in survivors (14/69, 20.3 % and 4/69, 5.8 %) respectively (p \ 0.01). Onlogistic regression analysis, none of the abnormalities in glucose homeostasis predictedmortality or secondary outcomes.CONCLUSIONS. Hyperglycemia was found in 88.2 % children admitted in our ICU andwas unrelated to mortality. BG variability and hypoglycemia occurred more frequently innon-survivors than in survivors. Children with weight for age Z score\-2 were less likelyto have hyperglycemia.
Heart failure: diagnosis & management: 0528–05410528HEART ATTACK AND YOUNG PATIENTS
J. Muñoz-Bono1, G. Jiménez-Pérez1, J.M. Mora-Ordóñez1, J.A. Arboleda Sánchez1,M.D. Fernández-Zamora1, G. Quesada-Garcı́a1
1Carlos Haya Regional Hospital, Intensive Care Unit, Málaga, SpainINTRODUCTION. Advanced age is a risk factor for acute myocardial infarction (AMI), but inyoung adults the AMI may have different characteristics from those of the older population.OBJECTIVES. Aim of this study was to evaluate the clinical features and complications ofthe patients with acute coronary syndrome admitted in the Intensive Care Units.METHODS. Multicenter observational and descriptive analysis of all patients under45 years admitted for acute coronary syndrome (ACS) in 12 hospitals of Andalusia regionfrom January 2008 to December 2012, included in the database ARIAM for acute coronarysyndrome.RESULTS. We collected 11,575 patients during the period of study of which 1,428(12.3 %) were \45 years. The 67.3 % were admitted with the diagnosis of STEMI and32.7 % with NSTEMI. 13 % were women. Only 5.7 % had no cardiovascular risk factor and62.2 % had at least two cardiovascular risk factors associated. Stresses that 72.5 % ofpatients were smokers, 36.6 % were dyslipidemic and 27.4 % hypertension. The 24 % ofpatients had any complication during their hospital stay, being ventricular arrhythmias (VF/VT) the most common (6.1 %), followed by cardiogenic shock (2.2 %). Mechanical com-plications were infrequent being acute MI (0.8 %) the most commont. The 1.8 % hadpostinfarction angina during the evolution.The average stay of patients in the intensive careunit and hospital was 2.26 and 5.71 days respectively. Hospital mortality was 1.6 %.CONCLUSIONS. The percentage of young patients with a novo coronary disease is notnegligible and their morbidity is comparable to that of other patients, despite the protectiveeffect would be expected from a younger age.REFERENCE(S). Awad HH, McManus DD, Anderson FA Jr, Gore JM, Goldberg RJ.Young patients hospitalizad with an acute coronary syndrome. Coron Artery Dis2013;24(1):54–60.GRANT ACKNOWLEDGMENT. Ariam Researchers.
0529ICU MORTALITY IN VERY ELDERLY PATIENTS ADMITTED FOR CARDIACDISEASE
D. Gamero-Donis1, J.A. Silva-Obregón1, J.E. Romo-Gonzales1, C. Marian-Crespo1,J.M. Borrallo-Pérez1, C. Martı́n-Dal Gesso1
1Hospital Universitario de Guadalajara, Intensive Care Unit, Guadalajara, SpainINTRODUCTION. Nowadays patients over 80-year-old with ischemic myocardiopathy orbradiarrythmia are routinely admitted to intensive care unit (ICU).OBJECTIVES. Our objective is to evaluate the mortality in this group of patients.METHODS. Retrospective, descriptive analysis of all the cardiac patients older than 80 yearsadmitted to ICU between January 2003 and May 2011. We divided the patients into two groups:ischemic (IM) and pacemaker (PM). ICU, in-hospital (HOS) and 12-month mortality wasanalyzed as well as mortality stratified by gender or reason for admission. We also evaluated theimpact on mortality of endotracheal intubation (EI), considering as intubated all patients whodied intubated or required more than 24 h of mechanical ventilation.RESULTS. 673 very-elderly patients were evaluated in the study period, 25 patients were lostdue to transfer to another hospital then 648 patients were analyzed. Of these 55.5 % (360) werecardiac patients. Mean age: 84.3 ± 3.3 years [p25 (81.7), p75 (86.2), 57.7 % (208)] were male.71 0.7 (258) were admitted for IM and 28.3 % for PM.
A 8 % (29) needed EI: (1) IM 86 % (25) & PM 14 % (4); (2) 58.6 % (17) were male. Therewere no significant differences. Overall mortality: ICU 32 [8.9 % (CI 95 %; 5.8–11.9)],HOS 52 [14.4 % (CI 95 %; 10.6–18.2)], 12 M 77 [21.4 % (CI 95 %; 17.0–25.7)].Mortality by gender: no significant differences. Male–female; ICU (9.6–7.9 %), HOS(15.4–13.2 %), 12 M (23.6–18.4 %). Mortality by groups: ICU: IM 11.6 % (30), PM 2 %(2); [RR 5.9; CI 95 %, 1.4–24.3, p = 0.04]. HOS: IM 17.8 % (46), PM 5.9 % (6); [RR 3.0;CI 95 %, 1.3–6.8, p = 0.04]. 12 M: IM 24.0 % (62), PM 14.7 % (15); (p = NS). Mortalityin EI vs non-EI: greater in EI, with no differences by gender or group. ICU (62.1 vs 4.2 %);(RR 14.6; CI 95 %, 8.1–26.3, p \ 0.001). HOS (65.5 vs 10 %); (RR 6.5; CI 95 %, 4.3–9.9,p \ 0.001). 12 M (72.4 vs 16.9 %); (RR 4.3; CI 95 %, 3.1–5.9, p \ 0.001).CONCLUSIONS. In our study the main patient was a male with IM. We did not findsignificant differences in overall or gender mortality. Compared with PM, IM had anincreased significant mortality in the ICU and in-hospital, although at 12 M mortality therewere no differences. In terms of EI there were no significant differences by gender or reasonof admission, but it is a determinant risk marker of mortality in patients due to an observedincrease in mortality up to 72.4 % at 12 months.
0530DIAGNOSTIC AND PROGNOSTIC PERFORMANCE OF CARDIAC TROPONIN-IIN A COHORT OF ADULT NON-TRAUMATIC EMERGENCY DEPARTMENTPATIENTS ACROSS TAIWAN
C.-Y. Chen1, L.-M. Chen1, K.-F. Chen1, Y.-L. Chan1
1Chang Gung Memorial Hospital, Linkou, Emergency Medicine, Taoyuan, Taiwan,Republic of ChinaINTRODUCTION. Cardiac troponin-I (cTn-I) has been widely utilized as the biomarker ofmyocardial injury, especially acute myocardial infarction (AMI). However, many otherclinical conditions, namely sepsis, chronic kidney disease and cerebrovascular accidents canalso cause elevations of blood cTn-I level. Moreover, higher blood cTn-I levels in theseconditions may also predict an unfavourable outcome.OBJECTIVES. To investigate the diagnostic and prognostic values of cTn-I in a largecohort of the emergency department (ED) patients.METHODS. Chang Gung Memorial Hospital (CGMH) has five branches (Keelung, Taipei,Linkou, Chiayi and Kaohsiung) across the island of Taiwan. Amongst the adult non-trau-matic patients who visited the ED of CGMH between 2009 and 2011, those with a bloodcTn-I level of[0.4 ng/ml and were subsequently admitted to the intensive care unit and thefloor were identified, and their medical records were reviewed. Presence of AMI wasidentified from the discharging diagnostic codes. Data were shown as mean ± standarderror of the mean.RESULTS. Of the 4,675 patients with elevated blood cTn-I levels, only 2,854 (61.0 %) hadthe discharging diagnosis of AMI. AMI patients had higher blood cTn-I levels (9.7 ± 0.5vs. 4.5 ± 0.3 ng/ml, p \ 0.05), but their in-hospital mortality rate was lower (9.0 vs.17.3 %; p \ 0.01) compared with non-AMI patients. Setting the cut-off blood cTn-I level at1.36 ng/ml yields highest combination of sensitivity (59 %) and specificity (60 %) in thispatient cohort. After adjusting age and presence of shock, altered consciousness and AMI,blood cTn-I level has been found an independent predictor of death (p \ 0.01).
cTn-I levels in co-morbidities
Non-myocardial infarction Myocardial infarction
n (%) cTn-I(ng/ml)
n (%) cTn-I(ng/ml)
Chronic kidney disease 121 (52.4)** 2.9 ± 1.0 110 (47.6) 4.4 ± 0.9
Sepsis 862 (56.5)** 4.0 ± 0.4 663 (43.5) 11.9 ± 1.7*
Liver cirrhosis 117 (74.5)** 3.9 ± 0.9 40 (25.5) 4.4 ± 1.0
Cerebrovascular accidents 113 (62.1) 5.2 ± 1.1 69 (37.9) 9.8 ± 2.3*
Fever 335 (66.3)* 4.9 ± 0.7 170 (33.7) 9.1 ± 1.4**
*p \ 0.05; **p \ 0.01
CONCLUSIONS. An elevated blood level of cTn-I does not always lead to the diagnosis ofAMI. However, those who had higher blood cTn-I levels not attributable to AMI had highermortality. Several kinds of co-morbidities can cause high blood cTn-I levels. However,regardless of the presence of AMI, blood cTn-I level is an independent predictor of death.
0531HIGH SENSITIVITY TROPONIN ASSAY IN THE INTENSIVE CARE UNIT
M. Abubaker1, H. Cooney1, J. Brohan1, G. Fitzpatrick1
1Tallaght Hospital, Anaesthesia/Intensive Care, Dublin 24, IrelandINTRODUCTION. The cardiac isoform Troponin T (cTnT), only expressed in cardiacmuscle, egresses rapidly from the myocyte following myocardial damage. cTnT and itsdetection in the blood using immunoassays is central to the diagnosis of myocardialinfarction. Elevated cTnT can also occur in pulmonary embolism, heart failure, renal failureand sepsis and is usually associated with a worse prognosis [1] One study in septic patientsfound that mortality in patients with elevated cTnT was 83 % compared with 38 % inpatients with no troponin elevation [2]. The new high sensitivity troponin assay (hs-cTnT) isa modification of the fourth generation troponin assay with improved analytical sensitivityand is thus able to detect more subtle elevations. The hs-cTnT assay was introduced to ourhospital in June 2012.OBJECTIVES. This observational study aimed to compare the prevalence of an elevatedcTnT in our ICU patients in the 6 weeks after the introduction of hs cTnT with the prev-alence of elevated cTnT in the 6 weeks before (using the older 4th generation assay).METHODS. A retrospective review of all patients admitted to ICU in the 6 weeks beforeand after the introduction of the hs-cTnT assay was carried out. Clinical and biochemicaldata including daily troponin was obtained from the ICU clinical information system(Phillips Medical, Amsterdam). Statistical analysis was carried out using Social ScienceStatistics. Differences in categorical variables were tested for significance using Chi Squaretest. Continuous variables were tested using Mann–Whitney U test.RESULTS. Seventy-six patients were admitted to ICU over the 12 weeks period. 51 %(n = 39) admitted in the first 6 weeks had daily cTnT measured using the 4th generationcTnT assay. Forty-nine percent (n = 37) admitted in the second 6 weeks and had troponinmeasured using the hs cTnT assay. There were no significant differences between the groups
26th ESICM ANNUAL CONGRESS — PARIS, FRANCE — 5–9 OCTOBER 2013
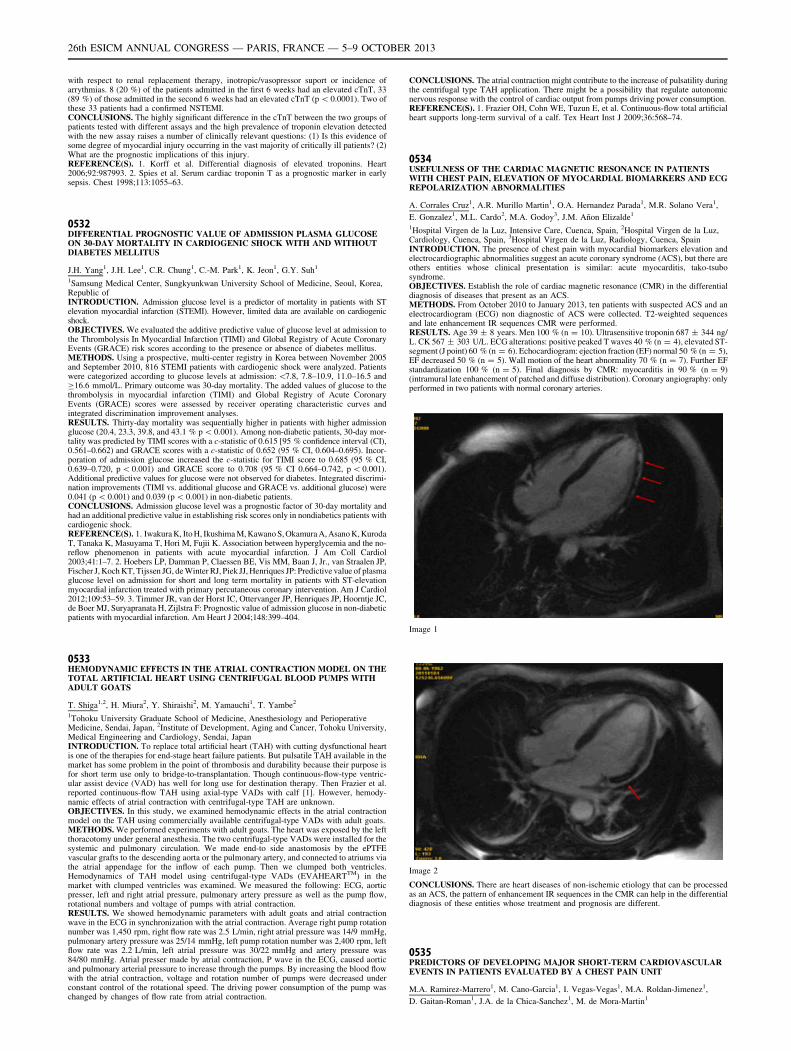
with respect to renal replacement therapy, inotropic/vasopressor suport or incidence ofarrythmias. 8 (20 %) of the patients admitted in the first 6 weeks had an elevated cTnT, 33(89 %) of those admitted in the second 6 weeks had an elevated cTnT (p \ 0.0001). Two ofthese 33 patients had a confirmed NSTEMI.CONCLUSIONS. The highly significant difference in the cTnT between the two groups ofpatients tested with different assays and the high prevalence of troponin elevation detectedwith the new assay raises a number of clinically relevant questions: (1) Is this evidence ofsome degree of myocardial injury occurring in the vast majority of critically ill patients? (2)What are the prognostic implications of this injury.REFERENCE(S). 1. Korff et al. Differential diagnosis of elevated troponins. Heart2006;92:987993. 2. Spies et al. Serum cardiac troponin T as a prognostic marker in earlysepsis. Chest 1998;113:1055–63.
0532DIFFERENTIAL PROGNOSTIC VALUE OF ADMISSION PLASMA GLUCOSEON 30-DAY MORTALITY IN CARDIOGENIC SHOCK WITH AND WITHOUTDIABETES MELLITUS
J.H. Yang1, J.H. Lee1, C.R. Chung1, C.-M. Park1, K. Jeon1, G.Y. Suh1
1Samsung Medical Center, Sungkyunkwan University School of Medicine, Seoul, Korea,Republic ofINTRODUCTION. Admission glucose level is a predictor of mortality in patients with STelevation myocardial infarction (STEMI). However, limited data are available on cardiogenicshock.OBJECTIVES. We evaluated the additive predictive value of glucose level at admission tothe Thrombolysis In Myocardial Infarction (TIMI) and Global Registry of Acute CoronaryEvents (GRACE) risk scores according to the presence or absence of diabetes mellitus.METHODS. Using a prospective, multi-center registry in Korea between November 2005and September 2010, 816 STEMI patients with cardiogenic shock were analyzed. Patientswere categorized according to glucose levels at admission: \7.8, 7.8–10.9, 11.0–16.5 andC16.6 mmol/L. Primary outcome was 30-day mortality. The added values of glucose to thethrombolysis in myocardial infarction (TIMI) and Global Registry of Acute CoronaryEvents (GRACE) scores were assessed by receiver operating characteristic curves andintegrated discrimination improvement analyses.RESULTS. Thirty-day mortality was sequentially higher in patients with higher admissionglucose (20.4, 23.3, 39.8, and 43.1 % p \ 0.001). Among non-diabetic patients, 30-day mor-tality was predicted by TIMI scores with a c-statistic of 0.615 [95 % confidence interval (CI),0.561–0.662) and GRACE scores with a c-statistic of 0.652 (95 % CI, 0.604–0.695). Incor-poration of admission glucose increased the c-statistic for TIMI score to 0.685 (95 % CI,0.639–0.720, p \ 0.001) and GRACE score to 0.708 (95 % CI 0.664–0.742, p \ 0.001).Additional predictive values for glucose were not observed for diabetes. Integrated discrimi-nation improvements (TIMI vs. additional glucose and GRACE vs. additional glucose) were0.041 (p \ 0.001) and 0.039 (p \ 0.001) in non-diabetic patients.CONCLUSIONS. Admission glucose level was a prognostic factor of 30-day mortality andhad an additional predictive value in establishing risk scores only in nondiabetics patients withcardiogenic shock.REFERENCE(S). 1. Iwakura K, Ito H, Ikushima M, Kawano S, Okamura A, Asano K, KurodaT, Tanaka K, Masuyama T, Hori M, Fujii K. Association between hyperglycemia and the no-reflow phenomenon in patients with acute myocardial infarction. J Am Coll Cardiol2003;41:1–7. 2. Hoebers LP, Damman P, Claessen BE, Vis MM, Baan J, Jr., van Straalen JP,Fischer J, Koch KT, Tijssen JG, de Winter RJ, Piek JJ, Henriques JP: Predictive value of plasmaglucose level on admission for short and long term mortality in patients with ST-elevationmyocardial infarction treated with primary percutaneous coronary intervention. Am J Cardiol2012;109:53–59. 3. Timmer JR, van der Horst IC, Ottervanger JP, Henriques JP, Hoorntje JC,de Boer MJ, Suryapranata H, Zijlstra F: Prognostic value of admission glucose in non-diabeticpatients with myocardial infarction. Am Heart J 2004;148:399–404.
0533HEMODYNAMIC EFFECTS IN THE ATRIAL CONTRACTION MODEL ON THETOTAL ARTIFICIAL HEART USING CENTRIFUGAL BLOOD PUMPS WITHADULT GOATS
T. Shiga1,2, H. Miura2, Y. Shiraishi2, M. Yamauchi1, T. Yambe2
1Tohoku University Graduate School of Medicine, Anesthesiology and PerioperativeMedicine, Sendai, Japan, 2Institute of Development, Aging and Cancer, Tohoku University,Medical Engineering and Cardiology, Sendai, JapanINTRODUCTION. To replace total artificial heart (TAH) with cutting dysfunctional heartis one of the therapies for end-stage heart failure patients. But pulsatile TAH available in themarket has some problem in the point of thrombosis and durability because their purpose isfor short term use only to bridge-to-transplantation. Though continuous-flow-type ventric-ular assist device (VAD) has well for long use for destination therapy. Then Frazier et al.reported continuous-flow TAH using axial-type VADs with calf [1]. However, hemody-namic effects of atrial contraction with centrifugal-type TAH are unknown.OBJECTIVES. In this study, we examined hemodynamic effects in the atrial contractionmodel on the TAH using commercially available centrifugal-type VADs with adult goats.METHODS. We performed experiments with adult goats. The heart was exposed by the leftthoracotomy under general anesthesia. The two centrifugal-type VADs were installed for thesystemic and pulmonary circulation. We made end-to side anastomosis by the ePTFEvascular grafts to the descending aorta or the pulmonary artery, and connected to atriums viathe atrial appendage for the inflow of each pump. Then we clumped both ventricles.Hemodynamics of TAH model using centrifugal-type VADs (EVAHEARTTM) in themarket with clumped ventricles was examined. We measured the following: ECG, aorticpresser, left and right atrial pressure, pulmonary artery pressure as well as the pump flow,rotational numbers and voltage of pumps with atrial contraction.RESULTS. We showed hemodynamic parameters with adult goats and atrial contractionwave in the ECG in synchronization with the atrial contraction. Average right pump rotationnumber was 1,450 rpm, right flow rate was 2.5 L/min, right atrial pressure was 14/9 mmHg,pulmonary artery pressure was 25/14 mmHg, left pump rotation number was 2,400 rpm, leftflow rate was 2.2 L/min, left atrial pressure was 30/22 mmHg and artery pressure was84/80 mmHg. Atrial presser made by atrial contraction, P wave in the ECG, caused aorticand pulmonary arterial pressure to increase through the pumps. By increasing the blood flowwith the atrial contraction, voltage and rotation number of pumps were decreased underconstant control of the rotational speed. The driving power consumption of the pump waschanged by changes of flow rate from atrial contraction.
CONCLUSIONS. The atrial contraction might contribute to the increase of pulsatility duringthe centrifugal type TAH application. There might be a possibility that regulate autonomicnervous response with the control of cardiac output from pumps driving power consumption.REFERENCE(S). 1. Frazier OH, Cohn WE, Tuzun E, et al. Continuous-flow total artificialheart supports long-term survival of a calf. Tex Heart Inst J 2009;36:568–74.
0534USEFULNESS OF THE CARDIAC MAGNETIC RESONANCE IN PATIENTSWITH CHEST PAIN, ELEVATION OF MYOCARDIAL BIOMARKERS AND ECGREPOLARIZATION ABNORMALITIES
A. Corrales Cruz1, A.R. Murillo Martin1, O.A. Hernandez Parada1, M.R. Solano Vera1,
E. Gonzalez1, M.L. Cardo2, M.A. Godoy3, J.M. Añon Elizalde1
1Hospital Virgen de la Luz, Intensive Care, Cuenca, Spain, 2Hospital Virgen de la Luz,Cardiology, Cuenca, Spain, 3Hospital Virgen de la Luz, Radiology, Cuenca, SpainINTRODUCTION. The presence of chest pain with myocardial biomarkers elevation andelectrocardiographic abnormalities suggest an acute coronary syndrome (ACS), but there areothers entities whose clinical presentation is similar: acute myocarditis, tako-tsubosyndrome.OBJECTIVES. Establish the role of cardiac magnetic resonance (CMR) in the differentialdiagnosis of diseases that present as an ACS.METHODS. From October 2010 to January 2013, ten patients with suspected ACS and anelectrocardiogram (ECG) non diagnostic of ACS were collected. T2-weighted sequencesand late enhancement IR sequences CMR were performed.RESULTS. Age 39 ± 8 years. Men 100 % (n = 10). Ultrasensitive troponin 687 ± 344 ng/L. CK 567 ± 303 U/L. ECG alterations: positive peaked T waves 40 % (n = 4), elevated ST-segment (J point) 60 % (n = 6). Echocardiogram: ejection fraction (EF) normal 50 % (n = 5),EF decreased 50 % (n = 5). Wall motion of the heart abnormality 70 % (n = 7). Further EFstandardization 100 % (n = 5). Final diagnosis by CMR: myocarditis in 90 % (n = 9)(intramural late enhancement of patched and diffuse distribution). Coronary angiography: onlyperformed in two patients with normal coronary arteries.
Image 1
Image 2
CONCLUSIONS. There are heart diseases of non-ischemic etiology that can be processedas an ACS, the pattern of enhancement IR sequences in the CMR can help in the differentialdiagnosis of these entities whose treatment and prognosis are different.
0535PREDICTORS OF DEVELOPING MAJOR SHORT-TERM CARDIOVASCULAREVENTS IN PATIENTS EVALUATED BY A CHEST PAIN UNIT
M.A. Ramirez-Marrero1, M. Cano-Garcia1, I. Vegas-Vegas1, M.A. Roldan-Jimenez1,
D. Gaitan-Roman1, J.A. de la Chica-Sanchez1, M. de Mora-Martin1
26th ESICM ANNUAL CONGRESS — PARIS, FRANCE — 5–9 OCTOBER 2013
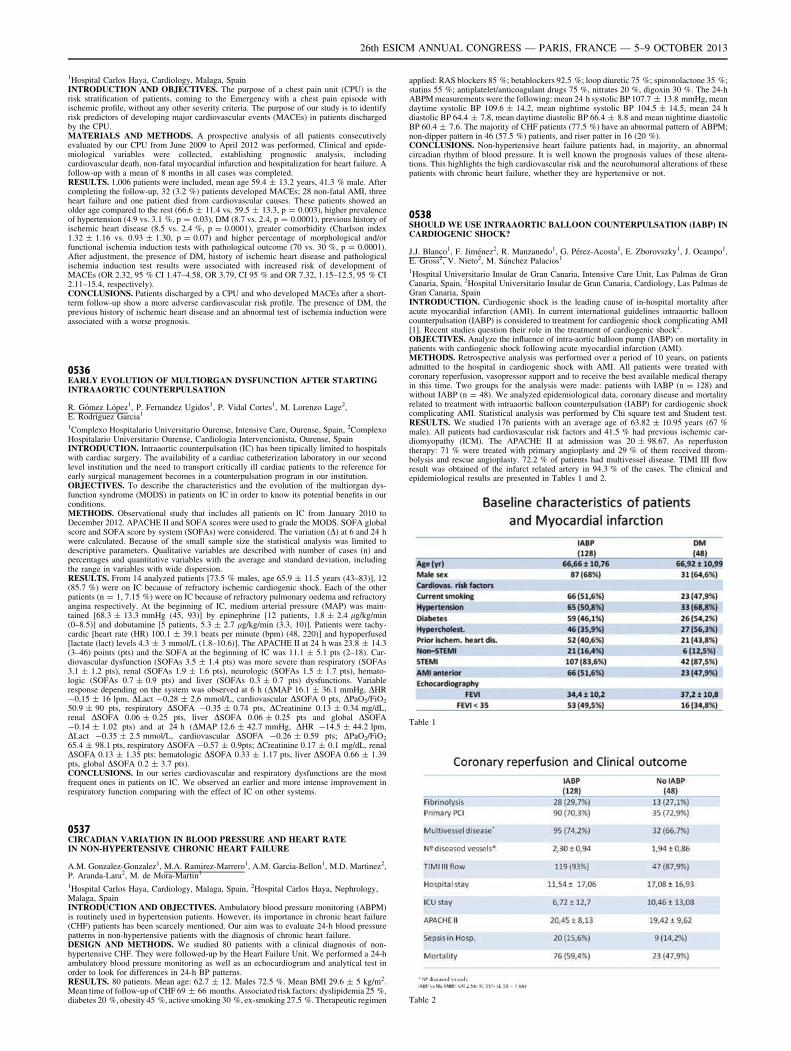
1Hospital Carlos Haya, Cardiology, Malaga, SpainINTRODUCTION AND OBJECTIVES. The purpose of a chest pain unit (CPU) is therisk stratification of patients, coming to the Emergency with a chest pain episode withischemic profile, without any other severity criteria. The purpose of our study is to identifyrisk predictors of developing major cardiovascular events (MACEs) in patients dischargedby the CPU.MATERIALS AND METHODS. A prospective analysis of all patients consecutivelyevaluated by our CPU from June 2009 to April 2012 was performed. Clinical and epide-miological variables were collected, establishing prognostic analysis, includingcardiovascular death, non-fatal myocardial infarction and hospitalization for heart failure. Afollow-up with a mean of 8 months in all cases was completed.RESULTS. 1,006 patients were included, mean age 59.4 ± 13.2 years, 41.3 % male. Aftercompleting the follow-up, 32 (3.2 %) patients developed MACEs; 28 non-fatal AMI, threeheart failure and one patient died from cardiovascular causes. These patients showed anolder age compared to the rest (66.6 ± 11.4 vs. 59.5 ± 13.3, p = 0.003), higher prevalenceof hypertension (4.9 vs. 3.1 %, p = 0.03), DM (8.7 vs. 2.4, p = 0.0001), previous history ofischemic heart disease (8.5 vs. 2.4 %, p = 0.0001), greater comorbidity (Charlson index1.32 ± 1.16 vs. 0.93 ± 1.30, p = 0.07) and higher percentage of morphological and/orfunctional ischemia induction tests with pathological outcome (70 vs. 30 %, p = 0.0001).After adjustment, the presence of DM, history of ischemic heart disease and pathologicalischemia induction test results were associated with increased risk of development ofMACEs (OR 2.32, 95 % CI 1.47–4.58, OR 3.79, CI 95 % and OR 7.32, 1.15–12.5, 95 % CI2.11–15.4, respectively).CONCLUSIONS. Patients discharged by a CPU and who developed MACEs after a short-term follow-up show a more adverse cardiovascular risk profile. The presence of DM, theprevious history of ischemic heart disease and an abnormal test of ischemia induction wereassociated with a worse prognosis.
0536EARLY EVOLUTION OF MULTIORGAN DYSFUNCTION AFTER STARTINGINTRAAORTIC COUNTERPULSATION
R. Gómez López1, P. Fernandez Ugidos1, P. Vidal Cortes1, M. Lorenzo Lage2,E. Rodriguez Garcia1
1Complexo Hospitalario Universitario Ourense, Intensive Care, Ourense, Spain, 2ComplexoHospitalario Universitario Ourense, Cardiologia Intervencionista, Ourense, SpainINTRODUCTION. Intraaortic counterpulsation (IC) has been tipically limited to hospitalswith cardiac surgery. The availability of a cardiac catheterization laboratory in our secondlevel institution and the need to transport critically ill cardiac patients to the reference forearly surgical management becomes in a counterpulsation program in our institution.OBJECTIVES. To describe the characteristics and the evolution of the multiorgan dys-function syndrome (MODS) in patients on IC in order to know its potential benefits in ourconditions.METHODS. Observational study that includes all patients on IC from January 2010 toDecember 2012. APACHE II and SOFA scores were used to grade the MODS. SOFA globalscore and SOFA score by system (SOFAs) were considered. The variation (D) at 6 and 24 hwere calculated. Because of the small sample size the statistical analysis was limited todescriptive parameters. Qualitative variables are described with number of cases (n) andpercentages and quantitative variables with the average and standard deviation, includingthe range in variables with wide dispersion.RESULTS. From 14 analyzed patients [73.5 % males, age 65.9 ± 11.5 years (43–83)], 12(85.7 %) were on IC because of refractory ischemic cardiogenic shock. Each of the otherpatients (n = 1, 7.15 %) were on IC because of refractory pulmonary oedema and refractoryangina respectively. At the beginning of IC, medium arterial pressure (MAP) was main-tained [68.3 ± 13.3 mmHg (45, 93)] by epinephrine [12 patients, 1.8 ± 2.4 lg/kg/min(0–8.5)] and dobutamine [5 patients, 5.3 ± 2.7 lg/kg/min (3.3, 10)]. Patients were tachy-cardic [heart rate (HR) 100.1 ± 39.1 beats per minute (bpm) (48, 220)] and hypoperfused[lactate (lact) levels 4.3 ± 3 mmol/L (1.8–10.6)]. The APACHE II at 24 h was 23.8 ± 14.3(3–46) points (pts) and the SOFA at the beginning of IC was 11.1 ± 5.1 pts (2–18). Car-diovascular dysfunction (SOFAs 3.5 ± 1.4 pts) was more severe than respiratory (SOFAs3.1 ± 1.2 pts), renal (SOFAs 1.9 ± 1.6 pts), neurologic (SOFAs 1.5 ± 1.7 pts), hemato-logic (SOFAs 0.7 ± 0.9 pts) and liver (SOFAs 0.3 ± 0.7 pts) dysfunctions. Variableresponse depending on the system was observed at 6 h (DMAP 16.1 ± 36.1 mmHg, DHR-0,15 ± 16 lpm, DLact -0,28 ± 2,6 mmol/L, cardiovascular DSOFA 0 pts, DPaO2/FiO2
50.9 ± 90 pts, respiratory DSOFA -0.35 ± 0.74 pts, DCreatinine 0.13 ± 0.34 mg/dL,renal DSOFA 0.06 ± 0.25 pts, liver DSOFA 0.06 ± 0.25 pts and global DSOFA-0.14 ± 1.02 pts) and at 24 h (DMAP 12.6 ± 42.7 mmHg, DHR -14.5 ± 44.2 lpm,DLact -0.35 ± 2.5 mmol/L, cardiovascular DSOFA -0.26 ± 0.59 pts; DPaO2/FiO2
65.4 ± 98.1 pts, respiratory DSOFA -0.57 ± 0.9pts; DCreatinine 0.17 ± 0.1 mg/dL, renalDSOFA 0.13 ± 1.35 pts; hematologic DSOFA 0.33 ± 1.17 pts, liver DSOFA 0.66 ± 1.39pts, global DSOFA 0.2 ± 3.7 pts).CONCLUSIONS. In our series cardiovascular and respiratory dysfunctions are the mostfrequent ones in patients on IC. We observed an earlier and more intense improvement inrespiratory function comparing with the effect of IC on other systems.
0537CIRCADIAN VARIATION IN BLOOD PRESSURE AND HEART RATEIN NON-HYPERTENSIVE CHRONIC HEART FAILURE
A.M. Gonzalez-Gonzalez1, M.A. Ramirez-Marrero1, A.M. Garcia-Bellon1, M.D. Martinez2,P. Aranda-Lara2, M. de Mora-Martin1
1Hospital Carlos Haya, Cardiology, Malaga, Spain, 2Hospital Carlos Haya, Nephrology,Malaga, SpainINTRODUCTION AND OBJECTIVES. Ambulatory blood pressure monitoring (ABPM)is routinely used in hypertension patients. However, its importance in chronic heart failure(CHF) patients has been scarcely mentioned. Our aim was to evaluate 24-h blood pressurepatterns in non-hypertensive patients with the diagnosis of chronic heart failure.DESIGN AND METHODS. We studied 80 patients with a clinical diagnosis of non-hypertensive CHF. They were followed-up by the Heart Failure Unit. We performed a 24-hambulatory blood pressure monitoring as well as an echocardiogram and analytical test inorder to look for differences in 24-h BP patterns.RESULTS. 80 patients. Mean age: 62.7 ± 12. Males 72.5 %. Mean BMI 29.6 ± 5 kg/m2.Mean time of follow-up of CHF 69 ± 66 months. Associated risk factors: dyslipidemia 25 %,diabetes 20 %, obesity 45 %, active smoking 30 %, ex-smoking 27.5 %. Therapeutic regimen
applied: RAS blockers 85 %; betablockers 92.5 %; loop diuretic 75 %; spironolactone 35 %;statins 55 %; antiplatelet/anticoagulant drugs 75 %, nitrates 20 %, digoxin 30 %. The 24-hABPM measurements were the following: mean 24 h systolic BP 107.7 ± 13.8 mmHg, meandaytime systolic BP 109.6 ± 14.2, mean nightime systolic BP 104.5 ± 14.5, mean 24 hdiastolic BP 64.4 ± 7.8, mean daytime diastolic BP 66.4 ± 8.8 and mean nightime diastolicBP 60.4 ± 7.6. The majority of CHF patients (77.5 %) have an abnormal pattern of ABPM;non-dipper pattern in 46 (57.5 %) patients, and riser patter in 16 (20 %).CONCLUSIONS. Non-hypertensive heart failure patients had, in majority, an abnormalcircadian rhythm of blood pressure. It is well known the prognosis values of these altera-tions. This highlights the high cardiovascular risk and the neurohumoral alterations of thesepatients with chronic heart failure, whether they are hypertensive or not.
0538SHOULD WE USE INTRAAORTIC BALLOON COUNTERPULSATION (IABP) INCARDIOGENIC SHOCK?
J.J. Blanco1, F. Jiménez2, R. Manzanedo1, G. Pérez-Acosta1, E. Zborovszky1, J. Ocampo1,E. Gross2, V. Nieto2, M. Sánchez Palacios1
1Hospital Universitario Insular de Gran Canaria, Intensive Care Unit, Las Palmas de GranCanaria, Spain, 2Hospital Universitario Insular de Gran Canaria, Cardiology, Las Palmas deGran Canaria, SpainINTRODUCTION. Cardiogenic shock is the leading cause of in-hospital mortality afteracute myocardial infarction (AMI). In current international guidelines intraaortic ballooncounterpulsation (IABP) is considered to treatment for cardiogenic shock complicating AMI[1]. Recent studies question their role in the treatment of cardiogenic shock2.OBJECTIVES. Analyze the influence of intra-aortic balloon pump (IABP) on mortality inpatients with cardiogenic shock following acute myocardial infarction (AMI).METHODS. Retrospective analysis was performed over a period of 10 years, on patientsadmitted to the hospital in cardiogenic shock with AMI. All patients were treated withcoronary reperfusion, vasopressor support and to receive the best available medical therapyin this time. Two groups for the analysis were made: patients with IABP (n = 128) andwithout IABP (n = 48). We analyzed epidemiological data, coronary disease and mortalityrelated to treatment with intraaortic balloon counterpulsation (IABP) for cardiogenic shockcomplicating AMI. Statistical analysis was performed by Chi square test and Student test.RESULTS. We studied 176 patients with an average age of 63.82 ± 10.95 years (67 %male). All patients had cardiovascular risk factors and 41.5 % had previous ischemic car-diomyopathy (ICM). The APACHE II at admission was 20 ± 98.67. As reperfusiontherapy: 71 % were treated with primary angioplasty and 29 % of them received throm-bolysis and rescue angioplasty. 72.2 % of patients had multivessel disease. TIMI III flowresult was obtained of the infarct related artery in 94.3 % of the cases. The clinical andepidemiological results are presented in Tables 1 and 2.
Table 1
Table 2
26th ESICM ANNUAL CONGRESS — PARIS, FRANCE — 5–9 OCTOBER 2013
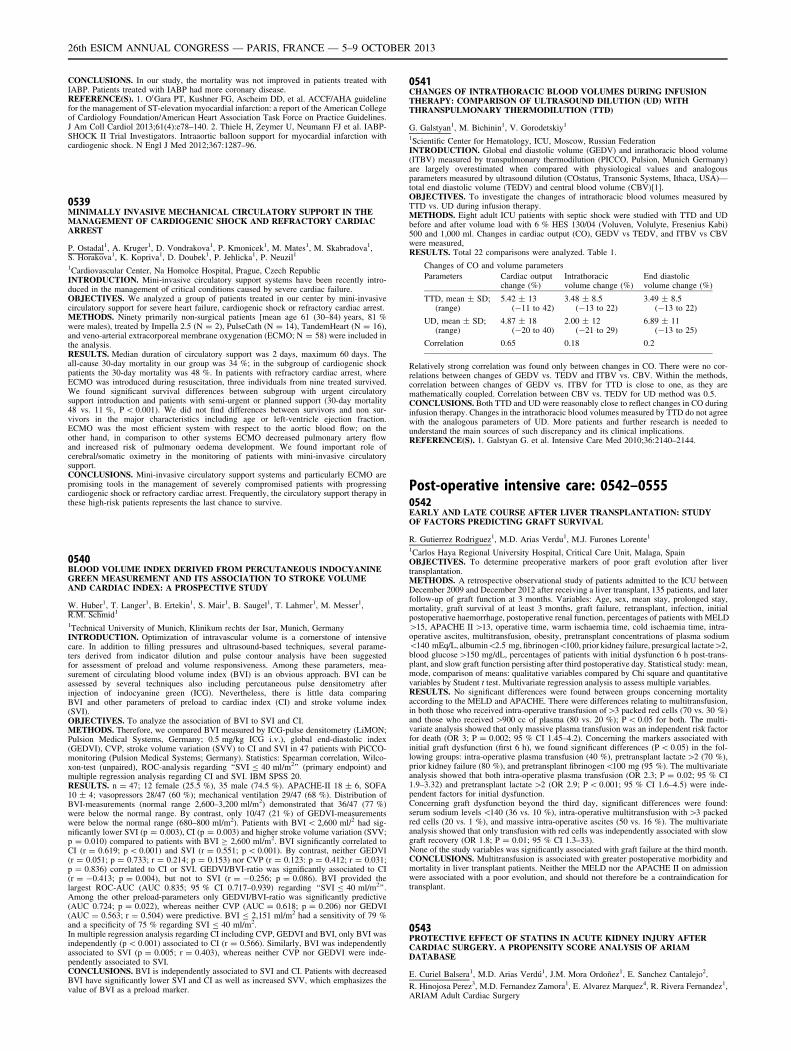
CONCLUSIONS. In our study, the mortality was not improved in patients treated withIABP. Patients treated with IABP had more coronary disease.REFERENCE(S). 1. O0Gara PT, Kushner FG, Ascheim DD, et al. ACCF/AHA guidelinefor the management of ST-elevation myocardial infarction: a report of the American Collegeof Cardiology Foundation/American Heart Association Task Force on Practice Guidelines.J Am Coll Cardiol 2013;61(4):e78–140. 2. Thiele H, Zeymer U, Neumann FJ et al. IABP-SHOCK II Trial Investigators. Intraaortic balloon support for myocardial infarction withcardiogenic shock. N Engl J Med 2012;367:1287–96.
0539MINIMALLY INVASIVE MECHANICAL CIRCULATORY SUPPORT IN THEMANAGEMENT OF CARDIOGENIC SHOCK AND REFRACTORY CARDIACARREST
P. Ostadal1, A. Kruger1, D. Vondrakova1, P. Kmonicek1, M. Mates1, M. Skabradova1,S. Horakova1, K. Kopriva1, D. Doubek1, P. Jehlicka1, P. Neuzil1
1Cardiovascular Center, Na Homolce Hospital, Prague, Czech RepublicINTRODUCTION. Mini-invasive circulatory support systems have been recently intro-duced in the management of critical conditions caused by severe cardiac failure.OBJECTIVES. We analyzed a group of patients treated in our center by mini-invasivecirculatory support for severe heart failure, cardiogenic shock or refractory cardiac arrest.METHODS. Ninety primarily non-surgical patients [mean age 61 (30–84) years, 81 %were males), treated by Impella 2.5 (N = 2), PulseCath (N = 14), TandemHeart (N = 16),and veno-arterial extracorporeal membrane oxygenation (ECMO; N = 58) were included inthe analysis.RESULTS. Median duration of circulatory support was 2 days, maximum 60 days. Theall-cause 30-day mortality in our group was 34 %; in the subgroup of cardiogenic shockpatients the 30-day mortality was 48 %. In patients with refractory cardiac arrest, whereECMO was introduced during resuscitation, three individuals from nine treated survived.We found significant survival differences between subgroup with urgent circulatorysupport introduction and patients with semi-urgent or planned support (30-day mortality48 vs. 11 %, P \ 0.001). We did not find differences between survivors and non sur-vivors in the major characteristics including age or left-ventricle ejection fraction.ECMO was the most efficient system with respect to the aortic blood flow; on theother hand, in comparison to other systems ECMO decreased pulmonary artery flowand increased risk of pulmonary oedema development. We found important role ofcerebral/somatic oximetry in the monitoring of patients with mini-invasive circulatorysupport.CONCLUSIONS. Mini-invasive circulatory support systems and particularly ECMO arepromising tools in the management of severely compromised patients with progressingcardiogenic shock or refractory cardiac arrest. Frequently, the circulatory support therapy inthese high-risk patients represents the last chance to survive.
0540BLOOD VOLUME INDEX DERIVED FROM PERCUTANEOUS INDOCYANINEGREEN MEASUREMENT AND ITS ASSOCIATION TO STROKE VOLUMEAND CARDIAC INDEX: A PROSPECTIVE STUDY
W. Huber1, T. Langer1, B. Ertekin1, S. Mair1, B. Saugel1, T. Lahmer1, M. Messer1,R.M. Schmid1
1Technical University of Munich, Klinikum rechts der Isar, Munich, GermanyINTRODUCTION. Optimization of intravascular volume is a cornerstone of intensivecare. In addition to filling pressures and ultrasound-based techniques, several parame-ters derived from indicator dilution and pulse contour analysis have been suggestedfor assessment of preload and volume responsiveness. Among these parameters, mea-surement of circulating blood volume index (BVI) is an obvious approach. BVI can beassessed by several techniques also including percutaneous pulse densitometry afterinjection of indocyanine green (ICG). Nevertheless, there is little data comparingBVI and other parameters of preload to cardiac index (CI) and stroke volume index(SVI).OBJECTIVES. To analyze the association of BVI to SVI and CI.METHODS. Therefore, we compared BVI measured by ICG-pulse densitometry (LiMON;Pulsion Medical Systems, Germany; 0.5 mg/kg ICG i.v.), global end-diastolic index(GEDVI), CVP, stroke volume variation (SVV) to CI and SVI in 47 patients with PiCCO-monitoring (Pulsion Medical Systems; Germany). Statistics: Spearman correlation, Wilco-xon-test (unpaired), ROC-analysis regarding ‘‘SVI B 40 ml/m2’’ (primary endpoint) andmultiple regression analysis regarding CI and SVI. IBM SPSS 20.RESULTS. n = 47; 12 female (25.5 %), 35 male (74.5 %). APACHE-II 18 ± 6, SOFA10 ± 4; vasopressors 28/47 (60 %); mechanical ventilation 29/47 (68 %). Distribution ofBVI-measurements (normal range 2,600–3,200 ml/m2) demonstrated that 36/47 (77 %)were below the normal range. By contrast, only 10/47 (21 %) of GEDVI-measurementswere below the normal range (680–800 ml/m2). Patients with BVI \ 2,600 ml/2 had sig-nificantly lower SVI (p = 0.003), CI (p = 0.003) and higher stroke volume variation (SVV;p = 0.010) compared to patients with BVI C 2,600 ml/m2. BVI significantly correlated toCI (r = 0.619; p \ 0.001) and SVI (r = 0.551; p \ 0.001). By contrast, neither GEDVI(r = 0.051; p = 0.733; r = 0.214; p = 0.153) nor CVP (r = 0.123: p = 0.412; r = 0.031;p = 0.836) correlated to CI or SVI. GEDVI/BVI-ratio was significantly associated to CI(r = -0.413; p = 0.004), but not to SVI (r = -0.256; p = 0.086). BVI provided thelargest ROC-AUC (AUC 0.835; 95 % CI 0.717–0.939) regarding ‘‘SVI B 40 ml/m2’’.Among the other preload-parameters only GEDVI/BVI-ratio was significantly predictive(AUC 0.724; p = 0.022), whereas neither CVP (AUC = 0.618; p = 0.206) nor GEDVI(AUC = 0.563; r = 0.504) were predictive. BVI B 2,151 ml/m2 had a sensitivity of 79 %and a specificity of 75 % regarding SVI B 40 ml/m2.In multiple regression analysis regarding CI including CVP, GEDVI and BVI, only BVI wasindependently (p \ 0.001) associated to CI (r = 0.566). Similarly, BVI was independentlyassociated to SVI (p = 0.005; r = 0.403), whereas neither CVP nor GEDVI were inde-pendently associated to SVI.CONCLUSIONS. BVI is independently associated to SVI and CI. Patients with decreasedBVI have significantly lower SVI and CI as well as increased SVV, which emphasizes thevalue of BVI as a preload marker.
0541CHANGES OF INTRATHORACIC BLOOD VOLUMES DURING INFUSIONTHERAPY: COMPARISON OF ULTRASOUND DILUTION (UD) WITHTHRANSPULMONARY THERMODILUTION (TTD)
G. Galstyan1, M. Bichinin1, V. Gorodetskiy1
1Scientific Center for Hematology, ICU, Moscow, Russian FederationINTRODUCTION. Global end diastolic volume (GEDV) and inrathoracic blood volume(ITBV) measured by transpulmonary thermodilution (PICCO, Pulsion, Munich Germany)are largely overestimated when compared with physiological values and analogousparameters measured by ultrasound dilution (COstatus, Transonic Systems, Ithaca, USA)—total end diastolic volume (TEDV) and central blood volume (CBV)[1].OBJECTIVES. To investigate the changes of intrathoracic blood volumes measured byTTD vs. UD during infusion therapy.METHODS. Eight adult ICU patients with septic shock were studied with TTD and UDbefore and after volume load with 6 % HES 130/04 (Voluven, Volulyte, Fresenius Kabi)500 and 1,000 ml. Changes in cardiac output (CO), GEDV vs TEDV, and ITBV vs CBVwere measured,RESULTS. Total 22 comparisons were analyzed. Table 1.
Changes of CO and volume parameters
Parameters Cardiac outputchange (%)
Intrathoracicvolume change (%)
End diastolicvolume change (%)
TTD, mean ± SD;(range)
5.42 ± 13(-11 to 42)
3.48 ± 8.5(-13 to 22)
3.49 ± 8.5(-13 to 22)
UD, mean ± SD;(range)
4.87 ± 18(-20 to 40)
2.00 ± 12(-21 to 29)
6.89 ± 11(-13 to 25)
Correlation 0.65 0.18 0.2
Relatively strong correlation was found only between changes in CO. There were no cor-relations between changes of GEDV vs. TEDV and ITBV vs. CBV. Within the methods,correlation between changes of GEDV vs. ITBV for TTD is close to one, as they aremathematically coupled. Correlation between CBV vs. TEDV for UD method was 0.5.CONCLUSIONS. Both TTD and UD were reasonably close to reflect changes in CO duringinfusion therapy. Changes in the intrathoracic blood volumes measured by TTD do not agreewith the analogous parameters of UD. More patients and further research is needed tounderstand the main sources of such discrepancy and its clinical implications.REFERENCE(S). 1. Galstyan G. et al. Intensive Care Med 2010;36:2140–2144.
Post-operative intensive care: 0542–05550542EARLY AND LATE COURSE AFTER LIVER TRANSPLANTATION: STUDYOF FACTORS PREDICTING GRAFT SURVIVAL
R. Gutierrez Rodriguez1, M.D. Arias Verdu1, M.J. Furones Lorente1
1Carlos Haya Regional University Hospital, Critical Care Unit, Malaga, SpainOBJECTIVES. To determine preoperative markers of poor graft evolution after livertransplantation.METHODS. A retrospective observational study of patients admitted to the ICU betweenDecember 2009 and December 2012 after receiving a liver transplant, 135 patients, and laterfollow-up of graft function at 3 months. Variables: Age, sex, mean stay, prolonged stay,mortality, graft survival of at least 3 months, graft failure, retransplant, infection, initialpostoperative haemorrhage, postoperative renal function, percentages of patients with MELD[15, APACHE II [13, operative time, warm ischaemia time, cold ischaemia time, intra-operative ascites, multitransfusion, obesity, pretransplant concentrations of plasma sodium\140 mEq/L, albumin\2.5 mg, fibrinogen\100, prior kidney failure, presurgical lactate[2,blood glucose[150 mg/dL, percentages of patients with initial dysfunction 6 h post-trans-plant, and slow graft function persisting after third postoperative day. Statistical study: mean,mode, comparison of means: qualitative variables compared by Chi square and quantitativevariables by Student t test. Multivariate regression analysis to assess multiple variables.RESULTS. No significant differences were found between groups concerning mortalityaccording to the MELD and APACHE. There were differences relating to multitransfusion,in both those who received intra-operative transfusion of[3 packed red cells (70 vs. 30 %)and those who received [900 cc of plasma (80 vs. 20 %); P \ 0.05 for both. The multi-variate analysis showed that only massive plasma transfusion was an independent risk factorfor death (OR 3; P = 0.002; 95 % CI 1.45–4.2). Concerning the markers associated withinitial graft dysfunction (first 6 h), we found significant differences (P \ 0.05) in the fol-lowing groups: intra-operative plasma transfusion (40 %), pretransplant lactate[2 (70 %),prior kidney failure (80 %), and pretransplant fibrinogen\100 mg (95 %). The multivariateanalysis showed that both intra-operative plasma transfusion (OR 2.3; P = 0.02; 95 % CI1.9–3.32) and pretransplant lactate [2 (OR 2.9; P \ 0.001; 95 % CI 1.6–4.5) were inde-pendent factors for initial dysfunction.Concerning graft dysfunction beyond the third day, significant differences were found:serum sodium levels \140 (36 vs. 10 %), intra-operative multitransfusion with [3 packedred cells (20 vs. 1 %), and massive intra-operative ascites (50 vs. 16 %). The multivariateanalysis showed that only transfusion with red cells was independently associated with slowgraft recovery (OR 1.8; P = 0.01; 95 % CI 1.3–33).None of the study variables was significantly associated with graft failure at the third month.CONCLUSIONS. Multitransfusion is associated with greater postoperative morbidity andmortality in liver transplant patients. Neither the MELD nor the APACHE II on admissionwere associated with a poor evolution, and should not therefore be a contraindication fortransplant.
0543PROTECTIVE EFFECT OF STATINS IN ACUTE KIDNEY INJURY AFTERCARDIAC SURGERY. A PROPENSITY SCORE ANALYSIS OF ARIAMDATABASE
E. Curiel Balsera1, M.D. Arias Verdú1, J.M. Mora Ordoñez1, E. Sanchez Cantalejo2,
R. Hinojosa Perez3, M.D. Fernandez Zamora1, E. Alvarez Marquez4, R. Rivera Fernandez1,ARIAM Adult Cardiac Surgery
26th ESICM ANNUAL CONGRESS — PARIS, FRANCE — 5–9 OCTOBER 2013
1Carlos Haya Regional University Hospital, Intensive Care Unit, Málaga, Spain, 2EscuelaAndaluza de Salud Publica, Granada, Spain, 3Virgen del Rocio Hospital, Intensive CareUnit, Seville, Spain, 4Virgen Macarena Hospital, Intensive Care Unit, Seville, SpainINTRODUCTION. In previous studies it seems that statins could be a protective factor ofdeveloping acute kidney injury (AKI) in cardiac surgery.OBJECTIVES. We tried to confirm this protective effect with a high quality analysis.METHODS. Prospective, observational and multicentre study of patients admitted in ICUafter major cardiac surgery in 13 hospitals of Spain.AKI was defined as double levels of creatinine if it was normal previously, or above 3.5 mg/dl if it was between 1.2 and 2.2 or need for renal replacement therapy (RRT).We used Chi square test and student-t test for univariate analysis and binary logisticregression for multivariate analysis, with p value \0.05.A propensity score-matched analysis was performed to compare AKI in patients treated ornot with statins previous major cardiac surgery.RESULTS. We included 7,276 patients and AKI was developed in 9.6 % of global pop-ulation. 8.5 % of 3,749 patients treated with statins developed AKI and 10.7 % of 3,527 nontreated (p = 0.002; OR 0.78, 95 % CI 0.67–0.91). After adjusted with logistic regression byEuroSCORE, bypass time and previous renal failure, statins continue being protective OR0.82, 95 % CI (0.7–0.96).In the propensity score-matched patient population realized in 3,056 (1,528 with statins and1,528 without), AKI was 10.8 % in patient without statins and 9.9 % in patients with statins,OR 0.91 (0-72–1.11). After adjustment by EuroSCORE, bypass time and previous renalfailure, OR was very similar 0.93 (0.73–1.18).CONCLUSIONS. Although multivariate analysis suggests a protective effect for statins interms of AKI after cardiac surgery, when we adjusted with a propensity score analysis,protective effect is rejected.REFERENCE(S). Prowle JR, Calzavacca P, Licari E, Ligabo EV, Echeverri JE, Haase M,Haase-Fielitz A, Bagshaw SM, Devarajan P, Bellomo R. Pilot double-blind, randomizedcontrolled trial of short-term atorvastatin for prevention of acute kidney injury after cardiacsurgery. Nephrology (Carlton) 2012;17(3):215–24.GRANT ACKNOWLEDGMENT. Josele Benitez-Parejo (ARIAM Secretary).
0544EFFECT OF BODY MASS INDEX IN OUTCOME OF PATIENTS UNDERGOINGCARDIAC SURGERY
J.C. Lopez Delgado1, H. Torrado1, F. Esteve1, M.L. Carrio1, D. Rodriguez-Castro1,E. Farrero1, R. Manez1, J.L. Ventura-Farré1, C. Javierre2
1Hospital Universitari de Bellvitge, Intensive Care, L’ Hospitalet de Llobregat, Spain,2Universitat de Barcelona, Physiological Sciences Department, L’Hospitalet de Llobregat,SpainINTRODUCTION. Obesity is not considered a risk factor for higher mortality after cardiacsurgery. Some reports have documented a better outcome in patients with higher body massindex(BMI) compared with those with normal BMI despite higher comorbidities in obesepatients.OBJECTIVES. The aim of this study is to quantify the effect of BMI on clinical outcomesafter cardiac surgery.METHODS. 2844 consecutive patients requiring all types of cardiac surgery betweenJanuary 2004 and February 2008 were prospectively studied at our institution. The patientswere divided based on BMI ranges: normal (BMI C 18.5–24.9 kg m-2; n = 644; 22.6 %),overweight (BMI C 25–29.9 kg m-2; n = 1,320; 46.4 %) and obese (BMI C 30 kg m-2;n = 856; 30.2 %). Preoperative, operative and postoperative data including main outcomeswere recorded together with cardiac surgery scores(Parsonnet,EuroSCORE) and ICUscores(APACHE,SAPS). ANOVA and Bonferroni post hoc analysis were used to comparedifferences between BMI groups. Multivariable analyses compared the risk of outcomesbetween different BMI groups after adjusting for case-mix. A complete follow-up wasperformed in 2,592 patients until January 2013.RESULTS. In higher BMI groups there were higher cardiovascular risk factors rates, suchas hypertension [odds ratio (OR) 3.51; 95 % confidence interval (CI) 2.58–4.78 for obese.OR 1.87 (95 % CI 1.46–2.40) for overweight; P = \ 0.001], diabetes (OR 2.05; 95 % CI1.16–3.63 for obese; P = 0.013. OR 1.53; 95 % CI 1.20–1.96 for overweight; P = 0.001)and including hypertrophic cardiomyopathy(OR 2.29; 95 % CI 1.66–3.16 for obese. OR1.69; 95 % CI 1.29–2.21 for overweight; P = \ 0.001) compared with normal BMIpatients. Respiratory-related morbidities were shown with higher BMI patients, such as aworst oxygenation reflected by lower PaO2/FiO2 12hs after admission in higher BMI groups(OR 0.95; 95 % CI 0.92–0.99 for obese; P = \ 0.001. OR 0.90; 95 % CI 0.85–0.95 foroverweight; P = \ 0.001) and longer ventilation times in obese (OR 0.97; 95 % CI0.94–0.98; P = 0.007), and higher risk for septicaemia in obese compared with normal (OR1.30; 95 % CI 1.06–1.60; P = 0.012) and overweight (OR 1.15; 95 % CI 1.03–1.28;P = 0.007) BMI groups.In-hospital mortality was 5.6 % (n = 160) and long-term mortality was about was 11.95 %(n = 310) during the follow-up (6.2 ± 4.1 years). No mortality and survival differenceswere shown between BMI groups.CONCLUSIONS. Despite higher respiratory-related morbidities with higher BMI andhigher septicaemia with obese during ICU stay, there is not any BMI related influence overin-hospital mortality and long-term survival after cardiac surgery.REFERENCE(S). 1. Stamou SC, Nussbaum M, Stiegel RM, et al. Effect of body massindex on outcomes after cardiac surgery: is there an obesity paradox? Ann Thorac Surg2001;91:42–7. 2. Sakr Y, Madl C, Filipescu D, et al. Obesity is associated with increasedmorbidity but not mortality in critically ill patients.Intensive Care Med 2008;34:1999–2009.
0545PREOPERATIVE HEMOGLOBIN-A1C AS A PREDICTOR FOR INFECTIONPOST CORONARY BYPASS SURGERY
A.Z. Hafez1, W. Abukhudair1, K. Othman1, M.F. Rajab1, M.M.H. Al-Najjar1
1King Fahd Armed Forces Hospital, Jeddah, Adult Cardiac Surgery Department, Jeddah,Saudi ArabiaINTRODUCTION. Diabetes is a widely recognized risk factor for coronary artery diseaseand is associated with increased early and late mortality after myocardial revascularizationin patients with multivessel disease(1). HbA1c refers to glucose bound hemoglobin Amolecule. The hemoglobin A1c (HbA1c) test can provide an assessment of average bloodglucose control during the 60–90 days (2–3 months) prior to the test [8–13]. Recent evi-dence suggests that hyperglycemia plays a significant role in the development ofpostoperative infections [2–5].
OBJECTIVES. To determine the prevalence of elevated Hemoglobin A1c levels, a markerof glycemic control in patients presenting for coronary artery bypass surgery, whetherpoorly controlled diabetes (high HbA1C) is a risk factor for infections and, if so, Is goodpreoperative glycemic control HbA1c levels \7 % is associated with decreased postoper-ative infections and Whether any protocol might improve outcome in diabetic patients.METHODS. Retrospective observational study using KFAFH-JEDDAH data base. FromJanuary 2006 to December 2008, including 712 patients underwent coronary artery bypasssurgery (CABG) + valve surgery. Among them, 478 patients (76.13 %) were diabetic and234 (32.86 %) were nondiabetic, with primary outcomes were infectious complications,including pneumonia, wound infection, urinary tract infection, or sepsis.RESULTS. The multivariable model includes age, sex, operation length and HbA1c levelswere significantly associated with postoperative infections. An HbA1c level of more than7 % was significantly associated with increased infectious complications with an adjustedodds ratio of 5 (95 % confidence interval, 2.7–9.3) and a P value of £0.001.CONCLUSIONS. Good preoperative glycemic control (HbA1c levels\7 %) is associatedwith a decrease in infectious complications post CABG.REFERENCE(S). 1. United Kingdom Prospective study, Lancet 1998;352:837–53. 2.Rochman, H. Hemoglobin A1c and Diabetes Mellitus. Ann Clin Lab Sci 1980;10:111–115.3. Nathan, et al. The effects of intensive treatment of diabetes on the development andprogression of long-term complications in insulin-dependent diabetes mellitus. New Eng-land J Med 1993;329:977–986. 4. Golden SH, Peart-Vigilance C, Kao WH, Brancati FL.Perioperative glycemic control and the risk of infectious complications in a cohort of adultswith diabetes. Diabetes Care 1999;22:1408–1414. 5. Latham R, Lancaster AD, CovingtonJF, Pirolo JS, Thomas CS. The association of diabetes and glucose control with surgical-siteinfections among cardiothoracic surgery patients. Infect Control Hosp Epidemiol.2001;22:607–612.
0546SYSTEMIC INFLAMMATORY RESPONSE TO ANESTHESIA: A COMPARISONOF FOUR DIFFERENT TECHNIQUES
C. Chelazzi1, R. Ricci1, E. Pettini1, G. Villa1, A.R. De Gaudio1
1University of Florence, Department of Critical Care, Section of Anesthesiology andIntensive Care, Florence, ItalyINTRODUCTION. Surgical injury induces systemic endocrine, metabolic and immune-inflammatory responses, activated by primary immune system and afferent neural stimulifrom the surgical area. An increase of counter-insulin hormones, cytokines and catechola-mines characterizes the post-operative hyper-metabolic phase [1]. Anesthesia can influencethese responses [2].OBJECTIVES. The aim of this study was to evaluate the post-operative systemicinflammatory response to four different anesthetic techniques: ‘‘blended’’ anesthesia(regional neural blockade plus general anesthesia, B), balanced anesthesia (Ba), TIVA(totally intra-venous anesthesia) and inhalational anesthesia (I).METHODS. A preliminary retrospective study was conducted. We collected data frompatients who underwent elective laparoscopic left hemicolectomy performed for colorectalcancer between January and December 2012. Patients who underwent emergency surgery,‘‘open’’ surgery and surgery performed for inflammatory bowel diseases were excluded.Patients were divided in four groups depending on the anesthetic technique used for thesurgery. Serum levels of glucose, leukocyte count and temperature were collected at dif-ferent times to evaluate the systemic inflammatory response: before induction (T0), at theend of the surgery (T1, only for blood glucose levels), at 24 (T24) and 48 (T48) h frominduction. Glucose variability, determined as the ratio of standard deviation to mean glucoselevels at T0, T1, T24 and T48, was used to evaluate the degree of insulin resistance in eachpatient. Data were subjected to analysis of variance (differences were considered significantwhen P values were \0.05).RESULTS. Thirty-two patients were eligible for the study: seven were included in the ‘‘B’’group, nine in the ‘‘Ba’’ group, eight in the ‘‘TIVA’’ group and eight in the ‘‘I’’ group.Median blood glucose values (mg/dl) were statistically significant at T1 (I 122.5; Ba 100;TIVA 97.5; B 94.5; p \ 0,05), T24 (I 135; Ba 114; TIVA 117.5; B 97.5; p \ 0,05) and T48(I 145; Ba 117.5; TIVA 123; B 105; p \ 0,05). Median temperature values (�C) werestatistically significant at T48 (I 37.3; Ba 37; TIVA 36.9; B 36.85; p \ 0,05). Medianleukocyte count values (n 9 106/l) were statistically significant at T24 (I 1,250; Ba 9,000;TIVA 8,550; B 7,300; p \ 0,05) and T48 (I 12,750; Ba 10,500; TIVA 9,250; B 7,600;p \ 0,05). The difference among mean glucose variability values (mean %) was statisticallysignificant (I 18.6; Ba 8.9; TIVA 11.8; B 5.1; p \ 0.05).CONCLUSIONS. Our preliminary data show that ‘‘blended’’ anesthesia seems to be able tomodulate the systemic inflammatory response. A statistically significant difference appearsalso between anesthetic techniques using opioids, balanced and TIVA, and the inhalationalanesthesia.REFERENCE(S). 1. Desborough: Br J Anaesth 2000;85:109–17. 2. Kehlet et al. Lancet2003;362:1921–28.
0547EFFECTS OF SYSTEMATIC LUNG RECRUITMENT IN POST-OPERATIVESTANDARD CARDIAC SURGERY : A PILOT STUDY
G. Abehsira1, F. Bagate1, A. Brusset1, P. Estagnasié1, P. Squara1
1Clinique Ambroise Paré, ICU, Neuilly-sur-Seine, FranceINTRODUCTION. Cardiac surgery with extracorporeal circulation is associated withinflammation, leucocytes and platelets activation, leading to lung capillary leak and microembolizations. This may prolong the duration of mechanical ventilation and increase theincidence of pulmonary complications.OBJECTIVES. To evaluate the impact of systematic lung recruitment on postoperative gasexchange and morbidity after standard on-pump cardiac surgery.METHODS. Prospective, randomized, single centre pilot study, including 100 consecutivepatients admitted in ICU after cardiac surgery. Pre- and post-operative shocks and emer-gencies were excluded. Patients were included in the immediate postoperative period, stillanesthetized, when hemodynamically stable and eligible for extubation. They were ran-domized for high PEEP application (35 cmH2O during 45 s) or not (control group). Then, aphysician blinded of the randomization applied standard protocols and collected thehemodynamic and ventilation variables at hours 1, 6, 12 and 24.RESULTS. Of the 100 patients included into the study, 49 were recruited and 51 were not.The two groups were not different in terms of age, gender, BMI, LVEF, type of surgery,postoperative lung compliance, blood pressure, blood gas and lactate. However, in the
26th ESICM ANNUAL CONGRESS — PARIS, FRANCE — 5–9 OCTOBER 2013
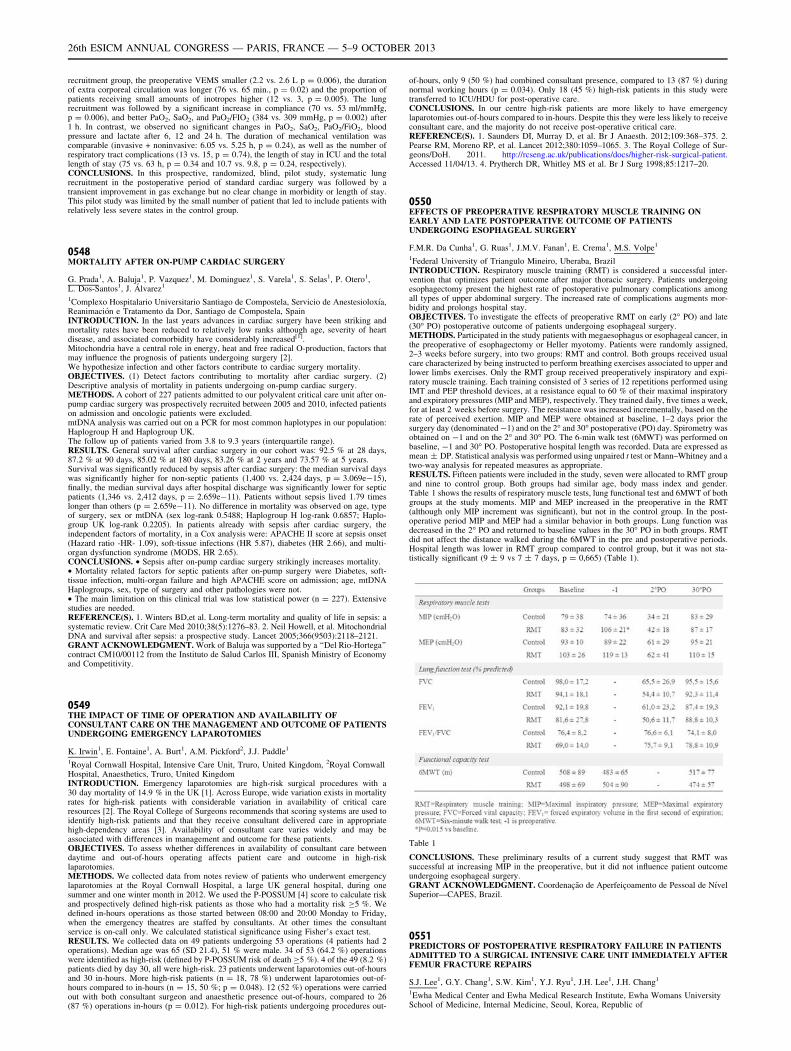
recruitment group, the preoperative VEMS smaller (2.2 vs. 2.6 L p = 0.006), the durationof extra corporeal circulation was longer (76 vs. 65 min., p = 0.02) and the proportion ofpatients receiving small amounts of inotropes higher (12 vs. 3, p = 0.005). The lungrecruitment was followed by a significant increase in compliance (70 vs. 53 ml/mmHg,p = 0.006), and better PaO2, SaO2, and PaO2/FIO2 (384 vs. 309 mmHg, p = 0.002) after1 h. In contrast, we observed no significant changes in PaO2, SaO2, PaO2/FiO2, bloodpressure and lactate after 6, 12 and 24 h. The duration of mechanical ventilation wascomparable (invasive + noninvasive: 6.05 vs. 5.25 h, p = 0.24), as well as the number ofrespiratory tract complications (13 vs. 15, p = 0.74), the length of stay in ICU and the totallength of stay (75 vs. 63 h, p = 0.34 and 10.7 vs. 9.8, p = 0.24, respectively).CONCLUSIONS. In this prospective, randomized, blind, pilot study, systematic lungrecruitment in the postoperative period of standard cardiac surgery was followed by atransient improvement in gas exchange but no clear change in morbidity or length of stay.This pilot study was limited by the small number of patient that led to include patients withrelatively less severe states in the control group.
0548MORTALITY AFTER ON-PUMP CARDIAC SURGERY
G. Prada1, A. Baluja1, P. Vazquez1, M. Dominguez1, S. Varela1, S. Selas1, P. Otero1,L. Dos-Santos1, J. Álvarez1
1Complexo Hospitalario Universitario Santiago de Compostela, Servicio de Anestesioloxı́a,Reanimación e Tratamento da Dor, Santiago de Compostela, SpainINTRODUCTION. In the last years advances in cardiac surgery have been striking andmortality rates have been reduced to relatively low ranks although age, severity of heartdisease, and associated comorbidity have considerably increased[1].Mitochondria have a central role in energy, heat and free radical O-production, factors thatmay influence the prognosis of patients undergoing surgery [2].We hypothesize infection and other factors contribute to cardiac surgery mortality.OBJECTIVES. (1) Detect factors contributing to mortality after cardiac surgery. (2)Descriptive analysis of mortality in patients undergoing on-pump cardiac surgery.METHODS. A cohort of 227 patients admitted to our polyvalent critical care unit after on-pump cardiac surgery was prospectively recruited between 2005 and 2010, infected patientson admission and oncologic patients were excluded.mtDNA analysis was carried out on a PCR for most common haplotypes in our population:Haplogroup H and Haplogroup UK.The follow up of patients varied from 3.8 to 9.3 years (interquartile range).RESULTS. General survival after cardiac surgery in our cohort was: 92.5 % at 28 days,87.2 % at 90 days, 85.02 % at 180 days, 83.26 % at 2 years and 73.57 % at 5 years.Survival was significantly reduced by sepsis after cardiac surgery: the median survival dayswas significantly higher for non-septic patients (1,400 vs. 2,424 days, p = 3.069e-15),finally, the median survival days after hospital discharge was significantly lower for septicpatients (1,346 vs. 2,412 days, p = 2.659e-11). Patients without sepsis lived 1.79 timeslonger than others (p = 2.659e-11). No difference in mortality was observed on age, typeof surgery, sex or mtDNA (sex log-rank 0.5488; Haplogroup H log-rank 0.6857; Haplo-group UK log-rank 0.2205). In patients already with sepsis after cardiac surgery, theindependent factors of mortality, in a Cox analysis were: APACHE II score at sepsis onset(Hazard ratio -HR- 1.09), soft-tissue infections (HR 5.87), diabetes (HR 2.66), and multi-organ dysfunction syndrome (MODS, HR 2.65).CONCLUSIONS. • Sepsis after on-pump cardiac surgery strikingly increases mortality.• Mortality related factors for septic patients after on-pump surgery were Diabetes, soft-tissue infection, multi-organ failure and high APACHE score on admission; age, mtDNAHaplogroups, sex, type of surgery and other pathologies were not.• The main limitation on this clinical trial was low statistical power (n = 227). Extensivestudies are needed.REFERENCE(S). 1. Winters BD,et al. Long-term mortality and quality of life in sepsis: asystematic review. Crit Care Med 2010;38(5):1276–83. 2. Neil Howell, et al. MitochondrialDNA and survival after sepsis: a prospective study. Lancet 2005;366(9503):2118–2121.GRANT ACKNOWLEDGMENT. Work of Baluja was supported by a ‘‘Del Rio-Hortega’’contract CM10/00112 from the Instituto de Salud Carlos III, Spanish Ministry of Economyand Competitivity.
0549THE IMPACT OF TIME OF OPERATION AND AVAILABILITY OFCONSULTANT CARE ON THE MANAGEMENT AND OUTCOME OF PATIENTSUNDERGOING EMERGENCY LAPAROTOMIES
K. Irwin1, E. Fontaine1, A. Burt1, A.M. Pickford2, J.J. Paddle1
1Royal Cornwall Hospital, Intensive Care Unit, Truro, United Kingdom, 2Royal CornwallHospital, Anaesthetics, Truro, United KingdomINTRODUCTION. Emergency laparotomies are high-risk surgical procedures with a30 day mortality of 14.9 % in the UK [1]. Across Europe, wide variation exists in mortalityrates for high-risk patients with considerable variation in availability of critical careresources [2]. The Royal College of Surgeons recommends that scoring systems are used toidentify high-risk patients and that they receive consultant delivered care in appropriatehigh-dependency areas [3]. Availability of consultant care varies widely and may beassociated with differences in management and outcome for these patients.OBJECTIVES. To assess whether differences in availability of consultant care betweendaytime and out-of-hours operating affects patient care and outcome in high-risklaparotomies.METHODS. We collected data from notes review of patients who underwent emergencylaparotomies at the Royal Cornwall Hospital, a large UK general hospital, during onesummer and one winter month in 2012. We used the P-POSSUM [4] score to calculate riskand prospectively defined high-risk patients as those who had a mortality risk C5 %. Wedefined in-hours operations as those started between 08:00 and 20:00 Monday to Friday,when the emergency theatres are staffed by consultants. At other times the consultantservice is on-call only. We calculated statistical significance using Fisher’s exact test.RESULTS. We collected data on 49 patients undergoing 53 operations (4 patients had 2operations). Median age was 65 (SD 21.4), 51 % were male. 34 of 53 (64.2 %) operationswere identified as high-risk (defined by P-POSSUM risk of death C5 %). 4 of the 49 (8.2 %)patients died by day 30, all were high-risk. 23 patients underwent laparotomies out-of-hoursand 30 in-hours. More high-risk patients (n = 18, 78 %) underwent laparotomies out-of-hours compared to in-hours (n = 15, 50 %; p = 0.048). 12 (52 %) operations were carriedout with both consultant surgeon and anaesthetic presence out-of-hours, compared to 26(87 %) operations in-hours (p = 0.012). For high-risk patients undergoing procedures out-
of-hours, only 9 (50 %) had combined consultant presence, compared to 13 (87 %) duringnormal working hours (p = 0.034). Only 18 (45 %) high-risk patients in this study weretransferred to ICU/HDU for post-operative care.CONCLUSIONS. In our centre high-risk patients are more likely to have emergencylaparotomies out-of-hours compared to in-hours. Despite this they were less likely to receiveconsultant care, and the majority do not receive post-operative critical care.REFERENCE(S). 1. Saunders DI, Murray D, et al. Br J Anaesth. 2012;109:368–375. 2.Pearse RM, Moreno RP, et al. Lancet 2012;380:1059–1065. 3. The Royal College of Sur-geons/DoH. 2011. http://rcseng.ac.uk/publications/docs/higher-risk-surgical-patient.Accessed 11/04/13. 4. Prytherch DR, Whitley MS et al. Br J Surg 1998;85:1217–20.
0550EFFECTS OF PREOPERATIVE RESPIRATORY MUSCLE TRAINING ONEARLY AND LATE POSTOPERATIVE OUTCOME OF PATIENTSUNDERGOING ESOPHAGEAL SURGERY
F.M.R. Da Cunha1, G. Ruas1, J.M.V. Fanan1, E. Crema1, M.S. Volpe1
1Federal University of Triangulo Mineiro, Uberaba, BrazilINTRODUCTION. Respiratory muscle training (RMT) is considered a successful inter-vention that optimizes patient outcome after major thoracic surgery. Patients undergoingesophagectomy present the highest rate of postoperative pulmonary complications amongall types of upper abdominal surgery. The increased rate of complications augments mor-bidity and prolongs hospital stay.OBJECTIVES. To investigate the effects of preoperative RMT on early (2� PO) and late(30� PO) postoperative outcome of patients undergoing esophageal surgery.METHODS. Participated in the study patients with megaesophagus or esophageal cancer, inthe preoperative of esophagectomy or Heller myotomy. Patients were randomly assigned,2–3 weeks before surgery, into two groups: RMT and control. Both groups received usualcare characterized by being instructed to perform breathing exercises associated to upper andlower limbs exercises. Only the RMT group received preoperatively inspiratory and expi-ratory muscle training. Each training consisted of 3 series of 12 repetitions performed usingIMT and PEP threshold devices, at a resistance equal to 60 % of their maximal inspiratoryand expiratory pressures (MIP and MEP), respectively. They trained daily, five times a week,for at least 2 weeks before surgery. The resistance was increased incrementally, based on therate of perceived exertion. MIP and MEP were obtained at baseline, 1–2 days prior thesurgery day (denominated -1) and on the 2� and 30� postoperative (PO) day. Spirometry wasobtained on -1 and on the 2� and 30� PO. The 6-min walk test (6MWT) was performed onbaseline, -1 and 30� PO. Postoperative hospital length was recorded. Data are expressed asmean ± DP. Statistical analysis was performed using unpaired t test or Mann–Whitney and atwo-way analysis for repeated measures as appropriate.RESULTS. Fifteen patients were included in the study, seven were allocated to RMT groupand nine to control group. Both groups had similar age, body mass index and gender.Table 1 shows the results of respiratory muscle tests, lung functional test and 6MWT of bothgroups at the study moments. MIP and MEP increased in the preoperative in the RMT(although only MIP increment was significant), but not in the control group. In the post-operative period MIP and MEP had a similar behavior in both groups. Lung function wasdecreased in the 2� PO and returned to baseline values in the 30� PO in both groups. RMTdid not affect the distance walked during the 6MWT in the pre and postoperative periods.Hospital length was lower in RMT group compared to control group, but it was not sta-tistically significant (9 ± 9 vs 7 ± 7 days, p = 0,665) (Table 1).
Table 1
CONCLUSIONS. These preliminary results of a current study suggest that RMT wassuccessful at increasing MIP in the preoperative, but it did not influence patient outcomeundergoing esophageal surgery.GRANT ACKNOWLEDGMENT. Coordenação de Aperfeiçoamento de Pessoal de Nı́velSuperior—CAPES, Brazil.
0551PREDICTORS OF POSTOPERATIVE RESPIRATORY FAILURE IN PATIENTSADMITTED TO A SURGICAL INTENSIVE CARE UNIT IMMEDIATELY AFTERFEMUR FRACTURE REPAIRS
S.J. Lee1, G.Y. Chang1, S.W. Kim1, Y.J. Ryu1, J.H. Lee1, J.H. Chang1
1Ewha Medical Center and Ewha Medical Research Institute, Ewha Womans UniversitySchool of Medicine, Internal Medicine, Seoul, Korea, Republic of
26th ESICM ANNUAL CONGRESS — PARIS, FRANCE — 5–9 OCTOBER 2013
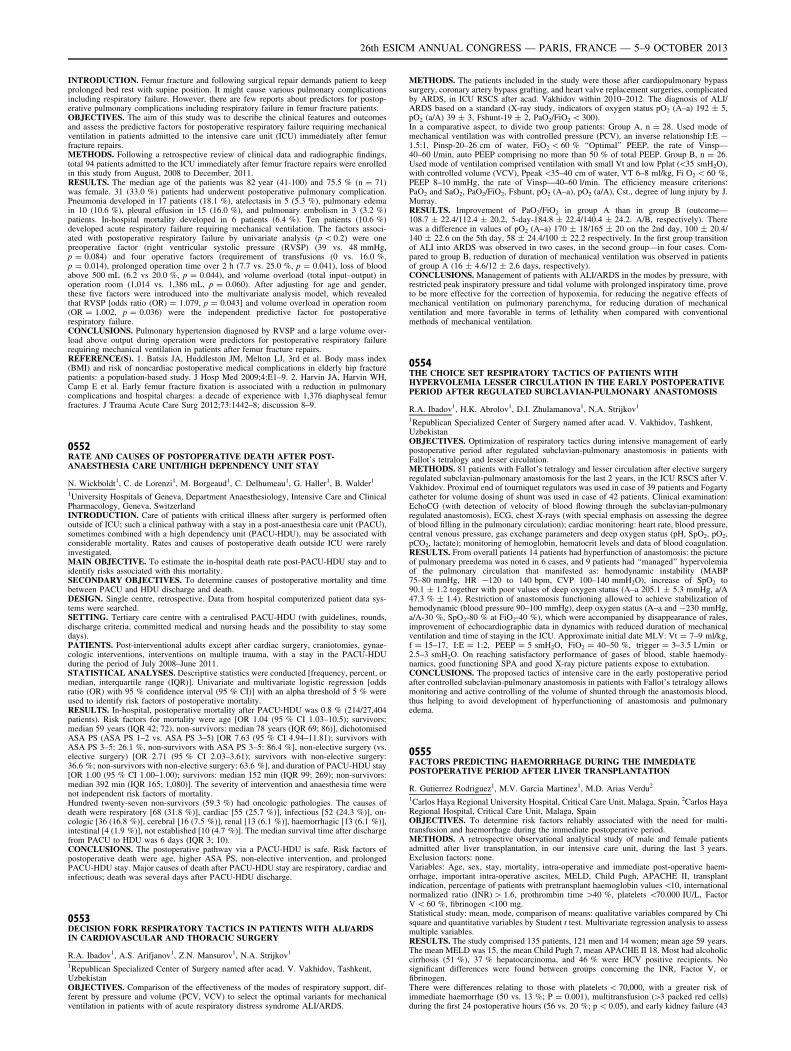
INTRODUCTION. Femur fracture and following surgical repair demands patient to keepprolonged bed rest with supine position. It might cause various pulmonary complicationsincluding respiratory failure. However, there are few reports about predictors for postop-erative pulmonary complications including respiratory failure in femur fracture patients.OBJECTIVES. The aim of this study was to describe the clinical features and outcomesand assess the predictive factors for postoperative respiratory failure requiring mechanicalventilation in patients admitted to the intensive care unit (ICU) immediately after femurfracture repairs.METHODS. Following a retrospective review of clinical data and radiographic findings,total 94 patients admitted to the ICU immediately after femur fracture repairs were enrolledin this study from August, 2008 to December, 2011.RESULTS. The median age of the patients was 82 year (41-100) and 75.5 % (n = 71)was female. 31 (33.0 %) patients had underwent postoperative pulmonary complication.Pneumonia developed in 17 patients (18.1 %), atelectasis in 5 (5.3 %), pulmonary edemain 10 (10.6 %), pleural effusion in 15 (16.0 %), and pulmonary embolism in 3 (3.2 %)patients. In-hospital mortality developed in 6 patients (6.4 %). Ten patients (10.6 %)developed acute respiratory failure requiring mechanical ventilation. The factors associ-ated with postoperative respiratory failure by univariate analysis (p \ 0.2) were onepreoperative factor (right ventricular systolic pressure (RVSP) (39 vs. 48 mmHg,p = 0.084) and four operative factors (requirement of transfusions (0 vs. 16.0 %,p = 0.014), prolonged operation time over 2 h (7.7 vs. 25.0 %, p = 0.041), loss of bloodabove 500 mL (6.2 vs 20.0 %, p = 0.044), and volume overload (total input–output) inoperation room (1,014 vs. 1,386 mL, p = 0.060). After adjusting for age and gender,these five factors were introduced into the multivariate analysis model, which revealedthat RVSP [odds ratio (OR) = 1.079, p = 0.043] and volume overload in operation room(OR = 1.002, p = 0.036) were the independent predictive factor for postoperativerespiratory failure.CONCLUSIONS. Pulmonary hypertension diagnosed by RVSP and a large volume over-load above output during operation were predictors for postoperative respiratory failurerequiring mechanical ventilation in patients after femur fracture repairs.REFERENCE(S). 1. Batsis JA, Huddleston JM, Melton LJ, 3rd et al. Body mass index(BMI) and risk of noncardiac postoperative medical complications in elderly hip fracturepatients: a population-based study. J Hosp Med 2009;4:E1–9. 2. Harvin JA, Harvin WH,Camp E et al. Early femur fracture fixation is associated with a reduction in pulmonarycomplications and hospital charges: a decade of experience with 1,376 diaphyseal femurfractures. J Trauma Acute Care Surg 2012;73:1442–8; discussion 8–9.
0552RATE AND CAUSES OF POSTOPERATIVE DEATH AFTER POST-ANAESTHESIA CARE UNIT/HIGH DEPENDENCY UNIT STAY
N. Wickboldt1, C. de Lorenzi1, M. Borgeaud1, C. Delhumeau1, G. Haller1, B. Walder1
1University Hospitals of Geneva, Department Anaesthesiology, Intensive Care and ClinicalPharmacology, Geneva, SwitzerlandINTRODUCTION. Care of patients with critical illness after surgery is performed oftenoutside of ICU; such a clinical pathway with a stay in a post-anaesthesia care unit (PACU),sometimes combined with a high dependency unit (PACU-HDU), may be associated withconsiderable mortality. Rates and causes of postoperative death outside ICU were rarelyinvestigated.MAIN OBJECTIVE. To estimate the in-hospital death rate post-PACU-HDU stay and toidentify risks associated with this mortality.SECONDARY OBJECTIVES. To determine causes of postoperative mortality and timebetween PACU and HDU discharge and death.DESIGN. Single centre, retrospective. Data from hospital computerized patient data sys-tems were searched.SETTING. Tertiary care centre with a centralised PACU-HDU (with guidelines, rounds,discharge criteria, committed medical and nursing heads and the possibility to stay somedays).PATIENTS. Post-interventional adults except after cardiac surgery, craniotomies, gynae-cologic interventions, interventions on multiple trauma, with a stay in the PACU-HDUduring the period of July 2008–June 2011.STATISTICAL ANALYSES. Descriptive statistics were conducted [frequency, percent, ormedian, interquartile range (IQR)]. Univariate and multivariate logistic regression [oddsratio (OR) with 95 % confidence interval (95 % CI)] with an alpha threshold of 5 % wereused to identify risk factors of postoperative mortality.RESULTS. In-hospital, postoperative mortality after PACU-HDU was 0.8 % (214/27,404patients). Risk factors for mortality were age [OR 1.04 (95 % CI 1.03–10.5); survivors:median 59 years (IQR 42; 72), non-survivors: median 78 years (IQR 69; 86)], dichotomisedASA PS (ASA PS 1–2 vs. ASA PS 3–5) [OR 7.63 (95 % CI 4.94–11.81); survivors withASA PS 3–5: 26.1 %, non-survivors with ASA PS 3–5: 86.4 %], non-elective surgery (vs.elective surgery) [OR 2.71 (95 % CI 2.03–3.61); survivors with non-elective surgery:36.6 %; non-survivors with non-elective surgery: 63.6 %], and duration of PACU-HDU stay[OR 1.00 (95 % CI 1.00–1.00); survivors: median 152 min (IQR 99; 269); non-survivors:median 392 min (IQR 165; 1,080)]. The severity of intervention and anaesthesia time werenot independent risk factors of mortality.Hundred twenty-seven non-survivors (59.3 %) had oncologic pathologies. The causes ofdeath were respiratory [68 (31.8 %)], cardiac [55 (25.7 %)], infectious [52 (24.3 %)], on-cologic [36 (16.8 %)], cerebral [16 (7.5 %)], renal [13 (6.1 %)], haemorrhagic [13 (6.1 %)],intestinal [4 (1.9 %)], not established [10 (4.7 %)]. The median survival time after dischargefrom PACU to HDU was 6 days (IQR 3; 10).CONCLUSIONS. The postoperative pathway via a PACU-HDU is safe. Risk factors ofpostoperative death were age, higher ASA PS, non-elective intervention, and prolongedPACU-HDU stay. Major causes of death after PACU-HDU stay are respiratory, cardiac andinfectious; death was several days after PACU-HDU discharge.
0553DECISION FORK RESPIRATORY TACTICS IN PATIENTS WITH ALI/ARDSIN CARDIOVASCULAR AND THORACIC SURGERY
R.A. Ibadov1, A.S. Arifjanov1, Z.N. Mansurov1, N.A. Strijkov1
1Republican Specialized Center of Surgery named after acad. V. Vakhidov, Tashkent,UzbekistanOBJECTIVES. Comparison of the effectiveness of the modes of respiratory support, dif-ferent by pressure and volume (PCV, VCV) to select the optimal variants for mechanicalventilation in patients with of acute respiratory distress syndrome ALI/ARDS.
METHODS. The patients included in the study were those after cardiopulmonary bypasssurgery, coronary artery bypass grafting, and heart valve replacement surgeries, complicatedby ARDS, in ICU RSCS after acad. Vakhidov within 2010–2012. The diagnosis of ALI/ARDS based on a standard (X-ray study, indicators of oxygen status pO2 (A–a) 192 ± 5,pO2 (a/A) 39 ± 3, Fshunt-19 ± 2, PaO2/FiO2 \ 300).In a comparative aspect, to divide two group patients: Group A, n = 28. Used mode ofmechanical ventilation was with controlled pressure (PCV), an inverse relationship I:E -1.5:1, Pinsp-20–26 cm of water, FiO2 \ 60 % ‘‘Optimal’’ PEEP, the rate of Vinsp—40–60 l/min, auto PEEP comprising no more than 50 % of total PEEP. Group B, n = 26.Used mode of ventilation comprised ventilation with small Vt and low Pplat (\35 smH2O),with controlled volume (VCV), Ppeak\35–40 cm of water, VT 6–8 ml/kg, Fi O2 \ 60 %,PEEP 8–10 mmHg, the rate of Vinsp—40–60 l/min. The efficiency measure criterions:PaO2 and SaO2, PaO2/FiO2, Fshunt, pO2 (A–a), pO2 (a/A), Cst., degree of lung injury by J.Murray.RESULTS. Improvement of PaO2/FiO2 in group A than in group B (outcome—108.7 ± 22.4/112.4 ± 20.2, 5-day-184.8 ± 22.4/140.4 ± 24.2. A/B, respectively). Therewas a difference in values of pO2 (A–a) 170 ± 18/165 ± 20 on the 2nd day, 100 ± 20.4/140 ± 22.6 on the 5th day, 58 ± 24.4/100 ± 22.2 respectively. In the first group transitionof ALI into ARDS was observed in two cases, in the second group—in four cases. Com-pared to group B, reduction of duration of mechanical ventilation was observed in patientsof group A (16 ± 4.6/12 ± 2.6 days, respectively).CONCLUSIONS. Management of patients with ALI/ARDS in the modes by pressure, withrestricted peak inspiratory pressure and tidal volume with prolonged inspiratory time, proveto be more effective for the correction of hypoxemia, for reducing the negative effects ofmechanical ventilation on pulmonary parenchyma, for reducing duration of mechanicalventilation and more favorable in terms of lethality when compared with conventionalmethods of mechanical ventilation.
0554THE CHOICE SET RESPIRATORY TACTICS OF PATIENTS WITHHYPERVOLEMIA LESSER CIRCULATION IN THE EARLY POSTOPERATIVEPERIOD AFTER REGULATED SUBCLAVIAN-PULMONARY ANASTOMOSIS
R.A. Ibadov1, H.K. Abrolov1, D.I. Zhulamanova1, N.A. Strijkov1
1Republican Specialized Center of Surgery named after acad. V. Vakhidov, Tashkent,UzbekistanOBJECTIVES. Optimization of respiratory tactics during intensive management of earlypostoperative period after regulated subclavian-pulmonary anastomosis in patients withFallot’s tetralogy and lesser circulation.METHODS. 81 patients with Fallot’s tetralogy and lesser circulation after elective surgeryregulated subclavian-pulmonary anastomosis for the last 2 years, in the ICU RSCS after V.Vakhidov. Proximal end of tourniquet regulators was used in case of 39 patients and Fogartycatheter for volume dosing of shunt was used in case of 42 patients. Clinical examination:EchoCG (with detection of velocity of blood flowing through the subclavian-pulmonaryregulated anastomosis), ECG, chest X-rays (with special emphasis on assessing the degreeof blood filling in the pulmonary circulation); cardiac monitoring: heart rate, blood pressure,central venous pressure, gas exchange parameters and deep oxygen status (pH, SpO2, pO2,pCO2, lactate); monitoring of hemoglobin, hematocrit levels and data of blood coagulation.RESULTS. From overall patients 14 patients had hyperfunction of anastomosis: the pictureof pulmonary preedema was noted in 6 cases, and 9 patients had ‘‘managed’’ hypervolemiaof the pulmonary circulation that manifested as: hemodynamic instability (MABP75–80 mmHg, HR -120 to 140 bpm, CVP 100–140 mmH2O), increase of SpO2 to90.1 ± 1.2 together with poor values of deep oxygen status (A–a 205.1 ± 5.3 mmHg, a/A47.3 % ± 1.4). Restriction of anastomosis functioning allowed to achieve stabilization ofhemodynamic (blood pressure 90–100 mmHg), deep oxygen status (A–a and -230 mmHg,a/A-30 %, SpO2-80 % at FiO2-40 %), which were accompanied by disappearance of rales,improvement of echocardiographic data in dynamics with reduced duration of mechanicalventilation and time of staying in the ICU. Approximate initial date MLV: Vt = 7–9 ml/kg,f = 15–17, I:E = 1:2, PEEP = 5 smH2O, FiO2 = 40–50 %, trigger = 3–3.5 L/min or2.5–3 smH2O. On reaching satisfactory performance of gases of blood, stable haemody-namics, good functioning SPA and good X-ray picture patients expose to extubation.CONCLUSIONS. The proposed tactics of intensive care in the early postoperative periodafter controlled subclavian-pulmonary anastomosis in patients with Fallot’s tetralogy allowsmonitoring and active controlling of the volume of shunted through the anastomosis blood,thus helping to avoid development of hyperfunctioning of anastomosis and pulmonaryedema.
0555FACTORS PREDICTING HAEMORRHAGE DURING THE IMMEDIATEPOSTOPERATIVE PERIOD AFTER LIVER TRANSPLANTATION
R. Gutierrez Rodriguez1, M.V. Garcia Martinez1, M.D. Arias Verdu2
1Carlos Haya Regional University Hospital, Critical Care Unit, Malaga, Spain, 2Carlos HayaRegional Hospital, Critical Care Unit, Malaga, SpainOBJECTIVES. To determine risk factors reliably associated with the need for multi-transfusion and haemorrhage during the immediate postoperative period.METHODS. A retrospective observational analytical study of male and female patientsadmitted after liver transplantation, in our intensive care unit, during the last 3 years.Exclusion factors: none.Variables: Age, sex, stay, mortality, intra-operative and immediate post-operative haem-orrhage, important intra-operative ascites, MELD, Child Pugh, APACHE II, transplantindication, percentage of patients with pretransplant haemoglobin values\10, internationalnormalized ratio (INR) [ 1.6, prothrombin time [40 %, platelets \70.000 IU/L, FactorV \ 60 %, fibrinogen \100 mg.Statistical study: mean, mode, comparison of means: qualitative variables compared by Chisquare and quantitative variables by Student t test. Multivariate regression analysis to assessmultiple variables.RESULTS. The study comprised 135 patients, 121 men and 14 women; mean age 59 years.The mean MELD was 15, the mean Child Pugh 7, mean APACHE II 18. Most had alcoholiccirrhosis (51 %), 37 % hepatocarcinoma, and 46 % were HCV positive recipients. Nosignificant differences were found between groups concerning the INR, Factor V, orfibrinogen.There were differences relating to those with platelets \ 70,000, with a greater risk ofimmediate haemorrhage (50 vs. 13 %; P = 0.001), multitransfusion ([3 packed red cells)during the first 24 postoperative hours (56 vs. 20 %; p \ 0.05), and early kidney failure (43
26th ESICM ANNUAL CONGRESS — PARIS, FRANCE — 5–9 OCTOBER 2013
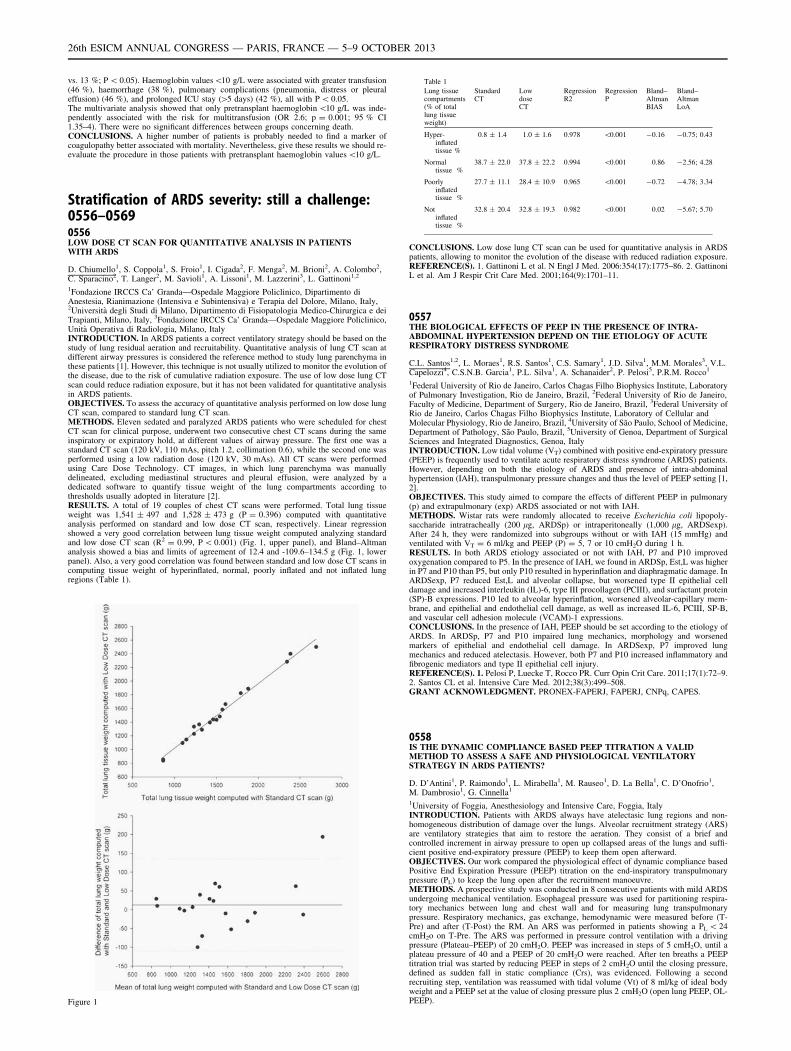
vs. 13 %; P \ 0.05). Haemoglobin values\10 g/L were associated with greater transfusion(46 %), haemorrhage (38 %), pulmonary complications (pneumonia, distress or pleuraleffusion) (46 %), and prolonged ICU stay ([5 days) (42 %), all with P \ 0.05.The multivariate analysis showed that only pretransplant haemoglobin \10 g/L was inde-pendently associated with the risk for multitransfusion (OR 2.6; p = 0.001; 95 % CI1.35–4). There were no significant differences between groups concerning death.CONCLUSIONS. A higher number of patients is probably needed to find a marker ofcoagulopathy better associated with mortality. Nevertheless, give these results we should re-evaluate the procedure in those patients with pretransplant haemoglobin values \10 g/L.
Stratification of ARDS severity: still a challenge:0556–05690556LOW DOSE CT SCAN FOR QUANTITATIVE ANALYSIS IN PATIENTSWITH ARDS
D. Chiumello1, S. Coppola1, S. Froio1, I. Cigada2, F. Menga2, M. Brioni2, A. Colombo2,C. Sparacino2, T. Langer2, M. Savioli1, A. Lissoni1, M. Lazzerini3, L. Gattinoni1,2
1Fondazione IRCCS Ca’ Granda—Ospedale Maggiore Policlinico, Dipartimento diAnestesia, Rianimazione (Intensiva e Subintensiva) e Terapia del Dolore, Milano, Italy,2Università degli Studi di Milano, Dipartimento di Fisiopatologia Medico-Chirurgica e deiTrapianti, Milano, Italy, 3Fondazione IRCCS Ca’ Granda—Ospedale Maggiore Policlinico,Unità Operativa di Radiologia, Milano, ItalyINTRODUCTION. In ARDS patients a correct ventilatory strategy should be based on thestudy of lung residual aeration and recruitability. Quantitative analysis of lung CT scan atdifferent airway pressures is considered the reference method to study lung parenchyma inthese patients [1]. However, this technique is not usually utilized to monitor the evolution ofthe disease, due to the risk of cumulative radiation exposure. The use of low dose lung CTscan could reduce radiation exposure, but it has not been validated for quantitative analysisin ARDS patients.OBJECTIVES. To assess the accuracy of quantitative analysis performed on low dose lungCT scan, compared to standard lung CT scan.METHODS. Eleven sedated and paralyzed ARDS patients who were scheduled for chestCT scan for clinical purpose, underwent two consecutive chest CT scans during the sameinspiratory or expiratory hold, at different values of airway pressure. The first one was astandard CT scan (120 kV, 110 mAs, pitch 1.2, collimation 0.6), while the second one wasperformed using a low radiation dose (120 kV, 30 mAs). All CT scans were performedusing Care Dose Technology. CT images, in which lung parenchyma was manuallydelineated, excluding mediastinal structures and pleural effusion, were analyzed by adedicated software to quantify tissue weight of the lung compartments according tothresholds usually adopted in literature [2].RESULTS. A total of 19 couples of chest CT scans were performed. Total lung tissueweight was 1,541 ± 497 and 1,528 ± 473 g (P = 0.396) computed with quantitativeanalysis performed on standard and low dose CT scan, respectively. Linear regressionshowed a very good correlation between lung tissue weight computed analyzing standardand low dose CT scan (R2 = 0.99, P \ 0.001) (Fig. 1, upper panel), and Bland–Altmananalysis showed a bias and limits of agreement of 12.4 and -109.6–134.5 g (Fig. 1, lowerpanel). Also, a very good correlation was found between standard and low dose CT scans incomputing tissue weight of hyperinflated, normal, poorly inflated and not inflated lungregions (Table 1).
Figure 1
Table 1
Lung tissuecompartments(% of totallung tissueweight)
StandardCT
LowdoseCT
RegressionR2
RegressionP
Bland–AltmanBIAS
Bland–AltmanLoA
Hyper-inflatedtissue %
0.8 ± 1.4 1.0 ± 1.6 0.978 \0.001 -0.16 -0.75; 0.43
Normaltissue %
38.7 ± 22.0 37.8 ± 22.2 0.994 \0.001 0.86 -2.56; 4.28
Poorlyinflatedtissue %
27.7 ± 11.1 28.4 ± 10.9 0.965 \0.001 -0.72 -4.78; 3.34
Notinflatedtissue %
32.8 ± 20.4 32.8 ± 19.3 0.982 \0.001 0.02 -5.67; 5.70
CONCLUSIONS. Low dose lung CT scan can be used for quantitative analysis in ARDSpatients, allowing to monitor the evolution of the disease with reduced radiation exposure.REFERENCE(S). 1. Gattinoni L et al. N Engl J Med. 2006:354(17):1775–86. 2. GattinoniL et al. Am J Respir Crit Care Med. 2001;164(9):1701–11.
0557THE BIOLOGICAL EFFECTS OF PEEP IN THE PRESENCE OF INTRA-ABDOMINAL HYPERTENSION DEPEND ON THE ETIOLOGY OF ACUTERESPIRATORY DISTRESS SYNDROME
C.L. Santos1,2, L. Moraes1, R.S. Santos1, C.S. Samary1, J.D. Silva1, M.M. Morales3, V.L.Capelozzi4, C.S.N.B. Garcia1, P.L. Silva1, A. Schanaider2, P. Pelosi5, P.R.M. Rocco1
1Federal University of Rio de Janeiro, Carlos Chagas Filho Biophysics Institute, Laboratoryof Pulmonary Investigation, Rio de Janeiro, Brazil, 2Federal University of Rio de Janeiro,Faculty of Medicine, Department of Surgery, Rio de Janeiro, Brazil, 3Federal University ofRio de Janeiro, Carlos Chagas Filho Biophysics Institute, Laboratory of Cellular andMolecular Physiology, Rio de Janeiro, Brazil, 4University of São Paulo, School of Medicine,Department of Pathology, São Paulo, Brazil, 5University of Genoa, Department of SurgicalSciences and Integrated Diagnostics, Genoa, ItalyINTRODUCTION. Low tidal volume (VT) combined with positive end-expiratory pressure(PEEP) is frequently used to ventilate acute respiratory distress syndrome (ARDS) patients.However, depending on both the etiology of ARDS and presence of intra-abdominalhypertension (IAH), transpulmonary pressure changes and thus the level of PEEP setting [1,2].OBJECTIVES. This study aimed to compare the effects of different PEEP in pulmonary(p) and extrapulmonary (exp) ARDS associated or not with IAH.METHODS. Wistar rats were randomly allocated to receive Escherichia coli lipopoly-saccharide intratracheally (200 lg, ARDSp) or intraperitoneally (1,000 lg, ARDSexp).After 24 h, they were randomized into subgroups without or with IAH (15 mmHg) andventilated with VT = 6 ml/kg and PEEP (P) = 5, 7 or 10 cmH2O during 1 h.RESULTS. In both ARDS etiology associated or not with IAH, P7 and P10 improvedoxygenation compared to P5. In the presence of IAH, we found in ARDSp, Est,L was higherin P7 and P10 than P5, but only P10 resulted in hyperinflation and diaphragmatic damage. InARDSexp, P7 reduced Est,L and alveolar collapse, but worsened type II epithelial celldamage and increased interleukin (IL)-6, type III procollagen (PCIII), and surfactant protein(SP)-B expressions. P10 led to alveolar hyperinflation, worsened alveolar-capillary mem-brane, and epithelial and endothelial cell damage, as well as increased IL-6, PCIII, SP-B,and vascular cell adhesion molecule (VCAM)-1 expressions.CONCLUSIONS. In the presence of IAH, PEEP should be set according to the etiology ofARDS. In ARDSp, P7 and P10 impaired lung mechanics, morphology and worsenedmarkers of epithelial and endothelial cell damage. In ARDSexp, P7 improved lungmechanics and reduced atelectasis. However, both P7 and P10 increased inflammatory andfibrogenic mediators and type II epithelial cell injury.REFERENCE(S). 1. Pelosi P, Luecke T, Rocco PR. Curr Opin Crit Care. 2011;17(1):72–9.2. Santos CL et al. Intensive Care Med. 2012;38(3):499–508.GRANT ACKNOWLEDGMENT. PRONEX-FAPERJ, FAPERJ, CNPq, CAPES.
0558IS THE DYNAMIC COMPLIANCE BASED PEEP TITRATION A VALIDMETHOD TO ASSESS A SAFE AND PHYSIOLOGICAL VENTILATORYSTRATEGY IN ARDS PATIENTS?
D. D’Antini1, P. Raimondo1, L. Mirabella1, M. Rauseo1, D. La Bella1, C. D’Onofrio1,M. Dambrosio1, G. Cinnella1
1University of Foggia, Anesthesiology and Intensive Care, Foggia, ItalyINTRODUCTION. Patients with ARDS always have atelectasic lung regions and non-homogeneous distribution of damage over the lungs. Alveolar recruitment strategy (ARS)are ventilatory strategies that aim to restore the aeration. They consist of a brief andcontrolled increment in airway pressure to open up collapsed areas of the lungs and suffi-cient positive end-expiratory pressure (PEEP) to keep them open afterward.OBJECTIVES. Our work compared the physiological effect of dynamic compliance basedPositive End Expiration Pressure (PEEP) titration on the end-inspiratory transpulmonarypressure (PL) to keep the lung open after the recruitment manoeuvre.METHODS. A prospective study was conducted in 8 consecutive patients with mild ARDSundergoing mechanical ventilation. Esophageal pressure was used for partitioning respira-tory mechanics between lung and chest wall and for measuring lung transpulmonarypressure. Respiratory mechanics, gas exchange, hemodynamic were measured before (T-Pre) and after (T-Post) the RM. An ARS was performed in patients showing a PL \ 24cmH2o on T-Pre. The ARS was performed in pressure control ventilation with a drivingpressure (Plateau–PEEP) of 20 cmH2O. PEEP was increased in steps of 5 cmH2O, until aplateau pressure of 40 and a PEEP of 20 cmH2O were reached. After ten breaths a PEEPtitration trial was started by reducing PEEP in steps of 2 cmH2O until the closing pressure,defined as sudden fall in static compliance (Crs), was evidenced. Following a secondrecruiting step, ventilation was reassumed with tidal volume (Vt) of 8 ml/kg of ideal bodyweight and a PEEP set at the value of closing pressure plus 2 cmH2O (open lung PEEP, OL-PEEP).
26th ESICM ANNUAL CONGRESS — PARIS, FRANCE — 5–9 OCTOBER 2013
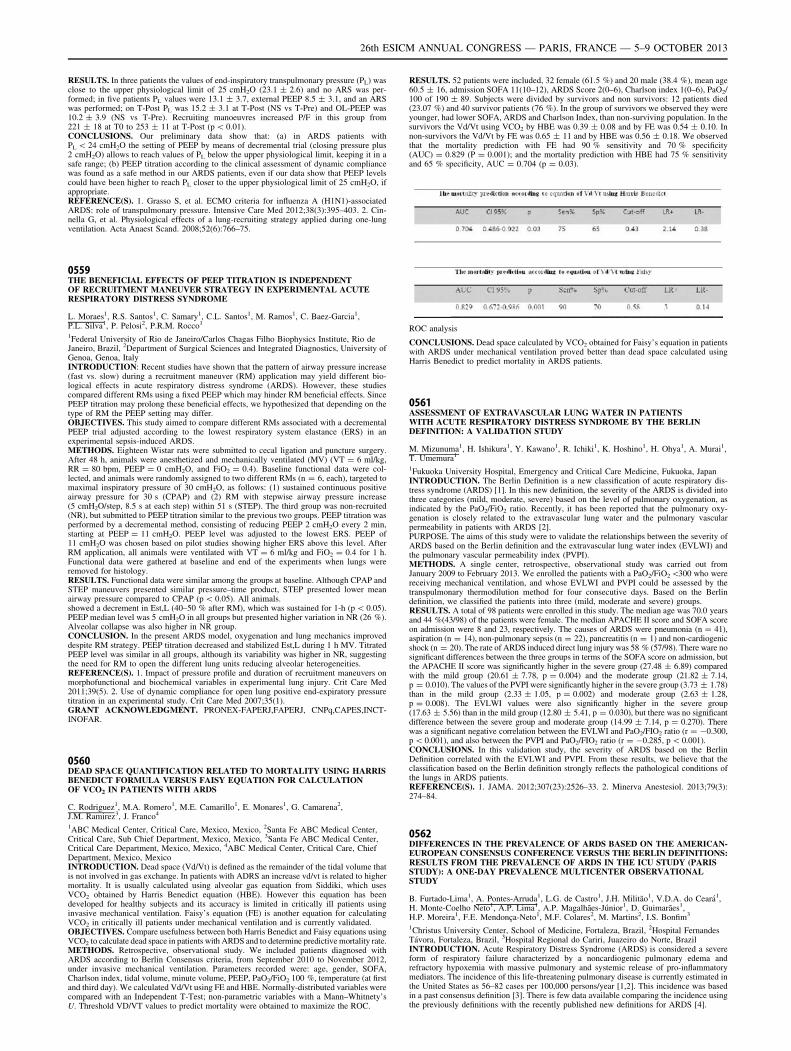
RESULTS. In three patients the values of end-inspiratory transpulmonary pressure (PL) wasclose to the upper physiological limit of 25 cmH2O (23.1 ± 2.6) and no ARS was per-formed; in five patients PL values were 13.1 ± 3.7, external PEEP 8.5 ± 3.1, and an ARSwas performed; on T-Post PL was 15.2 ± 3.1 at T-Post (NS vs T-Pre) and OL-PEEP was10.2 ± 3.9 (NS vs T-Pre). Recruiting manoeuvres increased P/F in this group from221 ± 18 at T0 to 253 ± 11 at T-Post (p \ 0.01).CONCLUSIONS. Our preliminary data show that: (a) in ARDS patients withPL \ 24 cmH2O the setting of PEEP by means of decremental trial (closing pressure plus2 cmH2O) allows to reach values of PL below the upper physiological limit, keeping it in asafe range; (b) PEEP titration according to the clinical assessment of dynamic compliancewas found as a safe method in our ARDS patients, even if our data show that PEEP levelscould have been higher to reach PL closer to the upper physiological limit of 25 cmH2O, ifappropriate.REFERENCE(S). 1. Grasso S, et al. ECMO criteria for influenza A (H1N1)-associatedARDS: role of transpulmonary pressure. Intensive Care Med 2012;38(3):395–403. 2. Cin-nella G, et al. Physiological effects of a lung-recruiting strategy applied during one-lungventilation. Acta Anaest Scand. 2008;52(6):766–75.
0559THE BENEFICIAL EFFECTS OF PEEP TITRATION IS INDEPENDENTOF RECRUITMENT MANEUVER STRATEGY IN EXPERIMENTAL ACUTERESPIRATORY DISTRESS SYNDROME
L. Moraes1, R.S. Santos1, C. Samary1, C.L. Santos1, M. Ramos1, C. Baez-Garcia1,P.L. Silva1, P. Pelosi2, P.R.M. Rocco1
1Federal University of Rio de Janeiro/Carlos Chagas Filho Biophysics Institute, Rio deJaneiro, Brazil, 2Department of Surgical Sciences and Integrated Diagnostics, University ofGenoa, Genoa, ItalyINTRODUCTION: Recent studies have shown that the pattern of airway pressure increase(fast vs. slow) during a recruitment maneuver (RM) application may yield different bio-logical effects in acute respiratory distress syndrome (ARDS). However, these studiescompared different RMs using a fixed PEEP which may hinder RM beneficial effects. SincePEEP titration may prolong these beneficial effects, we hypothesized that depending on thetype of RM the PEEP setting may differ.OBJECTIVES. This study aimed to compare different RMs associated with a decrementalPEEP trial adjusted according to the lowest respiratory system elastance (ERS) in anexperimental sepsis-induced ARDS.METHODS. Eighteen Wistar rats were submitted to cecal ligation and puncture surgery.After 48 h, animals were anesthetized and mechanically ventilated (MV) (VT = 6 ml/kg,RR = 80 bpm, PEEP = 0 cmH2O, and FiO2 = 0.4). Baseline functional data were col-lected, and animals were randomly assigned to two different RMs (n = 6, each), targeted tomaximal inspiratory pressure of 30 cmH2O, as follows: (1) sustained continuous positiveairway pressure for 30 s (CPAP) and (2) RM with stepwise airway pressure increase(5 cmH2O/step, 8.5 s at each step) within 51 s (STEP). The third group was non-recruited(NR), but submitted to PEEP titration similar to the previous two groups. PEEP titration wasperformed by a decremental method, consisting of reducing PEEP 2 cmH2O every 2 min,starting at PEEP = 11 cmH2O. PEEP level was adjusted to the lowest ERS. PEEP of11 cmH2O was chosen based on pilot studies showing higher ERS above this level. AfterRM application, all animals were ventilated with VT = 6 ml/kg and FiO2 = 0.4 for 1 h.Functional data were gathered at baseline and end of the experiments when lungs wereremoved for histology.RESULTS. Functional data were similar among the groups at baseline. Although CPAP andSTEP maneuvers presented similar pressure–time product, STEP presented lower meanairway pressure compared to CPAP (p \ 0.05). All animals.showed a decrement in Est,L (40–50 % after RM), which was sustained for 1-h (p \ 0.05).PEEP median level was 5 cmH2O in all groups but presented higher variation in NR (26 %).Alveolar collapse was also higher in NR group.CONCLUSION. In the present ARDS model, oxygenation and lung mechanics improveddespite RM strategy. PEEP titration decreased and stabilized Est,L during 1 h MV. TitratedPEEP level was similar in all groups, although its variability was higher in NR, suggestingthe need for RM to open the different lung units reducing alveolar heterogeneities.REFERENCE(S). 1. Impact of pressure profile and duration of recruitment maneuvers onmorphofunctional and biochemical variables in experimental lung injury. Crit Care Med2011;39(5). 2. Use of dynamic compliance for open lung positive end-expiratory pressuretitration in an experimental study. Crit Care Med 2007;35(1).GRANT ACKNOWLEDGMENT. PRONEX-FAPERJ,FAPERJ, CNPq,CAPES,INCT-INOFAR.
0560DEAD SPACE QUANTIFICATION RELATED TO MORTALITY USING HARRISBENEDICT FORMULA VERSUS FAISY EQUATION FOR CALCULATIONOF VCO2 IN PATIENTS WITH ARDS
C. Rodriguez1, M.A. Romero1, M.E. Camarillo1, E. Monares1, G. Camarena2,J.M. Ramirez3, J. Franco4
1ABC Medical Center, Critical Care, Mexico, Mexico, 2Santa Fe ABC Medical Center,Critical Care, Sub Chief Department, Mexico, Mexico, 3Santa Fe ABC Medical Center,Critical Care Department, Mexico, Mexico, 4ABC Medical Center, Critical Care, ChiefDepartment, Mexico, MexicoINTRODUCTION. Dead space (Vd/Vt) is defined as the remainder of the tidal volume thatis not involved in gas exchange. In patients with ADRS an increase vd/vt is related to highermortality. It is usually calculated using alveolar gas equation from Siddiki, which usesVCO2 obtained by Harris Benedict equation (HBE). However this equation has beendeveloped for healthy subjects and its accuracy is limited in critically ill patients usinginvasive mechanical ventilation. Faisy’s equation (FE) is another equation for calculatingVCO2 in critically ill patients under mechanical ventilation and is currently validated.OBJECTIVES. Compare usefulness between both Harris Benedict and Faisy equations usingVCO2 to calculate dead space in patients with ARDS and to determine predictive mortality rate.METHODS. Retrospective, observational study. We included patients diagnosed withARDS according to Berlin Consensus criteria, from September 2010 to November 2012,under invasive mechanical ventilation. Parameters recorded were: age, gender, SOFA,Charlson index, tidal volume, minute volume, PEEP, PaO2/FiO2 100 %, temperature (at firstand third day). We calculated Vd/Vt using FE and HBE. Normally-distributed variables werecompared with an Independent T-Test; non-parametric variables with a Mann–Whitnety’sU. Threshold VD/VT values to predict mortality were obtained to maximize the ROC.
RESULTS. 52 patients were included, 32 female (61.5 %) and 20 male (38.4 %), mean age60.5 ± 16, admission SOFA 11(10–12), ARDS Score 2(0–6), Charlson index 1(0–6), PaO2/100 of 190 ± 89. Subjects were divided by survivors and non survivors: 12 patients died(23.07 %) and 40 survivor patients (76 %). In the group of survivors we observed they wereyounger, had lower SOFA, ARDS and Charlson Index, than non-surviving population. In thesurvivors the Vd/Vt using VCO2 by HBE was 0.39 ± 0.08 and by FE was 0.54 ± 0.10. Innon-survivors the Vd/Vt by FE was 0.65 ± 11 and by HBE was 0.56 ± 0.18. We observedthat the mortality prediction with FE had 90 % sensitivity and 70 % specificity(AUC) = 0.829 (P = 0.001); and the mortality prediction with HBE had 75 % sensitivityand 65 % specificity, AUC = 0.704 (p = 0.03).
ROC analysis
CONCLUSIONS. Dead space calculated by VCO2 obtained for Faisy’s equation in patientswith ARDS under mechanical ventilation proved better than dead space calculated usingHarris Benedict to predict mortality in ARDS patients.
0561ASSESSMENT OF EXTRAVASCULAR LUNG WATER IN PATIENTSWITH ACUTE RESPIRATORY DISTRESS SYNDROME BY THE BERLINDEFINITION: A VALIDATION STUDY
M. Mizunuma1, H. Ishikura1, Y. Kawano1, R. Ichiki1, K. Hoshino1, H. Ohya1, A. Murai1,T. Umemura1
1Fukuoka University Hospital, Emergency and Critical Care Medicine, Fukuoka, JapanINTRODUCTION. The Berlin Definition is a new classification of acute respiratory dis-tress syndrome (ARDS) [1]. In this new definition, the severity of the ARDS is divided intothree categories (mild, moderate, severe) based on the level of pulmonary oxygenation, asindicated by the PaO2/FiO2 ratio. Recently, it has been reported that the pulmonary oxy-genation is closely related to the extravascular lung water and the pulmonary vascularpermeability in patients with ARDS [2].PURPOSE. The aims of this study were to validate the relationships between the severity ofARDS based on the Berlin definition and the extravascular lung water index (EVLWI) andthe pulmonary vascular permeability index (PVPI).METHODS. A single center, retrospective, observational study was carried out fromJanuary 2009 to February 2013. We enrolled the patients with a PaO2/FiO2\300 who werereceiving mechanical ventilation, and whose EVLWI and PVPI could be assessed by thetranspulmonary thermodilution method for four consecutive days. Based on the Berlindefinition, we classified the patients into three (mild, moderate and severe) groups.RESULTS. A total of 98 patients were enrolled in this study. The median age was 70.0 yearsand 44 %(43/98) of the patients were female. The median APACHE II score and SOFA scoreon admission were 8 and 23, respectively. The causes of ARDS were pneumonia (n = 41),aspiration (n = 14), non-pulmonary sepsis (n = 22), pancreatitis (n = 1) and non-cardiogenicshock (n = 20). The rate of ARDS induced direct lung injury was 58 % (57/98). There ware nosignificant differences between the three groups in terms of the SOFA score on admission, butthe APACHE II score was significantly higher in the severe group (27.48 ± 6.89) comparedwith the mild group (20.61 ± 7.78, p = 0.004) and the moderate group (21.82 ± 7.14,p = 0.010). The values of the PVPI were significantly higher in the severe group (3.73 ± 1.78)than in the mild group (2.33 ± 1.05, p = 0.002) and moderate group (2.63 ± 1.28,p = 0.008). The EVLWI values were also significantly higher in the severe group(17.63 ± 5.56) than in the mild group (12.80 ± 5.41, p = 0.030), but there was no significantdifference between the severe group and moderate group (14.99 ± 7.14, p = 0.270). Therewas a significant negative correlation between the EVLWI and PaO2/FIO2 ratio (r = -0.300,p \ 0.001), and also between the PVPI and PaO2/FIO2 ratio (r = -0.285, p \ 0.001).CONCLUSIONS. In this validation study, the severity of ARDS based on the BerlinDefinition correlated with the EVLWI and PVPI. From these results, we believe that theclassification based on the Berlin definition strongly reflects the pathological conditions ofthe lungs in ARDS patients.REFERENCE(S). 1. JAMA. 2012;307(23):2526–33. 2. Minerva Anestesiol. 2013;79(3):274–84.
0562DIFFERENCES IN THE PREVALENCE OF ARDS BASED ON THE AMERICAN-EUROPEAN CONSENSUS CONFERENCE VERSUS THE BERLIN DEFINITIONS:RESULTS FROM THE PREVALENCE OF ARDS IN THE ICU STUDY (PARISSTUDY): A ONE-DAY PREVALENCE MULTICENTER OBSERVATIONALSTUDY
B. Furtado-Lima1, A. Pontes-Arruda1, L.G. de Castro1, J.H. Militão1, V.D.A. do Ceará1,H. Monte-Coelho Neto1, A.P. Lima1, A.P. Magalhães-Júnior1, D. Guimarães1,H.P. Moreira1, F.E. Mendonça-Neto1, M.F. Colares2, M. Martins2, I.S. Bonfim3
1Christus University Center, School of Medicine, Fortaleza, Brazil, 2Hospital FernandesTávora, Fortaleza, Brazil, 3Hospital Regional do Cariri, Juazeiro do Norte, BrazilINTRODUCTION. Acute Respiratory Distress Syndrome (ARDS) is considered a severeform of respiratory failure characterized by a noncardiogenic pulmonary edema andrefractory hypoxemia with massive pulmonary and systemic release of pro-inflammatorymediators. The incidence of this life-threatening pulmonary disease is currently estimated inthe United States as 56–82 cases per 100,000 persons/year [1,2]. This incidence was basedin a past consensus definition [3]. There is few data available comparing the incidence usingthe previously definitions with the recently published new definitions for ARDS [4].
26th ESICM ANNUAL CONGRESS — PARIS, FRANCE — 5–9 OCTOBER 2013
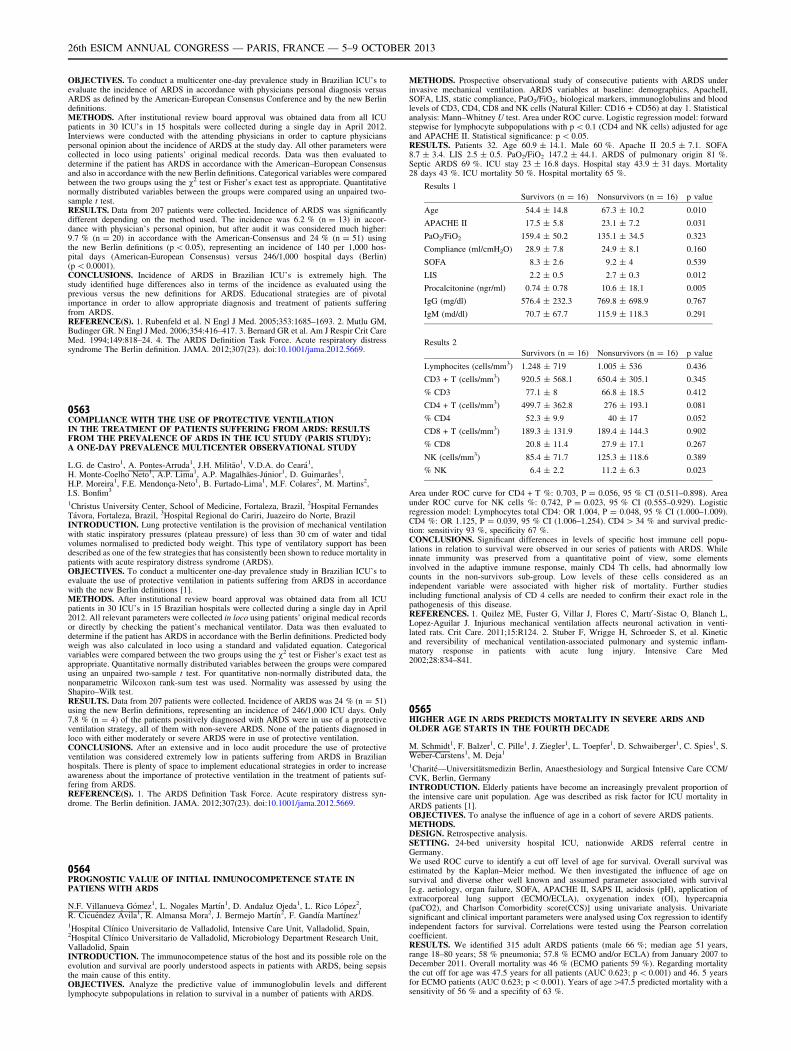
OBJECTIVES. To conduct a multicenter one-day prevalence study in Brazilian ICU’s toevaluate the incidence of ARDS in accordance with physicians personal diagnosis versusARDS as defined by the American-European Consensus Conference and by the new Berlindefinitions.METHODS. After institutional review board approval was obtained data from all ICUpatients in 30 ICU’s in 15 hospitals were collected during a single day in April 2012.Interviews were conducted with the attending physicians in order to capture physicianspersonal opinion about the incidence of ARDS at the study day. All other parameters werecollected in loco using patients’ original medical records. Data was then evaluated todetermine if the patient has ARDS in accordance with the American–European Consensusand also in accordance with the new Berlin definitions. Categorical variables were comparedbetween the two groups using the v2 test or Fisher’s exact test as appropriate. Quantitativenormally distributed variables between the groups were compared using an unpaired two-sample t test.RESULTS. Data from 207 patients were collected. Incidence of ARDS was significantlydifferent depending on the method used. The incidence was 6.2 % (n = 13) in accor-dance with physician’s personal opinion, but after audit it was considered much higher:9.7 % (n = 20) in accordance with the American-Consensus and 24 % (n = 51) usingthe new Berlin definitions (p \ 0.05), representing an incidence of 140 per 1,000 hos-pital days (American-European Consensus) versus 246/1,000 hospital days (Berlin)(p \ 0.0001).CONCLUSIONS. Incidence of ARDS in Brazilian ICU’s is extremely high. Thestudy identified huge differences also in terms of the incidence as evaluated using theprevious versus the new definitions for ARDS. Educational strategies are of pivotalimportance in order to allow appropriate diagnosis and treatment of patients sufferingfrom ARDS.REFERENCE(S). 1. Rubenfeld et al. N Engl J Med. 2005;353:1685–1693. 2. Mutlu GM,Budinger GR. N Engl J Med. 2006;354:416–417. 3. Bernard GR et al. Am J Respir Crit CareMed. 1994;149:818–24. 4. The ARDS Definition Task Force. Acute respiratory distresssyndrome The Berlin definition. JAMA. 2012;307(23). doi:10.1001/jama.2012.5669.
0563COMPLIANCE WITH THE USE OF PROTECTIVE VENTILATIONIN THE TREATMENT OF PATIENTS SUFFERING FROM ARDS: RESULTSFROM THE PREVALENCE OF ARDS IN THE ICU STUDY (PARIS STUDY):A ONE-DAY PREVALENCE MULTICENTER OBSERVATIONAL STUDY
L.G. de Castro1, A. Pontes-Arruda1, J.H. Militão1, V.D.A. do Ceará1,H. Monte-Coelho Neto1, A.P. Lima1, A.P. Magalhães-Júnior1, D. Guimarães1,H.P. Moreira1, F.E. Mendonça-Neto1, B. Furtado-Lima1, M.F. Colares2, M. Martins2,I.S. Bonfim3
1Christus University Center, School of Medicine, Fortaleza, Brazil, 2Hospital FernandesTávora, Fortaleza, Brazil, 3Hospital Regional do Cariri, Juazeiro do Norte, BrazilINTRODUCTION. Lung protective ventilation is the provision of mechanical ventilationwith static inspiratory pressures (plateau pressure) of less than 30 cm of water and tidalvolumes normalised to predicted body weight. This type of ventilatory support has beendescribed as one of the few strategies that has consistently been shown to reduce mortality inpatients with acute respiratory distress syndrome (ARDS).OBJECTIVES. To conduct a multicenter one-day prevalence study in Brazilian ICU’s toevaluate the use of protective ventilation in patients suffering from ARDS in accordancewith the new Berlin definitions [1].METHODS. After institutional review board approval was obtained data from all ICUpatients in 30 ICU’s in 15 Brazilian hospitals were collected during a single day in April2012. All relevant parameters were collected in loco using patients’ original medical recordsor directly by checking the patient’s mechanical ventilator. Data was then evaluated todetermine if the patient has ARDS in accordance with the Berlin definitions. Predicted bodyweigh was also calculated in loco using a standard and validated equation. Categoricalvariables were compared between the two groups using the v2 test or Fisher’s exact test asappropriate. Quantitative normally distributed variables between the groups were comparedusing an unpaired two-sample t test. For quantitative non-normally distributed data, thenonparametric Wilcoxon rank-sum test was used. Normality was assessed by using theShapiro–Wilk test.RESULTS. Data from 207 patients were collected. Incidence of ARDS was 24 % (n = 51)using the new Berlin definitions, representing an incidence of 246/1,000 ICU days. Only7,8 % (n = 4) of the patients positively diagnosed with ARDS were in use of a protectiveventilation strategy, all of them with non-severe ARDS. None of the patients diagnosed inloco with either moderately or severe ARDS were in use of protective ventilation.CONCLUSIONS. After an extensive and in loco audit procedure the use of protectiveventilation was considered extremely low in patients suffering from ARDS in Brazilianhospitals. There is plenty of space to implement educational strategies in order to increaseawareness about the importance of protective ventilation in the treatment of patients suf-fering from ARDS.REFERENCE(S). 1. The ARDS Definition Task Force. Acute respiratory distress syn-drome. The Berlin definition. JAMA. 2012;307(23). doi:10.1001/jama.2012.5669.
0564PROGNOSTIC VALUE OF INITIAL INMUNOCOMPETENCE STATE INPATIENS WITH ARDS
N.F. Villanueva Gómez1, L. Nogales Martı́n1, D. Andaluz Ojeda1, L. Rico López2,R. Cicuéndez Ávila1, R. Almansa Mora2, J. Bermejo Martı́n2, F. Gandı́a Martı́nez1
1Hospital Clı́nico Universitario de Valladolid, Intensive Care Unit, Valladolid, Spain,2Hospital Clı́nico Universitario de Valladolid, Microbiology Department Research Unit,Valladolid, SpainINTRODUCTION. The immunocompetence status of the host and its possible role on theevolution and survival are poorly understood aspects in patients with ARDS, being sepsisthe main cause of this entity.OBJECTIVES. Analyze the predictive value of immunoglobulin levels and differentlymphocyte subpopulations in relation to survival in a number of patients with ARDS.
METHODS. Prospective observational study of consecutive patients with ARDS underinvasive mechanical ventilation. ARDS variables at baseline: demographics, ApacheII,SOFA, LIS, static compliance, PaO2/FiO2, biological markers, immunoglobulins and bloodlevels of CD3, CD4, CD8 and NK cells (Natural Killer: CD16 + CD56) at day 1. Statisticalanalysis: Mann–Whitney U test. Area under ROC curve. Logistic regression model: forwardstepwise for lymphocyte subpopulations with p \ 0.1 (CD4 and NK cells) adjusted for ageand APACHE II. Statistical significance: p \ 0.05.RESULTS. Patients 32. Age 60.9 ± 14.1. Male 60 %. Apache II 20.5 ± 7.1. SOFA8.7 ± 3.4. LIS 2.5 ± 0.5. PaO2/FiO2 147.2 ± 44.1. ARDS of pulmonary origin 81 %.Septic ARDS 69 %. ICU stay 23 ± 16.8 days. Hospital stay 43.9 ± 31 days. Mortality28 days 43 %. ICU mortality 50 %. Hospital mortality 65 %.
Results 1
Survivors (n = 16) Nonsurvivors (n = 16) p value
Age 54.4 ± 14.8 67.3 ± 10.2 0.010
APACHE II 17.5 ± 5.8 23.1 ± 7.2 0.031
PaO2/FiO2 159.4 ± 50.2 135.1 ± 34.5 0.323
Compliance (ml/cmH2O) 28.9 ± 7.8 24.9 ± 8.1 0.160
SOFA 8.3 ± 2.6 9.2 ± 4 0.539
LIS 2.2 ± 0.5 2.7 ± 0.3 0.012
Procalcitonine (ngr/ml) 0.74 ± 0.78 10.6 ± 18.1 0.005
IgG (mg/dl) 576.4 ± 232.3 769.8 ± 698.9 0.767
IgM (md/dl) 70.7 ± 67.7 115.9 ± 118.3 0.291
Results 2
Survivors (n = 16) Nonsurvivors (n = 16) p value
Lymphocites (cells/mm3) 1.248 ± 719 1.005 ± 536 0.436
CD3 + T (cells/mm3) 920.5 ± 568.1 650.4 ± 305.1 0.345
% CD3 77.1 ± 8 66.8 ± 18.5 0.412
CD4 + T (cells/mm3) 499.7 ± 362.8 276 ± 193.1 0.081
% CD4 52.3 ± 9.9 40 ± 17 0.052
CD8 + T (cells/mm3) 189.3 ± 131.9 189.4 ± 144.3 0.902
% CD8 20.8 ± 11.4 27.9 ± 17.1 0.267
NK (cells/mm3) 85.4 ± 71.7 125.3 ± 118.6 0.389
% NK 6.4 ± 2.2 11.2 ± 6.3 0.023
Area under ROC curve for CD4 + T %: 0.703, P = 0.056, 95 % CI (0.511–0.898). Areaunder ROC curve for NK cells %: 0.742, P = 0.023, 95 % CI (0.555–0.929). Logisticregression model: Lymphocytes total CD4: OR 1.004, P = 0.048, 95 % CI (1.000–1.009).CD4 %: OR 1.125, P = 0.039, 95 % CI (1.006–1.254). CD4 [ 34 % and survival predic-tion: sensitivity 93 %, specificity 67 %.CONCLUSIONS. Significant differences in levels of specific host immune cell popu-lations in relation to survival were observed in our series of patients with ARDS. Whileinnate immunity was preserved from a quantitative point of view, some elementsinvolved in the adaptive immune response, mainly CD4 Th cells, had abnormally lowcounts in the non-survivors sub-group. Low levels of these cells considered as anindependent variable were associated with higher risk of mortality. Further studiesincluding functional analysis of CD 4 cells are needed to confirm their exact role in thepathogenesis of this disease.REFERENCES. 1. Quilez ME, Fuster G, Villar J, Flores C, Martı0-Sistac O, Blanch L,Lopez-Aguilar J. Injurious mechanical ventilation affects neuronal activation in venti-lated rats. Crit Care. 2011;15:R124. 2. Stuber F, Wrigge H, Schroeder S, et al. Kineticand reversibility of mechanical ventilation-associated pulmonary and systemic inflam-matory response in patients with acute lung injury. Intensive Care Med2002;28:834–841.
0565HIGHER AGE IN ARDS PREDICTS MORTALITY IN SEVERE ARDS ANDOLDER AGE STARTS IN THE FOURTH DECADE
M. Schmidt1, F. Balzer1, C. Pille1, J. Ziegler1, L. Toepfer1, D. Schwaiberger1, C. Spies1, S.Weber-Carstens1, M. Deja1
1Charité—Universitätsmedizin Berlin, Anaesthesiology and Surgical Intensive Care CCM/CVK, Berlin, GermanyINTRODUCTION. Elderly patients have become an increasingly prevalent proportion ofthe intensive care unit population. Age was described as risk factor for ICU mortality inARDS patients [1].OBJECTIVES. To analyse the influence of age in a cohort of severe ARDS patients.METHODS.DESIGN. Retrospective analysis.SETTING. 24-bed university hospital ICU, nationwide ARDS referral centre inGermany.We used ROC curve to identify a cut off level of age for survival. Overall survival wasestimated by the Kaplan–Meier method. We then investigated the influence of age onsurvival and diverse other well known and assumed parameter associated with survival[e.g. aetiology, organ failure, SOFA, APACHE II, SAPS II, acidosis (pH), application ofextracorporeal lung support (ECMO/ECLA), oxygenation index (OI), hypercapnia(paCO2), and Charlson Comorbidity score(CCS)] using univariate analysis. Univariatesignificant and clinical important parameters were analysed using Cox regression to identifyindependent factors for survival. Correlations were tested using the Pearson correlationcoefficient.RESULTS. We identified 315 adult ARDS patients (male 66 %; median age 51 years,range 18–80 years; 58 % pneumonia; 57.8 % ECMO and/or ECLA) from January 2007 toDecember 2011. Overall mortality was 46 % (ECMO patients 59 %). Regarding mortalitythe cut off for age was 47.5 years for all patients (AUC 0.623; p \ 0.001) and 46. 5 yearsfor ECMO patients (AUC 0.623; p \ 0.001). Years of age[47.5 predicted mortality with asensitivity of 56 % and a specifity of 63 %.
26th ESICM ANNUAL CONGRESS — PARIS, FRANCE — 5–9 OCTOBER 2013
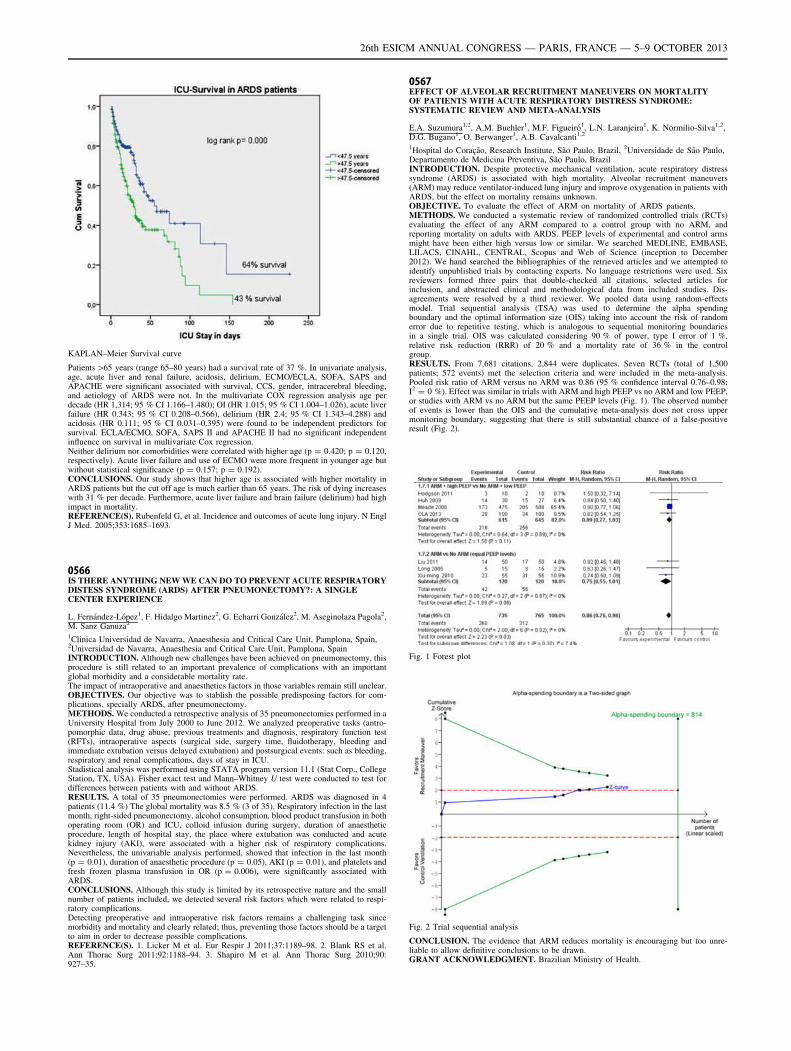
KAPLAN–Meier Survival curve
Patients[65 years (range 65–80 years) had a survival rate of 37 %. In univariate analysis,age, acute liver and renal failure, acidosis, delirium, ECMO/ECLA, SOFA, SAPS andAPACHE were significant associated with survival, CCS, gender, intracerebral bleeding,and aetiology of ARDS were not. In the multivariate COX regression analysis age perdecade (HR 1,314; 95 % CI 1.166–1.480); OI (HR 1.015; 95 % CI 1.004–1.026), acute liverfailure (HR 0.343; 95 % CI 0.208–0.566), delirium (HR 2.4; 95 % CI 1.343–4.288) andacidosis (HR 0.111; 95 % CI 0.031–0.395) were found to be independent predictors forsurvival. ECLA/ECMO, SOFA, SAPS II and APACHE II had no significant independentinfluence on survival in multivariate Cox regression.Neither delirium nor comorbidities were correlated with higher age (p = 0.420; p = 0.120,respectively). Acute liver failure and use of ECMO were more frequent in younger age butwithout statistical significance (p = 0.157; p = 0.192).CONCLUSIONS. Our study shows that higher age is associated with higher mortality inARDS patients but the cut off age is much earlier than 65 years. The risk of dying increaseswith 31 % per decade. Furthermore, acute liver failure and brain failure (delirium) had highimpact in mortality.REFERENCE(S). Rubenfeld G, et al. Incidence and outcomes of acute lung injury. N EnglJ Med. 2005;353:1685–1693.
0566IS THERE ANYTHING NEW WE CAN DO TO PREVENT ACUTE RESPIRATORYDISTESS SYNDROME (ARDS) AFTER PNEUMONECTOMY?: A SINGLECENTER EXPERIENCE
L. Fernández-López1, F. Hidalgo Martinez2, G. Echarri González2, M. Aseginolaza Pagola2,M. Sanz Ganuza2
1Clinica Universidad de Navarra, Anaesthesia and Critical Care Unit, Pamplona, Spain,2Universidad de Navarra, Anaesthesia and Critical Care Unit, Pamplona, SpainINTRODUCTION. Although new challenges have been achieved on pneumonectomy, thisprocedure is still related to an important prevalence of complications with an importantglobal morbidity and a considerable mortality rate.The impact of intraoperative and anaesthetics factors in those variables remain still unclear.OBJECTIVES. Our objective was to stablish the possible predisposing factors for com-plications, specially ARDS, after pneumonectomy.METHODS. We conducted a retrospective analysis of 35 pneumonectomies performed in aUniversity Hospital from July 2000 to June 2012. We analyzed preoperative tasks (antro-pomorphic data, drug abuse, previous treatments and diagnosis, respiratory function test(RFTs), intraoperative aspects (surgical side, surgery time, fluidotherapy, bleeding andimmediate extubation versus delayed extubation) and postsurgical events: such as bleeding,respiratory and renal complications, days of stay in ICU.Stadistical analysis was performed using STATA program version 11.1 (Stat Corp., CollegeStation, TX, USA). Fisher exact test and Mann–Whitney U test were conducted to test fordifferences between patients with and without ARDS.RESULTS. A total of 35 pneumonectomies were performed. ARDS was diagnosed in 4patients (11.4 %) The global mortality was 8.5 % (3 of 35). Respiratory infection in the lastmonth, right-sided pneumonectomy, alcohol consumption, blood product transfusion in bothoperating room (OR) and ICU, colloid infusion during surgery, duration of anaestheticprocedure, length of hospital stay, the place where extubation was conducted and acutekidney injury (AKI), were associated with a higher risk of respiratory complications.Nevertheless, the univariable analysis performed, showed that infection in the last month(p = 0.01), duration of anaesthetic procedure (p = 0.05), AKI (p = 0.01), and platelets andfresh frozen plasma transfusion in OR (p = 0.006), were significantly associated withARDS.CONCLUSIONS. Although this study is limited by its retrospective nature and the smallnumber of patients included, we detected several risk factors which were related to respi-ratory complications.Detecting preoperative and intraoperative risk factors remains a challenging task sincemorbidity and mortality and clearly related; thus, preventing those factors should be a targetto aim in order to decrease possible complications.REFERENCE(S). 1. Licker M et al. Eur Respir J 2011;37:1189–98. 2. Blank RS et al.Ann Thorac Surg 2011;92:1188–94. 3. Shapiro M et al. Ann Thorac Surg 2010;90:927–35.
0567EFFECT OF ALVEOLAR RECRUITMENT MANEUVERS ON MORTALITYOF PATIENTS WITH ACUTE RESPIRATORY DISTRESS SYNDROME:SYSTEMATIC REVIEW AND META-ANALYSIS
E.A. Suzumura1,2, A.M. Buehler1, M.F. Figueiró1, L.N. Laranjeira1, K. Normilio-Silva1,2,D.G. Bugano1, O. Berwanger1, A.B. Cavalcanti1,2
1Hospital do Coração, Research Institute, São Paulo, Brazil, 2Universidade de São Paulo,Departamento de Medicina Preventiva, São Paulo, BrazilINTRODUCTION. Despite protective mechanical ventilation, acute respiratory distresssyndrome (ARDS) is associated with high mortality. Alveolar recruitment maneuvers(ARM) may reduce ventilator-induced lung injury and improve oxygenation in patients withARDS, but the effect on mortality remains unknown.OBJECTIVE. To evaluate the effect of ARM on mortality of ARDS patients.METHODS. We conducted a systematic review of randomized controlled trials (RCTs)evaluating the effect of any ARM compared to a control group with no ARM, andreporting mortality on adults with ARDS. PEEP levels of experimental and control armsmight have been either high versus low or similar. We searched MEDLINE, EMBASE,LILACS, CINAHL, CENTRAL, Scopus and Web of Science (inception to December2012). We hand searched the bibliographies of the retrieved articles and we attempted toidentify unpublished trials by contacting experts. No language restrictions were used. Sixreviewers formed three pairs that double-checked all citations, selected articles forinclusion, and abstracted clinical and methodological data from included studies. Dis-agreements were resolved by a third reviewer. We pooled data using random-effectsmodel. Trial sequential analysis (TSA) was used to determine the alpha spendingboundary and the optimal information size (OIS) taking into account the risk of randomerror due to repetitive testing, which is analogous to sequential monitoring boundariesin a single trial. OIS was calculated considering 90 % of power, type I error of 1 %,relative risk reduction (RRR) of 20 % and a mortality rate of 36 % in the controlgroup.RESULTS. From 7,681 citations, 2,844 were duplicates. Seven RCTs (total of 1,500patients; 572 events) met the selection criteria and were included in the meta-analysis.Pooled risk ratio of ARM versus no ARM was 0.86 (95 % confidence interval 0.76–0.98;I2 = 0 %). Effect was similar in trials with ARM and high PEEP vs no ARM and low PEEP,or studies with ARM vs no ARM but the same PEEP levels (Fig. 1). The observed numberof events is lower than the OIS and the cumulative meta-analysis does not cross uppermonitoring boundary, suggesting that there is still substantial chance of a false-positiveresult (Fig. 2).
Fig. 1 Forest plot
Fig. 2 Trial sequential analysis
CONCLUSION. The evidence that ARM reduces mortality is encouraging but too unre-liable to allow definitive conclusions to be drawn.GRANT ACKNOWLEDGMENT. Brazilian Ministry of Health.
26th ESICM ANNUAL CONGRESS — PARIS, FRANCE — 5–9 OCTOBER 2013
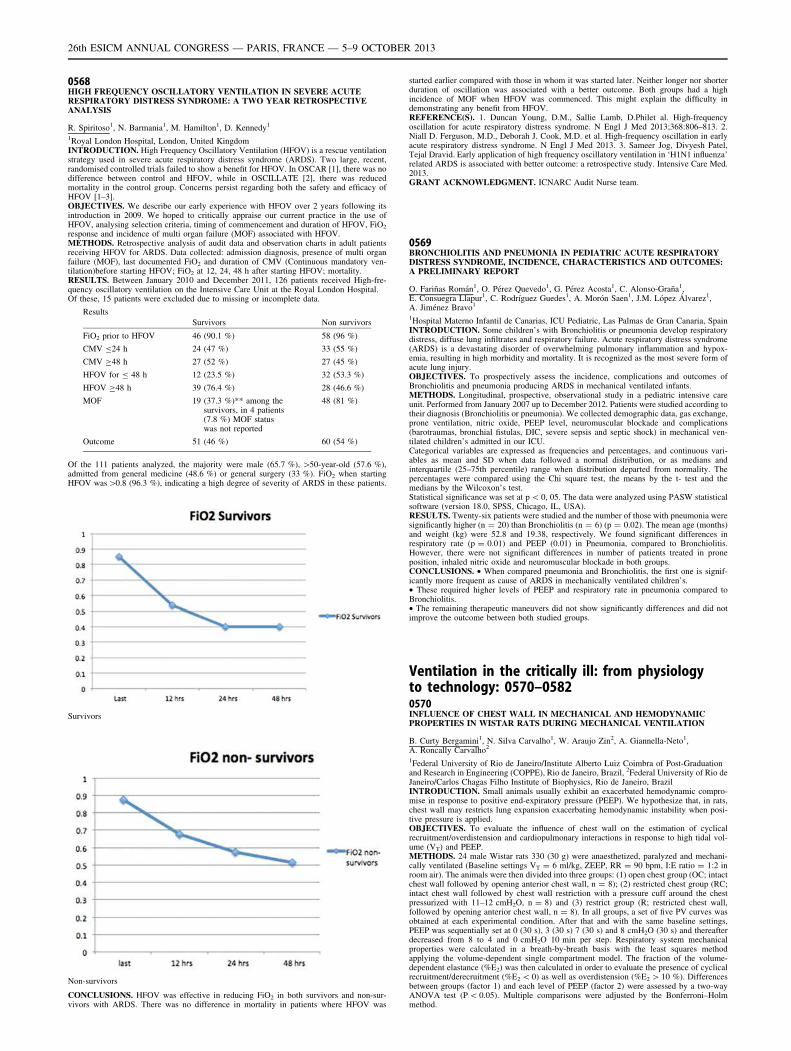
0568HIGH FREQUENCY OSCILLATORY VENTILATION IN SEVERE ACUTERESPIRATORY DISTRESS SYNDROME: A TWO YEAR RETROSPECTIVEANALYSIS
R. Spiritoso1, N. Barmania1, M. Hamilton1, D. Kennedy1
1Royal London Hospital, London, United KingdomINTRODUCTION. High Frequency Oscillatory Ventilation (HFOV) is a rescue ventilationstrategy used in severe acute respiratory distress syndrome (ARDS). Two large, recent,randomised controlled trials failed to show a benefit for HFOV. In OSCAR [1], there was nodifference between control and HFOV, while in OSCILLATE [2], there was reducedmortality in the control group. Concerns persist regarding both the safety and efficacy ofHFOV [1–3].OBJECTIVES. We describe our early experience with HFOV over 2 years following itsintroduction in 2009. We hoped to critically appraise our current practice in the use ofHFOV, analysing selection criteria, timing of commencement and duration of HFOV, FiO2
response and incidence of multi organ failure (MOF) associated with HFOV.METHODS. Retrospective analysis of audit data and observation charts in adult patientsreceiving HFOV for ARDS. Data collected: admission diagnosis, presence of multi organfailure (MOF), last documented FiO2 and duration of CMV (Continuous mandatory ven-tilation)before starting HFOV; FiO2 at 12, 24, 48 h after starting HFOV; mortality.RESULTS. Between January 2010 and December 2011, 126 patients received High-fre-quency oscillatory ventilation on the Intensive Care Unit at the Royal London Hospital.Of these, 15 patients were excluded due to missing or incomplete data.
Results
Survivors Non survivors
FiO2 prior to HFOV 46 (90.1 %) 58 (96 %)
CMV B24 h 24 (47 %) 33 (55 %)
CMV C48 h 27 (52 %) 27 (45 %)
HFOV for B 48 h 12 (23.5 %) 32 (53.3 %)
HFOV C48 h 39 (76.4 %) 28 (46.6 %)
MOF 19 (37.3 %)** among thesurvivors, in 4 patients(7.8 %) MOF statuswas not reported
48 (81 %)
Outcome 51 (46 %) 60 (54 %)
Of the 111 patients analyzed, the majority were male (65.7 %), [50-year-old (57.6 %),admitted from general medicine (48.6 %) or general surgery (33 %). FiO2 when startingHFOV was[0.8 (96.3 %), indicating a high degree of severity of ARDS in these patients.
Survivors
Non-survivors
CONCLUSIONS. HFOV was effective in reducing FiO2 in both survivors and non-sur-vivors with ARDS. There was no difference in mortality in patients where HFOV was
started earlier compared with those in whom it was started later. Neither longer nor shorterduration of oscillation was associated with a better outcome. Both groups had a highincidence of MOF when HFOV was commenced. This might explain the difficulty indemonstrating any benefit from HFOV.REFERENCE(S). 1. Duncan Young, D.M., Sallie Lamb, D.Philet al. High-frequencyoscillation for acute respiratory distress syndrome. N Engl J Med 2013;368:806–813. 2.Niall D. Ferguson, M.D., Deborah J. Cook, M.D. et al. High-frequency oscillation in earlyacute respiratory distress syndrome. N Engl J Med 2013. 3. Sameer Jog, Divyesh Patel,Tejal Dravid. Early application of high frequency oscillatory ventilation in ‘H1N1 influenza’related ARDS is associated with better outcome: a retrospective study. Intensive Care Med.2013.GRANT ACKNOWLEDGMENT. ICNARC Audit Nurse team.
0569BRONCHIOLITIS AND PNEUMONIA IN PEDIATRIC ACUTE RESPIRATORYDISTRESS SYNDROME, INCIDENCE, CHARACTERISTICS AND OUTCOMES:A PRELIMINARY REPORT
O. Fariñas Román1, O. Pérez Quevedo1, G. Pérez Acosta1, C. Alonso-Graña1,E. Consuegra Llapur1, C. Rodrı́guez Guedes1, A. Morón Saen1, J.M. López Álvarez1,A. Jiménez Bravo1
1Hospital Materno Infantil de Canarias, ICU Pediatric, Las Palmas de Gran Canaria, SpainINTRODUCTION. Some children’s with Bronchiolitis or pneumonia develop respiratorydistress, diffuse lung infiltrates and respiratory failure. Acute respiratory distress syndrome(ARDS) is a devastating disorder of overwhelming pulmonary inflammation and hypox-emia, resulting in high morbidity and mortality. It is recognized as the most severe form ofacute lung injury.OBJECTIVES. To prospectively assess the incidence, complications and outcomes ofBronchiolitis and pneumonia producing ARDS in mechanical ventilated infants.METHODS. Longitudinal, prospective, observational study in a pediatric intensive careunit. Performed from January 2007 up to December 2012. Patients were studied according totheir diagnosis (Bronchiolitis or pneumonia). We collected demographic data, gas exchange,prone ventilation, nitric oxide, PEEP level, neuromuscular blockade and complications(barotraumas, bronchial fistulas, DIC, severe sepsis and septic shock) in mechanical ven-tilated children’s admitted in our ICU.Categorical variables are expressed as frequencies and percentages, and continuous vari-ables as mean and SD when data followed a normal distribution, or as medians andinterquartile (25–75th percentile) range when distribution departed from normality. Thepercentages were compared using the Chi square test, the means by the t- test and themedians by the Wilcoxon’s test.Statistical significance was set at p \ 0, 05. The data were analyzed using PASW statisticalsoftware (version 18.0, SPSS, Chicago, IL, USA).RESULTS. Twenty-six patients were studied and the number of those with pneumonia weresignificantly higher (n = 20) than Bronchiolitis (n = 6) (p = 0.02). The mean age (months)and weight (kg) were 52.8 and 19.38, respectively. We found significant differences inrespiratory rate (p = 0.01) and PEEP (0.01) in Pneumonia, compared to Bronchiolitis.However, there were not significant differences in number of patients treated in proneposition, inhaled nitric oxide and neuromuscular blockade in both groups.CONCLUSIONS. • When compared pneumonia and Bronchiolitis, the first one is signif-icantly more frequent as cause of ARDS in mechanically ventilated children’s.• These required higher levels of PEEP and respiratory rate in pneumonia compared toBronchiolitis.• The remaining therapeutic maneuvers did not show significantly differences and did notimprove the outcome between both studied groups.
Ventilation in the critically ill: from physiologyto technology: 0570–05820570INFLUENCE OF CHEST WALL IN MECHANICAL AND HEMODYNAMICPROPERTIES IN WISTAR RATS DURING MECHANICAL VENTILATION
B. Curty Bergamini1, N. Silva Carvalho1, W. Araujo Zin2, A. Giannella-Neto1,A. Roncally Carvalho2
1Federal University of Rio de Janeiro/Institute Alberto Luiz Coimbra of Post-Graduationand Research in Engineering (COPPE), Rio de Janeiro, Brazil, 2Federal University of Rio deJaneiro/Carlos Chagas Filho Institute of Biophysics, Rio de Janeiro, BrazilINTRODUCTION. Small animals usually exhibit an exacerbated hemodynamic compro-mise in response to positive end-expiratory pressure (PEEP). We hypothesize that, in rats,chest wall may restricts lung expansion exacerbating hemodynamic instability when posi-tive pressure is applied.OBJECTIVES. To evaluate the influence of chest wall on the estimation of cyclicalrecruitment/overdistension and cardiopulmonary interactions in response to high tidal vol-ume (VT) and PEEP.METHODS. 24 male Wistar rats 330 (30 g) were anaesthetized, paralyzed and mechani-cally ventilated (Baseline settings VT = 6 ml/kg, ZEEP, RR = 90 bpm, I:E ratio = 1:2 inroom air). The animals were then divided into three groups: (1) open chest group (OC; intactchest wall followed by opening anterior chest wall, n = 8); (2) restricted chest group (RC;intact chest wall followed by chest wall restriction with a pressure cuff around the chestpressurized with 11–12 cmH2O, n = 8) and (3) restrict group (R; restricted chest wall,followed by opening anterior chest wall, n = 8). In all groups, a set of five PV curves wasobtained at each experimental condition. After that and with the same baseline settings,PEEP was sequentially set at 0 (30 s), 3 (30 s) 7 (30 s) and 8 cmH2O (30 s) and thereafterdecreased from 8 to 4 and 0 cmH2O 10 min per step. Respiratory system mechanicalproperties were calculated in a breath-by-breath basis with the least squares methodapplying the volume-dependent single compartment model. The fraction of the volume-dependent elastance (%E2) was then calculated in order to evaluate the presence of cyclicalrecruitment/derecruitment (%E2 \ 0) as well as overdistension (%E2 [ 10 %). Differencesbetween groups (factor 1) and each level of PEEP (factor 2) were assessed by a two-wayANOVA test (P \ 0.05). Multiple comparisons were adjusted by the Bonferroni–Holmmethod.
26th ESICM ANNUAL CONGRESS — PARIS, FRANCE — 5–9 OCTOBER 2013
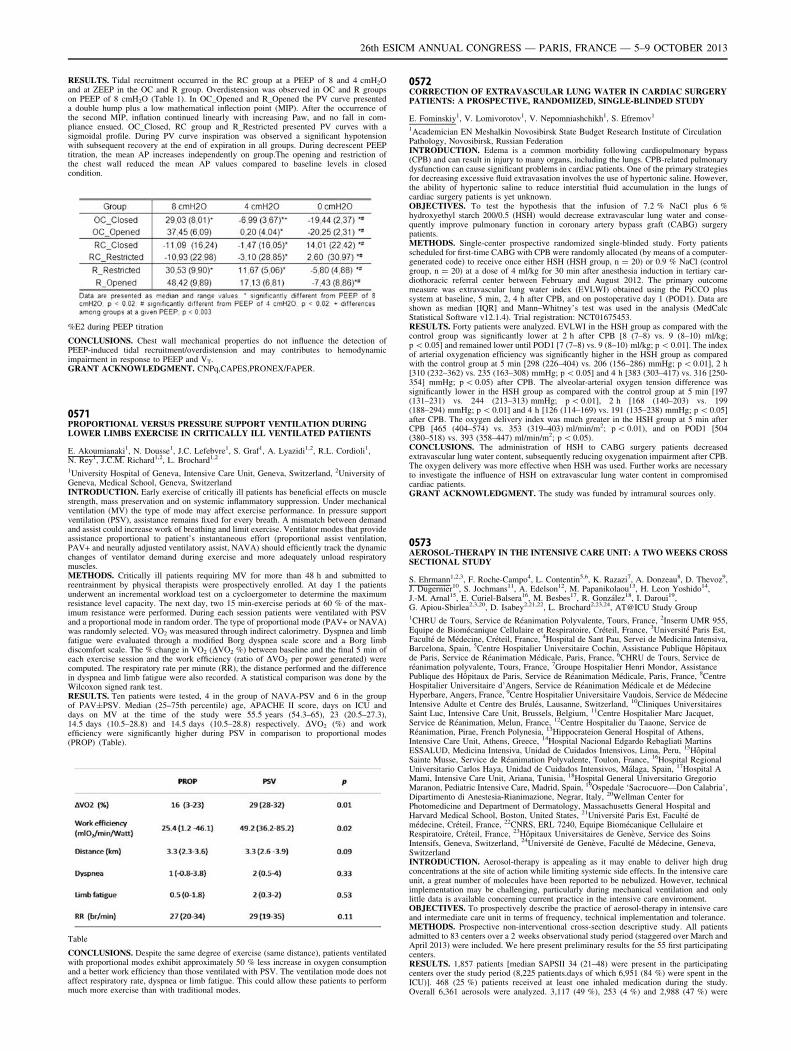
RESULTS. Tidal recruitment occurred in the RC group at a PEEP of 8 and 4 cmH2Oand at ZEEP in the OC and R group. Overdistension was observed in OC and R groupson PEEP of 8 cmH2O (Table 1). In OC_Opened and R_Opened the PV curve presenteda double hump plus a low mathematical inflection point (MIP). After the occurrence ofthe second MIP, inflation continued linearly with increasing Paw, and no fall in com-pliance ensued. OC_Closed, RC group and R_Restricted presented PV curves with asigmoidal profile. During PV curve inspiration was observed a significant hypotensionwith subsequent recovery at the end of expiration in all groups. During decrescent PEEPtitration, the mean AP increases independently on group.The opening and restriction ofthe chest wall reduced the mean AP values compared to baseline levels in closedcondition.
%E2 during PEEP titration
CONCLUSIONS. Chest wall mechanical properties do not influence the detection ofPEEP-induced tidal recruitment/overdistension and may contributes to hemodynamicimpairment in response to PEEP and VT.GRANT ACKNOWLEDGMENT. CNPq,CAPES,PRONEX/FAPER.
0571PROPORTIONAL VERSUS PRESSURE SUPPORT VENTILATION DURINGLOWER LIMBS EXERCISE IN CRITICALLY ILL VENTILATED PATIENTS
E. Akoumianaki1, N. Dousse1, J.C. Lefebvre1, S. Graf1, A. Lyazidi1,2, R.L. Cordioli1,N. Rey1, J.C.M. Richard1,2, L. Brochard1,2
1University Hospital of Geneva, Intensive Care Unit, Geneva, Switzerland, 2University ofGeneva, Medical School, Geneva, SwitzerlandINTRODUCTION. Early exercise of critically ill patients has beneficial effects on musclestrength, mass preservation and on systemic inflammatory suppression. Under mechanicalventilation (MV) the type of mode may affect exercise performance. In pressure supportventilation (PSV), assistance remains fixed for every breath. A mismatch between demandand assist could increase work of breathing and limit exercise. Ventilator modes that provideassistance proportional to patient’s instantaneous effort (proportional assist ventilation,PAV+ and neurally adjusted ventilatory assist, NAVA) should efficiently track the dynamicchanges of ventilator demand during exercise and more adequately unload respiratorymuscles.METHODS. Critically ill patients requiring MV for more than 48 h and submitted toreentrainment by physical therapists were prospectively enrolled. At day 1 the patientsunderwent an incremental workload test on a cycloergometer to determine the maximumresistance level capacity. The next day, two 15 min-exercise periods at 60 % of the max-imum resistance were performed. During each session patients were ventilated with PSVand a proportional mode in random order. The type of proportional mode (PAV+ or NAVA)was randomly selected. VO2 was measured through indirect calorimetry. Dyspnea and limbfatigue were evaluated through a modified Borg dyspnea scale score and a Borg limbdiscomfort scale. The % change in VO2 (DVO2 %) between baseline and the final 5 min ofeach exercise session and the work efficiency (ratio of DVO2 per power generated) werecomputed. The respiratory rate per minute (RR), the distance performed and the differencein dyspnea and limb fatigue were also recorded. A statistical comparison was done by theWilcoxon signed rank test.RESULTS. Ten patients were tested, 4 in the group of NAVA-PSV and 6 in the groupof PAV±PSV. Median (25–75th percentile) age, APACHE II score, days on ICU anddays on MV at the time of the study were 55.5 years (54.3–65), 23 (20.5–27.3),14.5 days (10.5–28.8) and 14.5 days (10.5–28.8) respectively. DVO2 (%) and workefficiency were significantly higher during PSV in comparison to proportional modes(PROP) (Table).
Table
CONCLUSIONS. Despite the same degree of exercise (same distance), patients ventilatedwith proportional modes exhibit approximately 50 % less increase in oxygen consumptionand a better work efficiency than those ventilated with PSV. The ventilation mode does notaffect respiratory rate, dyspnea or limb fatigue. This could allow these patients to performmuch more exercise than with traditional modes.
0572CORRECTION OF EXTRAVASCULAR LUNG WATER IN CARDIAC SURGERYPATIENTS: A PROSPECTIVE, RANDOMIZED, SINGLE-BLINDED STUDY
E. Fominskiy1, V. Lomivorotov1, V. Nepomniashchikh1, S. Efremov1
1Academician EN Meshalkin Novosibirsk State Budget Research Institute of CirculationPathology, Novosibirsk, Russian FederationINTRODUCTION. Edema is a common morbidity following cardiopulmonary bypass(CPB) and can result in injury to many organs, including the lungs. CPB-related pulmonarydysfunction can cause significant problems in cardiac patients. One of the primary strategiesfor decreasing excessive fluid extravasation involves the use of hypertonic saline. However,the ability of hypertonic saline to reduce interstitial fluid accumulation in the lungs ofcardiac surgery patients is yet unknown.OBJECTIVES. To test the hypothesis that the infusion of 7.2 % NaCl plus 6 %hydroxyethyl starch 200/0.5 (HSH) would decrease extravascular lung water and conse-quently improve pulmonary function in coronary artery bypass graft (CABG) surgerypatients.METHODS. Single-center prospective randomized single-blinded study. Forty patientsscheduled for first-time CABG with CPB were randomly allocated (by means of a computer-generated code) to receive once either HSH (HSH group, n = 20) or 0.9 % NaCl (controlgroup, n = 20) at a dose of 4 ml/kg for 30 min after anesthesia induction in tertiary car-diothoracic referral center between February and August 2012. The primary outcomemeasure was extravascular lung water index (EVLWI) obtained using the PiCCO plussystem at baseline, 5 min, 2, 4 h after CPB, and on postoperative day 1 (POD1). Data areshown as median [IQR] and Mann–Whitney’s test was used in the analysis (MedCalcStatistical Software v12.1.4). Trial registration: NCT01675453.RESULTS. Forty patients were analyzed. EVLWI in the HSH group as compared with thecontrol group was significantly lower at 2 h after CPB [8 (7–8) vs. 9 (8–10) ml/kg;p \ 0.05] and remained lower until POD1 [7 (7–8) vs. 9 (8–10) ml/kg; p \ 0.01]. The indexof arterial oxygenation efficiency was significantly higher in the HSH group as comparedwith the control group at 5 min [298 (226–404) vs. 206 (156–286) mmHg; p \ 0.01], 2 h[310 (232–362) vs. 235 (163–308) mmHg; p \ 0.05] and 4 h [383 (303–417) vs. 316 [250-354] mmHg; p \ 0.05) after CPB. The alveolar-arterial oxygen tension difference wassignificantly lower in the HSH group as compared with the control group at 5 min [197(131–231) vs. 244 (213–313) mmHg; p \ 0.01], 2 h [168 (140–203) vs. 199(188–294) mmHg; p \ 0.01] and 4 h [126 (114–169) vs. 191 (135–238) mmHg; p \ 0.05]after CPB. The oxygen delivery index was much greater in the HSH group at 5 min afterCPB [465 (404–574) vs. 353 (319–403) ml/min/m2; p \ 0.01), and on POD1 [504(380–518) vs. 393 (358–447) ml/min/m2; p \ 0.05).CONCLUSIONS. The administration of HSH to CABG surgery patients decreasedextravascular lung water content, subsequently reducing oxygenation impairment after CPB.The oxygen delivery was more effective when HSH was used. Further works are necessaryto investigate the influence of HSH on extravascular lung water content in compromisedcardiac patients.GRANT ACKNOWLEDGMENT. The study was funded by intramural sources only.
0573AEROSOL-THERAPY IN THE INTENSIVE CARE UNIT: A TWO WEEKS CROSSSECTIONAL STUDY
S. Ehrmann1,2,3, F. Roche-Campo4, L. Contentin5,6, K. Razazi7, A. Donzeau8, D. Thevoz9,J. Dugernier10, S. Jochmans11, A. Edelson12, M. Papanikolaou13, H. Leon Yoshido14,J.-M. Arnal15, E. Curiel-Balsera16, M. Besbes17, R. González18, I. Daroui19,G. Apiou-Sbirlea2,3,20, D. Isabey2,21,22, L. Brochard2,23,24, AT@ICU Study Group1CHRU de Tours, Service de Réanimation Polyvalente, Tours, France, 2Inserm UMR 955,Equipe de Biomécanique Cellulaire et Respiratoire, Créteil, France, 3Université Paris Est,Faculté de Médecine, Créteil, France, 4Hospital de Sant Pau, Servei de Medicina Intensiva,Barcelona, Spain, 5Centre Hospitalier Universitaire Cochin, Assistance Publique Hôpitauxde Paris, Service de Réanimation Médicale, Paris, France, 6CHRU de Tours, Service deréanimation polyvalente, Tours, France, 7Groupe Hospitalier Henri Mondor, AssistancePublique des Hôpitaux de Paris, Service de Réanimation Médicale, Paris, France, 8CentreHospitalier Universitaire d’Angers, Service de Réanimation Médicale et de MédecineHyperbare, Angers, France, 9Centre Hospitalier Universitaire Vaudois, Service de MédecineIntensive Adulte et Centre des Brulés, Lausanne, Switzerland, 10Cliniques UniversitairesSaint Luc, Intensive Care Unit, Brussels, Belgium, 11Centre Hospitalier Marc Jacquet,Service de Réanimation, Melun, France, 12Centre Hospitalier du Taaone, Service deRéanimation, Pirae, French Polynesia, 13Hippocrateion General Hospital of Athens,Intensive Care Unit, Athens, Greece, 14Hospital Nacional Edgardo Rebagliati MartinsESSALUD, Medicina Intensiva, Unidad de Cuidados Intensivos, Lima, Peru, 15HôpitalSainte Musse, Service de Réanimation Polyvalente, Toulon, France, 16Hospital RegionalUniversitario Carlos Haya, Unidad de Cuidados Intensivos, Málaga, Spain, 17Hospital AMami, Intensive Care Unit, Ariana, Tunisia, 18Hospital General Universitario GregorioMaranon, Pediatric Intensive Care, Madrid, Spain, 19Ospedale ‘Sacrocuore—Don Calabria’,Dipartimento di Anestesia-Rianimazione, Negrar, Italy, 20Wellman Center forPhotomedicine and Department of Dermatology, Massachusetts General Hospital andHarvard Medical School, Boston, United States, 21Université Paris Est, Faculté demédecine, Créteil, France, 22CNRS, ERL 7240, Equipe Biomécanique Cellulaire etRespiratoire, Créteil, France, 23Hôpitaux Universitaires de Genève, Service des SoinsIntensifs, Geneva, Switzerland, 24Université de Genève, Faculté de Médecine, Geneva,SwitzerlandINTRODUCTION. Aerosol-therapy is appealing as it may enable to deliver high drugconcentrations at the site of action while limiting systemic side effects. In the intensive careunit, a great number of molecules have been reported to be nebulized. However, technicalimplementation may be challenging, particularly during mechanical ventilation and onlylittle data is available concerning current practice in the intensive care environment.OBJECTIVES. To prospectively describe the practice of aerosol-therapy in intensive careand intermediate care unit in terms of frequency, technical implementation and tolerance.METHODS. Prospective non-interventional cross-section descriptive study. All patientsadmitted to 83 centers over a 2 weeks observational study period (staggered over March andApril 2013) were included. We here present preliminary results for the 55 first participatingcenters.RESULTS. 1,857 patients [median SAPSII 34 (21–48) were present in the participatingcenters over the study period (8,225 patients.days of which 6,951 (84 %) were spent in theICU)]. 468 (25 %) patients received at least one inhaled medication during the study.Overall 6,361 aerosols were analyzed. 3,117 (49 %), 253 (4 %) and 2,988 (47 %) were
26th ESICM ANNUAL CONGRESS — PARIS, FRANCE — 5–9 OCTOBER 2013
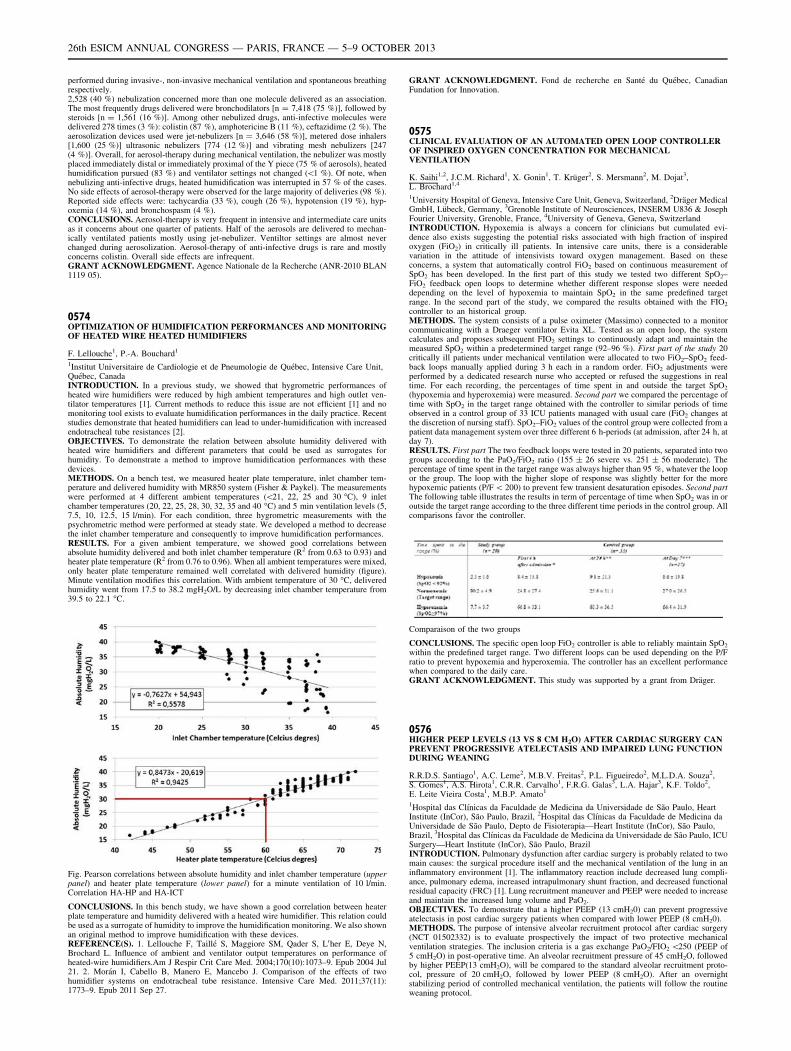
performed during invasive-, non-invasive mechanical ventilation and spontaneous breathingrespectively.2,528 (40 %) nebulization concerned more than one molecule delivered as an association.The most frequently drugs delivered were bronchodilators [n = 7,418 (75 %)], followed bysteroids [n = 1,561 (16 %)]. Among other nebulized drugs, anti-infective molecules weredelivered 278 times (3 %): colistin (87 %), amphotericine B (11 %), ceftazidime (2 %). Theaerosolization devices used were jet-nebulizers [n = 3,646 (58 %)], metered dose inhalers[1,600 (25 %)] ultrasonic nebulizers [774 (12 %)] and vibrating mesh nebulizers [247(4 %)]. Overall, for aerosol-therapy during mechanical ventilation, the nebulizer was mostlyplaced immediately distal or immediately proximal of the Y piece (75 % of aerosols), heatedhumidification pursued (83 %) and ventilator settings not changed (\1 %). Of note, whennebulizing anti-infective drugs, heated humidification was interrupted in 57 % of the cases.No side effects of aerosol-therapy were observed for the large majority of deliveries (98 %).Reported side effects were: tachycardia (33 %), cough (26 %), hypotension (19 %), hyp-oxemia (14 %), and bronchospasm (4 %).CONCLUSIONS. Aerosol-therapy is very frequent in intensive and intermediate care unitsas it concerns about one quarter of patients. Half of the aerosols are delivered to mechan-ically ventilated patients mostly using jet-nebulizer. Ventiltor settings are almost neverchanged during aerosolization. Aerosol-therapy of anti-infective drugs is rare and mostlyconcerns colistin. Overall side effects are infrequent.GRANT ACKNOWLEDGMENT. Agence Nationale de la Recherche (ANR-2010 BLAN1119 05).
0574OPTIMIZATION OF HUMIDIFICATION PERFORMANCES AND MONITORINGOF HEATED WIRE HEATED HUMIDIFIERS
F. Lellouche1, P.-A. Bouchard1
1Institut Universitaire de Cardiologie et de Pneumologie de Québec, Intensive Care Unit,Québec, CanadaINTRODUCTION. In a previous study, we showed that hygrometric performances ofheated wire humidifiers were reduced by high ambient temperatures and high outlet ven-tilator temperatures [1]. Current methods to reduce this issue are not efficient [1] and nomonitoring tool exists to evaluate humidification performances in the daily practice. Recentstudies demonstrate that heated humidifiers can lead to under-humidification with increasedendotracheal tube resistances [2].OBJECTIVES. To demonstrate the relation between absolute humidity delivered withheated wire humidifiers and different parameters that could be used as surrogates forhumidity. To demonstrate a method to improve humidification performances with thesedevices.METHODS. On a bench test, we measured heater plate temperature, inlet chamber tem-perature and delivered humidity with MR850 system (Fisher & Paykel). The measurementswere performed at 4 different ambient temperatures (\21, 22, 25 and 30 �C), 9 inletchamber temperatures (20, 22, 25, 28, 30, 32, 35 and 40 �C) and 5 min ventilation levels (5,7.5, 10, 12.5, 15 l/min). For each condition, three hygrometric measurements with thepsychrometric method were performed at steady state. We developed a method to decreasethe inlet chamber temperature and consequently to improve humidification performances.RESULTS. For a given ambient temperature, we showed good correlations betweenabsolute humidity delivered and both inlet chamber temperature (R2 from 0.63 to 0.93) andheater plate temperature (R2 from 0.76 to 0.96). When all ambient temperatures were mixed,only heater plate temperature remained well correlated with delivered humidity (figure).Minute ventilation modifies this correlation. With ambient temperature of 30 �C, deliveredhumidity went from 17.5 to 38.2 mgH2O/L by decreasing inlet chamber temperature from39.5 to 22.1 �C.
Fig. Pearson correlations between absolute humidity and inlet chamber temperature (upperpanel) and heater plate temperature (lower panel) for a minute ventilation of 10 l/min.Correlation HA-HP and HA-ICT
CONCLUSIONS. In this bench study, we have shown a good correlation between heaterplate temperature and humidity delivered with a heated wire humidifier. This relation couldbe used as a surrogate of humidity to improve the humidification monitoring. We also shownan original method to improve humidification with these devices.REFERENCE(S). 1. Lellouche F, Taillé S, Maggiore SM, Qader S, L0her E, Deye N,Brochard L. Influence of ambient and ventilator output temperatures on performance ofheated-wire humidifiers.Am J Respir Crit Care Med. 2004;170(10):1073–9. Epub 2004 Jul21. 2. Morán I, Cabello B, Manero E, Mancebo J. Comparison of the effects of twohumidifier systems on endotracheal tube resistance. Intensive Care Med. 2011;37(11):1773–9. Epub 2011 Sep 27.
GRANT ACKNOWLEDGMENT. Fond de recherche en Santé du Québec, CanadianFundation for Innovation.
0575CLINICAL EVALUATION OF AN AUTOMATED OPEN LOOP CONTROLLEROF INSPIRED OXYGEN CONCENTRATION FOR MECHANICALVENTILATION
K. Saihi1,2, J.C.M. Richard1, X. Gonin1, T. Krüger2, S. Mersmann2, M. Dojat3,L. Brochard1,4
1University Hospital of Geneva, Intensive Care Unit, Geneva, Switzerland, 2Dräger MedicalGmbH, Lübeck, Germany, 3Grenoble Institute of Neurosciences, INSERM U836 & JosephFourier University, Grenoble, France, 4University of Geneva, Geneva, SwitzerlandINTRODUCTION. Hypoxemia is always a concern for clinicians but cumulated evi-dence also exists suggesting the potential risks associated with high fraction of inspiredoxygen (FiO2) in critically ill patients. In intensive care units, there is a considerablevariation in the attitude of intensivists toward oxygen management. Based on theseconcerns, a system that automatically control FiO2 based on continuous measurement ofSpO2 has been developed. In the first part of this study we tested two different SpO2–FiO2 feedback open loops to determine whether different response slopes were neededdepending on the level of hypoxemia to maintain SpO2 in the same predefined targetrange. In the second part of the study, we compared the results obtained with the FIO2
controller to an historical group.METHODS. The system consists of a pulse oximeter (Massimo) connected to a monitorcommunicating with a Draeger ventilator Evita XL. Tested as an open loop, the systemcalculates and proposes subsequent FIO2 settings to continuously adapt and maintain themeasured SpO2 within a predetermined target range (92–96 %). First part of the study 20critically ill patients under mechanical ventilation were allocated to two FiO2–SpO2 feed-back loops manually applied during 3 h each in a random order. FiO2 adjustments wereperformed by a dedicated research nurse who accepted or refused the suggestions in realtime. For each recording, the percentages of time spent in and outside the target SpO2
(hypoxemia and hyperoxemia) were measured. Second part we compared the percentage oftime with SpO2 in the target range obtained with the controller to similar periods of timeobserved in a control group of 33 ICU patients managed with usual care (FiO2 changes atthe discretion of nursing staff). SpO2–FiO2 values of the control group were collected from apatient data management system over three different 6 h-periods (at admission, after 24 h, atday 7).RESULTS. First part The two feedback loops were tested in 20 patients, separated into twogroups according to the PaO2/FiO2 ratio (155 ± 26 severe vs. 251 ± 56 moderate). Thepercentage of time spent in the target range was always higher than 95 %, whatever the loopor the group. The loop with the higher slope of response was slightly better for the morehypoxemic patients (P/F \ 200) to prevent few transient desaturation episodes. Second partThe following table illustrates the results in term of percentage of time when SpO2 was in oroutside the target range according to the three different time periods in the control group. Allcomparisons favor the controller.
Comparaison of the two groups
CONCLUSIONS. The specific open loop FiO2 controller is able to reliably maintain SpO2
within the predefined target range. Two different loops can be used depending on the P/Fratio to prevent hypoxemia and hyperoxemia. The controller has an excellent performancewhen compared to the daily care.GRANT ACKNOWLEDGMENT. This study was supported by a grant from Dräger.
0576HIGHER PEEP LEVELS (13 VS 8 CM H2O) AFTER CARDIAC SURGERY CANPREVENT PROGRESSIVE ATELECTASIS AND IMPAIRED LUNG FUNCTIONDURING WEANING
R.R.D.S. Santiago1, A.C. Leme2, M.B.V. Freitas2, P.L. Figueiredo2, M.L.D.A. Souza2,S. Gomes1, A.S. Hirota1, C.R.R. Carvalho1, F.R.G. Galas3, L.A. Hajar3, K.F. Toldo2,E. Leite Vieira Costa1, M.B.P. Amato1
1Hospital das Clı́nicas da Faculdade de Medicina da Universidade de São Paulo, HeartInstitute (InCor), São Paulo, Brazil, 2Hospital das Clı́nicas da Faculdade de Medicina daUniversidade de São Paulo, Depto de Fisioterapia—Heart Institute (InCor), São Paulo,Brazil, 3Hospital das Clı́nicas da Faculdade de Medicina da Universidade de São Paulo, ICUSurgery—Heart Institute (InCor), São Paulo, BrazilINTRODUCTION. Pulmonary dysfunction after cardiac surgery is probably related to twomain causes: the surgical procedure itself and the mechanical ventilation of the lung in aninflammatory environment [1]. The inflammatory reaction include decreased lung compli-ance, pulmonary edema, increased intrapulmonary shunt fraction, and decreased functionalresidual capacity (FRC) [1]. Lung recruitment maneuver and PEEP were needed to increaseand maintain the increased lung volume and PaO2.OBJECTIVES. To demonstrate that a higher PEEP (13 cmH20) can prevent progressiveatelectasis in post cardiac surgery patients when compared with lower PEEP (8 cmH20).METHODS. The purpose of intensive alveolar recruitment protocol after cardiac surgery(NCT 01502332) is to evaluate prospectively the impact of two protective mechanicalventilation strategies. The inclusion criteria is a gas exchange PaO2/FIO2 \250 (PEEP of5 cmH2O) in post-operative time. An alveolar recruitment pressure of 45 cmH2O, followedby higher PEEP(13 cmH2O), will be compared to the standard alveolar recruitment proto-col, pressure of 20 cmH2O, followed by lower PEEP (8 cmH2O). After an overnightstabilizing period of controlled mechanical ventilation, the patients will follow the routineweaning protocol.
26th ESICM ANNUAL CONGRESS — PARIS, FRANCE — 5–9 OCTOBER 2013
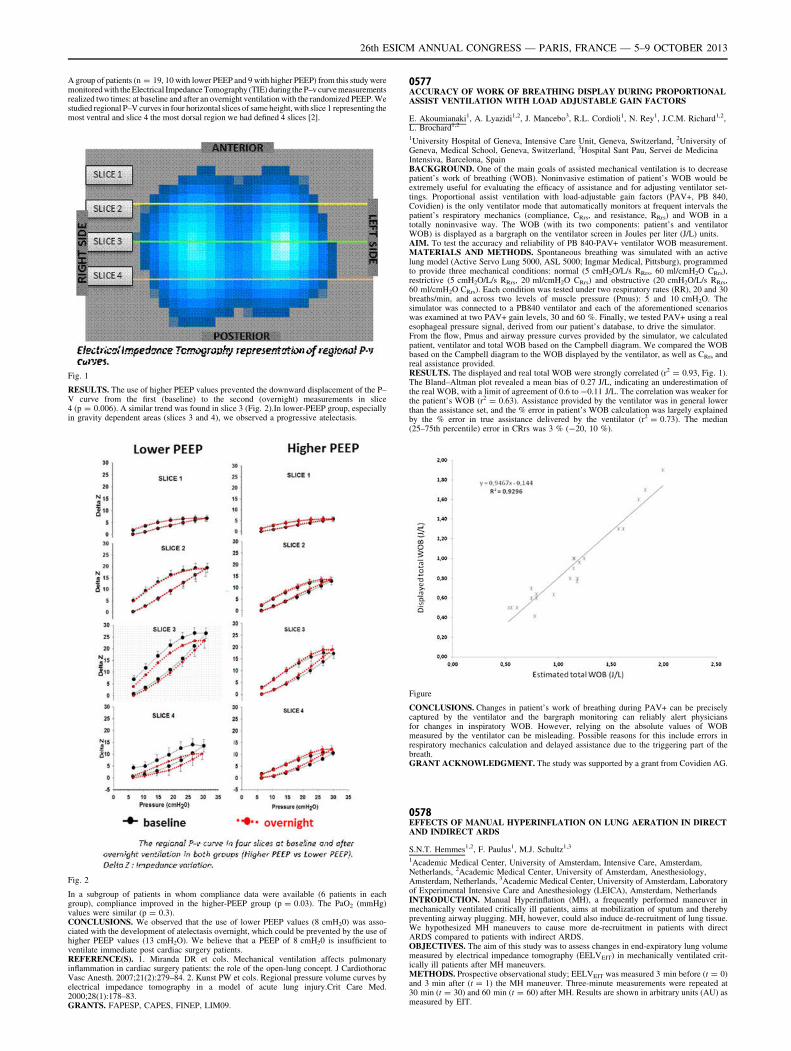
A group of patients (n = 19, 10 with lower PEEP and 9 with higher PEEP) from this study weremonitored with the Electrical Impedance Tomography (TIE) during the P–v curve measurementsrealized two times: at baseline and after an overnight ventilation with the randomized PEEP. Westudied regional P–V curves in four horizontal slices of same height, with slice 1 representing themost ventral and slice 4 the most dorsal region we had defined 4 slices [2].
Fig. 1
RESULTS. The use of higher PEEP values prevented the downward displacement of the P–V curve from the first (baseline) to the second (overnight) measurements in slice4 (p = 0.006). A similar trend was found in slice 3 (Fig. 2).In lower-PEEP group, especiallyin gravity dependent areas (slices 3 and 4), we observed a progressive atelectasis.
Fig. 2
In a subgroup of patients in whom compliance data were available (6 patients in eachgroup), compliance improved in the higher-PEEP group (p = 0.03). The PaO2 (mmHg)values were similar (p = 0.3).CONCLUSIONS. We observed that the use of lower PEEP values (8 cmH20) was asso-ciated with the development of atelectasis overnight, which could be prevented by the use ofhigher PEEP values (13 cmH2O). We believe that a PEEP of 8 cmH20 is insufficient toventilate immediate post cardiac surgery patients.REFERENCE(S). 1. Miranda DR et cols. Mechanical ventilation affects pulmonaryinflammation in cardiac surgery patients: the role of the open-lung concept. J CardiothoracVasc Anesth. 2007;21(2):279–84. 2. Kunst PW et cols. Regional pressure volume curves byelectrical impedance tomography in a model of acute lung injury.Crit Care Med.2000;28(1):178–83.GRANTS. FAPESP, CAPES, FINEP, LIM09.
0577ACCURACY OF WORK OF BREATHING DISPLAY DURING PROPORTIONALASSIST VENTILATION WITH LOAD ADJUSTABLE GAIN FACTORS
E. Akoumianaki1, A. Lyazidi1,2, J. Mancebo3, R.L. Cordioli1, N. Rey1, J.C.M. Richard1,2,L. Brochard1,2
1University Hospital of Geneva, Intensive Care Unit, Geneva, Switzerland, 2University ofGeneva, Medical School, Geneva, Switzerland, 3Hospital Sant Pau, Servei de MedicinaIntensiva, Barcelona, SpainBACKGROUND. One of the main goals of assisted mechanical ventilation is to decreasepatient’s work of breathing (WOB). Noninvasive estimation of patient’s WOB would beextremely useful for evaluating the efficacy of assistance and for adjusting ventilator set-tings. Proportional assist ventilation with load-adjustable gain factors (PAV+, PB 840,Covidien) is the only ventilator mode that automatically monitors at frequent intervals thepatient’s respiratory mechanics (compliance, CRrs, and resistance, RRrs) and WOB in atotally noninvasive way. The WOB (with its two components: patient’s and ventilatorWOB) is displayed as a bargraph on the ventilator screen in Joules per liter (J/L) units.AIM. To test the accuracy and reliability of PB 840-PAV+ ventilator WOB measurement.MATERIALS AND METHODS. Spontaneous breathing was simulated with an activelung model (Active Servo Lung 5000, ASL 5000; Ingmar Medical, Pittsburg), programmedto provide three mechanical conditions: normal (5 cmH2O/L/s RRrs, 60 ml/cmH2O CRrs),restrictive (5 cmH2O/L/s RRrs, 20 ml/cmH2O CRrs) and obstructive (20 cmH2O/L/s RRrs,60 ml/cmH2O CRrs). Each condition was tested under two respiratory rates (RR), 20 and 30breaths/min, and across two levels of muscle pressure (Pmus): 5 and 10 cmH2O. Thesimulator was connected to a PB840 ventilator and each of the aforementioned scenarioswas examined at two PAV+ gain levels, 30 and 60 %. Finally, we tested PAV+ using a realesophageal pressure signal, derived from our patient’s database, to drive the simulator.From the flow, Pmus and airway pressure curves provided by the simulator, we calculatedpatient, ventilator and total WOB based on the Campbell diagram. We compared the WOBbased on the Campbell diagram to the WOB displayed by the ventilator, as well as CRrs andreal assistance provided.RESULTS. The displayed and real total WOB were strongly correlated (r2 = 0.93, Fig. 1).The Bland–Altman plot revealed a mean bias of 0.27 J/L, indicating an underestimation ofthe real WOB, with a limit of agreement of 0.6 to -0.11 J/L. The correlation was weaker forthe patient’s WOB (r2 = 0.63). Assistance provided by the ventilator was in general lowerthan the assistance set, and the % error in patient’s WOB calculation was largely explainedby the % error in true assistance delivered by the ventilator (r2 = 0.73). The median(25–75th percentile) error in CRrs was 3 % (-20, 10 %).
Figure
CONCLUSIONS. Changes in patient’s work of breathing during PAV+ can be preciselycaptured by the ventilator and the bargraph monitoring can reliably alert physiciansfor changes in inspiratory WOB. However, relying on the absolute values of WOBmeasured by the ventilator can be misleading. Possible reasons for this include errors inrespiratory mechanics calculation and delayed assistance due to the triggering part of thebreath.GRANT ACKNOWLEDGMENT. The study was supported by a grant from Covidien AG.
0578EFFECTS OF MANUAL HYPERINFLATION ON LUNG AERATION IN DIRECTAND INDIRECT ARDS
S.N.T. Hemmes1,2, F. Paulus1, M.J. Schultz1,3
1Academic Medical Center, University of Amsterdam, Intensive Care, Amsterdam,Netherlands, 2Academic Medical Center, University of Amsterdam, Anesthesiology,Amsterdam, Netherlands, 3Academic Medical Center, University of Amsterdam, Laboratoryof Experimental Intensive Care and Anesthesiology (LEICA), Amsterdam, NetherlandsINTRODUCTION. Manual Hyperinflation (MH), a frequently performed maneuver inmechanically ventilated critically ill patients, aims at mobilization of sputum and therebypreventing airway plugging. MH, however, could also induce de-recruitment of lung tissue.We hypothesized MH maneuvers to cause more de-recruitment in patients with directARDS compared to patients with indirect ARDS.OBJECTIVES. The aim of this study was to assess changes in end-expiratory lung volumemeasured by electrical impedance tomography (EELVEIT) in mechanically ventilated crit-ically ill patients after MH maneuvers.METHODS. Prospective observational study; EELVEIT was measured 3 min before (t = 0)and 3 min after (t = 1) the MH maneuver. Three-minute measurements were repeated at30 min (t = 30) and 60 min (t = 60) after MH. Results are shown in arbitrary units (AU) asmeasured by EIT.
26th ESICM ANNUAL CONGRESS — PARIS, FRANCE — 5–9 OCTOBER 2013
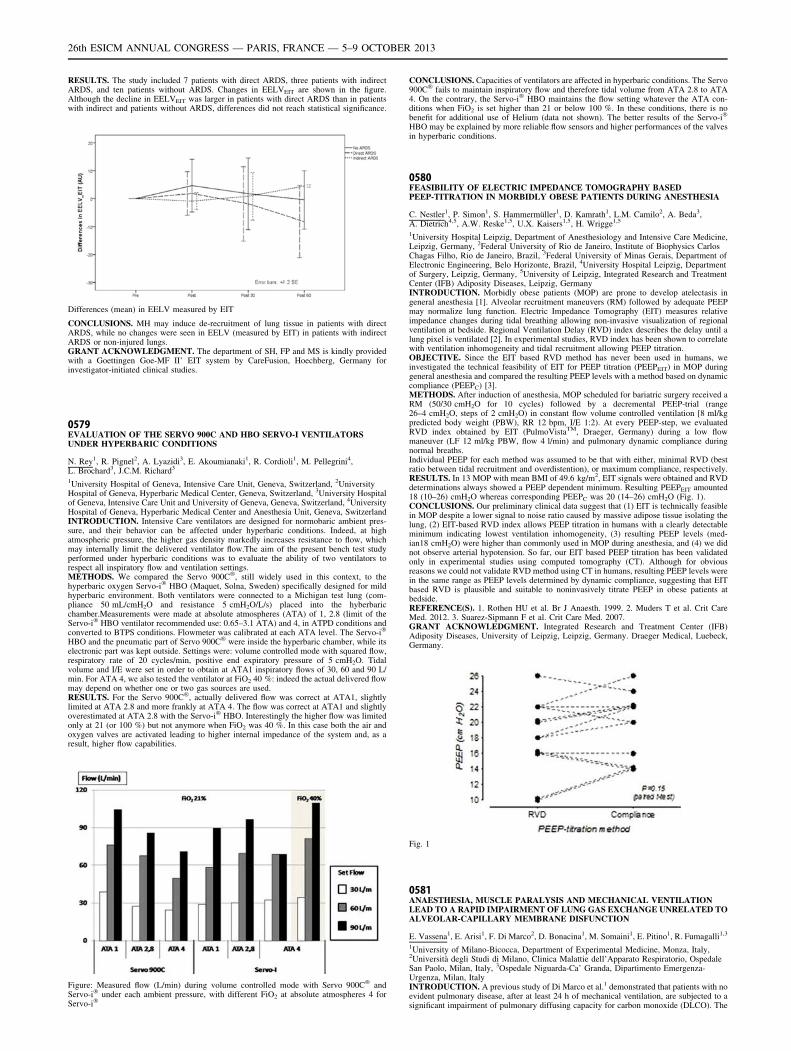
RESULTS. The study included 7 patients with direct ARDS, three patients with indirectARDS, and ten patients without ARDS. Changes in EELVEIT are shown in the figure.Although the decline in EELVEIT was larger in patients with direct ARDS than in patientswith indirect and patients without ARDS, differences did not reach statistical significance.
Differences (mean) in EELV measured by EIT
CONCLUSIONS. MH may induce de-recruitment of lung tissue in patients with directARDS, while no changes were seen in EELV (measured by EIT) in patients with indirectARDS or non-injured lungs.GRANT ACKNOWLEDGMENT. The department of SH, FP and MS is kindly providedwith a Goettingen Goe-MF II’ EIT system by CareFusion, Hoechberg, Germany forinvestigator-initiated clinical studies.
0579EVALUATION OF THE SERVO 900C AND HBO SERVO-I VENTILATORSUNDER HYPERBARIC CONDITIONS
N. Rey1, R. Pignel2, A. Lyazidi3, E. Akoumianaki1, R. Cordioli1, M. Pellegrini4,L. Brochard3, J.C.M. Richard3
1University Hospital of Geneva, Intensive Care Unit, Geneva, Switzerland, 2UniversityHospital of Geneva, Hyperbaric Medical Center, Geneva, Switzerland, 3University Hospitalof Geneva, Intensive Care Unit and University of Geneva, Geneva, Switzerland, 4UniversityHospital of Geneva, Hyperbaric Medical Center and Anesthesia Unit, Geneva, SwitzerlandINTRODUCTION. Intensive Care ventilators are designed for normobaric ambient pres-sure, and their behavior can be affected under hyperbaric conditions. Indeed, at highatmospheric pressure, the higher gas density markedly increases resistance to flow, whichmay internally limit the delivered ventilator flow.The aim of the present bench test studyperformed under hyperbaric conditions was to evaluate the ability of two ventilators torespect all inspiratory flow and ventilation settings.METHODS. We compared the Servo 900C�, still widely used in this context, to thehyperbaric oxygen Servo-i� HBO (Maquet, Solna, Sweden) specifically designed for mildhyperbaric environment. Both ventilators were connected to a Michigan test lung (com-pliance 50 mL/cmH2O and resistance 5 cmH2O/L/s) placed into the hyberbaricchamber.Measurements were made at absolute atmospheres (ATA) of 1, 2.8 (limit of theServo-i� HBO ventilator recommended use: 0.65–3.1 ATA) and 4, in ATPD conditions andconverted to BTPS conditions. Flowmeter was calibrated at each ATA level. The Servo-i�
HBO and the pneumatic part of Servo 900C� were inside the hyperbaric chamber, while itselectronic part was kept outside. Settings were: volume controlled mode with squared flow,respiratory rate of 20 cycles/min, positive end expiratory pressure of 5 cmH2O. Tidalvolume and I/E were set in order to obtain at ATA1 inspiratory flows of 30, 60 and 90 L/min. For ATA 4, we also tested the ventilator at FiO2 40 %: indeed the actual delivered flowmay depend on whether one or two gas sources are used.RESULTS. For the Servo 900C�, actually delivered flow was correct at ATA1, slightlylimited at ATA 2.8 and more frankly at ATA 4. The flow was correct at ATA1 and slightlyoverestimated at ATA 2.8 with the Servo-i� HBO. Interestingly the higher flow was limitedonly at 21 (or 100 %) but not anymore when FiO2 was 40 %. In this case both the air andoxygen valves are activated leading to higher internal impedance of the system and, as aresult, higher flow capabilities.
Figure: Measured flow (L/min) during volume controlled mode with Servo 900C� andServo-i� under each ambient pressure, with different FiO2 at absolute atmospheres 4 forServo-i�
CONCLUSIONS. Capacities of ventilators are affected in hyperbaric conditions. The Servo900C� fails to maintain inspiratory flow and therefore tidal volume from ATA 2.8 to ATA4. On the contrary, the Servo-i� HBO maintains the flow setting whatever the ATA con-ditions when FiO2 is set higher than 21 or below 100 %. In these conditions, there is nobenefit for additional use of Helium (data not shown). The better results of the Servo-i�
HBO may be explained by more reliable flow sensors and higher performances of the valvesin hyperbaric conditions.
0580FEASIBILITY OF ELECTRIC IMPEDANCE TOMOGRAPHY BASEDPEEP-TITRATION IN MORBIDLY OBESE PATIENTS DURING ANESTHESIA
C. Nestler1, P. Simon1, S. Hammermüller1, D. Kamrath1, L.M. Camilo2, A. Beda3,A. Dietrich4,5, A.W. Reske1,5, U.X. Kaisers1,5, H. Wrigge1,5
1University Hospital Leipzig, Department of Anesthesiology and Intensive Care Medicine,Leipzig, Germany, 2Federal University of Rio de Janeiro, Institute of Biophysics CarlosChagas Filho, Rio de Janeiro, Brazil, 3Federal University of Minas Gerais, Department ofElectronic Engineering, Belo Horizonte, Brazil, 4University Hospital Leipzig, Departmentof Surgery, Leipzig, Germany, 5University of Leipzig, Integrated Research and TreatmentCenter (IFB) Adiposity Diseases, Leipzig, GermanyINTRODUCTION. Morbidly obese patients (MOP) are prone to develop atelectasis ingeneral anesthesia [1]. Alveolar recruitment maneuvers (RM) followed by adequate PEEPmay normalize lung function. Electric Impedance Tomography (EIT) measures relativeimpedance changes during tidal breathing allowing non-invasive visualization of regionalventilation at bedside. Regional Ventilation Delay (RVD) index describes the delay until alung pixel is ventilated [2]. In experimental studies, RVD index has been shown to correlatewith ventilation inhomogeneity and tidal recruitment allowing PEEP titration.OBJECTIVE. Since the EIT based RVD method has never been used in humans, weinvestigated the technical feasibility of EIT for PEEP titration (PEEPEIT) in MOP duringgeneral anesthesia and compared the resulting PEEP levels with a method based on dynamiccompliance (PEEPC) [3].METHODS. After induction of anesthesia, MOP scheduled for bariatric surgery received aRM (50/30 cmH2O for 10 cycles) followed by a decremental PEEP-trial (range26–4 cmH2O, steps of 2 cmH2O) in constant flow volume controlled ventilation [8 ml/kgpredicted body weight (PBW), RR 12 bpm, I/E 1:2). At every PEEP-step, we evaluatedRVD index obtained by EIT (PulmoVistaTM, Draeger, Germany) during a low flowmaneuver (LF 12 ml/kg PBW, flow 4 l/min) and pulmonary dynamic compliance duringnormal breaths.Individual PEEP for each method was assumed to be that with either, minimal RVD (bestratio between tidal recruitment and overdistention), or maximum compliance, respectively.RESULTS. In 13 MOP with mean BMI of 49.6 kg/m2, EIT signals were obtained and RVDdeterminations always showed a PEEP dependent minimum. Resulting PEEPEIT amounted18 (10–26) cmH2O whereas corresponding PEEPC was 20 (14–26) cmH2O (Fig. 1).CONCLUSIONS. Our preliminary clinical data suggest that (1) EIT is technically feasiblein MOP despite a lower signal to noise ratio caused by massive adipose tissue isolating thelung, (2) EIT-based RVD index allows PEEP titration in humans with a clearly detectableminimum indicating lowest ventilation inhomogeneity, (3) resulting PEEP levels (med-ian18 cmH2O) were higher than commonly used in MOP during anesthesia, and (4) we didnot observe arterial hypotension. So far, our EIT based PEEP titration has been validatedonly in experimental studies using computed tomography (CT). Although for obviousreasons we could not validate RVD method using CT in humans, resulting PEEP levels werein the same range as PEEP levels determined by dynamic compliance, suggesting that EITbased RVD is plausible and suitable to noninvasively titrate PEEP in obese patients atbedside.REFERENCE(S). 1. Rothen HU et al. Br J Anaesth. 1999. 2. Muders T et al. Crit CareMed. 2012. 3. Suarez-Sipmann F et al. Crit Care Med. 2007.GRANT ACKNOWLEDGMENT. Integrated Research and Treatment Center (IFB)Adiposity Diseases, University of Leipzig, Leipzig, Germany. Draeger Medical, Luebeck,Germany.
Fig. 1
0581ANAESTHESIA, MUSCLE PARALYSIS AND MECHANICAL VENTILATIONLEAD TO A RAPID IMPAIRMENT OF LUNG GAS EXCHANGE UNRELATED TOALVEOLAR-CAPILLARY MEMBRANE DISFUNCTION
E. Vassena1, E. Arisi1, F. Di Marco2, D. Bonacina1, M. Somaini1, E. Pitino1, R. Fumagalli1,3
1University of Milano-Bicocca, Department of Experimental Medicine, Monza, Italy,2Università degli Studi di Milano, Clinica Malattie dell’Apparato Respiratorio, OspedaleSan Paolo, Milan, Italy, 3Ospedale Niguarda-Ca’ Granda, Dipartimento Emergenza-Urgenza, Milan, ItalyINTRODUCTION. A previous study of Di Marco et al.1 demonstrated that patients with noevident pulmonary disease, after at least 24 h of mechanical ventilation, are subjected to asignificant impairment of pulmonary diffusing capacity for carbon monoxide (DLCO). The
26th ESICM ANNUAL CONGRESS — PARIS, FRANCE — 5–9 OCTOBER 2013
reason of this gas exchange impairment is unknown but there are consistent data suggestingthat mechanical ventilation per se could be responsible of this derangement.OBJECTIVES. The aim of the study was to evaluate the effects of anaesthesia, muscleparalysis and mechanical ventilation on pulmonary capillary blood volume (VC) and pul-monary membrane diffusing capacity (DM).METHODS. We enrolled 27 patients without evidence of pulmonary disease scheduled forelective surgery. DLCO measurements for each patient were acquired through side-streaminfra-red gas analyser at the patient’s mouth, either during spontaneous breathing pre-surgery and mechanical ventilation (immediately after the intubation). At the same time,lung volumes (end-expiratory lung volume, EELV) were assessed through the method ofmethane dilution. DM and VC were calculated from DLCO using Roughton and Foster’smethod2 by using different inspiratory oxygen fractions. The data were compared eitherthrough paired T-test if normally distributed or Wilcoxon signed rank test if otherwise.RESULTS. We observed a significant reduction of DLCO from 16.7 ± 2.7 in spontaneousbreathing to 8.4 ± 2.3 mL/min/mmHg during mechanical ventilation (p \ 0.001). We alsofound a decrease in EELV from 3.068 ± 0.715 to 1.739 ± 0.466 L (p \ 0.001). There wasa significant reduction of both DM (from 21.5 ± 4.7 to 12.3 ± 4.2 ml/min/mmHg,p \ 0.001) and VC (from 205 ± 66 to 91 ± 58 mL, p \ 0.001). Normalizing the values ofboth DM and VC to EELV we found that there was no significant change in DM betweenspontaneous breathing and mechanical ventilation (7.3 ± 1.9 and 7.1 ± 1.9 ml/min/mmHg/L, p = 0.736), while there still was a difference in terms of VC (69 ± 43 and 51 ± 30 mL/L; p = 0,028), although it was less significant compared to the non-normalized data.CONCLUSIONS. Our results show that anaesthesia and muscle paralysis impair lung’s gasexchange through an alteration of both capillary blood volume and pulmonary membranediffusing capacity. Specifically, DM reduction seems to be mainly due to the reduction oflung volume (EELV), while other factors could be involved in VC impairment :atelectasisand positive pressure effects on microcirculation are the proposed explanations.REFERENCE(S). 1. Di Marco F, Devaquet J, Lyazidi A, Galia F, da Costa NP, FumagalliR, Brochard L. Positive end-expiratory pressure-induced functional recruitment in patientswith acute respiratory distress syndrome. Crit Care Med. 2010;38(1):127–32. 2. J.M.B.Hughes, D.V. Bates Historical review: the carbon monoxide diffusing capacity (DlCO) andits membrane (Dm) and red cell (H Vc) components. Respir Physiol Neurobiol.2003;138(2–3):115–42.
0582PULMONARY AND HEMODYNAMIC EFFECTS OF VENTILATORYSTRATEGY INDUCED ALVEOLAR HYPERDISTENSION OR CYCLICRECRUITMENT IN HEALTHY LUNGS UNDER ANESTHESIA
M.B. Ávila1, L.M. Camilo1, L.F. Cruz1, V.G.L. Mancin1, L.H. Travassos1, W.A. Zin1,A.R. Carvalho1
1Federal University of Rio de Janeiro, Carlos Chagas Filho Biophysics Institute, Rio deJaneiro, BrazilINTRODUCTION. Mechanical ventilation can induce lung injury and it has been asso-ciated with alveolar cyclic recruitment and overdistension. Protective ventilation strategieswith low tidal volume (Vt) could be beneficial, however do not prevent lung damage.OBJECTIVES. Evaluate the pulmonary and hemodynamic consequences of ventilatorystrategies with low Vt and predominance of alveolar cyclic recruitment or overdistensionbased on mathematical estimative of the percentage of volume-dependent elastance (%E2).METHODS. Eighteen male Wistar rats were sedated, paralyzed and mechanically venti-lated in volume control mode with a Vt of 6 mL/kg, ZEEP, and FiO2 0.5. Recruitmentmaneuver was performed by gradual elevation of PEEP until 8 cmH20, followed by PEEPtitrating (8–0 cmH2O, 1 cmH20/30 s by step) and new recruitment maneuver. The animalswere then divided into 3 groups according to the strategy used in PEEP titration and wereleft on mechanical ventilation for 2 h: NEG (ventilated with PEEP where %E2 \ 0, n = 6),MID (ventilated with PEEP where %E2 [ 0 and \10, n = 6) and MAX (ventilated withPEEP where %E2 [ 30, n = 6). Airway pressure, flow, blood pressure (BP) and heart ratewere continuously monitored. Arterial blood gases were analyzed after 5 and 120 min ofventilation. After mechanical ventilation, the lungs were removed, and prepared for histo-logical analysis of quantitative alveolar collapse/consolidation and surface/volume ratio(Sv). The ethics committee of IBCCF approved this study with number 012.RESULTS. After 2 h of ventilation, all groups presented lung function impairment, withincreased elastance. However, in the group with high %E2 (MAX), this impairment was lessevident (67.9, 45.0 and 16.6 % increase in NEG, MID and MAX groups, respectively). Incontrast, this group showed decreased BP (44.8 %) when compared with NEG and MID(NEG 33.3, MID 40.9 %). Histological analysis showed augmented collapse/consolidationin NEG group (60 %) with a lower Sv (7.27 mm-1), in sharp contrast with, MAX and MIDgroups (32 and 34 % of collapsed; Sv 20.33 and 17.6 mm-1, respectively). The PO2 showeda tendency to be higher in Max group in the end of the ventilation (117, 152 and 161 mmHg;in NEG, MID and MAX groups, respectively).CONCLUSIONS. Our results suggest that ventilation with higher %E2 in healthy lungswas less harmful to pulmonary mechanical, preserving lung surface area and improvingoxygenation after 2 h of mechanical ventilation at the expense of important deleterioushemodynamic consequences.GRANT ACKNOWLEDGMENT. CNPq, FAPERJ.
CAP, VAP & nosocomial infections: 0583–05960583SURFACTANT PROTEIN A GENETIC VARIANTS ASSOCIATED WITH SEVEREINFLUENZA VIRUS (H1N1PDM) INFECTION
J. Solé-Violán1, J.M. Ferrer Agüero1, E. Herrera-Ramos2, M. López-Rodrı́guez2,J.J. Ruı́z-Hernández3, J.P. Horcajada4, L. Borderı́as5, E. Lerma4, J. Blanquer6,M.C. Pérez-González7, M.I. Garcı́a-Laorden8, Y. Florido9, V. Mas4, M. Montero4,L. Sorlı́4, C. Villaplana10, O. Rajas11, M. Briones12, J. Aspa11, E. López-Granados13,
F. Rodrı́guez de Castro14, C. Rodrı́guez-Gallego9
1Hospital Universitario de Gran Canaria Dr. Negrı́n, Intensive Care Medicine, Las Palmasde Gran Canaria, Spain, 2Hospital Universitario de Gran Canaria Dr. Negrı́n, Immunology,Las Palmas, Spain, 3Hospital Universitario de Gran Canaria Dr. Negrı́n, Internal Medicine,Las Palmas, Spain, 4Hospital Universitari del Mar, Department of Infectious Diseases,Barcelona, Spain, 5Hospital San Jorge, Department of Respiratory Diseases, Huesca, Spain,6Hospital Clı́nico y Universitario de Valencia, Intensive Care Unit, Valencia, Spain,7Hospital Universitario de Gran Canaria Dr. Negrı́n, Department of Microbiology, Las
Palmas, Spain, 8Academic Medical Center, Center for Experimental and Molecular Medi-cine, Amsterdam, Netherlands, 9Hospital Universitario de Gran Canaria Dr. Negrı́n,Department of Immunology, Las Palmas de Gran Canaria, Spain, 10Laboratori de Referènciade Catalunya, Barcelona, Spain, 11Hospital Universitario de la Princesa, Department ofRespiratory Diseases, Madrid, Spain, 12Hospital Clı́nico y Universitario de Valencia.,Department of Respiratory Diseases, Valencia, Spain, 13Hospital Universitario La Paz,Department of Immunology, Madrid, Spain, 14Hospital Universitario de Gran Canaria Dr.Negrı́n, Department of Respiratory Diseases, Las Palmas de Gran Canaria, Spain.INTRODUCTION. Accumulating evidence suggests that inherited variability in hostimmune responses influences susceptibility and outcome of IAV (Influenza A virus)infection, but these factors remain largely unknown.OBJECTIVES. To analyze the role of genetic variants at the genes of MBL (MBL2), SP-A1 (SFTPA1), SP-A2 (SFTPA2) and SP-D (SFTPD) in the defense against IAV infection.PATIENTS: 93 unrelated white Spanish patients who have suffered H1N1pdm infectionbetween July 2009 and November 2011 were recruited. The general population groupconsisted of unrelated healthy volunteers analyzed for MBL2 (N = 1,736) and SFTPA1 andSFTPA2 (N = 769) polymorphisms.METHODS. Influenza A H1N1 virus was detected in nasopharyngeal swabs using the Real-Time PCR. Functional variants at MBL2, SFTPA1, SFTPA2 and SFTPD (rs721917) wereanalyzed. The Hardy–Weinberg equilibrium was analyzed by Haploview v. 4.2. Haplotypeswere estimated in silico by PHASE v. 2.1.1. The comparison of genotypes distribution basedon the susceptibility and severity were performed using the Chi-squared test or Fisher’sexact test when needed. The relationship between severity in hospitalized patients andgenotypes was evaluated by binary logistic regression models. Cox proportional hazardratios adjusted for the independent variables were also performed.RESULTS. None of the frequencies of the genetic variants under analysis was found to besignificantly different between H1N1pdm infected patients and general population. Whenseverity of infection was evaluated in patients hospitalized for H1N1pdm infection(N = 70), we found that two missense variants at SFTPA2 (rs1965708-C and rs1059046-A)were significantly associated with a higher rate of ICU admission as well as with devel-opment of acute respiratory failure (ARF) and acute respiratory distress syndrome (ARDS).In addition, the variant rs1965708-C was also associated with development of PVP andseptic shock. Seven different haplotypes for SFTPA1 and eight for SFTPA2 were found inour population. The haplotype 1A0 was found to be overrepresented in hospitalized patientswho developed ARF or ARDS, whereas the haplotype 1A1 was protective against the needof ICU admission and the development of ARF. These associations remained significant inmultivariate analysis adjusted for age, gender, risk factors and development of either sec-ondary bacterial pneumonia or bacteremia.CONCLUSIONS. Our pilot study suggests that variants at SFTPA2 influence the severityof H1N1pdm infection in hospitalized patients. The data from our study could pave the wayfor a potential treatment with SP-A2 for future IAV pandemics.GRANT ACKNOWLEDGMENT. FIS PI 02/1620, 04/1190, 06/1031, 10/01718 and12/01565 with the funding of FEDER-FSE; RedRespira-ISCIII-RTIC-03/11; SEPAR;Universidad de Las Palmas de Gran Canaria and Instituto de Salud Carlos III, FI 11/00593.
0584EFFICACY OF INHALED COLESTIMETHATE SODIUM IN VENTILATOR-ASSOCIATED TRACHEOBRONCHITIS DUE TO MULTIDRUG-RESISTANTGRAM-NEGATIVE BACTERIA
L.P. Maskin1, M. Setten1,2, P.O. Rodriguez1,3, I. Bonelli1, S. Attie1, R. Valentini1
1Instituto Universitario CEMIC, Intensive Care Unit, Buenos Aires, Argentina, 2InstitutoUniversitario CEMIC, Department of Physiotherapy, Buenos Aires, Argentina, 3InstitutoUniversitario CEMIC, Department of Medicine, Pulmonary Section, Buenos Aires,ArgentinaINTRODUCTION. Ventilator-associated tracheobronchitis (VAT) is thought to be anintermediate process between colonization of the lower respiratory tract and ventilator-associated pneumonia (VAP), occurring in 2.7–10 % of ventilated patients.OBJECTIVES. To evaluate the efficacy of inhaled colestimethate sodium (CMS) toimprove VAT signs. Additionally, to evaluate the safety of inhaled CMS.METHODS. We consecutively included all critically ill patients who met VAT due to mul-tidrug-resistant Gram-negative bacteria (MDRB) defined as new purulent respiratory secretionsin patients under MV ([48 h) with Pseudomonas spp. or Acinetobacter baumanii on culture,and without new infiltrates in the chest X-ray. Inhaled CMS (50 mg bid) was administrated for7 days. White blood cell count and creatinine were controlled daily. Secretion volume (1-scarce/2-normal/3-abundant) and purulence (1-non-purulent/2-mild purulent/3-frankly puru-lent) was daily assessed by the same physical therapist. A tracheal aspirate was obtained forculture on the 7 days of treatment. Patients were followed until hospital discharge searching forpulmonary infections. Data are expressed as median (IQR 25–75), or percentage, as needed.Student t test and Chi square test were used for comparisons.RESULTS. From September 2009 to December 2012, 716 patients were screened. Nineteenpatients were included (74 % male, 15/19). Median age: 67-year-old (56–76). APACHE IIscore: 23 (18–28). MV duration before VAT was 40 days (30–46), and 17 patients (89 %)had tracheotomy. Bacteriology: Pseudomonas 84 % (16 patients), and Acinetobacter 16 %(3 cases), most of them only sensitive to CMS and amikacin.At day 7 of CMS treatment,tracheal aspirate culture were negative in 94 % (18/19), secretions volume decreased[3(3–3) vs 1(1–2), p \ 0.001) and secretion purulence improved [3(2–3) vs 1(1–1),p \ 0.001). No differences were seen in white blood cells count (9.400/mm3 (7.450–11.950)vs 8.000 mm3 (6.200–8.800), p: 0.14], or in serum creatinine [0.55 mg/dl (0.50–1.02) vs0.64 mg/dl (0.53–0.92), p: 0.63] in the first 7 days of treatment. Only two patients devel-oped renal injury (defined as increased in basal creatinine[50 %—RIFLE criteria); but theyrecovered at the end of CMS treatment. Two patients developed mild bronchospasm duringa single CMS therapy sessions. Only one treatment was stopped in a neurological patientwho presented abnormal movements. One patient developed VAP after CMS treatment inthe ICU (5 %). Two others had pneumonia during ward stay. Neither of them was caused bymultidrug-resistant Gram-negative bacteria.CONCLUSIONS. Inhaled CMS decreased tracheal secretions volume, purulence andbacterial load in a group of patients with VAT ventilated for a long period of time in theICU. This improvement in VAT due to MDRB may reduce VAP risk.
0585CORTICOSTEROIDS IN INFLUENZA A/H1N1
I. Ben Saida1, A. Khedher1, J. Ayechi1, R. Chahed1, W. Hachfi2, H. Dammak3,A. Abdelghani4, M. Boussarsar1
26th ESICM ANNUAL CONGRESS — PARIS, FRANCE — 5–9 OCTOBER 2013
1Farhat Hached Hospital, ICU, Sousse, Tunisia, 2Farhat Hached Hospital, InfectiousDiseases, Sousse, Tunisia, 3Habib Bourguiba Hospital, ICU, Sfax, Tunisia, 4Farhat HachedHospital, Pulmonary Diseases, Sousse, TunisiaINTRODUCTION. Influenza A/H1N1 have been responsible for severe and potentiallyfatal forms of viral pneumonia. Clinicians have been urged to prescribe corticosteroids asadjunctive treatment for their modulating effect on the inflammatory response. Howeverresults were controversial.OBJECTIVE. To evaluate efficacy and safety of corticosteroids prescribed as adjunctivetreatment of A/H1N1viral pneumonia.METHODS. This is a retrospective study including the whole influenza A/H1N1-PCR-confirmed patients admitted to Farhat Hached Hospital, Sousse (n = 45) and patientsadmitted to the ICU of Habib Bourguiba Hospital, Sfax (n = 32). Demographic, clinical,treatment and outcome characteristics of the study patients were collected. Univariate andmultivariate analyses were performed to identify factors independently associated withmortality. Were also performed, subgroup analyses according to the severity of pneumoniaand center effect to identify the impact of corticosteroids. Univariate analysis was per-formed to identify factors associated with the decision of adding corticosteroids.RESULTS. Patients were 40.76 ± 16.73 years aged. They were managed 6.03 ± 4.06 daysfrom symptoms onset. 74.1 % presented with pneumonia. 31.2 % required mechanical ventila-tion. All patients received antiviral therapy at the admission. Corticosteroid therapy wasprescribed in 53 % of patients. Death occurred in 23.4 %. Univariate, multivariate and subgroupsanalyses identified no protective effect of corticosteroids on mortality. High doses of cortico-steroids were associated with more mortality. Corticosteroids were rather prescribed in patientswith the most severe forms of lung injury.CONCLUSION. Our study joins other reports in the literature [1–4] to confirm the inef-fectiveness and even harmful effect of corticosteroids as adjunctive treatment of influenzaA/H1N1 pneumonia. The lack of efficiency is probably the result of a prescription based ona poorly lit empiricism modeled on serious bacterial community-acquired pneumonia.REFERENCES. 1. Diaz E, et al. H1N1 SEMICYUC-CIBERES-REIPI Working Group(GETGAG). Corticosteroid therapy in patients with primary viral pneumonia due to pan-demic (H1N1) 2009 influenza. J Infect 2012;64(3):311–8. 2. Martin-Loeches I, et al. Use ofearly corticosteroid therapy on ICU admission in patients affected by severe pandemic(H1N1)v influenza A infection. Intensive Care Med. 2011;37(2):272–83. 3. Kim SH, et al.Korean Society of Critical Care Medicine H1N1 Collaborative. Corticosteroid treatment incritically ill patients with pandemic influenza A/H1N1 2009 infection: analytic strategyusing propensity scores. Am J Respir Crit Care Med 183(9):1207–14. 4. Brun-Buisson C,et al. REVA-SRLF A/H1N1v 2009 Registry Group. Early corticosteroids in severe influenzaA/H1N1 pneumonia and acute respiratory distress syndrome. Am J Respir Crit Care Med.2011;183(9):1200–6.
0586THE EFFECT OF COLISTIN AND CARBAPENEM IN THE TREATMENTOF MULTIDRUG-RESISTANT ACINETOBACTER BAUMANNII PNEUMONIAIN THE INTENSIVE CARE UNITS
S.J. Kwon1, J. Son2, E. Choi2, M. Na2, E.-H. Yu2, J.H. Kim2
1Konyang University Hospital, Internal Medicine, Daejeon, Korea, Republic of, 2KonyangUniversity Hospital, Daejeon, Korea, Republic ofINTRODUCTION. The nosocomial pneumonia due to Acinetobacter baumannii isincreased. However, it is difficult to treat due to limited treatment regimens.OBJECTIVES. To compare several antimicrobials with Colistin for suspected pneumonia inthe ICU.METHODS. The study included 179 mechanically ventilated patients more than 48 h whodeveloped suspected ventilator associated pneumonia (VAP) in 52 beds ICU of teaching hospitalin South Korea. We retrospectively analyzed 61 patients with A.baumannii pneumonia.RESULTS. 50 patients had multidrug-resistant A. baumannii (MDR-AB) pneumonia and11 patients had carbapenem-susceptible A. baumannii (CSAB) pneumonia. The age,APACHE-2 score and SOFA score at VAP episode and CPIS were 65.8 ± 15.9, 19.2 ± 7.4,8.0 ± 2.4 and 5.6 ± 1.6. There were no differences in the patient‘s characteristics betweenthe two groups. Clinical responses were observed in 52 % in MDR-AB pneumonia and63.6 % in CSAB pneumonia (p = 0.076). The adequacy of antimicrobials in CSABpneumonia was higher than MDR-AB pneumonia (90.9 vs 40 %, p = 0.003). There was notsignificant difference of 28-day mortality in CSAB and MDR-AB pneumonia (27.3 vs 44 %,p = 0.5). The 28-day mortality of 24 MDR-AB pneumonia who had clinical failure (75 %)was significantly higher than 26 patients who had clinical response (15.4 %, p = 0.00). Themonotherapy and combination regimen including Colistin were more effective in thetreatment of MDR-AB pneumonia. Clinical response with Colistin and without Colistinwere 53.8 and 29.2 % (p = 0.077) respectively. 35 patients who received either Colistin orCarbapenem had 73.2 % clinical response. The regimens including rifampicin or ampicillin/sulbactam were not effective in MDR-AB pneumonia.CONCLUSIONS. CSAB pneumonia could easily be treatment comared to MDR-AB, butthere was no significant difference of 28-day mortality in two groups. The mortality ofpatients who had clinical failure was higher and regimen including Colistin was moreeffective than other antimicrobials. Empirical need regimen including Colistin in thetreatment of MDR-AB pneumonia may be considered in the ICU.REFERENCE(S). 1. Li Jian, et al. Colistin: the re-emerging antibiotic for multidrug-resistant Gram-negative baterial infection. the lancet infection. 2006;6:589–601. 2. HeylandDK et al. Randomized trial of combination versus monotherapy for the empiric treatment ofsuspected ventilator-associated pneumonia. Crit Care Med 2008;36(3):737–744.
0587INTRAVENOUS USE OF COLISTIN IN ICU PATIENTS
A. Vakalos1, M. Gabra1
1Xanthi General Hospital, ICU, Xanthi, GreeceINTRODUCTION. Intravenous use of colistin is appropriate in order to control severesepsis from Gram negative pathogens in ICU patients. It remains one of the last resortantibiotic for multidrug-resistant Pseudomonas spp, Acinetobacter spp and Klebsiella sppresisted to carbapenems.OBJECTIVES. The aim of our study is to record the use of intravenous colistin according toclinical and nursing indexes in our both surgical and medical ICU, during 5 years time period.METHODS. From 2008 to 2012 admitted to our both medical and surgical ICU 384patients: mean age 65.1 years, mean length of stay (LOS) 13.8 days, mean APACHE IIscore on admition 20.9, mean vendilation days (VD) 11.75 days, predicted mortality37.6 %, actual mortality 31.78 %, standardized mortality ratio (SMR) 0.84. From thepharmacy department we used the records according the annual colistin items consumption
and from our database the annual number of patients (Pts), the ICU hospitalization days (H.Days), the number of ventilated patients (Pts V.) and the ventilation Days (V. Days). Afterthat, we calculated the ratio items over each index, per year and overall.RESULTS.
Results
2008 2009 2010 2011 2012 Overall
Pts 45 66 64 102 107 384
Items 292 1,378 907 1,472 3,138 7,187
Items/Pts 6.48 20.87 14.17 14.43 29.32 18.76
H. Days 695 757 881 1,434 1,304 5,071
Items/H. Days 0.42 1.82 1.02 1.02 2.40 1.41
Pts V. 41 57 57 88 93 336
Items/Pts V 7.12 24.17 15.91 16.72 33.74 21.38
V. Days 541 605 699 999 1,067 3,911
Items/V. Days 0.58 2.27 1.29 1.47 2.94 1.83
CONCLUSIONS. According to our data, there is an increasing use of intravenous colistinrecorded from year 2008 to 2012, especially in the years 3009 and the last year, not only perpatient, but per hospitalization days, per patient ventilated and per ventilation days as well.Our data suggest that our infection control policy is depended to last resort antibiotics likecolistin, due to high incidence of multidrug-resistant Gram negative pathogens.
0588INHALED COLISTIN FOR THE TREATMENT OF PATIENTSWITH PNEUMONIA BY MDR PATHOGENS
H.B. Lee1, S.Y. Park1
1Chonbuk National University Medical School & Hospital, Internal Medicine, Jeon-ju,Korea, Republic ofINTRODUCTION. Recently ventilator-associated pneumonia (VAP) caused by multi-drugresistant (MDR) gram-negative bacteria has been increasing and resulting in significantmorbidity and mortality. Colistin is active against gram-negative bacteria, including theMDR gram-negative bacteria such as Acinetobacter baumannii, Pseudomonas aeruginosa,and so on. However, intravenous administration of colistin was abandoned because of itsnephrotoxicity and neurotoxicity, and it was controversial problem whether inhaled colistinis effective or not.OBJECTIVES. We conducted the present study to assess the effectiveness and safety ofaerosolized colistin for the treatment of pneumonia by MDR gram-negative pathogens.METHODS. From February 2012 to February 2013 in medical ICU of Chonbuk NationalUniversity Hospital in Korea, we retrospectively reviewed patients, who received inhaledcolistin due to VAP by MDR A. baumannii, P. aeruginosa and Klebsiella pneumoniae. Thefavorable response was defined as clinically and radiologically improved case and/ormicrobiological results.RESULTS. In total 19 patients received aerosolized colistin. The mean length of stay in theMICU was 25.8 ± 32.0 days and the mean hospital stay was 61.7 ± 75.4 days. The meanduration of aerosolized colistin therapy was 10.9 ± 16.5 days. Eleven patients showed afavorable response to the therapy (11of 19, 57.9 %). Follow-up cultures were available in 17patients, and the negative conversion rate of responsible pathogens was 47.1 % (8 of 17).Six patients experienced adverse event related with nephrotoxicity (6 of 19, 26.3 %), andone asthmatic patient was stopped because of nebulize-inducing bronchial spasm (5.3 %).CONCLUSIONS. Aerosolized colistin appears to be relatively safe and effective option forthe treatment of VAP by MDR pathogens. Its role in the treatment of MDR gram-negativepneumonia needs further evaluation.
0589IMPLEMENTATION AND EVALUATION OF A EPIDEMIOLOGICALSURVEILLANCE PROTOCOL FOR THE MANAGEMENT AND CONTROLOF NOSOCOMIAL INFECTIONS IN ICU
A. Barrero-Almodovar1, F. Maroto-Monserrat1, F. Villarrasa-Clemente1, S. Gallego-Lara1,S. Exposito-Garcia2, J.L. Garcia-Garmendia1
1Hospital San Juan de Dios del Aljarafe, ICU, Seville, Spain, 2Hopital San Juan de Dios delAljarafe, Prevention Medicine Service, Seville, SpainINTRODUCTION. Nosocomial infection is one of the most prevalent problems in ICUs,having particular importance those caused by multiresistant bacteria (MRB). Tools allowingthe anticipation and prevention of MRB transmission, are of special interest for patients’safety.OBJECTIVES. To examine the effectiveness of a microbiological monitoring and pre-ventive patient isolation protocol in a mixed ICU.METHODS. Ambispective observational study in a District Hospital. Inclusion of patientswith MRB colonization/infection, and indication of contact isolation (CI) in the ICU, before(retrospective period,during 2010), and after the implementation of the Protocol (prospec-tive period, during 2012); and additional inclusion of those patients undergoing preventivecontact isolation (PCI) in 2012. Demographic variables, hospital stay, severity indexes(Apache II and SOFA), number and days of CI and PCI, and bacteriology of the microbi-ological isolates were collected. Descriptive analysis of all collected variables, including,the cumulative incidence of cases of colonization/infection due to MRB.RESULTS. In 2010, 385 admissions generated 2002 stays. In 2012 we admitted 269patients, who generated 2055 stays. Microbiological surveillance detected 41 and 34patients with MRB isolates in 2010, and 2012, respectively. The severity and demographiccharacteristics were similar. In 2010, 34 MRB isolates were considered infections, and 7MRB colonizations; the most frequently isolated bacteria was A. baumannii (n = 23),followed by E. coli (n = 13), and MRSA (n = 5). In 2012 we detected 11 MRB infectionsand 27 MRB colonizations; the most frequently isolated bacteria was ESBL-K. pneumoniae(n = 22), followed by A. baumannii (n = 7) and P. aeruginosa (n = 6). The number ofpatients with MRB isolates/100 ICU admissions in 2010 was 10.64, while in 2012 was12.63. The number of patients with MRB isolates/1,000 ICU stays was reduced from 20.47in 2010 to 16.54 in 2012.The number of MRB infections/100 ICU admissions was reducedfrom 8.83 in 2010 to 4.08 in 2012. The number of MRB infections/1,000 ICU stays wasreduced from 16.98 in 2010 to 5.35 in 2012. There was an increase in the number of total
26th ESICM ANNUAL CONGRESS — PARIS, FRANCE — 5–9 OCTOBER 2013
isolations days in 2012 (CI + PCI) with respect to 2010, due to an increase of PCI, and witha decrease in the number of CI.CONCLUSIONS. Microbiological surveillance constitutes a useful tool for the manage-ment and control of nosocomial infections in ICU; It does not imply an increase in work, butrather contributes to systematically assess the identification, management and control of theMRB colonized/infected patient.
0590SELECTIVE DIGESTIVE DECONTAMINATION AT POLYTRAUMA PATIENTSAS A PREVENTIVE TECHNOLOGY OF THE AIRWAYS AND URINARY TRACTINFECTIONS
Y. Nalapko1
1Lugansk State Medical University, Department of Anesthesiology and Intensive Care,Lugansk, UkraineINTRODUCTION. Polytrauma is one of the most severe pathologies in ICUs characterizedby high rate of complications, including infection, disability and mortality. Bacterialtranslocation leads to the progression of systemic inflammatory response syndrome thataggravates the posttraumatic period.OBJECTIVE. To detect the role of selective digestive decontamination as a preventivemeasure of nosocomial infections at polytrauma patients.METHODS. A comparison of the incidence of infections associated with medical care, in91 patients with severe polytrauma (ISS [ 26) was done. Standard care was given to 54patients. Therapy was aimed to stabilizing of the vital signs of body systems, systemicantibiotic therapy (control group). In 37 patients of the comparative group, intensive therapywas supplemented by enteral tube administration of 250 mg of pefloxacin and 100,000 IUof polymyxin E, four times a day for 5–7 days from the date of admission. The incidence ofthe nosocomial pneumonia, catheter-related urinary tract infection (UTI) and the terms oftheir manifestation was analyzed by the Centers for Disease Control criteria (2008) [1].RESULTS. The emergence of infections was observed in 90.7 % of patients in the controlgroup and 75.7 % of the comparative group. Thus, the introduction of early gut decon-tamination protocol showed a reduction in the incidence of nosocomial infections by15.0 %. In the structure of infectious complications in the control group and the comparisongroup the UTI were dominative and occurred in were, respectively, 83.3 and 62.1 %. In thecomparison group they developed on 5–6 days later than in the control group. The incidenceof nosocomial pneumonia was 51.9 vs. 43.2 % in control and comparative groups,respectively. The delay of manifestation in the comparison group did not exceed 3 days.CONCLUSIONS. (1) At polytrauma patients the approach with selective digestivedecontamination by pefloxacin and polymyxin E is an effective method of prevention of thehealthcare related pneumonia and UTI, but no infection of the blood flow and woundinfection. (2) Selective decontamination of the digestive tract at polytrauma can delay thedevelopment of infectious complications of respiratory and urinary systems to 4.4 days.REFERENCE(S). 1. CDC/NHSN surveillance definition of health care-associated infectionand criteria for specific types of infections in the acute care setting. Horan TC, Andrus M,Dudeck, MA. Am J Infect Control 2008;36:309–32.
0591A SERIES OF SEVERE COMMUNITY-ACQUIRED PNEUMONIAIN A POLYVALENT ICU
A. Puerto-Morlan1,2, M.-V. de la Torre-Prados1,2, A. Garcia-de la Torre2,3,J. Perez-Vacas1,2, N. Zamboschi1,2, C. Trujillano-Fernandez1,2, A. Garcia-Alcantara1,2,F. Cota-Delgado1,2
1Hospital Universitario Virgen de la Victoria, Intensive Care Unit, Malaga, Spain, 2IBIMAInstitute, Malaga, Spain, 3Hospital Universitario Puerto Real, Malaga, SpainINTRODUCTION. Despite advances in management of community-acquired pneumonia(CAP), it remains as the most common cause of severe sepsis. Early recognition of CAP iscrucial to avoid delays in management.OBJECTIVES. Factors related to survival will allow to improve clinical results in severeCAP, specially morbidity and mortality.METHODS. A retrospective chart review was performed on 175 patients admitted to ICUwith severe CAP diagnosis from January 2009 until December 2012. We analyzed demo-graphic, clinical and microbiological data. Descriptive and comparative statistical analysiswas performed using the statistical software packages SPSS version 15.0 (SPSS Inc.,Chicago, IL, USA).RESULTS. 69 % of our CAP cases suffer septic shock. The mean age was 57 ± 17 yearsand 33 % (n = 58) were women. APACHE II in the first 24 h of admission to ICU was18.74, ICU mortality was 31 % similar to predicted at 32 %. Mean SOFA score was 6.9.Mortality was related with elder patients (56 years ± 18 vs. 61 ± 13 years, p = 0.01),longer delay time in admission to ICU (0.82 vs. 1.41 days, p = 0.01), higher severity byAPACHE II (16 vs. 24, p = 0.000) and by SOFA score (5.5 vs. 10, p = 0.000), more organdysfunction (1.93 vs. 3.04 organs, p = 0.000), larger radiologic pathologic images (30 vs.60 %, p = 0.03), background of onco-haematological illness (n = 12, 67 vs. 29 %,p = 0.01), higher LDH (378 vs 852 UI/L, p = 0.01) and procalcitonin (13.38 vs 32.3 ng/ml,p = 0.01), showing at admission leucocytosis or leucocytopenia (n = 126, 17 vs. 83 %,p = 0.02) and longer mechanical ventilation time (8 vs. 10 days). No microorganism wasidentified in 38 % (n = 66) of cases. In 23 % (n = 40) of patients CAP etiology waspneumococcus, with a 25 % (n = 10) of bacteraemia showing a significant increase inmortality (26 vs. 80 %, p = 0.005).CONCLUSIONS. To improve the clinical results in CAP we must detect patients withmore than one dysfunctional organ earlier, admit to ICU and give intensive support. Thepresence of pneumococcus bacteraemia showed worse outcomes.REFERENCE(S). 1. Pereira JM et al. Severe sepsis in community-acquired pneumonia.Early recognition and treatment. Eur J Int Med 2012;23:412–419. 2. Chen et al. CochraneDatabase Syst Rev 2011;3.
0592UTILITY OF A MULTIPLE REAL-TIME PCR ASSAY FOR CHOICEOF EMPIRICAL ANTIBIOTICS IN VAP
E. Velasco López1, M. Rodrı́guez Gómez1, F. Martı́nez Sagasti1, J. Ramı́rez Larriviery1,M.A. González Gallego1, M. Nieto Cabrera1, M. Sanchez Garcı́a1
1Hospital Clı́nico San Carlos, Madrid, SpainOBJECTIVES.Main To evaluate the accuracy of a commercially available cartridge-based automatedpolymerase chain reaction (PCR) diagnostic test (Xpert MRSA/SA SSTIt�, Cepheid) andvalidate its clinical utility in detecting Staphylococcus aureus, both methicillin-susceptible(MSSA) and resistant (MRSA), in respiratory tract samples.Secondary To study whether a negative test result might have avoided unnecessaryempirical antibiotics for coverage of MRSA in patients with suspected VAP.MATERIALS AND METHODS. Prospective, observational study in consecutive patientsadmitted from September 2012 to April 2013 with suspected late-onset VAP ([1 week ofmechanical ventilation) who were about to receive empiric coverage for MRSA. Patientsalready on anti-MRSA antibiotic therapy were excluded.Aliquota of endotracheal aspirate (EA) or bronchoalveolar lavage (BAL) fluid samplesobtained for culture at the discretion of the attending physician for the diagnosis of VAPwere processed according to the manufacturer’s instructions. Time interval from sampling tofinal report was calculated for both molecular and culture methods. Attending physicianswere not informed of the PCR analyses and all details of antibiotic therapy were recorded.Other collected variables were: age, sex, APACHE II score, and ICU-mortality.Descriptive statistics are expressed as mean ± standard deviation (SD) or percentages.RESULTS. We studied 7 patients, 6 males, aged 55.8 ± 15, with APACHE II score20.8 ± 8.3. At the time of diagnosis 4 patients had septic shock and pO2/FiO2 152 ± 66 and5 died in the ICU. Neither PCR analysis nor conventional culture detected MSSA or MRSAin five EA and two BAL samples. The molecular test detected the mec gen in three samples.The corresponding conventional cultures yielded growth of a Gram-negative bacillus in oneand of coagulase-negative Staphylococci in two samples. Molecular test and culture resultswere available in 1 ± 0.3 and 74 ± 26 h, respectively. All sven patients received empiriclinezolid therapy for 5 ± 1 days. Supposing that all patients receive a single early dose ofempiric anti-MRSA antibiotic, the molecular test could have avoided 90 % of subsequentantibiotic exposure and cost.CONCLUSIONS. Our preliminary results suggest that negative PCR-based test results forMSSA and MRSA in EA and BAL samples predict negative cultures and, therefore, mayavoid unnecessary empirical antibiotic MRSA coverage. This diagnostic test may improveantibiotic treatment by allowing very early de-escalation, thereby reducing the risk ofdevelopment of bacterial resistance and other adverse events and costs.
0593THE CHRONICLE OF AN OUTBREAK
J.M. Mora Ordoñez1, V. Olea Jiménez1, G. Jiménez Pérez1, E. Curiel Balsera1
1Hospital Regional Carlos Haya, Medicina Intensiva, Málaga, SpainINTRODUCTION. The issue of antimicrobial resistance is not something trivial, we arefaced with the rapid emergente and spread of multidrug resistant bacteria. This represents anincrease in the costs, and increased morbidity and mortality. Between multi-resistant bac-teria are ESBL. Were detected for the first time in Germany in 1983 and in Spain in1988.The emergence of extended-spectrum beta-lactamases (ESBL) have been greatlydisrupted the treatment of these bacterial infections. The ESBL enzymes are able tohydrolyze the broad-spectrum cephalosporins and the monobactams. Along with tigecy-cline, carbapenems and Colistin are those with the highest activity have against most ofESBL producing strains.The progressive increase to the majority of the ESBL and carbapenemases, antibiotic groupthat was in most cases the last line of treatment, is currently being very common inhospitals.OBJECTIVES. To analyze the outbreak of ESBL Klebsiella Carlos Haya Hospital Com-plex in 2011 and control measures.METHODS. A prospective descriptive observational ESBL Klebsiella pneumoniae out-break carbapenemase. We collected all the outbreak patients, colonized or infected. The firstrecorded was in May 2012 and we finished the outbreak in October 2012.RESULTS. 135 patients were collected suspects of which 104 patients were confirmedESBL K. pneumoniae carbapenemase. After send the samples to reference center confirmedMajadahonda K. pneumoniae blaOXA 48 in 82 patients. The UCI service was the highestnumber of affected patients presented, being more than 46 % where first isolation and in71.3 % of patients in the outbreak had ICU stay.51 % of the cases was considered colonization. Among the 47.5 % had respiratory infection,22.5 % bacteriemia and 20 % UTI.The main reason for admission of patients was 29.2 % Neurosurgical, 10.9 % polytrauma,sepsis 15.8, 24.3 % other postoperatively, other 15.8 %.Epidemiologically the patients had a mean age of 60.5 ± 16.4 years, 70.7 % were male.Mean hospital stay was 61.46 ± 38 days and the average length of stay up to the firstisolation was 23.9 ± 16.3 days.Mortality was 21 % being attributable to only 2.4 %.CONCLUSIONS. We report a rare outbreak blaOXA48 K.pneumoniae nationally and firstdescribed in intensive care units at the level of Andalusia. The UCI is the first unit ofaccumulation and distribution of cases. The treatment for this infection outbreaks is difficultand prolonged.REFERENCE(S). Clinical microbiology and infection CMI 2012;18:413–431.
0594CYTOKINE EXPRESSION ACCORDING MICROBIOLOGICAL AETIOLOGYIN MECHANICALLY VENTILATED PATIENTS WITH PNEUMONIA
A. Estella1
1Hospital del SAS de Jerez, Intensive Care Unit, Jerez de la Frontera, SpainINTRODUCTION. Several studies have examined the role that cytokines play in severepneumonia. The specific relationship between microbiological aetiology and the inflam-matory response has been scarcely studied.OBJECTIVES. The aim of the present study was to investigate systemic and intrapul-monary cytokine response according culture results.METHODS. This study was conducted in a 17-bed Intensive Care Unit of a communityhospital. Mechanically ventilated patients with microbiologically confirmed pneumonia towhich cytokines were measured were retrospectively analysed. Patients with negative cul-tures, fungal pneumonia or polymicrobial etiology were excluded. Plasma andbronchoalveolar lavage (BAL) Interleukin (IL)-6, IL-8 and TNFa levels were analyzedaccording microbiological aetiology, we distinguish three groups: gram-negative, gram-positive and viral (Influenza A H1N1v). Statistical analysis: data were analyzed by SPSS 18.
26th ESICM ANNUAL CONGRESS — PARIS, FRANCE — 5–9 OCTOBER 2013
RESULTS. Fourteen patients were included. Three subgroups were defined according toGram stain and culture results of bronchoscopy bronchoalveolar samples: six patients withgram-negative pneumonia, five patients with gram-positive pneumonia and three patientswith primary viral pneumonia due to Influenza A H1N1v. The concentration of the cyto-kines measured in plasma and the BAL fluid are reported in table and are expressed inpg/ml.
Plasma and BAL cytokine levels
IL-6 BAL IL-6 IL-8 BAL IL-8 a -TNF BALa-TNF
Gram-negative
151.4 ±177.3
267.6 ±247.03
214.8 ±123.7
2,131.6 ±1035.2
3.6 ±4.07
39.6 ±30.7
Gram-positive
186.5 ±251.4
139.67 ±103.5
187 ±120.7
1.665 ±1612.25
14.65 ±21.46
549.8 ±431.7
Viral 85 \14 66.2 \62 \16 \16
CONCLUSIONS. The small sample size and retrospective design may result in limited datafor analysis, we conclude:Cytokine patterns in BAL fluid and plasma of mechanically ventilated patients with severepneumonia may differ, depending of the type of pathogen.Bacterial pneumonia induces stronger inflammatory cytokine mediated response than viralpneumonia.Gram positive bacteria elicit as much a-TNF release as did Gram negative bacteria.REFERENCE(S). Cytokine expression in severe pneumonia: a bronchoalveolar lavagestudy.Montón C, Torres A, El-Ebiary M, Filella X, Xaubet A, de la Bellacasa JP. Crit CareMed. 1999;27(9):1745–53.
0595COMPARATIVE STUDY OF THE COMBINATION OF HIGH DOSES OFAMPICILLINE/SULBACTAME WITH COLISTIN VERSUS MEROPENEM WITHCOLISTIN IN VENTILATOR ASSOCIATED PNEUMONIA CAUSED BYACINETOBACTER BAUMANNII
F. Frantzeskaki1, E.-S. Karampi1, P. Papadopoulos1, E. Paramythiotou1, M.Theodorakopoulou1, A. Flevari1, M. Rizos1, C. Diakaki1, A. Armaganidis1, G. Dimopoulos1
1Attikon University Hospital, University of Athens Medical School, Intensive Care Unit,Athens, GreeceINTRODUCTION. Ventilator associated pneumonia due to multidrug resistant Acineto-bacter baumannii carries significant morbidity and mortality in the intensive care unit (ICU)setting. Sulbactam, a b-lactamase inhibitor has shown bactericidal activity against A. bau-mannii. In vitro synergistic activity of the combination of sulbactam with colistin ormeropenem and colistin has been demonstrated in several studies.OBJECTIVES. We prospectively compared the clinical efficacy and safety of the com-bination of high doses of ampicilline/sulbactam with colistin versus meropenem withcolistin in ventilator associated pneumonia caused by multidrug resistant Acinetobacterbaumannii.METHODS. This prospective study was performed at 21-bed polyvalent intensive careunit. All mechanical ventilated patients [72 h who developed VAP and had positive A.baumannii tracheal aspirates ([106 cfu/ml) were enrolled in the study. The antimicrobialsusceptibility of the isolates was determined using the disk-diffusion (Kirby–Bauer) method,the VITEK II system and the E-test method (AB Biodisk, Solna-Sweden). All isolatesexhibited resistance to almost all antibiotics routinely tested, excluding colistin. Patientswere randomly assigned to receive intravenous ampicillin/sulbactam 6 g (at a rate 2:1) every6 h iv and colistin 3MIU every 8 h (group A) or meropenem 2gx3 iv and colistin 3MIUevery 8 h (group B), all adjusted to creatinine clearance. Follow up cultures and clinicalevaluation of all patients was performed 5 days after the initiation of therapy. Clinicalsuccess was defined by a lessening of the signs and symptoms of VAP, while microbiologicsuccess was defined as eradication of the pathogen in tracheal aspiration cultures.RESULTS. Twenty-four patients with VAP (mean age ± SD 62 ± 7), having positiveA.baumannii tracheal aspirates[106 were enrolled. Among them, 16 patients were includedin Group A and 8 in Group B. Clinical and microbiologic success was observed in 13patients of Group A (81 %) and 6 patients of Group B (75 %) (p = 0.1). There was nosignificant difference in 14 and 30 days mortality between the 2 groups. Adverse reactionsoccurred in 1 patient (15.3 %) of Group A (rush and eosinophilia), which led to discon-tinuation of treatment.CONCLUSIONS. The combination of A/S with colistin or meropenem with colistin mightbe equally safe and effective treatment options for these difficult to treat infections. How-ever, more data are needed to clarify the possible synergistic activities of these therapeuticcombinations against multidrug resistant A. baumanii strains.REFERENCE(S). 1. Kempf M, Djouhri-Bouktab L, Brunel JM, Raoult D, Rolain JM.Synergistic activity of sulbactam combined with colistin against colistin-resistant Acineto-bacter baumannii. Int J Antimicrob Agents 2012;39(2):180–1.
0596TUBERCULOSIS IN THE ICU: A TERTIARY HOSPITAL 11 YEARSEXPERIENCE
L. Fernandez1, J. Lopez1, M. Irazábal1, I. Pozuelo1, P. Millan1, C. Guallar1, B. Civantos1,
S. Yus1
1Hospital Universitario La Paz, Intensive Care Unit, Madrid, SpainINTRODUCTION. Tuberculosis (Tb) is a curable disease with a myriad of clinical pre-sentations, some of them very severe.OBJECTIVES. We describe some of the features of patients with tuberculosis (TB) whorequired admission to our ICU as: incidence, mortality, and delay or not in the onset ofspecific anti-tuberculous treatment.METHODS. A retrospective cohort study from January 2000 to October 2011, in a 20-bedintensive care unit (ICU) of a tertiary University Hospital. We included all patients with anactive TB, that required admission in our ICU during that period. Data collected includeddemographics, severity scores on admission (APACHEII, SOFA), risk factors (comorbidi-ties, toxic habits, HIV status, corticosteroids and immunosuppressive treatments), andclinical presentation. Early diagnosis of TB, time to initiation of specific treatment and itsrelation with ICU mortality were also analysed.
RESULTS. During the reviewed period (11 years), from 8,790 patients, only 23 wereadmitted due to active tuberculosis, with an incidence of 0.26 %. Of these, 78.28 % weremale, with a mean age of 40.8 years. Mean APACHEII and SOFA were 14.21 and 5.80respectively. The most common clinical presentation was pulmonary disease in 69.56 % (16patients) followed by 13 patients who met criteria of pneumonia and 3 patients who metcriteria of milliary disease. Developed ARDS five patients. The mortality rate of this groupwas 37.5 % (6 out of 16 patients). Five with ARDS and none with milliary TB. Centralnervous system involvement represented 30.43 % (7 patients), 5 had meningoencephalitisand 2 had space occupying lesions (SOL) tuberculomas. Mortality in this last group was42.85 % (3 out of 7 patients). There were three patients with both pulmonary and neuro-logical involvement. Six were known HIV positive patients.Mortality was 39.13 % (9 out of 23 patients) and it was statistically (p \ 0.002) higher thanthe global ICU mortality: 19.74 % (1,736 patients out of 8,790). Also, was related withseverity criteria at admission: APACHEII (21.66 vs 15.04), shock criteria (7 out of 9patients) and ARDS (5 out of 9 patients). There was delay in initiation of treatment in39.13 % with five deaths.CONCLUSIONS. Eventhough TB only represents 0.26 % of all the ICU admissions,appears to be a condition with higher mortality than rest of the ICU admissions.There was a high rate of treatment delay (39 %), although due to our limited number ofpatients, we cannot evaluate its effect on mortality.In the ICU TB is diagnosed and treated late, therefore, it is important to have a high index ofsuspicion to avoid treatment delays and prevention remains a challenge in this population.
Coagulation and transfusion: 0597–06100597LONG- VERSUS SHORT-AXIS ULTRASOUND GUIDANCE FOR SUBCLAVIANVEIN CANNULATION
A. Vezzani1, T. Manca1, F. Nicolini1, B. Borrello1, C. Brusasco2, F. Corradi1
1Cardiac Surgery Intensive Care Unit, Parma, Italy, 2University of Genoa, Genova, ItalyAIM. The aim of this study was to compare the short and long axis approaches to ultrasoundguided subclavian vein cannulation with respect to indicators of success.METHODS. Patients (n = 46) undergoing cardiac surgery and requiring central venouscannulation were randomised to undergo either long- or short-axis ultrasound-guided can-nulation of the subclavian vein by a skilled anesthesiologist. First pass success, number ofneedle passes, procedural taken and complications were documented for each procedure.RESULTS. The subclavian vein was successfully cannulated in all 46 patients.The first pass success rate was higher in the short axis group 86 % compared to the long axisgroup 56 % [24:28 (86 %) versus 10:18 (56 %) p = 0.043]. Procedural time was signifi-cantly lower in the short axis (1.44 ± 1.11 versus 3.00 ± 2.01 min p = 0.002). Fewerneedle redirections were required in the short axis group (0.14 ± 0.36 versus 1.11 ± 1.13p = 0.008).CONCLUSIONS. The short-axis procedure was associated with a higher first pass successrate, shorter procedure time and fewer needle redirections. A short-axis procedure forultrasound-guided subclavian cannulation offers advantages over long-axis procedure.
0598TOO HOT TO HANDLE! OUTCOMES OF CRITICALLY ILL PATIENTSWITH TEMPERATURE RELATED ILLNESS DURING A TROPICAL SUMMERIN SOUTHERN INDIA
S. Kalaiselvan Murugesan1, A.S. Arunkumar1, M.K. Renuka2
1Sri Ramachandra University, Critical Care Medicine, Chennai, India, 2Sri RamachandraUniversity, Anesthesiology, Chennai, IndiaINTRODUCTION. India is a tropical country with hot summers. ICU admissions due toheat related illness is common.OBJECTIVES. We evaluated the clinical features and outcome of patients admitted to ourtertiary care multidisciplinary ICU with heat related illness.METHODS. This is a retrospective observational study.We included all patients admittedduring April to July 2012, with fever, neurological symptoms and absence of meningism1.We excluded patients with features of infection in CSF analysis and neuroimaging studiesshowing acute stroke or CNS infection.Data on demographics, co-morbid illness, APACHE II, SOFA scores,presenting symptoms,vital parameters, lab parameters, concomitant medications, echocardiography and neuro-imaging studies were collected. Outcome data included, mortality, ICU length of stay(LOS), ventilator days, discharge SOFA and Glascow Coma Scale (GCS).Statistical analysis was done using student t test, Chi square test and multi-variate analysis.RESULTS. 26 patients were analysed. 15 were males. The mean age was 53.12(±18.6) years (mean ± S.D). Mean APACHE II was 19.6 ± 7.7 and SOFA was 7.5 ± 2.6.
Admission vital parameters
Vitals Mean ± SD
Temperature 102.7 ± 2.7 F
GCS 8.65 ± 4.2
Systolic BP 115.15 ± 23.98 mmHg
Diastolic BP 71.35 ± 14.70 mmHg
Admission lab values
Labs Mean ± S.D
Serum sodium 124.38 ± 13.33 meq/L
Serum lactate 2.3 ± 2.1 mmol/L
Serum creatinine 1.40 ± 0.67 mg/dl
Serum bilirubin 1.43 ± 1.36 mg/dl
Hematocrit 34.96 ± 7.5 %
CPK 1,856 ± 2,372 IU/L
Frequent co-morbid illness included hypertension (38 %), diabetes mellitus (26 %), neu-rological diseases (23 %) and coronary artery disease (11.5 %).The common presenting
26th ESICM ANNUAL CONGRESS — PARIS, FRANCE — 5–9 OCTOBER 2013
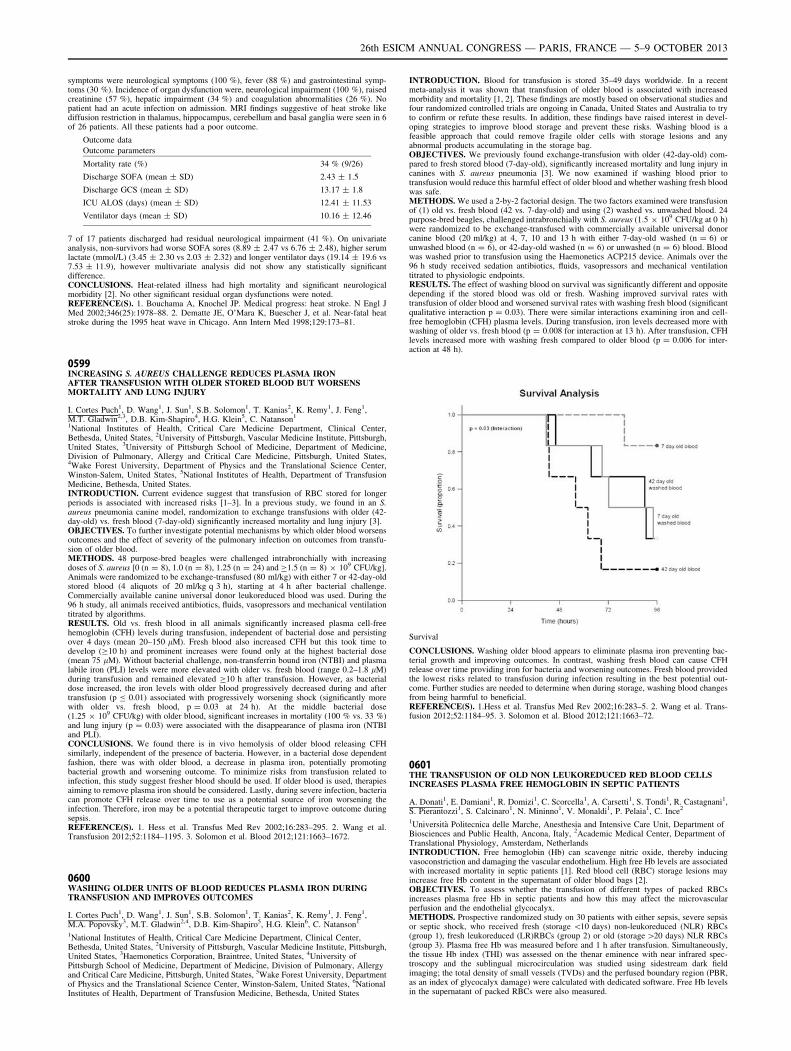
symptoms were neurological symptoms (100 %), fever (88 %) and gastrointestinal symp-toms (30 %). Incidence of organ dysfunction were, neurological impairment (100 %), raisedcreatinine (57 %), hepatic impairment (34 %) and coagulation abnormalities (26 %). Nopatient had an acute infection on admission. MRI findings suggestive of heat stroke likediffusion restriction in thalamus, hippocampus, cerebellum and basal ganglia were seen in 6of 26 patients. All these patients had a poor outcome.
Outcome data
Outcome parameters
Mortality rate (%) 34 % (9/26)
Discharge SOFA (mean ± SD) 2.43 ± 1.5
Discharge GCS (mean ± SD) 13.17 ± 1.8
ICU ALOS (days) (mean ± SD) 12.41 ± 11.53
Ventilator days (mean ± SD) 10.16 ± 12.46
7 of 17 patients discharged had residual neurological impairment (41 %). On univariateanalysis, non-survivors had worse SOFA sores (8.89 ± 2.47 vs 6.76 ± 2.48), higher serumlactate (mmol/L) (3.45 ± 2.30 vs 2.03 ± 2.32) and longer ventilator days (19.14 ± 19.6 vs7.53 ± 11.9), however multivariate analysis did not show any statistically significantdifference.CONCLUSIONS. Heat-related illness had high mortality and significant neurologicalmorbidity [2]. No other significant residual organ dysfunctions were noted.REFERENCE(S). 1. Bouchama A, Knochel JP. Medical progress: heat stroke. N Engl JMed 2002;346(25):1978–88. 2. Dematte JE, O’Mara K, Buescher J, et al. Near-fatal heatstroke during the 1995 heat wave in Chicago. Ann Intern Med 1998;129:173–81.
0599INCREASING S. AUREUS CHALLENGE REDUCES PLASMA IRONAFTER TRANSFUSION WITH OLDER STORED BLOOD BUT WORSENSMORTALITY AND LUNG INJURY
I. Cortes Puch1, D. Wang1, J. Sun1, S.B. Solomon1, T. Kanias2, K. Remy1, J. Feng1,M.T. Gladwin2,3, D.B. Kim-Shapiro4, H.G. Klein5, C. Natanson1
1National Institutes of Health, Critical Care Medicine Department, Clinical Center,Bethesda, United States, 2University of Pittsburgh, Vascular Medicine Institute, Pittsburgh,United States, 3University of Pittsburgh School of Medicine, Department of Medicine,Division of Pulmonary, Allergy and Critical Care Medicine, Pittsburgh, United States,4Wake Forest University, Department of Physics and the Translational Science Center,Winston-Salem, United States, 5National Institutes of Health, Department of TransfusionMedicine, Bethesda, United States.INTRODUCTION. Current evidence suggest that transfusion of RBC stored for longerperiods is associated with increased risks [1–3]. In a previous study, we found in an S.aureus pneumonia canine model, randomization to exchange transfusions with older (42-day-old) vs. fresh blood (7-day-old) significantly increased mortality and lung injury [3].OBJECTIVES. To further investigate potential mechanisms by which older blood worsensoutcomes and the effect of severity of the pulmonary infection on outcomes from transfu-sion of older blood.METHODS. 48 purpose-bred beagles were challenged intrabronchially with increasingdoses of S. aureus [0 (n = 8), 1.0 (n = 8), 1.25 (n = 24) and C1.5 (n = 8) 9 109 CFU/kg].Animals were randomized to be exchange-transfused (80 ml/kg) with either 7 or 42-day-oldstored blood (4 aliquots of 20 ml/kg q 3 h), starting at 4 h after bacterial challenge.Commercially available canine universal donor leukoreduced blood was used. During the96 h study, all animals received antibiotics, fluids, vasopressors and mechanical ventilationtitrated by algorithms.RESULTS. Old vs. fresh blood in all animals significantly increased plasma cell-freehemoglobin (CFH) levels during transfusion, independent of bacterial dose and persistingover 4 days (mean 20–150 lM). Fresh blood also increased CFH but this took time todevelop (C10 h) and prominent increases were found only at the highest bacterial dose(mean 75 lM). Without bacterial challenge, non-transferrin bound iron (NTBI) and plasmalabile iron (PLI) levels were more elevated with older vs. fresh blood (range 0.2–1.8 lM)during transfusion and remained elevated C10 h after transfusion. However, as bacterialdose increased, the iron levels with older blood progressively decreased during and aftertransfusion (p B 0.01) associated with progressively worsening shock (significantly morewith older vs. fresh blood, p = 0.03 at 24 h). At the middle bacterial dose(1.25 9 109 CFU/kg) with older blood, significant increases in mortality (100 % vs. 33 %)and lung injury (p = 0.03) were associated with the disappearance of plasma iron (NTBIand PLI).CONCLUSIONS. We found there is in vivo hemolysis of older blood releasing CFHsimilarly, independent of the presence of bacteria. However, in a bacterial dose dependentfashion, there was with older blood, a decrease in plasma iron, potentially promotingbacterial growth and worsening outcome. To minimize risks from transfusion related toinfection, this study suggest fresher blood should be used. If older blood is used, therapiesaiming to remove plasma iron should be considered. Lastly, during severe infection, bacteriacan promote CFH release over time to use as a potential source of iron worsening theinfection. Therefore, iron may be a potential therapeutic target to improve outcome duringsepsis.REFERENCE(S). 1. Hess et al. Transfus Med Rev 2002;16:283–295. 2. Wang et al.Transfusion 2012;52:1184–1195. 3. Solomon et al. Blood 2012;121:1663–1672.
0600WASHING OLDER UNITS OF BLOOD REDUCES PLASMA IRON DURINGTRANSFUSION AND IMPROVES OUTCOMES
I. Cortes Puch1, D. Wang1, J. Sun1, S.B. Solomon1, T. Kanias2, K. Remy1, J. Feng1,M.A. Popovsky3, M.T. Gladwin2,4, D.B. Kim-Shapiro5, H.G. Klein6, C. Natanson1
1National Institutes of Health, Critical Care Medicine Department, Clinical Center,Bethesda, United States, 2University of Pittsburgh, Vascular Medicine Institute, Pittsburgh,United States, 3Haemonetics Corporation, Braintree, United States, 4University ofPittsburgh School of Medicine, Department of Medicine, Division of Pulmonary, Allergyand Critical Care Medicine, Pittsburgh, United States, 5Wake Forest University, Departmentof Physics and the Translational Science Center, Winston-Salem, United States, 6NationalInstitutes of Health, Department of Transfusion Medicine, Bethesda, United States
INTRODUCTION. Blood for transfusion is stored 35–49 days worldwide. In a recentmeta-analysis it was shown that transfusion of older blood is associated with increasedmorbidity and mortality [1, 2]. These findings are mostly based on observational studies andfour randomized controlled trials are ongoing in Canada, United States and Australia to tryto confirm or refute these results. In addition, these findings have raised interest in devel-oping strategies to improve blood storage and prevent these risks. Washing blood is afeasible approach that could remove fragile older cells with storage lesions and anyabnormal products accumulating in the storage bag.OBJECTIVES. We previously found exchange-transfusion with older (42-day-old) com-pared to fresh stored blood (7-day-old), significantly increased mortality and lung injury incanines with S. aureus pneumonia [3]. We now examined if washing blood prior totransfusion would reduce this harmful effect of older blood and whether washing fresh bloodwas safe.METHODS. We used a 2-by-2 factorial design. The two factors examined were transfusionof (1) old vs. fresh blood (42 vs. 7-day-old) and using (2) washed vs. unwashed blood. 24purpose-bred beagles, challenged intrabronchially with S. aureus (1.5 9 109 CFU/kg at 0 h)were randomized to be exchange-transfused with commercially available universal donorcanine blood (20 ml/kg) at 4, 7, 10 and 13 h with either 7-day-old washed (n = 6) orunwashed blood (n = 6), or 42-day-old washed (n = 6) or unwashed (n = 6) blood. Bloodwas washed prior to transfusion using the Haemonetics ACP215 device. Animals over the96 h study received sedation antibiotics, fluids, vasopressors and mechanical ventilationtitrated to physiologic endpoints.RESULTS. The effect of washing blood on survival was significantly different and oppositedepending if the stored blood was old or fresh. Washing improved survival rates withtransfusion of older blood and worsened survival rates with washing fresh blood (significantqualitative interaction p = 0.03). There were similar interactions examining iron and cell-free hemoglobin (CFH) plasma levels. During transfusion, iron levels decreased more withwashing of older vs. fresh blood (p = 0.008 for interaction at 13 h). After transfusion, CFHlevels increased more with washing fresh compared to older blood (p = 0.006 for inter-action at 48 h).
Survival
CONCLUSIONS. Washing older blood appears to eliminate plasma iron preventing bac-terial growth and improving outcomes. In contrast, washing fresh blood can cause CFHrelease over time providing iron for bacteria and worsening outcomes. Fresh blood providedthe lowest risks related to transfusion during infection resulting in the best potential out-come. Further studies are needed to determine when during storage, washing blood changesfrom being harmful to beneficial.REFERENCE(S). 1.Hess et al. Transfus Med Rev 2002;16:283–5. 2. Wang et al. Trans-fusion 2012;52:1184–95. 3. Solomon et al. Blood 2012;121:1663–72.
0601THE TRANSFUSION OF OLD NON LEUKOREDUCED RED BLOOD CELLSINCREASES PLASMA FREE HEMOGLOBIN IN SEPTIC PATIENTS
A. Donati1, E. Damiani1, R. Domizi1, C. Scorcella1, A. Carsetti1, S. Tondi1, R. Castagnani1,S. Pierantozzi1, S. Calcinaro1, N. Mininno1, V. Monaldi1, P. Pelaia1, C. Ince2
1Università Politecnica delle Marche, Anesthesia and Intensive Care Unit, Department ofBiosciences and Public Health, Ancona, Italy, 2Academic Medical Center, Department ofTranslational Physiology, Amsterdam, NetherlandsINTRODUCTION. Free hemoglobin (Hb) can scavenge nitric oxide, thereby inducingvasoconstriction and damaging the vascular endothelium. High free Hb levels are associatedwith increased mortality in septic patients [1]. Red blood cell (RBC) storage lesions mayincrease free Hb content in the supernatant of older blood bags [2].OBJECTIVES. To assess whether the transfusion of different types of packed RBCsincreases plasma free Hb in septic patients and how this may affect the microvascularperfusion and the endothelial glycocalyx.METHODS. Prospective randomized study on 30 patients with either sepsis, severe sepsisor septic shock, who received fresh (storage \10 days) non-leukoreduced (NLR) RBCs(group 1), fresh leukoreduced (LR)RBCs (group 2) or old (storage [20 days) NLR RBCs(group 3). Plasma free Hb was measured before and 1 h after transfusion. Simultaneously,the tissue Hb index (THI) was assessed on the thenar eminence with near infrared spec-troscopy and the sublingual microcirculation was studied using sidestream dark fieldimaging; the total density of small vessels (TVDs) and the perfused boundary region (PBR,as an index of glycocalyx damage) were calculated with dedicated software. Free Hb levelsin the supernatant of packed RBCs were also measured.
26th ESICM ANNUAL CONGRESS — PARIS, FRANCE — 5–9 OCTOBER 2013
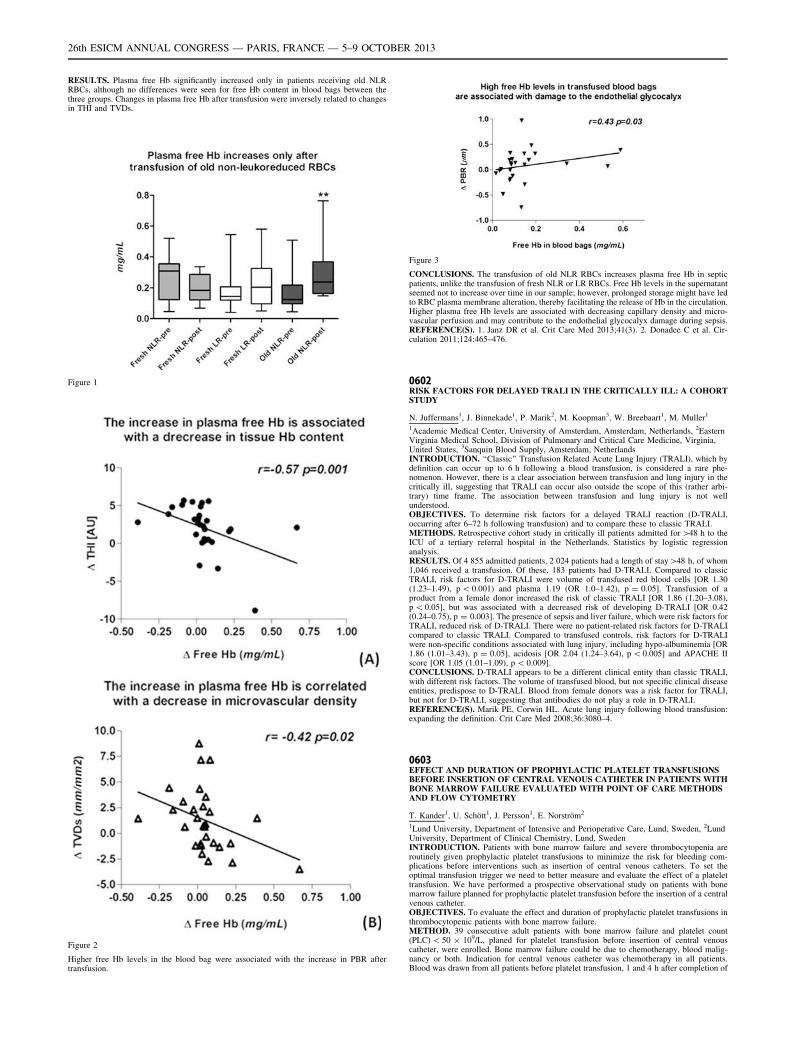
RESULTS. Plasma free Hb significantly increased only in patients receiving old NLRRBCs, although no differences were seen for free Hb content in blood bags between thethree groups. Changes in plasma free Hb after transfusion were inversely related to changesin THI and TVDs.
Figure 1
Figure 2
Higher free Hb levels in the blood bag were associated with the increase in PBR aftertransfusion.
Figure 3
CONCLUSIONS. The transfusion of old NLR RBCs increases plasma free Hb in septicpatients, unlike the transfusion of fresh NLR or LR RBCs. Free Hb levels in the supernatantseemed not to increase over time in our sample; however, prolonged storage might have ledto RBC plasma membrane alteration, thereby facilitating the release of Hb in the circulation.Higher plasma free Hb levels are associated with decreasing capillary density and micro-vascular perfusion and may contribute to the endothelial glycocalyx damage during sepsis.REFERENCE(S). 1. Janz DR et al. Crit Care Med 2013;41(3). 2. Donadee C et al. Cir-culation 2011;124:465–476.
0602RISK FACTORS FOR DELAYED TRALI IN THE CRITICALLY ILL: A COHORTSTUDY
N. Juffermans1, J. Binnekade1, P. Marik2, M. Koopman3, W. Breebaart1, M. Muller1
1Academic Medical Center, University of Amsterdam, Amsterdam, Netherlands, 2EasternVirginia Medical School, Division of Pulmonary and Critical Care Medicine, Virginia,United States, 3Sanquin Blood Supply, Amsterdam, NetherlandsINTRODUCTION. ‘‘Classic’’ Transfusion Related Acute Lung Injury (TRALI), which bydefinition can occur up to 6 h following a blood transfusion, is considered a rare phe-nomenon. However, there is a clear association between transfusion and lung injury in thecritically ill, suggesting that TRALI can occur also outside the scope of this (rather arbi-trary) time frame. The association between transfusion and lung injury is not wellunderstood.OBJECTIVES. To determine risk factors for a delayed TRALI reaction (D-TRALI,occurring after 6–72 h following transfusion) and to compare these to classic TRALI.METHODS. Retrospective cohort study in critically ill patients admitted for [48 h to theICU of a tertiary referral hospital in the Netherlands. Statistics by logistic regressionanalysis.RESULTS. Of 4 855 admitted patients, 2 024 patients had a length of stay[48 h, of whom1,046 received a transfusion. Of these, 183 patients had D-TRALI. Compared to classicTRALI, risk factors for D-TRALI were volume of transfused red blood cells [OR 1.30(1.23–1.49), p \ 0.001) and plasma 1.19 (OR 1.0–1.42), p = 0.05]. Transfusion of aproduct from a female donor increased the risk of classic TRALI [OR 1.86 (1.20–3.08),p \ 0.05], but was associated with a decreased risk of developing D-TRALI [OR 0.42(0.24–0.75), p = 0.003]. The presence of sepsis and liver failure, which were risk factors forTRALI, reduced risk of D-TRALI. There were no patient-related risk factors for D-TRALIcompared to classic TRALI. Compared to transfused controls, risk factors for D-TRALIwere non-specific conditions associated with lung injury, including hypo-albuminemia [OR1.86 (1.01–3.43), p = 0.05], acidosis [OR 2.04 (1.24–3.64), p \ 0.005] and APACHE IIscore [OR 1.05 (1.01–1.09), p \ 0.009].CONCLUSIONS. D-TRALI appears to be a different clinical entity than classic TRALI,with different risk factors. The volume of transfused blood, but not specific clinical diseaseentities, predispose to D-TRALI. Blood from female donors was a risk factor for TRALI,but not for D-TRALI, suggesting that antibodies do not play a role in D-TRALI.REFERENCE(S). Marik PE, Corwin HL. Acute lung injury following blood transfusion:expanding the definition. Crit Care Med 2008;36:3080–4.
0603EFFECT AND DURATION OF PROPHYLACTIC PLATELET TRANSFUSIONSBEFORE INSERTION OF CENTRAL VENOUS CATHETER IN PATIENTS WITHBONE MARROW FAILURE EVALUATED WITH POINT OF CARE METHODSAND FLOW CYTOMETRY
T. Kander1, U. Schött1, J. Persson1, E. Norström2
1Lund University, Department of Intensive and Perioperative Care, Lund, Sweden, 2LundUniversity, Department of Clinical Chemistry, Lund, SwedenINTRODUCTION. Patients with bone marrow failure and severe thrombocytopenia areroutinely given prophylactic platelet transfusions to minimize the risk for bleeding com-plications before interventions such as insertion of central venous catheters. To set theoptimal transfusion trigger we need to better measure and evaluate the effect of a platelettransfusion. We have performed a prospective observational study on patients with bonemarrow failure planned for prophylactic platelet transfusion before the insertion of a centralvenous catheter.OBJECTIVES. To evaluate the effect and duration of prophylactic platelet transfusions inthrombocytopenic patients with bone marrow failure.METHOD. 39 consecutive adult patients with bone marrow failure and platelet count(PLC) \ 50 9 109/L, planed for platelet transfusion before insertion of central venouscatheter, were enrolled. Bone marrow failure could be due to chemotherapy, blood malig-nancy or both. Indication for central venous catheter was chemotherapy in all patients.Blood was drawn from all patients before platelet transfusion, 1 and 4 h after completion of
26th ESICM ANNUAL CONGRESS — PARIS, FRANCE — 5–9 OCTOBER 2013
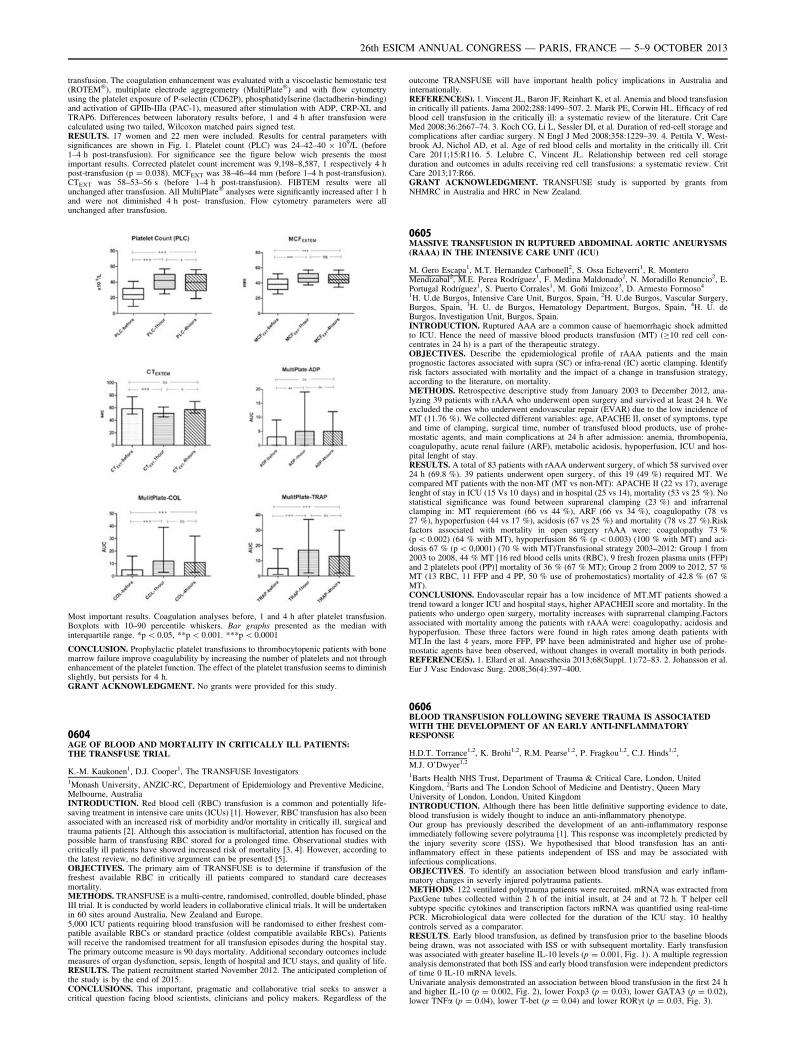
transfusion. The coagulation enhancement was evaluated with a viscoelastic hemostatic test(ROTEM�), multiplate electrode aggregometry (MultiPlate�) and with flow cytometryusing the platelet exposure of P-selectin (CD62P), phosphatidylserine (lactadherin-binding)and activation of GPIIb-IIIa (PAC-1), measured after stimulation with ADP, CRP-XL andTRAP6. Differences between laboratory results before, 1 and 4 h after transfusion werecalculated using two tailed, Wilcoxon matched pairs signed test.RESULTS. 17 women and 22 men were included. Results for central parameters withsignificances are shown in Fig. 1. Platelet count (PLC) was 24–42–40 9 109/L (before1–4 h post-transfusion). For significance see the figure below wich presents the mostimportant results. Corrected platelet count increment was 9,198–8,587, 1 respectively 4 hpost-transfusion (p = 0.038). MCFEXT was 38–46–44 mm (before 1–4 h post-transfusion).CTEXT was 58–53–56 s (before 1–4 h post-transfusion). FIBTEM results were allunchanged after transfusion. All MultiPlate� analyses were significantly increased after 1 hand were not diminished 4 h post- transfusion. Flow cytometry parameters were allunchanged after transfusion.
Most important results. Coagulation analyses before, 1 and 4 h after platelet transfusion.Boxplots with 10–90 percentile whiskers. Bar graphs presented as the median withinterquartile range. *p \ 0.05, **p \ 0.001. ***p \ 0.0001
CONCLUSION. Prophylactic platelet transfusions to thrombocytopenic patients with bonemarrow failure improve coagulability by increasing the number of platelets and not throughenhancement of the platelet function. The effect of the platelet transfusion seems to diminishslightly, but persists for 4 h.GRANT ACKNOWLEDGMENT. No grants were provided for this study.
0604AGE OF BLOOD AND MORTALITY IN CRITICALLY ILL PATIENTS:THE TRANSFUSE TRIAL
K.-M. Kaukonen1, D.J. Cooper1, The TRANSFUSE Investigators1Monash University, ANZIC-RC, Department of Epidemiology and Preventive Medicine,Melbourne, AustraliaINTRODUCTION. Red blood cell (RBC) transfusion is a common and potentially life-saving treatment in intensive care units (ICUs) [1]. However, RBC transfusion has also beenassociated with an increased risk of morbidity and/or mortality in critically ill, surgical andtrauma patients [2]. Although this association is multifactorial, attention has focused on thepossible harm of transfusing RBC stored for a prolonged time. Observational studies withcritically ill patients have showed increased risk of mortality [3, 4]. However, according tothe latest review, no definitive argument can be presented [5].OBJECTIVES. The primary aim of TRANSFUSE is to determine if transfusion of thefreshest available RBC in critically ill patients compared to standard care decreasesmortality.METHODS. TRANSFUSE is a multi-centre, randomised, controlled, double blinded, phaseIII trial. It is conducted by world leaders in collaborative clinical trials. It will be undertakenin 60 sites around Australia, New Zealand and Europe.5,000 ICU patients requiring blood transfusion will be randomised to either freshest com-patible available RBCs or standard practice (oldest compatible available RBCs). Patientswill receive the randomised treatment for all transfusion episodes during the hospital stay.The primary outcome measure is 90 days mortality. Additional secondary outcomes includemeasures of organ dysfunction, sepsis, length of hospital and ICU stays, and quality of life.RESULTS. The patient recruitment started November 2012. The anticipated completion ofthe study is by the end of 2015.CONCLUSIONS. This important, pragmatic and collaborative trial seeks to answer acritical question facing blood scientists, clinicians and policy makers. Regardless of the
outcome TRANSFUSE will have important health policy implications in Australia andinternationally.REFERENCE(S). 1. Vincent JL, Baron JF, Reinhart K, et al. Anemia and blood transfusionin critically ill patients. Jama 2002;288:1499–507. 2. Marik PE, Corwin HL. Efficacy of redblood cell transfusion in the critically ill: a systematic review of the literature. Crit CareMed 2008;36:2667–74. 3. Koch CG, Li L, Sessler DI, et al. Duration of red-cell storage andcomplications after cardiac surgery. N Engl J Med 2008;358:1229–39. 4. Pettila V, West-brook AJ, Nichol AD, et al. Age of red blood cells and mortality in the critically ill. CritCare 2011;15:R116. 5. Lelubre C, Vincent JL. Relationship between red cell storageduration and outcomes in adults receiving red cell transfusions: a systematic review. CritCare 2013;17:R66.GRANT ACKNOWLEDGMENT. TRANSFUSE study is supported by grants fromNHMRC in Australia and HRC in New Zealand.
0605MASSIVE TRANSFUSION IN RUPTURED ABDOMINAL AORTIC ANEURYSMS(RAAA) IN THE INTENSIVE CARE UNIT (ICU)
M. Gero Escapa1, M.T. Hernandez Carbonell2, S. Ossa Echeverri1, R. MonteroMendizabal2, M.E. Perea Rodrı́guez1, F. Medina Maldonado2, N. Moradillo Renuncio2, E.Portugal Rodrı́guez1, S. Puerto Corrales1, M. Goñi Imizcoz3, D. Armesto Formoso4
1H. U.de Burgos, Intensive Care Unit, Burgos, Spain, 2H. U.de Burgos, Vascular Surgery,Burgos, Spain, 3H. U. de Burgos, Hematology Department, Burgos, Spain, 4H. U. deBurgos, Investigation Unit, Burgos, Spain.INTRODUCTION. Ruptured AAA are a common cause of haemorrhagic shock admittedto ICU. Hence the need of massive blood products transfusion (MT) (C10 red cell con-centrates in 24 h) is a part of the therapeutic strategy.OBJECTIVES. Describe the epidemiological profile of rAAA patients and the mainprognostic factores associated with supra (SC) or infra-renal (IC) aortic clamping. Identifyrisk factors associated with mortality and the impact of a change in transfusion strategy,according to the literature, on mortality.METHODS. Retrospective descriptive study from January 2003 to December 2012, ana-lyzing 39 patients with rAAA who underwent open surgery and survived at least 24 h. Weexcluded the ones who underwent endovascular repair (EVAR) due to the low incidence ofMT (11.76 %). We collected different variables: age, APACHE II, onset of symptoms, typeand time of clamping, surgical time, number of transfused blood products, use of prohe-mostatic agents, and main complications at 24 h after admission: anemia, thrombopenia,coagulopathy, acute renal failure (ARF), metabolic acidosis, hypoperfusion, ICU and hos-pital lenght of stay.RESULTS. A total of 83 patients with rAAA underwent surgery, of which 58 survived over24 h (69.8 %). 39 patients underwent open surgery, of this 19 (49 %) required MT. Wecompared MT patients with the non-MT (MT vs non-MT): APACHE II (22 vs 17), averagelenght of stay in ICU (15 Vs 10 days) and in hospital (25 vs 14), mortality (53 vs 25 %). Nostatistical significance was found between suprarenal clamping (23 %) and infrarrenalclamping in: MT requierement (66 vs 44 %), ARF (66 vs 34 %), coagulopathy (78 vs27 %), hypoperfusion (44 vs 17 %), acidosis (67 vs 25 %) and mortality (78 vs 27 %).Riskfactors associated with mortality in open surgery rAAA were: coagulopathy 73 %(p \ 0.002) (64 % with MT), hypoperfusion 86 % (p \ 0.003) (100 % with MT) and aci-dosis 67 % (p \ 0,0001) (70 % with MT)Transfusional strategy 2003–2012: Group 1 from2003 to 2008, 44 % MT [16 red blood cells units (RBC), 9 fresh frozen plasma units (FFP)and 2 platelets pool (PP)] mortality of 36 % (67 % MT); Group 2 from 2009 to 2012, 57 %MT (13 RBC, 11 FFP and 4 PP, 50 % use of prohemostatics) mortality of 42.8 % (67 %MT).CONCLUSIONS. Endovascular repair has a low incidence of MT.MT patients showed atrend toward a longer ICU and hospital stays, higher APACHEII score and mortality. In thepatients who undergo open surgery, mortality increases with suprarrenal clamping.Factorsassociated with mortality among the patients with rAAA were: coagulopathy, acidosis andhypoperfusion. These three factors were found in high rates among death patients withMT.In the last 4 years, more FFP, PP have been administrated and higher use of prohe-mostatic agents have been observed, without changes in overall mortality in both periods.REFERENCE(S). 1. Ellard et al. Anaesthesia 2013;68(Suppl. 1):72–83. 2. Johansson et al.Eur J Vasc Endovasc Surg. 2008;36(4):397–400.
0606BLOOD TRANSFUSION FOLLOWING SEVERE TRAUMA IS ASSOCIATEDWITH THE DEVELOPMENT OF AN EARLY ANTI-INFLAMMATORYRESPONSE
H.D.T. Torrance1,2, K. Brohi1,2, R.M. Pearse1,2, P. Fragkou1,2, C.J. Hinds1,2,
M.J. O’Dwyer1,2
1Barts Health NHS Trust, Department of Trauma & Critical Care, London, UnitedKingdom, 2Barts and The London School of Medicine and Dentistry, Queen MaryUniversity of London, London, United KingdomINTRODUCTION. Although there has been little definitive supporting evidence to date,blood transfusion is widely thought to induce an anti-inflammatory phenotype.Our group has previously described the development of an anti-inflammatory responseimmediately following severe polytrauma [1]. This response was incompletely predicted bythe injury severity score (ISS). We hypothesised that blood transfusion has an anti-inflammatory effect in these patients independent of ISS and may be associated withinfectious complications.OBJECTIVES. To identify an association between blood transfusion and early inflam-matory changes in severly injured polytrauma patients.METHODS. 122 ventilated polytrauma patients were recruited. mRNA was extracted fromPaxGene tubes collected within 2 h of the initial insult, at 24 and at 72 h. T helper cellsubtype specific cytokines and transcription factors mRNA was quantified using real-timePCR. Microbiological data were collected for the duration of the ICU stay. 10 healthycontrols served as a comparator.RESULTS. Early blood transfusion, as defined by transfusion prior to the baseline bloodsbeing drawn, was not associated with ISS or with subsequent mortality. Early transfusionwas associated with greater baseline IL-10 levels (p = 0.001, Fig. 1). A multiple regressionanalysis demonstrated that both ISS and early blood transfusion were independent predictorsof time 0 IL-10 mRNA levels.Univariate analysis demonstrated an association between blood transfusion in the first 24 hand higher IL-10 (p = 0.002, Fig. 2), lower Foxp3 (p = 0.03), lower GATA3 (p = 0.02),lower TNFa (p = 0.04), lower T-bet (p = 0.04) and lower RORct (p = 0.03, Fig. 3).
26th ESICM ANNUAL CONGRESS — PARIS, FRANCE — 5–9 OCTOBER 2013
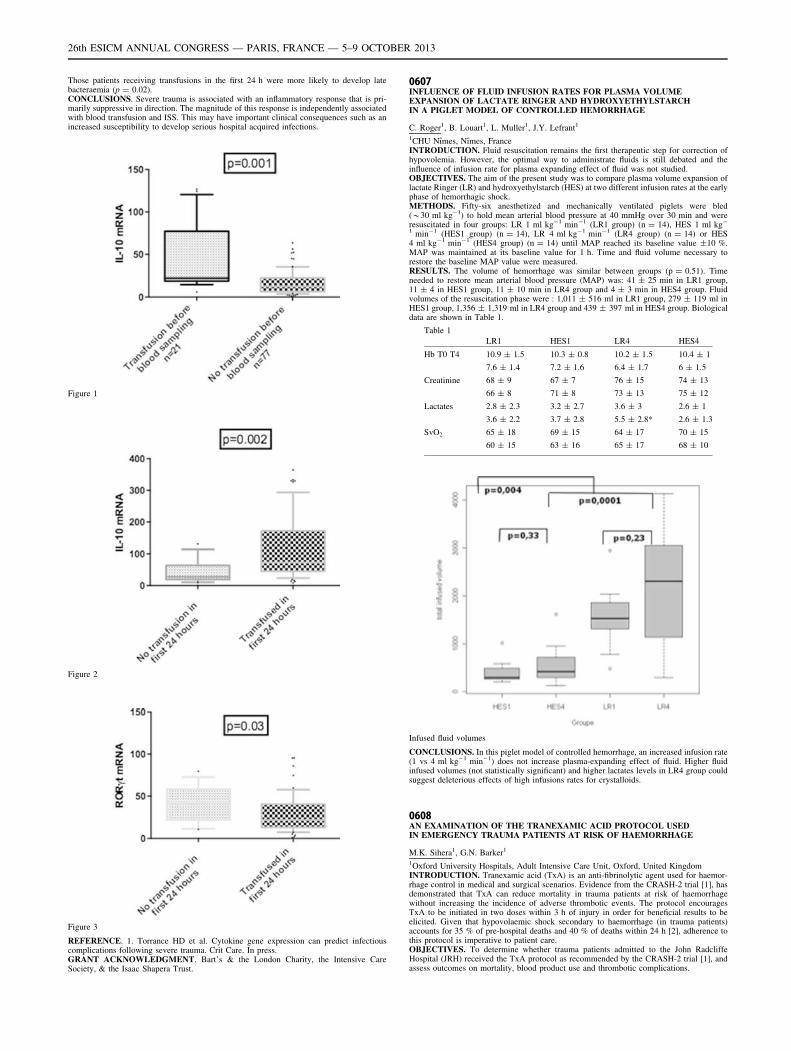
Those patients receiving transfusions in the first 24 h were more likely to develop latebacteraemia (p = 0.02).CONCLUSIONS. Severe trauma is associated with an inflammatory response that is pri-marily suppressive in direction. The magnitude of this response is independently associatedwith blood transfusion and ISS. This may have important clinical consequences such as anincreased susceptibility to develop serious hospital acquired infections.
Figure 1
Figure 2
Figure 3
REFERENCE. 1. Torrance HD et al. Cytokine gene expression can predict infectiouscomplications following severe trauma. Crit Care. In press.GRANT ACKNOWLEDGMENT. Bart’s & the London Charity, the Intensive CareSociety, & the Isaac Shapera Trust.
0607INFLUENCE OF FLUID INFUSION RATES FOR PLASMA VOLUMEEXPANSION OF LACTATE RINGER AND HYDROXYETHYLSTARCHIN A PIGLET MODEL OF CONTROLLED HEMORRHAGE
C. Roger1, B. Louart1, L. Muller1, J.Y. Lefrant1
1CHU Nı̂mes, Nı̂mes, FranceINTRODUCTION. Fluid resuscitation remains the first therapeutic step for correction ofhypovolemia. However, the optimal way to administrate fluids is still debated and theinfluence of infusion rate for plasma expanding effect of fluid was not studied.OBJECTIVES. The aim of the present study was to compare plasma volume expansion oflactate Ringer (LR) and hydroxyethylstarch (HES) at two different infusion rates at the earlyphase of hemorrhagic shock.METHODS. Fifty-six anesthetized and mechanically ventilated piglets were bled(*30 ml kg-1) to hold mean arterial blood pressure at 40 mmHg over 30 min and wereresuscitated in four groups: LR 1 ml kg-1 min-1 (LR1 group) (n = 14), HES 1 ml kg-
1 min-1 (HES1 group) (n = 14), LR 4 ml kg-1 min-1 (LR4 group) (n = 14) or HES4 ml kg-1 min-1 (HES4 group) (n = 14) until MAP reached its baseline value ±10 %.MAP was maintained at its baseline value for 1 h. Time and fluid volume necessary torestore the baseline MAP value were measured.RESULTS. The volume of hemorrhage was similar between groups (p = 0.51). Timeneeded to restore mean arterial blood pressure (MAP) was: 41 ± 25 min in LR1 group,11 ± 4 in HES1 group, 11 ± 10 min in LR4 group and 4 ± 3 min in HES4 group. Fluidvolumes of the resuscitation phase were : 1,011 ± 516 ml in LR1 group, 279 ± 119 ml inHES1 group, 1,356 ± 1,319 ml in LR4 group and 439 ± 397 ml in HES4 group. Biologicaldata are shown in Table 1.
Table 1
LR1 HES1 LR4 HES4
Hb T0 T4 10.9 ± 1.5 10.3 ± 0.8 10.2 ± 1.5 10.4 ± 1
7.6 ± 1.4 7.2 ± 1.6 6.4 ± 1.7 6 ± 1.5
Creatinine 68 ± 9 67 ± 7 76 ± 15 74 ± 13
66 ± 8 71 ± 8 73 ± 13 75 ± 12
Lactates 2.8 ± 2.3 3.2 ± 2.7 3.6 ± 3 2.6 ± 1
3.6 ± 2.2 3.7 ± 2.8 5.5 ± 2.8* 2.6 ± 1.3
SvO2 65 ± 18 69 ± 15 64 ± 17 70 ± 15
60 ± 15 63 ± 16 65 ± 17 68 ± 10
Infused fluid volumes
CONCLUSIONS. In this piglet model of controlled hemorrhage, an increased infusion rate(1 vs 4 ml kg-1 min-1) does not increase plasma-expanding effect of fluid. Higher fluidinfused volumes (not statistically significant) and higher lactates levels in LR4 group couldsuggest deleterious effects of high infusions rates for crystalloids.
0608AN EXAMINATION OF THE TRANEXAMIC ACID PROTOCOL USEDIN EMERGENCY TRAUMA PATIENTS AT RISK OF HAEMORRHAGE
M.K. Sihera1, G.N. Barker1
1Oxford University Hospitals, Adult Intensive Care Unit, Oxford, United KingdomINTRODUCTION. Tranexamic acid (TxA) is an anti-fibrinolytic agent used for haemor-rhage control in medical and surgical scenarios. Evidence from the CRASH-2 trial [1], hasdemonstrated that TxA can reduce mortality in trauma patients at risk of haemorrhagewithout increasing the incidence of adverse thrombotic events. The protocol encouragesTxA to be initiated in two doses within 3 h of injury in order for beneficial results to beelicited. Given that hypovolaemic shock secondary to haemorrhage (in trauma patients)accounts for 35 % of pre-hospital deaths and 40 % of deaths within 24 h [2], adherence tothis protocol is imperative to patient care.OBJECTIVES. To determine whether trauma patients admitted to the John RadcliffeHospital (JRH) received the TxA protocol as recommended by the CRASH-2 trial [1], andassess outcomes on mortality, blood product use and thrombotic complications.
26th ESICM ANNUAL CONGRESS — PARIS, FRANCE — 5–9 OCTOBER 2013
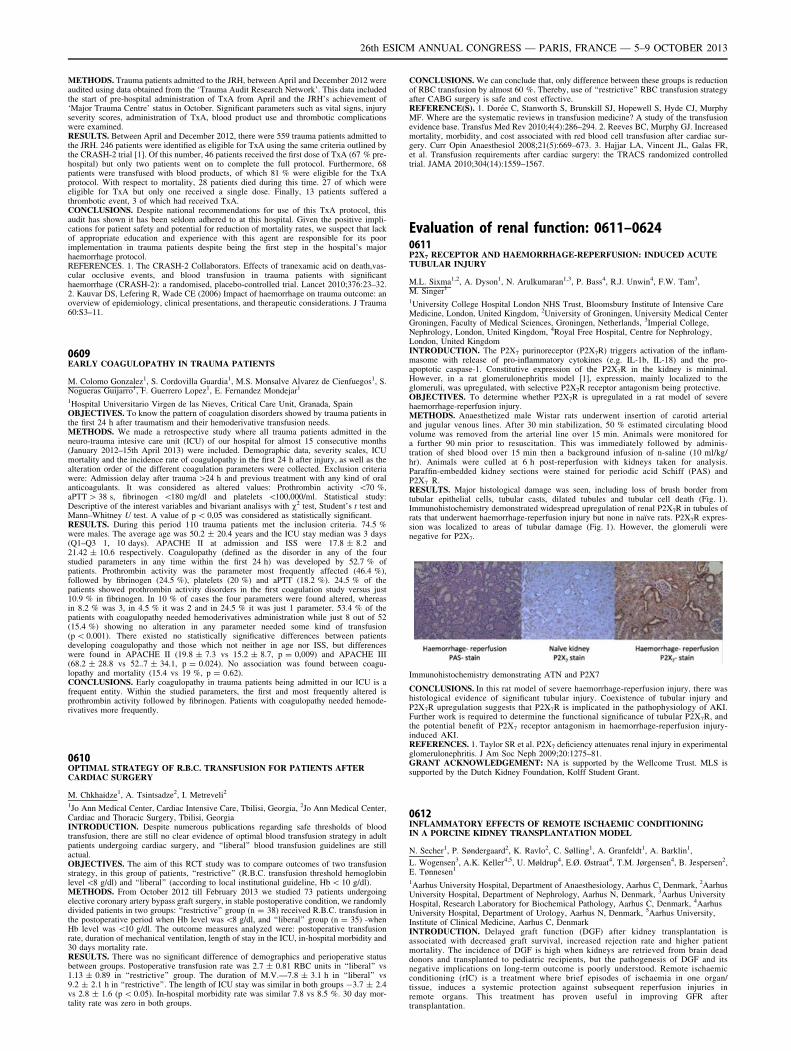
METHODS. Trauma patients admitted to the JRH, between April and December 2012 wereaudited using data obtained from the ‘Trauma Audit Research Network’. This data includedthe start of pre-hospital administration of TxA from April and the JRH’s achievement of‘Major Trauma Centre’ status in October. Significant parameters such as vital signs, injuryseverity scores, administration of TxA, blood product use and thrombotic complicationswere examined.RESULTS. Between April and December 2012, there were 559 trauma patients admitted tothe JRH. 246 patients were identified as eligible for TxA using the same criteria outlined bythe CRASH-2 trial [1]. Of this number, 46 patients received the first dose of TxA (67 % pre-hospital) but only two patients went on to complete the full protocol. Furthermore, 68patients were transfused with blood products, of which 81 % were eligible for the TxAprotocol. With respect to mortality, 28 patients died during this time. 27 of which wereeligible for TxA but only one received a single dose. Finally, 13 patients suffered athrombotic event, 3 of which had received TxA.CONCLUSIONS. Despite national recommendations for use of this TxA protocol, thisaudit has shown it has been seldom adhered to at this hospital. Given the positive impli-cations for patient safety and potential for reduction of mortality rates, we suspect that lackof appropriate education and experience with this agent are responsible for its poorimplementation in trauma patients despite being the first step in the hospital’s majorhaemorrhage protocol.REFERENCES. 1. The CRASH-2 Collaborators. Effects of tranexamic acid on death,vas-cular occlusive events, and blood transfusion in trauma patients with significanthaemorrhage (CRASH-2): a randomised, placebo-controlled trial. Lancet 2010;376:23–32.2. Kauvar DS, Lefering R, Wade CE (2006) Impact of haemorrhage on trauma outcome: anoverview of epidemiology, clinical presentations, and therapeutic considerations. J Trauma60:S3–11.
0609EARLY COAGULOPATHY IN TRAUMA PATIENTS
M. Colomo Gonzalez1, S. Cordovilla Guardia1, M.S. Monsalve Alvarez de Cienfuegos1, S.Nogueras Guijarro1, F. Guerrero Lopez1, E. Fernandez Mondejar1
1Hospital Universitario Virgen de las Nieves, Critical Care Unit, Granada, SpainOBJECTIVES. To know the pattern of coagulation disorders showed by trauma patients inthe first 24 h after traumatism and their hemoderivative transfusion needs.METHODS. We made a retrospective study where all trauma patients admitted in theneuro-trauma intesive care unit (ICU) of our hospital for almost 15 consecutive months(January 2012–15th April 2013) were included. Demographic data, severity scales, ICUmortality and the incidence rate of coagulopathy in the first 24 h after injury, as well as thealteration order of the different coagulation parameters were collected. Exclusion criteriawere: Admission delay after trauma [24 h and previous treatment with any kind of oralanticoagulants. It was considered as altered values: Prothrombin activity \70 %,aPTT [ 38 s, fibrinogen \180 mg/dl and platelets \100,000/ml. Statistical study:Descriptive of the interest variables and bivariant analisys with v2 test, Student’s t test andMann–Whitney U test. A value of p \ 0,05 was considered as statistically significant.RESULTS. During this period 110 trauma patients met the inclusion criteria. 74.5 %were males. The average age was 50.2 ± 20.4 years and the ICU stay median was 3 days(Q1–Q3 1, 10 days). APACHE II at admission and ISS were 17.8 ± 8.2 and21.42 ± 10.6 respectively. Coagulopathy (defined as the disorder in any of the fourstudied parameters in any time within the first 24 h) was developed by 52.7 % ofpatients. Prothrombin activity was the parameter most frequently affected (46.4 %),followed by fibrinogen (24.5 %), platelets (20 %) and aPTT (18.2 %). 24.5 % of thepatients showed prothrombin activity disorders in the first coagulation study versus just10.9 % in fibrinogen. In 10 % of cases the four parameters were found altered, whereasin 8.2 % was 3, in 4.5 % it was 2 and in 24.5 % it was just 1 parameter. 53.4 % of thepatients with coagulopathy needed hemoderivatives administration while just 8 out of 52(15.4 %) showing no alteration in any parameter needed some kind of transfusion(p \ 0.001). There existed no statistically significative differences between patientsdeveloping coagulopathy and those which not neither in age nor ISS, but differenceswere found in APACHE II (19.8 ± 7.3 vs 15.2 ± 8.7, p = 0,009) and APACHE III(68.2 ± 28.8 vs 52..7 ± 34.1, p = 0.024). No association was found between coagu-lopathy and mortality (15.4 vs 19 %, p = 0.62).CONCLUSIONS. Early coagulopathy in trauma patients being admitted in our ICU is afrequent entity. Within the studied parameters, the first and most frequently altered isprothrombin activity followed by fibrinogen. Patients with coagulopathy needed hemode-rivatives more frequently.
0610OPTIMAL STRATEGY OF R.B.C. TRANSFUSION FOR PATIENTS AFTERCARDIAC SURGERY
M. Chkhaidze1, A. Tsintsadze2, I. Metreveli2
1Jo Ann Medical Center, Cardiac Intensive Care, Tbilisi, Georgia, 2Jo Ann Medical Center,Cardiac and Thoracic Surgery, Tbilisi, GeorgiaINTRODUCTION. Despite numerous publications regarding safe thresholds of bloodtransfusion, there are still no clear evidence of optimal blood transfusion strategy in adultpatients undergoing cardiac surgery, and ‘‘liberal’’ blood transfusion guidelines are stillactual.OBJECTIVES. The aim of this RCT study was to compare outcomes of two transfusionstrategy, in this group of patients, ‘‘restrictive’’ (R.B.C. transfusion threshold hemoglobinlevel \8 g/dl) and ‘‘liberal’’ (according to local institutional guideline, Hb \ 10 g/dl).METHODS. From October 2012 till February 2013 we studied 73 patients undergoingelective coronary artery bypass graft surgery, in stable postoperative condition, we randomlydivided patients in two groups: ‘‘restrictive’’ group (n = 38) received R.B.C. transfusion inthe postoperative period when Hb level was \8 g/dl, and ‘‘liberal’’ group (n = 35) -whenHb level was \10 g/dl. The outcome measures analyzed were: postoperative transfusionrate, duration of mechanical ventilation, length of stay in the ICU, in-hospital morbidity and30 days mortality rate.RESULTS. There was no significant difference of demographics and perioperative statusbetween groups. Postoperative transfusion rate was 2.7 ± 0.81 RBC units in ‘‘liberal’’ vs1.13 ± 0.89 in ‘‘restrictive’’ group. The duration of M.V.—7.8 ± 3.1 h in ‘‘liberal’’ vs9.2 ± 2.1 h in ‘‘restrictive’’. The length of ICU stay was similar in both groups -3.7 ± 2.4vs 2.8 ± 1.6 (p \ 0.05). In-hospital morbidity rate was similar 7.8 vs 8.5 %. 30 day mor-tality rate was zero in both groups.
CONCLUSIONS. We can conclude that, only difference between these groups is reductionof RBC transfusion by almost 60 %. Thereby, use of ‘‘restrictive’’ RBC transfusion strategyafter CABG surgery is safe and cost effective.REFERENCE(S). 1. Dorée C, Stanworth S, Brunskill SJ, Hopewell S, Hyde CJ, MurphyMF. Where are the systematic reviews in transfusion medicine? A study of the transfusionevidence base. Transfus Med Rev 2010;4(4):286–294. 2. Reeves BC, Murphy GJ. Increasedmortality, morbidity, and cost associated with red blood cell transfusion after cardiac sur-gery. Curr Opin Anaesthesiol 2008;21(5):669–673. 3. Hajjar LA, Vincent JL, Galas FR,et al. Transfusion requirements after cardiac surgery: the TRACS randomized controlledtrial. JAMA 2010;304(14):1559–1567.
Evaluation of renal function: 0611–06240611P2X7 RECEPTOR AND HAEMORRHAGE-REPERFUSION: INDUCED ACUTETUBULAR INJURY
M.L. Sixma1,2, A. Dyson1, N. Arulkumaran1,3, P. Bass4, R.J. Unwin4, F.W. Tam3,M. Singer1
1University College Hospital London NHS Trust, Bloomsbury Institute of Intensive CareMedicine, London, United Kingdom, 2University of Groningen, University Medical CenterGroningen, Faculty of Medical Sciences, Groningen, Netherlands, 3Imperial College,Nephrology, London, United Kingdom, 4Royal Free Hospital, Centre for Nephrology,London, United KingdomINTRODUCTION. The P2X7 purinoreceptor (P2X7R) triggers activation of the inflam-masome with release of pro-inflammatory cytokines (e.g. IL-1b, IL-18) and the pro-apoptotic caspase-1. Constitutive expression of the P2X7R in the kidney is minimal.However, in a rat glomerulonephritis model [1], expression, mainly localized to theglomeruli, was upregulated, with selective P2X7R receptor antagonism being protective.OBJECTIVES. To determine whether P2X7R is upregulated in a rat model of severehaemorrhage-reperfusion injury.METHODS. Anaesthetized male Wistar rats underwent insertion of carotid arterialand jugular venous lines. After 30 min stabilization, 50 % estimated circulating bloodvolume was removed from the arterial line over 15 min. Animals were monitored fora further 90 min prior to resuscitation. This was immediately followed by adminis-tration of shed blood over 15 min then a background infusion of n-saline (10 ml/kg/hr). Animals were culled at 6 h post-reperfusion with kidneys taken for analysis.Paraffin-embedded kidney sections were stained for periodic acid Schiff (PAS) andP2X7 R.RESULTS. Major histological damage was seen, including loss of brush border fromtubular epithelial cells, tubular casts, dilated tubules and tubular cell death (Fig. 1).Immunohistochemistry demonstrated widespread upregulation of renal P2X7R in tubules ofrats that underwent haemorrhage-reperfusion injury but none in naı̈ve rats. P2X7R expres-sion was localized to areas of tubular damage (Fig. 1). However, the glomeruli werenegative for P2X7.
Immunohistochemistry demonstrating ATN and P2X7
CONCLUSIONS. In this rat model of severe haemorrhage-reperfusion injury, there washistological evidence of significant tubular injury. Coexistence of tubular injury andP2X7R upregulation suggests that P2X7R is implicated in the pathophysiology of AKI.Further work is required to determine the functional significance of tubular P2X7R, andthe potential benefit of P2X7 receptor antagonism in haemorrhage-reperfusion injury-induced AKI.REFERENCES. 1. Taylor SR et al. P2X7 deficiency attenuates renal injury in experimentalglomerulonephritis. J Am Soc Neph 2009;20:1275–81.GRANT ACKNOWLEDGEMENT: NA is supported by the Wellcome Trust. MLS issupported by the Dutch Kidney Foundation, Kolff Student Grant.
0612INFLAMMATORY EFFECTS OF REMOTE ISCHAEMIC CONDITIONINGIN A PORCINE KIDNEY TRANSPLANTATION MODEL
N. Secher1, P. Søndergaard2, K. Ravlo2, C. Sølling1, A. Granfeldt1, A. Barklin1,
L. Wogensen3, A.K. Keller4,5, U. Møldrup4, E.Ø. Østraat4, T.M. Jørgensen4, B. Jespersen2,E. Tønnesen1
1Aarhus University Hospital, Department of Anaesthesiology, Aarhus C, Denmark, 2AarhusUniversity Hospital, Department of Nephrology, Aarhus N, Denmark, 3Aarhus UniversityHospital, Research Laboratory for Biochemical Pathology, Aarhus C, Denmark, 4AarhusUniversity Hospital, Department of Urology, Aarhus N, Denmark, 5Aarhus University,Institute of Clinical Medicine, Aarhus C, DenmarkINTRODUCTION. Delayed graft function (DGF) after kidney transplantation isassociated with decreased graft survival, increased rejection rate and higher patientmortality. The incidence of DGF is high when kidneys are retrieved from brain deaddonors and transplanted to pediatric recipients, but the pathogenesis of DGF and itsnegative implications on long-term outcome is poorly understood. Remote ischaemicconditioning (rIC) is a treatment where brief episodes of ischaemia in one organ/tissue, induces a systemic protection against subsequent reperfusion injuries inremote organs. This treatment has proven useful in improving GFR aftertransplantation.
26th ESICM ANNUAL CONGRESS — PARIS, FRANCE — 5–9 OCTOBER 2013
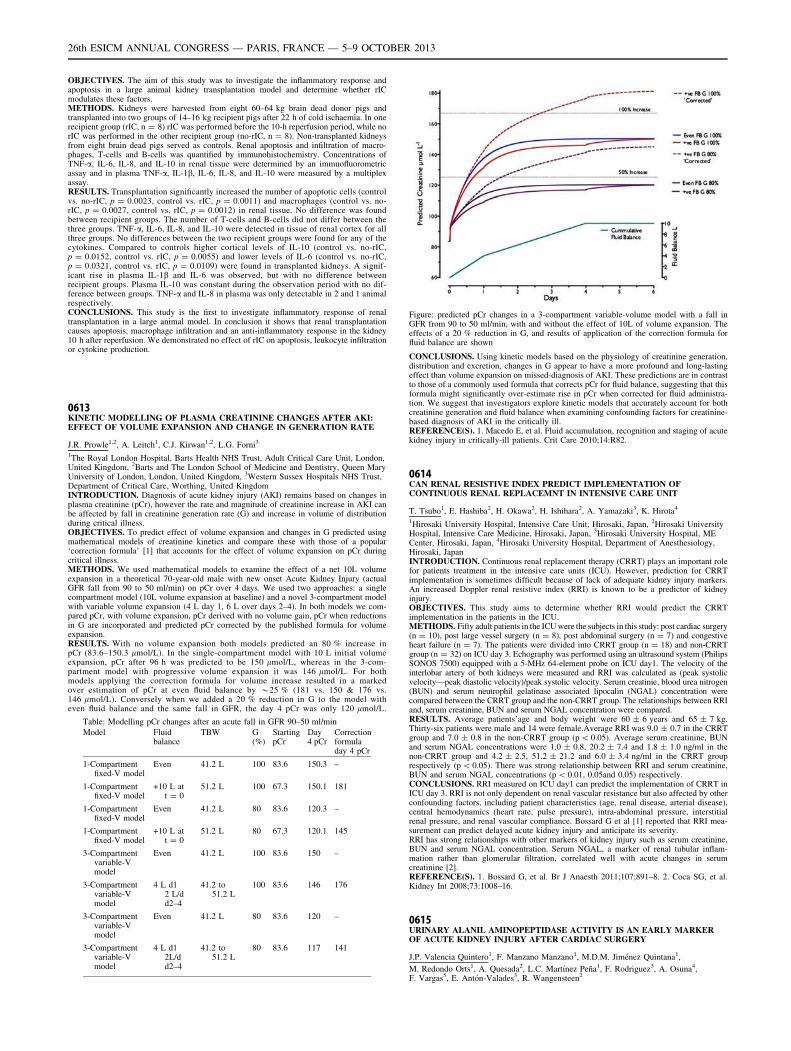
OBJECTIVES. The aim of this study was to investigate the inflammatory response andapoptosis in a large animal kidney transplantation model and determine whether rICmodulates these factors.METHODS. Kidneys were harvested from eight 60–64 kg brain dead donor pigs andtransplanted into two groups of 14–16 kg recipient pigs after 22 h of cold ischaemia. In onerecipient group (rIC, n = 8) rIC was performed before the 10-h reperfusion period, while norIC was performed in the other recipient group (no-rIC, n = 8). Non-transplanted kidneysfrom eight brain dead pigs served as controls. Renal apoptosis and infiltration of macro-phages, T-cells and B-cells was quantified by immunohistochemistry. Concentrations ofTNF-a, IL-6, IL-8, and IL-10 in renal tissue were determined by an immuofluorometricassay and in plasma TNF-a, IL-1b, IL-6, IL-8, and IL-10 were measured by a multiplexassay.RESULTS. Transplantation significantly increased the number of apoptotic cells (controlvs. no-rIC, p = 0.0023, control vs. rIC, p = 0.0011) and macrophages (control vs. no-rIC, p = 0.0027, control vs. rIC, p = 0.0012) in renal tissue. No difference was foundbetween recipient groups. The number of T-cells and B-cells did not differ between thethree groups. TNF-a, IL-6, IL-8, and IL-10 were detected in tissue of renal cortex for allthree groups. No differences between the two recipient groups were found for any of thecytokines. Compared to controls higher cortical levels of IL-10 (control vs. no-rIC,p = 0.0152, control vs. rIC, p = 0.0055) and lower levels of IL-6 (control vs. no-rIC,p = 0.0321, control vs. rIC, p = 0.0109) were found in transplanted kidneys. A signif-icant rise in plasma IL-1b and IL-6 was observed, but with no difference betweenrecipient groups. Plasma IL-10 was constant during the observation period with no dif-ference between groups. TNF-a and IL-8 in plasma was only detectable in 2 and 1 animalrespectively.CONCLUSIONS. This study is the first to investigate inflammatory response of renaltransplantation in a large animal model. In conclusion it shows that renal transplantationcauses apoptosis, macrophage infiltration and an anti-inflammatory response in the kidney10 h after reperfusion. We demonstrated no effect of rIC on apoptosis, leukocyte infiltrationor cytokine production.
0613KINETIC MODELLING OF PLASMA CREATININE CHANGES AFTER AKI:EFFECT OF VOLUME EXPANSION AND CHANGE IN GENERATION RATE
J.R. Prowle1,2, A. Leitch1, C.J. Kirwan1,2, L.G. Forni3
1The Royal London Hospital, Barts Health NHS Trust, Adult Critical Care Unit, London,United Kingdom, 2Barts and The London School of Medicine and Dentistry, Queen MaryUniversity of London, London, United Kingdom, 3Western Sussex Hospitals NHS Trust,Department of Critical Care, Worthing, United KingdomINTRODUCTION. Diagnosis of acute kidney injury (AKI) remains based on changes inplasma creatinine (pCr), however the rate and magnitude of creatinine increase in AKI canbe affected by fall in creatinine generation rate (G) and increase in volume of distributionduring critical illness.OBJECTIVES. To predict effect of volume expansion and changes in G predicted usingmathematical models of creatinine kinetics and compare these with those of a popular‘correction formula’ [1] that accounts for the effect of volume expansion on pCr duringcritical illness.METHODS. We used mathematical models to examine the effect of a net 10L volumeexpansion in a theoretical 70-year-old male with new onset Acute Kidney Injury (actualGFR fall from 90 to 50 ml/min) on pCr over 4 days. We used two approaches: a singlecompartment model (10L volume expansion at baseline) and a novel 3-compartment modelwith variable volume expansion (4 L day 1, 6 L over days 2–4). In both models we com-pared pCr, with volume expansion, pCr derived with no volume gain, pCr when reductionsin G are incorporated and predicted pCr corrected by the published formula for volumeexpansion.RESULTS. With no volume expansion both models predicted an 80 % increase inpCr (83.6–150.3 lmol/L). In the single-compartment model with 10 L initial volumeexpansion, pCr after 96 h was predicted to be 150 lmol/L, whereas in the 3-com-partment model with progressive volume expansion it was 146 lmol/L. For bothmodels applying the correction formula for volume increase resulted in a markedover estimation of pCr at even fluid balance by *25 % (181 vs. 150 & 176 vs.146 lmol/L). Conversely when we added a 20 % reduction in G to the model witheven fluid balance and the same fall in GFR, the day 4 pCr was only 120 lmol/L.
Table: Modelling pCr changes after an acute fall in GFR 90–50 ml/min
Model Fluidbalance
TBW G(%)
StartingpCr
Day4 pCr
Correctionformuladay 4 pCr
1-Compartmentfixed-V model
Even 41.2 L 100 83.6 150.3 –
1-Compartmentfixed-V model
+10 L att = 0
51.2 L 100 67.3 150.1 181
1-Compartmentfixed-V model
Even 41.2 L 80 83.6 120.3 –
1-Compartmentfixed-V model
+10 L att = 0
51.2 L 80 67.3 120.1 145
3-Compartmentvariable-Vmodel
Even 41.2 L 100 83.6 150 –
3-Compartmentvariable-Vmodel
4 L d12 L/dd2–4
41.2 to51.2 L
100 83.6 146 176
3-Compartmentvariable-Vmodel
Even 41.2 L 80 83.6 120 –
3-Compartmentvariable-Vmodel
4 L d12L/dd2–4
41.2 to51.2 L
80 83.6 117 141
Figure: predicted pCr changes in a 3-compartment variable-volume model with a fall inGFR from 90 to 50 ml/min, with and without the effect of 10L of volume expansion. Theeffects of a 20 % reduction in G, and results of application of the correction formula forfluid balance are shown
CONCLUSIONS. Using kinetic models based on the physiology of creatinine generation,distribution and excretion, changes in G appear to have a more profound and long-lastingeffect than volume expansion on missed-diagnosis of AKI. These predictions are in contrastto those of a commonly used formula that corrects pCr for fluid balance, suggesting that thisformula might significantly over-estimate rise in pCr when corrected for fluid administra-tion. We suggest that investigators explore kinetic models that accurately account for bothcreatinine generation and fluid balance when examining confounding factors for creatinine-based diagnosis of AKI in the critically ill.REFERENCE(S). 1. Macedo E, et al. Fluid accumulation, recognition and staging of acutekidney injury in critically-ill patients. Crit Care 2010;14:R82.
0614CAN RENAL RESISTIVE INDEX PREDICT IMPLEMENTATION OFCONTINUOUS RENAL REPLACEMNT IN INTENSIVE CARE UNIT
T. Tsubo1, E. Hashiba2, H. Okawa2, H. Ishihara2, A. Yamazaki3, K. Hirota4
1Hirosaki University Hospital, Intensive Care Unit, Hirosaki, Japan, 2Hirosaki UniversityHospital, Intensive Care Medicine, Hirosaki, Japan, 3Hirosaki University Hospital, MECenter, Hirosaki, Japan, 4Hirosaki University Hospital, Department of Anesthesiology,Hirosaki, JapanINTRODUCTION. Continuous renal replacement therapy (CRRT) plays an important rolefor patients treatment in the intensive care units (ICU). However, prediction for CRRTimplementation is sometimes difficult because of lack of adequate kidney injury markers.An increased Doppler renal resistive index (RRI) is known to be a predictor of kidneyinjury.OBJECTIVES. This study aims to determine whether RRI would predict the CRRTimplementation in the patients in the ICU.METHODS. Fifty adult patients in the ICU were the subjects in this study: post cardiac surgery(n = 10), post large vessel surgery (n = 8), post abdominal surgery (n = 7) and congestiveheart failure (n = 7). The patients were divided into CRRT group (n = 18) and non-CRRTgroup (n = 32) on ICU day 3. Echography was performed using an ultrasound system (PhilipsSONOS 7500) equipped with a 5-MHz 64-element probe on ICU day1. The velocity of theinterlobar artery of both kidneys were measured and RRI was calculated as (peak systolicvelocity—peak diastolic velocity)/peak systolic velocity. Serum creatinie, blood urea nitrogen(BUN) and serum neutrophil gelatinase associated lipocalin (NGAL) concentration werecompared between the CRRT group and the non-CRRT group. The relationships between RRIand, serum creatinine, BUN and serum NGAL concentration were compared.RESULTS. Average patients’age and body weight were 60 ± 6 years and 65 ± 7 kg.Thirty-six patients were male and 14 were female.Average RRI was 9.0 ± 0.7 in the CRRTgroup and 7.0 ± 0.8 in the non-CRRT group (p \ 0.05). Average serum creatinine, BUNand serum NGAL concentrations were 1.0 ± 0.8, 20.2 ± 7.4 and 1.8 ± 1.0 ng/ml in thenon-CRRT group and 4.2 ± 2.5, 51.2 ± 21.2 and 6.0 ± 3.4 ng/ml in the CRRT grouprespectively (p \ 0.05). There was strong relationship between RRI and serum creatinine,BUN and serum NGAL concentrations (p \ 0.01, 0.05and 0.05) respectively.CONCLUSIONS. RRI measured on ICU day1 can predict the implementation of CRRT inICU day 3. RRI is not only dependent on renal vascular resistance but also affected by otherconfounding factors, including patient characteristics (age, renal disease, arterial disease),central hemodynamics (heart rate, pulse pressure), intra-abdominal pressure, interstitialrenal pressure, and renal vascular compliance. Bossard G et al [1] reported that RRI mea-surement can predict delayed acute kidney injury and anticipate its severity.RRI has strong relationships with other markers of kidney injury such as serum creatinine,BUN and serum NGAL concentration. Serum NGAL, a marker of renal tubular inflam-mation rather than glomerular filtration, correlated well with acute changes in serumcreatinine [2].REFERENCE(S). 1. Bossard G, et al. Br J Anaesth 2011;107;891–8. 2. Coca SG, et al.Kidney Int 2008;73:1008–16.
0615URINARY ALANIL AMINOPEPTIDASE ACTIVITY IS AN EARLY MARKEROF ACUTE KIDNEY INJURY AFTER CARDIAC SURGERY
J.P. Valencia Quintero1, F. Manzano Manzano1, M.D.M. Jiménez Quintana1,
M. Redondo Orts1, A. Quesada2, L.C. Martı́nez Peña1, F. Rodriguez3, A. Osuna4,F. Vargas5, E. Antón-Valades3, R. Wangensteen2
26th ESICM ANNUAL CONGRESS — PARIS, FRANCE — 5–9 OCTOBER 2013
1Hospital Virgen de las Nieves, ICU, Granada, Spain, 2Universidad de Jaén, Área deCiencias de la Salud, Departamento de Fisiologı́a, Jaen, Spain, 3Hospital Virgen de lasNieves, Servicio de Análisis Clı́nicos, Granada, Spain, 4Hospital Virgen de las Nieves,Servicio de Nefrologı́a, Granada, Spain, 5Universidad de Granada, Facultad de Medicina,Departamento de Fisiologı́a, Granada, SpainINTRODUCTION. In a previous study, we have demonstrated that cisplatin injection inrats evokes an early augmentation of alanyl aminopeptidase (AlaAp) activity in urine [1]. Inthis work, we want to analyze if AlaAp activity is an early marker of acute kidney injury(AKI) development in patients undergoing to cardiac surgery in comparison with proteinuriaand microalbuminuria.METHODS. Sixty-three patients undergone to cardiac surgery without a previous history ofrenal dysfunction were selected for the study. Blood and urine samples from these patientswere taken before surgery, at the income in critical care unit, and at 12, 24 and 48 h afterincome. 33 patients exhibited an increase of at least 50 % in plasma creatinine levels in thenext 48 h after surgery, and were classified as AKI. AlaAp urinary activity was determinedby a fluorimetric kinetic method. Proteinuria and microalbuminuria were measured in theclinical laboratory of the hospital with a colorimetric and turbidimetric method, respec-tively. Results were expressed as the excretion of each marker per mg of urine creatinine.Differences between groups were analyzed with Mann–Whitney (Wilcoxon) test and ROC-AUC analysis.RESULTS. AlaAp urinary activity was significatively increased 12 h after surgery in thepatients that developed AKI in comparison with the patients that did not developed AKI (from650.9 ± 335.2 to 2,035 ± 705 nmol/min/mg creatinine; p \ 0.001). We also found a signifi-cative increase in AlaAp urinary activity of AKI group 24 h after surgery (from 331.9 ± 151.8to 1,645 ± 648 nmol/min/mg creatinine; p \ 0.01). There were no significative differencesbetween both groups in proteinuria or microalbuminuria at 12, 24 or 48 h after surgery. At 12 h,AlaAp showed the largest ROC-AUC of the three markers studied (0.7556 ± 0.062 vs.0.5166 ± 0.075 for proteinuria and 0.5853 ± 0.0719 for microalbuminuria).CONCLUSION. AlaAp urinary activity is an early marker of acute kidney injury devel-opment after cardiac surgery. Patients that developed AKI showed a significative increase inthe urinary excretion of this marker as soon as 12 h after surgery, while proteinuria andmicroalbuminuria remained unchanged. Also, it was the best discriminator between AKIand no AKI patients at this point. Further studies must be taken to analyze the reliability ofthis marker in other pathologic states that course with renal dysfunction.REFERENCE(S). 1. Quesada A, Vargas F, Montoro-Molina S, O0Valle F, Rodrı́guez-Martı́nez MD, Osuna A, Prieto I, Ramı́rez M, Wangensteen R. Urinary aminopeptidaseactivities as early and predictive biomarkers of renal dysfunction in cisplatin-treated rats.PLoS One 2012;7:e40402.
0616ASSESSMENT OF KIDNEY MICROCIRCULATION IN MODERATE ANDSEVERE ACUTE KIDNEY INJURY BY CONTRAST ENHANCEDULTRASONOGRAPHY
I. Goecze1, R. Herzog1, P. Ruemmele2, E.M. Jung3, B.M. Graf4, H.J. Schlitt5, K. Pfister5,T. Bein1
1University Hospital Regensburg, Intensive Care Unit, Regensburg, Germany, 2UniversityHospital Regensburg, Department of Pathology, Regensburg, Germany, 3UniversityHospital Regensburg, Department of Radiology, Regensburg, Germany, 4UniversityHospital Regensburg, Department of Anaesthesiology, Regensburg, Germany, 5UniversityHospital Regensburg, Department of Surgery, Regensburg, GermanyINTRODUCTION. Alteration of the kidney microcirculation may be constantly present inpatients with moderate and severe acute kidney injury (AKI). Contrast-enhanced ultraso-nography (CEUS) represents a new dynamic digital ultrasound-based imaging technique,which allows quantification of the microvascularisation up to the capillary vessels. Althoughhaving ideal properties with no nephrotoxicity, no transport requirements and high safetyprofile, the available data regarding use of CEUS in critically ill are lacking.OBJECTIVES. Assessment of renal circulation in acute kidney injury with contrastenhanced ultrasonography.METHODS. Eleven CEUS studies were performed in patients with moderate and severeAKI (KDIGO Grade 2 and 3) in a multidisciplinary intensive care unit. After conventionalB-Mode and Doppler sonography, standardised bolus injection of 2.0 ml SonoVue (Bracco,Italy) contrast agent was administered intravenously trough preexisting central venouscatheter. CEUS was performed at the bedside for evaluation of microcirculation from theearly arterial until late venous phase. For quantification of the perfusion time intensitycurves (TIC) and inflow-time color coded maps were created, assessing the peak contrastenhancement (power) and time to peak concentration (TTP) in selected areas of the kidney.RESULTS. Delayed and diminished microcirculation in the cortex and medulla diffusely orlocally (hypoperfused spots) represented the most frequent findings. The kidney biopsy wasperformed in three patients showing either ischemic changes with tubular necrosis or diffuseswelling with tubuli dilatation, closely correlating with perfusion findings by CEUS. Fourpatients required renal replacement therapy (RRT) at the time of CEUS. The mean peakcontrast enhancement in the kidney cortex was higher in patients with shorter duration ofRRT (1.73 9 10-3 vs 0.35 9 10-3 vs 0.09 9 10-3 decibels for 10 vs 23 vs [30 days ofRRT). Time to reach the peak concentration was more prolonged in long term RRT([30 days) as in patients with short duration of RRT (15.5 vs 6.75 s). None of patientsdeveloped any adverse reactions associated with the application of contrast agent andimaging technique.CONCLUSIONS. Contrast enhanced ultrasonography clearly improves visualization of themicrocirculation in patients with AKI at the bedside. It provides a good correlation withbiopsy findings and is able to discriminate differences in the kidney perfusion in patients onrenal replacement therapy.REFERENCE(S). 1. Clevert DA, D0Anastasi M, Jung EM: Contrast-enhanced ultrasoundand microcirculation: efficiency through dynamics–current developments. Clin HemorheolMicrocirc 2013;53:171–86.
0617IMPACT OF LIVER RESECTION ON PORTAL VENOUS PRESSUREAND RENAL FUNCTION
P. Biesenbach1, J. Mühlbacher1, E. Fleischmann1, T. Grünberger1, W. Druml1, F. Luf1
1Medical University of Vienna, Vienna, AustriaINTRODUCTION. Liver dysfuntction—in correlation to the severity of functionalimpairment—but also any increase in portal pressure per se (‘‘hepatorenal reflex’’) caninduce alterations in renal function and ultimately result in hepatorenal syndrome (HRS).
OBJECTIVES. To determined the impact of liver resection on portal venous pressure (bymeasuring the hepatic venous pressure gradient [HVPG]), on concentrations of vasoactivepeptides and on renal function.METHODS. In this prospective investigation twenty patients (mean age 66.3 years)undergoing elective liver resection surgery because of malignant tumor were assessed andgrouped according to resection size: (1) hemihepatectomy, n = 13 vs. (2) Segmentectomy,n = 7. HVPG was measured before and after resection by canulation of a hepatic vein underfluoroscopic guidance, liver function was assessed by indocyanine green plasma disap-pearance rate (ICG-PDR).RESULTS. HVPG increased in group 1 from 3.7 to 5.4 mmHg (p \ 0.05) and decreased ingroup 2 (4.8–4.3 mmHg, p = ns) (Table). Liver function as assessed by ICG-PDRdecreased in group 1 by day 1 (p \ 0.05) and remained stable in group 2. Renin, aldoste-rone, ADH, adrenaline, noradrenaline and dopamine increased significantly (p \ 0.05) ingroup 1 during operation. Group 2 showed a significant rise only in ADH and dopamine.Acute kidney injury occurred in 5 of 13 patients in group 1 and no patient in group 2.CONCLUSIONS. Liver resection increases the HPVG depending on resection size, pre-sumably by reduction of hepatic vascular reserve. Regulatory mechanisms such as RAASactivation and ADH release activate immediately during operation, suggesting an effectindependent of liver function. Acute kidney injury following liver resection in hemody-namically stable patients may be attributed to an increase in portalvenous pressure(hepatorenal syndrome).
0618ADHERENCE TO A CRITICAL CARE NETWORK BUNDLE OF CAREFOR ACUTE KIDNEY INJURY: AN AUDIT
A. Hall1, G. Masterson1,2
1Royal Liverpool University Hospital, Intensive Care Unit, Liverpool, United Kingdom,2Cheshire and Mersey Critical Care Network, Liverpool, United KingdomINTRODUCTION. Acute kidney injury in intensive care is very common and requiresmeticulous attention to prevent chronic kidney disease. Our local critical care network(CCN), which produces and monitors quality standards, has a number of published guide-lines which are either evidence based or best practice guidelines as published in theliterature.OBJECTIVES. The aims of this study were to review current literature, to improve therenal care bundle and to audit regional ICU adherence to it.METHODS. Six acute hospitals randomly selected from the CCN were invited to partic-ipate and included one teaching hospital and five District General Hospitals. Data on 31patients in total were collected. Standards audited against are shown in Table 1.Audited standards.Expected 100 %.Standard bloods, renal ultrasound, MAP [ 65 mmHg, Anticoagulation protocol used, drughistory, renal prescribing guidelines, correct dose renal replacement therapy (RRT).Expected 0 %:Furosemide and dopamine as treatments for AKI.Standards with disputed evidence base.Urine analysis, N-acetyl cysteine given for contrast CT.RESULTS. All patients had routine renal function and an ABG performed. 65 % had aurine dipstick (6 % were anuric). 38 % had a Renal USS. 84 % of patients hadMAP [ 65 mmHg maintained with fluids and/or vasopressors, 48 % were given furosemideas treatment for AKI and 3 % received dopamine. Of the 7/31 patients had a contrast CT,only 1 received pre-hydration and no patients received N-Acetylcysteine. A RRT dose of35 ml/kg/h was achieved in [95 % patients. All hospitals had an anticoagulation protocolavailable which was followed in all but one patient. All patients had a comprehensive drughistory taken and all units had prescribing guidelines for patients in renal failure.CONCLUSIONS. This audit demonstrates that hospitals in our network are compliant withRRT dosing, drug and anticoagulation prescribing. We are poorly compliant with the use ofurine dipsticks, furosemide and prevention of contrast nephropathy. Few patients are havingrenal imaging which is a known standard and needs to be improved to exclude obstructivecauses of AKI. These results have been published regionally, presented to the CCN andcascaded to units for service improvement. A follow-on audit looking at poor compliancewith renal imaging is underway.REFERENCE(S). 1. Ho KM, Sheridan DJ. Meta-analysis of frusemide to prevent or treatacute renal failure. BMJ 2006;333:420–3. 2. Marik PE. Low dose dopamine: a systematicreview. Intensive Care Med. 2002;28:877–83. 3. Ronco C, Bellomo R, Homel P, et al.Lancet 2000;356:26–30.GRANT ACKNOWLEDGMENT. We would like to thank the CMCCN staff for help withdata collection. There were no financial contributions to this audit.
0619GENERAL OUTCOMES IN ACUTE DIALYSIS PATIENTS ACCORDINGTO TIME OF INITIATION OF NUTRITION
J.E. Echeverri1,2,3, A. Gonzalez2, R. Patricia2, J. Cordoba2, G. Paola2, S. Rugeles4,
R.E. Dachiardi5
1Central Military Hospital, Nephrology, Bogota, Colombia, 2Hospital Universitario SanIgnacio, Nephrology, Bogota, Colombia, 3Universidad Militar Nueva Granada, Bogota,Colombia, 4Hospital Universitario San Ignacio, Surgery and Nutritional Support, Bogota,Colombia, 5Universidad Javeriana, Bogota, ColombiaINTRODUCTION. Acute kidney injury (AKI) is a very frequent complication in patientsin the intensive care unit (ICU) with severe illness. The patients with AKI usually havehypercatabolic states, associate with acid base and electrolytic disturbances and changes ingluconeogensis pattern, that can directly impact in the nutritional state. Renal support oftenimpacts the decision of starting nutritional support. There is widespread acceptance byexpert panels that early initiation of nutrition can improve the outcomes and complicationsrelated to the ICU stay.OBJECTIVE. To determine the mortality in patients with AKI and RRT according to thetime of initiation of nutritional support, that where treated in de UCI of an academichospital.STUDY DESIGN. Observational study. This is a retrospective analysis of the criticalnephrology program database of our institution. All data were prospectively collected.Inclusion criteria: patients older than 18 years with AKI and hemodialysis requirementduring ICU stay. Exclusion criteria: patients with obstructive AKI, acute glomerulone-phritis, end stage renal disease, renal transplant, dead in the first day of ICU admission or
26th ESICM ANNUAL CONGRESS — PARIS, FRANCE — 5–9 OCTOBER 2013

with vital prognosis less than 3 months. Groups for analysis according to time of initiationof nutrition: (a) from day 0 to 2 of ICU admission, (b) day 3 and 4, (c) more than 4 days..RESULTS. 199 patients were included in the analysis. 68 % were male with a mean of56.5 years. Sepsis was the primary ICU admission diagnosis (48 %). Enteral nutrition wasthe most common rout of administration, followed by oral and paraenteral rout. In relation tothe time of nutritional support initiation, 42 % received it in the first 3 days (Group A),31 % between the third and fourth days (Group B) and 23 % after the fourth day of ICUadmission. 4 % of patients never received nutritional support during ICU stay because ofclinical improvement or death in the first 24 h in RRT initiation. There were no differencesin the general outcomes of the population such as mortality, dialysis dependency andrecovery of renal function, according to the start time of nutrition. (a) mortality 55 %,dialysis dependence 15 %, (b) mortality 52 %, dialysis dependence 11 %, (c) mortality57 %, dialysis dependence 7 %. Mortality in the group of patients who did not receivenutrition was 63 %, there was no dependence of dialysis and renal function recovery was37 %.CONCLUSIONS. We did not find any association between the time of initiation ofnutritional support in acute hemodialysis patients and mortality. Although we appreciate thatthe proportion of patients with renal recovery was higher in the groups with nutritionalsupport start after the 3rd day this difference did not reach statistical significance.
0620CLINICAL OUTCOMES OF ACUTE KIDNEY INJURY IN ELDERLY PATIENTSADMITTED TO A RENAL HIGH DEPENDENCY UNIT (HDU)
J. Wang1, R. Jenkins1, J. Joslin1, P. Peto1, C. Sharpe1, S. Jayawardene1, S. Shah1
1King’s College Hospital NHS Foundation Trust, Department of Renal Medicine, London,United KingdomINTRODUCTION. The ageing population is susceptible to acute kidney injury (AKI) [1]and its sequelae. Previous studies examining the effect of age on AKI prognosis have mainlybeen derived from an ITU setting (Level 3 beds) with short follow-up periods leading toconflicting conclusions 2,3,4. We evaluated the outcomes in a cohort of patients that requiredhaemofiltration and were admitted to a Renal HDU (Level 2 beds) over a 3 years period toassess the influence of age on survival and renal recovery in this clinical setting.OBJECTIVES. To examine the long term outcomes of AKI in elderly patients admitted toa Renal HDU with regards to survival and renal recovery.METHODS. This was a retrospective observational study. All patients that were admittedto the Renal HDU from 2009 to 2011 requiring haemofiltration were identified. Patients whowere previously dialysis dependent or had a renal transplant were excluded. Patient data wasrecorded at discharge, 3 and 12 months from time of admission.RESULTS. Fifty patients were identified. 60 % were over 65 years of age, 60 % were maleand 74 % Caucasian. Unadjusted Kaplan–Meier curves demonstrated decreased survival inthose over 65 years of age at discharge (p = 0.03) but no significant difference at 3 or12 months was found. Cox regression analysis showed that only inotrope use was associatedwith survival at discharge (P \ 0.01). At 3 and 12 months, survival was associated withadmission eGFR, inotrope and NIV use (all P \ 0.01). Factors significantly associated witha lower discharge eGFR (MDRD) include female sex (37 ml/min in males v 22 ml/min infemales, P \ 0.01), baseline eGFR (P \ 0.01) and younger age (26 ml/min in\65 years v37 ml/min in[65 years, P = 0.01). At 1 year, a lower eGFR was associated with diabetics(31 vs 34 ml/min, P \ 0.01). The need for continued renal replacement therapy (RRT) atdischarge was significantly increased in non-Caucasians (P \ 0.01) and females (P = 0.04)though at 1 year continued RRT was more likely to be required in non-Caucasians alone(P = 0.02).CONCLUSIONS. Advancing age is not an independent factor associated with mortality,renal recovery or RRT dependence following admission to a level 2 bed up to 1 year afterdischarge. Therefore, we argue that chronological age alone should not be used to restrictaccess to a level 2 bed when haemofiltration is required.REFERENCE(S). 1. Uchino et al. Acute renal failure in critically ill patients: a multi-national, multicenter study. JAMA. 2005. 2. Xue et al. Incidence and mortality of acuterenal failure in medicare beneficiaries, 1992 to 2001. J Am Soc Nephrol. 2006. 3. Schmittet al. Recovery of kidney function after acute kidney injury in the elderly: a systematicreview and meta-analysis. Am J Kidney Dis. 2008. 4. Van den Noortgate et al. Outcome in apost-cardiac surgery population with acute renal failure requiring dialysis: does age make adifference? Nephrol Dial Transplant. 2003.
0621ESTIMATION OF BASELINE SERUM CREATININE IN SEVERE TRAUMAPATIENTS: A MORE ACCURATE EQUATION VALIDATED IN 652 TRAUMAPATIENTS
M. Saour1, J. Charbit1, J. Manzanera1, A. Damou1, M. Egan1, K. Klouche2, X. Capdevila1
1Lapeyronie University Hospital, Trauma Intensive Care Unit, DAR A, Montpellier, France,2Lapeyronie University Hospital, Intensive Care Medecine, Montpellier, FranceINTRODUCTION. The baseline Serum Creatinine (SCr) is required to classify acutekidney injury (AKI) by RIFLE criteria. The four-variable Modification of Diet in RenalDisease (MDRD) equation allows to estimate this SCr when it is unavaible, assuming anormal glomerular filtration rate (GFR) of 75 mL/min/1.73 m2 (eSCr75).[1, 2]. However,this equation is derived from patients with chronic kidney disease [3], consequently wehypothesize that it may not be appropriate in severe trauma patients due to their epidemi-ological caracteristics.OBJECTIVES. The objective was to define the more appropriate GFR to use in MDRDequation to predict accuratly SCr in this specific population.METHODS. Among 855 severe trauma patients admitted in our institution between Jan-uary 2006 and December 2009, all those older than 16-year-old with a minimal observedSCr (oSCr) below 120 lmol/l were included. The study was divided in two periods: duringperiod 1 (2006–2007), a mean GFR was deduced by MDRD-175 equation and was used in anew equation to estimate SCr for trauma patients (eSCr TRAUMA). During period 2(2008–2009), eSCr75 and eSCrTRAUMA were determined for each patient. The agreementbetween these two estimations and oSCr was evaluated using Bland–Altman approach(mean bias ± consistency interval), precision (root mean square error of differencesbetween oSCr and eSCr75 or eSCrTRAUMA) and accuracy (percentage of eSCr values thatdiffer of more than 15, 30, or 50 % relative to oSCr).RESULTS. Total, 652 patients were analyzed, 504 were men (77 %), mean age37.7 ± 18.7 and mean ISS 21.1 ± 15.7. Main characteristics of populations did not differ inperiod 1 (n = 314) and period 2 (n = 338). In period 1, mean estimated GFR was of
121 ± 30 ml/min/m2 and was used to determine eSCr TRAUMA. During period 2, the meanestimated GFR was 128 ± 34 ml/min/m2. In this population, eSCr75 equation had a meanbias of 38.6 ± 35.9 lmol/l compared to oSCr. The mean bias of eSCrTRAUMA equation wasmuch lower: 4.1 ± 31.7 lmol/l. In the same way, precision was much higher for eSCr-
TRAUMA equation than eSCr75 equation, 42.6 vs 16.7 lmol/l respectively. eSCrTRAUMA
equation had likewise an accuracy significantly higher compared to eSCr75 equation (Table).
Accuracy of equations to estimate SCr
eSCr75 eSCrTRAUMA P value
15 % Accuracy 8 % 57 % \0.001
30 % Accuracy 15 % 73 % \0.001
50 % Accuracy 31 % 88 % \0.001
CONCLUSIONS. MDRD equation is inaccurate to estimate SCr of severe trauma patientsbecause it assumes a GFR of 75 ml/min/m2, leading to a systematic overestimation. Thus,AKI incidence will be underestimated. In this specific population we proposed anotherequation using a mean GFR of 121 ml/min/m2 to estimate SCr more reliably and preciselyand avert misclassification of AKI.REFERENCE(S). 1. Kidney International Supplements (2012). 2. Crit Care2004;8:R204–212. 3. Ann Intern Med. 1999;130:461–470.
0622RENAL REPLACEMENT THERAPY IN PATIENTS WITH ELEVATED PLASMAMYOGLOBIN: A RETROSPECTIVE ANALYSIS OF PATIENTS WITHMYOGLOBIN ‡ 5000 lG/L HOSPITALIZED IN REGIONAL HOSPITALLIBEREC IN YEARS 2002-2012
I. Zykova1, B. Paldusova1, P. Škrabálek2, D. Morman1
1Regional Hospital Liberec, Anesthesia and Intensive Care Dept., Liberec, Czech Republic,2Regional Hospital Liberec, Clinical Biochemistry Dept., Liberec, Czech RepublicINTRODUCTION. Rhabdomyolysis is a clinical and a laboratory syndrome, caused by aninjury to sarcolemma of striated muscle. The content, which consists mainly of myoglobin,is released into extracellular space. Creatinkinase and myoglobin (MGLB) are both mea-sured in elevated concentrations in plasma and used as markers of rhabdomyolysis.OBJECTIVES. To determine the utilisation of renal replacement therapy (RRT) in patientswith elevated plasma myoglobin and the need for chronic dialysis therapy afterwards.METHODS. Retrospective observational study. All patients hospitalized in Regionalhospital Liberec in the study period from January 2002 until December 2012 with myo-globin C5,000 lg/l were included. Their charts were reviewed for the use of RRT, 28-daymortality and the need for chronic dialysis therapy in survivors.RESULTS. During the study period of 11 years 88 patients with peak myoglobinC5,000 lg/l were treated in Regional hospital Liberec. The 28-day mortality was 47.7 %(42 patients died). 39 patients (44.3 %) underwent renal replacement therapy (RRT). Therewere 18 survivors in the group on RRT and only one patient needed long term dialysistherapy. 79 patients were ventilated (89.8 %). There was an increasing trend in mortalityand a higher incidence of RRT with an increasing peak myoglobin concentration.
Peak value of myoglobin (MGLB) and use of RRT
Peak valueof MGLB
No. of patientson RRT
No. of patientswithout RRT
No. of patientswith limited care
MGLB 5,000–14,999 lg/l 15 (28.8 %) 29 (55.8 %) 8 (15.4 %)
MGLB 15,000–49,999 lg/l 14 (58.3 %) 5 (20.8 %) 5 (20.8 %)
MGLB C 50,000 lg/l 10 (83.3 %) 0 (0 %) 2 (16.7 %)
Peak value of MGLB and 28-day mortality
Peak value of MGLB Survivors Non survivors Unknown
MGLB 5,000–14,999 lg/l 28 (53.8 %) 21 (40.4 %) 3 (5.8 %)
MGLB 15,000–49,999 lg/l 10 (41.7 %) 13 (54.2 %) 1 (4.2 %)
MGLB C 50,000 lg/l 4 (33.3 %) 8 (66.7 %) 0 (0 %)
CONCLUSIONS. The importance of concentration of myoglobin in the diagnostics andtherapy of rhabdomyolysis according to literature remains uncertain although it appears tobe a better marker of prognosis and need for RRT than creatinkinase.The long term prognosis of patients with acute renal failure due to rhabdomyolysis appearsto be very good with a low incidence of chronic dialysis.REFERENCE(S). 1. Delaney KA et al.: Use of RIFLE criteria to predict the severity andprognosis of acute kidney injury in emergency department patients with rhabdomyolysis.J Emerg Med 2012;42(5):521–8. 2. Fernandez WG et al. Factors predictive of acute renalfailure and need for hemodialysis among ED patients with rhabdomyolysis, Am J EmergMed 2005;23(1):1–7. 3. Kasaoka S. et al.: Peak value of myoglobine predicts acute renalfailure induced by rhabdomyolysis, J Crit. Care 2010;25(4):601–4. 4. Lappalainen H. et al.Elimination kinetics of myoglobin and creatine kinase in rhabdomyolysis: implications forfollow up, Crit Care Med 2002;30(10):2212–5. 5. Melli G. et al. Rhabdomyolysis: anevaluation of 475 hospitalized patients, Medicine (Baltimore) 2005;84(6):377–85. 6. Mik-kelsen et al.: Prognostic value, kinetics and effect of CVVHDF on serum of the myoglobinand creatine kinase in critically ill patients with rhabdomyolysis, Acta Anaesthesiol Scand2005;49:859–864.
0623VASCULAR ACCESS LOCATION AND FILTER LIFESPAN DURINGCONTINUOUS RENAL REPLACEMENT THERAPY WITH CITRATEANTICOAGULATION
R. Jacobs1, P.M. Honoré1, M. Diltoer1, J. De Regt1, V. Van Gorp1, E. De Waele1,
J. Troubleyn1, H. Spapen1
1UZ Brussel, ICU, Brussels, BelgiumINTRODUCTION. According to recent guidelines, the right internal jugular (RIJ) veinshould be preferred above the femoral veins to obtain venous access for continuous renal
26th ESICM ANNUAL CONGRESS — PARIS, FRANCE — 5–9 OCTOBER 2013
replacement therapy (CRRT). Still, some studies suggest an equally long filter lifespan withthe femoral approach.OBJECTIVES. To determine whether CRRT performed through a RIJ approach is asso-ciated with a more optimal filter lifespan as compared to the femoral access.METHODS. We conducted a 6-month observational study in consecutive patients under-going CRRT. A double-lumen CRRT catheter was inserted either in the RIJ or in one of thefemoral veins. CRRT was delivered according to a dedicated ‘‘homemade’’ protocol. Thisprotocol runs two bags in a continuous veno-venous mode performed at a dose ofapproximately 25 ml/kg/h with 75 % in predilution. Anticoagulation was provided usingdiluted (0.5 %) citrate. Blood flow was started at 150 ml and adapted according to protocolthereafter. Citrate flow aimed to target strictly confined ionized calcium levels into thecircuit. Access and venous pressures were recorded on a regular base. The CRRT catheterwas promptly flushed when a sudden increase of these pressures occurred. Analysis ofvariance and Mann–Whitney U test were used to compare the two venous access locations.Values are expressed as means (range). Left and right femoral access were taken together as‘‘femoral access’’. Only the first inserted catheter was evaluated.RESULTS. Fifty-seven patients were studied. 33 subjects had a catheter inserted in the RIJand 24 had catheters located in the femoral veins. Filter lifespan did not differ between thetwo different venous access groups [femoral 3.21 days (1.46–4.96) vs. RIJ 3.78 days(1.33–6.23); p = 0.45].CONCLUSIONS. In patients receiving CRRT under citrate anticoagulation, filter lifespanis not affected by the choice of the right jugular or femoral veins as initial access. Itsobservational design, the fact that only the first inserted catheter was considered, and thelack of discrimination between left and right femoral approach, are obvious limitations ofour study that require further prospective evaluation.
0624POSTOPERATIVE LIVER TRANSPLANTATION. BASILIXIMAB INDICATIONIN PATIENTS WITH RENAL DYSFUNCTION AND/OR ASCITIES
V. Olea Jiménez1, M.E. Banderas Bravo1, M. Lebrón Gallardo1, A.M. Cabrera Calandria2,
J.M. Mora Ordóñez1, G. Quesada Garcı́a1
1Carlos Haya Regional University Hospital, Intensive Care Unit, Málaga, Spain, 2La Lı́neaHospital, Intensive Care Unit, Cádiz, SpainINTRODUCTION. Renal dysfunction (RD) is a common complication in the postoperativeperiod of liver transplantation, especially in patients with ascites. Basiliximab is used aspostoperative inmunosuppression in renal transplantation, and as compassive use in post-operative liver transplantation because it is not nephrotoxic, so it is possible introduce theanticalcineurin later.OBJECTIVES. To determine the profile of patients who used Basiliximab and to analyzethe presence of RD in the immediate postoperative period of liver transplantation, andfollow-up at 3 and 6 months.METHODS. Retrospective study which included 170 patients admitted in our ICU afterliver transplantation from January 2008 to June 2012. Basiliximab was used in patients withprevius RD (Creatinine [1.3 mg/dl), in those with a history of frequent hydropic decom-pensation, in those with ascites over 3 l during surgery and when the indication oftransplantation was liver failure acute. We expressed the results as percentages for quali-tative variables and mean or median ± standard deviation and interquartile range forquantitative. Statistical analysis was performed using Student t test and Chi square test witha significance level of 95 %.RESULTS. We analyzed 170 patients with a mean age of 54.52 ± 9.76 years, of which71.2 % were male. The most common indication for transplantation was HCV cirrhosis(25.9 %), followed by alcoholic cirrhosis (24.7 %) and both (18.8 %). Of the 170 patients,46.5 % had ascites, RD baseline 18.2 %, RD ICU discharge 32.3 %, requiring CRRT duringadmission 15.3 %. At 3 months showed 27.1 % RD, and at 6 months 24.1 %. The medianICU stay was 4 (2-7) days. In 62.3 % of patients Basiliximab was used as the inmuno-suppressive of choice, with the indication of intraoperative ascites in 64.2 % of cases. In thisgroup, presented RD ICU discharge 35.8 % of patients, needing CVVHDF (22.6 %). RDcontinuing at 3 months 32 % and at 6 months 31.1 %. No significant differences were foundbetween the group with ascites and previous RD group. In 62 patients was used cyclosporineor tacrolimus, and as expected, only two cases had basal RD, and 11 ascites. 11.3 % had RDat ICU discharge, and only one of them needed CVVHDF, RD at 3 months was 19.4 % andonly 12.9 % at 6 months. No significant differences were found in the comparison betweenpatients with and without ascites except at 6 months, at which the RD in the ascites isgreater (p \ 0.05). A small group of patients with ascites (6.5 %) not receiving Basiliximabhowever none developed RD to ICU discharge, and only two had RD at 3 and 6 months.CONCLUSIONS. RD is a major problem in postoperative liver transplantation, especiallyin patients who have it previously and/or have ascites, in fact almost exclusively CVVHDFwas necessary in this group. With the use of Basiliximab we try to reduce the long-term RDin this population because it allows the introduction of anticalcineurin delay between 5 and7 days.
Echocardiography and haemodynamic monitoring:0625–06380625FEASIBILITY AND MEAN VALUES OF RIGHT VENTRICULAR FUNCTIONINDICES AND 2D STRAIN IN MECHANICALLY-VENTILATED ICU PATIENTS
L. Potton1,2, C. Schwebel1,3, J.-C. Cartier1, A. Bonadona1, C. Ara-Somohano1,R. Hamidfar1, M. Lugosi1, C. Minet1, J.-P. Baguet3,4, J.-F. Timsit1,5
1Grenoble University Hospital, Medical Intensive Care Unit, Grenoble, France, 2HP2Laboratory, INSERM U 1042, UJF-Grenoble 1, La Tronche, France, 3BioclinicRadiopharmaceutics Laboratory, INSERM U 1039, UJF-Grenoble 1, Grenoble, France,4Department of Cardiology, University Hospital, Grenoble, France, 5Albert BonniotInstitute, Team 11 U 823, UJF-Grenoble 1, Grenoble, FranceINTRODUCTION. Mechanical ventilation is associated with an increase in right ven-tricular (RV) afterload that can lead to RV dysfunction and failure in the more severe cases.Echocardiography has become a first choice tool to assess RV function at the bedside.However, this evaluation is challenging under mechanical ventilation because of the supineposition, the presence of positive end-expiratory pressure and underlying diseases that canalter echogenicity. Moreover, RV dysfunction is detected by RV dilatation and septaldyskinesia, and one can question whether the diagnosis of RV dysfunction could be done atan earlier stage. Tricuspid annular plane systolic excursion (TAPSE) and tissue Doppler S
wave at the tricuspid annulus (St) are indices widely used in cardiology, easy to obtain andclosely related to RV function. Only one study has evaluated these indices in ARDS patientsshowing good feasibility but a weak correlation to commonly used parameters. Speckletracking imaging is a more recent technique that measures tissue displacement and derivesdeformation parameters. This technique has shown interesting results in detecting subtle andinfra-clinical abnormalities of RV function in the setting of pulmonary hypertension orscleroderma. Mean values of these parameters under mechanical ventilation are not known.OBJECTIVES. We sought to determine feasibility of these RV parameters and meanvalues in patients mechanically-ventilated for a non respiratory cause.METHODS. This is a prospective observational ongoing study conducted in the medicalICU at Grenoble University Hospital, France. Patients under mechanical ventilation for anon respiratory cause with a fraction of inspired oxygen B30 % and no history of cardio-pulmonary disease were included. Transthoracic echocardiography was performed and loopsof five beats were recorded with ECG and ventilation signals for off-line analysis. TAPSE,St and RV strain were measured during inspiration and expiration, and compared using aWilcoxon test. RV strain (eRV) was obtained for lateral wall divided in three segments:basal, mid and apical.RESULTS. Twelve patients of 61 ± 13 years were included. Nine patients were ventilatedfor neurologic disorder and three for digestive hemorrhage. During expiration, feasibilitywas 92 % for TAPSE and St, 100 % for basal eRV, 83 % for mid and apical eRV. Duringinspiration, feasibility was 100 % for St and basal eRV, 92 % for TAPSE, 92 % for mideRV and apical eRV. Mean values during inspiration and expiration respectively were:TAPSE:20 ± 5 mm versus 22 ± 5 mm, p = 0.03, St = 11.8 ± 2 cm/s versus12.8 ± 2.9 cm/s, p = 0.01, eRV = -25.8 ± 4 % versus -26.7 ± 4.7 %, p = 0.58.CONCLUSIONS. TAPSE, St and eRV measurement seem to be feasible under mechanicalventilation. Mean values are close to those obtained from non ventilated patients withoutRV dysfunction. TAPSE and St are significantly lower when insufflation occurs in contrastto eRV. These data deserve to be further explored. Study is still ongoing.
0626MEAN SYSTEMIC PRESSURE ANALOGUE, HEART PERFORMANCE ANDSHOCK INDEX PREDICTS MORTALITY IN SEPTIC SHOCK
E. Monares1, M.R. Pinsky2, A. Torres3, M. Poblano1, R. Chaires4, U. Ceron5, J. Franco6
1ABC Medical Center, Critical Care, Mexico, Mexico, 2University of Pittsburgh,Department of Critical Care Medicine, Pittsburgh, United States, 3ABC Medical Center,Orthopaedics, Mexico, Mexico, 4ABC Medical Center, Critical Care, PulmonaryPhysiology, Mexico, Mexico, 5UNAM, Hospital Angeles Linda Vista, Critical Care,Mexico, Mexico, 6ABC Medical Center, Critical Care, Chief Department, Mexico, MexicoINTRODUCTION. Measure of the upstream pressure for venous return, the mean systemicfilling pressure (Pmsf), is essential in the evaluation of the volume state and the control ofthe circulation. Since recently, these measurements can be performed easily at the bedside.Evaluate if these measurements help in determining prognosis of complex hemodynamicstate like the patients in septic shock is a priority.OBJECTIVES. To evaluate the usefulness of the mean systemic pressure analogue (Pmsa),heart performance (Eh) and shock index (SI) as tools for prediction of mortality in septicshock (SS).METHODS. The study was conducted in an Intensive Care Unit (ICU) of a tertiary carehospital. All patients diagnosed with SS, admitted to ICU from January 2008 to January2012 were included. Retrospective data analysis with split calibration and validation sub-groups was performed. SI was calculated as systolic pressure to heart rate ratio. Pmsa wasestimated from the cardiac output, mean arterial pressure and right atrial pressure (Pra), allmeasured 24 h after ICU admission and assuming fixed venous-arterial resistance andcompliance values. Eh was calculated as (Pmsa-Pra)/Pmsa. Threshold Pmsa, Eh and SIvalues predictive of mortality were obtained to maximize the ROC curves.RESULTS. In a first calibration group (G1) (n = 36, age = 59 ± 17 years;SOFA = 11 ± 3 points, 50 % predicted mortality), Pmsa [ 26 mmHg, SI C 0.9 andEh \ 0.25 mmHg predicted mortality. After split calibration the following values wereobtained: Pmsa [ 27 mmHg, SI [ 0.9 and Eh \ 0.25 and reanalyzed in a second group (G2)(n = 75, age = 63 ± 17 years, SOFA = 10 ± 3; 48 % predicted mortality). See Table 1.
Sensitivity, specificity and area under the curve
Mesurements n Cut-offpoint
Sen Sp LR+ AUC CI (95 %) p
Pmsa G1 36 26 0.22 0.95 4.40 0.690 0.50–0.90 0.041
Pmsa G2 75 26 0.87 0.56 1.98 0.714 0.60–0.80 0.014
Pmsacalibration
75 27 0.46 0.97 15.33 0.695 0.595–0.795 0.001
Eh G1 36 0.25 0.50 0.95 10.00 0.740 0.60–0.90 0.014
Eh G2 75 0.25 0.35 0.97 11.67 0.666 0.55–0.80 0.010
Eh calibration 75 0.25 0.57 0.75 2.28 0.673 0.573–0.744 0.002
SI G1 36 0.9 0.55 0.95 11.00 0.800 0.70–0.95 0.001
SI G2 75 0.9 0.87 0.80 4.35 0.839 0.70–0.90 0.001
SI calibration 75 0.9 0.90 0.73 3.33 0.809 0.724–0.894 0.002
CONCLUSIONS. The Pmsa [27 mmHg identifies patients with volume overload andincreased mortality. These patients have a decreased Eh, which may identify patients withseptic shock and myocardial depression. All SS patients who died had at least one abnormalindex (SI [ 0.9, HP \ 0.25, Pmsa [ 26) within 24 h of admission to ICU. These datasuggest that early derived measures of cardiovascular state define subsequent mortality fromSS. Potentially, such risk stratification could be used to identify SS patient subgroups:ending/increased monitoring/resuscitation.
0627ASSESSMENT OF STRESSED VOLUME AND VASCULAR COMPLIANCEIN SPONTANEOUSLY VENTILATED PATIENTS
H.D. Aya1, M. Geisen2, C. Ebm2, M. Grounds1, A. Rhodes1, M. Cecconi1
1St George’s Healthcare NHS Trust and St George’s University of London, Intensive CareDirectorate, London, United Kingdom, 2St George’s Healthcare NHS Trust, Intensive Care,London, United Kingdom
26th ESICM ANNUAL CONGRESS — PARIS, FRANCE — 5–9 OCTOBER 2013
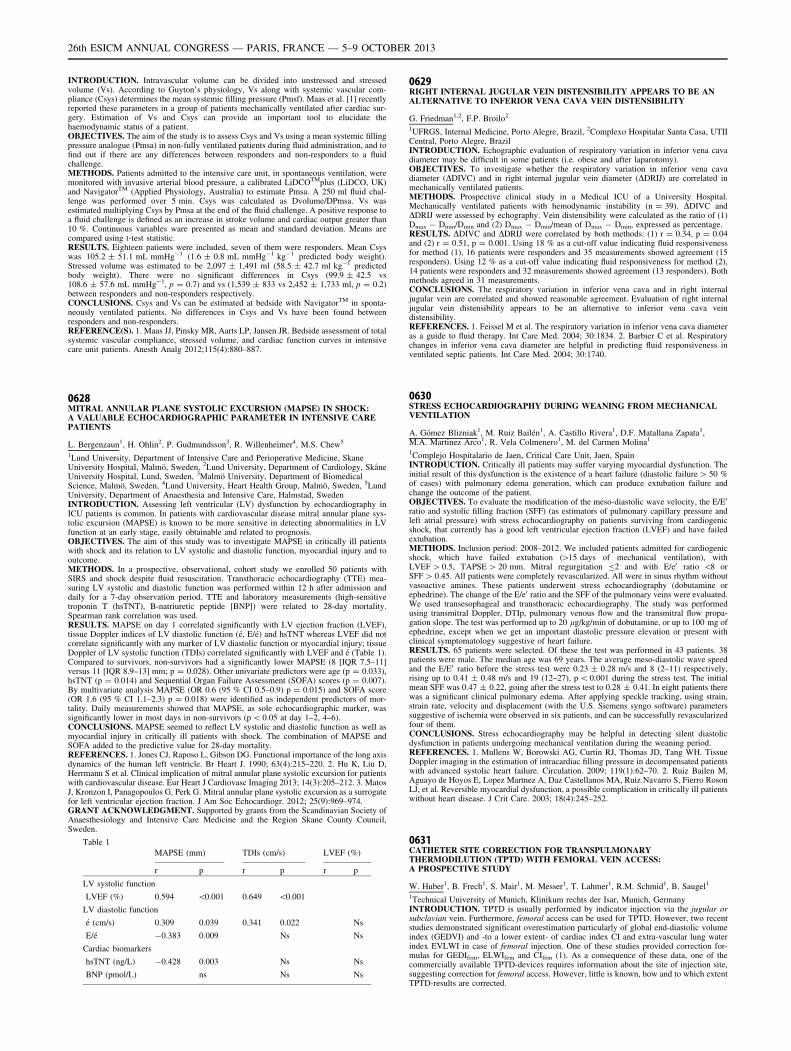
INTRODUCTION. Intravascular volume can be divided into unstressed and stressedvolume (Vs). According to Guyton’s physiology, Vs along with systemic vascular com-pliance (Csys) determines the mean systemic filling pressure (Pmsf). Maas et al. [1] recentlyreported these parameters in a group of patients mechanically ventilated after cardiac sur-gery. Estimation of Vs and Csys can provide an important tool to elucidate thehaemodynamic status of a patient.OBJECTIVES. The aim of the study is to assess Csys and Vs using a mean systemic fillingpressure analogue (Pmsa) in non-fully ventilated patients during fluid administration, and tofind out if there are any differences between responders and non-responders to a fluidchallenge.METHODS. Patients admitted to the intensive care unit, in spontaneous ventilation, weremonitored with invasive arterial blood pressure, a calibrated LiDCOTMplus (LiDCO, UK)and NavigatorTM (Applied Physiology, Australia) to estimate Pmsa. A 250 ml fluid chal-lenge was performed over 5 min. Csys was calculated as Dvolume/DPmsa. Vs wasestimated multiplying Csys by Pmsa at the end of the fluid challenge. A positive response toa fluid challenge is defined as an increase in stroke volume and cardiac output greater than10 %. Continuous variables ware presented as mean and standard deviation. Means arecompared using t-test statistic.RESULTS. Eighteen patients were included, seven of them were responders. Mean Csyswas 105.2 ± 51.1 mL mmHg-1 (1.6 ± 0.8 mL mmHg-1 kg-1 predicted body weight).Stressed volume was estimated to be 2,097 ± 1,491 ml (58.5 ± 42.7 ml kg-1 predictedbody weight). There were no significant differences in Csys (99.9 ± 42.5 vs108.6 ± 57.6 mL mmHg-1, p = 0.7) and vs (1,539 ± 833 vs 2,452 ± 1,733 ml, p = 0.2)between responders and non-responders respectively.CONCLUSIONS. Csys and Vs can be estimated at bedside with NavigatorTM in sponta-neously ventilated patients. No differences in Csys and Vs have been found betweenresponders and non-responders.REFERENCE(S). 1. Maas JJ, Pinsky MR, Aarts LP, Jansen JR. Bedside assessment of totalsystemic vascular compliance, stressed volume, and cardiac function curves in intensivecare unit patients. Anesth Analg 2012;115(4):880–887.
0628MITRAL ANNULAR PLANE SYSTOLIC EXCURSION (MAPSE) IN SHOCK:A VALUABLE ECHOCARDIOGRAPHIC PARAMETER IN INTENSIVE CAREPATIENTS
L. Bergenzaun1, H. Ohlin2, P. Gudmundsson3, R. Willenheimer4, M.S. Chew5
1Lund University, Department of Intensive Care and Perioperative Medicine, SkaneUniversity Hospital, Malmö, Sweden, 2Lund University, Department of Cardiology, SkåneUniversity Hospital, Lund, Sweden, 3Malmö University, Department of BiomedicalScience, Malmö, Sweden, 4Lund University, Heart Health Group, Malmö, Sweden, 5LundUniversity, Department of Anaesthesia and Intensive Care, Halmstad, SwedenINTRODUCTION. Assessing left ventricular (LV) dysfunction by echocardiography inICU patients is common. In patients with cardiovascular disease mitral annular plane sys-tolic excursion (MAPSE) is known to be more sensitive in detecting abnormalities in LVfunction at an early stage, easily obtainable and related to prognosis.OBJECTIVES. The aim of this study was to investigate MAPSE in critically ill patientswith shock and its relation to LV systolic and diastolic function, myocardial injury and tooutcome.METHODS. In a prospective, observational, cohort study we enrolled 50 patients withSIRS and shock despite fluid resuscitation. Transthoracic echocardiography (TTE) mea-suring LV systolic and diastolic function was performed within 12 h after admission anddaily for a 7-day observation period. TTE and laboratory measurements (high-sensitivetroponin T (hsTNT), B-natriuretic peptide [BNP]) were related to 28-day mortality.Spearman rank correlation was used.RESULTS. MAPSE on day 1 correlated significantly with LV ejection fraction (LVEF),tissue Doppler indices of LV diastolic function (é, E/é) and hsTNT whereas LVEF did notcorrelate significantly with any marker of LV diastolic function or myocardial injury; tissueDoppler of LV systolic function (TDIs) correlated significantly with LVEF and é (Table 1).Compared to survivors, non-survivors had a significantly lower MAPSE (8 [IQR 7.5–11]versus 11 [IQR 8.9–13] mm; p = 0.028). Other univariate predictors were age (p = 0.033),hsTNT (p = 0.014) and Sequential Organ Failure Assessment (SOFA) scores (p = 0.007).By multivariate analysis MAPSE (OR 0.6 (95 % CI 0.5–0.9) p = 0.015) and SOFA score(OR 1.6 (95 % CI 1.1–2.3) p = 0.018) were identified as independent predictors of mor-tality. Daily measurements showed that MAPSE, as sole echocardiographic marker, wassignificantly lower in most days in non-survivors (p \ 0.05 at day 1–2, 4–6).CONCLUSIONS. MAPSE seemed to reflect LV systolic and diastolic function as well asmyocardial injury in critically ill patients with shock. The combination of MAPSE andSOFA added to the predictive value for 28-day mortality.REFERENCES. 1. Jones CJ, Raposo L, Gibson DG. Functional importance of the long axisdynamics of the human left ventricle. Br Heart J. 1990; 63(4):215–220. 2. Hu K, Liu D,Herrmann S et al. Clinical implication of mitral annular plane systolic excursion for patientswith cardiovascular disease. Eur Heart J Cardiovasc Imaging 2013; 14(3):205–212. 3. MatosJ, Kronzon I, Panagopoulos G, Perk G. Mitral annular plane systolic excursion as a surrogatefor left ventricular ejection fraction. J Am Soc Echocardiogr. 2012; 25(9):969–974.GRANT ACKNOWLEDGMENT. Supported by grants from the Scandinavian Society ofAnaesthesiology and Intensive Care Medicine and the Region Skane County Council,Sweden.
Table 1
MAPSE (mm) TDIs (cm/s) LVEF (%)
r p r p r p
LV systolic function
LVEF (%) 0.594 \0.001 0.649 \0.001
LV diastolic function
é (cm/s) 0.309 0.039 0.341 0.022 Ns
E/é -0.383 0.009 Ns Ns
Cardiac biomarkers
hsTNT (ng/L) -0.428 0.003 Ns Ns
BNP (pmol/L) ns Ns Ns
0629RIGHT INTERNAL JUGULAR VEIN DISTENSIBILITY APPEARS TO BE ANALTERNATIVE TO INFERIOR VENA CAVA VEIN DISTENSIBILITY
G. Friedman1,2, F.P. Broilo2
1UFRGS, Internal Medicine, Porto Alegre, Brazil, 2Complexo Hospitalar Santa Casa, UTIICentral, Porto Alegre, BrazilINTRODUCTION. Echographic evaluation of respiratory variation in inferior vena cavadiameter may be difficult in some patients (i.e. obese and after laparotomy).OBJECTIVES. To investigate whether the respiratory variation in inferior vena cavadiameter (DDIVC) and in right internal jugular vein diameter (DDRIJ) are correlated inmechanically ventilated patients.METHODS. Prospective clinical study in a Medical ICU of a University Hospital.Mechanically ventilated patients with hemodynamic instability (n = 39). DDIVC andDDRIJ were assessed by echography. Vein distensibility were calculated as the ratio of (1)Dmax - Dmin/Dmin and (2) Dmax - Dmin/mean of Dmax - Dmin, expressed as percentage.RESULTS. DDIVC and DDRIJ were correlated by both methods: (1) r = 0.34, p = 0.04and (2) r = 0.51, p = 0.001. Using 18 % as a cut-off value indicating fluid responsivenessfor method (1), 16 patients were responders and 35 measurements showed agreement (15responders). Using 12 % as a cut-off value indicating fluid responsiveness for method (2),14 patients were responders and 32 measurements showed agreement (13 responders). Bothmethods agreed in 31 measurements.CONCLUSIONS. The respiratory variation in inferior vena cava and in right internaljugular vein are correlated and showed reasonable agreement. Evaluation of right internaljugular vein distensibility appears to be an alternative to inferior vena cava veindistensibility.REFERENCES. 1. Feissel M et al. The respiratory variation in inferior vena cava diameteras a guide to fluid therapy. Int Care Med. 2004; 30:1834. 2. Barbier C et al. Respiratorychanges in inferior vena cava diameter are helpful in predicting fluid responsiveness inventilated septic patients. Int Care Med. 2004; 30:1740.
0630STRESS ECHOCARDIOGRAPHY DURING WEANING FROM MECHANICALVENTILATION
A. Gómez Blizniak1, M. Ruiz Bailén1, A. Castillo Rivera1, D.F. Matallana Zapata1,M.A. Martinez Arco1, R. Vela Colmenero1, M. del Carmen Molina1
1Complejo Hospitalario de Jaen, Critical Care Unit, Jaen, SpainINTRODUCTION. Critically ill patients may suffer varying myocardial dysfunction. Theinitial result of this dysfunction is the existence of a heart failure (diastolic failure [ 50 %of cases) with pulmonary edema generation, which can produce extubation failure andchange the outcome of the patient.OBJECTIVES. To evaluate the modification of the meso-diastolic wave velocity, the E/E0
ratio and systolic filling fraction (SFF) (as estimators of pulmonary capillary pressure andleft atrial pressure) with stress echocardiography on patients surviving from cardiogenicshock, that currently has a good left ventricular ejection fraction (LVEF) and have failedextubation.METHODS. Inclusion period: 2008–2012. We included patients admitted for cardiogenicshock, which have failed extubation ([15 days of mechanical ventilation), withLVEF [ 0.5, TAPSE [ 20 mm. Mitral regurgitation B2 and with E/e0 ratio \8 orSFF [ 0.45. All patients were completely revascularized. All were in sinus rhythm withoutvasoactive amines. These patients underwent stress echocardiography (dobutamine orephedrine). The change of the E/e0 ratio and the SFF of the pulmonary veins were evaluated.We used transesophageal and transthoracic echocardiography. The study was performedusing transmitral Doppler, DTIp, pulmonary venous flow and the transmitral flow propa-gation slope. The test was performed up to 20 lg/kg/min of dobutamine, or up to 100 mg ofephedrine, except when we get an important diastolic pressure elevation or present withclinical symptomatology suggestive of heart failure.RESULTS. 65 patients were selected. Of these the test was performed in 43 patients. 38patients were male. The median age was 69 years. The average meso-diastolic wave speedand the E/E0 ratio before the stress test were 0.23 ± 0.28 m/s and 8 (2–11) respectively,rising up to 0.41 ± 0.48 m/s and 19 (12–27), p \ 0.001 during the stress test. The initialmean SFF was 0.47 ± 0.22, going after the stress test to 0.28 ± 0.41. In eight patients therewas a significant clinical pulmonary edema. After applying speckle tracking, using strain,strain rate, velocity and displacement (with the U.S. Siemens syngo software) parameterssuggestive of ischemia were observed in six patients, and can be successfully revascularizedfour of them.CONCLUSIONS. Stress echocardiography may be helpful in detecting silent diastolicdysfunction in patients undergoing mechanical ventilation during the weaning period.REFERENCES. 1. Mullens W, Borowski AG, Curtin RJ, Thomas JD, Tang WH. TissueDoppler imaging in the estimation of intracardiac filling pressure in decompensated patientswith advanced systolic heart failure. Circulation. 2009; 119(1):62–70. 2. Ruiz Bailen M,Aguayo de Hoyos E, Lopez Martnez A, Daz Castellanos MA, Ruiz Navarro S, Fierro RosonLJ, et al. Reversible myocardial dysfunction, a possible complication in critically ill patientswithout heart disease. J Crit Care. 2003; 18(4):245–252.
0631CATHETER SITE CORRECTION FOR TRANSPULMONARYTHERMODILUTION (TPTD) WITH FEMORAL VEIN ACCESS:A PROSPECTIVE STUDY
W. Huber1, B. Frech1, S. Mair1, M. Messer1, T. Lahmer1, R.M. Schmid1, B. Saugel1
1Technical University of Munich, Klinikum rechts der Isar, Munich, GermanyINTRODUCTION. TPTD is usually performed by indicator injection via the jugular orsubclavian vein. Furthermore, femoral access can be used for TPTD. However, two recentstudies demonstrated significant overestimation particularly of global end-diastolic volumeindex (GEDVI) and -to a lower extent- of cardiac index CI and extra-vascular lung waterindex EVLWI in case of femoral injection. One of these studies provided correction for-mulas for GEDIfem, ELWIfem and CIfem (1). As a consequence of these data, one of thecommercially available TPTD-devices requires information about the site of injection site,suggesting correction for femoral access. However, little is known, how and to which extentTPTD-results are corrected.
26th ESICM ANNUAL CONGRESS — PARIS, FRANCE — 5–9 OCTOBER 2013
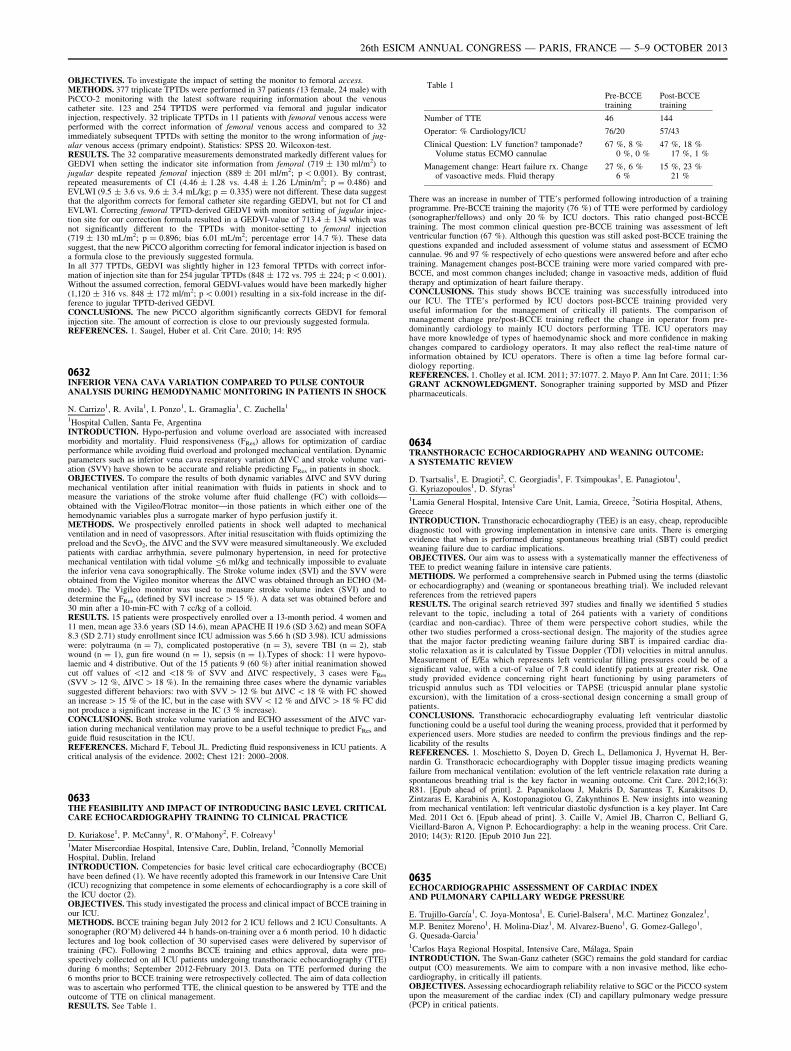
OBJECTIVES. To investigate the impact of setting the monitor to femoral access.METHODS. 377 triplicate TPTDs were performed in 37 patients (13 female, 24 male) withPiCCO-2 monitoring with the latest software requiring information about the venouscatheter site. 123 and 254 TPTDS were performed via femoral and jugular indicatorinjection, respectively. 32 triplicate TPTDs in 11 patients with femoral venous access wereperformed with the correct information of femoral venous access and compared to 32immediately subsequent TPTDs with setting the monitor to the wrong information of jug-ular venous access (primary endpoint). Statistics: SPSS 20. Wilcoxon-test.RESULTS. The 32 comparative measurements demonstrated markedly different values forGEDVI when setting the indicator site information from femoral (719 ± 130 ml/m2) tojugular despite repeated femoral injection (889 ± 201 ml/m2; p \ 0.001). By contrast,repeated measurements of CI (4.46 ± 1.28 vs. 4.48 ± 1.26 L/min/m2; p = 0.486) andEVLWI (9.5 ± 3.6 vs. 9.6 ± 3.4 mL/kg; p = 0.335) were not different. These data suggestthat the algorithm corrects for femoral catheter site regarding GEDVI, but not for CI andEVLWI. Correcting femoral TPTD-derived GEDVI with monitor setting of jugular injec-tion site for our correction formula resulted in a GEDVI-value of 713.4 ± 134 which wasnot significantly different to the TPTDs with monitor-setting to femoral injection(719 ± 130 mL/m2; p = 0.896; bias 6.01 mL/m2; percentage error 14.7 %). These datasuggest, that the new PiCCO algorithm correcting for femoral indicator injection is based ona formula close to the previously suggested formula.In all 377 TPTDs, GEDVI was slightly higher in 123 femoral TPTDs with correct infor-mation of injection site than for 254 jugular TPTDs (848 ± 172 vs. 795 ± 224; p \ 0.001).Without the assumed correction, femoral GEDVI-values would have been markedly higher(1,120 ± 316 vs. 848 ± 172 ml/m2; p \ 0.001) resulting in a six-fold increase in the dif-ference to jugular TPTD-derived GEDVI.CONCLUSIONS. The new PiCCO algorithm significantly corrects GEDVI for femoralinjection site. The amount of correction is close to our previously suggested formula.REFERENCES. 1. Saugel, Huber et al. Crit Care. 2010; 14: R95
0632INFERIOR VENA CAVA VARIATION COMPARED TO PULSE CONTOURANALYSIS DURING HEMODYNAMIC MONITORING IN PATIENTS IN SHOCK
N. Carrizo1, R. Avila1, I. Ponzo1, L. Gramaglia1, C. Zuchella1
1Hospital Cullen, Santa Fe, ArgentinaINTRODUCTION. Hypo-perfusion and volume overload are associated with increasedmorbidity and mortality. Fluid responsiveness (FRes) allows for optimization of cardiacperformance while avoiding fluid overload and prolonged mechanical ventilation. Dynamicparameters such as inferior vena cava respiratory variation DIVC and stroke volume vari-ation (SVV) have shown to be accurate and reliable predicting FRes in patients in shock.OBJECTIVES. To compare the results of both dynamic variables DIVC and SVV duringmechanical ventilation after initial reanimation with fluids in patients in shock and tomeasure the variations of the stroke volume after fluid challenge (FC) with colloids—obtained with the Vigileo/Flotrac monitor—in those patients in which either one of thehemodynamic variables plus a surrogate marker of hypo perfusion justify it.METHODS. We prospectively enrolled patients in shock well adapted to mechanicalventilation and in need of vasopressors. After initial resuscitation with fluids optimizing thepreload and the ScvO2, the DIVC and the SVV were measured simultaneously. We excludedpatients with cardiac arrhythmia, severe pulmonary hypertension, in need for protectivemechanical ventilation with tidal volume B6 ml/kg and technically impossible to evaluatethe inferior vena cava sonographically. The Stroke volume index (SVI) and the SVV wereobtained from the Vigileo monitor whereas the DIVC was obtained through an ECHO (M-mode). The Vigileo monitor was used to measure stroke volume index (SVI) and todetermine the FRes (defined by SVI increase [ 15 %). A data set was obtained before and30 min after a 10-min-FC with 7 cc/kg of a colloid.RESULTS. 15 patients were prospectively enrolled over a 13-month period. 4 women and11 men, mean age 33.6 years (SD 14.6), mean APACHE II 19.6 (SD 3.62) and mean SOFA8.3 (SD 2.71) study enrollment since ICU admission was 5.66 h (SD 3.98). ICU admissionswere: polytrauma (n = 7), complicated postoperative (n = 3), severe TBI (n = 2), stabwound (n = 1), gun fire wound (n = 1), sepsis (n = 1).Types of shock: 11 were hypovo-laemic and 4 distributive. Out of the 15 patients 9 (60 %) after initial reanimation showedcut off values of \12 and \18 % of SVV and DIVC respectively, 3 cases were FRes
(SVV [ 12 %, DIVC [ 18 %). In the remaining three cases where the dynamic variablessuggested different behaviors: two with SVV [ 12 % but DIVC \ 18 % with FC showedan increase [ 15 % of the IC, but in the case with SVV \ 12 % and DIVC [ 18 % FC didnot produce a significant increase in the IC (3 % increase).CONCLUSIONS. Both stroke volume variation and ECHO assessment of the DIVC var-iation during mechanical ventilation may prove to be a useful technique to predict FRes andguide fluid resuscitation in the ICU.REFERENCES. Michard F, Teboul JL. Predicting fluid responsiveness in ICU patients. Acritical analysis of the evidence. 2002; Chest 121: 2000–2008.
0633THE FEASIBILITY AND IMPACT OF INTRODUCING BASIC LEVEL CRITICALCARE ECHOCARDIOGRAPHY TRAINING TO CLINICAL PRACTICE
D. Kuriakose1, P. McCanny1, R. O’Mahony2, F. Colreavy1
1Mater Misercordiae Hospital, Intensive Care, Dublin, Ireland, 2Connolly MemorialHospital, Dublin, IrelandINTRODUCTION. Competencies for basic level critical care echocardiography (BCCE)have been defined (1). We have recently adopted this framework in our Intensive Care Unit(ICU) recognizing that competence in some elements of echocardiography is a core skill ofthe ICU doctor (2).OBJECTIVES. This study investigated the process and clinical impact of BCCE training inour ICU.METHODS. BCCE training began July 2012 for 2 ICU fellows and 2 ICU Consultants. Asonographer (RO’M) delivered 44 h hands-on-training over a 6 month period. 10 h didacticlectures and log book collection of 30 supervised cases were delivered by supervisor oftraining (FC). Following 2 months BCCE training and ethics approval, data were pro-spectively collected on all ICU patients undergoing transthoracic echocardiography (TTE)during 6 months; September 2012-February 2013. Data on TTE performed during the6 months prior to BCCE training were retrospectively collected. The aim of data collectionwas to ascertain who performed TTE, the clinical question to be answered by TTE and theoutcome of TTE on clinical management.RESULTS. See Table 1.
Table 1
Pre-BCCEtraining
Post-BCCEtraining
Number of TTE 46 144
Operator: % Cardiology/ICU 76/20 57/43
Clinical Question: LV function? tamponade?Volume status ECMO cannulae
67 %, 8 %0 %, 0 %
47 %, 18 %17 %, 1 %
Management change: Heart failure rx. Changeof vasoactive meds. Fluid therapy
27 %, 6 %6 %
15 %, 23 %21 %
There was an increase in number of TTE’s performed following introduction of a trainingprogramme. Pre-BCCE training the majority (76 %) of TTE were performed by cardiology(sonographer/fellows) and only 20 % by ICU doctors. This ratio changed post-BCCEtraining. The most common clinical question pre-BCCE training was assessment of leftventricular function (67 %). Although this question was still asked post-BCCE training thequestions expanded and included assessment of volume status and assessment of ECMOcannulae. 96 and 97 % respectively of echo questions were answered before and after echotraining. Management changes post-BCCE training were more varied compared with pre-BCCE, and most common changes included; change in vasoactive meds, addition of fluidtherapy and optimization of heart failure therapy.CONCLUSIONS. This study shows BCCE training was successfully introduced intoour ICU. The TTE’s performed by ICU doctors post-BCCE training provided veryuseful information for the management of critically ill patients. The comparison ofmanagement change pre/post-BCCE training reflect the change in operator from pre-dominantly cardiology to mainly ICU doctors performing TTE. ICU operators mayhave more knowledge of types of haemodynamic shock and more confidence in makingchanges compared to cardiology operators. It may also reflect the real-time nature ofinformation obtained by ICU operators. There is often a time lag before formal car-diology reporting.REFERENCES. 1. Cholley et al. ICM. 2011; 37:1077. 2. Mayo P. Ann Int Care. 2011; 1:36GRANT ACKNOWLEDGMENT. Sonographer training supported by MSD and Pfizerpharmaceuticals.
0634TRANSTHORACIC ECHOCARDIOGRAPHY AND WEANING OUTCOME:A SYSTEMATIC REVIEW
D. Tsartsalis1, E. Dragioti2, C. Georgiadis1, F. Tsimpoukas1, E. Panagiotou1,G. Kyriazopoulos1, D. Sfyras1
1Lamia General Hospital, Intensive Care Unit, Lamia, Greece, 2Sotiria Hospital, Athens,GreeceINTRODUCTION. Transthoracic echocardiography (TEE) is an easy, cheap, reproduciblediagnostic tool with growing implementation in intensive care units. There is emergingevidence that when is performed during spontaneous breathing trial (SBT) could predictweaning failure due to cardiac implications.OBJECTIVES. Our aim was to assess with a systematically manner the effectiveness ofTEE to predict weaning failure in intensive care patients.METHODS. We performed a comprehensive search in Pubmed using the terms (diastolicor echocardiography) and (weaning or spontaneous breathing trial). We included relevantreferences from the retrieved papersRESULTS. The original search retrieved 397 studies and finally we identified 5 studiesrelevant to the topic, including a total of 264 patients with a variety of conditions(cardiac and non-cardiac). Three of them were perspective cohort studies, while theother two studies performed a cross-sectional design. The majority of the studies agreethat the major factor predicting weaning failure during SBT is impaired cardiac dia-stolic relaxation as it is calculated by Tissue Doppler (TDI) velocities in mitral annulus.Measurement of E/Ea which represents left ventricular filling pressures could be of asignificant value, with a cut-of value of 7.8 could identify patients at greater risk. Onestudy provided evidence concerning right heart functioning by using parameters oftricuspid annulus such as TDI velocities or TAPSE (tricuspid annular plane systolicexcursion), with the limitation of a cross-sectional design concerning a small group ofpatients.CONCLUSIONS. Transthoracic echocardiography evaluating left ventricular diastolicfunctioning could be a useful tool during the weaning process, provided that it performed byexperienced users. More studies are needed to confirm the previous findings and the rep-licability of the resultsREFERENCES. 1. Moschietto S, Doyen D, Grech L, Dellamonica J, Hyvernat H, Ber-nardin G. Transthoracic echocardiography with Doppler tissue imaging predicts weaningfailure from mechanical ventilation: evolution of the left ventricle relaxation rate during aspontaneous breathing trial is the key factor in weaning outcome. Crit Care. 2012;16(3):R81. [Epub ahead of print]. 2. Papanikolaou J, Makris D, Saranteas T, Karakitsos D,Zintzaras E, Karabinis A, Kostopanagiotou G, Zakynthinos E. New insights into weaningfrom mechanical ventilation: left ventricular diastolic dysfunction is a key player. Int CareMed. 2011 Oct 6. [Epub ahead of print]. 3. Caille V, Amiel JB, Charron C, Belliard G,Vieillard-Baron A, Vignon P. Echocardiography: a help in the weaning process. Crit Care.2010; 14(3): R120. [Epub 2010 Jun 22].
0635ECHOCARDIOGRAPHIC ASSESSMENT OF CARDIAC INDEXAND PULMONARY CAPILLARY WEDGE PRESSURE
E. Trujillo-Garcı́a1, C. Joya-Montosa1, E. Curiel-Balsera1, M.C. Martinez Gonzalez1,
M.P. Benitez Moreno1, H. Molina-Diaz1, M. Alvarez-Bueno1, G. Gomez-Gallego1,G. Quesada-Garcia1
1Carlos Haya Regional Hospital, Intensive Care, Málaga, SpainINTRODUCTION. The Swan-Ganz catheter (SGC) remains the gold standard for cardiacoutput (CO) measurements. We aim to compare with a non invasive method, like echo-cardiography, in critically ill patients.OBJECTIVES. Assessing echocardiograph reliability relative to SGC or the PiCCO systemupon the measurement of the cardiac index (CI) and capillary pulmonary wedge pressure(PCP) in critical patients.
26th ESICM ANNUAL CONGRESS — PARIS, FRANCE — 5–9 OCTOBER 2013
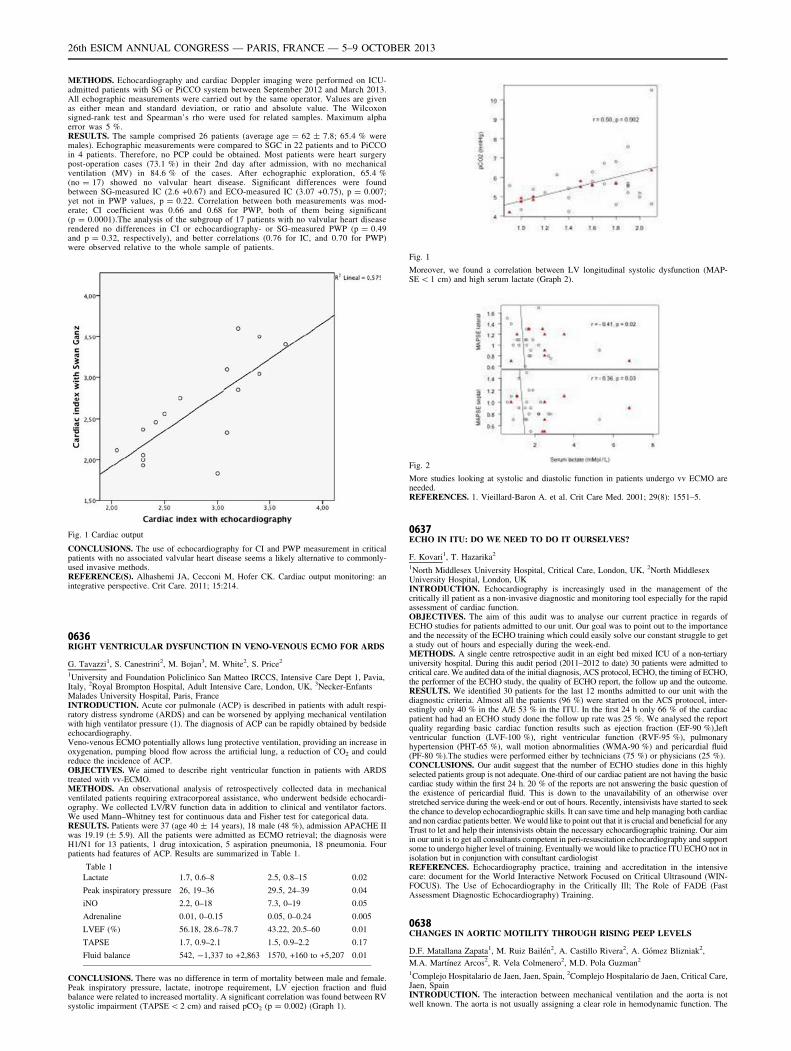
METHODS. Echocardiography and cardiac Doppler imaging were performed on ICU-admitted patients with SG or PiCCO system between September 2012 and March 2013.All echographic measurements were carried out by the same operator. Values are givenas either mean and standard deviation, or ratio and absolute value. The Wilcoxonsigned-rank test and Spearman’s rho were used for related samples. Maximum alphaerror was 5 %.RESULTS. The sample comprised 26 patients (average age = 62 ± 7.8; 65.4 % weremales). Echographic measurements were compared to SGC in 22 patients and to PiCCOin 4 patients. Therefore, no PCP could be obtained. Most patients were heart surgerypost-operation cases (73.1 %) in their 2nd day after admission, with no mechanicalventilation (MV) in 84.6 % of the cases. After echographic exploration, 65.4 %(no = 17) showed no valvular heart disease. Significant differences were foundbetween SG-measured IC (2.6 +0.67) and ECO-measured IC (3.07 +0.75), p = 0.007;yet not in PWP values, p = 0.22. Correlation between both measurements was mod-erate; CI coefficient was 0.66 and 0.68 for PWP, both of them being significant(p = 0.0001).The analysis of the subgroup of 17 patients with no valvular heart diseaserendered no differences in CI or echocardiography- or SG-measured PWP (p = 0.49and p = 0.32, respectively), and better correlations (0.76 for IC, and 0.70 for PWP)were observed relative to the whole sample of patients.
Fig. 1 Cardiac output
CONCLUSIONS. The use of echocardiography for CI and PWP measurement in criticalpatients with no associated valvular heart disease seems a likely alternative to commonly-used invasive methods.REFERENCE(S). Alhashemi JA, Cecconi M, Hofer CK. Cardiac output monitoring: anintegrative perspective. Crit Care. 2011; 15:214.
0636RIGHT VENTRICULAR DYSFUNCTION IN VENO-VENOUS ECMO FOR ARDS
G. Tavazzi1, S. Canestrini2, M. Bojan3, M. White2, S. Price2
1University and Foundation Policlinico San Matteo IRCCS, Intensive Care Dept 1, Pavia,Italy, 2Royal Brompton Hospital, Adult Intensive Care, London, UK, 3Necker-EnfantsMalades University Hospital, Paris, FranceINTRODUCTION. Acute cor pulmonale (ACP) is described in patients with adult respi-ratory distress syndrome (ARDS) and can be worsened by applying mechanical ventilationwith high ventilator pressure (1). The diagnosis of ACP can be rapidly obtained by bedsideechocardiography.Veno-venous ECMO potentially allows lung protective ventilation, providing an increase inoxygenation, pumping blood flow across the artificial lung, a reduction of CO2 and couldreduce the incidence of ACP.OBJECTIVES. We aimed to describe right ventricular function in patients with ARDStreated with vv-ECMO.METHODS. An observational analysis of retrospectively collected data in mechanicalventilated patients requiring extracorporeal assistance, who underwent bedside echocardi-ography. We collected LV/RV function data in addition to clinical and ventilator factors.We used Mann–Whitney test for continuous data and Fisher test for categorical data.RESULTS. Patients were 37 (age 40 ± 14 years), 18 male (48 %), admission APACHE IIwas 19.19 (± 5.9). All the patients were admitted as ECMO retrieval; the diagnosis wereH1/N1 for 13 patients, 1 drug intoxication, 5 aspiration pneumonia, 18 pneumonia. Fourpatients had features of ACP. Results are summarized in Table 1.
Table 1
Lactate 1.7, 0.6–8 2.5, 0.8–15 0.02
Peak inspiratory pressure 26, 19–36 29.5, 24–39 0.04
iNO 2.2, 0–18 7.3, 0–19 0.05
Adrenaline 0.01, 0–0.15 0.05, 0–0.24 0.005
LVEF (%) 56.18, 28.6–78.7 43.22, 20.5–60 0.01
TAPSE 1.7, 0.9–2.1 1.5, 0.9–2.2 0.17
Fluid balance 542, -1,337 to +2,863 1570, +160 to +5,207 0.01
CONCLUSIONS. There was no difference in term of mortality between male and female.Peak inspiratory pressure, lactate, inotrope requirement, LV ejection fraction and fluidbalance were related to increased mortality. A significant correlation was found between RVsystolic impairment (TAPSE \ 2 cm) and raised pCO2 (p = 0.002) (Graph 1).
Fig. 1
Moreover, we found a correlation between LV longitudinal systolic dysfunction (MAP-SE \ 1 cm) and high serum lactate (Graph 2).
Fig. 2
More studies looking at systolic and diastolic function in patients undergo vv ECMO areneeded.REFERENCES. 1. Vieillard-Baron A. et al. Crit Care Med. 2001; 29(8): 1551–5.
0637ECHO IN ITU: DO WE NEED TO DO IT OURSELVES?
F. Kovari1, T. Hazarika2
1North Middlesex University Hospital, Critical Care, London, UK, 2North MiddlesexUniversity Hospital, London, UKINTRODUCTION. Echocardiography is increasingly used in the management of thecritically ill patient as a non-invasive diagnostic and monitoring tool especially for the rapidassessment of cardiac function.OBJECTIVES. The aim of this audit was to analyse our current practice in regards ofECHO studies for patients admitted to our unit. Our goal was to point out to the importanceand the necessity of the ECHO training which could easily solve our constant struggle to geta study out of hours and especially during the week-end.METHODS. A single centre retrospective audit in an eight bed mixed ICU of a non-tertiaryuniversity hospital. During this audit period (2011–2012 to date) 30 patients were admitted tocritical care. We audited data of the initial diagnosis, ACS protocol, ECHO, the timing of ECHO,the performer of the ECHO study, the quality of ECHO report, the follow up and the outcome.RESULTS. We identified 30 patients for the last 12 months admitted to our unit with thediagnostic criteria. Almost all the patients (96 %) were started on the ACS protocol, inter-estingly only 40 % in the A/E 53 % in the ITU. In the first 24 h only 66 % of the cardiacpatient had had an ECHO study done the follow up rate was 25 %. We analysed the reportquality regarding basic cardiac function results such as ejection fraction (EF-90 %),leftventricular function (LVF-100 %), right ventricular function (RVF-95 %), pulmonaryhypertension (PHT-65 %), wall motion abnormalities (WMA-90 %) and pericardial fluid(PF-80 %).The studies were performed either by technicians (75 %) or physicians (25 %).CONCLUSIONS. Our audit suggest that the number of ECHO studies done in this highlyselected patients group is not adequate. One-third of our cardiac patient are not having the basiccardiac study within the first 24 h. 20 % of the reports are not answering the basic question ofthe existence of pericardial fluid. This is down to the unavailability of an otherwise overstretched service during the week-end or out of hours. Recently, intensivists have started to seekthe chance to develop echocardiographic skills. It can save time and help managing both cardiacand non cardiac patients better. We would like to point out that it is crucial and beneficial for anyTrust to let and help their intensivists obtain the necessary echocardiographic training. Our aimin our unit is to get all consultants competent in peri-resuscitation echocardiography and supportsome to undergo higher level of training. Eventually we would like to practice ITU ECHO not inisolation but in conjunction with consultant cardiologistREFERENCES. Echocardiography practice, training and accreditation in the intensivecare: document for the World Interactive Network Focused on Critical Ultrasound (WIN-FOCUS). The Use of Echocardiography in the Critically Ill; The Role of FADE (FastAssessment Diagnostic Echocardiography) Training.
0638CHANGES IN AORTIC MOTILITY THROUGH RISING PEEP LEVELS
D.F. Matallana Zapata1, M. Ruiz Bailén2, A. Castillo Rivera2, A. Gómez Blizniak2,
M.A. Martı́nez Arcos2, R. Vela Colmenero2, M.D. Pola Guzman2
1Complejo Hospitalario de Jaen, Jaen, Spain, 2Complejo Hospitalario de Jaen, Critical Care,Jaen, SpainINTRODUCTION. The interaction between mechanical ventilation and the aorta is notwell known. The aorta is not usually assigning a clear role in hemodynamic function. The
26th ESICM ANNUAL CONGRESS — PARIS, FRANCE — 5–9 OCTOBER 2013
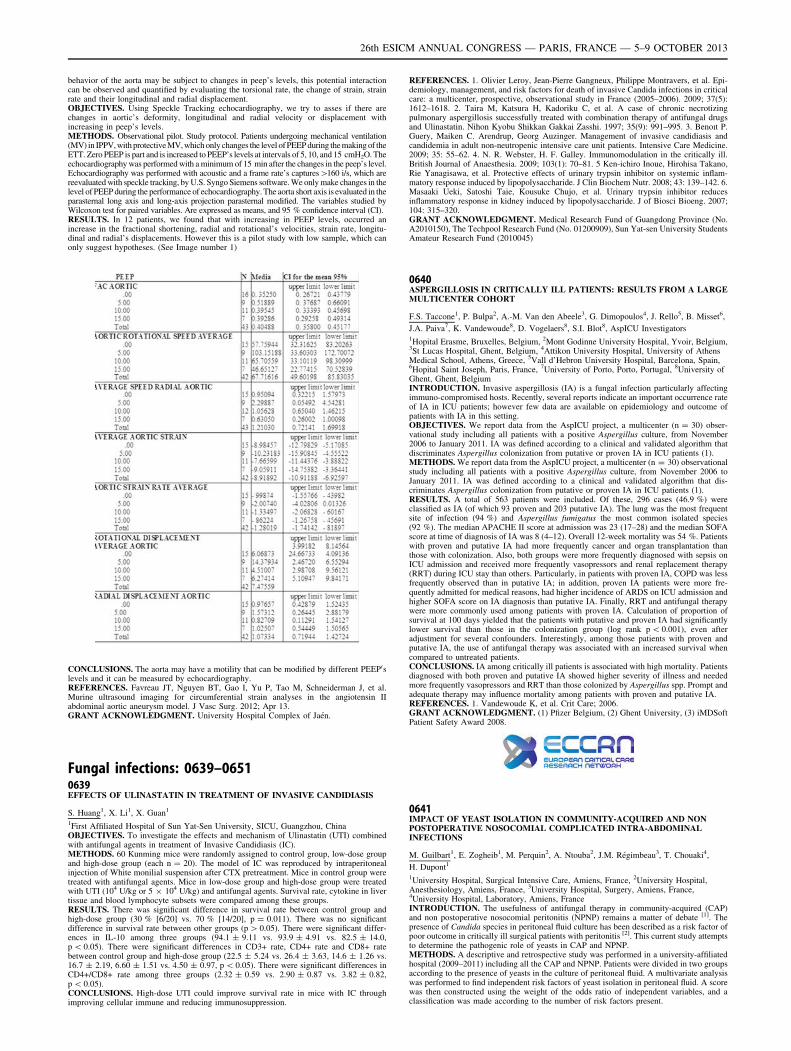
behavior of the aorta may be subject to changes in peep’s levels, this potential interactioncan be observed and quantified by evaluating the torsional rate, the change of strain, strainrate and their longitudinal and radial displacement.OBJECTIVES. Using Speckle Tracking echocardiography, we try to asses if there arechanges in aortic’s deformity, longitudinal and radial velocity or displacement withincreasing in peep’s levels.METHODS. Observational pilot. Study protocol. Patients undergoing mechanical ventilation(MV) in IPPV, with protective MV, which only changes the level of PEEP during the making of theETT. Zero PEEP is part and is increased to PEEP’s levels at intervals of 5, 10, and 15 cmH2O. Theechocardiography was performed with a minimum of 15 min after the changes in the peep’s level.Echocardiography was performed with acoustic and a frame rate’s captures[160 i/s, which arereevaluated with speckle tracking, by U.S. Syngo Siemens software. We only make changes in thelevel of PEEP during the performance of echocardiography. The aorta short axis is evaluated in theparasternal long axis and long-axis projection parasternal modified. The variables studied byWilcoxon test for paired variables. Are expressed as means, and 95 % confidence interval (CI).RESULTS. In 12 patients, we found that with increasing in PEEP levels, occurred anincrease in the fractional shortening, radial and rotational’s velocities, strain rate, longitu-dinal and radial’s displacements. However this is a pilot study with low sample, which canonly suggest hypotheses. (See Image number 1)
CONCLUSIONS. The aorta may have a motility that can be modified by different PEEP0slevels and it can be measured by echocardiography.REFERENCES. Favreau JT, Nguyen BT, Gao I, Yu P, Tao M, Schneiderman J, et al.Murine ultrasound imaging for circumferential strain analyses in the angiotensin IIabdominal aortic aneurysm model. J Vasc Surg. 2012; Apr 13.GRANT ACKNOWLEDGMENT. University Hospital Complex of Jaén.
Fungal infections: 0639–06510639EFFECTS OF ULINASTATIN IN TREATMENT OF INVASIVE CANDIDIASIS
S. Huang1, X. Li1, X. Guan1
1First Affiliated Hospital of Sun Yat-Sen University, SICU, Guangzhou, ChinaOBJECTIVES. To investigate the effects and mechanism of Ulinastatin (UTI) combinedwith antifungal agents in treatment of Invasive Candidiasis (IC).METHODS. 60 Kunming mice were randomly assigned to control group, low-dose groupand high-dose group (each n = 20). The model of IC was reproduced by intraperitonealinjection of White monilial suspension after CTX pretreatment. Mice in control group weretreated with antifungal agents. Mice in low-dose group and high-dose group were treatedwith UTI (104 U/kg or 5 9 104 U/kg) and antifungal agents. Survival rate, cytokine in livertissue and blood lymphocyte subsets were compared among these groups.RESULTS. There was significant difference in survival rate between control group andhigh-dose group (30 % [6/20] vs. 70 % [14/20], p = 0.011). There was no significantdifference in survival rate between other groups (p [ 0.05). There were significant differ-ences in IL-10 among three groups (94.1 ± 9.11 vs. 93.9 ± 4.91 vs. 82.5 ± 14.0,p \ 0.05). There were significant differences in CD3+ rate, CD4+ rate and CD8+ ratebetween control group and high-dose group (22.5 ± 5.24 vs. 26.4 ± 3.63, 14.6 ± 1.26 vs.16.7 ± 2.19, 6.60 ± 1.51 vs. 4.50 ± 0.97, p \ 0.05). There were significant differences inCD4+/CD8+ rate among three groups (2.32 ± 0.59 vs. 2.90 ± 0.87 vs. 3.82 ± 0.82,p \ 0.05).CONCLUSIONS. High-dose UTI could improve survival rate in mice with IC throughimproving cellular immune and reducing immunosuppression.
REFERENCES. 1. Olivier Leroy, Jean-Pierre Gangneux, Philippe Montravers, et al. Epi-demiology, management, and risk factors for death of invasive Candida infections in criticalcare: a multicenter, prospective, observational study in France (2005–2006). 2009; 37(5):1612–1618. 2. Taira M, Katsura H, Kadoriku C, et al. A case of chronic necrotizingpulmonary aspergillosis successfully treated with combination therapy of antifungal drugsand Ulinastatin. Nihon Kyobu Shikkan Gakkai Zasshi. 1997; 35(9): 991–995. 3. Benoıt P.Guery, Maiken C. Arendrup, Georg Auzinger. Management of invasive candidiasis andcandidemia in adult non-neutropenic intensive care unit patients. Intensive Care Medicine.2009; 35: 55–62. 4. N. R. Webster, H. F. Galley. Immunomodulation in the critically ill.British Journal of Anaesthesia. 2009; 103(1): 70–81. 5 Ken-ichiro Inoue, Hirohisa Takano,Rie Yanagisawa, et al. Protective effects of urinary trypsin inhibitor on systemic inflam-matory response induced by lipopolysaccharide. J Clin Biochem Nutr. 2008; 43: 139–142. 6.Masaaki Ueki, Satoshi Taie, Kousuke Chujo, et al. Urinary trypsin inhibitor reducesinflammatory response in kidney induced by lipopolysaccharide. J of Biosci Bioeng. 2007;104: 315–320.GRANT ACKNOWLEDGMENT. Medical Research Fund of Guangdong Province (No.A2010150), The Techpool Research Fund (No. 01200909), Sun Yat-sen University StudentsAmateur Research Fund (2010045)
0640ASPERGILLOSIS IN CRITICALLY ILL PATIENTS: RESULTS FROM A LARGEMULTICENTER COHORT
F.S. Taccone1, P. Bulpa2, A.-M. Van den Abeele3, G. Dimopoulos4, J. Rello5, B. Misset6,
J.A. Paiva7, K. Vandewoude8, D. Vogelaers8, S.I. Blot8, AspICU Investigators1Hopital Erasme, Bruxelles, Belgium, 2Mont Godinne University Hospital, Yvoir, Belgium,3St Lucas Hospital, Ghent, Belgium, 4Attikon University Hospital, University of AthensMedical School, Athens, Greece, 5Vall d’Hebron University Hospital, Barcelona, Spain,6Hopital Saint Joseph, Paris, France, 7University of Porto, Porto, Portugal, 8University ofGhent, Ghent, BelgiumINTRODUCTION. Invasive aspergillosis (IA) is a fungal infection particularly affectingimmuno-compromised hosts. Recently, several reports indicate an important occurrence rateof IA in ICU patients; however few data are available on epidemiology and outcome ofpatients with IA in this setting.OBJECTIVES. We report data from the AspICU project, a multicenter (n = 30) obser-vational study including all patients with a positive Aspergillus culture, from November2006 to January 2011. IA was defined according to a clinical and validated algorithm thatdiscriminates Aspergillus colonization from putative or proven IA in ICU patients (1).METHODS. We report data from the AspICU project, a multicenter (n = 30) observationalstudy including all patients with a positive Aspergillus culture, from November 2006 toJanuary 2011. IA was defined according to a clinical and validated algorithm that dis-criminates Aspergillus colonization from putative or proven IA in ICU patients (1).RESULTS. A total of 563 patients were included. Of these, 296 cases (46.9 %) wereclassified as IA (of which 93 proven and 203 putative IA). The lung was the most frequentsite of infection (94 %) and Aspergillus fumigatus the most common isolated species(92 %). The median APACHE II score at admission was 23 (17–28) and the median SOFAscore at time of diagnosis of IA was 8 (4–12). Overall 12-week mortality was 54 %. Patientswith proven and putative IA had more frequently cancer and organ transplantation thanthose with colonization. Also, both groups were more frequently diagnosed with sepsis onICU admission and received more frequently vasopressors and renal replacement therapy(RRT) during ICU stay than others. Particularly, in patients with proven IA, COPD was lessfrequently observed than in putative IA; in addition, proven IA patients were more fre-quently admitted for medical reasons, had higher incidence of ARDS on ICU admission andhigher SOFA score on IA diagnosis than putative IA. Finally, RRT and antifungal therapywere more commonly used among patients with proven IA. Calculation of proportion ofsurvival at 100 days yielded that the patients with putative and proven IA had significantlylower survival than those in the colonization group (log rank p \ 0.001), even afteradjustment for several confounders. Interestingly, among those patients with proven andputative IA, the use of antifungal therapy was associated with an increased survival whencompared to untreated patients.CONCLUSIONS. IA among critically ill patients is associated with high mortality. Patientsdiagnosed with both proven and putative IA showed higher severity of illness and neededmore frequently vasopressors and RRT than those colonized by Aspergillus spp. Prompt andadequate therapy may influence mortality among patients with proven and putative IA.REFERENCES. 1. Vandewoude K, et al. Crit Care; 2006.GRANT ACKNOWLEDGMENT. (1) Pfizer Belgium, (2) Ghent University, (3) iMDSoftPatient Safety Award 2008.
0641IMPACT OF YEAST ISOLATION IN COMMUNITY-ACQUIRED AND NONPOSTOPERATIVE NOSOCOMIAL COMPLICATED INTRA-ABDOMINALINFECTIONS
M. Guilbart1, E. Zogheib1, M. Perquin2, A. Ntouba2, J.M. Régimbeau3, T. Chouaki4,
H. Dupont1
1University Hospital, Surgical Intensive Care, Amiens, France, 2University Hospital,Anesthesiology, Amiens, France, 3University Hospital, Surgery, Amiens, France,4University Hospital, Laboratory, Amiens, FranceINTRODUCTION. The usefulness of antifungal therapy in community-acquired (CAP)and non postoperative nosocomial peritonitis (NPNP) remains a matter of debate [1]. Thepresence of Candida species in peritoneal fluid culture has been described as a risk factor ofpoor outcome in critically ill surgical patients with peritonitis [2]. This current study attemptsto determine the pathogenic role of yeasts in CAP and NPNP.METHODS. A descriptive and retrospective study was performed in a university-affiliatedhospital (2009–2011) including all the CAP and NPNP. Patients were divided in two groupsaccording to the presence of yeasts in the culture of peritoneal fluid. A multivariate analysiswas performed to find independent risk factors of yeast isolation in peritoneal fluid. A scorewas then constructed using the weight of the odds ratio of independent variables, and aclassification was made according to the number of risk factors present.
26th ESICM ANNUAL CONGRESS — PARIS, FRANCE — 5–9 OCTOBER 2013
RESULTS. Among 310 patients, 223 (71.9 %) had a CAP and 87 (28.1 %) a NPNP. Yeastswere found in peritoneal fluid in 39 cases (12.6 %). The main characteristics of the twogroups are presented in the Table. Isolation of yeasts was associated with more surgery (25.6vs. 11.4 %, p = 0.028), hemodynamic failure (46.2 vs. 15.1 %, p \ 0.001), duration ofmechanical ventilation (6 ± 13 days vs. 2 ± 9, p \ 0.001), length of stay in ICU (9 ± 16days vs. 3 ± 9, p \ 0.001), and in hospital (24 ± 26 days vs. 14 ± 17, p \ 0.001), anddeath (25.6 vs. 7.7 %, p = 0.014). Four independent risk factors of yeast isolation werefound: nosocomial infection (OR 3.3; CI 95 % [1.5–7.2], p = 0.002, 1 point), upper gastro-intestinal tract location (OR 2.8; CI 95 % [1.3–6.4], p = 0.01, 1 point), generalized peri-tonitis (OR 6,9; CI 95 % [2.8–16.9], p = 0.001, 2 points), and peroperative hemodynamicfailure (OR 3.4; CI 95 % [1.5–7.5], p = 0.002, 1 point). For a score C3, sensitivity was74 %, specificity was 77 %, positive and negative predictive values were 33 % and 95 %respectively, and overall accuracy was 77 %.
Main characteristics of the 2 groups
Yeast+(n = 39)
Yeast-(n = 271)
p value
ASA score 3 (1–5) 3 (2–4) 0.001
Malignancy (%) 7 (17.9) 14 (5.2) 0.008
Risk factor of multidrug resistantbacteria (%)
21 (53.8) 66 (24.4) \0.001
APACHE II score 14 ± 11 8 ± 8 \0.001
Nosocomial origin (%) 20 (51.3) 57 (21) \0.001
Generalized peritonitis (%) 31 (79.5) 100 (26.9) \0.001
Ongoing antimicrobial therapy (%) 12 (30.8) 38 (14) 0.015
Hemodynamic failure (%) 12 (30.8) 41 (15.1) \0.001
Upper gastrointestinal tractlocation (%)
18 (46.2) 78 (28.8) 0.044
CONCLUSIONS. The presence of yeasts in CAP and NPNP was associated with anincrease of morbidity and mortality. Only two independent risk factors were similar to thosedescribed in ICU patients [2] (upper gastro-intestinal tract location and cardiovascularfailure). The high negative predictive value of the score could help not to introduce anempirical antifungal treatment.REFERENCES. 1. Crit Care Med. 2006; 34: 646–652. 2. Crit Care Med. 2003; 31:752–757.
0642CEREBRAL ASPERGILLOSIS IN ADULT CRITICALLY ILL PATIENTS:A DESCRIPTIVE REPORT OF 10 PATIENTS FROM THE ASPICU COHORT
H. Spapen1, J. Spapen2, F.S. Taccone3, G. Dimopoulos4, J. Rello5, S. Blot6, and the AspICUstudy investigators1University Hospital Brussels, ICU Department, Brussels, Belgium, 2University HospitalBrussels, Brussels, Belgium, 3Erasme University Hospital, Brussels, Belgium, 4AttikonUniversity Hospital, University of Athens Medical School, Athens, Greece, 5HospitalUniversitari Vall d’Hebron, Barcelona, Spain, 6Ghent University, Ghent, BelgiumINTRODUCTION. An unexpectedly high incidence of invasive pulmonary aspergillosishas been reported in intensive care unit (ICU) patients without underlying immunosup-pression. Next to the respiratory tract, the brain is most often affected by invasiveaspergillosis. However, little is known about brain involvement by Aspergillus in criticallyill patients.OBJECTIVES. To study demographics, risk profile, diagnosis, treatment, and outcome ofcentral nervous system aspergillosis in ICU patients.METHODS. Retrospective analysis of proven cases of invasive cerebral aspergillosis takenfrom a cohort of 563 adult patients in whom Aspergillus involvement was evidenced duringtheir ICU stay.RESULTS. Ten patients with central nervous system aspergillosis were identified. All hadone or more host factors predisposing for invasive aspergillosis. Clinical presentation wassubtle and, apart from unexplained fever, mostly devoid from ‘‘classical’’ neurologicalmanifestations. All but one patient had proven or probable/putative invasive pulmonaryaspergillosis. On cerebral CT scanning, lesions appeared to be either solitary and hyper-dense or were multiple and randomly distributed throughout the brain. One patient presentedwith sole meningeal infestation. Aspergillus infection was confirmed by brain biopsy inthree subjects. Voriconazole was used as primary treatment in only half of the patients. Ninepatients died, six of them receiving antifungal treatment for \2 weeks.CONCLUSIONS. Central nervous system aspergillosis was not frequently observed inadult ICU patients. Diagnosis should be considered in patients at risk presenting with provenor probable/putative invasive pulmonary aspergillosis in association with suggestive neuro-radiological findings. The brain most likely was affected through haematogenous dissemi-nation from the lungs. Current treatment recommendations were not always applied andoutcome remains dismal.GRANT ACKNOWLEDGMENT. The AspICU project received an unrestricted educa-tional grant from Pfizer Belgium and a research grant from the Special Research Fund ofGhent University.
0643THE PROTECTIVE EFFECT OF PROTEASE INHIBITORS ON LIVERMITOCHONDRIA IN INVASIVE CANDIDA INFECTION MICE
S. Huang1, X. Li1
1The First Affiliated Hospital of Sun Yat-Sen University, SICU, Guangzhou, ChinaOBJECTIVES. To investigate the effects and mechanism of Ulinastatin (UTI) combinedwith antifungal agents in treatment of invasive candidiasis (IC).METHODS. 60 Kunming mice were randomly assigned to control group, low-dose groupand high-dose group (each n = 20). The model of IC was reproduced by intraperitonealinjection of White monilial suspension after CTX pretreatment. Mice in control group weretreated with antifungal agents. Mice in low-dose group and high-dose group were treatedwith UTI (104 or 5 9 104 U/kg) and antifungal agents. To observe the three groups of
mitochondria generate indicators and nitride stress indicators in 7 days were comparedamong these groups.RESULTS. In 7th days, PGC-1a mRNA of high-dose group was significantly higher thanthe low-dose group and the control group (2.12 ± 0.24 vs 1.52 ± 0.22 vs 0.64 ± 0.12,p \ 0.05).There was no significantly difference in PGC-1a mRNA between the low-dosegroup and the control group (1.52 ± 0.22 vs 0.64 ± 0.12, p [ 0.05). In 7th day, the nitridestress indicators (NO, Total NO and iNOS) in high dose group was significantly lower thanthe low-dose group and the control group (0.5 ± 0.1 vs 1.6 ± 0.3 vs 2.8 ± 0.5,1.2 ± 0.2 vs2.5 ± 0.2 vs 4.2 ± 0.5, 0.6 ± 0.1 vs 1.0 ± 0.5 vs 3.8 ± 0.4, p \ 0.05). There was nosignificantly difference in nitride stress indicators between the low-dose group and thecontrol group in 7th days (p [ 0.05).CONCLUSIONS. By inhibiting nitride stress, Ulinastatin protects liver mitochondria andpromotes liver mitochondria generate in invasive candida infection mice.REFERENCES. 1. Pfaller MA, Diekema DJ. Epidemiology of invasive candidiasis: apersistent public health problem. Clin Microbiol Rev. 2007; 20: 133–163. 2. Singer M.Mitochondrial function in sepsis: acute phase versus multiple organ failure. Crit Care Med.2007; 35(91): S441–448. 3. Ken-ichiro Inoue, Hirohisa Takano, Rie Yanagisawa, et al.Protective effects of urinary trypsin inhibitor on systemic inflammatory response induced bylipopolysaccharide. J Clin Biochem Nutr. 2008; 43: 139–142. 4. Masaaki Ueki, SatoshiTaie, Kousuke Chujo, et al. urinary trypsin inhibitor reduces inflammatory response inkidney induced by lipopolysaccharide. J Biosc Bioeng. 2007; 104: 315–320. 5. Zhou LW,Wang YL, Yan XT, et al. Urinary trypsin inhibitor treatment ameliorates acute lung andliver injury resulting from sepsis in a rat model. Saudi Med J. 2008; 29(3): 369–373. 6.Hirohisa Takano, Ken-ichiro Inoue, Akinori Shimada, et al. Urinary trypsin inhibitor pro-tects against liver injury and coagulation pathway dysregulation induced bylipopolysaccharide/D-galactosamine in mice. Lab Invest. 2009; 89: 833–839.GRANT ACKNOWLEDGMENT. Medical Research Fund of Guangdong Province(A2010150), college students in Guangdong Province innovative experiment plan (2010),Techpool Research Fund (01200909), Sun Yat-sen University students amateur ScientificResearch Fund (2010045).
0644POSTPONING THE ADMINISTRATION OF PARENTERAL NUTRITIONREDUCES THE NEED FOR ANTIFUNGAL THERAPY: A POST-HOC ANALYSISOF THE EPANIC CLINICAL TRIAL
T. Fivez1, M.P. Casaer1, S. Vanderheyden1, P. Wouters1, F. Beyls1, T. De Rijdt2,G. Van den Berghe1, D. Mesotten1
1KU Leuven, Intensive Care Medicine, Leuven, Belgium, 2KU Leuven, Department ofPharmacy, Leuven, BelgiumINTRODUCTION. In a large randomized controlled trial, postponing parenteral nutrition,when enteral nutrition was insufficient (Late-PN), enhanced recovery as compared to Early-PN (1). The duration of ICU dependency and organ dysfunction was shortened by Late-PN.Moreover, the incidence of ICU acquired infections was significantly reduced from 26.2 to22.8 %. PN use is associated with fungemia and is a factor in the candida score for earlyantifungal treatment (2). However costs may be high as often prolonged administration ofsometimes expensive antifungal drugs is needed.OBJECTIVES. To analyze the impact of Late-PN on the need for antifungal drugs.METHODS. This post hoc analysis of antifungal drug costs is based on prospectivelycollected pharmacy warehouse data in the participating hospitals. The pharmacy warehousecollaborators were blinded for the study intervention (3).Patients’ pharmacy costs were classified by the Anatomic Therapeutic Chemical (ATC)system. Total systemic antifungal drug (ATC J02A) costs during hospitalization were splitin costs generated during ICU stay and after ICU discharge. Between group differences werecompared by mean drug costs per patient (t test) and the distribution of costs was analyzedby medians and interquartile range (IQR) and Mann–Whitney U test.RESULTS. Pharmacy costs were available for all patients in the intention-to-treat popu-lation (n = 4,640). Total costs for systemic anti-fungal drugs during the entirehospitalization were 606180,04 EUR with Late-PN as compared to 1017399,54 EUR withEarly-PN. This is a mean reduction of 179,67 EUR per patient (p = 0.015).Baseline characteristics (including type and severity of disease) of patients requiring anti-fungal drugs in ICU were comparable in the Late and Early-PN group. In the ICU, Late-PNreduced the mean anti-fungal cost per patient by 107,87 EUR (p = 0.049). This reductionwas not explained by the proportion of patients who received one ore more doses of anti-fungal drugs in the ICU: 13.8 % (321/2328) with Late PN versus 14,6 % (337/2312) withEarly-PN (p = 0.44). However, in these treated patients, the median and IQR of antifungaltherapy costs in ICU were 69,01 [31,62 - 313,57] in the Late-PN group as compared to106,40 (37,39–736,69) EUR in the Early-PN group (p \ 0.001).CONCLUSIONS. Postponing parenteral nutrition in the ICU reduced total in-hospital anti-fungal drug costs. In ICU, cumulative antifungal drug costs in Late-PN patients requiringtherapy were much lower. Whether this is caused by shorter treatment or a reduced need forhigher generation antifungal is yet unknown. Both would possibly reflect fewer patientssuffering from invasive fungal infections.REFERENCES. 1. Casaer MP ea. N Engl J Med. 2011. 2. Pasero D ea. ICVTS. 2011. 3.Vanderheyden S ea. Crit Care 2012.GRANT ACKNOWLEDGMENT. FWO-Vlaanderen, Methusalem.
0645THE IMMUNE RESPONSE AFTER STIMULATION WITH WALL COMPONENTSOF FUNGI
S. Aloizos1, E. Tsigou2, P. Myrianthefs2, S. Gourgiotis1, A. Tsakris3, G. Baltopoulos2
1NIMTS Hospital, Athens, Greece, 2Agioi Anargiroi Hospital, Athens, Greece, 3AthensMedical School, Athens, GreeceINTRODUCTION. Although fungi are a leading cause of serious infections, induction ofinflammation by fungi has not been extensively studied.OBJECTIVES. The purpose of this study was to evaluate the immune response of patients(pts) susceptible to infection by fungi after ex vivo provocation using wall components offungi (mannan) and to compare the reaction to the one of healthy volunteers.METHODS. Blood sample was obtained from ten healthy volunteers, ten pts with end stagechronic renal failure (ESRD-CRF) immediately before hemodialysis, 10 pts with type IIdiabetes mellitus (DM) and ten Intensive Care Unit (ICU) pts on the 2nd day of hospital-ization, who suffered non septic Systemic Inflammatory Response Syndrome and had anAcute Physiology and Chronic Health Evaluation II score[25. After suitable treatment thesamples were incubated with 100 mg of mannan for 8 h and maintained at -20 �C until the
26th ESICM ANNUAL CONGRESS — PARIS, FRANCE — 5–9 OCTOBER 2013
measurement of the cytokines TNF-a, IL-6, IL-1b, and IL-10, using the ELISA method. Theresults are presented as mean values ± SEM, the variation of each cytokine for each groupof patients was assessed by Student0s t-test and the differences between the four groups withANOVA. Graph Pad 4.0 was used for data analysis.RESULTS. Baseline cytokine values in the three groups were increased compared tocontrol group, but the difference was statistically significant only for the ICU group(Table 1). The quotient IL-10/IL-6 of baseline values was found between 0.23 and 0.96among healthy, hemodialysis, and diabetic persons, while the quotient was 1.32 amongseverely ill pts. In all examined groups, the levels of cytokines increased significantly afterstimulation with mannan, with a differential expression between examined groups (five–seven-folds for ICU pts and ten–twenty-one-folds for the other groups).
Table 1 Levels of cytokines before and after stimulation
Valuesin pg/ml
Control Control ESRD ESRD DM DM ICU ICUBaseline Mannan Baseline Mannan Baseline Mannan Baseline Mannan
TNF-a 5.70 ±0.80
110.00 ±17.89
24.90 ±5.92
459.10 ±91.41
15.80 ±2.93
293.40 ±57.26
337.10 ±60.64
2,354.00 ±518.10
IL-6 8.90 ±0.76
156.00 ±18.63
86.60 ±45.55
842.10 ±35.37
15.90 ±1.89
176.00 ±28.92
372.40 ±120.6
2,385.00 ±741.10
IL-1b 4.30 ±0.56
75.80 ±11.07
23.50 ±7.32
487.20 ±72.82
14.30 ±2.35
274.30 ±64.40
277.10 ±53.36
1,722.00 ±383.10
IL-10 3.00 ±1.08
38.60 ±9.54
19.20 ±7.14
295.90 ±94.77
15.30 ±2.08
266.70 ±62.08
492.60 ±66.72
2,812.00 ±343.70
CONCLUSIONS. Severely ill pts and secondarily hemodialysis and diabetic pts are in apro-inflammatory state. The response of all pts groups was tested as sufficient and com-parable to that of healthy individuals, with a different cytokine production capacity betweenexamined groups, reflecting different immune status.REFERENCES. 1. Monerret G, et al. Medical mycology. 2011; 49: S17–23.
0646EPIDEMIOLOGY OF FUNGAL INFECTION IN MEDICO-SURGICAL ICU:OBSERVATIONAL STUDY
M.A. Mikaszewska-Sokolewicz1, A. Roziewska2, A. Sawicka2, T. Lazowski2, M. Mikaszewska2
1The Medical University Warsaw, 1st Clinic of Anaesthesiology and Intensive Care,Warsaw, Poland, 2The Medical University Warsaw, Warsaw, PolandINTRODUCTION. Invasive fungal infection are increasingly common in ICU population.Morbidity and mortality remains very high despite new diagnostic and therapeuticpossibilities.OBJECTIVES. Epidemiology of fungal infections on admission and acquired during ICUstay.METHODS. Prospective observational study of population of patients hospitalized inmedico-surgical ICU in 18 month period.RESULTS. There were 352 patients admitted to ICU; 33 medical and 49 surgical patientwere admitted to ICU with fungal infection. During ICU stay 47 patient acquired fungalinfection. Candida albicans was the most frequent pathogen (88 %) followed by Candidaglabrata and Candida parapsilosis. Invasive aspergillosis was diagnosed in four patients.Previous exposure to steroid and antibiotics was the main predisposing factor. Positiveblood cultures were obtained in 10 % of patients. Severity scores and mortality was highestin Aspergillosis. Susceptibility to fluconazole was observed in 64 % of Candida albicans.Appropriate antifungal therapy was implemented in 80 % of patients hospitalized longerthan 3 days in the ICU. Suboptimal fluconazole dose was given to 62 % of patients.Mortality rate was highest in Aspergillosis (100 %) and candida glabrata infection.Immunosuppression, diabetes and shock were independently associated with death in theICU.CONCLUSIONS. Mortality in fungal infection remains very high despite progress indiagnosing and treatment possibilities. Suboptimal dosing of antifungal medication isworrisome and may be responsible for high treatment futility rateREFERENCES. Leroy O, Gagneux JP, Montraves P et al. Epidemiology, management, andrisk factors for death of invasive Candida infections in critical care: a multicenter, pro-spective, observational study in France (2005–2006). Crit Care Med. 2009; 37:(5):1612–1618.GRANT ACKNOWLEDGMENT. PROSAFE 2007331.
0647ÉPICO PROJECT DEVELOPMENT OF EDUCATIONAL RECOMMENDATIONSUSING THE DELPHI TECHNIQUE ON INVASIVE CANDIDIASIS IN NONNEUTROPENIC CRITICALLY ILL ADULT PATIENTS
R. Zaragoza1, R. Ferrer2, P. Llinares3, E. Maseda4, A. Rodriguez5, THE EPICO PROJECTGROUP1Hospital Universitario Dr. Peset, Sepsis Unit, Intensive Care Unit, Valencia, Spain,2Hospital Universitario Mutua de Tarrasa, ICU, Tarrasa, Spain, 3Hospital Universitario JuanCanalejo, Infectious Diseases, A Coruña, Spain, 4Hospital Universitario La Paz,Anestesiology, Madrid, Spain, 5Hospital Universitari Joan XXIII, ICU, Tarragona, SpainINTRODUCTION. Although there has been an improved management of Invasive Can-didiasis in the last decade, still controversial issues remains, specially in the diagnostic andtherapeutic approach.OBJECTIVES. We sought to identify the core clinical knowledge and to achieve highagreement recommendations required to care for critically ill adults patients with invasivecandidiasis.METHODS. Prospective Spanish survey reaching consensus by the Delphi technique,conducted anonymously by electronic e-mail in a first term to 25 national multidisciplinaryexperts in invasive fungal infections from five national scientific societies including in-tensivists, anesthesiologists, microbiologists, pharmacologists and infectious diseasesspecialists, answering 47 questions prepared by a coordination group after an a strict reviewof literature in the last 5 years. The educational objectives spanned five categories, includingepidemiology, diagnostic tools, prediction rules, treatment and deescalation approach. Theagreement among panellist in each item should be higher than 75 % to be selected. In asecond term, after extracting recommendations from the selected items, a presential meetingwas performed where more than 80 specialists in a second round were invited to validate thepreselected recommendations.
RESULTS. In the first term 20 recommendations were preselected (Epidemiology 4, scores3, diagnostic tools 4, treatment 6 and de-escalation approach 3). After the second round thefollowing 12 were validatedEpidemiology (2): Think on Candidiasis in your ICU and do not forget that non- albicansspecies also exist.Diagnostic tools (4): Blood cultures should be extracted under suspicion each 2–3 days, andif positive each 3 days until the first negative one. Obtain sterile fluids and tissue if possible(direct examination of sample is important). Use non culture microbiological tools if youcan. Determination of antifungal susceptibility is mandatory.Scores (1): As screening tool in high risk patients use Candida score and determine multicolonization.Treatment (4): Start early. Choose Echinocandins. Withdraw the catheter. Fundoscopy isneeded.De-escalation (1): Only applied when knowing susceptibility and after 3 days of clinicalstability. The higher rate of agreement was achieved in the optimization of microbiologicaltools and the withdrawal of catheter whereas the lower rate corresponded to deescalationtherapy and the use of scores.CONCLUSIONS. Care of Invasive candidiasis in ICU patients requires a broad range ofknowledge application and skills that our recommendations resume. These recommenda-tions may help to identify the potential patients, to standardize the global management ofthese patients and improve their outcome based on DELPHI methodology.
0648STUDY OF THE ASSOCIATION BETWEEN THE TYPE OF ANTIFUNGALMEDICATION AND THE CAUSE OF PRESCRIPTION WITH THE PROGNOSISOF THE CRITICAL PATIENT
V. Trasmonte1, D. Pérez1, V. Jerez1, M. Robles1, P. Martı́nez1, P. Nieto1, M.Á. Santiago1,
B. Amores1, B. Bermejo1, V. Farje1, J.A. Rubio1, J. Ballesteros1, J.D. Jiménez1, Á. López1,R. Bayo1, J.A. Juliá1
1Hospital Infanta Cristina, Intensive Care Unit, Badajoz, SpainINTRODUCTION AND OBJECTIVES. The purpose of this poster is to determine ifeither the use of certain types of antifungal medications or the cause of the prescription havean influence in the prognosis of the critical patient.METHODS. Retrospective observational study based on the patients treated with antifungaltherapy in our Intensive Care Unit between 01/01/2010 and 12/12/2012. The patients weretreated as prophylactic, empiric or therapeutic therapy.RESULTS. 161 patients (micafungin 26.7 %, amphotericin B 6.2 %, anidulafungin 18.6 %,caspofungin 9.9 %, voriconazole 26.1 %, fluconazole 12.4 %), female 38.5 % (62/161).Mean age 58 ± 14.8. The average pre-admission APACHE II: 18.5 ± 7 and SOFA:6.4 ± 3.4. Diabetes mellitus and prior steroid treatment were the most frequent findings inthe medical history. The beginning of the treatment was empiric in 50 %, prophylactic in40 % and therapeutic in 10 %. The mortality was 44 % during this period (72 patients).We found statistically significant differences with regard to:-The most commonly used as prophylactic therapy was anidulafungin (32.3 %), as empiricvoriconazole (33.8 %) and fluconazole as therapeutic treatment (37.5 %) (p = 0.002)-Despite micafungin was the antifungal agent most commonly used in surgery patients, astatistical significance was only observed in patients who underwent surgery for tertiaryperitonitis (p = 0.016). If extrarenal depuration procedures were required, micafungin wasthe most commonly used antifungal (56 %, p \ 0.002).-Micafungin was also the most commonly used antifungal in patients with multi-coloni-zation (46.2 % p = 0.016), and its use was higher with statistical significance in multi-colonized patients who developed invasive fungal infections (IFIs).-Statistically significant differences with regard to death rate were observed for each anti-fungal agent (p = 0.03).-Mortality was higher in the group of patients treated with empiric (48.3 %) or prophylactic(40.4 %) antifungal therapy than in those with therapeutic strategy (11.3 %), but thisassociation was not statistically significant (p = 0.8). The need for mechanical ventilation inthe three different groups showed a similar association as mortality.CONCLUSIONS. Although a high morbi-mortality was noted, we observed that thetherapeutic strategy is associated with lower mortality rates and need for mechanical ven-tilation. Death rate was higher in the group treated with micafungin, probably related to thegreater severity of those patients (more preadmission risk factors, higher APACHE II andSOFA scores, more surgery procedures and extrarenal depuration procedures, longerduration of mechanical ventilation and higher rates of IFIs). Echinocandins were the anti-fungal agents more commonly used in the critical patient, whereas we used azoles fortherapeutic treatments aimed at certain fungal infections.
0649THE PROTECTIVE EFFECT OF PROTEASE INHIBITORS ON LIVERIN INVASIVE CANDIDIASIS MICE
S. Huang1, X. Li1
1The First Affiliated Hospital of Sun Yat-Sen University, SICU, Guangzhou, ChinaOBJECTIVES. To investigate the effects and mechanism of Ulinastatin (UTI) combinedwith antifungal agents in treatment of Invasive Candidiasis (IC).METHODS. 60 Kunming mice were randomly assigned to control group, low-dose groupand high-dose group (each n = 20). The model of IC was reproduced by intraperitonealinjection of White monilial suspension after CTX pretreatment. Mice in control group weretreated with antifungal agents. Mice in low-dose group and high-dose group were treatedwith UTI (104 or 5 9 104 U/kg) and antifungal agents. To observed survival and liverenzymology and liver morphological changes were compared among these groups in 7 days.RESULTS. Invasive candidiasis mouse model was successfully made. In 7 days, survival ofthe high dose group was significantly higher than that of the control group (70 vs. 30 %,p = 0.011). In 7th days, total bilirubin, aspartate aminotransferase and alanine amino-transferase in high dose group were significantly lower than low dose group and the controlgroup (12.1 ± 1.9 vs. 18.9 ± 2.6 vs. 21.0 ± 2.4, 624.8 ± 89.5 vs. 1,026.1 ± 162.5 vs.1,633.4 ± 160.2, 426.5 ± 78.0 vs. 934.9 ± 49.1 vs. 1,494.1 ± 123.1, p \ 0.05). Totalbilirubin, aspartate aminotransferase, alanine aminotransferase were no significantly dif-ference between low-dose group and the control group (18.9 ± 2.6 vs. 21.0 ± 2.4,1,026.1 ± 162.5 vs. 1,633.4 ± 160.2, p [ 0.05). Under microscope after H&E staining,liver sinusoidal congestive in the high-dose group was better than the control group. Underthe electron microscope, liver mitochondrial integrity in the high-dose group was better thanthe control group.
26th ESICM ANNUAL CONGRESS — PARIS, FRANCE — 5–9 OCTOBER 2013
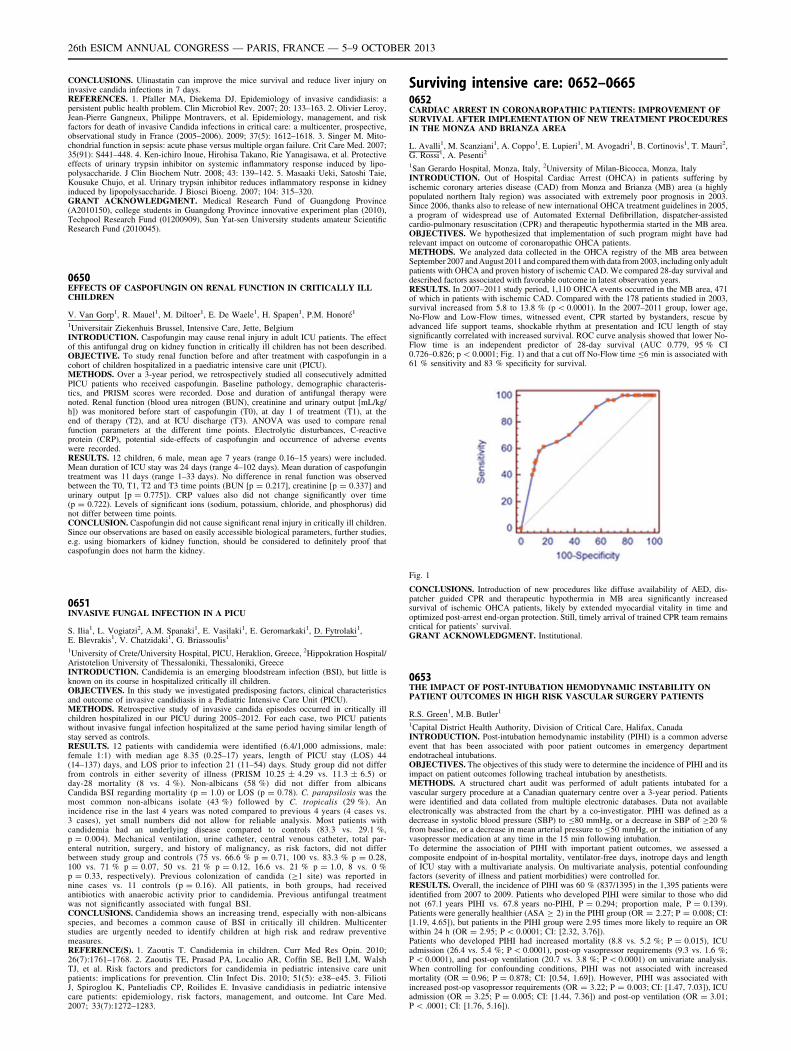
CONCLUSIONS. Ulinastatin can improve the mice survival and reduce liver injury oninvasive candida infections in 7 days.REFERENCES. 1. Pfaller MA, Diekema DJ. Epidemiology of invasive candidiasis: apersistent public health problem. Clin Microbiol Rev. 2007; 20: 133–163. 2. Olivier Leroy,Jean-Pierre Gangneux, Philippe Montravers, et al. Epidemiology, management, and riskfactors for death of invasive Candida infections in critical care: a multicenter, prospective,observational study in France (2005–2006). 2009; 37(5): 1612–1618. 3. Singer M. Mito-chondrial function in sepsis: acute phase versus multiple organ failure. Crit Care Med. 2007;35(91): S441–448. 4. Ken-ichiro Inoue, Hirohisa Takano, Rie Yanagisawa, et al. Protectiveeffects of urinary trypsin inhibitor on systemic inflammatory response induced by lipo-polysaccharide. J Clin Biochem Nutr. 2008; 43: 139–142. 5. Masaaki Ueki, Satoshi Taie,Kousuke Chujo, et al. Urinary trypsin inhibitor reduces inflammatory response in kidneyinduced by lipopolysaccharide. J Biosci Bioeng. 2007; 104: 315–320.GRANT ACKNOWLEDGMENT. Medical Research Fund of Guangdong Province(A2010150), college students in Guangdong Province innovative experiment plan (2010),Techpool Research Fund (01200909), Sun Yat-sen University students amateur ScientificResearch Fund (2010045).
0650EFFECTS OF CASPOFUNGIN ON RENAL FUNCTION IN CRITICALLY ILLCHILDREN
V. Van Gorp1, R. Mauel1, M. Diltoer1, E. De Waele1, H. Spapen1, P.M. Honoré1
1Universitair Ziekenhuis Brussel, Intensive Care, Jette, BelgiumINTRODUCTION. Caspofungin may cause renal injury in adult ICU patients. The effectof this antifungal drug on kidney function in critically ill children has not been described.OBJECTIVE. To study renal function before and after treatment with caspofungin in acohort of children hospitalized in a paediatric intensive care unit (PICU).METHODS. Over a 3-year period, we retrospectively studied all consecutively admittedPICU patients who received caspofungin. Baseline pathology, demographic characteris-tics, and PRISM scores were recorded. Dose and duration of antifungal therapy werenoted. Renal function (blood urea nitrogen (BUN), creatinine and urinary output [mL/kg/h]) was monitored before start of caspofungin (T0), at day 1 of treatment (T1), at theend of therapy (T2), and at ICU discharge (T3). ANOVA was used to compare renalfunction parameters at the different time points. Electrolytic disturbances, C-reactiveprotein (CRP), potential side-effects of caspofungin and occurrence of adverse eventswere recorded.RESULTS. 12 children, 6 male, mean age 7 years (range 0.16–15 years) were included.Mean duration of ICU stay was 24 days (range 4–102 days). Mean duration of caspofungintreatment was 11 days (range 1–33 days). No difference in renal function was observedbetween the T0, T1, T2 and T3 time points (BUN [p = 0.217], creatinine [p = 0.337] andurinary output [p = 0.775]). CRP values also did not change significantly over time(p = 0.722). Levels of significant ions (sodium, potassium, chloride, and phosphorus) didnot differ between time points.CONCLUSION. Caspofungin did not cause significant renal injury in critically ill children.Since our observations are based on easily accessible biological parameters, further studies,e.g. using biomarkers of kidney function, should be considered to definitely proof thatcaspofungin does not harm the kidney.
0651INVASIVE FUNGAL INFECTION IN A PICU
S. Ilia1, L. Vogiatzi2, A.M. Spanaki1, E. Vasilaki1, E. Geromarkaki1, D. Fytrolaki1,E. Blevrakis1, V. Chatzidaki1, G. Briassoulis1
1University of Crete/University Hospital, PICU, Heraklion, Greece, 2Hippokration Hospital/Aristotelion University of Thessaloniki, Thessaloniki, GreeceINTRODUCTION. Candidemia is an emerging bloodstream infection (BSI), but little isknown on its course in hospitalized critically ill children.OBJECTIVES. In this study we investigated predisposing factors, clinical characteristicsand outcome of invasive candidiasis in a Pediatric Intensive Care Unit (PICU).METHODS. Retrospective study of invasive candida episodes occurred in critically illchildren hospitalized in our PICU during 2005–2012. For each case, two PICU patientswithout invasive fungal infection hospitalized at the same period having similar length ofstay served as controls.RESULTS. 12 patients with candidemia were identified (6.4/1,000 admissions, male:female 1:1) with median age 8.35 (0.25–17) years, length of PICU stay (LOS) 44(14–137) days, and LOS prior to infection 21 (11–54) days. Study group did not differfrom controls in either severity of illness (PRISM 10.25 ± 4.29 vs. 11.3 ± 6.5) orday-28 mortality (8 vs. 4 %). Non-albicans (58 %) did not differ from albicansCandida BSI regarding mortality (p = 1.0) or LOS (p = 0.78). C. parapsilosis was themost common non-albicans isolate (43 %) followed by C. tropicalis (29 %). Anincidence rise in the last 4 years was noted compared to previous 4 years (4 cases vs.3 cases), yet small numbers did not allow for reliable analysis. Most patients withcandidemia had an underlying disease compared to controls (83.3 vs. 29.1 %,p = 0.004). Mechanical ventilation, urine catheter, central venous catheter, total par-enteral nutrition, surgery, and history of malignancy, as risk factors, did not differbetween study group and controls (75 vs. 66.6 % p = 0.71, 100 vs. 83.3 % p = 0.28,100 vs. 71 % p = 0.07, 50 vs. 21 % p = 0.12, 16.6 vs. 21 % p = 1.0, 8 vs. 0 %p = 0.33, respectively). Previous colonization of candida (C1 site) was reported innine cases vs. 11 controls (p = 0.16). All patients, in both groups, had receivedantibiotics with anaerobic activity prior to candidemia. Previous antifungal treatmentwas not significantly associated with fungal BSI.CONCLUSIONS. Candidemia shows an increasing trend, especially with non-albicansspecies, and becomes a common cause of BSI in critically ill children. Multicenterstudies are urgently needed to identify children at high risk and redraw preventivemeasures.REFERENCE(S). 1. Zaoutis T. Candidemia in children. Curr Med Res Opin. 2010;26(7):1761–1768. 2. Zaoutis TE, Prasad PA, Localio AR, Coffin SE, Bell LM, WalshTJ, et al. Risk factors and predictors for candidemia in pediatric intensive care unitpatients: implications for prevention. Clin Infect Dis. 2010; 51(5): e38–e45. 3. FiliotiJ, Spiroglou K, Panteliadis CP, Roilides E. Invasive candidiasis in pediatric intensivecare patients: epidemiology, risk factors, management, and outcome. Int Care Med.2007; 33(7):1272–1283.
Surviving intensive care: 0652–06650652CARDIAC ARREST IN CORONAROPATHIC PATIENTS: IMPROVEMENT OFSURVIVAL AFTER IMPLEMENTATION OF NEW TREATMENT PROCEDURESIN THE MONZA AND BRIANZA AREA
L. Avalli1, M. Scanziani1, A. Coppo1, E. Lupieri1, M. Avogadri1, B. Cortinovis1, T. Mauri2,G. Rossi1, A. Pesenti2
1San Gerardo Hospital, Monza, Italy, 2University of Milan-Bicocca, Monza, ItalyINTRODUCTION. Out of Hospital Cardiac Arrest (OHCA) in patients suffering byischemic coronary arteries disease (CAD) from Monza and Brianza (MB) area (a highlypopulated northern Italy region) was associated with extremely poor prognosis in 2003.Since 2006, thanks also to release of new international OHCA treatment guidelines in 2005,a program of widespread use of Automated External Defibrillation, dispatcher-assistedcardio-pulmonary resuscitation (CPR) and therapeutic hypothermia started in the MB area.OBJECTIVES. We hypothesized that implementation of such program might have hadrelevant impact on outcome of coronaropathic OHCA patients.METHODS. We analyzed data collected in the OHCA registry of the MB area betweenSeptember 2007 and August 2011 and compared them with data from 2003, including only adultpatients with OHCA and proven history of ischemic CAD. We compared 28-day survival anddescribed factors associated with favorable outcome in latest observation years.RESULTS. In 2007–2011 study period, 1,110 OHCA events occurred in the MB area, 471of which in patients with ischemic CAD. Compared with the 178 patients studied in 2003,survival increased from 5.8 to 13.8 % (p \ 0.0001). In the 2007–2011 group, lower age,No-Flow and Low-Flow times, witnessed event, CPR started by bystanders, rescue byadvanced life support teams, shockable rhythm at presentation and ICU length of staysignificantly correlated with increased survival. ROC curve analysis showed that lower No-Flow time is an independent predictor of 28-day survival (AUC 0.779, 95 % CI0.726–0.826; p \ 0.0001; Fig. 1) and that a cut off No-Flow time B6 min is associated with61 % sensitivity and 83 % specificity for survival.
Fig. 1
CONCLUSIONS. Introduction of new procedures like diffuse availability of AED, dis-patcher guided CPR and therapeutic hypothermia in MB area significantly increasedsurvival of ischemic OHCA patients, likely by extended myocardial vitality in time andoptimized post-arrest end-organ protection. Still, timely arrival of trained CPR team remainscritical for patients’ survival.GRANT ACKNOWLEDGMENT. Institutional.
0653THE IMPACT OF POST-INTUBATION HEMODYNAMIC INSTABILITY ONPATIENT OUTCOMES IN HIGH RISK VASCULAR SURGERY PATIENTS
R.S. Green1, M.B. Butler1
1Capital District Health Authority, Division of Critical Care, Halifax, CanadaINTRODUCTION. Post-intubation hemodynamic instability (PIHI) is a common adverseevent that has been associated with poor patient outcomes in emergency departmentendotracheal intubations.OBJECTIVES. The objectives of this study were to determine the incidence of PIHI and itsimpact on patient outcomes following tracheal intubation by anesthetists.METHODS. A structured chart audit was performed of adult patients intubated for avascular surgery procedure at a Canadian quaternary centre over a 3-year period. Patientswere identified and data collated from multiple electronic databases. Data not availableelectronically was abstracted from the chart by a co-investigator. PIHI was defined as adecrease in systolic blood pressure (SBP) to B80 mmHg, or a decrease in SBP of C20 %from baseline, or a decrease in mean arterial pressure to B50 mmHg, or the initiation of anyvasopressor medication at any time in the 15 min following intubation.To determine the association of PIHI with important patient outcomes, we assessed acomposite endpoint of in-hospital mortality, ventilator-free days, inotrope days and lengthof ICU stay with a multivariate analysis. On multivariate analysis, potential confoundingfactors (severity of illness and patient morbidities) were controlled for.RESULTS. Overall, the incidence of PIHI was 60 % (837/1395) in the 1,395 patients wereidentified from 2007 to 2009. Patients who developed PIHI were similar to those who didnot (67.1 years PIHI vs. 67.8 years no-PIHI, P = 0.294; proportion male, P = 0.139).Patients were generally healthier (ASA C 2) in the PIHI group (OR = 2.27; P = 0.008; CI:[1.19, 4.65]), but patients in the PIHI group were 2.95 times more likely to require an ORwithin 24 h (OR = 2.95; P \ 0.0001; CI: [2.32, 3.76]).Patients who developed PIHI had increased mortality (8.8 vs. 5.2 %; P = 0.015), ICUadmission (26.4 vs. 5.4 %; P \ 0.0001), post-op vasopressor requirements (9.3 vs. 1.6 %;P \ 0.0001), and post-op ventilation (20.7 vs. 3.8 %; P \ 0.0001) on univariate analysis.When controlling for confounding conditions, PIHI was not associated with increasedmortality (OR = 0.96; P = 0.878; CI: [0.54, 1.69]). However, PIHI was associated withincreased post-op vasopressor requirements (OR = 3.22; P = 0.003; CI: [1.47, 7.03]), ICUadmission (OR = 3.25; P = 0.005; CI: [1.44, 7.36]) and post-op ventilation (OR = 3.01;P \ .0001; CI: [1.76, 5.16]).
26th ESICM ANNUAL CONGRESS — PARIS, FRANCE — 5–9 OCTOBER 2013
Patients who developed PIHI were 85 % more likely to develop the composite endpoint(OR = 1.85; P = 0.002; CI: [1.25, 2.73]).CONCLUSIONS. PIHI occurs in 60 % of vascular surgery patients, and is associated withadverse patient outcomes: need for ICU admission, post-op vasopressor requirement, orpost-op ventilation.Prospective research is required to clarify the importance of PIHI in patients undergoingintubation under general anesthesia.GRANT ACKNOWLEDGMENT. Partial funding from a Clinician Scientist Award,Dalhousie University, Faculty of Medicine.
0654EVALUATION OF TIMI AND KILLIP SCALES SUPPLEMENTED WITH AGE INST ELEVATION MYOCARDIAL INFARCTION PATIENTS
E. Aguilar-Alonso1, M.D. Arias-Verdu2, R. Rivera-Lopez3, T. Garcia-Paredes2, F.J. Gomez-Jimenez4, M. Rojas-Amezcua1, R. Rivera-Fernandez2, G. Quesada-Garcia2
1Hospital Infanta Margarita, Cabra, Spain, 2Hospital Carlos Haya, Malaga, Spain, 3HospitalVirgen de las Nieves, Cardiology, Granada, Spain, 4Granada University, Granada, SpainINTRODUCTION. The general critical care prognostic indexes have not been systemati-cally applied AMII patients.OBJECTIVES. To evaluate the usefulness of Killip class, TIMI scale and age for initialrisk stratification of patients with ST-elevation myocardial infarction (STEMI).METHODS. This cohort study used data between 2004 and 2008 from all patients admittedfor STEMI to the Carlos Haya Hospital Intensive Care Unit in Malaga (Spain).We analyzedage, sex, Killip class, TIMI points, previous cardiovascular events, location, length of ICUstay, treatment times and ICU and hospital mortality. Data was expressed as mean ± SD forcontinuous variables and % for qualitative variables. Student’s t was used for comparison oftwo means. ANOVA and Newman–Keuls tests were used for multiple comparisons. The v2
test was used to compare proportions. Predictive models were generated using multivariatelogistic regression. The area under the ROC curve was used to assess discriminationcapacity. p \ 0.05.RESULTS. The study cohort consisted of 806 patients, of which 75.6 % male. Mean agewas 63.1 ± 12.83 years (3 missing) and TIMI score was 3.57 ± 2.38 points. 656 patients(81.4 %) were classified as Killip 1. ICU mortality was 10.3 % (83 patients) and hospitalmortality was 11.3 % (91 patients). Dead patients were older (72.73 ± 10.88 vs.61.90 ± 12.61 years, p \ 0.001), higher TIMI score and longer hospital stay.When age was categorized in intervals according to TIMI scale groups, the mortality was4.3 % in \ 65 years, 13 % in 65–74 years and 25.4 % [ 75 years (p \ 0.001). Mortalitywas 5.2, 29.6, 35.5, and 81 % for Killip scale 1, 2, 3, and 4, respectively. After multiplelinear regression, the relationship between the scale TIMI with Killip, the R was 0.626 andR2 was 0.369. Including the intervals age variable (by TIMI scale categories), the R is 0.792and the R2 was 0.608. 61 % of TIMI scale variability could be explained by Killip class andintervals age variables. Hospital mortality discrimination assessed by area under the ROCcurve was 0.832 (0.786–0.878) according TIMI scale, 0.76 (0.698–0.822) according Killipscale, and 0.846 (0.803–0.888) according age-Killip class model.CONCLUSIONS. TIMI scale discriminates well hospital mortality in STEMI patients.Discrimination capacity was higher than Killip class, but similar to a simple model usingKillip class and age. This simple model (with only two variables) can be useful to classifySTEMI patients.REFERENCES. 1. Steg PG, James SK, Atar D, et al. ESC Guidelines for the managementof acute myocardial infarction in patients presenting with ST-segment elevation. Eur HeartJ. 2012; 33(20):2569–619. 2. Morrow DA, Antman EM, Charlesworth A, et al. TIMI riskscore for ST-elevation myocardial infarction: a convenient, bedside, clinical score for riskassessment at presentation: an intravenous nPA for treatment of infracting myocardiumearly II trial substudy. Circulation. 2000; 102(17):2031–2037.
0655FUNCTIONAL STATUS AT ONE YEAR IN ICU PATIENTS WITH TRAUMATICBRAIN INJURY AND ITS RELATION WITH CRANIAL CT USING THEMARSHALL CLASSIFICATION
M. Arias-Verdú1, E. Curiel-Balsera1, E. Castillo-Lorente2, J. Mora-Ordóñez1, A. Muñoz-López1, C. Aragón-González1, R. Gutierrez-Rodriguez1, M.A. Prieto-Palomino1, R. Rivera-Fernández1
1Hospital Carlos Haya, Intensive Care Unit, Málaga, Spain, 2Hospital Neurotraumatologico,Intensive Care Unit, Jaen, SpainOBJECTIVE. To study the relation between the radiological findings on admissionassessed with the Marshall scale and the functional status at 1 year in patients with traumaticbrain injury (TBI).METHODS. A prospective cohort study of patients with TBI admitted to Carlos HayaHospital, Malaga, between 2004 and 2008.RESULTS. N = 531. Age 40.35 ± 19.75 years. In-hospital mortality 28.6 %. 1 yearmortality 171 (32.2 %), (missing: 6.6 %). At 1 year 22.8 % of the patients had a normalstatus and 42.7 % had a good evolution (GOS 4-5). These latter were younger(33.75 ± 16.44 vs. 45.35 ± 20.80; p \ 0.001), had a higher GCS (9.06 ± 3.57 vs.6.04 ± 3.32; p \ 0.001) and lower APACHE II (14.47 ± 5.37 vs. 20.06 ± 6.73;p \ 0.001), and had less severe injuries on the admission CT.Of 52 patients with diffuse type I injury 63.4 % had a good evolution (GOS 4-5); of 135with diffuse type II injury 60.7 % had a good evolution, of 126 with diffuse type III injury36.5 % had good evolution, of 44 patients with diffuse type IV injury 2.3 % had goodevolution, of 51 patients with evacuated mass lesion 32.1 % had good evolution and of 30patients with non-evacuated mass lesion 16.7 % had good evolution. (p \ 0.001).Logistic regression showed that the GOS at 1 year coded for two categories (poor and goodevolution) was related with the CT injury, with the OR increasing as the injury worsened,(diffuse grade I injury: OR 1; grade II: OR 1.77 [0.42–7.48]; grade III: OR 5.48[1.39–21.52]; grade IV: OR 22.13 [4.69–104.41]; surgically evacuated mass: OR 8.27[2.05–33.34]; non-evacuated mass: OR 23.24 [4.10–131.53]); with the ISS: OR 1.04(1.02–1.07), APACHE II: OR 1.12 (1.06–1.19); length of stay: OR 0.85 (0.81–0.89), GCS:OR 0.83 (0.74–0.93), and age: OR 1.03 (1.01–1.05).CONCLUSIONS. This study shows a high relation between functional status at 1 year withthe type of CT cranial lesion on admission evaluated with the Marshall classification. At 1year there was a worse functional status in the more severe lesions, given the same age, levelof consciousness and severity assessed on admission with the APACHE II and the ISS.
0656A REVIEW OF THE PERI-OPERATIVE MANAGEMENT OF PATIENTSUNDERGOING AN EMERGENCY LAPAROTOMY AT A UK TERTIARYCENTRE
A.L. Paterson1, R. Gokhale1, J. Davies2, R. Mahroof1
1John Farman Intensive Care Unit, Addenbrooke’s Hospital, Cambridge, UK, 2Departmentof Surgery, Addenbrooke’s Hospital, Cambridge, UKINTRODUCTION. Acute general surgical admissions constitute a high-risk patient groupthat accounts for a significant number of intensive care (ICU) admissions and the largestproportion of surgical deaths1, with an overall mortality of 13–15 %2,3.OBJECTIVES. We explored the care of patients undergoing an emergency laparotomy at aUK tertiary centre, Addenbrooke’s Hospital, with particular focus on ease of theatre access,clinician seniority and the location of post-operative care.METHODS. All laparotomies in patients aged 16 or over undertaken on the emergency listbetween 1st Aug 2011 and 31st July 2012 were identified. Transplants were excluded butlaparotomies for complications following elective or transplant surgery were included.RESULTS. Over 12 months, 453 emergency laparotomies were undertaken in 388 patients.The median age was 65 (range 16–96) and over 83 % met published criteria1 for being high-risk ([10 % predicted mortality). The majority, 64 %, were admitted via Accident andEmergency (A&E).134 (30 %) cases required surgery within an hour and a further 169 (37 %) cases within 6 h.A significant minority of laparotomies, 124 (27 %), were started out-of-hours (10 p.m.–8 a.m.); 77 % of these had required surgery within 6 h. A consultant surgeon was present in87 % of laparotomies whilst a consultant anaesthetist was present in 43 %.Post-operatively, 202 (45 %) patients were transferred to the ICU and a further 72 (16 %) toa High-Dependency Unit. The median APACHE II score for ICU admissions was 16 (range4–33); 80 % required mechanical ventilation and 32 % renal replacement therapy. Howeverthe median length of ICU stay was short, 3 days (range 1–75).The in-hospital mortality was 38/388 (10 %), including three intra-operative deaths. 30/35(86 %) patients had been managed on the ICU post-operatively and 23/35 (66 %) deathsoccurred on the ICU.The median length of hospital stay (LoS) was 15 days. Tertiary centre referrals had thelongest median LoS (29 days) and A&E admissions the shortest (13 days).CONCLUSIONS. This is the largest UK single-centre review of outcomes following anemergency laparotomy. Over 80 % of patients had a predicted mortality in excess of 10 %at presentation. Consultant surgeon presence intra-operatively was excellent, whilst that of aConsultant anaesthetist was lower and is under review. 45 % of patients were managed onICU post-op, usually for a short duration; with 61 % overall receiving Level 2 or 3 care. Anoverall mortality of 10 % confirms the high-risk nature of an emergency laparotomy butcompares favourably to published data2,3.REFERENCES. 1. The higher risk general surgical patient—towards improved care for theForgotten Group. RCS 2011. 2. Knowing the risk: a review of the peri-operative care ofgeneral surgical patients. NCEPOD 2010. 3. Variations in mortality after emergency lap-arotomy: The First Report of the UK Emergency Laparotomy Network. Brit J Anaesth.2012; 109(3) 368–75.
0657THE STRONG ION GAP AS PREDICTOR OF SURVIVAL IN THE EMERGENCYDEPARTMENT
J. Grundlingh1, C. Episkopos2, B. Bloom1, T. Harris1
1Barts Health NHS Trust, London, UK, 2Queen Mary, University of London, London, UKINTRODUCTION. With the advent of the different methods of interpretation of blood gasabnormalities, there has been debate regarding which method best predicts survival. Theclassic methods of interpretation have been well established as reliable, but have now beensuperseded by the Stewart approach. This approach has been shown to be better at predictingmortality in the paediatric intensive care setting (1) and is also better at identifying the causeof the disturbance by analysing the underlying biochemical abnormalities. Correlation of theStewart approach with hospital survival in an adult emergency department setting has neverbeen studied before and it is unknown whether this method can be used as a modifiabletreatment end-point.OBJECTIVES. Our objective was to evaluate the different methods of blood gas inter-pretation (base excess, bicarbonate, anion gap, corrected anion gap and strong ion gap) andcompare which method was better at predicting survival at 28 days in adults presenting to anEmergency Department.METHODS. A convenience sample of patients presenting to the Emergency Departmentwho had arterial and venous blood gas analysis performed (AVL800 flex, Radiometer) wereincluded. The presence of a metabolic acidosis as described by the different methods ofinterpretation was correlated with outcome. Patients were followed up to hospital dischargeor death and the primary outcome was survival at 28 days.RESULTS. A total of 98 patients were included in the study of which 18 (18.7 %) weredead at 28 days. The strong ion gap was 100 % sensitive for death at 28 days and had anegative predictive value of 100 %. The sensitivity of the combined actual base excess,bicarbonate and corrected anion gap was 55.6 % with a negative predictive value of 80.5 %.The sensitivity of the combination of base excess and bicarbonate approach was 50 % with anegative predictive value of 83 %.CONCLUSIONS. The strong ion gap method of blood gas interpretation was better than allother methods at predicting 28-day survival in this group of patients. The Stewart method ofblood gas analysis should be regularly calculated and included in routine blood gas analysisin the Emergency Department if it is to be used as a predictor of survival.REFERENCES. 1. Balasubramanyan N, Havens PL, Hoffman GM. Unmeasured anionsidentified by the Stewart–Fencl method predict mortality better than base excess, anion gapand lactate in patients in the paediatric intensive care unit. Crit Care Med. 1999; 27:1577.
0658ACUTE CARE INDEX OF FUNCTION PREDICTS HOSPITAL DISCHARGEDESTINATION IN INTENSIVE CARE PATIENTS EXPECTED TO BEVENTILATED FOR GREATER THAN 72 HOURS
S. Latham1, M. Green2,3, I. Mitchell1,2, I.A. Leditschke1,2, B. Bissett3,4, T. Neeman5
1Australian National University Medical School, Canberra, Australia, 2Intensive Care UnitCanberra Hospital, Canberra, Australia, 3Department of Physiotherapy Canberra Hospital,
26th ESICM ANNUAL CONGRESS — PARIS, FRANCE — 5–9 OCTOBER 2013
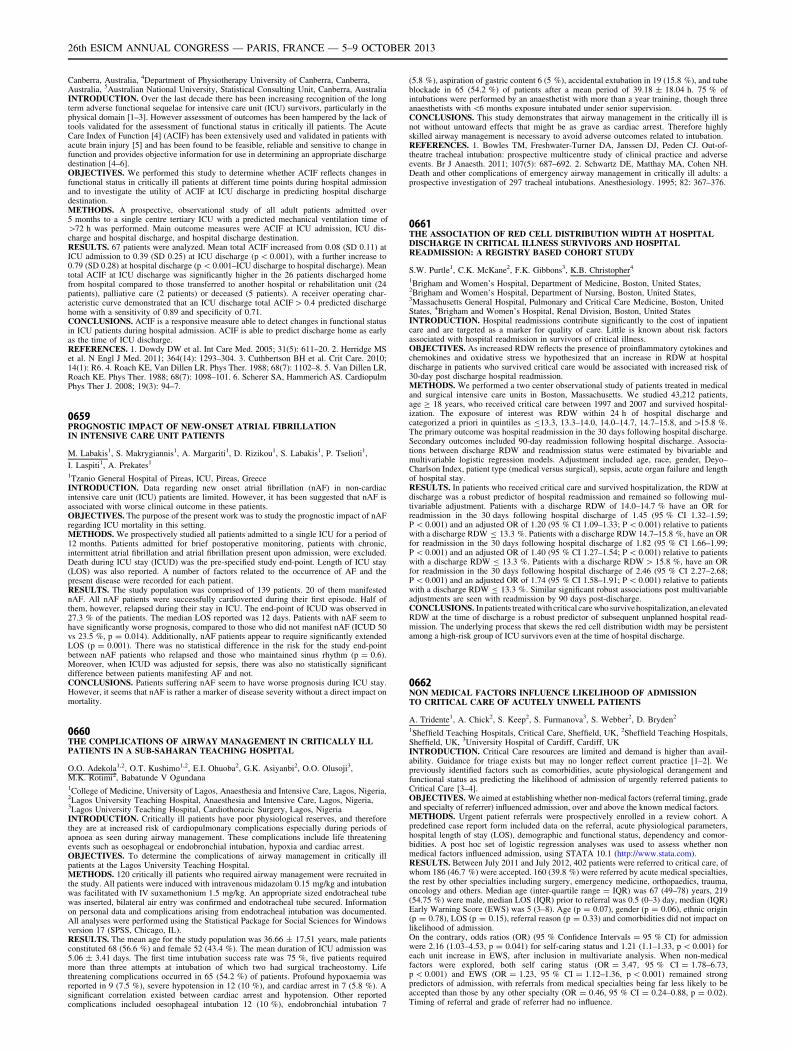
Canberra, Australia, 4Department of Physiotherapy University of Canberra, Canberra,Australia, 5Australian National University, Statistical Consulting Unit, Canberra, AustraliaINTRODUCTION. Over the last decade there has been increasing recognition of the longterm adverse functional sequelae for intensive care unit (ICU) survivors, particularly in thephysical domain [1–3]. However assessment of outcomes has been hampered by the lack oftools validated for the assessment of functional status in critically ill patients. The AcuteCare Index of Function [4] (ACIF) has been extensively used and validated in patients withacute brain injury [5] and has been found to be feasible, reliable and sensitive to change infunction and provides objective information for use in determining an appropriate dischargedestination [4–6].OBJECTIVES. We performed this study to determine whether ACIF reflects changes infunctional status in critically ill patients at different time points during hospital admissionand to investigate the utility of ACIF at ICU discharge in predicting hospital dischargedestination.METHODS. A prospective, observational study of all adult patients admitted over5 months to a single centre tertiary ICU with a predicted mechanical ventilation time of[72 h was performed. Main outcome measures were ACIF at ICU admission, ICU dis-charge and hospital discharge, and hospital discharge destination.RESULTS. 67 patients were analyzed. Mean total ACIF increased from 0.08 (SD 0.11) atICU admission to 0.39 (SD 0.25) at ICU discharge (p \ 0.001), with a further increase to0.79 (SD 0.28) at hospital discharge (p \ 0.001–ICU discharge to hospital discharge). Meantotal ACIF at ICU discharge was significantly higher in the 26 patients discharged homefrom hospital compared to those transferred to another hospital or rehabilitation unit (24patients), palliative care (2 patients) or deceased (5 patients). A receiver operating char-acteristic curve demonstrated that an ICU discharge total ACIF [ 0.4 predicted dischargehome with a sensitivity of 0.89 and specificity of 0.71.CONCLUSIONS. ACIF is a responsive measure able to detect changes in functional statusin ICU patients during hospital admission. ACIF is able to predict discharge home as earlyas the time of ICU discharge.REFERENCES. 1. Dowdy DW et al. Int Care Med. 2005; 31(5): 611–20. 2. Herridge MSet al. N Engl J Med. 2011; 364(14): 1293–304. 3. Cuthbertson BH et al. Crit Care. 2010;14(1): R6. 4. Roach KE, Van Dillen LR. Phys Ther. 1988; 68(7): 1102–8. 5. Van Dillen LR,Roach KE. Phys Ther. 1988; 68(7): 1098–101. 6. Scherer SA, Hammerich AS. CardiopulmPhys Ther J. 2008; 19(3): 94–7.
0659PROGNOSTIC IMPACT OF NEW-ONSET ATRIAL FIBRILLATIONIN INTENSIVE CARE UNIT PATIENTS
M. Labakis1, S. Makrygiannis1, A. Margariti1, D. Rizikou1, S. Labakis1, P. Tselioti1,
I. Laspiti1, A. Prekates1
1Tzanio General Hospital of Pireas, ICU, Pireas, GreeceINTRODUCTION. Data regarding new onset atrial fibrillation (nAF) in non-cardiacintensive care unit (ICU) patients are limited. However, it has been suggested that nAF isassociated with worse clinical outcome in these patients.OBJECTIVES. The purpose of the present work was to study the prognostic impact of nAFregarding ICU mortality in this setting.METHODS. We prospectively studied all patients admitted to a single ICU for a period of12 months. Patients admitted for brief postoperative monitoring, patients with chronic,intermittent atrial fibrillation and atrial fibrillation present upon admission, were excluded.Death during ICU stay (ICUD) was the pre-specified study end-point. Length of ICU stay(LOS) was also reported. A number of factors related to the occurrence of AF and thepresent disease were recorded for each patient.RESULTS. The study population was comprised of 139 patients. 20 of them manifestednAF. All nAF patients were successfully cardioverted during their first episode. Half ofthem, however, relapsed during their stay in ICU. The end-point of ICUD was observed in27.3 % of the patients. The median LOS reported was 12 days. Patients with nAF seem tohave significantly worse prognosis, compared to those who did not manifest nAF (ICUD 50vs 23.5 %, p = 0.014). Additionally, nAF patients appear to require significantly extendedLOS (p = 0.001). There was no statistical difference in the risk for the study end-pointbetween nAF patients who relapsed and those who maintained sinus rhythm (p = 0.6).Moreover, when ICUD was adjusted for sepsis, there was also no statistically significantdifference between patients manifesting AF and not.CONCLUSIONS. Patients suffering nAF seem to have worse prognosis during ICU stay.However, it seems that nAF is rather a marker of disease severity without a direct impact onmortality.
0660THE COMPLICATIONS OF AIRWAY MANAGEMENT IN CRITICALLY ILLPATIENTS IN A SUB-SAHARAN TEACHING HOSPITAL
O.O. Adekola1,2, O.T. Kushimo1,2, E.I. Ohuoba2, G.K. Asiyanbi2, O.O. Olusoji3,M.K. Rotimi2, Babatunde V Ogundana1College of Medicine, University of Lagos, Anaesthesia and Intensive Care, Lagos, Nigeria,2Lagos University Teaching Hospital, Anaesthesia and Intensive Care, Lagos, Nigeria,3Lagos University Teaching Hospital, Cardiothoracic Surgery, Lagos, NigeriaINTRODUCTION. Critically ill patients have poor physiological reserves, and thereforethey are at increased risk of cardiopulmonary complications especially during periods ofapnoea as seen during airway management. These complications include life threateningevents such as oesophageal or endobronchial intubation, hypoxia and cardiac arrest.OBJECTIVES. To determine the complications of airway management in critically illpatients at the Lagos University Teaching Hospital.METHODS. 120 critically ill patients who required airway management were recruited inthe study. All patients were induced with intravenous midazolam 0.15 mg/kg and intubationwas facilitated with IV suxamethonium 1.5 mg/kg. An appropriate sized endotracheal tubewas inserted, bilateral air entry was confirmed and endotracheal tube secured. Informationon personal data and complications arising from endotracheal intubation was documented.All analyses were performed using the Statistical Package for Social Sciences for Windowsversion 17 (SPSS, Chicago, IL).RESULTS. The mean age for the study population was 36.66 ± 17.51 years, male patientsconstituted 68 (56.6 %) and female 52 (43.4 %). The mean duration of ICU admission was5.06 ± 3.41 days. The first time intubation success rate was 75 %, five patients requiredmore than three attempts at intubation of which two had surgical tracheostomy. Lifethreatening complications occurred in 65 (54.2 %) of patients. Profound hypoxaemia wasreported in 9 (7.5 %), severe hypotension in 12 (10 %), and cardiac arrest in 7 (5.8 %). Asignificant correlation existed between cardiac arrest and hypotension. Other reportedcomplications included oesophageal intubation 12 (10 %), endobronchial intubation 7
(5.8 %), aspiration of gastric content 6 (5 %), accidental extubation in 19 (15.8 %), and tubeblockade in 65 (54.2 %) of patients after a mean period of 39.18 ± 18.04 h. 75 % ofintubations were performed by an anaesthetist with more than a year training, though threeanaesthetists with \6 months exposure intubated under senior supervision.CONCLUSIONS. This study demonstrates that airway management in the critically ill isnot without untoward effects that might be as grave as cardiac arrest. Therefore highlyskilled airway management is necessary to avoid adverse outcomes related to intubation.REFERENCES. 1. Bowles TM, Freshwater-Turner DA, Janssen DJ, Peden CJ. Out-of-theatre tracheal intubation: prospective multicentre study of clinical practice and adverseevents. Br J Anaesth. 2011; 107(5): 687–692. 2. Schwartz DE, Matthay MA, Cohen NH.Death and other complications of emergency airway management in critically ill adults: aprospective investigation of 297 tracheal intubations. Anesthesiology. 1995; 82: 367–376.
0661THE ASSOCIATION OF RED CELL DISTRIBUTION WIDTH AT HOSPITALDISCHARGE IN CRITICAL ILLNESS SURVIVORS AND HOSPITALREADMISSION: A REGISTRY BASED COHORT STUDY
S.W. Purtle1, C.K. McKane2, F.K. Gibbons3, K.B. Christopher4
1Brigham and Women’s Hospital, Department of Medicine, Boston, United States,2Brigham and Women’s Hospital, Department of Nursing, Boston, United States,3Massachusetts General Hospital, Pulmonary and Critical Care Medicine, Boston, UnitedStates, 4Brigham and Women’s Hospital, Renal Division, Boston, United StatesINTRODUCTION. Hospital readmissions contribute significantly to the cost of inpatientcare and are targeted as a marker for quality of care. Little is known about risk factorsassociated with hospital readmission in survivors of critical illness.OBJECTIVES. As increased RDW reflects the presence of proinflammatory cytokines andchemokines and oxidative stress we hypothesized that an increase in RDW at hospitaldischarge in patients who survived critical care would be associated with increased risk of30-day post discharge hospital readmission.METHODS. We performed a two center observational study of patients treated in medicaland surgical intensive care units in Boston, Massachusetts. We studied 43,212 patients,age C 18 years, who received critical care between 1997 and 2007 and survived hospital-ization. The exposure of interest was RDW within 24 h of hospital discharge andcategorized a priori in quintiles as B13.3, 13.3–14.0, 14.0–14.7, 14.7–15.8, and [15.8 %.The primary outcome was hospital readmission in the 30 days following hospital discharge.Secondary outcomes included 90-day readmission following hospital discharge. Associa-tions between discharge RDW and readmission status were estimated by bivariable andmultivariable logistic regression models. Adjustment included age, race, gender, Deyo–Charlson Index, patient type (medical versus surgical), sepsis, acute organ failure and lengthof hospital stay.RESULTS. In patients who received critical care and survived hospitalization, the RDW atdischarge was a robust predictor of hospital readmission and remained so following mul-tivariable adjustment. Patients with a discharge RDW of 14.0–14.7 % have an OR forreadmission in the 30 days following hospital discharge of 1.45 (95 % CI 1.32–1.59;P \ 0.001) and an adjusted OR of 1.20 (95 % CI 1.09–1.33; P \ 0.001) relative to patientswith a discharge RDW B 13.3 %. Patients with a discharge RDW 14.7–15.8 %, have an ORfor readmission in the 30 days following hospital discharge of 1.82 (95 % CI 1.66–1.99;P \ 0.001) and an adjusted OR of 1.40 (95 % CI 1.27–1.54; P \ 0.001) relative to patientswith a discharge RDW B 13.3 %. Patients with a discharge RDW [ 15.8 %, have an ORfor readmission in the 30 days following hospital discharge of 2.46 (95 % CI 2.27–2.68;P \ 0.001) and an adjusted OR of 1.74 (95 % CI 1.58–1.91; P \ 0.001) relative to patientswith a discharge RDW B 13.3 %. Similar significant robust associations post multivariableadjustments are seen with readmission by 90 days post-discharge.CONCLUSIONS. In patients treated with critical care who survive hospitalization, an elevatedRDW at the time of discharge is a robust predictor of subsequent unplanned hospital read-mission. The underlying process that skews the red cell distribution width may be persistentamong a high-risk group of ICU survivors even at the time of hospital discharge.
0662NON MEDICAL FACTORS INFLUENCE LIKELIHOOD OF ADMISSIONTO CRITICAL CARE OF ACUTELY UNWELL PATIENTS
A. Tridente1, A. Chick2, S. Keep2, S. Furmanova3, S. Webber2, D. Bryden2
1Sheffield Teaching Hospitals, Critical Care, Sheffield, UK, 2Sheffield Teaching Hospitals,Sheffield, UK, 3University Hospital of Cardiff, Cardiff, UKINTRODUCTION. Critical Care resources are limited and demand is higher than avail-ability. Guidance for triage exists but may no longer reflect current practice [1–2]. Wepreviously identified factors such as comorbidities, acute physiological derangement andfunctional status as predicting the likelihood of admission of urgently referred patients toCritical Care [3–4].OBJECTIVES. We aimed at establishing whether non-medical factors (referral timing, gradeand specialty of referrer) influenced admission, over and above the known medical factors.METHODS. Urgent patient referrals were prospectively enrolled in a review cohort. Apredefined case report form included data on the referral, acute physiological parameters,hospital length of stay (LOS), demographic and functional status, dependency and comor-bidities. A post hoc set of logistic regression analyses was used to assess whether nonmedical factors influenced admission, using STATA 10.1 (http://www.stata.com).RESULTS. Between July 2011 and July 2012, 402 patients were referred to critical care, ofwhom 186 (46.7 %) were accepted. 160 (39.8 %) were referred by acute medical specialties,the rest by other specialties including surgery, emergency medicine, orthopaedics, trauma,oncology and others. Median age (inter-quartile range = IQR) was 67 (49–78) years, 219(54.75 %) were male, median LOS (IQR) prior to referral was 0.5 (0–3) day, median (IQR)Early Warning Score (EWS) was 5 (3–8). Age (p = 0.07), gender (p = 0.06), ethnic origin(p = 0.78), LOS (p = 0.15), referral reason (p = 0.33) and comorbidities did not impact onlikelihood of admission.On the contrary, odds ratios (OR) (95 % Confidence Intervals = 95 % CI) for admissionwere 2.16 (1.03–4.53, p = 0.041) for self-caring status and 1.21 (1.1–1.33, p \ 0.001) foreach unit increase in EWS, after inclusion in multivariate analysis. When non-medicalfactors were explored, both self caring status (OR = 3.47, 95 % CI = 1.78–6.73,p \ 0.001) and EWS (OR = 1.23, 95 % CI = 1.12–1.36, p \ 0.001) remained strongpredictors of admission, with referrals from medical specialties being far less likely to beaccepted than those by any other specialty (OR = 0.46, 95 % CI = 0.24–0.88, p = 0.02).Timing of referral and grade of referrer had no influence.
26th ESICM ANNUAL CONGRESS — PARIS, FRANCE — 5–9 OCTOBER 2013
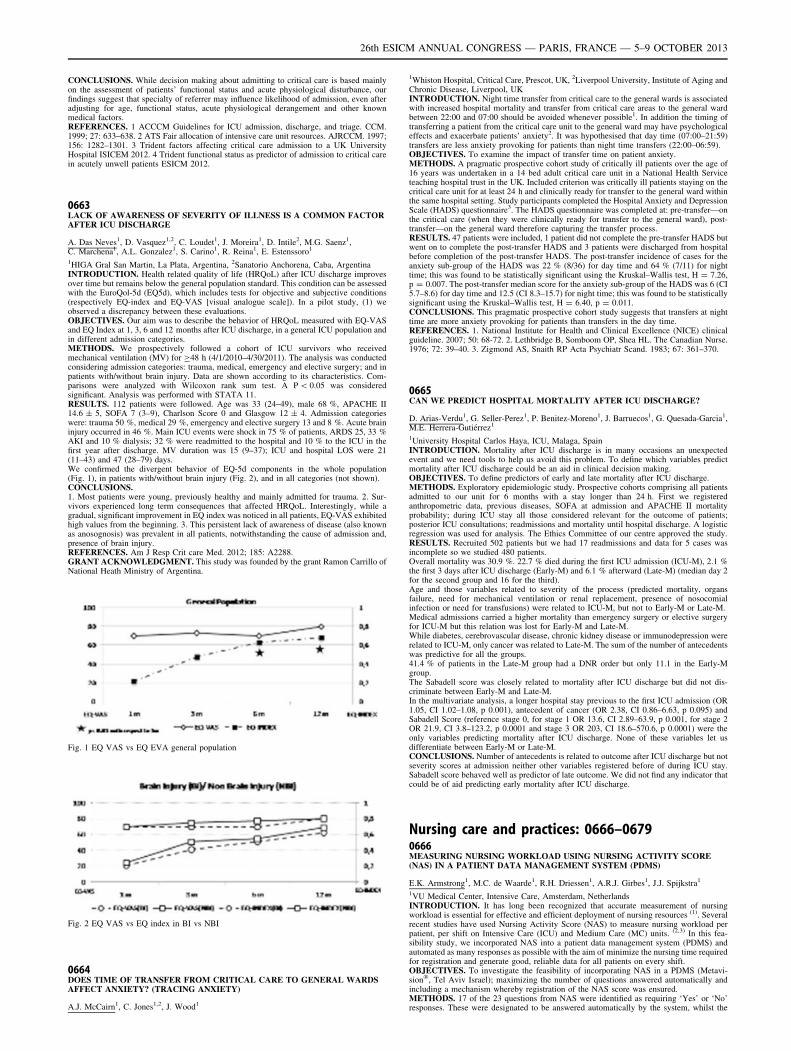
CONCLUSIONS. While decision making about admitting to critical care is based mainlyon the assessment of patients’ functional status and acute physiological disturbance, ourfindings suggest that specialty of referrer may influence likelihood of admission, even afteradjusting for age, functional status, acute physiological derangement and other knownmedical factors.REFERENCES. 1 ACCCM Guidelines for ICU admission, discharge, and triage. CCM.1999; 27: 633–638. 2 ATS Fair allocation of intensive care unit resources. AJRCCM. 1997;156: 1282–1301. 3 Trident factors affecting critical care admission to a UK UniversityHospital ISICEM 2012. 4 Trident functional status as predictor of admission to critical carein acutely unwell patients ESICM 2012.
0663LACK OF AWARENESS OF SEVERITY OF ILLNESS IS A COMMON FACTORAFTER ICU DISCHARGE
A. Das Neves1, D. Vasquez1,2, C. Loudet1, J. Moreira1, D. Intile2, M.G. Saenz1,C. Marchena1, A.L. Gonzalez1, S. Carino1, R. Reina1, E. Estenssoro1
1HIGA Gral San Martin, La Plata, Argentina, 2Sanatorio Anchorena, Caba, ArgentinaINTRODUCTION. Health related quality of life (HRQoL) after ICU discharge improvesover time but remains below the general population standard. This condition can be assessedwith the EuroQol-5d (EQ5d), which includes tests for objective and subjective conditions(respectively EQ-index and EQ-VAS [visual analogue scale]). In a pilot study, (1) weobserved a discrepancy between these evaluations.OBJECTIVES. Our aim was to describe the behavior of HRQoL measured with EQ-VASand EQ Index at 1, 3, 6 and 12 months after ICU discharge, in a general ICU population andin different admission categories.METHODS. We prospectively followed a cohort of ICU survivors who receivedmechanical ventilation (MV) for C48 h (4/1/2010–4/30/2011). The analysis was conductedconsidering admission categories: trauma, medical, emergency and elective surgery; and inpatients with/without brain injury. Data are shown according to its characteristics. Com-parisons were analyzed with Wilcoxon rank sum test. A P \ 0.05 was consideredsignificant. Analysis was performed with STATA 11.RESULTS. 112 patients were followed. Age was 33 (24–49), male 68 %, APACHE II14.6 ± 5, SOFA 7 (3–9), Charlson Score 0 and Glasgow 12 ± 4. Admission categorieswere: trauma 50 %, medical 29 %, emergency and elective surgery 13 and 8 %. Acute braininjury occurred in 46 %. Main ICU events were shock in 75 % of patients, ARDS 25, 33 %AKI and 10 % dialysis; 32 % were readmitted to the hospital and 10 % to the ICU in thefirst year after discharge. MV duration was 15 (9–37); ICU and hospital LOS were 21(11–43) and 47 (28–79) days.We confirmed the divergent behavior of EQ-5d components in the whole population(Fig. 1), in patients with/without brain injury (Fig. 2), and in all categories (not shown).CONCLUSIONS.1. Most patients were young, previously healthy and mainly admitted for trauma. 2. Sur-vivors experienced long term consequences that affected HRQoL. Interestingly, while agradual, significant improvement in EQ index was noticed in all patients, EQ-VAS exhibitedhigh values from the beginning. 3. This persistent lack of awareness of disease (also knownas anosognosis) was prevalent in all patients, notwithstanding the cause of admission and,presence of brain injury.REFERENCES. Am J Resp Crit care Med. 2012; 185: A2288.GRANT ACKNOWLEDGMENT. This study was founded by the grant Ramon Carrillo ofNational Heath Ministry of Argentina.
Fig. 1 EQ VAS vs EQ EVA general population
Fig. 2 EQ VAS vs EQ index in BI vs NBI
0664DOES TIME OF TRANSFER FROM CRITICAL CARE TO GENERAL WARDSAFFECT ANXIETY? (TRACING ANXIETY)
A.J. McCairn1, C. Jones1,2, J. Wood1
1Whiston Hospital, Critical Care, Prescot, UK, 2Liverpool University, Institute of Aging andChronic Disease, Liverpool, UKINTRODUCTION. Night time transfer from critical care to the general wards is associatedwith increased hospital mortality and transfer from critical care areas to the general wardbetween 22:00 and 07:00 should be avoided whenever possible1. In addition the timing oftransferring a patient from the critical care unit to the general ward may have psychologicaleffects and exacerbate patients’ anxiety2. It was hypothesised that day time (07:00–21:59)transfers are less anxiety provoking for patients than night time transfers (22:00–06:59).OBJECTIVES. To examine the impact of transfer time on patient anxiety.METHODS. A pragmatic prospective cohort study of critically ill patients over the age of16 years was undertaken in a 14 bed adult critical care unit in a National Health Serviceteaching hospital trust in the UK. Included criterion was critically ill patients staying on thecritical care unit for at least 24 h and clinically ready for transfer to the general ward withinthe same hospital setting. Study participants completed the Hospital Anxiety and DepressionScale (HADS) questionnaire3. The HADS questionnaire was completed at: pre-transfer—onthe critical care (when they were clinically ready for transfer to the general ward), post-transfer—on the general ward therefore capturing the transfer process.RESULTS. 47 patients were included, 1 patient did not complete the pre-transfer HADS butwent on to complete the post-transfer HADS and 3 patients were discharged from hospitalbefore completion of the post-transfer HADS. The post-transfer incidence of cases for theanxiety sub-group of the HADS was 22 % (8/36) for day time and 64 % (7/11) for nighttime; this was found to be statistically significant using the Kruskal–Wallis test, H = 7.26,p = 0.007. The post-transfer median score for the anxiety sub-group of the HADS was 6 (CI5.7–8.6) for day time and 12.5 (CI 8.3–15.7) for night time; this was found to be statisticallysignificant using the Kruskal–Wallis test, H = 6.40, p = 0.011.CONCLUSIONS. This pragmatic prospective cohort study suggests that transfers at nighttime are more anxiety provoking for patients than transfers in the day time.REFERENCES. 1. National Institute for Health and Clinical Excellence (NICE) clinicalguideline. 2007; 50: 68-72. 2. Lethbridge B, Somboom OP, Shea HL. The Canadian Nurse.1976; 72: 39–40. 3. Zigmond AS, Snaith RP Acta Psychiatr Scand. 1983; 67: 361–370.
0665CAN WE PREDICT HOSPITAL MORTALITY AFTER ICU DISCHARGE?
D. Arias-Verdu1, G. Seller-Perez1, P. Benitez-Moreno1, J. Barruecos1, G. Quesada-Garcia1,M.E. Herrera-Gutiérrez1
1University Hospital Carlos Haya, ICU, Malaga, SpainINTRODUCTION. Mortality after ICU discharge is in many occasions an unexpectedevent and we need tools to help us avoid this problem. To define which variables predictmortality after ICU discharge could be an aid in clinical decision making.OBJECTIVES. To define predictors of early and late mortality after ICU discharge.METHODS. Exploratory epidemiologic study. Prospective cohorts comprising all patientsadmitted to our unit for 6 months with a stay longer than 24 h. First we registeredanthropometric data, previous diseases, SOFA at admission and APACHE II mortalityprobability; during ICU stay all those considered relevant for the outcome of patients;posterior ICU consultations; readmissions and mortality until hospital discharge. A logisticregression was used for analysis. The Ethics Committee of our centre approved the study.RESULTS. Recruited 502 patients but we had 17 readmissions and data for 5 cases wasincomplete so we studied 480 patients.Overall mortality was 30.9 %. 22.7 % died during the first ICU admission (ICU-M), 2.1 %the first 3 days after ICU discharge (Early-M) and 6.1 % afterward (Late-M) (median day 2for the second group and 16 for the third).Age and those variables related to severity of the process (predicted mortality, organsfailure, need for mechanical ventilation or renal replacement, presence of nosocomialinfection or need for transfusions) were related to ICU-M, but not to Early-M or Late-M.Medical admissions carried a higher mortality than emergency surgery or elective surgeryfor ICU-M but this relation was lost for Early-M and Late-M.While diabetes, cerebrovascular disease, chronic kidney disease or immunodepression wererelated to ICU-M, only cancer was related to Late-M. The sum of the number of antecedentswas predictive for all the groups.41.4 % of patients in the Late-M group had a DNR order but only 11.1 in the Early-Mgroup.The Sabadell score was closely related to mortality after ICU discharge but did not dis-criminate between Early-M and Late-M.In the multivariate analysis, a longer hospital stay previous to the first ICU admission (OR1.05, CI 1.02–1.08, p 0.001), antecedent of cancer (OR 2.38, CI 0.86–6.63, p 0.095) andSabadell Score (reference stage 0, for stage 1 OR 13.6, CI 2.89–63.9, p 0.001, for stage 2OR 21.9, CI 3.8–123.2, p 0.0001 and stage 3 OR 203, CI 18.6–570.6, p 0.0001) were theonly variables predicting mortality after ICU discharge. None of these variables let usdifferentiate between Early-M or Late-M.CONCLUSIONS. Number of antecedents is related to outcome after ICU discharge but notseverity scores at admission neither other variables registered before of during ICU stay.Sabadell score behaved well as predictor of late outcome. We did not find any indicator thatcould be of aid predicting early mortality after ICU discharge.
Nursing care and practices: 0666–06790666MEASURING NURSING WORKLOAD USING NURSING ACTIVITY SCORE(NAS) IN A PATIENT DATA MANAGEMENT SYSTEM (PDMS)
E.K. Armstrong1, M.C. de Waarde1, R.H. Driessen1, A.R.J. Girbes1, J.J. Spijkstra1
1VU Medical Center, Intensive Care, Amsterdam, NetherlandsINTRODUCTION. It has long been recognized that accurate measurement of nursingworkload is essential for effective and efficient deployment of nursing resources (1). Severalrecent studies have used Nursing Activity Score (NAS) to measure nursing workload perpatient, per shift on Intensive Care (ICU) and Medium Care (MC) units. (2,3) In this fea-sibility study, we incorporated NAS into a patient data management system (PDMS) andautomated as many responses as possible with the aim of minimize the nursing time requiredfor registration and generate good, reliable data for all patients on every shift.OBJECTIVES. To investigate the feasibility of incorporating NAS in a PDMS (Metavi-sion�, Tel Aviv Israel); maximizing the number of questions answered automatically andincluding a mechanism whereby registration of the NAS score was ensured.METHODS. 17 of the 23 questions from NAS were identified as requiring ‘Yes’ or ‘No’responses. These were designated to be answered automatically by the system, whilst the
26th ESICM ANNUAL CONGRESS — PARIS, FRANCE — 5–9 OCTOBER 2013
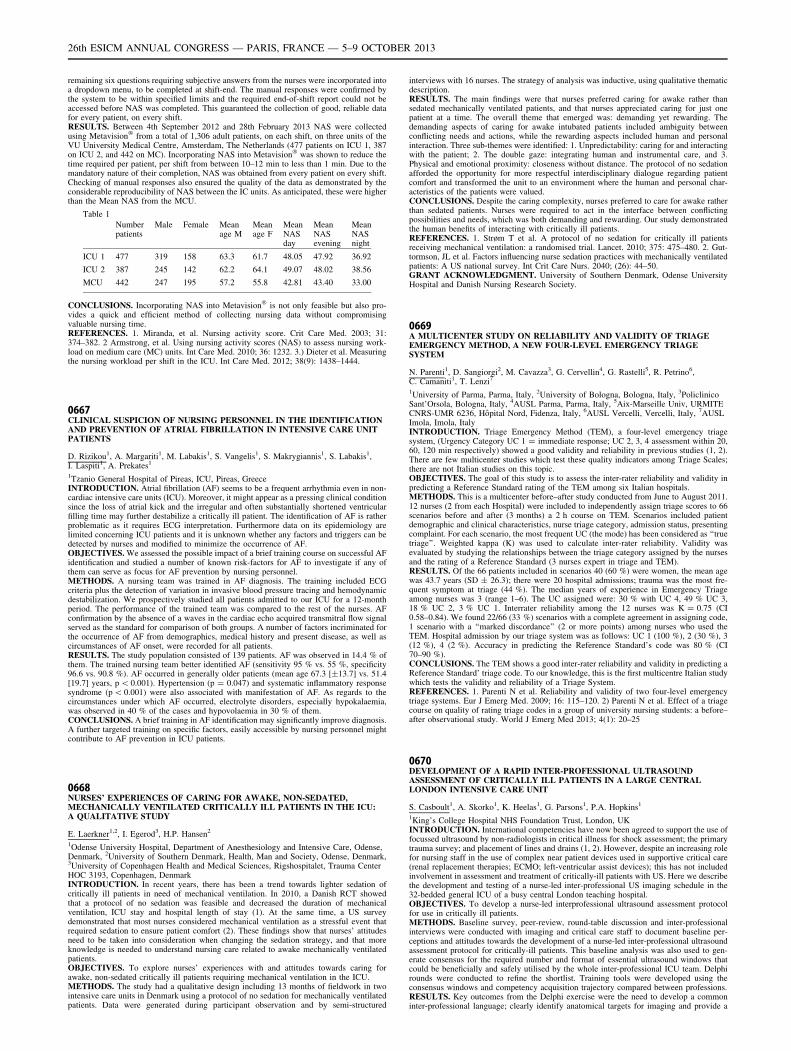
remaining six questions requiring subjective answers from the nurses were incorporated intoa dropdown menu, to be completed at shift-end. The manual responses were confirmed bythe system to be within specified limits and the required end-of-shift report could not beaccessed before NAS was completed. This guaranteed the collection of good, reliable datafor every patient, on every shift.RESULTS. Between 4th September 2012 and 28th February 2013 NAS were collectedusing Metavision� from a total of 1,306 adult patients, on each shift, on three units of theVU University Medical Centre, Amsterdam, The Netherlands (477 patients on ICU 1, 387on ICU 2, and 442 on MC). Incorporating NAS into Metavision� was shown to reduce thetime required per patient, per shift from between 10–12 min to less than 1 min. Due to themandatory nature of their completion, NAS was obtained from every patient on every shift.Checking of manual responses also ensured the quality of the data as demonstrated by theconsiderable reproducibility of NAS between the IC units. As anticipated, these were higherthan the Mean NAS from the MCU.
Table 1
Numberpatients
Male Female Meanage M
Meanage F
MeanNASday
MeanNASevening
MeanNASnight
ICU 1 477 319 158 63.3 61.7 48.05 47.92 36.92
ICU 2 387 245 142 62.2 64.1 49.07 48.02 38.56
MCU 442 247 195 57.2 55.8 42.81 43.40 33.00
CONCLUSIONS. Incorporating NAS into Metavision� is not only feasible but also pro-vides a quick and efficient method of collecting nursing data without compromisingvaluable nursing time.REFERENCES. 1. Miranda, et al. Nursing activity score. Crit Care Med. 2003; 31:374–382. 2 Armstrong, et al. Using nursing activity scores (NAS) to assess nursing work-load on medium care (MC) units. Int Care Med. 2010; 36: 1232. 3.) Dieter et al. Measuringthe nursing workload per shift in the ICU. Int Care Med. 2012; 38(9): 1438–1444.
0667CLINICAL SUSPICION OF NURSING PERSONNEL IN THE IDENTIFICATIONAND PREVENTION OF ATRIAL FIBRILLATION IN INTENSIVE CARE UNITPATIENTS
D. Rizikou1, A. Margariti1, M. Labakis1, S. Vangelis1, S. Makrygiannis1, S. Labakis1,I. Laspiti1, A. Prekates1
1Tzanio General Hospital of Pireas, ICU, Pireas, GreeceINTRODUCTION. Atrial fibrillation (AF) seems to be a frequent arrhythmia even in non-cardiac intensive care units (ICU). Moreover, it might appear as a pressing clinical conditionsince the loss of atrial kick and the irregular and often substantially shortened ventricularfilling time may further destabilize a critically ill patient. The identification of AF is ratherproblematic as it requires ECG interpretation. Furthermore data on its epidemiology arelimited concerning ICU patients and it is unknown whether any factors and triggers can bedetected by nurses and modified to minimize the occurrence of AF.OBJECTIVES. We assessed the possible impact of a brief training course on successful AFidentification and studied a number of known risk-factors for AF to investigate if any ofthem can serve as focus for AF prevention by nursing personnel.METHODS. A nursing team was trained in AF diagnosis. The training included ECGcriteria plus the detection of variation in invasive blood pressure tracing and hemodynamicdestabilization. We prospectively studied all patients admitted to our ICU for a 12-monthperiod. The performance of the trained team was compared to the rest of the nurses. AFconfirmation by the absence of a waves in the cardiac echo acquired transmitral flow signalserved as the standard for comparison of both groups. A number of factors incriminated forthe occurrence of AF from demographics, medical history and present disease, as well ascircumstances of AF onset, were recorded for all patients.RESULTS. The study population consisted of 139 patients. AF was observed in 14.4 % ofthem. The trained nursing team better identified AF (sensitivity 95 % vs. 55 %, specificity96.6 vs. 90.8 %). AF occurred in generally older patients (mean age 67.3 [±13.7] vs. 51.4[19.7] years, p \ 0.001). Hypertension (p = 0.047) and systematic inflammatory responsesyndrome (p \ 0.001) were also associated with manifestation of AF. As regards to thecircumstances under which AF occurred, electrolyte disorders, especially hypokalaemia,was observed in 40 % of the cases and hypovolaemia in 30 % of them.CONCLUSIONS. A brief training in AF identification may significantly improve diagnosis.A further targeted training on specific factors, easily accessible by nursing personnel mightcontribute to AF prevention in ICU patients.
0668NURSES’ EXPERIENCES OF CARING FOR AWAKE, NON-SEDATED,MECHANICALLY VENTILATED CRITICALLY ILL PATIENTS IN THE ICU:A QUALITATIVE STUDY
E. Laerkner1,2, I. Egerod3, H.P. Hansen2
1Odense University Hospital, Department of Anesthesiology and Intensive Care, Odense,Denmark, 2University of Southern Denmark, Health, Man and Society, Odense, Denmark,3University of Copenhagen Health and Medical Sciences, Rigshospitalet, Trauma CenterHOC 3193, Copenhagen, DenmarkINTRODUCTION. In recent years, there has been a trend towards lighter sedation ofcritically ill patients in need of mechanical ventilation. In 2010, a Danish RCT showedthat a protocol of no sedation was feasible and decreased the duration of mechanicalventilation, ICU stay and hospital length of stay (1). At the same time, a US surveydemonstrated that most nurses considered mechanical ventilation as a stressful event thatrequired sedation to ensure patient comfort (2). These findings show that nurses’ attitudesneed to be taken into consideration when changing the sedation strategy, and that moreknowledge is needed to understand nursing care related to awake mechanically ventilatedpatients.OBJECTIVES. To explore nurses’ experiences with and attitudes towards caring forawake, non-sedated critically ill patients requiring mechanical ventilation in the ICU.METHODS. The study had a qualitative design including 13 months of fieldwork in twointensive care units in Denmark using a protocol of no sedation for mechanically ventilatedpatients. Data were generated during participant observation and by semi-structured
interviews with 16 nurses. The strategy of analysis was inductive, using qualitative thematicdescription.RESULTS. The main findings were that nurses preferred caring for awake rather thansedated mechanically ventilated patients, and that nurses appreciated caring for just onepatient at a time. The overall theme that emerged was: demanding yet rewarding. Thedemanding aspects of caring for awake intubated patients included ambiguity betweenconflicting needs and actions, while the rewarding aspects included human and personalinteraction. Three sub-themes were identified: 1. Unpredictability: caring for and interactingwith the patient; 2. The double gaze: integrating human and instrumental care, and 3.Physical and emotional proximity: closeness without distance. The protocol of no sedationafforded the opportunity for more respectful interdisciplinary dialogue regarding patientcomfort and transformed the unit to an environment where the human and personal char-acteristics of the patients were valued.CONCLUSIONS. Despite the caring complexity, nurses preferred to care for awake ratherthan sedated patients. Nurses were required to act in the interface between conflictingpossibilities and needs, which was both demanding and rewarding. Our study demonstratedthe human benefits of interacting with critically ill patients.REFERENCES. 1. Strøm T et al. A protocol of no sedation for critically ill patientsreceiving mechanical ventilation: a randomised trial. Lancet. 2010; 375: 475–480. 2. Gut-tormson, JL et al. Factors influencing nurse sedation practices with mechanically ventilatedpatients: A US national survey. Int Crit Care Nurs. 2040; (26): 44–50.GRANT ACKNOWLEDGMENT. University of Southern Denmark, Odense UniversityHospital and Danish Nursing Research Society.
0669A MULTICENTER STUDY ON RELIABILITY AND VALIDITY OF TRIAGEEMERGENCY METHOD, A NEW FOUR-LEVEL EMERGENCY TRIAGESYSTEM
N. Parenti1, D. Sangiorgi2, M. Cavazza3, G. Cervellin4, G. Rastelli5, R. Petrino6,C. Camaniti1, T. Lenzi7
1University of Parma, Parma, Italy, 2University of Bologna, Bologna, Italy, 3PoliclinicoSant’Orsola, Bologna, Italy, 4AUSL Parma, Parma, Italy, 5Aix-Marseille Univ, URMITECNRS-UMR 6236, Hôpital Nord, Fidenza, Italy, 6AUSL Vercelli, Vercelli, Italy, 7AUSLImola, Imola, ItalyINTRODUCTION. Triage Emergency Method (TEM), a four-level emergency triagesystem, (Urgency Category UC 1 = immediate response; UC 2, 3, 4 assessment within 20,60, 120 min respectively) showed a good validity and reliability in previous studies (1, 2).There are few multicenter studies which test these quality indicators among Triage Scales;there are not Italian studies on this topic.OBJECTIVES. The goal of this study is to assess the inter-rater reliability and validity inpredicting a Reference Standard rating of the TEM among six Italian hospitals.METHODS. This is a multicenter before–after study conducted from June to August 2011.12 nurses (2 from each Hospital) were included to independently assign triage scores to 66scenarios before and after (3 months) a 2 h course on TEM. Scenarios included patientdemographic and clinical characteristics, nurse triage category, admission status, presentingcomplaint. For each scenario, the most frequent UC (the mode) has been considered as ‘‘truetriage’’. Weighted kappa (K) was used to calculate inter-rater reliability. Validity wasevaluated by studying the relationships between the triage category assigned by the nursesand the rating of a Reference Standard (3 nurses expert in triage and TEM).RESULTS. Of the 66 patients included in scenarios 40 (60 %) were women, the mean agewas 43.7 years (SD ± 26.3); there were 20 hospital admissions; trauma was the most fre-quent symptom at triage (44 %). The median years of experience in Emergency Triageamong nurses was 3 (range 1–6). The UC assigned were: 30 % with UC 4, 49 % UC 3,18 % UC 2, 3 % UC 1. Interrater reliability among the 12 nurses was K = 0.75 (CI0.58–0.84). We found 22/66 (33 %) scenarios with a complete agreement in assigning code,1 scenario with a ‘‘marked discordance’’ (2 or more points) among nurses who used theTEM. Hospital admission by our triage system was as follows: UC 1 (100 %), 2 (30 %), 3(12 %), 4 (2 %). Accuracy in predicting the Reference Standard’s code was 80 % (CI70–90 %).CONCLUSIONS. The TEM shows a good inter-rater reliability and validity in predicting aReference Standard’ triage code. To our knowledge, this is the first multicentre Italian studywhich tests the validity and reliability of a Triage System.REFERENCES. 1. Parenti N et al. Reliability and validity of two four-level emergencytriage systems. Eur J Emerg Med. 2009; 16: 115–120. 2) Parenti N et al. Effect of a triagecourse on quality of rating triage codes in a group of university nursing students: a before–after observational study. World J Emerg Med 2013; 4(1): 20–25
0670DEVELOPMENT OF A RAPID INTER-PROFESSIONAL ULTRASOUNDASSESSMENT OF CRITICALLY ILL PATIENTS IN A LARGE CENTRALLONDON INTENSIVE CARE UNIT
S. Casboult1, A. Skorko1, K. Heelas1, G. Parsons1, P.A. Hopkins1
1King’s College Hospital NHS Foundation Trust, London, UKINTRODUCTION. International competencies have now been agreed to support the use offocussed ultrasound by non-radiologists in critical illness for shock assessment; the primarytrauma survey; and placement of lines and drains (1, 2). However, despite an increasing rolefor nursing staff in the use of complex near patient devices used in supportive critical care(renal replacement therapies; ECMO; left-ventricular assist devices); this has not includedinvolvement in assessment and treatment of critically-ill patients with US. Here we describethe development and testing of a nurse-led inter-professional US imaging schedule in the32-bedded general ICU of a busy central London teaching hospital.OBJECTIVES. To develop a nurse-led interprofessional ultrasound assessment protocolfor use in critically ill patients.METHODS. Baseline survey, peer-review, round-table discussion and inter-professionalinterviews were conducted with imaging and critical care staff to document baseline per-ceptions and attitudes towards the development of a nurse-led inter-professional ultrasoundassessment protocol for critically-ill patients. This baseline analysis was also used to gen-erate consensus for the required number and format of essential ultrasound windows thatcould be beneficially and safely utilised by the whole inter-professional ICU team. Delphirounds were conducted to refine the shortlist. Training tools were developed using theconsensus windows and competency acquisition trajectory compared between professions.RESULTS. Key outcomes from the Delphi exercise were the need to develop a commoninter-professional language; clearly identify anatomical targets for imaging and provide a
26th ESICM ANNUAL CONGRESS — PARIS, FRANCE — 5–9 OCTOBER 2013
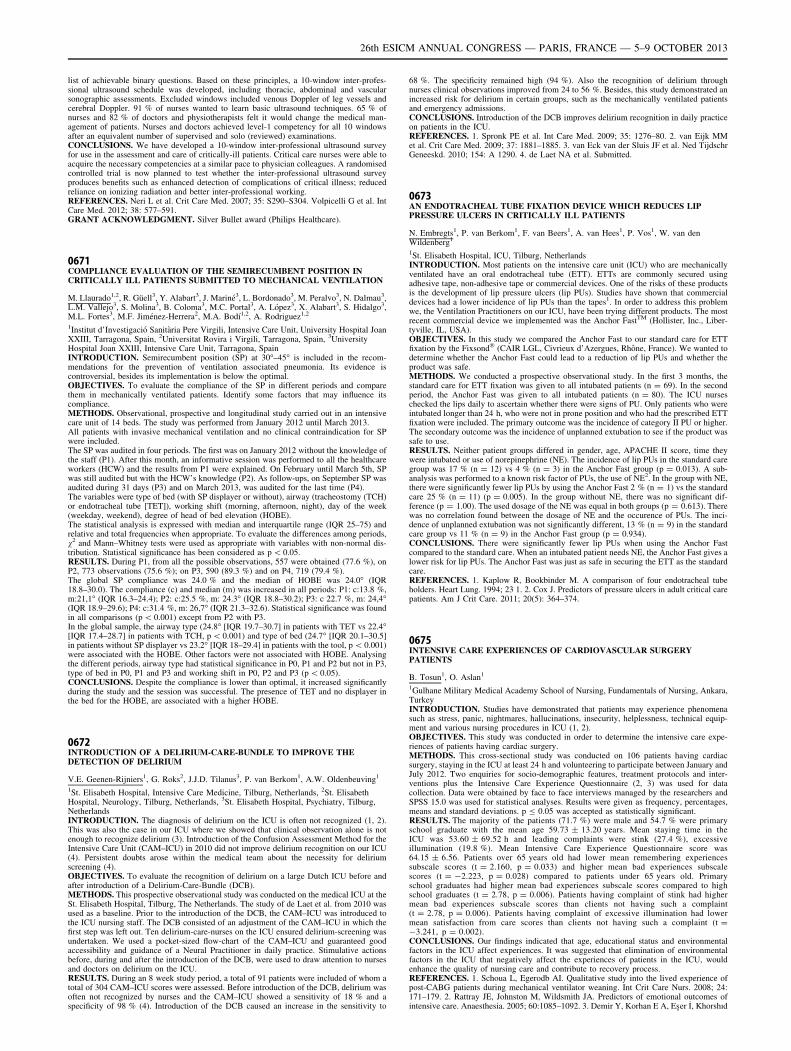
list of achievable binary questions. Based on these principles, a 10-window inter-profes-sional ultrasound schedule was developed, including thoracic, abdominal and vascularsonographic assessments. Excluded windows included venous Doppler of leg vessels andcerebral Doppler. 91 % of nurses wanted to learn basic ultrasound techniques. 65 % ofnurses and 82 % of doctors and physiotherapists felt it would change the medical man-agement of patients. Nurses and doctors achieved level-1 competency for all 10 windowsafter an equivalent number of supervised and solo (reviewed) examinations.CONCLUSIONS. We have developed a 10-window inter-professional ultrasound surveyfor use in the assessment and care of critically-ill patients. Critical care nurses were able toacquire the necessary competencies at a similar pace to physician colleagues. A randomisedcontrolled trial is now planned to test whether the inter-professional ultrasound surveyproduces benefits such as enhanced detection of complications of critical illness; reducedreliance on ionizing radiation and better inter-professional working.REFERENCES. Neri L et al. Crit Care Med. 2007; 35: S290–S304. Volpicelli G et al. IntCare Med. 2012; 38: 577–591.GRANT ACKNOWLEDGMENT. Silver Bullet award (Philips Healthcare).
0671COMPLIANCE EVALUATION OF THE SEMIRECUMBENT POSITION INCRITICALLY ILL PATIENTS SUBMITTED TO MECHANICAL VENTILATION
M. Llaurado1,2, R. Güell3, Y. Alabart3, J. Mariné3, L. Bordonado3, M. Peralvo3, N. Dalmau3,L.M. Vallejo3, S. Molina3, B. Coloma3, M.C. Portal3, A. López3, X. Alabart3, S. Hidalgo3,M.L. Fortes3, M.F. Jiménez-Herrera2, M.A. Bodı́1,2, A. Rodriguez1,2
1Institut d’Investigació Sanitària Pere Virgili, Intensive Care Unit, University Hospital JoanXXIII, Tarragona, Spain, 2Universitat Rovira i Virgili, Tarragona, Spain, 3UniversityHospital Joan XXIII, Intensive Care Unit, Tarragona, SpainINTRODUCTION. Semirecumbent position (SP) at 30�–45� is included in the recom-mendations for the prevention of ventilation associated pneumonia. Its evidence iscontroversial, besides its implementation is below the optimal.OBJECTIVES. To evaluate the compliance of the SP in different periods and comparethem in mechanically ventilated patients. Identify some factors that may influence itscompliance.METHODS. Observational, prospective and longitudinal study carried out in an intensivecare unit of 14 beds. The study was performed from January 2012 until March 2013.All patients with invasive mechanical ventilation and no clinical contraindication for SPwere included.The SP was audited in four periods. The first was on January 2012 without the knowledge ofthe staff (P1). After this month, an informative session was performed to all the healthcareworkers (HCW) and the results from P1 were explained. On February until March 5th, SPwas still audited but with the HCW’s knowledge (P2). As follow-ups, on September SP wasaudited during 31 days (P3) and on March 2013, was audited for the last time (P4).The variables were type of bed (with SP displayer or without), airway (tracheostomy (TCH)or endotracheal tube [TET]), working shift (morning, afternoon, night), day of the week(weekday, weekend), degree of head of bed elevation (HOBE).The statistical analysis is expressed with median and interquartile range (IQR 25–75) andrelative and total frequencies when appropriate. To evaluate the differences among periods,v2 and Mann–Whitney tests were used as appropriate with variables with non-normal dis-tribution. Statistical significance has been considered as p \ 0.05.RESULTS. During P1, from all the possible observations, 557 were obtained (77.6 %), onP2, 773 observations (75.6 %); on P3, 590 (89.3 %) and on P4, 719 (79.4 %).The global SP compliance was 24.0 % and the median of HOBE was 24.0� (IQR18.8–30.0). The compliance (c) and median (m) was increased in all periods: P1: c:13.8 %,m:21,1� (IQR 16.3–24.4); P2: c:25.5 %, m: 24.3� (IQR 18.8–30.2); P3: c 22.7 %, m: 24,4�(IQR 18.9–29.6); P4: c:31.4 %, m: 26,7� (IQR 21.3–32.6). Statistical significance was foundin all comparisons (p \ 0.001) except from P2 with P3.In the global sample, the airway type (24.8� [IQR 19.7–30.7] in patients with TET vs 22.4�[IQR 17.4–28.7] in patients with TCH, p \ 0.001) and type of bed (24.7� [IQR 20.1–30.5]in patients without SP displayer vs 23.2� [IQR 18–29.4] in patients with the tool, p \ 0.001)were associated with the HOBE. Other factors were not associated with HOBE. Analysingthe different periods, airway type had statistical significance in P0, P1 and P2 but not in P3,type of bed in P0, P1 and P3 and working shift in P0, P2 and P3 (p \ 0.05).CONCLUSIONS. Despite the compliance is lower than optimal, it increased significantlyduring the study and the session was successful. The presence of TET and no displayer inthe bed for the HOBE, are associated with a higher HOBE.
0672INTRODUCTION OF A DELIRIUM-CARE-BUNDLE TO IMPROVE THEDETECTION OF DELIRIUM
V.E. Geenen-Rijniers1, G. Roks2, J.J.D. Tilanus3, P. van Berkom1, A.W. Oldenbeuving1
1St. Elisabeth Hospital, Intensive Care Medicine, Tilburg, Netherlands, 2St. ElisabethHospital, Neurology, Tilburg, Netherlands, 3St. Elisabeth Hospital, Psychiatry, Tilburg,NetherlandsINTRODUCTION. The diagnosis of delirium on the ICU is often not recognized (1, 2).This was also the case in our ICU where we showed that clinical observation alone is notenough to recognize delirium (3). Introduction of the Confusion Assessment Method for theIntensive Care Unit (CAM–ICU) in 2010 did not improve delirium recognition on our ICU(4). Persistent doubts arose within the medical team about the necessity for deliriumscreening (4).OBJECTIVES. To evaluate the recognition of delirium on a large Dutch ICU before andafter introduction of a Delirium-Care-Bundle (DCB).METHODS. This prospective observational study was conducted on the medical ICU at theSt. Elisabeth Hospital, Tilburg, The Netherlands. The study of de Laet et al. from 2010 wasused as a baseline. Prior to the introduction of the DCB, the CAM–ICU was introduced tothe ICU nursing staff. The DCB consisted of an adjustment of the CAM–ICU in which thefirst step was left out. Ten delirium-care-nurses on the ICU ensured delirium-screening wasundertaken. We used a pocket-sized flow-chart of the CAM–ICU and guaranteed goodaccessibility and guidance of a Neural Practitioner in daily practice. Stimulative actionsbefore, during and after the introduction of the DCB, were used to draw attention to nursesand doctors on delirium on the ICU.RESULTS. During an 8 week study period, a total of 91 patients were included of whom atotal of 304 CAM–ICU scores were assessed. Before introduction of the DCB, delirium wasoften not recognized by nurses and the CAM–ICU showed a sensitivity of 18 % and aspecificity of 98 % (4). Introduction of the DCB caused an increase in the sensitivity to
68 %. The specificity remained high (94 %). Also the recognition of delirium throughnurses clinical observations improved from 24 to 56 %. Besides, this study demonstrated anincreased risk for delirium in certain groups, such as the mechanically ventilated patientsand emergency admissions.CONCLUSIONS. Introduction of the DCB improves delirium recognition in daily practiceon patients in the ICU.REFERENCES. 1. Spronk PE et al. Int Care Med. 2009; 35: 1276–80. 2. van Eijk MMet al. Crit Care Med. 2009; 37: 1881–1885. 3. van Eck van der Sluis JF et al. Ned TijdschrGeneeskd. 2010; 154: A 1290. 4. de Laet NA et al. Submitted.
0673AN ENDOTRACHEAL TUBE FIXATION DEVICE WHICH REDUCES LIPPRESSURE ULCERS IN CRITICALLY ILL PATIENTS
N. Embregts1, P. van Berkom1, F. van Beers1, A. van Hees1, P. Vos1, W. van denWildenberg1
1St. Elisabeth Hospital, ICU, Tilburg, NetherlandsINTRODUCTION. Most patients on the intensive care unit (ICU) who are mechanicallyventilated have an oral endotracheal tube (ETT). ETTs are commonly secured usingadhesive tape, non-adhesive tape or commercial devices. One of the risks of these productsis the development of lip pressure ulcers (lip PUs). Studies have shown that commercialdevices had a lower incidence of lip PUs than the tapes1. In order to address this problemwe, the Ventilation Practitioners on our ICU, have been trying different products. The mostrecent commercial device we implemented was the Anchor FastTM (Hollister, Inc., Liber-tyville, IL, USA).OBJECTIVES. In this study we compared the Anchor Fast to our standard care for ETTfixation by the Fixsond� (CAIR LGL, Civrieux d’Azergues, Rhône, France). We wanted todetermine whether the Anchor Fast could lead to a reduction of lip PUs and whether theproduct was safe.METHODS. We conducted a prospective observational study. In the first 3 months, thestandard care for ETT fixation was given to all intubated patients (n = 69). In the secondperiod, the Anchor Fast was given to all intubated patients (n = 80). The ICU nurseschecked the lips daily to ascertain whether there were signs of PU. Only patients who wereintubated longer than 24 h, who were not in prone position and who had the prescribed ETTfixation were included. The primary outcome was the incidence of category II PU or higher.The secondary outcome was the incidence of unplanned extubation to see if the product wassafe to use.RESULTS. Neither patient groups differed in gender, age, APACHE II score, time theywere intubated or use of norepinephrine (NE). The incidence of lip PUs in the standard caregroup was 17 % (n = 12) vs 4 % (n = 3) in the Anchor Fast group (p = 0.013). A sub-analysis was performed to a known risk factor of PUs, the use of NE2. In the group with NE,there were significantly fewer lip PUs by using the Anchor Fast 2 % (n = 1) vs the standardcare 25 % (n = 11) (p = 0.005). In the group without NE, there was no significant dif-ference (p = 1.00). The used dosage of the NE was equal in both groups (p = 0.613). Therewas no correlation found between the dosage of NE and the occurence of PUs. The inci-dence of unplanned extubation was not significantly different, 13 % (n = 9) in the standardcare group vs 11 % (n = 9) in the Anchor Fast group (p = 0.934).CONCLUSIONS. There were significantly fewer lip PUs when using the Anchor Fastcompared to the standard care. When an intubated patient needs NE, the Anchor Fast gives alower risk for lip PUs. The Anchor Fast was just as safe in securing the ETT as the standardcare.REFERENCES. 1. Kaplow R, Bookbinder M. A comparison of four endotracheal tubeholders. Heart Lung. 1994; 23 1. 2. Cox J. Predictors of pressure ulcers in adult critical carepatients. Am J Crit Care. 2011; 20(5): 364–374.
0675INTENSIVE CARE EXPERIENCES OF CARDIOVASCULAR SURGERYPATIENTS
B. Tosun1, O. Aslan1
1Gulhane Military Medical Academy School of Nursing, Fundamentals of Nursing, Ankara,TurkeyINTRODUCTION. Studies have demonstrated that patients may experience phenomenasuch as stress, panic, nightmares, hallucinations, insecurity, helplessness, technical equip-ment and various nursing procedures in ICU (1, 2).OBJECTIVES. This study was conducted in order to determine the intensive care expe-riences of patients having cardiac surgery.METHODS. This cross-sectional study was conducted on 106 patients having cardiacsurgery, staying in the ICU at least 24 h and volunteering to participate between January andJuly 2012. Two enquiries for socio-demographic features, treatment protocols and inter-ventions plus the Intensive Care Experience Questionnaire (2, 3) was used for datacollection. Data were obtained by face to face interviews managed by the researchers andSPSS 15.0 was used for statistical analyses. Results were given as frequency, percentages,means and standard deviations. p B 0.05 was accepted as statistically significant.RESULTS. The majority of the patients (71.7 %) were male and 54.7 % were primaryschool graduate with the mean age 59.73 ± 13.20 years. Mean staying time in theICU was 53.60 ± 69.52 h and leading complaints were stink (27.4 %), excessiveillumination (19.8 %). Mean Intensive Care Experience Questionnaire score was64.15 ± 6.56. Patients over 65 years old had lower mean remembering experiencessubscale scores (t = 2.160, p = 0.033) and higher mean bad experiences subscalescores (t = -2.223, p = 0.028) compared to patients under 65 years old. Primaryschool graduates had higher mean bad experiences subscale scores compared to highschool graduates (t = 2.78, p = 0.006). Patients having complaint of stink had highermean bad experiences subscale scores than clients not having such a complaint(t = 2.78, p = 0.006). Patients having complaint of excessive illumination had lowermean satisfaction from care scores than clients not having such a complaint (t =-3.241, p = 0.002).CONCLUSIONS. Our findings indicated that age, educational status and environmentalfactors in the ICU affect experiences. It was suggested that elimination of environmentalfactors in the ICU that negatively affect the experiences of patients in the ICU, wouldenhance the quality of nursing care and contribute to recovery process.REFERENCES. 1. Schoua L, Egerodb AI. Qualitative study into the lived experience ofpost-CABG patients during mechanical ventilator weaning. Int Crit Care Nurs. 2008; 24:171–179. 2. Rattray JE, Johnston M, Wildsmith JA. Predictors of emotional outcomes ofintensive care. Anaesthesia. 2005; 60:1085–1092. 3. Demir Y, Korhan E A, Eşer İ, Khorshıd
26th ESICM ANNUAL CONGRESS — PARIS, FRANCE — 5–9 OCTOBER 2013
L. Yoğun bakım deneyim ölçeğinin geçerlik ve güvenirlik çalışması. Turkiye Klinikleri JNurs. 2009; 1: 1–11.
0676CREATION AND DISTRIBUTION OF A DELPHI QUESTIONNAIRE TOEVALUATE THE FACTORS INFLUENCING THE COMPLIANCE OF THESEMIRECUMBENT POSITION IN CRITICALLY ILL PATIENTS REQUIRINGMECHANICAL VENTILATION
M. Llaurado1,2, L. Bordonado3, Y. Alabart3, A. López3, J. Mariné3, L.M. Vallejo3,R. Güell3, A. Lobo4, N. Montesinos4, S. Radaidan4, N. Calpe5, A. Ventura5, À. Piñol6,M. Treso6, R. Zamorano7, É. Bernal7, C. Paños8, L. Martı́nez8, M. Pi9, A. Valeiras9,M.L. Fortes3, M.F. Jiménez-Herrera2, CAPCRI Study Group1Institut d’Investigació Sanitària Pere Virgili, Intensive Care Unit–University Hospital JoanXXIII, Tarragona, Spain, 2Universitat Rovira i Virgili, Tarragona, Spain, 3UniversityHospital Joan XXIII, Intensive Care Unit, Tarragona, Spain, 4University Hospital DoctorJosep Trueta, Intensive Care Unit, Girona, Spain, 5Hospital General de Cataluña, IntensiveCare Unit, Barcelona, Spain, 6University Hospital Verge de la Cinta, Intensive Care Unit,Tortosa, Spain, 7Hospital Universitario de Torrejon, Intensive Care Unit, Torrejon, Spain,8University Hospital Sant Pau i Santa Tecla, Intensive Care Unit, Tarragona, Spain,9Hospital Sant Joan Despi Moisses Broggi, Intensive Care Unit, Barcelona, SpainINTRODUCTION. Delphi method has been used to get consensus, create guidelines in atopic where there is controversy and questionnaires. Semirecumbent position (SP) is arecommended measure to prevent ventilator associated pneumonia (VAP) but its imple-mentation is below the optimal.OBJECTIVES. To create and distribute a questionnaire that aims to evaluate the factorsthat healthcare workers (HCW) think may influence in the compliance of the SP in patientsrequiring mechanical ventilation as a prevention measure for VAP.METHODS. Initial questionnaire was obtained from literature review of factors influ-encing the SP compliance and patient safety. It included 65 items distributed in 5 areas(patient’s factors [A1], related to HCW [A2], to task [A3], to training [A4] and equipment[A5]). 14 participated and three rounds were made. In every round, each item wasevaluated from 1 to 7 according to its importance. Items with a score \5 from C80 % ofthe experts were deleted. Items with variability were reworded. When the final versionwas approved, a pilot test was done with nine HCW to evaluate its understanding andpossible mistakes.This questionnaire was distributed to seven intensive care units from 2012 to February 2013.RESULTS. In the first round, 37 items with low score and variability were reworded and 8items were added. In the second, 28 items were deleted and 8 were reformulated. Finally, inthe third, four were removed and four reworded. The final questionnaire includes 35 items(21 items in A1, 5 in A2, 4 in A3, 3 in A4 and 2 in A5) evaluated according to Likert scale(1 strong disagreement–5 strong agreement).During pilot test, six comprehension problems and eight improvements comments wereidentified. 337 questionnaires were obtained. Response rate was 70.4 %. 64 (19.1 %) werefrom nursing assistants, 215 (64.8 %) from nurses, 41 (12.2 %) from staff physicians and 15(4.5 %) from fellow physicians. 83.2 % were women, participants were 37.7 ± 10.6 yearsold and intensive care experience was 10.0 ± 8.34 years. 73 (25 %) nurses had post-graduate training in intensive care.The factors reported as related to not follow the SP recommendations were clinical con-traindications to SP (median 5 [IQR 4–5]) and patient’s discomfort when awake (median 4[IQR 2–4]). Patient’s wishes, abdominal surgery and open abdomen and the lack of feed-back when an intervention is implemented in the unit had disparity on the results (median 3[IQR 2–4]). There were no statistical differences among HCW, neither experience norpostgraduate training.CONCLUSIONS. Delphi method allowed creating the questionnaire with experts’ con-sensus in three rounds, pilot test was very useful to asses it is understanding.The only factors that seem to interfere with SP recommendation compliance from HCWopinion are patient’s discomfort and clinical contraindications for SP.GRANT ACKNOWLEDGMENT. Funded by the National Nursing Research Award fromUniversity Hospital ‘‘Marques de Valdecilla’’.
0677ARTIFACT PATTERNS IN CONTINUOUS NONINVASIVE MONITORINGOF PATIENTS
M. Hravnak1, L. Chen2, E. Bose1, M. Fiterau2, M. Guillame-Bert2, A. Dubrawski2,G. Clermont3, M.R. Pinsky3
1University of Pittsburgh, School of Nursing, Pittsburgh, US, 2Carnegie Mellon University,Auton Lab, Pittsburgh, US, 3University of Pittsburgh, School of Medicine, Department ofCritical Care Medicine, Pittsburgh, USINTRODUCTION. Instability can be missed in monitored patients. One contributing factoris alarm fatigue when false alarms originating from monitoring artifact desensitizes clini-cians to real alarms. Based on our clinical observation, we hypothesized that artifact is notrandom, but for each monitored parameter manifests in a small subset of patterns.OBJECTIVES. We aimed to describe monitor artifact patterns, extract their numericfeatures, and develop featurized rules for each pattern. Such information could be used todecrease false alarms by automated artifact filtering, and assist clinicians to target action toeliminate artifact.METHODS. We prospectively recruited admissions for 8 weeks in a 24 bed trauma unit.Noninvasive vital sign (VS) monitoring data recorded at a frequency of 1/20 Hz consisted ofheart rate (HR), respiratory rate (RR; bioimpedance), noninvasive (oscillometric) systolic(SBP) and diastolic (DBP) blood pressure, and peripheral oximetry (SpO2). VS deviations(events) beyond stability thresholds (HR \ 40 or [ 140, RR \ 8 or [ 36, SBP \ 80or [ 200, DBP [ 110, SpO2 \ 85 %) were visually adjudicated by two reviewers (MRP,MH) as real alerts or artifact. The reviewers developed a limited set of expert rulesdescribing perceived patterns in the artifacts. For each parameter type of artifact (HR, RR,SpO2, etc.) we extracted numeric features in the VS artifact signal data as guided by theexpert rules (e.g. data density of signal; gap to next time stamp, signal slope). We visualizedartifact events for each parameter type in a 1D or 2D space spanned by the extracted featuresand derived decision boundaries for numeric featurized rules that discriminated betweenartifact patterns and evaluated which patterns were most useful in achieving discrimination,and whether any cases did not fit any pattern.RESULTS. 308 admissions and [29,000 patient-hours of monitoring data were studied,yielding 812 events of VS beyond stability thresholds. Of these, 214 events (26 %) were
judged to be artifact. Artifacts were most common in RR (65 %), followed by SpO2 (17 %),DBP (11 %), SBP (5 %) and HR (2 %). All RR artifacts were captured by two featurizedpatterns, with the majority (91 %) associated with a pattern of abnormal RR in the absenceof HR signals, and the remaining 9 % due to oscillatory/sparse signal patterns withoutchange in other VS. All SpO2 artifacts were captured by three patterns, with the majority(57 %) associated with a pattern of oscillatory step increases and decreases, 24 % with apattern of abrupt step increase at conclusion, and 19 % due to sparse signal, also withoutchanges in other VS.CONCLUSIONS. VS artifact events are common in monitored data, and most artifactsfollow predictable patterns for specific VS. Building monitoring systems and sensors todetect artifact based on featurized numeric rules for common artifact patterns could mini-mize false alarms and improve monitoring utility and patient safety.GRANT ACKNOWLEDGMENT. NIH NINR R01NR013912
0678TEMPERATURE MEASUREMENT IN THE ICU: NOT ALL METHODS AREEQUAL
V. Bosschem1, N. Mauws1, D. Van Der Jeught1, E. Hoste1, J. Decruyenaere1, J. De Waele1
1University Hospital, Surgical Intensive Care, Ghent, BelgiumINTRODUCTION. Accurate measurement of body temperature is important in critically illpatients both as a diagnostic tool and as during therapy (e.g. during therapeutic hypother-mia). Various methods for core temperature measurement in critically ill patients areavailable, but the accuracy of the different methods has been poorly investigated.OBJECTIVES. To prospectively evaluate different commonly used non-invasive methodsfor temperature measurement in critically ill patients.METHODS. We conducted a prospective, comparative analysis of the accuracy of five non-invasive methods for temperature measurement compared with the temperature measured inthe bladder (reference core temperature). Body temperature was thereby measured simul-taneously with the digital axillary thermometer, the digital inguinal thermometer, thetympanic ear thermometer, the temporal scan thermometer and the frontal non-contactthermometer. Patients were eligible for the study if they were admitted to the surgical ICUof the Ghent University Hospital (Belgium), had their bladder temperature monitored, wereexpected to stay in the ICU for at least 4 days and if informed consent from the patient orhis/her relatives was available. Temperature was measured simultaneously with the differenttechniques three times per day, and was compared with the core temperature recorded by thebladder catheter. Demographic data were retrieved from the PDMS. Descriptive analysis ofdata was performed with SPSS 20.0, and Medcalc 12.0 was used for Bland and Altmananalysis.RESULTS. A total of 1,314 temperatures were obtained from 25 patients (15 men, 10women) using the different methods, resulting in 147 paired data sets. The median age of thepatients was 58 years (IQR 35–64), median APACHE-II and SOFA score were 11 (5–24)and 7 (6–10) respectively. Mean core temperature was 37.11 �C (SD 0.79); mean temper-atures of the other methods are in Table 1. Inguinal, axillary and tympanic temperaturemeasurement underestimate core temperature by 0.40–0.56 �C on average; temporal scannermethod on the other hand overestimated the core temperature. Bias averages calculated bythe Bland and Altman methodology are summarized in Table 1.
Table 1 Summary of Bland and Altman analysis of D
Method Meantemperaturerecorded(SD) (�C)
Bias averagecompared tobladdertemperature(Bladdertemperature–method studied)(�C)
Lower limit ofagreement(Bladdertemperature–method studied)(�C)
Upper limit ofagreement(Bladdertemperature–methodstudied) (�C)
Inguinal 36.73 (0.81) 0.43 -0.33 1.18
Axillary 36.59 (0.86) 0.56 -0.33 1.46
Tympanic 36.70 (0.92) 0.40 -0.85 1.65
Temporalscanner
37.62 (0.77) -0.46 -1.53 0.61
Frontal non-contact
37.10 (0.80) 0.05 -1.21 1.32
CONCLUSIONS. In ICU patients, temperature measurements may differ considerablyfrom core temperature measurements in the bladder. None of the methods for measuringtemperature at the bedside are perfect. Consequently, these methods should not be usedwhen accurate temperature measurement in the intensive care is required.
0679RESEARCHES ON STUDENT NURSES IN TURKEY: A DESCRIPTIVE ANALYSIS
O. Aslan1, T. Basak1, S. Aciksoz1, B. Tosun1
1Gulhane Military Medical Academy School of Nursing, Department of Fundamentalsof Nursing, Ankara, TurkeyINTRODUCTION. The important part of nursing literature in Turkey are on researchesrelated to student nurses.OBJECTIVES. The purpose of this study was to examine the characteristics of researcheson student nurses in Turkey during a 10 years period.METHODS. This study was planned as a retrospective and descriptive. Articles on studentnurses between 2001 and 2011 were examined in the ‘‘Turkish Index of Reference Data-base’’, ‘‘Turkish Medline Database of National Health Sciences Journals’’ and ‘‘TurkishNational Ulakbim Database’’ by the key word ‘‘student nurse’’. 108 articles were the universeof this research. After discarding repeated articles in these three databases, totally 86 full textarticles were accessed online in the sample. Data were collected with a data form prepared byresearchers. Descriptive statistics were used to analyze the data in SPSS 15.0 program.RESULTS. Studies were mostly descriptive (89.5 %). Most of the authors were academicnurses (81.5 %). Mean number of authors was 3.2 ± 1.5. Articles were published in medicaljournals (53.5 %), nursing journals (37.2 %) and health sciences journals (9.3 %). Topicswere mostly on the characteristics of student nurses (59.3 %), practical education (22.1 %),theoretical education (11.6 %). Mostly searched areas were knowledge, attitudes and
26th ESICM ANNUAL CONGRESS — PARIS, FRANCE — 5–9 OCTOBER 2013
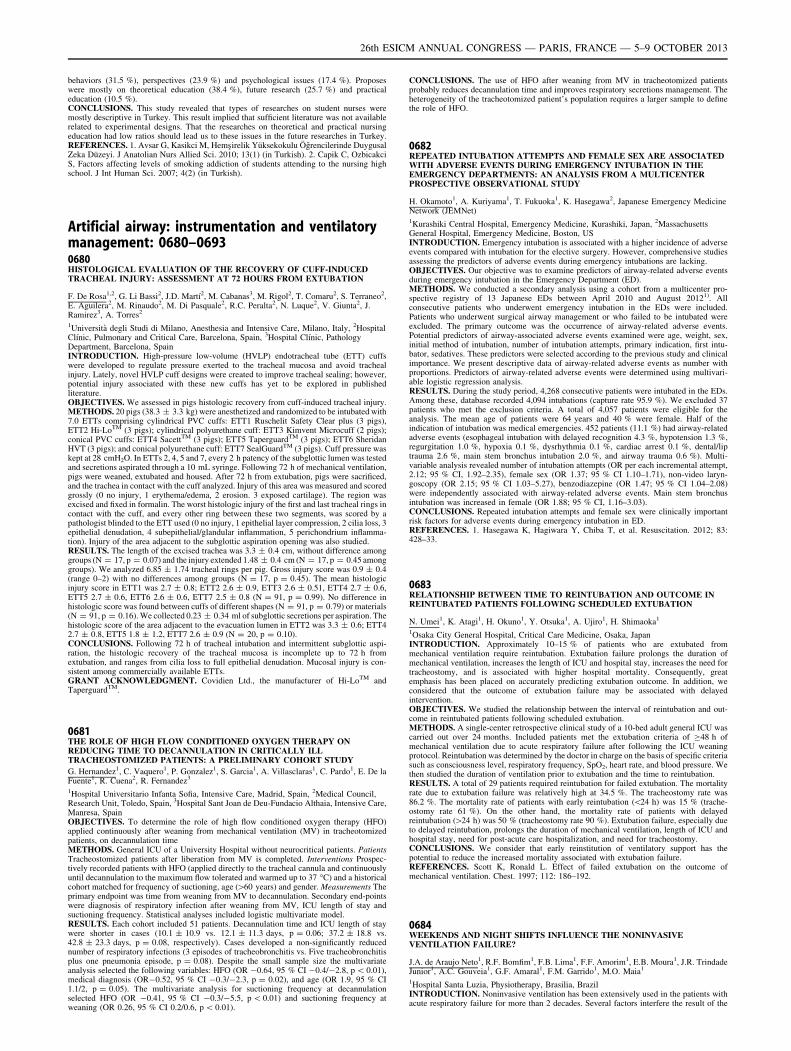
behaviors (31.5 %), perspectives (23.9 %) and psychological issues (17.4 %). Proposeswere mostly on theoretical education (38.4 %), future research (25.7 %) and practicaleducation (10.5 %).CONCLUSIONS. This study revealed that types of researches on student nurses weremostly descriptive in Turkey. This result implied that sufficient literature was not availablerelated to experimental designs. That the researches on theoretical and practical nursingeducation had low ratios should lead us to these issues in the future researches in Turkey.REFERENCES. 1. Avsar G, Kasikci M, Hemşirelik Yüksekokulu Öğrencilerinde DuygusalZeka Düzeyi. J Anatolian Nurs Allied Sci. 2010; 13(1) (in Turkish). 2. Capik C, OzbicakciS, Factors affecting levels of smoking addiction of students attending to the nursing highschool. J Int Human Sci. 2007; 4(2) (in Turkish).
Artificial airway: instrumentation and ventilatorymanagement: 0680–06930680HISTOLOGICAL EVALUATION OF THE RECOVERY OF CUFF-INDUCEDTRACHEAL INJURY: ASSESSMENT AT 72 HOURS FROM EXTUBATION
F. De Rosa1,2, G. Li Bassi2, J.D. Martı́2, M. Cabanas3, M. Rigol2, T. Comaru2, S. Terraneo2,E. Aguilera2, M. Rinaudo2, M. Di Pasquale2, R.C. Peralta2, N. Luque2, V. Giunta2, J.Ramirez3, A. Torres2
1Università degli Studi di Milano, Anesthesia and Intensive Care, Milano, Italy, 2HospitalClı́nic, Pulmonary and Critical Care, Barcelona, Spain, 3Hospital Clı́nic, PathologyDepartment, Barcelona, SpainINTRODUCTION. High-pressure low-volume (HVLP) endotracheal tube (ETT) cuffswere developed to regulate pressure exerted to the tracheal mucosa and avoid trachealinjury. Lately, novel HVLP cuff designs were created to improve tracheal sealing; however,potential injury associated with these new cuffs has yet to be explored in publishedliterature.OBJECTIVES. We assessed in pigs histologic recovery from cuff-induced tracheal injury.METHODS. 20 pigs (38.3 ± 3.3 kg) were anesthetized and randomized to be intubated with7.0 ETTs comprising cylindrical PVC cuffs: ETT1 Ruschelit Safety Clear plus (3 pigs),ETT2 Hi-LoTM (3 pigs); cylindrical polyurethane cuff: ETT3 Kimvent Microcuff (2 pigs);conical PVC cuffs: ETT4 SacettTM (3 pigs); ETT5 TaperguardTM (3 pigs); ETT6 SheridanHVT (3 pigs); and conical polyurethane cuff: ETT7 SealGuardTM (3 pigs). Cuff pressure waskept at 28 cmH2O. In ETTs 2, 4, 5 and 7, every 2 h patency of the subglottic lumen was testedand secretions aspirated through a 10 mL syringe. Following 72 h of mechanical ventilation,pigs were weaned, extubated and housed. After 72 h from extubation, pigs were sacrificed,and the trachea in contact with the cuff analyzed. Injury of this area was measured and scoredgrossly (0 no injury, 1 erythema/edema, 2 erosion. 3 exposed cartilage). The region wasexcised and fixed in formalin. The worst histologic injury of the first and last tracheal rings incontact with the cuff, and every other ring between these two segments, was scored by apathologist blinded to the ETT used (0 no injury, 1 epithelial layer compression, 2 cilia loss, 3epithelial denudation, 4 subepithelial/glandular inflammation, 5 perichondrium inflamma-tion). Injury of the area adjacent to the subglottic aspiration opening was also studied.RESULTS. The length of the excised trachea was 3.3 ± 0.4 cm, without difference amonggroups (N = 17, p = 0.07) and the injury extended 1.48 ± 0.4 cm (N = 17, p = 0.45 amonggroups). We analyzed 6.85 ± 1.74 tracheal rings per pig. Gross injury score was 0.9 ± 0.4(range 0–2) with no differences among groups (N = 17, p = 0.45). The mean histologicinjury score in ETT1 was 2.7 ± 0.8; ETT2 2.6 ± 0.9, ETT3 2.6 ± 0.51, ETT4 2.7 ± 0.6,ETT5 2.7 ± 0.6, ETT6 2.6 ± 0.6, ETT7 2.5 ± 0.8 (N = 91, p = 0.99). No difference inhistologic score was found between cuffs of different shapes (N = 91, p = 0.79) or materials(N = 91, p = 0.16). We collected 0.23 ± 0.34 ml of subglottic secretions per aspiration. Thehistologic score of the area adjacent to the evacuation lumen in ETT2 was 3.3 ± 0.6; ETT42.7 ± 0.8, ETT5 1.8 ± 1.2, ETT7 2.6 ± 0.9 (N = 20, p = 0.10).CONCLUSIONS. Following 72 h of tracheal intubation and intermittent subglottic aspi-ration, the histologic recovery of the tracheal mucosa is incomplete up to 72 h fromextubation, and ranges from cilia loss to full epithelial denudation. Mucosal injury is con-sistent among commercially available ETTs.GRANT ACKNOWLEDGMENT. Covidien Ltd., the manufacturer of Hi-LoTM andTaperguardTM.
0681THE ROLE OF HIGH FLOW CONDITIONED OXYGEN THERAPY ONREDUCING TIME TO DECANNULATION IN CRITICALLY ILLTRACHEOSTOMIZED PATIENTS: A PRELIMINARY COHORT STUDY
G. Hernandez1, C. Vaquero1, P. Gonzalez1, S. Garcia1, A. Villasclaras1, C. Pardo1, E. De laFuente1, R. Cuena2, R. Fernandez3
1Hospital Universitario Infanta Sofia, Intensive Care, Madrid, Spain, 2Medical Council,Research Unit, Toledo, Spain, 3Hospital Sant Joan de Deu-Fundacio Althaia, Intensive Care,Manresa, SpainOBJECTIVES. To determine the role of high flow conditioned oxygen therapy (HFO)applied continuously after weaning from mechanical ventilation (MV) in tracheotomizedpatients, on decannulation timeMETHODS. General ICU of a University Hospital without neurocritical patients. PatientsTracheostomized patients after liberation from MV is completed. Interventions Prospec-tively recorded patients with HFO (applied directly to the tracheal cannula and continuouslyuntil decannulation to the maximum flow tolerated and warmed up to 37 �C) and a historicalcohort matched for frequency of suctioning, age ([60 years) and gender. Measurements Theprimary endpoint was time from weaning from MV to decannulation. Secondary end-pointswere diagnosis of respiratory infection after weaning from MV, ICU length of stay andsuctioning frequency. Statistical analyses included logistic multivariate model.RESULTS. Each cohort included 51 patients. Decannulation time and ICU length of staywere shorter in cases (10.1 ± 10.9 vs. 12.1 ± 11.3 days, p = 0.06; 37.2 ± 18.8 vs.42.8 ± 23.3 days, p = 0.08, respectively). Cases developed a non-significantly reducednumber of respiratory infections (3 episodes of tracheobronchitis vs. Five tracheobronchitisplus one pneumonia episode, p = 0.08). Despite the small sample size the multivariateanalysis selected the following variables: HFO (OR -0.64, 95 % CI -0.4/-2.8, p \ 0.01),medical diagnosis (OR-0.52, 95 % CI -0.3/-2.3, p = 0.02), and age (OR 1.9, 95 % CI1.1/2, p = 0.05). The multivariate analysis for suctioning frequency at decannulationselected HFO (OR -0.41, 95 % CI -0.3/-5.5, p \ 0.01) and suctioning frequency atweaning (OR 0.26, 95 % CI 0.2/0.6, p \ 0.01).
CONCLUSIONS. The use of HFO after weaning from MV in tracheotomized patientsprobably reduces decannulation time and improves respiratory secretions management. Theheterogeneity of the tracheotomized patient’s population requires a larger sample to definethe role of HFO.
0682REPEATED INTUBATION ATTEMPTS AND FEMALE SEX ARE ASSOCIATEDWITH ADVERSE EVENTS DURING EMERGENCY INTUBATION IN THEEMERGENCY DEPARTMENTS: AN ANALYSIS FROM A MULTICENTERPROSPECTIVE OBSERVATIONAL STUDY
H. Okamoto1, A. Kuriyama1, T. Fukuoka1, K. Hasegawa2, Japanese Emergency MedicineNetwork (JEMNet)1Kurashiki Central Hospital, Emergency Medicine, Kurashiki, Japan, 2MassachusettsGeneral Hospital, Emergency Medicine, Boston, USINTRODUCTION. Emergency intubation is associated with a higher incidence of adverseevents compared with intubation for the elective surgery. However, comprehensive studiesassessing the predictors of adverse events during emergency intubations are lacking.OBJECTIVES. Our objective was to examine predictors of airway-related adverse eventsduring emergency intubation in the Emergency Department (ED).METHODS. We conducted a secondary analysis using a cohort from a multicenter pro-spective registry of 13 Japanese EDs between April 2010 and August 20121). Allconsecutive patients who underwent emergency intubation in the EDs were included.Patients who underwent surgical airway management or who failed to be intubated wereexcluded. The primary outcome was the occurrence of airway-related adverse events.Potential predictors of airway-associated adverse events examined were age, weight, sex,initial method of intubation, number of intubation attempts, primary indication, first intu-bator, sedatives. These predictors were selected according to the previous study and clinicalimportance. We present descriptive data of airway-related adverse events as number withproportions. Predictors of airway-related adverse events were determined using multivari-able logistic regression analysis.RESULTS. During the study period, 4,268 consecutive patients were intubated in the EDs.Among these, database recorded 4,094 intubations (capture rate 95.9 %). We excluded 37patients who met the exclusion criteria. A total of 4,057 patients were eligible for theanalysis. The mean age of patients were 64 years and 40 % were female. Half of theindication of intubation was medical emergencies. 452 patients (11.1 %) had airway-relatedadverse events (esophageal intubation with delayed recognition 4.3 %, hypotension 1.3 %,regurgitation 1.0 %, hypoxia 0.1 %, dysrhythmia 0.1 %, cardiac arrest 0.1 %, dental/liptrauma 2.6 %, main stem bronchus intubation 2.0 %, and airway trauma 0.6 %). Multi-variable analysis revealed number of intubation attempts (OR per each incremental attempt,2.12; 95 % CI, 1.92–2.35), female sex (OR 1.37; 95 % CI 1.10–1.71), non-video laryn-goscopy (OR 2.15; 95 % CI 1.03–5.27), benzodiazepine (OR 1.47; 95 % CI 1.04–2.08)were independently associated with airway-related adverse events. Main stem bronchusintubation was increased in female (OR 1.88; 95 % CI, 1.16–3.03).CONCLUSIONS. Repeated intubation attempts and female sex were clinically importantrisk factors for adverse events during emergency intubation in ED.REFERENCES. 1. Hasegawa K, Hagiwara Y, Chiba T, et al. Resuscitation. 2012; 83:428–33.
0683RELATIONSHIP BETWEEN TIME TO REINTUBATION AND OUTCOME INREINTUBATED PATIENTS FOLLOWING SCHEDULED EXTUBATION
N. Umei1, K. Atagi1, H. Okuno1, Y. Otsuka1, A. Ujiro1, H. Shimaoka1
1Osaka City General Hospital, Critical Care Medicine, Osaka, JapanINTRODUCTION. Approximately 10–15 % of patients who are extubated frommechanical ventilation require reintubation. Extubation failure prolongs the duration ofmechanical ventilation, increases the length of ICU and hospital stay, increases the need fortracheostomy, and is associated with higher hospital mortality. Consequently, greatemphasis has been placed on accurately predicting extubation outcome. In addition, weconsidered that the outcome of extubation failure may be associated with delayedintervention.OBJECTIVES. We studied the relationship between the interval of reintubation and out-come in reintubated patients following scheduled extubation.METHODS. A single-center retrospective clinical study of a 10-bed adult general ICU wascarried out over 24 months. Included patients met the extubation criteria of C48 h ofmechanical ventilation due to acute respiratory failure after following the ICU weaningprotocol. Reintubation was determined by the doctor in charge on the basis of specific criteriasuch as consciousness level, respiratory frequency, SpO2, heart rate, and blood pressure. Wethen studied the duration of ventilation prior to extubation and the time to reintubation.RESULTS. A total of 29 patients required reintubation for failed extubation. The mortalityrate due to extubation failure was relatively high at 34.5 %. The tracheostomy rate was86.2 %. The mortality rate of patients with early reintubation (\24 h) was 15 % (trache-ostomy rate 61 %). On the other hand, the mortality rate of patients with delayedreintubation ([24 h) was 50 % (tracheostomy rate 90 %). Extubation failure, especially dueto delayed reintubation, prolongs the duration of mechanical ventilation, length of ICU andhospital stay, need for post-acute care hospitalization, and need for tracheostomy.CONCLUSIONS. We consider that early reinstitution of ventilatory support has thepotential to reduce the increased mortality associated with extubation failure.REFERENCES. Scott K, Ronald L. Effect of failed extubation on the outcome ofmechanical ventilation. Chest. 1997; 112: 186–192.
0684WEEKENDS AND NIGHT SHIFTS INFLUENCE THE NONINVASIVEVENTILATION FAILURE?
J.A. de Araujo Neto1, R.F. Bomfim1, F.B. Lima1, F.F. Amorim1, E.B. Moura1, J.R. TrindadeJunior1, A.C. Gouveia1, G.F. Amaral1, F.M. Garrido1, M.O. Maia1
1Hospital Santa Luzia, Physiotherapy, Brasilia, BrazilINTRODUCTION. Noninvasive ventilation has been extensively used in the patients withacute respiratory failure for more than 2 decades. Several factors interfere the result of the
26th ESICM ANNUAL CONGRESS — PARIS, FRANCE — 5–9 OCTOBER 2013
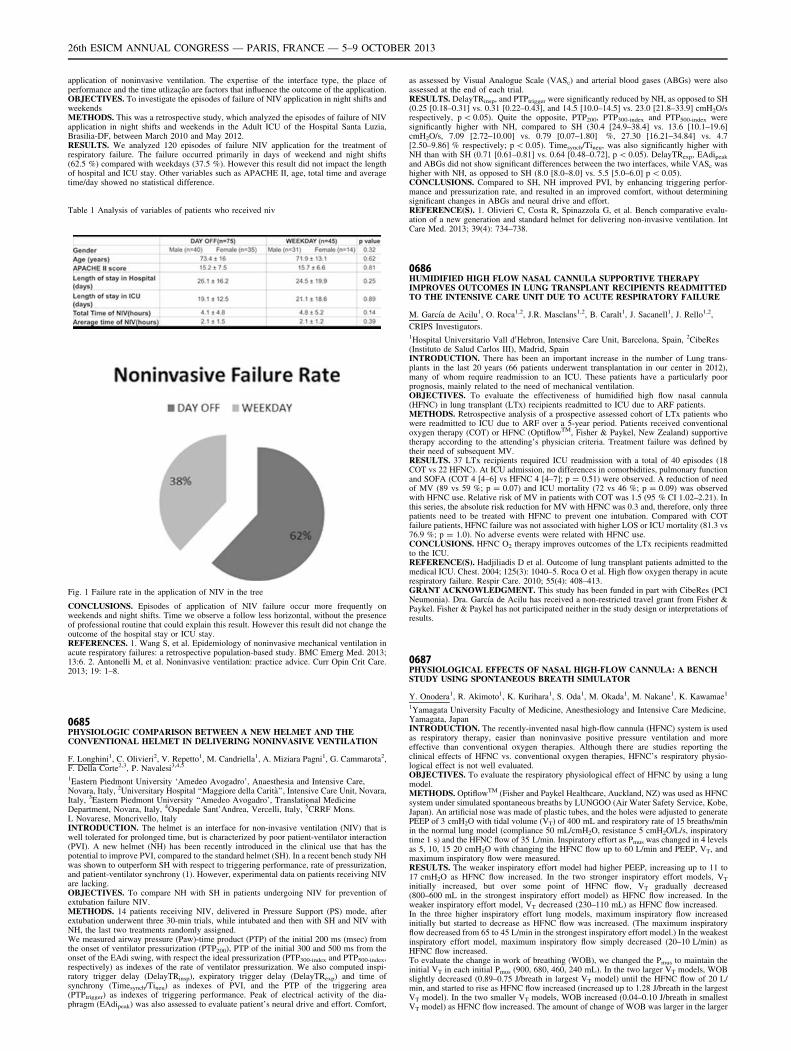
application of noninvasive ventilation. The expertise of the interface type, the place ofperformance and the time utlização are factors that influence the outcome of the application.OBJECTIVES. To investigate the episodes of failure of NIV application in night shifts andweekendsMETHODS. This was a retrospective study, which analyzed the episodes of failure of NIVapplication in night shifts and weekends in the Adult ICU of the Hospital Santa Luzia,Brasilia-DF, between March 2010 and May 2012.RESULTS. We analyzed 120 episodes of failure NIV application for the treatment ofrespiratory failure. The failure occurred primarily in days of weekend and night shifts(62.5 %) compared with weekdays (37.5 %). However this result did not impact the lengthof hospital and ICU stay. Other variables such as APACHE II, age, total time and averagetime/day showed no statistical difference.
Table 1 Analysis of variables of patients who received niv
Fig. 1 Failure rate in the application of NIV in the tree
CONCLUSIONS. Episodes of application of NIV failure occur more frequently onweekends and night shifts. Time we observe a follow less horizontal, without the presenceof professional routine that could explain this result. However this result did not change theoutcome of the hospital stay or ICU stay.REFERENCES. 1. Wang S, et al. Epidemiology of noninvasive mechanical ventilation inacute respiratory failures: a retrospective population-based study. BMC Emerg Med. 2013;13:6. 2. Antonelli M, et al. Noninvasive ventilation: practice advice. Curr Opin Crit Care.2013; 19: 1–8.
0685PHYSIOLOGIC COMPARISON BETWEEN A NEW HELMET AND THECONVENTIONAL HELMET IN DELIVERING NONINVASIVE VENTILATION
F. Longhini1, C. Olivieri2, V. Repetto1, M. Candriella1, A. Miziara Pagni1, G. Cammarota2,F. Della Corte2,3, P. Navalesi3,4,5
1Eastern Piedmont University ‘Amedeo Avogadro’, Anaesthesia and Intensive Care,Novara, Italy, 2Universitary Hospital ‘‘Maggiore della Carità’’, Intensive Care Unit, Novara,Italy, 3Eastern Piedmont University ‘‘Amedeo Avogadro’, Translational MedicineDepartment, Novara, Italy, 4Ospedale Sant’Andrea, Vercelli, Italy, 5CRRF Mons.L Novarese, Moncrivello, ItalyINTRODUCTION. The helmet is an interface for non-invasive ventilation (NIV) that iswell tolerated for prolonged time, but is characterized by poor patient-ventilator interaction(PVI). A new helmet (NH) has been recently introduced in the clinical use that has thepotential to improve PVI, compared to the standard helmet (SH). In a recent bench study NHwas shown to outperform SH with respect to triggering performance, rate of pressurization,and patient-ventilator synchrony (1). However, experimental data on patients receiving NIVare lacking.OBJECTIVES. To compare NH with SH in patients undergoing NIV for prevention ofextubation failure NIV.METHODS. 14 patients receiving NIV, delivered in Pressure Support (PS) mode, afterextubation underwent three 30-min trials, while intubated and then with SH and NIV withNH, the last two treatments randomly assigned.We measured airway pressure (Paw)-time product (PTP) of the initial 200 ms (msec) fromthe onset of ventilator pressurization (PTP200), PTP of the initial 300 and 500 ms from theonset of the EAdi swing, with respect the ideal pressurization (PTP300-index and PTP500-index,respectively) as indexes of the rate of ventilator pressurization. We also computed inspi-ratory trigger delay (DelayTRinsp), expiratory trigger delay (DelayTRexp) and time ofsynchrony (Timesynch/Tineu) as indexes of PVI, and the PTP of the triggering area(PTPtrigger) as indexes of triggering performance. Peak of electrical activity of the dia-phragm (EAdipeak) was also assessed to evaluate patient’s neural drive and effort. Comfort,
as assessed by Visual Analogue Scale (VASc) and arterial blood gases (ABGs) were alsoassessed at the end of each trial.RESULTS. DelayTRinsp, and PTPtrigger were significantly reduced by NH, as opposed to SH(0.25 [0.18–0.31] vs. 0.31 [0.22–0.43], and 14.5 [10.0–14.5] vs. 23.0 [21.8–33.9] cmH2O/srespectively, p \ 0.05). Quite the opposite, PTP200, PTP300-index and PTP500-index weresignificantly higher with NH, compared to SH (30.4 [24.9–38.4] vs. 13.6 [10.1–19.6]cmH2O/s, 7.09 [2.72–10.00] vs. 0.79 [0.07–1.80] %, 27.30 [16.21–34.84] vs. 4.7[2.50–9.86] % respectively; p \ 0.05). Timesynch/Tineu, was also significantly higher withNH than with SH (0.71 [0.61–0.81] vs. 0.64 [0.48–0.72], p \ 0.05). DelayTRexp, EAdipeak
and ABGs did not show significant differences between the two interfaces, while VASc washigher with NH, as opposed to SH (8.0 [8.0–8.0] vs. 5.5 [5.0–6.0] p \ 0.05).CONCLUSIONS. Compared to SH, NH improved PVI, by enhancing triggering perfor-mance and pressurization rate, and resulted in an improved comfort, without determiningsignificant changes in ABGs and neural drive and effort.REFERENCE(S). 1. Olivieri C, Costa R, Spinazzola G, et al. Bench comparative evalu-ation of a new generation and standard helmet for delivering non-invasive ventilation. IntCare Med. 2013; 39(4): 734–738.
0686HUMIDIFIED HIGH FLOW NASAL CANNULA SUPPORTIVE THERAPYIMPROVES OUTCOMES IN LUNG TRANSPLANT RECIPIENTS READMITTEDTO THE INTENSIVE CARE UNIT DUE TO ACUTE RESPIRATORY FAILURE
M. Garcı́a de Acilu1, O. Roca1,2, J.R. Masclans1,2, B. Caralt1, J. Sacanell1, J. Rello1,2,
CRIPS Investigators.1Hospital Universitario Vall d0Hebron, Intensive Care Unit, Barcelona, Spain, 2CibeRes(Instituto de Salud Carlos III), Madrid, SpainINTRODUCTION. There has been an important increase in the number of Lung trans-plants in the last 20 years (66 patients underwent transplantation in our center in 2012),many of whom require readmission to an ICU. These patients have a particularly poorprognosis, mainly related to the need of mechanical ventilation.OBJECTIVES. To evaluate the effectiveness of humidified high flow nasal cannula(HFNC) in lung transplant (LTx) recipients readmitted to ICU due to ARF patients.METHODS. Retrospective analysis of a prospective assessed cohort of LTx patients whowere readmitted to ICU due to ARF over a 5-year period. Patients received conventionaloxygen therapy (COT) or HFNC (OptiflowTM, Fisher & Paykel, New Zealand) supportivetherapy according to the attending’s physician criteria. Treatment failure was defined bytheir need of subsequent MV.RESULTS. 37 LTx recipients required ICU readmission with a total of 40 episodes (18COT vs 22 HFNC). At ICU admission, no differences in comorbidities, pulmonary functionand SOFA (COT 4 [4–6] vs HFNC 4 [4–7]; p = 0.51) were observed. A reduction of needof MV (89 vs 59 %; p = 0.07) and ICU mortality (72 vs 46 %; p = 0.09) was observedwith HFNC use. Relative risk of MV in patients with COT was 1.5 (95 % CI 1.02–2.21). Inthis series, the absolute risk reduction for MV with HFNC was 0.3 and, therefore, only threepatients need to be treated with HFNC to prevent one intubation. Compared with COTfailure patients, HFNC failure was not associated with higher LOS or ICU mortality (81.3 vs76.9 %; p = 1.0). No adverse events were related with HFNC use.CONCLUSIONS. HFNC O2 therapy improves outcomes of the LTx recipients readmittedto the ICU.REFERENCE(S). Hadjiliadis D et al. Outcome of lung transplant patients admitted to themedical ICU. Chest. 2004; 125(3): 1040–5. Roca O et al. High flow oxygen therapy in acuterespiratory failure. Respir Care. 2010; 55(4): 408–413.GRANT ACKNOWLEDGMENT. This study has been funded in part with CibeRes (PCINeumonia). Dra. Garcı́a de Acilu has received a non-restricted travel grant from Fisher &Paykel. Fisher & Paykel has not participated neither in the study design or interpretations ofresults.
0687PHYSIOLOGICAL EFFECTS OF NASAL HIGH-FLOW CANNULA: A BENCHSTUDY USING SPONTANEOUS BREATH SIMULATOR
Y. Onodera1, R. Akimoto1, K. Kurihara1, S. Oda1, M. Okada1, M. Nakane1, K. Kawamae1
1Yamagata University Faculty of Medicine, Anesthesiology and Intensive Care Medicine,Yamagata, JapanINTRODUCTION. The recently-invented nasal high-flow cannula (HFNC) system is usedas respiratory therapy, easier than noninvasive positive pressure ventilation and moreeffective than conventional oxygen therapies. Although there are studies reporting theclinical effects of HFNC vs. conventional oxygen therapies, HFNC’s respiratory physio-logical effect is not well evaluated.OBJECTIVES. To evaluate the respiratory physiological effect of HFNC by using a lungmodel.METHODS. OptiflowTM (Fisher and Paykel Healthcare, Auckland, NZ) was used as HFNCsystem under simulated spontaneous breaths by LUNGOO (Air Water Safety Service, Kobe,Japan). An artificial nose was made of plastic tubes, and the holes were adjusted to generatePEEP of 3 cmH2O with tidal volume (VT) of 400 mL and respiratory rate of 15 breaths/minin the normal lung model (compliance 50 mL/cmH2O, resistance 5 cmH2O/L/s, inspiratorytime 1 s) and the HFNC flow of 35 L/min. Inspiratory effort as Pmus was changed in 4 levelsas 5, 10, 15 20 cmH2O with changing the HFNC flow up to 60 L/min and PEEP, VT, andmaximum inspiratory flow were measured.RESULTS. The weaker inspiratory effort model had higher PEEP, increasing up to 11 to17 cmH2O as HFNC flow increased. In the two stronger inspiratory effort models, VT
initially increased, but over some point of HFNC flow, VT gradually decreased(800–600 mL in the strongest inspiratory effort model) as HFNC flow increased. In theweaker inspiratory effort model, VT decreased (230–110 mL) as HFNC flow increased.In the three higher inspiratory effort lung models, maximum inspiratory flow increasedinitially but started to decrease as HFNC flow was increased. (The maximum inspiratoryflow decreased from 65 to 45 L/min in the strongest inspiratory effort model.) In the weakestinspiratory effort model, maximum inspiratory flow simply decreased (20–10 L/min) asHFNC flow increased.To evaluate the change in work of breathing (WOB), we changed the Pmus to maintain theinitial VT in each initial Pmus (900, 680, 460, 240 mL). In the two larger VT models, WOBslightly decreased (0.89–0.75 J/breath in largest VT model) until the HFNC flow of 20 L/min, and started to rise as HFNC flow increased (increased up to 1.28 J/breath in the largestVT model). In the two smaller VT models, WOB increased (0.04–0.10 J/breath in smallestVT model) as HFNC flow increased. The amount of change of WOB was larger in the larger
26th ESICM ANNUAL CONGRESS — PARIS, FRANCE — 5–9 OCTOBER 2013
VT models. When comparing them by increased ratio, the smaller VT models had largerchanges which increased about 2.5 times the initial WOB.CONCLUSIONS. Our study showed that PEEP rises as HFNC flow increases, while VT
decreases and WOB increases from some point of HFNC flow. This suggests that there areprobably different indications and optimal flows of HFNC for various types of respiratoryfailure and patient conditions according to the need for PEEP and the influence of HFNCflow on VT or WOB.GRANT ACKNOWLEDGMENT. No conflicts of interest.
0688CURRENT PRACTICE OF MECHANICAL VENTILATION: PRELIMINARYRESULTS OF NATIONAL SURVEY IN UKRAINE
M.M. Pylypenko1
1National Medical Academy Postgraduate Education named by P.L. Shupyk, Department ofAnaesthesiology and Intensive Care, Kyiv, UkraineINTRODUCTION. Up to date more than half of respirators in Ukrainian ICUs are oldfashioned and allow only volume control ventilation. During the last decade the situationhas been changing and the majority of ICUs receiving different new ventilators, but thisprocess is rather unsystematic and often ICU received 3–4 respirators all of them are fromdifferent producers. The different user interface and unconformity of the names of regimensand ventilation parameters arouse difficulties for the medical staff.OBJECTIVES. To characterize the equipment of ICUs with ventilators, evaluate thecurrent practice on selections of ventilation regimens and parameters and the physicians’knowledge, believing and misunderstandings in this area.METHODS. The crosssectional, prospective, observational study, based on the filling of thesurvey about ICU equipping with respirators and current practice regimens/ventilationparameters of selections has been started aimed evaluation the situation over all regions ofUkraine. The intermitted analysis has been performed after completing of questionnaires bythe 98 physicians in 38 ICUs in 8 districts in Ukraine.RESULTS. In surveyed ICUs were indicated more than 25 models of respirators producedover the world (mostly from the budget and middle class) and more than 10 models ofproduced in post-soviet union area. Physicians selected more than 10 ventilation regimens;CMV and SIMV were the most frequently used. It has to be noticed that physicians oftenwere prone to use controlled modes and SIMV instead of respiratory support and regimenswith closed loop control even in cases that they have good enough ventilators. More than inhalf of questionnaires revealed some misunderstanding in writing of the names of regimensand their classification. Thus to the category of ‘‘intellectual’’ regimens sometimes assignedCMV, SIMV and PS that is not corresponds to internationally accepted classification. Thecorrect answers about the terms of controlled ventilation and respiratory support were foundin less than half of questionnaires as well. The absolute value of inspiratory pressure in bothvolume and pressure controlled regimens for the patients with normal static respiratorycompliance was often higher than predicted. It may suggest for the use of the higher valuesof tidal volume and, that is more likely, for the increased resistance of the airways or/andrespiratory circuit. More than in 10 % of questionnaires have been found that the level of theplato pressure is higher than the peak inspiratory pressure that could suggest about theoccurring of expiratory efforts at the end of inspiratory phase or about the physicians’misunderstanding of the interrelations between these parameters.CONCLUSIONS. The interim analysis of the observational study has revealed valuableinformation ICU equipping with respirators and new interesting and, sometimes, unexpecteddata corresponding to current ventilatory practice.
0689EFFECTS OF AMBU AND LAERDAL VALVES ON VENTILATORYPARAMETERS: A COMPARATIVE STUDY
A. Khoury1,2, P. Valero1, R. Sailley1, L. Pazart2, R. Martarello1,3, F.S. Sall1,2, A. De Luca1,2,G. Capellier1, SIM Team1University Hospital of Besancon, Emergency Medicine and Critical Care, Besancon,France, 2INSERM CIC-IT 808, University Hospital of Besancon, Besancon, France, 3HomeCare Division, Don Du Souffle, Besancon, FranceINTRODUCTION. Airway management is an important challenge for medical and para-medical staff in emergency situations; optimizing the settings and providing good-qualityventilation remain the key issues. Bag Valve Mask ventilation (BVM), although the mostly-worldwide-used technique for assisting respiratory-failing patients, remains the less pre-ferred one in comparison with transport ventilators and other ventilation devices. The mostwidespread BVM are the Ambu� and Laerdal� devices with unidirectional valves. Ourstudy aims to define whether there are differences in ventilation parameters according to thedevice used.MATERIALS AND METHODS. We carried the tests on the experimental lung modelIngmar� ASL 5000, to simulate patients with different pulmonary profiles/characteristics/parameters: normal, obstructive and restrictive. During the testing scenario, the patientventilated spontaneously; first without any device, then after several respiratory cycles, weconnected the Ambu� valve, and then the Laerdal� one. We simulated patients having a—10 cmH2O inspiratory effort, with two different respiratory frequencies: 15 and 30 bpm.The collected data were the Inspiratory tidal volume (Vtinsp), the inspiratory and expiratorywork, and the peak flow. The results are shown in Table 1. Statistical study was made byrepeated measures analysis of variance, a p \ 0.05 is considered as relevant. Analyses wereperformed using SAS v9.3 (SAS Institute Inc.; Cary, NC).RESULTS. The effects of Ambu valve and Laerdal valve in inspiratory tidal volume(Vtinsp), inspiratory and expiratory work and peak flow determined for normal, obstructiveand restrictive patients at two different respiratory frequencies are presented in Table 1 witha p \ 0.0001 for all.
Table 1 Effects of Ambu and Laerdal valves (p \ 0.0001)
Normal patient
with a respiratory
frequency of
15 bpm
Normal patient
with a respiratory
frequency of
30 bpm
Obstructive
patient with
a respiratory
frequency of
15 bpm
Obstructive
patient with
a respiratory
frequency of
30 bpm
Restrictive
patient with
a respiratory
frequency of
15 bpm
Restrictive
patient with
a respiratory
frequency of
30 bpm
Inspiratory Vt
(mL)with
Ambu� valve
(mean ±
standard
deviation)
388.83 ±
2.82
247.69 ±
2.72
60.65 ±
1.22
27.36 ±
0.58
238.51 ±
1.79
183.91 ±
1.41
Inspiratory Vt
(mL)with
Laerdal� valve
(mean ±
standard
deviation)
397.03 ±
4.15
255.55 ±
3.44
70.21 ±
1.15
32.62 ±
0.62
240.96 ±
1.98
186.17 ±
1.98
Inspiratory Work
(mJ)with
Ambu� valve
(mean ±
standard
deviation)
239.60 ±
3.57
136.93 ±
2.42
48.10 ±
0.89
22.30 ±
0.42
160.54 ±
1.30
116.61 ±
1.54
Inspiratory Work
(mJ)with
Laerdal� valve
(mean ±
standard
deviation)
231.82 ±
4.81
132.06 ±
3.09
57.18 ±
1.01
27.35 ±
0.46
157.32 ±
2.81
113.29 ±
2.39
Expiratory Work
(mJ)with
Ambu� valve
(mean ±
standard
deviation)
61.36 ±
1.56
28.63 ±
1.17
3.50 ±
0.36
1.61 ±
0.17
58.70 ±
0.92
30.42 ±
0.57
Expiratory work
(mJ)with
Laerdal� valve
(mean ±
standard
deviation)
53.23 ±
1.63
21.19 ±
1.24
0.94 ±
0.28
0.41 ±
0.19
57.95 ±
1.23
26.94 ±
0.91
Peak flow (mL/s)with
Ambu� valve
(mean ±
standard
deviation)
1,173.92 ±
12.07
1,205.03 ±
12.68
153.51 ±
2.10
145.00 ±
1.57
997.61 ±
9.26
1,114.33 ±
9.74
Peak flow (mL/s)with
Laerdal� valve
(mean ±
standard
deviation)
1,160.41 ±
13.85
1,214.54 ±
15.47
166.77 ±
1.94
159.02 ±
2.00
965.53 ±
13.68
1,106.56 ± 12.62
DISCUSSION AND CONCLUSION. For all patients, even in severe dyspnea, the Laer-dal� valve seems to facilitate ventilation. When it comes to obstructive situations, althoughthe Laerdal� valve ensures much better Vtinsp than the Ambu� one, the inspiratory work islower with the Ambu� valve, which means an easier ventilation for the patient. Thesedifferent results are probably due to the particular ‘‘duckbill’’ shape of the Laerdal� valve,which may need less inspiratory effort to open. These tests should also be done with aventilation bag connected to the valve, in order to see whether it is possible to override thesedifferences.
0690EVALUATION OF MANUAL AND AUTOMATIC MANUAL-TRIGGEREDVENTILATION PERFORMANCE AND ERGONOMY
E. L’Her1,2, N. Marjanovic1, S. Le Floch1, M. Jaffrelot1
1CHU de Brest/Université de Bretagne Occidentale, Réanimation Médicale et UrgencesAdultes, Brest, France, 2Université de Bretagne Occidentale, CHRU de Brest, LATIMINSERM UMR 1101, Brest, FranceINTRODUCTION. Manual bag-valve is the most frequent ventilation method duringresuscitation, in the absence of endotracheal intubation. Efficiency of other devices has beenfewly studied.OBJECTIVES. The objectives of this bench-test study were to evaluate the potentialimpact of training and professional category on manual bag-valve ventilation efficiency, andto assess the effectiveness of an automatic manual-triggered system.METHODS. A respiratory system analog was built up using a lung simulator connected to amanikin, in order to simulate a patient with unprotected airways. Five professional groups,emergency physicians, residents, advanced paramedics, nurses and paramedics) (n = 10 pergroup) evaluated manual bag-valve ventilation, as compared to an automatic manual-trig-gered device (EasyCPR). Three pathological situations were simulated (restrictive,obstructive, normal). Standard ventilatory parameters were recorded; Ergonomy was
26th ESICM ANNUAL CONGRESS — PARIS, FRANCE — 5–9 OCTOBER 2013
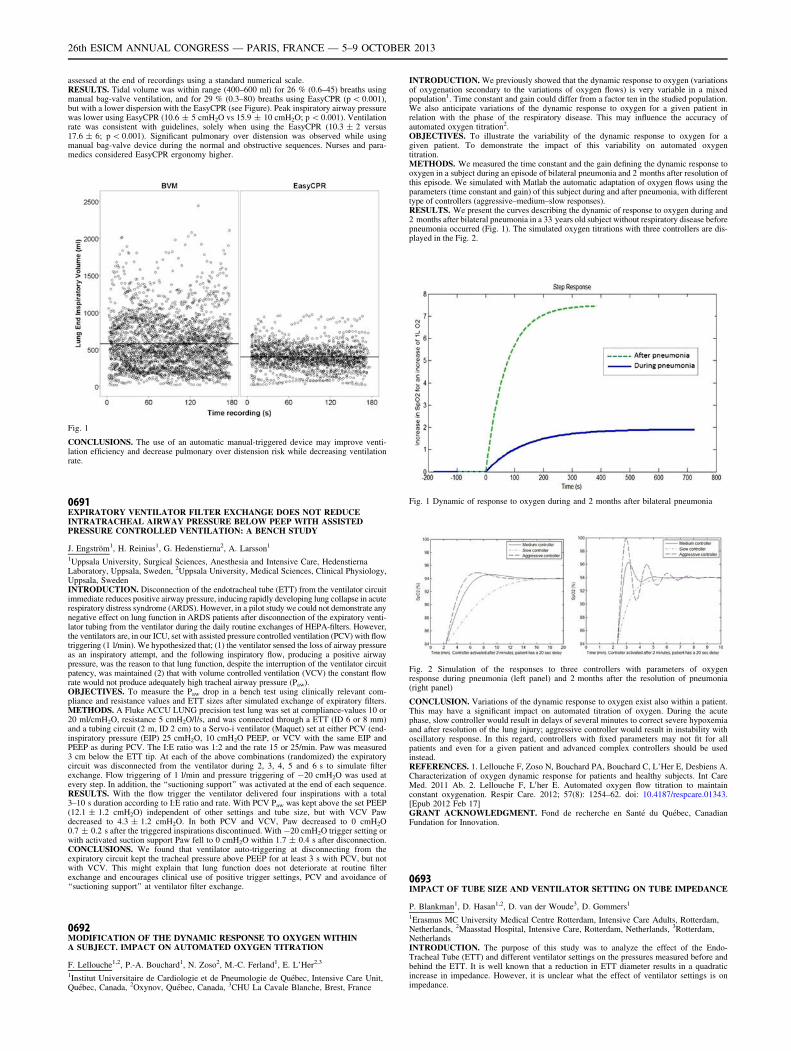
assessed at the end of recordings using a standard numerical scale.RESULTS. Tidal volume was within range (400–600 ml) for 26 % (0.6–45) breaths usingmanual bag-valve ventilation, and for 29 % (0.3–80) breaths using EasyCPR (p \ 0.001),but with a lower dispersion with the EasyCPR (see Figure). Peak inspiratory airway pressurewas lower using EasyCPR (10.6 ± 5 cmH2O vs 15.9 ± 10 cmH2O; p \ 0.001). Ventilationrate was consistent with guidelines, solely when using the EasyCPR (10.3 ± 2 versus17.6 ± 6; p \ 0.001). Significant pulmonary over distension was observed while usingmanual bag-valve device during the normal and obstructive sequences. Nurses and para-medics considered EasyCPR ergonomy higher.
Fig. 1
CONCLUSIONS. The use of an automatic manual-triggered device may improve venti-lation efficiency and decrease pulmonary over distension risk while decreasing ventilationrate.
0691EXPIRATORY VENTILATOR FILTER EXCHANGE DOES NOT REDUCEINTRATRACHEAL AIRWAY PRESSURE BELOW PEEP WITH ASSISTEDPRESSURE CONTROLLED VENTILATION: A BENCH STUDY
J. Engström1, H. Reinius1, G. Hedenstierna2, A. Larsson1
1Uppsala University, Surgical Sciences, Anesthesia and Intensive Care, HedenstiernaLaboratory, Uppsala, Sweden, 2Uppsala University, Medical Sciences, Clinical Physiology,Uppsala, SwedenINTRODUCTION. Disconnection of the endotracheal tube (ETT) from the ventilator circuitimmediate reduces positive airway pressure, inducing rapidly developing lung collapse in acuterespiratory distress syndrome (ARDS). However, in a pilot study we could not demonstrate anynegative effect on lung function in ARDS patients after disconnection of the expiratory venti-lator tubing from the ventilator during the daily routine exchanges of HEPA-filters. However,the ventilators are, in our ICU, set with assisted pressure controlled ventilation (PCV) with flowtriggering (1 l/min). We hypothesized that; (1) the ventilator sensed the loss of airway pressureas an inspiratory attempt, and the following inspiratory flow, producing a positive airwaypressure, was the reason to that lung function, despite the interruption of the ventilator circuitpatency, was maintained (2) that with volume controlled ventilation (VCV) the constant flowrate would not produce adequately high tracheal airway pressure (Paw).OBJECTIVES. To measure the Paw drop in a bench test using clinically relevant com-pliance and resistance values and ETT sizes after simulated exchange of expiratory filters.METHODS. A Fluke ACCU LUNG precision test lung was set at compliance-values 10 or20 ml/cmH2O, resistance 5 cmH2O/l/s, and was connected through a ETT (ID 6 or 8 mm)and a tubing circuit (2 m, ID 2 cm) to a Servo-i ventilator (Maquet) set at either PCV (end-inspiratory pressure (EIP) 25 cmH2O, 10 cmH2O PEEP, or VCV with the same EIP andPEEP as during PCV. The I:E ratio was 1:2 and the rate 15 or 25/min. Paw was measured3 cm below the ETT tip. At each of the above combinations (randomized) the expiratorycircuit was disconnected from the ventilator during 2, 3, 4, 5 and 6 s to simulate filterexchange. Flow triggering of 1 l/min and pressure triggering of -20 cmH2O was used atevery step. In addition, the ‘‘suctioning support’’ was activated at the end of each sequence.RESULTS. With the flow trigger the ventilator delivered four inspirations with a total3–10 s duration according to I:E ratio and rate. With PCV Paw was kept above the set PEEP(12.1 ± 1.2 cmH2O) independent of other settings and tube size, but with VCV Pawdecreased to 4.3 ± 1.2 cmH2O. In both PCV and VCV, Paw decreased to 0 cmH2O0.7 ± 0.2 s after the triggered inspirations discontinued. With -20 cmH2O trigger setting orwith activated suction support Paw fell to 0 cmH2O within 1.7 ± 0.4 s after disconnection.CONCLUSIONS. We found that ventilator auto-triggering at disconnecting from theexpiratory circuit kept the tracheal pressure above PEEP for at least 3 s with PCV, but notwith VCV. This might explain that lung function does not deteriorate at routine filterexchange and encourages clinical use of positive trigger settings, PCV and avoidance of‘‘suctioning support’’ at ventilator filter exchange.
0692MODIFICATION OF THE DYNAMIC RESPONSE TO OXYGEN WITHINA SUBJECT. IMPACT ON AUTOMATED OXYGEN TITRATION
F. Lellouche1,2, P.-A. Bouchard1, N. Zoso2, M.-C. Ferland1, E. L’Her2,3
1Institut Universitaire de Cardiologie et de Pneumologie de Québec, Intensive Care Unit,Québec, Canada, 2Oxynov, Québec, Canada, 3CHU La Cavale Blanche, Brest, France
INTRODUCTION. We previously showed that the dynamic response to oxygen (variationsof oxygenation secondary to the variations of oxygen flows) is very variable in a mixedpopulation1. Time constant and gain could differ from a factor ten in the studied population.We also anticipate variations of the dynamic response to oxygen for a given patient inrelation with the phase of the respiratory disease. This may influence the accuracy ofautomated oxygen titration2.OBJECTIVES. To illustrate the variability of the dynamic response to oxygen for agiven patient. To demonstrate the impact of this variability on automated oxygentitration.METHODS. We measured the time constant and the gain defining the dynamic response tooxygen in a subject during an episode of bilateral pneumonia and 2 months after resolution ofthis episode. We simulated with Matlab the automatic adaptation of oxygen flows using theparameters (time constant and gain) of this subject during and after pneumonia, with differenttype of controllers (aggressive–medium–slow responses).RESULTS. We present the curves describing the dynamic of response to oxygen during and2 months after bilateral pneumonia in a 33 years old subject without respiratory disease beforepneumonia occurred (Fig. 1). The simulated oxygen titrations with three controllers are dis-played in the Fig. 2.
Fig. 1 Dynamic of response to oxygen during and 2 months after bilateral pneumonia
Fig. 2 Simulation of the responses to three controllers with parameters of oxygenresponse during pneumonia (left panel) and 2 months after the resolution of pneumonia(right panel)
CONCLUSION. Variations of the dynamic response to oxygen exist also within a patient.This may have a significant impact on automated titration of oxygen. During the acutephase, slow controller would result in delays of several minutes to correct severe hypoxemiaand after resolution of the lung injury; aggressive controller would result in instability withoscillatory response. In this regard, controllers with fixed parameters may not fit for allpatients and even for a given patient and advanced complex controllers should be usedinstead.REFERENCES. 1. Lellouche F, Zoso N, Bouchard PA, Bouchard C, L’Her E, Desbiens A.Characterization of oxygen dynamic response for patients and healthy subjects. Int CareMed. 2011 Ab. 2. Lellouche F, L0her E. Automated oxygen flow titration to maintainconstant oxygenation. Respir Care. 2012; 57(8): 1254–62. doi: 10.4187/respcare.01343.[Epub 2012 Feb 17]GRANT ACKNOWLEDGMENT. Fond de recherche en Santé du Québec, CanadianFundation for Innovation.
0693IMPACT OF TUBE SIZE AND VENTILATOR SETTING ON TUBE IMPEDANCE
P. Blankman1, D. Hasan1,2, D. van der Woude3, D. Gommers1
1Erasmus MC University Medical Centre Rotterdam, Intensive Care Adults, Rotterdam,Netherlands, 2Maasstad Hospital, Intensive Care, Rotterdam, Netherlands, 3Rotterdam,NetherlandsINTRODUCTION. The purpose of this study was to analyze the effect of the Endo-Tracheal Tube (ETT) and different ventilator settings on the pressures measured before andbehind the ETT. It is well known that a reduction in ETT diameter results in a quadraticincrease in impedance. However, it is unclear what the effect of ventilator settings is onimpedance.
26th ESICM ANNUAL CONGRESS — PARIS, FRANCE — 5–9 OCTOBER 2013
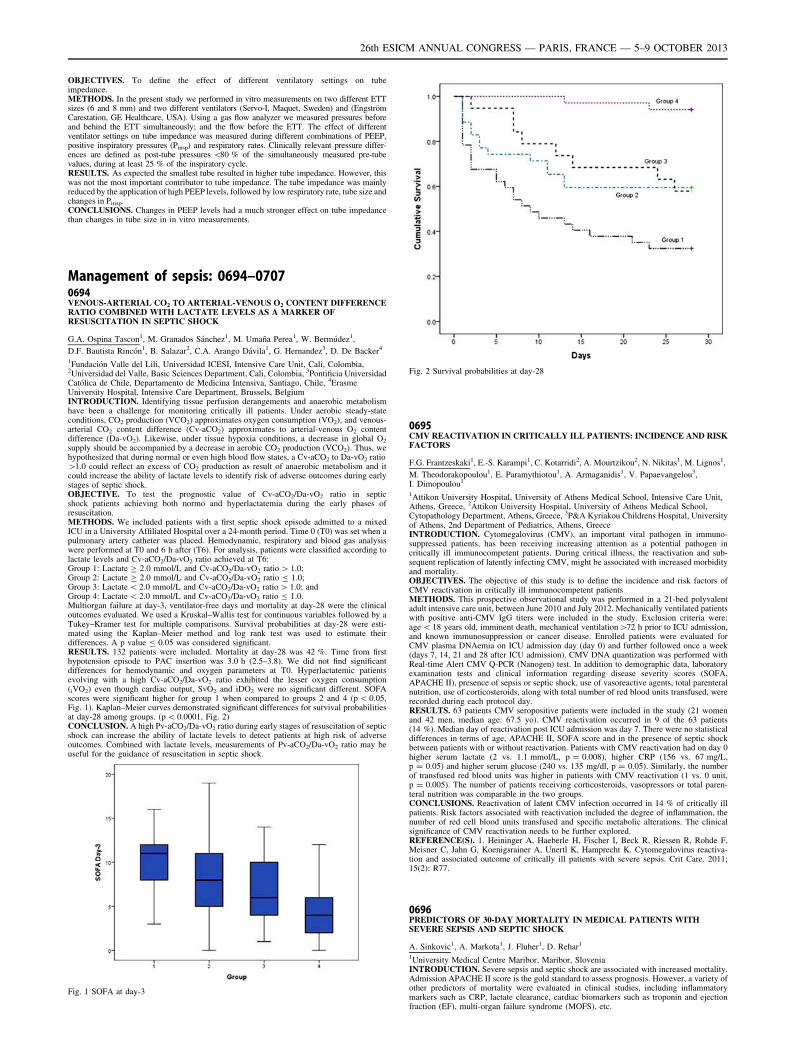
OBJECTIVES. To define the effect of different ventilatory settings on tubeimpedance.METHODS. In the present study we performed in vitro measurements on two different ETTsizes (6 and 8 mm) and two different ventilators (Servo-I, Maquet, Sweden) and (EngströmCarestation, GE Healthcare, USA). Using a gas flow analyzer we measured pressures beforeand behind the ETT simultaneously; and the flow before the ETT. The effect of differentventilator settings on tube impedance was measured during different combinations of PEEP,positive inspiratory pressures (Pinsp) and respiratory rates. Clinically relevant pressure differ-ences are defined as post-tube pressures \80 % of the simultaneously measured pre-tubevalues, during at least 25 % of the inspiratory cycle.RESULTS. As expected the smallest tube resulted in higher tube impedance. However, thiswas not the most important contributor to tube impedance. The tube impedance was mainlyreduced by the application of high PEEP levels, followed by low respiratory rate, tube size andchanges in Pinsp.CONCLUSIONS. Changes in PEEP levels had a much stronger effect on tube impedancethan changes in tube size in in vitro measurements.
Management of sepsis: 0694–07070694VENOUS-ARTERIAL CO2 TO ARTERIAL-VENOUS O2 CONTENT DIFFERENCERATIO COMBINED WITH LACTATE LEVELS AS A MARKER OFRESUSCITATION IN SEPTIC SHOCK
G.A. Ospina Tascon1, M. Granados Sánchez1, M. Umaña Perea1, W. Bermúdez1,
D.F. Bautista Rincón1, B. Salazar2, C.A. Arango Dávila1, G. Hernandez3, D. De Backer4
1Fundación Valle del Lili, Universidad ICESI, Intensive Care Unit, Cali, Colombia,2Universidad del Valle, Basic Sciences Department, Cali, Colombia, 3Pontificia UniversidadCatólica de Chile, Departamento de Medicina Intensiva, Santiago, Chile, 4ErasmeUniversity Hospital, Intensive Care Department, Brussels, BelgiumINTRODUCTION. Identifying tissue perfusion derangements and anaerobic metabolismhave been a challenge for monitoring critically ill patients. Under aerobic steady-stateconditions, CO2 production (VCO2) approximates oxygen consumption (VO2), and venous-arterial CO2 content difference (Cv-aCO2) approximates to arterial-venous O2 contentdifference (Da-vO2). Likewise, under tissue hypoxia conditions, a decrease in global O2
supply should be accompanied by a decrease in aerobic CO2 production (VCO2). Thus, wehypothesized that during normal or even high blood flow states, a Cv-aCO2 to Da-vO2 ratio[1.0 could reflect an excess of CO2 production as result of anaerobic metabolism and itcould increase the ability of lactate levels to identify risk of adverse outcomes during earlystages of septic shock.OBJECTIVE. To test the prognostic value of Cv-aCO2/Da-vO2 ratio in septicshock patients achieving both normo and hyperlactatemia during the early phases ofresuscitation.METHODS. We included patients with a first septic shock episode admitted to a mixedICU in a University Affiliated Hospital over a 24-month period. Time 0 (T0) was set when apulmonary artery catheter was placed. Hemodynamic, respiratory and blood gas analysiswere performed at T0 and 6 h after (T6). For analysis, patients were classified according tolactate levels and Cv-aCO2/Da-vO2 ratio achieved at T6:Group 1: Lactate C 2.0 mmol/L and Cv-aCO2/Da-vO2 ratio [ 1.0;Group 2: Lactate C 2.0 mmol/L and Cv-aCO2/Da-vO2 ratio B 1.0;Group 3: Lactate \ 2.0 mmol/L and Cv-aCO2/Da-vO2 ratio [ 1.0; andGroup 4: Lactate \ 2.0 mmol/L and Cv-aCO2/Da-vO2 ratio B 1.0.Multiorgan failure at day-3, ventilator-free days and mortality at day-28 were the clinicaloutcomes evaluated. We used a Kruskal–Wallis test for continuous variables followed by aTukey–Kramer test for multiple comparisons. Survival probabilities at day-28 were esti-mated using the Kaplan–Meier method and log rank test was used to estimate theirdifferences. A p value B 0.05 was considered significant.RESULTS. 132 patients were included. Mortality at day-28 was 42 %. Time from firsthypotension episode to PAC insertion was 3.0 h (2.5–3.8). We did not find significantdifferences for hemodynamic and oxygen parameters at T0. Hyperlactatemic patientsevolving with a high Cv-aCO2/Da-vO2 ratio exhibited the lesser oxygen consumption(iVO2) even though cardiac output, SvO2 and iDO2 were no significant different. SOFAscores were significant higher for group 1 when compared to groups 2 and 4 (p \ 0.05,Fig. 1). Kaplan–Meier curves demonstrated significant differences for survival probabilitiesat day-28 among groups. (p \ 0.0001, Fig. 2)CONCLUSION. A high Pv-aCO2/Da-vO2 ratio during early stages of resuscitation of septicshock can increase the ability of lactate levels to detect patients at high risk of adverseoutcomes. Combined with lactate levels, measurements of Pv-aCO2/Da-vO2 ratio may beuseful for the guidance of resuscitation in septic shock.
Fig. 1 SOFA at day-3
Fig. 2 Survival probabilities at day-28
0695CMV REACTIVATION IN CRITICALLY ILL PATIENTS: INCIDENCE AND RISKFACTORS
F.G. Frantzeskaki1, E.-S. Karampi1, C. Kotarridi2, A. Mourtzikou2, N. Nikitas1, M. Lignos1,
M. Theodorakopoulou1, E. Paramythiotou1, A. Armaganidis1, V. Papaevangelou3,I. Dimopoulou1
1Attikon University Hospital, University of Athens Medical School, Intensive Care Unit,Athens, Greece, 2Attikon University Hospital, University of Athens Medical School,Cytopathology Department, Athens, Greece, 3P&A Kyriakou Childrens Hospital, Universityof Athens, 2nd Department of Pediatrics, Athens, GreeceINTRODUCTION. Cytomegalovirus (CMV), an important viral pathogen in immuno-suppressed patients, has been receiving increasing attention as a potential pathogen incritically ill immunocompetent patients. During critical illness, the reactivation and sub-sequent replication of latently infecting CMV, might be associated with increased morbidityand mortality.OBJECTIVES. The objective of this study is to define the incidence and risk factors ofCMV reactivation in critically ill immunocompetent patientsMETHODS. This prospective observational study was performed in a 21-bed polyvalentadult intensive care unit, between June 2010 and July 2012. Mechanically ventilated patientswith positive anti-CMV IgG titers were included in the study. Exclusion criteria were:age \ 18 years old, imminent death, mechanical ventilation[72 h prior to ICU admission,and known immunosuppression or cancer disease. Enrolled patients were evaluated forCMV plasma DNAemia on ICU admission day (day 0) and further followed once a week(days 7, 14, 21 and 28 after ICU admission). CMV DNA quantization was performed withReal-time Alert CMV Q-PCR (Nanogen) test. In addition to demographic data, laboratoryexamination tests and clinical information regarding disease severity scores (SOFA,APACHE II), presence of sepsis or septic shock, use of vasoreactive agents, total parenteralnutrition, use of corticosteroids, along with total number of red blood units transfused, wererecorded during each protocol day.RESULTS. 63 patients CMV seropositive patients were included in the study (21 womenand 42 men, median age: 67.5 yo). CMV reactivation occurred in 9 of the 63 patients(14 %). Median day of reactivation post ICU admission was day 7. There were no statisticaldifferences in terms of age, APACHE II, SOFA score and in the presence of septic shockbetween patients with or without reactivation. Patients with CMV reactivation had on day 0higher serum lactate (2 vs. 1.1 mmol/L, p = 0.008), higher CRP (156 vs. 67 mg/L,p = 0.05) and higher serum glucose (240 vs. 135 mg/dl, p = 0.05). Similarly, the numberof transfused red blood units was higher in patients with CMV reactivation (1 vs. 0 unit,p = 0.005). The number of patients receiving corticosteroids, vasopressors or total paren-teral nutrition was comparable in the two groups.CONCLUSIONS. Reactivation of latent CMV infection occurred in 14 % of critically illpatients. Risk factors associated with reactivation included the degree of inflammation, thenumber of red cell blood units transfused and specific metabolic alterations. The clinicalsignificance of CMV reactivation needs to be further explored.REFERENCE(S). 1. Heininger A, Haeberle H, Fischer I, Beck R, Riessen R, Rohde F,Meisner C, Jahn G, Koenigsrainer A, Unertl K, Hamprecht K. Cytomegalovirus reactiva-tion and associated outcome of critically ill patients with severe sepsis. Crit Care. 2011;15(2): R77.
0696PREDICTORS OF 30-DAY MORTALITY IN MEDICAL PATIENTS WITHSEVERE SEPSIS AND SEPTIC SHOCK
A. Sinkovic1, A. Markota1, J. Fluher1, D. Rehar1
1University Medical Centre Maribor, Maribor, SloveniaINTRODUCTION. Severe sepsis and septic shock are associated with increased mortality.Admission APACHE II score is the gold standard to assess prognosis. However, a variety ofother predictors of mortality were evaluated in clinical studies, including inflammatorymarkers such as CRP, lactate clearance, cardiac biomarkers such as troponin and ejectionfraction (EF), multi-organ failure syndrome (MOFS), etc.
26th ESICM ANNUAL CONGRESS — PARIS, FRANCE — 5–9 OCTOBER 2013
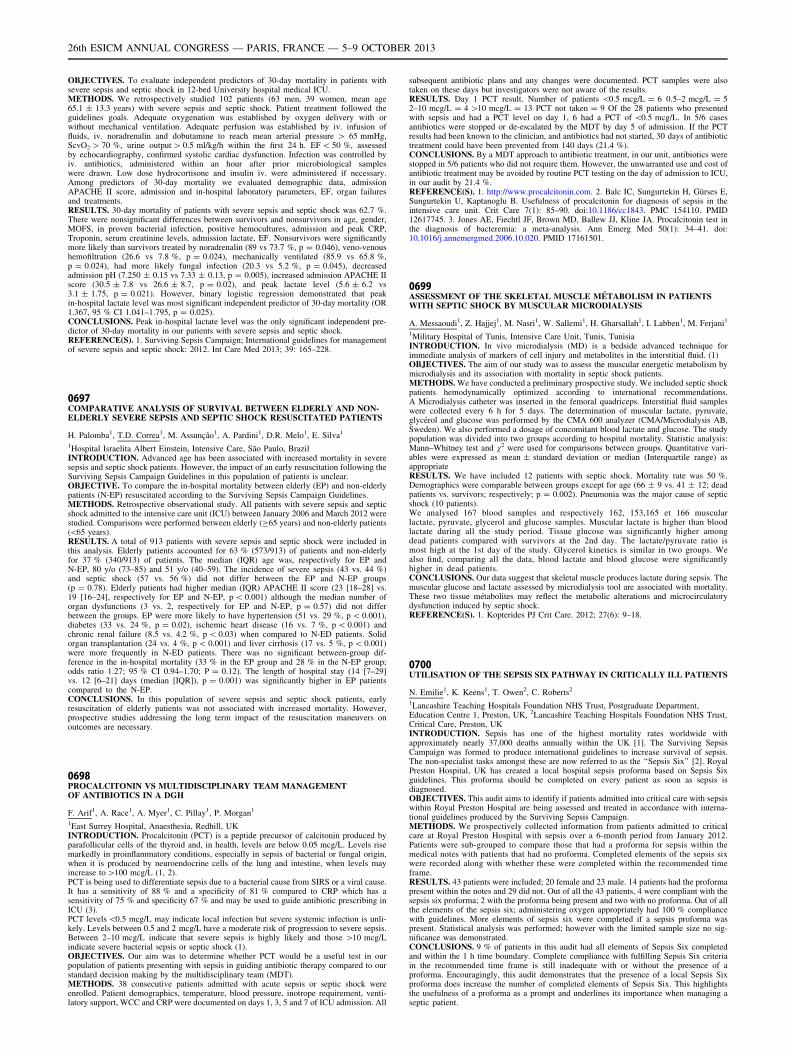
OBJECTIVES. To evaluate independent predictors of 30-day mortality in patients withsevere sepsis and septic shock in 12-bed University hospital medical ICU.METHODS. We retrospectively studied 102 patients (63 men, 39 women, mean age65.1 ± 13.3 years) with severe sepsis and septic shock. Patient treatment followed theguidelines goals. Adequate oxygenation was established by oxygen delivery with orwithout mechanical ventilation. Adequate perfusion was established by iv. infusion offluids, iv. noradrenalin and dobutamine to reach mean arterial pressure [ 65 mmHg,ScvO2 [ 70 %, urine output [ 0.5 ml/kg/h within the first 24 h. EF \ 50 %, assessedby echocardiography, confirmed systolic cardiac dysfunction. Infection was controlled byiv. antibiotics, administered within an hour after prior microbiological sampleswere drawn. Low dose hydrocortisone and insulin iv. were administered if necessary.Among predictors of 30-day mortality we evaluated demographic data, admissionAPACHE II score, admission and in-hospital laboratory parameters, EF, organ failuresand treatments.RESULTS. 30-day mortality of patients with severe sepsis and septic shock was 62.7 %.There were nonsignificant differences between survivors and nonsurvivors in age, gender,MOFS, in proven bacterial infection, positive hemocultures, admission and peak CRP,Troponin, serum creatinine levels, admission lactate, EF. Nonsurvivors were significantlymore likely than survivors treated by noradrenalin (89 vs 73.7 %, p = 0.046), veno-venoushemofiltration (26.6 vs 7.8 %, p = 0.024), mechanically ventilated (85.9 vs 65.8 %,p = 0.024), had more likely fungal infection (20.3 vs 5.2 %, p = 0.045), decreasedadmission pH (7.250 ± 0.15 vs 7.33 ± 0.13, p = 0.005), increased admission APACHE IIscore (30.5 ± 7.8 vs 26.6 ± 8.7, p = 0.02), and peak lactate level (5.6 ± 6.2 vs3.1 ± 1.75, p = 0.021). However, binary logistic regression demonstrated that peakin-hospital lactate level was most significant independent predictor of 30-day mortality (OR1.367, 95 % CI 1.041–1.795, p = 0.025).CONCLUSIONS. Peak in-hospital lactate level was the only significant independent pre-dictor of 30-day mortality in our patients with severe sepsis and septic shock.REFERENCE(S). 1. Surviving Sepsis Campaign; International guidelines for managementof severe sepsis and septic shock: 2012. Int Care Med 2013; 39: 165–228.
0697COMPARATIVE ANALYSIS OF SURVIVAL BETWEEN ELDERLY AND NON-ELDERLY SEVERE SEPSIS AND SEPTIC SHOCK RESUSCITATED PATIENTS
H. Palomba1, T.D. Correa1, M. Assunção1, A. Pardini1, D.R. Melo1, E. Silva1
1Hospital Israelita Albert Einstein, Intensive Care, São Paulo, BrazilINTRODUCTION. Advanced age has been associated with increased mortality in severesepsis and septic shock patients. However, the impact of an early resuscitation following theSurviving Sepsis Campaign Guidelines in this population of patients is unclear.OBJECTIVE. To compare the in-hospital mortality between elderly (EP) and non-elderlypatients (N-EP) resuscitated according to the Surviving Sepsis Campaign Guidelines.METHODS. Retrospective observational study. All patients with severe sepsis and septicshock admitted to the intensive care unit (ICU) between January 2006 and March 2012 werestudied. Comparisons were performed between elderly (C65 years) and non-elderly patients(\65 years).RESULTS. A total of 913 patients with severe sepsis and septic shock were included inthis analysis. Elderly patients accounted for 63 % (573/913) of patients and non-elderlyfor 37 % (340/913) of patients. The median (IQR) age was, respectively for EP andN-EP, 80 y/o (73–85) and 51 y/o (40–59). The incidence of severe sepsis (43 vs. 44 %)and septic shock (57 vs. 56 %) did not differ between the EP and N-EP groups(p = 0.78). Elderly patients had higher median (IQR) APACHE II score (23 [18–28] vs.19 [16–24], respectively for EP and N-EP, p \ 0.001) although the median number oforgan dysfunctions (3 vs. 2, respectively for EP and N-EP, p = 0.57) did not differbetween the groups. EP were more likely to have hypertension (51 vs. 29 %, p \ 0.001),diabetes (33 vs. 24 %, p = 0.02), ischemic heart disease (16 vs. 7 %, p \ 0.001) andchronic renal failure (8.5 vs. 4.2 %, p \ 0.03) when compared to N-ED patients. Solidorgan transplantation (24 vs. 4 %, p \ 0.001) and liver cirrhosis (17 vs. 5 %, p \ 0.001)were more frequently in N-ED patients. There was no significant between-group dif-ference in the in-hospital mortality (33 % in the EP group and 28 % in the N-EP group;odds ratio 1.27; 95 % CI 0.94–1.70; P = 0.12). The length of hospital stay (14 [7–29]vs. 12 [6–21] days (median [IQR]), p = 0.001) was significantly higher in EP patientscompared to the N-EP.CONCLUSIONS. In this population of severe sepsis and septic shock patients, earlyresuscitation of elderly patients was not associated with increased mortality. However,prospective studies addressing the long term impact of the resuscitation maneuvers onoutcomes are necessary.
0698PROCALCITONIN VS MULTIDISCIPLINARY TEAM MANAGEMENTOF ANTIBIOTICS IN A DGH
F. Arif1, A. Race1, A. Myer1, C. Pillay1, P. Morgan1
1East Surrey Hospital, Anaesthesia, Redhill, UKINTRODUCTION. Procalcitonin (PCT) is a peptide precursor of calcitonin produced byparafollicular cells of the thyroid and, in health, levels are below 0.05 mcg/L. Levels risemarkedly in proinflammatory conditions, especially in sepsis of bacterial or fungal origin,when it is produced by neuroendocrine cells of the lung and intestine, when levels mayincrease to [100 mcg/L (1, 2).PCT is being used to differentiate sepsis due to a bacterial cause from SIRS or a viral cause.It has a sensitivity of 88 % and a specificity of 81 % compared to CRP which has asensitivity of 75 % and specificity 67 % and may be used to guide antibiotic prescribing inICU (3).PCT levels \0.5 mcg/L may indicate local infection but severe systemic infection is unli-kely. Levels between 0.5 and 2 mcg/L have a moderate risk of progression to severe sepsis.Between 2–10 mcg/L indicate that severe sepsis is highly likely and those [10 mcg/Lindicate severe bacterial sepsis or septic shock (1).OBJECTIVES. Our aim was to determine whether PCT would be a useful test in ourpopulation of patients presenting with sepsis in guiding antibiotic therapy compared to ourstandard decision making by the multidisciplinary team (MDT).METHODS. 38 consecutive patients admitted with acute sepsis or septic shock wereenrolled. Patient demographics, temperature, blood pressure, inotrope requirement, venti-latory support, WCC and CRP were documented on days 1, 3, 5 and 7 of ICU admission. All
subsequent antibiotic plans and any changes were documented. PCT samples were alsotaken on these days but investigators were not aware of the results.RESULTS. Day 1 PCT result. Number of patients \0.5 mcg/L = 6 0.5–2 mcg/L = 52–10 mcg/L = 4 [10 mcg/L = 13 PCT not taken = 9 Of the 28 patients who presentedwith sepsis and had a PCT level on day 1, 6 had a PCT of \0.5 mcg/L. In 5/6 casesantibiotics were stopped or de-escalated by the MDT by day 5 of admission. If the PCTresults had been known to the clinician, and antibiotics had not started, 30 days of antibiotictreatment could have been prevented from 140 days (21.4 %).CONCLUSIONS. By a MDT approach to antibiotic treatment, in our unit, antibiotics werestopped in 5/6 patients who did not require them. However, the unwarranted use and cost ofantibiotic treatment may be avoided by routine PCT testing on the day of admission to ICU,in our audit by 21.4 %.REFERENCE(S). 1. http://www.procalcitonin.com. 2. Balc IC, Sungurtekin H, Gürses E,Sungurtekin U, Kaptanoglu B. Usefulness of procalcitonin for diagnosis of sepsis in theintensive care unit. Crit Care 7(1): 85–90. doi:10.1186/cc1843. PMC 154110. PMID12617745. 3. Jones AE, Fiechtl JF, Brown MD, Ballew JJ, Kline JA. Procalcitonin test inthe diagnosis of bacteremia: a meta-analysis. Ann Emerg Med 50(1): 34–41. doi:10.1016/j.annemergmed.2006.10.020. PMID 17161501.
0699ASSESSMENT OF THE SKELETAL MUSCLE MÉTABOLISM IN PATIENTSWITH SEPTIC SHOCK BY MUSCULAR MICRODIALYSIS
A. Messaoudi1, Z. Hajjej1, M. Nasri1, W. Sallemi1, H. Gharsallah1, I. Labben1, M. Ferjani1
1Military Hospital of Tunis, Intensive Care Unit, Tunis, TunisiaINTRODUCTION. In vivo microdialysis (MD) is a bedside advanced technique forimmediate analysis of markers of cell injury and metabolites in the interstitial fluid. (1)OBJECTIVES. The aim of our study was to assess the muscular energetic metabolism bymicrodialysis and its association with mortality in septic shock patients.METHODS. We have conducted a preliminary prospective study. We included septic shockpatients hemodynamically optimized according to international recommendations.A Microdialysis catheter was inserted in the femoral quadriceps. Interstitial fluid sampleswere collected every 6 h for 5 days. The determination of muscular lactate, pyruvate,glycérol and glucose was performed by the CMA 600 analyzer (CMA/Microdialysis AB,Sweden). We also performed a dosage of concomitant blood lactate and glucose. The studypopulation was divided into two groups according to hospital mortality. Statistic analysis:Mann–Whitney test and v2 were used for comparisons between groups. Quantitative vari-ables were expressed as mean ± standard deviation or median (Interquartile range) asappropriateRESULTS. We have included 12 patients with septic shock. Mortality rate was 50 %.Demographics were comparable between groups except for age (66 ± 9 vs. 41 ± 12; deadpatients vs. survivors; respectively; p = 0.002). Pneumonia was the major cause of septicshock (10 patients).We analysed 167 blood samples and respectively 162, 153,165 et 166 muscularlactate, pyruvate, glycerol and glucose samples. Muscular lactate is higher than bloodlactate during all the study period. Tissue glucose was significantly higher amongdead patients compared with survivors at the 2nd day. The lactate/pyruvate ratio ismost high at the 1st day of the study. Glycerol kinetics is similar in two groups. Wealso find, comparing all the data, blood lactate and blood glucose were significantlyhigher in dead patients.CONCLUSIONS. Our data suggest that skeletal muscle produces lactate during sepsis. Themuscular glucose and lactate assessed by microdialysis tool are associated with mortality.These two tissue métabolites may reflect the metabolic alterations and microcirculatorydysfunction induced by septic shock.REFERENCE(S). 1. Kopterides PJ Crit Care. 2012; 27(6): 9–18.
0700UTILISATION OF THE SEPSIS SIX PATHWAY IN CRITICALLY ILL PATIENTS
N. Emilie1, K. Keens1, T. Owen2, C. Roberts2
1Lancashire Teaching Hospitals Foundation NHS Trust, Postgraduate Department,Education Centre 1, Preston, UK, 2Lancashire Teaching Hospitals Foundation NHS Trust,Critical Care, Preston, UKINTRODUCTION. Sepsis has one of the highest mortality rates worldwide withapproximately nearly 37,000 deaths annually within the UK [1]. The Surviving SepsisCampaign was formed to produce international guidelines to increase survival of sepsis.The non-specialist tasks amongst these are now referred to as the ‘‘Sepsis Six’’ [2]. RoyalPreston Hospital, UK has created a local hospital sepsis proforma based on Sepsis Sixguidelines. This proforma should be completed on every patient as soon as sepsis isdiagnosed.OBJECTIVES. This audit aims to identify if patients admitted into critical care with sepsiswithin Royal Preston Hospital are being assessed and treated in accordance with interna-tional guidelines produced by the Surviving Sepsis Campaign.METHODS. We prospectively collected information from patients admitted to criticalcare at Royal Preston Hospital with sepsis over a 6-month period from January 2012.Patients were sub-grouped to compare those that had a proforma for sepsis within themedical notes with patients that had no proforma. Completed elements of the sepsis sixwere recorded along with whether these were completed within the recommended timeframe.RESULTS. 43 patients were included; 20 female and 23 male. 14 patients had the proformapresent within the notes and 29 did not. Out of all the 43 patients, 4 were compliant with thesepsis six proforma; 2 with the proforma being present and two with no proforma. Out of allthe elements of the sepsis six; administering oxygen appropriately had 100 % compliancewith guidelines. More elements of sepsis six were completed if a sepsis proforma waspresent. Statistical analysis was performed; however with the limited sample size no sig-nificance was demonstrated.CONCLUSIONS. 9 % of patients in this audit had all elements of Sepsis Six completedand within the 1 h time boundary. Complete compliance with fulfilling Sepsis Six criteriain the recommended time frame is still inadequate with or without the presence of aproforma. Encouragingly, this audit demonstrates that the presence of a local Sepsis Sixproforma does increase the number of completed elements of Sepsis Six. This highlightsthe usefulness of a proforma as a prompt and underlines its importance when managing aseptic patient.
26th ESICM ANNUAL CONGRESS — PARIS, FRANCE — 5–9 OCTOBER 2013
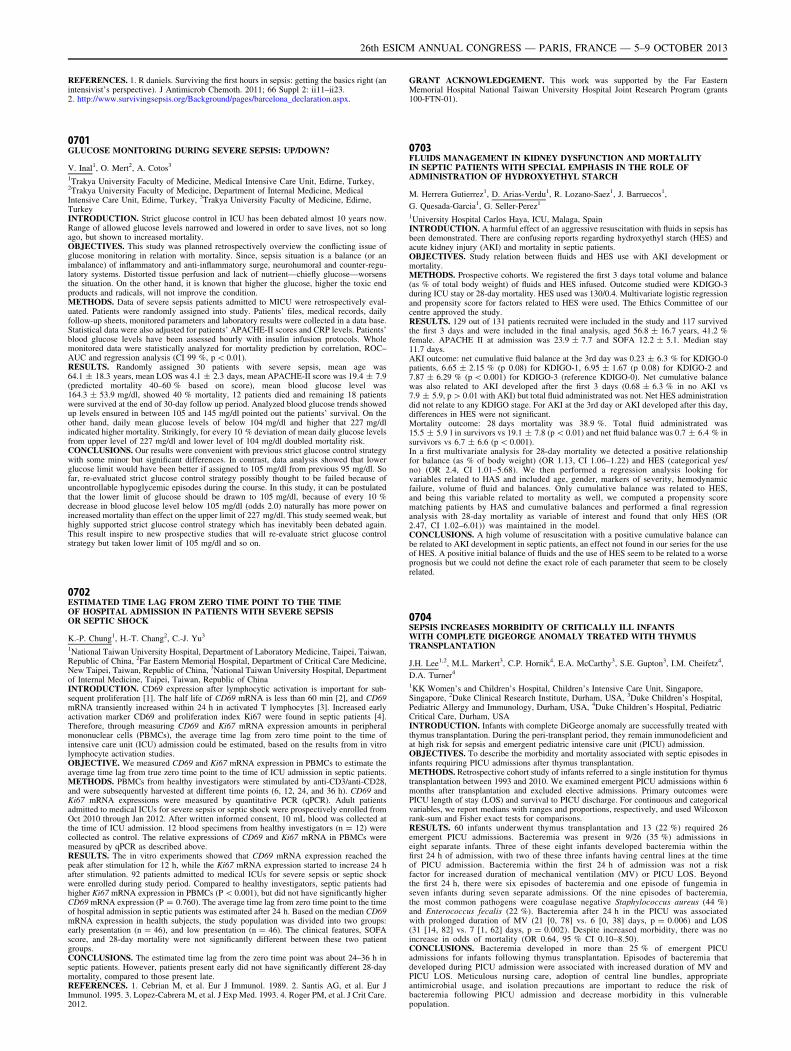
REFERENCES. 1. R daniels. Surviving the first hours in sepsis: getting the basics right (anintensivist’s perspective). J Antimicrob Chemoth. 2011; 66 Suppl 2: ii11–ii23.2. http://www.survivingsepsis.org/Background/pages/barcelona_declaration.aspx.
0701GLUCOSE MONITORING DURING SEVERE SEPSIS: UP/DOWN?
V. Inal1, O. Mert2, A. Cotos3
1Trakya University Faculty of Medicine, Medical Intensive Care Unit, Edirne, Turkey,2Trakya University Faculty of Medicine, Department of Internal Medicine, MedicalIntensive Care Unit, Edirne, Turkey, 3Trakya University Faculty of Medicine, Edirne,TurkeyINTRODUCTION. Strict glucose control in ICU has been debated almost 10 years now.Range of allowed glucose levels narrowed and lowered in order to save lives, not so longago, but shown to increased mortality.OBJECTIVES. This study was planned retrospectively overview the conflicting issue ofglucose monitoring in relation with mortality. Since, sepsis situation is a balance (or animbalance) of inflammatory and anti-inflammatory surge, neurohumoral and counter-regu-latory systems. Distorted tissue perfusion and lack of nutrient—chiefly glucose—worsensthe situation. On the other hand, it is known that higher the glucose, higher the toxic endproducts and radicals, will not improve the condition.METHODS. Data of severe sepsis patients admitted to MICU were retrospectively eval-uated. Patients were randomly assigned into study. Patients’ files, medical records, dailyfollow-up sheets, monitored parameters and laboratory results were collected in a data base.Statistical data were also adjusted for patients’ APACHE-II scores and CRP levels. Patients’blood glucose levels have been assessed hourly with insulin infusion protocols. Wholemonitored data were statistically analyzed for mortality prediction by correlation, ROC–AUC and regression analysis (CI 99 %, p \ 0.01).RESULTS. Randomly assigned 30 patients with severe sepsis, mean age was64.1 ± 18.3 years, mean LOS was 4.1 ± 2.3 days, mean APACHE-II score was 19.4 ± 7.9(predicted mortality 40–60 % based on score), mean blood glucose level was164.3 ± 53.9 mg/dl, showed 40 % mortality, 12 patients died and remaining 18 patientswere survived at the end of 30-day follow up period. Analyzed blood glucose trends showedup levels ensured in between 105 and 145 mg/dl pointed out the patients’ survival. On theother hand, daily mean glucose levels of below 104 mg/dl and higher that 227 mg/dlindicated higher mortality. Strikingly, for every 10 % deviation of mean daily glucose levelsfrom upper level of 227 mg/dl and lower level of 104 mg/dl doubled mortality risk.CONCLUSIONS. Our results were convenient with previous strict glucose control strategywith some minor but significant differences. In contrast, data analysis showed that lowerglucose limit would have been better if assigned to 105 mg/dl from previous 95 mg/dl. Sofar, re-evaluated strict glucose control strategy possibly thought to be failed because ofuncontrollable hypoglycemic episodes during the course. In this study, it can be postulatedthat the lower limit of glucose should be drawn to 105 mg/dl, because of every 10 %decrease in blood glucose level below 105 mg/dl (odds 2.0) naturally has more power onincreased mortality than effect on the upper limit of 227 mg/dl. This study seemed weak, buthighly supported strict glucose control strategy which has inevitably been debated again.This result inspire to new prospective studies that will re-evaluate strict glucose controlstrategy but taken lower limit of 105 mg/dl and so on.
0702ESTIMATED TIME LAG FROM ZERO TIME POINT TO THE TIMEOF HOSPITAL ADMISSION IN PATIENTS WITH SEVERE SEPSISOR SEPTIC SHOCK
K.-P. Chung1, H.-T. Chang2, C.-J. Yu3
1National Taiwan University Hospital, Department of Laboratory Medicine, Taipei, Taiwan,Republic of China, 2Far Eastern Memorial Hospital, Department of Critical Care Medicine,New Taipei, Taiwan, Republic of China, 3National Taiwan University Hospital, Departmentof Internal Medicine, Taipei, Taiwan, Republic of ChinaINTRODUCTION. CD69 expression after lymphocytic activation is important for sub-sequent proliferation [1]. The half life of CD69 mRNA is less than 60 min [2], and CD69mRNA transiently increased within 24 h in activated T lymphocytes [3]. Increased earlyactivation marker CD69 and proliferation index Ki67 were found in septic patients [4].Therefore, through measuring CD69 and Ki67 mRNA expression amounts in peripheralmononuclear cells (PBMCs), the average time lag from zero time point to the time ofintensive care unit (ICU) admission could be estimated, based on the results from in vitrolymphocyte activation studies.OBJECTIVE. We measured CD69 and Ki67 mRNA expression in PBMCs to estimate theaverage time lag from true zero time point to the time of ICU admission in septic patients.METHODS. PBMCs from healthy investigators were stimulated by anti-CD3/anti-CD28,and were subsequently harvested at different time points (6, 12, 24, and 36 h). CD69 andKi67 mRNA expressions were measured by quantitative PCR (qPCR). Adult patientsadmitted to medical ICUs for severe sepsis or septic shock were prospectively enrolled fromOct 2010 through Jan 2012. After written informed consent, 10 mL blood was collected atthe time of ICU admission. 12 blood specimens from healthy investigators (n = 12) werecollected as control. The relative expressions of CD69 and Ki67 mRNA in PBMCs weremeasured by qPCR as described above.RESULTS. The in vitro experiments showed that CD69 mRNA expression reached thepeak after stimulation for 12 h, while the Ki67 mRNA expression started to increase 24 hafter stimulation. 92 patients admitted to medical ICUs for severe sepsis or septic shockwere enrolled during study period. Compared to healthy investigators, septic patients hadhigher Ki67 mRNA expression in PBMCs (P \ 0.001), but did not have significantly higherCD69 mRNA expression (P = 0.760). The average time lag from zero time point to the timeof hospital admission in septic patients was estimated after 24 h. Based on the median CD69mRNA expression in health subjects, the study population was divided into two groups:early presentation (n = 46), and low presentation (n = 46). The clinical features, SOFAscore, and 28-day mortality were not significantly different between these two patientgroups.CONCLUSIONS. The estimated time lag from the zero time point was about 24–36 h inseptic patients. However, patients present early did not have significantly different 28-daymortality, compared to those present late.REFERENCES. 1. Cebrian M, et al. Eur J Immunol. 1989. 2. Santis AG, et al. Eur JImmunol. 1995. 3. Lopez-Cabrera M, et al. J Exp Med. 1993. 4. Roger PM, et al. J Crit Care.2012.
GRANT ACKNOWLEDGEMENT. This work was supported by the Far EasternMemorial Hospital National Taiwan University Hospital Joint Research Program (grants100-FTN-01).
0703FLUIDS MANAGEMENT IN KIDNEY DYSFUNCTION AND MORTALITYIN SEPTIC PATIENTS WITH SPECIAL EMPHASIS IN THE ROLE OFADMINISTRATION OF HYDROXYETHYL STARCH
M. Herrera Gutierrez1, D. Arias-Verdu1, R. Lozano-Saez1, J. Barruecos1,
G. Quesada-Garcia1, G. Seller-Perez1
1University Hospital Carlos Haya, ICU, Malaga, SpainINTRODUCTION. A harmful effect of an aggressive resuscitation with fluids in sepsis hasbeen demonstrated. There are confusing reports regarding hydroxyethyl starch (HES) andacute kidney injury (AKI) and mortality in septic patients.OBJECTIVES. Study relation between fluids and HES use with AKI development ormortality.METHODS. Prospective cohorts. We registered the first 3 days total volume and balance(as % of total body weight) of fluids and HES infused. Outcome studied were KDIGO-3during ICU stay or 28-day mortality. HES used was 130/0.4. Multivariate logistic regressionand propensity score for factors related to HES were used. The Ethics Committee of ourcentre approved the study.RESULTS. 129 out of 131 patients recruited were included in the study and 117 survivedthe first 3 days and were included in the final analysis, aged 56.8 ± 16.7 years, 41.2 %female. APACHE II at admission was 23.9 ± 7.7 and SOFA 12.2 ± 5.1. Median stay11.7 days.AKI outcome: net cumulative fluid balance at the 3rd day was 0.23 ± 6.3 % for KDIGO-0patients, 6.65 ± 2.15 % (p 0.08) for KDIGO-1, 6.95 ± 1.67 (p 0.08) for KDIGO-2 and7.87 ± 6.29 % (p \ 0.001) for KDIGO-3 (reference KDIGO-0). Net cumulative balancewas also related to AKI developed after the first 3 days (0.68 ± 6.3 % in no AKI vs7.9 ± 5.9, p [ 0.01 with AKI) but total fluid administrated was not. Net HES administrationdid not relate to any KDIGO stage. For AKI at the 3rd day or AKI developed after this day,differences in HES were not significant.Mortality outcome: 28 days mortality was 38.9 %. Total fluid administrated was15.5 ± 5.9 l in survivors vs 19.1 ± 7.8 (p \ 0.01) and net fluid balance was 0.7 ± 6.4 % insurvivors vs 6.7 ± 6.6 (p \ 0.001).In a first multivariate analysis for 28-day mortality we detected a positive relationshipfor balance (as % of body weight) (OR 1.13, CI 1.06–1.22) and HES (categorical yes/no) (OR 2.4, CI 1.01–5.68). We then performed a regression analysis looking forvariables related to HAS and included age, gender, markers of severity, hemodynamicfailure, volume of fluid and balances. Only cumulative balance was related to HES,and being this variable related to mortality as well, we computed a propensity scorematching patients by HAS and cumulative balances and performed a final regressionanalysis with 28-day mortality as variable of interest and found that only HES (OR2.47, CI 1.02–6.01)) was maintained in the model.CONCLUSIONS. A high volume of resuscitation with a positive cumulative balance canbe related to AKI development in septic patients, an effect not found in our series for the useof HES. A positive initial balance of fluids and the use of HES seem to be related to a worseprognosis but we could not define the exact role of each parameter that seem to be closelyrelated.
0704SEPSIS INCREASES MORBIDITY OF CRITICALLY ILL INFANTSWITH COMPLETE DIGEORGE ANOMALY TREATED WITH THYMUSTRANSPLANTATION
J.H. Lee1,2, M.L. Markert3, C.P. Hornik4, E.A. McCarthy3, S.E. Gupton3, I.M. Cheifetz4,
D.A. Turner4
1KK Women’s and Children’s Hospital, Children’s Intensive Care Unit, Singapore,Singapore, 2Duke Clinical Research Institute, Durham, USA, 3Duke Children’s Hospital,Pediatric Allergy and Immunology, Durham, USA, 4Duke Children’s Hospital, PediatricCritical Care, Durham, USAINTRODUCTION. Infants with complete DiGeorge anomaly are successfully treated withthymus transplantation. During the peri-transplant period, they remain immunodeficient andat high risk for sepsis and emergent pediatric intensive care unit (PICU) admission.OBJECTIVES. To describe the morbidity and mortality associated with septic episodes ininfants requiring PICU admissions after thymus transplantation.METHODS. Retrospective cohort study of infants referred to a single institution for thymustransplantation between 1993 and 2010. We examined emergent PICU admissions within 6months after transplantation and excluded elective admissions. Primary outcomes werePICU length of stay (LOS) and survival to PICU discharge. For continuous and categoricalvariables, we report medians with ranges and proportions, respectively, and used Wilcoxonrank-sum and Fisher exact tests for comparisons.RESULTS. 60 infants underwent thymus transplantation and 13 (22 %) required 26emergent PICU admissions. Bacteremia was present in 9/26 (35 %) admissions ineight separate infants. Three of these eight infants developed bacteremia within thefirst 24 h of admission, with two of these three infants having central lines at the timeof PICU admission. Bacteremia within the first 24 h of admission was not a riskfactor for increased duration of mechanical ventilation (MV) or PICU LOS. Beyondthe first 24 h, there were six episodes of bacteremia and one episode of fungemia inseven infants during seven separate admissions. Of the nine episodes of bacteremia,the most common pathogens were coagulase negative Staphylococcus aureus (44 %)and Enterococcus fecalis (22 %). Bacteremia after 24 h in the PICU was associatedwith prolonged duration of MV (21 [0, 78] vs. 6 [0, 38] days, p = 0.006) and LOS(31 [14, 82] vs. 7 [1, 62] days, p = 0.002). Despite increased morbidity, there was noincrease in odds of mortality (OR 0.64, 95 % CI 0.10–8.50).CONCLUSIONS. Bacteremia developed in more than 25 % of emergent PICUadmissions for infants following thymus transplantation. Episodes of bacteremia thatdeveloped during PICU admission were associated with increased duration of MV andPICU LOS. Meticulous nursing care, adoption of central line bundles, appropriateantimicrobial usage, and isolation precautions are important to reduce the risk ofbacteremia following PICU admission and decrease morbidity in this vulnerablepopulation.
26th ESICM ANNUAL CONGRESS — PARIS, FRANCE — 5–9 OCTOBER 2013
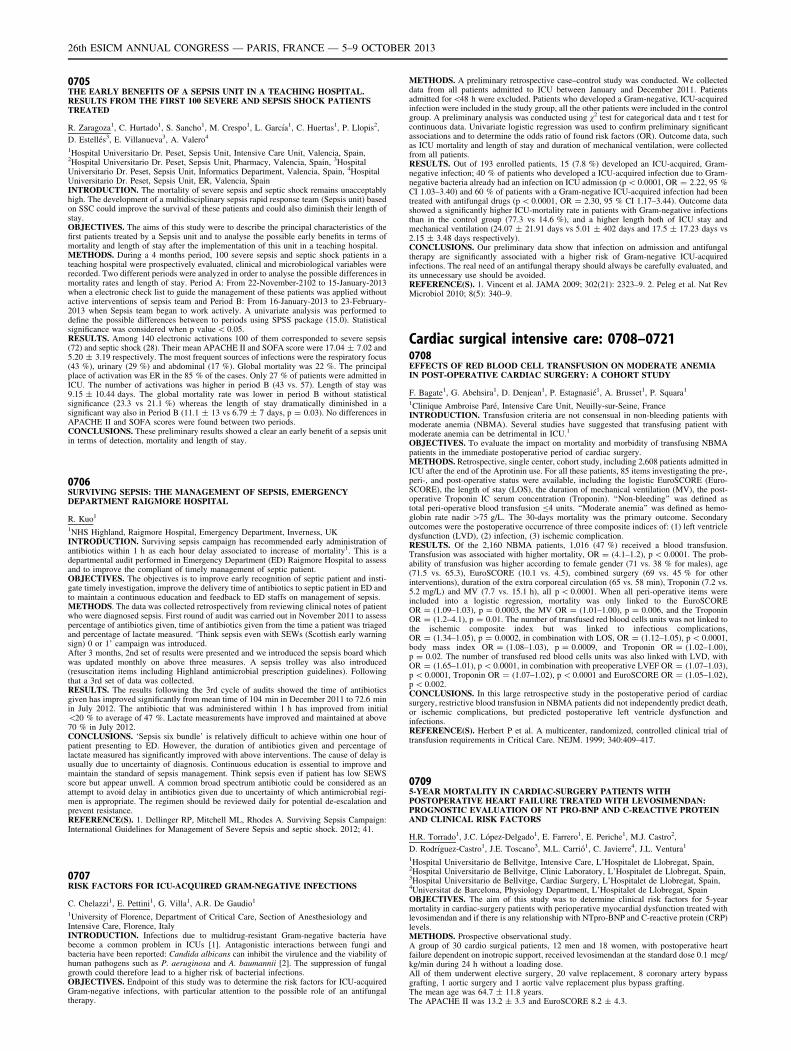
0705THE EARLY BENEFITS OF A SEPSIS UNIT IN A TEACHING HOSPITAL.RESULTS FROM THE FIRST 100 SEVERE AND SEPSIS SHOCK PATIENTSTREATED
R. Zaragoza1, C. Hurtado1, S. Sancho1, M. Crespo1, L. Garcı́a1, C. Huertas1, P. Llopis2,
D. Estellés3, E. Villanueva3, A. Valero4
1Hospital Universitario Dr. Peset, Sepsis Unit, Intensive Care Unit, Valencia, Spain,2Hospital Universitario Dr. Peset, Sepsis Unit, Pharmacy, Valencia, Spain, 3HospitalUniversitario Dr. Peset, Sepsis Unit, Informatics Department, Valencia, Spain, 4HospitalUniversitario Dr. Peset, Sepsis Unit, ER, Valencia, SpainINTRODUCTION. The mortality of severe sepsis and septic shock remains unacceptablyhigh. The development of a multidisciplinary sepsis rapid response team (Sepsis unit) basedon SSC could improve the survival of these patients and could also diminish their length ofstay.OBJECTIVES. The aims of this study were to describe the principal characteristics of thefirst patients treated by a Sepsis unit and to analyse the possible early benefits in terms ofmortality and length of stay after the implementation of this unit in a teaching hospital.METHODS. During a 4 months period, 100 severe sepsis and septic shock patients in ateaching hospital were prospectively evaluated, clinical and microbiological variables wererecorded. Two different periods were analyzed in order to analyse the possible differences inmortality rates and length of stay. Period A: From 22-November-2102 to 15-January-2013when a electronic check list to guide the management of these patients was applied withoutactive interventions of sepsis team and Period B: From 16-January-2013 to 23-February-2013 when Sepsis team began to work actively. A univariate analysis was performed todefine the possible differences between to periods using SPSS package (15.0). Statisticalsignificance was considered when p value \ 0.05.RESULTS. Among 140 electronic activations 100 of them corresponded to severe sepsis(72) and septic shock (28). Their mean APACHE II and SOFA score were 17.04 ± 7.02 and5.20 ± 3.19 respectively. The most frequent sources of infections were the respiratory focus(43 %), urinary (29 %) and abdominal (17 %). Global mortality was 22 %. The principalplace of activation was ER in the 85 % of the cases. Only 27 % of patients were admitted inICU. The number of activations was higher in period B (43 vs. 57). Length of stay was9.15 ± 10.44 days. The global mortality rate was lower in period B without statisticalsignificance (23.3 vs 21.1 %) whereas the length of stay dramatically diminished in asignificant way also in Period B (11.1 ± 13 vs 6.79 ± 7 days, p = 0.03). No differences inAPACHE II and SOFA scores were found between two periods.CONCLUSIONS. These preliminary results showed a clear an early benefit of a sepsis unitin terms of detection, mortality and length of stay.
0706SURVIVING SEPSIS: THE MANAGEMENT OF SEPSIS, EMERGENCYDEPARTMENT RAIGMORE HOSPITAL
R. Kuo1
1NHS Highland, Raigmore Hospital, Emergency Department, Inverness, UKINTRODUCTION. Surviving sepsis campaign has recommended early administration ofantibiotics within 1 h as each hour delay associated to increase of mortality1. This is adepartmental audit performed in Emergency Department (ED) Raigmore Hospital to assessand to improve the compliant of timely management of septic patient.OBJECTIVES. The objectives is to improve early recognition of septic patient and insti-gate timely investigation, improve the delivery time of antibiotics to septic patient in ED andto maintain a continuous education and feedback to ED staffs on management of sepsis.METHODS. The data was collected retrospectively from reviewing clinical notes of patientwho were diagnosed sepsis. First round of audit was carried out in November 2011 to assesspercentage of antibiotics given, time of antibiotics given from the time a patient was triagedand percentage of lactate measured. ‘Think sepsis even with SEWs (Scottish early warningsign) 0 or 1’ campaign was introduced.After 3 months, 2nd set of results were presented and we introduced the sepsis board whichwas updated monthly on above three measures. A sepsis trolley was also introduced(resuscitation items including Highland antimicrobial prescription guidelines). Followingthat a 3rd set of data was collected.RESULTS. The results following the 3rd cycle of audits showed the time of antibioticsgiven has improved significantly from mean time of 104 min in December 2011 to 72.6 minin July 2012. The antibiotic that was administered within 1 h has improved from initial\20 % to average of 47 %. Lactate measurements have improved and maintained at above70 % in July 2012.CONCLUSIONS. ‘Sepsis six bundle’ is relatively difficult to achieve within one hour ofpatient presenting to ED. However, the duration of antibiotics given and percentage oflactate measured has significantly improved with above interventions. The cause of delay isusually due to uncertainty of diagnosis. Continuous education is essential to improve andmaintain the standard of sepsis management. Think sepsis even if patient has low SEWSscore but appear unwell. A common broad spectrum antibiotic could be considered as anattempt to avoid delay in antibiotics given due to uncertainty of which antimicrobial regi-men is appropriate. The regimen should be reviewed daily for potential de-escalation andprevent resistance.REFERENCE(S). 1. Dellinger RP, Mitchell ML, Rhodes A. Surviving Sepsis Campaign:International Guidelines for Management of Severe Sepsis and septic shock. 2012; 41.
0707RISK FACTORS FOR ICU-ACQUIRED GRAM-NEGATIVE INFECTIONS
C. Chelazzi1, E. Pettini1, G. Villa1, A.R. De Gaudio1
1University of Florence, Department of Critical Care, Section of Anesthesiology andIntensive Care, Florence, ItalyINTRODUCTION. Infections due to multidrug-resistant Gram-negative bacteria havebecome a common problem in ICUs [1]. Antagonistic interactions between fungi andbacteria have been reported: Candida albicans can inhibit the virulence and the viability ofhuman pathogens such as P. aeruginosa and A. baumannii [2]. The suppression of fungalgrowth could therefore lead to a higher risk of bacterial infections.OBJECTIVES. Endpoint of this study was to determine the risk factors for ICU-acquiredGram-negative infections, with particular attention to the possible role of an antifungaltherapy.
METHODS. A preliminary retrospective case–control study was conducted. We collecteddata from all patients admitted to ICU between January and December 2011. Patientsadmitted for\48 h were excluded. Patients who developed a Gram-negative, ICU-acquiredinfection were included in the study group, all the other patients were included in the controlgroup. A preliminary analysis was conducted using v2 test for categorical data and t test forcontinuous data. Univariate logistic regression was used to confirm preliminary significantassociations and to determine the odds ratio of found risk factors (OR). Outcome data, suchas ICU mortality and length of stay and duration of mechanical ventilation, were collectedfrom all patients.RESULTS. Out of 193 enrolled patients, 15 (7.8 %) developed an ICU-acquired, Gram-negative infection; 40 % of patients who developed a ICU-acquired infection due to Gram-negative bacteria already had an infection on ICU admission (p \ 0.0001, OR = 2.22, 95 %CI 1.03–3.40) and 60 % of patients with a Gram-negative ICU-acquired infection had beentreated with antifungal drugs (p \ 0.0001, OR = 2.30, 95 % CI 1.17–3.44). Outcome datashowed a significantly higher ICU-mortality rate in patients with Gram-negative infectionsthan in the control group (77.3 vs 14.6 %), and a higher length both of ICU stay andmechanical ventilation (24.07 ± 21.91 days vs 5.01 ± 402 days and 17.5 ± 17.23 days vs2.15 ± 3.48 days respectively).CONCLUSIONS. Our preliminary data show that infection on admission and antifungaltherapy are significantly associated with a higher risk of Gram-negative ICU-acquiredinfections. The real need of an antifungal therapy should always be carefully evaluated, andits unnecessary use should be avoided.REFERENCE(S). 1. Vincent et al. JAMA 2009; 302(21): 2323–9. 2. Peleg et al. Nat RevMicrobiol 2010; 8(5): 340–9.
Cardiac surgical intensive care: 0708–07210708EFFECTS OF RED BLOOD CELL TRANSFUSION ON MODERATE ANEMIAIN POST-OPERATIVE CARDIAC SURGERY: A COHORT STUDY
F. Bagate1, G. Abehsira1, D. Denjean1, P. Estagnasié1, A. Brusset1, P. Squara1
1Clinique Ambroise Paré, Intensive Care Unit, Neuilly-sur-Seine, FranceINTRODUCTION. Transfusion criteria are not consensual in non-bleeding patients withmoderate anemia (NBMA). Several studies have suggested that transfusing patient withmoderate anemia can be detrimental in ICU.1
OBJECTIVES. To evaluate the impact on mortality and morbidity of transfusing NBMApatients in the immediate postoperative period of cardiac surgery.METHODS. Retrospective, single center, cohort study, including 2,608 patients admitted inICU after the end of the Aprotinin use. For all these patients, 85 items investigating the pre-,peri-, and post-operative status were available, including the logistic EuroSCORE (Euro-SCORE), the length of stay (LOS), the duration of mechanical ventilation (MV), the post-operative Troponin IC serum concentration (Troponin). ‘‘Non-bleeding’’ was defined astotal peri-operative blood transfusion B4 units. ‘‘Moderate anemia’’ was defined as hemo-globin rate nadir [75 g/L. The 30-days mortality was the primary outcome. Secondaryoutcomes were the postoperative occurrence of three composite indices of: (1) left ventricledysfunction (LVD), (2) infection, (3) ischemic complication.RESULTS. Of the 2,160 NBMA patients, 1,016 (47 %) received a blood transfusion.Transfusion was associated with higher mortality, OR = (4.1–1.2), p \ 0.0001. The prob-ability of transfusion was higher according to female gender (71 vs. 38 % for males), age(71.5 vs. 65.3), EuroSCORE (10.1 vs. 4.5), combined surgery (69 vs. 45 % for otherinterventions), duration of the extra corporeal circulation (65 vs. 58 min), Troponin (7.2 vs.5.2 mg/L) and MV (7.7 vs. 15.1 h), all p \ 0.0001. When all peri-operative items wereincluded into a logistic regression, mortality was only linked to the EuroSCOREOR = (1.09–1.03), p = 0.0003, the MV OR = (1.01–1.00), p = 0.006, and the TroponinOR = (1.2–4.1), p = 0.01. The number of transfused red blood cells units was not linked tothe ischemic composite index but was linked to infectious complications,OR = (1.34–1.05), p = 0.0002, in combination with LOS, OR = (1.12–1.05), p \ 0.0001,body mass index OR = (1.08–1.03), p = 0.0009, and Troponin OR = (1.02–1.00),p = 0.02. The number of transfused red blood cells units was also linked with LVD, withOR = (1.65–1.01), p \ 0.0001, in combination with preoperative LVEF OR = (1.07–1.03),p \ 0.0001, Troponin OR = (1.07–1.02), p \ 0.0001 and EuroSCORE OR = (1.05–1.02),p \ 0.002.CONCLUSIONS. In this large retrospective study in the postoperative period of cardiacsurgery, restrictive blood transfusion in NBMA patients did not independently predict death,or ischemic complications, but predicted postoperative left ventricle dysfunction andinfections.REFERENCE(S). Herbert P et al. A multicenter, randomized, controlled clinical trial oftransfusion requirements in Critical Care. NEJM. 1999; 340:409–417.
07095-YEAR MORTALITY IN CARDIAC-SURGERY PATIENTS WITHPOSTOPERATIVE HEART FAILURE TREATED WITH LEVOSIMENDAN:PROGNOSTIC EVALUATION OF NT PRO-BNP AND C-REACTIVE PROTEINAND CLINICAL RISK FACTORS
H.R. Torrado1, J.C. López-Delgado1, E. Farrero1, E. Periche1, M.J. Castro2,
D. Rodrı́guez-Castro1, J.E. Toscano3, M.L. Carrió1, C. Javierre4, J.L. Ventura1
1Hospital Universitario de Bellvitge, Intensive Care, L’Hospitalet de Llobregat, Spain,2Hospital Universitario de Bellvitge, Clinic Laboratory, L’Hospitalet de Llobregat, Spain,3Hospital Universitario de Bellvitge, Cardiac Surgery, L’Hospitalet de Llobregat, Spain,4Universitat de Barcelona, Physiology Department, L’Hospitalet de Llobregat, SpainOBJECTIVES. The aim of this study was to determine clinical risk factors for 5-yearmortality in cardiac-surgery patients with perioperative myocardial dysfunction treated withlevosimendan and if there is any relationship with NTpro-BNP and C-reactive protein (CRP)levels.METHODS. Prospective observational study.A group of 30 cardio surgical patients, 12 men and 18 women, with postoperative heartfailure dependent on inotropic support, received levosimendan at the standard dose 0.1 mcg/kg/min during 24 h without a loading dose.All of them underwent elective surgery, 20 valve replacement, 8 coronary artery bypassgrafting, 1 aortic surgery and 1 aortic valve replacement plus bypass grafting.The mean age was 64.7 ± 11.8 years.The APACHE II was 13.2 ± 3.3 and EuroSCORE 8.2 ± 4.3.
26th ESICM ANNUAL CONGRESS — PARIS, FRANCE — 5–9 OCTOBER 2013
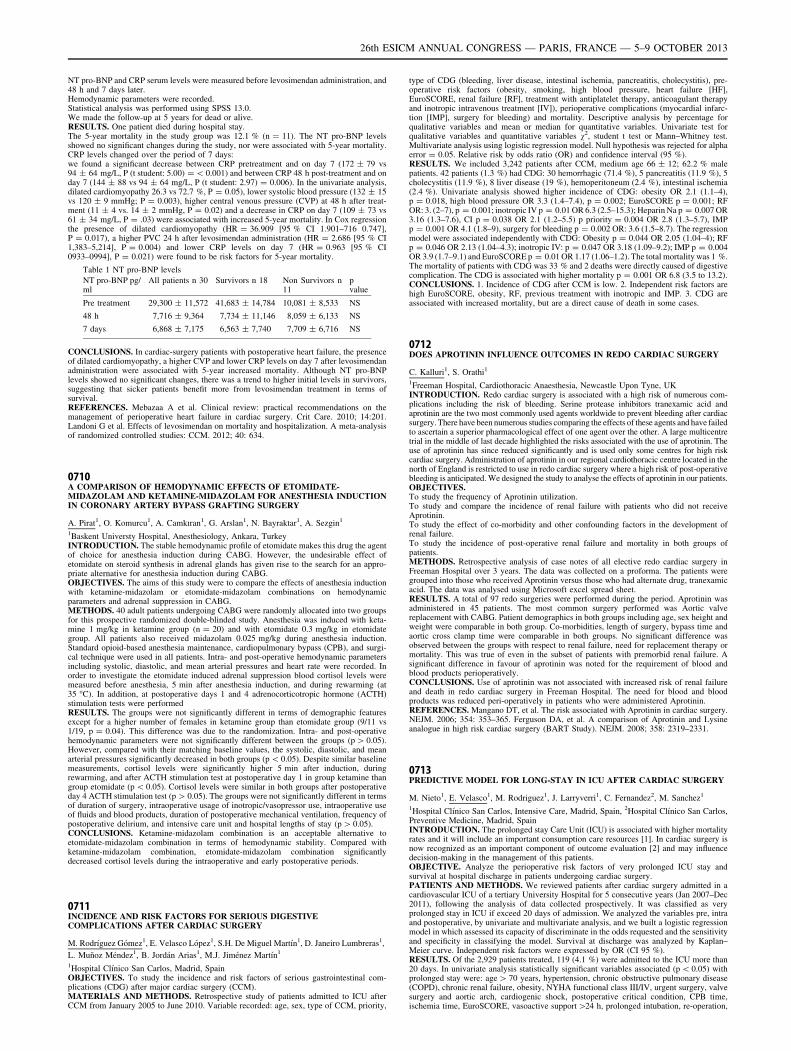
NT pro-BNP and CRP serum levels were measured before levosimendan administration, and48 h and 7 days later.Hemodynamic parameters were recorded.Statistical analysis was performed using SPSS 13.0.We made the follow-up at 5 years for dead or alive.RESULTS. One patient died during hospital stay.The 5-year mortality in the study group was 12.1 % (n = 11). The NT pro-BNP levelsshowed no significant changes during the study, nor were associated with 5-year mortality.CRP levels changed over the period of 7 days:we found a significant decrease between CRP pretreatment and on day 7 (172 ± 79 vs94 ± 64 mg/L, P (t student: 5.00) = \ 0.001) and between CRP 48 h post-treatment and onday 7 (144 ± 88 vs 94 ± 64 mg/L, P (t student: 2.97) = 0.006). In the univariate analysis,dilated cardiomyopathy 26.3 vs 72.7 %, P = 0.05), lower systolic blood pressure (132 ± 15vs 120 ± 9 mmHg; P = 0.003), higher central venous pressure (CVP) at 48 h after treat-ment (11 ± 4 vs. 14 ± 2 mmHg, P = 0.02) and a decrease in CRP on day 7 (109 ± 73 vs61 ± 34 mg/L, P = .03) were associated with increased 5-year mortality. In Cox regressionthe presence of dilated cardiomyopathy (HR = 36.909 [95 % CI 1.901–716 0.747],P = 0.017), a higher PVC 24 h after levosimendan administration (HR = 2.686 [95 % CI1,383–5,214], P = 0.004) and lower CRP levels on day 7 (HR = 0.963 [95 % CI0933–0994], P = 0.021) were found to be risk factors for 5-year mortality.
Table 1 NT pro-BNP levels
NT pro-BNP pg/ml
All patients n 30 Survivors n 18 Non Survivors n11
pvalue
Pre treatment 29,300 ± 11,572 41,683 ± 14,784 10,081 ± 8,533 NS
48 h 7,716 ± 9,364 7,734 ± 11,146 8,059 ± 6,133 NS
7 days 6,868 ± 7,175 6,563 ± 7,740 7,709 ± 6,716 NS
CONCLUSIONS. In cardiac-surgery patients with postoperative heart failure, the presenceof dilated cardiomyopathy, a higher CVP and lower CRP levels on day 7 after levosimendanadministration were associated with 5-year increased mortality. Although NT pro-BNPlevels showed no significant changes, there was a trend to higher initial levels in survivors,suggesting that sicker patients benefit more from levosimendan treatment in terms ofsurvival.REFERENCES. Mebazaa A et al. Clinical review: practical recommendations on themanagement of perioperative heart failure in cardiac surgery. Crit Care. 2010; 14:201.Landoni G et al. Effects of levosimendan on mortality and hospitalization. A meta-analysisof randomized controlled studies: CCM. 2012; 40: 634.
0710A COMPARISON OF HEMODYNAMIC EFFECTS OF ETOMIDATE-MIDAZOLAM AND KETAMINE-MIDAZOLAM FOR ANESTHESIA INDUCTIONIN CORONARY ARTERY BYPASS GRAFTING SURGERY
A. Pirat1, O. Komurcu1, A. Camkıran1, G. Arslan1, N. Bayraktar1, A. Sezgin1
1Baskent Universty Hospital, Anesthesiology, Ankara, TurkeyINTRODUCTION. The stable hemodynamic profile of etomidate makes this drug the agentof choice for anesthesia induction during CABG. However, the undesirable effect ofetomidate on steroid synthesis in adrenal glands has given rise to the search for an appro-priate alternative for anesthesia induction during CABG.OBJECTIVES. The aims of this study were to compare the effects of anesthesia inductionwith ketamine-midazolam or etomidate-midazolam combinations on hemodynamicparameters and adrenal suppression in CABG.METHODS. 40 adult patients undergoing CABG were randomly allocated into two groupsfor this prospective randomized double-blinded study. Anesthesia was induced with keta-mine 1 mg/kg in ketamine group (n = 20) and with etomidate 0.3 mg/kg in etomidategroup. All patients also received midazolam 0.025 mg/kg during anesthesia induction.Standard opioid-based anesthesia maintenance, cardiopulmonary bypass (CPB), and surgi-cal technique were used in all patients. Intra- and post-operative hemodynamic parametersincluding systolic, diastolic, and mean arterial pressures and heart rate were recorded. Inorder to investigate the etomidate induced adrenal suppression blood cortisol levels weremeasured before anesthesia, 5 min after anesthesia induction, and during rewarming (at35 �C). In addition, at postoperative days 1 and 4 adrenocorticotropic hormone (ACTH)stimulation tests were performedRESULTS. The groups were not significantly different in terms of demographic featuresexcept for a higher number of females in ketamine group than etomidate group (9/11 vs1/19, p = 0.04). This difference was due to the randomization. Intra- and post-operativehemodynamic parameters were not significantly different between the groups (p [ 0.05).However, compared with their matching baseline values, the systolic, diastolic, and meanarterial pressures significantly decreased in both groups (p \ 0.05). Despite similar baselinemeasurements, cortisol levels were significantly higher 5 min after induction, duringrewarming, and after ACTH stimulation test at postoperative day 1 in group ketamine thangroup etomidate (p \ 0.05). Cortisol levels were similar in both groups after postoperativeday 4 ACTH stimulation test (p [ 0.05). The groups were not significantly different in termsof duration of surgery, intraoperative usage of inotropic/vasopressor use, intraoperative useof fluids and blood products, duration of postoperative mechanical ventilation, frequency ofpostoperative delirium, and intensive care unit and hospital lengths of stay (p [ 0.05).CONCLUSIONS. Ketamine-midazolam combination is an acceptable alternative toetomidate-midazolam combination in terms of hemodynamic stability. Compared withketamine-midazolam combination, etomidate-midazolam combination significantlydecreased cortisol levels during the intraoperative and early postoperative periods.
0711INCIDENCE AND RISK FACTORS FOR SERIOUS DIGESTIVECOMPLICATIONS AFTER CARDIAC SURGERY
M. Rodrı́guez Gómez1, E. Velasco López1, S.H. De Miguel Martı́n1, D. Janeiro Lumbreras1,
L. Muñoz Méndez1, B. Jordán Arias1, M.J. Jiménez Martı́n1
1Hospital Clı́nico San Carlos, Madrid, SpainOBJECTIVES. To study the incidence and risk factors of serious gastrointestinal com-plications (CDG) after major cardiac surgery (CCM).MATERIALS AND METHODS. Retrospective study of patients admitted to ICU afterCCM from January 2005 to June 2010. Variable recorded: age, sex, type of CCM, priority,
type of CDG (bleeding, liver disease, intestinal ischemia, pancreatitis, cholecystitis), pre-operative risk factors (obesity, smoking, high blood pressure, heart failure [HF],EuroSCORE, renal failure [RF], treatment with antiplatelet therapy, anticoagulant therapyand inotropic intravenous treatment [IV]), perioperative complications (myocardial infarc-tion [IMP], surgery for bleeding) and mortality. Descriptive analysis by percentage forqualitative variables and mean or median for quantitative variables. Univariate test forqualitative variables and quantitative variables v2, student t test or Mann–Whitney test.Multivariate analysis using logistic regression model. Null hypothesis was rejected for alphaerror = 0.05. Relative risk by odds ratio (OR) and confidence interval (95 %).RESULTS. We included 3,242 patients after CCM, medium age 66 ± 12; 62.2 % malepatients. 42 patients (1.3 %) had CDG: 30 hemorrhagic (71.4 %), 5 pancreatitis (11.9 %), 5cholecystitis (11.9 %), 8 liver disease (19 %), hemoperitoneum (2.4 %), intestinal ischemia(2.4 %). Univariate analysis showed higher incidence of CDG: obesity OR 2.1 (1.1–4),p = 0.018, high blood pressure OR 3.3 (1.4–7.4), p = 0.002; EuroSCORE p = 0.001; RFOR: 3. (2–7), p = 0.001; inotropic IV p = 0.01 OR 6.3 (2.5–15.3); Heparin Na p = 0.007 OR3.16 (1.3–7.6), CI p = 0.038 OR 2.1 (1.2–5.5) p priority = 0.004 OR 2.8 (1.3–5.7), IMPp = 0.001 OR 4.1 (1.8–9), surgery for bleeding p = 0.002 OR: 3.6 (1.5–8.7). The regressionmodel were associated independently with CDG: Obesity p = 0.044 OR 2.05 (1.04–4); RFp = 0.046 OR 2.13 (1.04–4.3); inotropic IV: p = 0.047 OR 3.18 (1.09–9.2); IMP p = 0.004OR 3.9 (1.7–9.1) and EuroSCORE p = 0.01 OR 1.17 (1.06–1.2). The total mortality was 1 %.The mortality of patients with CDG was 33 % and 2 deaths were directly caused of digestivecomplication. The CDG is associated with higher mortality p = 0.001 OR 6.8 (3.5 to 13.2).CONCLUSIONS. 1. Incidence of CDG after CCM is low. 2. Independent risk factors arehigh EuroSCORE, obesity, RF, previous treatment with inotropic and IMP. 3. CDG areassociated with increased mortality, but are a direct cause of death in some cases.
0712DOES APROTININ INFLUENCE OUTCOMES IN REDO CARDIAC SURGERY
C. Kalluri1, S. Orathi1
1Freeman Hospital, Cardiothoracic Anaesthesia, Newcastle Upon Tyne, UKINTRODUCTION. Redo cardiac surgery is associated with a high risk of numerous com-plications including the risk of bleeding. Serine protease inhibitors tranexamic acid andaprotinin are the two most commonly used agents worldwide to prevent bleeding after cardiacsurgery. There have been numerous studies comparing the effects of these agents and have failedto ascertain a superior pharmacological effect of one agent over the other. A large multicentretrial in the middle of last decade highlighted the risks associated with the use of aprotinin. Theuse of aprotinin has since reduced significantly and is used only some centres for high riskcardiac surgery. Administration of aprotinin in our regional cardiothoracic centre located in thenorth of England is restricted to use in redo cardiac surgery where a high risk of post-operativebleeding is anticipated. We designed the study to analyse the effects of aprotinin in our patients.OBJECTIVES.To study the frequency of Aprotinin utilization.To study and compare the incidence of renal failure with patients who did not receiveAprotinin.To study the effect of co-morbidity and other confounding factors in the development ofrenal failure.To study the incidence of post-operative renal failure and mortality in both groups ofpatients.METHODS. Retrospective analysis of case notes of all elective redo cardiac surgery inFreeman Hospital over 3 years. The data was collected on a proforma. The patients weregrouped into those who received Aprotinin versus those who had alternate drug, tranexamicacid. The data was analysed using Microsoft excel spread sheet.RESULTS. A total of 97 redo surgeries were performed during the period. Aprotinin wasadministered in 45 patients. The most common surgery performed was Aortic valvereplacement with CABG. Patient demographics in both groups including age, sex height andweight were comparable in both group. Co-morbidities, length of surgery, bypass time andaortic cross clamp time were comparable in both groups. No significant difference wasobserved between the groups with respect to renal failure, need for replacement therapy ormortality. This was true of even in the subset of patients with premorbid renal failure. Asignificant difference in favour of aprotinin was noted for the requirement of blood andblood products perioperatively.CONCLUSIONS. Use of aprotinin was not associated with increased risk of renal failureand death in redo cardiac surgery in Freeman Hospital. The need for blood and bloodproducts was reduced peri-operatively in patients who were administered Aprotinin.REFERENCES. Mangano DT, et al. The risk associated with Aprotinin in cardiac surgery.NEJM. 2006; 354: 353–365. Ferguson DA, et al. A comparison of Aprotinin and Lysineanalogue in high risk cardiac surgery (BART Study). NEJM. 2008; 358: 2319–2331.
0713PREDICTIVE MODEL FOR LONG-STAY IN ICU AFTER CARDIAC SURGERY
M. Nieto1, E. Velasco1, M. Rodriguez1, J. Larryverri1, C. Fernandez2, M. Sanchez1
1Hospital Clı́nico San Carlos, Intensive Care, Madrid, Spain, 2Hospital Clı́nico San Carlos,Preventive Medicine, Madrid, SpainINTRODUCTION. The prolonged stay Care Unit (ICU) is associated with higher mortalityrates and it will include an important consumption care resources [1]. In cardiac surgery isnow recognized as an important component of outcome evaluation [2] and may influencedecision-making in the management of this patients.OBJECTIVE. Analyze the perioperative risk factors of very prolonged ICU stay andsurvival at hospital discharge in patients undergoing cardiac surgery.PATIENTS AND METHODS. We reviewed patients after cardiac surgery admitted in acardiovascular ICU of a tertiary University Hospital for 5 consecutive years (Jan 2007–Dec2011), following the analysis of data collected prospectively. It was classified as veryprolonged stay in ICU if exceed 20 days of admission. We analyzed the variables pre, intraand postoperative, by univariate and multivariate analysis, and we built a logistic regressionmodel in which assessed its capacity of discriminate in the odds requested and the sensitivityand specificity in classifying the model. Survival at discharge was analyzed by Kaplan–Meier curve. Independent risk factors were expressed by OR (CI 95 %).RESULTS. Of the 2,929 patients treated, 119 (4.1 %) were admitted to the ICU more than20 days. In univariate analysis statistically significant variables associated (p \ 0.05) withprolonged stay were: age [ 70 years, hypertension, chronic obstructive pulmonary disease(COPD), chronic renal failure, obesity, NYHA functional class III/IV, urgent surgery, valvesurgery and aortic arch, cardiogenic shock, postoperative critical condition, CPB time,ischemia time, EuroSCORE, vasoactive support[24 h, prolonged intubation, re-operation,
26th ESICM ANNUAL CONGRESS — PARIS, FRANCE — 5–9 OCTOBER 2013
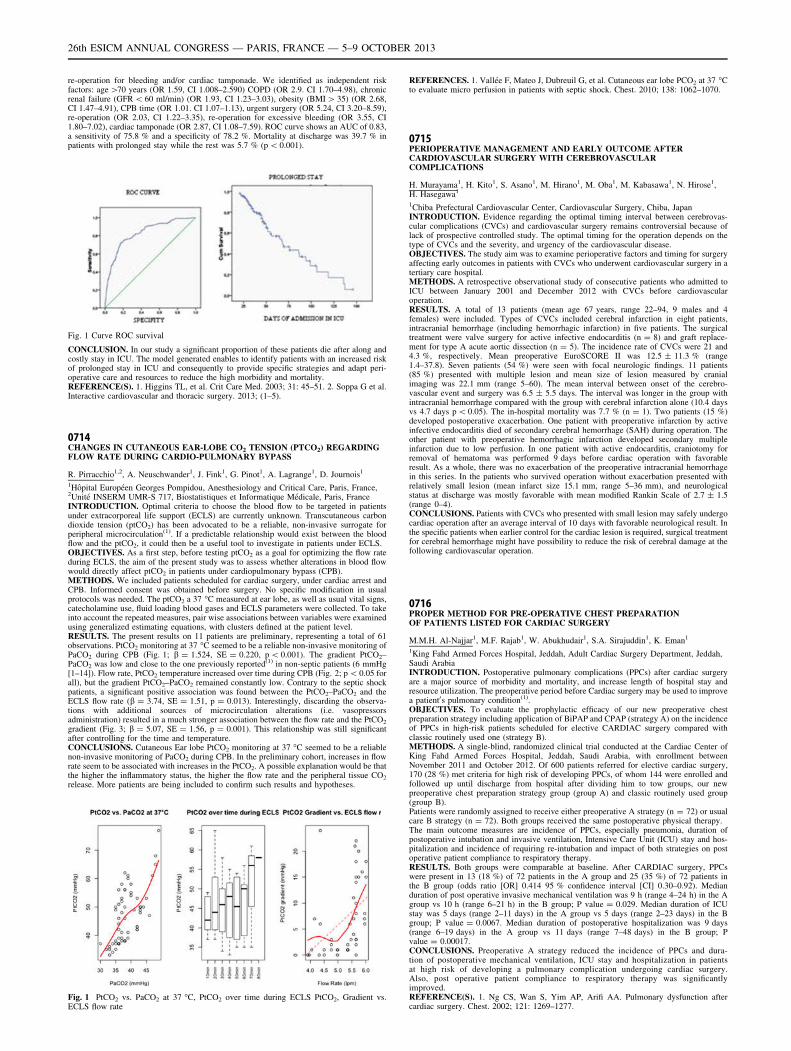
re-operation for bleeding and/or cardiac tamponade. We identified as independent riskfactors: age [70 years (OR 1.59, CI 1.008–2.590) COPD (OR 2.9. CI 1.70–4.98), chronicrenal failure (GFR \ 60 ml/min) (OR 1.93, CI 1.23–3.03), obesity (BMI [ 35) (OR 2.68,CI 1.47–4.91), CPB time (OR 1.01. CI 1.07–1.13), urgent surgery (OR 5.24, CI 3.20–8.59),re-operation (OR 2.03, CI 1.22–3.35), re-operation for excessive bleeding (OR 3.55, CI1.80–7.02), cardiac tamponade (OR 2.87, CI 1.08–7.59). ROC curve shows an AUC of 0.83,a sensitivity of 75.8 % and a specificity of 78.2 %. Mortality at discharge was 39.7 % inpatients with prolonged stay while the rest was 5.7 % (p \ 0.001).
Fig. 1 Curve ROC survival
CONCLUSION. In our study a significant proportion of these patients die after along andcostly stay in ICU. The model generated enables to identify patients with an increased riskof prolonged stay in ICU and consequently to provide specific strategies and adapt peri-operative care and resources to reduce the high morbidity and mortality.REFERENCE(S). 1. Higgins TL, et al. Crit Care Med. 2003; 31: 45–51. 2. Soppa G et al.Interactive cardiovascular and thoracic surgery. 2013; (1–5).
0714CHANGES IN CUTANEOUS EAR-LOBE CO2 TENSION (PTCO2) REGARDINGFLOW RATE DURING CARDIO-PULMONARY BYPASS
R. Pirracchio1,2, A. Neuschwander1, J. Fink1, G. Pinot1, A. Lagrange1, D. Journois1
1Hôpital Européen Georges Pompidou, Anesthesiology and Critical Care, Paris, France,2Unité INSERM UMR-S 717, Biostatistiques et Informatique Médicale, Paris, FranceINTRODUCTION. Optimal criteria to choose the blood flow to be targeted in patientsunder extracorporeal life support (ECLS) are currently unknown. Transcutaneous carbondioxide tension (ptCO2) has been advocated to be a reliable, non-invasive surrogate forperipheral microcirculation(1). If a predictable relationship would exist between the bloodflow and the ptCO2, it could then be a useful tool to investigate in patients under ECLS.OBJECTIVES. As a first step, before testing ptCO2 as a goal for optimizing the flow rateduring ECLS, the aim of the present study was to assess whether alterations in blood flowwould directly affect ptCO2 in patients under cardiopulmonary bypass (CPB).METHODS. We included patients scheduled for cardiac surgery, under cardiac arrest andCPB. Informed consent was obtained before surgery. No specific modification in usualprotocols was needed. The ptCO2 a 37 �C measured at ear lobe, as well as usual vital signs,catecholamine use, fluid loading blood gases and ECLS parameters were collected. To takeinto account the repeated measures, pair wise associations between variables were examinedusing generalized estimating equations, with clusters defined at the patient level.RESULTS. The present results on 11 patients are preliminary, representing a total of 61observations. PtCO2 monitoring at 37 �C seemed to be a reliable non-invasive monitoring ofPaCO2 during CPB (Fig. 1; b = 1.524, SE = 0.220, p \ 0.001). The gradient PtCO2–PaCO2 was low and close to the one previously reported(1) in non-septic patients (6 mmHg[1–14]). Flow rate, PtCO2 temperature increased over time during CPB (Fig. 2; p \ 0.05 forall), but the gradient PtCO2–PaCO2 remained constantly low. Contrary to the septic shockpatients, a significant positive association was found between the PtCO2–PaCO2 and theECLS flow rate (b = 3.74, SE = 1.51, p = 0.013). Interestingly, discarding the observa-tions with additional sources of microcirculation alterations (i.e. vasopressorsadministration) resulted in a much stronger association between the flow rate and the PtCO2
gradient (Fig. 3; b = 5.07, SE = 1.56, p = 0.001). This relationship was still significantafter controlling for the time and temperature.CONCLUSIONS. Cutaneous Ear lobe PtCO2 monitoring at 37 �C seemed to be a reliablenon-invasive monitoring of PaCO2 during CPB. In the preliminary cohort, increases in flowrate seem to be associated with increases in the PtCO2. A possible explanation would be thatthe higher the inflammatory status, the higher the flow rate and the peripheral tissue CO2
release. More patients are being included to confirm such results and hypotheses.
Fig. 1 PtCO2 vs. PaCO2 at 37 �C, PtCO2 over time during ECLS PtCO2, Gradient vs.ECLS flow rate
REFERENCES. 1. Vallée F, Mateo J, Dubreuil G, et al. Cutaneous ear lobe PCO2 at 37 �Cto evaluate micro perfusion in patients with septic shock. Chest. 2010; 138: 1062–1070.
0715PERIOPERATIVE MANAGEMENT AND EARLY OUTCOME AFTERCARDIOVASCULAR SURGERY WITH CEREBROVASCULARCOMPLICATIONS
H. Murayama1, H. Kito1, S. Asano1, M. Hirano1, M. Oba1, M. Kabasawa1, N. Hirose1,H. Hasegawa1
1Chiba Prefectural Cardiovascular Center, Cardiovascular Surgery, Chiba, JapanINTRODUCTION. Evidence regarding the optimal timing interval between cerebrovas-cular complications (CVCs) and cardiovascular surgery remains controversial because oflack of prospective controlled study. The optimal timing for the operation depends on thetype of CVCs and the severity, and urgency of the cardiovascular disease.OBJECTIVES. The study aim was to examine perioperative factors and timing for surgeryaffecting early outcomes in patients with CVCs who underwent cardiovascular surgery in atertiary care hospital.METHODS. A retrospective observational study of consecutive patients who admitted toICU between January 2001 and December 2012 with CVCs before cardiovascularoperation.RESULTS. A total of 13 patients (mean age 67 years, range 22–94, 9 males and 4females) were included. Types of CVCs included cerebral infarction in eight patients,intracranial hemorrhage (including hemorrhagic infarction) in five patients. The surgicaltreatment were valve surgery for active infective endocarditis (n = 8) and graft replace-ment for type A acute aortic dissection (n = 5). The incidence rate of CVCs were 21 and4.3 %, respectively. Mean preoperative EuroSCORE II was 12.5 ± 11.3 % (range1.4–37.8). Seven patients (54 %) were seen with focal neurologic findings. 11 patients(85 %) presented with multiple lesion and mean size of lesion measured by cranialimaging was 22.1 mm (range 5–60). The mean interval between onset of the cerebro-vascular event and surgery was 6.5 ± 5.5 days. The interval was longer in the group withintracranial hemorrhage compared with the group with cerebral infarction alone (10.4 daysvs 4.7 days p \ 0.05). The in-hospital mortality was 7.7 % (n = 1). Two patients (15 %)developed postoperative exacerbation. One patient with preoperative infarction by activeinfective endocarditis died of secondary cerebral hemorrhage (SAH) during operation. Theother patient with preoperative hemorrhagic infarction developed secondary multipleinfarction due to low perfusion. In one patient with active endocarditis, craniotomy forremoval of hematoma was performed 9 days before cardiac operation with favorableresult. As a whole, there was no exacerbation of the preoperative intracranial hemorrhagein this series. In the patients who survived operation without exacerbation presented withrelatively small lesion (mean infarct size 15.1 mm, range 5–36 mm), and neurologicalstatus at discharge was mostly favorable with mean modified Rankin Scale of 2.7 ± 1.5(range 0–4).CONCLUSIONS. Patients with CVCs who presented with small lesion may safely undergocardiac operation after an average interval of 10 days with favorable neurological result. Inthe specific patients when earlier control for the cardiac lesion is required, surgical treatmentfor cerebral hemorrhage might have possibility to reduce the risk of cerebral damage at thefollowing cardiovascular operation.
0716PROPER METHOD FOR PRE-OPERATIVE CHEST PREPARATIONOF PATIENTS LISTED FOR CARDIAC SURGERY
M.M.H. Al-Najjar1, M.F. Rajab1, W. Abukhudair1, S.A. Sirajuddin1, K. Eman1
1King Fahd Armed Forces Hospital, Jeddah, Adult Cardiac Surgery Department, Jeddah,Saudi ArabiaINTRODUCTION. Postoperative pulmonary complications (PPCs) after cardiac surgeryare a major source of morbidity and mortality, and increase length of hospital stay andresource utilization. The preoperative period before Cardiac surgery may be used to improvea patient0s pulmonary condition(1).OBJECTIVES. To evaluate the prophylactic efficacy of our new preoperative chestpreparation strategy including application of BiPAP and CPAP (strategy A) on the incidenceof PPCs in high-risk patients scheduled for elective CARDIAC surgery compared withclassic routinely used one (strategy B).METHODS. A single-blind, randomized clinical trial conducted at the Cardiac Center ofKing Fahd Armed Forces Hospital, Jeddah, Saudi Arabia, with enrollment betweenNovember 2011 and October 2012. Of 600 patients referred for elective cardiac surgery,170 (28 %) met criteria for high risk of developing PPCs, of whom 144 were enrolled andfollowed up until discharge from hospital after dividing him to tow groups, our newpreoperative chest preparation strategy group (group A) and classic routinely used group(group B).Patients were randomly assigned to receive either preoperative A strategy (n = 72) or usualcare B strategy (n = 72). Both groups received the same postoperative physical therapy.The main outcome measures are incidence of PPCs, especially pneumonia, duration ofpostoperative intubation and invasive ventilation, Intensive Care Unit (ICU) stay and hos-pitalization and incidence of requiring re-intubation and impact of both strategies on postoperative patient compliance to respiratory therapy.RESULTS. Both groups were comparable at baseline. After CARDIAC surgery, PPCswere present in 13 (18 %) of 72 patients in the A group and 25 (35 %) of 72 patients inthe B group (odds ratio [OR] 0.414 95 % confidence interval [CI] 0.30–0.92). Medianduration of post operative invasive mechanical ventilation was 9 h (range 4–24 h) in the Agroup vs 10 h (range 6–21 h) in the B group; P value = 0.029. Median duration of ICUstay was 5 days (range 2–11 days) in the A group vs 5 days (range 2–23 days) in the Bgroup; P value = 0.0067. Median duration of postoperative hospitalization was 9 days(range 6–19 days) in the A group vs 11 days (range 7–48 days) in the B group; Pvalue = 0.00017.CONCLUSIONS. Preoperative A strategy reduced the incidence of PPCs and dura-tion of postoperative mechanical ventilation, ICU stay and hospitalization in patientsat high risk of developing a pulmonary complication undergoing cardiac surgery.Also, post operative patient compliance to respiratory therapy was significantlyimproved.REFERENCE(S). 1. Ng CS, Wan S, Yim AP, Arifi AA. Pulmonary dysfunction aftercardiac surgery. Chest. 2002; 121: 1269–1277.
26th ESICM ANNUAL CONGRESS — PARIS, FRANCE — 5–9 OCTOBER 2013
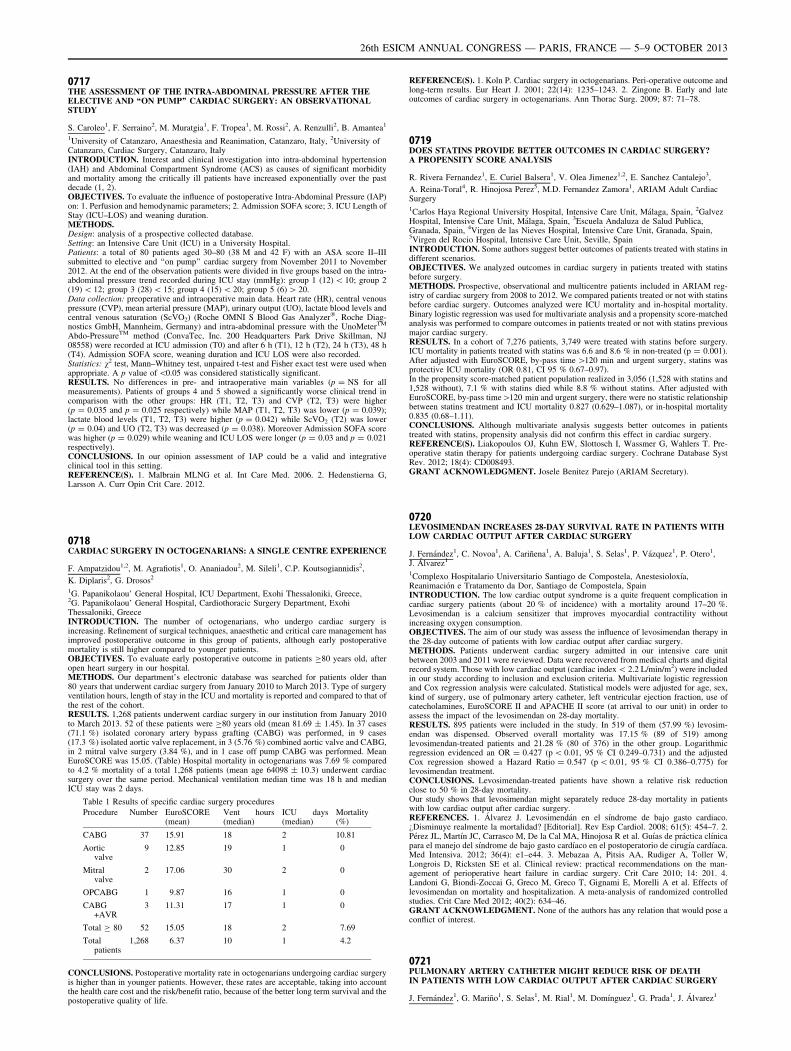
0717THE ASSESSMENT OF THE INTRA-ABDOMINAL PRESSURE AFTER THEELECTIVE AND ‘‘ON PUMP’’ CARDIAC SURGERY: AN OBSERVATIONALSTUDY
S. Caroleo1, F. Serraino2, M. Muratgia1, F. Tropea1, M. Rossi2, A. Renzulli2, B. Amantea1
1University of Catanzaro, Anaesthesia and Reanimation, Catanzaro, Italy, 2University ofCatanzaro, Cardiac Surgery, Catanzaro, ItalyINTRODUCTION. Interest and clinical investigation into intra-abdominal hypertension(IAH) and Abdominal Compartment Syndrome (ACS) as causes of significant morbidityand mortality among the critically ill patients have increased exponentially over the pastdecade (1, 2).OBJECTIVES. To evaluate the influence of postoperative Intra-Abdominal Pressure (IAP)on: 1. Perfusion and hemodynamic parameters; 2. Admission SOFA score; 3. ICU Length ofStay (ICU–LOS) and weaning duration.METHODS.Design: analysis of a prospective collected database.Setting: an Intensive Care Unit (ICU) in a University Hospital.Patients: a total of 80 patients aged 30–80 (38 M and 42 F) with an ASA score II–IIIsubmitted to elective and ‘‘on pump’’ cardiac surgery from November 2011 to November2012. At the end of the observation patients were divided in five groups based on the intra-abdominal pressure trend recorded during ICU stay (mmHg): group 1 (12) \ 10; group 2(19) \ 12; group 3 (28) \ 15; group 4 (15) \ 20; group 5 (6) [ 20.Data collection: preoperative and intraoperative main data. Heart rate (HR), central venouspressure (CVP), mean arterial pressure (MAP), urinary output (UO), lactate blood levels andcentral venous saturation (ScVO2) (Roche OMNI S Blood Gas Analyzer�, Roche Diag-nostics GmbH, Mannheim, Germany) and intra-abdominal pressure with the UnoMeterTM
Abdo-PressureTM method (ConvaTec, Inc. 200 Headquarters Park Drive Skillman, NJ08558) were recorded at ICU admission (T0) and after 6 h (T1), 12 h (T2), 24 h (T3), 48 h(T4). Admission SOFA score, weaning duration and ICU LOS were also recorded.Statistics: v2 test, Mann–Whitney test, unpaired t-test and Fisher exact test were used whenappropriate. A p value of \0.05 was considered statistically significant.RESULTS. No differences in pre- and intraoperative main variables (p = NS for allmeasurements). Patients of groups 4 and 5 showed a significantly worse clinical trend incomparison with the other groups: HR (T1, T2, T3) and CVP (T2, T3) were higher(p = 0.035 and p = 0.025 respectively) while MAP (T1, T2, T3) was lower (p = 0.039);lactate blood levels (T1, T2, T3) were higher (p = 0.042) while ScVO2 (T2) was lower(p = 0.04) and UO (T2, T3) was decreased (p = 0.038). Moreover Admission SOFA scorewas higher (p = 0.029) while weaning and ICU LOS were longer (p = 0.03 and p = 0.021respectively).CONCLUSIONS. In our opinion assessment of IAP could be a valid and integrativeclinical tool in this setting.REFERENCE(S). 1. Malbrain MLNG et al. Int Care Med. 2006. 2. Hedenstierna G,Larsson A. Curr Opin Crit Care. 2012.
0718CARDIAC SURGERY IN OCTOGENARIANS: A SINGLE CENTRE EXPERIENCE
F. Ampatzidou1,2, M. Agrafiotis1, O. Ananiadou2, M. Sileli1, C.P. Koutsogiannidis2,
K. Diplaris2, G. Drosos2
1G. Papanikolaou’ General Hospital, ICU Department, Exohi Thessaloniki, Greece,2G. Papanikolaou’ General Hospital, Cardiothoracic Surgery Department, ExohiThessaloniki, GreeceINTRODUCTION. The number of octogenarians, who undergo cardiac surgery isincreasing. Refinement of surgical techniques, anaesthetic and critical care management hasimproved postoperative outcome in this group of patients, although early postoperativemortality is still higher compared to younger patients.OBJECTIVES. To evaluate early postoperative outcome in patients C80 years old, afteropen heart surgery in our hospital.METHODS. Our department’s electronic database was searched for patients older than80 years that underwent cardiac surgery from January 2010 to March 2013. Type of surgeryventilation hours, length of stay in the ICU and mortality is reported and compared to that ofthe rest of the cohort.RESULTS. 1,268 patients underwent cardiac surgery in our institution from January 2010to March 2013. 52 of these patients were C80 years old (mean 81.69 ± 1.45). In 37 cases(71.1 %) isolated coronary artery bypass grafting (CABG) was performed, in 9 cases(17.3 %) isolated aortic valve replacement, in 3 (5.76 %) combined aortic valve and CABG,in 2 mitral valve surgery (3.84 %), and in 1 case off pump CABG was performed. MeanEuroSCORE was 15.05. (Table) Hospital mortality in octogenarians was 7.69 % comparedto 4.2 % mortality of a total 1,268 patients (mean age 64098 ± 10.3) underwent cardiacsurgery over the same period. Mechanical ventilation median time was 18 h and medianICU stay was 2 days.
Table 1 Results of specific cardiac surgery procedures
Procedure Number EuroSCORE(mean)
Vent hours(median)
ICU days(median)
Mortality(%)
CABG 37 15.91 18 2 10.81
Aorticvalve
9 12.85 19 1 0
Mitralvalve
2 17.06 30 2 0
OPCABG 1 9.87 16 1 0
CABG+AVR
3 11.31 17 1 0
Total C 80 52 15.05 18 2 7.69
Totalpatients
1,268 6.37 10 1 4.2
CONCLUSIONS. Postoperative mortality rate in octogenarians undergoing cardiac surgeryis higher than in younger patients. However, these rates are acceptable, taking into accountthe health care cost and the risk/benefit ratio, because of the better long term survival and thepostoperative quality of life.
REFERENCE(S). 1. Koln P. Cardiac surgery in octogenarians. Peri-operative outcome andlong-term results. Eur Heart J. 2001; 22(14): 1235–1243. 2. Zingone B. Early and lateoutcomes of cardiac surgery in octogenarians. Ann Thorac Surg. 2009; 87: 71–78.
0719DOES STATINS PROVIDE BETTER OUTCOMES IN CARDIAC SURGERY?A PROPENSITY SCORE ANALYSIS
R. Rivera Fernandez1, E. Curiel Balsera1, V. Olea Jimenez1,2, E. Sanchez Cantalejo3,
A. Reina-Toral4, R. Hinojosa Perez5, M.D. Fernandez Zamora1, ARIAM Adult CardiacSurgery1Carlos Haya Regional University Hospital, Intensive Care Unit, Málaga, Spain, 2GalvezHospital, Intensive Care Unit, Málaga, Spain, 3Escuela Andaluza de Salud Publica,Granada, Spain, 4Virgen de las Nieves Hospital, Intensive Care Unit, Granada, Spain,5Virgen del Rocio Hospital, Intensive Care Unit, Seville, SpainINTRODUCTION. Some authors suggest better outcomes of patients treated with statins indifferent scenarios.OBJECTIVES. We analyzed outcomes in cardiac surgery in patients treated with statinsbefore surgery.METHODS. Prospective, observational and multicentre patients included in ARIAM reg-istry of cardiac surgery from 2008 to 2012. We compared patients treated or not with statinsbefore cardiac surgery. Outcomes analyzed were ICU mortality and in-hospital mortality.Binary logistic regression was used for multivariate analysis and a propensity score-matchedanalysis was performed to compare outcomes in patients treated or not with statins previousmajor cardiac surgery.RESULTS. In a cohort of 7,276 patients, 3,749 were treated with statins before surgery.ICU mortality in patients treated with statins was 6.6 and 8.6 % in non-treated (p = 0.001).After adjusted with EuroSCORE, by-pass time [120 min and urgent surgery, statins wasprotective ICU mortality (OR 0.81, CI 95 % 0.67–0.97).In the propensity score-matched patient population realized in 3,056 (1,528 with statins and1,528 without), 7.1 % with statins died while 8.8 % without statins. After adjusted withEuroSCORE, by-pass time[120 min and urgent surgery, there were no statistic relationshipbetween statins treatment and ICU mortality 0.827 (0.629–1.087), or in-hospital mortality0.835 (0.68–1.11).CONCLUSIONS. Although multivariate analysis suggests better outcomes in patientstreated with statins, propensity analysis did not confirm this effect in cardiac surgery.REFERENCE(S). Liakopoulos OJ, Kuhn EW, Slottosch I, Wassmer G, Wahlers T. Pre-operative statin therapy for patients undergoing cardiac surgery. Cochrane Database SystRev. 2012; 18(4): CD008493.GRANT ACKNOWLEDGMENT. Josele Benitez Parejo (ARIAM Secretary).
0720LEVOSIMENDAN INCREASES 28-DAY SURVIVAL RATE IN PATIENTS WITHLOW CARDIAC OUTPUT AFTER CARDIAC SURGERY
J. Fernández1, C. Novoa1, A. Cariñena1, A. Baluja1, S. Selas1, P. Vázquez1, P. Otero1,J. Álvarez1
1Complexo Hospitalario Universitario Santiago de Compostela, Anestesioloxı́a,Reanimación e Tratamento da Dor, Santiago de Compostela, SpainINTRODUCTION. The low cardiac output syndrome is a quite frequent complication incardiac surgery patients (about 20 % of incidence) with a mortality around 17–20 %.Levosimendan is a calcium sensitizer that improves myocardial contractility withoutincreasing oxygen consumption.OBJECTIVES. The aim of our study was assess the influence of levosimendan therapy inthe 28-day outcome of patients with low cardiac output after cardiac surgery.METHODS. Patients underwent cardiac surgery admitted in our intensive care unitbetween 2003 and 2011 were reviewed. Data were recovered from medical charts and digitalrecord system. Those with low cardiac output (cardiac index \ 2.2 L/min/m2) were includedin our study according to inclusion and exclusion criteria. Multivariate logistic regressionand Cox regression analysis were calculated. Statistical models were adjusted for age, sex,kind of surgery, use of pulmonary artery catheter, left ventricular ejection fraction, use ofcatecholamines, EuroSCORE II and APACHE II score (at arrival to our unit) in order toassess the impact of the levosimendan on 28-day mortality.RESULTS. 895 patients were included in the study. In 519 of them (57.99 %) levosim-endan was dispensed. Observed overall mortality was 17.15 % (89 of 519) amonglevosimendan-treated patients and 21.28 % (80 of 376) in the other group. Logarithmicregression evidenced an OR = 0.427 (p \ 0.01, 95 % CI 0.249–0.731) and the adjustedCox regression showed a Hazard Ratio = 0.547 (p \ 0.01, 95 % CI 0.386–0.775) forlevosimendan treatment.CONCLUSIONS. Levosimendan-treated patients have shown a relative risk reductionclose to 50 % in 28-day mortality.Our study shows that levosimendan might separately reduce 28-day mortality in patientswith low cardiac output after cardiac surgery.REFERENCES. 1. Álvarez J. Levosimendán en el sı́ndrome de bajo gasto cardiaco.>Disminuye realmente la mortalidad? [Editorial]. Rev Esp Cardiol. 2008; 61(5): 454–7. 2.Pérez JL, Martı́n JC, Carrasco M, De la Cal MA, Hinojosa R et al. Guı́as de práctica clı́nicapara el manejo del sı́ndrome de bajo gasto cardı́aco en el postoperatorio de cirugı́a cardı́aca.Med Intensiva. 2012; 36(4): e1–e44. 3. Mebazaa A, Pitsis AA, Rudiger A, Toller W,Longrois D, Ricksten SE et al. Clinical review: practical recommendations on the man-agement of perioperative heart failure in cardiac surgery. Crit Care 2010; 14: 201. 4.Landoni G, Biondi-Zoccai G, Greco M, Greco T, Gignami E, Morelli A et al. Effects oflevosimendan on mortality and hospitalization. A meta-analysis of randomized controlledstudies. Crit Care Med 2012; 40(2): 634–46.GRANT ACKNOWLEDGMENT. None of the authors has any relation that would pose aconflict of interest.
0721PULMONARY ARTERY CATHETER MIGHT REDUCE RISK OF DEATHIN PATIENTS WITH LOW CARDIAC OUTPUT AFTER CARDIAC SURGERY
J. Fernández1, G. Mariño1, S. Selas1, M. Rial1, M. Domı́nguez1, G. Prada1, J. Álvarez1
26th ESICM ANNUAL CONGRESS — PARIS, FRANCE — 5–9 OCTOBER 2013
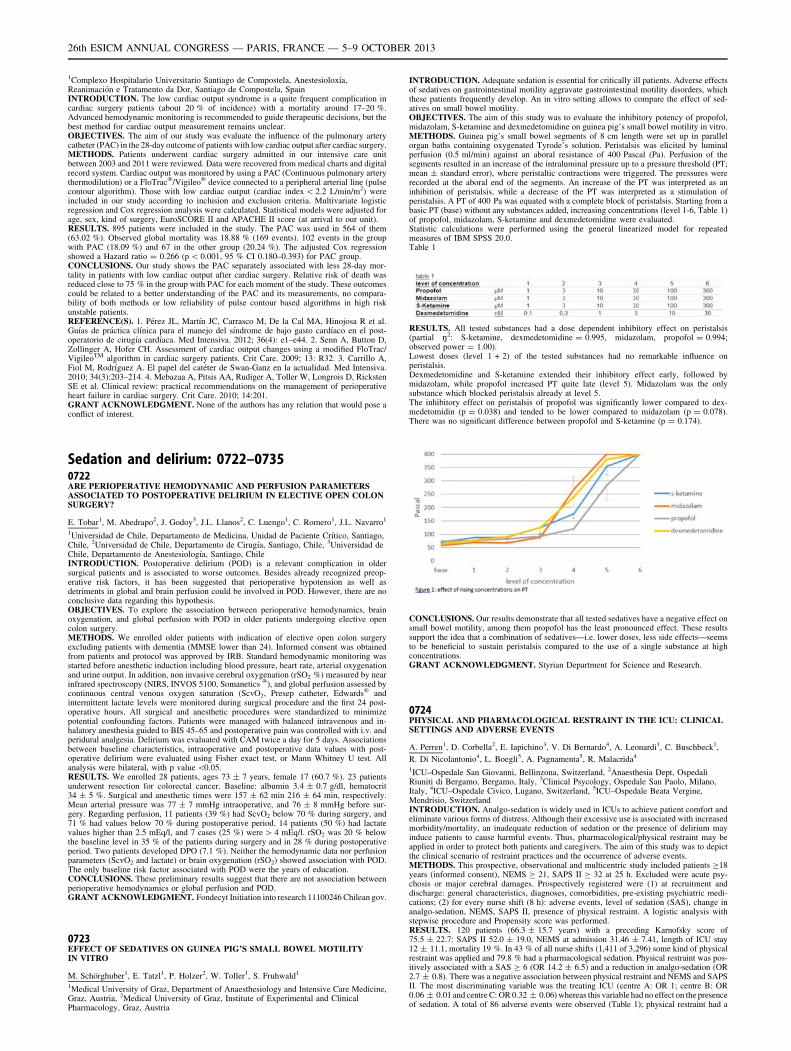
1Complexo Hospitalario Universitario Santiago de Compostela, Anestesioloxı́a,Reanimación e Tratamento da Dor, Santiago de Compostela, SpainINTRODUCTION. The low cardiac output syndrome is a quite frequent complication incardiac surgery patients (about 20 % of incidence) with a mortality around 17–20 %.Advanced hemodynamic monitoring is recommended to guide therapeutic decisions, but thebest method for cardiac output measurement remains unclear.OBJECTIVES. The aim of our study was evaluate the influence of the pulmonary arterycatheter (PAC) in the 28-day outcome of patients with low cardiac output after cardiac surgery.METHODS. Patients underwent cardiac surgery admitted in our intensive care unitbetween 2003 and 2011 were reviewed. Data were recovered from medical charts and digitalrecord system. Cardiac output was monitored by using a PAC (Continuous pulmonary arterythermodilution) or a FloTrac�/Vigileo� device connected to a peripheral arterial line (pulsecontour algorithm). Those with low cardiac output (cardiac index \ 2.2 L/min/m2) wereincluded in our study according to inclusion and exclusion criteria. Multivariate logisticregression and Cox regression analysis were calculated. Statistical models were adjusted forage, sex, kind of surgery, EuroSCORE II and APACHE II score (at arrival to our unit).RESULTS. 895 patients were included in the study. The PAC was used in 564 of them(63.02 %). Observed global mortality was 18.88 % (169 events). 102 events in the groupwith PAC (18.09 %) and 67 in the other group (20.24 %). The adjusted Cox regressionshowed a Hazard ratio = 0.266 (p \ 0.001, 95 % CI 0.180–0.393) for PAC group.CONCLUSIONS. Our study shows the PAC separately associated with less 28-day mor-tality in patients with low cardiac output after cardiac surgery. Relative risk of death wasreduced close to 75 % in the group with PAC for each moment of the study. These outcomescould be related to a better understanding of the PAC and its measurements, no compara-bility of both methods or low reliability of pulse contour based algorithms in high riskunstable patients.REFERENCE(S). 1. Pérez JL, Martı́n JC, Carrasco M, De la Cal MA, Hinojosa R et al.Guı́as de práctica clı́nica para el manejo del sı́ndrome de bajo gasto cardı́aco en el post-operatorio de cirugı́a cardı́aca. Med Intensiva. 2012; 36(4): e1–e44. 2. Senn A, Button D,Zollinger A, Hofer CH. Assessment of cardiac output changes using a modified FloTrac/VigileoTM algorithm in cardiac surgery patients. Crit Care. 2009; 13: R32. 3. Carrillo A,Fiol M, Rodrı́guez A. El papel del catéter de Swan-Ganz en la actualidad. Med Intensiva.2010; 34(3):203–214. 4. Mebazaa A, Pitsis AA, Rudiger A, Toller W, Longrois D, RickstenSE et al. Clinical review: practical recommendations on the management of perioperativeheart failure in cardiac surgery. Crit Care. 2010; 14:201.GRANT ACKNOWLEDGMENT. None of the authors has any relation that would pose aconflict of interest.
Sedation and delirium: 0722–07350722ARE PERIOPERATIVE HEMODYNAMIC AND PERFUSION PARAMETERSASSOCIATED TO POSTOPERATIVE DELIRIUM IN ELECTIVE OPEN COLONSURGERY?
E. Tobar1, M. Abedrapo2, J. Godoy3, J.L. Llanos2, C. Luengo1, C. Romero1, J.L. Navarro1
1Universidad de Chile, Departamento de Medicina, Unidad de Paciente Crı́tico, Santiago,Chile, 2Universidad de Chile, Departamento de Cirugı́a, Santiago, Chile, 3Universidad deChile, Departamento de Anestesiologı́a, Santiago, ChileINTRODUCTION. Postoperative delirium (POD) is a relevant complication in oldersurgical patients and is associated to worse outcomes. Besides already recognized preop-erative risk factors, it has been suggested that perioperative hypotension as well asdetriments in global and brain perfusion could be involved in POD. However, there are noconclusive data regarding this hypothesis.OBJECTIVES. To explore the association between perioperative hemodynamics, brainoxygenation, and global perfusion with POD in older patients undergoing elective opencolon surgery.METHODS. We enrolled older patients with indication of elective open colon surgeryexcluding patients with dementia (MMSE lower than 24). Informed consent was obtainedfrom patients and protocol was approved by IRB. Standard hemodynamic monitoring wasstarted before anesthetic induction including blood pressure, heart rate, arterial oxygenationand urine output. In addition, non invasive cerebral oxygenation (rSO2 %) measured by nearinfrared spectroscopy (NIRS, INVOS 5100, Somanetics �), and global perfusion assessed bycontinuous central venous oxygen saturation (ScvO2, Presep catheter, Edwards� andintermittent lactate levels were monitored during surgical procedure and the first 24 post-operative hours. All surgical and anesthetic procedures were standardized to minimizepotential confounding factors. Patients were managed with balanced intravenous and in-halatory anesthesia guided to BIS 45–65 and postoperative pain was controlled with i.v. andperidural analgesia. Delirium was evaluated with CAM twice a day for 5 days. Associationsbetween baseline characteristics, intraoperative and postoperative data values with post-operative delirium were evaluated using Fisher exact test, or Mann Whitney U test. Allanalysis were bilateral, with p value \0.05.RESULTS. We enrolled 28 patients, ages 73 ± 7 years, female 17 (60.7 %). 23 patientsunderwent resection for colorectal cancer. Baseline: albumin 3.4 ± 0.7 g/dl, hematocrit34 ± 5 %. Surgical and anesthetic times were 157 ± 62 min 216 ± 64 min, respectively.Mean arterial pressure was 77 ± 7 mmHg intraoperative, and 76 ± 8 mmHg before sur-gery. Regarding perfusion, 11 patients (39 %) had ScvO2 below 70 % during surgery, and71 % had values below 70 % during postoperative period. 14 patients (50 %) had lactatevalues higher than 2.5 mEq/l, and 7 cases (25 %) were [ 4 mEq/l. rSO2 was 20 % belowthe baseline level in 35 % of the patients during surgery and in 28 % during postoperativeperiod. Two patients developed DPO (7.1 %). Neither the hemodynamic data nor perfusionparameters (ScvO2 and lactate) or brain oxygenation (rSO2) showed association with POD.The only baseline risk factor associated with POD were the years of education.CONCLUSIONS. These preliminary results suggest that there are not association betweenperioperative hemodynamics or global perfusion and POD.GRANT ACKNOWLEDGMENT. Fondecyt Initiation into research 11100246 Chilean gov.
0723EFFECT OF SEDATIVES ON GUINEA PIG’S SMALL BOWEL MOTILITYIN VITRO
M. Schörghuber1, E. Tatzl1, P. Holzer2, W. Toller1, S. Fruhwald1
1Medical University of Graz, Department of Anaesthesiology and Intensive Care Medicine,Graz, Austria, 2Medical University of Graz, Institute of Experimental and ClinicalPharmacology, Graz, Austria
INTRODUCTION. Adequate sedation is essential for critically ill patients. Adverse effectsof sedatives on gastrointestinal motility aggravate gastrointestinal motility disorders, whichthese patients frequently develop. An in vitro setting allows to compare the effect of sed-atives on small bowel motility.OBJECTIVES. The aim of this study was to evaluate the inhibitory potency of propofol,midazolam, S-ketamine and dexmedetomidine on guinea pig’s small bowel motility in vitro.METHODS. Guinea pig’s small bowel segments of 8 cm length were set up in parallelorgan baths containing oxygenated Tyrode’s solution. Peristalsis was elicited by luminalperfusion (0.5 ml/min) against an aboral resistance of 400 Pascal (Pa). Perfusion of thesegments resulted in an increase of the intraluminal pressure up to a pressure threshold (PT;mean ± standard error), where peristaltic contractions were triggered. The pressures wererecorded at the aboral end of the segments. An increase of the PT was interpreted as aninhibition of peristalsis, while a decrease of the PT was interpreted as a stimulation ofperistalsis. A PT of 400 Pa was equated with a complete block of peristalsis. Starting from abasic PT (base) without any substances added, increasing concentrations (level 1-6, Table 1)of propofol, midazolam, S-ketamine and dexmedetomidine were evaluated.Statistic calculations were performed using the general linearized model for repeatedmeasures of IBM SPSS 20.0.Table 1
RESULTS. All tested substances had a dose dependent inhibitory effect on peristalsis(partial n2: S-ketamine, dexmedetomidine = 0.995, midazolam, propofol = 0.994;observed power = 1.00).Lowest doses (level 1 + 2) of the tested substances had no remarkable influence onperistalsis.Dexmedetomidine and S-ketamine extended their inhibitory effect early, followed bymidazolam, while propofol increased PT quite late (level 5). Midazolam was the onlysubstance which blocked peristalsis already at level 5.The inhibitory effect on peristalsis of propofol was significantly lower compared to dex-medetomidin (p = 0.038) and tended to be lower compared to midazolam (p = 0.078).There was no significant difference between propofol and S-ketamine (p = 0.174).
CONCLUSIONS. Our results demonstrate that all tested sedatives have a negative effect onsmall bowel motility, among them propofol has the least pronounced effect. These resultssupport the idea that a combination of sedatives—i.e. lower doses, less side effects—seemsto be beneficial to sustain peristalsis compared to the use of a single substance at highconcentrations.GRANT ACKNOWLEDGMENT. Styrian Department for Science and Research.
0724PHYSICAL AND PHARMACOLOGICAL RESTRAINT IN THE ICU: CLINICALSETTINGS AND ADVERSE EVENTS
A. Perren1, D. Corbella2, E. Iapichino3, V. Di Bernardo4, A. Leonardi1, C. Buschbeck1,
R. Di Nicolantonio4, L. Boegli5, A. Pagnamenta5, R. Malacrida4
1ICU–Ospedale San Giovanni, Bellinzona, Switzerland, 2Anaesthesia Dept, OspedaliRiuniti di Bergamo, Bergamo, Italy, 3Clinical Psycology, Ospedale San Paolo, Milano,Italy, 4ICU–Ospedale Civico, Lugano, Switzerland, 5ICU–Ospedale Beata Vergine,Mendrisio, SwitzerlandINTRODUCTION. Analgo-sedation is widely used in ICUs to achieve patient comfort andeliminate various forms of distress. Although their excessive use is associated with increasedmorbidity/mortality, an inadequate reduction of sedation or the presence of delirium mayinduce patients to cause harmful events. Thus, pharmacological/physical restraint may beapplied in order to protect both patients and caregivers. The aim of this study was to depictthe clinical scenario of restraint practices and the occurrence of adverse events.METHODS. This prospective, observational and multicentric study included patients C18years (informed consent), NEMS C 21, SAPS II C 32 at 25 h. Excluded were acute psy-chosis or major cerebral damages. Prospectively registered were (1) at recruitment anddischarge: general characteristics, diagnoses, comorbidities, pre-existing psychiatric medi-cations; (2) for every nurse shift (8 h): adverse events, level of sedation (SAS), change inanalgo-sedation, NEMS, SAPS II, presence of physical restraint. A logistic analysis withstepwise procedure and Propensity score was performed.RESULTS. 120 patients (66.3 ± 15.7 years) with a preceding Karnofsky score of75.5 ± 22.7: SAPS II 52.0 ± 19.0, NEMS at admission 31.46 ± 7.41, length of ICU stay12 ± 11.1, mortality 19 %. In 43 % of all nurse shifts (1,411 of 3,296) some kind of physicalrestraint was applied and 79.8 % had a pharmacological sedation. Physical restraint was pos-itively associated with a SAS C 6 (OR 14.2 ± 6.5) and a reduction in analgo-sedation (OR2.7 ± 0.8). There was a negative association between physical restraint and NEMS and SAPSII. The most discriminating variable was the treating ICU (centre A: OR 1; centre B: OR0.06 ± 0.01 and centre C: OR 0.32 ± 0.06) whereas this variable had no effect on the presenceof sedation. A total of 86 adverse events were observed (Table 1); physical restraint had a
26th ESICM ANNUAL CONGRESS — PARIS, FRANCE — 5–9 OCTOBER 2013
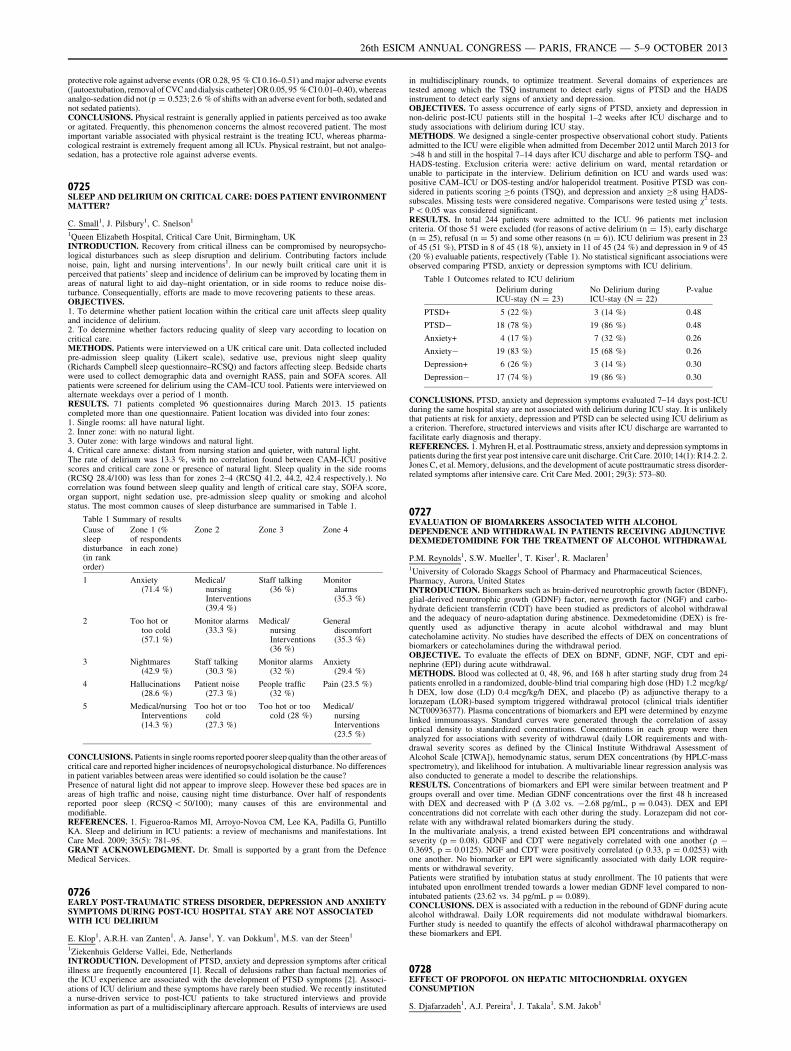
protective role against adverse events (OR 0.28, 95 % CI 0.16–0.51) and major adverse events([autoextubation, removal of CVC and dialysis catheter] OR 0.05, 95 % CI 0.01–0.40), whereasanalgo-sedation did not (p = 0.523; 2.6 % of shifts with an adverse event for both, sedated andnot sedated patients).CONCLUSIONS. Physical restraint is generally applied in patients perceived as too awakeor agitated. Frequently, this phenomenon concerns the almost recovered patient. The mostimportant variable associated with physical restraint is the treating ICU, whereas pharma-cological restraint is extremely frequent among all ICUs. Physical restraint, but not analgo-sedation, has a protective role against adverse events.
0725SLEEP AND DELIRIUM ON CRITICAL CARE: DOES PATIENT ENVIRONMENTMATTER?
C. Small1, J. Pilsbury1, C. Snelson1
1Queen Elizabeth Hospital, Critical Care Unit, Birmingham, UKINTRODUCTION. Recovery from critical illness can be compromised by neuropsycho-logical disturbances such as sleep disruption and delirium. Contributing factors includenoise, pain, light and nursing interventions1. In our newly built critical care unit it isperceived that patients’ sleep and incidence of delirium can be improved by locating them inareas of natural light to aid day–night orientation, or in side rooms to reduce noise dis-turbance. Consequentially, efforts are made to move recovering patients to these areas.OBJECTIVES.1. To determine whether patient location within the critical care unit affects sleep qualityand incidence of delirium.2. To determine whether factors reducing quality of sleep vary according to location oncritical care.METHODS. Patients were interviewed on a UK critical care unit. Data collected includedpre-admission sleep quality (Likert scale), sedative use, previous night sleep quality(Richards Campbell sleep questionnaire–RCSQ) and factors affecting sleep. Bedside chartswere used to collect demographic data and overnight RASS, pain and SOFA scores. Allpatients were screened for delirium using the CAM–ICU tool. Patients were interviewed onalternate weekdays over a period of 1 month.RESULTS. 71 patients completed 96 questionnaires during March 2013. 15 patientscompleted more than one questionnaire. Patient location was divided into four zones:1. Single rooms: all have natural light.2. Inner zone: with no natural light.3. Outer zone: with large windows and natural light.4. Critical care annexe: distant from nursing station and quieter, with natural light.The rate of delirium was 13.3 %, with no correlation found between CAM–ICU positivescores and critical care zone or presence of natural light. Sleep quality in the side rooms(RCSQ 28.4/100) was less than for zones 2–4 (RCSQ 41.2, 44.2, 42.4 respectively.). Nocorrelation was found between sleep quality and length of critical care stay, SOFA score,organ support, night sedation use, pre-admission sleep quality or smoking and alcoholstatus. The most common causes of sleep disturbance are summarised in Table 1.
Table 1 Summary of results
Cause ofsleepdisturbance(in rankorder)
Zone 1 (%of respondentsin each zone)
Zone 2 Zone 3 Zone 4
1 Anxiety(71.4 %)
Medical/nursingInterventions(39.4 %)
Staff talking(36 %)
Monitoralarms(35.3 %)
2 Too hot ortoo cold(57.1 %)
Monitor alarms(33.3 %)
Medical/nursingInterventions(36 %)
Generaldiscomfort(35.3 %)
3 Nightmares(42.9 %)
Staff talking(30.3 %)
Monitor alarms(32 %)
Anxiety(29.4 %)
4 Hallucinations(28.6 %)
Patient noise(27.3 %)
People traffic(32 %)
Pain (23.5 %)
5 Medical/nursingInterventions(14.3 %)
Too hot or toocold(27.3 %)
Too hot or toocold (28 %)
Medical/nursingInterventions(23.5 %)
CONCLUSIONS. Patients in single rooms reported poorer sleep quality than the other areas ofcritical care and reported higher incidences of neuropsychological disturbance. No differencesin patient variables between areas were identified so could isolation be the cause?Presence of natural light did not appear to improve sleep. However these bed spaces are inareas of high traffic and noise, causing night time disturbance. Over half of respondentsreported poor sleep (RCSQ \ 50/100); many causes of this are environmental andmodifiable.REFERENCES. 1. Figueroa-Ramos MI, Arroyo-Novoa CM, Lee KA, Padilla G, PuntilloKA. Sleep and delirium in ICU patients: a review of mechanisms and manifestations. IntCare Med. 2009; 35(5): 781–95.GRANT ACKNOWLEDGMENT. Dr. Small is supported by a grant from the DefenceMedical Services.
0726EARLY POST-TRAUMATIC STRESS DISORDER, DEPRESSION AND ANXIETYSYMPTOMS DURING POST-ICU HOSPITAL STAY ARE NOT ASSOCIATEDWITH ICU DELIRIUM
E. Klop1, A.R.H. van Zanten1, A. Janse1, Y. van Dokkum1, M.S. van der Steen1
1Ziekenhuis Gelderse Vallei, Ede, NetherlandsINTRODUCTION. Development of PTSD, anxiety and depression symptoms after criticalillness are frequently encountered [1]. Recall of delusions rather than factual memories ofthe ICU experience are associated with the development of PTSD symptoms [2]. Associ-ations of ICU delirium and these symptoms have rarely been studied. We recently instituteda nurse-driven service to post-ICU patients to take structured interviews and provideinformation as part of a multidisciplinary aftercare approach. Results of interviews are used
in multidisciplinary rounds, to optimize treatment. Several domains of experiences aretested among which the TSQ instrument to detect early signs of PTSD and the HADSinstrument to detect early signs of anxiety and depression.OBJECTIVES. To assess occurrence of early signs of PTSD, anxiety and depression innon-deliric post-ICU patients still in the hospital 1–2 weeks after ICU discharge and tostudy associations with delirium during ICU stay.METHODS. We designed a single-center prospective observational cohort study. Patientsadmitted to the ICU were eligible when admitted from December 2012 until March 2013 for[48 h and still in the hospital 7–14 days after ICU discharge and able to perform TSQ- andHADS-testing. Exclusion criteria were: active delirium on ward, mental retardation orunable to participate in the interview. Delirium definition on ICU and wards used was:positive CAM–ICU or DOS-testing and/or haloperidol treatment. Positive PTSD was con-sidered in patients scoring C6 points (TSQ), and depression and anxiety C8 using HADS-subscales. Missing tests were considered negative. Comparisons were tested using v2 tests.P \ 0.05 was considered significant.RESULTS. In total 244 patients were admitted to the ICU. 96 patients met inclusioncriteria. Of those 51 were excluded (for reasons of active delirium (n = 15), early discharge(n = 25), refusal (n = 5) and some other reasons (n = 6)). ICU delirium was present in 23of 45 (51 %), PTSD in 8 of 45 (18 %), anxiety in 11 of 45 (24 %) and depression in 9 of 45(20 %) evaluable patients, respectively (Table 1). No statistical significant associations wereobserved comparing PTSD, anxiety or depression symptoms with ICU delirium.
Table 1 Outcomes related to ICU delirium
Delirium duringICU-stay (N = 23)
No Delirium duringICU-stay (N = 22)
P-value
PTSD+ 5 (22 %) 3 (14 %) 0.48
PTSD- 18 (78 %) 19 (86 %) 0.48
Anxiety+ 4 (17 %) 7 (32 %) 0.26
Anxiety- 19 (83 %) 15 (68 %) 0.26
Depression+ 6 (26 %) 3 (14 %) 0.30
Depression- 17 (74 %) 19 (86 %) 0.30
CONCLUSIONS. PTSD, anxiety and depression symptoms evaluated 7–14 days post-ICUduring the same hospital stay are not associated with delirium during ICU stay. It is unlikelythat patients at risk for anxiety, depression and PTSD can be selected using ICU delirium asa criterion. Therefore, structured interviews and visits after ICU discharge are warranted tofacilitate early diagnosis and therapy.REFERENCES. 1. Myhren H, et al. Posttraumatic stress, anxiety and depression symptoms inpatients during the first year post intensive care unit discharge. Crit Care. 2010; 14(1): R14.2. 2.Jones C, et al. Memory, delusions, and the development of acute posttraumatic stress disorder-related symptoms after intensive care. Crit Care Med. 2001; 29(3): 573–80.
0727EVALUATION OF BIOMARKERS ASSOCIATED WITH ALCOHOLDEPENDENCE AND WITHDRAWAL IN PATIENTS RECEIVING ADJUNCTIVEDEXMEDETOMIDINE FOR THE TREATMENT OF ALCOHOL WITHDRAWAL
P.M. Reynolds1, S.W. Mueller1, T. Kiser1, R. Maclaren1
1University of Colorado Skaggs School of Pharmacy and Pharmaceutical Sciences,Pharmacy, Aurora, United StatesINTRODUCTION. Biomarkers such as brain-derived neurotrophic growth factor (BDNF),glial-derived neurotrophic growth (GDNF) factor, nerve growth factor (NGF) and carbo-hydrate deficient transferrin (CDT) have been studied as predictors of alcohol withdrawaland the adequacy of neuro-adaptation during abstinence. Dexmedetomidine (DEX) is fre-quently used as adjunctive therapy in acute alcohol withdrawal and may bluntcatecholamine activity. No studies have described the effects of DEX on concentrations ofbiomarkers or catecholamines during the withdrawal period.OBJECTIVE. To evaluate the effects of DEX on BDNF, GDNF, NGF, CDT and epi-nephrine (EPI) during acute withdrawal.METHODS. Blood was collected at 0, 48, 96, and 168 h after starting study drug from 24patients enrolled in a randomized, double-blind trial comparing high dose (HD) 1.2 mcg/kg/h DEX, low dose (LD) 0.4 mcg/kg/h DEX, and placebo (P) as adjunctive therapy to alorazepam (LOR)-based symptom triggered withdrawal protocol (clinical trials identifierNCT00936377). Plasma concentrations of biomarkers and EPI were determined by enzymelinked immunoassays. Standard curves were generated through the correlation of assayoptical density to standardized concentrations. Concentrations in each group were thenanalyzed for associations with severity of withdrawal (daily LOR requirements and with-drawal severity scores as defined by the Clinical Institute Withdrawal Assessment ofAlcohol Scale [CIWA]), hemodynamic status, serum DEX concentrations (by HPLC-massspectrometry), and likelihood for intubation. A multivariable linear regression analysis wasalso conducted to generate a model to describe the relationships.RESULTS. Concentrations of biomarkers and EPI were similar between treatment and Pgroups overall and over time. Median GDNF concentrations over the first 48 h increasedwith DEX and decreased with P (D 3.02 vs. -2.68 pg/mL, p = 0.043). DEX and EPIconcentrations did not correlate with each other during the study. Lorazepam did not cor-relate with any withdrawal related biomarkers during the study.In the multivariate analysis, a trend existed between EPI concentrations and withdrawalseverity (p = 0.08). GDNF and CDT were negatively correlated with one another (q -0.3695, p = 0.0125). NGF and CDT were positively correlated (q 0.33, p = 0.0253) withone another. No biomarker or EPI were significantly associated with daily LOR require-ments or withdrawal severity.Patients were stratified by intubation status at study enrollment. The 10 patients that wereintubated upon enrollment trended towards a lower median GDNF level compared to non-intubated patients (23.62 vs. 34 pg/mL p = 0.089).CONCLUSIONS. DEX is associated with a reduction in the rebound of GDNF during acutealcohol withdrawal. Daily LOR requirements did not modulate withdrawal biomarkers.Further study is needed to quantify the effects of alcohol withdrawal pharmacotherapy onthese biomarkers and EPI.
0728EFFECT OF PROPOFOL ON HEPATIC MITOCHONDRIAL OXYGENCONSUMPTION
S. Djafarzadeh1, A.J. Pereira1, J. Takala1, S.M. Jakob1
26th ESICM ANNUAL CONGRESS — PARIS, FRANCE — 5–9 OCTOBER 2013
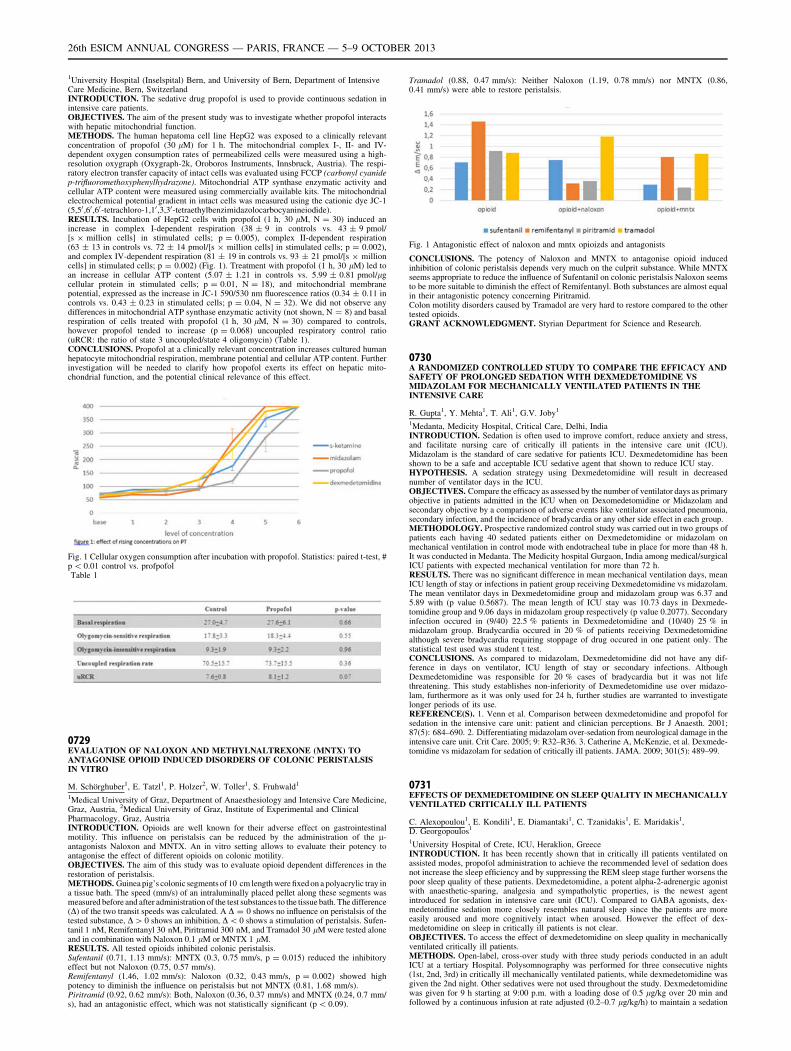
1University Hospital (Inselspital) Bern, and University of Bern, Department of IntensiveCare Medicine, Bern, SwitzerlandINTRODUCTION. The sedative drug propofol is used to provide continuous sedation inintensive care patients.OBJECTIVES. The aim of the present study was to investigate whether propofol interactswith hepatic mitochondrial function.METHODS. The human hepatoma cell line HepG2 was exposed to a clinically relevantconcentration of propofol (30 lM) for 1 h. The mitochondrial complex I-, II- and IV-dependent oxygen consumption rates of permeabilized cells were measured using a high-resolution oxygraph (Oxygraph-2k, Oroboros Instruments, Innsbruck, Austria). The respi-ratory electron transfer capacity of intact cells was evaluated using FCCP (carbonyl cyanidep-trifluoromethoxyphenylhydrazone). Mitochondrial ATP synthase enzymatic activity andcellular ATP content were measured using commercially available kits. The mitochondrialelectrochemical potential gradient in intact cells was measured using the cationic dye JC-1(5,50 ,60 ,60-tetrachloro-1,10 ,3,30-tetraethylbenzimidazolocarbocyanineiodide).RESULTS. Incubation of HepG2 cells with propofol (1 h, 30 lM, N = 30) induced anincrease in complex I-dependent respiration (38 ± 9 in controls vs. 43 ± 9 pmol/[s 9 million cells] in stimulated cells; p = 0.005), complex II-dependent respiration(63 ± 13 in controls vs. 72 ± 14 pmol/[s 9 million cells] in stimulated cells; p = 0.002),and complex IV-dependent respiration (81 ± 19 in controls vs. 93 ± 21 pmol/[s 9 millioncells] in stimulated cells; p = 0.002) (Fig. 1). Treatment with propofol (1 h, 30 lM) led toan increase in cellular ATP content (5.07 ± 1.21 in controls vs. 5.99 ± 0.81 pmol/lgcellular protein in stimulated cells; p = 0.01, N = 18), and mitochondrial membranepotential, expressed as the increase in JC-1 590/530 nm fluorescence ratios (0.34 ± 0.11 incontrols vs. 0.43 ± 0.23 in stimulated cells; p = 0.04, N = 32). We did not observe anydifferences in mitochondrial ATP synthase enzymatic activity (not shown, N = 8) and basalrespiration of cells treated with propofol (1 h, 30 lM, N = 30) compared to controls,however propofol tended to increase (p = 0.068) uncoupled respiratory control ratio(uRCR: the ratio of state 3 uncoupled/state 4 oligomycin) (Table 1).CONCLUSIONS. Propofol at a clinically relevant concentration increases cultured humanhepatocyte mitochondrial respiration, membrane potential and cellular ATP content. Furtherinvestigation will be needed to clarify how propofol exerts its effect on hepatic mito-chondrial function, and the potential clinical relevance of this effect.
Fig. 1 Cellular oxygen consumption after incubation with propofol. Statistics: paired t-test, #p \ 0.01 control vs. profpofolTable 1
0729EVALUATION OF NALOXON AND METHYLNALTREXONE (MNTX) TOANTAGONISE OPIOID INDUCED DISORDERS OF COLONIC PERISTALSISIN VITRO
M. Schörghuber1, E. Tatzl1, P. Holzer2, W. Toller1, S. Fruhwald1
1Medical University of Graz, Department of Anaesthesiology and Intensive Care Medicine,Graz, Austria, 2Medical University of Graz, Institute of Experimental and ClinicalPharmacology, Graz, AustriaINTRODUCTION. Opioids are well known for their adverse effect on gastrointestinalmotility. This influence on peristalsis can be reduced by the administration of the l-antagonists Naloxon and MNTX. An in vitro setting allows to evaluate their potency toantagonise the effect of different opioids on colonic motility.OBJECTIVES. The aim of this study was to evaluate opioid dependent differences in therestoration of peristalsis.METHODS. Guinea pig’s colonic segments of 10 cm length were fixed on a polyacrylic tray ina tissue bath. The speed (mm/s) of an intraluminally placed pellet along these segments wasmeasured before and after administration of the test substances to the tissue bath. The difference(D) of the two transit speeds was calculated. A D = 0 shows no influence on peristalsis of thetested substance, D[ 0 shows an inhibition, D\ 0 shows a stimulation of peristalsis. Sufen-tanil 1 nM, Remifentanyl 30 nM, Piritramid 300 nM, and Tramadol 30 lM were tested aloneand in combination with Naloxon 0.1 lM or MNTX 1 lM.RESULTS. All tested opioids inhibited colonic peristalsis.Sufentanil (0.71, 1.13 mm/s): MNTX (0.3, 0.75 mm/s, p = 0.015) reduced the inhibitoryeffect but not Naloxon (0.75, 0.57 mm/s).Remifentanyl (1.46, 1.02 mm/s): Naloxon (0.32, 0.43 mm/s, p = 0.002) showed highpotency to diminish the influence on peristalsis but not MNTX (0.81, 1.68 mm/s).Piritramid (0.92, 0.62 mm/s): Both, Naloxon (0.36, 0.37 mm/s) and MNTX (0.24, 0.7 mm/s), had an antagonistic effect, which was not statistically significant (p \ 0.09).
Tramadol (0.88, 0.47 mm/s): Neither Naloxon (1.19, 0.78 mm/s) nor MNTX (0.86,0.41 mm/s) were able to restore peristalsis.
Fig. 1 Antagonistic effect of naloxon and mntx opioizds and antagonists
CONCLUSIONS. The potency of Naloxon and MNTX to antagonise opioid inducedinhibition of colonic peristalsis depends very much on the culprit substance. While MNTXseems appropriate to reduce the influence of Sufentanil on colonic peristalsis Naloxon seemsto be more suitable to diminish the effect of Remifentanyl. Both substances are almost equalin their antagonistic potency concerning Piritramid.Colon motility disorders caused by Tramadol are very hard to restore compared to the othertested opioids.GRANT ACKNOWLEDGMENT. Styrian Department for Science and Research.
0730A RANDOMIZED CONTROLLED STUDY TO COMPARE THE EFFICACY ANDSAFETY OF PROLONGED SEDATION WITH DEXMEDETOMIDINE VSMIDAZOLAM FOR MECHANICALLY VENTILATED PATIENTS IN THEINTENSIVE CARE
R. Gupta1, Y. Mehta1, T. Ali1, G.V. Joby1
1Medanta, Medicity Hospital, Critical Care, Delhi, IndiaINTRODUCTION. Sedation is often used to improve comfort, reduce anxiety and stress,and facilitate nursing care of critically ill patients in the intensive care unit (ICU).Midazolam is the standard of care sedative for patients ICU. Dexmedetomidine has beenshown to be a safe and acceptable ICU sedative agent that shown to reduce ICU stay.HYPOTHESIS. A sedation strategy using Dexmedetomidine will result in decreasednumber of ventilator days in the ICU.OBJECTIVES. Compare the efficacy as assessed by the number of ventilator days as primaryobjective in patients admitted in the ICU when on Dexomedetomidine or Midazolam andsecondary objective by a comparison of adverse events like ventilator associated pneumonia,secondary infection, and the incidence of bradycardia or any other side effect in each group.METHODOLOGY. Prospective randomized control study was carried out in two groups ofpatients each having 40 sedated patients either on Dexmedetomidine or midazolam onmechanical ventilation in control mode with endotracheal tube in place for more than 48 h.It was conducted in Medanta. The Medicity hospital Gurgaon, India among medical/surgicalICU patients with expected mechanical ventilation for more than 72 h.RESULTS. There was no significant difference in mean mechanical ventilation days, meanICU length of stay or infections in patient group receiving Dexmedetomidine vs midazolam.The mean ventilator days in Dexmedetomidine group and midazolam group was 6.37 and5.89 with (p value 0.5687). The mean length of ICU stay was 10.73 days in Dexmede-tomidine group and 9.06 days in midazolam group respectively (p value 0.2077). Secondaryinfection occured in (9/40) 22.5 % patients in Dexmedetomidine and (10/40) 25 % inmidazolam group. Bradycardia occured in 20 % of patients receiving Dexmedetomidinealthough severe bradycardia requiring stoppage of drug occured in one patient only. Thestatistical test used was student t test.CONCLUSIONS. As compared to midazolam, Dexmedetomidine did not have any dif-ference in days on ventilator, ICU length of stay or secondary infections. AlthoughDexmedetomidine was responsible for 20 % cases of bradycardia but it was not lifethreatening. This study establishes non-inferiority of Dexmedetomidine use over midazo-lam, furthermore as it was only used for 24 h, further studies are warranted to investigatelonger periods of its use.REFERENCE(S). 1. Venn et al. Comparison between dexmedetomidine and propofol forsedation in the intensive care unit: patient and clinician perceptions. Br J Anaesth. 2001;87(5): 684–690. 2. Differentiating midazolam over-sedation from neurological damage in theintensive care unit. Crit Care. 2005; 9: R32–R36. 3. Catherine A, McKenzie, et al. Dexmede-tomidine vs midazolam for sedation of critically ill patients. JAMA. 2009; 301(5): 489–99.
0731EFFECTS OF DEXMEDETOMIDINE ON SLEEP QUALITY IN MECHANICALLYVENTILATED CRITICALLY ILL PATIENTS
C. Alexopoulou1, E. Kondili1, E. Diamantaki1, C. Tzanidakis1, E. Maridakis1,D. Georgopoulos1
1University Hospital of Crete, ICU, Heraklion, GreeceINTRODUCTION. It has been recently shown that in critically ill patients ventilated onassisted modes, propofol administration to achieve the recommended level of sedation doesnot increase the sleep efficiency and by suppressing the REM sleep stage further worsens thepoor sleep quality of these patients. Dexmedetomidine, a potent alpha-2-adrenergic agonistwith anaesthetic-sparing, analgesia and sympatholytic properties, is the newest agentintroduced for sedation in intensive care unit (ICU). Compared to GABA agonists, dex-medetomidine sedation more closely resembles natural sleep since the patients are moreeasily aroused and more cognitively intact when aroused. However the effect of dex-medetomidine on sleep in critically ill patients is not clear.OBJECTIVES. To access the effect of dexmedetomidine on sleep quality in mechanicallyventilated critically ill patients.METHODS. Open-label, cross-over study with three study periods conducted in an adultICU at a tertiary Hospital. Polysomnography was performed for three consecutive nights(1st, 2nd, 3rd) in critically ill mechanically ventilated patients, while dexmedetomidine wasgiven the 2nd night. Other sedatives were not used throughout the study. Dexmedetomidinewas given for 9 h starting at 9:00 p.m. with a loading dose of 0.5 lg/kg over 20 min andfollowed by a continuous infusion at rate adjusted (0.2–0.7 lg/kg/h) to maintain a sedation
26th ESICM ANNUAL CONGRESS — PARIS, FRANCE — 5–9 OCTOBER 2013
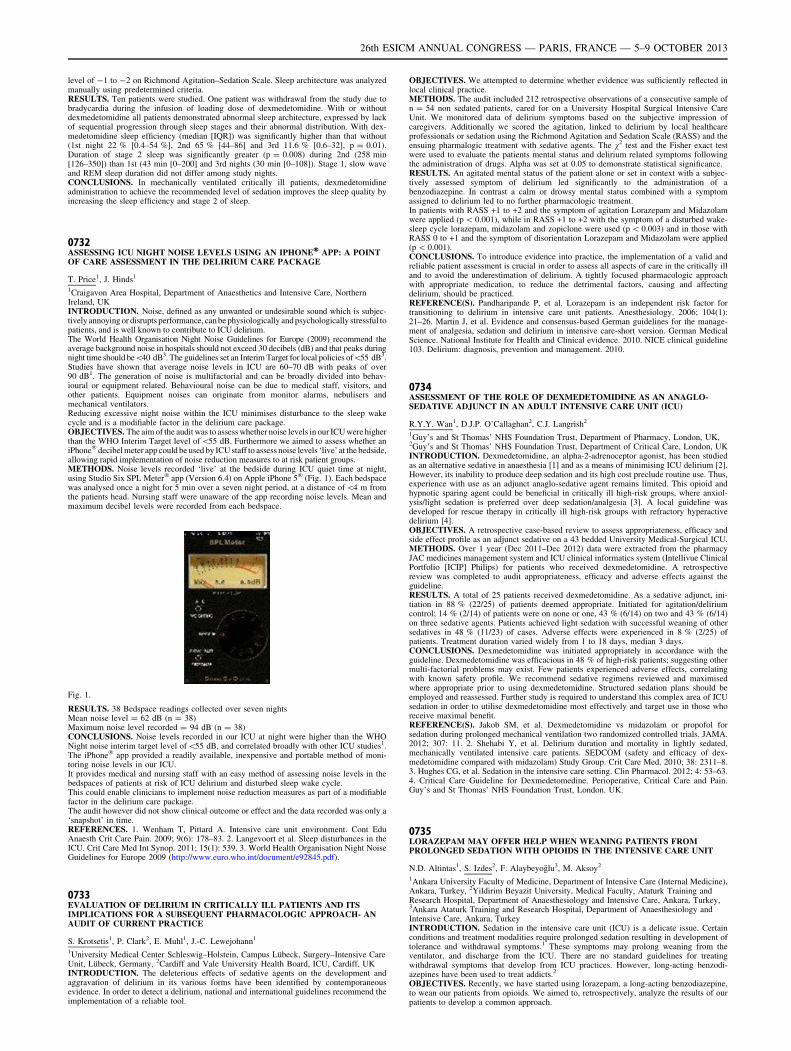
level of -1 to -2 on Richmond Agitation–Sedation Scale. Sleep architecture was analyzedmanually using predetermined criteria.RESULTS. Ten patients were studied. One patient was withdrawal from the study due tobradycardia during the infusion of loading dose of dexmedetomidine. With or withoutdexmedetomidine all patients demonstrated abnormal sleep architecture, expressed by lackof sequential progression through sleep stages and their abnormal distribution. With dex-medetomidine sleep efficiency (median [IQR]) was significantly higher than that without(1st night 22 % [0.4–54 %], 2nd 65 % [44–86] and 3rd 11.6 % [0.6–32], p = 0.01).Duration of stage 2 sleep was significantly greater (p = 0.008) during 2nd (258 min[126–350]) than 1st (43 min [0–200] and 3rd nights (30 min [0–108]). Stage 1, slow waveand REM sleep duration did not differ among study nights.CONCLUSIONS. In mechanically ventilated critically ill patients, dexmedetomidineadministration to achieve the recommended level of sedation improves the sleep quality byincreasing the sleep efficiency and stage 2 of sleep.
0732ASSESSING ICU NIGHT NOISE LEVELS USING AN IPHONE� APP: A POINTOF CARE ASSESSMENT IN THE DELIRIUM CARE PACKAGE
T. Price1, J. Hinds1
1Craigavon Area Hospital, Department of Anaesthetics and Intensive Care, NorthernIreland, UKINTRODUCTION. Noise, defined as any unwanted or undesirable sound which is subjec-tively annoying or disrupts performance, can be physiologically and psychologically stressful topatients, and is well known to contribute to ICU delirium.The World Health Organisation Night Noise Guidelines for Europe (2009) recommend theaverage background noise in hospitals should not exceed 30 decibels (dB) and that peaks duringnight time should be\40 dB3. The guidelines set an Interim Target for local policies of\55 dB3.Studies have shown that average noise levels in ICU are 60–70 dB with peaks of over90 dB1. The generation of noise is multifactorial and can be broadly divided into behav-ioural or equipment related. Behavioural noise can be due to medical staff, visitors, andother patients. Equipment noises can originate from monitor alarms, nebulisers andmechanical ventilators.Reducing excessive night noise within the ICU minimises disturbance to the sleep wakecycle and is a modifiable factor in the delirium care package.OBJECTIVES. The aim of the audit was to assess whether noise levels in our ICU were higherthan the WHO Interim Target level of\55 dB. Furthermore we aimed to assess whether aniPhone� decibel meter app could be used by ICU staff to assess noise levels ‘live’ at the bedside,allowing rapid implementation of noise reduction measures to at risk patient groups.METHODS. Noise levels recorded ‘live’ at the bedside during ICU quiet time at night,using Studio Six SPL Meter� app (Version 6.4) on Apple iPhone 5� (Fig. 1). Each bedspacewas analysed once a night for 5 min over a seven night period, at a distance of\4 m fromthe patients head. Nursing staff were unaware of the app recording noise levels. Mean andmaximum decibel levels were recorded from each bedspace.
Fig. 1.
RESULTS. 38 Bedspace readings collected over seven nightsMean noise level = 62 dB (n = 38)Maximum noise level recorded = 94 dB (n = 38)CONCLUSIONS. Noise levels recorded in our ICU at night were higher than the WHONight noise interim target level of\55 dB, and correlated broadly with other ICU studies1.The iPhone� app provided a readily available, inexpensive and portable method of moni-toring noise levels in our ICU.It provides medical and nursing staff with an easy method of assessing noise levels in thebedspaces of patients at risk of ICU delirium and disturbed sleep wake cycle.This could enable clinicians to implement noise reduction measures as part of a modifiablefactor in the delirium care package.The audit however did not show clinical outcome or effect and the data recorded was only a‘snapshot’ in time.REFERENCES. 1. Wenham T, Pittard A. Intensive care unit environment. Cont EduAnaesth Crit Care Pain. 2009; 9(6): 178–83. 2. Langevoort et al. Sleep disturbances in theICU. Crit Care Med Int Synop. 2011; 15(1): 539. 3. World Health Organisation Night NoiseGuidelines for Europe 2009 (http://www.euro.who.int/document/e92845.pdf).
0733EVALUATION OF DELIRIUM IN CRITICALLY ILL PATIENTS AND ITSIMPLICATIONS FOR A SUBSEQUENT PHARMACOLOGIC APPROACH- ANAUDIT OF CURRENT PRACTICE
S. Krotsetis1, P. Clark2, E. Muhl1, J.-C. Lewejohann1
1University Medical Center Schleswig–Holstein, Campus Lübeck, Surgery–Intensive CareUnit, Lübeck, Germany, 2Cardiff and Vale University Health Board, ICU, Cardiff, UKINTRODUCTION. The deleterious effects of sedative agents on the development andaggravation of delirium in its various forms have been identified by contemporaneousevidence. In order to detect a delirium, national and international guidelines recommend theimplementation of a reliable tool.
OBJECTIVES. We attempted to determine whether evidence was sufficiently reflected inlocal clinical practice.METHODS. The audit included 212 retrospective observations of a consecutive sample ofn = 54 non sedated patients, cared for on a University Hospital Surgical Intensive CareUnit. We monitored data of delirium symptoms based on the subjective impression ofcaregivers. Additionally we scored the agitation, linked to delirium by local healthcareprofessionals or sedation using the Richmond Agitation and Sedation Scale (RASS) and theensuing pharmalogic treatment with sedative agents. The v2 test and the Fisher exact testwere used to evaluate the patients mental status and delirium related symptoms followingthe administration of drugs. Alpha was set at 0.05 to demonstrate statistical significance.RESULTS. An agitated mental status of the patient alone or set in context with a subjec-tively assessed symptom of delirium led significantly to the administration of abenzodiazepine. In contrast a calm or drowsy mental status combined with a symptomassigned to delirium led to no further pharmacologic treatment.In patients with RASS +1 to +2 and the symptom of agitation Lorazepam and Midazolamwere applied (p \ 0.001), while in RASS +1 to +2 with the symptom of a disturbed wake-sleep cycle lorazepam, midazolam and zopiclone were used (p \ 0.003) and in those withRASS 0 to +1 and the symptom of disorientation Lorazepam and Midazolam were applied(p \ 0.001).CONCLUSIONS. To introduce evidence into practice, the implementation of a valid andreliable patient assessment is crucial in order to assess all aspects of care in the critically illand to avoid the underestimation of delirium. A tightly focused pharmacologic approachwith appropriate medication, to reduce the detrimental factors, causing and affectingdelirium, should be practiced.REFERENCE(S). Pandharipande P, et al. Lorazepam is an independent risk factor fortransitioning to delirium in intensive care unit patients. Anesthesiology. 2006; 104(1):21–26. Martin J, et al. Evidence and consensus-based German guidelines for the manage-ment of analgesia, sedation and delirium in intensive care-short version. German MedicalScience. National Institute for Health and Clinical evidence. 2010. NICE clinical guideline103. Delirium: diagnosis, prevention and management. 2010.
0734ASSESSMENT OF THE ROLE OF DEXMEDETOMIDINE AS AN ANAGLO-SEDATIVE ADJUNCT IN AN ADULT INTENSIVE CARE UNIT (ICU)
R.Y.Y. Wan1, D.J.P. O’Callaghan2, C.J. Langrish2
1Guy’s and St Thomas’ NHS Foundation Trust, Department of Pharmacy, London, UK,2Guy’s and St Thomas’ NHS Foundation Trust, Department of Critical Care, London, UKINTRODUCTION. Dexmedetomidine, an alpha-2-adrenoceptor agonist, has been studiedas an alternative sedative in anaesthesia [1] and as a means of minimising ICU delirium [2].However, its inability to produce deep sedation and its high cost preclude routine use. Thus,experience with use as an adjunct anaglo-sedative agent remains limited. This opioid andhypnotic sparing agent could be beneficial in critically ill high-risk groups, where anxiol-ysis/light sedation is preferred over deep sedation/analgesia [3]. A local guideline wasdeveloped for rescue therapy in critically ill high-risk groups with refractory hyperactivedelirium [4].OBJECTIVES. A retrospective case-based review to assess appropriateness, efficacy andside effect profile as an adjunct sedative on a 43 bedded University Medical-Surgical ICU.METHODS. Over 1 year (Dec 2011–Dec 2012) data were extracted from the pharmacyJAC medicines management system and ICU clinical informatics system (Intellivue ClinicalPortfolio [ICIP] Philips) for patients who received dexmedetomidine. A retrospectivereview was completed to audit appropriateness, efficacy and adverse effects against theguideline.RESULTS. A total of 25 patients received dexmedetomidine. As a sedative adjunct, ini-tiation in 88 % (22/25) of patients deemed appropriate. Initiated for agitation/deliriumcontrol; 14 % (2/14) of patients were on none or one, 43 % (6/14) on two and 43 % (6/14)on three sedative agents. Patients achieved light sedation with successful weaning of othersedatives in 48 % (11/23) of cases. Adverse effects were experienced in 8 % (2/25) ofpatients. Treatment duration varied widely from 1 to 18 days, median 3 days.CONCLUSIONS. Dexmedetomidine was initiated appropriately in accordance with theguideline. Dexmedetomidine was efficacious in 48 % of high-risk patients; suggesting othermulti-factorial problems may exist. Few patients experienced adverse effects, correlatingwith known safety profile. We recommend sedative regimens reviewed and maximisedwhere appropriate prior to using dexmedetomidine. Structured sedation plans should beemployed and reassessed. Further study is required to understand this complex area of ICUsedation in order to utilise dexmedetomidine most effectively and target use in those whoreceive maximal benefit.REFERENCE(S). Jakob SM, et al. Dexmedetomidine vs midazolam or propofol forsedation during prolonged mechanical ventilation two randomized controlled trials. JAMA.2012; 307: 11. 2. Shehabi Y, et al. Delirium duration and mortality in lightly sedated,mechanically ventilated intensive care patients. SEDCOM (safety and efficacy of dex-medetomidine compared with midazolam) Study Group. Crit Care Med. 2010; 38: 2311–8.3. Hughes CG, et al. Sedation in the intensive care setting. Clin Pharmacol. 2012; 4: 53–63.4. Critical Care Guideline for Dexmedetomedine. Perioperative, Critical Care and Pain.Guy’s and St Thomas’ NHS Foundation Trust, London. UK.
0735LORAZEPAM MAY OFFER HELP WHEN WEANING PATIENTS FROMPROLONGED SEDATION WITH OPIOIDS IN THE INTENSIVE CARE UNIT
N.D. Altintas1, S. Izdes2, F. Alaybeyoğlu3, M. Aksoy2
1Ankara University Faculty of Medicine, Department of Intensive Care (Internal Medicine),Ankara, Turkey, 2Yildirim Beyazit University, Medical Faculty, Ataturk Training andResearch Hospital, Department of Anaesthesiology and Intensive Care, Ankara, Turkey,3Ankara Ataturk Training and Research Hospital, Department of Anaesthesiology andIntensive Care, Ankara, TurkeyINTRODUCTION. Sedation in the intensive care unit (ICU) is a delicate issue. Certainconditions and treatment modalities require prolonged sedation resulting in development oftolerance and withdrawal symptoms.1 These symptoms may prolong weaning from theventilator, and discharge from the ICU. There are no standard guidelines for treatingwithdrawal symptoms that develop from ICU practices. However, long-acting benzodi-azepines have been used to treat addicts.2
OBJECTIVES. Recently, we have started using lorazepam, a long-acting benzodiazepine,to wean our patients from opioids. We aimed to, retrospectively, analyze the results of ourpatients to develop a common approach.
26th ESICM ANNUAL CONGRESS — PARIS, FRANCE — 5–9 OCTOBER 2013
METHODS. Patients whom lorazepam was administered to wean opioids were retro-spectively tracked starting from 2010 until end of 2012. Their demographic features,admission diagnosis, infused drugs, dose and time of lorazepam, hemodynamic variableswere noted.RESULTS. A total of 37 patients with a mean age of 56.6 were included in the analysis. Ofthese 30 (81 %) were men. Main admission diagnoses were multi-trauma in ten patients,respiratory problems (pneumonia/ards) in 16 patients, neurologic in 5 patients and post-cardiac arrest in 4 patients. Lorazepam was started at a dose of 3 9 1 mg per nasogastrictube, when hemodynamic instability and/or severe agitation occurred when weaning fromopioids were tried. After a median treatment duration of 10 days, patients were free ofopioids and benzodiazepines. After last dose of lorazepam the hemodynamic variables hadsignificantly improved (p \ 0.01). Longer duration of sedation with lorazepam was gen-erally a result of additional co-morbidities that required prolonged sedation. No adverseeffect associated with lorazepam administration was observed.CONCLUSIONS. Long-acting benzodiazepines may offer help during weaning of opioidsin patients who have been sedated more than 72 h. We suggest opioid weaning be startedafter lorazepam administration with careful observation of withdrawal symptoms. Loraze-pam may be stopped after opioids have been withdrawn. Provision of analgesia, withalternative agents should not be overlooked in these patients if required.REFERENCES. 1. Delvaux B, Ryckwaert Y, Van Boven M, De Kock M, Capdevila X.Remifentanil in the intensive care unit: tolerance and acute withdrawal syndrome afterprolonged sedation. Anesthesiology. 2005; 102: 1281–2. 2. Ockert DM, Volpicelli JR, BaierAR Jr, Coons EE, Fingesten A. A nonopioid procedure for outpatient opioid detoxification.J Addict Med. 2011; 5(2): 110–4.
Nutrition performance: 0736–07490736COST-EFFECTIVENESS ANALYSIS (CEA) OF EARLY ENTERAL NUTRITION(EEN) IN CRITICALLY ILL MECHANICALLY VENTILATED PATIENTS
H. Chevrou-Séverac1,2, G.S. Doig2
1Nestlé Health Science, Health Economics, Vevey, Switzerland, 2University of Sydney,Northern Clinical School Intensive Care Research Unit, Sydney, AustraliaINTRODUCTION. eEN, defined as enteral nutrition provided within 24 h of admission toan intensive care unit (ICU), has been shown in a meta-analysis (MA) to decrease the risk ofmortality (1). However results regarding length of stays or mechanical ventilation days werenot reported.OBJECTIVES. The purposes of this study are to expand the meta-analysis of Doig et al. toinvestigate the effect of eEN on measures of healthcare resource consumption and toconduct a cost-effectiveness analysis of eEN.METHODS. The following measures of resource consumption were abstracted from therandomised clinical trials included in the published MA: hospital length of stay (LOS),ICU LOS and mechanical ventilation (MV) days. MA of these outcomes was conductedusing a fixed effects model of the weighted mean difference metric in Revman 4.2. Fromthe perspective of the acute care hospital system, a CEA was undertaken to compare costsassociated with the use of eEN versus standard care (SC). A stochastic model wasdeveloped to generate a 1,000 patient database to reflect patient-types included in thepublished MA and a Monte Carlo simulation was conducted to create 1,000,000 uniquecopies of the database to provide accurate estimates of confidence intervals around costs.Daily costs of ICU care were extracted from the published literature (2). All costs arereported in 2012 US dollars. Sensitivity analyses to assess uncertainty around parameterswere undertaken.RESULTS. Based on updated MA, eEN did not have any effect on hospital LOS (wMD0.6 days, 95 % CI -1.8 to 3.1, I2 = 0 %), however there was a strong trend (p = 0.06)towards a reduction in ICU LOS (wMD -2.3 days, 95 % CI -4.8 to 0.1, I2 = 0 %)and MV days (wMD -2.5 days, 95 % CI -5.1 to 0.0, I2 = 0 %).To maintain consis-tency with the MA, the stochastic patient database was composed of 389 major surgerypatients, 538 trauma patients and 73 medical patients. The stochastic model used togenerate 1,000 patient database was based on ICU LOS estimates from the MA and amatrix of daily cost estimates from Dasta et al. that adequately captured the reductionin MV days. The large-scale Monte Carlo simulation required 1 h 42 min to create1,000,000 unique copies of the 1,000 patient database. Overall, the use of eEN resultedin a net savings of $14,813 per patient (95 % CI $5,811–$23,987). These savings donot change significantly if the patient population mix of mechanically ventilatedpatients is varied.CONCLUSIONS. eEN, provided to mechanically ventilated critically ill patients is adominant nutritional approach compared to SC: it saves lives as demonstrated by a pub-lished MA, and may significantly reduce costs of care as demonstrated in this cost-effectiveness analysis.REFERENCE(S). 1. Doig et al. Int Care Med. 2009; 35(12): 2018–27. 2. Dasta et al. CritCare Med. 2005; 33:1266–1271.GRANT ACKNOWLEDGMENT. No funding was received to conduct this CEA.
0737INCREASED CALORIE AND PROTEIN INTAKE BY ENTERAL NUTRITION ISASSOCIATED WITH IMPROVED OUTCOME IN SEPTIC PATIENTS:SECONDARY ANALYSIS OF A LARGE INTERNATIONAL NUTRITIONDATABASE
G. Elke1, M. Wang2, N. Weiler1, A.G. Day2, D.K. Heyland2
1University Medical Center Schleswig–Holstein, Campus Kiel, Department ofAnaesthesiology and Intensive Care Medicine, Kiel, Germany, 2Kingston General Hospital,Clinical Evaluation Research Unit, Kingston, CanadaINTRODUCTION. Recent international sepsis guidelines recommend low dose enteralnutrition for the first week [1]. This guideline contradicts nutrition guidelines for heterog-enous groups of ICU patients [2]. Data on the optimal dose of enteral nutrition (EN) inseptic patients are lacking.OBJECTIVES. The objective was to evaluate the effect of energy and protein amount onclinical outcomes in a large cohort of critically ill septic patients.METHODS. Secondary analysis of pooled data from the International Nutrition Survey(INS) and baseline data from the Enhanced Protein–Energy Provision via the Enteral Routein Critically Ill Patients (PEPuP) study [3, 4]. Ethics approval was obtained from Queen’sUniversity, Kingston, ON, Canada. Eligible patients had a diagnosis of sepsis and/or
pneumonia and were admitted to the ICU for C3 days, mechanically ventilated within 48 hof ICU admission. Moreover only those patients receiving EN only were included to accountfor possible confounding effects of different routes on the amount of nutrition. Baselinedemographics and data including relevant nutrition information were collected from ICUadmission up to a maximum of 12 days and clinical outcomes were collected at 60 days.Logistic regression models—both unadjusted and adjusted for days with nutrition, BMI, ageand APACHE score, respectively—were used to estimate 60-day mortality and ventilator-free days (VFDs) as predicted by the daily average of total energy and protein receivedduring the first 12 ICU days.RESULTS. Of the 13,630 patients included in the dataset, 2,270 (12.9 %) met the studyinclusion criteria where of 1,029 patients (45.3 %) had a diagnosis of sepsis and 1,241(54.7 %) pneumonia. Patients received a 1,057 ± 481 kcal/day (14.5 ± 7.2 kcal/kg/day,mean ± SD) and 49 ± 24 g protein/day (0.7 ± 0.3 g/kg/day) by EN alone. 60-day mor-tality was 30.5 % and patients were mechanically ventilated for median 8.4 (interquartilerange 4.6–19.2) days with a length of ICU stay of 11.5 (6.9–21.4) days. An increase of 1,000calories was associated with reduced 60-day mortality (odds ratio 0.61; 95 % confidenceintervals (CI) 0.48–0.77, p \ 0.001) and more VFDs (2.81 days, 95 % CI 0.53–5.08,p = 0.02). An increase of 30 g protein per day was also associated with lower mortality(odds ratio 0.76, 95 % CI 0.65–0.87, p \ 0.001) and increase in VFDs (1.92 days, 95 % CI0.58–3.27, p = 0.005).CONCLUSIONS. In critically ill septic patients, a daily increase in calorie as well asprotein intake by EN was associated with improved clinical outcomes.REFERENCES. 1. Dellinger RP et al. Crit Care Med. 2013; 41: 580–637.2. http://www.criticalcarenutrition.com/index.php?option=com_content&view=category&layout=blog&id=21&Itemid=10.3. Alberda C, et al. Int Care Med. 2009; 35: 1728–1737. 4. Heyland DK, et al. Crit Care.2010; 14: R78.
0738REDUCING THE ENERGY DEFICIT AFTER CARDIAC SURGERY BYIMPLEMENTING A NUTRITIONAL PROTOCOL AND INDIVIDUALIZEDCOUNSELING: A PROSPECTIVE AUDITING STUDY
E. De Waele1, K. De Bondt1, S. Mattens1, D. Nguyen1, P.M. Honoré1, H. Spapen1,F. Wellens2, L. Huyghens1
1Universitair Ziekenhuis Brussel, Intensive Care, Jette, Belgium, 2Universitair ZiekenhuisBrussel, Cardiac Surgery, Jette, BelgiumINTRODUCTION. Cardiac surgery patients suffer considerable physical, physiologicaland inflammatory stress which may significantly alter metabolic processes and influenceenergy demands. Care of these patients definitely requires adequate nutritional support asmalnutrition was found to enhance morbidity and mortality.OBJECTIVES. We studied baseline caloric intake in these patients under non-protocolizedstandard nutritional conditions and subsequently evaluated the effect a nutritional qualityimprovement program.METHODS. At first, we determined the non-intentional intravenous and oral caloric intakeof consecutive patients who underwent coronary artery bypass or valve surgery (observa-tional group). Calculated caloric deficit was recorded daily throughout the entirehospitalization. Then, a nutritional policy was implemented which consisted of dailycomputerized caloric intake calculations, personal coaching by a dietician and goal-orientedinterventions such as meal adaptation, administration of oral supplements, and tailored tubefeeding and parenteral nutrition (treatment group).RESULTS. In the observational group (19 patients; age 70 ± 10 years; 74 % male; meanAPACHE II score 13 ± 6), mean caloric intake was 765 ± 450 kcal/day, representing only37 % of the theoretical needs. In the intervention group (41 patients; 64 ± 13 years; 80 %male; mean APACHE II score 13 ± 6), caloric intake increased to 1,318 ± 279 kcal/day,representing 63 % of nutritional requirements.CONCLUSION. A nutritional protocol, driven by a dedicated ‘‘nutrition team’’ signifi-cantly improved nutritional support and reduced the energy deficit in cardiac surgerypatients.
0739FOOD FOR THOUGHT: DELIVERY OF ENTERAL NUTRITION IN THECRITICALLY ILL PATIENTS CAN BE IMPROVED BY INTRODUCING SIMPLEAND INEXPENSIVE CHANGES IN THE CLINICAL PRACTICE
P. Gandre1, J. Hadley1, R. White1, E. Kyriakidou1, G. Mandersloot1
1Royal London Hospital, Adult Critical Care Unit, London, UKINTRODUCTION. Negative energy balance in critically ill patients is associated withincreased number of complications, particularly infections, and the resulting energy debtcannot be compensated at a later stage during the critical illness. Berger et al. have con-sidered the findings of EPaNIC, SPN, TICACOS trials and ESPEN guidelines andpostulated that energy deficit of [4,000 kcal must be avoided at all times. The suggestedtiming for initiating the enteral feed is \24 h of the intensive care admission.Based on the results of our survey in 2010, we introduced some changes in theclinical practice of the intensive care nurses and doctors in order to address andcorrect the avoidable causes of the resultant energy deficit. The changes includededucating the intensive care nurses about the importance of providing enteral nutritionand to calculate the target feed rate before the input from the dieticians and intro-duction of administering feed at a higher catch up rate in case the feed remainssuspended for [4 h. We introduced a mandatory nutrition delivery sheet for use ofevery patient which allowed nurses to easily calculate the above. In order to avoidunnecessary preoperative starvation, we also encouraged our nurses and doctors tofollow the preoperative starvation guidelines for intubated and tracheostomizedpatients.OBJECTIVE. We repeated the same survey 10 months after the introduction of thesechanges to assess if the intended improvements had occurred.METHODS. We collected the data over a 2 week period in November 2011. As per ourfeed escalation policy, the final feed rate is expected to be reached at 8 h after initiation.RESULTS. Out of the 51 consecutive admissions, we analysed data of 33 patients. 18patients were excluded from the study because they were planned not to receive nasogastricfeed. The enteral nutrition was commenced within 24 h of admission in 76 % of thepatients. The main reasons for not achieving [80 % of the calculated energy requirementper day are presented in Graph 1.
26th ESICM ANNUAL CONGRESS — PARIS, FRANCE — 5–9 OCTOBER 2013
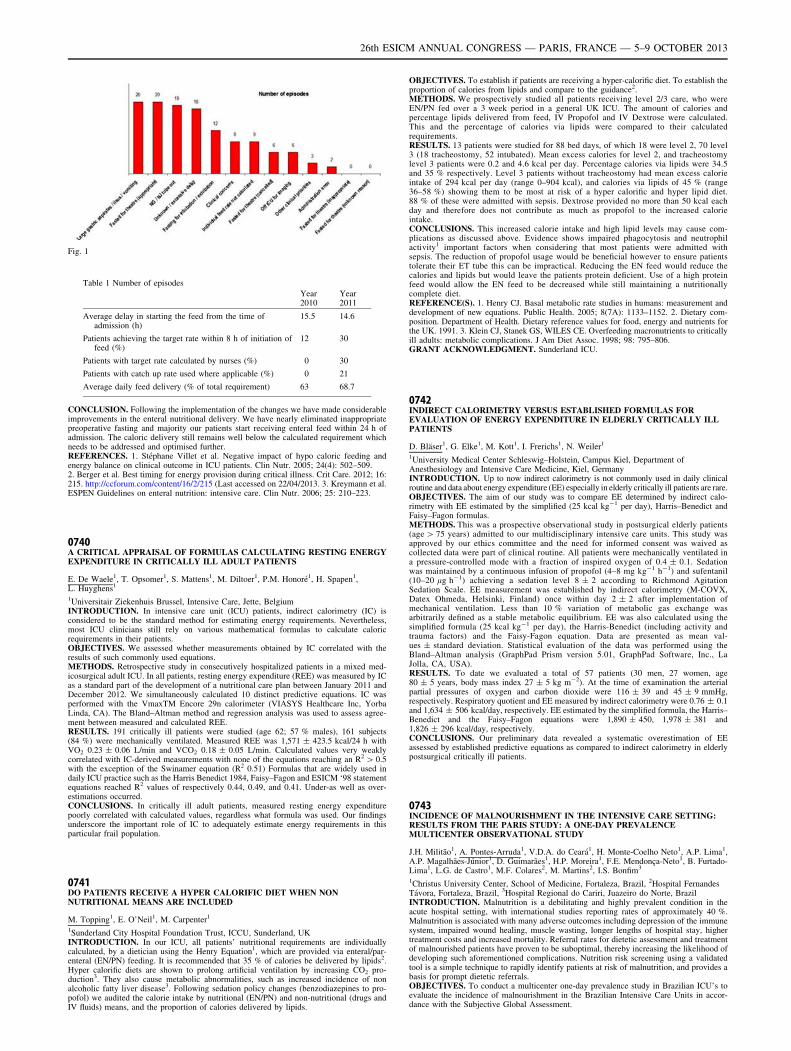
Fig. 1
Table 1 Number of episodes
Year2010
Year2011
Average delay in starting the feed from the time ofadmission (h)
15.5 14.6
Patients achieving the target rate within 8 h of initiation offeed (%)
12 30
Patients with target rate calculated by nurses (%) 0 30
Patients with catch up rate used where applicable (%) 0 21
Average daily feed delivery (% of total requirement) 63 68.7
CONCLUSION. Following the implementation of the changes we have made considerableimprovements in the enteral nutritional delivery. We have nearly eliminated inappropriatepreoperative fasting and majority our patients start receiving enteral feed within 24 h ofadmission. The caloric delivery still remains well below the calculated requirement whichneeds to be addressed and optimised further.REFERENCES. 1. Stéphane Villet et al. Negative impact of hypo caloric feeding andenergy balance on clinical outcome in ICU patients. Clin Nutr. 2005; 24(4): 502–509.2. Berger et al. Best timing for energy provision during critical illness. Crit Care. 2012; 16:215. http://ccforum.com/content/16/2/215 (Last accessed on 22/04/2013. 3. Kreymann et al.ESPEN Guidelines on enteral nutrition: intensive care. Clin Nutr. 2006; 25: 210–223.
0740A CRITICAL APPRAISAL OF FORMULAS CALCULATING RESTING ENERGYEXPENDITURE IN CRITICALLY ILL ADULT PATIENTS
E. De Waele1, T. Opsomer1, S. Mattens1, M. Diltoer1, P.M. Honoré1, H. Spapen1,L. Huyghens1
1Universitair Ziekenhuis Brussel, Intensive Care, Jette, BelgiumINTRODUCTION. In intensive care unit (ICU) patients, indirect calorimetry (IC) isconsidered to be the standard method for estimating energy requirements. Nevertheless,most ICU clinicians still rely on various mathematical formulas to calculate caloricrequirements in their patients.OBJECTIVES. We assessed whether measurements obtained by IC correlated with theresults of such commonly used equations.METHODS. Retrospective study in consecutively hospitalized patients in a mixed med-icosurgical adult ICU. In all patients, resting energy expenditure (REE) was measured by ICas a standard part of the development of a nutritional care plan between January 2011 andDecember 2012. We simultaneously calculated 10 distinct predictive equations. IC wasperformed with the VmaxTM Encore 29n calorimeter (VIASYS Healthcare Inc, YorbaLinda, CA). The Bland–Altman method and regression analysis was used to assess agree-ment between measured and calculated REE.RESULTS. 191 critically ill patients were studied (age 62; 57 % males), 161 subjects(84 %) were mechanically ventilated. Measured REE was 1,571 ± 423.5 kcal/24 h withVO2 0.23 ± 0.06 L/min and VCO2 0.18 ± 0.05 L/min. Calculated values very weaklycorrelated with IC-derived measurements with none of the equations reaching an R2 [ 0.5with the exception of the Swinamer equation (R2 0.51) Formulas that are widely used indaily ICU practice such as the Harris Benedict 1984, Faisy–Fagon and ESICM ‘98 statementequations reached R2 values of respectively 0.44, 0.49, and 0.41. Under-as well as over-estimations occurred.CONCLUSIONS. In critically ill adult patients, measured resting energy expenditurepoorly correlated with calculated values, regardless what formula was used. Our findingsunderscore the important role of IC to adequately estimate energy requirements in thisparticular frail population.
0741DO PATIENTS RECEIVE A HYPER CALORIFIC DIET WHEN NONNUTRITIONAL MEANS ARE INCLUDED
M. Topping1, E. O’Neil1, M. Carpenter1
1Sunderland City Hospital Foundation Trust, ICCU, Sunderland, UKINTRODUCTION. In our ICU, all patients’ nutritional requirements are individuallycalculated, by a dietician using the Henry Equation1, which are provided via enteral/par-enteral (EN/PN) feeding. It is recommended that 35 % of calories be delivered by lipids2.Hyper calorific diets are shown to prolong artificial ventilation by increasing CO2 pro-duction3. They also cause metabolic abnormalities, such as increased incidence of nonalcoholic fatty liver disease3. Following sedation policy changes (benzodiazepines to pro-pofol) we audited the calorie intake by nutritional (EN/PN) and non-nutritional (drugs andIV fluids) means, and the proportion of calories delivered by lipids.
OBJECTIVES. To establish if patients are receiving a hyper-calorific diet. To establish theproportion of calories from lipids and compare to the guidance2.METHODS. We prospectively studied all patients receiving level 2/3 care, who wereEN/PN fed over a 3 week period in a general UK ICU. The amount of calories andpercentage lipids delivered from feed, IV Propofol and IV Dextrose were calculated.This and the percentage of calories via lipids were compared to their calculatedrequirements.RESULTS. 13 patients were studied for 88 bed days, of which 18 were level 2, 70 level3 (18 tracheostomy, 52 intubated). Mean excess calories for level 2, and tracheostomylevel 3 patients were 0.2 and 4.6 kcal per day. Percentage calories via lipids were 34.5and 35 % respectively. Level 3 patients without tracheostomy had mean excess calorieintake of 294 kcal per day (range 0–904 kcal), and calories via lipids of 45 % (range36–58 %) showing them to be most at risk of a hyper calorific and hyper lipid diet.88 % of these were admitted with sepsis. Dextrose provided no more than 50 kcal eachday and therefore does not contribute as much as propofol to the increased calorieintake.CONCLUSIONS. This increased calorie intake and high lipid levels may cause com-plications as discussed above. Evidence shows impaired phagocytosis and neutrophilactivity1 important factors when considering that most patients were admitted withsepsis. The reduction of propofol usage would be beneficial however to ensure patientstolerate their ET tube this can be impractical. Reducing the EN feed would reduce thecalories and lipids but would leave the patients protein deficient. Use of a high proteinfeed would allow the EN feed to be decreased while still maintaining a nutritionallycomplete diet.REFERENCE(S). 1. Henry CJ. Basal metabolic rate studies in humans: measurement anddevelopment of new equations. Public Health. 2005; 8(7A): 1133–1152. 2. Dietary com-position. Department of Health. Dietary reference values for food, energy and nutrients forthe UK. 1991. 3. Klein CJ, Stanek GS, WILES CE. Overfeeding macronutrients to criticallyill adults: metabolic complications. J Am Diet Assoc. 1998; 98: 795–806.GRANT ACKNOWLEDGMENT. Sunderland ICU.
0742INDIRECT CALORIMETRY VERSUS ESTABLISHED FORMULAS FOREVALUATION OF ENERGY EXPENDITURE IN ELDERLY CRITICALLY ILLPATIENTS
D. Bläser1, G. Elke1, M. Kott1, I. Frerichs1, N. Weiler1
1University Medical Center Schleswig–Holstein, Campus Kiel, Department ofAnesthesiology and Intensive Care Medicine, Kiel, GermanyINTRODUCTION. Up to now indirect calorimetry is not commonly used in daily clinicalroutine and data about energy expenditure (EE) especially in elderly critically ill patients are rare.OBJECTIVES. The aim of our study was to compare EE determined by indirect calo-rimetry with EE estimated by the simplified (25 kcal kg-1 per day), Harris–Benedict andFaisy–Fagon formulas.METHODS. This was a prospective observational study in postsurgical elderly patients(age [ 75 years) admitted to our multidisciplinary intensive care units. This study wasapproved by our ethics committee and the need for informed consent was waived ascollected data were part of clinical routine. All patients were mechanically ventilated ina pressure-controlled mode with a fraction of inspired oxygen of 0.4 ± 0.1. Sedationwas maintained by a continuous infusion of propofol (4–8 mg kg-1 h-1) and sufentanil(10–20 lg h-1) achieving a sedation level 8 ± 2 according to Richmond AgitationSedation Scale. EE measurement was established by indirect calorimetry (M-COVX,Datex Ohmeda, Helsinki, Finland) once within day 2 ± 2 after implementation ofmechanical ventilation. Less than 10 % variation of metabolic gas exchange wasarbitrarily defined as a stable metabolic equilibrium. EE was also calculated using thesimplified formula (25 kcal kg-1 per day), the Harris-Benedict (including activity andtrauma factors) and the Faisy-Fagon equation. Data are presented as mean val-ues ± standard deviation. Statistical evaluation of the data was performed using theBland–Altman analysis (GraphPad Prism version 5.01, GraphPad Software, Inc., LaJolla, CA, USA).RESULTS. To date we evaluated a total of 57 patients (30 men, 27 women, age80 ± 5 years, body mass index 27 ± 5 kg m-2). At the time of examination the arterialpartial pressures of oxygen and carbon dioxide were 116 ± 39 and 45 ± 9 mmHg,respectively. Respiratory quotient and EE measured by indirect calorimetry were 0.76 ± 0.1and 1,634 ± 506 kcal/day, respectively. EE estimated by the simplified formula, the Harris–Benedict and the Faisy–Fagon equations were 1,890 ± 450, 1,978 ± 381 and1,826 ± 296 kcal/day, respectively.CONCLUSIONS. Our preliminary data revealed a systematic overestimation of EEassessed by established predictive equations as compared to indirect calorimetry in elderlypostsurgical critically ill patients.
0743INCIDENCE OF MALNOURISHMENT IN THE INTENSIVE CARE SETTING:RESULTS FROM THE PARIS STUDY: A ONE-DAY PREVALENCEMULTICENTER OBSERVATIONAL STUDY
J.H. Militão1, A. Pontes-Arruda1, V.D.A. do Ceará1, H. Monte-Coelho Neto1, A.P. Lima1,A.P. Magalhães-Júnior1, D. Guimarães1, H.P. Moreira1, F.E. Mendonça-Neto1, B. Furtado-Lima1, L.G. de Castro1, M.F. Colares2, M. Martins2, I.S. Bonfim3
1Christus University Center, School of Medicine, Fortaleza, Brazil, 2Hospital FernandesTávora, Fortaleza, Brazil, 3Hospital Regional do Cariri, Juazeiro do Norte, BrazilINTRODUCTION. Malnutrition is a debilitating and highly prevalent condition in theacute hospital setting, with international studies reporting rates of approximately 40 %.Malnutrition is associated with many adverse outcomes including depression of the immunesystem, impaired wound healing, muscle wasting, longer lengths of hospital stay, highertreatment costs and increased mortality. Referral rates for dietetic assessment and treatmentof malnourished patients have proven to be suboptimal, thereby increasing the likelihood ofdeveloping such aforementioned complications. Nutrition risk screening using a validatedtool is a simple technique to rapidly identify patients at risk of malnutrition, and provides abasis for prompt dietetic referrals.OBJECTIVES. To conduct a multicenter one-day prevalence study in Brazilian ICU’s toevaluate the incidence of malnourishment in the Brazilian Intensive Care Units in accor-dance with the Subjective Global Assessment.
26th ESICM ANNUAL CONGRESS — PARIS, FRANCE — 5–9 OCTOBER 2013
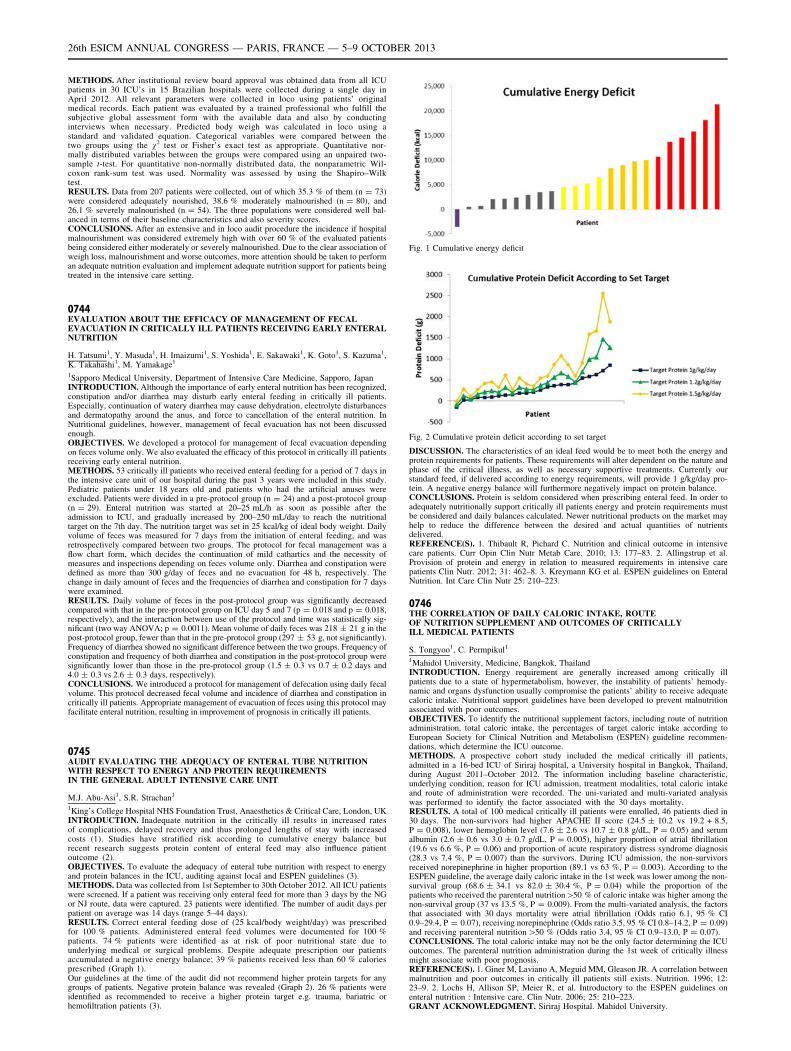
METHODS. After institutional review board approval was obtained data from all ICUpatients in 30 ICU’s in 15 Brazilian hospitals were collected during a single day inApril 2012. All relevant parameters were collected in loco using patients’ originalmedical records. Each patient was evaluated by a trained professional who fulfill thesubjective global assessment form with the available data and also by conductinginterviews when necessary. Predicted body weigh was calculated in loco using astandard and validated equation. Categorical variables were compared between thetwo groups using the v2 test or Fisher’s exact test as appropriate. Quantitative nor-mally distributed variables between the groups were compared using an unpaired two-sample t-test. For quantitative non-normally distributed data, the nonparametric Wil-coxon rank-sum test was used. Normality was assessed by using the Shapiro–Wilktest.RESULTS. Data from 207 patients were collected, out of which 35.3 % of them (n = 73)were considered adequately nourished, 38.6 % moderately malnourished (n = 80), and26.1 % severely malnourished (n = 54). The three populations were considered well bal-anced in terms of their baseline characteristics and also severity scores.CONCLUSIONS. After an extensive and in loco audit procedure the incidence if hospitalmalnourishment was considered extremely high with over 60 % of the evaluated patientsbeing considered either moderately or severely malnourished. Due to the clear association ofweigh loss, malnourishment and worse outcomes, more attention should be taken to performan adequate nutrition evaluation and implement adequate nutrition support for patients beingtreated in the intensive care setting.
0744EVALUATION ABOUT THE EFFICACY OF MANAGEMENT OF FECALEVACUATION IN CRITICALLY ILL PATIENTS RECEIVING EARLY ENTERALNUTRITION
H. Tatsumi1, Y. Masuda1, H. Imaizumi1, S. Yoshida1, E. Sakawaki1, K. Goto1, S. Kazuma1,K. Takahashi1, M. Yamakage1
1Sapporo Medical University, Department of Intensive Care Medicine, Sapporo, JapanINTRODUCTION. Although the importance of early enteral nutrition has been recognized,constipation and/or diarrhea may disturb early enteral feeding in critically ill patients.Especially, continuation of watery diarrhea may cause dehydration, electrolyte disturbancesand dermatopathy around the anus, and force to cancellation of the enteral nutrition. InNutritional guidelines, however, management of fecal evacuation has not been discussedenough.OBJECTIVES. We developed a protocol for management of fecal evacuation dependingon feces volume only. We also evaluated the efficacy of this protocol in critically ill patientsreceiving early enteral nutrition.METHODS. 53 critically ill patients who received enteral feeding for a period of 7 days inthe intensive care unit of our hospital during the past 3 years were included in this study.Pediatric patients under 18 years old and patients who had the artificial anuses wereexcluded. Patients were divided in a pre-protocol group (n = 24) and a post-protocol group(n = 29). Enteral nutrition was started at 20–25 mL/h as soon as possible after theadmission to ICU, and gradually increased by 200–250 mL/day to reach the nutritionaltarget on the 7th day. The nutrition target was set in 25 kcal/kg of ideal body weight. Dailyvolume of feces was measured for 7 days from the initiation of enteral feeding, and wasretrospectively compared between two groups. The protocol for fecal management was aflow chart form, which decides the continuation of mild cathartics and the necessity ofmeasures and inspections depending on feces volume only. Diarrhea and constipation weredefined as more than 300 g/day of feces and no evacuation for 48 h, respectively. Thechange in daily amount of feces and the frequencies of diarrhea and constipation for 7 dayswere examined.RESULTS. Daily volume of feces in the post-protocol group was significantly decreasedcompared with that in the pre-protocol group on ICU day 5 and 7 (p = 0.018 and p = 0.018,respectively), and the interaction between use of the protocol and time was statistically sig-nificant (two way ANOVA; p = 0.0011). Mean volume of daily feces was 218 ± 21 g in thepost-protocol group, fewer than that in the pre-protocol group (297 ± 53 g, not significantly).Frequency of diarrhea showed no significant difference between the two groups. Frequency ofconstipation and frequency of both diarrhea and constipation in the post-protocol group weresignificantly lower than those in the pre-protocol group (1.5 ± 0.3 vs 0.7 ± 0.2 days and4.0 ± 0.3 vs 2.6 ± 0.3 days, respectively).CONCLUSIONS. We introduced a protocol for management of defecation using daily fecalvolume. This protocol decreased fecal volume and incidence of diarrhea and constipation incritically ill patients. Appropriate management of evacuation of feces using this protocol mayfacilitate enteral nutrition, resulting in improvement of prognosis in critically ill patients.
0745AUDIT EVALUATING THE ADEQUACY OF ENTERAL TUBE NUTRITIONWITH RESPECT TO ENERGY AND PROTEIN REQUIREMENTSIN THE GENERAL ADULT INTENSIVE CARE UNIT
M.J. Abu-Asi1, S.R. Strachan1
1King’s College Hospital NHS Foundation Trust, Anaesthetics & Critical Care, London, UKINTRODUCTION. Inadequate nutrition in the critically ill results in increased ratesof complications, delayed recovery and thus prolonged lengths of stay with increasedcosts (1). Studies have stratified risk according to cumulative energy balance butrecent research suggests protein content of enteral feed may also influence patientoutcome (2).OBJECTIVES. To evaluate the adequacy of enteral tube nutrition with respect to energyand protein balances in the ICU, auditing against local and ESPEN guidelines (3).METHODS. Data was collected from 1st September to 30th October 2012. All ICU patientswere screened. If a patient was receiving only enteral feed for more than 3 days by the NGor NJ route, data were captured. 23 patients were identified. The number of audit days perpatient on average was 14 days (range 5–44 days).RESULTS. Correct enteral feeding dose of (25 kcal/body weight/day) was prescribedfor 100 % patients. Administered enteral feed volumes were documented for 100 %patients. 74 % patients were identified as at risk of poor nutritional state due tounderlying medical or surgical problems. Despite adequate prescription our patientsaccumulated a negative energy balance; 39 % patients received less than 60 % caloriesprescribed (Graph 1).Our guidelines at the time of the audit did not recommend higher protein targets for anygroups of patients. Negative protein balance was revealed (Graph 2). 26 % patients wereidentified as recommended to receive a higher protein target e.g. trauma, bariatric orhemofiltration patients (3).
Fig. 1 Cumulative energy deficit
Fig. 2 Cumulative protein deficit according to set target
DISCUSSION. The characteristics of an ideal feed would be to meet both the energy andprotein requirements for patients. These requirements will alter dependent on the nature andphase of the critical illness, as well as necessary supportive treatments. Currently ourstandard feed, if delivered according to energy requirements, will provide 1 g/kg/day pro-tein. A negative energy balance will furthermore negatively impact on protein balance.CONCLUSIONS. Protein is seldom considered when prescribing enteral feed. In order toadequately nutritionally support critically ill patients energy and protein requirements mustbe considered and daily balances calculated. Newer nutritional products on the market mayhelp to reduce the difference between the desired and actual quantities of nutrientsdelivered.REFERENCE(S). 1. Thibault R, Pichard C. Nutrition and clinical outcome in intensivecare patients. Curr Opin Clin Nutr Metab Care. 2010; 13: 177–83. 2. Allingstrup et al.Provision of protein and energy in relation to measured requirements in intensive carepatients Clin Nutr. 2012; 31: 462–8. 3. Kreymann KG et al. ESPEN guidelines on EnteralNutrition. Int Care Clin Nutr 25: 210–223.
0746THE CORRELATION OF DAILY CALORIC INTAKE, ROUTEOF NUTRITION SUPPLEMENT AND OUTCOMES OF CRITICALLYILL MEDICAL PATIENTS
S. Tongyoo1, C. Permpikul1
1Mahidol University, Medicine, Bangkok, ThailandINTRODUCTION. Energy requirement are generally increased among critically illpatients due to a state of hypermetabolism, however, the instability of patients’ hemody-namic and organs dysfunction usually compromise the patients’ ability to receive adequatecaloric intake. Nutritional support guidelines have been developed to prevent malnutritionassociated with poor outcomes.OBJECTIVES. To identify the nutritional supplement factors, including route of nutritionadministration, total caloric intake, the percentages of target caloric intake according toEuropean Society for Clinical Nutrition and Metabolism (ESPEN) guideline recommen-dations, which determine the ICU outcome.METHODS. A prospective cohort study included the medical critically ill patients,admitted in a 16-bed ICU of Siriraj hospital, a University hospital in Bangkok, Thailand,during August 2011–October 2012. The information including baseline characteristic,underlying condition, reason for ICU admission, treatment modalities, total caloric intakeand route of administration were recorded. The uni-variated and multi-variated analysiswas performed to identify the factor associated with the 30 days mortality.RESULTS. A total of 100 medical critically ill patients were enrolled, 46 patients died in30 days. The non-survivors had higher APACHE II score (24.5 ± 10.2 vs 19.2 + 8.5,P = 0.008), lower hemoglobin level (7.6 ± 2.6 vs 10.7 ± 0.8 g/dL, P = 0.05) and serumalbumin (2.6 ± 0.6 vs 3.0 ± 0.7 g/dL, P = 0.005), higher proportion of atrial fibrillation(19.6 vs 6.6 %, P = 0.06) and proportion of acute respiratory distress syndrome diagnosis(28.3 vs 7.4 %, P = 0.007) than the survivors. During ICU admission, the non-survivorsreceived norepinephrine in higher proportion (89.1 vs 63 %, P = 0.003). According to theESPEN guideline, the average daily caloric intake in the 1st week was lower among the non-survival group (68.6 ± 34.1 vs 82.0 ± 30.4 %, P = 0.04) while the proportion of thepatients who received the parenteral nutrition[50 % of caloric intake was higher among thenon-survival group (37 vs 13.5 %, P = 0.009). From the multi-variated analysis, the factorsthat associated with 30 days mortality were atrial fibrillation (Odds ratio 6.1, 95 % CI0.9–29.4, P = 0.07), receiving norepinephrine (Odds ratio 3.5, 95 % CI 0.8–14.2, P = 0.09)and receiving parenteral nutrition [50 % (Odds ratio 3.4, 95 % CI 0.9–13.0, P = 0.07).CONCLUSIONS. The total caloric intake may not be the only factor determining the ICUoutcomes. The parenteral nutrition administration during the 1st week of critically illnessmight associate with poor prognosis.REFERENCE(S). 1. Giner M, Laviano A, Meguid MM, Gleason JR. A correlation betweenmalnutrition and poor outcomes in critically ill patients still exists. Nutrition. 1996; 12:23–9. 2. Lochs H, Allison SP, Meier R, et al. Introductory to the ESPEN guidelines onenteral nutrition : Intensive care. Clin Nutr. 2006; 25: 210–223.GRANT ACKNOWLEDGMENT. Siriraj Hospital. Mahidol University.
26th ESICM ANNUAL CONGRESS — PARIS, FRANCE — 5–9 OCTOBER 2013
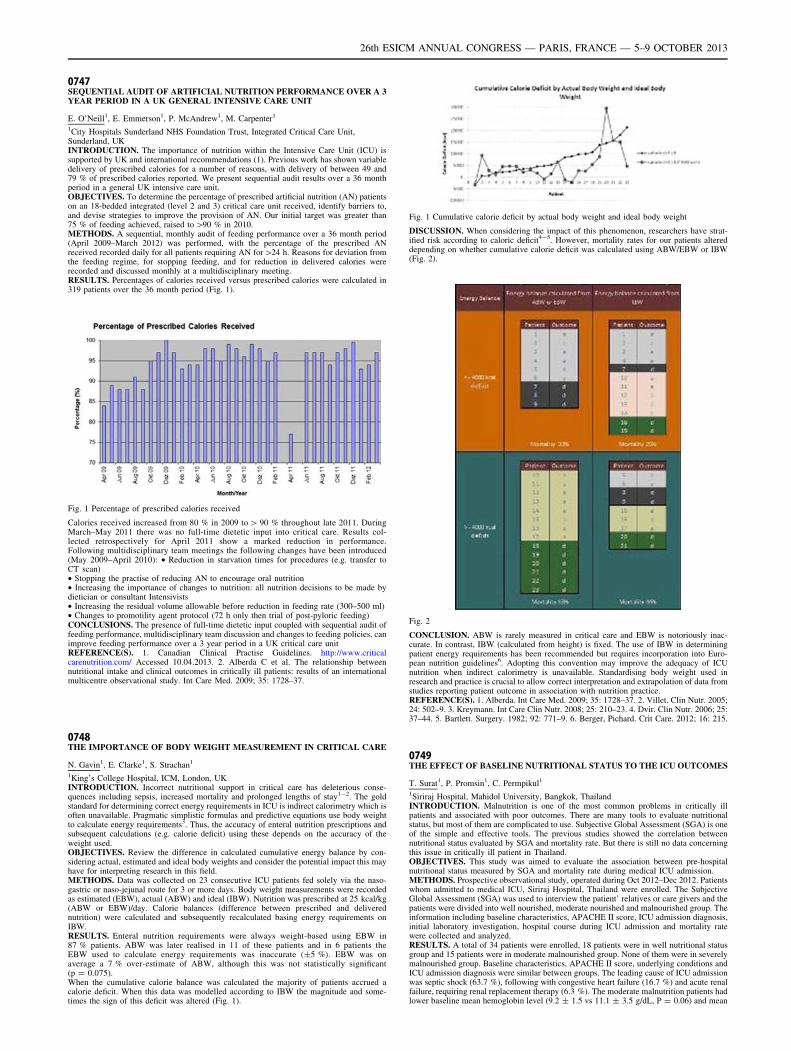
0747SEQUENTIAL AUDIT OF ARTIFICIAL NUTRITION PERFORMANCE OVER A 3YEAR PERIOD IN A UK GENERAL INTENSIVE CARE UNIT
E. O’Neill1, E. Emmerson1, P. McAndrew1, M. Carpenter1
1City Hospitals Sunderland NHS Foundation Trust, Integrated Critical Care Unit,Sunderland, UKINTRODUCTION. The importance of nutrition within the Intensive Care Unit (ICU) issupported by UK and international recommendations (1). Previous work has shown variabledelivery of prescribed calories for a number of reasons, with delivery of between 49 and79 % of prescribed calories reported. We present sequential audit results over a 36 monthperiod in a general UK intensive care unit.OBJECTIVES. To determine the percentage of prescribed artificial nutrition (AN) patientson an 18-bedded integrated (level 2 and 3) critical care unit received, identify barriers to,and devise strategies to improve the provision of AN. Our initial target was greater than75 % of feeding achieved, raised to [90 % in 2010.METHODS. A sequential, monthly audit of feeding performance over a 36 month period(April 2009–March 2012) was performed, with the percentage of the prescribed ANreceived recorded daily for all patients requiring AN for[24 h. Reasons for deviation fromthe feeding regime, for stopping feeding, and for reduction in delivered calories wererecorded and discussed monthly at a multidisciplinary meeting.RESULTS. Percentages of calories received versus prescribed calories were calculated in319 patients over the 36 month period (Fig. 1).
Fig. 1 Percentage of prescribed calories received
Calories received increased from 80 % in 2009 to [ 90 % throughout late 2011. DuringMarch–May 2011 there was no full-time dietetic input into critical care. Results col-lected retrospectively for April 2011 show a marked reduction in performance.Following multidisciplinary team meetings the following changes have been introduced(May 2009–April 2010): • Reduction in starvation times for procedures (e.g. transfer toCT scan)• Stopping the practise of reducing AN to encourage oral nutrition• Increasing the importance of changes to nutrition: all nutrition decisions to be made bydietician or consultant Intensivists• Increasing the residual volume allowable before reduction in feeding rate (300–500 ml)• Changes to promotility agent protocol (72 h only then trial of post-pyloric feeding)CONCLUSIONS. The presence of full-time dietetic input coupled with sequential audit offeeding performance, multidisciplinary team discussion and changes to feeding policies, canimprove feeding performance over a 3 year period in a UK critical care unitREFERENCE(S). 1. Canadian Clinical Practise Guidelines. http://www.criticalcarenutrition.com/ Accessed 10.04.2013. 2. Alberda C et al. The relationship betweennutritional intake and clinical outcomes in critically ill patients: results of an internationalmulticentre observational study. Int Care Med. 2009; 35: 1728–37.
0748THE IMPORTANCE OF BODY WEIGHT MEASUREMENT IN CRITICAL CARE
N. Gavin1, E. Clarke1, S. Strachan1
1King’s College Hospital, ICM, London, UKINTRODUCTION. Incorrect nutritional support in critical care has deleterious conse-quences including sepsis, increased mortality and prolonged lengths of stay1-2. The goldstandard for determining correct energy requirements in ICU is indirect calorimetry which isoften unavailable. Pragmatic simplistic formulas and predictive equations use body weightto calculate energy requirements3. Thus, the accuracy of enteral nutrition prescriptions andsubsequent calculations (e.g. calorie deficit) using these depends on the accuracy of theweight used.OBJECTIVES. Review the difference in calculated cumulative energy balance by con-sidering actual, estimated and ideal body weights and consider the potential impact this mayhave for interpreting research in this field.METHODS. Data was collected on 23 consecutive ICU patients fed solely via the naso-gastric or naso-jejunal route for 3 or more days. Body weight measurements were recordedas estimated (EBW), actual (ABW) and ideal (IBW). Nutrition was prescribed at 25 kcal/kg(ABW or EBW)/day. Calorie balances (difference between prescribed and deliverednutrition) were calculated and subsequently recalculated basing energy requirements onIBW.RESULTS. Enteral nutrition requirements were always weight-based using EBW in87 % patients. ABW was later realised in 11 of these patients and in 6 patients theEBW used to calculate energy requirements was inaccurate (±5 %). EBW was onaverage a 7 % over-estimate of ABW, although this was not statistically significant(p = 0.075).When the cumulative calorie balance was calculated the majority of patients accrued acalorie deficit. When this data was modelled according to IBW the magnitude and some-times the sign of this deficit was altered (Fig. 1).
Fig. 1 Cumulative calorie deficit by actual body weight and ideal body weight
DISCUSSION. When considering the impact of this phenomenon, researchers have strat-ified risk according to caloric deficit4-5. However, mortality rates for our patients altereddepending on whether cumulative calorie deficit was calculated using ABW/EBW or IBW(Fig. 2).
Fig. 2
CONCLUSION. ABW is rarely measured in critical care and EBW is notoriously inac-curate. In contrast, IBW (calculated from height) is fixed. The use of IBW in determiningpatient energy requirements has been recommended but requires incorporation into Euro-pean nutrition guidelines6. Adopting this convention may improve the adequacy of ICUnutrition when indirect calorimetry is unavailable. Standardising body weight used inresearch and practice is crucial to allow correct interpretation and extrapolation of data fromstudies reporting patient outcome in association with nutrition practice.REFERENCE(S). 1. Alberda. Int Care Med. 2009; 35: 1728–37. 2. Villet. Clin Nutr. 2005;24: 502–9. 3. Kreymann. Int Care Clin Nutr. 2008; 25: 210–23. 4. Dvir. Clin Nutr. 2006; 25:37–44. 5. Bartlett. Surgery. 1982; 92: 771–9. 6. Berger, Pichard. Crit Care. 2012; 16: 215.
0749THE EFFECT OF BASELINE NUTRITIONAL STATUS TO THE ICU OUTCOMES
T. Surat1, P. Promsin1, C. Permpikul1
1Siriraj Hospital, Mahidol University, Bangkok, ThailandINTRODUCTION. Malnutrition is one of the most common problems in critically illpatients and associated with poor outcomes. There are many tools to evaluate nutritionalstatus, but most of them are complicated to use. Subjective Global Assessment (SGA) is oneof the simple and effective tools. The previous studies showed the correlation betweennutritional status evaluated by SGA and mortality rate. But there is still no data concerningthis issue in critically ill patient in Thailand.OBJECTIVES. This study was aimed to evaluate the association between pre-hospitalnutritional status measured by SGA and mortality rate during medical ICU admission.METHODS. Prospective observational study, operated during Oct 2012–Dec 2012. Patientswhom admitted to medical ICU, Siriraj Hospital, Thailand were enrolled. The SubjectiveGlobal Assessment (SGA) was used to interview the patient’ relatives or care givers and thepatients were divided into well nourished, moderate nourished and malnourished group. Theinformation including baseline characteristics, APACHE II score, ICU admission diagnosis,initial laboratory investigation, hospital course during ICU admission and mortality ratewere collected and analyzed.RESULTS. A total of 34 patients were enrolled, 18 patients were in well nutritional statusgroup and 15 patients were in moderate malnourished group. None of them were in severelymalnourished group. Baseline characteristics, APACHE II score, underlying conditions andICU admission diagnosis were similar between groups. The leading cause of ICU admissionwas septic shock (63.7 %), following with congestive heart failure (16.7 %) and acute renalfailure, requiring renal replacement therapy (6.3 %). The moderate malnutrition patients hadlower baseline mean hemoglobin level (9.2 ± 1.5 vs 11.1 ± 3.5 g/dL, P = 0.06) and mean
26th ESICM ANNUAL CONGRESS — PARIS, FRANCE — 5–9 OCTOBER 2013
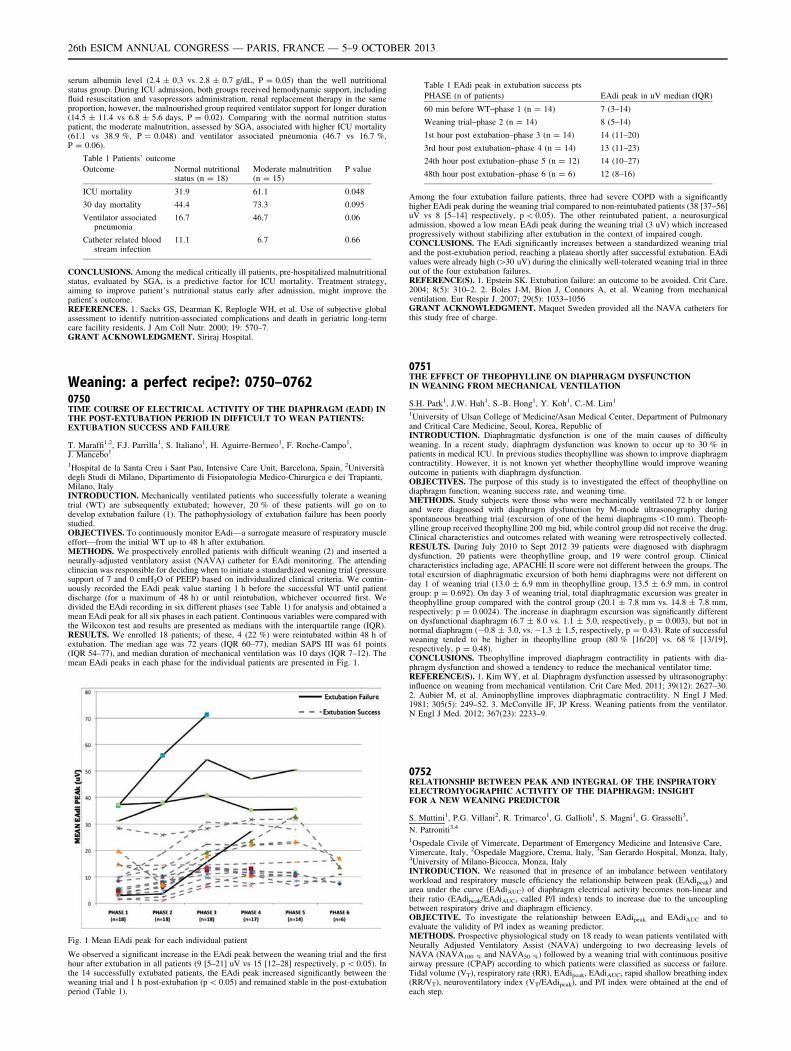
serum albumin level (2.4 ± 0.3 vs 2.8 ± 0.7 g/dL, P = 0.05) than the well nutritionalstatus group. During ICU admission, both groups received hemodynamic support, includingfluid resuscitation and vasopressors administration, renal replacement therapy in the sameproportion, however, the malnourished group required ventilator support for longer duration(14.5 ± 11.4 vs 6.8 ± 5.6 days, P = 0.02). Comparing with the normal nutrition statuspatient, the moderate malnutrition, assessed by SGA, associated with higher ICU mortality(61.1 vs 38.9 %, P = 0.048) and ventilator associated pneumonia (46.7 vs 16.7 %,P = 0.06).
Table 1 Patients’ outcome
Outcome Normal nutritionalstatus (n = 18)
Moderate malnutrition(n = 15)
P value
ICU mortality 31.9 61.1 0.048
30 day mortality 44.4 73.3 0.095
Ventilator associatedpneumonia
16.7 46.7 0.06
Catheter related bloodstream infection
11.1 6.7 0.66
CONCLUSIONS. Among the medical critically ill patients, pre-hospitalized malnutritionalstatus, evaluated by SGA, is a predictive factor for ICU mortality. Treatment strategy,aiming to improve patient’s nutritional status early after admission, might improve thepatient’s outcome.REFERENCES. 1. Sacks GS, Dearman K, Replogle WH, et al. Use of subjective globalassessment to identify nutrition-associated complications and death in geriatric long-termcare facility residents. J Am Coll Nutr. 2000; 19: 570–7.GRANT ACKNOWLEDGMENT. Siriraj Hospital.
Weaning: a perfect recipe?: 0750–07620750TIME COURSE OF ELECTRICAL ACTIVITY OF THE DIAPHRAGM (EADI) INTHE POST-EXTUBATION PERIOD IN DIFFICULT TO WEAN PATIENTS:EXTUBATION SUCCESS AND FAILURE
T. Maraffi1,2, F.J. Parrilla1, S. Italiano1, H. Aguirre-Bermeo1, F. Roche-Campo1,J. Mancebo1
1Hospital de la Santa Creu i Sant Pau, Intensive Care Unit, Barcelona, Spain, 2Universitàdegli Studi di Milano, Dipartimento di Fisiopatologia Medico-Chirurgica e dei Trapianti,Milano, ItalyINTRODUCTION. Mechanically ventilated patients who successfully tolerate a weaningtrial (WT) are subsequently extubated; however, 20 % of these patients will go on todevelop extubation failure (1). The pathophysiology of extubation failure has been poorlystudied.OBJECTIVES. To continuously monitor EAdi—a surrogate measure of respiratory muscleeffort—from the initial WT up to 48 h after extubation.METHODS. We prospectively enrolled patients with difficult weaning (2) and inserted aneurally-adjusted ventilatory assist (NAVA) catheter for EAdi monitoring. The attendingclinician was responsible for deciding when to initiate a standardized weaning trial (pressuresupport of 7 and 0 cmH2O of PEEP) based on individualized clinical criteria. We contin-uously recorded the EAdi peak value starting 1 h before the successful WT until patientdischarge (for a maximum of 48 h) or until reintubation, whichever occurred first. Wedivided the EAdi recording in six different phases (see Table 1) for analysis and obtained amean EAdi peak for all six phases in each patient. Continuous variables were compared withthe Wilcoxon test and results are presented as medians with the interquartile range (IQR).RESULTS. We enrolled 18 patients; of these, 4 (22 %) were reintubated within 48 h ofextubation. The median age was 72 years (IQR 60–77), median SAPS III was 61 points(IQR 54–77), and median duration of mechanical ventilation was 10 days (IQR 7–12). Themean EAdi peaks in each phase for the individual patients are presented in Fig. 1.
Fig. 1 Mean EAdi peak for each individual patient
We observed a significant increase in the EAdi peak between the weaning trial and the firsthour after extubation in all patients (9 [5–21] uV vs 15 [12–28] respectively, p \ 0.05). Inthe 14 successfully extubated patients, the EAdi peak increased significantly between theweaning trial and 1 h post-extubation (p \ 0.05) and remained stable in the post-extubationperiod (Table 1).
Table 1 EAdi peak in extubation success pts
PHASE (n of patients) EAdi peak in uV median (IQR)
60 min before WT–phase 1 (n = 14) 7 (3–14)
Weaning trial–phase 2 (n = 14) 8 (5–14)
1st hour post extubation–phase 3 (n = 14) 14 (11–20)
3rd hour post extubation–phase 4 (n = 14) 13 (11–23)
24th hour post extubation–phase 5 (n = 12) 14 (10–27)
48th hour post extubation–phase 6 (n = 6) 12 (8–16)
Among the four extubation failure patients, three had severe COPD with a significantlyhigher EAdi peak during the weaning trial compared to non-reintubated patients (38 [37–56]uV vs 8 [5–14] respectively, p \ 0.05). The other reintubated patient, a neurosurgicaladmission, showed a low mean EAdi peak during the weaning trial (3 uV) which increasedprogressively without stabilizing after extubation in the context of impaired cough.CONCLUSIONS. The EAdi significantly increases between a standardized weaning trialand the post-extubation period, reaching a plateau shortly after successful extubation. EAdivalues were already high ([30 uV) during the clinically well-tolerated weaning trial in threeout of the four extubation failures.REFERENCE(S). 1. Epstein SK. Extubation failure: an outcome to be avoided. Crit Care.2004; 8(5): 310–2. 2. Boles J-M, Bion J, Connors A, et al. Weaning from mechanicalventilation. Eur Respir J. 2007; 29(5): 1033–1056GRANT ACKNOWLEDGMENT. Maquet Sweden provided all the NAVA catheters forthis study free of charge.
0751THE EFFECT OF THEOPHYLLINE ON DIAPHRAGM DYSFUNCTIONIN WEANING FROM MECHANICAL VENTILATION
S.H. Park1, J.W. Huh1, S.-B. Hong1, Y. Koh1, C.-M. Lim1
1University of Ulsan College of Medicine/Asan Medical Center, Department of Pulmonaryand Critical Care Medicine, Seoul, Korea, Republic ofINTRODUCTION. Diaphragmatic dysfunction is one of the main causes of difficultyweaning. In a recent study, diaphragm dysfunction was known to occur up to 30 % inpatients in medical ICU. In previous studies theophylline was shown to improve diaphragmcontractility. However, it is not known yet whether theophylline would improve weaningoutcome in patients with diaphragm dysfunction.OBJECTIVES. The purpose of this study is to investigated the effect of theophylline ondiaphragm function, weaning success rate, and weaning time.METHODS. Study subjects were those who were mechanically ventilated 72 h or longerand were diagnosed with diaphragm dysfunction by M-mode ultrasonography duringspontaneous breathing trial (excursion of one of the hemi diaphragms \10 mm). Theoph-ylline group received theophylline 200 mg bid, while control group did not receive the drug.Clinical characteristics and outcomes related with weaning were retrospectively collected.RESULTS. During July 2010 to Sept 2012 39 patients were diagnosed with diaphragmdysfunction. 20 patients were theophylline group, and 19 were control group. Clinicalcharacteristics including age, APACHE II score were not different between the groups. Thetotal excursion of diaphragmatic excursion of both hemi diaphragms were not different onday 1 of weaning trial (13.0 ± 6.9 mm in theophylline group, 13.5 ± 6.9 mm, in controlgroup: p = 0.692). On day 3 of weaning trial, total diaphragmatic excursion was greater intheophylline group compared with the control group (20.1 ± 7.8 mm vs. 14.8 ± 7.8 mm,respectively: p = 0.0024). The increase in diaphragm excursion was significantly differenton dysfunctional diaphragm (6.7 ± 8.0 vs. 1.1 ± 5.0, respectively, p = 0.003), but not innormal diaphragm (-0.8 ± 3.0, vs. -1.3 ± 1.5, respectively, p = 0.43). Rate of successfulweaning tended to be higher in theophylline group (80 % [16/20] vs. 68 % [13/19],respectively, p = 0.48).CONCLUSIONS. Theophylline improved diaphragm contractility in patients with dia-phragm dysfunction and showed a tendency to reduce the mechanical ventilator time.REFERENCE(S). 1. Kim WY, et al. Diaphragm dysfunction assessed by ultrasonography:influence on weaning from mechanical ventilation. Crit Care Med. 2011; 39(12): 2627–30.2. Aubier M, et al. Aminophylline improves diaphragmatic contractility. N Engl J Med.1981; 305(5): 249–52. 3. McConville JF, JP Kress. Weaning patients from the ventilator.N Engl J Med. 2012; 367(23): 2233–9.
0752RELATIONSHIP BETWEEN PEAK AND INTEGRAL OF THE INSPIRATORYELECTROMYOGRAPHIC ACTIVITY OF THE DIAPHRAGM: INSIGHTFOR A NEW WEANING PREDICTOR
S. Muttini1, P.G. Villani2, R. Trimarco1, G. Gallioli1, S. Magni1, G. Grasselli3,
N. Patroniti3,4
1Ospedale Civile of Vimercate, Department of Emergency Medicine and Intensive Care,Vimercate, Italy, 2Ospedale Maggiore, Crema, Italy, 3San Gerardo Hospital, Monza, Italy,4University of Milano-Bicocca, Monza, ItalyINTRODUCTION. We reasoned that in presence of an imbalance between ventilatoryworkload and respiratory muscle efficiency the relationship between peak (EAdipeak) andarea under the curve (EAdiAUC) of diaphragm electrical activity becomes non-linear andtheir ratio (EAdipeak/EAdiAUC, called P/I index) tends to increase due to the uncouplingbetween respiratory drive and diaphragm efficiency.OBJECTIVE. To investigate the relationship between EAdipeak and EAdiAUC and toevaluate the validity of P/I index as weaning predictor.METHODS. Prospective physiological study on 18 ready to wean patients ventilated withNeurally Adjusted Ventilatory Assist (NAVA) undergoing to two decreasing levels ofNAVA (NAVA100 % and NAVA50 %) followed by a weaning trial with continuous positiveairway pressure (CPAP) according to which patients were classified as success or failure.Tidal volume (VT), respiratory rate (RR), EAdipeak, EAdiAUC, rapid shallow breathing index(RR/VT), neuroventilatory index (VT/EAdipeak), and P/I index were obtained at the end ofeach step.
26th ESICM ANNUAL CONGRESS — PARIS, FRANCE — 5–9 OCTOBER 2013
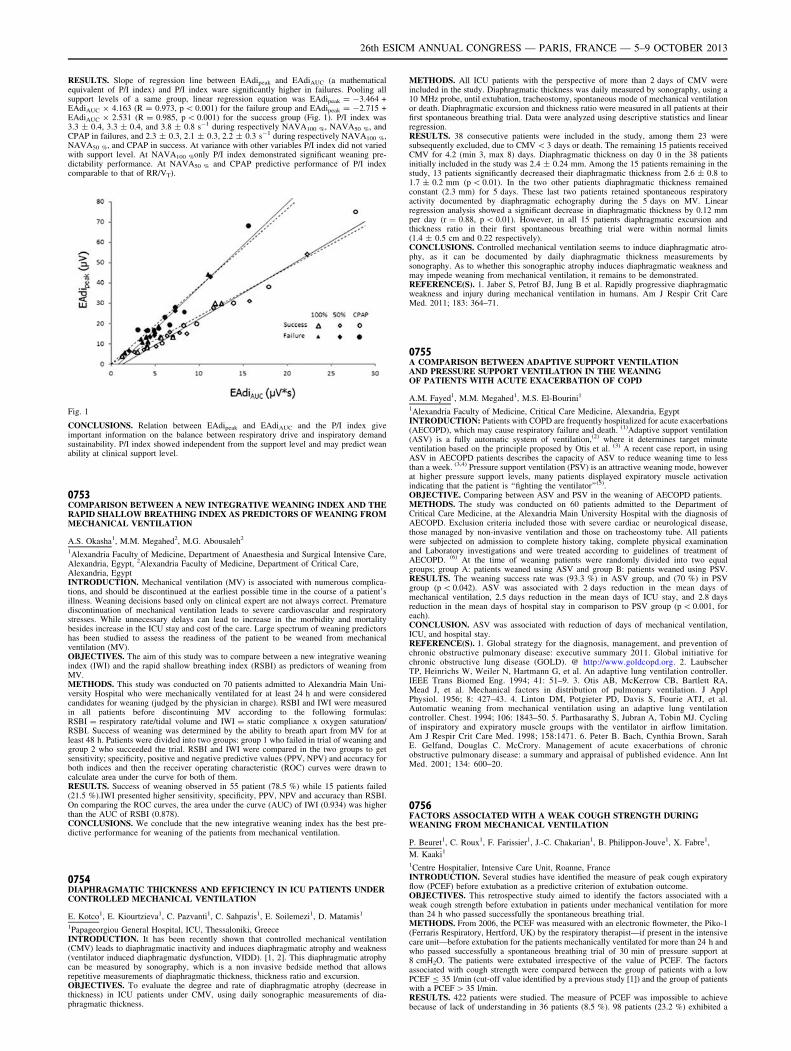
RESULTS. Slope of regression line between EAdipeak and EAdiAUC (a mathematicalequivalent of P/I index) and P/I index ware significantly higher in failures. Pooling allsupport levels of a same group, linear regression equation was EAdipeak = -3.464 +EAdiAUC 9 4.163 (R = 0.973, p \ 0.001) for the failure group and EAdipeak = -2.715 +EAdiAUC 9 2.531 (R = 0.985, p \ 0.001) for the success group (Fig. 1). P/I index was3.3 ± 0.4, 3.3 ± 0.4, and 3.8 ± 0.8 s-1 during respectively NAVA100 %, NAVA50 %, andCPAP in failures, and 2.3 ± 0.3, 2.1 ± 0.3, 2.2 ± 0.3 s-1 during respectively NAVA100 %,NAVA50 %, and CPAP in success. At variance with other variables P/I index did not variedwith support level. At NAVA100 %only P/I index demonstrated significant weaning pre-dictability performance. At NAVA50 % and CPAP predictive performance of P/I indexcomparable to that of RR/VT).
Fig. 1
CONCLUSIONS. Relation between EAdipeak and EAdiAUC and the P/I index giveimportant information on the balance between respiratory drive and inspiratory demandsustainability. P/I index showed independent from the support level and may predict weanability at clinical support level.
0753COMPARISON BETWEEN A NEW INTEGRATIVE WEANING INDEX AND THERAPID SHALLOW BREATHING INDEX AS PREDICTORS OF WEANING FROMMECHANICAL VENTILATION
A.S. Okasha1, M.M. Megahed2, M.G. Abousaleh2
1Alexandria Faculty of Medicine, Department of Anaesthesia and Surgical Intensive Care,Alexandria, Egypt, 2Alexandria Faculty of Medicine, Department of Critical Care,Alexandria, EgyptINTRODUCTION. Mechanical ventilation (MV) is associated with numerous complica-tions, and should be discontinued at the earliest possible time in the course of a patient’sillness. Weaning decisions based only on clinical expert are not always correct. Prematurediscontinuation of mechanical ventilation leads to severe cardiovascular and respiratorystresses. While unnecessary delays can lead to increase in the morbidity and mortalitybesides increase in the ICU stay and cost of the care. Large spectrum of weaning predictorshas been studied to assess the readiness of the patient to be weaned from mechanicalventilation (MV).OBJECTIVES. The aim of this study was to compare between a new integrative weaningindex (IWI) and the rapid shallow breathing index (RSBI) as predictors of weaning fromMV.METHODS. This study was conducted on 70 patients admitted to Alexandria Main Uni-versity Hospital who were mechanically ventilated for at least 24 h and were consideredcandidates for weaning (judged by the physician in charge). RSBI and IWI were measuredin all patients before discontinuing MV according to the following formulas:RSBI = respiratory rate/tidal volume and IWI = static compliance x oxygen saturation/RSBI. Success of weaning was determined by the ability to breath apart from MV for atleast 48 h. Patients were divided into two groups: group 1 who failed in trial of weaning andgroup 2 who succeeded the trial. RSBI and IWI were compared in the two groups to getsensitivity; specificity, positive and negative predictive values (PPV, NPV) and accuracy forboth indices and then the receiver operating characteristic (ROC) curves were drawn tocalculate area under the curve for both of them.RESULTS. Success of weaning observed in 55 patient (78.5 %) while 15 patients failed(21.5 %).IWI presented higher sensitivity, specificity, PPV, NPV and accuracy than RSBI.On comparing the ROC curves, the area under the curve (AUC) of IWI (0.934) was higherthan the AUC of RSBI (0.878).CONCLUSIONS. We conclude that the new integrative weaning index has the best pre-dictive performance for weaning of the patients from mechanical ventilation.
0754DIAPHRAGMATIC THICKNESS AND EFFICIENCY IN ICU PATIENTS UNDERCONTROLLED MECHANICAL VENTILATION
E. Kotco1, E. Kiourtzieva1, C. Pazvanti1, C. Sahpazis1, E. Soilemezi1, D. Matamis1
1Papageorgiou General Hospital, ICU, Thessaloniki, GreeceINTRODUCTION. It has been recently shown that controlled mechanical ventilation(CMV) leads to diaphragmatic inactivity and induces diaphragmatic atrophy and weakness(ventilator induced diaphragmatic dysfunction, VIDD). [1, 2]. This diaphragmatic atrophycan be measured by sonography, which is a non invasive bedside method that allowsrepetitive measurements of diaphragmatic thickness, thickness ratio and excursion.OBJECTIVES. To evaluate the degree and rate of diaphragmatic atrophy (decrease inthickness) in ICU patients under CMV, using daily sonographic measurements of dia-phragmatic thickness.
METHODS. All ICU patients with the perspective of more than 2 days of CMV wereincluded in the study. Diaphragmatic thickness was daily measured by sonography, using a10 MHz probe, until extubation, tracheostomy, spontaneous mode of mechanical ventilationor death. Diaphragmatic excursion and thickness ratio were measured in all patients at theirfirst spontaneous breathing trial. Data were analyzed using descriptive statistics and linearregression.RESULTS. 38 consecutive patients were included in the study, among them 23 weresubsequently excluded, due to CMV \ 3 days or death. The remaining 15 patients receivedCMV for 4.2 (min 3, max 8) days. Diaphragmatic thickness on day 0 in the 38 patientsinitially included in the study was 2.4 ± 0.24 mm. Among the 15 patients remaining in thestudy, 13 patients significantly decreased their diaphragmatic thickness from 2.6 ± 0.8 to1.7 ± 0.2 mm (p \ 0.01). In the two other patients diaphragmatic thickness remainedconstant (2.3 mm) for 5 days. These last two patients retained spontaneous respiratoryactivity documented by diaphragmatic echography during the 5 days on MV. Linearregression analysis showed a significant decrease in diaphragmatic thickness by 0.12 mmper day (r = 0.88, p \ 0.01). However, in all 15 patients diaphragmatic excursion andthickness ratio in their first spontaneous breathing trial were within normal limits(1.4 ± 0.5 cm and 0.22 respectively).CONCLUSIONS. Controlled mechanical ventilation seems to induce diaphragmatic atro-phy, as it can be documented by daily diaphragmatic thickness measurements bysonography. As to whether this sonographic atrophy induces diaphragmatic weakness andmay impede weaning from mechanical ventilation, it remains to be demonstrated.REFERENCE(S). 1. Jaber S, Petrof BJ, Jung B et al. Rapidly progressive diaphragmaticweakness and injury during mechanical ventilation in humans. Am J Respir Crit CareMed. 2011; 183: 364–71.
0755A COMPARISON BETWEEN ADAPTIVE SUPPORT VENTILATIONAND PRESSURE SUPPORT VENTILATION IN THE WEANINGOF PATIENTS WITH ACUTE EXACERBATION OF COPD
A.M. Fayed1, M.M. Megahed1, M.S. El-Bourini1
1Alexandria Faculty of Medicine, Critical Care Medicine, Alexandria, EgyptINTRODUCTION: Patients with COPD are frequently hospitalized for acute exacerbations(AECOPD), which may cause respiratory failure and death. (1)Adaptive support ventilation(ASV) is a fully automatic system of ventilation,(2) where it determines target minuteventilation based on the principle proposed by Otis et al. (3) A recent case report, in usingASV in AECOPD patients describes the capacity of ASV to reduce weaning time to lessthan a week. (3,4) Pressure support ventilation (PSV) is an attractive weaning mode, howeverat higher pressure support levels, many patients displayed expiratory muscle activationindicating that the patient is ‘‘fighting the ventilator’’(5).OBJECTIVE. Comparing between ASV and PSV in the weaning of AECOPD patients.METHODS. The study was conducted on 60 patients admitted to the Department ofCritical Care Medicine, at the Alexandria Main University Hospital with the diagnosis ofAECOPD. Exclusion criteria included those with severe cardiac or neurological disease,those managed by non-invasive ventilation and those on tracheostomy tube. All patientswere subjected on admission to complete history taking, complete physical examinationand Laboratory investigations and were treated according to guidelines of treatment ofAECOPD. (6) At the time of weaning patients were randomly divided into two equalgroups; group A: patients weaned using ASV and group B: patients weaned using PSV.RESULTS. The weaning success rate was (93.3 %) in ASV group, and (70 %) in PSVgroup (p \ 0.042). ASV was associated with 2 days reduction in the mean days ofmechanical ventilation, 2.5 days reduction in the mean days of ICU stay, and 2.8 daysreduction in the mean days of hospital stay in comparison to PSV group (p \ 0.001, foreach).CONCLUSION. ASV was associated with reduction of days of mechanical ventilation,ICU, and hospital stay.REFERENCE(S). 1. Global strategy for the diagnosis, management, and prevention ofchronic obstructive pulmonary disease: executive summary 2011. Global initiative forchronic obstructive lung disease (GOLD). @ http://www.goldcopd.org. 2. LaubscherTP, Heinrichs W, Weiler N, Hartmann G, et al. An adaptive lung ventilation controller.IEEE Trans Biomed Eng. 1994; 41: 51–9. 3. Otis AB, McKerrow CB, Bartlett RA,Mead J, et al. Mechanical factors in distribution of pulmonary ventilation. J ApplPhysiol. 1956; 8: 427–43. 4. Linton DM, Potgieter PD, Davis S, Fourie ATJ, et al.Automatic weaning from mechanical ventilation using an adaptive lung ventilationcontroller. Chest. 1994; 106: 1843–50. 5. Parthasarathy S, Jubran A, Tobin MJ. Cyclingof inspiratory and expiratory muscle groups with the ventilator in airflow limitation.Am J Respir Crit Care Med. 1998; 158:1471. 6. Peter B. Bach, Cynthia Brown, SarahE. Gelfand, Douglas C. McCrory. Management of acute exacerbations of chronicobstructive pulmonary disease: a summary and appraisal of published evidence. Ann IntMed. 2001; 134: 600–20.
0756FACTORS ASSOCIATED WITH A WEAK COUGH STRENGTH DURINGWEANING FROM MECHANICAL VENTILATION
P. Beuret1, C. Roux1, F. Farissier1, J.-C. Chakarian1, B. Philippon-Jouve1, X. Fabre1,
M. Kaaki1
1Centre Hospitalier, Intensive Care Unit, Roanne, FranceINTRODUCTION. Several studies have identified the measure of peak cough expiratoryflow (PCEF) before extubation as a predictive criterion of extubation outcome.OBJECTIVES. This retrospective study aimed to identify the factors associated with aweak cough strength before extubation in patients under mechanical ventilation for morethan 24 h who passed successfully the spontaneous breathing trial.METHODS. From 2006, the PCEF was measured with an electronic flowmeter, the Piko-1(Ferraris Respiratory, Hertford, UK) by the respiratory therapist—if present in the intensivecare unit—before extubation for the patients mechanically ventilated for more than 24 h andwho passed successfully a spontaneous breathing trial of 30 min of pressure support at8 cmH2O. The patients were extubated irrespective of the value of PCEF. The factorsassociated with cough strength were compared between the group of patients with a lowPCEF B 35 l/min (cut-off value identified by a previous study [1]) and the group of patientswith a PCEF [ 35 l/min.RESULTS. 422 patients were studied. The measure of PCEF was impossible to achievebecause of lack of understanding in 36 patients (8.5 %). 98 patients (23.2 %) exhibited a
26th ESICM ANNUAL CONGRESS — PARIS, FRANCE — 5–9 OCTOBER 2013
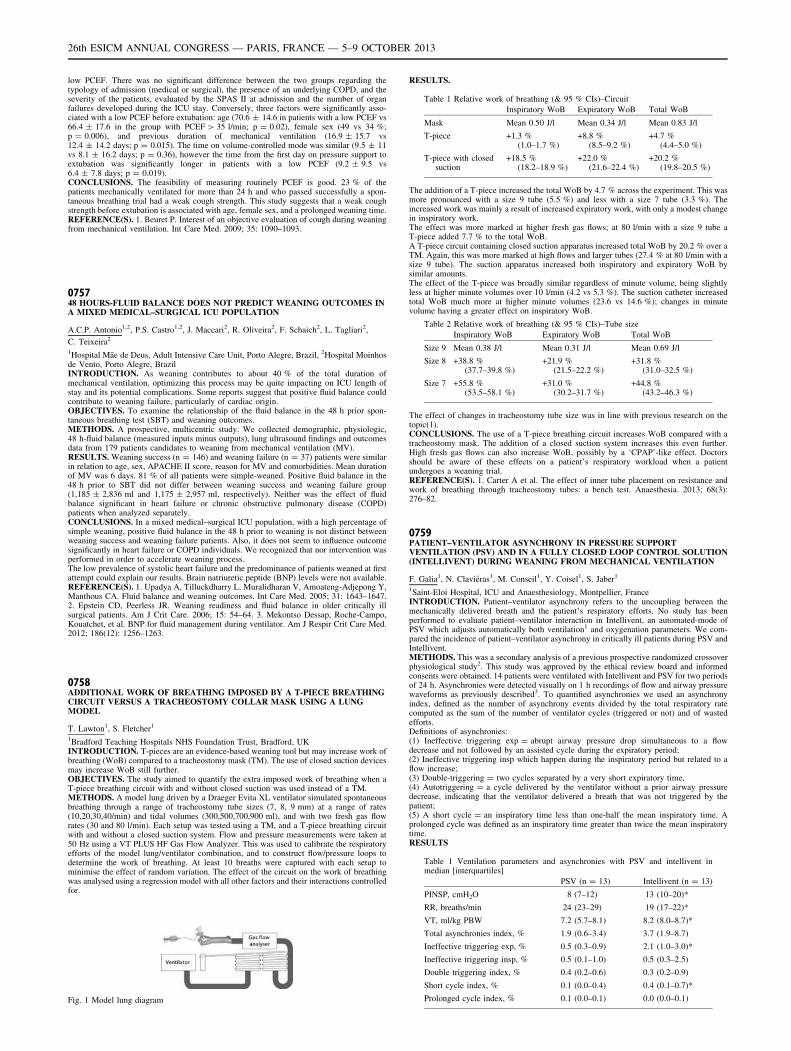
low PCEF. There was no significant difference between the two groups regarding thetypology of admission (medical or surgical), the presence of an underlying COPD, and theseverity of the patients, evaluated by the SPAS II at admission and the number of organfailures developed during the ICU stay. Conversely, three factors were significantly asso-ciated with a low PCEF before extubation: age (70.6 ± 14.6 in patients with a low PCEF vs66.4 ± 17.6 in the group with PCEF [ 35 l/min; p = 0.02), female sex (49 vs 34 %;p = 0.006), and previous duration of mechanical ventilation (16.9 ± 15.7 vs12.4 ± 14.2 days; p = 0.015). The time on volume-controlled mode was similar (9.5 ± 11vs 8.1 ± 16.2 days; p = 0.36), however the time from the first day on pressure support toextubation was significantly longer in patients with a low PCEF (9.2 ± 9.5 vs6.4 ± 7.8 days; p = 0.019).CONCLUSIONS. The feasibility of measuring routinely PCEF is good. 23 % of thepatients mechanically ventilated for more than 24 h and who passed successfully a spon-taneous breathing trial had a weak cough strength. This study suggests that a weak coughstrength before extubation is associated with age, female sex, and a prolonged weaning time.REFERENCE(S). 1. Beuret P. Interest of an objective evaluation of cough during weaningfrom mechanical ventilation. Int Care Med. 2009; 35: 1090–1093.
075748 HOURS-FLUID BALANCE DOES NOT PREDICT WEANING OUTCOMES INA MIXED MEDICAL–SURGICAL ICU POPULATION
A.C.P. Antonio1,2, P.S. Castro1,2, J. Maccari2, R. Oliveira2, F. Schaich2, L. Tagliari2,
C. Teixeira2
1Hospital Mãe de Deus, Adult Intensive Care Unit, Porto Alegre, Brazil, 2Hospital Moinhosde Vento, Porto Alegre, BrazilINTRODUCTION. As weaning contributes to about 40 % of the total duration ofmechanical ventilation, optimizing this process may be quite impacting on ICU length ofstay and its potential complications. Some reports suggest that positive fluid balance couldcontribute to weaning failure, particularly of cardiac origin.OBJECTIVES. To examine the relationship of the fluid balance in the 48 h prior spon-taneous breathing test (SBT) and weaning outcomes.METHODS. A prospective, multicentric study. We collected demographic, physiologic,48 h-fluid balance (measured inputs minus outputs), lung ultrasound findings and outcomesdata from 179 patients candidates to weaning from mechanical ventilation (MV).RESULTS. Weaning success (n = 146) and weaning failure (n = 37) patients were similarin relation to age, sex, APACHE II score, reason for MV and comorbidities. Mean durationof MV was 6 days. 81 % of all patients were simple-weaned. Positive fluid balance in the48 h prior to SBT did not differ between weaning success and weaning failure group(1,185 ± 2,836 ml and 1,175 ± 2,957 ml, respectively). Neither was the effect of fluidbalance significant in heart failure or chronic obstructive pulmonary disease (COPD)patients when analyzed separately.CONCLUSIONS. In a mixed medical–surgical ICU population, with a high percentage ofsimple weaning, positive fluid balance in the 48 h prior to weaning is not distinct betweenweaning success and weaning failure patients. Also, it does not seem to influence outcomesignificantly in heart failure or COPD individuals. We recognized that nor intervention wasperformed in order to accelerate weaning process.The low prevalence of systolic heart failure and the predominance of patients weaned at firstattempt could explain our results. Brain natriuretic peptide (BNP) levels were not available.REFERENCE(S). 1. Upadya A, Tilluckdharry L, Muralidharan V, Amoateng-Adjepong Y,Manthous CA. Fluid balance and weaning outcomes. Int Care Med. 2005; 31: 1643–1647.2. Epstein CD, Peerless JR. Weaning readiness and fluid balance in older critically illsurgical patients. Am J Crit Care. 2006; 15: 54–64. 3. Mekontso Dessap, Roche-Campo,Kouatchet, et al. BNP for fluid management during ventilator. Am J Respir Crit Care Med.2012; 186(12): 1256–1263.
0758ADDITIONAL WORK OF BREATHING IMPOSED BY A T-PIECE BREATHINGCIRCUIT VERSUS A TRACHEOSTOMY COLLAR MASK USING A LUNGMODEL
T. Lawton1, S. Fletcher1
1Bradford Teaching Hospitals NHS Foundation Trust, Bradford, UKINTRODUCTION. T-pieces are an evidence-based weaning tool but may increase work ofbreathing (WoB) compared to a tracheostomy mask (TM). The use of closed suction devicesmay increase WoB still further.OBJECTIVES. The study aimed to quantify the extra imposed work of breathing when aT-piece breathing circuit with and without closed suction was used instead of a TM.METHODS. A model lung driven by a Draeger Evita XL ventilator simulated spontaneousbreathing through a range of tracheostomy tube sizes (7, 8, 9 mm) at a range of rates(10,20,30,40/min) and tidal volumes (300,500,700,900 ml), and with two fresh gas flowrates (30 and 80 l/min). Each setup was tested using a TM, and a T-piece breathing circuitwith and without a closed suction system. Flow and pressure measurements were taken at50 Hz using a VT PLUS HF Gas Flow Analyzer. This was used to calibrate the respiratoryefforts of the model lung/ventilator combination, and to construct flow/pressure loops todetermine the work of breathing. At least 10 breaths were captured with each setup tominimise the effect of random variation. The effect of the circuit on the work of breathingwas analysed using a regression model with all other factors and their interactions controlledfor.
Fig. 1 Model lung diagram
RESULTS.
Table 1 Relative work of breathing (& 95 % CIs)–Circuit
Inspiratory WoB Expiratory WoB Total WoB
Mask Mean 0.50 J/l Mean 0.34 J/l Mean 0.83 J/l
T-piece +1.3 %(1.0–1.7 %)
+8.8 %(8.5–9.2 %)
+4.7 %(4.4–5.0 %)
T-piece with closedsuction
+18.5 %(18.2–18.9 %)
+22.0 %(21.6–22.4 %)
+20.2 %(19.8–20.5 %)
The addition of a T-piece increased the total WoB by 4.7 % across the experiment. This wasmore pronounced with a size 9 tube (5.5 %) and less with a size 7 tube (3.3 %). Theincreased work was mainly a result of increased expiratory work, with only a modest changein inspiratory work.The effect was more marked at higher fresh gas flows; at 80 l/min with a size 9 tube aT-piece added 7.7 % to the total WoB.A T-piece circuit containing closed suction apparatus increased total WoB by 20.2 % over aTM. Again, this was more marked at high flows and larger tubes (27.4 % at 80 l/min with asize 9 tube). The suction apparatus increased both inspiratory and expiratory WoB bysimilar amounts.The effect of the T-piece was broadly similar regardless of minute volume, being slightlyless at higher minute volumes over 10 l/min (4.2 vs 5.3 %). The suction catheter increasedtotal WoB much more at higher minute volumes (23.6 vs 14.6 %); changes in minutevolume having a greater effect on inspiratory WoB.
Table 2 Relative work of breathing (& 95 % CIs)–Tube size
Inspiratory WoB Expiratory WoB Total WoB
Size 9 Mean 0.38 J/l Mean 0.31 J/l Mean 0.69 J/l
Size 8 +38.8 %(37.7–39.8 %)
+21.9 %(21.5–22.2 %)
+31.8 %(31.0–32.5 %)
Size 7 +55.8 %(53.5–58.1 %)
+31.0 %(30.2–31.7 %)
+44.8 %(43.2–46.3 %)
The effect of changes in tracheostomy tube size was in line with previous research on thetopic(1).CONCLUSIONS. The use of a T-piece breathing circuit increases WoB compared with atracheostomy mask. The addition of a closed suction system increases this even further.High fresh gas flows can also increase WoB, possibly by a ‘CPAP’-like effect. Doctorsshould be aware of these effects on a patient’s respiratory workload when a patientundergoes a weaning trial.REFERENCE(S). 1. Carter A et al. The effect of inner tube placement on resistance andwork of breathing through tracheostomy tubes: a bench test. Anaesthesia. 2013; 68(3):276–82.
0759PATIENT–VENTILATOR ASYNCHRONY IN PRESSURE SUPPORTVENTILATION (PSV) AND IN A FULLY CLOSED LOOP CONTROL SOLUTION(INTELLIVENT) DURING WEANING FROM MECHANICAL VENTILATION
F. Galia1, N. Claviéras1, M. Conseil1, Y. Coisel1, S. Jaber1
1Saint-Eloi Hospital, ICU and Anaesthesiology, Montpellier, FranceINTRODUCTION. Patient–ventilator asynchrony refers to the uncoupling between themechanically delivered breath and the patient’s respiratory efforts. No study has beenperformed to evaluate patient–ventilator interaction in Intellivent, an automated-mode ofPSV which adjusts automatically both ventilation1 and oxygenation parameters. We com-pared the incidence of patient–ventilator asynchrony in critically ill patients during PSV andIntellivent.METHODS. This was a secondary analysis of a previous prospective randomized crossoverphysiological study2. This study was approved by the ethical review board and informedconsents were obtained. 14 patients were ventilated with Intellivent and PSV for two periodsof 24 h. Asynchronies were detected visually on 1 h recordings of flow and airway pressurewaveforms as previously described3. To quantified asynchronies we used an asynchronyindex, defined as the number of asynchrony events divided by the total respiratory ratecomputed as the sum of the number of ventilator cycles (triggered or not) and of wastedefforts.Definitions of asynchronies:(1) Ineffective triggering exp = abrupt airway pressure drop simultaneous to a flowdecrease and not followed by an assisted cycle during the expiratory period;(2) Ineffective triggering insp which happen during the inspiratory period but related to aflow increase;(3) Double-triggering = two cycles separated by a very short expiratory time,(4) Autotriggering = a cycle delivered by the ventilator without a prior airway pressuredecrease, indicating that the ventilator delivered a breath that was not triggered by thepatient;(5) A short cycle = an inspiratory time less than one-half the mean inspiratory time. Aprolonged cycle was defined as an inspiratory time greater than twice the mean inspiratorytime.RESULTS
Table 1 Ventilation parameters and asynchronies with PSV and intellivent inmedian [interquartiles]
PSV (n = 13) Intellivent (n = 13)
PINSP, cmH2O 8 (7–12) 13 (10–20)*
RR, breaths/min 24 (23–29) 19 (17–22)*
VT, ml/kg PBW 7.2 (5.7–8.1) 8.2 (8.0–8.7)*
Total asynchronies index, % 1.9 (0.6–3.4) 3.7 (1.9–8.7)
Ineffective triggering exp, % 0.5 (0.3–0.9) 2.1 (1.0–3.0)*
Ineffective triggering insp, % 0.5 (0.1–1.0) 0.5 (0.3–2.5)
Double triggering index, % 0.4 (0.2–0.6) 0.3 (0.2–0.9)
Short cycle index, % 0.1 (0.0–0.4) 0.4 (0.1–0.7)*
Prolonged cycle index, % 0.1 (0.0–0.1) 0.0 (0.0–0.1)
26th ESICM ANNUAL CONGRESS — PARIS, FRANCE — 5–9 OCTOBER 2013
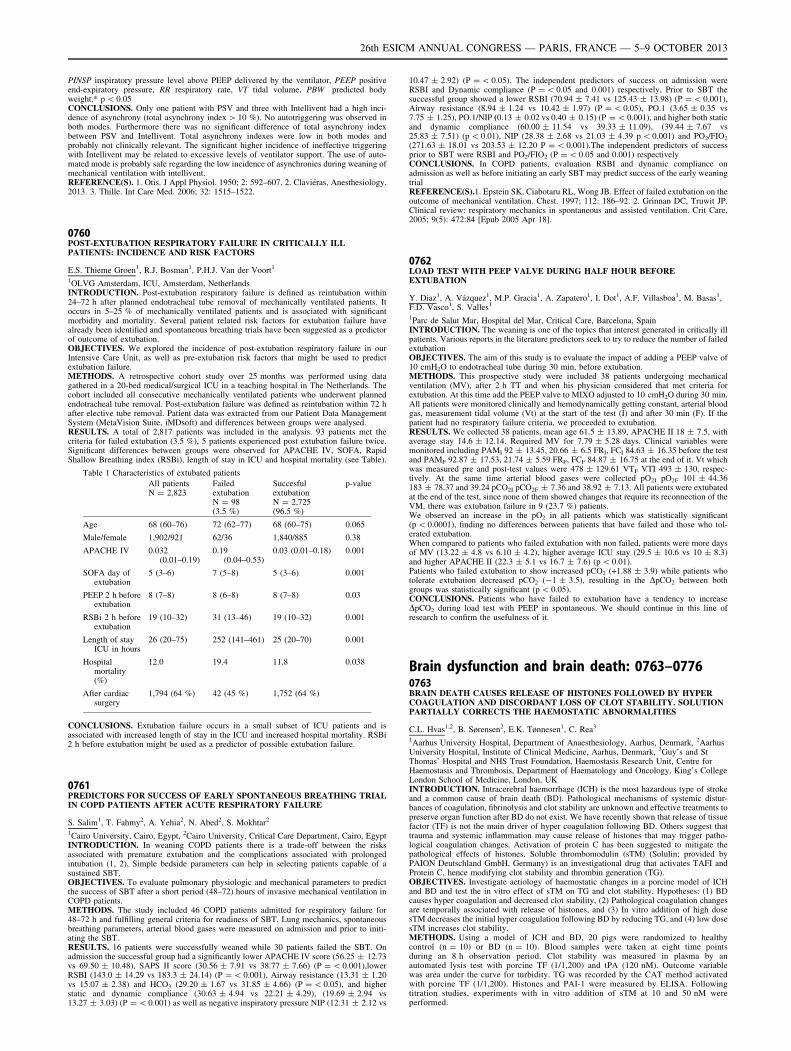
PINSP inspiratory pressure level above PEEP delivered by the ventilator, PEEP positiveend-expiratory pressure, RR respiratory rate, VT tidal volume, PBW predicted bodyweight,* p \ 0.05CONCLUSIONS. Only one patient with PSV and three with Intellivent had a high inci-dence of asynchrony (total asynchrony index [ 10 %). No autotriggering was observed inboth modes. Furthermore there was no significant difference of total asynchrony indexbetween PSV and Intellivent. Total asynchrony indexes were low in both modes andprobably not clinically relevant. The significant higher incidence of ineffective triggeringwith Intellivent may be related to excessive levels of ventilator support. The use of auto-mated mode is probably safe regarding the low incidence of asynchronies during weaning ofmechanical ventilation with intellivent.REFERENCE(S). 1. Otis. J Appl Physiol. 1950; 2: 592–607. 2. Claviéras, Anesthesiology.2013. 3. Thille. Int Care Med. 2006; 32: 1515–1522.
0760POST-EXTUBATION RESPIRATORY FAILURE IN CRITICALLY ILLPATIENTS: INCIDENCE AND RISK FACTORS
E.S. Thieme Groen1, R.J. Bosman1, P.H.J. Van der Voort1
1OLVG Amsterdam, ICU, Amsterdam, NetherlandsINTRODUCTION. Post-extubation respiratory failure is defined as reintubation within24–72 h after planned endotracheal tube removal of mechanically ventilated patients. Itoccurs in 5–25 % of mechanically ventilated patients and is associated with significantmorbidity and mortality. Several patient related risk factors for extubation failure havealready been identified and spontaneous breathing trials have been suggested as a predictorof outcome of extubation.OBJECTIVES. We explored the incidence of post-extubation respiratory failure in ourIntensive Care Unit, as well as pre-extubation risk factors that might be used to predictextubation failure.METHODS. A retrospective cohort study over 25 months was performed using datagathered in a 20-bed medical/surgical ICU in a teaching hospital in The Netherlands. Thecohort included all consecutive mechanically ventilated patients who underwent plannedendotracheal tube removal. Post-extubation failure was defined as reintubation within 72 hafter elective tube removal. Patient data was extracted from our Patient Data ManagementSystem (MetaVision Suite, iMDsoft) and differences between groups were analysed.RESULTS. A total of 2,817 patients was included in the analysis. 93 patients met thecriteria for failed extubation (3.5 %), 5 patients experienced post extubation failure twice.Significant differences between groups were observed for APACHE IV, SOFA, RapidShallow Breathing index (RSBi), length of stay in ICU and hospital mortality (see Table).
Table 1 Characteristics of extubated patients
All patientsN = 2,823
FailedextubationN = 98(3.5 %)
SuccesfulextubationN = 2,725(96.5 %)
p-value
Age 68 (60–76) 72 (62–77) 68 (60–75) 0.065
Male/female 1,902/921 62/36 1,840/885 0.38
APACHE IV 0.032(0.01–0.19)
0.19(0.04–0.53)
0.03 (0.01–0.18) 0.001
SOFA day ofextubation
5 (3–6) 7 (5–8) 5 (3–6) 0.001
PEEP 2 h beforeextubation
8 (7–8) 8 (6–8) 8 (7–8) 0.03
RSBi 2 h beforeextubation
19 (10–32) 31 (13–46) 19 (10–32) 0.001
Length of stayICU in hours
26 (20–75) 252 (141–461) 25 (20–70) 0.001
Hospitalmortality(%)
12.0 19.4 11.8 0.038
After cardiacsurgery
1,794 (64 %) 42 (45 %) 1,752 (64 %)
CONCLUSIONS. Extubation failure occurs in a small subset of ICU patients and isassociated with increased length of stay in the ICU and increased hospital mortality. RSBi2 h before extubation might be used as a predictor of possible extubation failure.
0761PREDICTORS FOR SUCCESS OF EARLY SPONTANEOUS BREATHING TRIALIN COPD PATIENTS AFTER ACUTE RESPIRATORY FAILURE
S. Salim1, T. Fahmy2, A. Yehia2, N. Abed2, S. Mokhtar2
1Cairo University, Cairo, Egypt, 2Cairo University, Critical Care Department, Cairo, EgyptINTRODUCTION. In weaning COPD patients there is a trade-off between the risksassociated with premature extubation and the complications associated with prolongedintubation (1, 2), Simple bedside parameters can help in selecting patients capable of asustained SBT.OBJECTIVES. To evaluate pulmonary physiologic and mechanical parameters to predictthe success of SBT after a short period (48–72) hours of invasive mechanical ventilation inCOPD patients.METHODS. The study included 46 COPD patients admitted for respiratory failure for48–72 h and fulfilling general criteria for readiness of SBT. Lung mechanics, spontaneousbreathing parameters, arterial blood gases were measured on admission and prior to initi-ating the SBT.RESULTS. 16 patients were successfully weaned while 30 patients failed the SBT. Onadmission the successful group had a significantly lower APACHE IV score (56.25 ± 12.73vs 69.50 ± 10.48), SAPS II score (30.56 ± 7.91 vs 38.77 ± 7.66) (P = \ 0.001),lowerRSBI (143.0 ± 14.29 vs 183.3 ± 24.14) (P = \ 0.001), Airway resistance (13.31 ± 1.20vs 15.07 ± 2.38) and HCO3 (29.20 ± 1.67 vs 31.85 ± 4.66) (P = \ 0.05), and higherstatic and dynamic compliance (30.63 ± 4.94 vs 22.21 ± 4.29), (19.69 ± 2.94 vs13.27 ± 3.03) (P = \ 0.001) as well as negative inspiratory pressure NIP (12.31 ± 2.12 vs
10.47 ± 2.92) (P = \ 0.05). The independent predictors of success on admission wereRSBI and Dynamic compliance (P = \ 0.05 and 0.001) respectively, Prior to SBT thesuccessful group showed a lower RSBI (70.94 ± 7.41 vs 125.43 ± 13.98) (P = \ 0.001),Airway resistance (8.94 ± 1.24 vs 10.42 ± 1.97) (P = \ 0.05), PO.1 (3.65 ± 0.35 vs7.75 ± 1.25), PO.1/NIP (0.13 ± 0.02 vs 0.40 ± 0.15) (P = \ 0.001), and higher both staticand dynamic compliance (60.00 ± 11.54 vs 39.33 ± 11.09), (39.44 ± 7.67 vs25.83 ± 7.51) (p \ 0.01), NIP (28.38 ± 2.68 vs 21.03 ± 4.39 p \ 0.001) and PO2/FIO2
(271.63 ± 18.01 vs 203.53 ± 12.20 P = \ 0.001).The independent predictors of successprior to SBT were RSBI and PO2/FIO2 (P = \ 0.05 and 0.001) respectivelyCONCLUSIONS. In COPD patients, evaluation RSBI and dynamic compliance onadmission as well as before initiating an early SBT may predict success of the early weaningtrialREFERENCE(S).1. Epstein SK, Ciabotaru RL, Wong JB. Effect of failed extubation on theoutcome of mechanical ventilation. Chest. 1997; 112: 186–92. 2. Grinnan DC, Truwit JP.Clinical review: respiratory mechanics in spontaneous and assisted ventilation. Crit Care,2005; 9(5): 472:84 [Epub 2005 Apr 18].
0762LOAD TEST WITH PEEP VALVE DURING HALF HOUR BEFOREEXTUBATION
Y. Diaz1, A. Vázquez1, M.P. Gracia1, A. Zapatero1, I. Dot1, A.F. Villasboa1, M. Basas1,F.D. Vasco1, S. Valles1
1Parc de Salut Mar, Hospital del Mar, Critical Care, Barcelona, SpainINTRODUCTION. The weaning is one of the topics that interest generated in critically illpatients. Various reports in the literature predictors seek to try to reduce the number of failedextubationOBJECTIVES. The aim of this study is to evaluate the impact of adding a PEEP valve of10 cmH2O to endotracheal tube during 30 min, before extubation.METHODS. This prospective study were included 38 patients undergoing mechanicalventilation (MV), after 2 h TT and when his physician considered that met criteria forextubation. At this time add the PEEP valve to MIXO adjusted to 10 cmH2O during 30 min.All patients were monitored clinically and hemodynamically getting constant, arterial bloodgas, measurement tidal volume (Vt) at the start of the test (I) and after 30 min (F). If thepatient had no respiratory failure criteria, we proceeded to extubation.RESULTS. We collected 38 patients, mean age 61.5 ± 13.89, APACHE II 18 ± 7.5, withaverage stay 14.6 ± 12.14. Required MV for 7.79 ± 5.28 days. Clinical variables weremonitored including PAMI 92 ± 13.45, 20.66 ± 6.5 FRI, FCI 84.63 ± 16.35 before the testand PAMF 92.87 ± 17.53, 21.74 ± 5.59 FRF, FCF 84.87 ± 16.75 at the end of it. Vt whichwas measured pre and post-test values were 478 ± 129.61 VTF VTI 493 ± 130, respec-tively. At the same time arterial blood gases were collected pO2I pO2F 101 ± 44.36183 ± 78.37 and 39.24 pCO2I pCO2F ± 7.36 and 38.92 ± 7.13. All patients were extubatedat the end of the test, since none of them showed changes that require its reconnection of theVM, there was extubation failure in 9 (23.7 %) patients.We observed an increase in the pO2 in all patients which was statistically significant(p \ 0.0001), finding no differences between patients that have failed and those who tol-erated extubation.When compared to patients who failed extubation with non failed, patients were more daysof MV (13.22 ± 4.8 vs 6.10 ± 4.2), higher average ICU stay (29.5 ± 10.6 vs 10 ± 8.3)and higher APACHE II (22.3 ± 5.1 vs 16.7 ± 7.6) (p \ 0.01).Patients who failed extubation to show increased pCO2 (+1.88 ± 3.9) while patients whotolerate extubation decreased pCO2 (-1 ± 3.5), resulting in the DpCO2 between bothgroups was statistically significant (p \ 0.05).CONCLUSIONS. Patients who have failed to extubation have a tendency to increaseDpCO2 during load test with PEEP in spontaneous. We should continue in this line ofresearch to confirm the usefulness of it.
Brain dysfunction and brain death: 0763–07760763BRAIN DEATH CAUSES RELEASE OF HISTONES FOLLOWED BY HYPERCOAGULATION AND DISCORDANT LOSS OF CLOT STABILITY. SOLUTIONPARTIALLY CORRECTS THE HAEMOSTATIC ABNORMALITIES
C.L. Hvas1,2, B. Sørensen2, E.K. Tønnesen1, C. Rea3
1Aarhus University Hospital, Department of Anaesthesiology, Aarhus, Denmark, 2AarhusUniversity Hospital, Institute of Clinical Medicine, Aarhus, Denmark, 3Guy’s and StThomas’ Hospital and NHS Trust Foundation, Haemostasis Research Unit, Centre forHaemostasis and Thrombosis, Department of Haematology and Oncology, King’s CollegeLondon School of Medicine, London, UKINTRODUCTION. Intracerebral haemorrhage (ICH) is the most hazardous type of strokeand a common cause of brain death (BD). Pathological mechanisms of systemic distur-bances of coagulation, fibrinolysis and clot stability are unknown and effective treatments topreserve organ function after BD do not exist. We have recently shown that release of tissuefactor (TF) is not the main driver of hyper coagulation following BD. Others suggest thattrauma and systemic inflammation may cause release of histones that may trigger patho-logical coagulation changes. Activation of protein C has been suggested to mitigate thepathological effects of histones. Soluble thrombomodulin (sTM) (Solulin; provided byPAION Deutschland GmbH, Germany) is an investigational drug that activates TAFI andProtein C, hence modifying clot stability and thrombin generation (TG).OBJECTIVES. Investigate aetiology of haemostatic changes in a porcine model of ICHand BD and test the in vitro effect of sTM on TG and clot stability. Hypotheses: (1) BDcauses hyper coagulation and decreased clot stability, (2) Pathological coagulation changesare temporally associated with release of histones, and (3) In vitro addition of high dosesTM decreases the initial hyper coagulation following BD by reducing TG, and (4) low dosesTM increases clot stability.METHODS. Using a model of ICH and BD, 20 pigs were randomized to healthycontrol (n = 10) or BD (n = 10). Blood samples were taken at eight time pointsduring an 8 h observation period. Clot stability was measured in plasma by anautomated lysis test with porcine TF (1/1,200) and tPA (120 nM). Outcome variablewas area under the curve for turbidity. TG was recorded by the CAT method activatedwith porcine TF (1/1,200). Histones and PAI-1 were measured by ELISA. Followingtitration studies, experiments with in vitro addition of sTM at 10 and 50 nM wereperformed.
26th ESICM ANNUAL CONGRESS — PARIS, FRANCE — 5–9 OCTOBER 2013
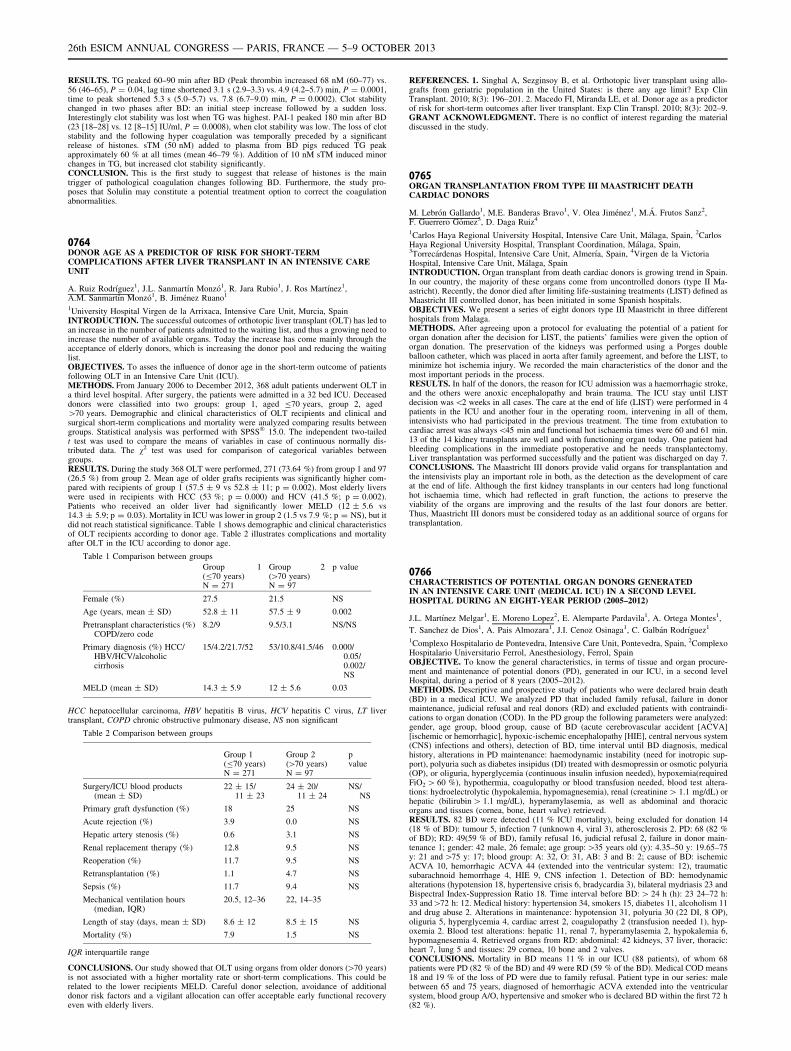
RESULTS. TG peaked 60–90 min after BD (Peak thrombin increased 68 nM (60–77) vs.56 (46–65), P = 0.04, lag time shortened 3.1 s (2.9–3.3) vs. 4.9 (4.2–5.7) min, P = 0.0001,time to peak shortened 5.3 s (5.0–5.7) vs. 7.8 (6.7–9.0) min, P = 0.0002). Clot stabilitychanged in two phases after BD: an initial steep increase followed by a sudden loss.Interestingly clot stability was lost when TG was highest. PAI-1 peaked 180 min after BD(23 [18–28] vs. 12 [8–15] IU/ml, P = 0.0008), when clot stability was low. The loss of clotstability and the following hyper coagulation was temporally preceded by a significantrelease of histones. sTM (50 nM) added to plasma from BD pigs reduced TG peakapproximately 60 % at all times (mean 46–79 %). Addition of 10 nM sTM induced minorchanges in TG, but increased clot stability significantly.CONCLUSION. This is the first study to suggest that release of histones is the maintrigger of pathological coagulation changes following BD. Furthermore, the study pro-poses that Solulin may constitute a potential treatment option to correct the coagulationabnormalities.
0764DONOR AGE AS A PREDICTOR OF RISK FOR SHORT-TERMCOMPLICATIONS AFTER LIVER TRANSPLANT IN AN INTENSIVE CAREUNIT
A. Ruiz Rodrı́guez1, J.L. Sanmartı́n Monzó1, R. Jara Rubio1, J. Ros Martı́nez1,A.M. Sanmartı́n Monzó1, B. Jiménez Ruano1
1University Hospital Virgen de la Arrixaca, Intensive Care Unit, Murcia, SpainINTRODUCTION. The successful outcomes of orthotopic liver transplant (OLT) has led toan increase in the number of patients admitted to the waiting list, and thus a growing need toincrease the number of available organs. Today the increase has come mainly through theacceptance of elderly donors, which is increasing the donor pool and reducing the waitinglist.OBJECTIVES. To asses the influence of donor age in the short-term outcome of patientsfollowing OLT in an Intensive Care Unit (ICU).METHODS. From January 2006 to December 2012, 368 adult patients underwent OLT ina third level hospital. After surgery, the patients were admitted in a 32 bed ICU. Deceaseddonors were classified into two groups: group 1, aged B70 years, group 2, aged[70 years. Demographic and clinical characteristics of OLT recipients and clinical andsurgical short-term complications and mortality were analyzed comparing results betweengroups. Statistical analysis was performed with SPSS� 15.0. The independent two-tailedt test was used to compare the means of variables in case of continuous normally dis-tributed data. The v2 test was used for comparison of categorical variables betweengroups.RESULTS. During the study 368 OLT were performed, 271 (73.64 %) from group 1 and 97(26.5 %) from group 2. Mean age of older grafts recipients was significantly higher com-pared with recipients of group 1 (57.5 ± 9 vs 52.8 ± 11; p = 0.002). Most elderly liverswere used in recipients with HCC (53 %; p = 0.000) and HCV (41.5 %; p = 0.002).Patients who received an older liver had significantly lower MELD (12 ± 5.6 vs14.3 ± 5.9; p = 0.03). Mortality in ICU was lower in group 2 (1.5 vs 7.9 %; p = NS), but itdid not reach statistical significance. Table 1 shows demographic and clinical characteristicsof OLT recipients according to donor age. Table 2 illustrates complications and mortalityafter OLT in the ICU according to donor age.
Table 1 Comparison between groups
Group 1(B70 years)N = 271
Group 2([70 years)N = 97
p value
Female (%) 27.5 21.5 NS
Age (years, mean ± SD) 52.8 ± 11 57.5 ± 9 0.002
Pretransplant characteristics (%)COPD/zero code
8.2/9 9.5/3.1 NS/NS
Primary diagnosis (%) HCC/HBV/HCV/alcoholiccirrhosis
15/4.2/21.7/52 53/10.8/41.5/46 0.000/0.05/0.002/NS
MELD (mean ± SD) 14.3 ± 5.9 12 ± 5.6 0.03
HCC hepatocellular carcinoma, HBV hepatitis B virus, HCV hepatitis C virus, LT livertransplant, COPD chronic obstructive pulmonary disease, NS non significant
Table 2 Comparison between groups
Group 1(B70 years)N = 271
Group 2([70 years)N = 97
pvalue
Surgery/ICU blood products(mean ± SD)
22 ± 15/11 ± 23
24 ± 20/11 ± 24
NS/NS
Primary graft dysfunction (%) 18 25 NS
Acute rejection (%) 3.9 0.0 NS
Hepatic artery stenosis (%) 0.6 3.1 NS
Renal replacement therapy (%) 12.8 9.5 NS
Reoperation (%) 11.7 9.5 NS
Retransplantation (%) 1.1 4.7 NS
Sepsis (%) 11.7 9.4 NS
Mechanical ventilation hours(median, IQR)
20.5, 12–36 22, 14–35
Length of stay (days, mean ± SD) 8.6 ± 12 8.5 ± 15 NS
Mortality (%) 7.9 1.5 NS
IQR interquartile range
CONCLUSIONS. Our study showed that OLT using organs from older donors ([70 years)is not associated with a higher mortality rate or short-term complications. This could berelated to the lower recipients MELD. Careful donor selection, avoidance of additionaldonor risk factors and a vigilant allocation can offer acceptable early functional recoveryeven with elderly livers.
REFERENCES. 1. Singhal A, Sezginsoy B, et al. Orthotopic liver transplant using allo-grafts from geriatric population in the United States: is there any age limit? Exp ClinTransplant. 2010; 8(3): 196–201. 2. Macedo FI, Miranda LE, et al. Donor age as a predictorof risk for short-term outcomes after liver transplant. Exp Clin Transpl. 2010; 8(3): 202–9.GRANT ACKNOWLEDGMENT. There is no conflict of interest regarding the materialdiscussed in the study.
0765ORGAN TRANSPLANTATION FROM TYPE III MAASTRICHT DEATHCARDIAC DONORS
M. Lebrón Gallardo1, M.E. Banderas Bravo1, V. Olea Jiménez1, M.Á. Frutos Sanz2,F. Guerrero Gómez3, D. Daga Ruiz4
1Carlos Haya Regional University Hospital, Intensive Care Unit, Málaga, Spain, 2CarlosHaya Regional University Hospital, Transplant Coordination, Málaga, Spain,3Torrecárdenas Hospital, Intensive Care Unit, Almerı́a, Spain, 4Virgen de la VictoriaHospital, Intensive Care Unit, Málaga, SpainINTRODUCTION. Organ transplant from death cardiac donors is growing trend in Spain.In our country, the majority of these organs come from uncontrolled donors (type II Ma-astricht). Recently, the donor died after limiting life-sustaining treatments (LIST) defined asMaastricht III controlled donor, has been initiated in some Spanish hospitals.OBJECTIVES. We present a series of eight donors type III Maastricht in three differenthospitals from Malaga.METHODS. After agreeing upon a protocol for evaluating the potential of a patient fororgan donation after the decision for LIST, the patients’ families were given the option oforgan donation. The preservation of the kidneys was performed using a Porges doubleballoon catheter, which was placed in aorta after family agreement, and before the LIST, tominimize hot ischemia injury. We recorded the main characteristics of the donor and themost important periods in the process.RESULTS. In half of the donors, the reason for ICU admission was a haemorrhagic stroke,and the others were anoxic encephalopathy and brain trauma. The ICU stay until LISTdecision was\2 weeks in all cases. The care at the end of life (LIST) were performed in 4patients in the ICU and another four in the operating room, intervening in all of them,intensivists who had participated in the previous treatment. The time from extubation tocardiac arrest was always\45 min and functional hot ischaemia times were 60 and 61 min.13 of the 14 kidney transplants are well and with functioning organ today. One patient hadbleeding complications in the immediate postoperative and he needs transplantectomy.Liver transplantation was performed successfully and the patient was discharged on day 7.CONCLUSIONS. The Maastricht III donors provide valid organs for transplantation andthe intensivists play an important role in both, as the detection as the development of careat the end of life. Although the first kidney transplants in our centers had long functionalhot ischaemia time, which had reflected in graft function, the actions to preserve theviability of the organs are improving and the results of the last four donors are better.Thus, Maastricht III donors must be considered today as an additional source of organs fortransplantation.
0766CHARACTERISTICS OF POTENTIAL ORGAN DONORS GENERATEDIN AN INTENSIVE CARE UNIT (MEDICAL ICU) IN A SECOND LEVELHOSPITAL DURING AN EIGHT-YEAR PERIOD (2005–2012)
J.L. Martı́nez Melgar1, E. Moreno Lopez2, E. Alemparte Pardavila1, A. Ortega Montes1,
T. Sanchez de Dios1, A. Pais Almozara1, J.I. Cenoz Osinaga1, C. Galbán Rodrı́guez1
1Complexo Hospitalario de Pontevedra, Intensive Care Unit, Pontevedra, Spain, 2ComplexoHospitalario Universitario Ferrol, Anesthesiology, Ferrol, SpainOBJECTIVE. To know the general characteristics, in terms of tissue and organ procure-ment and maintenance of potential donors (PD), generated in our ICU, in a second levelHospital, during a period of 8 years (2005–2012).METHODS. Descriptive and prospective study of patients who were declared brain death(BD) in a medical ICU. We analyzed PD that included family refusal, failure in donormaintenance, judicial refusal and real donors (RD) and excluded patients with contraindi-cations to organ donation (COD). In the PD group the following parameters were analyzed:gender, age group, blood group, cause of BD (acute cerebrovascular accident [ACVA][ischemic or hemorrhagic], hypoxic-ischemic encephalopathy [HIE], central nervous system(CNS) infections and others), detection of BD, time interval until BD diagnosis, medicalhistory, alterations in PD maintenance: haemodynamic instability (need for inotropic sup-port), polyuria such as diabetes insipidus (DI) treated with desmopressin or osmotic polyuria(OP), or oliguria, hyperglycemia (continuous insulin infusion needed), hypoxemia(requiredFiO2 [ 60 %), hypothermia, coagulopathy or blood transfusion needed, blood test altera-tions: hydroelectrolytic (hypokalemia, hypomagnesemia), renal (creatinine [ 1.1 mg/dL) orhepatic (bilirubin [ 1.1 mg/dL), hyperamylasemia, as well as abdominal and thoracicorgans and tissues (cornea, bone, heart valve) retrieved.RESULTS. 82 BD were detected (11 % ICU mortality), being excluded for donation 14(18 % of BD): tumour 5, infection 7 (unknown 4, viral 3), atherosclerosis 2. PD: 68 (82 %of BD); RD: 49(59 % of BD), family refusal 16, judicial refusal 2, failure in donor main-tenance 1; gender: 42 male, 26 female; age group:[35 years old (y): 4.35–50 y: 19.65–75y: 21 and [75 y: 17; blood group: A: 32, O: 31, AB: 3 and B: 2; cause of BD: ischemicACVA 10, hemorrhagic ACVA 44 (extended into the ventricular system: 12), traumaticsubarachnoid hemorrhage 4, HIE 9, CNS infection 1. Detection of BD: hemodynamicalterations (hypotension 18, hypertensive crisis 6, bradycardia 3), bilateral mydriasis 23 andBispectral Index-Suppression Ratio 18. Time interval before BD: [ 24 h (h): 23 24–72 h:33 and[72 h: 12. Medical history: hypertension 34, smokers 15, diabetes 11, alcoholism 11and drug abuse 2. Alterations in maintenance: hypotension 31, polyuria 30 (22 DI, 8 OP),oliguria 5, hyperglycemia 4, cardiac arrest 2, coagulopathy 2 (transfusion needed 1), hyp-oxemia 2. Blood test alterations: hepatic 11, renal 7, hyperamylasemia 2, hypokalemia 6,hypomagnesemia 4. Retrieved organs from RD: abdominal: 42 kidneys, 37 liver, thoracic:heart 7, lung 5 and tissues: 29 cornea, 10 bone and 2 valves.CONCLUSIONS. Mortality in BD means 11 % in our ICU (88 patients), of whom 68patients were PD (82 % of the BD) and 49 were RD (59 % of the BD). Medical COD means18 and 19 % of the loss of PD were due to family refusal. Patient type in our series: malebetween 65 and 75 years, diagnosed of hemorrhagic ACVA extended into the ventricularsystem, blood group A/O, hypertensive and smoker who is declared BD within the first 72 h(82 %).
26th ESICM ANNUAL CONGRESS — PARIS, FRANCE — 5–9 OCTOBER 2013
0767ANOXIC ENCEPHALOPATHY IN AN INTENSIVE CARE UNIT. A REPORTOF 14 YEARS OF EXPERIENCE
A. Estella1, L. Pérez Bello Fontaiña1, J. Sánchez1, V. Pérez Madueño1, M. Recuerda1,
M. Jaén1, A. Jareño1
1Hospital del SAS de Jerez, Intensive Care Unit, Jerez de la Frontera, SpainINTRODUCTION. Cardiac or respiratory arrests are the main potential causes of cerebralanoxia. Anoxic encephalopathy is a dreaded complication in critically ill patients aftercardiopulmonary resuscitation manoeuvres and involves a high mortality and long-termmorbidity.OBJECTIVES. The aim of the present study is to describe clinical profile of patients whodevelop anoxic encephalopathy during ICU admission, to identify the causes of this com-plication and to analyze clinical outcome and mortality of these patients.METHODS. Retrospective study performed in a 17 beds medical/surgical ICU of a com-munity hospital. Consecutive patients who developed hypoxic-ischemic encephalopathyduring their stay in the ICU were reviewed. Time of study analysed was 14 years. Age,gender, origin prior admission, ICU length of stay, tracheotomy requirements, duration ofcardiopulmonary resuscitation manoeuvres, defibrillations, ICU mortality, hidden mortalityand functional outcomes of survivors were collected. Statistical analysis: Data were ana-lyzed by SPSS 18.RESULTS. 116 patients, 84 male and 32 female, were analyzed. 50 % of patients wereinitially treated in extra hospitalary site. Half of patients had shockable rhythms with a meanof 4.75 ± 5.3 defibrillations required; mean time of cardiopulmonary resuscitation was17 min with a range (4–45). Mean age was 60.5 ± 14 years. ICU length of stay was8.2 ± 7.1 days. Only 15.5 % had not any risk vascular factor, 37.9 % were smoker, 40.5 %were hypertensive, 29.3 % had diabetes mellitus, 20.7 % dyslipidemia and 8.6 % wereobese. In 13.8 % of patients the cause of cardiac arrest was unknown. Main initial cause forinitiating cardiopulmonary resuscitation were acute coronary syndrome, 40.5 %, andrespiratory insufficiency, 25.9 %, other causes were ventricular fibrillation, 6.9 %, andhaemorrhagic shock, 3.4 %. Tracheotomy was performed in 25.9 % of patients, and 7.8 %were organ donors. 80 of 116 patients died in ICU (69 %), hidden mortality was 44.4 %, 14of 36 survivors died in hospital ward in the first month in a mean time of 7.5 ± 5.8 daysafter ICU discharge, and two patients died 6 months after ICU admission. Only nine patientssurvived with a reasonable meaningful quality of life, the remaining survivors had severeneurological sequelaes.CONCLUSIONS. �Anoxic encephalopathy is a severe complication associated with a highmortality and morbidity.�A low percentage of patients who develop anoxic encephalopathy in ICU survive to ameaningful life.�Predominant clinical profile was: 60 years old male patients with vascular risk factorsassociated and cardiac arrest due to acute coronary syndrome.
0768POTENTIALITY OF DONATION AFTER CONTROLLED ASYSTOLE (DCA)PROGRAM IN A SPANISH HOSPITAL
A. Sandiumenge1,2,3, M. Llauradó2,3, E. Cos1, V. Blazquez1, P. López4, J. Twose4,
M. Bodı́1,2,3
1University Hospital Joan XXIII, Intensive Care Unit, Tarragona, Spain, 2Universitat Rovirai Virgili, Tarragona, Spain, 3Institut d’Investigació Sanitària Pere Virgili, Intensive CareUnit-University Hospital Joan XXIII, Tarragona, Spain, 4Catalan Transplant Organization,Barcelona, SpainINTRODUCTION. In an effort to increase the pool of organs harvested for transplantationnew legal regulation and the publication of recommendations of DCA have been released inSpain. However, before investing human and technical resources in its implementation isadvisable to evaluate its potentiality.OBJECTIVE. To analyse the potentiality of a DCA program in our setting.METHODS. Prospective, observational, 9-months study of all patients who died after livesupport therapy limitation (LSTL) in a 30-bed adult polyvalent intensive care unit (ICU) of auniversity tertiary hospital.Patient’s characteristics and LSTL actions were described. Potentiality for DCA wasassessed through analysis of clinical, analytical and total ischemia times (Tit) in patients inwhom withdrawing of mechanical ventilation (MV) and/or vasoactive support (VAS) wasperformed as a form of LSTL.A total of 604 patients were admitted in the ICU during the study period with a mortalityrate of 20.5 % (n = 122; 7 utilized brain death donors).RESULTS. During the study period, 123 patients underwent LSTL, 74 of whom (60.6 %)died after LTST initiation (66.2 % male; 68.4 ± 14.2 years old; APACHE II 21.9 ± 6.7;73.0 % medical, 23.0 % surgical, 6.8 % trauma, and 21.6 % neurocritical).Main reasons to initiate LSTL were comorbidity (58.0 %) and futility of therapy (40.5 %)being withdrawal the main LSTL action implemented (n = 61, 82.4 %). LSTL actions wereinitiated 8 days (d) and 10 h (h) ± 10 d and 18 h after admission and 58 % (n = 43) of thepatients had already underwent a previous LSTL action.Patients died 14 h and 25 min (min) ± 29 h, 29 min after LTSL initiation, being MV or/andVAS (n = 39) discontinuation the measures showing the shortest time to cardiac arrest (3 h,45 min ± 4 h, 15 min). Of patients in whom VAS and/or VM was withdrawn, 21 wer-e B 70 years old and 15 of them (38.5 %) were medically eligible. Of these patients sevenhad Tit B60 min and two of them had no organ-specific contraindications for organdonation. A total of four kidneys, two livers and one lung could have been harvested.CONCLUSIONS. The initiation of a DCA program in our hospital would have increased by28 % our potential donor number (22.2 % kidneys, 33.3 % livers, 33.3 % lungs). It isimportant to evaluate the potentiality of DCA in a hospital prior to its implementation.
0769BENEFICIAL EFFECT OF CORTICOSTEROID USAGE ON NUMBEROF RETRIEVED ORGANS PER ORGAN DONOR IN OUR HOSPITALFROM 2004 TO 2012
Z. Gavranovic1, A. Horvat1, A. Gopcevic1, M. Vucic1, B. Rode1
1Clinical Hospital Center Sestre Milosrdnice, Zagreb, CroatiaINTRODUCTION. Brain death is followed by significant endocrine alterations due tohypothalamic disfunction. The secretion of hormones is impaired which is clinically man-ifested as fluid and electrolyte disturbances that contribute to hemodynamic instability of the
donor. Brain death also causes a systemic inflammatory response due to release of proin-flammatory cytokines which contributes to lower number of retrieved organs and worsegraft survival. Routine corticosteroid usage in donors decreases such an inflammatoryresponse and increases number of retrieved organs.OBJECTIVES. To evaluate effect of corticosteroid usage on number of retrieved organsper organ donor in our hospital from 2004 to 2012 comparing donors who did not receivecorticosteroid therapy and donors who received such therapy.METHODS. Retrospective study.RESULTS. We had 146 brain-dead organ donors in our intensive care unit in the periodfrom 2004 to 2012. Organ donors in year 2004 did not receive corticosteroid therapy andcorticosteroid usage was routinely implemented as the part of organ donor managementfrom year 2005. Hydrocortisone was given in boluses of 100 mg intravenously three timesdaily. Mean number of retrieved organs per organ donor in year 2004 was 1.6, and in theperiod from 2005 to 2012 it was 2.6 (P \ 0.001). All other pharmacological therapyregarding organ donor management did not differ in year 2004 from the period 2005–2012.CONCLUSIONS. Our results show a statistically significant increase in number ofretrieved organs per organ donor when comparing donors who did not receive corticosteroidtherapy and donors who received such therapy. Since all other pharmacological therapy wasthe same in both two periods analyzed, we conclude that corticosteroid usage had beneficialeffect in terms of increasing the number of retrieved organs per organ donor.REFERENCE(S). 1. Phongsamran PV. Critical care pharmacy in donor management. ProgTranspl. 2004; 14: 105–13. 2. Barklin A. Systemic inflammation in the brain-dead organdonor. Acta Anaesthesiol Scand. 2009; 53(4): 425–35. 3. Novitzky D, Cooper DK, Ro-sendale JD et al. Hormonal therapy of the brain-dead organ donor: experimental and clinicalstudies. Transplantation. 2006; 82(11): 1396–401. 4. Rosendale JD, Kauffman HM,McBride MA et al. Aggressive pharmacologic donor management results in more trans-planted organs. Transplantation. 2003; 75(4): 482–7.
0770EVALUATION OF SEPSIS IN ORGAN DONATION AND ITS IMPACTON PROCUREMENT
T. Goranovic1, D. Bejuk2, Z. Milan3, I. Bielen4, M. Martinac5, D. Tonkovic1
1Sveti Duh University Hospital, Department of Anaesthesiology and Intensive CareMedicine, Zagreb, Croatia, 2Sveti Duh University Hospital, Department of Microbiology,Zagreb, Croatia, 3King’s College Hospital, Department of Anaesthesia, London, UK, 4SvetiDuh University Hospital, Department of Neurology, Zagreb, Croatia, 5Sveti Duh UniversityHospital, Department of Surgery, Zagreb, CroatiaINTRODUCTION. Sepsis has been considered as a relative contraindication to organdonation. Blood culture screening is standardised and mandatory in all potential organdonors.OBJECTIVES. The purpose of this study was to examine the impact of evaluation of sepsisamongst potential organ donors on procurement process.METHODS. All neurological intensive care unit patients, who were admitted to Sveti DuhUniversity Hospital and were reported to the hospital transplant coordinator as potentialorgan donors from 01/2008 to 04/2013, were identified. Demographics, clinical, laboratoryand procurement data including the causes of procurement failure were abstracted.RESULTS. During a 5-year period, a total of 35 patients were evaluated for organ donationand a total of 11 patients were actual organ donors. Mean age of potential organ donors was61.26 ± 9.38 years; 18 (51 %) were male, 35 (100 %) were Caucasians, 4 (11 %) patientswith ischaemic stroke, and 31 (89 %) patients with a traumatic intracerebral and sub-arachnoid haemorrhage. Mean age of actual organ donors was 61.36 ± 10.60 years;4 (36 %) were male, 11 (100 %) were Caucasians, 1 (10 %) patients with ischaemic stroke,and 10 (90 %) patients with a traumatic intracerebral and subarachnoid haemorrhage. Inpotential organ donors, suspected positive blood cultures were found in one patient (3 %)and definite positive blood cultures in five patients (14 %). In one case of suspected positiveblood cultures, the samples were recultivated, and after receiving negative results theprocurement was finalized. In three cases of definitive positive blood cultures brain deathwas not confirmed by paraclinic study. In one case of definite positive blood cultures thefamily denied consent, so the support was further withdrawn. In another case of definitepositive blood cultures, the organs were maintained until laboratory data proved the treat-ment control over sepsis, so organ procurement was possible. Time to procurement in non-sepsis actual organ donors was significantly shorter (12.77 ± 2.38 vs 20.00 ± 2.83 h,p \ 0.05).CONCLUSIONS. Of all our patients screened for organ donation, sepsis was identified in14 %. Since it was well controlled, we can conclude that in our pool of patients, sepsis hadno impact on the final organ procurement. However, suspicion or prove of sepsis requiredmore diagnostics and treatment engagement and prolonged time to organ procurement.
0771REVERSIBLE CARDIOMYOPATHY AFTER STATUS EPILEPTICUSIN INTENSIVE CARE UNIT: INCIDENCE AND RISK FACTORS
D. Belcour1, J. Jabot1, B. Grard1, L. Ursulet1, A. Roussiaux1, C. Ferdynus2, D. Vandroux1,
P. Vignon3
1Hopital Félix Guyon CHU de la Réunion, Service de Réanimation Polyvalente, Saint-Denis, Reunion, 2Hopital Félix Guyon CHU de la Réunion, DRCI, Saint-Denis, Reunion,3CHU de Limoges, Service de Réanimation Polyvalente, Limoges, FranceINTRODUCTION. Epilepsy is a common etiology for stress-related reversible cardio-myopathy [1–3]. Its incidence after a status epilepticus requiring ICU admission has notbeen described yet. We hypothesize that Reversible Cardiomyopathy associated with StatusEpilepticus (ReCaSE) is underestimated.MATERIALS AND METHODS. This prospective observational study was conducted in a23-bed university hospital unit, from April 2011 to September 2012. Primary endpoint wasthe occurrence of ReCaSE in patients admitted in our intensive care unit. Secondary end-point was to discover potential risk factors for ReCaSE. All adults admitted in our center forstatus epilepticus were included. Data collection was conducted from admission (H0) to H48.At every time of the study (H0, H6, H12, H24 and H48), were collected hemodynamic data(obtained from transthoracic echocardiography and transpulmonary thermodilution), bio-logical data (troponin, arterial blood lactate, creatine kinase serum level and central venousblood oxygen saturation) and an electrocardiogram (ECG). Echocardiographic data wereanalyzed a posteriori by an independent and blinded expert. ReCaSE was defined as a 20 %increase in left ventricular ejection fraction (LVEF) from H0 or H6 to H48, which wasconsidered as the steady state (recovery from admission).
26th ESICM ANNUAL CONGRESS — PARIS, FRANCE — 5–9 OCTOBER 2013
RESULTS. 32 patients (21 male and 11 female) were included and 56 % of them developedreversible cardiomyopathy. Identified risk factors for ReCaSE were age and SAPS II. Nostatistical difference was found for other studied parameters, like age, gender, status epi-lepticus duration, seizure number, delay to treatment and thiopental administration. Whencompared to H24 and H48, cardiac index was significantly lower at H0 and H6 with noinfluence upon arterial blood pressure. Arterial blood lactate was higher at H0 than H12, H24
and H48. Over the observation period, other biological data were comparable and echo-cardiographic findings did not vary significantly. Catecholamine infusion (dobutamine and/or norepinephrine) was significantly more frequent in the ReCaSE group (n = 13 vs. n = 4,p = 0.03).CONCLUSION. In our study, the occurrence of ReCaSE is high and should incite phy-sicians caring for status epilepticus patients to use hemodynamic monitoring widely. Ageand SAPS II are the only two risk factors identified.REFERENCE(S).1. Stollberger C, Wegner C, Finsterer J. Seizure-associated Takotsubo cardiomyopathy.Epilepsia. 2011; 52(11): e160–167. 2. Stollberger C, Wegner C, Finsterer J. Seizure-inducedTakotsubo syndrome is more frequent than reported. Int J Cardiol. 2011; 150(3): 359–360.3. Le Ven F, Pennec PY, Timsit S, Blanc JJ. Takotsubo syndrome associated with seizures:an underestimated cause of sudden death in epilepsy? Int J Cardiol. 2011; 146(3): 475–479.
0772MEASUREMENT OF RADICAL OXYGEN SPECIES IN CEREBROSPINAL FLUIDFOR RAPID DIAGNOSIS OF NOSOCOMIAL MENINGITIS: A MULTICENTRESTUDY
A.-C. Lukaszewicz1, V. Faivre1, H. Bout2, E. Gayat1, T. Lagergren1, C. Damoisel1,D. Bresson1, J. Mantz2, D. Payen1
1Université Paris Diderot, Sorbonne Paris Cité, Paris, France, 2Université Paris Diderot,Sorbonne Paris Cité, Clichy, FranceINTRODUCTION. Nosocomial meningitis is a daily concern after traumatic brain injuryor neurosurgery, that imposes multiple microbiological and biochemical analyses of cere-brospinal fluid (CSF). Precautionary attitude leads to administer wide-spectrum antibioticswaiting for results of analyses.OBJECTIVES. To test the interest of radical oxygen species (ROS) measurement byluminescence in CSF for rapid diagnosis of meningitis (ref).METHODS. Patients were included in surgical ICU and neurosurgery department ofLariboisière and Beaujon Hospitals (Assistance Publique Hôpitaux de Paris), because offever in the context of brain trauma or postoperative period of neurosurgery, with or withoutexternal ventricular drainage. Test of ROS measurements was first applied in a monocentretraining cohort (cohort 1, n = 54) then in a multicentre testing cohort (cohort 2, n = 136).Luminescence was measured in presence of luminol in basal condition and after stimulationby phorbol 12-myristate 13-acetate (condition PMA). Because there is no consensus ondefinition of nosocomial meningitis, the performance of the test was compared to diagnosismade by two experts blinded for the results.RESULTS. Incidence of meningitis was 25.9 % in cohort 1 and 15.4 % in cohort 2(p = 0.1). Basal and PMA-stimulated production of ROS were higher in CSF of patientswith meningitis than in negative CSF in both cohorts (p \ 0.001). In cohort 2, prediction ofmeningitis was associated with AUC at 0.812 (0.680–0.815) in basal condition and 0.834(0.723–0.836) in PMA stimulation. Specificity of the test (0.9) and negative predictive value(0.95) were excellent.CONCLUSIONS. Interest of rapid ROS measurement was confirmed in suspicion ofmeningitis and should oriented diagnosis and eventually treatment. Such bedside diagnostictool may reduce the number of specialised analysis, over-treated febrile patients andresistances in bacterial ecology.REFERENCE(S). 1. Lukaszewicz AC, Gontier G, Faivre V, Ouanounou I, Payen D. AnnInt Care. 2012; 2:10.GRANT ACKNOWLEDGMENT. Patent: PCT/IB2011/053329 no. publication WO2012/014156.
0773ACQUIRED PSEUDOCHOLINESTERASE DEFICIENCY IN CRITICAL ILLNESSPOLYMYOPATHY
R.S. Prager1, C.A. Reid2, L.J. Simon1, A.A. Pastewski1, D. Bayard1, T.J. Diaz1, J.S. Socha1
1University of Miami, Jackson Health System, Jackson South Community Hospital,Department of Intensive Care, Palmetto Bay, USA, 2University of MIami, Jackson HealthSystem, Jackson South Community Hospital, Department of Intensive Care, Palmetto Bay,USAINTRODUCTION. Critical illness polymyopathy causes substantial limb weakness, con-tributes to ventilator dependency, and is associated with prolonged hospital stays andconsiderable morbidity. This retrospective study identifies acquired serum Pseudocholin-esterase deficiency occurrence as a pathologic mechanism for critical illness polymyopathy.The finding that critically ill patients may develop acquired pseudocholinesterase deficiencythat leads to muscle weakness and paralysis, allows for better intervention and reversal ofthis important, severe and often persistent complication among critically ill patientsadmitted to the intensive care unit.OBJECTIVES. Our retrospective study aimed to identify acquired pseudocholinesterasedeficiency as a cause of critical illness polymyopathy and how initiating treatment canreverse the progression of this disease.METHODS. 14 patients (7 males, 7 females) mean 64 ± 16 years; (range 42–92 years)participated in this study review. The patients were affected by sepsis syndrome, pneu-monia, respiratory failure and myopathy. Pre and Post serum pseudocholinesterase wasmeasured before and after treatment and muscle strength against gravity.RESULTS. The mean hospital length of stay was 39 ± 18 and intensive care unit length ofstay 29 ± 20 days respectively. The mean predicted mortality was 25.4 ± 22.5 % (range6.6–83 %) and APACHE II score mean 15.1 ± 8.5. The serum pre pseudocholinesteraselevel was mean 2.09 ± 0.98 (n = 14, range 0.70–4.10 mU/ml) (normal [ 5.9 mU/ml). Theserum post pseudocholinesterase level rose from mean 2.11 ± 1.07 to 4.48 ± 1.11 mU/ml(P = 0.0001, n = 12, paired sample t-test, SPSS, Data, version 20.0) (2 by attrition) afterreceiving fresh frozen plasma mean 12 ± 11 units (range 2–46 units) over a period of daysmean 7.1 ± 5.5 (range 1.0–18). All patients muscle strength improved against gravity withtreatment.
CONCLUSIONS. Our findings suggest that acquired pseudocholinesterase deficiency incritically ill patients leads to critical illness myopathy and initiating treatment can reverseand prevent the progression of this disease and should be considered as therapeutic benefitand cause for critical illness polymyopathy. Accordingly, clinical trials of acquired pseu-docholinesterase deficiency treatment in critically ill patients should be considered and arewarranted.
0774ELEVATED AMMONIUM LEVELS DURING TREATMENT WITH VALPROICACID
L. Khattar1, A. Brasseur1, E. Antonucci1, J.-L. Vincent1, F.S. Taccone1
1Hopital Erasme, Bruxelles, BelgiumINTRODUCTION. Elevated ammonium levels (EAL) are one of the side effects of val-proic acid (VPA) treatment. This complication has been described during long-term VPAtreatment, but less in critically ill patients.OBJECTIVES. The aim of this study was to evaluate the incidence and the factors asso-ciated with EAL in those patients.METHODS. A retrospective study in a mixed 35-bed ICU care of a tertiary universityhospital was conducted over a 4-year period (2007–2010). Inclusion criteria were; (a) VPAtherapy for more than 72 h; (b) age [18 years; (c) at least one measurement of ammoniumlevels during the ICU stay; (d) Child C liver cirrhosis. EAL was defined as ammoniumlevels above 50 mcg/dL. Demographic data, comorbidities, reason for VPA treatment,biological data, concomitant therapies, presence of infection and ICU mortality werecollected.RESULTS. A total of 168 patients met the inclusion criteria (median age 64 years, 95 malegender). Most of them (137/168) were admitted for neurological reasons. Overall ICUmortality was 23 %. Median ammonium levels were 88 (55–121) mcg/dL. EAL was foundin 121 (72 %) patients; of those, 38 (31 %) had ammonium levels between 100 and150 mcg/dL, 11 (9 %) between 150 and 200 mcg/dL and 13 (11 %) above 250 mcg/dL.Median time from start of VPA therapy to EAL was 4 (3–5) days. Median maximum VPAlevel during therapy was 72 (51–88) and was significantly higher in EAL patients than in theothers (76 [58–92] mcg/mL vs. 56 [39–81] mcg/mL, p \ 0.01). EAL were more frequentlyobserved in patients with sepsis (p \ 0.01) and in those treated with mechanical ventilation(p \ 0.01), vasopressors (p = 0.05) and at least one other antiepileptic drug (p = 0.02);these patients tended to have a higher ICU mortality (28 vs. 13 %, p = 0.06).CONCLUSIONS. Ammonium levels are often elevated during treatment with valproic acidin ICU patients, especially in those with the greatest severity. This alteration may contributeto their alteration in brain function.
0775STATUS EPILEPTICUS IN CIRRHOTIC PATIENTS: IMPACT OFA EXPERIMENTED PHYSICIANS AND ELECTROPHYSIOLOGIST’S INPUT TOAVOID OVER DIAGNOSIS IN PATIENTS WITH HEPATIC ENCEPHALOPATHY
C. Marois1, M. Rudler2, H. Benosman2, S. Mouri2, D. Thabut2, N. Weiss1, V. Navarro3
1Groupement Hospitalier Pitié-Salpêtrière-Charles Foix–Assistance Publique–Hôpitaux deParis, Neurological ICU, Neurology Department, Paris, France, 2Groupement HospitalierPitié-Salpêtrière-Charles Foix–Assistance Publique–Hôpitaux de Paris, Hepatology ICU,Paris, France, 3Groupement Hospitalier Pitié-Salpêtrière-Charles Foix–AssistancePublique–Hôpitaux de Paris, Neurophysiology Department, Paris, FranceINTRODUCTION. Status epilepticus (SE) is a rare condition in cirrhotic patients. How-ever (1) myoclonic jerks of hepatic encephalopathy (HE) can be misdiagnosed as seizuresand (2) subtle SE be cumbersome to distinguish from HE by non expert electrophysiologists.Therefore, SE may be overdiagnosed in cirrhotic patients, leading to abusive prescription ofantiepileptic drugs like benzodiazepine, which worsen HE.OBJECTIVES. To assess the proportion of confirmed SE in cirrhotic patients previouslydiagnosed with SE, using a critical reading of medical reports and EEG by experimentedphysicians and electrophysiologists.METHODS. We retrospectively reviewed all the files of patients hospitalized in Hepa-tology ICU for complication of cirrhosis in whom SE diagnosis was retained by thephysicians in charge of the patients. Medical reports and EEG were critically reviewed by anexpert electrophysiologist, a senior hepatologist and a senior neurologist. Final diagnosis ofSE was made by consensus.RESULTS. 12 patients were included in the study (age 62 [56–68], male gender 50 %).Etiologies of cirrhosis were: alcohol alone in 9 patients (75 %), alcohol and HCV in 2patients (17 %), HCV alone in 1 patient (8 %). Median MELD score was 25 (16–30); 1patient (8 %) was Child-Pugh A, 1 patient (8 %) Child-Pugh B and 10 patients (83 %)Child-Pugh C. Out of these 12 patients, 9 patients (75 %) presented generalized tonicoclonicseizures, 2 partial seizures and one was comatose. After critical review, nine diagnosis of SE(75 %) were finally retained. SE was overdiagnosed in three comatose patients. In thosepatients, two EEG showed figures of benzodiazepine impregnation, and one showed slowwaves without epileptic discharges.CONCLUSIONS. This preliminary study suggests that the diagnosis of SE was made inexcess 25 % of patients. In an emergency setting, precise physical examination by a skilledphysician is often impossible, and myoclonic jerks of HE could be misdiagnosed as seizures.Similarly, detailed EEG analysis is cumbersome to perform in this condition. The criticalreview of medical files and EEG seems able to minimize overdiagnosis of SE and abusiveprescription of antiepileptic drugs.
0776APNEA TESTING FOR DETERMINATION OF BRAIN DEATHON VENO-ARTERIAL ECMO: A PEDIATRIC CASE SERIES
S.J. Ajizian1, R. Jarrah1, T.A. Nakagawa1
1Wake Forest University School of Medicine, Anesthesiology, Section on Pediatric CriticalCare, Winston Salem, USAINTRODUCTION. The updated guidelines for the determination of brain death for infantsand children in the US provide important direction for clinicians tasked with determiningdeath.1 However, the consensus guidelines lack direction for apnea testing when a patient issupported on extracorporeal membrane oxygenation (ECMO), as no supporting literature
26th ESICM ANNUAL CONGRESS — PARIS, FRANCE — 5–9 OCTOBER 2013
exists for this clinical situation. This is the first pediatric report with a simple algorithm forapnea testing in this situation.METHODS. Retrospective observational case series.RESULTS. Three pediatric patients (pts), ages 5 months, 2, and 14 years, were supported onveno-arterial (VA) ECMO following cardiopulmonary arrest. Despite maximal resuscitativeefforts, all pts developed a neurologic exam consistent with brain death. Apnea testing on VAECMO was performed using the following method: 1. Normalizing PaCO2 by adjustingECMO sweep gas flow and obtaining a baseline ABG analysis. 2. Preoxygenation on VA-ECMO by increasing sweep gas FiO2 to 1.0. 3. Removing mechanical ventilation support byusing a self-inflating bag system with continuous positive airway pressure and FiO2 1.0. 4.ECMO sweep gas flow was reduced as low as possible while maintaining the ECMO sweepgas FiO2 at 1.0. The rate of PaCO2 rise on the CDI blood parameter monitoring system wasmonitored with correlating arterial blood gas to confirm the PaCO2 level reached theappropriate threshold to support the diagnosis of brain death. 5. The apnea test was termi-nated if respiratory effort was noted, desaturation to \85 %, or development ofhemodynamic instability occurred.1 Maintaining circulatory support for hypotension on VA-ECMO may be accomplished by increasing circuit flow, or using additional inotropic agents.
CONCLUSIONS. This is the first pediatric case series to describe a protocol to conductapnea testing while supported on VA ECMO. To date, there are no other reports in children.We address an important clinical scenario not described in for pediatric pts undergoing braindeath testing.REFERENCES. Nakagawa TA, Ashwal S, Mathur M, et al. Guidelines for the determi-nation of brain death in infants and children: an update of the 1987 Task Forcerecommendations. Crit Care Med. 2011; 39(9): 2139–2155.
VAP: prediction, prevention, outcomes: 0777–07900777EFFICACY OF A NOVEL CLOSED SUCTIONING SYSTEM FOR THE REMOVALOF ENDOTRACHEAL TUBE BIOFILM: A PRELIMINARY ASSESSMENTIN AN ANIMAL MODEL OF SEVERE P. AERUGINOSA PNEUMONIA
G. Li Bassi1, E. Aguilera1, J.D. Martı́1, D. Wyncoll2, G. Ntoumenopoulos2,3, L. Fernández1,S. Terraneo1, M. Rigol1, T. Comaru1, F. De Rosa1, R.C. Peralta1, M. Rinaudo1, N. Luque1,A. Torres1
1Hospital Clinic, IDIBAPS, CibeRes, Barcelona, Spain, 2Guy’s and St Thomas’ NHSFoundation Trust, London, UK, 3School of Physiotherapy, Australian Catholic University,Sydney, AustraliaINTRODUCTION. Following endotracheal intubation, biofilm forms on the internal sur-face of the endotracheal tube (ETT). A novel closed suctioning system was developed todislodge and mechanically remove ETT biofilm through high-pressure jets of sterile salineand an inflatable balloon.OBJECTIVES. We tested the efficacy of the novel closed suctioning system in an animalmodel of tracheal intubation and severe pneumonia.METHODS. We studied 10 pigs (32.4 ± 1.8 kg) with severe P. aeruginosa pneumonia (1).In five animals (control group) standard tracheal suctioning was performed using theKIMVENT* Closed Suction Systems (Kimberly Clark, USA); in five animals (study group)tracheal suctioning was carried out with the novel catheter (Airway Medix Closed SuctionSystem, Biovo Technologies, Israel). During suctioning, the new catheter was advanced upto the proximal trachea to aspirate retained secretions. The catheter was then pulled back tothe tip of the ETT and the balloon inflated to adhere against the ETT wall. Finally, thecatheter was gently withdrawn, while saline jets and aspiration operated simultaneously todisplace biofilm and remove biofilm debris. Upon autopsy—following 76 h from intuba-tion—the animal was extubated and the ETT longitudinally cut open. A 3 and 1 cm-longhemi-sections of the dependent part of the ETT were dissected for quantitative microbiologystudies and confocal microscopy, respectively. Confocal axial images of representativebiofilm accumulations were recorded. Biofilm area, maximal and minimal thickness werecomputed through dedicated software (ImageJ, NIH, Bethesda, MD, USA). During theanalyses, investigators were blind to treatment allocation.RESULTS. Both suctioning systems were easy to use. In the control and study group9.5 ± 4.5 and 8.5 ± 3.5 tracheal aspirations/day were carried out, respectively (N 30,p = 0.50). ETT P. aeruginosa colonization in the control group was 5.9 ± 0.8 log cfu/ml,in the study group was 4.5 ± 2.6 log cfu/ml (N: 10, p = 0.41). We examined 3.4 ± 1.5 and2.6 ± 1.7 pictures per pig in the control and study group, respectively (N: 10, p = 0.47).We found, in the control group, a mean biofilm area of 78,950 ± 184,111 lm2 (max779,448, min 3,743 lm2) in comparison with 46,098 ± 74,466 lm2 (max 237,558, min864.42 lm2) in the study group (N: 30, p = 0.28). The maximal biofilm thickness in thecontrol and study groups were 210 ± 302 and 126 ± 128 lm, respectively (N: 30,p = 0.17). The minimal biofilm thickness in the control group was over twice that of thestudy group, 79.1 ± 146.7 and 35.9 ± 86.9 lm, respectively (N: 30, p = 0.04).CONCLUSIONS. This very preliminary assessment shows that the novel closed suctioningsystem was slightly more effective in reducing biofilm accumulation from the ETT lumen inintubated and ventilated swine with P. aeruginosa colonization.REFERENCE(S). 1. Luna CM et al. Chest 132(2): 523–31.GRANT ACKNOWLEDGMENT. Biovo Technologies Inc.
0778INCIDENCE OF VENTILATOR-ASSOCIATED PNEUMONIA IN PATIENTSINTUBATED IN THE EMERGENCY DEPARTMENT
L.A. DeLuca1, L.R. Stoneking1, K. Grall1, L. Cox1, B. Munzer1, J. Rosell1, A. Vira1,
J. Gonzaga1, W. Larson1, A. Westergard1, K.R. Denninghoff1
1University of Arizona, Department of Emergency Medicine, Tucson, USAINTRODUCTION. Ventilator-Associated Pneumonia (VAP) is a nosocomial infection thatincreases morbidity and mortality in critically ill patients. Eckert (2006) demonstrated thattrauma patients intubated in the Emergency Department (ED) had significantly higher rates ofVAP than those intubated in the ICU, despite higher Glasgow Coma Scale (GCS) scores, lowerInjury Severity Scores (ISS), and lower Revised Trauma Scores. Carr (2007) described a rela-tionship between duration of time in the ED and pneumonia rate in intubated patients. Green andMcIntrye (2011) have shown that in Canadian ED’s critically ill patients are frequently housedfor many hours with a significant proportion of their care provided by ED physicians.OBJECTIVES. We sought to determine the overall VAP rate for patients intubated in theED, and the VAP rate for the ‘‘at-risk’’ population (those who remained intubated [48 h).
METHODS. Patients intubated in the ED were identified from an existing hospital registryover two 6-month periods. VAP was defined as a new infiltrate on chest X-ray (CXR) 48 ormore hours after intubation that was not present at the time of intubation. Patients wereexcluded for pneumonia on presentation, new infiltrate within 48 h of intubation, andextubation or death within 48 h.RESULTS. A total of 311 patients were intubated over the two 6-month periods. Of thosepatients, 40 (12.8 %) developed VAP. After excluding patients who were extubated or diedwithin 48 h (131), patients who had pneumonia at presentation (50), those who developedpneumonia in \48 h (14), and those lost to followup (7), an at-risk subset of 109 patientswas identified. The resulting VAP rate was 37.0 % (40/109) in the at-risk population.CONCLUSIONS. Patients intubated in the ED are at significant risk of developing VAP.Further research should be aimed at identifying the risk factors that predispose patientsintubated in the ED to VAP and to applying measures to reduce VAP rates in the ED.REFERENCE(S). 1. Carr BG, Kaye AJ, Wiebe DJ, Gracias VH, Schwab CW, Reilly PM.Emergency department length of stay: a major risk factor for pneumonia in intubated blunttrauma patients. J Trauma. 2007; 63: 9–12. 2. Eckert MJ, Davis KA, Reed L, et al. Ven-tilator-associated pneumonia, like real estate: location really matters. J Trauma. 2006; 60:104–110. 3. Green RS, McIntyre J. The provision of critical care in emergency departmentsat Canada. J Emerg Trauma Shock. 2011; 4(4): 488–493.
0779IMPACT OF DIAGNOSTIC CRITERIA ON THE INCIDENCE OF VENTILATOR-ASSOCIATED PNEUMONIA (VAP)
A. Ego1, J.-C. Preiser1, J.-L. Vincent1
1Université Libre de Bruxelles, Department of Intensive Care, Erasme University Hospital,Brussels, BelgiumINTRODUCTION. The development of ventilator-associated pneumonia (VAP) is some-times used as an index of the quality of care. However, the criteria used to diagnose VAP arevariable. Using less strict criteria to diagnose VAP may result in a lower reported incidenceof VAP and misleadingly suggest better quality of care.OBJECTIVES. We postulated that the use of different criteria to diagnose VAP would leadto substantial differences in the incidence of VAP.METHODS. We included all adult patients who were treated with mechanical ventilationfor more than 48 h over a 7-month period (January–July 2012), and who had no lunginfection during the first 48 h of ventilation. We applied 89 algorithms composed of dif-ferent criteria, including respiratory deterioration, inflammatory response, purulent trachealsecretions, abnormal chest radiography, and positive microbiologic findings.RESULTS. Of 1,806 patients admitted during the study period, 144 (8 %) were treated withmechanical ventilation for more than 48 h; 91 of these patients had no evidence of lunginfection during the first 48 h of mechanical ventilation. The application of the 89 algo-rithms resulted in a highly variable incidence of VAP, ranging from 0 to 44 % (Graph 1).The mortality rate and delay before the diagnosis of VAP increased with increasingstrictness of the criteria used, from 50 to 80 % and from 4 to 8 days, respectively.CONCLUSIONS. Applying different diagnostic criteria in a given patient population canresult in a wide variation in the apparent incidence of VAP, and even eliminate it com-pletely. The inverse correlation between the incidence of VAP and mortality, suggests thatstricter criteria are more specific for VAP. Stricter criteria also result in delayed diagnosis.
Fig. 1 Incidence of VAP according to algorithm used
0780EARLY DIAGNOSIS OF VENTILATOR-ASSOCIATED PNEUMONIA WITHMICROBIOLOGICAL MONITORIZATION AND SERIAL EVALUATION OFCYTOKINES AND BIOMARKERS IN BLOOD, MINI-BRONCHOALVEOLARLAVAGE AND EXHALED BREATH CONDENSATE. PILOT STUDY
S. Borrás1, J. Blanquer2, A. Serrano2, J. Ferreres2, M. Mata3, A. Carratala4
1Hospital de Manises, Intensive Care Unit, Valencia, Spain, 2Hospital Clı́nico Universitario,Intensive Care Unit, Valencia, Spain, 3Hospital General Universitario, Fundacion deInvestigacion, Valencia, Spain, 4Hospital Clı́nico Universitario, Laboratory, Valencia, SpainINTRODUCTION. Early diagnosis of Ventilator-associated pneumonia (VAP) is impor-tant because prompt treatment improves prognosis. Mini-bronchoalveolar Lavage (MBAL)is an accepted method to identify pathogen. Exhaled breath condensate (EBC) for theassessment of inflammation in lung disease is spreading and biologic markers can be used tosupport diagnosis.OBJECTIVES. Improve early diagnosis of VAP by: (1) Microbiological monitoring ofrespiratory samples with MBAL. (2) Sequential determination of cytokines (TNFa, IL-1ß,IL-6, IL-8, IL-10), and biomarkers (CRP, hsCRP and Procalcitonin-PCT-) in blood, MBALand EBC.METHODS. Prospective, observational study. We included adult patients, under MV morethan 48 h, without lung infection. At baseline, and then, every 3 days until VAP develop-ment (follow-up), MBAL for microbiological analysis and blood, MBAL and EBC samplesfor cytokines and biomarkers determination were obtained. MBAL involved the infusionand aspiration of three aliquots of 20 cc of saline through a CombicathTM catheter. EBC wascollected by a device for breath condensate collecting into the expiratory limb of ventilator
26th ESICM ANNUAL CONGRESS — PARIS, FRANCE — 5–9 OCTOBER 2013
for 30 min. Diagnosis of VAP was based upon CPIS score and clinical criteria (1). Forcytokines determination was used ELISA.RESULTS. 41 patients were included, 11 (26 %) developed VAP. APACHE II 24 ± 7.Development of VAP was associated with higher ICU stay, time under MV and mortality.Baseline Those who developed VAP presented worst pO2/FiO2 ratio 152 vs 259 (p \ 0.01).In 24 % of patients was identified a microorganism, (26 % of non-VAP patients and 18 % inVAP-patients, in which were multi-resistant). VAP-patients, showed significantly higherTNF-a blood levels 7.6 vs 5.5 pg/ml (p \ 0.05); MBAL TNF-a and IL-6 levels were lower6.4 vs 19.6 pg/ml (p 0.08) and 5.4 vs 9.2 pg/ml (p 0.06) respectively. There were nodifferences with other cytokines or biomarkers.CPR or hs-CPR were not detectable in EBC.Follow-Up: VAP-patients: in three cases (27 %), causal microorganism was present inprevious cultures. With regard to cytokines and biomarkers: blood TNF and MBAL IL-8levels were significantly lower in samples previous to diagnosis of VAP (6.6 vs 7.7 pg/mland 446 vs 2,460 pg/ml respectively). Those who developed VAP, at diagnosis, presentedsignificant higher levels of: blood IL-8 and CRP; and MBAL, hs-CRP. PCT was also higherin blood and MBAL but not significantly.CONCLUSIONS. Only in 27 % of patients who developed VAP, precious cultures werehelpful in diagnosis. We could not find a definite profile of any cytokine or biomarker thatcould anticipate diagnosis of VAP. Blood levels of IL-8 and CRP and MBAL levels of hs-CRP and PCT are elevated in VAP patients.REFERENCE(S).1. ATS, IDSA. Guidelines for the management of VAP. Am J Respir Crit Care Med. 2005.2. Bayley DL. Validation of assays for inflammatory mediators in exhaled breath conden-sate. Eur Respir J. 2008.GRANT ACKNOWLEDGMENT. This study was sponsored by Pfizer.
0781HIGH DOSE NEBULIZED AMIKACIN: A PILOT STUDY IN VENTILATEDPATIENTS WITH HEALTHCARE ASSOCIATED PNEUMONIA
S. Ehrmann1, F. Darrouzain2,3, T. Boulain4, D. Garot1, E. Masseret1, A. Petitcollin2,3,
A. Legras1, E. Mercier1, J. Badin1, A. Guillon1,5, D. Ternant2,3, L. Vecellio5, D. Perrotin1,G. Paintaud2,3, P.-F. Dequin1
1CHRU de Tours, Service de réanimation polyvalente, Tours, France, 2Université FrançoisRabelais, Faculté de Médecine, UMR CNRS 7292, Equipe GICC, Tours, France, 3CHRU deTours, Laboratoire de pharmacologie-toxicologie, Tours, France, 4Hôpital de la Source,Centre Hospitalier Régional d’Orléans, Réanimation médicale polyvalente, Orléans, France,5Université François Rabelais, Faculté de Médecine, Centre d’Etude des PathologiesRespiratoires, INSERM U1100/EA6305, Tours, FranceINTRODUCTION. High-dose nebulized antibiotics, as a complement to intravenous treat-ment, may improve pneumonia treatment efficacy, thanks to increased concentrations at the siteof infection. Up to 60 mg/Kg of amikacin have been successfully nebulized in animal studiesand to healthy subjects undergoing mechanical ventilation1,2. However, the pharmacokineticsand safety of such high doses have not been assessed in patients suffering of pneumonia.OBJECTIVES. To evaluate serum pharmacokinetics and safety of 60 mg/Kg amikacinnebulization during mechanical ventilationMETHODS. Patients undergoing invasive mechanical ventilation with a suspicion ofhospital acquired, healthcare- or ventilator-associated pneumonia were included. Aside ofan intravenous betalactam antibiotic, each patient received 20 mg/Kg amikacin intrave-nously at inclusion; thereafter amikacin was administered qd. for 3 days: 60 mg/Kgnebulized (prototype jet-nebulizer in a dry circuit or with a heated humidifier) or 20 mg/Kgintravenously. 10 serum concentration of amikacin were measured over 24 h after eachadministration for non-compartmental pharmacokinetic analysis. Safety/efficacy data wererecorded until day 10. Patients in whom pneumonia was not confirmed (amikacin sensitivebacterial documentation) or experiencing a side effect linked to amikacin administrationwere excluded from the study, but safety assessment was pursued until day 10.RESULTS. 22 patients were included in the study, after informed consent. Six patients wereexcluded because pneumonia was not confirmed (n = 5) or because of renal failure before thesecond amikacin administration (n = 1), leaving 16 patients with at least 2 amikacin adminis-trations: median age 59 years (interquartile range 51–72); n = 2 female; weight 75 Kg (63–78);body mass index 26 Kg/m2 (24–28); baseline serum creatinine 62 lmol (51–73).Overall 32 nebulizations were analysed: 4.5 g (4.1–4.9) nebulized over 2h15 (1h31–2h48);the area under the serum amikacin concentration curve (AUC) was 27 mg h/L (13–46),significantly lower than the AUC after intravenous administration: 396 mg h/L (pairedp \ 0.01). Serum bioavailability was 2.8 % (2.1–4.8), not significantly different, wether ornot, active humidification was present. Without humidification, two patients experiencedtracheal tube obstruction possibly related to amikacin nebulization, whereas this neverhappened in case of active humidification.CONCLUSIONS. Nebulization of up to 60 mg/Kg appeared feasible in intubated patients.Systemic toxicity is very unlikely to occur as serum AUC appeared well below those observedafter intravenous infusion. Active humidification may prevent tracheal tube obstruction withoutsignificant changes in bioavailability and thus in probable alveolar drug deposition.REFERENCES. 1. Goldstein I et al. Am J Respir Crit Care Med. 2002; 166: 1357–81.2. Ehrmann S et al. Int Care Med. 2008; 34: 755–62.
0782PHARMACOKINETICS OF COLISTIN AFTER THE ADMINISTRATIONOF A LOADING DOSE OF 4.5 MU OF COLISTIN METHANESULFONATE (CMS)IN OBESE CRITICALLY ILL PATIENTS VERSUS REGULAR WEIGHTCRITICALLY ILL PATIENTS
M.E. Pachón-Ibáñez1, F. Doboco2, A. Gutiérrez-Valencia3, A. Puppo-Moreno4,A. Gutiérrez-Pizarraya5, R. Ruiz-Valderas3, E. Fernández-Hinojosa4, C. Milara-Ibáñez5,S.R. Leal-Noval4, P. Moreno-Martı́nez3, R. Amaya4, C. Rosso6, L. López-Cortes7,J.M. Cisneros5, J. Garnacho-Montero4
1Hospital Universitario Virgen del Rocı́o/Instituto de Biomedicina de Sevilla (IBiS),Infectious Diseases, Sevilla, Spain, 2University Hospital Macarena, Microbiology, Sevilla,Spain, 3University Hospital Virgen del Rocı́o/Instituto de Biomedicina de Sevilla (IBiS),Infectious Diseases, Sevilla, Spain, 4University Hospital Virgen del Rocı́o, Critical Care andEmergency, Sevilla, Spain, 5University Hospital Virgen del Rocı́o, Infectious Diseases,Sevilla, Spain, 6University Hospital Virgen del Rocı́o, Pharmacology Clinical, Sevilla,Spain, 7University Hospital Virgen del Rocı́o, Sevilla, SpainINTRODUCTION. Although it is known the difficulty of the antimicrobial dosing in obesepatients so far there are no pharmacokinetic studies of colistin for these kinds of patients.
OBJECTIVES. The aim of the study is to describe the pharmacokinetics (PK) of CMS oftwo different critically ill populations of patients, obese vs. regular weight using a loadingdose of 4.5 MU of CMS.METHODS. A clinical trial (MagicBullet) is in progress at the ICUs of Virgen del Rocı́oUniversity Hospital, Seville, Spain, since January of 2012. Critically ill patients who met thefollowing inclusion criteria were enrolled: Age C 18 years, [96 h of mechanical ventilation,ventilator-associated pneumonia, CPIS [ 4, tracheo-bronchial culture, non-pregnant women,and normal renal function. The following data was collected: gender, age, weight, height,APACHE II score, body max index (BMI), plasma creatinine (Cr) and creatinine clearance(CLCR) on days 1 (1st CMS dose) and 3 (7th CMS dose), using the Cockcroft–Gault formula.Patients were treated with a loading dose of CMS of 4.5 MU (360 mg, 1 h infusion,followed by 3 MU (240 mg) every 8 h (30 min infusion). Venous blood samples weredrawn after the loading dose at 1, 2, 4, and 8 h after the beginning of the CMS infusion andat the steady state (7th dose) at 1, 4, and 8 h after the beginning of the CMS infusion. Allblood samples were immediately chilled and centrifuged, and the plasma was stored at -70 �C until assayed. Plasma colistin concentrations were determined by a HPLC–MS/MSmethod. A non-compartmental analysis of data was done (PKSolver 2.0). Due to the smallnumber of cases in each group, only descriptive analyses were performed (SPSS 15.0).RESULTS. Seven patients have been included: four in the obese group and three in theregular weight group. Demographic, clinical, and PK data are shown in Tables 1, 2 and 3.No deterioration of renal function was observed during the study in any of the patientsincluded. With regard to the PK at the steady state important differences in the maximumplasma colistin concentrations (total colistin and unbound colistin) 1.89 vs. 3.42 and 0.62 vs.1.13 were found between obese and regular weight patients.CONCLUSIONS. Although a higher number of patients have to be included to confirm theseresults, it looks like the actual dose regimen used for the treatment of obese patients is suboptimal.If these results are confirmed with the inclusion of more patients a higher dose of colistin forobese patients should be considered to treat severe infections caused by MDR bacteria.GRANT ACKNOWLEDGMENT. MagicBullet is a project funded by the EuropeanUnion–Directorate General for Research and Innovation through the Seventh FrameworkProgram for Research and Development (Grant Agreement 278232) and has been runningsince January 1st 2012 (duration 36 months).
Table 1 Demographic and clinical data
No APACHE IIScore
Demographic data
Gender Age (year) Weight (kg) Height BMI Diagnosis
1 25 M 68 120 174 39.6 VAP
2 19 M 47 80 178 25.3 VAP
3 17 M 76 110 175 35.9 VAP
4 26 F 67 90 150 40 VAP
5 24 F 57 57 168 20.2 VAP
6 12 M 54 100 185 29.2 VAP
7 15 M 68 150 164 55.7 VAP
Table 2 Renal function data
Plasma creatinine (mg/dL) Creatinine clearance (mL/min)
No Creatinine levelDay 1
Creatinine levelDay 3
Creatinineclearance Day 1
Creatinineclearance Day 3
1 0.67 0.54 179.10 222.22
2 0.75 0.75 137.78 137.78
3 1.36 1.29 71.90 75.80
4 0.51 0.39 152.08 198.88
5 0.9 1.16 62.06 48.15
6 0.79 0.99 151.20 120.65
7 0.47 0.35 319.15 428.57
Table 3 Pharmacokinetics data
Loading dose(1st dose)
Steady state(7th dose)
Obese Regularweight
Obese Regularweight
Total colistin Cmax (lg/mL) 2.71 2.62 1.89 3.42
Total colistin Tmax (h) 2.00 2.00 2.00 4.00
Total colistin T1/2 (h) 12.37 9.11 14.89 21.38
Total colistin AUC0–8 h (lg/mL 9 h) 14.57 15.37 10.99 22.75
Unbound colistin fCmax (lg/mL) 0.94 0.87 0.62 1.13
Unbound colistin fTmax (h) 2.00 2.00 2.00 4.00
Unbound colistin fT1/2 (h) 10.67 8.72 14.59 20.79
Unbound colistin fAUC0-8 h (lg/mL 9 h) 4.87 5.06 3.56 7.51
0783EVALUATING THE AMBU� ASCOPETM 3 SYSTEM FOR BRONCH-ALVEOLARLAVAGE AND BRONCHIAL WASH IN INVASIVELY VENTILATED PATIENTS
B.A. McGrath1, A.M. Bentley1
1University Hospital of South Manchester, Acute Intensive Care Unit, Manchester, UKINTRODUCTION. The Ambu� aScopeTM 3 system is a novel disposable bronchoscope(5.5 mm maximum external diameter with 2.2 mm suction/working channel) which con-nects to a separate portable aViewTM monitor. The range of tip movement is 150� upwardsand 130� downwards. We report the first observations in practice of this system for bronch-alveolar lavage (BAL) and bronchial wash (BW) in invasively ventilated patients.OBJECTIVES. To evaluate the functionality and ease of use of the aScopeTM 3 system.METHODS. 20 CE-marked aScopeTM three bronchoscopes and two aViewTM monitorswere supplied by Ambu� for the evaluation. Patients receiving invasive mechanical ven-tilation via endotracheal or tracheostomy tube who had a clinical indication for either BAL
26th ESICM ANNUAL CONGRESS — PARIS, FRANCE — 5–9 OCTOBER 2013
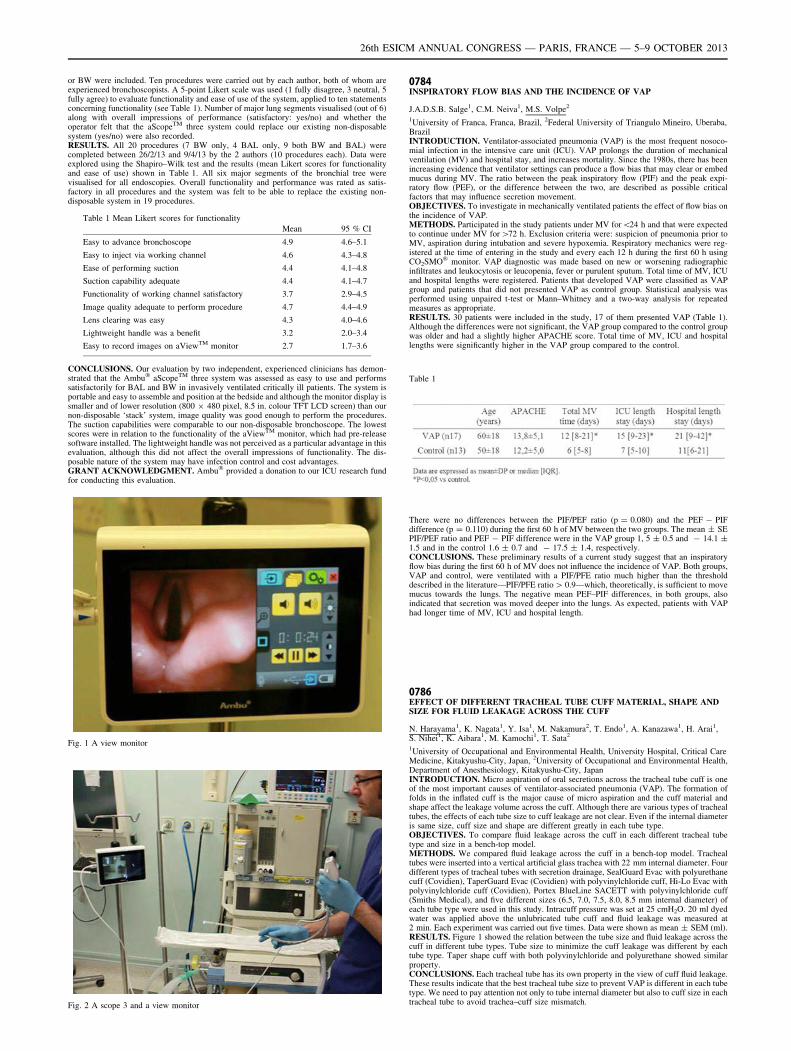
or BW were included. Ten procedures were carried out by each author, both of whom areexperienced bronchoscopists. A 5-point Likert scale was used (1 fully disagree, 3 neutral, 5fully agree) to evaluate functionality and ease of use of the system, applied to ten statementsconcerning functionality (see Table 1). Number of major lung segments visualised (out of 6)along with overall impressions of performance (satisfactory: yes/no) and whether theoperator felt that the aScopeTM three system could replace our existing non-disposablesystem (yes/no) were also recorded.RESULTS. All 20 procedures (7 BW only, 4 BAL only, 9 both BW and BAL) werecompleted between 26/2/13 and 9/4/13 by the 2 authors (10 procedures each). Data wereexplored using the Shapiro–Wilk test and the results (mean Likert scores for functionalityand ease of use) shown in Table 1. All six major segments of the bronchial tree werevisualised for all endoscopies. Overall functionality and performance was rated as satis-factory in all procedures and the system was felt to be able to replace the existing non-disposable system in 19 procedures.
Table 1 Mean Likert scores for functionality
Mean 95 % CI
Easy to advance bronchoscope 4.9 4.6–5.1
Easy to inject via working channel 4.6 4.3–4.8
Ease of performing suction 4.4 4.1–4.8
Suction capability adequate 4.4 4.1–4.7
Functionality of working channel satisfactory 3.7 2.9–4.5
Image quality adequate to perform procedure 4.7 4.4–4.9
Lens clearing was easy 4.3 4.0–4.6
Lightweight handle was a benefit 3.2 2.0–3.4
Easy to record images on aViewTM monitor 2.7 1.7–3.6
CONCLUSIONS. Our evaluation by two independent, experienced clinicians has demon-strated that the Ambu� aScopeTM three system was assessed as easy to use and performssatisfactorily for BAL and BW in invasively ventilated critically ill patients. The system isportable and easy to assemble and position at the bedside and although the monitor display issmaller and of lower resolution (800 9 480 pixel, 8.5 in. colour TFT LCD screen) than ournon-disposable ‘stack’ system, image quality was good enough to perform the procedures.The suction capabilities were comparable to our non-disposable bronchoscope. The lowestscores were in relation to the functionality of the aViewTM monitor, which had pre-releasesoftware installed. The lightweight handle was not perceived as a particular advantage in thisevaluation, although this did not affect the overall impressions of functionality. The dis-posable nature of the system may have infection control and cost advantages.GRANT ACKNOWLEDGMENT. Ambu� provided a donation to our ICU research fundfor conducting this evaluation.
Fig. 1 A view monitor
Fig. 2 A scope 3 and a view monitor
0784INSPIRATORY FLOW BIAS AND THE INCIDENCE OF VAP
J.A.D.S.B. Salge1, C.M. Neiva1, M.S. Volpe2
1University of Franca, Franca, Brazil, 2Federal University of Triangulo Mineiro, Uberaba,BrazilINTRODUCTION. Ventilator-associated pneumonia (VAP) is the most frequent nosoco-mial infection in the intensive care unit (ICU). VAP prolongs the duration of mechanicalventilation (MV) and hospital stay, and increases mortality. Since the 1980s, there has beenincreasing evidence that ventilator settings can produce a flow bias that may clear or embedmucus during MV. The ratio between the peak inspiratory flow (PIF) and the peak expi-ratory flow (PEF), or the difference between the two, are described as possible criticalfactors that may influence secretion movement.OBJECTIVES. To investigate in mechanically ventilated patients the effect of flow bias onthe incidence of VAP.METHODS. Participated in the study patients under MV for\24 h and that were expectedto continue under MV for [72 h. Exclusion criteria were: suspicion of pneumonia prior toMV, aspiration during intubation and severe hypoxemia. Respiratory mechanics were reg-istered at the time of entering in the study and every each 12 h during the first 60 h usingCO2SMO� monitor. VAP diagnostic was made based on new or worsening radiographicinfiltrates and leukocytosis or leucopenia, fever or purulent sputum. Total time of MV, ICUand hospital lengths were registered. Patients that developed VAP were classified as VAPgroup and patients that did not presented VAP as control group. Statistical analysis wasperformed using unpaired t-test or Mann–Whitney and a two-way analysis for repeatedmeasures as appropriate.RESULTS. 30 patients were included in the study, 17 of them presented VAP (Table 1).Although the differences were not significant, the VAP group compared to the control groupwas older and had a slightly higher APACHE score. Total time of MV, ICU and hospitallengths were significantly higher in the VAP group compared to the control.
Table 1
There were no differences between the PIF/PEF ratio (p = 0.080) and the PEF - PIFdifference (p = 0.110) during the first 60 h of MV between the two groups. The mean ± SEPIF/PEF ratio and PEF - PIF difference were in the VAP group 1, 5 ± 0.5 and - 14.1 ±1.5 and in the control 1.6 ± 0.7 and - 17.5 ± 1.4, respectively.CONCLUSIONS. These preliminary results of a current study suggest that an inspiratoryflow bias during the first 60 h of MV does not influence the incidence of VAP. Both groups,VAP and control, were ventilated with a PIF/PFE ratio much higher than the thresholddescribed in the literature—PIF/PFE ratio [ 0.9—which, theoretically, is sufficient to movemucus towards the lungs. The negative mean PEF–PIF differences, in both groups, alsoindicated that secretion was moved deeper into the lungs. As expected, patients with VAPhad longer time of MV, ICU and hospital length.
0786EFFECT OF DIFFERENT TRACHEAL TUBE CUFF MATERIAL, SHAPE ANDSIZE FOR FLUID LEAKAGE ACROSS THE CUFF
N. Harayama1, K. Nagata1, Y. Isa1, M. Nakamura2, T. Endo1, A. Kanazawa1, H. Arai1,S. Nihei1, K. Aibara1, M. Kamochi1, T. Sata2
1University of Occupational and Environmental Health, University Hospital, Critical CareMedicine, Kitakyushu-City, Japan, 2University of Occupational and Environmental Health,Department of Anesthesiology, Kitakyushu-City, JapanINTRODUCTION. Micro aspiration of oral secretions across the tracheal tube cuff is oneof the most important causes of ventilator-associated pneumonia (VAP). The formation offolds in the inflated cuff is the major cause of micro aspiration and the cuff material andshape affect the leakage volume across the cuff. Although there are various types of trachealtubes, the effects of each tube size to cuff leakage are not clear. Even if the internal diameteris same size, cuff size and shape are different greatly in each tube type.OBJECTIVES. To compare fluid leakage across the cuff in each different tracheal tubetype and size in a bench-top model.METHODS. We compared fluid leakage across the cuff in a bench-top model. Trachealtubes were inserted into a vertical artificial glass trachea with 22 mm internal diameter. Fourdifferent types of tracheal tubes with secretion drainage, SealGuard Evac with polyurethanecuff (Covidien), TaperGuard Evac (Covidien) with polyvinylchloride cuff, Hi-Lo Evac withpolyvinylchloride cuff (Covidien), Portex BlueLine SACETT with polyvinylchloride cuff(Smiths Medical), and five different sizes (6.5, 7.0, 7.5, 8.0, 8.5 mm internal diameter) ofeach tube type were used in this study. Intracuff pressure was set at 25 cmH2O. 20 ml dyedwater was applied above the unlubricated tube cuff and fluid leakage was measured at2 min. Each experiment was carried out five times. Data were shown as mean ± SEM (ml).RESULTS. Figure 1 showed the relation between the tube size and fluid leakage across thecuff in different tube types. Tube size to minimize the cuff leakage was different by eachtube type. Taper shape cuff with both polyvinylchloride and polyurethane showed similarproperty.CONCLUSIONS. Each tracheal tube has its own property in the view of cuff fluid leakage.These results indicate that the best tracheal tube size to prevent VAP is different in each tubetype. We need to pay attention not only to tube internal diameter but also to cuff size in eachtracheal tube to avoid trachea–cuff size mismatch.
26th ESICM ANNUAL CONGRESS — PARIS, FRANCE — 5–9 OCTOBER 2013
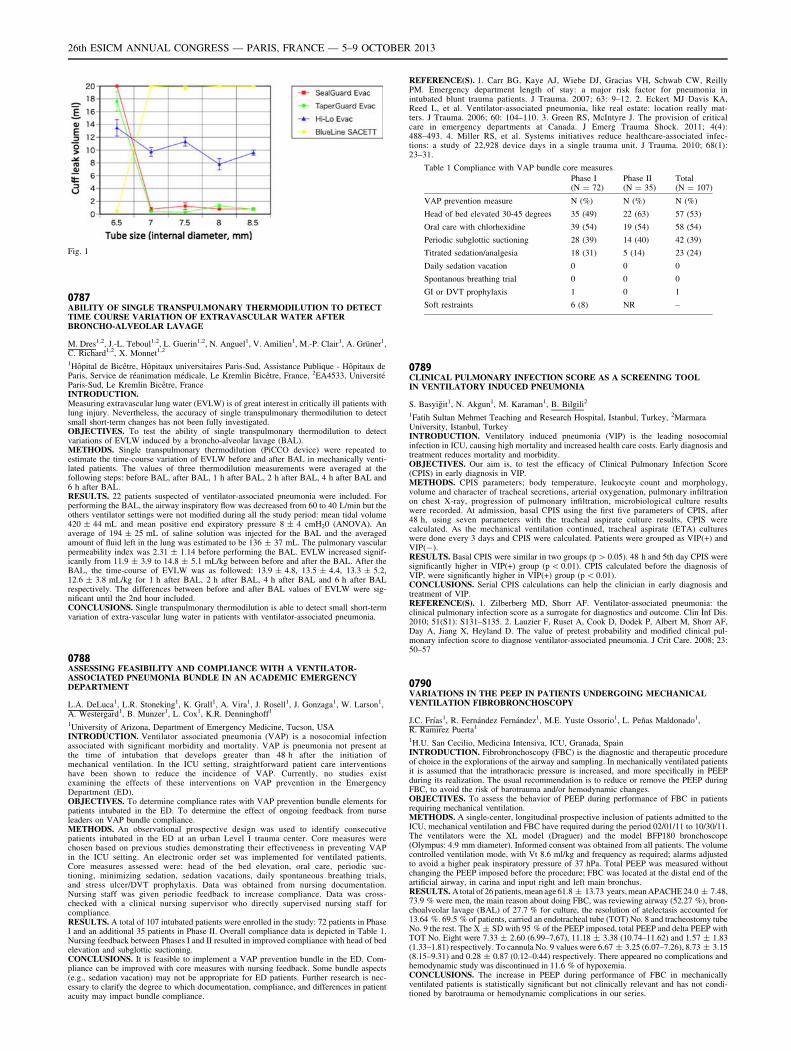
Fig. 1
0787ABILITY OF SINGLE TRANSPULMONARY THERMODILUTION TO DETECTTIME COURSE VARIATION OF EXTRAVASCULAR WATER AFTERBRONCHO-ALVEOLAR LAVAGE
M. Dres1,2, J.-L. Teboul1,2, L. Guerin1,2, N. Anguel1, V. Amilien1, M.-P. Clair1, A. Grüner1,C. Richard1,2, X. Monnet1,2
1Hôpital de Bicêtre, Hôpitaux universitaires Paris-Sud, Assistance Publique - Hôpitaux deParis, Service de réanimation médicale, Le Kremlin Bicêtre, France, 2EA4533, UniversitéParis-Sud, Le Kremlin Bicêtre, FranceINTRODUCTION.Measuring extravascular lung water (EVLW) is of great interest in critically ill patients withlung injury. Nevertheless, the accuracy of single transpulmonary thermodilution to detectsmall short-term changes has not been fully investigated.OBJECTIVES. To test the ability of single transpulmonary thermodilution to detectvariations of EVLW induced by a broncho-alveolar lavage (BAL).METHODS. Single transpulmonary thermodilution (PiCCO device) were repeated toestimate the time-course variation of EVLW before and after BAL in mechanically venti-lated patients. The values of three thermodilution measurements were averaged at thefollowing steps: before BAL, after BAL, 1 h after BAL, 2 h after BAL, 4 h after BAL and6 h after BAL.RESULTS. 22 patients suspected of ventilator-associated pneumonia were included. Forperforming the BAL, the airway inspiratory flow was decreased from 60 to 40 L/min but theothers ventilator settings were not modified during all the study period: mean tidal volume420 ± 44 mL and mean positive end expiratory pressure 8 ± 4 cmH20 (ANOVA). Anaverage of 194 ± 25 mL of saline solution was injected for the BAL and the averagedamount of fluid left in the lung was estimated to be 136 ± 37 mL. The pulmonary vascularpermeability index was 2.31 ± 1.14 before performing the BAL. EVLW increased signif-icantly from 11.9 ± 3.9 to 14.8 ± 5.1 mL/kg between before and after the BAL. After theBAL, the time-course of EVLW was as followed: 13.9 ± 4.8, 13.5 ± 4.4, 13.3 ± 5.2,12.6 ± 3.8 mL/kg for 1 h after BAL, 2 h after BAL, 4 h after BAL and 6 h after BALrespectively. The differences between before and after BAL values of EVLW were sig-nificant until the 2nd hour included.CONCLUSIONS. Single transpulmonary thermodilution is able to detect small short-termvariation of extra-vascular lung water in patients with ventilator-associated pneumonia.
0788ASSESSING FEASIBILITY AND COMPLIANCE WITH A VENTILATOR-ASSOCIATED PNEUMONIA BUNDLE IN AN ACADEMIC EMERGENCYDEPARTMENT
L.A. DeLuca1, L.R. Stoneking1, K. Grall1, A. Vira1, J. Rosell1, J. Gonzaga1, W. Larson1,A. Westergard1, B. Munzer1, L. Cox1, K.R. Denninghoff1
1University of Arizona, Department of Emergency Medicine, Tucson, USAINTRODUCTION. Ventilator associated pneumonia (VAP) is a nosocomial infectionassociated with significant morbidity and mortality. VAP is pneumonia not present atthe time of intubation that develops greater than 48 h after the initiation ofmechanical ventilation. In the ICU setting, straightforward patient care interventionshave been shown to reduce the incidence of VAP. Currently, no studies existexamining the effects of these interventions on VAP prevention in the EmergencyDepartment (ED).OBJECTIVES. To determine compliance rates with VAP prevention bundle elements forpatients intubated in the ED. To determine the effect of ongoing feedback from nurseleaders on VAP bundle compliance.METHODS. An observational prospective design was used to identify consecutivepatients intubated in the ED at an urban Level I trauma center. Core measures werechosen based on previous studies demonstrating their effectiveness in preventing VAPin the ICU setting. An electronic order set was implemented for ventilated patients.Core measures assessed were: head of the bed elevation, oral care, periodic suc-tioning, minimizing sedation, sedation vacations, daily spontaneous breathing trials,and stress ulcer/DVT prophylaxis. Data was obtained from nursing documentation.Nursing staff was given periodic feedback to increase compliance. Data was cross-checked with a clinical nursing supervisor who directly supervised nursing staff forcompliance.RESULTS. A total of 107 intubated patients were enrolled in the study: 72 patients in PhaseI and an additional 35 patients in Phase II. Overall compliance data is depicted in Table 1.Nursing feedback between Phases I and II resulted in improved compliance with head of bedelevation and subglottic suctioning.CONCLUSIONS. It is feasible to implement a VAP prevention bundle in the ED. Com-pliance can be improved with core measures with nursing feedback. Some bundle aspects(e.g., sedation vacation) may not be appropriate for ED patients. Further research is nec-essary to clarify the degree to which documentation, compliance, and differences in patientacuity may impact bundle compliance.
REFERENCE(S). 1. Carr BG, Kaye AJ, Wiebe DJ, Gracias VH, Schwab CW, ReillyPM. Emergency department length of stay: a major risk factor for pneumonia inintubated blunt trauma patients. J Trauma. 2007; 63: 9–12. 2. Eckert MJ Davis KA,Reed L, et al. Ventilator-associated pneumonia, like real estate: location really mat-ters. J Trauma. 2006; 60: 104–110. 3. Green RS, McIntyre J. The provision of criticalcare in emergency departments at Canada. J Emerg Trauma Shock. 2011; 4(4):488–493. 4. Miller RS, et al. Systems initiatives reduce healthcare-associated infec-tions: a study of 22,928 device days in a single trauma unit. J Trauma. 2010; 68(1):23–31.
Table 1 Compliance with VAP bundle core measures
Phase I(N = 72)
Phase II(N = 35)
Total(N = 107)
VAP prevention measure N (%) N (%) N (%)
Head of bed elevated 30-45 degrees 35 (49) 22 (63) 57 (53)
Oral care with chlorhexidine 39 (54) 19 (54) 58 (54)
Periodic subglottic suctioning 28 (39) 14 (40) 42 (39)
Titrated sedation/analgesia 18 (31) 5 (14) 23 (24)
Daily sedation vacation 0 0 0
Spontanous breathing trial 0 0 0
GI or DVT prophylaxis 1 0 1
Soft restraints 6 (8) NR –
0789CLINICAL PULMONARY INFECTION SCORE AS A SCREENING TOOLIN VENTILATORY INDUCED PNEUMONIA
S. Basyiğit1, N. Akgun1, M. Karaman1, B. Bilgili2
1Fatih Sultan Mehmet Teaching and Research Hospital, Istanbul, Turkey, 2MarmaraUniversity, Istanbul, TurkeyINTRODUCTION. Ventilatory induced pneumonia (VIP) is the leading nosocomialinfection in ICU, causing high mortality and increased health care costs. Early diagnosis andtreatment reduces mortality and morbidity.OBJECTIVES. Our aim is, to test the efficacy of Clinical Pulmonary Infection Score(CPIS) in early diagnosis in VIP.METHODS. CPIS parameters; body temperature, leukocyte count and morphology,volume and character of tracheal secretions, arterial oxygenation, pulmonary infiltrationon chest X-ray, progression of pulmonary infiltration, microbiological culture resultswere recorded. At admission, basal CPIS using the first five parameters of CPIS, after48 h, using seven parameters with the tracheal aspirate culture results, CPIS werecalculated. As the mechanical ventilation continued, tracheal aspirate (ETA) cultureswere done every 3 days and CPIS were calculated. Patients were grouped as VIP(+) andVIP(-).RESULTS. Basal CPIS were similar in two groups (p [ 0.05). 48 h and 5th day CPIS weresignificantly higher in VIP(+) group (p \ 0.01). CPIS calculated before the diagnosis ofVIP, were significantly higher in VIP(+) group (p \ 0.01).CONCLUSIONS. Serial CPIS calculations can help the clinician in early diagnosis andtreatment of VIP.REFERENCE(S). 1. Zilberberg MD, Shorr AF. Ventilator-associated pneumonia: theclinical pulmonary infection score as a surrogate for diagnostics and outcome. Clin İnf Dis.2010; 51(S1): S131–S135. 2. Lauzier F, Ruset A, Cook D, Dodek P, Albert M, Shorr AF,Day A, Jiang X, Heyland D. The value of pretest probability and modified clinical pul-monary infection score to diagnose ventilator-associated pneumonia. J Crit Care. 2008; 23:50–57
0790VARIATIONS IN THE PEEP IN PATIENTS UNDERGOING MECHANICALVENTILATION FIBROBRONCHOSCOPY
J.C. Frı́as1, R. Fernández Fernández1, M.E. Yuste Ossorio1, L. Peñas Maldonado1,R. Ramirez Puerta1
1H.U. San Cecilio, Medicina Intensiva, ICU, Granada, SpainINTRODUCTION. Fibrobronchoscopy (FBC) is the diagnostic and therapeutic procedureof choice in the explorations of the airway and sampling. In mechanically ventilated patientsit is assumed that the intrathoracic pressure is increased, and more specifically in PEEPduring its realization. The usual recommendation is to reduce or remove the PEEP duringFBC, to avoid the risk of barotrauma and/or hemodynamic changes.OBJECTIVES. To assess the behavior of PEEP during performance of FBC in patientsrequiring mechanical ventilation.METHODS. A single-center, longitudinal prospective inclusion of patients admitted to theICU, mechanical ventilation and FBC have required during the period 02/01/11 to 10/30/11.The ventilators were the XL model (Draguer) and the model BFP180 bronchoscope(Olympus: 4.9 mm diameter). Informed consent was obtained from all patients. The volumecontrolled ventilation mode, with Vt 8.6 ml/kg and frequency as required; alarms adjustedto avoid a higher peak inspiratory pressure of 37 hPa. Total PEEP was measured withoutchanging the PEEP imposed before the procedure; FBC was located at the distal end of theartificial airway, in carina and input right and left main bronchus.RESULTS. A total of 26 patients, mean age 61.8 ± 13.73 years, mean APACHE 24.0 ± 7.48,73.9 % were men, the main reason about doing FBC, was reviewing airway (52.27 %), bron-choalveolar lavage (BAL) of 27.7 % for culture, the resolution of atelectasis accounted for13.64 %. 69.5 % of patients, carried an endotracheal tube (TOT) No. 8 and tracheostomy tubeNo. 9 the rest. The X ± SD with 95 % of the PEEP imposed, total PEEP and delta PEEP withTOT No. Eight were 7.33 ± 2.60 (6.99–7.67), 11.18 ± 3.38 (10.74–11.62) and 1.57 ± 1.83(1.33–1.81) respectively. To cannula No. 9 values were 6.67 ± 3.25 (6.07–7.26), 8.73 ± 3.15(8.15–9.31) and 0.28 ± 0.87 (0.12–0.44) respectively. There appeared no complications andhemodynamic study was discontinued in 11.6 % of hypoxemia.CONCLUSIONS. The increase in PEEP during performance of FBC in mechanicallyventilated patients is statistically significant but not clinically relevant and has not condi-tioned by barotrauma or hemodynamic complications in our series.
26th ESICM ANNUAL CONGRESS — PARIS, FRANCE — 5–9 OCTOBER 2013
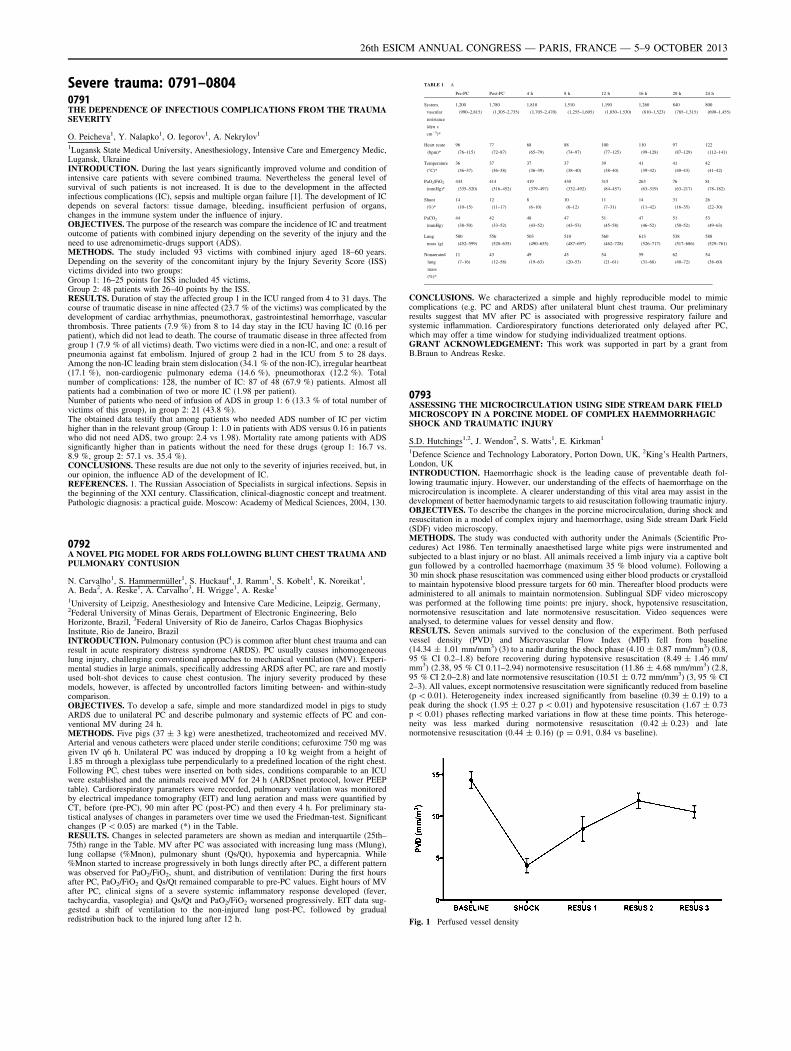
Severe trauma: 0791–08040791THE DEPENDENCE OF INFECTIOUS COMPLICATIONS FROM THE TRAUMASEVERITY
O. Peicheva1, Y. Nalapko1, O. Iegorov1, A. Nekrylov1
1Lugansk State Medical University, Anesthesiology, Intensive Care and Emergency Medic,Lugansk, UkraineINTRODUCTION. During the last years significantly improved volume and condition ofintensive care patients with severe combined trauma. Nevertheless the general level ofsurvival of such patients is not increased. It is due to the development in the affectedinfectious complications (IC), sepsis and multiple organ failure [1]. The development of ICdepends on several factors: tissue damage, bleeding, insufficient perfusion of organs,changes in the immune system under the influence of injury.OBJECTIVES. The purpose of the research was compare the incidence of IC and treatmentoutcome of patients with combined injury depending on the severity of the injury and theneed to use adrenomimetic-drugs support (ADS).METHODS. The study included 93 victims with combined injury aged 18–60 years.Depending on the severity of the concomitant injury by the Injury Severity Score (ISS)victims divided into two groups:Group 1: 16–25 points for ISS included 45 victims,Group 2: 48 patients with 26–40 points by the ISS.RESULTS. Duration of stay the affected group 1 in the ICU ranged from 4 to 31 days. Thecourse of traumatic disease in nine affected (23.7 % of the victims) was complicated by thedevelopment of cardiac arrhythmias, pneumothorax, gastrointestinal hemorrhage, vascularthrombosis. Three patients (7.9 %) from 8 to 14 day stay in the ICU having IC (0.16 perpatient), which did not lead to death. The course of traumatic disease in three affected fromgroup 1 (7.9 % of all victims) death. Two victims were died in a non-IC, and one: a result ofpneumonia against fat embolism. Injured of group 2 had in the ICU from 5 to 28 days.Among the non-IC leading brain stem dislocation (34.1 % of the non-IC), irregular heartbeat(17.1 %), non-cardiogenic pulmonary edema (14.6 %), pneumothorax (12.2 %). Totalnumber of complications: 128, the number of IC: 87 of 48 (67.9 %) patients. Almost allpatients had a combination of two or more IC (1.98 per patient).Number of patients who need of infusion of ADS in group 1: 6 (13.3 % of total number ofvictims of this group), in group 2: 21 (43.8 %).The obtained data testify that among patients who needed ADS number of IC per victimhigher than in the relevant group (Group 1: 1.0 in patients with ADS versus 0.16 in patientswho did not need ADS, two group: 2.4 vs 1.98). Mortality rate among patients with ADSsignificantly higher than in patients without the need for these drugs (group 1: 16.7 vs.8.9 %, group 2: 57.1 vs. 35.4 %).CONCLUSIONS. These results are due not only to the severity of injuries received, but, inour opinion, the influence AD of the development of IC.REFERENCES. 1. The Russian Association of Specialists in surgical infections. Sepsis inthe beginning of the XXI century. Classification, clinical-diagnostic concept and treatment.Pathologic diagnosis: a practical guide. Moscow: Academy of Medical Sciences, 2004, 130.
0792A NOVEL PIG MODEL FOR ARDS FOLLOWING BLUNT CHEST TRAUMA ANDPULMONARY CONTUSION
N. Carvalho1, S. Hammermüller1, S. Huckauf1, J. Ramm1, S. Kobelt1, K. Noreikat1,A. Beda2, A. Reske1, A. Carvalho3, H. Wrigge1, A. Reske1
1University of Leipzig, Anesthesiology and Intensive Care Medicine, Leipzig, Germany,2Federal University of Minas Gerais, Department of Electronic Engineering, BeloHorizonte, Brazil, 3Federal University of Rio de Janeiro, Carlos Chagas BiophysicsInstitute, Rio de Janeiro, BrazilINTRODUCTION. Pulmonary contusion (PC) is common after blunt chest trauma and canresult in acute respiratory distress syndrome (ARDS). PC usually causes inhomogeneouslung injury, challenging conventional approaches to mechanical ventilation (MV). Experi-mental studies in large animals, specifically addressing ARDS after PC, are rare and mostlyused bolt-shot devices to cause chest contusion. The injury severity produced by thesemodels, however, is affected by uncontrolled factors limiting between- and within-studycomparison.OBJECTIVES. To develop a safe, simple and more standardized model in pigs to studyARDS due to unilateral PC and describe pulmonary and systemic effects of PC and con-ventional MV during 24 h.METHODS. Five pigs (37 ± 3 kg) were anesthetized, tracheotomized and received MV.Arterial and venous catheters were placed under sterile conditions; cefuroxime 750 mg wasgiven IV q6 h. Unilateral PC was induced by dropping a 10 kg weight from a height of1.85 m through a plexiglass tube perpendicularly to a predefined location of the right chest.Following PC, chest tubes were inserted on both sides, conditions comparable to an ICUwere established and the animals received MV for 24 h (ARDSnet protocol, lower PEEPtable). Cardiorespiratory parameters were recorded, pulmonary ventilation was monitoredby electrical impedance tomography (EIT) and lung aeration and mass were quantified byCT, before (pre-PC), 90 min after PC (post-PC) and then every 4 h. For preliminary sta-tistical analyses of changes in parameters over time we used the Friedman-test. Significantchanges (P \ 0.05) are marked (*) in the Table.RESULTS. Changes in selected parameters are shown as median and interquartile (25th–75th) range in the Table. MV after PC was associated with increasing lung mass (Mlung),lung collapse (%Mnon), pulmonary shunt (Qs/Qt), hypoxemia and hypercapnia. While%Mnon started to increase progressively in both lungs directly after PC, a different patternwas observed for PaO2/FiO2, shunt, and distribution of ventilation: During the first hoursafter PC, PaO2/FiO2 and Qs/Qt remained comparable to pre-PC values. Eight hours of MVafter PC, clinical signs of a severe systemic inflammatory response developed (fever,tachycardia, vasoplegia) and Qs/Qt and PaO2/FiO2 worsened progressively. EIT data sug-gested a shift of ventilation to the non-injured lung post-PC, followed by gradualredistribution back to the injured lung after 12 h.
TABLE 1 A
Pre-PC Post-PC 4 h 8 h 12 h 16 h 20 h 24 h
System.
vascular
resistance
(dyn s
cm-5)*
1,200
(990–2,815)
1,780
(1,305–2,735)
1,810
(1,705–2,470)
1,510
(1,255–1,605)
1,190
(1,030–1,530)
1,260
(810–1,523)
840
(785–1,315)
800
(690–1,455)
Heart reate
(bpm)*
96
(76–115)
77
(72–87)
68
(65–79)
88
(74–97)
100
(77–125)
110
(99–128)
97
(87–129)
122
(112–141)
Temperature
(�C)*
36
(36–37)
37
(36–38)
37
(36–39)
37
(38–40)
39
(38–40)
41
(39–42)
41
(40–43)
42
(41–42)
PaO2/FiO2
(mmHg)*
443
(335–520)
414
(316–452)
419
(379–497)
430
(332–492)
315
(84–457)
263
(63–319)
76
(63–217)
81
(78–182)
Shunt
(%)*
14
(10–15)
12
(11–17)
8
(6–10)
10
(6–12)
11
(7–31)
14
(11–42)
31
(16–35)
26
(22–30)
PaCO2
(mmHg)
44
(38–50)
42
(33–52)
48
(43–52)
47
(43–53)
51
(45–58)
47
(46–52)
51
(50–52)
53
(49–63)
Lung
mass (g)
500
(452–599)
556
(528–635)
503
(490–655)
510
(487–697)
560
(462–728)
613
(526–717)
538
(517–686)
588
(529–761)
Nonaerated
lung
mass
(%)*
11
(7–16)
43
(12–58)
49
(19–63)
45
(20–53)
54
(21–61)
59
(31–68)
62
(40–72)
54
(38–60)
CONCLUSIONS. We characterized a simple and highly reproducible model to mimiccomplications (e.g. PC and ARDS) after unilateral blunt chest trauma. Our preliminaryresults suggest that MV after PC is associated with progressive respiratory failure andsystemic inflammation. Cardiorespiratory functions deteriorated only delayed after PC,which may offer a time window for studying individualized treatment options.GRANT ACKNOWLEDGEMENT: This work was supported in part by a grant fromB.Braun to Andreas Reske.
0793ASSESSING THE MICROCIRCULATION USING SIDE STREAM DARK FIELDMICROSCOPY IN A PORCINE MODEL OF COMPLEX HAEMMORRHAGICSHOCK AND TRAUMATIC INJURY
S.D. Hutchings1,2, J. Wendon2, S. Watts1, E. Kirkman1
1Defence Science and Technology Laboratory, Porton Down, UK, 2King’s Health Partners,London, UKINTRODUCTION. Haemorrhagic shock is the leading cause of preventable death fol-lowing traumatic injury. However, our understanding of the effects of haemorrhage on themicrocirculation is incomplete. A clearer understanding of this vital area may assist in thedevelopment of better haemodynamic targets to aid resuscitation following traumatic injury.OBJECTIVES. To describe the changes in the porcine microcirculation, during shock andresuscitation in a model of complex injury and haemorrhage, using Side stream Dark Field(SDF) video microscopy.METHODS. The study was conducted with authority under the Animals (Scientific Pro-cedures) Act 1986. Ten terminally anaesthetised large white pigs were instrumented andsubjected to a blast injury or no blast. All animals received a limb injury via a captive boltgun followed by a controlled haemorrhage (maximum 35 % blood volume). Following a30 min shock phase resuscitation was commenced using either blood products or crystalloidto maintain hypotensive blood pressure targets for 60 min. Thereafter blood products wereadministered to all animals to maintain normotension. Sublingual SDF video microscopywas performed at the following time points: pre injury, shock, hypotensive resuscitation,normotensive resuscitation and late normotensive resuscitation. Video sequences wereanalysed, to determine values for vessel density and flow.RESULTS. Seven animals survived to the conclusion of the experiment. Both perfusedvessel density (PVD) and Microvascular Flow Index (MFI) fell from baseline(14.34 ± 1.01 mm/mm3) (3) to a nadir during the shock phase (4.10 ± 0.87 mm/mm3) (0.8,95 % CI 0.2–1.8) before recovering during hypotensive resuscitation (8.49 ± 1.46 mm/mm3) (2.38, 95 % CI 0.11–2.94) normotensive resuscitation (11.86 ± 4.68 mm/mm3) (2.8,95 % CI 2.0–2.8) and late normotensive resuscitation (10.51 ± 0.72 mm/mm3) (3, 95 % CI2–3). All values, except normotensive resuscitation were significantly reduced from baseline(p \ 0.01). Heterogeneity index increased significantly from baseline (0.39 ± 0.19) to apeak during the shock (1.95 ± 0.27 p \ 0.01) and hypotensive resuscitation (1.67 ± 0.73p \ 0.01) phases reflecting marked variations in flow at these time points. This heteroge-neity was less marked during normotensive resuscitation (0.42 ± 0.23) and latenormotensive resuscitation (0.44 ± 0.16) (p = 0.91, 0.84 vs baseline).
Fig. 1 Perfused vessel density
26th ESICM ANNUAL CONGRESS — PARIS, FRANCE — 5–9 OCTOBER 2013
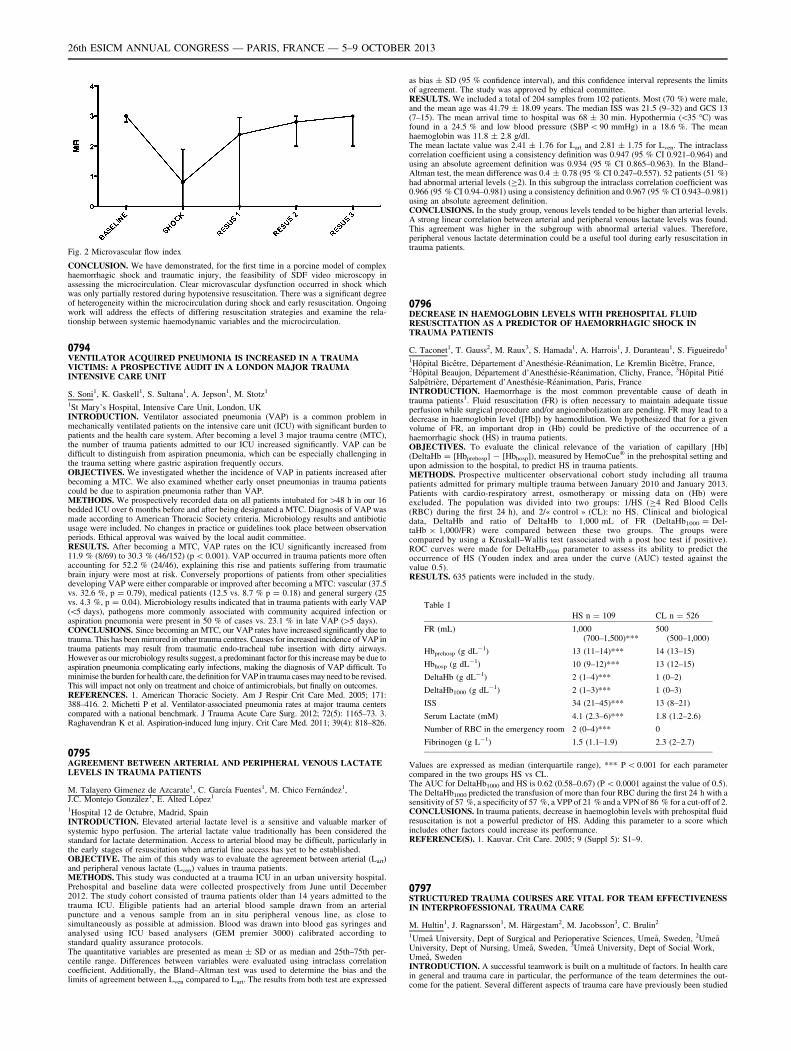
Fig. 2 Microvascular flow index
CONCLUSION. We have demonstrated, for the first time in a porcine model of complexhaemorrhagic shock and traumatic injury, the feasibility of SDF video microscopy inassessing the microcirculation. Clear microvascular dysfunction occurred in shock whichwas only partially restored during hypotensive resuscitation. There was a significant degreeof heterogeneity within the microcirculation during shock and early resuscitation. Ongoingwork will address the effects of differing resuscitation strategies and examine the rela-tionship between systemic haemodynamic variables and the microcirculation.
0794VENTILATOR ACQUIRED PNEUMONIA IS INCREASED IN A TRAUMAVICTIMS: A PROSPECTIVE AUDIT IN A LONDON MAJOR TRAUMAINTENSIVE CARE UNIT
S. Soni1, K. Gaskell1, S. Sultana1, A. Jepson1, M. Stotz1
1St Mary’s Hospital, Intensive Care Unit, London, UKINTRODUCTION. Ventilator associated pneumonia (VAP) is a common problem inmechanically ventilated patients on the intensive care unit (ICU) with significant burden topatients and the health care system. After becoming a level 3 major trauma centre (MTC),the number of trauma patients admitted to our ICU increased significantly. VAP can bedifficult to distinguish from aspiration pneumonia, which can be especially challenging inthe trauma setting where gastric aspiration frequently occurs.OBJECTIVES. We investigated whether the incidence of VAP in patients increased afterbecoming a MTC. We also examined whether early onset pneumonias in trauma patientscould be due to aspiration pneumonia rather than VAP.METHODS. We prospectively recorded data on all patients intubated for [48 h in our 16bedded ICU over 6 months before and after being designated a MTC. Diagnosis of VAP wasmade according to American Thoracic Society criteria. Microbiology results and antibioticusage were included. No changes in practice or guidelines took place between observationperiods. Ethical approval was waived by the local audit committee.RESULTS. After becoming a MTC, VAP rates on the ICU significantly increased from11.9 % (8/69) to 30.3 % (46/152) (p \ 0.001). VAP occurred in trauma patients more oftenaccounting for 52.2 % (24/46), explaining this rise and patients suffering from traumaticbrain injury were most at risk. Conversely proportions of patients from other specialitiesdeveloping VAP were either comparable or improved after becoming a MTC: vascular (37.5vs. 32.6 %, p = 0.79), medical patients (12.5 vs. 8.7 % p = 0.18) and general surgery (25vs. 4.3 %, p = 0.04). Microbiology results indicated that in trauma patients with early VAP(\5 days), pathogens more commonly associated with community acquired infection oraspiration pneumonia were present in 50 % of cases vs. 23.1 % in late VAP ([5 days).CONCLUSIONS. Since becoming an MTC, our VAP rates have increased significantly due totrauma. This has been mirrored in other trauma centres. Causes for increased incidence of VAP intrauma patients may result from traumatic endo-tracheal tube insertion with dirty airways.However as our microbiology results suggest, a predominant factor for this increase may be due toaspiration pneumonia complicating early infections, making the diagnosis of VAP difficult. Tominimise the burden for health care, the definition for VAP in trauma cases may need to be revised.This will impact not only on treatment and choice of antimicrobials, but finally on outcomes.REFERENCES. 1. American Thoracic Society. Am J Respir Crit Care Med. 2005; 171:388–416. 2. Michetti P et al. Ventilator-associated pneumonia rates at major trauma centerscompared with a national benchmark. J Trauma Acute Care Surg. 2012; 72(5): 1165–73. 3.Raghavendran K et al. Aspiration-induced lung injury. Crit Care Med. 2011; 39(4): 818–826.
0795AGREEMENT BETWEEN ARTERIAL AND PERIPHERAL VENOUS LACTATELEVELS IN TRAUMA PATIENTS
M. Talayero Gimenez de Azcarate1, C. Garcı́a Fuentes1, M. Chico Fernández1,J.C. Montejo González1, E. Alted López1
1Hospital 12 de Octubre, Madrid, SpainINTRODUCTION. Elevated arterial lactate level is a sensitive and valuable marker ofsystemic hypo perfusion. The arterial lactate value traditionally has been considered thestandard for lactate determination. Access to arterial blood may be difficult, particularly inthe early stages of resuscitation when arterial line access has yet to be established.OBJECTIVE. The aim of this study was to evaluate the agreement between arterial (Lart)and peripheral venous lactate (Lven) values in trauma patients.METHODS. This study was conducted at a trauma ICU in an urban university hospital.Prehospital and baseline data were collected prospectively from June until December2012. The study cohort consisted of trauma patients older than 14 years admitted to thetrauma ICU. Eligible patients had an arterial blood sample drawn from an arterialpuncture and a venous sample from an in situ peripheral venous line, as close tosimultaneously as possible at admission. Blood was drawn into blood gas syringes andanalysed using ICU based analysers (GEM premier 3000) calibrated according tostandard quality assurance protocols.The quantitative variables are presented as mean ± SD or as median and 25th–75th per-centile range. Differences between variables were evaluated using intraclass correlationcoefficient. Additionally, the Bland–Altman test was used to determine the bias and thelimits of agreement between Lven compared to Lart. The results from both test are expressed
as bias ± SD (95 % confidence interval), and this confidence interval represents the limitsof agreement. The study was approved by ethical committee.RESULTS. We included a total of 204 samples from 102 patients. Most (70 %) were male,and the mean age was 41.79 ± 18.09 years. The median ISS was 21.5 (9–32) and GCS 13(7–15). The mean arrival time to hospital was 68 ± 30 min. Hypothermia (\35 �C) wasfound in a 24.5 % and low blood pressure (SBP \ 90 mmHg) in a 18.6 %. The meanhaemoglobin was 11.8 ± 2.8 g/dl.The mean lactate value was 2.41 ± 1.76 for Lart and 2.81 ± 1.75 for Lven. The intraclasscorrelation coefficient using a consistency definition was 0.947 (95 % CI 0.921–0.964) andusing an absolute agreement definition was 0.934 (95 % CI 0.865–0.963). In the Bland–Altman test, the mean difference was 0.4 ± 0.78 (95 % CI 0.247–0.557). 52 patients (51 %)had abnormal arterial levels (C2). In this subgroup the intraclass correlation coefficient was0.966 (95 % CI 0.94–0.981) using a consistency definition and 0.967 (95 % CI 0.943–0.981)using an absolute agreement definition.CONCLUSIONS. In the study group, venous levels tended to be higher than arterial levels.A strong linear correlation between arterial and peripheral venous lactate levels was found.This agreement was higher in the subgroup with abnormal arterial values. Therefore,peripheral venous lactate determination could be a useful tool during early resuscitation intrauma patients.
0796DECREASE IN HAEMOGLOBIN LEVELS WITH PREHOSPITAL FLUIDRESUSCITATION AS A PREDICTOR OF HAEMORRHAGIC SHOCK INTRAUMA PATIENTS
C. Taconet1, T. Gauss2, M. Raux3, S. Hamada1, A. Harrois1, J. Duranteau1, S. Figueiredo1
1Hôpital Bicêtre, Département d’Anesthésie-Réanimation, Le Kremlin Bicêtre, France,2Hôpital Beaujon, Département d’Anesthésie-Réanimation, Clichy, France, 3Hôpital PitiéSalpêtrière, Département d’Anesthésie-Réanimation, Paris, FranceINTRODUCTION. Haemorrhage is the most common preventable cause of death intrauma patients1. Fluid resuscitation (FR) is often necessary to maintain adequate tissueperfusion while surgical procedure and/or angioembolization are pending. FR may lead to adecrease in haemoglobin level ([Hb]) by haemodilution. We hypothesized that for a givenvolume of FR, an important drop in (Hb) could be predictive of the occurrence of ahaemorrhagic shock (HS) in trauma patients.OBJECTIVES. To evaluate the clinical relevance of the variation of capillary [Hb](DeltaHb = [Hbprehosp] - [Hbhosp]), measured by HemoCue� in the prehospital setting andupon admission to the hospital, to predict HS in trauma patients.METHODS. Prospective multicenter observational cohort study including all traumapatients admitted for primary multiple trauma between January 2010 and January 2013.Patients with cardio-respiratory arrest, osmotherapy or missing data on (Hb) wereexcluded. The population was divided into two groups: 1/HS (C4 Red Blood Cells(RBC) during the first 24 h), and 2/« control » (CL): no HS. Clinical and biologicaldata, DeltaHb and ratio of DeltaHb to 1,000 mL of FR (DeltaHb1000 = Del-taHb 9 1,000/FR) were compared between these two groups. The groups werecompared by using a Kruskall–Wallis test (associated with a post hoc test if positive).ROC curves were made for DeltaHb1000 parameter to assess its ability to predict theoccurrence of HS (Youden index and area under the curve (AUC) tested against thevalue 0.5).RESULTS. 635 patients were included in the study.
Table 1
HS n = 109 CL n = 526
FR (mL) 1,000(700–1,500)***
500(500–1,000)
Hbprehosp (g dL-1) 13 (11–14)*** 14 (13–15)
Hbhosp (g dL-1) 10 (9–12)*** 13 (12–15)
DeltaHb (g dL-1) 2 (1–4)*** 1 (0–2)
DeltaHb1000 (g dL-1) 2 (1–3)*** 1 (0–3)
ISS 34 (21–45)*** 13 (8–21)
Serum Lactate (mM) 4.1 (2.3–6)*** 1.8 (1.2–2.6)
Number of RBC in the emergency room 2 (0–4)*** 0
Fibrinogen (g L-1) 1.5 (1.1–1.9) 2.3 (2–2.7)
Values are expressed as median (interquartile range), *** P \ 0.001 for each parametercompared in the two groups HS vs CL.The AUC for DeltaHb1000 and HS is 0.62 (0.58–0.67) (P \ 0.0001 against the value of 0.5).The DeltaHb1000 predicted the transfusion of more than four RBC during the first 24 h with asensitivity of 57 %, a specificity of 57 %, a VPP of 21 % and a VPN of 86 % for a cut-off of 2.CONCLUSIONS. In trauma patients, decrease in haemoglobin levels with prehospital fluidresuscitation is not a powerful predictor of HS. Adding this parameter to a score whichincludes other factors could increase its performance.REFERENCE(S). 1. Kauvar. Crit Care. 2005; 9 (Suppl 5): S1–9.
0797STRUCTURED TRAUMA COURSES ARE VITAL FOR TEAM EFFECTIVENESSIN INTERPROFESSIONAL TRAUMA CARE
M. Hultin1, J. Ragnarsson1, M. Härgestam2, M. Jacobsson3, C. Brulin2
1Umeå University, Dept of Surgical and Perioperative Sciences, Umeå, Sweden, 2UmeåUniversity, Dept of Nursing, Umeå, Sweden, 3Umeå University, Dept of Social Work,Umeå, SwedenINTRODUCTION. A successful teamwork is built on a multitude of factors. In health carein general and trauma care in particular, the performance of the team determines the out-come for the patient. Several different aspects of trauma care have previously been studied
26th ESICM ANNUAL CONGRESS — PARIS, FRANCE — 5–9 OCTOBER 2013
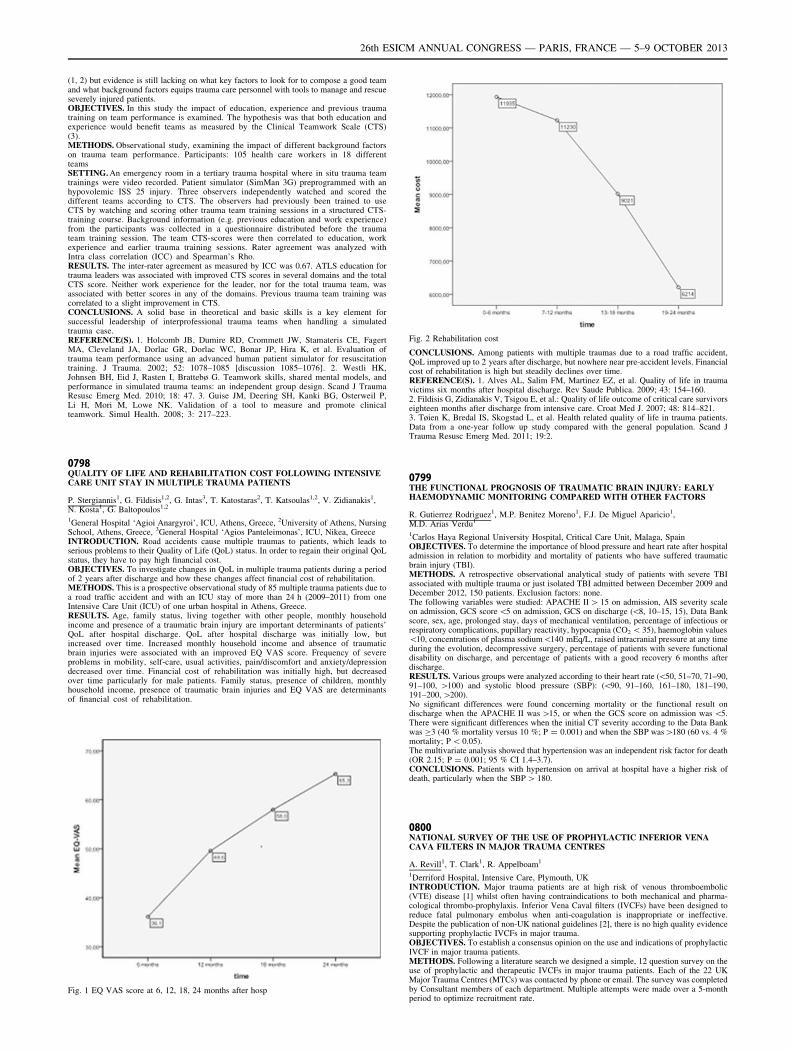
(1, 2) but evidence is still lacking on what key factors to look for to compose a good teamand what background factors equips trauma care personnel with tools to manage and rescueseverely injured patients.OBJECTIVES. In this study the impact of education, experience and previous traumatraining on team performance is examined. The hypothesis was that both education andexperience would benefit teams as measured by the Clinical Teamwork Scale (CTS)(3).METHODS. Observational study, examining the impact of different background factorson trauma team performance. Participants: 105 health care workers in 18 differentteamsSETTING. An emergency room in a tertiary trauma hospital where in situ trauma teamtrainings were video recorded. Patient simulator (SimMan 3G) preprogrammed with anhypovolemic ISS 25 injury. Three observers independently watched and scored thedifferent teams according to CTS. The observers had previously been trained to useCTS by watching and scoring other trauma team training sessions in a structured CTS-training course. Background information (e.g. previous education and work experience)from the participants was collected in a questionnaire distributed before the traumateam training session. The team CTS-scores were then correlated to education, workexperience and earlier trauma training sessions. Rater agreement was analyzed withIntra class correlation (ICC) and Spearman’s Rho.RESULTS. The inter-rater agreement as measured by ICC was 0.67. ATLS education fortrauma leaders was associated with improved CTS scores in several domains and the totalCTS score. Neither work experience for the leader, nor for the total trauma team, wasassociated with better scores in any of the domains. Previous trauma team training wascorrelated to a slight improvement in CTS.CONCLUSIONS. A solid base in theoretical and basic skills is a key element forsuccessful leadership of interprofessional trauma teams when handling a simulatedtrauma case.REFERENCE(S). 1. Holcomb JB, Dumire RD, Crommett JW, Stamateris CE, FagertMA, Cleveland JA, Dorlac GR, Dorlac WC, Bonar JP, Hira K, et al. Evaluation oftrauma team performance using an advanced human patient simulator for resuscitationtraining. J Trauma. 2002; 52: 1078–1085 [discussion 1085–1076]. 2. Westli HK,Johnsen BH, Eid J, Rasten I, Brattebø G. Teamwork skills, shared mental models, andperformance in simulated trauma teams: an independent group design. Scand J TraumaResusc Emerg Med. 2010; 18: 47. 3. Guise JM, Deering SH, Kanki BG, Osterweil P,Li H, Mori M, Lowe NK. Validation of a tool to measure and promote clinicalteamwork. Simul Health. 2008; 3: 217–223.
0798QUALITY OF LIFE AND REHABILITATION COST FOLLOWING INTENSIVECARE UNIT STAY IN MULTIPLE TRAUMA PATIENTS
P. Stergiannis1, G. Fildisis1,2, G. Intas3, T. Katostaras2, T. Katsoulas1,2, V. Zidianakis1,N. Kosta1, G. Baltopoulos1,2
1General Hospital ‘Agioi Anargyroi’, ICU, Athens, Greece, 2University of Athens, NursingSchool, Athens, Greece, 3General Hospital ‘Agios Panteleimonas’, ICU, Nikea, GreeceINTRODUCTION. Road accidents cause multiple traumas to patients, which leads toserious problems to their Quality of Life (QoL) status. In order to regain their original QoLstatus, they have to pay high financial cost.OBJECTIVES. To investigate changes in QoL in multiple trauma patients during a periodof 2 years after discharge and how these changes affect financial cost of rehabilitation.METHODS. This is a prospective observational study of 85 multiple trauma patients due toa road traffic accident and with an ICU stay of more than 24 h (2009–2011) from oneIntensive Care Unit (ICU) of one urban hospital in Athens, Greece.RESULTS. Age, family status, living together with other people, monthly householdincome and presence of a traumatic brain injury are important determinants of patients’QoL after hospital discharge. QoL after hospital discharge was initially low, butincreased over time. Increased monthly household income and absence of traumaticbrain injuries were associated with an improved EQ VAS score. Frequency of severeproblems in mobility, self-care, usual activities, pain/discomfort and anxiety/depressiondecreased over time. Financial cost of rehabilitation was initially high, but decreasedover time particularly for male patients. Family status, presence of children, monthlyhousehold income, presence of traumatic brain injuries and EQ VAS are determinantsof financial cost of rehabilitation.
Fig. 1 EQ VAS score at 6, 12, 18, 24 months after hosp
Fig. 2 Rehabilitation cost
CONCLUSIONS. Among patients with multiple traumas due to a road traffic accident,QoL improved up to 2 years after discharge, but nowhere near pre-accident levels. Financialcost of rehabilitation is high but steadily declines over time.REFERENCE(S). 1. Alves AL, Salim FM, Martinez EZ, et al. Quality of life in traumavictims six months after hospital discharge. Rev Saude Publica. 2009; 43: 154–160.2. Fildisis G, Zidianakis V, Tsigou E, et al.: Quality of life outcome of critical care survivorseighteen months after discharge from intensive care. Croat Med J. 2007; 48: 814–821.3. Tøien K, Bredal IS, Skogstad L, et al. Health related quality of life in trauma patients.Data from a one-year follow up study compared with the general population. Scand JTrauma Resusc Emerg Med. 2011; 19:2.
0799THE FUNCTIONAL PROGNOSIS OF TRAUMATIC BRAIN INJURY: EARLYHAEMODYNAMIC MONITORING COMPARED WITH OTHER FACTORS
R. Gutierrez Rodriguez1, M.P. Benitez Moreno1, F.J. De Miguel Aparicio1,M.D. Arias Verdu1
1Carlos Haya Regional University Hospital, Critical Care Unit, Malaga, SpainOBJECTIVES. To determine the importance of blood pressure and heart rate after hospitaladmission in relation to morbidity and mortality of patients who have suffered traumaticbrain injury (TBI).METHODS. A retrospective observational analytical study of patients with severe TBIassociated with multiple trauma or just isolated TBI admitted between December 2009 andDecember 2012, 150 patients. Exclusion factors: none.The following variables were studied: APACHE II [ 15 on admission, AIS severity scaleon admission, GCS score \5 on admission, GCS on discharge (\8, 10–15, 15), Data Bankscore, sex, age, prolonged stay, days of mechanical ventilation, percentage of infectious orrespiratory complications, pupillary reactivity, hypocapnia (CO2 \ 35), haemoglobin values\10, concentrations of plasma sodium\140 mEq/L, raised intracranial pressure at any timeduring the evolution, decompressive surgery, percentage of patients with severe functionaldisability on discharge, and percentage of patients with a good recovery 6 months afterdischarge.RESULTS. Various groups were analyzed according to their heart rate (\50, 51–70, 71–90,91–100, [100) and systolic blood pressure (SBP): (\90, 91–160, 161–180, 181–190,191–200, [200).No significant differences were found concerning mortality or the functional result ondischarge when the APACHE II was [15, or when the GCS score on admission was \5.There were significant differences when the initial CT severity according to the Data Bankwas C3 (40 % mortality versus 10 %; P = 0.001) and when the SBP was[180 (60 vs. 4 %mortality; P \ 0.05).The multivariate analysis showed that hypertension was an independent risk factor for death(OR 2.15; P = 0.001; 95 % CI 1.4–3.7).CONCLUSIONS. Patients with hypertension on arrival at hospital have a higher risk ofdeath, particularly when the SBP [ 180.
0800NATIONAL SURVEY OF THE USE OF PROPHYLACTIC INFERIOR VENACAVA FILTERS IN MAJOR TRAUMA CENTRES
A. Revill1, T. Clark1, R. Appelboam1
1Derriford Hospital, Intensive Care, Plymouth, UKINTRODUCTION. Major trauma patients are at high risk of venous thromboembolic(VTE) disease [1] whilst often having contraindications to both mechanical and pharma-cological thrombo-prophylaxis. Inferior Vena Caval filters (IVCFs) have been designed toreduce fatal pulmonary embolus when anti-coagulation is inappropriate or ineffective.Despite the publication of non-UK national guidelines [2], there is no high quality evidencesupporting prophylactic IVCFs in major trauma.OBJECTIVES. To establish a consensus opinion on the use and indications of prophylacticIVCF in major trauma patients.METHODS. Following a literature search we designed a simple, 12 question survey on theuse of prophylactic and therapeutic IVCFs in major trauma patients. Each of the 22 UKMajor Trauma Centres (MTCs) was contacted by phone or email. The survey was completedby Consultant members of each department. Multiple attempts were made over a 5-monthperiod to optimize recruitment rate.
26th ESICM ANNUAL CONGRESS — PARIS, FRANCE — 5–9 OCTOBER 2013
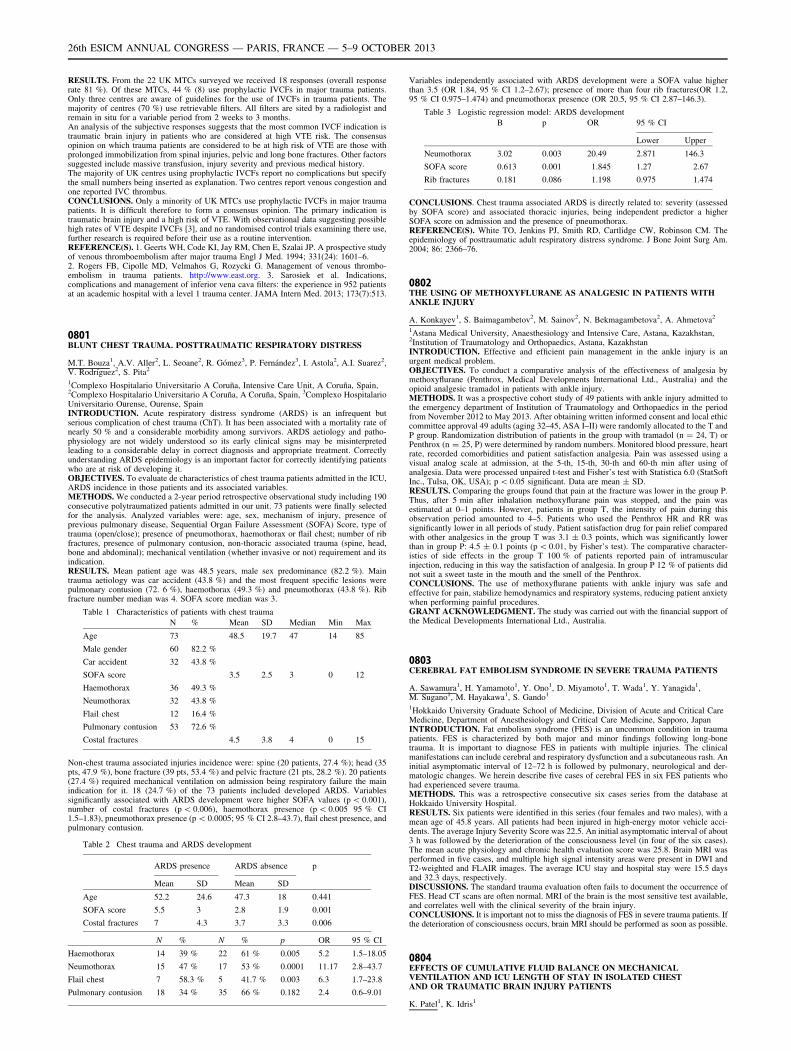
RESULTS. From the 22 UK MTCs surveyed we received 18 responses (overall responserate 81 %). Of these MTCs, 44 % (8) use prophylactic IVCFs in major trauma patients.Only three centres are aware of guidelines for the use of IVCFs in trauma patients. Themajority of centres (70 %) use retrievable filters. All filters are sited by a radiologist andremain in situ for a variable period from 2 weeks to 3 months.An analysis of the subjective responses suggests that the most common IVCF indication istraumatic brain injury in patients who are considered at high VTE risk. The consensusopinion on which trauma patients are considered to be at high risk of VTE are those withprolonged immobilization from spinal injuries, pelvic and long bone fractures. Other factorssuggested include massive transfusion, injury severity and previous medical history.The majority of UK centres using prophylactic IVCFs report no complications but specifythe small numbers being inserted as explanation. Two centres report venous congestion andone reported IVC thrombus.CONCLUSIONS. Only a minority of UK MTCs use prophylactic IVCFs in major traumapatients. It is difficult therefore to form a consensus opinion. The primary indication istraumatic brain injury and a high risk of VTE. With observational data suggesting possiblehigh rates of VTE despite IVCFs [3], and no randomised control trials examining there use,further research is required before their use as a routine intervention.REFERENCE(S). 1. Geerts WH, Code KI, Jay RM, Chen E, Szalai JP. A prospective studyof venous thromboembolism after major trauma Engl J Med. 1994; 331(24): 1601–6.2. Rogers FB, Cipolle MD, Velmahos G, Rozycki G. Management of venous thrombo-embolism in trauma patients. http://www.east.org. 3. Sarosiek et al. Indications,complications and management of inferior vena cava filters: the experience in 952 patientsat an academic hospital with a level 1 trauma center. JAMA Intern Med. 2013; 173(7):513.
0801BLUNT CHEST TRAUMA. POSTTRAUMATIC RESPIRATORY DISTRESS
M.T. Bouza1, A.V. Aller2, L. Seoane2, R. Gómez3, P. Fernández3, I. Astola2, A.I. Suarez2,V. Rodrı́guez2, S. Pita2
1Complexo Hospitalario Universitario A Coruña, Intensive Care Unit, A Coruña, Spain,2Complexo Hospitalario Universitario A Coruña, A Coruña, Spain, 3Complexo HospitalarioUniversitario Ourense, Ourense, SpainINTRODUCTION. Acute respiratory distress syndrome (ARDS) is an infrequent butserious complication of chest trauma (ChT). It has been associated with a mortality rate ofnearly 50 % and a considerable morbidity among survivors. ARDS aetiology and patho-physiology are not widely understood so its early clinical signs may be misinterpretedleading to a considerable delay in correct diagnosis and appropriate treatment. Correctlyunderstanding ARDS epidemiology is an important factor for correctly identifying patientswho are at risk of developing it.OBJECTIVES. To evaluate de characteristics of chest trauma patients admitted in the ICU,ARDS incidence in those patients and its associated variables.METHODS. We conducted a 2-year period retrospective observational study including 190consecutive polytraumatized patients admitted in our unit. 73 patients were finally selectedfor the analysis. Analyzed variables were: age, sex, mechanism of injury, presence ofprevious pulmonary disease, Sequential Organ Failure Assessment (SOFA) Score, type oftrauma (open/close); presence of pneumothorax, haemothorax or flail chest; number of ribfractures, presence of pulmonary contusion, non-thoracic associated trauma (spine, head,bone and abdominal); mechanical ventilation (whether invasive or not) requirement and itsindication.RESULTS. Mean patient age was 48.5 years, male sex predominance (82.2 %). Maintrauma aetiology was car accident (43.8 %) and the most frequent specific lesions werepulmonary contusion (72. 6 %), haemothorax (49.3 %) and pneumothorax (43.8 %). Ribfracture number median was 4. SOFA score median was 3.
Table 1 Characteristics of patients with chest trauma
N % Mean SD Median Min Max
Age 73 48.5 19.7 47 14 85
Male gender 60 82.2 %
Car accident 32 43.8 %
SOFA score 3.5 2.5 3 0 12
Haemothorax 36 49.3 %
Neumothorax 32 43.8 %
Flail chest 12 16.4 %
Pulmonary contusion 53 72.6 %
Costal fractures 4.5 3.8 4 0 15
Non-chest trauma associated injuries incidence were: spine (20 patients, 27.4 %); head (35pts, 47.9 %), bone fracture (39 pts, 53.4 %) and pelvic fracture (21 pts, 28.2 %). 20 patients(27.4 %) required mechanical ventilation on admission being respiratory failure the mainindication for it. 18 (24.7 %) of the 73 patients included developed ARDS. Variablessignificantly associated with ARDS development were higher SOFA values (p \ 0.001),number of costal fractures (p \ 0.006), haemothorax presence (p \ 0.005 95 % CI1.5–1.83), pneumothorax presence (p \ 0.0005; 95 % CI 2.8–43.7), flail chest presence, andpulmonary contusion.
Table 2 Chest trauma and ARDS development
ARDS presence ARDS absence p
Mean SD Mean SD
Age 52.2 24.6 47.3 18 0.441
SOFA score 5.5 3 2.8 1.9 0.001
Costal fractures 7 4.3 3.7 3.3 0.006
N % N % p OR 95 % CI
Haemothorax 14 39 % 22 61 % 0.005 5.2 1.5–18.05
Neumothorax 15 47 % 17 53 % 0.0001 11.17 2.8–43.7
Flail chest 7 58.3 % 5 41.7 % 0.003 6.3 1.7–23.8
Pulmonary contusion 18 34 % 35 66 % 0.182 2.4 0.6–9.01
Variables independently associated with ARDS development were a SOFA value higherthan 3.5 (OR 1.84, 95 % CI 1.2–2.67); presence of more than four rib fractures(OR 1.2,95 % CI 0.975–1.474) and pneumothorax presence (OR 20.5, 95 % CI 2.87–146.3).
Table 3 Logistic regression model: ARDS development
B p OR 95 % CI
Lower Upper
Neumothorax 3.02 0.003 20.49 2.871 146.3
SOFA score 0.613 0.001 1.845 1.27 2.67
Rib fractures 0.181 0.086 1.198 0.975 1.474
CONCLUSIONS. Chest trauma associated ARDS is directly related to: severity (assessedby SOFA score) and associated thoracic injuries, being independent predictor a higherSOFA score on admission and the presence of pneumothorax.REFERENCE(S). White TO, Jenkins PJ, Smith RD, Cartlidge CW, Robinson CM. Theepidemiology of posttraumatic adult respiratory distress syndrome. J Bone Joint Surg Am.2004; 86: 2366–76.
0802THE USING OF METHOXYFLURANE AS ANALGESIC IN PATIENTS WITHANKLE INJURY
A. Konkayev1, S. Baimagambetov2, M. Sainov2, N. Bekmagambetova2, A. Ahmetova2
1Astana Medical University, Anaesthesiology and Intensive Care, Astana, Kazakhstan,2Institution of Traumatology and Orthopaedics, Astana, KazakhstanINTRODUCTION. Effective and efficient pain management in the ankle injury is anurgent medical problem.OBJECTIVES. To conduct a comparative analysis of the effectiveness of analgesia bymethoxyflurane (Penthrox, Medical Developments International Ltd., Australia) and theopioid analgesic tramadol in patients with ankle injury.METHODS. It was a prospective cohort study of 49 patients with ankle injury admitted tothe emergency department of Institution of Traumatology and Orthopaedics in the periodfrom November 2012 to May 2013. After obtaining written informed consent and local ethiccommittee approval 49 adults (aging 32–45, ASA I–II) were randomly allocated to the T andP group. Randomization distribution of patients in the group with tramadol (n = 24, T) orPenthrox (n = 25, P) were determined by random numbers. Monitored blood pressure, heartrate, recorded comorbidities and patient satisfaction analgesia. Pain was assessed using avisual analog scale at admission, at the 5-th, 15-th, 30-th and 60-th min after using ofanalgesia. Data were processed unpaired t-test and Fisher’s test with Statistica 6.0 (StatSoftInc., Tulsa, OK, USA); p \ 0.05 significant. Data are mean ± SD.RESULTS. Comparing the groups found that pain at the fracture was lower in the group P.Thus, after 5 min after inhalation methoxyflurane pain was stopped, and the pain wasestimated at 0–1 points. However, patients in group T, the intensity of pain during thisobservation period amounted to 4–5. Patients who used the Penthrox HR and RR wassignificantly lower in all periods of study. Patient satisfaction drug for pain relief comparedwith other analgesics in the group T was 3.1 ± 0.3 points, which was significantly lowerthan in group P: 4.5 ± 0.1 points (p \ 0.01, by Fisher’s test). The comparative character-istics of side effects in the group T 100 % of patients reported pain of intramuscularinjection, reducing in this way the satisfaction of analgesia. In group P 12 % of patients didnot suit a sweet taste in the mouth and the smell of the Penthrox.CONCLUSIONS. The use of methoxyflurane patients with ankle injury was safe andeffective for pain, stabilize hemodynamics and respiratory systems, reducing patient anxietywhen performing painful procedures.GRANT ACKNOWLEDGMENT. The study was carried out with the financial support ofthe Medical Developments International Ltd., Australia.
0803CEREBRAL FAT EMBOLISM SYNDROME IN SEVERE TRAUMA PATIENTS
A. Sawamura1, H. Yamamoto1, Y. Ono1, D. Miyamoto1, T. Wada1, Y. Yanagida1,M. Sugano1, M. Hayakawa1, S. Gando1
1Hokkaido University Graduate School of Medicine, Division of Acute and Critical CareMedicine, Department of Anesthesiology and Critical Care Medicine, Sapporo, JapanINTRODUCTION. Fat embolism syndrome (FES) is an uncommon condition in traumapatients. FES is characterized by both major and minor findings following long-bonetrauma. It is important to diagnose FES in patients with multiple injuries. The clinicalmanifestations can include cerebral and respiratory dysfunction and a subcutaneous rash. Aninitial asymptomatic interval of 12–72 h is followed by pulmonary, neurological and der-matologic changes. We herein describe five cases of cerebral FES in six FES patients whohad experienced severe trauma.METHODS. This was a retrospective consecutive six cases series from the database atHokkaido University Hospital.RESULTS. Six patients were identified in this series (four females and two males), with amean age of 45.8 years. All patients had been injured in high-energy motor vehicle acci-dents. The average Injury Severity Score was 22.5. An initial asymptomatic interval of about3 h was followed by the deterioration of the consciousness level (in four of the six cases).The mean acute physiology and chronic health evaluation score was 25.8. Brain MRI wasperformed in five cases, and multiple high signal intensity areas were present in DWI andT2-weighted and FLAIR images. The average ICU stay and hospital stay were 15.5 daysand 32.3 days, respectively.DISCUSSIONS. The standard trauma evaluation often fails to document the occurrence ofFES. Head CT scans are often normal. MRI of the brain is the most sensitive test available,and correlates well with the clinical severity of the brain injury.CONCLUSIONS. It is important not to miss the diagnosis of FES in severe trauma patients. Ifthe deterioration of consciousness occurs, brain MRI should be performed as soon as possible.
0804EFFECTS OF CUMULATIVE FLUID BALANCE ON MECHANICALVENTILATION AND ICU LENGTH OF STAY IN ISOLATED CHESTAND OR TRAUMATIC BRAIN INJURY PATIENTS
K. Patel1, K. Idris1
26th ESICM ANNUAL CONGRESS — PARIS, FRANCE — 5–9 OCTOBER 2013
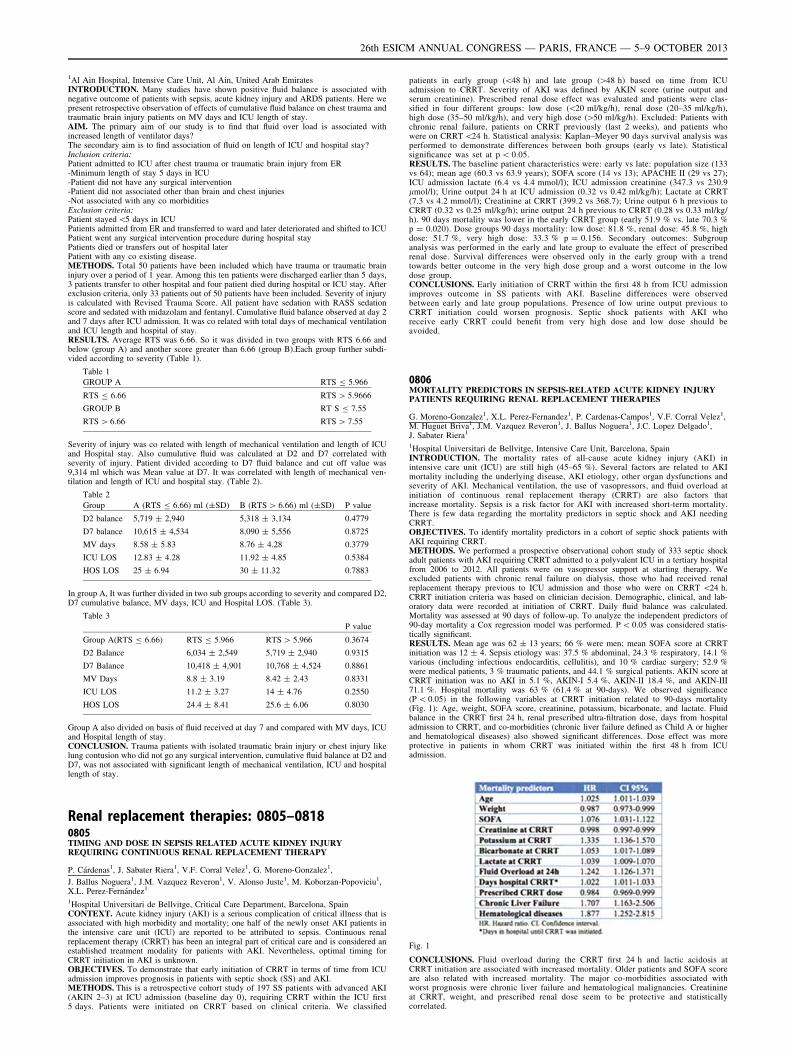
1Al Ain Hospital, Intensive Care Unit, Al Ain, United Arab EmiratesINTRODUCTION. Many studies have shown positive fluid balance is associated withnegative outcome of patients with sepsis, acute kidney injury and ARDS patients. Here wepresent retrospective observation of effects of cumulative fluid balance on chest trauma andtraumatic brain injury patients on MV days and ICU length of stay.AIM. The primary aim of our study is to find that fluid over load is associated withincreased length of ventilator days?The secondary aim is to find association of fluid on length of ICU and hospital stay?Inclusion criteria:Patient admitted to ICU after chest trauma or traumatic brain injury from ER-Minimum length of stay 5 days in ICU-Patient did not have any surgical intervention-Patient did not associated other than brain and chest injuries-Not associated with any co morbiditiesExclusion criteria:Patient stayed \5 days in ICUPatients admitted from ER and transferred to ward and later deteriorated and shifted to ICUPatient went any surgical intervention procedure during hospital stayPatients died or transfers out of hospital laterPatient with any co existing disease.METHODS. Total 50 patients have been included which have trauma or traumatic braininjury over a period of 1 year. Among this ten patients were discharged earlier than 5 days,3 patients transfer to other hospital and four patient died during hospital or ICU stay. Afterexclusion criteria, only 33 patients out of 50 patients have been included. Severity of injuryis calculated with Revised Trauma Score. All patient have sedation with RASS sedationscore and sedated with midazolam and fentanyl. Cumulative fluid balance observed at day 2and 7 days after ICU admission. It was co related with total days of mechanical ventilationand ICU length and hospital of stay.RESULTS. Average RTS was 6.66. So it was divided in two groups with RTS 6.66 andbelow (group A) and another score greater than 6.66 (group B).Each group further subdi-vided according to severity (Table 1).
Table 1
GROUP A RTS B 5.966
RTS B 6.66 RTS [ 5.9666
GROUP B RT S B 7.55
RTS [ 6.66 RTS [ 7.55
Severity of injury was co related with length of mechanical ventilation and length of ICUand Hospital stay. Also cumulative fluid was calculated at D2 and D7 correlated withseverity of injury. Patient divided according to D7 fluid balance and cut off value was9,314 ml which was Mean value at D7. It was correlated with length of mechanical ven-tilation and length of ICU and hospital stay. (Table 2).
Table 2
Group A (RTS B 6.66) ml (±SD) B (RTS [ 6.66) ml (±SD) P value
D2 balance 5,719 ± 2,940 5,318 ± 3,134 0.4779
D7 balance 10,615 ± 4,534 8,090 ± 5,556 0.8725
MV days 8.58 ± 5.83 8.76 ± 4.28 0.3779
ICU LOS 12.83 ± 4.28 11.92 ± 4.85 0.5384
HOS LOS 25 ± 6.94 30 ± 11.32 0.7883
In group A, It was further divided in two sub groups according to severity and compared D2,D7 cumulative balance, MV days, ICU and Hospital LOS. (Table 3).
Table 3
P value
Group A(RTS B 6.66) RTS B 5.966 RTS [ 5.966 0.3674
D2 Balance 6,034 ± 2,549 5,719 ± 2,940 0.9315
D7 Balance 10,418 ± 4,901 10,768 ± 4,524 0.8861
MV Days 8.8 ± 3.19 8.42 ± 2.43 0.8331
ICU LOS 11.2 ± 3.27 14 ± 4.76 0.2550
HOS LOS 24.4 ± 8.41 25.6 ± 6.06 0.8030
Group A also divided on basis of fluid received at day 7 and compared with MV days, ICUand Hospital length of stay.CONCLUSION. Trauma patients with isolated traumatic brain injury or chest injury likelung contusion who did not go any surgical intervention, cumulative fluid balance at D2 andD7, was not associated with significant length of mechanical ventilation, ICU and hospitallength of stay.
Renal replacement therapies: 0805–08180805TIMING AND DOSE IN SEPSIS RELATED ACUTE KIDNEY INJURYREQUIRING CONTINUOUS RENAL REPLACEMENT THERAPY
P. Cárdenas1, J. Sabater Riera1, V.F. Corral Velez1, G. Moreno-Gonzalez1,
J. Ballus Noguera1, J.M. Vazquez Reveron1, V. Alonso Juste1, M. Koborzan-Popoviciu1,X.L. Perez-Fernández1
1Hospital Universitari de Bellvitge, Critical Care Department, Barcelona, SpainCONTEXT. Acute kidney injury (AKI) is a serious complication of critical illness that isassociated with high morbidity and mortality; one half of the newly onset AKI patients inthe intensive care unit (ICU) are reported to be attributed to sepsis. Continuous renalreplacement therapy (CRRT) has been an integral part of critical care and is considered anestablished treatment modality for patients with AKI. Nevertheless, optimal timing forCRRT initiation in AKI is unknown.OBJECTIVES. To demonstrate that early initiation of CRRT in terms of time from ICUadmission improves prognosis in patients with septic shock (SS) and AKI.METHODS. This is a retrospective cohort study of 197 SS patients with advanced AKI(AKIN 2–3) at ICU admission (baseline day 0), requiring CRRT within the ICU first5 days. Patients were initiated on CRRT based on clinical criteria. We classified
patients in early group (\48 h) and late group ([48 h) based on time from ICUadmission to CRRT. Severity of AKI was defined by AKIN score (urine output andserum creatinine). Prescribed renal dose effect was evaluated and patients were clas-sified in four different groups: low dose (\20 ml/kg/h), renal dose (20–35 ml/kg/h),high dose (35–50 ml/kg/h), and very high dose ([50 ml/kg/h). Excluded: Patients withchronic renal failure, patients on CRRT previously (last 2 weeks), and patients whowere on CRRT \24 h. Statistical analysis: Kaplan–Meyer 90 days survival analysis wasperformed to demonstrate differences between both groups (early vs late). Statisticalsignificance was set at p \ 0.05.RESULTS. The baseline patient characteristics were: early vs late: population size (133vs 64); mean age (60.3 vs 63.9 years); SOFA score (14 vs 13); APACHE II (29 vs 27);ICU admission lactate (6.4 vs 4.4 mmol/l); ICU admission creatinine (347.3 vs 230.9lmol/l); Urine output 24 h at ICU admission (0.32 vs 0.42 ml/kg/h); Lactate at CRRT(7.3 vs 4.2 mmol/l); Creatinine at CRRT (399.2 vs 368.7); Urine output 6 h previous toCRRT (0.32 vs 0.25 ml/kg/h); urine output 24 h previous to CRRT (0.28 vs 0.33 ml/kg/h). 90 days mortality was lower in the early CRRT group (early 51.9 % vs. late 70.3 %p = 0.020). Dose groups 90 days mortality: low dose: 81.8 %, renal dose: 45.8 %, highdose: 51.7 %, very high dose: 33.3 % p = 0.156. Secondary outcomes: Subgroupanalysis was performed in the early and late group to evaluate the effect of prescribedrenal dose. Survival differences were observed only in the early group with a trendtowards better outcome in the very high dose group and a worst outcome in the lowdose group.CONCLUSIONS. Early initiation of CRRT within the first 48 h from ICU admissionimproves outcome in SS patients with AKI. Baseline differences were observedbetween early and late group populations. Presence of low urine output previous toCRRT initiation could worsen prognosis. Septic shock patients with AKI whoreceive early CRRT could benefit from very high dose and low dose should beavoided.
0806MORTALITY PREDICTORS IN SEPSIS-RELATED ACUTE KIDNEY INJURYPATIENTS REQUIRING RENAL REPLACEMENT THERAPIES
G. Moreno-Gonzalez1, X.L. Perez-Fernandez1, P. Cardenas-Campos1, V.F. Corral Velez1,M. Huguet Briva1, J.M. Vazquez Reveron1, J. Ballus Noguera1, J.C. Lopez Delgado1,J. Sabater Riera1
1Hospital Universitari de Bellvitge, Intensive Care Unit, Barcelona, SpainINTRODUCTION. The mortality rates of all-cause acute kidney injury (AKI) inintensive care unit (ICU) are still high (45–65 %). Several factors are related to AKImortality including the underlying disease, AKI etiology, other organ dysfunctions andseverity of AKI. Mechanical ventilation, the use of vasopressors, and fluid overload atinitiation of continuous renal replacement therapy (CRRT) are also factors thatincrease mortality. Sepsis is a risk factor for AKI with increased short-term mortality.There is few data regarding the mortality predictors in septic shock and AKI needingCRRT.OBJECTIVES. To identify mortality predictors in a cohort of septic shock patients withAKI requiring CRRT.METHODS. We performed a prospective observational cohort study of 333 septic shockadult patients with AKI requiring CRRT admitted to a polyvalent ICU in a tertiary hospitalfrom 2006 to 2012. All patients were on vasopressor support at starting therapy. Weexcluded patients with chronic renal failure on dialysis, those who had received renalreplacement therapy previous to ICU admission and those who were on CRRT \24 h.CRRT initiation criteria was based on clinician decision. Demographic, clinical, and lab-oratory data were recorded at initiation of CRRT. Daily fluid balance was calculated.Mortality was assessed at 90 days of follow-up. To analyze the independent predictors of90-day mortality a Cox regression model was performed. P \ 0.05 was considered statis-tically significant.RESULTS. Mean age was 62 ± 13 years; 66 % were men; mean SOFA score at CRRTinitiation was 12 ± 4. Sepsis etiology was: 37.5 % abdominal, 24.3 % respiratory, 14.1 %various (including infectious endocarditis, cellulitis), and 10 % cardiac surgery; 52.9 %were medical patients, 3 % traumatic patients, and 44.1 % surgical patients. AKIN score atCRRT initiation was no AKI in 5.1 %, AKIN-I 5.4 %, AKIN-II 18.4 %, and AKIN-III71.1 %. Hospital mortality was 63 % (61.4 % at 90-days). We observed significance(P \ 0.05) in the following variables at CRRT initiation related to 90-days mortality(Fig. 1): Age, weight, SOFA score, creatinine, potassium, bicarbonate, and lactate. Fluidbalance in the CRRT first 24 h, renal prescribed ultra-filtration dose, days from hospitaladmission to CRRT, and co-morbidities (chronic liver failure defined as Child A or higherand hematological diseases) also showed significant differences. Dose effect was moreprotective in patients in whom CRRT was initiated within the first 48 h from ICUadmission.
Fig. 1
CONCLUSIONS. Fluid overload during the CRRT first 24 h and lactic acidosis atCRRT initiation are associated with increased mortality. Older patients and SOFA scoreare also related with increased mortality. The major co-morbidities associated withworst prognosis were chronic liver failure and hematological malignancies. Creatinineat CRRT, weight, and prescribed renal dose seem to be protective and statisticallycorrelated.
26th ESICM ANNUAL CONGRESS — PARIS, FRANCE — 5–9 OCTOBER 2013
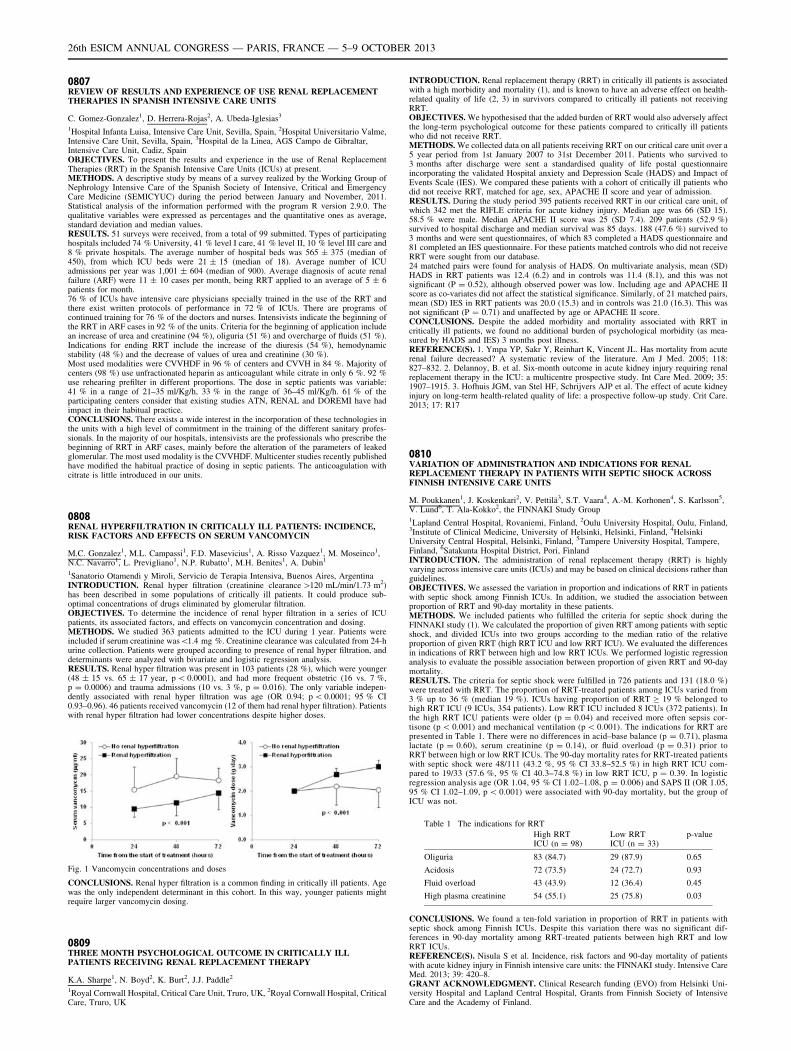
0807REVIEW OF RESULTS AND EXPERIENCE OF USE RENAL REPLACEMENTTHERAPIES IN SPANISH INTENSIVE CARE UNITS
C. Gomez-Gonzalez1, D. Herrera-Rojas2, A. Ubeda-Iglesias3
1Hospital Infanta Luisa, Intensive Care Unit, Sevilla, Spain, 2Hospital Universitario Valme,Intensive Care Unit, Sevilla, Spain, 3Hospital de la Linea, AGS Campo de Gibraltar,Intensive Care Unit, Cadiz, SpainOBJECTIVES. To present the results and experience in the use of Renal ReplacementTherapies (RRT) in the Spanish Intensive Care Units (ICUs) at present.METHODS. A descriptive study by means of a survey realized by the Working Group ofNephrology Intensive Care of the Spanish Society of Intensive, Critical and EmergencyCare Medicine (SEMICYUC) during the period between January and November, 2011.Statistical analysis of the information performed with the program R version 2.9.0. Thequalitative variables were expressed as percentages and the quantitative ones as average,standard deviation and median values.RESULTS. 51 surveys were received, from a total of 99 submitted. Types of participatinghospitals included 74 % University, 41 % level I care, 41 % level II, 10 % level III care and8 % private hospitals. The average number of hospital beds was 565 ± 375 (median of450), from which ICU beds were 21 ± 15 (median of 18). Average number of ICUadmissions per year was 1,001 ± 604 (median of 900). Average diagnosis of acute renalfailure (ARF) were 11 ± 10 cases per month, being RRT applied to an average of 5 ± 6patients for month.76 % of ICUs have intensive care physicians specially trained in the use of the RRT andthere exist written protocols of performance in 72 % of ICUs. There are programs ofcontinued training for 76 % of the doctors and nurses. Intensivists indicate the beginning ofthe RRT in ARF cases in 92 % of the units. Criteria for the beginning of application includean increase of urea and creatinine (94 %), oliguria (51 %) and overcharge of fluids (51 %).Indications for ending RRT include the increase of the diuresis (54 %), hemodynamicstability (48 %) and the decrease of values of urea and creatinine (30 %).Most used modalities were CVVHDF in 96 % of centers and CVVH in 84 %. Majority ofcenters (98 %) use unfractionated heparin as anticoagulant while citrate in only 6 %. 92 %use rehearing prefilter in different proportions. The dose in septic patients was variable:41 % in a range of 21–35 ml/Kg/h, 33 % in the range of 36–45 ml/Kg/h. 61 % of theparticipating centers consider that existing studies ATN, RENAL and DOREMI have hadimpact in their habitual practice.CONCLUSIONS. There exists a wide interest in the incorporation of these technologies inthe units with a high level of commitment in the training of the different sanitary profes-sionals. In the majority of our hospitals, intensivists are the professionals who prescribe thebeginning of RRT in ARF cases, mainly before the alteration of the parameters of leakedglomerular. The most used modality is the CVVHDF. Multicenter studies recently publishedhave modified the habitual practice of dosing in septic patients. The anticoagulation withcitrate is little introduced in our units.
0808RENAL HYPERFILTRATION IN CRITICALLY ILL PATIENTS: INCIDENCE,RISK FACTORS AND EFFECTS ON SERUM VANCOMYCIN
M.C. Gonzalez1, M.L. Campassi1, F.D. Masevicius1, A. Risso Vazquez1, M. Moseinco1,N.C. Navarro1, L. Previgliano1, N.P. Rubatto1, M.H. Benites1, A. Dubin1
1Sanatorio Otamendi y Miroli, Servicio de Terapia Intensiva, Buenos Aires, ArgentinaINTRODUCTION. Renal hyper filtration (creatinine clearance [120 mL/min/1.73 m2)has been described in some populations of critically ill patients. It could produce sub-optimal concentrations of drugs eliminated by glomerular filtration.OBJECTIVES. To determine the incidence of renal hyper filtration in a series of ICUpatients, its associated factors, and effects on vancomycin concentration and dosing.METHODS. We studied 363 patients admitted to the ICU during 1 year. Patients wereincluded if serum creatinine was\1.4 mg %. Creatinine clearance was calculated from 24-hurine collection. Patients were grouped according to presence of renal hyper filtration, anddeterminants were analyzed with bivariate and logistic regression analysis.RESULTS. Renal hyper filtration was present in 103 patients (28 %), which were younger(48 ± 15 vs. 65 ± 17 year, p \ 0.0001), and had more frequent obstetric (16 vs. 7 %,p = 0.0006) and trauma admissions (10 vs. 3 %, p = 0.016). The only variable indepen-dently associated with renal hyper filtration was age (OR 0.94; p \ 0.0001; 95 % CI0.93–0.96). 46 patients received vancomycin (12 of them had renal hyper filtration). Patientswith renal hyper filtration had lower concentrations despite higher doses.
Fig. 1 Vancomycin concentrations and doses
CONCLUSIONS. Renal hyper filtration is a common finding in critically ill patients. Agewas the only independent determinant in this cohort. In this way, younger patients mightrequire larger vancomycin dosing.
0809THREE MONTH PSYCHOLOGICAL OUTCOME IN CRITICALLY ILLPATIENTS RECEIVING RENAL REPLACEMENT THERAPY
K.A. Sharpe1, N. Boyd2, K. Burt2, J.J. Paddle2
1Royal Cornwall Hospital, Critical Care Unit, Truro, UK, 2Royal Cornwall Hospital, CriticalCare, Truro, UK
INTRODUCTION. Renal replacement therapy (RRT) in critically ill patients is associatedwith a high morbidity and mortality (1), and is known to have an adverse effect on health-related quality of life (2, 3) in survivors compared to critically ill patients not receivingRRT.OBJECTIVES. We hypothesised that the added burden of RRT would also adversely affectthe long-term psychological outcome for these patients compared to critically ill patientswho did not receive RRT.METHODS. We collected data on all patients receiving RRT on our critical care unit over a5 year period from 1st January 2007 to 31st December 2011. Patients who survived to3 months after discharge were sent a standardised quality of life postal questionnaireincorporating the validated Hospital anxiety and Depression Scale (HADS) and Impact ofEvents Scale (IES). We compared these patients with a cohort of critically ill patients whodid not receive RRT, matched for age, sex, APACHE II score and year of admission.RESULTS. During the study period 395 patients received RRT in our critical care unit, ofwhich 342 met the RIFLE criteria for acute kidney injury. Median age was 66 (SD 15).58.5 % were male. Median APACHE II score was 25 (SD 7.4). 209 patients (52.9 %)survived to hospital discharge and median survival was 85 days. 188 (47.6 %) survived to3 months and were sent questionnaires, of which 83 completed a HADS questionnaire and81 completed an IES questionnaire. For these patients matched controls who did not receiveRRT were sought from our database.24 matched pairs were found for analysis of HADS. On multivariate analysis, mean (SD)HADS in RRT patients was 12.4 (6.2) and in controls was 11.4 (8.1), and this was notsignificant (P = 0.52), although observed power was low. Including age and APACHE IIscore as co-variates did not affect the statistical significance. Similarly, of 21 matched pairs,mean (SD) IES in RRT patients was 20.0 (15.3) and in controls was 21.0 (16.3). This wasnot significant (P = 0.71) and unaffected by age or APACHE II score.CONCLUSIONS. Despite the added morbidity and mortality associated with RRT incritically ill patients, we found no additional burden of psychological morbidity (as mea-sured by HADS and IES) 3 months post illness.REFERENCE(S). 1. Ympa YP, Sakr Y, Reinhart K, Vincent JL. Has mortality from acuterenal failure decreased? A systematic review of the literature. Am J Med. 2005; 118:827–832. 2. Delannoy, B. et al. Six-month outcome in acute kidney injury requiring renalreplacement therapy in the ICU: a multicentre prospective study. Int Care Med. 2009; 35:1907–1915. 3. Hofhuis JGM, van Stel HF, Schrijvers AJP et al. The effect of acute kidneyinjury on long-term health-related quality of life: a prospective follow-up study. Crit Care.2013; 17: R17
0810VARIATION OF ADMINISTRATION AND INDICATIONS FOR RENALREPLACEMENT THERAPY IN PATIENTS WITH SEPTIC SHOCK ACROSSFINNISH INTENSIVE CARE UNITS
M. Poukkanen1, J. Koskenkari2, V. Pettilä3, S.T. Vaara4, A.-M. Korhonen4, S. Karlsson5,V. Lund6, T. Ala-Kokko2, the FINNAKI Study Group1Lapland Central Hospital, Rovaniemi, Finland, 2Oulu University Hospital, Oulu, Finland,3Institute of Clinical Medicine, University of Helsinki, Helsinki, Finland, 4HelsinkiUniversity Central Hospital, Helsinki, Finland, 5Tampere University Hospital, Tampere,Finland, 6Satakunta Hospital District, Pori, FinlandINTRODUCTION. The administration of renal replacement therapy (RRT) is highlyvarying across intensive care units (ICUs) and may be based on clinical decisions rather thanguidelines.OBJECTIVES. We assessed the variation in proportion and indications of RRT in patientswith septic shock among Finnish ICUs. In addition, we studied the association betweenproportion of RRT and 90-day mortality in these patients.METHODS. We included patients who fulfilled the criteria for septic shock during theFINNAKI study (1). We calculated the proportion of given RRT among patients with septicshock, and divided ICUs into two groups according to the median ratio of the relativeproportion of given RRT (high RRT ICU and low RRT ICU). We evaluated the differencesin indications of RRT between high and low RRT ICUs. We performed logistic regressionanalysis to evaluate the possible association between proportion of given RRT and 90-daymortality.RESULTS. The criteria for septic shock were fulfilled in 726 patients and 131 (18.0 %)were treated with RRT. The proportion of RRT-treated patients among ICUs varied from3 % up to 36 % (median 19 %). ICUs having proportion of RRT C 19 % belonged tohigh RRT ICU (9 ICUs, 354 patients). Low RRT ICU included 8 ICUs (372 patients). Inthe high RRT ICU patients were older (p = 0.04) and received more often sepsis cor-tisone (p \ 0.001) and mechanical ventilation (p \ 0.001). The indications for RRT arepresented in Table 1. There were no differences in acid–base balance (p = 0.71), plasmalactate (p = 0.60), serum creatinine (p = 0.14), or fluid overload (p = 0.31) prior toRRT between high or low RRT ICUs. The 90-day mortality rates for RRT-treated patientswith septic shock were 48/111 (43.2 %, 95 % CI 33.8–52.5 %) in high RRT ICU com-pared to 19/33 (57.6 %, 95 % CI 40.3–74.8 %) in low RRT ICU, p = 0.39. In logisticregression analysis age (OR 1.04, 95 % CI 1.02–1.08, p = 0.006) and SAPS II (OR 1.05,95 % CI 1.02–1.09, p \ 0.001) were associated with 90-day mortality, but the group ofICU was not.
Table 1 The indications for RRT
High RRTICU (n = 98)
Low RRTICU (n = 33)
p-value
Oliguria 83 (84.7) 29 (87.9) 0.65
Acidosis 72 (73.5) 24 (72.7) 0.93
Fluid overload 43 (43.9) 12 (36.4) 0.45
High plasma creatinine 54 (55.1) 25 (75.8) 0.03
CONCLUSIONS. We found a ten-fold variation in proportion of RRT in patients withseptic shock among Finnish ICUs. Despite this variation there was no significant dif-ferences in 90-day mortality among RRT-treated patients between high RRT and lowRRT ICUs.REFERENCE(S). Nisula S et al. Incidence, risk factors and 90-day mortality of patientswith acute kidney injury in Finnish intensive care units: the FINNAKI study. Intensive CareMed. 2013; 39: 420–8.GRANT ACKNOWLEDGMENT. Clinical Research funding (EVO) from Helsinki Uni-versity Hospital and Lapland Central Hospital, Grants from Finnish Society of IntensiveCare and the Academy of Finland.
26th ESICM ANNUAL CONGRESS — PARIS, FRANCE — 5–9 OCTOBER 2013
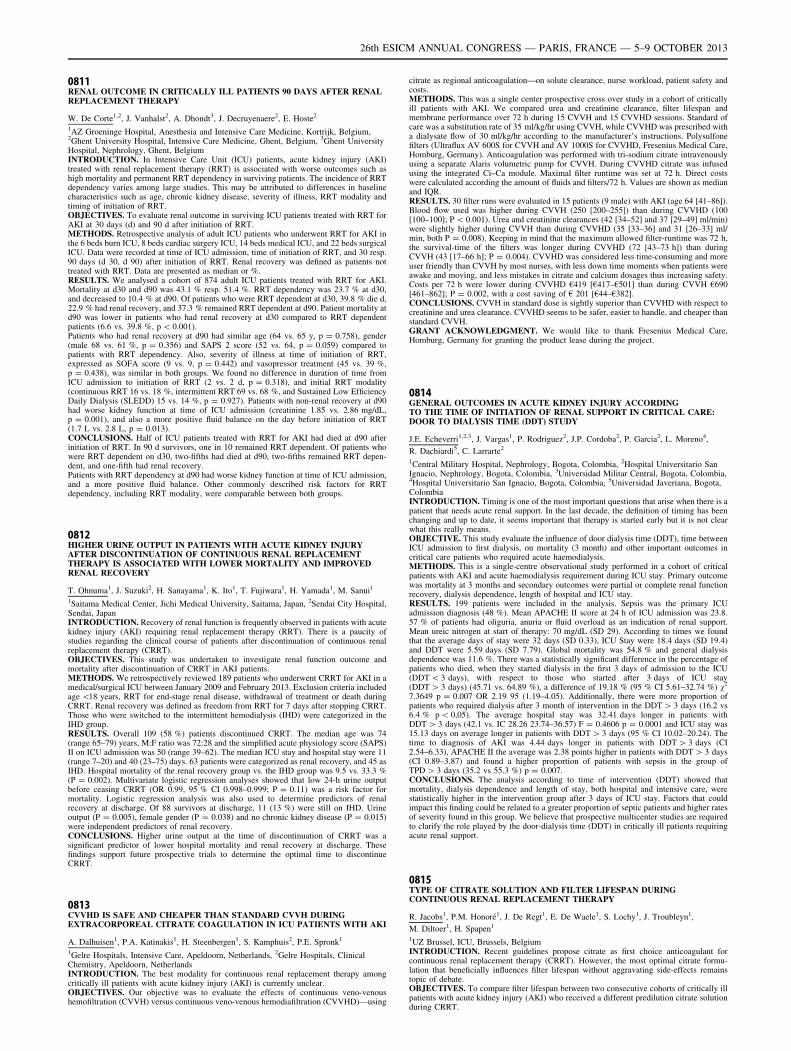
0811RENAL OUTCOME IN CRITICALLY ILL PATIENTS 90 DAYS AFTER RENALREPLACEMENT THERAPY
W. De Corte1,2, J. Vanhalst2, A. Dhondt3, J. Decruyenaere2, E. Hoste2
1AZ Groeninge Hospital, Anesthesia and Intensive Care Medicine, Kortrijk, Belgium,2Ghent University Hospital, Intensive Care Medicine, Ghent, Belgium, 3Ghent UniversityHospital, Nephrology, Ghent, BelgiumINTRODUCTION. In Intensive Care Unit (ICU) patients, acute kidney injury (AKI)treated with renal replacement therapy (RRT) is associated with worse outcomes such ashigh mortality and permanent RRT dependency in surviving patients. The incidence of RRTdependency varies among large studies. This may be attributed to differences in baselinecharacteristics such as age, chronic kidney disease, severity of illness, RRT modality andtiming of initiation of RRT.OBJECTIVES. To evaluate renal outcome in surviving ICU patients treated with RRT forAKI at 30 days (d) and 90 d after initiation of RRT.METHODS. Retrospective analysis of adult ICU patients who underwent RRT for AKI inthe 6 beds burn ICU, 8 beds cardiac surgery ICU, 14 beds medical ICU, and 22 beds surgicalICU. Data were recorded at time of ICU admission, time of initiation of RRT, and 30 resp.90 days (d 30, d 90) after initiation of RRT. Renal recovery was defined as patients nottreated with RRT. Data are presented as median or %.RESULTS. We analysed a cohort of 874 adult ICU patients treated with RRT for AKI.Mortality at d30 and d90 was 43.1 % resp. 51.4 %. RRT dependency was 23.7 % at d30,and decreased to 10.4 % at d90. Of patients who were RRT dependent at d30, 39.8 % die d,22.9 % had renal recovery, and 37.3 % remained RRT dependent at d90. Patient mortality atd90 was lower in patients who had renal recovery at d30 compared to RRT dependentpatients (6.6 vs. 39.8 %, p \ 0.001).Patients who had renal recovery at d90 had similar age (64 vs. 65 y, p = 0.758), gender(male 68 vs. 61 %, p = 0.356) and SAPS 2 score (52 vs. 64, p = 0.059) compared topatients with RRT dependency. Also, severity of illness at time of initiation of RRT,expressed as SOFA score (9 vs. 9, p = 0.442) and vasopressor treatment (45 vs. 39 %,p = 0.438), was similar in both groups. We found no difference in duration of time fromICU admission to initiation of RRT (2 vs. 2 d, p = 0.318), and initial RRT modality(continuous RRT 16 vs. 18 %, intermittent RRT 69 vs. 68 %, and Sustained Low EfficiencyDaily Dialysis (SLEDD) 15 vs. 14 %, p = 0.927). Patients with non-renal recovery at d90had worse kidney function at time of ICU admission (creatinine 1.85 vs. 2.86 mg/dL,p = 0.001), and also a more positive fluid balance on the day before initiation of RRT(1.7 L vs. 2.8 L, p = 0.013).CONCLUSIONS. Half of ICU patients treated with RRT for AKI had died at d90 afterinitiation of RRT. In 90 d survivors, one in 10 remained RRT dependent. Of patients whowere RRT dependent on d30, two-fifths had died at d90, two-fifths remained RRT depen-dent, and one-fifth had renal recovery.Patients with RRT dependency at d90 had worse kidney function at time of ICU admission,and a more positive fluid balance. Other commonly described risk factors for RRTdependency, including RRT modality, were comparable between both groups.
0812HIGHER URINE OUTPUT IN PATIENTS WITH ACUTE KIDNEY INJURYAFTER DISCONTINUATION OF CONTINUOUS RENAL REPLACEMENTTHERAPY IS ASSOCIATED WITH LOWER MORTALITY AND IMPROVEDRENAL RECOVERY
T. Ohnuma1, J. Suzuki2, H. Sanayama1, K. Ito1, T. Fujiwara1, H. Yamada1, M. Sanui1
1Saitama Medical Center, Jichi Medical University, Saitama, Japan, 2Sendai City Hospital,Sendai, JapanINTRODUCTION. Recovery of renal function is frequently observed in patients with acutekidney injury (AKI) requiring renal replacement therapy (RRT). There is a paucity ofstudies regarding the clinical course of patients after discontinuation of continuous renalreplacement therapy (CRRT).OBJECTIVES. This study was undertaken to investigate renal function outcome andmortality after discontinuation of CRRT in AKI patients.METHODS. We retrospectively reviewed 189 patients who underwent CRRT for AKI in amedical/surgical ICU between January 2009 and February 2013. Exclusion criteria includedage \18 years, RRT for end-stage renal disease, withdrawal of treatment or death duringCRRT. Renal recovery was defined as freedom from RRT for 7 days after stopping CRRT.Those who were switched to the intermittent hemodialysis (IHD) were categorized in theIHD group.RESULTS. Overall 109 (58 %) patients discontinued CRRT. The median age was 74(range 65–79) years, M:F ratio was 72:28 and the simplified acute physiology score (SAPS)II on ICU admission was 50 (range 39–62). The median ICU stay and hospital stay were 11(range 7–20) and 40 (23–75) days. 63 patients were categorized as renal recovery, and 45 asIHD. Hospital mortality of the renal recovery group vs. the IHD group was 9.5 vs. 33.3 %(P = 0.002). Multivariate logistic regression analyses showed that low 24-h urine outputbefore ceasing CRRT (OR 0.99, 95 % CI 0.998–0.999; P = 0.11) was a risk factor formortality. Logistic regression analysis was also used to determine predictors of renalrecovery at discharge. Of 88 survivors at discharge, 11 (13 %) were still on IHD. Urineoutput (P = 0.005), female gender (P = 0.038) and no chronic kidney disease (P = 0.015)were independent predictors of renal recovery.CONCLUSIONS. Higher urine output at the time of discontinuation of CRRT was asignificant predictor of lower hospital mortality and renal recovery at discharge. Thesefindings support future prospective trials to determine the optimal time to discontinueCRRT.
0813CVVHD IS SAFE AND CHEAPER THAN STANDARD CVVH DURINGEXTRACORPOREAL CITRATE COAGULATION IN ICU PATIENTS WITH AKI
A. Dalhuisen1, P.A. Katinakis1, H. Steenbergen1, S. Kamphuis2, P.E. Spronk1
1Gelre Hospitals, Intensive Care, Apeldoorn, Netherlands, 2Gelre Hospitals, ClinicalChemistry, Apeldoorn, NetherlandsINTRODUCTION. The best modality for continuous renal replacement therapy amongcritically ill patients with acute kidney injury (AKI) is currently unclear.OBJECTIVES. Our objective was to evaluate the effects of continuous veno-venoushemofiltration (CVVH) versus continuous veno-venous hemodiafiltration (CVVHD)—using
citrate as regional anticoagulation—on solute clearance, nurse workload, patient safety andcosts.METHODS. This was a single center prospective cross over study in a cohort of criticallyill patients with AKI. We compared urea and creatinine clearance, filter lifespan andmembrane performance over 72 h during 15 CVVH and 15 CVVHD sessions. Standard ofcare was a substitution rate of 35 ml/kg/hr using CVVH, while CVVHD was prescribed witha dialysate flow of 30 ml/kg/hr according to the manufacturer’s instructions. Polysulfonefilters (Ultraflux AV 600S for CVVH and AV 1000S for CVVHD, Fresenius Medical Care,Homburg, Germany). Anticoagulation was performed with tri-sodium citrate intravenouslyusing a separate Alaris volumetric pump for CVVH. During CVVHD citrate was infusedusing the integrated Ci–Ca module. Maximal filter runtime was set at 72 h. Direct costswere calculated according the amount of fluids and filters/72 h. Values are shown as medianand IQR.RESULTS. 30 filter runs were evaluated in 15 patients (9 male) with AKI (age 64 [41–86]).Blood flow used was higher during CVVH (250 [200–255]) than during CVVHD (100[100–100]; P \ 0.001). Urea and creatinine clearances (42 [34–52] and 37 [29–49] ml/min)were slightly higher during CVVH than during CVVHD (35 [33–36] and 31 [26–33] ml/min, both P = 0.008). Keeping in mind that the maximum allowed filter-runtime was 72 h,the survival-time of the filters was longer during CVVHD (72 [43–73 h]) than duringCVVH (43 [17–66 h]; P = 0.004). CVVHD was considered less time-consuming and moreuser friendly than CVVH by most nurses, with less down time moments when patients wereawake and moving, and less mistakes in citrate and calcium dosages thus increasing safety.Costs per 72 h were lower during CVVHD €419 [€417–€501] than during CVVH €690[461–862]; P = 0.002, with a cost saving of € 201 [€44–€382].CONCLUSIONS. CVVH in standard dose is sightly superior than CVVHD with respect tocreatinine and urea clearance. CVVHD seems to be safer, easier to handle, and cheaper thanstandard CVVH.GRANT ACKNOWLEDGMENT. We would like to thank Fresenius Medical Care,Homburg, Germany for granting the product lease during the project.
0814GENERAL OUTCOMES IN ACUTE KIDNEY INJURY ACCORDINGTO THE TIME OF INITIATION OF RENAL SUPPORT IN CRITICAL CARE:DOOR TO DIALYSIS TIME (DDT) STUDY
J.E. Echeverri1,2,3, J. Vargas1, P. Rodriguez2, J.P. Cordoba2, P. Garcia2, L. Moreno4,
R. Dachiardi5, C. Larrarte2
1Central Military Hospital, Nephrology, Bogota, Colombia, 2Hospital Universitario SanIgnacio, Nephrology, Bogota, Colombia, 3Universidad Militar Central, Bogota, Colombia,4Hospital Universitario San Ignacio, Bogota, Colombia, 5Universidad Javeriana, Bogota,ColombiaINTRODUCTION. Timing is one of the most important questions that arise when there is apatient that needs acute renal support. In the last decade, the definition of timing has beenchanging and up to date, it seems important that therapy is started early but it is not clearwhat this really means.OBJECTIVE. This study evaluate the influence of door dialysis time (DDT), time betweenICU admission to first dialysis, on mortality (3 month) and other important outcomes incritical care patients who required acute haemodialysis.METHODS. This is a single-centre observational study performed in a cohort of criticalpatients with AKI and acute haemodialysis requirement during ICU stay. Primary outcomewas mortality at 3 months and secondary outcomes were partial or complete renal functionrecovery, dialysis dependence, length of hospital and ICU stay.RESULTS. 199 patients were included in the analysis. Sepsis was the primary ICUadmission diagnosis (48 %). Mean APACHE II score at 24 h of ICU admission was 23.8.57 % of patients had oliguria, anuria or fluid overload as an indication of renal support.Mean ureic nitrogen at start of therapy: 70 mg/dL (SD 29). According to times we foundthat the average days of stay were 32 days (SD 0.33), ICU Stay were 18.4 days (SD 19.4)and DDT were 5.59 days (SD 7.79). Global mortality was 54.8 % and general dialysisdependence was 11.6 %. There was a statistically significant difference in the percentage ofpatients who died, when they started dialysis in the first 3 days of admission to the ICU(DDT \ 3 days), with respect to those who started after 3 days of ICU stay(DDT [ 3 days) (45.71 vs. 64.89 %), a difference of 19.18 % (95 % CI 5.61–32.74 %) v2
7.3649 p = 0.007 OR 2.19 95 (1.19–4.05). Additionally, there were more proportion ofpatients who required dialysis after 3 month of intervention in the DDT [ 3 days (16.2 vs6.4 % p \ 0,05). The average hospital stay was 32.41 days longer in patients withDDT [ 3 days (42.1 vs. IC 28.26 23.74–36.57) F = 0.4606 p = 0.0001 and ICU stay was15.13 days on average longer in patients with DDT [ 3 days (95 % CI 10.02–20.24). Thetime to diagnosis of AKI was 4.44 days longer in patients with DDT [ 3 days (CI2.54–6.33), APACHE II the average was 2.38 points higher in patients with DDT [ 3 days(CI 0.89–3.87) and found a higher proportion of patients with sepsis in the group ofTPD [ 3 days (35.2 vs 55.3 %) p = 0.007.CONCLUSIONS. The analysis according to time of intervention (DDT) showed thatmortality, dialysis dependence and length of stay, both hospital and intensive care, werestatistically higher in the intervention group after 3 days of ICU stay. Factors that couldimpact this finding could be related to a greater proportion of septic patients and higher ratesof severity found in this group. We believe that prospective multicenter studies are requiredto clarify the role played by the door-dialysis time (DDT) in critically ill patients requiringacute renal support.
0815TYPE OF CITRATE SOLUTION AND FILTER LIFESPAN DURINGCONTINUOUS RENAL REPLACEMENT THERAPY
R. Jacobs1, P.M. Honoré1, J. De Regt1, E. De Waele1, S. Lochy1, J. Troubleyn1,
M. Diltoer1, H. Spapen1
1UZ Brussel, ICU, Brussels, BelgiumINTRODUCTION. Recent guidelines propose citrate as first choice anticoagulant forcontinuous renal replacement therapy (CRRT). However, the most optimal citrate formu-lation that beneficially influences filter lifespan without aggravating side-effects remainstopic of debate.OBJECTIVES. To compare filter lifespan between two consecutive cohorts of critically illpatients with acute kidney injury (AKI) who received a different predilution citrate solutionduring CRRT.
26th ESICM ANNUAL CONGRESS — PARIS, FRANCE — 5–9 OCTOBER 2013
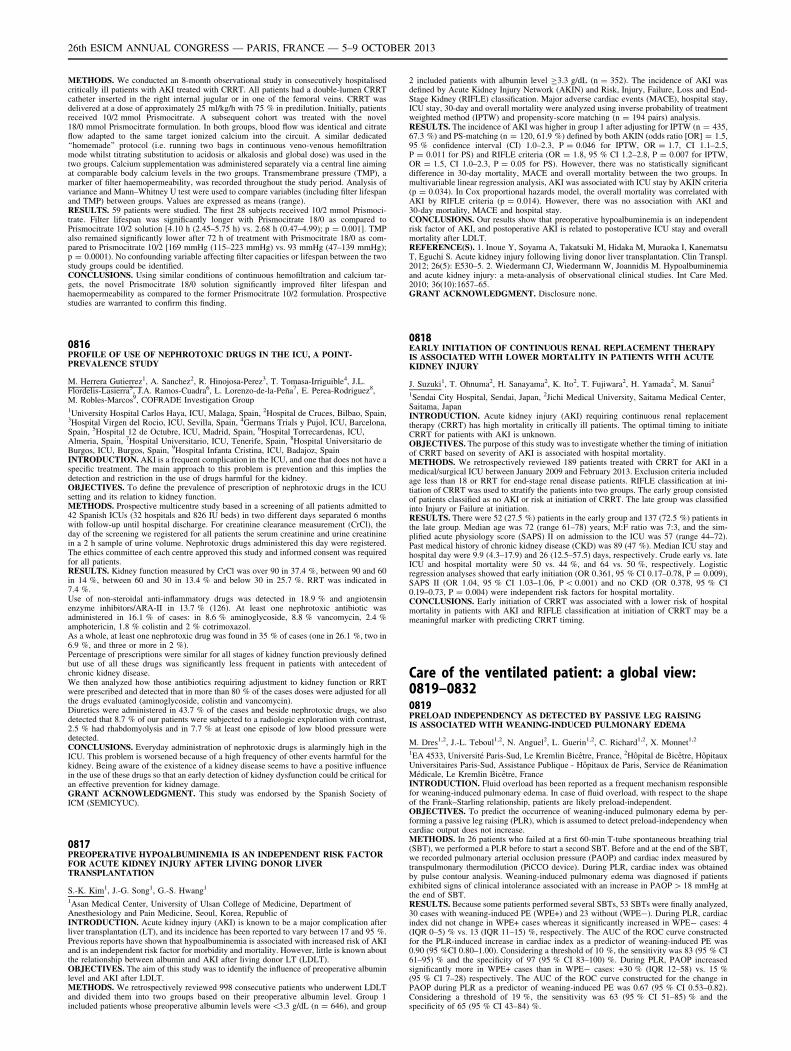
METHODS. We conducted an 8-month observational study in consecutively hospitalisedcritically ill patients with AKI treated with CRRT. All patients had a double-lumen CRRTcatheter inserted in the right internal jugular or in one of the femoral veins. CRRT wasdelivered at a dose of approximately 25 ml/kg/h with 75 % in predilution. Initially, patientsreceived 10/2 mmol Prismocitrate. A subsequent cohort was treated with the novel18/0 mmol Prismocitrate formulation. In both groups, blood flow was identical and citrateflow adapted to the same target ionized calcium into the circuit. A similar dedicated‘‘homemade’’ protocol (i.e. running two bags in continuous veno-venous hemofiltrationmode whilst titrating substitution to acidosis or alkalosis and global dose) was used in thetwo groups. Calcium supplementation was administered separately via a central line aimingat comparable body calcium levels in the two groups. Transmembrane pressure (TMP), amarker of filter haemopermeability, was recorded throughout the study period. Analysis ofvariance and Mann–Whitney U test were used to compare variables (including filter lifespanand TMP) between groups. Values are expressed as means (range).RESULTS. 59 patients were studied. The first 28 subjects received 10/2 mmol Prismoci-trate. Filter lifespan was significantly longer with Prismocitrate 18/0 as compared toPrismocitrate 10/2 solution [4.10 h (2.45–5.75 h) vs. 2.68 h (0.47–4.99); p = 0.001]. TMPalso remained significantly lower after 72 h of treatment with Prismocitrate 18/0 as com-pared to Prismocitrate 10/2 [169 mmHg (115–223 mmHg) vs. 93 mmHg (47–139 mmHg);p = 0.0001). No confounding variable affecting filter capacities or lifespan between the twostudy groups could be identified.CONCLUSIONS. Using similar conditions of continuous hemofiltration and calcium tar-gets, the novel Prismocitrate 18/0 solution significantly improved filter lifespan andhaemopermeability as compared to the former Prismocitrate 10/2 formulation. Prospectivestudies are warranted to confirm this finding.
0816PROFILE OF USE OF NEPHROTOXIC DRUGS IN THE ICU, A POINT-PREVALENCE STUDY
M. Herrera Gutierrez1, A. Sanchez2, R. Hinojosa-Perez3, T. Tomasa-Irriguible4, J.L.Flordelis-Lasierra5, J.A. Ramos-Cuadra6, L. Lorenzo-de-la-Peña7, E. Perea-Rodriguez8,M. Robles-Marcos9, COFRADE Investigation Group1University Hospital Carlos Haya, ICU, Malaga, Spain, 2Hospital de Cruces, Bilbao, Spain,3Hospital Virgen del Rocio, ICU, Sevilla, Spain, 4Germans Trials y Pujol, ICU, Barcelona,Spain, 5Hospital 12 de Octubre, ICU, Madrid, Spain, 6Hospital Torrecardenas, ICU,Almeria, Spain, 7Hospital Universitario, ICU, Tenerife, Spain, 8Hospital Universitario deBurgos, ICU, Burgos, Spain, 9Hospital Infanta Cristina, ICU, Badajoz, SpainINTRODUCTION. AKI is a frequent complication in the ICU, and one that does not have aspecific treatment. The main approach to this problem is prevention and this implies thedetection and restriction in the use of drugs harmful for the kidney.OBJECTIVES. To define the prevalence of prescription of nephrotoxic drugs in the ICUsetting and its relation to kidney function.METHODS. Prospective multicentre study based in a screening of all patients admitted to42 Spanish ICUs (32 hospitals and 826 IU beds) in two different days separated 6 monthswith follow-up until hospital discharge. For creatinine clearance measurement (CrCl), theday of the screening we registered for all patients the serum creatinine and urine creatininein a 2 h sample of urine volume. Nephrotoxic drugs administered this day were registered.The ethics committee of each centre approved this study and informed consent was requiredfor all patients.RESULTS. Kidney function measured by CrCl was over 90 in 37.4 %, between 90 and 60in 14 %, between 60 and 30 in 13.4 % and below 30 in 25.7 %. RRT was indicated in7.4 %.Use of non-steroidal anti-inflammatory drugs was detected in 18.9 % and angiotensinenzyme inhibitors/ARA-II in 13.7 % (126). At least one nephrotoxic antibiotic wasadministered in 16.1 % of cases: in 8.6 % aminoglycoside, 8.8 % vancomycin, 2.4 %amphotericin, 1.8 % colistin and 2 % cotrimoxazol.As a whole, at least one nephrotoxic drug was found in 35 % of cases (one in 26.1 %, two in6.9 %, and three or more in 2 %).Percentage of prescriptions were similar for all stages of kidney function previously definedbut use of all these drugs was significantly less frequent in patients with antecedent ofchronic kidney disease.We then analyzed how those antibiotics requiring adjustment to kidney function or RRTwere prescribed and detected that in more than 80 % of the cases doses were adjusted for allthe drugs evaluated (aminoglycoside, colistin and vancomycin).Diuretics were administered in 43.7 % of the cases and beside nephrotoxic drugs, we alsodetected that 8.7 % of our patients were subjected to a radiologic exploration with contrast,2.5 % had rhabdomyolysis and in 7.7 % at least one episode of low blood pressure weredetected.CONCLUSIONS. Everyday administration of nephrotoxic drugs is alarmingly high in theICU. This problem is worsened because of a high frequency of other events harmful for thekidney. Being aware of the existence of a kidney disease seems to have a positive influencein the use of these drugs so that an early detection of kidney dysfunction could be critical foran effective prevention for kidney damage.GRANT ACKNOWLEDGMENT. This study was endorsed by the Spanish Society ofICM (SEMICYUC).
0817PREOPERATIVE HYPOALBUMINEMIA IS AN INDEPENDENT RISK FACTORFOR ACUTE KIDNEY INJURY AFTER LIVING DONOR LIVERTRANSPLANTATION
S.-K. Kim1, J.-G. Song1, G.-S. Hwang1
1Asan Medical Center, University of Ulsan College of Medicine, Department ofAnesthesiology and Pain Medicine, Seoul, Korea, Republic ofINTRODUCTION. Acute kidney injury (AKI) is known to be a major complication afterliver transplantation (LT), and its incidence has been reported to vary between 17 and 95 %.Previous reports have shown that hypoalbuminemia is associated with increased risk of AKIand is an independent risk factor for morbidity and mortality. However, little is known aboutthe relationship between albumin and AKI after living donor LT (LDLT).OBJECTIVES. The aim of this study was to identify the influence of preoperative albuminlevel and AKI after LDLT.METHODS. We retrospectively reviewed 998 consecutive patients who underwent LDLTand divided them into two groups based on their preoperative albumin level. Group 1included patients whose preoperative albumin levels were\3.3 g/dL (n = 646), and group
2 included patients with albumin level C3.3 g/dL (n = 352). The incidence of AKI wasdefined by Acute Kidney Injury Network (AKIN) and Risk, Injury, Failure, Loss and End-Stage Kidney (RIFLE) classification. Major adverse cardiac events (MACE), hospital stay,ICU stay, 30-day and overall mortality were analyzed using inverse probability of treatmentweighted method (IPTW) and propensity-score matching (n = 194 pairs) analysis.RESULTS. The incidence of AKI was higher in group 1 after adjusting for IPTW (n = 435,67.3 %) and PS-matching (n = 120, 61.9 %) defined by both AKIN (odds ratio [OR] = 1.5,95 % confidence interval (CI) 1.0–2.3, P = 0.046 for IPTW, OR = 1.7, CI 1.1–2.5,P = 0.011 for PS) and RIFLE criteria (OR = 1.8, 95 % CI 1.2–2.8, P = 0.007 for IPTW,OR = 1.5, CI 1.0–2.3, P = 0.05 for PS). However, there was no statistically significantdifference in 30-day mortality, MACE and overall mortality between the two groups. Inmultivariable linear regression analysis, AKI was associated with ICU stay by AKIN criteria(p = 0.034). In Cox proportional hazards model, the overall mortality was correlated withAKI by RIFLE criteria (p = 0.014). However, there was no association with AKI and30-day mortality, MACE and hospital stay.CONCLUSIONS. Our results show that preoperative hypoalbuminemia is an independentrisk factor of AKI, and postoperative AKI is related to postoperative ICU stay and overallmortality after LDLT.REFERENCE(S). 1. Inoue Y, Soyama A, Takatsuki M, Hidaka M, Muraoka I, KanematsuT, Eguchi S. Acute kidney injury following living donor liver transplantation. Clin Transpl.2012; 26(5): E530–5. 2. Wiedermann CJ, Wiedermann W, Joannidis M. Hypoalbuminemiaand acute kidney injury: a meta-analysis of observational clinical studies. Int Care Med.2010; 36(10):1657–65.GRANT ACKNOWLEDGMENT. Disclosure none.
0818EARLY INITIATION OF CONTINUOUS RENAL REPLACEMENT THERAPYIS ASSOCIATED WITH LOWER MORTALITY IN PATIENTS WITH ACUTEKIDNEY INJURY
J. Suzuki1, T. Ohnuma2, H. Sanayama2, K. Ito2, T. Fujiwara2, H. Yamada2, M. Sanui2
1Sendai City Hospital, Sendai, Japan, 2Jichi Medical University, Saitama Medical Center,Saitama, JapanINTRODUCTION. Acute kidney injury (AKI) requiring continuous renal replacementtherapy (CRRT) has high mortality in critically ill patients. The optimal timing to initiateCRRT for patients with AKI is unknown.OBJECTIVES. The purpose of this study was to investigate whether the timing of initiationof CRRT based on severity of AKI is associated with hospital mortality.METHODS. We retrospectively reviewed 189 patients treated with CRRT for AKI in amedical/surgical ICU between January 2009 and February 2013. Exclusion criteria includedage less than 18 or RRT for end-stage renal disease patients. RIFLE classification at ini-tiation of CRRT was used to stratify the patients into two groups. The early group consistedof patients classified as no AKI or risk at initiation of CRRT. The late group was classifiedinto Injury or Failure at initiation.RESULTS. There were 52 (27.5 %) patients in the early group and 137 (72.5 %) patients inthe late group. Median age was 72 (range 61–78) years, M:F ratio was 7:3, and the sim-plified acute physiology score (SAPS) II on admission to the ICU was 57 (range 44–72).Past medical history of chronic kidney disease (CKD) was 89 (47 %). Median ICU stay andhospital day were 9.9 (4.3–17.9) and 26 (12.5–57.5) days, respectively. Crude early vs. lateICU and hospital mortality were 50 vs. 44 %, and 64 vs. 50 %, respectively. Logisticregression analyses showed that early initiation (OR 0.361, 95 % CI 0.17–0.78, P = 0.009),SAPS II (OR 1.04, 95 % CI 1.03–1.06, P \ 0.001) and no CKD (OR 0.378, 95 % CI0.19–0.73, P = 0.004) were independent risk factors for hospital mortality.CONCLUSIONS. Early initiation of CRRT was associated with a lower risk of hospitalmortality in patients with AKI and RIFLE classification at initiation of CRRT may be ameaningful marker with predicting CRRT timing.
Care of the ventilated patient: a global view:0819–08320819PRELOAD INDEPENDENCY AS DETECTED BY PASSIVE LEG RAISINGIS ASSOCIATED WITH WEANING-INDUCED PULMONARY EDEMA
M. Dres1,2, J.-L. Teboul1,2, N. Anguel2, L. Guerin1,2, C. Richard1,2, X. Monnet1,2
1EA 4533, Université Paris-Sud, Le Kremlin Bicêtre, France, 2Hôpital de Bicêtre, HôpitauxUniversitaires Paris-Sud, Assistance Publique - Hôpitaux de Paris, Service de RéanimationMédicale, Le Kremlin Bicêtre, FranceINTRODUCTION. Fluid overload has been reported as a frequent mechanism responsiblefor weaning-induced pulmonary edema. In case of fluid overload, with respect to the shapeof the Frank–Starling relationship, patients are likely preload-independent.OBJECTIVES. To predict the occurrence of weaning-induced pulmonary edema by per-forming a passive leg raising (PLR), which is assumed to detect preload-independency whencardiac output does not increase.METHODS. In 26 patients who failed at a first 60-min T-tube spontaneous breathing trial(SBT), we performed a PLR before to start a second SBT. Before and at the end of the SBT,we recorded pulmonary arterial occlusion pressure (PAOP) and cardiac index measured bytranspulmonary thermodilution (PiCCO device). During PLR, cardiac index was obtainedby pulse contour analysis. Weaning-induced pulmonary edema was diagnosed if patientsexhibited signs of clinical intolerance associated with an increase in PAOP [ 18 mmHg atthe end of SBT.RESULTS. Because some patients performed several SBTs, 53 SBTs were finally analyzed,30 cases with weaning-induced PE (WPE+) and 23 without (WPE-). During PLR, cardiacindex did not change in WPE+ cases whereas it significantly increased in WPE- cases: 4(IQR 0–5) % vs. 13 (IQR 11–15) %, respectively. The AUC of the ROC curve constructedfor the PLR-induced increase in cardiac index as a predictor of weaning-induced PE was0.90 (95 %CI 0.80–1.00). Considering a threshold of 10 %, the sensitivity was 83 (95 % CI61–95) % and the specificity of 97 (95 % CI 83–100) %. During PLR, PAOP increasedsignificantly more in WPE+ cases than in WPE- cases: +30 % (IQR 12–58) vs. 15 %(95 % CI 7–28) respectively. The AUC of the ROC curve constructed for the change inPAOP during PLR as a predictor of weaning-induced PE was 0.67 (95 % CI 0.53–0.82).Considering a threshold of 19 %, the sensitivity was 63 (95 % CI 51–85) % and thespecificity of 65 (95 % CI 43–84) %.
26th ESICM ANNUAL CONGRESS — PARIS, FRANCE — 5–9 OCTOBER 2013
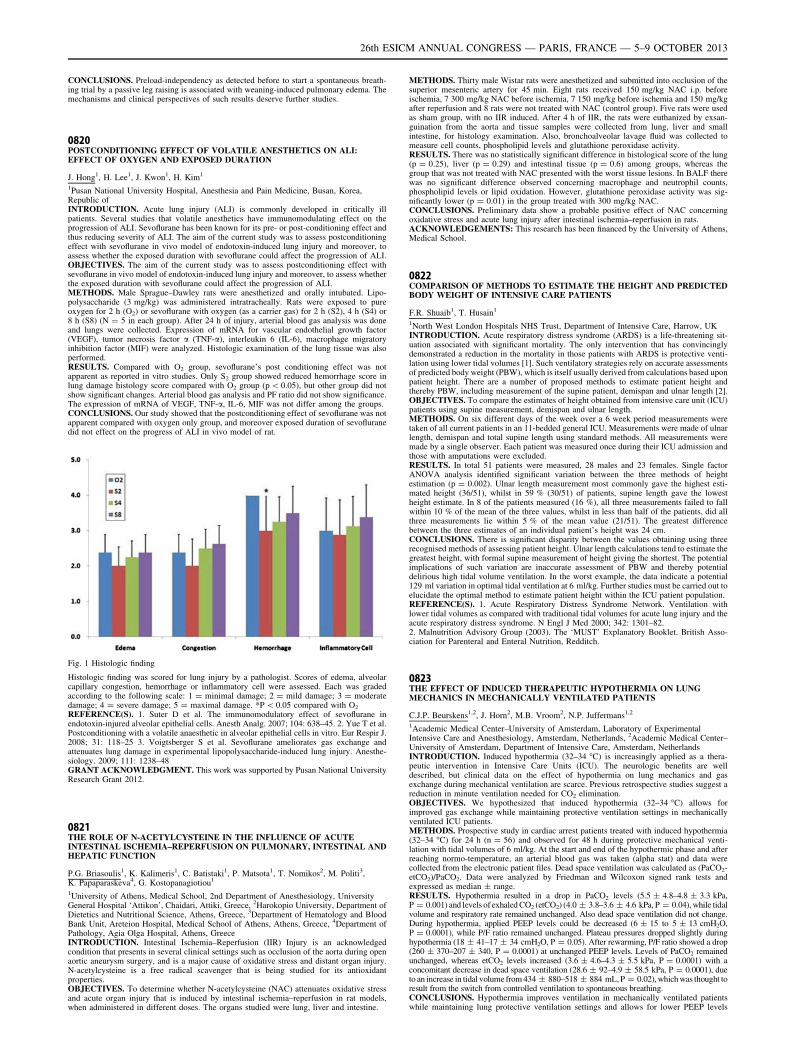
CONCLUSIONS. Preload-independency as detected before to start a spontaneous breath-ing trial by a passive leg raising is associated with weaning-induced pulmonary edema. Themechanisms and clinical perspectives of such results deserve further studies.
0820POSTCONDITIONING EFFECT OF VOLATILE ANESTHETICS ON ALI:EFFECT OF OXYGEN AND EXPOSED DURATION
J. Hong1, H. Lee1, J. Kwon1, H. Kim1
1Pusan National University Hospital, Anesthesia and Pain Medicine, Busan, Korea,Republic ofINTRODUCTION. Acute lung injury (ALI) is commonly developed in critically illpatients. Several studies that volatile anesthetics have immunomodulating effect on theprogression of ALI. Sevoflurane has been known for its pre- or post-conditioning effect andthus reducing severity of ALI. The aim of the current study was to assess postconditioningeffect with sevoflurane in vivo model of endotoxin-induced lung injury and moreover, toassess whether the exposed duration with sevoflurane could affect the progression of ALI.OBJECTIVES. The aim of the current study was to assess postconditioning effect withsevoflurane in vivo model of endotoxin-induced lung injury and moreover, to assess whetherthe exposed duration with sevoflurane could affect the progression of ALI.METHODS. Male Sprague–Dawley rats were anesthetized and orally intubated. Lipo-polysaccharide (3 mg/kg) was administered intratracheally. Rats were exposed to pureoxygen for 2 h (O2) or sevoflurane with oxygen (as a carrier gas) for 2 h (S2), 4 h (S4) or8 h (S8) (N = 5 in each group). After 24 h of injury, arterial blood gas analysis was doneand lungs were collected. Expression of mRNA for vascular endothelial growth factor(VEGF), tumor necrosis factor a (TNF-a), interleukin 6 (IL-6), macrophage migratoryinhibition factor (MIF) were analyzed. Histologic examination of the lung tissue was alsoperformed.RESULTS. Compared with O2 group, sevoflurane’s post conditioning effect was notapparent as reported in vitro studies. Only S2 group showed reduced hemorrhage score inlung damage histology score compared with O2 group (p \ 0.05), but other group did notshow significant changes. Arterial blood gas analysis and PF ratio did not show significance.The expression of mRNA of VEGF, TNF-a, IL-6, MIF was not differ among the groups.CONCLUSIONS. Our study showed that the postconditioning effect of sevoflurane was notapparent compared with oxygen only group, and moreover exposed duration of sevofluranedid not effect on the progress of ALI in vivo model of rat.
Fig. 1 Histologic finding
Histologic finding was scored for lung injury by a pathologist. Scores of edema, alveolarcapillary congestion, hemorrhage or inflammatory cell were assessed. Each was gradedaccording to the following scale: 1 = minimal damage; 2 = mild damage; 3 = moderatedamage; 4 = severe damage; 5 = maximal damage. *P \ 0.05 compared with O2
REFERENCE(S). 1. Suter D et al. The immunomodulatory effect of sevoflurane inendotoxin-injured alveolar epithelial cells. Anesth Analg. 2007; 104: 638–45. 2. Yue T et al.Postconditioning with a volatile anaesthetic in alveolar epithelial cells in vitro. Eur Respir J.2008; 31: 118–25 3. Voigtsberger S et al. Sevoflurane ameliorates gas exchange andattenuates lung damage in experimental lipopolysaccharide-induced lung injury. Anesthe-siology. 2009; 111: 1238–48GRANT ACKNOWLEDGMENT. This work was supported by Pusan National UniversityResearch Grant 2012.
0821THE ROLE OF N-ACETYLCYSTEINE IN THE INFLUENCE OF ACUTEINTESTINAL ISCHEMIA–REPERFUSION ON PULMONARY, INTESTINAL ANDHEPATIC FUNCTION
P.G. Briasoulis1, K. Kalimeris1, C. Batistaki1, P. Matsota1, T. Nomikos2, M. Politi3,K. Papaparaskeva4, G. Kostopanagiotiou1
1University of Athens, Medical School, 2nd Department of Anesthesiology, UniversityGeneral Hospital ‘Attikon’, Chaidari, Attiki, Greece, 2Harokopio University, Department ofDietetics and Nutritional Science, Athens, Greece, 3Department of Hematology and BloodBank Unit, Areteion Hospital, Medical School of Athens, Athens, Greece, 4Department ofPathology, Agia Olga Hospital, Athens, GreeceINTRODUCTION. Intestinal Ischemia–Reperfusion (IIR) Injury is an acknowledgedcondition that presents in several clinical settings such as occlusion of the aorta during openaortic aneurysm surgery, and is a major cause of oxidative stress and distant organ injury.N-acetylcysteine is a free radical scavenger that is being studied for its antioxidantproperties.OBJECTIVES. So determine whether N-acetylcysteine (NAC) attenuates oxidative stressand acute organ injury that is induced by intestinal ischemia–reperfusion in rat models,when administered in different doses. The organs studied were lung, liver and intestine.
METHODS. Thirty male Wistar rats were anesthetized and submitted into occlusion of thesuperior mesenteric artery for 45 min. Eight rats received 150 mg/kg NAC i.p. beforeischemia, 7 300 mg/kg NAC before ischemia, 7 150 mg/kg before ischemia and 150 mg/kgafter reperfusion and 8 rats were not treated with NAC (control group). Five rats were usedas sham group, with no IIR induced. After 4 h of IIR, the rats were euthanized by exsan-guination from the aorta and tissue samples were collected from lung, liver and smallintestine, for histology examination. Also, bronchoalveolar lavage fluid was collected tomeasure cell counts, phospholipid levels and glutathione peroxidase activity.RESULTS. There was no statistically significant difference in histological score of the lung(p = 0.25), liver (p = 0.29) and intestinal tissue (p = 0.6) among groups, whereas thegroup that was not treated with NAC presented with the worst tissue lesions. In BALF therewas no significant difference observed concerning macrophage and neutrophil counts,phospholipid levels or lipid oxidation. However, glutathione peroxidase activity was sig-nificantly lower (p = 0.01) in the group treated with 300 mg/kg NAC.CONCLUSIONS. Preliminary data show a probable positive effect of NAC concerningoxidative stress and acute lung injury after intestinal ischemia–reperfusion in rats.ACKNOWLEDGEMENTS: This research has been financed by the University of Athens,Medical School.
0822COMPARISON OF METHODS TO ESTIMATE THE HEIGHT AND PREDICTEDBODY WEIGHT OF INTENSIVE CARE PATIENTS
F.R. Shuaib1, T. Husain1
1North West London Hospitals NHS Trust, Department of Intensive Care, Harrow, UKINTRODUCTION. Acute respiratory distress syndrome (ARDS) is a life-threatening sit-uation associated with significant mortality. The only intervention that has convincinglydemonstrated a reduction in the mortality in those patients with ARDS is protective venti-lation using lower tidal volumes [1]. Such ventilatory strategies rely on accurate assessmentsof predicted body weight (PBW), which is itself usually derived from calculations based uponpatient height. There are a number of proposed methods to estimate patient height andthereby PBW, including measurement of the supine patient, demispan and ulnar length [2].OBJECTIVES. To compare the estimates of height obtained from intensive care unit (ICU)patients using supine measurement, demispan and ulnar length.METHODS. On six different days of the week over a 6 week period measurements weretaken of all current patients in an 11-bedded general ICU. Measurements were made of ulnarlength, demispan and total supine length using standard methods. All measurements weremade by a single observer. Each patient was measured once during their ICU admission andthose with amputations were excluded.RESULTS. In total 51 patients were measured, 28 males and 23 females. Single factorANOVA analysis identified significant variation between the three methods of heightestimation (p = 0.002). Ulnar length measurement most commonly gave the highest esti-mated height (36/51), whilst in 59 % (30/51) of patients, supine length gave the lowestheight estimate. In 8 of the patients measured (16 %), all three measurements failed to fallwithin 10 % of the mean of the three values, whilst in less than half of the patients, did allthree measurements lie within 5 % of the mean value (21/51). The greatest differencebetween the three estimates of an individual patient’s height was 24 cm.CONCLUSIONS. There is significant disparity between the values obtaining using threerecognised methods of assessing patient height. Ulnar length calculations tend to estimate thegreatest height, with formal supine measurement of height giving the shortest. The potentialimplications of such variation are inaccurate assessment of PBW and thereby potentialdelirious high tidal volume ventilation. In the worst example, the data indicate a potential129 ml variation in optimal tidal ventilation at 6 ml/kg. Further studies must be carried out toelucidate the optimal method to estimate patient height within the ICU patient population.REFERENCE(S). 1. Acute Respiratory Distress Syndrome Network. Ventilation withlower tidal volumes as compared with traditional tidal volumes for acute lung injury and theacute respiratory distress syndrome. N Engl J Med 2000; 342: 1301–82.2. Malnutrition Advisory Group (2003). The ‘MUST’ Explanatory Booklet. British Asso-ciation for Parenteral and Enteral Nutrition, Redditch.
0823THE EFFECT OF INDUCED THERAPEUTIC HYPOTHERMIA ON LUNGMECHANICS IN MECHANICALLY VENTILATED PATIENTS
C.J.P. Beurskens1,2, J. Horn2, M.B. Vroom2, N.P. Juffermans1,2
1Academic Medical Center–University of Amsterdam, Laboratory of ExperimentalIntensive Care and Anesthesiology, Amsterdam, Netherlands, 2Academic Medical Center–University of Amsterdam, Department of Intensive Care, Amsterdam, NetherlandsINTRODUCTION. Induced hypothermia (32–34 �C) is increasingly applied as a thera-peutic intervention in Intensive Care Units (ICU). The neurologic benefits are welldescribed, but clinical data on the effect of hypothermia on lung mechanics and gasexchange during mechanical ventilation are scarce. Previous retrospective studies suggest areduction in minute ventilation needed for CO2 elimination.OBJECTIVES. We hypothesized that induced hypothermia (32–34 �C) allows forimproved gas exchange while maintaining protective ventilation settings in mechanicallyventilated ICU patients.METHODS. Prospective study in cardiac arrest patients treated with induced hypothermia(32–34 �C) for 24 h (n = 56) and observed for 48 h during protective mechanical venti-lation with tidal volumes of 6 ml/kg. At the start and end of the hypothermic phase and afterreaching normo-temperature, an arterial blood gas was taken (alpha stat) and data werecollected from the electronic patient files. Dead space ventilation was calculated as (PaCO2-etCO2)/PaCO2. Data were analyzed by Friedman and Wilcoxon signed rank tests andexpressed as median ± range.RESULTS. Hypothermia resulted in a drop in PaCO2 levels (5.5 ± 4.8–4.8 ± 3.3 kPa,P = 0.001) and levels of exhaled CO2 (etCO2) (4.0 ± 3.8–3.6 ± 4.6 kPa, P = 0.04), while tidalvolume and respiratory rate remained unchanged. Also dead space ventilation did not change.During hypothermia, applied PEEP levels could be decreased (6 ± 15 to 5 ± 13 cmH2O,P = 0.0001), while P/F ratio remained unchanged. Plateau pressures dropped slightly duringhypothermia (18 ± 41–17 ± 34 cmH2O, P = 0.05). After rewarming, P/F ratio showed a drop(260 ± 370–207 ± 340, P = 0.0001) at unchanged PEEP levels. Levels of PaCO2 remainedunchanged, whereas etCO2 levels increased (3.6 ± 4.6–4.3 ± 5.5 kPa, P = 0.0001) with aconcomitant decrease in dead space ventilation (28.6 ± 92–4.9 ± 58.5 kPa, P = 0.0001), dueto an increase in tidal volume from 434 ± 880–518 ± 884 mL, P = 0.02), which was thought toresult from the switch from controlled ventilation to spontaneous breathing.CONCLUSIONS. Hypothermia improves ventilation in mechanically ventilated patientswhile maintaining lung protective ventilation settings and allows for lower PEEP levels
26th ESICM ANNUAL CONGRESS — PARIS, FRANCE — 5–9 OCTOBER 2013
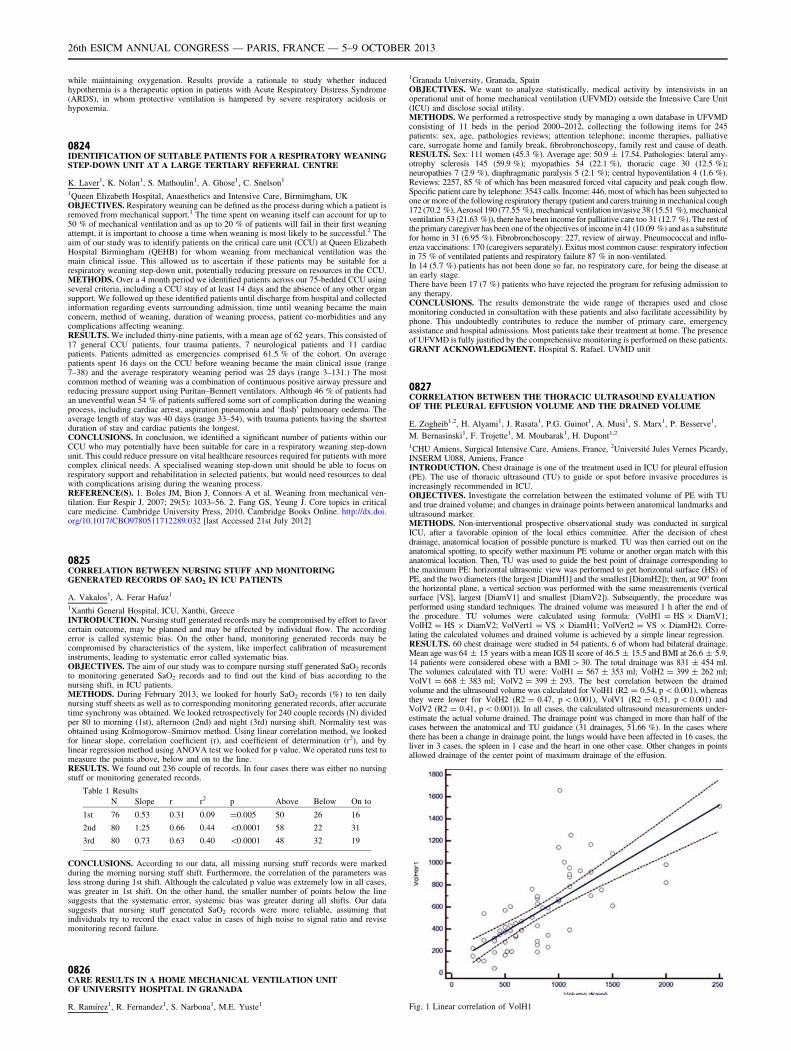
while maintaining oxygenation. Results provide a rationale to study whether inducedhypothermia is a therapeutic option in patients with Acute Respiratory Distress Syndrome(ARDS), in whom protective ventilation is hampered by severe respiratory acidosis orhypoxemia.
0824IDENTIFICATION OF SUITABLE PATIENTS FOR A RESPIRATORY WEANINGSTEP-DOWN UNIT AT A LARGE TERTIARY REFERRAL CENTRE
K. Laver1, K. Nolan1, S. Mathoulin1, A. Ghose1, C. Snelson1
1Queen Elizabeth Hospital, Anaesthetics and Intensive Care, Birmimgham, UKOBJECTIVES. Respiratory weaning can be defined as the process during which a patient isremoved from mechanical support.1 The time spent on weaning itself can account for up to50 % of mechanical ventilation and as up to 20 % of patients will fail in their first weaningattempt, it is important to choose a time when weaning is most likely to be successful.2 Theaim of our study was to identify patients on the critical care unit (CCU) at Queen ElizabethHospital Birmingham (QEHB) for whom weaning from mechanical ventilation was themain clinical issue. This allowed us to ascertain if these patients may be suitable for arespiratory weaning step-down unit, potentially reducing pressure on resources in the CCU.METHODS. Over a 4 month period we identified patients across our 75-bedded CCU usingseveral criteria, including a CCU stay of at least 14 days and the absence of any other organsupport. We followed up these identified patients until discharge from hospital and collectedinformation regarding events surrounding admission, time until weaning became the mainconcern, method of weaning, duration of weaning process, patient co-morbidities and anycomplications affecting weaning.RESULTS. We included thirty-nine patients, with a mean age of 62 years. This consisted of17 general CCU patients, four trauma patients, 7 neurological patients and 11 cardiacpatients. Patients admitted as emergencies comprised 61.5 % of the cohort. On averagepatients spent 16 days on the CCU before weaning became the main clinical issue (range7–38) and the average respiratory weaning period was 25 days (range 3–131.) The mostcommon method of weaning was a combination of continuous positive airway pressure andreducing pressure support using Puritan–Bennett ventilators. Although 46 % of patients hadan uneventful wean 54 % of patients suffered some sort of complication during the weaningprocess, including cardiac arrest, aspiration pneumonia and ‘flash’ pulmonary oedema. Theaverage length of stay was 40 days (range 33–54), with trauma patients having the shortestduration of stay and cardiac patients the longest.CONCLUSIONS. In conclusion, we identified a significant number of patients within ourCCU who may potentially have been suitable for care in a respiratory weaning step-downunit. This could reduce pressure on vital healthcare resources required for patients with morecomplex clinical needs. A specialised weaning step-down unit should be able to focus onrespiratory support and rehabilitation in selected patients, but would need resources to dealwith complications arising during the weaning process.REFERENCE(S). 1. Boles JM, Bion J, Connors A et al. Weaning from mechanical ven-tilation. Eur Respir J. 2007; 29(5): 1033–56. 2. Fang GS, Yeung J. Core topics in criticalcare medicine. Cambridge University Press, 2010. Cambridge Books Online. http://dx.doi.org/10.1017/CBO9780511712289.032 [last Accessed 21st July 2012]
0825CORRELATION BETWEEN NURSING STUFF AND MONITORINGGENERATED RECORDS OF SAO2 IN ICU PATIENTS
A. Vakalos1, A. Ferar Hafuz1
1Xanthi General Hospital, ICU, Xanthi, GreeceINTRODUCTION. Nursing stuff generated records may be compromised by effort to favorcertain outcome, may be planned and may be affected by individual flow. The accordingerror is called systemic bias. On the other hand, monitoring generated records may becompromised by characteristics of the system, like imperfect calibration of measurementinstruments, leading to systematic error called systematic bias.OBJECTIVES. The aim of our study was to compare nursing stuff generated SaO2 recordsto monitoring generated SaO2 records and to find out the kind of bias according to thenursing shift, in ICU patients.METHODS. During February 2013, we looked for hourly SaO2 records (%) to ten dailynursing stuff sheets as well as to corresponding monitoring generated records, after accuratetime synchrony was obtained. We looked retrospectively for 240 couple records (N) dividedper 80 to morning (1st), afternoon (2nd) and night (3rd) nursing shift. Normality test wasobtained using Kolmogorow–Smirnov method. Using linear correlation method, we lookedfor linear slope, correlation coefficient (r), and coefficient of determination (r2), and bylinear regression method using ANOVA test we looked for p value. We operated runs test tomeasure the points above, below and on to the line.RESULTS. We found out 236 couple of records. In four cases there was either no nursingstuff or monitoring generated records.
Table 1 Results
N Slope r r2 p Above Below On to
1st 76 0.53 0.31 0.09 =0.005 50 26 16
2nd 80 1.25 0.66 0.44 \0.0001 58 22 31
3rd 80 0.73 0.63 0.40 \0.0001 48 32 19
CONCLUSIONS. According to our data, all missing nursing stuff records were markedduring the morning nursing stuff shift. Furthermore, the correlation of the parameters wasless strong during 1st shift. Although the calculated p value was extremely low in all cases,was greater in 1st shift. On the other hand, the smaller number of points below the linesuggests that the systematic error, systemic bias was greater during all shifts. Our datasuggests that nursing stuff generated SaO2 records were more reliable, assuming thatindividuals try to record the exact value in cases of high noise to signal ratio and revisemonitoring record failure.
0826CARE RESULTS IN A HOME MECHANICAL VENTILATION UNITOF UNIVERSITY HOSPITAL IN GRANADA
R. Ramı́rez1, R. Fernandez1, S. Narbona1, M.E. Yuste1
1Granada University, Granada, SpainOBJECTIVES. We want to analyze statistically, medical activity by intensivists in anoperational unit of home mechanical ventilation (UFVMD) outside the Intensive Care Unit(ICU) and disclose social utility.METHODS. We performed a retrospective study by managing a own database in UFVMDconsisting of 11 beds in the period 2000–2012, collecting the following items for 245patients: sex, age, pathologies reviews; attention telephone; income therapies, palliativecare, surrogate home and family break, fibrobronchoscopy, family rest and cause of death.RESULTS. Sex: 111 women (45.3 %). Average age: 50.9 ± 17.54. Pathologies: lateral amy-otrophy sclerosis 145 (59.9 %); myopathies 54 (22.1 %), thoracic cage 30 (12.5 %);neuropathies 7 (2.9 %), diaphragmatic paralysis 5 (2.1 %); central hypoventilation 4 (1.6 %).Reviews: 2257, 85 % of which has been measured forced vital capacity and peak cough flow.Specific patient care by telephone: 3543 calls. Income: 446, most of which has been subjected toone or more of the following respiratory therapy (patient and carers training in mechanical cough172 (70.2 %), Aerosol 190 (77.55 %), mechanical ventilation invasive 38 (15.51 %), mechanicalventilation 53 (21.63 %)), there have been income for palliative care too 31 (12.7 %). The rest ofthe primary caregiver has been one of the objectives of income in 41 (10.09 %) and as a substitutefor home in 31 (6.95 %). Fibrobronchoscopy: 227, review of airway. Pneumococcal and influ-enza vaccinations: 170 (caregivers separately). Exitus most common cause: respiratory infectionin 75 % of ventilated patients and respiratory failure 87 % in non-ventilated.In 14 (5.7 %) patients has not been done so far, no respiratory care, for being the disease atan early stage.There have been 17 (7 %) patients who have rejected the program for refusing admission toany therapy.CONCLUSIONS. The results demonstrate the wide range of therapies used and closemonitoring conducted in consultation with these patients and also facilitate accessibility byphone. This undoubtedly contributes to reduce the number of primary care, emergencyassistance and hospital admissions. Most patients take their treatment at home. The presenceof UFVMD is fully justified by the comprehensive monitoring is performed on these patients.GRANT ACKNOWLEDGMENT. Hospital S. Rafael. UVMD unit
0827CORRELATION BETWEEN THE THORACIC ULTRASOUND EVALUATIONOF THE PLEURAL EFFUSION VOLUME AND THE DRAINED VOLUME
E. Zogheib1,2, H. Alyami1, J. Rasata1, P.G. Guinot1, A. Musi1, S. Marx1, P. Besserve1,
M. Bernasinski1, F. Trojette1, M. Moubarak1, H. Dupont1,2
1CHU Amiens, Surgical Intensive Care, Amiens, France, 2Université Jules Vernes Picardy,INSERM U088, Amiens, FranceINTRODUCTION. Chest drainage is one of the treatment used in ICU for pleural effusion(PE). The use of thoracic ultrasound (TU) to guide or spot before invasive procedures isincreasingly recommended in ICU.OBJECTIVES. Investigate the correlation between the estimated volume of PE with TUand true drained volume; and changes in drainage points between anatomical landmarks andultrasound marker.METHODS. Non-interventional prospective observational study was conducted in surgicalICU, after a favorable opinion of the local ethics committee. After the decision of chestdrainage, anatomical location of possible puncture is marked. TU was then carried out on theanatomical spotting, to specify wether maximum PE volume or another organ match with thisanatomical location. Then, TU was used to guide the best point of drainage corresponding tothe maximum PE: horizontal ultrasonic view was performed to get horizontal surface (HS) ofPE, and the two diameters (the largest [DiamH1] and the smallest [DiamH2]); then, at 90� fromthe horizontal plane, a vertical section was performed with the same measurements (verticalsurface [VS], largest [DiamV1] and smallest [DiamV2]). Subsequently, the procedure wasperformed using standard techniques. The drained volume was measured 1 h after the end ofthe procedure. TU volumes were calculated using formula: (VolH1 = HS 9 DiamV1;VolH2 = HS 9 DiamV2; VolVert1 = VS 9 DiamH1; VolVert2 = VS 9 DiamH2). Corre-lating the calculated volumes and drained volume is achieved by a simple linear regression.RESULTS. 60 chest drainage were studied in 54 patients, 6 of whom had bilateral drainage.Mean age was 64 ± 15 years with a mean IGS II score of 46.5 ± 15.5 and BMI at 26.6 ± 5.9,14 patients were considered obese with a BMI [ 30. The total drainage was 831 ± 454 ml.The volumes calculated with TU were: VolH1 = 567 ± 353 ml; VolH2 = 399 ± 262 ml;VolV1 = 668 ± 383 ml; VolV2 = 399 ± 293. The best correlation between the drainedvolume and the ultrasound volume was calculated for VolH1 (R2 = 0.54, p \ 0.001), whereasthey were lower for VolH2 (R2 = 0.47, p \ 0.001), VolV1 (R2 = 0.51, p \ 0.001) andVolV2 (R2 = 0.41, p \0.001)). In all cases, the calculated ultrasound measurements under-estimate the actual volume drained. The drainage point was changed in more than half of thecases between the anatomical and TU guidance (31 drainages, 51.66 %). In the cases wherethere has been a change in drainage point, the lungs would have been affected in 16 cases, theliver in 3 cases, the spleen in 1 case and the heart in one other case. Other changes in pointsallowed drainage of the center point of maximum drainage of the effusion.
Fig. 1 Linear correlation of VolH1
26th ESICM ANNUAL CONGRESS — PARIS, FRANCE — 5–9 OCTOBER 2013
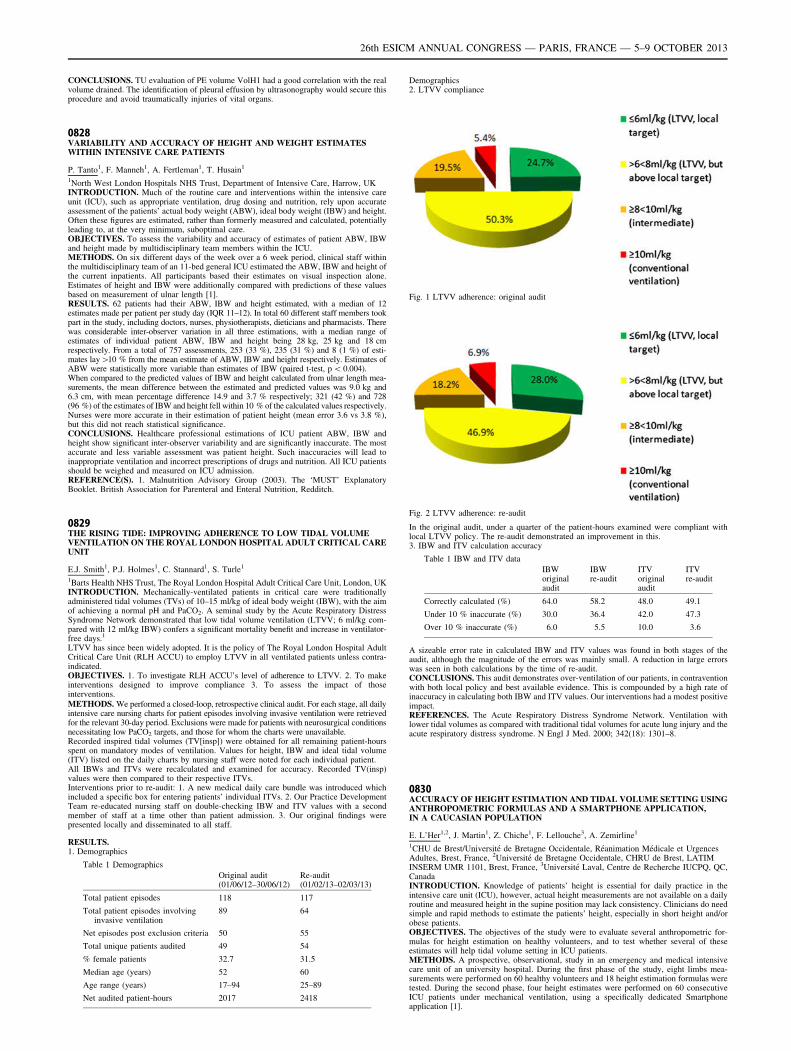
CONCLUSIONS. TU evaluation of PE volume VolH1 had a good correlation with the realvolume drained. The identification of pleural effusion by ultrasonography would secure thisprocedure and avoid traumatically injuries of vital organs.
0828VARIABILITY AND ACCURACY OF HEIGHT AND WEIGHT ESTIMATESWITHIN INTENSIVE CARE PATIENTS
P. Tanto1, F. Manneh1, A. Fertleman1, T. Husain1
1North West London Hospitals NHS Trust, Department of Intensive Care, Harrow, UKINTRODUCTION. Much of the routine care and interventions within the intensive careunit (ICU), such as appropriate ventilation, drug dosing and nutrition, rely upon accurateassessment of the patients’ actual body weight (ABW), ideal body weight (IBW) and height.Often these figures are estimated, rather than formerly measured and calculated, potentiallyleading to, at the very minimum, suboptimal care.OBJECTIVES. To assess the variability and accuracy of estimates of patient ABW, IBWand height made by multidisciplinary team members within the ICU.METHODS. On six different days of the week over a 6 week period, clinical staff withinthe multidisciplinary team of an 11-bed general ICU estimated the ABW, IBW and height ofthe current inpatients. All participants based their estimates on visual inspection alone.Estimates of height and IBW were additionally compared with predictions of these valuesbased on measurement of ulnar length [1].RESULTS. 62 patients had their ABW, IBW and height estimated, with a median of 12estimates made per patient per study day (IQR 11–12). In total 60 different staff members tookpart in the study, including doctors, nurses, physiotherapists, dieticians and pharmacists. Therewas considerable inter-observer variation in all three estimations, with a median range ofestimates of individual patient ABW, IBW and height being 28 kg, 25 kg and 18 cmrespectively. From a total of 757 assessments, 253 (33 %), 235 (31 %) and 8 (1 %) of esti-mates lay[10 % from the mean estimate of ABW, IBW and height respectively. Estimates ofABW were statistically more variable than estimates of IBW (paired t-test, p \ 0.004).When compared to the predicted values of IBW and height calculated from ulnar length mea-surements, the mean difference between the estimated and predicted values was 9.0 kg and6.3 cm, with mean percentage difference 14.9 and 3.7 % respectively; 321 (42 %) and 728(96 %) of the estimates of IBW and height fell within 10 % of the calculated values respectively.Nurses were more accurate in their estimation of patient height (mean error 3.6 vs 3.8 %),but this did not reach statistical significance.CONCLUSIONS. Healthcare professional estimations of ICU patient ABW, IBW andheight show significant inter-observer variability and are significantly inaccurate. The mostaccurate and less variable assessment was patient height. Such inaccuracies will lead toinappropriate ventilation and incorrect prescriptions of drugs and nutrition. All ICU patientsshould be weighed and measured on ICU admission.REFERENCE(S). 1. Malnutrition Advisory Group (2003). The ‘MUST’ ExplanatoryBooklet. British Association for Parenteral and Enteral Nutrition, Redditch.
0829THE RISING TIDE: IMPROVING ADHERENCE TO LOW TIDAL VOLUMEVENTILATION ON THE ROYAL LONDON HOSPITAL ADULT CRITICAL CAREUNIT
E.J. Smith1, P.J. Holmes1, C. Stannard1, S. Turle1
1Barts Health NHS Trust, The Royal London Hospital Adult Critical Care Unit, London, UKINTRODUCTION. Mechanically-ventilated patients in critical care were traditionallyadministered tidal volumes (TVs) of 10–15 ml/kg of ideal body weight (IBW), with the aimof achieving a normal pH and PaCO2. A seminal study by the Acute Respiratory DistressSyndrome Network demonstrated that low tidal volume ventilation (LTVV; 6 ml/kg com-pared with 12 ml/kg IBW) confers a significant mortality benefit and increase in ventilator-free days.1
LTVV has since been widely adopted. It is the policy of The Royal London Hospital AdultCritical Care Unit (RLH ACCU) to employ LTVV in all ventilated patients unless contra-indicated.OBJECTIVES. 1. To investigate RLH ACCU’s level of adherence to LTVV. 2. To makeinterventions designed to improve compliance 3. To assess the impact of thoseinterventions.METHODS. We performed a closed-loop, retrospective clinical audit. For each stage, all dailyintensive care nursing charts for patient episodes involving invasive ventilation were retrievedfor the relevant 30-day period. Exclusions were made for patients with neurosurgical conditionsnecessitating low PaCO2 targets, and those for whom the charts were unavailable.Recorded inspired tidal volumes (TV[insp]) were obtained for all remaining patient-hoursspent on mandatory modes of ventilation. Values for height, IBW and ideal tidal volume(ITV) listed on the daily charts by nursing staff were noted for each individual patient.All IBWs and ITVs were recalculated and examined for accuracy. Recorded TV(insp)values were then compared to their respective ITVs.Interventions prior to re-audit: 1. A new medical daily care bundle was introduced whichincluded a specific box for entering patients’ individual ITVs. 2. Our Practice DevelopmentTeam re-educated nursing staff on double-checking IBW and ITV values with a secondmember of staff at a time other than patient admission. 3. Our original findings werepresented locally and disseminated to all staff.
RESULTS.1. Demographics
Table 1 Demographics
Original audit(01/06/12–30/06/12)
Re-audit(01/02/13–02/03/13)
Total patient episodes 118 117
Total patient episodes involvinginvasive ventilation
89 64
Net episodes post exclusion criteria 50 55
Total unique patients audited 49 54
% female patients 32.7 31.5
Median age (years) 52 60
Age range (years) 17–94 25–89
Net audited patient-hours 2017 2418
Demographics2. LTVV compliance
Fig. 1 LTVV adherence: original audit
Fig. 2 LTVV adherence: re-audit
In the original audit, under a quarter of the patient-hours examined were compliant withlocal LTVV policy. The re-audit demonstrated an improvement in this.3. IBW and ITV calculation accuracy
Table 1 IBW and ITV data
IBWoriginalaudit
IBWre-audit
ITVoriginalaudit
ITVre-audit
Correctly calculated (%) 64.0 58.2 48.0 49.1
Under 10 % inaccurate (%) 30.0 36.4 42.0 47.3
Over 10 % inaccurate (%) 6.0 5.5 10.0 3.6
A sizeable error rate in calculated IBW and ITV values was found in both stages of theaudit, although the magnitude of the errors was mainly small. A reduction in large errorswas seen in both calculations by the time of re-audit.CONCLUSIONS. This audit demonstrates over-ventilation of our patients, in contraventionwith both local policy and best available evidence. This is compounded by a high rate ofinaccuracy in calculating both IBW and ITV values. Our interventions had a modest positiveimpact.REFERENCES. The Acute Respiratory Distress Syndrome Network. Ventilation withlower tidal volumes as compared with traditional tidal volumes for acute lung injury and theacute respiratory distress syndrome. N Engl J Med. 2000; 342(18): 1301–8.
0830ACCURACY OF HEIGHT ESTIMATION AND TIDAL VOLUME SETTING USINGANTHROPOMETRIC FORMULAS AND A SMARTPHONE APPLICATION,IN A CAUCASIAN POPULATION
E. L’Her1,2, J. Martin1, Z. Chiche1, F. Lellouche3, A. Zemirline1
1CHU de Brest/Université de Bretagne Occidentale, Réanimation Médicale et UrgencesAdultes, Brest, France, 2Université de Bretagne Occidentale, CHRU de Brest, LATIMINSERM UMR 1101, Brest, France, 3Université Laval, Centre de Recherche IUCPQ, QC,CanadaINTRODUCTION. Knowledge of patients’ height is essential for daily practice in theintensive care unit (ICU), however, actual height measurements are not available on a dailyroutine and measured height in the supine position may lack consistency. Clinicians do needsimple and rapid methods to estimate the patients’ height, especially in short height and/orobese patients.OBJECTIVES. The objectives of the study were to evaluate several anthropometric for-mulas for height estimation on healthy volunteers, and to test whether several of theseestimates will help tidal volume setting in ICU patients.METHODS. A prospective, observational, study in an emergency and medical intensivecare unit of an university hospital. During the first phase of the study, eight limbs mea-surements were performed on 60 healthy volunteers and 18 height estimation formulas weretested. During the second phase, four height estimates were performed on 60 consecutiveICU patients under mechanical ventilation, using a specifically dedicated Smartphoneapplication [1].
26th ESICM ANNUAL CONGRESS — PARIS, FRANCE — 5–9 OCTOBER 2013
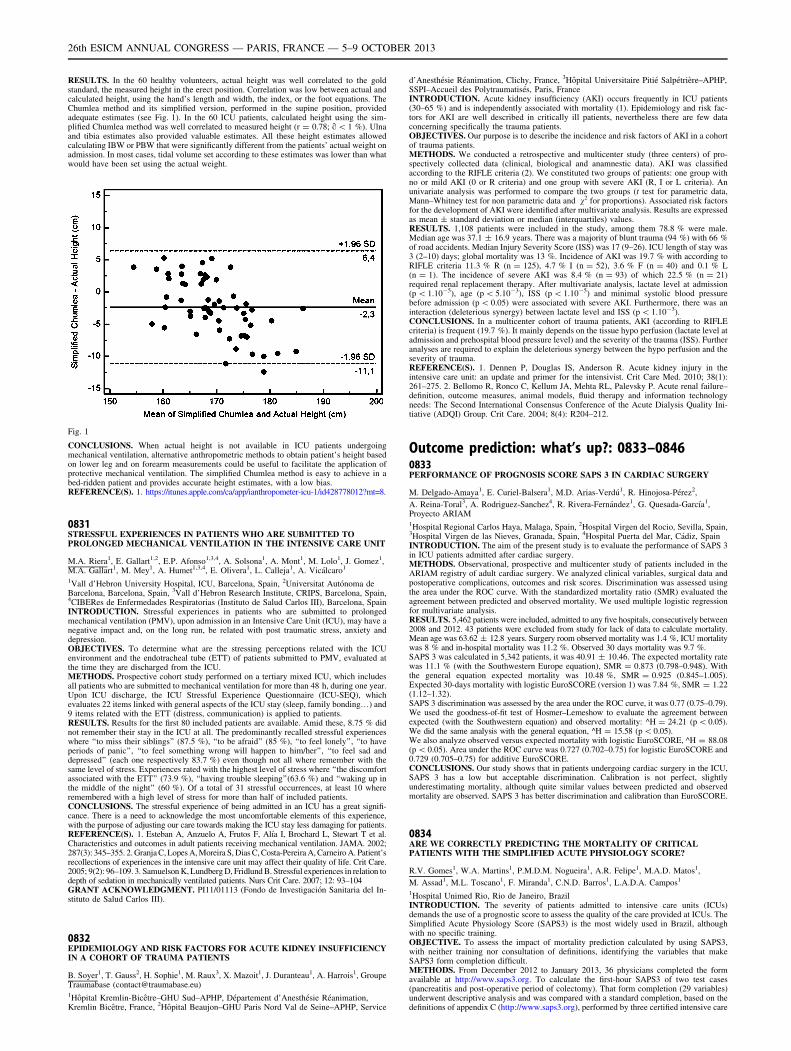
RESULTS. In the 60 healthy volunteers, actual height was well correlated to the goldstandard, the measured height in the erect position. Correlation was low between actual andcalculated height, using the hand’s length and width, the index, or the foot equations. TheChumlea method and its simplified version, performed in the supine position, providedadequate estimates (see Fig. 1). In the 60 ICU patients, calculated height using the sim-plified Chumlea method was well correlated to measured height (r = 0.78; q\ 1 %). Ulnaand tibia estimates also provided valuable estimates. All these height estimates allowedcalculating IBW or PBW that were significantly different from the patients’ actual weight onadmission. In most cases, tidal volume set according to these estimates was lower than whatwould have been set using the actual weight.
Fig. 1
CONCLUSIONS. When actual height is not available in ICU patients undergoingmechanical ventilation, alternative anthropometric methods to obtain patient’s height basedon lower leg and on forearm measurements could be useful to facilitate the application ofprotective mechanical ventilation. The simplified Chumlea method is easy to achieve in abed-ridden patient and provides accurate height estimates, with a low bias.REFERENCE(S). 1. https://itunes.apple.com/ca/app/ianthropometer-icu-1/id428778012?mt=8.
0831STRESSFUL EXPERIENCES IN PATIENTS WHO ARE SUBMITTED TOPROLONGED MECHANICAL VENTILATION IN THE INTENSIVE CARE UNIT
M.A. Riera1, E. Gallart1,2, E.P. Afonso1,3,4, A. Solsona1, A. Mont1, M. Lolo1, J. Gomez1,M.A. Gallart1, M. Mey1, A. Humet1,3,4, E. Olivera1, L. Calleja1, A. Vicálcaro1
1Vall d’Hebron University Hospital, ICU, Barcelona, Spain, 2Universitat Autónoma deBarcelona, Barcelona, Spain, 3Vall d’Hebron Research Institute, CRIPS, Barcelona, Spain,4CIBERes de Enfermedades Respiratorias (Instituto de Salud Carlos III), Barcelona, SpainINTRODUCTION. Stressful experiences in patients who are submitted to prolongedmechanical ventilation (PMV), upon admission in an Intensive Care Unit (ICU), may have anegative impact and, on the long run, be related with post traumatic stress, anxiety anddepression.OBJECTIVES. To determine what are the stressing perceptions related with the ICUenvironment and the endotracheal tube (ETT) of patients submitted to PMV, evaluated atthe time they are discharged from the ICU.METHODS. Prospective cohort study performed on a tertiary mixed ICU, which includesall patients who are submitted to mechanical ventilation for more than 48 h, during one year.Upon ICU discharge, the ICU Stressful Experience Questionnaire (ICU-SEQ), whichevaluates 22 items linked with general aspects of the ICU stay (sleep, family bonding…) and9 items related with the ETT (distress, communication) is applied to patients.RESULTS. Results for the first 80 included patients are available. Amid these, 8.75 % didnot remember their stay in the ICU at all. The predominantly recalled stressful experienceswhere ‘‘to miss their siblings’’ (87.5 %), ‘‘to be afraid’’ (85 %), ‘‘to feel lonely’’, ‘‘to haveperiods of panic’’, ‘‘to feel something wrong will happen to him/her’’, ‘‘to feel sad anddepressed’’ (each one respectively 83.7 %) even though not all where remember with thesame level of stress. Experiences rated with the highest level of stress where ‘‘the discomfortassociated with the ETT’’ (73.9 %), ‘‘having trouble sleeping’’(63.6 %) and ‘‘waking up inthe middle of the night’’ (60 %). Of a total of 31 stressful occurrences, at least 10 whereremembered with a high level of stress for more than half of included patients.CONCLUSIONS. The stressful experience of being admitted in an ICU has a great signifi-cance. There is a need to acknowledge the most uncomfortable elements of this experience,with the purpose of adjusting our care towards making the ICU stay less damaging for patients.REFERENCE(S). 1. Esteban A, Anzuelo A, Frutos F, Alı́a I, Brochard L, Stewart T et al.Characteristics and outcomes in adult patients receiving mechanical ventilation. JAMA. 2002;287(3): 345–355. 2. Granja C, Lopes A, Moreira S, Dias C, Costa-Pereira A, Carneiro A. Patient’srecollections of experiences in the intensive care unit may affect their quality of life. Crit Care.2005; 9(2): 96–109. 3. Samuelson K, Lundberg D, Fridlund B. Stressful experiences in relation todepth of sedation in mechanically ventilated patients. Nurs Crit Care. 2007; 12: 93–104GRANT ACKNOWLEDGMENT. PI11/01113 (Fondo de Investigación Sanitaria del In-stituto de Salud Carlos III).
0832EPIDEMIOLOGY AND RISK FACTORS FOR ACUTE KIDNEY INSUFFICIENCYIN A COHORT OF TRAUMA PATIENTS
B. Soyer1, T. Gauss2, H. Sophie1, M. Raux3, X. Mazoit1, J. Duranteau1, A. Harrois1, GroupeTraumabase ([email protected])1Hôpital Kremlin-Bicêtre–GHU Sud–APHP, Département d’Anesthésie Réanimation,Kremlin Bicêtre, France, 2Hôpital Beaujon–GHU Paris Nord Val de Seine–APHP, Service
d’Anesthésie Réanimation, Clichy, France, 3Hôpital Universitaire Pitié Salpétrière–APHP,SSPI–Accueil des Polytraumatisés, Paris, FranceINTRODUCTION. Acute kidney insufficiency (AKI) occurs frequently in ICU patients(30–65 %) and is independently associated with mortality (1). Epidemiology and risk fac-tors for AKI are well described in critically ill patients, nevertheless there are few dataconcerning specifically the trauma patients.OBJECTIVES. Our purpose is to describe the incidence and risk factors of AKI in a cohortof trauma patients.METHODS. We conducted a retrospective and multicenter study (three centers) of pro-spectively collected data (clinical, biological and anamnestic data). AKI was classifiedaccording to the RIFLE criteria (2). We constituted two groups of patients: one group withno or mild AKI (0 or R criteria) and one group with severe AKI (R, I or L criteria). Anunivariate analysis was performed to compare the two groups (t test for parametric data,Mann–Whitney test for non parametric data and v2 for proportions). Associated risk factorsfor the development of AKI were identified after multivariate analysis. Results are expressedas mean ± standard deviation or median (interquartiles) values.RESULTS. 1,108 patients were included in the study, among them 78.8 % were male.Median age was 37.1 ± 16.9 years. There was a majority of blunt trauma (94 %) with 66 %of road accidents. Median Injury Severity Score (ISS) was 17 (9–26). ICU length of stay was3 (2–10) days; global mortality was 13 %. Incidence of AKI was 19.7 % with according toRIFLE criteria 11.3 % R (n = 125), 4.7 % I (n = 52), 3.6 % F (n = 40) and 0.1 % L(n = 1). The incidence of severe AKI was 8.4 % (n = 93) of which 22.5 % (n = 21)required renal replacement therapy. After multivariate analysis, lactate level at admission(p \ 1.10-5), age (p \ 5.10-3), ISS (p \ 1.10-5) and minimal systolic blood pressurebefore admission (p \ 0.05) were associated with severe AKI. Furthermore, there was aninteraction (deleterious synergy) between lactate level and ISS (p \ 1.10-3).CONCLUSIONS. In a multicenter cohort of trauma patients, AKI (according to RIFLEcriteria) is frequent (19.7 %). It mainly depends on the tissue hypo perfusion (lactate level atadmission and prehospital blood pressure level) and the severity of the trauma (ISS). Furtheranalyses are required to explain the deleterious synergy between the hypo perfusion and theseverity of trauma.REFERENCE(S). 1. Dennen P, Douglas IS, Anderson R. Acute kidney injury in theintensive care unit: an update and primer for the intensivist. Crit Care Med. 2010; 38(1):261–275. 2. Bellomo R, Ronco C, Kellum JA, Mehta RL, Palevsky P. Acute renal failure–definition, outcome measures, animal models, fluid therapy and information technologyneeds: The Second International Consensus Conference of the Acute Dialysis Quality Ini-tiative (ADQI) Group. Crit Care. 2004; 8(4): R204–212.
Outcome prediction: what’s up?: 0833–08460833PERFORMANCE OF PROGNOSIS SCORE SAPS 3 IN CARDIAC SURGERY
M. Delgado-Amaya1, E. Curiel-Balsera1, M.D. Arias-Verdú1, R. Hinojosa-Pérez2,
A. Reina-Toral3, A. Rodriguez-Sanchez4, R. Rivera-Fernández1, G. Quesada-Garcı́a1,Proyecto ARIAM1Hospital Regional Carlos Haya, Malaga, Spain, 2Hospital Virgen del Rocio, Sevilla, Spain,3Hospital Virgen de las Nieves, Granada, Spain, 4Hospital Puerta del Mar, Cádiz, SpainINTRODUCTION. The aim of the present study is to evaluate the performance of SAPS 3in ICU patients admitted after cardiac surgery.METHODS. Observational, prospective and multicenter study of patients included in theARIAM registry of adult cardiac surgery. We analyzed clinical variables, surgical data andpostoperative complications, outcomes and risk scores. Discrimination was assessed usingthe area under the ROC curve. With the standardized mortality ratio (SMR) evaluated theagreement between predicted and observed mortality. We used multiple logistic regressionfor multivariate analysis.RESULTS. 5,462 patients were included, admitted to any five hospitals, consecutively between2008 and 2012. 43 patients were excluded from study for lack of data to calculate mortality.Mean age was 63.62 ± 12.8 years. Surgery room observed mortality was 1.4 %, ICU mortalitywas 8 % and in-hospital mortality was 11.2 %. Observed 30 days mortality was 9.7 %.SAPS 3 was calculated in 5,342 patients, it was 40.91 ± 10.46. The expected mortality ratewas 11.1 % (with the Southwestern Europe equation), SMR = 0.873 (0.798–0.948). Withthe general equation expected mortality was 10.48 %, SMR = 0.925 (0.845–1.005).Expected 30-days mortality with logistic EuroSCORE (version 1) was 7.84 %, SMR = 1.22(1.12–1.32).SAPS 3 discrimination was assessed by the area under the ROC curve, it was 0.77 (0.75–0.79).We used the goodness-of-fit test of Hosmer–Lemeshow to evaluate the agreement betweenexpected (with the Southwestern equation) and observed mortality: ^H = 24.21 (p\ 0.05).We did the same analysis with the general equation, ^H = 15.58 (p\0.05).We also analyze observed versus expected mortality with logistic EuroSCORE, ^H = 88.08(p \ 0.05). Area under the ROC curve was 0.727 (0.702–0.75) for logistic EuroSCORE and0.729 (0.705–0.75) for additive EuroSCORE.CONCLUSIONS. Our study shows that in patients undergoing cardiac surgery in the ICU,SAPS 3 has a low but acceptable discrimination. Calibration is not perfect, slightlyunderestimating mortality, although quite similar values between predicted and observedmortality are observed. SAPS 3 has better discrimination and calibration than EuroSCORE.
0834ARE WE CORRECTLY PREDICTING THE MORTALITY OF CRITICALPATIENTS WITH THE SIMPLIFIED ACUTE PHYSIOLOGY SCORE?
R.V. Gomes1, W.A. Martins1, P.M.D.M. Nogueira1, A.R. Felipe1, M.A.D. Matos1,
M. Assad1, M.L. Toscano1, F. Miranda1, C.N.D. Barros1, L.A.D.A. Campos1
1Hospital Unimed Rio, Rio de Janeiro, BrazilINTRODUCTION. The severity of patients admitted to intensive care units (ICUs)demands the use of a prognostic score to assess the quality of the care provided at ICUs. TheSimplified Acute Physiology Score (SAPS3) is the most widely used in Brazil, althoughwith no specific training.OBJECTIVE. To assess the impact of mortality prediction calculated by using SAPS3,with neither training nor consultation of definitions, identifying the variables that makeSAPS3 form completion difficult.METHODS. From December 2012 to January 2013, 36 physicians completed the formavailable at http://www.saps3.org. To calculate the first-hour SAPS3 of two test cases(pancreatitis and post-operative period of colectomy). That form completion (29 variables)underwent descriptive analysis and was compared with a standard completion, based on thedefinitions of appendix C (http://www.saps3.org), performed by three certified intensive care
26th ESICM ANNUAL CONGRESS — PARIS, FRANCE — 5–9 OCTOBER 2013
professionals (core). Variables with disparities were identified, as was the impact on mor-tality prediction.RESULTS. The two test cases showed high variability of results (Table below). The medianshowed a tendency to a reduction in mortality prediction in the pancreatitis case and a highincrease (almost 14 %) in mortality prediction in the post-operative case, which was morecomplex. The large variability in score calculation (table below) might significantly impactmortality prediction. The 29 variables were divided into the following 3 groups: A agree-ment in form completion, with no disparity (16–55.2 %); B B 2 disparities (7–24.2 %); andC[ 4 disparities (6–20.6 %). Group A variables were considered of easy understanding. Ingroup B, the errors were interpreted as lack of attention or familiarity with the score. GroupC variables were considered of difficult interpretation, but the way they are displayed in theform (no clear definition and no easy access) hinders form completion. In addition, lack ofproper training might cause severe distortions in mortality prediction. The following vari-ables were the most troublesome: cardiovascular (types of shock); hospital location; andcancer therapy. Their inadequate management can result in differences of as many as 18points in SAPS3, corresponding to a difference of as much as 25 % in mortality prediction.This might jeopardize the use of the score.Table 1 SAPS 3
Table
CONCLUSION. The SAPS3 form available at http://www.saps3.org is not easily under-stood and can jeopardize the results of the score. Using the SAPS3 form with neitheradequate training nor consultation to definitions results in inadequate mortality prediction.
0835DIFFERENT PATTERNS IN LONGITUDINAL [DAY 1 TO 4] SOFA TRENDSEXPLAINS HETEROGENEITY IN MORTALITY RISK SEEN WITHAGGREGATED SOFA TRENDS
M. Shankar-Hari1,2, S. Di-Gangi1, M. Terblanche1,2
1Guy’s and St Thomas’ NHS Foundation Trust, Critical Care Medicine, London, UK,2King’s College London, Division of Asthma, Allergy and Lung Biology, London, UKINTRODUCTION. Total admission SOFA score is a predictor of risk of death in criticallyill patients. Trends in SOFA score has also been reported as a predictor of risk of death.However, these reports use aggregate trends at the cohort level, dichotomised by mortality1.OBJECTIVES. To identify patterns of total SOFA trends at the individual patient levelduring the first 96 h after admission and evaluate their association with on 28-day mortality.METHODS. Retrospective cohort study of prospectively collected data extracted from theclinical information system (CIS; CareVueTM, Philips, Netherlands) in a single tertiaryacademic medical-surgical ICU. The study cohort is described using age, sex, admissionAPACHE II and SOFA scores, ICU and 28-day mortality. The main predictor variables areday 1–4 changes in t-SOFA score; the outcome variable 28-day mortality. At an individualpatient level, the differences in t-SOFA score on consecutive days were calculated to definepatterns of change. v2 test was used compare proportions in patterns observed.RESULTS. We report data from 1454 admissions. The mean (SD) age was 63.0 (16.9)years; 61.9 % were male. Mean (SD) admission APACHE II score was 19.19 (6.29) andmedian (IQR) admission t-SOFA sore was 7(5). The ICU and 28-day mortality were 22.6 %and 26.3 %.We identified seven different patterns of change in t-SOFA between admission day and day4 (Table 1). Worsening t-SOFA was not always associated with mortality. However, aconsistent trend was.CONCLUSIONS. Using daily trends in t-SOFA, we identified seven different patterns oft-SOFA change which influences the risk of 28-day mortality.
Table 1 Association between t-SOFA pattern and 28D-M
t-SOFA trend pattern Survivors N(%)
Non SurvivorsN (%)
p
Non increasing but with at least onereduction
459 (50.6) 91 (28.8) \0.001
Decrease following an increasing trend 134 (14.8) 53 (16.8) 0.39
Increase following a decreasing trend 123 (13.6) 65 (20.6) 0.003
Decrease following an increase precededby a decrease
68 (7.5) 22 (7.0) 0.76
Non decreasing 62 (6.8) 54 (17.1) \0.001
Constant 36 (4.0) 17 (5.4) 0.29
Increase following a decrease precededby an increase
26 (2.9) 14 (4.4) 0.18
REFERENCE(S). Minne L, Abu-Hanna A, de Jonge E. Evaluation of SOFA-based modelsfor predicting mortality in the ICU: A systematic review. Crit Care. 12: R161.
0836MORTALITY EVALUATION WITH SAPS3 PROGNOSIS SYSTEM IN ICUPATIENTS WITH ACUTE CORONARY SYNDROME WITH NON-ST SEGMENTELEVATION MYOCARDIAL INFARCTION
C. López-Caler1, R. Gutiérrez-Rodrı́guez1, J. Moreno-Quintana1, M. Garcı́a-Delgado2,
J. Álvarez-Rodrı́guez3, C. Lopez Caler4, R. Rivera-Fernández1
1Carlos Haya Regional University Hospital, Málaga, Spain, 2Virgen de las Nieves Hospital,Granada, Spain, 3Hospital de Fuenlabrada, Fuenlabrada, Spain, 4HospitalNeurotraumatológico, Jaen, Spain
OBJECTIVES. To analyze patients admitted into ICU with acute coronary syndrome withnon ST segment elevation myocardial infarction according to SAPS3 prognosis system.METHODS. The study has been developed in several Spanish hospitals. Data were col-lected since 2006–2012. High number of patients were from Motril Hospital (72), Virgen delas Nieves Hospital (63), Carlos Haya (66) y Fuenlabrada (26). Infanta Margarita Hospital inCabra and Neurotraumatolical in Jaen were also involved. Necessary data to develop SAPS3score were collected by participant hospitals staff. We have studied ICU mortality andhospital mortality. Data were expressed by mean ± standard deviation for quantitativevariables and frequencies for qualitative data. SMR (Standardized Mortality Reason) andHosmer–Lemeshow test were used to evaluate calibration and area under ROC curve wasused to assess discrimination.RESULTS. 250 patients were admitted. Age was 67.02 ± 12.51 years, ICU mortalitywas 3.2 % and hospital mortality 6 %. SAPS3 score was 43.19 ± 9.44 points, andprobability of death by our geographical area equation was 12.65 % and by generalequation 11.88 %. SMR by our geographical area was 0.47 (0.23–0.81) and by generalequation was 0.50 (0.25–0.75).We have divided population into five groups dependingon the probability of death by SAPS3 score and we compared observed and predictedmortality by Hosmer–Lemeshow test. This value for general equation was 11.50(p \ 0.05) and for our geographical area 12.49 (p \ 0.05).SAPS3 discrimination withrespect to hospital mortality was assessed by area under ROC curve was 0.73(0.60–0.87).CONCLUSIONS. Our study shows in patients admitted into ICU with coronary acutesyndrome with non-ST segment elevation low discrimination by SAPS3 system and also badcalibration with inferior mortality than predicted by SAPS3 system.
0837MORTALITY ASSESSMENT WITH SAPS-3 AND APACHE-III IN ICU PATIENTS
J. Moreno-Quintana1, E. Curiel-Balsera1, C. López-Caler1, E. Aguilar-Alonso2,E. Castillo-Lorente3, J. Álvarez-Rodrı́guez4, J. Carpio-Sanz5, R. Rivera-Fernández1
1Carlos Haya Regional University Hospital, Málaga, Spain, 2Hospital Infanta Margarita,Cabra, Spain, 3Hospital Neurotraumatológico, Jaen, Spain, 4Hospital de Fuenlabrada,Fuenlabrada, Spain, 5Hospital Santa Ana, Motril, SpainOBJECTIVES. Assess SAPS-3 prognosis system and APACHE-III in ICU patients.METHODS. We have study patients admitted into ICU between 2006 and 2007 in MotrilHospital, in Carlos Haya Hospital, four months between 2011 and 2012. In Cabra Hospitaland Jaen, 2 months in 2012. In Fuenlabrada all the patients admitted during 2011 and inVirgen de las Nieves four months in 2006. Data were collected to developed SAPS-3prognosis system and APACHE-3, and probability of death by these systems, ICU mortalityand Hospital mortality (ICU and Floor). Area under ROC curve was used to assess dis-crimination and Hosmer–Lemeshow test to assess agreement between observed andpredicted mortality.RESULTS. The sample were composed of 2,510 patients, age 61.43 ± 15.96 years. ICUmortality was 11 % and hospital mortality 16.06 %. Probability of death was 17.35 % bygeneral equation and 17.95 % by our geographical area equation and 16.06 % as we saidbefore. Hosmer–Lemeshow test for general equation was 16.28 (p \ 0.05) and for theSpanish equation 27.5 (p \ 0.05). In both cases we can observe differences betweenobserved and predicted mortality, statistically significant. Discrimination of the SAPS-3 forhospital mortality assessed with the area under the ROC curve was 0.842 (0819–0864).Wealso collected data to calculate APACHE-III in patients admitted into four hospitals(Malaga, Motril, Jaen and Goat). The sample was 1,422 patients, age was62.27 ± 15.85 years ICU mortality was 11 and 15.54 % hospital mortality; predictedmortality by APACHE-III was 16.81 %. The Hosmer–Lemeshow test for APACHE-III was17.21 (p \ 0.05). The differences were statistically significant. APACHE III discriminationto hospital mortality assessed with the area under the ROC curve was 0.883(0.858–0.908).SAPS-3 and APACHE-III have good discrimination, being better APACHE-III discrimination.CONCLUSIONS. Both instruments have differences between predicted and observedmortality and the largest ones with our geographical area SAPS-3 version. There are smalldifferences between observed and expected but statistically significant.
0838AORTIC VALVE REPLACEMENT: RESULTS AND PREDICTORSOF MORTALITY IN ELDERLY PATIENTS
M.R. Mañas Vera1, S. Silvente Fernández1, J.P. Valencia Quintero1, M. Redondo Orts1,V. Sáez Chica1, M.J. Garcı́a Delgado1, E. Aguayo De Hoyos1, A. Reina Toral1, on behalf ofARIAM Group1Hospital Universitario Virgen de las Nieves, Intensive Care Unit, Granada, SpainINTRODUCTION. Aortic valve replacement is a common procedure in elderly patients,and its benefits and indications have been clearly established. Among specific predictivemodels in cardiac surgery, EuroSCORE is currently the most accepted in Europe although itremains controversial, EuroSCORE II has recently been published, and Berstein–Parsonnet(Parsonnet) seems obsolete. A general model as SAPS 3 has also been used for the samepurpose.OBJECTIVES. The study’s objective was to evaluate the accuracy of predictive riskmodels on aortic valve replacement in patients older than 75 years.METHODS. Data from 124 patients older than 75 years undergoing isolated aortic valvereplacement between June 2008 and February 2013 were prospectively collected fromARIAM registry (Andalusian cardiac surgery registry). Preoperative, intraoperative andpostoperative variables were analyzed and EuroSCORE, EuroSCORE II, Parsonnet andSAPS 3 were applied. Results were expressed in frequency and percentage, or meanvalues.RESULTS. About 57 % of the population studied was female and 43 % was male. Allpatients underwent univalvular procedure. Overall hospital mortality was 12.1 %. By uni-variate analysis, no difference was seen between men and women regarding all classicalcardiovascular risk factors, COPD, pulmonary hypertension, New York Heart Associationclass, previous sternotomy or surgical priority. Postoperative complications (acute kidneyinjury, bleeding, length of mechanical ventilation, reoperation, readmission and stroke) werealso comparable between both genders. Additive and logistic EuroSCORE, logistic Euro-SCORE II, additive and logistic Parsonnet, and additive and logistic SAPS 3 predictive riskmodels were calculated as they are published. Their results are showed in the followingTables:
26th ESICM ANNUAL CONGRESS — PARIS, FRANCE — 5–9 OCTOBER 2013
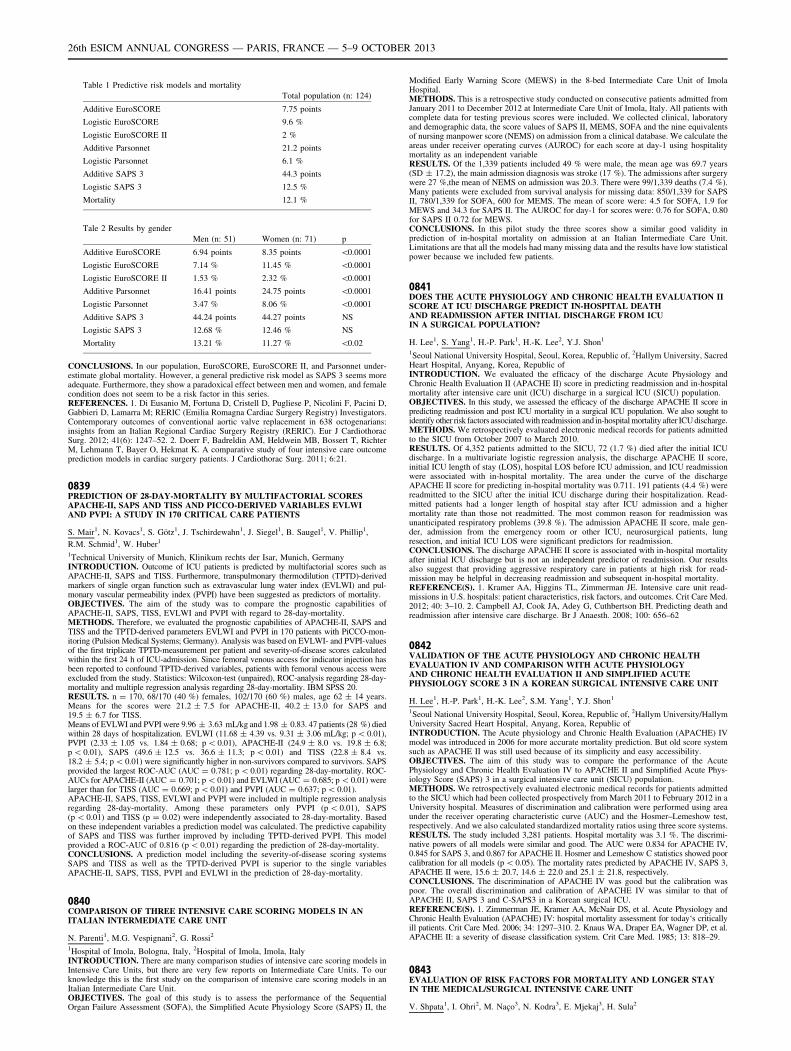
Table 1 Predictive risk models and mortality
Total population (n: 124)
Additive EuroSCORE 7.75 points
Logistic EuroSCORE 9.6 %
Logistic EuroSCORE II 2 %
Additive Parsonnet 21.2 points
Logistic Parsonnet 6.1 %
Additive SAPS 3 44.3 points
Logistic SAPS 3 12.5 %
Mortality 12.1 %
Tale 2 Results by gender
Men (n: 51) Women (n: 71) p
Additive EuroSCORE 6.94 points 8.35 points \0.0001
Logistic EuroSCORE 7.14 % 11.45 % \0.0001
Logistic EuroSCORE II 1.53 % 2.32 % \0.0001
Additive Parsonnet 16.41 points 24.75 points \0.0001
Logistic Parsonnet 3.47 % 8.06 % \0.0001
Additive SAPS 3 44.24 points 44.27 points NS
Logistic SAPS 3 12.68 % 12.46 % NS
Mortality 13.21 % 11.27 % \0.02
CONCLUSIONS. In our population, EuroSCORE, EuroSCORE II, and Parsonnet under-estimate global mortality. However, a general predictive risk model as SAPS 3 seems moreadequate. Furthermore, they show a paradoxical effect between men and women, and femalecondition does not seem to be a risk factor in this series.REFERENCES. 1. Di Eusanio M, Fortuna D, Cristell D, Pugliese P, Nicolini F, Pacini D,Gabbieri D, Lamarra M; RERIC (Emilia Romagna Cardiac Surgery Registry) Investigators.Contemporary outcomes of conventional aortic valve replacement in 638 octogenarians:insights from an Italian Regional Cardiac Surgery Registry (RERIC). Eur J CardiothoracSurg. 2012; 41(6): 1247–52. 2. Doerr F, Badreldin AM, Heldwein MB, Bossert T, RichterM, Lehmann T, Bayer O, Hekmat K. A comparative study of four intensive care outcomeprediction models in cardiac surgery patients. J Cardiothorac Surg. 2011; 6:21.
0839PREDICTION OF 28-DAY-MORTALITY BY MULTIFACTORIAL SCORESAPACHE-II, SAPS AND TISS AND PICCO-DERIVED VARIABLES EVLWIAND PVPI: A STUDY IN 170 CRITICAL CARE PATIENTS
S. Mair1, N. Kovacs1, S. Götz1, J. Tschirdewahn1, J. Siegel1, B. Saugel1, V. Phillip1,
R.M. Schmid1, W. Huber1
1Technical University of Munich, Klinikum rechts der Isar, Munich, GermanyINTRODUCTION. Outcome of ICU patients is predicted by multifactorial scores such asAPACHE-II, SAPS and TISS. Furthermore, transpulmonary thermodilution (TPTD)-derivedmarkers of single organ function such as extravascular lung water index (EVLWI) and pul-monary vascular permeability index (PVPI) have been suggested as predictors of mortality.OBJECTIVES. The aim of the study was to compare the prognostic capabilities ofAPACHE-II, SAPS, TISS, EVLWI and PVPI with regard to 28-day-mortality.METHODS. Therefore, we evaluated the prognostic capabilities of APACHE-II, SAPS andTISS and the TPTD-derived parameters EVLWI and PVPI in 170 patients with PiCCO-mon-itoring (Pulsion Medical Systems; Germany). Analysis was based on EVLWI- and PVPI-valuesof the first triplicate TPTD-measurement per patient and severity-of-disease scores calculatedwithin the first 24 h of ICU-admission. Since femoral venous access for indicator injection hasbeen reported to confound TPTD-derived variables, patients with femoral venous access wereexcluded from the study. Statistics: Wilcoxon-test (unpaired), ROC-analysis regarding 28-day-mortality and multiple regression analysis regarding 28-day-mortality. IBM SPSS 20.RESULTS. n = 170, 68/170 (40 %) females, 102/170 (60 %) males, age 62 ± 14 years.Means for the scores were 21.2 ± 7.5 for APACHE-II, 40.2 ± 13.0 for SAPS and19.5 ± 6.7 for TISS.Means of EVLWI and PVPI were 9.96 ± 3.63 mL/kg and 1.98 ± 0.83. 47 patients (28 %) diedwithin 28 days of hospitalization. EVLWI (11.68 ± 4.39 vs. 9.31 ± 3.06 mL/kg; p \ 0.01),PVPI (2.33 ± 1.05 vs. 1.84 ± 0.68; p \ 0.01), APACHE-II (24.9 ± 8.0 vs. 19.8 ± 6.8;p \ 0.01), SAPS (49.6 ± 12.5 vs. 36.6 ± 11.3; p \ 0.01) and TISS (22.8 ± 8.4 vs.18.2 ± 5.4; p \ 0.01) were significantly higher in non-survivors compared to survivors. SAPSprovided the largest ROC-AUC (AUC = 0.781; p \ 0.01) regarding 28-day-mortality. ROC-AUCs for APACHE-II (AUC = 0.701; p \ 0.01) and EVLWI (AUC = 0.685; p \ 0.01) werelarger than for TISS (AUC = 0.669; p \ 0.01) and PVPI (AUC = 0.637; p \ 0.01).APACHE-II, SAPS, TISS, EVLWI and PVPI were included in multiple regression analysisregarding 28-day-mortality. Among these parameters only PVPI (p \ 0.01), SAPS(p \ 0.01) and TISS (p = 0.02) were independently associated to 28-day-mortality. Basedon these independent variables a prediction model was calculated. The predictive capabilityof SAPS and TISS was further improved by including TPTD-derived PVPI. This modelprovided a ROC-AUC of 0.816 (p \ 0.01) regarding the prediction of 28-day-mortality.CONCLUSIONS. A prediction model including the severity-of-disease scoring systemsSAPS and TISS as well as the TPTD-derived PVPI is superior to the single variablesAPACHE-II, SAPS, TISS, PVPI and EVLWI in the prediction of 28-day-mortality.
0840COMPARISON OF THREE INTENSIVE CARE SCORING MODELS IN ANITALIAN INTERMEDIATE CARE UNIT
N. Parenti1, M.G. Vespignani2, G. Rossi2
1Hospital of Imola, Bologna, Italy, 2Hospital of Imola, Imola, ItalyINTRODUCTION. There are many comparison studies of intensive care scoring models inIntensive Care Units, but there are very few reports on Intermediate Care Units. To ourknowledge this is the first study on the comparison of intensive care scoring models in anItalian Intermediate Care Unit.OBJECTIVES. The goal of this study is to assess the performance of the SequentialOrgan Failure Assessment (SOFA), the Simplified Acute Physiology Score (SAPS) II, the
Modified Early Warning Score (MEWS) in the 8-bed Intermediate Care Unit of ImolaHospital.METHODS. This is a retrospective study conducted on consecutive patients admitted fromJanuary 2011 to December 2012 at Intermediate Care Unit of Imola, Italy. All patients withcomplete data for testing previous scores were included. We collected clinical, laboratoryand demographic data, the score values of SAPS II, MEMS, SOFA and the nine equivalentsof nursing manpower score (NEMS) on admission from a clinical database. We calculate theareas under receiver operating curves (AUROC) for each score at day-1 using hospitalitymortality as an independent variableRESULTS. Of the 1,339 patients included 49 % were male, the mean age was 69.7 years(SD ± 17.2), the main admission diagnosis was stroke (17 %). The admissions after surgerywere 27 %,the mean of NEMS on admission was 20.3. There were 99/1,339 deaths (7.4 %).Many patients were excluded from survival analysis for missing data: 850/1,339 for SAPSII, 780/1,339 for SOFA, 600 for MEMS. The mean of score were: 4.5 for SOFA, 1.9 forMEWS and 34.3 for SAPS II. The AUROC for day-1 for scores were: 0.76 for SOFA, 0.80for SAPS II 0.72 for MEWS.CONCLUSIONS. In this pilot study the three scores show a similar good validity inprediction of in-hospital mortality on admission at an Italian Intermediate Care Unit.Limitations are that all the models had many missing data and the results have low statisticalpower because we included few patients.
0841DOES THE ACUTE PHYSIOLOGY AND CHRONIC HEALTH EVALUATION IISCORE AT ICU DISCHARGE PREDICT IN-HOSPITAL DEATHAND READMISSION AFTER INITIAL DISCHARGE FROM ICUIN A SURGICAL POPULATION?
H. Lee1, S. Yang1, H.-P. Park1, H.-K. Lee2, Y.J. Shon1
1Seoul National University Hospital, Seoul, Korea, Republic of, 2Hallym University, SacredHeart Hospital, Anyang, Korea, Republic ofINTRODUCTION. We evaluated the efficacy of the discharge Acute Physiology andChronic Health Evaluation II (APACHE II) score in predicting readmission and in-hospitalmortality after intensive care unit (ICU) discharge in a surgical ICU (SICU) population.OBJECTIVES. In this study, we assessed the efficacy of the discharge APACHE II score inpredicting readmission and post ICU mortality in a surgical ICU population. We also sought toidentify other risk factors associated with readmission and in-hospital mortality after ICU discharge.METHODS. We retrospectively evaluated electronic medical records for patients admittedto the SICU from October 2007 to March 2010.RESULTS. Of 4,352 patients admitted to the SICU, 72 (1.7 %) died after the initial ICUdischarge. In a multivariate logistic regression analysis, the discharge APACHE II score,initial ICU length of stay (LOS), hospital LOS before ICU admission, and ICU readmissionwere associated with in-hospital mortality. The area under the curve of the dischargeAPACHE II score for predicting in-hospital mortality was 0.711. 191 patients (4.4 %) werereadmitted to the SICU after the initial ICU discharge during their hospitalization. Read-mitted patients had a longer length of hospital stay after ICU admission and a highermortality rate than those not readmitted. The most common reason for readmission wasunanticipated respiratory problems (39.8 %). The admission APACHE II score, male gen-der, admission from the emergency room or other ICU, neurosurgical patients, lungresection, and initial ICU LOS were significant predictors for readmission.CONCLUSIONS. The discharge APACHE II score is associated with in-hospital mortalityafter initial ICU discharge but is not an independent predictor of readmission. Our resultsalso suggest that providing aggressive respiratory care in patients at high risk for read-mission may be helpful in decreasing readmission and subsequent in-hospital mortality.REFERENCE(S). 1. Kramer AA, Higgins TL, Zimmerman JE. Intensive care unit read-missions in U.S. hospitals: patient characteristics, risk factors, and outcomes. Crit Care Med.2012; 40: 3–10. 2. Campbell AJ, Cook JA, Adey G, Cuthbertson BH. Predicting death andreadmission after intensive care discharge. Br J Anaesth. 2008; 100: 656–62
0842VALIDATION OF THE ACUTE PHYSIOLOGY AND CHRONIC HEALTHEVALUATION IV AND COMPARISON WITH ACUTE PHYSIOLOGYAND CHRONIC HEALTH EVALUATION II AND SIMPLIFIED ACUTEPHYSIOLOGY SCORE 3 IN A KOREAN SURGICAL INTENSIVE CARE UNIT
H. Lee1, H.-P. Park1, H.-K. Lee2, S.M. Yang1, Y.J. Shon1
1Seoul National University Hospital, Seoul, Korea, Republic of, 2Hallym University/HallymUniversity Sacred Heart Hospital, Anyang, Korea, Republic ofINTRODUCTION. The Acute physiology and Chronic Health Evaluation (APACHE) IVmodel was introduced in 2006 for more accurate mortality prediction. But old score systemsuch as APACHE II was still used because of its simplicity and easy accessibility.OBJECTIVES. The aim of this study was to compare the performance of the AcutePhysiology and Chronic Health Evaluation IV to APACHE II and Simplified Acute Phys-iology Score (SAPS) 3 in a surgical intensive care unit (SICU) population.METHODS. We retrospectively evaluated electronic medical records for patients admittedto the SICU which had been collected prospectively from March 2011 to February 2012 in aUniversity hospital. Measures of discrimination and calibration were performed using areaunder the receiver operating characteristic curve (AUC) and the Hosmer–Lemeshow test,respectively. And we also calculated standardized mortality ratios using three score systems.RESULTS. The study included 3,281 patients. Hospital mortality was 3.1 %. The discrimi-native powers of all models were similar and good. The AUC were 0.834 for APACHE IV,0.845 for SAPS 3, and 0.867 for APACHE II. Hosmer and Lemeshow C statistics showed poorcalibration for all models (p \ 0.05). The mortality rates predicted by APACHE IV, SAPS 3,APACHE II were, 15.6 ± 20.7, 14.6 ± 22.0 and 25.1 ± 21.8, respectively.CONCLUSIONS. The discrimination of APACHE IV was good but the calibration waspoor. The overall discrimination and calibration of APACHE IV was similar to that ofAPACHE II, SAPS 3 and C-SAPS3 in a Korean surgical ICU.REFERENCE(S). 1. Zimmerman JE, Kramer AA, McNair DS, et al. Acute Physiology andChronic Health Evaluation (APACHE) IV: hospital mortality assessment for today‘s criticallyill patients. Crit Care Med. 2006; 34: 1297–310. 2. Knaus WA, Draper EA, Wagner DP, et al.APACHE II: a severity of disease classification system. Crit Care Med. 1985; 13: 818–29.
0843EVALUATION OF RISK FACTORS FOR MORTALITY AND LONGER STAYIN THE MEDICAL/SURGICAL INTENSIVE CARE UNIT
V. Shpata1, I. Ohri2, M. Naço3, N. Kodra3, E. Mjekaj3, H. Sula2
26th ESICM ANNUAL CONGRESS — PARIS, FRANCE — 5–9 OCTOBER 2013
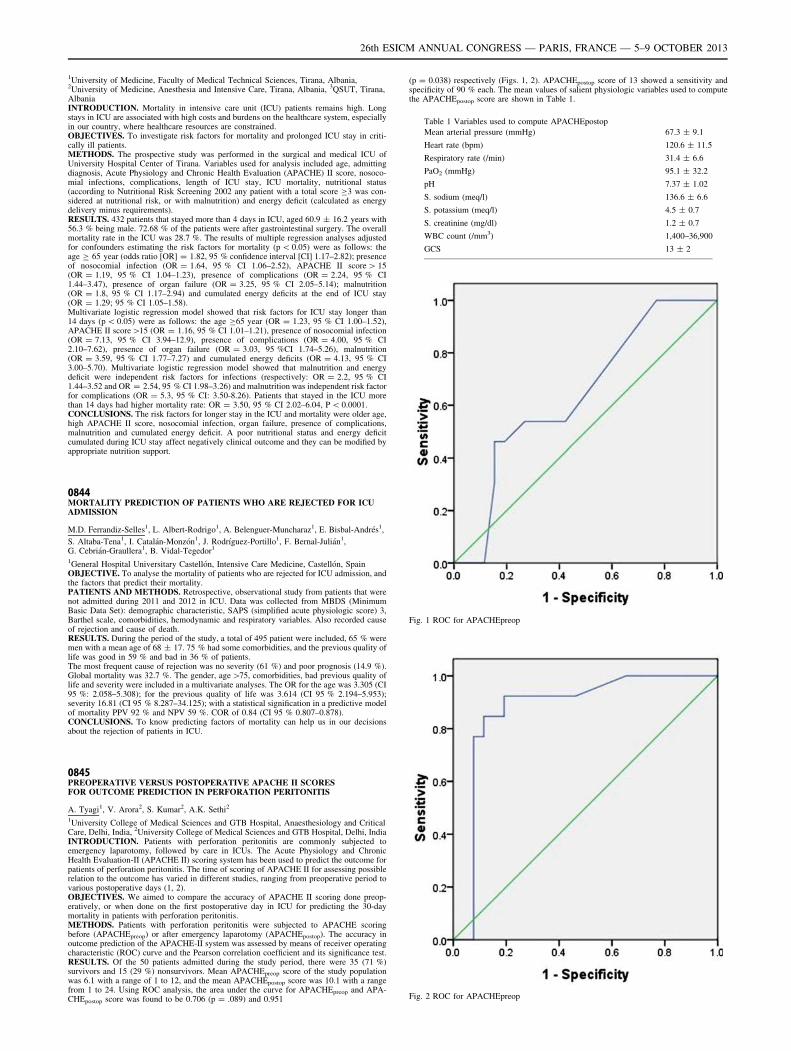
1University of Medicine, Faculty of Medical Technical Sciences, Tirana, Albania,2University of Medicine, Anesthesia and Intensive Care, Tirana, Albania, 3QSUT, Tirana,AlbaniaINTRODUCTION. Mortality in intensive care unit (ICU) patients remains high. Longstays in ICU are associated with high costs and burdens on the healthcare system, especiallyin our country, where healthcare resources are constrained.OBJECTIVES. To investigate risk factors for mortality and prolonged ICU stay in criti-cally ill patients.METHODS. The prospective study was performed in the surgical and medical ICU ofUniversity Hospital Center of Tirana. Variables used for analysis included age, admittingdiagnosis, Acute Physiology and Chronic Health Evaluation (APACHE) II score, nosoco-mial infections, complications, length of ICU stay, ICU mortality, nutritional status(according to Nutritional Risk Screening 2002 any patient with a total score C3 was con-sidered at nutritional risk, or with malnutrition) and energy deficit (calculated as energydelivery minus requirements).RESULTS. 432 patients that stayed more than 4 days in ICU, aged 60.9 ± 16.2 years with56.3 % being male. 72.68 % of the patients were after gastrointestinal surgery. The overallmortality rate in the ICU was 28.7 %. The results of multiple regression analyses adjustedfor confounders estimating the risk factors for mortality (p \ 0.05) were as follows: theage C 65 year (odds ratio [OR] = 1.82, 95 % confidence interval [CI] 1.17–2.82); presenceof nosocomial infection (OR = 1.64, 95 % CI 1.06–2.52), APACHE II score [ 15(OR = 1.19, 95 % CI 1.04–1.23), presence of complications (OR = 2.24, 95 % CI1.44–3.47), presence of organ failure (OR = 3.25, 95 % CI 2.05–5.14); malnutrition(OR = 1.8, 95 % CI 1.17–2.94) and cumulated energy deficits at the end of ICU stay(OR = 1.29; 95 % CI 1.05–1.58).Multivariate logistic regression model showed that risk factors for ICU stay longer than14 days (p \ 0.05) were as follows: the age C65 year (OR = 1.23, 95 % CI 1.00–1.52),APACHE II score[15 (OR = 1.16, 95 % CI 1.01–1.21), presence of nosocomial infection(OR = 7.13, 95 % CI 3.94–12.9), presence of complications (OR = 4.00, 95 % CI2.10–7.62), presence of organ failure (OR = 3.03, 95 %CI 1.74–5.26), malnutrition(OR = 3.59, 95 % CI 1.77–7.27) and cumulated energy deficits (OR = 4.13, 95 % CI3.00–5.70). Multivariate logistic regression model showed that malnutrition and energydeficit were independent risk factors for infections (respectively: OR = 2.2, 95 % CI1.44–3.52 and OR = 2.54, 95 % CI 1.98–3.26) and malnutrition was independent risk factorfor complications (OR = 5.3, 95 % CI: 3.50-8.26). Patients that stayed in the ICU morethan 14 days had higher mortality rate: OR = 3.50, 95 % CI 2.02–6.04, P \ 0.0001.CONCLUSIONS. The risk factors for longer stay in the ICU and mortality were older age,high APACHE II score, nosocomial infection, organ failure, presence of complications,malnutrition and cumulated energy deficit. A poor nutritional status and energy deficitcumulated during ICU stay affect negatively clinical outcome and they can be modified byappropriate nutrition support.
0844MORTALITY PREDICTION OF PATIENTS WHO ARE REJECTED FOR ICUADMISSION
M.D. Ferrandiz-Selles1, L. Albert-Rodrigo1, A. Belenguer-Muncharaz1, E. Bisbal-Andrés1,
S. Altaba-Tena1, I. Catalán-Monzón1, J. Rodrı́guez-Portillo1, F. Bernal-Julián1,G. Cebrián-Graullera1, B. Vidal-Tegedor1
1General Hospital Universitary Castellón, Intensive Care Medicine, Castellón, SpainOBJECTIVE. To analyse the mortality of patients who are rejected for ICU admission, andthe factors that predict their mortality.PATIENTS AND METHODS. Retrospective, observational study from patients that werenot admitted during 2011 and 2012 in ICU. Data was collected from MBDS (MinimumBasic Data Set): demographic characteristic, SAPS (simplified acute physiologic score) 3,Barthel scale, comorbidities, hemodynamic and respiratory variables. Also recorded causeof rejection and cause of death.RESULTS. During the period of the study, a total of 495 patient were included, 65 % weremen with a mean age of 68 ± 17. 75 % had some comorbidities, and the previous quality oflife was good in 59 % and bad in 36 % of patients.The most frequent cause of rejection was no severity (61 %) and poor prognosis (14.9 %).Global mortality was 32.7 %. The gender, age [75, comorbidities, bad previous quality oflife and severity were included in a multivariate analyses. The OR for the age was 3.305 (CI95 %: 2.058–5.308); for the previous quality of life was 3.614 (CI 95 % 2.194–5.953);severity 16.81 (CI 95 % 8.287–34.125); with a statistical signification in a predictive modelof mortality PPV 92 % and NPV 59 %. COR of 0.84 (CI 95 % 0.807–0.878).CONCLUSIONS. To know predicting factors of mortality can help us in our decisionsabout the rejection of patients in ICU.
0845PREOPERATIVE VERSUS POSTOPERATIVE APACHE II SCORESFOR OUTCOME PREDICTION IN PERFORATION PERITONITIS
A. Tyagi1, V. Arora2, S. Kumar2, A.K. Sethi2
1University College of Medical Sciences and GTB Hospital, Anaesthesiology and CriticalCare, Delhi, India, 2University College of Medical Sciences and GTB Hospital, Delhi, IndiaINTRODUCTION. Patients with perforation peritonitis are commonly subjected toemergency laparotomy, followed by care in ICUs. The Acute Physiology and ChronicHealth Evaluation-II (APACHE II) scoring system has been used to predict the outcome forpatients of perforation peritonitis. The time of scoring of APACHE II for assessing possiblerelation to the outcome has varied in different studies, ranging from preoperative period tovarious postoperative days (1, 2).OBJECTIVES. We aimed to compare the accuracy of APACHE II scoring done preop-eratively, or when done on the first postoperative day in ICU for predicting the 30-daymortality in patients with perforation peritonitis.METHODS. Patients with perforation peritonitis were subjected to APACHE scoringbefore (APACHEpreop) or after emergency laparotomy (APACHEpostop). The accuracy inoutcome prediction of the APACHE-II system was assessed by means of receiver operatingcharacteristic (ROC) curve and the Pearson correlation coefficient and its significance test.RESULTS. Of the 50 patients admitted during the study period, there were 35 (71 %)survivors and 15 (29 %) nonsurvivors. Mean APACHEpreop score of the study populationwas 6.1 with a range of 1 to 12, and the mean APACHEpostop score was 10.1 with a rangefrom 1 to 24. Using ROC analysis, the area under the curve for APACHEpreop and APA-CHEpostop score was found to be 0.706 (p = .089) and 0.951
(p = 0.038) respectively (Figs. 1, 2). APACHEpostop score of 13 showed a sensitivity andspecificity of 90 % each. The mean values of salient physiologic variables used to computethe APACHEpostop score are shown in Table 1.
Table 1 Variables used to compute APACHEpostop
Mean arterial pressure (mmHg) 67.3 ± 9.1
Heart rate (bpm) 120.6 ± 11.5
Respiratory rate (/min) 31.4 ± 6.6
PaO2 (mmHg) 95.1 ± 32.2
pH 7.37 ± 1.02
S. sodium (meq/l) 136.6 ± 6.6
S. potassium (meq/l) 4.5 ± 0.7
S. creatinine (mg/dl) 1.2 ± 0.7
WBC count (/mm3) 1,400–36,900
GCS 13 ± 2
Fig. 1 ROC for APACHEpreop
Fig. 2 ROC for APACHEpreop
26th ESICM ANNUAL CONGRESS — PARIS, FRANCE — 5–9 OCTOBER 2013
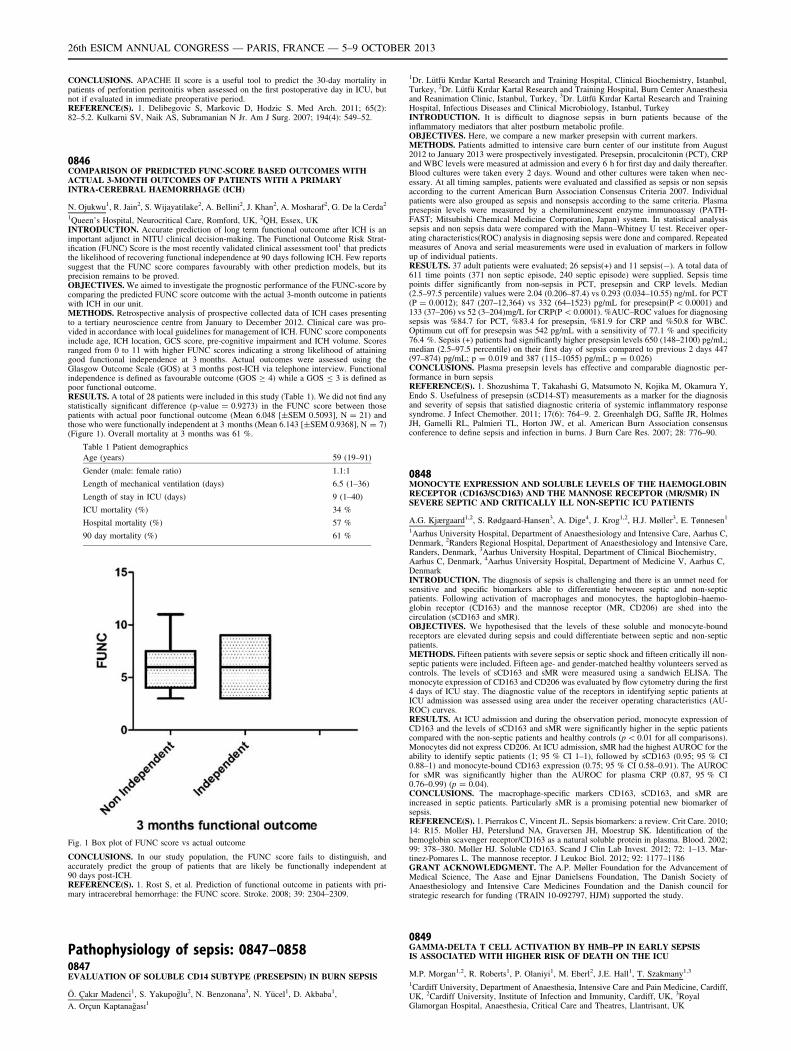
CONCLUSIONS. APACHE II score is a useful tool to predict the 30-day mortality inpatients of perforation peritonitis when assessed on the first postoperative day in ICU, butnot if evaluated in immediate preoperative period.REFERENCE(S). 1. Delibegovic S, Markovic D, Hodzic S. Med Arch. 2011; 65(2):82–5.2. Kulkarni SV, Naik AS, Subramanian N Jr. Am J Surg. 2007; 194(4): 549–52.
0846COMPARISON OF PREDICTED FUNC-SCORE BASED OUTCOMES WITHACTUAL 3-MONTH OUTCOMES OF PATIENTS WITH A PRIMARYINTRA-CEREBRAL HAEMORRHAGE (ICH)
N. Ojukwu1, R. Jain2, S. Wijayatilake2, A. Bellini2, J. Khan2, A. Mosharaf2, G. De la Cerda2
1Queen’s Hospital, Neurocritical Care, Romford, UK, 2QH, Essex, UKINTRODUCTION. Accurate prediction of long term functional outcome after ICH is animportant adjunct in NITU clinical decision-making. The Functional Outcome Risk Strat-ification (FUNC) Score is the most recently validated clinical assessment tool1 that predictsthe likelihood of recovering functional independence at 90 days following ICH. Few reportssuggest that the FUNC score compares favourably with other prediction models, but itsprecision remains to be proved.OBJECTIVES. We aimed to investigate the prognostic performance of the FUNC-score bycomparing the predicted FUNC score outcome with the actual 3-month outcome in patientswith ICH in our unit.METHODS. Retrospective analysis of prospective collected data of ICH cases presentingto a tertiary neuroscience centre from January to December 2012. Clinical care was pro-vided in accordance with local guidelines for management of ICH. FUNC score componentsinclude age, ICH location, GCS score, pre-cognitive impairment and ICH volume. Scoresranged from 0 to 11 with higher FUNC scores indicating a strong likelihood of attaininggood functional independence at 3 months. Actual outcomes were assessed using theGlasgow Outcome Scale (GOS) at 3 months post-ICH via telephone interview. Functionalindependence is defined as favourable outcome (GOS C 4) while a GOS B 3 is defined aspoor functional outcome.RESULTS. A total of 28 patients were included in this study (Table 1). We did not find anystatistically significant difference (p-value = 0.9273) in the FUNC score between thosepatients with actual poor functional outcome (Mean 6.048 [±SEM 0.5093], N = 21) andthose who were functionally independent at 3 months (Mean 6.143 [±SEM 0.9368], N = 7)(Figure 1). Overall mortality at 3 months was 61 %.
Table 1 Patient demographics
Age (years) 59 (19–91)
Gender (male: female ratio) 1.1:1
Length of mechanical ventilation (days) 6.5 (1–36)
Length of stay in ICU (days) 9 (1–40)
ICU mortality (%) 34 %
Hospital mortality (%) 57 %
90 day mortality (%) 61 %
Fig. 1 Box plot of FUNC score vs actual outcome
CONCLUSIONS. In our study population, the FUNC score fails to distinguish, andaccurately predict the group of patients that are likely be functionally independent at90 days post-ICH.REFERENCE(S). 1. Rost S, et al. Prediction of functional outcome in patients with pri-mary intracerebral hemorrhage: the FUNC score. Stroke. 2008; 39: 2304–2309.
Pathophysiology of sepsis: 0847–08580847EVALUATION OF SOLUBLE CD14 SUBTYPE (PRESEPSIN) IN BURN SEPSIS
Ö. Çakır Madenci1, S. Yakupoğlu2, N. Benzonana3, N. Yücel1, D. Akbaba1,
A. Orçun Kaptanağası1
1Dr. Lütfü Kırdar Kartal Research and Training Hospital, Clinical Biochemistry, Istanbul,Turkey, 2Dr. Lütfü Kırdar Kartal Research and Training Hospital, Burn Center Anaesthesiaand Reanimation Clinic, Istanbul, Turkey, 3Dr. Lütfü Kırdar Kartal Research and TrainingHospital, Infectious Diseases and Clinical Microbiology, Istanbul, TurkeyINTRODUCTION. It is difficult to diagnose sepsis in burn patients because of theinflammatory mediators that alter postburn metabolic profile.OBJECTIVES. Here, we compare a new marker presepsin with current markers.METHODS. Patients admitted to intensive care burn center of our institute from August2012 to January 2013 were prospectively investigated. Presepsin, procalcitonin (PCT), CRPand WBC levels were measured at admission and every 6 h for first day and daily thereafter.Blood cultures were taken every 2 days. Wound and other cultures were taken when nec-essary. At all timing samples, patients were evaluated and classified as sepsis or non sepsisaccording to the current American Burn Association Consensus Criteria 2007. Individualpatients were also grouped as sepsis and nonsepsis according to the same criteria. Plasmapresepsin levels were measured by a chemiluminescent enzyme immunoassay (PATH-FAST; Mitsubishi Chemical Medicine Corporation, Japan) system. İn statistical analysissepsis and non sepsis data were compared with the Mann–Whitney U test. Receiver oper-ating characteristics(ROC) analysis in diagnosing sepsis were done and compared. Repeatedmeasures of Anova and serial measurements were used in evaluation of markers in followup of individual patients.RESULTS. 37 adult patients were evaluated; 26 sepsis(+) and 11 sepsis(-). A total data of611 time points (371 non septic episode, 240 septic episode) were supplied. Sepsis timepoints differ significantly from non-sepsis in PCT, presepsin and CRP levels. Median(2.5–97.5 percentile) values were 2.04 (0.206–87.4) vs 0.293 (0.034–10.55) ng/mL for PCT(P = 0.0012); 847 (207–12,364) vs 332 (64–1523) pg/mL for presepsin(P \ 0.0001) and133 (37–206) vs 52 (3–204)mg/L for CRP(P \ 0.0001). %AUC–ROC values for diagnosingsepsis was %84.7 for PCT, %83.4 for presepsin, %81.9 for CRP and %50.8 for WBC.Optimum cut off for presepsin was 542 pg/mL with a sensitivity of 77.1 % and specificity76.4 %. Sepsis (+) patients had significantly higher presepsin levels 650 (148–2100) pg/mL;median (2.5–97.5 percentile) on their first day of sepsis compared to previous 2 days 447(97–874) pg/mL; p = 0.019 and 387 (115–1055) pg/mL; p = 0.026)CONCLUSIONS. Plasma presepsin levels has effective and comparable diagnostic per-formance in burn sepsisREFERENCE(S). 1. Shozushima T, Takahashi G, Matsumoto N, Kojika M, Okamura Y,Endo S. Usefulness of presepsin (sCD14-ST) measurements as a marker for the diagnosisand severity of sepsis that satisfied diagnostic criteria of systemic inflammatory responsesyndrome. J Infect Chemother. 2011; 17(6): 764–9. 2. Greenhalgh DG, Saffle JR, HolmesJH, Gamelli RL, Palmieri TL, Horton JW, et al. American Burn Association consensusconference to define sepsis and infection in burns. J Burn Care Res. 2007; 28: 776–90.
0848MONOCYTE EXPRESSION AND SOLUBLE LEVELS OF THE HAEMOGLOBINRECEPTOR (CD163/SCD163) AND THE MANNOSE RECEPTOR (MR/SMR) INSEVERE SEPTIC AND CRITICALLY ILL NON-SEPTIC ICU PATIENTS
A.G. Kjærgaard1,2, S. Rødgaard-Hansen3, A. Dige4, J. Krog1,2, H.J. Møller3, E. Tønnesen1
1Aarhus University Hospital, Department of Anaesthesiology and Intensive Care, Aarhus C,Denmark, 2Randers Regional Hospital, Department of Anaesthesiology and Intensive Care,Randers, Denmark, 3Aarhus University Hospital, Department of Clinical Biochemistry,Aarhus C, Denmark, 4Aarhus University Hospital, Department of Medicine V, Aarhus C,DenmarkINTRODUCTION. The diagnosis of sepsis is challenging and there is an unmet need forsensitive and specific biomarkers able to differentiate between septic and non-septicpatients. Following activation of macrophages and monocytes, the haptoglobin–haemo-globin receptor (CD163) and the mannose receptor (MR, CD206) are shed into thecirculation (sCD163 and sMR).OBJECTIVES. We hypothesised that the levels of these soluble and monocyte-boundreceptors are elevated during sepsis and could differentiate between septic and non-septicpatients.METHODS. Fifteen patients with severe sepsis or septic shock and fifteen critically ill non-septic patients were included. Fifteen age- and gender-matched healthy volunteers served ascontrols. The levels of sCD163 and sMR were measured using a sandwich ELISA. Themonocyte expression of CD163 and CD206 was evaluated by flow cytometry during the first4 days of ICU stay. The diagnostic value of the receptors in identifying septic patients atICU admission was assessed using area under the receiver operating characteristics (AU-ROC) curves.RESULTS. At ICU admission and during the observation period, monocyte expression ofCD163 and the levels of sCD163 and sMR were significantly higher in the septic patientscompared with the non-septic patients and healthy controls (p \ 0.01 for all comparisons).Monocytes did not express CD206. At ICU admission, sMR had the highest AUROC for theability to identify septic patients (1; 95 % CI 1–1), followed by sCD163 (0.95; 95 % CI0.88–1) and monocyte-bound CD163 expression (0.75; 95 % CI 0.58–0.91). The AUROCfor sMR was significantly higher than the AUROC for plasma CRP (0.87, 95 % CI0.76–0.99) (p = 0.04).CONCLUSIONS. The macrophage-specific markers CD163, sCD163, and sMR areincreased in septic patients. Particularly sMR is a promising potential new biomarker ofsepsis.REFERENCE(S). 1. Pierrakos C, Vincent JL. Sepsis biomarkers: a review. Crit Care. 2010;14: R15. Moller HJ, Peterslund NA, Graversen JH, Moestrup SK. Identification of thehemoglobin scavenger receptor/CD163 as a natural soluble protein in plasma. Blood. 2002;99: 378–380. Moller HJ. Soluble CD163. Scand J Clin Lab Invest. 2012; 72: 1–13. Mar-tinez-Pomares L. The mannose receptor. J Leukoc Biol. 2012; 92: 1177–1186GRANT ACKNOWLEDGMENT. The A.P. Møller Foundation for the Advancement ofMedical Science, The Aase and Ejnar Danielsens Foundation, The Danish Society ofAnaesthesiology and Intensive Care Medicines Foundation and the Danish council forstrategic research for funding (TRAIN 10-092797, HJM) supported the study.
0849GAMMA-DELTA T CELL ACTIVATION BY HMB–PP IN EARLY SEPSISIS ASSOCIATED WITH HIGHER RISK OF DEATH ON THE ICU
M.P. Morgan1,2, R. Roberts1, P. Olaniyi1, M. Eberl2, J.E. Hall1, T. Szakmany1,3
1Cardiff University, Department of Anaesthesia, Intensive Care and Pain Medicine, Cardiff,UK, 2Cardiff University, Institute of Infection and Immunity, Cardiff, UK, 3RoyalGlamorgan Hospital, Anaesthesia, Critical Care and Theatres, Llantrisant, UK
26th ESICM ANNUAL CONGRESS — PARIS, FRANCE — 5–9 OCTOBER 2013
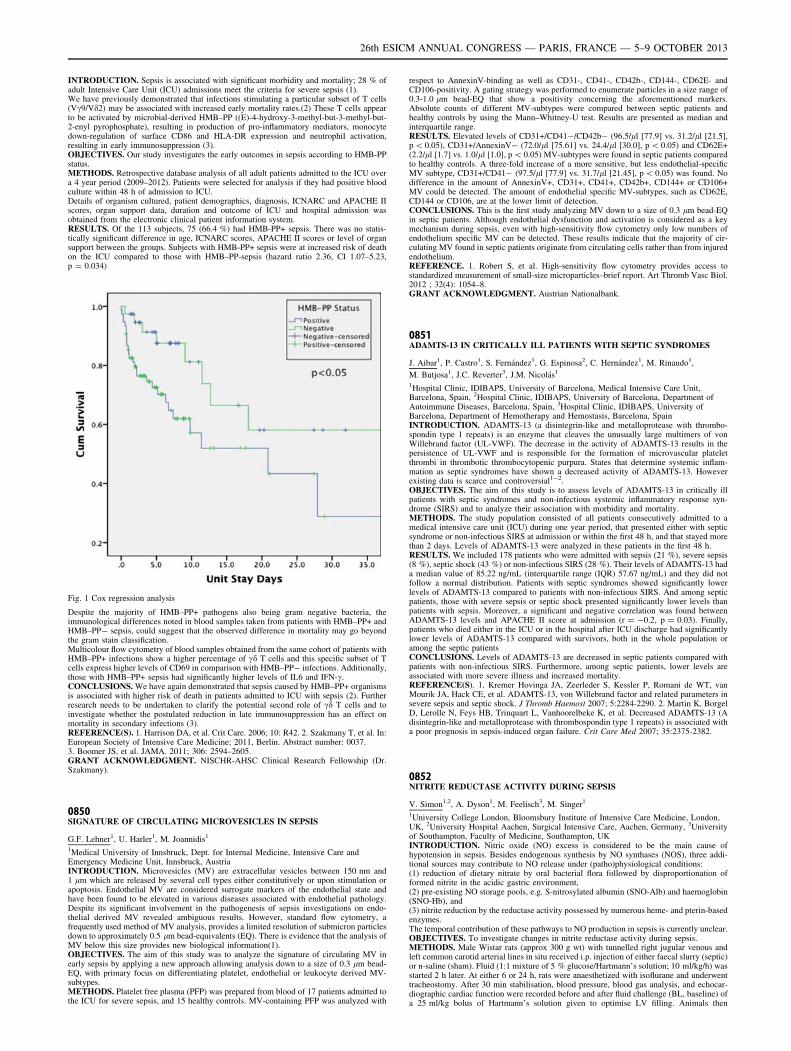
INTRODUCTION. Sepsis is associated with significant morbidity and mortality; 28 % ofadult Intensive Care Unit (ICU) admissions meet the criteria for severe sepsis (1).We have previously demonstrated that infections stimulating a particular subset of T cells(Vc9/Vd2) may be associated with increased early mortality rates.(2) These T cells appearto be activated by microbial-derived HMB–PP ((E)-4-hydroxy-3-methyl-but-3-methyl-but-2-enyl pyrophosphate), resulting in production of pro-inflammatory mediators, monocytedown-regulation of surface CD86 and HLA-DR expression and neutrophil activation,resulting in early immunosuppression (3).OBJECTIVES. Our study investigates the early outcomes in sepsis according to HMB-PPstatus.METHODS. Retrospective database analysis of all adult patients admitted to the ICU overa 4 year period (2009–2012). Patients were selected for analysis if they had positive bloodculture within 48 h of admission to ICU.Details of organism cultured, patient demographics, diagnosis, ICNARC and APACHE IIscores, organ support data, duration and outcome of ICU and hospital admission wasobtained from the electronic clinical patient information system.RESULTS. Of the 113 subjects, 75 (66.4 %) had HMB-PP+ sepsis. There was no statis-tically significant difference in age, ICNARC scores, APACHE II scores or level of organsupport between the groups. Subjects with HMB-PP+ sepsis were at increased risk of deathon the ICU compared to those with HMB–PP-sepsis (hazard ratio 2.36, CI 1.07–5.23,p = 0.034)
Fig. 1 Cox regression analysis
Despite the majority of HMB–PP+ pathogens also being gram negative bacteria, theimmunological differences noted in blood samples taken from patients with HMB–PP+ andHMB–PP- sepsis, could suggest that the observed difference in mortality may go beyondthe gram stain classification.Multicolour flow cytometry of blood samples obtained from the same cohort of patients withHMB–PP+ infections show a higher percentage of cd T cells and this specific subset of Tcells express higher levels of CD69 in comparison with HMB–PP- infections. Additionally,those with HMB–PP+ sepsis had significantly higher levels of IL6 and IFN-c.CONCLUSIONS. We have again demonstrated that sepsis caused by HMB–PP+ organismsis associated with higher risk of death in patients admitted to ICU with sepsis (2). Furtherresearch needs to be undertaken to clarify the potential second role of cd T cells and toinvestigate whether the postulated reduction in late immunosuppression has an effect onmortality in secondary infections (3).REFERENCE(S). 1. Harrison DA, et al. Crit Care. 2006; 10: R42. 2. Szakmany T, et al. In:European Society of Intensive Care Medicine; 2011, Berlin. Abstract number: 0037.3. Boomer JS, et al. JAMA. 2011; 306: 2594–2605.GRANT ACKNOWLEDGMENT. NISCHR-AHSC Clinical Research Fellowship (Dr.Szakmany).
0850SIGNATURE OF CIRCULATING MICROVESICLES IN SEPSIS
G.F. Lehner1, U. Harler1, M. Joannidis1
1Medical University of Innsbruck, Dept. for Internal Medicine, Intensive Care andEmergency Medicine Unit, Innsbruck, AustriaINTRODUCTION. Microvesicles (MV) are extracellular vesicles between 150 nm and1 lm which are released by several cell types either constitutively or upon stimulation orapoptosis. Endothelial MV are considered surrogate markers of the endothelial state andhave been found to be elevated in various diseases associated with endothelial pathology.Despite its significant involvement in the pathogenesis of sepsis investigations on endo-thelial derived MV revealed ambiguous results. However, standard flow cytometry, afrequently used method of MV analysis, provides a limited resolution of submicron particlesdown to approximately 0.5 lm bead-equivalents (EQ). There is evidence that the analysis ofMV below this size provides new biological information(1).OBJECTIVES. The aim of this study was to analyze the signature of circulating MV inearly sepsis by applying a new approach allowing analysis down to a size of 0.3 lm bead-EQ, with primary focus on differentiating platelet, endothelial or leukocyte derived MV-subtypes.METHODS. Platelet free plasma (PFP) was prepared from blood of 17 patients admitted tothe ICU for severe sepsis, and 15 healthy controls. MV-containing PFP was analyzed with
respect to AnnexinV-binding as well as CD31-, CD41-, CD42b-, CD144-, CD62E- andCD106-positivity. A gating strategy was performed to enumerate particles in a size range of0.3-1.0 lm bead-EQ that show a positivity concerning the aforementioned markers.Absolute counts of different MV-subtypes were compared between septic patients andhealthy controls by using the Mann–Whitney-U test. Results are presented as median andinterquartile range.RESULTS. Elevated levels of CD31+/CD41-/CD42b- (96.5/ll [77.9] vs. 31.2/ll [21.5],p \ 0.05), CD31+/AnnexinV- (72.0/ll [75.61] vs. 24.4/ll [30.0], p \ 0.05) and CD62E+(2.2/ll [1.7] vs. 1.0/ll [1.0], p \ 0.05) MV-subtypes were found in septic patients comparedto healthy controls. A three-fold increase of a more sensitive, but less endothelial-specificMV subtype, CD31+/CD41- (97.5/ll [77.9] vs. 31.7/ll [21.45], p \ 0.05) was found. Nodifference in the amount of AnnexinV+, CD31+, CD41+, CD42b+, CD144+ or CD106+MV could be detected. The amount of endothelial specific MV-subtypes, such as CD62E,CD144 or CD106, are at the lower limit of detection.CONCLUSIONS. This is the first study analyzing MV down to a size of 0.3 lm bead-EQin septic patients. Although endothelial dysfunction and activation is considered as a keymechanism during sepsis, even with high-sensitivity flow cytometry only low numbers ofendothelium specific MV can be detected. These results indicate that the majority of cir-culating MV found in septic patients originate from circulating cells rather than from injuredendothelium.REFERENCE. 1. Robert S, et al. High-sensitivity flow cytometry provides access tostandardized measurement of small-size microparticles–brief report. Art Thromb Vasc Biol.2012 ; 32(4): 1054–8.GRANT ACKNOWLEDGMENT. Austrian Nationalbank.
0851ADAMTS-13 IN CRITICALLY ILL PATIENTS WITH SEPTIC SYNDROMES
J. Aibar1, P. Castro1, S. Fernández1, G. Espinosa2, C. Hernández1, M. Rinaudo1,
M. Butjosa1, J.C. Reverter3, J.M. Nicolás1
1Hospital Clinic, IDIBAPS, University of Barcelona, Medical Intensive Care Unit,Barcelona, Spain, 2Hospital Clinic, IDIBAPS, University of Barcelona, Department ofAutoimmune Diseases, Barcelona, Spain, 3Hospital Clinic, IDIBAPS, University ofBarcelona, Department of Hemotherapy and Hemostasis, Barcelona, SpainINTRODUCTION. ADAMTS-13 (a disintegrin-like and metalloprotease with thrombo-spondin type 1 repeats) is an enzyme that cleaves the unusually large multimers of vonWillebrand factor (UL-VWF). The decrease in the activity of ADAMTS-13 results in thepersistence of UL-VWF and is responsible for the formation of microvascular plateletthrombi in thrombotic thrombocytopenic purpura. States that determine systemic inflam-mation as septic syndromes have shown a decreased activity of ADAMTS-13. Howeverexisting data is scarce and controversial1-2.OBJECTIVES. The aim of this study is to assess levels of ADAMTS-13 in critically illpatients with septic syndromes and non-infectious systemic inflammatory response syn-drome (SIRS) and to analyze their association with morbidity and mortality.METHODS. The study population consisted of all patients consecutively admitted to amedical intensive care unit (ICU) during one year period, that presented either with septicsyndrome or non-infectious SIRS at admission or within the first 48 h, and that stayed morethan 2 days. Levels of ADAMTS-13 were analyzed in these patients in the first 48 h.RESULTS. We included 178 patients who were admitted with sepsis (21 %), severe sepsis(8 %), septic shock (43 %) or non-infectious SIRS (28 %). Their levels of ADAMTS-13 hada median value of 85.22 ng/mL (interquartile range (IQR) 57.67 ng/mL) and they did notfollow a normal distribution. Patients with septic syndromes showed significantly lowerlevels of ADAMTS-13 compared to patients with non-infectious SIRS. And among septicpatients, those with severe sepsis or septic shock presented significantly lower levels thanpatients with sepsis. Moreover, a significant and negative correlation was found betweenADAMTS-13 levels and APACHE II score at admission (r = -0.2, p = 0.03). Finally,patients who died either in the ICU or in the hospital after ICU discharge had significantlylower levels of ADAMTS-13 compared with survivors, both in the whole population oramong the septic patientsCONCLUSIONS. Levels of ADAMTS-13 are decreased in septic patients compared withpatients with non-infectious SIRS. Furthermore, among septic patients, lower levels areassociated with more severe illness and increased mortality.REFERENCE(S). 1. Kremer Hovinga JA, Zeerleder S, Kessler P, Romani de WT, vanMourik JA, Hack CE, et al. ADAMTS-13, von Willebrand factor and related parameters insevere sepsis and septic shock. J Thromb Haemost 2007; 5:2284-2290. 2. Martin K, BorgelD, Lerolle N, Feys HB, Trinquart L, Vanhoorelbeke K, et al. Decreased ADAMTS-13 (Adisintegrin-like and metalloprotease with thrombospondin type 1 repeats) is associated witha poor prognosis in sepsis-induced organ failure. Crit Care Med 2007; 35:2375-2382.
0852NITRITE REDUCTASE ACTIVITY DURING SEPSIS
V. Simon1,2, A. Dyson1, M. Feelisch3, M. Singer1
1University College London, Bloomsbury Institute of Intensive Care Medicine, London,UK, 2University Hospital Aachen, Surgical Intensive Care, Aachen, Germany, 3Universityof Southampton, Faculty of Medicine, Southampton, UKINTRODUCTION. Nitric oxide (NO) excess is considered to be the main cause ofhypotension in sepsis. Besides endogenous synthesis by NO synthases (NOS), three addi-tional sources may contribute to NO release under (patho)physiological conditions:(1) reduction of dietary nitrate by oral bacterial flora followed by disproportionation offormed nitrite in the acidic gastric environment,(2) pre-existing NO storage pools, e.g. S-nitrosylated albumin (SNO-Alb) and haemoglobin(SNO-Hb), and(3) nitrite reduction by the reductase activity possessed by numerous heme- and pterin-basedenzymes.The temporal contribution of these pathways to NO production in sepsis is currently unclear.OBJECTIVES. To investigate changes in nitrite reductase activity during sepsis.METHODS. Male Wistar rats (approx 300 g wt) with tunnelled right jugular venous andleft common carotid arterial lines in situ received i.p. injection of either faecal slurry (septic)or n-saline (sham). Fluid (1:1 mixture of 5 % glucose/Hartmann’s solution; 10 ml/kg/h) wasstarted 2 h later. At either 6 or 24 h, rats were anaesthetized with isoflurane and underwenttracheostomy. After 30 min stabilisation, blood pressure, blood gas analysis, and echocar-diographic cardiac function were recorded before and after fluid challenge (BL, baseline) ofa 25 ml/kg bolus of Hartmann’s solution given to optimise LV filling. Animals then
26th ESICM ANNUAL CONGRESS — PARIS, FRANCE — 5–9 OCTOBER 2013
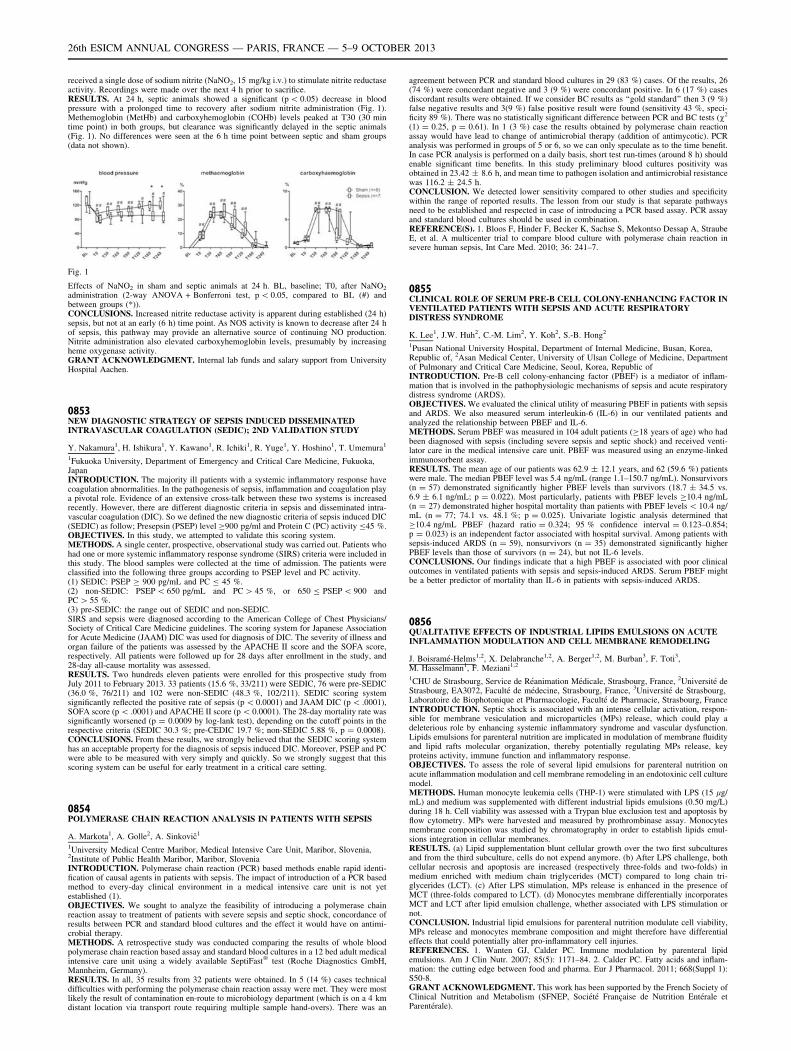
received a single dose of sodium nitrite (NaNO2, 15 mg/kg i.v.) to stimulate nitrite reductaseactivity. Recordings were made over the next 4 h prior to sacrifice.RESULTS. At 24 h, septic animals showed a significant (p \ 0.05) decrease in bloodpressure with a prolonged time to recovery after sodium nitrite administration (Fig. 1).Methemoglobin (MetHb) and carboxyhemoglobin (COHb) levels peaked at T30 (30 mintime point) in both groups, but clearance was significantly delayed in the septic animals(Fig. 1). No differences were seen at the 6 h time point between septic and sham groups(data not shown).
Fig. 1
Effects of NaNO2 in sham and septic animals at 24 h. BL, baseline; T0, after NaNO2
administration (2-way ANOVA + Bonferroni test, p \ 0.05, compared to BL (#) andbetween groups (*)).CONCLUSIONS. Increased nitrite reductase activity is apparent during established (24 h)sepsis, but not at an early (6 h) time point. As NOS activity is known to decrease after 24 hof sepsis, this pathway may provide an alternative source of continuing NO production.Nitrite administration also elevated carboxyhemoglobin levels, presumably by increasingheme oxygenase activity.GRANT ACKNOWLEDGMENT. Internal lab funds and salary support from UniversityHospital Aachen.
0853NEW DIAGNOSTIC STRATEGY OF SEPSIS INDUCED DISSEMINATEDINTRAVASCULAR COAGULATION (SEDIC); 2ND VALIDATION STUDY
Y. Nakamura1, H. Ishikura1, Y. Kawano1, R. Ichiki1, R. Yuge1, Y. Hoshino1, T. Umemura1
1Fukuoka University, Department of Emergency and Critical Care Medicine, Fukuoka,JapanINTRODUCTION. The majority ill patients with a systemic inflammatory response havecoagulation abnormalities. In the pathogenesis of sepsis, inflammation and coagulation playa pivotal role. Evidence of an extensive cross-talk between these two systems is increasedrecently. However, there are different diagnostic criteria in sepsis and disseminated intra-vascular coagulation (DIC). So we defined the new diagnostic criteria of sepsis induced DIC(SEDIC) as follow; Presepsin (PSEP) level C900 pg/ml and Protein C (PC) activity B45 %.OBJECTIVES. In this study, we attempted to validate this scoring system.METHODS. A single center, prospective, observational study was carried out. Patients whohad one or more systemic inflammatory response syndrome (SIRS) criteria were included inthis study. The blood samples were collected at the time of admission. The patients wereclassified into the following three groups according to PSEP level and PC activity.(1) SEDIC: PSEP C 900 pg/mL and PC B 45 %.(2) non-SEDIC: PSEP \ 650 pg/mL and PC [ 45 %, or 650 B PSEP \ 900 andPC [ 55 %.(3) pre-SEDIC: the range out of SEDIC and non-SEDIC.SIRS and sepsis were diagnosed according to the American College of Chest Physicians/Society of Critical Care Medicine guidelines. The scoring system for Japanese Associationfor Acute Medicine (JAAM) DIC was used for diagnosis of DIC. The severity of illness andorgan failure of the patients was assessed by the APACHE II score and the SOFA score,respectively. All patients were followed up for 28 days after enrollment in the study, and28-day all-cause mortality was assessed.RESULTS. Two hundreds eleven patients were enrolled for this prospective study fromJuly 2011 to February 2013. 33 patients (15.6 %, 33/211) were SEDIC, 76 were pre-SEDIC(36.0 %, 76/211) and 102 were non-SEDIC (48.3 %, 102/211). SEDIC scoring systemsignificantly reflected the positive rate of sepsis (p \ 0.0001) and JAAM DIC (p \ .0001),SOFA score (p \ .0001) and APACHE II score (p \ 0.0001). The 28-day mortality rate wassignificantly worsened (p = 0.0009 by log-lank test), depending on the cutoff points in therespective criteria (SEDIC 30.3 %; pre-CEDIC 19.7 %; non-SEDIC 5.88 %, p = 0.0008).CONCLUSIONS. From these results, we strongly believed that the SEDIC scoring systemhas an acceptable property for the diagnosis of sepsis induced DIC. Moreover, PSEP and PCwere able to be measured with very simply and quickly. So we strongly suggest that thisscoring system can be useful for early treatment in a critical care setting.
0854POLYMERASE CHAIN REACTION ANALYSIS IN PATIENTS WITH SEPSIS
A. Markota1, A. Golle2, A. Sinkovič1
1University Medical Centre Maribor, Medical Intensive Care Unit, Maribor, Slovenia,2Institute of Public Health Maribor, Maribor, SloveniaINTRODUCTION. Polymerase chain reaction (PCR) based methods enable rapid identi-fication of causal agents in patients with sepsis. The impact of introduction of a PCR basedmethod to every-day clinical environment in a medical intensive care unit is not yetestablished (1).OBJECTIVES. We sought to analyze the feasibility of introducing a polymerase chainreaction assay to treatment of patients with severe sepsis and septic shock, concordance ofresults between PCR and standard blood cultures and the effect it would have on antimi-crobial therapy.METHODS. A retrospective study was conducted comparing the results of whole bloodpolymerase chain reaction based assay and standard blood cultures in a 12 bed adult medicalintensive care unit using a widely available SeptiFast� test (Roche Diagnostics GmbH,Mannheim, Germany).RESULTS. In all, 35 results from 32 patients were obtained. In 5 (14 %) cases technicaldifficulties with performing the polymerase chain reaction assay were met. They were mostlikely the result of contamination en-route to microbiology department (which is on a 4 kmdistant location via transport route requiring multiple sample hand-overs). There was an
agreement between PCR and standard blood cultures in 29 (83 %) cases. Of the results, 26(74 %) were concordant negative and 3 (9 %) were concordant positive. In 6 (17 %) casesdiscordant results were obtained. If we consider BC results as ‘‘gold standard’’ then 3 (9 %)false negative results and 3(9 %) false positive result were found (sensitivity 43 %, speci-ficity 89 %). There was no statistically significant difference between PCR and BC tests (v2
(1) = 0.25, p = 0.61). In 1 (3 %) case the results obtained by polymerase chain reactionassay would have lead to change of antimicrobial therapy (addition of antimycotic). PCRanalysis was performed in groups of 5 or 6, so we can only speculate as to the time benefit.In case PCR analysis is performed on a daily basis, short test run-times (around 8 h) shouldenable significant time benefits. In this study preliminary blood cultures positivity wasobtained in 23.42 ± 8.6 h, and mean time to pathogen isolation and antimicrobial resistancewas 116.2 ± 24.5 h.CONCLUSION. We detected lower sensitivity compared to other studies and specificitywithin the range of reported results. The lesson from our study is that separate pathwaysneed to be established and respected in case of introducing a PCR based assay. PCR assayand standard blood cultures should be used in combination.REFERENCE(S). 1. Bloos F, Hinder F, Becker K, Sachse S, Mekontso Dessap A, StraubeE, et al. A multicenter trial to compare blood culture with polymerase chain reaction insevere human sepsis, Int Care Med. 2010; 36: 241–7.
0855CLINICAL ROLE OF SERUM PRE-B CELL COLONY-ENHANCING FACTOR INVENTILATED PATIENTS WITH SEPSIS AND ACUTE RESPIRATORYDISTRESS SYNDROME
K. Lee1, J.W. Huh2, C.-M. Lim2, Y. Koh2, S.-B. Hong2
1Pusan National University Hospital, Department of Internal Medicine, Busan, Korea,Republic of, 2Asan Medical Center, University of Ulsan College of Medicine, Departmentof Pulmonary and Critical Care Medicine, Seoul, Korea, Republic ofINTRODUCTION. Pre-B cell colony-enhancing factor (PBEF) is a mediator of inflam-mation that is involved in the pathophysiologic mechanisms of sepsis and acute respiratorydistress syndrome (ARDS).OBJECTIVES. We evaluated the clinical utility of measuring PBEF in patients with sepsisand ARDS. We also measured serum interleukin-6 (IL-6) in our ventilated patients andanalyzed the relationship between PBEF and IL-6.METHODS. Serum PBEF was measured in 104 adult patients (C18 years of age) who hadbeen diagnosed with sepsis (including severe sepsis and septic shock) and received venti-lator care in the medical intensive care unit. PBEF was measured using an enzyme-linkedimmunosorbent assay.RESULTS. The mean age of our patients was 62.9 ± 12.1 years, and 62 (59.6 %) patientswere male. The median PBEF level was 5.4 ng/mL (range 1.1–150.7 ng/mL). Nonsurvivors(n = 57) demonstrated significantly higher PBEF levels than survivors (18.7 ± 34.5 vs.6.9 ± 6.1 ng/mL; p = 0.022). Most particularly, patients with PBEF levels C10.4 ng/mL(n = 27) demonstrated higher hospital mortality than patients with PBEF levels \ 10.4 ng/mL (n = 77; 74.1 vs. 48.1 %; p = 0.025). Univariate logistic analysis determined thatC10.4 ng/mL PBEF (hazard ratio = 0.324; 95 % confidence interval = 0.123–0.854;p = 0.023) is an independent factor associated with hospital survival. Among patients withsepsis-induced ARDS (n = 59), nonsurvivors (n = 35) demonstrated significantly higherPBEF levels than those of survivors (n = 24), but not IL-6 levels.CONCLUSIONS. Our findings indicate that a high PBEF is associated with poor clinicaloutcomes in ventilated patients with sepsis and sepsis-induced ARDS. Serum PBEF mightbe a better predictor of mortality than IL-6 in patients with sepsis-induced ARDS.
0856QUALITATIVE EFFECTS OF INDUSTRIAL LIPIDS EMULSIONS ON ACUTEINFLAMMATION MODULATION AND CELL MEMBRANE REMODELING
J. Boisramé-Helms1,2, X. Delabranche1,2, A. Berger1,2, M. Burban3, F. Toti3,M. Hasselmann1, F. Meziani1,2
1CHU de Strasbourg, Service de Réanimation Médicale, Strasbourg, France, 2Université deStrasbourg, EA3072, Faculté de médecine, Strasbourg, France, 3Université de Strasbourg,Laboratoire de Biophotonique et Pharmacologie, Faculté de Pharmacie, Strasbourg, FranceINTRODUCTION. Septic shock is associated with an intense cellular activation, respon-sible for membrane vesiculation and microparticles (MPs) release, which could play adeleterious role by enhancing systemic inflammatory syndrome and vascular dysfunction.Lipids emulsions for parenteral nutrition are implicated in modulation of membrane fluidityand lipid rafts molecular organization, thereby potentially regulating MPs release, keyproteins activity, immune function and inflammatory response.OBJECTIVES. To assess the role of several lipid emulsions for parenteral nutrition onacute inflammation modulation and cell membrane remodeling in an endotoxinic cell culturemodel.METHODS. Human monocyte leukemia cells (THP-1) were stimulated with LPS (15 lg/mL) and medium was supplemented with different industrial lipids emulsions (0.50 mg/L)during 18 h. Cell viability was assessed with a Trypan blue exclusion test and apoptosis byflow cytometry. MPs were harvested and measured by prothrombinase assay. Monocytesmembrane composition was studied by chromatography in order to establish lipids emul-sions integration in cellular membranes.RESULTS. (a) Lipid supplementation blunt cellular growth over the two first subculturesand from the third subculture, cells do not expend anymore. (b) After LPS challenge, bothcellular necrosis and apoptosis are increased (respectively three-folds and two-folds) inmedium enriched with medium chain triglycerides (MCT) compared to long chain tri-glycerides (LCT). (c) After LPS stimulation, MPs release is enhanced in the presence ofMCT (three-folds compared to LCT). (d) Monocytes membrane differentially incorporatesMCT and LCT after lipid emulsion challenge, whether associated with LPS stimulation ornot.CONCLUSION. Industrial lipid emulsions for parenteral nutrition modulate cell viability,MPs release and monocytes membrane composition and might therefore have differentialeffects that could potentially alter pro-inflammatory cell injuries.REFERENCES. 1. Wanten GJ, Calder PC. Immune modulation by parenteral lipidemulsions. Am J Clin Nutr. 2007; 85(5): 1171–84. 2. Calder PC. Fatty acids and inflam-mation: the cutting edge between food and pharma. Eur J Pharmacol. 2011; 668(Suppl 1):S50-8.GRANT ACKNOWLEDGMENT. This work has been supported by the French Society ofClinical Nutrition and Metabolism (SFNEP, Société Française de Nutrition Entérale etParentérale).
26th ESICM ANNUAL CONGRESS — PARIS, FRANCE — 5–9 OCTOBER 2013
0857C-REACTIVE PROTEIN ADJUSTED THE INTERNATIONAL SOCIETY ONTHROMBOSIS AND HAEMOSTASIS DISSEMINATED INTRAVASCULARCOAGULATION CRITERIA IN PATIENT WITH SEVERE SEPSIS AND SEPTICSHOCK
S.O. Ha1
1University of Ulsan College of Medicine and Asan Medical Center, Department ofEmergency Medicine, Seoul, Korea, Republic ofINTRODUCTION. The standard International Society on Thrombosis and Haemostasis(ISTH) criteria, the Japanese Association for Acute Medicine (JAAM) criteria and therevised JAAM criteria are world widely used for disseminated intravascular coagulation(DIC). However, low sensitivity of ISTH criteria and low specificity of JAAM and revisedcriteria are disadvantages to complement.OBJECTIVES. We adjusted fibrinogen level according to C-reactive protein (CRP) level inThe International Society on Thrombosis and Haemostasis (ISTH) disseminated intravas-cular coagulation (DIC) criteria.METHODS. The data was prospectively collected and retrospectively analyzed in thisstudy during 4-month period. A total of 79 critically ill septic patients with platelet\150,000/lL or [50 % decrease within 24 h were enrolled. The samples from patientswere collected on day 1, 2, 3, 4 and 8. The CRP adjusted ISTH criteria were compared to thethree sets of diagnostic criteria, the standard ISTH, the JAAM and R-JAAM criteria in thisstudy.RESULTS. 49 (62 %) patients were diagnosed with DIC on the standard ISTH criteria for8 days. According to the standard ISTH criteria, the CRP adjusted ISTH criteria showedsame sensitivity (100 %) and higher specificity (80.0 % versus 46.7 % versus 40.0 %)compare to the JAAM criteria and R-JAAM criteria. The CRP adjusted ISTH criteriashowed improved the sensitivity (69.0 % versus 51.7 %) compared to the standard ISTHcriteria, also improved the specificity (60.0 vs 42.0 vs 40.0 %) compared to of JAAM andR-JAAM criteria for prediction for the mortality in intensive care unit on day 1.CONCLUSIONS. In critically ill septic patients, the CRP adjusted ISTH criteria applyingCRP adjusted fibrinogen score showed possibility of a role to overcome the disadvantage ofinitial low sensitivity of standard ISTH criteria and low specificity of JAAM and R-JAAMcriteria.REFERENCE(S). 1. Gando S, Saitoh D, Ogura H, Mayumi T, Koseki K, Ikeda T, IshikuraH, Iba T, Ueyama M, Eguchi Y et al. Natural history of disseminated intravascular coag-ulation diagnosed based on the newly established diagnostic criteria for critically ill patients:results of a multicenter, prospective survey. Crit Care Med. 2008; 36(1): 145–150. 2.Bakhtiari K, Meijers JCM, de Jonge E, Levi M. Prospective validation of the InternationalSociety of Thrombosis and Haemostasis scoring system for disseminated intravascularcoagulation*. Crit Care Med. 2004; 32(12): 2416–2421. 3. Gando S Evaluation of NewJapanese Diagnostic Criteria for Disseminated Intravascular Coagulation in Critically IllPatients. Clin Appl Thromb Hemost. 2005; 11(1): 71–76. 4. Sivula M, Tallgren M, Pettila V:Modified score for disseminated intravascular coagulation in the critically ill. Int Care Med.2005; 31(9): 1209–1214.
0858ANTIOXIDANT STATUS IN ERYTHROCYTES OF SEPTIC SHOCK PATIENTS
M. Karapetsa1, M. Pitsika2, N. Goutzourelas2, D. Stagos2, A. Tousia Becker2,E. Zakynthinos1, D. Kouretas2
1University Hospital of Thessaly Biopolis, Intensive Care Department, Larissa, Greece,2University of Thessaly, Department of Biochemistry and Biotechnology, Larissa, GreeceINTRODUCTION. Nowadays there is compelling evidence that erythrocytes contributefundamentally to the circulating antioxidant levels1. A better understanding of oxidativestress pathophysiology in sepsis may lead to more effective treatment strategies.OBJECTIVE. To estimate oxidative stress and the antioxidant status in the erythrocytes ofseptic shock patients.METHODS. ICU patients with the diagnosis of septic shock were included and healthyvolunteers served as controls. Besides other oxidative markers assessed in plasma, reduced(GSH) glutathione and catalase activity were determined in erythrocyte lysate of thepatients, at the time of septic shock diagnosis. Measurements were performed with alreadydescribed methods2.RESULTS. 17 septic shock patients with an APACHE II score of 16.4 ± 6.4, a SOFA scoreof 9.6 ± 2.3 (both without CNS estimation) and a CRP value of 24.4 ± 14.1 (normalrange \ 0.5) were compared to 11 healthy controls. Levels of GSH were significantly lowerthan those of healthy controls (p = 0.02) (Fig. 1) while catalase activity levels were sig-nificantly higher showing a p value of 0.01 (p significant \ 0.05) (Fig. 2). Non-significantcorrelations were found among the markers assessed with APACHE II, SOFA score andCRP.CONCLUSION. A diverse antioxidant response within the erythrocytes upon the septicinsult was certified, compared to healthy controls.REFERENCES. 1. Nikolaidis M, Jamurtas A. Blood as a reactive species generator andredox status regulator during exercise. Arch Biochem Biophys. 2009; 490: 77–84. 2. AebiH. Catalase in vitro. Methods Enzymol. 1984; 105: 121–26. 3. Tietze F. Enzymic methodfor quantitative determination of nanogram amounts of total and oxidized glutathione:applications to mammalian blood and other tissues. Anal Biochem. 1969; 27: 502–22.
Rehabilitation and nursing outcomes: 0859–08720859ACUTE MICROCIRCULATORY EFFECTS OF MEDIUM-FREQUENCY VERSUSHIGH-FREQUENCY NEUROMUSCULAR ELECTRICAL STIMULATION INCRITICALLY ILL PATIENTS: A RANDOMIZED, PILOT STUDY
E. Angelopoulos1, E. Karatzanos1, S. Dimopoulos1, G. Mitsiou1, C. Stefanou1, I. Patsaki1,A. Kotanidou1, G. Petrikkos2, C. Routsi1, S. Nanas1
1National and Kapodistrian University of Athens Medical School, 1st Critical CareDepartment, Evangelismos Hospital, Athens, Greece, 2National and Kapodistrian Universityof Athens Medical School, 4th Department of Internal Medicine, Attikon University GeneralHospital, Athens, GreeceINTRODUCTION. Intensive Care Unit-Acquired Weakness (ICUAW) is a commoncomplication of ICU stay, associated with significant morbidity. neuromuscular electricalstimulation (NMES) has shown promising results as a preventive tool. NMES application
acutely affects skeletal muscle microcirculation, and such effects could be related to thefavorable outcomes. However, optimal current characteristics have not been defined.OBJECTIVES. To compare the effects on muscle microcirculation of a single NMESsession using medium and high frequency currents.METHODS. ICU patients with SIRS or sepsis of 3–5 days duration (‘‘acute group’’) andICU patients with clinically diagnosed ICUAW (‘‘ICUAW group’’). A single 30-min NMESsession was applied to the quadriceps, tibialis anterior and peroneus longus muscles bilat-erally using symmetric, biphasic current of increasing intensity. Patients were randomlyassigned to one of two protocols: HF (75 Hz, pulse 400 ls, cycle 5 s on–21 s off) and MF(45 Hz, pulse 400 ls, cycle 5 s on–12 s off). The peripheral microcirculation was monitoredat the thenar eminence using Near-Infrared Spectroscopy (NIRS); a vascular occlusion testwas applied before and after the NMES session. Local microcirculation of an exercisingmuscle (vastus lateralis) was also monitored using NIRS.RESULTS. 31 patients (19 acute and 12 ICUAW) were randomized. In the HF protocol (17patients), peripheral microcirculatory parameters responded as follows: thenar O2 con-sumption rate (%/min) from 8.6 ± 2.2 to 9.9 ± 5.1 (p = 0.08), endothelial reactivity (%/s)from 2.7 ± 1.4 to 3.2 ± 1.9 (p = 0.04), vascular reserve (s) from 160 ± 55 to 145 ± 49(p = 0.03). In the MF protocol: thenar O2 consumption rate (%/min) from 8.8 ± 3.8 to9.9 ± 3.6 (p = 0.07), endothelial reactivity (%/s) from 2.5 ± 1.4 to 3.1 ± 1.7 (p = 0.03),vascular reserve (s) from 163 ± 37 to 144 ± 33 (p = 0.001). Peripheral microcirculatoryparameters improved with both protocols in a similar degree. In the vastus lateralis muscle,average muscle O2 consumption rate was 61 ± 9 %/min during the HF protocol vs 69 ± 23during the MF protocol (p = 0.5). The minimum amplitude in tissue saturation was 5 ± 4StO2 units with the HF protocol vs 7 ± 4 StO2 units with the MF protocol (p = 0.3). Post-exercise hyperemia was 6 ± 7 StO2 units with the HF protocol vs 5 ± 4 StO2 units with theMF protocol (p = 0.6). Changes in the microcirculatory parameters of the exercising musclecorrelated well with the strength of contractions achieved with NMES.CONCLUSIONS. A single NMES session induced beneficial modifications in both localand peripheral skeletal muscle microcirculation. Medium and high frequency currents wereequally effective in this regard. Increasing the current intensity throughout the session tomaintain the torque of muscle contraction is crucial for its effects to occur.
0860EYE CARE IN ICU: MORE THAN WHAT MEETS THE EYE?
V. Joshi1, J. Nikhilesh2, M. Joshi3, J. Vandana4, P. Bajpai5
1Rajshree Hospital and Research Centre, Critical Care Unit, Indore, India, 2CHL Hospitals,Critical Care Unit, Indore, India, 3Aurobindo Hospital, Ophthalmology, Indore, India, 4ESIHospital, Ophthalmology, Indore, India, 5Aurobindo Hospital, Medicine, Indore, IndiaINTRODUCTION. Eye care for patients sedated and ventilated in ICU remains a con-tentious issue. There are various modalities for the same and the optimal modus operandi forthe same remains variable depending upon the institutional practice.OBJECTIVES. Comparison of outcomes in corneal ulcer prevention strategies in ICUusing sodium carboxymethyl cellulose 0.5 %(CMC)or polyvinyl alcohol 14 mg, povidone6 mg (PVA) for adult patients sedated and ventilated in ICUs of tertiary care hospitals.METHODS. Patients on mechanical ventilation on sedatives were analyzed with a fluo-rescein staining test (for corneal integrity) with CMC or PVA eye drops in one drop QIDschedule for each eye or simple bandage dressing cover. Death/discharge from ICU wasconsidered as end points. The entire cohort was divided in three groups [A] CMC group,[B] PVA group and [C] simple eye pads, getting admitted to hospital in the same durationfor almost similar variables. A multivariate logistic regression analysis was done usingSPSS version 11.RESULTS. Eighty patients were enrolled for CMC group (n = 80, M: F-50:30) duringApril 10–Dec 11 which were compared against a control group of eighty patients wherePVA was used (n = 80, M: F-48:32) and simple pad group (n = 40, M: F-28:12). Theresults were as follows.
Comparison of outcomes in corneal ulcer prevention
Feature CMC gr. PVA gr. Simple eye pad
Age (years) 55.7 ± 7.2 51.9 ± 8.7 54.9 ± 8.7
Stay in ICU 4.6 ± 1.2 6.1 ± 4 5.2 ± 1.8
Corneal ulcer 0(0 %) 6(7.5 %) 12 (30 %)
Highest rates for loss of epithelial integrity were documented with simple eye pads (30 %v/s 7.5 % and 0 for PVA and CMC group respectively). The difference between the CMCgroup and the eye pads group was statistically significant in terms of integrity of cornealepithelium (p = 0.012).CONCLUSIONS. In our study the CMC group performed best vis-à-vis PVA group and thesimple eye pads group. However the sample size remains small and validation with largergroups may be required to push for a standardized therapeutic intervention required for eyecare of sedated patients on mechanical ventilation.
0861DOES THE INTRODUCTION OF THE SARA COMBILIZER� REDUCE THETIME TAKEN TO FIRST MOBILISATION IN INTENSIVE CARE?
D.J. Mcwilliams1, T.J. Lea1
1Queen Elizabeth Hospital, Therapy Services, Birmingham, UKINTRODUCTION. There is a growing body of evidence to support programmes of earlymobilisation within intensive care units (ICU). When utilised, early mobility is associatedwith reduced ICU and hospital length of stay (1), and improved functional outcomes (2).The exact definition of early mobility is still not defined, and actual ability to mobilise canbe limited by certain factors such as haemofiltration, airway stability or the use of inotropes(3). The Sara Combilizer� is a combined tilt table and stretcher chair, which aims to allowearlier transfer of patients into the chair. As transfer is passive via the use of a patslide (orsimilar), it is hypothesised this should allow patients to sit out earlier in their ICU stay,which may subsequently further improve outcomes.OBJECTIVES. This study aimed to assess whether the introduction of the Sara Combi-lizer� reduced time taken to mobilise, defined as sitting out of the bed for the first time.METHODS. All patients admitted to a large UK teaching hospital during the trial periodand ventilated for C 5 days were included in the study. We collected information withregards to time taken to mobilise and final level of mobility achieved prior to obtain a
26th ESICM ANNUAL CONGRESS — PARIS, FRANCE — 5–9 OCTOBER 2013
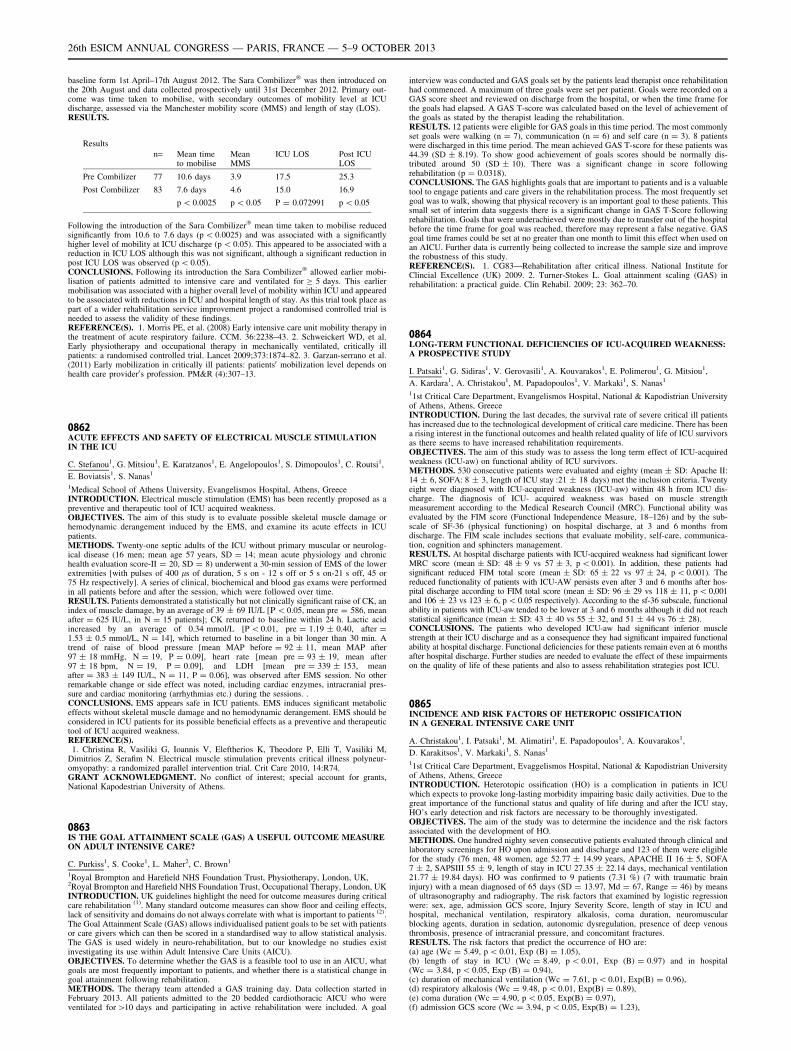
baseline form 1st April–17th August 2012. The Sara Combilizer� was then introduced onthe 20th August and data collected prospectively until 31st December 2012. Primary out-come was time taken to mobilise, with secondary outcomes of mobility level at ICUdischarge, assessed via the Manchester mobility score (MMS) and length of stay (LOS).RESULTS.
Results
n= Mean timeto mobilise
MeanMMS
ICU LOS Post ICULOS
Pre Combilizer 77 10.6 days 3.9 17.5 25.3
Post Combilizer 83 7.6 days 4.6 15.0 16.9
p \ 0.0025 p \ 0.05 P = 0.072991 p \ 0.05
Following the introduction of the Sara Combilizer� mean time taken to mobilise reducedsignificantly from 10.6 to 7.6 days (p \ 0.0025) and was associated with a significantlyhigher level of mobility at ICU discharge (p \ 0.05). This appeared to be associated with areduction in ICU LOS although this was not significant, although a significant reduction inpost ICU LOS was observed (p \ 0.05).CONCLUSIONS. Following its introduction the Sara Combilizer� allowed earlier mobi-lisation of patients admitted to intensive care and ventilated for C 5 days. This earliermobilisation was associated with a higher overall level of mobility within ICU and appearedto be associated with reductions in ICU and hospital length of stay. As this trial took place aspart of a wider rehabilitation service improvement project a randomised controlled trial isneeded to assess the validity of these findings.REFERENCE(S). 1. Morris PE, et al. (2008) Early intensive care unit mobility therapy inthe treatment of acute respiratory failure. CCM. 36:2238–43. 2. Schweickert WD, et al.Early physiotherapy and occupational therapy in mechanically ventilated, critically illpatients: a randomised controlled trial. Lancet 2009;373:1874–82. 3. Garzan-serrano et al.(2011) Early mobilization in critically ill patients: patients0 mobilization level depends onhealth care provider0s profession. PM&R (4):307–13.
0862ACUTE EFFECTS AND SAFETY OF ELECTRICAL MUSCLE STIMULATIONIN THE ICU
C. Stefanou1, G. Mitsiou1, E. Karatzanos1, E. Angelopoulos1, S. Dimopoulos1, C. Routsi1,
E. Boviatsis1, S. Nanas1
1Medical School of Athens University, Evangelismos Hospital, Athens, GreeceINTRODUCTION. Electrical muscle stimulation (EMS) has been recently proposed as apreventive and therapeutic tool of ICU acquired weakness.OBJECTIVES. The aim of this study is to evaluate possible skeletal muscle damage orhemodynamic derangement induced by the EMS, and examine its acute effects in ICUpatients.METHODS. Twenty-one septic adults of the ICU without primary muscular or neurolog-ical disease (16 men; mean age 57 years, SD = 14; mean acute physiology and chronichealth evaluation score-II = 20, SD = 8) underwent a 30-min session of EMS of the lowerextremities [with pulses of 400 ls of duration, 5 s on - 12 s off or 5 s on-21 s off, 45 or75 Hz respectively]. A series of clinical, biochemical and blood gas exams were performedin all patients before and after the session, which were followed over time.RESULTS. Patients demonstrated a statistically but not clinically significant raise of CK, anindex of muscle damage, by an average of 39 ± 69 IU/L [Q\ 0.05, mean pre = 586, meanafter = 625 IU/L, in N = 15 patients]; CK returned to baseline within 24 h. Lactic acidincreased by an average of 0.34 mmol/L [P \ 0.01, pre = 1.19 ± 0.40, after =1.53 ± 0.5 mmol/L, N = 14], which returned to baseline in a bit longer than 30 min. Atrend of raise of blood pressure [mean MAP before = 92 ± 11, mean MAP after97 ± 18 mmHg, N = 19, P = 0.09], heart rate [mean pre = 93 ± 19, mean after97 ± 18 bpm, N = 19, P = 0.09], and LDH [mean pre = 339 ± 153, meanafter = 383 ± 149 IU/L, N = 11, P = 0.06], was observed after EMS session. No otherremarkable change or side effect was noted, including cardiac enzymes, intracranial pres-sure and cardiac monitoring (arrhythmias etc.) during the sessions. .CONCLUSIONS. EMS appears safe in ICU patients. EMS induces significant metaboliceffects without skeletal muscle damage and no hemodynamic derangement. EMS should beconsidered in ICU patients for its possible beneficial effects as a preventive and therapeutictool of ICU acquired weakness.REFERENCE(S).1. Christina R, Vasiliki G, Ioannis V, Eleftherios K, Theodore P, Elli T, Vasiliki M,
Dimitrios Z, Serafim N. Electrical muscle stimulation prevents critical illness polyneur-omyopathy: a randomized parallel intervention trial. Crit Care 2010, 14:R74.GRANT ACKNOWLEDGMENT. No conflict of interest; special account for grants,National Kapodestrian University of Athens.
0863IS THE GOAL ATTAINMENT SCALE (GAS) A USEFUL OUTCOME MEASUREON ADULT INTENSIVE CARE?
C. Purkiss1, S. Cooke1, L. Maher2, C. Brown1
1Royal Brompton and Harefield NHS Foundation Trust, Physiotherapy, London, UK,2Royal Brompton and Harefield NHS Foundation Trust, Occupational Therapy, London, UKINTRODUCTION. UK guidelines highlight the need for outcome measures during criticalcare rehabilitation (1). Many standard outcome measures can show floor and ceiling effects,lack of sensitivity and domains do not always correlate with what is important to patients (2).The Goal Attainment Scale (GAS) allows individualised patient goals to be set with patientsor care givers which can then be scored in a standardised way to allow statistical analysis.The GAS is used widely in neuro-rehabilitation, but to our knowledge no studies existinvestigating its use within Adult Intensive Care Units (AICU).OBJECTIVES. To determine whether the GAS is a feasible tool to use in an AICU, whatgoals are most frequently important to patients, and whether there is a statistical change ingoal attainment following rehabilitation.METHODS. The therapy team attended a GAS training day. Data collection started inFebruary 2013. All patients admitted to the 20 bedded cardiothoracic AICU who wereventilated for [10 days and participating in active rehabilitation were included. A goal
interview was conducted and GAS goals set by the patients lead therapist once rehabilitationhad commenced. A maximum of three goals were set per patient. Goals were recorded on aGAS score sheet and reviewed on discharge from the hospital, or when the time frame forthe goals had elapsed. A GAS T-score was calculated based on the level of achievement ofthe goals as stated by the therapist leading the rehabilitation.RESULTS. 12 patients were eligible for GAS goals in this time period. The most commonlyset goals were walking (n = 7), communication (n = 6) and self care (n = 3). 8 patientswere discharged in this time period. The mean achieved GAS T-score for these patients was44.39 (SD ± 8.19). To show good achievement of goals scores should be normally dis-tributed around 50 (SD ± 10). There was a significant change in score followingrehabilitation (p = 0.0318).CONCLUSIONS. The GAS highlights goals that are important to patients and is a valuabletool to engage patients and care givers in the rehabilitation process. The most frequently setgoal was to walk, showing that physical recovery is an important goal to these patients. Thissmall set of interim data suggests there is a significant change in GAS T-Score followingrehabilitation. Goals that were underachieved were mostly due to transfer out of the hospitalbefore the time frame for goal was reached, therefore may represent a false negative. GASgoal time frames could be set at no greater than one month to limit this effect when used onan AICU. Further data is currently being collected to increase the sample size and improvethe robustness of this study.REFERENCE(S). 1. CG83—Rehabilitation after critical illness. National Institute forClincial Excellence (UK) 2009. 2. Turner-Stokes L. Goal attainment scaling (GAS) inrehabilitation: a practical guide. Clin Rehabil. 2009; 23: 362–70.
0864LONG-TERM FUNCTIONAL DEFICIENCIES OF ICU-ACQUIRED WEAKNESS:A PROSPECTIVE STUDY
I. Patsaki1, G. Sidiras1, V. Gerovasili1, A. Kouvarakos1, E. Polimerou1, G. Mitsiou1,
A. Kardara1, A. Christakou1, M. Papadopoulos1, V. Markaki1, S. Nanas1
11st Critical Care Department, Evangelismos Hospital, National & Kapodistrian Universityof Athens, Athens, GreeceINTRODUCTION. During the last decades, the survival rate of severe critical ill patientshas increased due to the technological development of critical care medicine. There has beena rising interest in the functional outcomes and health related quality of life of ICU survivorsas there seems to have increased rehabilitation requirements.OBJECTIVES. The aim of this study was to assess the long term effect of ICU-acquiredweakness (ICU-aw) on functional ability of ICU survivors.METHODS. 530 consecutive patients were evaluated and eighty (mean ± SD: Apache II:14 ± 6, SOFA: 8 ± 3, length of ICU stay :21 ± 18 days) met the inclusion criteria. Twentyeight were diagnosed with ICU-acquired weakness (ICU-aw) within 48 h from ICU dis-charge. The diagnosis of ICU- acquired weakness was based on muscle strengthmeasurement according to the Medical Research Council (MRC). Functional ability wasevaluated by the FIM score (Functional Independence Measure, 18–126) and by the sub-scale of SF-36 (physical functioning) on hospital discharge, at 3 and 6 months fromdischarge. The FIM scale includes sections that evaluate mobility, self-care, communica-tion, cognition and sphincters management.RESULTS. At hospital discharge patients with ICU-acquired weakness had significant lowerMRC score (mean ± SD: 48 ± 9 vs 57 ± 3, p\ 0.001). In addition, these patients hadsignificant reduced FIM total score (mean ± SD: 65 ± 22 vs 97 ± 24, p \ 0.001). Thereduced functionality of patients with ICU-AW persists even after 3 and 6 months after hos-pital discharge according to FIM total score (mean ± SD: 96 ± 29 vs 118 ± 11, p \ 0,001and 106 ± 23 vs 123 ± 6, p \ 0.05 respectively). According to the sf-36 subscale, functionalability in patients with ICU-aw tended to be lower at 3 and 6 months although it did not reachstatistical significance (mean ± SD: 43 ± 40 vs 55 ± 32, and 51 ± 44 vs 76 ± 28).CONCLUSIONS. The patients who developed ICU-aw had significant inferior musclestrength at their ICU discharge and as a consequence they had significant impaired functionalability at hospital discharge. Functional deficiencies for these patients remain even at 6 monthsafter hospital discharge. Further studies are needed to evaluate the effect of these impairmentson the quality of life of these patients and also to assess rehabilitation strategies post ICU.
0865INCIDENCE AND RISK FACTORS OF HETEROPIC OSSIFICATIONIN A GENERAL INTENSIVE CARE UNIT
A. Christakou1, I. Patsaki1, M. Alimatiri1, E. Papadopoulos1, A. Kouvarakos1,
D. Karakitsos1, V. Markaki1, S. Nanas1
11st Critical Care Department, Evaggelismos Hospital, National & Kapodistrian Universityof Athens, Athens, GreeceINTRODUCTION. Heterotopic ossification (HO) is a complication in patients in ICUwhich expects to provoke long-lasting morbidity impairing basic daily activities. Due to thegreat importance of the functional status and quality of life during and after the ICU stay,HO’s early detection and risk factors are necessary to be thoroughly investigated.OBJECTIVES. The aim of the study was to determine the incidence and the risk factorsassociated with the development of HO.METHODS. One hundred nighty seven consecutive patients evaluated through clinical andlaboratory screenings for HO upon admission and discharge and 123 of them were eligiblefor the study (76 men, 48 women, age 52.77 ± 14.99 years, APACHE II 16 ± 5, SOFA7 ± 2, SAPSIII 55 ± 9, length of stay in ICU 27.35 ± 22.14 days, mechanical ventilation21.77 ± 19.84 days). HO was confirmed to 9 patients (7.31 %) (7 with traumatic braininjury) with a mean diagnosed of 65 days (SD = 13.97, Md = 67, Range = 46) by meansof ultrasonography and radiography. The risk factors that examined by logistic regressionwere: sex, age, admission GCS score, Injury Severity Score, length of stay in ICU andhospital, mechanical ventilation, respiratory alkalosis, coma duration, neuromuscularblocking agents, duration in sedation, autonomic dysregulation, presence of deep venousthrombosis, presence of intracranial pressure, and concomitant fractures.RESULTS. The risk factors that predict the occurrence of HO are:(a) age (Wc = 5.49, p \ 0.01, Exp (B) = 1.05),(b) length of stay in ICU (Wc = 8.49, p \ 0.01, Exp (B) = 0.97) and in hospital(Wc = 3.84, p \ 0.05, Exp (B) = 0.94),(c) duration of mechanical ventilation (Wc = 7.61, p \ 0.01, Exp(B) = 0.96),(d) respiratory alkalosis (Wc = 9.48, p \ 0.01, Exp(B) = 0.89),(e) coma duration (Wc = 4.90, p \ 0.05, Exp(B) = 0.97),(f) admission GCS score (Wc = 3.94, p \ 0.05, Exp(B) = 1.23),
26th ESICM ANNUAL CONGRESS — PARIS, FRANCE — 5–9 OCTOBER 2013
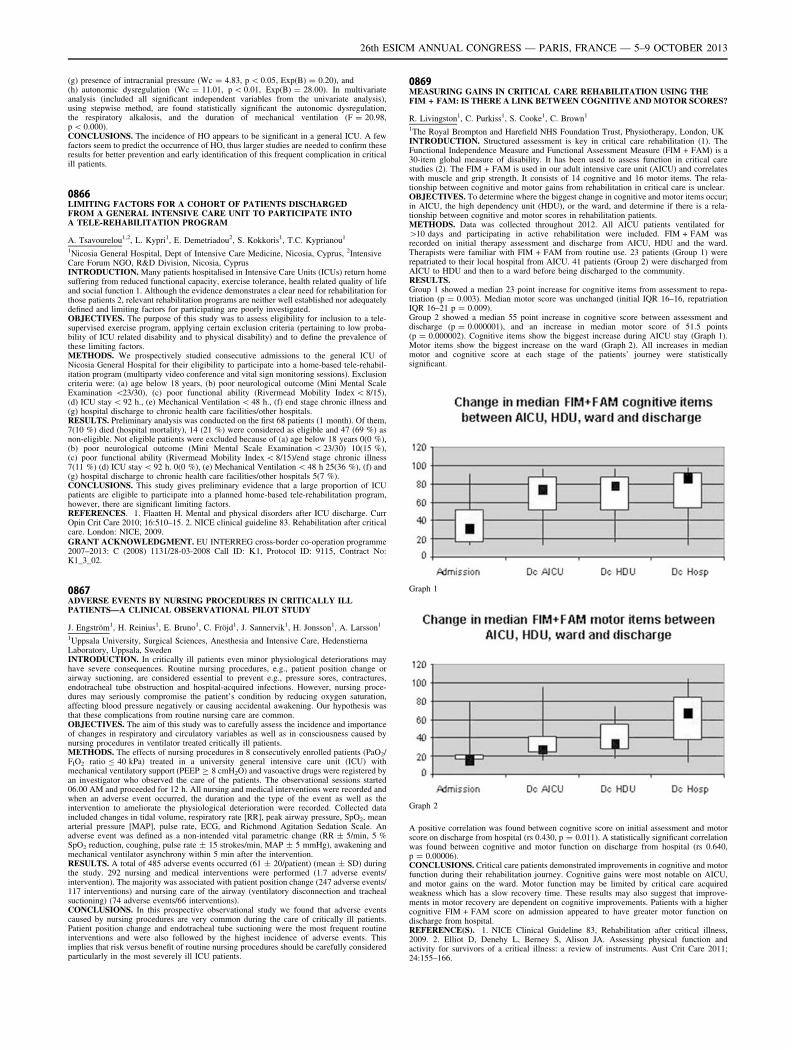
(g) presence of intracranial pressure (Wc = 4.83, p \ 0.05, Exp(B) = 0.20), and(h) autonomic dysregulation (Wc = 11.01, p \ 0.01, Exp(B) = 28.00). In multivariateanalysis (included all significant independent variables from the univariate analysis),using stepwise method, are found statistically significant the autonomic dysregulation,the respiratory alkalosis, and the duration of mechanical ventilation (F = 20.98,p \ 0.000).CONCLUSIONS. The incidence of HO appears to be significant in a general ICU. A fewfactors seem to predict the occurrence of HO, thus larger studies are needed to confirm theseresults for better prevention and early identification of this frequent complication in criticalill patients.
0866LIMITING FACTORS FOR A COHORT OF PATIENTS DISCHARGEDFROM A GENERAL INTENSIVE CARE UNIT TO PARTICIPATE INTOA TELE-REHABILITATION PROGRAM
A. Tsavourelou1,2, L. Kypri1, E. Demetriadou2, S. Kokkoris1, T.C. Kyprianou1
1Nicosia General Hospital, Dept of Intensive Care Medicine, Nicosia, Cyprus, 2IntensiveCare Forum NGO, R&D Division, Nicosia, CyprusINTRODUCTION. Many patients hospitalised in Intensive Care Units (ICUs) return homesuffering from reduced functional capacity, exercise tolerance, health related quality of lifeand social function 1. Although the evidence demonstrates a clear need for rehabilitation forthose patients 2, relevant rehabilitation programs are neither well established nor adequatelydefined and limiting factors for participating are poorly investigated.OBJECTIVES. The purpose of this study was to assess eligibility for inclusion to a tele-supervised exercise program, applying certain exclusion criteria (pertaining to low proba-bility of ICU related disability and to physical disability) and to define the prevalence ofthese limiting factors.METHODS. We prospectively studied consecutive admissions to the general ICU ofNicosia General Hospital for their eligibility to participate into a home-based tele-rehabil-itation program (multiparty video conference and vital sign monitoring sessions). Exclusioncriteria were: (a) age below 18 years, (b) poor neurological outcome (Mini Mental ScaleExamination \23/30), (c) poor functional ability (Rivermead Mobility Index \ 8/15),(d) ICU stay \ 92 h., (e) Mechanical Ventilation \ 48 h., (f) end stage chronic illness and(g) hospital discharge to chronic health care facilities/other hospitals.RESULTS. Preliminary analysis was conducted on the first 68 patients (1 month). Of them,7(10 %) died (hospital mortality), 14 (21 %) were considered as eligible and 47 (69 %) asnon-eligible. Not eligible patients were excluded because of (a) age below 18 years 0(0 %),(b) poor neurological outcome (Mini Mental Scale Examination \ 23/30) 10(15 %),(c) poor functional ability (Rivermead Mobility Index \ 8/15)/end stage chronic illness7(11 %) (d) ICU stay \ 92 h. 0(0 %), (e) Mechanical Ventilation \ 48 h 25(36 %), (f) and(g) hospital discharge to chronic health care facilities/other hospitals 5(7 %).CONCLUSIONS. This study gives preliminary evidence that a large proportion of ICUpatients are eligible to participate into a planned home-based tele-rehabilitation program,however, there are significant limiting factors.REFERENCES. 1. Flaatten H. Mental and physical disorders after ICU discharge. CurrOpin Crit Care 2010; 16:510–15. 2. NICE clinical guideline 83. Rehabilitation after criticalcare. London: NICE, 2009.GRANT ACKNOWLEDGMENT. EU INTERREG cross-border co-operation programme2007–2013: C (2008) 1131/28-03-2008 Call ID: J1, Protocol ID: 9115, Contract No:K1_3_02.
0867ADVERSE EVENTS BY NURSING PROCEDURES IN CRITICALLY ILLPATIENTS—A CLINICAL OBSERVATIONAL PILOT STUDY
J. Engström1, H. Reinius1, E. Bruno1, C. Fröjd1, J. Sannervik1, H. Jonsson1, A. Larsson1
1Uppsala University, Surgical Sciences, Anesthesia and Intensive Care, HedenstiernaLaboratory, Uppsala, SwedenINTRODUCTION. In critically ill patients even minor physiological deteriorations mayhave severe consequences. Routine nursing procedures, e.g., patient position change orairway suctioning, are considered essential to prevent e.g., pressure sores, contractures,endotracheal tube obstruction and hospital-acquired infections. However, nursing proce-dures may seriously compromise the patient’s condition by reducing oxygen saturation,affecting blood pressure negatively or causing accidental awakening. Our hypothesis wasthat these complications from routine nursing care are common.OBJECTIVES. The aim of this study was to carefully assess the incidence and importanceof changes in respiratory and circulatory variables as well as in consciousness caused bynursing procedures in ventilator treated critically ill patients.METHODS. The effects of nursing procedures in 8 consecutively enrolled patients (PaO2/FIO2 ratio B 40 kPa) treated in a university general intensive care unit (ICU) withmechanical ventilatory support (PEEP C 8 cmH2O) and vasoactive drugs were registered byan investigator who observed the care of the patients. The observational sessions started06.00 AM and proceeded for 12 h. All nursing and medical interventions were recorded andwhen an adverse event occurred, the duration and the type of the event as well as theintervention to ameliorate the physiological deterioration were recorded. Collected dataincluded changes in tidal volume, respiratory rate [RR], peak airway pressure, SpO2, meanarterial pressure [MAP], pulse rate, ECG, and Richmond Agitation Sedation Scale. Anadverse event was defined as a non-intended vital parametric change (RR ± 5/min, 5 %SpO2 reduction, coughing, pulse rate ± 15 strokes/min, MAP ± 5 mmHg), awakening andmechanical ventilator asynchrony within 5 min after the intervention.RESULTS. A total of 485 adverse events occurred (61 ± 20/patient) (mean ± SD) duringthe study. 292 nursing and medical interventions were performed (1.7 adverse events/intervention). The majority was associated with patient position change (247 adverse events/117 interventions) and nursing care of the airway (ventilatory disconnection and trachealsuctioning) (74 adverse events/66 interventions).CONCLUSIONS. In this prospective observational study we found that adverse eventscaused by nursing procedures are very common during the care of critically ill patients.Patient position change and endotracheal tube suctioning were the most frequent routineinterventions and were also followed by the highest incidence of adverse events. Thisimplies that risk versus benefit of routine nursing procedures should be carefully consideredparticularly in the most severely ill ICU patients.
0869MEASURING GAINS IN CRITICAL CARE REHABILITATION USING THEFIM + FAM: IS THERE A LINK BETWEEN COGNITIVE AND MOTOR SCORES?
R. Livingston1, C. Purkiss1, S. Cooke1, C. Brown1
1The Royal Brompton and Harefield NHS Foundation Trust, Physiotherapy, London, UKINTRODUCTION. Structured assessment is key in critical care rehabilitation (1). TheFunctional Independence Measure and Functional Assessment Measure (FIM + FAM) is a30-item global measure of disability. It has been used to assess function in critical carestudies (2). The FIM + FAM is used in our adult intensive care unit (AICU) and correlateswith muscle and grip strength. It consists of 14 cognitive and 16 motor items. The rela-tionship between cognitive and motor gains from rehabilitation in critical care is unclear.OBJECTIVES. To determine where the biggest change in cognitive and motor items occur;in AICU, the high dependency unit (HDU), or the ward, and determine if there is a rela-tionship between cognitive and motor scores in rehabilitation patients.METHODS. Data was collected throughout 2012. All AICU patients ventilated for[10 days and participating in active rehabilitation were included. FIM + FAM wasrecorded on initial therapy assessment and discharge from AICU, HDU and the ward.Therapists were familiar with FIM + FAM from routine use. 23 patients (Group 1) wererepatriated to their local hospital from AICU. 41 patients (Group 2) were discharged fromAICU to HDU and then to a ward before being discharged to the community.RESULTS.Group 1 showed a median 23 point increase for cognitive items from assessment to repa-triation (p = 0.003). Median motor score was unchanged (initial IQR 16–16, repatriationIQR 16–21 p = 0.009).Group 2 showed a median 55 point increase in cognitive score between assessment anddischarge (p = 0.000001), and an increase in median motor score of 51.5 points(p = 0.000002). Cognitive items show the biggest increase during AICU stay (Graph 1).Motor items show the biggest increase on the ward (Graph 2). All increases in medianmotor and cognitive score at each stage of the patients’ journey were statisticallysignificant.
Graph 1
Graph 2
A positive correlation was found between cognitive score on initial assessment and motorscore on discharge from hospital (rs 0.430, p = 0.011). A statistically significant correlationwas found between cognitive and motor function on discharge from hospital (rs 0.640,p = 0.00006).CONCLUSIONS. Critical care patients demonstrated improvements in cognitive and motorfunction during their rehabilitation journey. Cognitive gains were most notable on AICU,and motor gains on the ward. Motor function may be limited by critical care acquiredweakness which has a slow recovery time. These results may also suggest that improve-ments in motor recovery are dependent on cognitive improvements. Patients with a highercognitive FIM + FAM score on admission appeared to have greater motor function ondischarge from hospital.REFERENCE(S). 1. NICE Clinical Guideline 83, Rehabilitation after critical illness,2009. 2. Elliot D, Denehy L, Berney S, Alison JA. Assessing physical function andactivity for survivors of a critical illness: a review of instruments. Aust Crit Care 2011;24:155–166.
26th ESICM ANNUAL CONGRESS — PARIS, FRANCE — 5–9 OCTOBER 2013
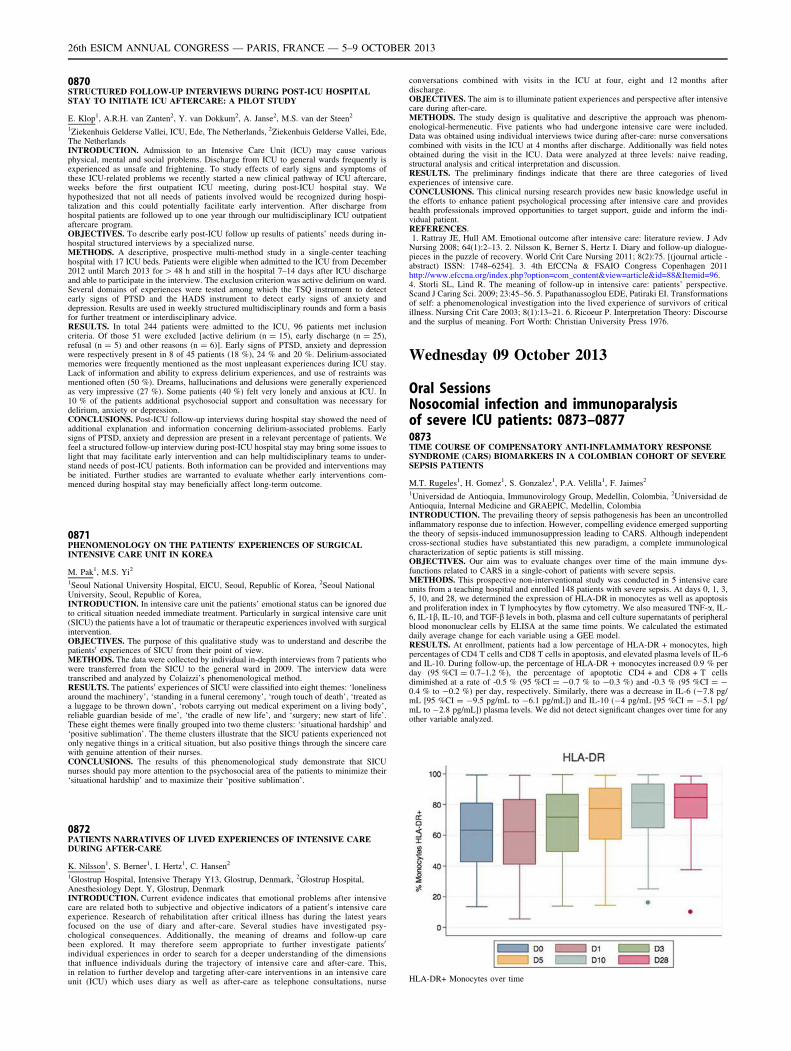
0870STRUCTURED FOLLOW-UP INTERVIEWS DURING POST-ICU HOSPITALSTAY TO INITIATE ICU AFTERCARE: A PILOT STUDY
E. Klop1, A.R.H. van Zanten2, Y. van Dokkum2, A. Janse2, M.S. van der Steen2
1Ziekenhuis Gelderse Vallei, ICU, Ede, The Netherlands, 2Ziekenhuis Gelderse Vallei, Ede,The NetherlandsINTRODUCTION. Admission to an Intensive Care Unit (ICU) may cause variousphysical, mental and social problems. Discharge from ICU to general wards frequently isexperienced as unsafe and frightening. To study effects of early signs and symptoms ofthese ICU-related problems we recently started a new clinical pathway of ICU aftercare,weeks before the first outpatient ICU meeting, during post-ICU hospital stay. Wehypothesized that not all needs of patients involved would be recognized during hospi-talization and this could potentially facilitate early intervention. After discharge fromhospital patients are followed up to one year through our multidisciplinary ICU outpatientaftercare program.OBJECTIVES. To describe early post-ICU follow up results of patients’ needs during in-hospital structured interviews by a specialized nurse.METHODS. A descriptive, prospective multi-method study in a single-center teachinghospital with 17 ICU beds. Patients were eligible when admitted to the ICU from December2012 until March 2013 for [ 48 h and still in the hospital 7–14 days after ICU dischargeand able to participate in the interview. The exclusion criterion was active delirium on ward.Several domains of experiences were tested among which the TSQ instrument to detectearly signs of PTSD and the HADS instrument to detect early signs of anxiety anddepression. Results are used in weekly structured multidisciplinary rounds and form a basisfor further treatment or interdisciplinary advice.RESULTS. In total 244 patients were admitted to the ICU, 96 patients met inclusioncriteria. Of those 51 were excluded [active delirium (n = 15), early discharge (n = 25),refusal (n = 5) and other reasons (n = 6)]. Early signs of PTSD, anxiety and depressionwere respectively present in 8 of 45 patients (18 %), 24 % and 20 %. Delirium-associatedmemories were frequently mentioned as the most unpleasant experiences during ICU stay.Lack of information and ability to express delirium experiences, and use of restraints wasmentioned often (50 %). Dreams, hallucinations and delusions were generally experiencedas very impressive (27 %). Some patients (40 %) felt very lonely and anxious at ICU. In10 % of the patients additional psychosocial support and consultation was necessary fordelirium, anxiety or depression.CONCLUSIONS. Post-ICU follow-up interviews during hospital stay showed the need ofadditional explanation and information concerning delirium-associated problems. Earlysigns of PTSD, anxiety and depression are present in a relevant percentage of patients. Wefeel a structured follow-up interview during post-ICU hospital stay may bring some issues tolight that may facilitate early intervention and can help multidisciplinary teams to under-stand needs of post-ICU patients. Both information can be provided and interventions maybe initiated. Further studies are warranted to evaluate whether early interventions com-menced during hospital stay may beneficially affect long-term outcome.
0871PHENOMENOLOGY ON THE PATIENTS0 EXPERIENCES OF SURGICALINTENSIVE CARE UNIT IN KOREA
M. Pak1, M.S. Yi2
1Seoul National University Hospital, EICU, Seoul, Republic of Korea, 2Seoul NationalUniversity, Seoul, Republic of Korea,INTRODUCTION. In intensive care unit the patients’ emotional status can be ignored dueto critical situation needed immediate treatment. Particularly in surgical intensive care unit(SICU) the patients have a lot of traumatic or therapeutic experiences involved with surgicalintervention.OBJECTIVES. The purpose of this qualitative study was to understand and describe thepatients0 experiences of SICU from their point of view.METHODS. The data were collected by individual in-depth interviews from 7 patients whowere transferred from the SICU to the general ward in 2009. The interview data weretranscribed and analyzed by Colaizzi’s phenomenological method.RESULTS. The patients0 experiences of SICU were classified into eight themes: ‘lonelinessaround the machinery’, ‘standing in a funeral ceremony’, ‘rough touch of death’, ‘treated asa luggage to be thrown down’, ‘robots carrying out medical experiment on a living body’,reliable guardian beside of me’, ‘the cradle of new life’, and ‘surgery; new start of life’.These eight themes were finally grouped into two theme clusters: ‘situational hardship’ and‘positive sublimation’. The theme clusters illustrate that the SICU patients experienced notonly negative things in a critical situation, but also positive things through the sincere carewith genuine attention of their nurses.CONCLUSIONS. The results of this phenomenological study demonstrate that SICUnurses should pay more attention to the psychosocial area of the patients to minimize their‘situational hardship’ and to maximize their ‘positive sublimation’.
0872PATIENTS NARRATIVES OF LIVED EXPERIENCES OF INTENSIVE CAREDURING AFTER-CARE
K. Nilsson1, S. Berner1, I. Hertz1, C. Hansen2
1Glostrup Hospital, Intensive Therapy Y13, Glostrup, Denmark, 2Glostrup Hospital,Anesthesiology Dept. Y, Glostrup, DenmarkINTRODUCTION. Current evidence indicates that emotional problems after intensivecare are related both to subjective and objective indicators of a patient0s intensive careexperience. Research of rehabilitation after critical illness has during the latest yearsfocused on the use of diary and after-care. Several studies have investigated psy-chological consequences. Additionally, the meaning of dreams and follow-up carebeen explored. It may therefore seem appropriate to further investigate patients0
individual experiences in order to search for a deeper understanding of the dimensionsthat influence individuals during the trajectory of intensive care and after-care. This,in relation to further develop and targeting after-care interventions in an intensive careunit (ICU) which uses diary as well as after-care as telephone consultations, nurse
conversations combined with visits in the ICU at four, eight and 12 months afterdischarge.OBJECTIVES. The aim is to illuminate patient experiences and perspective after intensivecare during after-care.METHODS. The study design is qualitative and descriptive the approach was phenom-enological-hermeneutic. Five patients who had undergone intensive care were included.Data was obtained using individual interviews twice during after-care: nurse conversationscombined with visits in the ICU at 4 months after discharge. Additionally was field notesobtained during the visit in the ICU. Data were analyzed at three levels: naive reading,structural analysis and critical interpretation and discussion.RESULTS. The preliminary findings indicate that there are three categories of livedexperiences of intensive care.CONCLUSIONS. This clinical nursing research provides new basic knowledge useful inthe efforts to enhance patient psychological processing after intensive care and provideshealth professionals improved opportunities to target support, guide and inform the indi-vidual patient.REFERENCES.1. Rattray JE, Hull AM. Emotional outcome after intensive care: literature review. J Adv
Nursing 2008; 64(1):2–13. 2. Nilsson K, Berner S, Hertz I. Diary and follow-up dialogue-pieces in the puzzle of recovery. World Crit Care Nursing 2011; 8(2):75. [(journal article -abstract) ISSN: 1748–6254]. 3. 4th EfCCNa & FSAIO Congress Copenhagen 2011http://www.efccna.org/index.php?option=com_content&view=article&id=88&Itemid=96.4. Storli SL, Lind R. The meaning of follow-up in intensive care: patients’ perspective.Scand J Caring Sci. 2009; 23:45–56. 5. Papathanassoglou EDE, Patiraki EI. Transformationsof self: a phenomenological investigation into the lived experience of survivors of criticalillness. Nursing Crit Care 2003; 8(1):13–21. 6. Ricoeur P. Interpretation Theory: Discourseand the surplus of meaning. Fort Worth: Christian University Press 1976.
Wednesday 09 October 2013
Oral SessionsNosocomial infection and immunoparalysisof severe ICU patients: 0873–08770873TIME COURSE OF COMPENSATORY ANTI-INFLAMMATORY RESPONSESYNDROME (CARS) BIOMARKERS IN A COLOMBIAN COHORT OF SEVERESEPSIS PATIENTS
M.T. Rugeles1, H. Gomez1, S. Gonzalez1, P.A. Velilla1, F. Jaimes2
1Universidad de Antioquia, Immunovirology Group, Medellin, Colombia, 2Universidad deAntioquia, Internal Medicine and GRAEPIC, Medellin, ColombiaINTRODUCTION. The prevailing theory of sepsis pathogenesis has been an uncontrolledinflammatory response due to infection. However, compelling evidence emerged supportingthe theory of sepsis-induced immunosuppression leading to CARS. Although independentcross-sectional studies have substantiated this new paradigm, a complete immunologicalcharacterization of septic patients is still missing.OBJECTIVES. Our aim was to evaluate changes over time of the main immune dys-functions related to CARS in a single-cohort of patients with severe sepsis.METHODS. This prospective non-interventional study was conducted in 5 intensive careunits from a teaching hospital and enrolled 148 patients with severe sepsis. At days 0, 1, 3,5, 10, and 28, we determined the expression of HLA-DR in monocytes as well as apoptosisand proliferation index in T lymphocytes by flow cytometry. We also measured TNF-a, IL-6, IL-1b, IL-10, and TGF-b levels in both, plasma and cell culture supernatants of peripheralblood mononuclear cells by ELISA at the same time points. We calculated the estimateddaily average change for each variable using a GEE model.RESULTS. At enrollment, patients had a low percentage of HLA-DR + monocytes, highpercentages of CD4 T cells and CD8 T cells in apoptosis, and elevated plasma levels of IL-6and IL-10. During follow-up, the percentage of HLA-DR + monocytes increased 0.9 % perday (95 %CI = 0.7–1.2 %), the percentage of apoptotic CD4 + and CD8 + T cellsdiminished at a rate of -0.5 % (95 %CI = -0.7 % to -0.3 %) and -0.3 % (95 %CI = -0.4 % to -0.2 %) per day, respectively. Similarly, there was a decrease in IL-6 (-7.8 pg/mL [95 %CI = -9.5 pg/mL to -6.1 pg/mL]) and IL-10 (-4 pg/mL [95 %CI = -5.1 pg/mL to -2.8 pg/mL]) plasma levels. We did not detect significant changes over time for anyother variable analyzed.
HLA-DR+ Monocytes over time
26th ESICM ANNUAL CONGRESS — PARIS, FRANCE — 5–9 OCTOBER 2013
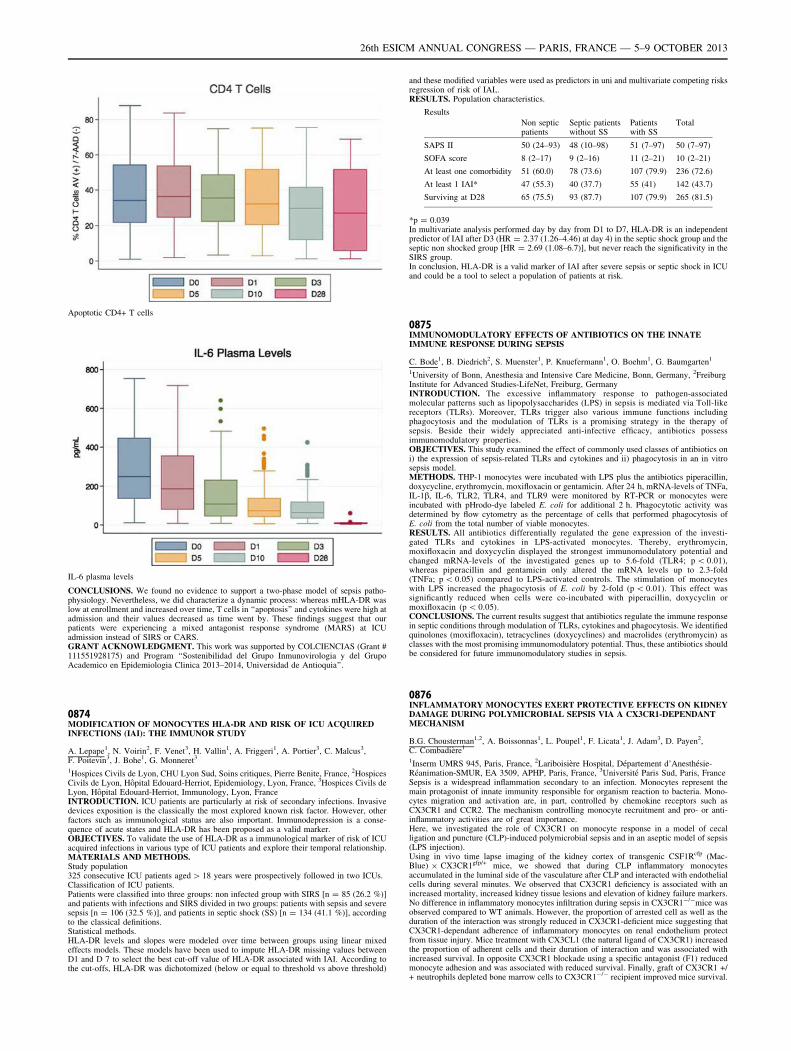
Apoptotic CD4+ T cells
IL-6 plasma levels
CONCLUSIONS. We found no evidence to support a two-phase model of sepsis patho-physiology. Nevertheless, we did characterize a dynamic process: whereas mHLA-DR waslow at enrollment and increased over time, T cells in ‘‘apoptosis’’ and cytokines were high atadmission and their values decreased as time went by. These findings suggest that ourpatients were experiencing a mixed antagonist response syndrome (MARS) at ICUadmission instead of SIRS or CARS.GRANT ACKNOWLEDGMENT. This work was supported by COLCIENCIAS (Grant #111551928175) and Program ‘‘Sostenibilidad del Grupo Inmunovirologia y del GrupoAcademico en Epidemiologia Clinica 2013–2014, Universidad de Antioquia’’.
0874MODIFICATION OF MONOCYTES HLA-DR AND RISK OF ICU ACQUIREDINFECTIONS (IAI): THE IMMUNOR STUDY
A. Lepape1, N. Voirin2, F. Venet3, H. Vallin1, A. Friggeri1, A. Portier3, C. Malcus3,F. Poitevin3, J. Bohe1, G. Monneret3
1Hospices Civils de Lyon, CHU Lyon Sud, Soins critiques, Pierre Benite, France, 2HospicesCivils de Lyon, Hôpital Edouard-Herriot, Epidemiology, Lyon, France, 3Hospices Civils deLyon, Hôpital Edouard-Herriot, Immunology, Lyon, FranceINTRODUCTION. ICU patients are particularly at risk of secondary infections. Invasivedevices exposition is the classically the most explored known risk factor. However, otherfactors such as immunological status are also important. Immunodepression is a conse-quence of acute states and HLA-DR has been proposed as a valid marker.OBJECTIVES. To validate the use of HLA-DR as a immunological marker of risk of ICUacquired infections in various type of ICU patients and explore their temporal relationship.MATERIALS AND METHODS.Study population325 consecutive ICU patients aged [ 18 years were prospectively followed in two ICUs.Classification of ICU patients.Patients were classified into three groups: non infected group with SIRS [n = 85 (26.2 %)]and patients with infections and SIRS divided in two groups: patients with sepsis and severesepsis [n = 106 (32.5 %)], and patients in septic shock (SS) [n = 134 (41.1 %)], accordingto the classical definitions.Statistical methods.HLA-DR levels and slopes were modeled over time between groups using linear mixedeffects models. These models have been used to impute HLA-DR missing values betweenD1 and D 7 to select the best cut-off value of HLA-DR associated with IAI. According tothe cut-offs, HLA-DR was dichotomized (below or equal to threshold vs above threshold)
and these modified variables were used as predictors in uni and multivariate competing risksregression of risk of IAI,.RESULTS. Population characteristics.
Results
Non septicpatients
Septic patientswithout SS
Patientswith SS
Total
SAPS II 50 (24–93) 48 (10–98) 51 (7–97) 50 (7–97)
SOFA score 8 (2–17) 9 (2–16) 11 (2–21) 10 (2–21)
At least one comorbidity 51 (60.0) 78 (73.6) 107 (79.9) 236 (72.6)
At least 1 IAI* 47 (55.3) 40 (37.7) 55 (41) 142 (43.7)
Surviving at D28 65 (75.5) 93 (87.7) 107 (79.9) 265 (81.5)
*p = 0.039In multivariate analysis performed day by day from D1 to D7, HLA-DR is an independentpredictor of IAI after D3 (HR = 2.37 (1.26–4.46) at day 4) in the septic shock group and theseptic non shocked group [HR = 2.69 (1.08–6.7)], but never reach the significativity in theSIRS group.In conclusion, HLA-DR is a valid marker of IAI after severe sepsis or septic shock in ICUand could be a tool to select a population of patients at risk.
0875IMMUNOMODULATORY EFFECTS OF ANTIBIOTICS ON THE INNATEIMMUNE RESPONSE DURING SEPSIS
C. Bode1, B. Diedrich2, S. Muenster1, P. Knuefermann1, O. Boehm1, G. Baumgarten1
1University of Bonn, Anesthesia and Intensive Care Medicine, Bonn, Germany, 2FreiburgInstitute for Advanced Studies-LifeNet, Freiburg, GermanyINTRODUCTION. The excessive inflammatory response to pathogen-associatedmolecular patterns such as lipopolysaccharides (LPS) in sepsis is mediated via Toll-likereceptors (TLRs). Moreover, TLRs trigger also various immune functions includingphagocytosis and the modulation of TLRs is a promising strategy in the therapy ofsepsis. Beside their widely appreciated anti-infective efficacy, antibiotics possessimmunomodulatory properties.OBJECTIVES. This study examined the effect of commonly used classes of antibiotics oni) the expression of sepsis-related TLRs and cytokines and ii) phagocytosis in an in vitrosepsis model.METHODS. THP-1 monocytes were incubated with LPS plus the antibiotics piperacillin,doxycycline, erythromycin, moxifloxacin or gentamicin. After 24 h, mRNA-levels of TNFa,IL-1b, IL-6, TLR2, TLR4, and TLR9 were monitored by RT-PCR or monocytes wereincubated with pHrodo-dye labeled E. coli for additional 2 h. Phagocytotic activity wasdetermined by flow cytometry as the percentage of cells that performed phagocytosis ofE. coli from the total number of viable monocytes.RESULTS. All antibiotics differentially regulated the gene expression of the investi-gated TLRs and cytokines in LPS-activated monocytes. Thereby, erythromycin,moxifloxacin and doxycyclin displayed the strongest immunomodulatory potential andchanged mRNA-levels of the investigated genes up to 5.6-fold (TLR4; p \ 0.01),whereas piperacillin and gentamicin only altered the mRNA levels up to 2.3-fold(TNFa; p \ 0.05) compared to LPS-activated controls. The stimulation of monocyteswith LPS increased the phagocytosis of E. coli by 2-fold (p \ 0.01). This effect wassignificantly reduced when cells were co-incubated with piperacillin, doxycyclin ormoxifloxacin (p \ 0.05).CONCLUSIONS. The current results suggest that antibiotics regulate the immune responsein septic conditions through modulation of TLRs, cytokines and phagocytosis. We identifiedquinolones (moxifloxacin), tetracyclines (doxycyclines) and macrolides (erythromycin) asclasses with the most promising immunomodulatory potential. Thus, these antibiotics shouldbe considered for future immunomodulatory studies in sepsis.
0876INFLAMMATORY MONOCYTES EXERT PROTECTIVE EFFECTS ON KIDNEYDAMAGE DURING POLYMICROBIAL SEPSIS VIA A CX3CR1-DEPENDANTMECHANISM
B.G. Chousterman1,2, A. Boissonnas1, L. Poupel1, F. Licata1, J. Adam3, D. Payen2,C. Combadière1
1Inserm UMRS 945, Paris, France, 2Lariboisière Hospital, Département d’Anesthésie-Réanimation-SMUR, EA 3509, APHP, Paris, France, 3Université Paris Sud, Paris, FranceSepsis is a widespread inflammation secondary to an infection. Monocytes represent themain protagonist of innate immunity responsible for organism reaction to bacteria. Mono-cytes migration and activation are, in part, controlled by chemokine receptors such asCX3CR1 and CCR2. The mechanism controlling monocyte recruitment and pro- or anti-inflammatory activities are of great importance.Here, we investigated the role of CX3CR1 on monocyte response in a model of cecalligation and puncture (CLP)-induced polymicrobial sepsis and in an aseptic model of sepsis(LPS injection).Using in vivo time lapse imaging of the kidney cortex of transgenic CSF1Rcfp (Mac-Blue) 9 CX3CR1gfp/+ mice, we showed that during CLP inflammatory monocytesaccumulated in the luminal side of the vasculature after CLP and interacted with endothelialcells during several minutes. We observed that CX3CR1 deficiency is associated with anincreased mortality, increased kidney tissue lesions and elevation of kidney failure markers.No difference in inflammatory monocytes infiltration during sepsis in CX3CR1-/-mice wasobserved compared to WT animals. However, the proportion of arrested cell as well as theduration of the interaction was strongly reduced in CX3CR1-deficient mice suggesting thatCX3CR1-dependant adherence of inflammatory monocytes on renal endothelium protectfrom tissue injury. Mice treatment with CX3CL1 (the natural ligand of CX3CR1) increasedthe proportion of adherent cells and their duration of interaction and was associated withincreased survival. In opposite CX3CR1 blockade using a specific antagonist (F1) reducedmonocyte adhesion and was associated with reduced survival. Finally, graft of CX3CR1 +/+ neutrophils depleted bone marrow cells to CX3CR1-/- recipient improved mice survival.
26th ESICM ANNUAL CONGRESS — PARIS, FRANCE — 5–9 OCTOBER 2013
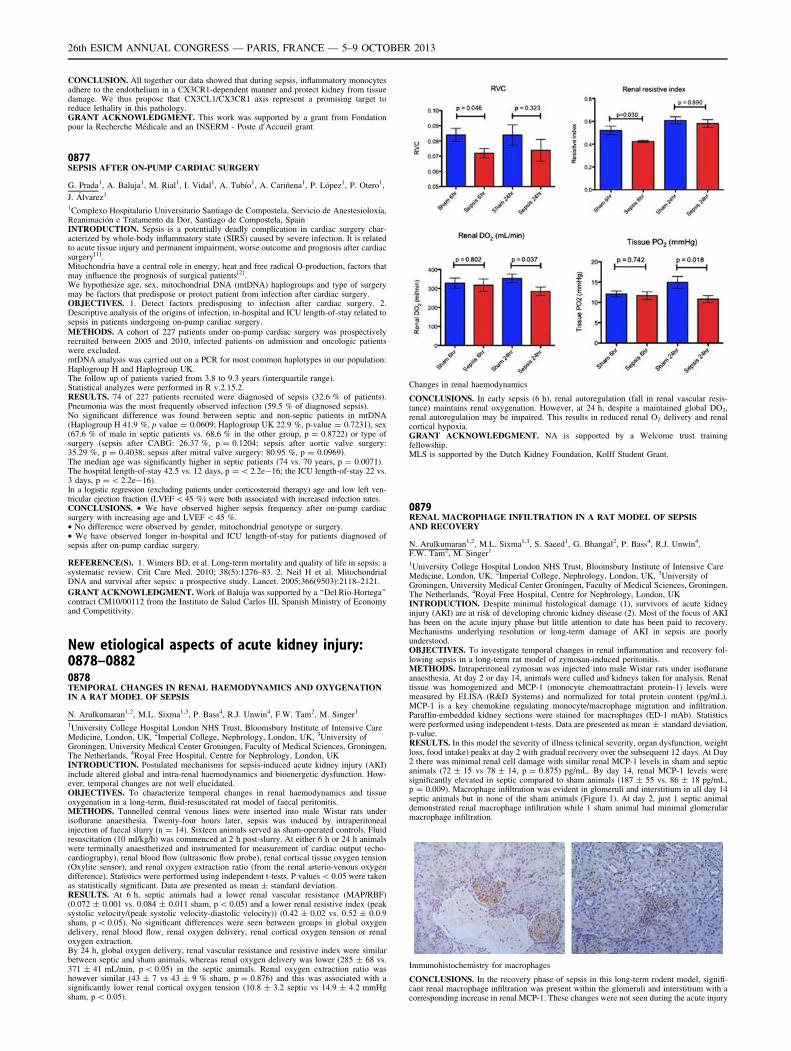
CONCLUSION. All together our data showed that during sepsis, inflammatory monocytesadhere to the endothelium in a CX3CR1-dependent manner and protect kidney from tissuedamage. We thus propose that CX3CL1/CX3CR1 axis represent a promising target toreduce lethality in this pathology.GRANT ACKNOWLEDGMENT. This work was supported by a grant from Fondationpour la Recherche Médicale and an INSERM - Poste d0Accueil grant.
0877SEPSIS AFTER ON-PUMP CARDIAC SURGERY
G. Prada1, A. Baluja1, M. Rial1, I. Vidal1, A. Tubı́o1, A. Cariñena1, P. López1, P. Otero1,
J. Álvarez1
1Complexo Hospitalario Universitario Santiago de Compostela, Servicio de Anestesioloxı́a,Reanimación e Tratamento da Dor, Santiago de Compostela, SpainINTRODUCTION. Sepsis is a potentially deadly complication in cardiac surgery char-acterized by whole-body inflammatory state (SIRS) caused by severe infection. It is relatedto acute tissue injury and permanent impairment, worse outcome and prognosis after cardiacsurgery[1].Mitochondria have a central role in energy, heat and free radical O-production, factors thatmay influence the prognosis of surgical patients[2].We hypothesize age, sex, mitochondrial DNA (mtDNA) haplogroups and type of surgerymay be factors that predispose or protect patient from infection after cardiac surgery.OBJECTIVES. 1. Detect factors predisposing to infection after cardiac surgery. 2.Descriptive analysis of the origins of infection, in-hospital and ICU length-of-stay related tosepsis in patients undergoing on-pump cardiac surgery.METHODS. A cohort of 227 patients under on-pump cardiac surgery was prospectivelyrecruited between 2005 and 2010, infected patients on admission and oncologic patientswere excluded.mtDNA analysis was carried out on a PCR for most common haplotypes in our population:Haplogroup H and Haplogroup UK.The follow up of patients varied from 3.8 to 9.3 years (interquartile range).Statistical analyzes were performed in R v.2.15.2.RESULTS. 74 of 227 patients recruited were diagnosed of sepsis (32.6 % of patients).Pneumonia was the most frequently observed infection (59.5 % of diagnosed sepsis).No significant difference was found between septic and non-septic patients in mtDNA(Haplogroup H 41.9 %, p value = 0.0609; Haplogroup UK 22.9 %, p-value = 0.7231), sex(67.6 % of male in septic patients vs. 68.6 % in the other group, p = 0.8722) or type ofsurgery (sepsis after CABG: 26.37 %, p = 0.1204; sepsis after aortic valve surgery:35.29 %, p = 0.4038; sepsis after mitral valve surgery: 80.95 %, p = 0.0969).The median age was significantly higher in septic patients (74 vs. 70 years, p = 0.0071).The hospital length-of-stay 42.5 vs. 12 days, p = \ 2.2e-16; the ICU length-of-stay 22 vs.3 days, p = \ 2.2e-16).In a logistic regression (excluding patients under corticosteroid therapy) age and low left ven-tricular ejection fraction (LVEF\45 %) were both associated with increased infection rates.CONCLUSIONS. • We have observed higher sepsis frequency after on-pump cardiacsurgery with increasing age and LVEF \ 45 %.• No difference were observed by gender, mitochondrial genotype or surgery.• We have observed longer in-hospital and ICU length-of-stay for patients diagnosed ofsepsis after on-pump cardiac surgery.
REFERENCE(S). 1. Winters BD, et al. Long-term mortality and quality of life in sepsis: asystematic review. Crit Care Med. 2010; 38(5):1276–83. 2. Neil H et al. MitochondrialDNA and survival after sepsis: a prospective study. Lancet. 2005;366(9503):2118–2121.
GRANT ACKNOWLEDGMENT. Work of Baluja was supported by a ‘‘Del Rio-Hortega’’contract CM10/00112 from the Instituto de Salud Carlos III, Spanish Ministry of Economyand Competitivity.
New etiological aspects of acute kidney injury:0878–08820878TEMPORAL CHANGES IN RENAL HAEMODYNAMICS AND OXYGENATIONIN A RAT MODEL OF SEPSIS
N. Arulkumaran1,2, M.L. Sixma1,3, P. Bass4, R.J. Unwin4, F.W. Tam2, M. Singer1
1University College Hospital London NHS Trust, Bloomsbury Institute of Intensive CareMedicine, London, UK, 2Imperial College, Nephrology, London, UK, 3University ofGroningen, University Medical Center Groningen, Faculty of Medical Sciences, Groningen,The Netherlands, 4Royal Free Hospital, Centre for Nephrology, London, UKINTRODUCTION. Postulated mechanisms for sepsis-induced acute kidney injury (AKI)include altered global and intra-renal haemodynamics and bioenergetic dysfunction. How-ever, temporal changes are not well elucidated.OBJECTIVES. To characterize temporal changes in renal haemodynamics and tissueoxygenation in a long-term, fluid-resuscitated rat model of faecal peritonitis.METHODS. Tunnelled central venous lines were inserted into male Wistar rats underisoflurane anaesthesia. Twenty-four hours later, sepsis was induced by intraperitonealinjection of faecal slurry (n = 14). Sixteen animals served as sham-operated controls. Fluidresuscitation (10 ml/kg/h) was commenced at 2 h post-slurry. At either 6 h or 24 h animalswere terminally anaesthetized and instrumented for measurement of cardiac output (echo-cardiography), renal blood flow (ultrasonic flow probe), renal cortical tissue oxygen tension(Oxylite sensor), and renal oxygen extraction ratio (from the renal arterio-venous oxygendifference). Statistics were performed using independent t-tests. P values \ 0.05 were takenas statistically significant. Data are presented as mean ± standard deviation.RESULTS. At 6 h, septic animals had a lower renal vascular resistance (MAP/RBF)(0.072 ± 0.001 vs. 0.084 ± 0.011 sham, p \ 0.05) and a lower renal resistive index (peaksystolic velocity/(peak systolic velocity-diastolic velocity)) (0.42 ± 0.02 vs. 0.52 ± 0.0.9sham, p \ 0.05). No significant differences were seen between groups in global oxygendelivery, renal blood flow, renal oxygen delivery, renal cortical oxygen tension or renaloxygen extraction.By 24 h, global oxygen delivery, renal vascular resistance and resistive index were similarbetween septic and sham animals, whereas renal oxygen delivery was lower (285 ± 68 vs.371 ± 41 mL/min, p \ 0.05) in the septic animals. Renal oxygen extraction ratio washowever similar (43 ± 7 vs 43 ± 9 % sham, p = 0.876) and this was associated with asignificantly lower renal cortical oxygen tension (10.8 ± 3.2 septic vs 14.9 ± 4.2 mmHgsham, p \ 0.05).
Changes in renal haemodynamics
CONCLUSIONS. In early sepsis (6 h), renal autoregulation (fall in renal vascular resis-tance) maintains renal oxygenation. However, at 24 h, despite a maintained global DO2,renal autoregulation may be impaired. This results in reduced renal O2 delivery and renalcortical hypoxia.GRANT ACKNOWLEDGMENT. NA is supported by a Welcome trust trainingfellowship.MLS is supported by the Dutch Kidney Foundation, Kolff Student Grant.
0879RENAL MACROPHAGE INFILTRATION IN A RAT MODEL OF SEPSISAND RECOVERY
N. Arulkumaran1,2, M.L. Sixma1,3, S. Saeed1, G. Bhangal2, P. Bass4, R.J. Unwin4,F.W. Tam2, M. Singer1
1University College Hospital London NHS Trust, Bloomsbury Institute of Intensive CareMedicine, London, UK, 2Imperial College, Nephrology, London, UK, 3University ofGroningen, University Medical Center Groningen, Faculty of Medical Sciences, Groningen,The Netherlands, 4Royal Free Hospital, Centre for Nephrology, London, UKINTRODUCTION. Despite minimal histological damage (1), survivors of acute kidneyinjury (AKI) are at risk of developing chronic kidney disease (2). Most of the focus of AKIhas been on the acute injury phase but little attention to date has been paid to recovery.Mechanisms underlying resolution or long-term damage of AKI in sepsis are poorlyunderstood.OBJECTIVES. To investigate temporal changes in renal inflammation and recovery fol-lowing sepsis in a long-term rat model of zymosan-induced peritonitis.METHODS. Intraperitoneal zymosan was injected into male Wistar rats under isofluraneanaesthesia. At day 2 or day 14, animals were culled and kidneys taken for analysis. Renaltissue was homogenized and MCP-1 (monocyte chemoattractant protein-1) levels weremeasured by ELISA (R&D Systems) and normalized for total protein content (pg/mL).MCP-1 is a key chemokine regulating monocyte/macrophage migration and infiltration.Paraffin-embedded kidney sections were stained for macrophages (ED-1 mAb). Statisticswere performed using independent t-tests. Data are presented as mean ± standard deviation,p-value.RESULTS. In this model the severity of illness (clinical severity, organ dysfunction, weightloss, food intake) peaks at day 2 with gradual recovery over the subsequent 12 days. At Day2 there was minimal renal cell damage with similar renal MCP-1 levels in sham and septicanimals (72 ± 15 vs 78 ± 14, p = 0.875) pg/mL. By day 14, renal MCP-1 levels weresignificantly elevated in septic compared to sham animals (187 ± 55 vs. 86 ± 18 pg/mL,p = 0.009). Macrophage infiltration was evident in glomeruli and interstitium in all day 14septic animals but in none of the sham animals (Figure 1). At day 2, just 1 septic animaldemonstrated renal macrophage infiltration while 1 sham animal had minimal glomerularmacrophage infiltration.
Immunohistochemistry for macrophages
CONCLUSIONS. In the recovery phase of sepsis in this long-term rodent model, signifi-cant renal macrophage infiltration was present within the glomeruli and interstitium with acorresponding increase in renal MCP-1. These changes were not seen during the acute injury
26th ESICM ANNUAL CONGRESS — PARIS, FRANCE — 5–9 OCTOBER 2013
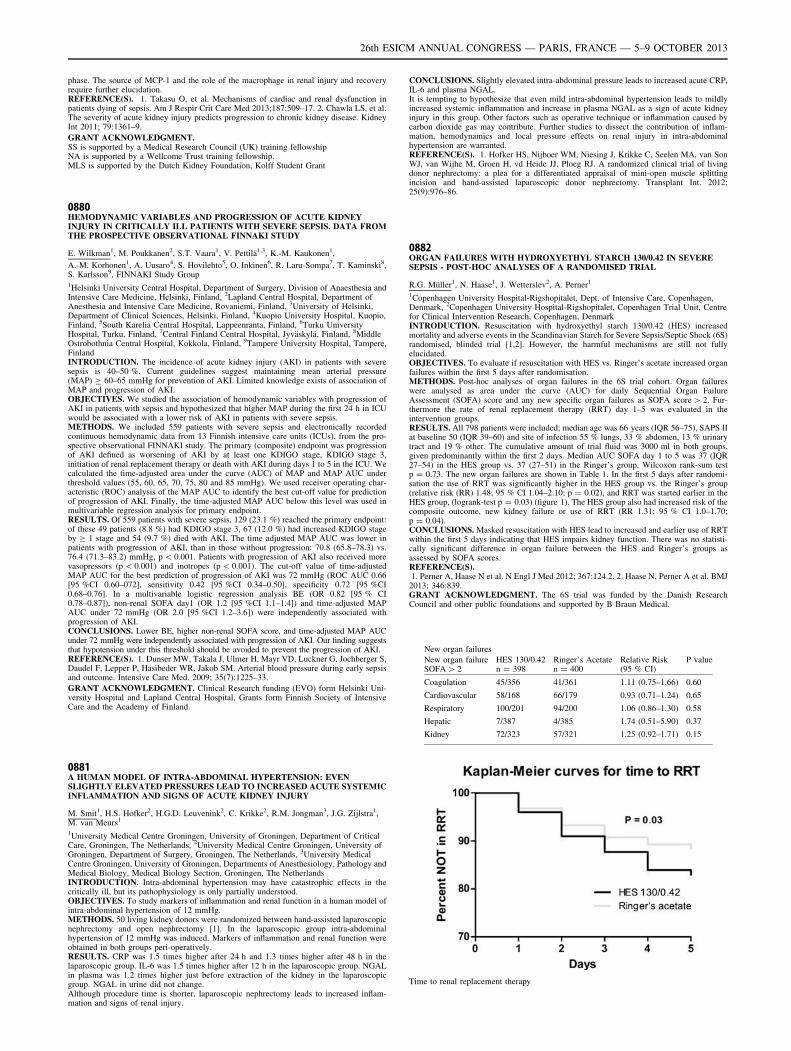
phase. The source of MCP-1 and the role of the macrophage in renal injury and recoveryrequire further elucidation.REFERENCE(S). 1. Takasu O, et al. Mechanisms of cardiac and renal dysfunction inpatients dying of sepsis. Am J Respir Crit Care Med 2013;187:509–17. 2. Chawla LS, et al.The severity of acute kidney injury predicts progression to chronic kidney disease. KidneyInt 2011; 79:1361–9.
GRANT ACKNOWLEDGMENT.SS is supported by a Medical Research Council (UK) training fellowshipNA is supported by a Wellcome Trust training fellowship.MLS is supported by the Dutch Kidney Foundation, Kolff Student Grant
0880HEMODYNAMIC VARIABLES AND PROGRESSION OF ACUTE KIDNEYINJURY IN CRITICALLY ILL PATIENTS WITH SEVERE SEPSIS. DATA FROMTHE PROSPECTIVE OBSERVATIONAL FINNAKI STUDY
E. Wilkman1, M. Poukkanen2, S.T. Vaara1, V. Pettilä1,3, K.-M. Kaukonen1,
A.-M. Korhonen1, A. Uusaro4, S. Hovilehto5, O. Inkinen6, R. Laru-Sompa7, T. Kaminski8,S. Karlsson9, FINNAKI Study Group1Helsinki University Central Hospital, Department of Surgery, Division of Anaesthesia andIntensive Care Medicine, Helsinki, Finland, 2Lapland Central Hospital, Department ofAnesthesia and Intensive Care Medicine, Rovaniemi, Finland, 3University of Helsinki,Department of Clinical Sciences, Helsinki, Finland, 4Kuopio University Hospital, Kuopio,Finland, 5South Karelia Central Hospital, Lappeenranta, Finland, 6Turku UniversityHospital, Turku, Finland, 7Central Finland Central Hospital, Jyväskylä, Finland, 8MiddleOstrobothnia Central Hospital, Kokkola, Finland, 9Tampere University Hospital, Tampere,FinlandINTRODUCTION. The incidence of acute kidney injury (AKI) in patients with severesepsis is 40–50 %. Current guidelines suggest maintaining mean arterial pressure(MAP) C 60–65 mmHg for prevention of AKI. Limited knowledge exists of association ofMAP and progression of AKI.OBJECTIVES. We studied the association of hemodynamic variables with progression ofAKI in patients with sepsis and hypothesized that higher MAP during the first 24 h in ICUwould be associated with a lower risk of AKI in patients with severe sepsis.METHODS. We included 559 patients with severe sepsis and electronically recordedcontinuous hemodynamic data from 13 Finnish intensive care units (ICUs), from the pro-spective observational FINNAKI study. The primary (composite) endpoint was progressionof AKI defined as worsening of AKI by at least one KDIGO stage, KDIGO stage 3,initiation of renal replacement therapy or death with AKI during days 1 to 5 in the ICU. Wecalculated the time-adjusted area under the curve (AUC) of MAP and MAP AUC underthreshold values (55, 60, 65, 70, 75, 80 and 85 mmHg). We used receiver operating char-acteristic (ROC) analysis of the MAP AUC to identify the best cut-off value for predictionof progression of AKI. Finally, the time-adjusted MAP AUC below this level was used inmultivariable regression analysis for primary endpoint.RESULTS. Of 559 patients with severe sepsis, 129 (23.1 %) reached the primary endpoint:of these 49 patients (8.8 %) had KDIGO stage 3, 67 (12.0 %) had increased KDIGO stageby C 1 stage and 54 (9.7 %) died with AKI. The time adjusted MAP AUC was lower inpatients with progression of AKI, than in those without progression: 70.8 (65.8–78.3) vs.76.4 (71.3–83.2) mmHg, p \ 0.001. Patients with progression of AKI also received morevasopressors (p \ 0.001) and inotropes (p \ 0.001). The cut-off value of time-adjustedMAP AUC for the best prediction of progression of AKI was 72 mmHg (ROC AUC 0.66[95 %CI 0.60–072], sensitivity 0.42 [95 %CI 0.34–0.50], specificity 0.72 [95 %CI0.68–0.76]. In a multivariable logistic regression analysis BE (OR 0.82 [95 % CI0.78–0.87]), non-renal SOFA day1 (OR 1.2 [95 %CI 1.1–1.4]) and time-adjusted MAPAUC under 72 mmHg (OR 2.0 [95 %CI 1.2–3.6]) were independently associated withprogression of AKI.CONCLUSIONS. Lower BE, higher non-renal SOFA score, and time-adjusted MAP AUCunder 72 mmHg were independently associated with progression of AKI. Our finding suggeststhat hypotension under this threshold should be avoided to prevent the progression of AKI.REFERENCE(S). 1. Dunser MW, Takala J, Ulmer H, Mayr VD, Luckner G, Jochberger S,Daudel F, Lepper P, Hasibeder WR, Jakob SM. Arterial blood pressure during early sepsisand outcome. Intensive Care Med. 2009; 35(7):1225–33.
GRANT ACKNOWLEDGMENT. Clinical Research funding (EVO) form Helsinki Uni-versity Hospital and Lapland Central Hospital, Grants form Finnish Society of IntensiveCare and the Academy of Finland.
0881A HUMAN MODEL OF INTRA-ABDOMINAL HYPERTENSION: EVENSLIGHTLY ELEVATED PRESSURES LEAD TO INCREASED ACUTE SYSTEMICINFLAMMATION AND SIGNS OF ACUTE KIDNEY INJURY
M. Smit1, H.S. Hofker2, H.G.D. Leuvenink2, C. Krikke2, R.M. Jongman3, J.G. Zijlstra1,M. van Meurs1
1University Medical Centre Groningen, University of Groningen, Department of CriticalCare, Groningen, The Netherlands, 2University Medical Centre Groningen, University ofGroningen, Department of Surgery, Groningen, The Netherlands, 3University MedicalCentre Groningen, University of Groningen, Departments of Anesthesiology, Pathology andMedical Biology, Medical Biology Section, Groningen, The NetherlandsINTRODUCTION. Intra-abdominal hypertension may have catastrophic effects in thecritically ill, but its pathophysiology is only partially understood.OBJECTIVES. To study markers of inflammation and renal function in a human model ofintra-abdominal hypertension of 12 mmHg.METHODS. 50 living kidney donors were randomized between hand-assisted laparoscopicnephrectomy and open nephrectomy [1]. In the laparoscopic group intra-abdominalhypertension of 12 mmHg was induced. Markers of inflammation and renal function wereobtained in both groups peri-operatively.RESULTS. CRP was 1.5 times higher after 24 h and 1.3 times higher after 48 h in thelaparoscopic group. IL-6 was 1.5 times higher after 12 h in the laparoscopic group. NGALin plasma was 1.2 times higher just before extraction of the kidney in the laparoscopicgroup. NGAL in urine did not change.Although procedure time is shorter, laparoscopic nephrectomy leads to increased inflam-mation and signs of renal injury.
CONCLUSIONS. Slightly elevated intra-abdominal pressure leads to increased acute CRP,IL-6 and plasma NGAL.It is tempting to hypothesize that even mild intra-abdominal hypertension leads to mildlyincreased systemic inflammation and increase in plasma NGAL as a sign of acute kidneyinjury in this group. Other factors such as operative technique or inflammation caused bycarbon dioxide gas may contribute. Further studies to dissect the contribution of inflam-mation, hemodynamics and local pressure effects on renal injury in intra-abdominalhypertension are warranted.REFERENCE(S). 1. Hofker HS, Nijboer WM, Niesing J, Krikke C, Seelen MA, van SonWJ, van Wijhe M, Groen H, vd Heide JJ, Ploeg RJ. A randomized clinical trial of livingdonor nephrectomy: a plea for a differentiated appraisal of mini-open muscle splittingincision and hand-assisted laparoscopic donor nephrectomy. Transplant Int. 2012;25(9):976–86.
0882ORGAN FAILURES WITH HYDROXYETHYL STARCH 130/0.42 IN SEVERESEPSIS - POST-HOC ANALYSES OF A RANDOMISED TRIAL
R.G. Müller1, N. Haase1, J. Wetterslev2, A. Perner1
1Copenhagen University Hospital-Rigshopitalet, Dept. of Intensive Care, Copenhagen,Denmark, 2Copenhagen University Hospital-Rigshopitalet, Copenhagen Trial Unit, Centrefor Clinical Intervention Research, Copenhagen, DenmarkINTRODUCTION. Resuscitation with hydroxyethyl starch 130/0.42 (HES) increasedmortality and adverse events in the Scandinavian Starch for Severe Sepsis/Septic Shock (6S)randomised, blinded trial [1,2]. However, the harmful mechanisms are still not fullyelucidated.OBJECTIVES. To evaluate if resuscitation with HES vs. Ringer’s acetate increased organfailures within the first 5 days after randomisation.METHODS. Post-hoc analyses of organ failures in the 6S trial cohort. Organ failureswere analysed as area under the curve (AUC) for daily Sequential Organ FailureAssessment (SOFA) score and any new specific organ failures as SOFA score [ 2. Fur-thermore the rate of renal replacement therapy (RRT) day 1–5 was evaluated in theintervention groups.RESULTS. All 798 patients were included; median age was 66 years (IQR 56–75), SAPS IIat baseline 50 (IQR 39–60) and site of infection 55 % lungs, 33 % abdomen, 13 % urinarytract and 19 % other. The cumulative amount of trial fluid was 3000 ml in both groups,given predominantly within the first 2 days. Median AUC SOFA day 1 to 5 was 37 (IQR27–54) in the HES group vs. 37 (27–51) in the Ringer’s group, Wilcoxon rank-sum testp = 0.73. The new organ failures are shown in Table 1. In the first 5 days after randomi-sation the use of RRT was significantly higher in the HES group vs. the Ringer’s group(relative risk (RR) 1.48; 95 % CI 1.04–2.10; p = 0.02), and RRT was started earlier in theHES group, (logrank-test p = 0.03) (figure 1). The HES group also had increased risk of thecomposite outcome, new kidney failure or use of RRT (RR 1.31; 95 % CI 1.0–1.70;p = 0.04).CONCLUSIONS. Masked resuscitation with HES lead to increased and earlier use of RRTwithin the first 5 days indicating that HES impairs kidney function. There was no statisti-cally significant difference in organ failure between the HES and Ringer’s groups asassessed by SOFA scores.REFERENCE(S).1. Perner A, Haase N et al. N Engl J Med 2012; 367:124.2. 2. Haase N, Perner A et al. BMJ
2013; 346:839.GRANT ACKNOWLEDGMENT. The 6S trial was funded by the Danish ResearchCouncil and other public foundations and supported by B Braun Medical.
New organ failures
New organ failureSOFA [ 2
HES 130/0.42n = 398
Ringer’s Acetaten = 400
Relative Risk(95 % CI)
P value
Coagulation 45/356 41/361 1.11 (0.75–1.66) 0.60
Cardiovascular 58/168 66/179 0.93 (0.71–1.24) 0.65
Respiratory 100/201 94/200 1.06 (0.86–1.30) 0.58
Hepatic 7/387 4/385 1.74 (0.51–5.90) 0.37
Kidney 72/323 57/321 1.25 (0.92–1.71) 0.15
Time to renal replacement therapy
26th ESICM ANNUAL CONGRESS — PARIS, FRANCE — 5–9 OCTOBER 2013
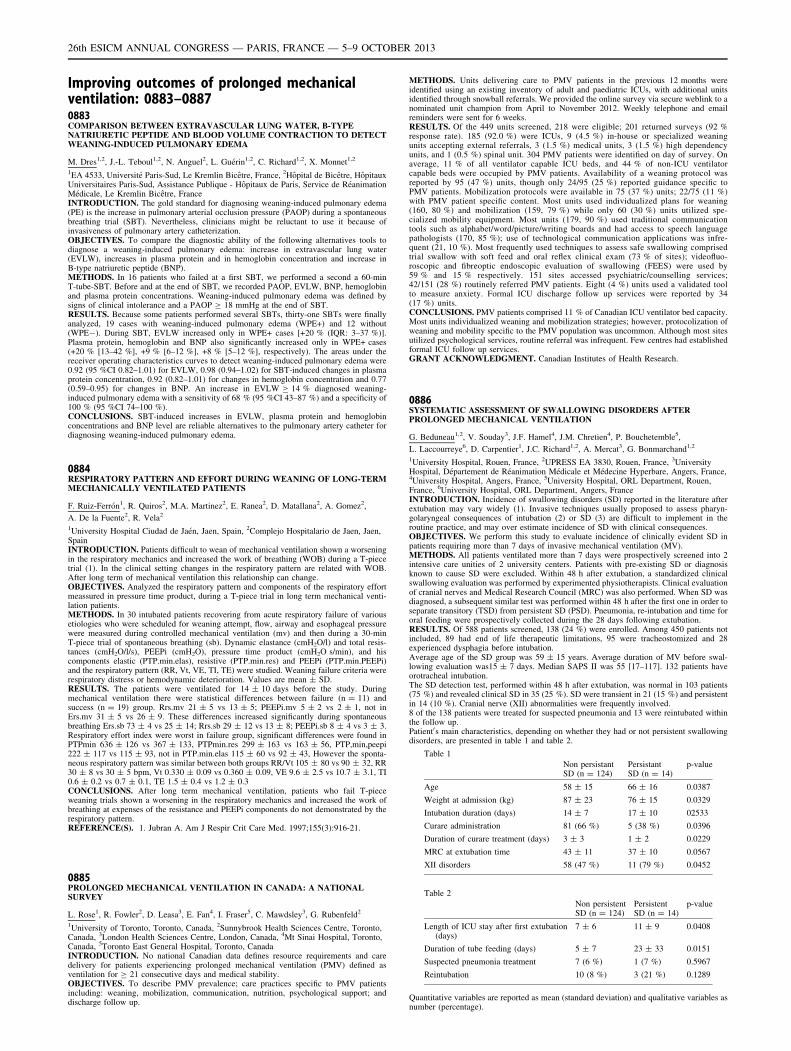
Improving outcomes of prolonged mechanicalventilation: 0883–08870883COMPARISON BETWEEN EXTRAVASCULAR LUNG WATER, B-TYPENATRIURETIC PEPTIDE AND BLOOD VOLUME CONTRACTION TO DETECTWEANING-INDUCED PULMONARY EDEMA
M. Dres1,2, J.-L. Teboul1,2, N. Anguel2, L. Guérin1,2, C. Richard1,2, X. Monnet1,2
1EA 4533, Université Paris-Sud, Le Kremlin Bicêtre, France, 2Hôpital de Bicêtre, HôpitauxUniversitaires Paris-Sud, Assistance Publique - Hôpitaux de Paris, Service de RéanimationMédicale, Le Kremlin Bicêtre, FranceINTRODUCTION. The gold standard for diagnosing weaning-induced pulmonary edema(PE) is the increase in pulmonary arterial occlusion pressure (PAOP) during a spontaneousbreathing trial (SBT). Nevertheless, clinicians might be reluctant to use it because ofinvasiveness of pulmonary artery catheterization.OBJECTIVES. To compare the diagnostic ability of the following alternatives tools todiagnose a weaning-induced pulmonary edema: increase in extravascular lung water(EVLW), increases in plasma protein and in hemoglobin concentration and increase inB-type natriuretic peptide (BNP).METHODS. In 16 patients who failed at a first SBT, we performed a second a 60-minT-tube-SBT. Before and at the end of SBT, we recorded PAOP, EVLW, BNP, hemoglobinand plasma protein concentrations. Weaning-induced pulmonary edema was defined bysigns of clinical intolerance and a PAOP C 18 mmHg at the end of SBT.RESULTS. Because some patients performed several SBTs, thirty-one SBTs were finallyanalyzed, 19 cases with weaning-induced pulmonary edema (WPE+) and 12 without(WPE-). During SBT, EVLW increased only in WPE+ cases [+20 % (IQR: 3–37 %)].Plasma protein, hemoglobin and BNP also significantly increased only in WPE+ cases(+20 % [13–42 %], +9 % [6–12 %], +8 % [5–12 %], respectively). The areas under thereceiver operating characteristics curves to detect weaning-induced pulmonary edema were0.92 (95 %CI 0.82–1.01) for EVLW, 0.98 (0.94–1.02) for SBT-induced changes in plasmaprotein concentration, 0.92 (0.82–1.01) for changes in hemoglobin concentration and 0.77(0.59–0.95) for changes in BNP. An increase in EVLW C 14 % diagnosed weaning-induced pulmonary edema with a sensitivity of 68 % (95 %CI 43–87 %) and a specificity of100 % (95 %CI 74–100 %).CONCLUSIONS. SBT-induced increases in EVLW, plasma protein and hemoglobinconcentrations and BNP level are reliable alternatives to the pulmonary artery catheter fordiagnosing weaning-induced pulmonary edema.
0884RESPIRATORY PATTERN AND EFFORT DURING WEANING OF LONG-TERMMECHANICALLY VENTILATED PATIENTS
F. Ruiz-Ferrón1, R. Quiros2, M.A. Martinez2, E. Ranea2, D. Matallana2, A. Gomez2,
A. De la Fuente2, R. Vela2
1University Hospital Ciudad de Jaén, Jaen, Spain, 2Complejo Hospitalario de Jaen, Jaen,SpainINTRODUCTION. Patients difficult to wean of mechanical ventilation shown a worseningin the respiratory mechanics and increased the work of breathing (WOB) during a T-piecetrial (1). In the clinical setting changes in the respiratory pattern are related with WOB.After long term of mechanical ventilation this relationship can change.OBJECTIVES. Analyzed the respiratory pattern and components of the respiratory effortmeassured in pressure time product, during a T-piece trial in long term mechanical venti-lation patients.METHODS. In 30 intubated patients recovering from acute respiratory failure of variousetiologies who were scheduled for weaning attempt, flow, airway and esophageal pressurewere measured during controlled mechanical ventilation (mv) and then during a 30-minT-piece trial of spontaneous breathing (sb). Dynamic elastance (cmH2O/l) and total resis-tances (cmH2O/l/s), PEEPi (cmH2O), pressure time product (cmH2O s/min), and hiscomponents elastic (PTP.min.elas), resistive (PTP.min.res) and PEEPi (PTP.min.PEEPi)and the respiratory pattern (RR, Vt, VE, TI, TE) were studied. Weaning failure criteria wererespiratory distress or hemodynamic deterioration. Values are mean ± SD.RESULTS. The patients were ventilated for 14 ± 10 days before the study. Duringmechanical ventilation there were statistical differences between failure (n = 11) andsuccess (n = 19) group. Rrs.mv 21 ± 5 vs 13 ± 5; PEEPi.mv 5 ± 2 vs 2 ± 1, not inErs.mv 31 ± 5 vs 26 ± 9. These differences increased significantly during spontaneousbreathing Ers.sb 73 ± 4 vs 25 ± 14; Rrs.sb 29 ± 12 vs 13 ± 8; PEEPi.sb 8 ± 4 vs 3 ± 3.Respiratory effort index were worst in failure group, significant differences were found inPTPmin 636 ± 126 vs 367 ± 133, PTPmin.res 299 ± 163 vs 163 ± 56, PTP,min,peepi222 ± 117 vs 115 ± 93, not in PTP.min.elas 115 ± 60 vs 92 ± 43, However the sponta-neous respiratory pattern was similar between both groups RR/Vt 105 ± 80 vs 90 ± 32, RR30 ± 8 vs 30 ± 5 bpm, Vt 0.330 ± 0.09 vs 0.360 ± 0.09, VE 9.6 ± 2.5 vs 10.7 ± 3.1, TI0.6 ± 0.2 vs 0.7 ± 0.1, TE 1.5 ± 0.4 vs 1.2 ± 0.3CONCLUSIONS. After long term mechanical ventilation, patients who fail T-pieceweaning trials shown a worsening in the respiratory mechanics and increased the work ofbreathing at expenses of the resistance and PEEPi components do not demonstrated by therespiratory pattern.REFERENCE(S). 1. Jubran A. Am J Respir Crit Care Med. 1997;155(3):916-21.
0885PROLONGED MECHANICAL VENTILATION IN CANADA: A NATIONALSURVEY
L. Rose1, R. Fowler2, D. Leasa3, E. Fan4, I. Fraser5, C. Mawdsley3, G. Rubenfeld2
1University of Toronto, Toronto, Canada, 2Sunnybrook Health Sciences Centre, Toronto,Canada, 3London Health Sciences Centre, London, Canada, 4Mt Sinai Hospital, Toronto,Canada, 5Toronto East General Hospital, Toronto, CanadaINTRODUCTION. No national Canadian data defines resource requirements and caredelivery for patients experiencing prolonged mechanical ventilation (PMV) defined asventilation for C 21 consecutive days and medical stability.OBJECTIVES. To describe PMV prevalence; care practices specific to PMV patientsincluding: weaning, mobilization, communication, nutrition, psychological support; anddischarge follow up.
METHODS. Units delivering care to PMV patients in the previous 12 months wereidentified using an existing inventory of adult and paediatric ICUs, with additional unitsidentified through snowball referrals. We provided the online survey via secure weblink to anominated unit champion from April to November 2012. Weekly telephone and emailreminders were sent for 6 weeks.RESULTS. Of the 449 units screened, 218 were eligible; 201 returned surveys (92 %response rate). 185 (92.0 %) were ICUs, 9 (4.5 %) in-house or specialized weaningunits accepting external referrals, 3 (1.5 %) medical units, 3 (1.5 %) high dependencyunits, and 1 (0.5 %) spinal unit. 304 PMV patients were identified on day of survey. Onaverage, 11 % of all ventilator capable ICU beds, and 44 % of non-ICU ventilatorcapable beds were occupied by PMV patients. Availability of a weaning protocol wasreported by 95 (47 %) units, though only 24/95 (25 %) reported guidance specific toPMV patients. Mobilization protocols were available in 75 (37 %) units; 22/75 (11 %)with PMV patient specific content. Most units used individualized plans for weaning(160, 80 %) and mobilization (159, 79 %) while only 60 (30 %) units utilized spe-cialized mobility equipment. Most units (179, 90 %) used traditional communicationtools such as alphabet/word/picture/writing boards and had access to speech languagepathologists (170, 85 %); use of technological communication applications was infre-quent (21, 10 %). Most frequently used techniques to assess safe swallowing comprisedtrial swallow with soft feed and oral reflex clinical exam (73 % of sites); videofluo-roscopic and fibreoptic endoscopic evaluation of swallowing (FEES) were used by59 % and 15 % respectively. 151 sites accessed psychiatric/counselling services;42/151 (28 %) routinely referred PMV patients. Eight (4 %) units used a validated toolto measure anxiety. Formal ICU discharge follow up services were reported by 34(17 %) units.CONCLUSIONS. PMV patients comprised 11 % of Canadian ICU ventilator bed capacity.Most units individualized weaning and mobilization strategies; however, protocolization ofweaning and mobility specific to the PMV population was uncommon. Although most sitesutilized psychological services, routine referral was infrequent. Few centres had establishedformal ICU follow up services.GRANT ACKNOWLEDGMENT. Canadian Institutes of Health Research.
0886SYSTEMATIC ASSESSMENT OF SWALLOWING DISORDERS AFTERPROLONGED MECHANICAL VENTILATION
G. Beduneau1,2, V. Souday3, J.F. Hamel4, J.M. Chretien4, P. Bouchetemble5,
L. Laccourreye6, D. Carpentier1, J.C. Richard1,2, A. Mercat3, G. Bonmarchand1,2
1University Hospital, Rouen, France, 2UPRESS EA 3830, Rouen, France, 3UniversityHospital, Département de Réanimation Médicale et Médecine Hyperbare, Angers, France,4University Hospital, Angers, France, 5University Hospital, ORL Department, Rouen,France, 6University Hospital, ORL Department, Angers, FranceINTRODUCTION. Incidence of swallowing disorders (SD) reported in the literature afterextubation may vary widely (1). Invasive techniques usually proposed to assess pharyn-golaryngeal consequences of intubation (2) or SD (3) are difficult to implement in theroutine practice, and may over estimate incidence of SD with clinical consequences.OBJECTIVES. We perform this study to evaluate incidence of clinically evident SD inpatients requiring more than 7 days of invasive mechanical ventilation (MV).METHODS. All patients ventilated more than 7 days were prospectively screened into 2intensive care unities of 2 university centers. Patients with pre-existing SD or diagnosisknown to cause SD were excluded. Within 48 h after extubation, a standardized clinicalswallowing evaluation was performed by experimented physiotherapists. Clinical evaluationof cranial nerves and Medical Research Council (MRC) was also performed. When SD wasdiagnosed, a subsequent similar test was performed within 48 h after the first one in order toseparate transitory (TSD) from persistent SD (PSD). Pneumonia, re-intubation and time fororal feeding were prospectively collected during the 28 days following extubation.RESULTS. Of 588 patients screened, 138 (24 %) were enrolled. Among 450 patients notincluded, 89 had end of life therapeutic limitations, 95 were tracheostomized and 28experienced dysphagia before intubation.Average age of the SD group was 59 ± 15 years. Average duration of MV before swal-lowing evaluation was15 ± 7 days. Median SAPS II was 55 [17–117]. 132 patients haveorotracheal intubation.The SD detection test, performed within 48 h after extubation, was normal in 103 patients(75 %) and revealed clinical SD in 35 (25 %). SD were transient in 21 (15 %) and persistentin 14 (10 %). Cranial nerve (XII) abnormalities were frequently involved.8 of the 138 patients were treated for suspected pneumonia and 13 were reintubated withinthe follow up.Patient0s main characteristics, depending on whether they had or not persistent swallowingdisorders, are presented in table 1 and table 2.
Table 1
Non persistantSD (n = 124)
PersistantSD (n = 14)
p-value
Age 58 ± 15 66 ± 16 0.0387
Weight at admission (kg) 87 ± 23 76 ± 15 0.0329
Intubation duration (days) 14 ± 7 17 ± 10 02533
Curare administration 81 (66 %) 5 (38 %) 0.0396
Duration of curare treatment (days) 3 ± 3 1 ± 2 0.0229
MRC at extubation time 43 ± 11 37 ± 10 0.0567
XII disorders 58 (47 %) 11 (79 %) 0.0452
Table 2
Non persistentSD (n = 124)
PersistentSD (n = 14)
p-value
Length of ICU stay after first extubation(days)
7 ± 6 11 ± 9 0.0408
Duration of tube feeding (days) 5 ± 7 23 ± 33 0.0151
Suspected pneumonia treatment 7 (6 %) 1 (7 %) 0.5967
Reintubation 10 (8 %) 3 (21 %) 0.1289
Quantitative variables are reported as mean (standard deviation) and qualitative variables asnumber (percentage).
26th ESICM ANNUAL CONGRESS — PARIS, FRANCE — 5–9 OCTOBER 2013
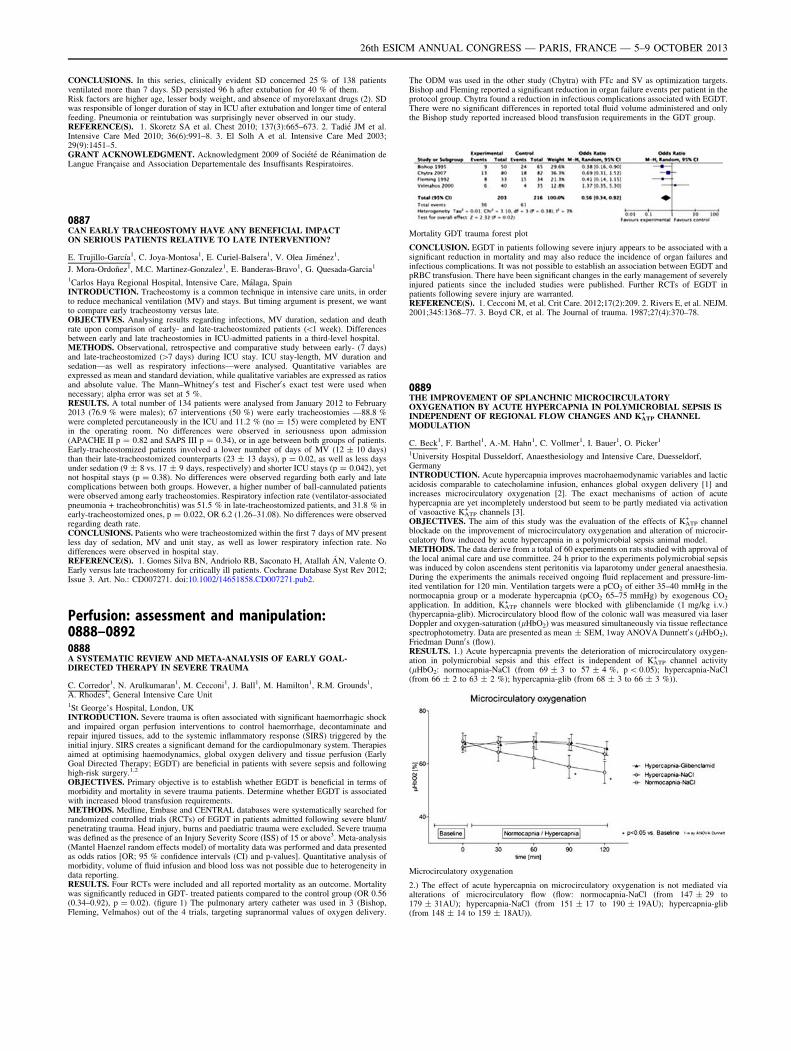
CONCLUSIONS. In this series, clinically evident SD concerned 25 % of 138 patientsventilated more than 7 days. SD persisted 96 h after extubation for 40 % of them.Risk factors are higher age, lesser body weight, and absence of myorelaxant drugs (2). SDwas responsible of longer duration of stay in ICU after extubation and longer time of enteralfeeding. Pneumonia or reintubation was surprisingly never observed in our study.REFERENCE(S). 1. Skoretz SA et al. Chest 2010; 137(3):665–673. 2. Tadié JM et al.Intensive Care Med 2010; 36(6):991–8. 3. El Solh A et al. Intensive Care Med 2003;29(9):1451–5.GRANT ACKNOWLEDGMENT. Acknowledgment 2009 of Société de Réanimation deLangue Française and Association Departementale des Insuffisants Respiratoires.
0887CAN EARLY TRACHEOSTOMY HAVE ANY BENEFICIAL IMPACTON SERIOUS PATIENTS RELATIVE TO LATE INTERVENTION?
E. Trujillo-Garcı́a1, C. Joya-Montosa1, E. Curiel-Balsera1, V. Olea Jiménez1,
J. Mora-Ordoñez1, M.C. Martinez-Gonzalez1, E. Banderas-Bravo1, G. Quesada-Garcia1
1Carlos Haya Regional Hospital, Intensive Care, Málaga, SpainINTRODUCTION. Tracheostomy is a common technique in intensive care units, in orderto reduce mechanical ventilation (MV) and stays. But timing argument is present, we wantto compare early tracheostomy versus late.OBJECTIVES. Analysing results regarding infections, MV duration, sedation and deathrate upon comparison of early- and late-tracheostomized patients (\1 week). Differencesbetween early and late tracheostomies in ICU-admitted patients in a third-level hospital.METHODS. Observational, retrospective and comparative study between early- (7 days)and late-tracheostomized ([7 days) during ICU stay. ICU stay-length, MV duration andsedation—as well as respiratory infections—were analysed. Quantitative variables areexpressed as mean and standard deviation, while qualitative variables are expressed as ratiosand absolute value. The Mann–Whitney0s test and Fischer0s exact test were used whennecessary; alpha error was set at 5 %.RESULTS. A total number of 134 patients were analysed from January 2012 to February2013 (76.9 % were males); 67 interventions (50 %) were early tracheostomies —88.8 %were completed percutaneously in the ICU and 11.2 % (no = 15) were completed by ENTin the operating room. No differences were observed in seriousness upon admission(APACHE II p = 0.82 and SAPS III p = 0.34), or in age between both groups of patients.Early-tracheostomized patients involved a lower number of days of MV (12 ± 10 days)than their late-tracheostomized counterparts (23 ± 13 days), p = 0.02, as well as less daysunder sedation (9 ± 8 vs. 17 ± 9 days, respectively) and shorter ICU stays (p = 0.042), yetnot hospital stays (p = 0.38). No differences were observed regarding both early and latecomplications between both groups. However, a higher number of ball-cannulated patientswere observed among early tracheostomies. Respiratory infection rate (ventilator-associatedpneumonia + tracheobronchitis) was 51.5 % in late-tracheostomized patients, and 31.8 % inearly-tracheostomized ones, p = 0.022, OR 6.2 (1.26–31.08). No differences were observedregarding death rate.CONCLUSIONS. Patients who were tracheostomized within the first 7 days of MV presentless day of sedation, MV and unit stay, as well as lower respiratory infection rate. Nodifferences were observed in hospital stay.REFERENCE(S). 1. Gomes Silva BN, Andriolo RB, Saconato H, Atallah ÁN, Valente O.Early versus late tracheostomy for critically ill patients. Cochrane Database Syst Rev 2012;Issue 3. Art. No.: CD007271. doi:10.1002/14651858.CD007271.pub2.
Perfusion: assessment and manipulation:0888–08920888A SYSTEMATIC REVIEW AND META-ANALYSIS OF EARLY GOAL-DIRECTED THERAPY IN SEVERE TRAUMA
C. Corredor1, N. Arulkumaran1, M. Cecconi1, J. Ball1, M. Hamilton1, R.M. Grounds1,A. Rhodes1, General Intensive Care Unit1St George’s Hospital, London, UKINTRODUCTION. Severe trauma is often associated with significant haemorrhagic shockand impaired organ perfusion interventions to control haemorrhage, decontaminate andrepair injured tissues, add to the systemic inflammatory response (SIRS) triggered by theinitial injury. SIRS creates a significant demand for the cardiopulmonary system. Therapiesaimed at optimising haemodynamics, global oxygen delivery and tissue perfusion (EarlyGoal Directed Therapy; EGDT) are beneficial in patients with severe sepsis and followinghigh-risk surgery.1,2
OBJECTIVES. Primary objective is to establish whether EGDT is beneficial in terms ofmorbidity and mortality in severe trauma patients. Determine whether EGDT is associatedwith increased blood transfusion requirements.METHODS. Medline, Embase and CENTRAL databases were systematically searched forrandomized controlled trials (RCTs) of EGDT in patients admitted following severe blunt/penetrating trauma. Head injury, burns and paediatric trauma were excluded. Severe traumawas defined as the presence of an Injury Severity Score (ISS) of 15 or above3. Meta-analysis(Mantel Haenzel random effects model) of mortality data was performed and data presentedas odds ratios [OR; 95 % confidence intervals (CI) and p-values]. Quantitative analysis ofmorbidity, volume of fluid infusion and blood loss was not possible due to heterogeneity indata reporting.RESULTS. Four RCTs were included and all reported mortality as an outcome. Mortalitywas significantly reduced in GDT- treated patients compared to the control group (OR 0.56(0.34–0.92), p = 0.02). (figure 1) The pulmonary artery catheter was used in 3 (Bishop,Fleming, Velmahos) out of the 4 trials, targeting supranormal values of oxygen delivery.
The ODM was used in the other study (Chytra) with FTc and SV as optimization targets.Bishop and Fleming reported a significant reduction in organ failure events per patient in theprotocol group. Chytra found a reduction in infectious complications associated with EGDT.There were no significant differences in reported total fluid volume administered and onlythe Bishop study reported increased blood transfusion requirements in the GDT group.
Mortality GDT trauma forest plot
CONCLUSION. EGDT in patients following severe injury appears to be associated with asignificant reduction in mortality and may also reduce the incidence of organ failures andinfectious complications. It was not possible to establish an association between EGDT andpRBC transfusion. There have been significant changes in the early management of severelyinjured patients since the included studies were published. Further RCTs of EGDT inpatients following severe injury are warranted.REFERENCE(S). 1. Cecconi M, et al. Crit Care. 2012;17(2):209. 2. Rivers E, et al. NEJM.2001;345:1368–77. 3. Boyd CR, et al. The Journal of trauma. 1987;27(4):370–78.
0889THE IMPROVEMENT OF SPLANCHNIC MICROCIRCULATORYOXYGENATION BY ACUTE HYPERCAPNIA IN POLYMICROBIAL SEPSIS ISINDEPENDENT OF REGIONAL FLOW CHANGES AND KATP
+ CHANNELMODULATION
C. Beck1, F. Barthel1, A.-M. Hahn1, C. Vollmer1, I. Bauer1, O. Picker1
1University Hospital Dusseldorf, Anaesthesiology and Intensive Care, Duesseldorf,GermanyINTRODUCTION. Acute hypercapnia improves macrohaemodynamic variables and lacticacidosis comparable to catecholamine infusion, enhances global oxygen delivery [1] andincreases microcirculatory oxygenation [2]. The exact mechanisms of action of acutehypercapnia are yet incompletely understood but seem to be partly mediated via activationof vasoactive KATP
+ channels [3].OBJECTIVES. The aim of this study was the evaluation of the effects of KATP
+ channelblockade on the improvement of microcirculatory oxygenation and alteration of microcir-culatory flow induced by acute hypercapnia in a polymicrobial sepsis animal model.METHODS. The data derive from a total of 60 experiments on rats studied with approval ofthe local animal care and use committee. 24 h prior to the experiments polymicrobial sepsiswas induced by colon ascendens stent peritonitis via laparotomy under general anaesthesia.During the experiments the animals received ongoing fluid replacement and pressure-lim-ited ventilation for 120 min. Ventilation targets were a pCO2 of either 35–40 mmHg in thenormocapnia group or a moderate hypercapnia (pCO2 65–75 mmHg) by exogenous CO2
application. In addition, KATP+ channels were blocked with glibenclamide (1 mg/kg i.v.)
(hypercapnia-glib). Microcirculatory blood flow of the colonic wall was measured via laserDoppler and oxygen-saturation (lHbO2) was measured simultaneously via tissue reflectancespectrophotometry. Data are presented as mean ± SEM, 1way ANOVA Dunnett0s (lHbO2),Friedman Dunn0s (flow).RESULTS. 1.) Acute hypercapnia prevents the deterioration of microcirculatory oxygen-ation in polymicrobial sepsis and this effect is independent of KATP
+ channel activity(lHbO2: normocapnia-NaCl (from 69 ± 3 to 57 ± 4 %, p \ 0.05); hypercapnia-NaCl(from 66 ± 2 to 63 ± 2 %); hypercapnia-glib (from 68 ± 3 to 66 ± 3 %)).
Microcirculatory oxygenation
2.) The effect of acute hypercapnia on microcirculatory oxygenation is not mediated viaalterations of microcirculatory flow (flow: normocapnia-NaCl (from 147 ± 29 to179 ± 31AU); hypercapnia-NaCl (from 151 ± 17 to 190 ± 19AU); hypercapnia-glib(from 148 ± 14 to 159 ± 18AU)).
26th ESICM ANNUAL CONGRESS — PARIS, FRANCE — 5–9 OCTOBER 2013
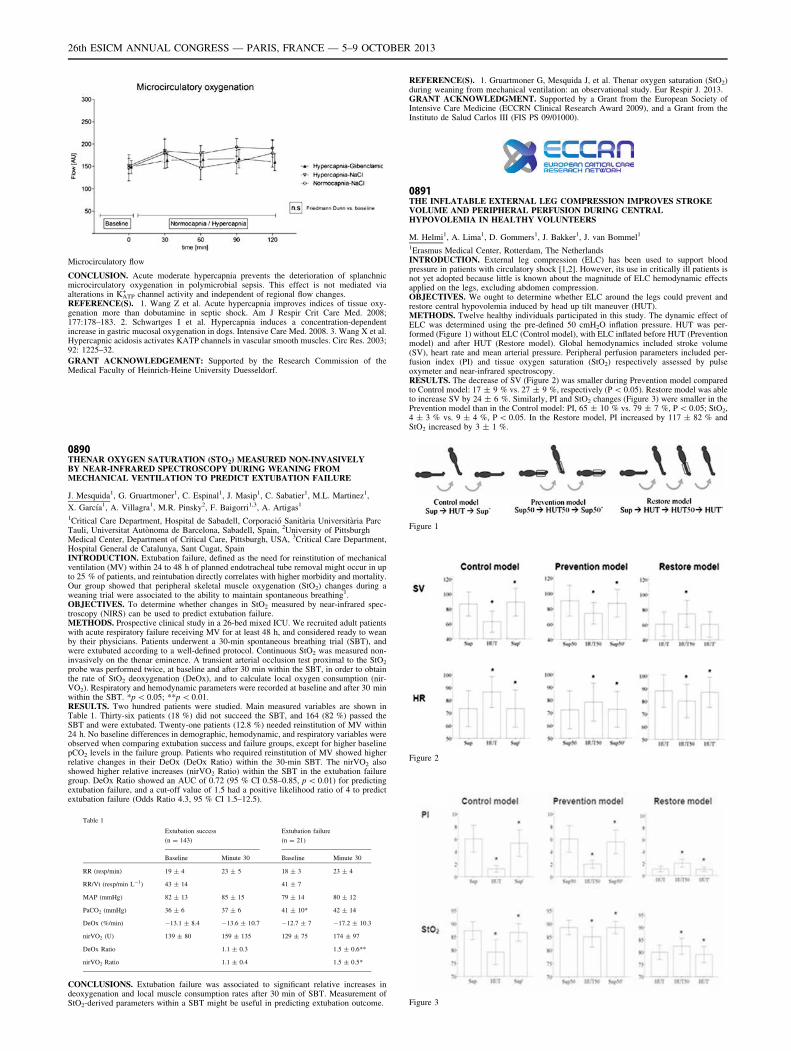
Microcirculatory flow
CONCLUSION. Acute moderate hypercapnia prevents the deterioration of splanchnicmicrocirculatory oxygenation in polymicrobial sepsis. This effect is not mediated viaalterations in KATP
+ channel activity and independent of regional flow changes.REFERENCE(S). 1. Wang Z et al. Acute hypercapnia improves indices of tissue oxy-genation more than dobutamine in septic shock. Am J Respir Crit Care Med. 2008;177:178–183. 2. Schwartges I et al. Hypercapnia induces a concentration-dependentincrease in gastric mucosal oxygenation in dogs. Intensive Care Med. 2008. 3. Wang X et al.Hypercapnic acidosis activates KATP channels in vascular smooth muscles. Circ Res. 2003;92: 1225–32.
GRANT ACKNOWLEDGEMENT: Supported by the Research Commission of theMedical Faculty of Heinrich-Heine University Duesseldorf.
0890THENAR OXYGEN SATURATION (STO2) MEASURED NON-INVASIVELYBY NEAR-INFRARED SPECTROSCOPY DURING WEANING FROMMECHANICAL VENTILATION TO PREDICT EXTUBATION FAILURE
J. Mesquida1, G. Gruartmoner1, C. Espinal1, J. Masip1, C. Sabatier1, M.L. Martinez1,
X. Garcı́a1, A. Villagra1, M.R. Pinsky2, F. Baigorri1,3, A. Artigas1
1Critical Care Department, Hospital de Sabadell, Corporació Sanitària Universitària ParcTauli, Universitat Autònoma de Barcelona, Sabadell, Spain, 2University of PittsburghMedical Center, Department of Critical Care, Pittsburgh, USA, 3Critical Care Department,Hospital General de Catalunya, Sant Cugat, SpainINTRODUCTION. Extubation failure, defined as the need for reinstitution of mechanicalventilation (MV) within 24 to 48 h of planned endotracheal tube removal might occur in upto 25 % of patients, and reintubation directly correlates with higher morbidity and mortality.Our group showed that peripheral skeletal muscle oxygenation (StO2) changes during aweaning trial were associated to the ability to maintain spontaneous breathing1.OBJECTIVES. To determine whether changes in StO2 measured by near-infrared spec-troscopy (NIRS) can be used to predict extubation failure.METHODS. Prospective clinical study in a 26-bed mixed ICU. We recruited adult patientswith acute respiratory failure receiving MV for at least 48 h, and considered ready to weanby their physicians. Patients underwent a 30-min spontaneous breathing trial (SBT), andwere extubated according to a well-defined protocol. Continuous StO2 was measured non-invasively on the thenar eminence. A transient arterial occlusion test proximal to the StO2
probe was performed twice, at baseline and after 30 min within the SBT, in order to obtainthe rate of StO2 deoxygenation (DeOx), and to calculate local oxygen consumption (nir-VO2). Respiratory and hemodynamic parameters were recorded at baseline and after 30 minwithin the SBT. *p \ 0.05; **p \ 0.01.RESULTS. Two hundred patients were studied. Main measured variables are shown inTable 1. Thirty-six patients (18 %) did not succeed the SBT, and 164 (82 %) passed theSBT and were extubated. Twenty-one patients (12.8 %) needed reinstitution of MV within24 h. No baseline differences in demographic, hemodynamic, and respiratory variables wereobserved when comparing extubation success and failure groups, except for higher baselinepCO2 levels in the failure group. Patients who required reinstitution of MV showed higherrelative changes in their DeOx (DeOx Ratio) within the 30-min SBT. The nirVO2 alsoshowed higher relative increases (nirVO2 Ratio) within the SBT in the extubation failuregroup. DeOx Ratio showed an AUC of 0.72 (95 % CI 0.58–0.85, p \ 0.01) for predictingextubation failure, and a cut-off value of 1.5 had a positive likelihood ratio of 4 to predictextubation failure (Odds Ratio 4.3, 95 % CI 1.5–12.5).
Table 1
Extubation success
(n = 143)
Extubation failure
(n = 21)
Baseline Minute 30 Baseline Minute 30
RR (resp/min) 19 ± 4 23 ± 5 18 ± 3 23 ± 4
RR/Vt (resp/min L-1) 43 ± 14 41 ± 7
MAP (mmHg) 82 ± 13 85 ± 15 79 ± 14 80 ± 12
PaCO2 (mmHg) 36 ± 6 37 ± 6 41 ± 10* 42 ± 14
DeOx (%/min) -13.1 ± 8.4 -13.6 ± 10.7 -12.7 ± 7 -17.2 ± 10.3
nirVO2 (U) 139 ± 80 159 ± 135 129 ± 75 174 ± 97
DeOx Ratio 1.1 ± 0.3 1.5 ± 0.6**
nirVO2 Ratio 1.1 ± 0.4 1.5 ± 0.5*
CONCLUSIONS. Extubation failure was associated to significant relative increases indeoxygenation and local muscle consumption rates after 30 min of SBT. Measurement ofStO2-derived parameters within a SBT might be useful in predicting extubation outcome.
REFERENCE(S). 1. Gruartmoner G, Mesquida J, et al. Thenar oxygen saturation (StO2)during weaning from mechanical ventilation: an observational study. Eur Respir J. 2013.GRANT ACKNOWLEDGMENT. Supported by a Grant from the European Society ofIntensive Care Medicine (ECCRN Clinical Research Award 2009), and a Grant from theInstituto de Salud Carlos III (FIS PS 09/01000).
0891THE INFLATABLE EXTERNAL LEG COMPRESSION IMPROVES STROKEVOLUME AND PERIPHERAL PERFUSION DURING CENTRALHYPOVOLEMIA IN HEALTHY VOLUNTEERS
M. Helmi1, A. Lima1, D. Gommers1, J. Bakker1, J. van Bommel1
1Erasmus Medical Center, Rotterdam, The NetherlandsINTRODUCTION. External leg compression (ELC) has been used to support bloodpressure in patients with circulatory shock [1,2]. However, its use in critically ill patients isnot yet adopted because little is known about the magnitude of ELC hemodynamic effectsapplied on the legs, excluding abdomen compression.OBJECTIVES. We ought to determine whether ELC around the legs could prevent andrestore central hypovolemia induced by head up tilt maneuver (HUT).METHODS. Twelve healthy individuals participated in this study. The dynamic effect ofELC was determined using the pre-defined 50 cmH2O inflation pressure. HUT was per-formed (Figure 1) without ELC (Control model), with ELC inflated before HUT (Preventionmodel) and after HUT (Restore model). Global hemodynamics included stroke volume(SV), heart rate and mean arterial pressure. Peripheral perfusion parameters included per-fusion index (PI) and tissue oxygen saturation (StO2) respectively assessed by pulseoxymeter and near-infrared spectroscopy.RESULTS. The decrease of SV (Figure 2) was smaller during Prevention model comparedto Control model: 17 ± 9 % vs. 27 ± 9 %, respectively (P \ 0.05). Restore model was ableto increase SV by 24 ± 6 %. Similarly, PI and StO2 changes (Figure 3) were smaller in thePrevention model than in the Control model: PI, 65 ± 10 % vs. 79 ± 7 %, P \ 0.05; StO2,4 ± 3 % vs. 9 ± 4 %, P \ 0.05. In the Restore model, PI increased by 117 ± 82 % andStO2 increased by 3 ± 1 %.
Figure 1
Figure 2
Figure 3
26th ESICM ANNUAL CONGRESS — PARIS, FRANCE — 5–9 OCTOBER 2013
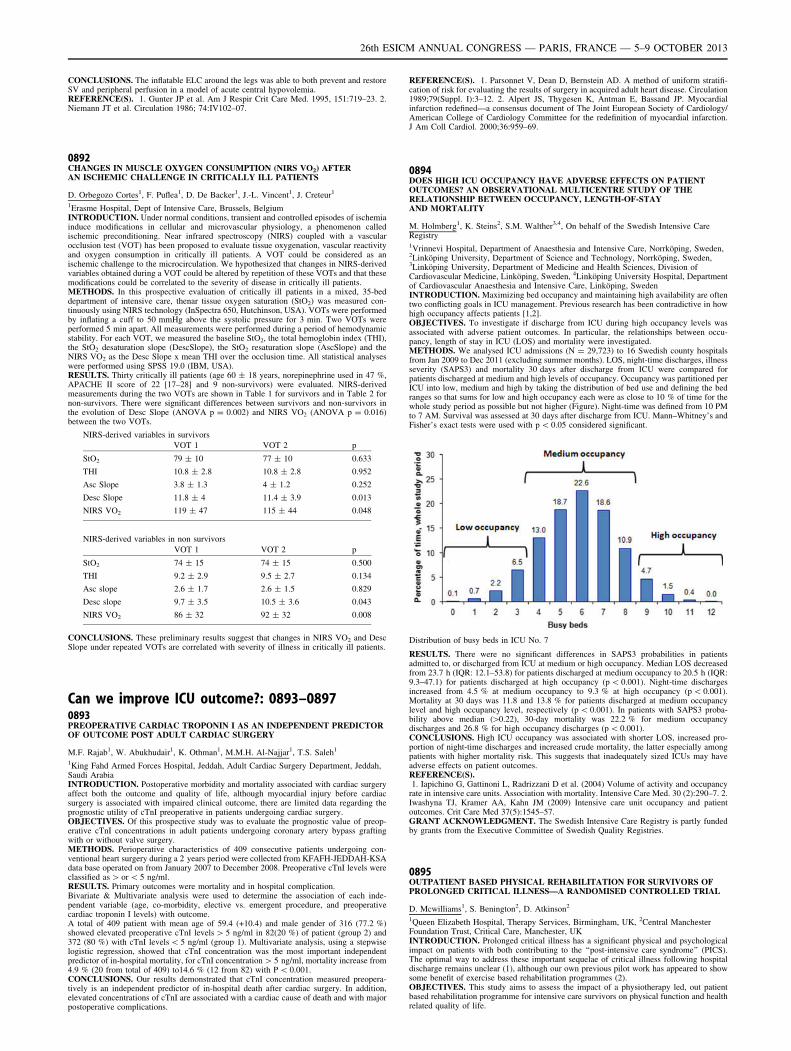
CONCLUSIONS. The inflatable ELC around the legs was able to both prevent and restoreSV and peripheral perfusion in a model of acute central hypovolemia.REFERENCE(S). 1. Gunter JP et al. Am J Respir Crit Care Med. 1995, 151:719–23. 2.Niemann JT et al. Circulation 1986; 74:IV102–07.
0892CHANGES IN MUSCLE OXYGEN CONSUMPTION (NIRS VO2) AFTERAN ISCHEMIC CHALLENGE IN CRITICALLY ILL PATIENTS
D. Orbegozo Cortes1, F. Puflea1, D. De Backer1, J.-L. Vincent1, J. Creteur1
1Erasme Hospital, Dept of Intensive Care, Brussels, BelgiumINTRODUCTION. Under normal conditions, transient and controlled episodes of ischemiainduce modifications in cellular and microvascular physiology, a phenomenon calledischemic preconditioning. Near infrared spectroscopy (NIRS) coupled with a vascularocclusion test (VOT) has been proposed to evaluate tissue oxygenation, vascular reactivityand oxygen consumption in critically ill patients. A VOT could be considered as anischemic challenge to the microcirculation. We hypothesized that changes in NIRS-derivedvariables obtained during a VOT could be altered by repetition of these VOTs and that thesemodifications could be correlated to the severity of disease in critically ill patients.METHODS. In this prospective evaluation of critically ill patients in a mixed, 35-beddepartment of intensive care, thenar tissue oxygen saturation (StO2) was measured con-tinuously using NIRS technology (InSpectra 650, Hutchinson, USA). VOTs were performedby inflating a cuff to 50 mmHg above the systolic pressure for 3 min. Two VOTs wereperformed 5 min apart. All measurements were performed during a period of hemodynamicstability. For each VOT, we measured the baseline StO2, the total hemoglobin index (THI),the StO2 desaturation slope (DescSlope), the StO2 resaturation slope (AscSlope) and theNIRS VO2 as the Desc Slope x mean THI over the occlusion time. All statistical analyseswere performed using SPSS 19.0 (IBM, USA).RESULTS. Thirty critically ill patients (age 60 ± 18 years, norepinephrine used in 47 %,APACHE II score of 22 [17–28] and 9 non-survivors) were evaluated. NIRS-derivedmeasurements during the two VOTs are shown in Table 1 for survivors and in Table 2 fornon-survivors. There were significant differences between survivors and non-survivors inthe evolution of Desc Slope (ANOVA p = 0.002) and NIRS VO2 (ANOVA p = 0.016)between the two VOTs.
NIRS-derived variables in survivors
VOT 1 VOT 2 p
StO2 79 ± 10 77 ± 10 0.633
THI 10.8 ± 2.8 10.8 ± 2.8 0.952
Asc Slope 3.8 ± 1.3 4 ± 1.2 0.252
Desc Slope 11.8 ± 4 11.4 ± 3.9 0.013
NIRS VO2 119 ± 47 115 ± 44 0.048
NIRS-derived variables in non survivors
VOT 1 VOT 2 p
StO2 74 ± 15 74 ± 15 0.500
THI 9.2 ± 2.9 9.5 ± 2.7 0.134
Asc slope 2.6 ± 1.7 2.6 ± 1.5 0.829
Desc slope 9.7 ± 3.5 10.5 ± 3.6 0.043
NIRS VO2 86 ± 32 92 ± 32 0.008
CONCLUSIONS. These preliminary results suggest that changes in NIRS VO2 and DescSlope under repeated VOTs are correlated with severity of illness in critically ill patients.
Can we improve ICU outcome?: 0893–08970893PREOPERATIVE CARDIAC TROPONIN I AS AN INDEPENDENT PREDICTOROF OUTCOME POST ADULT CARDIAC SURGERY
M.F. Rajab1, W. Abukhudair1, K. Othman1, M.M.H. Al-Najjar1, T.S. Saleh1
1King Fahd Armed Forces Hospital, Jeddah, Adult Cardiac Surgery Department, Jeddah,Saudi ArabiaINTRODUCTION. Postoperative morbidity and mortality associated with cardiac surgeryaffect both the outcome and quality of life, although myocardial injury before cardiacsurgery is associated with impaired clinical outcome, there are limited data regarding theprognostic utility of cTnI preoperative in patients undergoing cardiac surgery.OBJECTIVES. Of this prospective study was to evaluate the prognostic value of preop-erative cTnI concentrations in adult patients undergoing coronary artery bypass graftingwith or without valve surgery.METHODS. Perioperative characteristics of 409 consecutive patients undergoing con-ventional heart surgery during a 2 years period were collected from KFAFH-JEDDAH-KSAdata base operated on from January 2007 to December 2008. Preoperative cTnI levels wereclassified as [ or \ 5 ng/ml.RESULTS. Primary outcomes were mortality and in hospital complication.Bivariate & Multivariate analysis were used to determine the association of each inde-pendent variable (age, co-morbidity, elective vs. emergent procedure, and preoperativecardiac troponin I levels) with outcome.A total of 409 patient with mean age of 59.4 (+10.4) and male gender of 316 (77.2 %)showed elevated preoperative cTnI levels [ 5 ng/ml in 82(20 %) of patient (group 2) and372 (80 %) with cTnI levels \ 5 ng/ml (group 1). Multivariate analysis, using a stepwiselogistic regression, showed that cTnI concentration was the most important independentpredictor of in-hospital mortality, for cTnI concentration [ 5 ng/ml, mortality increase from4.9 % (20 from total of 409) to14.6 % (12 from 82) with P \ 0.001.CONCLUSIONS. Our results demonstrated that cTnI concentration measured preopera-tively is an independent predictor of in-hospital death after cardiac surgery. In addition,elevated concentrations of cTnI are associated with a cardiac cause of death and with majorpostoperative complications.
REFERENCE(S). 1. Parsonnet V, Dean D, Bernstein AD. A method of uniform stratifi-cation of risk for evaluating the results of surgery in acquired adult heart disease. Circulation1989;79(Suppl. I):3–12. 2. Alpert JS, Thygesen K, Antman E, Bassand JP. Myocardialinfarction redefined—a consensus document of The Joint European Society of Cardiology/American College of Cardiology Committee for the redefinition of myocardial infarction.J Am Coll Cardiol. 2000;36:959–69.
0894DOES HIGH ICU OCCUPANCY HAVE ADVERSE EFFECTS ON PATIENTOUTCOMES? AN OBSERVATIONAL MULTICENTRE STUDY OF THERELATIONSHIP BETWEEN OCCUPANCY, LENGTH-OF-STAYAND MORTALITY
M. Holmberg1, K. Steins2, S.M. Walther3,4, On behalf of the Swedish Intensive CareRegistry1Vrinnevi Hospital, Department of Anaesthesia and Intensive Care, Norrköping, Sweden,2Linköping University, Department of Science and Technology, Norrköping, Sweden,3Linköping University, Department of Medicine and Health Sciences, Division ofCardiovascular Medicine, Linköping, Sweden, 4Linköping University Hospital, Departmentof Cardiovascular Anaesthesia and Intensive Care, Linköping, SwedenINTRODUCTION. Maximizing bed occupancy and maintaining high availability are oftentwo conflicting goals in ICU management. Previous research has been contradictive in howhigh occupancy affects patients [1,2].OBJECTIVES. To investigate if discharge from ICU during high occupancy levels wasassociated with adverse patient outcomes. In particular, the relationships between occu-pancy, length of stay in ICU (LOS) and mortality were investigated.METHODS. We analysed ICU admissions (N = 29,723) to 16 Swedish county hospitalsfrom Jan 2009 to Dec 2011 (excluding summer months). LOS, night-time discharges, illnessseverity (SAPS3) and mortality 30 days after discharge from ICU were compared forpatients discharged at medium and high levels of occupancy. Occupancy was partitioned perICU into low, medium and high by taking the distribution of bed use and defining the bedranges so that sums for low and high occupancy each were as close to 10 % of time for thewhole study period as possible but not higher (Figure). Night-time was defined from 10 PMto 7 AM. Survival was assessed at 30 days after discharge from ICU. Mann–Whitney’s andFisher’s exact tests were used with p \ 0.05 considered significant.
Distribution of busy beds in ICU No. 7
RESULTS. There were no significant differences in SAPS3 probabilities in patientsadmitted to, or discharged from ICU at medium or high occupancy. Median LOS decreasedfrom 23.7 h (IQR: 12.1–53.8) for patients discharged at medium occupancy to 20.5 h (IQR:9.3–47.1) for patients discharged at high occupancy (p \ 0.001). Night-time dischargesincreased from 4.5 % at medium occupancy to 9.3 % at high occupancy (p \ 0.001).Mortality at 30 days was 11.8 and 13.8 % for patients discharged at medium occupancylevel and high occupancy level, respectively (p \ 0.001). In patients with SAPS3 proba-bility above median ([0.22), 30-day mortality was 22.2 % for medium occupancydischarges and 26.8 % for high occupancy discharges (p \ 0.001).CONCLUSIONS. High ICU occupancy was associated with shorter LOS, increased pro-portion of night-time discharges and increased crude mortality, the latter especially amongpatients with higher mortality risk. This suggests that inadequately sized ICUs may haveadverse effects on patient outcomes.REFERENCE(S).1. Iapichino G, Gattinoni L, Radrizzani D et al. (2004) Volume of activity and occupancy
rate in intensive care units. Association with mortality. Intensive Care Med. 30 (2):290–7. 2.Iwashyna TJ, Kramer AA, Kahn JM (2009) Intensive care unit occupancy and patientoutcomes. Crit Care Med 37(5):1545–57.GRANT ACKNOWLEDGMENT. The Swedish Intensive Care Registry is partly fundedby grants from the Executive Committee of Swedish Quality Registries.
0895OUTPATIENT BASED PHYSICAL REHABILITATION FOR SURVIVORS OFPROLONGED CRITICAL ILLNESS—A RANDOMISED CONTROLLED TRIAL
D. Mcwilliams1, S. Benington2, D. Atkinson2
1Queen Elizabeth Hospital, Therapy Services, Birmingham, UK, 2Central ManchesterFoundation Trust, Critical Care, Manchester, UKINTRODUCTION. Prolonged critical illness has a significant physical and psychologicalimpact on patients with both contributing to the ‘‘post-intensive care syndrome’’ (PICS).The optimal way to address these important sequelae of critical illness following hospitaldischarge remains unclear (1), although our own previous pilot work has appeared to showsome benefit of exercise based rehabilitation programmes (2).OBJECTIVES. This study aims to assess the impact of a physiotherapy led, out patientbased rehabilitation programme for intensive care survivors on physical function and healthrelated quality of life.
26th ESICM ANNUAL CONGRESS — PARIS, FRANCE — 5–9 OCTOBER 2013
METHODS. 73 patients from a UK based ICU tertiary intensive care unit and inva-sively ventilated for C5 days completed the study. A baseline symptom limited maximalbicycle cardio-pulmonary exercise test (CPET) and SF36v2 questionnaire were per-formed within the first month following hospital discharge. Randomization to eithertreatment (TG) or control (CG) groups was performed. The TG underwent a 7-week out-patient based structured exercise and education programme with the CG receiving nointervention during the study period. 2nd assessment for both groups was performed8–10 weeks from baseline with a CPET and SF36v2 repeated. Primary outcome mea-sures were changes in functional capacity as defined by changes in peak VO2 andanaerobic threshold (AT). Secondary outcome measures were changes in mental andphysical component scores (MCS and PCS) of the SF36v2 and changes in other CPETparameters e.g. peak power output.RESULTS.
Patient demographics
Control (n = 36) Treatment (n = 37)
Age 60.8 55
APACHE II 15.9 16.6
Days Ventilated 12.7 19.8
ICU LOS 22.2 29.1
Hospital LOS 39.3 51
Results
Control Treatment p
Physical Component Score 4.1 8.0 p \ 0.05
Mental Component Score 4.0 10.6 p \ 0.01
AT Improvement 16.2 % 13.9 % p = 0.74)
Peak VO2 improvement 15.3 % 17.7 % p = 0.68
Peak power improvement 20.4 % 47.7 % p = 0.024
Improvements in both peak VO2 and AT were seen in botht the TG and CG from baselinelevels, but no significant difference between groups was evident. PCS and MCS scores frombaseline improved in both TG and CG with improvement significantly greater in the TG(PCS 4.1 vs 8.0 p = 0.048; MCS 4.0 vs 10.6, p = 0.017). Significan t improvements werealso seen in terms of peak power output for those patients who had completed the reha-bilitation programme.CONCLUSIONS. A 7-week out patient based exercise and education programme forsurvivors of prolonged critical illness results in improved PCS and MCS scores of theSF36v2 and peak power output achieved during CPET. Although no significant improve-ments were seen in terms of CPET parameters, such programmes appear to provide a costeffective method of improving quality of life and perceived physical and psychologicalstatus in survivors.REFERENCE(S). 1. Connolly et al. Exercise rehabilitation following hospital discharge insurvivors of critical illness: an integrative review. 2012; 16:226 2. McWilliams et al. (2009)The impact and feasibility of a physiotherapy led, exercise based rehabilitation programmefor intensive care survivors. Physiother Theory Pract. 2009.
0896DELAYED DISCHARGE FROM THE INTENSIVE CARE UNIT IS ASSOCIATEDWITH PROLONGED HOSPITAL STAY
S.L. Sanders1, C. Bourdeaux1, J. Brown2, J. Parry-Jones3
1University Hospital Bristol, Bristol, UK, 2North Bristol NHS Trust, Bristol, UK, 3AneurinBevan Health Board, Intensive Care Unit, Newport, UKINTRODUCTION. Delayed discharge from the intensive care unit (ICU) of patientsdeemed fit for the ward is common and often results from a lack of available ward bed.Obvious consequences of delayed discharge include: bed block to critically ill patientsrequiring admission, cancellation of elective surgery and increased costs. There is howeverpaucity of data regarding the effects on the patients who have their discharge from ICUdelayed.OBJECTIVE. To determine effect of delayed ICU discharge on length of hospital stay(LOS).METHODS. The study was carried out in 3 British ICU populations in Wales andBristol covering mixed medical/surgical neurosurgical and tertiary referral centres. Thestudy was approved as service evaluation by the Local Research Ethics Committee. Datawas extracted and analysed retrospectively using the ward watcher software used tocollect data for the Intensive Care National Audit and Research Centre Case MixProgram. All patients discharged alive to a ward within each hospital were analysed.Patients that did not have a medically ready for discharge time and date recorded wereexcluded from the analysis. Patients were analysed in 2 groups, those with no delay andthose with delayed discharge, defined as discharge [ 24 h post the time declared med-ically fit for discharge. Baseline data was collected including age, sex, APACHE II, anddiagnosis.RESULTS. Median Post ICU Hospital LOS (days) for prompt and delayed discharge andMedian delay to ICU discharge (days) (inter-quartile range).NBT 15 (N = 1,966) 17.5 (N = 344) 1.44 (1.21–2.31)UHB 10 (N = 8,207) 12 (N = 1,698) 1.84 (1.25–3.23)Wales 10(N = 1,902) 11 (N = 957) 2.13 (1.25–3.23)Our results suggest that ICU patients who are medically fit for the ward experience anincreased hospital length of stay post ICU discharge if their ICU discharge is delayed forgreater than 24 h. Hospital LOS post ICU discharge is longer in patients in whom ICUdischarge was delayed. These results are consistent across large ICUs with differing patientpopulations. This finding has implications when prioritising ward bed allocation and patientflow through the hospital.CONCLUSIONS. Delayed discharge is associated with prolonged hospital stay andincreased potential for patient harm. Further work should focus on identifying the riskfactors for, and causes of delayed ICU discharge and the causes of increased hospital LOSpost ICU discharge. This would enable modification of system processes and improvedpatient care.REFERENCE(S). 1. Williams T, Leslie G. Delayed discharges from an adult intensivecare unit. Aust Health Rev. 2004; 28(1): 87–96.
0897IMPACT OF ICU-ACQUIRED WEAKNESS ON FUNCTIONAL OUTCOME—PRELIMINARY ANALYSIS OF A PROSPECTIVE OBSERVATIONAL STUDY
L. Wieske1,2, D. Dettling-Ihnenfeldt3, F. Nollet3, I.N. van Schaik2, M.J. Schultz1,
M. van der Schaaf3, J. Horn1
1Academic Medical Center, University of Amsterdam, Intensive Care Medicine,Amsterdam, The Netherlands, 2Academic Medical Center, University of Amsterdam,Neurology, Amsterdam, The Netherlands, 3Academic Medical Center, University ofAmsterdam, Rehabilitation, Amsterdam, The NetherlandsINTRODUCTION. Many survivors of critical illness have long-term functional limita-tions and reduced quality of life. This has been largely attributed to intensive care unit-acquired weakness (ICU-AW) [1]. Direct evidence of the impact of ICU-AW on long-term functional outcome is unavailable, because large prospective studies are lacking [2].We hypothesized that patients with ICU-AW have poorer physical functioning andhigher mortality rates at 6 months after ICU discharge compared to patients withoutICU-AW.OBJECTIVES. To investigate differences in physical functioning and mortality of patientswith ICU-AW compared to patients without ICU-AW at 6 months after ICU discharge.METHODS. We performed a prospective cohort study in a tertiary 30-bed mixed medical-surgical ICU. ICU-patients who needed mechanically ventilated for C 48 h were included.Exclusion criteria included any central nervous system disorder, spinal cord disorder orneuromuscular disorder as reasons for admission. In addition, pre-existing poor functionalstatus; language barrier and impossibility to assess muscle strength were reasons forexclusion. ICU-AW was defined as a mean Medical Research Council (MRC) score \ 4,assessed in 6 muscle groups bilaterally [3]. At 6 months after final ICU discharge physicalfunctioning and mortality were determined. Physical functioning was measured by tele-phone or mail using the physical functioning domain score of the Medical Outcomes Study36-Item Short-Form Health Survey (SF-36).RESULTS. In total 156 patients were included in the study; in this preliminary analysis,121 patients for who the follow up period had passed were analyzed. Of those patients, 65(54 %) had developed ICU-AW. Patient characteristics are displayed in table 1. At6 months after ICU discharge, 29 patients with ICU-AW (45 %) had died compared to 9patients without ICU-AW (16 %; p \ 0.01). Of the 83 surviving patients, 13 patients (6patients with ICU-AW) could not be reached or were unable to provide follow-upinformation. The median SF-36 physical functioning domain score of patients withICU-AW was 45 (IQR: 30–70) compared to 75 (IQR: 50–90; p: 0.02) for patients withoutICU-AW.CONCLUSIONS. In this preliminary analysis, patients with ICU-AW had higher mortalityrates and impaired physical functioning compared to patients without ICU-AW. Data col-lection of this study will be completed in September 2013.REFERENCE(S). 1. Herridge MS, Tansey CM, Matté A et al. Functional disability 5 yearsafter acute respiratory distress syndrome. N Engl J Med. 2011; 364;1293–1304 2. ConnollyB, Denehy L, Brett S et al. Exercise rehabilitation following hospital discharge in survivorsof critical illness: an integrative review. Crit Care 2012; 20:226 3. Stevens RD, MarshallSA, Cornblath DR et al. A framework for diagnosing and classifying intensive care unit-acquired weakness. Crit Care Med 2009; 37:S299–308
Patient characteristics
Interim analysis population(N: 121)
ICU-AW(N:65)
NoICU-AW(N:56)
p-value
Age, mean ± SD 65 ± 15 61 ± 15 0.14
Gender (male), n (%) 36 (55) 36 (64) 0.36
APACHE IV score, mean ± SD 88 ± 25 76 ± 26 0.02
Medical admission, n (%) 40 (62) 32 (57) 0.87 (for alladmissiontypes)
Emergency surgical admission, n (%) 12 (18) 11 (20)
Planned surgical admission, n (%) 13 (20) 13 (23)
Length of stay in the ICU (days),median (IQR)
16 (9–23) 7 (5–10) \0.01
Mean MRC, median (IQR) 2.8 (1.1–3.3) 4.8 (4.4–5.0)
Ventilator associated prenumonia: new insights:0898–09020898REDUCTION IN VAP INCIDENCE BY SUBGLOTTIC SECRETION DRAINAGEAND ANTIBIOTIC CONSUMPTION IN ICU PATIENTS
I. Van Cauwenberge1, A. Ancion2, B. Lambermont2, D. Ledoux1, M. Nys1, N. Samalea1,
P. Damas1
1University Hospital Centre, Department of General Intensive Care, Liege, Belgium,2University Hospital Centre, Department of Medical Intensive Care, Liege, BelgiumINTRODUCTION. What is the impact of ventilatory associated pneumonia (VAP)reduction by prevention measures on antibiotic consumption (ABC)?OBJECTIVES. A randomized controlled study on the efficacy of subglottic secretiondrainage was performed in the 5 ICU of the Liege university hospital in Belgium.METHODS. Three hundred and twelve patients, intubated with Teleflex ISIS endotrachealtube were prospectively and randomly assigned to subglottic suction (group 1, n = 154) ornot (group 2, n = 158) if they were expected to be ventilated for more than 2 days betweenJanuary 2012 and March 2013. VAP was defined by a clinical pulmonary severity scoreabove 6, a new pulmonary infiltrate and a quantitative endotracheal aspiration culture ofmore than 105 CFU/ml of relevant pathogens. ABC was evaluated by the number of ven-tilatory days (VD) during which patients received antibiotics for any reasons.RESULTS. The 312 patients were 67 % males, with a median age of 65 y (range 18–94),and their ICU admission were due to medical (75 %), surgical (20 %) or traumatic causes(4 %). Patients did no differ between groups. The median VD in group 1 was 8 days (range3–37) and in group 2, 8 days (range 3–38) totalizing 1,559 VD in group 1 and 1,570 VD ingroup 2. VAP occurred in 15 patients of group 1 and in 30 of group 2 (p = 0.024),corresponding to a decrease in the rate of VAP caused by subglottic suctioning from 19.1
26th ESICM ANNUAL CONGRESS — PARIS, FRANCE — 5–9 OCTOBER 2013
VAP/1,000 VD to 9.6 VAP/1,000 VD. The impact on ABC was less clear: Group 1 receivedantibiotics during 69 % of VD and group 2 during 75 % of VD. This was not statisticallysignificant, p = 0.075. In group 1 and 2, 104 and 114 patients were respectively treated byantibiotics the day of intubation. In this subgroup of patients, VAP rate was 6/1,000 VD inthe 104 patients from group 1 and 12/1,000 VD in patients from group 2. ABC was observedin 85 % of VD in both groups. Regarding patients with no treatment the day of intubation,VAP rate reached 19/1,000 VD in patients from group 1 and 39/1,000 VD in patients ofgroup 2. Interestingly, it was in these subgroups that the decrease in ABC could be seen:patients from group 1 received antibiotic treatment during 32 % of VD and patients fromgroup 2 during 52 % of VD (p \ 0.0001).CONCLUSIONS. Subglottic suctioning significantly decreased the rate of VAP. An impacton ABC was only observed in patients not treated by antibiotics the day of intubation. TheABC also had a great impact on the level of VAP incidence. This last parameter should bebetter known in all the prevention studies.
0899SIMVASTATIN AND THE PROGNOSIS OF VENTILATOR-ASSOCIATEDPNEUMONIA (STATIN-VAP): MULTICENTER RANDOMIZED CONTROLLEDTRIAL
L. Papazian1, A. Roch1, P.-E. Charles2, C. Penot-Ragon3, G. Perrin3, P. Roulier4,
P. Goutorbe5, J.-Y. Lefrant6, J. Textoris7, B. Jung8, J.-M. Constantin9, L. Argaud10,A. Nau11, O. Baldesi12, K. Baumstark3, E. Jouve3, M. Moussa3, J.-M. Forel1, For theSTATIN-VAP Study Group1Hopital Nord, Réanimation DRIS, Marseille, France, 2CHU de Dijon, Dijon, France, 3CHUde Marseille, Marseille, France, 4CH de Perpignan, Perpignan, France, 5HIA Sainte-Anne,Toulon, France, 6CHU de Nimes, Nimes, France, 7Hopital Nord, Marseille, France, 8CHUde Montpellier, Montpellier, France, 9CHU de Clermont-Ferrand, Clermont-Ferrand,France, 10Hospices Civils de Lyon, Hôpital Edouard-Herriot, Lyon, France, 11HIA Laveran,Marseille, France, 12CH Aix-en-Provence, Aix-en-Provence, FranceINTRODUCTION. Some epidemiological studies have suggested that the use of statinsduring the ICU stay could improve the outcome in patients presenting an infection. How-ever, there was no convincing proof of the ability of statins to alter the outcome in specificICU infections. We therefore designed this prospective multicenter double-blinded ran-domized controlled trial comparing simvastatine and placebo as adjunctive therapy in thetreatment of patients presenting with ventilator-associated pneumonia (VAP).OBJECTIVES. The main objective of the study was to show that simvastatin was able todecrease the 28-day mortality rate.METHODS. Adults who had received mechanical ventilation in the ICU for at least 2 dayswere eligible if they had suspected pneumonia, defined by a simplified Clinical PulmonaryInfection Score (CPIS) score of at least 5 (1), and if a quantitative bacteriological culture ofBAL, protected telescopic catheter (PTC) or endotracheal aspirate was done. Simvastatin60 mg or placebo was given until ICU discharge or death and for a maximum of 28 days.Assuming a 28-day mortality rate of 30 % (2) and two planned interim analyses, we cal-culated that we needed to enroll 1,002 patients. The trial was monitored by an independentdata and safety monitoring board (DSMB). The first interim analysis was done after theanalysis of 251 completed inclusions. The DSMB proposed to stop the inclusions when theanalysis was completed.RESULTS. Three hundred patients were finally included. The intention-to-treat analysiswas possible for 284 patients (16 patients unable to give their consent or who withdrew theirconsent). Finally 146 patients were included in the simvastatin group and 138 patients in theplacebo group. The mean age of the 284 patients was 59 ± 17 years. The mean SAPS IIscore on admission was 47 ± 15. The simplified CPIS at enrollment was 7.0 ± 1.4 and theSOFA score at day 1 was 7.0 ± 3.3. Thirty-six percent of the patients were not receivingantibiotics during the 3-day period preceding the inclusion. The 28-day mortality rate for theentire group of 284 patients was 18.3 %. The overall hospital mortality was 28.5 %. Therewas no clinically relevant difference among the two groups regarding side-effects of thetreatment.CONCLUSIONS. This prospective randomized controlled trial was prematurely stopped bythe steering committee after the first interim analysis report done by the DSMB.REFERENCE(S). 1. Luna CM et al. Resolution of ventilator-associated pneumonia:prospective evaluation of the clinical pulmonary infection score as an early clinical pre-dictor of outcome. Crit Care Med. 2003;31(3):676–82. 2. Fagon JY et al. Invasive andnoninvasive strategies for management of suspected ventilator-associated pneumonia. Arandomized trial. Ann Intern Med. 2000; 18;132(8):621–30.GRANT OBTAINED. Projet Hospitalier de Recherche Clinique 2007
0900A PATH TOWARDS ZERO VENTILATOR ASSOCIATED PNEUMONIA EVENTS;5-YEAR EXPERIENCE FROM MAYO CLINIC FLORIDA
E. Festic1, K. Thompson1, W. Hellinger1, D. Carey1, G. Divertie1
1Mayo Clinic, Jacksonville, USAINTRODUCTION. Ventilator-associated pneumonia (VAP) is a known complication ofmechanical ventilation (MV), which increases patients’ morbidity, mortality, length of stayand associated costs. A multidisciplinary VAP prevention team was reassembled in 2008 atMayo Clinic Florida (MCF) in order to reduce the VAP rates.OBJECTIVES. To decrease VAP rates by 50 % every year with a longer-term goal of zeroannual events of VAP.METHODS. The patient population included all patients requiring mechanical ventilationat MCF, an academic medical center with 54 critical care beds equally split between two,medical (MICU) and surgical (SICU), ICU wings from 2008 to 2012. In addition to theInstitute for Healthcare Improvement VAP I and VAP II bundle protocols already in place, amultidisciplinary team with clinical and quality improvement expertise was reassembledand initiated a sequence of 5 novel interventions: 1. Early screening with chest radiographsor CT scans of patients at high risk for aspiration prior to the onset of MV; 2. Protocol forantiseptic oral care; 3. Protocol for daily antiseptic baths; 4. Early bronchoscopy; and 5.Protocol for endotracheal tube (ETT) cuff care. The data was continuously tracked andanalyzed on monthly meetings.RESULTS. The final objective of zero annual VAP events was achieved. The results arepresented as summed events as well as separately for MICU and SICU wings. In 2008, therewere 14 summed VAP events (3.33 events/1,000 ventilator days); in 2009, there were 7 (1.97/1,000); in 2010 there were 3 (0.72/1,000); in 2011 there was only 1 VAP (0.24/1,000); and in2012 there were no summed VAP events (0). Summed ventilator days ranged from 3,495 to
4,206 per year in this 5-year period. In MICU and SICU, respectively, in 2008 there were 3 and11 VAP events (1.9/1,000 and 4.19/1,000); in 2009, there were 0 and 7 (0 and 3.21/1,000); in2010 there were 2 and 1 (1.39/1,000 and 0.37/1,000); in 2011 there were 0 and 1 (0 and 0.39/1,000); and in 2012 there were no VAP events in either MICU or SICU. Ventilator days inMICU and SICU ranged from 1,288 and 2,184 to 1,622 and 2,734, respectively, per year in this5-year period. Majority but not all neurological and transplant patients, who in general tend tohave higher VAP rates per literature, were treated in SICU wing.CONCLUSIONS. The goal of zero VAP events at MCF has been achieved nearly 5 yearsafter the implementation of a multidisciplinary VAP prevention team with not only aclinical but also an expertise in quality improvement strategies.
0901VENTILATOR-ASSOCIATED COMPLICATION: INCIDENCE, OUTCOME ANDRELATIONSHIP WITH VENTILATOR-ASSOCIATED PNEUMONIA
L. Bouadma1, B. Mourvillier1, M. Garrouste-Orgeas2, S. Ruckly3,4, C. Clec’h5,B. Souweine6, G. Voiriot1, L. Potton2, M. Darmon7, B. Allaouchiche8, L. Argaud9,E. Azoulay10, D. Goldgran-Toledano11, H. Haouache6, J.-F. Timsit3,4, on behalf of theOutcomerea Study Group1Hôpital Bichat Claude Bernard, Réanimation Médicale, Paris, France, 2Groupe HospitalierSt Joseph, Polyvalent ICU, Paris, France, 3Grenoble University Hospital, Polyvalent ICU,Grenoble, France, 4Grenoble University Hospital, University of Grenoble 1 (Joseph Fourier)Integrated Research Center U 823, Albert Bonniot Institute, La Tronche, Grenoble, France,5Avicenne University Hospital, Medical-Surgical ICU, Bobigny, France, 6Gabriel MontpiedUniversity Hospital, Medical ICU, Clermont-Ferrand, France, 7Saint-Etienne UniversityHospital, Medical ICU, Saint-Priest-en-Jarez, France, 8Edouard Herriot University Hospital,Surgical ICU, Lyon, France, 9Edouard Herriot University Hospital, Medical ICU, Lyon,France, 10Saint Louis University Hospital, Medical ICU, Paris, France, 11Gonesse Hospital,Polyvalent ICU, Gonesse, FranceINTRODUCTION. Ventilator-Associated Pneumonia (VAP) surveillance is needed tomeasure incidence and to gauge the success of prevention efforts [1]. However, VAPdiagnosis is a complex issue for intensivists [2]. Therefore, the CDC developed a newapproach to VAP surveillance [3]. The result is an algorithm for diagnosis of Ventilator-associated complications (VACs) based on objective criterion, i.e. an improvement ofventilator settings after a period of stable or decreasing ventilator support.OBJECTIVES. We assessed(1) the current incidence of VACs;(2) events related to the first episode of VACs, i.e.; nosocomial infections (including VAPs),iatrogenic adverse events (IAEs) and interventions (transport and fluid resuscitation);(3) the reality of a correlation between VACs and VAPs episodes,(4) the impact of VAC on patient outcomes.METHODS. Patients (n = 13,702) from the longitudinal prospective French multicenterOutcomerea database were included if they were under mechanical ventilation for C5 daysand classified as to the presence of at least one VAC episode. VAC was defined as arespiratory alteration (C2 days of stable or decreasing level of PEEP range (C6, C10 andC16 mmHg) and a stable or improved PaO2/FiO2 ratio followed by a rise in level of PEEPC2 days or a decreasing PaO2/FiO2 ratio C2 days by more than 50 mmHg with the samelevel of PEEP or by more than 100 mmHg whatever the level of PEEP. VAP diagnosis usedclinical suspicion and a quantitative proximal (TA [ 105 CFU/ml) or distal samples (BALculture [ 104 CFU/ml or PTC/PSB [ 103 CFU/ml.RESULTS. A total of 3,028 patients were included in this study. Among them, 2,331(77 %) patients experienced at least one episode of VAC. There was a good correlationbetween VACs and VAPs occurrences, but only 14.5 % of the first episode of VAC wasrelated (2 calendar days before or after the onset of worsening oxygenation) to an episode ofVAP. The median [interquartile range] of episodes per patient was 2 [1–3]. Overall, nos-ocomial infections accounted for 27.3 %, IAEs for 13.8 %, transport for 16.5 % and fluidresuscitation for 5.4 % of VAC first episodes. The number of days alive without antibioticsat day 28 was significantly lesser in patients with at least one episode of VAC (17 [4;23] vs.24 [2;6], p \ 0.005). Moreover using statistical models able to handle time-dependentcovariates and competing risks and after adjustment for confounding factors we found thatVAC was an independent factors for day-28 mortality (Hazard ratio = 1.29; Confidenceinterval 95 % [1.07;1.56], p \ 0.01).CONCLUSIONS. VACs may not be useful for VAP surveillance in ICUs, however, thesefeatures makes VAC a possible quality indicator candidate for quality improvementprograms.REFERENCE(S). 1. Zahar JR Crit Care Med. 2009;37:2545–51. 2. Klompas M JAMA2007;297:1583–93. 3. Klompas M PLoS One 6:e18062.
0902‘VOLATILE METABOLITE FINGERPRINTS’ OF TRACHEAL ASPIRATESDISCRIMINATES PATIENTS WITH VAP FROM CONTROLS
L.D.J. Bos1,2, J. Kastelijn1,2, I. Martin-Loeches2, C. de Haro2, G. Gilis2, P. Povoa3,A. Torres4, A. Kolk5, H.-G. Janssen5, P.J. Sterk1, A. Artigas2, M.J. Schultz1, BIOVAPStudy Group1Academic Medical Center, University of Amsterdam, Amsterdam, The Netherlands,2Corporació Sanitaria Parc Taulı́ Universitaria, Hospital de Sabadell, AutonomousUniversity of Barcelona, Critical Care Centre, CIBER Enfermedades Respiratorias,Sabadell, Spain, 3Sao Francisco Xavier Hospital, Lisbon, Portugal, 4Hospital Clı́nic deBarcelona, Barcelona, Spain, 5University of Amsterdam, Amsterdam, The NetherlandsINTRODUCTION. VAP may result in changes in the composition of volatile metabolitesin the lung. An electronic nose (eNose) can rapidly fingerprint these changes. In a bench-study we determined changes in the composition of volatile metabolites in air from head-space of thawed tracheal aspirates (TA) of patients with or without VAP.HYPOTHESES. We hypothesized that the volatile metabolite fingerprint of trachealaspirates can discriminate between patients with and without VAP.METHODS. Sub-study of an international multi-national cohort study of ventilated criti-cally ill patients, using prospectively obtained TA. VAP was diagnosed using clinicalcriteria (chest X-ray infiltrate, fever, leucocytosis, purulent sputum) but always neededmicrobiological confirmation (‘definitive VAP’) (103/106 CFU for BAL/TA). Patients whomet the clinical criteria for VAP but with negative TA culture were classified as ‘suspectedbut unconfirmed VAP’. Patients who did not meet clinical criteria for VAP were furtherclassified as having ‘colonized’ airways (positive TA culture), or ‘non-colonized airways’(negative TA culture). TA obtained at the day closest to the day VAP was diagnosed
26th ESICM ANNUAL CONGRESS — PARIS, FRANCE — 5–9 OCTOBER 2013
(median 7 [25 –75 %: 5–9] days after ICU admission) was compared to a randomly selectedTA from a patient not developing VAP (4 [25–75 %: 2–8] days after ICU admission). Adiagnostic model to discriminate definitive VAP from patients who did not develop VAPand had non-colonized airways was produced using sparse partial least square. This modelwas then applied to colonized patients and patients with suspected but unconfirmed VAP.RESULTS. The analysis included 12 patients with definitive VAP, 7 patients with sus-pected but unconfirmed VAP, and 14 patients with and 17 patients without colonized andnon-colonized airways. The eNose model discriminated patients with VAP from patientswithout VAP and non-colonized airways with an ROC-AUC of 0.80 [95 %-CI: 0.61–0.99].VAP was discriminated from colonized patients with an ROC-AUC of 0.83 [95 %-CI:0.67–1.0] and from patients with suspected but unconfirmed VAP with an ROC-AUC of0.82 [95 %-CI: 0.63–1.0]. Colonized and non-colonized airways in patients without VAPwere not discriminated (ROC-AUC: 0.56 [95 %-CI: 0.28–0.83].CONCLUSIONS. eNose technologies can discriminate tracheal aspirates of patients withVAP from patients without VAP. These results require validation in larger, prospectiveclinical trials possibly focussing on exhaled volatile metabolites.GRANT ACKNOWLEDGMENT. LDB is supported by the ESICM Young InvestigatorAward (2012).
Neurointensive care: outcome prediction:0903–09070903CSF AND PLASMA AMYLOID-B TEMPORAL PROFILES AND RELATIONSHIPSWITH NEUROLOGICAL STATUS AND MORTALITY AFTER SEVERETRAUMATIC BRAIN INJURY: RESULTS OF A PILOT STUDY
S. Mondello1, A. Buki2, J. Randall3, G. Provuncher3, D. Hanlon3, D. Wilson3, D. Italiano1,
F. Tomasello1, A. Jeromin4
1University of Messina, Messina, Italy, 2University of Pecs, Pecs, Hungary, 3QuanterixCorporation, Lexington, USA, 4NextGen Science Dx, Gainesville, USAINTRODUCTION. Recent experimental and human studies have shown that traumaticbrain injury (TBI) results in significant changes in the concentration and dynamics ofamyloid-b (Ab) in the human brain (1, 2). This condition is believed to accelerate Ab-related pathophysiologic processes and affect neuronal function in patients with severe TBI.OBJECTIVES. To assess amyloid-b1–42 (Ab42) concentrations and time-course in CSFand in plasma of patients with severe TBI and their relationship to injury characteristics,neurological status and clinical outcome.METHODS. A total of 12 patients with severe TBI [Glasgow Coma Scale (GCS) B 8] and20 controls were included in this prospective study. We evaluated levels of Ab42 in pairedCSF and plasma samples taken from each TBI patient at admission and daily up to 7 days.Ab42 concentrations were assessed by utilizing an ultrasensitive digital ELISA approach.This method is based on isolating single immunocomplexes labeled with an enzyme inarrays of femtoliter wells, sealing the arrays in the presence of the enzyme substrate, andfluorescently imaging the array. Isolation of single immunocomplexes in this way gives riseto a dramatic increase in sensitivity over bulk, ensemble detection methods. The limit ofdetection was 0.02 pg/mL in plasma. Data collected included demographic and clinicalvariables as well as survival 6 months post-injury.RESULTS. CSF Ab42 levels were significantly lower in TBI patients acutely after injury ascompared to controls (median 105.9 vs. 537.6 pg/ml, p \ 0.0001) with lower levels inpatients who died 6 months post injury than in those who were alive. Conversely, plasmaAb42 levels were significantly increased in TBI as compared to controls (median 17.0vs.7.3 pg/ml, p \ 0.0001) with higher levels in patients who survived. A trend analysisusing the Jonckheere-Terpstra test showed that both CSF and plasma Ab42 levels stronglycorrelated with mortality (P \ 0.0001). CSF and plasma Ab42 concentrations within thefirst 24 h after injury did not correlate with TBI characteristics. A positive correlationbetween changes in CSF Ab42 concentrations and neurological status as assessed by GCSwas identified. CSF Ab42 levels tended to increase as neurological status improved anddecrease when neurological status deteriorated. There was no correlation between CSF andplasma Ab42 levels.CONCLUSIONS. These results suggest that determination of Ab42 may be valuable toobtain prognostic information in patients with severe TBI as well as in monitoring theresponse of the brain to injury.REFERENCE(S). 1. Magnoni S, Brody DL. Arch Neurol. 2010;67(9):1068–73. 2. TranHT, Sanchez L, Esparza TJ, Brody DL. PLoS One. 2011;6(9):e25475.GRANT ACKNOWLEDGMENT. Supported by Department of Defense (DAMD17-03-1-0772 and DAMD17-03-1-0066).
0904EVOLUTIONARY ANALYSIS OF SPONTANEOUS SUBARACHNOIDHEMORRHAGE (SAH) IN A 17 YEARS PERIOD
F. Guerrero López1, F.I. Pino Sánchez1, M. Colomo González1, M. Monsalve Álvarez deCienfuegos1, S. Nogueras Guijarro1, J. de la Cruz Sabido2
1H.U. Virgen de las Nieves, Intensive Care Unit, Granada, Spain, 2H.U. Virgen de lasNieves, Neurosurgery, Granada, SpainINTRODUCTION. SAH remains a prevalent clinical entity, having emerged in last dec-ades handling modifications affecting the results of these patients.METHODS. It‘s a retrospective analysis of all patients admitted with a diagnosis ofspontaneous SAH in a Neuro Intensive Care Unit. We included demographic variables,treatment schedule, specific severity criteria (Glasgow Coma Scale-GCS-, Hunt-Hess score -HH-, World Federation of Neurosurgeons -WFNS-, Fisher) and general of critical patient(APACHE III), aneurysm responsible for the bleeding and its treatment, patient0s overalltreatment, neurological and extra-neurological complications, time from SAH to aneurysmtreatment and time from admission in our service to aneurysm treatment, hospital mortality,hospital outcomes (GOS) and length of stay in ICU and hospital. To compare results in anevolutionary way, we have created three periods within these 17 years. We present basicdescriptive statistics with means and standard deviation, median and interquartile range andabsolute and relative frequencies. For comparison of qualitative variables we used the Chisquare test and for quantitative variables ANOVA and Kruskal–Wallis test, as adjusted ornot to a normal distribution. It was considered statistically significant at p \ 0.05.RESULTS. We included 925 cases, 58.6 % female, age 55.7 ± 14.7 years. In 714 cases(77.2 %) an aneurysm was found like responsible for the bleeding and anterior
communicating artery was the most common location. Initially 30 % were in poor neuro-logical condition (HH IV-V), 37.1 % according WFNS (IV-V), 21.7 % had a GCSscore B 8 and almost 80 % were Fisher III–IV. The APACHE III was 43.9 ± 31.5. A39.4 % of patients required mechanical ventilation (not as a support for surgery or embo-lization). Of the patients with aneurysms, 194 were treated surgically, 380 by endovascularand in 15 cases both treatments were used in the acute phase. The median of time frombleeding until aneurysm treatment was 3 days [1, 7] and from hospitalization 1.9 [1, 5].Hydrocephalus was present in 315 patients (34.1 %), vasospasm in 143 (15.5 %), rebleedingin 95 (10.3 %) and 160 patients developed a stroke (17.3 %). The most frequent extra-neurological complication was nosocomial pneumonia in 13.1 %. The hospital mortalitywas 24.4 % and overall poor outcomes (GOS I–III) of 43.7 %. The median ICU stay was4 days [2, 9] and hospital stay 14 [5, 26]. In table 1 we can compare the results in the 3 timeperiods.
Evolutionary profile of SAH in three time periods
1996–2002(n = 257)
2003–2007(n = 311)
2008–2013(n = 357)
p
Hunt-Hess IV–V 41.7 % 29.6 % 21.8 % 0.001
Fisher III–IV 83 % 80.8 % 77.1 % 0.07
Endovasculartreatment
31.7 % 38.9 % 52.7 % 0.001
Time admission-treatment
5 (2, 15.25) 1 (1, 5) 1 (1, 2) 0.001
ICU LOS* 5 (2, 10) 4 (2, 9) 3 (1, 8) 0.001
Vasospasm 24.5 % 10 % 13.7 % 0.001
Rebleeding 17.5 % 9.3 % 5.9 % 0.001
GOS I–III 54 % 45.9 % 33 % 0.0001
Hospital mortality 35.3 % 25.4 % 15 % 0.001
CONCLUSION. With course of time we have better outcomes (lower mortality and betterfunctional outcome), partly because of lower severity of patients admitted (increase incomecriteria) but also by shortening treatment times, increased frequency of endovasculartreatment and lower percentage of neurological complications.
0905CLINICAL SPECTRUM AND OUTCOMES OF PATIENTS WITH ENCEPHALITISREQUIRING ICU ADMISSION
R. Sonneville1, N. Gault2, I. Klein3, E. De Montmollin1, S. Chemam1, E. Mariotte1,B. Mourvillier1, F. Tubach2, M. Wolff1, L. Bouadma1
1Bichat University Hospital, Intensive Care Medicine, Paris, France, 2Bichat UniversityHospital, Epidemiology, Paris, France, 3Bichat University Hospital, Radiology, Paris,FranceINTRODUCTION. Acute encephalitis is a severe neurological condition which is asso-ciated with significant morbidity and mortality. Few epidemiological studies are available inEurope and determinants of outcome in patients admitted to the ICU are unknown.OBJECTIVES. We aimed to describe the epidemiology, the clinical presentation andfunctional outcomes of patients with encephalitis requiring ICU admission.METHODS. We performed a retrospective cohort study (1991–2012) on consecutivepatients with encephalitis admitted to the ICU of a French University hospital. Cases werereviewed by two investigators and patients were classified into three categories according tothe etiology: (1) infectious causes; (2) immune-mediated causes; (3) undetermined causes.Functional outcome was graded at hospital discharge using the modified Rankin score(mRs).We compared patients’ characteristics and causes of encephalitis between two 10-yearperiods (period 1: 1991–2001 and period 2: 2002–2012). We used multivariate logisticregression to analyze factors associated with a poor outcome, as defined by a mRs [ 2(severe disability or death). Data are expressed as median (interquartile range) or number(percentage).RESULTS. We included 279 patients [Age: 39 (29–57) years, SAPS 2: 26 (16–41)] over thestudy period. Patients presented with impaired consciousness (GCS score of 12 (8–14)),seizures (35 %), focal signs (25 %) and fever [38.3 �C (37.5–39.0)]. Among them, 154(55 %) were mechanically ventilated. The causes of encephalitis were: (1) infections in 149(53 %) patients, including Mycobacterium tuberculosis (n = 65), herpes simplex virus(n = 40), and varicella zoster virus (n = 14); (2) immune-mediated causes in 41 (15 %)patients; (3) undetermined in 89 (32 %) patients. The distribution of causes differed sig-nificantly between the two periods (period 2 versus period 1, p = 0.03): (1) infections (61(48 %) vs 88 (58 %) patients), (2) immune-mediated [26 (21 %) vs 15 (10 %) patients], (3)undetermined [39 (31 %) vs 50 (33 %) patients]. At hospital discharge, 208 (74.5 %)patients had a mRs = 0–2 (functional independence), 24 (8.5 %) had a mRs = 3–5 (severedisability), 47 (17.0 %) had a mRs = 6 (death). After adjusting for confounding factors(study period and functional status before ICU admission), our multivariate analysis iden-tified 5 baseline characteristics associated with a poor outcome: a low GCS score, presenceof focal signs, aspiration pneumonia, a low body temperature, and elevated cerebrospinalfluid protein levels (Table). Among identified causes, patients with tuberculous meningitishad the worst outcomes.
Independent predictors of poor outcome
Variable OR 95 % CI p
Study period (2002–2012) 1.78 0.92–3.50 0.09
Knaus score C or D 8.54 2.79–28.73 \0.001
GCS score (per 1-point increase) 0.76 0.69–0.84 \0.001
Focal sign (s) 2.72 1.32–5.64 0.007
Body temperature, �C (per 1-point increase) 0.73 0.55–0.95 0.02
Aspiration pneumonia 2.32 0.99–5.39 0.05
CSF protein levels, g/l (per 1-point increase) 1.11 1.02–1.26 0.03
CONCLUSIONS. The clinical profile of patients admitted to the ICU for encephalitis haschanged over the past 20 years, with an increase in the proportion of immune-mediatedcauses. Overall, intensive care management yielded a good functional prognosis in 75 % of
26th ESICM ANNUAL CONGRESS — PARIS, FRANCE — 5–9 OCTOBER 2013
cases. Our study identified early indicators of poor outcome, irrespective of the underlyingetiology.
0906SUBARACHNOID HAEMORRHAGE - WHICH GRADING SCALE BESTPREDICTS THE OUTCOME?
K. Suchdev1, R. Damani1, N.S. Bozorgzad1, G. Norris1
1Wayne State University/DMC, Neurology, Detroit, USAINTRODUCTION. Multiple grading scales have been developed to grade the severity ofsubarachonid haemorrhage (SAH). The most widely used scales,Hunt and Hess (H&H),Fischer, Glasgow Coma Scale (GCS) and World Federation of Neurological Societies(WFNS) scale were developed based on severity of symptoms,which has resulted in unclearcorrelation with the eventual outcome.OBJECTIVES. To determine which scale best predicts the outcome of SAH among H&H,GCS and Fischer grade,independent of demographic risk factors such as age and otherbaseline comorbidities.METHODS. A retrospective chart review of 141 consecutive patients who presented totwo academic institutions between July 2009 to April 2012 and met criteria for spon-taneous SAH was done. For each,demographics information (age, gender and race) andpresence of comorbidities (diabetes, hypertension and hyperlipidemia) were recordedalong with GCS, H&H and Fischer grade. Primary outcome was discharge modifiedRankin Scale (mRS) which was further dichotomized into good outcome (mRS B 2) andpoor outcome (mRS [ 2). Results were analyzed using the SYSTAT software. Canonicalcorrelation coefficients were calculated between each scale and mRS scores, controllingfor age, hypertension, hyperlipidemia and diabetes. The performance of individual scalein predicting the dichotomized outcome measure (poor vs good) was assessed usingbinary logistic regression model, into which comorbidities of hypertension, hyperlipid-emia, and diabetes as well as baseline demographics (age, gender and race) wereincorporated.RESULTS. All three scales correlated with discharge mRS score,even after controlling forthe effect of age, hypertension, hyperlipidemia and diabetes. The GCS scale (R2 = 0.369,p \ 0.001) had the highest correlation coefficient, followed by H&H scale (R2 = 0.276,p \ 0.001) and Fischer scale (R2 = 0.054, p = 0.003),which had the least correlation. Inlogistic regression model, the GCS score was again the best in predicting the dichotomousoutcome measure, with receiver operating characteristic (ROC) AUC of 0.878(OR = 1.440, [1.257–1.649], p \ 0.001) followed by the H&H score with ROC area of0.850 (H&H OR = 0.384 [0.258–0.574], p \ 0.001). The Fischer scale did not reach sta-tistical significance (Fischer scale OR: 0.617 [0.374–1.018], (p = 0.059).CONCLUSIONS. Our study shows that admission GCS score is best predictor of outcomesin SAH patients when compared with other widely used scales (H&H and Fisher). Fur-thermore familiarity of admission GCS amongst all health care personnel makes it a betterscale to follow compared to other grading scales which are only familiar to neurologists,neurosurgeons and intensivists and hence preclude their universality.REFERENCE(S).1. Rosen DS et al. Subarachnoid haemorrhage grading scales. Neurocrit. Care 2005. 2.
Starke RM et al. Predicting long-term outcome in poor grade aneurysmal subarachnoidhaemorrhage patients utilising the Glasgow Coma Scale. J Neurosci (2009).
0907SPONTANEOUS CEREBRAL HAEMORRHAGE AND MORTALITY ACCORD-ING TO THE LEVEL OF CONSCIOUSNESS AND INTRAVENTRICULARHAEMORRHAGE
M. Arias-Verdú1, E. Castillo-Lorente2, F. Guerrero-López3, R. Gutierrez-Rodriguez1,E. Banderas-Bravo1, E. Aguilar-Alonso4, G. Quesada-Garcia1, R. Rivera-Fernández1
1Hospital Carlos Haya, Intensive Care Unit, Málaga, Spain, 2Hospital Neurotraumatológico,Intensive Care Unit, Jaen, Spain, 3Hospital Virgen de las Nieves, Intensive Care Unit,Granada, Spain, 4Hospital Infanta Margarita, Intensive Care Unit, Córdoba, SpainOBJECTIVE. To assess mortality of patients admitted to the ICU with spontaneouscerebral haemorrhage according to the level of consciousness and the presence of intra-ventricular haemorrhage.METHODS. A multicentre, prospective cohort study of patients with spontaneous intra-cerebral haemorrhage and/or non-traumatic subarachnoid haemorrhage admitted to 3hospitals (Carlos Haya in Malaga, Virgen de las Nieves in Granada, and the Trauma hospitalin Jaén) between 2003–2008. We analyzed age, sex, type of haemorrhage, Glasgow onadmission, APACHE-III, intraventricular haemorrhage, and ICU and hospital mortality. Thestatistical study was done with the Student, X2 and logistic regression.RESULTS. 203 patients. Age 55.65 ± 14.69 years, APACHE-III 51.48 ± 33.02, GCS onadmission 9.66 ± 4.73. Hospital mortality 43.3 %. GCS on admission: 12.30 ± 3.80 insurvivors versus 6.22 ± 3.43 in those who died (p \ 0.001). In 30 patients the best GCSscore was 4 points and their mortality was 90 %. The remaining 173 patients had a hospitalmortality of 35.3 %.Intraventricular haemorrhage (IVH) was present in 92 patients (mortality 66.3 %) andabsent in 104 patients (mortality 21.2 %); p \ 0.001. We analyzed mortality according tothe level of consciousness on admission and the presence of IVH. The GCS on admissionwas: GCS [ 8 (N = 90) and GCS \ 8 (N = 108). Three of 73 patients without IVH andGCS [ 8 died (mortality 4.1 %), and 19 of 29 patients without IVH and GCS B 8 died(mortality: 65.5 %), (p \ 0.001). Fourteen of 33 patients with IVH and GCS [ 8 died(mortality: 42.4 %), and 45 of 56 patients with IVH and GCS B 8 died (mortality: 80.4 %),(p \ 0.001). Mortality was higher in the patients with IVH and a better level of con-sciousness on admission in comparison to those without IVH. This increased mortalityassociated with the presence of IVH was also seen in those who had a low level of con-sciousness, though much less markedly than in those with GCS [ 8.The multivariate analysis detected a relation between hospital mortality and GCS onadmission: OR 0.75 (0.68–0.82), type of haemorrhage: OR 2.4 (1.04–5.54), and the presenceof IVH: OR 5.85 (2.58–13.28). Analysis of the interaction between level of consciousnesson admission and the presence of IVH showed an interaction with IVH: OR for IVH plusGCS B 8 of 2.72 (0.94–7.83) and for IVH plus GCS [ 8 of 16.55 (4.25–64.49).CONCLUSIONS. The presence of IVH in patients admitted to the ICU with spontaneouscerebral haemorrhage is associated with an increased mortality, independently of the type ofhaemorrhage. This increase in mortality associated with IVH is much greater in patientswith a better level of consciousness on admission to the ICU than in those with a low levelof consciousness on admission.
Improving knowledge on sedation and delirium:0908–09120908RECALL OF ICU STAY IN MECHANICALLY VENTILATED PATIENTSMANAGED WITH A SEDATION PROTOCOL OR A SEDATION PROTOCOLWITH DAILY INTERRUPTION: RESULTS OF THE SLEAP MULTICENTERRANDOMIZED TRIAL
S. Mehta1, D. Cook2, M. Meade3, R. Mallick4, D. Fergusson4, M. Herridge5, M. Steinberg1,J. Granton5, N. Ferguson5, J. Devlin6, M. Tanios7, P. Dodek8, R. Fowler9, K. Burns10, M.Jacka11, K. Olafson12, S. Keenan13, S. Reynolds13, Y. Skrobik14, L. Burry1, the SLEAPInvestigators and the Canadian Critical Care Trials Group1Mount Sinai Hospital, Toronto, Canada, 2Macmaster University, Medicine, Critical Care,Hamilton, Canada, 3Macmaster University, Hamilton, Canada, 4Ottawa Hospital ResearchInstitute, Ottawa, Canada, 5University Health Network, Toronto, Canada, 6NortheasternUniversity, Boston, USA, 7Long Beach Memorial Medical Centre, Long Beach, USA, 8St.Paul’s Hospital, Vancouver, Canada, 9Sunnybrook Health Sciences Centre, Toronto, Can-ada, 10St. Michael’s Hospital, Toronto, Canada, 11University of Alberta, Edmonton, Canada,12University of Manitoba, Winnipeg, Canada, 13Fraser Health Authority, New Westminster,Canada, 14Hopital Maisonneuve Rosemont, Montreal, CanadaINTRODUCTION. Survivors of critical illness may have decreased recall of factual eventsyet report delusional memories, dreams, nightmares or hallucinations.OBJECTIVES. To evaluate factual and delusional memories of the ICU stay in patientsenrolled in a randomized trial comparing two sedation strategies.METHODS. SLEAP was a prospective, randomized trial in 16 centres. 419 mechanicallyventilated adults receiving opioid and/or benzodiazepine infusions were randomized toprotocolized sedation (PS), or protocolized sedation plus daily sedation interruption(PS + DI). There was no difference in the primary outcome of duration of mechanicalventilation, and the PS + DI group received significantly higher sedative doses [JAMA2012;308(19):1985]. Following ICU discharge, patients were interviewed on Days 3, 28 and90 by research personnel, in person or by telephone, using the ICU Memory Tool. Patientswere asked about factual memories (e.g. family presence, suctioning, lights, breathing tube,ICU admission and discharge), emotional memories (e.g. panic, pain, feeling down), anddelusional memories (nightmares, hallucinations, someone trying to harm the patient).RESULTS. 368 interviews were conducted in 289 of 297 survivors (97.3 %); from 146patients in the PS group, and 143 in PS + DI group. 58 % of interviews were conducted inperson and 42 % by telephone. The mean age was 56.6 years (SD 16.6), 132 were female(45.7 %), mean APACHE II score 23.1 (SD 7.4), and SOFA 6.3 (SD 3.2). On days 3, 28 and90, 28 %, 26 %, and 36 % (p = 0.748) respectively had no recall of being in the ICU. Therewere no differences between PS and PS + DI groups in recall of hospital or ICU admission,sleep adequacy, panic, or intrusive memories (Table 1). On day 3, 97.2 % of patients had atleast one factual memory from the ICU admission, and 72.2 % had at least one delusionalmemory; these frequencies remained stable on days 28 and 90 (Table 2 & 3). Specific factualmemories remained stable over time, other than recollection of faces and the endotrachealtube, which declined significantly over time. The percentage of patients having at least onememory of feelings (e.g. pain, discomfort, anxiety) while in the ICU declined significantlyover the 3 time points; specific memories of pain, confusion, and panic also individuallydeclined significantly. There was a trend towards a decline in delusional memories over time(P = 0.057). Between the PS and PS + DI groups, the proportion of patients having at leastone factual memory, memory of feelings, and delusional memory, was similar.
Recall on Day 28 after ICU dischargePS + DI(N = 62)n (%)
PS(N = 59)n (%)
Remember admission to hospital - clearly 25 (41.7) 31 (52.5)
Remember time before ICU - all of it 6 (10) 7 (12.1)
Remember being in the ICU 48 (78.7) 40 (69.0)
Remember all of the ICU stay 6 (10) 4 (6.9)
Enough sleep 39 (65.0) 36 (67.9)
Remember transfer from ICU - clearly 37 (61.7) 28 (49.1)
Panic or apprehension 12 (21.0) 14 (25.0)
Intrusive memories 9 (15.5) 12 (21.4)
P [ 0.05 for all comparisons
Factual memories in all patientsDay 3 N = 144n (%)
Day 28 N = 113n (%)
Day 90 N = 92n (%)
P value
Any factual memory 140 (97.2) 107 (94.7) 87 (94.6) 0.055
Faces 80 (55.6) 55 (48.7) 42 (45.6) 0.049
Voices 88 (61.1) 61 (54.0) 55 (59.8) 0.064
Alarms 71 (49.3) 49 (43.4) 41 (44.6) 0.149
Lights 64 (44.4) 50 (44.2) 38 (41.3) 0.492
Breathing tube 88 (61.1) 60 (53.1) 47 (51.1) 0.012
Suctioning 59 (41.0) 41 (36.3) 28 (30.4) 0.079
Tube in nose 62 (43.1) 49 (43.4) 36 (39.1) 0.452
Ward rounds 54 (37.5) 38 (33.6) 35 (38.0) 0.248
Emotional and delusional memories all patientsDay 3 N = 144n (%)
Day 28 N = 113n (%)
Day 90 N = 92n (%)
P value
At least one memoryof feeling
129 (89.6) 91 (80.5) 72 (78.3) 0.006
Pain 51 (35.4) 33 (29.2) 20 (21.7) 0.041
Feeling confused 82 (57.0) 53 (46.9) 49 (53.3) 0.016
Panic 60 (41.7) 36 (31.9) 29 (31.5) 0.013
At least one delusionalmemory
104 (72.2) 79 (69.9) 57 (62.0) 0.057
Hallucinations 60 (41.7) 45 (39.8) 34 (37.0) 0.293
Dreams 80 (55.6) 57 (50.4) 46 (50.0) 0.051
Nightmares 46 (31.9) 38 (33.6) 26 (28.3) 0.585
Feeling people weretrying to hurt you
23 (16.0) 18 (15.9) 21 (22.8) 0.415
CONCLUSIONS. Approximately 1/3 of patients in the SLEAP Trial had no recall of ICUadmission; however, the majority had at least one factual memory and more than 60 % had
26th ESICM ANNUAL CONGRESS — PARIS, FRANCE — 5–9 OCTOBER 2013
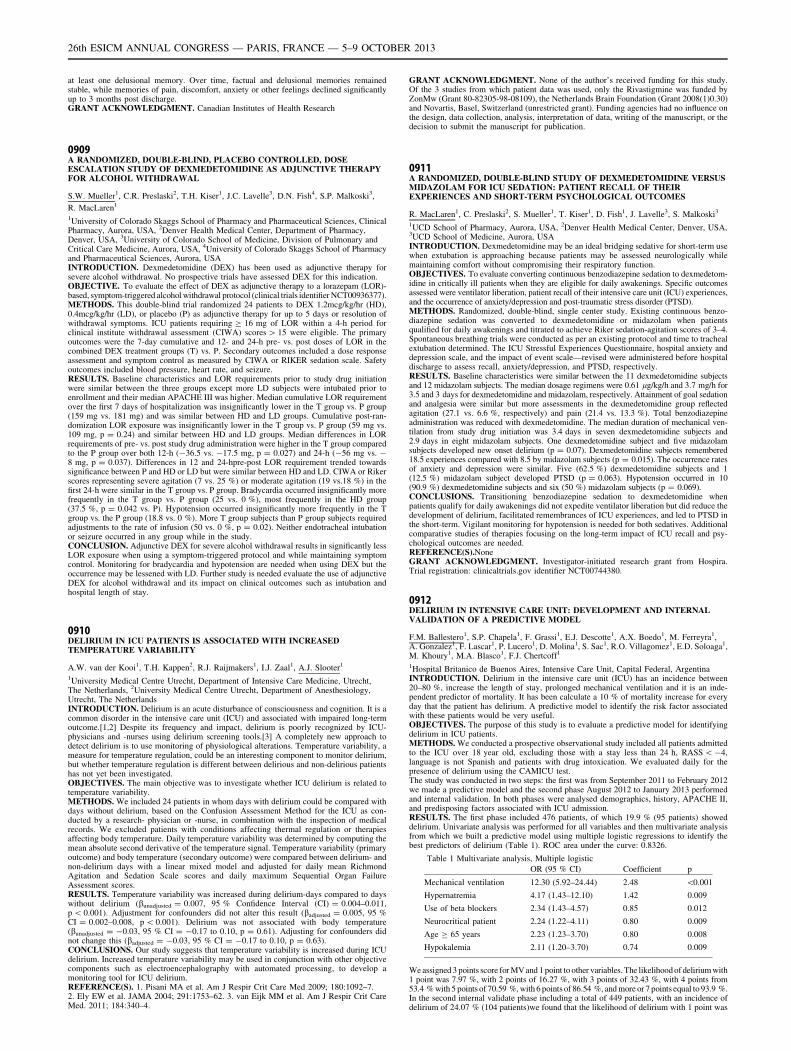
at least one delusional memory. Over time, factual and delusional memories remainedstable, while memories of pain, discomfort, anxiety or other feelings declined significantlyup to 3 months post discharge.GRANT ACKNOWLEDGMENT. Canadian Institutes of Health Research
0909A RANDOMIZED, DOUBLE-BLIND, PLACEBO CONTROLLED, DOSEESCALATION STUDY OF DEXMEDETOMIDINE AS ADJUNCTIVE THERAPYFOR ALCOHOL WITHDRAWAL
S.W. Mueller1, C.R. Preslaski2, T.H. Kiser1, J.C. Lavelle3, D.N. Fish4, S.P. Malkoski3,
R. MacLaren1
1University of Colorado Skaggs School of Pharmacy and Pharmaceutical Sciences, ClinicalPharmacy, Aurora, USA, 2Denver Health Medical Center, Department of Pharmacy,Denver, USA, 3University of Colorado School of Medicine, Division of Pulmonary andCritical Care Medicine, Aurora, USA, 4University of Colorado Skaggs School of Pharmacyand Pharmaceutical Sciences, Aurora, USAINTRODUCTION. Dexmedetomidine (DEX) has been used as adjunctive therapy forsevere alcohol withdrawal. No prospective trials have assessed DEX for this indication.OBJECTIVE. To evaluate the effect of DEX as adjunctive therapy to a lorazepam (LOR)-based, symptom-triggered alcohol withdrawal protocol (clinical trials identifier NCT00936377).METHODS. This double-blind trial randomized 24 patients to DEX 1.2mcg/kg/hr (HD),0.4mcg/kg/hr (LD), or placebo (P) as adjunctive therapy for up to 5 days or resolution ofwithdrawal symptoms. ICU patients requiring C 16 mg of LOR within a 4-h period forclinical institute withdrawal assessment (CIWA) scores [ 15 were eligible. The primaryoutcomes were the 7-day cumulative and 12- and 24-h pre- vs. post doses of LOR in thecombined DEX treatment groups (T) vs. P. Secondary outcomes included a dose responseassessment and symptom control as measured by CIWA or RIKER sedation scale. Safetyoutcomes included blood pressure, heart rate, and seizure.RESULTS. Baseline characteristics and LOR requirements prior to study drug initiationwere similar between the three groups except more LD subjects were intubated prior toenrollment and their median APACHE III was higher. Median cumulative LOR requirementover the first 7 days of hospitalization was insignificantly lower in the T group vs. P group(159 mg vs. 181 mg) and was similar between HD and LD groups. Cumulative post-ran-domization LOR exposure was insignificantly lower in the T group vs. P group (59 mg vs.109 mg, p = 0.24) and similar between HD and LD groups. Median differences in LORrequirements of pre- vs. post study drug administration were higher in the T group comparedto the P group over both 12-h (-36.5 vs. -17.5 mg, p = 0.027) and 24-h (-56 mg vs. -8 mg, p = 0.037). Differences in 12 and 24-hpre-post LOR requirement trended towardssignificance between P and HD or LD but were similar between HD and LD. CIWA or Rikerscores representing severe agitation (7 vs. 25 %) or moderate agitation (19 vs.18 %) in thefirst 24-h were similar in the T group vs. P group. Bradycardia occurred insignificantly morefrequently in the T group vs. P group (25 vs. 0 %), most frequently in the HD group(37.5 %, p = 0.042 vs. P). Hypotension occurred insignificantly more frequently in the Tgroup vs. the P group (18.8 vs. 0 %). More T group subjects than P group subjects requiredadjustments to the rate of infusion (50 vs. 0 %, p = 0.02). Neither endotracheal intubationor seizure occurred in any group while in the study.CONCLUSION. Adjunctive DEX for severe alcohol withdrawal results in significantly lessLOR exposure when using a symptom-triggered protocol and while maintaining symptomcontrol. Monitoring for bradycardia and hypotension are needed when using DEX but theoccurrence may be lessened with LD. Further study is needed evaluate the use of adjunctiveDEX for alcohol withdrawal and its impact on clinical outcomes such as intubation andhospital length of stay.
0910DELIRIUM IN ICU PATIENTS IS ASSOCIATED WITH INCREASEDTEMPERATURE VARIABILITY
A.W. van der Kooi1, T.H. Kappen2, R.J. Raijmakers1, I.J. Zaal1, A.J. Slooter1
1University Medical Centre Utrecht, Department of Intensive Care Medicine, Utrecht,The Netherlands, 2University Medical Centre Utrecht, Department of Anesthesiology,Utrecht, The NetherlandsINTRODUCTION. Delirium is an acute disturbance of consciousness and cognition. It is acommon disorder in the intensive care unit (ICU) and associated with impaired long-termoutcome.[1,2] Despite its frequency and impact, delirium is poorly recognized by ICU-physicians and -nurses using delirium screening tools.[3] A completely new approach todetect delirium is to use monitoring of physiological alterations. Temperature variability, ameasure for temperature regulation, could be an interesting component to monitor delirium,but whether temperature regulation is different between delirious and non-delirious patientshas not yet been investigated.OBJECTIVES. The main objective was to investigate whether ICU delirium is related totemperature variability.METHODS. We included 24 patients in whom days with delirium could be compared withdays without delirium, based on the Confusion Assessment Method for the ICU as con-ducted by a research- physician or -nurse, in combination with the inspection of medicalrecords. We excluded patients with conditions affecting thermal regulation or therapiesaffecting body temperature. Daily temperature variability was determined by computing themean absolute second derivative of the temperature signal. Temperature variability (primaryoutcome) and body temperature (secondary outcome) were compared between delirium- andnon-delirium days with a linear mixed model and adjusted for daily mean RichmondAgitation and Sedation Scale scores and daily maximum Sequential Organ FailureAssessment scores.RESULTS. Temperature variability was increased during delirium-days compared to dayswithout delirium (bunadjusted = 0.007, 95 % Confidence Interval (CI) = 0.004–0.011,p \ 0.001). Adjustment for confounders did not alter this result (badjusted = 0.005, 95 %CI = 0.002–0.008, p \ 0.001). Delirium was not associated with body temperature(bunadjusted = -0.03, 95 % CI = -0.17 to 0.10, p = 0.61). Adjusting for confounders didnot change this (badjusted = -0.03, 95 % CI = -0.17 to 0.10, p = 0.63).CONCLUSIONS. Our study suggests that temperature variability is increased during ICUdelirium. Increased temperature variability may be used in conjunction with other objectivecomponents such as electroencephalography with automated processing, to develop amonitoring tool for ICU delirium.REFERENCE(S). 1. Pisani MA et al. Am J Respir Crit Care Med 2009; 180:1092–7.2. Ely EW et al. JAMA 2004; 291:1753–62. 3. van Eijk MM et al. Am J Respir Crit CareMed. 2011; 184:340–4.
GRANT ACKNOWLEDGMENT. None of the author’s received funding for this study.Of the 3 studies from which patient data was used, only the Rivastigmine was funded byZonMw (Grant 80-82305-98-08109), the Netherlands Brain Foundation (Grant 2008(1)0.30)and Novartis, Basel, Switzerland (unrestricted grant). Funding agencies had no influence onthe design, data collection, analysis, interpretation of data, writing of the manuscript, or thedecision to submit the manuscript for publication.
0911A RANDOMIZED, DOUBLE-BLIND STUDY OF DEXMEDETOMIDINE VERSUSMIDAZOLAM FOR ICU SEDATION: PATIENT RECALL OF THEIREXPERIENCES AND SHORT-TERM PSYCHOLOGICAL OUTCOMES
R. MacLaren1, C. Preslaski2, S. Mueller1, T. Kiser1, D. Fish1, J. Lavelle3, S. Malkoski3
1UCD School of Pharmacy, Aurora, USA, 2Denver Health Medical Center, Denver, USA,3UCD School of Medicine, Aurora, USAINTRODUCTION. Dexmedetomidine may be an ideal bridging sedative for short-term usewhen extubation is approaching because patients may be assessed neurologically whilemaintaining comfort without compromising their respiratory function.OBJECTIVES. To evaluate converting continuous benzodiazepine sedation to dexmedetom-idine in critically ill patients when they are eligible for daily awakenings. Specific outcomesassessed were ventilator liberation, patient recall of their intensive care unit (ICU) experiences,and the occurrence of anxiety/depression and post-traumatic stress disorder (PTSD).METHODS. Randomized, double-blind, single center study. Existing continuous benzo-diazepine sedation was converted to dexmedetomidine or midazolam when patientsqualified for daily awakenings and titrated to achieve Riker sedation-agitation scores of 3–4.Spontaneous breathing trials were conducted as per an existing protocol and time to trachealextubation determined. The ICU Stressful Experiences Questionnaire, hospital anxiety anddepression scale, and the impact of event scale—revised were administered before hospitaldischarge to assess recall, anxiety/depression, and PTSD, respectively.RESULTS. Baseline characteristics were similar between the 11 dexmedetomidine subjectsand 12 midazolam subjects. The median dosage regimens were 0.61 lg/kg/h and 3.7 mg/h for3.5 and 3 days for dexmedetomidine and midazolam, respectively. Attainment of goal sedationand analgesia were similar but more assessments in the dexmedetomidine group reflectedagitation (27.1 vs. 6.6 %, respectively) and pain (21.4 vs. 13.3 %). Total benzodiazepineadministration was reduced with dexmedetomidine. The median duration of mechanical ven-tilation from study drug initiation was 3.4 days in seven dexmedetomidine subjects and2.9 days in eight midazolam subjects. One dexmedetomidine subject and five midazolamsubjects developed new onset delirium (p = 0.07). Dexmedetomidine subjects remembered18.5 experiences compared with 8.5 by midazolam subjects (p = 0.015). The occurrence ratesof anxiety and depression were similar. Five (62.5 %) dexmedetomidine subjects and 1(12.5 %) midazolam subject developed PTSD (p = 0.063). Hypotension occurred in 10(90.9 %) dexmedetomidine subjects and six (50 %) midazolam subjects (p = 0.069).CONCLUSIONS. Transitioning benzodiazepine sedation to dexmedetomidine whenpatients qualify for daily awakenings did not expedite ventilator liberation but did reduce thedevelopment of delirium, facilitated remembrances of ICU experiences, and led to PTSD inthe short-term. Vigilant monitoring for hypotension is needed for both sedatives. Additionalcomparative studies of therapies focusing on the long-term impact of ICU recall and psy-chological outcomes are needed.REFERENCE(S).NoneGRANT ACKNOWLEDGMENT. Investigator-initiated research grant from Hospira.Trial registration: clinicaltrials.gov identifier NCT00744380.
0912DELIRIUM IN INTENSIVE CARE UNIT: DEVELOPMENT AND INTERNALVALIDATION OF A PREDICTIVE MODEL
F.M. Ballestero1, S.P. Chapela1, F. Grassi1, E.J. Descotte1, A.X. Boedo1, M. Ferreyra1,A. Gonzalez1, F. Lascar1, P. Lucero1, D. Molina1, S. Sac1, R.O. Villagomez1, E.D. Soloaga1,M. Khoury1, M.A. Blasco1, F.J. Chertcoff1
1Hospital Britanico de Buenos Aires, Intensive Care Unit, Capital Federal, ArgentinaINTRODUCTION. Delirium in the intensive care unit (ICU) has an incidence between20–80 %, increase the length of stay, prolonged mechanical ventilation and it is an inde-pendent predictor of mortality. It has been calculate a 10 % of mortality increase for everyday that the patient has delirium. A predictive model to identify the risk factor associatedwith these patients would be very useful.OBJECTIVES. The purpose of this study is to evaluate a predictive model for identifyingdelirium in ICU patients.METHODS. We conducted a prospective observational study included all patients admittedto the ICU over 18 year old, excluding those with a stay less than 24 h, RASS \ -4,language is not Spanish and patients with drug intoxication. We evaluated daily for thepresence of delirium using the CAMICU test.The study was conducted in two steps: the first was from September 2011 to February 2012we made a predictive model and the second phase August 2012 to January 2013 performedand internal validation. In both phases were analysed demographics, history, APACHE II,and predisposing factors associated with ICU admission.RESULTS. The first phase included 476 patients, of which 19.9 % (95 patients) showeddelirium. Univariate analysis was performed for all variables and then multivariate analysisfrom which we built a predictive model using multiple logistic regressions to identify thebest predictors of delirium (Table 1). ROC area under the curve: 0.8326.
Table 1 Multivariate analysis, Multiple logistic
OR (95 % CI) Coefficient p
Mechanical ventilation 12.30 (5.92–24.44) 2.48 \0.001
Hypernatremia 4.17 (1.43–12.10) 1.42 0.009
Use of beta blockers 2.34 (1.43–4.57) 0.85 0.012
Neurocritical patient 2.24 (1.22–4.11) 0.80 0.009
Age C 65 years 2.23 (1.23–3.70) 0.80 0.008
Hypokalemia 2.11 (1.20–3.70) 0.74 0.009
We assigned 3 points score for MV and 1 point to other variables. The likelihood of delirium with1 point was 7.97 %, with 2 points of 16.27 %, with 3 points of 32.43 %, with 4 points from53.4 % with 5 points of 70.59 %, with 6 points of 86.54 %, and more or 7 points equal to 93.9 %.In the second internal validate phase including a total of 449 patients, with an incidence ofdelirium of 24.07 % (104 patients)we found that the likelihood of delirium with 1 point was
26th ESICM ANNUAL CONGRESS — PARIS, FRANCE — 5–9 OCTOBER 2013
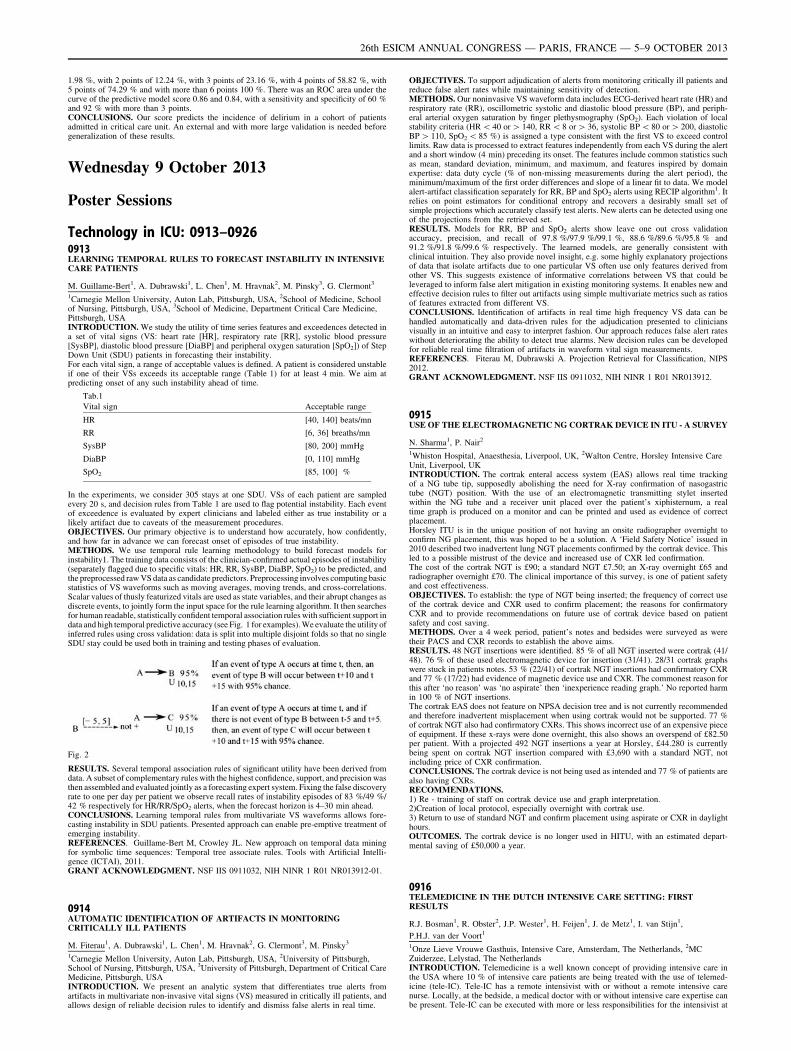
1.98 %, with 2 points of 12.24 %, with 3 points of 23.16 %, with 4 points of 58.82 %, with5 points of 74.29 % and with more than 6 points 100 %. There was an ROC area under thecurve of the predictive model score 0.86 and 0.84, with a sensitivity and specificity of 60 %and 92 % with more than 3 points.CONCLUSIONS. Our score predicts the incidence of delirium in a cohort of patientsadmitted in critical care unit. An external and with more large validation is needed beforegeneralization of these results.
Wednesday 9 October 2013
Poster Sessions
Technology in ICU: 0913–09260913LEARNING TEMPORAL RULES TO FORECAST INSTABILITY IN INTENSIVECARE PATIENTS
M. Guillame-Bert1, A. Dubrawski1, L. Chen1, M. Hravnak2, M. Pinsky3, G. Clermont3
1Carnegie Mellon University, Auton Lab, Pittsburgh, USA, 2School of Medicine, Schoolof Nursing, Pittsburgh, USA, 3School of Medicine, Department Critical Care Medicine,Pittsburgh, USAINTRODUCTION. We study the utility of time series features and exceedences detected ina set of vital signs (VS: heart rate [HR], respiratory rate [RR], systolic blood pressure[SysBP], diastolic blood pressure [DiaBP] and peripheral oxygen saturation [SpO2]) of StepDown Unit (SDU) patients in forecasting their instability.For each vital sign, a range of acceptable values is defined. A patient is considered unstableif one of their VSs exceeds its acceptable range (Table 1) for at least 4 min. We aim atpredicting onset of any such instability ahead of time.
Tab.1
Vital sign Acceptable range
HR [40, 140] beats/mn
RR [6, 36] breaths/mn
SysBP [80, 200] mmHg
DiaBP [0, 110] mmHg
SpO2 [85, 100] %
In the experiments, we consider 305 stays at one SDU. VSs of each patient are sampledevery 20 s, and decision rules from Table 1 are used to flag potential instability. Each eventof exceedence is evaluated by expert clinicians and labeled either as true instability or alikely artifact due to caveats of the measurement procedures.OBJECTIVES. Our primary objective is to understand how accurately, how confidently,and how far in advance we can forecast onset of episodes of true instability.METHODS. We use temporal rule learning methodology to build forecast models forinstability1. The training data consists of the clinician-confirmed actual episodes of instability(separately flagged due to specific vitals: HR, RR, SysBP, DiaBP, SpO2) to be predicted, andthe preprocessed raw VS data as candidate predictors. Preprocessing involves computing basicstatistics of VS waveforms such as moving averages, moving trends, and cross-correlations.Scalar values of thusly featurized vitals are used as state variables, and their abrupt changes asdiscrete events, to jointly form the input space for the rule learning algorithm. It then searchesfor human readable, statistically confident temporal association rules with sufficient support indata and high temporal predictive accuracy (see Fig. 1 for examples). We evaluate the utility ofinferred rules using cross validation: data is split into multiple disjoint folds so that no singleSDU stay could be used both in training and testing phases of evaluation.
Fig. 2
RESULTS. Several temporal association rules of significant utility have been derived fromdata. A subset of complementary rules with the highest confidence, support, and precision wasthen assembled and evaluated jointly as a forecasting expert system. Fixing the false discoveryrate to one per day per patient we observe recall rates of instability episodes of 83 %/49 %/42 % respectively for HR/RR/SpO2 alerts, when the forecast horizon is 4–30 min ahead.CONCLUSIONS. Learning temporal rules from multivariate VS waveforms allows fore-casting instability in SDU patients. Presented approach can enable pre-emptive treatment ofemerging instability.REFERENCES. Guillame-Bert M, Crowley JL. New approach on temporal data miningfor symbolic time sequences: Temporal tree associate rules. Tools with Artificial Intelli-gence (ICTAI), 2011.GRANT ACKNOWLEDGMENT. NSF IIS 0911032, NIH NINR 1 R01 NR013912-01.
0914AUTOMATIC IDENTIFICATION OF ARTIFACTS IN MONITORINGCRITICALLY ILL PATIENTS
M. Fiterau1, A. Dubrawski1, L. Chen1, M. Hravnak2, G. Clermont3, M. Pinsky3
1Carnegie Mellon University, Auton Lab, Pittsburgh, USA, 2University of Pittsburgh,School of Nursing, Pittsburgh, USA, 3University of Pittsburgh, Department of Critical CareMedicine, Pittsburgh, USAINTRODUCTION. We present an analytic system that differentiates true alerts fromartifacts in multivariate non-invasive vital signs (VS) measured in critically ill patients, andallows design of reliable decision rules to identify and dismiss false alerts in real time.
OBJECTIVES. To support adjudication of alerts from monitoring critically ill patients andreduce false alert rates while maintaining sensitivity of detection.METHODS. Our noninvasive VS waveform data includes ECG-derived heart rate (HR) andrespiratory rate (RR), oscillometric systolic and diastolic blood pressure (BP), and periph-eral arterial oxygen saturation by finger plethysmography (SpO2). Each violation of localstability criteria (HR \ 40 or [ 140, RR \ 8 or [ 36, systolic BP \ 80 or [ 200, diastolicBP [ 110, SpO2 \ 85 %) is assigned a type consistent with the first VS to exceed controllimits. Raw data is processed to extract features independently from each VS during the alertand a short window (4 min) preceding its onset. The features include common statistics suchas mean, standard deviation, minimum, and maximum, and features inspired by domainexpertise: data duty cycle (% of non-missing measurements during the alert period), theminimum/maximum of the first order differences and slope of a linear fit to data. We modelalert-artifact classification separately for RR, BP and SpO2 alerts using RECIP algorithm1. Itrelies on point estimators for conditional entropy and recovers a desirably small set ofsimple projections which accurately classify test alerts. New alerts can be detected using oneof the projections from the retrieved set.RESULTS. Models for RR, BP and SpO2 alerts show leave one out cross validationaccuracy, precision, and recall of 97.8 %/97.9 %/99.1 %, 88.6 %/89.6 %/95.8 % and91.2 %/91.8 %/99.6 % respectively. The learned models, are generally consistent withclinical intuition. They also provide novel insight, e.g. some highly explanatory projectionsof data that isolate artifacts due to one particular VS often use only features derived fromother VS. This suggests existence of informative correlations between VS that could beleveraged to inform false alert mitigation in existing monitoring systems. It enables new andeffective decision rules to filter out artifacts using simple multivariate metrics such as ratiosof features extracted from different VS.CONCLUSIONS. Identification of artifacts in real time high frequency VS data can behandled automatically and data-driven rules for the adjudication presented to cliniciansvisually in an intuitive and easy to interpret fashion. Our approach reduces false alert rateswithout deteriorating the ability to detect true alarms. New decision rules can be developedfor reliable real time filtration of artifacts in waveform vital sign measurements.REFERENCES. Fiterau M, Dubrawski A. Projection Retrieval for Classification, NIPS2012.GRANT ACKNOWLEDGMENT. NSF IIS 0911032, NIH NINR 1 R01 NR013912.
0915USE OF THE ELECTROMAGNETIC NG CORTRAK DEVICE IN ITU - A SURVEY
N. Sharma1, P. Nair2
1Whiston Hospital, Anaesthesia, Liverpool, UK, 2Walton Centre, Horsley Intensive CareUnit, Liverpool, UKINTRODUCTION. The cortrak enteral access system (EAS) allows real time trackingof a NG tube tip, supposedly abolishing the need for X-ray confirmation of nasogastrictube (NGT) position. With the use of an electromagnetic transmitting stylet insertedwithin the NG tube and a receiver unit placed over the patient’s xiphisternum, a realtime graph is produced on a monitor and can be printed and used as evidence of correctplacement.Horsley ITU is in the unique position of not having an onsite radiographer overnight toconfirm NG placement, this was hoped to be a solution. A ‘Field Safety Notice’ issued in2010 described two inadvertent lung NGT placements confirmed by the cortrak device. Thisled to a possible mistrust of the device and increased use of CXR led confirmation.The cost of the cortrak NGT is £90; a standard NGT £7.50; an X-ray overnight £65 andradiographer overnight £70. The clinical importance of this survey, is one of patient safetyand cost effectiveness.OBJECTIVES. To establish: the type of NGT being inserted; the frequency of correct useof the cortrak device and CXR used to confirm placement; the reasons for confirmatoryCXR and to provide recommendations on future use of cortrak device based on patientsafety and cost saving.METHODS. Over a 4 week period, patient’s notes and bedsides were surveyed as weretheir PACS and CXR records to establish the above aims.RESULTS. 48 NGT insertions were identified. 85 % of all NGT inserted were cortrak (41/48). 76 % of these used electromagnetic device for insertion (31/41). 28/31 cortrak graphswere stuck in patients notes. 53 % (22/41) of cortrak NGT insertions had confirmatory CXRand 77 % (17/22) had evidence of magnetic device use and CXR. The commonest reason forthis after ‘no reason’ was ‘no aspirate’ then ‘inexperience reading graph.’ No reported harmin 100 % of NGT insertions.The cortrak EAS does not feature on NPSA decision tree and is not currently recommendedand therefore inadvertent misplacement when using cortrak would not be supported. 77 %of cortrak NGT also had confirmatory CXRs. This shows incorrect use of an expensive pieceof equipment. If these x-rays were done overnight, this also shows an overspend of £82.50per patient. With a projected 492 NGT insertions a year at Horsley, £44.280 is currentlybeing spent on cortrak NGT insertion compared with £3,690 with a standard NGT, notincluding price of CXR confirmation.CONCLUSIONS. The cortrak device is not being used as intended and 77 % of patients arealso having CXRs.RECOMMENDATIONS.1) Re - training of staff on cortrak device use and graph interpretation.2)Creation of local protocol, especially overnight with cortrak use.3) Return to use of standard NGT and confirm placement using aspirate or CXR in daylighthours.OUTCOMES. The cortrak device is no longer used in HITU, with an estimated depart-mental saving of £50,000 a year.
0916TELEMEDICINE IN THE DUTCH INTENSIVE CARE SETTING: FIRSTRESULTS
R.J. Bosman1, R. Obster2, J.P. Wester1, H. Feijen1, J. de Metz1, I. van Stijn1,
P.H.J. van der Voort1
1Onze Lieve Vrouwe Gasthuis, Intensive Care, Amsterdam, The Netherlands, 2MCZuiderzee, Lelystad, The NetherlandsINTRODUCTION. Telemedicine is a well known concept of providing intensive care inthe USA where 10 % of intensive care patients are being treated with the use of telemed-icine (tele-IC). Tele-IC has a remote intensivist with or without a remote intensive carenurse. Locally, at the bedside, a medical doctor with or without intensive care expertise canbe present. Tele-IC can be executed with more or less responsibilities for the intensivist at
26th ESICM ANNUAL CONGRESS — PARIS, FRANCE — 5–9 OCTOBER 2013
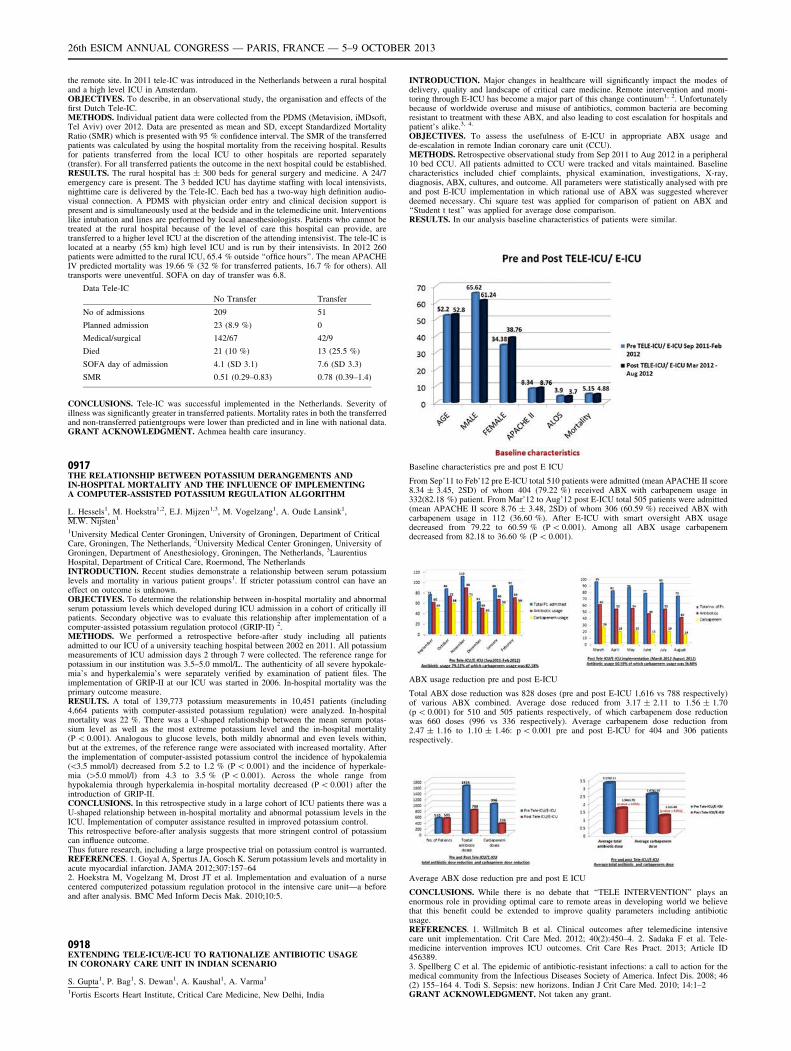
the remote site. In 2011 tele-IC was introduced in the Netherlands between a rural hospitaland a high level ICU in Amsterdam.OBJECTIVES. To describe, in an observational study, the organisation and effects of thefirst Dutch Tele-IC.METHODS. Individual patient data were collected from the PDMS (Metavision, iMDsoft,Tel Aviv) over 2012. Data are presented as mean and SD, except Standardized MortalityRatio (SMR) which is presented with 95 % confidence interval. The SMR of the transferredpatients was calculated by using the hospital mortality from the receiving hospital. Resultsfor patients transferred from the local ICU to other hospitals are reported separately(transfer). For all transferred patients the outcome in the next hospital could be established.RESULTS. The rural hospital has ± 300 beds for general surgery and medicine. A 24/7emergency care is present. The 3 bedded ICU has daytime staffing with local intensivists,nighttime care is delivered by the Tele-IC. Each bed has a two-way high definition audio-visual connection. A PDMS with physician order entry and clinical decision support ispresent and is simultaneously used at the bedside and in the telemedicine unit. Interventionslike intubation and lines are performed by local anaesthesiologists. Patients who cannot betreated at the rural hospital because of the level of care this hospital can provide, aretransferred to a higher level ICU at the discretion of the attending intensivist. The tele-IC islocated at a nearby (55 km) high level ICU and is run by their intensivists. In 2012 260patients were admitted to the rural ICU, 65.4 % outside ‘‘office hours’’. The mean APACHEIV predicted mortality was 19.66 % (32 % for transferred patients, 16.7 % for others). Alltransports were uneventful. SOFA on day of transfer was 6.8.
Data Tele-IC
No Transfer Transfer
No of admissions 209 51
Planned admission 23 (8.9 %) 0
Medical/surgical 142/67 42/9
Died 21 (10 %) 13 (25.5 %)
SOFA day of admission 4.1 (SD 3.1) 7.6 (SD 3.3)
SMR 0.51 (0.29–0.83) 0.78 (0.39–1.4)
CONCLUSIONS. Tele-IC was successful implemented in the Netherlands. Severity ofillness was significantly greater in transferred patients. Mortality rates in both the transferredand non-transferred patientgroups were lower than predicted and in line with national data.GRANT ACKNOWLEDGMENT. Achmea health care insurancy.
0917THE RELATIONSHIP BETWEEN POTASSIUM DERANGEMENTS ANDIN-HOSPITAL MORTALITY AND THE INFLUENCE OF IMPLEMENTINGA COMPUTER-ASSISTED POTASSIUM REGULATION ALGORITHM
L. Hessels1, M. Hoekstra1,2, E.J. Mijzen1,3, M. Vogelzang1, A. Oude Lansink1,M.W. Nijsten1
1University Medical Center Groningen, University of Groningen, Department of CriticalCare, Groningen, The Netherlands, 2University Medical Center Groningen, University ofGroningen, Department of Anesthesiology, Groningen, The Netherlands, 3LaurentiusHospital, Department of Critical Care, Roermond, The NetherlandsINTRODUCTION. Recent studies demonstrate a relationship between serum potassiumlevels and mortality in various patient groups1. If stricter potassium control can have aneffect on outcome is unknown.OBJECTIVES. To determine the relationship between in-hospital mortality and abnormalserum potassium levels which developed during ICU admission in a cohort of critically illpatients. Secondary objective was to evaluate this relationship after implementation of acomputer-assisted potassium regulation protocol (GRIP-II) 2.METHODS. We performed a retrospective before-after study including all patientsadmitted to our ICU of a university teaching hospital between 2002 en 2011. All potassiummeasurements of ICU admission days 2 through 7 were collected. The reference range forpotassium in our institution was 3.5–5.0 mmol/L. The authenticity of all severe hypokale-mia’s and hyperkalemia’s were separately verified by examination of patient files. Theimplementation of GRIP-II at our ICU was started in 2006. In-hospital mortality was theprimary outcome measure.RESULTS. A total of 139,773 potassium measurements in 10,451 patients (including4,664 patients with computer-assisted potassium regulation) were analyzed. In-hospitalmortality was 22 %. There was a U-shaped relationship between the mean serum potas-sium level as well as the most extreme potassium level and the in-hospital mortality(P \ 0.001). Analogous to glucose levels, both mildly abnormal and even levels within,but at the extremes, of the reference range were associated with increased mortality. Afterthe implementation of computer-assisted potassium control the incidence of hypokalemia(\3.5 mmol/l) decreased from 5.2 to 1.2 % (P \ 0.001) and the incidence of hyperkale-mia ([5.0 mmol/l) from 4.3 to 3.5 % (P \ 0.001). Across the whole range fromhypokalemia through hyperkalemia in-hospital mortality decreased (P \ 0.001) after theintroduction of GRIP-II.CONCLUSIONS. In this retrospective study in a large cohort of ICU patients there was aU-shaped relationship between in-hospital mortality and abnormal potassium levels in theICU. Implementation of computer assistance resulted in improved potassium control.This retrospective before-after analysis suggests that more stringent control of potassiumcan influence outcome.Thus future research, including a large prospective trial on potassium control is warranted.REFERENCES. 1. Goyal A, Spertus JA, Gosch K. Serum potassium levels and mortality inacute myocardial infarction. JAMA 2012;307:157–642. Hoekstra M, Vogelzang M, Drost JT et al. Implementation and evaluation of a nursecentered computerized potassium regulation protocol in the intensive care unit—a beforeand after analysis. BMC Med Inform Decis Mak. 2010;10:5.
0918EXTENDING TELE-ICU/E-ICU TO RATIONALIZE ANTIBIOTIC USAGEIN CORONARY CARE UNIT IN INDIAN SCENARIO
S. Gupta1, P. Bag1, S. Dewan1, A. Kaushal1, A. Varma1
1Fortis Escorts Heart Institute, Critical Care Medicine, New Delhi, India
INTRODUCTION. Major changes in healthcare will significantly impact the modes ofdelivery, quality and landscape of critical care medicine. Remote intervention and moni-toring through E-ICU has become a major part of this change continuum1, 2. Unfortunatelybecause of worldwide overuse and misuse of antibiotics, common bacteria are becomingresistant to treatment with these ABX, and also leading to cost escalation for hospitals andpatient’s alike.3, 4.
OBJECTIVES. To assess the usefulness of E-ICU in appropriate ABX usage andde-escalation in remote Indian coronary care unit (CCU).METHODS. Retrospective observational study from Sep 2011 to Aug 2012 in a peripheral10 bed CCU. All patients admitted to CCU were tracked and vitals maintained. Baselinecharacteristics included chief complaints, physical examination, investigations, X-ray,diagnosis, ABX, cultures, and outcome. All parameters were statistically analysed with preand post E-ICU implementation in which rational use of ABX was suggested whereverdeemed necessary. Chi square test was applied for comparison of patient on ABX and‘‘Student t test’’ was applied for average dose comparison.RESULTS. In our analysis baseline characteristics of patients were similar.
Baseline characteristics pre and post E ICU
From Sep’11 to Feb’12 pre E-ICU total 510 patients were admitted (mean APACHE II score8.34 ± 3.45, 2SD) of whom 404 (79.22 %) received ABX with carbapenem usage in332(82.18 %) patient. From Mar’12 to Aug’12 post E-ICU total 505 patients were admitted(mean APACHE II score 8.76 ± 3.48, 2SD) of whom 306 (60.59 %) received ABX withcarbapenem usage in 112 (36.60 %). After E-ICU with smart oversight ABX usagedecreased from 79.22 to 60.59 % (P \ 0.001). Among all ABX usage carbapenemdecreased from 82.18 to 36.60 % (P \ 0.001).
ABX usage reduction pre and post E-ICU
Total ABX dose reduction was 828 doses (pre and post E-ICU 1,616 vs 788 respectively)of various ABX combined. Average dose reduced from 3.17 ± 2.11 to 1.56 ± 1.70(p \ 0.001) for 510 and 505 patients respectively, of which carbapenem dose reductionwas 660 doses (996 vs 336 respectively). Average carbapenem dose reduction from2.47 ± 1.16 to 1.10 ± 1.46: p \ 0.001 pre and post E-ICU for 404 and 306 patientsrespectively.
Average ABX dose reduction pre and post E ICU
CONCLUSIONS. While there is no debate that ‘‘TELE INTERVENTION’’ plays anenormous role in providing optimal care to remote areas in developing world we believethat this benefit could be extended to improve quality parameters including antibioticusage.REFERENCES. 1. Willmitch B et al. Clinical outcomes after telemedicine intensivecare unit implementation. Crit Care Med. 2012; 40(2):450–4. 2. Sadaka F et al. Tele-medicine intervention improves ICU outcomes. Crit Care Res Pract. 2013; Article ID456389.3. Spellberg C et al. The epidemic of antibiotic-resistant infections: a call to action for themedical community from the Infectious Diseases Society of America. Infect Dis. 2008; 46(2) 155–164 4. Todi S. Sepsis: new horizons. Indian J Crit Care Med. 2010; 14:1–2GRANT ACKNOWLEDGMENT. Not taken any grant.
26th ESICM ANNUAL CONGRESS — PARIS, FRANCE — 5–9 OCTOBER 2013
0919MORBIDITY AND OUTCOME OF PATIENTS WITH PROLONGED STAYIN PEDIATRIC INTENSIVE CARE UNIT (PICU)
L. Vogiatzi1, E. Volakli1, S. Kalamitsou1, K. Skoumis1, S. Stabouli1, A. Violaki1,
M. Sdougka1
1Ippokration Hospital, PICU, Thessaloniki, GreeceOBJECTIVES. To evaluate morbidity and outcome of patients with prolonged PICU stayand the impact on resource utilization.METHODS. Cross-sectional retrospective study in PICU of Hippokration Hospital ofThessaloniki including all patients admitted during 2010–2012. Demographic and clinicaldata were recorded by review of the medical and nursing notes. Statistical analysis wasperformed with SPSS 19. Fisher’s exact test and Mann–Whitney test were used whereappropriate.RESULTS. 228 admissions concerning 205 patients were recorded. The median age onadmission was 3 years (range 0.1–19), median PICU length of stay (LOS) was 7 days (range1–548) and median PRISM score on admission was 7 (range 0–43). In 207 cases mechanicalventilation (MV) was required. LOS was [ 14 days in 72 cases, representing 31.5 % of thecases admitted but requiring 82 % of the total days of MV and 79.5 % of the total ICU days.The median PICU stay, in this group of patients, was 21.5 (range 14–548) days. Respiratoryinsufficiency was the most common admission reason (23/72). LOS [ 14 days did notcorrelate with age, PRISM score or presence of developmental delay (DD), although therewas a tendency towards longer stay in children with DD (12.7 vs 31.7 days, p = 0.13).These patients were at greater risk of hospital acquired infection (RR: 5.83, 95 % CI0.08–0.25). Mortality was 9.7 % while the overall mortality was 16.6 % (p = 0.05).CONCLUSIONS. Long stay PICU patients form a small group of PICU patients yet theyconsume a significant share of PICU resources. Hospital-acquired infections are significantfactor of morbidity although mortality is not affected.REFERENCES.1. Williams TA, Ho KM, Dobb GJ, Finn JC, Knuiman M, Webb SAR. Effect of length of
stay in intensive care unit on hospital and long-term mortality of critically ill adult patients.British J Anaesth. 2010; 104(4):459–464. 2. Marcin JP, Slonim AD, Pollack MM, Rutti-mann UE. Long-stay patients in the pediatric intensive care unit. Crit Care Med.2001;29(3):652–7.
0920INTENSIVE-CARE UNIT ACQUIRED WEAKNESS (ICUAW): SPECTRUMOF DISABILITY IN SURVIVORS OF PROLONGED MECHANICALVENTILATION AT 7 DAYS AND 6 MONTHS POST ICU DISCHARGE
J. Batt1, M.S. Herridge2, W. Gage3, S. Mathur4, J. Cameron3, C. dos Santos4
1University of Toronto, Respirology, Toronto, Canada, 2University of Toronto, Respirologyand Critical Care, Toronto, Canada, 3Toronto Rehabilitation Institute, Department ofOccupational Science and Occupational Therapy, Toronto, Canada, 4University of Toronto,Toronto, CanadaINTRODUCTION. ICU acquired weakness (ICUAW), attributed to Critical Illnessmyopathy (CIM) and Critical Illness Polyneuropathy (CIP), is a major cause of morbidityfor the long term ventilated ([1 week) patient that influences their functional status, dis-position, quality of life and health care utilization.OBJECTIVES. To define the nature of the neuromuscular dysfunction in critically illpatients after an episode of prolonged mechanical ventilation.METHODS. Nested prospective pilot study aimed at delineating functional capacity,muscle mass and muscle power at 7 days and 6 months post-ICU discharge in a cohort ofpatients with sustained CIM recruited from Towards RECOVER (Multi-Centre ProspectiveCohort Study Evaluating 2-Year Outcomes in Survivors of Prolonged Mechanical Venti-lation and their Family Caregivers). Skeletal muscle weakness and functional impairmentwas assessed by: 6 MW, SF-36, MRC bedside assessment of muscle power, measures ofquiet postural standing, gait control, isokinetic strength testing, CT mid-thigh quadricepsfemoris cross-sectional area (CSA), nerve conduction studies, and electromyography.RESULTS. We have recruited 17 patients (13 from St Michaels Hospital over 2 years and 4from the Toronto General Hospital over 1 year). 22 patients were consented at SMH from atotal of 80 individuals in Towards RECOVER. 36 patients were excluded and consent wasrefused by 23 patients or their substitute decision makers. Of the consented patients 10 died,were transferred to another institution or developed a complication precluding biopsy. Atotal of 13 individuals have completed both the 7 day and 6 month post discharge clinicalmeasures and biopsies to date. Healthy age and gender matched controls were retrospec-tively selected from the SMH Healthy Lung Research Registry.CONCLUSIONS. Patients with sustained ICUAW fall into two phenotypic groups, thosethat show clinical functional and structural improvement at 6 months and those that havepersistent and protracted functional disability and structural abnormalities. Future studies todetermine the molecular basis of protracted ICUAW will be determine by molecular ana-lysis of muscle samples from percutaneous biopsy of the vastus lateralis.REFERENCES. 1. Batt J et al. Am J Respir Crit Care Med. 2013;187(3):238–46. 2. DosSantos CC, Batt J. Curr Opin Crit Care. 2012;18(5):509–17.GRANT ACKNOWLEDGMENT. This work is supported by the Canadian Institutes ofHealth Sciences, The Physicians Services Incorporate and the Ministry of Research andInnovation of Ontario, Canada.
0921RECOLLECTION OF ICU MEMORIES ONE YEAR POST ICU ADMISSIONFOR MULTI-ORGAN FAILURE PATIENTS
S. Rodriguez Villar1, M. Sánchez Casado2, C. Carlo Marco Schulke3, V.A.A. HortigüelaMartı́n4, H. Fletcher5
1Queen Elizabeth Hospital, Critical Care Medicine, London, UK, 2Hospital 12 de OctubreVirgen de la Salud, Critical Care Medicine, Toledo, Spain, 3Hospital Virgen de la Salud,Toledo, UK, 4Hospital Virgen de la Salud, Critical Care Medicine, Toledo, Spain, 5QueenElizabeth Hospital, London, UKINTRODUCTION. The ICU environment is often experienced as adverse and hostile. Thishas an impact on patients’ psychological health and may influence their quality of life, bothduring their ICU stay and after discharge. Multi organ failure syndrome is the most commoncause for a long stay in ICU and requires extensive therapeutic management resulting insignificant physiological stress.
AIMS AND OBJECTIVES. To determine whether patients recall experiences of their stayin ICU following admission for multi-organ failure syndrome and to identify the associatedfactors impacting on the inability to recall.DESIGN. Medical and surgical patients presenting with multiple organ dysfunction on thefirst day of admission were included in the study.METHODS. One year following discharge from ICU, a telephone survey was conductedconcerning the ex-patients’ memories of their stay in ICU. Data also collected: Personalinformation, medical history, baseline data, source of admission, reason for admission,specialty (medical or surgical), severity scores and patient data: demographics, length ofICU stay, readmissions, and transfer/discharge destination.RESULTS. 283 patients were contacted. 62.2 % male; age 59.7 ± 17.5; 67.8 % medicalpatients; 36.1 % did not have any recollection of their ICU stay, 39.7 % had a positiverecollection, 23.3 % negative memories and 0.9 % very unpleasant memories.CONCLUSIONS. Two-thirds of patients were able to recall their experience. The factorsassociated with the lack of recollection are: extensive co-morbidity, a high APACHE score,cardiac arrest within the first 12 h of ICU admission, endotracheal intubation, prolongedmechanical ventilation, an increased ICU length of stay and low GCS on admission.REFERENCES. 1. Badia-Castelló M, Trujillano-Cabello J, Serviá-Goixart L, March-Llanes J y Rodrı́guez-Pozo A. Recuerdos y memoria del paciente crı́tico a largo plazo.Desarrollo de estrés postraumático. Med Clin (Barc). 2006; 126(15):561. 2. Besendorfer A.Experience of patients in the intensive care unit. A qualitative study. Pflege. 2002;15(6):301–8. 3. Burchardi H. Aims of sedation/analgesia. Minerva Anestesiol. 2004;70(4):137–43. 4. Capuzzo M, Valpondi V, Cingolani E, De Luca S, Gianstefani G, Grassi L,et al. Application of the Italian version of the Intensive Care Unit Memory tool in theclinical setting. Crit Care. 2004;8(1):R48–55. 5. Capuzzo M, Valpondi V, Cingolani E,Gianstefani G, De Luca S, Grassi L, et al. Post-traumatic stress disorder-related symptomsafter intensive care. Minerva Anestesiol. 2005;71(4):167–79. 6. Ciesla DJ, Moore FA,Moore EE. Multiple organ failure. In: Feliciano DV, MatoxKL, Moore EE editors. Trauma.6th edn. New York: Mc Graw-Hill; 2008.FUNDING. Financial support, including any institutional departmental funds, was notsought for the study.
0922SETTING UP TELEMEDICINE CRITICAL CARE SERVICE AT A CRITICALACCESS HOSPITAL IN THE UNITED STATES
S.V. Chhangani1,2
1Massachusetts General Hospital, Anesthesia Critical Care and Pain Medicine, Boston,USA, 2Martha’s Vineyard Hospital, Anesthesia, Oak Bluffs, USAINTRODUCTION. With the aging population and continued healthcare reform, thedelivery of critical care is likely to face significant workforce issues, especially in the UnitedStates (US). Martha’s Vineyard Hospital (MVH) is one of 1,328 critical access hospitals(CAH) in the US with 3 ICU beds without critical care service. CAH is typically located in arural healthcare environment and has 25 or less total beds. We report the results of initialstep in establishing telemedicine critical care service (TM-CCS) at MVH.OBJECTIVES. The goal of this project was to establish TM-CCS between MVH and atertiary care hospital within the same healthcare system. The phase 1 of the project beganwith critical care education and analysis of transfer data.METHODS. Total number of transfers out of MVH between 2009 and 2012 were analyzed.Based on needs assessment of MVH providers the Fundamental Critical Care SupportCourse (FCCS) was administered during the phase 1 of the TM-CCS project.RESULTS. 333 patients were transferred from MVH between 2009 and 2012. Of these22 % were admitted to a non-ICU bed at the tertiary care hospital. Majority of ICU transfersoccurred between May and December. Average hospital LOS was 8 days (range0–28 days). The common reasons for transfer were cardiac (acute coronary event,arrhythmia or heart failure), respiratory (aspiration, intoxication, pneumonia, allergicreaction), GI hemorrhage, and sepsis. Fifteen MVH providers (12 nurses, 2 respiratorytherapists and 1 physician) took the FCCS Course. Majority of the participants highly ratedthe importance of recognition and management of acute life-threatening conditions, prior-itizing assessment needs of critically ill patients, and sepsis. Because of FCCS course theparticipants reported improved focus on patient monitoring and interpretation of critical labdata and became comfortable with ventilator and sepsis management. Phase 2 of the projectwould establish 24/7 TM-CCS oversight to MVH.CONCLUSIONS. Transfer of patients frequently occurs between CAH and tertiary carehospital. Although many transfers are unavoidable, patients with potentially short-stay andrapidly reversible critical conditions may be safely cared for at CAH. TM-CCS representspotential solution to limited critical care workforce issues. Providing TM-CCS oversight andFCCS education can be the keys to paradigm shift in providing critical care at CAH andimprove its bottom-line. More physician buy-in is needed with FCCS education at CAH.REFERENCES. 1. Chest 2004. 2. J Rural Health 2012.GRANT ACKNOWLEDGMENT. The FCCS Course was supported by MVH and Mas-sachusetts General Hospital.
0923TRIANGULATING PERCEIVED NEEDS, PEER ASSESSMENT AND CLINICALAUDIT TO DESIGN EDUCATIONAL PROCESSES FOR ICU HEALTH CAREPROFESSIONALS: INITIAL REPORT ON THE DEVELOPMENTOF THE ‘TELEPROMETHEUS’ E-LEARNING PLATFORM
S. Kokkoris1,2, M. Foka1,3, N. Stylianides3,4, E. Demetriadou1,3, A. Ioannides2, A. Samara1,E. Kondili5, M. Epiphaniou6, G. Christodoulou6, P. Papapavlou6, A. Pavlakis6,D. Georgopoulos5, S. Nanas7, T.C. Kyprianou1,2,3
1Nicosia General Hospital, Dept of Intensive Care Medicine, Nicosia, Cyprus, 2St GeorgesUniversity of London Medical School at University of Nicosia, Nicosia, Cyprus, 3IntensiveCare Forum NGO, R&D Division, Nicosia, Cyprus, 4University of Cyprus, Dept ofElectrical Engineering, Nicosia, Cyprus, 5University Hospital of Heraklion, Dept ofIntensive Care Medicine, Heraklion, Greece, 6Open University of Cyprus, Nicosia, Cyprus,7Evangelismos General Hospital, First Critical Care Dept, Athens, GreeceINTRODUCTION. Training in demanding professional environments, such as that of anICU, combines theoretical knowledge, practical skills, integration of information technology(IT) into clinical practice and attitude formation tailored to extreme conditions. It is also achallenge for Health Education and IT, given the high standards (zero tolerance for errors),high cost, time constraints and the proven inefficiency of conventional educational meth-odology. ‘Teleprometheus’ is a novel e-learning platform for ICU professionals andpatients’ relatives, comprising four distinct components:a) An e-learning platform (Moodle),
26th ESICM ANNUAL CONGRESS — PARIS, FRANCE — 5–9 OCTOBER 2013
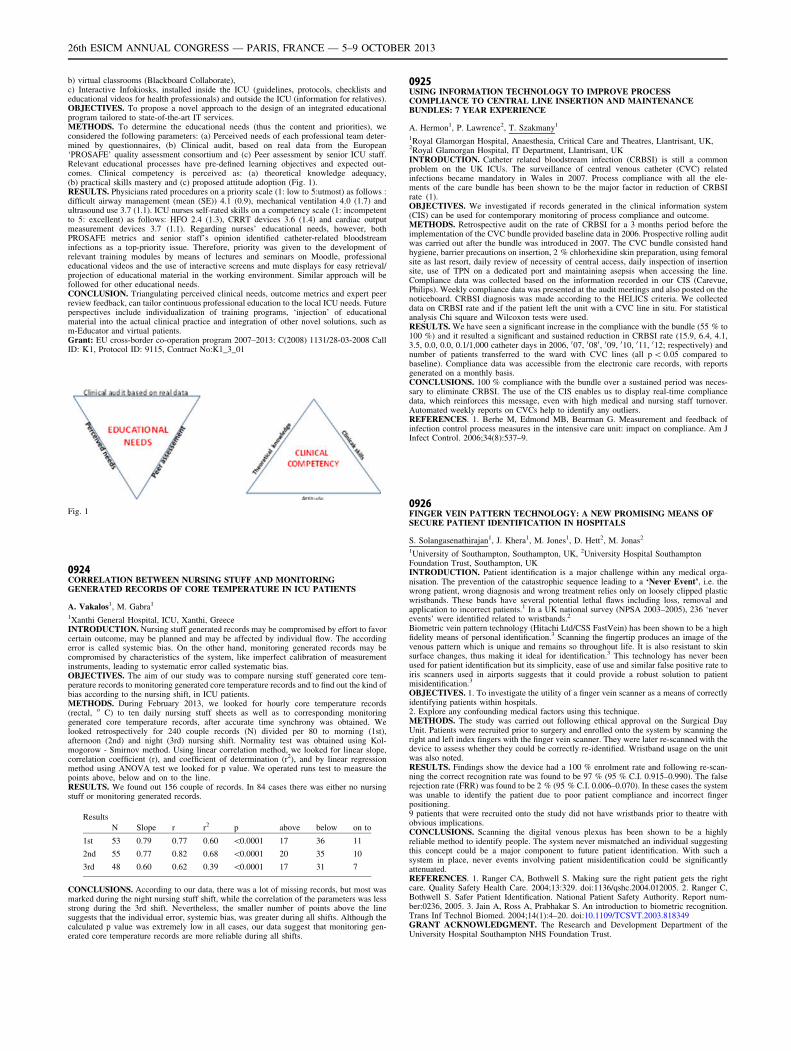
b) virtual classrooms (Blackboard Collaborate),c) Interactive Infokiosks, installed inside the ICU (guidelines, protocols, checklists andeducational videos for health professionals) and outside the ICU (information for relatives).OBJECTIVES. To propose a novel approach to the design of an integrated educationalprogram tailored to state-of-the-art IT services.METHODS. To determine the educational needs (thus the content and priorities), weconsidered the following parameters: (a) Perceived needs of each professional team deter-mined by questionnaires, (b) Clinical audit, based on real data from the European‘PROSAFE’ quality assessment consortium and (c) Peer assessment by senior ICU staff.Relevant educational processes have pre-defined learning objectives and expected out-comes. Clinical competency is perceived as: (a) theoretical knowledge adequacy,(b) practical skills mastery and (c) proposed attitude adoption (Fig. 1).RESULTS. Physicians rated procedures on a priority scale (1: low to 5:utmost) as follows :difficult airway management (mean (SE)) 4.1 (0.9), mechanical ventilation 4.0 (1.7) andultrasound use 3.7 (1.1). ICU nurses self-rated skills on a competency scale (1: incompetentto 5: excellent) as follows: HFO 2.4 (1.3), CRRT devices 3.6 (1.4) and cardiac outputmeasurement devices 3.7 (1.1). Regarding nurses’ educational needs, however, bothPROSAFE metrics and senior staff’s opinion identified catheter-related bloodstreaminfections as a top-priority issue. Therefore, priority was given to the development ofrelevant training modules by means of lectures and seminars on Moodle, professionaleducational videos and the use of interactive screens and mute displays for easy retrieval/projection of educational material in the working environment. Similar approach will befollowed for other educational needs.CONCLUSION. Triangulating perceived clinical needs, outcome metrics and expert peerreview feedback, can tailor continuous professional education to the local ICU needs. Futureperspectives include individualization of training programs, ‘injection’ of educationalmaterial into the actual clinical practice and integration of other novel solutions, such asm-Educator and virtual patients.Grant: EU cross-border co-operation program 2007–2013: C(2008) 1131/28-03-2008 CallID: J1, Protocol ID: 9115, Contract No:K1_3_01
Fig. 1
0924CORRELATION BETWEEN NURSING STUFF AND MONITORINGGENERATED RECORDS OF CORE TEMPERATURE IN ICU PATIENTS
A. Vakalos1, M. Gabra1
1Xanthi General Hospital, ICU, Xanthi, GreeceINTRODUCTION. Nursing stuff generated records may be compromised by effort to favorcertain outcome, may be planned and may be affected by individual flow. The accordingerror is called systemic bias. On the other hand, monitoring generated records may becompromised by characteristics of the system, like imperfect calibration of measurementinstruments, leading to systematic error called systematic bias.OBJECTIVES. The aim of our study was to compare nursing stuff generated core tem-perature records to monitoring generated core temperature records and to find out the kind ofbias according to the nursing shift, in ICU patients.METHODS. During February 2013, we looked for hourly core temperature records(rectal, o C) to ten daily nursing stuff sheets as well as to corresponding monitoringgenerated core temperature records, after accurate time synchrony was obtained. Welooked retrospectively for 240 couple records (N) divided per 80 to morning (1st),afternoon (2nd) and night (3rd) nursing shift. Normality test was obtained using Kol-mogorow - Smirnov method. Using linear correlation method, we looked for linear slope,correlation coefficient (r), and coefficient of determination (r2), and by linear regressionmethod using ANOVA test we looked for p value. We operated runs test to measure thepoints above, below and on to the line.RESULTS. We found out 156 couple of records. In 84 cases there was either no nursingstuff or monitoring generated records.
Results
N Slope r r2 p above below on to
1st 53 0.79 0.77 0.60 \0.0001 17 36 11
2nd 55 0.77 0.82 0.68 \0.0001 20 35 10
3rd 48 0.60 0.62 0.39 \0.0001 17 31 7
CONCLUSIONS. According to our data, there was a lot of missing records, but most wasmarked during the night nursing stuff shift, while the correlation of the parameters was lessstrong during the 3rd shift. Nevertheless, the smaller number of points above the linesuggests that the individual error, systemic bias, was greater during all shifts. Although thecalculated p value was extremely low in all cases, our data suggest that monitoring gen-erated core temperature records are more reliable during all shifts.
0925USING INFORMATION TECHNOLOGY TO IMPROVE PROCESSCOMPLIANCE TO CENTRAL LINE INSERTION AND MAINTENANCEBUNDLES: 7 YEAR EXPERIENCE
A. Hermon1, P. Lawrence2, T. Szakmany1
1Royal Glamorgan Hospital, Anaesthesia, Critical Care and Theatres, Llantrisant, UK,2Royal Glamorgan Hospital, IT Department, Llantrisant, UKINTRODUCTION. Catheter related bloodstream infection (CRBSI) is still a commonproblem on the UK ICUs. The surveillance of central venous catheter (CVC) relatedinfections became mandatory in Wales in 2007. Process compliance with all the ele-ments of the care bundle has been shown to be the major factor in reduction of CRBSIrate (1).OBJECTIVES. We investigated if records generated in the clinical information system(CIS) can be used for contemporary monitoring of process compliance and outcome.METHODS. Retrospective audit on the rate of CRBSI for a 3 months period before theimplementation of the CVC bundle provided baseline data in 2006. Prospective rolling auditwas carried out after the bundle was introduced in 2007. The CVC bundle consisted handhygiene, barrier precautions on insertion, 2 % chlorhexidine skin preparation, using femoralsite as last resort, daily review of necessity of central access, daily inspection of insertionsite, use of TPN on a dedicated port and maintaining asepsis when accessing the line.Compliance data was collected based on the information recorded in our CIS (Carevue,Philips). Weekly compliance data was presented at the audit meetings and also posted on thenoticeboard. CRBSI diagnosis was made according to the HELICS criteria. We collecteddata on CRBSI rate and if the patient left the unit with a CVC line in situ. For statisticalanalysis Chi square and Wilcoxon tests were used.RESULTS. We have seen a significant increase in the compliance with the bundle (55 % to100 %) and it resulted a significant and sustained reduction in CRBSI rate (15.9, 6.4, 4.1,3.5, 0.0, 0.0, 0.1/1,000 catheter days in 2006, 007, 0080 , 009, 010, 011, 012; respectively) andnumber of patients transferred to the ward with CVC lines (all p \ 0.05 compared tobaseline). Compliance data was accessible from the electronic care records, with reportsgenerated on a monthly basis.CONCLUSIONS. 100 % compliance with the bundle over a sustained period was neces-sary to eliminate CRBSI. The use of the CIS enables us to display real-time compliancedata, which reinforces this message, even with high medical and nursing staff turnover.Automated weekly reports on CVCs help to identify any outliers.REFERENCES. 1. Berhe M, Edmond MB, Bearman G. Measurement and feedback ofinfection control process measures in the intensive care unit: impact on compliance. Am JInfect Control. 2006;34(8):537–9.
0926FINGER VEIN PATTERN TECHNOLOGY: A NEW PROMISING MEANS OFSECURE PATIENT IDENTIFICATION IN HOSPITALS
S. Solangasenathirajan1, J. Khera1, M. Jones1, D. Hett2, M. Jonas2
1University of Southampton, Southampton, UK, 2University Hospital SouthamptonFoundation Trust, Southampton, UKINTRODUCTION. Patient identification is a major challenge within any medical orga-nisation. The prevention of the catastrophic sequence leading to a ‘Never Event’, i.e. thewrong patient, wrong diagnosis and wrong treatment relies only on loosely clipped plasticwristbands. These bands have several potential lethal flaws including loss, removal andapplication to incorrect patients.1 In a UK national survey (NPSA 2003–2005), 236 ‘neverevents’ were identified related to wristbands.2
Biometric vein pattern technology (Hitachi Ltd/CSS FastVein) has been shown to be a highfidelity means of personal identification.3 Scanning the fingertip produces an image of thevenous pattern which is unique and remains so throughout life. It is also resistant to skinsurface changes, thus making it ideal for identification.3 This technology has never beenused for patient identification but its simplicity, ease of use and similar false positive rate toiris scanners used in airports suggests that it could provide a robust solution to patientmisidentification.3
OBJECTIVES. 1. To investigate the utility of a finger vein scanner as a means of correctlyidentifying patients within hospitals.2. Explore any confounding medical factors using this technique.METHODS. The study was carried out following ethical approval on the Surgical DayUnit. Patients were recruited prior to surgery and enrolled onto the system by scanning theright and left index fingers with the finger vein scanner. They were later re-scanned with thedevice to assess whether they could be correctly re-identified. Wristband usage on the unitwas also noted.RESULTS. Findings show the device had a 100 % enrolment rate and following re-scan-ning the correct recognition rate was found to be 97 % (95 % C.I. 0.915–0.990). The falserejection rate (FRR) was found to be 2 % (95 % C.I. 0.006–0.070). In these cases the systemwas unable to identify the patient due to poor patient compliance and incorrect fingerpositioning.9 patients that were recruited onto the study did not have wristbands prior to theatre withobvious implications.CONCLUSIONS. Scanning the digital venous plexus has been shown to be a highlyreliable method to identify people. The system never mismatched an individual suggestingthis concept could be a major component to future patient identification. With such asystem in place, never events involving patient misidentification could be significantlyattenuated.REFERENCES. 1. Ranger CA, Bothwell S. Making sure the right patient gets the rightcare. Quality Safety Health Care. 2004;13:329. doi:1136/qshc.2004.012005. 2. Ranger C,Bothwell S. Safer Patient Identification. National Patient Safety Authority. Report num-ber:0236, 2005. 3. Jain A, Ross A, Prabhakar S. An introduction to biometric recognition.Trans Inf Technol Biomed. 2004;14(1):4–20. doi:10.1109/TCSVT.2003.818349GRANT ACKNOWLEDGMENT. The Research and Development Department of theUniversity Hospital Southampton NHS Foundation Trust.
26th ESICM ANNUAL CONGRESS — PARIS, FRANCE — 5–9 OCTOBER 2013
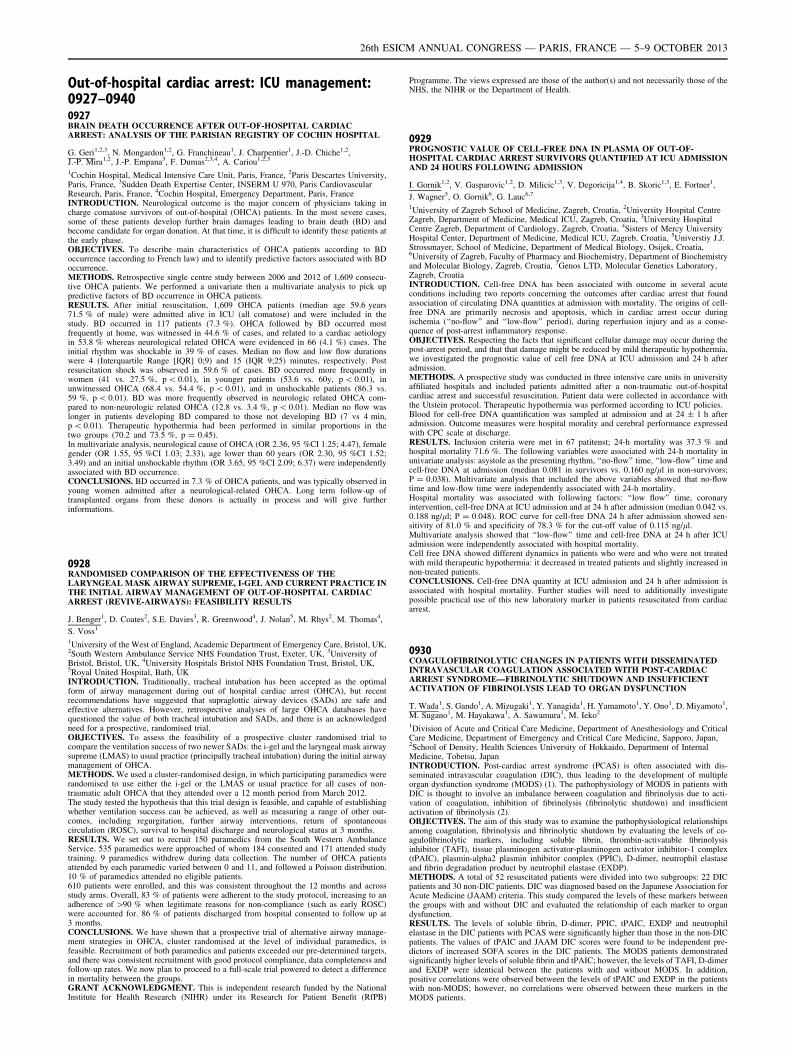
Out-of-hospital cardiac arrest: ICU management:0927–09400927BRAIN DEATH OCCURRENCE AFTER OUT-OF-HOSPITAL CARDIACARREST: ANALYSIS OF THE PARISIAN REGISTRY OF COCHIN HOSPITAL
G. Geri1,2,3, N. Mongardon1,2, G. Franchineau1, J. Charpentier1, J.-D. Chiche1,2,J.-P. Mira1,2, J.-P. Empana3, F. Dumas2,3,4, A. Cariou1,2,3
1Cochin Hospital, Medical Intensive Care Unit, Paris, France, 2Paris Descartes University,Paris, France, 3Sudden Death Expertise Center, INSERM U 970, Paris CardiovascularResearch, Paris, France, 4Cochin Hospital, Emergency Department, Paris, FranceINTRODUCTION. Neurological outcome is the major concern of physicians taking incharge comatose survivors of out-of-hospital (OHCA) patients. In the most severe cases,some of these patients develop further brain damages leading to brain death (BD) andbecome candidate for organ donation. At that time, it is difficult to identify these patients atthe early phase.OBJECTIVES. To describe main characteristics of OHCA patients according to BDoccurrence (according to French law) and to identify predictive factors associated with BDoccurrence.METHODS. Retrospective single centre study between 2006 and 2012 of 1,609 consecu-tive OHCA patients. We performed a univariate then a multivariate analysis to pick uppredictive factors of BD occurrence in OHCA patients.RESULTS. After initial resuscitation, 1,609 OHCA patients (median age 59.6 years71.5 % of male) were admitted alive in ICU (all comatose) and were included in thestudy. BD occurred in 117 patients (7.3 %). OHCA followed by BD occurred mostfrequently at home, was witnessed in 44.6 % of cases, and related to a cardiac aetiologyin 53.8 % whereas neurological related OHCA were evidenced in 66 (4.1 %) cases. Theinitial rhythm was shockable in 39 % of cases. Median no flow and low flow durationswere 4 (Interquartile Range [IQR] 0;9) and 15 (IQR 9;25) minutes, respectively. Postresuscitation shock was observed in 59.6 % of cases. BD occurred more frequently inwomen (41 vs. 27.5 %, p \ 0.01), in younger patients (53.6 vs. 60y, p \ 0.01), inunwitnessed OHCA (68.4 vs. 54.4 %, p \ 0.01), and in unshockable patients (86.3 vs.59 %, p \ 0.01). BD was more frequently observed in neurologic related OHCA com-pared to non-neurologic related OHCA (12.8 vs. 3.4 %, p \ 0.01). Median no flow waslonger in patients developing BD compared to those not developing BD (7 vs 4 min,p \ 0.01). Therapeutic hypothermia had been performed in similar proportions in thetwo groups (70.2 and 73.5 %, p = 0.45).In multivariate analysis, neurological cause of OHCA (OR 2.36, 95 %CI 1.25; 4.47), femalegender (OR 1.55, 95 %CI 1.03; 2.33), age lower than 60 years (OR 2.30, 95 %CI 1.52;3.49) and an initial unshockable rhythm (OR 3.65, 95 %CI 2.09; 6.37) were independentlyassociated with BD occurrence.CONCLUSIONS. BD occurred in 7.3 % of OHCA patients, and was typically observed inyoung women admitted after a neurological-related OHCA. Long term follow-up oftransplanted organs from these donors is actually in process and will give furtherinformations.
0928RANDOMISED COMPARISON OF THE EFFECTIVENESS OF THELARYNGEAL MASK AIRWAY SUPREME, I-GEL AND CURRENT PRACTICE INTHE INITIAL AIRWAY MANAGEMENT OF OUT-OF-HOSPITAL CARDIACARREST (REVIVE-AIRWAYS): FEASIBILITY RESULTS
J. Benger1, D. Coates2, S.E. Davies3, R. Greenwood4, J. Nolan5, M. Rhys2, M. Thomas4,
S. Voss1
1University of the West of England, Academic Department of Emergency Care, Bristol, UK,2South Western Ambulance Service NHS Foundation Trust, Exeter, UK, 3University ofBristol, Bristol, UK, 4University Hospitals Bristol NHS Foundation Trust, Bristol, UK,5Royal United Hospital, Bath, UKINTRODUCTION. Traditionally, tracheal intubation has been accepted as the optimalform of airway management during out of hospital cardiac arrest (OHCA), but recentrecommendations have suggested that supraglottic airway devices (SADs) are safe andeffective alternatives. However, retrospective analyses of large OHCA databases havequestioned the value of both tracheal intubation and SADs, and there is an acknowledgedneed for a prospective, randomised trial.OBJECTIVES. To assess the feasibility of a prospective cluster randomised trial tocompare the ventilation success of two newer SADs: the i-gel and the laryngeal mask airwaysupreme (LMAS) to usual practice (principally tracheal intubation) during the initial airwaymanagement of OHCA.METHODS. We used a cluster-randomised design, in which participating paramedics wererandomised to use either the i-gel or the LMAS or usual practice for all cases of non-traumatic adult OHCA that they attended over a 12 month period from March 2012.The study tested the hypothesis that this trial design is feasible, and capable of establishingwhether ventilation success can be achieved, as well as measuring a range of other out-comes, including regurgitation, further airway interventions, return of spontaneouscirculation (ROSC), survival to hospital discharge and neurological status at 3 months.RESULTS. We set out to recruit 150 paramedics from the South Western AmbulanceService. 535 paramedics were approached of whom 184 consented and 171 attended studytraining. 9 paramedics withdrew during data collection. The number of OHCA patientsattended by each paramedic varied between 0 and 11, and followed a Poisson distribution.10 % of paramedics attended no eligible patients.610 patients were enrolled, and this was consistent throughout the 12 months and acrossstudy arms. Overall, 83 % of patients were adherent to the study protocol, increasing to anadherence of [90 % when legitimate reasons for non-compliance (such as early ROSC)were accounted for. 86 % of patients discharged from hospital consented to follow up at3 months.CONCLUSIONS. We have shown that a prospective trial of alternative airway manage-ment strategies in OHCA, cluster randomised at the level of individual paramedics, isfeasible. Recruitment of both paramedics and patients exceeded our pre-determined targets,and there was consistent recruitment with good protocol compliance, data completeness andfollow-up rates. We now plan to proceed to a full-scale trial powered to detect a differencein mortality between the groups.GRANT ACKNOWLEDGMENT. This is independent research funded by the NationalInstitute for Health Research (NIHR) under its Research for Patient Benefit (RfPB)
Programme. The views expressed are those of the author(s) and not necessarily those of theNHS, the NIHR or the Department of Health.
0929PROGNOSTIC VALUE OF CELL-FREE DNA IN PLASMA OF OUT-OF-HOSPITAL CARDIAC ARREST SURVIVORS QUANTIFIED AT ICU ADMISSIONAND 24 HOURS FOLLOWING ADMISSION
I. Gornik1,2, V. Gasparovic1,2, D. Milicic1,3, V. Degoricija1,4, B. Skoric1,3, E. Fortner1,
J. Wagner5, O. Gornik6, G. Lauc6,7
1University of Zagreb School of Medicine, Zagreb, Croatia, 2University Hospital CentreZagreb, Department of Medicine, Medical ICU, Zagreb, Croatia, 3University HospitalCentre Zagreb, Department of Cardiology, Zagreb, Croatia, 4Sisters of Mercy UniversityHospital Center, Department of Medicine, Medical ICU, Zagreb, Croatia, 5Universtiy J.J.Strossmayer, School of Medicine, Department of Medical Biology, Osijek, Croatia,6University of Zagreb, Faculty of Pharmacy and Biochemistry, Department of Biochemistryand Molecular Biology, Zagreb, Croatia, 7Genos LTD, Molecular Genetics Laboratory,Zagreb, CroatiaINTRODUCTION. Cell-free DNA has been associated with outcome in several acuteconditions including two reports concerning the outcomes after cardiac arrest that foundassociation of circulating DNA quantities at admission with mortality. The origins of cell-free DNA are primarily necrosis and apoptosis, which in cardiac arrest occur duringischemia (‘‘no-flow’’ and ‘‘low-flow’’ period), during reperfusion injury and as a conse-quence of post-arrest inflammatory response.OBJECTIVES. Respecting the facts that significant cellular damage may occur during thepost-arrest period, and that that damage might be reduced by mild therapeutic hypothermia,we investigated the prognostic value of cell free DNA at ICU admission and 24 h afteradmission.METHODS. A prospective study was conducted in three intensive care units in universityaffiliated hospitals and included patients admitted after a non-traumatic out-of-hospitalcardiac arrest and successful resuscitation. Patient data were collected in accordance withthe Utstein protocol. Therapeutic hypothermia was performed according to ICU policies.Blood for cell-free DNA quantification was sampled at admission and at 24 ± 1 h afteradmission. Outcome measures were hospital morality and cerebral performance expressedwith CPC scale at discharge.RESULTS. Inclusion criteria were met in 67 patitenst; 24-h mortality was 37.3 % andhospital mortality 71.6 %. The following variables were associated with 24-h mortality inunivariate analysis: asystole as the presenting rhythm, ‘‘no-flow’’ time, ‘‘low-flow’’ time andcell-free DNA at admission (median 0.081 in survivors vs. 0.160 ng/ll in non-survivors;P = 0.038). Multivariate analysis that included the above variables showed that no-flowtime and low-flow time were independently associated with 24-h mortality.Hospital mortality was associated with following factors: ‘‘low flow’’ time, coronaryintervention, cell-free DNA at ICU admission and at 24 h after admission (median 0.042 vs.0.188 ng/ll; P = 0.048). ROC curve for cell-free DNA 24 h after admission showed sen-sitivity of 81.0 % and specificity of 78.3 % for the cut-off value of 0.115 ng/ll.Multivariate analysis showed that ‘‘low-flow’’ time and cell-free DNA at 24 h after ICUadmission were independently associated with hospital mortality.Cell free DNA showed different dynamics in patients who were and who were not treatedwith mild therapeutic hypothermia: it decreased in treated patients and slightly increased innon-treated patients.CONCLUSIONS. Cell-free DNA quantity at ICU admission and 24 h after admission isassociated with hospital mortality. Further studies will need to additionally investigatepossible practical use of this new laboratory marker in patients resuscitated from cardiacarrest.
0930COAGULOFIBRINOLYTIC CHANGES IN PATIENTS WITH DISSEMINATEDINTRAVASCULAR COAGULATION ASSOCIATED WITH POST-CARDIACARREST SYNDROME—FIBRINOLYTIC SHUTDOWN AND INSUFFICIENTACTIVATION OF FIBRINOLYSIS LEAD TO ORGAN DYSFUNCTION
T. Wada1, S. Gando1, A. Mizugaki1, Y. Yanagida1, H. Yamamoto1, Y. Ono1, D. Miyamoto1,M. Sugano1, M. Hayakawa1, A. Sawamura1, M. Ieko2
1Division of Acute and Critical Care Medicine, Department of Anesthesiology and CriticalCare Medicine, Department of Emergency and Critical Care Medicine, Sapporo, Japan,2School of Density, Health Sciences University of Hokkaido, Department of InternalMedicine, Tobetsu, JapanINTRODUCTION. Post-cardiac arrest syndrome (PCAS) is often associated with dis-seminated intravascular coagulation (DIC), thus leading to the development of multipleorgan dysfunction syndrome (MODS) (1). The pathophysiology of MODS in patients withDIC is thought to involve an imbalance between coagulation and fibrinolysis due to acti-vation of coagulation, inhibition of fibrinolysis (fibrinolytic shutdown) and insufficientactivation of fibrinolysis (2).OBJECTIVES. The aim of this study was to examine the pathophysiological relationshipsamong coagulation, fibrinolysis and fibrinolytic shutdown by evaluating the levels of co-agulofibrinolytic markers, including soluble fibrin, thrombin-activatable fibrinolysisinhibitor (TAFI), tissue plasminogen activator-plasminogen activator inhibitor-1 complex(tPAIC), plasmin-alpha2 plasmin inhibitor complex (PPIC), D-dimer, neutrophil elastaseand fibrin degradation product by neutrophil elastase (EXDP).METHODS. A total of 52 resuscitated patients were divided into two subgroups: 22 DICpatients and 30 non-DIC patients. DIC was diagnosed based on the Japanese Association forAcute Medicine (JAAM) criteria. This study compared the levels of these markers betweenthe groups with and without DIC and evaluated the relationship of each marker to organdysfunction.RESULTS. The levels of soluble fibrin, D-dimer, PPIC, tPAIC, EXDP and neutrophilelastase in the DIC patients with PCAS were significantly higher than those in the non-DICpatients. The values of tPAIC and JAAM DIC scores were found to be independent pre-dictors of increased SOFA scores in the DIC patients. The MODS patients demonstratedsignificantly higher levels of soluble fibrin and tPAIC; however, the levels of TAFI, D-dimerand EXDP were identical between the patients with and without MODS. In addition,positive correlations were observed between the levels of tPAIC and EXDP in the patientswith non-MODS; however, no correlations were observed between these markers in theMODS patients.
26th ESICM ANNUAL CONGRESS — PARIS, FRANCE — 5–9 OCTOBER 2013
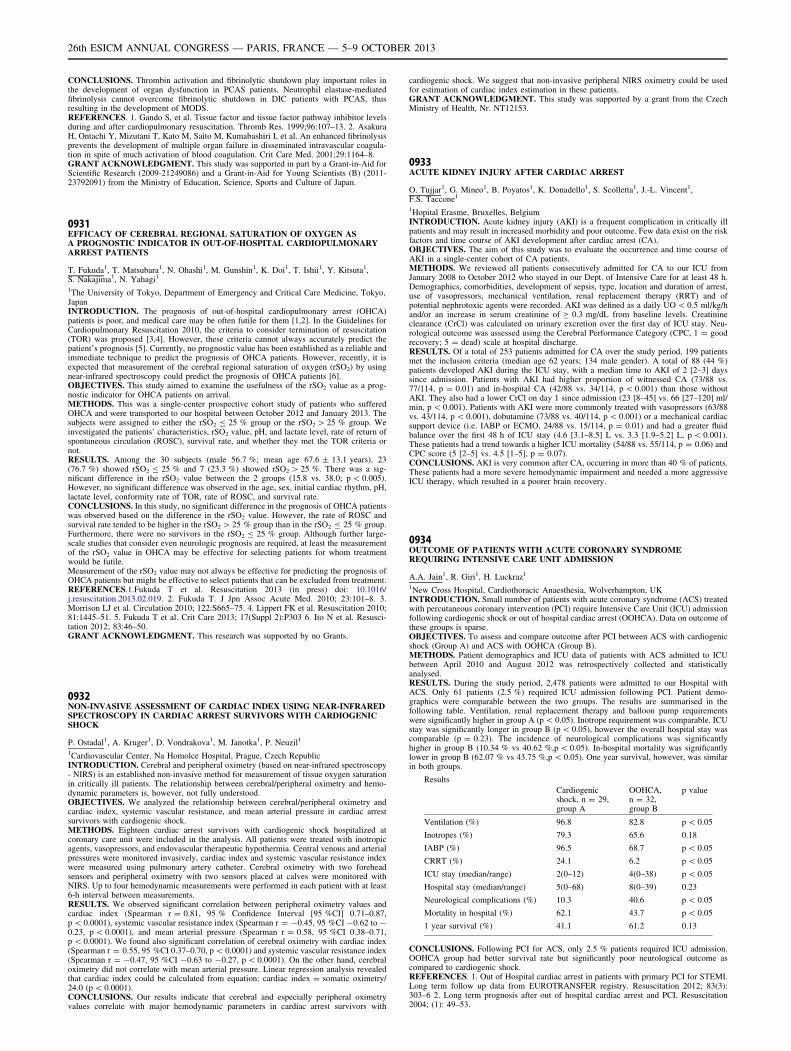
CONCLUSIONS. Thrombin activation and fibrinolytic shutdown play important roles inthe development of organ dysfunction in PCAS patients. Neutrophil elastase-mediatedfibrinolysis cannot overcome fibrinolytic shutdown in DIC patients with PCAS, thusresulting in the development of MODS.REFERENCES. 1. Gando S, et al. Tissue factor and tissue factor pathway inhibitor levelsduring and after cardiopulmonary resuscitation. Thromb Res. 1999;96:107–13. 2. AsakuraH, Ontachi Y, Mizutani T, Kato M, Saito M, Kumabashiri I, et al. An enhanced fibrinolysisprevents the development of multiple organ failure in disseminated intravascular coagula-tion in spite of much activation of blood coagulation. Crit Care Med. 2001;29:1164–8.GRANT ACKNOWLEDGMENT. This study was supported in part by a Grant-in-Aid forScientific Research (2009-21249086) and a Grant-in-Aid for Young Scientists (B) (2011-23792091) from the Ministry of Education, Science, Sports and Culture of Japan.
0931EFFICACY OF CEREBRAL REGIONAL SATURATION OF OXYGEN ASA PROGNOSTIC INDICATOR IN OUT-OF-HOSPITAL CARDIOPULMONARYARREST PATIENTS
T. Fukuda1, T. Matsubara1, N. Ohashi1, M. Gunshin1, K. Doi1, T. Ishii1, Y. Kitsuta1,S. Nakajima1, N. Yahagi1
1The University of Tokyo, Department of Emergency and Critical Care Medicine, Tokyo,JapanINTRODUCTION. The prognosis of out-of-hospital cardiopulmonary arrest (OHCA)patients is poor, and medical care may be often futile for them [1,2]. In the Guidelines forCardiopulmonary Resuscitation 2010, the criteria to consider termination of resuscitation(TOR) was proposed [3,4]. However, these criteria cannot always accurately predict thepatient’s prognosis [5]. Currently, no prognostic value has been established as a reliable andimmediate technique to predict the prognosis of OHCA patients. However, recently, it isexpected that measurement of the cerebral regional saturation of oxygen (rSO2) by usingnear-infrared spectroscopy could predict the prognosis of OHCA patients [6].OBJECTIVES. This study aimed to examine the usefulness of the rSO2 value as a prog-nostic indicator for OHCA patients on arrival.METHODS. This was a single-center prospective cohort study of patients who sufferedOHCA and were transported to our hospital between October 2012 and January 2013. Thesubjects were assigned to either the rSO2 B 25 % group or the rSO2 [ 25 % group. Weinvestigated the patients’ characteristics, rSO2 value, pH, and lactate level, rate of return ofspontaneous circulation (ROSC), survival rate, and whether they met the TOR criteria ornot.RESULTS. Among the 30 subjects (male 56.7 %; mean age 67.6 ± 13.1 years), 23(76.7 %) showed rSO2 B 25 % and 7 (23.3 %) showed rSO2 [ 25 %. There was a sig-nificant difference in the rSO2 value between the 2 groups (15.8 vs. 38.0; p \ 0.005).However, no significant difference was observed in the age, sex, initial cardiac rhythm, pH,lactate level, conformity rate of TOR, rate of ROSC, and survival rate.CONCLUSIONS. In this study, no significant difference in the prognosis of OHCA patientswas observed based on the difference in the rSO2 value. However, the rate of ROSC andsurvival rate tended to be higher in the rSO2 [ 25 % group than in the rSO2 B 25 % group.Furthermore, there were no survivors in the rSO2 B 25 % group. Although further large-scale studies that consider even neurologic prognosis are required, at least the measurementof the rSO2 value in OHCA may be effective for selecting patients for whom treatmentwould be futile.Measurement of the rSO2 value may not always be effective for predicting the prognosis ofOHCA patients but might be effective to select patients that can be excluded from treatment.REFERENCES.1.Fukuda T et al. Resuscitation 2013 (in press) doi: 10.1016/j.resuscitation.2013.02.019. 2. Fukuda T. J Jpn Assoc Acute Med. 2010; 23:101–8. 3.Morrison LJ et al. Circulation 2010; 122:S665–75. 4. Lippert FK et al. Resuscitation 2010;81:1445–51. 5. Fukuda T et al. Crit Care 2013; 17(Suppl 2):P303 6. Ito N et al. Resusci-tation 2012; 83:46–50.GRANT ACKNOWLEDGMENT. This research was supported by no Grants.
0932NON-INVASIVE ASSESSMENT OF CARDIAC INDEX USING NEAR-INFRAREDSPECTROSCOPY IN CARDIAC ARREST SURVIVORS WITH CARDIOGENICSHOCK
P. Ostadal1, A. Kruger1, D. Vondrakova1, M. Janotka1, P. Neuzil1
1Cardiovascular Center, Na Homolce Hospital, Prague, Czech RepublicINTRODUCTION. Cerebral and peripheral oximetry (based on near-infrared spectroscopy- NIRS) is an established non-invasive method for measurement of tissue oxygen saturationin critically ill patients. The relationship between cerebral/peripheral oximetry and hemo-dynamic parameters is, however, not fully understood.OBJECTIVES. We analyzed the relationship between cerebral/peripheral oximetry andcardiac index, systemic vascular resistance, and mean arterial pressure in cardiac arrestsurvivors with cardiogenic shock.METHODS. Eighteen cardiac arrest survivors with cardiogenic shock hospitalized atcoronary care unit were included in the analysis. All patients were treated with inotropicagents, vasopressors, and endovascular therapeutic hypothermia. Central venous and arterialpressures were monitored invasively, cardiac index and systemic vascular resistance indexwere measured using pulmonary artery catheter. Cerebral oximetry with two foreheadsensors and peripheral oximetry with two sensors placed at calves were monitored withNIRS. Up to four hemodynamic measurements were performed in each patient with at least6-h interval between measurements.RESULTS. We observed significant correlation between peripheral oximetry values andcardiac index (Spearman r = 0.81, 95 % Confidence Interval [95 %CI] 0.71–0.87,p \ 0.0001), systemic vascular resistance index (Spearman r = -0.45, 95 %CI -0.62 to -0.23, p \ 0.0001), and mean arterial pressure (Spearman r = 0.58, 95 %CI 0.38–0.71,p \ 0.0001). We found also significant correlation of cerebral oximetry with cardiac index(Spearman r = 0.55, 95 %CI 0.37–0.70, p \ 0.0001) and systemic vascular resistance index(Spearman r = -0.47, 95 %CI -0.63 to -0.27, p \ 0.0001). On the other hand, cerebraloximetry did not correlate with mean arterial pressure. Linear regression analysis revealedthat cardiac index could be calculated from equation: cardiac index = somatic oximetry/24.0 (p \ 0.0001).CONCLUSIONS. Our results indicate that cerebral and especially peripheral oximetryvalues correlate with major hemodynamic parameters in cardiac arrest survivors with
cardiogenic shock. We suggest that non-invasive peripheral NIRS oximetry could be usedfor estimation of cardiac index estimation in these patients.GRANT ACKNOWLEDGMENT. This study was supported by a grant from the CzechMinistry of Health, Nr. NT12153.
0933ACUTE KIDNEY INJURY AFTER CARDIAC ARREST
O. Tujjar1, G. Mineo1, B. Poyatos1, K. Donadello1, S. Scolletta1, J.-L. Vincent1,F.S. Taccone1
1Hopital Erasme, Bruxelles, BelgiumINTRODUCTION. Acute kidney injury (AKI) is a frequent complication in critically illpatients and may result in increased morbidity and poor outcome. Few data exist on the riskfactors and time course of AKI development after cardiac arrest (CA).OBJECTIVES. The aim of this study was to evaluate the occurrence and time course ofAKI in a single-center cohort of CA patients.METHODS. We reviewed all patients consecutively admitted for CA to our ICU fromJanuary 2008 to October 2012 who stayed in our Dept. of Intensive Care for at least 48 h.Demographics, comorbidities, development of sepsis, type, location and duration of arrest,use of vasopressors, mechanical ventilation, renal replacement therapy (RRT) and ofpotential nephrotoxic agents were recorded. AKI was defined as a daily UO \ 0.5 ml/kg/hand/or an increase in serum creatinine of C 0.3 mg/dL from baseline levels. Creatinineclearance (CrCl) was calculated on urinary excretion over the first day of ICU stay. Neu-rological outcome was assessed using the Cerebral Performance Category (CPC, 1 = goodrecovery; 5 = dead) scale at hospital discharge.RESULTS. Of a total of 253 patients admitted for CA over the study period, 199 patientsmet the inclusion criteria (median age 62 years; 134 male gender). A total of 88 (44 %)patients developed AKI during the ICU stay, with a median time to AKI of 2 [2–3] dayssince admission. Patients with AKI had higher proportion of witnessed CA (73/88 vs.77/114, p = 0.01) and in-hospital CA (42/88 vs. 34/114, p \ 0.001) than those withoutAKI. They also had a lower CrCl on day 1 since admission (23 [8–45] vs. 66 [27–120] ml/min, p \ 0.001). Patients with AKI were more commonly treated with vasopressors (63/88vs. 43/114, p \ 0.001), dobutamine (73/88 vs. 40/114, p \ 0.001) or a mechanical cardiacsupport device (i.e. IABP or ECMO, 24/88 vs. 15/114, p = 0.01) and had a greater fluidbalance over the first 48 h of ICU stay (4.6 [3.1–8.5] L vs. 3.3 [1.9–5.2] L, p \ 0.001).These patients had a trend towards a higher ICU mortality (54/88 vs. 55/114, p = 0.06) andCPC score (5 [2–5] vs. 4.5 [1–5], p = 0.07).CONCLUSIONS. AKI is very common after CA, occurring in more than 40 % of patients.These patients had a more severe hemodynamic impairment and needed a more aggressiveICU therapy, which resulted in a poorer brain recovery.
0934OUTCOME OF PATIENTS WITH ACUTE CORONARY SYNDROMEREQUIRING INTENSIVE CARE UNIT ADMISSION
A.A. Jain1, R. Giri1, H. Luckraz1
1New Cross Hospital, Cardiothoracic Anaesthesia, Wolverhampton, UKINTRODUCTION. Small number of patients with acute coronary syndrome (ACS) treatedwith percutaneous coronary intervention (PCI) require Intensive Care Unit (ICU) admissionfollowing cardiogenic shock or out of hospital cardiac arrest (OOHCA). Data on outcome ofthese groups is sparse.OBJECTIVES. To assess and compare outcome after PCI between ACS with cardiogenicshock (Group A) and ACS with OOHCA (Group B).METHODS. Patient demographics and ICU data of patients with ACS admitted to ICUbetween April 2010 and August 2012 was retrospectively collected and statisticallyanalysed.RESULTS. During the study period, 2,478 patients were admitted to our Hospital withACS. Only 61 patients (2.5 %) required ICU admission following PCI. Patient demo-graphics were comparable between the two groups. The results are summarised in thefollowing table. Ventilation, renal replacement therapy and balloon pump requirementswere significantly higher in group A (p \ 0.05). Inotrope requirement was comparable. ICUstay was significantly longer in group B (p \ 0.05), however the overall hospital stay wascomparable (p = 0.23). The incidence of neurological complications was significantlyhigher in group B (10.34 % vs 40.62 %,p \ 0.05). In-hospital mortality was significantlylower in group B (62.07 % vs 43.75 %,p \ 0.05). One year survival, however, was similarin both groups.
Results
Cardiogenicshock, n = 29,group A
OOHCA,n = 32,group B
p value
Ventilation (%) 96.8 82.8 p \ 0.05
Inotropes (%) 79.3 65.6 0.18
IABP (%) 96.5 68.7 p \ 0.05
CRRT (%) 24.1 6.2 p \ 0.05
ICU stay (median/range) 2(0–12) 4(0–38) p \ 0.05
Hospital stay (median/range) 5(0–68) 8(0–39) 0.23
Neurological complications (%) 10.3 40.6 p \ 0.05
Mortality in hospital (%) 62.1 43.7 p \ 0.05
1 year survival (%) 41.1 61.2 0.13
CONCLUSIONS. Following PCI for ACS, only 2.5 % patients required ICU admission.OOHCA group had better survival rate but significantly poor neurological outcome ascompared to cardiogenic shock.REFERENCES. 1. Out of Hospital cardiac arrest in patients with primary PCI for STEMI.Long term follow up data from EUROTRANSFER registry. Resuscitation 2012; 83(3):303–6 2. Long term prognosis after out of hospital cardiac arrest and PCI. Resuscitation2004; (1): 49–53.
26th ESICM ANNUAL CONGRESS — PARIS, FRANCE — 5–9 OCTOBER 2013
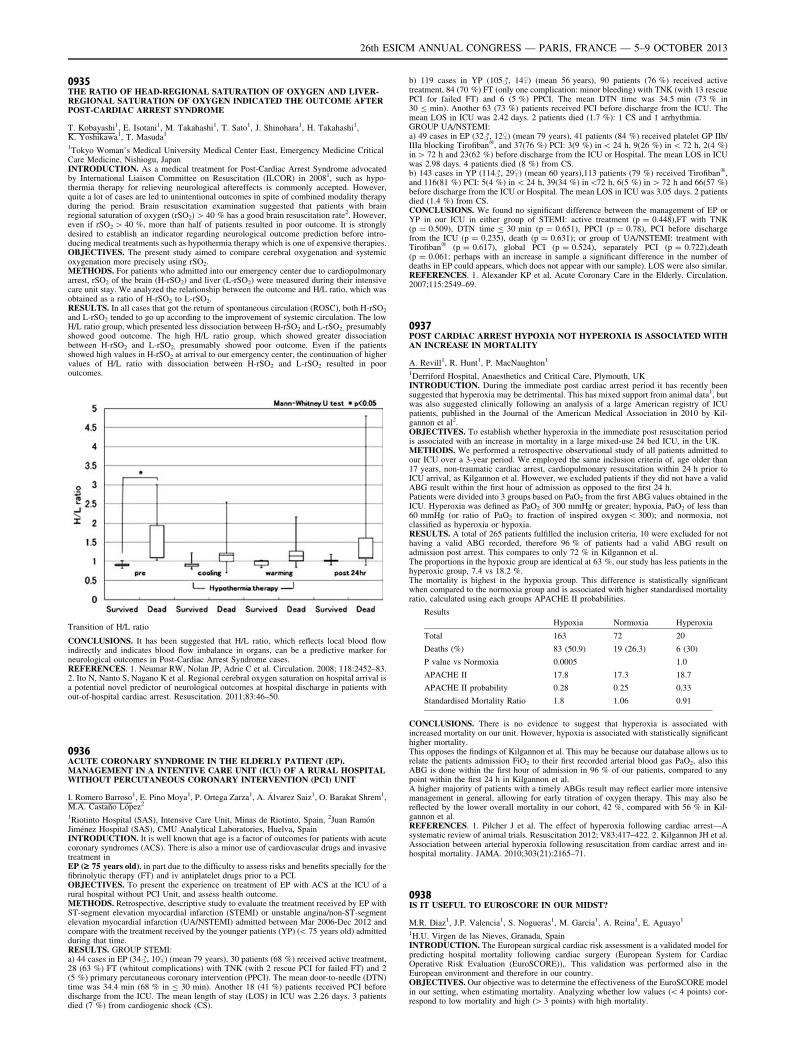
0935THE RATIO OF HEAD-REGIONAL SATURATION OF OXYGEN AND LIVER-REGIONAL SATURATION OF OXYGEN INDICATED THE OUTCOME AFTERPOST-CARDIAC ARREST SYNDROME
T. Kobayashi1, E. Isotani1, M. Takahashi1, T. Sato1, J. Shinohara1, H. Takahashi1,K. Yoshikawa1, T. Masuda1
1Tokyo Woman’s Medical University Medical Center East, Emergency Medicine CriticalCare Medicine, Nishiogu, JapanINTRODUCTION. As a medical treatment for Post-Cardiac Arrest Syndrome advocatedby International Liaison Committee on Resuscitation (ILCOR) in 20081, such as hypo-thermia therapy for relieving neurological aftereffects is commonly accepted. However,quite a lot of cases are led to unintentional outcomes in spite of combined modality therapyduring the period. Brain resuscitation examination suggested that patients with brainregional saturation of oxygen (rSO2) [ 40 % has a good brain resuscitation rate2. However,even if rSO2 [ 40 %, more than half of patients resulted in poor outcome. It is stronglydesired to establish an indicator regarding neurological outcome prediction before intro-ducing medical treatments such as hypothermia therapy which is one of expensive therapies.OBJECTIVES. The present study aimed to compare cerebral oxygenation and systemicoxygenation more precisely using rSO2.METHODS. For patients who admitted into our emergency center due to cardiopulmonaryarrest, rSO2 of the brain (H-rSO2) and liver (L-rSO2) were measured during their intensivecare unit stay. We analyzed the relationship between the outcome and H/L ratio, which wasobtained as a ratio of H-rSO2 to L-rSO2.RESULTS. In all cases that got the return of spontaneous circulation (ROSC), both H-rSO2
and L-rSO2 tended to go up according to the improvement of systemic circulation. The lowH/L ratio group, which presented less dissociation between H-rSO2 and L-rSO2, presumablyshowed good outcome. The high H/L ratio group, which showed greater dissociationbetween H-rSO2 and L-rSO2, presumably showed poor outcome. Even if the patientsshowed high values in H-rSO2 at arrival to our emergency center, the continuation of highervalues of H/L ratio with dissociation between H-rSO2 and L-rSO2 resulted in pooroutcomes.
Transition of H/L ratio
CONCLUSIONS. It has been suggested that H/L ratio, which reflects local blood flowindirectly and indicates blood flow imbalance in organs, can be a predictive marker forneurological outcomes in Post-Cardiac Arrest Syndrome cases.REFERENCES. 1. Neumar RW, Nolan JP, Adrie C et al. Circulation. 2008; 118:2452–83.2. Ito N, Nanto S, Nagano K et al. Regional cerebral oxygen saturation on hospital arrival isa potential novel predictor of neurological outcomes at hospital discharge in patients without-of-hospital cardiac arrest. Resuscitation. 2011;83:46–50.
0936ACUTE CORONARY SYNDROME IN THE ELDERLY PATIENT (EP).MANAGEMENT IN A INTENTIVE CARE UNIT (ICU) OF A RURAL HOSPITALWITHOUT PERCUTANEOUS CORONARY INTERVENTION (PCI) UNIT
I. Romero Barroso1, E. Pino Moya1, P. Ortega Zarza1, A. Álvarez Saiz1, O. Barakat Shrem1,M.A. Castaño López2
1Riotinto Hospital (SAS), Intensive Care Unit, Minas de Riotinto, Spain, 2Juan RamónJiménez Hospital (SAS), CMU Analytical Laboratories, Huelva, SpainINTRODUCTION. It is well known that age is a factor of outcomes for patients with acutecoronary syndromes (ACS). There is also a minor use of cardiovascular drugs and invasivetreatment inEP (‡ 75 years old), in part due to the difficulty to assess risks and benefits specially for thefibrinolytic therapy (FT) and iv antiplatelet drugs prior to a PCI.OBJECTIVES. To present the experience on treatment of EP with ACS at the ICU of arural hospital without PCI Unit, and assess health outcome.METHODS. Retrospective, descriptive study to evaluate the treatment received by EP withST-segment elevation myocardial infarction (STEMI) or unstable angina/non-ST-segmentelevation myocardial infarction (UA/NSTEMI) admitted between Mar 2006-Dec 2012 andcompare with the treatment received by the younger patients (YP) (\ 75 years old) admittedduring that time.RESULTS. GROUP STEMI:a) 44 cases in EP (34#, 10$) (mean 79 years), 30 patients (68 %) received active treatment,28 (63 %) FT (whitout complications) with TNK (with 2 rescue PCI for failed FT) and 2(5 %) primary percutaneous coronary intervention (PPCI). The mean door-to-needle (DTN)time was 34.4 min (68 % in B 30 min). Another 18 (41 %) patients received PCI beforedischarge from the ICU. The mean length of stay (LOS) in ICU was 2.26 days. 3 patientsdied (7 %) from cardiogenic shock (CS).
b) 119 cases in YP (105#, 14$) (mean 56 years), 90 patients (76 %) received activetreatment, 84 (70 %) FT (only one complication: minor bleeding) with TNK (with 13 rescuePCI for failed FT) and 6 (5 %) PPCI. The mean DTN time was 34.5 min (73 % in30 B min). Another 63 (73 %) patients received PCI before discharge from the ICU. Themean LOS in ICU was 2.42 days. 2 patients died (1.7 %): 1 CS and 1 arrhythmia.GROUP UA/NSTEMI:a) 49 cases in EP (32#, 12$) (mean 79 years), 41 patients (84 %) received platelet GP IIb/IIIa blocking Tirofiban�, and 37(76 %) PCI: 3(9 %) in \ 24 h, 9(26 %) in \ 72 h, 2(4 %)in [ 72 h and 23(62 %) before discharge from the ICU or Hospital. The mean LOS in ICUwas 2.98 days. 4 patients died (8 %) from CS.b) 143 cases in YP (114#, 29$) (mean 60 years),113 patients (79 %) received Tirofiban�,and 116(81 %) PCI: 5(4 %) in \ 24 h, 39(34 %) in\72 h, 6(5 %) in [ 72 h and 66(57 %)before discharge from the ICU or Hospital. The mean LOS in ICU was 3.05 days. 2 patientsdied (1.4 %) from CS.CONCLUSIONS. We found no significant difference between the management of EP orYP in our ICU in either group of STEMI: active treatment (p = 0.448),FT with TNK(p = 0.509), DTN time B 30 min (p = 0.651), PPCI (p = 0.78), PCI before dischargefrom the ICU (p = 0.235), death (p = 0.631); or group of UA/NSTEMI: treatment withTirofiban� (p = 0.617), global PCI (p = 0.524), separately PCI (p = 0.722),death(p = 0.061; perhaps with an increase in sample a significant difference in the number ofdeaths in EP could appears, which does not appear with our sample). LOS were also similar.REFERENCES. 1. Alexander KP et al. Acute Coronary Care in the Elderly. Circulation.2007;115:2549–69.
0937POST CARDIAC ARREST HYPOXIA NOT HYPEROXIA IS ASSOCIATED WITHAN INCREASE IN MORTALITY
A. Revill1, R. Hunt1, P. MacNaughton1
1Derriford Hospital, Anaesthetics and Critical Care, Plymouth, UKINTRODUCTION. During the immediate post cardiac arrest period it has recently beensuggested that hyperoxia may be detrimental. This has mixed support from animal data1, butwas also suggested clinically following an analysis of a large American registry of ICUpatients, published in the Journal of the American Medical Association in 2010 by Kil-gannon et al2.OBJECTIVES. To establish whether hyperoxia in the immediate post resuscitation periodis associated with an increase in mortality in a large mixed-use 24 bed ICU, in the UK.METHODS. We performed a retrospective observational study of all patients admitted toour ICU over a 3-year period. We employed the same inclusion criteria of, age older than17 years, non-traumatic cardiac arrest, cardiopulmonary resuscitation within 24 h prior toICU arrival, as Kilgannon et al. However, we excluded patients if they did not have a validABG result within the first hour of admission as opposed to the first 24 h.Patients were divided into 3 groups based on PaO2 from the first ABG values obtained in theICU. Hyperoxia was defined as PaO2 of 300 mmHg or greater; hypoxia, PaO2 of less than60 mmHg (or ratio of PaO2 to fraction of inspired oxygen \ 300); and normoxia, notclassified as hyperoxia or hypoxia.RESULTS. A total of 265 patients fulfilled the inclusion criteria, 10 were excluded for nothaving a valid ABG recorded, therefore 96 % of patients had a valid ABG result onadmission post arrest. This compares to only 72 % in Kilgannon et al.The proportions in the hypoxic group are identical at 63 %, our study has less patients in thehyperoxic group, 7.4 vs 18.2 %.The mortality is highest in the hypoxia group. This difference is statistically significantwhen compared to the normoxia group and is associated with higher standardised mortalityratio, calculated using each groups APACHE II probabilities.
Results
Hypoxia Normoxia Hyperoxia
Total 163 72 20
Deaths (%) 83 (50.9) 19 (26.3) 6 (30)
P value vs Normoxia 0.0005 1.0
APACHE II 17.8 17.3 18.7
APACHE II probability 0.28 0.25 0.33
Standardised Mortality Ratio 1.8 1.06 0.91
CONCLUSIONS. There is no evidence to suggest that hyperoxia is associated withincreased mortality on our unit. However, hypoxia is associated with statistically significanthigher mortality.This opposes the findings of Kilgannon et al. This may be because our database allows us torelate the patients admission FiO2 to their first recorded arterial blood gas PaO2, also thisABG is done within the first hour of admission in 96 % of our patients, compared to anypoint within the first 24 h in Kilgannon et al.A higher majority of patients with a timely ABGs result may reflect earlier more intensivemanagement in general, allowing for early titration of oxygen therapy. This may also bereflected by the lower overall mortality in our cohort, 42 %, compared with 56 % in Kil-gannon et al.REFERENCES. 1. Pilcher J et al. The effect of hyperoxia following cardiac arrest—Asystematic review of animal trials. Resuscitation 2012; V83:417–422. 2. Kilgannon JH et al.Association between arterial hyperoxia following resuscitation from cardiac arrest and in-hospital mortality. JAMA. 2010;303(21):2165–71.
0938IS IT USEFUL TO EUROSCORE IN OUR MIDST?
M.R. Diaz1, J.P. Valencia1, S. Nogueras1, M. Garcia1, A. Reina1, E. Aguayo1
1H.U. Virgen de las Nieves, Granada, SpainINTRODUCTION. The European surgical cardiac risk assessment is a validated model forpredicting hospital mortality following cardiac surgery (European System for CardiacOperative Risk Evaluation (EuroSCORE)),. This validation was performed also in theEuropean environment and therefore in our country.OBJECTIVES. Our objective was to determine the effectiveness of the EuroSCORE modelin our setting, when estimating mortality. Analyzing whether low values (\ 4 points) cor-respond to low mortality and high ([ 3 points) with high mortality.
26th ESICM ANNUAL CONGRESS — PARIS, FRANCE — 5–9 OCTOBER 2013
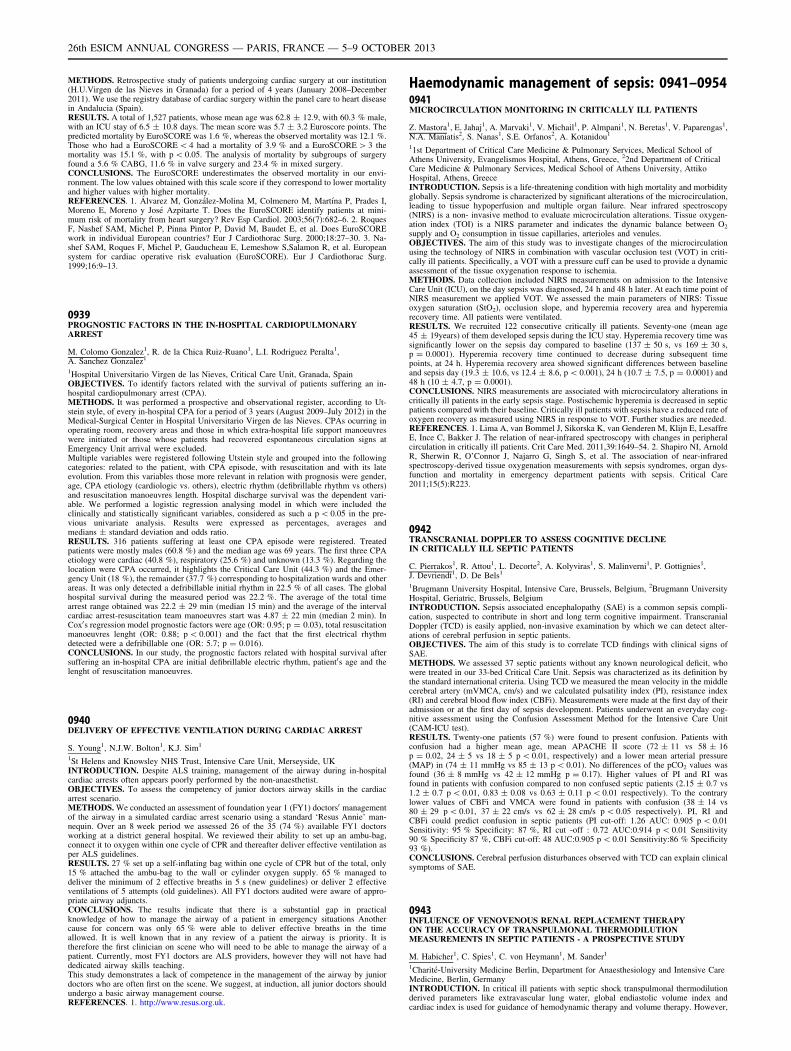
METHODS. Retrospective study of patients undergoing cardiac surgery at our institution(H.U.Virgen de las Nieves in Granada) for a period of 4 years (January 2008–December2011). We use the registry database of cardiac surgery within the panel care to heart diseasein Andalucia (Spain).RESULTS. A total of 1,527 patients, whose mean age was 62.8 ± 12.9, with 60.3 % male,with an ICU stay of 6.5 ± 10.8 days. The mean score was 5.7 ± 3.2 Euroscore points. Thepredicted mortality by EuroSCORE was 1.6 %, whereas the observed mortality was 12.1 %.Those who had a EuroSCORE \ 4 had a mortality of 3.9 % and a EuroSCORE [ 3 themortality was 15.1 %, with p \ 0.05. The analysis of mortality by subgroups of surgeryfound a 5.6 % CABG, 11.6 % in valve surgery and 23.4 % in mixed surgery.CONCLUSIONS. The EuroSCORE underestimates the observed mortality in our envi-ronment. The low values obtained with this scale score if they correspond to lower mortalityand higher values with higher mortality.REFERENCES. 1. Álvarez M, González-Molina M, Colmenero M, Martı́na P, Prades I,Moreno E, Moreno y José Azpitarte T. Does the EuroSCORE identify patients at mini-mum risk of mortality from heart surgery? Rev Esp Cardiol. 2003;56(7):682–6. 2. RoquesF, Nashef SAM, Michel P, Pinna Pintor P, David M, Baudet E, et al. Does EuroSCOREwork in individual European countries? Eur J Cardiothorac Surg. 2000;18:27–30. 3. Na-shef SAM, Roques F, Michel P, Gauducheau E, Lemeshow S,Salamon R, et al. Europeansystem for cardiac operative risk evaluation (EuroSCORE). Eur J Cardiothorac Surg.1999;16:9–13.
0939PROGNOSTIC FACTORS IN THE IN-HOSPITAL CARDIOPULMONARYARREST
M. Colomo Gonzalez1, R. de la Chica Ruiz-Ruano1, L.I. Rodriguez Peralta1,A. Sanchez Gonzalez1
1Hospital Universitario Virgen de las Nieves, Critical Care Unit, Granada, SpainOBJECTIVES. To identify factors related with the survival of patients suffering an in-hospital cardiopulmonary arrest (CPA).METHODS. It was performed a prospective and observational register, according to Ut-stein style, of every in-hospital CPA for a period of 3 years (August 2009–July 2012) in theMedical-Surgical Center in Hospital Universitario Virgen de las Nieves. CPAs ocurring inoperating room, recovery areas and those in which extra-hospital life support manoeuvreswere initiated or those whose patients had recovered espontaneous circulation signs atEmergency Unit arrival were excluded.Multiple variables were registered following Utstein style and grouped into the followingcategories: related to the patient, with CPA episode, with resuscitation and with its lateevolution. From this variables those more relevant in relation with prognosis were gender,age, CPA etiology (cardiologic vs. others), electric rhythm (defibrillable rhythm vs others)and resuscitation manoeuvres length. Hospital discharge survival was the dependent vari-able. We performed a logistic regression analysing model in which were included theclinically and statistically significant variables, considered as such a p \ 0.05 in the pre-vious univariate analysis. Results were expressed as percentages, averages andmedians ± standard deviation and odds ratio.RESULTS. 316 patients suffering at least one CPA episode were registered. Treatedpatients were mostly males (60.8 %) and the median age was 69 years. The first three CPAetiology were cardiac (40.8 %), respiratory (25.6 %) and unknown (13.3 %). Regarding thelocation were CPA occurred, it highlights the Critical Care Unit (44.3 %) and the Emer-gency Unit (18 %), the remainder (37.7 %) corresponding to hospitalization wards and otherareas. It was only detected a defribillable initial rhythm in 22.5 % of all cases. The globalhospital survival during the measured period was 22.2 %. The average of the total timearrest range obtained was 22.2 ± 29 min (median 15 min) and the average of the intervalcardiac arrest-resuscitation team manoeuvres start was 4.87 ± 22 min (median 2 min). InCox0s regression model prognostic factors were age (OR: 0.95; p = 0.03), total resuscitationmanoeuvres lenght (OR: 0.88; p \ 0.001) and the fact that the first electrical rhythmdetected were a defribillable one (OR: 5.7; p = 0.016).CONCLUSIONS. In our study, the prognostic factors related with hospital survival aftersuffering an in-hospital CPA are initial defibrillable electric rhythm, patient0s age and thelenght of resuscitation manoeuvres.
0940DELIVERY OF EFFECTIVE VENTILATION DURING CARDIAC ARREST
S. Young1, N.J.W. Bolton1, K.J. Sim1
1St Helens and Knowsley NHS Trust, Intensive Care Unit, Merseyside, UKINTRODUCTION. Despite ALS training, management of the airway during in-hospitalcardiac arrests often appears poorly performed by the non-anaesthetist.OBJECTIVES. To assess the competency of junior doctors airway skills in the cardiacarrest scenario.METHODS. We conducted an assessment of foundation year 1 (FY1) doctors0 managementof the airway in a simulated cardiac arrest scenario using a standard ‘Resus Annie’ man-nequin. Over an 8 week period we assessed 26 of the 35 (74 %) available FY1 doctorsworking at a district general hospital. We reviewed their ability to set up an ambu-bag,connect it to oxygen within one cycle of CPR and thereafter deliver effective ventilation asper ALS guidelines.RESULTS. 27 % set up a self-inflating bag within one cycle of CPR but of the total, only15 % attached the ambu-bag to the wall or cylinder oxygen supply. 65 % managed todeliver the minimum of 2 effective breaths in 5 s (new guidelines) or deliver 2 effectiveventilations of 5 attempts (old guidelines). All FY1 doctors audited were aware of appro-priate airway adjuncts.CONCLUSIONS. The results indicate that there is a substantial gap in practicalknowledge of how to manage the airway of a patient in emergency situations Anothercause for concern was only 65 % were able to deliver effective breaths in the timeallowed. It is well known that in any review of a patient the airway is priority. It istherefore the first clinician on scene who will need to be able to manage the airway of apatient. Currently, most FY1 doctors are ALS providers, however they will not have haddedicated airway skills teaching.This study demonstrates a lack of competence in the management of the airway by juniordoctors who are often first on the scene. We suggest, at induction, all junior doctors shouldundergo a basic airway management course.REFERENCES. 1. http://www.resus.org.uk.
Haemodynamic management of sepsis: 0941–09540941LICROCIRCULATION MONITORING IN CRITICALLY ILL PATIENTS
Z. Mastora1, E. Jahaj1, A. Marvaki1, V. Michail1, P. Almpani1, N. Beretas1, V. Paparengas1,N.A. Maniatis2, S. Nanas1, S.E. Orfanos2, A. Kotanidou1
11st Department of Critical Care Medicine & Pulmonary Services, Medical School ofAthens University, Evangelismos Hospital, Athens, Greece, 22nd Department of CriticalCare Medicine & Pulmonary Services, Medical School of Athens University, AttikoHospital, Athens, GreeceINTRODUCTION. Sepsis is a life-threatening condition with high mortality and morbidityglobally. Sepsis syndrome is characterized by significant alterations of the microcirculation,leading to tissue hypoperfusion and multiple organ failure. Near infrared spectroscopy(NIRS) is a non- invasive method to evaluate microcirculation alterations. Tissue oxygen-ation index (TOI) is a NIRS parameter and indicates the dynamic balance between O2
supply and O2 consumption in tissue capillaries, arterioles and venules.OBJECTIVES. The aim of this study was to investigate changes of the microcirculationusing the technology of NIRS in combination with vascular occlusion test (VOT) in criti-cally ill patients. Specifically, a VOT with a pressure cuff can be used to provide a dynamicassessment of the tissue oxygenation response to ischemia.METHODS. Data collection included NIRS measurements on admission to the IntensiveCare Unit (ICU), on the day sepsis was diagnosed, 24 h and 48 h later. At each time point ofNIRS measurement we applied VOT. We assessed the main parameters of NIRS: Tissueoxygen saturation (StO2), occlusion slope, and hyperemia recovery area and hyperemiarecovery time. All patients were ventilated.RESULTS. We recruited 122 consecutive critically ill patients. Seventy-one (mean age45 ± 19years) of them developed sepsis during the ICU stay. Hyperemia recovery time wassignificantly lower on the sepsis day compared to baseline (137 ± 50 s, vs 169 ± 30 s,p = 0.0001). Hyperemia recovery time continued to decrease during subsequent timepoints, at 24 h. Hyperemia recovery area showed significant differences between baselineand sepsis day (19.3 ± 10.6, vs 12.4 ± 8.6, p \ 0.001), 24 h (10.7 ± 7.5, p = 0.0001) and48 h (10 ± 4.7, p = 0.0001).CONCLUSIONS. NIRS measurements are associated with microcirculatory alterations incritically ill patients in the early sepsis stage. Postischemic hyperemia is decreased in septicpatients compared with their baseline. Critically ill patients with sepsis have a reduced rate ofoxygen recovery as measured using NIRS in response to VOT. Further studies are needed.REFERENCES. 1. Lima A, van Bommel J, Sikorska K, van Genderen M, Klijn E, LesaffreE, Ince C, Bakker J. The relation of near-infrared spectroscopy with changes in peripheralcirculation in critically ill patients. Crit Care Med. 2011,39:1649–54. 2. Shapiro NI, ArnoldR, Sherwin R, O’Connor J, Najarro G, Singh S, et al. The association of near-infraredspectroscopy-derived tissue oxygenation measurements with sepsis syndromes, organ dys-function and mortality in emergency department patients with sepsis. Critical Care2011;15(5):R223.
0942TRANSCRANIAL DOPPLER TO ASSESS COGNITIVE DECLINEIN CRITICALLY ILL SEPTIC PATIENTS
C. Pierrakos1, R. Attou1, L. Decorte2, A. Kolyviras1, S. Malinverni1, P. Gottignies1,J. Devriendt1, D. De Bels1
1Brugmann University Hospital, Intensive Care, Brussels, Belgium, 2Brugmann UniversityHospital, Geriatric, Brussels, BelgiumINTRODUCTION. Sepsis associated encephalopathy (SAE) is a common sepsis compli-cation, suspected to contribute in short and long term cognitive impairment. TranscranialDoppler (TCD) is easily applied, non-invasive examination by which we can detect alter-ations of cerebral perfusion in septic patients.OBJECTIVES. The aim of this study is to correlate TCD findings with clinical signs ofSAE.METHODS. We assessed 37 septic patients without any known neurological deficit, whowere treated in our 33-bed Critical Care Unit. Sepsis was characterized as its definition bythe standard international criteria. Using TCD we measured the mean velocity in the middlecerebral artery (mVMCA, cm/s) and we calculated pulsatility index (PI), resistance index(RI) and cerebral blood flow index (CBFi). Measurements were made at the first day of theiradmission or at the first day of sepsis development. Patients underwent an everyday cog-nitive assessment using the Confusion Assessment Method for the Intensive Care Unit(CAM-ICU test).RESULTS. Twenty-one patients (57 %) were found to present confusion. Patients withconfusion had a higher mean age, mean APACHE II score (72 ± 11 vs 58 ± 16p = 0.02, 24 ± 5 vs 18 ± 5 p \ 0.01, respectively) and a lower mean arterial pressure(MAP) in (74 ± 11 mmHg vs 85 ± 13 p \ 0.01). No differences of the pCO2 values wasfound (36 ± 8 mmHg vs 42 ± 12 mmHg p = 0.17). Higher values of PI and RI wasfound in patients with confusion compared to non confused septic patients (2.15 ± 0.7 vs1.2 ± 0.7 p \ 0.01, 0.83 ± 0.08 vs 0.63 ± 0.11 p \ 0.01 respectively). To the contrarylower values of CBFi and VMCA were found in patients with confusion (38 ± 14 vs80 ± 29 p \ 0.01, 37 ± 22 cm/s vs 62 ± 28 cm/s p \ 0.05 respectively). PI, RI andCBFi could predict confusion in septic patients (PI cut-off: 1.26 AUC: 0.905 p \ 0.01Sensitivity: 95 % Specificity: 87 %, RI cut -off : 0.72 AUC:0.914 p \ 0.01 Sensitivity90 % Specificity 87 %, CBFi cut-off: 48 AUC:0.905 p \ 0.01 Sensitivity:86 % Specificity93 %).CONCLUSIONS. Cerebral perfusion disturbances observed with TCD can explain clinicalsymptoms of SAE.
0943INFLUENCE OF VENOVENOUS RENAL REPLACEMENT THERAPYON THE ACCURACY OF TRANSPULMONAL THERMODILUTIONMEASUREMENTS IN SEPTIC PATIENTS - A PROSPECTIVE STUDY
M. Habicher1, C. Spies1, C. von Heymann1, M. Sander1
1Charité-University Medicine Berlin, Department for Anaesthesiology and Intensive CareMedicine, Berlin, GermanyINTRODUCTION. In critical ill patients with septic shock transpulmonal thermodilutionderived parameters like extravascular lung water, global endiastolic volume index andcardiac index is used for guidance of hemodynamic therapy and volume therapy. However,
26th ESICM ANNUAL CONGRESS — PARIS, FRANCE — 5–9 OCTOBER 2013
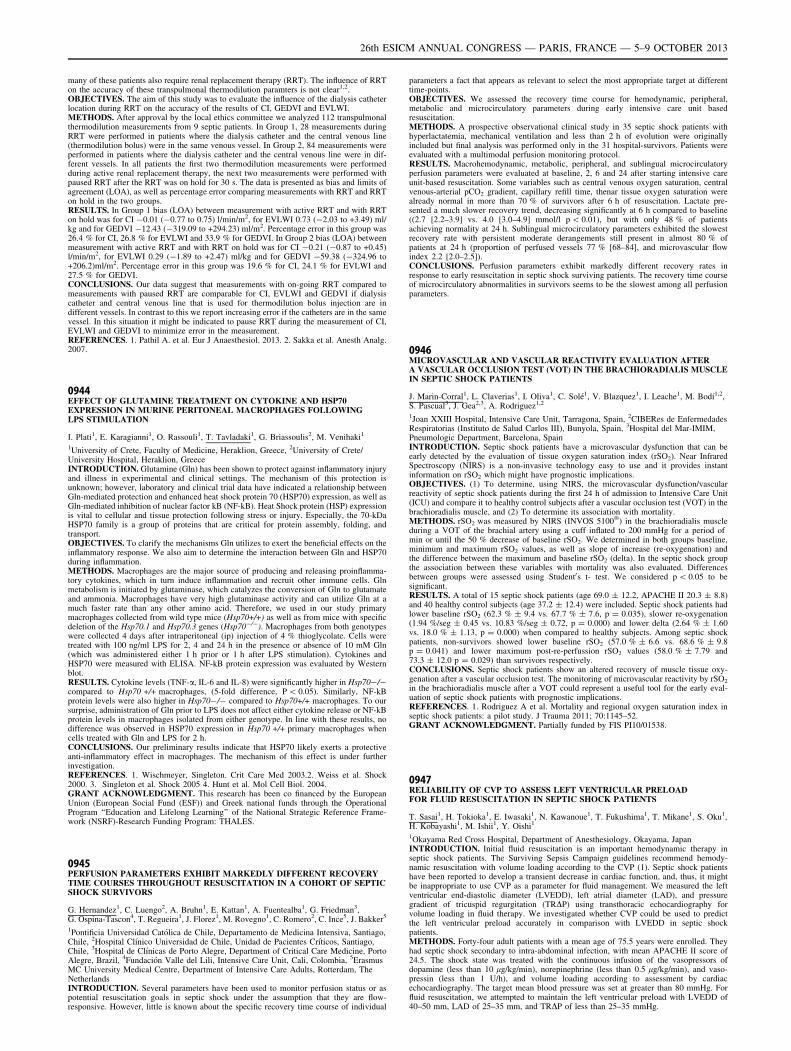
many of these patients also require renal replacement therapy (RRT). The influence of RRTon the accuracy of these transpulmonal thermodilution paramters is not clear1,2.OBJECTIVES. The aim of this study was to evaluate the influence of the dialysis catheterlocation during RRT on the accuracy of the results of CI, GEDVI and EVLWI.METHODS. After approval by the local ethics committee we analyzed 112 transpulmonalthermodilution measurements from 9 septic patients. In Group 1, 28 measurements duringRRT were performed in patients where the dialysis catheter and the central venous line(thermodilution bolus) were in the same venous vessel. In Group 2, 84 measurements wereperformed in patients where the dialysis catheter and the central venous line were in dif-ferent vessels. In all patients the first two thermodilution measurements were performedduring active renal replacement therapy, the next two measurements were performed withpaused RRT after the RRT was on hold for 30 s. The data is presented as bias and limits ofagreement (LOA), as well as percentage error comparing measurements with RRT and RRTon hold in the two groups.RESULTS. In Group 1 bias (LOA) between measurement with active RRT and with RRTon hold was for CI -0.01 (-0.77 to 0.75) l/min/m2, for EVLWI 0.73 (-2.03 to +3.49) ml/kg and for GEDVI -12.43 (-319.09 to +294.23) ml/m2. Percentage error in this group was26.4 % for CI, 26.8 % for EVLWI and 33.9 % for GEDVI. In Group 2 bias (LOA) betweenmeasurement with active RRT and with RRT on hold was for CI -0.21 (-0.87 to +0.45)l/min/m2, for EVLWI 0.29 (-1.89 to +2.47) ml/kg and for GEDVI -59.38 (-324.96 to+206.2)ml/m2. Percentage error in this group was 19.6 % for CI, 24.1 % for EVLWI and27.5 % for GEDVI.CONCLUSIONS. Our data suggest that measurements with on-going RRT compared tomeasurements with paused RRT are comparable for CI, EVLWI and GEDVI if dialysiscatheter and central venous line that is used for thermodilution bolus injection are indifferent vessels. In contrast to this we report increasing error if the catheters are in the samevessel. In this situation it might be indicated to pause RRT during the measurement of CI,EVLWI and GEDVI to minimize error in the measurement.REFERENCES. 1. Pathil A. et al. Eur J Anaesthesiol. 2013. 2. Sakka et al. Anesth Analg.2007.
0944EFFECT OF GLUTAMINE TREATMENT ON CYTOKINE AND HSP70EXPRESSION IN MURINE PERITONEAL MACROPHAGES FOLLOWINGLPS STIMULATION
I. Plati1, E. Karagianni1, O. Rassouli1, T. Tavladaki1, G. Briassoulis2, M. Venihaki1
1University of Crete, Faculty of Medicine, Heraklion, Greece, 2University of Crete/University Hospital, Heraklion, GreeceINTRODUCTION. Glutamine (Gln) has been shown to protect against inflammatory injuryand illness in experimental and clinical settings. The mechanism of this protection isunknown; however, laboratory and clinical trial data have indicated a relationship betweenGln-mediated protection and enhanced heat shock protein 70 (HSP70) expression, as well asGln-mediated inhibition of nuclear factor kB (NF-kB). Heat Shock protein (HSP) expressionis vital to cellular and tissue protection following stress or injury. Especially, the 70-kDaHSP70 family is a group of proteins that are critical for protein assembly, folding, andtransport.OBJECTIVES. To clarify the mechanisms Gln utilizes to exert the beneficial effects on theinflammatory response. We also aim to determine the interaction between Gln and HSP70during inflammation.METHODS. Macrophages are the major source of producing and releasing proinflamma-tory cytokines, which in turn induce inflammation and recruit other immune cells. Glnmetabolism is initiated by glutaminase, which catalyzes the conversion of Gln to glutamateand ammonia. Macrophages have very high glutaminase activity and can utilize Gln at amuch faster rate than any other amino acid. Therefore, we used in our study primarymacrophages collected from wild type mice (Hsp70+/+) as well as from mice with specificdeletion of the Hsp70.1 and Hsp70.3 genes (Hsp70-/-). Macrophages from both genotypeswere collected 4 days after intraperitoneal (ip) injection of 4 % thioglycolate. Cells weretreated with 100 ng/ml LPS for 2, 4 and 24 h in the presence or absence of 10 mM Gln(which was administered either 1 h prior or 1 h after LPS stimulation). Cytokines andHSP70 were measured with ELISA. NF-kB protein expression was evaluated by Westernblot.RESULTS. Cytokine levels (TNF-a, IL-6 and IL-8) were significantly higher in Hsp70-/-compared to Hsp70 +/+ macrophages, (5-fold difference, P \ 0.05). Similarly, NF-kBprotein levels were also higher in Hsp70-/- compared to Hsp70+/+ macrophages. To oursurprise, administration of Gln prior to LPS does not affect either cytokine release or NF-kBprotein levels in macrophages isolated from either genotype. In line with these results, nodifference was observed in HSP70 expression in Hsp70 +/+ primary macrophages whencells treated with Gln and LPS for 2 h.CONCLUSIONS. Our preliminary results indicate that HSP70 likely exerts a protectiveanti-inflammatory effect in macrophages. The mechanism of this effect is under furtherinvestigation.REFERENCES. 1. Wischmeyer, Singleton. Crit Care Med 2003.2. Weiss et al. Shock2000. 3. Singleton et al. Shock 2005 4. Hunt et al. Mol Cell Biol. 2004.GRANT ACKNOWLEDGMENT. This research has been co financed by the EuropeanUnion (European Social Fund (ESF)) and Greek national funds through the OperationalProgram ‘‘Education and Lifelong Learning’’ of the National Strategic Reference Frame-work (NSRF)-Research Funding Program: THALES.
0945PERFUSION PARAMETERS EXHIBIT MARKEDLY DIFFERENT RECOVERYTIME COURSES THROUGHOUT RESUSCITATION IN A COHORT OF SEPTICSHOCK SURVIVORS
G. Hernandez1, C. Luengo2, A. Bruhn1, E. Kattan1, A. Fuentealba1, G. Friedman3,G. Ospina-Tascon4, T. Regueira1, J. Florez1, M. Rovegno1, C. Romero2, C. Ince5, J. Bakker5
1Pontificia Universidad Católica de Chile, Departamento de Medicina Intensiva, Santiago,Chile, 2Hospital Clı́nico Universidad de Chile, Unidad de Pacientes Crı́ticos, Santiago,Chile, 3Hospital de Clı́nicas de Porto Alegre, Department of Critical Care Medicine, PortoAlegre, Brazil, 4Fundación Valle del Lili, Intensive Care Unit, Cali, Colombia, 5ErasmusMC University Medical Centre, Department of Intensive Care Adults, Rotterdam, TheNetherlandsINTRODUCTION. Several parameters have been used to monitor perfusion status or aspotential resuscitation goals in septic shock under the assumption that they are flow-responsive. However, little is known about the specific recovery time course of individual
parameters a fact that appears as relevant to select the most appropriate target at differenttime-points.OBJECTIVES. We assessed the recovery time course for hemodynamic, peripheral,metabolic and microcirculatory parameters during early intensive care unit basedresuscitation.METHODS. A prospective observational clinical study in 35 septic shock patients withhyperlactatemia, mechanical ventilation and less than 2 h of evolution were originallyincluded but final analysis was performed only in the 31 hospital-survivors. Patients wereevaluated with a multimodal perfusion monitoring protocol.RESULTS. Macrohemodynamic, metabolic, peripheral, and sublingual microcirculatoryperfusion parameters were evaluated at baseline, 2, 6 and 24 after starting intensive careunit-based resuscitation. Some variables such as central venous oxygen saturation, centralvenous-arterial pCO2 gradient, capillary refill time, thenar tissue oxygen saturation werealready normal in more than 70 % of survivors after 6 h of resuscitation. Lactate pre-sented a much slower recovery trend, decreasing significantly at 6 h compared to baseline((2.7 [2.2–3.9] vs. 4.0 [3.0–4.9] mmol/l p \ 0.01), but with only 48 % of patientsachieving normality at 24 h. Sublingual microcirculatory parameters exhibited the slowestrecovery rate with persistent moderate derangements still present in almost 80 % ofpatients at 24 h (proportion of perfused vessels 77 % [68–84], and microvascular flowindex 2.2 [2.0–2.5]).CONCLUSIONS. Perfusion parameters exhibit markedly different recovery rates inresponse to early resuscitation in septic shock surviving patients. The recovery time courseof microcirculatory abnormalities in survivors seems to be the slowest among all perfusionparameters.
0946MICROVASCULAR AND VASCULAR REACTIVITY EVALUATION AFTERA VASCULAR OCCLUSION TEST (VOT) IN THE BRACHIORADIALIS MUSCLEIN SEPTIC SHOCK PATIENTS
J. Marin-Corral1, L. Claverias1, I. Oliva1, C. Solé1, V. Blazquez1, I. Leache1, M. Bodı́1,2,S. Pascual3, J. Gea2,3, A. Rodriguez1,2
1Joan XXIII Hospital, Intensive Care Unit, Tarragona, Spain, 2CIBERes de EnfermedadesRespiratorias (Instituto de Salud Carlos III), Bunyola, Spain, 3Hospital del Mar-IMIM,Pneumologic Department, Barcelona, SpainINTRODUCTION. Septic shock patients have a microvascular dysfunction that can beearly detected by the evaluation of tissue oxygen saturation index (rSO2). Near InfraredSpectroscopy (NIRS) is a non-invasive technology easy to use and it provides instantinformation on rSO2 which might have prognostic implications.OBJECTIVES. (1) To determine, using NIRS, the microvascular dysfunction/vascularreactivity of septic shock patients during the first 24 h of admission to Intensive Care Unit(ICU) and compare it to healthy control subjects after a vascular occlusion test (VOT) in thebrachioradialis muscle, and (2) To determine its association with mortality.METHODS. rSO2 was measured by NIRS (INVOS 5100�) in the brachioradialis muscleduring a VOT of the brachial artery using a cuff inflated to 200 mmHg for a period ofmin or until the 50 % decrease of baseline rSO2. We determined in both groups baseline,minimum and maximum rSO2 values, as well as slope of increase (re-oxygenation) andthe difference between the maximum and baseline rSO2 (delta). In the septic shock groupthe association between these variables with mortality was also evaluated. Differencesbetween groups were assessed using Student0s t- test. We considered p \ 0.05 to besignificant.RESULTS. A total of 15 septic shock patients (age 69.0 ± 12.2, APACHE II 20.3 ± 8.8)and 40 healthy control subjects (age 37.2 ± 12.4) were included. Septic shock patients hadlower baseline rSO2 (62.3 % ± 9.4 vs. 67.7 % ± 7.6, p = 0.035), slower re-oxygenation(1.94 %/seg ± 0.45 vs. 10.83 %/seg ± 0.72, p = 0.000) and lower delta (2.64 % ± 1.60vs. 18.0 % ± 1.13, p = 0.000) when compared to healthy subjects. Among septic shockpatients, non-survivors showed lower baseline rSO2 (57.0 % ± 6.6 vs. 68.6 % ± 9.8p = 0.041) and lower maximum post-re-perfussion rSO2 values (58.0 % ± 7.79 and73.3 ± 12.0 p = 0.029) than survivors respectively.CONCLUSIONS. Septic shock patients show an altered recovery of muscle tissue oxy-genation after a vascular occlusion test. The monitoring of microvascular reactivity by rSO2
in the brachioradialis muscle after a VOT could represent a useful tool for the early eval-uation of septic shock patients with prognostic implications.REFERENCES. 1. Rodriguez A et al. Mortality and regional oxygen saturation index inseptic shock patients: a pilot study. J Trauma 2011; 70:1145–52.GRANT ACKNOWLEDGMENT. Partially funded by FIS PI10/01538.
0947RELIABILITY OF CVP TO ASSESS LEFT VENTRICULAR PRELOADFOR FLUID RESUSCITATION IN SEPTIC SHOCK PATIENTS
T. Sasai1, H. Tokioka1, E. Iwasaki1, N. Kawanoue1, T. Fukushima1, T. Mikane1, S. Oku1,H. Kobayashi1, M. Ishii1, Y. Oishi1
1Okayama Red Cross Hospital, Department of Anesthesiology, Okayama, JapanINTRODUCTION. Initial fluid resuscitation is an important hemodynamic therapy inseptic shock patients. The Surviving Sepsis Campaign guidelines recommend hemody-namic resuscitation with volume loading according to the CVP (1). Septic shock patientshave been reported to develop a transient decrease in cardiac function, and, thus, it mightbe inappropriate to use CVP as a parameter for fluid management. We measured the leftventricular end-diastolic diameter (LVEDD), left atrial diameter (LAD), and pressuregradient of tricuspid regurgitation (TRDP) using transthoracic echocardiography forvolume loading in fluid therapy. We investigated whether CVP could be used to predictthe left ventricular preload accurately in comparison with LVEDD in septic shockpatients.METHODS. Forty-four adult patients with a mean age of 75.5 years were enrolled. Theyhad septic shock secondary to intra-abdominal infection, with mean APACHE II score of24.5. The shock state was treated with the continuous infusion of the vasopressors ofdopamine (less than 10 lg/kg/min), norepinephrine (less than 0.5 lg/kg/min), and vaso-pressin (less than 1 U/h), and volume loading according to assessment by cardiacechocardiography. The target mean blood pressure was set at greater than 80 mmHg. Forfluid resuscitation, we attempted to maintain the left ventricular preload with LVEDD of40–50 mm, LAD of 25–35 mm, and TRDP of less than 25–35 mmHg.
26th ESICM ANNUAL CONGRESS — PARIS, FRANCE — 5–9 OCTOBER 2013
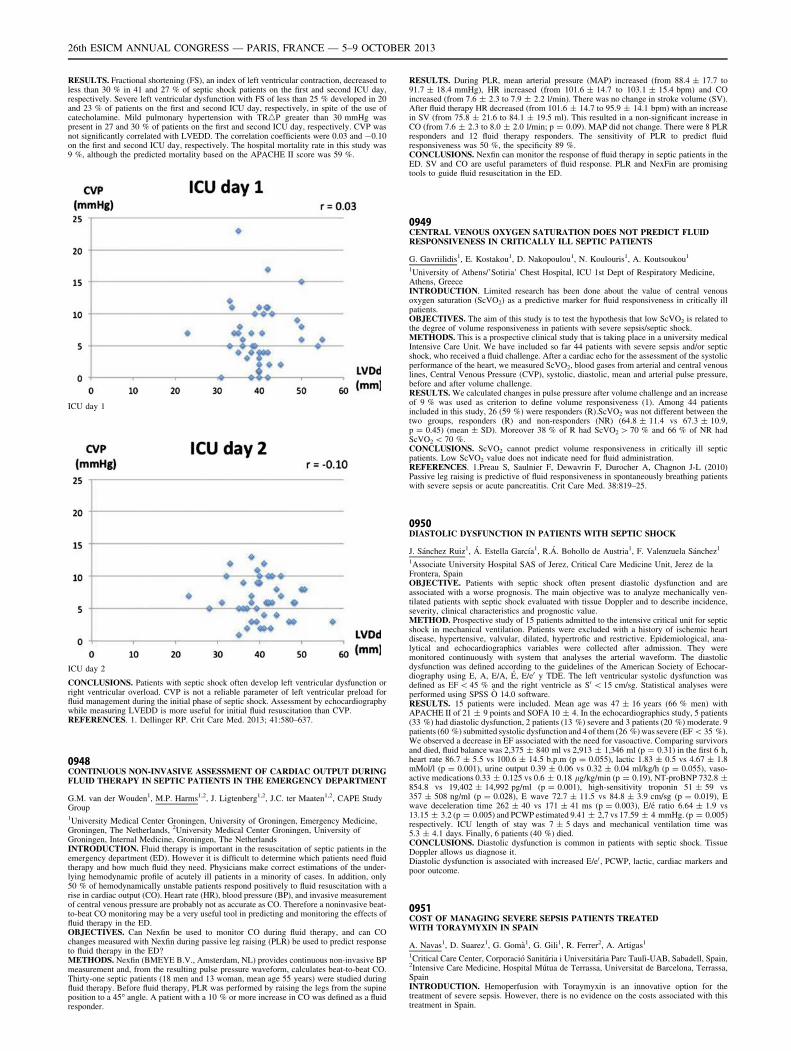
RESULTS. Fractional shortening (FS), an index of left ventricular contraction, decreased toless than 30 % in 41 and 27 % of septic shock patients on the first and second ICU day,respectively. Severe left ventricular dysfunction with FS of less than 25 % developed in 20and 23 % of patients on the first and second ICU day, respectively, in spite of the use ofcatecholamine. Mild pulmonary hypertension with TR4P greater than 30 mmHg waspresent in 27 and 30 % of patients on the first and second ICU day, respectively. CVP wasnot significantly correlated with LVEDD. The correlation coefficients were 0.03 and -0.10on the first and second ICU day, respectively. The hospital mortality rate in this study was9 %, although the predicted mortality based on the APACHE II score was 59 %.
ICU day 1
ICU day 2
CONCLUSIONS. Patients with septic shock often develop left ventricular dysfunction orright ventricular overload. CVP is not a reliable parameter of left ventricular preload forfluid management during the initial phase of septic shock. Assessment by echocardiographywhile measuring LVEDD is more useful for initial fluid resuscitation than CVP.REFERENCES. 1. Dellinger RP. Crit Care Med. 2013; 41:580–637.
0948CONTINUOUS NON-INVASIVE ASSESSMENT OF CARDIAC OUTPUT DURINGFLUID THERAPY IN SEPTIC PATIENTS IN THE EMERGENCY DEPARTMENT
G.M. van der Wouden1, M.P. Harms1,2, J. Ligtenberg1,2, J.C. ter Maaten1,2, CAPE StudyGroup1University Medical Center Groningen, University of Groningen, Emergency Medicine,Groningen, The Netherlands, 2University Medical Center Groningen, University ofGroningen, Internal Medicine, Groningen, The NetherlandsINTRODUCTION. Fluid therapy is important in the resuscitation of septic patients in theemergency department (ED). However it is difficult to determine which patients need fluidtherapy and how much fluid they need. Physicians make correct estimations of the under-lying hemodynamic profile of acutely ill patients in a minority of cases. In addition, only50 % of hemodynamically unstable patients respond positively to fluid resuscitation with arise in cardiac output (CO). Heart rate (HR), blood pressure (BP), and invasive measurementof central venous pressure are probably not as accurate as CO. Therefore a noninvasive beat-to-beat CO monitoring may be a very useful tool in predicting and monitoring the effects offluid therapy in the ED.OBJECTIVES. Can Nexfin be used to monitor CO during fluid therapy, and can COchanges measured with Nexfin during passive leg raising (PLR) be used to predict responseto fluid therapy in the ED?METHODS. Nexfin (BMEYE B.V., Amsterdam, NL) provides continuous non-invasive BPmeasurement and, from the resulting pulse pressure waveform, calculates beat-to-beat CO.Thirty-one septic patients (18 men and 13 woman, mean age 55 years) were studied duringfluid therapy. Before fluid therapy, PLR was performed by raising the legs from the supineposition to a 45� angle. A patient with a 10 % or more increase in CO was defined as a fluidresponder.
RESULTS. During PLR, mean arterial pressure (MAP) increased (from 88.4 ± 17.7 to91.7 ± 18.4 mmHg), HR increased (from 101.6 ± 14.7 to 103.1 ± 15.4 bpm) and COincreased (from 7.6 ± 2.3 to 7.9 ± 2.2 l/min). There was no change in stroke volume (SV).After fluid therapy HR decreased (from 101.6 ± 14.7 to 95.9 ± 14.1 bpm) with an increasein SV (from 75.8 ± 21.6 to 84.1 ± 19.5 ml). This resulted in a non-significant increase inCO (from 7.6 ± 2.3 to 8.0 ± 2.0 l/min; p = 0.09). MAP did not change. There were 8 PLRresponders and 12 fluid therapy responders. The sensitivity of PLR to predict fluidresponsiveness was 50 %, the specificity 89 %.CONCLUSIONS. Nexfin can monitor the response of fluid therapy in septic patients in theED. SV and CO are useful parameters of fluid response. PLR and NexFin are promisingtools to guide fluid resuscitation in the ED.
0949CENTRAL VENOUS OXYGEN SATURATION DOES NOT PREDICT FLUIDRESPONSIVENESS IN CRITICALLY ILL SEPTIC PATIENTS
G. Gavriilidis1, E. Kostakou1, D. Nakopoulou1, N. Koulouris1, A. Koutsoukou1
1University of Athens/’Sotiria’ Chest Hospital, ICU 1st Dept of Respiratory Medicine,Athens, GreeceINTRODUCTION. Limited research has been done about the value of central venousoxygen saturation (ScVO2) as a predictive marker for fluid responsiveness in critically illpatients.OBJECTIVES. The aim of this study is to test the hypothesis that low ScVO2 is related tothe degree of volume responsiveness in patients with severe sepsis/septic shock.METHODS. This is a prospective clinical study that is taking place in a university medicalIntensive Care Unit. We have included so far 44 patients with severe sepsis and/or septicshock, who received a fluid challenge. After a cardiac echo for the assessment of the systolicperformance of the heart, we measured ScVO2, blood gases from arterial and central venouslines, Central Venous Pressure (CVP), systolic, diastolic, mean and arterial pulse pressure,before and after volume challenge.RESULTS. We calculated changes in pulse pressure after volume challenge and an increaseof 9 % was used as criterion to define volume responsiveness (1). Among 44 patientsincluded in this study, 26 (59 %) were responders (R).ScVO2 was not different between thetwo groups, responders (R) and non-responders (NR) (64.8 ± 11.4 vs 67.3 ± 10.9,p = 0.45) (mean ± SD). Moreover 38 % of R had ScVO2 [ 70 % and 66 % of NR hadScVO2 \ 70 %.CONCLUSIONS. ScVO2 cannot predict volume responsiveness in critically ill septicpatients. Low ScVO2 value does not indicate need for fluid administration.REFERENCES. 1.Preau S, Saulnier F, Dewavrin F, Durocher A, Chagnon J-L (2010)Passive leg raising is predictive of fluid responsiveness in spontaneously breathing patientswith severe sepsis or acute pancreatitis. Crit Care Med. 38:819–25.
0950DIASTOLIC DYSFUNCTION IN PATIENTS WITH SEPTIC SHOCK
J. Sánchez Ruiz1, Á. Estella Garcı́a1, R.Á. Bohollo de Austria1, F. Valenzuela Sánchez1
1Associate University Hospital SAS of Jerez, Critical Care Medicine Unit, Jerez de laFrontera, SpainOBJECTIVE. Patients with septic shock often present diastolic dysfunction and areassociated with a worse prognosis. The main objective was to analyze mechanically ven-tilated patients with septic shock evaluated with tissue Doppler and to describe incidence,severity, clinical characteristics and prognostic value.METHOD. Prospective study of 15 patients admitted to the intensive critical unit for septicshock in mechanical ventilation. Patients were excluded with a history of ischemic heartdisease, hypertensive, valvular, dilated, hypertrofic and restrictive. Epidemiological, ana-lytical and echocardiographics variables were collected after admission. They weremonitored continuously with system that analyses the arterial waveform. The diastolicdysfunction was defined according to the guidelines of the American Society of Echocar-diography using E, A, E/A, É, E/e0 y TDE. The left ventricular systolic dysfunction wasdefined as EF \ 45 % and the right ventricle as S0\ 15 cm/sg. Statistical analyses wereperformed using SPSS Ò 14.0 software.RESULTS. 15 patients were included. Mean age was 47 ± 16 years (66 % men) withAPACHE II of 21 ± 9 points and SOFA 10 ± 4. In the echocardiographics study, 5 patients(33 %) had diastolic dysfunction, 2 patients (13 %) severe and 3 patients (20 %) moderate. 9patients (60 %) submitted systolic dysfunction and 4 of them (26 %) was severe (EF \ 35 %).We observed a decrease in EF associated with the need for vasoactive. Comparing survivorsand died, fluid balance was 2,375 ± 840 ml vs 2,913 ± 1,346 ml (p = 0.31) in the first 6 h,heart rate 86.7 ± 5.5 vs 100.6 ± 14.5 b.p.m (p = 0.055), lactic 1.83 ± 0.5 vs 4.67 ± 1.8mMol/l (p = 0.001), urine output 0.39 ± 0.06 vs 0.32 ± 0.04 ml/kg/h (p = 0.055), vaso-active medications 0.33 ± 0.125 vs 0.6 ± 0.18 lg/kg/min (p = 0.19), NT-proBNP 732.8 ±854.8 vs 19,402 ± 14,992 pg/ml (p = 0.001), high-sensitivity troponin 51 ± 59 vs357 ± 508 ng/ml (p = 0.028), E wave 72.7 ± 11.5 vs 84.8 ± 3.9 cm/sg (p = 0.019), Ewave deceleration time 262 ± 40 vs 171 ± 41 ms (p = 0.003), E/é ratio 6.64 ± 1.9 vs13.15 ± 3.2 (p = 0.005) and PCWP estimated 9.41 ± 2,7 vs 17.59 ± 4 mmHg. (p = 0.005)respectively. ICU length of stay was 7 ± 5 days and mechanical ventilation time was5.3 ± 4.1 days. Finally, 6 patients (40 %) died.CONCLUSIONS. Diastolic dysfunction is common in patients with septic shock. TissueDoppler allows us diagnose it.Diastolic dysfunction is associated with increased E/e0 , PCWP, lactic, cardiac markers andpoor outcome.
0951COST OF MANAGING SEVERE SEPSIS PATIENTS TREATEDWITH TORAYMYXIN IN SPAIN
A. Navas1, D. Suarez1, G. Gomà1, G. Gili1, R. Ferrer2, A. Artigas1
1Critical Care Center, Corporació Sanitária i Universitária Parc Taulı̀-UAB, Sabadell, Spain,2Intensive Care Medicine, Hospital Mútua de Terrassa, Universitat de Barcelona, Terrassa,SpainINTRODUCTION. Hemoperfusion with Toraymyxin is an innovative option for thetreatment of severe sepsis. However, there is no evidence on the costs associated with thistreatment in Spain.
26th ESICM ANNUAL CONGRESS — PARIS, FRANCE — 5–9 OCTOBER 2013
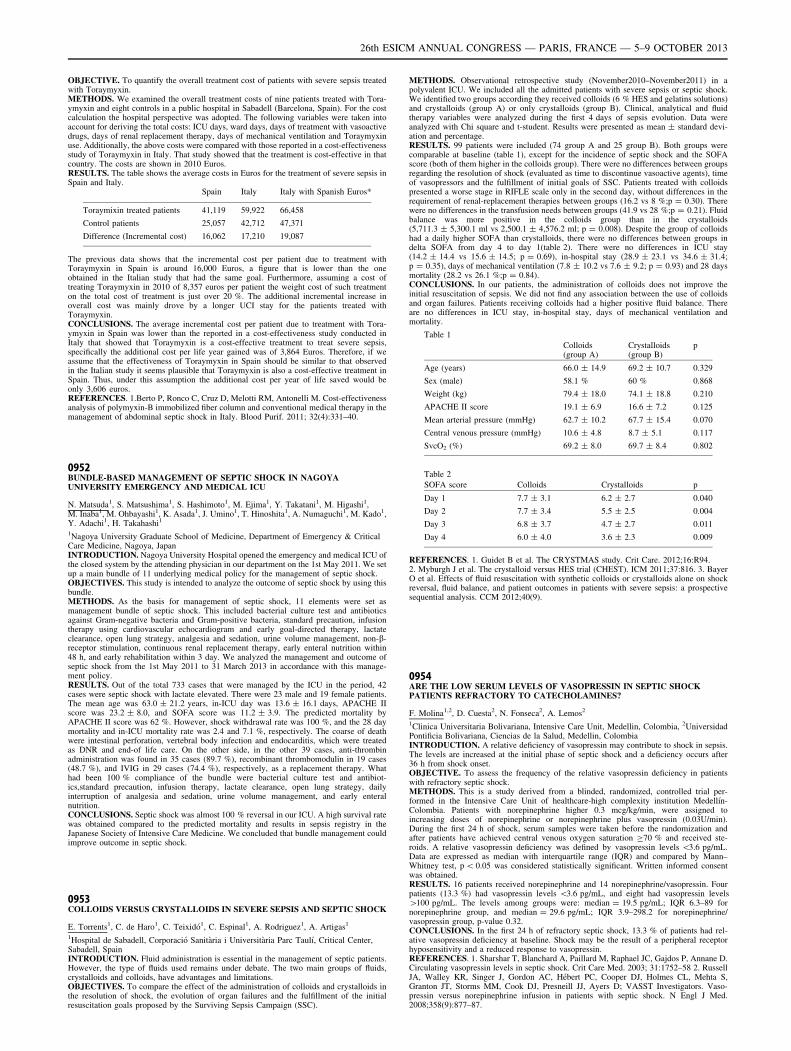
OBJECTIVE. To quantify the overall treatment cost of patients with severe sepsis treatedwith Toraymyxin.METHODS. We examined the overall treatment costs of nine patients treated with Tora-ymyxin and eight controls in a public hospital in Sabadell (Barcelona, Spain). For the costcalculation the hospital perspective was adopted. The following variables were taken intoaccount for deriving the total costs: ICU days, ward days, days of treatment with vasoactivedrugs, days of renal replacement therapy, days of mechanical ventilation and Toraymyxinuse. Additionally, the above costs were compared with those reported in a cost-effectivenessstudy of Toraymyxin in Italy. That study showed that the treatment is cost-effective in thatcountry. The costs are shown in 2010 Euros.RESULTS. The table shows the average costs in Euros for the treatment of severe sepsis inSpain and Italy.
Spain Italy Italy with Spanish Euros*
Toraymixin treated patients 41,119 59,922 66,458
Control patients 25,057 42,712 47,371
Difference (Incremental cost) 16,062 17,210 19,087
The previous data shows that the incremental cost per patient due to treatment withToraymyxin in Spain is around 16,000 Euros, a figure that is lower than the oneobtained in the Italian study that had the same goal. Furthermore, assuming a cost oftreating Toraymyxin in 2010 of 8,357 euros per patient the weight cost of such treatmenton the total cost of treatment is just over 20 %. The additional incremental increase inoverall cost was mainly drove by a longer UCI stay for the patients treated withToraymyxin.CONCLUSIONS. The average incremental cost per patient due to treatment with Tora-ymyxin in Spain was lower than the reported in a cost-effectiveness study conducted inItaly that showed that Toraymyxin is a cost-effective treatment to treat severe sepsis,specifically the additional cost per life year gained was of 3,864 Euros. Therefore, if weassume that the effectiveness of Toraymyxin in Spain should be similar to that observedin the Italian study it seems plausible that Toraymyxin is also a cost-effective treatment inSpain. Thus, under this assumption the additional cost per year of life saved would beonly 3,606 euros.REFERENCES. 1.Berto P, Ronco C, Cruz D, Melotti RM, Antonelli M. Cost-effectivenessanalysis of polymyxin-B immobilized fiber column and conventional medical therapy in themanagement of abdominal septic shock in Italy. Blood Purif. 2011; 32(4):331–40.
0952BUNDLE-BASED MANAGEMENT OF SEPTIC SHOCK IN NAGOYAUNIVERSITY EMERGENCY AND MEDICAL ICU
N. Matsuda1, S. Matsushima1, S. Hashimoto1, M. Ejima1, Y. Takatani1, M. Higashi1,M. Inaba1, M. Ohbayashi1, K. Asada1, J. Umino1, T. Hinoshita1, A. Numaguchi1, M. Kado1,Y. Adachi1, H. Takahashi1
1Nagoya University Graduate School of Medicine, Department of Emergency & CriticalCare Medicine, Nagoya, JapanINTRODUCTION. Nagoya University Hospital opened the emergency and medical ICU ofthe closed system by the attending physician in our department on the 1st May 2011. We setup a main bundle of 11 underlying medical policy for the management of septic shock.OBJECTIVES. This study is intended to analyze the outcome of septic shock by using thisbundle.METHODS. As the basis for management of septic shock, 11 elements were set asmanagement bundle of septic shock. This included bacterial culture test and antibioticsagainst Gram-negative bacteria and Gram-positive bacteria, standard precaution, infusiontherapy using cardiovascular echocardiogram and early goal-directed therapy, lactateclearance, open lung strategy, analgesia and sedation, urine volume management, non-b-receptor stimulation, continuous renal replacement therapy, early enteral nutrition within48 h, and early rehabilitation within 3 day. We analyzed the management and outcome ofseptic shock from the 1st May 2011 to 31 March 2013 in accordance with this manage-ment policy.RESULTS. Out of the total 733 cases that were managed by the ICU in the period, 42cases were septic shock with lactate elevated. There were 23 male and 19 female patients.The mean age was 63.0 ± 21.2 years, in-ICU day was 13.6 ± 16.1 days, APACHE IIscore was 23.2 ± 8.0, and SOFA score was 11.2 ± 3.9. The predicted mortality byAPACHE II score was 62 %. However, shock withdrawal rate was 100 %, and the 28 daymortality and in-ICU mortality rate was 2.4 and 7.1 %, respectively. The coarse of deathwere intestinal perforation, vertebral body infection and endocarditis, which were treatedas DNR and end-of life care. On the other side, in the other 39 cases, anti-thrombinadministration was found in 35 cases (89.7 %), recombinant thrombomodulin in 19 cases(48.7 %), and IVIG in 29 cases (74.4 %), respectively, as a replacement therapy. Whathad been 100 % compliance of the bundle were bacterial culture test and antibiot-ics,standard precaution, infusion therapy, lactate clearance, open lung strategy, dailyinterruption of analgesia and sedation, urine volume management, and early enteralnutrition.CONCLUSIONS. Septic shock was almost 100 % reversal in our ICU. A high survival ratewas obtained compared to the predicted mortality and results in sepsis registry in theJapanese Society of Intensive Care Medicine. We concluded that bundle management couldimprove outcome in septic shock.
0953COLLOIDS VERSUS CRYSTALLOIDS IN SEVERE SEPSIS AND SEPTIC SHOCK
E. Torrents1, C. de Haro1, C. Teixidó1, C. Espinal1, A. Rodriguez1, A. Artigas1
1Hospital de Sabadell, Corporació Sanitària i Universitària Parc Taulı́, Critical Center,Sabadell, SpainINTRODUCTION. Fluid administration is essential in the management of septic patients.However, the type of fluids used remains under debate. The two main groups of fluids,crystalloids and colloids, have advantages and limitations.OBJECTIVES. To compare the effect of the administration of colloids and crystalloids inthe resolution of shock, the evolution of organ failures and the fulfillment of the initialresuscitation goals proposed by the Surviving Sepsis Campaign (SSC).
METHODS. Observational retrospective study (November2010–November2011) in apolyvalent ICU. We included all the admitted patients with severe sepsis or septic shock.We identified two groups according they received colloids (6 % HES and gelatins solutions)and crystalloids (group A) or only crystalloids (group B). Clinical, analytical and fluidtherapy variables were analyzed during the first 4 days of sepsis evolution. Data wereanalyzed with Chi square and t-student. Results were presented as mean ± standard devi-ation and percentage.RESULTS. 99 patients were included (74 group A and 25 group B). Both groups werecomparable at baseline (table 1), except for the incidence of septic shock and the SOFAscore (both of them higher in the colloids group). There were no differences between groupsregarding the resolution of shock (evaluated as time to discontinue vasoactive agents), timeof vasopressors and the fulfillment of initial goals of SSC. Patients treated with colloidspresented a worse stage in RIFLE scale only in the second day, without differences in therequirement of renal-replacement therapies between groups (16.2 vs 8 %;p = 0.30). Therewere no differences in the transfusion needs between groups (41.9 vs 28 %;p = 0.21). Fluidbalance was more positive in the colloids group than in the crystalloids(5,711.3 ± 5,300.1 ml vs 2,500.1 ± 4,576.2 ml; p = 0.008). Despite the group of colloidshad a daily higher SOFA than crystalloids, there were no differences between groups indelta SOFA from day 4 to day 1(table 2). There were no differences in ICU stay(14.2 ± 14.4 vs 15.6 ± 14.5; p = 0.69), in-hospital stay (28.9 ± 23.1 vs 34.6 ± 31.4;p = 0.35), days of mechanical ventilation (7.8 ± 10.2 vs 7.6 ± 9.2; p = 0.93) and 28 daysmortality (28.2 vs 26.1 %;p = 0.84).CONCLUSIONS. In our patients, the administration of colloids does not improve theinitial resuscitation of sepsis. We did not find any association between the use of colloidsand organ failures. Patients receiving colloids had a higher positive fluid balance. Thereare no differences in ICU stay, in-hospital stay, days of mechanical ventilation andmortality.
Table 1
Colloids(group A)
Crystalloids(group B)
p
Age (years) 66.0 ± 14.9 69.2 ± 10.7 0.329
Sex (male) 58.1 % 60 % 0.868
Weight (kg) 79.4 ± 18.0 74.1 ± 18.8 0.210
APACHE II score 19.1 ± 6.9 16.6 ± 7.2 0.125
Mean arterial pressure (mmHg) 62.7 ± 10.2 67.7 ± 15.4 0.070
Central venous pressure (mmHg) 10.6 ± 4.8 8.7 ± 5.1 0.117
SvcO2 (%) 69.2 ± 8.0 69.7 ± 8.4 0.802
Table 2
SOFA score Colloids Crystalloids p
Day 1 7.7 ± 3.1 6.2 ± 2.7 0.040
Day 2 7.7 ± 3.4 5.5 ± 2.5 0.004
Day 3 6.8 ± 3.7 4.7 ± 2.7 0.011
Day 4 6.0 ± 4.0 3.6 ± 2.3 0.009
REFERENCES. 1. Guidet B et al. The CRYSTMAS study. Crit Care. 2012;16:R94.2. Myburgh J et al. The crystalloid versus HES trial (CHEST). ICM 2011;37:816. 3. BayerO et al. Effects of fluid resuscitation with synthetic colloids or crystalloids alone on shockreversal, fluid balance, and patient outcomes in patients with severe sepsis: a prospectivesequential analysis. CCM 2012;40(9).
0954ARE THE LOW SERUM LEVELS OF VASOPRESSIN IN SEPTIC SHOCKPATIENTS REFRACTORY TO CATECHOLAMINES?
F. Molina1,2, D. Cuesta2, N. Fonseca2, A. Lemos2
1Clinica Universitaria Bolivariana, Intensive Care Unit, Medellin, Colombia, 2UniversidadPontificia Bolivariana, Ciencias de la Salud, Medellin, ColombiaINTRODUCTION. A relative deficiency of vasopressin may contribute to shock in sepsis.The levels are increased at the initial phase of septic shock and a deficiency occurs after36 h from shock onset.OBJECTIVE. To assess the frequency of the relative vasopressin deficiency in patientswith refractory septic shock.METHODS. This is a study derived from a blinded, randomized, controlled trial per-formed in the Intensive Care Unit of healthcare-high complexity institution Medellı́n-Colombia. Patients with norepinephrine higher 0.3 mcg/kg/min, were assigned toincreasing doses of norepinephrine or norepinephrine plus vasopressin (0.03U/min).During the first 24 h of shock, serum samples were taken before the randomization andafter patients have achieved central venous oxygen saturation C70 % and received ste-roids. A relative vasopressin deficiency was defined by vasopressin levels \3.6 pg/mL.Data are expressed as median with interquartile range (IQR) and compared by Mann–Whitney test, p \ 0.05 was considered statistically significant. Written informed consentwas obtained.RESULTS. 16 patients received norepinephrine and 14 norepinephrine/vasopressin. Fourpatients (13.3 %) had vasopressin levels \3.6 pg/mL, and eight had vasopressin levels[100 pg/mL. The levels among groups were: median = 19.5 pg/mL; IQR 6.3–89 fornorepinephrine group, and median = 29.6 pg/mL; IQR 3.9–298.2 for norepinephrine/vasopressin group, p-value 0.32.CONCLUSIONS. In the first 24 h of refractory septic shock, 13.3 % of patients had rel-ative vasopressin deficiency at baseline. Shock may be the result of a peripheral receptorhyposensitivity and a reduced response to vasopressin.REFERENCES. 1. Sharshar T, Blanchard A, Paillard M, Raphael JC, Gajdos P, Annane D.Circulating vasopressin levels in septic shock. Crit Care Med. 2003; 31:1752–58 2. RussellJA, Walley KR, Singer J, Gordon AC, Hébert PC, Cooper DJ, Holmes CL, Mehta S,Granton JT, Storms MM, Cook DJ, Presneill JJ, Ayers D; VASST Investigators. Vaso-pressin versus norepinephrine infusion in patients with septic shock. N Engl J Med.2008;358(9):877–87.
26th ESICM ANNUAL CONGRESS — PARIS, FRANCE — 5–9 OCTOBER 2013
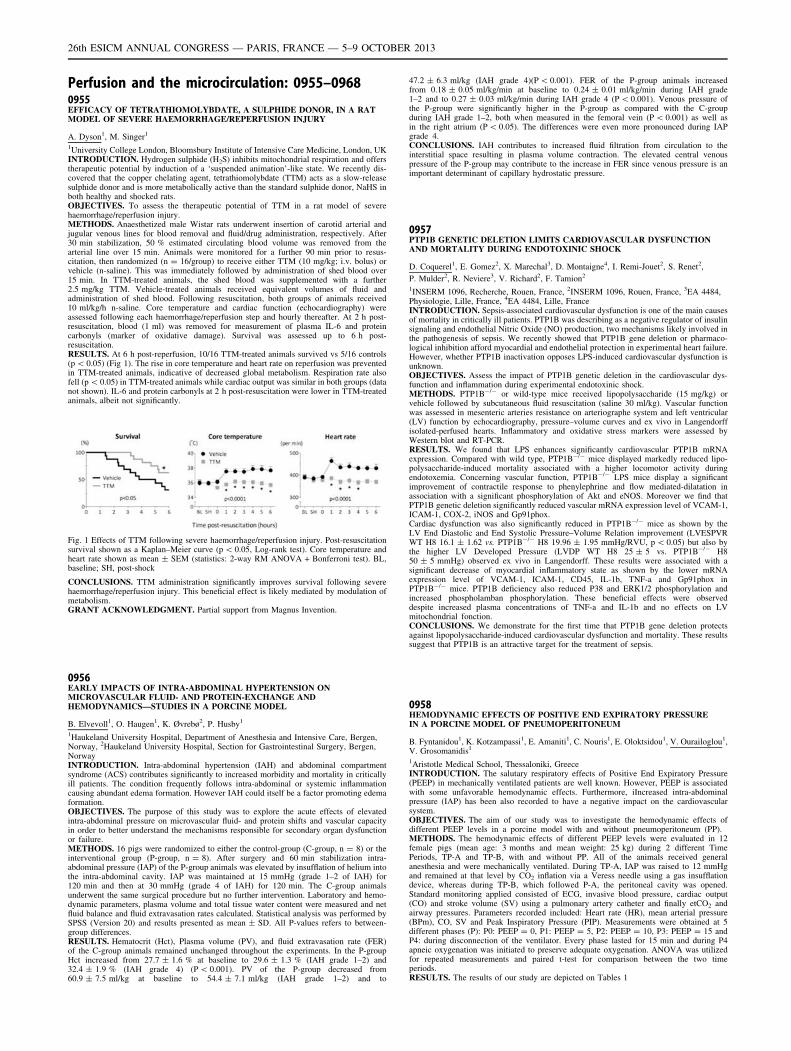
Perfusion and the microcirculation: 0955–09680955EFFICACY OF TETRATHIOMOLYBDATE, A SULPHIDE DONOR, IN A RATMODEL OF SEVERE HAEMORRHAGE/REPERFUSION INJURY
A. Dyson1, M. Singer1
1University College London, Bloomsbury Institute of Intensive Care Medicine, London, UKINTRODUCTION. Hydrogen sulphide (H2S) inhibits mitochondrial respiration and offerstherapeutic potential by induction of a ‘suspended animation’-like state. We recently dis-covered that the copper chelating agent, tetrathiomolybdate (TTM) acts as a slow-releasesulphide donor and is more metabolically active than the standard sulphide donor, NaHS inboth healthy and shocked rats.OBJECTIVES. To assess the therapeutic potential of TTM in a rat model of severehaemorrhage/reperfusion injury.METHODS. Anaesthetized male Wistar rats underwent insertion of carotid arterial andjugular venous lines for blood removal and fluid/drug administration, respectively. After30 min stabilization, 50 % estimated circulating blood volume was removed from thearterial line over 15 min. Animals were monitored for a further 90 min prior to resus-citation, then randomized (n = 16/group) to receive either TTM (10 mg/kg; i.v. bolus) orvehicle (n-saline). This was immediately followed by administration of shed blood over15 min. In TTM-treated animals, the shed blood was supplemented with a further2.5 mg/kg TTM. Vehicle-treated animals received equivalent volumes of fluid andadministration of shed blood. Following resuscitation, both groups of animals received10 ml/kg/h n-saline. Core temperature and cardiac function (echocardiography) wereassessed following each haemorrhage/reperfusion step and hourly thereafter. At 2 h post-resuscitation, blood (1 ml) was removed for measurement of plasma IL-6 and proteincarbonyls (marker of oxidative damage). Survival was assessed up to 6 h post-resuscitation.RESULTS. At 6 h post-reperfusion, 10/16 TTM-treated animals survived vs 5/16 controls(p \ 0.05) (Fig 1). The rise in core temperature and heart rate on reperfusion was preventedin TTM-treated animals, indicative of decreased global metabolism. Respiration rate alsofell (p \ 0.05) in TTM-treated animals while cardiac output was similar in both groups (datanot shown). IL-6 and protein carbonyls at 2 h post-resuscitation were lower in TTM-treatedanimals, albeit not significantly.
Fig. 1 Effects of TTM following severe haemorrhage/reperfusion injury. Post-resuscitationsurvival shown as a Kaplan–Meier curve (p \ 0.05, Log-rank test). Core temperature andheart rate shown as mean ± SEM (statistics: 2-way RM ANOVA + Bonferroni test). BL,baseline; SH, post-shock
CONCLUSIONS. TTM administration significantly improves survival following severehaemorrhage/reperfusion injury. This beneficial effect is likely mediated by modulation ofmetabolism.GRANT ACKNOWLEDGMENT. Partial support from Magnus Invention.
0956EARLY IMPACTS OF INTRA-ABDOMINAL HYPERTENSION ONMICROVASCULAR FLUID- AND PROTEIN-EXCHANGE ANDHEMODYNAMICS—STUDIES IN A PORCINE MODEL
B. Elvevoll1, O. Haugen1, K. Øvrebø2, P. Husby1
1Haukeland University Hospital, Department of Anesthesia and Intensive Care, Bergen,Norway, 2Haukeland University Hospital, Section for Gastrointestinal Surgery, Bergen,NorwayINTRODUCTION. Intra-abdominal hypertension (IAH) and abdominal compartmentsyndrome (ACS) contributes significantly to increased morbidity and mortality in criticallyill patients. The condition frequently follows intra-abdominal or systemic inflammationcausing abundant edema formation. However IAH could itself be a factor promoting edemaformation.OBJECTIVES. The purpose of this study was to explore the acute effects of elevatedintra-abdominal pressure on microvascular fluid- and protein shifts and vascular capacityin order to better understand the mechanisms responsible for secondary organ dysfunctionor failure.METHODS. 16 pigs were randomized to either the control-group (C-group, n = 8) or theinterventional group (P-group, n = 8). After surgery and 60 min stabilization intra-abdominal pressure (IAP) of the P-group animals was elevated by insufflation of helium intothe intra-abdominal cavity. IAP was maintained at 15 mmHg (grade 1–2 of IAH) for120 min and then at 30 mmHg (grade 4 of IAH) for 120 min. The C-group animalsunderwent the same surgical procedure but no further intervention. Laboratory and hemo-dynamic parameters, plasma volume and total tissue water content were measured and netfluid balance and fluid extravasation rates calculated. Statistical analysis was performed bySPSS (Version 20) and results presented as mean ± SD. All P-values refers to between-group differences.RESULTS. Hematocrit (Hct), Plasma volume (PV), and fluid extravasation rate (FER)of the C-group animals remained unchanged throughout the experiments. In the P-groupHct increased from 27.7 ± 1.6 % at baseline to 29.6 ± 1.3 % (IAH grade 1–2) and32.4 ± 1.9 % (IAH grade 4) (P \ 0.001). PV of the P-group decreased from60.9 ± 7.5 ml/kg at baseline to 54.4 ± 7.1 ml/kg (IAH grade 1–2) and to
47.2 ± 6.3 ml/kg (IAH grade 4)(P \ 0.001). FER of the P-group animals increasedfrom 0.18 ± 0.05 ml/kg/min at baseline to 0.24 ± 0.01 ml/kg/min during IAH grade1–2 and to 0.27 ± 0.03 ml/kg/min during IAH grade 4 (P \ 0.001). Venous pressure ofthe P-group were significantly higher in the P-group as compared with the C-groupduring IAH grade 1–2, both when measured in the femoral vein (P \ 0.001) as well asin the right atrium (P \ 0.05). The differences were even more pronounced during IAPgrade 4.CONCLUSIONS. IAH contributes to increased fluid filtration from circulation to theinterstitial space resulting in plasma volume contraction. The elevated central venouspressure of the P-group may contribute to the increase in FER since venous pressure is animportant determinant of capillary hydrostatic pressure.
0957PTP1B GENETIC DELETION LIMITS CARDIOVASCULAR DYSFUNCTIONAND MORTALITY DURING ENDOTOXINIC SHOCK
D. Coquerel1, E. Gomez2, X. Marechal3, D. Montaigne4, I. Remi-Jouet2, S. Renet2,
P. Mulder2, R. Neviere3, V. Richard2, F. Tamion2
1INSERM 1096, Recherche, Rouen, France, 2INSERM 1096, Rouen, France, 3EA 4484,Physiologie, Lille, France, 4EA 4484, Lille, FranceINTRODUCTION. Sepsis-associated cardiovascular dysfunction is one of the main causesof mortality in critically ill patients. PTP1B was describing as a negative regulator of insulinsignaling and endothelial Nitric Oxide (NO) production, two mechanisms likely involved inthe pathogenesis of sepsis. We recently showed that PTP1B gene deletion or pharmaco-logical inhibition afford myocardial and endothelial protection in experimental heart failure.However, whether PTP1B inactivation opposes LPS-induced cardiovascular dysfunction isunknown.OBJECTIVES. Assess the impact of PTP1B genetic deletion in the cardiovascular dys-function and inflammation during experimental endotoxinic shock.METHODS. PTP1B-/- or wild-type mice received lipopolysaccharide (15 mg/kg) orvehicle followed by subcutaneous fluid resuscitation (saline 30 ml/kg). Vascular functionwas assessed in mesenteric arteries resistance on arteriographe system and left ventricular(LV) function by echocardiography, pressure–volume curves and ex vivo in Langendorffisolated-perfused hearts. Inflammatory and oxidative stress markers were assessed byWestern blot and RT-PCR.RESULTS. We found that LPS enhances significantly cardiovascular PTP1B mRNAexpression. Compared with wild type, PTP1B-/- mice displayed markedly reduced lipo-polysaccharide-induced mortality associated with a higher locomotor activity duringendotoxemia. Concerning vascular function, PTP1B-/- LPS mice display a significantimprovement of contractile response to phenylephrine and flow mediated-dilatation inassociation with a significant phosphorylation of Akt and eNOS. Moreover we find thatPTP1B genetic deletion significantly reduced vascular mRNA expression level of VCAM-1,ICAM-1, COX-2, iNOS and Gp91phox.Cardiac dysfunction was also significantly reduced in PTP1B-/- mice as shown by theLV End Diastolic and End Systolic Pressure–Volume Relation improvement (LVESPVRWT H8 16.1 ± 1.62 vs. PTP1B-/- H8 19.96 ± 1.95 mmHg/RVU, p \ 0.05) but also bythe higher LV Developed Pressure (LVDP WT H8 25 ± 5 vs. PTP1B-/- H850 ± 5 mmHg) observed ex vivo in Langendorff. These results were associated with asignificant decrease of myocardial inflammatory state as shown by the lower mRNAexpression level of VCAM-1, ICAM-1, CD45, IL-1b, TNF-a and Gp91phox inPTP1B-/- mice. PTP1B deficiency also reduced P38 and ERK1/2 phosphorylation andincreased phospholamban phosphorylation. These beneficial effects were observeddespite increased plasma concentrations of TNF-a and IL-1b and no effects on LVmitochondrial fonction.CONCLUSIONS. We demonstrate for the first time that PTP1B gene deletion protectsagainst lipopolysaccharide-induced cardiovascular dysfunction and mortality. These resultssuggest that PTP1B is an attractive target for the treatment of sepsis.
0958HEMODYNAMIC EFFECTS OF POSITIVE END EXPIRATORY PRESSUREIN A PORCINE MODEL OF PNEUMOPERITONEUM
B. Fyntanidou1, K. Kotzampassi1, E. Amaniti1, C. Nouris1, E. Oloktsidou1, V. Ourailoglou1,V. Grosomanidis1
1Aristotle Medical School, Thessaloniki, GreeceINTRODUCTION. The salutary respiratory effects of Positive End Expiratory Pressure(PEEP) in mechanically ventilated patients are well known. However, PEEP is associatedwith some unfavorable hemodynamic effects. Furthermore, iIncreased intra-abdominalpressure (IAP) has been also recorded to have a negative impact on the cardiovascularsystem.OBJECTIVES. The aim of our study was to investigate the hemodynamic effects ofdifferent PEEP levels in a porcine model with and without pneumoperitoneum (PP).METHODS. The hemodynamic effects of different PEEP levels were evaluated in 12female pigs (mean age: 3 months and mean weight: 25 kg) during 2 different TimePeriods, TP-A and TP-B, with and without PP. All of the animals received generalanesthesia and were mechanically ventilated. During TP-A, IAP was raised to 12 mmHgand remained at that level by CO2 inflation via a Veress needle using a gas insufflationdevice, whereas during TP-B, which followed P-A, the peritoneal cavity was opened.Standard monitoring applied consisted of ECG, invasive blood pressure, cardiac output(CO) and stroke volume (SV) using a pulmonary artery catheter and finally etCO2 andairway pressures. Parameters recorded included: Heart rate (HR), mean arterial pressure(BPm), CO, SV and Peak Inspiratory Pressure (PIP). Measurements were obtained at 5different phases (P): P0: PEEP = 0, P1: PEEP = 5, P2: PEEP = 10, P3: PEEP = 15 andP4: during disconnection of the ventilator. Every phase lasted for 15 min and during P4apneic oxygenation was initiated to preserve adequate oxygenation. ANOVA was utilizedfor repeated measurements and paired t-test for comparison between the two timeperiods.RESULTS. The results of our study are depicted on Tables 1
26th ESICM ANNUAL CONGRESS — PARIS, FRANCE — 5–9 OCTOBER 2013
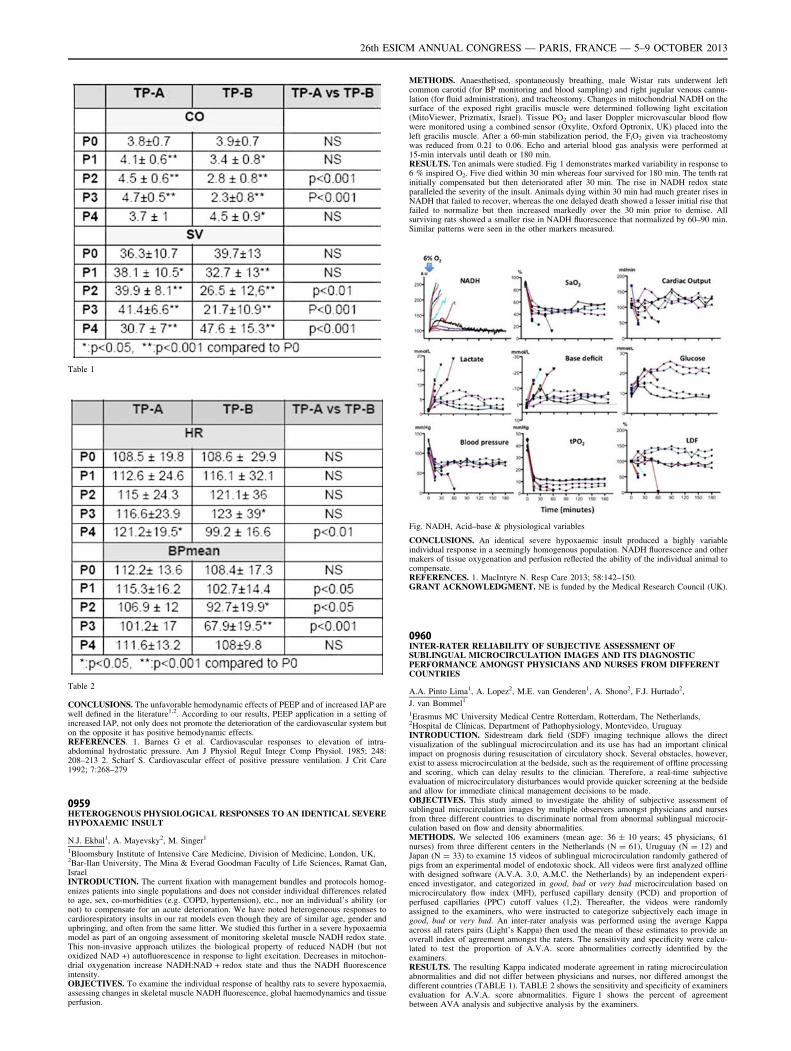
Table 1
Table 2
CONCLUSIONS. The unfavorable hemodynamic effects of PEEP and of increased IAP arewell defined in the literature1,2. According to our results, PEEP application in a setting ofincreased IAP, not only does not promote the deterioration of the cardiovascular system buton the opposite it has positive hemodynamic effects.REFERENCES. 1. Barnes G et al. Cardiovascular responses to elevation of intra-abdominal hydrostatic pressure. Am J Physiol Regul Integr Comp Physiol. 1985; 248:208–213 2. Scharf S. Cardiovascular effect of positive pressure ventilation. J Crit Care1992; 7:268–279
0959HETEROGENOUS PHYSIOLOGICAL RESPONSES TO AN IDENTICAL SEVEREHYPOXAEMIC INSULT
N.J. Ekbal1, A. Mayevsky2, M. Singer1
1Bloomsbury Institute of Intensive Care Medicine, Division of Medicine, London, UK,2Bar-Ilan University, The Mina & Everad Goodman Faculty of Life Sciences, Ramat Gan,IsraelINTRODUCTION. The current fixation with management bundles and protocols homog-enizes patients into single populations and does not consider individual differences relatedto age, sex, co-morbidities (e.g. COPD, hypertension), etc., nor an individual’s ability (ornot) to compensate for an acute deterioration. We have noted heterogeneous responses tocardiorespiratory insults in our rat models even though they are of similar age, gender andupbringing, and often from the same litter. We studied this further in a severe hypoxaemiamodel as part of an ongoing assessment of monitoring skeletal muscle NADH redox state.This non-invasive approach utilizes the biological property of reduced NADH (but notoxidized NAD +) autofluorescence in response to light excitation. Decreases in mitochon-drial oxygenation increase NADH:NAD + redox state and thus the NADH fluorescenceintensity.OBJECTIVES. To examine the individual response of healthy rats to severe hypoxaemia,assessing changes in skeletal muscle NADH fluorescence, global haemodynamics and tissueperfusion.
METHODS. Anaesthetised, spontaneously breathing, male Wistar rats underwent leftcommon carotid (for BP monitoring and blood sampling) and right jugular venous cannu-lation (for fluid administration), and tracheostomy. Changes in mitochondrial NADH on thesurface of the exposed right gracilis muscle were determined following light excitation(MitoViewer, Prizmatix, Israel). Tissue PO2 and laser Doppler microvascular blood flowwere monitored using a combined sensor (Oxylite, Oxford Optronix, UK) placed into theleft gracilis muscle. After a 60-min stabilization period, the FiO2 given via tracheostomywas reduced from 0.21 to 0.06. Echo and arterial blood gas analysis were performed at15-min intervals until death or 180 min.RESULTS. Ten animals were studied. Fig 1 demonstrates marked variability in response to6 % inspired O2. Five died within 30 min whereas four survived for 180 min. The tenth ratinitially compensated but then deteriorated after 30 min. The rise in NADH redox stateparalleled the severity of the insult. Animals dying within 30 min had much greater rises inNADH that failed to recover, whereas the one delayed death showed a lesser initial rise thatfailed to normalize but then increased markedly over the 30 min prior to demise. Allsurviving rats showed a smaller rise in NADH fluorescence that normalized by 60–90 min.Similar patterns were seen in the other markers measured.
Fig. NADH, Acid–base & physiological variables
CONCLUSIONS. An identical severe hypoxaemic insult produced a highly variableindividual response in a seemingly homogenous population. NADH fluorescence and othermakers of tissue oxygenation and perfusion reflected the ability of the individual animal tocompensate.REFERENCES. 1. MacIntyre N. Resp Care 2013; 58:142–150.GRANT ACKNOWLEDGMENT. NE is funded by the Medical Research Council (UK).
0960INTER-RATER RELIABILITY OF SUBJECTIVE ASSESSMENT OFSUBLINGUAL MICROCIRCULATION IMAGES AND ITS DIAGNOSTICPERFORMANCE AMONGST PHYSICIANS AND NURSES FROM DIFFERENTCOUNTRIES
A.A. Pinto Lima1, A. Lopez2, M.E. van Genderen1, A. Shono2, F.J. Hurtado2,
J. van Bommel1
1Erasmus MC University Medical Centre Rotterdam, Rotterdam, The Netherlands,2Hospital de Clı́nicas, Department of Pathophysiology, Montevideo, UruguayINTRODUCTION. Sidestream dark field (SDF) imaging technique allows the directvisualization of the sublingual microcirculation and its use has had an important clinicalimpact on prognosis during resuscitation of circulatory shock. Several obstacles, however,exist to assess microcirculation at the bedside, such as the requirement of offline processingand scoring, which can delay results to the clinician. Therefore, a real-time subjectiveevaluation of microcirculatory disturbances would provide quicker screening at the bedsideand allow for immediate clinical management decisions to be made.OBJECTIVES. This study aimed to investigate the ability of subjective assessment ofsublingual microcirculation images by multiple observers amongst physicians and nursesfrom three different countries to discriminate normal from abnormal sublingual microcir-culation based on flow and density abnormalities.METHODS. We selected 106 examiners (mean age: 36 ± 10 years; 45 physicians, 61nurses) from three different centers in the Netherlands (N = 61), Uruguay (N = 12) andJapan (N = 33) to examine 15 videos of sublingual microcirculation randomly gathered ofpigs from an experimental model of endotoxic shock. All videos were first analyzed offlinewith designed software (A.V.A. 3.0, A.M.C. the Netherlands) by an independent experi-enced investigator, and categorized in good, bad or very bad microcirculation based onmicrocirculatory flow index (MFI), perfused capillary density (PCD) and proportion ofperfused capillaries (PPC) cutoff values (1,2). Thereafter, the videos were randomlyassigned to the examiners, who were instructed to categorize subjectively each image ingood, bad or very bad. An inter-rater analysis was performed using the average Kappaacross all raters pairs (Light’s Kappa) then used the mean of these estimates to provide anoverall index of agreement amongst the raters. The sensitivity and specificity were calcu-lated to test the proportion of A.V.A. score abnormalities correctly identified by theexaminers.RESULTS. The resulting Kappa indicated moderate agreement in rating microcirculationabnormalities and did not differ between physicians and nurses, nor differed amongst thedifferent countries (TABLE 1). TABLE 2 shows the sensitivity and specificity of examinersevaluation for A.V.A. score abnormalities. Figure 1 shows the percent of agreementbetween AVA analysis and subjective analysis by the examiners.
26th ESICM ANNUAL CONGRESS — PARIS, FRANCE — 5–9 OCTOBER 2013
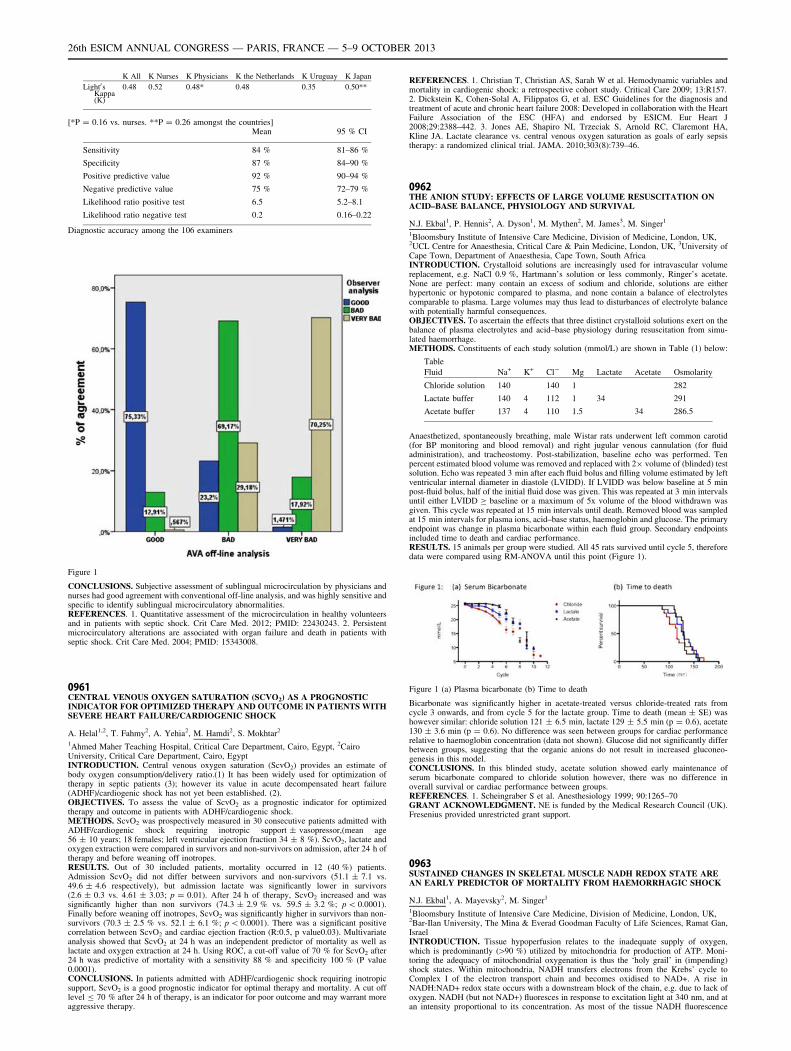
K All K Nurses K Physicians K the Netherlands K Uruguay K Japan
Light0sKappa(K)
0.48 0.52 0.48* 0.48 0.35 0.50**
[*P = 0.16 vs. nurses. **P = 0.26 amongst the countries]Mean 95 % CI
Sensitivity 84 % 81–86 %
Specificity 87 % 84–90 %
Positive predictive value 92 % 90–94 %
Negative predictive value 75 % 72–79 %
Likelihood ratio positive test 6.5 5.2–8.1
Likelihood ratio negative test 0.2 0.16–0.22
Diagnostic accuracy among the 106 examiners
Figure 1
CONCLUSIONS. Subjective assessment of sublingual microcirculation by physicians andnurses had good agreement with conventional off-line analysis, and was highly sensitive andspecific to identify sublingual microcirculatory abnormalities.REFERENCES. 1. Quantitative assessment of the microcirculation in healthy volunteersand in patients with septic shock. Crit Care Med. 2012; PMID: 22430243. 2. Persistentmicrocirculatory alterations are associated with organ failure and death in patients withseptic shock. Crit Care Med. 2004; PMID: 15343008.
0961CENTRAL VENOUS OXYGEN SATURATION (SCVO2) AS A PROGNOSTICINDICATOR FOR OPTIMIZED THERAPY AND OUTCOME IN PATIENTS WITHSEVERE HEART FAILURE/CARDIOGENIC SHOCK
A. Helal1,2, T. Fahmy2, A. Yehia2, M. Hamdi2, S. Mokhtar2
1Ahmed Maher Teaching Hospital, Critical Care Department, Cairo, Egypt, 2CairoUniversity, Critical Care Department, Cairo, EgyptINTRODUCTION. Central venous oxygen saturation (ScvO2) provides an estimate ofbody oxygen consumption/delivery ratio.(1) It has been widely used for optimization oftherapy in septic patients (3); however its value in acute decompensated heart failure(ADHF)/cardiogenic shock has not yet been established. (2).OBJECTIVES. To assess the value of ScvO2 as a prognostic indicator for optimizedtherapy and outcome in patients with ADHF/cardiogenic shock.METHODS. ScvO2 was prospectively measured in 30 consecutive patients admitted withADHF/cardiogenic shock requiring inotropic support ± vasopressor,(mean age56 ± 10 years; 18 females; left ventricular ejection fraction 34 ± 8 %). ScvO2, lactate andoxygen extraction were compared in survivors and non-survivors on admission, after 24 h oftherapy and before weaning off inotropes.RESULTS. Out of 30 included patients, mortality occurred in 12 (40 %) patients.Admission ScvO2 did not differ between survivors and non-survivors (51.1 ± 7.1 vs.49.6 ± 4.6 respectively), but admission lactate was significantly lower in survivors(2.6 ± 0.3 vs. 4.61 ± 3.03; p = 0.01). After 24 h of therapy, ScvO2 increased and wassignificantly higher than non survivors (74.3 ± 2.9 % vs. 59.5 ± 3.2 %; p \ 0.0001).Finally before weaning off inotropes, ScvO2 was significantly higher in survivors than non-survivors (70.3 ± 2.5 % vs. 52.1 ± 6.1 %; p \ 0.0001). There was a significant positivecorrelation between ScvO2 and cardiac ejection fraction (R:0.5, p value0.03). Multivariateanalysis showed that ScvO2 at 24 h was an independent predictor of mortality as well aslactate and oxygen extraction at 24 h. Using ROC, a cut-off value of 70 % for ScvO2 after24 h was predictive of mortality with a sensitivity 88 % and specificity 100 % (P value0.0001).CONCLUSIONS. In patients admitted with ADHF/cardiogenic shock requiring inotropicsupport, ScvO2 is a good prognostic indicator for optimal therapy and mortality. A cut offlevel B 70 % after 24 h of therapy, is an indicator for poor outcome and may warrant moreaggressive therapy.
REFERENCES. 1. Christian T, Christian AS, Sarah W et al. Hemodynamic variables andmortality in cardiogenic shock: a retrospective cohort study. Critical Care 2009; 13:R157.2. Dickstein K, Cohen-Solal A, Filippatos G, et al. ESC Guidelines for the diagnosis andtreatment of acute and chronic heart failure 2008: Developed in collaboration with the HeartFailure Association of the ESC (HFA) and endorsed by ESICM. Eur Heart J2008;29:2388–442. 3. Jones AE, Shapiro NI, Trzeciak S, Arnold RC, Claremont HA,Kline JA. Lactate clearance vs. central venous oxygen saturation as goals of early sepsistherapy: a randomized clinical trial. JAMA. 2010;303(8):739–46.
0962THE ANION STUDY: EFFECTS OF LARGE VOLUME RESUSCITATION ONACID–BASE BALANCE, PHYSIOLOGY AND SURVIVAL
N.J. Ekbal1, P. Hennis2, A. Dyson1, M. Mythen2, M. James3, M. Singer1
1Bloomsbury Institute of Intensive Care Medicine, Division of Medicine, London, UK,2UCL Centre for Anaesthesia, Critical Care & Pain Medicine, London, UK, 3University ofCape Town, Department of Anaesthesia, Cape Town, South AfricaINTRODUCTION. Crystalloid solutions are increasingly used for intravascular volumereplacement, e.g. NaCl 0.9 %, Hartmann’s solution or less commonly, Ringer’s acetate.None are perfect: many contain an excess of sodium and chloride, solutions are eitherhypertonic or hypotonic compared to plasma, and none contain a balance of electrolytescomparable to plasma. Large volumes may thus lead to disturbances of electrolyte balancewith potentially harmful consequences.OBJECTIVES. To ascertain the effects that three distinct crystalloid solutions exert on thebalance of plasma electrolytes and acid–base physiology during resuscitation from simu-lated haemorrhage.METHODS. Constituents of each study solution (mmol/L) are shown in Table (1) below:
Table
Fluid Na+ K+ Cl- Mg Lactate Acetate Osmolarity
Chloride solution 140 140 1 282
Lactate buffer 140 4 112 1 34 291
Acetate buffer 137 4 110 1.5 34 286.5
Anaesthetized, spontaneously breathing, male Wistar rats underwent left common carotid(for BP monitoring and blood removal) and right jugular venous cannulation (for fluidadministration), and tracheostomy. Post-stabilization, baseline echo was performed. Tenpercent estimated blood volume was removed and replaced with 29 volume of (blinded) testsolution. Echo was repeated 3 min after each fluid bolus and filling volume estimated by leftventricular internal diameter in diastole (LVIDD). If LVIDD was below baseline at 5 minpost-fluid bolus, half of the initial fluid dose was given. This was repeated at 3 min intervalsuntil either LVIDD C baseline or a maximum of 5x volume of the blood withdrawn wasgiven. This cycle was repeated at 15 min intervals until death. Removed blood was sampledat 15 min intervals for plasma ions, acid–base status, haemoglobin and glucose. The primaryendpoint was change in plasma bicarbonate within each fluid group. Secondary endpointsincluded time to death and cardiac performance.RESULTS. 15 animals per group were studied. All 45 rats survived until cycle 5, thereforedata were compared using RM-ANOVA until this point (Figure 1).
Figure 1 (a) Plasma bicarbonate (b) Time to death
Bicarbonate was significantly higher in acetate-treated versus chloride-treated rats fromcycle 3 onwards, and from cycle 5 for the lactate group. Time to death (mean ± SE) washowever similar: chloride solution 121 ± 6.5 min, lactate 129 ± 5.5 min (p = 0.6), acetate130 ± 3.6 min (p = 0.6). No difference was seen between groups for cardiac performancerelative to haemoglobin concentration (data not shown). Glucose did not significantly differbetween groups, suggesting that the organic anions do not result in increased gluconeo-genesis in this model.CONCLUSIONS. In this blinded study, acetate solution showed early maintenance ofserum bicarbonate compared to chloride solution however, there was no difference inoverall survival or cardiac performance between groups.REFERENCES. 1. Scheingraber S et al. Anesthesiology 1999; 90:1265–70GRANT ACKNOWLEDGMENT. NE is funded by the Medical Research Council (UK).Fresenius provided unrestricted grant support.
0963SUSTAINED CHANGES IN SKELETAL MUSCLE NADH REDOX STATE AREAN EARLY PREDICTOR OF MORTALITY FROM HAEMORRHAGIC SHOCK
N.J. Ekbal1, A. Mayevsky2, M. Singer1
1Bloomsbury Institute of Intensive Care Medicine, Division of Medicine, London, UK,2Bar-Ilan University, The Mina & Everad Goodman Faculty of Life Sciences, Ramat Gan,IsraelINTRODUCTION. Tissue hypoperfusion relates to the inadequate supply of oxygen,which is predominantly ([90 %) utilized by mitochondria for production of ATP. Moni-toring the adequacy of mitochondrial oxygenation is thus the ‘holy grail’ in (impending)shock states. Within mitochondria, NADH transfers electrons from the Krebs’ cycle toComplex I of the electron transport chain and becomes oxidised to NAD+. A rise inNADH:NAD+ redox state occurs with a downstream block of the chain, e.g. due to lack ofoxygen. NADH (but not NAD+) fluoresces in response to excitation light at 340 nm, and atan intensity proportional to its concentration. As most of the tissue NADH fluorescence
26th ESICM ANNUAL CONGRESS — PARIS, FRANCE — 5–9 OCTOBER 2013
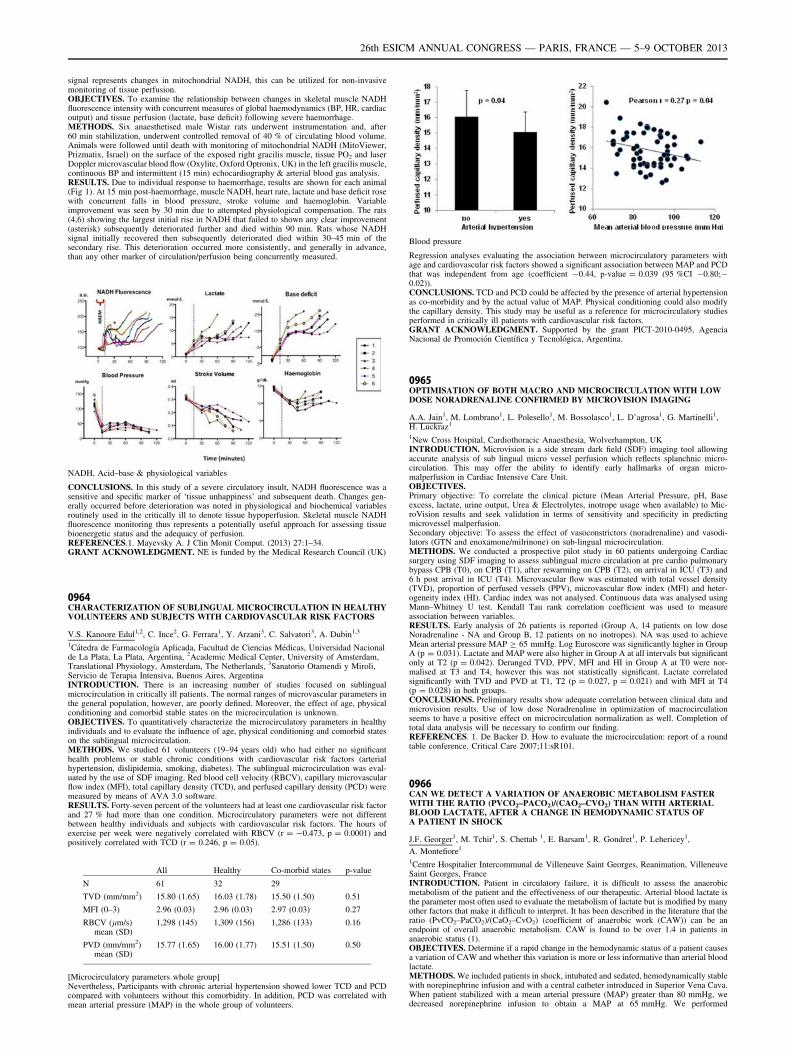
signal represents changes in mitochondrial NADH, this can be utilized for non-invasivemonitoring of tissue perfusion.OBJECTIVES. To examine the relationship between changes in skeletal muscle NADHfluorescence intensity with concurrent measures of global haemodynamics (BP, HR, cardiacoutput) and tissue perfusion (lactate, base deficit) following severe haemorrhage.METHODS. Six anaesthetised male Wistar rats underwent instrumentation and, after60 min stabilization, underwent controlled removal of 40 % of circulating blood volume.Animals were followed until death with monitoring of mitochondrial NADH (MitoViewer,Prizmatix, Israel) on the surface of the exposed right gracilis muscle, tissue PO2 and laserDoppler microvascular blood flow (Oxylite, Oxford Optronix, UK) in the left gracilis muscle,continuous BP and intermittent (15 min) echocardiography & arterial blood gas analysis.RESULTS. Due to individual response to haemorrhage, results are shown for each animal(Fig 1). At 15 min post-haemorrhage, muscle NADH, heart rate, lactate and base deficit rosewith concurrent falls in blood pressure, stroke volume and haemoglobin. Variableimprovement was seen by 30 min due to attempted physiological compensation. The rats(4,6) showing the largest initial rise in NADH that failed to shown any clear improvement(asterisk) subsequently deteriorated further and died within 90 min. Rats whose NADHsignal initially recovered then subsequently deteriorated died within 30–45 min of thesecondary rise. This deterioration occurred more consistently, and generally in advance,than any other marker of circulation/perfusion being concurrently measured.
NADH, Acid–base & physiological variables
CONCLUSIONS. In this study of a severe circulatory insult, NADH fluorescence was asensitive and specific marker of ‘tissue unhappiness’ and subsequent death. Changes gen-erally occurred before deterioration was noted in physiological and biochemical variablesroutinely used in the critically ill to denote tissue hypoperfusion. Skeletal muscle NADHfluorescence monitoring thus represents a potentially useful approach for assessing tissuebioenergetic status and the adequacy of perfusion.REFERENCES.1. Mayevsky A. J Clin Monit Comput. (2013) 27:1–34.GRANT ACKNOWLEDGMENT. NE is funded by the Medical Research Council (UK)
0964CHARACTERIZATION OF SUBLINGUAL MICROCIRCULATION IN HEALTHYVOLUNTEERS AND SUBJECTS WITH CARDIOVASCULAR RISK FACTORS
V.S. Kanoore Edul1,2, C. Ince2, G. Ferrara1, Y. Arzani3, C. Salvatori3, A. Dubin1,3
1Cátedra de Farmacologı́a Aplicada, Facultad de Ciencias Médicas, Universidad Nacionalde La Plata, La Plata, Argentina, 2Academic Medical Center, University of Amsterdam,Translational Physiology, Amsterdam, The Netherlands, 3Sanatorio Otamendi y Miroli,Servicio de Terapia Intensiva, Buenos Aires, ArgentinaINTRODUCTION. There is an increasing number of studies focused on sublingualmicrocirculation in critically ill patients. The normal ranges of microvascular parameters inthe general population, however, are poorly defined. Moreover, the effect of age, physicalconditioning and comorbid stable states on the microcirculation is unknown.OBJECTIVES. To quantitatively characterize the microcirculatory parameters in healthyindividuals and to evaluate the influence of age, physical conditioning and comorbid stateson the sublingual microcirculation.METHODS. We studied 61 volunteers (19–94 years old) who had either no significanthealth problems or stable chronic conditions with cardiovascular risk factors (arterialhypertension, dislipidemia, smoking, diabetes). The sublingual microcirculation was eval-uated by the use of SDF imaging. Red blood cell velocity (RBCV), capillary microvascularflow index (MFI), total capillary density (TCD), and perfused capillary density (PCD) weremeasured by means of AVA 3.0 software.RESULTS. Forty-seven percent of the volunteers had at least one cardiovascular risk factorand 27 % had more than one condition. Microcirculatory parameters were not differentbetween healthy individuals and subjects with cardiovascular risk factors. The hours ofexercise per week were negatively correlated with RBCV (r = -0.473, p = 0.0001) andpositively correlated with TCD (r = 0.246, p = 0.05).
All Healthy Co-morbid states p-value
N 61 32 29
TVD (mm/mm2) 15.80 (1.65) 16.03 (1.78) 15.50 (1.50) 0.51
MFI (0–3) 2.96 (0.03) 2.96 (0.03) 2.97 (0.03) 0.27
RBCV (lm/s)mean (SD)
1,298 (145) 1,309 (156) 1,286 (133) 0.16
PVD (mm/mm2)mean (SD)
15.77 (1.65) 16.00 (1.77) 15.51 (1.50) 0.50
[Microcirculatory parameters whole group]Nevertheless, Participants with chronic arterial hypertension showed lower TCD and PCDcompared with volunteers without this comorbidity. In addition, PCD was correlated withmean arterial pressure (MAP) in the whole group of volunteers.
Blood pressure
Regression analyses evaluating the association between microcirculatory parameters withage and cardiovascular risk factors showed a significant association between MAP and PCDthat was independent from age (coefficient -0.44, p-value = 0.039 (95 %CI -0.80;-0.02)).CONCLUSIONS. TCD and PCD could be affected by the presence of arterial hypertensionas co-morbidity and by the actual value of MAP. Physical conditioning could also modifythe capillary density. This study may be useful as a reference for microcirculatory studiesperformed in critically ill patients with cardiovascular risk factors.GRANT ACKNOWLEDGMENT. Supported by the grant PICT-2010-0495, AgenciaNacional de Promoción Cientı́fica y Tecnológica, Argentina.
0965OPTIMISATION OF BOTH MACRO AND MICROCIRCULATION WITH LOWDOSE NORADRENALINE CONFIRMED BY MICROVISION IMAGING
A.A. Jain1, M. Lombrano1, L. Polesello1, M. Bossolasco1, L. D’agrosa1, G. Martinelli1,H. Luckraz1
1New Cross Hospital, Cardiothoracic Anaesthesia, Wolverhampton, UKINTRODUCTION. Microvision is a side stream dark field (SDF) imaging tool allowingaccurate analysis of sub lingual micro vessel perfusion which reflects splanchnic micro-circulation. This may offer the ability to identify early hallmarks of organ micro-malperfusion in Cardiac Intensive Care Unit.OBJECTIVES.Primary objective: To correlate the clinical picture (Mean Arterial Pressure, pH, Baseexcess, lactate, urine output, Urea & Electrolytes, inotrope usage when available) to Mic-roVision results and seek validation in terms of sensitivity and specificity in predictingmicrovessel malperfusion.Secondary objective: To assess the effect of vasoconstrictors (noradrenaline) and vasodi-lators (GTN and enoxamone/milrinone) on sub-lingual microcirculation.METHODS. We conducted a prospective pilot study in 60 patients undergoing Cardiacsurgery using SDF imaging to assess sublingual micro circulation at pre cardio pulmonarybypass CPB (T0), on CPB (T1), after rewarming on CPB (T2), on arrival in ICU (T3) and6 h post arrival in ICU (T4). Microvascular flow was estimated with total vessel density(TVD), proportion of perfused vessels (PPV), microvascular flow index (MFI) and heter-ogeneity index (HI). Cardiac index was not analysed. Continuous data was analysed usingMann–Whitney U test. Kendall Tau rank correlation coefficient was used to measureassociation between variables.RESULTS. Early analysis of 26 patients is reported (Group A, 14 patients on low doseNoradrenaline - NA and Group B, 12 patients on no inotropes). NA was used to achieveMean arterial pressure MAP C 65 mmHg. Log Euroscore was significantly higher in GroupA (p = 0.031). Lactate and MAP were also higher in Group A at all intervals but significantonly at T2 (p = 0.042). Deranged TVD, PPV, MFI and HI in Group A at T0 were nor-malised at T3 and T4, however this was not statistically significant. Lactate correlatedsignificantly with TVD and PVD at T1, T2 (p = 0.027, p = 0.021) and with MFI at T4(p = 0.028) in both groups.CONCLUSIONS. Preliminary results show adequate correlation between clinical data andmicrovision results. Use of low dose Noradrenaline in optimization of macrocirculationseems to have a positive effect on microcirculation normalization as well. Completion oftotal data analysis will be necessary to confirm our finding.REFERENCES. 1. De Backer D. How to evaluate the microcirculation: report of a roundtable conference. Critical Care 2007;11:sR101.
0966CAN WE DETECT A VARIATION OF ANAEROBIC METABOLISM FASTERWITH THE RATIO (PVCO2–PACO2)/(CAO2–CVO2) THAN WITH ARTERIALBLOOD LACTATE, AFTER A CHANGE IN HEMODYNAMIC STATUS OFA PATIENT IN SHOCK
J.F. Georger1, M. Tchir1, S. Chettab 1, E. Barsam1, R. Gondret1, P. Lehericey1,
A. Montefiore1
1Centre Hospitalier Intercommunal de Villeneuve Saint Georges, Reanimation, VilleneuveSaint Georges, FranceINTRODUCTION. Patient in circulatory failure, it is difficult to assess the anaerobicmetabolism of the patient and the effectiveness of our therapeutic. Arterial blood lactate isthe parameter most often used to evaluate the metabolism of lactate but is modified by manyother factors that make it difficult to interpret. It has been described in the literature that theratio (PvCO2–PaCO2)/(CaO2–CvO2) (coefficient of anaerobic work (CAW)) can be anendpoint of overall anaerobic metabolism. CAW is found to be over 1.4 in patients inanaerobic status (1).OBJECTIVES. Determine if a rapid change in the hemodynamic status of a patient causesa variation of CAW and whether this variation is more or less informative than arterial bloodlactate.METHODS. We included patients in shock, intubated and sedated, hemodynamically stablewith norepinephrine infusion and with a central catheter introduced in Superior Vena Cava.When patient stabilized with a mean arterial pressure (MAP) greater than 80 mmHg, wedecreased norepinephrine infusion to obtain a MAP at 65 mmHg. We performed
26th ESICM ANNUAL CONGRESS — PARIS, FRANCE — 5–9 OCTOBER 2013
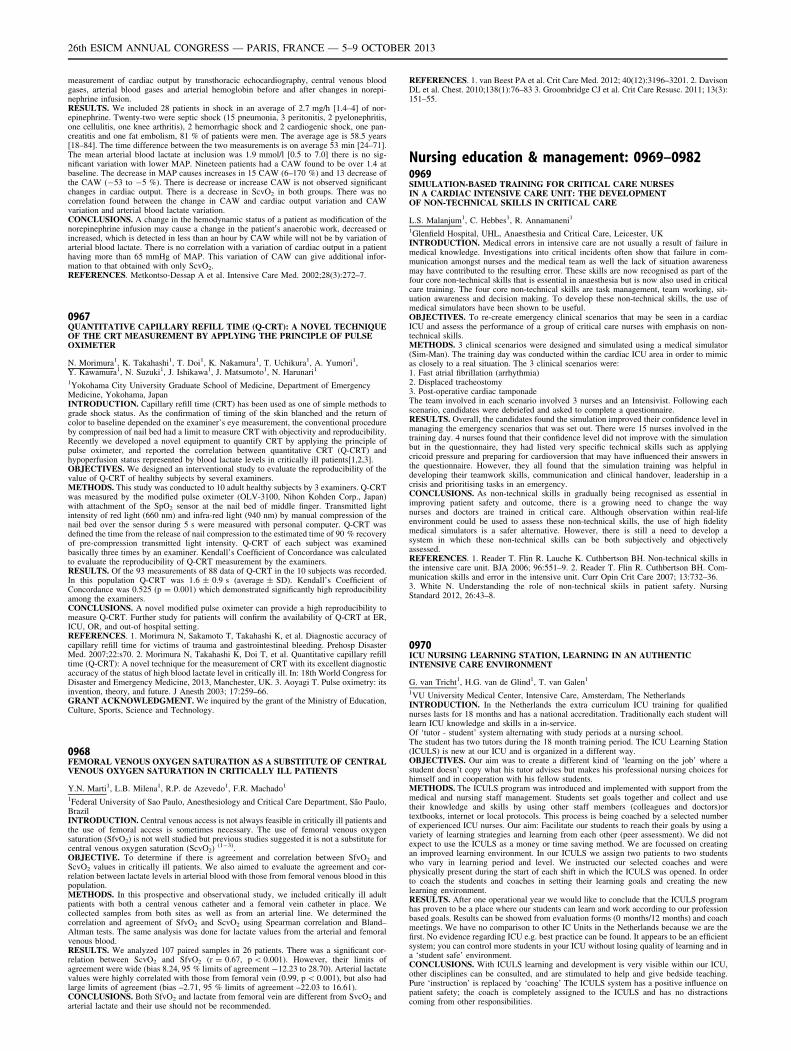
measurement of cardiac output by transthoracic echocardiography, central venous bloodgases, arterial blood gases and arterial hemoglobin before and after changes in norepi-nephrine infusion.RESULTS. We included 28 patients in shock in an average of 2.7 mg/h [1.4–4] of nor-epinephrine. Twenty-two were septic shock (15 pneumonia, 3 peritonitis, 2 pyelonephritis,one cellulitis, one knee arthritis), 2 hemorrhagic shock and 2 cardiogenic shock, one pan-creatitis and one fat embolism, 81 % of patients were men. The average age is 58.5 years[18–84]. The time difference between the two measurements is on average 53 min [24–71].The mean arterial blood lactate at inclusion was 1.9 mmol/l [0.5 to 7.0] there is no sig-nificant variation with lower MAP. Nineteen patients had a CAW found to be over 1.4 atbaseline. The decrease in MAP causes increases in 15 CAW (6–170 %) and 13 decrease ofthe CAW (-53 to -5 %). There is decrease or increase CAW is not observed significantchanges in cardiac output. There is a decrease in ScvO2 in both groups. There was nocorrelation found between the change in CAW and cardiac output variation and CAWvariation and arterial blood lactate variation.CONCLUSIONS. A change in the hemodynamic status of a patient as modification of thenorepinephrine infusion may cause a change in the patient0s anaerobic work, decreased orincreased, which is detected in less than an hour by CAW while will not be by variation ofarterial blood lactate. There is no correlation with a variation of cardiac output in a patienthaving more than 65 mmHg of MAP. This variation of CAW can give additional infor-mation to that obtained with only ScvO2.REFERENCES. Metkontso-Dessap A et al. Intensive Care Med. 2002;28(3):272–7.
0967QUANTITATIVE CAPILLARY REFILL TIME (Q-CRT): A NOVEL TECHNIQUEOF THE CRT MEASUREMENT BY APPLYING THE PRINCIPLE OF PULSEOXIMETER
N. Morimura1, K. Takahashi1, T. Doi1, K. Nakamura1, T. Uchikura1, A. Yumori1,Y. Kawamura1, N. Suzuki1, J. Ishikawa1, J. Matsumoto1, N. Harunari1
1Yokohama City University Graduate School of Medicine, Department of EmergencyMedicine, Yokohama, JapanINTRODUCTION. Capillary refill time (CRT) has been used as one of simple methods tograde shock status. As the confirmation of timing of the skin blanched and the return ofcolor to baseline depended on the examiner’s eye measurement, the conventional procedureby compression of nail bed had a limit to measure CRT with objectivity and reproducibility.Recently we developed a novel equipment to quantify CRT by applying the principle ofpulse oximeter, and reported the correlation between quantitative CRT (Q-CRT) andhypoperfusion status represented by blood lactate levels in critically ill patients[1,2,3].OBJECTIVES. We designed an interventional study to evaluate the reproducibility of thevalue of Q-CRT of healthy subjects by several examiners.METHODS. This study was conducted to 10 adult healthy subjects by 3 examiners. Q-CRTwas measured by the modified pulse oximeter (OLV-3100, Nihon Kohden Corp., Japan)with attachment of the SpO2 sensor at the nail bed of middle finger. Transmitted lightintensity of red light (660 nm) and infra-red light (940 nm) by manual compression of thenail bed over the sensor during 5 s were measured with personal computer. Q-CRT wasdefined the time from the release of nail compression to the estimated time of 90 % recoveryof pre-compression transmitted light intensity. Q-CRT of each subject was examinedbasically three times by an examiner. Kendall’s Coefficient of Concordance was calculatedto evaluate the reproducibility of Q-CRT measurement by the examiners.RESULTS. Of the 93 measurements of 88 data of Q-CRT in the 10 subjects was recorded.In this population Q-CRT was 1.6 ± 0.9 s (average ± SD). Kendall’s Coefficient ofConcordance was 0.525 (p = 0.001) which demonstrated significantly high reproducibilityamong the examiners.CONCLUSIONS. A novel modified pulse oximeter can provide a high reproducibility tomeasure Q-CRT. Further study for patients will confirm the availability of Q-CRT at ER,ICU, OR, and out-of hospital setting.REFERENCES. 1. Morimura N, Sakamoto T, Takahashi K, et al. Diagnostic accuracy ofcapillary refill time for victims of trauma and gastrointestinal bleeding. Prehosp DisasterMed. 2007;22:s70. 2. Morimura N, Takahashi K, Doi T, et al. Quantitative capillary refilltime (Q-CRT): A novel technique for the measurement of CRT with its excellent diagnosticaccuracy of the status of high blood lactate level in critically ill. In: 18th World Congress forDisaster and Emergency Medicine, 2013, Manchester, UK. 3. Aoyagi T. Pulse oximetry: itsinvention, theory, and future. J Anesth 2003; 17:259–66.GRANT ACKNOWLEDGMENT. We inquired by the grant of the Ministry of Education,Culture, Sports, Science and Technology.
0968FEMORAL VENOUS OXYGEN SATURATION AS A SUBSTITUTE OF CENTRALVENOUS OXYGEN SATURATION IN CRITICALLY ILL PATIENTS
Y.N. Marti1, L.B. Milena1, R.P. de Azevedo1, F.R. Machado1
1Federal University of Sao Paulo, Anesthesiology and Critical Care Department, São Paulo,BrazilINTRODUCTION. Central venous access is not always feasible in critically ill patients andthe use of femoral access is sometimes necessary. The use of femoral venous oxygensaturation (SfvO2) is not well studied but previous studies suggested it is not a substitute forcentral venous oxygen saturation (ScvO2) (1-3).OBJECTIVE. To determine if there is agreement and correlation between SfvO2 andScvO2 values in critically ill patients. We also aimed to evaluate the agreement and cor-relation between lactate levels in arterial blood with those from femoral venous blood in thispopulation.METHODS. In this prospective and observational study, we included critically ill adultpatients with both a central venous catheter and a femoral vein catheter in place. Wecollected samples from both sites as well as from an arterial line. We determined thecorrelation and agreement of SfvO2 and ScvO2 using Spearman correlation and Bland–Altman tests. The same analysis was done for lactate values from the arterial and femoralvenous blood.RESULTS. We analyzed 107 paired samples in 26 patients. There was a significant cor-relation between ScvO2 and SfvO2 (r = 0.67, p \ 0.001). However, their limits ofagreement were wide (bias 8.24, 95 % limits of agreement -12.23 to 28.70). Arterial lactatevalues were highly correlated with those from femoral vein (0.99, p \ 0.001), but also hadlarge limits of agreement (bias –2.71, 95 % limits of agreement –22.03 to 16.61).CONCLUSIONS. Both SfvO2 and lactate from femoral vein are different from SvcO2 andarterial lactate and their use should not be recommended.
REFERENCES. 1. van Beest PA et al. Crit Care Med. 2012; 40(12):3196–3201. 2. DavisonDL et al. Chest. 2010;138(1):76–83 3. Groombridge CJ et al. Crit Care Resusc. 2011; 13(3):151–55.
Nursing education & management: 0969–09820969SIMULATION-BASED TRAINING FOR CRITICAL CARE NURSESIN A CARDIAC INTENSIVE CARE UNIT: THE DEVELOPMENTOF NON-TECHNICAL SKILLS IN CRITICAL CARE
L.S. Malanjum1, C. Hebbes1, R. Annamaneni1
1Glenfield Hospital, UHL, Anaesthesia and Critical Care, Leicester, UKINTRODUCTION. Medical errors in intensive care are not usually a result of failure inmedical knowledge. Investigations into critical incidents often show that failure in com-munication amongst nurses and the medical team as well the lack of situation awarenessmay have contributed to the resulting error. These skills are now recognised as part of thefour core non-technical skills that is essential in anaesthesia but is now also used in criticalcare training. The four core non-technical skills are task management, team working, sit-uation awareness and decision making. To develop these non-technical skills, the use ofmedical simulators have been shown to be useful.OBJECTIVES. To re-create emergency clinical scenarios that may be seen in a cardiacICU and assess the performance of a group of critical care nurses with emphasis on non-technical skills.METHODS. 3 clinical scenarios were designed and simulated using a medical simulator(Sim-Man). The training day was conducted within the cardiac ICU area in order to mimicas closely to a real situation. The 3 clinical scenarios were:1. Fast atrial fibrillation (arrhythmia)2. Displaced tracheostomy3. Post-operative cardiac tamponadeThe team involved in each scenario involved 3 nurses and an Intensivist. Following eachscenario, candidates were debriefed and asked to complete a questionnaire.RESULTS. Overall, the candidates found the simulation improved their confidence level inmanaging the emergency scenarios that was set out. There were 15 nurses involved in thetraining day. 4 nurses found that their confidence level did not improve with the simulationbut in the questionnaire, they had listed very specific technical skills such as applyingcricoid pressure and preparing for cardioversion that may have influenced their answers inthe questionnaire. However, they all found that the simulation training was helpful indeveloping their teamwork skills, communication and clinical handover, leadership in acrisis and prioritising tasks in an emergency.CONCLUSIONS. As non-technical skills in gradually being recognised as essential inimproving patient safety and outcome, there is a growing need to change the waynurses and doctors are trained in critical care. Although observation within real-lifeenvironment could be used to assess these non-technical skills, the use of high fidelitymedical simulators is a safer alternative. However, there is still a need to develop asystem in which these non-technical skills can be both subjectively and objectivelyassessed.REFERENCES. 1. Reader T. Flin R. Lauche K. Cuthbertson BH. Non-technical skills inthe intensive care unit. BJA 2006; 96:551–9. 2. Reader T. Flin R. Cuthbertson BH. Com-munication skills and error in the intensive unit. Curr Opin Crit Care 2007; 13:732–36.3. White N. Understanding the role of non-technical skiils in patient safety. NursingStandard 2012, 26:43–8.
0970ICU NURSING LEARNING STATION, LEARNING IN AN AUTHENTICINTENSIVE CARE ENVIRONMENT
G. van Tricht1, H.G. van de Glind1, T. van Galen1
1VU University Medical Center, Intensive Care, Amsterdam, The NetherlandsINTRODUCTION. In the Netherlands the extra curriculum ICU training for qualifiednurses lasts for 18 months and has a national accreditation. Traditionally each student willlearn ICU knowledge and skills in a in-service.Of ‘tutor - student’ system alternating with study periods at a nursing school.The student has two tutors during the 18 month training period. The ICU Learning Station(ICULS) is new at our ICU and is organized in a different way.OBJECTIVES. Our aim was to create a different kind of ‘learning on the job’ where astudent doesn’t copy what his tutor advises but makes his professional nursing choices forhimself and in cooperation with his fellow students.METHODS. The ICULS program was introduced and implemented with support from themedical and nursing staff management. Students set goals together and collect and usetheir knowledge and skills by using other staff members (colleagues and doctors)ortextbooks, internet or local protocols. This process is being coached by a selected numberof experienced ICU nurses. Our aim: Facilitate our students to reach their goals by using avariety of learning strategies and learning from each other (peer assessment). We did notexpect to use the ICULS as a money or time saving method. We are focussed on creatingan improved learning environment. In our ICULS we assign two patients to two studentswho vary in learning period and level. We instructed our selected coaches and werephysically present during the start of each shift in which the ICULS was opened. In orderto coach the students and coaches in setting their learning goals and creating the newlearning environment.RESULTS. After one operational year we would like to conclude that the ICULS programhas proven to be a place where our students can learn and work according to our professionbased goals. Results can be showed from evaluation forms (0 months/12 months) and coachmeetings. We have no comparison to other IC Units in the Netherlands because we are thefirst. No evidence regarding ICU e.g. best practice can be found. It appears to be an efficientsystem; you can control more students in your ICU without losing quality of learning and ina ‘student safe’ environment.CONCLUSIONS. With ICULS learning and development is very visible within our ICU,other disciplines can be consulted, and are stimulated to help and give bedside teaching.Pure ‘instruction’ is replaced by ‘coaching’ The ICULS system has a positive influence onpatient safety; the coach is completely assigned to the ICULS and has no distractionscoming from other responsibilities.
26th ESICM ANNUAL CONGRESS — PARIS, FRANCE — 5–9 OCTOBER 2013
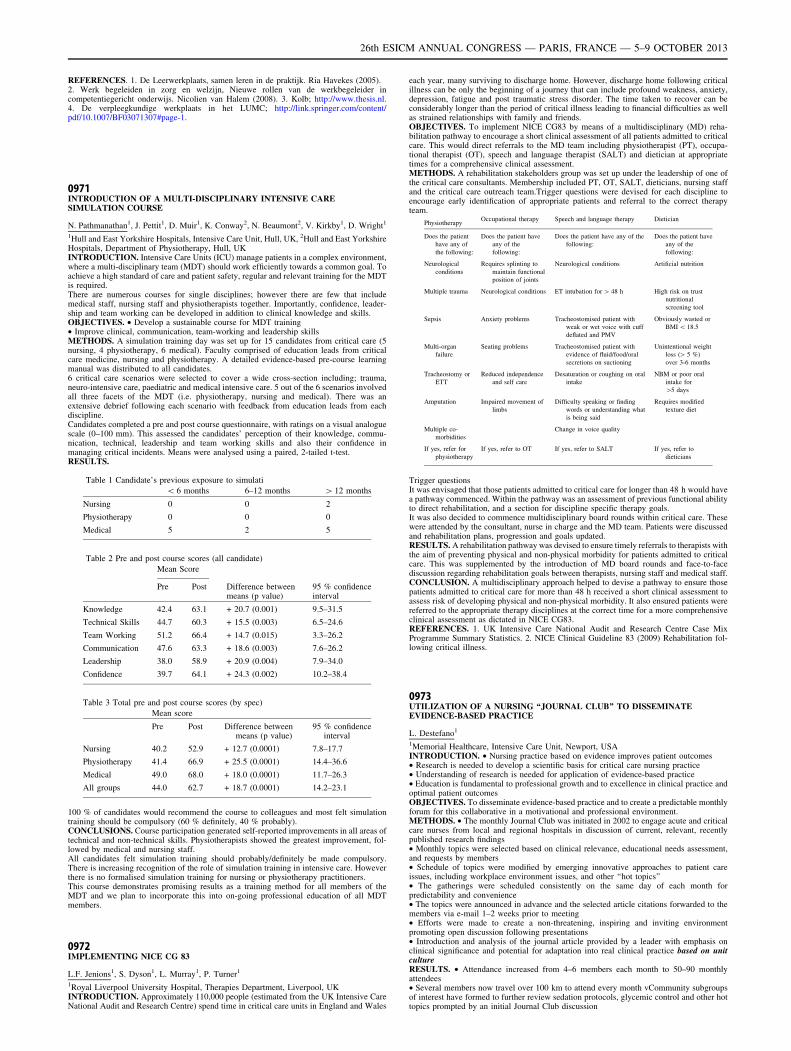
REFERENCES. 1. De Leerwerkplaats, samen leren in de praktijk. Ria Havekes (2005).2. Werk begeleiden in zorg en welzijn, Nieuwe rollen van de werkbegeleider incompetentiegericht onderwijs. Nicolien van Halem (2008). 3. Kolb; http://www.thesis.nl.4. De verpleegkundige werkplaats in het LUMC; http://link.springer.com/content/pdf/10.1007/BF03071307#page-1.
0971INTRODUCTION OF A MULTI-DISCIPLINARY INTENSIVE CARESIMULATION COURSE
N. Pathmanathan1, J. Pettit1, D. Muir1, K. Conway2, N. Beaumont2, V. Kirkby1, D. Wright1
1Hull and East Yorkshire Hospitals, Intensive Care Unit, Hull, UK, 2Hull and East YorkshireHospitals, Department of Physiotherapy, Hull, UKINTRODUCTION. Intensive Care Units (ICU) manage patients in a complex environment,where a multi-disciplinary team (MDT) should work efficiently towards a common goal. Toachieve a high standard of care and patient safety, regular and relevant training for the MDTis required.There are numerous courses for single disciplines; however there are few that includemedical staff, nursing staff and physiotherapists together. Importantly, confidence, leader-ship and team working can be developed in addition to clinical knowledge and skills.OBJECTIVES. • Develop a sustainable course for MDT training• Improve clinical, communication, team-working and leadership skillsMETHODS. A simulation training day was set up for 15 candidates from critical care (5nursing, 4 physiotherapy, 6 medical). Faculty comprised of education leads from criticalcare medicine, nursing and physiotherapy. A detailed evidence-based pre-course learningmanual was distributed to all candidates.6 critical care scenarios were selected to cover a wide cross-section including; trauma,neuro-intensive care, paediatric and medical intensive care. 5 out of the 6 scenarios involvedall three facets of the MDT (i.e. physiotherapy, nursing and medical). There was anextensive debrief following each scenario with feedback from education leads from eachdiscipline.Candidates completed a pre and post course questionnaire, with ratings on a visual analoguescale (0–100 mm). This assessed the candidates’ perception of their knowledge, commu-nication, technical, leadership and team working skills and also their confidence inmanaging critical incidents. Means were analysed using a paired, 2-tailed t-test.RESULTS.
Table 1 Candidate’s previous exposure to simulati
\ 6 months 6–12 months [ 12 months
Nursing 0 0 2
Physiotherapy 0 0 0
Medical 5 2 5
Table 2 Pre and post course scores (all candidate)
Mean Score
Pre Post Difference betweenmeans (p value)
95 % confidenceinterval
Knowledge 42.4 63.1 + 20.7 (0.001) 9.5–31.5
Technical Skills 44.7 60.3 + 15.5 (0.003) 6.5–24.6
Team Working 51.2 66.4 + 14.7 (0.015) 3.3–26.2
Communication 47.6 63.3 + 18.6 (0.003) 7.6–26.2
Leadership 38.0 58.9 + 20.9 (0.004) 7.9–34.0
Confidence 39.7 64.1 + 24.3 (0.002) 10.2–38.4
Table 3 Total pre and post course scores (by spec)
Mean score
Pre Post Difference betweenmeans (p value)
95 % confidenceinterval
Nursing 40.2 52.9 + 12.7 (0.0001) 7.8–17.7
Physiotherapy 41.4 66.9 + 25.5 (0.0001) 14.4–36.6
Medical 49.0 68.0 + 18.0 (0.0001) 11.7–26.3
All groups 44.0 62.7 + 18.7 (0.0001) 14.2–23.1
100 % of candidates would recommend the course to colleagues and most felt simulationtraining should be compulsory (60 % definitely, 40 % probably).CONCLUSIONS. Course participation generated self-reported improvements in all areas oftechnical and non-technical skills. Physiotherapists showed the greatest improvement, fol-lowed by medical and nursing staff.All candidates felt simulation training should probably/definitely be made compulsory.There is increasing recognition of the role of simulation training in intensive care. Howeverthere is no formalised simulation training for nursing or physiotherapy practitioners.This course demonstrates promising results as a training method for all members of theMDT and we plan to incorporate this into on-going professional education of all MDTmembers.
0972IMPLEMENTING NICE CG 83
L.F. Jenions1, S. Dyson1, L. Murray1, P. Turner1
1Royal Liverpool University Hospital, Therapies Department, Liverpool, UKINTRODUCTION. Approximately 110,000 people (estimated from the UK Intensive CareNational Audit and Research Centre) spend time in critical care units in England and Wales
each year, many surviving to discharge home. However, discharge home following criticalillness can be only the beginning of a journey that can include profound weakness, anxiety,depression, fatigue and post traumatic stress disorder. The time taken to recover can beconsiderably longer than the period of critical illness leading to financial difficulties as wellas strained relationships with family and friends.OBJECTIVES. To implement NICE CG83 by means of a multidisciplinary (MD) reha-bilitation pathway to encourage a short clinical assessment of all patients admitted to criticalcare. This would direct referrals to the MD team including physiotherapist (PT), occupa-tional therapist (OT), speech and language therapist (SALT) and dietician at appropriatetimes for a comprehensive clinical assessment.METHODS. A rehabilitation stakeholders group was set up under the leadership of one ofthe critical care consultants. Membership included PT, OT, SALT, dieticians, nursing staffand the critical care outreach team.Trigger questions were devised for each discipline toencourage early identification of appropriate patients and referral to the correct therapyteam.
PhysiotherapyOccupational therapy Speech and language therapy Dietician
Does the patient
have any of
the following:
Does the patient have
any of the
following:
Does the patient have any of the
following:
Does the patient have
any of the
following:
Neurological
conditions
Requires splinting to
maintain functional
position of joints
Neurological conditions Artificial nutrition
Multiple trauma Neurological conditions ET intubation for [ 48 h High risk on trust
nutritional
screening tool
Sepsis Anxiety problems Tracheostomised patient with
weak or wet voice with cuff
deflated and PMV
Obviously wasted or
BMI \ 18.5
Multi-organ
failure
Seating problems Tracheostomised patient with
evidence of fluid/food/oral
secretions on suctioning
Unintentional weight
loss ([ 5 %)
over 3-6 months
Tracheostomy or
ETT
Reduced independence
and self care
Desaturation or coughing on oral
intake
NBM or poor oral
intake for
[5 days
Amputation Impaired movement of
limbs
Difficulty speaking or finding
words or understanding what
is being said
Requires modified
texture diet
Multiple co-
morbidities
Change in voice quality
If yes, refer for
physiotherapy
If yes, refer to OT If yes, refer to SALT If yes, refer to
dieticians
Trigger questionsIt was envisaged that those patients admitted to critical care for longer than 48 h would havea pathway commenced. Within the pathway was an assessment of previous functional abilityto direct rehabilitation, and a section for discipline specific therapy goals.It was also decided to commence multidisciplinary board rounds within critical care. Thesewere attended by the consultant, nurse in charge and the MD team. Patients were discussedand rehabilitation plans, progression and goals updated.RESULTS. A rehabilitation pathway was devised to ensure timely referrals to therapists withthe aim of preventing physical and non-physical morbidity for patients admitted to criticalcare. This was supplemented by the introduction of MD board rounds and face-to-facediscussion regarding rehabilitation goals between therapists, nursing staff and medical staff.CONCLUSION. A multidisciplinary approach helped to devise a pathway to ensure thosepatients admitted to critical care for more than 48 h received a short clinical assessment toassess risk of developing physical and non-physical morbidity. It also ensured patients werereferred to the appropriate therapy disciplines at the correct time for a more comprehensiveclinical assessment as dictated in NICE CG83.REFERENCES. 1. UK Intensive Care National Audit and Research Centre Case MixProgramme Summary Statistics. 2. NICE Clinical Guideline 83 (2009) Rehabilitation fol-lowing critical illness.
0973UTILIZATION OF A NURSING ‘‘JOURNAL CLUB’’ TO DISSEMINATEEVIDENCE-BASED PRACTICE
L. Destefano1
1Memorial Healthcare, Intensive Care Unit, Newport, USAINTRODUCTION. • Nursing practice based on evidence improves patient outcomes• Research is needed to develop a scientific basis for critical care nursing practice• Understanding of research is needed for application of evidence-based practice• Education is fundamental to professional growth and to excellence in clinical practice andoptimal patient outcomesOBJECTIVES. To disseminate evidence-based practice and to create a predictable monthlyforum for this collaborative in a motivational and professional environment.METHODS. • The monthly Journal Club was initiated in 2002 to engage acute and criticalcare nurses from local and regional hospitals in discussion of current, relevant, recentlypublished research findings• Monthly topics were selected based on clinical relevance, educational needs assessment,and requests by members• Schedule of topics were modified by emerging innovative approaches to patient careissues, including workplace environment issues, and other ‘‘hot topics’’• The gatherings were scheduled consistently on the same day of each month forpredictability and convenience• The topics were announced in advance and the selected article citations forwarded to themembers via e-mail 1–2 weeks prior to meeting• Efforts were made to create a non-threatening, inspiring and inviting environmentpromoting open discussion following presentations• Introduction and analysis of the journal article provided by a leader with emphasis onclinical significance and potential for adaptation into real clinical practice based on unitcultureRESULTS. • Attendance increased from 4–6 members each month to 50–90 monthlyattendees• Several members now travel over 100 km to attend every month vCommunity subgroupsof interest have formed to further review sedation protocols, glycemic control and other hottopics prompted by an initial Journal Club discussion
26th ESICM ANNUAL CONGRESS — PARIS, FRANCE — 5–9 OCTOBER 2013
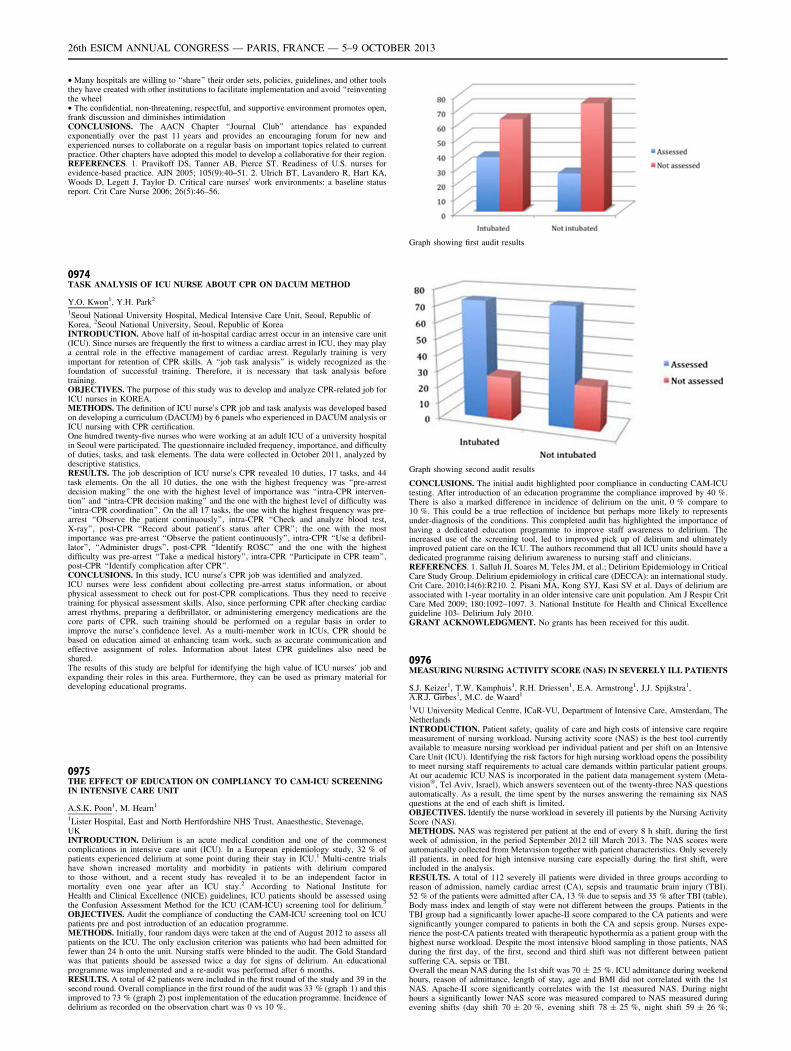
• Many hospitals are willing to ‘‘share’’ their order sets, policies, guidelines, and other toolsthey have created with other institutions to facilitate implementation and avoid ‘‘reinventingthe wheel• The confidential, non-threatening, respectful, and supportive environment promotes open,frank discussion and diminishes intimidationCONCLUSIONS. The AACN Chapter ‘‘Journal Club’’ attendance has expandedexponentially over the past 11 years and provides an encouraging forum for new andexperienced nurses to collaborate on a regular basis on important topics related to currentpractice. Other chapters have adopted this model to develop a collaborative for their region.REFERENCES. 1. Pravikoff DS, Tanner AB, Pierce ST. Readiness of U.S. nurses forevidence-based practice. AJN 2005; 105(9):40–51. 2. Ulrich BT, Lavandero R, Hart KA,Woods D, Legett J, Taylor D. Critical care nurses0 work environments: a baseline statusreport. Crit Care Nurse 2006; 26(5):46–56.
0974TASK ANALYSIS OF ICU NURSE ABOUT CPR ON DACUM METHOD
Y.O. Kwon1, Y.H. Park2
1Seoul National University Hospital, Medical Intensive Care Unit, Seoul, Republic ofKorea, 2Seoul National University, Seoul, Republic of KoreaINTRODUCTION. Above half of in-hospital cardiac arrest occur in an intensive care unit(ICU). Since nurses are frequently the first to witness a cardiac arrest in ICU, they may playa central role in the effective management of cardiac arrest. Regularly training is veryimportant for retention of CPR skills. A ‘‘job task analysis’’ is widely recognized as thefoundation of successful training. Therefore, it is necessary that task analysis beforetraining.OBJECTIVES. The purpose of this study was to develop and analyze CPR-related job forICU nurses in KOREA.METHODS. The definition of ICU nurse0s CPR job and task analysis was developed basedon developing a curriculum (DACUM) by 6 panels who experienced in DACUM analysis orICU nursing with CPR certification.One hundred twenty-five nurses who were working at an adult ICU of a university hospitalin Seoul were participated. The questionnaire included frequency, importance, and difficultyof duties, tasks, and task elements. The data were collected in October 2011, analyzed bydescriptive statistics.RESULTS. The job description of ICU nurse0s CPR revealed 10 duties, 17 tasks, and 44task elements. On the all 10 duties, the one with the highest frequency was ‘‘pre-arrestdecision making’’ the one with the highest level of importance was ‘‘intra-CPR interven-tion’’ and ‘‘intra-CPR decision making’’ and the one with the highest level of difficulty was‘‘intra-CPR coordination’’. On the all 17 tasks, the one with the highest frequency was pre-arrest ‘‘Observe the patient continuously’’, intra-CPR ‘‘Check and analyze blood test,X-ray’’, post-CPR ‘‘Record about patient0s status after CPR’’; the one with the mostimportance was pre-arrest ‘‘Observe the patient continuously’’, intra-CPR ‘‘Use a defibril-lator’’, ‘‘Administer drugs’’, post-CPR ‘‘Identify ROSC’’ and the one with the highestdifficulty was pre-arrest ‘‘Take a medical history’’, intra-CPR ‘‘Participate in CPR team’’,post-CPR ‘‘Identify complication after CPR’’.CONCLUSIONS. In this study, ICU nurse0s CPR job was identified and analyzed.ICU nurses were less confident about collecting pre-arrest status information, or aboutphysical assessment to check out for post-CPR complications. Thus they need to receivetraining for physical assessment skills. Also, since performing CPR after checking cardiacarrest rhythms, preparing a defibrillator, or administering emergency medications are thecore parts of CPR, such training should be performed on a regular basis in order toimprove the nurse’s confidence level. As a multi-member work in ICUs, CPR should bebased on education aimed at enhancing team work, such as accurate communication andeffective assignment of roles. Information about latest CPR guidelines also need beshared.The results of this study are helpful for identifying the high value of ICU nurses’ job andexpanding their roles in this area. Furthermore, they can be used as primary material fordeveloping educational programs.
0975THE EFFECT OF EDUCATION ON COMPLIANCY TO CAM-ICU SCREENINGIN INTENSIVE CARE UNIT
A.S.K. Poon1, M. Hearn1
1Lister Hospital, East and North Hertfordshire NHS Trust, Anaesthestic, Stevenage,UKINTRODUCTION. Delirium is an acute medical condition and one of the commonestcomplications in intensive care unit (ICU). In a European epidemiology study, 32 % ofpatients experienced delirium at some point during their stay in ICU.1 Multi-centre trialshave shown increased mortality and morbidity in patients with delirium comparedto those without, and a recent study has revealed it to be an independent factor inmortality even one year after an ICU stay.2 According to National Institute forHealth and Clinical Excellence (NICE) guidelines, ICU patients should be assessed usingthe Confusion Assessment Method for the ICU (CAM-ICU) screening tool for delirium.3
OBJECTIVES. Audit the compliance of conducting the CAM-ICU screening tool on ICUpatients pre and post introduction of an education programme.METHODS. Initially, four random days were taken at the end of August 2012 to assess allpatients on the ICU. The only exclusion criterion was patients who had been admitted forfewer than 24 h onto the unit. Nursing staffs were blinded to the audit. The Gold Standardwas that patients should be assessed twice a day for signs of delirium. An educationalprogramme was implemented and a re-audit was performed after 6 months.RESULTS. A total of 42 patients were included in the first round of the study and 39 in thesecond round. Overall compliance in the first round of the audit was 33 % (graph 1) and thisimproved to 73 % (graph 2) post implementation of the education programme. Incidence ofdelirium as recorded on the observation chart was 0 vs 10 %.
Graph showing first audit results
Graph showing second audit results
CONCLUSIONS. The initial audit highlighted poor compliance in conducting CAM-ICUtesting. After introduction of an education programme the compliance improved by 40 %.There is also a marked difference in incidence of delirium on the unit, 0 % compare to10 %. This could be a true reflection of incidence but perhaps more likely to representsunder-diagnosis of the conditions. This completed audit has highlighted the importance ofhaving a dedicated education programme to improve staff awareness to delirium. Theincreased use of the screening tool, led to improved pick up of delirium and ultimatelyimproved patient care on the ICU. The authors recommend that all ICU units should have adedicated programme raising delirium awareness to nursing staff and clinicians.REFERENCES. 1. Salluh JI, Soares M, Teles JM, et al.; Delirium Epidemiology in CriticalCare Study Group. Delirium epidemiology in critical care (DECCA): an international study.Crit Care. 2010;14(6):R210. 2. Pisani MA, Kong SYJ, Kasi SV et al. Days of delirium areassociated with 1-year mortality in an older intensive care unit population. Am J Respir CritCare Med 2009; 180:1092–1097. 3. National Institute for Health and Clinical Excellenceguideline 103- Delirium July 2010.GRANT ACKNOWLEDGMENT. No grants has been received for this audit.
0976MEASURING NURSING ACTIVITY SCORE (NAS) IN SEVERELY ILL PATIENTS
S.J. Keizer1, T.W. Kamphuis1, R.H. Driessen1, E.A. Armstrong1, J.J. Spijkstra1,A.R.J. Girbes1, M.C. de Waard1
1VU University Medical Centre, ICaR-VU, Department of Intensive Care, Amsterdam, TheNetherlandsINTRODUCTION. Patient safety, quality of care and high costs of intensive care requiremeasurement of nursing workload. Nursing activity score (NAS) is the best tool currentlyavailable to measure nursing workload per individual patient and per shift on an IntensiveCare Unit (ICU). Identifying the risk factors for high nursing workload opens the possibilityto meet nursing staff requirements to actual care demands within particular patient groups.At our academic ICU NAS is incorporated in the patient data management system (Meta-vision�, Tel Aviv, Israel), which answers seventeen out of the twenty-three NAS questionsautomatically. As a result, the time spent by the nurses answering the remaining six NASquestions at the end of each shift is limited.OBJECTIVES. Identify the nurse workload in severely ill patients by the Nursing ActivityScore (NAS).METHODS. NAS was registered per patient at the end of every 8 h shift, during the firstweek of admission, in the period September 2012 till March 2013. The NAS scores wereautomatically collected from Metavision together with patient characteristics. Only severelyill patients, in need for high intensive nursing care especially during the first shift, wereincluded in the analysis.RESULTS. A total of 112 severely ill patients were divided in three groups according toreason of admission, namely cardiac arrest (CA), sepsis and traumatic brain injury (TBI).52 % of the patients were admitted after CA, 13 % due to sepsis and 35 % after TBI (table).Body mass index and length of stay were not different between the groups. Patients in theTBI group had a significantly lower apache-II score compared to the CA patients and weresignificantly younger compared to patients in both the CA and sepsis group. Nurses expe-rience the post-CA patients treated with therapeutic hypothermia as a patient group with thehighest nurse workload. Despite the most intensive blood sampling in those patients, NASduring the first day, of the first, second and third shift was not different between patientsuffering CA, sepsis or TBI.Overall the mean NAS during the 1st shift was 70 ± 25 %. ICU admittance during weekendhours, reason of admittance, length of stay, age and BMI did not correlated with the 1stNAS. Apache-II score significantly correlates with the 1st measured NAS. During nighthours a significantly lower NAS score was measured compared to NAS measured duringevening shifts (day shift 70 ± 20 %, evening shift 78 ± 25 %, night shift 59 ± 26 %;
26th ESICM ANNUAL CONGRESS — PARIS, FRANCE — 5–9 OCTOBER 2013
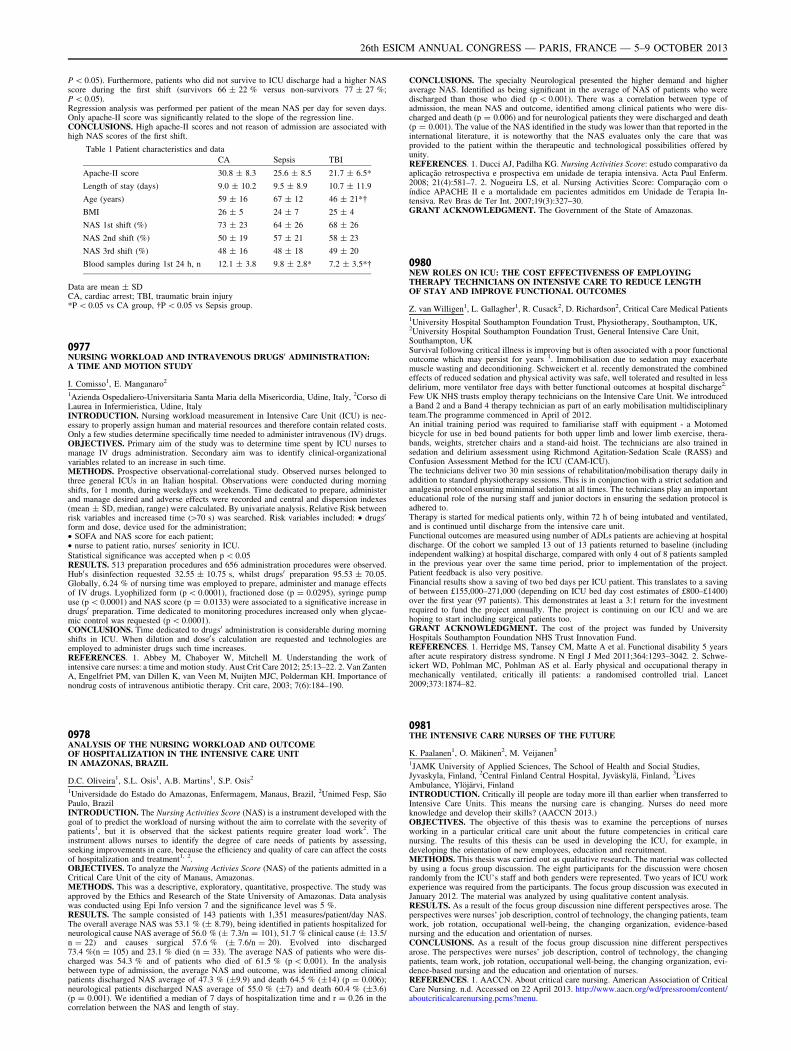
P \ 0.05). Furthermore, patients who did not survive to ICU discharge had a higher NASscore during the first shift (survivors 66 ± 22 % versus non-survivors 77 ± 27 %;P \ 0.05).Regression analysis was performed per patient of the mean NAS per day for seven days.Only apache-II score was significantly related to the slope of the regression line.CONCLUSIONS. High apache-II scores and not reason of admission are associated withhigh NAS scores of the first shift.
Table 1 Patient characteristics and data
CA Sepsis TBI
Apache-II score 30.8 ± 8.3 25.6 ± 8.5 21.7 ± 6.5*
Length of stay (days) 9.0 ± 10.2 9.5 ± 8.9 10.7 ± 11.9
Age (years) 59 ± 16 67 ± 12 46 ± 21*�
BMI 26 ± 5 24 ± 7 25 ± 4
NAS 1st shift (%) 73 ± 23 64 ± 26 68 ± 26
NAS 2nd shift (%) 50 ± 19 57 ± 21 58 ± 23
NAS 3rd shift (%) 48 ± 16 48 ± 18 49 ± 20
Blood samples during 1st 24 h, n 12.1 ± 3.8 9.8 ± 2.8* 7.2 ± 3.5*�
Data are mean ± SDCA, cardiac arrest; TBI, traumatic brain injury*P \ 0.05 vs CA group, �P \ 0.05 vs Sepsis group.
0977NURSING WORKLOAD AND INTRAVENOUS DRUGS0 ADMINISTRATION:A TIME AND MOTION STUDY
I. Comisso1, E. Manganaro2
1Azienda Ospedaliero-Universitaria Santa Maria della Misericordia, Udine, Italy, 2Corso diLaurea in Infermieristica, Udine, ItalyINTRODUCTION. Nursing workload measurement in Intensive Care Unit (ICU) is nec-essary to properly assign human and material resources and therefore contain related costs.Only a few studies determine specifically time needed to administer intravenous (IV) drugs.OBJECTIVES. Primary aim of the study was to determine time spent by ICU nurses tomanage IV drugs administration. Secondary aim was to identify clinical-organizationalvariables related to an increase in such time.METHODS. Prospective observational-correlational study. Observed nurses belonged tothree general ICUs in an Italian hospital. Observations were conducted during morningshifts, for 1 month, during weekdays and weekends. Time dedicated to prepare, administerand manage desired and adverse effects were recorded and central and dispersion indexes(mean ± SD, median, range) were calculated. By univariate analysis, Relative Risk betweenrisk variables and increased time ([70 s) was searched. Risk variables included: • drugs0
form and dose, device used for the administration;• SOFA and NAS score for each patient;• nurse to patient ratio, nurses0 seniority in ICU.Statistical significance was accepted when p \ 0.05RESULTS. 513 preparation procedures and 656 administration procedures were observed.Hub0s disinfection requested 32.55 ± 10.75 s, whilst drugs0 preparation 95.53 ± 70.05.Globally, 6.24 % of nursing time was employed to prepare, administer and manage effectsof IV drugs. Lyophilized form (p \ 0.0001), fractioned dose (p = 0.0295), syringe pumpuse (p \ 0.0001) and NAS score (p = 0.0133) were associated to a significative increase indrugs0 preparation. Time dedicated to monitoring procedures increased only when glycae-mic control was requested (p \ 0.0001).CONCLUSIONS. Time dedicated to drugs0 administration is considerable during morningshifts in ICU. When dilution and dose0s calculation are requested and technologies areemployed to administer drugs such time increases.REFERENCES. 1. Abbey M, Chaboyer W, Mitchell M. Understanding the work ofintensive care nurses: a time and motion study. Aust Crit Care 2012; 25:13–22. 2. Van ZantenA, Engelfriet PM, van Dillen K, van Veen M, Nuijten MJC, Polderman KH. Importance ofnondrug costs of intravenous antibiotic therapy. Crit care, 2003; 7(6):184–190.
0978ANALYSIS OF THE NURSING WORKLOAD AND OUTCOMEOF HOSPITALIZATION IN THE INTENSIVE CARE UNITIN AMAZONAS, BRAZIL
D.C. Oliveira1, S.L. Osis1, A.B. Martins1, S.P. Osis2
1Universidade do Estado do Amazonas, Enfermagem, Manaus, Brazil, 2Unimed Fesp, SãoPaulo, BrazilINTRODUCTION. The Nursing Activities Score (NAS) is a instrument developed with thegoal of to predict the workload of nursing without the aim to correlate with the severity ofpatients1, but it is observed that the sickest patients require greater load work2. Theinstrument allows nurses to identify the degree of care needs of patients by assessing,seeking improvements in care, because the efficiency and quality of care can affect the costsof hospitalization and treatment1, 2.OBJECTIVES. To analyze the Nursing Activies Score (NAS) of the patients admitted in aCritical Care Unit of the city of Manaus, Amazonas.METHODS. This was a descriptive, exploratory, quantitative, prospective. The study wasapproved by the Ethics and Research of the State University of Amazonas. Data analysiswas conducted using Epi Info version 7 and the significance level was 5 %.RESULTS. The sample consisted of 143 patients with 1,351 measures/patient/day NAS.The overall average NAS was 53.1 % (± 8.79), being identified in patients hospitalized forneurological cause NAS average of 56.0 % (± 7.3/n = 101), 51.7 % clinical cause (± 13.5/n = 22) and causes surgical 57.6 % (± 7.6/n = 20). Evolved into discharged73.4 %(n = 105) and 23.1 % died (n = 33). The average NAS of patients who were dis-charged was 54.3 % and of patients who died of 61.5 % (p \ 0.001). In the analysisbetween type of admission, the average NAS and outcome, was identified among clinicalpatients discharged NAS average of 47.3 % (±9.9) and death 64.5 % (±14) (p = 0.006);neurological patients discharged NAS average of 55.0 % (±7) and death 60.4 % (±3.6)(p = 0.001). We identified a median of 7 days of hospitalization time and r = 0.26 in thecorrelation between the NAS and length of stay.
CONCLUSIONS. The specialty Neurological presented the higher demand and higheraverage NAS. Identified as being significant in the average of NAS of patients who weredischarged than those who died (p \ 0.001). There was a correlation between type ofadmission, the mean NAS and outcome, identified among clinical patients who were dis-charged and death (p = 0.006) and for neurological patients they were discharged and death(p = 0.001). The value of the NAS identified in the study was lower than that reported in theinternational literature, it is noteworthy that the NAS evaluates only the care that wasprovided to the patient within the therapeutic and technological possibilities offered byunity.REFERENCES. 1. Ducci AJ, Padilha KG. Nursing Activities Score: estudo comparativo daaplicação retrospectiva e prospectiva em unidade de terapia intensiva. Acta Paul Enferm.2008; 21(4):581–7. 2. Nogueira LS, et al. Nursing Activities Score: Comparação com oı́ndice APACHE II e a mortalidade em pacientes admitidos em Unidade de Terapia In-tensiva. Rev Bras de Ter Int. 2007;19(3):327–30.GRANT ACKNOWLEDGMENT. The Government of the State of Amazonas.
0980NEW ROLES ON ICU: THE COST EFFECTIVENESS OF EMPLOYINGTHERAPY TECHNICIANS ON INTENSIVE CARE TO REDUCE LENGTHOF STAY AND IMPROVE FUNCTIONAL OUTCOMES
Z. van Willigen1, L. Gallagher1, R. Cusack2, D. Richardson2, Critical Care Medical Patients1University Hospital Southampton Foundation Trust, Physiotherapy, Southampton, UK,2University Hospital Southampton Foundation Trust, General Intensive Care Unit,Southampton, UKSurvival following critical illness is improving but is often associated with a poor functionaloutcome which may persist for years 1. Immobilisation due to sedation may exacerbatemuscle wasting and deconditioning. Schweickert et al. recently demonstrated the combinedeffects of reduced sedation and physical activity was safe, well tolerated and resulted in lessdelirium, more ventilator free days with better functional outcomes at hospital discharge2.
Few UK NHS trusts employ therapy technicians on the Intensive Care Unit. We introduceda Band 2 and a Band 4 therapy technician as part of an early mobilisation multidisciplinaryteam.The programme commenced in April of 2012.An initial training period was required to familiarise staff with equipment - a Motomedbicycle for use in bed bound patients for both upper limb and lower limb exercise, thera-bands, weights, stretcher chairs and a stand-aid hoist. The technicians are also trained insedation and delirium assessment using Richmond Agitation-Sedation Scale (RASS) andConfusion Assessment Method for the ICU (CAM-ICU).The technicians deliver two 30 min sessions of rehabilitation/mobilisation therapy daily inaddition to standard physiotherapy sessions. This is in conjunction with a strict sedation andanalgesia protocol ensuring minimal sedation at all times. The technicians play an importanteducational role of the nursing staff and junior doctors in ensuring the sedation protocol isadhered to.Therapy is started for medical patients only, within 72 h of being intubated and ventilated,and is continued until discharge from the intensive care unit.Functional outcomes are measured using number of ADLs patients are achieving at hospitaldischarge. Of the cohort we sampled 13 out of 13 patients returned to baseline (includingindependent walking) at hospital discharge, compared with only 4 out of 8 patients sampledin the previous year over the same time period, prior to implementation of the project.Patient feedback is also very positive.Financial results show a saving of two bed days per ICU patient. This translates to a savingof between £155,000–271,000 (depending on ICU bed day cost estimates of £800–£1400)over the first year (97 patients). This demonstrates at least a 3:1 return for the investmentrequired to fund the project annually. The project is continuing on our ICU and we arehoping to start including surgical patients too.GRANT ACKNOWLEDGMENT. The cost of the project was funded by UniversityHospitals Southampton Foundation NHS Trust Innovation Fund.REFERENCES. 1. Herridge MS, Tansey CM, Matte A et al. Functional disability 5 yearsafter acute respiratory distress syndrome. N Engl J Med 2011;364:1293–3042. 2. Schwe-ickert WD, Pohlman MC, Pohlman AS et al. Early physical and occupational therapy inmechanically ventilated, critically ill patients: a randomised controlled trial. Lancet2009;373:1874–82.
0981THE INTENSIVE CARE NURSES OF THE FUTURE
K. Paalanen1, O. Mäkinen2, M. Veijanen3
1JAMK University of Applied Sciences, The School of Health and Social Studies,Jyvaskyla, Finland, 2Central Finland Central Hospital, Jyväskylä, Finland, 3LivesAmbulance, Ylöjärvi, FinlandINTRODUCTION. Critically ill people are today more ill than earlier when transferred toIntensive Care Units. This means the nursing care is changing. Nurses do need moreknowledge and develop their skills? (AACCN 2013.)OBJECTIVES. The objective of this thesis was to examine the perceptions of nursesworking in a particular critical care unit about the future competencies in critical carenursing. The results of this thesis can be used in developing the ICU, for example, indeveloping the orientation of new employees, education and recruitment.METHODS. This thesis was carried out as qualitative research. The material was collectedby using a focus group discussion. The eight participants for the discussion were chosenrandomly from the ICU’s staff and both genders were represented. Two years of ICU workexperience was required from the participants. The focus group discussion was executed inJanuary 2012. The material was analyzed by using qualitative content analysis.RESULTS. As a result of the focus group discussion nine different perspectives arose. Theperspectives were nurses’ job description, control of technology, the changing patients, teamwork, job rotation, occupational well-being, the changing organization, evidence-basednursing and the education and orientation of nurses.CONCLUSIONS. As a result of the focus group discussion nine different perspectivesarose. The perspectives were nurses’ job description, control of technology, the changingpatients, team work, job rotation, occupational well-being, the changing organization, evi-dence-based nursing and the education and orientation of nurses.REFERENCES. 1. AACCN. About critical care nursing. American Association of CriticalCare Nursing. n.d. Accessed on 22 April 2013. http://www.aacn.org/wd/pressroom/content/aboutcriticalcarenursing.pcms?menu.
26th ESICM ANNUAL CONGRESS — PARIS, FRANCE — 5–9 OCTOBER 2013
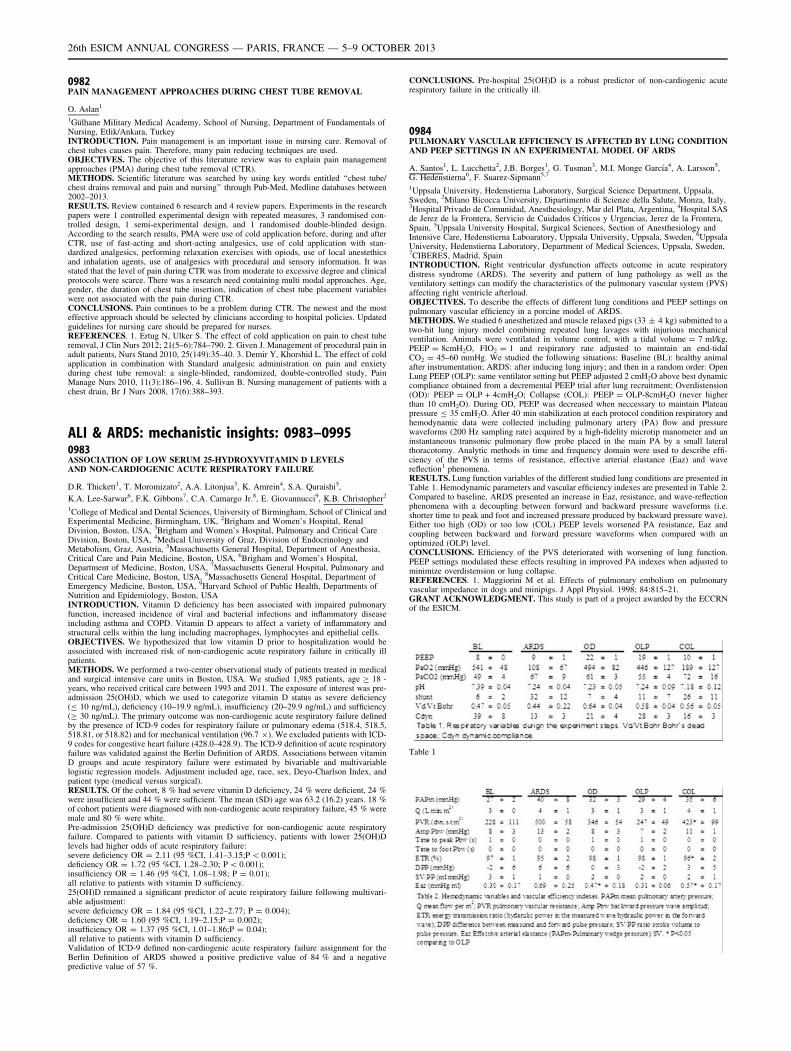
0982PAIN MANAGEMENT APPROACHES DURING CHEST TUBE REMOVAL
O. Aslan1
1Gülhane Military Medical Academy, School of Nursing, Department of Fundamentals ofNursing, Etlik/Ankara, TurkeyINTRODUCTION. Pain management is an important issue in nursing care. Removal ofchest tubes causes pain. Therefore, many pain reducing techniques are used.OBJECTIVES. The objective of this literature review was to explain pain managementapproaches (PMA) during chest tube removal (CTR).METHODS. Scientific literature was searched by using key words entitled ‘‘chest tube/chest drains removal and pain and nursing’’ through Pub-Med, Medline databases between2002–2013.RESULTS. Review contained 6 research and 4 review papers. Experiments in the researchpapers were 1 controlled experimental design with repeated measures, 3 randomised con-trolled design, 1 semi-experimental design, and 1 randomised double-blinded design.According to the search results, PMA were use of cold application before, during and afterCTR, use of fast-acting and short-acting analgesics, use of cold application with stan-dardized analgesics, performing relaxation exercises with opiods, use of local anestethicsand inhalation agents, use of analgesics with procedural and sensory information. It wasstated that the level of pain during CTR was from moderate to excessive degree and clinicalprotocols were scarce. There was a research need containing multi modal approaches. Age,gender, the duration of chest tube insertion, indication of chest tube placement variableswere not associated with the pain during CTR.CONCLUSIONS. Pain continues to be a problem during CTR. The newest and the mosteffective approach should be selected by clinicians according to hospital policies. Updatedguidelines for nursing care should be prepared for nurses.REFERENCES. 1. Ertug N, Ulker S. The effect of cold application on pain to chest tuberemoval, J Clin Nurs 2012; 21(5–6):784–790. 2. Given J. Management of procedural pain inadult patients, Nurs Stand 2010, 25(149):35–40. 3. Demir Y, Khorshid L. The effect of coldapplication in combination with Standard analgesic administration on pain and enxietyduring chest tube removal: a single-blinded, randomized, double-controlled study, PainManage Nurs 2010, 11(3):186–196. 4. Sullivan B. Nursing management of patients with achest drain, Br J Nurs 2008, 17(6):388–393.
ALI & ARDS: mechanistic insights: 0983–09950983ASSOCIATION OF LOW SERUM 25-HYDROXYVITAMIN D LEVELSAND NON-CARDIOGENIC ACUTE RESPIRATORY FAILURE
D.R. Thickett1, T. Moromizato2, A.A. Litonjua3, K. Amrein4, S.A. Quraishi5,
K.A. Lee-Sarwar6, F.K. Gibbons7, C.A. Camargo Jr.8, E. Giovannucci9, K.B. Christopher2
1College of Medical and Dental Sciences, University of Birmingham, School of Clinical andExperimental Medicine, Birmingham, UK, 2Brigham and Women’s Hospital, RenalDivision, Boston, USA, 3Brigham and Women’s Hospital, Pulmonary and Critical CareDivision, Boston, USA, 4Medical University of Graz, Division of Endocrinology andMetabolism, Graz, Austria, 5Massachusetts General Hospital, Department of Anesthesia,Critical Care and Pain Medicine, Boston, USA, 6Brigham and Women’s Hospital,Department of Medicine, Boston, USA, 7Massachusetts General Hospital, Pulmonary andCritical Care Medicine, Boston, USA, 8Massachusetts General Hospital, Department ofEmergency Medicine, Boston, USA, 9Harvard School of Public Health, Departments ofNutrition and Epidemiology, Boston, USAINTRODUCTION. Vitamin D deficiency has been associated with impaired pulmonaryfunction, increased incidence of viral and bacterial infections and inflammatory diseaseincluding asthma and COPD. Vitamin D appears to affect a variety of inflammatory andstructural cells within the lung including macrophages, lymphocytes and epithelial cells.OBJECTIVES. We hypothesized that low vitamin D prior to hospitalization would beassociated with increased risk of non-cardiogenic acute respiratory failure in critically illpatients.METHODS. We performed a two-center observational study of patients treated in medicaland surgical intensive care units in Boston, USA. We studied 1,985 patients, age C 18 -years, who received critical care between 1993 and 2011. The exposure of interest was pre-admission 25(OH)D, which we used to categorize vitamin D status as severe deficiency(B 10 ng/mL), deficiency (10–19.9 ng/mL), insufficiency (20–29.9 ng/mL) and sufficiency(C 30 ng/mL). The primary outcome was non-cardiogenic acute respiratory failure definedby the presence of ICD-9 codes for respiratory failure or pulmonary edema (518.4, 518.5,518.81, or 518.82) and for mechanical ventilation (96.7 9). We excluded patients with ICD-9 codes for congestive heart failure (428.0–428.9). The ICD-9 definition of acute respiratoryfailure was validated against the Berlin Definition of ARDS. Associations between vitaminD groups and acute respiratory failure were estimated by bivariable and multivariablelogistic regression models. Adjustment included age, race, sex, Deyo-Charlson Index, andpatient type (medical versus surgical).RESULTS. Of the cohort, 8 % had severe vitamin D deficiency, 24 % were deficient, 24 %were insufficient and 44 % were sufficient. The mean (SD) age was 63.2 (16.2) years. 18 %of cohort patients were diagnosed with non-cardiogenic acute respiratory failure, 45 % weremale and 80 % were white.Pre-admission 25(OH)D deficiency was predictive for non-cardiogenic acute respiratoryfailure. Compared to patients with vitamin D sufficiency, patients with lower 25(OH)Dlevels had higher odds of acute respiratory failure:severe deficiency OR = 2.11 (95 %CI, 1.41–3.15;P \ 0.001);deficiency OR = 1.72 (95 %CI, 1.28–2.30; P \ 0.001);insufficiency OR = 1.46 (95 %CI, 1.08–1.98; P = 0.01);all relative to patients with vitamin D sufficiency.25(OH)D remained a significant predictor of acute respiratory failure following multivari-able adjustment:severe deficiency OR = 1.84 (95 %CI, 1.22–2.77; P = 0.004);deficiency OR = 1.60 (95 %CI, 1.19–2.15;P = 0.002);insufficiency OR = 1.37 (95 %CI, 1.01–1.86;P = 0.04);all relative to patients with vitamin D sufficiency.Validation of ICD-9 defined non-cardiogenic acute respiratory failure assignment for theBerlin Definition of ARDS showed a positive predictive value of 84 % and a negativepredictive value of 57 %.
CONCLUSIONS. Pre-hospital 25(OH)D is a robust predictor of non-cardiogenic acuterespiratory failure in the critically ill.
0984PULMONARY VASCULAR EFFICIENCY IS AFFECTED BY LUNG CONDITIONAND PEEP SETTINGS IN AN EXPERIMENTAL MODEL OF ARDS
A. Santos1, L. Lucchetta2, J.B. Borges1, G. Tusman3, M.I. Monge Garcı́a4, A. Larsson5,G. Hedenstierna6, F. Suarez-Sipmann5,7
1Uppsala University, Hedenstierna Laboratory, Surgical Science Department, Uppsala,Sweden, 2Milano Bicocca University, Dipartimento di Scienze della Salute, Monza, Italy,3Hospital Privado de Comunidad, Anesthesiology, Mar del Plata, Argentina, 4Hospital SASde Jerez de la Frontera, Servicio de Cuidados Crı́ticos y Urgencias, Jerez de la Frontera,Spain, 5Uppsala University Hospital, Surgical Sciences, Section of Anesthesiology andIntensive Care, Hedenstierna Laboaratory, Uppsala University, Uppsala, Sweden, 6UppsalaUniversity, Hedenstierna Laboratory, Department of Medical Sciences, Uppsala, Sweden,7CIBERES, Madrid, SpainINTRODUCTION. Right ventricular dysfunction affects outcome in acute respiratorydistress syndrome (ARDS). The severity and pattern of lung pathology as well as theventilatory settings can modify the characteristics of the pulmonary vascular system (PVS)affecting right ventricle afterload.OBJECTIVES. To describe the effects of different lung conditions and PEEP settings onpulmonary vascular efficiency in a porcine model of ARDS.METHODS. We studied 6 anesthetized and muscle relaxed pigs (33 ± 4 kg) submitted to atwo-hit lung injury model combining repeated lung lavages with injurious mechanicalventilation. Animals were ventilated in volume control, with a tidal volume = 7 ml/kg,PEEP = 8cmH2O, FIO2 = 1 and respiratory rate adjusted to maintain an end-tidalCO2 = 45–60 mmHg. We studied the following situations: Baseline (BL): healthy animalafter instrumentation; ARDS: after inducing lung injury; and then in a random order: OpenLung PEEP (OLP): same ventilator setting but PEEP adjusted 2 cmH2O above best dynamiccompliance obtained from a decremental PEEP trial after lung recruitment; Overdistension(OD): PEEP = OLP + 4cmH2O; Collapse (COL): PEEP = OLP-8cmH2O (never higherthan 10 cmH2O). During OD, PEEP was decreased when neccessary to maintain Plateaupressure B 35 cmH2O. After 40 min stabilization at each protocol condition respiratory andhemodynamic data were collected including pulmonary artery (PA) flow and pressurewaveforms (200 Hz sampling rate) acquired by a high-fidelity microtip manometer and aninstantaneous transonic pulmonary flow probe placed in the main PA by a small lateralthoracotomy. Analytic methods in time and frequency domain were used to describe effi-ciency of the PVS in terms of resistance, effective arterial elastance (Eaz) and wavereflection1 phenomena.RESULTS. Lung function variables of the different studied lung conditions are presented inTable 1. Hemodynamic parameters and vascular efficiency indexes are presented in Table 2.Compared to baseline, ARDS presented an increase in Eaz, resistance, and wave-reflectionphenomena with a decoupling between forward and backward pressure waveforms (i.e.shorter time to peak and foot and increased pressure produced by backward pressure wave).Either too high (OD) or too low (COL) PEEP levels worsened PA resistance, Eaz andcoupling between backward and forward pressure waveforms when compared with anoptimized (OLP) level.CONCLUSIONS. Efficiency of the PVS deteriorated with worsening of lung function.PEEP settings modulated these effects resulting in improved PA indexes when adjusted tominimize overdistension or lung collapse.REFERENCES. 1. Maggiorini M et al. Effects of pulmonary embolism on pulmonaryvascular impedance in dogs and minipigs. J Appl Physiol. 1998; 84:815–21.GRANT ACKNOWLEDGMENT. This study is part of a project awarded by the ECCRNof the ESICM.
Table 1
26th ESICM ANNUAL CONGRESS — PARIS, FRANCE — 5–9 OCTOBER 2013
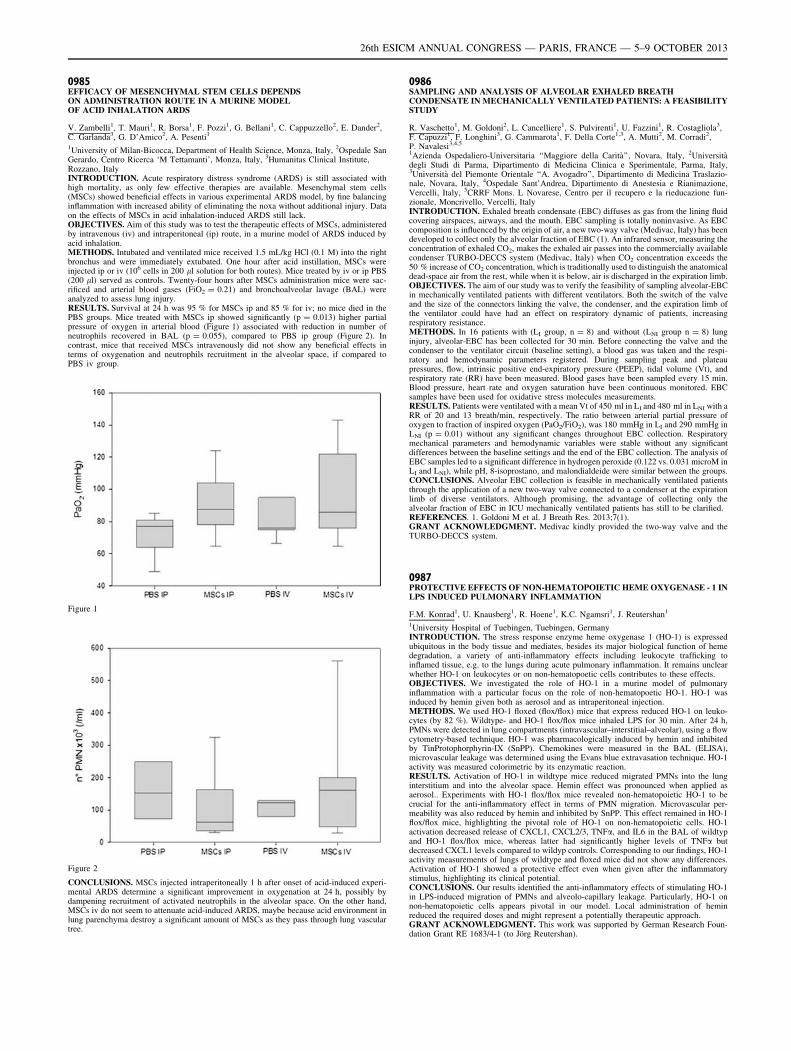
0985EFFICACY OF MESENCHYMAL STEM CELLS DEPENDSON ADMINISTRATION ROUTE IN A MURINE MODELOF ACID INHALATION ARDS
V. Zambelli1, T. Mauri1, R. Borsa1, F. Pozzi1, G. Bellani1, C. Cappuzzello2, E. Dander2,C. Garlanda3, G. D’Amico2, A. Pesenti1
1University of Milan-Bicocca, Department of Health Science, Monza, Italy, 2Ospedale SanGerardo, Centro Ricerca ‘M Tettamanti’, Monza, Italy, 3Humanitas Clinical Institute,Rozzano, ItalyINTRODUCTION. Acute respiratory distress syndrome (ARDS) is still associated withhigh mortality, as only few effective therapies are available. Mesenchymal stem cells(MSCs) showed beneficial effects in various experimental ARDS model, by fine balancinginflammation with increased ability of eliminating the noxa without additional injury. Dataon the effects of MSCs in acid inhalation-induced ARDS still lack.OBJECTIVES. Aim of this study was to test the therapeutic effects of MSCs, administeredby intravenous (iv) and intraperitoneal (ip) route, in a murine model of ARDS induced byacid inhalation.METHODS. Intubated and ventilated mice received 1.5 mL/kg HCl (0.1 M) into the rightbronchus and were immediately extubated. One hour after acid instillation, MSCs wereinjected ip or iv (106 cells in 200 ll solution for both routes). Mice treated by iv or ip PBS(200 ll) served as controls. Twenty-four hours after MSCs administration mice were sac-rificed and arterial blood gases (FiO2 = 0.21) and bronchoalveolar lavage (BAL) wereanalyzed to assess lung injury.RESULTS. Survival at 24 h was 95 % for MSCs ip and 85 % for iv; no mice died in thePBS groups. Mice treated with MSCs ip showed significantly (p = 0.013) higher partialpressure of oxygen in arterial blood (Figure 1) associated with reduction in number ofneutrophils recovered in BAL (p = 0.055), compared to PBS ip group (Figure 2). Incontrast, mice that received MSCs intravenously did not show any beneficial effects interms of oxygenation and neutrophils recruitment in the alveolar space, if compared toPBS iv group.
Figure 1
Figure 2
CONCLUSIONS. MSCs injected intraperitoneally 1 h after onset of acid-induced experi-mental ARDS determine a significant improvement in oxygenation at 24 h, possibly bydampening recruitment of activated neutrophils in the alveolar space. On the other hand,MSCs iv do not seem to attenuate acid-induced ARDS, maybe because acid environment inlung parenchyma destroy a significant amount of MSCs as they pass through lung vasculartree.
0986SAMPLING AND ANALYSIS OF ALVEOLAR EXHALED BREATHCONDENSATE IN MECHANICALLY VENTILATED PATIENTS: A FEASIBILITYSTUDY
R. Vaschetto1, M. Goldoni2, L. Cancelliere1, S. Pulvirenti1, U. Fazzini1, R. Costagliola3,F. Capuzzi1, F. Longhini3, G. Cammarota1, F. Della Corte1,3, A. Mutti2, M. Corradi2,P. Navalesi3,4,5
1Azienda Ospedaliero-Universitaria ‘‘Maggiore della Carità’’, Novara, Italy, 2Universitàdegli Studi di Parma, Dipartimento di Medicina Clinica e Sperimentale, Parma, Italy,3Università del Piemonte Orientale ‘‘A. Avogadro’’, Dipartimento di Medicina Traslazio-nale, Novara, Italy, 4Ospedale Sant’Andrea, Dipartimento di Anestesia e Rianimazione,Vercelli, Italy, 5CRRF Mons. L Novarese, Centro per il recupero e la rieducazione fun-zionale, Moncrivello, Vercelli, ItalyINTRODUCTION. Exhaled breath condensate (EBC) diffuses as gas from the lining fluidcovering airspaces, airways, and the mouth. EBC sampling is totally noninvasive. As EBCcomposition is influenced by the origin of air, a new two-way valve (Medivac, Italy) has beendeveloped to collect only the alveolar fraction of EBC (1). An infrared sensor, measuring theconcentration of exhaled CO2, makes the exhaled air passes into the commercially availablecondenser TURBO-DECCS system (Medivac, Italy) when CO2 concentration exceeds the50 % increase of CO2 concentration, which is traditionally used to distinguish the anatomicaldead-space air from the rest, while when it is below, air is discharged in the expiration limb.OBJECTIVES. The aim of our study was to verify the feasibility of sampling alveolar-EBCin mechanically ventilated patients with different ventilators. Both the switch of the valveand the size of the connectors linking the valve, the condenser, and the expiration limb ofthe ventilator could have had an effect on respiratory dynamic of patients, increasingrespiratory resistance.METHODS. In 16 patients with (LI group, n = 8) and without (LNI group n = 8) lunginjury, alveolar-EBC has been collected for 30 min. Before connecting the valve and thecondenser to the ventilator circuit (baseline setting), a blood gas was taken and the respi-ratory and hemodynamic parameters registered. During sampling peak and plateaupressures, flow, intrinsic positive end-expiratory pressure (PEEP), tidal volume (Vt), andrespiratory rate (RR) have been measured. Blood gases have been sampled every 15 min.Blood pressure, heart rate and oxygen saturation have been continuous monitored. EBCsamples have been used for oxidative stress molecules measurements.RESULTS. Patients were ventilated with a mean Vt of 450 ml in LI and 480 ml in LNI with aRR of 20 and 13 breath/min, respectively. The ratio between arterial partial pressure ofoxygen to fraction of inspired oxygen (PaO2/FiO2), was 180 mmHg in LI and 290 mmHg inLNI (p = 0.01) without any significant changes throughout EBC collection. Respiratorymechanical parameters and hemodynamic variables were stable without any significantdifferences between the baseline settings and the end of the EBC collection. The analysis ofEBC samples led to a significant difference in hydrogen peroxide (0.122 vs. 0.031 microM inLI and LNI), while pH, 8-isoprostano, and malondialdeide were similar between the groups.CONCLUSIONS. Alveolar EBC collection is feasible in mechanically ventilated patientsthrough the application of a new two-way valve connected to a condenser at the expirationlimb of diverse ventilators. Although promising, the advantage of collecting only thealveolar fraction of EBC in ICU mechanically ventilated patients has still to be clarified.REFERENCES. 1. Goldoni M et al. J Breath Res. 2013;7(1).GRANT ACKNOWLEDGMENT. Medivac kindly provided the two-way valve and theTURBO-DECCS system.
0987PROTECTIVE EFFECTS OF NON-HEMATOPOIETIC HEME OXYGENASE - 1 INLPS INDUCED PULMONARY INFLAMMATION
F.M. Konrad1, U. Knausberg1, R. Hoene1, K.C. Ngamsri1, J. Reutershan1
1University Hospital of Tuebingen, Tuebingen, GermanyINTRODUCTION. The stress response enzyme heme oxygenase 1 (HO-1) is expressedubiquitous in the body tissue and mediates, besides its major biological function of hemedegradation, a variety of anti-inflammatory effects including leukocyte trafficking toinflamed tissue, e.g. to the lungs during acute pulmonary inflammation. It remains unclearwhether HO-1 on leukocytes or on non-hematopoetic cells contributes to these effects.OBJECTIVES. We investigated the role of HO-1 in a murine model of pulmonaryinflammation with a particular focus on the role of non-hematopoetic HO-1. HO-1 wasinduced by hemin given both as aerosol and as intraperitoneal injection.METHODS. We used HO-1 floxed (flox/flox) mice that express reduced HO-1 on leuko-cytes (by 82 %). Wildtype- and HO-1 flox/flox mice inhaled LPS for 30 min. After 24 h,PMNs were detected in lung compartments (intravascular–interstitial–alveolar), using a flowcytometry-based technique. HO-1 was pharmacologically induced by hemin and inhibitedby TinProtophorphyrin-IX (SnPP). Chemokines were measured in the BAL (ELISA),microvascular leakage was determined using the Evans blue extravasation technique. HO-1activity was measured colorimetric by its enzymatic reaction.RESULTS. Activation of HO-1 in wildtype mice reduced migrated PMNs into the lunginterstitium and into the alveolar space. Hemin effect was pronounced when applied asaerosol.. Experiments with HO-1 flox/flox mice revealed non-hematopoietic HO-1 to becrucial for the anti-inflammatory effect in terms of PMN migration. Microvascular per-meability was also reduced by hemin and inhibited by SnPP. This effect remained in HO-1flox/flox mice, highlighting the pivotal role of HO-1 on non-hematopoietic cells. HO-1activation decreased release of CXCL1, CXCL2/3, TNFa, and IL6 in the BAL of wildtypand HO-1 flox/flox mice, whereas latter had significantly higher levels of TNFa butdecreased CXCL1 levels compared to wildyp controls. Corresponding to our findings, HO-1activity measurements of lungs of wildtype and floxed mice did not show any differences.Activation of HO-1 showed a protective effect even when given after the inflammatorystimulus, highlighting its clinical potential.CONCLUSIONS. Our results identified the anti-inflammatory effects of stimulating HO-1in LPS-induced migration of PMNs and alveolo-capillary leakage. Particularly, HO-1 onnon-hematopoietic cells appears pivotal in our model. Local administration of heminreduced the required doses and might represent a potentially therapeutic approach.GRANT ACKNOWLEDGMENT. This work was supported by German Research Foun-dation Grant RE 1683/4-1 (to Jörg Reutershan).
26th ESICM ANNUAL CONGRESS — PARIS, FRANCE — 5–9 OCTOBER 2013
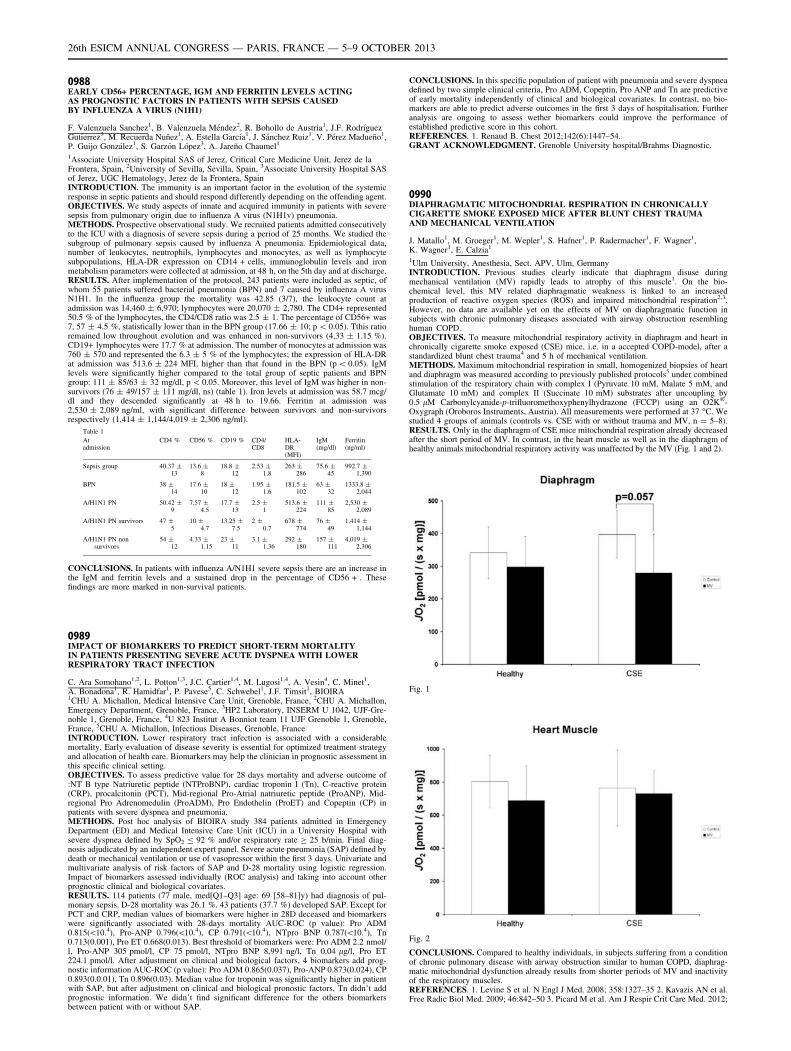
0988EARLY CD56+ PERCENTAGE, IGM AND FERRITIN LEVELS ACTINGAS PROGNOSTIC FACTORS IN PATIENTS WITH SEPSIS CAUSEDBY INFLUENZA A VIRUS (N1H1)
F. Valenzuela Sanchez1, B. Valenzuela Méndez2, R. Bohollo de Austria1, J.F. Rodrı́guezGutierrez3, M. Recuerda Nuñez1, A. Estella Garcı́a1, J. Sánchez Ruiz1, V. Pérez Madueño1,P. Guijo González1, S. Garzón López3, A. Jareño Chaumel1
1Associate University Hospital SAS of Jerez, Critical Care Medicine Unit, Jerez de laFrontera, Spain, 2University of Sevilla, Sevilla, Spain, 3Associate University Hospital SASof Jerez, UGC Hematology, Jerez de la Frontera, SpainINTRODUCTION. The immunity is an important factor in the evolution of the systemicresponse in septic patients and should respond differently depending on the offending agent.OBJECTIVES. We study aspects of innate and acquired immunity in patients with severesepsis from pulmonary origin due to influenza A virus (N1H1v) pneumonia.METHODS. Prospective observational study. We recruited patients admitted consecutivelyto the ICU with a diagnosis of severe sepsis during a period of 25 months. We studied thesubgroup of pulmonary sepsis caused by influenza A pneumonia. Epidemiological data,number of leukocytes, neutrophils, lymphocytes and monocytes, as well as lymphocytesubpopulations, HLA-DR expression on CD14 + cells, immunoglobulin levels and ironmetabolism parameters were collected at admission, at 48 h, on the 5th day and at discharge.RESULTS. After implementation of the protocol, 243 patients were included as septic, ofwhom 55 patients suffered bacterial pneumonia (BPN) and 7 caused by influenza A virusN1H1. In the influenza group the mortality was 42.85 (3/7), the leukocyte count atadmission was 14,460 ± 6,970; lymphocytes were 20,070 ± 2,780. The CD4+ represented50.5 % of the lymphocytes, the CD4/CD8 ratio was 2.5 ± 1. The percentage of CD56+ was7, 57 ± 4.5 %, statistically lower than in the BPN group (17.66 ± 10; p \ 0.05). Tthis ratioremained low throughout evolution and was enhanced in non-survivors (4,33 ± 1.15 %).CD19+ lymphocytes were 17.7 % at admission. The number of monocytes at admission was760 ± 570 and represented the 6.3 ± 5 % of the lymphocytes; the expression of HLA-DRat admission was 513.6 ± 224 MFI, higher than that found in the BPN (p \ 0.05). IgMlevels were significantly higher compared to the total group of septic patients and BPNgroup: 111 ± 85/63 ± 32 mg/dl, p \ 0.05. Moreover, this level of IgM was higher in non-survivors (76 ± 49/157 ± 111 mg/dl, ns) (table 1). Iron levels at admission was 58.7 mcg/dl and they descended significantly at 48 h to 19.66. Ferritin at admission was2,530 ± 2,089 ng/ml, with significant difference between survivors and non-survivorsrespectively (1,414 ± 1,144/4,019 ± 2,306 ng/ml).
Table 1
Atadmission
CD4 % CD56 % CD19 % CD4/CD8
HLA-DR(MFI)
IgM(mg/dl)
Ferritin(ng/ml)
Sepsis group 40.37 ±13
13.6 ±8
18.8 ±12
2.53 ±1.8
263 ±286
75.6 ±45
992.7 ±1,390
BPN 38 ±14
17.6 ±10
18 ±12
1.95 ±1.6
181.5 ±102
63 ±32
1333.8 ±2,044
A/H1N1 PN 50.42 ±9
7.57 ±4.5
17.7 ±13
2.5 ±1
513.6 ±224
111 ±85
2,530 ±2,089
A/H1N1 PN survivors 47 ±5
10 ±4.7
13.25 ±7.5
2 ±0.7
678 ±774
76 ±49
1,414 ±1,144
A/H1N1 PN nonsurvivors
54 ±12
4.33 ±1.15
23 ±11
3.1 ±1.36
292 ±180
157 ±111
4,019 ±2,306
CONCLUSIONS. In patients with influenza A/N1H1 severe sepsis there are an increase inthe IgM and ferritin levels and a sustained drop in the percentage of CD56 + . Thesefindings are more marked in non-survival patients.
0989IMPACT OF BIOMARKERS TO PREDICT SHORT-TERM MORTALITYIN PATIENTS PRESENTING SEVERE ACUTE DYSPNEA WITH LOWERRESPIRATORY TRACT INFECTION
C. Ara Somohano1,2, L. Potton1,3, J.C. Cartier1,4, M. Lugosi1,4, A. Vesin4, C. Minet1,A. Bonadona1, R. Hamidfar1, P. Pavese5, C. Schwebel1, J.F. Timsit1, BIOIRA1CHU A. Michallon, Medical Intensive Care Unit, Grenoble, France, 2CHU A. Michallon,Emergency Department, Grenoble, France, 3HP2 Laboratory, INSERM U 1042, UJF-Gre-noble 1, Grenoble, France, 4U 823 Institut A Bonniot team 11 UJF Grenoble 1, Grenoble,France, 5CHU A. Michallon, Infectious Diseases, Grenoble, FranceINTRODUCTION. Lower respiratory tract infection is associated with a considerablemortality. Early evaluation of disease severity is essential for optimized treatment strategyand allocation of health care. Biomarkers may help the clinician in prognostic assessment inthis specific clinical setting.OBJECTIVES. To assess predictive value for 28 days mortality and adverse outcome of:NT B type Natriuretic peptide (NTProBNP), cardiac troponin I (Tn), C-reactive protein(CRP), procalcitonin (PCT), Mid-regional Pro-Atrial natriuretic peptide (ProANP), Mid-regional Pro Adrenomedulin (ProADM), Pro Endothelin (ProET) and Copeptin (CP) inpatients with severe dyspnea and pneumonia.METHODS. Post hoc analysis of BIOIRA study 384 patients admitted in EmergencyDepartment (ED) and Medical Intensive Care Unit (ICU) in a University Hospital withsevere dyspnea defined by SpO2 B 92 % and/or respiratory rate C 25 b/min. Final diag-nosis adjudicated by an independent expert panel. Severe acute pneumonia (SAP) defined bydeath or mechanical ventilation or use of vasopressor within the first 3 days. Univariate andmultivariate analysis of risk factors of SAP and D-28 mortality using logistic regression.Impact of biomarkers assessed individually (ROC analysis) and taking into account otherprognostic clinical and biological covariates.RESULTS. 114 patients (77 male, med[Q1–Q3] age: 69 [58–81]y) had diagnosis of pul-monary sepsis. D-28 mortality was 26.1 %. 43 patients (37.7 %) developed SAP. Except forPCT and CRP, median values of biomarkers were higher in 28D deceased and biomarkerswere significantly associated with 28-days mortality AUC-ROC (p value): Pro ADM0.815(\10.4), Pro-ANP 0.796(\10.4), CP 0.791(\10.4), NTpro BNP 0.787(\10.4), Tn0.713(0.001), Pro ET 0.668(0.013). Best threshold of biomarkers were: Pro ADM 2.2 nmol/l, Pro-ANP 305 pmol/l, CP 75 pmol/l, NTpro BNP 8,991 ng/l, Tn 0.04 lg/l, Pro ET224.1 pmol/l. After adjustment on clinical and biological factors, 4 biomarkers add prog-nostic information AUC-ROC (p value): Pro ADM 0.865(0.037), Pro-ANP 0.873(0.024), CP0.893(0.0.01), Tn 0.896(0.03). Median value for troponin was significantly higher in patientwith SAP, but after adjustment on clinical and biological pronostic factors, Tn didn’t addprognostic information. We didn’t find significant difference for the others biomarkersbetween patient with or without SAP.
CONCLUSIONS. In this specific population of patient with pneumonia and severe dyspneadefined by two simple clinical criteria, Pro ADM, Copeptin, Pro ANP and Tn are predictiveof early mortality independently of clinical and biological covariates. In contrast, no bio-markers are able to predict adverse outcomes in the first 3 days of hospitalisation. Furtheranalysis are ongoing to assess wether biomarkers could improve the performance ofestablished predictive score in this cohort.REFERENCES. 1. Renaud B. Chest 2012;142(6):1447–54.GRANT ACKNOWLEDGMENT. Grenoble University hospital/Brahms Diagnostic.
0990DIAPHRAGMATIC MITOCHONDRIAL RESPIRATION IN CHRONICALLYCIGARETTE SMOKE EXPOSED MICE AFTER BLUNT CHEST TRAUMAAND MECHANICAL VENTILATION
J. Matallo1, M. Groeger1, M. Wepler1, S. Hafner1, P. Radermacher1, F. Wagner1,K. Wagner1, E. Calzia1
1Ulm University, Anesthesia, Sect. APV, Ulm, GermanyINTRODUCTION. Previous studies clearly indicate that diaphragm disuse duringmechanical ventilation (MV) rapidly leads to atrophy of this muscle1. On the bio-chemical level, this MV related diaphragmatic weakness is linked to an increasedproduction of reactive oxygen species (ROS) and impaired mitochondrial respiration2,3.However, no data are available yet on the effects of MV on diaphragmatic function insubjects with chronic pulmonary diseases associated with airway obstruction resemblinghuman COPD.OBJECTIVES. To measure mitochondrial respiratory activity in diaphragm and heart inchronically cigarette smoke exposed (CSE) mice, i.e. in a accepted COPD-model, after astandardized blunt chest trauma4 and 5 h of mechanical ventilation.METHODS. Maximum mitochondrial respiration in small, homogenized biopsies of heartand diaphragm was measured according to previously published protocols5 under combinedstimulation of the respiratory chain with complex I (Pyruvate 10 mM, Malate 5 mM, andGlutamate 10 mM) and complex II (Succinate 10 mM) substrates after uncoupling by0.5 lM Carbonylcyanide-p-trifluoromethoxyphenylhydrazone (FCCP) using an O2K�-Oxygraph (Oroboros Instruments, Austria). All measurements were performed at 37 �C. Westudied 4 groups of animals (controls vs. CSE with or without trauma and MV, n = 5–8).RESULTS. Only in the diaphragm of CSE mice mitochondrial respiration already decreasedafter the short period of MV. In contrast, in the heart muscle as well as in the diaphragm ofhealthy animals mitochondrial respiratory activity was unaffected by the MV (Fig. 1 and 2).
Fig. 1
Fig. 2
CONCLUSIONS. Compared to healthy individuals, in subjects suffering from a conditionof chronic pulmonary disease with airway obstruction similar to human COPD, diaphrag-matic mitochondrial dysfunction already results from shorter periods of MV and inactivityof the respiratory muscles.REFERENCES. 1. Levine S et al. N Engl J Med. 2008; 358:1327–35 2. Kavazis AN et al.Free Radic Biol Med. 2009; 46:842–50 3. Picard M et al. Am J Respir Crit Care Med. 2012;
26th ESICM ANNUAL CONGRESS — PARIS, FRANCE — 5–9 OCTOBER 2013
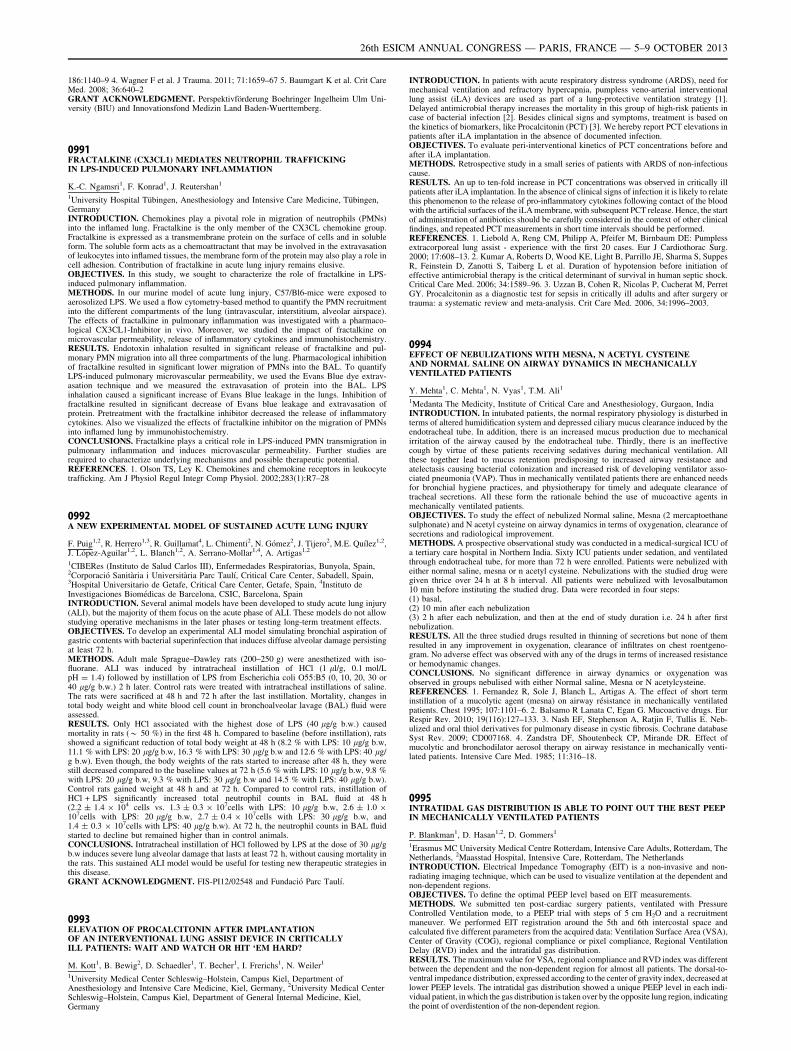
186:1140–9 4. Wagner F et al. J Trauma. 2011; 71:1659–67 5. Baumgart K et al. Crit CareMed. 2008; 36:640–2GRANT ACKNOWLEDGMENT. Perspektivförderung Boehringer Ingelheim Ulm Uni-versity (BIU) and Innovationsfond Medizin Land Baden-Wuerttemberg.
0991FRACTALKINE (CX3CL1) MEDIATES NEUTROPHIL TRAFFICKINGIN LPS-INDUCED PULMONARY INFLAMMATION
K.-C. Ngamsri1, F. Konrad1, J. Reutershan1
1University Hospital Tübingen, Anesthesiology and Intensive Care Medicine, Tübingen,GermanyINTRODUCTION. Chemokines play a pivotal role in migration of neutrophils (PMNs)into the inflamed lung. Fractalkine is the only member of the CX3CL chemokine group.Fractalkine is expressed as a transmembrane protein on the surface of cells and in solubleform. The soluble form acts as a chemoattractant that may be involved in the extravasationof leukocytes into inflamed tissues, the membrane form of the protein may also play a role incell adhesion. Contribution of fractalkine in acute lung injury remains elusive.OBJECTIVES. In this study, we sought to characterize the role of fractalkine in LPS-induced pulmonary inflammation.METHODS. In our murine model of acute lung injury, C57/Bl6-mice were exposed toaerosolized LPS. We used a flow cytometry-based method to quantify the PMN recruitmentinto the different compartments of the lung (intravascular, interstitium, alveolar airspace).The effects of fractalkine in pulmonary inflammation was investigated with a pharmaco-logical CX3CL1-Inhibitor in vivo. Moreover, we studied the impact of fractalkine onmicrovascular permeability, release of inflammatory cytokines and immunohistochemistry.RESULTS. Endotoxin inhalation resulted in significant release of fractalkine and pul-monary PMN migration into all three compartments of the lung. Pharmacological inhibitionof fractalkine resulted in significant lower migration of PMNs into the BAL. To quantifyLPS-induced pulmonary microvascular permeability, we used the Evans Blue dye extrav-asation technique and we measured the extravasation of protein into the BAL. LPSinhalation caused a significant increase of Evans Blue leakage in the lungs. Inhibition offractalkine resulted in significant decrease of Evans blue leakage and extravasation ofprotein. Pretreatment with the fractalkine inhibitor decreased the release of inflammatorycytokines. Also we visualized the effects of fractalkine inhibitor on the migration of PMNsinto inflamed lung by immunohistochemistry.CONCLUSIONS. Fractalkine plays a critical role in LPS-induced PMN transmigration inpulmonary inflammation and induces microvascular permeability. Further studies arerequired to characterize underlying mechanisms and possible therapeutic potential.REFERENCES. 1. Olson TS, Ley K. Chemokines and chemokine receptors in leukocytetrafficking. Am J Physiol Regul Integr Comp Physiol. 2002;283(1):R7–28
0992A NEW EXPERIMENTAL MODEL OF SUSTAINED ACUTE LUNG INJURY
F. Puig1,2, R. Herrero1,3, R. Guillamat4, L. Chimenti2, N. Gómez2, J. Tijero2, M.E. Quı́lez1,2,J. López-Aguilar1,2, L. Blanch1,2, A. Serrano-Mollar1,4, A. Artigas1,2
1CIBERes (Instituto de Salud Carlos III), Enfermedades Respiratorias, Bunyola, Spain,2Corporació Sanitària i Universitària Parc Taulı́, Critical Care Center, Sabadell, Spain,3Hospital Universitario de Getafe, Critical Care Center, Getafe, Spain, 4Instituto deInvestigaciones Biomédicas de Barcelona, CSIC, Barcelona, SpainINTRODUCTION. Several animal models have been developed to study acute lung injury(ALI), but the majority of them focus on the acute phase of ALI. These models do not allowstudying operative mechanisms in the later phases or testing long-term treatment effects.OBJECTIVES. To develop an experimental ALI model simulating bronchial aspiration ofgastric contents with bacterial superinfection that induces diffuse alveolar damage persistingat least 72 h.METHODS. Adult male Sprague–Dawley rats (200–250 g) were anesthetized with iso-fluorane. ALI was induced by intratracheal instillation of HCl (1 ll/g, 0.1 mol/LpH = 1.4) followed by instillation of LPS from Escherichia coli O55:B5 (0, 10, 20, 30 or40 lg/g b.w.) 2 h later. Control rats were treated with intratracheal instillations of saline.The rats were sacrificed at 48 h and 72 h after the last instillation. Mortality, changes intotal body weight and white blood cell count in bronchoalveolar lavage (BAL) fluid wereassessed.RESULTS. Only HCl associated with the highest dose of LPS (40 lg/g b.w.) causedmortality in rats (* 50 %) in the first 48 h. Compared to baseline (before instillation), ratsshowed a significant reduction of total body weight at 48 h (8.2 % with LPS: 10 lg/g b.w,11.1 % with LPS: 20 lg/g b.w, 16.3 % with LPS: 30 lg/g b.w and 12.6 % with LPS: 40 lg/g b.w). Even though, the body weights of the rats started to increase after 48 h, they werestill decreased compared to the baseline values at 72 h (5.6 % with LPS: 10 lg/g b.w, 9.8 %with LPS: 20 lg/g b.w, 9.3 % with LPS: 30 lg/g b.w and 14.5 % with LPS: 40 lg/g b.w).Control rats gained weight at 48 h and at 72 h. Compared to control rats, instillation ofHCl + LPS significantly increased total neutrophil counts in BAL fluid at 48 h(2.2 ± 1.4 9 104 cells vs. 1.3 ± 0.3 9 107cells with LPS: 10 lg/g b.w, 2.6 ± 1.0 9107cells with LPS: 20 lg/g b.w, 2.7 ± 0.4 9 107cells with LPS: 30 lg/g b.w, and1.4 ± 0.3 9 107cells with LPS: 40 lg/g b.w). At 72 h, the neutrophil counts in BAL fluidstarted to decline but remained higher than in control animals.CONCLUSIONS. Intratracheal instillation of HCl followed by LPS at the dose of 30 lg/gb.w induces severe lung alveolar damage that lasts at least 72 h, without causing mortality inthe rats. This sustained ALI model would be useful for testing new therapeutic strategies inthis disease.GRANT ACKNOWLEDGMENT. FIS-PI12/02548 and Fundació Parc Taulı́.
0993ELEVATION OF PROCALCITONIN AFTER IMPLANTATIONOF AN INTERVENTIONAL LUNG ASSIST DEVICE IN CRITICALLYILL PATIENTS: WAIT AND WATCH OR HIT ‘EM HARD?
M. Kott1, B. Bewig2, D. Schaedler1, T. Becher1, I. Frerichs1, N. Weiler1
1University Medical Center Schleswig–Holstein, Campus Kiel, Department ofAnesthesiology and Intensive Care Medicine, Kiel, Germany, 2University Medical CenterSchleswig–Holstein, Campus Kiel, Department of General Internal Medicine, Kiel,Germany
INTRODUCTION. In patients with acute respiratory distress syndrome (ARDS), need formechanical ventilation and refractory hypercapnia, pumpless veno-arterial interventionallung assist (iLA) devices are used as part of a lung-protective ventilation strategy [1].Delayed antimicrobial therapy increases the mortality in this group of high-risk patients incase of bacterial infection [2]. Besides clinical signs and symptoms, treatment is based onthe kinetics of biomarkers, like Procalcitonin (PCT) [3]. We hereby report PCT elevations inpatients after iLA implantation in the absence of documented infection.OBJECTIVES. To evaluate peri-interventional kinetics of PCT concentrations before andafter iLA implantation.METHODS. Retrospective study in a small series of patients with ARDS of non-infectiouscause.RESULTS. An up to ten-fold increase in PCT concentrations was observed in critically illpatients after iLA implantation. In the absence of clinical signs of infection it is likely to relatethis phenomenon to the release of pro-inflammatory cytokines following contact of the bloodwith the artificial surfaces of the iLA membrane, with subsequent PCT release. Hence, the startof administration of antibiotics should be carefully considered in the context of other clinicalfindings, and repeated PCT measurements in short time intervals should be performed.REFERENCES. 1. Liebold A, Reng CM, Philipp A, Pfeifer M, Birnbaum DE: Pumplessextracorporeal lung assist - experience with the first 20 cases. Eur J Cardiothorac Surg.2000; 17:608–13. 2. Kumar A, Roberts D, Wood KE, Light B, Parrillo JE, Sharma S, SuppesR, Feinstein D, Zanotti S, Taiberg L et al. Duration of hypotension before initiation ofeffective antimicrobial therapy is the critical determinant of survival in human septic shock.Critical Care Med. 2006; 34:1589–96. 3. Uzzan B, Cohen R, Nicolas P, Cucherat M, PerretGY. Procalcitonin as a diagnostic test for sepsis in critically ill adults and after surgery ortrauma: a systematic review and meta-analysis. Crit Care Med. 2006, 34:1996–2003.
0994EFFECT OF NEBULIZATIONS WITH MESNA, N ACETYL CYSTEINEAND NORMAL SALINE ON AIRWAY DYNAMICS IN MECHANICALLYVENTILATED PATIENTS
Y. Mehta1, C. Mehta1, N. Vyas1, T.M. Ali1
1Medanta The Medicity, Institute of Critical Care and Anesthesiology, Gurgaon, IndiaINTRODUCTION. In intubated patients, the normal respiratory physiology is disturbed interms of altered humidification system and depressed ciliary mucus clearance induced by theendotracheal tube. In addition, there is an increased mucus production due to mechanicalirritation of the airway caused by the endotracheal tube. Thirdly, there is an ineffectivecough by virtue of these patients receiving sedatives during mechanical ventilation. Allthese together lead to mucus retention predisposing to increased airway resistance andatelectasis causing bacterial colonization and increased risk of developing ventilator asso-ciated pneumonia (VAP). Thus in mechanically ventilated patients there are enhanced needsfor bronchial hygiene practices, and physiotherapy for timely and adequate clearance oftracheal secretions. All these form the rationale behind the use of mucoactive agents inmechanically ventilated patients.OBJECTIVES. To study the effect of nebulized Normal saline, Mesna (2 mercaptoethanesulphonate) and N acetyl cysteine on airway dynamics in terms of oxygenation, clearance ofsecretions and radiological improvement.METHODS. A prospective observational study was conducted in a medical-surgical ICU ofa tertiary care hospital in Northern India. Sixty ICU patients under sedation, and ventilatedthrough endotracheal tube, for more than 72 h were enrolled. Patients were nebulized witheither normal saline, mesna or n acetyl cysteine. Nebulizations with the studied drug weregiven thrice over 24 h at 8 h interval. All patients were nebulized with levosalbutamon10 min before instituting the studied drug. Data were recorded in four steps:(1) basal,(2) 10 min after each nebulization(3) 2 h after each nebulization, and then at the end of study duration i.e. 24 h after firstnebulization.RESULTS. All the three studied drugs resulted in thinning of secretions but none of themresulted in any improvement in oxygenation, clearance of infiltrates on chest roentgeno-gram. No adverse effect was observed with any of the drugs in terms of increased resistanceor hemodynamic changes.CONCLUSIONS. No significant difference in airway dynamics or oxygenation wasobserved in groups nebulised with either Normal saline, Mesna or N acetylcysteine.REFERENCES. 1. Fernandez R, Sole J, Blanch L, Artigas A. The effect of short terminstillation of a mucolytic agent (mesna) on airway résistance in mechanically ventilatedpatients. Chest 1995; 107:1101–6. 2. Balsamo R Lanata C, Egan G. Mucoactive drugs. EurRespir Rev. 2010; 19(116):127–133. 3. Nash EF, Stephenson A, Ratjin F, Tullis E. Neb-ulized and oral thiol derivatives for pulmonary disease in cystic fibrosis. Cochrane databaseSyst Rev. 2009; CD007168. 4. Zandstra DF, Shoutenbeck CP, Mirande DR. Effect ofmucolytic and bronchodilator aerosol therapy on airway resistance in mechanically venti-lated patients. Intensive Care Med. 1985; 11:316–18.
0995INTRATIDAL GAS DISTRIBUTION IS ABLE TO POINT OUT THE BEST PEEPIN MECHANICALLY VENTILATED PATIENTS
P. Blankman1, D. Hasan1,2, D. Gommers1
1Erasmus MC University Medical Centre Rotterdam, Intensive Care Adults, Rotterdam, TheNetherlands, 2Maasstad Hospital, Intensive Care, Rotterdam, The NetherlandsINTRODUCTION. Electrical Impedance Tomography (EIT) is a non-invasive and non-radiating imaging technique, which can be used to visualize ventilation at the dependent andnon-dependent regions.OBJECTIVES. To define the optimal PEEP level based on EIT measurements.METHODS. We submitted ten post-cardiac surgery patients, ventilated with PressureControlled Ventilation mode, to a PEEP trial with steps of 5 cm H2O and a recruitmentmaneuver. We performed EIT registration around the 5th and 6th intercostal space andcalculated five different parameters from the acquired data: Ventilation Surface Area (VSA),Center of Gravity (COG), regional compliance or pixel compliance, Regional VentilationDelay (RVD) index and the intratidal gas distribution.RESULTS. The maximum value for VSA, regional compliance and RVD index was differentbetween the dependent and the non-dependent region for almost all patients. The dorsal-to-ventral impedance distribution, expressed according to the center of gravity index, decreased atlower PEEP levels. The intratidal gas distribution showed a unique PEEP level in each indi-vidual patient, in which the gas distribution is taken over by the opposite lung region, indicatingthe point of overdistention of the non-dependent region.
26th ESICM ANNUAL CONGRESS — PARIS, FRANCE — 5–9 OCTOBER 2013
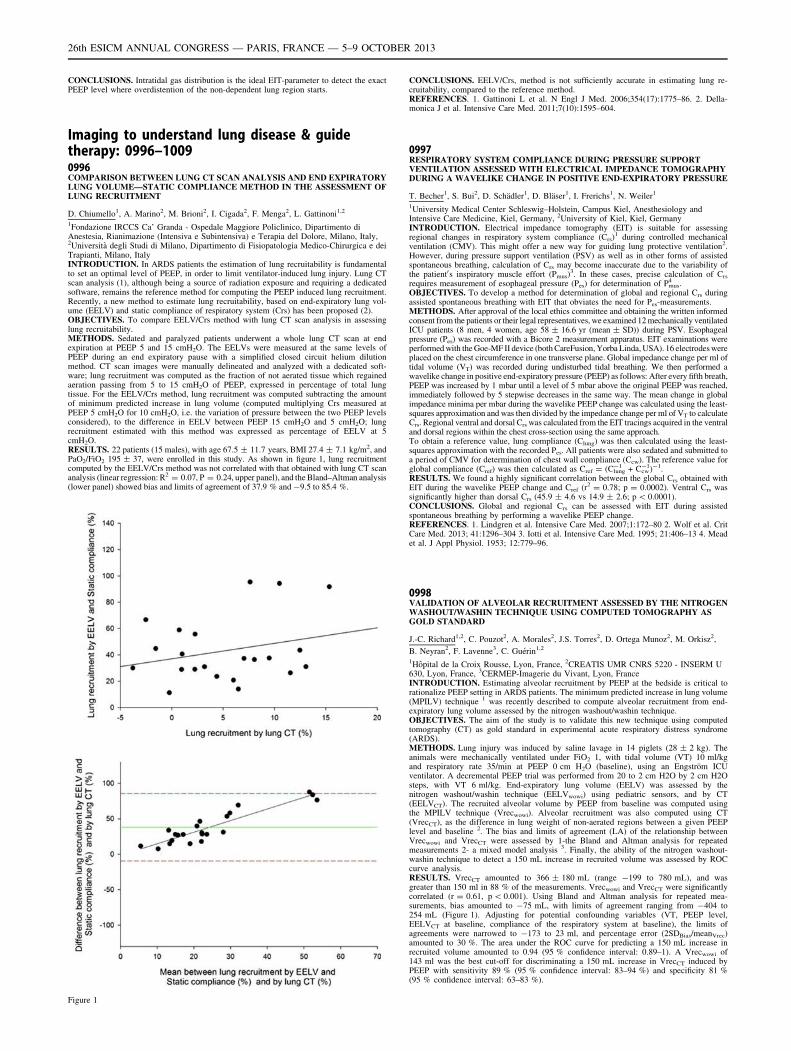
CONCLUSIONS. Intratidal gas distribution is the ideal EIT-parameter to detect the exactPEEP level where overdistention of the non-dependent lung region starts.
Imaging to understand lung disease & guidetherapy: 0996–10090996COMPARISON BETWEEN LUNG CT SCAN ANALYSIS AND END EXPIRATORYLUNG VOLUME—STATIC COMPLIANCE METHOD IN THE ASSESSMENT OFLUNG RECRUITMENT
D. Chiumello1, A. Marino2, M. Brioni2, I. Cigada2, F. Menga2, L. Gattinoni1,2
1Fondazione IRCCS Ca’ Granda - Ospedale Maggiore Policlinico, Dipartimento diAnestesia, Rianimazione (Intensiva e Subintensiva) e Terapia del Dolore, Milano, Italy,2Università degli Studi di Milano, Dipartimento di Fisiopatologia Medico-Chirurgica e deiTrapianti, Milano, ItalyINTRODUCTION. In ARDS patients the estimation of lung recruitability is fundamentalto set an optimal level of PEEP, in order to limit ventilator-induced lung injury. Lung CTscan analysis (1), although being a source of radiation exposure and requiring a dedicatedsoftware, remains the reference method for computing the PEEP induced lung recruitment.Recently, a new method to estimate lung recruitability, based on end-expiratory lung vol-ume (EELV) and static compliance of respiratory system (Crs) has been proposed (2).OBJECTIVES. To compare EELV/Crs method with lung CT scan analysis in assessinglung recruitability.METHODS. Sedated and paralyzed patients underwent a whole lung CT scan at endexpiration at PEEP 5 and 15 cmH2O. The EELVs were measured at the same levels ofPEEP during an end expiratory pause with a simplified closed circuit helium dilutionmethod. CT scan images were manually delineated and analyzed with a dedicated soft-ware; lung recruitment was computed as the fraction of not aerated tissue which regainedaeration passing from 5 to 15 cmH2O of PEEP, expressed in percentage of total lungtissue. For the EELV/Crs method, lung recruitment was computed subtracting the amountof minimum predicted increase in lung volume (computed multiplying Crs measured atPEEP 5 cmH2O for 10 cmH2O, i.e. the variation of pressure between the two PEEP levelsconsidered), to the difference in EELV between PEEP 15 cmH2O and 5 cmH2O; lungrecruitment estimated with this method was expressed as percentage of EELV at 5cmH2O.RESULTS. 22 patients (15 males), with age 67.5 ± 11.7 years, BMI 27.4 ± 7.1 kg/m2, andPaO2/FiO2 195 ± 37, were enrolled in this study. As shown in figure 1, lung recruitmentcomputed by the EELV/Crs method was not correlated with that obtained with lung CT scananalysis (linear regression: R2 = 0.07, P = 0.24, upper panel), and the Bland–Altman analysis(lower panel) showed bias and limits of agreement of 37.9 % and -9.5 to 85.4 %.
Figure 1
CONCLUSIONS. EELV/Crs, method is not sufficiently accurate in estimating lung re-cruitability, compared to the reference method.REFERENCES. 1. Gattinoni L et al. N Engl J Med. 2006;354(17):1775–86. 2. Della-monica J et al. Intensive Care Med. 2011;7(10):1595–604.
0997RESPIRATORY SYSTEM COMPLIANCE DURING PRESSURE SUPPORTVENTILATION ASSESSED WITH ELECTRICAL IMPEDANCE TOMOGRAPHYDURING A WAVELIKE CHANGE IN POSITIVE END-EXPIRATORY PRESSURE
T. Becher1, S. Bui2, D. Schädler1, D. Bläser1, I. Frerichs1, N. Weiler1
1University Medical Center Schleswig–Holstein, Campus Kiel, Anesthesiology andIntensive Care Medicine, Kiel, Germany, 2University of Kiel, Kiel, GermanyINTRODUCTION. Electrical impedance tomography (EIT) is suitable for assessingregional changes in respiratory system compliance (Crs)
1 during controlled mechanicalventilation (CMV). This might offer a new way for guiding lung protective ventilation2.However, during pressure support ventilation (PSV) as well as in other forms of assistedspontaneous breathing, calculation of Crs may become inaccurate due to the variability ofthe patient0s inspiratory muscle effort (Pmus)
3. In these cases, precise calculation of Crs
requires measurement of esophageal pressure (Pes) for determination of Pmus4 .
OBJECTIVES. To develop a method for determination of global and regional Crs duringassisted spontaneous breathing with EIT that obviates the need for Pes-measurements.METHODS. After approval of the local ethics committee and obtaining the written informedconsent from the patients or their legal representatives, we examined 12 mechanically ventilatedICU patients (8 men, 4 women, age 58 ± 16.6 yr (mean ± SD)) during PSV. Esophagealpressure (Pes) was recorded with a Bicore 2 measurement apparatus. EIT examinations wereperformed with the Goe-MF II device (both CareFusion, Yorba Linda, USA). 16 electrodes wereplaced on the chest circumference in one transverse plane. Global impedance change per ml oftidal volume (VT) was recorded during undisturbed tidal breathing. We then performed awavelike change in positive end-expiratory pressure (PEEP) as follows: After every fifth breath,PEEP was increased by 1 mbar until a level of 5 mbar above the original PEEP was reached,immediately followed by 5 stepwise decreases in the same way. The mean change in globalimpedance minima per mbar during the wavelike PEEP change was calculated using the least-squares approximation and was then divided by the impedance change per ml of VT to calculateCrs. Regional ventral and dorsal Crs was calculated from the EIT tracings acquired in the ventraland dorsal regions within the chest cross-section using the same approach.To obtain a reference value, lung compliance (Clung) was then calculated using the least-squares approximation with the recorded Pes. All patients were also sedated and submitted toa period of CMV for determination of chest wall compliance (Ccw). The reference value forglobal compliance (Cref) was then calculated as Cref = (Clung
-1 + Ccw-1)-1.
RESULTS. We found a highly significant correlation between the global Crs obtained withEIT during the wavelike PEEP change and Cref (r2 = 0.78; p = 0.0002). Ventral Crs wassignificantly higher than dorsal Crs (45.9 ± 4.6 vs 14.9 ± 2.6; p \ 0.0001).CONCLUSIONS. Global and regional Crs can be assessed with EIT during assistedspontaneous breathing by performing a wavelike PEEP change.REFERENCES. 1. Lindgren et al. Intensive Care Med. 2007;1:172–80 2. Wolf et al. CritCare Med. 2013; 41:1296–304 3. Iotti et al. Intensive Care Med. 1995; 21:406–13 4. Meadet al. J Appl Physiol. 1953; 12:779–96.
0998VALIDATION OF ALVEOLAR RECRUITMENT ASSESSED BY THE NITROGENWASHOUT/WASHIN TECHNIQUE USING COMPUTED TOMOGRAPHY ASGOLD STANDARD
J.-C. Richard1,2, C. Pouzot2, A. Morales2, J.S. Torres2, D. Ortega Munoz2, M. Orkisz2,
B. Neyran2, F. Lavenne3, C. Guérin1,2
1Hôpital de la Croix Rousse, Lyon, France, 2CREATIS UMR CNRS 5220 - INSERM U630, Lyon, France, 3CERMEP-Imagerie du Vivant, Lyon, FranceINTRODUCTION. Estimating alveolar recruitment by PEEP at the bedside is critical torationalize PEEP setting in ARDS patients. The minimum predicted increase in lung volume(MPILV) technique 1 was recently described to compute alveolar recruitment from end-expiratory lung volume assessed by the nitrogen washout/washin technique.OBJECTIVES. The aim of the study is to validate this new technique using computedtomography (CT) as gold standard in experimental acute respiratory distress syndrome(ARDS).METHODS. Lung injury was induced by saline lavage in 14 piglets (28 ± 2 kg). Theanimals were mechanically ventilated under FiO2 1, with tidal volume (VT) 10 ml/kgand respiratory rate 35/min at PEEP 0 cm H2O (baseline), using an Engström ICUventilator. A decremental PEEP trial was performed from 20 to 2 cm H2O by 2 cm H2Osteps, with VT 6 ml/kg. End-expiratory lung volume (EELV) was assessed by thenitrogen washout/washin technique (EELVwowi) using pediatric sensors, and by CT(EELVCT). The recruited alveolar volume by PEEP from baseline was computed usingthe MPILV technique (Vrecwowi). Alveolar recruitment was also computed using CT(VrecCT), as the difference in lung weight of non-aerated regions between a given PEEPlevel and baseline 2. The bias and limits of agreement (LA) of the relationship betweenVrecwowi and VrecCT were assessed by 1-the Bland and Altman analysis for repeatedmeasurements 2- a mixed model analysis 3. Finally, the ability of the nitrogen washout-washin technique to detect a 150 mL increase in recruited volume was assessed by ROCcurve analysis.RESULTS. VrecCT amounted to 366 ± 180 mL (range -199 to 780 mL), and wasgreater than 150 ml in 88 % of the measurements. Vrecwowi and VrecCT were significantlycorrelated (r = 0.61, p \ 0.001). Using Bland and Altman analysis for repeated mea-surements, bias amounted to -75 mL, with limits of agreement ranging from -404 to254 mL (Figure 1). Adjusting for potential confounding variables (VT, PEEP level,EELVCT at baseline, compliance of the respiratory system at baseline), the limits ofagreements were narrowed to -173 to 23 ml, and percentage error (2SDBias/meanVrec)amounted to 30 %. The area under the ROC curve for predicting a 150 mL increase inrecruited volume amounted to 0.94 (95 % confidence interval: 0.89–1). A Vrecwowi of143 ml was the best cut-off for discriminating a 150 mL increase in VrecCT induced byPEEP with sensitivity 89 % (95 % confidence interval: 83–94 %) and specificity 81 %(95 % confidence interval: 63–83 %).
26th ESICM ANNUAL CONGRESS — PARIS, FRANCE — 5–9 OCTOBER 2013
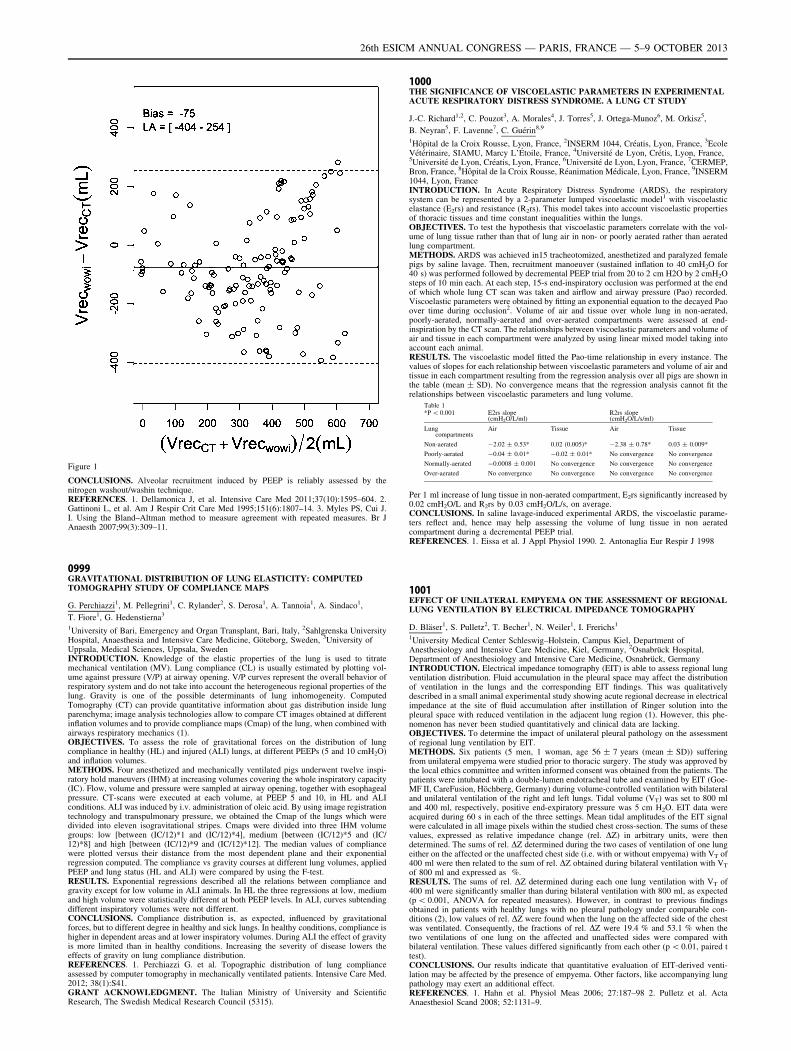
Figure 1
CONCLUSIONS. Alveolar recruitment induced by PEEP is reliably assessed by thenitrogen washout/washin technique.REFERENCES. 1. Dellamonica J, et al. Intensive Care Med 2011;37(10):1595–604. 2.Gattinoni L, et al. Am J Respir Crit Care Med 1995;151(6):1807–14. 3. Myles PS, Cui J.I. Using the Bland–Altman method to measure agreement with repeated measures. Br JAnaesth 2007;99(3):309–11.
0999GRAVITATIONAL DISTRIBUTION OF LUNG ELASTICITY: COMPUTEDTOMOGRAPHY STUDY OF COMPLIANCE MAPS
G. Perchiazzi1, M. Pellegrini1, C. Rylander2, S. Derosa1, A. Tannoia1, A. Sindaco1,
T. Fiore1, G. Hedenstierna3
1University of Bari, Emergency and Organ Transplant, Bari, Italy, 2Sahlgrenska UniversityHospital, Anaesthesia and Intensive Care Medicine, Göteborg, Sweden, 3University ofUppsala, Medical Sciences, Uppsala, SwedenINTRODUCTION. Knowledge of the elastic properties of the lung is used to titratemechanical ventilation (MV). Lung compliance (CL) is usually estimated by plotting vol-ume against pressure (V/P) at airway opening. V/P curves represent the overall behavior ofrespiratory system and do not take into account the heterogeneous regional properties of thelung. Gravity is one of the possible determinants of lung inhomogeneity. ComputedTomography (CT) can provide quantitative information about gas distribution inside lungparenchyma; image analysis technologies allow to compare CT images obtained at differentinflation volumes and to provide compliance maps (Cmap) of the lung, when combined withairways respiratory mechanics (1).OBJECTIVES. To assess the role of gravitational forces on the distribution of lungcompliance in healthy (HL) and injured (ALI) lungs, at different PEEPs (5 and 10 cmH2O)and inflation volumes.METHODS. Four anesthetized and mechanically ventilated pigs underwent twelve inspi-ratory hold maneuvers (IHM) at increasing volumes covering the whole inspiratory capacity(IC). Flow, volume and pressure were sampled at airway opening, together with esophagealpressure. CT-scans were executed at each volume, at PEEP 5 and 10, in HL and ALIconditions. ALI was induced by i.v. administration of oleic acid. By using image registrationtechnology and transpulmonary pressure, we obtained the Cmap of the lungs which weredivided into eleven isogravitational stripes. Cmaps were divided into three IHM volumegroups: low [between (IC/12)*1 and (IC/12)*4], medium [between (IC/12)*5 and (IC/12)*8] and high [between (IC/12)*9 and (IC/12)*12]. The median values of compliancewere plotted versus their distance from the most dependent plane and their exponentialregression computed. The compliance vs gravity courses at different lung volumes, appliedPEEP and lung status (HL and ALI) were compared by using the F-test.RESULTS. Exponential regressions described all the relations between compliance andgravity except for low volume in ALI animals. In HL the three regressions at low, mediumand high volume were statistically different at both PEEP levels. In ALI, curves subtendingdifferent inspiratory volumes were not different.CONCLUSIONS. Compliance distribution is, as expected, influenced by gravitationalforces, but to different degree in healthy and sick lungs. In healthy conditions, compliance ishigher in dependent areas and at lower inspiratory volumes. During ALI the effect of gravityis more limited than in healthy conditions. Increasing the severity of disease lowers theeffects of gravity on lung compliance distribution.REFERENCES. 1. Perchiazzi G. et al. Topographic distribution of lung complianceassessed by computer tomography in mechanically ventilated patients. Intensive Care Med.2012; 38(1):S41.GRANT ACKNOWLEDGMENT. The Italian Ministry of University and ScientificResearch, The Swedish Medical Research Council (5315).
1000THE SIGNIFICANCE OF VISCOELASTIC PARAMETERS IN EXPERIMENTALACUTE RESPIRATORY DISTRESS SYNDROME. A LUNG CT STUDY
J.-C. Richard1,2, C. Pouzot3, A. Morales4, J. Torres5, J. Ortega-Munoz6, M. Orkisz5,
B. Neyran5, F. Lavenne7, C. Guérin8,9
1Hôpital de la Croix Rousse, Lyon, France, 2INSERM 1044, Créatis, Lyon, France, 3EcoleVétérinaire, SIAMU, Marcy L’Étoile, France, 4Université de Lyon, Crétis, Lyon, France,5Université de Lyon, Créatis, Lyon, France, 6Université de Lyon, Lyon, France, 7CERMEP,Bron, France, 8Hôpital de la Croix Rousse, Réanimation Médicale, Lyon, France, 9INSERM1044, Lyon, FranceINTRODUCTION. In Acute Respiratory Distress Syndrome (ARDS), the respiratorysystem can be represented by a 2-parameter lumped viscoelastic model1 with viscoelasticelastance (E2rs) and resistance (R2rs). This model takes into account viscoelastic propertiesof thoracic tissues and time constant inequalities within the lungs.OBJECTIVES. To test the hypothesis that viscoelastic parameters correlate with the vol-ume of lung tissue rather than that of lung air in non- or poorly aerated rather than aeratedlung compartment.METHODS. ARDS was achieved in15 tracheotomized, anesthetized and paralyzed femalepigs by saline lavage. Then, recruitment manoeuver (sustained inflation to 40 cmH2O for40 s) was performed followed by decremental PEEP trial from 20 to 2 cm H2O by 2 cmH2Osteps of 10 min each. At each step, 15-s end-inspiratory occlusion was performed at the endof which whole lung CT scan was taken and airflow and airway pressure (Pao) recorded.Viscoelastic parameters were obtained by fitting an exponential equation to the decayed Paoover time during occlusion2. Volume of air and tissue over whole lung in non-aerated,poorly-aerated, normally-aerated and over-aerated compartments were assessed at end-inspiration by the CT scan. The relationships between viscoelastic parameters and volume ofair and tissue in each compartment were analyzed by using linear mixed model taking intoaccount each animal.RESULTS. The viscoelastic model fitted the Pao-time relationship in every instance. Thevalues of slopes for each relationship between viscoelastic parameters and volume of air andtissue in each compartment resulting from the regression analysis over all pigs are shown inthe table (mean ± SD). No convergence means that the regression analysis cannot fit therelationships between viscoelastic parameters and lung volume.
Table 1*P \ 0.001 E2rs slope
(cmH2O/L/ml)R2rs slope(cmH2O/L/s/ml)
Lungcompartments
Air Tissue Air Tissue
Non-aerated -2.02 ± 0.53* 0.02 (0.005)* -2.38 ± 0.78* 0.03 ± 0.009*
Poorly-aerated -0.04 ± 0.01* -0.02 ± 0.01* No convergence No convergence
Normally-aerated -0.0008 ± 0.001 No convergence No convergence No convergence
Over-aerated No convergence No convergence No convergence No convergence
Per 1 ml increase of lung tissue in non-aerated compartment, E2rs significantly increased by0.02 cmH2O/L and R2rs by 0.03 cmH2O/L/s, on average.CONCLUSIONS. In saline lavage-induced experimental ARDS, the viscoelastic parame-ters reflect and, hence may help assessing the volume of lung tissue in non aeratedcompartment during a decremental PEEP trial.REFERENCES. 1. Eissa et al. J Appl Physiol 1990. 2. Antonaglia Eur Respir J 1998
1001EFFECT OF UNILATERAL EMPYEMA ON THE ASSESSMENT OF REGIONALLUNG VENTILATION BY ELECTRICAL IMPEDANCE TOMOGRAPHY
D. Bläser1, S. Pulletz2, T. Becher1, N. Weiler1, I. Frerichs1
1University Medical Center Schleswig–Holstein, Campus Kiel, Department ofAnesthesiology and Intensive Care Medicine, Kiel, Germany, 2Osnabrück Hospital,Department of Anesthesiology and Intensive Care Medicine, Osnabrück, GermanyINTRODUCTION. Electrical impedance tomography (EIT) is able to assess regional lungventilation distribution. Fluid accumulation in the pleural space may affect the distributionof ventilation in the lungs and the corresponding EIT findings. This was qualitativelydescribed in a small animal experimental study showing acute regional decrease in electricalimpedance at the site of fluid accumulation after instillation of Ringer solution into thepleural space with reduced ventilation in the adjacent lung region (1). However, this phe-nomenon has never been studied quantitatively and clinical data are lacking.OBJECTIVES. To determine the impact of unilateral pleural pathology on the assessmentof regional lung ventilation by EIT.METHODS. Six patients (5 men, 1 woman, age 56 ± 7 years (mean ± SD)) sufferingfrom unilateral empyema were studied prior to thoracic surgery. The study was approved bythe local ethics committee and written informed consent was obtained from the patients. Thepatients were intubated with a double-lumen endotracheal tube and examined by EIT (Goe-MF II, CareFusion, Höchberg, Germany) during volume-controlled ventilation with bilateraland unilateral ventilation of the right and left lungs. Tidal volume (VT) was set to 800 mland 400 ml, respectively, positive end-expiratory pressure was 5 cm H2O. EIT data wereacquired during 60 s in each of the three settings. Mean tidal amplitudes of the EIT signalwere calculated in all image pixels within the studied chest cross-section. The sums of thesevalues, expressed as relative impedance change (rel. DZ) in arbitrary units, were thendetermined. The sums of rel. DZ determined during the two cases of ventilation of one lungeither on the affected or the unaffected chest side (i.e. with or without empyema) with VT of400 ml were then related to the sum of rel. DZ obtained during bilateral ventilation with VT
of 800 ml and expressed as %.RESULTS. The sums of rel. DZ determined during each one lung ventilation with VT of400 ml were significantly smaller than during bilateral ventilation with 800 ml, as expected(p \ 0.001, ANOVA for repeated measures). However, in contrast to previous findingsobtained in patients with healthy lungs with no pleural pathology under comparable con-ditions (2), low values of rel. DZ were found when the lung on the affected side of the chestwas ventilated. Consequently, the fractions of rel. DZ were 19.4 % and 53.1 % when thetwo ventilations of one lung on the affected and unaffected sides were compared withbilateral ventilation. These values differed significantly from each other (p \ 0.01, paired ttest).CONCLUSIONS. Our results indicate that quantitative evaluation of EIT-derived venti-lation may be affected by the presence of empyema. Other factors, like accompanying lungpathology may exert an additional effect.REFERENCES. 1. Hahn et al. Physiol Meas 2006; 27:187–98 2. Pulletz et al. ActaAnaesthesiol Scand 2008; 52:1131–9.
26th ESICM ANNUAL CONGRESS — PARIS, FRANCE — 5–9 OCTOBER 2013
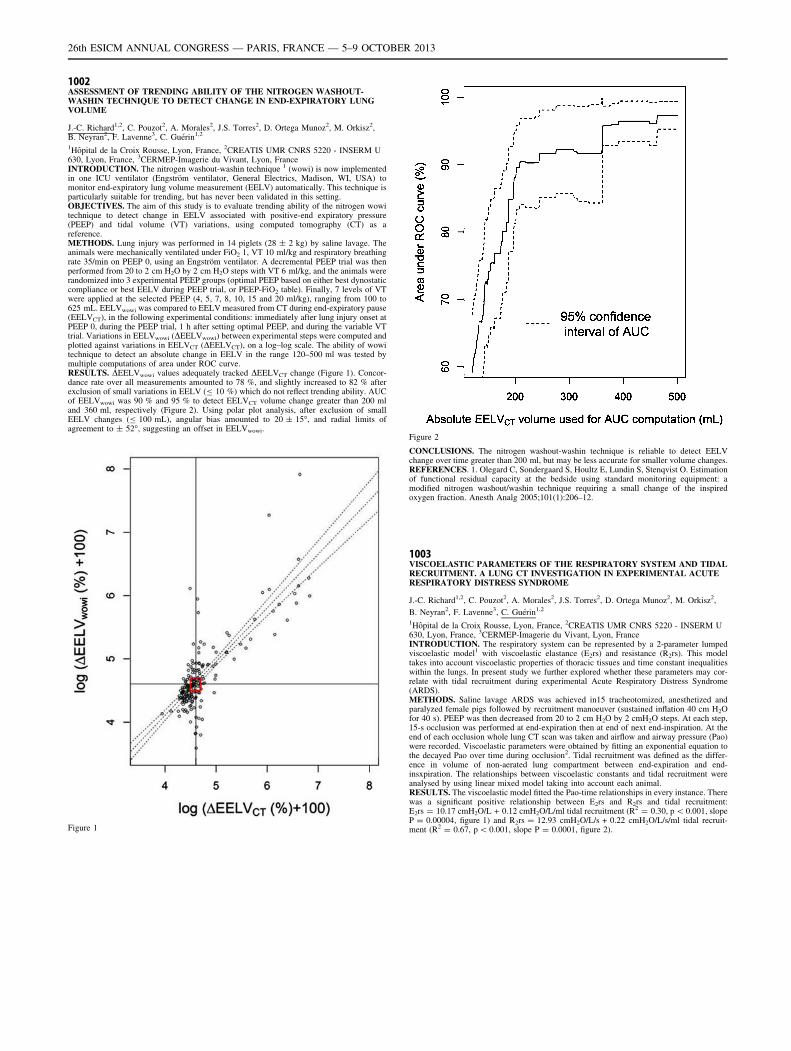
1002ASSESSMENT OF TRENDING ABILITY OF THE NITROGEN WASHOUT-WASHIN TECHNIQUE TO DETECT CHANGE IN END-EXPIRATORY LUNGVOLUME
J.-C. Richard1,2, C. Pouzot2, A. Morales2, J.S. Torres2, D. Ortega Munoz2, M. Orkisz2,B. Neyran2, F. Lavenne3, C. Guérin1,2
1Hôpital de la Croix Rousse, Lyon, France, 2CREATIS UMR CNRS 5220 - INSERM U630, Lyon, France, 3CERMEP-Imagerie du Vivant, Lyon, FranceINTRODUCTION. The nitrogen washout-washin technique 1 (wowi) is now implementedin one ICU ventilator (Engström ventilator, General Electrics, Madison, WI, USA) tomonitor end-expiratory lung volume measurement (EELV) automatically. This technique isparticularly suitable for trending, but has never been validated in this setting.OBJECTIVES. The aim of this study is to evaluate trending ability of the nitrogen wowitechnique to detect change in EELV associated with positive-end expiratory pressure(PEEP) and tidal volume (VT) variations, using computed tomography (CT) as areference.METHODS. Lung injury was performed in 14 piglets (28 ± 2 kg) by saline lavage. Theanimals were mechanically ventilated under FiO2 1, VT 10 ml/kg and respiratory breathingrate 35/min on PEEP 0, using an Engström ventilator. A decremental PEEP trial was thenperformed from 20 to 2 cm H2O by 2 cm H2O steps with VT 6 ml/kg, and the animals wererandomized into 3 experimental PEEP groups (optimal PEEP based on either best dynostaticcompliance or best EELV during PEEP trial, or PEEP-FiO2 table). Finally, 7 levels of VTwere applied at the selected PEEP (4, 5, 7, 8, 10, 15 and 20 ml/kg), ranging from 100 to625 mL. EELVwowi was compared to EELV measured from CT during end-expiratory pause(EELVCT), in the following experimental conditions: immediately after lung injury onset atPEEP 0, during the PEEP trial, 1 h after setting optimal PEEP, and during the variable VTtrial. Variations in EELVwowi (DEELVwowi) between experimental steps were computed andplotted against variations in EELVCT (DEELVCT), on a log–log scale. The ability of wowitechnique to detect an absolute change in EELV in the range 120–500 ml was tested bymultiple computations of area under ROC curve.RESULTS. DEELVwowi values adequately tracked DEELVCT change (Figure 1). Concor-dance rate over all measurements amounted to 78 %, and slightly increased to 82 % afterexclusion of small variations in EELV (B 10 %) which do not reflect trending ability. AUCof EELVwowi was 90 % and 95 % to detect EELVCT volume change greater than 200 mland 360 ml, respectively (Figure 2). Using polar plot analysis, after exclusion of smallEELV changes (B 100 mL), angular bias amounted to 20 ± 15�, and radial limits ofagreement to ± 52�, suggesting an offset in EELVwowi.
Figure 1
Figure 2
CONCLUSIONS. The nitrogen washout-washin technique is reliable to detect EELVchange over time greater than 200 ml, but may be less accurate for smaller volume changes.REFERENCES. 1. Olegard C, Sondergaard S, Houltz E, Lundin S, Stenqvist O. Estimationof functional residual capacity at the bedside using standard monitoring equipment: amodified nitrogen washout/washin technique requiring a small change of the inspiredoxygen fraction. Anesth Analg 2005;101(1):206–12.
1003VISCOELASTIC PARAMETERS OF THE RESPIRATORY SYSTEM AND TIDALRECRUITMENT. A LUNG CT INVESTIGATION IN EXPERIMENTAL ACUTERESPIRATORY DISTRESS SYNDROME
J.-C. Richard1,2, C. Pouzot2, A. Morales2, J.S. Torres2, D. Ortega Munoz2, M. Orkisz2,
B. Neyran2, F. Lavenne3, C. Guérin1,2
1Hôpital de la Croix Rousse, Lyon, France, 2CREATIS UMR CNRS 5220 - INSERM U630, Lyon, France, 3CERMEP-Imagerie du Vivant, Lyon, FranceINTRODUCTION. The respiratory system can be represented by a 2-parameter lumpedviscoelastic model1 with viscoelastic elastance (E2rs) and resistance (R2rs). This modeltakes into account viscoelastic properties of thoracic tissues and time constant inequalitieswithin the lungs. In present study we further explored whether these parameters may cor-relate with tidal recruitment during experimental Acute Respiratory Distress Syndrome(ARDS).METHODS. Saline lavage ARDS was achieved in15 tracheotomized, anesthetized andparalyzed female pigs followed by recruitment manoeuver (sustained inflation 40 cm H2Ofor 40 s). PEEP was then decreased from 20 to 2 cm H2O by 2 cmH2O steps. At each step,15-s occlusion was performed at end-expiration then at end of next end-inspiration. At theend of each occlusion whole lung CT scan was taken and airflow and airway pressure (Pao)were recorded. Viscoelastic parameters were obtained by fitting an exponential equation tothe decayed Pao over time during occlusion2. Tidal recruitment was defined as the differ-ence in volume of non-aerated lung compartment between end-expiration and end-insxpiration. The relationships between viscoelastic constants and tidal recruitment wereanalysed by using linear mixed model taking into account each animal.RESULTS. The viscoelastic model fitted the Pao-time relationships in every instance. Therewas a significant positive relationship between E2rs and R2rs and tidal recruitment:E2rs = 10.17 cmH2O/L + 0.12 cmH2O/L/ml tidal recruitment (R2 = 0.30, p \ 0.001, slopeP = 0.00004, figure 1) and R2rs = 12.93 cmH2O/L/s + 0.22 cmH2O/L/s/ml tidal recruit-ment (R2 = 0.67, p \ 0.001, slope P = 0.0001, figure 2).
26th ESICM ANNUAL CONGRESS — PARIS, FRANCE — 5–9 OCTOBER 2013
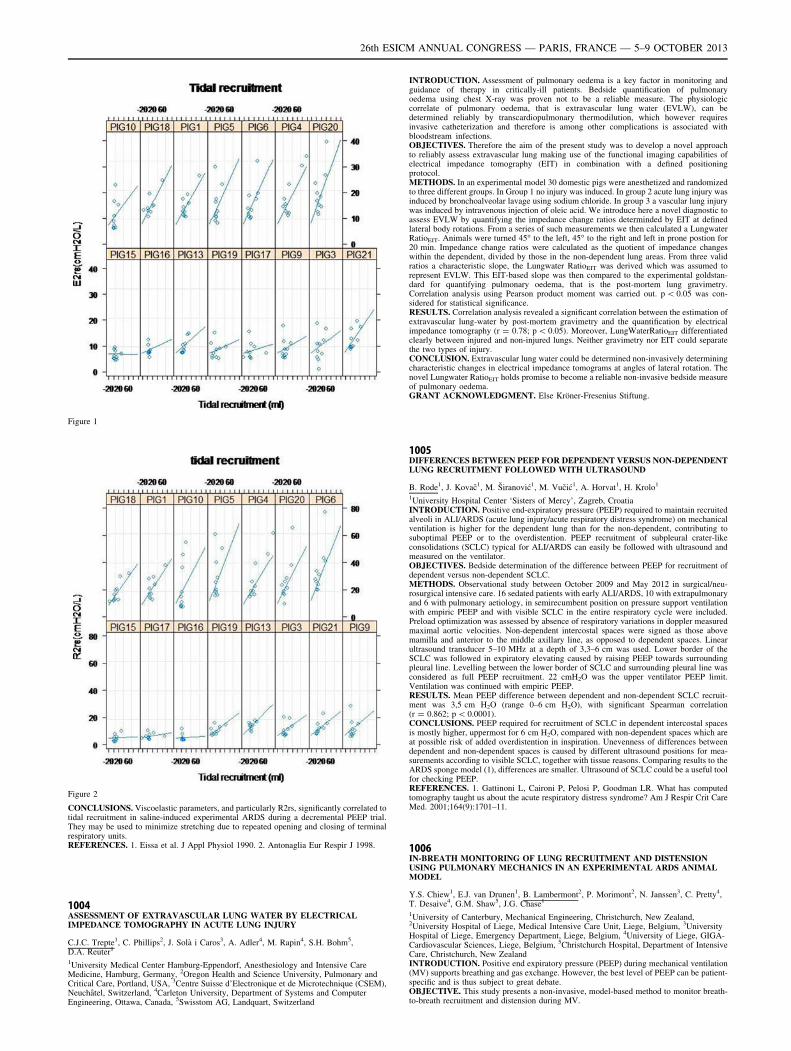
Figure 1
Figure 2
CONCLUSIONS. Viscoelastic parameters, and particularly R2rs, significantly correlated totidal recruitment in saline-induced experimental ARDS during a decremental PEEP trial.They may be used to minimize stretching due to repeated opening and closing of terminalrespiratory units.REFERENCES. 1. Eissa et al. J Appl Physiol 1990. 2. Antonaglia Eur Respir J 1998.
1004ASSESSMENT OF EXTRAVASCULAR LUNG WATER BY ELECTRICALIMPEDANCE TOMOGRAPHY IN ACUTE LUNG INJURY
C.J.C. Trepte1, C. Phillips2, J. Solà i Caros3, A. Adler4, M. Rapin4, S.H. Bohm5,D.A. Reuter1
1University Medical Center Hamburg-Eppendorf, Anesthesiology and Intensive CareMedicine, Hamburg, Germany, 2Oregon Health and Science University, Pulmonary andCritical Care, Portland, USA, 3Centre Suisse d’Electronique et de Microtechnique (CSEM),Neuchâtel, Switzerland, 4Carleton University, Department of Systems and ComputerEngineering, Ottawa, Canada, 5Swisstom AG, Landquart, Switzerland
INTRODUCTION. Assessment of pulmonary oedema is a key factor in monitoring andguidance of therapy in critically-ill patients. Bedside quantification of pulmonaryoedema using chest X-ray was proven not to be a reliable measure. The physiologiccorrelate of pulmonary oedema, that is extravascular lung water (EVLW), can bedetermined reliably by transcardiopulmonary thermodilution, which however requiresinvasive catheterization and therefore is among other complications is associated withbloodstream infections.OBJECTIVES. Therefore the aim of the present study was to develop a novel approachto reliably assess extravascular lung making use of the functional imaging capabilities ofelectrical impedance tomography (EIT) in combination with a defined positioningprotocol.METHODS. In an experimental model 30 domestic pigs were anesthetized and randomizedto three different groups. In Group 1 no injury was induced. In group 2 acute lung injury wasinduced by bronchoalveolar lavage using sodium chloride. In group 3 a vascular lung injurywas induced by intravenous injection of oleic acid. We introduce here a novel diagnostic toassess EVLW by quantifying the impedance change ratios determinded by EIT at definedlateral body rotations. From a series of such measurements we then calculated a LungwaterRatioEIT. Animals were turned 45� to the left, 45� to the right and left in prone postion for20 min. Impedance change ratios were calculated as the quotient of impedance changeswithin the dependent, divided by those in the non-dependent lung areas. From three validratios a characteristic slope, the Lungwater RatioEIT was derived which was assumed torepresent EVLW. This EIT-based slope was then compared to the experimental goldstan-dard for quantifying pulmonary oedema, that is the post-mortem lung gravimetry.Correlation analysis using Pearson product moment was carried out. p \ 0.05 was con-sidered for statistical significance.RESULTS. Correlation analysis revealed a significant correlation between the estimation ofextravascular lung-water by post-mortem gravimetry and the quantification by electricalimpedance tomography (r = 0.78; p \ 0.05). Moreover, LungWaterRatioEIT differentiatedclearly between injured and non-injured lungs. Neither gravimetry nor EIT could separatethe two types of injury.CONCLUSION. Extravascular lung water could be determined non-invasively determiningcharacteristic changes in electrical impedance tomograms at angles of lateral rotation. Thenovel Lungwater RatioEIT holds promise to become a reliable non-invasive bedside measureof pulmonary oedema.GRANT ACKNOWLEDGMENT. Else Kröner-Fresenius Stiftung.
1005DIFFERENCES BETWEEN PEEP FOR DEPENDENT VERSUS NON-DEPENDENTLUNG RECRUITMENT FOLLOWED WITH ULTRASOUND
B. Rode1, J. Kovač1, M. Širanović1, M. Vučić1, A. Horvat1, H. Krolo1
1University Hospital Center ‘Sisters of Mercy’, Zagreb, CroatiaINTRODUCTION. Positive end-expiratory pressure (PEEP) required to maintain recruitedalveoli in ALI/ARDS (acute lung injury/acute respiratory distress syndrome) on mechanicalventilation is higher for the dependent lung than for the non-dependent, contributing tosuboptimal PEEP or to the overdistention. PEEP recruitment of subpleural crater-likeconsolidations (SCLC) typical for ALI/ARDS can easily be followed with ultrasound andmeasured on the ventilator.OBJECTIVES. Bedside determination of the difference between PEEP for recruitment ofdependent versus non-dependent SCLC.METHODS. Observational study between October 2009 and May 2012 in surgical/neu-rosurgical intensive care. 16 sedated patients with early ALI/ARDS, 10 with extrapulmonaryand 6 with pulmonary aetiology, in semirecumbent position on pressure support ventilationwith empiric PEEP and with visible SCLC in the entire respiratory cycle were included.Preload optimization was assessed by absence of respiratory variations in doppler measuredmaximal aortic velocities. Non-dependent intercostal spaces were signed as those abovemamilla and anterior to the middle axillary line, as opposed to dependent spaces. Linearultrasound transducer 5–10 MHz at a depth of 3,3–6 cm was used. Lower border of theSCLC was followed in expiratory elevating caused by raising PEEP towards surroundingpleural line. Levelling between the lower border of SCLC and surrounding pleural line wasconsidered as full PEEP recruitment. 22 cmH2O was the upper ventilator PEEP limit.Ventilation was continued with empiric PEEP.RESULTS. Mean PEEP difference between dependent and non-dependent SCLC recruit-ment was 3,5 cm H2O (range 0–6 cm H2O), with significant Spearman correlation(r = 0.862; p \ 0.0001).CONCLUSIONS. PEEP required for recruitment of SCLC in dependent intercostal spacesis mostly higher, uppermost for 6 cm H2O, compared with non-dependent spaces which areat possible risk of added overdistention in inspiration. Unevenness of differences betweendependent and non-dependent spaces is caused by different ultrasound positions for mea-surements according to visible SCLC, together with tissue reasons. Comparing results to theARDS sponge model (1), differences are smaller. Ultrasound of SCLC could be a useful toolfor checking PEEP.REFERENCES. 1. Gattinoni L, Caironi P, Pelosi P, Goodman LR. What has computedtomography taught us about the acute respiratory distress syndrome? Am J Respir Crit CareMed. 2001;164(9):1701–11.
1006IN-BREATH MONITORING OF LUNG RECRUITMENT AND DISTENSIONUSING PULMONARY MECHANICS IN AN EXPERIMENTAL ARDS ANIMALMODEL
Y.S. Chiew1, E.J. van Drunen1, B. Lambermont2, P. Morimont2, N. Janssen3, C. Pretty4,T. Desaive4, G.M. Shaw5, J.G. Chase1
1University of Canterbury, Mechanical Engineering, Christchurch, New Zealand,2University Hospital of Liege, Medical Intensive Care Unit, Liege, Belgium, 3UniversityHospital of Liege, Emergency Department, Liege, Belgium, 4University of Liege, GIGA-Cardiovascular Sciences, Liege, Belgium, 5Christchurch Hospital, Department of IntensiveCare, Christchurch, New ZealandINTRODUCTION. Positive end expiratory pressure (PEEP) during mechanical ventilation(MV) supports breathing and gas exchange. However, the best level of PEEP can be patient-specific and is thus subject to great debate.OBJECTIVE. This study presents a non-invasive, model-based method to monitor breath-to-breath recruitment and distension during MV.
26th ESICM ANNUAL CONGRESS — PARIS, FRANCE — 5–9 OCTOBER 2013
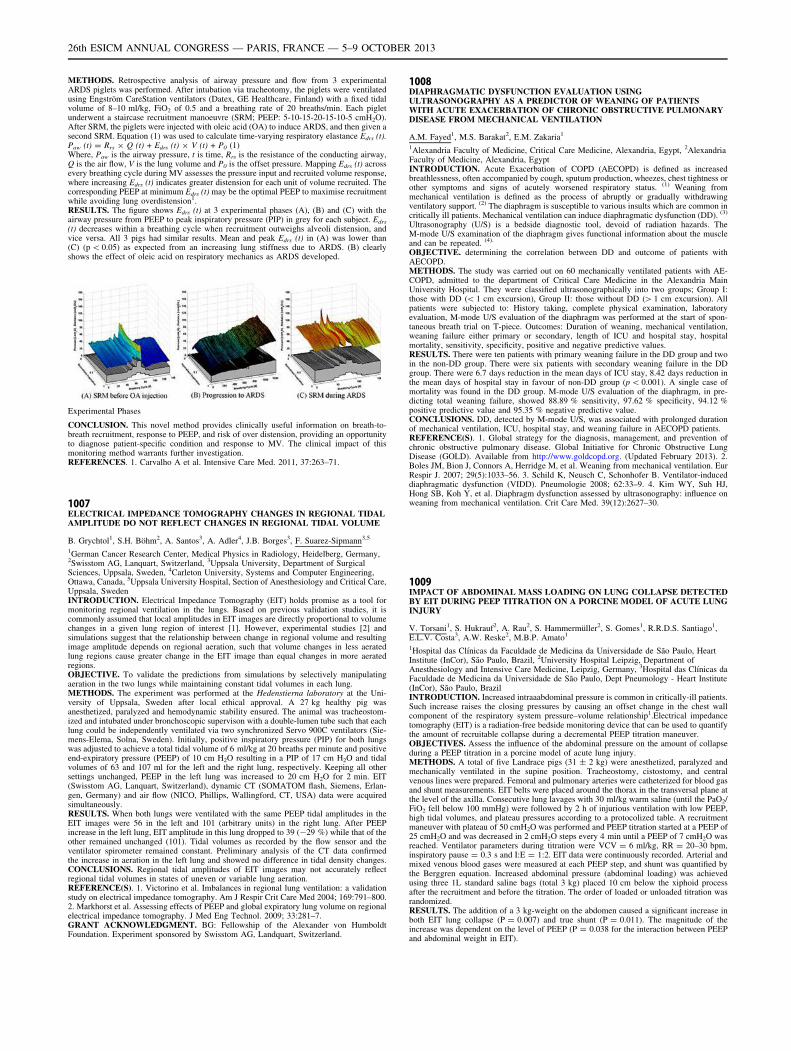
METHODS. Retrospective analysis of airway pressure and flow from 3 experimentalARDS piglets was performed. After intubation via tracheotomy, the piglets were ventilatedusing Engström CareStation ventilators (Datex, GE Healthcare, Finland) with a fixed tidalvolume of 8–10 ml/kg, FiO2 of 0.5 and a breathing rate of 20 breaths/min. Each pigletunderwent a staircase recruitment manoeuvre (SRM; PEEP: 5-10-15-20-15-10-5 cmH2O).After SRM, the piglets were injected with oleic acid (OA) to induce ARDS, and then given asecond SRM. Equation (1) was used to calculate time-varying respiratory elastance Edrs (t).Paw (t) = Rrs 9 Q (t) + Edrs (t) 9 V (t) + P0 (1)Where, Paw is the airway pressure, t is time, Rrs is the resistance of the conducting airway,Q is the air flow, V is the lung volume and P0 is the offset pressure. Mapping Edrs (t) acrossevery breathing cycle during MV assesses the pressure input and recruited volume response,where increasing Edrs (t) indicates greater distension for each unit of volume recruited. Thecorresponding PEEP at minimum Edrs (t) may be the optimal PEEP to maximise recruitmentwhile avoiding lung overdistension1.RESULTS. The figure shows Edrs (t) at 3 experimental phases (A), (B) and (C) with theairway pressure from PEEP to peak inspiratory pressure (PIP) in grey for each subject. Edrs
(t) decreases within a breathing cycle when recruitment outweighs alveoli distension, andvice versa. All 3 pigs had similar results. Mean and peak Edrs (t) in (A) was lower than(C) (p \ 0.05) as expected from an increasing lung stiffness due to ARDS. (B) clearlyshows the effect of oleic acid on respiratory mechanics as ARDS developed.
Experimental Phases
CONCLUSION. This novel method provides clinically useful information on breath-to-breath recruitment, response to PEEP, and risk of over distension, providing an opportunityto diagnose patient-specific condition and response to MV. The clinical impact of thismonitoring method warrants further investigation.REFERENCES. 1. Carvalho A et al. Intensive Care Med. 2011, 37:263–71.
1007ELECTRICAL IMPEDANCE TOMOGRAPHY CHANGES IN REGIONAL TIDALAMPLITUDE DO NOT REFLECT CHANGES IN REGIONAL TIDAL VOLUME
B. Grychtol1, S.H. Böhm2, A. Santos3, A. Adler4, J.B. Borges3, F. Suarez-Sipmann3,5
1German Cancer Research Center, Medical Physics in Radiology, Heidelberg, Germany,2Swisstom AG, Lanquart, Switzerland, 3Uppsala University, Department of SurgicalSciences, Uppsala, Sweden, 4Carleton University, Systems and Computer Engineering,Ottawa, Canada, 5Uppsala University Hospital, Section of Anesthesiology and Critical Care,Uppsala, SwedenINTRODUCTION. Electrical Impedance Tomography (EIT) holds promise as a tool formonitoring regional ventilation in the lungs. Based on previous validation studies, it iscommonly assumed that local amplitudes in EIT images are directly proportional to volumechanges in a given lung region of interest [1]. However, experimental studies [2] andsimulations suggest that the relationship between change in regional volume and resultingimage amplitude depends on regional aeration, such that volume changes in less aeratedlung regions cause greater change in the EIT image than equal changes in more aeratedregions.OBJECTIVE. To validate the predictions from simulations by selectively manipulatingaeration in the two lungs while maintaining constant tidal volumes in each lung.METHODS. The experiment was performed at the Hedenstierna laboratory at the Uni-versity of Uppsala, Sweden after local ethical approval. A 27 kg healthy pig wasanesthetized, paralyzed and hemodynamic stability ensured. The animal was tracheostom-ized and intubated under bronchoscopic supervison with a double-lumen tube such that eachlung could be independently ventilated via two synchronized Servo 900C ventilators (Sie-mens-Elema, Solna, Sweden). Initially, positive inspiratory pressure (PIP) for both lungswas adjusted to achieve a total tidal volume of 6 ml/kg at 20 breaths per minute and positiveend-expiratory pressure (PEEP) of 10 cm H2O resulting in a PIP of 17 cm H2O and tidalvolumes of 63 and 107 ml for the left and the right lung, respectively. Keeping all othersettings unchanged, PEEP in the left lung was increased to 20 cm H2O for 2 min. EIT(Swisstom AG, Lanquart, Switzerland), dynamic CT (SOMATOM flash, Siemens, Erlan-gen, Germany) and air flow (NICO, Phillips, Wallingford, CT, USA) data were acquiredsimultaneously.RESULTS. When both lungs were ventilated with the same PEEP tidal amplitudes in theEIT images were 56 in the left and 101 (arbitrary units) in the right lung. After PEEPincrease in the left lung, EIT amplitude in this lung dropped to 39 (-29 %) while that of theother remained unchanged (101). Tidal volumes as recorded by the flow sensor and theventilator spirometer remained constant. Preliminary analysis of the CT data confirmedthe increase in aeration in the left lung and showed no difference in tidal density changes.CONCLUSIONS. Regional tidal amplitudes of EIT images may not accurately reflectregional tidal volumes in states of uneven or variable lung aeration.REFERENCE(S). 1. Victorino et al. Imbalances in regional lung ventilation: a validationstudy on electrical impedance tomography. Am J Respir Crit Care Med 2004; 169:791–800.2. Markhorst et al. Assessing effects of PEEP and global expiratory lung volume on regionalelectrical impedance tomography. J Med Eng Technol. 2009; 33:281–7.GRANT ACKNOWLEDGMENT. BG: Fellowship of the Alexander von HumboldtFoundation. Experiment sponsored by Swisstom AG, Landquart, Switzerland.
1008DIAPHRAGMATIC DYSFUNCTION EVALUATION USINGULTRASONOGRAPHY AS A PREDICTOR OF WEANING OF PATIENTSWITH ACUTE EXACERBATION OF CHRONIC OBSTRUCTIVE PULMONARYDISEASE FROM MECHANICAL VENTILATION
A.M. Fayed1, M.S. Barakat2, E.M. Zakaria1
1Alexandria Faculty of Medicine, Critical Care Medicine, Alexandria, Egypt, 2AlexandriaFaculty of Medicine, Alexandria, EgyptINTRODUCTION. Acute Exacerbation of COPD (AECOPD) is defined as increasedbreathlessness, often accompanied by cough, sputum production, wheezes, chest tightness orother symptoms and signs of acutely worsened respiratory status. (1) Weaning frommechanical ventilation is defined as the process of abruptly or gradually withdrawingventilatory support. (2) The diaphragm is susceptible to various insults which are common incritically ill patients. Mechanical ventilation can induce diaphragmatic dysfunction (DD). (3)
Ultrasonography (U/S) is a bedside diagnostic tool, devoid of radiation hazards. TheM-mode U/S examination of the diaphragm gives functional information about the muscleand can be repeated. (4).
OBJECTIVE. determining the correlation between DD and outcome of patients withAECOPD.METHODS. The study was carried out on 60 mechanically ventilated patients with AE-COPD, admitted to the department of Critical Care Medicine in the Alexandria MainUniversity Hospital. They were classified ultrasonographically into two groups; Group I:those with DD (\ 1 cm excursion), Group II: those without DD ([ 1 cm excursion). Allpatients were subjected to: History taking, complete physical examination, laboratoryevaluation, M-mode U/S evaluation of the diaphragm was performed at the start of spon-taneous breath trial on T-piece. Outcomes: Duration of weaning, mechanical ventilation,weaning failure either primary or secondary, length of ICU and hospital stay, hospitalmortality, sensitivity, specificity, positive and negative predictive values.RESULTS. There were ten patients with primary weaning failure in the DD group and twoin the non-DD group. There were six patients with secondary weaning failure in the DDgroup. There were 6.7 days reduction in the mean days of ICU stay, 8.42 days reduction inthe mean days of hospital stay in favour of non-DD group (p \ 0.001). A single case ofmortality was found in the DD group. M-mode U/S evaluation of the diaphragm, in pre-dicting total weaning failure, showed 88.89 % sensitivity, 97.62 % specificity, 94.12 %positive predictive value and 95.35 % negative predictive value.CONCLUSIONS. DD, detected by M-mode U/S, was associated with prolonged durationof mechanical ventilation, ICU, hospital stay, and weaning failure in AECOPD patients.REFERENCE(S). 1. Global strategy for the diagnosis, management, and prevention ofchronic obstructive pulmonary disease. Global Initiative for Chronic Obstructive LungDisease (GOLD). Available from http://www.goldcopd.org. (Updated February 2013). 2.Boles JM, Bion J, Connors A, Herridge M, et al. Weaning from mechanical ventilation. EurRespir J. 2007; 29(5):1033–56. 3. Schild K, Neusch C, Schonhofer B. Ventilator-induceddiaphragmatic dysfunction (VIDD). Pneumologie 2008; 62:33–9. 4. Kim WY, Suh HJ,Hong SB, Koh Y, et al. Diaphragm dysfunction assessed by ultrasonography: influence onweaning from mechanical ventilation. Crit Care Med. 39(12):2627–30.
1009IMPACT OF ABDOMINAL MASS LOADING ON LUNG COLLAPSE DETECTEDBY EIT DURING PEEP TITRATION ON A PORCINE MODEL OF ACUTE LUNGINJURY
V. Torsani1, S. Hukrauf2, A. Rau2, S. Hammermüller2, S. Gomes1, R.R.D.S. Santiago1,E.L.V. Costa3, A.W. Reske2, M.B.P. Amato1
1Hospital das Clı́nicas da Faculdade de Medicina da Universidade de São Paulo, HeartInstitute (InCor), São Paulo, Brazil, 2University Hospital Leipzig, Department ofAnesthesiology and Intensive Care Medicine, Leipzig, Germany, 3Hospital das Clı́nicas daFaculdade de Medicina da Universidade de São Paulo, Dept Pneumology - Heart Institute(InCor), São Paulo, BrazilINTRODUCTION. Increased intraaabdominal pressure is common in critically-ill patients.Such increase raises the closing pressures by causing an offset change in the chest wallcomponent of the respiratory system pressure–volume relationship1.Electrical impedancetomography (EIT) is a radiation-free bedside monitoring device that can be used to quantifythe amount of recruitable collapse during a decremental PEEP titration maneuver.OBJECTIVES. Assess the influence of the abdominal pressure on the amount of collapseduring a PEEP titration in a porcine model of acute lung injury.METHODS. A total of five Landrace pigs (31 ± 2 kg) were anesthetized, paralyzed andmechanically ventilated in the supine position. Tracheostomy, cistostomy, and centralvenous lines were prepared. Femoral and pulmonary arteries were catheterized for blood gasand shunt measurements. EIT belts were placed around the thorax in the transversal plane atthe level of the axilla. Consecutive lung lavages with 30 ml/kg warm saline (until the PaO2/FiO2 fell below 100 mmHg) were followed by 2 h of injurious ventilation with low PEEP,high tidal volumes, and plateau pressures according to a protocolized table. A recruitmentmaneuver with plateau of 50 cmH2O was performed and PEEP titration started at a PEEP of25 cmH2O and was decreased in 2 cmH2O steps every 4 min until a PEEP of 7 cmH2O wasreached. Ventilator parameters during titration were VCV = 6 ml/kg, RR = 20–30 bpm,inspiratory pause = 0.3 s and I:E = 1:2. EIT data were continuously recorded. Arterial andmixed venous blood gases were measured at each PEEP step, and shunt was quantified bythe Berggren equation. Increased abdominal pressure (abdominal loading) was achievedusing three 1L standard saline bags (total 3 kg) placed 10 cm below the xiphoid processafter the recruitment and before the titration. The order of loaded or unloaded titration wasrandomized.RESULTS. The addition of a 3 kg-weight on the abdomen caused a significant increase inboth EIT lung collapse (P = 0.007) and true shunt (P = 0.011). The magnitude of theincrease was dependent on the level of PEEP (P = 0.038 for the interaction between PEEPand abdominal weight in EIT).
26th ESICM ANNUAL CONGRESS — PARIS, FRANCE — 5–9 OCTOBER 2013
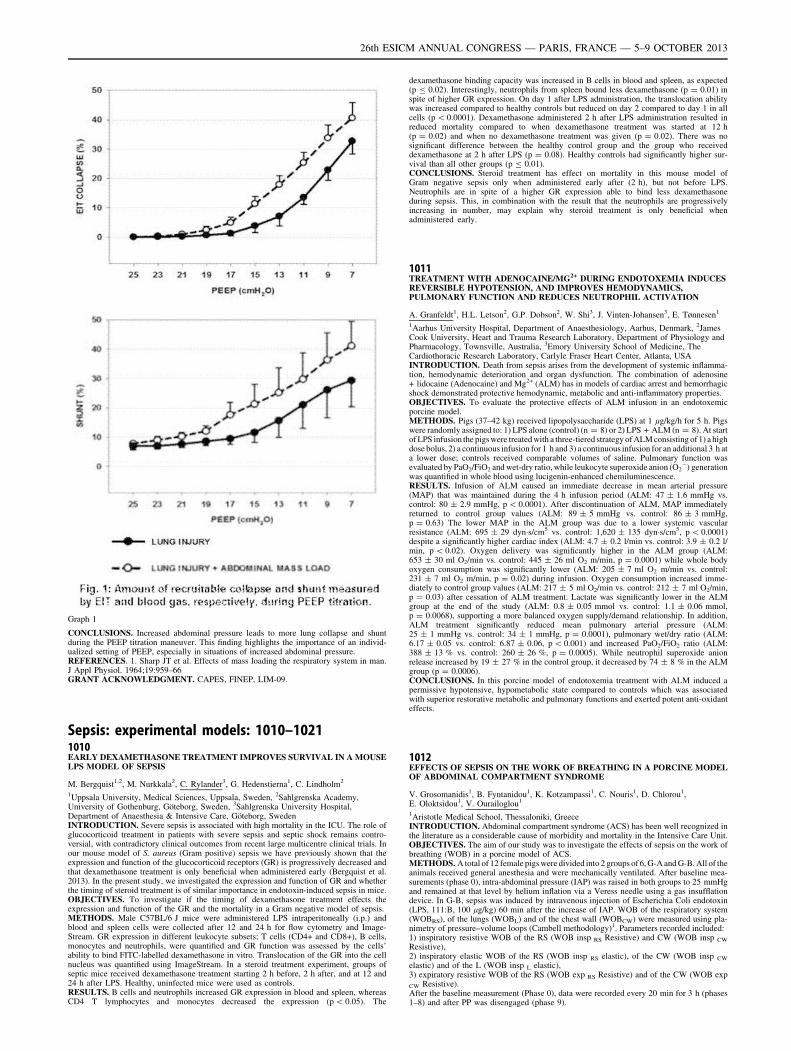
Graph 1
CONCLUSIONS. Increased abdominal pressure leads to more lung collapse and shuntduring the PEEP titration maneuver. This finding highlights the importance of an individ-ualized setting of PEEP, especially in situations of increased abdominal pressure.REFERENCES. 1. Sharp JT et al. Effects of mass loading the respiratory system in man.J Appl Physiol. 1964;19:959–66GRANT ACKNOWLEDGMENT. CAPES, FINEP, LIM-09.
Sepsis: experimental models: 1010–10211010EARLY DEXAMETHASONE TREATMENT IMPROVES SURVIVAL IN A MOUSELPS MODEL OF SEPSIS
M. Bergquist1,2, M. Nurkkala2, C. Rylander3, G. Hedenstierna1, C. Lindholm2
1Uppsala University, Medical Sciences, Uppsala, Sweden, 2Sahlgrenska Academy,University of Gothenburg, Göteborg, Sweden, 3Sahlgrenska University Hospital,Department of Anaesthesia & Intensive Care, Göteborg, SwedenINTRODUCTION. Severe sepsis is associated with high mortality in the ICU. The role ofglucocorticoid treatment in patients with severe sepsis and septic shock remains contro-versial, with contradictory clinical outcomes from recent large multicentre clinical trials. Inour mouse model of S. aureus (Gram positive) sepsis we have previously shown that theexpression and function of the glucocorticoid receptors (GR) is progressively decreased andthat dexamethasone treatment is only beneficial when administered early (Bergquist et al.2013). In the present study, we investigated the expression and function of GR and whetherthe timing of steroid treatment is of similar importance in endotoxin-induced sepsis in mice.OBJECTIVES. To investigate if the timing of dexamethasone treatment effects theexpression and function of the GR and the mortality in a Gram negative model of sepsis.METHODS. Male C57BL/6 J mice were administered LPS intraperitoneally (i.p.) andblood and spleen cells were collected after 12 and 24 h for flow cytometry and Image-Stream. GR expression in different leukocyte subsets; T cells (CD4+ and CD8+), B cells,monocytes and neutrophils, were quantified and GR function was assessed by the cells’ability to bind FITC-labelled dexamethasone in vitro. Translocation of the GR into the cellnucleus was quantified using ImageStream. In a steroid treatment experiment, groups ofseptic mice received dexamethasone treatment starting 2 h before, 2 h after, and at 12 and24 h after LPS. Healthy, uninfected mice were used as controls.RESULTS. B cells and neutrophils increased GR expression in blood and spleen, whereasCD4 T lymphocytes and monocytes decreased the expression (p \ 0.05). The
dexamethasone binding capacity was increased in B cells in blood and spleen, as expected(p B 0.02). Interestingly, neutrophils from spleen bound less dexamethasone (p = 0.01) inspite of higher GR expression. On day 1 after LPS administration, the translocation abilitywas increased compared to healthy controls but reduced on day 2 compared to day 1 in allcells (p \ 0.0001). Dexamethasone administered 2 h after LPS administration resulted inreduced mortality compared to when dexamethasone treatment was started at 12 h(p = 0.02) and when no dexamethasone treatment was given (p = 0.02). There was nosignificant difference between the healthy control group and the group who receiveddexamethasone at 2 h after LPS (p = 0.08). Healthy controls had significantly higher sur-vival than all other groups (p B 0.01).CONCLUSIONS. Steroid treatment has effect on mortality in this mouse model ofGram negative sepsis only when administered early after (2 h), but not before LPS.Neutrophils are in spite of a higher GR expression able to bind less dexamethasoneduring sepsis. This, in combination with the result that the neutrophils are progressivelyincreasing in number, may explain why steroid treatment is only beneficial whenadministered early.
1011TREATMENT WITH ADENOCAINE/MG2+ DURING ENDOTOXEMIA INDUCESREVERSIBLE HYPOTENSION, AND IMPROVES HEMODYNAMICS,PULMONARY FUNCTION AND REDUCES NEUTROPHIL ACTIVATION
A. Granfeldt1, H.L. Letson2, G.P. Dobson2, W. Shi3, J. Vinten-Johansen3, E. Tønnesen1
1Aarhus University Hospital, Department of Anaesthesiology, Aarhus, Denmark, 2JamesCook University, Heart and Trauma Research Laboratory, Department of Physiology andPharmacology, Townsville, Australia, 3Emory University School of Medicine, TheCardiothoracic Research Laboratory, Carlyle Fraser Heart Center, Atlanta, USAINTRODUCTION. Death from sepsis arises from the development of systemic inflamma-tion, hemodynamic deterioration and organ dysfunction. The combination of adenosine+ lidocaine (Adenocaine) and Mg2+ (ALM) has in models of cardiac arrest and hemorrhagicshock demonstrated protective hemodynamic, metabolic and anti-inflammatory properties.OBJECTIVES. To evaluate the protective effects of ALM infusion in an endotoxemicporcine model.METHODS. Pigs (37–42 kg) received lipopolysaccharide (LPS) at 1 lg/kg/h for 5 h. Pigswere randomly assigned to: 1) LPS alone (control) (n = 8) or 2) LPS + ALM (n = 8). At startof LPS infusion the pigs were treated with a three-tiered strategy of ALM consisting of 1) a highdose bolus, 2) a continuous infusion for 1 h and 3) a continuous infusion for an additional 3 h ata lower dose; controls received comparable volumes of saline. Pulmonary function wasevaluated by PaO2/FiO2 and wet-dry ratio, while leukocyte superoxide anion (̇O2
-) generationwas quantified in whole blood using lucigenin-enhanced chemiluminescence.RESULTS. Infusion of ALM caused an immediate decrease in mean arterial pressure(MAP) that was maintained during the 4 h infusion period (ALM: 47 ± 1.6 mmHg vs.control: 80 ± 2.9 mmHg, p \ 0.0001). After discontinuation of ALM, MAP immediatelyreturned to control group values (ALM: 89 ± 5 mmHg vs. control: 86 ± 3 mmHg,p = 0.63) The lower MAP in the ALM group was due to a lower systemic vascularresistance (ALM: 695 ± 29 dyn�s/cm5 vs. control: 1,620 ± 135 dyn�s/cm5, p \ 0.0001)despite a significantly higher cardiac index (ALM: 4.7 ± 0.2 l/min vs. control: 3.9 ± 0.2 l/min, p \ 0.02). Oxygen delivery was significantly higher in the ALM group (ALM:653 ± 30 ml O2/min vs. control: 445 ± 26 ml O2 m/min, p = 0.0001) while whole bodyoxygen consumption was significantly lower (ALM: 205 ± 7 ml O2 m/min vs. control:231 ± 7 ml O2 m/min, p = 0.02) during infusion. Oxygen consumption increased imme-diately to control group values (ALM: 217 ± 5 ml O2/min vs. control: 212 ± 7 ml O2/min,p = 0.03) after cessation of ALM treatment. Lactate was significantly lower in the ALMgroup at the end of the study (ALM: 0.8 ± 0.05 mmol vs. control: 1.1 ± 0.06 mmol,p = 0.0068), supporting a more balanced oxygen supply/demand relationship. In addition,ALM treatment significantly reduced mean pulmonary arterial pressure (ALM:25 ± 1 mmHg vs. control: 34 ± 1 mmHg, p = 0.0001), pulmonary wet/dry ratio (ALM:6.17 ± 0.05 vs. control: 6.87 ± 0.06, p \ 0.001) and increased PaO2/FiO2 ratio (ALM:388 ± 13 % vs. control: 260 ± 26 %, p = 0.0005). While neutrophil superoxide anionrelease increased by 19 ± 27 % in the control group, it decreased by 74 ± 8 % in the ALMgroup (p = 0.0006).CONCLUSIONS. In this porcine model of endotoxemia treatment with ALM induced apermissive hypotensive, hypometabolic state compared to controls which was associatedwith superior restorative metabolic and pulmonary functions and exerted potent anti-oxidanteffects.
1012EFFECTS OF SEPSIS ON THE WORK OF BREATHING IN A PORCINE MODELOF ABDOMINAL COMPARTMENT SYNDROME
V. Grosomanidis1, B. Fyntanidou1, K. Kotzampassi1, C. Nouris1, D. Chlorou1,E. Oloktsidou1, V. Ourailoglou1
1Aristotle Medical School, Thessaloniki, GreeceINTRODUCTION. Abdominal compartment syndrome (ACS) has been well recognized inthe literature as a considerable cause of morbidity and mortality in the Intensive Care Unit.OBJECTIVES. The aim of our study was to investigate the effects of sepsis on the work ofbreathing (WOB) in a porcine model of ACS.METHODS. A total of 12 female pigs were divided into 2 groups of 6, G-A and G-B. All of theanimals received general anesthesia and were mechanically ventilated. After baseline mea-surements (phase 0), intra-abdominal pressure (IAP) was raised in both groups to 25 mmHgand remained at that level by helium inflation via a Veress needle using a gas insufflationdevice. In G-B, sepsis was induced by intravenous injection of Escherichia Coli endotoxin(LPS, 111:B, 100 lg/kg) 60 min after the increase of IAP. WOB of the respiratory system(WOBRS), of the lungs (WOBL) and of the chest wall (WOBCW) were measured using pla-nimetry of pressure–volume loops (Cambell methodology)1. Parameters recorded included:1) inspiratory resistive WOB of the RS (WOB insp RS Resistive) and CW (WOB insp CW
Resistive),2) inspiratory elastic WOB of the RS (WOB insp RS elastic), of the CW (WOB insp CW
elastic) and of the L (WOB insp L elastic),3) expiratory resistive WOB of the RS (WOB exp RS Resistive) and of the CW (WOB exp
CW Resistive).After the baseline measurement (Phase 0), data were recorded every 20 min for 3 h (phases1–8) and after PP was disengaged (phase 9).
26th ESICM ANNUAL CONGRESS — PARIS, FRANCE — 5–9 OCTOBER 2013
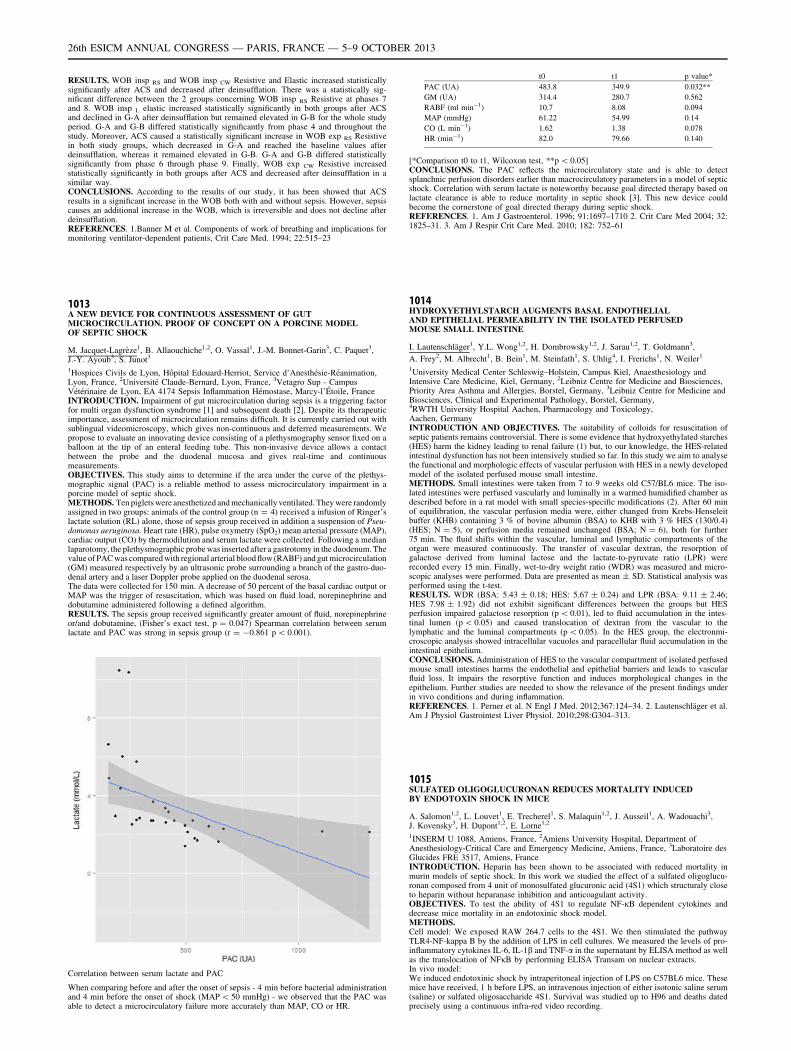
RESULTS. WOB insp RS and WOB insp CW Resistive and Elastic increased statisticallysignificantly after ACS and decreased after deinsufflation. There was a statistically sig-nificant difference between the 2 groups concerning WOB insp RS Resistive at phases 7and 8. WOB insp L elastic increased statistically significantly in both groups after ACSand declined in G-A after deinsufflation but remained elevated in G-B for the whole studyperiod. G-A and G-B differed statistically significantly from phase 4 and throughout thestudy. Moreover, ACS caused a statistically significant increase in WOB exp RS Resistivein both study groups, which decreased in G-A and reached the baseline values afterdeinsufflation, whereas it remained elevated in G-B. G-A and G-B differed statisticallysignificantly from phase 6 through phase 9. Finally, WOB exp CW Resistive increasedstatistically significantly in both groups after ACS and decreased after deinsufflation in asimilar way.CONCLUSIONS. According to the results of our study, it has been showed that ACSresults in a significant increase in the WOB both with and without sepsis. However, sepsiscauses an additional increase in the WOB, which is irreversible and does not decline afterdeinsufflation.REFERENCES. 1.Banner M et al. Components of work of breathing and implications formonitoring ventilator-dependent patients, Crit Care Med. 1994; 22:515–23
1013A NEW DEVICE FOR CONTINUOUS ASSESSMENT OF GUTMICROCIRCULATION. PROOF OF CONCEPT ON A PORCINE MODELOF SEPTIC SHOCK
M. Jacquet-Lagrèze1, B. Allaouchiche1,2, O. Vassal1, J.-M. Bonnet-Garin3, C. Paquet3,J.-Y. Ayoub3, S. Junot3
1Hospices Civils de Lyon, Hôpital Edouard-Herriot, Service d’Anesthésie-Réanimation,Lyon, France, 2Université Claude-Bernard, Lyon, France, 3Vetagro Sup - CampusVétérinaire de Lyon, EA 4174 Sepsis Inflammation Hémostase, Marcy-l’Étoile, FranceINTRODUCTION. Impairment of gut microcirculation during sepsis is a triggering factorfor multi organ dysfunction syndrome [1] and subsequent death [2]. Despite its therapeuticimportance, assessment of microcirculation remains difficult. It is currently carried out withsublingual videomicroscopy, which gives non-continuous and deferred measurements. Wepropose to evaluate an innovating device consisting of a plethysmography sensor fixed on aballoon at the tip of an enteral feeding tube. This non-invasive device allows a contactbetween the probe and the duodenal mucosa and gives real-time and continuousmeasurements.OBJECTIVES. This study aims to determine if the area under the curve of the plethys-mographic signal (PAC) is a reliable method to assess microcirculatory impairment in aporcine model of septic shock.METHODS. Ten piglets were anesthetized and mechanically ventilated. They were randomlyassigned in two groups: animals of the control group (n = 4) received a infusion of Ringer’slactate solution (RL) alone, those of sepsis group received in addition a suspension of Pseu-domonas aeruginosa. Heart rate (HR), pulse oxymetry (SpO2) mean arterial pressure (MAP),cardiac output (CO) by thermodilution and serum lactate were collected. Following a medianlaparotomy, the plethysmographic probe was inserted after a gastrotomy in the duodenum. Thevalue of PAC was compared with regional arterial blood flow (RABF) and gut microcirculation(GM) measured respectively by an ultrasonic probe surrounding a branch of the gastro-duo-denal artery and a laser Doppler probe applied on the duodenal serosa.The data were collected for 150 min. A decrease of 50 percent of the basal cardiac output orMAP was the trigger of resuscitation, which was based on fluid load, norepinephrine anddobutamine administered following a defined algorithm.RESULTS. The sepsis group received significantly greater amount of fluid, norepinephrineor/and dobutamine, (Fisher’s exact test, p = 0.047) Spearman correlation between serumlactate and PAC was strong in sepsis group (r = -0.861 p \ 0.001).
Correlation between serum lactate and PAC
When comparing before and after the onset of sepsis - 4 min before bacterial administrationand 4 min before the onset of shock (MAP \ 50 mmHg) - we observed that the PAC wasable to detect a microcirculatory failure more accurately than MAP, CO or HR.
t0 t1 p value*
PAC (UA) 483.8 349.9 0.032**
GM (UA) 314.4 280.7 0.562
RABF (ml min-1) 10.7 8.08 0.094
MAP (mmHg) 61.22 54.99 0.14
CO (L min-1) 1.62 1.38 0.078
HR (min-1) 82.0 79.66 0.140
[*Comparison t0 to t1, Wilcoxon test, **p \ 0.05]CONCLUSIONS. The PAC reflects the microcirculatory state and is able to detectsplanchnic perfusion disorders earlier than macrocirculatory parameters in a model of septicshock. Correlation with serum lactate is noteworthy because goal directed therapy based onlactate clearance is able to reduce mortality in septic shock [3]. This new device couldbecome the cornerstone of goal directed therapy during septic shock.REFERENCES. 1. Am J Gastroenterol. 1996; 91:1697–1710 2. Crit Care Med 2004; 32:1825–31. 3. Am J Respir Crit Care Med. 2010; 182: 752–61
1014HYDROXYETHYLSTARCH AUGMENTS BASAL ENDOTHELIALAND EPITHELIAL PERMEABILITY IN THE ISOLATED PERFUSEDMOUSE SMALL INTESTINE
I. Lautenschläger1, Y.L. Wong1,2, H. Dombrowsky1,2, J. Sarau1,2, T. Goldmann3,
A. Frey2, M. Albrecht1, B. Bein1, M. Steinfath1, S. Uhlig4, I. Frerichs1, N. Weiler1
1University Medical Center Schleswig–Holstein, Campus Kiel, Anaesthesiology andIntensive Care Medicine, Kiel, Germany, 2Leibniz Centre for Medicine and Biosciences,Priority Area Asthma and Allergies, Borstel, Germany, 3Leibniz Centre for Medicine andBiosciences, Clinical and Experimental Pathology, Borstel, Germany,4RWTH University Hospital Aachen, Pharmacology and Toxicology,Aachen, GermanyINTRODUCTION AND OBJECTIVES. The suitability of colloids for resuscitation ofseptic patients remains controversial. There is some evidence that hydroxyethylated starches(HES) harm the kidney leading to renal failure (1) but, to our knowledge, the HES-relatedintestinal dysfunction has not been intensively studied so far. In this study we aim to analysethe functional and morphologic effects of vascular perfusion with HES in a newly developedmodel of the isolated perfused mouse small intestine.METHODS. Small intestines were taken from 7 to 9 weeks old C57/BL6 mice. The iso-lated intestines were perfused vascularly and luminally in a warmed humidified chamber asdescribed before in a rat model with small species-specific modifications (2). After 60 minof equilibration, the vascular perfusion media were, either changed from Krebs-Henseleitbuffer (KHB) containing 3 % of bovine albumin (BSA) to KHB with 3 % HES (130/0.4)(HES; N = 5), or perfusion media remained unchanged (BSA; N = 6), both for further75 min. The fluid shifts within the vascular, luminal and lymphatic compartments of theorgan were measured continuously. The transfer of vascular dextran, the resorption ofgalactose derived from luminal lactose and the lactate-to-pyruvate ratio (LPR) wererecorded every 15 min. Finally, wet-to-dry weight ratio (WDR) was measured and micro-scopic analyses were performed. Data are presented as mean ± SD. Statistical analysis wasperformed using the t-test.RESULTS. WDR (BSA: 5.43 ± 0.18; HES: 5.67 ± 0.24) and LPR (BSA: 9.11 ± 2.46;HES 7.98 ± 1.92) did not exhibit significant differences between the groups but HESperfusion impaired galactose resorption (p \ 0.01), led to fluid accumulation in the intes-tinal lumen (p \ 0.05) and caused translocation of dextran from the vascular to thelymphatic and the luminal compartments (p \ 0.05). In the HES group, the electronmi-croscopic analysis showed intracellular vacuoles and paracellular fluid accumulation in theintestinal epithelium.CONCLUSIONS. Administration of HES to the vascular compartment of isolated perfusedmouse small intestines harms the endothelial and epithelial barriers and leads to vascularfluid loss. It impairs the resorptive function and induces morphological changes in theepithelium. Further studies are needed to show the relevance of the present findings underin vivo conditions and during inflammation.REFERENCES. 1. Perner et al. N Engl J Med. 2012;367:124–34. 2. Lautenschläger et al.Am J Physiol Gastrointest Liver Physiol. 2010;298:G304–313.
1015SULFATED OLIGOGLUCURONAN REDUCES MORTALITY INDUCEDBY ENDOTOXIN SHOCK IN MICE
A. Salomon1,2, L. Louvet1, E. Trecherel1, S. Malaquin1,2, J. Ausseil1, A. Wadouachi3,J. Kovensky3, H. Dupont1,2, E. Lorne1,2
1INSERM U 1088, Amiens, France, 2Amiens University Hospital, Department ofAnesthesiology-Critical Care and Emergency Medicine, Amiens, France, 3Laboratoire desGlucides FRE 3517, Amiens, FranceINTRODUCTION. Heparin has been shown to be associated with reduced mortality inmurin models of septic shock. In this work we studied the effect of a sulfated oligoglucu-ronan composed from 4 unit of monosulfated glucuronic acid (4S1) which structuraly closeto heparin without heparanase inhibition and anticoagulant activity.OBJECTIVES. To test the ability of 4S1 to regulate NF-jB dependent cytokines anddecrease mice mortality in an endotoxinic shock model.METHODS.Cell model: We exposed RAW 264.7 cells to the 4S1. We then stimulated the pathwayTLR4-NF-kappa B by the addition of LPS in cell cultures. We measured the levels of pro-inflammatory cytokines IL-6, IL-1b and TNF-a in the supernatant by ELISA method as wellas the translocation of NFjB by performing ELISA Transam on nuclear extracts.In vivo model:We induced endotoxinic shock by intraperitoneal injection of LPS on C57BL6 mice. Thesemice have received, 1 h before LPS, an intravenous injection of either isotonic saline serum(saline) or sulfated oligosaccharide 4S1. Survival was studied up to H96 and deaths datedprecisely using a continuous infra-red video recording.
26th ESICM ANNUAL CONGRESS — PARIS, FRANCE — 5–9 OCTOBER 2013
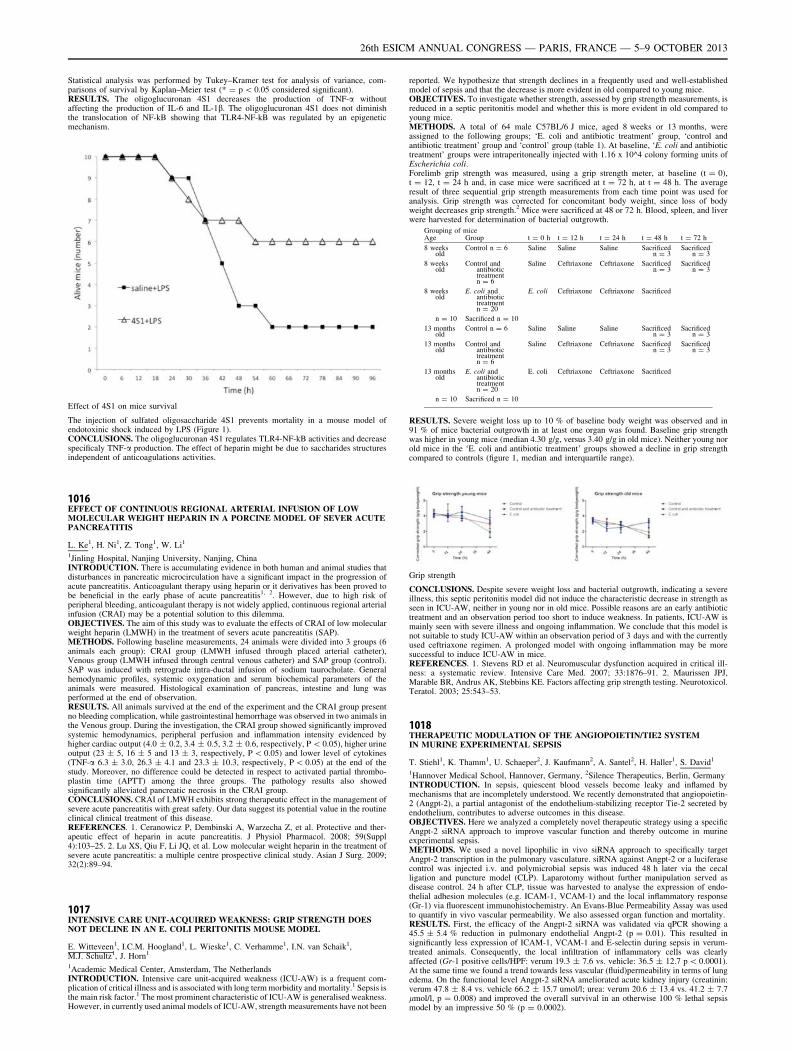
Statistical analysis was performed by Tukey–Kramer test for analysis of variance, com-parisons of survival by Kaplan–Meier test (* = p \ 0.05 considered significant).RESULTS. The oligoglucuronan 4S1 decreases the production of TNF-a withoutaffecting the production of IL-6 and IL-1b. The oligoglucuronan 4S1 does not diminishthe translocation of NF-kB showing that TLR4-NF-kB was regulated by an epigeneticmechanism.
Effect of 4S1 on mice survival
The injection of sulfated oligosaccharide 4S1 prevents mortality in a mouse model ofendotoxinic shock induced by LPS (Figure 1).CONCLUSIONS. The oligoglucuronan 4S1 regulates TLR4-NF-kB activities and decreasespecificaly TNF-a production. The effect of heparin might be due to saccharides structuresindependent of anticoagulations activities.
1016EFFECT OF CONTINUOUS REGIONAL ARTERIAL INFUSION OF LOWMOLECULAR WEIGHT HEPARIN IN A PORCINE MODEL OF SEVER ACUTEPANCREATITIS
L. Ke1, H. Ni1, Z. Tong1, W. Li1
1Jinling Hospital, Nanjing University, Nanjing, ChinaINTRODUCTION. There is accumulating evidence in both human and animal studies thatdisturbances in pancreatic microcirculation have a significant impact in the progression ofacute pancreatitis. Anticoagulant therapy using heparin or it derivatives has been proved tobe beneficial in the early phase of acute pancreatitis1, 2. However, due to high risk ofperipheral bleeding, anticoagulant therapy is not widely applied, continuous regional arterialinfusion (CRAI) may be a potential solution to this dilemma.OBJECTIVES. The aim of this study was to evaluate the effects of CRAI of low molecularweight heparin (LMWH) in the treatment of severs acute pancreatitis (SAP).METHODS. Following baseline measurements, 24 animals were divided into 3 groups (6animals each group): CRAI group (LMWH infused through placed arterial catheter),Venous group (LMWH infused through central venous catheter) and SAP group (control).SAP was induced with retrograde intra-ductal infusion of sodium taurocholate. Generalhemodynamic profiles, systemic oxygenation and serum biochemical parameters of theanimals were measured. Histological examination of pancreas, intestine and lung wasperformed at the end of observation.RESULTS. All animals survived at the end of the experiment and the CRAI group presentno bleeding complication, while gastrointestinal hemorrhage was observed in two animals inthe Venous group. During the investigation, the CRAI group showed significantly improvedsystemic hemodynamics, peripheral perfusion and inflammation intensity evidenced byhigher cardiac output (4.0 ± 0.2, 3.4 ± 0.5, 3.2 ± 0.6, respectively, P \ 0.05), higher urineoutput (23 ± 5, 16 ± 5 and 13 ± 3, respectively, P \ 0.05) and lower level of cytokines(TNF-a 6.3 ± 3.0, 26.3 ± 4.1 and 23.3 ± 10.3, respectively, P \ 0.05) at the end of thestudy. Moreover, no difference could be detected in respect to activated partial thrombo-plastin time (APTT) among the three groups. The pathology results also showedsignificantly alleviated pancreatic necrosis in the CRAI group.CONCLUSIONS. CRAI of LMWH exhibits strong therapeutic effect in the management ofsevere acute pancreatitis with great safety. Our data suggest its potential value in the routineclinical clinical treatment of this disease.REFERENCES. 1. Ceranowicz P, Dembinski A, Warzecha Z, et al. Protective and ther-apeutic effect of heparin in acute pancreatitis. J Physiol Pharmacol. 2008; 59(Suppl4):103–25. 2. Lu XS, Qiu F, Li JQ, et al. Low molecular weight heparin in the treatment ofsevere acute pancreatitis: a multiple centre prospective clinical study. Asian J Surg. 2009;32(2):89–94.
1017INTENSIVE CARE UNIT-ACQUIRED WEAKNESS: GRIP STRENGTH DOESNOT DECLINE IN AN E. COLI PERITONITIS MOUSE MODEL
E. Witteveen1, I.C.M. Hoogland1, L. Wieske1, C. Verhamme1, I.N. van Schaik1,M.J. Schultz1, J. Horn1
1Academic Medical Center, Amsterdam, The NetherlandsINTRODUCTION. Intensive care unit-acquired weakness (ICU-AW) is a frequent com-plication of critical illness and is associated with long term morbidity and mortality.1 Sepsis isthe main risk factor.1 The most prominent characteristic of ICU-AW is generalised weakness.However, in currently used animal models of ICU-AW, strength measurements have not been
reported. We hypothesize that strength declines in a frequently used and well-establishedmodel of sepsis and that the decrease is more evident in old compared to young mice.OBJECTIVES. To investigate whether strength, assessed by grip strength measurements, isreduced in a septic peritonitis model and whether this is more evident in old compared toyoung mice.METHODS. A total of 64 male C57BL/6 J mice, aged 8 weeks or 13 months, wereassigned to the following groups; ‘E. coli and antibiotic treatment’ group, ‘control andantibiotic treatment’ group and ‘control’ group (table 1). At baseline, ‘E. coli and antibiotictreatment’ groups were intraperitoneally injected with 1.16 x 10^4 colony forming units ofEscherichia coli.Forelimb grip strength was measured, using a grip strength meter, at baseline (t = 0),t = 12, t = 24 h and, in case mice were sacrificed at t = 72 h, at t = 48 h. The averageresult of three sequential grip strength measurements from each time point was used foranalysis. Grip strength was corrected for concomitant body weight, since loss of bodyweight decreases grip strength.2 Mice were sacrificed at 48 or 72 h. Blood, spleen, and liverwere harvested for determination of bacterial outgrowth.
Grouping of miceAge Group t = 0 h t = 12 h t = 24 h t = 48 h t = 72 h
8 weeksold
Control n = 6 Saline Saline Saline Sacrificedn = 3
Sacrificedn = 3
8 weeksold
Control andantibiotictreatmentn = 6
Saline Ceftriaxone Ceftriaxone Sacrificedn = 3
Sacrificedn = 3
8 weeksold
E. coli andantibiotictreatmentn = 20
E. coli Ceftriaxone Ceftriaxone Sacrificed
n = 10 Sacrificed n = 10
13 monthsold
Control n = 6 Saline Saline Saline Sacrificedn = 3
Sacrificedn = 3
13 monthsold
Control andantibiotictreatmentn = 6
Saline Ceftriaxone Ceftriaxone Sacrificedn = 3
Sacrificedn = 3
13 monthsold
E. coli andantibiotictreatmentn = 20
E. coli Ceftriaxone Ceftriaxone Sacrificed
n = 10 Sacrificed n = 10
RESULTS. Severe weight loss up to 10 % of baseline body weight was observed and in91 % of mice bacterial outgrowth in at least one organ was found. Baseline grip strengthwas higher in young mice (median 4.30 g/g, versus 3.40 g/g in old mice). Neither young norold mice in the ‘E. coli and antibiotic treatment’ groups showed a decline in grip strengthcompared to controls (figure 1, median and interquartile range).
Grip strength
CONCLUSIONS. Despite severe weight loss and bacterial outgrowth, indicating a severeillness, this septic peritonitis model did not induce the characteristic decrease in strength asseen in ICU-AW, neither in young nor in old mice. Possible reasons are an early antibiotictreatment and an observation period too short to induce weakness. In patients, ICU-AW ismainly seen with severe illness and ongoing inflammation. We conclude that this model isnot suitable to study ICU-AW within an observation period of 3 days and with the currentlyused ceftriaxone regimen. A prolonged model with ongoing inflammation may be moresuccessful to induce ICU-AW in mice.REFERENCES. 1. Stevens RD et al. Neuromuscular dysfunction acquired in critical ill-ness: a systematic review. Intensive Care Med. 2007; 33:1876–91. 2. Maurissen JPJ,Marable BR, Andrus AK, Stebbins KE. Factors affecting grip strength testing. Neurotoxicol.Teratol. 2003; 25:543–53.
1018THERAPEUTIC MODULATION OF THE ANGIOPOIETIN/TIE2 SYSTEMIN MURINE EXPERIMENTAL SEPSIS
T. Stiehl1, K. Thamm1, U. Schaeper2, J. Kaufmann2, A. Santel2, H. Haller1, S. David1
1Hannover Medical School, Hannover, Germany, 2Silence Therapeutics, Berlin, GermanyINTRODUCTION. In sepsis, quiescent blood vessels become leaky and inflamed bymechanisms that are incompletely understood. We recently demonstrated that angiopoietin-2 (Angpt-2), a partial antagonist of the endothelium-stabilizing receptor Tie-2 secreted byendothelium, contributes to adverse outcomes in this disease.OBJECTIVES. Here we analyzed a completely novel therapeutic strategy using a specificAngpt-2 siRNA approach to improve vascular function and thereby outcome in murineexperimental sepsis.METHODS. We used a novel lipophilic in vivo siRNA approach to specifically targetAngpt-2 transcription in the pulmonary vasculature. siRNA against Angpt-2 or a luciferasecontrol was injected i.v. and polymicrobial sepsis was induced 48 h later via the cecalligation and puncture model (CLP). Laparotomy without further manipulation served asdisease control. 24 h after CLP, tissue was harvested to analyse the expression of endo-thelial adhesion molecules (e.g. ICAM-1, VCAM-1) and the local inflammatory response(Gr-1) via fluorescent immunohistochemistry. An Evans-Blue Permeability Assay was usedto quantify in vivo vascular permeability. We also assessed organ function and mortality.RESULTS. First, the efficacy of the Angpt-2 siRNA was validated via qPCR showing a45.5 ± 5.4 % reduction in pulmonary endothelial Angpt-2 (p = 0.01). This resulted insignificantly less expression of ICAM-1, VCAM-1 and E-selectin during sepsis in verum-treated animals. Consequently, the local infiltration of inflammatory cells was clearlyaffected (Gr-1 positive cells/HPF: verum 19.3 ± 7.6 vs. vehicle: 36.5 ± 12.7 p \ 0.0001).At the same time we found a trend towards less vascular (fluid)permeability in terms of lungedema. On the functional level Angpt-2 siRNA ameliorated acute kidney injury (creatinin:verum 47.8 ± 8.4 vs. vehicle 66.2 ± 15.7 umol/l; urea: verum 20.6 ± 13.4 vs. 41.2 ± 7.7lmol/l, p = 0.008) and improved the overall survival in an otherwise 100 % lethal sepsismodel by an impressive 50 % (p = 0.0002).
26th ESICM ANNUAL CONGRESS — PARIS, FRANCE — 5–9 OCTOBER 2013
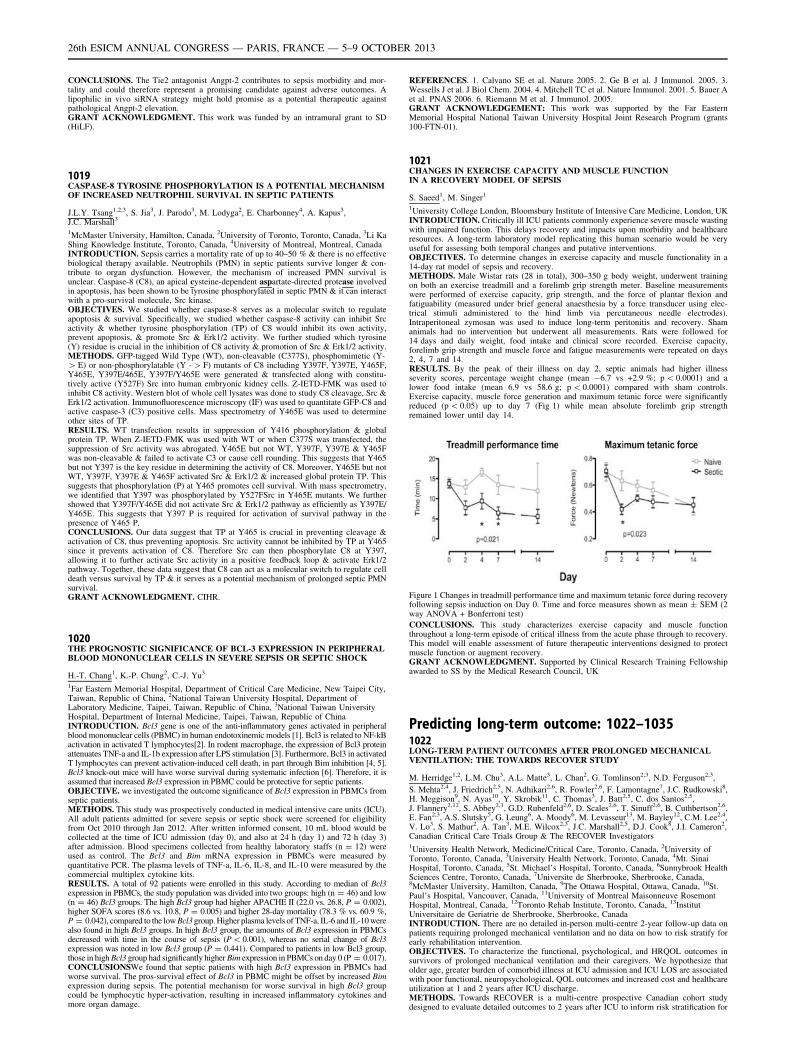
CONCLUSIONS. The Tie2 antagonist Angpt-2 contributes to sepsis morbidity and mor-tality and could therefore represent a promising candidate against adverse outcomes. Alipophilic in vivo siRNA strategy might hold promise as a potential therapeutic againstpathological Angpt-2 elevation.GRANT ACKNOWLEDGMENT. This work was funded by an intramural grant to SD(HiLF).
1019CASPASE-8 TYROSINE PHOSPHORYLATION IS A POTENTIAL MECHANISMOF INCREASED NEUTROPHIL SURVIVAL IN SEPTIC PATIENTS
J.L.Y. Tsang1,2,3, S. Jia3, J. Parodo3, M. Lodyga2, E. Charbonney4, A. Kapus3,J.C. Marshall3
1McMaster University, Hamilton, Canada, 2University of Toronto, Toronto, Canada, 3Li KaShing Knowledge Institute, Toronto, Canada, 4University of Montreal, Montreal, CanadaINTRODUCTION. Sepsis carries a mortality rate of up to 40–50 % & there is no effectivebiological therapy available. Neutrophils (PMN) in septic patients survive longer & con-tribute to organ dysfunction. However, the mechanism of increased PMN survival isunclear. Caspase-8 (C8), an apical cysteine-dependent aspartate-directed protease involvedin apoptosis, has been shown to be tyrosine phosphorylated in septic PMN & it can interactwith a pro-survival molecule, Src kinase.OBJECTIVES. We studied whether caspase-8 serves as a molecular switch to regulateapoptosis & survival. Specifically, we studied whether caspase-8 activity can inhibit Srcactivity & whether tyrosine phosphorylation (TP) of C8 would inhibit its own activity,prevent apoptosis, & promote Src & Erk1/2 activity. We further studied which tyrosine(Y) residue is crucial in the inhibition of C8 activity & promotion of Src & Erk1/2 activity.METHODS. GFP-tagged Wild Type (WT), non-cleavable (C377S), phosphomimetic (Y-[ E) or non-phosphorylatable (Y - [ F) mutants of C8 including Y397F, Y397E, Y465F,Y465E, Y397E/465E, Y397F/Y465E were generated & transfected along with constitu-tively active (Y527F) Src into human embryonic kidney cells. Z-IETD-FMK was used toinhibit C8 activity. Western blot of whole cell lysates was done to study C8 cleavage, Src &Erk1/2 activation. Immunofluorescence microscopy (IF) was used to quantitate GFP-C8 andactive caspase-3 (C3) positive cells. Mass spectrometry of Y465E was used to determineother sites of TP.RESULTS. WT transfection results in suppression of Y416 phosphorylation & globalprotein TP. When Z-IETD-FMK was used with WT or when C377S was transfected, thesuppression of Src activity was abrogated. Y465E but not WT, Y397F, Y397E & Y465Fwas non-cleavable & failed to activate C3 or cause cell rounding. This suggests that Y465but not Y397 is the key residue in determining the activity of C8. Moreover, Y465E but notWT, Y397F, Y397E & Y465F activated Src & Erk1/2 & increased global protein TP. Thissuggests that phosphorylation (P) at Y465 promotes cell survival. With mass spectrometry,we identified that Y397 was phosphorylated by Y527FSrc in Y465E mutants. We furthershowed that Y397F/Y465E did not activate Src & Erk1/2 pathway as efficiently as Y397E/Y465E. This suggests that Y397 P is required for activation of survival pathway in thepresence of Y465 P.CONCLUSIONS. Our data suggest that TP at Y465 is crucial in preventing cleavage &activation of C8, thus preventing apoptosis. Src activity cannot be inhibited by TP at Y465since it prevents activation of C8. Therefore Src can then phosphorylate C8 at Y397,allowing it to further activate Src activity in a positive feedback loop & activate Erk1/2pathway. Together, these data suggest that C8 can act as a molecular switch to regulate celldeath versus survival by TP & it serves as a potential mechanism of prolonged septic PMNsurvival.GRANT ACKNOWLEDGMENT. CIHR.
1020THE PROGNOSTIC SIGNIFICANCE OF BCL-3 EXPRESSION IN PERIPHERALBLOOD MONONUCLEAR CELLS IN SEVERE SEPSIS OR SEPTIC SHOCK
H.-T. Chang1, K.-P. Chung2, C.-J. Yu3
1Far Eastern Memorial Hospital, Department of Critical Care Medicine, New Taipei City,Taiwan, Republic of China, 2National Taiwan University Hospital, Department ofLaboratory Medicine, Taipei, Taiwan, Republic of China, 3National Taiwan UniversityHospital, Department of Internal Medicine, Taipei, Taiwan, Republic of ChinaINTRODUCTION. Bcl3 gene is one of the anti-inflammatory genes activated in peripheralblood mononuclear cells (PBMC) in human endotoxinemic models [1]. Bcl3 is related to NF-kBactivation in activated T lymphocytes[2]. In rodent macrophage, the expression of Bcl3 proteinattenuates TNF-a and IL-1b expression after LPS stimulation [3]. Furthermore, Bcl3 in activatedT lymphocytes can prevent activation-induced cell death, in part through Bim inhibition [4, 5].Bcl3 knock-out mice will have worse survival during systematic infection [6]. Therefore, it isassumed that increased Bcl3 expression in PBMC could be protective for septic patients.OBJECTIVE. we investigated the outcome significance of Bcl3 expression in PBMCs fromseptic patients.METHODS. This study was prospectively conducted in medical intensive care units (ICU).All adult patients admitted for severe sepsis or septic shock were screened for eligibilityfrom Oct 2010 through Jan 2012. After written informed consent, 10 mL blood would becollected at the time of ICU admission (day 0), and also at 24 h (day 1) and 72 h (day 3)after admission. Blood specimens collected from healthy laboratory staffs (n = 12) wereused as control. The Bcl3 and Bim mRNA expression in PBMCs were measured byquantitative PCR. The plasma levels of TNF-a, IL-6, IL-8, and IL-10 were measured by thecommercial multiplex cytokine kits.RESULTS. A total of 92 patients were enrolled in this study. According to median of Bcl3expression in PBMCs, the study population was divided into two groups: high (n = 46) and low(n = 46) Bcl3 groups. The high Bcl3 group had higher APACHE II (22.0 vs. 26.8, P = 0.002),higher SOFA scores (8.6 vs. 10.8, P = 0.005) and higher 28-day mortality (78.3 % vs. 60.9 %,P = 0.042), compared to the low Bcl3 group. Higher plasma levels of TNF-a, IL-6 and IL-10 werealso found in high Bcl3 groups. In high Bcl3 group, the amounts of Bcl3 expression in PBMCsdecreased with time in the course of sepsis (P\ 0.001), whereas no serial change of Bcl3expression was noted in low Bcl3 group (P = 0.441). Compared to patients in low Bcl3 group,those in high Bcl3 group had significantly higher Bim expression in PBMCs on day 0 (P = 0.017).CONCLUSIONSWe found that septic patients with high Bcl3 expression in PBMCs hadworse survival. The pros-survival effect of Bcl3 in PBMC might be offset by increased Bimexpression during sepsis. The potential mechanism for worse survival in high Bcl3 groupcould be lymphocytic hyper-activation, resulting in increased inflammatory cytokines andmore organ damage.
REFERENCES. 1. Calvano SE et al. Nature 2005. 2. Ge B et al. J Immunol. 2005. 3.Wessells J et al. J Biol Chem. 2004. 4. Mitchell TC et al. Nature Immunol. 2001. 5. Bauer Aet al. PNAS 2006. 6. Riemann M et al. J Immunol. 2005.GRANT ACKNOWLEDGEMENT: This work was supported by the Far EasternMemorial Hospital National Taiwan University Hospital Joint Research Program (grants100-FTN-01).
1021CHANGES IN EXERCISE CAPACITY AND MUSCLE FUNCTIONIN A RECOVERY MODEL OF SEPSIS
S. Saeed1, M. Singer1
1University College London, Bloomsbury Institute of Intensive Care Medicine, London, UKINTRODUCTION. Critically ill ICU patients commonly experience severe muscle wastingwith impaired function. This delays recovery and impacts upon morbidity and healthcareresources. A long-term laboratory model replicating this human scenario would be veryuseful for assessing both temporal changes and putative interventions.OBJECTIVES. To determine changes in exercise capacity and muscle functionality in a14-day rat model of sepsis and recovery.METHODS. Male Wistar rats (28 in total), 300–350 g body weight, underwent trainingon both an exercise treadmill and a forelimb grip strength meter. Baseline measurementswere performed of exercise capacity, grip strength, and the force of plantar flexion andfatiguability (measured under brief general anaesthesia by a force transducer using elec-trical stimuli administered to the hind limb via percutaneous needle electrodes).Intraperitoneal zymosan was used to induce long-term peritonitis and recovery. Shamanimals had no intervention but underwent all measurements. Rats were followed for14 days and daily weight, food intake and clinical score recorded. Exercise capacity,forelimb grip strength and muscle force and fatigue measurements were repeated on days2, 4, 7 and 14.RESULTS. By the peak of their illness on day 2, septic animals had higher illnessseverity scores, percentage weight change (mean -6.7 vs +2.9 %; p \ 0.0001) and alower food intake (mean 6.9 vs 58.6 g; p \ 0.0001) compared with sham controls.Exercise capacity, muscle force generation and maximum tetanic force were significantlyreduced (p \ 0.05) up to day 7 (Fig 1) while mean absolute forelimb grip strengthremained lower until day 14.
Figure 1 Changes in treadmill performance time and maximum tetanic force during recoveryfollowing sepsis induction on Day 0. Time and force measures shown as mean ± SEM (2way ANOVA + Bonferroni test)
CONCLUSIONS. This study characterizes exercise capacity and muscle functionthroughout a long-term episode of critical illness from the acute phase through to recovery.This model will enable assessment of future therapeutic interventions designed to protectmuscle function or augment recovery.GRANT ACKNOWLEDGMENT. Supported by Clinical Research Training Fellowshipawarded to SS by the Medical Research Council, UK
Predicting long-term outcome: 1022–10351022LONG-TERM PATIENT OUTCOMES AFTER PROLONGED MECHANICALVENTILATION: THE TOWARDS RECOVER STUDY
M. Herridge1,2, L.M. Chu3, A.L. Matte3, L. Chan2, G. Tomlinson2,3, N.D. Ferguson2,3,
S. Mehta2,4, J. Friedrich2,5, N. Adhikari2,6, R. Fowler2,6, F. Lamontagne7, J.C. Rudkowski8,H. Meggison9, N. Ayas10, Y. Skrobik11, C. Thomas3, J. Batt2,5, C. dos Santos2,5,J. Flannery2,12, S. Abbey2,3, G.D. Rubenfeld2,6, D. Scales2,6, T. Sinuff2,6, B. Cuthbertson2,6,E. Fan2,3, A.S. Slutsky5, G. Leung6, A. Moody6, M. Levasseur13, M. Bayley12, C.M. Lee2,4,V. Lo3, S. Mathur2, A. Tan3, M.E. Wilcox2,3, J.C. Marshall2,5, D.J. Cook8, J.I. Cameron2,Canadian Critical Care Trials Group & The RECOVER Investigators1University Health Network, Medicine/Critical Care, Toronto, Canada, 2University ofToronto, Toronto, Canada, 3University Health Network, Toronto, Canada, 4Mt. SinaiHospital, Toronto, Canada, 5St. Michael’s Hospital, Toronto, Canada, 6Sunnybrook HealthSciences Centre, Toronto, Canada, 7Universite de Sherbrooke, Sherbrooke, Canada,8McMaster University, Hamilton, Canada, 9The Ottawa Hospital, Ottawa, Canada, 10St.Paul’s Hospital, Vancouver, Canada, 11University of Montreal Maisonneuve RosemontHospital, Montreal, Canada, 12Toronto Rehab Institute, Toronto, Canada, 13InstitutUniversitaire de Geriatrie de Sherbrooke, Sherbrooke, CanadaINTRODUCTION. There are no detailed in-person multi-centre 2-year follow-up data onpatients requiring prolonged mechanical ventilation and no data on how to risk stratify forearly rehabilitation intervention.OBJECTIVES. To characterize the functional, psychological, and HRQOL outcomes insurvivors of prolonged mechanical ventilation and their caregivers. We hypothesize thatolder age, greater burden of comorbid illness at ICU admission and ICU LOS are associatedwith poor functional, neuropsychological, QOL outcomes and increased cost and healthcareutilization at 1 and 2 years after ICU discharge.METHODS. Towards RECOVER is a multi-centre prospective Canadian cohort studydesigned to evaluate detailed outcomes to 2 years after ICU to inform risk stratification for
26th ESICM ANNUAL CONGRESS — PARIS, FRANCE — 5–9 OCTOBER 2013
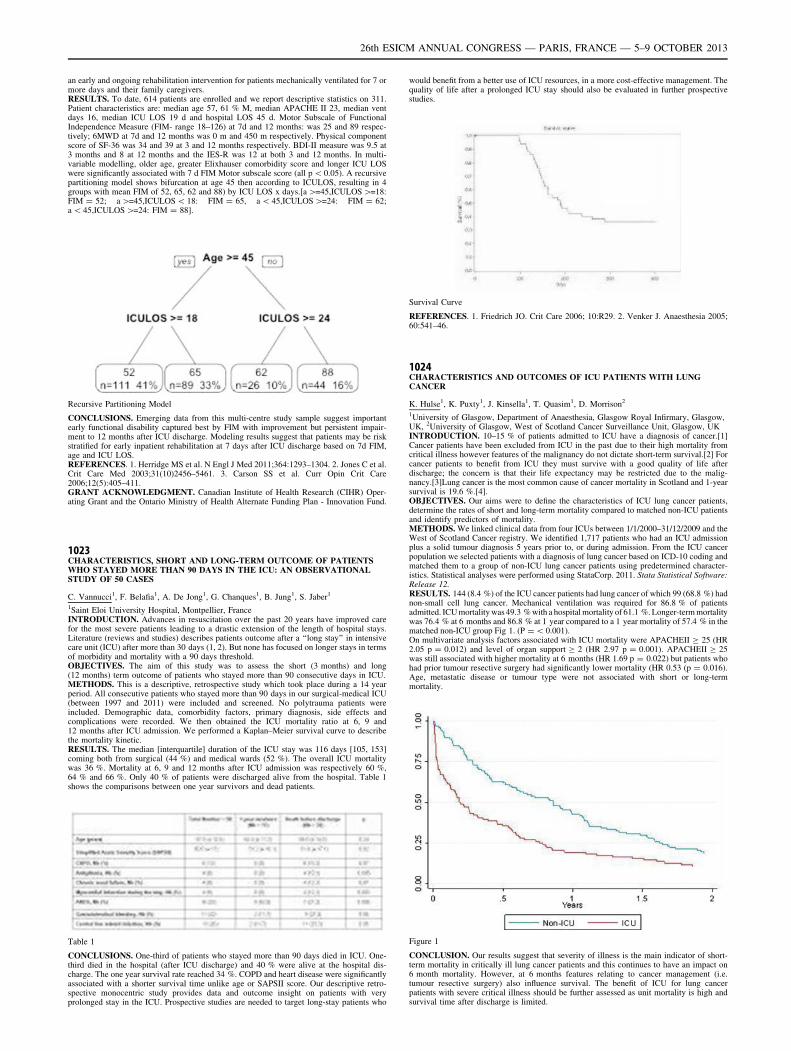
an early and ongoing rehabilitation intervention for patients mechanically ventilated for 7 ormore days and their family caregivers.RESULTS. To date, 614 patients are enrolled and we report descriptive statistics on 311.Patient characteristics are: median age 57, 61 % M, median APACHE II 23, median ventdays 16, median ICU LOS 19 d and hospital LOS 45 d. Motor Subscale of FunctionalIndependence Measure (FIM- range 18–126) at 7d and 12 months: was 25 and 89 respec-tively; 6MWD at 7d and 12 months was 0 m and 450 m respectively. Physical componentscore of SF-36 was 34 and 39 at 3 and 12 months respectively. BDI-II measure was 9.5 at3 months and 8 at 12 months and the IES-R was 12 at both 3 and 12 months. In multi-variable modelling, older age, greater Elixhauser comorbidity score and longer ICU LOSwere significantly associated with 7 d FIM Motor subscale score (all p \ 0.05). A recursivepartitioning model shows bifurcation at age 45 then according to ICULOS, resulting in 4groups with mean FIM of 52, 65, 62 and 88) by ICU LOS x days.[a [=45,ICULOS [=18:FIM = 52; a [=45,ICULOS \ 18: FIM = 65, a \ 45,ICULOS [=24: FIM = 62;a \ 45,ICULOS [=24: FIM = 88].
Recursive Partitioning Model
CONCLUSIONS. Emerging data from this multi-centre study sample suggest importantearly functional disability captured best by FIM with improvement but persistent impair-ment to 12 months after ICU discharge. Modeling results suggest that patients may be riskstratified for early inpatient rehabilitation at 7 days after ICU discharge based on 7d FIM,age and ICU LOS.REFERENCES. 1. Herridge MS et al. N Engl J Med 2011;364:1293–1304. 2. Jones C et al.Crit Care Med 2003;31(10)2456–5461. 3. Carson SS et al. Curr Opin Crit Care2006;12(5):405–411.GRANT ACKNOWLEDGMENT. Canadian Institute of Health Research (CIHR) Oper-ating Grant and the Ontario Ministry of Health Alternate Funding Plan - Innovation Fund.
1023CHARACTERISTICS, SHORT AND LONG-TERM OUTCOME OF PATIENTSWHO STAYED MORE THAN 90 DAYS IN THE ICU: AN OBSERVATIONALSTUDY OF 50 CASES
C. Vannucci1, F. Belafia1, A. De Jong1, G. Chanques1, B. Jung1, S. Jaber1
1Saint Eloi University Hospital, Montpellier, FranceINTRODUCTION. Advances in resuscitation over the past 20 years have improved carefor the most severe patients leading to a drastic extension of the length of hospital stays.Literature (reviews and studies) describes patients outcome after a ‘‘long stay’’ in intensivecare unit (ICU) after more than 30 days (1, 2). But none has focused on longer stays in termsof morbidity and mortality with a 90 days threshold.OBJECTIVES. The aim of this study was to assess the short (3 months) and long(12 months) term outcome of patients who stayed more than 90 consecutive days in ICU.METHODS. This is a descriptive, retrospective study which took place during a 14 yearperiod. All consecutive patients who stayed more than 90 days in our surgical-medical ICU(between 1997 and 2011) were included and screened. No polytrauma patients wereincluded. Demographic data, comorbidity factors, primary diagnosis, side effects andcomplications were recorded. We then obtained the ICU mortality ratio at 6, 9 and12 months after ICU admission. We performed a Kaplan–Meier survival curve to describethe mortality kinetic.RESULTS. The median [interquartile] duration of the ICU stay was 116 days [105, 153]coming both from surgical (44 %) and medical wards (52 %). The overall ICU mortalitywas 36 %. Mortality at 6, 9 and 12 months after ICU admission was respectively 60 %,64 % and 66 %. Only 40 % of patients were discharged alive from the hospital. Table 1shows the comparisons between one year survivors and dead patients.
Table 1
CONCLUSIONS. One-third of patients who stayed more than 90 days died in ICU. One-third died in the hospital (after ICU discharge) and 40 % were alive at the hospital dis-charge. The one year survival rate reached 34 %. COPD and heart disease were significantlyassociated with a shorter survival time unlike age or SAPSII score. Our descriptive retro-spective monocentric study provides data and outcome insight on patients with veryprolonged stay in the ICU. Prospective studies are needed to target long-stay patients who
would benefit from a better use of ICU resources, in a more cost-effective management. Thequality of life after a prolonged ICU stay should also be evaluated in further prospectivestudies.
Survival Curve
REFERENCES. 1. Friedrich JO. Crit Care 2006; 10:R29. 2. Venker J. Anaesthesia 2005;60:541–46.
1024CHARACTERISTICS AND OUTCOMES OF ICU PATIENTS WITH LUNGCANCER
K. Hulse1, K. Puxty1, J. Kinsella1, T. Quasim1, D. Morrison2
1University of Glasgow, Department of Anaesthesia, Glasgow Royal Infirmary, Glasgow,UK, 2University of Glasgow, West of Scotland Cancer Surveillance Unit, Glasgow, UKINTRODUCTION. 10–15 % of patients admitted to ICU have a diagnosis of cancer.[1]Cancer patients have been excluded from ICU in the past due to their high mortality fromcritical illness however features of the malignancy do not dictate short-term survival.[2] Forcancer patients to benefit from ICU they must survive with a good quality of life afterdischarge; the concern is that their life expectancy may be restricted due to the malig-nancy.[3]Lung cancer is the most common cause of cancer mortality in Scotland and 1-yearsurvival is 19.6 %.[4].OBJECTIVES. Our aims were to define the characteristics of ICU lung cancer patients,determine the rates of short and long-term mortality compared to matched non-ICU patientsand identify predictors of mortality.METHODS. We linked clinical data from four ICUs between 1/1/2000–31/12/2009 and theWest of Scotland Cancer registry. We identified 1,717 patients who had an ICU admissionplus a solid tumour diagnosis 5 years prior to, or during admission. From the ICU cancerpopulation we selected patients with a diagnosis of lung cancer based on ICD-10 coding andmatched them to a group of non-ICU lung cancer patients using predetermined character-istics. Statistical analyses were performed using StataCorp. 2011. Stata Statistical Software:Release 12.RESULTS. 144 (8.4 %) of the ICU cancer patients had lung cancer of which 99 (68.8 %) hadnon-small cell lung cancer. Mechanical ventilation was required for 86.8 % of patientsadmitted. ICU mortality was 49.3 % with a hospital mortality of 61.1 %. Longer-term mortalitywas 76.4 % at 6 months and 86.8 % at 1 year compared to a 1 year mortality of 57.4 % in thematched non-ICU group Fig 1. (P = \ 0.001).On multivariate analysis factors associated with ICU mortality were APACHEII C 25 (HR2.05 p = 0.012) and level of organ support C 2 (HR 2.97 p = 0.001). APACHEII C 25was still associated with higher mortality at 6 months (HR 1.69 p = 0.022) but patients whohad prior tumour resective surgery had significantly lower mortality (HR 0.53 (p = 0.016).Age, metastatic disease or tumour type were not associated with short or long-termmortality.
Figure 1
CONCLUSION. Our results suggest that severity of illness is the main indicator of short-term mortality in critically ill lung cancer patients and this continues to have an impact on6 month mortality. However, at 6 months features relating to cancer management (i.e.tumour resective surgery) also influence survival. The benefit of ICU for lung cancerpatients with severe critical illness should be further assessed as unit mortality is high andsurvival time after discharge is limited.
26th ESICM ANNUAL CONGRESS — PARIS, FRANCE — 5–9 OCTOBER 2013
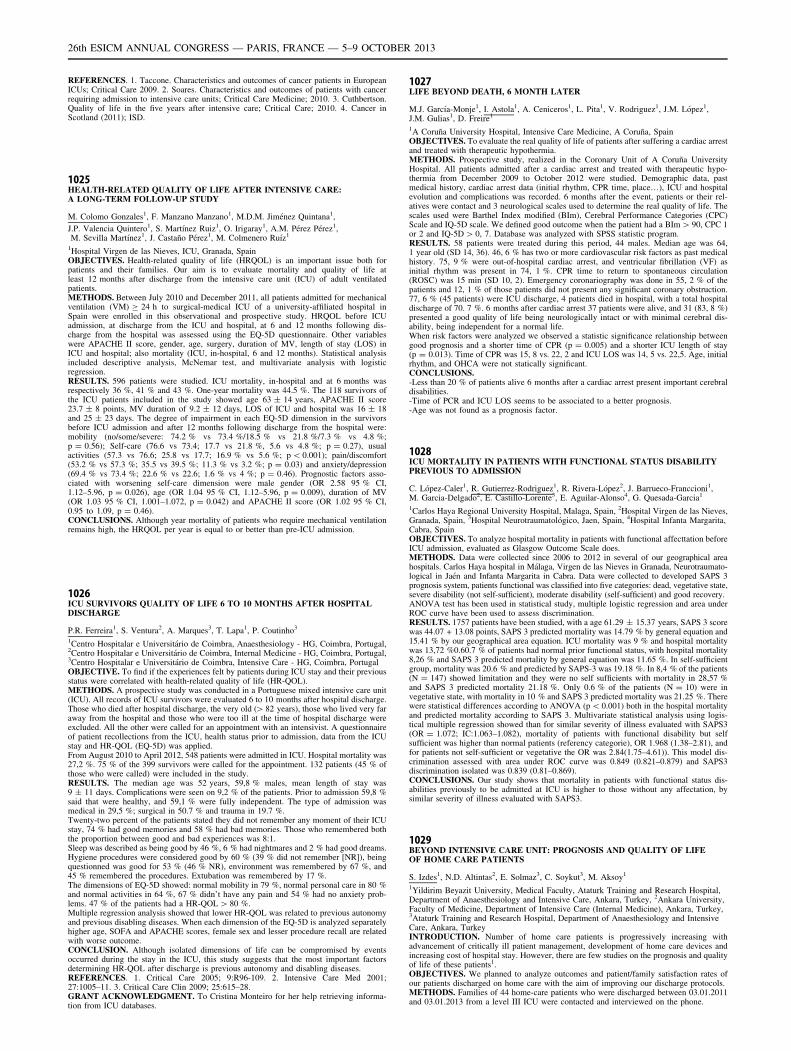
REFERENCES. 1. Taccone. Characteristics and outcomes of cancer patients in EuropeanICUs; Critical Care 2009. 2. Soares. Characteristics and outcomes of patients with cancerrequiring admission to intensive care units; Critical Care Medicine; 2010. 3. Cuthbertson.Quality of life in the five years after intensive care; Critical Care; 2010. 4. Cancer inScotland (2011); ISD.
1025HEALTH-RELATED QUALITY OF LIFE AFTER INTENSIVE CARE:A LONG-TERM FOLLOW-UP STUDY
M. Colomo Gonzales1, F. Manzano Manzano1, M.D.M. Jiménez Quintana1,
J.P. Valencia Quintero1, S. Martı́nez Ruiz1, O. Irigaray1, A.M. Pérez Pérez1,M. Sevilla Martı́nez1, J. Castaño Pérez1, M. Colmenero Ruı́z1
1Hospital Virgen de las Nieves, ICU, Granada, SpainOBJECTIVES. Health-related quality of life (HRQOL) is an important issue both forpatients and their families. Our aim is to evaluate mortality and quality of life atleast 12 months after discharge from the intensive care unit (ICU) of adult ventilatedpatients.METHODS. Between July 2010 and December 2011, all patients admitted for mechanicalventilation (VM) C 24 h to surgical-medical ICU of a university-affiliated hospital inSpain were enrolled in this observational and prospective study. HRQOL before ICUadmission, at discharge from the ICU and hospital, at 6 and 12 months following dis-charge from the hospital was assessed using the EQ-5D questionnaire. Other variableswere APACHE II score, gender, age, surgery, duration of MV, length of stay (LOS) inICU and hospital; also mortality (ICU, in-hospital, 6 and 12 months). Statistical analysisincluded descriptive analysis, McNemar test, and multivariate analysis with logisticregression.RESULTS. 596 patients were studied. ICU mortality, in-hospital and at 6 months wasrespectively 36 %, 41 % and 43 %. One-year mortality was 44.5 %. The 118 survivors ofthe ICU patients included in the study showed age 63 ± 14 years, APACHE II score23.7 ± 8 points, MV duration of 9.2 ± 12 days, LOS of ICU and hospital was 16 ± 18and 25 ± 23 days. The degree of impairment in each EQ-5D dimension in the survivorsbefore ICU admission and after 12 months following discharge from the hospital were:mobility (no/some/severe: 74.2 % vs 73.4 %/18.5 % vs 21.8 %/7.3 % vs 4.8 %;p = 0.56); Self-care (76.6 vs 73.4; 17.7 vs 21.8 %, 5.6 vs 4.8 %; p = 0.27), usualactivities (57.3 vs 76.6; 25.8 vs 17.7; 16.9 % vs 5.6 %; p \ 0.001); pain/discomfort(53.2 % vs 57.3 %; 35.5 vs 39.5 %; 11.3 % vs 3.2 %; p = 0.03) and anxiety/depression(69.4 % vs 73.4 %; 22.6 % vs 22.6; 1.6 % vs 4 %; p = 0.46). Prognostic factors asso-ciated with worsening self-care dimension were male gender (OR 2.58 95 % CI,1.12–5.96, p = 0.026), age (OR 1.04 95 % CI, 1.12–5.96, p = 0.009), duration of MV(OR 1.03 95 % CI, 1.001–1.072, p = 0.042) and APACHE II score (OR 1.02 95 % CI,0.95 to 1.09, p = 0.46).CONCLUSIONS. Although year mortality of patients who require mechanical ventilationremains high, the HRQOL per year is equal to or better than pre-ICU admission.
1026ICU SURVIVORS QUALITY OF LIFE 6 TO 10 MONTHS AFTER HOSPITALDISCHARGE
P.R. Ferreira1, S. Ventura2, A. Marques3, T. Lapa1, P. Coutinho3
1Centro Hospitalar e Universitário de Coimbra, Anaesthesiology - HG, Coimbra, Portugal,2Centro Hospitalar e Universitário de Coimbra, Internal Medicine - HG, Coimbra, Portugal,3Centro Hospitalar e Universitário de Coimbra, Intensive Care - HG, Coimbra, PortugalOBJECTIVE. To find if the experiences felt by patients during ICU stay and their previousstatus were correlated with health-related quality of life (HR-QOL).METHODS. A prospective study was conducted in a Portuguese mixed intensive care unit(ICU). All records of ICU survivors were evaluated 6 to 10 months after hospital discharge.Those who died after hospital discharge, the very old ([ 82 years), those who lived very faraway from the hospital and those who were too ill at the time of hospital discharge wereexcluded. All the other were called for an appointment with an intensivist. A questionnaireof patient recollections from the ICU, health status prior to admission, data from the ICUstay and HR-QOL (EQ-5D) was applied.From August 2010 to April 2012, 548 patients were admitted in ICU. Hospital mortality was27,2 %. 75 % of the 399 survivors were called for the appointment. 132 patients (45 % ofthose who were called) were included in the study.RESULTS. The median age was 52 years, 59,8 % males, mean length of stay was9 ± 11 days. Complications were seen on 9,2 % of the patients. Prior to admission 59,8 %said that were healthy, and 59,1 % were fully independent. The type of admission wasmedical in 29,5 %; surgical in 50.7 % and trauma in 19.7 %.Twenty-two percent of the patients stated they did not remember any moment of their ICUstay, 74 % had good memories and 58 % had bad memories. Those who remembered boththe proportion between good and bad experiences was 8:1.Sleep was described as being good by 46 %, 6 % had nightmares and 2 % had good dreams.Hygiene procedures were considered good by 60 % (39 % did not remember [NR]), beingquestionned was good for 53 % (46 % NR), environment was remembered by 67 %, and45 % remembered the procedures. Extubation was remembered by 17 %.The dimensions of EQ-5D showed: normal mobility in 79 %, normal personal care in 80 %and normal activities in 64 %, 67 % didn’t have any pain and 54 % had no anxiety prob-lems. 47 % of the patients had a HR-QOL [ 80 %.Multiple regression analysis showed that lower HR-QOL was related to previous autonomyand previous disabling diseases. When each dimension of the EQ-5D is analyzed separatelyhigher age, SOFA and APACHE scores, female sex and lesser procedure recall are relatedwith worse outcome.CONCLUSION. Although isolated dimensions of life can be compromised by eventsoccurred during the stay in the ICU, this study suggests that the most important factorsdetermining HR-QOL after discharge is previous autonomy and disabling diseases.REFERENCES. 1. Critical Care 2005; 9:R96-109. 2. Intensive Care Med 2001;27:1005–11. 3. Critical Care Clin 2009; 25:615–28.GRANT ACKNOWLEDGMENT. To Cristina Monteiro for her help retrieving informa-tion from ICU databases.
1027LIFE BEYOND DEATH, 6 MONTH LATER
M.J. Garcı́a-Monje1, I. Astola1, A. Ceniceros1, L. Pita1, V. Rodriguez1, J.M. López1,J.M. Gulias1, D. Freire1
1A Coruña University Hospital, Intensive Care Medicine, A Coruña, SpainOBJECTIVES. To evaluate the real quality of life of patients after suffering a cardiac arrestand treated with therapeutic hypothermia.METHODS. Prospective study, realized in the Coronary Unit of A Coruña UniversityHospital. All patients admitted after a cardiac arrest and treated with therapeutic hypo-thermia from December 2009 to October 2012 were studied. Demographic data, pastmedical history, cardiac arrest data (initial rhythm, CPR time, place…), ICU and hospitalevolution and complications was recorded. 6 months after the event, patients or their rel-atives were contact and 3 neurological scales used to determine the real quality of life. Thescales used were Barthel Index modified (BIm), Cerebral Performance Categories (CPC)Scale and IQ-5D scale. We defined good outcome when the patient had a BIm [ 90, CPC 1or 2 and IQ-5D [ 0, 7. Database was analyzed with SPSS statistic program.RESULTS. 58 patients were treated during this period, 44 males. Median age was 64,1 year old (SD 14, 36). 46, 6 % has two or more cardiovascular risk factors as past medicalhistory. 75, 9 % were out-of-hospital cardiac arrest, and ventricular fibrillation (VF) asinitial rhythm was present in 74, 1 %. CPR time to return to spontaneous circulation(ROSC) was 15 min (SD 10, 2). Emergency coronariography was done in 55, 2 % of thepatients and 12, 1 % of those patients did not present any significant coronary obstruction.77, 6 % (45 patients) were ICU discharge, 4 patients died in hospital, with a total hospitaldischarge of 70. 7 %. 6 months after cardiac arrest 37 patients were alive, and 31 (83, 8 %)presented a good quality of life being neurologically intact or with minimal cerebral dis-ability, being independent for a normal life.When risk factors were analyzed we observed a statistic significance relationship betweengood prognosis and a shorter time of CPR (p = 0.005) and a shorter ICU length of stay(p = 0.013). Time of CPR was 15, 8 vs. 22, 2 and ICU LOS was 14, 5 vs. 22,5. Age, initialrhythm, and OHCA were not statically significant.CONCLUSIONS.-Less than 20 % of patients alive 6 months after a cardiac arrest present important cerebraldisabilities.-Time of PCR and ICU LOS seems to be associated to a better prognosis.-Age was not found as a prognosis factor.
1028ICU MORTALITY IN PATIENTS WITH FUNCTIONAL STATUS DISABILITYPREVIOUS TO ADMISSION
C. López-Caler1, R. Gutierrez-Rodriguez1, R. Rivera-López2, J. Barrueco-Franccioni1,M. Garcia-Delgado2, E. Castillo-Lorente3, E. Aguilar-Alonso4, G. Quesada-Garcia1
1Carlos Haya Regional University Hospital, Malaga, Spain, 2Hospital Virgen de las Nieves,Granada, Spain, 3Hospital Neurotraumatológico, Jaen, Spain, 4Hospital Infanta Margarita,Cabra, SpainOBJECTIVES. To analyze hospital mortality in patients with functional affecttation beforeICU admission, evaluated as Glasgow Outcome Scale does.METHODS. Data were collected since 2006 to 2012 in several of our geographical areahospitals. Carlos Haya hospital in Málaga, Virgen de las Nieves in Granada, Neurotraumato-logical in Jaén and Infanta Margarita in Cabra. Data were collected to developed SAPS 3prognosis system, patients functional was classified into five categories: dead, vegetative state,severe disability (not self-sufficient), moderate disability (self-sufficient) and good recovery.ANOVA test has been used in statistical study, multiple logistic regression and area underROC curve have been used to assess discrimination.RESULTS. 1757 patients have been studied, with a age 61.29 ± 15.37 years, SAPS 3 scorewas 44.07 + 13.08 points, SAPS 3 predicted mortality was 14.79 % by general equation and15.41 % by our geographical area equation. ICU mortality was 9 % and hospital mortalitywas 13,72 %0.60.7 % of patients had normal prior functional status, with hospital mortality8,26 % and SAPS 3 predicted mortality by general equation was 11.65 %. In self-sufficientgroup, mortality was 20.6 % and predicted by SAPS-3 was 19.18 %. In 8,4 % of the patients(N = 147) showed limitation and they were no self sufficients with mortality in 28,57 %and SAPS 3 predicted mortality 21.18 %. Only 0.6 % of the patients (N = 10) were invegetative state, with mortality in 10 % and SAPS 3 predicted mortality was 21.25 %. Therewere statistical differences according to ANOVA (p \ 0.001) both in the hospital mortalityand predicted mortality according to SAPS 3. Multivariate statistical analysis using logis-tical multiple regression showed than for similar severity of illness evaluated with SAPS3(OR = 1.072; IC:1.063–1.082), mortality of patients with functional disability but selfsufficient was higher than normal patients (referency categorie), OR 1.968 (1.38–2.81), andfor patients not self-sufficient or vegetative the OR was 2.84(1.75–4.61)). This model dis-crimination assessed with area under ROC curve was 0.849 (0.821–0.879) and SAPS3discrimination isolated was 0.839 (0.81–0.869).CONCLUSIONS. Our study shows that mortality in patients with functional status dis-abilities previously to be admitted at ICU is higher to those without any affectation, bysimilar severity of illness evaluated with SAPS3.
1029BEYOND INTENSIVE CARE UNIT: PROGNOSIS AND QUALITY OF LIFEOF HOME CARE PATIENTS
S. Izdes1, N.D. Altintas2, E. Solmaz3, C. Soykut3, M. Aksoy1
1Yildirim Beyazit University, Medical Faculty, Ataturk Training and Research Hospital,Department of Anaesthesiology and Intensive Care, Ankara, Turkey, 2Ankara University,Faculty of Medicine, Department of Intensive Care (Internal Medicine), Ankara, Turkey,3Ataturk Training and Research Hospital, Department of Anaesthesiology and IntensiveCare, Ankara, TurkeyINTRODUCTION. Number of home care patients is progressively increasing withadvancement of critically ill patient management, development of home care devices andincreasing cost of hospital stay. However, there are few studies on the prognosis and qualityof life of these patients1.OBJECTIVES. We planned to analyze outcomes and patient/family satisfaction rates ofour patients discharged on home care with the aim of improving our discharge protocols.METHODS. Families of 44 home-care patients who were discharged between 03.01.2011and 03.01.2013 from a level III ICU were contacted and interviewed on the phone.
26th ESICM ANNUAL CONGRESS — PARIS, FRANCE — 5–9 OCTOBER 2013
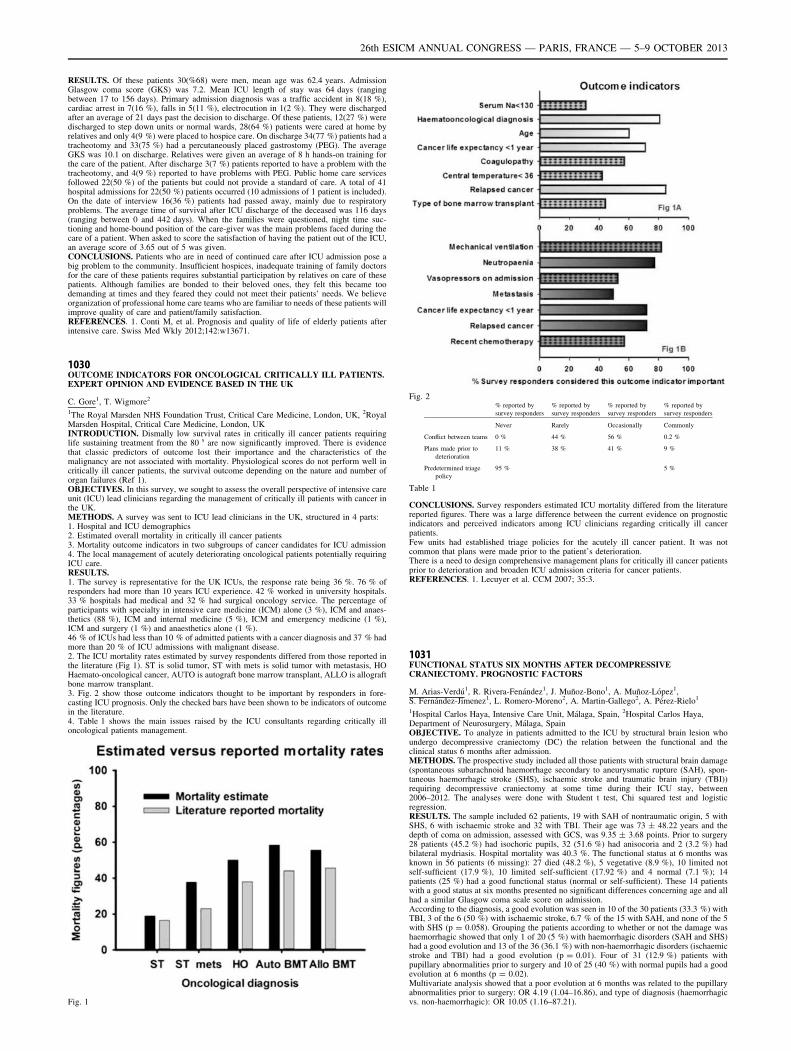
RESULTS. Of these patients 30(%68) were men, mean age was 62.4 years. AdmissionGlasgow coma score (GKS) was 7.2. Mean ICU length of stay was 64 days (rangingbetween 17 to 156 days). Primary admission diagnosis was a traffic accident in 8(18 %),cardiac arrest in 7(16 %), falls in 5(11 %), electrocution in 1(2 %). They were dischargedafter an average of 21 days past the decision to discharge. Of these patients, 12(27 %) weredischarged to step down units or normal wards, 28(64 %) patients were cared at home byrelatives and only 4(9 %) were placed to hospice care. On discharge 34(77 %) patients had atracheotomy and 33(75 %) had a percutaneously placed gastrostomy (PEG). The averageGKS was 10.1 on discharge. Relatives were given an average of 8 h hands-on training forthe care of the patient. After discharge 3(7 %) patients reported to have a problem with thetracheotomy, and 4(9 %) reported to have problems with PEG. Public home care servicesfollowed 22(50 %) of the patients but could not provide a standard of care. A total of 41hospital admissions for 22(50 %) patients occurred (10 admissions of 1 patient is included).On the date of interview 16(36 %) patients had passed away, mainly due to respiratoryproblems. The average time of survival after ICU discharge of the deceased was 116 days(ranging between 0 and 442 days). When the families were questioned, night time suc-tioning and home-bound position of the care-giver was the main problems faced during thecare of a patient. When asked to score the satisfaction of having the patient out of the ICU,an average score of 3.65 out of 5 was given.CONCLUSIONS. Patients who are in need of continued care after ICU admission pose abig problem to the community. Insufficient hospices, inadequate training of family doctorsfor the care of these patients requires substantial participation by relatives on care of thesepatients. Although families are bonded to their beloved ones, they felt this became toodemanding at times and they feared they could not meet their patients’ needs. We believeorganization of professional home care teams who are familiar to needs of these patients willimprove quality of care and patient/family satisfaction.REFERENCES. 1. Conti M, et al. Prognosis and quality of life of elderly patients afterintensive care. Swiss Med Wkly 2012;142:w13671.
1030OUTCOME INDICATORS FOR ONCOLOGICAL CRITICALLY ILL PATIENTS.EXPERT OPINION AND EVIDENCE BASED IN THE UK
C. Gore1, T. Wigmore2
1The Royal Marsden NHS Foundation Trust, Critical Care Medicine, London, UK, 2RoyalMarsden Hospital, Critical Care Medicine, London, UKINTRODUCTION. Dismally low survival rates in critically ill cancer patients requiringlife sustaining treatment from the 80 s are now significantly improved. There is evidencethat classic predictors of outcome lost their importance and the characteristics of themalignancy are not associated with mortality. Physiological scores do not perform well incritically ill cancer patients, the survival outcome depending on the nature and number oforgan failures (Ref 1).OBJECTIVES. In this survey, we sought to assess the overall perspective of intensive careunit (ICU) lead clinicians regarding the management of critically ill patients with cancer inthe UK.METHODS. A survey was sent to ICU lead clinicians in the UK, structured in 4 parts:1. Hospital and ICU demographics2. Estimated overall mortality in critically ill cancer patients3. Mortality outcome indicators in two subgroups of cancer candidates for ICU admission4. The local management of acutely deteriorating oncological patients potentially requiringICU care.RESULTS.1. The survey is representative for the UK ICUs, the response rate being 36 %. 76 % ofresponders had more than 10 years ICU experience. 42 % worked in university hospitals.33 % hospitals had medical and 32 % had surgical oncology service. The percentage ofparticipants with specialty in intensive care medicine (ICM) alone (3 %), ICM and anaes-thetics (88 %), ICM and internal medicine (5 %), ICM and emergency medicine (1 %),ICM and surgery (1 %) and anaesthetics alone (1 %).46 % of ICUs had less than 10 % of admitted patients with a cancer diagnosis and 37 % hadmore than 20 % of ICU admissions with malignant disease.2. The ICU mortality rates estimated by survey respondents differed from those reported inthe literature (Fig 1). ST is solid tumor, ST with mets is solid tumor with metastasis, HOHaemato-oncological cancer, AUTO is autograft bone marrow transplant, ALLO is allograftbone marrow transplant.3. Fig. 2 show those outcome indicators thought to be important by responders in fore-casting ICU prognosis. Only the checked bars have been shown to be indicators of outcomein the literature.4. Table 1 shows the main issues raised by the ICU consultants regarding critically illoncological patients management.
Fig. 1
Fig. 2% reported by
survey responders
% reported by
survey responders
% reported by
survey responders
% reported by
survey responders
Never Rarely Occasionally Commonly
Conflict between teams 0 % 44 % 56 % 0.2 %
Plans made prior to
deterioration
11 % 38 % 41 % 9 %
Predetermined triage
policy
95 % 5 %
Table 1
CONCLUSIONS. Survey responders estimated ICU mortality differed from the literaturereported figures. There was a large difference between the current evidence on prognosticindicators and perceived indicators among ICU clinicians regarding critically ill cancerpatients.Few units had established triage policies for the acutely ill cancer patient. It was notcommon that plans were made prior to the patient’s deterioration.There is a need to design comprehensive management plans for critically ill cancer patientsprior to deterioration and broaden ICU admission criteria for cancer patients.REFERENCES. 1. Lecuyer et al. CCM 2007; 35:3.
1031FUNCTIONAL STATUS SIX MONTHS AFTER DECOMPRESSIVECRANIECTOMY. PROGNOSTIC FACTORS
M. Arias-Verdú1, R. Rivera-Fenández1, J. Muñoz-Bono1, A. Muñoz-López1,S. Fernández-Jimenez1, L. Romero-Moreno2, A. Martin-Gallego2, A. Pérez-Rielo1
1Hospital Carlos Haya, Intensive Care Unit, Málaga, Spain, 2Hospital Carlos Haya,Department of Neurosurgery, Málaga, SpainOBJECTIVE. To analyze in patients admitted to the ICU by structural brain lesion whoundergo decompressive craniectomy (DC) the relation between the functional and theclinical status 6 months after admission.METHODS. The prospective study included all those patients with structural brain damage(spontaneous subarachnoid haemorrhage secondary to aneurysmatic rupture (SAH), spon-taneous haemorrhagic stroke (SHS), ischaemic stroke and traumatic brain injury (TBI))requiring decompressive craniectomy at some time during their ICU stay, between2006–2012. The analyses were done with Student t test, Chi squared test and logisticregression.RESULTS. The sample included 62 patients, 19 with SAH of nontraumatic origin, 5 withSHS, 6 with ischaemic stroke and 32 with TBI. Their age was 73 ± 48.22 years and thedepth of coma on admission, assessed with GCS, was 9.35 ± 3.68 points. Prior to surgery28 patients (45.2 %) had isochoric pupils, 32 (51.6 %) had anisocoria and 2 (3.2 %) hadbilateral mydriasis. Hospital mortality was 40.3 %. The functional status at 6 months wasknown in 56 patients (6 missing): 27 died (48.2 %), 5 vegetative (8.9 %), 10 limited notself-sufficient (17.9 %), 10 limited self-sufficient (17.92 %) and 4 normal (7.1 %); 14patients (25 %) had a good functional status (normal or self-sufficient). These 14 patientswith a good status at six months presented no significant differences concerning age and allhad a similar Glasgow coma scale score on admission.According to the diagnosis, a good evolution was seen in 10 of the 30 patients (33.3 %) withTBI, 3 of the 6 (50 %) with ischaemic stroke, 6.7 % of the 15 with SAH, and none of the 5with SHS (p = 0.058). Grouping the patients according to whether or not the damage washaemorrhagic showed that only 1 of 20 (5 %) with haemorrhagic disorders (SAH and SHS)had a good evolution and 13 of the 36 (36.1 %) with non-haemorrhagic disorders (ischaemicstroke and TBI) had a good evolution (p = 0.01). Four of 31 (12.9 %) patients withpupillary abnormalities prior to surgery and 10 of 25 (40 %) with normal pupils had a goodevolution at 6 months (p = 0.02).Multivariate analysis showed that a poor evolution at 6 months was related to the pupillaryabnormalities prior to surgery: OR 4.19 (1.04–16.86), and type of diagnosis (haemorrhagicvs. non-haemorrhagic): OR 10.05 (1.16–87.21).
26th ESICM ANNUAL CONGRESS — PARIS, FRANCE — 5–9 OCTOBER 2013
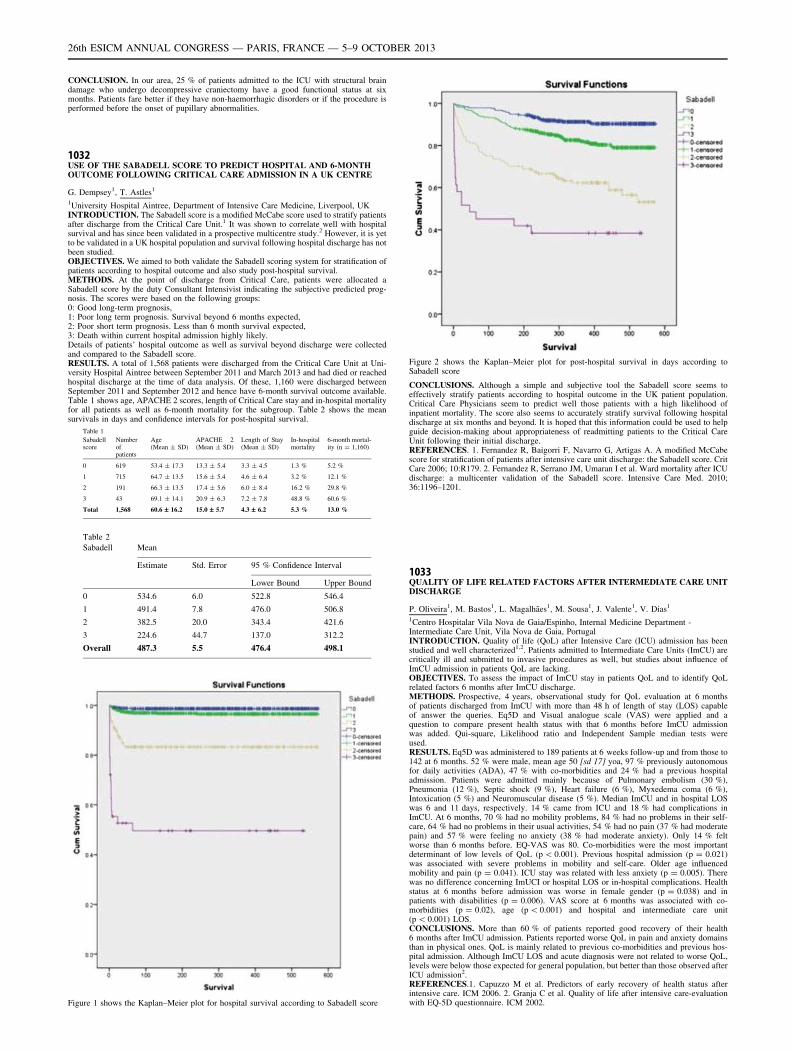
CONCLUSION. In our area, 25 % of patients admitted to the ICU with structural braindamage who undergo decompressive craniectomy have a good functional status at sixmonths. Patients fare better if they have non-haemorrhagic disorders or if the procedure isperformed before the onset of pupillary abnormalities.
1032USE OF THE SABADELL SCORE TO PREDICT HOSPITAL AND 6-MONTHOUTCOME FOLLOWING CRITICAL CARE ADMISSION IN A UK CENTRE
G. Dempsey1, T. Astles1
1University Hospital Aintree, Department of Intensive Care Medicine, Liverpool, UKINTRODUCTION. The Sabadell score is a modified McCabe score used to stratify patientsafter discharge from the Critical Care Unit.1 It was shown to correlate well with hospitalsurvival and has since been validated in a prospective multicentre study.2 However, it is yetto be validated in a UK hospital population and survival following hospital discharge has notbeen studied.OBJECTIVES. We aimed to both validate the Sabadell scoring system for stratification ofpatients according to hospital outcome and also study post-hospital survival.METHODS. At the point of discharge from Critical Care, patients were allocated aSabadell score by the duty Consultant Intensivist indicating the subjective predicted prog-nosis. The scores were based on the following groups:0: Good long-term prognosis,1: Poor long term prognosis. Survival beyond 6 months expected,2: Poor short term prognosis. Less than 6 month survival expected,3: Death within current hospital admission highly likely.Details of patients’ hospital outcome as well as survival beyond discharge were collectedand compared to the Sabadell score.RESULTS. A total of 1,568 patients were discharged from the Critical Care Unit at Uni-versity Hospital Aintree between September 2011 and March 2013 and had died or reachedhospital discharge at the time of data analysis. Of these, 1,160 were discharged betweenSeptember 2011 and September 2012 and hence have 6-month survival outcome available.Table 1 shows age, APACHE 2 scores, length of Critical Care stay and in-hospital mortalityfor all patients as well as 6-month mortality for the subgroup. Table 2 shows the meansurvivals in days and confidence intervals for post-hospital survival.
Table 1
Sabadellscore
Numberofpatients
Age(Mean ± SD)
APACHE 2(Mean ± SD)
Length of Stay(Mean ± SD)
In-hospitalmortality
6-month mortal-ity (n = 1,160)
0 619 53.4 ± 17.3 13.3 ± 5.4 3.3 ± 4.5 1.3 % 5.2 %
1 715 64.7 ± 13.5 15.6 ± 5.4 4.6 ± 6.4 3.2 % 12.1 %
2 191 66.3 ± 13.5 17.4 ± 5.6 6.0 ± 8.4 16.2 % 29.8 %
3 43 69.1 ± 14.1 20.9 ± 6.3 7.2 ± 7.8 48.8 % 60.6 %
Total 1,568 60.6 – 16.2 15.0 – 5.7 4.3 – 6.2 5.3 % 13.0 %
Table 2
Sabadell Mean
Estimate Std. Error 95 % Confidence Interval
Lower Bound Upper Bound
0 534.6 6.0 522.8 546.4
1 491.4 7.8 476.0 506.8
2 382.5 20.0 343.4 421.6
3 224.6 44.7 137.0 312.2
Overall 487.3 5.5 476.4 498.1
Figure 1 shows the Kaplan–Meier plot for hospital survival according to Sabadell score
Figure 2 shows the Kaplan–Meier plot for post-hospital survival in days according toSabadell score
CONCLUSIONS. Although a simple and subjective tool the Sabadell score seems toeffectively stratify patients according to hospital outcome in the UK patient population.Critical Care Physicians seem to predict well those patients with a high likelihood ofinpatient mortality. The score also seems to accurately stratify survival following hospitaldischarge at six months and beyond. It is hoped that this information could be used to helpguide decision-making about appropriateness of readmitting patients to the Critical CareUnit following their initial discharge.REFERENCES. 1. Fernandez R, Baigorri F, Navarro G, Artigas A. A modified McCabescore for stratification of patients after intensive care unit discharge: the Sabadell score. CritCare 2006; 10:R179. 2. Fernandez R, Serrano JM, Umaran I et al. Ward mortality after ICUdischarge: a multicenter validation of the Sabadell score. Intensive Care Med. 2010;36:1196–1201.
1033QUALITY OF LIFE RELATED FACTORS AFTER INTERMEDIATE CARE UNITDISCHARGE
P. Oliveira1, M. Bastos1, L. Magalhães1, M. Sousa1, J. Valente1, V. Dias1
1Centro Hospitalar Vila Nova de Gaia/Espinho, Internal Medicine Department -Intermediate Care Unit, Vila Nova de Gaia, PortugalINTRODUCTION. Quality of life (QoL) after Intensive Care (ICU) admission has beenstudied and well characterized1,2. Patients admitted to Intermediate Care Units (ImCU) arecritically ill and submitted to invasive procedures as well, but studies about influence ofImCU admission in patients QoL are lacking.OBJECTIVES. To assess the impact of ImCU stay in patients QoL and to identify QoLrelated factors 6 months after ImCU discharge.METHODS. Prospective, 4 years, observational study for QoL evaluation at 6 monthsof patients discharged from ImCU with more than 48 h of length of stay (LOS) capableof answer the queries. Eq5D and Visual analogue scale (VAS) were applied and aquestion to compare present health status with that 6 months before ImCU admissionwas added. Qui-square, Likelihood ratio and Independent Sample median tests wereused.RESULTS. Eq5D was administered to 189 patients at 6 weeks follow-up and from those to142 at 6 months. 52 % were male, mean age 50 [sd 17] yoa, 97 % previously autonomousfor daily activities (ADA), 47 % with co-morbidities and 24 % had a previous hospitaladmission. Patients were admitted mainly because of Pulmonary embolism (30 %),Pneumonia (12 %), Septic shock (9 %), Heart failure (6 %), Myxedema coma (6 %),Intoxication (5 %) and Neuromuscular disease (5 %). Median ImCU and in hospital LOSwas 6 and 11 days, respectively. 14 % came from ICU and 18 % had complications inImCU. At 6 months, 70 % had no mobility problems, 84 % had no problems in their self-care, 64 % had no problems in their usual activities, 54 % had no pain (37 % had moderatepain) and 57 % were feeling no anxiety (38 % had moderate anxiety). Only 14 % feltworse than 6 months before. EQ-VAS was 80. Co-morbidities were the most importantdeterminant of low levels of QoL (p \ 0.001). Previous hospital admission (p = 0.021)was associated with severe problems in mobility and self-care. Older age influencedmobility and pain (p = 0.041). ICU stay was related with less anxiety (p = 0.005). Therewas no difference concerning ImUCI or hospital LOS or in-hospital complications. Healthstatus at 6 months before admission was worse in female gender (p = 0.038) and inpatients with disabilities (p = 0.006). VAS score at 6 months was associated with co-morbidities (p = 0.02), age (p \ 0.001) and hospital and intermediate care unit(p \ 0.001) LOS.CONCLUSIONS. More than 60 % of patients reported good recovery of their health6 months after ImCU admission. Patients reported worse QoL in pain and anxiety domainsthan in physical ones. QoL is mainly related to previous co-morbidities and previous hos-pital admission. Although ImCU LOS and acute diagnosis were not related to worse QoL,levels were below those expected for general population, but better than those observed afterICU admission2.REFERENCES.1. Capuzzo M et al. Predictors of early recovery of health status afterintensive care. ICM 2006. 2. Granja C et al. Quality of life after intensive care-evaluationwith EQ-5D questionnaire. ICM 2002.
26th ESICM ANNUAL CONGRESS — PARIS, FRANCE — 5–9 OCTOBER 2013
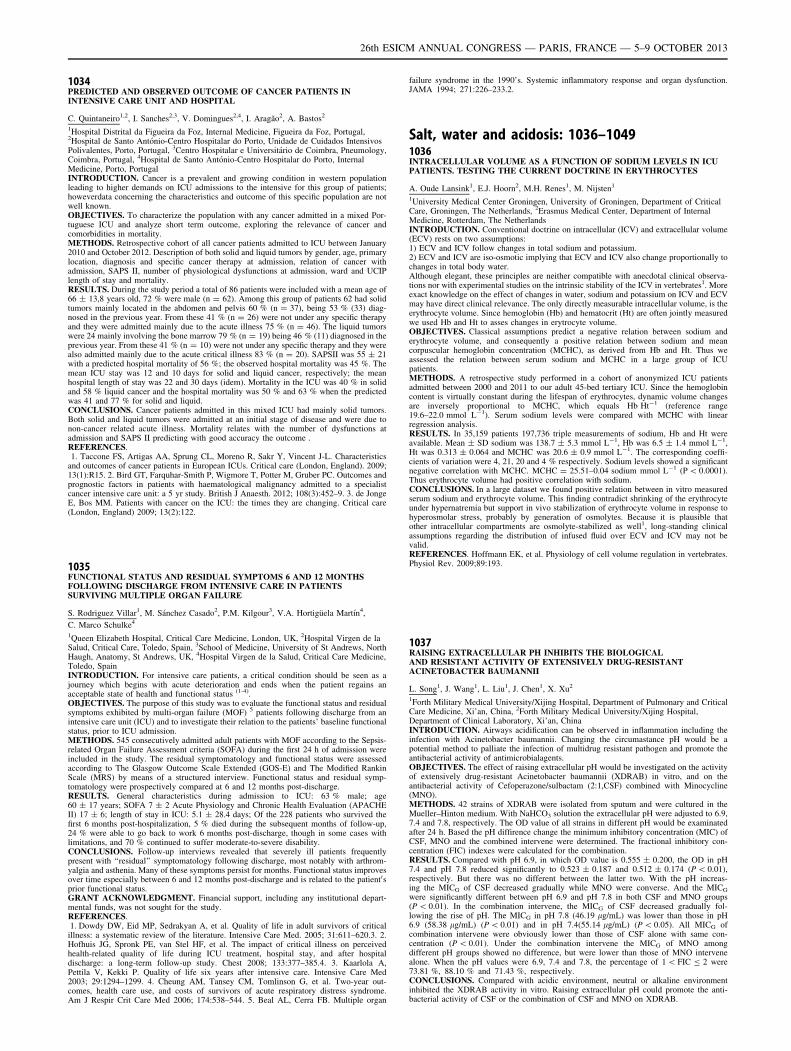
1034PREDICTED AND OBSERVED OUTCOME OF CANCER PATIENTS ININTENSIVE CARE UNIT AND HOSPITAL
C. Quintaneiro1,2, I. Sanches2,3, V. Domingues2,4, I. Aragão2, A. Bastos2
1Hospital Distrital da Figueira da Foz, Internal Medicine, Figueira da Foz, Portugal,2Hospital de Santo António-Centro Hospitalar do Porto, Unidade de Cuidados IntensivosPolivalentes, Porto, Portugal, 3Centro Hospitalar e Universitário de Coimbra, Pneumology,Coimbra, Portugal, 4Hospital de Santo António-Centro Hospitalar do Porto, InternalMedicine, Porto, PortugalINTRODUCTION. Cancer is a prevalent and growing condition in western populationleading to higher demands on ICU admissions to the intensive for this group of patients;howeverdata concerning the characteristics and outcome of this specific population are notwell known.OBJECTIVES. To characterize the population with any cancer admitted in a mixed Por-tuguese ICU and analyze short term outcome, exploring the relevance of cancer andcomorbidities in mortality.METHODS. Retrospective cohort of all cancer patients admitted to ICU between January2010 and October 2012. Description of both solid and liquid tumors by gender, age, primarylocation, diagnosis and specific cancer therapy at admission, relation of cancer withadmission, SAPS II, number of physiological dysfunctions at admission, ward and UCIPlength of stay and mortality.RESULTS. During the study period a total of 86 patients were included with a mean age of66 ± 13,8 years old, 72 % were male (n = 62). Among this group of patients 62 had solidtumors mainly located in the abdomen and pelvis 60 % (n = 37), being 53 % (33) diag-nosed in the previous year. From these 41 % (n = 26) were not under any specific therapyand they were admitted mainly due to the acute illness 75 % (n = 46). The liquid tumorswere 24 mainly involving the bone marrow 79 % (n = 19) being 46 % (11) diagnosed in theprevious year. From these 41 % (n = 10) were not under any specific therapy and they werealso admitted mainly due to the acute critical illness 83 % (n = 20). SAPSII was 55 ± 21with a predicted hospital mortality of 56 %; the observed hospital mortality was 45 %. Themean ICU stay was 12 and 10 days for solid and liquid cancer, respectively; the meanhospital length of stay was 22 and 30 days (idem). Mortality in the ICU was 40 % in solidand 58 % liquid cancer and the hospital mortality was 50 % and 63 % when the predictedwas 41 and 77 % for solid and liquid.CONCLUSIONS. Cancer patients admitted in this mixed ICU had mainly solid tumors.Both solid and liquid tumors were admitted at an initial stage of disease and were due tonon-cancer related acute illness. Mortality relates with the number of dysfunctions atadmission and SAPS II predicting with good accuracy the outcome .REFERENCES.1. Taccone FS, Artigas AA, Sprung CL, Moreno R, Sakr Y, Vincent J-L. Characteristics
and outcomes of cancer patients in European ICUs. Critical care (London, England). 2009;13(1):R15. 2. Bird GT, Farquhar-Smith P, Wigmore T, Potter M, Gruber PC. Outcomes andprognostic factors in patients with haematological malignancy admitted to a specialistcancer intensive care unit: a 5 yr study. British J Anaesth. 2012; 108(3):452–9. 3. de JongeE, Bos MM. Patients with cancer on the ICU: the times they are changing. Critical care(London, England) 2009; 13(2):122.
1035FUNCTIONAL STATUS AND RESIDUAL SYMPTOMS 6 AND 12 MONTHSFOLLOWING DISCHARGE FROM INTENSIVE CARE IN PATIENTSSURVIVING MULTIPLE ORGAN FAILURE
S. Rodriguez Villar1, M. Sánchez Casado2, P.M. Kilgour3, V.A. Hortigüela Martı́n4,
C. Marco Schulke4
1Queen Elizabeth Hospital, Critical Care Medicine, London, UK, 2Hospital Virgen de laSalud, Critical Care, Toledo, Spain, 3School of Medicine, University of St Andrews, NorthHaugh, Anatomy, St Andrews, UK, 4Hospital Virgen de la Salud, Critical Care Medicine,Toledo, SpainINTRODUCTION. For intensive care patients, a critical condition should be seen as ajourney which begins with acute deterioration and ends when the patient regains anacceptable state of health and functional status (1-4).OBJECTIVES. The purpose of this study was to evaluate the functional status and residualsymptoms exhibited by multi-organ failure (MOF) 5 patients following discharge from anintensive care unit (ICU) and to investigate their relation to the patients’ baseline functionalstatus, prior to ICU admission.METHODS. 545 consecutively admitted adult patients with MOF according to the Sepsis-related Organ Failure Assessment criteria (SOFA) during the first 24 h of admission wereincluded in the study. The residual symptomatology and functional status were assessedaccording to The Glasgow Outcome Scale Extended (GOS-E) and The Modified RankinScale (MRS) by means of a structured interview. Functional status and residual symp-tomatology were prospectively compared at 6 and 12 months post-discharge.RESULTS. General characteristics during admission to ICU: 63 % male; age60 ± 17 years; SOFA 7 ± 2 Acute Physiology and Chronic Health Evaluation (APACHEII) 17 ± 6; length of stay in ICU: 5.1 ± 28.4 days; Of the 228 patients who survived thefirst 6 months post-hospitalization, 5 % died during the subsequent months of follow-up,24 % were able to go back to work 6 months post-discharge, though in some cases withlimitations, and 70 % continued to suffer moderate-to-severe disability.CONCLUSIONS. Follow-up interviews revealed that severely ill patients frequentlypresent with ‘‘residual’’ symptomatology following discharge, most notably with arthrom-yalgia and asthenia. Many of these symptoms persist for months. Functional status improvesover time especially between 6 and 12 months post-discharge and is related to the patient0sprior functional status.GRANT ACKNOWLEDGMENT. Financial support, including any institutional depart-mental funds, was not sought for the study.REFERENCES.1. Dowdy DW, Eid MP, Sedrakyan A, et al. Quality of life in adult survivors of critical
illness: a systematic review of the literature. Intensive Care Med. 2005; 31:611–620.3. 2.Hofhuis JG, Spronk PE, van Stel HF, et al. The impact of critical illness on perceivedhealth-related quality of life during ICU treatment, hospital stay, and after hospitaldischarge: a long-term follow-up study. Chest 2008; 133:377–385.4. 3. Kaarlola A,Pettila V, Kekki P. Quality of life six years after intensive care. Intensive Care Med2003; 29:1294–1299. 4. Cheung AM, Tansey CM, Tomlinson G, et al. Two-year out-comes, health care use, and costs of survivors of acute respiratory distress syndrome.Am J Respir Crit Care Med 2006; 174:538–544. 5. Beal AL, Cerra FB. Multiple organ
failure syndrome in the 1990’s. Systemic inflammatory response and organ dysfunction.JAMA 1994; 271:226–233.2.
Salt, water and acidosis: 1036–10491036INTRACELLULAR VOLUME AS A FUNCTION OF SODIUM LEVELS IN ICUPATIENTS. TESTING THE CURRENT DOCTRINE IN ERYTHROCYTES
A. Oude Lansink1, E.J. Hoorn2, M.H. Renes1, M. Nijsten1
1University Medical Center Groningen, University of Groningen, Department of CriticalCare, Groningen, The Netherlands, 2Erasmus Medical Center, Department of InternalMedicine, Rotterdam, The NetherlandsINTRODUCTION. Conventional doctrine on intracellular (ICV) and extracellular volume(ECV) rests on two assumptions:1) ECV and ICV follow changes in total sodium and potassium.2) ECV and ICV are iso-osmotic implying that ECV and ICV also change proportionally tochanges in total body water.Although elegant, these principles are neither compatible with anecdotal clinical observa-tions nor with experimental studies on the intrinsic stability of the ICV in vertebrates1. Moreexact knowledge on the effect of changes in water, sodium and potassium on ICV and ECVmay have direct clinical relevance. The only directly measurable intracellular volume, is theerythrocyte volume. Since hemoglobin (Hb) and hematocrit (Ht) are often jointly measuredwe used Hb and Ht to asses changes in erytrocyte volume.OBJECTIVES. Classical assumptions predict a negative relation between sodium anderythrocyte volume, and consequently a positive relation between sodium and meancorpuscular hemoglobin concentration (MCHC), as derived from Hb and Ht. Thus weassessed the relation between serum sodium and MCHC in a large group of ICUpatients.METHODS. A retrospective study performed in a cohort of anonymized ICU patientsadmitted between 2000 and 2011 to our adult 45-bed tertiary ICU. Since the hemoglobincontent is virtually constant during the lifespan of erythrocytes, dynamic volume changesare inversely proportional to MCHC, which equals Hb Ht-1 (reference range19.6–22.0 mmol L-1). Serum sodium levels were compared with MCHC with linearregression analysis.RESULTS. In 35,159 patients 197,736 triple measurements of sodium, Hb and Ht wereavailable. Mean ± SD sodium was 138.7 ± 5.3 mmol L-1, Hb was 6.5 ± 1.4 mmol L-1,Ht was 0.313 ± 0.064 and MCHC was 20.6 ± 0.9 mmol L-1. The corresponding coeffi-cients of variation were 4, 21, 20 and 4 % respectively. Sodium levels showed a significantnegative correlation with MCHC. MCHC = 25.51–0.04 sodium mmol L-1 (P \ 0.0001).Thus erythrocyte volume had positive correlation with sodium.CONCLUSIONS. In a large dataset we found positive relation between in vitro measuredserum sodium and erythrocyte volume. This finding contradict shrinking of the erythrocyteunder hypernatremia but support in vivo stabilization of erythrocyte volume in response tohyperosmolar stress, probably by generation of osmolytes. Because it is plausible thatother intracellular compartments are osmolyte-stabilized as well1, long-standing clinicalassumptions regarding the distribution of infused fluid over ECV and ICV may not bevalid.REFERENCES. Hoffmann EK, et al. Physiology of cell volume regulation in vertebrates.Physiol Rev. 2009;89:193.
1037RAISING EXTRACELLULAR PH INHIBITS THE BIOLOGICALAND RESISTANT ACTIVITY OF EXTENSIVELY DRUG-RESISTANTACINETOBACTER BAUMANNII
L. Song1, J. Wang1, L. Liu1, J. Chen1, X. Xu2
1Forth Military Medical University/Xijing Hospital, Department of Pulmonary and CriticalCare Medicine, Xi’an, China, 2Forth Military Medical University/Xijing Hospital,Department of Clinical Laboratory, Xi’an, ChinaINTRODUCTION. Airways acidification can be observed in inflammation including theinfection with Acinetobacter baumannii. Changing the circumastance pH would be apotential method to palliate the infection of multidrug resistant pathogen and promote theantibacterial activity of antimicrobialagents.OBJECTIVES. The effect of raising extracellular pH would be investigated on the activityof extensively drug-resistant Acinetobacter baumannii (XDRAB) in vitro, and on theantibacterial activity of Cefoperazone/sulbactam (2:1,CSF) combined with Minocycline(MNO).METHODS. 42 strains of XDRAB were isolated from sputum and were cultured in theMueller–Hinton medium. With NaHCO3 solution the extracellular pH were adjusted to 6.9,7.4 and 7.8, respectively. The OD value of all strains in different pH would be examinatedafter 24 h. Based the pH diffirence change the minimum inhibitory concentration (MIC) ofCSF, MNO and the combined intervene were determined. The fractional inhibitory con-centration (FIC) indexes were calculated for the combination.RESULTS. Compared with pH 6.9, in which OD value is 0.555 ± 0.200, the OD in pH7.4 and pH 7.8 reduced significantly to 0.523 ± 0.187 and 0.512 ± 0.174 (P \ 0.01),respectively. But there was no different between the latter two. With the pH increas-ing the MICG of CSF decreased gradually while MNO were converse. And the MICG
were significantly different between pH 6.9 and pH 7.8 in both CSF and MNO groups(P \ 0.01). In the combination intervene, the MICG of CSF decreased gradually fol-lowing the rise of pH. The MICG in pH 7.8 (46.19 lg/mL) was lower than those in pH6.9 (58.38 lg/mL) (P \ 0.01) and in pH 7.4(55.14 lg/mL) (P \ 0.05). All MICG ofcombination intervene were obviously lower than those of CSF alone with same con-centration (P \ 0.01). Under the combination intervene the MICG of MNO amongdifferent pH groups showed no difference, but were lower than those of MNO intervenealone. When the pH values were 6.9, 7.4 and 7.8, the percentage of 1 \ FIC B 2 were73.81 %, 88.10 % and 71.43 %, respectively.CONCLUSIONS. Compared with acidic environment, neutral or alkaline environmentinhibited the XDRAB activity in vitro. Raising extracellular pH could promote the anti-bacterial activity of CSF or the combination of CSF and MNO on XDRAB.
26th ESICM ANNUAL CONGRESS — PARIS, FRANCE — 5–9 OCTOBER 2013
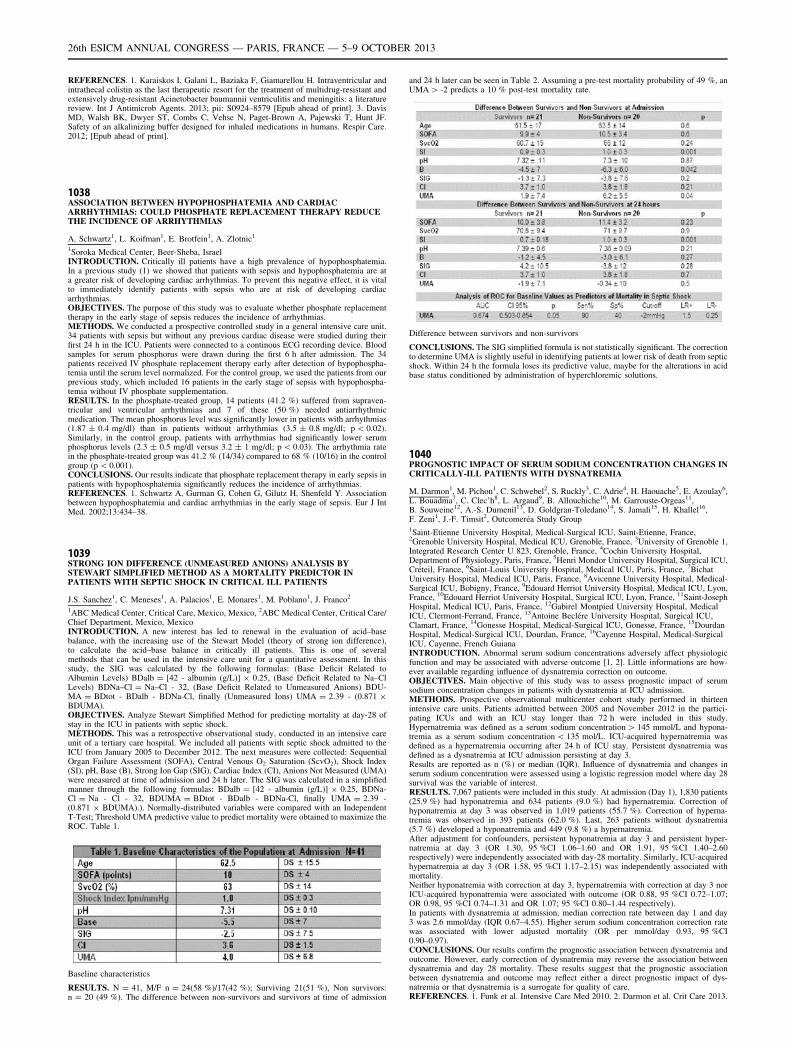
REFERENCES. 1. Karaiskos I, Galani L, Baziaka F, Giamarellou H. Intraventricular andintrathecal colistin as the last therapeutic resort for the treatment of multidrug-resistant andextensively drug-resistant Acinetobacter baumannii ventriculitis and meningitis: a literaturereview. Int J Antimicrob Agents. 2013; pii: S0924–8579 [Epub ahead of print]. 3. DavisMD, Walsh BK, Dwyer ST, Combs C, Vehse N, Paget-Brown A, Pajewski T, Hunt JF.Safety of an alkalinizing buffer designed for inhaled medications in humans. Respir Care.2012; [Epub ahead of print].
1038ASSOCIATION BETWEEN HYPOPHOSPHATEMIA AND CARDIACARRHYTHMIAS: COULD PHOSPHATE REPLACEMENT THERAPY REDUCETHE INCIDENCE OF ARRHYTHMIAS
A. Schwartz1, L. Koifman1, E. Brotfein1, A. Zlotnic1
1Soroka Medical Center, Beer-Sheba, IsraelINTRODUCTION. Critically ill patients have a high prevalence of hypophosphatemia.In a previous study (1) we showed that patients with sepsis and hypophosphatemia are ata greater risk of developing cardiac arrhythmias. To prevent this negative effect, it is vitalto immediately identify patients with sepsis who are at risk of developing cardiacarrhythmias.OBJECTIVES. The purpose of this study was to evaluate whether phosphate replacementtherapy in the early stage of sepsis reduces the incidence of arrhythmias.METHODS. We conducted a prospective controlled study in a general intensive care unit.34 patients with sepsis but without any previous cardiac disease were studied during theirfirst 24 h in the ICU. Patients were connected to a continous ECG recording device. Bloodsamples for serum phosphorus were drawn during the first 6 h after admission. The 34patients received IV phosphate replacement therapy early after detection of hypophospha-temia until the serum level normalized. For the control group, we used the patients from ourprevious study, which included 16 patients in the early stage of sepsis with hypophospha-temia without IV phosphate supplementation.RESULTS. In the phosphate-treated group, 14 patients (41.2 %) suffered from supraven-tricular and ventricular arrhythmias and 7 of these (50 %) needed antiarrhythmicmedication. The mean phosphorus level was significantly lower in patients with arrhythmias(1.87 ± 0.4 mg/dl) than in patients without arrhythmias (3.5 ± 0.8 mg/dl; p \ 0.02).Similarly, in the control group, patients with arrhythmias had significantly lower serumphosphorus levels (2.3 ± 0.5 mg/dl versus 3.2 ± 1 mg/dl; p \ 0.03). The arrhythmia ratein the phosphate-treated group was 41.2 % (14/34) compared to 68 % (10/16) in the controlgroup (p \ 0.001).CONCLUSIONS. Our results indicate that phosphate replacement therapy in early sepsis inpatients with hypophosphatemia significantly reduces the incidence of arrhythmias.REFERENCES. 1. Schwartz A, Gurman G, Cohen G, Gilutz H, Shenfeld Y. Associationbetween hypophosphatemia and cardiac arrhythmias in the early stage of sepsis. Eur J IntMed. 2002;13:434–38.
1039STRONG ION DIFFERENCE (UNMEASURED ANIONS) ANALYSIS BYSTEWART SIMPLIFIED METHOD AS A MORTALITY PREDICTOR INPATIENTS WITH SEPTIC SHOCK IN CRITICAL ILL PATIENTS
J.S. Sanchez1, C. Meneses1, A. Palacios1, E. Monares1, M. Poblano1, J. Franco2
1ABC Medical Center, Critical Care, Mexico, Mexico, 2ABC Medical Center, Critical Care/Chief Department, Mexico, MexicoINTRODUCTION. A new interest has led to renewal in the evaluation of acid–basebalance, with the increasing use of the Stewart Model (theory of strong ion difference),to calculate the acid–base balance in critically ill patients. This is one of severalmethods that can be used in the intensive care unit for a quantitative assessment. In thisstudy, the SIG was calculated by the following formulas: (Base Deficit Related toAlbumin Levels) BDalb = [42 - albumin (g/L)] 9 0.25, (Base Deficit Related to Na–ClLevels) BDNa–Cl = Na–Cl - 32, (Base Deficit Related to Unmeasured Anions) BDU-MA = BDtot - BDalb - BDNa-Cl, finally (Unmeasured Ions) UMA = 2.39 - (0.871 9BDUMA).OBJECTIVES. Analyze Stewart Simplified Method for predicting mortality at day-28 ofstay in the ICU in patients with septic shock.METHODS. This was a retrospective observational study, conducted in an intensive careunit of a tertiary care hospital. We included all patients with septic shock admitted to theICU from January 2005 to December 2012. The next measures were collected: SequentialOrgan Failure Assessment (SOFA), Central Venous O2 Saturation (ScvO2), Shock Index(SI), pH, Base (B), Strong Ion Gap (SIG), Cardiac Index (CI), Anions Not Measured (UMA)were measured at time of admission and 24 h later. The SIG was calculated in a simplifiedmanner through the following formulas: BDalb = [42 - albumin (g/L)] 9 0.25, BDNa-Cl = Na - Cl - 32, BDUMA = BDtot - BDalb - BDNa-Cl, finally UMA = 2.39 -(0.871 9 BDUMA).). Normally-distributed variables were compared with an IndependentT-Test; Threshold UMA predictive value to predict mortality were obtained to maximize theROC. Table 1.
Baseline characteristics
RESULTS. N = 41, M/F n = 24(58 %)/17(42 %); Surviving 21(51 %), Non survivors:n = 20 (49 %). The difference between non-survivors and survivors at time of admission
and 24 h later can be seen in Table 2. Assuming a pre-test mortality probability of 49 %, anUMA [ -2 predicts a 10 % post-test mortality rate.
Difference between survivors and non-survivors
CONCLUSIONS. The SIG simplified formula is not statistically significant. The correctionto determine UMA is slightly useful in identifying patients at lower risk of death from septicshock. Within 24 h the formula loses its predictive value, maybe for the alterations in acidbase status conditioned by administration of hyperchloremic solutions.
1040PROGNOSTIC IMPACT OF SERUM SODIUM CONCENTRATION CHANGES INCRITICALLY-ILL PATIENTS WITH DYSNATREMIA
M. Darmon1, M. Pichon1, C. Schwebel2, S. Ruckly3, C. Adrie4, H. Haouache5, E. Azoulay6,L. Bouadma7, C. Clec’h8, L. Argaud9, B. Allouchiche10, M. Garrouste-Orgeas11,B. Souweine12, A.-S. Dumenil13, D. Goldgran-Toledano14, S. Jamali15, H. Khallel16,F. Zeni1, J.-F. Timsit2, Outcomeréa Study Group1Saint-Etienne University Hospital, Medical-Surgical ICU, Saint-Etienne, France,2Grenoble University Hospital, Medical ICU, Grenoble, France, 3University of Grenoble 1,Integrated Research Center U 823, Grenoble, France, 4Cochin University Hospital,Department of Physiology, Paris, France, 5Henri Mondor University Hospital, Surgical ICU,Créteil, France, 6Saint-Louis University Hospital, Medical ICU, Paris, France, 7BichatUniversity Hospital, Medical ICU, Paris, France, 8Avicenne University Hospital, Medical-Surgical ICU, Bobigny, France, 9Edouard Herriot University Hospital, Medical ICU, Lyon,France, 10Edouard Herriot University Hospital, Surgical ICU, Lyon, France, 11Saint-JosephHospital, Medical ICU, Paris, France, 12Gabirel Montpied University Hospital, MedicalICU, Clermont-Ferrand, France, 13Antoine Beclére University Hospital, Surgical ICU,Clamart, France, 14Gonesse Hospital, Medical-Surgical ICU, Gonesse, France, 15DourdanHospital, Medical-Surgical ICU, Dourdan, France, 16Cayenne Hospital, Medical-SurgicalICU, Cayenne, French GuianaINTRODUCTION. Abnormal serum sodium concentrations adversely affect physiologicfunction and may be associated with adverse outcome [1, 2]. Little informations are how-ever available regarding influence of dysnatremia correction on outcome.OBJECTIVES. Main objective of this study was to assess prognostic impact of serumsodium concentration changes in patients with dysnatremia at ICU admission.METHODS. Prospective observational multicenter cohort study performed in thirteenintensive care units. Patients admitted between 2005 and November 2012 in the partici-pating ICUs and with an ICU stay longer than 72 h were included in this study.Hypernatremia was defined as a serum sodium concentration [ 145 mmol/L and hypona-tremia as a serum sodium concentration \ 135 mol/L. ICU-acquired hypernatremia wasdefined as a hypernatremia occurring after 24 h of ICU stay. Persistent dysnatremia wasdefined as a dysnatremia at ICU admission persisting at day 3.Results are reported as n (%) or median (IQR). Influence of dysnatremia and changes inserum sodium concentration were assessed using a logistic regression model where day 28survival was the variable of interest.RESULTS. 7,067 patients were included in this study. At admission (Day 1), 1,830 patients(25.9 %) had hyponatremia and 634 patients (9.0 %) had hypernatremia. Correction ofhyponatremia at day 3 was observed in 1,019 patients (55.7 %). Correction of hyperna-tremia was observed in 393 patients (62.0 %). Last, 263 patients without dysnatremia(5.7 %) developed a hyponatremia and 449 (9.8 %) a hypernatremia.After adjustment for confounders, persistent hyponatremia at day 3 and persistent hyper-natremia at day 3 (OR 1.30, 95 %CI 1.06–1.60 and OR 1.91, 95 %CI 1.40–2.60respectively) were independently associated with day-28 mortality. Similarly, ICU-acquiredhypernatremia at day 3 (OR 1.58, 95 %CI 1.17–2.15) was independently associated withmortality.Neither hyponatremia with correction at day 3, hypernatremia with correction at day 3 norICU-acquired hyponatremia were associated with outcome (OR 0.88, 95 %CI 0.72–1.07;OR 0.98, 95 %CI 0.74–1.31 and OR 1.07; 95 %CI 0.80–1.44 respectively).In patients with dysnatremia at admission, median correction rate between day 1 and day3 was 2.6 mmol/day (IQR 0.67–4.55). Higher serum sodium concentration correction ratewas associated with lower adjusted mortality (OR per mmol/day 0.93, 95 %CI0.90–0.97).CONCLUSIONS. Our results confirm the prognostic association between dysnatremia andoutcome. However, early correction of dysnatremia may reverse the association betweendysnatremia and day 28 mortality. These results suggest that the prognostic associationbetween dysnatremia and outcome may reflect either a direct prognostic impact of dys-natremia or that dysnatremia is a surrogate for quality of care.REFERENCES. 1. Funk et al. Intensive Care Med 2010. 2. Darmon et al. Crit Care 2013.
26th ESICM ANNUAL CONGRESS — PARIS, FRANCE — 5–9 OCTOBER 2013
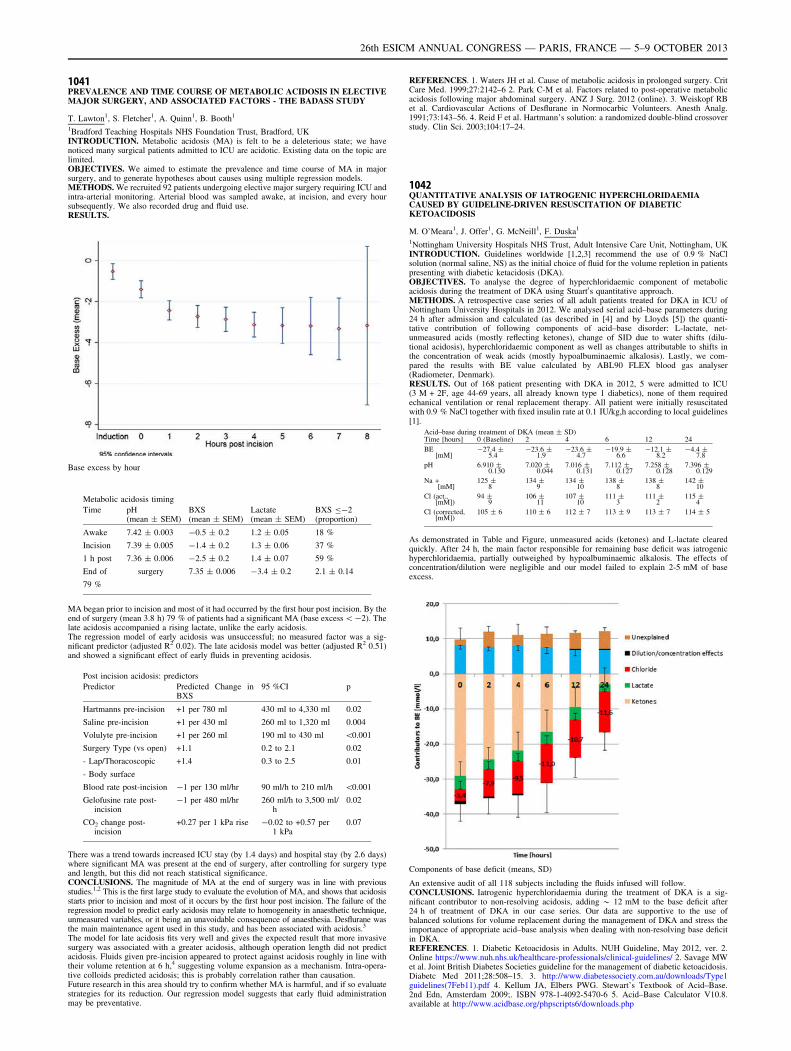
1041PREVALENCE AND TIME COURSE OF METABOLIC ACIDOSIS IN ELECTIVEMAJOR SURGERY, AND ASSOCIATED FACTORS - THE BADASS STUDY
T. Lawton1, S. Fletcher1, A. Quinn1, B. Booth1
1Bradford Teaching Hospitals NHS Foundation Trust, Bradford, UKINTRODUCTION. Metabolic acidosis (MA) is felt to be a deleterious state; we havenoticed many surgical patients admitted to ICU are acidotic. Existing data on the topic arelimited.OBJECTIVES. We aimed to estimate the prevalence and time course of MA in majorsurgery, and to generate hypotheses about causes using multiple regression models.METHODS. We recruited 92 patients undergoing elective major surgery requiring ICU andintra-arterial monitoring. Arterial blood was sampled awake, at incision, and every hoursubsequently. We also recorded drug and fluid use.RESULTS.
Base excess by hour
Metabolic acidosis timing
Time pH(mean ± SEM)
BXS(mean ± SEM)
Lactate(mean ± SEM)
BXS B-2(proportion)
Awake 7.42 ± 0.003 -0.5 ± 0.2 1.2 ± 0.05 18 %
Incision 7.39 ± 0.005 -1.4 ± 0.2 1.3 ± 0.06 37 %
1 h post 7.36 ± 0.006 -2.5 ± 0.2 1.4 ± 0.07 59 %
End of surgery 7.35 ± 0.006 -3.4 ± 0.2 2.1 ± 0.14
79 %
MA began prior to incision and most of it had occurred by the first hour post incision. By theend of surgery (mean 3.8 h) 79 % of patients had a significant MA (base excess \ -2). Thelate acidosis accompanied a rising lactate, unlike the early acidosis.The regression model of early acidosis was unsuccessful; no measured factor was a sig-nificant predictor (adjusted R2 0.02). The late acidosis model was better (adjusted R2 0.51)and showed a significant effect of early fluids in preventing acidosis.
Post incision acidosis: predictors
Predictor Predicted Change inBXS
95 %CI p
Hartmanns pre-incision +1 per 780 ml 430 ml to 4,330 ml 0.02
Saline pre-incision +1 per 430 ml 260 ml to 1,320 ml 0.004
Volulyte pre-incision +1 per 260 ml 190 ml to 430 ml \0.001
Surgery Type (vs open)
- Lap/Thoracoscopic
- Body surface
+1.1
+1.4
0.2 to 2.1
0.3 to 2.5
0.02
0.01
Blood rate post-incision -1 per 130 ml/hr 90 ml/h to 210 ml/h \0.001
Gelofusine rate post-incision
-1 per 480 ml/hr 260 ml/h to 3,500 ml/h
0.02
CO2 change post-incision
+0.27 per 1 kPa rise -0.02 to +0.57 per1 kPa
0.07
There was a trend towards increased ICU stay (by 1.4 days) and hospital stay (by 2.6 days)where significant MA was present at the end of surgery, after controlling for surgery typeand length, but this did not reach statistical significance.CONCLUSIONS. The magnitude of MA at the end of surgery was in line with previousstudies.1,2 This is the first large study to evaluate the evolution of MA, and shows that acidosisstarts prior to incision and most of it occurs by the first hour post incision. The failure of theregression model to predict early acidosis may relate to homogeneity in anaesthetic technique,unmeasured variables, or it being an unavoidable consequence of anaesthesia. Desflurane wasthe main maintenance agent used in this study, and has been associated with acidosis.3
The model for late acidosis fits very well and gives the expected result that more invasivesurgery was associated with a greater acidosis, although operation length did not predictacidosis. Fluids given pre-incision appeared to protect against acidosis roughly in line withtheir volume retention at 6 h,4 suggesting volume expansion as a mechanism. Intra-opera-tive colloids predicted acidosis; this is probably correlation rather than causation.Future research in this area should try to confirm whether MA is harmful, and if so evaluatestrategies for its reduction. Our regression model suggests that early fluid administrationmay be preventative.
REFERENCES. 1. Waters JH et al. Cause of metabolic acidosis in prolonged surgery. CritCare Med. 1999;27:2142–6 2. Park C-M et al. Factors related to post-operative metabolicacidosis following major abdominal surgery. ANZ J Surg. 2012 (online). 3. Weiskopf RBet al. Cardiovascular Actions of Desflurane in Normocarbic Volunteers. Anesth Analg.1991;73:143–56. 4. Reid F et al. Hartmann’s solution: a randomized double-blind crossoverstudy. Clin Sci. 2003;104:17–24.
1042QUANTITATIVE ANALYSIS OF IATROGENIC HYPERCHLORIDAEMIACAUSED BY GUIDELINE-DRIVEN RESUSCITATION OF DIABETICKETOACIDOSIS
M. O’Meara1, J. Offer1, G. McNeill1, F. Duska1
1Nottingham University Hospitals NHS Trust, Adult Intensive Care Unit, Nottingham, UKINTRODUCTION. Guidelines worldwide [1,2,3] recommend the use of 0.9 % NaClsolution (normal saline, NS) as the initial choice of fluid for the volume repletion in patientspresenting with diabetic ketacidosis (DKA).OBJECTIVES. To analyse the degree of hyperchloridaemic component of metabolicacidosis during the treatment of DKA using Stuart0s quantitative approach.METHODS. A retrospective case series of all adult patients treated for DKA in ICU ofNottingham University Hospitals in 2012. We analysed serial acid–base parameters during24 h after admission and calculated (as described in [4] and by Lloyds [5]) the quanti-tative contribution of following components of acid–base disorder: L-lactate, net-unmeasured acids (mostly reflecting ketones), change of SID due to water shifts (dilu-tional acidosis), hyperchloridaemic component as well as changes attributable to shifts inthe concentration of weak acids (mostly hypoalbuminaemic alkalosis). Lastly, we com-pared the results with BE value calculated by ABL90 FLEX blood gas analyser(Radiometer, Denmark).RESULTS. Out of 168 patient presenting with DKA in 2012, 5 were admitted to ICU(3 M + 2F, age 44-69 years, all already known type 1 diabetics), none of them requiredechanical ventilation or renal replacement therapy. All patient were initially resuscitatedwith 0.9 % NaCl together with fixed insulin rate at 0.1 IU/kg,h according to local guidelines[1].
Acid–base during treatment of DKA (mean ± SD)Time [hours] 0 (Baseline) 2 4 6 12 24
BE[mM]
-27.4 ±5.4
-23.6 ±1.9
-23.6 ±4.7
-19.9 ±6.6
-12.1 ±8.2
-4.4 ±7.8
pH 6.910 ±0.130
7.020 ±0.044
7.016 ±0.131
7.112 ±0.127
7.258 ±0.128
7.396 ±0.129
Na +[mM]
125 ±8
134 ±9
134 ±10
138 ±8
138 ±8
142 ±10
Cl (act.,[mM])
94 ±9
106 ±11
107 ±10
111 ±3
111 ±2
115 ±4
Cl (corrected,[mM])
105 ± 6 110 ± 6 112 ± 7 113 ± 9 113 ± 7 114 ± 5
As demonstrated in Table and Figure, unmeasured acids (ketones) and L-lactate clearedquickly. After 24 h, the main factor responsible for remaining base deficit was iatrogenichyperchloridaemia, partially outweighed by hypoalbuminaemic alkalosis. The effects ofconcentration/dilution were negligible and our model failed to explain 2-5 mM of baseexcess.
Components of base deficit (means, SD)
An extensive audit of all 118 subjects including the fluids infused will follow.CONCLUSIONS. Iatrogenic hyperchloridaemia during the treatment of DKA is a sig-nificant contributor to non-resolving acidosis, adding * 12 mM to the base deficit after24 h of treatment of DKA in our case series. Our data are supportive to the use ofbalanced solutions for volume replacement during the management of DKA and stress theimportance of appropriate acid–base analysis when dealing with non-resolving base deficitin DKA.REFERENCES. 1. Diabetic Ketoacidosis in Adults. NUH Guideline, May 2012, ver. 2.Online https://www.nuh.nhs.uk/healthcare-professionals/clinical-guidelines/ 2. Savage MWet al. Joint British Diabetes Societies guideline for the management of diabetic ketoacidosis.Diabetc Med 2011;28:508–15. 3. http://www.diabetessociety.com.au/downloads/Type1guidelines(7Feb11).pdf 4. Kellum JA, Elbers PWG. Stewart’s Textbook of Acid–Base.2nd Edn, Amsterdam 2009;. ISBN 978-1-4092-5470-6 5. Acid–Base Calculator V10.8.available at http://www.acidbase.org/phpscripts6/downloads.php
26th ESICM ANNUAL CONGRESS — PARIS, FRANCE — 5–9 OCTOBER 2013
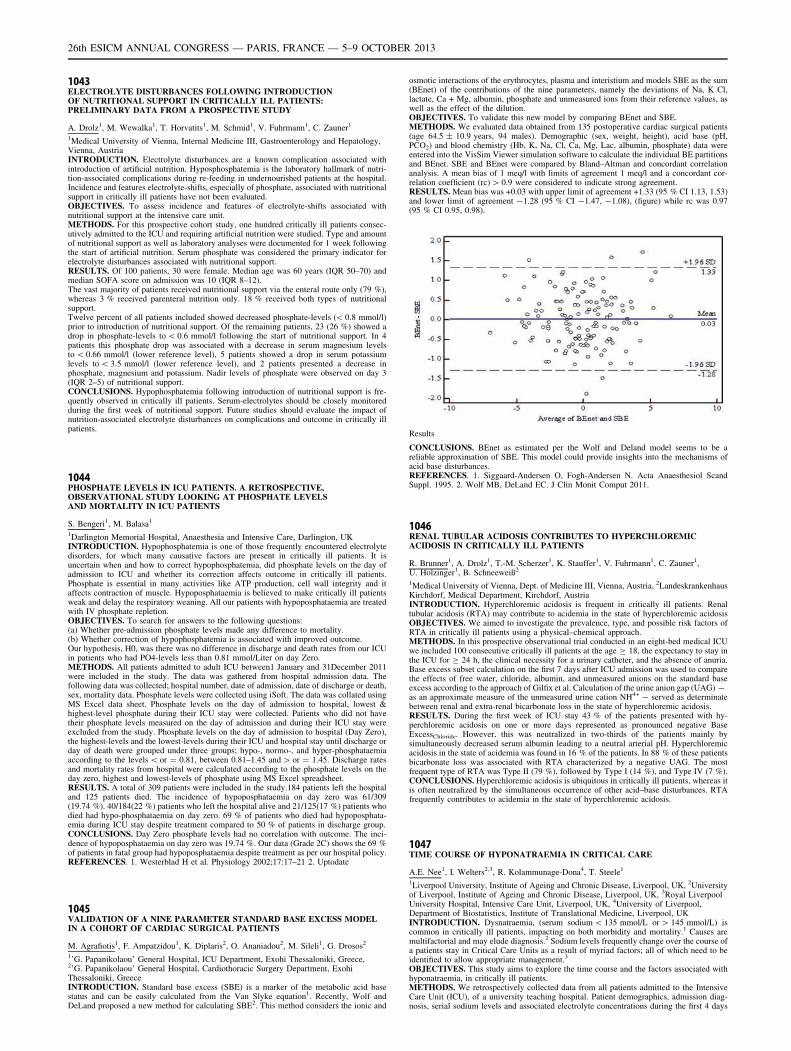
1043ELECTROLYTE DISTURBANCES FOLLOWING INTRODUCTIONOF NUTRITIONAL SUPPORT IN CRITICALLY ILL PATIENTS:PRELIMINARY DATA FROM A PROSPECTIVE STUDY
A. Drolz1, M. Wewalka1, T. Horvatits1, M. Schmid1, V. Fuhrmann1, C. Zauner1
1Medical University of Vienna, Internal Medicine III, Gastroenterology and Hepatology,Vienna, AustriaINTRODUCTION. Electrolyte disturbances are a known complication associated withintroduction of artificial nutrition. Hyposphosphatemia is the laboratory hallmark of nutri-tion-associated complications during re-feeding in undernourished patients at the hospital.Incidence and features electrolyte-shifts, especially of phosphate, associated with nutritionalsupport in critically ill patients have not been evaluated.OBJECTIVES. To assess incidence and features of electrolyte-shifts associated withnutritional support at the intensive care unit.METHODS. For this prospective cohort study, one hundred critically ill patients consec-utively admitted to the ICU and requiring artificial nutrition were studied. Type and amountof nutritional support as well as laboratory analyses were documented for 1 week followingthe start of artificial nutrition. Serum phosphate was considered the primary indicator forelectrolyte disturbances associated with nutritional support.RESULTS. Of 100 patients, 30 were female. Median age was 60 years (IQR 50–70) andmedian SOFA score on admission was 10 (IQR 8–12).The vast majority of patients received nutritional support via the enteral route only (79 %),whereas 3 % received parenteral nutrition only. 18 % received both types of nutritionalsupport.Twelve percent of all patients included showed decreased phosphate-levels (\ 0.8 mmol/l)prior to introduction of nutritional support. Of the remaining patients, 23 (26 %) showed adrop in phosphate-levels to \ 0.6 mmol/l following the start of nutritional support. In 4patients this phosphate drop was associated with a decrease in serum magnesium levelsto \ 0.66 mmol/l (lower reference level), 5 patients showed a drop in serum potassiumlevels to \ 3.5 mmol/l (lower reference level), and 2 patients presented a decrease inphosphate, magnesium and potassium. Nadir levels of phosphate were observed on day 3(IQR 2–5) of nutritional support.CONCLUSIONS. Hypophosphatemia following introduction of nutritional support is fre-quently observed in critically ill patients. Serum-electrolytes should be closely monitoredduring the first week of nutritional support. Future studies should evaluate the impact ofnutrition-associated electrolyte disturbances on complications and outcome in critically illpatients.
1044PHOSPHATE LEVELS IN ICU PATIENTS. A RETROSPECTIVE,OBSERVATIONAL STUDY LOOKING AT PHOSPHATE LEVELSAND MORTALITY IN ICU PATIENTS
S. Bengeri1, M. Balasa1
1Darlington Memorial Hospital, Anaesthesia and Intensive Care, Darlington, UKINTRODUCTION. Hypophosphatemia is one of those frequently encountered electrolytedisorders, for which many causative factors are present in critically ill patients. It isuncertain when and how to correct hypophosphatemia, did phosphate levels on the day ofadmission to ICU and whether its correction affects outcome in critically ill patients.Phosphate is essential in many activities like ATP production, cell wall integrity and itaffects contraction of muscle. Hypoposphataemia is believed to make critically ill patientsweak and delay the respiratory weaning. All our patients with hypoposphataemia are treatedwith IV phosphate repletion.OBJECTIVES. To search for answers to the following questions:(a) Whether pre-admission phosphate levels made any difference to mortality.(b) Whether correction of hypophosphatemia is associated with improved outcome.Our hypothesis, H0, was there was no difference in discharge and death rates from our ICUin patients who had PO4-levels less than 0.81 mmol/Liter on day Zero.METHODS. All patients admitted to adult ICU between1 January and 31December 2011were included in the study. The data was gathered from hospital admission data. Thefollowing data was collected; hospital number, date of admission, date of discharge or death,sex, mortality data. Phosphate levels were collected using iSoft. The data was collated usingMS Excel data sheet. Phosphate levels on the day of admission to hospital, lowest &highest-level phosphate during their ICU stay were collected. Patients who did not havetheir phosphate levels measured on the day of admission and during their ICU stay wereexcluded from the study. Phosphate levels on the day of admission to hospital (Day Zero),the highest-levels and the lowest-levels during their ICU and hospital stay until discharge orday of death were grouped under three groups; hypo-, normo-, and hyper-phosphataemiaaccording to the levels \ or = 0.81, between 0.81–1.45 and [ or = 1.45. Discharge ratesand mortality rates from hospital were calculated according to the phosphate levels on theday zero, highest and lowest-levels of phosphate using MS Excel spreadsheet.RESULTS. A total of 309 patients were included in the study.184 patients left the hospitaland 125 patients died. The incidence of hypoposphataemia on day zero was 61/309(19.74 %). 40/184(22 %) patients who left the hospital alive and 21/125(17 %) patients whodied had hypo-phosphataemia on day zero. 69 % of patients who died had hypoposphata-emia during ICU stay despite treatment compared to 50 % of patients in discharge group.CONCLUSIONS. Day Zero phosphate levels had no correlation with outcome. The inci-dence of hypoposphataemia on day zero was 19.74 %. Our data (Grade 2C) shows the 69 %of patients in fatal group had hypoposphataemia despite treatment as per our hospital policy.REFERENCES. 1. Westerblad H et al. Physiology 2002;17:17–21 2. Uptodate
1045VALIDATION OF A NINE PARAMETER STANDARD BASE EXCESS MODELIN A COHORT OF CARDIAC SURGICAL PATIENTS
M. Agrafiotis1, F. Ampatzidou1, K. Diplaris2, O. Ananiadou2, M. Sileli1, G. Drosos2
1’G. Papanikolaou’ General Hospital, ICU Department, Exohi Thessaloniki, Greece,2’G. Papanikolaou’ General Hospital, Cardiothoracic Surgery Department, ExohiThessaloniki, GreeceINTRODUCTION. Standard base excess (SBE) is a marker of the metabolic acid basestatus and can be easily calculated from the Van Slyke equation1. Recently, Wolf andDeLand proposed a new method for calculating SBE2. This method considers the ionic and
osmotic interactions of the erythrocytes, plasma and interistium and models SBE as the sum(BEnet) of the contributions of the nine parameters, namely the deviations of Na, K Cl,lactate, Ca + Mg, albumin, phosphate and unmeasured ions from their reference values, aswell as the effect of the dilution.OBJECTIVES. To validate this new model by comparing BEnet and SBE.METHODS. We evaluated data obtained from 135 postoperative cardiac surgical patients(age 64.5 ± 10.9 years, 94 males). Demographic (sex, weight, height), acid base (pH,PCO2) and blood chemistry (Hb, K, Na, Cl, Ca, Mg, Lac, albumin, phosphate) data wereentered into the VisSim Viewer simulation software to calculate the individual BE partitionsand BEnet. SBE and BEnet were compared by Bland–Altman and concordant correlationanalysis. A mean bias of 1 meq/l with limits of agreement 1 meq/l and a concordant cor-relation coefficient (rc) [ 0.9 were considered to indicate strong agreement.RESULTS. Mean bias was +0.03 with upper limit of agreement +1.33 (95 % CI 1.13, 1.53)and lower limit of agreement -1.28 (95 % CI -1.47, -1.08), (figure) while rc was 0.97(95 % CI 0.95, 0.98).
Results
CONCLUSIONS. BEnet as estimated per the Wolf and Deland model seems to be areliable approximation of SBE. This model could provide insights into the mechanisms ofacid base disturbances.REFERENCES. 1. Siggaard-Andersen O, Fogh-Andersen N. Acta Anaesthesiol ScandSuppl. 1995. 2. Wolf MB, DeLand EC. J Clin Monit Comput 2011.
1046RENAL TUBULAR ACIDOSIS CONTRIBUTES TO HYPERCHLOREMICACIDOSIS IN CRITICALLY ILL PATIENTS
R. Brunner1, A. Drolz1, T.-M. Scherzer1, K. Stauffer1, V. Fuhrmann1, C. Zauner1,U. Holzinger1, B. Schneeweiß2
1Medical University of Vienna, Dept. of Medicine III, Vienna, Austria, 2LandeskrankenhausKirchdorf, Medical Department, Kirchdorf, AustriaINTRODUCTION. Hyperchloremic acidosis is frequent in critically ill patients. Renaltubular acidosis (RTA) may contribute to acidemia in the state of hyperchloremic acidosisOBJECTIVES. We aimed to investigate the prevalence, type, and possible risk factors ofRTA in critically ill patients using a physical–chemical approach.METHODS. In this prospective observational trial conducted in an eight-bed medical ICUwe included 100 consecutive critically ill patients at the age C 18, the expectancy to stay inthe ICU for C 24 h, the clinical necessity for a urinary catheter, and the absence of anuria.Base excess subset calculation on the first 7 days after ICU admission was used to comparethe effects of free water, chloride, albumin, and unmeasured anions on the standard baseexcess according to the approach of Gilfix et al. Calculation of the urine anion gap (UAG) -as an approximate measure of the unmeasured urine cation NH4+ - served as determinatebetween renal and extra-renal bicarbonate loss in the state of hyperchloremic acidosis.RESULTS. During the first week of ICU stay 43 % of the patients presented with hy-perchloremic acidosis on one or more days represented as pronounced negative BaseExcessChloride. However, this was neutralized in two-thirds of the patients mainly bysimultaneously decreased serum albumin leading to a neutral arterial pH. Hyperchloremicacidosis in the state of acidemia was found in 16 % of the patients. In 88 % of these patientsbicarbonate loss was associated with RTA characterized by a negative UAG. The mostfrequent type of RTA was Type II (79 %), followed by Type I (14 %), and Type IV (7 %).CONCLUSIONS. Hyperchloremic acidosis is ubiquitous in critically ill patients, whereas itis often neutralized by the simultaneous occurrence of other acid–base disturbances. RTAfrequently contributes to acidemia in the state of hyperchloremic acidosis.
1047TIME COURSE OF HYPONATRAEMIA IN CRITICAL CARE
A.E. Nee1, I. Welters2,3, R. Kolammunage-Dona4, T. Steele1
1Liverpool University, Institute of Ageing and Chronic Disease, Liverpool, UK, 2Universityof Liverpool, Institute of Ageing and Chronic Disease, Liverpool, UK, 3Royal LiverpoolUniversity Hospital, Intensive Care Unit, Liverpool, UK, 4University of Liverpool,Department of Biostatistics, Institute of Translational Medicine, Liverpool, UKINTRODUCTION. Dysnatraemia, (serum sodium \ 135 mmol/L or [ 145 mmol/L) iscommon in critically ill patients, impacting on both morbidity and mortality.1 Causes aremultifactorial and may elude diagnosis.2 Sodium levels frequently change over the course ofa patients stay in Critical Care Units as a result of myriad factors; all of which need to beidentified to allow appropriate management.3
OBJECTIVES. This study aims to explore the time course and the factors associated withhyponatraemia, in critically ill patients.METHODS. We retrospectively collected data from all patients admitted to the IntensiveCare Unit (ICU), of a university teaching hospital. Patient demographics, admission diag-nosis, serial sodium levels and associated electrolyte concentrations during the first 4 days
26th ESICM ANNUAL CONGRESS — PARIS, FRANCE — 5–9 OCTOBER 2013
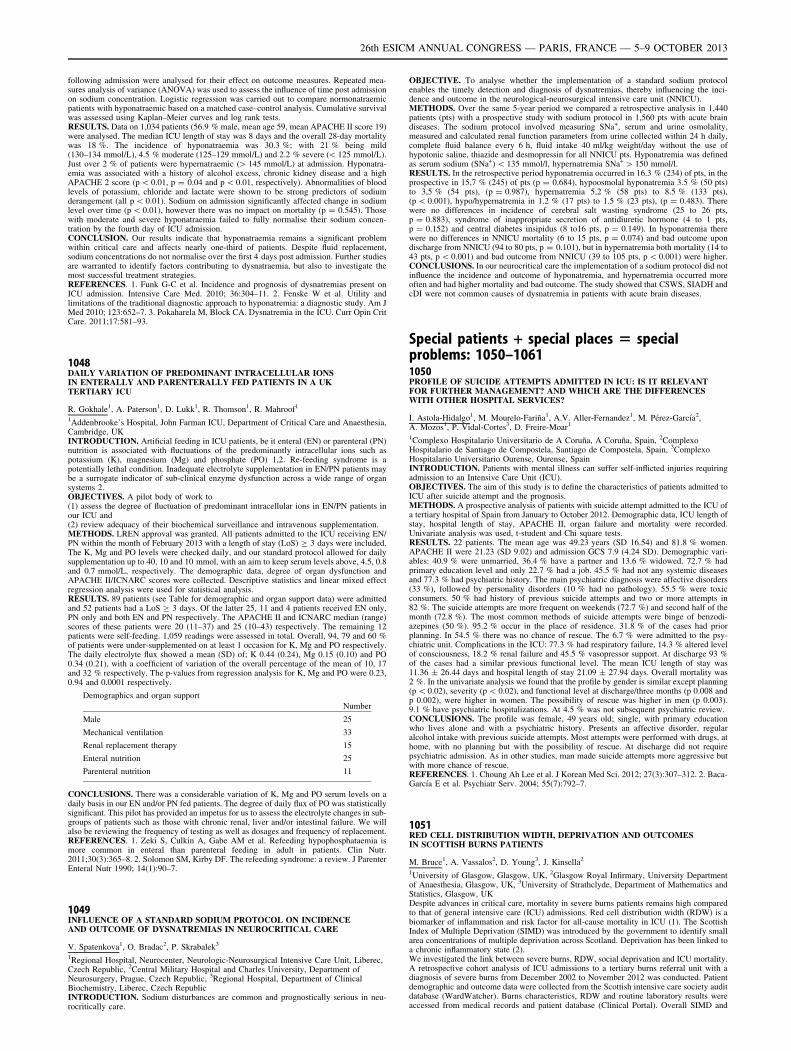
following admission were analysed for their effect on outcome measures. Repeated mea-sures analysis of variance (ANOVA) was used to assess the influence of time post admissionon sodium concentration. Logistic regression was carried out to compare normonatraemicpatients with hyponatraemic based on a matched case–control analysis. Cumulative survivalwas assessed using Kaplan–Meier curves and log rank tests.RESULTS. Data on 1,034 patients (56.9 % male, mean age 59, mean APACHE II score 19)were analysed. The median ICU length of stay was 8 days and the overall 28-day mortalitywas 18 %. The incidence of hyponatraemia was 30.3 %; with 21 % being mild(130–134 mmol/L), 4.5 % moderate (125–129 mmol/L) and 2.2 % severe (\ 125 mmol/L).Just over 2 % of patients were hypernatraemic ([ 145 mmol/L) at admission. Hyponatra-emia was associated with a history of alcohol excess, chronic kidney disease and a highAPACHE 2 score (p \ 0.01, p = 0.04 and p \ 0.01, respectively). Abnormalities of bloodlevels of potassium, chloride and lactate were shown to be strong predictors of sodiumderangement (all p \ 0.01). Sodium on admission significantly affected change in sodiumlevel over time (p \ 0.01), however there was no impact on mortality (p = 0.545). Thosewith moderate and severe hyponatraemia failed to fully normalise their sodium concen-tration by the fourth day of ICU admission.CONCLUSION. Our results indicate that hyponatraemia remains a significant problemwithin critical care and affects nearly one-third of patients. Despite fluid replacement,sodium concentrations do not normalise over the first 4 days post admission. Further studiesare warranted to identify factors contributing to dysnatraemia, but also to investigate themost successful treatment strategies.REFERENCES. 1. Funk G-C et al. Incidence and prognosis of dysnatremias present onICU admission. Intensive Care Med. 2010; 36:304–11. 2. Fenske W et al. Utility andlimitations of the traditional diagnostic approach to hyponatremia: a diagnostic study. Am JMed 2010; 123:652–7. 3. Pokaharela M, Block CA. Dysnatremia in the ICU. Curr Opin CritCare. 2011;17:581–93.
1048DAILY VARIATION OF PREDOMINANT INTRACELLULAR IONSIN ENTERALLY AND PARENTERALLY FED PATIENTS IN A UKTERTIARY ICU
R. Gokhale1, A. Paterson1, D. Lukk1, R. Thomson1, R. Mahroof1
1Addenbrooke’s Hospital, John Farman ICU, Department of Critical Care and Anaesthesia,Cambridge, UKINTRODUCTION. Artificial feeding in ICU patients, be it enteral (EN) or parenteral (PN)nutrition is associated with fluctuations of the predominantly intracellular ions such aspotassium (K), magnesium (Mg) and phosphate (PO) 1,2. Re-feeding syndrome is apotentially lethal condition. Inadequate electrolyte supplementation in EN/PN patients maybe a surrogate indicator of sub-clinical enzyme dysfunction across a wide range of organsystems 2.OBJECTIVES. A pilot body of work to(1) assess the degree of fluctuation of predominant intracellular ions in EN/PN patients inour ICU and(2) review adequacy of their biochemical surveillance and intravenous supplementation.METHODS. LREN approval was granted. All patients admitted to the ICU receiving EN/PN within the month of February 2013 with a length of stay (LoS) C 3 days were included.The K, Mg and PO levels were checked daily, and our standard protocol allowed for dailysupplementation up to 40, 10 and 10 mmol, with an aim to keep serum levels above, 4.5, 0.8and 0.7 mmol/L, respectively. The demographic data, degree of organ dysfunction andAPACHE II/ICNARC scores were collected. Descriptive statistics and linear mixed effectregression analysis were used for statistical analysis.RESULTS. 89 patients (see Table for demographic and organ support data) were admittedand 52 patients had a LoS C 3 days. Of the latter 25, 11 and 4 patients received EN only,PN only and both EN and PN respectively. The APACHE II and ICNARC median (range)scores of these patients were 20 (11–37) and 25 (10–43) respectively. The remaining 12patients were self-feeding. 1,059 readings were assessed in total. Overall, 94, 79 and 60 %of patients were under-supplemented on at least 1 occasion for K, Mg and PO respectively.The daily electrolyte flux showed a mean (SD) of; K 0.44 (0.24), Mg 0.15 (0.10) and PO0.34 (0.21), with a coefficient of variation of the overall percentage of the mean of 10, 17and 32 % respectively. The p-values from regression analysis for K, Mg and PO were 0.23,0.94 and 0.0001 respectively.
Demographics and organ support
Number
Male 25
Mechanical ventilation 33
Renal replacement therapy 15
Enteral nutrition 25
Parenteral nutrition 11
CONCLUSIONS. There was a considerable variation of K, Mg and PO serum levels on adaily basis in our EN and/or PN fed patients. The degree of daily flux of PO was statisticallysignificant. This pilot has provided an impetus for us to assess the electrolyte changes in sub-groups of patients such as those with chronic renal, liver and/or intestinal failure. We willalso be reviewing the frequency of testing as well as dosages and frequency of replacement.REFERENCES. 1. Zeki S, Culkin A, Gabe AM et al. Refeeding hypophosphataemia ismore common in enteral than parenteral feeding in adult in patients. Clin Nutr.2011;30(3):365–8. 2. Solomon SM, Kirby DF. The refeeding syndrome: a review. J ParenterEnteral Nutr 1990; 14(1):90–7.
1049INFLUENCE OF A STANDARD SODIUM PROTOCOL ON INCIDENCEAND OUTCOME OF DYSNATREMIAS IN NEUROCRITICAL CARE
V. Spatenkova1, O. Bradac2, P. Skrabalek3
1Regional Hospital, Neurocenter, Neurologic-Neurosurgical Intensive Care Unit, Liberec,Czech Republic, 2Central Military Hospital and Charles University, Department ofNeurosurgery, Prague, Czech Republic, 3Regional Hospital, Department of ClinicalBiochemistry, Liberec, Czech RepublicINTRODUCTION. Sodium disturbances are common and prognostically serious in neu-rocritically care.
OBJECTIVE. To analyse whether the implementation of a standard sodium protocolenables the timely detection and diagnosis of dysnatremias, thereby influencing the inci-dence and outcome in the neurological-neurosurgical intensive care unit (NNICU).METHODS. Over the same 5-year period we compared a retrospective analysis in 1,440patients (pts) with a prospective study with sodium protocol in 1,560 pts with acute braindiseases. The sodium protocol involved measuring SNa+, serum and urine osmolality,measured and calculated renal function parameters from urine collected within 24 h daily,complete fluid balance every 6 h, fluid intake 40 ml/kg weight/day without the use ofhypotonic saline, thiazide and desmopressin for all NNICU pts. Hyponatremia was definedas serum sodium (SNa+) \ 135 mmol/l, hypernatremia SNa+ [ 150 mmol/l.RESULTS. In the retrospective period hyponatremia occurred in 16.3 % (234) of pts, in theprospective in 15,7 % (245) of pts (p = 0.684), hypoosmolal hyponatremia 3.5 % (50 pts)to 3,5 % (54 pts), (p = 0.987), hypernatremia 5,2 % (58 pts) to 8.5 % (133 pts),(p \ 0.001), hypo/hypernatremia in 1.2 % (17 pts) to 1.5 % (23 pts), (p = 0.483). Therewere no differences in incidence of cerebral salt wasting syndrome (25 to 26 pts,p = 0.883), syndrome of inappropriate secretion of antidiuretic hormone (4 to 1 pts,p = 0.152) and central diabetes insipidus (8 to16 pts, p = 0.149). In hyponatremia therewere no differences in NNICU mortality (6 to 15 pts, p = 0.074) and bad outcome upondischarge from NNICU (94 to 80 pts, p = 0.101), but in hypernatremia both mortality (14 to43 pts, p \ 0.001) and bad outcome from NNICU (39 to 105 pts, p \ 0.001) were higher.CONCLUSIONS. In our neurocritical care the implementation of a sodium protocol did notinfluence the incidence and outcome of hyponatremia, and hypernatremia occurred moreoften and had higher mortality and bad outcome. The study showed that CSWS, SIADH andcDI were not common causes of dysnatremia in patients with acute brain diseases.
Special patients + special places 5 specialproblems: 1050–10611050PROFILE OF SUICIDE ATTEMPTS ADMITTED IN ICU: IS IT RELEVANTFOR FURTHER MANAGEMENT? AND WHICH ARE THE DIFFERENCESWITH OTHER HOSPITAL SERVICES?
I. Astola-Hidalgo1, M. Mourelo-Fariña1, A.V. Aller-Fernandez1, M. Pérez-Garcı́a2,A. Mozos1, P. Vidal-Cortes3, D. Freire-Moar1
1Complexo Hospitalario Universitario de A Coruña, A Coruña, Spain, 2ComplexoHospitalario de Santiago de Compostela, Santiago de Compostela, Spain, 3ComplexoHospitalario Universitario Ourense, Ourense, SpainINTRODUCTION. Patients with mental illness can suffer self-inflicted injuries requiringadmission to an Intensive Care Unit (ICU).OBJECTIVES. The aim of this study is to define the characteristics of patients admitted toICU after suicide attempt and the prognosis.METHODS. A prospective analysis of patients with suicide attempt admitted to the ICU ofa tertiary hospital of Spain from January to October 2012. Demographic data, ICU length ofstay, hospital length of stay, APACHE II, organ failure and mortality were recorded.Univariate analysis was used, t-student and Chi square tests.RESULTS. 22 patients. The mean age was 49.23 years (SD 16.54) and 81.8 % women.APACHE II were 21.23 (SD 9.02) and admission GCS 7.9 (4.24 SD). Demographic vari-ables: 40.9 % were unmarried, 36.4 % have a partner and 13.6 % widowed. 72.7 % hadprimary education level and only 22.7 % had a job. 45.5 % had not any systemic diseasesand 77.3 % had psychiatric history. The main psychiatric diagnosis were affective disorders(33 %), followed by personality disorders (10 % had no pathology). 55.5 % were toxicconsumers. 50 % had history of previous suicide attempts and two or more attempts in82 %. The suicide attempts are more frequent on weekends (72.7 %) and second half of themonth (72.8 %). The most common methods of suicide attempts were binge of benzodi-azepines (50 %). 95.2 % occur in the place of residence. 31.8 % of the cases had priorplanning. In 54.5 % there was no chance of rescue. The 6.7 % were admitted to the psy-chiatric unit. Complications in the ICU: 77.3 % had respiratory failure, 14.3 % altered levelof consciousness, 18.2 % renal failure and 45.5 % vasopressor support. At discharge 93 %of the cases had a similar previous functional level. The mean ICU length of stay was11.36 ± 26.44 days and hospital length of stay 21.09 ± 27.94 days. Overall mortality was2 %. In the univariate analysis we found that the profile by gender is similar except planning(p \ 0.02), severity (p \ 0.02), and functional level at discharge/three months (p 0.008 andp 0.002), were higher in women. The possibility of rescue was higher in men (p 0.003).9.1 % have psychiatric hospitalizations. At 4.5 % was not subsequent psychiatric review.CONCLUSIONS. The profile was female, 49 years old; single, with primary educationwho lives alone and with a psychiatric history. Presents an affective disorder, regularalcohol intake with previous suicide attempts. Most attempts were performed with drugs, athome, with no planning but with the possibility of rescue. At discharge did not requirepsychiatric admission. As in other studies, man made suicide attempts more aggressive butwith more chance of rescue.REFERENCES. 1. Choung Ah Lee et al. J Korean Med Sci. 2012; 27(3):307–312. 2. Baca-Garcı́a E et al. Psychiatr Serv. 2004; 55(7):792–7.
1051RED CELL DISTRIBUTION WIDTH, DEPRIVATION AND OUTCOMESIN SCOTTISH BURNS PATIENTS
M. Bruce1, A. Vassalos2, D. Young3, J. Kinsella2
1University of Glasgow, Glasgow, UK, 2Glasgow Royal Infirmary, University Departmentof Anaesthesia, Glasgow, UK, 3University of Strathclyde, Department of Mathematics andStatistics, Glasgow, UKDespite advances in critical care, mortality in severe burns patients remains high comparedto that of general intensive care (ICU) admissions. Red cell distribution width (RDW) is abiomarker of inflammation and risk factor for all-cause mortality in ICU (1). The ScottishIndex of Multiple Deprivation (SIMD) was introduced by the government to identify smallarea concentrations of multiple deprivation across Scotland. Deprivation has been linked toa chronic inflammatory state (2).We investigated the link between severe burns, RDW, social deprivation and ICU mortality.A retrospective cohort analysis of ICU admissions to a tertiary burns referral unit with adiagnosis of severe burns from December 2002 to November 2012 was conducted. Patientdemographic and outcome data were collected from the Scottish intensive care society auditdatabase (WardWatcher). Burns characteristics, RDW and routine laboratory results wereaccessed from medical records and patient database (Clinical Portal). Overall SIMD and
26th ESICM ANNUAL CONGRESS — PARIS, FRANCE — 5–9 OCTOBER 2013
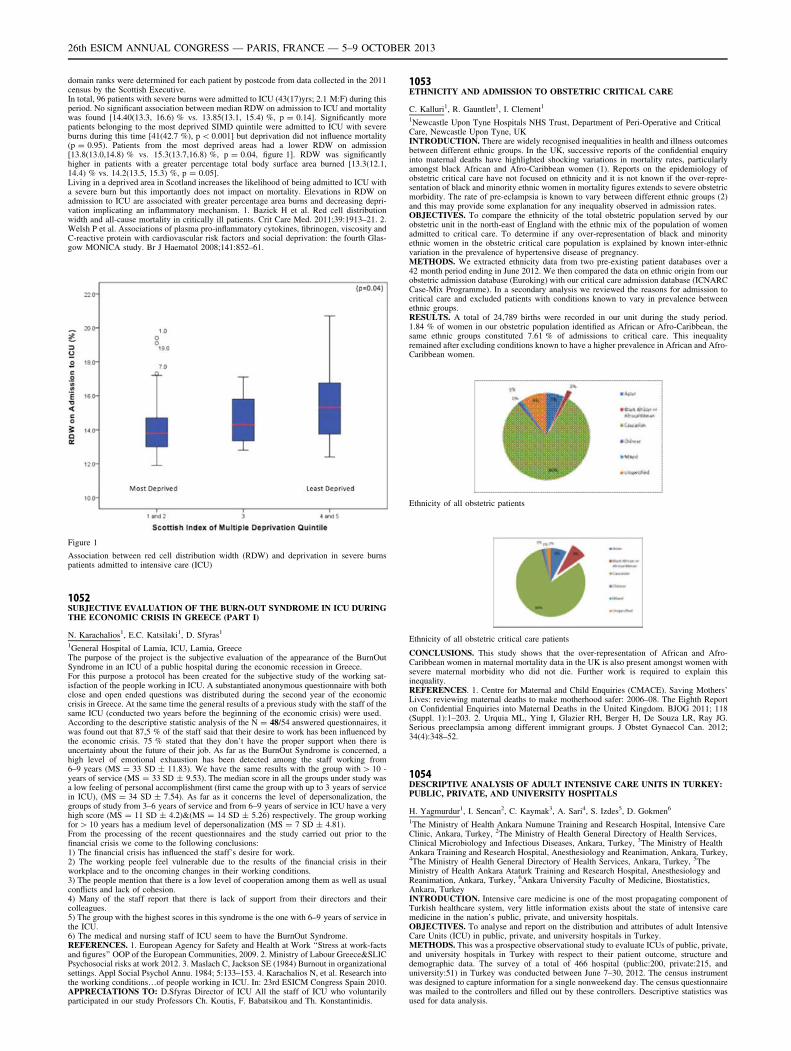
domain ranks were determined for each patient by postcode from data collected in the 2011census by the Scottish Executive.In total, 96 patients with severe burns were admitted to ICU (43(17)yrs; 2.1 M:F) during thisperiod. No significant association between median RDW on admission to ICU and mortalitywas found [14.40(13.3, 16.6) % vs. 13.85(13.1, 15.4) %, p = 0.14]. Significantly morepatients belonging to the most deprived SIMD quintile were admitted to ICU with severeburns during this time [41(42.7 %), p \ 0.001] but deprivation did not influence mortality(p = 0.95). Patients from the most deprived areas had a lower RDW on admission[13.8(13.0,14.8) % vs. 15.3(13.7,16.8) %, p = 0.04, figure 1]. RDW was significantlyhigher in patients with a greater percentage total body surface area burned [13.3(12.1,14.4) % vs. 14.2(13.5, 15.3) %, p = 0.05].Living in a deprived area in Scotland increases the likelihood of being admitted to ICU witha severe burn but this importantly does not impact on mortality. Elevations in RDW onadmission to ICU are associated with greater percentage area burns and decreasing depri-vation implicating an inflammatory mechanism. 1. Bazick H et al. Red cell distributionwidth and all-cause mortality in critically ill patients. Crit Care Med. 2011;39:1913–21. 2.Welsh P et al. Associations of plasma pro-inflammatory cytokines, fibrinogen, viscosity andC-reactive protein with cardiovascular risk factors and social deprivation: the fourth Glas-gow MONICA study. Br J Haematol 2008;141:852–61.
Figure 1
Association between red cell distribution width (RDW) and deprivation in severe burnspatients admitted to intensive care (ICU)
1052SUBJECTIVE EVALUATION OF THE BURN-OUT SYNDROME IN ICU DURINGTHE ECONOMIC CRISIS IN GREECE (PART I)
N. Karachalios1, E.C. Katsilaki1, D. Sfyras1
1General Hospital of Lamia, ICU, Lamia, GreeceThe purpose of the project is the subjective evaluation of the appearance of the BurnOutSyndrome in an ICU of a public hospital during the economic recession in Greece.For this purpose a protocol has been created for the subjective study of the working sat-isfaction of the people working in ICU. A substantiated anonymous questionnaire with bothclose and open ended questions was distributed during the second year of the economiccrisis in Greece. At the same time the general results of a previous study with the staff of thesame ICU (conducted two years before the beginning of the economic crisis) were used.According to the descriptive statistic analysis of the N = 48/54 answered questionnaires, itwas found out that 87,5 % of the staff said that their desire to work has been influenced bythe economic crisis. 75 % stated that they don’t have the proper support when there isuncertainty about the future of their job. As far as the BurnOut Syndrome is concerned, ahigh level of emotional exhaustion has been detected among the staff working from6–9 years (MS = 33 SD ± 11.83). We have the same results with the group with [ 10 -years of service (MS = 33 SD ± 9.53). The median score in all the groups under study wasa low feeling of personal accomplishment (first came the group with up to 3 years of servicein ICU), (MS = 34 SD ± 7.54). As far as it concerns the level of depersonalization, thegroups of study from 3–6 years of service and from 6–9 years of service in ICU have a veryhigh score (MS = 11 SD ± 4.2)&(MS = 14 SD ± 5.26) respectively. The group workingfor [ 10 years has a medium level of depersonalization (MS = 7 SD ± 4.81).From the processing of the recent questionnaires and the study carried out prior to thefinancial crisis we come to the following conclusions:1) The financial crisis has influenced the staff’s desire for work.2) The working people feel vulnerable due to the results of the financial crisis in theirworkplace and to the oncoming changes in their working conditions.3) The people mention that there is a low level of cooperation among them as well as usualconflicts and lack of cohesion.4) Many of the staff report that there is lack of support from their directors and theircolleagues.5) The group with the highest scores in this syndrome is the one with 6–9 years of service inthe ICU.6) The medical and nursing staff of ICU seem to have the BurnOut Syndrome.REFERENCES. 1. European Agency for Safety and Health at Work ‘‘Stress at work-factsand figures’’ OOP of the European Communities, 2009. 2. Ministry of Labour Greece&SLICPsychosocial risks at work 2012. 3. Maslach C, Jackson SE (1984) Burnout in organizationalsettings. Appl Social Psychol Annu. 1984; 5:133–153. 4. Karachalios N, et al. Research intothe working conditions…of people working in ICU. In: 23rd ESICM Congress Spain 2010.APPRECIATIONS TO: D.Sfyras Director of ICU All the staff of ICU who voluntarilyparticipated in our study Professors Ch. Koutis, F. Babatsikou and Th. Konstantinidis.
1053ETHNICITY AND ADMISSION TO OBSTETRIC CRITICAL CARE
C. Kalluri1, R. Gauntlett1, I. Clement1
1Newcastle Upon Tyne Hospitals NHS Trust, Department of Peri-Operative and CriticalCare, Newcastle Upon Tyne, UKINTRODUCTION. There are widely recognised inequalities in health and illness outcomesbetween different ethnic groups. In the UK, successive reports of the confidential enquiryinto maternal deaths have highlighted shocking variations in mortality rates, particularlyamongst black African and Afro-Caribbean women (1). Reports on the epidemiology ofobstetric critical care have not focused on ethnicity and it is not known if the over-repre-sentation of black and minority ethnic women in mortality figures extends to severe obstetricmorbidity. The rate of pre-eclampsia is known to vary between different ethnic groups (2)and this may provide some explanation for any inequality observed in admission rates.OBJECTIVES. To compare the ethnicity of the total obstetric population served by ourobstetric unit in the north-east of England with the ethnic mix of the population of womenadmitted to critical care. To determine if any over-representation of black and minorityethnic women in the obstetric critical care population is explained by known inter-ethnicvariation in the prevalence of hypertensive disease of pregnancy.METHODS. We extracted ethnicity data from two pre-existing patient databases over a42 month period ending in June 2012. We then compared the data on ethnic origin from ourobstetric admission database (Euroking) with our critical care admission database (ICNARCCase-Mix Programme). In a secondary analysis we reviewed the reasons for admission tocritical care and excluded patients with conditions known to vary in prevalence betweenethnic groups.RESULTS. A total of 24,789 births were recorded in our unit during the study period.1.84 % of women in our obstetric population identified as African or Afro-Caribbean, thesame ethnic groups constituted 7.61 % of admissions to critical care. This inequalityremained after excluding conditions known to have a higher prevalence in African and Afro-Caribbean women.
Ethnicity of all obstetric patients
Ethnicity of all obstetric critical care patients
CONCLUSIONS. This study shows that the over-representation of African and Afro-Caribbean women in maternal mortality data in the UK is also present amongst women withsevere maternal morbidity who did not die. Further work is required to explain thisinequality.REFERENCES. 1. Centre for Maternal and Child Enquiries (CMACE). Saving Mothers’Lives: reviewing maternal deaths to make motherhood safer: 2006–08. The Eighth Reporton Confidential Enquiries into Maternal Deaths in the United Kingdom. BJOG 2011; 118(Suppl. 1):1–203. 2. Urquia ML, Ying I, Glazier RH, Berger H, De Souza LR, Ray JG.Serious preeclampsia among different immigrant groups. J Obstet Gynaecol Can. 2012;34(4):348–52.
1054DESCRIPTIVE ANALYSIS OF ADULT INTENSIVE CARE UNITS IN TURKEY:PUBLIC, PRIVATE, AND UNIVERSITY HOSPITALS
H. Yagmurdur1, I. Sencan2, C. Kaymak3, A. Sari4, S. Izdes5, D. Gokmen6
1The Ministry of Health Ankara Numune Training and Research Hospital, Intensive CareClinic, Ankara, Turkey, 2The Ministry of Health General Directory of Health Services,Clinical Microbiology and Infectious Diseases, Ankara, Turkey, 3The Ministry of HealthAnkara Training and Research Hospital, Anesthesiology and Reanimation, Ankara, Turkey,4The Ministry of Health General Directory of Health Services, Ankara, Turkey, 5TheMinistry of Health Ankara Ataturk Training and Research Hospital, Anesthesiology andReanimation, Ankara, Turkey, 6Ankara University Faculty of Medicine, Biostatistics,Ankara, TurkeyINTRODUCTION. Intensive care medicine is one of the most propagating component ofTurkish healthcare system, very little information exists about the state of intensive caremedicine in the nation’s public, private, and university hospitals.OBJECTIVES. To analyse and report on the distribution and attributes of adult IntensiveCare Units (ICU) in public, private, and university hospitals in Turkey.METHODS. This was a prospective observational study to evaluate ICUs of public, private,and university hospitals in Turkey with respect to their patient outcome, structure anddemographic data. The survey of a total of 466 hospital (public:200, private:215, anduniversity:51) in Turkey was conducted between June 7–30, 2012. The census instrumentwas designed to capture information for a single nonweekend day. The census questionnairewas mailed to the controllers and filled out by these controllers. Descriptive statistics wasused for data analysis.
26th ESICM ANNUAL CONGRESS — PARIS, FRANCE — 5–9 OCTOBER 2013
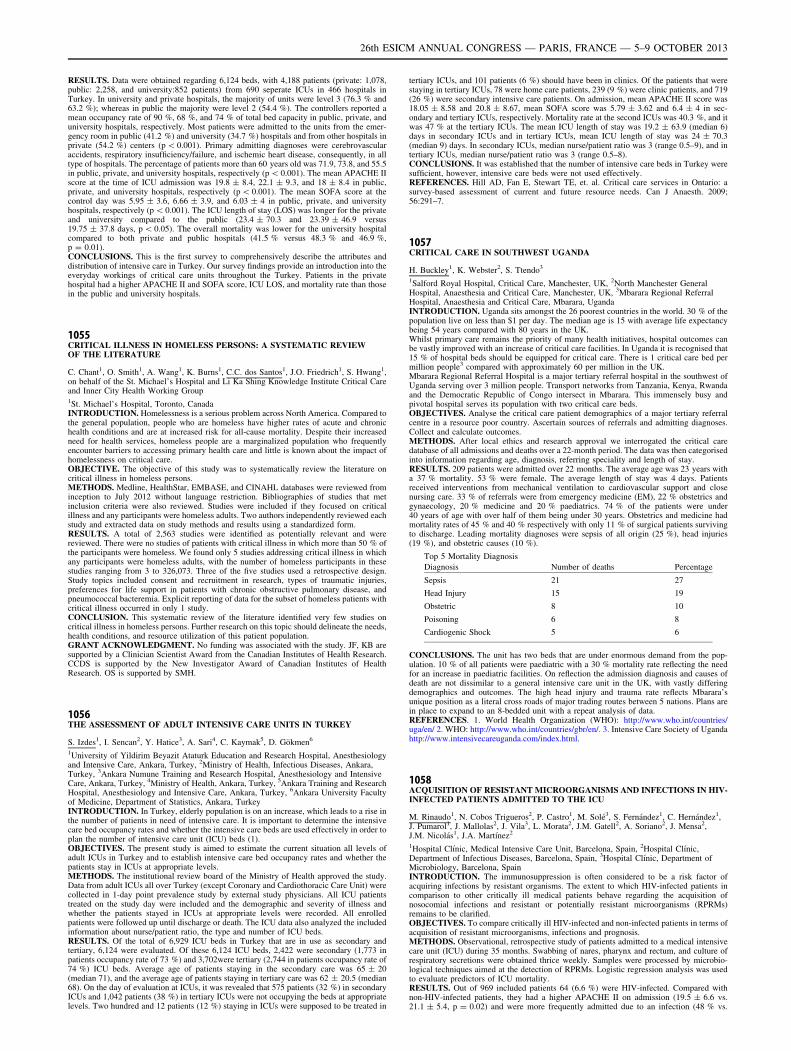
RESULTS. Data were obtained regarding 6,124 beds, with 4,188 patients (private: 1,078,public: 2,258, and university:852 patients) from 690 seperate ICUs in 466 hospitals inTurkey. In university and private hospitals, the majority of units were level 3 (76.3 % and63.2 %); whereas in public the majority were level 2 (54.4 %). The controllers reported amean occupancy rate of 90 %, 68 %, and 74 % of total bed capacity in public, private, anduniversity hospitals, respectively. Most patients were admitted to the units from the emer-gency room in public (41.2 %) and university (34.7 %) hospitals and from other hospitals inprivate (54.2 %) centers (p \ 0.001). Primary admitting diagnoses were cerebrovascularaccidents, respiratory insufficiency/failure, and ischemic heart disease, consequently, in alltype of hospitals. The percentage of patients more than 60 years old was 71.9, 73.8, and 55.5in public, private, and university hospitals, respectively (p \ 0.001). The mean APACHE IIscore at the time of ICU admission was 19.8 ± 8.4, 22.1 ± 9.3, and 18 ± 8.4 in public,private, and university hospitals, respectively (p \ 0.001). The mean SOFA score at thecontrol day was 5.95 ± 3.6, 6.66 ± 3.9, and 6.03 ± 4 in public, private, and universityhospitals, respectively (p \ 0.001). The ICU length of stay (LOS) was longer for the privateand university compared to the public (23.4 ± 70.3 and 23.39 ± 46.9 versus19.75 ± 37.8 days, p \ 0.05). The overall mortality was lower for the university hospitalcompared to both private and public hospitals (41.5 % versus 48.3 % and 46.9 %,p = 0.01).CONCLUSIONS. This is the first survey to comprehensively describe the attributes anddistribution of intensive care in Turkey. Our survey findings provide an introduction into theeveryday workings of critical care units throughout the Turkey. Patients in the privatehospital had a higher APACHE II and SOFA score, ICU LOS, and mortality rate than thosein the public and university hospitals.
1055CRITICAL ILLNESS IN HOMELESS PERSONS: A SYSTEMATIC REVIEWOF THE LITERATURE
C. Chant1, O. Smith1, A. Wang1, K. Burns1, C.C. dos Santos1, J.O. Friedrich1, S. Hwang1,on behalf of the St. Michael’s Hospital and Li Ka Shing Knowledge Institute Critical Careand Inner City Health Working Group1St. Michael’s Hospital, Toronto, CanadaINTRODUCTION. Homelessness is a serious problem across North America. Compared tothe general population, people who are homeless have higher rates of acute and chronichealth conditions and are at increased risk for all-cause mortality. Despite their increasedneed for health services, homeless people are a marginalized population who frequentlyencounter barriers to accessing primary health care and little is known about the impact ofhomelessness on critical care.OBJECTIVE. The objective of this study was to systematically review the literature oncritical illness in homeless persons.METHODS. Medline, HealthStar, EMBASE, and CINAHL databases were reviewed frominception to July 2012 without language restriction. Bibliographies of studies that metinclusion criteria were also reviewed. Studies were included if they focused on criticalillness and any participants were homeless adults. Two authors independently reviewed eachstudy and extracted data on study methods and results using a standardized form.RESULTS. A total of 2,563 studies were identified as potentially relevant and werereviewed. There were no studies of patients with critical illness in which more than 50 % ofthe participants were homeless. We found only 5 studies addressing critical illness in whichany participants were homeless adults, with the number of homeless participants in thesestudies ranging from 3 to 326,073. Three of the five studies used a retrospective design.Study topics included consent and recruitment in research, types of traumatic injuries,preferences for life support in patients with chronic obstructive pulmonary disease, andpneumococcal bacteremia. Explicit reporting of data for the subset of homeless patients withcritical illness occurred in only 1 study.CONCLUSION. This systematic review of the literature identified very few studies oncritical illness in homeless persons. Further research on this topic should delineate the needs,health conditions, and resource utilization of this patient population.GRANT ACKNOWLEDGMENT. No funding was associated with the study. JF, KB aresupported by a Clinician Scientist Award from the Canadian Institutes of Health Research.CCDS is supported by the New Investigator Award of Canadian Institutes of HealthResearch. OS is supported by SMH.
1056THE ASSESSMENT OF ADULT INTENSIVE CARE UNITS IN TURKEY
S. Izdes1, I. Sencan2, Y. Hatice3, A. Sari4, C. Kaymak5, D. Gökmen6
1University of Yildirim Beyazit Ataturk Education and Research Hospital, Anesthesiologyand Intensive Care, Ankara, Turkey, 2Ministry of Health, Infectious Diseases, Ankara,Turkey, 3Ankara Numune Training and Research Hospital, Anesthesiology and IntensiveCare, Ankara, Turkey, 4Ministry of Health, Ankara, Turkey, 5Ankara Training and ResearchHospital, Anesthesiology and Intensive Care, Ankara, Turkey, 6Ankara University Facultyof Medicine, Department of Statistics, Ankara, TurkeyINTRODUCTION. In Turkey, elderly population is on an increase, which leads to a rise inthe number of patients in need of intensive care. It is important to determine the intensivecare bed occupancy rates and whether the intensive care beds are used effectively in order toplan the number of intensive care unit (ICU) beds (1).OBJECTIVES. The present study is aimed to estimate the current situation all levels ofadult ICUs in Turkey and to establish intensive care bed occupancy rates and whether thepatients stay in ICUs at appropriate levels.METHODS. The institutional review board of the Ministry of Health approved the study.Data from adult ICUs all over Turkey (except Coronary and Cardiothoracic Care Unit) werecollected in 1-day point prevalence study by external study physicians. All ICU patientstreated on the study day were included and the demographic and severity of illness andwhether the patients stayed in ICUs at appropriate levels were recorded. All enrolledpatients were followed up until discharge or death. The ICU data also analyzed the includedinformation about nurse/patient ratio, the type and number of ICU beds.RESULTS. Of the total of 6,929 ICU beds in Turkey that are in use as secondary andtertiary, 6,124 were evaluated. Of these 6,124 ICU beds, 2,422 were secondary (1,773 inpatients occupancy rate of 73 %) and 3,702were tertiary (2,744 in patients occupancy rate of74 %) ICU beds. Average age of patients staying in the secondary care was 65 ± 20(median 71), and the average age of patients staying in tertiary care was 62 ± 20.5 (median68). On the day of evaluation at ICUs, it was revealed that 575 patients (32 %) in secondaryICUs and 1,042 patients (38 %) in tertiary ICUs were not occupying the beds at appropriatelevels. Two hundred and 12 patients (12 %) staying in ICUs were supposed to be treated in
tertiary ICUs, and 101 patients (6 %) should have been in clinics. Of the patients that werestaying in tertiary ICUs, 78 were home care patients, 239 (9 %) were clinic patients, and 719(26 %) were secondary intensive care patients. On admission, mean APACHE II score was18.05 ± 8.58 and 20.8 ± 8.67, mean SOFA score was 5.79 ± 3.62 and 6.4 ± 4 in sec-ondary and tertiary ICUs, respectively. Mortality rate at the second ICUs was 40.3 %, and itwas 47 % at the tertiary ICUs. The mean ICU length of stay was 19.2 ± 63.9 (median 6)days in secondary ICUs and in tertiary ICUs, mean ICU length of stay was 24 ± 70.3(median 9) days. In secondary ICUs, median nurse/patient ratio was 3 (range 0.5–9), and intertiary ICUs, median nurse/patient ratio was 3 (range 0.5–8).CONCLUSIONS. It was established that the number of intensive care beds in Turkey weresufficient, however, intensive care beds were not used effectively.REFERENCES. Hill AD, Fan E, Stewart TE, et. al. Critical care services in Ontario: asurvey-based assessment of current and future resource needs. Can J Anaesth. 2009;56:291–7.
1057CRITICAL CARE IN SOUTHWEST UGANDA
H. Buckley1, K. Webster2, S. Ttendo3
1Salford Royal Hospital, Critical Care, Manchester, UK, 2North Manchester GeneralHospital, Anaesthesia and Critical Care, Manchester, UK, 3Mbarara Regional ReferralHospital, Anaesthesia and Critical Care, Mbarara, UgandaINTRODUCTION. Uganda sits amongst the 26 poorest countries in the world. 30 % of thepopulation live on less than $1 per day. The median age is 15 with average life expectancybeing 54 years compared with 80 years in the UK.Whilst primary care remains the priority of many health initiatives, hospital outcomes canbe vastly improved with an increase of critical care facilities. In Uganda it is recognised that15 % of hospital beds should be equipped for critical care. There is 1 critical care bed permillion people3 compared with approximately 60 per million in the UK.Mbarara Regional Referral Hospital is a major tertiary referral hospital in the southwest ofUganda serving over 3 million people. Transport networks from Tanzania, Kenya, Rwandaand the Democratic Republic of Congo intersect in Mbarara. This immensely busy andpivotal hospital serves its population with two critical care beds.OBJECTIVES. Analyse the critical care patient demographics of a major tertiary referralcentre in a resource poor country. Ascertain sources of referrals and admitting diagnoses.Collect and calculate outcomes.METHODS. After local ethics and research approval we interrogated the critical caredatabase of all admissions and deaths over a 22-month period. The data was then categorisedinto information regarding age, diagnosis, referring speciality and length of stay.RESULTS. 209 patients were admitted over 22 months. The average age was 23 years witha 37 % mortality. 53 % were female. The average length of stay was 4 days. Patientsreceived interventions from mechanical ventilation to cardiovascular support and closenursing care. 33 % of referrals were from emergency medicine (EM), 22 % obstetrics andgynaecology, 20 % medicine and 20 % paediatrics. 74 % of the patients were under40 years of age with over half of them being under 30 years. Obstetrics and medicine hadmortality rates of 45 % and 40 % respectively with only 11 % of surgical patients survivingto discharge. Leading mortality diagnoses were sepsis of all origin (25 %), head injuries(19 %), and obstetric causes (10 %).
Top 5 Mortality Diagnosis
Diagnosis Number of deaths Percentage
Sepsis 21 27
Head Injury 15 19
Obstetric 8 10
Poisoning 6 8
Cardiogenic Shock 5 6
CONCLUSIONS. The unit has two beds that are under enormous demand from the pop-ulation. 10 % of all patients were paediatric with a 30 % mortality rate reflecting the needfor an increase in paediatric facilities. On reflection the admission diagnosis and causes ofdeath are not dissimilar to a general intensive care unit in the UK, with vastly differingdemographics and outcomes. The high head injury and trauma rate reflects Mbarara’sunique position as a literal cross roads of major trading routes between 5 nations. Plans arein place to expand to an 8-bedded unit with a repeat analysis of data.REFERENCES. 1. World Health Organization (WHO): http://www.who.int/countries/uga/en/ 2. WHO: http://www.who.int/countries/gbr/en/. 3. Intensive Care Society of Ugandahttp://www.intensivecareuganda.com/index.html.
1058ACQUISITION OF RESISTANT MICROORGANISMS AND INFECTIONS IN HIV-INFECTED PATIENTS ADMITTED TO THE ICU
M. Rinaudo1, N. Cobos Trigueros2, P. Castro1, M. Solé3, S. Fernández1, C. Hernández1,J. Pumarol1, J. Mallolas2, J. Vila3, L. Morata2, J.M. Gatell2, A. Soriano2, J. Mensa2,J.M. Nicolás1, J.A. Martı́nez2
1Hospital Clı́nic, Medical Intensive Care Unit, Barcelona, Spain, 2Hospital Clı́nic,Department of Infectious Diseases, Barcelona, Spain, 3Hospital Clı́nic, Department ofMicrobiology, Barcelona, SpainINTRODUCTION. The immunosuppression is often considered to be a risk factor ofacquiring infections by resistant organisms. The extent to which HIV-infected patients incomparison to other critically ill medical patients behave regarding the acquisition ofnosocomial infections and resistant or potentially resistant microorganisms (RPRMs)remains to be clarified.OBJECTIVES. To compare critically ill HIV-infected and non-infected patients in terms ofacquisition of resistant microorganisms, infections and prognosis.METHODS. Observational, retrospective study of patients admitted to a medical intensivecare unit (ICU) during 35 months. Swabbing of nares, pharynx and rectum, and culture ofrespiratory secretions were obtained thrice weekly. Samples were processed by microbio-logical techniques aimed at the detection of RPRMs. Logistic regression analysis was usedto evaluate predictors of ICU mortality.RESULTS. Out of 969 included patients 64 (6.6 %) were HIV-infected. Compared withnon-HIV-infected patients, they had a higher APACHE II on admission (19.5 ± 6.6 vs.21.1 ± 5.4, p = 0.02) and were more frequently admitted due to an infection (48 % vs.
26th ESICM ANNUAL CONGRESS — PARIS, FRANCE — 5–9 OCTOBER 2013
77 %, p \ 0.0001). HIV-infected patients stayed longer in the unit and were more exposedto several invasive devices and antibiotics. There were no differences in the rate ofacquisition of RPRMs and the only difference in ICU-acquired infections was a significantlyhigher incidence of catheter-related bacteraemia (3 % vs. 9 %, p = 0.03). ICU-relatedmortality were similar in both groups (14 % vs. 16 %, p = 0.70), and in HIV-infectedpatients it was independent from CD4 cell count.CONCLUSIONS. Despite a longer ICU stay, critically ill HIV-infected patients did notshow a higher rate of RPRMs acquisition regardless of their CD4 cell count. The rate ofICU-acquired infection was similar between HIV-infected and non-infected patients, exceptfor catheter-related bacteraemia, which was higher in the HIV-infected population. Mor-tality was similar in both groups.GRANT ACKNOWLEDGMENT. This work was supported by a grant from the ‘‘Fondode Investigaciones Sanitarias, Subdirección General de Evaluación y Fomento de la In-vestigación, Ministerio de Ciencia e Innovación, Gobierno de España, (PI050167)’’.
1059CLINICAL FEATURES AND OUTCOMES PATIENTS WITH DISSEMINATEDTOXOPLASMOSIS ADMITTED TO THE ICU: A MULTICENTER STUDY
M. Schmidt1, R. Sonneville2, S. David3, N. Bigé4, R. Hamifadar5, N. Mongardon6,V. Castelain7, K. Razazi8, A. Marty9, F. Vincent10, M. Dres11, S. Gaudry12, C.E. Luyt13,V. Das14, J.B. Micol15, A. Duguet1, A. Demoule1, J. Mayaux1
1La Pitié Salpêtrière - Charles Foix, Service de Pneumologie et Réanimation Médicale,Paris, France, 2Bichat University Hospital, Réanimation Médicale, Paris, France, 3Saint-Louis University Hospital, Réanimation Médicale, Paris, France, 4Saint Antoine Hospital,Réanimation Médicale, Paris, France, 5Albert Michalon Hospital, Réanimation Médicale,Grenoble, France, 6Cochin University Hospital, Réanimation Médicale, Paris, France,7Haute Pierre Hospital, Réanimation Médicale, Strasbourg, France, 8Henri MondorUniversity Hospital, Réanimation Médicale, Creteil, France, 9Institut Gustave Roussy,Réanimation Médicale, Paris, France, 10Avicenne University Hospital, RéanimationMédicale, Paris, France, 11Bicêtre University Hospital, Réanimation Médicale, Paris,France, 12Louis Mourier Hospital, Réanimation, Colombes, France, 13La Pitié Salpêtrière -Charles Foix, Réanimation Médicale, Paris, France, 14Andre Gregoire Hospital, Montreuil,France, 15Institut Gustave Roussy, Paris, FranceBACKGROUND. Characteristics and outcomes of adult disseminated toxoplasmosispatients admitted in intensive care unit (ICU) have rarely been described.METHODS. We performed a retrospective study on consecutive cases of adult patientswith disseminated toxoplasmosis who were admitted to the ICU from January 2002 throughDecember 2012 in the ICU of 14 University-affiliated hospitals. Disseminated toxoplas-mosis was defined as microbiological, or histological evidence of disease affecting [ 1organ in immunosuppressed patients. Isolated cerebral toxoplasmosis were not included inthis study. Initial clinical presentation, risk factors and impact on 60-day mortality ofdisseminated toxoplasmosis were analyzed.RESULTS. Among the 38 patients who were identified during the study period, 22 (58 %)had received an allogeneic hematopoietic stem cell transplantation (61 [43–175] days beforeICU admission), 4 (10 %) were solid organ transplantation recipients and 10 (27 %) wereHIV-positive (CD4-cell count, 14 [6–33] cells/lL). Main reasons for ICU admission wereacute respiratory failure (89 %) and/or shock (53 %), leading to 82 % of 60-day mortalityrate. Allogeneic hematopoietic stem cell transplantation recipient.(HR = 2.28, 95 % CI, 1.05–5.35, P = 0.04), systolic cardiac dysfunction (HR = 3.54,95 % CI, 1.60–8.10,P \ 0.01), SAPS II and SOFA at day 1 were associated with 60-day mortality.CONCLUSIONS. Severe disseminated toxoplasmosis leading to intensive care admissionhas a poor prognosis. Allogeneic hematopoietic stem cell transplantation recipients seem tobe particularly exposed to this fatal issue. Strategies aimed at preventing this fatal oppor-tunistic infection may improve outcomes.
1060OUTCOME OF 86 PATIENTS WITH SYSTEMIC AUTO-IMMUNE DISEASESADMITTED TO AN INTENSIVE CARE UNIT: A RETROSPECTIVE CASE SERIES
T. Heijnen1, D. Blockmans2, M. Van de Velde1, L. Henckaerts2
1UZ Leuven, Anesthesiology, Leuven, Belgium, 2UZ Leuven, Internal Medicine, Leuven,BelgiumINTRODUCTION. Systemic autoimmune diseases form a rare and heterogeneous group ofdiseases, with an important morbidity caused by disease evolution and/or treatment.Admission to an intensive care unit (ICU) is necessary in 10 % of patients, with a mortalityof up to 50 %, according to previous studies.OBJECTIVES. Description of patient characteristics, clinical features and outcome ofpatients with systemic autoimmune diseases admitted to a referral hospital intensive careunit in Belgium.METHODS. We performed a single center retrospective case series review of all patientswith a systemic autoimmune disease (n = 86) admitted to the medical intensive care unit ofLeuven University Hospital between May 2007 and September 2012. Patients with rheu-matoid arthritis were not included in this study.RESULTS. The most frequent diagnoses in the studied group included vasculitis (n = 31),sarcoidosis (n = 15), systemic sclerosis (n = 9) and systemic lupus erythematosus (n = 7).In the vasculitis group, granulomatosis with polyangiitis (n = 10) was the most frequentdisease. In 10 patients (12 %), the diagnosis was made during their ICU admission; 6 otherpatients (7 %) had a recent diagnosis within a month previous to their admission. Fiftypercent of the patients were female. Mean age on ICU admission was 60 years (± 16).Median time from disease diagnosis to ICU admission was 3,7 years (IQR 0.25–14 years,min 0–max 36). Fifty-seven percent of the patients were treated with immunosuppressivedrugs at least in de 3 months before their admission. Comorbidities included diabetes(21 %), chronic renal failure (41 %) and history of cancer (15 %). Thirteen percent ofpatients (n = 11) had been transplanted before. Main reason for admission was infection(60 %) followed by disease related organ failure (47 %). The respiratory system was the mostcommon organ failure (60 %). Mean APACHE II score was 28 (± 10). Mortality during ICU-admission was 19 %, during hospital stay 39 % and at the end of follow-up 58 %. Hospitalmortality was high in systemic sclerosis (50 %), sarcoidosis (47 %) and vasculitis (41 %).Mean age at death was 65 years (± 13). Hospital death (n = 34) was caused by an infection inthe majority of cases (56 %), and by evolution of the underlying disease in 32 %. Only age andAPACHE II score were associated with mortality in this study.
CONCLUSIONS. Mortality of patients with systemic autoimmune diseases admitted to theintensive care unit is high, both in ICU and afterwards. Comparison of studies is difficultbecause of the different case-mix. Systemic autoimmune diseases are rare, with broad heter-ogeneity both within and between the groups. Only a large prospective and multicenter studywill therefore be able to identify all variables associated with mortality in this population.REFERENCES. 1. Quintero OL, Rojas-Villarraga A, Mantilla RD, Anaya JM. Autoim-mune diseases in the intensive care unit, an update. Autoimmun Rev. 2013;12(3):380–95.GRANT ACKNOWLEDGMENT. None.
1061‘‘AUTOIMMUNE DISEASES IN THE INTENSIVE CARE UNIT’’:A RETROSPECTIVE STUDY IN A PORTUGUESE HOSPITAL
S.P. Nunes1, S.V. Silva1, I. Aragão2, F. Farinha3, C. Vasconcelos3, G. Campello2
1Hospital de Santo António-Centro Hospitalar do Porto, Department of Internal Medicine,Oporto, Portugal, 2Hospital de Santo António-Centro Hospitalar do Porto, Intensive CareUnit, Oporto, Portugal, 3Hospital de Santo António-Centro Hospitalar do Porto, ClinicalImmunology Unit, Oporto, PortugalINTRODUCTION. Patients with systemic autoimmune diseases constitute a small per-centage of the admissions on the medical intensive care units (ICU). Their managementremains a challenge in this context. New and more aggressive diagnostic and therapeuticapproaches have improved the care provided to these patients. The authors provide a clinicalcharacterization of the patients with autoimmune diseases admitted in ICU, including out-come comparison with general ICU patients.METHODS. Retrospective cohort study of all patients with systemic autoimmune diseaseadmitted in a mixed ICU between 2007 and 2012. Data was collected on demographics,clinical data and outcomes.RESULTS. During the study period, 2,326 patients were admitted in the ICU, 22 patients(1 %) had autoimmune disease. The study population had a mean age of 57 ± 16 years,77 % female (n = 17). The mean previous autoimmune disease evolution was 9 years, in 2the diagnosis was made in ICU. Eight patients had systemic lupus erythematous (SLE), 4primary biliary cirrhosis, 3 reumathoid arthritis, 3 systemic vasculitis, 2 dermato/poli-myositis, 1 primary antiphospholipid syndrome and 1 had psoriatic arthritis. Fourteenpatients were on imunossupressive therapy at ICU admission, mainly steroids. The maindiagnosis leading to hospitalization was infection (n = 11) with or without associated flare.The main reason for ICU admission was respiratory failure (n = 6), regardless of theautoimmune disease. Mean SOFA was 9 and more than half of the patients had three ormore organ dysfunction (n = 12). Eight patients needed specific immunotherapy in ICUcontext. Mean ICU length of stay was 9 days compared with the 8 days in general ICUpopulation. The general ICU population in the same period of time had mean SAPS II of 44and ICU mortality rate of 29 %. The value of the SAPS II in the study population (47)predicted a hospital mortality of 37 %, but the mortality rate verified was 32 %. Seventeenpatients were discharged from the ICU, but only nine were alive 12 months after ICUdischarge (mortality rate at 1 year = 59 %).CONCLUSIONS. Systemic autoimmune disease admissions to the ICU are rare and usuallyassociated with a significant high mortality, mainly longtime mortality. In our population,the ICU length of stay and mortality was similar to general ICU population.
Fighting multidrug resistant pathogens: 1062–10751062SCREENING FOR RESISTANT ORGANISMS IN THE ICU
P.D. Levin1, E. Orenbuch-Harroch1, S. Benenson2, A.E. Moses2, C.L. Sprung1, M.J. Cohen2
1Hadassah Hebrew University Medical Center, Anesthesia and Critical Care, Jerusalem,Israel, 2Hadassah Hebrew University Medical Center, Clinical Microbiology and InfectiousDiseases, Jerusalem, IsraelINTRODUCTION. Methicillin-resistant Staphylococcus aureus (MRSA) and carbepenem-resistant enterobacteriaceae (CRE) are common causes of healthcare-associated infections.Screening allows for earlier detection of carriage, prevention of spread and optimization ofantibiotic coverage when needed. Our patients have(1) surveillance cultures (nasal and peri-anal cultures on admission and weekly thereafter forMRSA and CRE),(2) routine cultures (sputum and urine cultures 3 times per week cultured for all bacteria) and(3) clinical cultures (sent according to clinical indications).Overlap might exist in the information provided by these three groups of cultures providingan opportunity for cost savings.OBJECTIVES. To measure detection rates of MRSA and CRE by surveillance, routine andclinical cultures in order to determine if culturing policy could be safely reduced.METHODS. A retrospective analysis of surveillance, routine and clinical cultures. Pro-portion of MRSA and CRE affected patients identified by each culture group was measured.RESULTS. From 2009 to 2012, 1,834 patients were admitted to ICU. MRSA was detected in86 (4.7 %) patients and CRE in 112 (6.1 %). Overall 24,088 cultures were taken, including4,430 (18 %) surveillance, 11,343 (47 %) routine and 8,315 (35 %) clinical cultures. Thesewere positive for MRSA on 93 (2.1 %), 124 (1.1 %) and 45 (0.5 %) occasions and for CRE on212 (4.8 %), 67 (0.6 %) and 86 (1 %) occasions respectively.Among 86 MRSA positive patients, 42 (48.8 %) were identified from surveillance cultures,30 (34.9 %) from routine cultures and 14 (16.3 %) from clinical cultures. MRSA bacteremiarepresented the MRSA defining event for 3/86 (3.5 %) patients. A further 3 patientsdeveloped bacteremia after MRSA detection from another source.Among 112 CRE cases, 92 (82.1 %) were identified from surveillance cultures (p \ 0.001 vsMRSA surveillance), 8 (7.1 %) from routine cultures (P \ 0.001 vs MRSA) and 12 (10.7 %)from clinical cultures (p = 0.25 vs MRSA). Bacteremia was the CRE defining event for 8/112(7 %) patients. Bacteremia occurred in 13 other known CRE patients.Repeating the analysis with surveillance cultures excluded from the database, MRSAdetection decreased to 58 patients (67.4 % of the 84 patients identified using all cultureresults) and CRE to 42 (37.5 % of 112) patients. Median time from admission to detectionincreased from 8.5 (IQR 3-25) to 10 (IQR 3–24, p = 0.70) days for MRSA patients andfrom 17 (IQR 8–33.5) to 17.5 (IQR 8–35, p = 0.84) days for CRE patients.CONCLUSIONS. Effective detection of MRSA carriage requires both surveillance androutine cultures. The majority of CRE carriage is detected by surveillance cultures alone.Bacteremia may be the defining event for the presence of MRSA or CRE. Omission ofsurveillance cultures may decrease detection of MRSA and CRE patients, but not changetime to detection for those detected.
26th ESICM ANNUAL CONGRESS — PARIS, FRANCE — 5–9 OCTOBER 2013
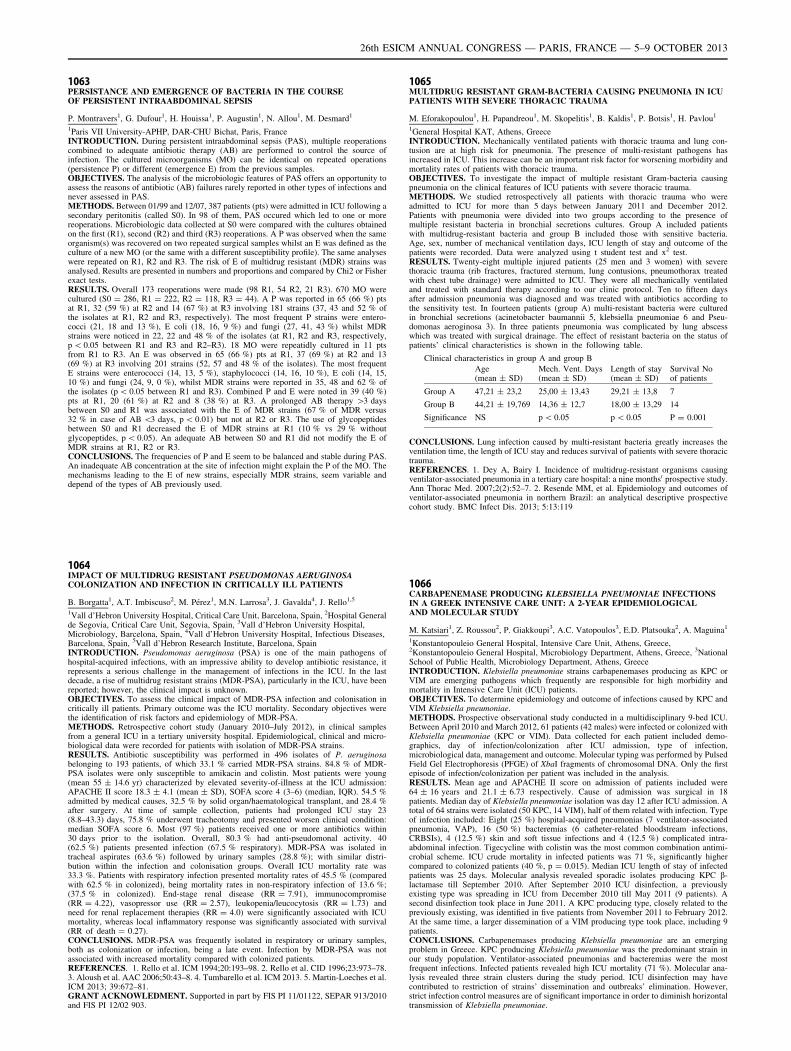
1063PERSISTANCE AND EMERGENCE OF BACTERIA IN THE COURSEOF PERSISTENT INTRAABDOMINAL SEPSIS
P. Montravers1, G. Dufour1, H. Houissa1, P. Augustin1, N. Allou1, M. Desmard1
1Paris VII University-APHP, DAR-CHU Bichat, Paris, FranceINTRODUCTION. During persistent intraabdominal sepsis (PAS), multiple reoperationscombined to adequate antibiotic therapy (AB) are performed to control the source ofinfection. The cultured microorganisms (MO) can be identical on repeated operations(persistence P) or different (emergence E) from the previous samples.OBJECTIVES. The analysis of the microbiologic features of PAS offers an opportunity toassess the reasons of antibiotic (AB) failures rarely reported in other types of infections andnever assessed in PAS.METHODS. Between 01/99 and 12/07, 387 patients (pts) were admitted in ICU following asecondary peritonitis (called S0). In 98 of them, PAS occured which led to one or morereoperations. Microbiologic data collected at S0 were compared with the cultures obtainedon the first (R1), second (R2) and third (R3) reoperations. A P was observed when the sameorganism(s) was recovered on two repeated surgical samples whilst an E was defined as theculture of a new MO (or the same with a different susceptibility profile). The same analyseswere repeated on R1, R2 and R3. The risk of E of multidrug resistant (MDR) strains wasanalysed. Results are presented in numbers and proportions and compared by Chi2 or Fisherexact tests.RESULTS. Overall 173 reoperations were made (98 R1, 54 R2, 21 R3). 670 MO werecultured (S0 = 286, R1 = 222, R2 = 118, R3 = 44). A P was reported in 65 (66 %) ptsat R1, 32 (59 %) at R2 and 14 (67 %) at R3 involving 181 strains (37, 43 and 52 % ofthe isolates at R1, R2 and R3, respectively). The most frequent P strains were entero-cocci (21, 18 and 13 %), E coli (18, 16, 9 %) and fungi (27, 41, 43 %) whilst MDRstrains were noticed in 22, 22 and 48 % of the isolates (at R1, R2 and R3, respectively,p \ 0.05 between R1 and R3 and R2–R3). 18 MO were repeatidly cultured in 11 ptsfrom R1 to R3. An E was observed in 65 (66 %) pts at R1, 37 (69 %) at R2 and 13(69 %) at R3 involving 201 strains (52, 57 and 48 % of the isolates). The most frequentE strains were enterococci (14, 13, 5 %), staphylococci (14, 16, 10 %), E coli (14, 15,10 %) and fungi (24, 9, 0 %), whilst MDR strains were reported in 35, 48 and 62 % ofthe isolates (p \ 0.05 between R1 and R3). Combined P and E were noted in 39 (40 %)pts at R1, 20 (61 %) at R2 and 8 (38 %) at R3. A prolonged AB therapy [3 daysbetween S0 and R1 was associated with the E of MDR strains (67 % of MDR versus32 % in case of AB \3 days, p \ 0.01) but not at R2 or R3. The use of glycopeptidesbetween S0 and R1 decreased the E of MDR strains at R1 (10 % vs 29 % withoutglycopeptides, p \ 0.05). An adequate AB between S0 and R1 did not modify the E ofMDR strains at R1, R2 or R3.CONCLUSIONS. The frequencies of P and E seem to be balanced and stable during PAS.An inadequate AB concentration at the site of infection might explain the P of the MO. Themechanisms leading to the E of new strains, especially MDR strains, seem variable anddepend of the types of AB previously used.
1064IMPACT OF MULTIDRUG RESISTANT PSEUDOMONAS AERUGINOSACOLONIZATION AND INFECTION IN CRITICALLY ILL PATIENTS
B. Borgatta1, A.T. Imbiscuso2, M. Pérez1, M.N. Larrosa3, J. Gavalda4, J. Rello1,5
1Vall d’Hebron University Hospital, Critical Care Unit, Barcelona, Spain, 2Hospital Generalde Segovia, Critical Care Unit, Segovia, Spain, 3Vall d’Hebron University Hospital,Microbiology, Barcelona, Spain, 4Vall d’Hebron University Hospital, Infectious Diseases,Barcelona, Spain, 5Vall d’Hebron Research Institute, Barcelona, SpainINTRODUCTION. Pseudomonas aeruginosa (PSA) is one of the main pathogens ofhospital-acquired infections, with an impressive ability to develop antibiotic resistance, itrepresents a serious challenge in the management of infections in the ICU. In the lastdecade, a rise of multidrug resistant strains (MDR-PSA), particularly in the ICU, have beenreported; however, the clinical impact is unknown.OBJECTIVES. To assess the clinical impact of MDR-PSA infection and colonisation incritically ill patients. Primary outcome was the ICU mortality. Secondary objectives werethe identification of risk factors and epidemiology of MDR-PSA.METHODS. Retrospective cohort study (January 2010–July 2012), in clinical samplesfrom a general ICU in a tertiary university hospital. Epidemiological, clinical and micro-biological data were recorded for patients with isolation of MDR-PSA strains.RESULTS. Antibiotic susceptibility was performed in 496 isolates of P. aeruginosabelonging to 193 patients, of which 33.1 % carried MDR-PSA strains. 84.8 % of MDR-PSA isolates were only susceptible to amikacin and colistin. Most patients were young(mean 55 ± 14.6 yr) characterized by elevated severity-of-illness at the ICU admission:APACHE II score 18.3 ± 4.1 (mean ± SD), SOFA score 4 (3–6) (median, IQR). 54.5 %admitted by medical causes, 32.5 % by solid organ/haematological transplant, and 28.4 %after surgery. At time of sample collection, patients had prolonged ICU stay 23(8.8–43.3) days, 75.8 % underwent tracheotomy and presented worsen clinical condition:median SOFA score 6. Most (97 %) patients received one or more antibiotics within30 days prior to the isolation. Overall, 80.3 % had anti-pseudomonal activity. 40(62.5 %) patients presented infection (67.5 % respiratory). MDR-PSA was isolated intracheal aspirates (63.6 %) followed by urinary samples (28.8 %); with similar distri-bution within the infection and colonisation groups. Overall ICU mortality rate was33.3 %. Patients with respiratory infection presented mortality rates of 45.5 % (comparedwith 62.5 % in colonized), being mortality rates in non-respiratory infection of 13.6 %;(37.5 % in colonized). End-stage renal disease (RR = 7.91), immunocompromise(RR = 4.22), vasopressor use (RR = 2.57), leukopenia/leucocytosis (RR = 1.73) andneed for renal replacement therapies (RR = 4.0) were significantly associated with ICUmortality, whereas local inflammatory response was significantly associated with survival(RR of death = 0.27).CONCLUSIONS. MDR-PSA was frequently isolated in respiratory or urinary samples,both as colonization or infection, being a late event. Infection by MDR-PSA was notassociated with increased mortality compared with colonized patients.REFERENCES. 1. Rello et al. ICM 1994;20:193–98. 2. Rello et al. CID 1996;23:973–78.3. Aloush et al. AAC 2006;50:43–8. 4. Tumbarello et al. ICM 2013. 5. Martin-Loeches et al.ICM 2013; 39:672–81.GRANT ACKNOWLEDMENT. Supported in part by FIS PI 11/01122, SEPAR 913/2010and FIS PI 12/02 903.
1065MULTIDRUG RESISTANT GRAM-BACTERIA CAUSING PNEUMONIA IN ICUPATIENTS WITH SEVERE THORACIC TRAUMA
M. Eforakopoulou1, H. Papandreou1, M. Skopelitis1, B. Kaldis1, P. Botsis1, H. Pavlou1
1General Hospital KAT, Athens, GreeceINTRODUCTION. Mechanically ventilated patients with thoracic trauma and lung con-tusion are at high risk for pneumonia. The presence of multi-resistant pathogens hasincreased in ICU. This increase can be an important risk factor for worsening morbidity andmortality rates of patients with thoracic trauma.OBJECTIVES. To investigate the impact of multiple resistant Gram-bacteria causingpneumonia on the clinical features of ICU patients with severe thoracic trauma.METHODS. We studied retrospectively all patients with thoracic trauma who wereadmitted to ICU for more than 5 days between January 2011 and December 2012.Patients with pneumonia were divided into two groups according to the presence ofmultiple resistant bacteria in bronchial secretions cultures. Group A included patientswith multidrug-resistant bacteria and group B included those with sensitive bacteria.Age, sex, number of mechanical ventilation days, ICU length of stay and outcome of thepatients were recorded. Data were analyzed using t student test and x2 test.RESULTS. Twenty-eight multiple injured patients (25 men and 3 women) with severethoracic trauma (rib fractures, fractured sternum, lung contusions, pneumothorax treatedwith chest tube drainage) were admitted to ICU. They were all mechanically ventilatedand treated with standard therapy according to our clinic protocol. Ten to fifteen daysafter admission pneumonia was diagnosed and was treated with antibiotics according tothe sensitivity test. In fourteen patients (group A) multi-resistant bacteria were culturedin bronchial secretions (acinetobacter baumannii 5, klebsiella pneumoniae 6 and Pseu-domonas aeroginosa 3). In three patients pneumonia was complicated by lung abscesswhich was treated with surgical drainage. The effect of resistant bacteria on the status ofpatients’ clinical characteristics is shown in the following table.
Clinical characteristics in group A and group B
Age(mean ± SD)
Mech. Vent. Days(mean ± SD)
Length of stay(mean ± SD)
Survival Noof patients
Group A 47,21 ± 23,2 25,00 ± 13,43 29,21 ± 13,8 7
Group B 44,21 ± 19,769 14,36 ± 12,7 18,00 ± 13,29 14
Significance NS p \ 0.05 p \ 0.05 P = 0.001
CONCLUSIONS. Lung infection caused by multi-resistant bacteria greatly increases theventilation time, the length of ICU stay and reduces survival of patients with severe thoracictrauma.REFERENCES. 1. Dey A, Bairy I. Incidence of multidrug-resistant organisms causingventilator-associated pneumonia in a tertiary care hospital: a nine months0 prospective study.Ann Thorac Med. 2007;2(2):52–7. 2. Resende MM, et al. Epidemiology and outcomes ofventilator-associated pneumonia in northern Brazil: an analytical descriptive prospectivecohort study. BMC Infect Dis. 2013; 5:13:119
1066CARBAPENEMASE PRODUCING KLEBSIELLA PNEUMONIAE INFECTIONSIN A GREEK INTENSIVE CARE UNIT: A 2-YEAR EPIDEMIOLOGICALAND MOLECULAR STUDY
M. Katsiari1, Z. Roussou2, P. Giakkoupi3, A.C. Vatopoulos3, E.D. Platsouka2, A. Maguina1
1Konstantopouleio General Hospital, Intensive Care Unit, Athens, Greece,2Konstantopouleio General Hospital, Microbiology Department, Athens, Greece, 3NationalSchool of Public Health, Microbiology Department, Athens, GreeceINTRODUCTION. Klebsiella pneumoniae strains carbapenemases producing as KPC orVIM are emerging pathogens which frequently are responsible for high morbidity andmortality in Intensive Care Unit (ICU) patients.OBJECTIVES. To determine epidemiology and outcome of infections caused by KPC andVIM Klebsiella pneumoniae.METHODS. Prospective observational study conducted in a multidisciplinary 9-bed ICU.Between April 2010 and March 2012, 61 patients (42 males) were infected or colonized withKlebsiella pneumoniae (KPC or VIM). Data collected for each patient included demo-graphics, day of infection/colonization after ICU admission, type of infection,microbiological data, management and outcome. Molecular typing was performed by PulsedField Gel Electrophoresis (PFGE) of XbaI fragments of chromosomal DNA. Only the firstepisode of infection/colonization per patient was included in the analysis.RESULTS. Mean age and APACHE II score on admission of patients included were64 ± 16 years and 21.1 ± 6.73 respectively. Cause of admission was surgical in 18patients. Median day of Klebsiella pneumoniae isolation was day 12 after ICU admission. Atotal of 64 strains were isolated (50 KPC, 14 VIM), half of them related with infection. Typeof infection included: Eight (25 %) hospital-acquired pneumonias (7 ventilator-associatedpneumonia, VAP), 16 (50 %) bacteremias (6 catheter-related bloodstream infections,CRBSIs), 4 (12.5 %) skin and soft tissue infections and 4 (12.5 %) complicated intra-abdominal infection. Tigecycline with colistin was the most common combination antimi-crobial scheme. ICU crude mortality in infected patients was 71 %, significantly highercompared to colonized patients (40 %, p = 0.015). Median ICU length of stay of infectedpatients was 25 days. Molecular analysis revealed sporadic isolates producing KPC b-lactamase till September 2010. After September 2010 ICU disinfection, a previouslyexisting type was spreading in ICU from December 2010 till May 2011 (9 patients). Asecond disinfection took place in June 2011. A KPC producing type, closely related to thepreviously existing, was identified in five patients from November 2011 to February 2012.At the same time, a larger dissemination of a VIM producing type took place, including 9patients.CONCLUSIONS. Carbapenemases producing Klebsiella pneumoniae are an emergingproblem in Greece. KPC producing Klebsiella pneumoniae was the predominant strain inour study population. Ventilator-associated pneumonias and bacteremias were the mostfrequent infections. Infected patients revealed high ICU mortality (71 %). Molecular ana-lysis revealed three strain clusters during the study period. ICU disinfection may havecontributed to restriction of strains’ dissemination and outbreaks’ elimination. However,strict infection control measures are of significant importance in order to diminish horizontaltransmission of Klebsiella pneumoniae.
26th ESICM ANNUAL CONGRESS — PARIS, FRANCE — 5–9 OCTOBER 2013
1067PREVALENCE AND RISK FACTORS FOR COLONIZATION WITHMULTIDRUG RESISTANT BACTERIA AMONG PATIENTS ADMITTEDTO THE INTENSIVE CARE UNIT RETURNING FROM ABROAD
M. Angue1, D. Vandroux1, Y. Lefort1, M. Orabona1, O. Belmonte2, N. Lugagne3, J. Allyn1
1CHU F Guyon, La Réunion, Réanimation Polyvalente, Saint Denis de La Réunion, France,2CHU F Guyon, La Réunion, Bactériologie, Saint Denis de La Réunion, France, 3CHU FGuyon, La Réunion, CLIN, Saint Denis de La Réunion, FranceINTRODUCTION. The management of ICU patients returning from abroad poses envi-ronmental and treatment problems. French recommendations are preventive contactisolation only for patients who have been hospitalized abroad; there is no mention ofpatients returning from abroad in general. No study has been carried out on this topic inICU.OBJECTIVES. Describe the characteristics of patients having been abroad during the past6 months and identify factors associated with colonization with MRB.METHODS. Retrospective study of 15 months (2012–2013) in the ICU of the UniversityHospital North of Reunion. Inclusion of all patients admitted to the ICU during this periodand identification of patients who have been abroad at any time within 6 months prior to theadmission. Statistical analysis of the data (including sampling hygiene research MRBsystematically performed on admission to the unit) consisted of uni and multivariate ana-lysis to identify factors related to the carriage of MRB. Results are presented as median(Q1–Q3) and percentage.RESULTS. Of 1,157 patients admitted to the ICU, 79 (6.8 %) had been abroad in theprevious 6 months (50 % Madagascar, Mayotte/Comoros 30 %, India/Mauritius 13 %). Ofthe 79 patients, 49 (62 %) resided abroad, 44 (56 %) had been repatriated by a foreignhospital, 24 (30 %) had received antibiotics on site. The median age was 59 (38–64) years,SAPS II at admission was 49 (29–62), and an infection was the reason for admission in47 %0.29 (37 %) of these 79 patients had a positive screening MRB at admission (71 %among the subpopulation of patients who received antibiotics, 50 % of repatriated patients,49 % of foreign residents, and 17 % of tourists), against 7.2 % among other patientsadmitted to the ICU (p \ 0.01). MRB (44 Enterobacteriaceae ESBL and 1 carbapenemase, 5acinetobacter baumanii resistant to carbapenems, 1 Pseudomonas aeruginosa resistant toceftazidime, 3 Stenotrophomonas maltophilia, 0 MRSA, glycopeptide-resistant enterococci0) was pathogenic in 7 of 29 cases (24 %) from admission. Probabilistic antibiotherapy wasprescribed before the 4th day in 84 % of cases; it contained a carbapenem in 36 % of cases,and covered MRSA in 26 % of cases. 11 (28 %) patients experienced an MRB infectionduring their stay. The univariate and multivariate identified one factor associated withcolonization with MRB admission in these patients, taking antibiotics: OR (95 % CI): 5.2(1.2 to 21.4), p = 0.02.CONCLUSIONS. We report, in this large cohort, a carriage of MRB very common, evenamong tourists, justifying isolation and MRB carriage screening for any patient having beenabroad during the past 6 months, beyond recommendations. The rate of infection onadmission to the MRB and related factors identified can challenge a systematic probabilisticvery broad spectrum antibiotherapy.
1068IMPACT OF INFECTION PREVENTION PROGRAMS IN ANTIBIOTICUSE IN CRITICALLY ILL PATIENTS
M. Palomar1, F. Alvarez lerma2, X. Nuvials1, P. Olaechea3, J.J. Otal4, R. Gimeno5,
I. Seijas6, M. Catalan7, M. Arenillas2, ENVIN-HELICS Group1IRBLleida, Lleida, Spain, 2Hospital Mar, Barcelona, Spain, 3Hospital Galdakao, Galdakao,Spain, 4Hospital Galdakao Vall Hebron, Barcelona, Spain, 5Hospital La Fe, Valencia, Spain,6Hospital Cruces, Bilbo, Spain, 7Hospital Doce de Octubre, Madrid, SpainINTRODUCTION. According to the literature, rates of associated device’s infections aredecreasing but the consumption of antibiotics (ATB) in the ICUs remains high.OBJECTIVES. To asses whether prevention programs for bacteriemia (BZ) and VAP(NZ), initiated in 2009 and 2011,have had some impact on the use of ATB in Spanish ICUs.METHODS. ENVIN-HELICS, prospective, multicenter, observational study, including allpatients admitted to the ICU from April to July from 2008 to 2012. Patients with ATB,indications as community-acquired infection (CAI), extra-ICU (NI) and ICU (ICU-AI)nosocomial infections, and days of treatment (ATB-days) were documented. Statisticalanalysis: Chi square test, significance * = p \ 0.05.RESULTS. We documented 84,107 patients and 637,647 patient-days. A total of 116,432ATB and 753,628 ATB-days were prescribed.The percentage of patients with ICU-NI drecreased from 13.5 % in 2008 to 10.24 % in2012*, while Pts with CAI increased from 13.4 to 14.3 %.The percentage of patients with ATB ranged from 60 % in 2009 to 63 % in 2012. However,the percentage of ATB free-days in ICU increased from 33 to 37 % *and the total ATB-daysin relation to the patient days fell from 116.8 to 113.4 *as well.ATB for ICU-NI, declined both in number of indications* (27.2 % 2008 to 20.7 % in2012*) and ATB-days (35.1 to 26.8 %) of total use, while ATB, (number and days) for CAIincreased (25.8 and 26.3 % to 29.3 and 32.7 %).ATB for NI increased in a lower degree (20.1 and 21.9 % to 20.7 and 23.4 %*) .CONCLUSIONS. The decrease of ICU-NI as a result of implementation of safety patientprograms (BZ and NZ) has been reflected in a significant lower use of ATB for theseindications and overall.REFERENCES. 1. http://hws.vhebron.net/envin-helics/GRANT ACKNOWLEDGMENT. Pfizer
1069DOXYCYCLINE AND CO-TRIMETHOXAZOLE: A NEW COMBINATION FORTREATMENT OF MDR ACINETOBACTER BAUMANNII. DOES IT WORK?
S. Farid1, A. Abouelela2, M. Eliwa2
1Alexandria University, Microbiology & Immunology, Alexandria, Egypt, 2AlexandriaUniversity, Critical Care Medicine, Alexandria, EgyptINTRODUCTION. Acinetobacter baumannii has proven to be an increasingly importantand demanding species in health care-associated infections. The drug-resistant nature of thepathogen and its unusual and unpredictable susceptibility patterns make empirical andtherapeutic decisions even more difficult. Most of the published and running studies fortreatment of multidrug-resistant Acinetobacter baumannii (MDR-AB) depends on the usageof older class of antibiotic (Colistin) either alone as a single therapy or in combination with
another antibacterial agents. the fact that new strains of Acinetobacter baumannii started toshow resistance to colistin obliged the investigators to search for other alternatives fortreatment.OBJECTIVE. The aim of this study was to assess the effect of combination of Doxycyclineand co-trimethoxazole in the cure of nosocomial MDR-AB infection in critically ill patientsand its effect on the patients outcome.METHODS. The study was done on 50 adult critically ill patients who developed noso-comial isolated MDR-AB in the Critical Care Medicine Department of AlexandriaUniversity in Egypt and received combination of Doxycycline 100 mg twice daily Withtrimethoprime-sulphamethoxazole (co-trimethoxazole) in a dose of 80 mg Trimethoprime/400 mg Sulphamethoxazole twice daily for 1 week. patients who are allergic to the anti-biotics used or those who did not continue 7 days treatment were excluded from the study.Approval of local ethical committee as well as consent from patients relatives wereobtained. culture and sensitivity was repeated after 1 week treatment.RESULTS. The microbiological cure rate was 60 % as 30/50 patients were cured. The bestcure rate was in surgical site infection with 88.9 % (8/9) while the cure in pneumonia was56.7 % (17/30). Two cases with blood steam infection were not cured while (5/9) patientsfrom those who had more than one site infection were cured. The total 30 days mortalitywas 20 % (10/50) while the mortality related infection was 12 %.CONCLUSIONS. We concluded that combination of Doxycycline and co-trimethoxazolecan be used in the treatment of nosocomial MDR-AB infection resistant to colistin or incases with contraindications or unavailability of colistin especially in surgical site infectionand to less extent in pneumonia.. However, further larger studies are needed to validate theresults of this study.REFERENCES. 1. Maragakis LL, Perl TM. Acinetobacter baumannii: epidemiology,antimicrobial resistance, and treatment options. Clin Infect Dis 2008; 46(8):1254–63. 2.Popescu GA. Antimicrobial resistance of Acinetobacter baumannii strains isolated in,,MATEI BAL national institute of infectious diseases. Therapeutics, Pharmacology andClinical Toxicology 2011; 15(3): 225–9. 3. Eberle BM. The impact of Acinetobacter bau-mannii infections on outcome in trauma patients: a matched cohort study. Crit Care Med.2010;38(11):2133–8.
1070WE ARE ALL NECESSARY AGAINST THE OUTBREAK
V. Olea Jiménez1, J.M. Mora Ordoñez1, E. Curiel Balsera1
1Hospital Regional Carlos Haya, Medicina Intensiva, Málaga, SpainINTRODUCTION. Strains resistant ESBL and carbapenem are increasing. The first was in1993 carbapenemase in Enterobacter cloacae coded in NmcA. We have identified a varietyof carbapenem in enterobacteria, (A, B and D). Class D are mostly OXA-48 and OXA-181are endemic to the Mediterranean basin. The Hodge test can be used as a first step in thedetection of carbapenemases. The time required is 24–48 h and is better for the detection ofcarbapenemase KPC and OXA-48. The main mechanism of spread is patient–patient. TheControl strategies are surveillance cultures, cleaning up the environment, contact precau-tions and prudent use of antibiotics antimicrobianos. These strains are sensitive to colistina,some aminoglycoside and tigeciclina.OBJECTIVES. Describe the measures to control the outbreak.METHODS. Descriptive observational study of the measures taken during the outbreak K.pneumoniae bla-OXA48 from October 2011 to 2012.RESULTS. Collected 135 ESBL. 104K. pneumoniae ESBL with carbapenemase OXAsuspect phenotype 48. Interventions are by a multidisciplinary group. When It confirms theexistence of the outbreak, were provides guidelines to follow. Monitoring is performedKlebsiella isolates from culture and antibiogram of samples as well as molecular typing.Described 82 patients OXA 48 confirmed. The 98.7 % were CTX-M15. Although the studyshowed polyclonality clone 5 was predominant with 90 %. The Samples which was firstisolated from rectal swab 41.5 %, 22 % respiratory secretions, urine culture, blood culture,17.1 % and 8.5 %. Were transferred infected and colonized patients in single rooms. ThePatient cohorts with this organism were in a particular area. Measures contact isolation wereimplemented, until we had 3 negative cultures. The cultures were monitoring through rectalswabs of all patients who may have been in contact and those with more than 48 h of ICU.Repeat once a week. Priority was given to the cleaning. Equipment non-critical was devotedfor individual use. It is increased the points of hand hygiene. Informative talks were con-ducted. After six month at the persistence of the outbreak are increased measures. Acommission was created to improve multidisciplinary, were assigned specific areas ofinsulation out of ICU, dedicated staff exclusive, were cleanings terminals, was introducedSelective Digestive Decontamination and the establishment of specific PCR moleculartechnique to detect OXA-48. It was controlled the outbreak in October 2012.CONCLUSIONS. The emergence of multidrug-resistant germ outbreak increases bothmorbidity and mortality. It is essential to the performance of a multidisciplinary team withthe support of management. The high suspicion or early detection with PCR techniqueallows early action. Insulation measures, exclusive personal hygiene, proper treatment andthe use of SDD controlled the outbreak difficult.REFERENCES. 1. CMI 18:439–448. 2. CMI 18:413–431.
1071MULTIDRUG RESISTANT ACINETOBACTER INFECTION IN A SECONDLEVEL INTENSIVE CARE UNIT
C. Trujillano-Fernandez1, M.-V. de la Torre-Prados1, N. Zamboschi1, J. Perez-Vacas1,
A. Puerto-Morlan1, E. Camara-Sola1, P. Martinez-Lopez1,2, A. Garcia-Alcantara1,2
1Hospital Universitario Virgen de la Victoria, Intensive Care Unit, Malaga, Spain, 2IBIMAInstitute, Malaga, SpainINTRODUCTION. Multidrug resistant (MDR) Acinetobacter has emerged as a cause ofinfection in critically ill patients. Broad spectrum antibiotics, mechanical ventilation, centralvenous catheter and tracheostomy are well-known risk factors for developing this infection.The development of Intensive Care Unit (ICU) acquired infections is strongly related toprolonged ICU stay and worse outcomes including increased morbidity and mortality.OBJECTIVES. To describe demographic, clinical characteristics and the associated out-comes of patients who develop MDR Acinetobacter infections in ICU.METHODS. A retrospective study of 22 cases admitted to a second level ICU with thiskind of infection was made during the period November 2010 to January 2013, with areview of medical records, laboratory tests and microbiological isolates during the admis-sion period. Descriptive and comparative statistical analysis was performed using thestatistical software packages SPSS version 15.0 (SPSS Inc., Chicago, IL, USA).
26th ESICM ANNUAL CONGRESS — PARIS, FRANCE — 5–9 OCTOBER 2013
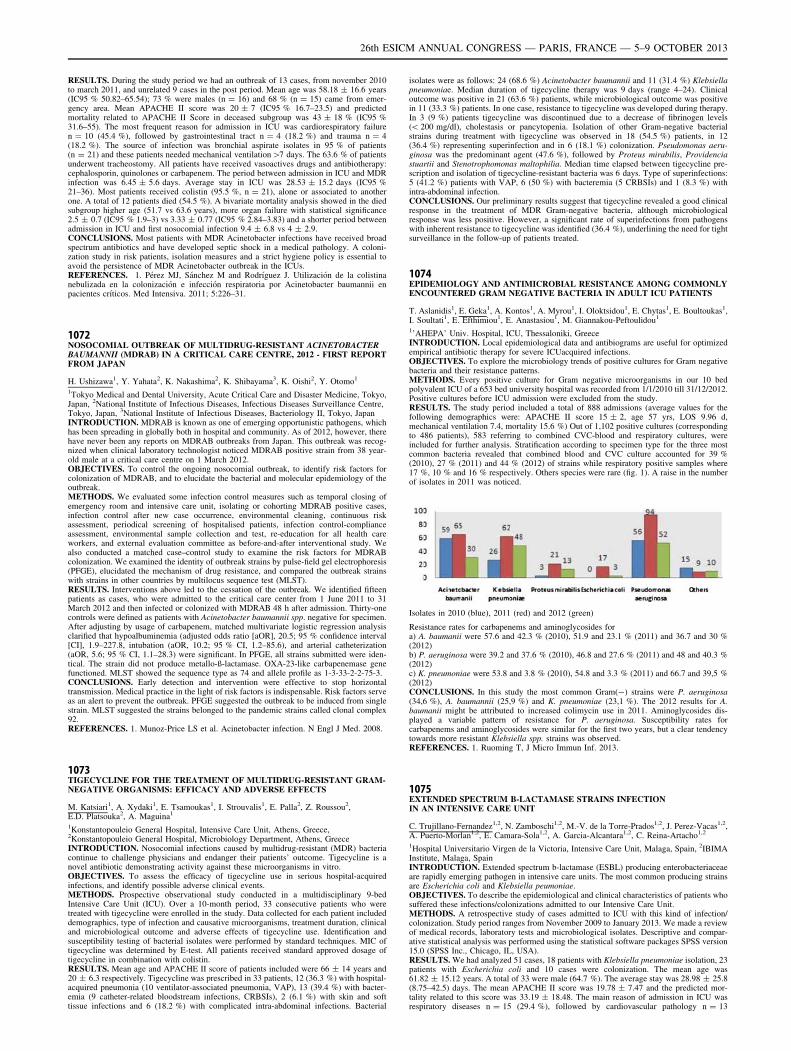
RESULTS. During the study period we had an outbreak of 13 cases, from november 2010to march 2011, and unrelated 9 cases in the post period. Mean age was 58.18 ± 16.6 years(IC95 % 50.82–65.54); 73 % were males (n = 16) and 68 % (n = 15) came from emer-gency area. Mean APACHE II score was 20 ± 7 (IC95 % 16.7–23.5) and predictedmortality related to APACHE II Score in deceased subgroup was 43 ± 18 % (IC95 %31.6–55). The most frequent reason for admission in ICU was cardiorespiratory failuren = 10 (45.4 %), followed by gastrointestinal tract n = 4 (18.2 %) and trauma n = 4(18.2 %). The source of infection was bronchial aspirate isolates in 95 % of patients(n = 21) and these patients needed mechanical ventilation[7 days. The 63.6 % of patientsunderwent tracheostomy. All patients have received vasoactives drugs and antibiotherapy:cephalosporin, quinolones or carbapenem. The period between admission in ICU and MDRinfection was 6.45 ± 5.6 days. Average stay in ICU was 28.53 ± 15.2 days (IC95 %21–36). Most patients received colistin (95.5 %, n = 21), alone or associated to anotherone. A total of 12 patients died (54.5 %). A bivariate mortality analysis showed in the diedsubgroup higher age (51.7 vs 63.6 years), more organ failure with statistical significance2.5 ± 0.7 (IC95 % 1.9–3) vs 3.33 ± 0.77 (IC95 % 2.84–3.83) and a shorter period betweenadmission in ICU and first nosocomial infection 9.4 ± 6.8 vs 4 ± 2.9.CONCLUSIONS. Most patients with MDR Acinetobacter infections have received broadspectrum antibiotics and have developed septic shock in a medical pathology. A coloni-zation study in risk patients, isolation measures and a strict hygiene policy is essential toavoid the persistence of MDR Acinetobacter outbreak in the ICUs.REFERENCES. 1. Pérez MJ, Sánchez M and Rodrı́guez J. Utilización de la colistinanebulizada en la colonización e infección respiratoria por Acinetobacter baumannii enpacientes crı́ticos. Med Intensiva. 2011; 5:226–31.
1072NOSOCOMIAL OUTBREAK OF MULTIDRUG-RESISTANT ACINETOBACTERBAUMANNII (MDRAB) IN A CRITICAL CARE CENTRE, 2012 - FIRST REPORTFROM JAPAN
H. Ushizawa1, Y. Yahata2, K. Nakashima2, K. Shibayama3, K. Oishi2, Y. Otomo1
1Tokyo Medical and Dental University, Acute Critical Care and Disaster Medicine, Tokyo,Japan, 2National Institute of Infectious Diseases, Infectious Diseases Surveillance Centre,Tokyo, Japan, 3National Institute of Infectious Diseases, Bacteriology II, Tokyo, JapanINTRODUCTION. MDRAB is known as one of emerging opportunistic pathogens, whichhas been spreading in globally both in hospital and community. As of 2012, however, therehave never been any reports on MDRAB outbreaks from Japan. This outbreak was recog-nized when clinical laboratory technologist noticed MDRAB positive strain from 38 year-old male at a critical care centre on 1 March 2012.OBJECTIVES. To control the ongoing nosocomial outbreak, to identify risk factors forcolonization of MDRAB, and to elucidate the bacterial and molecular epidemiology of theoutbreak.METHODS. We evaluated some infection control measures such as temporal closing ofemergency room and intensive care unit, isolating or cohorting MDRAB positive cases,infection control after new case occurrence, environmental cleaning, continuous riskassessment, periodical screening of hospitalised patients, infection control-complianceassessment, environmental sample collection and test, re-education for all health careworkers, and external evaluation committee as before-and-after interventional study. Wealso conducted a matched case–control study to examine the risk factors for MDRABcolonization. We examined the identity of outbreak strains by pulse-field gel electrophoresis(PFGE), elucidated the mechanism of drug resistance, and compared the outbreak strainswith strains in other countries by multilocus sequence test (MLST).RESULTS. Interventions above led to the cessation of the outbreak. We identified fifteenpatients as cases, who were admitted to the critical care center from 1 June 2011 to 31March 2012 and then infected or colonized with MDRAB 48 h after admission. Thirty-onecontrols were defined as patients with Acinetobacter baumannii spp. negative for specimen.After adjusting by usage of carbapenem, matched multivariate logistic regression analysisclarified that hypoalbuminemia (adjusted odds ratio [aOR], 20.5; 95 % confidence interval[CI], 1.9–227.8, intubation (aOR, 10.2; 95 % CI, 1.2–85.6), and arterial catheterization(aOR, 5.6; 95 % CI, 1.1–28.3) were significant. In PFGE, all strains submitted were iden-tical. The strain did not produce metallo-ß-lactamase. OXA-23-like carbapenemase genefunctioned. MLST showed the sequence type as 74 and allele profile as 1-3-33-2-2-75-3.CONCLUSIONS. Early detection and intervention were effective to stop horizontaltransmission. Medical practice in the light of risk factors is indispensable. Risk factors serveas an alert to prevent the outbreak. PFGE suggested the outbreak to be induced from singlestrain. MLST suggested the strains belonged to the pandemic strains called clonal complex92.REFERENCES. 1. Munoz-Price LS et al. Acinetobacter infection. N Engl J Med. 2008.
1073TIGECYCLINE FOR THE TREATMENT OF MULTIDRUG-RESISTANT GRAM-NEGATIVE ORGANISMS: EFFICACY AND ADVERSE EFFECTS
M. Katsiari1, A. Xydaki1, E. Tsamoukas1, I. Strouvalis1, E. Palla2, Z. Roussou2,E.D. Platsouka2, A. Maguina1
1Konstantopouleio General Hospital, Intensive Care Unit, Athens, Greece,2Konstantopouleio General Hospital, Microbiology Department, Athens, GreeceINTRODUCTION. Nosocomial infections caused by multidrug-resistant (MDR) bacteriacontinue to challenge physicians and endanger their patients’ outcome. Tigecycline is anovel antibiotic demonstrating activity against these microorganisms in vitro.OBJECTIVES. To assess the efficacy of tigecycline use in serious hospital-acquiredinfections, and identify possible adverse clinical events.METHODS. Prospective observational study conducted in a multidisciplinary 9-bedIntensive Care Unit (ICU). Over a 10-month period, 33 consecutive patients who weretreated with tigecycline were enrolled in the study. Data collected for each patient includeddemographics, type of infection and causative microorganisms, treatment duration, clinicaland microbiological outcome and adverse effects of tigecycline use. Identification andsusceptibility testing of bacterial isolates were performed by standard techniques. MIC oftigecycline was determined by E-test. All patients received standard approved dosage oftigecycline in combination with colistin.RESULTS. Mean age and APACHE II score of patients included were 66 ± 14 years and20 ± 6.3 respectively. Tigecycline was prescribed in 33 patients, 12 (36.3 %) with hospital-acquired pneumonia (10 ventilator-associated pneumonia, VAP), 13 (39.4 %) with bacter-emia (9 catheter-related bloodstream infections, CRBSIs), 2 (6.1 %) with skin and softtissue infections and 6 (18.2 %) with complicated intra-abdominal infections. Bacterial
isolates were as follows: 24 (68.6 %) Acinetobacter baumannii and 11 (31.4 %) Klebsiellapneumoniae. Median duration of tigecycline therapy was 9 days (range 4–24). Clinicaloutcome was positive in 21 (63.6 %) patients, while microbiological outcome was positivein 11 (33.3 %) patients. In one case, resistance to tigecycline was developed during therapy.In 3 (9 %) patients tigecycline was discontinued due to a decrease of fibrinogen levels(\ 200 mg/dl), cholestasis or pancytopenia. Isolation of other Gram-negative bacterialstrains during treatment with tigecycline was observed in 18 (54.5 %) patients, in 12(36.4 %) representing superinfection and in 6 (18.1 %) colonization. Pseudomonas aeru-ginosa was the predominant agent (47.6 %), followed by Proteus mirabilis, Providenciastuartii and Stenotrophomonas maltophilia. Median time elapsed between tigecycline pre-scription and isolation of tigecycline-resistant bacteria was 6 days. Type of superinfections:5 (41.2 %) patients with VAP, 6 (50 %) with bacteremia (5 CRBSIs) and 1 (8.3 %) withintra-abdominal infection.CONCLUSIONS. Our preliminary results suggest that tigecycline revealed a good clinicalresponse in the treatment of MDR Gram-negative bacteria, although microbiologicalresponse was less positive. However, a significant rate of superinfections from pathogenswith inherent resistance to tigecycline was identified (36.4 %), underlining the need for tightsurveillance in the follow-up of patients treated.
1074EPIDEMIOLOGY AND ANTIMICROBIAL RESISTANCE AMONG COMMONLYENCOUNTERED GRAM NEGATIVE BACTERIA IN ADULT ICU PATIENTS
T. Aslanidis1, E. Geka1, A. Kontos1, A. Myrou1, I. Oloktsidou1, E. Chytas1, E. Boultoukas1,I. Soultati1, E. Efthimiou1, E. Anastasiou1, M. Giannakou-Peftoulidou1
1’AHEPA’ Univ. Hospital, ICU, Thessaloniki, GreeceINTRODUCTION. Local epidemiological data and antibiograms are useful for optimizedempirical antibiotic therapy for severe ICUacquired infections.OBJECTIVES. To explore the microbiology trends of positive cultures for Gram negativebacteria and their resistance patterns.METHODS. Every positive culture for Gram negative microorganisms in our 10 bedpolyvalent ICU of a 653 bed university hospital was recorded from 1/1/2010 till 31/12/2012.Positive cultures before ICU admission were excluded from the study.RESULTS. The study period included a total of 888 admissions (average values for thefollowing demographics were: APACHE II score 15 ± 2, age 57 yrs, LOS 9.96 d,mechanical ventilation 7.4, mortality 15.6 %) Out of 1,102 positive cultures (correspondingto 486 patients), 583 referring to combined CVC-blood and respiratory cultures, wereincluded for further analysis. Stratification according to specimen type for the three mostcommon bacteria revealed that combined blood and CVC culture accounted for 39 %(2010), 27 % (2011) and 44 % (2012) of strains while respiratory positive samples where17 %, 10 % and 16 % respectively. Others species were rare (fig. 1). A raise in the numberof isolates in 2011 was noticed.
Isolates in 2010 (blue), 2011 (red) and 2012 (green)
Resistance rates for carbapenems and aminoglycosides fora) A. baumanii were 57.6 and 42.3 % (2010), 51.9 and 23.1 % (2011) and 36.7 and 30 %(2012)b) P. aeruginosa were 39.2 and 37.6 % (2010), 46.8 and 27.6 % (2011) and 48 and 40.3 %(2012)c) K. pneumoniae were 53.8 and 3.8 % (2010), 54.8 and 3.3 % (2011) and 66.7 and 39,5 %(2012)CONCLUSIONS. In this study the most common Gram(-) strains were P. aeruginosa(34,6 %), A. baumannii (25,9 %) and K. pneumoniae (23,1 %). The 2012 results for A.baumanii might be attributed to increased colimycin use in 2011. Aminoglycosides dis-played a variable pattern of resistance for P. aeruginosa. Susceptibility rates forcarbapenems and aminoglycosides were similar for the first two years, but a clear tendencytowards more resistant Klebsiella spp. strains was observed.REFERENCES. 1. Ruoming T, J Micro Immun Inf. 2013.
1075EXTENDED SPECTRUM B-LACTAMASE STRAINS INFECTIONIN AN INTENSIVE CARE UNIT
C. Trujillano-Fernandez1,2, N. Zamboschi1,2, M.-V. de la Torre-Prados1,2, J. Perez-Vacas1,2,A. Puerto-Morlan1,2, E. Camara-Sola1,2, A. Garcia-Alcantara1,2, C. Reina-Artacho1,2
1Hospital Universitario Virgen de la Victoria, Intensive Care Unit, Malaga, Spain, 2IBIMAInstitute, Malaga, SpainINTRODUCTION. Extended spectrum b-lactamase (ESBL) producing enterobacteriaceaeare rapidly emerging pathogen in intensive care units. The most common producing strainsare Escherichia coli and Klebsiella peumoniae.OBJECTIVES. To describe the epidemiological and clinical characteristics of patients whosuffered these infections/colonizations admitted to our Intensive Care Unit.METHODS. A retrospective study of cases admitted to ICU with this kind of infection/colonization. Study period ranges from November 2009 to January 2013. We made a reviewof medical records, laboratory tests and microbiological isolates. Descriptive and compar-ative statistical analysis was performed using the statistical software packages SPSS version15.0 (SPSS Inc., Chicago, IL, USA).RESULTS. We had analyzed 51 cases, 18 patients with Klebsiella pneumoniae isolation, 23patients with Escherichia coli and 10 cases were colonization. The mean age was61.82 ± 15.12 years. A total of 33 were male (64.7 %). The average stay was 28.98 ± 25.8(8.75–42.5) days. The mean APACHE II score was 19.78 ± 7.47 and the predicted mor-tality related to this score was 33.19 ± 18.48. The main reason of admission in ICU wasrespiratory diseases n = 15 (29.4 %), followed by cardiovascular pathology n = 13
26th ESICM ANNUAL CONGRESS — PARIS, FRANCE — 5–9 OCTOBER 2013
(25.5 %) and gastrointestinal diseases n = 10 (19.6 %), other causes of admission wererenal failure or trauma. Most patients came from the emergency department n = 39(76.5 %) with medical pathology, n = 39 (76.5 %). The first source of infection wasbronchoaspirate isolates n = 18 (35.35 %), followed by urine isolates n = 8 (15.7 %) andblood cultures n = 6 (11.8 %). Most patients needed vasopresor drug n = 42 (82.4 %),mechanical ventilation n = 45 (88.2 %) and 29 patients underwent tracheostomy. Allpatients 100 % received previous antibiotics before the ESBL isolation and the drug chosento treat the infection was a carbapenem in 41 patients (80.4 %), either alone or associated toanother antibiotic. 16 patients died in the total group (31.4 %) and mortality was higher inthe Escherichia subgroup than the Klebsiella subgroup 47.8 % vs. 22.2 %. A bivariatemortality analysis showed in the subgroup of deceased a higher age (67 vs. 59.43 years),more organ failures (3.56 vs. 2.55), longer duration in mechanical ventilation (20.81 vs.18 days) and a shorter period of time between admission in ICU and first nosocomialinfection (15.5 vs. 19.75 days).CONCLUSIONS. ESBL producing enterobacteriaceae infection is an important cause ofnosocomial infection with long stays and high intensive support. A program based onobtaining early samples, especially for patients from ward and other hospitals, and increasedsurveillance and strict infection control measures for these organism.REFERENCES. 1. Prashant N et al. An observational study on bloodstream extended-spectrum beta-lactamase infection in critical care unit: incidence, risk factors and its impacton outcome. Eur J Internal Med. 2012; 23: 192–95.
Prognosis of sepsis: 1076–10891076SEPTIC SHOCK HEMODYNAMIC MANAGEMENT: EVOLUTION IN A DECADE
G. Zani1, F. Freddi1, B. Gemelli1, S. Vitali1, E. Bergamini1, S. Tisato1, D. Morri1,S. Spadaro1, R. Ragazzi1, C.A. Volta1
1University of Ferrara, Anesthesiology and Intensive Care, Department of Morphology,Surgery and Sperimental Medicine, Ferrara, ItalyINTRODUCTION. Septic shock patients are a very heterogeneous population and thisreason make them so hard to investigate. The early treatment and the use of specific goalsseem able to influence the outcome of these patients. Although recent guidelines of theSurviving Sepsis Campaign (SSC) on the hemodynamic management are most clear [1],there are still some controversies: does one fit all? And what about the treatment subsequentto the first 6 h [2, 3]?OBJECTIVES. Primary aim of this study was to analyze the evolution in hemodynamicmanagement in septic shock patients from 2003 to 2012 in our general ICU. Secondaryobjective was to discover if and how this strategy could influence the outcome.METHODS. We analyzed vasopressor and fluid management in all patients admitted to ourICU with a diagnosis of septic shock in 2003, 2007 and 2012. Data were collected retro-spectively for 2003 and 2007 and prospectively for 2012. We considered 2003 because therewere still no guidelines and 2007 and 2012 as representative of the first and second editionof SSC guidelines. Patients’ data were recorded by consulting medical records.RESULTS. 63 patients were finally enrolled (18 in 2003, 20 in 2007 and 25 in 2012).- Inhospital mortality fall from 72 % in 2003 to 55 % in 2007 and 44 % in 2012, with a totalreduction in mortality of 28 %.- No differences were found for median age, SAPS II score and cardiovascular dysfunctionassessed by SOFA score.- SSC hemodynamic targets were reached in 2007 and in 2012.- Use of dopamine was prevalent in 2003; instead, norepinephrine was the first choice drugboth for 2007 and 2012.- We found a reduction of both dosage of vasoactive drugs from 2003 to 2012 (p \ 0.05)and duration of infusion of dopamine (p \ 0.01).- The use of saline solutions seems to correlate with a worse outcome at the limit ofstatistical significance (p = 0.06).- Lactate C 4 mmol/l at ICU admission and after 6 h of treatment were predictive ofmortality (p \ 0.05).CONCLUSIONS. Application of the SSC guidelines for septic shock patients improved theoutcome. Norepinephrine has been identified as the first choice already in 2007, according tothe most recent SSC guidelines, but the best strategy to improve the outcome seems the useof vasopressors in low doses, for a short time and in combination with an appropriate fluidtherapy. Lactacidemia was a simple parameter able to predict mortality and it should be usedas a guide for fluid therapy in addition to other hemodynamic parameters. The low numberof patients enrolled is probably responsible of lack of significance about the use of normalsaline in septic shock. However it is tempting to believe that the use of balanced solutionsmight be associated with a better outcome compared with normal saline.REFERENCES. 1. The SSC Guidelines Committee. Intensive Care Med 2013;39:165 2.Perel A. Crit Care 2008;12:223 3. Marik PE. Ann Intensive Care 2011;1:17.
1077STATISTICAL STUDY OF URINARY INFECTIONS RELATED TO URETHRALCATHETER IN OUR INTENSIVE CARE UNIT (ICU)
R. Fernandez1, J.C. Frı́as1, M. Muñoz1, M.E. Yuste1, R. Ramı́rez1
1Granada University, Granada, SpainINTRODUCTION. Urinary tract infection is the most common nosocomial infection,accounting for 23 to 30 % of all infections acquired during hospitalization. Increases hos-pital stay by an average of 4 days. Mortality is low and is particularly associated withsecondary bacteremia, which occurs from 0.5 to 4 % of these patients. Bladder catheteri-zation (CV) is the most influential factor for developing an urinary tract infection (UTI).Approximately 75 % of UTIs, affect patients that have required catheterization. Through theapplication of some of medical and sanitary steps,UTI may decrease about 30 %, infectiouscomplications of bladder catheterization.OBJECTIVES. We want to describe the incidence of UTI associated with urethral catheter,using data from the National Nosocomial Infections Surveillance (ENVIN) in a 18-bed ICU.METHODS. The patients of our study, were admitted to our ICU from 01.04.11, until01.01.13, dividing them in two periods: from 01.04.11 to 01.01.12 and 01.01.12 to01.01.13.. We included only patients admitted for more than 24 h. All were followed untildischarge from the ICU. As statistical parameters, we used the rate per 100 patients admitted(total of 1,821 patients) and the incidence density (ID) per 1,000 days of ICU stay(8,599 days) and ID per 1,000 urinary catheter days (6,122).RESULTS. The profile of patients with catheter-associated urinary tract infection in our ICUis: mean age 61 years with standard desviation (SD) 24.65, 60 % women, 80 % artificial
airway, central venous catheter (CVC) 80 %, SAPS II half 42, SD18.38. Half APACHE 21.20,SD 6.87 and half days of stay: 108 with SD 122.75 (maximum 242, minimum 4). According toENVIN-ICU, national average rate is between 4.08 per 1,000 days of catheterization.In the first period, we had a total of 7 UTIs with a rate of 0.99 UTIs per 100 patientsadmitted and 1.96 UTIs per 100 catheterized patients.The ID was 1.86 UTIs per 1,000 days of ICU stay and 2.73 per 1,000 catheter days. Themost frequently isolated microorganisms were E. coli and K. pneumoniae.During the second period, we also present 7 urinary infections, with a rate of 0.63 per 100 patientsadmitted and 1.16 per 100 patients with urinary catheter. The DI was 1.30 UTIs per 1,000 days ofstay and 20.1 per 1,000 urinary catheter days. During this year, shared first place E. coli,K.pneumoniaeplus P. Aeruginosa. In the two cuts, one was isolated fungus, being C. albicans.In both periods, the most common inflammatory response was sepsis (71.43 %, 85.71 %respectively) with proper treatment in 85.71 % and 100 % of cases, respectively, it was thendemonstrated with the culture and sensitivity.CONCLUSIONS. We are below the rate and the national ID catheter-associated UTI. It isrelationated to the exclusive probing to patients who require it, to the sterile conditions ofthe technicalREFERENCES. 1. Flores J, Bustinza A. Vesical catheterization guidelines. Grupo SECIP.2012GRANT ACKNOWLEDGMENT. Dra Yuste, Dra Ramı́rez
1078OUTCOME PREDICTORS IN SEVERE DENGUE INFECTION WITHMULTIORGAN DYSFUNCTION SYNDROME—A PROSPECTIVEMULTICENTERED STUDY IN INDIA (IPRI-DIMODS STUDY)
S. Jog1,2, S. Prayag2,3, P. Joshi2,4, S. Dixit2,5, P. Rajhans1,2, K. Zirpe2,6, M. Penurkar2,7,
J. Shah2,8, A. Kakrani9, A. Yadav2,10, K. Kadapatti2,11, B. Pawar1,2, S. Gurav2,6,K. Borawake2,9, D. Patel1,2, ISCCM Pune Research Initiative (IPRI)1Deenanath Mangeshkar Hospital, Intensive Care Medicine, Pune, India, 2ISCCM Pune,Pune, India, 3Shree Medical Foundation, Intensive Care Medicine, Pune, India, 4NiramayHospital, Pune, India, 5Sanjeevan Hospital, Intensive Care Medicine, Pune, India, 6RubyHall Clinic, Intensive Care Medicine, Pune, India, 7Shashwat Hospital, Intensive CareMedicine, Pune, India, 8Bharati Veedyapeeth Medical College, Intensive Care Medicine,Pune, India, 9D Y Patil Medical College, Medicine, Pune, India, 10Niramay Hospital,Intensive Care Medicine, Pune, India, 11Jehangir Hospital, Intensive Care Medicine, Pune,IndiaINTRODUCTION. Outcome predictors of Severe Dengue Infection (1) in tertiary levelIntensive Care Units (ICU) are not well studied and mortality rates reported in the publishedliterature have significant variablility. (2,3)
OBJECTIVES. To study outcome predictors in patients with severe dengue infection withmultiorgan dysfunction admitted in intensive care units.METHODS-This prospective Multicentered study was conducted in 14 multidisciplinarytertiary level intensive care units in Pune,India during the period July 2012 to December2012. The inclusion criteria were:1) Age above 18 years,2) Diagnosis of Dengue infection by either Dengue NS1 antigen or Dengue IgM antibody orDengue PCR positivity.3) Presence of at least 2 organ dysfunction by SOFA criteria. Exclusion criteria were:1) Concomittent other tropical/bacterial infection2) Presence of MODS more than 5 days before ICU admission. Contemporary standard ICUcare including advanced hemodynamic monitoring & treatment, mechanical ventilation,renal replacement therapy,blood products transfusion were instituted as per respective ICU0spolicy without having any resource limitations.RESULTS. 410 patients with Dengue infection were screened of which 86 patients who metinclusion criteria were enrolled. Average age was 40.40 ± 17.86 years and average SOFAscore on the first day of ICU admission was 3.36 ± 3.80. All cause 28 day mortality was29.10 % (25/86). We studied various demographic, clinical, laboratory and therapeuticparameters as outcome predictors of mortality. On binomial logistic regression analysis needof vasopressor within 24 h of ICU admission (Cardiovascular SOFA score C 2) (p = 0.009)along with acute kidney injury (Renal SOFA score C 1) (p = 0.002) were statisticallysignificantly related to mortality. Patient characteristics like duration of illness before ICUadmission; respiratory, hepatic, hematological, neurological dysfunction as well as baselinehematocrit, serum albumin level, global systolic LV function on echocardiography had noco relation with mortality. Therapeutic interventions like positive fluid balance at 24 h ofICU admission,use of colloids, choice of vasipressor, modality of renal replacement therapy,use of systemic steroids, RBC transfusion, plasma replacement, platelet transfusion had nostatistically significant co-relation with mortality.
Outcome predictors on logistic regression analysisVariable B value Std error p value Odds ratio (C.I.)
CVS SOFA C 2 -1.64 0.63 0.01 0.19(0.06–0.66)
Renal SOFA C 1 -2.21 0.71 0.002 0.11(0.02–0.44)
CONCLUSIONS. Severe Dengue Infection with multiorgan dysfunction,despite treated intertiary care ICU, without having any resource limitations, had high mortality. Cardiovas-cular and renal dysfunction during first 24 h of ICU admission were predictors of highermortality.REFERENCES. 1. Dengue guidelines for diagnosis, treatment, prevention and control.Geneva: World Health Organization, 2009. 2. J Critical Care 2011; 26:441–448 3. Am JTrop Med Hyg. 2011; 84(1):127–134.GRANT ACKNOWLEDGMENT. Research grant from ISCCM, Pune Branch
1079NEW STRATEGY IN PATIENTS WITH SEPTIC COMPLICATIONS AFTERSURGERY
Y. Miyerbekov1, G. Svyatova2, V. Mutagirov1
1National Scientific Cetre of Surgery, Anaesthesiology, Almaty, Kazakhstan, 2NationalScientific Cetre of Surgery, Clinical Laboratory, Almaty, KazakhstanINTRODUCTION. Mortality in patients with peritonitis and abdominal sepsis may be ashigh as 50–70 %0.1, 2 Numerous mortality predicting scales are very useful to determine therate of death probability in septic patients. 3, 4 But there are no predicting scales or signs forrate of sepsis occurrence in patients after urgent abdominal surgery.OBJECTIVES. to study the role of the tumor necrosis factor (TNFa) gene polymorphismas prognostic factor of septic complications in patients after urgent abdominal surgery.
26th ESICM ANNUAL CONGRESS — PARIS, FRANCE — 5–9 OCTOBER 2013
METHODS. After local ethic Committee approval and informed concern 152 pts underwenturgent abdominal surgery were studied. We studied frequency of septic complications aftersurgery. All patients underwent genotype examination to reveal abnormalities of TNFa gene.RESULTS. 49 (32.2 %) pts had septic complications after surgery (group 1), 103 (37.8 %)pts had no complications (group 2). We have revealed pathological genotype AA of TNFagene in group 1 in 68.6 ± 6.62 % of patients and 9.9 ± 3.36 % in patients of group 2(p \ 0.05). AG genotype was in 19.7 ± 9.45 % in group 1 and 38.5 ± 6.7 % in group 2(p \ 0.05). Genotype GG have 13.5 ± 9.05 % of patients in group 1 and 53.9 ± 6.93 % ofpatients in group 2 (p \ 0.05).CONCLUSIONS. Revealed prevalence of genotype AA of TNFa gene in patients with septiccomplications after surgery let us to suggest its role in development of septic complicationsafter surgery. Genotype AA of TNFa gene can be settled as early prognostic criteria of high riskfor development of septic complications in surgical patients and may substantiate earlyaggressive prevention of septic complications in surgical patients to decrease mortality.REFERENCES. 1. Bartlett J. Intra-abdominal sepsis. Med Clin North Am.1995;79(3):599–617. 2. Friedman G, Silva E, Vincent J. Has the mortality of septic shockchanged with time. Crit. Care Med. 1998; 26(12):2078–86. 3. Bohnen J, Mustard R, OxholmS, Schouten B. APACHE II score and abdominal sepsis. A prospective study. Arch. Surg.1988; 123:225–229. 4. Ohmann C, Wittmann D, Wacha H. Prospective evaluation ofprognostic scoring systems in peritonitis. Eur J Surg. 1993; 159:267–74.
1080OUTCOMES OF SEPSIS IN PATIENTS ADMITTED TO A TERTIARY HOSPITALIN INDIA AFTER IMPLEMENTATION OF A SEPSIS PATHWAY:A RETROSPECTIVE STUDY
S. Jakkinaboina1, T. Patil Ashish1, Z.A. Mohammed1, A.L.V. Ramakrishna1
1Apollo Health City, Critical Care Medicine, Hyderabad, IndiaINTRODUCTION. The application in clinical practice of evidence-based guidelines forthe management of patients with sepsis improves outcomes. The adherence to a sepsismanagement pathway is poor in many hospitals despite the introduction of such a pathway.OBJECTIVES. The objectives of this study were to evaluate the effect of an in-hospitalsepsis program on the adherence to evidence-based guidelines and outcome of patients withsepsis admitted to the hospital.METHODS. A retrospective study was done for a period of 6 months from July 2012 toDecember 2012. The data was collected from patient records after ethics committeeapproval. The primary end point was mortality. The secondary outcomes were hospital andICU length of stay. The following were the parameters monitored: age, sex, diagnosis,source of infection, APACHE II score, serum lactate at 1 and 6 h, time to antibioticadministration after the diagnosis of sepsis, comorbidities, organs failure, EGDT goalsachieved in 6 h,use of vasopressors, type of fluids, capillary glucose at admission andglucose control in 48 h, hospital and ICU length of stay and use of steroids in septic shock.RESULTS. The total number of patients were 150. The patients were divided into 4 groups1) sepsis 2) severe sepsis 3) septic shock 4) over all group (comprises of sepsis + severesepsis + septic shock patients). The baseline characteristics are represented in the table no 1.The average initial antibiotic time in sepsis, severe sepsis, septic shock and overall groupwere 30.97 min, 22.5 min, 83.25 min, 41.63 min respectively. The most common antibioticused in all groups were beta lactum + beta lactamase inhibitor. The outcomes are repre-sented in table no 2.The early goal directed theraphy was acheived in 73.8 % of patients.0.9 % saline was the most common fluid used for resusitation.In septic shock 28.125 % patients received steroids.The following were the results for the multivariate analysis for the increased hospitallength of stay.In Sepsis - uncontrolled blood sugars in 48 h, and increased APACHE 2 score.In Severe sepsis - uncontrolled blood sugars in 48 h, and increased age.In Septic shock - uncontrolled blood sugars in 48 h.In Overall group - uncontrolled blood sugars in 48 h, and increased APACHE 2 score anduse of vasopressors.The following were the results for the multivariate analysis for the increased hospitalmortality.In sepsis and septic shock - increased APACHE 2 score.In severe sepsis - increased hospital stay.In overall group - Increased APACHE 2 score and use of vasopressors.
Baseline characteristics of the patients
Groups of
patients
Apache
ii
Age
in
years
Sex
ratio
M:F
Lactate
in
mmol/l
Blood sugar at
admission mg/
dl
Most common
source of infection
IN %
Most common
comorbidities %
Organs fail-
ure in %
Sepsis 8.53 54.48 70:30 2.28 185.7 Lung-55 Urinary
Tract
Infection-16.8
Diabetes 21.5
Hypertension
13
Lung 38 Kidney
12
Severe sepsis 20.5 47.40 70:30
7.22 247 Cellulites 30
Urinary
Tract
Infection
20
Diabetes 40
Hypertension
30
Lung 40 Kidney
20
Septic shock 21.18 52.96 59:41
7.94 153.93 Lung 65 Acute Gastroenteritis
9.38
Diabetes 25
Hypertension 5 Lung 34 Kidney
10
Overall group 17 53.68 32:68
2.75 183 Lung- 54.36
Urinary
Tract
Infection-
14.77
Diabetes 23.49
Hypertension
16.78
Lung 33.36
Kidney 12
Death patients 21.29 50.92 66:34
2.74 146.8 Lung- 37.40
Urinary
Tract
Infection-
14.81
Diabetes 25.93
Hypertension
11.11
Lung 22.22
Kidney
11.11
Discharge patients 16.19 53.18 68:32
2.75 191 Lung- 58 Urinary
Tract
Infection-
18
Diabetes 22.90
Hypertension
17.21
Lung 36 Kidney
11.48
Primary and Secondary outcomes
Groups of patients Hospital length
of stay in days
Intensive care unit (icu)
length of stay in days
Mortality IN %
Sepsis 8.90 4.30 11.21
Severe sepsis 12 6 20
Septic shock 16.87 9.96 40.63
Overall outcome 10.84 5.74 18.12
Death patients 11.08 7.5 100
Discharge patients 10.45 4.88 0
CONCLUSIONS. The increased APACHE II and use of vasopressors increased the mor-bidity and mortality. Uncontrolled blood sugar in first 48 h increased hospital length of stay.The adherence to sepsis pathway is 73.8 % but needs further improvement.REFERENCES. 1. Chest 2010;138:476–483.
1081PREINFECTION SYSTEMIC INFLAMMATORY CONDITION, NOT THE ONETHAT OCCURS AFTER INFECTION, DETERMINES SEPSIS SURVIVAL
R. Manez1, M. Perez-Cruz2, C. Costa2
1Belvitge University Hospital, Intensive Care Medicine, Hospitalet de Llobregat, Spain,2Bellvitge Biomedical Research Institute (IDIBELL), Infections and Transplantation,Hospitalet de Llobregat, SpainINTRODUCTION. Sepsis is considered a hyperinflammatory state that shifts towards ananti-inflammatory response that ends predominating. However, sepsis occurs mostly inpatients with other medical, surgical or traumatic conditions that may influence the outcome.OBJECTIVES. To ascertain the role of preinfection inflammatory condition on suscepti-bility to sepsis.METHODS. Isogenic Lewis rats were submitted to a non-infectious insult (xenogenicimmunization with three every-other-day intraperitoneal injections of 1 ml of hamsterblood), which boosts natural T-independent (TI) antibodies cross-reactive with bacteriaalong with systemic inflammation. The day after the last injection cecal ligation andpuncture (CLP) was performed with two severity levels: a moderate-severe (17G needle)and a low-grade (19G needle) sepsis. Rat serum was analyzed for the presence of 34cytokines using a rat antibody cytokine array from RayBiotech (Norcross, GA, USA).RESULTS. Xenoimmunization was associated with the boosting of mainly TI IgM anti-bodies at the time of CLP, along with hematological and biochemical signs of inflammation.It also led to a significant reduction in animal survival in moderate-severe sepsis (p \ 0.005,as determined by log rank survival analysis), with all rats dying within 20 h of CLP. Allcontrol animals (C-TI) that had a final survival of 20 %, were still alive at this time point.Enhancement of TI xenoantibodies was also associated with decreased survival in low-gradesepsis, which was 88.2 % in C-TI and 52.9 % after hamster blood immunization (p \ 0.05).Bacterial loads were observed in blood samples 12 h after CLP for moderate-severe sepsisin both C-TI and xenoimmunized rats. In contrast, no bacteria was detected 24 h after CLPin blood samples from rats with low-grade sepsis either after boosting TI xenoantibodies ornot, despite the presence of abscesses in the abdomen. Within the xenoimmunized group, nodifferences were found in the level of TI IgM or IgG anti-hamster xenoantibodies at the timeof CLP between animals that survived and those which died after the procedure. Cytokineanalysis in low-grade sepsis 48 h after CLP showed a simultaneous decrease in proin-flammatory and anti-inflammatory cytokines in C-TI animals or augmented in TI rats thatsurvived the procedure. In the latter group, xenoimmunization was associated with adecrease of both proinflammatory and anti-inflammatory cytokines at the time of CLP,which contrasted with the augment observed in animals that died after the procedure.Furthermore, animals that died after low-grade sepsis showed a higher body weight atbaseline along with an absence of weight gain after xenoimmunization compared to C-TIand TI animals that survived after CLP.CONCLUSION. Xenoimmunization may lead to two different patterns of inflammatoryresponses in genetically identical rats, apparently influenced by animal weight, whichdetermines animal survival after sepsis even with local infection.
1082ANALYSIS OF THE EVOLUTION OF MORTALITY OF SEVERE SEPSISIN SPANISH ICUS IN THE LAST 6 YEARS
B. Sánchez1, D. Suárez2, A. Artigas3, R. Ferrer1, Edusepsis Study Group1Hospital Universitario Mutua Terrassa, Universidad de Barcelona, Intensive CareDepartment, Terrassa, Spain, 2Fundació Parc Taulı́, Sabadell, Spain, 3Hospital de Sabadell,Corporación Sanitaria Parc Taulı́, Universidad Autónoma de Barcelona, Critical CareCenter, Sabadell, SpainINTRODUCTION. In Spain, the incidence of septic shock is 31 cases per 100 000 adults/year, with a mortality rate of 45.7 % (1) Several treatments have shown improved survivalresulting in the development of treatment guidelines of the Surviving Sepsis Campaign(SSC) (2) However initial compliance with these recommendations was low. For this reason,the SSC developed an international project of quality improvement based on these rec-ommendations; in Spain it had a specific format and design through Edusepsis study: firsteducation intervention was general (3) and the second intervention was focused on earlyantibiotics (ABISS-Edusepsis) and is still on going.OBJECTIVES. Determine if since the introduction of SSC guidelines in Spain, the mor-tality of sepsis has been reduced and if this reduction is attributable to improved treatment.METHODS. Prospective cohort study. We included all consecutive patients with severesepsis or septic shock admitted to 41 Spanish ICUs during two time periods: first group (11/1/2005 to 12/31/2005) was the pre-intervention group of the Edusepsis study and secondgroup (4/11/2011 to 10/07/2011) was the pre-intervention group of the study ABISS-Edu-sepsis. We compared the clinical characteristics, treatments administered and mortalitybetween the two groups. Statistical analysis: Descriptive statistics including percentages,means, standard deviations, confidence intervals for categorical or continuous variables. Tocompare variables between the two periods was used student0s t test or Chi square asappropriate. We performed a multivariate analysis of factors associated with mortality.RESULTS. 1,369 patients were included in the study, 646 in 2005 and 723 in 2011. Patientsin 2011 were older (62.1 ± 16.7 vs 64.9 ± 14.9y, p = 0.023) and more severe (APACHE IIscore 20.7 ± 7.2 vs 22.4 ± 7.9, p = 0.001). In 2011 there has been a significantimprovement in the treatments administered: Resuscitation Bundle (Table 1) and BundleTreatment (Table 2). Absolute hospital mortality was lower in 2011 43.5 % vs 32.6 %,p \ 0.001) and also the adjusted mortality (OR 0.638 (0.49 to 0.831), p = 0.001) (Table 3).
26th ESICM ANNUAL CONGRESS — PARIS, FRANCE — 5–9 OCTOBER 2013
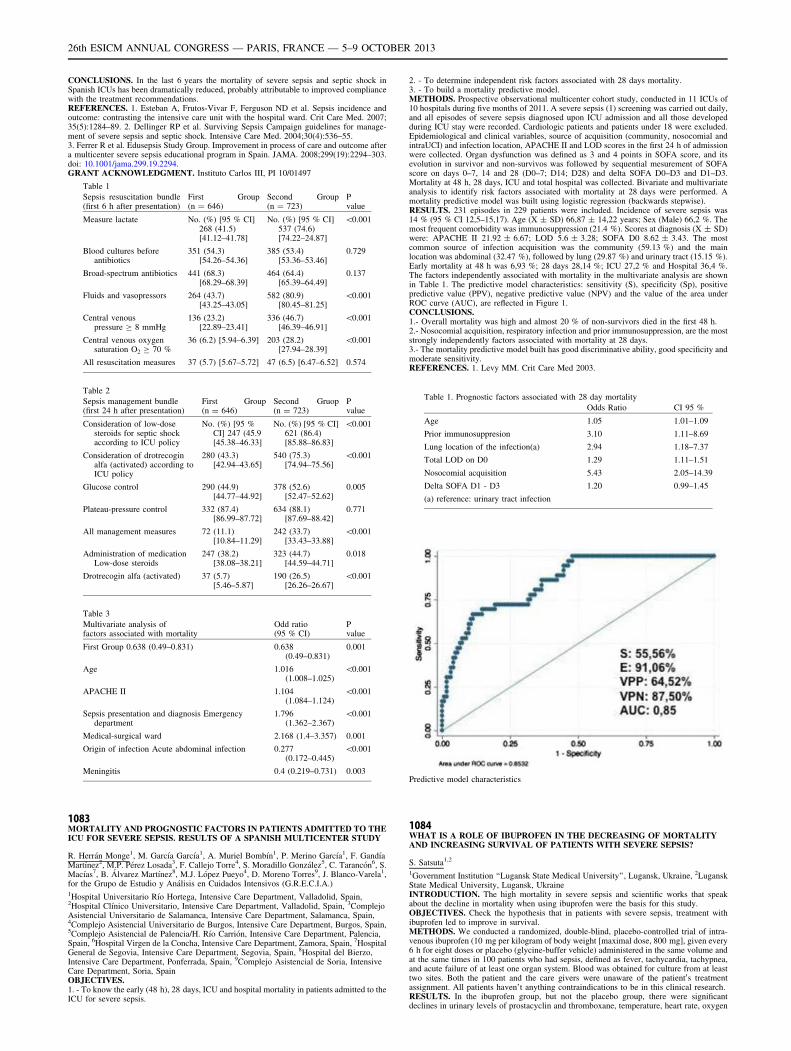
CONCLUSIONS. In the last 6 years the mortality of severe sepsis and septic shock inSpanish ICUs has been dramatically reduced, probably attributable to improved compliancewith the treatment recommendations.REFERENCES. 1. Esteban A, Frutos-Vivar F, Ferguson ND et al. Sepsis incidence andoutcome: contrasting the intensive care unit with the hospital ward. Crit Care Med. 2007;35(5):1284–89. 2. Dellinger RP et al. Surviving Sepsis Campaign guidelines for manage-ment of severe sepsis and septic shock. Intensive Care Med. 2004;30(4):536–55.3. Ferrer R et al. Edusepsis Study Group. Improvement in process of care and outcome aftera multicenter severe sepsis educational program in Spain. JAMA. 2008;299(19):2294–303.doi: 10.1001/jama.299.19.2294.GRANT ACKNOWLEDGMENT. Instituto Carlos III, PI 10/01497
Table 1
Sepsis resuscitation bundle(first 6 h after presentation)
First Group(n = 646)
Second Group(n = 723)
Pvalue
Measure lactate No. (%) [95 % CI]268 (41.5)[41.12–41.78]
No. (%) [95 % CI]537 (74.6)[74.22–24.87]
\0.001
Blood cultures beforeantibiotics
351 (54.3)[54.26–54.36]
385 (53.4)[53.36–53.46]
0.729
Broad-spectrum antibiotics 441 (68.3)[68.29–68.39]
464 (64.4)[65.39–64.49]
0.137
Fluids and vasopressors 264 (43.7)[43.25–43.05]
582 (80.9)[80.45–81.25]
\0.001
Central venouspressure C 8 mmHg
136 (23.2)[22.89–23.41]
336 (46.7)[46.39–46.91]
\0.001
Central venous oxygensaturation O2 C 70 %
36 (6.2) [5.94–6.39] 203 (28.2)[27.94–28.39]
\0.001
All resuscitation measures 37 (5.7) [5.67–5.72] 47 (6.5) [6.47–6.52] 0.574
Table 2
Sepsis management bundle(first 24 h after presentation)
First Group(n = 646)
Second Gruop(n = 723)
Pvalue
Consideration of low-dosesteroids for septic shockaccording to ICU policy
No. (%) [95 %CI] 247 (45.9[45.38–46.33]
No. (%) [95 % CI]621 (86.4)[85.88–86.83]
\0.001
Consideration of drotrecoginalfa (activated) according toICU policy
280 (43.3)[42.94–43.65]
540 (75.3)[74.94–75.56]
\0.001
Glucose control 290 (44.9)[44.77–44.92]
378 (52.6)[52.47–52.62]
0.005
Plateau-pressure control 332 (87.4)[86.99–87.72]
634 (88.1)[87.69–88.42]
0.771
All management measures 72 (11.1)[10.84–11.29]
242 (33.7)[33.43–33.88]
\0.001
Administration of medicationLow-dose steroids
247 (38.2)[38.08–38.21]
323 (44.7)[44.59–44.71]
0.018
Drotrecogin alfa (activated) 37 (5.7)[5.46–5.87]
190 (26.5)[26.26–26.67]
\0.001
Table 3
Multivariate analysis offactors associated with mortality
Odd ratio(95 % CI)
Pvalue
First Group 0.638 (0.49–0.831) 0.638(0.49–0.831)
0.001
Age 1.016(1.008–1.025)
\0.001
APACHE II 1.104(1.084–1.124)
\0.001
Sepsis presentation and diagnosis Emergencydepartment
1.796(1.362–2.367)
\0.001
Medical-surgical ward 2.168 (1.4–3.357) 0.001
Origin of infection Acute abdominal infection 0.277(0.172–0.445)
\0.001
Meningitis 0.4 (0.219–0.731) 0.003
1083MORTALITY AND PROGNOSTIC FACTORS IN PATIENTS ADMITTED TO THEICU FOR SEVERE SEPSIS. RESULTS OF A SPANISH MULTICENTER STUDY
R. Herrán Monge1, M. Garcı́a Garcı́a1, A. Muriel Bombı́n1, P. Merino Garcı́a1, F. Gandı́aMartı́nez2, M.P. Pérez Losada3, F. Callejo Torre4, S. Moradillo González5, C. Tarancón6, S.Macı́as7, B. Álvarez Martı́nez8, M.J. López Pueyo4, D. Moreno Torres9, J. Blanco-Varela1,for the Grupo de Estudio y Análisis en Cuidados Intensivos (G.R.E.C.I.A.)1Hospital Universitario Rı́o Hortega, Intensive Care Department, Valladolid, Spain,2Hospital Clı́nico Universitario, Intensive Care Department, Valladolid, Spain, 3ComplejoAsistencial Universitario de Salamanca, Intensive Care Department, Salamanca, Spain,4Complejo Asistencial Universitario de Burgos, Intensive Care Department, Burgos, Spain,5Complejo Asistencial de Palencia/H. Rı́o Carrión, Intensive Care Department, Palencia,Spain, 6Hospital Virgen de la Concha, Intensive Care Department, Zamora, Spain, 7HospitalGeneral de Segovia, Intensive Care Department, Segovia, Spain, 8Hospital del Bierzo,Intensive Care Department, Ponferrada, Spain, 9Complejo Asistencial de Soria, IntensiveCare Department, Soria, SpainOBJECTIVES.1. - To know the early (48 h), 28 days, ICU and hospital mortality in patients admitted to theICU for severe sepsis.
2. - To determine independent risk factors associated with 28 days mortality.3. - To build a mortality predictive model.METHODS. Prospective observational multicenter cohort study, conducted in 11 ICUs of10 hospitals during five months of 2011. A severe sepsis (1) screening was carried out daily,and all episodes of severe sepsis diagnosed upon ICU admission and all those developedduring ICU stay were recorded. Cardiologic patients and patients under 18 were excluded.Epidemiological and clinical variables, source of acquisition (community, nosocomial andintraUCI) and infection location, APACHE II and LOD scores in the first 24 h of admissionwere collected. Organ dysfunction was defined as 3 and 4 points in SOFA score, and itsevolution in survivor and non-survivos was followed by sequential mesurement of SOFAscore on days 0–7, 14 and 28 (D0–7; D14; D28) and delta SOFA D0–D3 and D1–D3.Mortality at 48 h, 28 days, ICU and total hospital was collected. Bivariate and multivariateanalysis to identify risk factors associated with mortality at 28 days were performed. Amortality predictive model was built using logistic regression (backwards stepwise).RESULTS. 231 episodes in 229 patients were included. Incidence of severe sepsis was14 % (95 % CI 12,5–15,17). Age (X ± SD) 66,87 ± 14,22 years; Sex (Male) 66,2 %. Themost frequent comorbidity was immunosuppression (21.4 %). Scores at diagnosis (X ± SD)were: APACHE II 21.92 ± 6.67; LOD 5.6 ± 3.28; SOFA D0 8.62 ± 3.43. The mostcommon source of infection acquisition was the community (59.13 %) and the mainlocation was abdominal (32.47 %), followed by lung (29.87 %) and urinary tract (15.15 %).Early mortality at 48 h was 6,93 %; 28 days 28,14 %; ICU 27,2 % and Hospital 36,4 %.The factors independently associated with mortality in the multivariate analysis are shownin Table 1. The predictive model characteristics: sensitivity (S), specificity (Sp), positivepredictive value (PPV), negative predictive value (NPV) and the value of the area underROC curve (AUC), are reflected in Figure 1.CONCLUSIONS.1.- Overall mortality was high and almost 20 % of non-survivors died in the first 48 h.2.- Nosocomial acquisition, respiratory infection and prior immunosuppression, are the moststrongly independently factors associated with mortality at 28 days.3.- The mortality predictive model built has good discriminative ability, good specificity andmoderate sensitivity.REFERENCES. 1. Levy MM. Crit Care Med 2003.
Table 1. Prognostic factors associated with 28 day mortality
Odds Ratio CI 95 %
Age 1.05 1.01–1.09
Prior immunosuppresion 3.10 1.11–8.69
Lung location of the infection(a) 2.94 1.18–7.37
Total LOD on D0 1.29 1.11–1.51
Nosocomial acquisition 5.43 2.05–14.39
Delta SOFA D1 - D3 1.20 0.99–1.45
(a) reference: urinary tract infection
Predictive model characteristics
1084WHAT IS A ROLE OF IBUPROFEN IN THE DECREASING OF MORTALITYAND INCREASING SURVIVAL OF PATIENTS WITH SEVERE SEPSIS?
S. Satsuta1,2
1Government Institution ‘‘Lugansk State Medical University’’, Lugansk, Ukraine, 2LuganskState Medical University, Lugansk, UkraineINTRODUCTION. The high mortality in severe sepsis and scientific works that speakabout the decline in mortality when using ibuprofen were the basis for this study.OBJECTIVES. Check the hypothesis that in patients with severe sepsis, treatment withibuprofen led to improve in survival.METHODS. We conducted a randomized, double-blind, placebo-controlled trial of intra-venous ibuprofen (10 mg per kilogram of body weight [maximal dose, 800 mg], given every6 h for eight doses or placebo (glycine-buffer vehicle) administered in the same volume andat the same times in 100 patients who had sepsis, defined as fever, tachycardia, tachypnea,and acute failure of at least one organ system. Blood was obtained for culture from at leasttwo sites. Both the patient and the care givers were unaware of the patient0s treatmentassignment. All patients haven’t anything contraindications to be in this clinical research.RESULTS. In the ibuprofen group, but not the placebo group, there were significantdeclines in urinary levels of prostacyclin and thromboxane, temperature, heart rate, oxygen
26th ESICM ANNUAL CONGRESS — PARIS, FRANCE — 5–9 OCTOBER 2013
consumption, and lactic acidosis. With ibuprofen therapy there was no increased incidenceof renal dysfunction, gastrointestinal bleeding, or other adverse events. However, treatmentwith ibuprofen did not reduce the incidence or duration of shock or the acute respiratorydistress syndrome and did not significantly improve the rate of survival at 30 days (mor-tality, 38 percent with ibuprofen vs. 41 percent with placebo).CONCLUSIONS. Treatment with ibuprofen has no effect on survival or the developmentof shock or acute respiratory distress syndrome. Treatment with ibuprofen does have clearphysiologic effects on fever, tachycardia, oxygen consumption, and lactic acidosis inpatients with severe sepsis.REFERENCES. 1. Carey PD, Winsdor AC, Walsh CJ. Drug treatment of microcirculatorydisorders caused by sepsis. Br J Surg. 1994; 81(12):1752–6.
1085OUTCOME OF PATIENTS ADMITTED TO THE ICU WITH WEST NILE VIRUSNEUROINVASIVE DISEASE
K. Sakagianni1, D. Evrenoglou1, A. Kessaris1, E. Stagaki1, T. Bakogianni1, S. Michelidou1,V. Harizopoulou1, K. Valakis1
1Sismanoglio General Hospital of Athens, Intensive Care Unit, Athens, GreeceINTRODUCTION. West Nile virus (WNV), a mosquito-borne flavivirus has been recentlyrecognized as an emerging human neuropathogen, in several European and Mediterraneancountries. Less than 1 % of infected cases present severe neuroinvasive disease withencephalitis, meningitis and/or acute flaccid paralysis.OBJECTIVES. This is a retrospective study that focuses on patients with WNV neuroin-vasive disease (WNND) admitted to our intensive care unit during the recent outbreaks ofWNV infection in Greece, in the years 2011 and 2012.METHODS. We reviewed the demographic and clinical characteristics, cerebrospinal fluid(CSF) findings, underlying chronic medical conditions, brain MRI findings and outcome ofpatients admitted with WNND (see Table). Serum and (CSF) specimens were tested for thepresence of WNV-specific IgM and IgG antibodies, using commercial Elisa kits.RESULTS. From August 2011 until August 2012 five patients were admitted to our ICUwith confirmed WNV infection. The median age of the patients was 74 years (range 57–82).Four of them (80 %) were males. Median APACHE II score was 19 and at least twounderlying chronic medical conditions were present; arterial hypertension (n = 5), car-diovascular disease (n = 3) and diabetes mellitus (n = 2). In all patients WNV-specific IgMantibodies were detected in CSF and blood specimens. CSF analysis revealed pleocytosisand elevated protein with normal glucose. All of them presented with high fever, symptomsof meningoencephalitis/meningitis and rapidly progressive acute flaccid paralysis, rangingfrom monoplegia of the upper extremity to asymmetrical quadriparesis and flaccid quad-riplegia, after a viral prodromal syndrome. Significant hyponatremia was present in twopatients with severe CNS disease. All the cases were intubated and mechanically ventilated.Length of ICU stay ranged from 28–150 days (median 90 d). Two patients had completemental recovery, with residual weakness of the affected extremity. Three patients withsevere meningoencephalitis and diffuse flaccid paralysis died after long-term ICU stay, asmental and motor functions never recovered. The patients who died were older with amedian age of 78 (range 74–82), had more comorbidities, and severe neuroimagingabnormalities, in contrast with the patients who recovered that were younger and hadmononeuropathies.CONCLUSIONS. WNV infection should be included in the differential diagnosis of acuteneurologic disease during seasonal outbreaks. Advanced age and existence of comorbiditiesare associated with severe disease and worse prognosis. Acute flaccid paralysis has a poorprognosis regarding recovery of physical function.
Demographic and clinical features of patients
Case Age Sex Comorbidities Clinical features CSF
WBC
(cell/ll)
CSF
protein
(g/L)
Brain MRI findings Outcome
1 57 M Hypertension, alcoholism Meningitis, flaccid paralysis LUE 60 (70 % lympho) 0.8
Negative Residual limb weakness
2 61 M Hypertension, diabetes mellitus, COPD Meningitis,tremor, flaccid paralysis RUE,
respiratory distress
130 (90 % lympho) 1.6
Left basal ganglia signal intensity
abnormalities
Residual limb weakness
3 74 M Hypertension, dyslipidemia, vascular disease Drowsiness,coma,asymmetrical flaccid
quadriparesis
108 (75 % neutro) 0.43
Signal intensity abnormalities in basal
ganglia and frontal horns of lateral
ventricles
PVS, flaccid paralysis, death
4 82 M Hypertension, CAD, AF, dyslipidemia,
vascular disease, stroke
Respiratory distress,
drowsiness,myoclonus,coma, flaccid
quadriplegia
110 (70 % lympho) 1.57
Dural enhancement,increased signal
intensity in the cerebral cortex and
subcortical white matter of both
hemispheres
PVS, flaccid paralysis, death
5 78 F Hypertension, AF, Diabetes mellitus Aphasia, ataxia,seizures, coma, flaccid
quadriplegia
535 (90 % neutro) 1.27
Signal intensity abnormalities in the pons,
and inferior cerebellar peduncles
PVS, Guillain-Barré, death
PVS, persistent vegetative state; CAD, coronary artery disease; AF, atrial fibrillation; RUE,right upper extremity; LUE, left upper extremity; COPD, chronic obstructive pulmonarydiseaseREFERENCES. 1. Danis K, Papa A, Papanikolaou E, et al. Ongoing outbreak of West Nilevirus infection in humans, Greece, July to August 2011. Euro Surveillance 2011; 25:16(34).2. Leis A, Stokic D. Neuromuscular manifestations of West Nile virus infection. FrontNeurol. 2012; 3:37. Epub 2012 Mar 21.
1086THERAPEUTIC GOAL ACHIEVEMENTS AND THEIR ASSOCIATIONWITH PATIENTS’ OUTCOMES DURING SEPSIS AND SEPTIC SHOCKRESUSCITATION
C. Permpikul1, S. Tongyoo1
1Siriraj Hospital, Mahidol University, Medicine, Bangkok, ThailandINTRODUCTION. Severe sepsis and septic shock are serious conditions associated withhigh mortality. Resuscitation protocol aimed toward early stabilization of tissue perfusionproves to maximize treatment results.OBJECTIVES. To examine the adherence to the protocol and the association with patients’outcomes.
METHODS. A prospective cohort included patients with sepsis and septic shock who wereadmitted from the emergency department during April 2011 to September 2012. All patientsunderwent sepsis resuscitation protocol aimed to achieve defined hemodynamic goals within6 h. These goals included: a. a mean arterial pressure of [ 65 mmHg (MAP goal), b. urineoutput of [ 0.5 ml/kg/hr (organ perfusion or urine goal), and c. central venous saturationof [ 70 % or lactate clearance [ 10 % (tissue perfusion goal). Patients’ baseline infor-mation, treatment received and outcomes were recorded.RESULTS. A total of 175 patients were included. Nineteen (10.8 %) patients achieved all 3goals while 79 (45.1 %) achieved 2 goals and 52 (29.8 %) achieved 1 goal. The survival inpatients who achieved all 3 goals was 94.7 %, in those who achieved 2 goals 81 % and 1goal (61.5 %). The patients who did not achieve any goal at 6 h had 56 % survival. Duringthis period, ScvO2 was measured in only 13 patients (7.4 %) and serum lactate in51(29.1 %). When focusing on the patients who achieved MAP target, they had lower initialAPACHE II score as compared with those who did not (20.6 ± 7.2 vs. 23.9 ± 8.2). Alsothey had higher blood pressures and lower initial lactate level (MAP 61.9 ± 18 vs.58.5 ± 18.1, p = 0.024; lactate 3.9 ± 4.4 vs. 7.7 ± 6.3, p = 0.004). These patientsreceived less total fluid replacement at 6 h, 24 h and at 72 h (6 h2.33 ± 1.15vs.2.72 ± 1.01L, p = 0.03; 24 h 5.01 ± 1.9 vs. 5.8 ± 1.7L, p = 0.02; 72 h9.92 ± 9.53 vs. 15.57 ± 14.3L, p = 0.023), with less uses of norepinephrine. They hadmore urine output (1.34 ± 1.28 vs. 0.63 ± 0.82, p = 0.001) and more of them achievedurine goal (75.8 % vs. 46.7 %, p \ 0.001) and tissue perfusion goal (55.9 % vs. 46.7 %,p \ 0.001). Their hospital mortality and 28 day mortality were lower (ICU mortality19.4 % vs.34.9, p = 0.043; hospital mortality 22.5 % ± 39.1, p = 0.034).CONCLUSIONS. During early sepsis resuscitation, blood pressure achievement resulted inbetter outcomes and the achievement of more goals improved survival. Low rate of centralvenous sampling was noted in this report.REFERENCES. 1. Permpikul C, Tongyoo S, Ratanarat R, et al. Impact of septic shockhemodynamic resuscitation guidelines on rapid early volume replacement and reducedmortality. J Med Assoc Thai 2010;93(Suppl.1):S102–9. 2. Permpikul C, Noppakaorattan-amanee K, Tongyoo S, et al. Dynamics of central venous oxygen saturation and serumlactate during septic shock resuscitation. J Med Assoc Thai 2013;96(Suppl.2):S232–7.GRANT ACKNOWLEDGMENT. Siriraj Hospital, Mahidol University.
1087THE INTENSIVE CARE OVER NATIONS (ICON) AUDIT: PATTERNSOF ORGAN FAILURE AND OUTCOME
J.L. Vincent1, Y. Sakr2, on behalf of the ICON investigators1Erasme Hospital, Université libre de Bruxelles, Dept of Intensive Care, Brussels, Belgium,2Friedrich-Schiller-University Hospital, Dept of Anesthesiology and Intensive Care, Jena,GermanyINTRODUCTION. The ICON Audit was sponsored by the World Federation of Intensiveand Critical Care Societies to gather data from ICUs around the world.OBJECTIVES. To describe the patterns of organ failure in this international cohort of ICUpatients.METHODS. ICON was a multicenter, worldwide audit in which all adult patients([ 16 years) admitted to the 730 participating centers in 84 countries between May 8 andMay 18, 2012 were included. Patients were followed up until death, hospital discharge, orfor 60 days. Infection was defined according to the definitions of the International SepsisForum. Organ failure was defined as a SOFA score [ 2 for the organ in question. Organfailure was judged not to be related to sepsis if it was already present 24 h before the onsetof sepsis or more than 24 h after the disappearance of sepsis criteria.RESULTS. Of the 10,069 patients included, 3,718 (36.9 %) had sepsis during the ICU stay.Organ failure was present in 2,967 (79.8 %) of these patients and in 4,266 (67.2 %) of the6,351 patients who did not have sepsis during their ICU stay. In sepsis-associated organfailure, the number of failing organs was greater than the number in non-sepsis-associatedorgan failure. Renal (54.7 %), cardiovascular (54.1 %) and respiratory (51.1 %) failureswere the most commonly reported organ failures in association with sepsis, whereas renalfailure (41.2 %) was predominant in non-septic patients. ICU and hospital mortality ratesincreased steadily according to the number of organ failures and the degree of organ failureas assessed by the SOFAmax score, irrespective of the presence of sepsis. In-hospitalmortality in patients with isolated single organ failure was higher for the renal (11.2 vs.6.2 %, p \ 0.005) and coagulation (30.8 vs. 6.7 %, p = 0.001) systems when associatedwith sepsis compared to patients without sepsis.CONCLUSION. Renal failure is even more common than cardiovascular or respiratoryfailure in sepsis. The impact of sepsis-related isolated organ failure on hospital mortality isgreatest with renal and coagulation failures.
1088CHANGES OF OUTCOME IN SEPSIS FOR A PERIOD EXTENDING FROM 1980THROUGH 2012 IN IWATE PREFECTURAL ADVANCED CRITICAL CAREAND EMERGENCY CENTER
G. Takahashi1, C. Onodera1, R. Akimaru1, N. Matumoto1, M. Kojika1, Y. Yoshida1,Y. Inoue1, S. Endo1
1Iwate Medical University, Iwate, JapanBACKGROUND. Sepsis has remained one of the primary causes of death over the last fewdecades. The Iwate Prefectural Advanced Critical Care and Emergency Center was estab-lished in November 1980 and has been in existence for over 32 years. Changes in thetreatment results of sepsis over the past 32 years will be assessed.Materials and methods. The total number of inpatients admitted between November 1,1980 and December 31, 2012 is 40,651. A prospective (partly retrospective) study wasconducted using the ACCP/SCCM diagnostic criteria for diagnosing sepsis and theAPACHE II score for severity assessment. The assessment of sepsis and severity was madeafter consultation between the same physicians qualified for both ICDs and medical spe-cialists in emergency medicine, and clinical research coordinators.RESULTS. Three thousand, and eighty-nine (7.6 %) of 40,651 patients had sepsis(including severe sepsis and septic shock). The overall 28-day mortality rate for sepsis hasbeen markedly reduced from 26.3 % (APACHE II score: 22.1) to 3.9 % (APACHE II score:26.8) and the 90-day mortality rate from 37.4 % to 6.9 % in the last 32 years.CONCLUSION. We shall set the goal for 28-day mortality from sepsis at 5 % or less ofand for 90-day mortality from sepsis at 10 % or less in the sepsis group ranked 25th in theaverage APACHE II score, while treating sepsis. Also, we hope to demonstrate that thesevalues are achievable.
26th ESICM ANNUAL CONGRESS — PARIS, FRANCE — 5–9 OCTOBER 2013
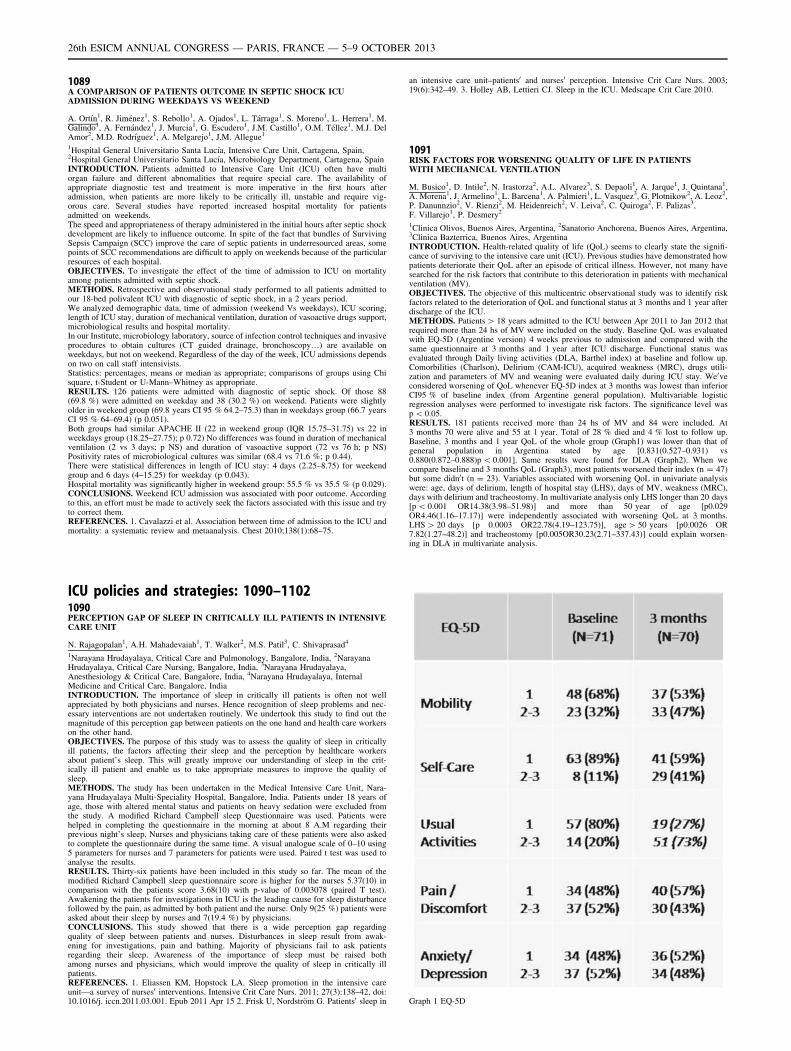
1089A COMPARISON OF PATIENTS OUTCOME IN SEPTIC SHOCK ICUADMISSION DURING WEEKDAYS VS WEEKEND
A. Ortı́n1, R. Jiménez1, S. Rebollo1, A. Ojados1, L. Tárraga1, S. Moreno1, L. Herrera1, M.Galindo1, A. Fernández1, J. Murcia1, G. Escudero1, J.M. Castillo1, O.M. Téllez1, M.J. DelAmor2, M.D. Rodrı́guez1, A. Melgarejo1, J.M. Allegue1
1Hospital General Universitario Santa Lucı́a, Intensive Care Unit, Cartagena, Spain,2Hospital General Universitario Santa Lucı́a, Microbiology Department, Cartagena, SpainINTRODUCTION. Patients admitted to Intensive Care Unit (ICU) often have multiorgan failure and different abnomalities that require special care. The availability ofappropriate diagnostic test and treatment is more imperative in the first hours afteradmission, when patients are more likely to be critically ill, unstable and require vig-orous care. Several studies have reported increased hospital mortality for patientsadmitted on weekends.The speed and appropriateness of therapy administered in the initial hours after septic shockdevelopment are likely to influence outcome. In spite of the fact that bundles of SurvivingSepsis Campaign (SCC) improve the care of septic patients in underresourced areas, somepoints of SCC recommendations are difficult to apply on weekends because of the particularresources of each hospital.OBJECTIVES. To investigate the effect of the time of admission to ICU on mortalityamong patients admitted with septic shock.METHODS. Retrospective and observational study performed to all patients admitted toour 18-bed polivalent ICU with diagnostic of septic shock, in a 2 years period.We analyzed demographic data, time of admission (weekend Vs weekdays), ICU scoring,length of ICU stay, duration of mechanical ventilation, duration of vasoactive drugs support,microbiological results and hospital mortality.In our Institute, microbiology laboratory, source of infection control techniques and invasiveprocedures to obtain cultures (CT guided drainage, bronchoscopy…) are available onweekdays, but not on weekend. Regardless of the day of the week, ICU admissions dependson two on call staff intensivists.Statistics: percentages, means or median as appropriate; comparisons of groups using Chisquare, t-Student or U-Mann–Whitney as appropriate.RESULTS. 126 patients were admitted with diagnostic of septic shock. Of those 88(69.8 %) were admitted on weekday and 38 (30.2 %) on weekend. Patients were slightlyolder in weekend group (69.8 years CI 95 % 64.2–75.3) than in weekdays group (66.7 yearsCI 95 % 64–69.4) (p 0.051).Both groups had similar APACHE II (22 in weekend group (IQR 15.75–31.75) vs 22 inweekdays group (18.25–27.75); p 0.72) No differences was found in duration of mechanicalventilation (2 vs 3 days; p NS) and duration of vasoactive support (72 vs 76 h; p NS)Positivity rates of microbiological cultures was similar (68.4 vs 71.6 %; p 0.44).There were statistical differences in length of ICU stay: 4 days (2.25–8.75) for weekendgroup and 6 days (4–15.25) for weekday (p 0.043).Hospital mortality was significantly higher in weekend group: 55.5 % vs 35.5 % (p 0.029).CONCLUSIONS. Weekend ICU admission was associated with poor outcome. Accordingto this, an effort must be made to actively seek the factors associated with this issue and tryto correct them.REFERENCES. 1. Cavalazzi et al. Association between time of admission to the ICU andmortality: a systematic review and metaanalysis. Chest 2010;138(1):68–75.
ICU policies and strategies: 1090–11021090PERCEPTION GAP OF SLEEP IN CRITICALLY ILL PATIENTS IN INTENSIVECARE UNIT
N. Rajagopalan1, A.H. Mahadevaiah1, T. Walker2, M.S. Patil3, C. Shivaprasad4
1Narayana Hrudayalaya, Critical Care and Pulmonology, Bangalore, India, 2NarayanaHrudayalaya, Critical Care Nursing, Bangalore, India, 3Narayana Hrudayalaya,Anesthesiology & Critical Care, Bangalore, India, 4Narayana Hrudayalaya, InternalMedicine and Critical Care, Bangalore, IndiaINTRODUCTION. The importance of sleep in critically ill patients is often not wellappreciated by both physicians and nurses. Hence recognition of sleep problems and nec-essary interventions are not undertaken routinely. We undertook this study to find out themagnitude of this perception gap between patients on the one hand and health care workerson the other hand.OBJECTIVES. The purpose of this study was to assess the quality of sleep in criticallyill patients, the factors affecting their sleep and the perception by healthcare workersabout patient’s sleep. This will greatly improve our understanding of sleep in the crit-ically ill patient and enable us to take appropriate measures to improve the quality ofsleep.METHODS. The study has been undertaken in the Medical Intensive Care Unit, Nara-yana Hrudayalaya Multi-Speciality Hospital, Bangalore, India. Patients under 18 years ofage, those with altered mental status and patients on heavy sedation were excluded fromthe study. A modified Richard Campbell sleep Questionnaire was used. Patients werehelped in completing the questionnaire in the morning at about 8 A.M regarding theirprevious night’s sleep. Nurses and physicians taking care of these patients were also askedto complete the questionnaire during the same time. A visual analogue scale of 0–10 using5 parameters for nurses and 7 parameters for patients were used. Paired t test was used toanalyse the results.RESULTS. Thirty-six patients have been included in this study so far. The mean of themodified Richard Campbell sleep questionnaire score is higher for the nurses 5.37(10) incomparison with the patients score 3.68(10) with p-value of 0.003078 (paired T test).Awakening the patients for investigations in ICU is the leading cause for sleep disturbancefollowed by the pain, as admitted by both patient and the nurse. Only 9(25 %) patients wereasked about their sleep by nurses and 7(19.4 %) by physicians.CONCLUSIONS. This study showed that there is a wide perception gap regardingquality of sleep between patients and nurses. Disturbances in sleep result from awak-ening for investigations, pain and bathing. Majority of physicians fail to ask patientsregarding their sleep. Awareness of the importance of sleep must be raised bothamong nurses and physicians, which would improve the quality of sleep in critically illpatients.REFERENCES. 1. Eliassen KM, Hopstock LA. Sleep promotion in the intensive careunit—a survey of nurses0 interventions. Intensive Crit Care Nurs. 2011; 27(3):138–42, doi:10.1016/j. iccn.2011.03.001. Epub 2011 Apr 15 2. Frisk U, Nordström G. Patients0 sleep in
an intensive care unit–patients0 and nurses0 perception. Intensive Crit Care Nurs. 2003;19(6):342–49. 3. Holley AB, Lettieri CJ. Sleep in the ICU. Medscape Crit Care 2010.
1091RISK FACTORS FOR WORSENING QUALITY OF LIFE IN PATIENTSWITH MECHANICAL VENTILATION
M. Busico1, D. Intile2, N. Irastorza2, A.L. Alvarez3, S. Depaoli1, A. Jarque1, J. Quintana1,A. Morena1, J. Armelino1, L. Barcena1, A. Palmieri1, L. Vasquez3, G. Plotnikow2, A. Leoz2,P. Danunnzio2, V. Rienzi2, M. Heidenreich2, V. Leiva2, C. Quiroga2, F. Palizas3,F. Villarejo1, P. Desmery2
1Clinica Olivos, Buenos Aires, Argentina, 2Sanatorio Anchorena, Buenos Aires, Argentina,3Clinica Bazterrica, Buenos Aires, ArgentinaINTRODUCTION. Health-related quality of life (QoL) seems to clearly state the signifi-cance of surviving to the intensive care unit (ICU). Previous studies have demonstrated howpatients deteriorate their QoL after an episode of critical illness. However, not many havesearched for the risk factors that contribute to this deterioration in patients with mechanicalventilation (MV).OBJECTIVES. The objective of this multicentric observational study was to identify riskfactors related to the deterioration of QoL and functional status at 3 months and 1 year afterdischarge of the ICU.METHODS. Patients [ 18 years admitted to the ICU between Apr 2011 to Jan 2012 thatrequired more than 24 hs of MV were included on the study. Baseline QoL was evaluatedwith EQ-5D (Argentine version) 4 weeks previous to admission and compared with thesame questionnaire at 3 months and 1 year after ICU discharge. Functional status wasevaluated through Daily living activities (DLA, Barthel index) at baseline and follow up.Comorbilities (Charlson), Delirium (CAM-ICU), acquired weakness (MRC), drugs utili-zation and parameters of MV and weaning were evaluated daily during ICU stay. We0veconsidered worsening of QoL whenever EQ-5D index at 3 months was lowest than inferiorCI95 % of baseline index (from Argentine general population). Multivariable logisticregression analyses were performed to investigate risk factors. The significance level wasp \ 0.05.RESULTS. 181 patients received more than 24 hs of MV and 84 were included. At3 months 70 were alive and 55 at 1 year. Total of 28 % died and 4 % lost to follow up.Baseline, 3 months and 1 year QoL of the whole group (Graph1) was lower than that ofgeneral population in Argentina stated by age [0.831(0.527–0.931) vs0.880(0.872–0.888)p \ 0.001]. Same results were found for DLA (Graph2). When wecompare baseline and 3 months QoL (Graph3), most patients worsened their index (n = 47)but some didn0t (n = 23). Variables associated with worsening QoL in univariate analysiswere: age, days of delirium, length of hospital stay (LHS), days of MV, weakness (MRC),days with delirium and tracheostomy. In multivariate analysis only LHS longer than 20 days[p \ 0.001 OR14.38(3.98–51.98)] and more than 50 year of age [p0.029OR4.46(1.16–17.17)] were independently associated with worsening QoL at 3 months.LHS [ 20 days [p 0.0003 OR22.78(4.19–123.75)], age [ 50 years [p0.0026 OR7.82(1.27–48.2)] and tracheostomy [p0.005OR30.23(2.71–337.43)] could explain worsen-ing in DLA in multivariate analysis.
Graph 1 EQ-5D
26th ESICM ANNUAL CONGRESS — PARIS, FRANCE — 5–9 OCTOBER 2013
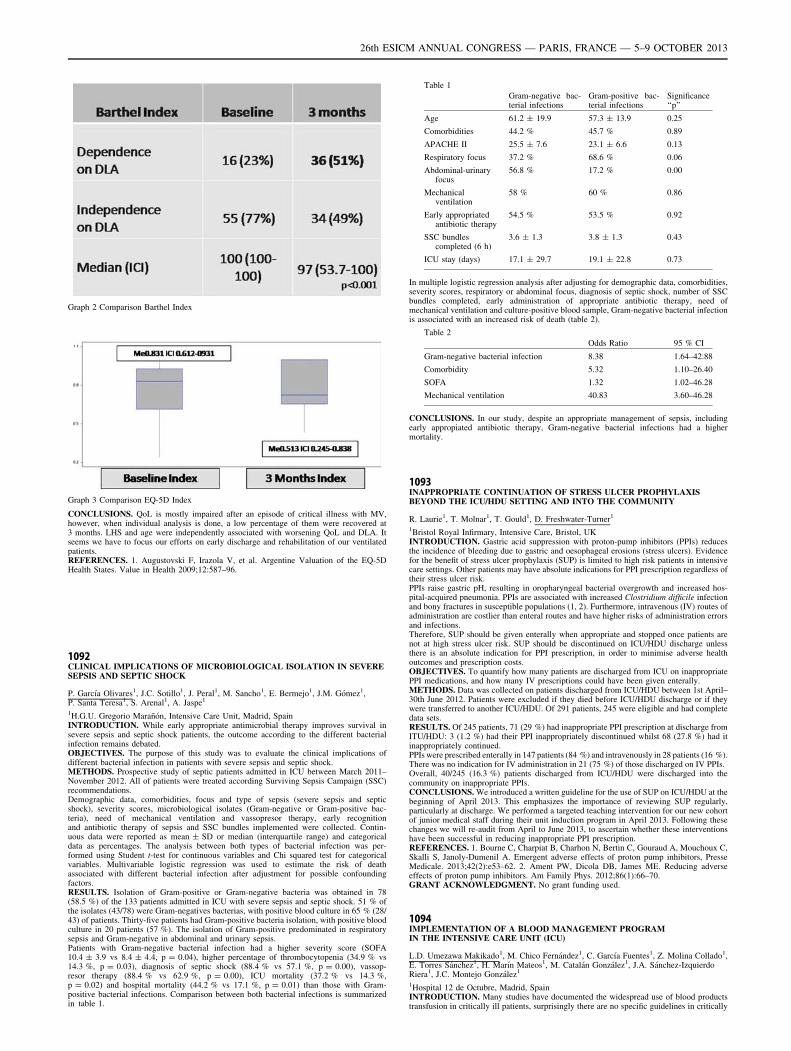
Graph 2 Comparison Barthel Index
Graph 3 Comparison EQ-5D Index
CONCLUSIONS. QoL is mostly impaired after an episode of critical illness with MV,however, when individual analysis is done, a low percentage of them were recovered at3 months. LHS and age were independently associated with worsening QoL and DLA. Itseems we have to focus our efforts on early discharge and rehabilitation of our ventilatedpatients.REFERENCES. 1. Augustovski F, Irazola V, et al. Argentine Valuation of the EQ-5DHealth States. Value in Health 2009;12:587–96.
1092CLINICAL IMPLICATIONS OF MICROBIOLOGICAL ISOLATION IN SEVERESEPSIS AND SEPTIC SHOCK
P. Garcı́a Olivares1, J.C. Sotillo1, J. Peral1, M. Sancho1, E. Bermejo1, J.M. Gómez1,P. Santa Teresa1, S. Arenal1, A. Jaspe1
1H.G.U. Gregorio Marañón, Intensive Care Unit, Madrid, SpainINTRODUCTION. While early appropriate antimicrobial therapy improves survival insevere sepsis and septic shock patients, the outcome according to the different bacterialinfection remains debated.OBJECTIVES. The purpose of this study was to evaluate the clinical implications ofdifferent bacterial infection in patients with severe sepsis and septic shock.METHODS. Prospective study of septic patients admitted in ICU between March 2011–November 2012. All of patients were treated according Surviving Sepsis Campaign (SSC)recommendations.Demographic data, comorbidities, focus and type of sepsis (severe sepsis and septicshock), severity scores, microbiological isolates (Gram-negative or Gram-positive bac-teria), need of mechanical ventilation and vassopresor therapy, early recognitionand antibiotic therapy of sepsis and SSC bundles implemented were collected. Contin-uous data were reported as mean ± SD or median (interquartile range) and categoricaldata as percentages. The analysis between both types of bacterial infection was per-formed using Student t-test for continuous variables and Chi squared test for categoricalvariables. Multivariable logistic regression was used to estimate the risk of deathassociated with different bacterial infection after adjustment for possible confoundingfactors.RESULTS. Isolation of Gram-positive or Gram-negative bacteria was obtained in 78(58.5 %) of the 133 patients admitted in ICU with severe sepsis and septic shock. 51 % ofthe isolates (43/78) were Gram-negatives bacterias, with positive blood culture in 65 % (28/43) of patients. Thirty-five patients had Gram-positive bacteria isolation, with positive bloodculture in 20 patients (57 %). The isolation of Gram-positive predominated in respiratorysepsis and Gram-negative in abdominal and urinary sepsis.Patients with Gram-negative bacterial infection had a higher severity score (SOFA10.4 ± 3.9 vs 8.4 ± 4.4, p = 0.04), higher percentage of thrombocytopenia (34.9 % vs14.3 %, p = 0.03), diagnosis of septic shock (88.4 % vs 57.1 %, p = 0.00), vassop-resor therapy (88.4 % vs 62.9 %, p = 0.00), ICU mortality (37.2 % vs 14.3 %,p = 0.02) and hospital mortality (44.2 % vs 17.1 %, p = 0.01) than those with Gram-positive bacterial infections. Comparison between both bacterial infections is summarizedin table 1.
Table 1
Gram-negative bac-terial infections
Gram-positive bac-terial infections
Significance‘‘p’’
Age 61.2 ± 19.9 57.3 ± 13.9 0.25
Comorbidities 44.2 % 45.7 % 0.89
APACHE II 25.5 ± 7.6 23.1 ± 6.6 0.13
Respiratory focus 37.2 % 68.6 % 0.06
Abdominal-urinaryfocus
56.8 % 17.2 % 0.00
Mechanicalventilation
58 % 60 % 0.86
Early appropriatedantibiotic therapy
54.5 % 53.5 % 0.92
SSC bundlescompleted (6 h)
3.6 ± 1.3 3.8 ± 1.3 0.43
ICU stay (days) 17.1 ± 29.7 19.1 ± 22.8 0.73
In multiple logistic regression analysis after adjusting for demographic data, comorbidities,severity scores, respiratory or abdominal focus, diagnosis of septic shock, number of SSCbundles completed, early administration of appropriate antibiotic therapy, need ofmechanical ventilation and culture-positive blood sample, Gram-negative bacterial infectionis associated with an increased risk of death (table 2).
Table 2
Odds Ratio 95 % CI
Gram-negative bacterial infection 8.38 1.64–42.88
Comorbidity 5.32 1.10–26.40
SOFA 1.32 1.02–46.28
Mechanical ventilation 40.83 3.60–46.28
CONCLUSIONS. In our study, despite an appropriate management of sepsis, includingearly appropiated antibiotic therapy, Gram-negative bacterial infections had a highermortality.
1093INAPPROPRIATE CONTINUATION OF STRESS ULCER PROPHYLAXISBEYOND THE ICU/HDU SETTING AND INTO THE COMMUNITY
R. Laurie1, T. Molnar1, T. Gould1, D. Freshwater-Turner1
1Bristol Royal Infirmary, Intensive Care, Bristol, UKINTRODUCTION. Gastric acid suppression with proton-pump inhibitors (PPIs) reducesthe incidence of bleeding due to gastric and oesophageal erosions (stress ulcers). Evidencefor the benefit of stress ulcer prophylaxis (SUP) is limited to high risk patients in intensivecare settings. Other patients may have absolute indications for PPI prescription regardless oftheir stress ulcer risk.PPIs raise gastric pH, resulting in oropharyngeal bacterial overgrowth and increased hos-pital-acquired pneumonia. PPIs are associated with increased Clostridium difficile infectionand bony fractures in susceptible populations (1, 2). Furthermore, intravenous (IV) routes ofadministration are costlier than enteral routes and have higher risks of administration errorsand infections.Therefore, SUP should be given enterally when appropriate and stopped once patients arenot at high stress ulcer risk. SUP should be discontinued on ICU/HDU discharge unlessthere is an absolute indication for PPI prescription, in order to minimise adverse healthoutcomes and prescription costs.OBJECTIVES. To quantify how many patients are discharged from ICU on inappropriatePPI medications, and how many IV prescriptions could have been given enterally.METHODS. Data was collected on patients discharged from ICU/HDU between 1st April–30th June 2012. Patients were excluded if they died before ICU/HDU discharge or if theywere transferred to another ICU/HDU. Of 291 patients, 245 were eligible and had completedata sets.RESULTS. Of 245 patients, 71 (29 %) had inappropriate PPI prescription at discharge fromITU/HDU: 3 (1.2 %) had their PPI inappropriately discontinued whilst 68 (27.8 %) had itinappropriately continued.PPIs were prescribed enterally in 147 patients (84 %) and intravenously in 28 patients (16 %).There was no indication for IV administration in 21 (75 %) of those discharged on IV PPIs.Overall, 40/245 (16.3 %) patients discharged from ICU/HDU were discharged into thecommunity on inappropriate PPIs.CONCLUSIONS. We introduced a written guideline for the use of SUP on ICU/HDU at thebeginning of April 2013. This emphasizes the importance of reviewing SUP regularly,particularly at discharge. We performed a targeted teaching intervention for our new cohortof junior medical staff during their unit induction program in April 2013. Following thesechanges we will re-audit from April to June 2013, to ascertain whether these interventionshave been successful in reducing inappropriate PPI prescription.REFERENCES. 1. Bourne C, Charpiat B, Charhon N, Bertin C, Gouraud A, Mouchoux C,Skalli S, Janoly-Dumenil A. Emergent adverse effects of proton pump inhibitors, PresseMedicale. 2013;42(2):e53–62. 2. Ament PW, Dicola DB, James ME. Reducing adverseeffects of proton pump inhibitors. Am Family Phys. 2012;86(1):66–70.GRANT ACKNOWLEDGMENT. No grant funding used.
1094IMPLEMENTATION OF A BLOOD MANAGEMENT PROGRAMIN THE INTENSIVE CARE UNIT (ICU)
L.D. Umezawa Makikado1, M. Chico Fernández1, C. Garcı́a Fuentes1, Z. Molina Collado1,E. Torres Sánchez1, H. Marı́n Mateos1, M. Catalán González1, J.A. Sánchez-IzquierdoRiera1, J.C. Montejo González1
1Hospital 12 de Octubre, Madrid, SpainINTRODUCTION. Many studies have documented the widespread use of blood productstransfusion in critically ill patients, surprisingly there are no specific guidelines in critically
26th ESICM ANNUAL CONGRESS — PARIS, FRANCE — 5–9 OCTOBER 2013
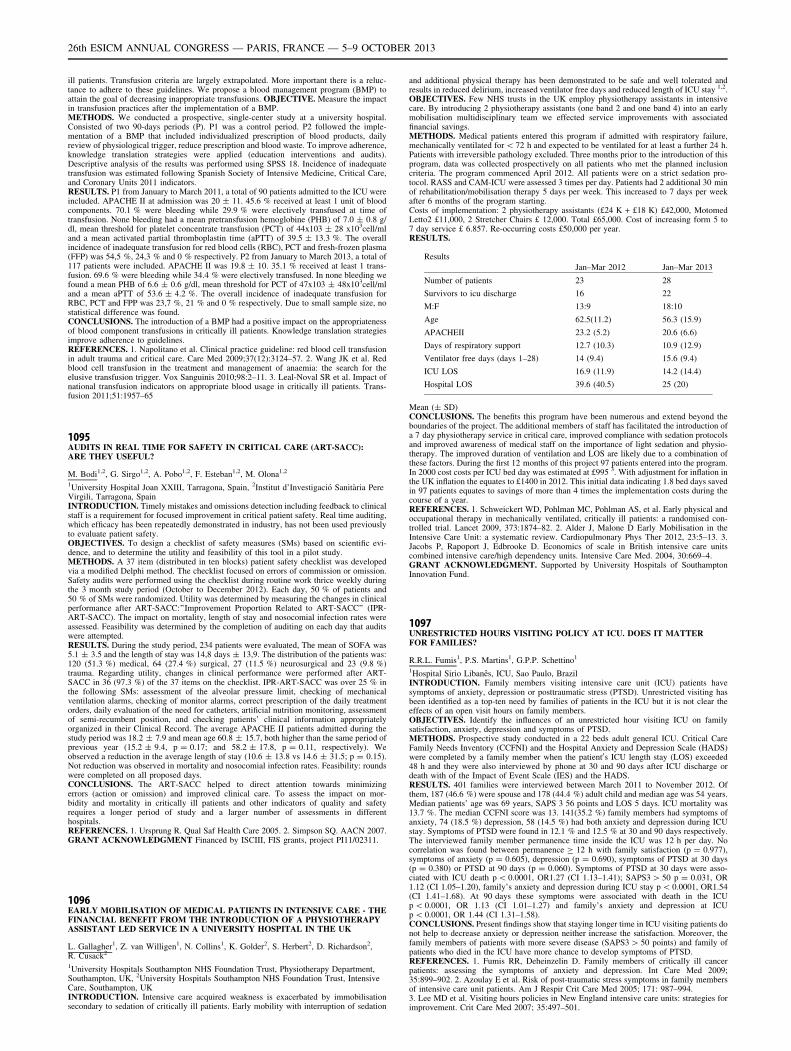
ill patients. Transfusion criteria are largely extrapolated. More important there is a reluc-tance to adhere to these guidelines. We propose a blood management program (BMP) toattain the goal of decreasing inappropriate transfusions. OBJECTIVE. Measure the impactin transfusion practices after the implementation of a BMP.METHODS. We conducted a prospective, single-center study at a university hospital.Consisted of two 90-days periods (P). P1 was a control period. P2 followed the imple-mentation of a BMP that included individualized prescription of blood products, dailyreview of physiological trigger, reduce prescription and blood waste. To improve adherence,knowledge translation strategies were applied (education interventions and audits).Descriptive analysis of the results was performed using SPSS 18. Incidence of inadequatetransfusion was estimated following Spanish Society of Intensive Medicine, Critical Care,and Coronary Units 2011 indicators.RESULTS. P1 from January to March 2011, a total of 90 patients admitted to the ICU wereincluded. APACHE II at admission was 20 ± 11. 45.6 % received at least 1 unit of bloodcomponents. 70.1 % were bleeding while 29.9 % were electively transfused at time oftransfusion. None bleeding had a mean pretransfusion hemoglobine (PHB) of 7.0 ± 0.8 g/dl, mean threshold for platelet concentrate transfusion (PCT) of 44x103 ± 28 x103cell/mland a mean activated partial thromboplastin time (aPTT) of 39.5 ± 13.3 %. The overallincidence of inadequate transfusion for red blood cells (RBC), PCT and fresh-frozen plasma(FFP) was 54,5 %, 24,3 % and 0 % respectively. P2 from January to March 2013, a total of117 patients were included. APACHE II was 19.8 ± 10. 35.1 % received at least 1 trans-fusion. 69.6 % were bleeding while 34.4 % were electively transfused. In none bleeding wefound a mean PHB of 6.6 ± 0.6 g/dl, mean threshold for PCT of 47x103 ± 48x103cell/mland a mean aPTT of 53.6 ± 4.2 %. The overall incidence of inadequate transfusion forRBC, PCT and FPP was 23,7 %, 21 % and 0 % respectively. Due to small sample size, nostatistical difference was found.CONCLUSIONS. The introduction of a BMP had a positive impact on the appropriatenessof blood component transfusions in critically ill patients. Knowledge translation strategiesimprove adherence to guidelines.REFERENCES. 1. Napolitano et al. Clinical practice guideline: red blood cell transfusionin adult trauma and critical care. Care Med 2009;37(12):3124–57. 2. Wang JK et al. Redblood cell transfusion in the treatment and management of anaemia: the search for theelusive transfusion trigger. Vox Sanguinis 2010;98:2–11. 3. Leal-Noval SR et al. Impact ofnational transfusion indicators on appropriate blood usage in critically ill patients. Trans-fusion 2011;51:1957–65
1095AUDITS IN REAL TIME FOR SAFETY IN CRITICAL CARE (ART-SACC):ARE THEY USEFUL?
M. Bodi1,2, G. Sirgo1,2, A. Pobo1,2, F. Esteban1,2, M. Olona1,2
1University Hospital Joan XXIII, Tarragona, Spain, 2Institut d’Investigació Sanitària PereVirgili, Tarragona, SpainINTRODUCTION. Timely mistakes and omissions detection including feedback to clinicalstaff is a requirement for focused improvement in critical patient safety. Real time auditing,which efficacy has been repeatedly demonstrated in industry, has not been used previouslyto evaluate patient safety.OBJECTIVES. To design a checklist of safety measures (SMs) based on scientific evi-dence, and to determine the utility and feasibility of this tool in a pilot study.METHODS. A 37 item (distributed in ten blocks) patient safety checklist was developedvia a modified Delphi method. The checklist focused on errors of commission or omission.Safety audits were performed using the checklist during routine work thrice weekly duringthe 3 month study period (October to December 2012). Each day, 50 % of patients and50 % of SMs were randomized. Utility was determined by measuring the changes in clinicalperformance after ART-SACC:’’Improvement Proportion Related to ART-SACC’’ (IPR-ART-SACC). The impact on mortality, length of stay and nosocomial infection rates wereassessed. Feasibility was determined by the completion of auditing on each day that auditswere attempted.RESULTS. During the study period, 234 patients were evaluated, The mean of SOFA was5.1 ± 3.5 and the length of stay was 14,8 days ± 13,9. The distribution of the patients was:120 (51.3 %) medical, 64 (27.4 %) surgical, 27 (11.5 %) neurosurgical and 23 (9.8 %)trauma. Regarding utility, changes in clinical performance were performed after ART-SACC in 36 (97.3 %) of the 37 items on the checklist. IPR-ART-SACC was over 25 % inthe following SMs: assessment of the alveolar pressure limit, checking of mechanicalventilation alarms, checking of monitor alarms, correct prescription of the daily treatmentorders, daily evaluation of the need for catheters, artificial nutrition monitoring, assessmentof semi-recumbent position, and checking patients’ clinical information appropriatelyorganized in their Clinical Record. The average APACHE II patients admitted during thestudy period was 18.2 ± 7.9 and mean age 60.8 ± 15.7, both higher than the same period ofprevious year (15.2 ± 9.4, p = 0.17; and 58.2 ± 17.8, p = 0.11, respectively). Weobserved a reduction in the average length of stay (10.6 ± 13.8 vs 14.6 ± 31.5; p = 0.15).Not reduction was observed in mortality and nosocomial infection rates. Feasibility: roundswere completed on all proposed days.CONCLUSIONS. The ART-SACC helped to direct attention towards minimizingerrors (action or omission) and improved clinical care. To assess the impact on mor-bidity and mortality in critically ill patients and other indicators of quality and safetyrequires a longer period of study and a larger number of assessments in differenthospitals.REFERENCES. 1. Ursprung R. Qual Saf Health Care 2005. 2. Simpson SQ. AACN 2007.GRANT ACKNOWLEDGMENT Financed by ISCIII, FIS grants, project PI11/02311.
1096EARLY MOBILISATION OF MEDICAL PATIENTS IN INTENSIVE CARE - THEFINANCIAL BENEFIT FROM THE INTRODUCTION OF A PHYSIOTHERAPYASSISTANT LED SERVICE IN A UNIVERSITY HOSPITAL IN THE UK
L. Gallagher1, Z. van Willigen1, N. Collins1, K. Golder2, S. Herbert2, D. Richardson2,R. Cusack2
1University Hospitals Southampton NHS Foundation Trust, Physiotherapy Department,Southampton, UK, 2University Hospitals Southampton NHS Foundation Trust, IntensiveCare, Southampton, UKINTRODUCTION. Intensive care acquired weakness is exacerbated by immobilisationsecondary to sedation of critically ill patients. Early mobility with interruption of sedation
and additional physical therapy has been demonstrated to be safe and well tolerated andresults in reduced delirium, increased ventilator free days and reduced length of ICU stay 1,2.OBJECTIVES. Few NHS trusts in the UK employ physiotherapy assistants in intensivecare. By introducing 2 physiotherapy assistants (one band 2 and one band 4) into an earlymobilisation multidisciplinary team we effected service improvements with associatedfinancial savings.METHODS. Medical patients entered this program if admitted with respiratory failure,mechanically ventilated for \ 72 h and expected to be ventilated for at least a further 24 h.Patients with irreversible pathology excluded. Three months prior to the introduction of thisprogram, data was collected prospectively on all patients who met the planned inclusioncriteria. The program commenced April 2012. All patients were on a strict sedation pro-tocol. RASS and CAM-ICU were assessed 3 times per day. Patients had 2 additional 30 minof rehabilitation/mobilisation therapy 5 days per week. This increased to 7 days per weekafter 6 months of the program starting.Costs of implementation: 2 physiotherapy assistants (£24 K + £18 K) £42,000, MotomedLetto2 £11,000, 2 Stretcher Chairs £ 12,000. Total £65,000. Cost of increasing form 5 to7 day service £ 6.857. Re-occurring costs £50,000 per year.RESULTS.
Results
Jan–Mar 2012 Jan–Mar 2013
Number of patients 23 28
Survivors to icu discharge 16 22
M:F 13:9 18:10
Age 62.5(11.2) 56.3 (15.9)
APACHEII 23.2 (5.2) 20.6 (6.6)
Days of respiratory support 12.7 (10.3) 10.9 (12.9)
Ventilator free days (days 1–28) 14 (9.4) 15.6 (9.4)
ICU LOS 16.9 (11.9) 14.2 (14.4)
Hospital LOS 39.6 (40.5) 25 (20)
Mean (± SD)CONCLUSIONS. The benefits this program have been numerous and extend beyond theboundaries of the project. The additional members of staff has facilitated the introduction ofa 7 day physiotherapy service in critical care, improved compliance with sedation protocolsand improved awareness of medical staff on the importance of light sedation and physio-therapy. The improved duration of ventilation and LOS are likely due to a combination ofthese factors. During the first 12 months of this project 97 patients entered into the program.In 2000 cost costs per ICU bed day was estimated at £995 3. With adjustment for inflation inthe UK inflation the equates to £1400 in 2012. This initial data indicating 1.8 bed days savedin 97 patients equates to savings of more than 4 times the implementation costs during thecourse of a year.REFERENCES. 1. Schweickert WD, Pohlman MC, Pohlman AS, et al. Early physical andoccupational therapy in mechanically ventilated, critically ill patients: a randomised con-trolled trial. Lancet 2009, 373:1874–82. 2. Alder J, Malone D Early Mobilisation in theIntensive Care Unit: a systematic review. Cardiopulmonary Phys Ther 2012, 23:5–13. 3.Jacobs P, Rapoport J, Edbrooke D. Economics of scale in British intensive care unitscombined intensive care/high dependency units. Intensive Care Med. 2004, 30:669–4.GRANT ACKNOWLEDGMENT. Supported by University Hospitals of SouthamptonInnovation Fund.
1097UNRESTRICTED HOURS VISITING POLICY AT ICU. DOES IT MATTERFOR FAMILIES?
R.R.L. Fumis1, P.S. Martins1, G.P.P. Schettino1
1Hospital Sirio Libanês, ICU, Sao Paulo, BrazilINTRODUCTION. Family members visiting intensive care unit (ICU) patients havesymptoms of anxiety, depression or posttraumatic stress (PTSD). Unrestricted visiting hasbeen identified as a top-ten need by families of patients in the ICU but it is not clear theeffects of an open visit hours on family members.OBJECTIVES. Identify the influences of an unrestricted hour visiting ICU on familysatisfaction, anxiety, depression and symptoms of PTSD.METHODS. Prospective study conducted in a 22 beds adult general ICU. Critical CareFamily Needs Inventory (CCFNI) and the Hospital Anxiety and Depression Scale (HADS)were completed by a family member when the patient0s ICU length stay (LOS) exceeded48 h and they were also interviewed by phone at 30 and 90 days after ICU discharge ordeath with of the Impact of Event Scale (IES) and the HADS.RESULTS. 401 families were interviewed between March 2011 to November 2012. Ofthem, 187 (46.6 %) were spouse and 178 (44.4 %) adult child and median age was 54 years.Median patients’ age was 69 years, SAPS 3 56 points and LOS 5 days. ICU mortality was13.7 %. The median CCFNI score was 13. 141(35.2 %) family members had symptoms ofanxiety, 74 (18.5 %) depression, 58 (14.5 %) had both anxiety and depression during ICUstay. Symptoms of PTSD were found in 12.1 % and 12.5 % at 30 and 90 days respectively.The interviewed family member permanence time inside the ICU was 12 h per day. Nocorrelation was found between permanence C 12 h with family satisfaction (p = 0.977),symptoms of anxiety (p = 0.605), depression (p = 0.690), symptoms of PTSD at 30 days(p = 0.380) or PTSD at 90 days (p = 0.060). Symptoms of PTSD at 30 days were asso-ciated with ICU death p \ 0.0001, OR1.27 (CI 1.13–1.41); SAPS3 [ 50 p = 0.031, OR1.12 (CI 1.05–1.20), family’s anxiety and depression during ICU stay p \ 0.0001, OR1.54(CI 1.41–1.68). At 90 days these symptoms were associated with death in the ICUp \ 0.0001, OR 1.13 (CI 1.01–1.27) and family’s anxiety and depression at ICUp \ 0.0001, OR 1.44 (CI 1.31–1.58).CONCLUSIONS. Present findings show that staying longer time in ICU visiting patients donot help to decrease anxiety or depression neither increase the satisfaction. Moreover, thefamily members of patients with more severe disease (SAPS3 [ 50 points) and family ofpatients who died in the ICU have more chance to develop symptoms of PTSD.REFERENCES. 1. Fumis RR, Deheinzelin D. Family members of critically ill cancerpatients: assessing the symptoms of anxiety and depression. Int Care Med 2009;35:899–902. 2. Azoulay E et al. Risk of post-traumatic stress symptoms in family membersof intensive care unit patients. Am J Respir Crit Care Med 2005; 171: 987–994.3. Lee MD et al. Visiting hours policies in New England intensive care units: strategies forimprovement. Crit Care Med 2007; 35:497–501.
26th ESICM ANNUAL CONGRESS — PARIS, FRANCE — 5–9 OCTOBER 2013
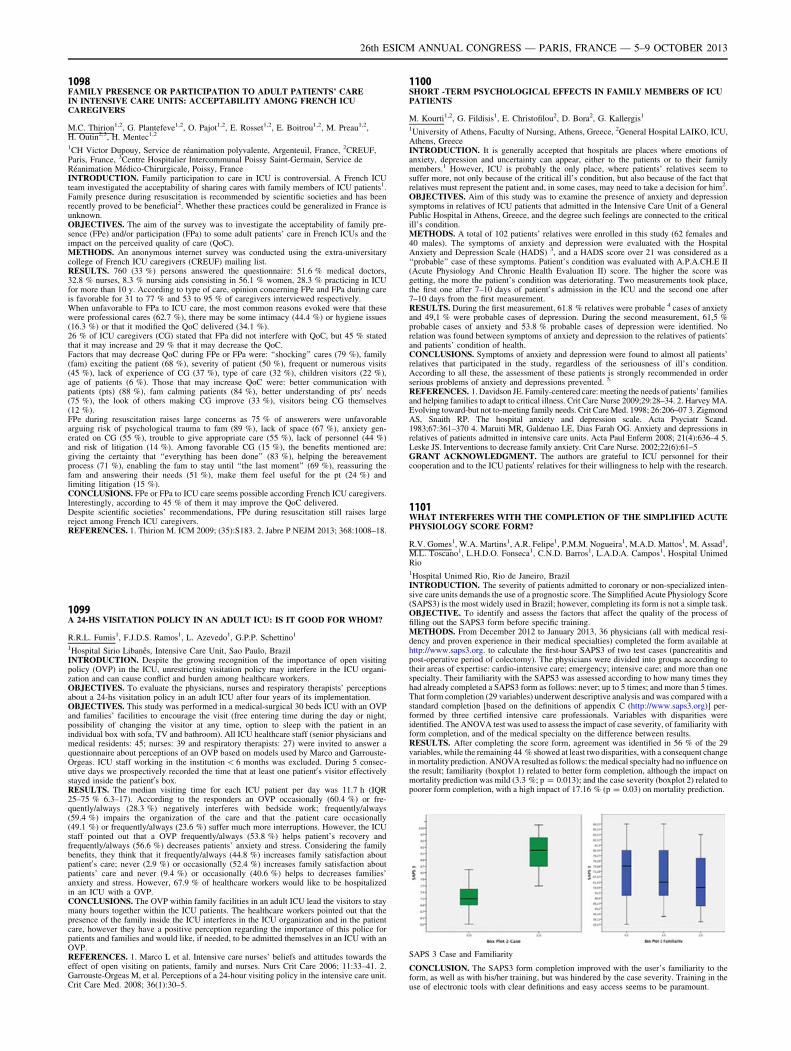
1098FAMILY PRESENCE OR PARTICIPATION TO ADULT PATIENTS’ CAREIN INTENSIVE CARE UNITS: ACCEPTABILITY AMONG FRENCH ICUCAREGIVERS
M.C. Thirion1,2, G. Plantefeve1,2, O. Pajot1,2, E. Rosset1,2, E. Boitrou1,2, M. Preau1,2,H. Outin2,3, H. Mentec1,2
1CH Victor Dupouy, Service de réanimation polyvalente, Argenteuil, France, 2CREUF,Paris, France, 3Centre Hospitalier Intercommunal Poissy Saint-Germain, Service deRéanimation Médico-Chirurgicale, Poissy, FranceINTRODUCTION. Family participation to care in ICU is controversial. A French ICUteam investigated the acceptability of sharing cares with family members of ICU patients1.Family presence during resuscitation is recommended by scientific societies and has beenrecently proved to be beneficial2. Whether these practices could be generalized in France isunknown.OBJECTIVES. The aim of the survey was to investigate the acceptability of family pre-sence (FPe) and/or participation (FPa) to some adult patients’ care in French ICUs and theimpact on the perceived quality of care (QoC).METHODS. An anonymous internet survey was conducted using the extra-universitarycollege of French ICU caregivers (CREUF) mailing list.RESULTS. 760 (33 %) persons answered the questionnaire: 51.6 % medical doctors,32.8 % nurses, 8.3 % nursing aids consisting in 56.1 % women, 28.3 % practicing in ICUfor more than 10 y. According to type of care, opinion concerning FPe and FPa during careis favorable for 31 to 77 % and 53 to 95 % of caregivers interviewed respectively.When unfavorable to FPa to ICU care, the most common reasons evoked were that thesewere professional cares (62.7 %), there may be some intimacy (44.4 %) or hygiene issues(16.3 %) or that it modified the QoC delivered (34.1 %).26 % of ICU caregivers (CG) stated that FPa did not interfere with QoC, but 45 % statedthat it may increase and 29 % that it may decrease the QoC.Factors that may decrease QoC during FPe or FPa were: ‘‘shocking’’ cares (79 %), family(fam) exciting the patient (68 %), severity of patient (50 %), frequent or numerous visits(45 %), lack of experience of CG (37 %), type of care (32 %), children visitors (22 %),age of patients (6 %). Those that may increase QoC were: better communication withpatients (pts) (88 %), fam calming patients (84 %), better understanding of pts0 needs(75 %), the look of others making CG improve (33 %), visitors being CG themselves(12 %).FPe during resuscitation raises large concerns as 75 % of answerers were unfavorablearguing risk of psychological trauma to fam (89 %), lack of space (67 %), anxiety gen-erated on CG (55 %), trouble to give appropriate care (55 %), lack of personnel (44 %)and risk of litigation (14 %). Among favorable CG (15 %), the benefits mentioned are:giving the certainty that ‘‘everything has been done’’ (83 %), helping the bereavementprocess (71 %), enabling the fam to stay until ‘‘the last moment’’ (69 %), reassuring thefam and answering their needs (51 %), make them feel useful for the pt (24 %) andlimiting litigation (15 %).CONCLUSIONS. FPe or FPa to ICU care seems possible according French ICU caregivers.Interestingly, according to 45 % of them it may improve the QoC delivered.Despite scientific societies’ recommendations, FPe during resuscitation still raises largereject among French ICU caregivers.REFERENCES. 1. Thirion M. ICM 2009; (35):S183. 2. Jabre P NEJM 2013; 368:1008–18.
1099A 24-HS VISITATION POLICY IN AN ADULT ICU: IS IT GOOD FOR WHOM?
R.R.L. Fumis1, F.J.D.S. Ramos1, L. Azevedo1, G.P.P. Schettino1
1Hospital Sirio Libanês, Intensive Care Unit, Sao Paulo, BrazilINTRODUCTION. Despite the growing recognition of the importance of open visitingpolicy (OVP) in the ICU, unrestricting visitation policy may interfere in the ICU organi-zation and can cause conflict and burden among healthcare workers.OBJECTIVES. To evaluate the physicians, nurses and respiratory therapists’ perceptionsabout a 24-hs visitation policy in an adult ICU after four years of its implementation.OBJECTIVES. This study was performed in a medical-surgical 30 beds ICU with an OVPand families’ facilities to encourage the visit (free entering time during the day or night,possibility of changing the visitor at any time, option to sleep with the patient in anindividual box with sofa, TV and bathroom). All ICU healthcare staff (senior physicians andmedical residents: 45; nurses: 39 and respiratory therapists: 27) were invited to answer aquestionnaire about perceptions of an OVP based on models used by Marco and Garrouste-Orgeas. ICU staff working in the institution \ 6 months was excluded. During 5 consec-utive days we prospectively recorded the time that at least one patient0s visitor effectivelystayed inside the patient0s box.RESULTS. The median visiting time for each ICU patient per day was 11.7 h (IQR25–75 % 6.3–17). According to the responders an OVP occasionally (60.4 %) or fre-quently/always (28.3 %) negatively interferes with bedside work; frequently/always(59.4 %) impairs the organization of the care and that the patient care occasionally(49.1 %) or frequently/always (23.6 %) suffer much more interruptions. However, the ICUstaff pointed out that a OVP frequently/always (53.8 %) helps patient’s recovery andfrequently/always (56.6 %) decreases patients’ anxiety and stress. Considering the familybenefits, they think that it frequently/always (44.8 %) increases family satisfaction aboutpatient0s care; never (2.9 %) or occasionally (52.4 %) increases family satisfaction aboutpatients’ care and never (9.4 %) or occasionally (40.6 %) helps to decreases families’anxiety and stress. However, 67.9 % of healthcare workers would like to be hospitalizedin an ICU with a OVP.CONCLUSIONS. The OVP within family facilities in an adult ICU lead the visitors to staymany hours together within the ICU patients. The healthcare workers pointed out that thepresence of the family inside the ICU interferes in the ICU organization and in the patientcare, however they have a positive perception regarding the importance of this police forpatients and families and would like, if needed, to be admitted themselves in an ICU with anOVP.REFERENCES. 1. Marco L et al. Intensive care nurses’ beliefs and attitudes towards theeffect of open visiting on patients, family and nurses. Nurs Crit Care 2006; 11:33–41. 2.Garrouste-Orgeas M, et al. Perceptions of a 24-hour visiting policy in the intensive care unit.Crit Care Med. 2008; 36(1):30–5.
1100SHORT -TERM PSYCHOLOGICAL EFFECTS IN FAMILY MEMBERS OF ICUPATIENTS
M. Kourti1,2, G. Fildisis1, E. Christofilou2, D. Bora2, G. Kallergis1
1University of Athens, Faculty of Nursing, Athens, Greece, 2General Hospital LAIKO, ICU,Athens, GreeceINTRODUCTION. It is generally accepted that hospitals are places where emotions ofanxiety, depression and uncertainty can appear, either to the patients or to their familymembers.1 However, ICU is probably the only place, where patients’ relatives seem tosuffer more, not only because of the critical ill’s condition, but also because of the fact thatrelatives must represent the patient and, in some cases, may need to take a decision for him2.OBJECTIVES. Aim of this study was to examine the presence of anxiety and depressionsymptoms in relatives of ICU patients that admitted in the Intensive Care Unit of a GeneralPublic Hospital in Athens, Greece, and the degree such feelings are connected to the criticalill’s condition.METHODS. A total of 102 patients’ relatives were enrolled in this study (62 females and40 males). The symptoms of anxiety and depression were evaluated with the HospitalAnxiety and Depression Scale (HADS) 3, and a HADS score over 21 was considered as a‘‘probable’’ case of these symptoms. Patient’s condition was evaluated with A.P.A.CH.E II(Acute Physiology And Chronic Health Evaluation II) score. The higher the score wasgetting, the more the patient’s condition was deteriorating. Two measurements took place,the first one after 7–10 days of patient’s admission in the ICU and the second one after7–10 days from the first measurement.RESULTS. During the first measurement, 61.8 % relatives were probable 4 cases of anxietyand 49,1 % were probable cases of depression. During the second measurement, 61,5 %probable cases of anxiety and 53.8 % probable cases of depression were identified. Norelation was found between symptoms of anxiety and depression to the relatives of patients’and patients’ condition of health.CONCLUSIONS. Symptoms of anxiety and depression were found to almost all patients’relatives that participated in the study, regardless of the seriousness of ill’s condition.According to all these, the assessment of these patients is strongly recommended in orderserious problems of anxiety and depressions prevented. 5.
REFERENCES. 1. Davidson JE. Family-centered care: meeting the needs of patients’ familiesand helping families to adapt to critical illness. Crit Care Nurse 2009;29:28–34. 2. Harvey MA.Evolving toward-but not to-meeting family needs. Crit Care Med. 1998; 26:206–07 3. ZigmondAS, Snaith RP. The hospital anxiety and depression scale. Acta Psyciatr Scand.1983;67:361–370 4. Maruiti MR, Galdenao LE, Dias Farah OG. Anxiety and depressions inrelatives of patients admitted in intensive care units. Acta Paul Enferm 2008; 21(4):636–4 5.Leske JS. Interventions to decrease family anxiety. Crit Care Nurse. 2002;22(6):61–5GRANT ACKNOWLEDGMENT. The authors are grateful to ICU personnel for theircooperation and to the ICU patients0 relatives for their willingness to help with the research.
1101WHAT INTERFERES WITH THE COMPLETION OF THE SIMPLIFIED ACUTEPHYSIOLOGY SCORE FORM?
R.V. Gomes1, W.A. Martins1, A.R. Felipe1, P.M.M. Nogueira1, M.A.D. Mattos1, M. Assad1,M.L. Toscano1, L.H.D.O. Fonseca1, C.N.D. Barros1, L.A.D.A. Campos1, Hospital UnimedRio1Hospital Unimed Rio, Rio de Janeiro, BrazilINTRODUCTION. The severity of patients admitted to coronary or non-specialized inten-sive care units demands the use of a prognostic score. The Simplified Acute Physiology Score(SAPS3) is the most widely used in Brazil; however, completing its form is not a simple task.OBJECTIVE. To identify and assess the factors that affect the quality of the process offilling out the SAPS3 form before specific training.METHODS. From December 2012 to January 2013, 36 physicians (all with medical resi-dency and proven experience in their medical specialties) completed the form available athttp://www.saps3.org. to calculate the first-hour SAPS3 of two test cases (pancreatitis andpost-operative period of colectomy). The physicians were divided into groups according totheir areas of expertise: cardio-intensive care; emergency; intensive care; and more than onespecialty. Their familiarity with the SAPS3 was assessed according to how many times theyhad already completed a SAPS3 form as follows: never; up to 5 times; and more than 5 times.That form completion (29 variables) underwent descriptive analysis and was compared with astandard completion [based on the definitions of appendix C (http://www.saps3.org)] per-formed by three certified intensive care professionals. Variables with disparities wereidentified. The ANOVA test was used to assess the impact of case severity, of familiarity withform completion, and of the medical specialty on the difference between results.RESULTS. After completing the score form, agreement was identified in 56 % of the 29variables, while the remaining 44 % showed at least two disparities, with a consequent changein mortality prediction. ANOVA resulted as follows: the medical specialty had no influence onthe result; familiarity (boxplot 1) related to better form completion, although the impact onmortality prediction was mild (3.3 %; p = 0.013); and the case severity (boxplot 2) related topoorer form completion, with a high impact of 17.16 % (p = 0.03) on mortality prediction.
SAPS 3 Case and Familiarity
CONCLUSION. The SAPS3 form completion improved with the user’s familiarity to theform, as well as with his/her training, but was hindered by the case severity. Training in theuse of electronic tools with clear definitions and easy access seems to be paramount.
26th ESICM ANNUAL CONGRESS — PARIS, FRANCE — 5–9 OCTOBER 2013
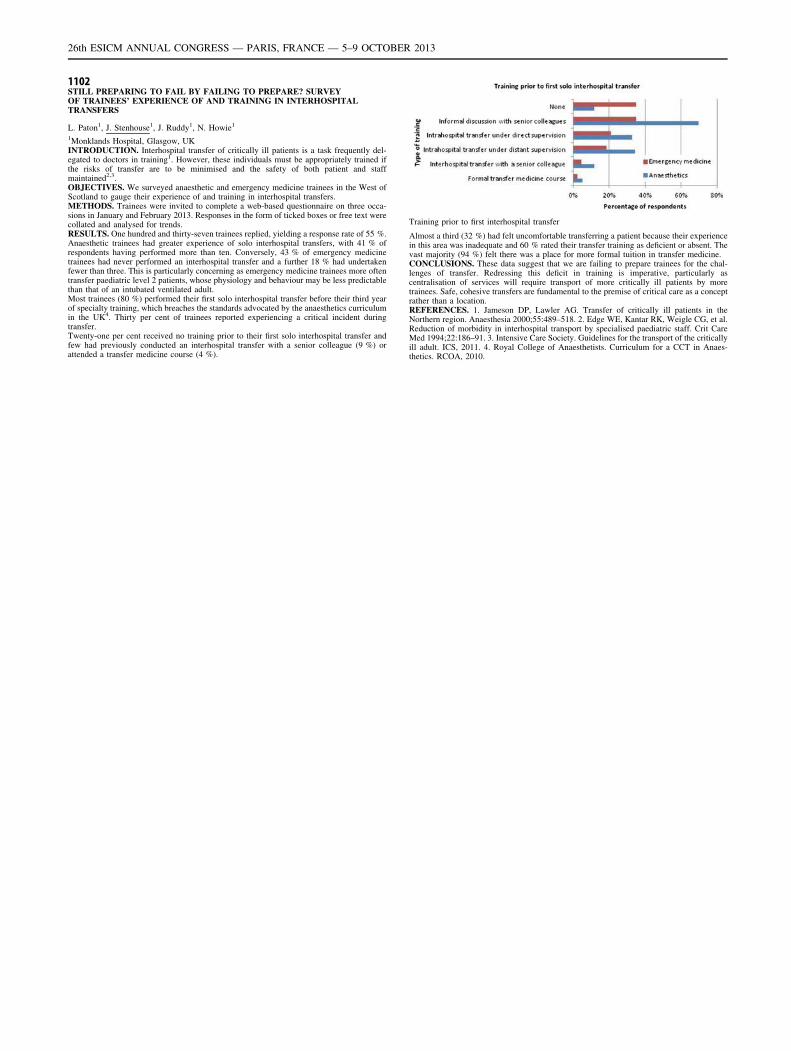
1102STILL PREPARING TO FAIL BY FAILING TO PREPARE? SURVEYOF TRAINEES’ EXPERIENCE OF AND TRAINING IN INTERHOSPITALTRANSFERS
L. Paton1, J. Stenhouse1, J. Ruddy1, N. Howie1
1Monklands Hospital, Glasgow, UKINTRODUCTION. Interhospital transfer of critically ill patients is a task frequently del-egated to doctors in training1. However, these individuals must be appropriately trained ifthe risks of transfer are to be minimised and the safety of both patient and staffmaintained2,3.OBJECTIVES. We surveyed anaesthetic and emergency medicine trainees in the West ofScotland to gauge their experience of and training in interhospital transfers.METHODS. Trainees were invited to complete a web-based questionnaire on three occa-sions in January and February 2013. Responses in the form of ticked boxes or free text werecollated and analysed for trends.RESULTS. One hundred and thirty-seven trainees replied, yielding a response rate of 55 %.Anaesthetic trainees had greater experience of solo interhospital transfers, with 41 % ofrespondents having performed more than ten. Conversely, 43 % of emergency medicinetrainees had never performed an interhospital transfer and a further 18 % had undertakenfewer than three. This is particularly concerning as emergency medicine trainees more oftentransfer paediatric level 2 patients, whose physiology and behaviour may be less predictablethan that of an intubated ventilated adult.Most trainees (80 %) performed their first solo interhospital transfer before their third yearof specialty training, which breaches the standards advocated by the anaesthetics curriculumin the UK4. Thirty per cent of trainees reported experiencing a critical incident duringtransfer.Twenty-one per cent received no training prior to their first solo interhospital transfer andfew had previously conducted an interhospital transfer with a senior colleague (9 %) orattended a transfer medicine course (4 %).
Training prior to first interhospital transfer
Almost a third (32 %) had felt uncomfortable transferring a patient because their experiencein this area was inadequate and 60 % rated their transfer training as deficient or absent. Thevast majority (94 %) felt there was a place for more formal tuition in transfer medicine.CONCLUSIONS. These data suggest that we are failing to prepare trainees for the chal-lenges of transfer. Redressing this deficit in training is imperative, particularly ascentralisation of services will require transport of more critically ill patients by moretrainees. Safe, cohesive transfers are fundamental to the premise of critical care as a conceptrather than a location.REFERENCES. 1. Jameson DP, Lawler AG. Transfer of critically ill patients in theNorthern region. Anaesthesia 2000;55:489–518. 2. Edge WE, Kantar RK, Weigle CG, et al.Reduction of morbidity in interhospital transport by specialised paediatric staff. Crit CareMed 1994;22:186–91. 3. Intensive Care Society. Guidelines for the transport of the criticallyill adult. ICS, 2011. 4. Royal College of Anaesthetists. Curriculum for a CCT in Anaes-thetics. RCOA, 2010.
26th ESICM ANNUAL CONGRESS — PARIS, FRANCE — 5–9 OCTOBER 2013
Author Index
AAach M. 0168Abbessi E. 0437Abbey S. 1022Abdelaal A. 0303Abdelghani A. 0585Abdelhakim M. 0220, 0222, 0398Abe K. 0478Abed N. 0506, 0761Abedrapo M. 0298, 0722Abehsira G. 0547, 0708Abifarin B. 0378Aboab J. 0001Abou Arab O. 0451Abouelela A. 1069Abousaleh M.G. 0753Abrolov H.K. 0554Absalom A.R. 0453Abu-Asi M.J. 0745Abubaker M. 0531Abu-Hanna A. 0517Abukhudair W. 0545, 0716, 0893Acıksoz S. 0062, 0679Accardo A. 0024Acheampong A. 0386Acosta F. 0213Acosta J. 0110Adachi Y. 0102, 0952Adam J. 0876Adda M. 0331, 0346Adekola O.O. 0660Adhikari N. 1022Adler A. 0081, 0092, 1004, 1007Adrie C. 0002, 0422, 1040Afonso E.P. 0831Aggarwal A. 0237Aggou M. 0418Agra Y. 0429Agrafiotis M. 0505, 0718, 1045Agrawal R. 0364, 0435Aguayo E. 0362, 0938Aguayo De Hoyos E. 0838Aguilar-Alonso E. 0124,
0654, 0837, 0907, 1028Aguilera E. 0093, 0483, 0680, 0777Aguirre-Bermeo H. 0448, 0750Ahlgren O. 0339Ahmetova A. 0802Aibar J. 0099, 0851Aibara K. 0786Airaksinen J. 0444Airapetian N. 0464, 0468Ajizian S.J. 0776Akbaba D. 0847Akcan Arikan A. 0188Akgun N. 0789Akimaru R. 1088Akimoto R. 0687Akole P. 0084Akoumianaki E. 0358, 0359,
0571, 0577, 0579Akova M. 0031Aksoy M. 0735, 1029Al Jaridi N. 0311Al Sulaiti G.S. 0166Alabart X. 0671Alabart Y. 0671, 0676Ala-Kokko T. 0100, 0810Al-Atroush H.H. 0147Alaybeyoğlu F. 0735Albaiceta G.M. 0409Albalá N. 0078Albaladejo M.D. 0393Albert P. 0415, 0416, 0417Albert-Rodrigo L. 0064, 0844Albrecht M. 1014Alcántara Carmona S. 0148Aldabó-Payás T. 0032Aleksandrova I. 0187Alemparte Pardavila E. 0766Alexopoulou C. 0731Ali T. 0146, 0167, 0730Ali T.M. 0994Aliberti S. 0210Alimatiri M. 0865Allaouchiche B. 0007, 0354,
0901, 1013Allegue J.M. 0209, 0393, 1089Aller A.V. 0801Aller Fernandez A.V. 0438Aller Fernández V. 0496Aller-Fernandez A.V. 1050Allou N. 1063Allouchiche B. 1040Allyn J. 1067Almansa Mora R. 0564Almeida B.F.C. 0407
Almpani P. 0941Al-Najjar M.M.H. 0147, 0545,
0716, 0893Aloizos S. 0645Alonso Juste V. 0805Alonso-Graña C. 0569Al-Shafee M.A. 0147Altaba-Tena S. 0064, 0844Alted Lopez E. 0027Alted López E. 0795Altintas N.D. 0735, 1029Alvarez A.L. 1091Álvarez B. 0078Álvarez J. 0249, 0548, 0720,
0721, 0877Alvarez lerma F. 1068Alvarez Lerma F. 0214, 0429Alvarez Marquez E. 0543Álvarez Martı́nez B. 1083Álvarez Saiz A. 0936Alvarez-Bueno M. 0635Alvarez-Lerma F. 0044, 0492Álvarez-Rodrı́guez J. 0836, 0837Alves F. 0397Alves M. 0500Alvisi V. 0091Aly M. 0258Alyami H. 0827Alzubaidy R. 0351Amaniti E. 0418, 0958Amantea B. 0717Amaral G.F. 0684Amato M.B.P. 0136, 0576, 1009Amatullah H. 0010, 0096Amaya R. 0032, 0782Ambrós Checa A. 0174Amilien V. 0787Ammenouche N. 0464, 0468Amores B. 0648Amorim F.F. 0684Ampatzidou F. 0505, 0718, 1045Amrani O. 0290Amrein K. 0983Amsallem M. 0327An H.C. 0264, 0273Anan’ev E. 0175Ananiadou O. 0505, 0718, 1045Anastasiou E. 1074Ancion A. 0898Andaluz Ojeda D. 0564Andersen G.Ø. 0036Anderson S. 0192Andreis D.T. 0330Andrivet P. 0500Angelopoulos E. 0859, 0862Angermair S. 0324Angue M. 1067Anguel N. 0445, 0787, 0819, 0883Anillo V. 0456Annamaneni R. 0969Añon Elizalde J.M. 0534Añón Elizalde J.M. 0405Antcliffe D.B. 0353Antonelli M. 0208, 0512Antoniadou E. 0404Antonicelli F. 0208Antonio A.C.P. 0757Antonopoulou A. 0112Antonucci E. 0325, 0774Antón-Valades E. 0615Anumakonda V. 0243Anwar S. 0204Anzueto A. 0210Apiou-Sbirlea G. 0573Apostolou K. 0106Apostolou K.T. 0103Appavu S. 0089Appelboam R. 0800Appleton R. 0304Aquevedo A. 0013Ara Somohano C. 0989Aragão I. 0310, 0400, 0402,
1034, 1061Aragón-González C. 0655Arai H. 0786Arakawa K. 0085Aranda M. 0241Aranda-Lara P. 0537Arango A. 0210Arango Dávila C.A. 0694Ara-Somohano C. 0625Araujo Alcántara J.B. 0405Araujo Zin W. 0570Arboleda Sánchez J.A. 0528Arboleda-Sánchez J. 0124Arboleda-Sánchez J.A. 0129Arenal S. 0033, 1092
Arenilla M.P. 0214Arenillas M. 1068Argacha J.F. 0040Argaud L. 0007, 0354, 0899, 0901,
1040Arias J.J. 0361Arias Garrido J. 0460Arias Verdu M.D. 0542, 0555, 0799Arias Verdú M.D. 0543Arias-Verdu D. 0235, 0236, 0665, 0703Arias-Verdu M.D. 0654Arias-Verdú M. 0124, 0173, 0176, 0655,
0907, 1031Arias-Verdú M.D. 0833Arif F. 0216, 0217, 0698Arifjanov A.S. 0155, 0553Arisi E. 0581Armaganidis A. 0105, 0112, 0126,
0595, 0695Armelino J. 1091Arméstar F. 0410Armesto Formoso D. 0605Armstrong E.A. 0976Armstrong E.K. 0666Armstrong M. 0191Arnal J.-M. 0573Arneth B. 0104Arola O. 0444Arora V. 0845Arrabal S. 0123Arrebola-Ramirez M. 0235, 0236Arrigo M. 0275Arroliga A. 0006Arroyo N. 0430Arslan G. 0710Artero J.M. 0209Artigas A. 0014, 0343, 0890, 0902,
0951, 0953, 0992, 1082Arul N. 0191Arulkumaran N. 0611, 0878, 0879, 0888Arunkumar A.S. 0598Arzani Y. 0964Asada K. 0952Asano S. 0715Aseginolaza Pagola M. 0566Asehnoune K. 0279Asfar P. 0234, 0445Asiyanbi G.K. 0660Aslami H. 0141, 0334Aslan F.G. 0218Aslan O. 0062, 0675, 0679, 0982Aslanidis T. 1074Aspa J. 0583Assad M. 0197, 0834, 1101Assink-de Jong E. 0255, 0344Assmann A. 0224Assunção M. 0697Astegiano P. 0475Astles T. 0051, 0403, 1032Astola I. 0801, 1027Astola Hidalgo I. 0496Astola-Hidalgo I. 1050Atagi K. 0683Ateca B. 0274Atkins G. 0481Atkinson D. 0161, 0895Attie S. 0584Attou R. 0942Aubrun F. 0007, 0354Augustin P. 0300, 1063Ausseil J. 1015Avalli L. 0652Avila R. 0381, 0632Ávila M.B. 0140, 0582Avogadri M. 0652Aya H.D. 0627Ayas N. 1022Ayechi J. 0585Ayestarán J.I. 0409Ayoub J.-Y. 1013Ayzac L. 0007, 0354Azevedo L. 0397, 0406, 0411, 1099Azevedo L.C.P. 0407Azevedo P.S. 0219, 0390, 0394Azim A. 0237Azoulay E. 0002, 0003, 0183, 0420,
0422, 0500, 0901, 1040Azoulay É. 0001, 0407
BBaboi L. 0007, 0354Bäcklund M. 0444Badin J. 0781Baez-Garcia C. 0559Baez-Garcia C.S.N. 0337Bag P. 0918
Bagate F. 0547, 0708Bagos P. 0126Baguet J.-P. 0625Baietto L. 0205Baigorri F. 0890Bailey A. 0267Bailey M. 0520Baimagambetov S. 0802Bajpai P. 0156, 0860Baker A. 0521Baker S. 0349Bakker J. 0891, 0945Bakogianni T. 1085Balaguer M. 0244Balakumar E. 0171Balandı́n Moreno B. 0212Balasa M. 1044Baldassarri R. 0087Baldesi O. 0899Baldini G. 0297Balik M. 0377Ball J. 0378, 0888Ballestero F.M. 0912Ballesteros J. 0648Ballesteros Ortega D. 0514Ballus Noguera J. 0805, 0806Balmaceda Y. 0475Baltopoulos G. 0645, 0798Baluja A. 0249, 0548, 0720, 0877Balzer F. 0184, 0230, 0455, 0565Banck M. 0262Banderas Bravo M.E. 0624, 0765Banderas-Bravo E. 0887, 0907Banerjee T. 0243Bangstad I.-L. 0073Bansal M. 0301Baptista J.P. 0207Barado J. 0042Barakat M.S. 1008Barakat Shrem O. 0936Barbalat V. 0391Barbancho Fernández M.A. 0278Barcena L. 1091Barenco M. 0191Bargay J. 0409Barge Caballero E. 0438Barker G. 0363Barker G.N. 0608Barklin A. 0612Barletta A. 0338Barmania N. 0568Barnard M. 0267Barnes A.-M. 0055Baron D.M. 0254Baronia A. 0237, 0527Barr D.A. 0510Barranco M. 0362Barrero A. 0061Barrero-Almodovar A. 0589Barrientos Vega R. 0199Barrientos Yuste R. 0199Barros C.N.D. 0197, 0834, 1101Barrueco-Franccioni J. 1028Barruecos J. 0665, 0703Barsam E. 0966Bart F. 0487Barthel F. 0889Basak T. 0679Basas M. 0385, 0762Bass F. 0521Bass P. 0611, 0878, 0879Bassetti M. 0031Bastien O. 0007, 0354Bastos A. 1034Bastos M. 1033Basyiğit S. 0789Bates D.G. 0146Bates L. 0161Batista Borges J. 0086Batistaki C. 0821Batlle M. 0410Batranovic U. 0292Batt J. 0920, 1022Bauer I. 0889Baumgarten G. 0875Baumstark K. 0899Bautista Rincón D.F. 0694Bayard D. 0773Bayer O. 0068, 0295, 0465Bayley M. 1022Bayo R. 0648Bayraktar N. 0710Bayram B. 0218Beane A. 0357Beardow Z.J. 0308Beaulieu M. 0183Beaumont N. 0971
26th ESICM ANNUAL CONGRESS — PARIS, FRANCE — 5–9 OCTOBER 2013
Becher T. 0993, 0997, 1001Beck C. 0889Beda A. 0336, 0447, 0580, 0792Beduneau G. 0886Behlaj A. 0040Behnes M. 0101Beilicke A. 0336Bein B. 1014Bein T. 0616Beirão S. 0498Beishuizen A. 0045, 0255,
0266, 0344Bejuk D. 0770Bekmagambetova N. 0802Belafia F. 1023Belcour D. 0771Belenguer-Muncharaz A. 0844Belkhouja K. 0508Bell C. 0139Bellani G. 0338, 0985Belli A. 0145Bellini A. 0846Bellomo R. 0018, 0520Belloni I. 0488Belmondo B. 0513Belmonte O. 1067Ben Khelil J. 0508Ben Nunn M. 0423Ben Romdhane K. 0508Ben Saida I. 0585Benbenishty J. 0423Bendel S. 0018Benenson S. 1062Benger J. 0928Bengeri S. 1044Benham S. 0152Benington S. 0895Benites M.H. 0808Benitez Moreno M.P. 0635, 0799Benitez-Moreno P. 0665Benosman H. 0775Ben-Rehouma M. 0422Bentley A.M. 0153, 0783Benveniste E. 0410Benzonana N. 0847Beraldo M. 0136Berard L. 0290Berardino M. 0170Berdnikov G. 0187Beretas N. 0941Bergamini B. 0009Bergamini E. 1076Bergenzaun L. 0628Berger A. 0098, 0234, 0856Bergquist M. 1010Bergs J. 0428, 0484Berkius J. 0004Bermejo B. 0648Bermejo E. 0033, 1092Bermejo Aznárez S. 0027Bermejo Martı́n J. 0564Bermúdez W. 0694Bernal É. 0676Bernal T. 0409Bernal-Julián F. 0064, 0844Bernard F. 0163Bernasinski M. 0827Berner S. 0872Bersten A. 0458Bertini P. 0087Berton A. 0170Bertsch T. 0101Berwanger O. 0567Besbes M. 0508, 0573Besserve P. 0827Besteiro Grandı́o B. 0496Bettex D. 0275Beumier M. 0325Beuret P. 0756Beurskens C.J.P. 0141, 0823Bewig B. 0993Beyls F. 0644Bhamani A.A. 0373Bhangal G. 0879Bhurke B. 0084Biagioli B. 0082, 0297Bialais E. 0138Bianchi A.M.A. 0342Biancone M. 0208, 0368Bichinin M. 0541Bielen I. 0770Biesenbach P. 0617Bigé N. 1059Bilgili B. 0789Binnekade J. 0602Bion J.F. 0345Bird S. 0521Bisbal-Andrés E. 0844Bissett B. 0658Björne H. 0086
Black C. 0058Blackwood B. 0450Blancas Gómez-Casero R. 0514Blanch L. 0343, 0992Blanco J. 0078Blanco J.J. 0538Blanco-Varela J. 1083Blankman P. 0693, 0995Blanloeil Y. 0279Blanquer J. 0210, 0355, 0583, 0780Blanquer Olivas J. 0221Blasco M.A. 0912Bläser D. 0742, 0997, 1001Blazquez V. 0768, 0946Blázquez V. 0426Blesa A. 0110Blevrakis E. 0369, 0651Bloch A. 0501Bloch J. 0442Blockmans D. 1060Bloom B. 0657Bloomer M.J. 0050Bloos F. 0068Blot F. 0407Blot K. 0428, 0484Blot S. 0428, 0484, 0642Blot S.I. 0640Bocanegra C. 0281, 0457, 0459Bode C. 0875Bode-Böger S.M. 0324Bodi M. 1095Bodi V. 0122, 0130Bodı́ M. 0348, 0392, 0426, 0768,
0946Bodı́ M.A. 0671Boedo A.X. 0912Boegli L. 0724Boehm O. 0875Boelens J. 0347Boerma E.C. 0256Boffini R. 0205Bohe J. 0874Bohm S.H. 0081, 0092, 1004Böhm S.H. 1007Bohollo de Austria R. 0460, 0988Bohollo de Austria R.Á. 0950Boisramé-Helms J. 0098, 0234, 0856Boissonnas A. 0876Boitrou E. 1098Bojan M. 0636Bolton N.J.W. 0940Bomfim R.F. 0684Bonacina D. 0581Bonadona A. 0625, 0989Bonastre J. 0288, 0409Bonato R. 0205Bonelli I. 0584Boner K.S. 0433Bonfim I.S. 0114, 0232, 0562,
0563, 0743Bongaerts D. 0263Bongiorni G. 0381Bonmarchand G. 0886Bonnet-Garin J.-M. 1013Bonovas S. 0126Bonzanini L. 0117Boom D.T. 0522Booth B. 1041Bora D. 1100Borawake K. 1078Bordejè L. 0474Borderı́as L. 0583Bordes Benitez A. 0206, 0211Bordonado L. 0671, 0676Borelli F. 0170Borgatta B. 1064Borgeaud M. 0552Borges J.B. 0339, 0984, 1007Borges M. 0241, 0409Borggrefe M. 0101Borrallo-Pérez J.M. 0529Borrás S. 0780Borrello B. 0597Borremans M. 0449Borsa R. 0985Bos L.D. 0440Bos L.D.J. 0902Boschmann M. 0224Bose E. 0677Bosman R.J. 0376, 0515, 0522,
0760, 0916Bosschem V. 0678Bossolasco M. 0965Botros M. 0352Botsis P. 1065Bottino N. 0326Bouadma L. 0002, 0901, 0905, 1040Bouchard P.-A. 0574, 0692Bouchetemble P. 0886Boucly A. 0327
Bougle A. 0037Bouglé A. 0299Bougouin W. 0037Boulain T. 0279, 0781Boulanger C. 0423Boultoukas E. 1074Bourcier S. 0037, 0299Bourdeaux C. 0896Bourdin G. 0407Bourke J. 0433Boussarsar M. 0585Bout H. 0772Bouvet P. 0493Bouza M.T. 0801Bouza Vieiro M.T. 0438Bouzat P. 0442Boviatsis E. 0862Boyd N. 0809Boyer A. 0503Boyer C. 0423Bozorgzad N.S. 0906Bozza F.A. 0406Bradac O. 1049Brasseur A. 0774Braun F. 0092Braun J. 0184Braune S.A. 0160, 0322Bray B. 0162Bréchot N. 0327Brederlau J. 0015Breebaart W. 0602Brégeon F. 0346Breitenstein A. 0275Bresson D. 0772Briasoulis P.G. 0821Briassouli E. 0103Briassoulis G. 0103, 0106,
0369, 0651, 0944Briassoulis P. 0369Bringas Bollada M. 0367Brinkman A.C. 0266Briones M. 0583Brioni M. 0556, 0996Brisard L. 0290Brochard L. 0001, 0003, 0358,
0359, 0379, 0571, 0573, 0575,0577, 0579
Brodska H. 0377Brohan J. 0531Brohi K. 0606Broilo F.P. 0629Brotfein E. 1038Brouwer R. 0396Brown C. 0863, 0869Brown J. 0896Bruce M. 1051Brueckmann M. 0101Bruhn A. 0013, 0945Bruins N.A. 0256Brulin C. 0797Brümmer I. 0201Brunner R. 1046Bruno E. 0867Brusasco C. 0597Brusset A. 0547, 0708Bryden D. 0662Bucciero M. 0487Buchloh D. 0336Buchwald D. 0328, 0329Buckley H. 1057Budding A.E. 0344Buehler A.M. 0567Bueno González A.M. 0174Buensuseso A. 0471Bugano D.G. 0567Buhre W.F. 0477Bui H.N. 0503Bui S. 0997Buitrago G. 0247, 0251, 0281Buki A. 0903Bullen E.C. 0296Bulpa P. 0640Burban M. 0098, 0856Burghi G. 0407Burin L.M. 0117Burke J. 0035Burns K. 0908, 1055Burón Mediavilla F.J. 0321Burry L. 0908Burt A. 0549Burt K. 0809Busatti S. 0145Buschbeck C. 0724Busico M. 1091Bustinza A. 0074Butjosa M. 0099, 0851Butler M.B. 0203, 0289, 0653Butrov A. 0021Buzenet J. 0142Byrne K. 0196
CCabana M.L. 0475Cabanas M. 0680Cabrera Calandria A.M. 0624Cabrera Santana M. 0206, 0211Cabrera-Arrocha J. 0366, 0489Caciano C. 0247, 0457, 0459Cai C. 0309Caipe Balcazar L. 0206Çakır Madenci Ö. 0847Calbo Caballos L. 0460Calcinaro S. 0601Callaway C.W. 0368Calleja L. 0831Callejo Torre F. 1083Calligaris W. 0024Calpe N. 0676Calvo E. 0474Calzada Y. 0244Calzia E. 0990Camaniti C. 0669Camara-Sola E. 0226, 1071, 1075Camarena G. 0560Camargo Jr. C.A. 0983Camarillo M.E. 0341, 0560Cambra F.J. 0244Cameron J. 0920Cameron J.I. 1022Camila C. 0402Camilo L.M. 0140, 0447, 0580, 0582Camkıran A. 0710Cammarota G. 0504, 0685, 0986Campassi M.L. 0808Campello G. 0310, 1061Campion S. 0030Campos J.M. 0415, 0416, 0417Campos L.A.D.A. 0197, 0834, 1101Can F.M. 0062Cancelliere L. 0986Candidi F. 0145Candriella M. 0685Canestrini S. 0636Cano Nieto J. 0132Cano-Garcia M. 0127, 0286, 0535Capdevila J.A. 0430Capdevila X. 0028, 0279, 0335, 0621Capela S. 0387Capela S.N. 0382Capellier G. 0689Capelozzi V.L. 0557Capisani C. 0170Cappuzzello C. 0985Capurro G. 0475Capuzzi F. 0986Caralt B. 0686Carballo Ruiz M. 0283Carbery C. 0485Carbon N. 0230Cárdenas P. 0805Cardenas-Campos P. 0806Cardo M.L. 0534Cardoso T. 0400, 0402Cardwell C. 0450Carey D. 0900Cariñena A. 0720, 0877Carino S. 0663Cariou A. 0037, 0299, 0927Carlo Marco Schulke C. 0921Carmona J.A. 0340Carnero M. 0276Caroleo S. 0717Carpenter M. 0741, 0747Carpentier D. 0886Carpio-Sanz J. 0837Carrasco I. 0202Carratala A. 0780Carriedo Ule D. 0432Carrio M.L. 0544Carrió M.L. 0709Carrizo N. 0381, 0632Carsetti A. 0601Cartier J.C. 0989Cartier J.-C. 0625Caruso P. 0406Carvalho A. 0336, 0792Carvalho A.R. 0009, 0140, 0582Carvalho C.R.R. 0576Carvalho N. 0009, 0336, 0792Carvalho P. 0053Carver A.L. 0313Casaer M.P. 0644Casanova M. 0475Casboult S. 0670Casey J.D. 0223, 0227Castagnani R. 0601Castaño López M.A. 0936Castaño Pérez J. 1025Castelain V. 1059Castillo J.M. 0209, 0393, 1089Castillo Castillo M.C. 0277, 0365
26th ESICM ANNUAL CONGRESS — PARIS, FRANCE — 5–9 OCTOBER 2013
Castillo Rivera A. 0630, 0638Castillo-Lorente E. 0655, 0907,
0837, 1028Castro M.J. 0709Castro P. 0099, 0412, 0851, 1058Castro P.S. 0757Castro Gallego M.O. 0405Catalan M. 0044, 0214, 1068Catalán González M. 1094Catalán-Monzón I. 0844Cavalcanti A.B. 0567Cavallaro F. 0368Cavallo S. 0170Cavazza M. 0669Cavé L. 0391Cazalis M.A. 0391Cebrián J. 0288Cebrián-Graullera G. 0844Cecconi M. 0443, 0627, 0888Ceniceros A. 1027Cenoz Osinaga J.I. 0766Cerejo A. 0025Ceron U. 0626Cerrato E. 0391Cervellin G. 0669Chabrière E. 0346Chacón Alves S. 0027Chahed R. 0585Chaires R. 0341, 0626Chaize M. 0420Chakarian J.-C. 0756Chakkalakal N. 0186Chakraborty M. 0231Chalmers C.M. 0053Chamberlain D. 0458Chamberlain W. 0423Chamroo T. 0159Chan L. 1022Chan W.M. 0384Chan Y.-L. 0530Chana M. 0514Chang G.Y. 0551Chang H.-T. 0702, 1020Chang J.H. 0551Chang Y. 0022Chanques G. 1023Chant C. 1055Chantler J. 0152, 0363Chaparro-Sánchez M.J. 0287Chapela S.P. 0912Chapman M.J. 0519Charbit J. 0028, 0335, 0621Charbonney E. 1019Charles P.-E. 0899Charpentier J. 0037, 0299, 0927Chase G. 0268Chase J.G. 0143, 1006Chassou E. 0404Chastre J. 0327Chastrusse M. 0414, 0421Chatzidaki V. 0369, 0651Chatzimichali A. 0369Chau C. 0521Cheboksarov D. 0021Cheifetz I.M. 0704Chelazzi C. 0546, 0707Chemam S. 0905Chen C.-Y. 0530Chen J. 0309, 1037Chen K.-F. 0530Chen L. 0677, 0913, 0914Chen L.-M. 0530Chen M. 0309Chertcoff F.J. 0912Chettab S. 0966Chevret S. 0001, 0003, 0041Chevrou-Séverac H. 0736Chew M.S. 0628Chhangani S.V. 0922Chiarini G. 0472Chiche J.-D. 0037, 0927Chiche Z. 0830Chick A. 0662Chico Fernández M. 0027, 0795,
1094Chiew Y.S. 0143, 1006Chihara S. 0094Chihebeddine R. 0398Chikhani M. 0146Chimenti L. 0343, 0992Chiumello D. 0556, 0996Chiurazzi C. 0326Chkhaidze M. 0610Chlorou D. 0418, 1012Cho J.S. 0264, 0273Choe W.J. 0149Choi E. 0586Choi S.M. 0265Choi S.-S. 0293Choi S.-H. 0128
Cholley B. 0190Chong M. 0162Chorro F.J. 0122, 0130Chouaki T. 0641Chousterman B.G. 0876Chretien J.M. 0886Christakou A. 0864, 0865Christiansen C.F. 0434Christmann Y.W. 0117Christodoulou G. 0923Christofilou E. 1100Christopher K.B. 0223, 0227,
0252, 0315, 0661, 0983Christophoridis E.K. 0436Chu L.M. 1022Chua H.C. 0075Chua M.J. 0401Chung C.R. 0128, 0395, 0532Chung K.-P. 0248, 0702, 1020Churchill S. 0259Chytas E. 1074Cicuéndez Ávila R. 0564Cigada I. 0556, 0996Cinnella G. 0558Cinotti R. 0279Cisneros J.M. 0032, 0782Citerio G. 0164Cı́tores R. 0078Civantos B. 0596Civiletti F. 0170Clair M.-P. 0787Clark P. 0733Clark T. 0800Clarke E. 0748Claverias L. 0348, 0392, 0946Claviéras N. 0759Clec’h C. 0422, 0901, 1040Clement I. 1053Clergue C. 0001Clermont G. 0523, 0677,
0913, 0914Clos S. 0448Clouzeau B. 0503Coates D. 0928Cobos Trigueros N. 1058Cohen M.J. 1062Cohen Y. 0002Coisel Y. 0759Cojocaru V. 0125Colak Z. 0185Colares M.F. 0114, 0232, 0562,
0563, 0743Cole A. 0146Colet F. 0500Collins N. 1096Colmenero Ruı́z M. 1025Coloma B. 0671Colombaroli E. 0311Colombo A. 0556Colombo D. 0504Colomo M. 0362Colomo Gonzales M. 1025Colomo Gonzáles M. 0431Colomo Gonzalez M. 0609, 0939Colomo González M. 0490, 0494, 0904Colon C. 0061Colreavy F. 0633Comaru T. 0093, 0483, 0680, 0777Combadière C. 0876Combes A. 0327Comini B. 0330Comisso I. 0977Concha A. 0074Conrad M. 0445Conrick-Martin I. 0433Conseil M. 0500, 0759Constantin J.-M. 0899Constantinou I. 0516Consuegra Llapur E. 0569Conte B. 0335Contentin L. 0573Conway K. 0971Cook D. 0908Cook D.J. 1022Cooke S. 0863, 0869Cooney H. 0531Cooper D.J. 0604Cope T. 0051Copnell B. 0050Coppadoro A. 0338Coppo A. 0652Coppola S. 0556Coquerel D. 0957Coquet I. 0414, 0420, 0421Corbella D. 0724Corcione S. 0205Corcobado Marquez M.C. 0174Cordero Vallejo M. 0321Cordini V. 0381Cordioli R. 0579
Cordioli R.L. 0358, 0359, 0571, 0577Cordoba J. 0619Cordoba J.P. 0814Cordovilla Guardia S. 0609Corniero P. 0244Coroir M. 0487Corradi F. 0597Corradi M. 0986Corral Velez V.F. 0805, 0806Corrales Cruz A. 0405, 0534Correa T.D. 0697Corredor C. 0888Cortes Puch I. 0599, 0600Cortinovis B. 0652Cos E. 0392, 0426, 0768Coss-Bu J.A. 0229Costa C. 1081Costa E.L.V. 1009Costa L. 0170Costa N.A. 0219, 0390, 0394Costa Pereira C. 0388Costagliola R. 0986Costamagna A. 0205Costelloe K. 0058Cota Delgado F. 0283Cota-Delgado F. 0238, 0591Cotos A. 0701Cotting J. 0119Cottle D. 0383Cotton F. 0325Coudrot M. 0493Coutinho P. 0071, 0498, 1026Cowley N. 0345Cox L. 0778, 0788Cracco C. 0500Crago E. 0022Crawford S. 0193Crema E. 0550Crespo M. 0705Crespo Leiro M.G. 0438Creteur J. 0311, 0892Crews M. 0065Cristallini S. 0023, 0325Cristina A. 0042Cronberg T. 0261Crotti S. 0326Crouzet A.-S. 0279Cruz A.T. 0188Cruz L.F. 0140, 0582Cuena R. 0511, 0681Cuervo A.L. 0245Cuesta D. 0954Cuesta J.M. 0193Culshaw N. 0469Cumpstey A. 0152Curiel Balsera E. 0176, 0182, 0543,
0593, 0719, 1070Curiel-Balsera E. 0059, 0278, 0287,
0573, 0635, 0655, 0833, 0837, 0887Curty Bergamini B. 0570Cusack R. 0980, 1096Cusenza M. 0024Cuthbertson B. 1022Cuthill J. 0425Cutuli S.L. 0208Czepielewski M.A. 0117Czosnyka M. 0025
DDa Cunha F.M.R. 0550Da Silva S. 0306Dabbous H. 0303Dachiardi R. 0814Dachiardi R.E. 0619Daga Ruiz D. 0765D’agrosa L. 0965Daillet F. 0354Dal Pizzol F. 0406Dalhuisen A. 0813Dalmau N. 0671Dalorzo M. 0457, 0459Dalton R.N. 0017Daly K. 0063Damanhuri N.S. 0143Damani R. 0906Damas P. 0898Dambrosio M. 0558Damiani E. 0601D’Amico G. 0985Dammak H. 0585Damoisel C. 0772Damou A. 0621Dander E. 0985Danilovich A. 0242D’Antini D. 0558Danunnzio P. 1091Darmon M. 0002, 0183, 0420, 0422,
0493, 0901, 1040Daroui I. 0573D’Arrigo S. 0368
Darroch J. 0159Darrouzain F. 0781Das A. 0146Das V. 1059Das Neves A. 0663Daviaud F. 0037, 0299David S. 1018, 1059Davies J. 0656Davies S.E. 0928Davis T. 0229D’Avolio A. 0205Day A.G. 0737De Araujo Neto J.A. 0684De Azevedo R.P. 0968De Backer D. 0023, 0040, 0311,
0694, 0892De Beer F.M. 0141, 0334, 0440De Bels D. 0942De Bondt K. 0738De Bruijn W. 0467De Bus L. 0347De Castro L.G. 0114, 0120, 0232,
0257, 0302, 0562, 0563, 0743De Corte W. 0811De Decker K. 0317De Dios B. 0241De Gaudio A.R. 0546, 0707De Gendt L. 0317De Haro C. 0014, 0902, 0953De Jager P. 0467De Jong A. 1023De Keyser Ganz F. 0423De la Cerda G. 0159, 0486, 0846De la Chica Ruiz-Ruano R. 0939De la Chica-Sanchez J.A. 0286, 0535De la Cruz Sabido J. 0490, 0904De la Fuente A. 0884De la Fuente E. 0511, 0681De la Torre Prados M.V. 0283De la Torre-Prados M.-V. 0226,
0238, 0591, 1071, 1075De León-Belmar J. 0064De Lorenzi C. 0552De Luca A. 0689De Metz J. 0916De Miguel Aparicio F.J. 0799De Miguel Martı́n S.H. 0711De Montmollin E. 0905De Mora Martin M. 0132, 0133De Mora-Martin M. 0127, 0131,
0286, 0535, 0537De Neve N. 0317De Pascale G. 0208De Regt J. 0449, 0623, 0815De Rijdt T. 0644De Rosa F. 0093, 0483, 0680,
0777De Rosa F.G. 0205De Santis P. 0208De Sousa I.A. 0281, 0457, 0459De Stefano L.M. 0219De Vries J.H. 0515De Waard M.C. 0255, 0266,
0269, 0344, 0976De Waarde M.C. 0666De Waele E. 0449, 0623, 0650,
0738, 0740, 0815De Waele J. 0031, 0678De Windt A. 0290Deane A.M. 0519Decorte L. 0942Decruyenaere J. 0347, 0678, 0811Degoricija V. 0929Deja M. 0324, 0565Del Amor M.J. 0209, 1089Del Carmen Molina M. 0630Del Castillo A. 0241Del Sorbo L. 0205Del Valle M. 0247, 0251, 0281Delabranche X. 0098, 0234, 0856Delange-Van Der Kroff M. 0176Delannoy B. 0007Delanoy B. 0354Delgado M. 0430, 0446Delgado-Amaya M. 0173, 0833Delgado-Prieto J.L. 0127, 0131Delhumeau C. 0026, 0552Della Corte F. 0504, 0685, 0986Della Marca G. 0368Dellamonica J. 0001Deloya E. 0090DeLuca L.A. 0316, 0370,
0371, 0778, 0788Demaret C. 0007, 0354Demars N. 0037Demetriadou E. 0866, 0923Demiri S. 0487Demoule A. 0001, 0003, 0500,
1059Dempsey G. 0403, 1032
26th ESICM ANNUAL CONGRESS — PARIS, FRANCE — 5–9 OCTOBER 2013
Denjean D. 0708Denninghoff K. 0370, 0371Denninghoff K.R. 0316, 0778,
0788Depaoli S. 1091Depeyre J. 0119Depuydt P. 0001, 0347Dequin P.F. 0445Dequin P.-F. 0351, 0781Deransy R. 0468Deras P. 0028Derosa S. 0332, 0999Desai M. 0229Desaive T. 0143, 0268, 1006Descotte E.J. 0912Desmard M. 0300, 1063Desmery P. 1091Destefano L. 0973Dettling-Ihnenfeldt D. 0897Devaney M.M. 0193Devlin J. 0908Devriendt J. 0942Dewan S. 0043, 0918Dhondt A. 0811Di Bernardo V. 0724Di Marco F. 0581Di Nicolantonio R. 0724Di Pasquale M. 0680Diakaki C. 0595Diamantaki E. 0731Diamantakis A. 0112Dias C. 0025Dias C.C. 0400Dias V. 1033Diaz M.R. 0362, 0938Diaz T.J. 0773Diaz Y. 0116, 0385, 0492, 0762Dı́az M. 0033, 0281, 0457, 0459Dı́az Domı́nguez F.J. 0432Dı́az Mendoza C. 0077Diaz Pernalete R. 0502Diaz-Martinez A. 0032Diaz-Prieto A. 0446Dickinson M. 0053Diconne E. 0493Diedrich B. 0875Dieperink W. 0060, 0195Dietrich A. 0447, 0580Diez-de-los-Rios-Carrasco
M.-J. 0235, 0236Di-Gangi S. 0835Dige A. 0848Dijkema L.M. 0060Dikaiakos M. 0516Diltoer M. 0449, 0623, 0650,
0740, 0815Dimitriou H. 0106Dimopoulos G. 0031, 0595,
0640, 0642Dimopoulos S. 0859, 0862Dimopoulou I. 0105, 0112, 0695Dinic M. 0183Diogo A.C. 0476Dios-Torronteras F. 0182Diplaris K. 0505, 0718, 1045Divertie G. 0900Dixit S. 1078Dixon J.J. 0017Djafarzadeh S. 0095, 0728Djukanovic M. 0292Do Ceará V.D.A. 0114, 0120,
0232, 0257, 0302, 0562, 0563,0743
Doboco F. 0782Dobson G.P. 1011Dodek P. 0908Doi K. 0931Doi T. 0240, 0967Doig G.S. 0736Dojat M. 0575Dombrowsky H. 1014Domingues V. 1034Dominguez M. 0548Domı́nguez M. 0721Domı́nguez-Berrot A.M. 0157Dominguez-Paez M. 0176Domizi R. 0601Donadello K. 0023, 0082,
0297, 0311, 0325, 0933Donati A. 0601Dong Z. 0480Donnelly M. 0055D’Onofrio C. 0558Donzeau A. 0573Dorna M.S. 0219Dorner L. 0419Doroni L. 0087Dos Santos C. 0010, 0096, 0920,
1022Dos Santos C.C. 1055
Dos-Santos L. 0548Dot I. 0116, 0385, 0492, 0762Doubek D. 0539Douma M.R. 0255, 0344Dousse N. 0571Dovbysh N. 0242, 0497Doxaki C. 0008Drægni T. 0036Dragioti E. 0634Draisci A. 0024Dres M. 0500, 0787, 0819, 0883,
1059Driessen R.H. 0255, 0666, 0976Drolz A. 1043, 1046Drosos G. 0505, 0718, 1045Druml W. 0617Dubin A. 0808, 0964Dubrawski A. 0677, 0913, 0914Ducati A. 0170Ducos G. 0183, 0420Dufour G. 0300, 1063Dugernier J. 0573Duguet A. 1059Dumas F. 0037, 0927Dumenil A.-S. 0002, 1040Dumitras T. 0125Dunouvion-Magnier C. 0354Dünser M. 0261Dupont H. 0150, 0451, 0464, 0468,
0641, 0827, 1015Duranteau J. 0029, 0183, 0261,
0796, 0832Duska F. 0109, 1042Dutta D. 0424, 0427Duwat A. 0464, 0468Dyson A. 0611, 0852, 0955, 0962Dyson S. 0972Dzupa V. 0109
EEbelt H. 0465Eberl M. 0849Eblimit Z. 0229Ebm C. 0627Echarri González G. 0566Echeverri J.E. 0619, 0814Edelson A. 0573Edmond I. 0363Eduard M. 0410Ee S. 0401Eforakopoulou M. 1065Efremov S. 0572Efthimiou E. 1074Egan M. 0621Egerod I. 0668Ego A. 0779Ehrmann S. 0279, 0351, 0573, 0781Ejima M. 0952Ekanayaka A.S. 0215Ekbal N.J. 0959, 0962, 0963Ekemen S. 0218El Rayes M. 0163Eladawy A. 0258Elazizi H. 0352El-Bourini M.S. 0755Elcano J. 0272Elghonemi M.O. 0165Eliasson E. 0034Eliwa M. 1069Elke G. 0737, 0742Ellermann-Eriksen S. 0434Elliot S.C. 0308Elliott S. 0316El-Meteini M. 0303Elvevoll B. 0956Eman K. 0716Embregts N. 0673Emilie N. 0700Emmerson E. 0747Empana J.-P. 0927Endacott R. 0050, 0056, 0423Endo S. 1088Endo T. 0786Engel C. 0015Engström J. 0691, 0867Enguix A. 0238Epiphaniou M. 0923Episkopos C. 0657Epker J.L. 0047Erkasap N. 0218Eronia N. 0338Ertekin B. 0540Escudero G. 1089Escuela Gericó M.P. 0405Eshonkhodjaev O.D. 0155Esparza L. 0042Espinal C. 0014, 0890, 0953Espinosa G. 0851Espinosa González M.C. 0174Estagnasié P. 0547, 0708
Esteban E. 0074, 0244Esteban F. 1095Esteban P. 0393Estébanez B. 0514Estella A. 0361, 0594, 0767Estella Garcı́a A. 0988Estella Garcı́a Á. 0277, 0285, 0365,
0950Estellés D. 0705Estenssoro E. 0663Esteve F. 0544Esteve J. 0412Estévez M.A. 0247, 0457, 0459Eurin M. 0030Evelein-Brugman S. 0045Evrenoglou D. 1085Exposito-Garcia S. 0589
FFabiani J.N. 0190Fabio Silvio Taccone F.S. 0325Fabre X. 0500, 0756Fagnoul D. 0023, 0040Fahmy T. 0506, 0761, 0961Fahmy T.S. 0147Faivre V. 0772Faiz S. 0279Falco M. 0145Fan E. 0885, 1022Fanan J.M.V. 0550Fanelli C. 0297Fanelli V. 0170, 0205Farid S. 1069Fariñas Román O. 0569Farinha F. 1061Farissier F. 0756Farje V. 0648Farouk S. 0258, 0352Farrag M. 0258Farrero E. 0544, 0709Farrugia A. 0301Fassio F. 0083Faverio P. 0210Fawzy I. 0303Fayed A.M. 0755, 1008Fazzini U. 0986Feehan A. 0139Feelisch M. 0852Feijen H. 0916Felipe A. 0074Felipe A.R. 0197, 0834, 1101Felix N.S. 0337Feng J. 0599, 0600Ferar Hafuz A. 0825Ferdynus C. 0771Ferguson A. 0144Ferguson N. 0908Ferguson N.D. 0006, 1022Fergusson D. 0908Ferjani M. 0437, 0699Ferland M.-C. 0692Fernandes M.J. 0250, 0306, 0382,
0387, 0388Fernandez C. 0713Fernandez L. 0093, 0246, 0596Fernandez M. 0290Fernandez R. 0076, 0213, 0350,
0446, 0511, 0681, 0826, 1077Fernández A. 0209, 1089Fernández J. 0249, 0720, 0721Fernández L. 0777Fernández M.J. 0078Fernández P. 0801Fernández S. 0099, 0412, 0851, 1058Fernández de Larrea C. 0412Fernández Fernández R. 0790Fernandez Mondejar E. 0609Fernández Simón I. 0148Fernandez Ugidos P. 0438, 0536Fernandez Zamora M.D. 0543, 0719Fernández-Hinojosa E. 0782Fernández-Jimenez S. 0173, 1031Fernández-López L. 0566Fernández-Mondéjar E.A. 0494Fernández-Ortega P. 0176Fernández-Zamora M.D. 0129,
0287, 0528Ferra C. 0410Ferrand E. 0414, 0421Ferrándiz-Millón C.M. 0032Ferrandiz-Selles M.D. 0064, 0844Ferrão C. 0400, 0402Ferrara G. 0964Ferraresi A. 0091Ferrari D. 0472Ferreira A. 0382Ferreira B. 0406Ferreira P. 0498Ferreira P.R. 0071, 1026Ferreira da Silva M.J. 0172
Ferrer R. 0074, 0274, 0647, 0951, 1082Ferrer Agüero J.M. 0583Ferreres J. 0780Ferreyra M. 0912Ferro B. 0087Fertleman A. 0828Festa R. 0208Festic E. 0900Fielitz J. 0225, 0228Figueiredo P.L. 0576Figueiredo S. 0029, 0796Figueiró M.F. 0567Fildisis G. 0798, 1100Filippini C. 0170Finfer S. 0011, 0520, 0521Fink J. 0714Fiore T. 0999Fischler M. 0414, 0421Fish D. 0911Fish D.N. 0909Fiterau M. 0677, 0914Fitrolaki M.D. 0369Fitzgerald E. 0433Fitzpatrick G. 0531Fivez T. 0644Flannery J. 1022Fleischmann E. 0617Fletcher H. 0921Fletcher S. 0758, 1041Flevari A. 0595Flordelis-Lasierra J.L. 0816Florez J. 0013, 0945Florido Y. 0583Flower O. 0521Fluher J. 0696Flynn M. 0058Fojon Polanco S. 0438Foka M. 0923Fominskiy E. 0572Fonseca L.H.D.O. 1101Fonseca N. 0954Fontaine E. 0549Fontaneda López D. 0432Forel J.-M. 0331, 0346, 0899Forni L.G. 0613Fortes M.L. 0671, 0676Forteza C. 0241Fortner E. 0929Fortounis K. 0418Fortuna S. 0208Fowler R. 0885, 0908, 1022Frager F. 0391Fragkou P. 0606Franchi F. 0082, 0297Franchineau G. 0927Franco J. 0341, 0463, 0560,
0626, 1039Frantzeskaki F. 0112, 0595Frantzeskaki F.G. 0695Fraser I. 0885Frech B. 0631Freddi F. 1076Freire D. 1027Freire Moar D. 0496Freire-Moar D. 1050Freitas M.B.V. 0576Frerichs I. 0742, 0993, 0997,
1001, 1014Freshwater-Turner D. 1093Frey A. 1014Frı́as J.C. 0350, 0790, 1077Friberg H. 0261Fric M. 0109Friedlander R.M. 0022Friedman G. 0117, 0406, 0629,
0945Friedrich J. 1022Friedrich J.O. 1055Friggeri A. 0391, 0874Froio S. 0556Fröjd C. 0867Fruhwald S. 0723, 0729Frutos Sanz M.Á. 0765Fucini G. 0455Fuentealba A. 0013, 0945Fuentes J. 0381Fuentes M.E. 0415, 0416, 0417Fuhrmann V. 1043, 1046Fujii K. 0478Fujita M. 0314Fujita Y. 0319Fujiwara T. 0812, 0818Fukuda S. 0314Fukuda T. 0931Fukuoka T. 0682Fukusaki M. 0291Fukushima T. 0947Fulgencio J.-P. 0414, 0421Fumagalli R. 0070, 0581Fumis R.R.L. 1097, 1099
26th ESICM ANNUAL CONGRESS — PARIS, FRANCE — 5–9 OCTOBER 2013
Furmanova S. 0662Furones Lorente M.J. 0542Furtado-Lima B. 0114, 0120,
0232, 0257, 0302, 0562, 0563,0743
Fyntanidou B. 0418, 0958, 1012Fysh E. 0349Fytrolaki D. 0651
GGabelica R. 0185Gabillo A. 0430Gabra M. 0587, 0924Gado A. 0352Gage W. 0920Gaitan Roman D. 0132, 0133Gaitan-Roman D. 0286, 0535Galarza-Barrachina L. 0064Galas F.R.G. 0576Galbán Rodrı́guez C. 0766Galeiras Vázquez R. 0496Gali P. 0010, 0096Galia F. 0759Galindo M. 0209, 1089Gallagher L. 0980, 1096Gallart E. 0831Gallart M.A. 0831Gallego S. 0061Gallego-Lara S. 0589Galli P. 0472Gallioli G. 0752Galstyan G. 0541Gamaza Chulian S. 0285Gamero-Donis D. 0529Ganau M. 0024Gandı́a Martı́nez F. 0564, 1083Gando S. 0113, 0803, 0930Gandre P. 0739Garcia A. 0241Garcia C.S.N.B. 0557Garcia M. 0938Garcia P. 0814Garcia S. 0511, 0681Garcı́a E. 0415, 0416, 0417Garcı́a F. 0123Garcı́a L. 0705Garcı́a M. 0078Garcı́a X. 0890Garcia Alcantara A. 0283Garcı́a Bautista E. 0490Garcia Bellon A.M. 0132, 0133Garcı́a de Acilu M. 0686Garcı́a de Guadiana L. 0393Garcia de Lorenzo A. 0246Garcı́a de Lorenzo A. 0474Garcı́a Delgado M.J. 0838Garcı́a Fuentes C. 0027, 0795,
1094Garcı́a Garcı́a M. 1083Garcia Martinez M.V. 0555Garcı́a Monge M.J. 0318Garcı́a Olivares P. 0033,
0247, 0251, 0281, 0457,0459, 1092
Garcı́a Sanz E. 0212Garcı́a Simón M. 0221Garcia-Alcantara A. 0226, 0591,
1071, 1075Garcı́a-Alcántara A. 0238Garcia-Bellon A.M. 0537Garcia-de la Torre A. 0226, 0591Garcı́a-de la Torre A. 0238Garcia-Delgado M. 1028Garcı́a-Delgado M. 0836Garcia-Garmendia J.L. 0061, 0589Garcı́a-Laorden M.I. 0583Garcı́a-Monje M.J. 1027Garcia-Paredes T. 0654Garcı́a-Paredes T. 0124, 0129Garcia-Rodriguez D. 0202Garijo Catalina M.Á. 0405Garlanda C. 0985Garnacho-Montero J. 0032, 0782Garot D. 0351, 0781Garrido F.M. 0684Garrouste-Orgeas M. 0002,
0422, 0901, 1040Garzón López S. 0460, 0988Gaskell K. 0794Gasparini L. 0070Gasparovic V. 0929Gatell J.M. 1058Gattinoni L. 0326, 0330, 0556,
0996Gaudry S. 1059Gault N. 0905Gauntlett R. 1053Gauss T. 0030, 0796, 0832Gavalda J. 1064Gavin N. 0748
Gavranovic Z. 0769Gavriilidis G. 0949Gayat E. 0461, 0487, 0772Gazenkampf A. 0242, 0497Gea J. 0348, 0392, 0946Geenen-Rijniers V.E. 0672Gehrisch S. 0104Geisen M. 0627Geka E. 1074Gemelli B. 1076Georger J.F. 0966Georges H. 0001Georgiadis C. 0634Georgopoulos D. 0008, 0106, 0731,
0923Gergaud S. 0445Geri G. 0037, 0927Géri G. 0299Gero Escapa M. 0605Geromarkaki E. 0369, 0651Gerovasili V. 0864Gery P. 0493Ghaith D. 0352Gharsallah H. 0437, 0699Ghigo E. 0170Ghose A. 0824Giakkoupi P. 1066Giani M. 0320Giannakou-Peftoulidou M. 1074Giannella-Neto A. 0570Gibbons F.K. 0227, 0252, 0315,
0661, 0983Gigon F. 0046Gil Cano A. 0080, 0462Gili G. 0951Gilis G. 0902Gil-Navarro M.V. 0032Gilsanz F. 0456Gimbernat R. 0475Gimenez S. 0448Gimeno R. 0044, 1068Giovannucci E. 0983Giraldeau G. 0163Girbes A.R.J. 0255, 0269, 0344,
0666, 0976Girbes A. 0045Girbes A.R. 0266Giri R. 0934Giske C.G. 0034Giunta V. 0680Gladwin M.T. 0599, 0600Glass P. 0011Glynos C. 0105Gödje O. 0083Godoy J. 0298, 0722Godoy M.A. 0534Goecze I. 0616Gokhale R. 0020, 0656, 1048Gokmen D. 1054Gökmen D. 0253, 1056Golder K. 1096Goldgran-Toledano D. 0002, 0901, 1040Goldmann T. 1014Goldoni M. 0986Goll M. 0230Golle A. 0854Gomà G. 0951Gomes R.V. 0197, 0834, 1101Gomes S. 0136, 0576, 1009Gomes da Silva J. 0388Gomez A. 0884Gomez E. 0957Gomez H. 0245, 0873Gomez J. 0831Gomez M.N. 0343Gómez F. 0074Gómez J.M. 0033, 1092Gómez N. 0992Gómez R. 0801Gómez Blizniak A. 0630, 0638Gomez Lopez R. 0438Gómez López R. 0536Gomez-Gallego G. 0635Gomez-Gonzalez C. 0807Gomez-Jimenez F.J. 0654Gómez-Martı́n J. 0124Gommers D. 0693, 0891, 0995Gonçalves A.F. 0394Gondret R. 0966Goñi Imizcoz M. 0605Gonin X. 0575Gonzaga J. 0778, 0788Gonzalez A.L. 0663Gonzalez A. 0619, 0912Gonzalez E. 0534Gonzalez F. 0445Gonzalez M.C. 0808Gonzalez P. 0511, 0681Gonzalez S. 0873González R. 0573
González S. 0249González Fernández C. 0321González Gallego M.A. 0592Gonzalez Gonzalez A.M. 0132, 0133González Higueras E. 0405González Iglesias C. 0474Gonzalez Robledo J. 0200Gonzalez Santos J.M. 0200Gonzalez-Gonzalez A.M. 0537González-Sanz V. 0409González-Vaquero M. 0157Gopcevic A. 0769Goranovic T. 0770Gordon A.C. 0353Gordts B. 0263Gore C. 1030Gornik I. 0929Gornik O. 0929Gorodetskiy V. 0541Goryachev A. 0175Goto K. 0094, 0744Goto T. 0374Gottignies P. 0942Gottin L. 0311Gottschlich B. 0177Götz S. 0839Gould T. 1093Gourgiotis S. 0645Goutorbe P. 0899Goutzourelas N. 0858Gouveia A.C. 0684Gracia M.P. 0044, 0116, 0385, 0492,
0762Gracia Romero M. 0080, 0277,
0365, 0462Graf B.M. 0616Graf J.M. 0188Graf S. 0571Grall K. 0370, 0778, 0788Gramaglia L. 0632Granados Sánchez M. 0694Grandjean J. 0448Granfeldt A. 0612, 1011Granier J.M. 0358, 0359Granton J. 0908Grard B. 0771Grasselli G. 0752Grassi F. 0912Gravenor M.B. 0479Green M. 0658Green R. 0203Green R.S. 0289, 0653Greenwood R. 0928Grelon F. 0445Grieco D.L. 0512Gritsan A. 0242, 0497Gritsan G. 0497Groeger M. 0990Groeneveld A.B.J. 0396Grönlund J. 0444Grosomanidis V. 0418, 0958, 1012Gross E. 0538Gross J. 0191Gross J.L. 0193Grottoli S. 0170Grounds M. 0627Grounds R.M. 0017, 0080, 0462, 0888Gruartmoner G. 0890Grünberger T. 0617Grundlingh J. 0657Grunebaum L. 0234Grüner A. 0787Gruson D. 0503Grychtol B. 0092, 1007Guallar C. 0246, 0596Guan X. 0309, 0639Guaraldi F. 0170Guarracino F. 0087Gudmundsson M. 0332Gudmundsson P. 0628Guell E. 0430Güell R. 0671, 0676Guenther A. 0049Guerin C. 0354Guerin L. 0787, 0819Guérin A.M. 0150Guérin C. 0001, 0007, 0142, 0333,
0998, 1000, 1002, 1003Guérin L. 0883Guerot E. 0003, 0500Guerrero J.E. 0251Guerrero Gómez F. 0765Guerrero Lopez F. 0609Guerrero López F. 0490, 0904Guerrero-López F. 0494, 0907Guervilly C. 0331, 0346Guijo González P. 0988Guilbart M. 0641Guillamat R. 0992Guillame-Bert M. 0677, 0913
Guillon A. 0351, 0781Guimarães D. 0114, 0120, 0232,
0257, 0302, 0562, 0563, 0743Guinot P.G. 0150, 0451, 0827Guisto J. 0371Gulcher S.S. 0256Gulias J.M. 1027Gunshin M. 0931Gupta A. 0260Gupta A.K. 0364Gupta D. 0260Gupta L.K. 0260Gupta R. 0454, 0730Gupta S. 0043, 0435, 0918Gupton S.E. 0704Gurav S. 1078Gurjar M. 0237Gurschi N. 0125Gustad L.T. 0073Gustot T. 0311Gut A.L. 0219, 0390, 0394Gutierrez L. 0241Gutiérrez Martı́n S. 0432Gutierrez Rodriguez R. 0542,
0555, 0799Gutierrez-Pizarraya A. 0032Gutiérrez-Pizarraya A. 0782Gutierrez-Rodriguez R. 0655,
0907, 1028Gutiérrez-Rodriguez R. 0173Gutiérrez-Rodrı́guez R. 0836Gutiérrez-Valencia A. 0782Gutu-Bahov C. 0125Guy J. 0144Guyomarc’h S. 0493
HHa E. 0482Ha S.O. 0399, 0857Haas J. 0336Haas K. 0225, 0228, 0230Haase N. 0012, 0019, 0882Habicher M. 0455, 0943Hachfi W. 0585Haddara W. 0192Hadem J. 0322Hadley J. 0357, 0739Hafez A.Z. 0545Hafner S. 0990Hahn A.-M. 0889Haitsma J. 0096Hajar L.A. 0576Hajjej Z. 0437, 0699Hall A. 0618Hall J.E. 0849Hallbäck M. 0086Haller G. 0026, 0552Haller H. 1018Hällsjö Sander C. 0086Hamada S. 0029, 0030, 0796Hamati J. 0225, 0228Hamdi M. 0961Hamel J.F. 0445, 0886Hamidfar R. 0625, 0989Hamifadar R. 1059Hamilton M. 0568, 0888Hammermüller S. 0336, 0447,
0580, 0792, 1009Hammond N. 0521Hammond N.E. 0011Hamsen U. 0168Hand L. 0006Hankovszky P. 0233Hanlon D. 0903Hansen C. 0872Hansen H.P. 0668Hanssens Y. 0166, 0284Hantson P. 0138Haouache H. 0901, 1040Hapfelmeier A. 0083Haque M. 0146Haraguchi G. 0480Haranath S.P. 0054Harayama N. 0786Hardman J.G. 0146Haren A. 0196Härgestam M. 0797Hargreaves T. 0065Harizopoulou V. 1085Harjola V.-P. 0444Harler U. 0850Harms M.P. 0948Harris T. 0657Harrois A. 0029, 0030, 0796,
0832Hartog C. 0068, 0295, 0465Hartog C.S. 0049, 0419Harunari N. 0967Hasan D. 0693, 0995Hasanin A. 0258, 0352
26th ESICM ANNUAL CONGRESS — PARIS, FRANCE — 5–9 OCTOBER 2013
Hase M. 0323Hasegawa H. 0715Hasegawa K. 0052, 0682Hashiba E. 0614Hashimoto S. 0952Hassan K. 0260Hasselmann M. 0098, 0856Hatice Y. 1056Haugen O. 0956Hayakawa M. 0113, 0360, 0803,
0930Hayes N. 0055Hazama K. 0094Hazarika T. 0637Healy M. 0186Hearn M. 0975Hebbes C. 0969Hedenstierna G. 0332, 0339, 0691,
0984, 0999, 1010Heelas K. 0670Hegazy M.A. 0441Heidenreich M. 1091Heijnen T. 1060Helal A. 0961Heller U. 0262Hellinger W. 0900Hellings J. 0428, 0484Helmi M. 0891Hemmes S.N.T. 0578Henckaerts L. 1060Hendriks B. 0263Hengy B. 0358, 0359Hennis P. 0962Heras-Javierre Á. 0064Herbert S. 1096Herdtle S. 0068Hermon A. 0035, 0925Hermosa C. 0446Hernandez D. 0090, 0340, 0471Hernandez G. 0013, 0511, 0681,
0694, 0945Hernández C. 0099, 0851, 1058Hernández G. 0298Hernandez Carbonell M.T. 0605Hernandez Gancedo C. 0456Hernandez Parada O.A. 0534Hernández Parada Ó.A. 0405Hernández Viera M.A. 0206Hernando A. 0393Hernangómez A.M. 0247, 0251,
0281Hernu R. 0007, 0354Herodes K. 0372Herrán R. 0078Herrán Monge R. 1083Herrera L. 0209, 1089Herrera Gutierrez M. 0703, 0816Herrera-Gutiérrez M.E. 0235, 0236,
0665Herrera-Ramos E. 0583Herrera-Rojas D. 0807Herrero I. 0110Herrero R. 0992Herridge M. 0908, 1022Herridge M.S. 0920Hertz I. 0872Herzog R. 0616Hessels L. 0452, 0917Hett D. 0926Heyland D.K. 0737Hiblot J. 0346Hickey A. 0231Hidalgo S. 0671Hidalgo Martinez F. 0566Higashi M. 0952Hilbert G. 0503Hill L. 0357Hinder S.L. 0479Hinds C.J. 0606Hinds J. 0732Hinojosa Perez R. 0543, 0719Hinojosa-Perez R. 0816Hinojosa-Pérez R. 0833Hinoshita T. 0952Hı́pola Escalada S. 0206, 0211Hirano M. 0715Hirose N. 0715Hirota A.S. 0576Hirota K. 0614Hjortrup P.B. 0019Hochrieser H. 0254, 0443Hoekstra M. 0195, 0452, 0917Hoene R. 0987Hoffmann U. 0101Hofker H.S. 0881Hohenstein C. 0068Holmberg M. 0894Holmes P.J. 0829Holzer P. 0723, 0729Holzinger U. 1046
Hommel K. 0104Hone R. 0433Hong G. 0482Hong J. 0820Hong S.B. 0399Hong S.-B. 0751, 0855Honoré P.M. 0449, 0623, 0650,
0738, 0740, 0815Hoogenberg K. 0518Hoogewerf M. 0344Hoogland I.C.M. 1017Hoorn E.J. 1036Hopkins P.A. 0139, 0670Horakova S. 0539Horcajada J.P. 0583Horn J. 0261, 0440, 0823, 0897, 1017Hornik C.P. 0704Hornsby J. 0510Horowitz M. 0519Hortigüela Martı́n V.A. 1035Hortigüela Martı́n V.A.A. 0921Horvat A. 0769, 1005Horvatits T. 1043Horwell E. 0152Hoshino K. 0561Hoshino Y. 0853Hoste E. 0678, 0811Houissa H. 1063Houlihan T. 0210Hovilehto S. 0880Howie N. 1102Hoyos N. 0245Hraiech S. 0331, 0346Hravnak M. 0022, 0677, 0913, 0914Hu X. 0309Huang A. 0154Huang S. 0639, 0643, 0649Huber W. 0083, 0540, 0631, 0839Hubert V. 0468Huckauf S. 0792Huddart S. 0053Huerta R.C. 0122, 0130Huerta Bravo R.C. 0355Huertas C. 0705Hughes J. 0194Huguet Briva M. 0806Huh J.W. 0751, 0855Hukrauf S. 1009Hulse K. 1024Hultin M. 0797Humet A. 0831Hunt R. 0937Huotari V. 0100Hurtado C. 0705Hurtado F.J. 0960Hurtado Doce A.I. 0318Husain T. 0822, 0828Husby P. 0956Huson M.A. 0440Huss F.R. 0069Hussein M. 0303Hutchings S.D. 0793Huyghens L. 0738, 0740Hvas C.L. 0763Hwang G.-S. 0293, 0817Hwang S. 1055Hyder R. 0158Hylander Møller M. 0305Hynninen M. 0444
IIannuccelli F. 0476Iapichino E. 0724Iapichino G.E. 0330Ibadov R.A. 0155, 0553, 0554Ibañez P. 0241Ichiki R. 0561, 0853Idone F.A. 0512Idris K. 0804Iegorov O. 0107, 0791Ieko M. 0930Iheb L. 0220, 0398Ilia S. 0369, 0651Ilyinskiy M. 0187Imaizumi H. 0094, 0744Imbiscuso A.T. 1064Imen N. 0398Inaba M. 0952Inal V. 0701Ince C. 0013, 0601, 0945, 0964Inkinen O. 0444, 0880Inoue Y. 1088Insausti J. 0409Intas G. 0798Intile D. 0663, 1091Ioannides A. 0923Irastorza N. 1091Irazábal M. 0246, 0596Irigaray O. 1025Irrazabal C. 0407
Irwin K. 0549Isa Y. 0786Isabey D. 0573Ishihara H. 0614Ishii M. 0947Ishii T. 0931Ishikawa J. 0967Ishikura H. 0561, 0853Ismael F. 0452Isotani E. 0935Italiano D. 0903Italiano S. 0448, 0750Ito K. 0812, 0818Itoh R. 0102Ivancan V. 0185Iwakura K. 0478Iwasaki E. 0947Izdes S. 0735, 1029, 1054, 1056İzdeş S. 0253
JJaber S. 0001, 0003, 0759, 1023Jabot J. 0771Jacka M. 0908Jacobs F. 0325Jacobs R. 0449, 0623, 0815Jacobsson M. 0797Jacquet-Lagrèze M. 1013Jaen M. 0361Jaén M. 0767Jaen Franco M. 0460Jaén Franco M. 0277, 0285, 0365Jaffrelot M. 0690Jahaj E. 0389, 0941Jaimes F. 0245, 0873Jain A.A. 0934, 0965Jain R. 0846Jakkinaboina S. 0054, 1080Jakob S.M. 0095, 0728Jakobsen D. 0036Jamali S. 0002, 1040James A. 0056James M. 0962Jamoussi A. 0508Jämsä J. 0100Janeiro D. 0276Janeiro Lumbreras D. 0711Jang D.-M. 0293Jang J.H. 0264, 0273Jang S. 0399Jankowitz B. 0022Janotka M. 0932Janse A. 0726, 0870Janssen H.-G. 0902Janssen N. 1006Japiassu A.M. 0009Jara Rubio R. 0764Jareño A. 0767Jareño Chaumel A. 0988Jarque A. 1091Jarque I. 0409Jarrah R. 0776Jaspe A. 0033, 1092Javierre C. 0544, 0709Jayashree M. 0111, 0118Jayawardene S. 0620Jeger V. 0095Jehlicka P. 0539Jenions L.F. 0972Jenkins R. 0620Jens P. 0177Jeon K. 0128, 0395, 0532Jepson A. 0794Jerez V. 0648Jeromin A. 0903Jespersen B. 0612Jewell W. 0267Jia S. 1019Jimenez F. 0090Jiménez F. 0538Jiménez J.D. 0648Jiménez M.J. 0276Jiménez R. 0209, 0393, 1089Jiménez Bravo A. 0569Jiménez Garcı́a P. 0432Jiménez Martı́n M.J. 0711Jiménez Pérez G. 0593Jiménez Quintana M.D.M. 0431,
0615, 1025Jiménez Ruano B. 0764Jiménez-Garcı́a P. 0157Jiménez-Herrera M.F. 0671, 0676Jimenez-Navarro M. 0127, 0131Jiménez-Pérez G. 0173, 0287, 0528Jimeno R. 0214Jiminez E. 0006Jiroutkova K. 0109Joannidis M. 0850Joby G.V. 0730Jochmans S. 0573
Jog S. 0084, 1078Jõgela K. 0307Johno T. 0097Johnston A.J. 0020Johnston B. 0204Jolliet P. 0513Jonas M. 0294, 0926Jones A. 0469Jones C. 0664Jones J. 0159Jones M. 0294, 0926Jongman R.M. 0453, 0881Jonsson H. 0867Jordá Miñana A. 0221Jordan B.N. 0267Jordan I. 0244Jordán Arias B. 0711Joret A. 0351Jorge V. 0061Jørgensen T.M. 0612Jörres A. 0015Joshi M. 0860Joshi P. 1078Joshi V. 0072, 0108, 0156, 0860Joslin J. 0620Jotterand C. 0119Journois D. 0714Jouve E. 0899Jouvet P. 0450Joya-Montosa C. 0059, 0635, 0887Juffermans N. 0602Juffermans N.P. 0141, 0823Juliá J.A. 0648Jung B. 0899, 1023Jung E.M. 0616Jung Y.S. 0470Junot S. 1013Justyna S. 0329
KKaaki M. 0756Kabasawa M. 0715Kabisch B. 0049, 0068, 0295Kadapatti K. 1078Kado M. 0952Kaiser A.-M. 0045Kaisers U.X. 0447, 0580Kakrani A. 1078Kalaiselvan Murugesan S. 0598Kalakonas A. 0005Kalamitsou S. 0919Kaldis B. 1065Kalem V. 0328, 0329Kalimeris K. 0821Kallergi M. 0105Kallergis G. 1100Kalluri C. 0712, 1053Kaminski T. 0880Kamochi M. 0786Kamohara H. 0097Kamphuis S. 0813Kamphuis T.W. 0976Kamrath D. 0580Kanazawa A. 0786Kander T. 0603Kaneda K. 0314Kaneko N. 0052Kang Y.R. 0395Kanias T. 0599, 0600Kano T. 0507Kanoore Edul V.S. 0964Kappen T.H. 0910Kapus A. 1019Karachalios N. 1052Karadaş D. 0253Karagianni E. 0944Karakitsos D. 0865Karaman M. 0789Karambi S. 0112Karampi E.-S. 0595, 0695Karapetsa M. 0858Karapetyan E.A. 0499Karatzanos E. 0859, 0862Kardara A. 0864Karjagin J. 0372Karlsson S. 0810, 0880Karystinaki F. 0105Kastelijn J. 0902Katinakis P.A. 0813Katiyar S. 0158Katostaras T. 0798Katsiari M. 1066, 1073Katsifa K. 0280Katsilaki E.C. 1052Katsoulas T. 0798Kattan E. 0013, 0945Kaufmann J. 1018Kaukonen K.-M. 0016, 0018, 0520,
0604, 0880Kaukonen M. 0031
26th ESICM ANNUAL CONGRESS — PARIS, FRANCE — 5–9 OCTOBER 2013
Kaushal A. 0043, 0918Kavanagh B.P. 0136Kawamae K. 0507, 0687Kawamura Y. 0314, 0967Kawano Y. 0561, 0853Kawanoue N. 0947Kay I. 0349Kaymak C. 1054, 1056Kaymak Ç. 0253Kazuma S. 0744Ke L. 0309, 1016Kechagias S. 0404Keenan S. 0908Keens K. 0700Keep S. 0662Keizer S.J. 0976Keller A.K. 0612Kellum J. 0015Kennedy C.E. 0188Kennedy D. 0568Kennedy N. 0521Keough E. 0457, 0459Kern H.R. 0372Kessaris A. 1085Khaled M. 0258Khallel H. 1040Khan J. 0846Kharbanda M. 0312Khattar L. 0774Khedher A. 0585Khera J. 0926Khera J.K. 0294Khomenko O. 0198Khoury A. 0689Khoury M. 0912Khudaybergenov S.N. 0155Kidney E. 0055Kienast S. 0322Kilgour P.M. 1035Kim H. 0820Kim H.M. 0470Kim J.H. 0149, 0586Kim J. 0038Kim K.S. 0470Kim K. 0038Kim S.W. 0551Kim S.H. 0265Kim S.-K. 0817Kim-Shapiro D.B. 0599, 0600Kingma W.P. 0256Kingston D. 0020Kingston H.E. 0065Kinoshita Y. 0097Kinross J. 0353Kinsella J. 0413, 1024, 1051Kiourtzieva E. 0754Kipper K. 0372Kirk-Bayley J. 0053Kirkby V. 0971Kirkman E. 0793Kirwan C.J. 0178, 0186, 0613Kiselev V. 0187Kiser T. 0727, 0911Kiser T.H. 0909Kito H. 0715Kitsuta Y. 0931Kızılca O. 0062Kjærgaard A.G. 0848Klamburg J. 0410Kleber C. 0225, 0228Klein H.G. 0599, 0600Klein I. 0905Klingel M. 0192Klop E. 0726, 0870Klouche K. 0621Kluge S. 0160, 0322Kmonicek P. 0539Knausberg U. 0987Knibel M. 0406Knuefermann P. 0875Kobayashi H. 0947Kobayashi T. 0935Kobelt S. 0792Koborzan-Popoviciu M. 0805Kodra N. 0843Kogan A. 0179Koh Y. 0751, 0855Kohlrausch A. 0467Koifman L. 1038Kojika M. 1088Kokkoris S. 0516, 0866, 0923Kolammunage-Dona R. 1047Kolic I. 0178Kolk A. 0902Kolyviras A. 0942Kompanje E.J.O. 0047Komurcu O. 0710Kondili E. 0008, 0106, 0731, 0923Kondratyev A. 0169Kongsayreepong S. 0181
Konishi Y. 0102Konkayev A. 0802Konosic S. 0185Konrad F. 0991Konrad F.M. 0987Konstantonis D. 0126Kontakiotis T. 0505Kontos A. 1074Koo S.J. 0229Koopman M. 0602Kopriva K. 0539Kopterides P. 0105, 0112, 0126Korhonen A.-M. 0016, 0018, 0810,
0880Korpi K. 0444Kortgen A. 0295Koskenkari J. 0810Kosta N. 0798Kostakou E. 0949Kostopanagiotiou G. 0821Kotanidou A. 0105, 0389, 0859, 0941Kotarridi C. 0695Kotco E. 0005, 0754Kothari M. 0084Kott M. 0742, 0993Kotzampassi K. 0958, 1012Kouatchet A. 0001, 0003Koulenti D. 0031Kouliatsis G.A. 0436Koulouris N. 0949Kouretas D. 0858Kourti E. 0105Kourti M. 1100Koutsogiannidis C.P. 0718Koutsoukou A. 0949Kouvarakos A. 0864, 0865Kovač J. 1005Kovacs N. 0839Kovari F. 0637Kovensky J. 1015Krag M. 0305Krajcova A. 0109Krebs M. 0224, 0225, 0228, 0230Kreder S. 0522Kremer H. 0098Krikke C. 0881Kristoferzon M.-L. 0270Kristofferzon M.-L. 0039Krog J. 0848Krolo H. 1005Krotsetis S. 0733Kruger A. 0539, 0932Krüger T. 0575Krylov V.V. 0499Ksibi H. 0420Kuhlmann M.K. 0015Kuhs O. 0168Kuitunen A. 0079Kumar S. 0845Kuo R. 0706Kuriakose D. 0633Kurihara K. 0687Kuriyama A. 0682Kushimo O.T. 0660Kuslapuu M. 0307Kwon J. 0820Kwon S.J. 0586Kwon W.Y. 0470Kwon Y.O. 0974Kye Y.C. 0470Kypri L. 0866Kyprianou T.C. 0516, 0866, 0923Kyriakides E. 0516Kyriakidou E. 0739Kyriazopoulos G. 0634
LLa Bella D. 0558Labakis M. 0280, 0282, 0659, 0667Labakis S. 0659, 0667Labbe V. 0500Labben I. 0699Labeit S. 0225, 0228Laccourreye L. 0886L’Acqua C. 0326Laerkner E. 0668Lafuente E. 0250, 0388, 0306Lafuente E.M. 0382, 0387Lagergren T. 0772Lages A. 0172Lagrand W.K. 0334Lagrange A. 0714Laha S. 0161Lahmer T. 0540, 0631Laitio R. 0444Laitio T. 0444Lakhal K. 0028, 0279Lakshmanan S. 0479Lal R. 0527Laluque C. 0503
Lam M.F. 0384Lambermont B. 0143, 0898, 1006Lambert D. 0001Lamer C. 0407Lamontagne F. 1022Lane K. 0017Lang S. 0101Langer T. 0540, 0556Langhans C. 0225, 0228Langrish C.J. 0734Langwieser N. 0083Lanza F. 0234Lapa T. 1026Lapa e Silva J.R. 0411Lara Rosales R. 0494Laranjeira L.N. 0567Laratta M. 0070Larrarte C. 0814Larrosa M.N. 1064Larryverri J. 0713Larson W. 0778, 0788Larsson A. 0086, 0339, 0691, 0867,
0984Larsson I.-M. 0039, 0270Laru-Sompa R. 0880Lascar F. 0912Laserna E. 0210Laspiti I. 0280, 0282, 0659, 0667Laterre P.-F. 0138Latham S. 0658Lathyris D. 0404Latronico N. 0472Latry P. 0028Lauc G. 0929Laurie R. 1093Lautenschläger I. 1014Lavelle J. 0911Lavelle J.C. 0909Lavenne F. 0333, 0998, 1000, 1002,
1003Laver K. 0824Lawrence P. 0925Lawton T. 0758, 1041Lazowski T. 0646Lazzerini M. 0556Le Dorze M. 0491Le Floch S. 0690Le Maho A.-L. 0183Le Tulzo Y. 0445Lea T.J. 0861Leache I. 0946Leal-Noval S.R. 0782Leasa D. 0885Lebouvier T. 0343Lebron J.M. 0123Lebrón Gallardo M. 0624, 0765Leco S. 0090, 0340, 0471Leden P. 0377Leditschke I.A. 0658Ledoux D. 0898Lee C.M. 1022Lee H. 0820, 0841, 0842Lee H.B. 0588Lee H.-K. 0841, 0842Lee J.H. 0532, 0551, 0704Lee K. 0855Lee P.R. 0401Lee S.J. 0551Lee S.E. 0470Lee Y.C.G. 0349Lee-Sarwar K.A. 0252, 0983Lefebvre J.C. 0571Lefort Y. 1067Lefrant J.Y. 0607Lefrant J.-Y. 0899Legall A. 0461Legay F. 0445Legrand M. 0190Legras A. 0351, 0781Legriel S. 0003Lehericey P. 0966Lehner G.F. 0850Lehot J.-J. 0007Lei Q. 0309Leitch A. 0613Leite Vieira Costa E. 0576Leiva V. 1091Lejus C. 0290Lellouche F. 0137, 0574, 0692, 0830Leme A.C. 0576Lemos A. 0954Lencastre L. 0172Lenzi T. 0669León Y. 0410León Jiménez J. 0285Leon Lopez R. 0502Leon Yoshido H. 0573Leonardi A. 0724Leong T. 0524Leoz A. 1091
Lepape A. 0007, 0354, 0391, 0874Lepe J.A. 0032Lepiorz D. 0101Lerma E. 0583Letsiou E. 0105Letson H.L. 1011Leung G. 1022Leung N.Y.Y. 0384Leuvenink H.G.D. 0881Levasseur M. 1022Levin P.D. 1062Levrard M. 0464, 0468Lewejohann J.-C. 0733L’Her E. 0137, 0509, 0690, 0692,
0830Lhommet C. 0351Li W. 1016Li X. 0639, 0643, 0649Li Bassi G. 0093, 0483, 0680, 0777Librande M. 0521Licata F. 0876Lignos M. 0695Ligtenberg B.A.B. 0060Ligtenberg J.J.M. 0060, 0201, 0453Ligtenberg J. 0948Li-Hua C. 0526Liles C. 0010, 0096Lim C.-M. 0751, 0855Lim T.K. 0401Lim Y.S. 0264, 0273Lima A. 0891Lima A.P. 0114, 0120, 0232, 0257,
0302, 0562, 0563, 0743Lima F.B. 0684Lima R. 0406Linares-Buitrago D. 0489Lind R. 0048Linda S. 0408Lindholm C. 1010Lipman J. 0031Lipperheide Vallhonrat I. 0148Lisboa T.C. 0117Lissoni A. 0556Litonjua A.A. 0983Liu B. 0011Liu L. 1037Livingston R. 0869Llanos J.L. 0298, 0722Llaurado M. 0671, 0676Llauradó M. 0426, 0768Llinares P. 0647Llopis P. 0705Lluch Candal C. 0274Lo V. 1022Lobo A. 0676Lobo G. 0110Lobo S. 0406Lobo Valbuena B. 0148, 0212Lochy S. 0815Lodka D. 0225, 0228Lodyga M. 1019Lofty A. 0258, 0352Loh M.L. 0401Loh M.W. 0154Loizou L. 0516Lolo M. 0831Lombrano M. 0965Lomivorotov V. 0572Londoño J. 0245Long S. 0171Longhini F. 0504, 0685, 0986Longrois D. 0451Lopez A. 0960Lopez J. 0596López Á. 0648López A. 0671, 0676López J.M. 1027López P. 0249, 0426, 0768, 0877López Álvarez J.M. 0569Lopez Caler C. 0836López Curbeira Y. 0496Lopez Delgado J.C. 0544, 0806López Matamala M.B. 0514Lopez Pueyo M.J. 0429López Pueyo M.J. 1083López Sánchez M. 0321López-Aguilar J. 0343, 0992López-Caler C. 0836, 0837, 1028López-Cortes L. 0782López-Delgado J.C. 0709López-Granados E. 0583López-Pueyo M.J. 0078López-Rodrı́guez M. 0583Lopez-Tofiño A. 0456Lorenzo Lage M. 0536Lorenzo-de-la-Peña L. 0816Lorne E. 0464, 1015Louart B. 0607Loudet C. 0663Loudet C.I. 0475
26th ESICM ANNUAL CONGRESS — PARIS, FRANCE — 5–9 OCTOBER 2013
Louvet L. 1015Lovas A. 0239Lozano F. 0099Lozano-Moreno B.B. 0495Lozano-Saez R. 0235, 0236, 0703Lübbe-Vazquez F. 0366Lucchetta L. 0984Lucchiari M. 0170Lucero P. 0912Lucinda L.M.F. 0342Luckraz H. 0479, 0934, 0965Luengo C. 0013, 0298, 0722, 0945Luf F. 0617Lugagne N. 1067Lugosi M. 0408, 0625, 0989Lui M.M.S. 0384Lukaszewicz A.-C. 0772Lukk D. 1048Luna C. 0210Lund V. 0810Lupieri E. 0652Luque N. 0093, 0483, 0680, 0777Luther-Schroeder A. 0228Luyt C.E. 1059Luyt C.-E. 0327Lyazidi A. 0358, 0359, 0571, 0577,
0579Lynch M. 0433
MMacarthur K. 0356Maccari J. 0757Macdonald J. 0231Machado F. 0397Machado F.R. 0968Macı́as S. 1083Macias-Guarasa I. 0176Macken L. 0521Mackovskij I. 0175MacLaren R. 0909, 0911Maclaren R. 0727MacNaughton P. 0937MacPhee I.A.M. 0017Madadaki K. 0487, 0461Madder H. 0167Madrigal-Garcia M.I. 0193Maekawa K. 0323Magalhães L. 1033Magalhães-Júnior A.P. 0114, 0120,
0232, 0257, 0302, 0562, 0563, 0743Magdaleno G. 0090, 0471Magdaleno Lara G.A. 0340Magdy R. 0258Mageira E. 0103Maggiore S.M. 0512Magistretti P.J. 0442Magni S. 0752Magnin C. 0007, 0354Magret M. 0348Maguina A. 1066, 1073Mahadevaiah A.H. 1090Maher L. 0863Mahjoub Y. 0464, 0468Mahroof R. 0020, 0656, 1048Mai K. 0224Maia M.O. 0684Mainardi J.L. 0190Mair S. 0540, 0631, 0839Mäkinen O. 0981Makrygiannis S. 0282, 0659, 0667Makrygiannis S.S. 0280Malacrida R. 0724Malanjum L.S. 0969Malaquin S. 0464, 1015Malbrain M. 0263Malcus C. 0874Malinverni S. 0942Malkoski S. 0911Malkoski S.P. 0909Malleike J. 0230Mallick R. 0908Mallolas J. 1058Mallor F. 0042Malmstrom M.F. 0284Mañas Vera M.R. 0838Manca T. 0597Mancebo J. 0448, 0577, 0750Mancin V.G.L. 0140, 0582Mandersloot G. 0739Manez R. 0544, 1081Manganaro E. 0977Maniatis N.A. 0105, 0941Mankikian J. 0351Manneh F. 0828Manolakopoulos S. 0389Mansurov Z.N. 0553Mantz J. 0772Manzanedo R. 0538Manzanera J. 0028, 0621Manzano Manzano F. 0431, 0615, 1025
Maraffi T. 0448, 0750Marchena C. 0663Marchena M.C. 0475Marchenkova L. 0187Marco Schulke C. 1035Marcolin R. 0338Marcos P.J. 0210Marcos P. 0409, 0410Marechal X. 0957Margariti A. 0280, 0282, 0659, 0667Marian-Crespo C. 0529Mariani M.A. 0453Maridakis E. 0731Marienne J.P. 0150Marik P. 0602Marimon M.M. 0117Marı́n J. 0392Marı́n Mateos H. 0027, 1094Marin Salazar J.J. 0200Marin-Corral J. 0348, 0946Mariné J. 0671, 0676Marini M. 0472Marino A. 0996Marino R. 0472Mariño G. 0721Mariotte E. 0905Marjanovic N. 0690Markaki V. 0864, 0865Markert M.L. 0704Markota A. 0271, 0696, 0854Marois C. 0775Maron-Gutierrez T. 0096Maroto F. 0061Maroto-Monserrat F. 0589Marques A. 0071, 0498, 1026Marques L. 0117Marquez-Vácaro J.A. 0032Marsh B. 0196Marshall G. 0186Marshall J.C. 1019, 1022Marsili S. 0208Martarello R. 0689Marti Y.N. 0968Martı́ J.D. 0093, 0483, 0680, 0777Martin C. 0031Martin H. 0162Martin J. 0830Martin M. 0279Martin O. 0007, 0354Martin P.-Y. 0379Martı́n C. 0514Martı́n Benitez J.C. 0367Martina D. 0177Martinac M. 0770Martı́n-Dal Gesso C. 0529Martinelli G. 0965Martinez M.A. 0884Martinez M.D. 0537Martinez M.L. 0890Martı́nez J.A. 1058Martı́nez L. 0676Martı́nez M. 0099Martı́nez P. 0648Martinez Arco M.A. 0630Martı́nez Arcos M.A. 0638Martinez Gonzalez M.C. 0635Martı́nez González O. 0514Martı́nez Melgar J.L. 0766Martı́nez Peña L.C. 0615Martı́nez Ruiz R. 0212Martı́nez Ruiz S. 1025Martı́nez Sagasti F. 0592Martı́nez Sanz N. 0148, 0212Martinez-Gonzalez M.C. 0059, 0887Martinez-Lopez P. 1071Martı́nez-Lozano F. 0110Martin-Gallego A. 1031Martini S. 0145Martin-Loeches I. 0210, 0902Martins A.B. 0978Martins M. 0114, 0232, 0562, 0563, 0743Martins P.S. 1097Martins W.A. 0197, 0834, 1101Martin-Sanchez E. 0366Martola J. 0444Marty A. 1059Marvaki A. 0941Marx G. 0015Marx S. 0827Mas V. 0583Masai T. 0478Mascia L. 0170, 0205Masclans J.R. 0686Maseda E. 0456, 0647Masevicius F.D. 0808Masip J. 0890Maskin L.P. 0584Masseret E. 0781Masterson G. 0618Mastora Z. 0941
Mastromauro I. 0170Masuda T. 0935Masuda Y. 0094, 0744Mata M. 0780Matallana D. 0884Matallana Zapata D.F. 0630, 0638Matallo J. 0990Matamis D. 0005, 0754Matcovschi S. 0125Mateo D. 0202Mates M. 0539Mateu-Campos M.L. 0064Mathoulin S. 0824Mathur S. 0920, 1022Matos M.A.D. 0834Matsota P. 0821Matsubara T. 0931Matsuda N. 0102, 0952Matsumaru N. 0240Matsumoto J. 0967Matsumoto S. 0291Matsushima S. 0952Matsushita S. 0507Matte A.L. 1022Mattens S. 0738, 0740Mattos M.A.D. 0197, 1101Matumoto N. 1088Mauel R. 0650Mauri T. 0338, 0652, 0985Maurizio C. 0080, 0462Maury C. 0335Mauws N. 0678Mawdsley C. 0885Mayaux J. 0003, 1059Mayevsky A. 0959, 0963Mayssa D. 0220Mazar M. 0185Mazoit X. 0832Mazzeo A.T. 0170Mc Guinness S. 0501McAndrew P. 0747Mcauley D. 0450McCairn A.J. 0664McCanny P. 0633McCarthy E.A. 0704McGovern M.E. 0433McGrath B. 0151, 0161McGrath B.A. 0153, 0783McKane C.K. 0223, 0315, 0661McKechnie S. 0152McLeod S. 0192McNeill G. 1042McNeill L. 0144Mcwilliams D. 0895Mcwilliams D.J. 0481, 0861Meade M. 0908Meade M.O. 0006Meadows C.I. 0063Mebazaa A. 0461, 0487Mebrate Y. 0088Medina Maldonado F. 0605Meert A.-P. 0003Megahed M.M. 0753, 0755Megarbane B. 0445Meggison H. 1022Mehl A. 0073Mehta C. 0994Mehta S. 0908, 1022Mehta Y. 0730, 0994Mei S. 0096Meidert A.S. 0083Meier-Hellmann A. 0015Meislin H. 0371Melgarejo A. 1089Melis V. 0330Melo D.R. 0697Mendez J. 0430Mendiguren A. 0241Mendonça-Neto F.E. 0114, 0120,
0232, 0257, 0302, 0562, 0563, 0743Mendoza J. 0090Meneses C. 0341, 0463, 1039Menga F. 0556, 0996Mengozzi G. 0170Mensa J. 1058Mentec H. 1098Meraglia A. 0479Mercat A. 0003, 0886Mercier E. 0351, 0781Merino P. 0078Merino Garcı́a P. 1083Merlani P. 0046Mermigkis D. 0280Mersmann S. 0575Mert O. 0701Mesejo A. 0110Mesotten D. 0644Mesquida J. 0890Messaoudi A. 0699Messer M. 0540, 0631
Messina A. 0504Metaxa V. 0202Metnitz B. 0254, 0443Metnitz P. 0254, 0443Metreveli I. 0610Metschke M. 0160Metsvaht T. 0372Meuli R. 0442Mey M. 0831Meyer J. 0138Meyer R. 0316Mezger V. 0455Meziani F. 0001, 0003, 0098,
0183, 0234, 0445, 0856Michail V. 0941Michelidou S. 1085Micol J.B. 1059Miguel S. 0276Mijzen E.J. 0917Mikane T. 0947Mikaszewska-Sokolewicz M.A. 0646Milan Z. 0770Milara-Ibáñez C. 0782Milena L.B. 0968Milesi M. 0330Milicic D. 0929Militão J.H. 0114, 0120, 0232,
0257, 0302, 0562, 0563, 0743Millan P. 0246, 0596Millar J. 0345Millar M. 0357Millet I. 0335Mima H. 0085Mineo G. 0933Minet C. 0500, 0625, 0989Minicucci M.F. 0219, 0390, 0394Mininno N. 0601Mira J.P. 0445Mira J.-P. 0927Mirabella L. 0558Miranda F. 0834Miranda F.F. 0197Misset B. 0640Mitaka C. 0480Mitchell I. 0658Mitsiou G. 0859, 0862, 0864Miura H. 0533Miyamoto D. 0803, 0930Miyasho T. 0374Miyauchi T. 0314Miyerbekov Y. 1079Miziara Pagni A. 0685Mizugaki A. 0930Mizunuma M. 0561Mjekaj E. 0843Modesto i Alapont V. 0221Mogensen K.M. 0223, 0315Mogk M. 0065Mohamed Anis L. 0222Mohammed F. 0479Mohammed Z.A. 1080Mohan Maharaj T. 0054Mohseni M. 0396Mokhtar S. 0147, 0506, 0761, 0961Molchanov I.V. 0121Møldrup U. 0612Molema G. 0453Molina D. 0912Molina F. 0954Molina S. 0671Molina Collado Z. 0027, 1094Molina-Diaz H. 0059, 0635Møller H.J. 0848Møller M.H. 0019Molnar T. 1093Molnar Z. 0233, 0239Momose N. 0507Monaldi V. 0601Monares E. 0341, 0463, 0560, 0626, 1039Mondello S. 0903Mondragon T. 0090, 0471Mondragon Labelle T.O. 0340Mongardon N. 0500, 0927, 1059Monge Garcia M.I. 0462, 0080Monge Garcı́a M.I. 0984Mongelli P. 0082Monkhouse A. 0167Monleón Salvado D. 0221Monneret G. 0391, 0874Monnet X. 0787, 0819, 0883Monsalve M.S. 0362Monsalve Alvarez de Cienfuegos
M.S. 0609Monsalve Álvarez de Cienfuegos
M. 0490, 0904Mont A. 0831Montaigne D. 0957Monteban H. 0517Monte-Coelho Neto H. 0114, 0120,
0232, 0257, 0302, 0562, 0563, 0743
26th ESICM ANNUAL CONGRESS — PARIS, FRANCE — 5–9 OCTOBER 2013
Montefiore A. 0966Montejo J.C. 0110, 0474Montejo González J.C. 0027, 0795,
1094Montero M. 0583Montero Mendizabal R. 0605Montesinos N. 0676Monti F. 0024Monti G. 0070Monti M. 0330Montini L. 0208, 0512Montravers P. 0031, 0300, 1063Monzon D. 0412Moody A. 1022Moonesinghe S.R. 0510Moore J. 0161Mootien Y. 0234Mora Ordoñez J.M. 0543, 0593, 1070Mora Ordóñez J.M. 0624Moradillo González S. 1083Moradillo Renuncio N. 0605Moraes L. 0557, 0559Moraes R.B. 0117Morales A. 0333, 0998, 1000, 1002,
1003Morales M.M. 0557Morales Sorribas E. 0367Morales Tatay J.M. 0221Mora-Ordoñez J. 0059, 0887Mora-Ordóñez J. 0655Mora-Ordóñez J.M. 0278, 0528Morata L. 1058Moreira H.P. 0114, 0120, 0232, 0257,
0302, 0562, 0563, 0743Moreira J. 0663Moreira N. 0071Morena A. 1091Moreno L. 0814Moreno M. 0090, 0471Moreno M.A. 0340Moreno R. 0443, 0476Moreno R.P. 0254, 0477Moreno S. 0209, 0393, 1089Moreno Calvo V. 0460Moreno Lopez E. 0766Moreno Torres D. 1083Moreno-Gonzalez G. 0805, 0806Moreno-Martı́nez P. 0782Moreno-Quintana J. 0836, 0837Morgades M. 0410Morgan M.P. 0849Morgan P. 0162, 0216, 0217, 0698Morgan T. 0194Mörgeli R. 0230Morichau-Beauchant T. 0037, 0299Morimont P. 0143, 1006Morimura N. 0967Morman D. 0622Moromizato T. 0223, 0227, 0315, 0983Morón Saen A. 0569Moro-Sibilot D. 0408Morri D. 1076Morrison D. 0413, 1024Mortaza S. 0003Mortensen E.M. 0210Moseinco M. 0808Moser J. 0453Moses A.E. 1062Mosharaf A. 0846Mosier J. 0371Moss P. 0345Mostafa H. 0258, 0352Moubarak M. 0827Moullet C. 0119Moura E.B. 0684Mourad N. 0222Mourelo Fariña M. 0496Mourelo-Fariña M. 1050Mouri S. 0775Mourtzikou A. 0695Mourvillier B. 0901, 0905Mousdale S. 0383Moussa M. 0899Mozos A. 1050Mrevlje Z. 0313Muchoki N. 0159Mudarra Reche C. 0027Muders T. 0336Mueller S. 0911Mueller S.W. 0909, 0727Muenster S. 0875Muhl E. 0733Mühlbacher J. 0617Muir D. 0971Mukhopadhyay A. 0401Mukhtar A. 0258, 0303, 0352Mulder M.R. 0517Mulder P. 0957Muller L. 0607Muller M. 0602
Müller R.G. 0882Muñiz D. 0241Muñiz J. 0438Muñoz L. 0093, 0276Muñoz M. 0076, 0213, 1077Muñoz Bono J. 0182Muñoz Méndez L. 0711Muñoz-Bono J. 0129, 0278, 0287,
0528, 1031Muñoz-López A. 0173, 0655, 1031Munzer B. 0778, 0788Murai A. 0561Muratgia M. 0717Murayama H. 0715Murcia J. 0209, 1089Muriel A. 0078Muriel Bombı́n A. 1083Murillo Martin A.R. 0534Murillo Martı́n Á. 0405Murray L. 0972Musi A. 0827Mustapha F. 0220, 0222, 0398Mutagirov V. 1079Muthuswamy M.B. 0259Mutti A. 0986Muttini S. 0752Muzzi L. 0297Myburgh J. 0011Myer A. 0698Myers A. 0216, 0217Myrianthefs P. 0645Myrou A. 1074Mythen M. 0962
NNa M. 0586Naber C.K. 0439Nachum E. 0179Naço M. 0843Nagaraja S. 0051Nagata K. 0786Nagel F.M. 0117Nair P. 0915Nakagawa T.A. 0776Nakahara T. 0314Nakajima S. 0931Nakamura K. 0967Nakamura M. 0786Nakamura Y. 0853Nakane M. 0507, 0687Nakashima K. 1072Nakopoulou D. 0949Nalapko Y. 0107, 0590, 0791Nallasamy K. 0118Nanas S. 0103, 0516, 0859, 0864, 0862,
0865, 0923, 0941Nandabalan P. 0191Naranje K. 0527Narbona S. 0213, 0826Narimatsu E. 0323Nasri M. 0437, 0699Natalini D. 0512Natanson C. 0599, 0600Nau A. 0899Navalesi P. 0504, 0685, 0986Navarra P. 0208Navarrete-Navarro P. 0494Navarro J.L. 0298, 0722Navarro N.C. 0808Navarro V. 0775Navas A. 0951Nazarov R. 0169Nechaeva A. 0175Nee A.E. 1047Neeman T. 0658Nehls F. 0230Neiva C.M. 0784Nekrylov A. 0791Nemeth M. 0233, 0239Nepomniashchikh V. 0572Nestler C. 0447, 0580Netto J.J. 0406Neuschwander A. 0299, 0714Neuzil P. 0539, 0932Neviere R. 0957Newby L. 0231Neyran B. 0333, 0998, 1000, 1002,
1003Ng W.Y. 0401Ngamsri K.C. 0987Ngamsri K.-C. 0991Nguyen D. 0738Nguyen Q.-T. 0137Nguyen T. 0229Nguyen Y.-L. 0037Ni H. 1016Ni Mhuircheartaigh R. 0196Nicholas O. 0424Nicolás J.M. 0099, 0412, 0851, 1058Nicolet L. 0445
Nicolini F. 0597Nielsson M.S. 0434Nierhaus A. 0322Nieszkowska A. 0327Nieto M. 0713Nieto P. 0648Nieto V. 0538Nieto Cabrera M. 0592Nieuwendijk R. 0263Nihei S. 0786Niimori D. 0097Niiranen J. 0444Nijsten M. 1036Nijsten M.W. 0195, 0452, 0518,
0525, 0917Nikhilesh J. 0072, 0108, 0156, 0860Nikitas N. 0105, 0112, 0695Nikolopoulos G. 0126Nilsson K. 0872Niño C.D. 0245Niquille M. 0358, 0359Nisula S. 0016Nitikaroon P. 0181Nocci M. 0082Nogales Martı́n L. 0564Nogueira L. 0250, 0387, 0388Nogueira P.M.D.M. 0834Nogueira P.M.M. 0197, 1101Nogueras S. 0938Nogueras Guijarro S. 0490, 0609, 0904Nolan J. 0928Nolan J.P. 0368Nolan K. 0824Nolla J. 0116Nollet F. 0897Nomikos T. 0821Noreikat K. 0336, 0792Nørgaard M. 0434Normilio-Silva K. 0567Norris G. 0906Norström E. 0603Nortvedt P. 0048Nouris C. 0958, 1012Novak D.J. 0316Novoa C. 0720Novotni D. 0138Ntouba A. 0641Ntoumenopoulos G. 0483, 0777Nukarinen E. 0444Numaguchi A. 0952Nunes S.P. 1061Nurkkala M. 1010Nuvials X. 0044, 0214, 1068Nys M. 0898
OOba M. 0715Obayah G. 0303Obster R. 0916O’Callaghan D.J.P. 0734Ocampo J. 0538Ocampo Perez J. 0077Occhionero A. 0208O’Connor M. 0050Oda S. 0687Oda Y. 0314Oddo M. 0164, 0261, 0442O’Dwyer M.J. 0606Offer J. 1042Ogura S. 0240Ohashi N. 0931Ohbayashi M. 0952Ohlin H. 0628Ohnuma T. 0812, 0818Ohri I. 0843Ohuoba E.I. 0660Ohya H. 0561Ois A. 0492Oishi K. 1072Oishi Y. 0947Ojados A. 0209, 0393, 1089Ojukwu N. 0159, 0846Okada M. 0291, 0687Okamoto H. 0682Okasha A.S. 0753Okawa H. 0614O’Kelly P. 0058Oku S. 0947Okuno H. 0683Okurzati P. 0475Olaechea P. 0044, 0214, 0429, 1068Olafson K. 0908Olaniyi P. 0849Olasveengen T.M. 0036Olbricht C. 0225, 0230Oldenbeuving A.W. 0672Oldner A. 0086Olea Jimenez V. 0182, 0719Olea Jiménez V. 0593, 0624, 0765,
0887, 1070
Olea-Jiménez V. 0278O’Leary R.A. 0196Oliva I. 0392, 0946Olivares-Durán E.M. 0495Oliveira D.C. 0978Oliveira J.C.A. 0342Oliveira P. 1033Oliveira R. 0757Olivera E. 0831Olivieri C. 0504, 0685Olkkola K. 0444Ollivier-Coutant M. 0509Oloktsidou E. 0958, 1012Oloktsidou I. 1074Olona M. 1095Oltra R. 0122, 0130Olusoji O.O. 0660O’Mahony R. 0633Omar A.S. 0441O’Meara M. 1042Ondoy R. 0378O’Neil E. 0741O’Neill E. 0747Ono Y. 0803, 0930Onodera C. 1088Onodera Y. 0507, 0687Onsiong S. 0401Opsomer T. 0740Orabona M. 1067Orathi S. 0712Orbegozo Cortes D. 0892Orçun Kaptanağası A. 0847Orden Martinez B. 0212Orellana R.A. 0229Orenbuch-Harroch E. 1062Orfanos S.E. 0105, 0112, 0389, 0941Orford N. 0520Orkisz M. 0333, 0998, 1000, 1002,
1003Orr K. 0144Ortega J.A. 0123Ortega Montes A. 0766Ortega Munoz D. 0333, 0998,
1002, 1003Ortega Zarza P. 0936Ortega-Munoz J. 1000Ortı́n A. 0209, 0393, 1089Ortı́z M.M. 0209, 0393Ortiz Leyba C. 0474Ortiz-Leyba C. 0032Oselin K. 0372Oshorov A. 0175Osis S.L. 0978Osis S.P. 0978Osman H. 0345Ospina Tascon G.A. 0694Ospina-Tascon G. 0945Ossa Echeverri S. 0605Ostadal P. 0539, 0932Ostermann M. 0469Østraat E.Ø. 0612Osuna A. 0615Osztroluczki A. 0233, 0239Otahal M. 0377Otal J.J. 0214, 1068Otero P. 0548, 0720, 0877Othman K. 0545, 0893Otomo Y. 1072Otsuka Y. 0683Oude Lansink A. 0452, 0917, 1036Ourailoglou V. 0418, 0958, 1012Outin H. 1098Ouyang B. 0309Oveges N. 0233Overend J. 0383Øvrebø K. 0956Owen T. 0700Özkurt M. 0218
PPaalanen K. 0981Pachón-Ibáñez M.E. 0782Pachot A. 0391Paddle J. 0267Paddle J.J. 0549, 0809Padrón Mujica A. 0211Page D. 0493Pagnamenta A. 0724Paintaud G. 0781Pairumani R. 0013Pais Almozara A. 0766Paiva J.A. 0640Paiva J.-A. 0025Paiva S.A.R. 0219, 0390, 0394Pajot O. 1098Pak M. 0871Palacios A. 0341, 0463, 1039Palacios Gamir L. 0122, 0130, 0221,
0355Paldusova B. 0622
26th ESICM ANNUAL CONGRESS — PARIS, FRANCE — 5–9 OCTOBER 2013
Palermo A. 0349Palfy M. 0271Palibrk I. 0292Palizas F. 1091Palla E. 1073Palmieri A. 1091Palomar M. 0044, 0214, 0429, 1068Palomba H. 0697Panagiotou E. 0634Paniagua Martin M.J. 0438Paños C. 0676Paola G. 0619Papadopoulos E. 0865Papadopoulos M. 0864Papadopoulos P. 0112, 0595Papaevangelou V. 0695Papaioannou V.E. 0436Papandreou H. 1065Papanikolaou M. 0573Papaparaskeva K. 0821Papapavlou P. 0923Paparengas V. 0941Papazian L. 0003, 0331, 0346, 0899Paquet C. 1013Paramythiotou E. 0595, 0695Parasiliti Caprino M. 0170Paratte G. 0513Pardavila E.V. 0409Pardini A. 0697Pardo C. 0511, 0681Parenti N. 0669, 0840Paries M. 0420Park C. 0038Park C.-M. 0128, 0532Park H.-P. 0841, 0842Park K.N. 0265Park M. 0467Park S.H. 0399, 0751Park S.C. 0345Park S.Y. 0588Park T.K. 0128Park Y.H. 0974Parke R. 0501Parker R.S. 0523Parkkola R. 0444Parodo J. 1019Parreño E. 0288Parrilla F.J. 0448, 0750Parro Herrero L. 0367Parrot A. 0407Parry N. 0192Parry-Jones J. 0896Parsons A. 0296Parsons G. 0139, 0670Pascual S. 0348, 0392, 0946Passouant O. 0461, 0487Pastewski A.A. 0773Pastor D. 0137Pastor Marcos D. 0432Pastor-Marcos D. 0157Patel B. 0188Patel D. 0084, 1078Patel K. 0804Patel N. 0159Paterson A. 1048Paterson A.L. 0020, 0656Pathmanathan N. 0171, 0971Patil M.S. 1090Patil Ashish T. 1080Paton L. 1102Patricia R. 0619Patroniti N. 0752, 0320Patsaki I. 0859, 0864, 0865Pattison N. 0407Paugam-Burtz C. 0030Paulus F. 0578Pauly D. 0101Pavese P. 0989Pavlakis A. 0923Pavlou H. 1065Pawar B. 0084, 1078Payen D. 0491, 0772, 0876Pazart L. 0689Pazvanti C. 0754Pearce J.T.M. 0353Pearse R. 0443, 0476Pearse R.M. 0254, 0477, 0606Peh J. 0378Peicheva O. 0107, 0791Peigne V. 0500Pelaia P. 0601Pellegrini M. 0579, 0999Pelosi P. 0337, 0557, 0559Peña Morant V. 0211Peñas Maldonado L. 0790Pène F. 0037Pennisi M.A. 0208Penot-Ragon C. 0899Penurkar M. 1078Peppink J. 0045
Peral J. 0033, 1092Peralta R.C. 0093, 0483, 0680, 0777Peralvo M. 0671Perbet S. 0500Perchiazzi G. 0332, 0999Perea Rodrı́guez M.E. 0605Perea-Rodriguez E. 0816Pereira A.J. 0728Pereira B.L.B. 0390Pereira C.C. 0250Pereira C. 0310Pereira E. 0025Pereira S. 0306, 0382, 0387Perez A.F. 0241Perez M.-H. 0119Perez O. 0241Pérez D. 0648Pérez M. 1064Pérez V. 0361Pérez Acosta G. 0569Pérez Bello Fontaiña L. 0767Perez Cheng M. 0200Pérez Llorens J.C. 0405Pérez Losada M.P. 1083Pérez Madueño V. 0277, 0285,
0365, 0767, 0988Pérez Pérez A.M. 1025Pérez Quevedo O. 0569Pérez Redondo M. 0148Perez Villardon B. 0133Pérez Villardón B. 0132Pérez-Acosta G. 0538Pérez-Baena L. 0074Pérez-Bello Fontaina L. 0285Perez-Cruz M. 1081Perez-Fernandez X.L. 0806Perez-Fernández X.L. 0805Pérez-Garcı́a M. 1050Pérez-González M.C. 0583Pérez-Rielo A. 0173, 1031Perez-Vacas J. 0226, 0591, 1071, 1075Pérez-Vacas J. 0238Pérez-Villardón B. 0278Pericas J.M. 0412Periche E. 0709Perks A. 0161Permpikul C. 0746, 0749, 1086Perner A. 0012, 0019, 0305, 0882Perquin M. 0641Perren A. 0724Perrin G. 0899Perrotin D. 0351, 0781Persico P. 0205Persson J. 0603Pesenti A. 0320, 0338, 0652, 0985Peters K. 0139Petersen M. 0041, 0190Petersson J. 0034Petiot S. 0150, 0468Petitcollin A. 0781Peto P. 0620Petrikkos G. 0859Petrikov S.S. 0499Petrino R. 0669Pettilä V. 0016, 0018, 0079, 0810,
0880Pettini E. 0546, 0707Pettit J. 0971Pfeifer R. 0049Pfister K. 0616Pham T. 0414, 0421Phelan D. 0433Philipp S. 0419Philippon-Jouve B. 0756Philips B.J. 0017Phillip V. 0839Phillips A. 0231Phillips C. 0081, 1004Phua J. 0401Phua Z. 0075Pi M. 0676Pichon M. 1040Picker O. 0889Pickford A.M. 0549Piednoir P. 0300Pierantozzi S. 0601Pierrakos C. 0942Pietilä M. 0444Pignel R. 0579Pilcher D. 0520Pillay C. 0216, 0217, 0698Pille C. 0565Pillet O. 0503Pilsbury J. 0725Pimentel J. 0207Pinheiro B.V. 0342Pino Moya E. 0936Pino Sánchez F.I. 0490, 0904Piñol À. 0676Pino-Sánchez F.I. 0494
Pinot G. 0714Pinsky M. 0913, 0914Pinsky M.R. 0463, 0626, 0677, 0890Pinto Lima A.A. 0960Piquilloud L. 0513Piras C. 0406, 0407Pirat A. 0710Piriou V. 0007, 0354Pirracchio R. 0041, 0190, 0714Pita L. 1027Pita S. 0801Pitino E. 0581Pitsika M. 0858Pitsoulis A. 0005Piyawechvirutana K. 0135Plamping D. 0063Planquette B. 0002Plantefeve G. 1098Plati I. 0106, 0944Platsouka E.D. 1066, 1073Plotnikow G. 1091Plummer M.P. 0519Pneumatikos I.A. 0436Poblano M. 0090, 0340, 0471, 0626,
1039Pobo A. 1095Poddar B. 0237, 0527Podlepich V. 0175Poitevin F. 0874Pola Guzman M.D. 0638Polesello L. 0965Polimerou E. 0864Politi M. 0821Polli F. 0326Pons B. 0493Ponte B. 0379Pontes-Arruda A. 0114, 0120, 0232,
0257, 0302, 0562, 0563, 0743Ponzo I. 0632Poole S. 0143Poon A.S.K. 0975Pop O. 0408Poply K. 0373Popovsky M.A. 0600Porras-López M. 0032Portal M.C. 0671Portier A. 0874Portilla Botelho M. 0174Portugal Rodrı́guez E. 0605Porzilius C. 0015Posma R.A. 0525Potievskaya V.I. 0121Potton L. 0625, 0901, 0989Poukkanen M. 0016, 0810, 0880Poupel L. 0876Pouzot C. 0333, 0998, 1000, 1002,
1003Povoa P. 0902Poyatos B. 0933Poyo-Guerrero R. 0241Pozuelo I. 0246, 0596Pozzi F. 0985Pozzi M. 0070Prada G. 0548, 0721, 0877Prager R.S. 0773Pranay B. 0108Prayag S. 1078Prchalova M. 0055Preau M. 1098Preiser J.-C. 0268, 0779Prekates A. 0280, 0282, 0659, 0667Preslaski C. 0911Preslaski C.R. 0909Pretty C. 0143, 1006Previgliano L. 0808Price S. 0088, 0636Price T. 0144, 0732Price Jr. T.J. 0022Prieto-Palomino M.A. 0176, 0655Prisco L. 0024Pritchard G. 0370Proença M. 0092Promsin P. 0749Protti A. 0326, 0330Provuncher G. 0903Prowle J.R. 0178, 0186, 0613Psara K. 0103Puerto Corrales S. 0605Puerto Morlan A. 0238Puerto-Morlan A. 0226, 0591,
1071, 1075Puflea F. 0892Pugin J. 0379Pugni P. 0330Puig F. 0343, 0992Pulletz S. 1001Pulvirenti S. 0986Pumarol J. 1058Puppo-Moreno A. 0782Purdell-Lewis J. 0178
Purkiss C. 0863, 0869Purtle S.W. 0661Purushothaman G. 0171Püschel K. 0160Putensen C. 0015Puxty A. 0375Puxty K. 1024Puxty K.A. 0413Pylypenko M. 0198Pylypenko M.M. 0688
QQuasim T. 0304, 0413, 1024Quesada A. 0615Quesada Garcı́a G. 0624Quesada-Garcia G. 0059, 0124,
0635, 0654, 0665, 0703, 0887,0907, 1028
Quesada-Garcı́a G. 0287, 0528, 0833Quesnel C. 0414, 0421Quı́lez M.E. 0992Quinn A. 1041Quintana J. 1091Quintana S. 0274Quintaneiro C. 0402, 1034Quintaneiro C.E.G. 0400Quintel M. 0015Quiroga C. 1091Quiros R. 0884Quraishi S.A. 0983
RRaanani E. 0179Rabah A. 0165Rabbat A. 0001, 0003, 0407Rabello L. 0411Rabuel C. 0491Race A. 0216, 0217, 0698Radaidan S. 0676Radermacher P. 0445, 0990Radwan W. 0165, 0441Rafacho B.P.M. 0394Rafat C. 0500Ragaller M. 0104, 0177Ragavan D. 0427Ragazzi R. 0091, 1076Ragnarsson J. 0797Ragozzino C. 0082Raijmakers R.J. 0910Raimondo P. 0558Raj J. 0519Rajab M.F. 0545, 0716, 0893Rajagopalan N. 1090Rajas O. 0583Rajhans P. 0084, 1078Rajsman G. 0185Ramakrishna A.L.V. 1080Ramczykowski T. 0168Ramirez J. 0680Ramirez J.M. 0560Ramı́rez C. 0457, 0459, 0247Ramı́rez R. 0076, 0213, 0350, 0826, 1077Ramı́rez Larriviery J. 0592Ramirez Marrero M.A. 0133Ramirez Marrero M. 0132Ramirez Puerta R. 0790Ramirez-Cardozo J.L. 0489Ramirez-Marrero M.A. 0127, 0131,
0286, 0535, 0537Ramm J. 0792Ramos F.J.D.S. 1099Ramos M. 0559Ramos M.B. 0337Ramos-Cuadra J.A. 0816Randall J. 0903Ranea E. 0884Ranieri V.M. 0205Raoult D. 0346Rapin M. 0081, 1004Rasata J. 0827Rasmussen B.S. 0434Rassouli O. 0944Rastelli G. 0669Rathke T. 0228Rau A. 0336, 1009Rauseo M. 0558Raux M. 0030, 0796, 0832Ravelo-Hernandez P. 0366Ravlo K. 0612Rawn J.D. 0223Raza A. 0284Razazi K. 0500, 0573, 1059Rea C. 0763Rea-Neto A. 0406Rebollo S. 0209, 0393, 1089Reboredo M.M. 0342Rechner I. 0194Recuerda M. 0361, 0767Recuerda Nuñez M. 0460, 0988
26th ESICM ANNUAL CONGRESS — PARIS, FRANCE — 5–9 OCTOBER 2013
Recuerda Núñez M. 0277, 0285, 0365Reddi B.A. 0519Redondo Orts M. 0615, 0838Régimbeau J.M. 0641Regueira T. 0013, 0945Rehar D. 0696Rehfeldt N. 0224Rei S. 0187Reichel J. 0068Reid C.A. 0773Reig-Valero R. 0064Reina A. 0362, 0938Reina R. 0663Reina Toral A. 0838Reina-Artacho C. 1075Reina-Toral A. 0182, 0719, 0833Reinhart K. 0049, 0068, 0295, 0465Reinikainen M. 0016, 0018Reinius H. 0691, 0867Reintam A. 0307Reintam Blaser A. 0473Reis F.F. 0342Rello J. 0031, 0210, 0640, 0642,
0686, 1064Remi-Jouet I. 0957Reminiac F. 0279Remy K. 0599, 0600Renes M.H. 1036Renet S. 0957Renninson T. 0267Renta F. 0404Renuka M.K. 0598Renzulli A. 0717Repetto V. 0504, 0685Repusseau B. 0503Resche-Rigon M. 0420Reske A. 0336, 0792Reske A.W. 0447, 0580, 1009Restrepo M.I. 0210Reuter D.A. 0081, 1004Reuter D. 0500Reutershan J. 0987, 0991Revelly J.-P. 0513Reverter J.C. 0851Revill A. 0800, 0937Rey N. 0358, 0359, 0571, 0577, 0579Reychler G. 0138Reynaud M. 0183Reynolds P.M. 0727Reynolds S. 0908Rezende E. 0406Rhee J.E. 0038Rhodes A. 0031, 0080, 0254, 0443, 0462,
0476, 0477, 0627, 0888Rhys M. 0928Rial M. 0721, 0877Rialp G. 0241Ribeiro G.C.M. 0140Ribera J.M. 0410Ricci R. 0546Rice O. 0199Richard C. 0787, 0819, 0883Richard J.C. 0358, 0359, 0886Richard J.C.M. 0571, 0575, 0577, 0579Richard J.-C. 0007, 0333, 0354,
0998, 1000, 1002, 1003Richard V. 0957Richardson C. 0380Richardson D. 0980, 1096Rico López L. 0564Ricou B. 0046Rider C. 0524Riedemann N.C. 0295Rienzi V. 1091Riera J. 0446Riera M.A. 0831Riesco-Crespo M. 0157Riffard G. 0142Rigby M.R. 0524Rigol M. 0093, 0483, 0680, 0777Rijkenberg S. 0522Rimmele T. 0354Rimmelé T. 0007Rinaldi M. 0205Rinaudo M. 0093, 0099, 0412,
0483, 0680, 0777, 0851, 1058Risso Vazquez A. 0808Rivera Fernandez R. 0182, 0543, 0719Rivera-Fenández R. 1031Rivera-Fernandez R. 0654Rivera-Fernández R. 0124, 0129,
0173, 0176, 0655, 0833, 0836,0837, 0907
Rivera-Lopez R. 0654Rivera-López R. 0124, 1028Rizikou D. 0280, 0282, 0659, 0667Rizos M. 0595Robert R. 0445Roberts B. 0349Roberts C. 0700
Roberts J. 0031Roberts R. 0849Robinson M.K. 0223Robles A. 0474Robles M. 0648Robles-Marcos M. 0816Roca I. 0093Roca O. 0686Rocco P.R.M. 0337, 0557, 0559Roch A. 0331, 0346, 0899Roche-Campo F. 0448, 0573, 0750Roda G. 0475Rode B. 0769, 1005Rødgaard-Hansen S. 0848Rodrigues M. 0310Rodrigues M.V. 0117Rodriguez A. 0014, 0210, 0647,
0671, 0946, 0953Rodriguez C. 0560Rodriguez F. 0615Rodriguez M. 0713Rodriguez P.O. 0584Rodriguez P. 0814Rodriguez V. 1027Rodrı́guez A. 0348, 0392Rodrı́guez M.D. 0209, 0393, 1089Rodrı́guez M. 0276Rodrı́guez V. 0801Rodrı́guez Borregán J.C. 0321Rodrı́guez Bugueiro J. 0475Rodrı́guez de Castro F. 0583Rodriguez Encinas A. 0200Rodriguez Garcia E. 0536Rodrı́guez Gómez M. 0367, 0592,
0711Rodrı́guez Guedes C. 0569Rodrı́guez Gutierrez J.F. 0460, 0988Rodriguez Lopez V. 0438Rodriguez Peralta L.I. 0939Rodriguez Perea A. 0502Rodriguez Villar S. 0199, 0921, 1035Rodriguez-Castro D. 0544Rodrı́guez-Castro D. 0709Rodrı́guez-Gallego C. 0583Rodrı́guez-Portillo J. 0844Rodriguez-Sanchez A. 0833Roeseler J. 0138Roger C. 0607Rogiers P. 0263Rohit S. 0111Roine R.O. 0444Rojas-Amezcua M. 0654Roks G. 0672Roldan-Jimenez M.A. 0131, 0286,
0535Román Alonso F. 0212Romano G. 0024Romera Ortega M.Á. 0212Romero C. 0298, 0722, 0945Romero E. 0381Romero M.A. 0560Romero M. 0241Romero Barroso I. 0936Romero Luján J.L. 0206, 0211Romero-Moreno L. 1031Romo-Gonzales J.E. 0529Roncally Carvalho A. 0570Rondelet B. 0023, 0040Roquer J. 0492Ros Martı́nez J. 0764Rose L. 0450, 0885Rosell J. 0778, 0788Rosenstengel A. 0349Rosich S. 0392Rosset E. 1098Rossi G. 0652, 0840Rossi M. 0717Rosso C. 0782Roth M.C. 0475Rotimi M.K. 0660Rotondo G. 0205Roulier P. 0899Roussiaux A. 0771Roussou Z. 1066, 1073Roustan J.-P. 0335Routsi C. 0103, 0859, 0862Roux C. 0756Rovegno M. 0945Rovira M. 0412Rozec B. 0279Roziewska A. 0646Ruas G. 0550Rubatto N.P. 0808Rubenfeld G. 0885Rubenfeld G.D. 1022Rubert C. 0241Rubertsson S. 0039, 0270Rubio J.A. 0648Rubio López M.I. 0321Ruckly S. 0422, 0901, 1040
Ruddy J. 1102Rudiger A. 0275Rudkowski J.C. 1022Rudler M. 0775Ruemmele P. 0616Rufli G. 0058Rufo O. 0061Rugeles M.T. 0245, 0873Rugeles S. 0619Ruı́z J. 0288Ruiz Bailén M. 0630, 0638Ruiz del Fresno L. 0283Ruiz Ferron F. 0502Ruiz Rodrı́guez A. 0764Ruiz Santana S. 0206, 0211Ruiz-Ferrón F. 0884Ruı́z-Hernández J.J. 0583Ruiz-Santana S. 0366, 0489Ruiz-Valderas R. 0782Rulisek J. 0377Russell M. 0466Rutkovskii R. 0169Ryan H. 0423Rylander C. 0332, 0999, 1010Ryu Y.J. 0551
SSaavedra P. 0489Saavedra Santana P. 0206, 0211Saavedra-Santana P. 0366Sabater Riera J. 0805, 0806Sabatier C. 0890Saber H. 0165Sable S. 0084Sac S. 0912Sacanell J. 0686Saeed S. 0879, 1021Saenz M.G. 0663Saerens L. 0347Sáez Chica V. 0838Saghi T. 0503Sagishima K. 0097Sagra F.J. 0247Sagredo Meneses V. 0200Sah Pri A. 0268Saha S. 0373Sahajanandan R. 0479Sahiner G. 0062Sahpazis C. 0754Saihi K. 0575Sailley R. 0689Sainov M. 0802Sakagianni K. 1085Sakai A. 0291Sakawaki E. 0744Sakellaridis K. 0282Sakr Y. 0066, 0067, 0295, 0465, 1087Sala N. 0442Salazar B. 0694Salazar Ramirez C. 0283Salcedo A. 0410Saleh T.S. 0893Salge J.A.D.S.B. 0784Salim S. 0506, 0761Sall F.S. 0689Sallemi W. 0437, 0699Salluh J. 0411Salluh J.I.F. 0406, 0407Salomon A. 1015Salvatori C. 0964Salzberg S. 0275Samalea N. 0898Samara A. 0923Samary C. 0559Samary C.S. 0337, 0557Samir N. 0441Samuelsson C. 0262San Pedro J.M. 0361Sanayama H. 0812, 0818Sanches I. 1034Sanchez A. 0816Sanchez J.S. 1039Sanchez J. 0006Sanchez M. 0246, 0713Sanchez S. 0341Sánchez B. 0274, 1082Sánchez J. 0767Sánchez J.S. 0463Sánchez M. 0415, 0416, 0417Sánchez Alvarez C. 0474Sanchez Cantalejo E. 0543, 0719Sánchez Casado M. 0921, 1035Sanchez de Dios T. 0766Sanchez Garcı́a M. 0592Sánchez Garcı́a M. 0367Sanchez Gonzalez A. 0939Sanchez Montori L. 0200Sanchez Palacios M. 0077Sánchez Palacios M. 0538Sánchez Ramı́rez C. 0206, 0211
Sánchez Romero I. 0212Sánchez Ruiz J. 0277, 0285, 0365,
0460, 0950, 0988Sánchez Saez V. 0431Sánchez-González M.A. 0415, 0416,
0417Sánchez-Izquierdo Riera J.A. 1094Sanchez-Ramirez C. 0366Sánchez-Rodrı́guez A.C. 0182Sancho J.M. 0410Sancho M. 0033, 1092Sancho S. 0705Sandalinas I. 0274Sander M. 0455, 0943Sanders S.L. 0896Sandiumenge A. 0426, 0768Sandroni C. 0368Sangil Monroy N. 0206, 0211Sangiorgi D. 0669Sanmartı́n Monzó A.M. 0764Sanmartı́n Monzó J.L. 0764Sanna T. 0368Sannervik J. 0867Santa Teresa P. 0033, 1092Santantonio M.T. 0512Santel A. 1018Santiago M.Á. 0648Santiago R.R.D.S. 0136, 0576, 1009Santos A. 0984, 1007Santos C.L. 0337, 0557, 0559Santos F. 0250, 0306, 0382, 0387,
0388Santos R.S. 0337, 0557, 0559Sanui M. 0812, 0818Sanz F. 0210Sanz Ganuza M. 0566Saour M. 0621Sarabia M. 0378Saraste A. 0444Sarau J. 1014Sari A. 0253, 1054, 1056Sarralde Aguayo J.A. 0321Sasai T. 0947Sasu L. 0504Sata T. 0786Sato T. 0935Satsuta S. 1084Sauca G. 0430Saudan P. 0379Saugel B. 0083, 0540, 0631, 0839Saunavaara J. 0444Savary D. 0359Savin I. 0175Savioli M. 0556Savolainen E.-R. 0100Sawamura A. 0113, 0803, 0930Sawicka A. 0646Saxena M. 0011Scales D. 1022Scanziani M. 0652Scaravilli V. 0320Schädler D. 0015, 0997Schaedler D. 0993Schaeper U. 1018Schäfer R. 0068Schaich F. 0757Schanaider A. 0557Scheeren T.W.L. 0453Scheinin H. 0444Scherzer T.-M. 1046Schettino G.P.P. 1097, 1099Schildhauer T.A. 0168, 0328Schiza I. 0005Schlemmer B. 0420Schlitt H.J. 0616Schmid M. 1043Schmid R.M. 0083, 0540, 0631, 0839Schmidt M. 0500, 0565, 1059Schmidt Z. 0007, 0354Schmitt M. 0001Schneeweiß B. 1046Schneider K. 0068Schnell D. 0001, 0002, 0003, 0183Schønheyder H.C. 0434Schörghuber M. 0723, 0729Schött U. 0603Schroeder H.T. 0117Schuelke M. 0228Schultz M. 0450Schultz M.J. 0256, 0334, 0440,
0517, 0578, 0897, 0902, 1017Schwaiberger D. 0565Schwartz A. 1038Schwarzkopf D. 0049, 0295,
0419, 0465Schwebel C. 0002, 0408, 0625, 0989,
1040Scolletta S. 0023, 0082, 0297, 0311,
0488, 0933Scorcella C. 0601
26th ESICM ANNUAL CONGRESS — PARIS, FRANCE — 5–9 OCTOBER 2013
Sdougka M. 0919Sebastian C.G. 0272Secher N. 0612Sechterberger M.K. 0515, 0522See K.C. 0401Segotic I. 0185Segura S. 0074Seijas I. 0044, 0214, 1068Selas S. 0548, 0720, 0721Selfridge J. 0304Seller-Perez G. 0235, 0236, 0665,
0703Semencic M. 0024Sencan I. 1054, 1056Şencan İ. 0253Senturk M. 0339Seoane L. 0801Seoane Quiroga L. 0318Seppelt I. 0011Serraino F. 0717Serrano A. 0780Serrano Lázaro A. 0174Serrano Simon J.M. 0502Serrano-Mollar A. 0992Serri K. 0163Sethi A. 0486Sethi A.K. 0845Setten M. 0584Settmacher U. 0295Sevilla Martı́nez M. 1025Sezgin A. 0710Sfyras D. 0634, 1052Shah J. 1078Shah S. 0620Shaikh N. 0166, 0284Shan Y. 0010, 0096Shankar-Hari M. 0835Sharma N. 0915Sharpe C. 0620Sharpe K.A. 0809Shaw G.M. 0143, 0268, 1006Shebzuhova E.H. 0121Sheng-Kok K. 0216, 0217Shevelev M. 0021Shevelev O. 0021Shi W. 1011Shibayama K. 1072Shichinohe Y. 0094Shiga T. 0533Shimanskij V. 0175Shimaoka H. 0683Shimozono T. 0085Shinohara J. 0935Shirai K. 0240Shiraishi Y. 0533Shirazi F. 0371Shivaprasad C. 1090Shon Y.J. 0841, 0842Shono A. 0960Shpata V. 0843Shuaib F.R. 0373, 0822Shyamsundar M. 0194Sibila O. 0210Sidiras G. 0864Siegel J. 0839Siegert G. 0104Sihera M.K. 0608Sileli M. 0505, 0718, 1045Silva E. 0406, 0697Silva J. 0229Silva J.D. 0557Silva J.G. 0250, 0306, 0382, 0387Silva P.L. 0337, 0557, 0559Silva S.V. 1061Silva S. 0250, 0382, 0387, 0388Silva U.V.A. 0406, 0407Silva Carvalho N. 0570Silva-Obregón J.A. 0529Silvasti P. 0444Silveira P. 0172Silvennoinen H. 0444Silvente Fernández S. 0838Sim D. 0231Sim K.J. 0940Similowski T. 0500Simon L.J. 0773Simon M. 0160, 0322Simon P. 0447, 0580Simon V. 0852Simons K.S. 0467Simpson W. 0151Sindaco A. 0999Singer M. 0611, 0852, 0878, 0879,
0955, 0959, 0962, 0963, 1021Singh M. 0378Singh R. 0237Singh S. 0237Singhi S. 0111, 0118Sinha S. 0312Sinkovič A. 0271, 0854
Sinkovic A. 0696Sinuff T. 1022Sirajuddin S.A. 0716Širanović M. 1005Sirgo G. 1095Sixma M.L. 0611, 0878, 0879Sjöberg F. 0069, 0262Skabradova M. 0539Skopelitis M. 1065Skoric B. 0929Skorko A. 0670Skoumis K. 0919Skrabalek P. 1049Škrabálek P. 0622Skrobik Y. 0908, 1022Skupin H. 0049, 0419Slooter A.J. 0910Sluijs J.P. 0517Slutsky A.S. 1022Smaı̈li Z. 0464Small C. 0725Smit B. 0269Smit M. 0881Smith C. 0316Smith E.J. 0829Smith L. 0035Smith O. 1055Snelson C. 0466, 0481, 0725,
0824Soares M. 0406, 0407, 0411Sobue K. 0319Socha J.S. 0773Socias A. 0241Socias L. 0241Soilemezi E. 0005, 0754Sokolova E. 0175Solà J. 0092Solà i Caros J. 0081, 1004Solangasenathirajan S. 0294,
0926Solano Vera M.R. 0405, 0534Solé C. 0392, 0946Solé M. 1058Solé-Violán J. 0583Solla Buceta M.A. 0318Sollazzo A. 0170Sølling C. 0612Solmaz E. 1029Soloaga E.D. 0912Solodov A.A. 0499Solomon S.B. 0599, 0600Solsona A. 0831Solsona F. 0116Somaini M. 0581Son J. 0586Søndergaard P. 0612Song J.-G. 0293, 0817Song L. 1037Soni P. 0115Soni S. 0794Sonneville R. 0500, 0905, 1059Sonomdagva G. 0230Soon Y. 0053Sophie H. 0832Sørensen B. 0763Soriano A. 1058Soriano C. 0492Sorlı́ L. 0583Sotillo J.C. 0033, 1092Sotomi Y. 0478Sottiaux T. 0138Souday V. 0886Soufir L. 0002Soultati I. 1074Sousa M. 1033Souweine B. 0002, 0901, 1040Souza I.A. 0411Souza M.L.D.A. 0576Souza-Dantas V.C. 0407Soyer B. 0832Soykut C. 1029Spadaro S. 0091, 1076Spanaki A.M. 0106, 0369, 0651Spapen H. 0449, 0623, 0642,
0650, 0738, 0740, 0815Spapen J. 0642Sparacino C. 0556Spatenkova V. 1049Spaziani L. 0512Spies C. 0228, 0565, 0943Spies C.D. 0015, 0224Spijkstra J.J. 0057, 0666, 0976Spinelli E. 0326Spiritoso R. 0568Spoelstra-de Man A.M.E. 0269Spranger J. 0224, 0225, 0228Spronk P.E. 0517, 0813Sprung C.L. 1062Spuler S. 0224, 0228Spyridonidou S. 0389
Squara P. 0547, 0708Stabouli S. 0919Stacke A. 0068Stær-Jensen H. 0036Stagaki E. 1085Stagos D. 0858Stanescu D.O. 0247, 0251, 0281Stangl K. 0455Stannard C. 0829Starkopf J. 0307, 0372, 0473Starkopf L. 0473Starr T. 0031Stauffer K. 1046Steele T. 1047Steenbergen H. 0813Stefanou C. 0859, 0862Stehman C.R. 0315Steinberg M. 0908Steinfath M. 1014Steinmann M. 0095Steins K. 0894Stenhouse E. 0056Stenhouse J. 1102Stergiannis P. 0798Sterk P.J. 0902Sternik L. 0179Steuten L.M.G. 0517Steward D. 0096Stiehl T. 1018Stockman B. 0317Stoneking L.R. 0316, 0370, 0778,
0788Stotz M. 0794Stožer A. 0271Straat M. 0440Strachan S. 0748Strachan S.R. 0745Strasma P. 0521Strauch J. 0328, 0329Strijkov N.A. 0553, 0554Strouvalis I. 1073Struys M. 0452Struys M.M.R.F. 0453Stucker F. 0379Stui R. 0057Stumme C. 0068Stylianides N. 0516, 0923Suarez A.I. 0801Suarez D. 0951Suarez R. 0415, 0416, 0417Suárez D. 1082Suarez de la Rica A. 0456Suarez Freire A.I. 0438Suarez Sipmann F. 0086Suárez-Lledó M. 0412Suarez-Sipmann F. 0092, 0339,
0984, 1007Subira C. 0446Suchdev K. 0906Sugano M. 0113, 0803, 0930Sugiura T. 0319Suh G.Y. 0128, 0395, 0532Suh G.J. 0470Sujith M.P. 0166Sula H. 0843Sultana S. 0794Sumikawa K. 0291Sun G. 0309Sun J. 0599, 0600Sundararajan K. 0519Sunde K. 0036Suppan L. 0358, 0359Surat T. 0749Suryawan A. 0229Suys T. 0442Suzuki J. 0812, 0818Suzuki N. 0967Suzumura E.A. 0567Svyatova G. 1079Sweeney E. 0427Swol J. 0168, 0328Syed Mohammad A. 0158Syrjälä H. 0100Szakmany T. 0035, 0356, 0524,
0849, 0925Sztrymf B. 0500
TTabah A. 0422Taccone F. 0040Taccone F.S. 0023, 0082, 0164,
0268, 0297, 0311, 0488, 0640,0642, 0774, 0933
Taconet C. 0796Tadeu J.P. 0306Tadeu P. 0250, 0382, 0388Tagliari L. 0757Tai B.C. 0401Takahashi G. 1088Takahashi H. 0935, 0952
Takahashi K. 0094, 0744, 0967Takahashi M. 0935Takahito M. 0240Takala J. 0095, 0728Takatani Y. 0952Talayero Gimenez de Azcarate
M. 0795Talegaonkar M. 0364Talmaci C. 0125Tam F.W. 0611, 0878, 0879Tamion F. 0445, 0957Tamme K. 0372Tan A. 1022Tanaka R. 0052Tanczos K. 0233, 0239Tang L. 0281, 0457, 0459Tanios M. 0908Tanizaki R. 0240Tanno K. 0323Tannoia A. 0999Tanto P. 0828Tantot A. 0029Tanzarella E.S. 0208Taourel P. 0335Tarancón C. 1083Tárraga L. 0209, 0393, 1089Tartari F. 0091Tashiro T. 0097Tasioudis P. 0404Tatsumi H. 0094, 0744Tattaw J. 0379Tatzl E. 0723, 0729Tavazzi G. 0088, 0636Tavladaki T. 0103, 0106, 0369,
0944Taylor C. 0011Taylor R. 0178, 0186Tchir M. 0966Teboul J.L. 0445Teboul J.-L. 0787, 0819, 0883Teixeira C. 0757Teixido C. 0014Teixidó C. 0953Tejero A.I. 0276Tejero Redondo A.I. 0367Teles J.M.M. 0406Téllez O.M. 1089Templeton R. 0151Ten Tusscher B.-L. 0266Tendillo F. 0090, 0471Teneja R. 0006Ter Maaten J.C. 0201, 0948Terao Y. 0291Terblanche M. 0835Ternant D. 0781Terragni P.P. 0205Terraneo S. 0093, 0483, 0680, 0777Terreau J. 0183Terzi N. 0500Textoris J. 0899Thabut D. 0775Thamm K. 1018Thekkudan J. 0479Theodorakopoulou M. 0112, 0595,
0695Theodorou V. 0436Thevoz D. 0513, 0573Thickett D.R. 0983Thiele M. 0447Thieme Groen E.S. 0760Thiollière F. 0354Thiran J.-P. 0092Thirion M.C. 1098Thomas C. 1022Thomas M. 0928Thomas S. 0329Thompson K. 0900Thomson R. 1048Tiainen M. 0444Tijero J. 0343, 0992Tilanus J.J.D. 0672Tillmann B. 0192Timsit J.F. 0989Timsit J.-F. 0002, 0407, 0408, 0422,
0625, 0901, 1040Tinturier F. 0464, 0468Tipu S. 0158Tisato S. 1076Titova J.V. 0499Tkachenko R. 0198Tobar E. 0298, 0407, 0722Tochikubo J. 0102Todani M. 0314Todi S. 0312Toepfer L. 0565Toffart A.-C. 0407, 0408Tohme S. 0026Tokioka H. 0947Toldo K.F. 0576Toller W. 0723, 0729
26th ESICM ANNUAL CONGRESS — PARIS, FRANCE — 5–9 OCTOBER 2013
Tomasa-Irriguible T. 0816Tomasello F. 0903Tomey M.L. 0251Tomlinson G. 1022Tondi S. 0601Tong Z. 1016Tongyoo S. 0746, 1086Toni F. 0512Tonkovic D. 0770Tonnelier J.M. 0445Tønnesen E. 0434, 0612, 0848, 1011Tønnesen E.K. 0763Topping M. 0741Toral Vázquez D. 0027Torelly A. 0406Torrado H. 0544Torrado H.R. 0709Torrance H.D.T. 0606Torrents E. 0014, 0953Torres A. 0093, 0341, 0463, 0483,
0626, 0680, 0777, 0902Torres J. 1000Torres J.S. 0333, 0998, 1002, 1003Torres L. 0090, 0471Torres Lopez L. 0340Torres Sánchez E. 1094Torres-Garcı́a J. 0064Torsani V. 0136, 1009Torsvik M. 0073Toscano J.E. 0709Toscano M.L. 0197, 0834, 1101Tosetto S. 0170Tosun B. 0062, 0675, 0679Toti F. 0098, 0234, 0856Tournoud M. 0391Tousia Becker A. 0858Toynbee M. 0424Toyoda I. 0240Tran-Dinh A. 0300Trasmonte V. 0648Trasy D. 0233, 0239Travassos L.H. 0140, 0582Trecherel E. 1015Trefler S. 0348, 0392Trepte C.J.C. 0081, 1004Treschow F. 0019Treskatsch S. 0184Treso M. 0676Tridente A. 0662Trimarco R. 0752Trindade Junior J.R. 0684Tripsianis G.A. 0436Tröger U. 0324Trojette F. 0827Trongtrakul K. 0135Tropea F. 0717Troubleyn J. 0449, 0623, 0815Trouillet J.-L. 0327Trujillano-Fernandez C. 0226, 0591,
1071, 1075Trujillano-Fernández C. 0238Trujillo-Garcı́a E. 0059, 0129, 0635, 0887Tsakiris S. 0389Tsaknis G. 0126Tsakris A. 0645Tsamoukas E. 1073Tsang J.L.Y. 1019Tsangaris I. 0126Tsantes A. 0126Tsartsalis D. 0634Tsatsanis C. 0008Tsavourelou A. 0866Tschirdewahn J. 0839Tselioti P. 0659Tsigou E. 0645Tsimpoukas F. 0634Tsintsadze A. 0610Tsubo T. 0374, 0614Tsuruta R. 0314Ttendo S. 1057Tubach F. 0905Tubı́o A. 0877Tubı́o A.G. 0249Tucci E. 0297Tucci M.R. 0136Tufton H. 0427Tuip-de Boer A.M. 0440Tujjar O. 0488, 0933Tumino L.I. 0475Tunnicliffe B. 0380Turani F. 0145Turbelin A. 0468Turle S. 0829Turner C. 0017Turner D.A. 0704Turner P. 0972Tusman G. 0984Twose J. 0426, 0768Tyagi A. 0845Tzanidakis C. 0731
UUbeda-Iglesias A. 0807Uchikura T. 0967Uchino S. 0180Uegaki S. 0360Ueta H. 0085Uhlig S. 1014Ujiro A. 0683Umaña Perea M. 0694Umei N. 0683Umemura T. 0561, 0853Umezawa Makikado L.D. 0027,
1094Umino J. 0952Unwin R.J. 0611, 0878, 0879Ursulet L. 0771Us T. 0218Ushizawa H. 1072Uusaro A. 0880Uzun S. 0185
VVaara S. 0016, 0018Vaara S.T. 0810, 0880Vacacela K. 0288Vakalos A. 0587, 0825, 0924Valakis K. 1085Valanne L. 0444Valdivia de la Fuente M. 0212Valdivia-Ruiz J. 0157Valeiras A. 0676Valencia J.P. 0938Valencia Quintero J.P. 0431, 0615,
0838, 1025Valente J. 1033Valentini R. 0584Valenzuela Méndez B. 0460, 0988Valenzuela Sanchez F. 0460, 0988Valenzuela Sánchez F. 0277, 0950Valero A. 0705Valero P. 0689Vallée F. 0461, 0487Vallejo L.M. 0671, 0676Vallejo-Baez A. 0226Valles S. 0116, 0385, 0762Vallin H. 0007, 0354, 0874Van Beers F. 0673Van Berkom P. 0672, 0673Van Bommel J. 0891, 0960Van Braam Houckgeest F. 0517Van Cauwenberge I. 0898Van de Glind H.G. 0970Van de Velde M. 1060Van den Abeele A.-M. 0640Van den Berghe G. 0644Van den Boogaard M. 0467Van den Hoven B. 0396Van den Wildenberg W. 0673Van der Geest P.J. 0396Van der Horst I.C. 0452Van der Horst I.C.C. 0195Van Der Jeught D. 0678Van der Kooi A.W. 0910Van der Laan M. 0041, 0190Van der Maaten J. 0452Van der Schaaf M. 0897Van der Sluijs K.F. 0440Van der Steen M.S. 0726, 0870Van der Voort P.H.J. 0376, 0515,
0522, 0760, 0916Van der Weerd L. 0525Van der Wolk A. 0376Van der Woude D. 0693Van der Wouden G.M. 0948Van Dokkum Y. 0726, 0870Van Drunen E.J. 0143, 1006Van Galen T. 0057, 0970Van Genderen M.E. 0960Van Gorp V. 0449, 0623, 0650Van Hees A. 0673Van Hooijdonk R.T.M. 0517Van Klei W.A. 0477Van Meurs M. 0453, 0881Van Pelt J. 0518Van Putten T.S. 0525Van Schaik I.N. 0897, 1017Van Stijn I. 0916Van Tricht G. 0970Van Vught L.A. 0440Van Willigen Z. 0980, 1096Van Zaane B. 0477Van Zanten A.R.H. 0726, 0870Vandana J. 0860Vandenbroucke-Grauls C. 0045Vanderheyden S. 0644Vandewoude K. 0640Vandijck D. 0428, 0484Vandroux D. 0771, 1067Vangelis S. 0282, 0667Vanhalst J. 0811
Vannucci C. 1023Vaporidi K. 0008Vaquerizo C. 0110Vaquero C. 0511, 0681Vardas K. 0103Varela S. 0249, 0548Vargas F. 0503, 0615Vargas J. 0814Vargas Atehortua A. 0355Vargas-Rocha P. 0495Varma A. 0043, 0364, 0435, 0918Varpula M. 0079, 0444Varrier M. 0469Vaschetto R. 0504, 0986Vasco F.D. 0385, 0762Vasconcelos C. 1061Vasilaki E. 0369, 0651Vasquez D. 0663Vasquez L. 1091Vassal O. 1013Vassalos A. 1051Vassena E. 0581Vassiliadi D. 0105Vassiliou A. 0105Vassiliou A.G. 0389Vatopoulos A.C. 1066Vazquez P. 0548Vázquez A. 0385, 0762Vázquez P. 0720Vázquez González A. 0496Vazquez Paredes P. 0200Vazquez Reveron J.M. 0805, 0806Vecellio L. 0781Veerappa S.N. 0454Vegas-Vegas I. 0286, 0535Veijanen M. 0981Vela R. 0884Vela Colmenero R. 0630, 0638Velasco E. 0276, 0713Velasco J. 0244Velasco López E. 0592, 0711Velásquez M.A. 0475Velez N.A. 0382, 0387Velickovic D. 0292Velickovic J. 0292Velilla P.A. 0873Vena A. 0332Venet F. 0391, 0874Venihaki M. 0944Venot M. 0183Ventura A. 0676Ventura J.L. 0709Ventura S. 1026Ventura-Farré J.L. 0544Verbeke J. 0317Vergadi E. 0008Verhamme C. 1017Verhoeven J. 0513Veselkov K. 0353Vesin A. 0002, 0408, 0989Vespignani M.G. 0840Vezzani A. 0597Vicálcaro A. 0831Vidal I. 0249, 0877Vidal Cortes P. 0438, 0536Vidal-Cortes P. 1050Vidal-Tegedor B. 0844Videcoq M. 0290Vignaux L. 0138Vignon P. 0771Vila D. 0244Vila J. 0093, 1058Villa G. 0546, 0707Villagomez R.O. 0912Villagra A. 0890Villani P.G. 0752Villanueva E. 0705Villanueva Fernández H. 0148Villanueva Gómez N.F. 0564Villaplana C. 0583Villarejo F. 1091Villarrasa F. 0061Villarrasa-Clemente F. 0589Villarreal E. 0288Villasboa A.F. 0385, 0762Villasclaras A. 0511, 0681Vincent F. 1059Vincent J.L. 0040, 0066, 0067, 1087Vincent J.-L. 0023, 0311, 0325,
0386, 0488, 0774, 0779, 0892, 0933Vinten-Johansen J. 1011Violaki A. 0919Viqueira M. 0209, 0393Vira A. 0778, 0788Virtanen S. 0444Vitali S. 1076Vitaller S. 0123Vivancos Delgado R. 0132Vives S. 0410Vogelaers D. 0640
Vogelzang M. 0452, 0917Vogiatzi L. 0651, 0919Voigt I. 0439Voirin N. 0874Voiriot G. 0901Volakli E. 0919Vollmer C. 0889Volpe M.S. 0550, 0784Volta C.A. 0091, 1076Von Heymann C. 0943Von Walter J. 0004Vondrakova D. 0539, 0932Vos P. 0673Voss S. 0928Vrigkou E. 0126Vroom M.B. 0141, 0823Vučić M. 1005Vucic M. 0769Vyas N. 0994
WWada T. 0113, 0803, 0930Wade-Smith F. 0139Wadouachi A. 1015Wagner F. 0990Wagner J. 0929Wagner J.Y. 0083Wagner K. 0990Wagner L. 0324Walden A. 0194Walder B. 0026, 0552Walid S. 0220Walker D. 0191Walker T. 1090Wallet F. 0007, 0354, 0407Wallin E. 0039, 0270Wallin M. 0086Wallis S. 0031Walshe C. 0058Walshe C.M. 0433Walther S. 0069, 0262Walther S.M. 0004, 0894Wan R.Y.Y. 0734Wang A. 1055Wang D. 0599, 0600Wang J. 0620, 1037Wang M. 0737Wang P. 0309Wang Q. 0309Wang W. 0146Wangensteen R. 0615Waterbrook A. 0370Waterer G. 0210Watts S. 0793Webb S. 0521Webber S. 0662Weber S. 0441Weber-Carstens S. 0224, 0225,
0228, 0230, 0565Weblin J. 0481Webster K. 0151, 1057Weiler N. 0015, 0737, 0742, 0993,
0997, 1001, 1014Weiss N. 0445, 0775Wellens F. 0738Welte T. 0322Welters I. 0065, 1047Wendon J. 0313, 0793Wendt K.W. 0525Wennervirta J. 0444Wepler M. 0990Werdan K. 0465Wester J.P.J. 0376Wester J.P. 0916Westergard A. 0778, 0788Wetterslev J. 0012, 0305, 0882Wewalka M. 1043White M. 0088, 0636White R. 0739Whitehouse T. 0215Whitmore S. 0371Wichmann D. 0322Wickboldt N. 0552Wickerts C.-J. 0004, 0262Wieland C.W. 0440Wieske L. 0440, 0897, 1017Wiesner O. 0322Wigmore T. 1030Wijayatilake S. 0486, 0846Wilcox M.E. 1022Wilhelms S.B. 0069Wilkman E. 0079, 0880Willenberg L. 0011Willenheimer R. 0628Williams A.B. 0316Williams A. 0063Williams E.A. 0188Willis E. 0458Wilson D. 0903Windsor J. 0231
26th ESICM ANNUAL CONGRESS — PARIS, FRANCE — 5–9 OCTOBER 2013

Winkel P. 0012Winning J. 0068Wise M.P. 0305Wittebole X. 0138Witteveen E. 1017Woehlecke J. 0225, 0228Wogensen L. 0612Woittiez L. 0518Wolff M. 0905Wolk D. 0316Wollersheim T. 0224, 0225, 0228, 0230Wong Y.L. 1014Wongsa A. 0135Woo J.H. 0264, 0273Wood J. 0664Wood S. 0035Wouters M. 0525Wouters P. 0644Wrigge H. 0336, 0447, 0580, 0792Wright C.J. 0510Wright D. 0971Wu D. 0065Wu S.-G. 0248Wunderink R. 0210Wyncoll D. 0777Wysocki M. 0138
XXéridat F. 0331Xiaoyue L. 0526Xicoy B. 0410Xu X. 1037Xydaki A. 1073
YYadav A. 1078Yagmurdur H. 1054Yağmurdur H. 0253Yahagi N. 0931Yahata Y. 1072Yakupoğlu S. 0847Yamada H. 0812, 0818Yamada N. 0240Yamakage M. 0094, 0744Yamamoto H. 0113, 0803, 0930Yamauchi M. 0533Yamazaki A. 0374, 0614Yamazaki K. 0085Yambe T. 0533Yanagida Y. 0113, 0803, 0930Yang H.J. 0264, 0273Yang J.H. 0128, 0532Yang S. 0841Yang S.M. 0842Yarad E. 0521Yasuda H. 0180Yébenes J.C. 0430, 0474Yegneswaran B. 0523Yeh L. 0452Yehia A. 0506, 0761, 0961Yelken B. 0218Yi M.S. 0871Ylikoski E. 0444Yogendran A. 0349Yoon C.S. 0265Yoshida J. 0478Yoshida S. 0094, 0240, 0744
Yoshida T. 0136Yoshida Y. 1088Yoshikawa K. 0935Yoshioka J. 0507Young D. 1051Young L.G. 0375, 0425Young S. 0940Yu C.-J. 0248, 0702, 1020Yu E.-H. 0586Yücel N. 0847Yuge R. 0853Yumori A. 0967Yunoki K. 0085Yus S. 0596Yuste M.E. 0076, 0213, 0350, 0826,
1077Yuste Ossorio M.E. 0790
ZZaal I.J. 0910Zabarte M. 0110Zaghlol A. 0352Zakaria E.M. 1008Zakharchenko M. 0377Zaknic A.V. 0519Zakynthinos E. 0858Zambelli V. 0985Zamboschi N. 0226, 0238, 0591,
1071, 1075Zamora S.E. 0340Zamorano R. 0676Zanella A. 0320Zani G. 0091, 1076
Zapatero A. 0116, 0385, 0492, 0762Zaragoza R. 0647, 0705Zauner C. 1043, 1046Zborovszky E. 0077, 0538Zemirline A. 0830Zeni F. 0183, 0493, 1040Zhang Y. 0309Zhou D.Y. 0010, 0096Zhou L. 0010Zhulamanova D.I. 0554Ziak J. 0109Zidianakis V. 0798Zied H. 0220, 0222, 0398Ziegler J. 0565Zijlstra F. 0452Zijlstra J.G. 0060, 0453, 0881Zin W.A. 0136, 0140, 0582Zirpe K. 1078Zlotnic A. 1038Zogheib E. 0150, 0641, 0827Zolfaghari P. 0357Zornoff L.A.M. 0219, 0390, 0394Zoso N. 0692Zuber B. 0001Zuchella C. 0632Zuleika M. 0053Zwiers E. 0195Zykova I. 0622
26th ESICM ANNUAL CONGRESS — PARIS, FRANCE — 5–9 OCTOBER 2013


