Embed Size (px)
Citation preview
Education and Science
Vol 39 (2014) No 176 69-79
69
Acceptence of TPC Scale - Validity and Reliability Study
Özlem Canan Güngören 1, Mustafa Bektaş 2, Ergün Öztürk 3,
Mehmet Barış Horzum 4
Abstract Keywords
Technology is oftenly used in numerous areas, also including the
field of education. Especially the tablet computers (TPC) play an
important role in increasing the efficiency and effectiveness of the
educational studies. In order for the emergence of the
aforementioned effect and the effective use of the TPCs by the
students, it is necessary for the students to accept the tablet
computers by having a positive behaviour towards them, feeling
that they are easy to use and also useful for the learning activities,
while also having intentions of using them in the learning
activities. In this study, the secondary education students’
acceptance of the TPCs was analyzed by selecting the technology
acceptance model as the baseline and developing the Tablet
Computer Acceptance Scale. A valid and reliable scale that
measured the secondary education students’ acceptance of the
TPC emerged as a result of the study.
Technology acceptance
Tablet PC
Perceived usefulness
Perceived ease of use
Attitude toward using
Behavioural intention
Article Info
Received: 06.13.2014
Accepted: 11.05.2014
Online Published: 12.16.2014
DOI: 10.15390/EB.2014.3497
Introduction
Information and Communication Technologies are being used widely and actively in the
contemporary era. The countries also emphasize the importance of the technology components such
as the computers and mobile devices, and support the use of them. Just as in every other area, the aim
also in the field of education is to integrate the information and communication technologies into use.
Moreover, in order to transmit the knowledge and teach the skills the students will require to be able
to use these technologies effectively and actively, it is necessary to restructure the education in the
direction of information and communication technologies.
Changes occur in the schools and classrooms as a result of the interaction between technology
and education. Students are the main subject of being affected by these changes. Information
regarding the use of these technologies is transmitted to the students along the expansion of the
technologies; therefore they are expected to be literate in technology. However, it is vital that the
students are willing to use this technology and their belief, behavior and intentions towards
technology are positive. When looked at from this perspective, it is necessary that the students accept
the technology.
1 Sakarya University, Education Faculty, Computer and Educational Technology, Turkey, [email protected] 2 Sakarya University, Education Faculty, Primary Education, Turkey, [email protected] 3 Sakarya University, Education Faculty, Primary Education, Turkey, [email protected] 4 Sakarya University, Education Faculty, Computer and Educational Technology, Turkey, [email protected]
Education and Science 2014, Vol 39, No 176, 69-79 Ö. Canan Güngören, M. Bektaş, E. Öztürk & M. B. Horzum
70
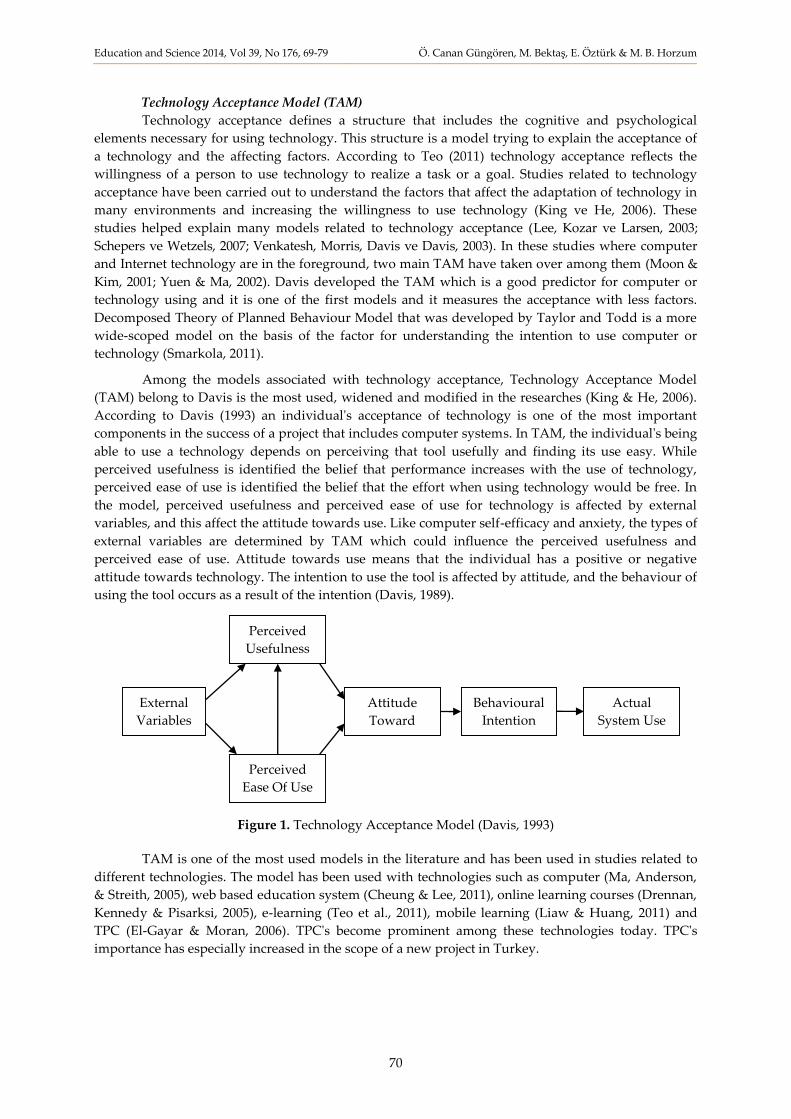
Technology Acceptance Model (TAM)
Technology acceptance defines a structure that includes the cognitive and psychological
elements necessary for using technology. This structure is a model trying to explain the acceptance of
a technology and the affecting factors. According to Teo (2011) technology acceptance reflects the
willingness of a person to use technology to realize a task or a goal. Studies related to technology
acceptance have been carried out to understand the factors that affect the adaptation of technology in
many environments and increasing the willingness to use technology (King ve He, 2006). These
studies helped explain many models related to technology acceptance (Lee, Kozar ve Larsen, 2003;
Schepers ve Wetzels, 2007; Venkatesh, Morris, Davis ve Davis, 2003). In these studies where computer
and Internet technology are in the foreground, two main TAM have taken over among them (Moon &
Kim, 2001; Yuen & Ma, 2002). Davis developed the TAM which is a good predictor for computer or
technology using and it is one of the first models and it measures the acceptance with less factors.
Decomposed Theory of Planned Behaviour Model that was developed by Taylor and Todd is a more
wide-scoped model on the basis of the factor for understanding the intention to use computer or
technology (Smarkola, 2011).
Among the models associated with technology acceptance, Technology Acceptance Model
(TAM) belong to Davis is the most used, widened and modified in the researches (King & He, 2006).
According to Davis (1993) an individual's acceptance of technology is one of the most important
components in the success of a project that includes computer systems. In TAM, the individual's being
able to use a technology depends on perceiving that tool usefully and finding its use easy. While
perceived usefulness is identified the belief that performance increases with the use of technology,
perceived ease of use is identified the belief that the effort when using technology would be free. In
the model, perceived usefulness and perceived ease of use for technology is affected by external
variables, and this affect the attitude towards use. Like computer self-efficacy and anxiety, the types of
external variables are determined by TAM which could influence the perceived usefulness and
perceived ease of use. Attitude towards use means that the individual has a positive or negative
attitude towards technology. The intention to use the tool is affected by attitude, and the behaviour of
using the tool occurs as a result of the intention (Davis, 1989).
Figure 1. Technology Acceptance Model (Davis, 1993)
TAM is one of the most used models in the literature and has been used in studies related to
different technologies. The model has been used with technologies such as computer (Ma, Anderson,
& Streith, 2005), web based education system (Cheung & Lee, 2011), online learning courses (Drennan,
Kennedy & Pisarksi, 2005), e-learning (Teo et al., 2011), mobile learning (Liaw & Huang, 2011) and
TPC (El-Gayar & Moran, 2006). TPC's become prominent among these technologies today. TPC's
importance has especially increased in the scope of a new project in Turkey.
External
Variables
Perceived
Usefulness
Perceived
Ease Of Use
Behavioural
Intention
Actual
System Use
Attitude
Toward
Using
Education and Science 2014, Vol 39, No 176, 69-79 Ö. Canan Güngören, M. Bektaş, E. Öztürk & M. B. Horzum
71
Turkey has started an application named FATIH to increase the technology ownership rates
and ICT use and to make education of good quality. In the scope of this FATIH project, there will be a
laptop, a smart board, TPC's for each students and Internet connection in every classroom (MEB,
2012). It is said that educational system will be changed by almost all technologies related to
education, and these tools will replace the black board, book and notebook trio. However, this has not
been possible in any technology yet (Şimşek, 2009). Same words have been spoken for this effect to
occur through TPCs. That technology needs to be accepted in daily life and in educational context for
the fact that TPC and the other technologies become dominant applications like board, book and
notebook (Davis, 1989).
TPC and TPC Acceptance
TPCs have similarities with other computers and while they are advantageous for their
functionality, ease of use, interaction, touch screen and appropriate softwares, they also can be
disadvantageous and limited in using the productivity tools (Mock, 2004). These advantages helped
the TPCs to be listed as one of the tools to be potentially used in the education system. The positive
effect of the TPCs on the performance (Pryor & Bauer, 2008, Enriquez, 2010) interaction (Koile &
Singer, 2006), communication (Galligan, Hobohm & Loch, 2012), class dynamics, teaching
effectiveness and student learning (Rogers & Cox, 2008), group cooperation (Ellington, Wilson &
Nugent, 2011) and problem solving skills (Gök, 2012) ensured the wide use of these tools. The
acceptance of the TPCs gains importance for the effective reflection of the benefits that arise by the use
of the TPCs.
When examined the researches related to TPC acceptance, there are studies at university level
in which the TPC acceptance is examined with Unified Theory of Acceptance and Use of Technology.
In these studies, it was found that UTAUT model predicted 267 students' TPC acceptance
significantly. In this research, self-efficacy, attitude towards using technology and anxiety were found
as the predictor of behavioural intention. The strongest of these variables was the attitude towards
using technology (El-Gayar & Moran, 2006). A similar model was used in the study where similar
results was found in 367 higher education students by Moran, Hawkes, and El-Gayar (2010). Although
a different model was preferred in another study, similar results were obtained, and the model
explained students' acceptance of TPC in educational environments in a good way. Again, attitude
towards technology was found as the most effective variable (El-Gayar, Moran & Hawkes, 2011). In
another study conducted with teacher candidates, Cuhadar (2014) has concluded that there is a
positive attitudes and intention towards the use of TPC in spite of the negative effects of software,
hardware and communication over the teacher candidates’ acceptance of TPC.
In another research, tablet PC acceptance in engineering faculty was examined in two stages.
As a result of the research, it was found that tablet PC is more useful and easier to use in the first stage
than the second one. The main reason for this can be considered that self-efficacy perceptions of the
students in the second stage towards tablet PC were lower than the students in the first stage. Most of
the students who were in the first stage told that they did not have problem while learning to use
tablet PC and intended to use it for educational reasons at the class (Toto, Lim, Nguyen, Zappe &
Litzinger, 2008).
Ruyter (2014) examined the primary students’ acceptance of TPC in her study. As a result of
this study, students were observed to exhibit a positive attitude toward TPC. In addition, it has been
expressed that the acceptance of TPC increased when students choose their own computer programs
according to the their preferences and characteristics for TPC. E-books were also significant impact on
the acceptance of TPC within study (Ruyter, 2014).
Education and Science 2014, Vol 39, No 176, 69-79 Ö. Canan Güngören, M. Bektaş, E. Öztürk & M. B. Horzum
72
When the previous studies are examined, it is seen that the students’ acceptance of the TPCs is
important in regards of their use of the TPCs. With the light of the changes that are performed in the
field of education in Turkey, it can be stated that the TPCs hold an important place in the education
system, therefore the acceptance of the TPCs gains importance. With the initiation of TPC use in the
education system, the literature in this field was analyzed and it was seen that a scale for examining
the students’ acceptance of the TPCs was non-existent, and as a result the aim was to develop a scale
for the evaluation of the students’ acceptance of the TPCs with taking the technology acceptance
model as the base.
Method
This research was conducted in order to develop a scale about the high school students’
acceptance of the TPCs . The acceptance of TPC scale is developed in this scope.
Participants
The participants of the research for developing the acceptance of TPC scale consisted of 400
ninth grade students in a variety of high schools located in the city center of Sakarya. 216 (54%) of the
students are female while 184 (46%) are male. The students are between the ages of 14-16, while most
of them are 15 years old.
Instrument
The acceptance of TPC scale (ATPS) is developed by the researchers by taking Davis’s
technology acceptance model as a base. There are four dimensions in this model. These dimensions,
which are identical to those of the technology acceptance model, are perceived benefit, perceived ease
of use, and behaviour towards usage and intention towards usage. During the development of the
scale, the researches reviewed the literature in this field, elicited items appropriate for each dimension
and made the appropriate changes to the items to suit them to the TPC use. The item pool created by
the researchers rendered 5 items in the first three factors and 3 items in the last factor. 5 Point Likert
scale was used for the participation level of the item pool and the degrees were identified as “Totally
Agree (5), Agree (4), Indecisive (3), Disagree (2), Totally Disagree (1)”. The validity-reliability studies
followed this process. The scale is presented in Appendix 1.
Processes
The extent, appearance and structure validity were examined in order to complete the validity
studies of the scale. Academicians from the fields of computer and instructional technologies,
assessment and evaluation, development psychology, and Turkish language were selected as the
experts to receive the scale for the extent and appearance validity. The four experts examined the
items and suggested one of the items in the behaviour towards usage dimension to be removed and
four items consisting of one item in each dimension, to be changed. All of the suggestions emphasized
by the experts during the expert examination were applied to the items and one item was removed
from the scale. The scale consisted of a total 17 items after the extent and appearance validity.
The structure validity and reliability studies followed this process. In the structure validity of
the scale, exploratory factor analysis (EFA) was used to examine the structure and confirmatory factor
analysis (CFA) was used to confirm this structure. The scale was distributed to 450 students and a
total of 408 of them returned. 8 of these were disqualified due to the fact that only one participation
level was chosen. In addition, if any of the items of the scale was left blank, this data were excluded
from the study. Ultimately the process was applied to the data collected from the 400 high school
students. This data was divided into two halves and EFA and CFA analyses were performed on the
200 data for each, with two different sets. In addition, the relation between the factors forming the
scale was examined. SPSS 13.0 was used for EFA and correlation, while Lisrel 8.54 software was used
for the CFA.
Education and Science 2014, Vol 39, No 176, 69-79 Ö. Canan Güngören, M. Bektaş, E. Öztürk & M. B. Horzum
73
Results
In the study, EFA was performed through the data of the first set of 200 students and CFA
was executed through the second set of 200 students and in the end, the findings related to reliability
were presented in the set of the total 400 students. According to Worthington and Whittaker (2006),
EFA and CFA must be performed in different samples. Therefore, a group of 400 students were
randomly divided into two groups, EFA analysis was performed in a group, CFA was performed in
the other group.
Results From EFA
EFA was performed with the 17 items in the ATPS. The Kaiser-Meyer-Olkin (KMO) value was
used in the AFA in order to test the sufficiency of the sample and Bartlett’s Sphericity value was used
to examine the appropriateness of the data with the factor analysis. The KMO value was found to be
.86 and as a result of the Bartlett test, a statistically significant difference (χ2 =1692.037, p.=.000) was
seen. In the light of these values, it was seen that EFA can be applied to these data. The 17 items of the
scale were taken into principal components analysis while setting the factor amount to 4 and
performing varimax (25) axis rotation.
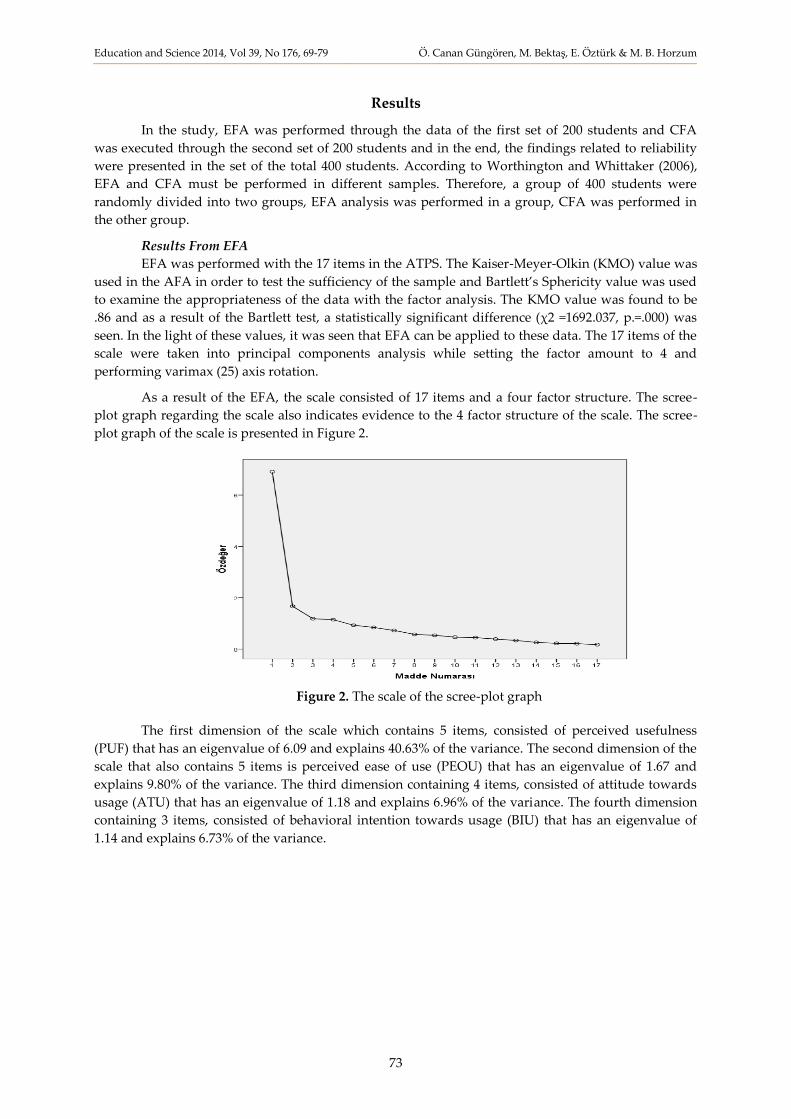
As a result of the EFA, the scale consisted of 17 items and a four factor structure. The scree-
plot graph regarding the scale also indicates evidence to the 4 factor structure of the scale. The scree-
plot graph of the scale is presented in Figure 2.
Figure 2. The scale of the scree-plot graph
The first dimension of the scale which contains 5 items, consisted of perceived usefulness
(PUF) that has an eigenvalue of 6.09 and explains 40.63% of the variance. The second dimension of the
scale that also contains 5 items is perceived ease of use (PEOU) that has an eigenvalue of 1.67 and
explains 9.80% of the variance. The third dimension containing 4 items, consisted of attitude towards
usage (ATU) that has an eigenvalue of 1.18 and explains 6.96% of the variance. The fourth dimension
containing 3 items, consisted of behavioral intention towards usage (BIU) that has an eigenvalue of
1.14 and explains 6.73% of the variance.
Education and Science 2014, Vol 39, No 176, 69-79 Ö. Canan Güngören, M. Bektaş, E. Öztürk & M. B. Horzum
74
The total eigenvalue of the ATPS as a result of the EFA is 10.08 and the total amount of of
variance it explains is 64.12%. It is seen that the variance explained by the scale states that it measured
the feature sufficiently. As a result, the scale was finalized as consisting of 17 items and a structure
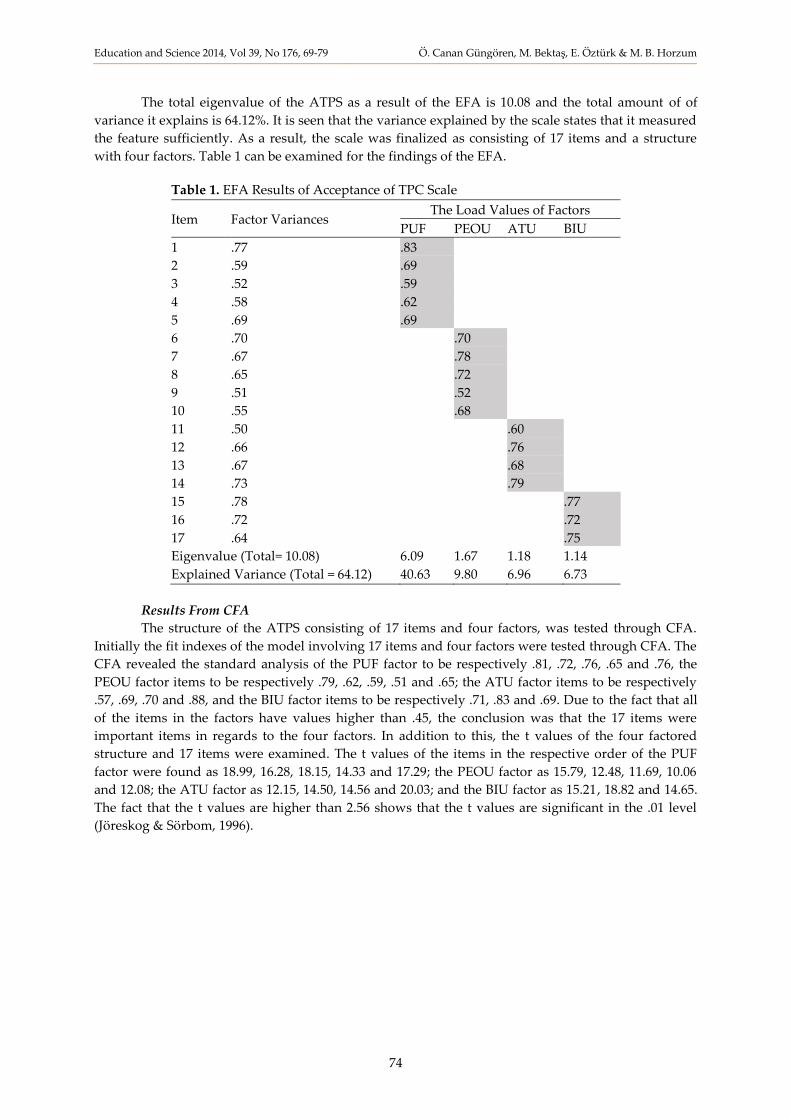
with four factors. Table 1 can be examined for the findings of the EFA.
Table 1. EFA Results of Acceptance of TPC Scale
Item Factor Variances The Load Values of Factors
PUF PEOU ATU BIU
1 .77 .83
2 .59 .69
3 .52 .59
4 .58 .62
5 .69 .69
6 .70 .70
7 .67 .78
8 .65 .72
9 .51 .52
10 .55 .68
11 .50 .60
12 .66 .76
13 .67 .68
14 .73 .79
15 .78 .77
16 .72 .72
17 .64 .75
Eigenvalue (Total= 10.08) 6.09 1.67 1.18 1.14
Explained Variance (Total = 64.12) 40.63 9.80 6.96 6.73
Results From CFA
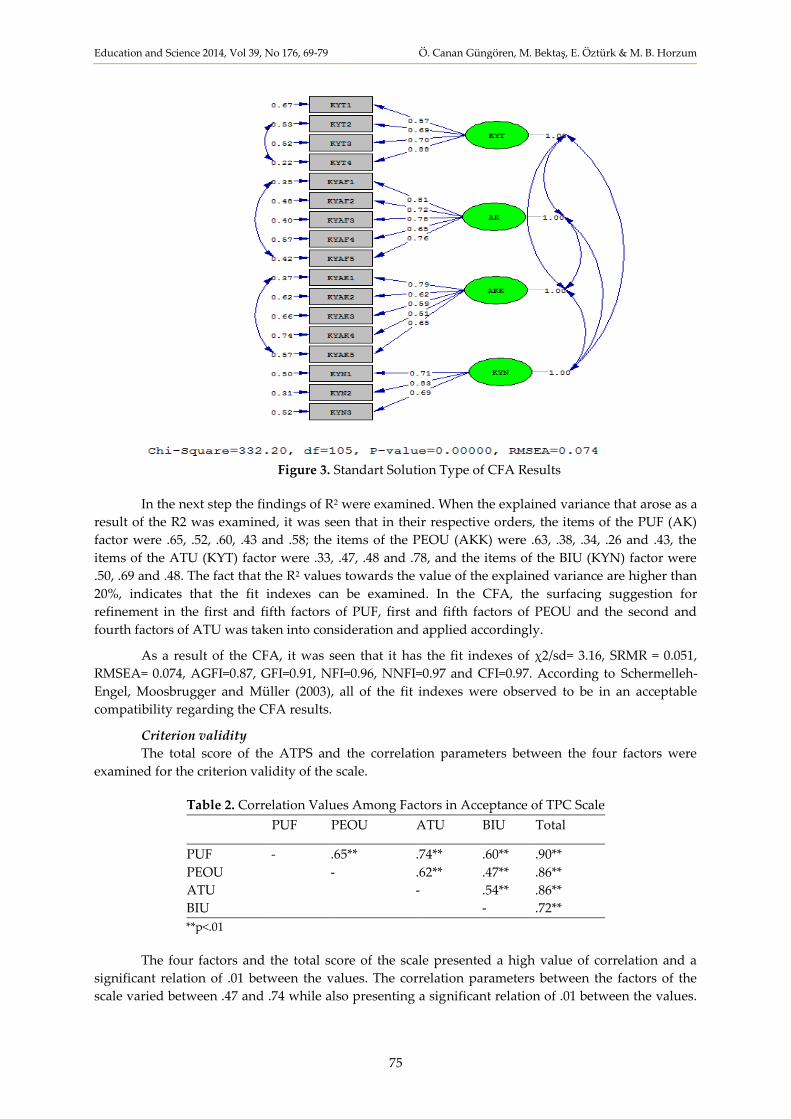
The structure of the ATPS consisting of 17 items and four factors, was tested through CFA.
Initially the fit indexes of the model involving 17 items and four factors were tested through CFA. The
CFA revealed the standard analysis of the PUF factor to be respectively .81, .72, .76, .65 and .76, the
PEOU factor items to be respectively .79, .62, .59, .51 and .65; the ATU factor items to be respectively
.57, .69, .70 and .88, and the BIU factor items to be respectively .71, .83 and .69. Due to the fact that all
of the items in the factors have values higher than .45, the conclusion was that the 17 items were
important items in regards to the four factors. In addition to this, the t values of the four factored
structure and 17 items were examined. The t values of the items in the respective order of the PUF
factor were found as 18.99, 16.28, 18.15, 14.33 and 17.29; the PEOU factor as 15.79, 12.48, 11.69, 10.06
and 12.08; the ATU factor as 12.15, 14.50, 14.56 and 20.03; and the BIU factor as 15.21, 18.82 and 14.65.
The fact that the t values are higher than 2.56 shows that the t values are significant in the .01 level
(Jöreskog & Sörbom, 1996).
Education and Science 2014, Vol 39, No 176, 69-79 Ö. Canan Güngören, M. Bektaş, E. Öztürk & M. B. Horzum
75
Figure 3. Standart Solution Type of CFA Results
In the next step the findings of R2 were examined. When the explained variance that arose as a
result of the R2 was examined, it was seen that in their respective orders, the items of the PUF (AK)
factor were .65, .52, .60, .43 and .58; the items of the PEOU (AKK) were .63, .38, .34, .26 and .43, the
items of the ATU (KYT) factor were .33, .47, .48 and .78, and the items of the BIU (KYN) factor were
.50, .69 and .48. The fact that the R2 values towards the value of the explained variance are higher than
20%, indicates that the fit indexes can be examined. In the CFA, the surfacing suggestion for
refinement in the first and fifth factors of PUF, first and fifth factors of PEOU and the second and
fourth factors of ATU was taken into consideration and applied accordingly.
As a result of the CFA, it was seen that it has the fit indexes of χ2/sd= 3.16, SRMR = 0.051,
RMSEA= 0.074, AGFI=0.87, GFI=0.91, NFI=0.96, NNFI=0.97 and CFI=0.97. According to Schermelleh-
Engel, Moosbrugger and Müller (2003), all of the fit indexes were observed to be in an acceptable
compatibility regarding the CFA results.
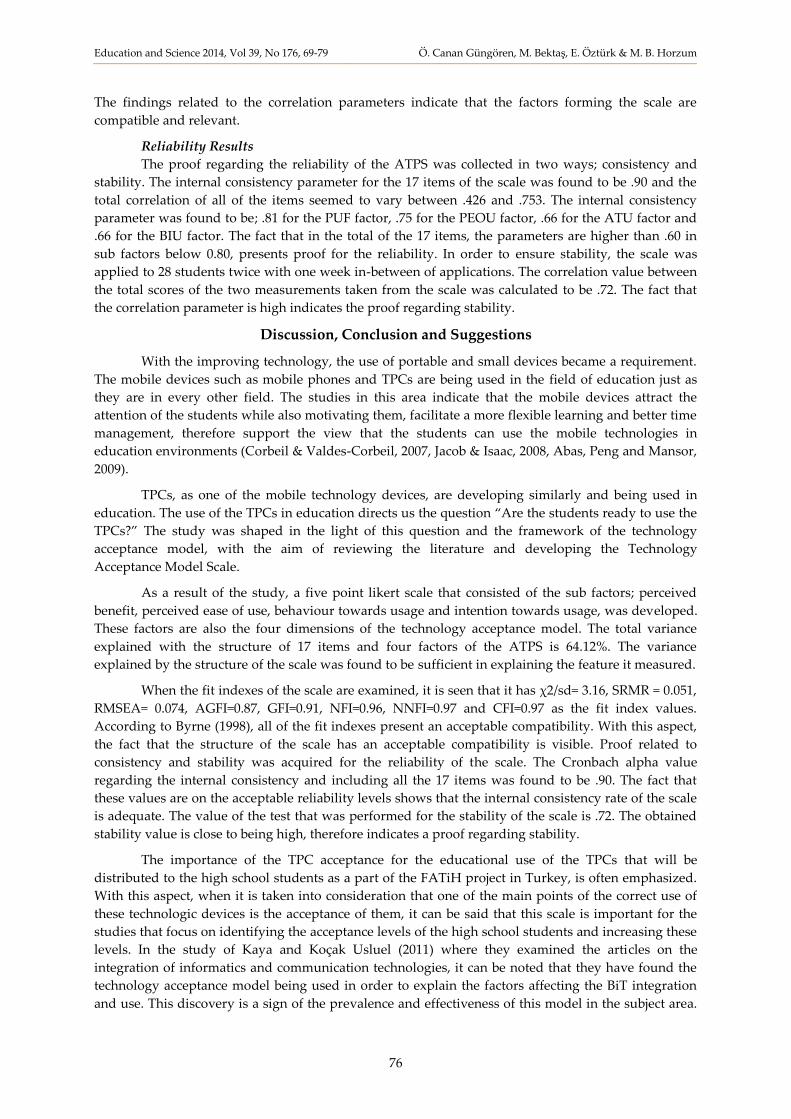
Criterion validity
The total score of the ATPS and the correlation parameters between the four factors were
examined for the criterion validity of the scale.
Table 2. Correlation Values Among Factors in Acceptance of TPC Scale
PUF PEOU ATU BIU Total
PUF - .65** .74** .60** .90**
PEOU - .62** .47** .86**
ATU - .54** .86**
BIU - .72**
**p<.01
The four factors and the total score of the scale presented a high value of correlation and a
significant relation of .01 between the values. The correlation parameters between the factors of the
scale varied between .47 and .74 while also presenting a significant relation of .01 between the values.
Education and Science 2014, Vol 39, No 176, 69-79 Ö. Canan Güngören, M. Bektaş, E. Öztürk & M. B. Horzum
76
The findings related to the correlation parameters indicate that the factors forming the scale are
compatible and relevant.
Reliability Results
The proof regarding the reliability of the ATPS was collected in two ways; consistency and
stability. The internal consistency parameter for the 17 items of the scale was found to be .90 and the
total correlation of all of the items seemed to vary between .426 and .753. The internal consistency
parameter was found to be; .81 for the PUF factor, .75 for the PEOU factor, .66 for the ATU factor and
.66 for the BIU factor. The fact that in the total of the 17 items, the parameters are higher than .60 in
sub factors below 0.80, presents proof for the reliability. In order to ensure stability, the scale was
applied to 28 students twice with one week in-between of applications. The correlation value between
the total scores of the two measurements taken from the scale was calculated to be .72. The fact that
the correlation parameter is high indicates the proof regarding stability.
Discussion, Conclusion and Suggestions
With the improving technology, the use of portable and small devices became a requirement.
The mobile devices such as mobile phones and TPCs are being used in the field of education just as
they are in every other field. The studies in this area indicate that the mobile devices attract the
attention of the students while also motivating them, facilitate a more flexible learning and better time
management, therefore support the view that the students can use the mobile technologies in
education environments (Corbeil & Valdes-Corbeil, 2007, Jacob & Isaac, 2008, Abas, Peng and Mansor,
2009).
TPCs, as one of the mobile technology devices, are developing similarly and being used in
education. The use of the TPCs in education directs us the question “Are the students ready to use the
TPCs?” The study was shaped in the light of this question and the framework of the technology
acceptance model, with the aim of reviewing the literature and developing the Technology
Acceptance Model Scale.
As a result of the study, a five point likert scale that consisted of the sub factors; perceived
benefit, perceived ease of use, behaviour towards usage and intention towards usage, was developed.
These factors are also the four dimensions of the technology acceptance model. The total variance
explained with the structure of 17 items and four factors of the ATPS is 64.12%. The variance
explained by the structure of the scale was found to be sufficient in explaining the feature it measured.
When the fit indexes of the scale are examined, it is seen that it has χ2/sd= 3.16, SRMR = 0.051,
RMSEA= 0.074, AGFI=0.87, GFI=0.91, NFI=0.96, NNFI=0.97 and CFI=0.97 as the fit index values.
According to Byrne (1998), all of the fit indexes present an acceptable compatibility. With this aspect,
the fact that the structure of the scale has an acceptable compatibility is visible. Proof related to
consistency and stability was acquired for the reliability of the scale. The Cronbach alpha value
regarding the internal consistency and including all the 17 items was found to be .90. The fact that
these values are on the acceptable reliability levels shows that the internal consistency rate of the scale
is adequate. The value of the test that was performed for the stability of the scale is .72. The obtained
stability value is close to being high, therefore indicates a proof regarding stability.
The importance of the TPC acceptance for the educational use of the TPCs that will be
distributed to the high school students as a part of the FATiH project in Turkey, is often emphasized.
With this aspect, when it is taken into consideration that one of the main points of the correct use of
these technologic devices is the acceptance of them, it can be said that this scale is important for the
studies that focus on identifying the acceptance levels of the high school students and increasing these
levels. In the study of Kaya and Koçak Usluel (2011) where they examined the articles on the
integration of informatics and communication technologies, it can be noted that they have found the
technology acceptance model being used in order to explain the factors affecting the BiT integration
and use. This discovery is a sign of the prevalence and effectiveness of this model in the subject area.
Education and Science 2014, Vol 39, No 176, 69-79 Ö. Canan Güngören, M. Bektaş, E. Öztürk & M. B. Horzum
77
With this aspect, in the process of the acceptance of the TPCs, the significance of a measurement tool
related to this model comes to light. It can be stated that the acceptance of the TPCs can be measured
effectively and reliably with the help of the scale that was developed within the scope of this study,
while the scale is also thought to be useful for overcoming the deficiency of a measurement tool in this
field. These measurements are expected to bring standardization to the future measurements around
the country, and also ensure the raise of equality of opportunities.
Comparison studies related to the high school students around the country can be conducted
with the help of the acceptance of TPC scale that is a product of this research. In the forthcoming
studies, whether the scale has a similar structure in the primary school or middle school students can
be researched. In addition, future studies can be performed with the help of the data collected in this
study, in order to identify whether the TPC acceptance shows any significant difference according to
different types of high schools, gender, age, demographic info such as the region the students attend
to school, individual differences such as learning styles, approaches, strategies and preferences. On
the other hand, this scale can be used to compare models or examine the modelings that measure the
external variables that affect the TPC acceptance of the primary, medium or high school students, such
as self-sufficiency, anxiety, reliance, experience, and entertainment. Again, studies with this scale can
be performed in order to ensure the planning of educational activities and identify the information,
skill and affective features necessary to be taught to the students for the integration of these devices.
Moreover, further studies can be performed in order to outline the importance of the TPC acceptance
in education within the framework of the FATiH project, and also develop classes that will include the
use of these devices, while experiencing different activities and collecting data of the effectiveness and
productivity of these activities.
There are some limitations to this study. The first limitation of the study was that external
criterion validity was not evaluated within the scope of the validity studies. In subsequent works for
external criterion validity, in order to ensure the external validity criteria of the measuring tool an
instrument dealing with gender, age and technology acceptance model for personal computer may be
referred to external criterion validity. Secondly, students sampling from different types of high
schools such as social sciences, science education, Anatolian teacher training and vocational high
schools has not been taken to the study. In future researches, this work can be carried out by taking
samples from these schools.
Education and Science 2014, Vol 39, No 176, 69-79 Ö. Canan Güngören, M. Bektaş, E. Öztürk & M. B. Horzum
78
References
Abas, Z. W., Peng, C. L., & Mansor, N. (2009). A study on learner readiness for mobile learning at
Open University Malaysia. IADIS International Conference Mobile Learning, 2009, 26-28 Feb 2009,
pp. 151-157. Barcelona, Spain.
Byrne, B. M. (1998). Structural equation modeling with LISREL, PRELIS and SIMPLIS: Basic concepts,
applications, and programmings. London: Lawrence Erlbaum Assocatiates, Publishers.
Cheung, C. M. K., & Lee, M. K. O. (2011). Exploring the gender differences in student acceptance of an
internet-based learning medium. In T. Teo (Ed.), Technology acceptance in education: Research and
issues (pp. 183-199). Boston: Sense Publishers.
Corbeil, J. R., & Valdes-Corbeil, M. E. (2007). Are you ready for mobile learning? Educase Quarterly, 2,
51-58.
Çuhadar, C. (2014). Information Technologies Pre-service Teachers’ Acceptance of Tablet PCs as an
Innovative Learning Tool. Educational Sciences: Theory & Practice, 14(2), 741-753.
Davis, F. D. (1989). Perceived usefulness, perceived ease of use and user acceptance of information
technology. MIS Quarterly, 13(3), 319-339.
Davis, F. D. (1993). User acceptance of information technology: System characteristics, user
perceptions and behavioral impacts. International Journal of Man-Machine Studies, 38(3), 475-487.
Drennan, J., Kennedy, J., & Pisarksi, A. (2005). Factors affecting student attitudes toward flexible
online learning in management education. The Journal of Educational Research, 98(6), 331-340.
El-Gayar, O. F., & Moran, M. (2006). College students’ acceptance of tablet PCs: An application of the
UTAUT model. Dakota State University, 2845-2850. Retrieved October 28, 2012 from
http://www.homepages.dsu.edu/moranm/Research/ Publications/DSI06-RIP-TAM-UTAUT.pdf.
El-Gayar, O., Moran, M., & Hawkes, M. (2011). Students' acceptance of tablet PCs and implications for
educational institutions. Educational Technology & Society, 14(2), 58-70.
Ellington, A. J., Wilson, J. H., & Nugent, J. S. (2011). Use of tablet PCs to enhance instruction and
promote group collaboration in a course to prepare future mathematics specialists. Mathematics
and Computer Education, 45(2), 92-105.
Enriquez, A. G. (2010). Enhancing student performance using tablet computers. College Teaching, 58(3),
77-84.
Galligan, L., Hobohm, C., & Loch, B. (2012). Tablet technology to facilitate improved interaction and
communication with students studying mathematics at a distance. Journal of Computers in
Mathematics and Science Teaching, 31(4), 363-385.
Gök, T. (2012). Real-time assessment of problem-solving of physics students using computer-based
technology. Hacettepe University Journal of Education, 43, 210-221.
Jacob, S. M., & Issac, B. (2008). The mobile devices and its mobile learning usage analysis. In
Proceedings of the International MultiConference of Engineers and Computer Scientists-IMECS, 19-21
March, 2008, Hong Kong, (Vol. 1, pp. 19-21), Prentice Hall.
Kaya, G., & Koçak Usluel, Y. (2012). Öğrenme-öğretme süreçlerinde BİT entegrasyonunu etkileyen
faktörlere yönelik içerik analizi. Buca Eğitim Fakültesi Dergisi, 31, 48-67.
King, W. R., & He, J. (2006). A meta-analysis of the technology acceptance model. Information &
Management, 43(6), 740-755.
Koile, K., & Singer, D. (2006). Development of a tablet-PC-based system to increase instructor-student
classroom interactions and student learning. D. Berque, J. Prey, and R. Reed (Edts). The impact of
pen-based technology on education: Vignettes, evaluations, and future directions. USA: Purdue
University Press.
Lee, Y., Kozar, K. A., & Larsen, K. R. (2003). The technology acceptance model: Past, present, and
future. Communications of the Association for Information Systems, 12, 752-780.
Education and Science 2014, Vol 39, No 176, 69-79 Ö. Canan Güngören, M. Bektaş, E. Öztürk & M. B. Horzum
79
Liaw, S. S. L., & Huang, H. M. (2011). Exploring learners’ acceptance toward mobile learning. In T. Teo
(Ed.), Technology acceptance in education: Research and issues (pp. 145-157). Boston: Sense Publishers.
Ma, W. W. K., Anderson, R., & Streith, K. O. (2005). Examining user acceptance of computer
technology: An empirical study of student teachers. Journal of Computer Assisted Learning, 21, 387-
395.
MEB, (2012). Milli Eğitim Bakanlığı Fatih Projesi [Ministry of National Education FATIH Project].
Retrieved October 28, 2012 from http://www.meb.gov.tr.
Mock, K. (2004). Teaching with tablet PC's. Journal of Computing Sciences in Colleges, 20(2), 17-27.
Moon, J. W., & Kim, Y. G. (2001). Extending the TAM for a world wide web context. Information
&Management, 38, 217-230.
Moran, M., Hawkes,M., & El-Gayar, O. (2010). Tablet personal computer integration in higher
education: Applying the unified theory of acceptance and use technology model to understand
supporting factors. Journal of Educational Computing Research, 42(1), 79-101.
Pryor, G., & Bauer, V. (2008). Building a better biology lab? Testing tablet PC technology in a core
laboratory course. Journal of College Science Teaching, 38(2), 44-48.
Ruyter, L. P. (2014). Using the tablet PC for education? The adoption process of primary schools and
children’s acceptance. (Doktoral thesis) University of Twente, Behavioral Science/
Communication Studies.
Schepers, J., & Wetzels, M. (2007). A meta-analysis of the technology acceptance model: Investigating
subjective norm and moderation effects. Information & Management, 44(1), 90-103.
Schermelleh-Engel, K., Moosbrugger, H., & Müller, H. (2003). Evaluating the fit of structural equation
models: tests of significance and descriptive goodness-of-fit measures. Methods of Psychological
Research Online, 8(2), 23-74.
Smarkola, C. (2011). Mixed-methodological technology adoption study: cognitive belief-behavioural
model assessments in predicting computer usage factors in the classroom. In T. Teo (Ed.),
Technology Acceptance in Education: Research and Issues (pp. 9-41). Boston: Sense Publishers.
Şimşek A. (2009). Öğretim Tasarımı [Instructional Design]. Ankara: Nobel Yayıncılık.
Teo, T. (2011). Technology acceptance research in education. In T. Teo (Ed.), Technology Acceptance in
Education: Research and Issues (pp. 1-5). Boston: Sense Publishers.
Teo, T., Luan, S., Thammetar, T., & Chattiwat, W. (2011). Assessing e-learning acceptance by
university students in Thailand. Australasian Journal of Educational Technology, 27(8), 1356-1368.
Toto, R., Lim, K. Y., Nguyen, H., Zappe, S., & Litzinger, T. (2008, October). Acceptance of Tablet PC
technology by engineering faculty. In 38th Annual Frontiers in Education Conference (pp. S4D-7),
IEEE. October 22-25, 2008, Saratoga Springs, NY.
Venkatesh, V., Morris, M. G., Davis, G. B., & Davis, F. D. (2003). User acceptance of information
technology: Toward a unified view. MIS quarterly, 27(3), 425-478.
Worthington, R. L., & Whittaker, T. A. (2006). Scale development research a content analysis and
recommendations for best practices. The Counseling Psychologist, 34(6), 806-838.
Yuen, A. H. K., & Ma, W. W. K. (2002). Gender differences in teacher computer acceptance. Journal of
Technology and Teacher Education, 10(3), 365-382.


