Embed Size (px)
Citation preview

Electronic copy available at: http://ssrn.com/abstract=1934347
1
Accountability assessment of not-for-profits: A zoo story
Jill Hooks# and Anne de Bruin*
June 20, 2011
Abstract
Not-for-profit organisations that are public benefit entities are subject to public accountability. They have an obligation to provide financial and non-financial information in sufficient detail for stakeholders to gain an understanding of their objectives and performance. This paper evaluates a ‘zoo story’. It examines the annual report of the Wellington Zoo 2009/10 to determine how well the story is told and whether stakeholder expectations of accountability are being met. The annual report of Perth Zoo (2009/10) is also used as a basis of comparison.
________________________
# Correspondence Author, School of Accountancy (Albany), and Social Innovation and Entrepreneurship Research Centre (SIERC), Massey University, Private Bag 102904, NSMC, Auckland 0745, New Zealand. Email: [email protected] * School of Economics and Finance (Albany), and Social Innovation and Entrepreneurship Research Centre (SIERC), Massey University, Private Bag 102904, NSMC, Auckland 0745, New Zealand.

Electronic copy available at: http://ssrn.com/abstract=1934347
2
1. Introduction
It is estimated that there are 90,000 not-for-profit organisations in New Zealand which received
$356 million in donations from the public in 2005 (Cullen and Dunne, 2006). The Wellington
Zoo is a not-for-profit entity and depends on Wellington City Council for almost half of its
operating income. This relationship imposes accountability obligations as does the Zoo’s
registration as a Charitable Trust. It is governed by the Wellington Zoo Trust which was
established in 2003 by Wellington City Council. Prior to that time the Zoo operated as a council
business unit (from 1906). The Zoo therefore is no longer a local government entity but rather a
public benefit entity. The New Zealand Institute of Chartered Accountants (NZICA) defines
public benefit entities as:
“… reporting entities whose primary objective is to provide goods and services for
community or social benefit and where any equity has been provided with a view to
supporting that primary objective rather than for a financial return to equity holders” (NZ
IAS 1, para.11.2).
Thus Wellington Zoo is subject to public accountability and therefore has an obligation to
provide information on managements’ performance in respect of how wisely the resources
provided have been used.
Public accountability is based on a stewardship relationship in which the Zoo is a steward of the
resources provided to it by sponsors, the community and the council. As stated by Coy, Fischer
and Gordon (2001, p.8) “public accountability refers to the public right to know about the
condition and performance of the organisation under the accountor’s charge”. This means that
both financial and non-financial information should be provided in sufficient detail for interested
parties to gain an understanding of the objectives and performance of the zoo. This stewardship
responsibility of management for the use of public funds encompasses all aspects of performance
as well as the security and development of the council’s and the public’s investment of capital.
Records and reports should therefore be designed to properly account for the financial activities
(Ijiri, 1983). In this respect, Christensen and Ebrahim (2006) identify two forms of
accountability – upwards accountability to the various stakeholders that the entity answers to,

Electronic copy available at: http://ssrn.com/abstract=1934347
3
and downwards accountability to those that are impacted by the entity. In the case of
Wellington Zoo, upwards accountability is to the council and to other financial providers and is
usually focused on the use of funds. Downwards accountability is to the public for high
standards of asset management which includes governance, performance and development, and
maintenance of its mission (Ebrahim, 2010).
In a broad sense, the Zoo is accountable, for all aspects of its performance, to those who are
affected by its operation. There is an implied public right to know about the performance of the
organisation (Coy et al, 2001). Therefore, accounting reports should provide information to
satisfy the information needs of “those groups without whose support the organisation would
cease to exist” (Freeman, 1984, p31). With reference to charities, interested groups (loosely
termed, stakeholders) have been identified by a number of researchers including Kilcullen,
Hancock and Izan (2008) and Kreander, Beattie and McPhail (2009) and generally include
resource providers such as funders, donors, lenders and creditors, government bodies including
local councils, the public, and beneficiaries. The main purpose of this accountability is “to
provide mechanisms through which all those affected by an organisation’s actions can demand
an account from the managers of that organisation regarding how and why the organisation has
acted in the manner it has” (Unerman and O’Dwyer, 2006, p.351) and to “manage its
accountabilities to its stakeholders and to the public in a way that is timely, transparent and
understandable” (Charities Commission, 2009, p.3).
Mulgan (1997) contends that a key component of an accountability relationship is a reporting
function and Deegan (2002) identifies disclosure policy as an important mechanism through
which corporations are able to influence society’s perception of the entity. There have been calls
for greater accountability from the not-for-profit sector (Kreander et al., 2009; Hooper, Sinclair,
Hui and Mataira, 2008; Kilcullen, Hancock and Izan, 2007). We examine the accountability
reporting of a not-for-profit, public-funded entity, Wellington Zoo. Accountability is particularly
important for this organisation as it receives approximately $6m per annum in public funding and
therefore needs to maintain the confidence and financial support of the public by giving an
account of its activities. As the annual report is really the only comprehensive statement of
stewardship available to the public we examine this document for the financial year 2009/10 in

4
order to assess how well Wellington Zoo is fulfilling its accountability obligations to a wide
group of stakeholders. We compare this report with the annual report of the Western Australia
Zoological Parks Authority, which controls Perth Zoo, to compare and contrast performance
reporting of the two entities. In this study, Wellington Zoo Trust is referred to as “Wellington
Zoo” and Western Australia Zoological Parks Authority is referred to as “Perth Zoo”. Perth Zoo
has been chosen for the comparison, for the following reasons:
• Both zoos have similar objectives: Wellington aims to be the “the best little Zoo in the
world” (Trust Chair Report 2009/10) and Perth claims to be “Australia’s best small zoo”
(Perth Zoo website).
• Perth Zoo has a focus on sustainability and conservation which is similar to the vision of the
Wellington Zoo Trust.
• Both zoos have placed significant emphasis on veterinary services provided.
• The governance structure for Perth Zoo is different to that for Wellington Zoo. Perth Zoo is
administered by the Western Australian Zoological Parks Authority. The members of the
Authority are appointed by, and responsible to the Western Australia Minister for the
Environment. The Authority is an agent of the Crown, and is ultimately responsible to the
WA State Government.
• The Annual Report for Perth Zoo was available from the internet, and the amount of detail
provided in it overall was similar to that provided by the Wellington Zoo Trust Annual
Report. However, the content of the two reports was biased towards those areas which the
governing body and/or executive team considered to be most important.
In addition, some comparisons have been made between reporting disclosure for Wellington
Zoo, and for Auckland Zoo. Auckland Zoo was controlled by the Auckland City Council during
the period of this study. The information relevant to Auckland Zoo was derived, where it was
available, from the annual accounts for Auckland City.

5
2. Best practice reporting
There is currently no comprehensive reporting framework which specifically relates to not-for-
profit organisations (Ryan, Mack, Tooley and Irvine, 2010). However, the NZICA Public
Benefit Entity working group has prepared a financial reporting guide for not-for-profit entities
NZICA, 2007). This is, in part, based on the New Zealand Framework (2006) which is a
foundation document for the development of financial reporting standards. In terms of this
framework, accountability requires that an entity reflect the nature and dimensions of
performance that are relevant to the entity by:
(a) Identifying the objective and targets (financial or non-financial) normally established by
formal process; and
(b) Recognising, measuring and disclosing actual achievements in relation to these objectives
and targets (NZ Framework, para. 14.2).
To achieve this an entity would provide a range of non-financial information in addition to the
usual Statement of Financial Position (Balance Sheet), Statement of Financial Performance
(Statement of Comprehensive Income), Statement of Cash Flows, and Statement of Changes in
Equity required by NZ IAS 1, para. 8. Although a Statement of Service Performance is not
required for not-for-profit entities it is encouraged because of its usefulness in demonstrating
accountability to stakeholders. It generally shows:
• Inputs used by the entity;
• Desired outcomes;
• An explanation of rationale on which the entity has based its selection of activities; and
• A comparison of planned outputs to actual outputs (including performance measures)
(NZICA, 2007, p.74-77).
Hyndman (1990) and Khumawala and Gordon (1997) note that users find this service
information useful. Hyndman also identifies measures of efficiency and cost effectiveness as
important information items. In this respect, Bowman (2006) notes the importance of the
expenditure overheads ratio which relates expenditure overheads to revenue. De Mesa Graziano
(2006) includes prior year events and future prospects in the list of user needs. Mook, Quarter

6
and Richmond (2003) include social inputs and outputs and suggest that monetary values should
be assigned, if possible, including the value from the use of volunteers. Other expectations of
accountability disclosure include a description of outcomes which “refer to the state, condition,
impacts on, or consequences for the community, society, economy, or environment resulting
from the existence and operations of the reporting entity” (Controller and Auditor-General, 2008,
p.41).
Bird and Morgan-Jones (1981) find that stakeholders (including donors) are mainly interested in
average administration costs (including fund raising expenses), the profit/loss for the year, total
income and the composition of income, and asset structure. Khumawala and Gordon (1997)
add non-financial information about the purpose of the organisation, activities and
accomplishments, and programmes provided. Much of this information can be incorporated into
a Statement of Service Performance (mentioned above).
3. Research Method
The annual report of Wellington Zoo 2009/10 is assessed to determine how well the ‘zoo story’
is told and whether stakeholder expectations of accountability, as posited in the literature, are
being met. The annual report of Perth Zoo (2009/10) is used as a basis of comparison, not to
conduct a line-by-line analysis of each report but rather to ensure that all material issues
disclosed in the Perth Zoo report have an equivalent in the Wellington Zoo Annual Report.
4. Findings
The findings are discussed under headings that identify key reporting components of the annual
reports: non-current assets, operating revenues, operating expenses, volunteers, funds, Statement
of Service Performance, and social responsibility and environmental reporting.
4.1 Non-current Assets
The major component of non-current assets is Property, Plant and Equipment (PPE) and the
information about the operation of these assets is a key component of accountability. The Not-
For-Profit Financial Reporting Guide (NZICA, 2007) stipulates that the value of PPE should be

7
reviewed regularly for impairment (para.4.83). Donated PPE should be recorded at fair value,
capitalised and depreciated.
One of the major differences between Wellington Zoo and Perth Zoo is the information
available on non-current assets. The Wellington Zoo accounts record only $118,000 for Non-
Current Assets, of which Property, Plant and Equipment make up $82,000; the Perth Zoo
accounts record $48.1 million for Non-Current Assets, of which Land, Buildings, Infrastructure,
Plant, and Equipment make up $34.2 million. This difference arises because the Wellington zoo
assets (land, buildings, infrastructure and major items of plant) are vested in the Wellington City
Council, and are not “owned” by the Wellington Zoo Trust. It is therefore difficult to ascertain
the value of the zoo assets, because they are neither included in the accounts of the Wellington
Zoo Trust, nor identified separately in accounts published by the Wellington City Council.
The only assets relating to Wellington Zoo which are specifically identified in the accounts of
the Wellington City Council are Zoo Animals – at cost $500,000 (refer Wellington City Council
Annual Report 2009/10, p.176). Other non-current Zoo assets are presumably included in the
total of just over $6 billion of Wellington City Council owned assets under the heading Total
Property, Plant, and Equipment. However, assets specific to Wellington Zoo (apart from Zoo
Animals) are not identified separately. This treatment differs from the reporting of non-current
assets of other council-owned entities - the Civic Centre Complex, Library Collections, and Art
and Cultural Collections - where the accounts show specific values related to various assets.
The result is that the stakeholders are not able to ascertain the values attributed to Zoo assets, and
cannot make a judgement as to whether this investment aligns with their perception of ‘value for
money’. This is not a criticism of the Wellington Zoo Trust, but an observation that the split
between asset custody and zoo operations makes it more difficult to get a complete picture of the
zoo’s financial position.
The Wellington City Council is one of several local government organisations in New Zealand
which own zoo assets and/or manage zoo operations. During 2009/10 Auckland City Council
owned and managed the Auckland Zoo, and therefore the annual accounts of Auckland City

8
were analysed to ascertain whether the value of zoo property, plant and equipment were
separately disclosed.
The Auckland City annual accounts disclose two items only, relating to zoo assets. The first is an
estimate of net book value at 1 November 2010 for assets transferred to Regional Facilities
Auckland (a Council Controlled Organisation). The aggregate value of $778 million (Auckland
City Council Annual Report 2009/10, p. 211), comprises the following assets: Auckland Art
Gallery, Aotea Centre, Civic Theatre, Auckland Zoo, Vector Arena, Viaduct Events Centre, and
Western Springs.
The second disclosure relating to zoo assets (Auckland City Council Annual Report 2009/10, p.
140) is under the Statement of Accounting Policies, and states that “Zoo animals are valued at
$1, in line with international practice”.
Neither Auckland nor Wellington councils provide sufficient information to ascertain the value
of zoo property, plant, and equipment.
4.2 Operating revenues
Table 1 shows revenue sources for Wellington Zoo and Perth Zoo, as a proportion of total
operating revenues:
Table 1 Sources of Revenue
Revenue source Wellington Perth
Government appropriations/Council grants 49% 45%
Admissions 27% 31%
Membership (Perth Zoo Friends) * 4%
Commercial activities/Corporate income 8% 7%
Retail sales 4% 6%
Grants, donations, fundraising 12% 7%
TOTAL 100% 100%

9
ANNUAL INCOME 2009/10 $NZ 5.6m $A 21.1m
*Wellington Zoo has a similar programme (called Zoo Crew) which provides members with unlimited zoo entries and other discounts, for a one-off annual payment. However, the income from Zoo Crew membership is not disclosed separately.
Table 2 shows relative revenues from admissions, comparing Wellington Zoo and Perth
Zoo. While the catchment area of Perth Zoo is obviously much larger some useful
comparisons can be made.
Table 2 Admissions
Measure Wellington Perth
Population of region* 448,956 1,659,000
Revenue from admissions $1,483,000 $6,504,176
Number of visits 183,286 635,136
Average yield per visitor $8.09 $10.24
Annual visits per head of population 0.41 0.38
Admission price - adult $20.00 $21.00
Admission price - child $9.00 $10.50
* Data source: Wellington – Statistics NZ (2006 census): Perth – Australian Bureau of Statistics (2009).
The following observations have been derived from these figures:
• Both organisations require a similar proportion of assistance from their parent
organisations – Wellington City Council (49%) and Western Australian State
Government (45%) – to cover operating expenses and capital works programmes.
• Perth Zoo derives 35% of revenues from admissions and the ‘Zoo Friends’
programme, while the equivalent for Wellington is 27%.
• Wellington Zoo has been more successful at obtaining grants and donations from
parties independent of the parent organisation – 12% of total revenue was sourced
from grants and donations in 2009/10; the figure in 2008/09 was over 17%, including

10
one-off grants from the NZ Lottery Grants Board and NZ Community Trust. It is
noted that the ability of the Wellington Zoo Trust to access these funds may be
influenced by the fact that that it is a Charitable Trust, rather than being regarded as
an arm of local or state government.
• The greater proportion of revenue earned from admissions in Perth arises from the
fact that the average yield per visit in Perth is 27% higher than in Wellington. This is
partially explained by the fact that admission charges are higher. Other reasons
include the proportion of adult/child visits; the number of visits at discounted rates
(e.g. special promotions for combining zoo visits with using public transport,
promotions for National Children’s Day, Fathers’ Day, and Mothers’ Day); and
special school concessions.
• Offsetting the lower yield in Wellington somewhat is the fact that the number of visits
per head of population is greater. During the 2009/10 year, zoo visits in Wellington
represented 41% of the Wellington region’s population, while the equivalent figure
for Perth was only 38%.
• The population of Perth is 3.7 times greater than that of Wellington. This ratio is
mirrored almost exactly in the ratio of total revenues. The number of zoo visits
(proportionate to population) is higher for Wellington, although income from
admissions is proportionately lower than Perth, for the reasons given above. This
leads to the conclusion that Wellington Zoo performs remarkably well, given that it
has to perform a similar role to Perth, with much fewer resources; and given that the
amount of financial assistance from local government (on a pro rate basis) is only
slightly greater than that for Perth Zoo.
4.3 Operating expenses
The non-current assets of Wellington Zoo are vested in the Wellington City Council and
therefore only a small amount ($10,000) of depreciation is recorded in the zoo accounts. In
order to make a valid comparison with Perth Zoo, depreciation costs were eliminated from
both sets of accounts, and Asset Vesting Expenses were eliminated from Wellington’s

11
Statement of Comprehensive Income. The proportion of Operating Expenses (Cost of
Services) was then compared under five major headings shown in Table 3.
Table 3 Operating Expenses
Expense item Wellington Perth
Personnel 65% 65%
Direct costs (maintenance and operations)* 19% 16%
Cost of goods sold (retail shop) 2% 3%
Administration 12% 14%
Other 2% 2%
TOTAL 100% 100%
TOTAL OPERATING EXPENDITURE (EXCLUDING DEPRECIATION)
$NZ 5.1m $A 18.3m
*Includes utilities, materials and services.
The only significant difference between the two organisations is that the amount Wellington Zoo
spends on direct costs is slightly larger, and this is offset by a lower spend on administration.
However, the difference (2%) amounts to only $100,000, so may be explained by different
categorisation of costs between the two zoos. The total operating expenditure (excluding
depreciation) for Perth Zoo is 3.6 times greater than for Wellington Zoo, remarkably close to the
population ratio between the two cities. The conclusion from this comparison is that both
communities have committed to spend the same amount, per head of population, on zoo
facilities; although Wellington has a slight edge in minimising administration costs.
4.4 Volunteers
Volunteer contributions are often a significant resource for a not-for-profit organisation.
Andersen and Zimmerer (2003) consider that disclosure of volunteer contributions and public
recognition of volunteer input are part of the accountability obligations of the not-for-profit
sector. The valuation and reporting of volunteer contributions has been discussed by researchers
(e.g. Brown, 1999; Handy & Srinivasan, 2004; Bowman, 2009; O’Brien, 2010) and the Not-For-

12
Profit Financial Reporting Guide (NZICA, 2007) recommends that the value of volunteer
services be recognised in the financial statements if the amount can be reliably measured. While
measurement is a complex issue1 and a best practice model has not been identified, researchers
generally agree that minimum disclosure should include the contribution of volunteers in terms
of hours worked and duties performed.
Both the Wellington Zoo and Perth Zoo make extensive use of volunteers. While neither
organisation attributes a monetary value to the work undertaken by volunteers, both
organisations provide statistics relating to the number of volunteers and the hours of work
provided. The comparative figures are shown in table 4.
Table 4 Volunteers
Measure Wellington Perth Notes
Number of individual volunteers 54 251 (1)
Number of corporate volunteer groups 40 - (2)
Number of unpaid hours by volunteers
10,633 40,041
1. Perth Zoo has a more formal structure for volunteers. The Perth Zoo Docent Association (Inc) is a separately incorporated volunteer organisation which acts in a partner relationship with the Zoo to provide ancillary customer service. It has a target of retaining 300 members. This target represents 5.5 times the number of volunteers currently utilized by Wellington Zoo, although the actual number of volunteers stands at 4.7 times that of Wellington. Both figures are above the population ratio (3.7 times). There may be merit therefore in adopting the more formal structure used in Perth, or finding other means of encouraging growth in numbers of individual volunteers. 2. Wellington utilized corporate volunteer groups from ANZ, National, Kiwibank, and BNZ banks; and not-for-profit organisations like Rotary, YHA, and Capability NZ. Perth did not appear to use similar resources.
4.5 Funds
Newberry (1992) found that 62% of New Zealand charities report funds in some form. These
funds have a restriction imposed by the donor. The Not-for Profit Reporting Guide (NZICA,
1 The New Zealand Federation of Voluntary Welfare Organisations (2004) suggests appropriate valuation methodology.

13
2007, para.4.172) defines restricted reserves as amounts that have been set aside by the entity for
future expenses or as a buffer against adverse events). However, no specific mention is made of
how these funds should be recorded although NZ IAS 7 Statement of Cash Flows (para 49.1)
requires that any restriction on the use of cash must be disclosed. Heritage and Fisher (2005)
suggest that equity should be separated into restricted and unrestricted with a note disclosing the
restriction. The main thing is to present the information in such a way that the user can identify
the various funds and movements within and between funds.
At 30th June 2010 Wellington Zoo reported Total Equity of $542,000, of which $290,000 was
classified as ‘Restricted Funds’. The Trust’s 2009/10 Annual Accounts (page 15) describe the
Restricted Funds as follows:
“Restricted funds are those reserves which are subject to specific conditions of use whether under Statute or accepted as binding by the Trust because of the specific reason for which the funds were provided. Transfers from these reserves may be made only for specified purposes or when certain specified conditions are met”.
There is no mention of Restricted Funds in the Equity section of the Statement of Financial
Position of Perth Zoo, or in the notes relating to this section. However, under Current Assets
there is an item for Restricted Cash and cash equivalents $405,795. The notes relating to this
entry state:
“Restricted cash and cash equivalents represent cash resources for which the use is restricted, wholly or partially by regulations or other externally imposed requirements. The Authority is the recipient of a number of grants which are restricted in their use according to the terms of the grant. The Authority has also made provision to cover the unfunded additional pay which occurs every 11 years, the next being 2015.”
Thus both organisations have reported on Restricted Funds – Wellington as part of Total Equity;
and Perth by identifying specific cash and cash equivalents which have a restricted use.
However, the accounting for restricted funds is not clear in either Wellington Zoo’s or Perth
Zoo’s annual reports.
4.6 Statement of Service Performance
A Statement of Service Performance is a useful document for providing information on
organisational activity. Key items identified previously in this paper include the inputs used by

14
the entity, the outputs produced by the entity, the strategic goals/outcomes of the entity, outcome
indicators and efficiency and cost effectiveness indicators. Wellington Zoo does not include a
Statement of Service Performance in its annual report. However a ‘Statement of Intent’ for the
2009/10 financial year includes 20 Key Performance Indicators (KPIs) with targets, actuals and
narrative for each one. Financial measures include: number of visitors, average zoo shop income
per visitor, average income per visitor (excluding the Wellington Council grant). Other KPIs
relate to less objective measures such as ‘valued and motivated staff (3 KPIs) and unique visitor
experiences (4 KPIs).
4.7 Social Responsibility and Environmental Reporting
Social and environmental responsibility increasingly pervades everything an organisation does.
This leads to a concern for entities to report to stakeholders on the initiatives undertaken in
respect of strategies and performance. Voluntary disclosures can be a means to provide society
with a positive account of the entity’s environmental activities and performance (Mobus, 2005).
A number of researchers have identified information related to social responsibility and
environmental issues which a wide range of stakeholders may be interested in. Van Staden and
Hooks (2007) developed a best practice disclosure index for corporate entities. The index was
based on the United Nations Environment Programme/SustainAbility Index (1997) and indices
used by other researchers: Wiseman, 1982; Roberts, 1991; Hackston and Milne, 1996; Davis-
Walling and Batterman, 1997; Deloitte et al, 1997; Kolk, 1999; Hughes, Anderson and Golden,
2001; Milne, Tregidga and Walton, 2003). We adapt this comprehensive index so that it is
appropriate to a public benefit entity such as Wellington Zoo and posit the following items as
relevant disclosures:
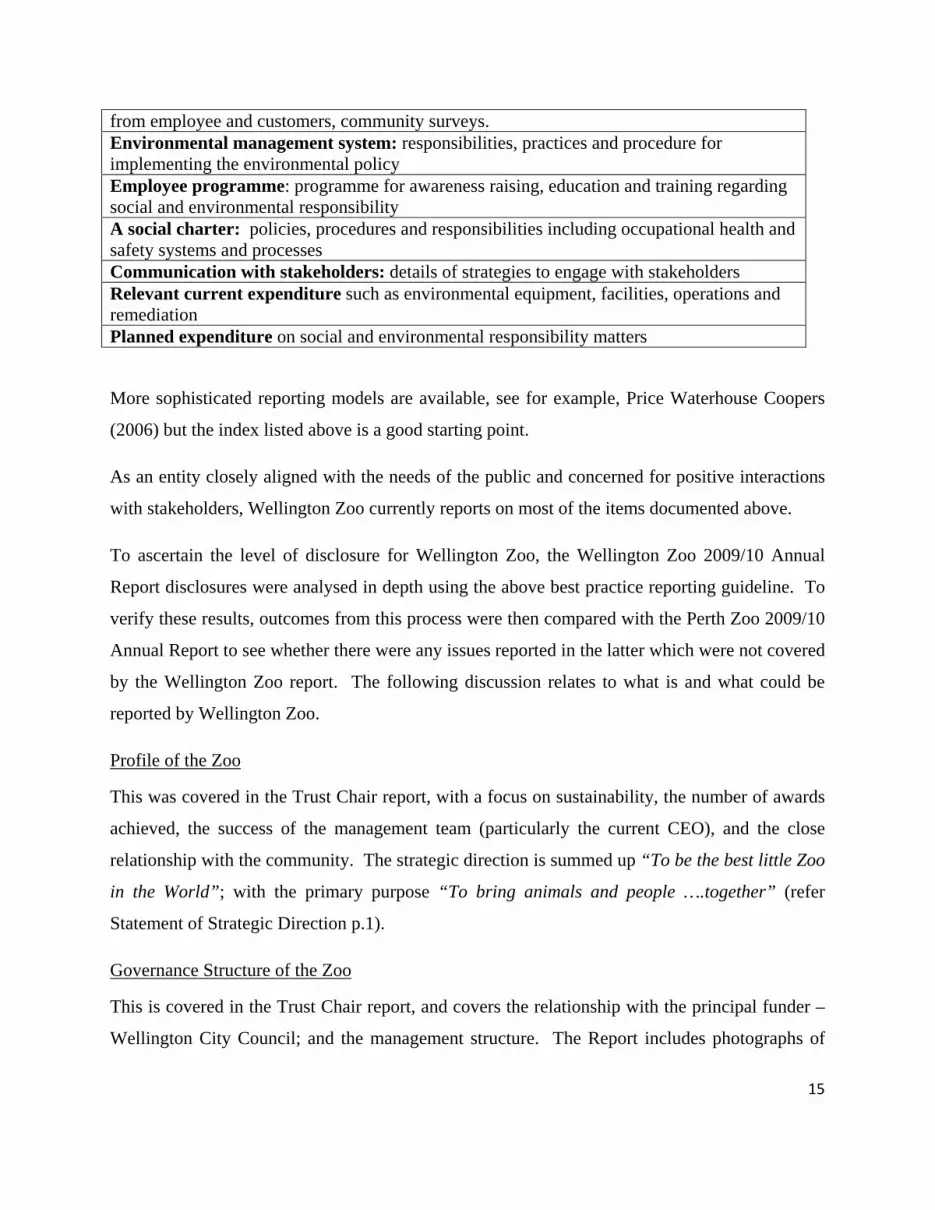
The profile of the zoo to provide a context for understanding social responsibility and environmental performance (SREP) The governance structure of the zoo: in particular where the responsibility for SREP lies, policies, procedures and accountabilities. The social responsibility and environmental (SREP) policy: the main issues for zoo in relation to its interaction with society and the environment. SREP objectives/targets: specific aims to address relevant impacts from the day-to-day running of the zoo, in particular outputs such as waste reduction and disposal , noise and odours. Social and environmental responsibility challenges. SREP performance measured against targets: key performance indicators formulated
15
from employee and customers, community surveys. Environmental management system: responsibilities, practices and procedure for implementing the environmental policy Employee programme: programme for awareness raising, education and training regarding social and environmental responsibility A social charter: policies, procedures and responsibilities including occupational health and safety systems and processes Communication with stakeholders: details of strategies to engage with stakeholders Relevant current expenditure such as environmental equipment, facilities, operations and remediation Planned expenditure on social and environmental responsibility matters
More sophisticated reporting models are available, see for example, Price Waterhouse Coopers
(2006) but the index listed above is a good starting point.
As an entity closely aligned with the needs of the public and concerned for positive interactions
with stakeholders, Wellington Zoo currently reports on most of the items documented above.
To ascertain the level of disclosure for Wellington Zoo, the Wellington Zoo 2009/10 Annual
Report disclosures were analysed in depth using the above best practice reporting guideline. To
verify these results, outcomes from this process were then compared with the Perth Zoo 2009/10
Annual Report to see whether there were any issues reported in the latter which were not covered
by the Wellington Zoo report. The following discussion relates to what is and what could be
reported by Wellington Zoo.
Profile of the Zoo
This was covered in the Trust Chair report, with a focus on sustainability, the number of awards
achieved, the success of the management team (particularly the current CEO), and the close
relationship with the community. The strategic direction is summed up “To be the best little Zoo
in the World”; with the primary purpose “To bring animals and people ….together” (refer
Statement of Strategic Direction p.1).
Governance Structure of the Zoo
This is covered in the Trust Chair report, and covers the relationship with the principal funder –
Wellington City Council; and the management structure. The Report includes photographs of

16
the six trustees, but there is no biographical detail; nor any information on the process of
appointment of trustees, or their length of tenure. This lack of information contrasts with the
Perth Zoo, which includes 8 pages2 of detail under the heading ‘Operational Structure’. This
includes an Organisation chart (commencing from the Minister for the Environment) and
detailed biographies of all Board members and the Executive Management team.
Social Responsibility and Environmental Policy
A number of New Zealand firms include an Environmental Policy statement in their annual
reports (see Van Staden and Hooks, 2007). Although there is no specific environmental policy
in the annual report of Wellington Zoo, there are six strategic elements identified and discussed
in the Chief Executive’s report which relate to social responsibility and the environment: Visitor
engagement; Financial sustainability; Valuing staff; Community support; Conservation
outcomes; and Industry leadership.
SREP objectives/targets and SREP performance measured against targets Each of the above six elements has a number of key performance indicators. Targets for each of
these KPIs were set by the Zoo Trust management, and approved by the Wellington City
Council. Of the 20 targets set, 15 were met or exceeded. The measures, targets and results are
analysed in an attachment to the Annual Report. Narratives have been provided to explain the
target, and how the result was achieved.
Environmental management system
The Wellington Zoo Trust report does not include any commentary or KPIs relating to
environmental management. As a comparison, the Perth Zoo report (page 52) includes a section
under Community Engagement Directorate which monitors water conservation measures,
reductions in energy consumption, and recycling of waste products. This does not mean that
Perth Zoo does a more effective job in environmental management – merely that they monitor
and report on measures taken. 2 A cost/benefit analysis of this amount of detail is not included in this paper.

17
Employee programme
Wellington Zoo’s Annual Report includes sections on Leadership and People Power which
report on initiatives including training, the appointment of Zoo “Ambassadors”, and participation
of staff in industry forums to ensure that Wellington Zoo is a leader in areas of conservation,
sustainability, and visitor experience. One outcome was that the Zoo was placed in the top 25%
of organisations that entered the JRA Best Places to Work survey.
Social charter
The concept of a “social charter” is embedded in the identification and discussion of the six key
elements listed in the Strategic Direction section of the Wellington Zoo Annual Report. In these
six key elements, summarised in less than one page, the word conservation appears 7 times.
Learning and sustainability are also key words which appear in four of the six key strategies.
Further ‘social charter’ information is reflected in two of the 15 KPIs which were monitored
during the year and relate to the objective of ‘Lead or participate in conservation and research
programmes’. A further three KPIs related to visitor learning outcomes.
In addition, much of the Annual Report is devoted to writing about successful conservation
outcomes – for example
• the development of The Nest – Te Kohanga animal hospital, awarded Best New Large
Exhibit (Australia, New Zealand, South Pacific) at the Zoo and Aquarium regional
conference;
• involvement in the Places for Penguins programme;
• fund raising for the Zoo Conservation Fund, and disbursement of these funds for specific
conservation initiatives;
• leadership in animal breeding programmes, and public education campaigns.
Communication with stakeholders The Annual Report contains a section on Visitor Engagement which focuses on visitor
interaction and , formal learning outcomes. Five KPIs measure the Zoo’s success in this area.
Moreover, the report also includes an additional 3 KPIs which relate to Lasting community

18
support and participation. The text of the report describes a number of events and initiatives to
build a good relationship with the wider community. These range from National Children’s Day
celebrations, to a Neighbours BBQ for residents of surrounding streets, to encouragement and
development of programmes for individual and corporate volunteers.
The success of the Wellington Zoo Trust in building good relationships with the wider
Wellington community has been reflected in a Colmar Brunton poll (findings released 8/04/11).
The results showed that 76% of respondents would be willing to pay a regional tax to fund major
events and amenities – half would be willing to pay up to $25 per annum. Wellington Zoo was
rated 4th preference on the list of regional amenities to be funded, after Wellington Free
Ambulance, Westpac Stadium, and Te Papa (Museum of New Zealand).
Relevant current and planned expenditure
The Annual Report includes details of funding arrangements agreed with the Wellington City
Council. The Zoo Capital Programme (ZCP) is currently in year 5 of a 10-year programme. The
major initiatives completed in the current year programme were:
• The Nest – Te Kohanga animal hospital and centre for native wildlife care ($6 million
complex);
• African Village;
• Improved visitor facilities.
The report also lists major developments planned for completion in the following year and
beyond.
In summary, the Wellington Zoo Trust Annual Report 2009/10 contains comprehensive coverage
of most issues in the disclosure index. The report could be improved by adding further
information on:
• Governance structure – brief biographical details of the Trustees and Senior Management
team, and information on the process for appointing Trustees.

19
• Environmental management – a description of what action is being taken, if any, to reduce or
contain the zoo’s environmental ‘footprint’: for example, water conservation measures,
reductions in energy consumption, and recycling of waste products.
5. Conclusion
We have identified key disclosures that are necessary to provide external stakeholders with
information about the governance and accountability of Wellington Zoo. The annual report is the
main vehicle for informing stakeholders about organisational activities and must provide
sufficient information for enable them to ascertain whether the organisation is meeting good
governance standards.
The analysis of the annual report 2009/10 of Wellington Zoo found that the following areas were
very well-articulated:
• Vision and destination
• Management of resources
• Engagement with stakeholders
• Values relating to conservation, learning, and sustainability.
By comparing the financial and statistical measures reported by the Wellington Zoo, and those
reported by the Perth Zoo we found that Wellington Zoo provided information to enable external
stakeholders to gain useful insights as to its vision, its goals and accomplishments, efficiency,
effectivenesss and social and environmental performance. The key issues of conservation,
learning, sustainability, and visitor engagement were emphasised in the report and were
measured with meaningful KPIs. (In comparing Wellington with Perth Zoo, one key fact
emerged: the number of zoo visits per head of population was greater in Wellington). Notably
the KPIs agreed with the principal funder – Wellington City Council – were identified,
monitored and reported on. The majority of targets were met.

20
It was found that there were some areas where relatively small additions to the report would
provide readers of the Annual report with a more ‘complete’ picture of the zoo’s operations.
These are:
• Disclosure of the value of non-current assets administered by the Wellington Zoo Trust, with
an indication of their age, and any plans for their renewal, replacement, or retirement. It is
appreciated that this disclosure would not form part of the Statement of Financial Position, as
the assets would continue to be “owned” by the Wellington City Council. However,
inclusion of this information as a note to the accounts would be helpful so that readers were
aware of the value of the investment made by the Wellington community over a long period.
It would also inform readers of the long-term plans to renew, replace, or retire these assets,
and the financial provision which will be required to do this. This information would tie in
with details of the 10-year zoo capital programme (ZCP) agreed with the Wellington City
Council.
• Governance structure – brief biographical details of the Trustees and Senior Management
team, and information on the process for appointing Trustees.
• Environmental management – a description of what action is being taken, if any, to reduce or
contain the zoo’s environmental ‘footprint’: for example, water conservation measures,
reductions in energy consumption, and recycling of waste products.
We conclude that the level of downwards accountability of Wellington Zoo is high and the story
of governance and accountability is well told. The report compares favourably with the
accountability of Perth Zoo despite the fact that Perth’s population is 3.7 times that of
Wellington, and the revenues and resources available to Perth Zoo were approximately 3.7 times
larger.
References:
Anderson, P., and Zimmerer, M. (2003). Dollar value of volunteer time: A review of five estimation methods. Journal of Volunteer Administration, 21 (2), 39-44.

21
Bird, P. & Morgan-Jones, P. (1981). Financial Reporting by Charities. The Institute of Chartered Accountants of England and Wales, London.
Bowman, W. (2006). Should donors care about overhead costs? Do they care? Nonprofit and voluntary sector quarterly, Vol 35, No 2, pp288-310.
Bowman W. (2009). The economic value of volunteers to nonprofit organizations. Nonprofit Management and Leadership, 19 (4), 491-506.
Brown, E. (1999). Assessing the value of volunteer activity. Nonprofit and Voluntary Sector Quarterly, 28 (1), 3-17.
Charities Commission (2009). Part C – Summary Information Return Retrieved 19 April 2011, from http://www.charity-commission.gov.uk/Charity requirements_guidance/Accounting_and_reporting/Preparing_annual_reports/Part_C.aspx
Christensen, R. & Ebrahim, A. (2006). How does accountability affect mission? The case of a nonprofit serving immigrants and refugees. Nonprofit Management and Leadership 17, no. 2, 195-209.
Controller and Auditor-General (2008). The Auditor-General’s observations on the quality of performance reporting. Wellington: Controller and Auditor-General. Retrieved from http://www.oag.govt.nz/2008/performance-reporting/docs/performance-reporting.pdf.
Coy, D. Fischer, M. & Gordon, T. (2001). Public accountability: a new paradigm for college and university annual reports, Critical Perspectives on Accounting, Vol 12, No.1 pp1-31.
Cullen, M. & Dunne, P. (2006). Tax incentives for giving to charities and other not-for-profit organisations. Inland Revenue Department, Wellington.
Davis-Walling, P. & Batterman, S.A. (1997). Environmental reporting by the fortune 50 firms. Environmental Management, 21 (6), 865-875.
Deegan, C. (2002). The legitimising effect of social and environmental disclosures – a theoretical foundation. Accounting, Auditing & Accountability Journal, 15 (3), 282-311.
Deloitte, Touche, Tohmatsu (1997). Corporate environmental report score card. A benchmarking tool for continuous improvement. Available online: http://www.deloitte, com/dtt/home/0,1044.sid%253D10000.00 html (accessed 7 May 2004).
De Mesa Graziano, C. (2006). What do users of private company financial statements want? Financial Executive, 22(4), 44-47.

22
Ebrahim, A. (2010). The many faces of nonprofit accountability. Harvard Business School, Working paper 10-069.
Freeman, R.E. (1984). Strategic Management: a stakeholder approach. Pitman: Boston.
Hackston, D. & Milne, M.J. (1996). Some determinants of social and environmental disclosures in New Zealand companies. Accounting, Auditing & Accountability Journal, 9 (1), 77-108.
Handy, F. & Srinivasan, N. (2004). Valuing volunteers: an economic valuation of the net benefits of hospital volunteers. Nonprofit and Voluntary Sector Quarterly, 33, 28-54.
Heritage, B. & Fisher, C. (2005). Model Financial Statements. Brookers, Wellington.
Hooper, K., Sinclair, R., Hui, D., & Mataira, K. (2008). Financial reporting by New Zealand charities: finding a way forward. Managerial Auditing Journal, 23 (1), 68-83.
Hughes, S.B., Anderson, A., & Golden, S. (2001). Corporate environmental disclosures: are they useful in determining environmental performance? Journal of Accounting and Public Policy, 20 (3), 217-240.
Hyndman, N. (1990) Charity accounting: an empirical study of the information needs of contributors to UK fund raising charities, Financial Accountability & Management, Vol. 6 No. 4 pp.295-307.
Ijiri, Y. (1983). On the accountability-based conceptual framework of accounting. Journal of Accounting and Public Policy, 2, 75-81.
Khumawala, S.B., & Gordon, T.P. (1997). Bridging the credibility of GAAP: Individual donors and the new accounting standards for nonprofit organisations. Accounting Horizons, Vol.11, No.3, pp.45-68.
Kilcullen, L., Hancock, P. & Izan, H. (2007). User requirements for not-for-profit entity financial reporting: an international comparison. Australian Accounting Review, 17 (1), 26-37.
Kilcullen, L., Hancock, P. & Izan, H. (2008). Identifying users of external financial information of private sector not for profit entities: perspectives from preparers and users. Annual Conference, Accounting and Finance Association of Australia and New Zealand, Sydney.
Kolk, A. (1999). Evaluating corporate environmental reporting. Business Strategy and the Envrionment, Vol. 8, No.4, pp. 225-237.
Kreander, N., Beattie, V., & McPhail, K. (2009). Putting our money where their mouth is: Alighnment of charitable aims with charity investments – Tensions in policy and practice. The British Accounting Review, Vol.41, No.3, pp.154-168.
23
Milne, M.J., Tregidga, H. & Walton, S. (2003). The triple bottom line: benchmarking New Zealand’s early reporters. University of Auckland Business Review, 5(2), 37-48.
Mobus, J. (2005). Mandatory environmental disclosures in a legitimacy theory context. Accounting, Auditing & Accountability Journal, 18, 492-517.
Mook, L, Quarter, J. & Richmond, B. (2003). Social accounting for nonprofits: Two models. Nonprofit Management and Leadership, 13 (4), 308-324.
Mulgan, R. (1997). The process of public accountability. Australian Journal of Public Administration, Vol. 56, No.1, pp.25-37.
Newberry, S. (1992). Special issues of accounting for charities in New Zealand, New Zealand Society of Accountants: Wellington, New Zealand.
New Zealand Federation of Voluntary Welfare Organisations (2004). Counting for something. Value added by voluntary agencies. The VAVA project, New Zealand Federation of Voluntary Welfare Organisations: Wellington.
New Zealand Institute of Chartered Accountants (NZICA) (2007). Not For Profit Financial Reporting Guide.New Zealand Institute of Chartered Accountants, Wellington. New Zealand.
New Zealand Institute of Chartered Accountants (NZICA) (2006). NZ Framework. Applicable Financial Reporting Standards, Volume 1, New Zealand Institute of Chartered Accountants, Wellington, New Zealand.
O’Brien, E. (2010). Volunteer visibility: What and how Australian not-for-profit organisations report volunteer contributions. Unpublished Bachelor of Business Studies (Honours) thesis. Queensland University of Technology, Queensland, Australia.
PriceWaterhouseCoopers (2007) Best practice environmental social and governance (ESG) reporting, PriceWaterhouseCoopers, Australia.
Roberts, C. (1991). Environmental disclosures: a note on reporting practices in mainland Europe. Accounting, Auditing & Accountability Journal, 4 (3), 62-71.
Ryan, C., Mack, J., Tooley, S., & Irvine, H. (2010). A conceptual framework for not-for-profit sustainability renovation or reconstruction? Paper presented at Asian Pacific Interdisciplinary Research in Accounting (APIRA) conference, Sydney, Australia.
Unerman, J., & O’Dwyer, B. (2006). Theorising accountability for NGO advocacy. Accounting, Auditing & Accountability Journal, 19 (3), 349-376.

24
Van Staden, C. & Hooks, J. (2007). A comprehensive comparison of corporate environmental reporting and responsiveness. The British Accounting Review, Vol. 39 No. 3, pp. 197-210
Wiseman, J. (1982).An evaluation of environmental disclosures made in corporate annual reports. Accounting, Organisations & Society, Vol. 7, No. 1, 53-63.