Embed Size (px)
Citation preview
CZECH TECHNICAL UNIVERSITY IN PRAGUE
Faculty of Electrical Engineering
Department of Economics, Management and Humanities
Prague 2014
Accumulation of electricity
Master Thesis
Study Programme: Electrical Engineering, Power Engineering and Management
Branch of study: Economy and Management of Power Engineering
Thesis advisor, CTU: Ing. Tomáš Králík
Thesis advisor, TPU: Doc. Igor A. Plotnikov, Ph. D.
Bc. Ondřej Grygar
Thanks
Thanks to mine supervisors of the master thesis to Ing. Tomáš Králík and to
Doc. Igor A. Plotnikov, Ph. D. for help during consultations and all advices, which were
always gladly provided.
In Prague at ……………………… …………………………..
Author’s signature
Declaration
I declare that thesis has been made independently and consistent with guidelines on
compliance with ethical principles for the development of theses, and that I indicated all the
information sources.
I do not have a compelling reason against use the school work in accordance with § 60 of
Act No. 121/2000 Coll. copyright, rights related to copyright and amending certain Acts
(the Copyright Act).
In Prague at ……………………… …………………………..
Author’s signature
Abstract
This master thesis deals with issue of electricity accumulation. The aim of this thesis is
technically and economically evaluate options of electricity accumulation and optimization of
a power system with accumulation. In the first part of the thesis the most common
accumulator types with their storage principle, construction, technical parameters, advantages
and disadvantages were described. Then possibilities of using accumulation in power
engineering were defined and described. The next part of the thesis was focused on
accumulation in stand-alone system with renewable energy sources especially with
photovoltaic panels. The stand-alone system was the subject of the thesis case study. The goal
of the case study was to evaluate construction of stand-alone system in Tomsk region of
Russian Federation. The stand-alone system was designed, described and optimized for better
economics results, which were reflected in a lower cost of electricity for consumers.
Abstrakt
Tato diplomová práce se zabývá problematikou akumulace elektrické energie. Cílem práce je
technické a ekonomické zhodnocení možností akumulace elektrické energie a optimalizace
energetického systému s akumulací. V první části této práce jsou popsány nejrozšířenější typy
akumulace elektrické energie. U každého typu akumulace je uveden princip uchování energie,
konstrukce, technické parametry spolu s výhodami a nevýhodami této technologie. Dále jsou
v práci popsány možné případy užití akumulace v energetických systémech. Další část práce
je zaměřená na použití akumulace ve spojení s obnovitelnými zdroji energie, konkrétně s
fotovoltaickými panely, v ostrovních systémech. Cílem případová studie této práce je
zhodnotit výstavbu ostrovního systému v Tomské oblasti Ruské Federace
a následnou její optimalizaci s cílem minimalizace ceny elektrické energie pro uživatele
ostrovního systému.
List of abbreviations
AGM Absorbed Glass Mat
AFC Alkaline Fuel Cells
A Ampere
Ah Ampere-hour
CAES Compressed Air Energy Storages
dm decimeter
DOD Depth Of Discharge
DG Diesel Generator
ESOI Energy Stored On Investment
kg kilogram
Li-Ion Lithium-Ion
MCFC Molten Carbonate Fuel Cells
NPV Nett Present Value
NiCd Nickel–Cadmium
PAFC Phosphoric Acid Fuel Cells
PVC Polyvinyl chloride
PEM Proton Excange Membrane
RF Russian Federation
SOFC Solid Oxide Fuel Cells
UPS
Uninterruptible Power Supply
(Source)
VRB Vanadium Redox Battery
V Volt
W Watt
Wh Watt-hour
YSZ Yttria-Stabilized Zircona
Outline
Introduction ................................................................................................................................. 1
1 Accumulators ...................................................................................................................... 3
1.1 Quantitative storage ..................................................................................................... 4
1.2 Thermal accumulation .................................................................................................. 4
1.3 Chemical accumulators ................................................................................................ 5
1.3.1 Lead-acid batteries ................................................................................................ 5
1.3.2 NiCd batteries ....................................................................................................... 8
1.3.3 Li-Ion batteries .................................................................................................... 10
1.3.4 Fuel cells ............................................................................................................. 12
1.3.5 Flow batteries ...................................................................................................... 16
1.4 Mechanical accumulators ........................................................................................... 19
1.4.1 Using kinetic energy - Flywheels ....................................................................... 19
1.4.2 Using potential energy - Hydro pumped storage power stations ........................ 22
1.4.3 Using pressure energy - Compressed air ............................................................ 24
1.5 Electromagnetic accumulators ................................................................................... 27
1.5.1 Supercapacitors ................................................................................................... 27
2 Comparison of accumulators ............................................................................................ 30
3 Energy storage in power grid ............................................................................................ 33
3.1 Voltage regulation ...................................................................................................... 33
3.2 Frequency regulation .................................................................................................. 34
3.3 Supply time-shift ........................................................................................................ 34
3.4 Accumulation with renewable sources ....................................................................... 35
3.5 Stand-alone systems ................................................................................................... 35
3.6 End-User bill optimization ......................................................................................... 35
3.7 Smart grid ................................................................................................................... 36
4 Stand-alone systems with photovoltaic panels ................................................................. 37
4.1 Solar energy ............................................................................................................... 37
4.1.1 Calculation of falling sun radiation .................................................................... 38
4.1.2 Shockley–Queisser limit ..................................................................................... 39
4.2 Photovoltaic (PV) ....................................................................................................... 40
4.2.1 Solar (photovoltaic) cell ...................................................................................... 40
4.2.2 Solar cells types .................................................................................................. 41
4.2.3 PV systems .......................................................................................................... 44
4.2.4 Schemes of connection of solar panels without accumulation ........................... 44
4.2.5 Schemes of connection of solar panels with accumulation ................................ 47
5 Case study ......................................................................................................................... 49
5.1 Project description ...................................................................................................... 50
5.2 Input data .................................................................................................................... 50
5.2.1 Consumer load .................................................................................................... 50
5.2.2 Insolation ............................................................................................................ 51
5.2.3 Sources of electricity .......................................................................................... 53
5.2.4 Fuel price trends .................................................................................................. 54
5.2.5 Accumulation ...................................................................................................... 54
5.3 Technical calculations ................................................................................................ 56
5.3.1 Solar generation .................................................................................................. 56
5.3.2 Accumulation ...................................................................................................... 56
5.3.3 Connection scheme ............................................................................................. 57
5.4 Economic model ......................................................................................................... 57
5.4.1 Investment ........................................................................................................... 58
5.4.2 Operating costs ................................................................................................... 59
5.4.3 Recovery of old equipment ................................................................................. 60
5.5 Optimization of economic model ............................................................................... 61
5.5.1 Choosing the equipment ..................................................................................... 61
5.5.2 Choosing the operational variant ........................................................................ 62
5.5.3 Choosing the depth of discharge ......................................................................... 67
5.5.4 Comparison of prices per kWh ........................................................................... 68
5.6 Sensitivity analyses .................................................................................................... 69

5.7 Case study results ........................................................................................................73
Conclusion ................................................................................................................................ 73
References ................................................................................................................................. 78
Appendices ................................................................................................................................ 84
Contents of enclosed CD.......................................................................................................... 99
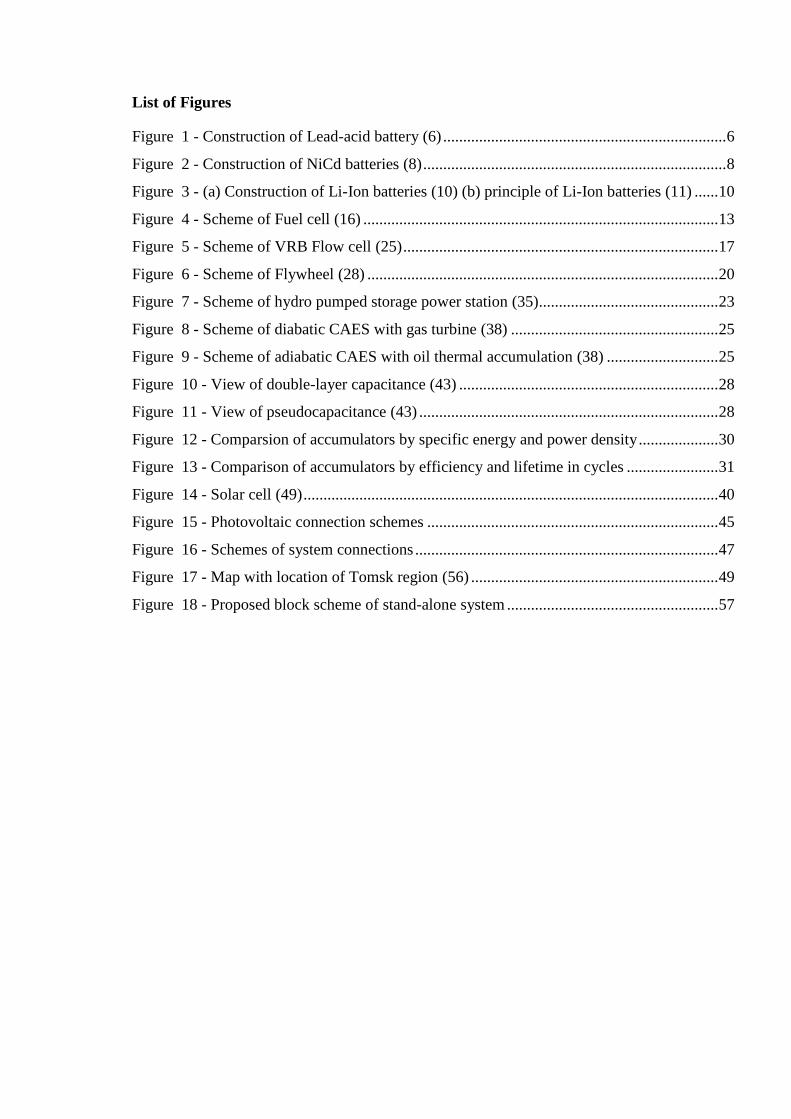
List of Figures
Figure 1 - Construction of Lead-acid battery (6) ....................................................................... 6
Figure 2 - Construction of NiCd batteries (8) ............................................................................ 8
Figure 3 - (a) Construction of Li-Ion batteries (10) (b) principle of Li-Ion batteries (11) ...... 10
Figure 4 - Scheme of Fuel cell (16) ......................................................................................... 13
Figure 5 - Scheme of VRB Flow cell (25) ............................................................................... 17
Figure 6 - Scheme of Flywheel (28) ........................................................................................ 20
Figure 7 - Scheme of hydro pumped storage power station (35) ............................................. 23
Figure 8 - Scheme of diabatic CAES with gas turbine (38) .................................................... 25
Figure 9 - Scheme of adiabatic CAES with oil thermal accumulation (38) ............................ 25
Figure 10 - View of double-layer capacitance (43) ................................................................. 28
Figure 11 - View of pseudocapacitance (43) ........................................................................... 28
Figure 12 - Comparsion of accumulators by specific energy and power density .................... 30
Figure 13 - Comparison of accumulators by efficiency and lifetime in cycles ....................... 31
Figure 14 - Solar cell (49) ........................................................................................................ 40
Figure 15 - Photovoltaic connection schemes ......................................................................... 45
Figure 16 - Schemes of system connections ............................................................................ 47
Figure 17 - Map with location of Tomsk region (56) .............................................................. 49
Figure 18 - Proposed block scheme of stand-alone system ..................................................... 57
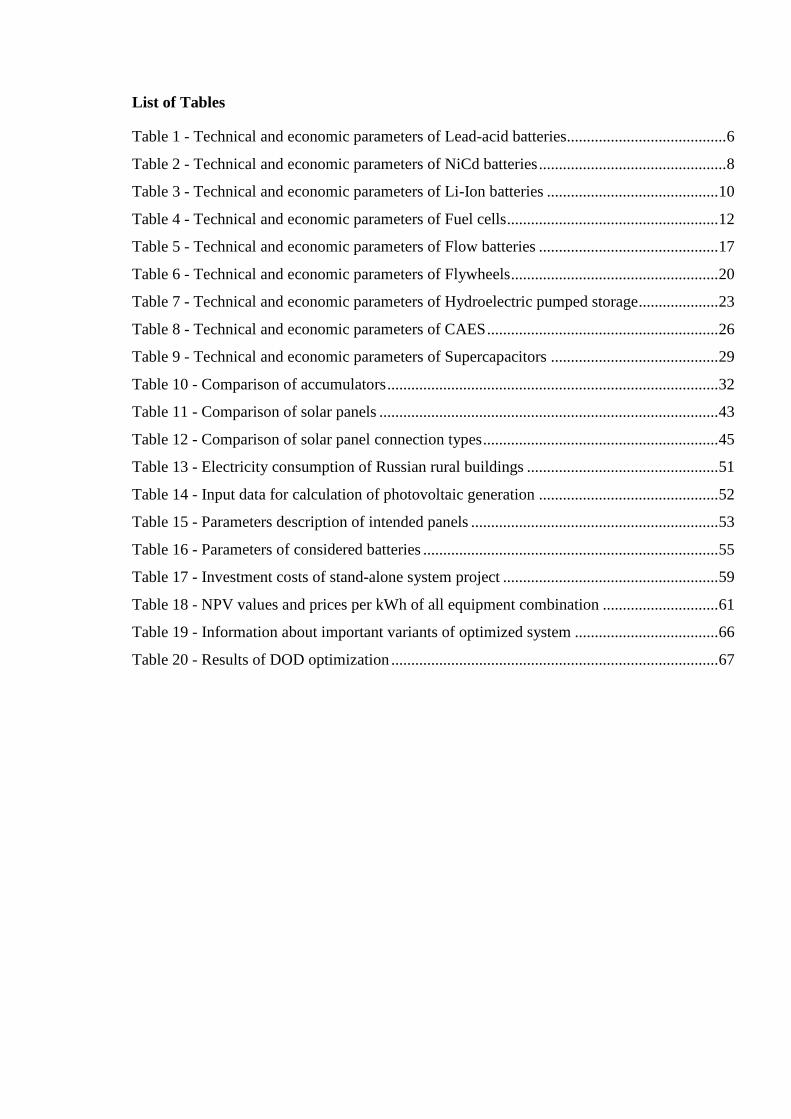
List of Tables
Table 1 - Technical and economic parameters of Lead-acid batteries........................................ 6
Table 2 - Technical and economic parameters of NiCd batteries ............................................... 8
Table 3 - Technical and economic parameters of Li-Ion batteries ........................................... 10
Table 4 - Technical and economic parameters of Fuel cells ..................................................... 12
Table 5 - Technical and economic parameters of Flow batteries ............................................. 17
Table 6 - Technical and economic parameters of Flywheels .................................................... 20
Table 7 - Technical and economic parameters of Hydroelectric pumped storage .................... 23
Table 8 - Technical and economic parameters of CAES .......................................................... 26
Table 9 - Technical and economic parameters of Supercapacitors .......................................... 29
Table 10 - Comparison of accumulators ................................................................................... 32
Table 11 - Comparison of solar panels ..................................................................................... 43
Table 12 - Comparison of solar panel connection types ........................................................... 45
Table 13 - Electricity consumption of Russian rural buildings ................................................ 51
Table 14 - Input data for calculation of photovoltaic generation ............................................. 52
Table 15 - Parameters description of intended panels .............................................................. 53
Table 16 - Parameters of considered batteries .......................................................................... 55
Table 17 - Investment costs of stand-alone system project ...................................................... 59
Table 18 - NPV values and prices per kWh of all equipment combination ............................. 61
Table 19 - Information about important variants of optimized system .................................... 66
Table 20 - Results of DOD optimization .................................................................................. 67
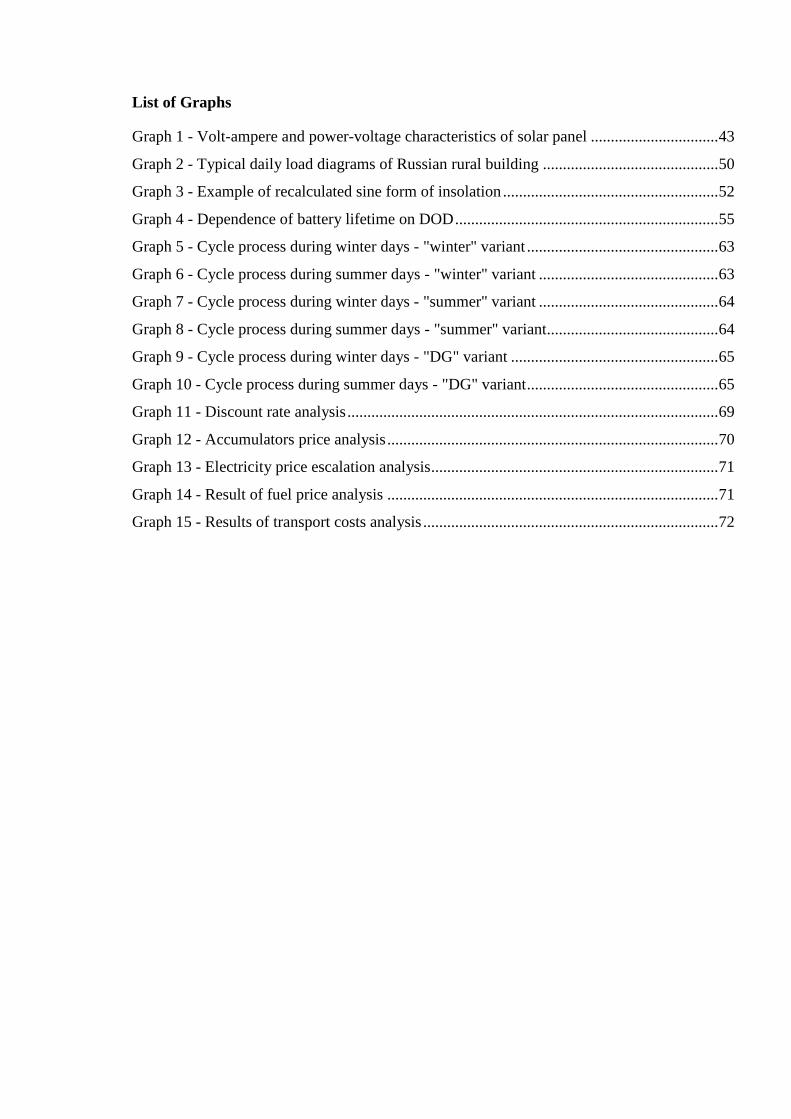
List of Graphs
Graph 1 - Volt-ampere and power-voltage characteristics of solar panel ................................ 43
Graph 2 - Typical daily load diagrams of Russian rural building ............................................ 50
Graph 3 - Example of recalculated sine form of insolation ...................................................... 52
Graph 4 - Dependence of battery lifetime on DOD .................................................................. 55
Graph 5 - Cycle process during winter days - "winter" variant ................................................ 63
Graph 6 - Cycle process during summer days - "winter" variant ............................................. 63
Graph 7 - Cycle process during winter days - "summer" variant ............................................. 64
Graph 8 - Cycle process during summer days - "summer" variant........................................... 64
Graph 9 - Cycle process during winter days - "DG" variant .................................................... 65
Graph 10 - Cycle process during summer days - "DG" variant ................................................ 65
Graph 11 - Discount rate analysis ............................................................................................. 69
Graph 12 - Accumulators price analysis ................................................................................... 70
Graph 13 - Electricity price escalation analysis ........................................................................ 71
Graph 14 - Result of fuel price analysis ................................................................................... 71
Graph 15 - Results of transport costs analysis .......................................................................... 72
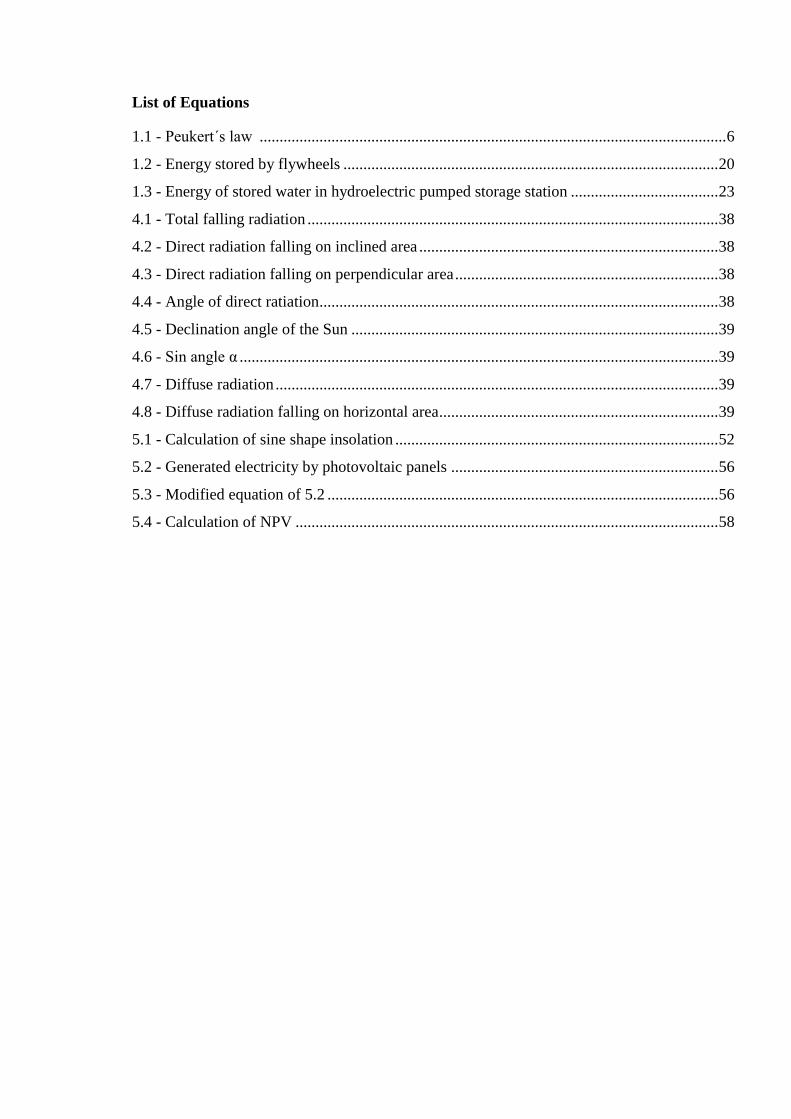
List of Equations
1.1 - Peukert´s law ..................................................................................................................... 6
1.2 - Energy stored by flywheels .............................................................................................. 20
1.3 - Energy of stored water in hydroelectric pumped storage station ..................................... 23
4.1 - Total falling radiation ....................................................................................................... 38
4.2 - Direct radiation falling on inclined area ........................................................................... 38
4.3 - Direct radiation falling on perpendicular area .................................................................. 38
4.4 - Angle of direct ratiation .................................................................................................... 38
4.5 - Declination angle of the Sun ............................................................................................ 39
4.6 - Sin angle α ........................................................................................................................ 39
4.7 - Diffuse radiation ............................................................................................................... 39
4.8 - Diffuse radiation falling on horizontal area ...................................................................... 39
5.1 - Calculation of sine shape insolation ................................................................................. 52
5.2 - Generated electricity by photovoltaic panels ................................................................... 56
5.3 - Modified equation of 5.2 .................................................................................................. 56
5.4 - Calculation of NPV .......................................................................................................... 58
1
Introduction
In the beginning of the 19th century Alessandro Volta discovered the first electric cell and the
power of direct current at the same time. After almost 90 years from discovering of direct
current, Nikola Tesla invented alternating current and laid the foundation for today´s power
industry. The last century the mankind started to generating and consuming electricity in large
scale. Electric power helps people in all areas of their activity. Due to large extension of usage
electric power people started to be dependent on its supply.
Electricity is generated in power plants from primary sources. The most widespread type of
power plant is thermal power station using coal or gas as a primary source of energy. More
than 60 % of energy generated in the world is from this type of power plants, but coal
reserves on earth are not endless and their combustion leads to air pollution.
In the first half of the 20th century scientists tried to find a new source of cheap energy and
after long years they invented how to get large amount of energy from fission of uranium.
The first nuclear power plant was built in Obninsk near to Moscow in 1954. Since that time
nuclear power plants were built worldwide. One of many advantages of nuclear power plants
is no air pollution, but big disadvantage is nuclear waste of burned out fuel. The waste
products volume of nuclear power plants compared to the amount of produced electricity is
much better than at heat power plants. Prosperity of nuclear power plants was slowed by
Chernobyl disaster in 1986.
People started to think about more safe sources of energy with no air pollutions and
potentially endless reserves. These sources are called renewable resources and include energy
of sun, wind, water, biofuel, geothermal energy and energy of biomass. In the last decade
renewable resources began to take a greater share of the energy mix. In 2011 there was an
accident on nuclear power plant Fukushima Daiichi. After the Fukushima disaster all around
the world tightened up operation and security systems of all nuclear power plants. In some
countries all nuclear power plants were shut down and new aim of power industry was
development of renewable power sources.
Advantage of renewable resources is that they produce clean energy without pollution.
The main disadvantage of renewable resources is their unpredictability and therefore it is
difficult to control them. Their decentralized character can be an advantage or a disadvantage.
2
One way how to improve system containing renewable resources of energy is accumulators
enabling accumulation of energy from period of generation to period of consumption.
By using of accumulators the energy power systems can become independent and allow
operation as stand-alone system.
The topic of energy accumulation was chosen for several reasons. First reason was an interest
to problems of accumulation, new types of storage elements and cases of their using. Second
and the main reason was that in the future storage technology will be used on a larger scale
than today. Trends in the energy industry focus on energy efficiency, increasing the security
of electricity supply and generation of electricity from renewable sources. In all these areas
can be used accumulation of energy like a tool to achieve the goals.
For example accumulators can locally act as a backup power sources for individual buildings
or entire areas. They will serve as a bridging source until a backup power like diesel
generators will start up or classic power source is restored. They can also provide energy
storage from period of production for later consumption. These properties can be used in
conjunction with renewable resources such as wind power or solar, which have variable
production and can be heavily regulated.
Using accumulators in a large scale can increase the efficiency of electricity production in
power plants. Power plants will be able to work in their economic points and surpluses will be
stored in accumulators. Energy from these accumulators can balance energy in the grid or
compensate frequency. Accumulators have fast response and they are the best elements for
this purpose.
The aim of this work is to analyze the use of energy storage elements in power engineering.
Describe the various possible situations in which it is appropriate to use accumulators and
more focus on storage systems in conjunction with photovoltaic power plants. Outcome of
this work will be the technical and economic evaluation of the stand alone system project with
photovoltaic panels and accumulation of energy. System has to secure electricity supply for
several residential buildings. As a part of the work also will be the optimization of the
dynamic model of accumulation.
3
1 Accumulators
Electrical energy is used in almost all areas of human activity. Humanity has become
dependent on its supply. To cover the consumption the electrical energy is mass-produced in
power plants and then transported to individual consumers. Electrical energy has one great
disadvantage. It is not possible to store electricity in its form in large scale. Because of it,
power plants have to generate the exact amount of electric energy, which will be consumed at
every moment. With this issue, it must be estimated the prediction of consumption based on
a statistical analysis. But there is a way to accumulate energy.
Currently, the only possibility of storing electrical energy is transformation into another form
as for example chemical, thermal or mechanical energy. In these forms it is possible to
preserve energy for longer periods of time. Unfortunately with any storage or energy
transformation are connected with energy losses. It is therefore the primary aim to regulate the
production of the power stations and then to use the stored energy. Nevertheless, with
appropriately combination of the production of electric power and its accumulation, it can be
achieved a higher efficiency of production and distribution of electricity.
Accumulators are technical devices, which allow us to store energy. Stored energy can be
subsequently used and accumulator works like an energy source. Most of the storage elements
allow to repeat charging and discharging and therefore it works in cycles. All energy storage
devices are possible to divide into groups according to the principle of energy conservation.
Each type of accumulators has another characteristics, advantages, disadvantages and
functions of use. Accumulators of energy have a large scale of use, from providing of energy
to supply of watches or mobile phones to balancing frequency and electricity amount in the
power grid.
4
1.1 Quantitative storage
Quantitative storage includes stocks of solid, liquid or gaseous fuels. (1) It is the accumulation
of fuels for its subsequent transformation into electrical, thermal, mechanical or chemical
energy. This accumulation is not explicitly considered like accumulators which can
temporarily receive and store energy for later use. Quantitative storage elements are simple
reservoirs of fuel, which will be used in the time of need.
1.2 Thermal accumulation
Thermal accumulators are sets of different technologies which store thermal energy into
a particular mediums. These mediums are usually water or molten salts. (2) Accumulated
thermal energy can be stored for hours, days, months or for the period between the seasons.
A typical short-term storage is to preserve the heat energy, for example obtained from solar
panels, from the day to the night when will be used. The storage tanks may have different
sizes depending on locality, which they provide the thermal energy for. Accumulator tanks
can be from small ones, providing thermal energy only for one house, to huge massive tanks
or rock caverns which collecting thermal energy for whole region. (3)
The main goal of thermal accumulators is conservation of heat energy with minimal losses
therefore the tanks with a heat transfer medium must be perfectly insulated. Typically the heat
from the accumulators is used directly, or via the heat exchanger. There are also technologies
in which are huge accumulators used in conjunction with power plants to achieve better
efficiency (see in appendix A for diagram example). During off-peak periods excess steam
from turbine heats the storage medium in tanks. Then accumulated heat in peak periods helps
to pre-heat feed water instead of tapped turbine steam. Thanks to this, steam goes through the
entire turbine and producing more electricity.
5
1.3 Chemical accumulators
1.3.1 Lead-acid batteries
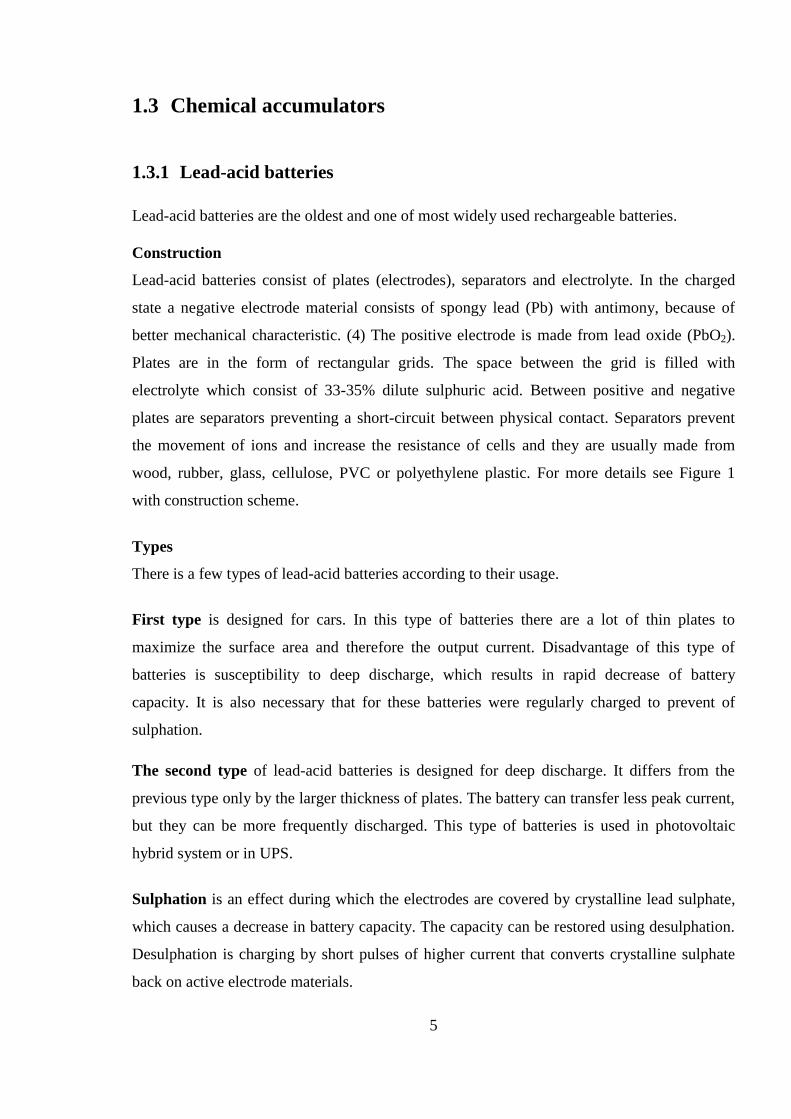
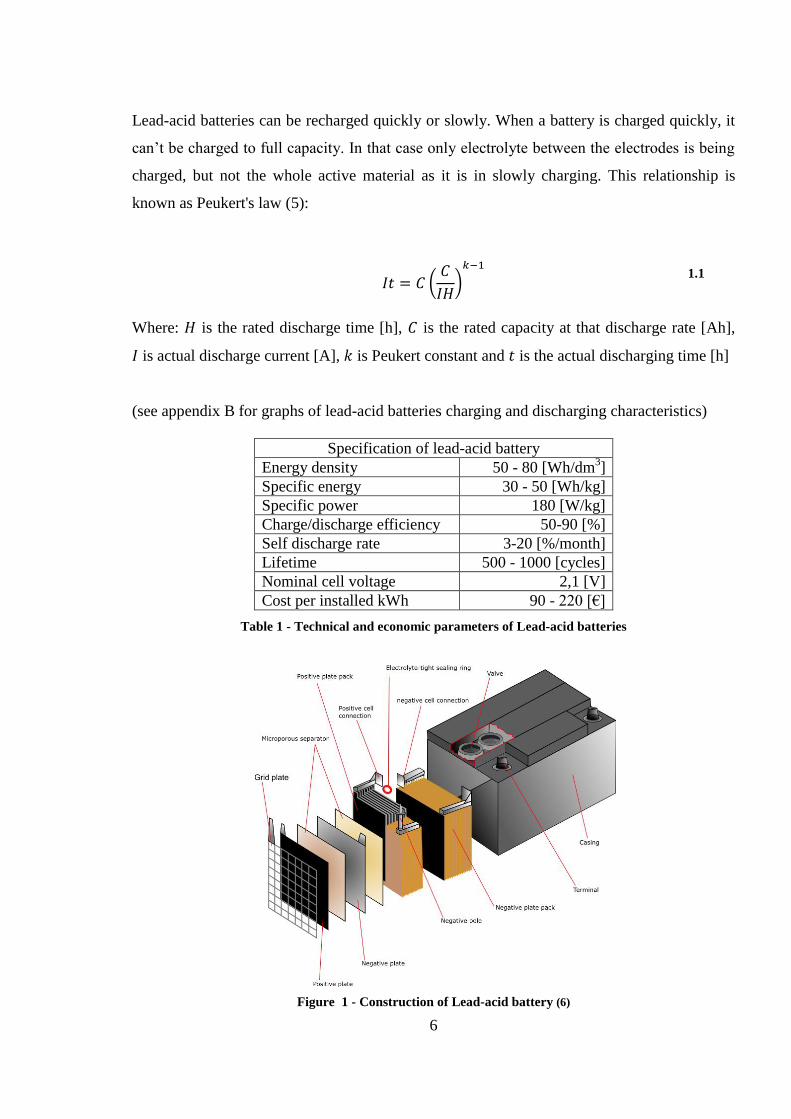
Lead-acid batteries are the oldest and one of most widely used rechargeable batteries.
Construction
Lead-acid batteries consist of plates (electrodes), separators and electrolyte. In the charged
state a negative electrode material consists of spongy lead (Pb) with antimony, because of
better mechanical characteristic. (4) The positive electrode is made from lead oxide (PbO2).
Plates are in the form of rectangular grids. The space between the grid is filled with
electrolyte which consist of 33-35% dilute sulphuric acid. Between positive and negative
plates are separators preventing a short-circuit between physical contact. Separators prevent
the movement of ions and increase the resistance of cells and they are usually made from
wood, rubber, glass, cellulose, PVC or polyethylene plastic. For more details see Figure 1
with construction scheme.
Types
There is a few types of lead-acid batteries according to their usage.
First type is designed for cars. In this type of batteries there are a lot of thin plates to
maximize the surface area and therefore the output current. Disadvantage of this type of
batteries is susceptibility to deep discharge, which results in rapid decrease of battery
capacity. It is also necessary that for these batteries were regularly charged to prevent of
sulphation.
The second type of lead-acid batteries is designed for deep discharge. It differs from the
previous type only by the larger thickness of plates. The battery can transfer less peak current,
but they can be more frequently discharged. This type of batteries is used in photovoltaic
hybrid system or in UPS.
Sulphation is an effect during which the electrodes are covered by crystalline lead sulphate,
which causes a decrease in battery capacity. The capacity can be restored using desulphation.
Desulphation is charging by short pulses of higher current that converts crystalline sulphate
back on active electrode materials.
6
Lead-acid batteries can be recharged quickly or slowly. When a battery is charged quickly, it
can’t be charged to full capacity. In that case only electrolyte between the electrodes is being
charged, but not the whole active material as it is in slowly charging. This relationship is
known as Peukert's law (5):
1.1
Where: is the rated discharge time [h], is the rated capacity at that discharge rate [Ah],
is actual discharge current [A], is Peukert constant and is the actual discharging time [h]
(see appendix B for graphs of lead-acid batteries charging and discharging characteristics)
Specification of lead-acid battery
Energy density 50 - 80 [Wh/dm3]
Specific energy 30 - 50 [Wh/kg]
Specific power 180 [W/kg]
Charge/discharge efficiency 50-90 [%]
Self discharge rate 3-20 [%/month]
Lifetime 500 - 1000 [cycles]
Nominal cell voltage 2,1 [V]
Cost per installed kWh 90 - 220 [€]
Table 1 - Technical and economic parameters of Lead-acid batteries
Figure 1 - Construction of Lead-acid battery (6)
7
Chemical reactions of lead-acid batteries on electrodes during the cycles:
Charging
Negative plate reaction: PbSO4(s) + H+(aq) + 2-
e → Pb(s) + HSO−4(aq)
Positive plate reaction: PbSO4(s) + 2H2O(l) → PbO2(s) + HSO−4(aq) + 3H
+(aq) + 2-
e
Discharging
Negative electrode reaction: Pb(s) + HSO−4(aq) → PbSO4(s) + H
+(aq) + 2-
e
Positive electrode reaction: PbO2(s) + HSO−4(aq) + 3H
+(aq) + 2-
e → PbSO4(s) + 2H2O(l)
Advantages
low price
ease of manufacturing
high power
Disadvantages
low specific energy and energy density
self discharging
impact on the environment
Application
Lead-acid batteries are mainly used in automobiles and in applications where there is not
problem with small specific energy and energy density of battery. For example like backup
power (UPS). Also lead-acid batteries are used like traction batteries used in battery electric
vehicles or in submarines like part of diesel-electric system. (7)
8
1.3.2 NiCd batteries
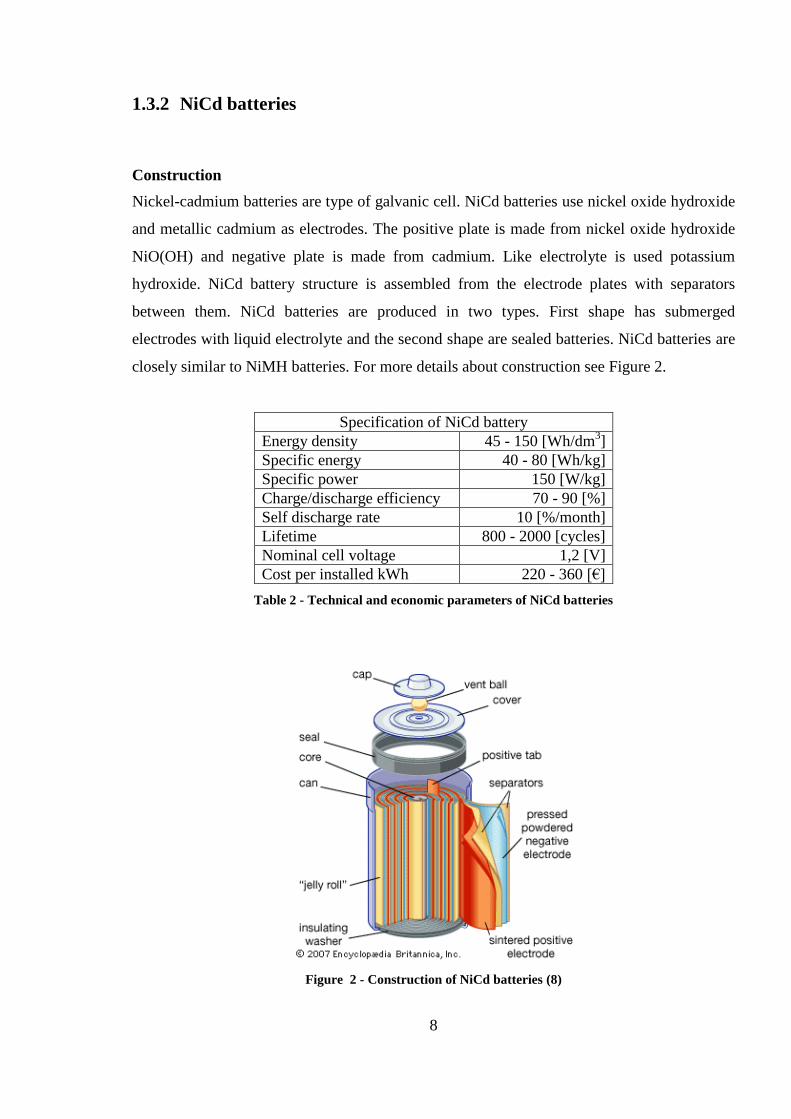
Construction
Nickel-cadmium batteries are type of galvanic cell. NiCd batteries use nickel oxide hydroxide
and metallic cadmium as electrodes. The positive plate is made from nickel oxide hydroxide
NiO(OH) and negative plate is made from cadmium. Like electrolyte is used potassium
hydroxide. NiCd battery structure is assembled from the electrode plates with separators
between them. NiCd batteries are produced in two types. First shape has submerged
electrodes with liquid electrolyte and the second shape are sealed batteries. NiCd batteries are
closely similar to NiMH batteries. For more details about construction see Figure 2.
Specification of NiCd battery
Energy density 45 - 150 [Wh/dm3]
Specific energy 40 - 80 [Wh/kg]
Specific power 150 [W/kg]
Charge/discharge efficiency 70 - 90 [%]
Self discharge rate 10 [%/month]
Lifetime 800 - 2000 [cycles]
Nominal cell voltage 1,2 [V]
Cost per installed kWh 220 - 360 [€]
Table 2 - Technical and economic parameters of NiCd batteries
Figure 2 - Construction of NiCd batteries (8)
9
Charging
Charging of NiCd batteries is possible in a few ways with differing charging ratios. Batteries
are charged by constant current and regardless of the charging speed it is necessary to supply
more energy than actual capacity of batteries because of the losses during the charging.
For example charging with rate C for one hour will charge battery at 80%. It is also possible
to charge the batteries by rates C/10 for 14-16 hours or 4-6C for about 15 minutes. NiCd
batteries may suffer by memory effect. Memory effect is the memory of battery of state of
charge. If the NiCd battery is charged or discharged to same state of charge hundred times
then on these points may occur sudden drops in voltage.
Discharging
Negative electrode reaction: 2NiO(OH) + 2H2O+2-e → 2Ni(OH)2 + 2OH
-
Positive electrode reaction: 2NiO(OH) + Cd + 2H2O → 2Ni(OH)2 + Cd(OH)2
(see appendix C for graphs of charging and discharging characteristics)
Advantages
deep discharging without negative effect
long life
possibility of charging by higher current
functionality at low temperatures
Disadvantages
high price
big difference between the highest charging and lowest discharging voltage
toxicity of cadmium
Application
The sealed type of NiCd batteries is used in small portable electronics like cameras, radios,
calculators, instruments or television sets. The larger type of batteries with liquid electrolyte
is used mainly like standby power or like aircraft starting batteries.
10
1.3.3 Li-Ion batteries
Construction
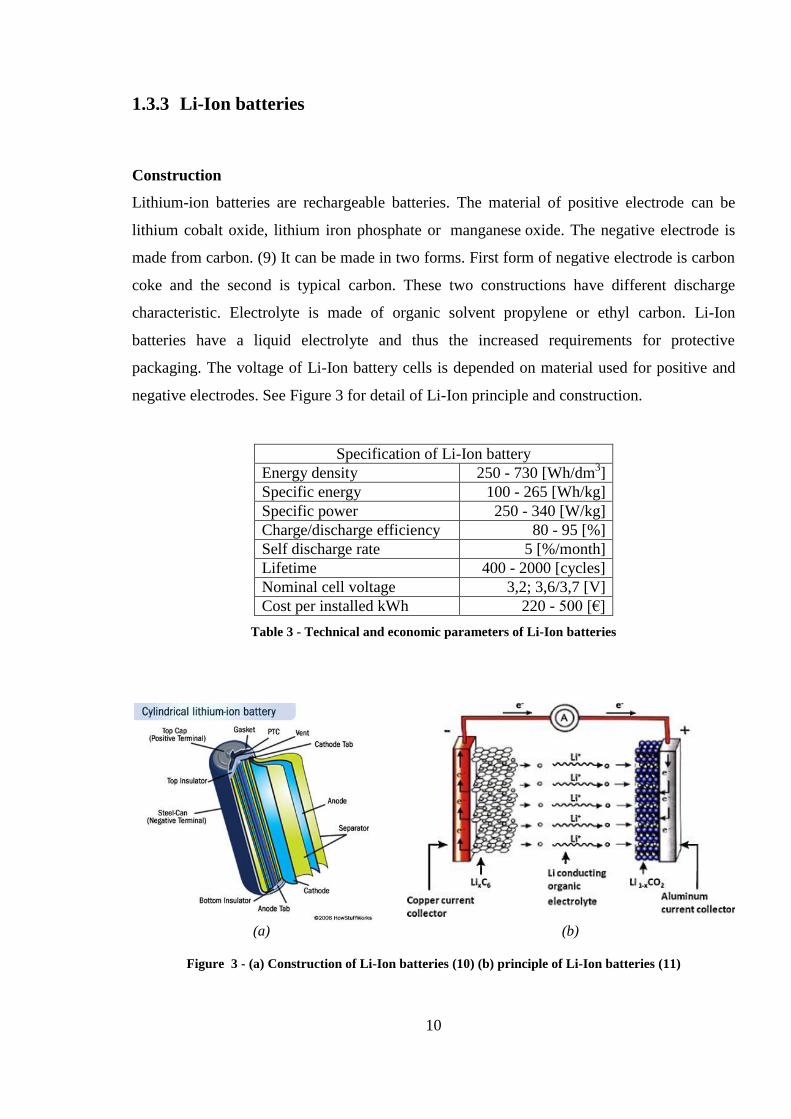
Lithium-ion batteries are rechargeable batteries. The material of positive electrode can be
lithium cobalt oxide, lithium iron phosphate or manganese oxide. The negative electrode is
made from carbon. (9) It can be made in two forms. First form of negative electrode is carbon
coke and the second is typical carbon. These two constructions have different discharge
characteristic. Electrolyte is made of organic solvent propylene or ethyl carbon. Li-Ion
batteries have a liquid electrolyte and thus the increased requirements for protective
packaging. The voltage of Li-Ion battery cells is depended on material used for positive and
negative electrodes. See Figure 3 for detail of Li-Ion principle and construction.
Specification of Li-Ion battery
Energy density 250 - 730 [Wh/dm3]
Specific energy 100 - 265 [Wh/kg]
Specific power 250 - 340 [W/kg]
Charge/discharge efficiency 80 - 95 [%]
Self discharge rate 5 [%/month]
Lifetime 400 - 2000 [cycles]
Nominal cell voltage 3,2; 3,6/3,7 [V]
Cost per installed kWh 220 - 500 [€]
Table 3 - Technical and economic parameters of Li-Ion batteries
(a) (b)
Figure 3 - (a) Construction of Li-Ion batteries (10) (b) principle of Li-Ion batteries (11)
11
Charging
When Li-Ion batteries are charged the external source has higher voltage and the same
polarity like the battery. The time of charging is depended on battery capacity and charging
power. (12)
Negative electrode reaction: Cn + xLi+ + xe
- → CnLix
Positive electrode reaction: LiCo2 → Li1-xCoO2 + xLi+ +xe
-
Overall reaction: LiCoO2 + Cn → Li1-xCoO2 + CnLix
Discharging
Current is carried by lithium ions which during discharge goes from negative to positive
electrode through electrolyte and separator.
Negative electrode reaction: CnLix→ Cn + xLi+ + xe
-
Positive electrode reaction: Li1-xCoO2 + xLi+ +xe
-→ LiCo2
Overall reaction: Li1-xCoO2 + CnLix → LiCoO2 + Cn
(see appendix D for charging and discharging characteristics of Li-Ion batteries)
Advantages
high specific energy and energy density
no memory effect
number of charge cycles
can be made in different shapes
Disadvantages
high price
ignition hazard
reduction of capacity with age
damage when fully discharged
Application
Li-ion batteries are most commonly used as a power source for consumer portable devices.
Recently, more and more applied in military equipment, electric vehicles and aerospace
industries. (13)
12
1.3.4 Fuel cells
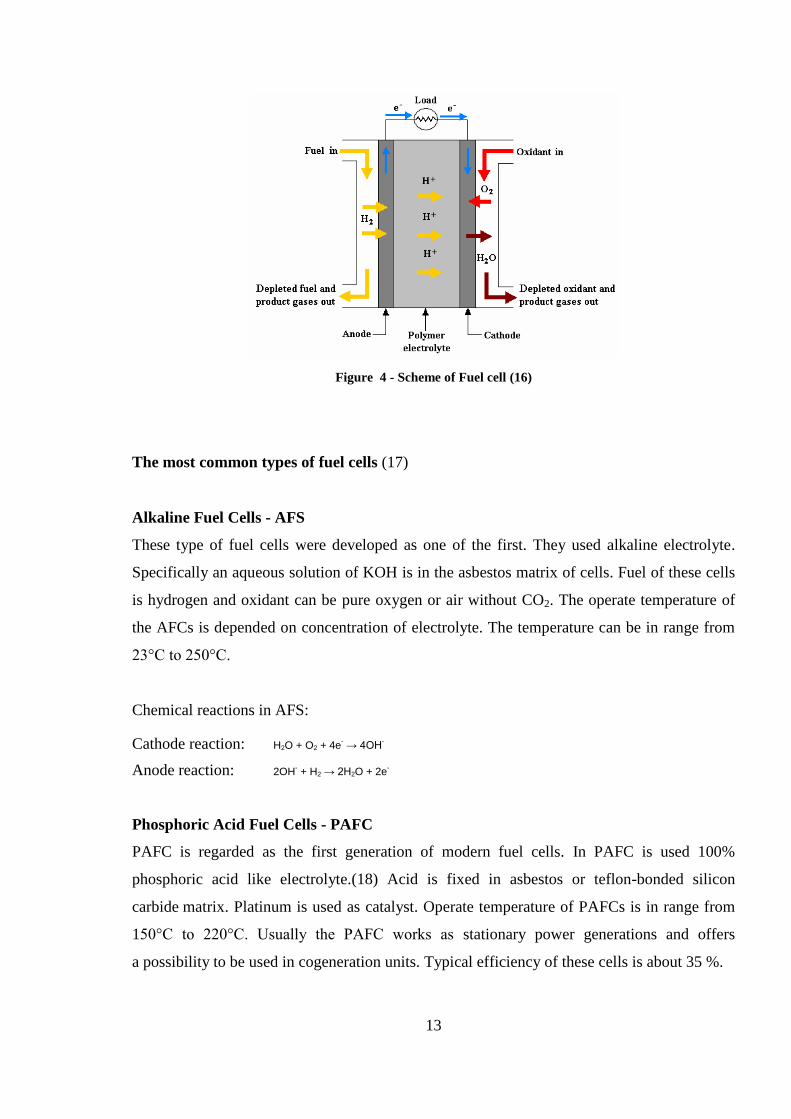
Construction
Fuel cell is an device which converts chemical energy of fuel and oxidant directly to electrical
energy. Fuel cells are galvanic cells which consist of two electrodes separated by membrane
or electrolyte. To the negative electrode a fuel is supplied and the oxidant to the positive
electrode. Electrodes of fuel cells are catalytically and reactively stable. Material of electrodes
is usually metals or carbon nanotubes. (14) Electrodes can be coated with catalyst to higher
efficiency. Electrolyte in fuel cells can be made from acids, alkalis or compressed gas.
The type of fuel cell is determined according to used electrolyte, fuel, or electrode catalysts.
The most common fuel cells are hydrogen with potassium hydroxide (KOH) as electrolyte.
(15)
The fuel in fuel cells is divided to a positively charged ions and negative charged electrons
during the reaction. Only positive ions can pass through the and negative electrons are passing
through output terminals to the load in form of electrical current. Fuel cells produce direct
current continuously until the fuel or oxidizer is disconnected from the cell. For detail of fuel
cell scheme see Figure 4.
Specification of Fuel cells
Energy density 205 - 400 [Wh/ dm3]
Specific density 300 - 400 [Wh/kg]
Power to area of cell 0,5 [W/cm2]
Efficiency 55 - 80 [%]
Operating temperature -20 - 1000 [°C]
Nominal cell voltage 0,5 - 1,23 [V]
Lifetime 2000 - 60 000 [h]
Table 4 - Technical and economic parameters of Fuel cells
(see appendix E for charging and discharging characteristics of fuel cells)
13
Figure 4 - Scheme of Fuel cell (16)
The most common types of fuel cells (17)
Alkaline Fuel Cells - AFS
These type of fuel cells were developed as one of the first. They used alkaline electrolyte.
Specifically an aqueous solution of KOH is in the asbestos matrix of cells. Fuel of these cells
is hydrogen and oxidant can be pure oxygen or air without CO2. The operate temperature of
the AFCs is depended on concentration of electrolyte. The temperature can be in range from
23°C to 250°C.
Chemical reactions in AFS:
Cathode reaction: H2O + O2 + 4e- → 4OH
-
Anode reaction: 2OH- + H2 → 2H2O + 2e
-
Phosphoric Acid Fuel Cells - PAFC
PAFC is regarded as the first generation of modern fuel cells. In PAFC is used 100%
phosphoric acid like electrolyte.(18) Acid is fixed in asbestos or teflon-bonded silicon
carbide matrix. Platinum is used as catalyst. Operate temperature of PAFCs is in range from
150°C to 220°C. Usually the PAFC works as stationary power generations and offers
a possibility to be used in cogeneration units. Typical efficiency of these cells is about 35 %.
14
Chemical reactions in PAFC:
Cathode reaction: O2(g) + 4H+ + 4e
- → 2H2O
Anode reaction: 2H2 → 4H+ + 4e
-
Molten Carbonate Fuel Cells - MCFC
Electrolyte in MCFC is molten mixture of alkalines like Li, Na and K. Electrolyte in cell is in
ceramic lithium aluminum oxide (LiAlO2) matrix. Fuel for MCFCs can be gas from steam
reforming of fossil fuels or biogas. Oxidant is air. The operate temperature is from 600° C to
700 ° C. The molten salts provides high conductance of CO3-II group. Efficiency of cell is
usually around 50 %, but if cell is connected to turbine efficiency can be around 65 %.
The MCFCs are usually used in cogeneration units or in power plants.
Chemical reactions in MCFC:
Cathode reaction: CO2 + ½O2 + 2e− → CO3
2−
Anode reaction: CO32−
+ H2 → H2O + CO2 + 2e−
Solid Oxide Fuel Cells - SOFC
The electrolyte in SOFC is yttria-stabilized zirconia (YSZ). It is solid ceramic membrane
based on ZrO2 stabilized by Y2O3. Advantage of these cells is that it is not necessary to use
catalysts. Operate temperature is around 800-1000 °C. Normal efficiency of the SOFCs is
around 50-60 %, but due to thermal reaction product which can be used in expanse turbine the
efficiency can be higher up to 85 %. As fuel for these cells is used biogas, fuel gas or gas
from the steam reforming of fossil fuel and air works as an oxidant.
Chemical reactions in SOFC:
Cathode reaction: O2 + 4e– → 2O
2−
Anode reaction: 2H2 + 2O2−
→ 2H2O + 4e−
15
Advantages
environmentally friendly
extremely reliable
high efficiency
reactions in fuel cells are not degraded over time
continuously electricity supply
Disadvantages
start-up times of certain types of fuel cells
the need for hydrogen infrastructure
energy intensity of production
Application
Fuel cells have a large range of applications. They can be used like stationary or portable
energy sources. Stationary fuel cells are very often used like a commercial primary and
backup power in industries or in other sectors. Fuel cells are also used in space program and
in military technologies. Also the fuel cells are used in all types of transportation (cars, buses,
motorcycles, airplanes, boats and submarines). (19) (20) (21)
16
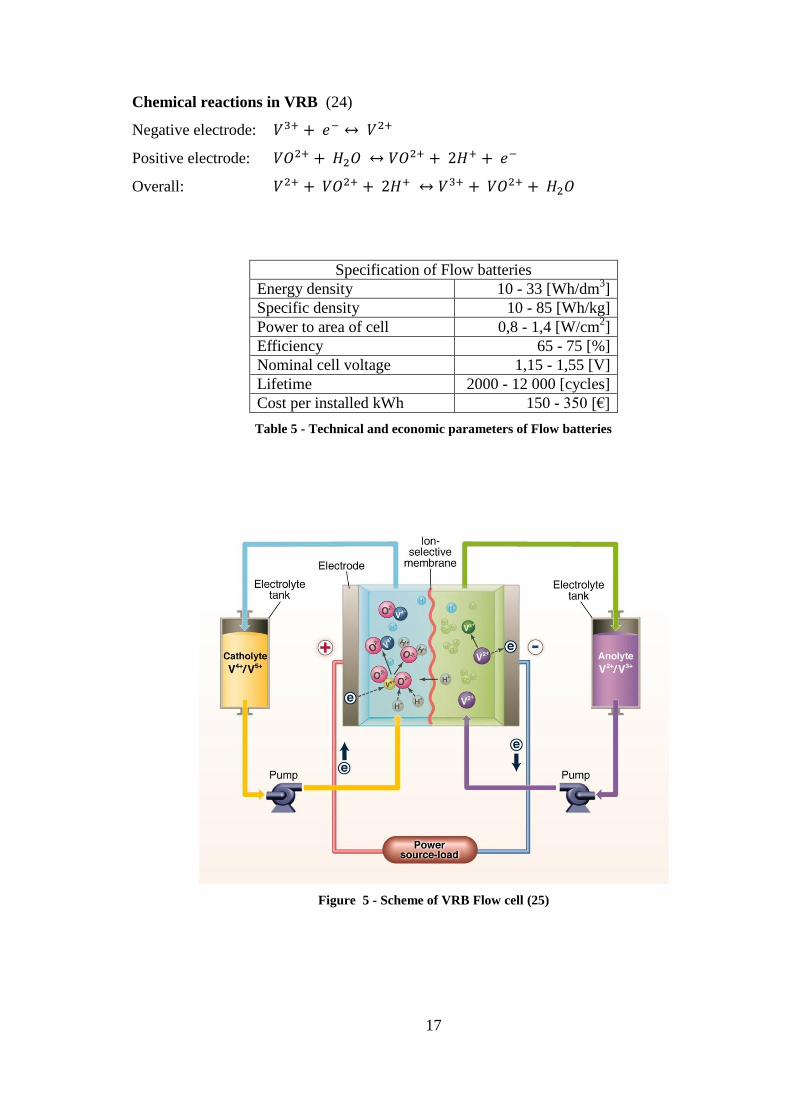
1.3.5 Flow batteries
Construction
Flow batteries are rechargeable fuel cells with external tanks for electrolytes. There are two
types of electrolyte: positive charged and negative charged. Electrolyte is pumped from tanks
into reaction cell. In the cell there is membrane separating electrolytes. Electrical energy is
stored in electrochemical potential of different oxidation states of salts dissolved in the
electrolyte. Ions between electrolytes are exchanged through membrane and free electrons in
electrolyte are caught in collector generating electrical current. Thus cells transform chemical
energy of electrolytes directly to the electricity, so flow batteries have high efficiency. (22)
Number of cycles is theoretically limitless, because electrolytes in tanks are separated and at
any it is possible to refill electrolyte at any time. In technical documentations of flow batteries
there is usually written lifetime of thousands of cycles in dependence on type of flow
batteries. For example lifetime of Vanadium redox batteries is more than 12 000 cycles. Big
advantages of flow batteries are fast response about 1ms and possibility of discharging to
100% depth without impact on electrolytes and lifetime of batteries. (23)
There are many types of flow batteries: reduction-oxidation (redox), hybrid, organic or
membraneless. One of the most common type of flow cells is vanadium redox batteries.
Vanadium redox batteries
Vanadium redox batteries (VRB) contains the active vanadium salt in different oxidation
states of redox pairs (positive pairs: V(IV)/V(V), negative: V(II)/V(III)) and concentrated
sulphuric acid. VBR cells have ion exchange membrane (PEM) with thickness about 0,25
mm, where on one side proceeds oxidation of electrolyte and on the other side of membrane
proceeds electrochemical reduction of electrolyte ions. Voltage of VBR cell is in range of
1,2 - 1,6 V and cells in accumulator are connected in series. During charging and discharging
decisive chemical reactions take place on the carbon electrodes where vanadium oxidation is
changed. Scheme of VRB is shown on Figure 5.
17
Chemical reactions in VRB (24)
Negative electrode:
Positive electrode:
Overall:
Specification of Flow batteries
Energy density 10 - 33 [Wh/dm3]
Specific density 10 - 85 [Wh/kg]
Power to area of cell 0,8 - 1,4 [W/cm2]
Efficiency 65 - 75 [%]
Nominal cell voltage 1,15 - 1,55 [V]
Lifetime 2000 - 12 000 [cycles]
Cost per installed kWh 150 - 350 [€]
Table 5 - Technical and economic parameters of Flow batteries
Figure 5 - Scheme of VRB Flow cell (25)
18
Advantages
fast response in 1 ms
reliability
high efficiency
long lifetime without self-discharge
high number of cycles
without harmful emissions.
Disadvantages
pumping losses
chemical reaction losses
Application
Flow batteries can work as energy storage in range from small UPS system to large
accumulation of electrical energy connected to power grid. In power grid flow batteries can
help with load balancing, peak shaving. Also is possible to connect flow batteries to
renewable resources to store unused electric power or use it in stand-alone systems.
19
1.4 Mechanical accumulators
1.4.1 Using kinetic energy - Flywheels
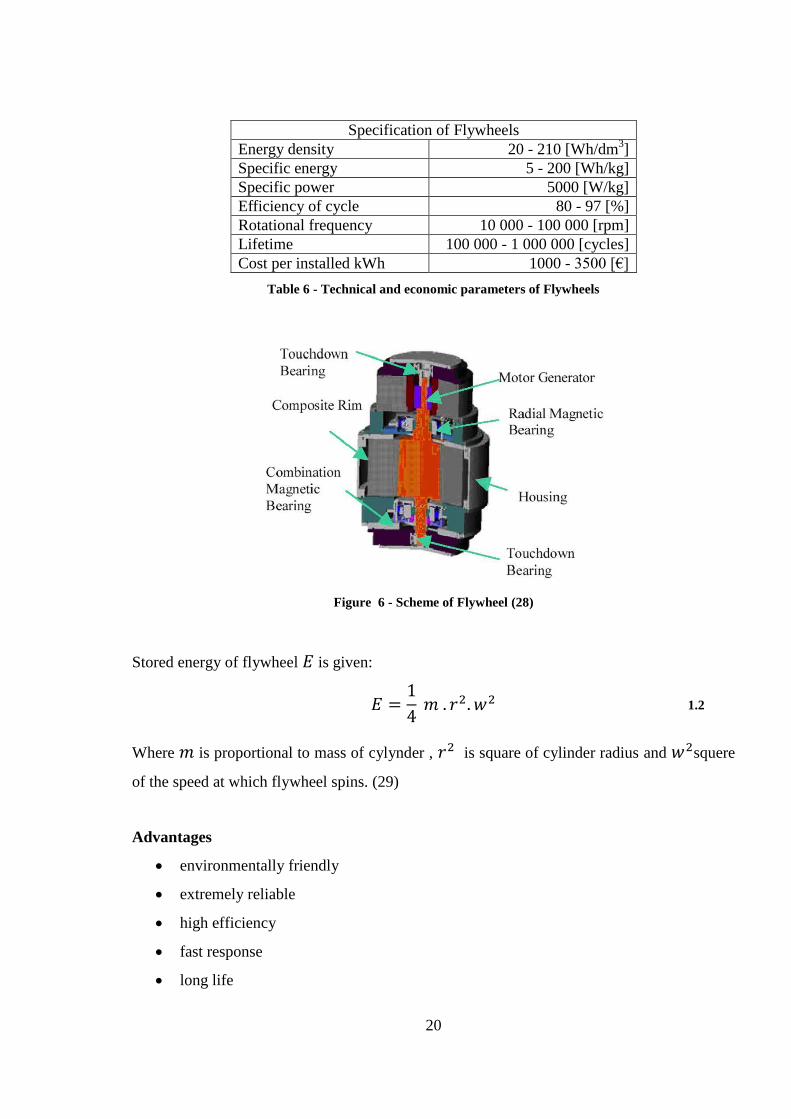
Construction
The flywheel is a device, which allows to store energy in motion of rotation. In flywheel is
accelerated massive cylinder called rotor by electric motor. Electric power is transformed to
kinetic power of spinning rotor. The first rotors of flywheels were made of steel and energy
was mainly stored in weight of rotor´s cylinder. But strength of steel was limiting during the
faster rotation. There was a danger of disintegration of the material of the rotor and thus the
destruction of the entire flywheel. Modern flywheel´s rotors are made of carbon-fibres.
This material is much stronger than steel and allow accelerate rotor to higher rotation.
Adverse effects reducing efficiency of flywheel are aerodynamic drag and frictions.
To minimize aerodynamic drag the rotor is rotating in vacuum. Vacuum, which is provided by
vacuum pump system. In classic bearings there are big frictions. In modern flywheels the
magnetic bearings are used in order to improve efficiency and elimination of frictions. With
all these improvements the rotor of the modern flywheels is able to spin up to 50 000 rounds
per minute. In this speed in case of accident arises a risk of danger and due to this danger
flywheels are installed under the ground. (26)
In time of need the flywheel is slowed down and motor working as generator to supply
electricity into a power grid. Stored energy depends on mass of rotor, rotation speed square
and radius. Flywheels can provide short-term power backup and bridge the time needed for
start of long-term power backup systems with larger capacity because of fast response. Next
usage of flywheels can be balancing of frequency in the power grid. For this way of use is
typical more cycles of charging and discharging. The flywheels are suitable for these purposes
because of excellent cycle and load following characteristic. (27) Technology of modern
flywheels allows more than ten of thousands deep cycles with minimal maintenance.Usually
life time of flywheels is around 20 years. For detailed scheme of flywheel see Figure 6.
20
Specification of Flywheels
Energy density 20 - 210 [Wh/dm3]
Specific energy 5 - 200 [Wh/kg]
Specific power 5000 [W/kg]
Efficiency of cycle 80 - 97 [%]
Rotational frequency 10 000 - 100 000 [rpm]
Lifetime 100 000 - 1 000 000 [cycles]
Cost per installed kWh 1000 - 3500 [€]
Table 6 - Technical and economic parameters of Flywheels
Figure 6 - Scheme of Flywheel (28)
Stored energy of flywheel is given:
1.2
Where is proportional to mass of cylynder , is square of cylinder radius and squere
of the speed at which flywheel spins. (29)
Advantages
environmentally friendly
extremely reliable
high efficiency
fast response
long life
21
Disadvantages
possibility of an accident at high rotation speed
Application
The flywheel storage is used in power engineering as uninterruptible power supply, peak
buffer or with renewable resources to store excess electricity. Also the flywheels have
application in other fields as in automotive industry in hybrid/electric cars. (30) (31)
22
1.4.2 Using potential energy - Hydro pumped storage power stations
Construction
Hydroelectric pumped storage power plants accumulate energy in potential energy of water.
Power plant has two water reservoirs. One of them is located on the lower place and the
second on the higher place. The height difference between the reservoirs is one of the
parameters determining the amount of stored energy. The reservoirs are connected with
gravity pipe of large diameter.
Principle of hydroelectric pumped storage power plants is that in time of off-peak period or in
time when is in the grid more electricity, which unbalancing the flows in the grid, the water is
pumped from lower reservoir to the higher reservoir. The power plant consumes electricity
from the grid and transforms in into potential energy of water in the higher reservoir. In the
higher reservoir water can be accumulated for a long period of time. In peak time or when is
necessary provide electricity to the grid, the water is pumped down into the turbine to
generate electric energy.
Building of hydroelectric pumped storage power plants is quite difficult. At first it is
necessary to have a suitable and enough large location, which would meet the requirements
for the construction of reservoirs. During the construction can be used of relief of nature for
build reservoirs near watercourses, lakes or the sea shore. It is possible to build artificial
dams. (32) The process of construction is really expensive, but hydroelectric pumped storage
power plants has really long lifetime. Usually a lifetime of this type of power plants is
supposed to be approximately 100 years.
Importance of hydroelectric pumped storage power plants was increased with expansion of
nuclear power plants. Nuclear power plants are hard to regulate, but they are one of the
cheapest producers of electricity so far. Due to this fact the goal is to keep continuing
operation of nuclear power plants in the economic point. This operation affect the off-peak
periods, where is in grid more electricity. Hydroelectric pumped storage can compensate for
this excess electricity and accumulate energy for peak periods. (33)
23
Hydroelectric pumped storage power plant is the only accumulator of energy where can be
electricity stored in large scale and for a long time periods. Another advantage is the quick
response and the ability to control. Efficiency of modern pumped storage power stations in
small cycle is up to 75 %. Small cycle is counted without losses generated by transportation
of electricity from producer to station and from station to consumer. Hydroelectric pumped
storage units can compensate amount of electricity in power grid and balance drop of
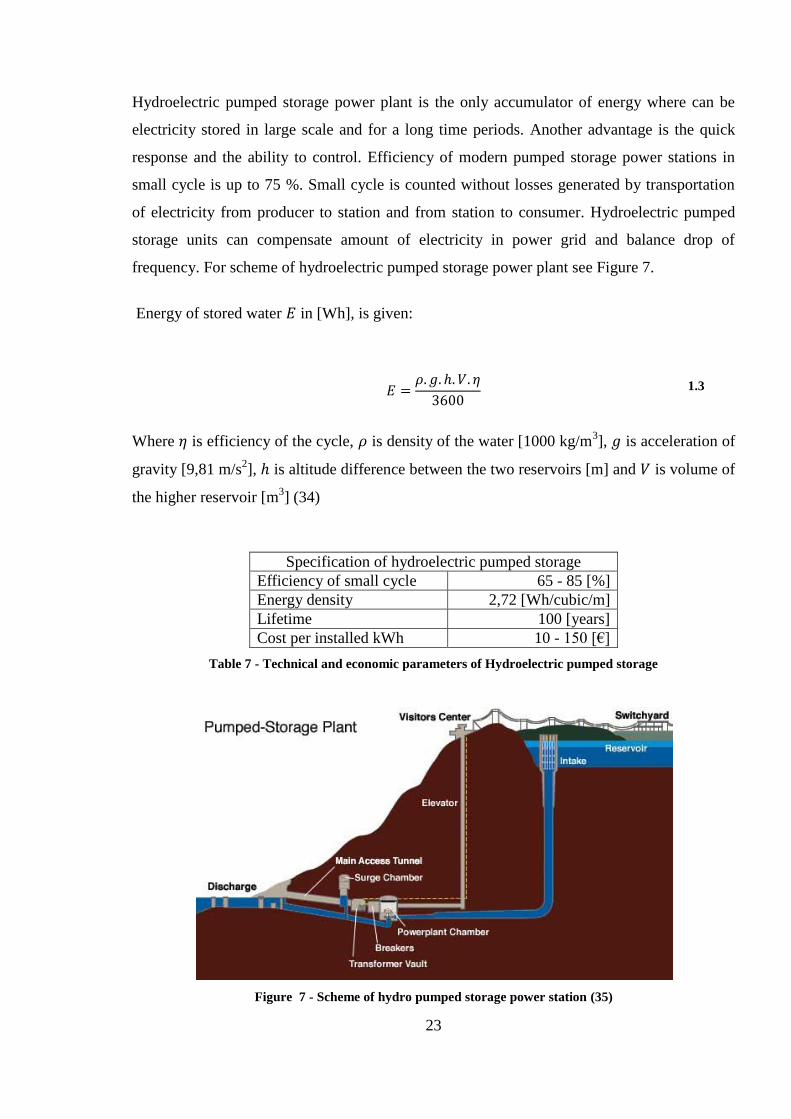
frequency. For scheme of hydroelectric pumped storage power plant see Figure 7.
Energy of stored water in [Wh], is given:
1.3
Where is efficiency of the cycle, is density of the water [1000 kg/m3], is acceleration of
gravity [9,81 m/s2], is altitude difference between the two reservoirs [m] and is volume of
the higher reservoir [m3] (34)
Specification of hydroelectric pumped storage
Efficiency of small cycle 65 - 85 [%]
Energy density 2,72 [Wh/cubic/m]
Lifetime 100 [years]
Cost per installed kWh 10 - 150 [€]
Table 7 - Technical and economic parameters of Hydroelectric pumped storage
Figure 7 - Scheme of hydro pumped storage power station (35)
24
1.4.3 Using pressure energy - Compressed air
Construction
One of the most prospective methods of energy accumulation is using the compressed air.
Compressed air energy storages (CAES) are able to store large amounts of energy for long
periods. Principle of CAES is to use electricity in off-peak time to compress air into reservoir
and in the peak time, when there is the deficiency of electricity in the grid, use pressure
energy of the compressed air to generate electricity in turbine. This process is simple, but
there are some complications with compressing. When air is compressed the temperature is
increasing. The temperature of the stored air can reach more than 650 °C and it leads to heat
losses during the storing. (36) Next problem is that during the expansion temperature drops.
Heat during expansion is important because it is one of the parameters determining the
amount of the stored energy. Therefore before expansion it is necessary to re-heat compressed
air. It can be done by gas turbines. As reservoirs for the compressed air are usually used
underground caverns or old mines. There are also in developing another ways how to store
compressed air for example huge air bags placed on the bottom of the sea and using natural
water pressure. (37) Lifetime of CAES is counted more than 30 years. Accumulation of
energy in compressed air is environmentally friendly without pollutions. Disadvantages of
CAES are small energy density, high investment and long construction time. There are three
main types of CAES and in each type are used other physical principles: diabatic, adiabatic
and isothermal CAES.
Diabatic CAES
In this type of CAES is heat from compression of the air lost. Usually is dissipated into the
atmosphere as waste. It means that stored energy in CAES is decreased. In process of
expansion lost heat is missing and it is necessary to add it. The heat is the most often
generated by burning of natural gas in the turbine which generate electricity. Exhaust from
gas burning re-heat compressed air travelling to the turbine where expands. By heat losses of
the compressed air the efficiency of accumulation is degraded. Also burning of the natural gas
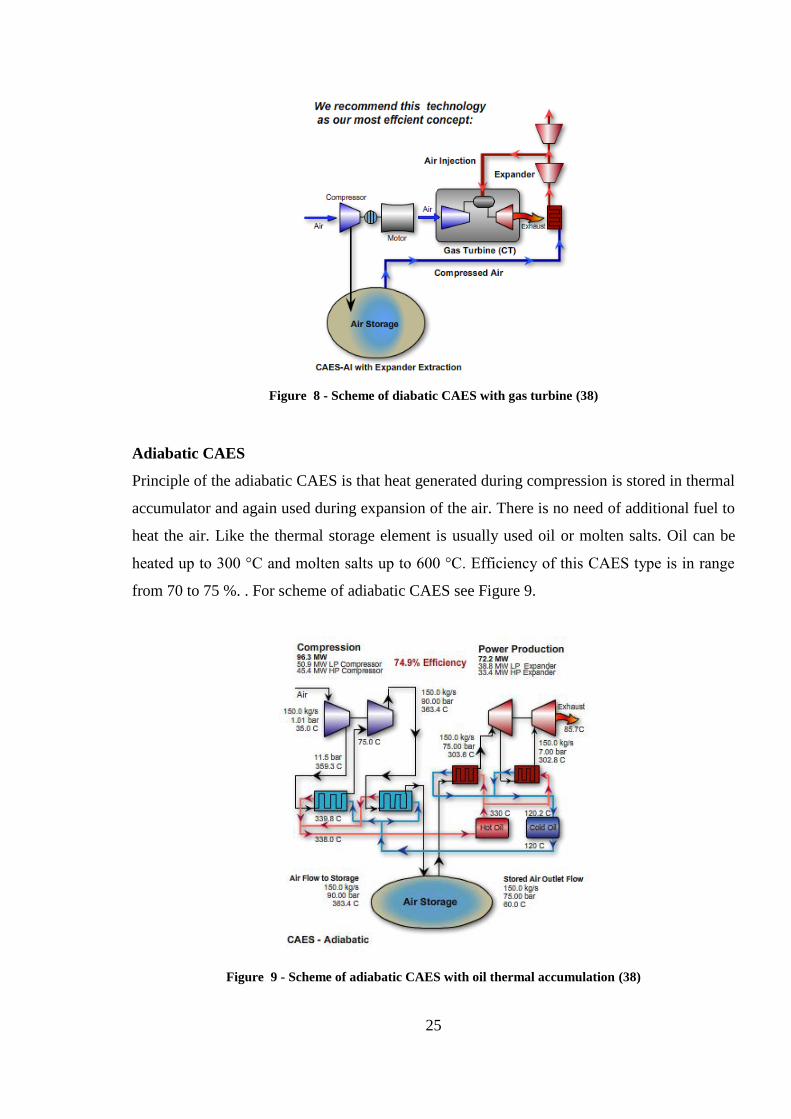
leads to additional costs and pollution. For scheme of diabatic CAES see Figure 8.
25
Figure 8 - Scheme of diabatic CAES with gas turbine (38)
Adiabatic CAES
Principle of the adiabatic CAES is that heat generated during compression is stored in thermal
accumulator and again used during expansion of the air. There is no need of additional fuel to
heat the air. Like the thermal storage element is usually used oil or molten salts. Oil can be
heated up to 300 °C and molten salts up to 600 °C. Efficiency of this CAES type is in range
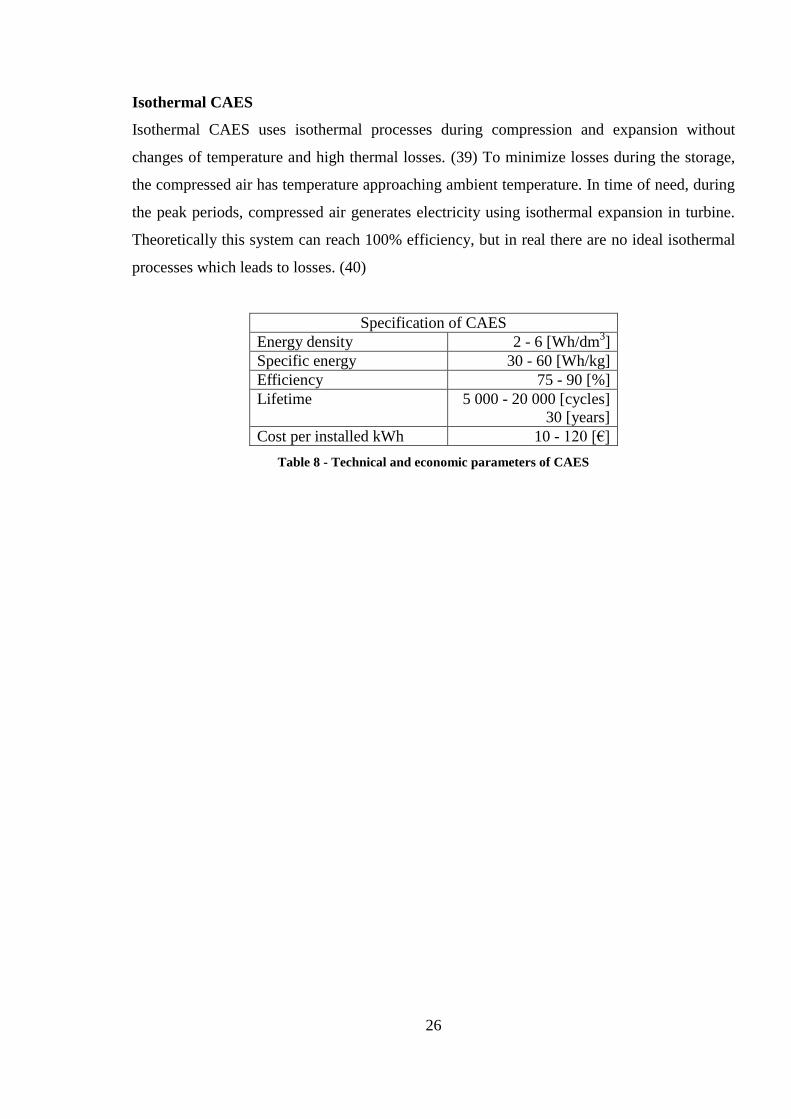
from 70 to 75 %. . For scheme of adiabatic CAES see Figure 9.
Figure 9 - Scheme of adiabatic CAES with oil thermal accumulation (38)
26
Isothermal CAES
Isothermal CAES uses isothermal processes during compression and expansion without
changes of temperature and high thermal losses. (39) To minimize losses during the storage,
the compressed air has temperature approaching ambient temperature. In time of need, during
the peak periods, compressed air generates electricity using isothermal expansion in turbine.
Theoretically this system can reach 100% efficiency, but in real there are no ideal isothermal
processes which leads to losses. (40)
Specification of CAES
Energy density 2 - 6 [Wh/dm3]
Specific energy 30 - 60 [Wh/kg]
Efficiency 75 - 90 [%]
Lifetime 5 000 - 20 000 [cycles]
30 [years]
Cost per installed kWh 10 - 120 [€]
Table 8 - Technical and economic parameters of CAES
27
1.5 Electromagnetic accumulators
1.5.1 Supercapacitors
Construction
Supercapacitors are special electrolytic capacitors with large capacity. Principle of storing
electricity is something between classical capacitors and batteries. In supercapacitors the
electric charge is stored by electrostatic force on the surface of electrodes. Electrodes are
made from porous materials, which have large surface area for example carbon which has up
to 2000 m2/g. The new nanomaterials with extreme large active surface can also help to
increase the capacity of supercapacitors. Between electrodes is electrolyte which can be
aqueous-based or consist of anhydrous organic solvent. Usually electrolyte is liquid or like
a gel. Electrodes are separated by dielectric of thickness of tenths of nanometers. Thanks to
small thickness of dielectric is also small breakdown voltage. Voltage range of
supercapacitors with aqueous-based electrolyte is from 1 to 1,2 V and with anhydrous organic
solvent electrolyte is from 2,3 to 3 V. (41) In order to achieve a higher voltage , the
supercapacitors are serially connected, but the total capacity is reduced. The strings with more
than three capacitors require voltage balancing as prevention from over-voltage.
Supercapacitors can be charged and discharged in a few seconds. Due to small internal
resistance the supercapacitors can be discharged with current in order of kA. (42) Lifetime of
supercapacitors is in the hundreds of thousands of cycles. Sometimes is quoted to one million
cycles. Disadvantage of supercapacitors is self-discharge. Supercapacitors are suited to short
term cover of peak currents.
There are two principles how supercapacitors store electricity. The first principle is called
"double-layer capacitance". It is electrostatic process where a separated charge is stored on
Helmholtz double layer. The second one is pseudocapacitance. Pseudocapacitacne is
electrochemical storage achieved by faradic reduction-oxidation reactions with charge
transfer.
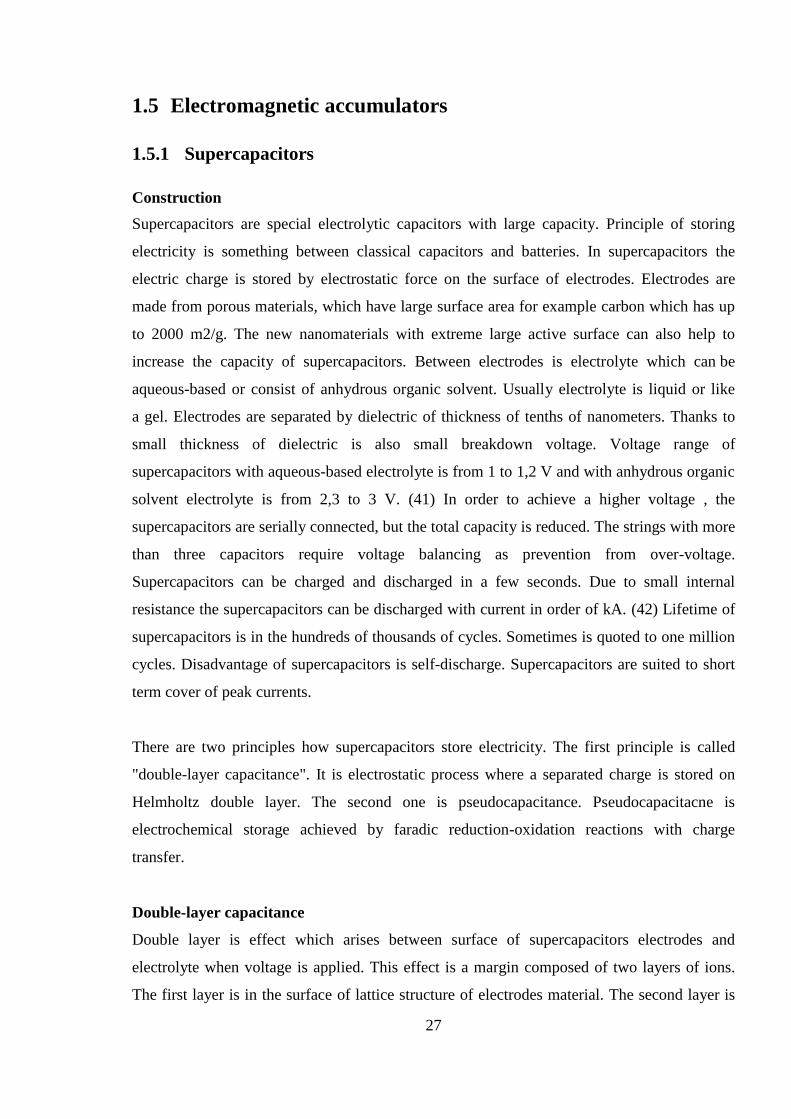
Double-layer capacitance
Double layer is effect which arises between surface of supercapacitors electrodes and
electrolyte when voltage is applied. This effect is a margin composed of two layers of ions.
The first layer is in the surface of lattice structure of electrodes material. The second layer is
28
made of ions from electrolyte and has opposite polarity. Between these two layers is only
monolayer of solvent molecules. The monolayer of solvent is called the inner Helmholtz
plane and creates a molecular dielectric between oppositely polarized ions. This layer is
adheres by physical forces. Chemical bonds in molecules are polarized. The outer Helmholtz
plane consists of counter-charges and indicates the amount of stored charge.
Figure 10 - View of double-layer capacitance (43)
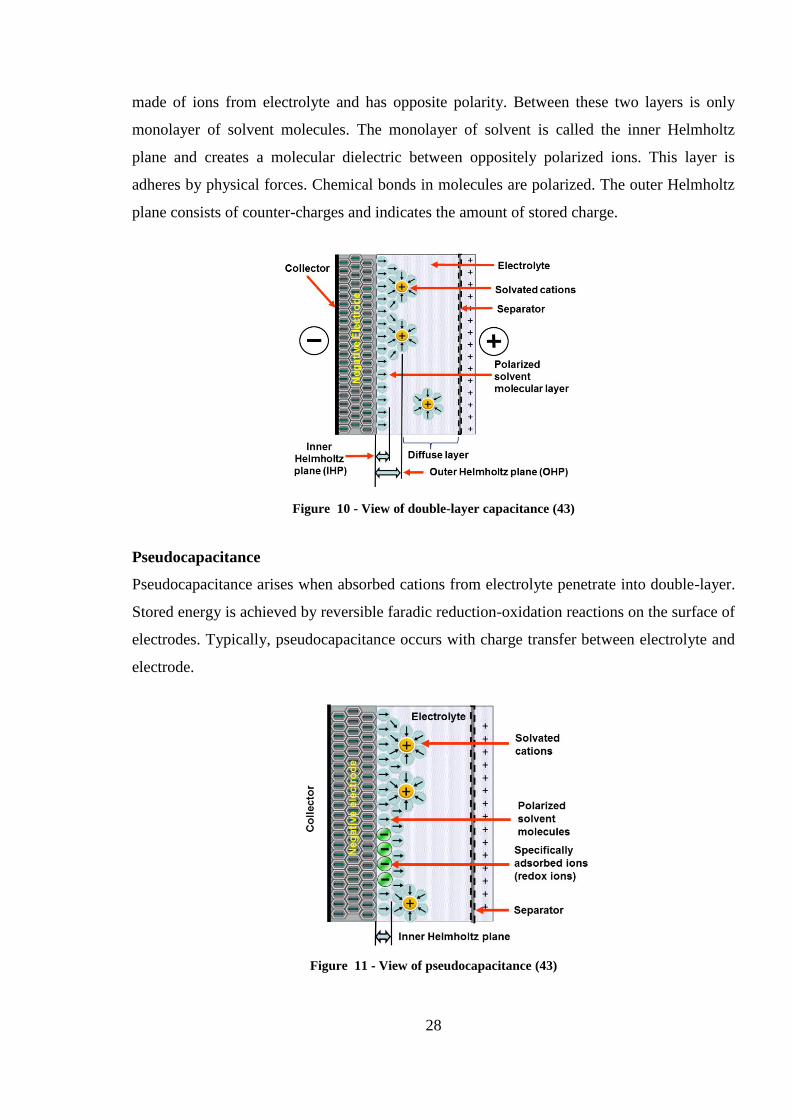
Pseudocapacitance
Pseudocapacitance arises when absorbed cations from electrolyte penetrate into double-layer.
Stored energy is achieved by reversible faradic reduction-oxidation reactions on the surface of
electrodes. Typically, pseudocapacitance occurs with charge transfer between electrolyte and
electrode.
Figure 11 - View of pseudocapacitance (43)
29
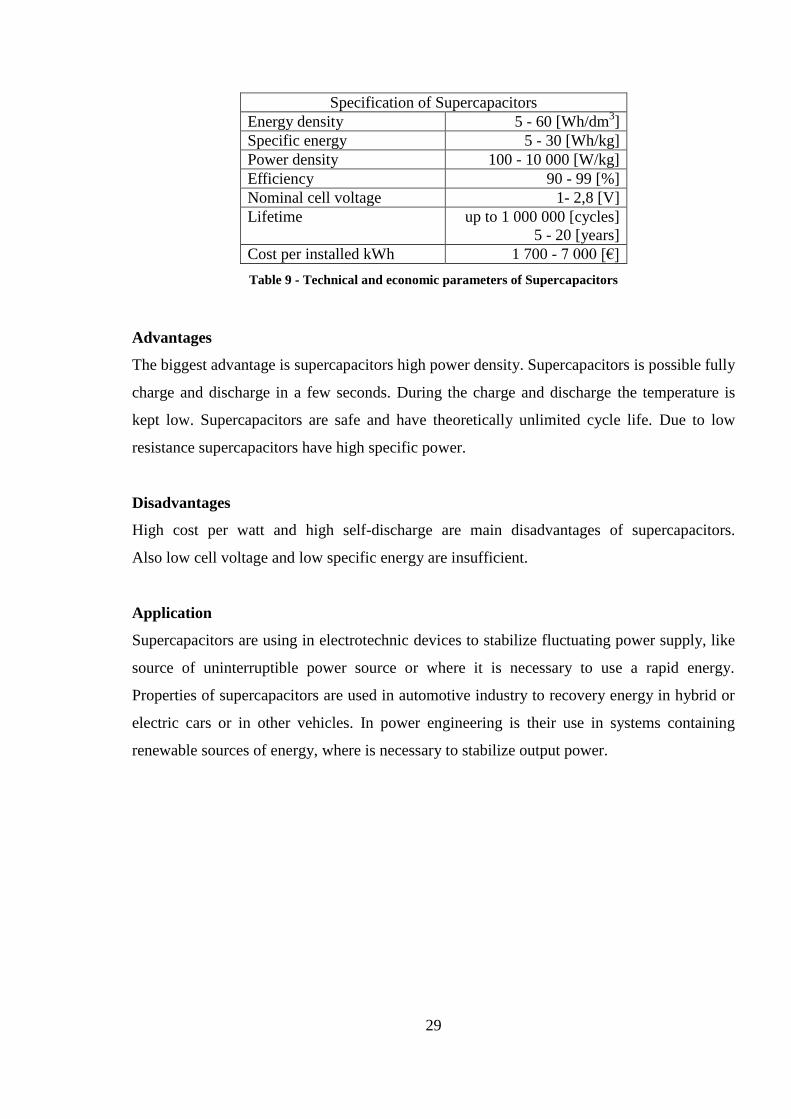
Specification of Supercapacitors
Energy density 5 - 60 [Wh/dm3]
Specific energy 5 - 30 [Wh/kg]
Power density 100 - 10 000 [W/kg]
Efficiency 90 - 99 [%]
Nominal cell voltage 1- 2,8 [V]
Lifetime up to 1 000 000 [cycles]
5 - 20 [years]
Cost per installed kWh 1 700 - 7 000 [€]
Table 9 - Technical and economic parameters of Supercapacitors
Advantages
The biggest advantage is supercapacitors high power density. Supercapacitors is possible fully
charge and discharge in a few seconds. During the charge and discharge the temperature is
kept low. Supercapacitors are safe and have theoretically unlimited cycle life. Due to low
resistance supercapacitors have high specific power.
Disadvantages
High cost per watt and high self-discharge are main disadvantages of supercapacitors.
Also low cell voltage and low specific energy are insufficient.
Application
Supercapacitors are using in electrotechnic devices to stabilize fluctuating power supply, like
source of uninterruptible power source or where it is necessary to use a rapid energy.
Properties of supercapacitors are used in automotive industry to recovery energy in hybrid or
electric cars or in other vehicles. In power engineering is their use in systems containing
renewable sources of energy, where is necessary to stabilize output power.
30
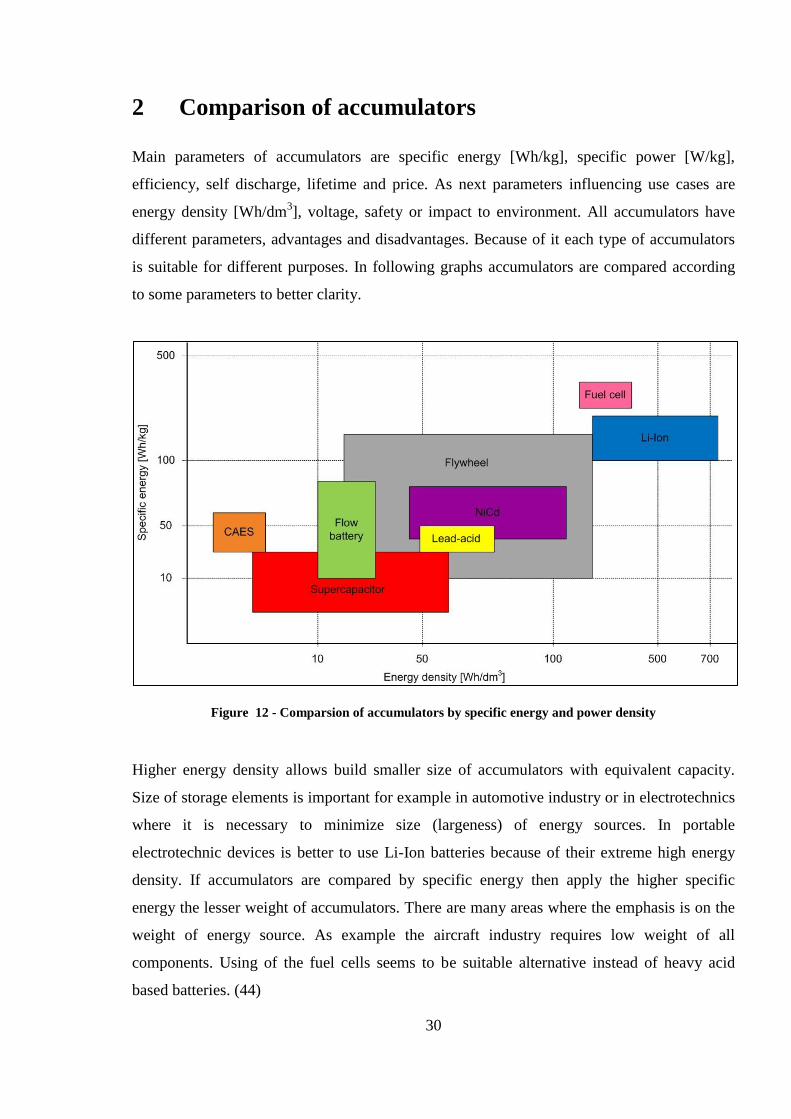
2 Comparison of accumulators
Main parameters of accumulators are specific energy [Wh/kg], specific power [W/kg],
efficiency, self discharge, lifetime and price. As next parameters influencing use cases are
energy density [Wh/dm3], voltage, safety or impact to environment. All accumulators have
different parameters, advantages and disadvantages. Because of it each type of accumulators
is suitable for different purposes. In following graphs accumulators are compared according
to some parameters to better clarity.
Figure 12 - Comparsion of accumulators by specific energy and power density
Higher energy density allows build smaller size of accumulators with equivalent capacity.
Size of storage elements is important for example in automotive industry or in electrotechnics
where it is necessary to minimize size (largeness) of energy sources. In portable
electrotechnic devices is better to use Li-Ion batteries because of their extreme high energy
density. If accumulators are compared by specific energy then apply the higher specific
energy the lesser weight of accumulators. There are many areas where the emphasis is on the
weight of energy source. As example the aircraft industry requires low weight of all
components. Using of the fuel cells seems to be suitable alternative instead of heavy acid
based batteries. (44)
31
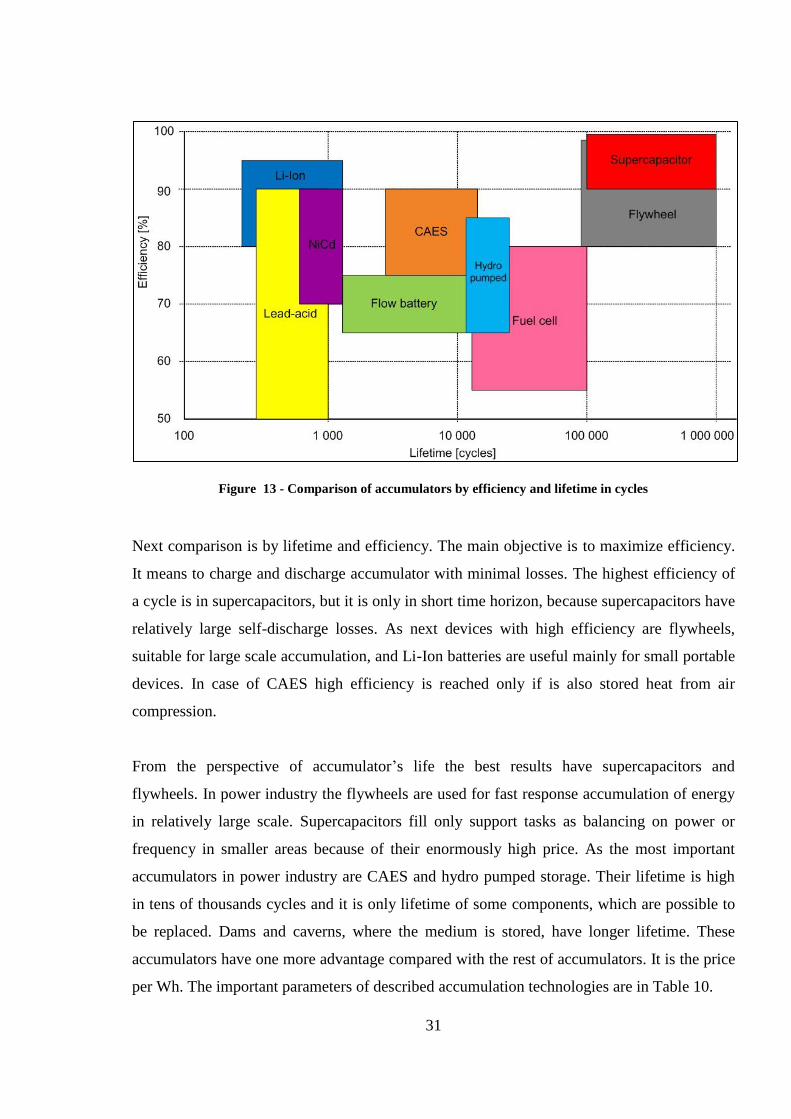
Figure 13 - Comparison of accumulators by efficiency and lifetime in cycles
Next comparison is by lifetime and efficiency. The main objective is to maximize efficiency.
It means to charge and discharge accumulator with minimal losses. The highest efficiency of
a cycle is in supercapacitors, but it is only in short time horizon, because supercapacitors have
relatively large self-discharge losses. As next devices with high efficiency are flywheels,
suitable for large scale accumulation, and Li-Ion batteries are useful mainly for small portable
devices. In case of CAES high efficiency is reached only if is also stored heat from air
compression.
From the perspective of accumulator’s life the best results have supercapacitors and
flywheels. In power industry the flywheels are used for fast response accumulation of energy
in relatively large scale. Supercapacitors fill only support tasks as balancing on power or
frequency in smaller areas because of their enormously high price. As the most important
accumulators in power industry are CAES and hydro pumped storage. Their lifetime is high
in tens of thousands cycles and it is only lifetime of some components, which are possible to
be replaced. Dams and caverns, where the medium is stored, have longer lifetime. These
accumulators have one more advantage compared with the rest of accumulators. It is the price
per Wh. The important parameters of described accumulation technologies are in Table 10.
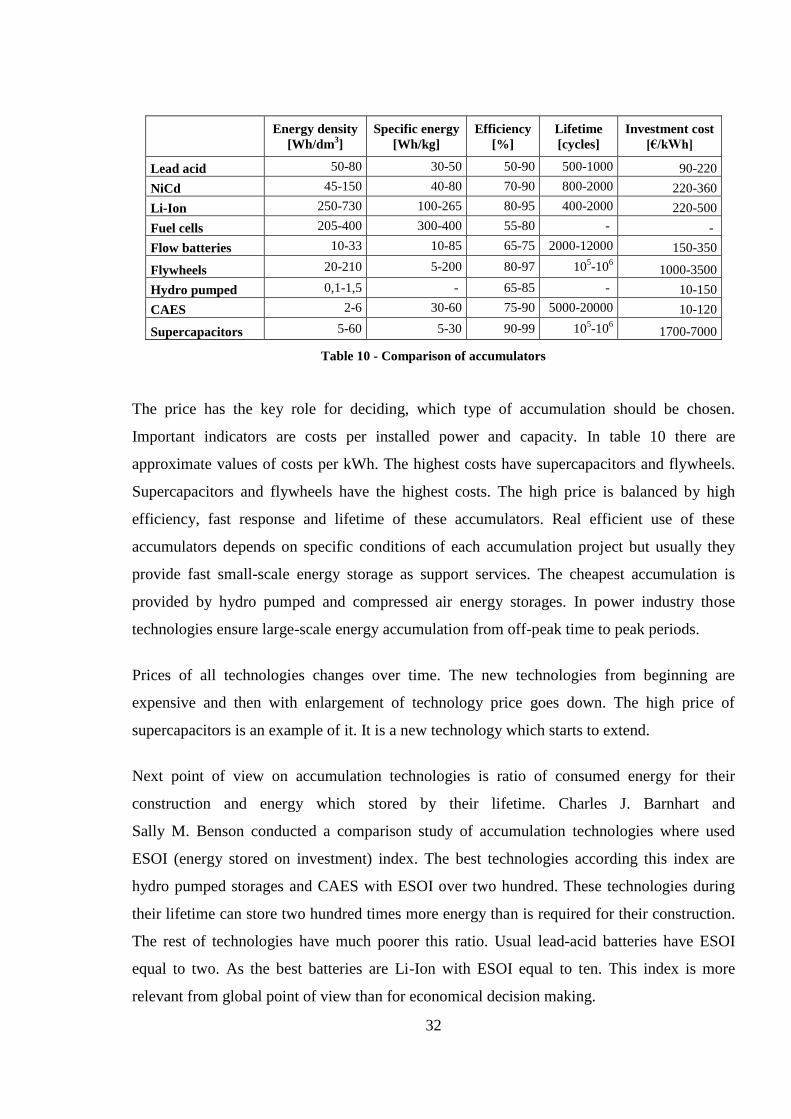
32
Energy density
[Wh/dm3]
Specific energy
[Wh/kg]
Efficiency
[%]
Lifetime
[cycles]
Investment cost
[€/kWh]
Lead acid 50-80 30-50 50-90 500-1000 90-220
NiCd 45-150 40-80 70-90 800-2000 220-360
Li-Ion 250-730 100-265 80-95 400-2000 220-500
Fuel cells 205-400 300-400 55-80 - -
Flow batteries 10-33 10-85 65-75 2000-12000 150-350
Flywheels 20-210 5-200 80-97 105-10
6 1000-3500
Hydro pumped 0,1-1,5 - 65-85 - 10-150
CAES 2-6 30-60 75-90 5000-20000 10-120
Supercapacitors 5-60 5-30 90-99 105-10
6 1700-7000
Table 10 - Comparison of accumulators
The price has the key role for deciding, which type of accumulation should be chosen.
Important indicators are costs per installed power and capacity. In table 10 there are
approximate values of costs per kWh. The highest costs have supercapacitors and flywheels.
Supercapacitors and flywheels have the highest costs. The high price is balanced by high
efficiency, fast response and lifetime of these accumulators. Real efficient use of these
accumulators depends on specific conditions of each accumulation project but usually they
provide fast small-scale energy storage as support services. The cheapest accumulation is
provided by hydro pumped and compressed air energy storages. In power industry those
technologies ensure large-scale energy accumulation from off-peak time to peak periods.
Prices of all technologies changes over time. The new technologies from beginning are
expensive and then with enlargement of technology price goes down. The high price of
supercapacitors is an example of it. It is a new technology which starts to extend.
Next point of view on accumulation technologies is ratio of consumed energy for their
construction and energy which stored by their lifetime. Charles J. Barnhart and
Sally M. Benson conducted a comparison study of accumulation technologies where used
ESOI (energy stored on investment) index. The best technologies according this index are
hydro pumped storages and CAES with ESOI over two hundred. These technologies during
their lifetime can store two hundred times more energy than is required for their construction.
The rest of technologies have much poorer this ratio. Usual lead-acid batteries have ESOI
equal to two. As the best batteries are Li-Ion with ESOI equal to ten. This index is more
relevant from global point of view than for economical decision making.
33
3 Energy storage in power grid
Energetics, like other area of industry is not stable but still evolving. In recent years, there are
noticeable changes in the composition of production. Earlier coal and nuclear power plants
were the main producers of electricity supporting by hydro and hydro pumped power plants.
During the last decade the renewable sources such as photovoltaic and wind power plants
have started to take their places on the field of electricity production. These power plants
achieve cleaner production of electricity without emitting greenhouse gases, pollution and
conserve limited primary energy sources such as coal, gas and oil. Disadvantages of these
power sources consider to be randomness and instability of production. The most hopeful
solution to these problems is the use of accumulation which can stabilize production or store
electricity from time of production to time of demand.
Accumulators may not only solve the problems associated with renewable resources but can
solve a large variety of cases. Using the accumulators can help power plants to work with
higher efficiency, allow systems to work in stand-alone mode, to increase reliability of power
grid and many others. Accumulators are one of the main elements of modern concept Smart
Grid. This is simply a list of several examples of using accumulators, because their real use is
much wider.
Nowadays there is a large scale of accumulation technologies. Each of these technologies has
their specific parameters, advantages and disadvantages. Therefore the each type of
accumulator is appropriate for other purposes.
3.1 Voltage regulation
The one of parameters of quality of electricity is voltage. In power transmission and
distribution networks are voltage levels which must be followed. Voltage on these levels has
to be kept within specified limits. Usually acceptable voltage deviation is up to ± 5 % of
voltage level. To keep voltage deviations in limits there are a few methods. The first method
is regulation by tap-changing of transformers. The second one is using reactive elements as
capacitors. In case of voltage drop in power lines there are accumulators connected to the
nodes, they have capacitive character which improves voltage. In case of overvoltage
inductive compensators are connected. (45) (46)
34
3.2 Frequency regulation
The frequency is also important quality parameter of electricity. In power grid have to be
filled equation between electricity generation and consumption. If this condition is not
observed the frequency deviates from the desired value. In Europe the frequency value is 50
Hz. Any larger deviation can lead to losses and damage of connected equipment. To maintain
the frequency balanced, regulation on the generator side or consumer side must be added.
One way how to regulate balance is usage of accumulators. In period when generation is
bigger than consumption the frequency is higher. Accumulators can absorb energy from the
grid to decrease frequency to desired value and return the required balance. In period when
generation is lower the accumulators provide missing energy to stabilize the frequency.
3.3 Supply time-shift
Consumption of electricity is changing every moment and the difference between
consumption in the day and at night is huge. Generating of electricity in power plants must
react on this fact and adapt production. Regulation of production is usually done by changing
of output power in base power plants or by turning on and off other production units.
Consumption of electricity is covered by nuclear and coal power plants for their lowest
production costs. Additional power units as gas turbines have higher production costs and
they are used in peak periods when demand is highest. In night when consumption is low the
peak power plants are switched off and output power of remaining power plants is reduced to
keep balance between generation and consumption. It leads to increasing of production costs
because of power plants don´t work in their economic points with the lowest costs.
This problem can be solved by using accumulators. Accumulation elements in off peak
periods as nights can absorb energy from the grid and store it for the peak periods when
provide energy back to the grid. Accumulation allows base power plants to work with the
lowest production costs which increase their effectiveness. The suitable accumulators for this
purpose can have lower response and cycle lifetime, but higher capacity.
35
3.4 Accumulation with renewable sources
Renewable sources of energy (RES) as wind and sun radiation have their own advantages and
disadvantages. The biggest advantage is that generation of electricity from these sources is
environmentally friendly without pollutions. Also they save the primary sources as gas, oil
and coal. The disadvantages, which affecting power grid, are randomness and changeability of
electricity generation.
Systems of renewable sources of energy with accumulation element can provide stable output
power without deviations. Accumulators can absorb deviations in generation to stabilize
output power or absorb surpluses in peak periods and in off peak periods providing electricity.
3.5 Stand-alone systems
Special cases of power supply are stand-alone power systems (SAPS). These systems do not
depend on external power and they are built in remote locations where the connection with
distribution network is not possible. As energy source usually serves RES with diesel
generators. In stand-alone systems it is necessary to use accumulators which store surpluses of
energy production to the time of demand. The next application of accumulators is to maintain
the quality of the supplied electricity such as voltage and current stabilization.
3.6 End-User bill optimization
By accumulation is possible manage bills of end users. Users pay for connected point and
consumed energy. Payment for connected point is given by maximum power of demand. In
this case usage of accumulators with required capacity can help to shave peaks in
consumption and allow to install circuit breakers with lower nominal current and thereby
reduce the payment. Consumers with two-part tariffs can use accumulators to store electricity
during low tariff and during high tariff consume it. By this end-users can reduce their
payment for electricity and also increase their supply security.
The next option is use accumulators for commercial purposes and store low price electrical
energy within low tariff period and provide this energy to the grid in time of high tariff
period.
36
3.7 Smart grid
Smart Grid is concept of energy networks consist of power lines and communication
technology system to monitor and optimize energy flow in the lines. Goal of Smart Grids is to
improve efficiency of electricity generation, transmission and consumption. The Smart Grid
concept is based on collection data from metering in nodes of power grid. Based on this
information the electricity generation is managed. The higher efficiency can be achieved by
generation of electrical energy in near locations from their consumption. This process
minimizes the transmission losses.
One part of these systems are accumulators storing surpluses to time of demand, improving
security of supply, balancing voltage and frequency and improving economy. Rather than
large scale accumulators will be supported smaller local energy storage devices working and
supporting adjacent areas. In Smart Grid concept are also considered electric cars which
would serve as accumulators to provide balancing of the grid.
37
4 Stand-alone systems with photovoltaic panels
The stand-alone systems are very problematic from viewpoint of power supply.
These systems cannot rely on external power supply and have to be totally independent.
Because of it stand-alone systems have to have large enough source of energy to cover all
demand throughout the year. As main source usually work RES. The most widely used RES
are solar and wind power plants. To provide permanent supply of electrical energy the
systems have to contain storage elements. As storage elements are used batteries, fuel-cells,
flow batteries and for special purposes supercapacitors.
The next part of this work is especially aimed on problems of stand-alone systems with
photovoltaic panels. Photovoltaic plants don´t have mechanical parts, which mitigate
fluctuations of output power due to their inertia, as wind power plants do. Therefore
generation of electricity from photovoltaic power plants is extreme variable compared to other
RES and strongly needs accumulation for balancing of power supply.
For better understanding of electricity generation from photovoltaic power plants, a brief
description of solar energy with calculations of incident sun radiation, principle and types of
photovoltaic panels and schemes of solar panels connections in stand-alone energy systems is
given below. This information can help to better calculate and optimize energy storage in
these systems.
4.1 Solar energy
Solar energy is energy of radiated light and heat from the Sun. Inside the Sun there are
nuclear transformations which cause radiation. The fossil fuel energy, wind energy, energy of
biomass, water energy and heat are manifestations of solar radiation on the Earth. Solar power
plants convert solar energy directly from incident solar radiation. Solar devices which
transform solar energy to electric power can be divided into two groups according their type
of transformation (Photovoltaic, Concentrated/Thermal)
Sun radiation consists of ultraviolet (wavelength less than 400 nm), visible light (wavelength
from 400 to 750 nm) and infrared (wavelength over 750 nm). Share of visible light under the
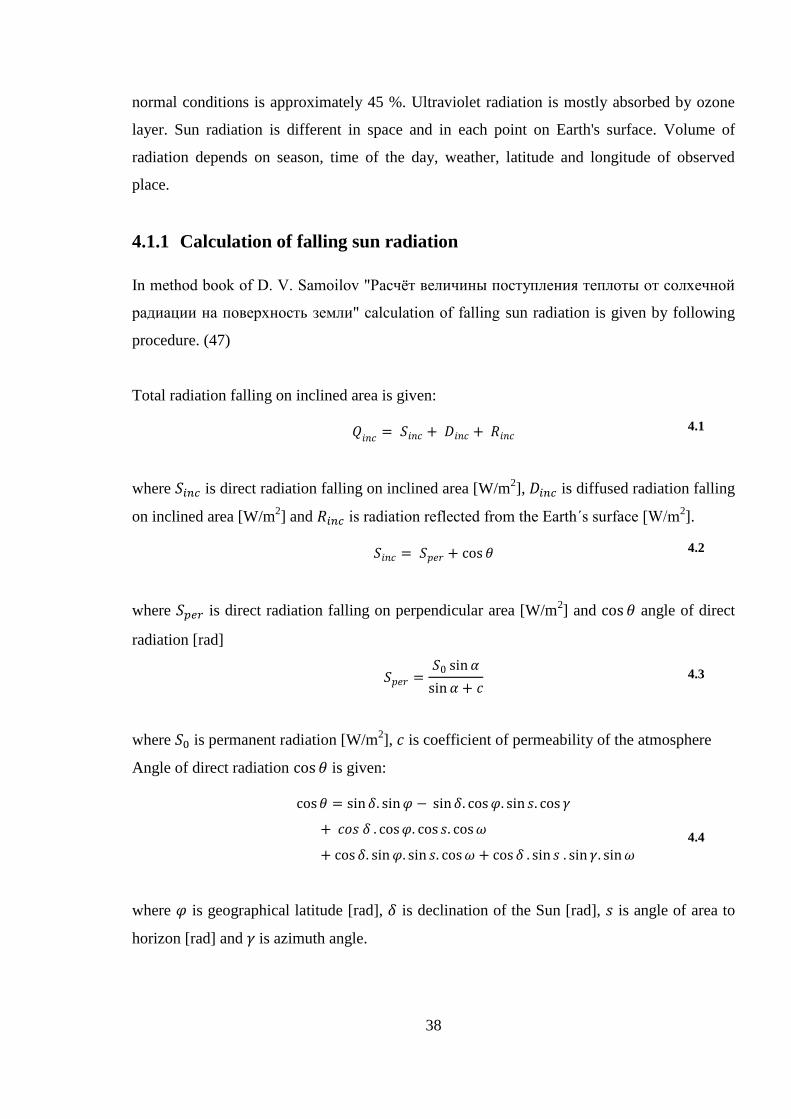
38
normal conditions is approximately 45 %. Ultraviolet radiation is mostly absorbed by ozone
layer. Sun radiation is different in space and in each point on Earth's surface. Volume of
radiation depends on season, time of the day, weather, latitude and longitude of observed
place.
4.1.1 Calculation of falling sun radiation
In method book of D. V. Samoilov "Расчёт величины поступления теплоты от солхечной
радиации на поверхность земли" calculation of falling sun radiation is given by following
procedure. (47)
Total radiation falling on inclined area is given:
4.1
where is direct radiation falling on inclined area [W/m2], is diffused radiation falling
on inclined area [W/m2] and is radiation reflected from the Earth´s surface [W/m
2].
4.2
where is direct radiation falling on perpendicular area [W/m2] and angle of direct
radiation [rad]
4.3
where is permanent radiation [W/m2], is coefficient of permeability of the atmosphere
Angle of direct radiation is given:
4.4
where is geographical latitude [rad], is declination of the Sun [rad], is angle of area to
horizon [rad] and is azimuth angle.
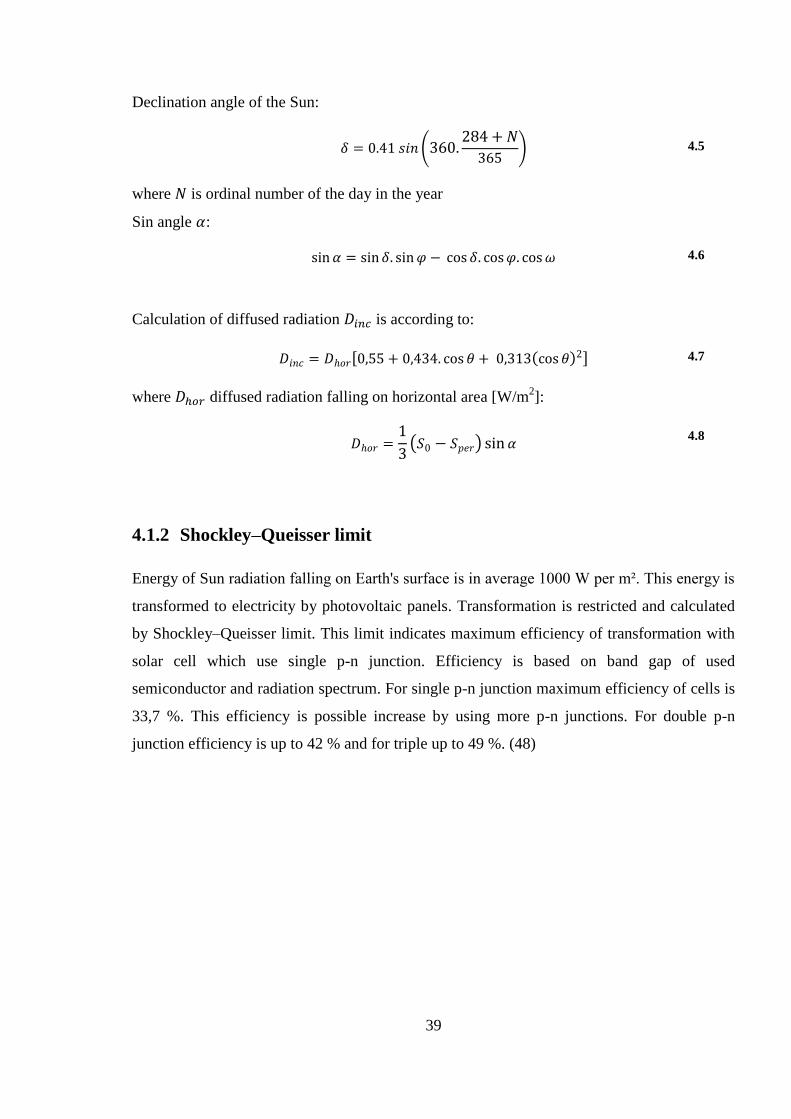
39
Declination angle of the Sun:
4.5
where is ordinal number of the day in the year
Sin angle :
4.6
Calculation of diffused radiation is according to:
4.7
where diffused radiation falling on horizontal area [W/m2]:
4.8
4.1.2 Shockley–Queisser limit
Energy of Sun radiation falling on Earth's surface is in average 1000 W per m². This energy is
transformed to electricity by photovoltaic panels. Transformation is restricted and calculated
by Shockley–Queisser limit. This limit indicates maximum efficiency of transformation with
solar cell which use single p-n junction. Efficiency is based on band gap of used
semiconductor and radiation spectrum. For single p-n junction maximum efficiency of cells is
33,7 %. This efficiency is possible increase by using more p-n junctions. For double p-n
junction efficiency is up to 42 % and for triple up to 49 %. (48)
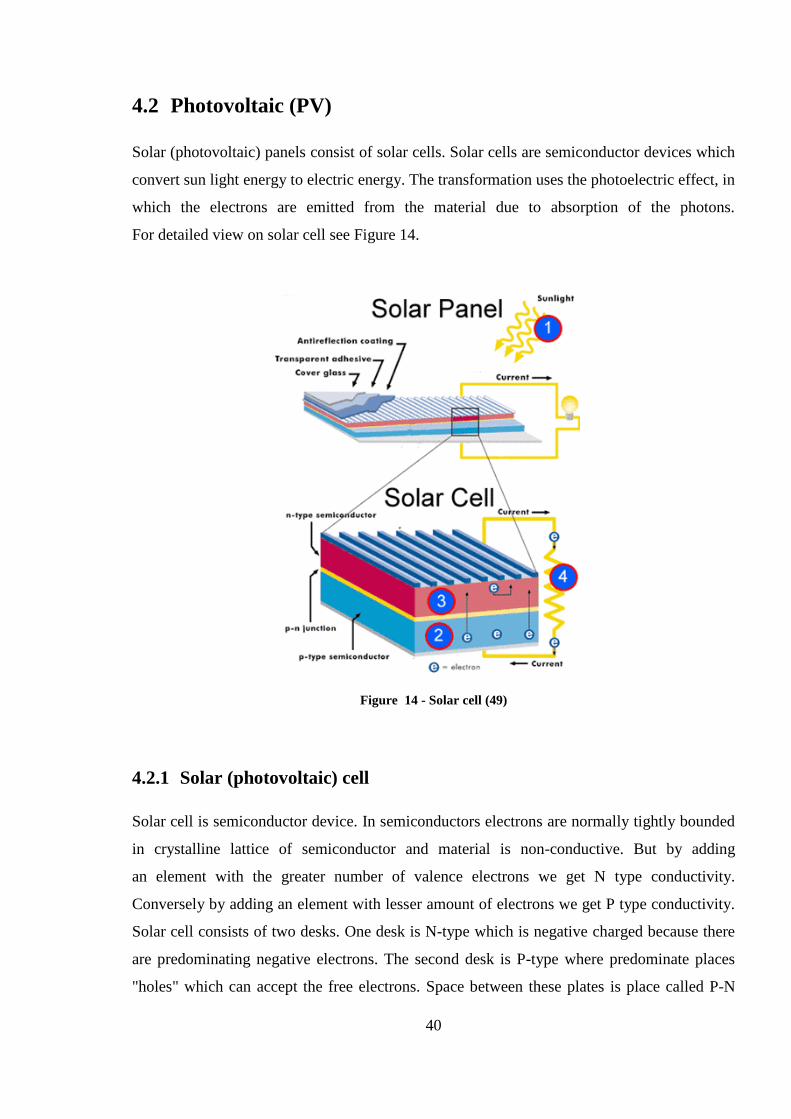
40
4.2 Photovoltaic (PV)
Solar (photovoltaic) panels consist of solar cells. Solar cells are semiconductor devices which
convert sun light energy to electric energy. The transformation uses the photoelectric effect, in
which the electrons are emitted from the material due to absorption of the photons.
For detailed view on solar cell see Figure 14.
Figure 14 - Solar cell (49)
4.2.1 Solar (photovoltaic) cell
Solar cell is semiconductor device. In semiconductors electrons are normally tightly bounded
in crystalline lattice of semiconductor and material is non-conductive. But by adding
an element with the greater number of valence electrons we get N type conductivity.
Conversely by adding an element with lesser amount of electrons we get P type conductivity.
Solar cell consists of two desks. One desk is N-type which is negative charged because there
are predominating negative electrons. The second desk is P-type where predominate places
"holes" which can accept the free electrons. Space between these plates is place called P-N
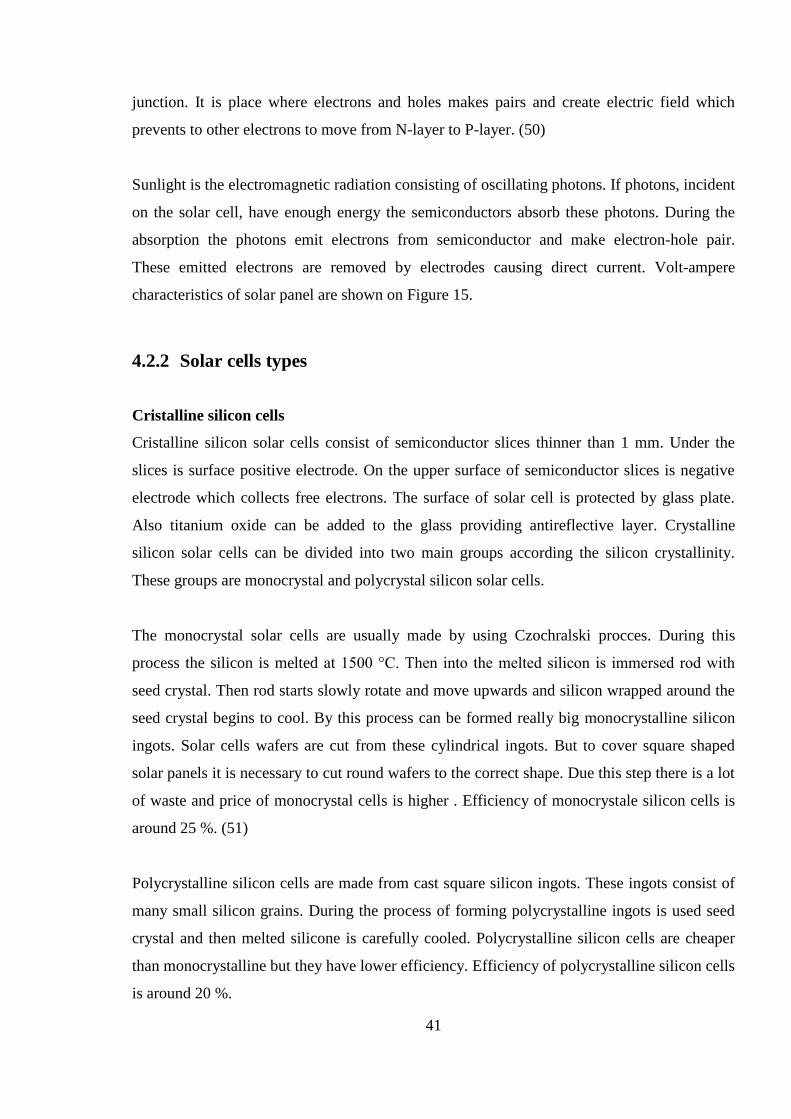
41
junction. It is place where electrons and holes makes pairs and create electric field which
prevents to other electrons to move from N-layer to P-layer. (50)
Sunlight is the electromagnetic radiation consisting of oscillating photons. If photons, incident
on the solar cell, have enough energy the semiconductors absorb these photons. During the
absorption the photons emit electrons from semiconductor and make electron-hole pair.
These emitted electrons are removed by electrodes causing direct current. Volt-ampere
characteristics of solar panel are shown on Figure 15.
4.2.2 Solar cells types
Cristalline silicon cells
Cristalline silicon solar cells consist of semiconductor slices thinner than 1 mm. Under the
slices is surface positive electrode. On the upper surface of semiconductor slices is negative
electrode which collects free electrons. The surface of solar cell is protected by glass plate.
Also titanium oxide can be added to the glass providing antireflective layer. Crystalline
silicon solar cells can be divided into two main groups according the silicon crystallinity.
These groups are monocrystal and polycrystal silicon solar cells.
The monocrystal solar cells are usually made by using Czochralski procces. During this
process the silicon is melted at 1500 °C. Then into the melted silicon is immersed rod with
seed crystal. Then rod starts slowly rotate and move upwards and silicon wrapped around the
seed crystal begins to cool. By this process can be formed really big monocrystalline silicon
ingots. Solar cells wafers are cut from these cylindrical ingots. But to cover square shaped
solar panels it is necessary to cut round wafers to the correct shape. Due this step there is a lot
of waste and price of monocrystal cells is higher . Efficiency of monocrystale silicon cells is
around 25 %. (51)
Polycrystalline silicon cells are made from cast square silicon ingots. These ingots consist of
many small silicon grains. During the process of forming polycrystalline ingots is used seed
crystal and then melted silicone is carefully cooled. Polycrystalline silicon cells are cheaper
than monocrystalline but they have lower efficiency. Efficiency of polycrystalline silicon cells
is around 20 %.
42
Thin film
Thin film solar cells are the third generation of solar cells and they are made by different
technology process, then classical crystaline silicon solar cells. Technology of creating thin
film solar cells allows reduce the amount of active material of solar cell. The material is
deposited in thin layers usually thick from a few nanometers to tens micrometers. These
layers are made by similar process like printing of the ink printer. Thin film solar cells are
more effective than normal crystaline silicon solar cells and lots of variants of these panels
exist varying in price and efficiency. Thin film solar cells can be divided into two groups:
rigid and flexible.
Rigid thin film cells are sandwiched between two glass panels because of protection of cells
and antireflective function. This type of cells is two times heavier than normal silicon cells
because of glass panels. Main technologies of this group of cells are CdTe, CIGS and
Amorphous silicon (a-Si). The cadmium telluride (CdTe) thin film solar cells are most
competitive because of low price.
Flexible thin film cells are created by depositing the photoactive layer on a flexible substrate
which can be insulator or conductor. If the substrate is an insulating material then monolithic
integration is used. The most effective solar cells are gallium arsenide multijunction
photovoltaic cells with efficiency up to 44 %. (52) Commercially available flexible thin film
solar cells are modules using amorphous silicon triple junction.
Organic solar cells
These solar cells are possible to create because of new technologies and knowledge of genetic
engineering and nanotechnology. Organic solar cells are made by using proteins and
photosynthesis to generation of electric power. Organic solar cells should be cheaper and in
the future more effective than classical crystaline silicon solar cells.
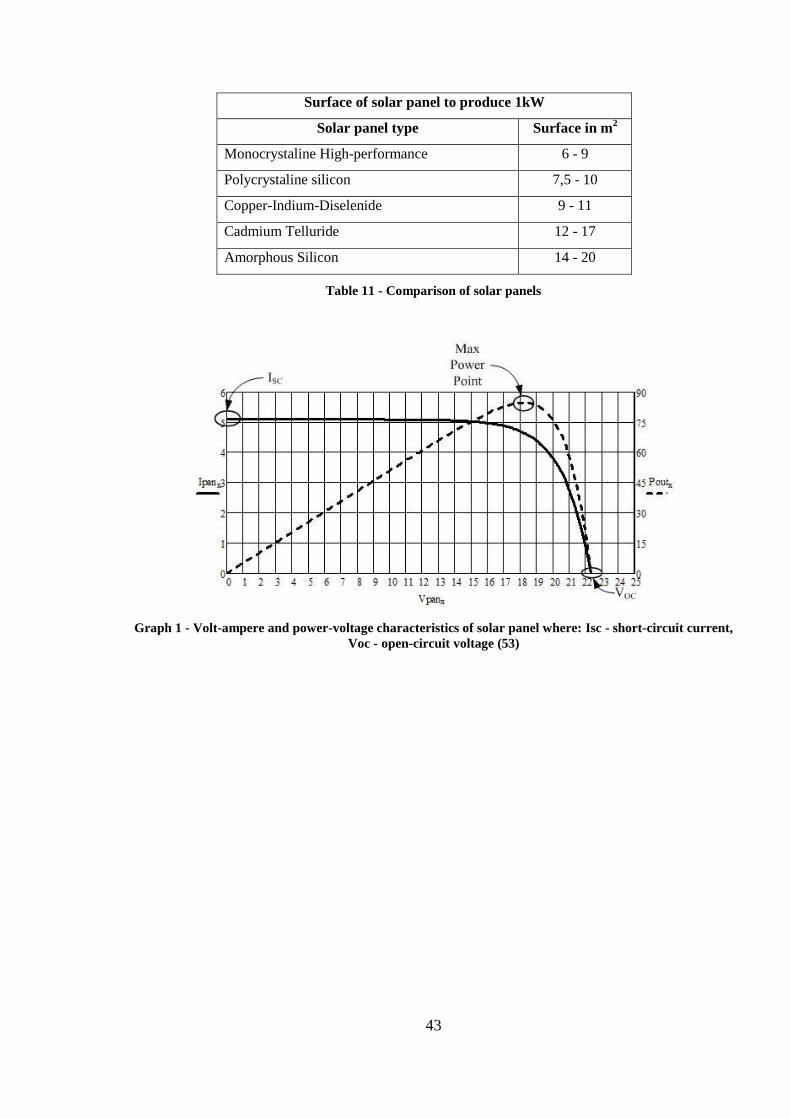
43
Surface of solar panel to produce 1kW
Solar panel type Surface in m2
Monocrystaline High-performance 6 - 9
Polycrystaline silicon 7,5 - 10
Copper-Indium-Diselenide 9 - 11
Cadmium Telluride 12 - 17
Amorphous Silicon 14 - 20
Table 11 - Comparison of solar panels
Graph 1 - Volt-ampere and power-voltage characteristics of solar panel where: Isc - short-circuit current,
Voc - open-circuit voltage (53)
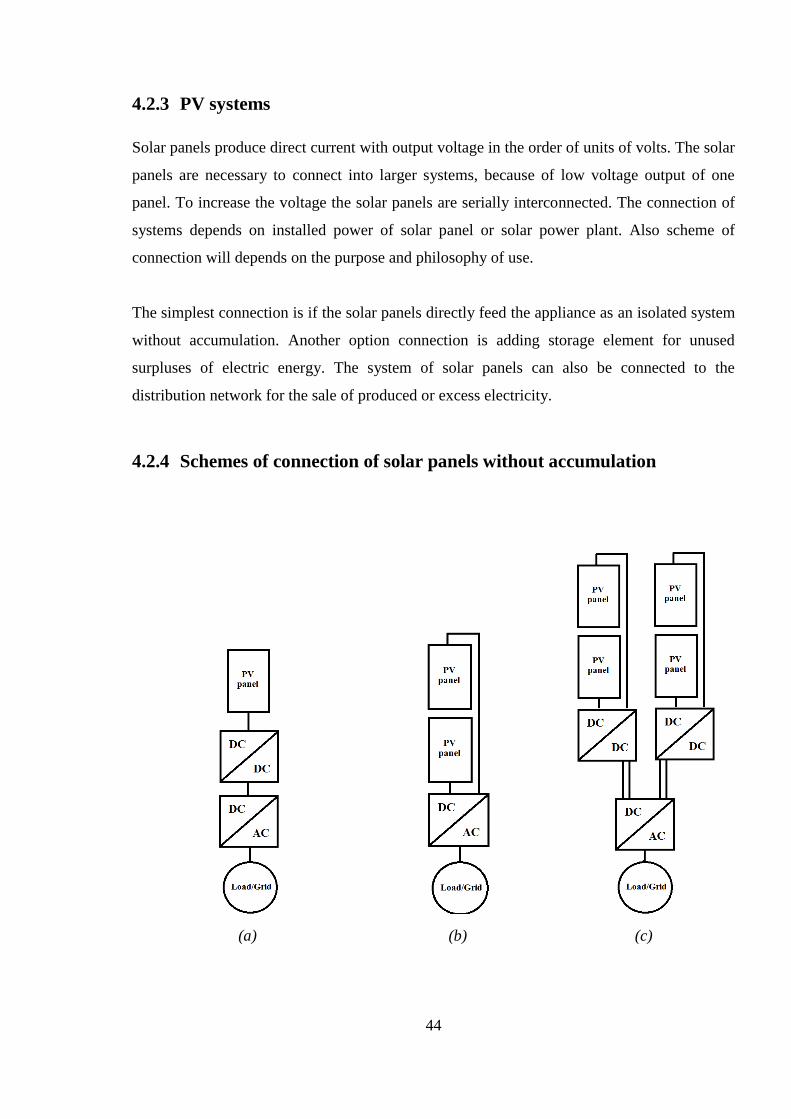
44
4.2.3 PV systems
Solar panels produce direct current with output voltage in the order of units of volts. The solar
panels are necessary to connect into larger systems, because of low voltage output of one
panel. To increase the voltage the solar panels are serially interconnected. The connection of
systems depends on installed power of solar panel or solar power plant. Also scheme of
connection will depends on the purpose and philosophy of use.
The simplest connection is if the solar panels directly feed the appliance as an isolated system
without accumulation. Another option connection is adding storage element for unused
surpluses of electric energy. The system of solar panels can also be connected to the
distribution network for the sale of produced or excess electricity.
4.2.4 Schemes of connection of solar panels without accumulation
(a) (b) (c)
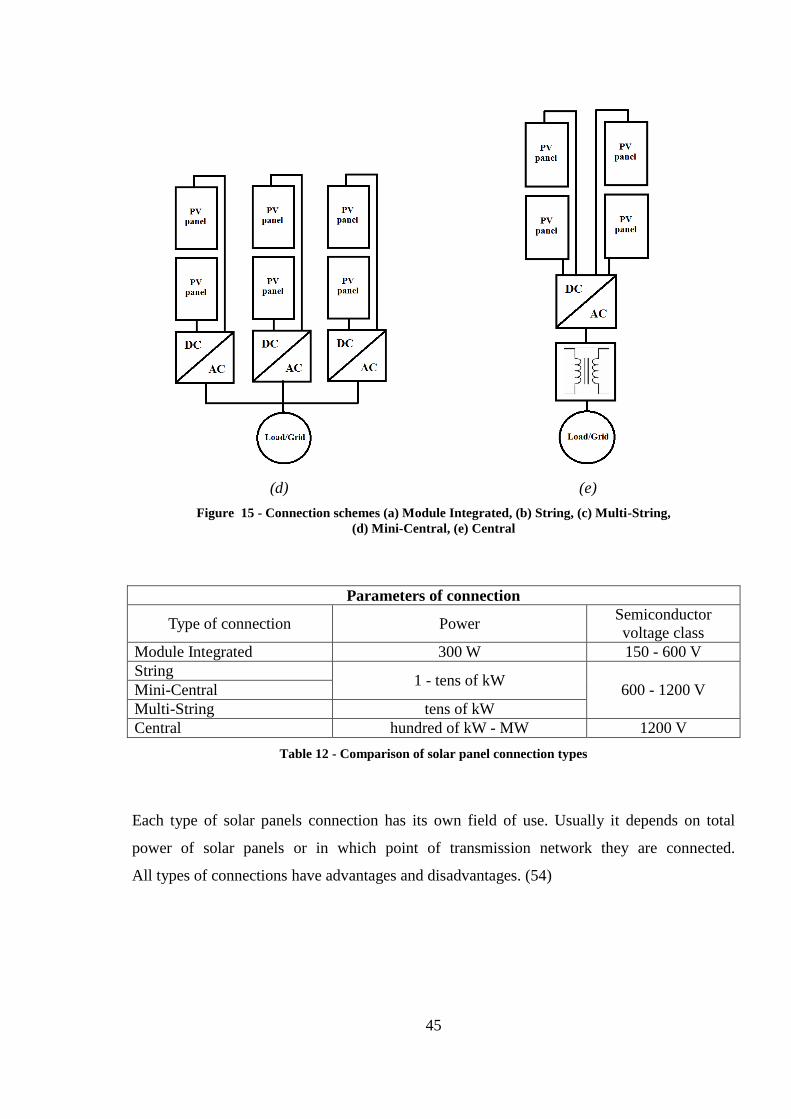
45
(d) (e)
Figure 15 - Connection schemes (a) Module Integrated, (b) String, (c) Multi-String,
(d) Mini-Central, (e) Central
Parameters of connection
Type of connection Power Semiconductor
voltage class
Module Integrated 300 W 150 - 600 V
String 1 - tens of kW
600 - 1200 V Mini-Central
Multi-String tens of kW
Central hundred of kW - MW 1200 V
Table 12 - Comparison of solar panel connection types
Each type of solar panels connection has its own field of use. Usually it depends on total
power of solar panels or in which point of transmission network they are connected.
All types of connections have advantages and disadvantages. (54)
46
Module integrated
Module integrated scheme is used for low power solar power plants. All solar panels are
connected to converters. In the first step of conversion, the direct voltage is charged to desired
value and in second step of conversion the direct current to altering current. Disadvantage of
this scheme is lesser reliability in case of fault of any element in this scheme.
String
String scheme is designed for connection of more solar panels. It allows build power plants
with higher power than in case of Module integrated scheme. In this scheme there is only one
converter converting direct current from solar panels to alternate current. This scheme has
higher reliability in case of fail of one solar panel part because supply in this case will not be
interrupted. The weakest point of this scheme is converter because in case of fail of converter
all supply will be interrupted.
Multi-String
Multi-String scheme is consist of branches of String scheme connected to DC/AC convertor.
In each branch are solar panels connected to DC/DC convertor changing voltage to designated
value. Also this step is to stabilize the supply. In this scheme is also the weakest point the
DC/AC converter. In case of its fault the supply will be interrupted.
Mini-Central
Mini-Central scheme solves a problem with weak point in reliability of previous variants. In
this scheme the String schemes branches are parallel connected to the load. Advantage of this
scheme is higher reliability due to independent parallel lines but disadvantage is higher price
as a consequence of many converters.
Central
Central scheme of connection of solar panels is designed for solar power plants with big
installed power. Solar panels are connected to the converter where the direct current is
converted on alternate current and in the next step transformed on high voltage via the
transformer. Output of this system is high voltage of electricity prepared for connection to the
distribution or transmission network.
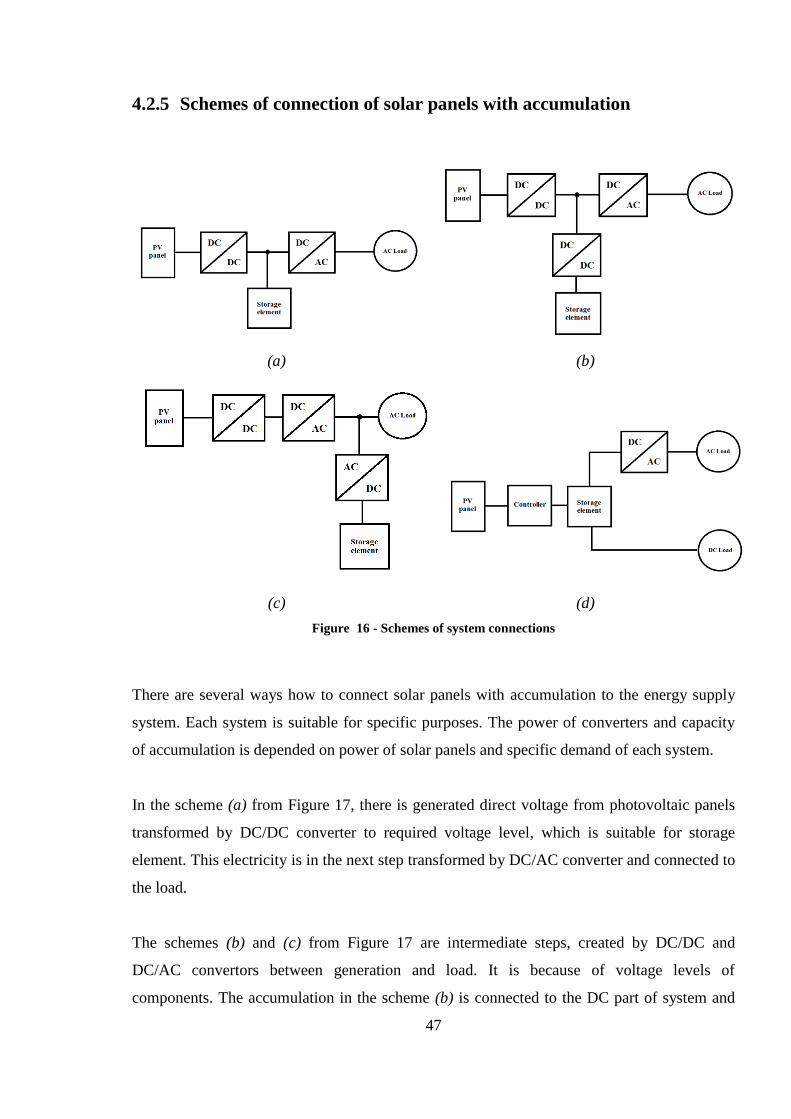
47
4.2.5 Schemes of connection of solar panels with accumulation
(a) (b)
(c) (d)
Figure 16 - Schemes of system connections
There are several ways how to connect solar panels with accumulation to the energy supply
system. Each system is suitable for specific purposes. The power of converters and capacity
of accumulation is depended on power of solar panels and specific demand of each system.
In the scheme (a) from Figure 17, there is generated direct voltage from photovoltaic panels
transformed by DC/DC converter to required voltage level, which is suitable for storage
element. This electricity is in the next step transformed by DC/AC converter and connected to
the load.
The schemes (b) and (c) from Figure 17 are intermediate steps, created by DC/DC and
DC/AC convertors between generation and load. It is because of voltage levels of
components. The accumulation in the scheme (b) is connected to the DC part of system and
48
provided by the DC/DC converter which is necessary for transformation of voltage level. In
the scheme (c) there is energy storage connected to the AC node via AC/DC converter,
because accumulation works in DC mode.
In the scheme (d) from Figure 17 there is charging of accumulators driven by controller.
Electricity from accumulators is supplied to DC load and via DC/AC converter to the AC
load.
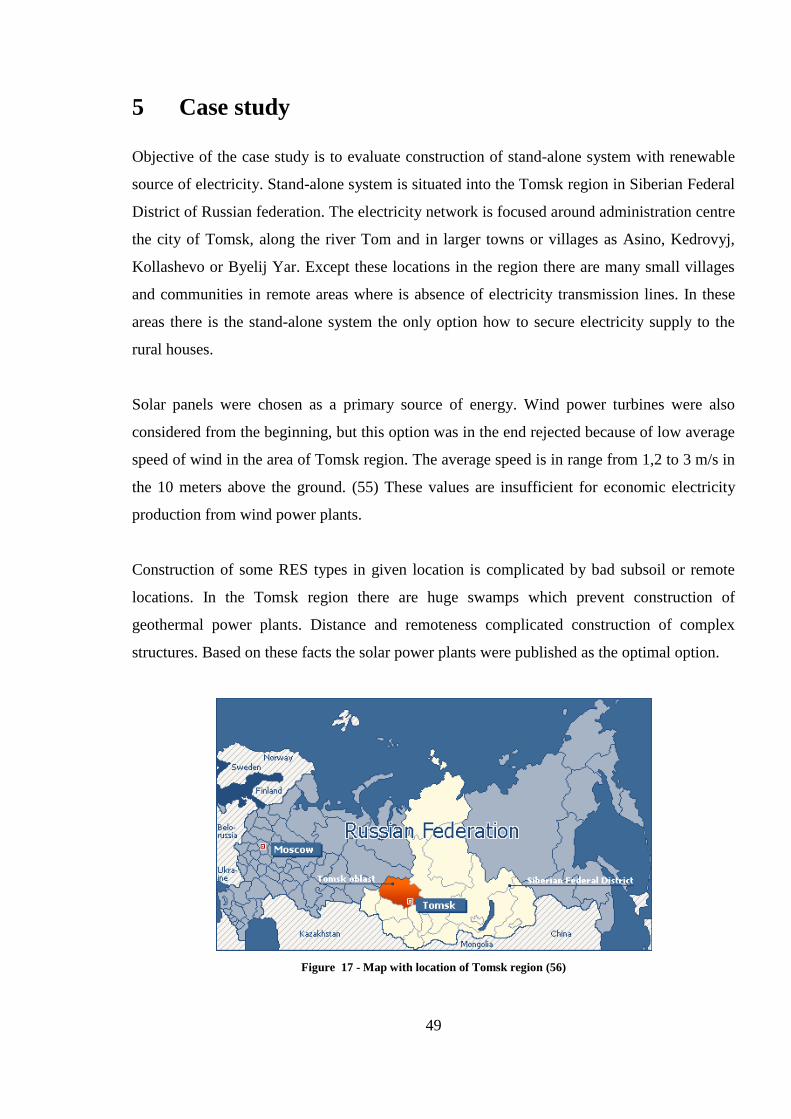
49
5 Case study
Objective of the case study is to evaluate construction of stand-alone system with renewable
source of electricity. Stand-alone system is situated into the Tomsk region in Siberian Federal
District of Russian federation. The electricity network is focused around administration centre
the city of Tomsk, along the river Tom and in larger towns or villages as Asino, Kedrovyj,
Kollashevo or Byelij Yar. Except these locations in the region there are many small villages
and communities in remote areas where is absence of electricity transmission lines. In these
areas there is the stand-alone system the only option how to secure electricity supply to the
rural houses.
Solar panels were chosen as a primary source of energy. Wind power turbines were also
considered from the beginning, but this option was in the end rejected because of low average
speed of wind in the area of Tomsk region. The average speed is in range from 1,2 to 3 m/s in
the 10 meters above the ground. (55) These values are insufficient for economic electricity
production from wind power plants.
Construction of some RES types in given location is complicated by bad subsoil or remote
locations. In the Tomsk region there are huge swamps which prevent construction of
geothermal power plants. Distance and remoteness complicated construction of complex
structures. Based on these facts the solar power plants were published as the optimal option.
Figure 17 - Map with location of Tomsk region (56)
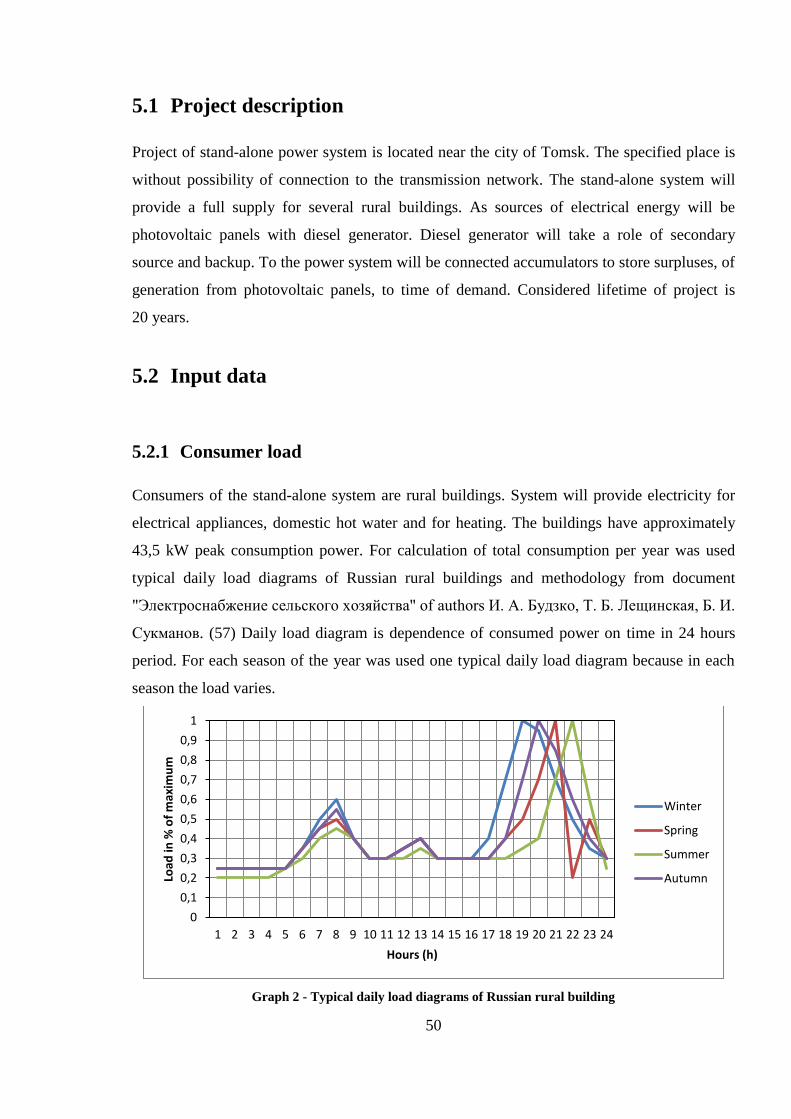
50
5.1 Project description
Project of stand-alone power system is located near the city of Tomsk. The specified place is
without possibility of connection to the transmission network. The stand-alone system will
provide a full supply for several rural buildings. As sources of electrical energy will be
photovoltaic panels with diesel generator. Diesel generator will take a role of secondary
source and backup. To the power system will be connected accumulators to store surpluses, of
generation from photovoltaic panels, to time of demand. Considered lifetime of project is
20 years.
5.2 Input data
5.2.1 Consumer load
Consumers of the stand-alone system are rural buildings. System will provide electricity for
electrical appliances, domestic hot water and for heating. The buildings have approximately
43,5 kW peak consumption power. For calculation of total consumption per year was used
typical daily load diagrams of Russian rural buildings and methodology from document
"Электроснабжение сельского хозяйства" of authors И. А. Будзко, Т. Б. Лещинская, Б. И.
Сукманов. (57) Daily load diagram is dependence of consumed power on time in 24 hours
period. For each season of the year was used one typical daily load diagram because in each
season the load varies.
Graph 2 - Typical daily load diagrams of Russian rural building
0
0,1
0,2
0,3
0,4
0,5
0,6
0,7
0,8
0,9
1
1 2 3 4 5 6 7 8 9 10 11 12 13 14 15 16 17 18 19 20 21 22 23 24
Load
in %
of
max
imu
m
Hours (h)
Winter
Spring
Summer
Autumn
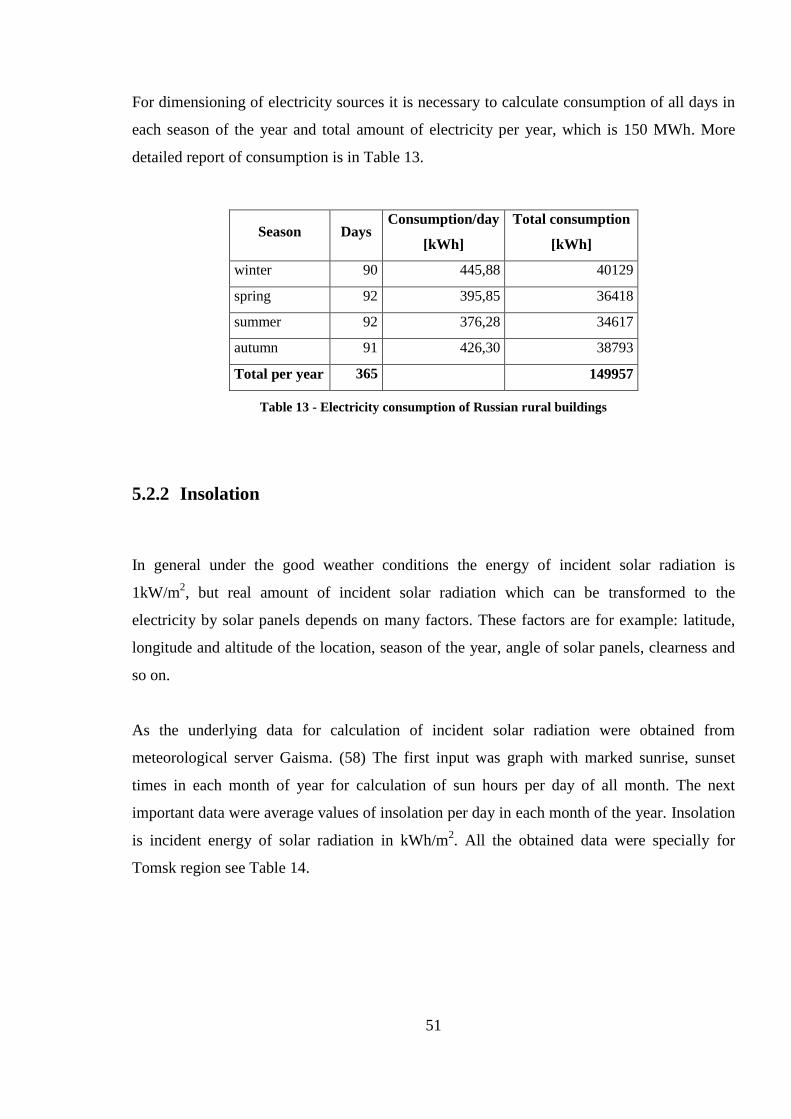
51
For dimensioning of electricity sources it is necessary to calculate consumption of all days in
each season of the year and total amount of electricity per year, which is 150 MWh. More
detailed report of consumption is in Table 13.
Season Days Consumption/day
[kWh]
Total consumption
[kWh]
winter 90 445,88 40129
spring 92 395,85 36418
summer 92 376,28 34617
autumn 91 426,30 38793
Total per year 365 149957
Table 13 - Electricity consumption of Russian rural buildings
5.2.2 Insolation
In general under the good weather conditions the energy of incident solar radiation is
1kW/m2, but real amount of incident solar radiation which can be transformed to the
electricity by solar panels depends on many factors. These factors are for example: latitude,
longitude and altitude of the location, season of the year, angle of solar panels, clearness and
so on.
As the underlying data for calculation of incident solar radiation were obtained from
meteorological server Gaisma. (58) The first input was graph with marked sunrise, sunset
times in each month of year for calculation of sun hours per day of all month. The next
important data were average values of insolation per day in each month of the year. Insolation
is incident energy of solar radiation in kWh/m2. All the obtained data were specially for
Tomsk region see Table 14.
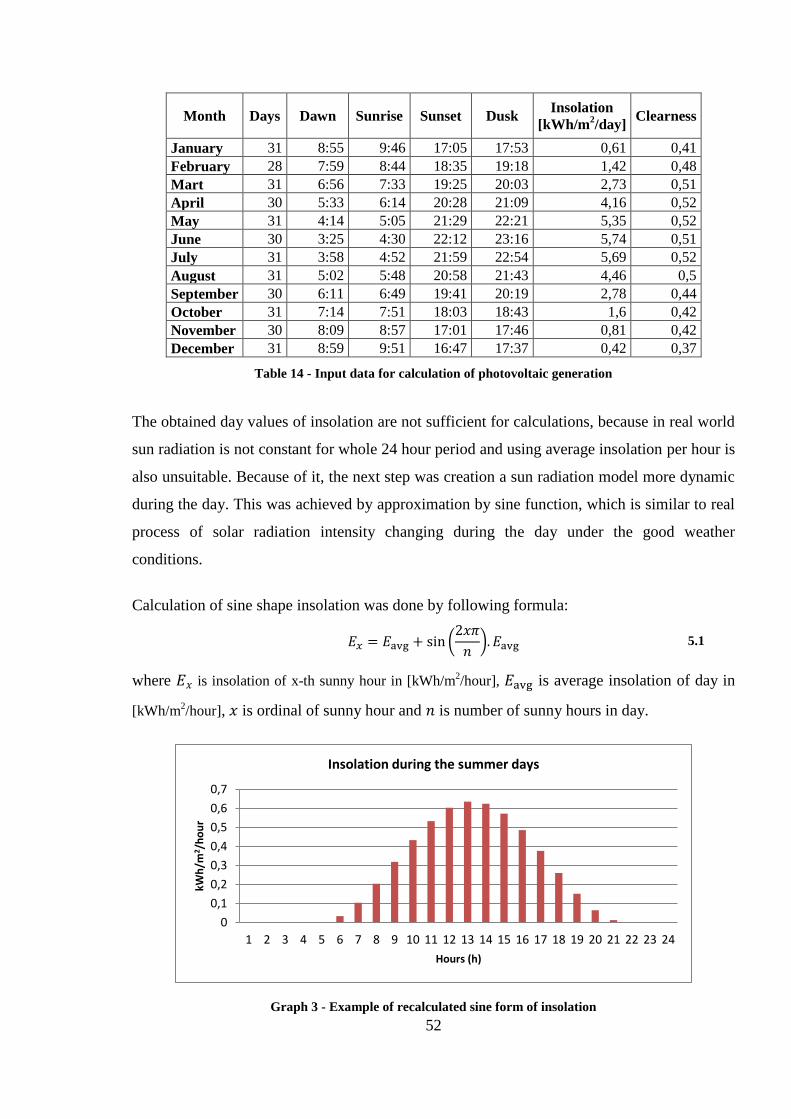
52
Month Days Dawn Sunrise Sunset Dusk Insolation
[kWh/m2/day]
Clearness
January 31 8:55 9:46 17:05 17:53 0,61 0,41
February 28 7:59 8:44 18:35 19:18 1,42 0,48
Mart 31 6:56 7:33 19:25 20:03 2,73 0,51
April 30 5:33 6:14 20:28 21:09 4,16 0,52
May 31 4:14 5:05 21:29 22:21 5,35 0,52
June 30 3:25 4:30 22:12 23:16 5,74 0,51
July 31 3:58 4:52 21:59 22:54 5,69 0,52
August 31 5:02 5:48 20:58 21:43 4,46 0,5
September 30 6:11 6:49 19:41 20:19 2,78 0,44
October 31 7:14 7:51 18:03 18:43 1,6 0,42
November 30 8:09 8:57 17:01 17:46 0,81 0,42
December 31 8:59 9:51 16:47 17:37 0,42 0,37
Table 14 - Input data for calculation of photovoltaic generation
The obtained day values of insolation are not sufficient for calculations, because in real world
sun radiation is not constant for whole 24 hour period and using average insolation per hour is
also unsuitable. Because of it, the next step was creation a sun radiation model more dynamic
during the day. This was achieved by approximation by sine function, which is similar to real
process of solar radiation intensity changing during the day under the good weather
conditions.
Calculation of sine shape insolation was done by following formula:
5.1
where is insolation of x-th sunny hour in [kWh/m2/hour], is average insolation of day in
[kWh/m2/hour], is ordinal of sunny hour and is number of sunny hours in day.
Graph 3 - Example of recalculated sine form of insolation
0
0,1
0,2
0,3
0,4
0,5
0,6
0,7
1 2 3 4 5 6 7 8 9 10 11 12 13 14 15 16 17 18 19 20 21 22 23 24
kWh
/m2 /
ho
ur
Hours (h)
Insolation during the summer days
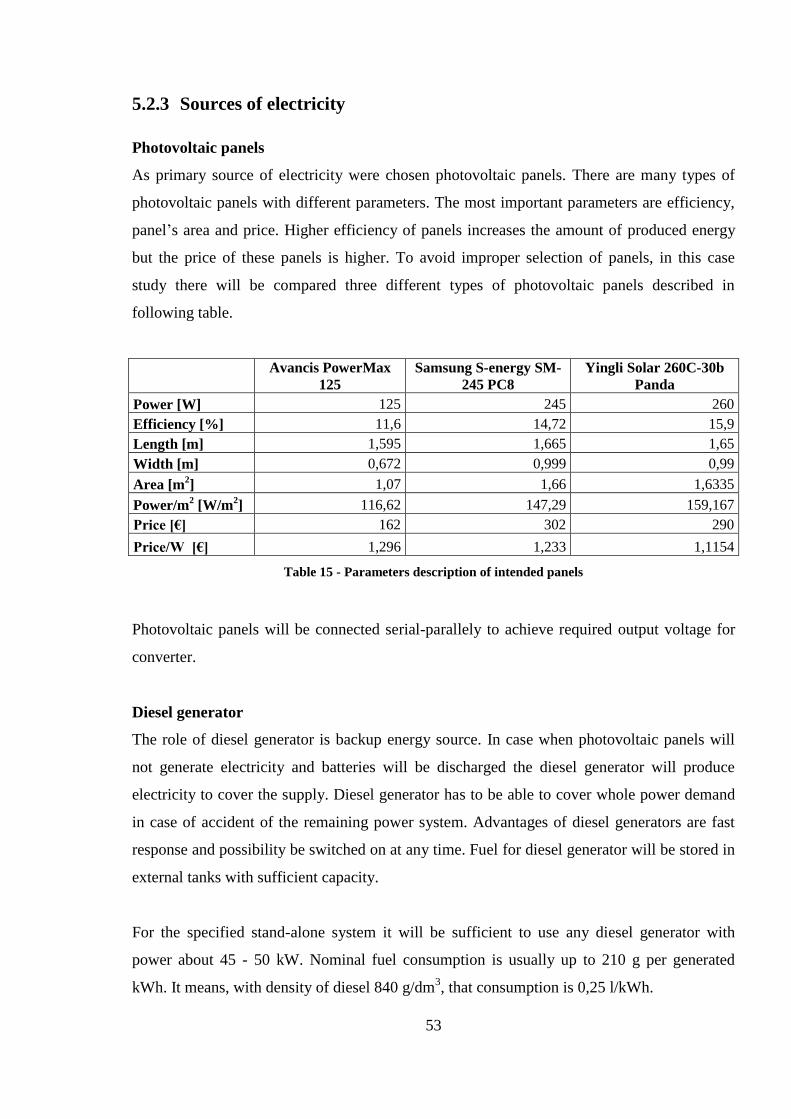
53
5.2.3 Sources of electricity
Photovoltaic panels
As primary source of electricity were chosen photovoltaic panels. There are many types of
photovoltaic panels with different parameters. The most important parameters are efficiency,
panel’s area and price. Higher efficiency of panels increases the amount of produced energy
but the price of these panels is higher. To avoid improper selection of panels, in this case
study there will be compared three different types of photovoltaic panels described in
following table.
Avancis PowerMax
125 Samsung S-energy SM-
245 PC8 Yingli Solar 260C-30b
Panda
Power [W] 125 245 260
Efficiency [%] 11,6 14,72 15,9
Length [m] 1,595 1,665 1,65
Width [m] 0,672 0,999 0,99
Area [m2] 1,07 1,66 1,6335
Power/m2 [W/m
2] 116,62 147,29 159,167
Price [€] 162 302 290
Price/W [€] 1,296 1,233 1,1154
Table 15 - Parameters description of intended panels
Photovoltaic panels will be connected serial-parallely to achieve required output voltage for
converter.
Diesel generator
The role of diesel generator is backup energy source. In case when photovoltaic panels will
not generate electricity and batteries will be discharged the diesel generator will produce
electricity to cover the supply. Diesel generator has to be able to cover whole power demand
in case of accident of the remaining power system. Advantages of diesel generators are fast
response and possibility be switched on at any time. Fuel for diesel generator will be stored in
external tanks with sufficient capacity.
For the specified stand-alone system it will be sufficient to use any diesel generator with
power about 45 - 50 kW. Nominal fuel consumption is usually up to 210 g per generated
kWh. It means, with density of diesel 840 g/dm3, that consumption is 0,25 l/kWh.
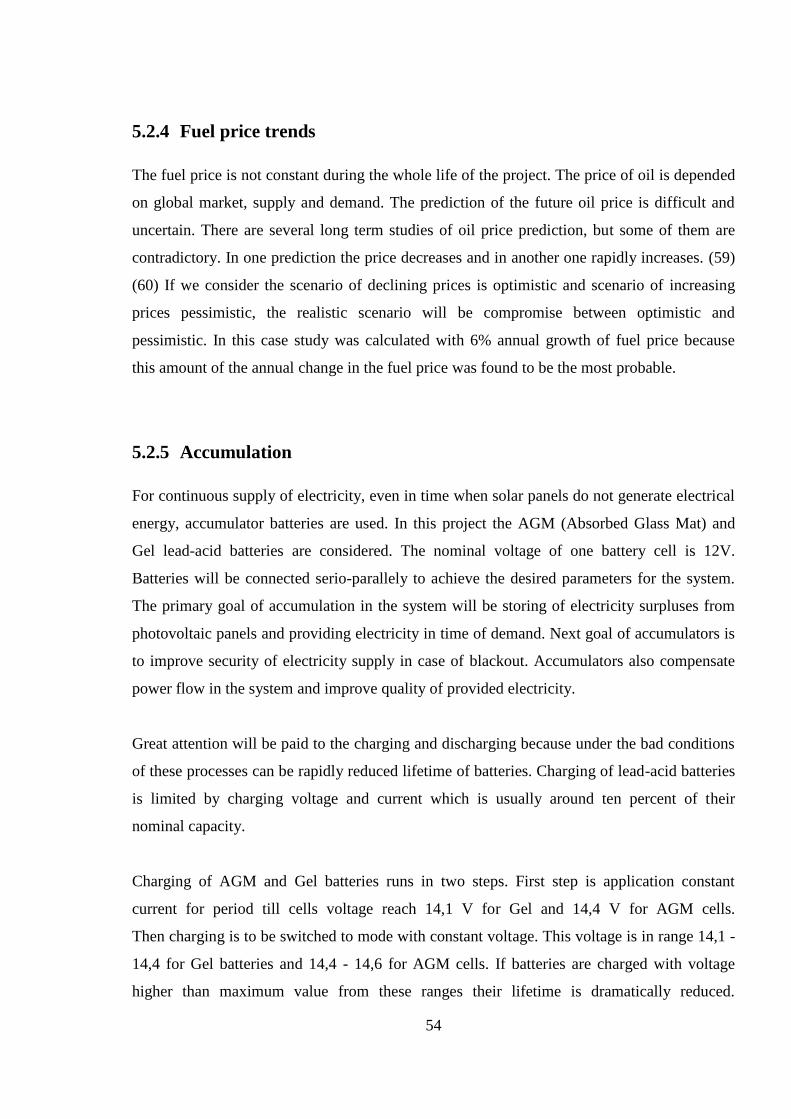
54
5.2.4 Fuel price trends
The fuel price is not constant during the whole life of the project. The price of oil is depended
on global market, supply and demand. The prediction of the future oil price is difficult and
uncertain. There are several long term studies of oil price prediction, but some of them are
contradictory. In one prediction the price decreases and in another one rapidly increases. (59)
(60) If we consider the scenario of declining prices is optimistic and scenario of increasing
prices pessimistic, the realistic scenario will be compromise between optimistic and
pessimistic. In this case study was calculated with 6% annual growth of fuel price because
this amount of the annual change in the fuel price was found to be the most probable.
5.2.5 Accumulation
For continuous supply of electricity, even in time when solar panels do not generate electrical
energy, accumulator batteries are used. In this project the AGM (Absorbed Glass Mat) and
Gel lead-acid batteries are considered. The nominal voltage of one battery cell is 12V.
Batteries will be connected serio-parallely to achieve the desired parameters for the system.
The primary goal of accumulation in the system will be storing of electricity surpluses from
photovoltaic panels and providing electricity in time of demand. Next goal of accumulators is
to improve security of electricity supply in case of blackout. Accumulators also compensate
power flow in the system and improve quality of provided electricity.
Great attention will be paid to the charging and discharging because under the bad conditions
of these processes can be rapidly reduced lifetime of batteries. Charging of lead-acid batteries
is limited by charging voltage and current which is usually around ten percent of their
nominal capacity.
Charging of AGM and Gel batteries runs in two steps. First step is application constant
current for period till cells voltage reach 14,1 V for Gel and 14,4 V for AGM cells.
Then charging is to be switched to mode with constant voltage. This voltage is in range 14,1 -
14,4 for Gel batteries and 14,4 - 14,6 for AGM cells. If batteries are charged with voltage
higher than maximum value from these ranges their lifetime is dramatically reduced.
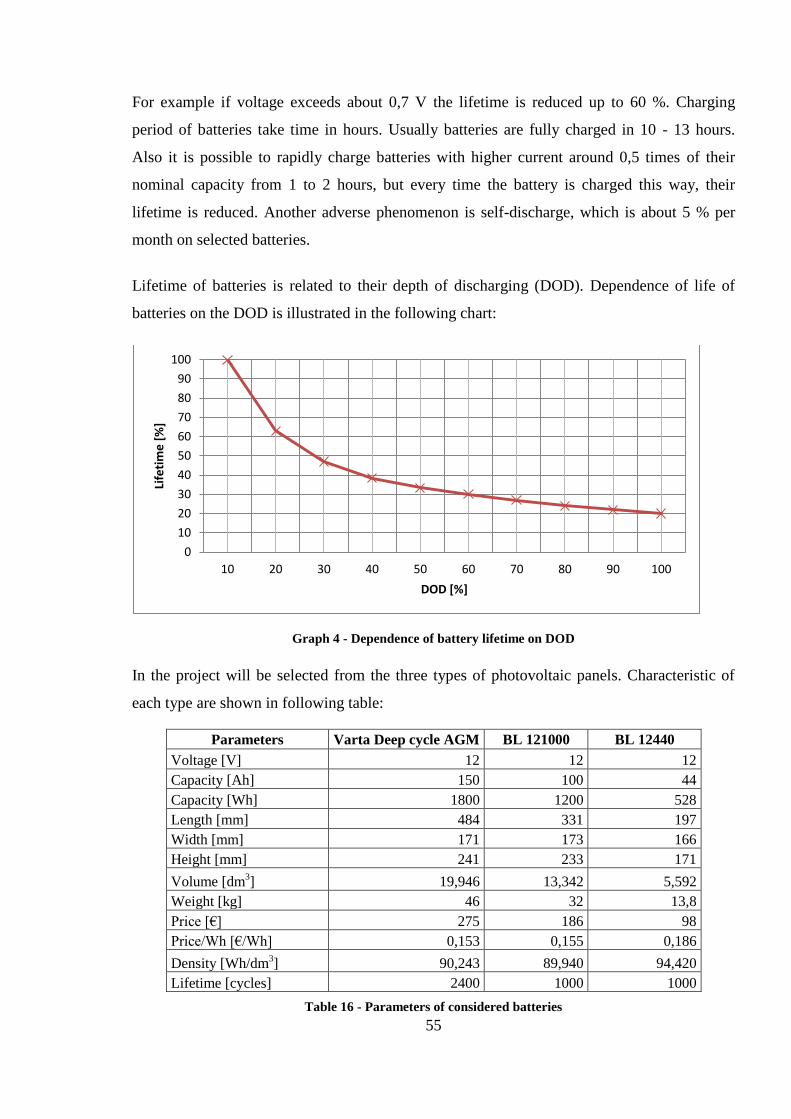
55
For example if voltage exceeds about 0,7 V the lifetime is reduced up to 60 %. Charging
period of batteries take time in hours. Usually batteries are fully charged in 10 - 13 hours.
Also it is possible to rapidly charge batteries with higher current around 0,5 times of their
nominal capacity from 1 to 2 hours, but every time the battery is charged this way, their
lifetime is reduced. Another adverse phenomenon is self-discharge, which is about 5 % per
month on selected batteries.
Lifetime of batteries is related to their depth of discharging (DOD). Dependence of life of
batteries on the DOD is illustrated in the following chart:
Graph 4 - Dependence of battery lifetime on DOD
In the project will be selected from the three types of photovoltaic panels. Characteristic of
each type are shown in following table:
Parameters Varta Deep cycle AGM BL 121000 BL 12440
Voltage [V] 12 12 12
Capacity [Ah] 150 100 44
Capacity [Wh] 1800 1200 528
Length [mm] 484 331 197
Width [mm] 171 173 166
Height [mm] 241 233 171
Volume [dm3] 19,946 13,342 5,592
Weight [kg] 46 32 13,8
Price [€] 275 186 98
Price/Wh [€/Wh] 0,153 0,155 0,186
Density [Wh/dm3] 90,243 89,940 94,420
Lifetime [cycles] 2400 1000 1000
Table 16 - Parameters of considered batteries
0
10
20
30
40
50
60
70
80
90
100
10 20 30 40 50 60 70 80 90 100
Life
tim
e [
%]
DOD [%]
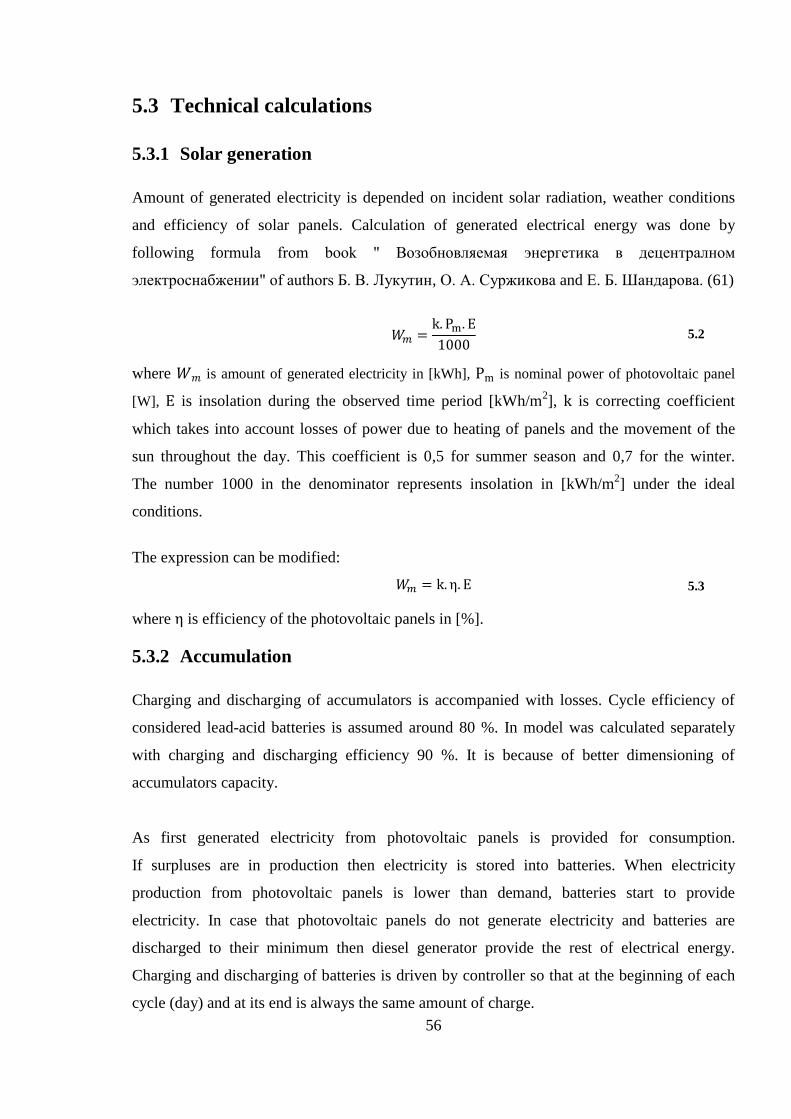
56
5.3 Technical calculations
5.3.1 Solar generation
Amount of generated electricity is depended on incident solar radiation, weather conditions
and efficiency of solar panels. Calculation of generated electrical energy was done by
following formula from book " Возобновляемая энергетика в децентралном
электроснабжении" of authors Б. В. Лукутин, О. А. Суржикова and Е. Б. Шандарова. (61)
5.2
where is amount of generated electricity in [kWh], is nominal power of photovoltaic panel
[W], is insolation during the observed time period [kWh/m2], is correcting coefficient
which takes into account losses of power due to heating of panels and the movement of the
sun throughout the day. This coefficient is 0,5 for summer season and 0,7 for the winter.
The number 1000 in the denominator represents insolation in [kWh/m2] under the ideal
conditions.
The expression can be modified:
5.3
where is efficiency of the photovoltaic panels in [%].
5.3.2 Accumulation
Charging and discharging of accumulators is accompanied with losses. Cycle efficiency of
considered lead-acid batteries is assumed around 80 %. In model was calculated separately
with charging and discharging efficiency 90 %. It is because of better dimensioning of
accumulators capacity.
As first generated electricity from photovoltaic panels is provided for consumption.
If surpluses are in production then electricity is stored into batteries. When electricity
production from photovoltaic panels is lower than demand, batteries start to provide
electricity. In case that photovoltaic panels do not generate electricity and batteries are
discharged to their minimum then diesel generator provide the rest of electrical energy.
Charging and discharging of batteries is driven by controller so that at the beginning of each
cycle (day) and at its end is always the same amount of charge.
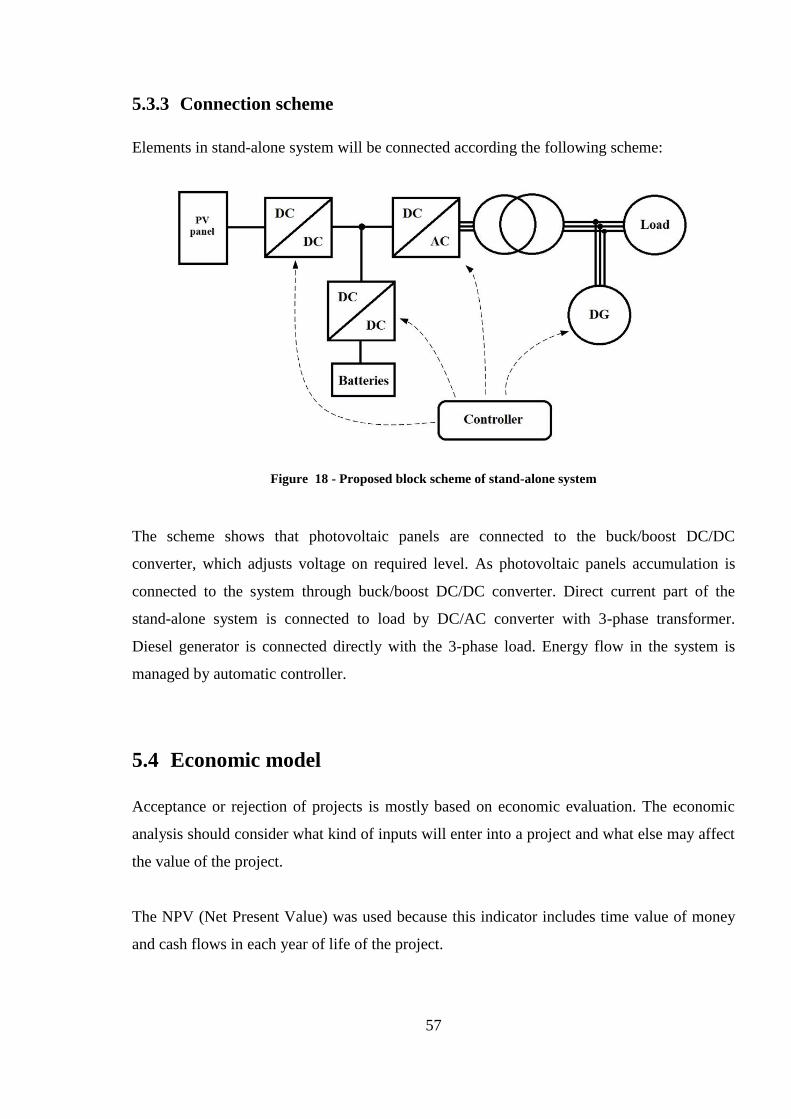
57
5.3.3 Connection scheme
Elements in stand-alone system will be connected according the following scheme:
Figure 18 - Proposed block scheme of stand-alone system
The scheme shows that photovoltaic panels are connected to the buck/boost DC/DC
converter, which adjusts voltage on required level. As photovoltaic panels accumulation is
connected to the system through buck/boost DC/DC converter. Direct current part of the
stand-alone system is connected to load by DC/AC converter with 3-phase transformer.
Diesel generator is connected directly with the 3-phase load. Energy flow in the system is
managed by automatic controller.
5.4 Economic model
Acceptance or rejection of projects is mostly based on economic evaluation. The economic
analysis should consider what kind of inputs will enter into a project and what else may affect
the value of the project.
The NPV (Net Present Value) was used because this indicator includes time value of money
and cash flows in each year of life of the project.
58
Formula for calculation NPV:
5.4
where: is the discount rate (opportunity cost of capital), is lifetime of project, is t-th year
of the project, is cash flow in t-th year of project.
The inflation was also used in calculations. Values of inflation were found in long term
prediction of inflation in Russia Federation.(62) The project used a inflation value 5 %, which
is average value of inflation during the project lifetime. Real inflation may not be strictly the
same as in the prediction because inflation depends on the economic and political situation,
which may change.
In this project there are not incomes during its lifetime because generated electricity is
consumed by owners of the system. Thanks to this in project there are no revenues only
investment cost in the beginning and operating cost in the following years. The NPV indicator
shows all costs for the life of the project implied to the beginning. From NPV value is
subsequently easy to count theoretical price per kWh given from stand-alone system.
Constant price of electricity without taking into account escalations was calculated from NPV
via discounted production. If escalations of electricity price are taken into account the fictive
revenues from electricity sales are added. Minimal price of electricity is then calculated under
condition when NPV of the project is equal zero.
All prices in case study are given in EUR (€) but fully reflected prices in Tomsk region.
Used convert ratio of rubles to the euro was 1 € = 49 rubles. For calculations was used 7%
discount rate.
5.4.1 Investment
Investment includes all costs connected with the project in the zeroth year, before putting the
system into operation. These costs are project documentation, purchase prices of equipment,
transportation of equipment and construction works. All investment costs are shown in
following table:
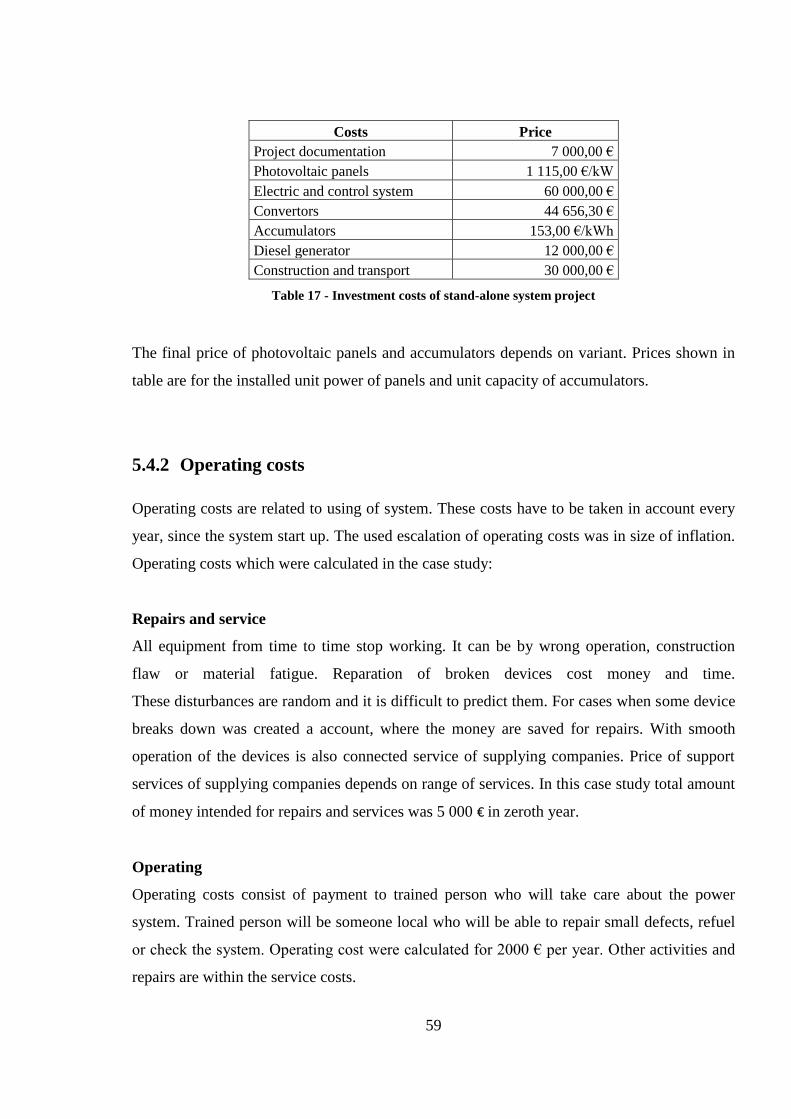
59
Costs Price
Project documentation 7 000,00 €
Photovoltaic panels 1 115,00 €/kW
Electric and control system 60 000,00 €
Convertors 44 656,30 €
Accumulators 153,00 €/kWh
Diesel generator 12 000,00 €
Construction and transport 30 000,00 €
Table 17 - Investment costs of stand-alone system project
The final price of photovoltaic panels and accumulators depends on variant. Prices shown in
table are for the installed unit power of panels and unit capacity of accumulators.
5.4.2 Operating costs
Operating costs are related to using of system. These costs have to be taken in account every
year, since the system start up. The used escalation of operating costs was in size of inflation.
Operating costs which were calculated in the case study:
Repairs and service
All equipment from time to time stop working. It can be by wrong operation, construction
flaw or material fatigue. Reparation of broken devices cost money and time.
These disturbances are random and it is difficult to predict them. For cases when some device
breaks down was created a account, where the money are saved for repairs. With smooth
operation of the devices is also connected service of supplying companies. Price of support
services of supplying companies depends on range of services. In this case study total amount
of money intended for repairs and services was 5 000 € in zeroth year.
Operating
Operating costs consist of payment to trained person who will take care about the power
system. Trained person will be someone local who will be able to repair small defects, refuel
or check the system. Operating cost were calculated for 2000 € per year. Other activities and
repairs are within the service costs.
60
Insurance
In project it was also calculated with insurance of the power system for cases of its damage.
In this case study was insurance calculated from value of investment. Insurance costs are
1 % of investment per year.
Fuel costs and transport
Fuel costs depends on variant of stand-alone system. In variants where there is huge
electricity generation from photovoltaic panels the fuel consumption and fuel costs are lesser.
Price of fuel evolves through the years and as the most probable evolution was used 6% year
over year ratio.
Transport of fuel will be realized by tanks with volume 10 000 litres. The frequency of supply
depends on variant of stand-alone system. Cost of fuel transport was calculated for 700 € per
one supply. The amount of costs also depends on exact location of stand-alone system and on
various options of transport.
5.4.3 Recovery of old equipment
All devices in power system has their lifetime or number of operating hours. Because of it,
some devices have to be replaced during the lifetime of project.
Batteries
The batteries have the shortest life. Their lifetime depends on DOD and on their type.
The average lifetime of batteries is around 1000 cycles. Each cycle of batteries in stand-alone
system take place in one day. Because of this, the batteries are necessary to replace every two
or three years.
Diesel generator
The next device which should be replaced during the lifetime of project is diesel generator.
Typical lifetime of diesel generators is in range from 20 to 30 years. If diesel generator is
frequently used the life is up to 25 000 operating hours. Life of diesel generator in this project
depends on variant, but after each 25 000 hours of work should be replaced by the new one.
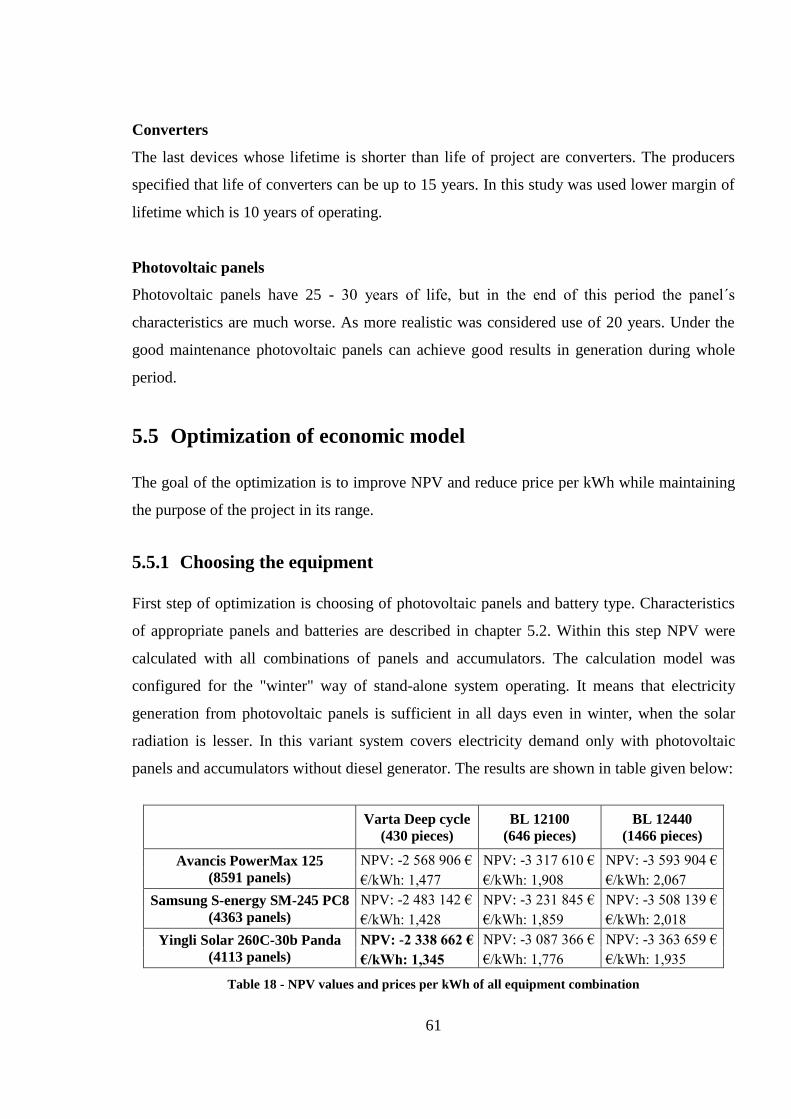
61
Converters
The last devices whose lifetime is shorter than life of project are converters. The producers
specified that life of converters can be up to 15 years. In this study was used lower margin of
lifetime which is 10 years of operating.
Photovoltaic panels
Photovoltaic panels have 25 - 30 years of life, but in the end of this period the panel´s
characteristics are much worse. As more realistic was considered use of 20 years. Under the
good maintenance photovoltaic panels can achieve good results in generation during whole
period.
5.5 Optimization of economic model
The goal of the optimization is to improve NPV and reduce price per kWh while maintaining
the purpose of the project in its range.
5.5.1 Choosing the equipment
First step of optimization is choosing of photovoltaic panels and battery type. Characteristics
of appropriate panels and batteries are described in chapter 5.2. Within this step NPV were
calculated with all combinations of panels and accumulators. The calculation model was
configured for the "winter" way of stand-alone system operating. It means that electricity
generation from photovoltaic panels is sufficient in all days even in winter, when the solar
radiation is lesser. In this variant system covers electricity demand only with photovoltaic
panels and accumulators without diesel generator. The results are shown in table given below:
Varta Deep cycle
(430 pieces) BL 12100
(646 pieces) BL 12440
(1466 pieces)
Avancis PowerMax 125
(8591 panels) NPV: -2 568 906 € NPV: -3 317 610 € NPV: -3 593 904 €
€/kWh: 1,477 €/kWh: 1,908 €/kWh: 2,067
Samsung S-energy SM-245 PC8
(4363 panels) NPV: -2 483 142 € NPV: -3 231 845 € NPV: -3 508 139 €
€/kWh: 1,428 €/kWh: 1,859 €/kWh: 2,018
Yingli Solar 260C-30b Panda
(4113 panels) NPV: -2 338 662 € NPV: -3 087 366 € NPV: -3 363 659 €
€/kWh: 1,345 €/kWh: 1,776 €/kWh: 1,935
Table 18 - NPV values and prices per kWh of all equipment combination
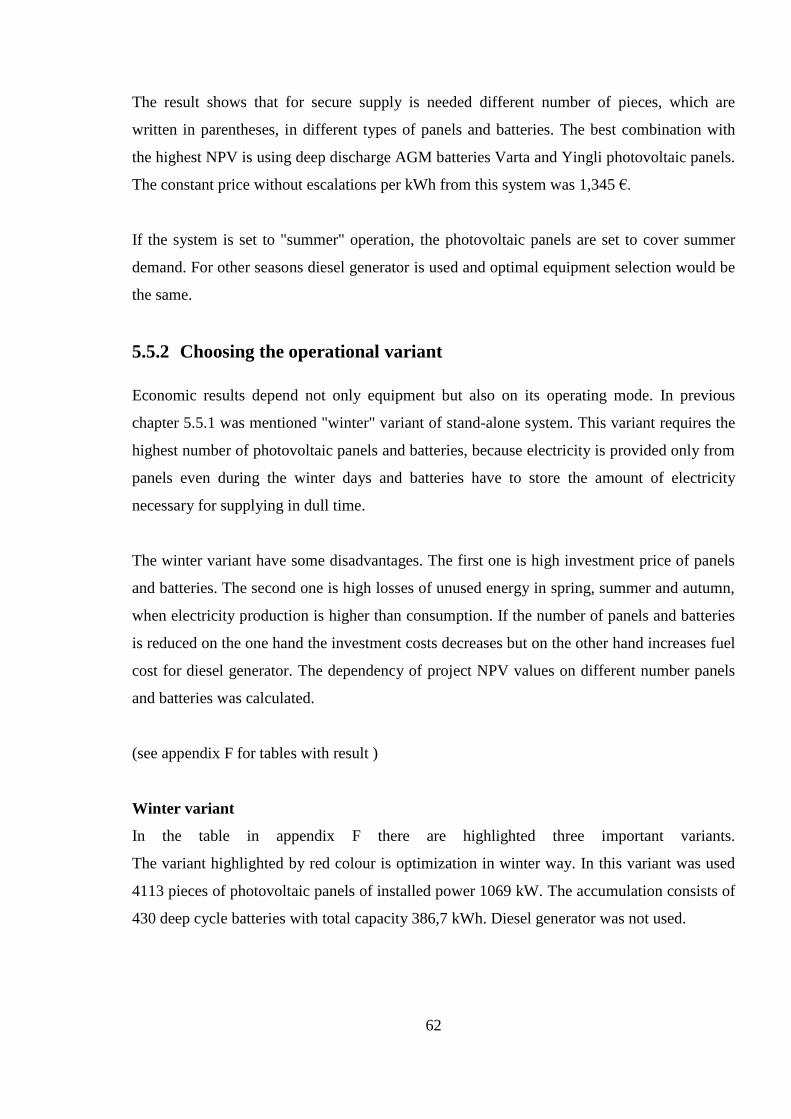
62
The result shows that for secure supply is needed different number of pieces, which are
written in parentheses, in different types of panels and batteries. The best combination with
the highest NPV is using deep discharge AGM batteries Varta and Yingli photovoltaic panels.
The constant price without escalations per kWh from this system was 1,345 €.
If the system is set to "summer" operation, the photovoltaic panels are set to cover summer
demand. For other seasons diesel generator is used and optimal equipment selection would be
the same.
5.5.2 Choosing the operational variant
Economic results depend not only equipment but also on its operating mode. In previous
chapter 5.5.1 was mentioned "winter" variant of stand-alone system. This variant requires the
highest number of photovoltaic panels and batteries, because electricity is provided only from
panels even during the winter days and batteries have to store the amount of electricity
necessary for supplying in dull time.
The winter variant have some disadvantages. The first one is high investment price of panels
and batteries. The second one is high losses of unused energy in spring, summer and autumn,
when electricity production is higher than consumption. If the number of panels and batteries
is reduced on the one hand the investment costs decreases but on the other hand increases fuel
cost for diesel generator. The dependency of project NPV values on different number panels
and batteries was calculated.
(see appendix F for tables with result )
Winter variant
In the table in appendix F there are highlighted three important variants.
The variant highlighted by red colour is optimization in winter way. In this variant was used
4113 pieces of photovoltaic panels of installed power 1069 kW. The accumulation consists of
430 deep cycle batteries with total capacity 386,7 kWh. Diesel generator was not used.
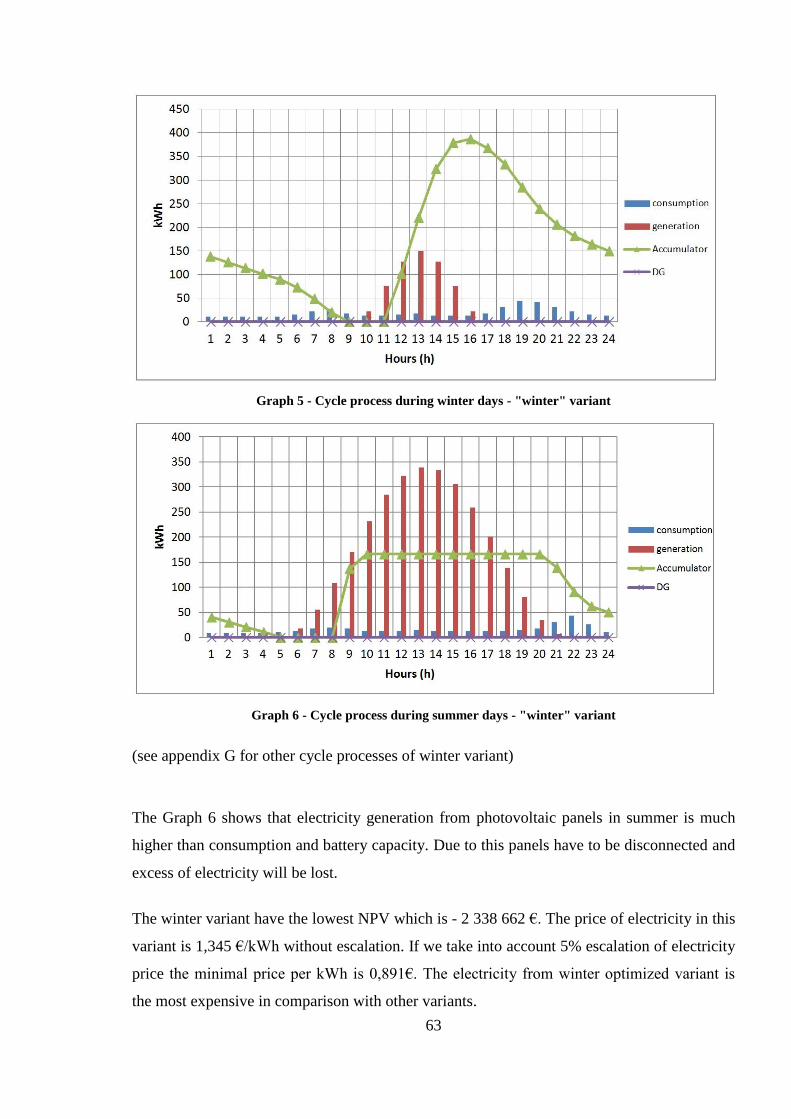
63
Graph 5 - Cycle process during winter days - "winter" variant
Graph 6 - Cycle process during summer days - "winter" variant
(see appendix G for other cycle processes of winter variant)
The Graph 6 shows that electricity generation from photovoltaic panels in summer is much
higher than consumption and battery capacity. Due to this panels have to be disconnected and
excess of electricity will be lost.
The winter variant have the lowest NPV which is - 2 338 662 €. The price of electricity in this
variant is 1,345 €/kWh without escalation. If we take into account 5% escalation of electricity
price the minimal price per kWh is 0,891€. The electricity from winter optimized variant is
the most expensive in comparison with other variants.
64
Summer variant
The second variant is highlighted by blue colour and represents system optimised in summer
way. The system consist of 601 photovoltaic panels with installed power 156 kW and 242
batteries with 216,5 kWh capacity. Photovoltaic panels are set to cover whole summer
demand only in combination with batteries. In other seasons whole amount of electricity
provided by panels is consumed and in periods, when generation from photovoltaic panels is
lower than demand, the diesel generator helps with supply. In this variant diesel generator
provides around 62,25 MWh per year.
Graph 7 - Cycle process during winter days - "summer" variant
Graph 8 - Cycle process during summer days - "summer" variant
(see appendix H for other cycle processes of summer variant)
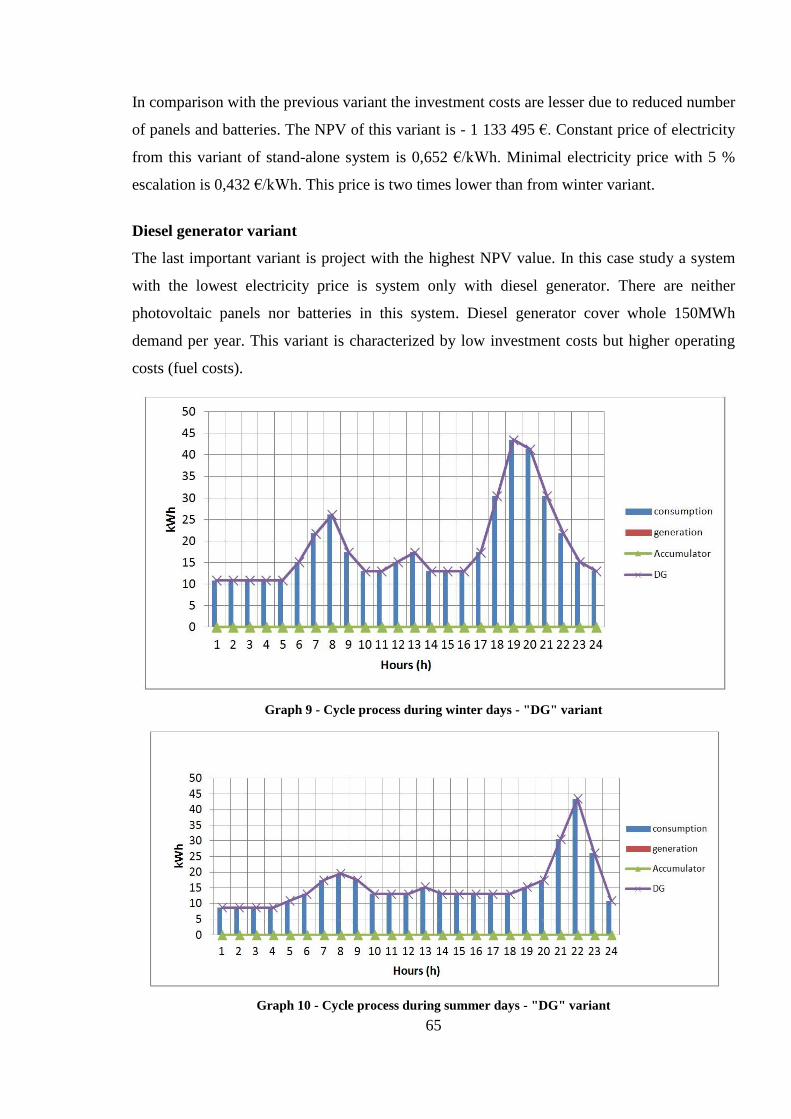
65
In comparison with the previous variant the investment costs are lesser due to reduced number
of panels and batteries. The NPV of this variant is - 1 133 495 €. Constant price of electricity
from this variant of stand-alone system is 0,652 €/kWh. Minimal electricity price with 5 %
escalation is 0,432 €/kWh. This price is two times lower than from winter variant.
Diesel generator variant
The last important variant is project with the highest NPV value. In this case study a system
with the lowest electricity price is system only with diesel generator. There are neither
photovoltaic panels nor batteries in this system. Diesel generator cover whole 150MWh
demand per year. This variant is characterized by low investment costs but higher operating
costs (fuel costs).
Graph 9 - Cycle process during winter days - "DG" variant
Graph 10 - Cycle process during summer days - "DG" variant
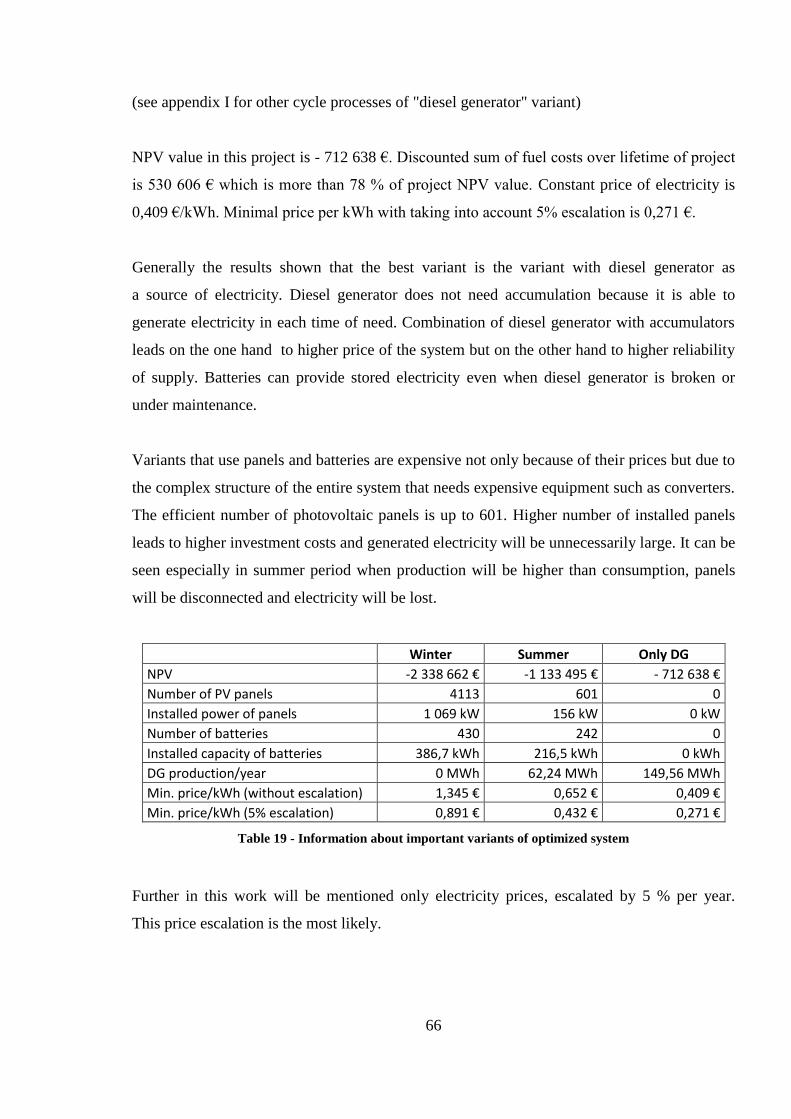
66
(see appendix I for other cycle processes of "diesel generator" variant)
NPV value in this project is - 712 638 €. Discounted sum of fuel costs over lifetime of project
is 530 606 € which is more than 78 % of project NPV value. Constant price of electricity is
0,409 €/kWh. Minimal price per kWh with taking into account 5% escalation is 0,271 €.
Generally the results shown that the best variant is the variant with diesel generator as
a source of electricity. Diesel generator does not need accumulation because it is able to
generate electricity in each time of need. Combination of diesel generator with accumulators
leads on the one hand to higher price of the system but on the other hand to higher reliability
of supply. Batteries can provide stored electricity even when diesel generator is broken or
under maintenance.
Variants that use panels and batteries are expensive not only because of their prices but due to
the complex structure of the entire system that needs expensive equipment such as converters.
The efficient number of photovoltaic panels is up to 601. Higher number of installed panels
leads to higher investment costs and generated electricity will be unnecessarily large. It can be
seen especially in summer period when production will be higher than consumption, panels
will be disconnected and electricity will be lost.
Winter Summer Only DG NPV -2 338 662 € -1 133 495 € - 712 638 € Number of PV panels 4113 601 0 Installed power of panels 1 069 kW 156 kW 0 kW Number of batteries 430 242 0 Installed capacity of batteries 386,7 kWh 216,5 kWh 0 kWh DG production/year 0 MWh 62,24 MWh 149,56 MWh Min. price/kWh (without escalation) 1,345 € 0,652 € 0,409 € Min. price/kWh (5% escalation) 0,891 € 0,432 € 0,271 €
Table 19 - Information about important variants of optimized system
Further in this work will be mentioned only electricity prices, escalated by 5 % per year.
This price escalation is the most likely.
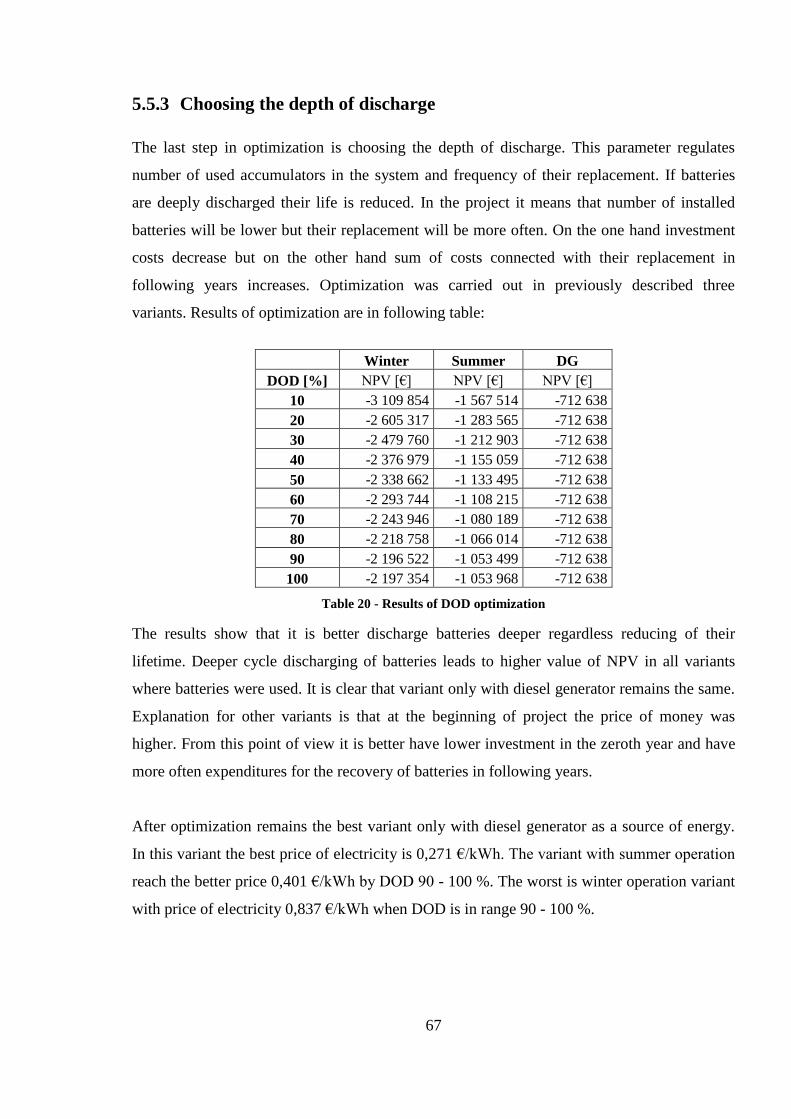
67
5.5.3 Choosing the depth of discharge
The last step in optimization is choosing the depth of discharge. This parameter regulates
number of used accumulators in the system and frequency of their replacement. If batteries
are deeply discharged their life is reduced. In the project it means that number of installed
batteries will be lower but their replacement will be more often. On the one hand investment
costs decrease but on the other hand sum of costs connected with their replacement in
following years increases. Optimization was carried out in previously described three
variants. Results of optimization are in following table:
Winter Summer DG
DOD [%] NPV [€] NPV [€] NPV [€]
10 -3 109 854 -1 567 514 -712 638
20 -2 605 317 -1 283 565 -712 638
30 -2 479 760 -1 212 903 -712 638
40 -2 376 979 -1 155 059 -712 638
50 -2 338 662 -1 133 495 -712 638
60 -2 293 744 -1 108 215 -712 638
70 -2 243 946 -1 080 189 -712 638
80 -2 218 758 -1 066 014 -712 638
90 -2 196 522 -1 053 499 -712 638
100 -2 197 354 -1 053 968 -712 638
Table 20 - Results of DOD optimization
The results show that it is better discharge batteries deeper regardless reducing of their
lifetime. Deeper cycle discharging of batteries leads to higher value of NPV in all variants
where batteries were used. It is clear that variant only with diesel generator remains the same.
Explanation for other variants is that at the beginning of project the price of money was
higher. From this point of view it is better have lower investment in the zeroth year and have
more often expenditures for the recovery of batteries in following years.
After optimization remains the best variant only with diesel generator as a source of energy.
In this variant the best price of electricity is 0,271 €/kWh. The variant with summer operation
reach the better price 0,401 €/kWh by DOD 90 - 100 %. The worst is winter operation variant
with price of electricity 0,837 €/kWh when DOD is in range 90 - 100 %.
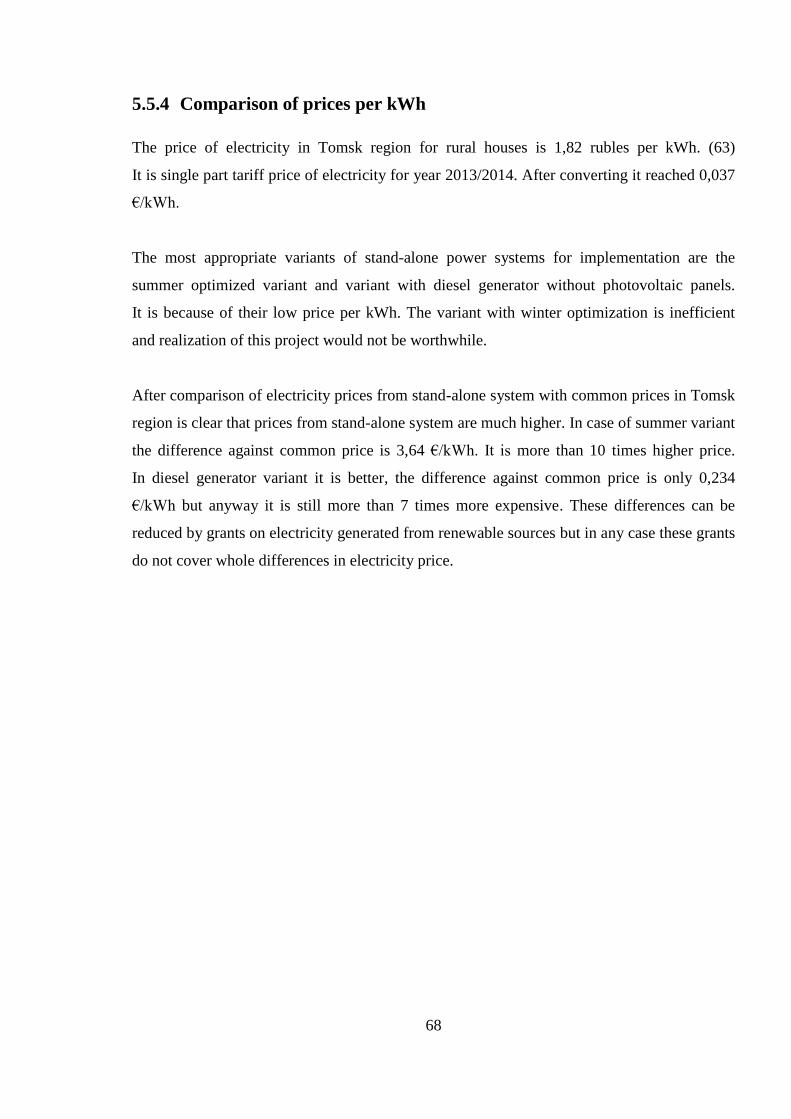
68
5.5.4 Comparison of prices per kWh
The price of electricity in Tomsk region for rural houses is 1,82 rubles per kWh. (63)
It is single part tariff price of electricity for year 2013/2014. After converting it reached 0,037
€/kWh.
The most appropriate variants of stand-alone power systems for implementation are the
summer optimized variant and variant with diesel generator without photovoltaic panels.
It is because of their low price per kWh. The variant with winter optimization is inefficient
and realization of this project would not be worthwhile.
After comparison of electricity prices from stand-alone system with common prices in Tomsk
region is clear that prices from stand-alone system are much higher. In case of summer variant
the difference against common price is 3,64 €/kWh. It is more than 10 times higher price.
In diesel generator variant it is better, the difference against common price is only 0,234
€/kWh but anyway it is still more than 7 times more expensive. These differences can be
reduced by grants on electricity generated from renewable sources but in any case these grants
do not cover whole differences in electricity price.
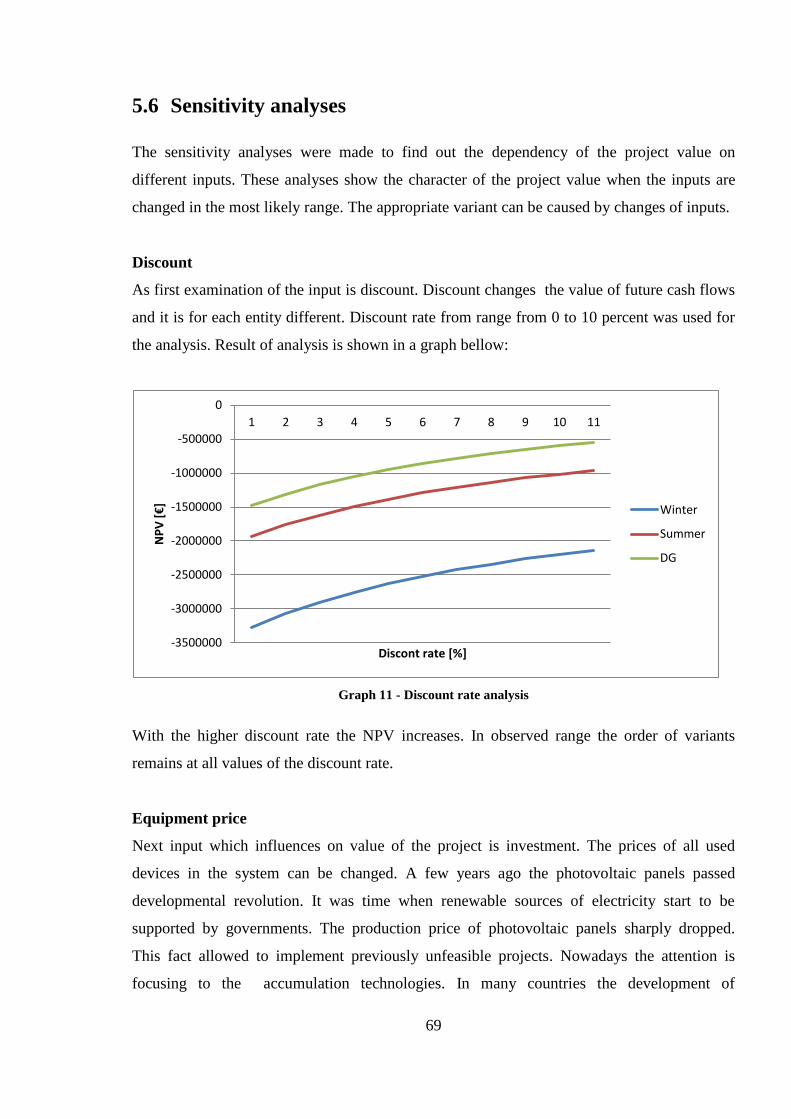
69
5.6 Sensitivity analyses
The sensitivity analyses were made to find out the dependency of the project value on
different inputs. These analyses show the character of the project value when the inputs are
changed in the most likely range. The appropriate variant can be caused by changes of inputs.
Discount
As first examination of the input is discount. Discount changes the value of future cash flows
and it is for each entity different. Discount rate from range from 0 to 10 percent was used for
the analysis. Result of analysis is shown in a graph bellow:
Graph 11 - Discount rate analysis
With the higher discount rate the NPV increases. In observed range the order of variants
remains at all values of the discount rate.
Equipment price
Next input which influences on value of the project is investment. The prices of all used
devices in the system can be changed. A few years ago the photovoltaic panels passed
developmental revolution. It was time when renewable sources of electricity start to be
supported by governments. The production price of photovoltaic panels sharply dropped.
This fact allowed to implement previously unfeasible projects. Nowadays the attention is
focusing to the accumulation technologies. In many countries the development of
-3500000
-3000000
-2500000
-2000000
-1500000
-1000000
-500000
0
1 2 3 4 5 6 7 8 9 10 11
NP
V [€
]
Discont rate [%]
Winter
Summer
DG
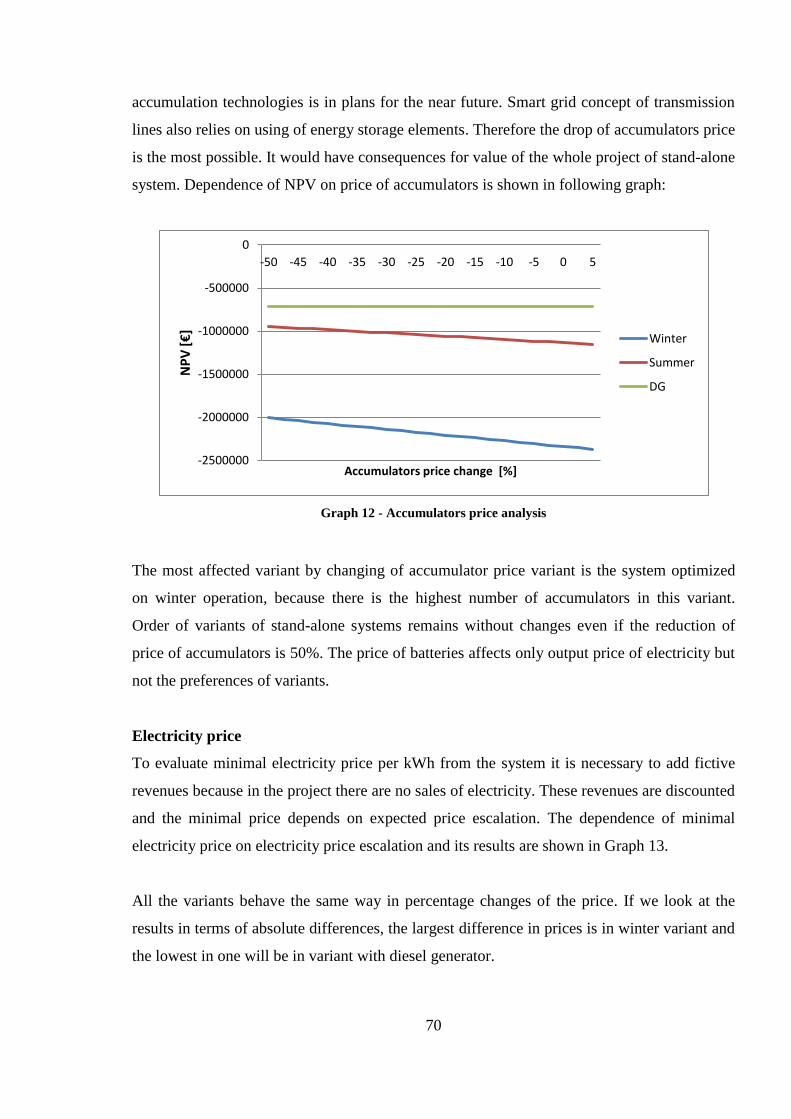
70
accumulation technologies is in plans for the near future. Smart grid concept of transmission
lines also relies on using of energy storage elements. Therefore the drop of accumulators price
is the most possible. It would have consequences for value of the whole project of stand-alone
system. Dependence of NPV on price of accumulators is shown in following graph:
Graph 12 - Accumulators price analysis
The most affected variant by changing of accumulator price variant is the system optimized
on winter operation, because there is the highest number of accumulators in this variant.
Order of variants of stand-alone systems remains without changes even if the reduction of
price of accumulators is 50%. The price of batteries affects only output price of electricity but
not the preferences of variants.
Electricity price
To evaluate minimal electricity price per kWh from the system it is necessary to add fictive
revenues because in the project there are no sales of electricity. These revenues are discounted
and the minimal price depends on expected price escalation. The dependence of minimal
electricity price on electricity price escalation and its results are shown in Graph 13.
All the variants behave the same way in percentage changes of the price. If we look at the
results in terms of absolute differences, the largest difference in prices is in winter variant and
the lowest in one will be in variant with diesel generator.
-2500000
-2000000
-1500000
-1000000
-500000
0
-50 -45 -40 -35 -30 -25 -20 -15 -10 -5 0 5
NP
V [€
]
Accumulators price change [%]
Winter
Summer
DG
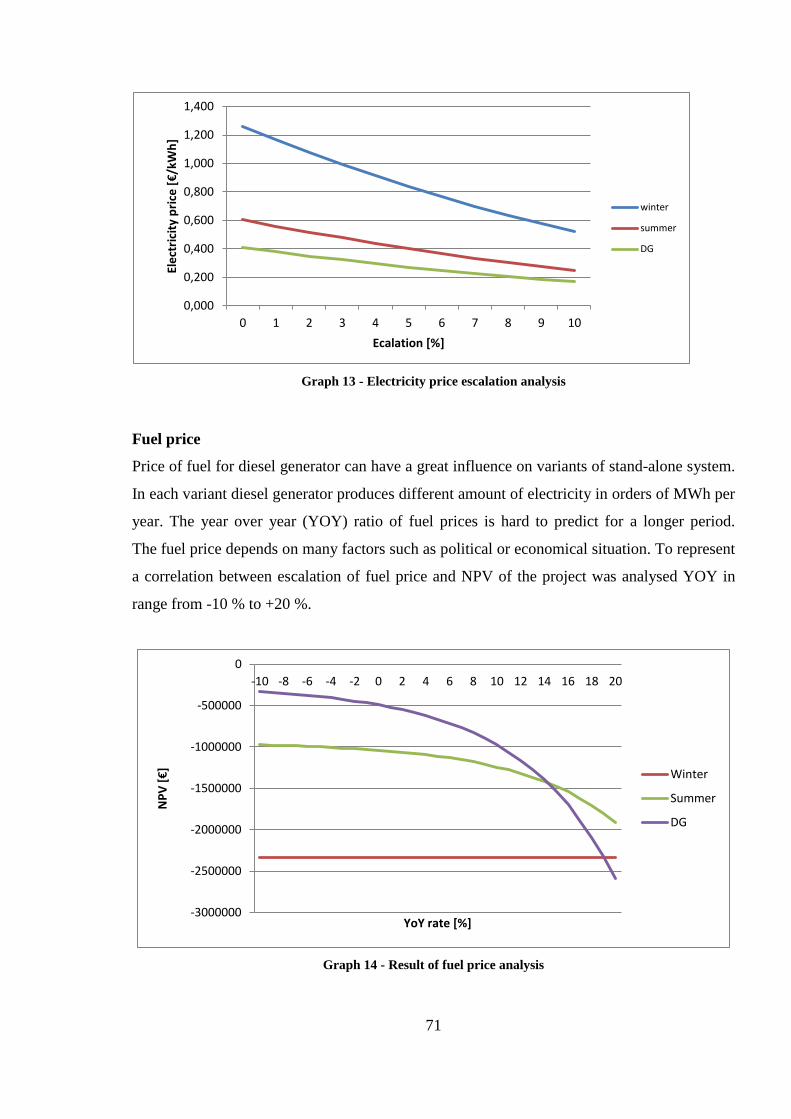
71
Graph 13 - Electricity price escalation analysis
Fuel price
Price of fuel for diesel generator can have a great influence on variants of stand-alone system.
In each variant diesel generator produces different amount of electricity in orders of MWh per
year. The year over year (YOY) ratio of fuel prices is hard to predict for a longer period.
The fuel price depends on many factors such as political or economical situation. To represent
a correlation between escalation of fuel price and NPV of the project was analysed YOY in
range from -10 % to +20 %.
Graph 14 - Result of fuel price analysis
0,000
0,200
0,400
0,600
0,800
1,000
1,200
1,400
0 1 2 3 4 5 6 7 8 9 10
Ele
ctri
city
pri
ce [€
/kW
h]
Ecalation [%]
winter
summer
DG
-3000000
-2500000
-2000000
-1500000
-1000000
-500000
0
-10 -8 -6 -4 -2 0 2 4 6 8 10 12 14 16 18 20
NP
V [€
]
YoY rate [%]
Winter
Summer
DG
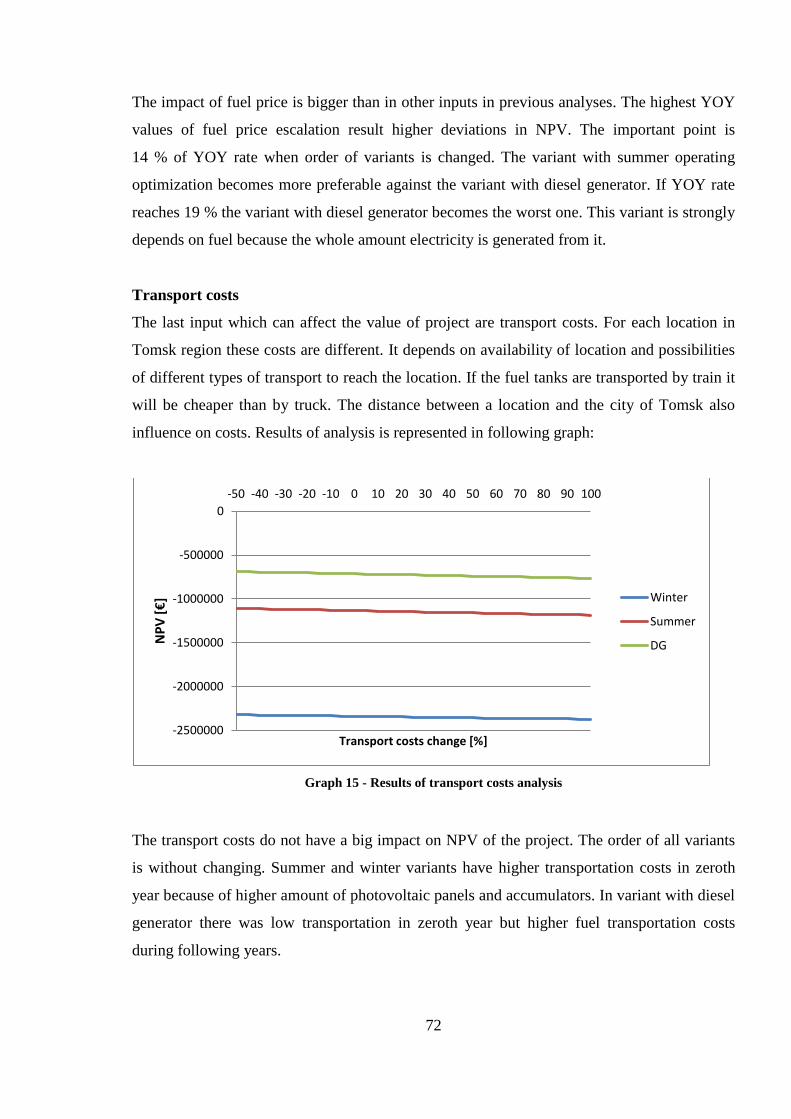
72
The impact of fuel price is bigger than in other inputs in previous analyses. The highest YOY
values of fuel price escalation result higher deviations in NPV. The important point is
14 % of YOY rate when order of variants is changed. The variant with summer operating
optimization becomes more preferable against the variant with diesel generator. If YOY rate
reaches 19 % the variant with diesel generator becomes the worst one. This variant is strongly
depends on fuel because the whole amount electricity is generated from it.
Transport costs
The last input which can affect the value of project are transport costs. For each location in
Tomsk region these costs are different. It depends on availability of location and possibilities
of different types of transport to reach the location. If the fuel tanks are transported by train it
will be cheaper than by truck. The distance between a location and the city of Tomsk also
influence on costs. Results of analysis is represented in following graph:
Graph 15 - Results of transport costs analysis
The transport costs do not have a big impact on NPV of the project. The order of all variants
is without changing. Summer and winter variants have higher transportation costs in zeroth
year because of higher amount of photovoltaic panels and accumulators. In variant with diesel
generator there was low transportation in zeroth year but higher fuel transportation costs
during following years.
-2500000
-2000000
-1500000
-1000000
-500000
0
-50 -40 -30 -20 -10 0 10 20 30 40 50 60 70 80 90 100
NP
V [€
]
Transport costs change [%]
Winter
Summer
DG
73
5.7 Case study results
This case study evaluate project of stand-alone system in Tomsk region. All inputs for the
calculation and optimization were defined and taken into account. The consumer load and
solar generation models were carried out according to the given methods. A base variant of
stand-alone system was the winter operation variant. The optimization was performed in
several steps. In the first step the equipment was chosen, then operational mode and in the end
the depth of battery discharge. In process of optimization there appeared two more important
variants of stand-alone system: optimized for summer operating and only with diesel
generator.
The variant with diesel generator is the cheapest one with final price of electricity 0,271
€/kWh. Electricity supply from this variant of the system is not secured in case of diesel
generator fault. The electricity from summer optimized variant costs 0,401 €/kWh. The
electricity price is higher than in previous variant but supply is more secure. This security is
provided by two electricity sources and batteries, which can serve in case of system fault as
a backup.
The effective number of photovoltaic panels and batteries in the system is up to number in
summer variant. Higher installation of panels and batteries is redundant. Optimal portfolio of
variants is between diesel generator variant and summer optimization. The price of kWh will
be in range 0,271 - 0,401 €/kWh but the higher price will provide higher security of supply
and share of clear energy generated from renewable resources. The most important thing in
making a choice between variants is requirement of supply security. Ecology impact can be
also decisive for the selection of variant.
74
Conclusion
Nowadays the energetics is an area that ensures activity of the whole civilization as we know
it. Mankind becomes completely dependent on electricity supply. Energetics is still
developing new technologies, which allow more efficient production of electric energy at
power plants and by that save primary energy sources. The last decade renewable sources of
electricity as solar, wind, geothermal, biofuel power plants are strongly supported. These
technologies are more often represented in energy mixes of states all around the world.
On the one hand renewable sources of electricity as photovoltaic panel and wind turbines use
almost free and inexhaustible sources for electricity production but on the other hand this
production is random and unpredictable. This can affect transmission and energy quality.
If renewable sources provide larger amount of electricity in time of low demand there will be
more electricity in transmission lines which leads to increasing of electricity frequency and
voltage. Voltage and frequency are important parameters of electrical energy quality.
Electricity parameters are strictly monitored to prevent their deviation from the predetermined
values because in that case electrical equipment can be seriously damaged.
For regulation of energy amount in transmission lines the storage elements are used.
Electricity is not storable in its form. The only way how to storage electrical energy is
transformation into another form of energy as mechanical, chemical or thermal. Losses are the
main disadvantage of these transformations. Because of losses the usable amount of
electricity is reduced sometimes up to 50 %. There are many storage elements as hydro
pumped storage plants, compressed air energy storages, flywheels, batteries, flow batteries,
fuel cells or supercapacitors. Each type of accumulation has its own efficiency, advantages,
disadvantages and field of use.
For long term energy storage are suitable hydro pumped storage plants and CAES.
These accumulators have low losses in "charged" state and can store a large amount of
energy. These two types together with flywheels can serve as centralized regulators of energy
in transmission. Flywheels have advantage of fast response against hydro pumped storage
plants and CAES.
75
For decentralized accumulation with lower capacity are suitable all chemical accumulators
and small flywheels. There are a lot of types of chemical accumulators as lead-acid, Li-Ion,
NiCd, fuel cells and flow batteries. Li-Ion batteries are used in small portable devices, but for
purposes of high voltage power are inappropriate. The most widely used batteries are lead-
acid batteries which are used in automotive industry as well in energetics. Maintenance-free
gel and AGM lead-acid batteries are suitable for accumulation connected to renewable
resources with low and medium installed power. These batteries are produced in many
variants as long life or allowing deep discharge. Disadvantage of all chemical batteries is self-
discharge.
Another technology is used in flow batteries. These accumulators have tanks with electrolyte
and electricity is generated in reactor cell. Because of separate tanks the flow batteries do not
self-discharge and their capacity depends only on volume of electrolyte tanks. This type of
accumulator is one of the most perspective. Nowadays already exist workable systems with
vanadium redox flow batteries but this technology is still under development.
For special purposes supercapacitors are used. This type of accumulation store electricity in
its form but has huge self-discharge losses. The supercapacitors have extremely fast response
and can be charged and discharged by large currents therefore the supercapacitors can work as
energy buffers storing high energy peaks. This technology is really expensive in comparison
to other accumulators and using of supercapacitors is limited by this.
Accumulators can be used in power system for several purposes. The most common is storage
electricity from time when surpluses are in generation to time of demand. The next purpose of
accumulators is compensation of voltage and frequency for improving the quality of electrical
energy in the power systems. Accumulators can serve as backup sources of electricity to
secure electricity supply in case of power failure.
The special type of power systems are stand-alone systems. These autonomous power systems
are built in remote locations or in places where is no possibility of connection to the
transmission grid. As the most suitable sources of electricity for stand-alone systems are
renewable resources as photovoltaic panels and wind turbines. Due to irregularities in the
76
production from RES the accumulators are required for security of supply in each time of
demand. Often a diesel generator is used as an additional source of electricity.
The Tomsk region is a large location with area 316 900 km². Its population is around one
million. The highest population density is in the city of Tomsk, adjacent areas and in bigger
cities and villages. In these areas is also concentrated electrification and transmission
network. In the Tomsk region there are many small villages or remote dwellings where is not
possibility of electrical supply. If the inhabitants of these places want to have electricity the
stand-alone system will be the only choice.
The case studied in this work was focused especially on stand-alone system providing
electricity for buildings in remote area of the Tomsk region. The goal was to evaluate the
project of power system construction providing the electricity supply to people living there.
With regard to the local conditions the photovoltaic panels were chosen as a main source of
electricity. Lead-acid batteries were used for accumulation. The diesel generator was
considered as an additional source. The evaluation from a technical and economic point of
view was made after designing the system.
In economic model the system was optimized to achieve lower electricity price. Firstly the
equipment was chosen, secondly operating mode and as the last step the battery deepness of
discharge. In each of these steps the price of electricity from stand alone system was
successfully reduced. In the end of optimization two viable variants remained. It was the
system with photovoltaic panels optimized for summer operating and the system only with
diesel generator. The variant with diesel generator was found as the best one with the lowest
price per kWh. NPV value of diesel generator variant was -712 638 € and price of electricity
was 0,271 €/kWh. The NPV of the summer optimized variant was -1 053 968 € with price of
electricity 0,401 €/kWh.
The choice of variants depends on point of view. If the price of electricity is the only
condition the variant with diesel generator is the most suitable. The price of electricity is not
the only condition because the security of supply is also important. If diesel generator breaks
down electricity supply will be stopped. Therefore, when taking into account security of
electricity supply and quality of electricity the summer variant is better. The next point is an
77
influence of electricity generation on environment. Photovoltaic panels in summer variant of
the system generate clear energy that is another advantage of this system against the variant
with diesel generator which pollutes the environment.
The real values of project depend on many factors such price of equipment, transport, fuel,
discount or price escalation. According to the result of sensitivity analyses only the price of
fuel has larger influence on total value of the project and order of project variants. The variant
with diesel generator is the mostly affected by this parameter because it completely depends
on fuel. Change in order of variants occurs only when the annual changes in fuel prices are
larger than 14 %, which can occur only in exceptional cases.
The common price of electricity in Tomsk region is 0,037 €/kWh. This price is several times
lower than cost of electricity provided from optimized stand-alone system variants. The
difference between prices can be reduced by government grants on electricity generation from
renewable resources. The next improvements of project value can be done by drop of used
equipment prices or by using of another technology in the system. Changing of accumulation
technology during the project lifetime can be one of the way to achieve better results. The
new perspective vanadium redox flow batteries can substitute the common lead-acid batteries
and improve economics of the project.
The next ways how to expand case study of stand-alone system can be consideration of
another accumulation types in calculation, prediction of price changes of each accumulation
type and created according to these results optimization of accumulation deployment. To
achieve better economics results types of accumulation may be changed during the lifetime of
stand-alone system.
78
References
[1] 1. diskuse.energetika.cz. energetika.cz. [Online] 17 July 2004. [Cited: 19 January 2014.]
http://diskuse.elektrika.cz/index.php?topic=1599.0.
[2] 2. Faninger, Gerhard. Thermal energy storage. Celsius. [Online] [Cited: 21 January
2014.]http://celsius.co.kr/phase_change_materials/download/energy/Thermal_Energy_S
torage.pdf.
[3] 3. Thermal storage in district heating system. International district energy association.
[Online] [Cited: 26 January 2014.] http://www.districtenergy.org/assets/pdfs/
03AnnualConference/Monday-A/A4.1OVERBYERamboll-A4ThermalStoresinDH-
slidesonly.pdf.
[4] 4. Ing. Jan Mareš, prof. Ing. Martin Libra, CSc., Ing. Vladislav Poulek, CSc.
Akumulace elektrické energie. ELEKTRO časopis pro elektrotechniku. [Online] [Cited:
14 March 2013.] http://www.odbornecasopisy.cz/index.php?id_document=42869.
[5] 5. Peukert’s Law. Battery stuff. [Online] 20 September 2012. [Cited: 15 April 2013.]
http://www.batterystuff.com/kb/tools/peukert-s-law-a-nerds-attempt-to-explain-battery-
capacity.html.
[6] 6. Lead/acid batteries. University of Cambridge. [Online] [Cited: 23 February 2013.]
http://www.doitpoms.ac.uk/tlplib/batteries/batteries_lead_acid.php.
[7] 7. Ing. Petr Dvořák, doc. Ing. Petr Bača, Ph.D., Ing. David Pléha. Akumulace
elektřiny. tzb info. [Online] 9 May 2011. [Cited: 2 March 2013.] http://oze.tzb-
info.cz/7435-akumulace-elektriny.
[8] 8. Nickel Cadmium battery. The Web´s Where You Study In! [Online] [Cited: 8
February 2013.] http://www.ustudy.in/node/4920.
[9] 9. Michele P., Hubert G. AMS Battery. Technische Universität München. [Online] 22
May 2012. [Cited: 4 April 2013.] http://www.tec.ch.tum.de/uploads/media/2012-05-
22_AMS_Battery___FC_Lectures_-_Battery__Michele_P._for_Hubert_G.__01.pdf.
[10] 10. How Lithium-ion Batteries Work. How stuff works. [Online] [Cited: 22 March
2013.] http://electronics.howstuffworks.com/everyday-tech/lithium-ion-battery1.htm.
[11] 11. Bruno Scrosati, Jürgen Garche. Lithium batteries: Status, prospects and future.
[Online] 2009. [Cited: 22 March 2013.] http://www.sciencedirect.com/science/
article/pii/S0378775309020564.
79
[12] 12. Nano Device Processing Laboratory. Hanyang University Department of Energy
Engineering. [Online] [Cited: 6 May 2013.] http://energy.hanyang.ac.kr
/paik/battery.htm.
[13] 13. Co s Li-Ion Články. Cettra. [Online] [Cited: 15 April 2013.] http://www.cettra.cz
/vysilacky-radiostanice/MOTOROLA/Baterie-NiCd,-NiMH-.../Co-s-Li-Ion-clanky/22.
[14] 14. Products. Fuel Cell Energy. [Online] [Cited: 23 May 2013.]
http://www.fuelcellenergy.com/products.php.
[15] 15. Fuel Cells. IEA Energy Technology Essentials. [Online] April 2007. [Cited: 23 May
2013.]
[16] 16. Fuel Cells. Electrochem. [Online] [Cited: 17 May 2013.]
http://electrochem.cwru.edu/encycl/art-f04-fuel-cells-pem.htm.
[17] 17. Types of Fuel Cells. Fuel Cells. [Online] [Cited: 23 May 2013.]
http://www.fuelcells.org/fuel-cells-and-hydrogen/types/.
[18] 18. PAFC - Phosphoric Acid Fuel Cells Portal Page. Fuel Cells Markets. [Online]
[Cited: 23 May 2013.] http://www.fuelcellmarkets.com/fuel_cell_markets
/phosphoric_acid_fuel_cells_pafc/4,1,1,2507.html.
[19] 19. Types of Fuel Cells. Energy.gov. [Online] [Cited: 24 May 2013.]
http://www1.eere.energy.gov/hydrogenandfuelcells/fuelcells/fc_types.html.
[20] 20. Stambouli, A. Boudghene. Fuel cells: The expectations for an environmental-
friendly and sustainable source of energy. Science Direct. [Online] 2011. [Cited: 25
May 2013.] http://www.sciencedirect.com/science/article/pii/S1364032111003455.
[21] 21. Fuel Cells . Alternative Energy. [Online] [Cited: 25 May 2013.]
http://www.altenergy.org/renewables/fuel_cells.html.
[22] 22. Flow battery. Center for Low Carbon Futures. [Online] [Cited: 15 January 2013.]
http://www.lowcarbonfutures.org/sites/default/files/Flow%20Battery_final.pdf.
[23] 23. Trung Nguyen, Robert F. Savinell. Flow Batteries. The Electrochemical Society.
[Online] 2010. [Cited: 18 January 2014.] http://www.electrochem.org/dl
/interface/fal/fal10/fal10_p054-056.pdf.
[24] 24. Vanadové redoxní baterie. Chem Point. [Online] 15 Jun 2011. [Cited: 26 January
2014.] http://www.chempoint.cz/vanadove-redoxni-baterie.
[25] 25. Bruce Dunn Haresh Kamath, Jean-Marie Tarascon. Electrical Energy Storage
for the Grid: A Battery of Choices. Science/AAAS. [Online] 18 November 2011. [Cited:
18 January 2014.] http://www.sciencemag.org/content/334/6058/928.figures-only.
80
[26] 26. About Flywheel Energy Storage. Beacon Power. [Online] [Cited: 18 December
2013.] http://www.beaconpower.com/products/about-flywheels.asp.
[27] 27. Flywheels. Energy Storage Association. [Online] [Cited: 20 December 2013.]
http://energystorage.org/energy-storage/technologies/flywheels.
[28] 28. Energy storage: flywheels. ClimateTechWiki. [Online] [Cited: 18 December 2013.]
http://climatetechwiki.org/technology/jiqweb-es-fw.
[29] 29. Sousa, Luis de. Energy Storage - Flywheel. The Oil Drum. [Online] 5 October
2011. [Cited: 20 December 2013.] http://www.theoildrum.com/node/8428.
[30] 30. Ragheb, M. Kinetic energy flywheel energy storage. Dr. Magdi Ragheb. [Online]
16 September 2013. [Cited: 20 December 2013.] http://mragheb.com
/NPRE%20498ES%20Energy%20Storage%20Systems/Kinetic%20Energy%20Flywhee
l%20Energy%20Storage.pdf.
[31] 31. Storage Technologies. Novolta. [Online] [Cited: 28 November 2013.]
http://www.novolta.com.au/solutions/storagetechnologies.htm.
[32] 32. Miner, Mark. Pumped Hydro. Neural Energy. [Online] 18 April 2012. [Cited: 28
November 2013.] http://www.neuralenergy.info/2009/06/pumped-hydro.html.
[33] 33. Suul, Jon Are. Variable speed pumped storage hydropower plants for integration of
wind power in isolated power systems. Intech Open Science. [Online] 1 December
2009. [Cited: 3 December 2013.] http://www.intechopen.com/download
/get/type/pdfs/id/9345.
[34] 34. Doshay, Sage. Pumped Hydroelectric Storage: Making Renewable Energy.
Standford University. [Online] 1 December 2012. [Cited: 5 December 2013.]
http://large.stanford.edu/courses/2012/ph240/doshay1/.
[35] 35. Power Generation-hydro Power. Wikiversity. [Online] [Cited: 25 November 2013.]
[36] 36. OpenEI. Compressed Air Energy Storage (CAES). [Online] [Citace: 11. 3 2014.]
[37] 37. Zolfagharifard, Ellie. The Engineer. [Online] 25. 4 2011. [Citace: 11. 3 2014.]
http://www.theengineer.co.uk/in-depth/the-big-story/compressed-air-energy-storage-
has-bags-of-potential/1008374.article.
[38] 38. CAES Adiabatic. Energy storage power corporation. [Online] [Cited: 2 12 2014.]
http://www.espcinc.com/mobile/index.php?option=com_k2&view=item&id=10:caes-
adiabatic&Itemid=3.
[39] 39. Compressed air energy storage. Wikia. [Online] [Citace: 10. 3 2014.]
http://cair.wikia.com/wiki/Compressed_air_energy_storage.
81
[40] 40. SustainX's ICAES. Sustain X. [Online] [Citace: 11. 3 2014.]
http://www.sustainx.com/technology-isothermal-caes.htm.
[41] 41. Supercapacitor. Battery University. [Online] [Citace: 23. 3 2014.]
http://batteryuniversity.com/learn/article/whats_the_role_of_the_supercapacitor.
[42] 42. Superkapacitor. Fyzmatik. [Online] 21. 4 2011. [Citace: 20. 3 2014.]
http://fyzmatik.pise.cz/1076-superkapacitor.html.
[43] 43. Superkapacitors. Wikipedia. [Online] [Citace: 18. 3 2014.]
http://en.wikipedia.org/wiki/Supercapacitor.
[44] 44. Hydrogen fuel cell airplane. Hydrogen house. [Online] 2013. [Citace: 15. 3 2014.]
http://hydrogenhouseproject.org/fuel-cell-airplane.html.
[45] 45. Power Capacitors and Reactive Power Controls. Electrical Power Engineering.
[Online] [Citace: 25. 3 2014.] http://www.electricalengineering-book.com/system-
voltage-regulation-and-improving-power-quality.html.
[46] 46. Romero, David Sáez. Voltage regulation in distribution systems - Tap changer and
Wind Power. Industrial Electrical Engineerign and Automation. [Online] 2010. [Citace:
24. 3 2014.] http://www.iea.lth.se/publications/MS-Theses/Full%20document
/5270_full_document.pdf.
[47] 47. Samoilov, D. V. Расчёт величины поступления теплоты от солхечной
радиации на поверхность земли. Москва : Издательство МГГУ им. Х.Э. Баумана,
2006.
[48] 48. School of Physics and Astronomy. The Shockley-Queisser limit. [Online] [Citace:
22. 3 2014.] http://ph.qmul.ac.uk/sites/default/files/u75
/Solar%20cells_environmental%20impact.pdf.
[49] 49. Stanford researchers develop new technology for cheaper, more efficient solar cells.
Solar and Wind Living. [Online] 21. 2 2011.
http://thesolarandwindexpo.blogspot.ru/2011/02/stanford-researchers-develop-
new.html.
[50] 50. Science Behind the Solar Cell. Kyocera. [Online] [Citace: 12. 10 2013.]
http://global.kyocera.com/prdct/solar/spirit/about_solar/cell.html.
[51] 51. Ouma, Clint. Monocristaline solar cells. Exploring green technology. [Online]
[Citace: 16. 9 2013.] http://exploringgreentechnology.com/solar-
energy/technology/monocrystalline-solar-cells/.
82
[52] 52. Clarke, Chris. San Jose Solar Company Breaks Efficiency Record for PV. KCET.
[Online] 16. 10 2012. [Citace: 25. 9 2013.] http://www.kcet.org/news/rewire
/solar/photovoltaic-pv/san-jose-solar-company-breaks-efficiency-record-for-pv.html.
[53] 53. Gumm, Linley. RV Solar Electrical Systems. The Lazy Daze Companion. [Online]
12 2011. [Citace: 15. 4 2013.] http://lazydazearticles.blogspot.ru/2011/12/rv-solar-
electrical-systems.html.
[54] 54. Туев А.В., Пуцко С.В., Кочетков А.А. Фотоэлектрические технологии 03.
[55] 55. Томская область. Ecomurman. [Online] [Citace: 14. 4 2014.] ecomurman.ru/карта-
ветров/томская-область.
[56] 56. The Legislative Duma of Tomsk Oblast. Дума Томской области. [Online] [Citace:
15. 3 2013.] http://eng.duma.tomsk.ru/page/192/.
[57] 57. И. А. Будзко, Т. Б. Лещинская, Б. И. Сукманов. Электроснабжение
сельского хозяйства . [DjVu Document] Москва : Колос, 2000.
[58] 58. Gaisma. [Online] [Citace: 4. 10 2013.] http://www.gaisma.com/en/.
[59] 59. Crude Oil Price Forecast: Long Term to 2025 | Data and Charts. Knoema. [Online]
[Citace: 25. 3 2014.] http://knoema.com/yxptpab/crude-oil-price-forecast-long-term-to-
2025-data-and-charts.
[60] 60. Clemente, Jude. The Global Oil Outlook Until 2020 . Judeclemente. [Online] 4
2012. [Citace: 26. 3 2014.] http://www.judeclemente.com/wp-
content/uploads/2010/07/The-Global-Oil-Outlook-Until-2020.pdf.
[61] 61. Б. В. Лукутин, О. А. Суржикова, Е. Б. Шандарова. Возобновляемая
энергетика в децентралном электроснабжении. Москва : Энергоатомиздат,
2008. 978-5-283-03272-9.
[62] 62. МЭР: инфляция в России сохранится на уровне 5% до 2020 года. Newsland.
[Online] [Citace: 15. 4 2014.] http://newsland.com/news/detail/id/1071485/.
[63] 63. Тарифы на электроэнергию. Энерговопрос. [Online] 16. 4 2013. [Citace: 28. 4
2014.] http://energovopros.ru/spravochnik/elektrosnabzhenie/tarify-na-
elektroenergiju/tomskaya_oblast/29883/.
[64] 64. [Online] [Citace: 3. March 2013.] http://www.google.es/patents/US4399656.
[65] 65. [Online] [Citace: 12. 4 2013.] http://iranbattery.ir/university/print-partone-13.htm.
[66] 66. Microcontroller-based on-line state-of-charge estimator for sealed lead–acid
batteries. Science Direct. [Online] 11 2003. [Citace: 25. 3 2013.]
http://www.sciencedirect.com/science/article/pii/S0378775303010668.
83
[67] 67. Charging Nickel-cadmium. Battery University. [Online] [Citace: 20. 5 2013.]
http://batteryuniversity.com/learn/article/charging_nickel_based_batteries.
[68] 68. Krusikak. [Online] [Citace: 25. 5 2013.] http://krusikak.co.rs/products/ni-cd/kph-
type/.
[69] 69. Maximum Current Draw vs. State of Charge. Tesla motors club. [Online] 15. 15
2009. [Citace: 12. 6 2013.] http://www.teslamotorsclub.com/showthread.php/3607-
Maximum-Current-Draw-vs-State-of-Charge.
[70] 70. Li-Ion cells charging. Belza. [Online] 13. 4 2001. [Citace: 16. 6 2013.]
http://www.belza.cz/charge/liion1.htm.
[71] 71. [Online] [Citace: 16. 6 2013.] http://www.efirstpower.com/li.html.
[72] 72. Fuel cells: The expectations for an environmental-friendly and sustainable source of
energy. Science direct. [Online] 7 2011. [Citace: 13. 5 2013.]
http://www.sciencedirect.com/science/article/pii/S1364032111003455.
[73] 73. McDowall, Jim. UNDERSTANDING LITHIUM-ION TECHNOLOGY . Battcon.
[Online] [Cited: 23 March 2013.] http://www.battcon.com/PapersFinal2008
/McDowallPaper2008PROOF_9.pdf.
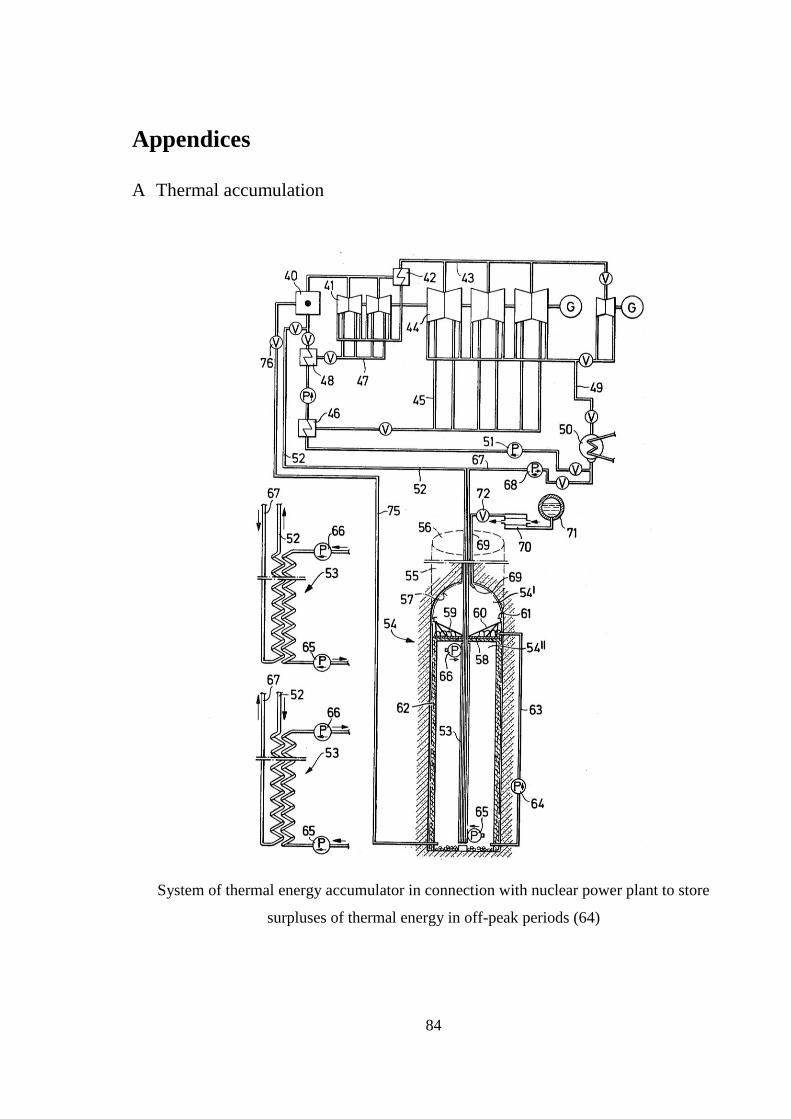
84
Appendices
A Thermal accumulation
System of thermal energy accumulator in connection with nuclear power plant to store
surpluses of thermal energy in off-peak periods (64)
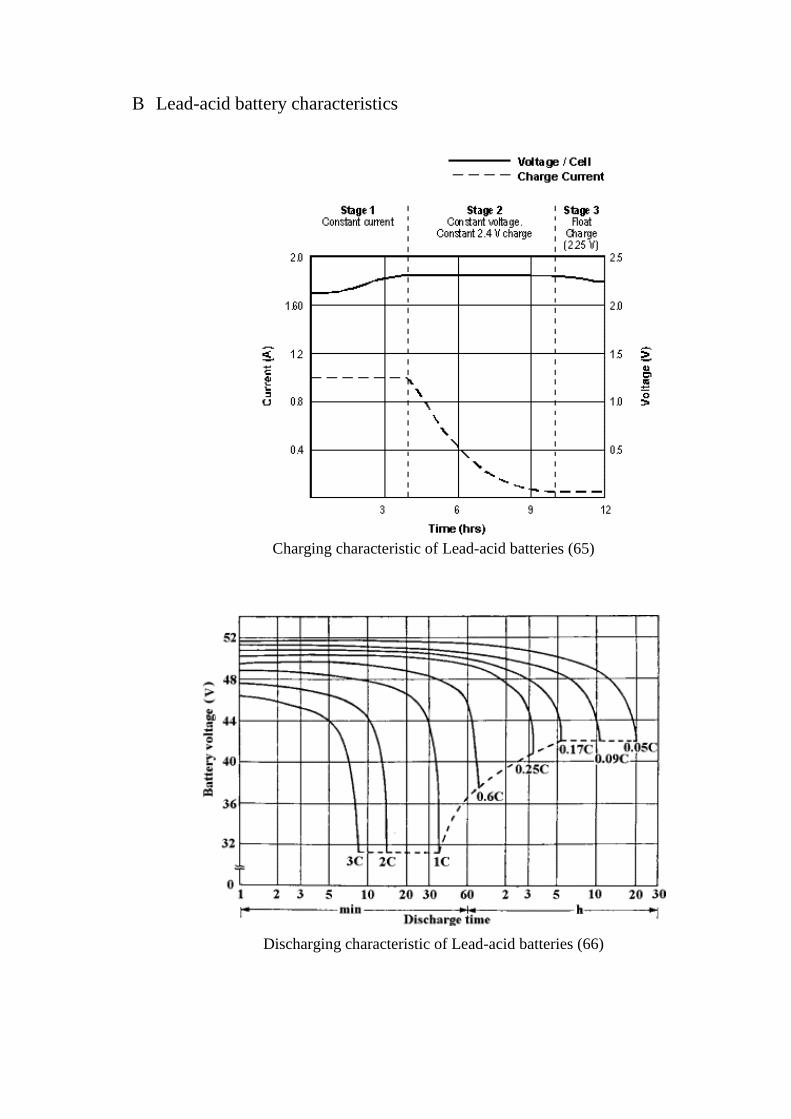
B Lead-acid battery characteristics
Charging characteristic of Lead-acid batteries (65)
Discharging characteristic of Lead-acid batteries (66)
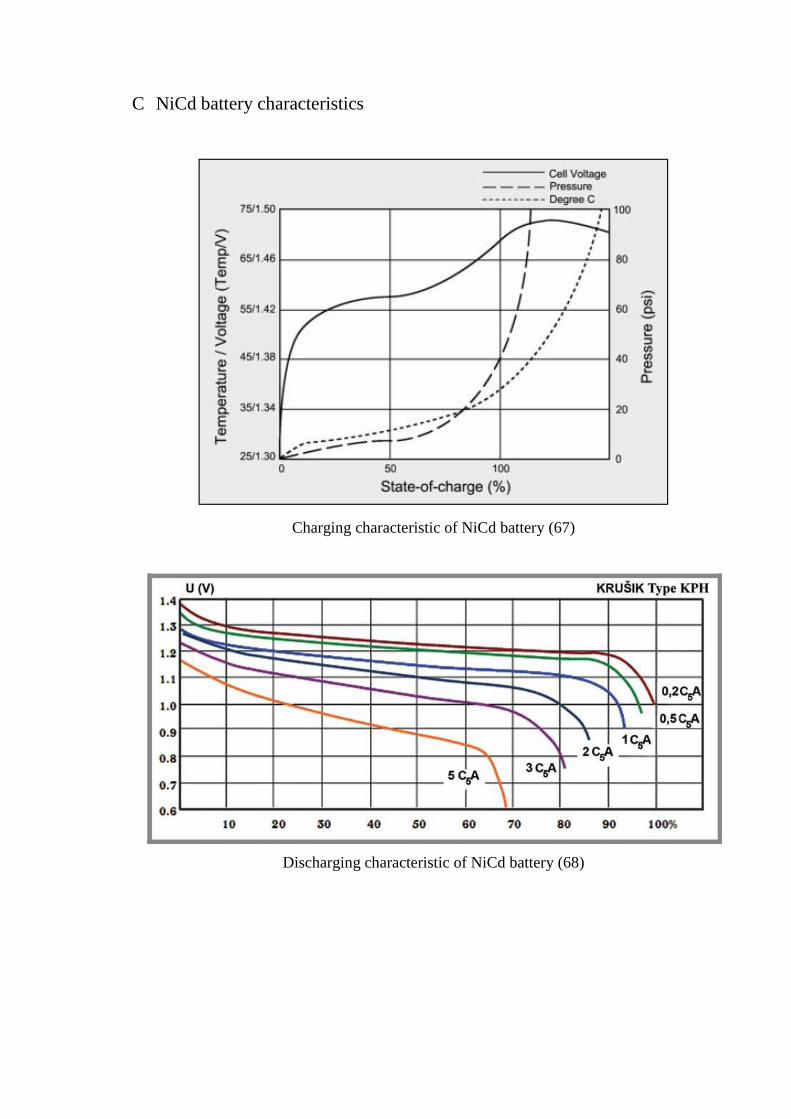
C NiCd battery characteristics
Charging characteristic of NiCd battery (67)
Discharging characteristic of NiCd battery (68)
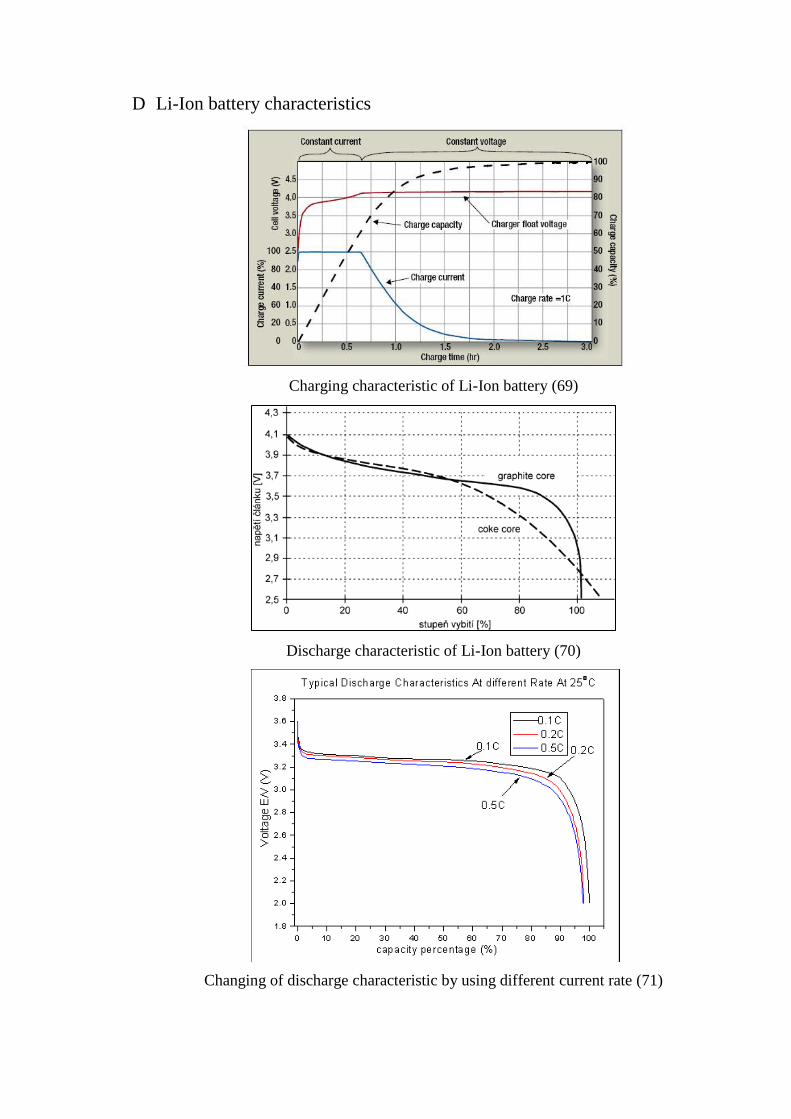
D Li-Ion battery characteristics
Charging characteristic of Li-Ion battery (69)
Discharge characteristic of Li-Ion battery (70)
Changing of discharge characteristic by using different current rate (71)
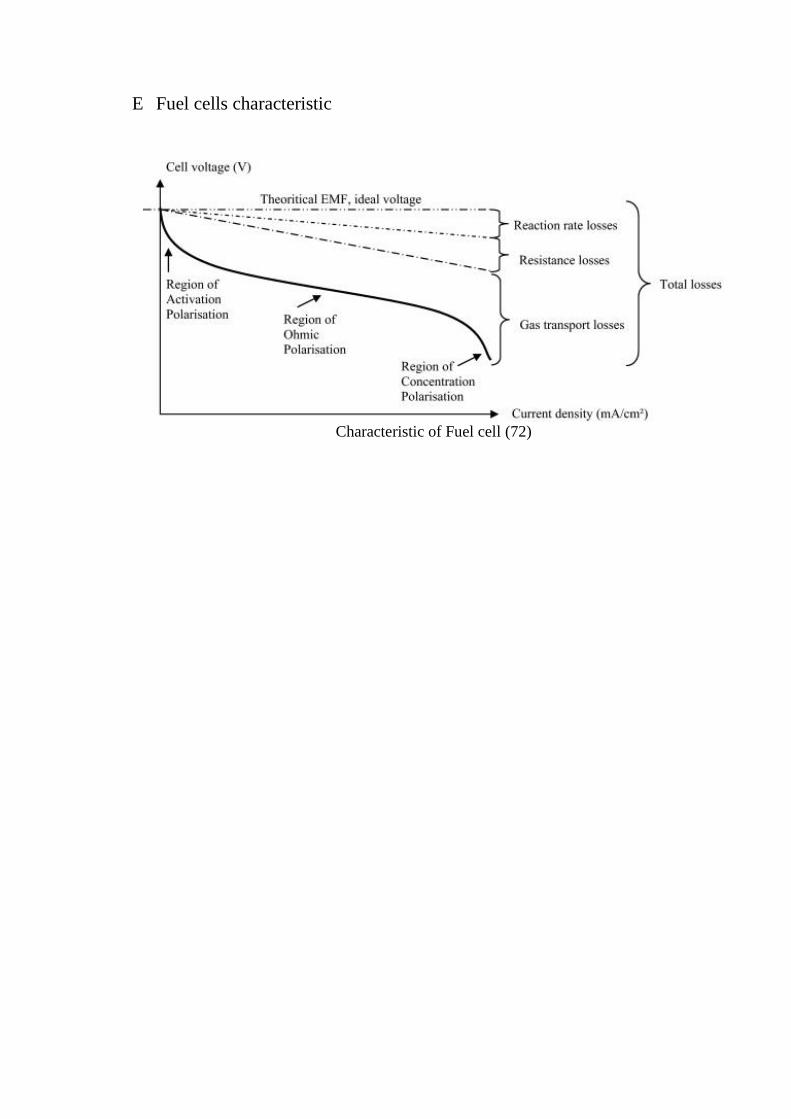
E Fuel cells characteristic
Characteristic of Fuel cell (72)
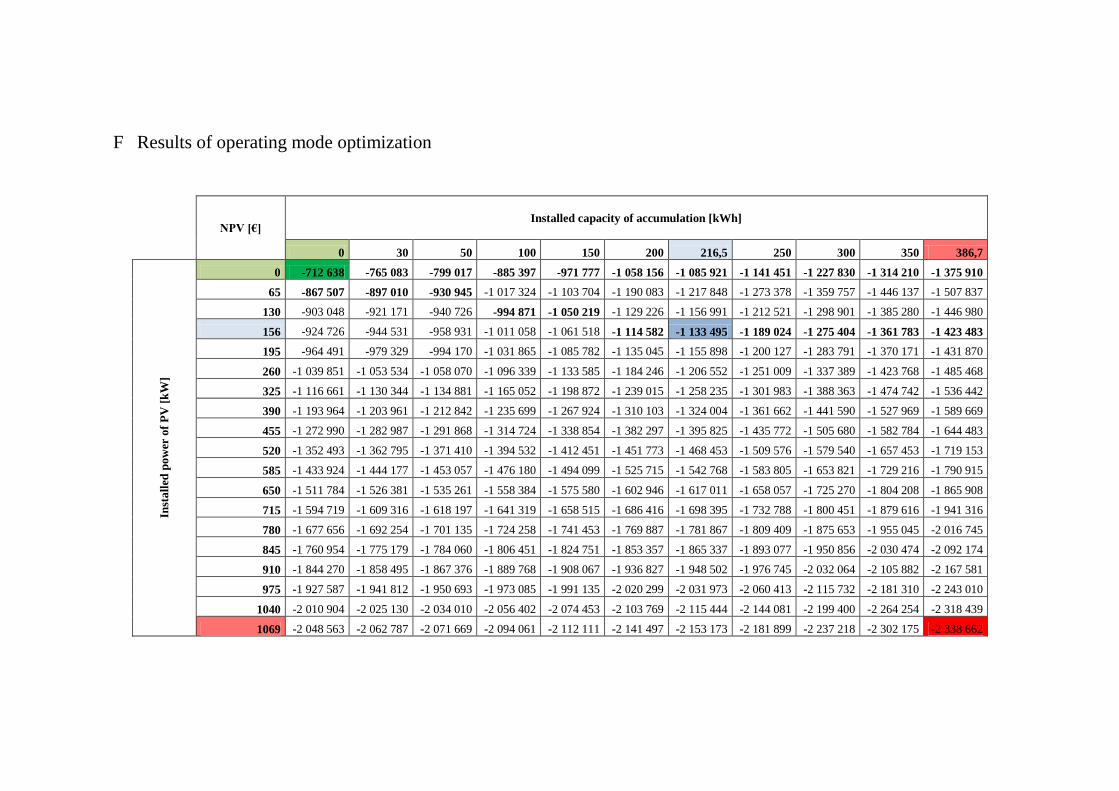
F Results of operating mode optimization
NPV [€] Installed capacity of accumulation [kWh]
0 30 50 100 150 200 216,5 250 300 350 386,7
Inst
all
ed p
ow
er o
f P
V [
kW
]
0 -712 638 -765 083 -799 017 -885 397 -971 777 -1 058 156 -1 085 921 -1 141 451 -1 227 830 -1 314 210 -1 375 910
65 -867 507 -897 010 -930 945 -1 017 324 -1 103 704 -1 190 083 -1 217 848 -1 273 378 -1 359 757 -1 446 137 -1 507 837
130 -903 048 -921 171 -940 726 -994 871 -1 050 219 -1 129 226 -1 156 991 -1 212 521 -1 298 901 -1 385 280 -1 446 980
156 -924 726 -944 531 -958 931 -1 011 058 -1 061 518 -1 114 582 -1 133 495 -1 189 024 -1 275 404 -1 361 783 -1 423 483
195 -964 491 -979 329 -994 170 -1 031 865 -1 085 782 -1 135 045 -1 155 898 -1 200 127 -1 283 791 -1 370 171 -1 431 870
260 -1 039 851 -1 053 534 -1 058 070 -1 096 339 -1 133 585 -1 184 246 -1 206 552 -1 251 009 -1 337 389 -1 423 768 -1 485 468
325 -1 116 661 -1 130 344 -1 134 881 -1 165 052 -1 198 872 -1 239 015 -1 258 235 -1 301 983 -1 388 363 -1 474 742 -1 536 442
390 -1 193 964 -1 203 961 -1 212 842 -1 235 699 -1 267 924 -1 310 103 -1 324 004 -1 361 662 -1 441 590 -1 527 969 -1 589 669
455 -1 272 990 -1 282 987 -1 291 868 -1 314 724 -1 338 854 -1 382 297 -1 395 825 -1 435 772 -1 505 680 -1 582 784 -1 644 483
520 -1 352 493 -1 362 795 -1 371 410 -1 394 532 -1 412 451 -1 451 773 -1 468 453 -1 509 576 -1 579 540 -1 657 453 -1 719 153
585 -1 433 924 -1 444 177 -1 453 057 -1 476 180 -1 494 099 -1 525 715 -1 542 768 -1 583 805 -1 653 821 -1 729 216 -1 790 915
650 -1 511 784 -1 526 381 -1 535 261 -1 558 384 -1 575 580 -1 602 946 -1 617 011 -1 658 057 -1 725 270 -1 804 208 -1 865 908
715 -1 594 719 -1 609 316 -1 618 197 -1 641 319 -1 658 515 -1 686 416 -1 698 395 -1 732 788 -1 800 451 -1 879 616 -1 941 316
780 -1 677 656 -1 692 254 -1 701 135 -1 724 258 -1 741 453 -1 769 887 -1 781 867 -1 809 409 -1 875 653 -1 955 045 -2 016 745
845 -1 760 954 -1 775 179 -1 784 060 -1 806 451 -1 824 751 -1 853 357 -1 865 337 -1 893 077 -1 950 856 -2 030 474 -2 092 174
910 -1 844 270 -1 858 495 -1 867 376 -1 889 768 -1 908 067 -1 936 827 -1 948 502 -1 976 745 -2 032 064 -2 105 882 -2 167 581
975 -1 927 587 -1 941 812 -1 950 693 -1 973 085 -1 991 135 -2 020 299 -2 031 973 -2 060 413 -2 115 732 -2 181 310 -2 243 010
1040 -2 010 904 -2 025 130 -2 034 010 -2 056 402 -2 074 453 -2 103 769 -2 115 444 -2 144 081 -2 199 400 -2 264 254 -2 318 439
1069 -2 048 563 -2 062 787 -2 071 669 -2 094 061 -2 112 111 -2 141 497 -2 153 173 -2 181 899 -2 237 218 -2 302 175 -2 338 662
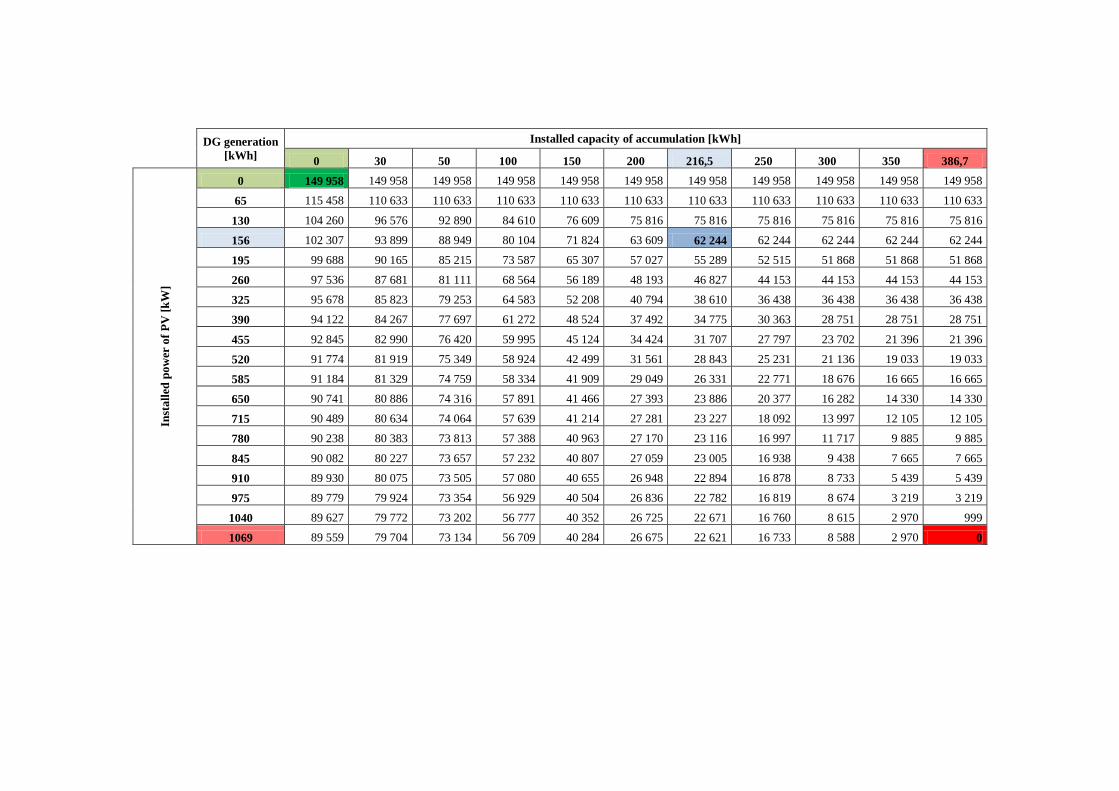
DG generation
[kWh]
Installed capacity of accumulation [kWh]
0 30 50 100 150 200 216,5 250 300 350 386,7
Inst
all
ed p
ow
er o
f P
V [
kW
]
0 149 958 149 958 149 958 149 958 149 958 149 958 149 958 149 958 149 958 149 958 149 958
65 115 458 110 633 110 633 110 633 110 633 110 633 110 633 110 633 110 633 110 633 110 633
130 104 260 96 576 92 890 84 610 76 609 75 816 75 816 75 816 75 816 75 816 75 816
156 102 307 93 899 88 949 80 104 71 824 63 609 62 244 62 244 62 244 62 244 62 244
195 99 688 90 165 85 215 73 587 65 307 57 027 55 289 52 515 51 868 51 868 51 868
260 97 536 87 681 81 111 68 564 56 189 48 193 46 827 44 153 44 153 44 153 44 153
325 95 678 85 823 79 253 64 583 52 208 40 794 38 610 36 438 36 438 36 438 36 438
390 94 122 84 267 77 697 61 272 48 524 37 492 34 775 30 363 28 751 28 751 28 751
455 92 845 82 990 76 420 59 995 45 124 34 424 31 707 27 797 23 702 21 396 21 396
520 91 774 81 919 75 349 58 924 42 499 31 561 28 843 25 231 21 136 19 033 19 033
585 91 184 81 329 74 759 58 334 41 909 29 049 26 331 22 771 18 676 16 665 16 665
650 90 741 80 886 74 316 57 891 41 466 27 393 23 886 20 377 16 282 14 330 14 330
715 90 489 80 634 74 064 57 639 41 214 27 281 23 227 18 092 13 997 12 105 12 105
780 90 238 80 383 73 813 57 388 40 963 27 170 23 116 16 997 11 717 9 885 9 885
845 90 082 80 227 73 657 57 232 40 807 27 059 23 005 16 938 9 438 7 665 7 665
910 89 930 80 075 73 505 57 080 40 655 26 948 22 894 16 878 8 733 5 439 5 439
975 89 779 79 924 73 354 56 929 40 504 26 836 22 782 16 819 8 674 3 219 3 219
1040 89 627 79 772 73 202 56 777 40 352 26 725 22 671 16 760 8 615 2 970 999
1069 89 559 79 704 73 134 56 709 40 284 26 675 22 621 16 733 8 588 2 970 0
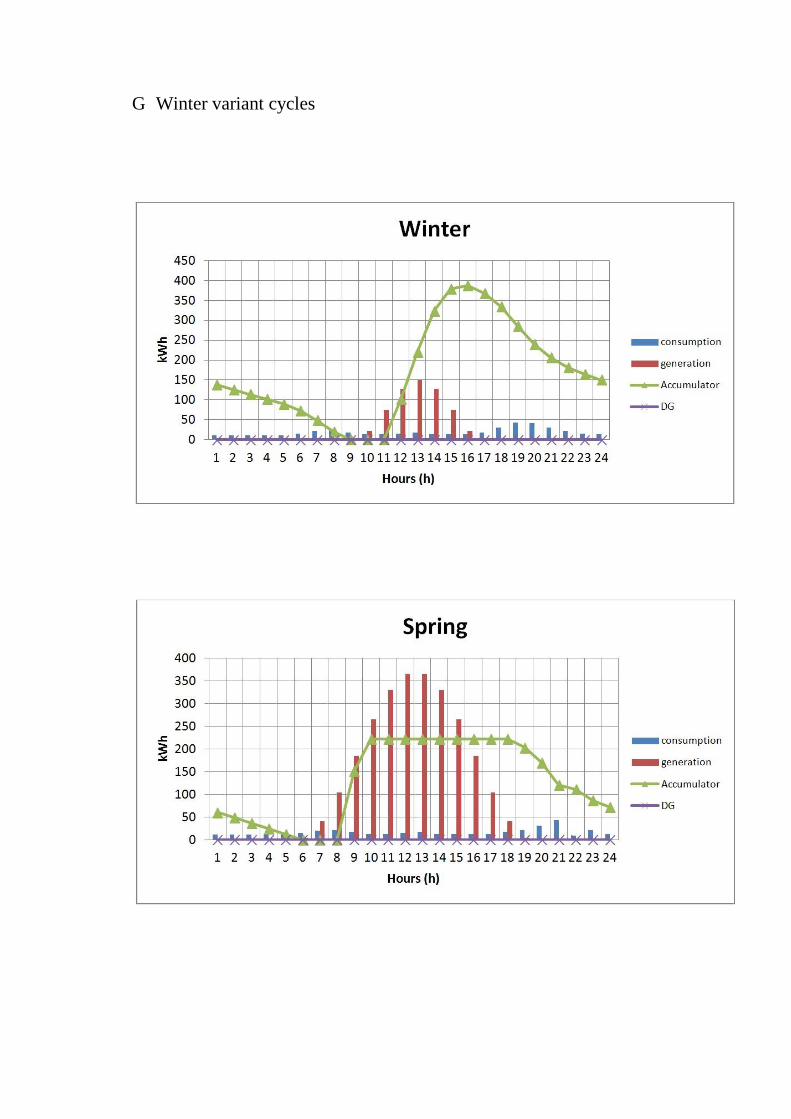
G Winter variant cycles
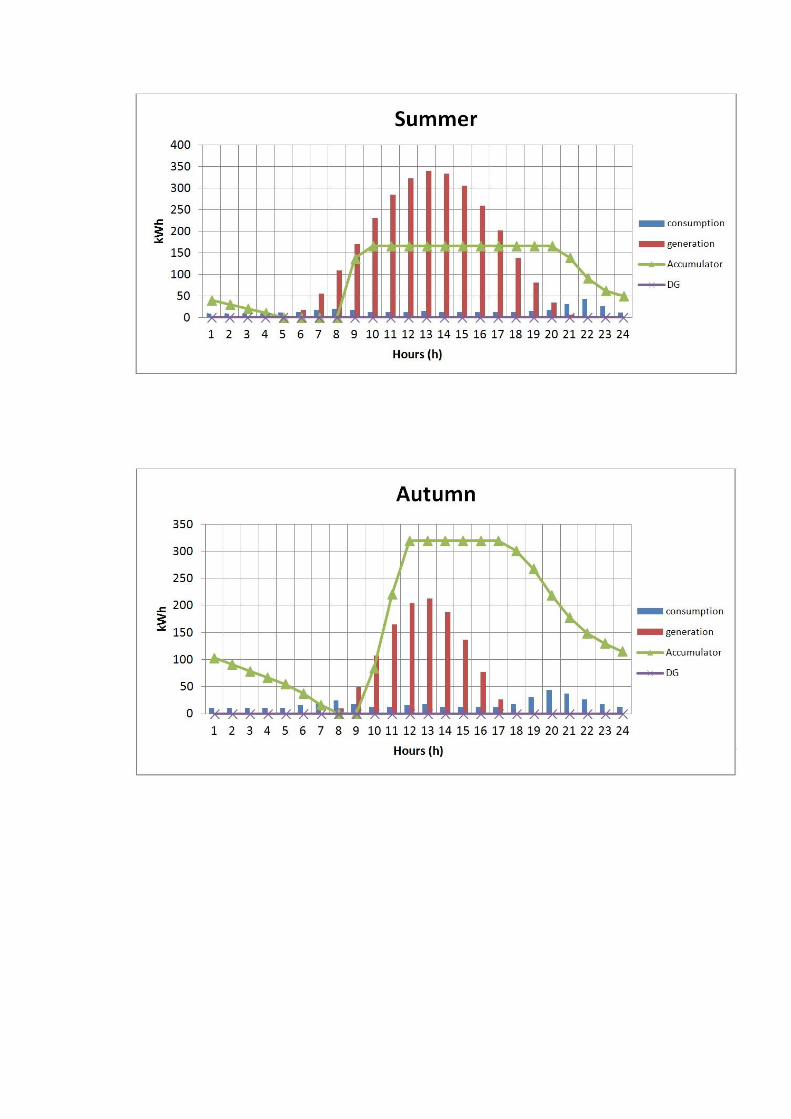
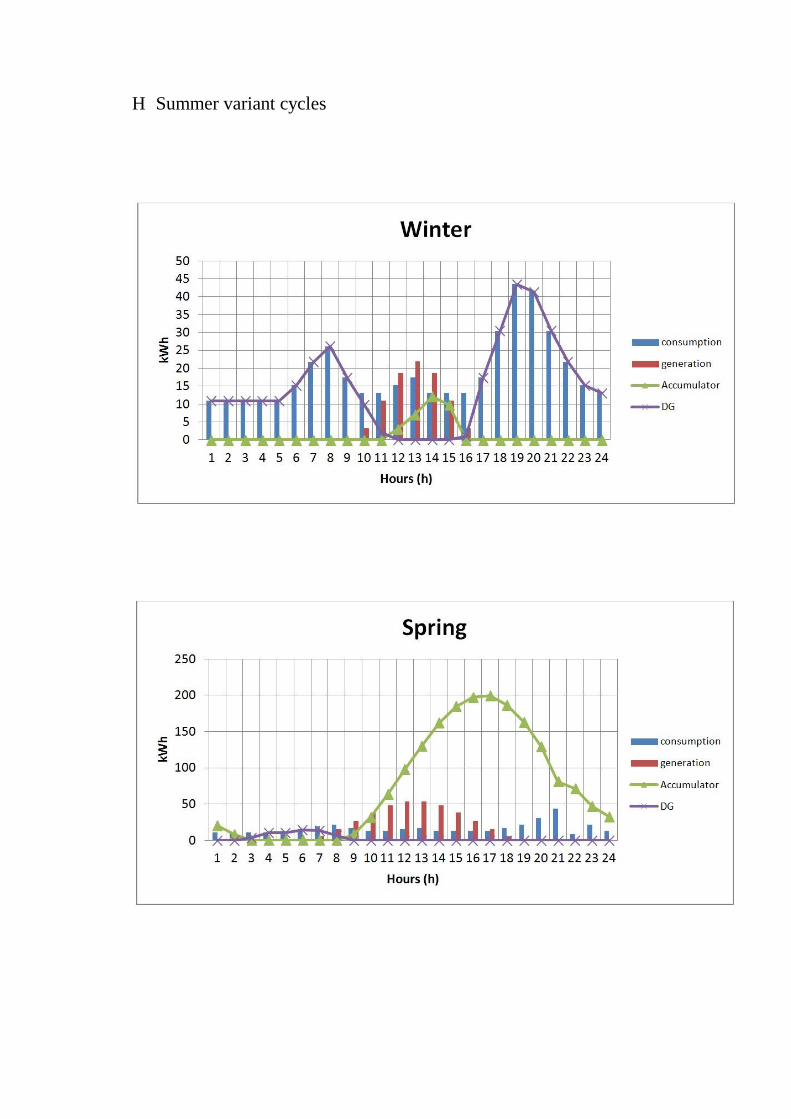
H Summer variant cycles
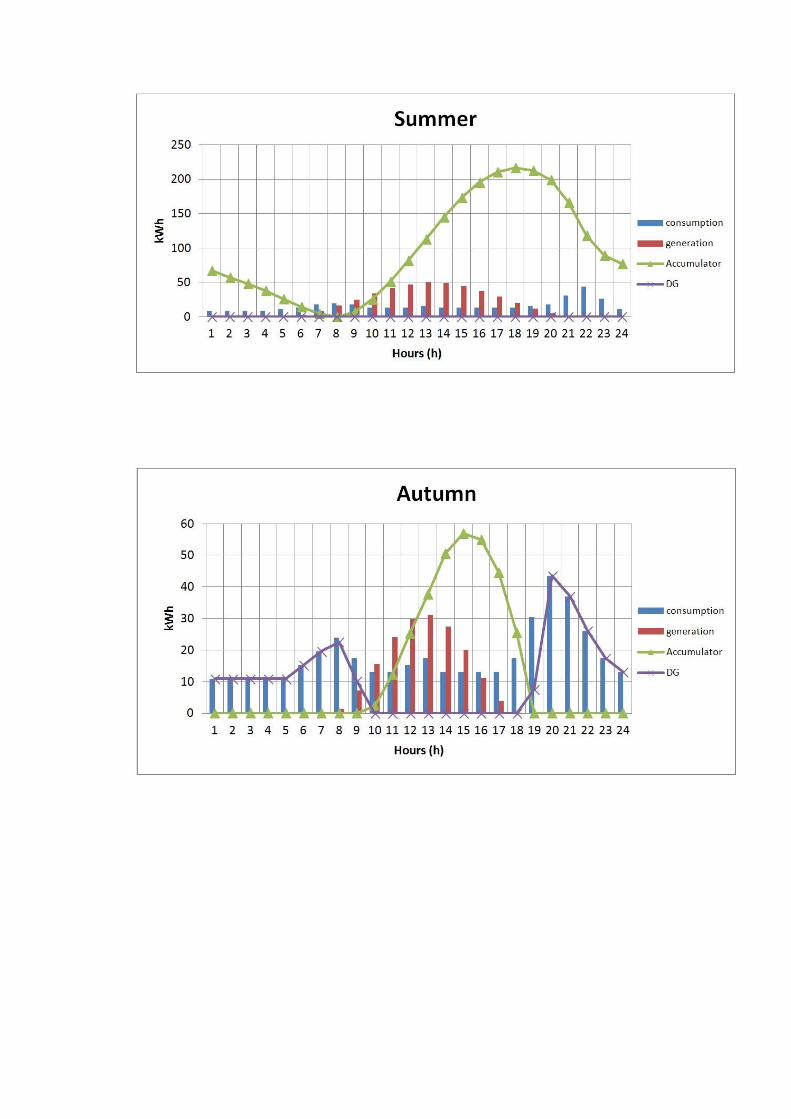
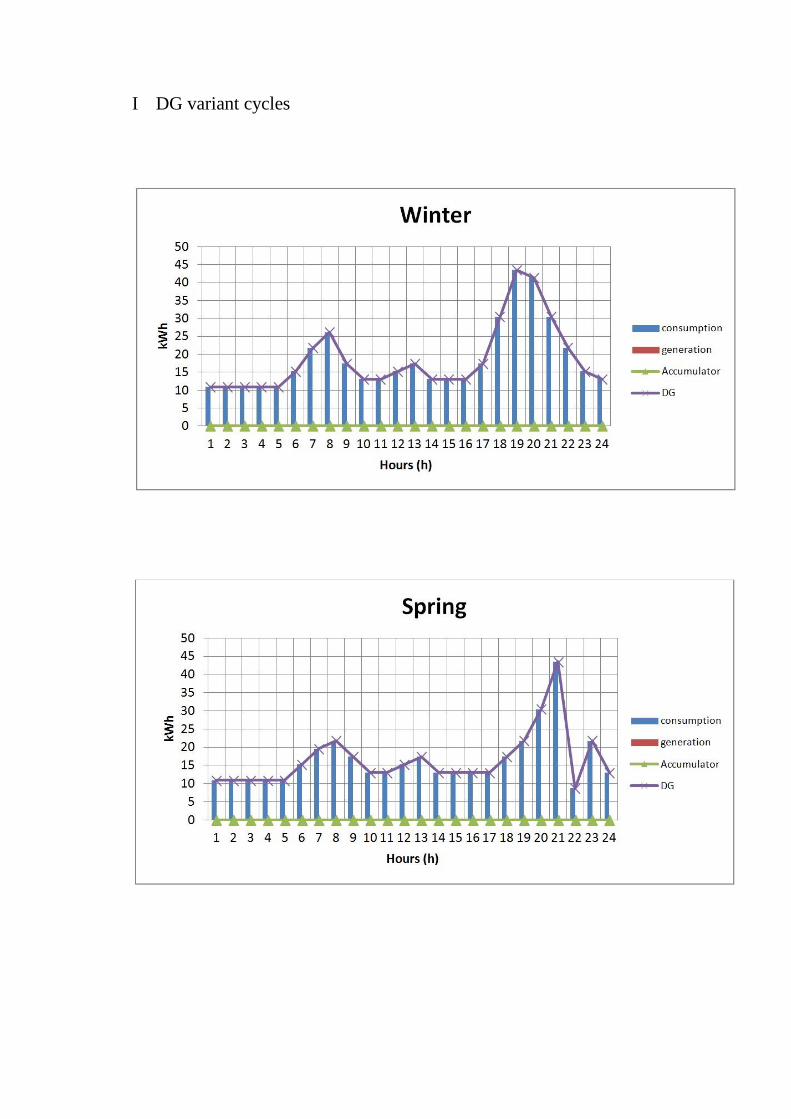
I DG variant cycles
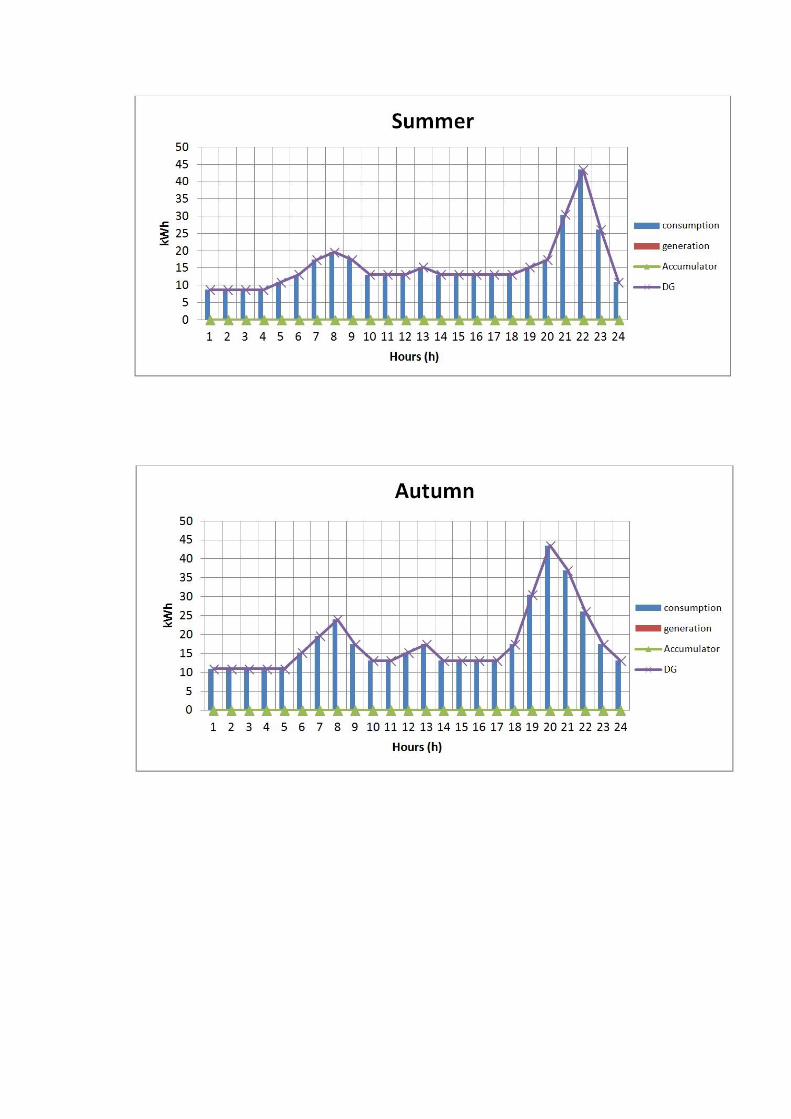
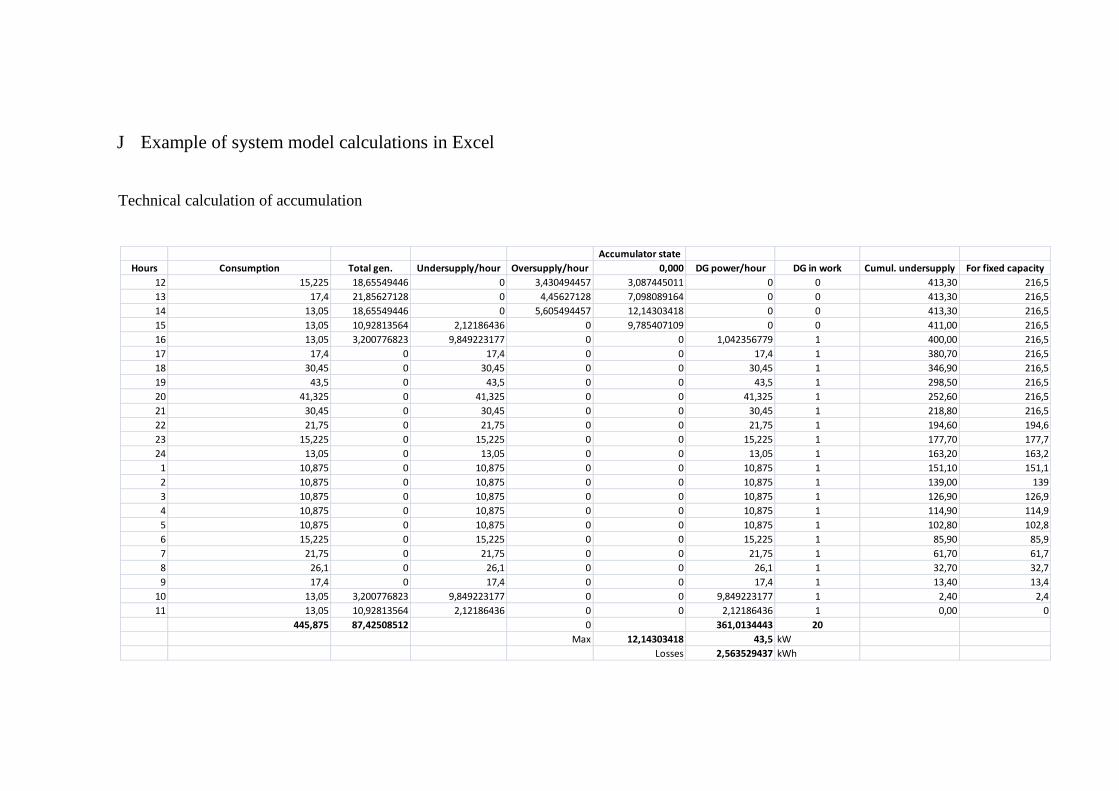
J Example of system model calculations in Excel
Technical calculation of accumulation
Accumulator state
Hours Consumption Total gen. Undersupply/hour Oversupply/hour 0,000 DG power/hour DG in work Cumul. undersupply For fixed capacity
12 15,225 18,65549446 0 3,430494457 3,087445011 0 0 413,30 216,5
13 17,4 21,85627128 0 4,45627128 7,098089164 0 0 413,30 216,5
14 13,05 18,65549446 0 5,605494457 12,14303418 0 0 413,30 216,5
15 13,05 10,92813564 2,12186436 0 9,785407109 0 0 411,00 216,5
16 13,05 3,200776823 9,849223177 0 0 1,042356779 1 400,00 216,5
17 17,4 0 17,4 0 0 17,4 1 380,70 216,5
18 30,45 0 30,45 0 0 30,45 1 346,90 216,5
19 43,5 0 43,5 0 0 43,5 1 298,50 216,5
20 41,325 0 41,325 0 0 41,325 1 252,60 216,5
21 30,45 0 30,45 0 0 30,45 1 218,80 216,5
22 21,75 0 21,75 0 0 21,75 1 194,60 194,6
23 15,225 0 15,225 0 0 15,225 1 177,70 177,7
24 13,05 0 13,05 0 0 13,05 1 163,20 163,2
1 10,875 0 10,875 0 0 10,875 1 151,10 151,1
2 10,875 0 10,875 0 0 10,875 1 139,00 139
3 10,875 0 10,875 0 0 10,875 1 126,90 126,9
4 10,875 0 10,875 0 0 10,875 1 114,90 114,9
5 10,875 0 10,875 0 0 10,875 1 102,80 102,8
6 15,225 0 15,225 0 0 15,225 1 85,90 85,9
7 21,75 0 21,75 0 0 21,75 1 61,70 61,7
8 26,1 0 26,1 0 0 26,1 1 32,70 32,7
9 17,4 0 17,4 0 0 17,4 1 13,40 13,4
10 13,05 3,200776823 9,849223177 0 0 9,849223177 1 2,40 2,4
11 13,05 10,92813564 2,12186436 0 0 2,12186436 1 0,00 0
445,875 87,42508512 0 361,0134443 20
Max 12,14303418 43,5 kW
Losses 2,563529437 kWh
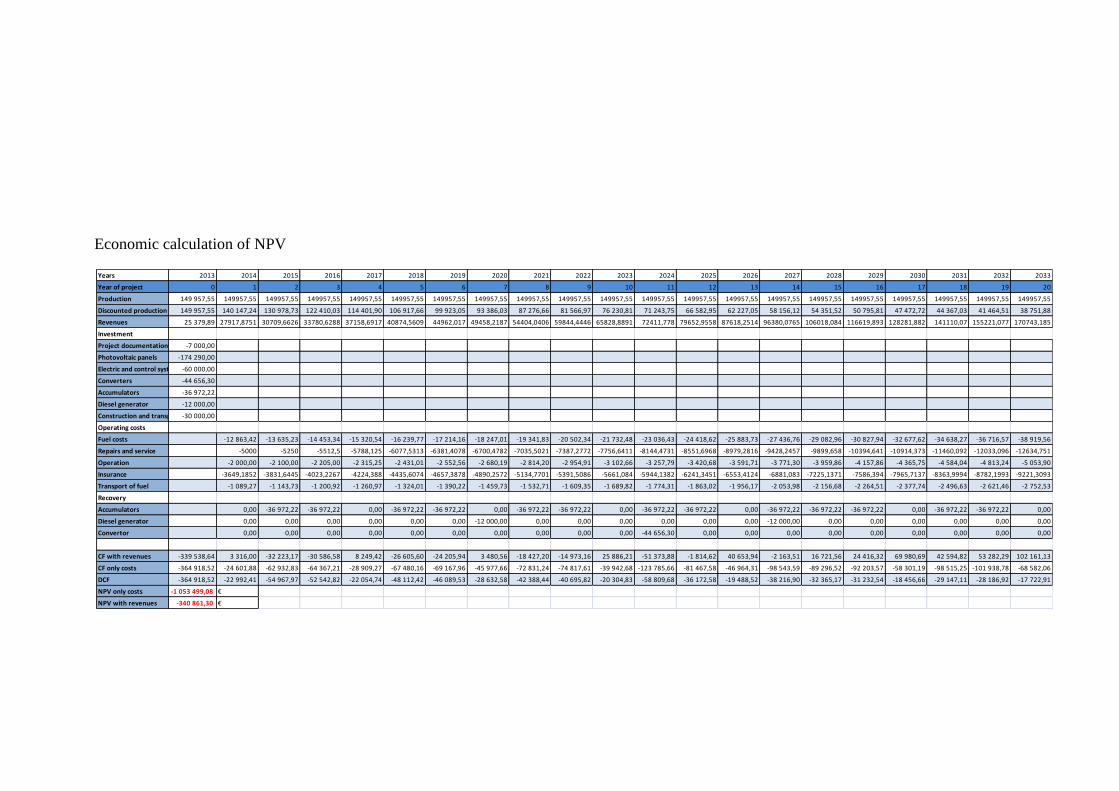
Economic calculation of NPV
Years 2013 2014 2015 2016 2017 2018 2019 2020 2021 2022 2023 2024 2025 2026 2027 2028 2029 2030 2031 2032 2033
Year of project 0 1 2 3 4 5 6 7 8 9 10 11 12 13 14 15 16 17 18 19 20
Production 149 957,55 149957,55 149957,55 149957,55 149957,55 149957,55 149957,55 149957,55 149957,55 149957,55 149957,55 149957,55 149957,55 149957,55 149957,55 149957,55 149957,55 149957,55 149957,55 149957,55 149957,55
Discounted production 149 957,55 140 147,24 130 978,73 122 410,03 114 401,90 106 917,66 99 923,05 93 386,03 87 276,66 81 566,97 76 230,81 71 243,75 66 582,95 62 227,05 58 156,12 54 351,52 50 795,81 47 472,72 44 367,03 41 464,51 38 751,88
Revenues 25 379,89 27917,8751 30709,6626 33780,6288 37158,6917 40874,5609 44962,017 49458,2187 54404,0406 59844,4446 65828,8891 72411,778 79652,9558 87618,2514 96380,0765 106018,084 116619,893 128281,882 141110,07 155221,077 170743,185
Investment
Project documentation -7 000,00
Photovoltaic panels -174 290,00
Electric and control system -60 000,00
Converters -44 656,30
Accumulators -36 972,22
Diesel generator -12 000,00
Construction and transport -30 000,00
Operating costs
Fuel costs -12 863,42 -13 635,23 -14 453,34 -15 320,54 -16 239,77 -17 214,16 -18 247,01 -19 341,83 -20 502,34 -21 732,48 -23 036,43 -24 418,62 -25 883,73 -27 436,76 -29 082,96 -30 827,94 -32 677,62 -34 638,27 -36 716,57 -38 919,56
Repairs and service -5000 -5250 -5512,5 -5788,125 -6077,5313 -6381,4078 -6700,4782 -7035,5021 -7387,2772 -7756,6411 -8144,4731 -8551,6968 -8979,2816 -9428,2457 -9899,658 -10394,641 -10914,373 -11460,092 -12033,096 -12634,751
Operation -2 000,00 -2 100,00 -2 205,00 -2 315,25 -2 431,01 -2 552,56 -2 680,19 -2 814,20 -2 954,91 -3 102,66 -3 257,79 -3 420,68 -3 591,71 -3 771,30 -3 959,86 -4 157,86 -4 365,75 -4 584,04 -4 813,24 -5 053,90
Insurance -3649,1852 -3831,6445 -4023,2267 -4224,388 -4435,6074 -4657,3878 -4890,2572 -5134,7701 -5391,5086 -5661,084 -5944,1382 -6241,3451 -6553,4124 -6881,083 -7225,1371 -7586,394 -7965,7137 -8363,9994 -8782,1993 -9221,3093
Transport of fuel -1 089,27 -1 143,73 -1 200,92 -1 260,97 -1 324,01 -1 390,22 -1 459,73 -1 532,71 -1 609,35 -1 689,82 -1 774,31 -1 863,02 -1 956,17 -2 053,98 -2 156,68 -2 264,51 -2 377,74 -2 496,63 -2 621,46 -2 752,53
Recovery
Accumulators 0,00 -36 972,22 -36 972,22 0,00 -36 972,22 -36 972,22 0,00 -36 972,22 -36 972,22 0,00 -36 972,22 -36 972,22 0,00 -36 972,22 -36 972,22 -36 972,22 0,00 -36 972,22 -36 972,22 0,00
Diesel generator 0,00 0,00 0,00 0,00 0,00 0,00 -12 000,00 0,00 0,00 0,00 0,00 0,00 0,00 -12 000,00 0,00 0,00 0,00 0,00 0,00 0,00
Convertor 0,00 0,00 0,00 0,00 0,00 0,00 0,00 0,00 0,00 0,00 -44 656,30 0,00 0,00 0,00 0,00 0,00 0,00 0,00 0,00 0,00
CF with revenues -339 538,64 3 316,00 -32 223,17 -30 586,58 8 249,42 -26 605,60 -24 205,94 3 480,56 -18 427,20 -14 973,16 25 886,21 -51 373,88 -1 814,62 40 653,94 -2 163,51 16 721,56 24 416,32 69 980,69 42 594,82 53 282,29 102 161,13
CF only costs -364 918,52 -24 601,88 -62 932,83 -64 367,21 -28 909,27 -67 480,16 -69 167,96 -45 977,66 -72 831,24 -74 817,61 -39 942,68 -123 785,66 -81 467,58 -46 964,31 -98 543,59 -89 296,52 -92 203,57 -58 301,19 -98 515,25 -101 938,78 -68 582,06
DCF -364 918,52 -22 992,41 -54 967,97 -52 542,82 -22 054,74 -48 112,42 -46 089,53 -28 632,58 -42 388,44 -40 695,82 -20 304,83 -58 809,68 -36 172,58 -19 488,52 -38 216,90 -32 365,17 -31 232,54 -18 456,66 -29 147,11 -28 186,92 -17 722,91
NPV only costs -1 053 499,08 €
NPV with revenues -340 861,30 €

Contents of enclosed CD
Diploma thesis - Accumulation of electricity.doc - contain the main text of the thesis
Diploma thesis - Accumulation of electricity.pdf - contain the main text of the thesis
Diploma thesis - System model.xlsx - contain tables, graphs and all calculations


