Embed Size (px)
Citation preview
Prateek AggarwalAnjali ViswamohananDanwant NarayanaswamyShruti Sharma
December 2020© 2020 International Institute for Sustainable Development | IISD.org /gsi
Unpacking India’s Electricity Subsidies:Reporting, transparency, and efficacy
REPORT
IISD.org/gsi ii
Unpacking India’s Electricity Subsidies: Reporting, transparency, and efficacy
© 2020 International Institute for Sustainable Development Published by the International Institute for Sustainable Development
International Institute for Sustainable Development
The International Institute for Sustainable Development (IISD) is an independent think tank championing sustainable solutions to 21st–century problems. Our mission is to promote human development and environmental sustainability. We do this through research, analysis and knowledge products that support sound policy-making. Our big-picture view allows us to address the root causes of some of the greatest challenges facing our planet today: ecological destruction, social exclusion, unfair laws and economic rules, a changing climate. IISD’s staff of over 120 people, plus over 50 associates and 100 consultants, come from across the globe and from many disciplines. Our work affects lives in nearly 100 countries. Part scientist, part strategist—IISD delivers the knowledge to act.
IISD is registered as a charitable organization in Canada and has 501(c)(3) status in the United States. IISD receives core operating support from the Government of Canada, provided through the International Development Research Centre (IDRC) and from the Province of Manitoba. The Institute receives project funding from numerous governments inside and outside Canada, United Nations agencies, foundations, the private sector and individuals.
Global Subsidies Initiative
The IISD Global Subsidies Initiative (GSI) supports international processes, national governments and civil society organizations to align subsidies with sustainable development. GSI does this by promoting transparency on the nature and size of subsidies; evaluating the economic, social and environmental impacts of subsidies; and, where necessary, advising on how inefficient and wasteful subsidies can best be reformed. GSI is headquartered in Geneva, Switzerland, and works with partners located around the world. Its principal funders have included the governments of Denmark, Finland, New Zealand, Norway, Sweden, Switzerland and the United Kingdom, as well as the KR Foundation.
Council on Energy, Environment and WaterThe Council on Energy, Environment and Water is one of South Asia’s leading not-for-profit policy research institutions. The Council uses data, integrated analysis, and strategic outreach to explain and change the use, reuse, and misuse of resources. It prides itself on the independence of its high-quality research, develops partnerships with public and private institutions and engages with the wider public. In 2018, CEEW has once again been featured across nine categories in the “2017 Global Go To Think Tank Index Report.” It has also been consistently ranked among the world’s top climate change think tanks. Follow us on Twitter @CEEWIndia for the latest updates.
Unpacking India’s Electricity Subsidies: Reporting, transparency, and efficacy
December 2020
Written by Prateek Aggarwal, Anjali Viswamohanan, Danwant Narayanaswamy and Shruti Sharma.
Head Office
111 Lombard Avenue, Suite 325 Winnipeg, Manitoba Canada R3B 0T4
Tel: +1 (204) 958-7700 Website: www.iisd.org Twitter: @IISD_news
Global Subsidies Initiative
International Environment House 2, 9 chemin de Balexert 1219 Châtelaine Geneva, Switzerland Canada R3B 0T4
Tel: +1 (204) 958-7700 Website: www.iisd.org/gsi Twitter: @globalsubsidies
Council on Energy, Environment and Water (CEEW)
Sanskrit Bhawan, A-10, Qutab Institutional Area Aruna Asaf Ali Marg, New Delhi - 110067, India
Tel: +91 11 40733300 Website: www.ceew.in Twitter: @CEEWIndia
IISD.org/gsi iii
Unpacking India’s Electricity Subsidies: Reporting, transparency, and efficacy
ACKNOWLEDGEMENTS
The authors would like to thank a number of individuals who contributed to this project, including: on project design, Christopher Beaton from the International Institute for Sustainable Development (IISD) and Karthik Ganesan from the Council on Energy, Environment and Water (CEEW); for contributing to data collection, A. R. Vishnuvardhan, former consultant at CEEW; and on data quality control, Balasubramanian Viswanathan from IISD.
The peer reviewers patiently read through our draft analysis in depth, provided critical comments, and offered crucial and highly relevant suggestions. This went a long way in upgrading the quality of the report in terms of its narrative and analysis. We owe them an immense debt of gratitude. The authors of this update would like to thank the following individuals and institutions for their valuable comments and recommendations:
• Debajit Palit, The Energy and Resources Institute
• Manabika Mandal, Prayas (Energy Group)
• Maria Chirayil, Prayas (Energy Group)
• Neelima Jain, Centre for Strategic and International Studies
• Nishant Chadha, IDF Research
• Rasika Athawale, Regulatory Assistance Project
• Sarabjeet Singh Dhingra, Uttar Pradesh Electricity Regulatory Commission
• Srinivas Krishnaswamy, Vasudha Foundation
• Udit Mathur, Foreign, Commonwealth and Development Office
• Vibhuti Garg, Institute for Energy Economics and Financial Analysis
We would also like to thank the governments of Denmark, Norway, and Sweden for their generous support of this publication. The opinions expressed and the arguments employed in this paper do not necessarily reflect those of the peer reviewers and funders, nor should they be attributed to them.
IISD.org/gsi iv
Unpacking India’s Electricity Subsidies: Reporting, transparency, and efficacy
Executive SummarySubsidies play an important role in ensuring electricity affordability, but they also need to be well designed so they do not undermine the financial viability of electricity distribution companies (DISCOMs). This report brings together data on the state of electricity subsidies in India, covering all states and union territories (UTs), based on Power Finance Corporation (PFC) reports and state-level documentation. It analyzes changes from FY 2016 to FY 2019—before and after the implementation of the Ujjwal DISCOM Assurance Yojana (UDAY) scheme, a central government bailout that required DISCOMs to improve performance in many areas.
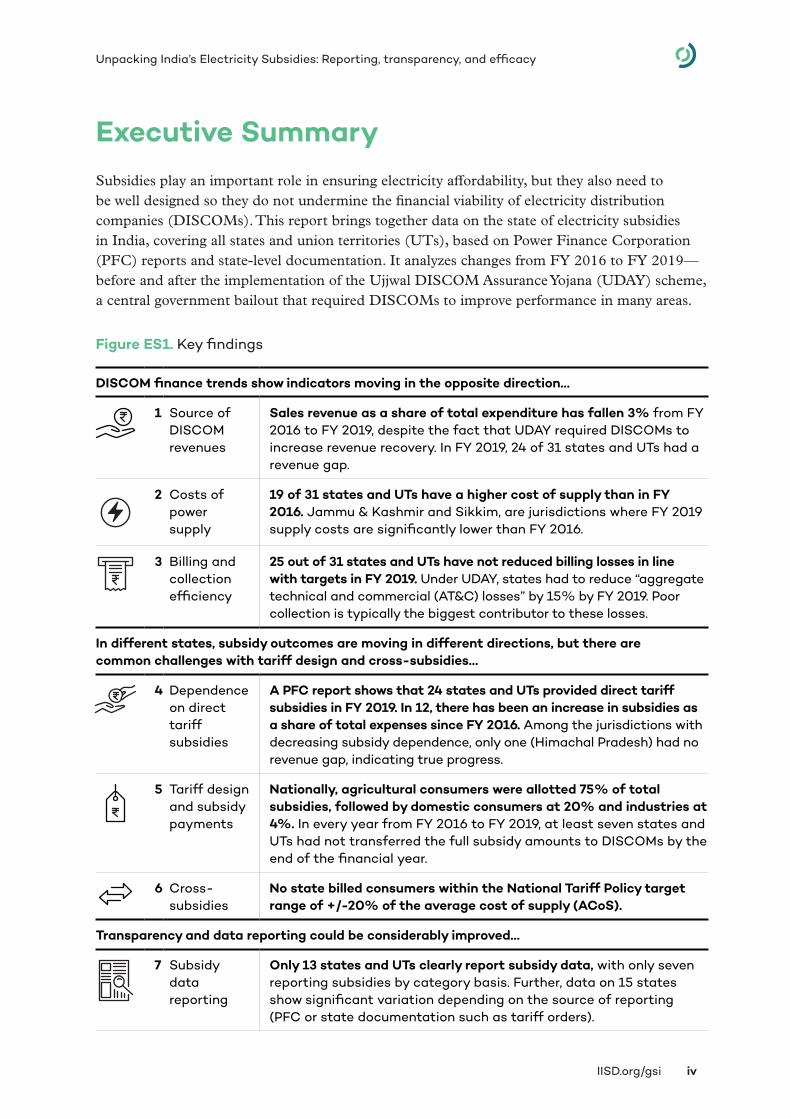
Figure ES1. Key findings
DISCOM finance trends show indicators moving in the opposite direction…
1 Source of DISCOM revenues
Sales revenue as a share of total expenditure has fallen 3% from FY 2016 to FY 2019, despite the fact that UDAY required DISCOMs to increase revenue recovery. In FY 2019, 24 of 31 states and UTs had a revenue gap.
2 Costs of power supply
19 of 31 states and UTs have a higher cost of supply than in FY 2016. Jammu & Kashmir and Sikkim, are jurisdictions where FY 2019 supply costs are significantly lower than FY 2016.
3 Billing and collection efficiency
25 out of 31 states and UTs have not reduced billing losses in line with targets in FY 2019. Under UDAY, states had to reduce “aggregate technical and commercial (AT&C) losses” by 15% by FY 2019. Poor collection is typically the biggest contributor to these losses.
In different states, subsidy outcomes are moving in different directions, but there are common challenges with tariff design and cross-subsidies…
4 Dependence on direct tariff subsidies
A PFC report shows that 24 states and UTs provided direct tariff subsidies in FY 2019. In 12, there has been an increase in subsidies as a share of total expenses since FY 2016. Among the jurisdictions with decreasing subsidy dependence, only one (Himachal Pradesh) had no revenue gap, indicating true progress.
5 Tariff design and subsidy payments
Nationally, agricultural consumers were allotted 75% of total subsidies, followed by domestic consumers at 20% and industries at 4%. In every year from FY 2016 to FY 2019, at least seven states and UTs had not transferred the full subsidy amounts to DISCOMs by the end of the financial year.
6 Cross-subsidies
No state billed consumers within the National Tariff Policy target range of +/-20% of the average cost of supply (ACoS).
Transparency and data reporting could be considerably improved…
7 Subsidy data reporting
Only 13 states and UTs clearly report subsidy data, with only seven reporting subsidies by category basis. Further, data on 15 states show significant variation depending on the source of reporting (PFC or state documentation such as tariff orders).
IISD.org/gsi v
Unpacking India’s Electricity Subsidies: Reporting, transparency, and efficacy
Key Recommendations
1. IMPROVE DATA REPORTING TO HELP INFORM EFFECTIVE POLICY
For further action on reviving DISCOM finances, it is crucial to have clear and verifiable data on performance across a range of parameters, such as cost of supply, revenue sources, subsidy dependence and billing and collection. This review found a clear discrepancy among different data sources for subsidy dependence. Further, regulatory orders are not standardized across states to facilitate easy comparison and learnings. We recommend that DISCOMs, state regulators, the Central Electricity Regulatory Commission, and the Forum of Regulators work together to improve transparency and reporting by:
• Creating a uniform reporting format and synchronizing terminology across regulatory orders
• Mandating transparency on consumer electricity bills
• The timely release of regulatory orders and data reports
• The commissioning of independent evaluations of attempts to improve DISCOM performance.
2. EXPLORE SUBSIDY TARGETING: DISTRIBUTIONAL DATA
This review shows that, despite the efforts of UDAY, DISCOM finances continue to worsen, and subsidy dependence among many states and UTs is increasing. Further, we find that many jurisdictions are providing subsidized tariffs even for very high volumes of electricity consumption or providing electricity to certain consumer categories at nominal rates. All of this suggests that part of the DISCOM reform puzzle is likely to include subsidy “targeting”—that is, reducing subsidies for higher-income consumers so that benefits are clustered on and even expanded for lower-income consumers.
A recent companion study by Sharma et al. (2020) found that residential electricity subsidies in Jharkhand were regressively distributed—with over 60% of benefits being captured by the top 40% of households. This report’s review of tariff design confirms that these findings are likely to be representative of a larger trend in India. We therefore recommend that state governments, DISCOMs, and regulators explore the potential for subsidy targeting. This should include efforts to improve data on the distribution of existing subsidy benefits. If states choose to go further ahead with targeting plans, they should also conduct thorough stakeholder impact assessments and consultations.
3. CONTINUE TO PRIORITIZE THE IMPROVEMENT OF BILLING AND COLLECTION SYSTEMS
Finally, electricity pricing is just one piece of the puzzle. Among other reforms that can help close the gap between DISCOM costs and revenues, billing and collection systems stand out as a priority. State governments, DISCOMs, and regulators are recommended to work together to ensure adequate investments are made for the long-term improvement of billing and collection systems. This will enable a smoother transition for DISCOMs to meet cross-subsidy targets, reduce dependence on subsidies, and improve the condition of overall DISCOM finances.
IISD.org/gsi vi
Unpacking India’s Electricity Subsidies: Reporting, transparency, and efficacy
Table of Contents
1.0 Introduction .................................................................................................................................................................... 1
2.0 Context ............................................................................................................................................................................. 2
2.1 What Are Electricity Subsidies? ...................................................................................................................................... 2
2.2 Who Decides Subsidy Policy and How Are Subsidies Paid? ..................................................................... 3
2.3 Why Is There a Financial Sustainability Concern? ........................................................................................... 3
2.4 Who Reports on Electricity Subsidies? ..................................................................................................................... 3
2.5 What Are India’s Major Policy Objectives on Electricity Subsidies? ..................................................4
2.6 How Has COVID-19 Affected This Situation? ..................................................................................................... 5
3.0 Methodology ...................................................................................................................................................................6
4.0 Trends in Electricity Subsidies Across Indian States ................................................................................8
4.1 Source of DISCOM Revenues ............................................................................................................................................8
4.2 Average Cost of Supply and Power Procurement ...........................................................................................13
4.3 Billing and Collection Efficiency ...................................................................................................................................15
4.4 Dependence on Direct State Subsidy Transfers .............................................................................................. 17
4.5 Comparing State-Wise Subsidy Data Reporting Across Forums ......................................................19
5.0 Understanding Subsidies Through Tariff Design .......................................................................................21
5.1 Overview of Subsidy Data Reporting Practices in State Regulatory Documents .................21
5.2. Direct Tariff Subsidy Disbursement and Accountability ......................................................................... 22
5.3 Tariff Design: Main beneficiary consumer groups .......................................................................................... 25
5.4 Cross-Subsidies .........................................................................................................................................................................31
6.0 Key Findings and Recommendations .............................................................................................................. 36
6.1 Key Findings ..................................................................................................................................................................................36
6.2 Recommendations...................................................................................................................................................................39
References ........................................................................................................................................................................... 43
Annex 1. State-wise Average Power Purchase Cost (INR/kWh) Change Between FY 2016 and FY 2019 ...................................................................................................................................................... 46
Annex 2. Status on Subsidized Domestic Consumption Across States/UTs.......................................47
Annex 3. Subsidizing and Subsidized Categories Comparison Across States Between FY 2016 and FY 2019 ..................................................................................................................................48
Annex 4. State Categories Based on the Level of cost coverage ............................................................50
IISD.org/gsi vii
Unpacking India’s Electricity Subsidies: Reporting, transparency, and efficacy
List of Figures
Figure ES1. Key findings.......................................................................................................................................................................... iv
Figure 1. Key policy objectives of electricity subsidies ..................................................................................................4
Figure 2. Comparison of national monthly electricity demand: April to September, 2019 and 2020 ................................................................................................................................................................................................ 5
Figure 3. Change in national share of revenue sources from FY 2016 to FY 2019 ...................................9
Figure 4. Revenue sources as a share of total expenses in FY 2016 and FY 2019 .................................11
Figure 5. Sales and revenue mix of different states for FY 2019 ..........................................................................12
Figure 6. Change in state-wise ACoS (INR/kWh) between FY 2016 and FY 2019 ................................ 14
Figure 7. How AT&C losses have improved or worsened pre-UDAY (FY 2016) and during the UDAY scheme (FY 2019) ............................................................................................................................................ 16
Figure 8. Change in subsidy share in total expenses between FY 2016 and FY 2019 ........................ 18
Figure 9. Subsidy reporting in PFC reports and Regulatory Orders ...................................................................20
Figure 10. State-wise, category-wise subsidy dependency for FY 2020 ..................................................... 26
Figure 11. Subsidy support for the domestic category for 100 kWh of consumption .......................28
Figure 12. Slab-wise tariff structure of domestic category across 28 states and UTs .................... 29
Figure 13. State categories based on the level of cost coverage in FY 2016 ............................................ 32
Figure 14. State categories based on the level of cost coverage in FY 2019 ............................................ 32
Figure 15. Cross-subsidies across the five consumer categories in the larger Indian states/UTs in FY 2016 & FY 2019 .................................................................................................................................34
List of Tables
Table 1. Mapping the subsidy practice across states ................................................................................................... 22
Table 2. States with pending government subsidy payments to DISCOMs across states, indicating the percentage of the received portion of government subsidy............................................... 24
Table 3. Summary of state leaders and laggards over subsidy reform categories ................................37
IISD.org/gsi viii
Unpacking India’s Electricity Subsidies: Reporting, transparency, and efficacy
Acronyms and AbbreviationsACoS average cost of supply
Amendment Bill Electricity (Amendment) Bill, 2020
ARR aggregate revenue realized
APPC average power procurement cost
AT&C aggregate technical and commercial loss
BPL below poverty line
C&I commercial and industrial
CEA Central Electricity Authority
COVID-19 Novel coronavirus disease 2019
D&A domestic and agricultural
DBT Direct Benefit Transfer
DISCOM (electricity) distribution company
FY fiscal year
IEA International Energy Agency
MERC Maharashtra Electricity Regulatory Commission
PFC Power Finance Corporation Limited
UDAY Ujjwal DISCOM Assurance Yojana
UT union territories
IISD.org/gsi 1
Unpacking India’s Electricity Subsidies: Reporting, transparency, and efficacy
1.0 IntroductionIn fiscal year (FY) 2019, direct tariff subsidies from state governments in India amounted to INR 110,391 crore (USD 15 billion) (Power Finance Corporation Limited [PFC], 2020a). While price support is vital for small consumers, electricity distribution companies (DISCOMs) have been struggling financially. In most states, tariffs are too low to cover the costs of domestic and agriculture consumers, and the expenditure-revenue gap is not fully compensated by direct tariff subsidies and cross-subsidies. DISCOM revenues have only worsened with the COVID-19 crisis because of high fixed costs burden (on account of low utilization of tied up generation capacity) and the reduction in demand from high-revenue commercial and industrial consumers. Working out a solution to India’s electricity pricing dilemma—one that protects the poor but also ensures cost-recovery for a reliable, quality electricity supply—is essential to achieving sustainable and affordable energy access for all.
This report aims to contribute to reforms by improving the accessibility of data on how DISCOM finances and electricity subsidies have evolved over the last 5 years in all states and union territories (UTs) across India. Using publicly available information sources, it identifies trends across DISCOM finances, DISCOM subsidies, and transparency. All of the data are available online in a supporting datasheet to encourage further analysis by policy-makers and policy researchers. The report includes:
• Section 2 – An explanation of the key context around India’s electricity subsidies, existing reform measures, and policy objectives.
• Section 3 – Methodology behind the data collection and review.
• Section 4 – A summary of data collected from PFC reports (for 31 states and UTs) between FY 2016 and FY 2019 and interlinkages among the various reported categories. We also identify the differences between subsidy reporting in regulatory orders and PFC reports.
• Section 5 – A deep dive into understanding electricity subsidy mechanisms across states through regulatory orders and other state-level regulations, including cross-subsidies and delays in subsidy disbursement to DISCOMs.
• Section 6 – Findings and recommendations, including the leaders in implementing commitments on electricity subsidies, and how to further improve data transparency and reporting.
This report is part of the series, India’s Energy Transition, which examines the role of government support in the transformation of India’s energy systems. For more information about targeting electricity subsidies, see How to Target Electricity and LPG Subsidies in India: Step 1. Identifying Policy Options and How to Target Residential Electricity Subsidies in India: Step 2. Evaluating policy options in the State of Jharkhand.
For more information about central government energy subsidies for fossil fuels, clean energy, and electricity transmission and distribution, see Mapping India's Energy Subsidies 2020: Fossil Fuels, Renewables and Electric Vehicles and the accompanying interactive data platform: https://www.iisd.org/gsi/india-energy-transition-2020-data/
IISD.org/gsi 2
Unpacking India’s Electricity Subsidies: Reporting, transparency, and efficacy
2.0 Context
2.1 What Are Electricity Subsidies?In most states in India, DISCOMs sell electricity at a subsidized price to certain consumers—that is, a price below the cost of supply. Most often, but not always, this is focused on residential and agricultural consumers. Subsidies come in several forms:
1. Direct tariff subsidies: this is mostly made up of annual payments from state governments to state DISCOMs to help cover the cost of selling electricity at low prices.
2. Cross-subsidies: this is when the DISCOM charges some consumers (often commercial and industrial users) higher prices to help cover subsidized prices for others.
3. Other indirect subsidies: In addition to cross-subsidies, the central and state governments may provide other indirect assistance, such as loans to DISCOMs at below-market rates.
4. Grants and bailouts: Any costs that are not covered by sales or subsidies will accrue over time as losses. Such losses don’t just derive from pricing—they can result from all sorts of DISCOM challenges, such as inefficient power purchase planning and procurement or poor billing and collection. In the short term, they are paid through inadequate investment in infrastructure, which compromises the quality of supply and can further entrench inefficiencies. In the medium term, subsidies in the form of capital grants may be provided to help DISCOMs build infrastructure, and every few years, losses are typically addressed by large bailout packages.
In FY 2019,1 direct tariff subsidies amounted to at least INR 110,391 crore (USD 15 billion) (PFC, 2020a). Cross-subsidies aren’t reported on well at a national level, but we estimate that they amounted to at least INR 75,027 crore (USD 10.2 billion) (see Section 5 for details). There is even less reporting on other indirect subsidies. There were no big bailout schemes in FY 2019, but the Ujjwal DISCOM Assurance Yojana (UDAY) program disbursed INR 92,113 crore (USD 12.5 billion) and INR 74,228 crore (USD 10.1 billion) in FY 2016 and FY 2017, respectively (Garg et al., 2020).2
1 FY 2019 refers to the year beginning in April 2018 and ending in March 2019, and likewise for other FY periods.2 Other bailouts include the State Electricity Board bailout in 2001 (INR 41,473 crore [USD 5.6 billion]), the transfer scheme during unbundling of utilities in 2003, and the Financial Restructuring Plan in 2012 (INR 1.19 lakh crore [USD 16.1 billion]) (Mandal et al., 2020).
IISD.org/gsi 3
Unpacking India’s Electricity Subsidies: Reporting, transparency, and efficacy
2.2 Who Decides Subsidy Policy and How Are Subsidies Paid?Every year, DISCOMs estimate what tariffs should be and approach regulators with a tariff petition. Usually, tariffs differ by consumer category (domestic, agriculture, commercial, industry, and railways) and by blocks of consumption volume, with prices getting higher as consumers use more electricity. At the beginning of the year, states are supposed to announce a lump-sum direct subsidy for DISCOMs. This is called the “subsidy booked.” If it has been announced, DISCOMs factor it into the petition. The petition is reviewed by the electricity regulatory commission, who may make changes. Once finished, the commission publishes the final rates as part of the “tariff order.”
According to Section 65 of the Electricity Act 2003, subsidies should be paid in advance. In practice, they are more often paid later. The actual payment is called the “subsidy released,” and in some states, it is much lower than the subsidy booked. When funds are delayed or incomplete, DISCOMs have to resort to short-term borrowing at high interest costs. At the end of the year, a review is conducted to check actual costs and revenues. If subsidies were too high or low, they are “trued-up” and adjusted for that year or the ensuing year.
2.3 Why Is There a Financial Sustainability Concern?The International Energy Agency (IEA, 2020) projects that India’s electricity demand will triple by 2040. This will push up subsidy costs because there will be more and more subsidized consumption. At the same time, consumers who pay cross-subsidies may buy less from DISCOMs, as they purchase power competitively through an open access provision and even build their own generation capacity for cheaper electricity. DISCOM finances are at a crisis point: as of September 2020, DISCOMs across India owed INR 125,349 crore (USD 17 billion) to power generators (Ministry of Power, 2020b). To date, there has been a worrying tendency to just leave DISCOMs to absorb losses because it is the least politically challenging approach. But a DISCOM in financial distress is a problem for everyone, particularly the poor and marginalized, who will face the most problems from limited hours of supply and voltage fluctuations.
2.4 Who Reports on Electricity Subsidies?Apart from the tariff and true-up orders issued by the electricity regulatory commissions, the PFC publishes an annual report on the performance of DISCOMs and other players in the power system, drawing on accounts (audited where available and, otherwise, provisional), tariff orders, true-up orders, and petitions, as well as data from DISCOMs directly. It compares every parameter across a 3-year timescale so that it is possible to compare trends for states and DISCOMs. The reports, however, are often very delayed: for both FY 2019 and FY 2018, they were released only earlier this year (2020).
IISD.org/gsi 4
Unpacking India’s Electricity Subsidies: Reporting, transparency, and efficacy
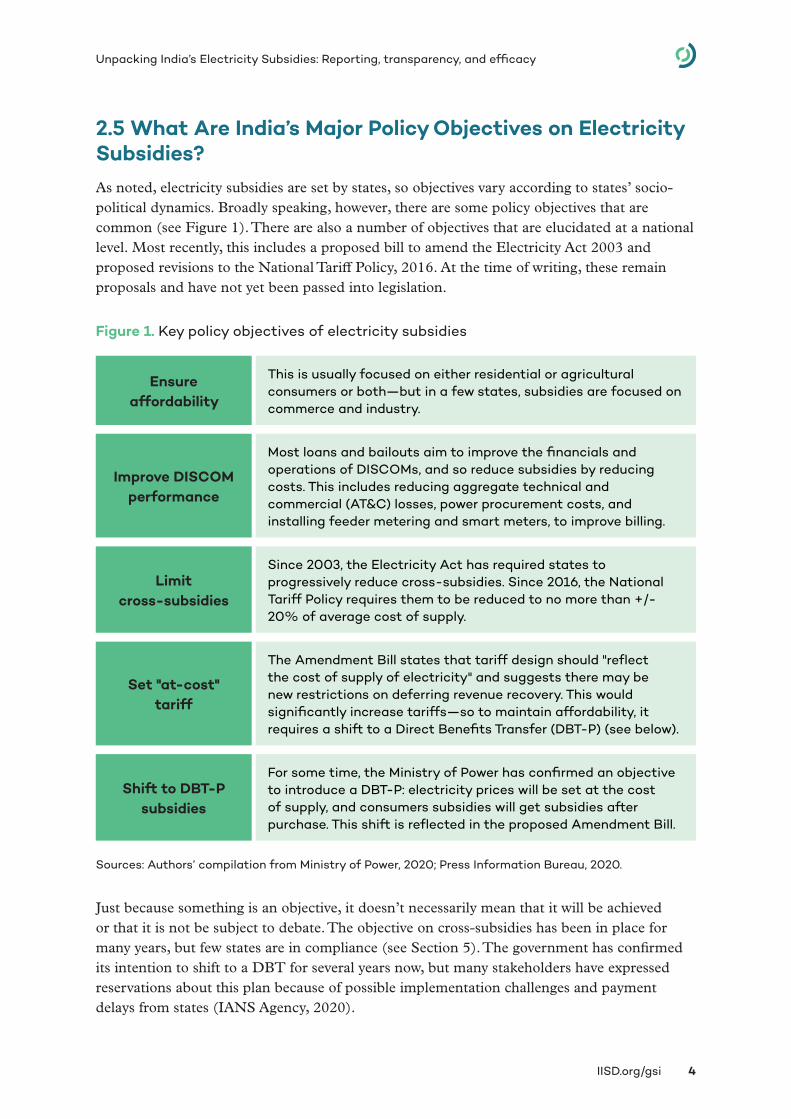
2.5 What Are India’s Major Policy Objectives on Electricity Subsidies?As noted, electricity subsidies are set by states, so objectives vary according to states’ socio-political dynamics. Broadly speaking, however, there are some policy objectives that are common (see Figure 1). There are also a number of objectives that are elucidated at a national level. Most recently, this includes a proposed bill to amend the Electricity Act 2003 and proposed revisions to the National Tariff Policy, 2016. At the time of writing, these remain proposals and have not yet been passed into legislation.
Figure 1. Key policy objectives of electricity subsidies
Sources: Authors’ compilation from Ministry of Power, 2020; Press Information Bureau, 2020.
Just because something is an objective, it doesn’t necessarily mean that it will be achieved or that it is not be subject to debate. The objective on cross-subsidies has been in place for many years, but few states are in compliance (see Section 5). The government has confirmed its intention to shift to a DBT for several years now, but many stakeholders have expressed reservations about this plan because of possible implementation challenges and payment delays from states (IANS Agency, 2020).
Ensure affordability
This is usually focused on either residential or agricultural consumers or both—but in a few states, subsidies are focused on commerce and industry.
Improve DISCOM performance
Most loans and bailouts aim to improve the financials and operations of DISCOMs, and so reduce subsidies by reducing costs. This includes reducing aggregate technical and commercial (AT&C) losses, power procurement costs, and installing feeder metering and smart meters, to improve billing.
Set "at-cost" tariff
The Amendment Bill states that tariff design should "reflect the cost of supply of electricity" and suggests there may be new restrictions on deferring revenue recovery. This would significantly increase tariffs—so to maintain affordability, it requires a shift to a Direct Benefits Transfer (DBT-P) (see below).
Shift to DBT-P subsidies
For some time, the Ministry of Power has confirmed an objective to introduce a DBT-P: electricity prices will be set at the cost of supply, and consumers subsidies will get subsidies after purchase. This shift is reflected in the proposed Amendment Bill.
Limit cross-subsidies
Since 2003, the Electricity Act has required states to progressively reduce cross-subsidies. Since 2016, the National Tariff Policy requires them to be reduced to no more than +/- 20% of average cost of supply.
IISD.org/gsi 5
Unpacking India’s Electricity Subsidies: Reporting, transparency, and efficacy
2.6 How Has COVID-19 Affected This Situation?This study covers PFC reports until FY 2019 and tariff orders until FY 2020 for most states, none of which will reflect the changed circumstances created since March 2020 from the COVID-19 crisis.
In April 2020, demand fell sharply, by 23% compared to 2019, owing to minimal industrial and commercial activity. This amplified the long-standing financial issues for many DISCOMs because industrial and commercial consumers pay significant cross-subsidies (Aggarwal & Ganesan, 2020). At the same time, DISCOMs could do little to reduce their power procurement costs by the same proportion that demand had fallen. The government also suspended manual meter reading, which created big delays with billing, as only a small share of consumers shifted to online payments (Balani et al., 2020). Finally, COVID-19 created a major income shock for low-income households, severely affecting their ability to afford the cost of living (Totapally et al., 2020). In sum, it has become harder for DISCOMs to sustain under-pricing while at the same time ensuring reliable electricity supply to consumers who are in need of more assistance. This only increases the urgency of a socially responsible strategy for addressing electricity subsidies in the coming years.
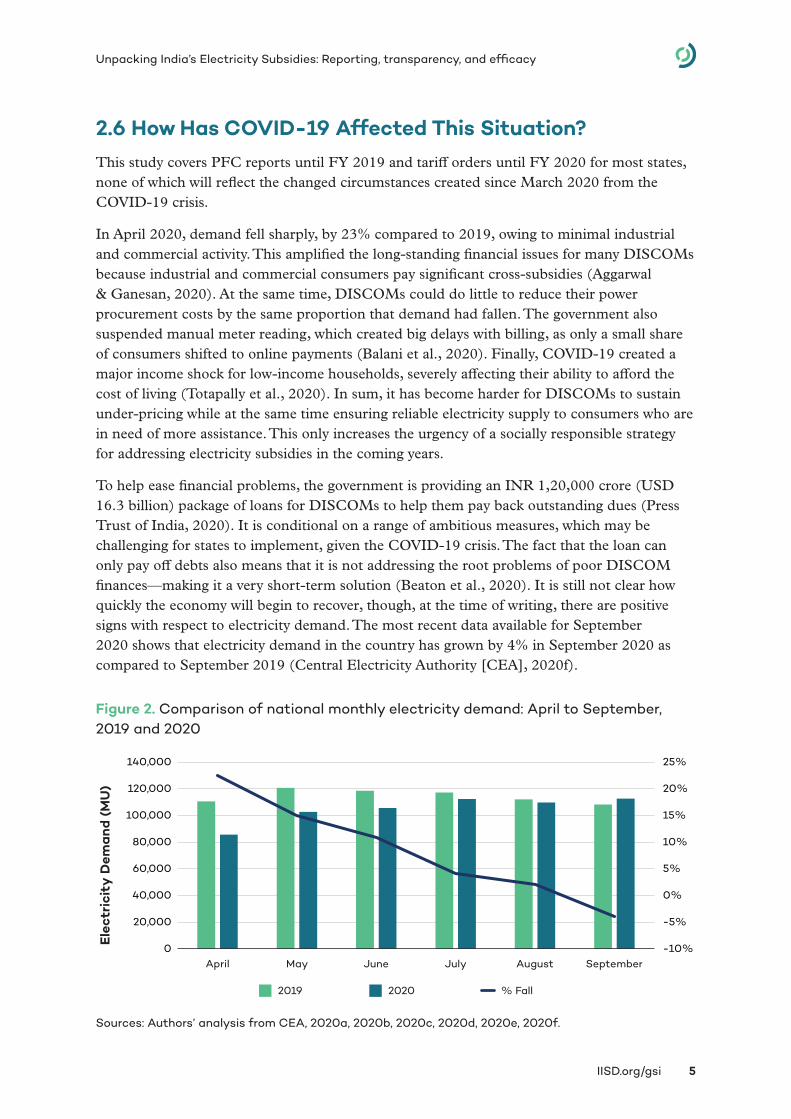
To help ease financial problems, the government is providing an INR 1,20,000 crore (USD 16.3 billion) package of loans for DISCOMs to help them pay back outstanding dues (Press Trust of India, 2020). It is conditional on a range of ambitious measures, which may be challenging for states to implement, given the COVID-19 crisis. The fact that the loan can only pay off debts also means that it is not addressing the root problems of poor DISCOM finances—making it a very short-term solution (Beaton et al., 2020). It is still not clear how quickly the economy will begin to recover, though, at the time of writing, there are positive signs with respect to electricity demand. The most recent data available for September 2020 shows that electricity demand in the country has grown by 4% in September 2020 as compared to September 2019 (Central Electricity Authority [CEA], 2020f).
Figure 2. Comparison of national monthly electricity demand: April to September, 2019 and 2020
Sources: Authors’ analysis from CEA, 2020a, 2020b, 2020c, 2020d, 2020e, 2020f.
-10%
-5%
0%
5%
10%
15%
20%
25%
0
20,000
40,000
60,000
80,000
100,000
120,000
140,000
April May June July August September
Ele
ctri
city
Dem
and
(M
U)
2019 2020 % Fall
IISD.org/gsi 6
Unpacking India’s Electricity Subsidies: Reporting, transparency, and efficacy
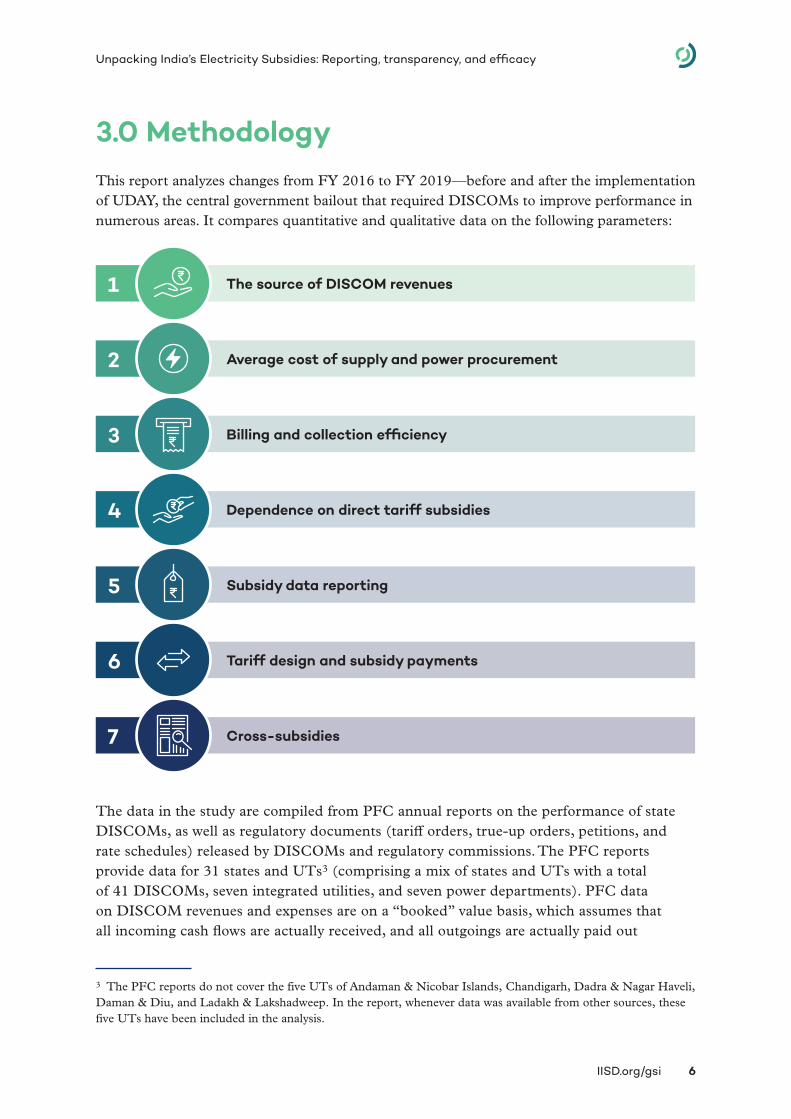
3.0 MethodologyThis report analyzes changes from FY 2016 to FY 2019—before and after the implementation of UDAY, the central government bailout that required DISCOMs to improve performance in numerous areas. It compares quantitative and qualitative data on the following parameters:
The data in the study are compiled from PFC annual reports on the performance of state DISCOMs, as well as regulatory documents (tariff orders, true-up orders, petitions, and rate schedules) released by DISCOMs and regulatory commissions. The PFC reports provide data for 31 states and UTs3 (comprising a mix of states and UTs with a total of 41 DISCOMs, seven integrated utilities, and seven power departments). PFC data on DISCOM revenues and expenses are on a “booked” value basis, which assumes that all incoming cash flows are actually received, and all outgoings are actually paid out
3 The PFC reports do not cover the five UTs of Andaman & Nicobar Islands, Chandigarh, Dadra & Nagar Haveli, Daman & Diu, and Ladakh & Lakshadweep. In the report, whenever data was available from other sources, these five UTs have been included in the analysis.
The source of DISCOM revenues
Average cost of supply and power procurement
Billing and collection efficiency
Dependence on direct tariff subsidies
Subsidy data reporting
Tariff design and subsidy payments
Cross-subsidies
1
2
3
4
5
6
7
IISD.org/gsi 7
Unpacking India’s Electricity Subsidies: Reporting, transparency, and efficacy
(Devaguptapu & Tongia, 2020). The regulatory documents have undergone regulatory and public scrutiny, but most of them do not contain consistent and reliable reporting on electricity subsidies and have gaps. The gaps include details on subsidized categories, consumer category-wise subsidies, and subsidies committed by the government, and the actual subsidy received by DISCOMs. To plug these gaps, the report also draws on a review of individual state government orders on subsidies and tariffs.
All figures are presented in nominal values (except for average cost of supply [ACoS] and average power purchase cost in Section 4.2), as this is the way that the figures are reported in their original sources. It should be noted that the total rate of inflation between 2016 and 2019 is a little under 12% (Inflation Tool, 2019). Wherever relevant in the following chapters, we highlight where comparisons between years may not, in fact, be significant, owing to inflation.
IISD.org/gsi 8
Unpacking India’s Electricity Subsidies: Reporting, transparency, and efficacy
4.0 Trends in Electricity Subsidies Across Indian StatesThis chapter broadly examines trends pertaining to DISCOM revenue, sales mix, ACoS, power purchase cost, subsidy dependence, and aggregate technical and commercial (AT&C) losses between FY 2016 and FY 2019. The data source in this chapter is almost entirely PFC reports. In Section 4.6, we highlight the main differences between this PFC data and data reported in state regulatory orders.
4.1 Source of DISCOM RevenuesExamining the source of DISCOM revenues helps to establish the importance of subsidies in the wider context of DISCOM finances. The total revenue billed to electricity consumers in FY 2019 (which includes cross-subsidies) stood at INR 4,91,985 crore (USD 66.7 billion). This covered 89% of the power purchase cost and only 69% of total expenses. In addition to this revenue, states received direct tariff subsidies, regulatory income,4 and various revenue grants. On a “booked” basis5—that is, committed but not necessarily realized payments—states provided direct tariff subsidy transfers to DISCOMs worth INR 1,10,391 crore (USD 15 billion). Grants, such as for revenue grants under UDAY and other revenue grants (including interest subsidy and viability gap funding), were an additional INR 60,717 crore (USD 8.2 billion). The total revenue received (on a subsidy booked basis) was therefore INR 6,63,093 crore (USD 89.9 billion), leaving a deficit of about INR 49,517 crore (USD 6.7 billion).
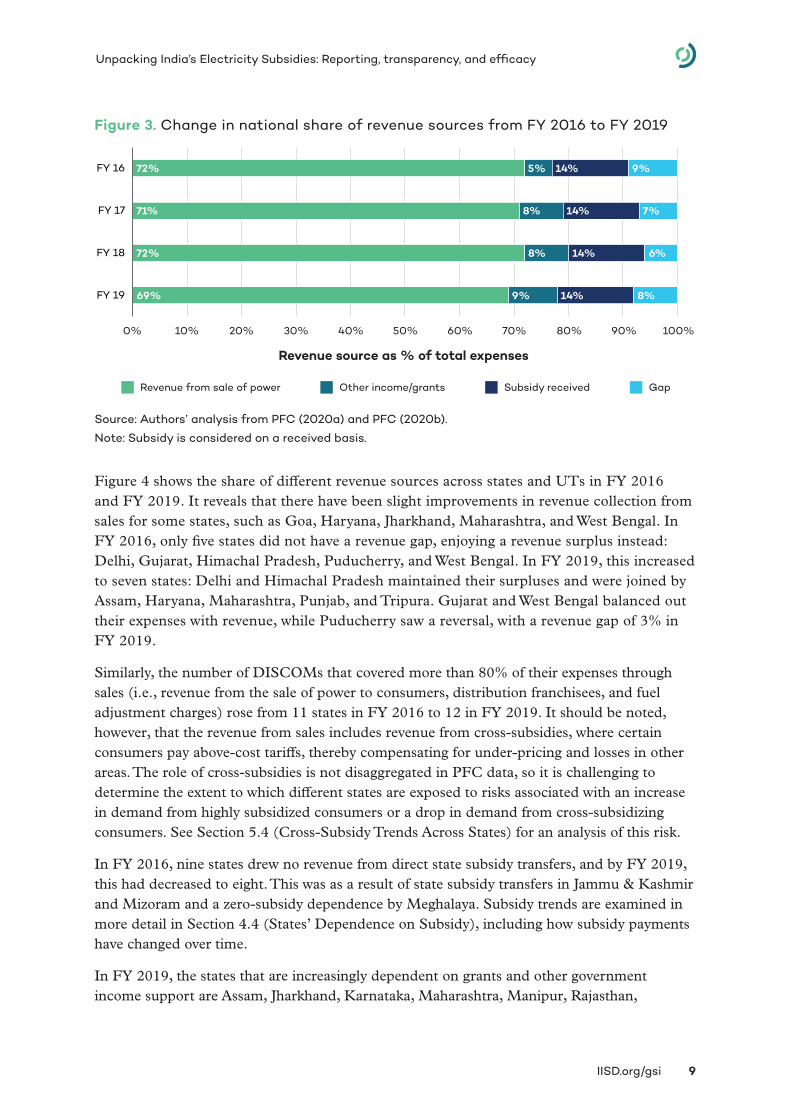
One of the primary goals of the UDAY scheme was to increase revenue recovery from sales and to address the inefficiencies in metering, billing, and collection. But, as we see in Figure 3, nationally in FY 2019, revenue from sales as a share of total expenditure had fallen by 3% since FY 2016. The subsidy component has remained almost constant throughout the four years, standing at 14% of total expenditure. However, due to an increase in total electricity consumption and cost of supply, the subsidy received has still significantly increased in absolute terms: a 32% increase at INR 98,653 crore (USD 13.4 billion), from INR 74,514 crore (USD 10.1 billion), since FY 2016. Worryingly, states seem to have become more dependent on government grants since FY 2016, which have increased from 5% to 9% in a span of four years, partially due to committed support under the UDAY scheme.
4 PFC reports define regulatory income as the income recoverable from future tariffs as included in the profit and loss statement of DISCOMs.5 PFC reports are based on a subsidy “booked” and subsidy “received” basis. Subsidy booked is the subsidy committed by the government. Subsidy received is the actual subsidy paid by the government, which can be more or less than booked. To explain the trends, subsidy booked and subsidy received are specified and appropriately used in the report.
IISD.org/gsi 9
Unpacking India’s Electricity Subsidies: Reporting, transparency, and efficacy
Figure 3. Change in national share of revenue sources from FY 2016 to FY 2019
Source: Authors’ analysis from PFC (2020a) and PFC (2020b).
Note: Subsidy is considered on a received basis.
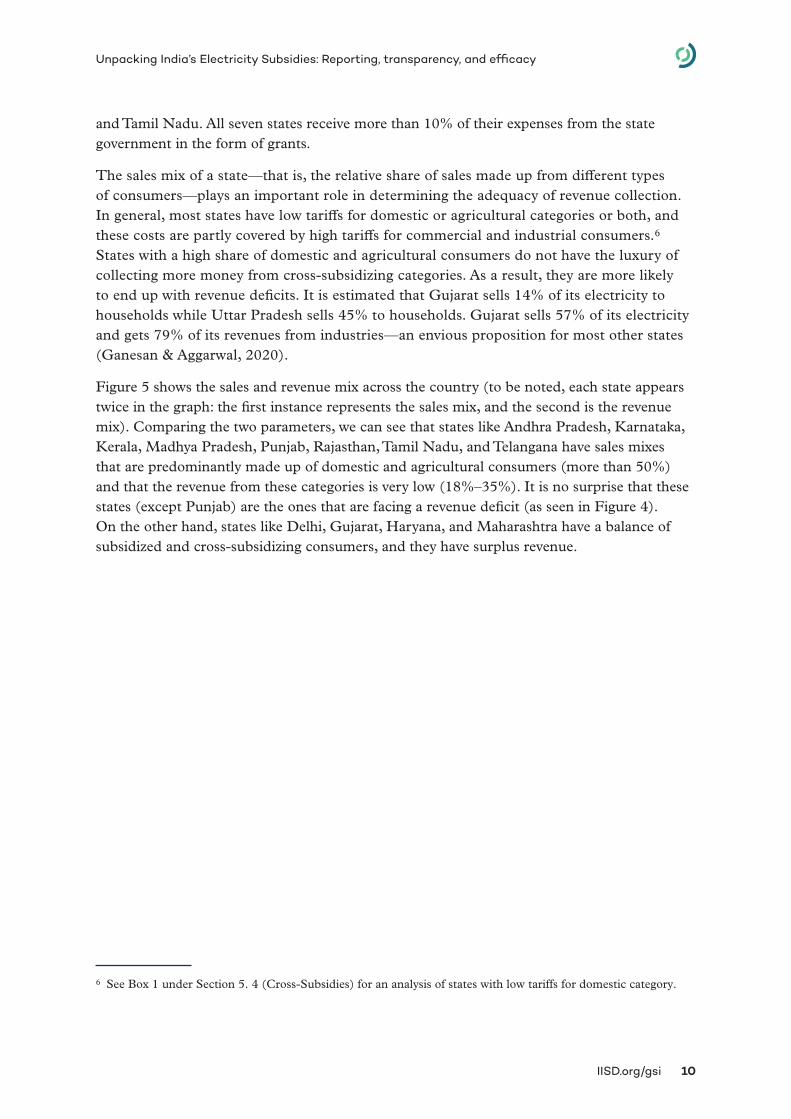
Figure 4 shows the share of different revenue sources across states and UTs in FY 2016 and FY 2019. It reveals that there have been slight improvements in revenue collection from sales for some states, such as Goa, Haryana, Jharkhand, Maharashtra, and West Bengal. In FY 2016, only five states did not have a revenue gap, enjoying a revenue surplus instead: Delhi, Gujarat, Himachal Pradesh, Puducherry, and West Bengal. In FY 2019, this increased to seven states: Delhi and Himachal Pradesh maintained their surpluses and were joined by Assam, Haryana, Maharashtra, Punjab, and Tripura. Gujarat and West Bengal balanced out their expenses with revenue, while Puducherry saw a reversal, with a revenue gap of 3% in FY 2019.
Similarly, the number of DISCOMs that covered more than 80% of their expenses through sales (i.e., revenue from the sale of power to consumers, distribution franchisees, and fuel adjustment charges) rose from 11 states in FY 2016 to 12 in FY 2019. It should be noted, however, that the revenue from sales includes revenue from cross-subsidies, where certain consumers pay above-cost tariffs, thereby compensating for under-pricing and losses in other areas. The role of cross-subsidies is not disaggregated in PFC data, so it is challenging to determine the extent to which different states are exposed to risks associated with an increase in demand from highly subsidized consumers or a drop in demand from cross-subsidizing consumers. See Section 5.4 (Cross-Subsidy Trends Across States) for an analysis of this risk.
In FY 2016, nine states drew no revenue from direct state subsidy transfers, and by FY 2019, this had decreased to eight. This was as a result of state subsidy transfers in Jammu & Kashmir and Mizoram and a zero-subsidy dependence by Meghalaya. Subsidy trends are examined in more detail in Section 4.4 (States’ Dependence on Subsidy), including how subsidy payments have changed over time.
In FY 2019, the states that are increasingly dependent on grants and other government income support are Assam, Jharkhand, Karnataka, Maharashtra, Manipur, Rajasthan,
Revenue from sale of power Other income/grants Subsidy received Gap
69%
72%
71%
72%
9%
8%
8%
5%
14%
14%
14%
14%
8%
6%
7%
9%
0% 10% 20% 30% 40% 50% 60% 70% 80% 90% 100%
FY 19
FY 18
FY 17
FY 16
Revenue source as % of total expenses
IISD.org/gsi 10
Unpacking India’s Electricity Subsidies: Reporting, transparency, and efficacy
and Tamil Nadu. All seven states receive more than 10% of their expenses from the state government in the form of grants.
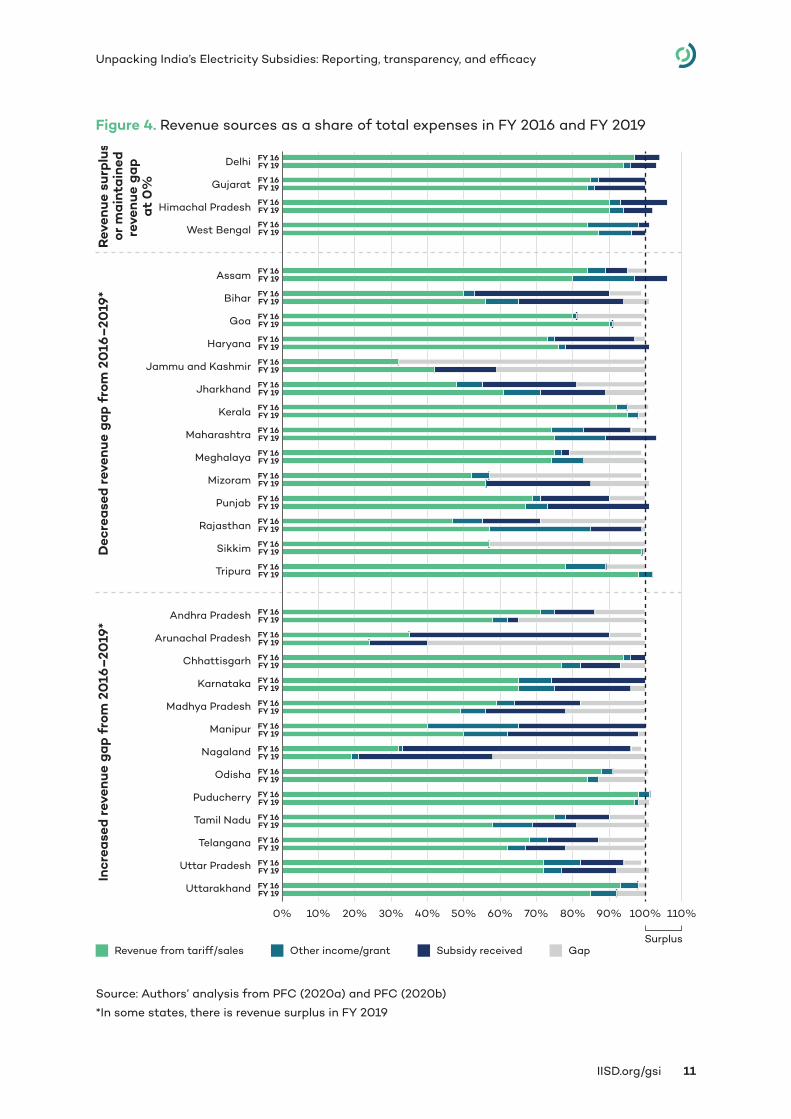
The sales mix of a state—that is, the relative share of sales made up from different types of consumers—plays an important role in determining the adequacy of revenue collection. In general, most states have low tariffs for domestic or agricultural categories or both, and these costs are partly covered by high tariffs for commercial and industrial consumers.6 States with a high share of domestic and agricultural consumers do not have the luxury of collecting more money from cross-subsidizing categories. As a result, they are more likely to end up with revenue deficits. It is estimated that Gujarat sells 14% of its electricity to households while Uttar Pradesh sells 45% to households. Gujarat sells 57% of its electricity and gets 79% of its revenues from industries—an envious proposition for most other states (Ganesan & Aggarwal, 2020).
Figure 5 shows the sales and revenue mix across the country (to be noted, each state appears twice in the graph: the first instance represents the sales mix, and the second is the revenue mix). Comparing the two parameters, we can see that states like Andhra Pradesh, Karnataka, Kerala, Madhya Pradesh, Punjab, Rajasthan, Tamil Nadu, and Telangana have sales mixes that are predominantly made up of domestic and agricultural consumers (more than 50%) and that the revenue from these categories is very low (18%–35%). It is no surprise that these states (except Punjab) are the ones that are facing a revenue deficit (as seen in Figure 4). On the other hand, states like Delhi, Gujarat, Haryana, and Maharashtra have a balance of subsidized and cross-subsidizing consumers, and they have surplus revenue.
6 See Box 1 under Section 5. 4 (Cross-Subsidies) for an analysis of states with low tariffs for domestic category.
IISD.org/gsi 11
Unpacking India’s Electricity Subsidies: Reporting, transparency, and efficacy
Figure 4. Revenue sources as a share of total expenses in FY 2016 and FY 2019
Source: Authors’ analysis from PFC (2020a) and PFC (2020b)
*In some states, there is revenue surplus in FY 2019
0% 10% 20% 30% 40% 50% 60% 70% 80% 90% 100% 110%
Uttarakhand
Uttar Pradesh
Telangana
Tamil Nadu
Puducherry
Odisha
Nagaland
Manipur
Madhya Pradesh
Karnataka
Chhattisgarh
Arunachal Pradesh
Andhra Pradesh
Tripura
Sikkim
Rajasthan
Punjab
Mizoram
Meghalaya
Maharashtra
Kerala
Jharkhand
Jammu and Kashmir
Haryana
Goa
Bihar
Assam
West Bengal
Himachal Pradesh
Gujarat
Delhi FY 16FY 19
FY 16FY 19
FY 16FY 19
FY 16FY 19
FY 16FY 19
FY 16FY 19
FY 16FY 19
FY 16FY 19
FY 16FY 19
FY 16FY 19
FY 16FY 19
FY 16FY 19
FY 16FY 19
FY 16FY 19
FY 16FY 19
FY 16FY 19
FY 16FY 19
FY 16FY 19
FY 16FY 19
FY 16FY 19
FY 16FY 19
FY 16FY 19
FY 16FY 19
FY 16FY 19
FY 16FY 19
FY 16FY 19
FY 16FY 19
FY 16FY 19
FY 16FY 19
FY 16FY 19
FY 16FY 19
Surplus
Rev
enue
sur
plus
or
mai
ntai
ned
reve
nue
gap
at 0
%
Dec
reas
ed r
even
ue g
ap f
rom
20
16–
2019
*In
crea
sed
reve
nue
gap
from
20
16–
2019
*
Revenue from tariff/sales Other income/grant Subsidy received Gap
IISD.org/gsi 12
Unpacking India’s Electricity Subsidies: Reporting, transparency, and efficacy
Figure 5. Sales and revenue mix of different states for FY 2019
Source: Authors’ analysis from PFC (2020a)Note 1: Each state appears twice in the figure. The first instance represents sales mix, and the second is the revenue mix. Note 2: The “Others” category includes public lighting, public waterworks, signboards, hoardings, railway traction, airports, etc.
0% 10% 20% 30% 40% 50% 60% 70% 80% 90% 100%
Domestic Commercial Agricultural Industrial Others
Low
pro
port
ion
of
reve
nue
reco
very
(ag
ricu
ltur
al)
Low
pro
port
ion
of r
even
ue
reco
very
(do
mes
tic)
Low
pro
port
ion
of r
even
ue
reco
very
(dom
esti
c an
d ag
ricu
ltur
al)
Sm
all d
iffe
renc
esbe
twee
n sa
les
and
reve
nues
Oth
er
Chhattisgarh SALREV
Jammu & Kashmir SALREV
Tamil Nadu SALREV
SALAndhra Pradesh REV
SALJharkhand REV
SALKarnataka REV
SALMadhya Pradesh REV
SALPunjab REV
SALRajasthan REV
SALTelangana REV
SALUttar Pradesh REV
Gujarat SALREV
Haryana SALREV
Maharashtra SALREV
Arunachal Pradesh SALREV
Meghalaya SALREV
Tripura SALREV
Uttarakhand SALREV
West Bengal SALREV
Assam SALREV
Delhi SALREV
Manipur SALREV
Nagaland SALREV
Mizoram SALREV
Odisha SALREV
Bihar SALREV
Goa SALREV
Himachal Pradesh SALREV
Kerala SALREV
Puducherry SALREV
Sikkim SALREV
REV Revenue share
SAL Sales share
IISD.org/gsi 13
Unpacking India’s Electricity Subsidies: Reporting, transparency, and efficacy
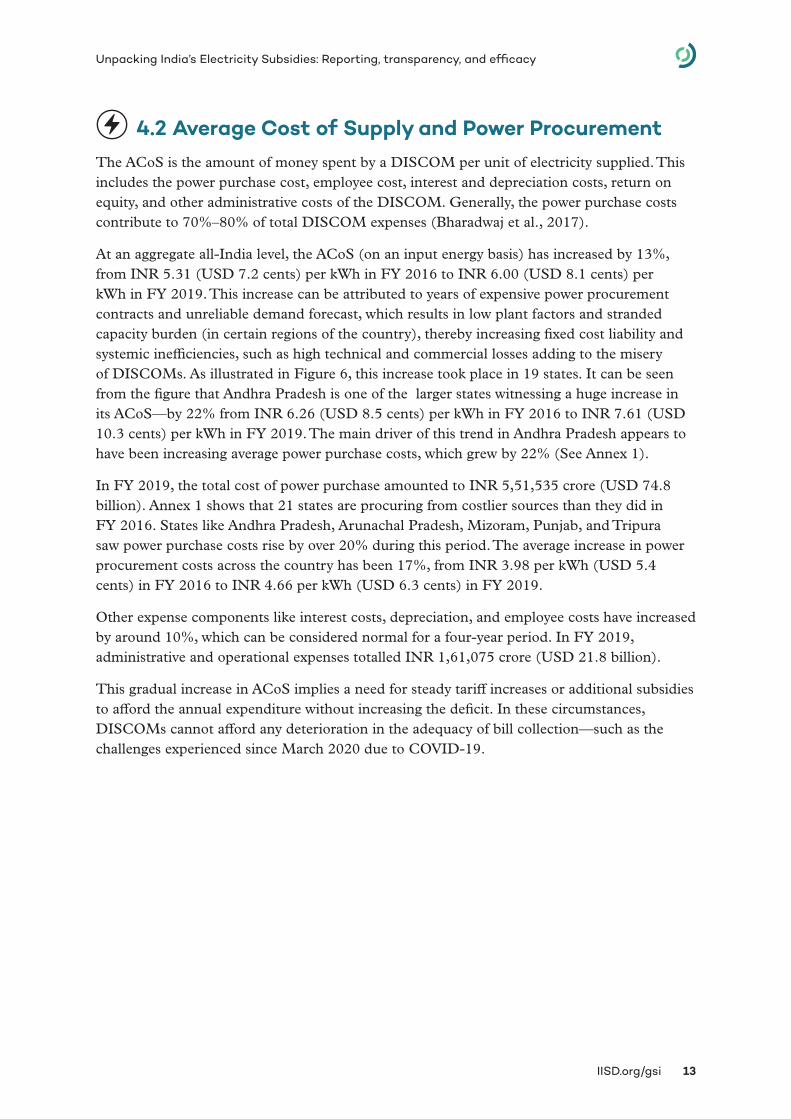
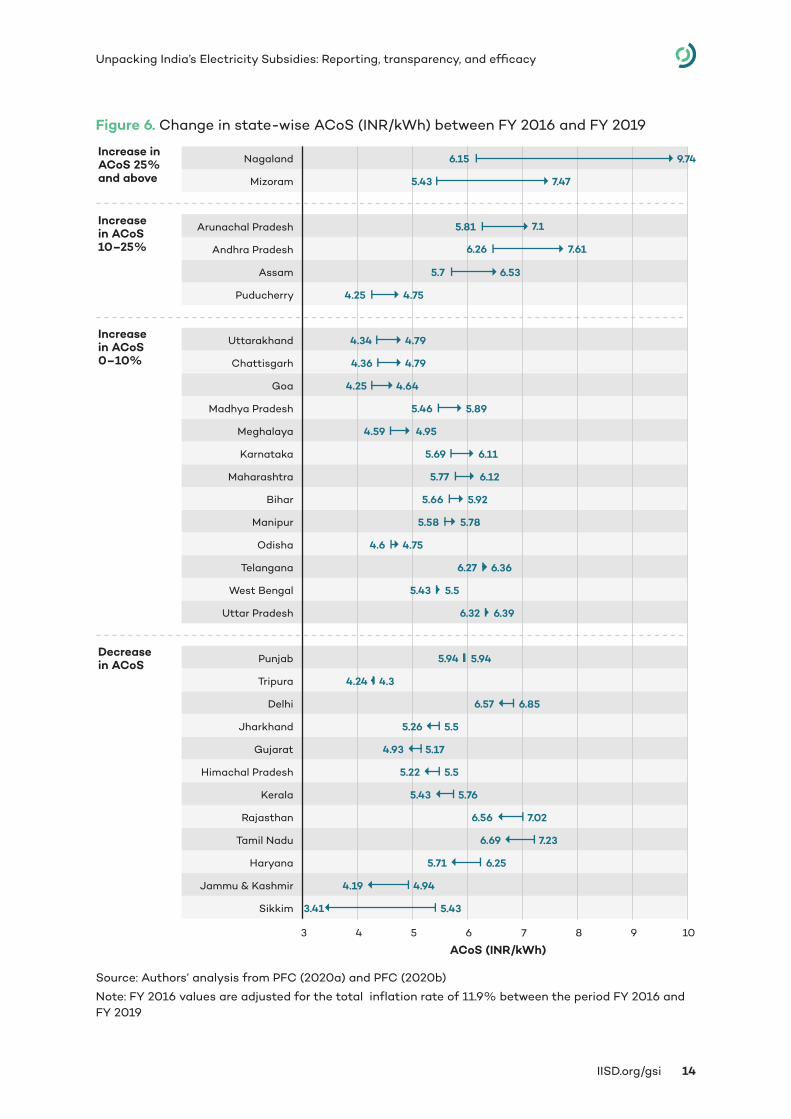
4.2 Average Cost of Supply and Power ProcurementThe ACoS is the amount of money spent by a DISCOM per unit of electricity supplied. This includes the power purchase cost, employee cost, interest and depreciation costs, return on equity, and other administrative costs of the DISCOM. Generally, the power purchase costs contribute to 70%–80% of total DISCOM expenses (Bharadwaj et al., 2017).
At an aggregate all-India level, the ACoS (on an input energy basis) has increased by 13%, from INR 5.31 (USD 7.2 cents) per kWh in FY 2016 to INR 6.00 (USD 8.1 cents) per kWh in FY 2019. This increase can be attributed to years of expensive power procurement contracts and unreliable demand forecast, which results in low plant factors and stranded capacity burden (in certain regions of the country), thereby increasing fixed cost liability and systemic inefficiencies, such as high technical and commercial losses adding to the misery of DISCOMs. As illustrated in Figure 6, this increase took place in 19 states. It can be seen from the figure that Andhra Pradesh is one of the larger states witnessing a huge increase in its ACoS—by 22% from INR 6.26 (USD 8.5 cents) per kWh in FY 2016 to INR 7.61 (USD 10.3 cents) per kWh in FY 2019. The main driver of this trend in Andhra Pradesh appears to have been increasing average power purchase costs, which grew by 22% (See Annex 1).
In FY 2019, the total cost of power purchase amounted to INR 5,51,535 crore (USD 74.8 billion). Annex 1 shows that 21 states are procuring from costlier sources than they did in FY 2016. States like Andhra Pradesh, Arunachal Pradesh, Mizoram, Punjab, and Tripura saw power purchase costs rise by over 20% during this period. The average increase in power procurement costs across the country has been 17%, from INR 3.98 per kWh (USD 5.4 cents) in FY 2016 to INR 4.66 per kWh (USD 6.3 cents) in FY 2019.
Other expense components like interest costs, depreciation, and employee costs have increased by around 10%, which can be considered normal for a four-year period. In FY 2019, administrative and operational expenses totalled INR 1,61,075 crore (USD 21.8 billion).
This gradual increase in ACoS implies a need for steady tariff increases or additional subsidies to afford the annual expenditure without increasing the deficit. In these circumstances, DISCOMs cannot afford any deterioration in the adequacy of bill collection—such as the challenges experienced since March 2020 due to COVID-19.
IISD.org/gsi 14
Unpacking India’s Electricity Subsidies: Reporting, transparency, and efficacy
Figure 6. Change in state-wise ACoS (INR/kWh) between FY 2016 and FY 2019
Source: Authors’ analysis from PFC (2020a) and PFC (2020b)
Note: FY 2016 values are adjusted for the total inflation rate of 11.9% between the period FY 2016 and FY 2019
3 4 5 6 7 8 9 10
Sikkim
Jammu & Kashmir
Haryana
Tamil Nadu
Rajasthan
Kerala
Himachal Pradesh
Gujarat
Jharkhand
Delhi
Tripura
Punjab
Uttar Pradesh
West Bengal
Telangana
Odisha
Manipur
Bihar
Maharashtra
Karnataka
Meghalaya
Madhya Pradesh
Goa
Chattisgarh
Uttarakhand
Puducherry
Assam
Andhra Pradesh
Arunachal Pradesh
Mizoram
Nagaland
3.41
4.19
5.71
6.69
6.56
5.43
5.22
4.93
5.26
6.57
4.24
5.94
6.32
5.43
6.27
4.6
5.58
5.66
5.77
5.69
4.59
5.46
4.25
4.36
4.34
4.25
5.7
5.43
6.15
5.43
4.94
6.25
7.23
7.02
5.76
5.5
5.17
5.5
6.85
4.3
5.94
6.39
5.5
6.36
4.75
5.78
5.92
6.12
6.11
4.95
5.89
4.64
4.79
4.79
4.75
6.53
7.47
9.74
6.26 7.61
5.81 7.1
Increase inACoS 25%and above
Increase in ACoS 10–25%
Increase in ACoS 0–10%
Decreasein ACoS
ACoS (INR/kWh)
IISD.org/gsi 15
Unpacking India’s Electricity Subsidies: Reporting, transparency, and efficacy
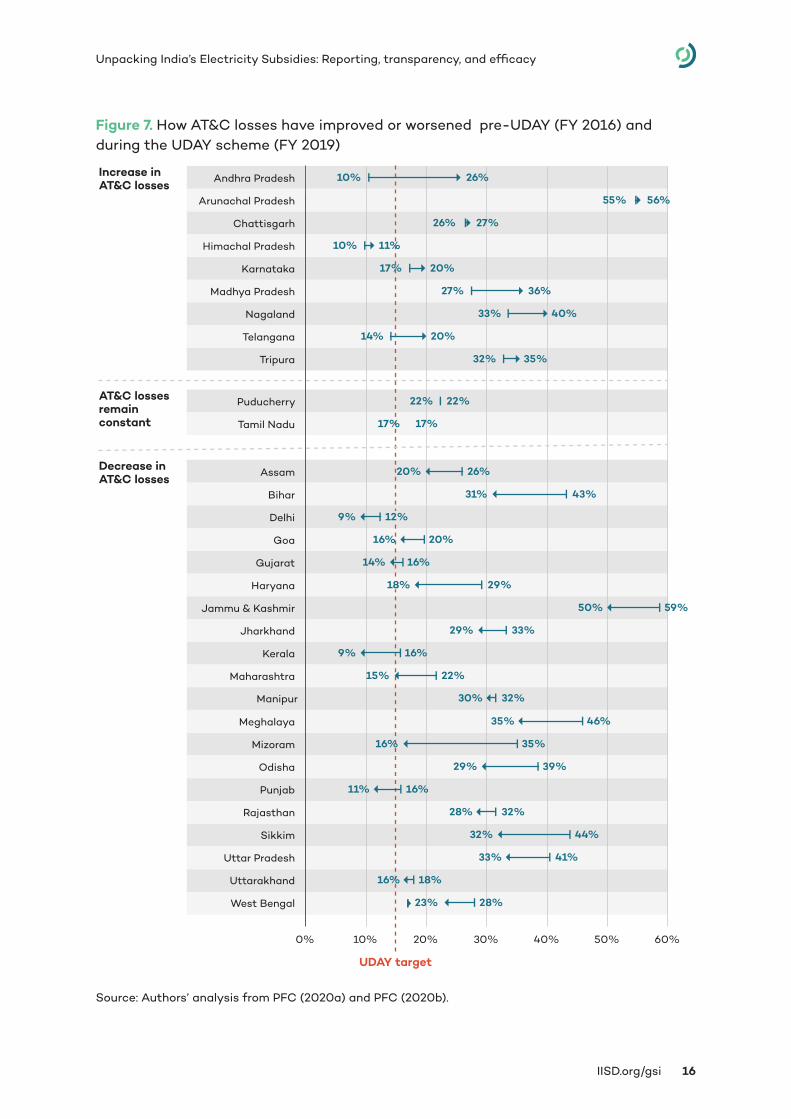
4.3 Billing and Collection EfficiencyOne of the major objectives of the UDAY scheme was to bring down AT&C losses7 to below 15% (by FY 2019) from the levels in FY 2016. In particular, a major source of DISCOM commercial losses are inefficient billing and collection practices. As seen in Figure 7, in nine states, AT&C losses have increased since the introduction of the UDAY scheme. Out of the remaining 22 states, only six states achieved the UDAY target of below 15%. The worst performer is Andhra Pradesh: it had an AT&C loss of 10% in FY 2016, and this increased to 25.67% in FY 2019. The drop in performance is mainly attributed to falling collection efficiency from 96.91% in FY 2016 to 80.53% in FY 2019.
7 Aggregate Technical and Commercial losses: Technical loss is what is otherwise known as transmission and distribution (T&D) losses—that is, the energy that is lost while transmitting and distributing electricity to consumers. Commercial losses “occur mostly due to human errors, theft, meter tampering, and defective meters, among others” (CRISIL Infrastructure Advisory, 2019)
IISD.org/gsi 16
Unpacking India’s Electricity Subsidies: Reporting, transparency, and efficacy
Figure 7. How AT&C losses have improved or worsened pre-UDAY (FY 2016) and during the UDAY scheme (FY 2019)
Source: Authors’ analysis from PFC (2020a) and PFC (2020b).
0% 10% 20% 30% 40% 50% 60%
Tripura
Telangana
Nagaland
Madhya Pradesh
Karnataka
Himachal Pradesh
Chattisgarh
Arunachal Pradesh
Andhra Pradesh
32%
14%
33%
27%
17%
10%
26%
55%
10%
35%
20%
40%
36%
20%
11%
27%
56%
26%
Tamil Nadu
Puducherry
17%
22%
17%
22%AT&C losses remain constant
West Bengal
Uttarakhand
Uttar Pradesh
Sikkim
Rajasthan
Punjab
Odisha
Mizoram
Meghalaya
Maharashtra
Kerala
Jharkhand
Jammu & Kashmir
Haryana
Gujarat
Goa
Delhi
Bihar
Assam
23%
16%
33%
32%
28%
11%
29%
16%
35%
15%
9%
29%
50%
18%
14%
16%
9%
31%
20%
28%
18%
41%
44%
32%
Manipur 30% 32%
16%
39%
35%
46%
22%
16%
33%
59%
29%
16%
20%
12%
43%
26%Decrease inAT&C losses
Increase inAT&C losses
UDAY target
IISD.org/gsi 17
Unpacking India’s Electricity Subsidies: Reporting, transparency, and efficacy
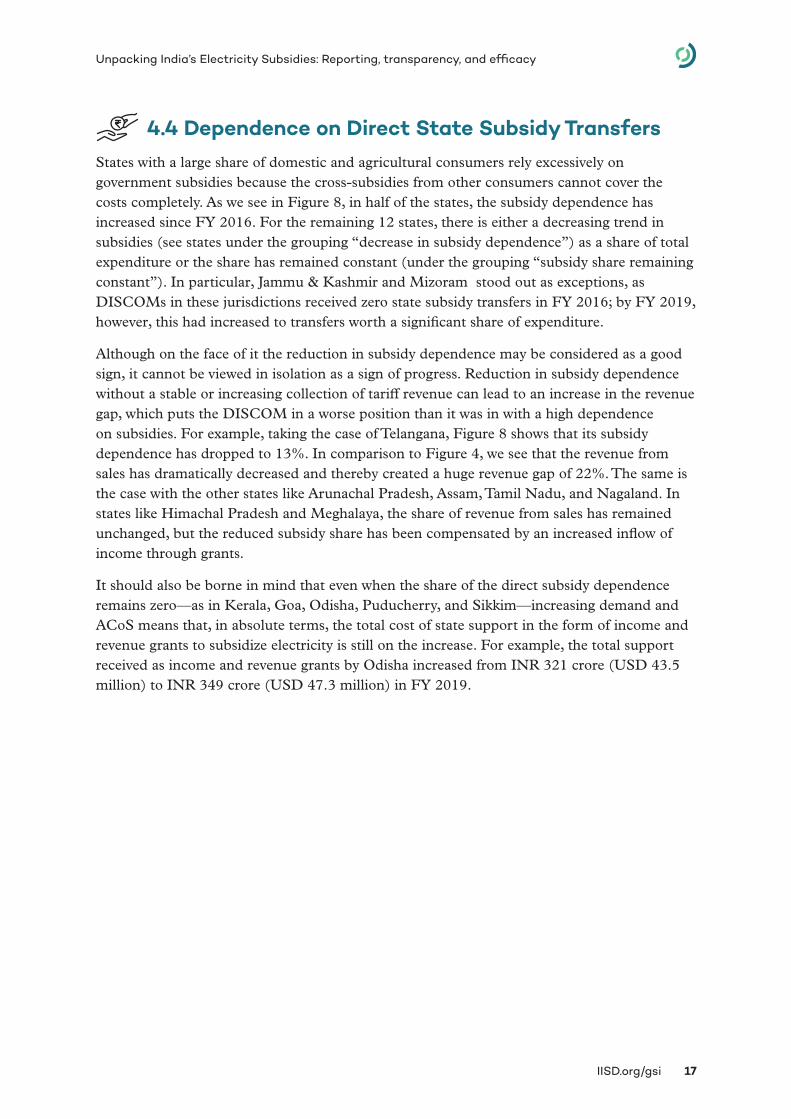
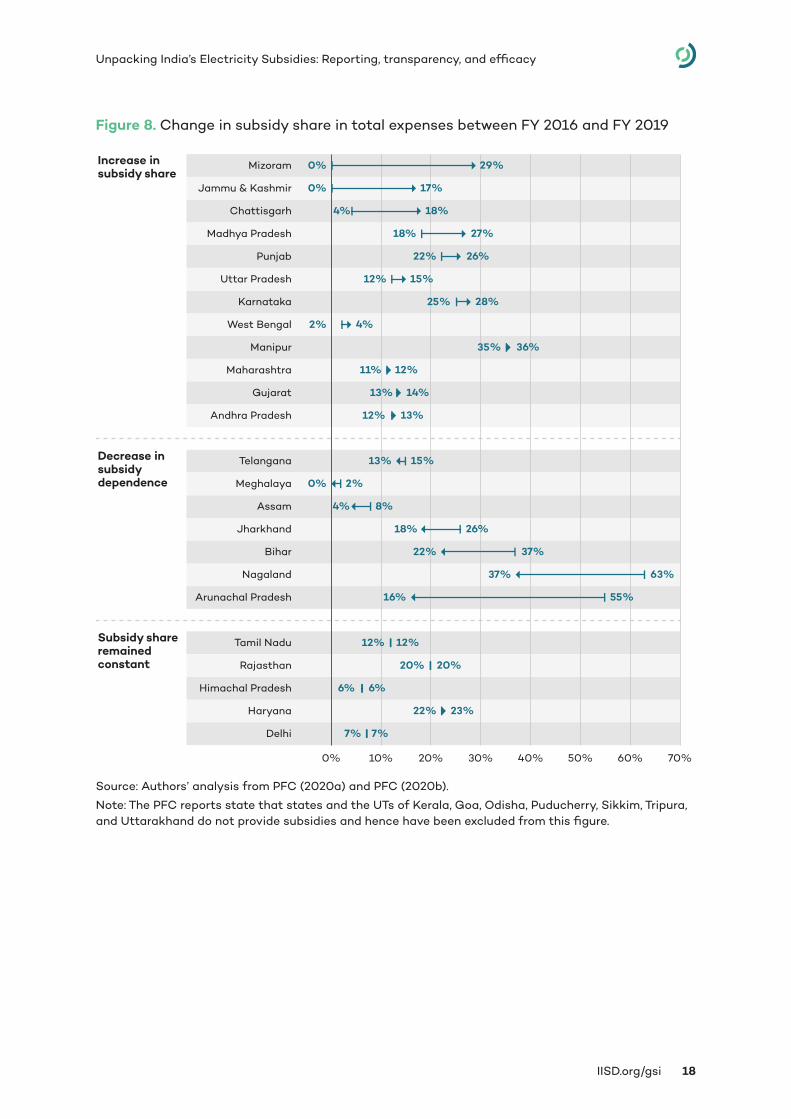
4.4 Dependence on Direct State Subsidy TransfersStates with a large share of domestic and agricultural consumers rely excessively on government subsidies because the cross-subsidies from other consumers cannot cover the costs completely. As we see in Figure 8, in half of the states, the subsidy dependence has increased since FY 2016. For the remaining 12 states, there is either a decreasing trend in subsidies (see states under the grouping “decrease in subsidy dependence”) as a share of total expenditure or the share has remained constant (under the grouping “subsidy share remaining constant”). In particular, Jammu & Kashmir and Mizoram stood out as exceptions, as DISCOMs in these jurisdictions received zero state subsidy transfers in FY 2016; by FY 2019, however, this had increased to transfers worth a significant share of expenditure.
Although on the face of it the reduction in subsidy dependence may be considered as a good sign, it cannot be viewed in isolation as a sign of progress. Reduction in subsidy dependence without a stable or increasing collection of tariff revenue can lead to an increase in the revenue gap, which puts the DISCOM in a worse position than it was in with a high dependence on subsidies. For example, taking the case of Telangana, Figure 8 shows that its subsidy dependence has dropped to 13%. In comparison to Figure 4, we see that the revenue from sales has dramatically decreased and thereby created a huge revenue gap of 22%. The same is the case with the other states like Arunachal Pradesh, Assam, Tamil Nadu, and Nagaland. In states like Himachal Pradesh and Meghalaya, the share of revenue from sales has remained unchanged, but the reduced subsidy share has been compensated by an increased inflow of income through grants.
It should also be borne in mind that even when the share of the direct subsidy dependence remains zero—as in Kerala, Goa, Odisha, Puducherry, and Sikkim—increasing demand and ACoS means that, in absolute terms, the total cost of state support in the form of income and revenue grants to subsidize electricity is still on the increase. For example, the total support received as income and revenue grants by Odisha increased from INR 321 crore (USD 43.5 million) to INR 349 crore (USD 47.3 million) in FY 2019.
IISD.org/gsi 18
Unpacking India’s Electricity Subsidies: Reporting, transparency, and efficacy
Figure 8. Change in subsidy share in total expenses between FY 2016 and FY 2019
Source: Authors’ analysis from PFC (2020a) and PFC (2020b).
Note: The PFC reports state that states and the UTs of Kerala, Goa, Odisha, Puducherry, Sikkim, Tripura, and Uttarakhand do not provide subsidies and hence have been excluded from this figure.
Delhi
Haryana
Himachal Pradesh
Rajasthan
Tamil Nadu
Arunachal Pradesh
Nagaland
Bihar
Jharkhand
Assam
Meghalaya
Telangana
Andhra Pradesh
Gujarat
Maharashtra
Manipur
West Bengal
Karnataka
Uttar Pradesh
Punjab
Madhya Pradesh
Chattisgarh
Jammu & Kashmir
Mizoram
7%
22%
6%
20%
12%
16%
37%
22%
18%
4%
0%
13%
12%
13%
11%
35%
2%
25%
12%
22%
18%
4%
0%
0%
7%
23%
6%
20%
12%
55%
63%
37%
26%
8%
2%
15%
13%
14%
12%
36%
4%
28%
15%
26%
27%
18%
17%
29%
0% 10% 20% 30% 40% 50% 60% 70%
Increase insubsidy share
Decrease insubsidydependence
Subsidy shareremainedconstant
IISD.org/gsi 19
Unpacking India’s Electricity Subsidies: Reporting, transparency, and efficacy
4.5 Comparing State-Wise Subsidy Data Reporting Across Forums
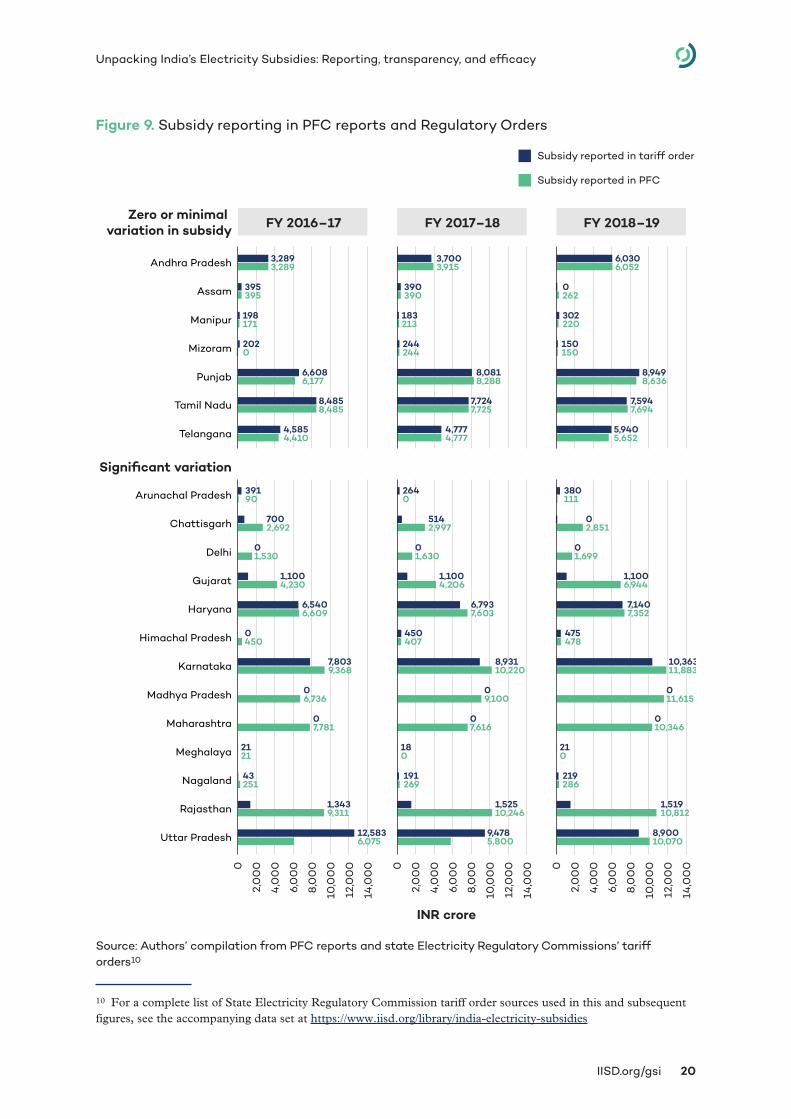
PFC reports on DISCOMs track subsidy-related data in a very limited fashion, in the form of subsidy “booked” and subsidy “received.” They do not capture data on revisions of subsidies during the year or the impact that delayed state subsidy transfers have on DISCOM finances (Das et al., 2019). In an effort to cross-validate the total subsidy outlay in each state, we have mapped the reporting from PFC reports8 and the state regulatory orders. This exercise is limited to 20 states and UTs, as subsidy data is clearly reported for them in regulatory orders.
In Figure 9, we can see that there are stark variations between the subsidy amounts reported by PFC and those in regulatory orders. Some states—such as Tamil Nadu, Andhra Pradesh, Telangana, Punjab, Manipur, Assam, and Mizoram—have marginal or zero variations. Other states—such as Maharashtra,9 Madhya Pradesh, and Delhi—have no mention of subsidies in their regulatory orders, but subsidy amounts are provided in PFC reporting.
PFC reports are published based on information submitted by DISCOMs and are widely accepted by stakeholders as a reliable source on state-level power sectors (Das et al., 2019). Stark differences between PFC data and state-level regulatory orders can only prove misleading to policy-makers or other stakeholders and can potentially result in very different conclusions being reached depending on which source is used by different analysts.
Another major challenge is that terminology is not consistent in documents across different states and UTs. For example, in Rajasthan, the terms “subvention from State govt against ED” and “subsidy against compounding charges” are used to refer to direct state subsidy transfers. This makes it difficult to assess if the reduction in the tariff reported in regulatory orders is due to subsidies or some other reason. In Uttar Pradesh, the subsidy considered by the regulator consists of the direct state government subsidy transfer as well as the “additional subsidy” estimated by the regulatory commission. Across the board, cross-subsidy reporting is poor, making it hard to assess the extent to which revenue collected from sales is a risk for DISCOM finances. Clear reporting of all subsidy numbers, with consistent language and methodologies across all documentation, is essential to ensure transparency and aid policy-makers in making informed decisions in targeting, subsidy optimization, and tariff design.
8 For some states, the audited data was available in the PFC reports, whereas for others, provisional data was available. In the regulatory orders for individual states, data was available in two forms: as tariff orders and as true-up orders (states where true-up was done) for the respective year. To draw comparison for respective years, the data has been appropriately picked up from PFC and regulatory orders.9 For Maharashtra, it was observed, subsidy reporting was done as part of the Technical Validation Session, generally an unusual practise seen as compared to other states.
IISD.org/gsi 20
Unpacking India’s Electricity Subsidies: Reporting, transparency, and efficacy
Figure 9. Subsidy reporting in PFC reports and Regulatory Orders
Source: Authors’ compilation from PFC reports and state Electricity Regulatory Commissions’ tariff orders10
10 For a complete list of State Electricity Regulatory Commission tariff order sources used in this and subsequent figures, see the accompanying data set at https://www.iisd.org/library/india-electricity-subsidies
Zero or minimal variation in subsidy
Subsidy reported in tariff order
Subsidy reported in PFC
0
2,0
00
4,0
00
6,0
00
8,0
00
10,0
00
12,0
00
14,0
00 0
2,0
00
4,0
00
6,0
00
8,0
00
10,0
00
12,0
00
14,0
00 0
2,0
00
4,0
00
6,0
00
8,0
00
10,0
00
12,0
00
14,0
00
Significant variation
INR crore
FY 2016–17 FY 2017–18 FY 2018–19
Tamil Nadu 8,4858,485
7,7247,725
7,5947,694
Assam 395395
390390
0262
Andhra Pradesh 3,2893,289
3,7003,915
6,0306,052
Mizoram 2020
244244
150150
Telangana 4,5854,410
4,7774,777
5,9405,652
Manipur 198171
183213
302220
Punjab 6,6086,177
8,0818,288
8,9498,636
Haryana 6,5406,609
6,7937,603
7,1407,352
Karnataka 7,8039,368
8,93110,220
10,36311,883
Chattisgarh 7002,692
5142,997
02,851
Gujarat 1,1004,230
1,1004,206
1,1006,944
Rajasthan 1,3439,311
1,52510,246
1,51910,812
Uttar Pradesh 12,5836,075
9,4785,800
8,90010,070
Arunachal Pradesh 39190
2640
380111
Himachal Pradesh 0450
450407
475478
Nagaland 43251
191269
219286
Meghalaya 2121
180
210
Maharashtra 07,781
07,616
010,346
Madhya Pradesh 06,736
09,100
011,615
Delhi 01,530
01,630
01,699
IISD.org/gsi 21
Unpacking India’s Electricity Subsidies: Reporting, transparency, and efficacy
5.0 Understanding Subsidies Through Tariff DesignThis section examines the key takeaways from regulatory documents (tariff orders and petitions) in all states/UTs where these documents were available for FY 2016 to FY 2020. The focus of this section is to indicate the status of data availability, as well as identify practices followed by states in allocating and reporting subsidies and their compliance with regulatory mandates on subsidy reforms.
5.1 Overview of Subsidy Data Reporting Practices in State Regulatory Documents
For state governments, tariffs are a politically sensitive subject because they have a substantial impact on the social, economic, and financial well-being of various consumer categories, as well as the viability and growth of the power sector. Regulatory commissions determine the annual revenue requirement of DISCOMs and their tariffs, guided by the provisions of the Electricity Act 2003, the National Tariff Policy 2016, and state-specific regulations. Section 61 of the Electricity Act 2003 lays down the broad principles for determining retail tariffs. As per these principles, the tariff should progressively reflect the cost of supply and also reduce cross-subsidies within the period to be specified by the appropriate commission. The Electricity Act 2003 lays emphasis on safeguarding individual consumer interests but still specifies that the cost of supply should be recovered in a reasonable manner.
To ensure the affordability of tariffs for consumers, the state government, under the provisions of Section 65 of the Electricity Act 2003, provides subsidy support to any consumer or class of consumer. State or joint regulatory commissions account for subsidies when they determine tariffs or conduct a “true-up” to reconcile projected performance with actual costs and revenues.
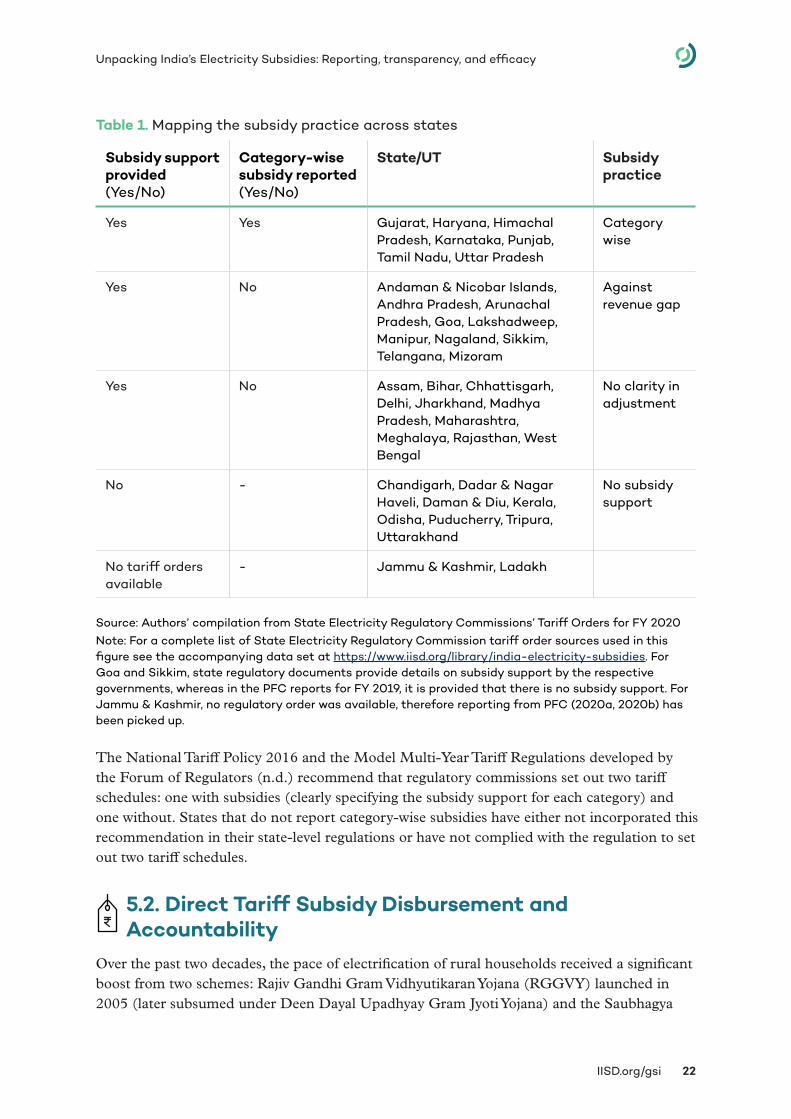
The way in which tariffs are adjusted to account for subsidies is not consistent across states and UTs. There may be two kinds of adjustments: (i) providing subsidy support to a specific category of consumer and (ii) providing subsidy support against the entire revenue gap (total revenue minus total expenditure), which in turn effectively distributes subsidy support across all consumers, in most cases. As summarized in Table 1, the provision of subsidies to specific consumer categories has been noted only across seven states (Gujarat, Haryana, Himachal Pradesh, Karnataka, Punjab, Tamil Nadu, and Uttar Pradesh). In 10 states and UTs, subsidy support is provided against the entire revenue gap. For a further 10 states, including Assam, Bihar, Chhattisgarh, Delhi, and Jharkhand, regulatory documents do not make it clear what approach is taken. A number of experts and think tanks in India have already identified the extent to which this lack of transparency on subsidy implementation is problematic. Such information is crucial to enabling informed debate on state-level electricity subsidies, particularly with respect to ensuring timely payments, improving subsidy targeting, and rationalizing subsidy expenditures (Das et al., 2019).
IISD.org/gsi 22
Unpacking India’s Electricity Subsidies: Reporting, transparency, and efficacy
Table 1. Mapping the subsidy practice across states
Subsidy support provided (Yes/No)
Category-wise subsidy reported (Yes/No)
State/UT Subsidy practice
Yes Yes Gujarat, Haryana, Himachal Pradesh, Karnataka, Punjab, Tamil Nadu, Uttar Pradesh
Category wise
Yes No Andaman & Nicobar Islands, Andhra Pradesh, Arunachal Pradesh, Goa, Lakshadweep, Manipur, Nagaland, Sikkim, Telangana, Mizoram
Against revenue gap
Yes No Assam, Bihar, Chhattisgarh, Delhi, Jharkhand, Madhya Pradesh, Maharashtra, Meghalaya, Rajasthan, West Bengal
No clarity in adjustment
No - Chandigarh, Dadar & Nagar Haveli, Daman & Diu, Kerala, Odisha, Puducherry, Tripura, Uttarakhand
No subsidy support
No tariff orders available
- Jammu & Kashmir, Ladakh
Source: Authors’ compilation from State Electricity Regulatory Commissions’ Tariff Orders for FY 2020Note: For a complete list of State Electricity Regulatory Commission tariff order sources used in this figure see the accompanying data set at https://www.iisd.org/library/india-electricity-subsidies. For Goa and Sikkim, state regulatory documents provide details on subsidy support by the respective governments, whereas in the PFC reports for FY 2019, it is provided that there is no subsidy support. For Jammu & Kashmir, no regulatory order was available, therefore reporting from PFC (2020a, 2020b) has been picked up.
The National Tariff Policy 2016 and the Model Multi-Year Tariff Regulations developed by the Forum of Regulators (n.d.) recommend that regulatory commissions set out two tariff schedules: one with subsidies (clearly specifying the subsidy support for each category) and one without. States that do not report category-wise subsidies have either not incorporated this recommendation in their state-level regulations or have not complied with the regulation to set out two tariff schedules.
5.2. Direct Tariff Subsidy Disbursement and Accountability
Over the past two decades, the pace of electrification of rural households received a significant boost from two schemes: Rajiv Gandhi Gram Vidhyutikaran Yojana (RGGVY) launched in 2005 (later subsumed under Deen Dayal Upadhyay Gram Jyoti Yojana) and the Saubhagya
IISD.org/gsi 23
Unpacking India’s Electricity Subsidies: Reporting, transparency, and efficacy
scheme (launched in 2017). As a result, the share of households using electricity as the primary lighting source in rural India more than doubled from 44% in 2001 to 96% in 2020. As the number of consumers with low paying capacity (subsidized consumers) has grown, so has the need for states to transfer subsidy payments to DISCOMs in an adequate and timely manner. Delays in subsidy payments lead to a liquidity crunch for DISCOMs, who then must resort to short-term, costly loans to meet their working capital requirements. Most DISCOMs also depend on commercial and industrial consumers to provide an adequate cushion to their working capital through cross-subsidies. Such dependence indirectly leads to hesitation in implementing reforms, such as open access provisions, promoting energy-efficiency programs and demand-side measures.
Risk allocation in case of subsidy disbursement delays (as per regulations): The regulations mandate that state governments determine and pay the subsidy amount that they want to provide to various consumer categories in advance (Section 65 of the 2003 Electricity Act). Further, the 2016 National Tariff Policy prescribes that the state electricity regulatory commission “should determine the tariff initially, without considering the subsidy commitment by the State Government and subsidised tariff shall be arrived at thereafter considering the subsidy by the State Government for the respective categories of consumers” (Ministry of Power 2016). In case there are delays in state subsidy disbursement, DISCOMs are to levy the tariff rates from the initial tariff schedule that does not consider the subsidy amount in the calculation of tariff rates. These provisions are in place to help DISCOMs manage their finances in an efficient manner. In these cases, however, vagaries in the subsidy disbursement schedule lead to expensive electricity for the subsidized consumers.
Risk allocation in case of subsidy disbursement delays (as per practice): In reality, state governments tend to delay in stating the amount of subsidy that they want to provide to consumers so that this information is not available at the time of filing tariff petitions. In most cases and in practice, the regulatory commissions or the DISCOMs typically calculate tariffs based on an estimate of the previous year’s subsidy. It is worthwhile to note here that, out of the 36 jurisdictions reviewed, only seven states and UTs specified the domestic rates for categories both with and without subsidy (see Table 1). Among the remaining 22 states and UTs that provide tariff subsidy support, the notified tariff rates are inclusive of the subsidy, and therefore there is no scope for those DISCOMs to charge an unsubsidized rate. Here, the risk is borne entirely by the DISCOMs, and sometimes a few DISCOMs are in violation of the requirement to charge consumers the unsubsidized tariff rates in case of a delay in the subsidy disbursement by state governments.
Timelines: State-level regulations set out binding timelines for actual subsidy disbursement by state governments. For example, tariff regulations by the regulator in Rajasthan provide that if the subsidy amount is more than INR 5 crore (USD 0.7 million), the payment may be conducted on a monthly basis; however, an annual payment is required if the amount is less than this sum (Rajasthan Electricity Regulatory Commission, 2019). Other states, such as Tamil Nadu, prescribe timelines based on categories—monthly for domestic consumers, half-yearly for agricultural consumers, and quarterly for other consumers (Tamil Nadu
IISD.org/gsi 24
Unpacking India’s Electricity Subsidies: Reporting, transparency, and efficacy
Electricity Regulatory Commission, 2008). Almost all states’ tariff orders are opaque on the aspect of agreed time schedules and actual dates of disbursement of subsidies from the state governments. Delayed allocation or disbursement of subsidies can have significant impacts on DISCOM finances.
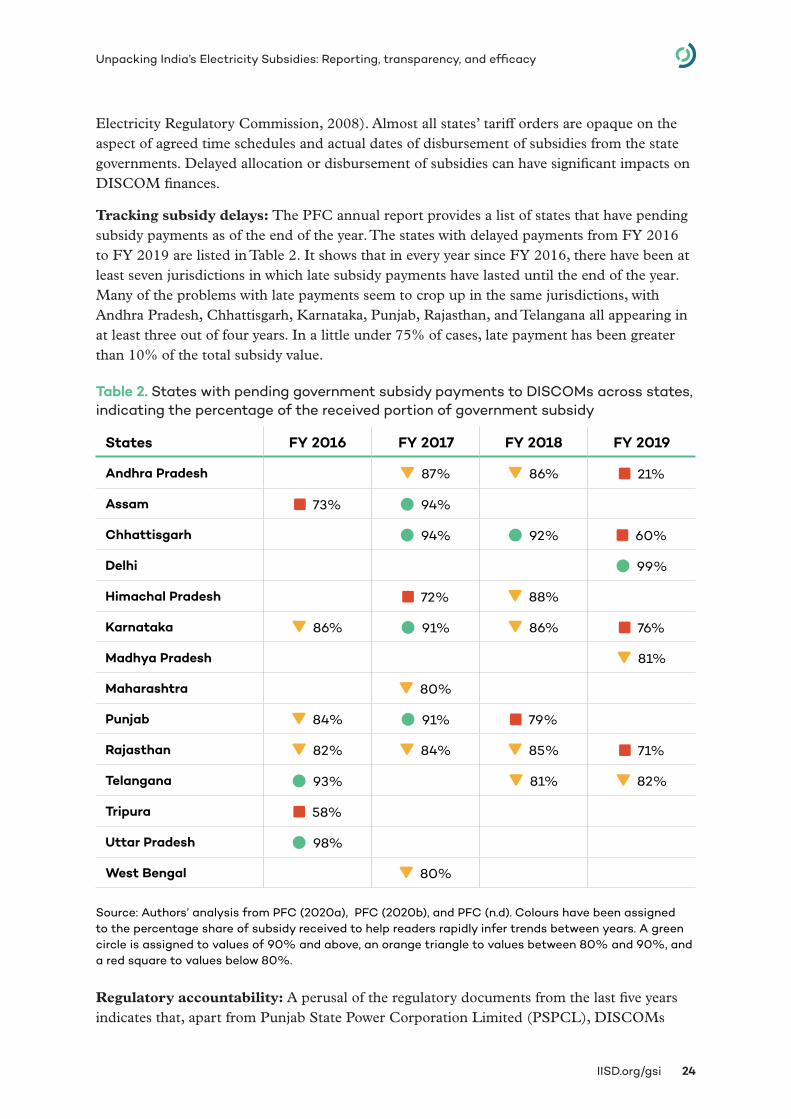
Tracking subsidy delays: The PFC annual report provides a list of states that have pending subsidy payments as of the end of the year. The states with delayed payments from FY 2016 to FY 2019 are listed in Table 2. It shows that in every year since FY 2016, there have been at least seven jurisdictions in which late subsidy payments have lasted until the end of the year. Many of the problems with late payments seem to crop up in the same jurisdictions, with Andhra Pradesh, Chhattisgarh, Karnataka, Punjab, Rajasthan, and Telangana all appearing in at least three out of four years. In a little under 75% of cases, late payment has been greater than 10% of the total subsidy value.
Table 2. States with pending government subsidy payments to DISCOMs across states, indicating the percentage of the received portion of government subsidy
States FY 2016 FY 2017 FY 2018 FY 2019
Andhra Pradesh 87% 86% square 21%
Assam square 73% circle 94%
Chhattisgarh circle 94% circle 92% square 60%
Delhi circle 99%
Himachal Pradesh square 72% 88%
Karnataka 86% circle 91% 86% square 76%
Madhya Pradesh 81%
Maharashtra 80%
Punjab 84% circle 91% square 79%
Rajasthan 82% 84% 85% square 71%
Telangana circle 93% 81% 82%
Tripura square 58%
Uttar Pradesh circle 98%
West Bengal 80%
Source: Authors’ analysis from PFC (2020a), PFC (2020b), and PFC (n.d). Colours have been assigned to the percentage share of subsidy received to help readers rapidly infer trends between years. A green circle is assigned to values of 90% and above, an orange triangle to values between 80% and 90%, and a red square to values below 80%.
Regulatory accountability: A perusal of the regulatory documents from the last five years indicates that, apart from Punjab State Power Corporation Limited (PSPCL), DISCOMs
IISD.org/gsi 25
Unpacking India’s Electricity Subsidies: Reporting, transparency, and efficacy
do not regularly and consistently report delays in subsidy disbursement. The disclosure in Punjab’s electricity tariff orders is linked to a mechanism that penalizes the Punjab state government for delays in quarterly disbursement. The state regulator levies an interest rate corresponding to that on the working capital loan availed to cushion the liquidity crunch caused by the delay. A similar measure exists in Haryana, where the tariff orders prescribe that any delay in the release of the agriculture pump set supply subsidy, including arrears, will be subject to 9% interest per year and will be deducted from the return on equity (Haryana Electricity Regulatory Commission, 2019). However, it does not report on actual experienced delays. Otherwise, states such as Gujarat and Rajasthan have acknowledged in some tariff orders a delay in subsidy disbursements but have not imposed any penalties for the additional costs incurred.
There is limited tracking by regulatory commissions to ensure that the interest burdens due to delayed subsidy payments are borne by the state governments rather than the DISCOMs (Mandal et al., 2020). If state governments are not penalized for delays, the additional costs will be borne by DISCOMs, with knock-on impacts on consumers and generators. Impacts may be by way of direct increases in consumer tariffs as prescribed by model tariff regulations. In other cases, where DISCOMs are not in a position to pass on these risks directly, they may be forced to avail short-term loans to meet operational expenses (Swain, 2016). The interest rates associated with these short-term loans are typically high and have to be borne by DISCOMs themselves. This adds to the DISCOMs’ financial woes and will likely result in worse services for consumers or late payments to generators.
5.3 Tariff Design: Main beneficiary consumer groupsAccording to state tariff orders from 17 states and UTs that provide sufficiently disaggregated information,11 subsidies formed 10% to 30% of the total expenditure (annual revenue requirements) of DISCOMs in various states. These subsidies are not limited to domestic and agriculture consumers alone, as many non-domestic and even industrial consumers receive free or subsidized power.
Figure 10 summarizes data on which consumer groups benefit most from electricity subsidies across these 17 states and UTs:
1. At an aggregate level, agriculture consumers were allotted the largest share of support, receiving 75% of the total subsidy value. Agriculture is unmetered in most states in the country. Few states charge a nominal fixed fee every month, implying payment is not based on the quantity of electricity consumed. In fact, several states, such as Tamil Nadu, Telangana, and Punjab, provide free power to the unmetered agriculture category. While the Electricity Act, 2003 (Section 55) prescribes that no electricity should be supplied without meter installation, most states continue to add unmetered consumers to meet state-level priorities. The problem is that the unmetered consumption is typically overestimated, and, thus, the subsidy allocated to such categories could also be overestimated (Das et al., 2019).
11 Out of 36 states/UTs, the data was available for 17. Seven states/UTs do not provide any subsidy support and there was no data available for 12 states/UTs.
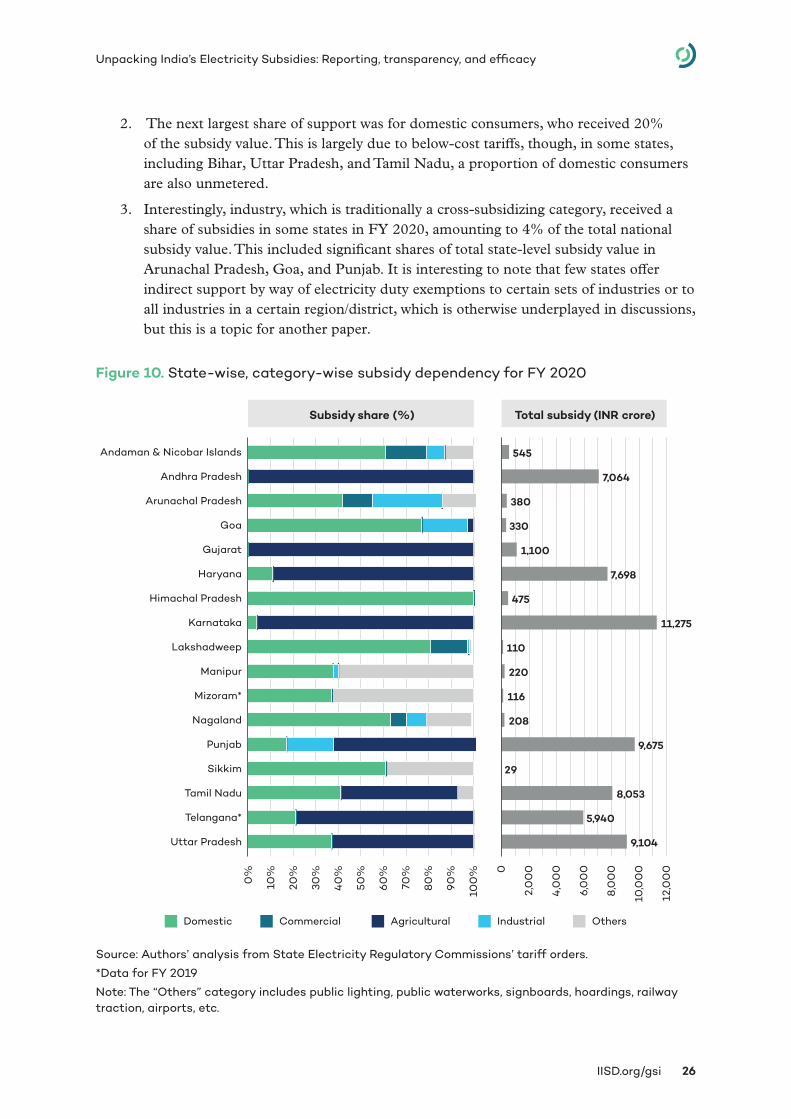
IISD.org/gsi 26
Unpacking India’s Electricity Subsidies: Reporting, transparency, and efficacy
2. The next largest share of support was for domestic consumers, who received 20% of the subsidy value. This is largely due to below-cost tariffs, though, in some states, including Bihar, Uttar Pradesh, and Tamil Nadu, a proportion of domestic consumers are also unmetered.
3. Interestingly, industry, which is traditionally a cross-subsidizing category, received a share of subsidies in some states in FY 2020, amounting to 4% of the total national subsidy value. This included significant shares of total state-level subsidy value in Arunachal Pradesh, Goa, and Punjab. It is interesting to note that few states offer indirect support by way of electricity duty exemptions to certain sets of industries or to all industries in a certain region/district, which is otherwise underplayed in discussions, but this is a topic for another paper.
Figure 10. State-wise, category-wise subsidy dependency for FY 2020
Source: Authors’ analysis from State Electricity Regulatory Commissions’ tariff orders.
*Data for FY 2019
Note: The “Others” category includes public lighting, public waterworks, signboards, hoardings, railway traction, airports, etc.
0%
10%
20%
30%
40
%
50%
60
%
70%
80
%
90
%
100
%
Uttar Pradesh
Telangana*
Tamil Nadu
Sikkim
Punjab
Nagaland
Mizoram*
Manipur
Lakshadweep
Karnataka
Himachal Pradesh
Haryana
Gujarat
Goa
Arunachal Pradesh
Andhra Pradesh
Andaman & Nicobar Islands
0
2,0
00
4,0
00
6,0
00
8,0
00
10,0
00
12,0
00
Subsidy share (%) Total subsidy (INR crore)
Domestic Commercial Agricultural Industrial Others
9,104
5,940
8,053
29
9,675
208
116
220
110
11,275
475
7,698
1,100
330
380
7,064
545
IISD.org/gsi 27
Unpacking India’s Electricity Subsidies: Reporting, transparency, and efficacy
Recognizing that the domestic and agriculture consumer categories make up to 95% of total subsidy across states, we attempt to understand the level of subsidy support. This understanding is crucial to be able to outline strategies for better subsidy targeting and subsidy rationalization. A mapping exercise was undertaken across states and UTs to gauge the number of subsidized units in the agricultural and domestic categories. The findings from the mapping exercise are both interesting and stark at the same time.
Agricultural Category: In several states, electricity consumption in agriculture is in the range of 15%–40% of the total electricity consumption. In most states, agriculture is unmetered, either partially or fully, and consumption is estimated using different methodologies (Das et al., 2019). As the entire agricultural category is typically subsidized in most states, different approaches to estimating sales invite uncertainty and disagreement on actual consumption. As noted by Maharashtra’s Electricity Regulatory Commission (MERC) in a recent field-level study, meters were present for only 27% of agricultural consumers. Of that, half of the meter readings were found to be incorrect (Working Group for Agricultural Consumption, 2020). MERC also noted that methods used by the DISCOM thus far to estimate sales to unmetered categories of consumers have been inadequate and unrealistic. It is also pertinent to note that there is significant mistrust in the system currently among the farmers, the DISCOMs, the government, and the regulator regarding power supply, with the government and regulator mistrust of the DISCOMs stemming from inaccurate reporting of actual agricultural electricity consumption.
Domestic Category: An analysis of domestic tariff categories created across the states and UTs brings out the following key insights:
• The domestic category typically caters to residential consumers (individuals, colonies, multi-storey apartments), Below Poverty Line (BPL) consumers or lifeline category, and all other facilities within the premises of a housing colony.
• In addition, professionals such as lawyers and doctors having a residential establishment are also considered under the domestic category.
The governments in four states and UTs, namely Delhi, Haryana, Tamil Nadu, and Uttar Pradesh,12 have explicitly specified subsidy support for domestic consumers (other than the lifeline category) for a fixed number of units: 400, 150, 50, and 150 kWh, respectively. For 14 other states and UTs, there was no explicit mention of how many units the subsidy was clearly on offer. However, in these states, it is possible that the tariffs for higher slabs (300 kWh and above) are in line with the ACoS (as discussed in Box 1). Of the total number of states and UTs, there were seven states with no clarity on subsidy support, two UTs with a lack of data, and eight states with no subsidy support for the domestic category (See Annex 2 for the classification of states in this regard).
Of the 36 jurisdictions reviewed, only seven states and UTs specified the domestic rates for categories both with and without subsidy. For the other states and UTs (provided there is subsidy support), the notified domestic rates were inclusive of the subsidy.
12 In Uttar Pradesh, the fixed 150 kWh subsidised consumption is for rural domestic consumers.
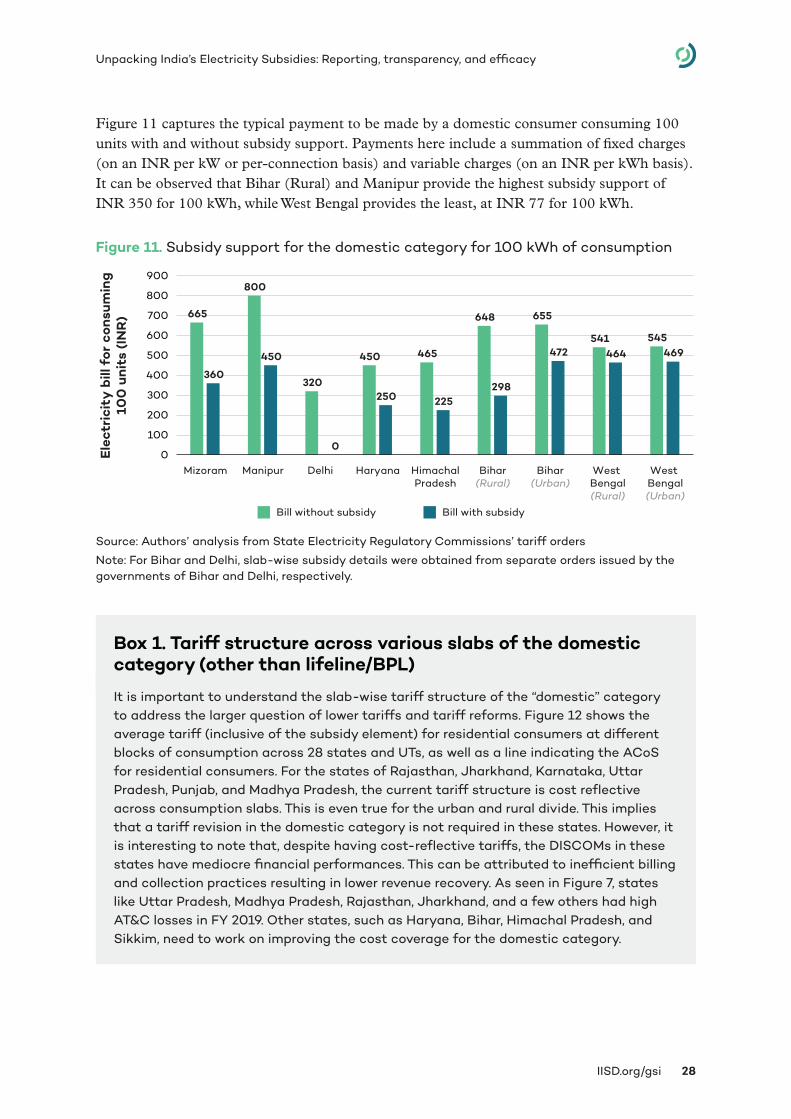
IISD.org/gsi 28
Unpacking India’s Electricity Subsidies: Reporting, transparency, and efficacy
Figure 11 captures the typical payment to be made by a domestic consumer consuming 100 units with and without subsidy support. Payments here include a summation of fixed charges (on an INR per kW or per-connection basis) and variable charges (on an INR per kWh basis). It can be observed that Bihar (Rural) and Manipur provide the highest subsidy support of INR 350 for 100 kWh, while West Bengal provides the least, at INR 77 for 100 kWh.
Figure 11. Subsidy support for the domestic category for 100 kWh of consumption
Source: Authors’ analysis from State Electricity Regulatory Commissions’ tariff orders
Note: For Bihar and Delhi, slab-wise subsidy details were obtained from separate orders issued by the governments of Bihar and Delhi, respectively.
Box 1. Tariff structure across various slabs of the domestic category (other than lifeline/BPL)
It is important to understand the slab-wise tariff structure of the “domestic” category to address the larger question of lower tariffs and tariff reforms. Figure 12 shows the average tariff (inclusive of the subsidy element) for residential consumers at different blocks of consumption across 28 states and UTs, as well as a line indicating the ACoS for residential consumers. For the states of Rajasthan, Jharkhand, Karnataka, Uttar Pradesh, Punjab, and Madhya Pradesh, the current tariff structure is cost reflective across consumption slabs. This is even true for the urban and rural divide. This implies that a tariff revision in the domestic category is not required in these states. However, it is interesting to note that, despite having cost-reflective tariffs, the DISCOMs in these states have mediocre financial performances. This can be attributed to inefficient billing and collection practices resulting in lower revenue recovery. As seen in Figure 7, states like Uttar Pradesh, Madhya Pradesh, Rajasthan, Jharkhand, and a few others had high AT&C losses in FY 2019. Other states, such as Haryana, Bihar, Himachal Pradesh, and Sikkim, need to work on improving the cost coverage for the domestic category.
665
800
320
450 465
648 655
541 545
360
450
0
250 225298
472 464 469
0
100
200
300
400
500
600
700
800
900
Mizoram Manipur Delhi Haryana HimachalPradesh
Bihar(Rural)
Bihar(Urban)
West Bengal(Rural)
West Bengal(Urban)
Ele
ctri
city
bill
for
con
sum
ing
100
uni
ts (
INR
)
Bill without subsidy Bill with subsidy
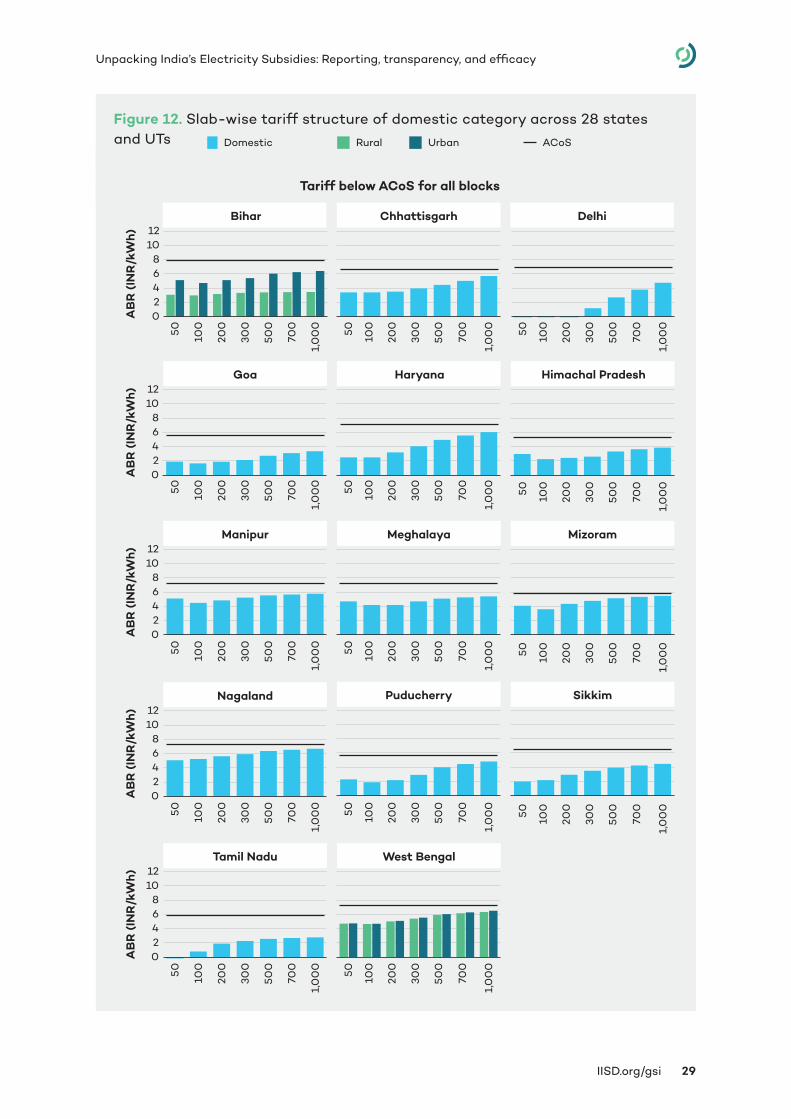
IISD.org/gsi 29
Unpacking India’s Electricity Subsidies: Reporting, transparency, and efficacy
Figure 12. Slab-wise tariff structure of domestic category across 28 states and UTs
02468
1012
Bihar
1,0
00
700
500
300
200
10050
AB
R (
INR
/kW
h)
Chhattisgarh
1,0
00
700
500
300
200
10050
1,0
00
700
500
300
200
10050
Delhi
02468
1012
AB
R (
INR
/kW
h)
1,0
00
700
500
300
200
10050
1,0
00
700
500
300
200
10050
1,0
00
700
500
300
200
10050
Goa Haryana Himachal Pradesh
AB
R (
INR
/kW
h)
02468
1012
Manipur Meghalaya
1,0
00
700
500
300
200
10050
1,0
00
700
500
300
200
10050
1,0
00
700
500
300
200
10050
Mizoram
02468
1012
AB
R (
INR
/kW
h)
1,0
00
700
500
300
200
10050
1,0
00
700
500
300
200
10050
Tamil Nadu West Bengal
02468
1012
AB
R (
INR
/kW
h)
1,0
00
700
500
300
200
10050
1,0
00
700
500
300
200
10050
1,0
00
700
500
300
200
10050
Nagaland Puducherry Sikkim
Tariff below ACoS for all blocks
Domestic Rural Urban ACoS
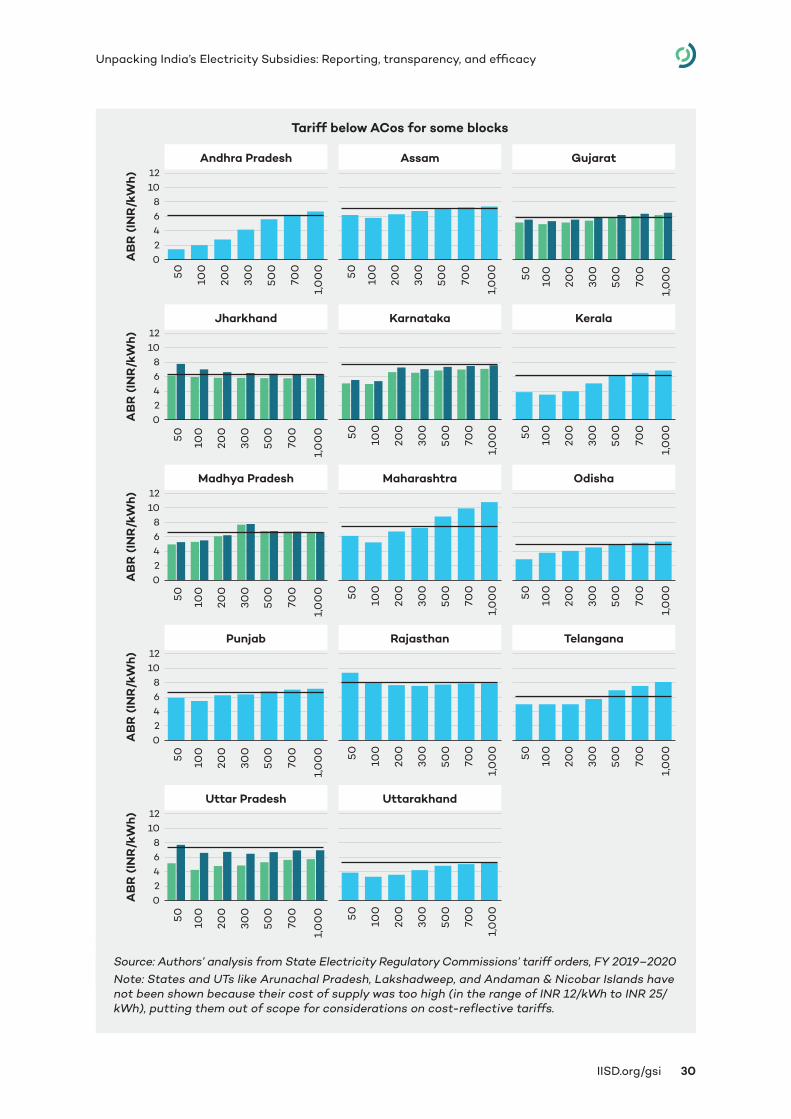
IISD.org/gsi 30
Unpacking India’s Electricity Subsidies: Reporting, transparency, and efficacy
Source: Authors’ analysis from State Electricity Regulatory Commissions’ tariff orders, FY 2019–2020Note: States and UTs like Arunachal Pradesh, Lakshadweep, and Andaman & Nicobar Islands have not been shown because their cost of supply was too high (in the range of INR 12/kWh to INR 25/kWh), putting them out of scope for considerations on cost-reflective tariffs.
1,0
00
700
500
300
200
10050
1,0
00
700
500
300
200
10050
1,0
00
700
500
300
200
10050
Tariff below ACos for some blocks
02468
1012
AB
R (
INR
/kW
h)
Andhra Pradesh Assam Gujarat
02468
1012
AB
R (
INR
/kW
h)
02468
1012
AB
R (
INR
/kW
h)
02468
1012
AB
R (
INR
/kW
h)
02468
1012
AB
R (
INR
/kW
h)
1,0
00
700
500
300
200
10050
Rajasthan
1,0
00
700
500
300
200
10050
Telangana
1,0
00
700
500
300
200
10050
Kerala
1,0
00
700
500
300
200
10050
Odisha1,
00
0
700
500
300
200
10050
Maharashtra
1,0
00
700
500
300
200
10050
Uttar Pradesh
1,0
00
700
500
300
200
10050
Madhya Pradesh
1,0
00
700
500
300
200
10050
Punjab
1,0
00
700
500
300
200
10050
Uttarakhand
1,0
00
700
500
300
200
10050
Jharkhand
1,0
00
700
500
300
200
10050
Karnataka
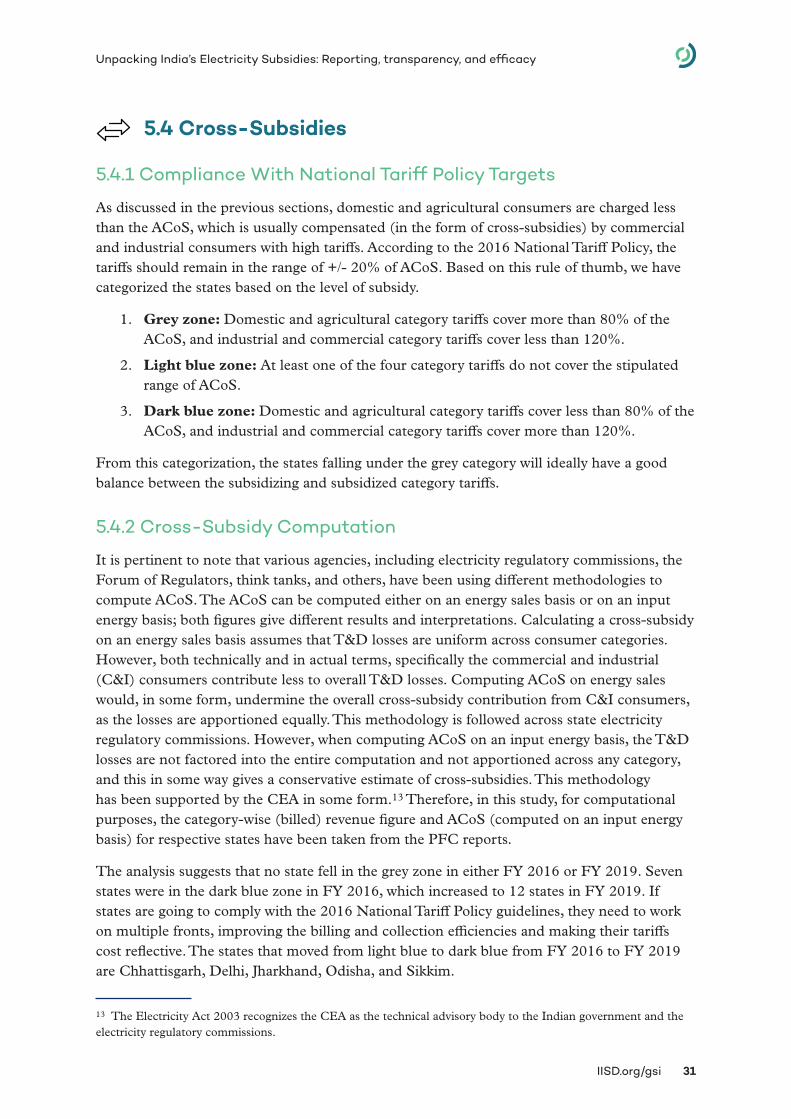
IISD.org/gsi 31
Unpacking India’s Electricity Subsidies: Reporting, transparency, and efficacy
5.4 Cross-Subsidies
5.4.1 Compliance With National Tariff Policy Targets
As discussed in the previous sections, domestic and agricultural consumers are charged less than the ACoS, which is usually compensated (in the form of cross-subsidies) by commercial and industrial consumers with high tariffs. According to the 2016 National Tariff Policy, the tariffs should remain in the range of +/- 20% of ACoS. Based on this rule of thumb, we have categorized the states based on the level of subsidy.
1. Grey zone: Domestic and agricultural category tariffs cover more than 80% of the ACoS, and industrial and commercial category tariffs cover less than 120%.
2. Light blue zone: At least one of the four category tariffs do not cover the stipulated range of ACoS.
3. Dark blue zone: Domestic and agricultural category tariffs cover less than 80% of the ACoS, and industrial and commercial category tariffs cover more than 120%.
From this categorization, the states falling under the grey category will ideally have a good balance between the subsidizing and subsidized category tariffs.
5.4.2 Cross-Subsidy Computation
It is pertinent to note that various agencies, including electricity regulatory commissions, the Forum of Regulators, think tanks, and others, have been using different methodologies to compute ACoS. The ACoS can be computed either on an energy sales basis or on an input energy basis; both figures give different results and interpretations. Calculating a cross-subsidy on an energy sales basis assumes that T&D losses are uniform across consumer categories. However, both technically and in actual terms, specifically the commercial and industrial (C&I) consumers contribute less to overall T&D losses. Computing ACoS on energy sales would, in some form, undermine the overall cross-subsidy contribution from C&I consumers, as the losses are apportioned equally. This methodology is followed across state electricity regulatory commissions. However, when computing ACoS on an input energy basis, the T&D losses are not factored into the entire computation and not apportioned across any category, and this in some way gives a conservative estimate of cross-subsidies. This methodology has been supported by the CEA in some form.13 Therefore, in this study, for computational purposes, the category-wise (billed) revenue figure and ACoS (computed on an input energy basis) for respective states have been taken from the PFC reports.
The analysis suggests that no state fell in the grey zone in either FY 2016 or FY 2019. Seven states were in the dark blue zone in FY 2016, which increased to 12 states in FY 2019. If states are going to comply with the 2016 National Tariff Policy guidelines, they need to work on multiple fronts, improving the billing and collection efficiencies and making their tariffs cost reflective. The states that moved from light blue to dark blue from FY 2016 to FY 2019 are Chhattisgarh, Delhi, Jharkhand, Odisha, and Sikkim.
13 The Electricity Act 2003 recognizes the CEA as the technical advisory body to the Indian government and the electricity regulatory commissions.
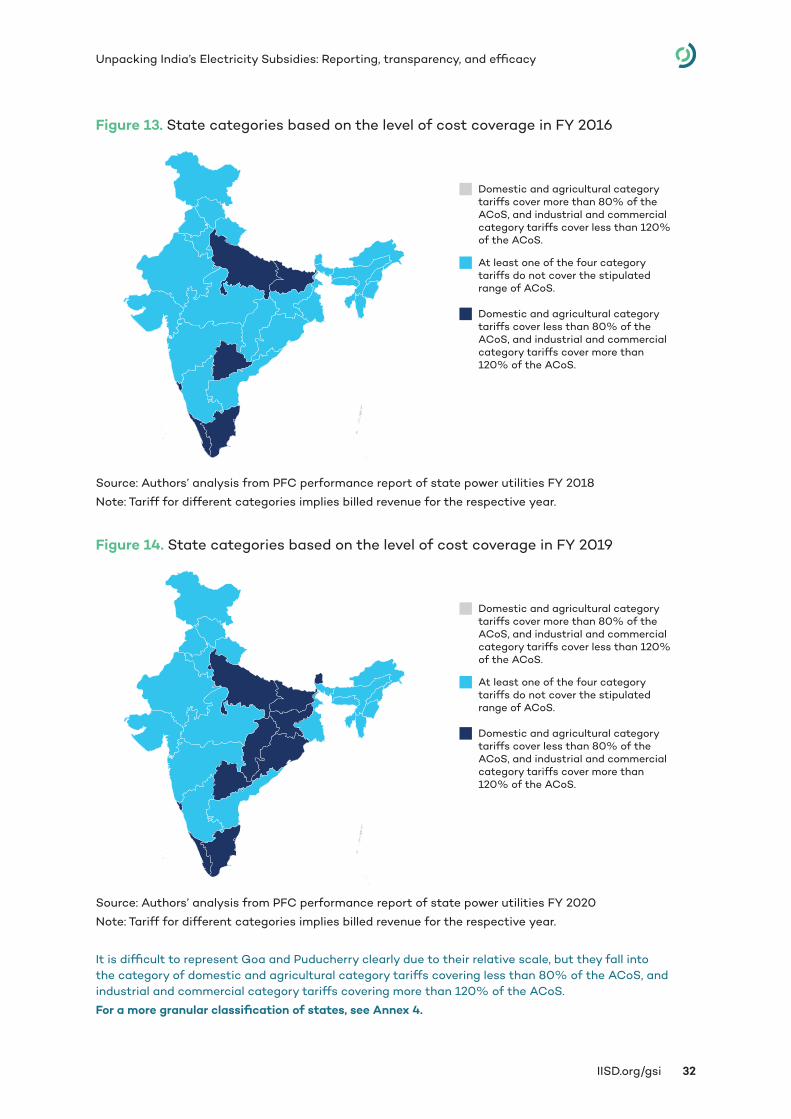
IISD.org/gsi 32
Unpacking India’s Electricity Subsidies: Reporting, transparency, and efficacy
Figure 13. State categories based on the level of cost coverage in FY 2016
Source: Authors’ analysis from PFC performance report of state power utilities FY 2018
Note: Tariff for different categories implies billed revenue for the respective year.
Figure 14. State categories based on the level of cost coverage in FY 2019
Source: Authors’ analysis from PFC performance report of state power utilities FY 2020
Note: Tariff for different categories implies billed revenue for the respective year.
It is difficult to represent Goa and Puducherry clearly due to their relative scale, but they fall into the category of domestic and agricultural category tariffs covering less than 80% of the ACoS, and industrial and commercial category tariffs covering more than 120% of the ACoS.
For a more granular classification of states, see Annex 4.
Domestic and agricultural category tariffs cover more than 80% of the ACoS, and industrial and commercial category tariffs cover less than 120% of the ACoS.
At least one of the four category tariffs do not cover the stipulated range of ACoS.
Domestic and agricultural category tariffs cover less than 80% of the ACoS, and industrial and commercial category tariffs cover more than 120% of the ACoS.
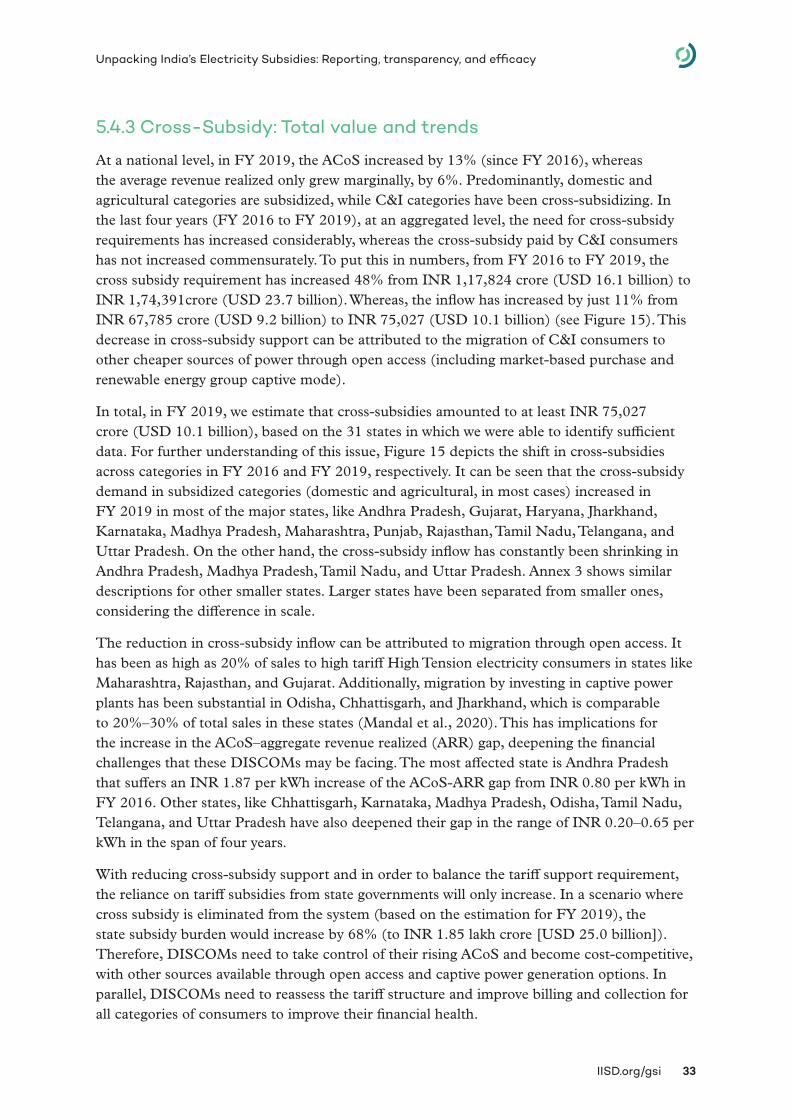
IISD.org/gsi 33
Unpacking India’s Electricity Subsidies: Reporting, transparency, and efficacy
5.4.3 Cross-Subsidy: Total value and trends
At a national level, in FY 2019, the ACoS increased by 13% (since FY 2016), whereas the average revenue realized only grew marginally, by 6%. Predominantly, domestic and agricultural categories are subsidized, while C&I categories have been cross-subsidizing. In the last four years (FY 2016 to FY 2019), at an aggregated level, the need for cross-subsidy requirements has increased considerably, whereas the cross-subsidy paid by C&I consumers has not increased commensurately. To put this in numbers, from FY 2016 to FY 2019, the cross subsidy requirement has increased 48% from INR 1,17,824 crore (USD 16.1 billion) to INR 1,74,391crore (USD 23.7 billion). Whereas, the inflow has increased by just 11% from INR 67,785 crore (USD 9.2 billion) to INR 75,027 (USD 10.1 billion) (see Figure 15). This decrease in cross-subsidy support can be attributed to the migration of C&I consumers to other cheaper sources of power through open access (including market-based purchase and renewable energy group captive mode).
In total, in FY 2019, we estimate that cross-subsidies amounted to at least INR 75,027 crore (USD 10.1 billion), based on the 31 states in which we were able to identify sufficient data. For further understanding of this issue, Figure 15 depicts the shift in cross-subsidies across categories in FY 2016 and FY 2019, respectively. It can be seen that the cross-subsidy demand in subsidized categories (domestic and agricultural, in most cases) increased in FY 2019 in most of the major states, like Andhra Pradesh, Gujarat, Haryana, Jharkhand, Karnataka, Madhya Pradesh, Maharashtra, Punjab, Rajasthan, Tamil Nadu, Telangana, and Uttar Pradesh. On the other hand, the cross-subsidy inflow has constantly been shrinking in Andhra Pradesh, Madhya Pradesh, Tamil Nadu, and Uttar Pradesh. Annex 3 shows similar descriptions for other smaller states. Larger states have been separated from smaller ones, considering the difference in scale.
The reduction in cross-subsidy inflow can be attributed to migration through open access. It has been as high as 20% of sales to high tariff High Tension electricity consumers in states like Maharashtra, Rajasthan, and Gujarat. Additionally, migration by investing in captive power plants has been substantial in Odisha, Chhattisgarh, and Jharkhand, which is comparable to 20%–30% of total sales in these states (Mandal et al., 2020). This has implications for the increase in the ACoS–aggregate revenue realized (ARR) gap, deepening the financial challenges that these DISCOMs may be facing. The most affected state is Andhra Pradesh that suffers an INR 1.87 per kWh increase of the ACoS-ARR gap from INR 0.80 per kWh in FY 2016. Other states, like Chhattisgarh, Karnataka, Madhya Pradesh, Odisha, Tamil Nadu, Telangana, and Uttar Pradesh have also deepened their gap in the range of INR 0.20–0.65 per kWh in the span of four years.
With reducing cross-subsidy support and in order to balance the tariff support requirement, the reliance on tariff subsidies from state governments will only increase. In a scenario where cross subsidy is eliminated from the system (based on the estimation for FY 2019), the state subsidy burden would increase by 68% (to INR 1.85 lakh crore [USD 25.0 billion]). Therefore, DISCOMs need to take control of their rising ACoS and become cost-competitive, with other sources available through open access and captive power generation options. In parallel, DISCOMs need to reassess the tariff structure and improve billing and collection for all categories of consumers to improve their financial health.
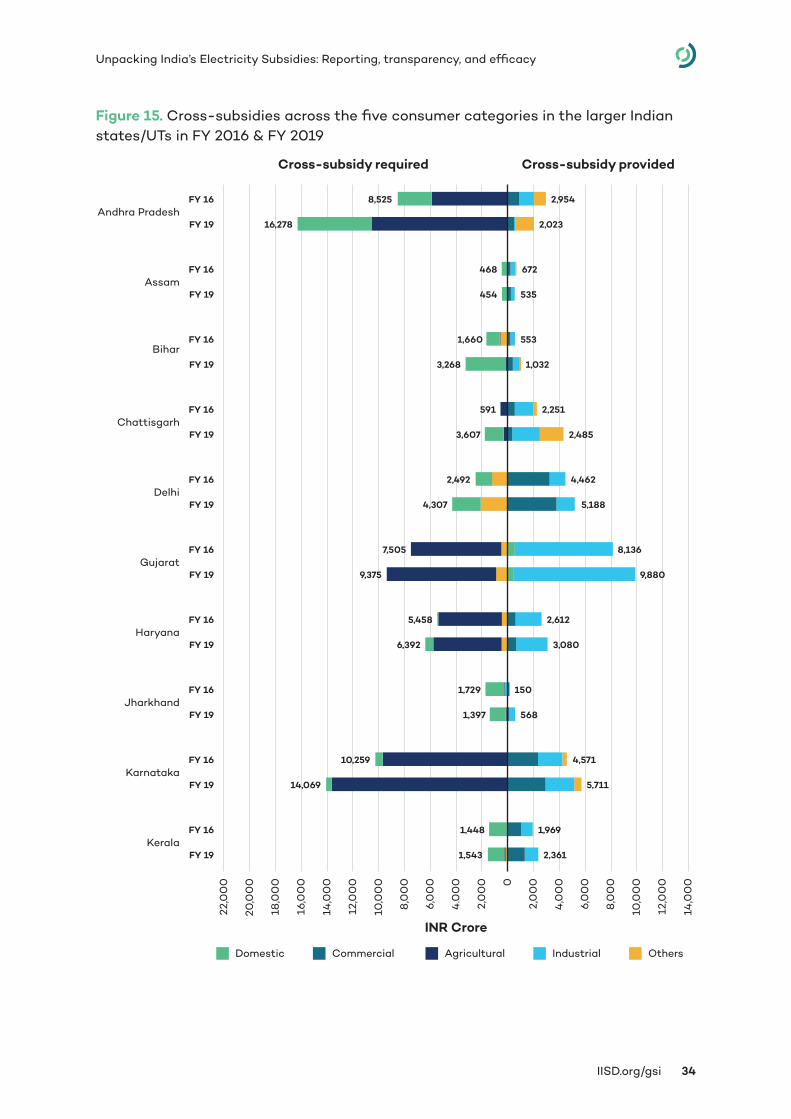
IISD.org/gsi 34
Unpacking India’s Electricity Subsidies: Reporting, transparency, and efficacy
Figure 15. Cross-subsidies across the five consumer categories in the larger Indian states/UTs in FY 2016 & FY 2019
Domestic Commercial Agricultural Industrial Others
Cross-subsidy providedCross-subsidy required
Andhra Pradesh FY 16
FY 19
Kerala FY 16
FY 19
Karnataka FY 16
FY 19
Jharkhand FY 19
FY 16
Haryana FY 19
FY 16
Gujarat FY 16
FY 19
Delhi FY 19
FY 16
Bihar FY 19
FY 16
Assam FY 16
FY 19
Chattisgarh FY 16
FY 19
14,0
00
12,0
00
10,0
00
20,0
00
22,0
00
18,0
00
16,0
00
8,0
00
6,0
00
4.0
00
2,0
00 0
2,0
00
4,0
00
6,0
00
8,0
00
10,0
00
12,0
00
14,0
00
2,954
2,023
1,969
2,361
4,571
5,711
568
150
3,080
2,612
8,136
9,880
5,188
4,462
1,032
553
672
535
2,251
2,485
8,525
16,278
1,448
1,543
10,259
14,069
1,397
1,729
6,392
5,458
7,505
9,375
4,307
2,492
3,268
1,660
468
454
591
3,607
INR Crore
IISD.org/gsi 35
Unpacking India’s Electricity Subsidies: Reporting, transparency, and efficacy
Source: Authors’ analysis from PFC (2020a) and PFC (2020b)
Note 1: Cross-subsidies have been computed based on ACoS (on an input energy basis) and billed revenue for each category.
Cross-subsidy providedCross-subsidy required
Domestic Commercial Agricultural Industrial Others
West Bengal FY 16
FY 19
Uttar Pradesh FY 16
FY 19
Telangana FY 16
FY 19
Tamil Nadu FY 19
FY 16
Rajasthan FY 16
FY 19
Punjab FY 19
FY 16
Odisha FY 16
FY 19
Madhya Pradesh FY 19
FY 16
Maharashtra FY 16
FY 19
14,0
00
12,0
00
10,0
00
20,0
00
22,0
00
18,0
00
16,0
00
8,0
00
6,0
00
4.0
00
2,0
00 0
2,0
00
4,0
00
6,0
00
8,0
00
10,0
00
12,0
00
14,0
00
3,028
3,001
2,477
2,891
5,893
5,439
4,656
3,578
12,568
6,079
1,606
331
1,618
1,991
5,747
11,702
2,225
2,242
7,289
12,290
628
824
14,843
10,206
17,793
8,732
16,156
21,072
15,637
13,679
943
295
10,604
18,024
7,039
8,482
INR Crore
IISD.org/gsi 36
Unpacking India’s Electricity Subsidies: Reporting, transparency, and efficacy
6.0 Key Findings and Recommendations
6.1 Key FindingsOut of the 31 Indian states and UTs covered by the PFC reports, we find that only five do not provide any direct tariff subsidies.14 Table 3 gives a consolidated overview of findings on the performance of the 31 states across four parameters from FY 2016 to FY 2019: supply cost, direct tariff subsidy disbursement and data transparency, dependence on subsidies, and cross-subsidies.
Increasing ACoS (supply cost)
In FY 2019, 19 of 31 states and UTs had a higher supply cost as compared to FY 2016. Higher supply cost is mainly driven by high power purchase costs, which include inefficient planning and forecasting of demand, fixed cost commitments going up while demand has not, increasing fuel costs, or increasing system costs (such as transmission).
Good performers: Punjab, Tripura, Delhi, Jharkhand, Gujarat, Himachal Pradesh, Kerala, Rajasthan, Tamil Nadu, Haryana, Jammu & Kashmir and Sikkim, the jurisdictions where FY 2019 supply costs are lower than FY 2016 (adjusted for inflation)
Biggest challenges: Andhra Pradesh, Assam, Uttar Pradesh, and Telangana have power purchase costs above INR 5 (6.8 USD cents) per unit.
Direct Tariff Subsidy Disbursement and Data Transparency
Only four states and UTs have specified subsidy support for a fixed number of units. In every year from FY 2016 to FY 2019, at least seven subsidizing states and UTs had not paid DISCOMs all transfers for subsidies by the end of the FY. Only 15 out of the 26 states that provide subsidies clearly report on the value of the subsidy payments. Punjab also accounted for delays in subsidy disbursement by imposing a penalty interest rate.
Good performers
Clear category-wise reporting: Gujarat, Haryana, Himachal Pradesh, Karnataka, Punjab, Tamil Nadu, and Uttar Pradesh
14 As indicated in Table 1, the PFC Report for FY 2019 states that 7 states and UTs do not provide subsidy support, including Goa and Sikkim. However, state regulatory documents provide details on subsidy support by the governments of Goa and Sikkim.
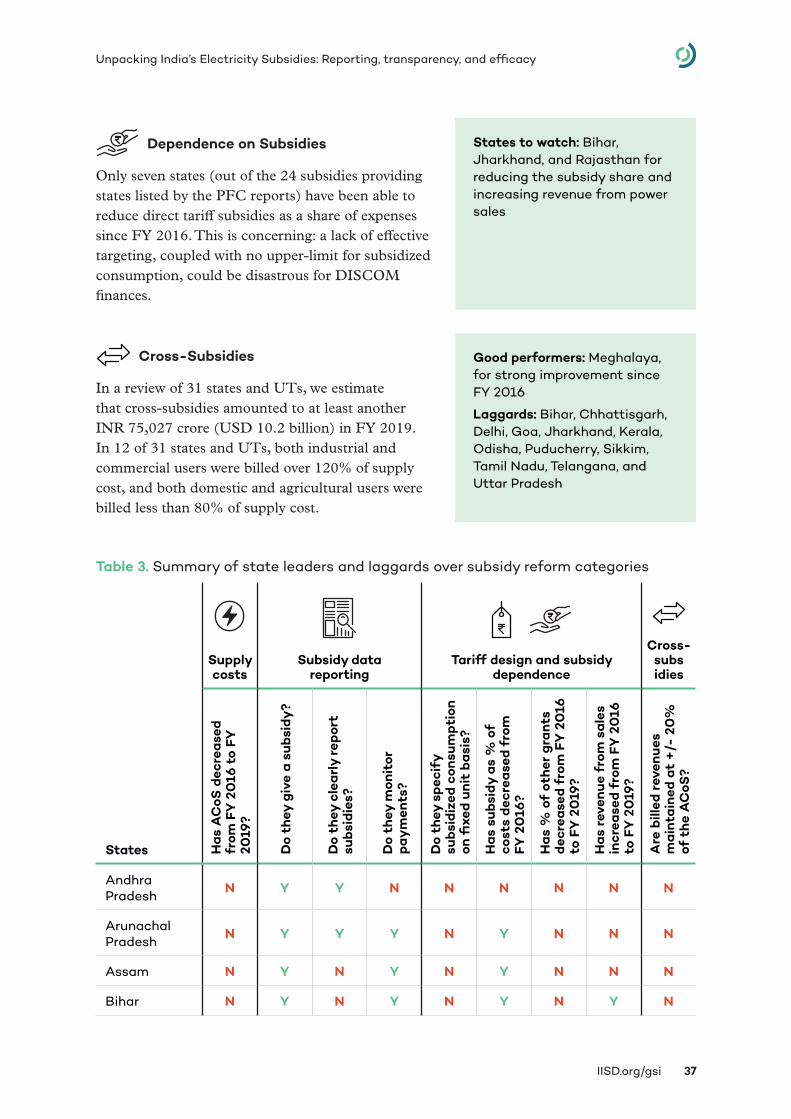
IISD.org/gsi 37
Unpacking India’s Electricity Subsidies: Reporting, transparency, and efficacy
Dependence on Subsidies
Only seven states (out of the 24 subsidies providing states listed by the PFC reports) have been able to reduce direct tariff subsidies as a share of expenses since FY 2016. This is concerning: a lack of effective targeting, coupled with no upper-limit for subsidized consumption, could be disastrous for DISCOM finances.
States to watch: Bihar, Jharkhand, and Rajasthan for reducing the subsidy share and increasing revenue from power sales
Cross-Subsidies
In a review of 31 states and UTs, we estimate that cross-subsidies amounted to at least another INR 75,027 crore (USD 10.2 billion) in FY 2019. In 12 of 31 states and UTs, both industrial and commercial users were billed over 120% of supply cost, and both domestic and agricultural users were billed less than 80% of supply cost.
Good performers: Meghalaya, for strong improvement since FY 2016
Laggards: Bihar, Chhattisgarh, Delhi, Goa, Jharkhand, Kerala, Odisha, Puducherry, Sikkim, Tamil Nadu, Telangana, and Uttar Pradesh
Table 3. Summary of state leaders and laggards over subsidy reform categories
States
Supply costs
Subsidy data reporting
Tariff design and subsidy dependence
Cross-subs idies
Has
AC
oS d
ecre
ased
fr
om F
Y 2
016
to
FY
2019
?
Do
they
giv
e a
subs
idy
?
Do
they
cle
arly
rep
ort
subs
idie
s?
Do
they
mon
itor
pa
ym
ents
?
Do
they
spe
cify
su
bsid
ized
con
sum
ptio
n on
fixe
d un
it b
asis
?
Has
sub
sidy
as
% o
f co
sts
decr
ease
d fr
om
FY 2
016
?
Has
% o
f ot
her
gra
nts
decr
ease
d fr
om F
Y 2
016
to
FY
20
19?
Has
rev
enue
fro
m s
ales
in
crea
sed
from
FY
20
16
to F
Y 2
019
?
Are
bill
ed r
even
ues
mai
ntai
ned
at +
/- 2
0%
of
the
AC
oS?
Andhra Pradesh N Y Y N N N N N N
Arunachal Pradesh N Y Y Y N Y N N N
Assam N Y N Y N Y N N N
Bihar N Y N Y N Y N Y N
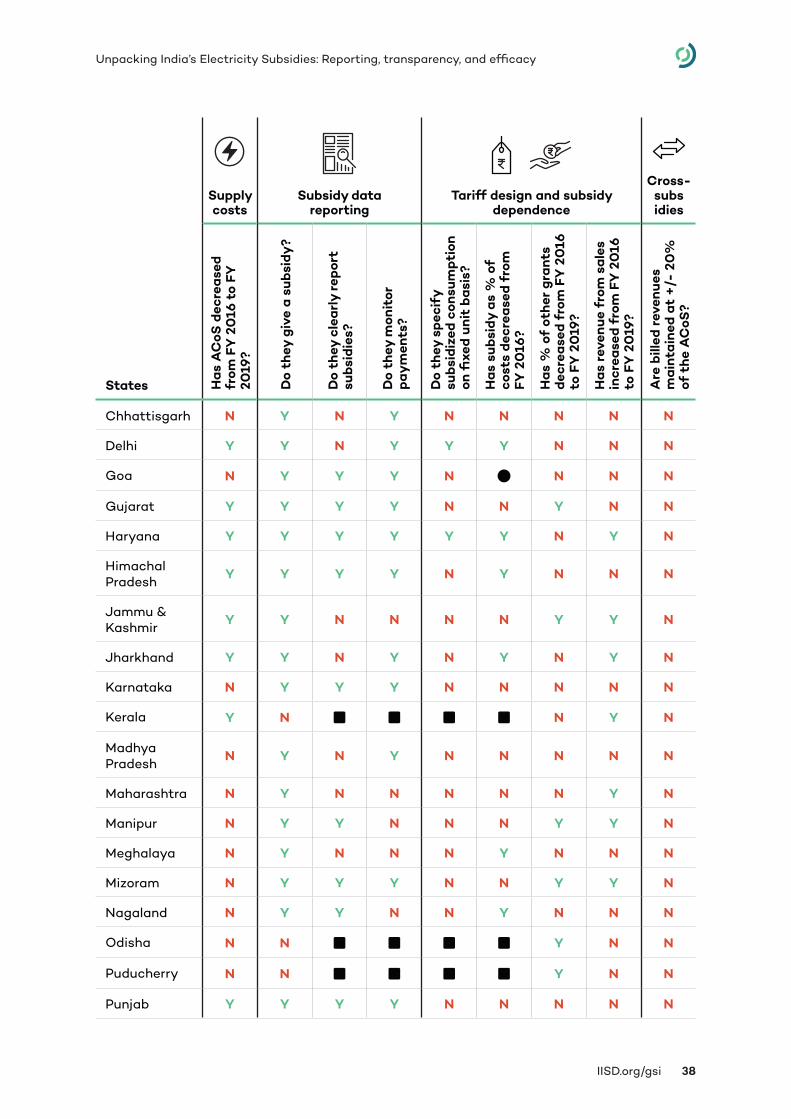
IISD.org/gsi 38
Unpacking India’s Electricity Subsidies: Reporting, transparency, and efficacy
States
Supply costs
Subsidy data reporting
Tariff design and subsidy dependence
Cross-subs idies
Has
AC
oS d
ecre
ased
fr
om F
Y 2
016
to
FY
2019
?
Do
they
giv
e a
subs
idy
?
Do
they
cle
arly
rep
ort
subs
idie
s?
Do
they
mon
itor
pa
ym
ents
?
Do
they
spe
cify
su
bsid
ized
con
sum
ptio
n on
fixe
d un
it b
asis
?
Has
sub
sidy
as
% o
f co
sts
decr
ease
d fr
om
FY 2
016
?
Has
% o
f ot
her
gra
nts
decr
ease
d fr
om F
Y 2
016
to
FY
20
19?
Has
rev
enue
fro
m s
ales
in
crea
sed
from
FY
20
16
to F
Y 2
019
?
Are
bill
ed r
even
ues
mai
ntai
ned
at +
/- 2
0%
of
the
AC
oS?
Chhattisgarh N Y N Y N N N N N
Delhi Y Y N Y Y Y N N N
Goa N Y Y Y N circle N N N
Gujarat Y Y Y Y N N Y N N
Haryana Y Y Y Y Y Y N Y N
Himachal Pradesh Y Y Y Y N Y N N N
Jammu & Kashmir Y Y N N N N Y Y N
Jharkhand Y Y N Y N Y N Y N
Karnataka N Y Y Y N N N N N
Kerala Y N square square square square N Y N
Madhya Pradesh N Y N Y N N N N N
Maharashtra N Y N N N N N Y N
Manipur N Y Y N N N Y Y N
Meghalaya N Y N N N Y N N N
Mizoram N Y Y Y N N Y Y N
Nagaland N Y Y N N Y N N N
Odisha N N square square square square Y N N
Puducherry N N square square square square Y N N
Punjab Y Y Y Y N N N N N
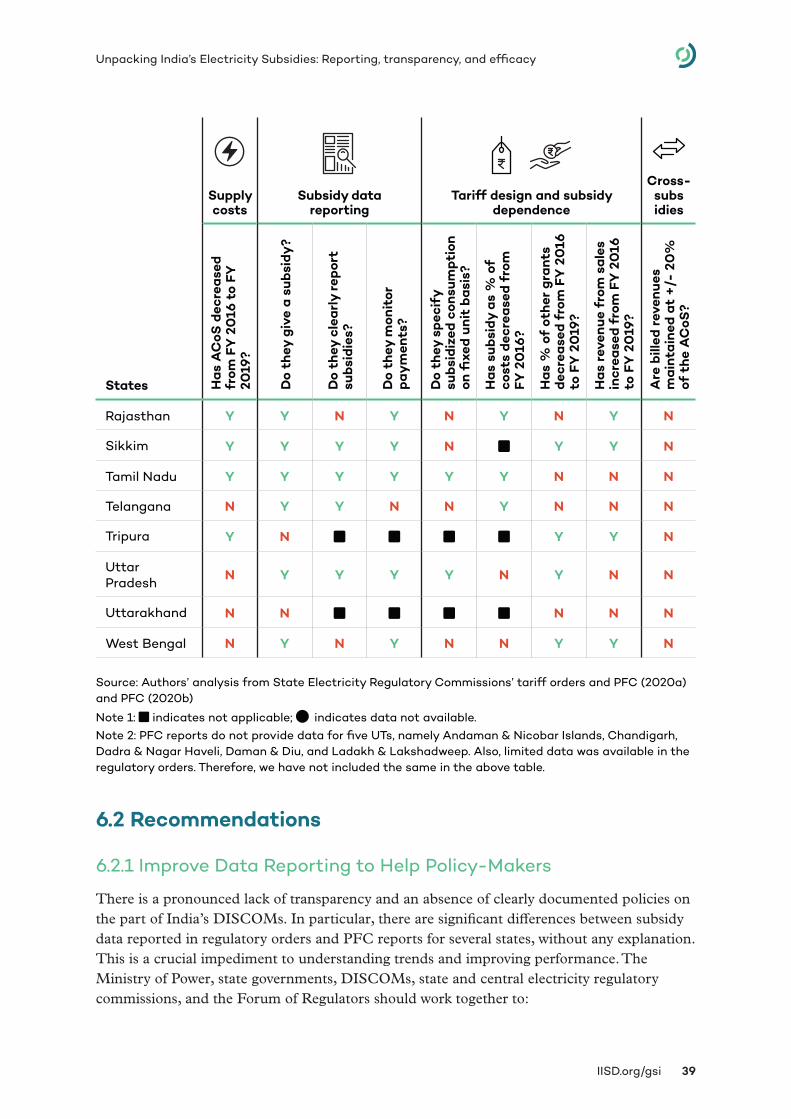
IISD.org/gsi 39
Unpacking India’s Electricity Subsidies: Reporting, transparency, and efficacy
States
Supply costs
Subsidy data reporting
Tariff design and subsidy dependence
Cross-subs idies
Has
AC
oS d
ecre
ased
fr
om F
Y 2
016
to
FY
2019
?
Do
they
giv
e a
subs
idy
?
Do
they
cle
arly
rep
ort
subs
idie
s?
Do
they
mon
itor
pa
ym
ents
?
Do
they
spe
cify
su
bsid
ized
con
sum
ptio
n on
fixe
d un
it b
asis
?
Has
sub
sidy
as
% o
f co
sts
decr
ease
d fr
om
FY 2
016
?
Has
% o
f ot
her
gra
nts
decr
ease
d fr
om F
Y 2
016
to
FY
20
19?
Has
rev
enue
fro
m s
ales
in
crea
sed
from
FY
20
16
to F
Y 2
019
?
Are
bill
ed r
even
ues
mai
ntai
ned
at +
/- 2
0%
of
the
AC
oS?
Rajasthan Y Y N Y N Y N Y N
Sikkim Y Y Y Y N square Y Y N
Tamil Nadu Y Y Y Y Y Y N N N
Telangana N Y Y N N Y N N N
Tripura Y N square square square square Y Y N
Uttar Pradesh N Y Y Y Y N Y N N
Uttarakhand N N square square square square N N N
West Bengal N Y N Y N N Y Y N
Source: Authors’ analysis from State Electricity Regulatory Commissions’ tariff orders and PFC (2020a) and PFC (2020b)
Note 1: square indicates not applicable; circle indicates data not available.Note 2: PFC reports do not provide data for five UTs, namely Andaman & Nicobar Islands, Chandigarh, Dadra & Nagar Haveli, Daman & Diu, and Ladakh & Lakshadweep. Also, limited data was available in the regulatory orders. Therefore, we have not included the same in the above table.
6.2 Recommendations
6.2.1 Improve Data Reporting to Help Policy-Makers
There is a pronounced lack of transparency and an absence of clearly documented policies on the part of India’s DISCOMs. In particular, there are significant differences between subsidy data reported in regulatory orders and PFC reports for several states, without any explanation. This is a crucial impediment to understanding trends and improving performance. The Ministry of Power, state governments, DISCOMs, state and central electricity regulatory commissions, and the Forum of Regulators should work together to:
IISD.org/gsi 40
Unpacking India’s Electricity Subsidies: Reporting, transparency, and efficacy
• Create a uniform reporting format to eliminate differences in data among various reporting sources. The Forum of Regulators should develop uniform formats to ensure the standardization of information and uniform reporting across forums.
• Synchronize the terminology used in regulatory orders across regulatory commissions to enable transparency and easy comparison between DISCOMs’ financial and technical data. It is essential to ensure that there is a clear baseline in place for reforms to deliver visible results on an operational and financial turnaround.
• Mandate transparency on consumer electricity bills and levy penalties for subsidy disbursement delays. Consumer bills should indicate the consumer category tariff determined by the respective electricity regulatory commission, along with the amount of subsidy paid by the respective state governments/UTs. This will increase accountability on the subsidy disbursement process. Several states have already indicated this measure in the tariff regulations, but it needs more widespread implementation. Delhi is one state that has implemented the provision of showing subsidies in consumer bills. Further, practices that have already been implemented by the Punjab Electricity Regulatory Commission to penalize the state government for delays in the release of subsidies should also be implemented by other states. This practice would ensure timely disbursements and fairer sharing of the cost burden in the case of delays.
• Ensure the timely release of regulatory orders and data reports. State electricity regulatory commissions could mandate DISCOMs to publish quarterly reports on crucial issues such as category-wise subsidy quantum committed and disbursed, a schedule of subsidy payments, and details of payment delays. One step further could be a comprehensive and structured repository of information on all DISCOMs’ technical and financial parameters, available online and updated on a regular basis. The Ministry of Power could manage such a portal.
• Commission and publish independent evaluations of attempts to improve DISCOM performance. Successive schemes to help the power sector overcome financial losses have been implemented with limited success. Grants, incentives, and progress under various schemes should be clearly tracked and reported. For example, working capital borrowings and compliance with targets under UDAY should be tracked and reported to better evaluate DISCOMs’ progress. Similarly, schemes for smart meters and deepening the short-term market also require careful reporting. This will help policy-makers assess the shortcomings of both DISCOMs and the implemented schemes and to structure future schemes to fill in these gaps.
6.2.2 Improve Data on Subsidy Distribution to Explore Better Subsidy Targeting
The growth in electricity demand and the increasing pressure on DISCOM finances make it hard to see how DISCOM performance can be improved without some degree of subsidy reform. Given the importance of ensuring affordability for vulnerable consumers, subsidy “targeting”—that is, reducing subsidies for higher-income consumers so that benefits are clustered on and even expanded for lower-income consumers—is important to explore. Better
IISD.org/gsi 41
Unpacking India’s Electricity Subsidies: Reporting, transparency, and efficacy
subsidy targeting will ensure avoiding inefficient use of electricity and improving payments from consumers.
This report shows that agriculture consumers in many states—such as Andhra Pradesh, Gujarat, Karnataka, Punjab, Tamil Nadu, and Uttar Pradesh—continue to receive power for free or at a very nominal rate. Such extremely low tariffs undermine the quality of supply and the trust between agriculture consumers and DISCOMs, and they may also contribute to excessive use of electricity and water pumping. While it is true that agricultural subsidies can be viewed as a type of food subsidy, there are good arguments to focus it on the disadvantaged (Mandal et al., 2020)
A recent study on Jharkhand found that residential electricity subsidies were regressively distributed, with the richest 40% of urban households receiving 60% of electricity subsidies while the poorest 40% only received 25% of subsidies (Sharma et al., 2020). Similar results were observed for rural households. The lack of national data is a major knowledge gap, but with most state DISCOMs having a similar tariff approach as Jharkhand, the study’s findings could represent a larger trend in India, where electricity subsidies are regressively distributed.
Given the diversity across states in terms of their consumer and sales mix, generation and demand profile, political economy, etc., solutions will have to be based on numerous consultations and stakeholder-specific studies, and will then have to be tailored for each state. State governments, DISCOMs, and regulatory authorities should seek to map out the extent to which different groups benefit from electricity subsidies, in order to identify the potential for improved subsidy targeting. Wherever subsidy targeting can be introduced, it can allow for upward tariff revisions for higher-income consumers that do not harm the poor and vulnerable, and this, in turn, can help to enable a reduction in cross-subsidies. They should also explore how subsidies can be shifted out of DISCOM finances. The KUSUM scheme,15 for example, that aims to deploy solar water pumps, can help to reduce on-grid subsidies for agricultural users and also reduce the cost of power procurement and transmission losses (Garg & Shah, 2020; Sen, 2020).
6.2.3 Coordinate DBT Implementation With Subsidy Targeting Efforts
All states are likely to be implementing DBT-P mechanisms for electricity subsidies in the coming years, as well as implementing regulations on electricity consumer rights where DISCOMs will have to pay compensation to consumers through the DBT for problems like electricity outages (Bhaskar, 2020). The DBT-P model will only change the transfer mechanism for subsidies, allowing tariffs to be set at average costs and then providing subsidies when electricity is purchased. It also offers tremendous scope for supporting efforts to improve subsidy targeting. This is particularly important in light of the COVID-19 crisis, which has only increased the importance of ensuring that any change in subsidy policy is socially responsible.
15 KUSUM is short for Pradhan Mantri Kisan Urja Suraksha evem Utthan Mahabhiyan (the scheme to support the installation of off-grid solar pumps in rural areas).
IISD.org/gsi 42
Unpacking India’s Electricity Subsidies: Reporting, transparency, and efficacy
DBT-P implementation could be structured to ensure that the underlying registry of beneficiaries contains data that makes it easier to explore subsidy targeting options in collaboration with agencies that manage non-energy social protection schemes. The DBT-P model could also include an electricity equivalent of the Give It Up campaign for liquefied petroleum gas, where higher-income consumers were encouraged to voluntarily opt out of subsidies. It must be noted that there will be many challenges associated with DBT-P implementation and that all such efforts require careful piloting and evaluation. Before implementing DBT in the whole state, close attention needs to be paid to ongoing pilots and more large-scale pilots with strong monitoring, evaluation, and learning mechanisms to ensure smooth implementation (Rao & Balani, 2020).
6.2.4 Billing and Collection
DISCOMs must continue their ongoing efforts to achieve universal metering of all consumers in order to perform better on the billing and collection front. The right accounting of sales to the agricultural consumers category has a big impact on the financial health of DISCOMs (Working Group for Agricultural Consumption, 2020). There are numerous issues with the achievement of the metering target, starting with DISCOMs’ capital availability to procure adequate meters for their existing unmetered consumers and new consumers. An interim mechanism suggested to bill unmetered agricultural consumers is to charge these consumers at the average agricultural consumption index for the state (Working Group for Agricultural Consumption, 2020). Prayas (Energy Group) (Dharmadhikary et al., 2018) identifies a state government-coordinated approach to determine subsidies and set tariffs to ensure that the larger social perspective of the various interlinked issues in supplying power to the agricultural sector is not ignored. As recommended by the 2016 National Tariff Policy, subsidy levels could be decided based on conditions of the groundwater table—higher subsidies could be allocated to support farmers that require large quantities of electricity for irrigation, provided that suitable measures are in place for maintaining adequate groundwater levels (Ministry of Power 2016).
For the metered categories, the DISCOMs need to ensure timely delivery of accurate bills. For this, DISCOMs need to strengthen their management systems, keep a check on erroneous bills, expand their human resource base, and provide appropriate incentives to meter readers. Existing electricity meters must be progressively replaced by smart meters, including smart prepaid meters. This will help DISCOMs understand and manage their load better and will reduce metering and billing losses and theft (Garg & Shah 2020).
IISD.org/gsi 43
Unpacking India’s Electricity Subsidies: Reporting, transparency, and efficacy
ReferencesAggarwal, P., & Ganesan, K. (2020). Revisiting and resolving Discoms’ legacy issues (Navigating
India’s Power Crisis During Covid-19). https://www.ceew.in/blogs/revisiting-and-resolving-discoms-legacy-issues
Balani, K., Mani, S., & Agrawal, S. (2020). Solving for billing and revenue collection challenges. Council on Energy, Environment and Water. https://www.ceew.in/blogs/solving-billing-and-revenue-collection-challenges
Beaton, C., Viswamohanan, A., & Aggarwal, P. (2020). How can India’s energy sector recover sustainably from COVID-19? International Institute for Sustainable Development. https://www.iisd.org/articles/india-energy-sector-recover-covid-19
Bharadwaj, K., Ganesan, K., & Kuldeep, N. (2017). Retail tariffs for electricity consumers in Bangalore: A forward looking assessment. Council on Energy, Environment and Water.
Bhaskar, U. (2020). India drafts electricity consumers’ rights. Mint. https://www.livemint.com/industry/energy/india-drafts-electricity-consumers-rights-11600248832373.html
Central Electricity Authority (CEA). (2020a). Executive summary on power sector: April 2020. Ministry of Power, Government of India. https://www.cea.nic.in/reports/monthly/executivesummary/2020/exe_summary-04.pdf
Central Electricity Authority. (2020b). Executive summary on power sector: August 2020. Ministry of Power, Government of India. https://cea.nic.in/monthlyexesummary.html
Central Electricity Authority. (2020c). Executive summary on power sector: July 2020. Ministry of Power, Government of India. http://www.cea.nic.in/reports/monthly/executivesummary/2020/exe_summary-07.pdf
Central Electricity Authority. (2020d). Executive summary on power sector: June 2020. Ministry of Power, Government of India. http://www.cea.nic.in/reports/monthly/executivesummary/2020/exe_summary-06.pdf
Central Electricity Authority. (2020e). Executive summary on power sector: May 2020. Ministry of Power, Government of India. https://cea.nic.in/reports/monthly/executivesummary/2020/exe_summary-05.pdf
Central Electricity Authority. (2020f). Executive summary on power sector: September 2020. Ministry of Power, Government of India. https://cea.nic.in/monthlyexesummary.html
CRISIL Infrastructure Advisory. (2019). Diagnostic study of the power distribution sector. Niti Aayog, Government of India. https://niti.gov.in/sites/default/files/2019-08/Final%20Report%20of%20the%20Research%20Study%20on%20Diagnostic%20Study%20for%20power%20Distribution_CRISIL_Mumbai.pdf
Das, N., Dabadge, A., Chirayil, M., Mandal, M., & Josey, A. (2019). Elephant in the room: Implications of subsidy practices on DISCOM finances. Prayas (Energy Group). https://www.prayaspune.org/peg/publications/item/419-elephant-in-the-room-implications-of-subsidy-practices-on-discom-finances.html
IISD.org/gsi 44
Unpacking India’s Electricity Subsidies: Reporting, transparency, and efficacy
Devaguptapu, R., & Tongia, R. (2020). Reconciling DisCom ‘stimulus’ and dues: We must look beyond the tip of the iceberg. Centre for Social and Economic Progress. https://csep.org/impact-paper/reconciling-discom-stimulus-and-dues-we-must-look-beyond-the-tip-of-the-iceberg/
Dharmadhikary, S., Bhalerao, R., Dabadge, A., & Sreekumar, N. (2018). Understanding the electricity, water, agriculture linkages (Vol. 2). Prayas (Energy Group). https://www.prayaspune.org/peg/publications/item/395-understanding-the-electricity-water-and-agriculture-linkages.html
Forum of Regulators. (n.d.) Model Regulations for Multi Year Distribution Tariff. http://www.forumofregulators.gov.in/Data/study/Model_Tariff_Regulations__14_11.pdf
Ganesan, K., & Aggarwal, P. (2020). Addressing the power sector’s Achilles heel. Economic Times. https://energy.economictimes.indiatimes.com/news/power/opinion-addressing-the-power-sectors-achilles-heel/78125403
Garg, V., Viswanathan, B., Narayanaswamy, D., Beaton, C., Ganesan, K., Sharma, S., & Bridle, R. (2020). Mapping India’s energy subsidies 2020: Fossil fuels, renewables, and electric vehicles. Global Subsidies Initiative of the International Institute for Sustainable Development. https://www.iisd.org/sites/default/files/publications/india-energy-transition-2020.pdf.
Garg, V.,& Shah, K. (2020). The curious case of India’s Discoms: How renewable energy could reduce their financial distress. Institute for Energy Economics and Financial Analysis. https://ieefa.org/wp-content/uploads/2020/08/The-Curious-Case-of-Indias-Discoms_August-2020.pdf
Haryana Electricity Regulatory Commission. (2019). Distribution and Retail Supply Tariff Determination FY2020 for Uttar Haryana Bijli Vitaran Nigam Limited (UHBVNL) and Dakshin Haryana Bijli Vitaran Nigam Limited (DHBVNL).
IANS Agency. (2020). States to get 2 years for dbt, a/cs with Discoms to be used: Power minister. ETEnergyworld.com https://energy.economictimes.indiatimes.com/news/power/states-to-get-2-years-for-dbt-a/cs-with-discoms-to-be-used-power-minister/77851427
Inflation Tool. (2019). Inflation calculator: Indian Rupee. https://www.inflationtool.com/indian-rupee?amount=100&year1=2016&year2=2019
International Energy Agency. (2020). India 2020: Energy Policy Review. https://webstore.iea.org/download/direct/2933?fileName=India_2020-Policy_Energy_Review.pdf
Josey, A. (2018, August 12). DBT for Power: Prepare the ground first. HinduBusinessLine. https://www.thehindubusinessline.com/opinion/dbt-for-power-prepare-the-ground-first/article25569297.ece
Mandal, M., Nhalur, S. & Josey, A. (2020, October). The critical role of state government revenue subsidy in electricity supply. Prayas (Energy Group). https://www.prayaspune.org/peg/publications/item/471-the-critical-role-of-state-government-revenue-subsidy-in-electricity-supply.html
Ministry of Power. (2016). National Tariff Policy, 2016.
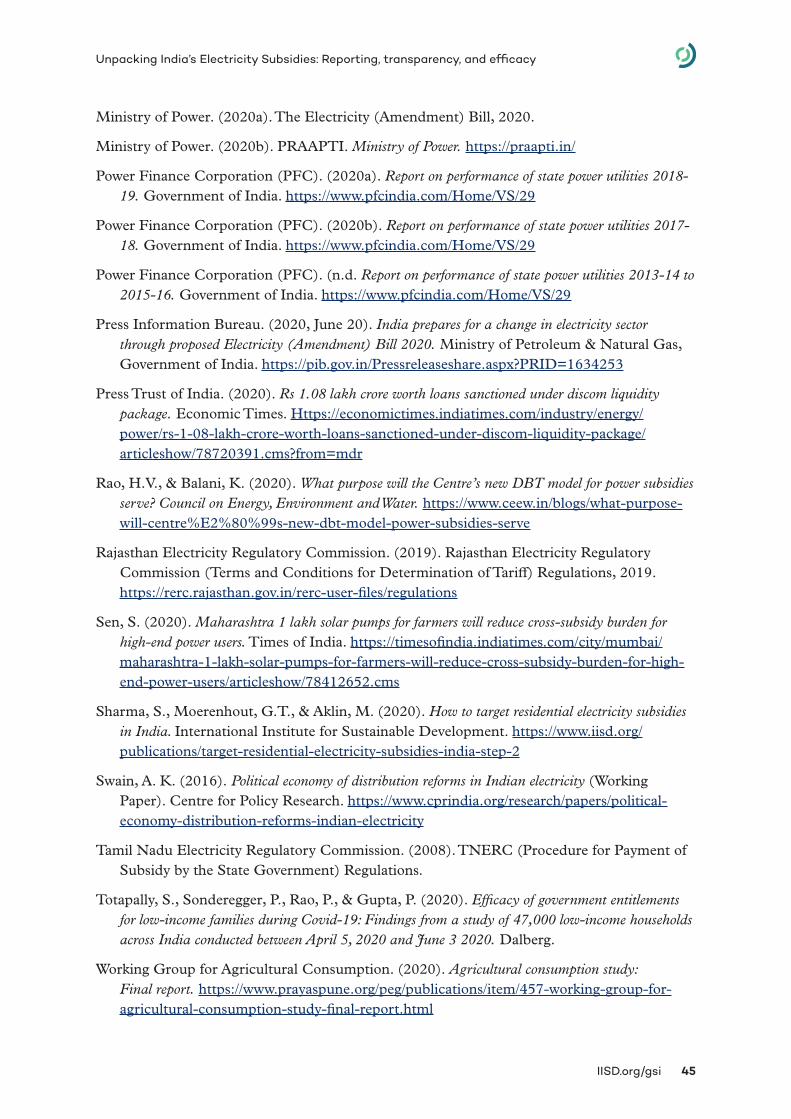
IISD.org/gsi 45
Unpacking India’s Electricity Subsidies: Reporting, transparency, and efficacy
Ministry of Power. (2020a). The Electricity (Amendment) Bill, 2020.
Ministry of Power. (2020b). PRAAPTI. Ministry of Power. https://praapti.in/
Power Finance Corporation (PFC). (2020a). Report on performance of state power utilities 2018-19. Government of India. https://www.pfcindia.com/Home/VS/29
Power Finance Corporation (PFC). (2020b). Report on performance of state power utilities 2017-18. Government of India. https://www.pfcindia.com/Home/VS/29
Power Finance Corporation (PFC). (n.d. Report on performance of state power utilities 2013-14 to 2015-16. Government of India. https://www.pfcindia.com/Home/VS/29
Press Information Bureau. (2020, June 20). India prepares for a change in electricity sector through proposed Electricity (Amendment) Bill 2020. Ministry of Petroleum & Natural Gas, Government of India. https://pib.gov.in/Pressreleaseshare.aspx?PRID=1634253
Press Trust of India. (2020). Rs 1.08 lakh crore worth loans sanctioned under discom liquidity package. Economic Times. Https://economictimes.indiatimes.com/industry/energy/power/rs-1-08-lakh-crore-worth-loans-sanctioned-under-discom-liquidity-package/articleshow/78720391.cms?from=mdr
Rao, H.V., & Balani, K. (2020). What purpose will the Centre’s new DBT model for power subsidies serve? Council on Energy, Environment and Water. https://www.ceew.in/blogs/what-purpose-will-centre%E2%80%99s-new-dbt-model-power-subsidies-serve
Rajasthan Electricity Regulatory Commission. (2019). Rajasthan Electricity Regulatory Commission (Terms and Conditions for Determination of Tariff) Regulations, 2019. https://rerc.rajasthan.gov.in/rerc-user-files/regulations
Sen, S. (2020). Maharashtra 1 lakh solar pumps for farmers will reduce cross-subsidy burden for high-end power users. Times of India. https://timesofindia.indiatimes.com/city/mumbai/maharashtra-1-lakh-solar-pumps-for-farmers-will-reduce-cross-subsidy-burden-for-high-end-power-users/articleshow/78412652.cms
Sharma, S., Moerenhout, G.T., & Aklin, M. (2020). How to target residential electricity subsidies in India. International Institute for Sustainable Development. https://www.iisd.org/publications/target-residential-electricity-subsidies-india-step-2
Swain, A. K. (2016). Political economy of distribution reforms in Indian electricity (Working Paper). Centre for Policy Research. https://www.cprindia.org/research/papers/political-economy-distribution-reforms-indian-electricity
Tamil Nadu Electricity Regulatory Commission. (2008). TNERC (Procedure for Payment of Subsidy by the State Government) Regulations.
Totapally, S., Sonderegger, P., Rao, P., & Gupta, P. (2020). Efficacy of government entitlements for low-income families during Covid-19: Findings from a study of 47,000 low-income households across India conducted between April 5, 2020 and June 3 2020. Dalberg.
Working Group for Agricultural Consumption. (2020). Agricultural consumption study: Final report. https://www.prayaspune.org/peg/publications/item/457-working-group-for-agricultural-consumption-study-final-report.html
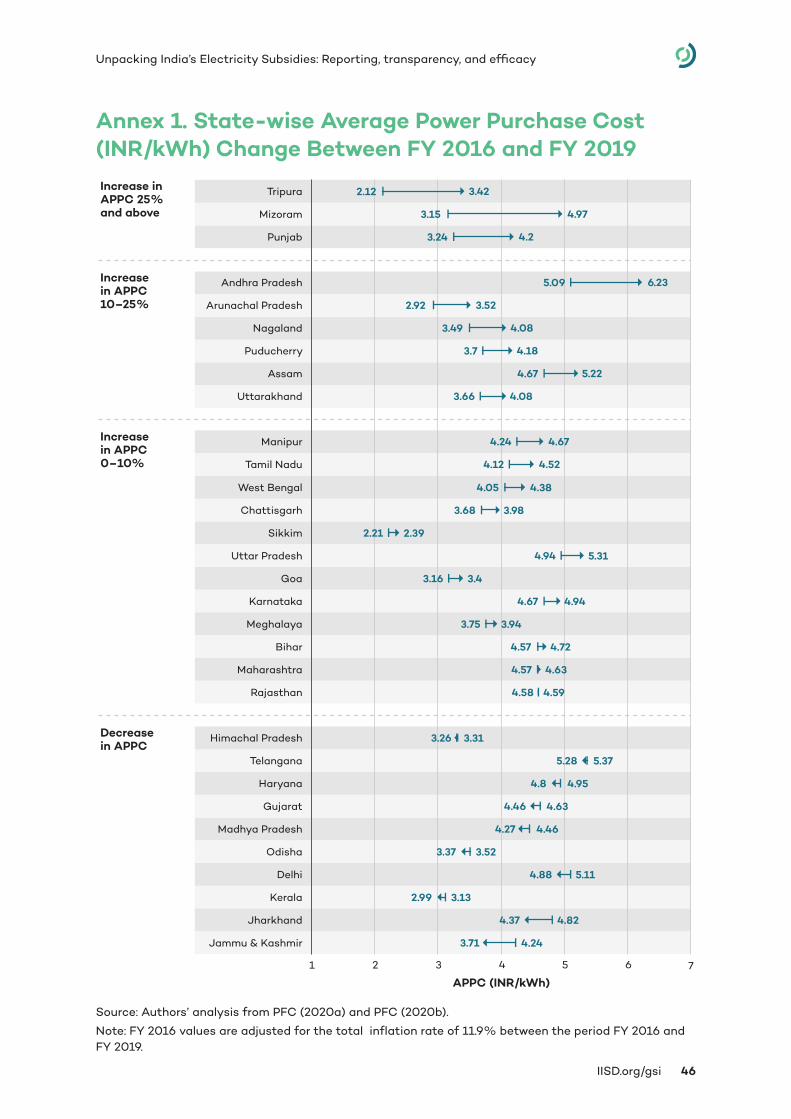
IISD.org/gsi 46
Unpacking India’s Electricity Subsidies: Reporting, transparency, and efficacy
Annex 1. State-wise Average Power Purchase Cost (INR/kWh) Change Between FY 2016 and FY 2019
Source: Authors’ analysis from PFC (2020a) and PFC (2020b).
Note: FY 2016 values are adjusted for the total inflation rate of 11.9% between the period FY 2016 and FY 2019.
Increase inAPPC 25%and above
Increase in APPC 10–25%
Increase in APPC 0–10%
Decrease in APPC
1 2 3 4 5 6 7
Jammu & Kashmir
Jharkhand
Kerala
Delhi
Odisha
Madhya Pradesh
Gujarat
Haryana
Telangana
Himachal Pradesh
Rajasthan
Maharashtra
Bihar
Meghalaya
Karnataka
Goa
Uttar Pradesh
Sikkim
Chattisgarh
West Bengal
Assam
Puducherry
Nagaland
Arunachal Pradesh
Andhra Pradesh
Punjab
Mizoram
Tripura
3.71
4.37
2.99
4.88
3.37
4.27
4.46
4.8
5.28
3.26
4.58
4.57
4.57
3.75
4.67
3.16
4.94
2.21
3.68
4.05
4.67
3.7
3.49
2.92
5.09
3.24
3.15
2.12
4.24
4.82
3.13
5.11
3.52
4.46
4.63
4.95
5.37
3.31
4.59
4.63
4.72
3.94
4.94
3.4
5.31
2.39
3.98
4.38
Tamil Nadu
Manipur
4.12
4.24
4.52
4.67
Uttarakhand 3.66 4.08
5.22
4.18
4.08
3.52
6.23
4.2
4.97
3.42
APPC (INR/kWh)
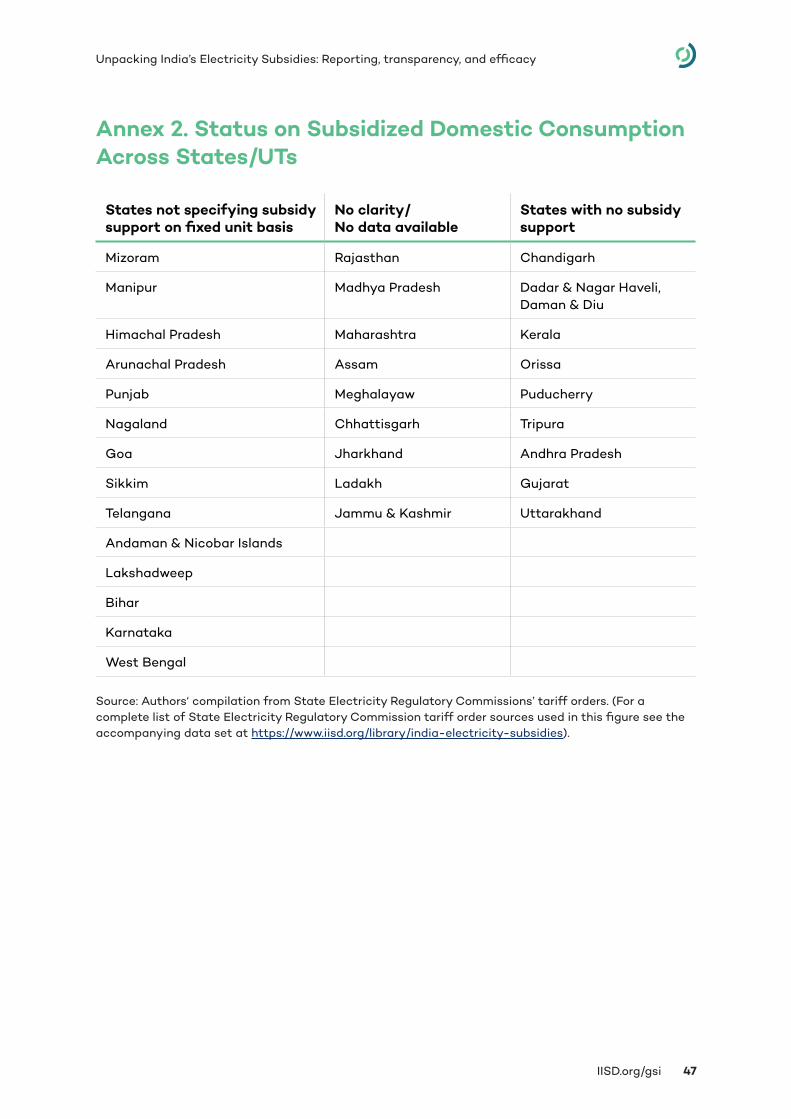
IISD.org/gsi 47
Unpacking India’s Electricity Subsidies: Reporting, transparency, and efficacy
Annex 2. Status on Subsidized Domestic Consumption Across States/UTs
States not specifying subsidy support on fixed unit basis
No clarity/ No data available
States with no subsidy support
Mizoram Rajasthan Chandigarh
Manipur Madhya Pradesh Dadar & Nagar Haveli, Daman & Diu
Himachal Pradesh Maharashtra Kerala
Arunachal Pradesh Assam Orissa
Punjab Meghalayaw Puducherry
Nagaland Chhattisgarh Tripura
Goa Jharkhand Andhra Pradesh
Sikkim Ladakh Gujarat
Telangana Jammu & Kashmir Uttarakhand
Andaman & Nicobar Islands
Lakshadweep
Bihar
Karnataka
West Bengal
Source: Authors‘ compilation from State Electricity Regulatory Commissions’ tariff orders. (For a complete list of State Electricity Regulatory Commission tariff order sources used in this figure see the accompanying data set at https://www.iisd.org/library/india-electricity-subsidies).
IISD.org/gsi 48
Unpacking India’s Electricity Subsidies: Reporting, transparency, and efficacy
Annex 3. Subsidizing and Subsidized Categories Comparison Across States Between FY 2016 and FY 2019
Source: Authors’ analysis from PFC (2020a) and PFC (2020b)
Note: For the convenience of scaling, we have kept smaller and larger states in separate figures.
0
200
40
0
60
0
80
0
100
300
500
700
90
0
80
0
60
0
40
0
200
90
0
700
500
1,4
00
1,20
0
1,0
00
1,30
0
1,10
0
300
100
Domestic Commercial Agricultural Industrial Others
Arunachal Pradesh FY 19
FY 16
Goa FY 19
FY 16
FY 19Himachal Pradesh
FY 16
Jammu & Kashmir FY 19
FY 16
Manipur FY 19
FY 16
Mizoram FY 19
FY 16
Meghalaya FY 19
FY 16
Nagaland FY 19
FY 16
Puducherry FY 19
FY 16
Sikkim FY 19
FY 16
Tripura FY 19
FY 16
Uttarakhand FY 19
FY 16
152
73
219
188
565
597
1,306
1,105
123
162
149
52
98
143
430
169
161
117
36
134
0
159
556
162
0
0
318
223
483
350
344
207
2
0
0
0
104
103
0
0
364
263
91
15
217
85
552
826
Cross-subsidy providedCross-subsidy required
INR Crore
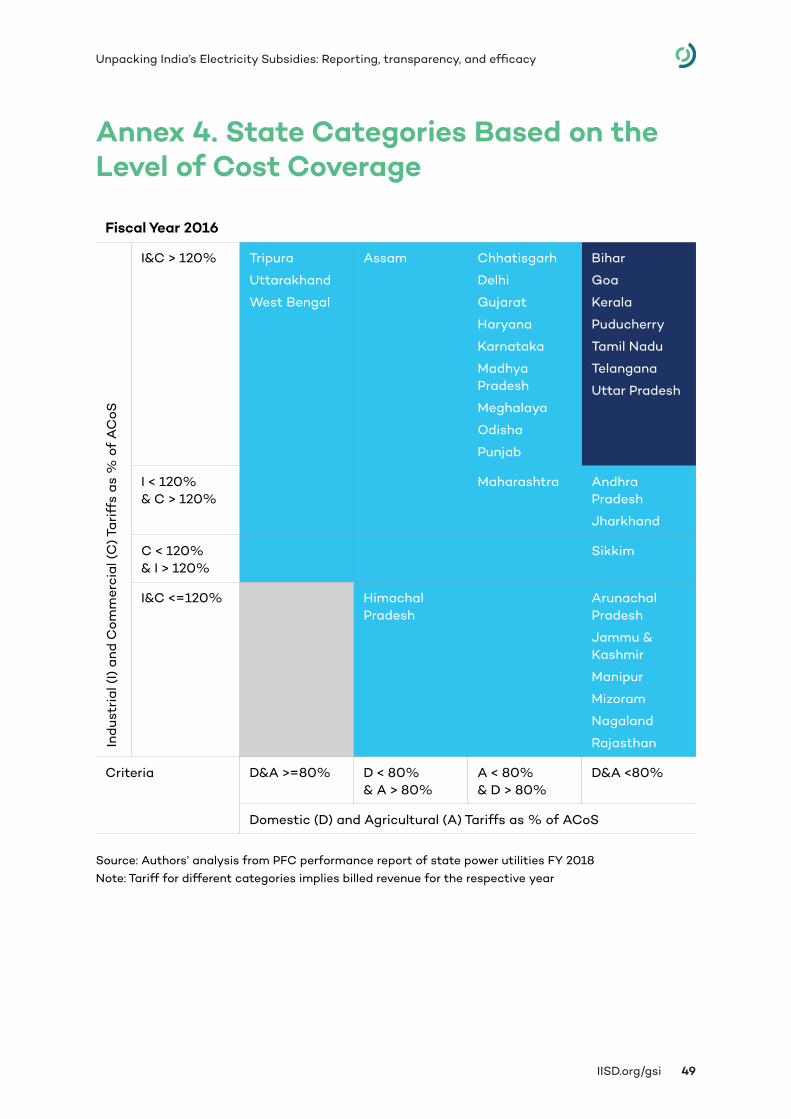
IISD.org/gsi 49
Unpacking India’s Electricity Subsidies: Reporting, transparency, and efficacy
Annex 4. State Categories Based on the Level of Cost Coverage
Fiscal Year 2016
Ind
ustr
ial (
I) a
nd C
omm
erci
al (
C) T
ari
ffs
as
% o
f A
CoS
I&C > 120% Tripura
Uttarakhand
West Bengal
Assam Chhatisgarh
Delhi
Gujarat
Haryana
Karnataka
Madhya Pradesh
Meghalaya
Odisha
Punjab
Bihar
Goa
Kerala
Puducherry
Tamil Nadu
Telangana
Uttar Pradesh
I < 120% & C > 120%
Maharashtra Andhra Pradesh
Jharkhand
C < 120% & I > 120%
Sikkim
I&C <=120% Himachal Pradesh
Arunachal Pradesh
Jammu & Kashmir
Manipur
Mizoram
Nagaland
Rajasthan
Criteria D&A >=80% D < 80% & A > 80%
A < 80% & D > 80%
D&A <80%
Domestic (D) and Agricultural (A) Tariffs as % of ACoS
Source: Authors’ analysis from PFC performance report of state power utilities FY 2018Note: Tariff for different categories implies billed revenue for the respective year
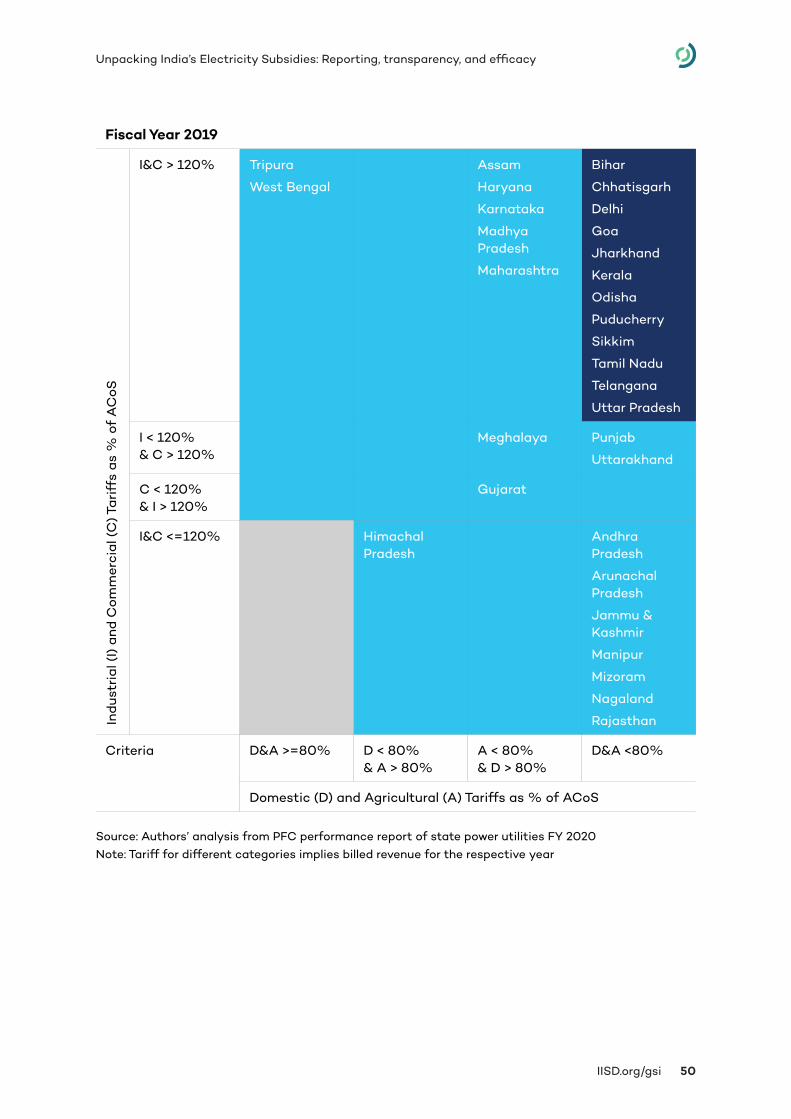
IISD.org/gsi 50
Unpacking India’s Electricity Subsidies: Reporting, transparency, and efficacy
Fiscal Year 2019
Ind
ustr
ial (
I) a
nd C
omm
erci
al (
C) T
ari
ffs
as
% o
f A
CoS
I&C > 120% Tripura
West Bengal
Assam
Haryana
Karnataka
Madhya Pradesh
Maharashtra
Bihar
Chhatisgarh
Delhi
Goa
Jharkhand
Kerala
Odisha
Puducherry
Sikkim
Tamil Nadu
Telangana
Uttar Pradesh
I < 120% & C > 120%
Meghalaya Punjab
Uttarakhand
C < 120% & I > 120%
Gujarat
I&C <=120% Himachal Pradesh
Andhra Pradesh
Arunachal Pradesh
Jammu & Kashmir
Manipur
Mizoram
Nagaland
Rajasthan
Criteria D&A >=80% D < 80% & A > 80%
A < 80% & D > 80%
D&A <80%
Domestic (D) and Agricultural (A) Tariffs as % of ACoS
Source: Authors’ analysis from PFC performance report of state power utilities FY 2020Note: Tariff for different categories implies billed revenue for the respective year