Embed Size (px)
Citation preview
�����������������
Citation: Sziva, R.E.; Ács, J.; Tokés,
A.-M.; Korsós-Novák, Á.; Nádasy,
G.L.; Ács, N.; Horváth, P.G.; Szabó,
A.; Ke, H.; Horváth, E.M.; et al.
Accurate Quantitative
Histomorphometric-Mathematical
Image Analysis Methodology of
Rodent Testicular Tissue and Its
Possible Future Research
Perspectives in Andrology and
Reproductive Medicine. Life 2022, 12,
189. https://doi.org/10.3390/
life12020189
Academic Editors:
Renata Walczak-Jedrzejowska,
Małgorzata Piasecka,
Jolanta Słowikowska-Hilczer and
Paola Grimaldi
Received: 25 September 2021
Accepted: 21 January 2022
Published: 27 January 2022
Publisher’s Note: MDPI stays neutral
with regard to jurisdictional claims in
published maps and institutional affil-
iations.
Copyright: © 2022 by the authors.
Licensee MDPI, Basel, Switzerland.
This article is an open access article
distributed under the terms and
conditions of the Creative Commons
Attribution (CC BY) license (https://
creativecommons.org/licenses/by/
4.0/).
life
Article
Accurate Quantitative Histomorphometric-Mathematical ImageAnalysis Methodology of Rodent Testicular Tissue and ItsPossible Future Research Perspectives in Andrology andReproductive MedicineRéka Eszter Sziva 1,2,3,* , Júlia Ács 1,2, Anna-Mária Tokés 4, Ágnes Korsós-Novák 5, György L. Nádasy 2 ,Nándor Ács 1, Péter Gábor Horváth 6, Anett Szabó 7, Haoran Ke 2, Eszter Mária Horváth 2,†, Zsolt Kopa 7,†
and Szabolcs Várbíró 1,3,†
1 Department of Obstetrics and Gynecology, Semmelweis University, Ülloi Street 78/a,1082 Budapest, Hungary; [email protected] (J.Á.); [email protected] (N.Á.);[email protected] (S.V.)
2 Department of Physiology, Semmelweis University, Tuzoltó Street 37-47, 1094 Budapest, Hungary;[email protected] (G.L.N.); [email protected] (H.K.);[email protected] (E.M.H.)
3 Workgroup of Research Management, Doctoral School, Semmelweis University, Ülloi Street 22,1085 Budapest, Hungary
4 2nd Department of Pathology, Semmelweis University, Ülloi Street 93, 1091 Budapest, Hungary;[email protected]
5 Department of Pathology, Géza Hetényi Hospital, Tószegi Street 21, 5000 Szolnok, Hungary;[email protected]
6 Budapest 3rd District General Practitioner, Hegyestu Bt., Füst Milán Street 28, 1039 Budapest, Hungary;[email protected]
7 Andrology Centre, Department of Urology, Semmelweis University, Ülloi Street 78/b,1082 Budapest, Hungary; [email protected] (A.S.); [email protected] (Z.K.)
* Correspondence: [email protected]† These authors contributed equally to this work.
Abstract: Infertility is increasing worldwide; male factors can be identified in nearly half of allinfertile couples. Histopathologic evaluation of testicular tissue can provide valuable informationabout infertility; however, several different evaluation methods and semi-quantitative score sys-tems exist. Our goal was to describe a new, accurate and easy-to-use quantitative computer-basedhistomorphometric-mathematical image analysis methodology for the analysis of testicular tissue.On digitized, original hematoxylin-eosin (HE)-stained slides (scanned by slide-scanner), quantita-tively describable characteristics such as area, perimeter and diameter of testis cross-sections andof individual tubules were measured with the help of continuous magnification. Immunohisto-chemically (IHC)-stained slides were digitized with a microscope-coupled camera, and IHC-stainingintensity measurements on digitized images were also taken. Suggested methods are presented withmathematical equations, step-by-step detailed characterization and representative images are given.Our novel quantitative histomorphometric-mathematical image analysis method can improve thereproducibility, objectivity, quality and comparability of andrological-reproductive medicine researchby recognizing even the mild impairments of the testicular structure expressed numerically, whichmight not be detected with the present semi-quantitative score systems. The technique is apt to besubjected to further automation with machine learning and artificial intelligence and can be named‘Computer-Assisted or -Aided Testis Histology’ (CATHI).
Keywords: quantitative histomorphometry; mathematical image analysis; method; digital pathology;testis; research; andrology; reproductive medicine; future
Life 2022, 12, 189. https://doi.org/10.3390/life12020189 https://www.mdpi.com/journal/life
Life 2022, 12, 189 2 of 19
1. Introduction
Infertility incidence and prevalence are increasing worldwide, up to 15% of reproductive-aged couples are affected by infertility according to the World Health Organization [1].
According to the International Glossary on Infertility and Fertility Care, infertility canbe defined as: ‘a disease characterized by the failure to establish a clinical pregnancy after12 months of regular, unprotected sexual intercourse or due to an impairment of a person’scapacity to reproduce either as an individual or with his/her partner. Fertility interventionsmay be initiated in less than 1 year based on medical, sexual and reproductive history; age;physical findings and diagnostic testing. Infertility is a disease, which generates disabilityas an impairment of function.’ [2].
In Europe, the cause of infertility is unknown in 10–15% of infertile couples, andamong those cases, male factors can be identified in approximately 45–50% [3]. Thus, basic,translational and clinical research in the field of andrology and reproductive medicine areof the utmost importance. Histopathological evaluation of testicular tissue in these studiesis also of great importance and can provide valuable information about spermatogenesisand fertility. Beside these research studies, in case of diagnostic andrological evaluation,human testicular histological sampling can improve our knowledge of male infertility.
Nowadays, from a clinical diagnostic point of view, several 1 to 10 or 0 to 10 pointsscore systems have been developed based on the microscopic view of the testicular tissue,such as the Johnsen score [4], Modified Johnsen or de Kretser and Holstein score [5] and theBergmann-Kliesch score [6,7]. The Johnsen score evaluates all of the tubular section in onesection of the sample and gives scores from 1–10 according to the number and presenceor absence of spermatozoa, spermatids, spermatocytes, spermatogonia, Sertoli cells andorganization of the germinal epithelium [4], while the modified Johnsen or De Kretser andHolstein score introduced the concept of complete, normal and incomplete spermatogenesisand differentiated between late and early spermatids [7]. The Bergmann-Kliesch scorecompares the number of tubules containing elongated late spermatids and sperm to thetotal number of tubules on the sample and gives 0–10 points according to the calculatedpercentages [6,7]. These score systems are semi-quantitative and do not provide exactquantitative numerical details of the structure of the spermatogenic epithelium, tubules ortestis tissue.
However, quantitative histometric or morphometric analysis of the testicular tissueis not an unknown field of andrology. In as early as the 1950s–1990s, numerous lightand electron microscopic methods were developed, mostly points- or lines-signed micro-scope eyepieces with fix magnification and a predetermined number of investigated livecross-sectioned microscopic fields were used to identify or score the different componentsof animal and human testicular tissue in various andrological conditions. The distinctmeasured or counted components were seminiferous tubules; germinal or spermatogenicepithelium and lumen; spermatogenic cell types (spermatogonia, spermatocytes, sper-matids); different cycles, stages and kinetics of the seminiferous epithelium; Sertoli cells;interstitial and connective tissue; intertubular space cell types (e.g., Leydig cells, fibroblasts)and other distinct cells and debris [8–40].
These microscopic methods were complicated, heterogenous and time-consuming,although really creative and innovative at the time.
Later, the improvement of microscope and computer techniques made it possibleto create a microscope-coupled camera, and several image analysis programs have beendeveloped which allowed the examination of the live microscopic images. Furthermore,capture of these live microscopic images on fixed magnifications (5×, 10×, 20×, 40×, 100×or higher) resulted in digitized images where several various quantitative measurementson testicular components could be taken for further research purposes [41–46]. However, inorder to investigate the whole testicular tissue, a huge number of digitized images wouldbe necessary. Moreover, these evaluation techniques are not uniform; thus, the results arenot completely comparable.
Life 2022, 12, 189 3 of 19
Here we would like to present and describe a new, useful and accurate quantitativehistomorphometric-mathematical image analysis methodology of testicular tissue, whichcould be used not only in basic animal and translational research but which could hopefully,in the future, help the human clinical diagnostics and may contribute to the future researchperspectives of andrology and reproductive medicine. As basic and translational androlog-ical researches are often carried out on rodents nowadays, we used rodent testicular tissuefrom one of our previous experiments; however, our technique could also be easily appliedto human testicular tissue.
2. Materials and Methods: Basic Methodology and Conceptions2.1. Rodent Testicular Histology Sections for Quantitative Image Analysis2.1.1. Animals, Standard and Immunohistochemical Stainings
Different vitamin D status was induced in 22 4-week-old male Wistar rats in an8-week-long experiment. The control group (n = 11) received conventional vitamin D con-taining rat chow with additional vitamin D supplementation, whereas vitamin D deficient(VDD) animals (n = 11) received a special vitamin D-free diet [47]. After 8 weeks, serum25-hydroxivitamin D levels indicated a significant, fivefold reduction in the VDD groupcompared with the control animals [48]; these results validated our model.
The testes of the sacrificed animals were removed. After weighing them, the testeswere freshly fixed with 4% paraformaldehyde, embedded in paraffin. Native and standardhematoxylin-eosin (HE) stained sections were made. HE-stained sections from differentgroups were used to present our accurate quantitative histomorphometric-mathematicalimage analysis measurement, and native slides were stained against VDR and MAGE-A4to present our immunohistochemical evaluation method.
2.1.2. Digitization of the Stained Testis Tissue Cross Sections
HE-stained cross sections were digitized and scanned with slide-scanner (PANNORAM-IC® 1000 DX, 3DHISTECH Ltd., Budapest, Hungary) and a free-access slide-viewingsoftware from the same firm, CaseViewer, was used (CaseViewer 2.3.0.99276, 3DHISTECHLtd., Budapest, Hungary) in order to allow visualization and evaluation of the whole testiscross section (Figure 1).
Immunohistochemical (IHC) VDR- and MAGE-A4-stained sections were digitizedwith a microscope-coupled camera (Nikon Eclipse Ni-U, 933584 microscope with NikonDS-Ri2 camera, NIS Elements BR image software, Nikon Corporation, Minato City, Tokyo,Japan). Randomized pictures were taken on 10× magnification and each picture repre-sented at least 6–8 whole seminiferous tubules. Fourteen pictures were made of eachtestis per group. The use of microscope-coupled camera-made images is beneficial for theimmunohistochemical staining intensity measurements because the microscope-coupledcamera provided high-resolution images of the staining of the tubules. This method al-lowed the visualization of at least 80–100 pieces of IHC-stained whole tubules in the caseof rat testis (Figure 2).
2.2. Quantitative Histomorphometric-Mathematical Image Analysis Measurements onDigitized Pictures
For our novel quantitative histomorphometric-mathematical image analysis measure-ments the slide-viewing CaseViewer software was used (CaseViewer 2.3.0.99276, 3DHIS-TECH Ltd., Budapest, Hungary). This program allows the use of any magnification(Figure 1a–d) and can measure the concrete area, perimeter, length and ‘thickness’, insquare-micrometers (µm2) and micrometers (µm), of any organ or tissue compartmenton the scanned slides with the appropriate settings and calibration. This method ensuresthat the whole testis cross section of typical laboratory animals, which are commonlyused in andrological basic and translational research (e.g., rodents, rats, mice) or evenhuman testis tissues from biopsies or surgical-microsurgical operational procedures, canalso be visualized, continuously magnified and quantitatively measured and evaluated.
Life 2022, 12, 189 4 of 19
Another benefit of the program is that the measured data are exportable into an Excel-file forfurther computations.
2.2.1. Geometrical Measurements on Scanned Standard Hematoxylin-Eosin-Stained Slides
The visibility of the whole testis tissue or biopsy cross sections provides the possibilityto count and measure several accurate histomorphometric-mathematical parameters.
The testis can be divided into capsule, seminiferous tubules and interstitium. A single sem-iniferous tubule can be divided further into lamina basalis and seminiferous or spermatogenicepithelium (SE) with intratubular lumina [33]. The cross section of the seminiferous tubulecan be further subdivided into lamina basalis, Sertoli cells, Sertoli cell nucleus, spermatogo-nia, spermatocytes, round spermatids, elongated spermatids and tubular lumen [49]. Theinterstitium contains peritubular myoid cells, blood vessels, collagen fibers, intercellularspace, Leydig cells, macrophages and lymphatic vessels [33]. However, the condition ofspermatogenic epithelium of one tubule is affected by the particular stage of spermatogenicwave, the characteristics of which are species-specific [50,51].
In accordance with the morphometric model, the following histomorphometric-mathem-atical parameters can be determined:
Total Seminiferous Tubule Number
We can count all seminiferous tubules (both cross- and longitudinal-sectioned tubules)on the cross section of the testis tissue. One can use the ’Take a snap’ option of the programor take a ‘PrintScreen’ on a certain magnification where the whole testis cross section andall of the tubules can be seen well and use Microsoft Paint software (Microsoft Corporation,Redmond, WA, USA) to make JPEG or TIFF images. Then each tubular cross section can benumbered (unit: pieces). It can serve also as an internal control (Figure 3b–d).
The Counting of ‘Elongated Spermatid-Positive’ Seminiferous Tubules to Determine‘Histomorphometric’ Bergmann-Kliesch Percentage Score
Having counted all of the seminiferous tubules, we can determine which tubulescontain elongated spermatids (spermatid cells which have an elongated head and are nolonger attached to spermatogenic epithelium) indicating spermatogenesis and which donot; thus ‘Histomorphometric’ Bergmann-Kliesch score can be calculated:
′Histomorphometric′ Bergmann−Kliesch score percentage (%) =′Elongated spermatid− positive′ seminiferous tubules (pieces)
Total seminiferous tubule number (pieces)× 100. (1)
Internal control images are also useful to sign the ‘elongated spermatid-positive’ tubules.
Total Testis Tissue Cross-Section Area, Perimeter and Average Total Testis Tissue Diameter
With accurate manual round-selection of the whole testis tissue cross section, Case-Viewer program measures area (unit: µm2) and perimeter (unit: µm).
The two longest perpendicular (e.g., horizontal and vertical) diameters (unit: µm) canalso be measured, and using the average calculation, the average total testis tissue diameter(unit: µm) can be defined (Figure 3e–g):
Average total testis tissue diameter (µm) ==Total testis tissue diameter (µm)1 + Total testis tissue diameter (µm)2⊥1
2(2)
Random Choice of Predetermined Number of Seminiferous Tubule Cross-Sections forFurther Detailed Investigation
To get an even deeper insight into the morphology of individual tubules, we have todetermine how many tubules should be included in the study and choose a random selec-tion of them. Longitudinally-sectioned tubules are inappropriate for these measurements.In case of animal studies, the number depends on the size of the animals (e.g., rat testesare larger than mouse testes). We can perform preliminary power-analysis to determinethe number of tubules to be tested or just choose 75–100 pieces of seminiferous tubules perexperimental animal to ensure adequate sampling.
Life 2022, 12, 189 5 of 19
One further complication is that human testis biopsy and histological samples fromsurgical-microsurgical operations are much smaller than a whole rodent testis cross section.In this case it is advantageous to include all available cross-sectioned tubules in the sample.
Life 2022, 12, x FOR PEER REVIEW 5 of 20
Random Choice of Predetermined Number of Seminiferous Tubule Cross-Sections for Further Detailed Investigation
To get an even deeper insight into the morphology of individual tubules, we have to determine how many tubules should be included in the study and choose a random se-lection of them. Longitudinally-sectioned tubules are inappropriate for these measure-ments. In case of animal studies, the number depends on the size of the animals (e.g., rat testes are larger than mouse testes). We can perform preliminary power-analysis to deter-mine the number of tubules to be tested or just choose 75–100 pieces of seminiferous tu-bules per experimental animal to ensure adequate sampling.
One further complication is that human testis biopsy and histological samples from surgical-microsurgical operations are much smaller than a whole rodent testis cross sec-tion. In this case it is advantageous to include all available cross-sectioned tubules in the sample.
Area and perimeter measurements, calculations With accurate manual round-selection of the ‘cell-border’ of a tubule and the lumen
of the tubule, we can determine area and perimeter characteristics of one single tubule (Figure 4a–c): • Seminiferous tubule area (μm2) and perimeter (μm) • Seminiferous tubule lumen area (μm2) and perimeter (μm)
In case of tubular area measurement, we have to be careful to identify the tubule we have chosen and do not include the tubule wall. Otherwise repeated measurements can deform the statistics. In addition, when assigning the lumen of a tubule, we should precisely follow the luminal border. Although clear limits can be determined in certain cases, it is also possible that the borders of the lumen cannot be distin-guished clearly from the spermatogenic epithelium (e.g., head of the sperm is still in Sertoli cell—in the spermatogenic epithelium—but the tail belongs to the lumen al-ready). In this case, it might help if we consider the border to be the neck or midpiece of the sperm which is already separated from Sertoli cells.
• Spermatogenic epithelium area (μm2) From the abovementioned measured characteristics of a tubule, we can calculate the spermatogenic epithelium area of one particular tubule if we extract the lumen-area from the tubule-area of the tubule in question by using the following equation: Spermatogenic epithelium area (μm ) == Seminiferous tubule area (μm ) − Seminiferous tubule lumen area (μm )
(3)
• Spermatogenic epithelium area ratio (%) A ratio of spermatogenic epithelium area and tubule-area of the same seminiferous tubule gives us the area percentage of the spermatogenic epithelium: Spermatogenic epithelium area ratio (%) = ( ) ( ) × 100
(4)
‘Distance’ measurements: Diameter and ‘Thickness’ By measuring the two perpendicular diameters (unit: μm) of the tubule and its lumen,
we can calculate (Figure 5a–c): • Average seminiferous tubule diameter (μm) Average seminiferous tubule diameter (μm) == Seminiferous tubule diameter (μm) + Seminiferous tubule diameter (μm)2 (5)
Area and perimeter measurements, calculationsWith accurate manual round-selection of the ‘cell-border’ of a tubule and the lumen
of the tubule, we can determine area and perimeter characteristics of one single tubule(Figure 4a–c):
• Seminiferous tubule area (µm2) and perimeter (µm)• Seminiferous tubule lumen area (µm2) and perimeter (µm) In case of tubular area
measurement, we have to be careful to identify the tubule we have chosen and donot include the tubule wall. Otherwise repeated measurements can deform the statis-tics. In addition, when assigning the lumen of a tubule, we should precisely followthe luminal border. Although clear limits can be determined in certain cases, it isalso possible that the borders of the lumen cannot be distinguished clearly from thespermatogenic epithelium (e.g., head of the sperm is still in Sertoli cell—in the sper-matogenic epithelium—but the tail belongs to the lumen already). In this case, it mighthelp if we consider the border to be the neck or midpiece of the sperm which is alreadyseparated from Sertoli cells.
• Spermatogenic epithelium area (µm2) From the abovementioned measured character-istics of a tubule, we can calculate the spermatogenic epithelium area of one particulartubule if we extract the lumen-area from the tubule-area of the tubule in question byusing the following equation:
Spermatogenic epithelium area (µm2) == Seminiferous tubule area (µm2)identical − Seminiferous tubule lumen area (µm2)identical (3)
• Spermatogenic epithelium area ratio (%) A ratio of spermatogenic epithelium areaand tubule-area of the same seminiferous tubule gives us the area percentage of thespermatogenic epithelium:
Spermatogenic epithelium area ratio (%)=Spermatogenic epithelium area (µm2)identical
Seminiferous tubule area (µm2)identical× 100 (4)
Life 2022, 12, x FOR PEER REVIEW 5 of 20
Random Choice of Predetermined Number of Seminiferous Tubule Cross-Sections for Further Detailed Investigation
To get an even deeper insight into the morphology of individual tubules, we have to determine how many tubules should be included in the study and choose a random se-lection of them. Longitudinally-sectioned tubules are inappropriate for these measure-ments. In case of animal studies, the number depends on the size of the animals (e.g., rat testes are larger than mouse testes). We can perform preliminary power-analysis to deter-mine the number of tubules to be tested or just choose 75–100 pieces of seminiferous tu-bules per experimental animal to ensure adequate sampling.
One further complication is that human testis biopsy and histological samples from surgical-microsurgical operations are much smaller than a whole rodent testis cross sec-tion. In this case it is advantageous to include all available cross-sectioned tubules in the sample.
Area and perimeter measurements, calculations With accurate manual round-selection of the ‘cell-border’ of a tubule and the lumen
of the tubule, we can determine area and perimeter characteristics of one single tubule (Figure 4a–c): • Seminiferous tubule area (μm2) and perimeter (μm) • Seminiferous tubule lumen area (μm2) and perimeter (μm)
In case of tubular area measurement, we have to be careful to identify the tubule we have chosen and do not include the tubule wall. Otherwise repeated measurements can deform the statistics. In addition, when assigning the lumen of a tubule, we should precisely follow the luminal border. Although clear limits can be determined in certain cases, it is also possible that the borders of the lumen cannot be distin-guished clearly from the spermatogenic epithelium (e.g., head of the sperm is still in Sertoli cell—in the spermatogenic epithelium—but the tail belongs to the lumen al-ready). In this case, it might help if we consider the border to be the neck or midpiece of the sperm which is already separated from Sertoli cells.
• Spermatogenic epithelium area (μm2) From the abovementioned measured characteristics of a tubule, we can calculate the spermatogenic epithelium area of one particular tubule if we extract the lumen-area from the tubule-area of the tubule in question by using the following equation: Spermatogenic epithelium area (μm ) == Seminiferous tubule area (μm ) − Seminiferous tubule lumen area (μm )
(3)
• Spermatogenic epithelium area ratio (%) A ratio of spermatogenic epithelium area and tubule-area of the same seminiferous tubule gives us the area percentage of the spermatogenic epithelium: Spermatogenic epithelium area ratio (%) = ( ) ( ) × 100
(4)
‘Distance’ measurements: Diameter and ‘Thickness’ By measuring the two perpendicular diameters (unit: μm) of the tubule and its lumen,
we can calculate (Figure 5a–c): • Average seminiferous tubule diameter (μm) Average seminiferous tubule diameter (μm) == Seminiferous tubule diameter (μm) + Seminiferous tubule diameter (μm)2 (5)
‘Distance’ measurements: Diameter and ‘Thickness’By measuring the two perpendicular diameters (unit: µm) of the tubule and its lumen,
we can calculate (Figure 5a–c):
• Average seminiferous tubule diameter (µm)
Average seminiferous tubule diameter (µm) ==Seminiferous tubule diameter (µm)1 + Seminiferous tubule diameter (µm)2⊥1
2(5)
• Average seminiferous tubule lumen diameter (µm)
Average seminiferous tubule lumen diameter (µm) =
=Seminiferous tubule lumen diameter (µm)1+Seminiferous tubule lumen diameter (µm)2⊥1
2
(6)
The ‘thickness’ of the spermatogenic epithelium (SE) is also a measurable parameter.For accurate sampling, choose five different points of spermatogenic epithelium randomlywhere we can measure length (in µm):
• Average spermatogenic epithelium thickness (µm)
Spermatogenic epithelium (SE) thickness (µm) =
SE length (µm)1+ SE length (µm)2+ SE length (µm)3+ SE length (µm)4+ SE length (µm)55
(7)
Other Useful Measurements
• Total interstitial and other tissue area (µm2) We can also discover some useful andinteresting pieces of information about the possible changes of the interstitial compo-nents of testis tissue if we measure the area of all of the seminiferous tubules (in this
Life 2022, 12, 189 6 of 19
case, the cross and longitudinal-sectioned tubules also) and extract it from total testistissue cross-section (CS) area:
Total interstitial and other tissue area (µm2)CS =
= Total testis tissue area (µm2)CS
−Seminiferous tubule area (µm2)All countable tubules on CS
(8)
• Total seminiferous tubule area ratio (%) We can correlate the area of all of the semi-niferous tubules (cross and longitudinal-sectioned tubules) with the total testis tissuecross-section area and with this calculation we receive information about what per-centage of the testicular tissue area is occupied by tubular area:
Total seminiferous tubule area ratio (%)CS =Seminiferous tubule area (µm2)All countable tubules on CS
Total testis tissue area (µm2)CS× 100 (9)
• Total seminiferous tubule number ratio (pieces/µm2) With the following method, wecan normalize the counted tubules data to the size of the investigated testis tissuecross section, so the different-sized testis tissue cross sections can be comparable:
Total seminiferous tubule number ratio (pieces/µm2)CS ==Total seminiferous tubule number (pieces)All countable tubules on CS
Total testis tissue area (µm2)CS(10)
2.2.2. Staining Intensity and Density Measurements on DigitalizedImmunohistochemically-Stained Slides
With immunohistochemical staining of any tissue, receptor expression and other levelsof expressed materials can be evaluated. To quantitatively determine the level of expressionof the tested receptors or other materials we can use another free software, Image J or thenewer version, FIJI (ImageJ 1.50b or 1.52i, National Institutes of Health, Bethesda, MD,USA). During the immunohistochemical staining, the use of chromogens—such as brown-colored diamino-benzidine (DAB) or black-colored nickel-DAB (Ni-DAB)—is essential,while counterstaining is optional (usually Hematoxylin in case of DAB or Nuclear Fast Redin case of Ni-DAB). Here, we present both staining types: testis tissue with and withoutcounterstaining (VDR and MAGE A4 staining, Figures 6 and 7).
When using counterstaining, with ‘Colour deconvolution’ plugin, the program dis-assembles our original DAB- and Hematoxylin-stained immunohistochemical image bycolor. Generally, DAB staining is brown-colored and the color of Hematoxylin is blue orviolet (if counterstaining was used, and the third image is complementary of the first twocolors, usually light green or nothing/white). For immunostained slides, the ‘H DAB’ or‘FastRed/FastBlue/DAB’ option may be adequate, but the possibility of disassemblingmany other types of staining is also available in the program. Specific basic testis cell-markers, such as MAGE-A4 for spermatogonia, WT-1 and SF-1 for Sertoli cells and INSL-3for Leydig cells allow us to examine or count concrete cell types. It is also important touse such specific immunohistochemical markers or their combinations, which indicate theearly/round, late/elongated spermatids and sperms (e.g., DOG1), to help to find possiblyusable cells in different histopathological conditions such as maturation arrest, tubularfibrosis, mixed atrophy and Sertoli-cell-only syndrome [5,52].
• Randomly choosing a predetermined number of evaluable seminiferous tubules orother parts of the testicular tissue. For accurate evaluation of the level of expression,we randomly have to choose a predetermined number of both cross-sectioned andlongitudinal-sectioned tubules from previously digitized pictures. In case of tubules,choosing only cross sections may simplify the evaluation. In the program we canmanually round-select each evaluable tubule and cut it out from the original pictureby clearing the background (Figure 2a,b). This can be done for each predeterminednumber of evaluable tubules. Thus, with this method we have only one single tubulein one picture without any background to distract from the tubule, and now wecan disassemble the single stained tubule by color with the ‘Colour deconvolution’
Life 2022, 12, 189 7 of 19
plugin. Logically, a brown-colored picture shows DAB-staining that indicates thepositively-stained area or components of the tubule, and a blue- or violet-coloredpicture represents the counterstained background (Figure 6a,b,e). By converting thecolored pictures into 8-bit gray-scale images (‘Image/Type/8 bit’ option), we canset a threshold (‘Image/Adjust/Threshold’ option) for the stained structures in eachpicture, which has been selected by the program, usually with a red color (Figure 6b–f).With regard to determining the threshold (0–255) for the positively-stained area (DABpicture), it is advantageous to compare the threshold-selected positively-stained areaon the DAB 8-bit gray-scale image with the original un-disassembled picture (onlypositively-stained components should be red) (Figure 6c compared to Figure 6a). Tooutline the total stained area, we should convert the counterstained blue pictureinto 8-bit grey-scale image and use the threshold-setting to select the entire stainedarea (all components are red) (Figure 6a,e,f). After threshold-setting, using the ‘An-alyze/Measure’ function offered by the program, the stained area can be measured(in pixel) on each image and from the measured data, the positively-stained areapercentage can be calculated if we compare the positively-stained area to the totalstained area (Figure 6c compared to Figure 6f):
• Positively-stained area percentage (%):
Positively-stained area percentage (%)=Positively-stained area (pixel)area in DAB brown 8-bit image
Total stained area (pixel)area in ′H′ or ′FastBlue′ 8-bit image× 100 (11)
Additionally, the program also measures mean pixel values on the 8-bit images. Fromthe mean pixel value, which was measured on DAB 8-bit image by thres- hold setting(Figure 6d), uncalibrated optical density of the positively-stained structures can be calcu-lated with an equation recommended by Image J:
• Uncalibrated optical density/OD (Arbitrary Unit):
Uncalibrated optical density (A.U.) = log10(255
Mean pixel valueDAB brown 8-bit image) (12)
3. Application of Our Technique: Realization and Implementation
Before any histological examination, careful measurements of the removed animaltestis (or of human biopsy material) should be performed: sample size in 3 dimensions, colorand any abnormal visible difference or impairment on its surface should be photograph-ically documented and the wet and dry weight of the samples should be measured—asin a routine clinical pathological examination. In case of animal experiments, we have thepossibility to cut and embed samples from different parts of the same testis (e.g., proximal,median and distal); the contralateral testis can be embedded in a longitudinal direction toexamine single tubules lengthwise.
In the following representative images, we demonstrate our carefully applied quanti-tative histomorphometric-mathematical image analysis method of the testis cross-sectionaltissue. (At the beginning of our method-development, we measured most of the de-scribed quantitative parameters on our test tissue: testis cross sections of Vitamin Dsupplemented and Vitamin D deficient rats, n = 8/groups. Our graphical and numer-ical data can be found in the ‘Supplementary Materials’ paragraph. According to ournegative results, we hypothesize that; short-term (8-week-long) Vitamin D deficiency doesnot affect the quantitative-mathematical parameters or the structure of the spermatogenictesticular tissue.)
3.1. Digitization of Hematoxylin-Eosin- and Immunohistochemically-Stained Slides
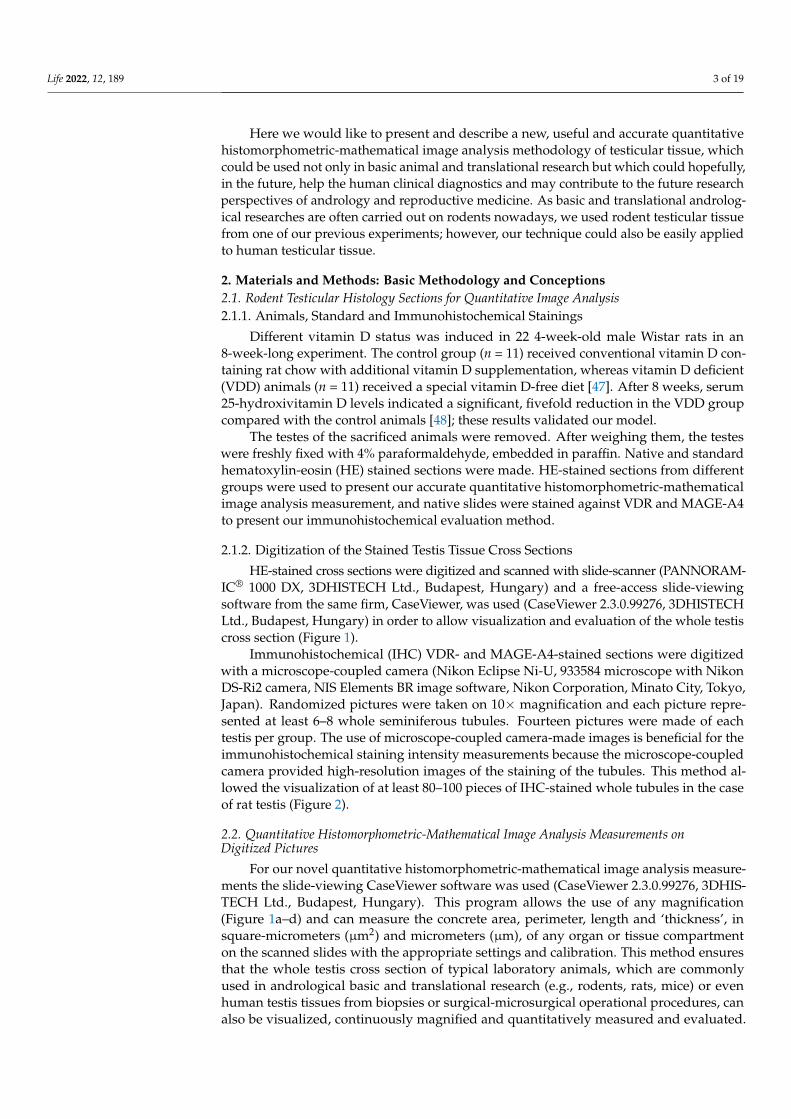
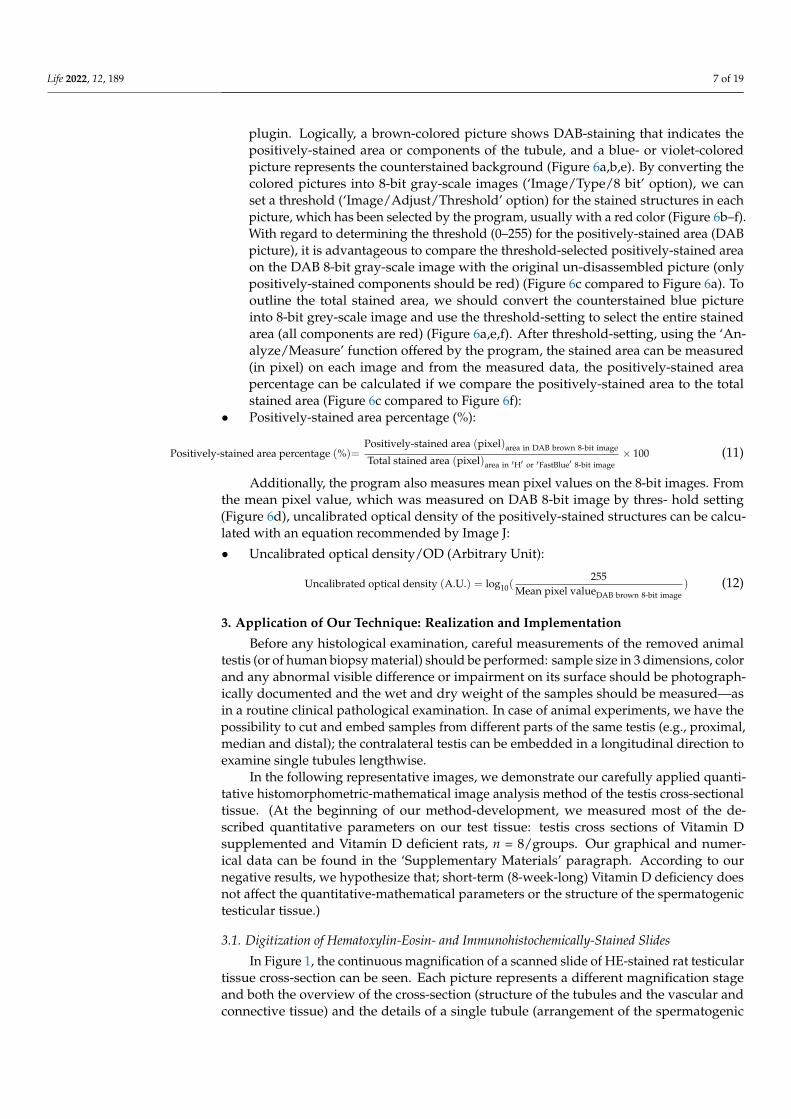
In Figure 1, the continuous magnification of a scanned slide of HE-stained rat testiculartissue cross-section can be seen. Each picture represents a different magnification stageand both the overview of the cross-section (structure of the tubules and the vascular andconnective tissue) and the details of a single tubule (arrangement of the spermatogenic
Life 2022, 12, 189 8 of 19
epithelium, containing the tubule lumen and single sperm and other spermatogenic linecells) can also be seen (Figure 1a–d).
Life 2022, 12, x FOR PEER REVIEW 9 of 20
Figure 1. Representative images of Hematoxylin-Eosin-stained testis tissue cross sections from the control group at different magnifications. (a) Whole scanned slide with two testis tissue cross sec-tions, scale bar: 10,000 μm; (b) A whole testis tissue cross section, scale bar: 1000 μm; (c) Magnified cross- and longitudinal-sectioned seminiferous tubules, scale bar: 200 μm and (d) Single cross-sec-tioned seminiferous tubule with sperm cells in the lumen, scale bar: 50 μm. Images were captured with the ‘Take a snap’ tool of the CaseViewer program.
In Figure 2, VDR and MAGE-A4 immunohistochemically-stained rat testicular tissue can be seen on 10× magnifications from our different groups. In the first column (Figure 2a,c), on the original images, we indicated the detailed manual round-selection of the pre-viously picked single tubules in each picture; thus, in the second column, the previously round-selected single tubules appear totally cleared from the background, so the posi-tively-stained area and staining-intensity measurements can be done on a single tubule.
Figure 1. Representative images of Hematoxylin-Eosin-stained testis tissue cross sections from thecontrol group at different magnifications. (a) Whole scanned slide with two testis tissue cross sections,scale bar: 10,000 µm; (b) A whole testis tissue cross section, scale bar: 1000 µm; (c) Magnified cross-and longitudinal-sectioned seminiferous tubules, scale bar: 200 µm and (d) Single cross-sectionedseminiferous tubule with sperm cells in the lumen, scale bar: 50 µm. Images were captured with the‘Take a snap’ tool of the CaseViewer program.
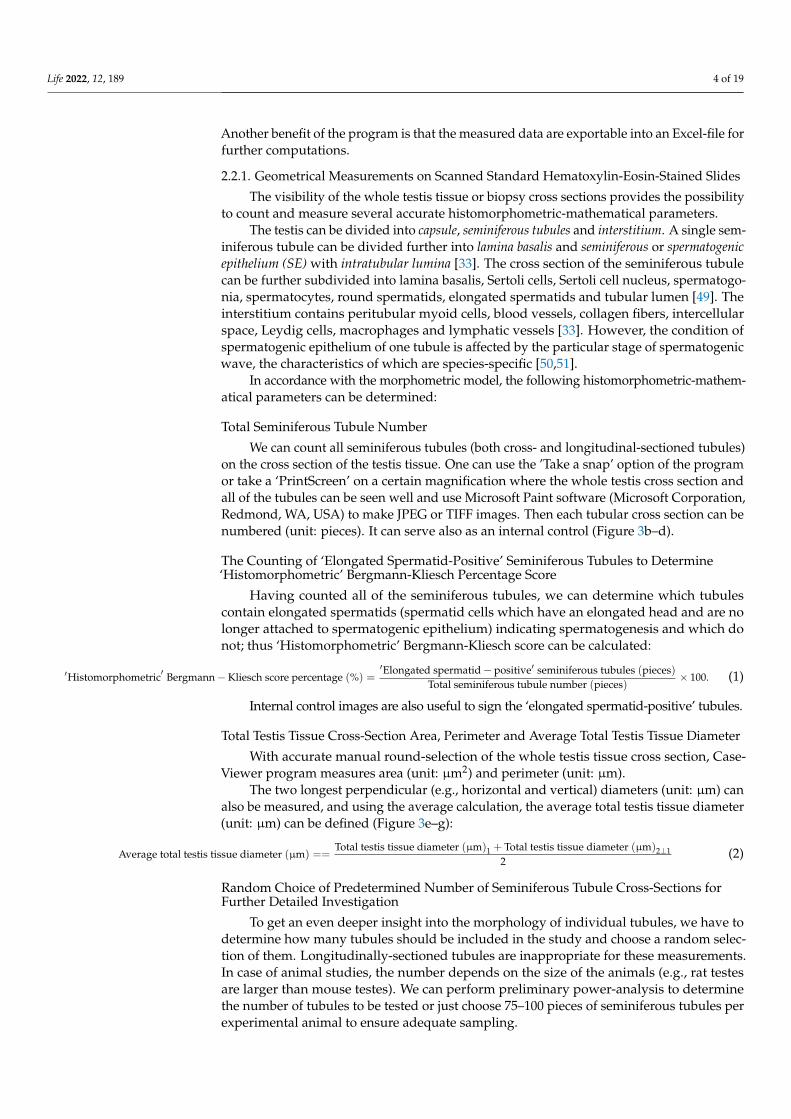
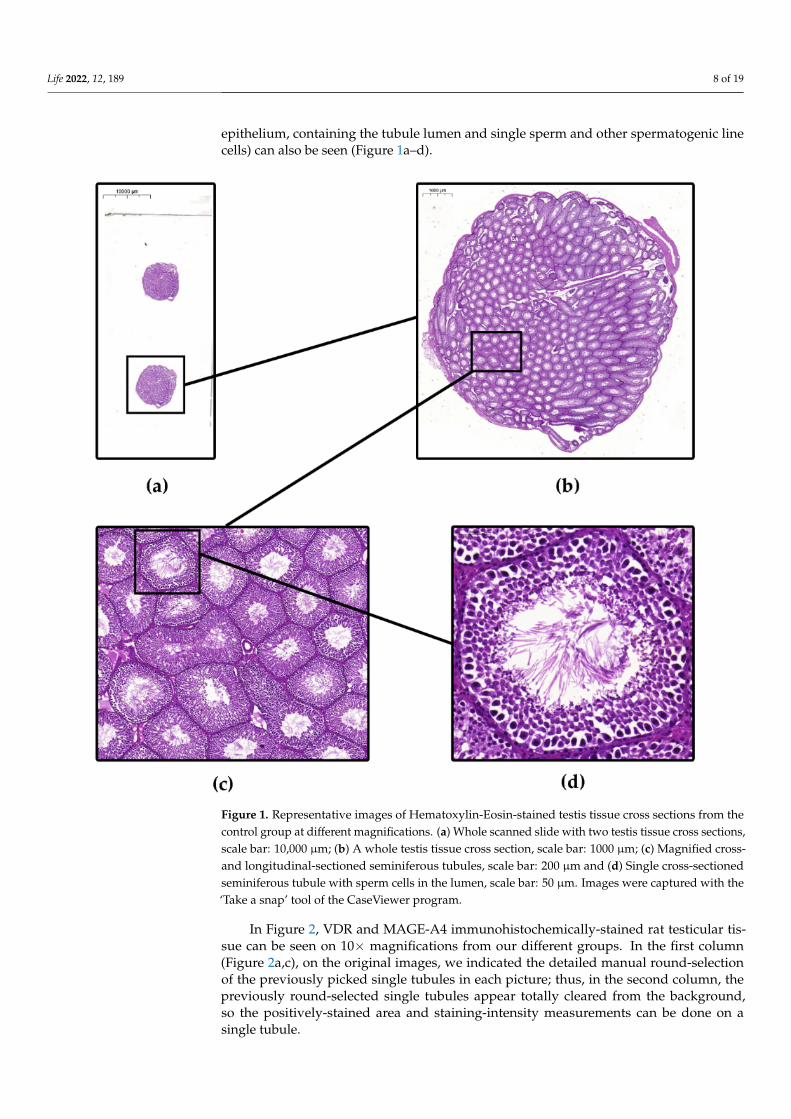
In Figure 2, VDR and MAGE-A4 immunohistochemically-stained rat testicular tis-sue can be seen on 10× magnifications from our different groups. In the first column(Figure 2a,c), on the original images, we indicated the detailed manual round-selectionof the previously picked single tubules in each picture; thus, in the second column, thepreviously round-selected single tubules appear totally cleared from the background,so the positively-stained area and staining-intensity measurements can be done on asingle tubule.
Life 2022, 12, 189 9 of 19Life 2022, 12, x FOR PEER REVIEW 10 of 20
Figure 2. Representative images of immunohistochemically stained testicular tissue. (a,b) Stained against vitamin D receptor protein with Hematoxylin-counterstaining (Control group). (c,d) Stained against MAGE-A4, a specific spermatogonium marker protein (Vitamin D deficient group). The im-ages were taken with a Nikon Eclipse Ni-U microscope coupled with a Nikon DS-Ri2 camera using NIS Elements BR and Image J 1.50b image analysis software. The brown color shows DAB chromo-gen-positivity which indicates receptor-positivity, and the blue/violet color represents hematoxylin counterstaining. (b,d) Single tubules from (a,c) panels without background, the previously round-selected tubules have been cleared of background with the ‘Image/Clear outside’ tool from the Im-age J program. 10× objective, scale bars: 200 μm.
3.2. Quantitative Image Analysis of Histological Sections 3.2.1. Geometrical Measurements on Scanned Standard Hematoxylin-Eosin-Stained Slides
In Figure 3, first, we present a schematic drawing of a testis cross-section (Figure 3a) to allow the visualization of geometrical measurements (Figure 3b: total seminiferous tu-bule counting, Figure 3e: total testis tissue cross-section area, perimeter and average total testis tissue diameter measurements), then the described real measurements can be seen on the cross-sections derived from our experimental animals (Figure 3c,d,f,g).
Figure 2. Representative images of immunohistochemically stained testicular tissue. (a,b) Stainedagainst vitamin D receptor protein with Hematoxylin-counterstaining (Control group). (c,d) Stainedagainst MAGE-A4, a specific spermatogonium marker protein (Vitamin D deficient group). Theimages were taken with a Nikon Eclipse Ni-U microscope coupled with a Nikon DS-Ri2 camera usingNIS Elements BR and Image J 1.50b image analysis software. The brown color shows DAB chromogen-positivity which indicates receptor-positivity, and the blue/violet color represents hematoxylincounterstaining. (b,d) Single tubules from (a,c) panels without background, the previously round-selected tubules have been cleared of background with the ‘Image/Clear outside’ tool from the ImageJ program. 10× objective, scale bars: 200 µm.
3.2. Quantitative Image Analysis of Histological Sections3.2.1. Geometrical Measurements on Scanned Standard Hematoxylin-Eosin-Stained Slides
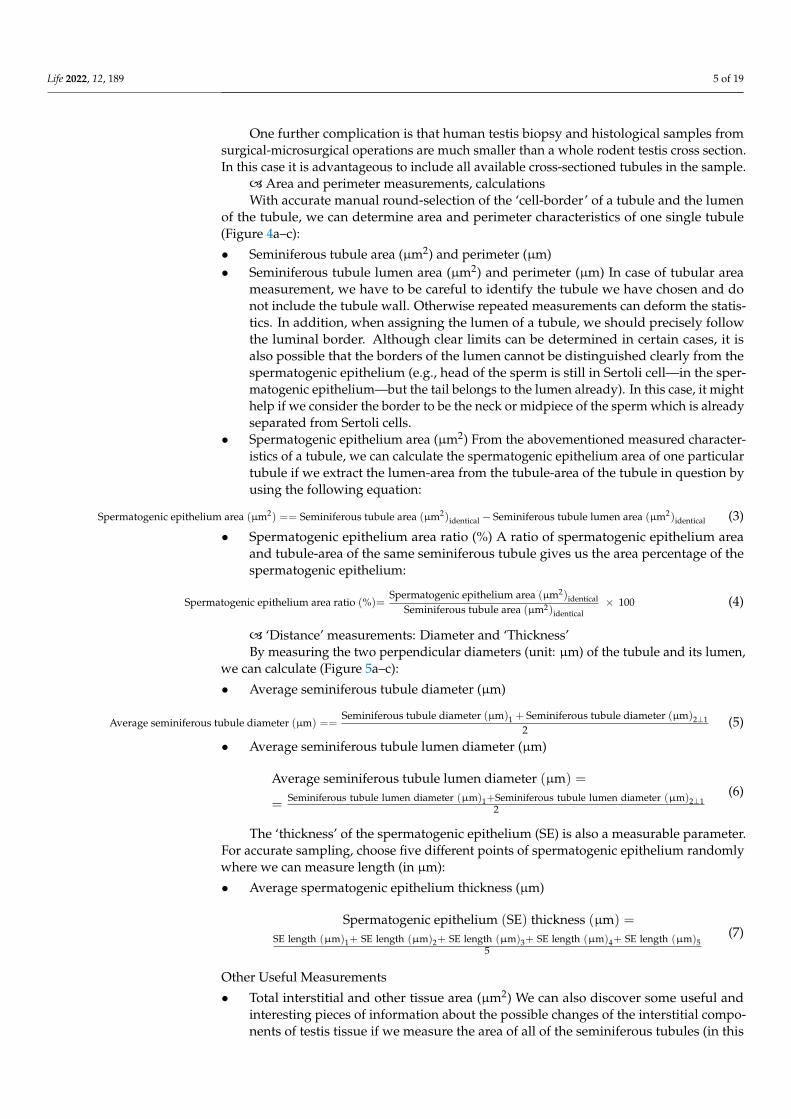
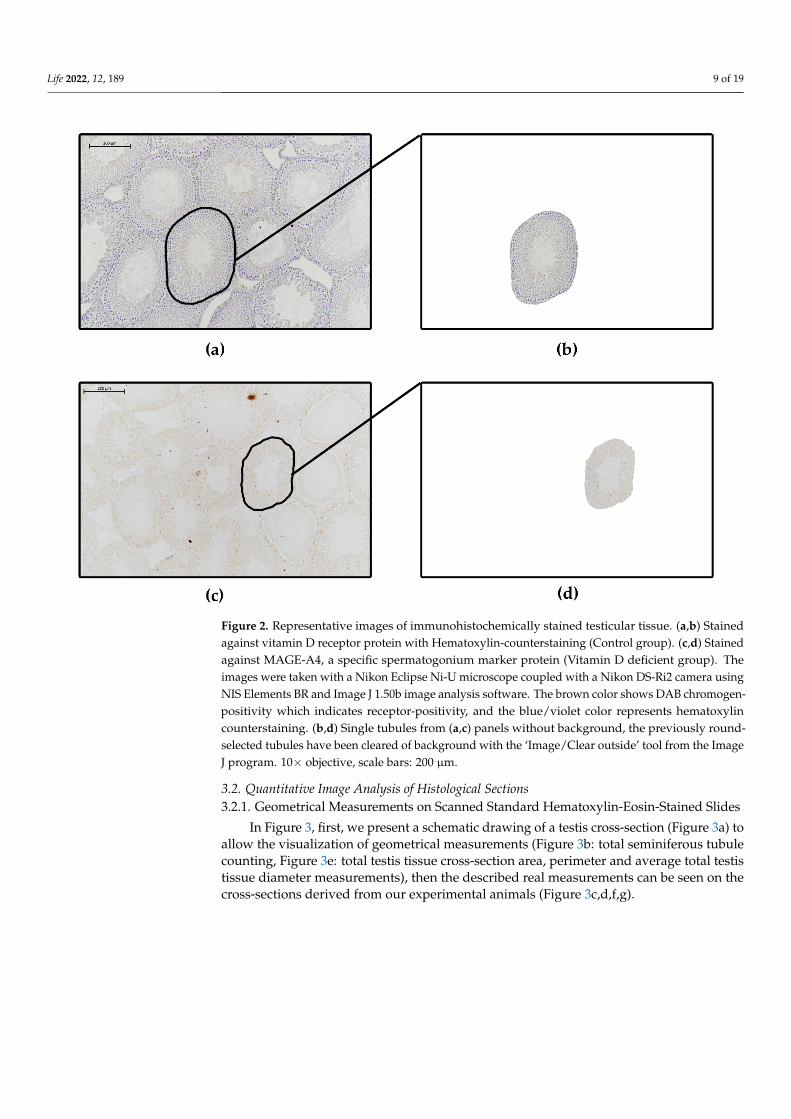
In Figure 3, first, we present a schematic drawing of a testis cross-section (Figure 3a) toallow the visualization of geometrical measurements (Figure 3b: total seminiferous tubulecounting, Figure 3e: total testis tissue cross-section area, perimeter and average total testistissue diameter measurements), then the described real measurements can be seen on thecross-sections derived from our experimental animals (Figure 3c,d,f,g).
Life 2022, 12, 189 10 of 19Life 2022, 12, x FOR PEER REVIEW 11 of 20
(a) (b) (c) (d)
(e) (f) (g)
Figure 3. Total seminiferous tubule-counting and measuring the geometrical parameters of the testis: total testis tissue cross-section area, perimeter and average total testis tissue diameter measurements. (a,b,e) Schematic simplified drawings of laboratory animal testis cross sections illustrating tubule-counting and area, perimeter and diameter measurement. (c,d) Realization of total seminiferous tu-bule number determination: in our (c) Control group, scale bar: 1000 μm, n(all counted tubules) = 557; and in our (d) VDD group, scale bar: 2000 μm, n(all counted tubules) = 332. (f,g) Realization of total testis tissue cross-section area, perimeter and average total testis tissue diameter measurements: in the (f) Con-trol group, scale bar: 1000 μm, and in the (g) VDD group, scale bar: 1000 μm. Measured data can be read in yellow brackets. The drawings are hand-made, whereas in case of the images, CaseViewer and Microsoft Paint programs were used.
Figures 4 and 5 show the geometrical measurements of a single tubule; first the meth-ods are visualized on a schematic drawing (Figures 4a and 5a), after which the execution of the measurements on tubules of experimental rats can be seen. (Figures 4b,c and 5b,c).
(a) (b) (c)
Figure 3. Total seminiferous tubule-counting and measuring the geometrical parameters of the testis:total testis tissue cross-section area, perimeter and average total testis tissue diameter measurements.(a,b,e) Schematic simplified drawings of laboratory animal testis cross sections illustrating tubule-counting and area, perimeter and diameter measurement. (c,d) Realization of total seminiferoustubule number determination: in our (c) Control group, scale bar: 1000 µm, n(all counted tubules) = 557;and in our (d) VDD group, scale bar: 2000 µm, n(all counted tubules) = 332. (f,g) Realization of total testistissue cross-section area, perimeter and average total testis tissue diameter measurements: in the (f)Control group, scale bar: 1000 µm, and in the (g) VDD group, scale bar: 1000 µm. Measured data canbe read in yellow brackets. The drawings are hand-made, whereas in case of the images, CaseViewerand Microsoft Paint programs were used.
Figures 4 and 5 show the geometrical measurements of a single tubule; first themethods are visualized on a schematic drawing (Figures 4a and 5a), after which theexecution of the measurements on tubules of experimental rats can be seen. (Figures 4b,cand 5b,c).
Life 2022, 12, 189 11 of 19
Life 2022, 12, x FOR PEER REVIEW 11 of 20
(a) (b) (c) (d)
(e) (f) (g)
Figure 3. Total seminiferous tubule-counting and measuring the geometrical parameters of the testis: total testis tissue cross-section area, perimeter and average total testis tissue diameter measurements. (a,b,e) Schematic simplified drawings of laboratory animal testis cross sections illustrating tubule-counting and area, perimeter and diameter measurement. (c,d) Realization of total seminiferous tu-bule number determination: in our (c) Control group, scale bar: 1000 μm, n(all counted tubules) = 557; and in our (d) VDD group, scale bar: 2000 μm, n(all counted tubules) = 332. (f,g) Realization of total testis tissue cross-section area, perimeter and average total testis tissue diameter measurements: in the (f) Con-trol group, scale bar: 1000 μm, and in the (g) VDD group, scale bar: 1000 μm. Measured data can be read in yellow brackets. The drawings are hand-made, whereas in case of the images, CaseViewer and Microsoft Paint programs were used.
Figures 4 and 5 show the geometrical measurements of a single tubule; first the meth-ods are visualized on a schematic drawing (Figures 4a and 5a), after which the execution of the measurements on tubules of experimental rats can be seen. (Figures 4b,c and 5b,c).
(a) (b) (c)
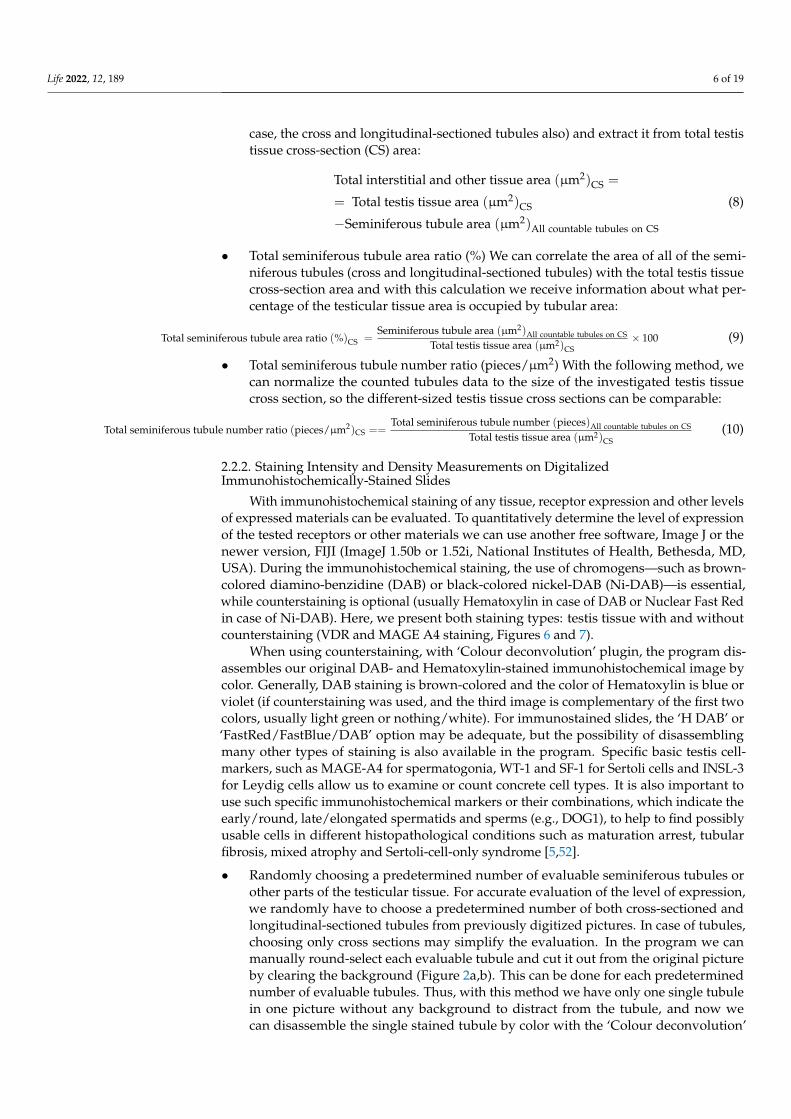
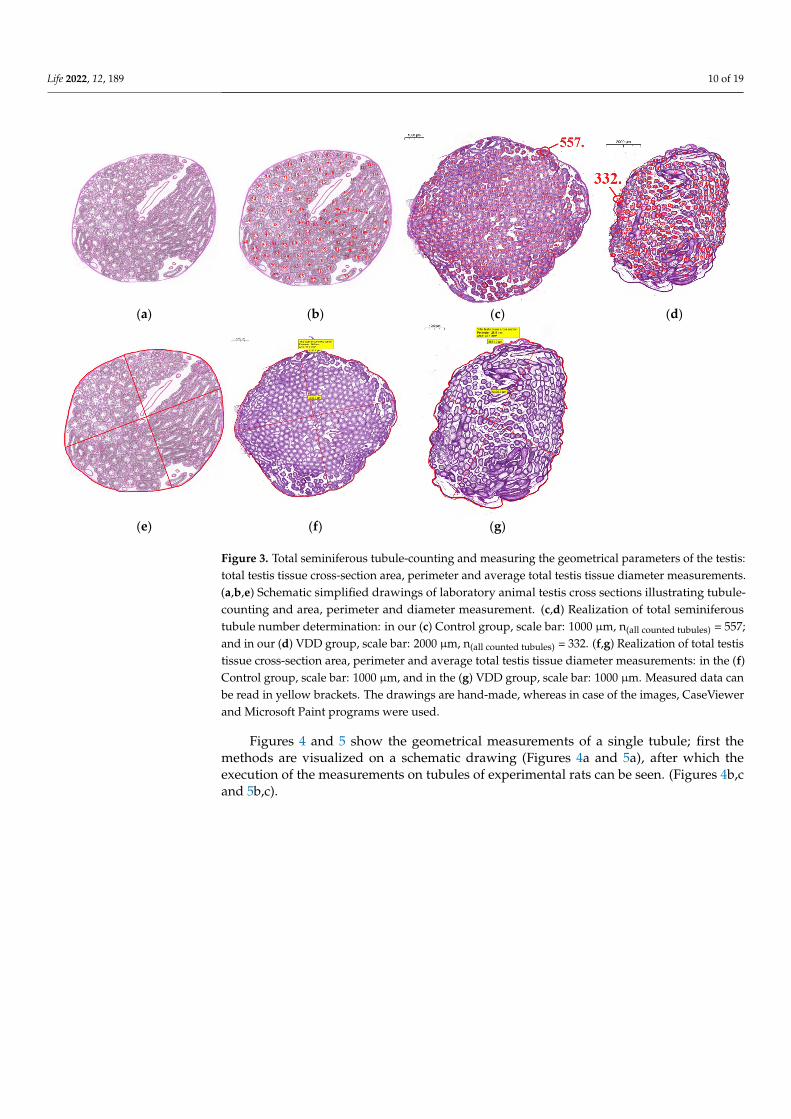
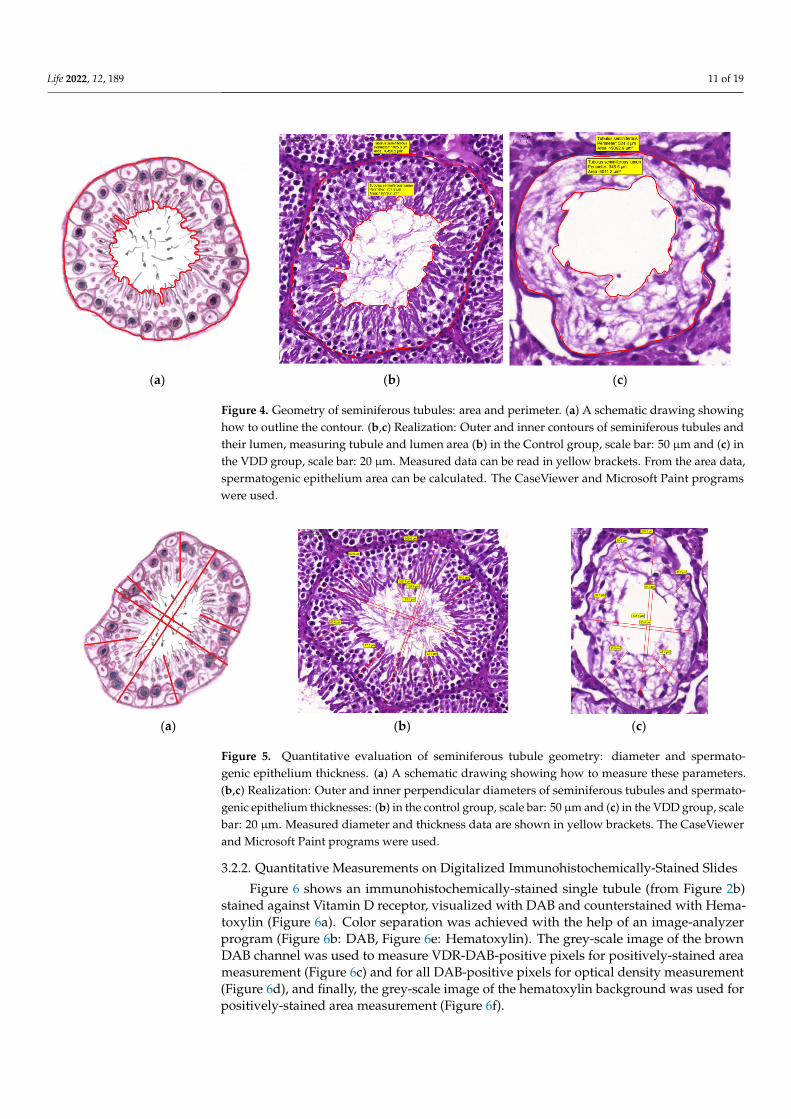
Figure 4. Geometry of seminiferous tubules: area and perimeter. (a) A schematic drawing showinghow to outline the contour. (b,c) Realization: Outer and inner contours of seminiferous tubules andtheir lumen, measuring tubule and lumen area (b) in the Control group, scale bar: 50 µm and (c) inthe VDD group, scale bar: 20 µm. Measured data can be read in yellow brackets. From the area data,spermatogenic epithelium area can be calculated. The CaseViewer and Microsoft Paint programswere used.
Life 2022, 12, x FOR PEER REVIEW 12 of 20
Figure 4. Geometry of seminiferous tubules: area and perimeter. (a) A schematic drawing showing how to outline the contour. (b,c) Realization: Outer and inner contours of seminiferous tubules and their lumen, measuring tubule and lumen area (b) in the Control group, scale bar: 50 μm and (c) in the VDD group, scale bar: 20 μm. Measured data can be read in yellow brackets. From the area data, spermatogenic epithelium area can be calculated. The CaseViewer and Microsoft Paint programs were used.
(a) (b) (c)
Figure 5. Quantitative evaluation of seminiferous tubule geometry: diameter and spermatogenic epithelium thickness. (a) A schematic drawing showing how to measure these parameters. (b,c) Re-alization: Outer and inner perpendicular diameters of seminiferous tubules and spermatogenic ep-ithelium thicknesses: (b) in the control group, scale bar: 50 μm and (c) in the VDD group, scale bar: 20 μm. Measured diameter and thickness data are shown in yellow brackets. The CaseViewer and Microsoft Paint programs were used.
3.2.2. Quantitative Measurements on Digitalized Immunohistochemically-Stained Slides
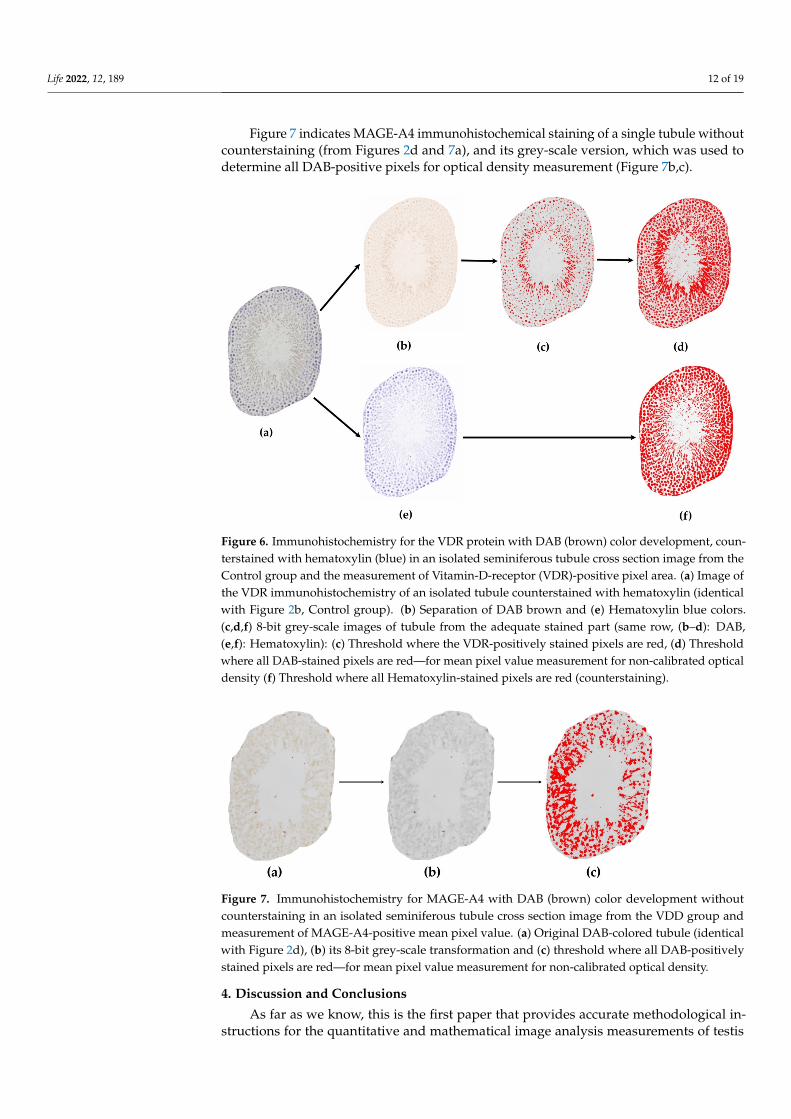
Figure 6 shows an immunohistochemically-stained single tubule (from Figure 2b) stained against Vitamin D receptor, visualized with DAB and counterstained with Hema-toxylin (Figure 6a). Color separation was achieved with the help of an image-analyzer program (Figure 6b: DAB, Figure 6e: Hematoxylin). The grey-scale image of the brown DAB channel was used to measure VDR-DAB-positive pixels for positively-stained area measurement (Figure 6c) and for all DAB-positive pixels for optical density measurement (Figure 6d), and finally, the grey-scale image of the hematoxylin background was used for positively-stained area measurement (Figure 6f).
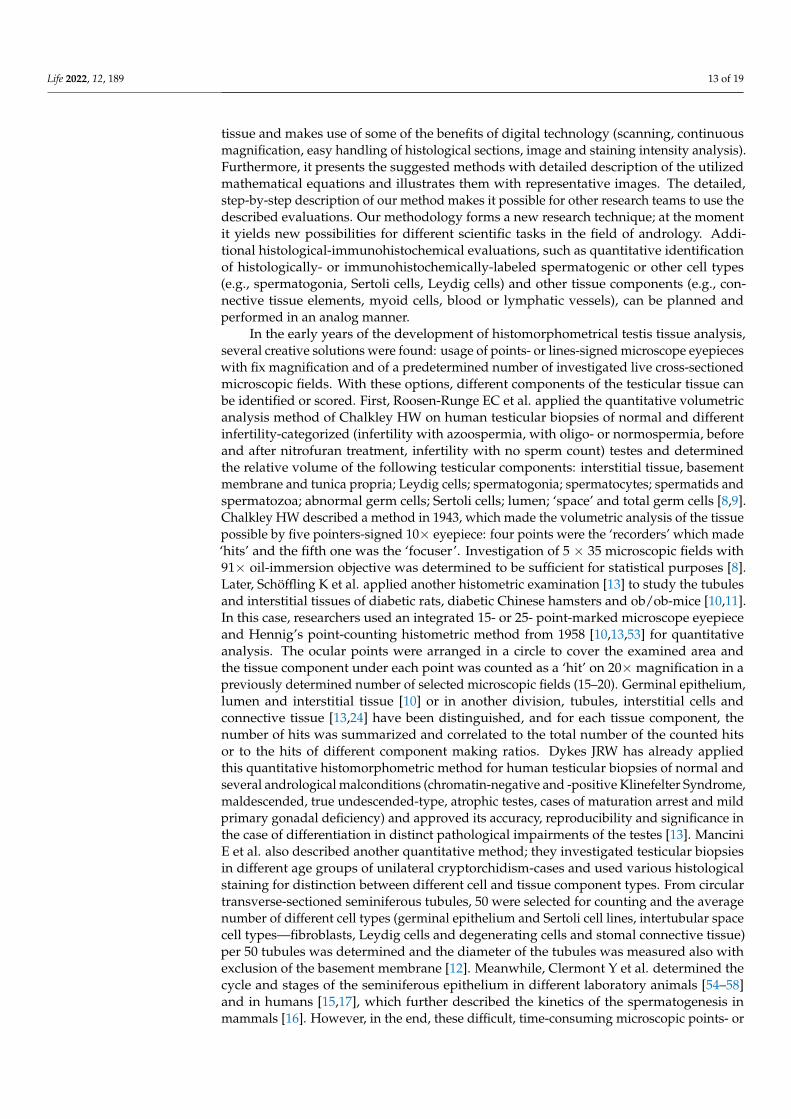
Figure 7 indicates MAGE-A4 immunohistochemical staining of a single tubule with-out counterstaining (from Figures 2d and 7a), and its grey-scale version, which was used to determine all DAB-positive pixels for optical density measurement (Figure 7b,c).
Figure 5. Quantitative evaluation of seminiferous tubule geometry: diameter and spermato-genic epithelium thickness. (a) A schematic drawing showing how to measure these parameters.(b,c) Realization: Outer and inner perpendicular diameters of seminiferous tubules and spermato-genic epithelium thicknesses: (b) in the control group, scale bar: 50 µm and (c) in the VDD group, scalebar: 20 µm. Measured diameter and thickness data are shown in yellow brackets. The CaseViewerand Microsoft Paint programs were used.
3.2.2. Quantitative Measurements on Digitalized Immunohistochemically-Stained Slides
Figure 6 shows an immunohistochemically-stained single tubule (from Figure 2b)stained against Vitamin D receptor, visualized with DAB and counterstained with Hema-toxylin (Figure 6a). Color separation was achieved with the help of an image-analyzerprogram (Figure 6b: DAB, Figure 6e: Hematoxylin). The grey-scale image of the brownDAB channel was used to measure VDR-DAB-positive pixels for positively-stained areameasurement (Figure 6c) and for all DAB-positive pixels for optical density measurement(Figure 6d), and finally, the grey-scale image of the hematoxylin background was used forpositively-stained area measurement (Figure 6f).
Life 2022, 12, 189 12 of 19
Figure 7 indicates MAGE-A4 immunohistochemical staining of a single tubule withoutcounterstaining (from Figures 2d and 7a), and its grey-scale version, which was used todetermine all DAB-positive pixels for optical density measurement (Figure 7b,c).
Life 2022, 12, x FOR PEER REVIEW 13 of 20
Figure 6. Immunohistochemistry for the VDR protein with DAB (brown) color development, coun-terstained with hematoxylin (blue) in an isolated seminiferous tubule cross section image from the Control group and the measurement of Vitamin-D-receptor (VDR)-positive pixel area. (a) Image of the VDR immunohistochemistry of an isolated tubule counterstained with hematoxylin (identical with Figure 2b, Control group). (b) Separation of DAB brown and (e) Hematoxylin blue colors. (c,d,f) 8-bit grey-scale images of tubule from the adequate stained part (same row, (b–d): DAB, (e,f): He-matoxylin): (c) Threshold where the VDR-positively stained pixels are red, (d) Threshold where all DAB-stained pixels are red—for mean pixel value measurement for non-calibrated optical density (f) Threshold where all Hematoxylin-stained pixels are red (counterstaining).
Figure 7. Immunohistochemistry for MAGE-A4 with DAB (brown) color development without counterstaining in an isolated seminiferous tubule cross section image from the VDD group and measurement of MAGE-A4-positive mean pixel value. (a) Original DAB-colored tubule (identical with Figure 2d), (b) its 8-bit grey-scale transformation and (c) threshold where all DAB-positively stained pixels are red—for mean pixel value measurement for non-calibrated optical density.
4. Discussion and Conclusions As far as we know, this is the first paper that provides accurate methodological in-
structions for the quantitative and mathematical image analysis measurements of testis tissue and makes use of some of the benefits of digital technology (scanning, continuous magnification, easy handling of histological sections, image and staining intensity analy-sis). Furthermore, it presents the suggested methods with detailed description of the uti-lized mathematical equations and illustrates them with representative images. The de-tailed, step-by-step description of our method makes it possible for other research teams
Figure 6. Immunohistochemistry for the VDR protein with DAB (brown) color development, coun-terstained with hematoxylin (blue) in an isolated seminiferous tubule cross section image from theControl group and the measurement of Vitamin-D-receptor (VDR)-positive pixel area. (a) Image ofthe VDR immunohistochemistry of an isolated tubule counterstained with hematoxylin (identicalwith Figure 2b, Control group). (b) Separation of DAB brown and (e) Hematoxylin blue colors.(c,d,f) 8-bit grey-scale images of tubule from the adequate stained part (same row, (b–d): DAB,(e,f): Hematoxylin): (c) Threshold where the VDR-positively stained pixels are red, (d) Thresholdwhere all DAB-stained pixels are red—for mean pixel value measurement for non-calibrated opticaldensity (f) Threshold where all Hematoxylin-stained pixels are red (counterstaining).
Life 2022, 12, x FOR PEER REVIEW 13 of 20
Figure 6. Immunohistochemistry for the VDR protein with DAB (brown) color development, coun-terstained with hematoxylin (blue) in an isolated seminiferous tubule cross section image from the Control group and the measurement of Vitamin-D-receptor (VDR)-positive pixel area. (a) Image of the VDR immunohistochemistry of an isolated tubule counterstained with hematoxylin (identical with Figure 2b, Control group). (b) Separation of DAB brown and (e) Hematoxylin blue colors. (c,d,f) 8-bit grey-scale images of tubule from the adequate stained part (same row, (b–d): DAB, (e,f): He-matoxylin): (c) Threshold where the VDR-positively stained pixels are red, (d) Threshold where all DAB-stained pixels are red—for mean pixel value measurement for non-calibrated optical density (f) Threshold where all Hematoxylin-stained pixels are red (counterstaining).
Figure 7. Immunohistochemistry for MAGE-A4 with DAB (brown) color development without counterstaining in an isolated seminiferous tubule cross section image from the VDD group and measurement of MAGE-A4-positive mean pixel value. (a) Original DAB-colored tubule (identical with Figure 2d), (b) its 8-bit grey-scale transformation and (c) threshold where all DAB-positively stained pixels are red—for mean pixel value measurement for non-calibrated optical density.
4. Discussion and Conclusions As far as we know, this is the first paper that provides accurate methodological in-
structions for the quantitative and mathematical image analysis measurements of testis tissue and makes use of some of the benefits of digital technology (scanning, continuous magnification, easy handling of histological sections, image and staining intensity analy-sis). Furthermore, it presents the suggested methods with detailed description of the uti-lized mathematical equations and illustrates them with representative images. The de-tailed, step-by-step description of our method makes it possible for other research teams
Figure 7. Immunohistochemistry for MAGE-A4 with DAB (brown) color development withoutcounterstaining in an isolated seminiferous tubule cross section image from the VDD group andmeasurement of MAGE-A4-positive mean pixel value. (a) Original DAB-colored tubule (identicalwith Figure 2d), (b) its 8-bit grey-scale transformation and (c) threshold where all DAB-positivelystained pixels are red—for mean pixel value measurement for non-calibrated optical density.
4. Discussion and Conclusions
As far as we know, this is the first paper that provides accurate methodological in-structions for the quantitative and mathematical image analysis measurements of testis
Life 2022, 12, 189 13 of 19
tissue and makes use of some of the benefits of digital technology (scanning, continuousmagnification, easy handling of histological sections, image and staining intensity analysis).Furthermore, it presents the suggested methods with detailed description of the utilizedmathematical equations and illustrates them with representative images. The detailed,step-by-step description of our method makes it possible for other research teams to use thedescribed evaluations. Our methodology forms a new research technique; at the momentit yields new possibilities for different scientific tasks in the field of andrology. Addi-tional histological-immunohistochemical evaluations, such as quantitative identificationof histologically- or immunohistochemically-labeled spermatogenic or other cell types(e.g., spermatogonia, Sertoli cells, Leydig cells) and other tissue components (e.g., con-nective tissue elements, myoid cells, blood or lymphatic vessels), can be planned andperformed in an analog manner.
In the early years of the development of histomorphometrical testis tissue analysis,several creative solutions were found: usage of points- or lines-signed microscope eyepieceswith fix magnification and of a predetermined number of investigated live cross-sectionedmicroscopic fields. With these options, different components of the testicular tissue canbe identified or scored. First, Roosen-Runge EC et al. applied the quantitative volumetricanalysis method of Chalkley HW on human testicular biopsies of normal and differentinfertility-categorized (infertility with azoospermia, with oligo- or normospermia, beforeand after nitrofuran treatment, infertility with no sperm count) testes and determinedthe relative volume of the following testicular components: interstitial tissue, basementmembrane and tunica propria; Leydig cells; spermatogonia; spermatocytes; spermatids andspermatozoa; abnormal germ cells; Sertoli cells; lumen; ‘space’ and total germ cells [8,9].Chalkley HW described a method in 1943, which made the volumetric analysis of the tissuepossible by five pointers-signed 10× eyepiece: four points were the ‘recorders’ which made‘hits’ and the fifth one was the ‘focuser’. Investigation of 5 × 35 microscopic fields with91× oil-immersion objective was determined to be sufficient for statistical purposes [8].Later, Schöffling K et al. applied another histometric examination [13] to study the tubulesand interstitial tissues of diabetic rats, diabetic Chinese hamsters and ob/ob-mice [10,11].In this case, researchers used an integrated 15- or 25- point-marked microscope eyepieceand Hennig’s point-counting histometric method from 1958 [10,13,53] for quantitativeanalysis. The ocular points were arranged in a circle to cover the examined area andthe tissue component under each point was counted as a ‘hit’ on 20×magnification in apreviously determined number of selected microscopic fields (15–20). Germinal epithelium,lumen and interstitial tissue [10] or in another division, tubules, interstitial cells andconnective tissue [13,24] have been distinguished, and for each tissue component, thenumber of hits was summarized and correlated to the total number of the counted hitsor to the hits of different component making ratios. Dykes JRW has already appliedthis quantitative histomorphometric method for human testicular biopsies of normal andseveral andrological malconditions (chromatin-negative and -positive Klinefelter Syndrome,maldescended, true undescended-type, atrophic testes, cases of maturation arrest and mildprimary gonadal deficiency) and approved its accuracy, reproducibility and significance inthe case of differentiation in distinct pathological impairments of the testes [13]. ManciniE et al. also described another quantitative method; they investigated testicular biopsiesin different age groups of unilateral cryptorchidism-cases and used various histologicalstaining for distinction between different cell and tissue component types. From circulartransverse-sectioned seminiferous tubules, 50 were selected for counting and the averagenumber of different cell types (germinal epithelium and Sertoli cell lines, intertubular spacecell types—fibroblasts, Leydig cells and degenerating cells and stomal connective tissue)per 50 tubules was determined and the diameter of the tubules was measured also withexclusion of the basement membrane [12]. Meanwhile, Clermont Y et al. determined thecycle and stages of the seminiferous epithelium in different laboratory animals [54–58]and in humans [15,17], which further described the kinetics of the spermatogenesis inmammals [16]. However, in the end, these difficult, time-consuming microscopic points- or
Life 2022, 12, 189 14 of 19
lines-signed eyepieces methodologies were not used widely. Moreover, the lack of archivingof the evaluated images further deteriorated the reproducibility of these methods.
The invention of the microscope-coupled camera and its combination with com-puter image-analyzer programs offered opportunities of the investigation of the real, fix-magnified, microscopic images of testicular tissue and semen smears. Sukura A et al.investigated the total tissue area; seminiferous tubule and interstitium area; Leydig and Ser-toli cell numbers and different cell-density in spermatogenic epithelium in a particular field.And further morphological parameters (area, lengths, axes) of spermatozoa have been ad-ditionally determined, but these measurements performed only on six, randomly collectedtissue-section images of both-side testicles from each animals [41]. Herrera-Alarcon J et al.,in four quadrants of fix-magnified digital testicular images, evaluated the volume per-centage and tubular components of the testicular parenchyma and counted the tubuleswith and without lumen and the elongated spermatid-containing tubules. With the helpof an analysis software they calculated several variables (area, perimeter, minor-majordiameters) from the number of measured tubules. They investigated four randomly se-lected areas representing each quadrant of lamb’s testicular cross-section [42]. Ma L et al.counted and calculated the volume fractions (proportions) of different testicular structures(volume of the seminiferous tubule, interstitial tissue, tubule lumen, length and diame-ter of tubules, thickness of seminiferous epithelium) with (9 or 20) computer-generatedpoint-hitting technique on systematically-sampled fields of digital testicular sections andtheir total volumes were further estimated [43]. Zamani A et al., with the point-countingmethod on fix-magnified digitized pictures, estimated the volume densities, and the totalvolumes of seminiferous tubules, interstitial tissue, and germinal epithelium, numericaldensities of Leydig, Sertoli and germ cells were also calculated [59]. But point-hittingtechniques are a little bit antique in the time of the microscopic image digitization andmeasurements [43]. Nihi F et al. used camera-coupled high-resolution light microscopy andtransmission electron-microscopy with image-analysis software to identify the germ cellsand determine the duration of the stages of the human seminiferous epithelium cycle [44].Xu J et al. developed a computerized spermatogenesis staging system to determine andsubclassify the stages of the spermatogenic cycle [60]. Umar Z et al. used Image J onfix-magnified photomicrographs of testis tissue to determine the diameter, area, luminaldiameter and spermatogenic cell layer of seminiferous tubules and the thickness of thegerminal layer [45]. Kazemi S et al. used another software to measure, on fix-magnifiedimages, the perpendicular diameters, surface area of tubules and epithelium height, to de-termine the number of spermatogonia and spermatocytes and the number of seminiferoustubules in 1 cm2 [46]. According to previously well-described digital histomorphometricalmeasurement methods reported by former researchers, we planned and implemented acomplex and detailed methodology: we determined multiple measurable and calculableparameters not only on the tubular level but on the whole testis cross-sectional level atthe same time. Dumont L et al., based on the microscope-coupled image-making method,has already developed an automated digital immunohistochemistry image analysis toolto reduce the background and noise, to generate stitched high-resolution images of testissections and to extract the necrotic area and to count the immunostained cells [61].
Digital pathology and histology have been undergoing huge developments recently,several benefits can be claimed: scanned and digitized slides can be accessed regard-less of place, time and equipment (computer, phone, tablet instead of microscope); theyhave portability, shareability, easy-handling, available at any time, standardization andusability in any field of medicine [62,63]. The utilization of artificial intelligence and deepmachine-learning coupled with microscopic techniques in reproductive medicine and as-sisted reproductive techniques (oocyte, sperm and embryo assessment) is increasinglypopular [64,65]. Nowadays, 2-dimensional serial-sectioning in combination with computersoftware, 3-dimensional reconstruction of several organs and tissues, such as the testicularcord or seminiferous tubules became possible [66]. The combination of digital histology-
Life 2022, 12, 189 15 of 19
pathology, artificial intelligence and machine-learning can provide promising diagnosticand therapeutic opportunities in various medical specialties.
Benefits of slide-scanning technique is not unknown in andrology, similar ones havebeen used for quantitative sperm morphology analysis [67,68] which could be comple-mented with the help of convolutional neuronal network deep-learning [69]. A super-vised machine learning-based prediction model that has been developed for the identi-fication of patients with Klinefelter-syndrome among azoospermic patients, has signifi-cantly better sensitivity and can improve diagnostic rate of the illness [70]. Another deeplearning-based method was developed to assess the stages of Wistar rat spermatogeniccycle on hematoxylin-eosin-stained digital slides, which makes the quick evaluation ofstage-frequency possible [71]. Deep learning can be used in the classification of the im-munohistochemistry images of human testis and improve the diagnostic performance [72].
Although our quantitative histomorphometric-mathematical image analysis is still amanual evaluation, the accurate counting and geometrical measurements can serve as abasis for later automation. The computer-based identification of testicular tissue structuresand cell types with the application of artificial intelligence and deep machine learning tech-niques under strict human supervision can be implemented in analogy with the abovemen-tioned examples and Computer-Assisted or -Aided Sperm Analysis (CASA) [73]. Variousautomated semen quality analysis systems exist and demonstrate highly concordant results,which can be compared to manual analyzing methods [74].
From the clinical point of view, our method may provide an approach for the differen-tial diagnosis of certain histopathological conditions of infertility (hypospermatogenesis,different levels of maturation arrest, tubular fibrosis, mixed atrophy and Sertoli-cell-onlysyndrome). For instance, in the case of maturation arrest, the elongated/late spermatids areabsent, correspondingly the number/ratio of ‘elongated spermatid-positive’ seminiferoustubules or ‘Histometric’ Bergmann-Kliesch percentage score would be lower. In tubularfibrosis, the tubules are constricted and disappeared; therefore, the number, area, perimeterand diameter of the tubules would reduce while the interstitial tissue amount would rela-tively increase as the result of fibrosis. In Sertoli-cell-only syndrome, the spermatogenicepithelium is severely reduced or absent, leading to a greater area, perimeter, diameter oftubular lumen and a smaller thickness of the spermatogenic epithelium.
In conclusion, our novel quantitative histomorphometric-mathematical image analysismethod can improve the reproducibility, objectivity, quality and comparability of basic,translational and clinical histologic-histomorphometric research and investigations oftesticular tissues. It may contribute to the recognition of mild, initial impairments anddifferences of testicular structure, providing precise values of measurable parameters,increasing the sensitivity for the distinction of animal experimental and human studygroups which may not be achieved with semi-quantitative score systems. Additionally,with the accumulation of experience, a clinical-diagnostic application can be developedin the near future that can recognize and quantitatively characterize pathologic situationswith much higher accuracy compared to the semi-quantitative systems presently used.Furthermore, additional immunohistochemical staining can be used to identify the presenceof possibly usable spermatids and sperms for assisted reproductive techniques. In thefuture, our evaluation, automated with the help of artificial intelligence and deep machinelearning, could be named ‘Computer-Assisted or -Aided Testis Histology (CATHI)’.
Limitations of our study: we demonstrated the suggested methods on rat testiculartissue instead of human testicular biopsy samples; thus, further basic, translational andclinical human studies are required to confirm our method.
Supplementary Materials: The following supporting information can be downloaded at: https://www.mdpi.com/article/10.3390/life12020189/s1, Figure S1-Table S1: Total seminiferous tubulenumber; Figure S2-Table S2: Average seminiferous tubule area; Figure S3-Table S3: Average seminifer-ous tubule lumen area; Figure S4-Table S4: Average seminiferous tubule perimeter; Figure S5-Table S5:Average seminiferous tubule lumen perimeter; Figure S6-Table S6: Average calculated spermatogenicepithelium area; Figure S7-Table S7: Average calculated spermatogenic epithelium area ratio; Figure
Life 2022, 12, 189 16 of 19
S8-Table S8: Average seminiferous tubule diameter; Figure S9-Table S9: Average seminiferous tubulelumen diameter; Figure S10-Table S10: Average spermatogenic epithelium thickness; Picture S1-S2:Representative histological picture of testicular tissue from our groups. Figure S11-Table S11: VitaminD Receptor (VDR)-positively-stained area percentage.
Author Contributions: Conceptualization, R.E.S., E.M.H. and S.V.; Data curation, R.E.S. and J.Á.;Formal analysis, R.E.S.; Investigation, R.E.S., J.Á., A.-M.T. and Á.K.-N.; Methodology, R.E.S., E.M.H.and S.V.; Project administration, R.E.S. and S.V.; Resources, E.M.H. and S.V.; Software, R.E.S., J.Á. andA.-M.T.; Supervision, G.L.N., E.M.H., Z.K. and S.V.; Validation, R.E.S., E.M.H. and S.V.; Visualization,R.E.S. and J.Á.; Writing—original draft, R.E.S., G.L.N., E.M.H., Z.K. and S.V.; Writing—review &editing, R.E.S., J.Á., A.-M.T., Á.K.-N., G.L.N., N.Á., P.G.H., A.S., H.K., E.M.H., Z.K. and S.V. Allauthors have read and agreed to the published version of the manuscript.
Funding: This research received no external funding.
Institutional Review Board Statement: All procedures conformed to the Guide for the Care andUse of Laboratory Animals published by the US National Institutes of Health (8th edition, 2011) andthe EU-conform Hungarian Law on Animal Care (XXVIII/1998). The Institutional Animal Care andUse Committee of Semmelweis University and Hungarian authorities approved the study protocol(PEI/001/820-2/2015).
Informed Consent Statement: Not applicable.
Data Availability Statement: The data which are additionally presented in this methodologicalarticle are openly available in our [Supplementary Materials].
Acknowledgments: The expert technical assistance of Éva Pál, Leila Hadjadj and Ildikó MolnárnéKedves is gratefully acknowledged. The authors thank Ilona Sziva especially for critically readingthe manuscript.
Conflicts of Interest: The authors declare no conflict of interest.
References1. Cui, W. Mother or nothing: The agony of infertility. Bull. World Health Organ. 2010, 88, 881–882. [CrossRef] [PubMed]2. Zegers-Hochschild, F.; Adamson, G.D.; Dyer, S.; Racowsky, C.; de Mouzon, J.; Sokol, R.; Rienzi, L.; Sunde, A.; Schmidt, L.; Cooke,
I.D.; et al. The International Glossary on Infertility and Fertility Care, 2017. Fertil. Steril. 2017, 108, 393–406. [CrossRef] [PubMed]3. Jungwirth, A.; Giwercman, A.; Tournaye, H.; Diemer, T.; Kopa, Z.; Dohle, G.; Krausz, C.; European Association of Urology
Working Group on Male Infertility. European Association of Urology guidelines on Male Infertility: The 2012 update. Eur. Urol.2012, 62, 324–332. [CrossRef] [PubMed]
4. Johnsen, S.G. Testicular biopsy score count–a method for registration of spermatogenesis in human testes: Normal values andresults in 335 hypogonadal males. Hormones 1970, 1, 2–25. [CrossRef]
5. McLachlan, R.I.; Rajpert-De Meyts, E.; Hoei-Hansen, C.E.; de Kretser, D.M.; Skakkebaek, N.E. Histological evaluation of thehuman testis–approaches to optimizing the clinical value of the assessment: Mini review. Hum. Reprod. 2007, 22, 2–16. [CrossRef]
6. Bergmann, M.; Kliesch, S. Testicular biopsy and histology. In Andrology Male Reproductive Health and Dysfunction; Nieschlag, E.,Behre, H.M., Nieschlag, S., Eds.; Springer: Berlin/Heidelberg, Germany, 2010; pp. 155–167.
7. Nieschlag, E.; Behre, H.M.; Nieschlag, S. Andrology: Male Reproductive Health and Dysfunction, 3rd ed.; Springer: Berlin/Heidelberg,Germany, 2010; Volume XVII, p. 629. [CrossRef]
8. Roosen-Runge, E.C. Quantitative investigations on human testicular biopsies. I. Normal testis. Fertil. Steril. 1956, 7, 251–261.[CrossRef]
9. Roosen-Runge, E.C.; Marberger, E.; Nelson, W.O. Quantitative investigations on human testicular biopsies. II. Infertility andother conditions. Fertil. Steril. 1957, 8, 203–219. [CrossRef]
10. Schoffling, K.; Federlin, K.; Schmitt, W.; Pfeiffer, E.F. Histometric investigations on the testicular tissue of rats with alloxandiabetes and Chinese hamsters with spontaneous diabetes. Acta Endocrinol. 1967, 54, 335–346. [CrossRef]
11. Usadel, K.H.; Mummert, W.; Schoffling, K. Histometric investigations on testicular tissue of obob-mice in various developmentalstages before and after stimulation with gonadotropins. Acta Endocrinol. Suppl. 1971, 152, 48.
12. Mancini, R.E.; Rosemberg, E.; Cullen, M.; Lavieri, J.C.; Vilar, O.; Bergada, C.; Andrada, J.A. Cryptorchid and Scrotal HumanTestes. I. Cytological, Cytochemical and Quantitative Studies. J. Clin. Endocrinol. Metab. 1965, 25, 927–942. [CrossRef]
13. Dykes, J.R. Histometric assessment of human testicular biopsies. J. Pathol. 1969, 97, 429–440. [CrossRef] [PubMed]14. Steinberger, E.; Tjioe, D.Y. A method for quantitative analysis of human seminiferous epithelium. Fertil Steril 1968, 19, 959–961.
[CrossRef]15. Clermont, Y. The cycle of the seminiferous epithelium in man. Am. J. Anat. 1963, 112, 35–51. [CrossRef] [PubMed]
Life 2022, 12, 189 17 of 19
16. Clermont, Y. Kinetics of spermatogenesis in mammals: Seminiferous epithelium cycle and spermatogonial renewal. Physiol. Rev.1972, 52, 198–236. [CrossRef]
17. Heller, C.G.; Clermont, Y. Spermatogenesis in man: An estimate of its duration. Science 1963, 140, 184–186. [CrossRef]18. Leblond, C.P.; Clermont, Y. Definition of the stages of the cycle of the seminiferous epithelium in the rat. Ann. N. Y. Acad. Sci.
1952, 55, 548–573. [CrossRef]19. Rowley, M.J.; Heller, C.G. Quantitation of the cells of the seminiferous epithelium of the human testis employing the sertoli cell as
a constant. Z. Fur Zellforsch. Und Mikrosk. Anat. 1971, 115, 461–472. [CrossRef]20. Skakkebaek, N.E.; Heller, C.G. Quantification of human seminiferous epithelium. I. Histological studies in twenty-one fertile men
with normal chromosome complements. J. Reprod. Fertil. 1973, 32, 379–389. [CrossRef]21. Skakkebaek, N.E.; Hulten, M.; Philip, J. Quantification of human seminiferous epithelium. IV. Histological studies in 17 men with
numerical and structural autosomal aberrations. Acta Pathol. Microbiol. Scand. A 1973, 81, 112–124.22. Zukerman, Z.; Rodriguez-Rigau, L.J.; Weiss, D.B.; Chowdhury, A.K.; Smith, K.D.; Steinberger, E. Quantitative analysis of the
seminiferous epithelium in human testicular biopsies, and the relation of spermatogenesis to sperm density. Fertil. Steril. 1978, 30,448–455. [CrossRef]
23. Levin, H.S. Testicular biopsy in the study of male infertility: Its current usefulness, histologic techniques, and prospects for thefuture. Hum. Pathol. 1979, 10, 569–584. [CrossRef]
24. Dias, P.L. Histometric analysis of the effects of reserpine on the interstitial cells of the rat testis. Br. J. Exp. Pathol. 1982, 63, 518–521.[PubMed]
25. Chakraborty, J.; Sinha-Hikim, A.P.; Jhunjhunwala, J. A simple method for quantitative analysis of human testicular biopsies fromepon sections. Ann. N. Y. Acad. Sci. 1984, 438, 481–484. [CrossRef] [PubMed]
26. Muller, J. Morphometry and histology of gonads from twelve children and adolescents with the androgen insensitivity (testicularfeminization) syndrome. J. Clin. Endocrinol. Metab. 1984, 59, 785–789. [CrossRef]
27. Hafez, M.M.; Heidger, P.M., Jr. Stereological study of Leydig cell density in the guinea pig testis. Arch. Androl. 1986, 17, 1–7.[CrossRef]
28. Chen, C.; Scott, M.H.; Wolf, P.L.; Moossa, A.R.; Lee, S. Histometric investigations of the effect of cyclosporin A on the testiculartissue of rats. Exp. Mol. Pathol. 1988, 49, 185–195. [CrossRef]
29. Berndtson, W.E.; Neefus, C.; Foote, R.H.; Amann, R.P. Optimal replication for histometric analyses of testicular function in rats orrabbits. Fundam. Appl. Toxicol. 1989, 12, 291–302. [CrossRef]
30. Sosnik, H. Histometry of male gonad in liver cirrhosis. Gegenbaurs Morphol. Jahrb. 1990, 136, 295–325.31. Pylkkanen, L.; Jahnukainen, K.; Parvinen, M.; Santti, R. Testicular toxicity and mutagenicity of steroidal and non-steroidal
estrogens in the male mouse. Mutat. Res. 1991, 261, 181–191. [CrossRef]32. Hirsch, I.H.; Kulp-Hugues, D.; McCue, P.; Flanigan, M.; Sedor, J.; Stevenson, A.; Staas, W.E. The value of quantitative testicular
biopsy and deoxyribonucleic acid flow cytometry in predicting sperm recovery from electrostimulated ejaculates. J. Urol. 1993,149, 1345–1349. [CrossRef]
33. Ichihara, I.; Kawamura, H.; Pelliniemi, L.J. Ultrastructure and morphometry of testicular Leydig cells and the interstitialcomponents correlated with testosterone in aging rats. Cell Tissue Res. 1993, 271, 241–255. [CrossRef] [PubMed]
34. Thompson, T.L.; Berndtson, W.E. Testicular weight, Sertoli cell number, daily sperm production, and sperm output of sexuallymature rabbits after neonatal or prepubertal hemicastration. Biol. Reprod. 1993, 48, 952–957. [CrossRef] [PubMed]
35. Matsui, H.; Mitsumori, K.; Yasuhara, K.; Onodera, H.; Shimo, T.; Takahashi, M. Morphological evaluation of cyclophosphamidetesticular toxicity in rats using quantitative morphometry of spermatogenic cycle stages. J. Toxicol. Sci. 1995, 20, 407–414.[CrossRef]
36. Zayed, A.E.; Hifny, A.; Abou-Elmagd, A.; Wrobel, K.H. Seasonal changes in the intertubular tissue of the camel testis (Camelusdromedarius). Ann. Anat. 1995, 177, 199–212. [CrossRef]
37. Lue, Y.; Hikim, A.P.; Wang, C.; Bonavera, J.J.; Baravarian, S.; Leung, A.; Swerdloff, R.S. Early effects of vasectomy on testicularstructure and on germ cell and macrophage apoptosis in the hamster. J. Androl. 1997, 18, 166–173. [PubMed]
38. De Miguel, M.P.; Marino, J.M.; Martinez-Garcia, F.; Nistal, M.; Paniagua, R.; Regadera, J. Pre- and post-natal growth of the humanductus epididymidis. A morphometric study. Reprod. Fertil. Dev. 1998, 10, 271–277. [CrossRef] [PubMed]
39. Hata, J.; Takahashi, H.; Nakahara, C.; Namiki, A.; Uno, H.; Asano, S. Collaborative work to evaluate toxicity on male reproductiveorgans by repeated dose studies in rats: 1). Effects of 2-weeks daily administration of estradiol benzoate. J. Toxicol. Sci. 2000, 25,23–31. [CrossRef] [PubMed]
40. Watanabe, A.; Nakano, Y.; Endo, T.; Sato, N.; Kai, K.; Shiraiwa, K. Collaborative work to evaluate toxicity on male reproductiveorgans by repeated dose studies in rats: 27). Repeated toxicity study on ethylene glycol monomethyl ether for 2 and 4 weeks todetect effects on male reproductive organs in rats. J. Toxicol. Sci. 2000, 25, 259–266. [CrossRef]
41. Sukura, A.; Makipaaa, R.; Vierula, M.; Rodriguez-Martinez, H.; Sundback, P.; Andersson, M. Hereditary sterilizing short-tailsperm defect in Finnish Yorkshire boars. J. Vet. Diagn. Investig. 2002, 14, 382–388. [CrossRef]
42. Herrera-Alarcon, J.; Villagomez-Amezcua, E.; Gonzalez-Padilla, E.; Jimenez-Severiano, H. Stereological study of postnataltesticular development in Blackbelly sheep. Theriogenology 2007, 68, 582–591. [CrossRef]
43. Ma, L.; Guo, Y.; Yuan, Y.; Li, Y.G.; Deng, X.Z.; Yang, Z.W. Morphometric study of the testis and reproductive tract (includingsperm granuloma) after vasectomy in mature rats. Asian J. Androl. 2016, 18, 66–73. [CrossRef] [PubMed]
Life 2022, 12, 189 18 of 19
44. Nihi, F.; Gomes, M.L.M.; Carvalho, F.A.R.; Reis, A.B.; Martello, R.; Melo, R.C.N.; Almeida, F.; Chiarini-Garcia, H. Revisiting thehuman seminiferous epithelium cycle. Hum. Reprod. 2017, 32, 1170–1182. [CrossRef] [PubMed]
45. Umar, Z.; Qureshi, A.S.; Rehan, S.; Ijaz, M.; Faisal, T.; Umar, S. Effects of oral administration of black seed (Nigella sativa) oil onhistomorphometric dynamics of testes and testosterone profile in rabbits. Pak. J. Pharm. Sci. 2017, 30, 531–536. [PubMed]
46. Kazemi, S.; Feizi, F.; Aghapour, F.; Joorsaraee, G.A.; Moghadamnia, A.A. Histopathology and Histomorphometric Investigation ofBisphenol A and Nonylphenol on the Male Rat Reproductive System. N. Am. J. Med. Sci. 2016, 8, 215–221. [CrossRef] [PubMed]
47. Sziva, R.E.; Fontanyi, Z.; Pal, E.; Hadjadj, L.; Monori-Kiss, A.; Horvath, E.M.; Benko, R.; Magyar, A.; Heinzlmann, A.; Benyo,Z.; et al. Vitamin D Deficiency Induces Elevated Oxidative and Biomechanical Damage in Coronary Arterioles in Male Rats.Antioxidants 2020, 9, 997. [CrossRef] [PubMed]
48. Pal, E.; Hadjadj, L.; Fontanyi, Z.; Monori-Kiss, A.; Mezei, Z.; Lippai, N.; Magyar, A.; Heinzlmann, A.; Karvaly, G.; Monos, E.; et al.Vitamin D deficiency causes inward hypertrophic remodeling and alters vascular reactivity of rat cerebral arterioles. PLoS ONE2018, 13, e0192480. [CrossRef]
49. Ichihara, I.; Pelliniemi, L.J. Morphometric and ultrastructural analysis of stage-specific effects of Sertoli and spermatogenic cellsseen after short-term testosterone treatment in young adult rat testes. Ann. Anat. 2007, 189, 520–532. [CrossRef]
50. Zhu, Z.J.; Yang, S.; Li, Z. Transcriptome research on spermatogenic molecular drive in mammals. Asian J. Androl. 2015, 17, 961–971.[CrossRef]
51. Gewiss, R.; Topping, T.; Griswold, M.D. Cycles, waves, and pulses: Retinoic acid and the organization of spermatogenesis.Andrology 2020, 8, 892–897. [CrossRef]
52. Dhakal, H.P.; Coleman, J.; Przybycin, C.G. A Novel Dual Immunostain to Characterize Sloughed Cells in Testicular Biopsies forInfertility. Am. J. Surg. Pathol. 2019, 43, 1123–1128. [CrossRef]
53. Dunnill, M.S.; Anderson, J.A.; Whitehead, R. Quantitative histological studies on age changes in bone. J. Pathol. Bacteriol. 1967, 94,275–291. [CrossRef] [PubMed]
54. Clermont, Y. Cycle of the seminiferous epithelium and mode of renewal of spermatogonia in the hamster. Rev. Can. Biol. 1954, 13,208–245. [PubMed]
55. Clermont, Y. Structure of the epithelium of the seminiferous tubules and the mechanism of regeneration of the spermatogonia inthe duck. Arch. Anat. Microsc. Morphol. Exp. 1958, 47, 47–66. [PubMed]
56. Clermont, Y. Cycle of the seminiferous epithelium of the guinea pig. A method for identification of the stages. Fertil. Steril. 1960,11, 563–573. [CrossRef]
57. Clermont, Y.; Perey, B. Quantitative study of the cell population of the seminiferous tubules in immature rats. Am. J. Anat 1957,100, 241–267. [CrossRef]
58. Clermont, Y.; Perey, B. The stages of the cycle of the seminiferous epithelium of the rat: Practical definitions in PA-Schiff-hematoxylin and hematoxylin-eosin stained sections. Rev. Can. Biol. 1957, 16, 451–462.
59. Zamani, A.; Saki, F.; Hatami, N.; Koohpeyma, F. Stereological assessment of the effects of vitamin D deficiency on the rat testis.BMC Endocr. Disord. 2020, 20, 162. [CrossRef]
60. Xu, J.; Lu, H.; Li, H.; Yan, C.; Wang, X.; Zang, M.; Rooij, D.G.; Madabhushi, A.; Xu, E.Y. Computerized spermatogenesis staging(CSS) of mouse testis sections via quantitative histomorphological analysis. Med. Image Anal. 2021, 70, 101835. [CrossRef]
61. Dumont, L.; Levacher, N.; Schapman, D.; Rives-Feraille, A.; Moutard, L.; Delessard, M.; Saulnier, J.; Rondanino, C.; Rives, N. IHC_Tool:An open-source Fiji procedure for quantitative evaluation of cross sections of testicular explants. Reprod Biol. 2021, 21, 100507. [CrossRef]
62. Giovagnoli, M.R.; Giansanti, D. Artificial Intelligence in Digital Pathology: What Is the Future? Part 1: From the Digital SlideOnwards. Healthcare 2021, 9, 858. [CrossRef]
63. Giovagnoli, M.R.; Ciucciarelli, S.; Castrichella, L.; Giansanti, D. Artificial Intelligence in Digital Pathology: What Is the Future?Part 2: An Investigation on the Insiders. Healthcare 2021, 9, 1347. [CrossRef] [PubMed]
64. Siristatidis, C.; Stavros, S.; Drakeley, A.; Bettocchi, S.; Pouliakis, A.; Drakakis, P.; Papapanou, M.; Vlahos, N. Omics and ArtificialIntelligence to Improve In Vitro Fertilization (IVF) Success: A Proposed Protocol. Diagnostics 2021, 11, 743. [CrossRef] [PubMed]
65. Zmuidinaite, R.; Sharara, F.I.; Iles, R.K. Current Advancements in Noninvasive Profiling of the Embryo Culture Media Secretome.Int. J. Mol. Sci. 2021, 22, 2513. [CrossRef]
66. Nakata, H.; Iseki, S.; Mizokami, A. Three-dimensional reconstruction of testis cords/seminiferous tubules. Reprod. Med. Biol.2021, 20, 402–409. [CrossRef] [PubMed]
67. Sofikitis, N.V.; Miyagawa, I.; Zavos, P.M.; Toda, T.; Iino, A.; Terakawa, N. Confocal scanning laser microscopy of morphometrichuman sperm parameters: Correlation with acrosin profiles and fertilizing capacity. Fertil. Steril. 1994, 62, 376–386. [CrossRef]
68. Yamamoto, Y.; Sofikitis, N.; Mio, Y.; Loutradis, D.; Kaponis, A.; Miyagawa, I. Morphometric and cytogenetic characteristics oftesticular germ cells and Sertoli cell secretory function in men with non-mosaic Klinefelter’s syndrome. Hum. Reprod. 2002, 17,886–896. [CrossRef]
69. Iqbal, I.; Mustafa, G.; Ma, J. Deep Learning-Based Morphological Classification of Human Sperm Heads. Diagnostics 2020, 10, 325.[CrossRef]
70. Krenz, H.; Sansone, A.; Fujarski, M.; Krallmann, C.; Zitzmann, M.; Dugas, M.; Kliesch, S.; Varghese, J.; Tuttelmann, F.; Gromoll, J.Machine learning based prediction models in male reproductive health: Development of a proof-of-concept model for KlinefelterSyndrome in azoospermic patients. Andrology 2021, in press. [CrossRef]
Life 2022, 12, 189 19 of 19
71. Creasy, D.M.; Panchal, S.T.; Garg, R.; Samanta, P. Deep Learning-Based Spermatogenic Staging Assessment for Hematoxylin andEosin-Stained Sections of Rat Testes. Toxicol. Pathol. 2021, 49, 872–887. [CrossRef]
72. Ghoshal, B.; Hikmet, F.; Pineau, C.; Tucker, A.; Lindskog, C. DeepHistoClass: A Novel Strategy for Confident Classification ofImmunohistochemistry Images Using Deep Learning. Mol. Cell Proteom. 2021, 20, 100140. [CrossRef]
73. Baskaran, S.; Finelli, R.; Agarwal, A.; Henkel, R. Diagnostic value of routine semen analysis in clinical andrology. Andrologia 2021,53, e13614. [CrossRef] [PubMed]
74. Agarwal, A.; Panner Selvam, M.K.; Ambar, R.F. Validation of LensHooke(R) X1 PRO and Computer-Assisted Semen AnalyzerCompared with Laboratory-Based Manual Semen Analysis. World J. Mens Health 2021, 39, 496–505. [CrossRef] [PubMed]