Embed Size (px)
Citation preview
DownloaTerms o
JSLHR
Research Article
aDepartmentbDropbox, Au
Rachael C. G
Corresponden
Editor: Julie LAssociate Edi
Received AprRevision receAccepted Mahttps://doi.org
Journal of Speec
ded From: httf Use: http://pu
Acoustics of Clear and Noise-AdaptedSpeech in Children, Young,
and Older Adults
Rajka Smiljanica and Rachael C. GilbertbPurpose: This study investigated acoustic–phoneticmodifications produced in noise-adapted speech (NAS)and clear speech (CS) by children, young adults, andolder adults.Method: Ten children (11–13 years of age), 10 young adults(18–29 years of age), and 10 older adults (60–84 years ofage) read sentences in conversational and clear speakingstyle in quiet and in noise. A number of acoustic measurementswere obtained.Results: NAS and CS were characterized by a decreasein speaking rate and an increase in 1–3 kHz energy,sound pressure level (SPL), vowel space area (VSA), andharmonics-to-noise ratio. NAS increased fundamental
of Linguistics, University of Texas at Austinstin, TX
ilbert is now at Atlassian, San Francisco, CA.
ce to Rajka Smiljanic: [email protected]
isstor: Amy Neel
il 4, 2016ived October 23, 2016y 8, 2017/10.1044/2017_JSLHR-S-16-0130
h, Language, and Hearing Research • Vol. 60 • 3081–3096 • November 20
p://jslhr.pubs.asha.org/ by a ReadCube User on 11/09/2017bs.asha.org/ss/rights_and_permissions.aspx
frequency (F0) mean and decreased jitter and shimmer. CSincreased frequency and duration of pauses. Older adultsproduced the slowest speaking rate, longest pauses, andsmallest increase in F0 mean, 1–3 kHz energy, and SPL whenspeaking clearly. They produced the smallest increases inVSA in NAS and CS. Children slowed down less, increasedthe VSA least, increased harmonics-to-noise ratio, anddecreased jitter and shimmer most in CS. Children increasedmean F0 and F1 most in noise.Conclusions: Findings have implications for a model ofspeech production in healthy speakers as well as thepotential to aid in clinical decision making for individualswith speech disorders, particularly dysarthria.
This study is the first of two articles examiningspeaking style adaptations that children, youngadults, and older adults implement when speaking
in response to noise (noise-adapted speech, NAS) and wheninstructed to speak clearly (clear speech, CS). The focusof the current research article is on identifying some of theacoustic–articulatory modifications characterizing a responseto the two communicative barriers, both separately and inconjunction. In the companion article (Smiljanic & Gilbert,2017), we examine whether intelligibility for young adultlisteners is enhanced through these adaptations. Combined,these findings may be useful in guiding clinicians in choosingtreatment for individuals whose intelligibility is compromisedand in situating these treatment options within cognitive–perceptual models of intelligibility (Cooke, King, Garnier, &Aubanel, 2013; Lansford, Liss, Caviness, & Utianski, 2011).
NAS and CSCompared with speech produced in quiet, NAS typi-
cally exhibits a decrease in speech rate, an increase invocal levels, longer vowel duration, a higher average funda-mental frequency (F0), a higher peak F0, and increasedenergy at higher frequencies (Cooke & Lu, 2010; Junqua,1993; Lane & Tranel, 1971; Lombard, 1911; Navarro, 1996;Pittman & Wiley, 2001; Summers, Pisoni, Bernacki, Pedlow,& Stokes, 1988). Relative to conversational (CO) speech,CS is most often characterized by a decrease in speaking rate(longer segments as well as longer and more frequent pauses),an increase in vocal levels, a wider F0 range, more salientstop releases, an expanded vowel space, greater obstruentrms energy, and increased energy at higher frequencies(Bradlow, Kraus, & Hayes, 2003; Ferguson & Kewley-Port, 2002; Krause & Braida, 2004; Liu, Del Rio, Bradlow,& Zeng, 2004; Picheny, Durlach, & Braida, 1986; Smiljanic& Bradlow, 2005). Perceptually, it is well established thatboth NAS and CS improve word recognition for a varietyof listener groups and listening conditions (for reviews, seeCooke et al., 2013; Pichora-Fuller, Goy, & van Lieshout,2010; Smiljanic & Bradlow, 2011).
While NAS and CS share many acoustic–articulatoryfeatures, differences between the two adaptations have also
Disclosure: The authors have declared that no competing interests existed at the timeof publication.
17 • Copyright © 2017 American Speech-Language-Hearing Association 3081
DownloaTerms o
been established (Cooke et al., 2013; Gilbert, Chandrasekaran,& Smiljanic, 2014; Godoy, Koutsogiannaki, & Stylianou,2014). For instance, increase in the distinctiveness of pho-nological vowel and consonant contrasts has been shownmuch more reliably in CS (Ferguson & Kewley-Port, 2002;Lu & Cooke, 2008; Maniwa, Jongman, & Wade, 2008;Smiljanic & Bradlow, 2005, 2008), whereas increased spec-tral energy in a band spanning the range of formants isfound more commonly in NAS (Krause & Braida, 2004; Lu& Cooke, 2009; Summers et al., 1988). It is important tonote, though, that NAS and CS studies do not always com-pare the same set of acoustic–phonetic features, nor do theyuse consistent instructions to elicit CS or NAS; hence, thecross-study comparisons are not possible (Pichora-Fulleret al., 2010). A few studies that compared acoustic modifi-cations for NAS and CS directly reported mixed results(Godoy et al., 2014; Goy, Pichora-Fuller, & van Lieshout,2013; Gilbert et al., 2014). Goy, Pichora-Fuller, et al. (2013)found a significantly lower mean F0 on target words inCS and higher F0 mean in loud speech compared with anyother condition, and no differences in F0 range across theconditions. They also reported a significantly slower speak-ing rate in CS compared with loud and CO speech. Gilbertet al. (2014), on the other hand, showed significantly slowerspeech rates, higher mean pitch, and more energy in the1–3 kHz range for both speaking style adaptations. Addi-tionally, a significantly larger F0 range in CS comparedwith CO speech but smaller F0 range in NAS comparedwith quiet speech was found. With an eye toward usingcue enhancement algorithms for improving speech intel-ligibility, Godoy et al. (2014) reported trends for spectralenergy boosting in NAS only and vowel space expansionfor CS only. Note that Goy, Pichora-Fuller, et al. (2013) andGilbert et al. (2014) examined speech of only one talker,whereas Godoy et al. (2014) used different materials to ex-amine NAS and CS.
Given that both speaking in noise and with listenerswho are hard of hearing or nonnative speakers of the tar-get language characterize everyday communication inter-actions, the current investigation is relevant from both thetheoretical and clinical perspectives. Within the hypo-and hyper-articulation (H&H) theory (Lindblom, 1990;Perkell, Zandipour, Matthies, & Lane, 2002), CO speechis at the hypo-articulation end of the continuum, and CSand NAS are at the hyper-articulation end. Young healthyadults can successfully modify their output from hypo- tohyper-articulated speech in response to different communi-cation challenges (Hazan & Baker, 2011). Lam, Tjaden,and Wilding (2012) demonstrated that young adult talkersproduced gradient acoustic–articulatory modifications inresponse to different instructions to clarify their speech(overnunciate vs. hearing impairment conditions). Focus-ing on suprasegmental characteristics, Hazan, Tuomainen,and Pettinato (2016) showed that children were still devel-oping a full range of intelligibility-enhancing strategies inresponse to the degraded transmission condition (vocodedspeech) at the ages of 9–14. This suggests that adoles-cents do not yet have a fully developed skill set to produce
3082 Journal of Speech, Language, and Hearing Research • Vol. 60 •
ded From: http://jslhr.pubs.asha.org/ by a ReadCube User on 11/09/2017f Use: http://pubs.asha.org/ss/rights_and_permissions.aspx
gradient responses on the hypo- to hyper-articulationcontinuum. The current study builds on this work by ex-amining whether talkers produce similar hyper-articulatorymodifications when speaking in response to noise andwhen speaking clearly and whether developmental andage-related factors affect hypo- and hyper-articulationabilities.
CS and loud speech have also been used as behav-ioral treatment techniques for maximizing intelligibilityin speakers whose production of voice pitch, loudness,speaking rate, vowel formants, and distribution of energyare disrupted (Beukelman, Fager, Ullman, Hanson, &Logemann, 2002; Hustad & Weismer, 2007; Park, Theodoros,Finch, & Cardell, 2016; Sadagopan & Huber, 2007) andin aural rehabilitation programs (Schum, 1997). In responseto CS instructions, talkers with dysarthria produced in-creases in vowel space area (VSA), vocal intensity, and meanF0 and a decrease in speaking rate (Goberman & Elmer,2005; Tjaden, Kain, & Lam, 2014; Tjaden, Lam, & Wilding,2013; Tjaden, Sussman, & Wilding, 2014). Lam andTjaden (2016) found that, similar to healthy adults, talkerswith Parkinson’s disease (PD) also produced differentdegrees of modifications in response to the varied CS in-structions. Talkers with PD were found to successfully in-crease vocal effort in response to masking noise (Stathopoulos,Huber, & Sussman, 2011) although the response differedbetween the control participants and individuals with PD(Adams, Moon, Page, & Jog, 2006; Darling & Huber,2011). Evidence is emerging that these speech-oriented,behavioral treatments may lead to enhanced intelligibil-ity for talkers with dysarthria (Park et al., 2016; Tjaden,Sussman, et al., 2014). CS and NAS thus have great po-tential as therapy techniques for addressing speech im-pairment in patients with dysarthria. Examining thesimilarities and differences between the two adaptationsacross the same set of acoustic–articulatory features andwith consistent elicitation methods can provide usefulbenchmarks for clinicians in treatment goals for individ-uals with dysarthria. Furthermore, better understandingof the impact of the treatment targets on the speech out-put and their consequences for speech processing can pro-vide support for a cognitive–perceptual framework withinwhich to conceptualize treatment goals (Cooke et al., 2013;Lansford et al., 2011).
Age Effect on Speaking Style AdaptationsChildren, young adults, and older adults differ sig-
nificantly in their speech production systems (e.g., vocaltract length, speech motor control) and auditory and cog-nitive abilities, leading to qualitatively different speechpatterns (Benjamin, 1982; Gordon-Salant & Fitzgibbons,1997; Goy, Fernandes, Pichora-Fuller, & van Lieshout, 2013;Lee, Potamianos, & Narayanan, 1999; Pichora-Fuller,Schneider, & Daneman, 1995; Schneider, Daneman, &Pichora-Fuller, 2002). Children have more variable soundproductions, greater within-category dispersion, and smallerdistances between contrasting phonemes compared with
3081–3096 • November 2017
DownloaTerms o
adults (Lee et al., 1999; Nissen & Fox, 2005; Romeo, Hazan,& Pettinato, 2013). Some of the differences may be due tothe children’s still-developing motor speech control, which canextend well into adolescence (Murdoch, Cheng, & Goozee,2012; Walsh & Smith, 2002). Similarly, the quality of thespeech signal is affected by aging for older adults. Listenerscan easily distinguish between older and younger talkers,revealing that voice quality and speech patterns change withage (Goy, Fernandes, et al., 2013; Ryan & Burk, 1974). Theseage-related differences can arise from an interaction of sen-sorimotor changes and declines in auditory feedback (Liss,Weismer, & Rosenbek, 1990). Older adults have also beenshown to have increased segment durations, slower overallspeaking rate, spirantized stops, and more centralized vowels(Benjamin, 1982; Halle & Myerson, 1996; Liss et al., 1990).Speech patterns with these characteristics (both in healthyand clinical populations) may lead to lower accuracy inperception and intelligibility as well as more effortful pro-cessing on the part of the listener (Hazan, Romeo, & Pettinato,2013; Liss et al., 1990; McAuliffe, Wilding, Rickard, &O’Beirne, 2012; Newman, Clouse, & Burnham, 2001; Torre& Barlow, 2009).
While some work has examined nonnative (Rogers,DeMasi, & Krause, 2010; Smiljanic & Bradlow, 2011) andgender-related differences in CS production (Ferguson, 2004),large gaps remain in our understanding of age-relatedchanges in the production of intelligibility-enhancing speak-ing styles. Previous work with young children showed that3-, 4-, and 5-year-olds showed similar or larger vocal inten-sity increases in response to noise compared with adults(Garber, Speidel, & Siegel, 1980; Garber, Speidel, Siegel,Miller, & Glass, 1980; Siegel, Pick, Olsen, & Sawin, 1976).Redford and Gildersleeve-Neumann (2009) found that lis-teners were not able to differentiate CS from casual pro-ductions in 3-year-olds but could do so in 4- and 5-year-olds,even though they exhibited different acoustic–articulatoryadjustments compared with adults (e.g., faster speaking rateand lower overall F0 in CS compared with casual speech).Syrett and Kawahara (2013) showed that 3- to 5-year-oldchildren produced conversational-to-clear speech modifica-tions typically found for adults (e.g., expanded F0 range;longer, louder, and more dispersed vowels). In contrast,Pettinato and Hazan (2013); Pettinato, Tuominen, Granlund,and Hazan (2016); and Hazan et al. (2016) found that dif-ferences between children’s and adult’s CS productions(e.g., vowel hyper-articulation) persisted even for 9–10 and13–14 years old. These findings suggest that many featuresof adultlike speaking style adaptations continue to developinto adolescence. Since few of these speaking adaptationstudies examined children over age 6, the current study seeksto provide additional findings on older children who ex-hibit more developed articulatory control and planningand who can participate in more comparable tasks to theadults.
A number of studies examined acoustic–articulatorymodifications that older adults produced when instructedto speak clearly, to speak slowly, or in response to differentlevels of background noise (Adams, Dykstra, Jenkins, &
Smiljani
ded From: http://jslhr.pubs.asha.org/ by a ReadCube User on 11/09/2017f Use: http://pubs.asha.org/ss/rights_and_permissions.aspx
Jog, 2008; Adams, Winnell, & Jog, 2010; Darling & Huber,2011; Sadagopan & Huber, 2007; Tjaden et al., 2013;Turner, Tjaden, &Weismer, 1995). In these studies, older adultsserved as age-matched controls to the groups of individualswith PD, amyotrophic lateral sclerosis (ALS), or multiplesclerosis (MS). Older adults were shown to significantlymodify their speech (e.g., increased vocal intensity, VSA, ab-dominal effort, and decreased speaking rate) in response tothese varied challenges. While the older adults were moresuccessful in implementing some of the adjustments comparedwith the individuals with PD, ALS, or MS, it is not clearfrom these studies how they would compare to the healthyyoung talkers. Schum (1996) found that older adults pro-vided the same CS intelligibility benefit as young adults,whereas Smiljanic (2013) found a significantly smaller benefitfor older adult talkers. In terms of the acoustic–phonetic ad-justments, Smiljanic (2013) provided only speaking rate anal-ysis, which revealed that older adults produced overallslower CO speech as well as a smaller CS speaking ratedecrease compared with the young adults. Schum (1996)only reported that “similar acoustic effects” were foundfor older adults as reported in other CS literature (cf., Pichenyet al., 1986; Schum, 1996, p. 215). Examining CS and NASdifferences in children, young adults, and older adults willadd to our understanding of the scope of variation within theneurologically healthy talkers related to developmental andaging factors.
The aim of the current production study was to ex-amine acoustic–articulatory modifications that characterizeCO and CS sentences produced both in quiet and in noiseby children, young adults, and older adults. Understand-ing adaptations to different communicative challenges maybe important in clinical decision making for individualswith speech disorders, particularly dysarthria. This exami-nation can also enhance our understanding of whetherauditory, articulatory, and cognitive changes across life spanaffect how talkers respond to the noise in the environmentand when they attempt to increase their intelligibility byspeaking clearly. In the companion article (Smiljanic &Gilbert, 2017), we report on the effect that NAS and CShave on intelligibility for the three talker groups. The twostudies contribute toward a deeper understanding of the ef-fects of inter- and intra-talker variability and environmentalfactors on intelligibility.
MethodTalkers
Ten children (11–13 years old, mean 12.3 years),10 young adults (18–29 years old, mean 21.0 years), and10 older adults (60–84 years old, mean 70.2 years) partici-pated in the study. All talkers were native monolingualspeakers of English and balanced for gender within eachgroup. The hearing thresholds were obtained for both earsusing an ascending method in 5-dB steps for octave fre-quencies of 500, 1000, 2000, and 4000 Hz. Children and youngadults had typical hearing (thresholds below 25 dB HL
c & Gilbert: Acoustics of Clear and Noise-Adapted Speech 3083
DownloaTerms o
at octave frequencies between 500 and 4000 Hz). Fourout of 10 adult talkers had hearing within normal limitsthrough 4000 Hz. Three out of 10 older adults had hear-ing within normal limits through 2000 Hz with 4000-Hzthresholds ranging between 40 and 45 dB HL. Three talkershad some degree of high-frequency hearing loss typical forpresbycusis (ranging between 35–45 dB HL at 2000 Hzand 40–75 dB HL at 4000 Hz). None of the older adultswere hearing aid users. The young adults were all Univer-sity of Texas at Austin undergraduate students. Childrenand older adults were recruited from the Austin, Texas,community. All materials and procedures were approvedby the Institutional Review Board at the University ofTexas at Austin.
Stimuli and MaskerEach talker produced 60 meaningful sentences (e.g.,
Farm animals stay in a barn) developed for use with chil-dren (Fallon, Trehub, & Schneider, 2002).1 Each talkerproduced all of the sentences in CO speech first and thenin CS. The conversational and clear sentences were firstelicited in quiet. Next, both styles were elicited in responseto speech-shaped noise (SSN) interference presented dioti-cally over Sennheiser HD 280 pro headphones (80 dB SPL).2
SSN was generated by obtaining the long-term averagespectrum of 6-talker babble (three males, three females;Van Engen & Bradlow, 2007) and shaping white noise tomatch that spectrum. For CO speech, talkers were instructedto speak in a casual manner as if they were talking to afriend or a family member. For CS, they were instructedto speak as if they were talking to someone who has a lowproficiency in English and has difficulty following themconversationally. When eliciting NAS, the talkers read ona slide: “Now, you will hear some background noise. Pre-tend that you are in a noisy place, talking to your friendsor family.” This announcement was followed by the sameinstructions for CO and CS as provided when recordingswere done in quiet. Participants were asked if they had anyquestions, and none of them indicated that they did not
1Reprinted with permission from Fallon, Trehub, & Schneider.Copyright © 2002, Acoustic Society of America.2While the use of headphones to play masking noise could introducefrequency-dependent own-voice attenuation (Arlinger, 1986; Bořil,Bořil, & Pollák, 2006), it is a commonly used method in elicitingLombard speech (e.g., Summers et al., 1988). Lu and Cooke (2008)compared the closed headphone setup with a compensated transmissionchannel and found no significant differences in the productionmodifications. Furthermore, in our study, all talker groups heard maskingnoise using the same setup, and the attenuation characteristics would haveimpacted all equally. Finally, the acoustic–articulatory modificationsreported here are in line with what has been reported previously(Cooke et al., 2014; Pichora-Fuller et al., 2010; Smiljanic & Bradlow,2009). This, coupled with the intelligibility benefit produced by the twomodifications reported in the companion article (Smiljanic & Gilbert,2017), suggests that this effect would have been rather negligible.
3084 Journal of Speech, Language, and Hearing Research • Vol. 60 •
ded From: http://jslhr.pubs.asha.org/ by a ReadCube User on 11/09/2017f Use: http://pubs.asha.org/ss/rights_and_permissions.aspx
understand the instructions. The same elicitation orderwas maintained for all talkers.3
This set of instructions follows elicitation methodsused previously in our work and work by other researchersexamining CS and NAS (Gilbert et al., 2014; Pichora-Fuller et al., 2010; Smiljanic & Bradlow, 2009). It is wellestablished that varied instructions to elicit speaking stylemodifications will result in different acoustic–phonetic modi-fications implemented by talkers (Hazan & Baker, 2011;Lam & Tjaden, 2013; Lam et al., 2012). It is important tokeep this in mind when comparing the results of this studywith previous work that may have used different instruc-tions. However, in line with the goals of this study, the con-sistent set of instructions used here allowed us to comparespeaking style adaptation strategies across our talker groupsand across the two communication barriers.
ProcedureA hearing test with a portable screening audiometer
(GSI 18, Grason-Stadler) followed by the recording tookplace in a sound-attenuated booth in the phonetics labat the University of Texas at Austin. Sentences were pre-sented to the talker one at a time on a computer monitor.Recordings were made using a Shure SM10A head-mountedmicrophone and a MOTU UltraLite-MK3 Hybrid recorder.All four sets (CO and CS in quiet and in noise) of 60 sen-tences per talker were recorded in one session lasting approx-imately 1 hr. Only one repetition of each sentence in eachspeaking style condition was elicited. Talkers were instructedto repeat a sentence if they mispronounced it. Breaks wereprovided as needed. The total set of recordings contained7,200 sentences (60 unique sentences × 4 speaking styles ×30 talkers). The recorded sentences were segmented into indi-vidual files for acoustic analyses.
Acoustic AnalysesThe specific global acoustic–phonetic parameters
that we targeted in this analysis were F0 range (differencebetween the highest and lowest tonal targets in the sen-tence), F0 mean, speech rate (overall sentence duration,number and duration of pauses), energy in the 1–3 kHzrange,4 and SPL. Speaking rate was calculated as the
3The decision to keep the elicitation in the same order and constantacross participants was based on our previous work (Gilbert et al., 2014;Smiljanic & Bradlow, 2005) and piloting which revealed that it is moredifficult for talkers to produce more conversational and casual speechafter they had been asked to speak clearly or spoke in response to noise.If there was any effect of fatigue resulting in smaller or fewer adaptations,it would have likely impacted the most hyper-articulated speaking style(NAS CS). This suggests that any across-style differences we find in thepresent study may be more pronounced in real-life situations.4This measure was chosen since energy increases in this frequencyband have been shown to characterize CS modifications (Hazan &Baker, 2011; Hazan et al., 2016; Krause & Braida, 2004). Energyincrease in this frequency range reflects a reduction of spectral tilt,which characterizes speech produced with increased vocal effort (e.g.,Glave & Rietveld, 1975; Sluijter & van Heuven, 1996).
3081–3096 • November 2017
DownloaTerms o
number of syllables produced per second after the pauseswere excluded. A pause was defined as a period of silenceof at least 100 ms in duration, excluding silent periods be-fore word-initial stop consonants where it would be impos-sible to determine the end of a pause and the beginning ofthe stop closure (similar to Smiljanic & Bradlow, 2005). En-ergy in the 1–3 kHz range was measured by averaging thelong-term average spectrum energy between 1 and 3 kHzacross each sentence. The mean dB SPL of each sentencewas obtained by averaging the root-mean-square (rms) in-tensity for each sentence. Praat scripts (Boersma & Weenink,2014) were used to obtain acoustic values automaticallyfrom each sentence file. Any measurements that deviated by2 standard deviations from the mean for the particulartalker/speaking condition were hand checked and correctedfor errors.
Vowel measurements were obtained from a subset ofvowel tokens. These consisted of corner vowels (/i, ɑ, ae, u/)in monosyllabic words embedded between two obstruents.Vowel durations were measured from the onset of voicingand periodicity, as seen in the spectrogram and the wave-form, to the beginning of the closure for the following stop,as marked by the cessation of regular periodicity and a sub-stantial decrease in the amplitude of the waveform, or astart of the aperiodic waveform in case of fricatives. Mea-surements were based on two tokens per vowel per style perspeaker (960 total), one from a sentence-final content wordand one from a mid-sentence content word. The speakingstyle effects on vowel characteristics were always comparedacross the same vowel token (e.g., vowel in cheese producedin CO and CS in quiet and in noise), thus controlling forthe sound environment and prosodic context effects. F1 andF2 frequencies were automatically extracted from the mid-point of each vowel using a linear predictive coding (LPC)formant tracking algorithm in Praat, thus precluding errorsintroduced by hand measurements. Values that differed bymore than 200 Hz from the mean of the category werehand checked and corrected if necessary. Additionally,VSA was calculated for each condition using the formulafor the area of an irregular quadrilateral in Vorperian andKent (2007), as follows.
Area ¼ 0:5 � fð=i=F2 � =æ=F1þ =æ=F2 � =ɑ=F1
þ=ɑ=F2 � =u=F1þ =u=F2 � =i=F1Þ−ð=i=F1 � =æ=F2þ =æ=F1 � =ɑ=F2
þ=ɑ=F1 � =u=F2þ =u=F1 � =i=F2Þg
Following Goy, Fernandes, et al. (2013), voice mea-surements, harmonics-to-noise ratio (HNR; dB), jitterpercent, and shimmer percent were obtained from all /ɑ/tokens (2 per style per speaker, 240 total). Seventeen vowelswere excluded from these analyses due to the presence ofcreak throughout most of the vowel duration. All measureswere obtained automatically using Praat. Jitter was measuredas the average absolute difference between consecutive
Smiljani
ded From: http://jslhr.pubs.asha.org/ by a ReadCube User on 11/09/2017f Use: http://pubs.asha.org/ss/rights_and_permissions.aspx
periods, divided by the average period, using the jitter (local)method. Shimmer was measured as the average absolutedifference between the amplitudes of consecutive periods, di-vided by the average amplitude, using the shimmer (local)method. Harmonicity was measured as the mean HNR.
Data AnalysisEach acoustic feature was analyzed using mixed-
effect linear regression in SPSS with Talker Age Group(children, young adults, or older adults), Noise (producedin quiet or in response to noise), Style (conversational orclear), and their interactions as fixed effects. To accountfor talker and item variability, random intercepts for Talkerand Sentence were included as well. Random slopes wereincluded in the model for both Style and Noise at the levelof Talker, since this level showed the greatest variance. ForF1 and F2 analyses, Vowel Type (/i, ɑ, ae, u/) was addedas an additional fixed effect to examine how formant fre-quencies differed for each of the four corner vowels. Thesemodels determined the impact of age and communicativebarrier on production.
ResultsGlobal Measurements
Table 1 lists F0 range and mean, speaking rate, pauserate (number of pauses per talker), pause duration, energyin the 1–3 kHz range, and SPL in CO and CS produced innoise and in quiet for each talker group.
F0 mean was significantly affected by Talker AgeGroup, F(2, 27) = 8.830, p = .001. As expected, childrenshowed a significantly higher mean F0 than both adultgroups. A significant main effect of Noise was also found,F(1, 54.001) = 122.514, p < .001, with higher F0 mean inNAS compared with speech produced in quiet. There wasno significant main effect of Style, F(1, 54.001) = 1.130,p = .292. A significant two-way interaction between Noiseand Talker Age Group, F(2, 54.001) = 8.184, p = .001,indicated that children made a significantly larger F0 in-crease than adults in response to noise. Noise also interactedwith Style, F(1, 7041.013) = 8.385, p = .004. Pairwisecomparisons revealed that while F0 range was increasedin quiet-to-noise adjustments for both CO and CS, theincrease was larger for CO. Finally, a three-way interactionwas found between Talker Age Group, Noise, and Style,F(2, 7041.013) = 9.311, p < .001. All talker groups showedsignificantly higher F0 in noise relative to quiet; however,the quiet-to-noise F0 increase for older adults’ CS was smallerthan any of the other quiet-to-noise increases across talkergroups. The interaction between Noise and Style (in whichthe quiet-to-noise changes were larger for CO than for CS)arose from the older adult’s significantly smaller quiet-to-noise increase in CS. F0 range analyses showed a significantmain effect of both Noise, F(1, 53.995) = 6.444, p = .014,and Style, F(1, 53.995) = 5.627, p = .021, but not of TalkerAge Group, F(2, 27) = 1.572, p = .226. NAS and CS hadwider F0 range compared with quiet speech and CO speech,
c & Gilbert: Acoustics of Clear and Noise-Adapted Speech 3085
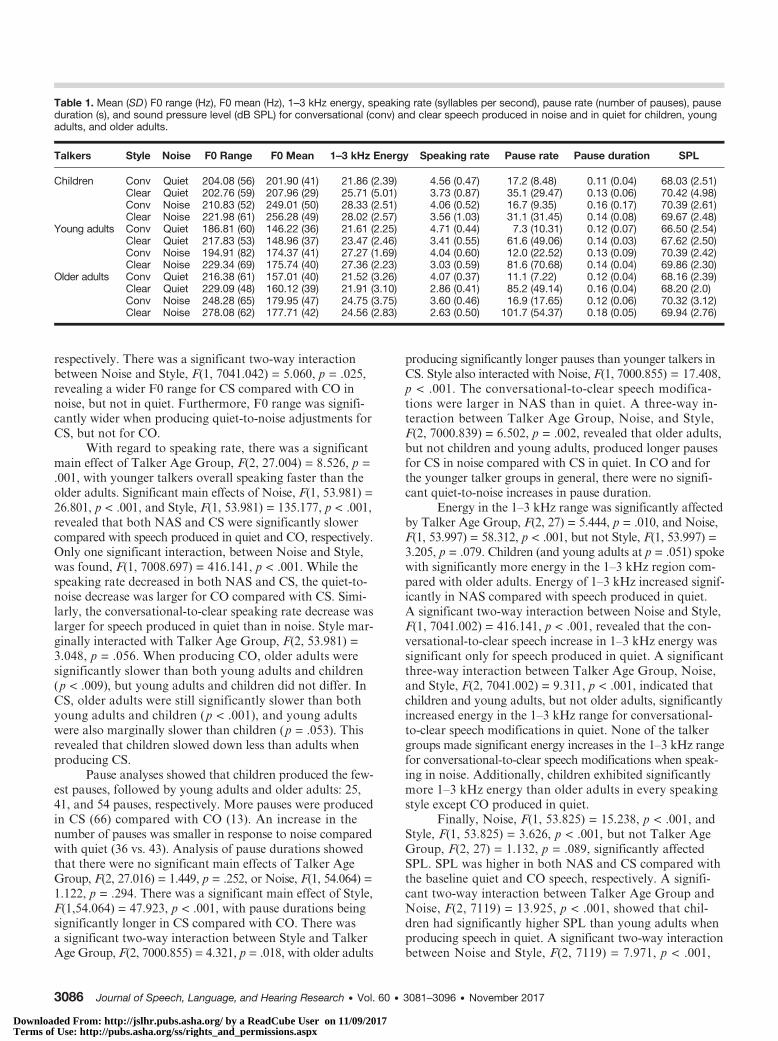
Table 1. Mean (SD ) F0 range (Hz), F0 mean (Hz), 1–3 kHz energy, speaking rate (syllables per second), pause rate (number of pauses), pauseduration (s), and sound pressure level (dB SPL) for conversational (conv) and clear speech produced in noise and in quiet for children, youngadults, and older adults.
Talkers Style Noise F0 Range F0 Mean 1–3 kHz Energy Speaking rate Pause rate Pause duration SPL
Children Conv Quiet 204.08 (56) 201.90 (41) 21.86 (2.39) 4.56 (0.47) 17.2 (8.48) 0.11 (0.04) 68.03 (2.51)Clear Quiet 202.76 (59) 207.96 (29) 25.71 (5.01) 3.73 (0.87) 35.1 (29.47) 0.13 (0.06) 70.42 (4.98)Conv Noise 210.83 (52) 249.01 (50) 28.33 (2.51) 4.06 (0.52) 16.7 (9.35) 0.16 (0.17) 70.39 (2.61)Clear Noise 221.98 (61) 256.28 (49) 28.02 (2.57) 3.56 (1.03) 31.1 (31.45) 0.14 (0.08) 69.67 (2.48)
Young adults Conv Quiet 186.81 (60) 146.22 (36) 21.61 (2.25) 4.71 (0.44) 7.3 (10.31) 0.12 (0.07) 66.50 (2.54)Clear Quiet 217.83 (53) 148.96 (37) 23.47 (2.46) 3.41 (0.55) 61.6 (49.06) 0.14 (0.03) 67.62 (2.50)Conv Noise 194.91 (82) 174.37 (41) 27.27 (1.69) 4.04 (0.60) 12.0 (22.52) 0.13 (0.09) 70.39 (2.42)Clear Noise 229.34 (69) 175.74 (40) 27.36 (2.23) 3.03 (0.59) 81.6 (70.68) 0.14 (0.04) 69.86 (2.30)
Older adults Conv Quiet 216.38 (61) 157.01 (40) 21.52 (3.26) 4.07 (0.37) 11.1 (7.22) 0.12 (0.04) 68.16 (2.39)Clear Quiet 229.09 (48) 160.12 (39) 21.91 (3.10) 2.86 (0.41) 85.2 (49.14) 0.16 (0.04) 68.20 (2.0)Conv Noise 248.28 (65) 179.95 (47) 24.75 (3.75) 3.60 (0.46) 16.9 (17.65) 0.12 (0.06) 70.32 (3.12)Clear Noise 278.08 (62) 177.71 (42) 24.56 (2.83) 2.63 (0.50) 101.7 (54.37) 0.18 (0.05) 69.94 (2.76)
DownloaTerms o
respectively. There was a significant two-way interactionbetween Noise and Style, F(1, 7041.042) = 5.060, p = .025,revealing a wider F0 range for CS compared with CO innoise, but not in quiet. Furthermore, F0 range was signifi-cantly wider when producing quiet-to-noise adjustments forCS, but not for CO.
With regard to speaking rate, there was a significantmain effect of Talker Age Group, F(2, 27.004) = 8.526, p =.001, with younger talkers overall speaking faster than theolder adults. Significant main effects of Noise, F(1, 53.981) =26.801, p < .001, and Style, F(1, 53.981) = 135.177, p < .001,revealed that both NAS and CS were significantly slowercompared with speech produced in quiet and CO, respectively.Only one significant interaction, between Noise and Style,was found, F(1, 7008.697) = 416.141, p < .001. While thespeaking rate decreased in both NAS and CS, the quiet-to-noise decrease was larger for CO compared with CS. Simi-larly, the conversational-to-clear speaking rate decrease waslarger for speech produced in quiet than in noise. Style mar-ginally interacted with Talker Age Group, F(2, 53.981) =3.048, p = .056. When producing CO, older adults weresignificantly slower than both young adults and children(p < .009), but young adults and children did not differ. InCS, older adults were still significantly slower than bothyoung adults and children (p < .001), and young adultswere also marginally slower than children (p = .053). Thisrevealed that children slowed down less than adults whenproducing CS.
Pause analyses showed that children produced the few-est pauses, followed by young adults and older adults: 25,41, and 54 pauses, respectively. More pauses were producedin CS (66) compared with CO (13). An increase in thenumber of pauses was smaller in response to noise comparedwith quiet (36 vs. 43). Analysis of pause durations showedthat there were no significant main effects of Talker AgeGroup, F(2, 27.016) = 1.449, p = .252, or Noise, F(1, 54.064) =1.122, p = .294. There was a significant main effect of Style,F(1,54.064) = 47.923, p < .001, with pause durations beingsignificantly longer in CS compared with CO. There wasa significant two-way interaction between Style and TalkerAge Group, F(2, 7000.855) = 4.321, p = .018, with older adults
3086 Journal of Speech, Language, and Hearing Research • Vol. 60 •
ded From: http://jslhr.pubs.asha.org/ by a ReadCube User on 11/09/2017f Use: http://pubs.asha.org/ss/rights_and_permissions.aspx
producing significantly longer pauses than younger talkers inCS. Style also interacted with Noise, F(1, 7000.855) = 17.408,p < .001. The conversational-to-clear speech modifica-tions were larger in NAS than in quiet. A three-way in-teraction between Talker Age Group, Noise, and Style,F(2, 7000.839) = 6.502, p = .002, revealed that older adults,but not children and young adults, produced longer pausesfor CS in noise compared with CS in quiet. In CO and forthe younger talker groups in general, there were no signifi-cant quiet-to-noise increases in pause duration.
Energy in the 1–3 kHz range was significantly affectedby Talker Age Group, F(2, 27) = 5.444, p = .010, and Noise,F(1, 53.997) = 58.312, p < .001, but not Style, F(1, 53.997) =3.205, p = .079. Children (and young adults at p = .051) spokewith significantly more energy in the 1–3 kHz region com-pared with older adults. Energy of 1–3 kHz increased signif-icantly in NAS compared with speech produced in quiet.A significant two-way interaction between Noise and Style,F(1, 7041.002) = 416.141, p < .001, revealed that the con-versational-to-clear speech increase in 1–3 kHz energy wassignificant only for speech produced in quiet. A significantthree-way interaction between Talker Age Group, Noise,and Style, F(2, 7041.002) = 9.311, p < .001, indicated thatchildren and young adults, but not older adults, significantlyincreased energy in the 1–3 kHz range for conversational-to-clear speech modifications in quiet. None of the talkergroups made significant energy increases in the 1–3 kHz rangefor conversational-to-clear speech modifications when speak-ing in noise. Additionally, children exhibited significantlymore 1–3 kHz energy than older adults in every speakingstyle except CO produced in quiet.
Finally, Noise, F(1, 53.825) = 15.238, p < .001, andStyle, F(1, 53.825) = 3.626, p < .001, but not Talker AgeGroup, F(2, 27) = 1.132, p = .089, significantly affectedSPL. SPL was higher in both NAS and CS compared withthe baseline quiet and CO speech, respectively. A signifi-cant two-way interaction between Talker Age Group andNoise, F(2, 7119) = 13.925, p < .001, showed that chil-dren had significantly higher SPL than young adults whenproducing speech in quiet. A significant two-way interactionbetween Noise and Style, F(2, 7119) = 7.971, p < .001,
3081–3096 • November 2017
DownloaTerms o
indicated that SPL was higher in CS compared with COin quiet, but not in noise. There was a significant three-wayinteraction of Talker Age Group, Noise, and Style, F(2,7119) = 4.934, p < .001. Pairwise comparisons revealed thatboth children and young adults had significantly higherSPL when producing CS compared with CO in quiet.Children furthermore had a significantly higher SPL thanyoung and older adults when producing CS in quiet. Innoise, children and young adults had significantly lowerSPL in CS compared with CO. Older adults had signifi-cantly higher SPL than young adults in CO quiet. Therewere no significant SPL differences between CS and COin quiet or in noise for older adults.
Segmental MeasurementsTable 2 lists mean vowel duration, and Table 3 lists
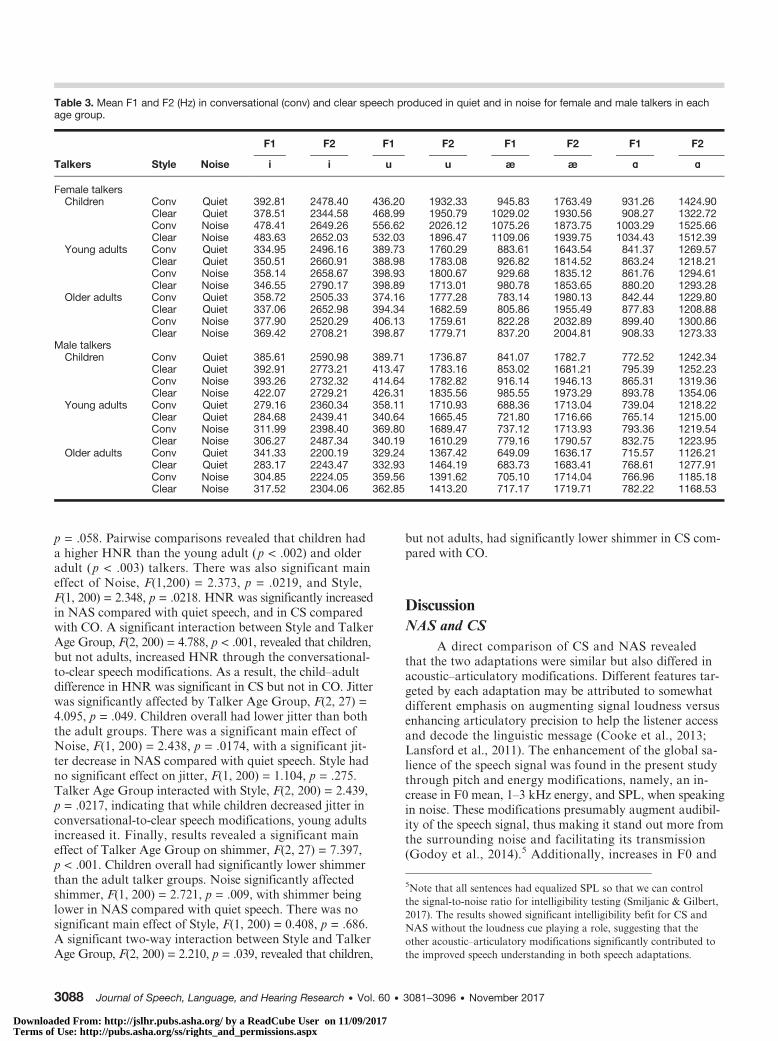
F1 and F2 for each vowel category and all speaking styles(male and female talkers’ formant values are providedseparately although the analyses collapse across gender).Figure 1 shows the average F1 × F2 data in CO and CSproduced in quiet and in noise for female and male talkersseparately in each age group. VSA can be inferred fromthe lines connecting vowel coordinates.
Analyses of vowel duration revealed a significant maineffect of Talker Age Group, F(2, 27) = 4.305, p = .024. Inline with the overall slower speaking rate, older adultsproduced significantly longer vowels than both youngergroups. There were significant main effects of both Noise,F(1, 54) = 93.220, p < .001, and Style, F(1, 54) = 61.175,p < .001. Vowels were significantly lengthened in NAS andCS relative to speech in quiet and CO speech, respectively.Two interactions approached significance: Noise and TalkerAge Group, F(2, 54) = 3.028, p = .057, and Noise and Style,F(1, 860) = 3.861, p = .051. While older adults producedsignificantly longer vowels than the younger groups inquiet, they were only marginally slower than young adults innoise (p = .056). That is, younger talker groups made largervowel duration increases when producing NAS comparedwith older adults. Noise × Style interaction revealed thatthe quiet-to-noise lengthening was larger for CO than for
Table 2. Mean (SD ) vowel duration (s) in conversational (conv) andclear speech produced in noise and in quiet for each talker group.
Talkers Style Noise Vowel duration
Children Conv Quiet 0.141 (0.02)Clear Quiet 0.187 (0.04)Conv Noise 0.213 (0.05)Clear Noise 0.240 (0.06)
Young adults Conv Quiet 0.160 (0.02)Clear Quiet 0.197 (0.03)Conv Noise 0.199 (0.02)Clear Noise 0.242 (0.03)
Older adults Conv Quiet 0.193 (0.02)Clear Quiet 0.240 (0.05)Conv Noise 0.237 (0.04)Clear Noise 0.265 (0.05)
Smiljani
ded From: http://jslhr.pubs.asha.org/ by a ReadCube User on 11/09/2017f Use: http://pubs.asha.org/ss/rights_and_permissions.aspx
CS. Additionally, the conversational-to-clear speech length-ening was larger for speech produced in quiet than for NAS.
As expected, F1 was significantly affected by Vowel,F(3, 4) = 171.994, p < .001, with low /ɑ, æ/ and high /i, u/vowels systematically differing in F1 frequency. There wasalso a significant main effect of Talker Age Group on F1,F(2, 27) = 9.458, p = .001. Consistent with smaller vocaltracts, children had higher F1 frequencies than adults. Interms of speaking styles, there were significant main ef-fects of both Noise, F(1, 54) = 66.935, p < .001, and Style,F(1, 54) = 6.552, p = .013. F1 was significantly higher inNAS compared with speech produced in quiet, and in CScompared with CO. There was a significant interactionbetween Noise and Talker Age Group, F(2, 54) = 8.989,p < .001. All talker groups made significant quiet-to-noiseincreases in F1, but children raised F1 more than eitheradult group. Each of the three main factors interacted withVowel Type: Vowel × Talker Age Group, F(6, 833) = 23.605,p < .001, Vowel × Noise, F(3, 833) = 5.740, p = .001, andVowel × Style, F(3, 833) = 5.305, p = .001. These interactionsrevealed that young and older adult talkers had similar F1frequencies for all vowels except /æ/, for which young adultshad a significantly higher F1 (i.e., they produced a lower, moreopen /æ/). Children had different F1 frequencies from theadults for all vowels. While F1 was raised for all vowels innoise, F1 increase was larger for the low vowels /ɑ, ae/ thanfor the high vowels /i, u/. In CS, F1 for the low vowels /ɑ, æ/but not the high vowels /i, u/ was significantly increased.
F2 was also significantly affected by Vowel, F(3, 4) =26.231, p = .004. As expected, front /i, æ/ and back /u, ɑ/vowels systematically differed in F2. There was a significantmain effect of Talker Age Group, F(2, 27) = 3.938, p =.032, with children showing significantly higher F2 valuesthan older adults and marginally higher F2 values (p = .067)than young adults. There was a significant main effect ofNoise, F(1, 54) = 15.827, p < .001, with higher F2 in NAScompared with quiet. There was no significant main effectof Style, F(1, 54) = 2.165, p = .147. The main effect ofTalker Age Group significantly interacted with VowelType, F(6, 833) = 6.111, p < .001. Children produced a sig-nificantly higher F2 than older adults for /i/. All three talkergroups had significantly different F2 frequencies for /u/,with children having the highest and older adults the lowestF2 frequency. For /ɑ/, children produced a significantlyhigher F2 than both adult talker groups. There were no dif-ferences in F2 for /æ/ across talker groups. Analyses of theVSA revealed a significant effect of both Style, F(2, 27) =12.071, p < .01, and Noise, F(2, 27) = 23.88, p < .001, butnot Talker Age Group, F(2, 27) = 0.136, p = .873. VSAwas significantly enlarged in CS and in NAS. None of theinteractions were significant.
Voice MeasurementsTable 4 lists mean HNR, jitter, and shimmer in CO
and CS produced in quiet and in noise for each talker group.Voice analyses revealed that the effect of Talker Age
Group on HNR approached significance, F(2, 27) = 4.929,
c & Gilbert: Acoustics of Clear and Noise-Adapted Speech 3087
5Note that all sentences had equalized SPL so that we can controlthe signal-to-noise ratio for intelligibility testing (Smiljanic & Gilbert,2017). The results showed significant intelligibility befit for CS andNAS without the loudness cue playing a role, suggesting that theother acoustic–articulatory modifications significantly contributed tothe improved speech understanding in both speech adaptations.
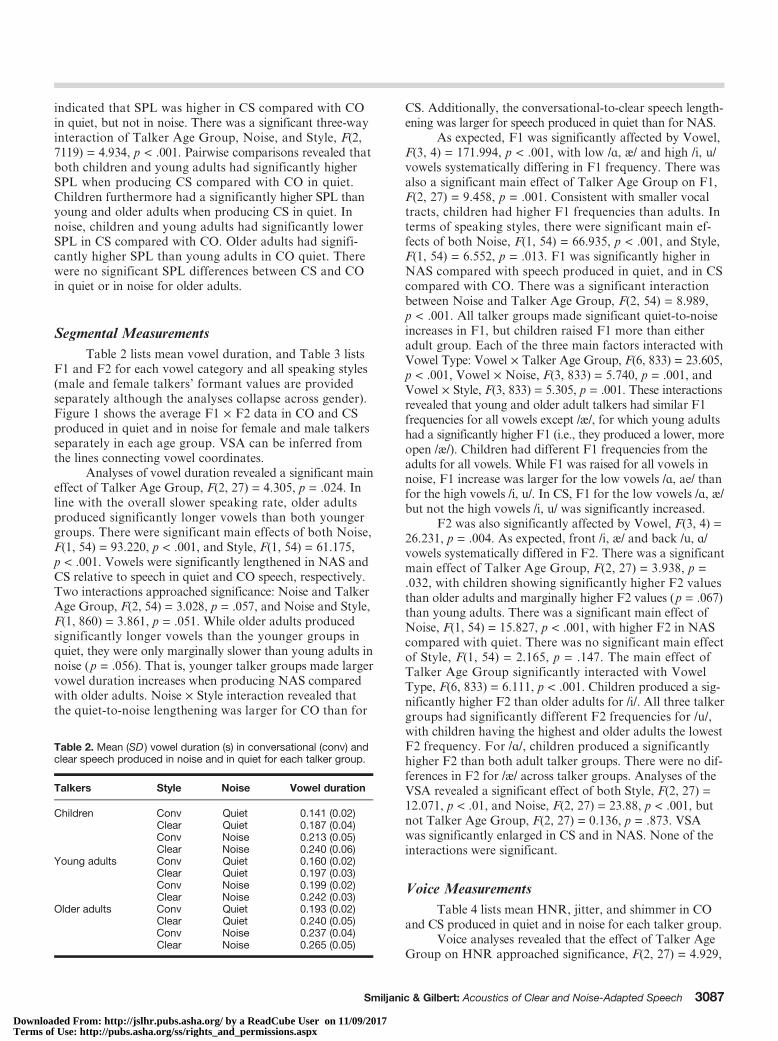
Table 3. Mean F1 and F2 (Hz) in conversational (conv) and clear speech produced in quiet and in noise for female and male talkers in eachage group.
Talkers Style Noise
F1 F2 F1 F2 F1 F2 F1 F2
i i u u æ æ ɑ ɑ
Female talkersChildren Conv Quiet 392.81 2478.40 436.20 1932.33 945.83 1763.49 931.26 1424.90
Clear Quiet 378.51 2344.58 468.99 1950.79 1029.02 1930.56 908.27 1322.72Conv Noise 478.41 2649.26 556.62 2026.12 1075.26 1873.75 1003.29 1525.66Clear Noise 483.63 2652.03 532.03 1896.47 1109.06 1939.75 1034.43 1512.39
Young adults Conv Quiet 334.95 2496.16 389.73 1760.29 883.61 1643.54 841.37 1269.57Clear Quiet 350.51 2660.91 388.98 1783.08 926.82 1814.52 863.24 1218.21Conv Noise 358.14 2658.67 398.93 1800.67 929.68 1835.12 861.76 1294.61Clear Noise 346.55 2790.17 398.89 1713.01 980.78 1853.65 880.20 1293.28
Older adults Conv Quiet 358.72 2505.33 374.16 1777.28 783.14 1980.13 842.44 1229.80Clear Quiet 337.06 2652.98 394.34 1682.59 805.86 1955.49 877.83 1208.88Conv Noise 377.90 2520.29 406.13 1759.61 822.28 2032.89 899.40 1300.86Clear Noise 369.42 2708.21 398.87 1779.71 837.20 2004.81 908.33 1273.33
Male talkersChildren Conv Quiet 385.61 2590.98 389.71 1736.87 841.07 1782.7 772.52 1242.34
Clear Quiet 392.91 2773.21 413.47 1783.16 853.02 1681.21 795.39 1252.23Conv Noise 393.26 2732.32 414.64 1782.82 916.14 1946.13 865.31 1319.36Clear Noise 422.07 2729.21 426.31 1835.56 985.55 1973.29 893.78 1354.06
Young adults Conv Quiet 279.16 2360.34 358.11 1710.93 688.36 1713.04 739.04 1218.22Clear Quiet 284.68 2439.41 340.64 1665.45 721.80 1716.66 765.14 1215.00Conv Noise 311.99 2398.40 369.80 1689.47 737.12 1713.93 793.36 1219.54Clear Noise 306.27 2487.34 340.19 1610.29 779.16 1790.57 832.75 1223.95
Older adults Conv Quiet 341.33 2200.19 329.24 1367.42 649.09 1636.17 715.57 1126.21Clear Quiet 283.17 2243.47 332.93 1464.19 683.73 1683.41 768.61 1277.91Conv Noise 304.85 2224.05 359.56 1391.62 705.10 1714.04 766.96 1185.18Clear Noise 317.52 2304.06 362.85 1413.20 717.17 1719.71 782.22 1168.53
DownloaTerms o
p = .058. Pairwise comparisons revealed that children hada higher HNR than the young adult (p < .002) and olderadult (p < .003) talkers. There was also significant maineffect of Noise, F(1,200) = 2.373, p = .0219, and Style,F(1, 200) = 2.348, p = .0218. HNR was significantly increasedin NAS compared with quiet speech, and in CS comparedwith CO. A significant interaction between Style and TalkerAge Group, F(2, 200) = 4.788, p < .001, revealed that children,but not adults, increased HNR through the conversational-to-clear speech modifications. As a result, the child–adultdifference in HNR was significant in CS but not in CO. Jitterwas significantly affected by Talker Age Group, F(2, 27) =4.095, p = .049. Children overall had lower jitter than boththe adult groups. There was a significant main effect ofNoise, F(1, 200) = 2.438, p = .0174, with a significant jit-ter decrease in NAS compared with quiet speech. Style hadno significant effect on jitter, F(1, 200) = 1.104, p = .275.Talker Age Group interacted with Style, F(2, 200) = 2.439,p = .0217, indicating that while children decreased jitter inconversational-to-clear speech modifications, young adultsincreased it. Finally, results revealed a significant maineffect of Talker Age Group on shimmer, F(2, 27) = 7.397,p < .001. Children overall had significantly lower shimmerthan the adult talker groups. Noise significantly affectedshimmer, F(1, 200) = 2.721, p = .009, with shimmer beinglower in NAS compared with quiet speech. There was nosignificant main effect of Style, F(1, 200) = 0.408, p = .686.A significant two-way interaction between Style and TalkerAge Group, F(2, 200) = 2.210, p = .039, revealed that children,
3088 Journal of Speech, Language, and Hearing Research • Vol. 60 •
ded From: http://jslhr.pubs.asha.org/ by a ReadCube User on 11/09/2017f Use: http://pubs.asha.org/ss/rights_and_permissions.aspx
but not adults, had significantly lower shimmer in CS com-pared with CO.
DiscussionNAS and CS
A direct comparison of CS and NAS revealedthat the two adaptations were similar but also differed inacoustic–articulatory modifications. Different features tar-geted by each adaptation may be attributed to somewhatdifferent emphasis on augmenting signal loudness versusenhancing articulatory precision to help the listener accessand decode the linguistic message (Cooke et al., 2013;Lansford et al., 2011). The enhancement of the global sa-lience of the speech signal was found in the present studythrough pitch and energy modifications, namely, an in-crease in F0 mean, 1–3 kHz energy, and SPL, when speakingin noise. These modifications presumably augment audibil-ity of the speech signal, thus making it stand out more fromthe surrounding noise and facilitating its transmission(Godoy et al., 2014).5 Additionally, increases in F0 and
3081–3096 • November 2017
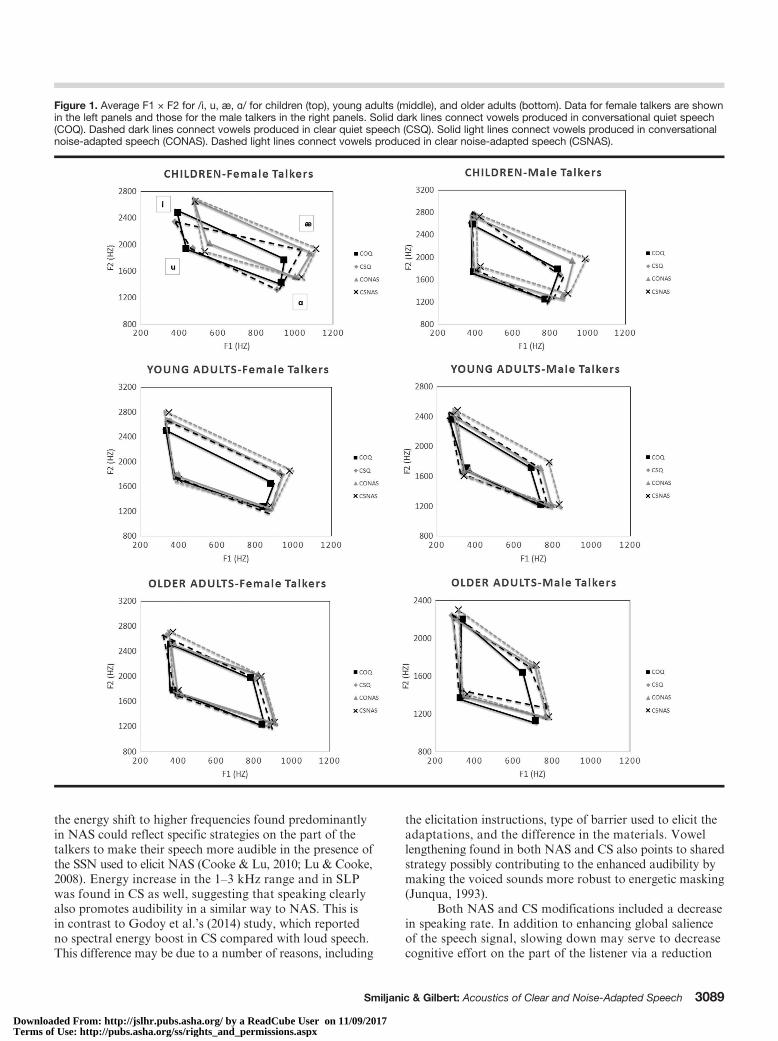
Figure 1. Average F1 × F2 for /i, u, æ, ɑ/ for children (top), young adults (middle), and older adults (bottom). Data for female talkers are shownin the left panels and those for the male talkers in the right panels. Solid dark lines connect vowels produced in conversational quiet speech(COQ). Dashed dark lines connect vowels produced in clear quiet speech (CSQ). Solid light lines connect vowels produced in conversationalnoise-adapted speech (CONAS). Dashed light lines connect vowels produced in clear noise-adapted speech (CSNAS).
DownloaTerms o
the energy shift to higher frequencies found predominantlyin NAS could reflect specific strategies on the part of thetalkers to make their speech more audible in the presence ofthe SSN used to elicit NAS (Cooke & Lu, 2010; Lu & Cooke,2008). Energy increase in the 1–3 kHz range and in SLPwas found in CS as well, suggesting that speaking clearlyalso promotes audibility in a similar way to NAS. This isin contrast to Godoy et al.’s (2014) study, which reportedno spectral energy boost in CS compared with loud speech.This difference may be due to a number of reasons, including
Smiljani
ded From: http://jslhr.pubs.asha.org/ by a ReadCube User on 11/09/2017f Use: http://pubs.asha.org/ss/rights_and_permissions.aspx
the elicitation instructions, type of barrier used to elicit theadaptations, and the difference in the materials. Vowellengthening found in both NAS and CS also points to sharedstrategy possibly contributing to the enhanced audibility bymaking the voiced sounds more robust to energetic masking(Junqua, 1993).
Both NAS and CS modifications included a decreasein speaking rate. In addition to enhancing global salienceof the speech signal, slowing down may serve to decreasecognitive effort on the part of the listener via a reduction
c & Gilbert: Acoustics of Clear and Noise-Adapted Speech 3089
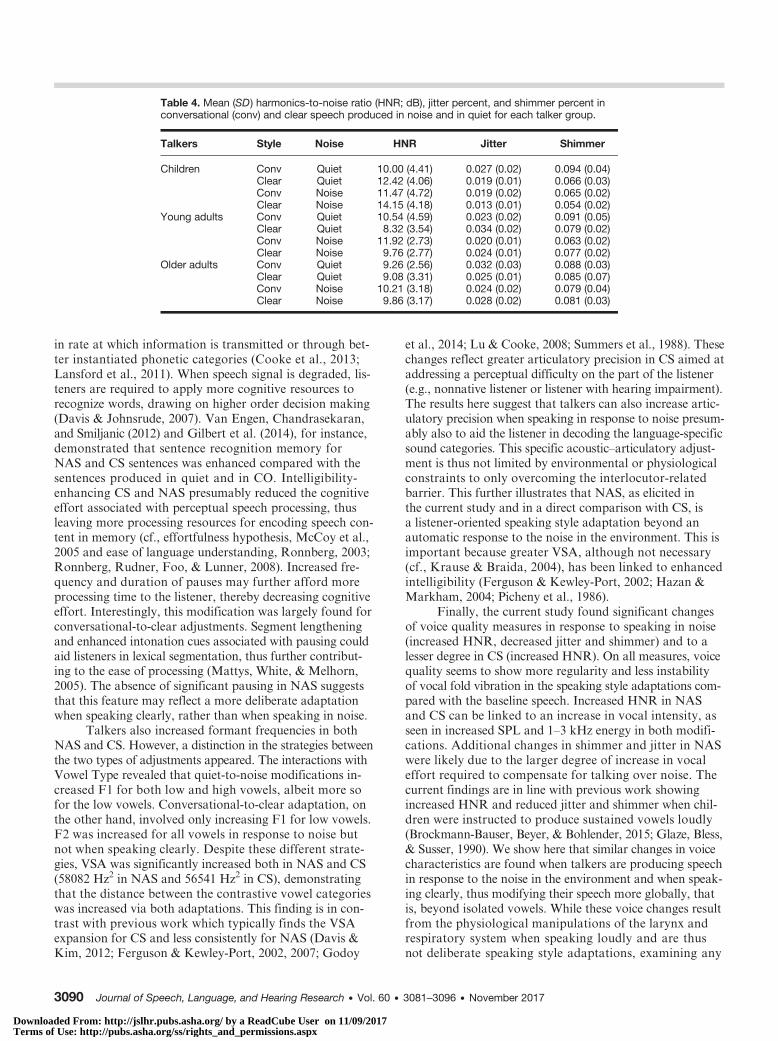
Table 4. Mean (SD) harmonics-to-noise ratio (HNR; dB), jitter percent, and shimmer percent inconversational (conv) and clear speech produced in noise and in quiet for each talker group.
Talkers Style Noise HNR Jitter Shimmer
Children Conv Quiet 10.00 (4.41) 0.027 (0.02) 0.094 (0.04)Clear Quiet 12.42 (4.06) 0.019 (0.01) 0.066 (0.03)Conv Noise 11.47 (4.72) 0.019 (0.02) 0.065 (0.02)Clear Noise 14.15 (4.18) 0.013 (0.01) 0.054 (0.02)
Young adults Conv Quiet 10.54 (4.59) 0.023 (0.02) 0.091 (0.05)Clear Quiet 8.32 (3.54) 0.034 (0.02) 0.079 (0.02)Conv Noise 11.92 (2.73) 0.020 (0.01) 0.063 (0.02)Clear Noise 9.76 (2.77) 0.024 (0.01) 0.077 (0.02)
Older adults Conv Quiet 9.26 (2.56) 0.032 (0.03) 0.088 (0.03)Clear Quiet 9.08 (3.31) 0.025 (0.01) 0.085 (0.07)Conv Noise 10.21 (3.18) 0.024 (0.02) 0.079 (0.04)Clear Noise 9.86 (3.17) 0.028 (0.02) 0.081 (0.03)
DownloaTerms o
in rate at which information is transmitted or through bet-ter instantiated phonetic categories (Cooke et al., 2013;Lansford et al., 2011). When speech signal is degraded, lis-teners are required to apply more cognitive resources torecognize words, drawing on higher order decision making(Davis & Johnsrude, 2007). Van Engen, Chandrasekaran,and Smiljanic (2012) and Gilbert et al. (2014), for instance,demonstrated that sentence recognition memory forNAS and CS sentences was enhanced compared with thesentences produced in quiet and in CO. Intelligibility-enhancing CS and NAS presumably reduced the cognitiveeffort associated with perceptual speech processing, thusleaving more processing resources for encoding speech con-tent in memory (cf., effortfulness hypothesis, McCoy et al.,2005 and ease of language understanding, Ronnberg, 2003;Ronnberg, Rudner, Foo, & Lunner, 2008). Increased fre-quency and duration of pauses may further afford moreprocessing time to the listener, thereby decreasing cognitiveeffort. Interestingly, this modification was largely found forconversational-to-clear adjustments. Segment lengtheningand enhanced intonation cues associated with pausing couldaid listeners in lexical segmentation, thus further contribut-ing to the ease of processing (Mattys, White, & Melhorn,2005). The absence of significant pausing in NAS suggeststhat this feature may reflect a more deliberate adaptationwhen speaking clearly, rather than when speaking in noise.
Talkers also increased formant frequencies in bothNAS and CS. However, a distinction in the strategies betweenthe two types of adjustments appeared. The interactions withVowel Type revealed that quiet-to-noise modifications in-creased F1 for both low and high vowels, albeit more sofor the low vowels. Conversational-to-clear adaptation, onthe other hand, involved only increasing F1 for low vowels.F2 was increased for all vowels in response to noise butnot when speaking clearly. Despite these different strate-gies, VSA was significantly increased both in NAS and CS(58082 Hz2 in NAS and 56541 Hz2 in CS), demonstratingthat the distance between the contrastive vowel categorieswas increased via both adaptations. This finding is in con-trast with previous work which typically finds the VSAexpansion for CS and less consistently for NAS (Davis &Kim, 2012; Ferguson & Kewley-Port, 2002, 2007; Godoy
3090 Journal of Speech, Language, and Hearing Research • Vol. 60 •
ded From: http://jslhr.pubs.asha.org/ by a ReadCube User on 11/09/2017f Use: http://pubs.asha.org/ss/rights_and_permissions.aspx
et al., 2014; Lu & Cooke, 2008; Summers et al., 1988). Thesechanges reflect greater articulatory precision in CS aimed ataddressing a perceptual difficulty on the part of the listener(e.g., nonnative listener or listener with hearing impairment).The results here suggest that talkers can also increase artic-ulatory precision when speaking in response to noise presum-ably also to aid the listener in decoding the language-specificsound categories. This specific acoustic–articulatory adjust-ment is thus not limited by environmental or physiologicalconstraints to only overcoming the interlocutor-relatedbarrier. This further illustrates that NAS, as elicited inthe current study and in a direct comparison with CS, isa listener-oriented speaking style adaptation beyond anautomatic response to the noise in the environment. This isimportant because greater VSA, although not necessary(cf., Krause & Braida, 2004), has been linked to enhancedintelligibility (Ferguson & Kewley-Port, 2002; Hazan &Markham, 2004; Picheny et al., 1986).
Finally, the current study found significant changesof voice quality measures in response to speaking in noise(increased HNR, decreased jitter and shimmer) and to alesser degree in CS (increased HNR). On all measures, voicequality seems to show more regularity and less instabilityof vocal fold vibration in the speaking style adaptations com-pared with the baseline speech. Increased HNR in NASand CS can be linked to an increase in vocal intensity, asseen in increased SPL and 1–3 kHz energy in both modifi-cations. Additional changes in shimmer and jitter in NASwere likely due to the larger degree of increase in vocaleffort required to compensate for talking over noise. Thecurrent findings are in line with previous work showingincreased HNR and reduced jitter and shimmer when chil-dren were instructed to produce sustained vowels loudly(Brockmann-Bauser, Beyer, & Bohlender, 2015; Glaze, Bless,& Susser, 1990). We show here that similar changes in voicecharacteristics are found when talkers are producing speechin response to the noise in the environment and when speak-ing clearly, thus modifying their speech more globally, thatis, beyond isolated vowels. While these voice changes resultfrom the physiological manipulations of the larynx andrespiratory system when speaking loudly and are thusnot deliberate speaking style adaptations, examining any
3081–3096 • November 2017
DownloaTerms o
differences that may occur in various communicative situa-tions is important for our understanding of normal and dis-ordered voice characteristics. Future work on voicecharacteristics in speaking style adaptations should in-clude cepstral- and spectral-based measures that havebeen shown to be reliable in analyzing continuous speechand exhibited higher correlation with auditory–perceptualjudgments (Barsties & De Bodt, 2015; Lowell & Hylkema,2016; Lowell, Colton, Kelley, & Mizia, 2013).
Age Effect on Speaking Style AdaptationsOlder adult speech was characterized by less energy
in the 1–3 kHz range and a slower speaking rate (includinglonger vowels) compared with that of the younger talkers.This is in line with previous research showing productiondifferences between older and young adults (Brückl &Sendlmeier, 2003; Linville & Rens, 2001; Shipp, Qi, Huntley,& Hollien, 1992; Winkler, Brückl, & Sendlmeier, 2003; Xue& Hao, 2003). These differences can be attributed to theage-related anatomical changes, slower cognitive process-ing (Craik & Byrd, 1982; Salthouse, 1996), and neuromus-cular changes affecting the rate and precision of articulatormovement (Hartman & Danhauer, 1976). Older adultsalso had overall higher SPL in quiet CO speech comparedwith young adults, which is in contrast to previous workthat either reported no age-related differences (Prakup, 2012)or found older male talkers to have lower SPL than youngmale talkers (Goy, Fernandes, et al., 2013; Hodge, Colton,& Kelly, 2001). This, along with the lack of significantyounger–older adult differences on F0, F1, F2 and voicemeasurements found here, could be attributed to the goodoverall physiological condition of the older adult talkersin this study. Research has shown that a speech productionmechanism is shaped by both chronological age and physi-ological differences (physical condition) among individuals(Ferrand, 2000; Ramig & Ringel, 1983; Ringel & Chodzko-Zajko, 1987). All of the older participants were activeenough to volunteer for on-campus research, and severalcommented on their regular physical activities. Combined,the similarities and differences between young and olderadult talkers suggest that not all components of the speechproduction mechanism are equally affected by age-relatedchanges. In the case of these older adults, articulatory pre-cision (similar F1 and F2 with young adults) and vocalintensity (higher SPL) could be maintained even thoughsome other age-related physiological changes (less energy in1–3 kHz range) may occur. How these various factors inter-act to determine speech production in individual talkersacross the life span remains to be determined.
Voice analyses revealed significant differences betweenchildren and adult talkers, but not between young and olderadults. Children had overall higher HNR and lower jitterand shimmer than the adult talkers. Previous work hasshown a lower HNR in children 4–10 years old comparedwith adults arising from the anatomical differences in vocalfold structure (Ferrand, 2000) and no differences in jitterfor children 7–15 years old (Linders, Massa, Boersma, &
Smiljani
ded From: http://jslhr.pubs.asha.org/ by a ReadCube User on 11/09/2017f Use: http://pubs.asha.org/ss/rights_and_permissions.aspx
Dejonckere, 1995). In comparison with older adult talkers,children in this study had higher HNR, demonstrating thatchildren’s voices at 11–13 years of age have less additivenoise in the voice signal. Higher HNR could also be relatedto lower jitter and shimmer found here as the measuresare interrelated (Hillenbrand, 1987). The marginally higherHNR and lower jitter and shimmer found in children com-pared with adults could reflect an overshoot in these acousticparameters (similar to Lee et al., 1999) as children aretuning their productions to become adultlike. Additionally,these differences could arise from children producing morecareful and hyper-articulated speech while reading com-pared with the adult talkers.
The three groups diverged in some of their responsesin noise and when speaking clearly. Children slowed downless in CS than the adults. This is in contrast with thefindings of Pettinato and Hazan (2013), who found similarword duration lengthening for children 13–14 years oldand young adults in response to vocoded speech. Pettinatoand Hazan (2013) also found, unlike in the current study,that children were overall slower than young adults. Thesedifferences could be a result of the task used in the twostudies. In their study, children participated in the spot-the-difference picture task, which may require more cognitiveeffort to complete, thus slowing down their speech, whereashere, they read sentences from the computer monitor. Further-more, vocoded speech may elicit a different response com-pared with the noise in the environment or when speakingclearly (Hazan & Baker, 2011; Lam et al., 2012). In thecurrent study, children also produced fewest pauses overall.Compared with the young adults, children produced 27and 50 fewer pauses for CS in quiet and in noise, respec-tively. When they did pause, children produced pauses ofsimilar length to the adults. The differences in speakingrate and pause information between children and youngadults could arise from the children’s inability to deliber-ately change their speech in the absence of the obviouscommunicative goal, such as the presence of a listenerwith perceptual difficulty (Junqua, Fincke, & Field,1999;Summers et al., 1988). However, children, as well as youngadults, increased SPL in CS relative to CO in quiet. Thisadultlike response showed that children did modify theirspeech in response to the instructions to speak clearly. It isthus possible that children may not have developed a fulladultlike spectrum of CS strategies by the age of 11–13 years.
While older adults had the overall slowest speakingrate, young and older adults in the current study made sim-ilar decreases to speaking rate when producing CS (1.16and 1.09 syll/s, respectively). Given their overall slowerbaseline and similar decrease, the resulting CS speakingrate was still significantly slower for older adults comparedwith the other two talker groups. This is in contrast toSmiljanic (2013) in which the older adults’ speaking ratedecrease was smaller than that of young adults, resulting ina similar CS speaking rate. The difference in the speakingstyle rates between the two studies could reflect the mate-rials used in the two studies. In the current study, talkersproduced simple meaningful sentences, whereas in Smiljanic
c & Gilbert: Acoustics of Clear and Noise-Adapted Speech 3091
DownloaTerms o
(2013), they produced semantically anomalous sentencesthat may result in different speech patterns. The currentresults suggest that older adults can slow down by the samedecrement as young adults when producing intelligibility-enhancing CS. Older adults also produced the most pausesoverall (54 for older adults, 41 for young adults, and 25 forchildren). Compared with young adults, they produced morepauses for CS in quiet and for CS in noise as well as thelongest pauses when speaking clearly in noise. While olderadults produced significantly longer vowels than childrenand young adults in quiet, this difference was diminished innoise where older adults had only marginally longer vowelsthan young adults. This shows that older adults lengthenedtheir vowels the least in response to noise (35 ms comparedto 42 and 63 ms for young adults and children, respectively).The pausing patterns could reflect a deliberate strategy onthe part of the older adults to enhance saliency of the speechsignal and decrease cognitive effort for the listener byallowing them more time to process the incoming informa-tion (Cooke et al., 2013). The increased pausing, in additionto the overall slower speech, could alternatively reflect aspeech planning and production difficulty in a cognitivelydemanding communicative situation (speaking clearly while,at the same time, trying to overcome the environmentalnoise). The precise source of this difference between youngand older adults remains to be determined.
The VSA increase when speaking in noise (noiseminus quiet) was similar for children and young adults(73862 Hz2 vs. 73930 Hz2). Children increased the VSAless in CS (clear minus conversational) compared with theyoung adults (42678 Hz2 vs. 96363 Hz2), although thedifference was not significant. The smaller adjustment inVSA found in CS mirrors differences in VSA expansionfound in Pettinato and Hazan (2013) and Pettinato et al.(2016) for children 9–14 years old and young adults inresponse to vocoded speech. The fact that children couldincrease VSA in noise suggests that the somewhat smallerVSA expansion in CS is not the result of the children’sinability to produce hyper-articulated vowels. Rather, itsuggests that children do not have fully adultlike CS strate-gies and, furthermore, that speaking in noise seems to inducea more automatic repertoire of responses resulting fromincreased vocal effort. Similar to Pettinato et al. (2016), chil-dren in the current study had a slightly larger overall VSAthan young adults in their baseline CO speech (271414 Hz2
vs. 231831 Hz2), which could indicate, as Pettinato andcolleagues argue, that children also need to learn how toproduce hypo-articulated variants when appropriate. Olderadults made smaller VSA increases in both noise (26453 Hz2)and CS (30583 Hz2) compared with young adults, albeitthese differences were not statistically significant. This sug-gests that older adults were overall successful in modifyingtheir vowel productions although the resulting vowel cate-gories were less dispersed compared with younger talkers.Interestingly, older adults also had a somewhat larger base-line VSA than young adults (268510 Hz2 vs. 231831 Hz2).It is unlikely that older adults do not know how to hypo-articulate vowel categories in CO speech. The difference
3092 Journal of Speech, Language, and Hearing Research • Vol. 60 •
ded From: http://jslhr.pubs.asha.org/ by a ReadCube User on 11/09/2017f Use: http://pubs.asha.org/ss/rights_and_permissions.aspx
in VSA between young and older adults could arise fromtheir overall slower speaking rate, which may allow timefor more extreme tongue movements.
Finally, children made significantly larger mean F0increases in response to noise compared with older adulttalkers. Older adults made the smallest mean F0 increasein quiet-to-noise modifications for CS. Children and youngadults, but not older adults, increased energy in the 1–3 kHzrange when producing conversational-to-clear speech adjust-ments in quiet. This absence of energy increase in CS mayreflect age-related changes to the articulatory and respiratorycontrol in older adults. The larger mean F0 modificationsin children, on the other hand, could reflect an acoustic tar-get overshoot (cf., Lee et al., 1999) as children are align-ing their strategies when responding to noise to those ofadults. Finally, voice analyses showed that children increasedHNR and decreased shimmer and jitter when producingconversational-to-clear speech adjustments. This result issimilar to Glaze et al. (1990), who found that children in-creased HNR and decreased shimmer when asked to speakloudly. In line with this, children here were also found tohave higher SPL in CS compared with CO. Modificationsthat children implemented in CS led to a greater reductionin the amount of noise in their voice quality (harmonics,amplitude) compared with the adults whose modificationsalso included louder speech in NAS and CS.
General DiscussionThe current study examined similarities and differ-
ences in acoustic–articulatory adjustments that talkers ofthree different age groups make in response to noise andwhen speaking clearly. The findings suggest that althoughthere are overlapping NAS and CS modifications, eachspeaking style adaptation also targets a distinct set ofacoustic–phonetic features. The common adaptation strate-gies could reflect the shared listener-oriented goals of pro-moting the audibility of the signal (e.g., F0 raising, boostin spectral energy, increase in SPL, longer voiced segments),enhancing linguistic structure (e.g., increased VSA), anddecreasing cognitive effort (e.g., slower speaking rate) (Cookeet al., 2013; Lansford et al., 2011). On the other hand, thedifferences in acoustic–articulatory features characterizingthe two adaptations (e.g., increased F0, jitter, and shimmerin NAS vs. increased pausing in CS) reflect the specifictype of communicative barrier that the talkers are trying toovercome. In the NAS condition, talkers were producingspeech in response to the actual noise which may induce amore automatic adaptation through increased vocal effort.In the CS condition, on the other hand, talkers were instructedto speak clearly, addressing a perceptual difficulty on the partof the listener with low proficiency, which may be a moreintentional adaptation inducing, for instance, simplificationof the prosodic structure. CS and NAS can thus be viewedas two varieties of hyper-articulated speech (H&H, Lindblom,1990) with talkers being able to fine-tune their response todifferent communication barriers (Hazan & Baker, 2011;Lam et al., 2012).
3081–3096 • November 2017
DownloaTerms o
The comparison of CS and NAS strategies acrossthe three talker groups revealed a number of age-relateddifferences. It is not straightforward to account for someof these differences. Auditory and cognitive changes andchanges in the rate and precision of articulatory controland phonatory function associated with aging could under-lie some of the observed differences between the young andolder adults. Speaking style adaptation differences betweenchildren and adult talkers, on the other hand, may reflectthe children’s on-going tuning of the acoustic–articulatoryadjustments needed to produce hypo-articulated variantsand for overcoming communicative barriers. This suggeststhat not all neurologically typical talkers have all of thehypo- and hyper-strategies available to them (Lindblom,1990). Future work should further investigate the role thatdevelopment and aging play in the acquisition versus lossof the ability to produce intelligibility-enhancing adapta-tions. A wider span of age groups should be included in thisexamination to more precisely determine when some ofthese differences occur.
An important question is how these CS and NAS modi-fications affect intelligibility. For these particular talkers, thisquestion is addressed in the companion article (Smiljanic& Gilbert, 2017). More generally, speech-oriented, behav-ioral therapy techniques using rate reduction, increased vo-cal intensity, and CS (Darling & Huber, 2011; Duffy,2013; Lam & Tjaden, 2016) aim to improve speech produc-tion and maximize speech intelligibility for talkers withdysarthria (Beukelman et al., 2002; Park et al., 2016; Tjaden,Sussman, et al., 2014). The findings here provide evidencethat NAS and CS simultaneously affect articulatory and re-spiratory–phonatory behavior. As such, either method hasthe potential to induce intelligibility-enhancing adaptations.It is important to note though that a direct link betweenany one acoustic–articulatory modification and increasedintelligibility remains tenuous (Cooke, Mayo, & Villegas, 2014;Godoy et al., 2014; Krause, 2001; Krause & Braida, 2004;Liu & Zeng, 2006; Picheny et al., 1986; Tjaden, Kain, et al.,2014; Uchanski et al., 1996). It is likely that a combinationof a number of cue modifications that talkers make givesrise to the intelligibility benefit. To that end, using CS andNAS as global, speech-oriented techniques, rather than tar-geting individual speech parameters, may be an effectiveway of eliciting a number of modifications simultaneously(Yorkston, Hakel, Beukelman, & Fager, 2007). Future workneeds to examine how exactly these enhancement strate-gies aid speech processing beyond word recognition innoise (Cooke et al., 2013; Lansford et al., 2011).
ReferencesAdams, S., Dykstra, A., Jenkins, M., & Jog, M. (2008). Speech-
to-noise levels and conversational intelligibility in hypophoniaand Parkinson’s disease. Journal of Medical Speech-LanguagePathology, 16(4), 165–172.
Adams, S., Moon, B.-H., Page, A., & Jog, M. (2006). Effects ofmultitalker noise on conversational speech intensity in Parkinson’sdisease. Journal of Medical Speech-Language Pathology, 14(4),221–228.
Smiljani
ded From: http://jslhr.pubs.asha.org/ by a ReadCube User on 11/09/2017f Use: http://pubs.asha.org/ss/rights_and_permissions.aspx
Adams, S., Winnell, J., & Jog, M. (2010). Effects of interlocutordistance, multi-talker background noise, and a concurrentmanual task on speech intensity in Parkinson’s disease. Journalof Medical Speech-Language Pathology, 18(4), 1–8.
Arlinger, S. D. (1986). Sound attenuation of TDH-39 earphonesin a diffuse field of narrow-band noise. The Journal of theAcoustical Society of America, 79, 189–191.
Barsties, B., & De Bodt, M. (2015). Assessment of voice quality:Current state-of-art. Auris Nasus Larynx, 42, 183–188.
Benjamin, B. J. (1982). Phonological performance in gerontologicalspeech. Journal of Psycholinguistic Research, 11(2), 159–167.
Beukelman, D. R., Fager, S., Ullman, C., Hanson, E., & Logemann, J.(2002). The impact of speech supplementation and clear speechon the intelligibility and speaking rate of people with traumaticbrain injury. Journal of Medical Speech-Language Pathology,10, 237–242.
Boersma, P., & Weenink, D. (2014). Praat speech processingsoftware. Institute of Phonetics Sciences of the University ofAmsterdam. Retrieved from http://www.praat.org
Bořil, H., Bořil, T., & Pollák, P. (2006). Methodology of Lom-bard speech database acquisition: Experiences with CLSD. InProceedings of the Fifth International Conference on LanguageResources and Evaluation (pp. 1644–1647). Genoa, Italy: Euro-pean Language Resources Association.
Bradlow, A. R., Kraus, N., & Hayes, E. (2003). Speaking clearly forchildren with learning disabilities: Sentence perception in noise.Journal of Speech, Language, and Hearing Research, 46, 80–97.
Brockmann-Bauser, M., Beyer, D., & Bohlender, J. (2015). Reli-able acoustic measurements in children between 5;0 and 9;11 years:Gender, age, height and weight effects on fundamental fre-quency, jitter and shimmer in phonations without and withcontrolled voice SPL. International Journal of Pediatric Oto-rhinolaryngology, 79, 2035–2042.
Brückl, M., & Sendlmeier, W. (2003). Aging female voices: Anacoustic and perceptive analysis. In Voice Quality: Functions,Analysis and Synthesis (pp. 163–168). Retrieved from http://www.isca-speech.org/archive_open/voqual03/voq3_163.html
Cooke, M., King, S., Garnier, M., & Aubanel, V. (2013). The listen-ing talker: A review of human and algorithmic context-inducedmodifications of speech. Computer, Speech and Language, 28(2),543–571.
Cooke, M., & Lu, Y. (2010). Spectral and temporal changes tospeech produced in the presence of energetic and informationalmaskers. The Journal of the Acoustical Society of America,128(4), 2059–2069.
Cooke, M., Mayo, C., & Villegas, J. (2014). The contribution ofdurational and spectral changes to the Lombard speech intelligi-bility benefit. The Journal of the Acoustical Society of America,135(2), 874–883.
Craik, F. I. M., & Byrd, M. (1982). Aging and cognitive defi-cits: The role of attentional resources. In F. I. M. Craik &S. Trehub (Eds.), Aging and cognitive processes (pp. 191–211).New York: Plenum.
Darling, M., & Huber, J. E. (2011). Changes to articulatory kinemat-ics in response to loudness cues in individuals with Parkinson’sdisease. Journal of Speech, Language, and Hearing Research,54, 1247–1259.
Davis, C., & Kim, J. (2012). Is speech produced in noise more dis-tinct and/or consistent? Speech Science and Technology, 46–49.
Davis, M. H., & Johnsrude, I. S. (2007). Hearing speech sounds:Top-down influences on the interface between audition andspeech perception. Hearing Research, 229(1–2), 132–147.
Duffy, J. (2013). Motor speech disorders: Substrates, differentialdiagnosis, and management (3rd ed.). St. Louis, MO: Mosby.
c & Gilbert: Acoustics of Clear and Noise-Adapted Speech 3093
DownloaTerms o
Fallon, M., Trehub, S. E., & Schneider, B. A. (2002). Children’suse of semantic cues in degraded listening environments. TheJournal of the Acoustical Society of America, 111, 2242–2249.
Ferguson, S. H. (2004). Talker differences in clear and conversationalspeech: Vowel intelligibility for normal-hearing listeners. TheJournal of the Acoustical Society of America, 116, 2365–2373.
Ferguson, S. H., & Kewley-Port, D. (2002). Vowel intelligibility inclear and conversational speech for normal-hearing and hear-ing-impaired listeners. The Journal of the Acoustical Society ofAmerica, 112, 259–271.
Ferguson, S. H., & Kewley-Port, D. (2007). Talker differences inclear and conversational speech: Acoustic characteristics ofvowels. Journal of Speech, Language, and Hearing Research,50(5), 1241–1255.
Ferrand, C. T. (2000). Harmonics-to-noise ratios in normallyspeaking prepubescent girls and boys. Journal of Voice, 14(1),17–21.
Garber, S., Speidel, T., & Siegel, G. (1980). The effects of noiseand palatal appliances on the speech of five-year-old children.Journal of Speech and Hearing Research, 23, 853–863.
Garber, S., Speidel, T., Siegel, G., Miller, E., & Glass, L. (1980).The effects of presentation of noise and dental appliances onspeech. Journal of Speech and Hearing Research, 23, 836–850.
Gilbert, R., Chandrasekaran, B., & Smiljanic, R. (2014). Recogni-tion memory in noise for speech of varying intelligibility. TheJournal of the Acoustical Society of America, 135, 389–399.
Glave, R. D., & Rietveld, A. C. M. (1975). Is the effort depen-dence of speech loudness explicable on the basis of acousticalcues? The Journal of the Acoustical Society of America, 58,875–879.
Glaze, L. E., Bless, D. M., & Susser, R. D. (1990). Acoustic analy-sis of vowel and loudness differences in children’s voice. Jour-nal of Voice, 4(1), 37–44.
Goberman, A. M., & Elmer, L. W. (2005). Acoustic analysis of clearversus conversational speech in individuals with Parkinson dis-ease. Journal of Communication Disorders, 38, 215–230.
Godoy, E., Koutsogiannaki, M., & Stylianou, Y. (2014). Approach-ing speech intelligibility enhancement with inspiration fromLombard and clear speaking styles. Computer Speech & Lan-guage, 28(2), 629–647.
Gordon-Salant, S., & Fitzgibbons, P. J. (1997). Selected cognitivefactors and speech recognition performance among young andelderly listeners. Journal of Speech, Language, and HearingResearch, 40(2), 423–431.
Goy, H., Fernandes, D. N., Pichora-Fuller, M. K., & van Lieshout,P. (2013). Normative voice data for younger and older adults.Journal of Voice, 27, 545–555.
Goy, H., Pichora-Fuller, M. K., & van Lieshout, P. (2013). Effectsof intra-talker differences on speech understanding in noiseby younger and older adults. Canadian Acoustics, 41(2),23–30.
Halle, S., & Myerson, J. (1996). Experimental evidence for differ-ential slowing in the lexical and non-lexical domains. Aging,Neuropsychology, and Cognition, 3, 154–165.
Hartman, D. E., & Danhauer, J. L. (1976). Perceptual features ofspeech for males in four perceived decades. The Journal of theAcoustical Society of America, 59, 713–715.
Hazan, V., & Baker, R. (2011). Acoustic–phonetic characteristicsof speech produced with communicative intent to counter ad-verse listening conditions. The Journal of the Acoustical Societyof America, 130(4), 2139–2152.
Hazan, V., & Markham, D. (2004). Acoustic–phonetic correlatesof talker intelligibility for adults and children. The Journal ofthe Acoustical Society of America, 116, 3108–3118.
3094 Journal of Speech, Language, and Hearing Research • Vol. 60 •
ded From: http://jslhr.pubs.asha.org/ by a ReadCube User on 11/09/2017f Use: http://pubs.asha.org/ss/rights_and_permissions.aspx
Hazan, V., Romeo, R., & Pettinato, M. (2013). The impact of var-iation in phoneme category structure on consonant intelligibil-ity. Proceedings of Meetings on Acoustics, 19, 060103.
Hazan, V., Tuomainen, O., & Pettinato, M. (2016). Suprasegmen-tal characteristics of spontaneous speech produced in goodand challenging communicative conditions by talkers aged 9to 14 years old. Journal of Speech, Language, and HearingResearch, 59, S1596–S1607.
Hillenbrand, J. (1987). A methodological study of perturbed andadditive noise in synthetically generated voice signals. Journalof Speech and Hearing Research, 30, 448–461.
Hodge, F. S., Colton, R. H., & Kelly, R. T. (2001). Vocal intensitycharacteristics in normal and elderly speakers. Journal of Voice,15, 503–511.
Hustad, K. C., & Weismer, G. (2007). Interventions to improveintelligibility and communicative success for speakers withdysarthria. In G. Weismer (Ed.), Motor speech disorders(pp. 217–228). San Diego, CA: Plural.
Junqua, J. C. (1993). The Lombard reflex and its role on humanlisteners and automatic speech recognizers. The Journal ofthe Acoustical Society of America, 93(1), 510–524.
Junqua, J.-C., Fincke, S., & Field, K. (1999). The Lombard effect:A reflex to better communicate with others in noise. In Pro-ceedings of the 1999 IEEE International Conference on Acoustics,Speech, and Signal Processing, (pp. 2083–2086). Phoenix, AZ:IEEE Signal Processing Society. https://doi.org/10.1109/ICASSP.1999.758343
Krause, J. C. (2001). Properties of naturally produced clear speechat normal rates and implications for intelligibility enhancement(Doctoral dissertation). Retrieved from http://hdl.handle.net/1721.1/8762
Krause, J. C., & Braida, L. D. (2004). Acoustic properties of natu-rally produced clear speech at normal speaking rates. TheJournal of the Acoustical Society of America, 115, 362–378.
Lam, J., & Tjaden, K. (2013). Intelligibility of clear speech: Effectof instruction. Journal of Speech, Language, and HearingResearch, 56, 1429–1440.
Lam, J., & Tjaden, K. (2016). Clear speech variants: An acousticstudy in Parkinson’s disease. Journal of Speech, Language, andHearing Research, 59, 631–646.
Lam, J., Tjaden, K., & Wilding, G. (2012). Acoustics of clear speech:Effect of instruction. Journal of Speech, Language, and HearingResearch, 55, 1807–1821.
Lane, H., & Tranel, B. (1971). The Lombard sign and the role ofhearing in speech. Journal of Speech and Hearing Research,14(4), 677–709.
Lansford, K., Liss, J., Caviness, J., & Utianski, R. (2011). Acognitive–perceptual approach to conceptualizing speech in-telligibility deficits and remediation practice in hypokineticdysarthria. Parkinson’s Disease, 2011, 150962. https://doi.org/10.4061/2011/150962
Lee, S., Potamianos, A., & Narayanan, S. (1999). Acoustics ofchildren’s speech: Developmental changes of temporal andspectral parameters. The Journal of the Acoustical Society ofAmerica, 105, 1455–1468.
Lindblom, B. (1990). Explaining phonetic variation: A sketch ofthe H & H theory. In W. J. Hardcastle & A. Marchal (Eds.),Speech Production and Speech Modelling (pp. 403–439).Dordrecht: Kluwer Academic.
Linders, B., Massa, G. G., Boersma, B., & Dejonckere, P. H.(1995). Fundamental voice frequency and jitter in girls andboys measured with electroglottography: Influence of age andheight. International Journal of Pediatric Otorhinolaryngology,33(1), 61–65.
3081–3096 • November 2017
DownloaTerms o
Linville, S. E., & Rens, J. (2001). Vocal tract resonance analysisof aging voice using long-term average spectra. Journal ofVoice, 15(3), 323–330.
Liss, J. M., Weismer, G., & Rosenbek, J. C. (1990). Selectedacoustic characteristics of speech production in very old males.Journals of Gerontology: Series B: Psychological Sciences andSocial Sciences, 45, P35–P45.
Liu, S., Del Rio, E., Bradlow, A. R., & Zeng, F. G. (2004). Clearspeech perception in acoustic and electric hearing. The Journalof the Acoustical Society of America, 116, 2374–2383.
Liu, S., & Zeng, F.-G. (2006). Temporal properties in clear speechperception. The Journal of the Acoustical Society of America,120(1), 424–432.
Lombard, E. (1911). Le signe de l’elevation de la voix [The signof the rise in the voice]. Annales des maladies de l’oreille, dularynx du nez et du pharynx, 37, 101–119.
Lowell, S. Y., Colton, R. H., Kelley, R. T., & Mizia, S. A. (2013).Predictive value and discriminant capacity of cepstral- andspectral-based measures during continuous speech. Journal ofVoice, 27, 393–400.
Lowell, S. Y., & Hylkema, J. (2016) The effect of speaking con-text on spectral- and cepstral-based acoustic features of normalvoice. Clinical Linguistics & Phonetics, 30(1), 1–11.
Lu, Y., & Cooke, M. (2008). Speech production modificationsproduced by competing talkers, babble, and stationary noise.The Journal of the Acoustical Society of America, 124(5),3261–3275.
Lu, Y., & Cooke, M. (2009). The contribution of changes in F0and spectral tilt to increased intelligibility of speech producedin noise. Speech Communication, 51(12), 1253–1262.
Maniwa, K., Jongman, A., & Wade, T. (2008). Perception of clearfricatives by normal-hearing and simulated hearing-impairedlisteners. The Journal of the Acoustical Society of America,123(2), 1114–1125.
Mattys, S. L., White, L., & Melhorn, J. F. (2005). Integration ofmultiple speech segmentation cues: A hierarchical framework.Journal of Experimental Psychology, 134(4), 477–500.
McAuliffe, M. J., Wilding, P. J., Rickard, N. A., & O’Beirne,G. A. (2012). Effect of speaker age on speech recognitionand perceived listening effort in older adults with hearingloss. Journal of Speech, Language, and Hearing Research, 55,838–847.
McCoy, S. L., Tun, P. A., Cod, L. C., Colangelo, M., Stewart, R. A.,& Wingfield, A. (2005). Hearing loss and perceptual effort:Downstream effects on older adults’ memory for speech. Quar-terly Journal of Experimental Psychology, 58A, 22–33.
Murdoch, B. E., Cheng, H. Y., & Goozee, J. V. (2012). Develop-mental changes in the variability of tongue and lip movementsduring speech from childhood to adulthood: An EMA study.Clinical Linguistics & Phonetics, 26, 216–231.
Navarro, R. (1996). Effects of ear canal occlusion and maskingon the perception of voice. Perceptual and Motor Skills, 82,199–208.
Newman, R. S., Clouse, S. A., & Burnham, J. L. (2001). The per-ceptual consequences of within-talker variability in fricativeproduction. The Journal of the Acoustical Society of America,109, 1181–1196.
Nissen, S. L., & Fox, R. A. (2005). Acoustic and spectral charac-teristics of young children’s fricative productions: A develop-mental perspective. The Journal of the Acoustical Society ofAmerica, 118, 2570–2578.
Park, S., Theodoros, D., Finch, E., & Cardell, E. (2016). Be clear:A new intensive speech treatment for adults with nonprogressivedysarthria. American Journal of Speech-Language Pathology,25, 97–110.
Smiljani
ded From: http://jslhr.pubs.asha.org/ by a ReadCube User on 11/09/2017f Use: http://pubs.asha.org/ss/rights_and_permissions.aspx
Pettinato, M., & Hazan, V. (2013). The development of clearspeech strategies in 9–14 year olds. In Proceedings of Meetingson Acoustics, 19, 060121.
Pettinato, M., Tuominen, O., Granlund, S., & Hazan, V. (2016). Vowelspace area in later childhood and adolescence: Effects of age,sex and ease of communication. Journal of Phonetics, 54, 1–14.
Perkell, J. S., Zandipour, M., Matthies, M. L., & Lane, H. (2002).Economy of effort in different speaking conditions. I. A prelimi-nary study of intersubject differences and modeling issues. TheJournal of the Acoustical Society of America, 112(4), 1627–1641.
Picheny, M. A., Durlach, N. I., & Braida, L. D. (1986). Speakingclearly for the hard of hearing II. Acoustic characteristics ofclear and conversational speech. Journal of Speech and HearingResearch, 29, 434–446.
Pichora-Fuller, M. K., Goy, H., & van Lieshout, P. (2010). Effecton speech intelligibility of changes in speech production influ-enced by instructions and communication environments. Semi-nars in Hearing, 31, 77–94.
Pichora-Fuller, M., Schneider, B., & Daneman, M. (1995). Howyoung and old adults listen to and remember speech in noise.The Journal of the Acoustical Society of America, 97(1),593–608.
Pittman, A. L., & Wiley, T. L. (2001). Recognition of speechproduced in noise. Journal of Speech, Language, and HearingResearch, 44, 487–496.
Prakup, B. (2012). Acoustic measures of the voices of oldersingers and nonsingers. Journal of Voice, 26, 341–350.
Ramig, L. A., & Ringel, R. L. (1983). Effects of physiologicalaging on selected acoustic characteristics of voice. Journal ofSpeech and Hearing Research, 26(1), 22–30.
Redford, M. A., & Gildersleeve-Neumann, C. E. (2009). The devel-opment of distinct speaking styles in preschool children. Journalof Speech, Language, and Hearing Research, 52(6), 1434–1448.
Ringel, R. L., & Chodzko-Zajko, W. J. (1987). Vocal indices ofbiological age. Journal of Voice, 1, 31–37.
Rogers, C. L., DeMasi, T. M., & Krause, J. C. (2010). Conversa-tional and clear speech intelligibility of bVd syllables pro-duced by native and non-native English speakers. The Journalof the Acoustical Society of America, 128(1), 410–423.
Romeo, R., Hazan, V., & Pettinato, M. (2013). Developmentaland gender-related trends of intra-talker variability in conso-nant production. The Journal of the Acoustical Society ofAmerica, 134(5), 3781–3792.
Ronnberg, J. (2003). Cognition in the hearing impaired and deafas a bridge between signal and dialogue: A framework anda model. International Journal of Audiology, 42(S1), 68–76.
Ronnberg, J., Rudner, M., Foo, C., & Lunner, T. (2008). Cogni-tion counts: A working memory system for ease of languageunderstanding (ELU). International Journal of Audiology,47(S2), S99–S105.
Ryan, W. J., & Burk, K. W. (1974). Perceptual and acoustic cor-relates of aging in the speech of males. Journal of Communica-tion Disorders, 7, 181–192.
Sadagopan, N., & Huber, J. (2007). Effects of loudness cues onrespiration in individuals with Parkinson’s disease. MovementDisorders, 22, 651–659.
Salthouse, T. A. (1996). The processing-speed theory of adult agedifferences in cognition. Psychological Review, 103, 403–428.
Schneider, B. A., Daneman, M., & Pichora-Fuller, M. K. (2002).Listening in aging adults: From discourse comprehension topsychoacoustics. Canadian Journal of Experimental Psychol-ogy, 56, 139–152.
Schum, D. J. (1996). Intelligibility of clear and conversationalspeech of young and elderly talkers. Journal of the AmericanAcademy of Audiology, 7, 212–218.
c & Gilbert: Acoustics of Clear and Noise-Adapted Speech 3095
DownloaTerms o
Schum, D. J. (1997). Beyond hearing aids: Clear speech trainingas an intervention strategy. Hearing Journal, 50, 36–40.
Shipp, T., Qi, Y., Huntley, R., & Hollien, H. (1992). Acousticand temporal correlates of perceived age. Journal of Voice, 6,211–216.
Siegel, G., Pick, H. L., Olsen, M., & Sawin, L. (1976). Auditoryfeedback in the regulation of vocal intensity of preschool chil-dren. Developmental Psychology, 12, 255–261.
Sluijter, A. C. M., & van Heuven, V. J. (1996). Spectral balanceas an acoustic correlate of linguistic stress. The Journal of theAcoustical Society of America, 100, 2471–2485.
Smiljanic, R. (2013). Can older adults enhance the intelligibility oftheir speech? The Journal of the Acoustical Society of America,133(2), EL129–EL135.
Smiljanic, R., & Bradlow, A. R. (2005). Production and perceptionof clear speech in Croatian and English. The Journal of theAcoustical Society of America, 118, 1677–1688.
Smiljanic, R., & Bradlow, A. R. (2008). Stability of temporal con-trasts across speaking styles in English and Croatian. Journalof Phonetics, 36(1), 91–113.
Smiljanic, R., & Bradlow, A. R. (2009). Speaking and hearingclearly: Talker and listener factors in speaking style changes.Language and Linguistics Compass, 3, 236–264.
Smiljanic, R., & Bradlow, A. R. (2011). Bidirectional clear speechperception benefit for native and high-proficiency non-nativetalkers and listeners: Intelligibility and accentedness. The Jour-nal of the Acoustical Society of America, 130(6), 4020–4031.
Smiljanic, R., & Gilbert, R. (2017). Intelligibility of noise-adaptedand clear speech in child, young adult, and older adult talkers.Journal of Speech, Language, and Hearing Research, 60,3069–3080. https://doi.org/10.1044/2017_JSLHR-S-16-0165
Stathopoulos, E., Huber, J., & Sussman, J. (2011). Changes inacoustic characteristics of the voice across the life span: Mea-sures from individuals 4–93 years of age. Journal of Speech,Language, and Hearing Research, 54, 1011–1021.
Summers, W. V., Pisoni, D. B., Bernacki, R. H., Pedlow, R. I., &Stokes, M. A. (1988). Effects of noise on speech production:Acoustic and perceptual analyses. The Journal of the Acousti-cal Society of America, 84(3), 917–928.
Syrett, K., & Kawahara, S. (2013). Production and perceptionof listener-oriented clear speech in child language. Journal ofChild Language, 1–17.
Tjaden, K., Kain, A., & Lam, J. (2014). Hybridizing conversationaland clear speech to investigate the source of increased intelligi-bility in Parkinson’s disease. Journal of Speech, Language, andHearing Research, 57, 1191–1205.
Tjaden, K., Lam, J., & Wilding, G. (2013). Vowel acoustics inParkinson’s disease and Multiple Sclerosis: Comparison of
3096 Journal of Speech, Language, and Hearing Research • Vol. 60 •
ded From: http://jslhr.pubs.asha.org/ by a ReadCube User on 11/09/2017f Use: http://pubs.asha.org/ss/rights_and_permissions.aspx
clear, loud, and slow speaking conditions. Journal of Speech,Language, and Hearing Research, 56, 1485–1502.
Tjaden, K., Sussman, J. E., & Wilding, G. E. (2014). Impact ofclear, loud, and slow speech on scaled intelligibility andspeech severity in Parkinson’s disease and multiple sclerosis.Journal of Speech, Language, and Hearing Research, 57,779–792.
Torre, P., III, & Barlow, J. A. (2009). Age-related changes inacoustic characteristics of adult speech. Journal of Communi-cation Disorders, 42, 324–333.
Turner, G. S., Tjaden, K., & Weismer, G. (1995). The influenceof speaking rate on vowel space and speech intelligibility forindividuals with amyotrophic lateral sclerosis. Journal ofSpeech and Hearing Research, 38, 1001–1013.
Uchanski, R. M., Choi, S. S., Braida, L. D., Reed, C. M., &Durlach, N. I. (1996). Speaking clearly for the hard of hearingIV: Further studies of the role of speaking rate. Journal ofSpeech, Language, and Hearing Research, 39, 494–509.
Van Engen, K. J., & Bradlow, A. R. (2007). Sentence recogni-tion in native- and foreign-language multi-talker backgroundnoise. The Journal of the Acoustical Society of America,121(1), 519.
Van Engen, K. J., Chandrasekaran, B., & Smiljanic, R. (2012).Effects of speech clarity on recognition memory for spokensentences. PLoS ONE, 7(9), e43753. https://doi.org/10.1371/journal.pone.0043753
Vorperian, H. K., & Kent, R. D. (2007). Vowel acoustic spacedevelopment in children: A synthesis of acoustic and ana-tomic data. Journal of Speech, Language, and Hearing Research,50(6), 1510–1545.
Walsh, B., & Smith, A. (2002). Articulatory movements in adoles-cents: Evidence for protracted development of speech motorcontrol processes. Journal of Speech, Language, and HearingResearch, 45(6), 1119–1133.
Winkler, R., Brückl, M., & Sendlmeier, W. (2003). The agingvoice: An acoustic, electroglottographic and perceptive analysisof male and female voices. In Proceedings of the 15th Interna-tional Congress of Phonetic Sciences (pp. 2869–2872). Retrievedfrom https://www.internationalphoneticassociation.org/icphs/icphs2003
Xue, S. A., & Hao, G. J. (2003). Changes in the human vocal tractdue to aging and the acoustic correlates of speech production:A pilot study. Journal of Speech, Language, and Hearing Research,46(3), 689–701.
Yorkston, K., Hakel, M., Beukelman, D. R., & Fager, S. (2007).Evidence for effectiveness of treatment of loudness, rate, orprosody in dysarthria: A systematic review. Journal of Medi-cal Speech-Language Pathology, 15, 11–36.
3081–3096 • November 2017


