Embed Size (px)
Citation preview

Journal of Log' Temperature Physics. VoL 95, Nos. 3/4, t994
Experiments on Nonlinear Acoustics in 3He-B
A. J. Manninen,* H. Alles, K. Torizuka,# A. V. Babkin, and J. P. Pekola**
Low Temperature Laboratory, Helsinki University o f Technology, 02150 Espoo, Finland
(Received July 30, 1993; revised November 24, 1993)
Observations and applications of nonlinear acoustic phenomena in superjTuid 3He-B are reported. Two-phonon absorption (TPA) by the real squashing (rsq) mode has been detected under several experimental conditions below p = 3.5 bar, using two coincident sound pulses. The attenuation peak height has been investigated as a function of the energy densities of the two sound waves. We discovered the five-fold Zeeman splitting of TPA by parallel sound pulses in an applied magnetic field and the two-fold dispersion splitting due to the finite wave vector of the mode when the two sound pulses are mutually perpendicular. The dispersion relation of the real squashing mode has been investigated at zero pressure and in zero magnetic field by exciting the mode with two parallel, perpendicular, or antiparallel sound waves. Experimental values for the parameters that determine the collective-mode velocities have been extracted from the positions of the observed attenuation maxima. An anomalous structure has been observed in the attenuation and phase velocity spectra of a single high-intensity sound wave near the threshold for pair breaking by two phonons; in an applied magnetic field the phase velocity anomaly sp6ts into a triplet.
1. INTRODUCTION
In addition to nuclear magnetic resonance (NMR), ultrasound has proven to be the most versatile experimental technique for investigations on the superfluid phases of 3He.a The method has been employed to study the local microscopic properties as well as the global macroscopic textures of the liquid. 2'3 The usefulness of ultrasound as a probe of the superfluid order parameter stems from the fact that in the frequency range from about
*Present address: Department of Physics, University of Manchester, Manchester, M13 9PL, United Kingdom,
tPresent address: School of Physics and Materials, Lancaster University, Lancaster, LA1 4YB, United Kingdom.
**Present address: Department of Physics, University of Jyv~iskyl~i, P. O. Box 35, 40351 Jyv~iskyl/i, Finland.
579
0022-229i]94/0500-0579507.00/0 �9 [994 Ptenum Publishing Corporation

580 A.J . Manninen etaL
10 to 100 MHz the relevant phonon energy, hf is of the same order of magnitude as the superfluid energy gap A(T). Moreover, ultrasound which propagates as collisionless zero sound in 3He, can serve to excite several collective oscillation modes of the order parameter.
The Cooper pairs in superfluid 3He are in the spin-triplet state, S-- 1, h a v i n g a n orbital angular momentum L = 1. The order parameter A,j, which describes the properties of the pair condensate, is a complex 3 x 3 second-rank tensor, having 18 independent real parameters. For 3He-B, it can be conveniently represented as ~
A~j = A(T) eir O) (1)
where qt is a phase factor and R~j a matrix which rotates the spin and orbital coordinates with respect to each other by an angle 0 about the axis ft. The modulus of A,j is isotropic (in the absence of magnetic field) and is given by the energy gap A(T); its value in the zero-temperature limit is A(0) = 1.764kBTc according to the weak-coupling BCS theory, while A(T) tends to zero as 3.06kB To(1- T/To) m near To .~
The rich internal structure of the order parameter allows a wide spec- trum of oscillations: altogether 18 collective vibrational modes exist. 4 One can excite and study several of these modes by zero sound. In many ways, acoustic studies of superfluid 3He are analogous to the optical spectroscopy of atoms and molecules. Perhaps the best example is the analogue to the Zeeman effect in the collective modes of the B-phase. The modes have a well-defined total angular momentum J = 0 , 1, or 2 and, in an applied magnetic field, they split into 2 J + 1 substates according to the magnetic quantum number m j = --J, --J-}- 1 . . . . . J. In this paper, we show that non- linear effects which have become important in optics, provide interesting applications within acoustic investigations on superfiuid 3He as well.
In particular, we have been able, for the first time, to excite one of the collective modes, the J = 2 + real squashing (rsq) mode, by a two- phonon process, 5'6 as predicted by McKenzie and Sauls. 7 In our method, two sound waves of different frequencies were transmitted simultaneously through the sample. We applied this two-phonon absorption (TPA) to directly study the dispersion relation co = co(q) of the rsq mode. s This was possible because of a unique property of TPA: the wave number q and the frequency co of the excited mode can be altered independently, simply by changing the angle between the two sound waves. We detected an anomalous structure in the ultrasound reponse near the condition where breaking of the Cooper pairs by two phonons becomes possible, by trans- mitting only one energetic single-frequency pulse through the sample at a time. In an applied magnetic field the anomaly split into a triplet.
Experiments on Nonlinear Acoustics in 3He-B 581
Experiments near the "two-phonon pair-breaking edge" have also been performed by Peters and Eska 9 in the absence of a magnetic field.
This paper is organized as follows: Chapter2 reviews ultrasound propagation in the linear region, and the experiments and theory on non- linear acoustics in 3He-B prior to our work. A description of experimental techniques is given in Chapter 3. In Chapter 4 we present and discuss the results on the two-phonon absorption by the real squashing mode. Our studies near the two-phonon pair-breaking edge are described in Chapter 5, while the principal results are summarized in Chapter 6.
2. ACOUSTICS IN 3He-B REVIEWED
In this Chapter, previous acoustic investigations of 3He-B are discussed, primarily those topics which are most closely related to the present work. Comprehensive reviews have been written by Halperin and Varoquaux, 2 Dobbs and Saunders, 3 and Zhao et al. 1~ McKenzie and Sauls have reviewed theoretical work on nonlinear acoustics in Ref. 11.
2.1. Propagation of Ultrasound in the Linear Regime
Ultrasonic attenuation in superfluid 3He-B is governed by three pro- cessesfl Firstly, zero sound can break the Cooper pairs of the superfluid condensate if the frequency f obeys hf> 2A, i.e., the phonons have enough energy to transfer both members of a Cooper pair over the gap edge A. Secondly, ultrasound can excite some of the collective order-parameter modes, whose resonance frequencies are on the order of A(T)/h. Thirdly, zero sound and other collective modes are damped by collisions between the "normal" quasiparticles, whose number density vanishes exponentially for T--* 0; the principal effect to ultrasound attenuation is that the quasi- particle collisions broaden the collective-mode resonances, especially near To.
In 3He-B, the collisionless collective oscillations of the order parameter A~j about its equilibrium state, Eq. (1), are eigenstates of an operator J. This is the operator for the "twisted" total angular momentum, written in a coordinate system where the orbital and spin axes are mutually rotated through the matrix R,~: Jj= Lj+ RujS, (summation over/1), where L and S are the orbital and spin angular momenta, respectively. 2"~2 The 18 collec- tive modes can be classified by quantum numbers JC and ms. The twisted total angular momentum can obtain the values J = 0, 1, and 2, its projection to a quantization axis ms= - J , - J + 1 . . . . . J, and the signature ~ equals + or - , depending on whether the real or imaginary parts of A,j oscillate. The "imaginary" modes couple predominantly to the density fluctuations

582 A.J . Manninen et aL
while the "real" modes interact with spin-density fluctuations. The modes with a common J and ~ but different mj are degenerate, i.e., they have the same frequency, when the magnetic field H = 0 and the wave number q = 0.
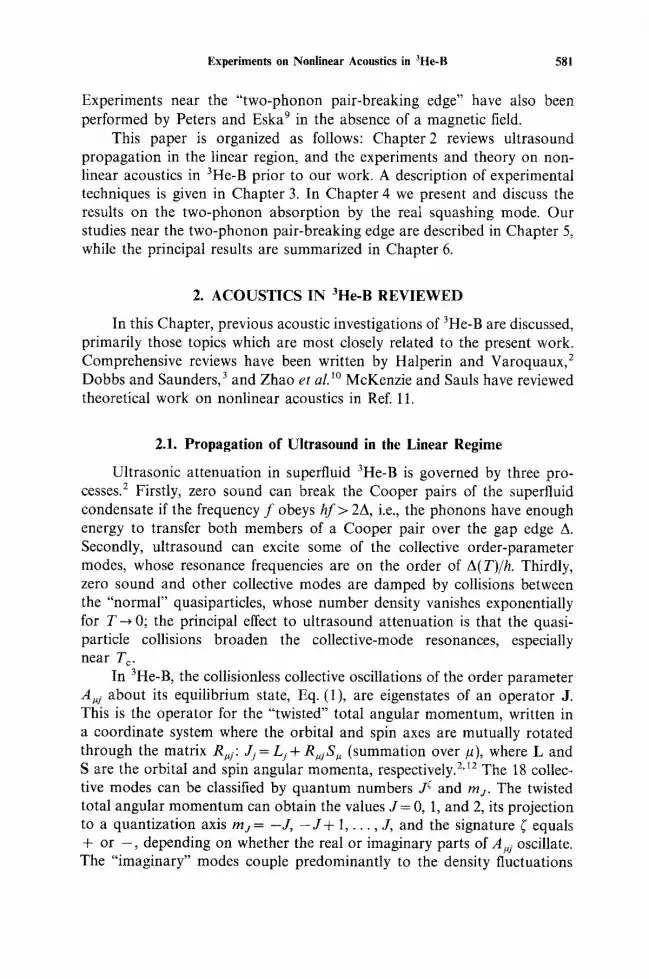
The most extensively studied collective excitations of the 3He-B order parameter are the JC = 2 - imaginary squashing (sq) modes and the JC= 2 + real squashing (rsq) modes, both of which are five-fold degenerate. The resonance frequenc~__~_ the sq modes, which couple to ultrasound very strongly, is e0sq = x/12/5 A(T)/h at H = 0 and q = 0, according to the weak- coupling BCS theory, neglecting Fermi-liquid corrections. 2 The rsq modes have 09rs q - - ~ A(T)/h and their coupling to ultrasound is very weak, 13 arising from the small particle-hole asymmetry: 14 the density of states just above and just below the Fermi surface differ slightly. The degeneracy of the different ms-substates of the same J; is lifted by an external magnetic field (Zeeman effect) 15 and, partially, also by dispersion due to nonzero q, 16,17 as shown schematically in Fig. 1.
The Zeeman splitting of the rsq mode can be observed very clearly in a magnetic field not parallel to the direction of ultrasound propagation:IS' 19 five separate attenuation peaks appear, corresponding to mj = 0, _ 1, +2. In fields from about 20 to 70 mT, the splitting is almost linear in H and, neglecting the dispersion corrections, of the form
(-0rsq, mj = (Orsq, 0 + 2rcemsH (2)
1
1.2 ~ _-!
1.o H (T) q (cm 1)
Fig. 1. (a) Linear five-fold Zeeman splitting of the J= 2 collec- tive modes (sq and rsq) in an applied magnetic field for q=0. (b) The dispersion curves of the J = 2 modes in the absence of a magnetic field, showing the three-fold splitting when the wave number q is finite. A mode can be excited in a linear pro- cess only when the dispersion lines of the mode and of zero sound, ~o = cq, cross,

Experiments on Nonlinear Acoustics in 3He-B 583
where 8= 7 . . . 10 MHz/T, depending on pressure and temperature. 19 In low magnetic fields (<20roT) the linear field dependence is not obeyed due to dispersion. On the other hand, large magnetic fields (>70roT) deform the B-phase energy gap so extensively that Eq. (2) loses validity: terms quadratic in H become important (Paschen-Back effect). 2~
The coupling of the mj-substates of the rsq mode to ultrasound depends on the angle 7 between the direction ~ of sound propagation and the quantization axis of the collective modes. When Eq. (2) is valid, the quantization axis is h with the components
hj = R,jH~,/H (3)
where Ruj is the rotation matrix (see Eq. (1)). In bulk liquid, h is parallel to the magnetic field H, but within the magnetic healing length ~H ~- 1 mm, fa tends to turn perpendicular to the walls. If dispersion is neglected, the coupling is proportional to the square of the spherical harmonics of rank 2, [y~nj(,y)[2:18 when ~[[h, only the m j = O substate couples to ultrasound. Dispersion corrections cause some deviation from this function. = Their most notable effect is the asymmetry between the heights of the attenuation maxima corresponding to positive and negative values of mj. 19'23
For H = 0, the dispersion relations for the rsq submodes are, to the lowest order in q,=
[~%q, (T)] 2 = [(Ooo(T)] 2 + v~jq 2 (4)
where (Ooo(T)=arsqA(T)/h with arsq~8/ ' -5 , and [m[ can assume the values 0, 1, and 2. The states with Iml = 1 and Imt = 2 are two-fold degenerate. The wave vector q of the excited mode is the same as that of ultrasound in linear process. The mode velocities vl,,j may be written as
2 2 Vlmj = Ca-l- ~(4-1ml2)c~ (5) The parameters c a and c b are on the order of the Fermi velocity Vv~-30 . . . 60m/s, depending on pressure. Without Fermi-liquid and higher-order pairing contributions, these parameters are given by 24'25
2 1 (6) Ca = 7 20,]
2v2( 32 ) T 1 +7Too (7)

584 A.J . Manninen et aL
where
2o(CO, T) = A(T) 2 f ~ 1 tanh(e/2k8 T) rl ~/g2--A(T)2 g2_h2co2/4 de (8)
C?2Ofl_2A(T)2) 2A(T) 2 [ 1 _ ( hco ~27022o )~l(C~ -f fuj2j ~ [_ \ 2 A ( T ) J J ~ J (9)
In the zero-temperature limit, 21/•0=-0.43 where arsq=X/- ~ is used. One then obtains Ca=2 0.224V~ and c~=0.327v~ and, from Eq.(5),
2 = 0.388v2, and 2 = 0.224v 2. v 2 = 0.442v 2, v 1 v~ The quantization axis of the modes is ~ at H = 0. When a magnetic
field is applied, the quantization axis turns smoothly from ~ to [i, and the mode frequencies evolve towards those given by Eq. (2). I7'22 One should note that the "dispersion" quantum numbers m at H = 0 do not directly correspond to the magnetic quantum numbers mj of Eq. (2), unless ~ II h. For example, the Iml = 2 resonance at H = 0 does not necessarily split into the ms=_+2 substates at H > 0 . The three-fold dispersion splitting of the rsq mode at H = 0, predicted by Eq. (4), is difficult to observe experi- mentally because only the m = 0 substate should couple to ultrasound. However, there is one acoustic experiment at a low field, H = 7.8 roT, in which three anomalies near the rsq resonance were resolved. 26 The authors interpreted them as the dispersion-split substates of the rsq mode, which coupled to ultrasound owing to textural effects or superflow.
Recently, the onset of attenuation at the pair-breaking edge of 3He-B, where hf= 2A(T), has been under active study. These experiments provide direct information on the magnitude of the energy gap. The evolution of the pair-breaking edge as a function of pressure 27 and magnetic field 28 has been measured. An interesting peak-antipeak structure has been detected near hf= 2A(T) in applied magnetic field; 29 it has been identified with the J~ = 1- collective mode, 3~ but with some discussion. 31
An external magnetic field has twofold effects on the effective pair- breaking edge. Firstly, the energy gap becomes distorted, so that its mimimum All is given by 21
All (T) 2 = A(T) 2 -- Ch2F2H 2 (lo)
where A(T) is the energy gap in zero magnetic field. The coefficient F is given by 10
F = ?(1 + F~/5) (11) 1 + [ 2 + Y(T)]F~/3+ [1 + (2 + 3F(]) Y(T)]F~/15
Experiments on Nonlinear Acoustics in 3He-B 585
where Y is the isotropic Yosida function for the BW state (Ref. 1, p. 86), 7 = 2.038.108 s - iT -1 is the gyromagnetic ratio, and Fg and F~ are Fermi- liquid parameters. 2 The factor C in Eq. (10) is defined by 3~
1 A c ? [ l n ( 1 - Y)] C = 2 + 4 ~A (12)
C = 1 at T= To, and C = 1/2 for T= 0. Secondly, an external magnetic field causes a Zeeman splitting of the quasiparticle states, such that the final expression for the effective pair-breaking edge ~Ops becomes 2s'3~
he)pB = 2A H - hFH (13)
2.2. Nonlinear Acoustics
Nonlinear acoustic effects in superfluid 3He have close analogues in nonlinear optics, which has evolved into an important field of physics along with the development of powerful lasers. 32 Acoustic analogues of saturation and self-induced transparency have been observed in previous experiments on superfluid 3He. 33'34 Our investigations focus on the general class of parametric processes, 11 which involve the absorption and emission of modes with different frequencies and include, among other phenomena, the harmonic generation, two-photon (two-phonon) absorption, and stimu- lated Raman-scattering.
2.2.1. Previous Experiments
Nonlinear acoustics in superfluid 3He was pioneered by Polturak et al., 33 who measured the transmission of energetic ultrasound pulses through 3He-B near the resonance temperature of the rsq mode. When the input energy of pulses was increased over a well-defined threshold, the size of the received signal became independent of the energy: the amplitude of the detected sound pulse increased with excitation but its width decreased. When the input energy was further increased, one or several secondary peaks appeared on the received signal. Finally all the peaks merged into one whose height was proportional to the excitation. The sample became almost transparent to ultrasound when the energy density was more than about 1% of the superfluid condensation energy: the attenuation peak caused by the rsq mode could not be resolved at all. 35 The results have been interpreted in terms of soliton propagation and self-induced trans- parency, 33'36"37 but there are both qualitative 35 and quantitative 38 discrepancies between this model and the experimental data.
Avenel et aL 39 have observed, but not systematically studied, another kind of nonlinear phenomenon in their measurements of longitudinal

586 A.J. Manninen et aL
acoustic impedance of 3He-B near the sq mode. At input energies above 30 pJ/cm 2 there is a side peak on the high-temperature side of the main resonance. The "horn" has the same shape as the main peak and its size increases with input energy. So far, there is no explanation for this effect. Avenel et al. 34 also detected nonlinear acoustic effects in 3He-A; later they were observed by our group as well. 4~
2.2.2. Parametric Effects
Conceptually, the simplest parametric process is a three-wave reso- nance: two modes with angular frequencies 0)1 and 0)2 and wave vectors ql and q2 together excite a third mode with o)3, q3, such that 0)1 +0)2= 0)3 and ql + q2 = 1t3. In other words, the quanta of the modes 1 and 2 fuse into one quantum of the mode 3 in such a way that energy and momentum are conserved (see Fig. 2a). The excitation of a collective mode (0)3) in 3He-B by two sound waves (0)1 and 0)2) is called two-phonon absorption (TPA). The corresponding process in nonlinear optics is known as two-photon absorption. The inverse process, the decay of a phonon with frequency o) 1 into a photon with a lower frequency 092 and into a quantum of a collective mode with frequency 0)3 = 0)1 -0)2 , in the presence of a sound wave with frequency 0)2, is called stimulated Raman scattering (Fig. 2b). Parametric acoustic effects in 3He-B have been discussed by McKenzie and Sauls. 7'11'41
In three-wave processes the selection rules, arising from symmetry, are different from those in the linear regime. In the case of acoustics in 3He-B, the approximate particle-hole symmetry of the 3He Fermi liquid is of particular importance. Under the particle-hole transformation C, a density fluctuation (sound) transforms as fin ~ -fin and an order-parameter fluc- tuation as 6A,j --* 6A*j. Thus, because the parties of an imaginary squashon (a quantum of the Jr --- 2 - sq mode) and a phonon are both negative under C, zero sound can couple strongly to the sq mode in the linear regime. On the other hand, this symmetry forbids the excitation of a real squashon (a
(a) �9 ~ 1 (phonon)
sq)
~ 2 ' q'2 (phonon)
~ 3 ' q3 (rsq)
~ ql (phonon) c02, ~-2~'~
(phonon)
Fig. 2. Schematic presentations of (a) two-phonon absorption and (b) stimulated Raman scattering by the rsq mode in 3He-B.

Experiments on Nonlinear Acoustics in 3He-B 587
quantum of the J ~ = 2 + rsq mode), with positive parity under C, by a single phonon. However, there is a small linear coupling because the particle- hole symmetry is weakly broken.14
The situation is reversed in the case of three-wave processes: the rsq mode can be excited by ultrasound but the sq mode cannot, except for the weak particle-hole asymmetry contribution again. In the two-phonon absorption by the rsq mode,
phonon ( - ) + phonon ( - ) ~ real squashon ( + )
the net parity under C is positive on both sides of the arrow, whereas in the stimulated Raman scattering,
phonon ( - ) ~ real squashon ( + ) + phonon ( - )
the net parity on both sides is negative. These two processes are thus possible even in the case of exact particle-hole symmetry.
McKenzie and Sauls 7'1~ considered the situation in which two sound waves, the signal and the pump wave with angular frequencies cos and COp, respectively, are simultaneously transmitted through the 3He-B sample. They showed that the oscillation of the liquid density, 6n, contains terms with frequencies COs, COp, 3COs, 3COp, 2CO s + COp, and 2COp __. COs. The generated waves, like the third harmonics with angular frequencies 3CO s and 3COp which were first predicted by Serene 42 and the anti-Stokes waves with 2COs- COp and 2COp- COs, have not been observed yet.
For our experiments it is important that the rsq mode is excited in a three-wave process when any of the frequencies COs+COp (two-phonon absorption), ]co s -copl (stimulated Raman scattering), or 2cos (or 2cop) is in resonance with the mode, causing anomalies in attenuation and velocity of the signal wave. If the pump wave is of much higher an intensity than the signal wave, the height of the attenuation peak in the signal wave at a temperature where fCOs---COpl = COrsq(T) is given by 41
3cos IA(cos, "TCOp, COrsq, T)Znc(~s,~p)l 2 A2(T) Uo A~M = 50 (.Ors q •0(O)rsq, T) cF(1 + F~) 2 U c
(14)
where M is either the dispersion quantum number m or the magnetic quan- tum number mj. The upper sign refers to two-phonon absorption and the lower one to stimulated Raman scattering. 1IF is the mode lifetime due to quasiparticle collisions, F~,,~ 10 . . . 90 is a Fermi-liquid parameter, c is the velocity of zero sound, Up the energy density of the pump wave, and

588 A.J. Manninen et al.
Uc~0.1 J/m 3 is the superfluid condensation energy density, defined in Ref. 41 as
Uc = �89 A2(T) (15)
Above, N(Ev) is the density of single spin states at the Fermi surface:
N(EF ) = m*kr (16) 292h 2
where m* is the effective mass of the 3He-quasiparticles.2 The dimensionless function A in Eq. (14) is typically on the order of
0.1, and its expression is given in Eqs. (153), (154) and (162) of Ref. 11; for corrections of misprints, see Ref. 41. The Tsuneto function 20(0o, T), given in the high-frequency long-wavelength limit (qvv 4~hoo~A) by Eq. (8), is on the order of unity when h~o <2A(T). The dependence of A~ on the directions of propagation of the two sound waves and on the quantum number m or m~ of the rsq submode is contained in the factor
ZM(~ ,g )= (~ .g ) M . . ~ M- - ~ M- * (17) t .j s .qj-- gt ~j S~Sj-- 5t ~j qvqj
M Analytic expressions for the J = 2 eigentensors t.j are possible for zero magnetic field and for large fields where the Zeeman effect dominates over dispersion. In both cases, the eigentensors can be expressed as
o = xf~ ( e . e / _ , tuj ~6uj ) (18a)
t + ' = T �89 [ (~u +- i9.) ej + e~(~j + i33j)] (18b)
t +2 = 1(i~ +_ i,9u)(,~y + i3~j) (18c)
At large fields the mode quantization axis 2 points in the direction of the effective magnetic field fl, given by Eq. (3), while for H = 0 ~ is parallel to the mode wave vector q, + %. When q~ H %, the height of the attenuation peak has the same dependence on the angle between the wave vector and the quantization axis as in the linear case.
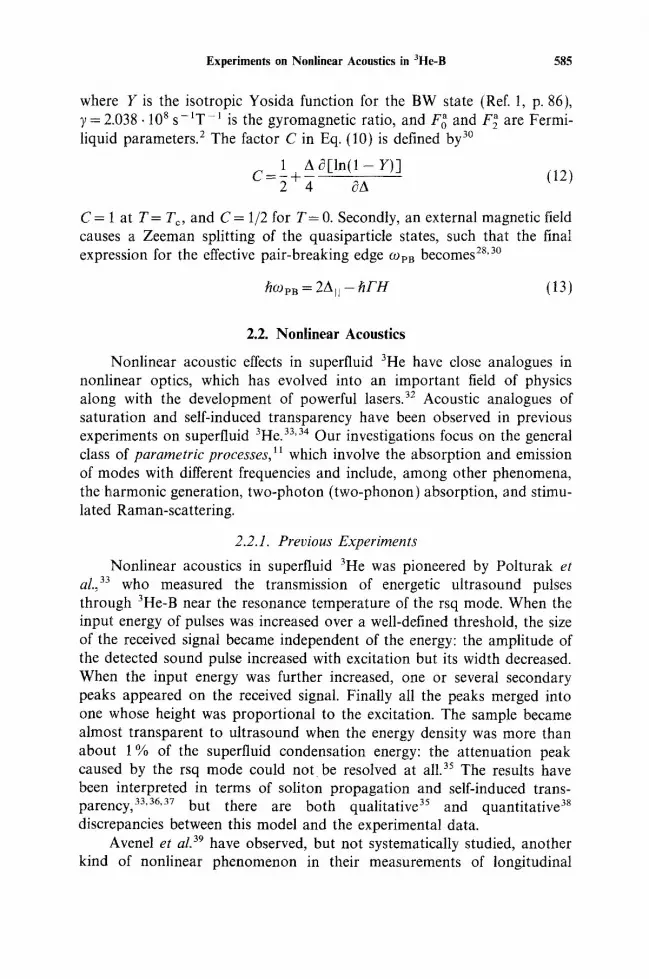
Figures 3a and 3b show examples of the calculated attenuation spectra of a low-intensity signal wave in the presence of a parallel pump wave of energy density Up = 0.2U~ at zero pressure and zero magnetic field, v In this case, only the m = 0 rsq submode can couple to ultrasound. In Fig. 3a, the monitored signal wave has the frequency f~-= ~oJ2n = 38.3 MHz, and the pump-wave frequency is fp = 3.45 MHz. The attenuation peak at tem- perature T+ is caused by two-phonon absorption: f~ + f p = O~r~q.o(T +)/2n. At T , for which f~-fp=OO~sq.o(T)/21t, the signal wave is attenuated because of stimulated Raman scattering. The strong feature at To is caused

Experiments on Nonlinear Acoustics in 3He-B 589
by the linear excitation of the rsq mode by the signal wave; at this tem- perature f~= COrsq,0(To)/2rc. The continuous increase above T~-0.65Tc in the background attenuation is caused by linear coupling to the sq mode.
In Fig. 3b, the roles of the two waves are interchanged: the 3.45 MHz wave is used as the signal, i.e., its attenuation is determined, while the 38.3 MHz wave the high intensity Up =0.2Uc is employed for pumping. The nonlinear features again occur at the same temperatures T+ and T as in Fig. 3a, but now they are predicted to be much weaker. However, the most noteworthy difference is that the signal wave is now amplified at T = T because of the stimulated Raman scattering: the 38.3 MHz pump
40
I I I I I I I
To (a)
Eo T+
z 0 0 I I ,
rr ~ (b) 0 T- O <
-2 0.4 0.5 0.6 0.7 0.8
T/T c
Fig. 3. Calculated temperature dependence of the attenuation of ultrasound signal with frequency f~, in the presence of a parallel pump wave of frequency fp (from Ref. 7). In (a) f~ = 38.3 MHz and fp = 3.45 MHz, and in (b) f s=3 .45MHz and fp=38.3MHz. The energy density of the pump wave Up = 0.2Uc, and p = 0 and H = 0. The features at T+ are due to two-phonon absorption by the rsq mode (see Fig. 2a). At T_, stimulated Raman scattering takes place; in this process a high-frequency phonon decays into a low-frequency phonon and a real squashon (see Fig. 2b), i.e., the high- frequency wave is attenuated and the low-frequency wave amplified. The peak in (a) at To is caused by linear coupling to the rsq mode.

590 A.J . Manninen et aL
phonons decay into the real squashons and the 3.45 MHz signal phonons. The linear coupling between the 3.45 MHz signal wave and the rsq mode occurs very near Tc and cannot be resolved in the temperature range of Fig. 3b.
3. EXPERIMENTAL TECHNIQUES
The experiments were performed using the nuclear demagnetization cryostat ROTA2, which has been described in detail elsewhere. 43 The cryostat can be rotated around its axis, but most of the experiments discussed in this paper were made in the stationary state.
Fig. 4 displays the experimental region of the cryostat. The heat exchanger between the vertically slit OFHC-copper nuclear stage and the 3He-sample was made of 14 silver plates, each of which was silver sintered on both surfaces. The plates were electron-beam welded together after
BE
m
Pt-NMR ..------THERMO-
METER
SINTERED SILVER HEAT EXCHANGER [ 2cm [
Fig. 4. Low-temperature parts of the experimental setup, showing the ultrasonic cell mounted in the epoxy tower, the silver-sinter heat-exchanger plates, and the Pt NMR thermometer. A vertical magnetic field can be applied by a superconducting solenoid (not shown).

Experiments on Nonlinear Acoustics in 3He-B 591
sintering, and the stack then likewise electron-beam welded from its top to a big bore at the upper end of the nuclear stage. The large surface area of the sinter, nominally more than 100m 2, allowed us to use the large ultrasound intensities needed for nonlinear phenomena to occur, without too severe heating of the sample. A superconducting solenoid, hanging from the bottom of the mixing chamber, could produce a vertical field of up to 1 T, with inhomogeneity of less than 10 3 inside the experimental volume.
Two different experimental cells were used, each of them mounted in an epoxy tower. In both cases, the 3He-sample was in liquid contact with the heat exchanger volume via a 40-ram-long, 4-ram-diameter tube in the axis of the tower. No special care was taken for pressure stabilization because of the large volume of the heat exchanger compared to the fill line. In the first cell, the sample space consisted of two X-cut quartz crystals with fundamental frequency 8.9 MHz, which were glued with a droplet of diluted GE-varnish on ends of a 4 mm thick cylindrical quartz spacer of 6 mm inner diameter, as shown in Fig. 5a. The quartz crystals were gold plated from both surfaces, to which wires were indium soldered. The back side of the crystals faced an open volume of liquid; the surrounding walls were rough-machined Stycast 1266. The chamber was mounted such that the propagation direction of ultrasound was vertical, i.e., parallel to the applied magnetic field (and the rotation axis of the cryostat). The liquid 3He could enter the chamber through several square holes, I x 1 mm ~, around both ends of the spacer.
The construction of the newer, cubic cell is shown in Fig. 5b. It consists of four quartz crystals, each with fundamental frequency 5 MHz,
(a) (b)
~G IUARTZ :RYSTAL ( ~
~ . . . ~ QUARTZ _....].SPACER
i 5mm I I 5ram I
._• MACOR GLASS CUBE
Fig. 5. Construction of (a) the cylindrical and (b) the cubic ultrasound chambers.

592 A.J . Manninen et aL
and a 9.5 x 9.5 x 9.5 mm 3 cube machined of Macor glass. The sample space is formed by three crossed holes with 6 mm diameter, bored through each side of the solid cube. Two of the crystals were glued on the top and bot tom faces, and the other two on the opposite vertical sides, so that the separation of each pair was L = 9.5 ram. The simultaneous propagation of a vertical and a horizontal sound wave was possible. Both ends of the other horizontal hole were left open to the rest of the 3He volume.
In our wiring setup commercial stainless steel coaxial cable was used between 300 K and 4 K. In the low temperature section we employed a
(a) PUMP WAVE SIGNAL WAVE [DIGITAL GENERATOR GENERATOR ref / OsCILLOsCOPE
IHP3325B HP8656B ] I I LeCroy 9400 ooo ,5- -- -~ . . . . . . . . . . . J TRANSM,~ER ! _ RECE,VE___ _R _____1, . . . . . . ] - " -
VARIABLE f [ [LOCAL . . . . . ' / \ ATTENUATORI s OSCILLATOR vv,-ou,-, L _x
�9 ,L I I HP8654A . " " ~ , f , directional / I(fs +21.5MHz) son,c/Z= = ~ AMPLIFIER bridge ~ cell V" =:r'f-1 AnzacENI ~ HP8721AI ~ fs fn \ J
' I ' ' P ~ 1 ~ ' r
r l I
(b) PUMP WAVE SIGNAL WAVE DIGITAL GENERATOR GENERATOR ref OSCILLOSCOPE
I HP3325B HP8656B I LeCroy 9400
_L c EO ,VE
I , - ~,- -,f - I LOCAL I Trontech/~ VAHIA~L~- W250B OSCILLATOR Z ~ ATTENUATOR H P8654A T
I (fs -+21.5MHz)] s o n i c l f - - - - J cell ]
AMPLIF ER f 4 - = = % I Anzac,ENI / s = Iii IH
fp ~ 1 ~ .L
Fig. 6. Block diagrams of the electronics for creating (a) parallel and (b) perpendicular signal and pump pulses�9

Experiments on Nonlinear Acoustics in 3He-B 593
home-made superconducting cable with monofilament wire inside and 1 mm Nb tube as an outer conductor. The feedthrough into the epoxy tower was made by home-made "50 f2" strip lines. The total length of these cables was about 2 m which is about two third of a quarter wavelength even at 25 MHz.
In order to be able to study two-phonon absorption or other three- wave processes, two simultaneously propagating sound waves, the pump wave with frequency fp and the signal wave with frequency fs, are needed. In our cylindrical cell, this was made possible by sending the pump pulse from one rf generator and the signal pulse from the other generator con- currently, through a directional bridge, into the same ultrasound crystal, as shown in Fig. 6a. Thus the transmitter crystal oscillated simultaneously with two frequencies. A similar scheme was also employed in our cubic cell to produce two parallel sound waves with different frequencies. A typical spectrum of the if-excitation is presented in Fig. 7. The signal and the pump waves, at fs = 25.15 MHz and fp = 15.1 MHz, are present, and the amplitudes of other frequencies are very small. Sometimes we had to employ back-to-back diodes in the pump wave circuit to decrease leakage through the switch when it was open, even though the diodes caused some
I I
4O
Lu 30 s
~ 2o <
10
50
0 I I
0 10 20 30
f (MHz)
40 50
Fig. 7. Typical spectrum of the excitation voltage applied to the transmitter crystal for f~ = 25,15 MHz and fp = 15.1 MHz measured at a point between the sonic cell and the directional bridge in the Fig. 6 (a). Hence this indicates the purity of the spectrum of the "double-pulse" transmitted into the cryostat. The drive level of the signal wave is almost as large as that of the pump wave because less power can be transmitted through at a higher frequency,

594 A.J . Manninen et aL
disturbance to the pump wave. The finite length of the excitation pulses produced harmonic components to the spectrum, too. For creating crossed waves, the circuit of Fig. 6b was employed: one of the vertical and one of the horizontal crystals were excited simultaneously.
The sound waves were transmitted in short pulses, with a repetition rate of typically 0.5 Hz. In the cylindrical cell the duration of the generated pulses was normally 12 #s, whereas in the larger cubic chamber 30 or 45/is was used. The pulse lengths were chosen such that the sound propagating directly was clearly separated from the echoes. Each crystal could be excited only at its fundamental frequency or its odd harmonics. Sound propagated through the sample to the receiving crystal. From there the if-voltage was fed via a preamplifier to a dual phase-sensitive detector, 44 whose intermediate frequency was 21.5 MHz. This device selected the signal of frequency fs from the received pulse and decomposed it into the in-phase and out-of-phase components. Their amplitudes were read by a digital oscilloscope and subsequently analyzed by a computer. The attenuation ~(T) and phase <0(T) of the signal wave were obtained from the area under the two pulse components, as explained in Ref. 45. The phase velocity c(T) is related to ~0(T) by
c(T)-c(To) ~o(T)- qo(T~)
c(To) 2rcfL/c( Tc) + ~o( T ) - ~o( Tc) (19)
where L is the distance between the transmitter and the receiver crystals. The energy of the sound waves was determined calorimetrically. After
the temperature of 3He was stabilized slightly above To, about one million identical sound pulses, with a repetition rate of 10 kHz, were transmitted through the sample. The liquid first warmed up to a few mK, but reached within about twenty minutes a new equilibrium, about 0.l mK above the original temperature. The energy of the sound pulses was calculated from this rise in equilibrium temperature and the heat capacity of the system, which was dominated by the 32-mol copper nuclear stage in a magnetic field H - 200 roT. The energy was typically Ep ~- 1 nJ for each pump pulse and Es ~ 0.1 nJ for each signal pulse, and was proportional to the square of the exciting voltage. The calorimetric measurement was thus needed only to determine the constant of proportionality. The energy density Up(s) of the pulse was obtained from
Up[s} = Ep~s)/crS (20)
where c is the velocity of ultrasound, r the duration of each pulse, and S the area of the quartz crystals.

Experiments on Nonlinear Acoustics in 3He-B 595
To check that the heating of the sample was really caused by the sound wave and not electrically by the if-excitation, the measurement was repeated after the if-frequency was tuned slightly off the resonance of the transmitter crystal, such that no sound was produced. The heating of the sample was then normally only a small fraction of that in the on-resonance situation. One has to realize that only about one half of the sound energy passes through the sample. The other half is emitted by the "back side" of the crystal and proceeds into the opposite direction. This was not take into account in Ref. 5, where the estimated values for the energy densities of the sound pulses are thus too large by a factor of two. There is naturally some uncertainty in the actual sound energy due to the finite thermally dissipative internal losses within the transducers themselves.
Our thermometry was based on measuring the susceptibility Z of 195pt by pulsed NMR, assuming X oc T-1 and using the To-values of 3He reported by Greywal146 as the calibration points. The powdered platinum was immersed in 3He in a separate tower (see Fig. 4), which was connected to the liquid at the bottom of the heat exchanger through a 70 mm long Cu-Ni-tube of 3-mm diameter. In the experiments to be described in Section 4.2 we used as a secondary thermometer the phase velocity of ultrasound, which is sensitive to temperature. Very near the TPA- resonance the temperature was interpolated using values far away from the peak, because two-phonon absorption causes anomalies in the phase velocity as well (see Fig. 8b). This could have been eliminated by employ- ing every second signal pulse just for measuring the temperature, without applying any pump wave. The main errors in thermometry were caused by uncertainties in the calibration of the phase vs. temperature, which was done by using the Pt thermometer during several separate runs, in which only the signal wave was transmitted through the sample. The uncertainties are partly caused by the long distance between the sample cell and the Pt probe, and partly by a fairly large background reading of the thermometer.
There were some nonidealities in our setup which affected the experiments. In the cylindrical cell (Fig. 5a) one of the crystals was much better than the other one both in exciting and detecting sound, probably owing to differences in the electrical couplings. With a constant excitation voltage, the energy of the sound pulses in one direction of propagation was about 40 times larger than that in the other direction, but the amplitude of the received signal was independent of the direction of propagation. In our previous linear experiments 23,45 we customarily used the inferior crystal to send and the better one to receive the sound, because this gave a cleaner output signal. However, to observe two-phonon absorption we had to employ the other direction of sound to produce high enough acoustic intensities. In our cubic cell (Fig. 5b) there was another problem: The top

596 A.J. Manninen et aL
and bottom crystals were not sufficiently parallel, so that they could only be used to produce the pump wave but not to excite and detect the signal wave, because of phase cancellation. Thus the signal wave in the cubic cell was always horizontal, i.e., perpendicular to the applied magnetic field.
4. TWO-PHONON ABSORPTION (TPA) BY THE REAL S Q U A S H I N G (RSQ) M O D E
4.1. Observation and Identification of TPA
4.1.1. Location of TPA
We observed TPA first in our cylindrical cell (see Fig. 5a), exciting one of the quartz crystals simultaneously by two 12-/~s if-pulses using the electronics circuit in Fig. 6a. 5'47 The attenuation of the signal wave of frequency fs = 26.8 MHz was measured, while the high-intensity pump wave at fp = 8.9 MHz provided the parametric excitation. The experiment was performed at zero pressure, where the two-phonon absorption is most pronounced according to Eq. (14): the Fermi-liquid parameter F; increases from 9 at 0 bar to 87 at 34 bar. 2 Low temperatures, where 1/F is large, are favorable for the detection of TPA as well.
The attenuation e of the signal wave is presented in Fig. 8a for H = 0 in the presence of a parallel pump wave at three different power levels. In each trace, two peaks are present, which grow as the energy of the pump pulse is increased. Without pumping, no attenuation peak in the signal wave could be observed in this temperature interval. The temperature of the main peak is T/Tr ~- 0.72, which is in good agreement with the expected location of the two-phonon absorption by the rsq mode (see Table I). There is a small satellite on the low-temperature side of the main peak, at a distance AT+/Tc ~- 0.014. It is present only when a pump wave is applied and is thus caused by two-phonon absorption as well. The origin of the satellite will be discussed below. It is shown in Fig. 8b that both features can be seen also in the phase of the sound signal received; qo is related to the phase velocity of the signal wave according to Eq. (19).
Two-phonon absorption by the rsq mode was observed under several experimental conditions, from zero pressure up to 3.5 bars. The temperatures T+ at which the main attenuation peak occurs when H = 0 are summarized in Table I. The first four values were obtained in the cylindrical cell, and the other three in the cubic chamber with two parallel sound pulses: only the submode with m = 0 was excited. We have also included the expected TPA-temperatures, calculated from Eqs. (4)-(9): the rsq mode can be excited by two phonons at temperature T+ where COrsq,o(T+)/2n = f s +fp"

Experiments on Nonlinear Acoustics in 3He-B 597
2 0.442V 2 was used for the mode velocity, and The weak-coupling value v o = two different choices of constant ars q in the definition of COoo = arsqA(T)/h were employed. The value ar2qs = 8/5 = 1.60 is obtained using the weak- coupling BCS-theory without Fermi-liquid and higher-order pairing correc- tions, 2 whereas the value ars q2 = 1.43 comes from the previous linear experiments at low pressures, 2"4s taking the dispersion correction into account. The Greywall temperature scale 46 and the weak-coupling energy gap 49 A(T) are used throughout this paper. One can see that the locations T+ of the observed attenuation peaks are in reasonable agreement with the positions expected for TPA.
9- <1
(a) AT+ =0.014. / Tc f
(b)
/
TEMPERATURE
Fig. 8. Two-phonon absorption by the real squashing mode at p = 0, H = 0, T+/Tc ~- 0.72. 5 (a) Attenuation
and (b) the corresponding change A~o in the phase of the received signal are presented against tempera- ture for three different energies Ep of the 12-#s p u m p pulses; from top to bottom, E v = 1.5, 1.0, and 0.3 nJ. The vertical positions of different curves are chosen arbitrarily, only the heights of the peaks should be compared. The energy of the signal-wave pulses is Es = 0.06 nJ in all cases. Frequencies of the signal and p u m p waves are fs = 26.8 M H z and fp = 8.9 MHz, respectively. The temperature interval is from about 0.67Tc to 0.74To.

598 A . J . Manninen et aL
TABLEI
Comparison of the experimentally measured temperatures for the main two-phonon absorp- tion peak T+ with theoretically calculated values when qsllq- and H=0. The computed results were obtained from Eq. (4), or Eq. (26), with v~=0.442@, and using two different values of arsq=hoooo/A(T). The calculated values for T+ have been revised from those presented in our earlier reports 5'6 by taking into account the dispersion shift of the mode
frequency, caused by the nonzero v 0
T + / T c (calculated) p L f, V+/Tc
(bar) (MHz) (MHz) a~s q = 1.60 a2sq = 1 . 4 3 (measured)
0 26.8 8.9 0.721 0.672 0.72 __+ 0.02 2.7 44.7 8.9 0.606 0.504 0.56 __ 0.03 2.7 26.8 26.8 0.606 0.504 0.54 __ 0.02 3.5 44.7 8.9 0.676 0.611 0.64 __+ 0.02 0 15.1 5.0 0.927 0.918 0.93 __+0.02 0 25.15 15.1 0.593 0.482 0.53 _+ 0.02 2.0 25.15 15.1 0.791 0.759 0.75 _+0.03
4.1.2. Power Dependence of Coupling Strength
In Fig. 9 we present results on the height Ac~ of the main TPA-attenua- tion peak as a function of the energy Ep (or energy density Up) of the pump pulses for two different pressures at zero magnetic field. The quantity A~ was determined as an excess attenuation above the background in the c~ versus T plot. The energy of the signal pulses was kept constant, at a value one or two orders of magnitude lower than that of the pump pulses. It is evident that the height of the attenuation peak is directly proportional to the energy density of the pump pulses when Up is below about 0.15Ur At larger power levels the height tends to saturate. Linear dependence of attenuation on the energy density of the pump wave is just what Eq. (14) suggests for two-phonon absorption. The feature is unique for nonlinear processes.
The measured TPA peak heights are also in surprisingly good quan- titative agreement with theory, if the linewidth F in Eq. (14) is determined from the temperature width 3T of the attenuation peak in our experiments, viz.,
F - arsq dA. ~S T (21) h dT
Eq. (14) predicts for the product of the height and the width of the attenua- tion peak Acc .6T=24 Up/Uc cm I - # K under the conditions of Fig. 9a and Ae. 6T= 14 Up/Uo cm 1. # K in the case of Fig. 9b, 41'5~ whereas the

Experiments on Nonlinear Acoustics in 3He-B 599
e x p e r i m e n t a l values are 19 Up/Uc cm 1 . ~ K a n d 11 Up/Uc c m - l . # K ,
respectively. The wid th of the peaks was f T ~ 3 / ~ K in b o t h cases, bu t we
cou ld m e a s u r e it on ly w i th in a n accuracy of a b o u t _+ 30 %. I n a d d i t i o n to the i n a c c u r a c y of fiT, there are several o the r r easons
which cou ld cause dev ia t ions of the expe r imen ta l c o u p l i n g s t rengths from the theore t ica l predic t ions . There m a y be some er ror in Up/Uc, because ou r
(a) 0
1.5
'E v 1.0
<1
0.5
0 0
Up/Uc 0.1 0.2 0.3
I I 1
0 ~
�9 �9
0 ~ o
I I D
0.5 1.0 1.5 Ep (n J)
(b) Up/Uc 0 0.05 0.10 0.15
0 . 6 i J i
'~ 0.4
<1 0.2
0 i L i 0 1 2 3
Ep (n J)
Fig. 9. Height A~ of the main TPA peak as a func- tion of energy Ep of the pump pulses at (a) p = 0 and (b) p=3.5 bar, in zero magnetic field. 5 The upper axes show the energy densities Up of the pump pulses, scaled by the superfluid condensation energy density Uc (Eq. (15)); Uc=0.084J/m 3 in (a) and 0.25 J/m 3 in (b). The frequencies of the sound waves in (a) were f~=26.8MHz and fp=8.9 MHz, and two different energies for the signal wave were used: E~=0.06 nJ (open circles) and E~=0.03nJ (filled circles), corresponding to Us/Uc=O.O1 and 0.005, respectively. In (b) f~= 44.7 MHz and fp = 8.9 MHz; E s was not measured. The curves are just for guiding the eyes.

600 A.J. Manninen et aL
calorimetric measurement gives actually only an upper limit for the pump- wave energy. However, we believe that the measured energies are not far from the actual ones. Moreover, we assumed that the energy density of the sound wave during the pulse is constant, given by Eq. (20), but actually this is not the case: the rise time of the quartz crystals is on the same order of magnitude as the length of the sound pulses (12/~s). The finite duration of the pulses also causes another problem: in pulse-transmission experiments the attenuation peak due to the linearly coupling rsq mode can be as much as ten times lower than expected in the continuous-wave limit, 51 because of transient effects.
The height of the TPA-attenuation maximum is also affected by the intensity of the signal wave, even when its energy density is well below Up and U~. This can be seen from Fig. 9a: the peak height increases when Us is reduced from 0.01Ur to 0.005U~. A more systematic study of this effect is presented in Fig. 10. We measured the attenuation of the 25.15 MHz signal wave in the presence of a parallel 15.1 MHz pump wave in our cubic
(a)
z 0 I.-- ,<
z i.Ju I - I - ,<
oo
ooo UjUc
\0.0oo o o (b) I' o.oo o �9 s - " 0 . 8
, ~ ~ ~ " ,~ ~ ' : ~ , ~ 0.4
0 ' 0%
_o~OOO~Ooo0.0150 I oo ~ ~
TEMPERATURE
O 0
i I t i I
10 -3 10 -2
U s / U c
Fig. 10. Dependence of the main TPA attenuation peak on the energy density U~/U~ of the signal wave. The energy density of the pump wave was kept constant at Up/Uc=O.I1. The experiment was performed at zero pressure and zero magnetic field, with qsIIqp, and the sound frequencies were f s=25.15MHz and fp= 15.1 MHz. (a) TPA-spectra with several values of UJUr (b) Peak heights Act plotted against U j U c. The numbers here deviate somewhat from those of the corresponding figures in Ref. 6.

Experiments on Nonlinear Acoustics in 3He-B 601
cell at p = 0 and H = 0. The energy density of the 45-~ts pump pulses was kept constant, at Up=0.11 Uc, whereas that of the signal pulses, Us, was varied. When Us/Uc was decreased from 0.015 down to 0.00015, the peak height Act increased by more than a factor of 5. Simultaneously, the peak narrowed, such that its area remained approximately constant: Act. c~T= (1.9 + 0.5) cm -1 �9 #K. Eq. (14) predicts 5~ Act. 6T= 2.7 c m - l # K at Up/Uc = 0.11, in reasonable agreement with our measurement.
We do not know the reason for the dependence of the peak height on the power of the signal wave. Eq. (14), which is valid as long as Us ,~ Up, does not contain any Us-dependence. The most obvious explanation for the broadening of the peak would be an increase of temperature differences inside the chamber when Us is increased. However, it is difficult to believe that the power of the signal wave would appreciably affect the temperature gradients, in the presence of a 1-3 orders of magnitude stronger pump wave. It is possible that the Us-dependence has the same origin as the qualitatively similar observation near the linearly coupling rsq mode, 35 which was discussed in Section 2.2.1: In the experiments of de Vegvar et al., the attenuation peak caused by the rsq mode disappeared when the energy density of the sound pulses was more than 0.01Uo.
The Us-dependence is one explanation why TPA was not detected by Peters and Eska; 9 they used very large signal pulses, with energies Es more than 5 nJ, whereas in Fig. 10 the largest E s is 0.5 nJ. Another reason for the negative result of Ref. 9 is that the experiments were performed at quite high pressures, above 5 bars.
4.1.3. TPA Excited by a Single Sound Wave
We could also detect TPA by single-frequency high-intensity sound pulses, which acted simultaneously as the signal and the pump wave, in our cylindrical cell at p = 2.7 bar and also at p = 3.5 bar. We measured the attenuation o f f - - 26.8 MHz sound pulses with power density U--- 0.02U~ in the absence of any pump wave. A clear peak at T/To ~- 0.54 and a weak but reproducible satellite at T/T~"~0.51 were observed, as shown in Fig. l la. The position of the main peak is governed by COrsq(T)/27z = 2f: two signal- wave phonons combine to excite the rsq mode together. The two-frequency TPA with fs = 44.7 MHz and fp = 8.9 MHz should be located at the same temperature: 26.8 + 26.8 = 44.7 + 8.9. Experimentally, the main peak in the latter case was found at T/Tc-~0.56 (see Fig. l lb) which agrees with the temperature of the main single-frequency peak (Fig. l l a ) within the accuracy of our thermometry, about _+0.02To. The distance between the main and side peaks in Fig. 1 lb is about one half of that in Fig. 1 la.
The theoretical power dependence of the strength of TPA in the case of a single high-intensity sound wave is discussed in Ref. 41. Experimen-

602 A. ,L Manninen et al.
Z �9
<
z LU f--
<
i I t
) fl
g" o ,0
I , I , 1 ,
0.50 0.52 0.54 0.56
T / T c
I I ' I '
(b) �9 ~ tt
o
d
! ~-,,= =1 t I I 0.52 0.54 0.56 0.58
T / T c
Fig. 11. (a) Two-phonon absorption by a single 26.8 MHz sound wave with power density U/Uc ~- 0.02 at p = 2.7 bar and H = 0 . (b) TPA for two parallel sound pulses, with f~ = 44.7 MHz and fp = 8.9 MHz, under the conditions of (a); Up/Uc ~- 0.05 and Us/Uc ~ 0.01. The distance between the main peak (I"T) and the satellite (T$) is different in the two cases because of a difference in the wave number of the mode which was excited by antiparallel pulses: in (a) the side peak was excited with q~*=0, whereas in (b) q n = 2~z(f~ - f p ) / c = 1.0 #m -
tally, the main effect of increasing the energy density was that the TPA peak broadened. No clear power dependence in the height of the peak was detected, possibly because the "pump energy dependence" (Fig. 9) was compensated by the "signal energy dependence" (Fig. 10).
4.1.4. Satellite Peak
A satellite peak was observed on the low-temperature side of the main TPA-attenuation maximum under several experimental conditions (see Figs. 8 and 11), both in our cylindrical and cubic sound chambers. The measured separations between the two peaks at H = 0 are given in Table II. The properties of the side peak seemed quite puzzling at first. A number of

Experiments on Nonlinear Acoustics in 3He-B 603
possible explanations for its origin were ruled out by means of our experiments, as is discussed in Ref. 6.
The double-peak structure cannot be caused by dispersion splitting of the rsq mode to states with different quantum numbers ]mt, because only the m = 0 submode can couple to ultrasound at zero magnetic field, when the signal wave is parallel to the pump wave. Moreover, our experi- ments at finite magnetic fields H[Iqsllqp do not show the expected trans- formation of the dispersion splitting into the five-fold Zeeman-splitting (see Section 4.1.5). The textural splitting of the ms = 0 mode 26'52 can be excluded, because the satellite was present even in the absence of magnetic field. Thermally induced superflow 53 cannot explain the side peak, either, since there were no differences in the TPA-spectra when the temperature drift rate through the resonance was varied or when the cryostat was rotated in zero magnetic field.
The problem of the doublet splitting of TPA was solved when Volovik and Shen, 54 independently, proposed a mechanism that is unique for multi- wave processes: the signal wave interacts with the counter-propagating pump wave that is first reflected from the receiver crystal, as shown in Fig. 12. Because of conservation of momentum, the wave vector of the excited rsq mode is given by qrsq = qs -t- qp. So far we have assumed that the signal and the pump waves are parallel, qs 1"T qp; then the wave number qrsq, denoted as q in Eq. (4), has the v a l u e q~rTsq = qs +qo = 27r(fs +fp)/C. However, when the two waves are counterpropagating, qs T J, %, the wave number of the excited mode becomes q[)q = [q~ - qpf = 2re lf~ - f p [ / c < q~q. Thus the signal wave propagating towards the receiver and the pump wave reflected from it excite the m = 0 mode at a lower temperature T~, 0 than the parallel signal and pump waves, which cause the main peak at T~. o (see Eq. (4)).
From Eqs. (4)-(9) in the T = 0 limit, with ars q = X ~ ' one obtains for the distance between the peaks fiT = T~. o - T~, o = 0.013T c under the con- ditions of Fig. 8, in excellent agreement with the measured 6T+ ~_ 0.014To. In Table II we have collected the values of the measured and calculated peak separations under conditions at which the doublet was observed. The experimental and calculated values are in nice qualitative agreement, but the measured splittings are systematically somewhat larger than expected, especially at low temperatures where the energy gap A(T) becomes expo- nentially flat. This suggests that the mode velocity v o is somewhat larger than the weak-coupling result Vo2=0.442v 2 used in the calculations of Table II, our experimental determination of the mode velocities is discussed in Section 4.2.
In the single-frequency experiments at H = 0 the distance between the two peaks is larger than in the double-frequency experiments (see Fig. 11 ),

604 A.J. Manninen et aL
TABLE II
Temperature intervals AT+ between the main TPA peak and the satellite under different experimental conditions, when qs ]b qp and H = 0. Theoretical results show the expected separa- tion between the TPA peaks excited by parallel and antiparallel sound waves. The values of AT+ were calculated from Eqs. (26) and (27), as in Table I, but choosing arsq in each case such that the experimental and theoretical locations of the main peak coincide. There is some difference between the experimental values given here and in Ref. 6 because of an error in
thermometry in the preliminary data analysis
p L L ar+/To ar+/rc (bar) (MHz) (MHz) (calculated) (measured)
0 26.8 8.9 0.013 0.014 +__ 0.003 2.7 44.7 8.9 0.013 0.017 4- 0.002 2.7 26.8 26.8 0.027 0.033 4- 0.003 3.5 44.7 8.9 0.008 0.011 + 0.003 0 25.15 15.1 0.049 0.064 4- 0.005 2.0 25.15 15.1 0.009 0.009 4- 0.002
because the T$-resonance is excited with different wave numbers in the two cases. It is interesting to note that the side peak observed with the single sound wave in Fig. 1 la is caused by two phonons, which move in opposite directions with the same wave number. Therefore, the excited real squashon has q--0, i.e., its group velocity is zero, and there is no disper- sion effect on the mode frequency.
The expected strength of the satellite peak, compared to that of the main peak, can be estimated from the ratio of the integrated overlap volume I= S V(t) dt of the signal and the pump pulses in the two cases; here V(t) is the overlap volume between the pulses at time t. There is a complete overlap between the parallel signal and pump waves (see Fig. 12a), and we get I t* = SLr; here S is the cross-sectional area of the sound pulses, ~ their
(a) (b) (c)
t tlN F4 ............................ H I
Fig. 12. Formation of antiparallel signal and pump waves by reflection from the receiving top crystal. In (a) the pulses (shown by the shadowed region) have not yet reached the receiver crystal, i.e., q~ T~ qp everywhere. In (b) the pulses have been partially reflected, and in the darkened region the signal wave (thin arrows) interacts with an antiparallel pump wave (thick arrows). In (c) the pulses have been fully reflected. The over- lapping signal and pump waves propagate approximately at the same velocity c.

E x p e r i m e n t s on N o n l i n e a r Acous t i c s in 3He-B 605
duration, and L the distance between the transmitter and receiver crystals. On the other hand, the signal wave that propagates towards the receiver crystal interacts with the reflected pump wave (see Fig. 12b) only during the time interval L/c < t < L/c + z, and we get IT+= Scr2/4. Thus the ratio between the heights of the satellite peak (AaH) and the main peak (A~ tt) is
A0~ t~ I t~ cz A~Tt - it r R = ~-~ R (22)
where R is the reflection efficiency of the receiver crystal. In our cylindrical cell, L = 4 mm and the sound pulses were 12 #s
long; Eq. (22) with R = 1 then predicts A~t+/A~ TT =0.14 at zero pressure. Experimentally, the side peak is somewhat larger (see Figs. 8 and 13a):
1.0
I
E o
0.5
0 . 0 1 8
\ H- 0 .014 <:]
0 . 010
(a ] ~ I ~ I ~ I 0
~:~ 0 0
O O
~ 0
i
(b) I I I
A A
- A A A ,6
I I
0 20 I
4O
H (mT)
B I"1
t I z
I
A
{. . I
60 80
Fig. 13. (a) Magnetic-field dependence of the height An of the main TPA peak (circles) and of the side peak (squares) at zero pressure. 5 The dip in experimental data for the main peak at H ~ 2 5 m T is caused by textural effects, as explained in the text. (b) Temperature interval AT/To between the two peaks as a function of magnetic field. Ul t rasound frequencies were fs = 26.8 M Hz and fp = 8.9 MHz, and the energy density of the pump wave was Up/Uc = 0.18. The magnetic field was applied parallel to the com- mon direction of propagation of the two sound waves.

606 A.J . Manninen et al.
A~r+/Ae T* "-- 0.2. This discrepancy is, at least partly, caused by the shape of the sound pulses, whose envelopes are not of the rectangular form as assumed in our simplified analysis: the effective length of the pulses is longer than 12 #s because of the long ringing time ( --- 10/~s) of the quartz crystals. On the other hand, in the cubic cell the observed side peak was smaller than expected: Eq. (22) with L=9.5 ram, r =45/~s, and R = 1, predicts AaTt/A~ TI =0.22, but the measured value is Ac~Tt/Aa +t --0.1 (see Fig. 14). A possible reason for the discrepancy is that the reflection coefficient R of the receiver crystal is less than unity.
4.1.5. Experiments in an Axial Magnetic FieM
Our experimental results on the heights e of the main and satellite peaks and their separation AT as a function of a magnetic field are shown in Fig. 13. The field was applied parallel to the common propagation direc- tion of the pump and signal waves, so that only the ms =0 submode coupled to ultrasound, except possibly near the walls. Within the rather large scatter of our data, the separation between the peaks did not depend on magnetic field (see Fig. 13b). This was the reason for excluding disper- sion splitting of the rsq mode to different Iml-states as an origin for the double peak structure 5'6 (see Section 4.1.4).
The minimum in the height of the main peak at H - 25 mT (see Fig. 13a) can be explained by textural effects. This field is large enough such that the quantization axis i of the mode is determined by h, given in Eq. (3). With qs II qp, coupling of zero sound to the ms= 0 mode is largest when the wave vector of the excited rsq mode, qrsq = qs -~ qp , is parallel to
(see Eq. (17)). In the center of the cylinder, the external magnetic field keeps [111Ht] qrsq and the coupling of ultrasound to the mj = 0 rsq mode is maximal, whereas within the magnetic healing length ~H---- 1 mm from the perimeter h turns perpendicular to the cylinder walls and the coupling is weaker. When the magnetic field is increased, ~ oc 1/H decreases and the central region with qrsq ]l ~ grows: the TPA peak then becomes larger. On the other hand, when H ~ 25 mT, s is determined by qrsq itself, such that the two-phonon coupling to the ms = 0 mode is maximal everywhere in the cell and the peak is high again.
As was mentioned in Section 4.1.4, rotation of the cryostat around the axis of the sound cell did not change the TPA-spectrum in zero magnetic field. On the other hand, at H = 35 mT, applied parallel to if2 and the sound propagation direction, rotation by 92=0.3 rad/s almost totally destroyed the main peak, but practicMly the satellite did not change at all. This can again be explained with the h-texture of the sample. The height of the main peak decreases under rotation, when superflow turns the [~-vector away from axial direction, as in the linear c a s e . 23 The side peak does not

Experiments on Nonlinear Acoustics in 3He-B 607
change much, because it arises from interaction within the distance cr/2 1.1 mm from the receiving crystal, which locks [~ II qrsq within 4 , ~ 1 mm from the surface; here r = 12 ~t s is the duration of the sound pulses.
4.1.6. Zeeman Splitting
Let us now proceed to our observation on the Zeeman splitting of the TT-resonance in a perpendicular magnetic field. 6 As in the linear case, 18 the five-fold splitting ultimately shows that the attenuation peak which we have discovered is caused by the J = 2 § rsq mode. We measured the attenuation of an fs = 25.15 MHz signal wave in the presence of a parallel f p = 15.1 MHz pump wave at p = O in the cubic cell. The 45-/~s sound pulses propagated horizontally, perpendicular to the vertically applied magnetic field. At H=O, Fig. 14a, the satellite peak (T+), caused by the reflected pump wave, is again present. At H = 34.8 mT, Fig. 14b, all the five mfsubstates of the main resonance with qs l"t qp can be seen. The peaks with mg>O are clearly higher than those with rag<O, as in the linear case , 45 and the mode with m j=-+2 produces the largest attenuation maximum. In a perpendicular magnetic field all the submodes of the T$-resonance are too weak to be observable.
Eq. (17) predicts that, as in the linear case, only the m j = +2 modes couple to ultrasound, when qs II q~ • f~. However, fl is turned off the direc- tion of the applied magnetic field near the walls, and also the mg = +_ 1
Z LU I.--
0.45
L
(a) H = 0 H
" I t. o
I I (b) H = 34.8 mT 4 t , ,
,,~,~
mj -2 -1 0 +1 +2 I I
0.50 0.55 T/To
0.04
0.02
o.oo
-0.02
-0.04
I
(c)
[ . I
0 10
i I I
�9 �9 �9 i �9 �9 �9 , q �9 �9 �9
0
1 I I
20 30 40 m (mT)
Fig. 14. Magnetic field dependence of TPA for q~ dr q p at zero pressure, when f~ = 25.15 M Hz and fp = 15.1 MHz. (a) Attenuation spectrum in zero magnetic field, showing the main peak excited with qs I"T qp and the satellite created with q~ ~'~ qp. (b) Spectrum in H = 34.8 naT field, applied perpendicular to the direction of propagation of the sound waves, showing the five- fold Zeeman splitting. (c) Evolution of the positions of the peaks in an increasing magnetic field H 2_ qsF[qp. AT/To is the relative temperature of the peaks with respect to that of the main attenuation maximum in zero field.

608 A.J. Manninen et aL
submodes with qs TT qp are resolved, though only weakly. The positions of the attenuation maxima as a function of the magnetic field are presented in Fig. 14c. For the magnitude of the Zeeman splitting, expressed in terms of the coefficient e in Eq. (2), we obtain ~=(9.5_+ 1.0) MHz/T. Earlier experiments in the linear regime at low pressure and low temperatures 19 give a somewhat smaller value e ~- 7.5 MHz/T.
4.1.7. Experiments with f~ < f p
All our observations of the two-phonon absorption were made with fs > fp, i.e., in the situation corresponding to Fig. 3a. We could not observe TPA when the frequency of the signal wave was smaller than that of the pump wave, as is the case in Fig. 3b: the energy densities that we could apply by high frequencies were not large enough for two-phonon processes. Observation of stimulated Raman scattering was prevented by an addi- tional difficulty; with any combination of frequencies available in our setup, the wave with higher frequency is attenuated very effectively (~ > 10 c m - l ) by linear coupling to the sq mode in the expected location of the stimulated Raman peak. In other words, if sound with higher frequency were used as the signal wave, no signal at all could be detected at T (see Fig. 3a). On the other hand, if the pump wave is of high frequency, its power density decreases quickly when the wave travels through the sample and, as a result, stimulated Raman scattering and other nonlinear phenomena are possible only in the immediate vicinity of the transmitting crystal.
4.2. TPA with Crossed Sound Pulses: Dispersion of the rsq Mode
4.2.1. General Discussion
Multiwave resonances have remarkable advantages as probes of collective modes in 3He-B. One of them is that in two-phonon absorption the quantization axis of the excited mode is determined by the vector sum of the signal and pump wave vectors, and not by either of them alone. This facilitates the direct observation of dispersion splitting of the rsq mode in zero magnetic field: when the signal and the pump waves are not parallel, submodes with the quantum number Im[ # 0 can couple to ultrasound even when H = 0, unlike the linear case.
Another reason for the superiority of TPA is that one may alter the wave number qrsq and the frequency cor~ q of the excited mode independ- ently. This can be done by changing the angle 0 between the signal wave vector q~ and the pump wave vector %: the wave number of the excited mode is given by qrsq = Iqs + qpl = ~/q~ + q2 + 2qsqp cos 0, but the angular frequency is always Ogrsq=2~(fs-+-fp) , independent of 0. It is, therefore,
Experiments on Nonlinear Acoustics in 3He-B 609
possible to measure directly the dispersion relation corsq=Okrsq(q), o r Trs q = Trsq(q) in constant-frequency experiments. In one-phonon studies the collective modes can be excited only along one line in the q - co plane: along the line defined by the dispersion relation of ultrasound, co = cq (see Fig~ lb).
We exploited both of these unique properties of TPA in our experiments in the cubic cell. When the pump pulse was perpendicular to the signal, we could observe the dispersion splitting of the rsq mode at H = 0: two attenuation peaks were detected, corresponding to the m = 0 and fm] = 2 submodes. The dispersion relation of the J = 2 +, m = 0 mode could be measured directly, using a pump pulse parallel, perpendicular, or antiparallel (reflection) to the signal pulse. In this way, the location of the m = 0 submode could be determined at three different wave numbers:
2 qs + qp, x~2s 2 + qp, and qs - qp.8
4.2.2. Expected Magnitudes and Locations of TPA
Before proceeding to the experimental results in more detail, let us consider the expected magnitudes and locations of the TPA peaks that should be observed in our setup. As discussed earlier (see Section 4.1.4), in zero field only the m = 0 substate of the rsq mode couples to ultrasound when the pump and signal waves are parallel or antiparallel. This can be seen from Eqs. (17) and (18), which determine the Jm[-dependence of the TPA coupling strength, Eq. (14). Putting ~= +~ in Eq. (17) and taking into account that the quantization axis ~ = q [lqs[[ qp for H = 0 , one obtains
IZ~l = ~- /27 , IZl~l =0, IZd~=l = 0 (23)
On the other hand, when qs 3_qp, the quantization axis points to the direction of q~ + qp at H = 0 , and Eq. (17) gives
IZo~l = 1/x/~, IZ~ll =0, IZ~21 = 1/6 (24)
independent of the relative magnitudes of q~ and qp. Eqs. (23) and (24) indicate that the m = 0 and Im[ = 2 submodes are
excited by TPA when q~ 1 qp, but only the substate with m = 0 couples to ultrasound when q~ II qp. The [ml = 1 mode is not excited in zero magnetic field in our setup. The relative magnitudes of the observable attenuation peaks are
A~o~ : A ~ - : A ~ = Z• z'2. z• 2"lZ~12= 1:3:4 (25)
Here Iz~212 is multiplied by 2, because the resonance with [mi = 2 consists of two degenerate submodes. When Eq. (25) is applied in practice, one must take into account that the physical overlap, or the interaction time,

610 A . J . Manninen et aL
between the signal and pump waves is different for parallel, antiparallel, and perpendicular pulses.
The expected locations of the attenuation maxima can be calculated from Eq. (4), putting (-Ors q = 2~(fs + f p ) , r = arsqA(T)/h, and q = Iqs + qp[. The m = 0 submode is excited with parallel (1"1"), antiparallel (T+), and perpendicular (2) pulses, at temperatures Tto T, To Tt, and To= given by
A( Tro *) = ~ x/4g2(fs + fp)~ - v~(q~ + qp)--5_ (26) arsq
A( Tro t) = h____ x/4~z2(f ~ + fp)2 _ v2(q~ _ qp)2 (27) arsq
A(T~-)= h x /4~z2 (A+fp )2 2 2 ~ - - Vo( G + qp) (28) arsq
from now on the lower index + of T, referring to two-phonon absorption, has been dropped for clarity. The ]ml = 2 resonance is excited only with perpendicular pulses, at the temperature T~-:
A(T~-) = ~ x/47z2(fs +fp)2 _ v22(q2 + q~) (29) arsq
The mode velocities v0 and v2 are, from Eq. (5),
vo2 = c~ + gCb2 2 (30a)
2 (30b) I) 2 = C a
and qs(p) = 27~fs(p)/C" In our experimental conditions, at p = 0 and with fs = 25.15 MHz and fp=15.1 MHz, we obtain Trot~To=0.593, Tto+/Tc=0.560,
3_ T o/T~- 0.577, and T~/T~ = 0.567, when the weak-coupling theory without Fermi-liquid interaction effects is used.
4.2.3. Dispersion Splitting Fig. 15 shows two spectra, in which all the predicted attenuation
maxima can be seen) Both traces were obtained in the cubic cell at p = 0, H = 0 , with f~=25.15 MHz and f p = 15.1 MHz. Ultrasound pulses were 45/~s long, and the energy density of the horizontally propagating signal wave was UJU~ ~-0.0015. The spectrum in Fig. 15a was measured applying a pump wave with Up/U~ = 0.11 parallel to the signal wave. Two-phonon excitation of the rsq mode with qs TI" qp causes the large peak at TtJ/T~ ~- 0.53. It is about 1.5 times higher than that measured with the nominally same ultrasound power densities in Fig. lOa. The difference results from the inaccuracy in our measurement of Up/Ur The side peak at Trot~To <~ 0.47 is

Experiments on Nonlinear Acoustics in 3He-B 611
caused by the reflected p u m p wave, which is an t ipa ra l l e l to the signal. As
was d iscussed in Sect ion 4.1, this peak is smal le r t h a n pred ic ted by Eq. (22)
wi th R = 1. The lower spec t rum, Fig. 15b, was o b t a i n e d w h e n the p u m p wave wi th
Up/Uc _~0.16 p r o p a g a t e d vert ically, p e r p e n d i c u l a r to the s ignal wave. The two peaks at T~/Tc<0.48 a n d at • To/Tc > 0.49 arise f rom the d i spe r s ion sp l i t t ing of the rsq mo d e : because of the n o n - z e r o wave vector the sub-
I I I I
(a) ff
E I :~
e o
o ~
I-- < m=O m=O
Z I I 1 I I LU
(b) f - -
Iml=2 m=O I I I I I
0.46 0.48 0.50 0.52 0 .54-
T/Tc Fig. 15. Temperature dependence of the attenua- tion of a f~=25.15 MHz signal wave in the presence of a fp=15.1MHz pump wave? Pressure is zero, and no magnetic field is pre- sent. In (a) the transmitted sound pulses are parallel; the two peaks originate from two- phonon excitation of the m = 0 mode by parallel (I"T) and antiparallel (T,L) pulses, caused by reflection of the pump wave from the receiving crystal (see Fig. 12). In (b) the sound pulses are perpendicular, and the rsq submodes with m = 0 and Im[ = 2 are excited. Energy densities of the pump and signal waves in (a) are Up/Uc=O.I! and Us/Ur and in (b) Up/Uc=O.16 and Us/Uc = 0.0015. The curves in both (a) and (b) have the same absolute position in tem- perature.

612 A.J . Manninen et aL
modes with [m[ = 2 and m = 0 are excited at different temperatures, T~ and T~, even in the absence of a magnetic field. The ratio between the heights of the two peaks is in agreement with theory, but the signal-to-noise ratio is quite small and there was a lot of scatter between different runs: Eq. (25) predicts A~01/A~ = 0.33, and the measured values varied from about 0.3 to almost 1.
However, both peaks are smaller than predicted. The height of the peak corresponding to the Iml=2 resonance is Ae2~---0.10cm -1 in Fig. 15b, whereas one would expect As 2 ~- = (3 L4)- (0.16/0.11 ). 0.44. A~o ~* --- 0.36 cm 1 on the basis of the height of the main peak in Fig. 15a. Here the factor 3/4 comes from Eq. (25), and 0.16/0.11 is the ratio of the calorimetri- cally measured energy densities of the pump waves in Figs. 15b and 15a. The factor 0.44 is due to the decreased overlap between the signal and pump pulses in the case of crossed waves; the value was calculated in a way similar to Eq. (22), assuming rectangular envelope for the sound pulses. We cannot exclude the possibility that the smallness of the peaks with perpendicular sound propagation follows from a systematic error in the measurement of the energy densities of vertical sound waves, i.e., that Up/Uo < 0.16 in the case of Fig. 15b.
4.2.4. Determination of the Mode Velocities
The attenuation maxima in Fig. 15 are located at lower temperatures than predicted by the weak-coupling theory (see the end of Section 4.2.2). This is mainly because the value of ars q is not exactly x / ~ (see Table I). However, the relative positions of the observed peaks are in qualitative agreement with calculations. Their absolute positions could be determined within +0.02To and their separations much more accurately. If we fix T*o*/To = 0.530, which is the average value from several runs, the locations of the other peaks are T*o+/Tc = 0.466 +_ 0.005, TUTc = 0.493 +_ 0.005, and T~/T c =0.477_+0.005. The separation between the two peaks in Fig. 15b could be measured more accurately: (T~ - T~)/Tc = 0.0156 _+ 0.0015, which is an average from twelve runs, with the standard deviation as an estimate of error.
We can extract experimental values for the coefficients arsq, Ca, and Cb from the measured locations of the peaks, using the formulae
4h2(f~ + fp)2f~fp (31a) 2 __ arsq -- 4fsfp A(T;T) 2 + (fs + fp )2 [A(T ;+ ) 2 -- A(T;}) 2 ]
2(arsqC~2[A(rTo't)2-A(r;T)2 A(T~-)2 - A( r ~ ) 2 1 Ca -- ~ , , T ] [_ 4--f--sf p f~ +f~ (318)
2 3(arsqC~ 2 A(T2~)2 -- A(To-)2 C b = 2 \ h J f~+f--~p (31c)

Experiments on Nonlinear Acoustics in 3He-B 613
TABLE IIl
Parameters a~sq, (Ca/VF) 2, and (Cb/fJF) 2 derived from the weak-coupling theory and from our data as explained in the text. 8 Theoretical values for (s 2 and (cb/vv) 2 were calculated in the T = 0 limit for two cases: without any interaction effects using Eqs. (6) and (7), and with a Fermi-liquid correction 2 F~ = -0 .57 using Eq. (80) of Ref. 24. The influence of nonzero F~ on (Ca/VF) 2 and (eb/vv) 2 is larger than that of other interaction effects 24 or the temperature
dependence of 41/20 in Eqs. (6) and (7)
Calculated
Quanti ty F~ = 0 F~ = -0 .57 Measured
arsq2 1.60 - - 1.47 _+ 0.03 (CjVv) 2 0.224 0.213 0.30 _+ 0.07 (Cb/Vv) 2 0.327 0.297 0.30 + 0.06
which follow directly from Eqs. (26)-(30). The results are presented in Table III, together with theoretical values. The velocity of hydrodynamic sound, 183.1 m/s, was used for c; this is a very good approximation under our experimental conditions, i.e., at T ~ Tc and far away from the linearly coupling collective modes.
2 is smaller than predicted by the weak-coupling theory Our value for ars q
without Fermi-liquid interaction effects, but it is consistent with earlier 2 experiments: at low pressures ars ~ ~-1.43, when the BCS energy gap was
used. 2'48 The measured value of c 2 agrees well with the weak-coupling theory at the T = 0 limit without interaction effects, Eq. (7), but the
2 is just below the error bar of our experimental result. theoretical value of c a The quite large uncertainties in the data are caused by our less-than-perfect thermometry. Our other observations on the distance between the m = 0 peaks excited with qs "~T qp and with qs T$ qp , summarized in Table II, also suggest that vo=ca+2 a (2/3)c~ is somewhat larger than that predicted by the weak-coupling theory. The Fermi-liquid interaction and higher-order pair- ing effects 24 and the temperature dependence of 41/20 in Eqs. (6) and (7) do not change the theoretical results significantly. The most important
a a 2 corrections are due to finite F~ and possibly also F ~ With F ~ - -0.57, 3" the calculated value of c 2 decreases by 5%, i.e., somewhat further away from our experimental result. We made the experiment on mode velocities only at zero pressure. For p ~> 3 bar only the peak caused by parallel waves could be observed, and even it was very weak.
Our experiment is the first attempt to measure ca; the contribution of this coefficient in linear studies is very difficult to distinguish from the effect of arsq. The value of Cb has been deduced earlier from two experi- ments. 26'55 Interpreting the three peaks observed in Ref. 26 at p=4 .9 bar and H = 7.8 mT as dispersion splitting of the rsq mode, one obtains from the separation (Cb/t~F) 2 = 0.29 + 0.07 . 2,56 This is in good agreement with our

614 A. J, Manninen et aL
result; eb/V F should depend on pressure only weakly, via the Fermi-liquid corrections. This value is also consistent with the observed magnitude in the textural doublet splitting of the J = 2 +, m j = O mode. 2'26 In Ref. 55, CB was determined from the uneven spacings of the five at tenuat ion peaks, caused by Zeeman splitting of the rsq mode in a nonzero magnetic field and under rotation. The values of (cJvv) 2 range from 0.24 to 0.38 at pressures from 3 to 12 bars. Unfortunately, these results are not very reliable because they were obtained using a model 22 in which the Paschen- Back effect, i.e., the nonlinear field evolution of the rsq peak positions in large magnetic fields, 2~ was not taken into account. The Paschen-Back effect has a considerable contr ibut ion to the uneven spacing of the at tenua- tion peaks in the conditions of the experiments reported in Ref. 55.
4.2.5. Dispersion Relation of the J = 2 +, m = 0 Mode
We also investigated how well the dispersion relation, Eq. (4), for the rsq mode is actually valid. This could be done for one of the submodes, m = 0 , which was excited with three different wave numbers: q s - q p , x/~2 + q 2, and qs+qp. In Fig. 16, A(T) 2 at the position of the peak has
2.95
2.90
2.85 ~~
2.80
2.75
i I I t
I I I I
0 1 2 3 4
(15c/k 8Tc )2q2
Fig. 16. A check of the dispersion relation for the rsq submode with m =0 under the experimental conditions of Fig. 15. 8 The square of the BCS gap parameter [A(T)] 2, at the temperature of TPA for the m =0 submode and scaled by (kBTc) 2, is shown as a function of qZ= Iqs_~_qpl2, multiplied by the constant (hc/kBTc) 2. Here q is the magnitude of the wave vector at which the mode was excited. The expected linear relationship between [A(T)] 2 and q2, Eq. (4), is plotted as a solid line, with v0 a = 0.50v2v obtained using the experimental values from Table III for c a and c b.

Experiments on Nonlinear Acoustics in 3He-B 615
been plotted against qZ (in scaled units). We have again fixed TToT/Tc= 0.530. Eq. (4), with cO rsq.o= 2rc(f~+fp)= constant and e)oo=arsqA(T)/h, predicts a linear relationship between A(T) 2 and q2. This is plotted as the solid line, using the measured values from Table III for arsq, Ca, and %. The line goes through points measured with q~ TT qp and q~ T~, qp, because c a was determined using these two positions. One can see that the datum
2 9 measured with perpendicular pulses, q = ~ p , lies near but slightly above the line.
A small curvature in the plot of A(T) 2 vs. q2 is, in principle, allowed by theory. The slope can change by a factor of about (vv/c)2~ 10% between q2=0 and q2= (r (qs ~'~ qp), if higher-order corrections to Eq. (4) are taken into account. However, the deviation of the point measured with qs _1_ qp from the line can again, at least partly, be caused by an inaccuracy in thermometry. It is more uncertain to determine the tem- perature difference T~0 T - To ~ than To TT - To ~+, because in the former case the positions of the peaks must be measured in two separate runs (see Fig. 15).
2 in Table III was determined using just Eq. (31b), i.e., the This is why c a temperatures To Tt and To T+.
4.2.6. TPA with Crossed Pulses in a Magnetic Field
Using perpendicular sound waves to excite the rsq mode one can observe the transformation of the dispersion splitting into Zeeman splitting in an applied magnetic field. This is shown in Fig. 17, The field was applied in the direction of the pump wave propagation. At H = 23.1 roT, three attenuation maxima can be observed quite clearly. These may be identified as the rsq submodes with m s = -2 , 0, and +2. The relative magnitudes and positions of the attenuation maxima changed from one cooldown to the next, possibly owing to textural effects. The distance AT between the m j--= +2 and m j = - 2 peaks varied from about 0.07To to 0.08To at H = 23 mT. The separation of the peaks is larger than the linear Zeeman splitting with parallel pulses in the same field, AT_~ 0.05To (see Fig. 14c). This is partly because the slope of A(T) vs. T decreases by 25% between T/T~ = 0.53 and T/T~ = 0.48: the same frequency difference corresponds to a larger temperature difference at lower temperatures. Using Eq. (2), (cOw,q. +2 - ~Or~q, _2)/2r~ = 4ell, with e = 9.5 MHz/T obtained from Fig. 14c, the expected separation between the m j---+2 and m j = - 2 peaks in Fig. 17c is AT= 0.065T~.
The expected relative strengths of the attenuation maxima in small magnetic fields can be calculated using the phenomenological model of Salomaa and Volovik. 22 As in the linear case, we have to solve the equa- tion ( Q - E I _ ) u = b , s7 where the 5 x 5 matrix Q is given by Eq.(9) of Ref. 22. Q depends on the magnetic field H and on the angle 7 between the

616 A . J . Manninen et aL
I I I
(a) . = o
~,x." - . . . ~ . ~
I I I (b)
z H = 11.6 mT 0
< - ~ . g'.- . �9
z :.,< : . . . ; ; . - . - . .
<
I I I (c)
H = 2 3 1 mT 2-~'.
-"% % ~
~, ,gz;-...:-,~'-=, . . . . -.,... ,. �9 ,. �9 z . ~ r ." ~,-~ v~.z . ."2. �9
I I I
0.42 0.45 0.48 0.51 0.54
T/Tc
Fig. 17. Two-photon absorption for perpendicular sound pulses in three different magnetic fields under the experimental conditions of Fig. 15b. 8 The field is applied parallel to the direction of the pump wave.
wave vector of the mode and the direction of the effective magnetic field [1 defined in Eq. (3). The vector b in the case of TPA is 57
b = (2yz+2~y, 2x~+2zx, ( 2 2 ~ z - 2 x x - 2 y y ) / x / - 3 , 2 x x - 2 y y , 2xy+ 2yx) T (32a)
P (32b) 2ik = T 0 T ik
T~p = iN3 v 0 " - - t/ins'P ns'P~lj (32c)
where the indices s and p again refer to the signal and the pump waves, respectively, and T denotes the transpose. When qs L qp we obtain
b = (0, 0, l/V/3, 1, 0) T (33)
assuming that fa is in the same plane with qs and qp. Equat ion (32a) is valid in one -phonon case as well, but with 2ik = qiqk"

Experiments on Nonlinear Acoustics in 3He-B 617
The positions O)mj through
of the peaks are related to the eigenvalues Em, of _G
2(o9 2, -- 0920 - C2aq 2 ) Em, - c~q2 (34)
and the strengths of the peaks are proportional to Pms = [Umj.b[ 2, where u,,, is the normalized eigenvector of Q with an eigenvalue Emj. Fig. 18 shows the magnetic field dependence of Era, and Pro, with 7 = 60~ In our case the angle between qs + qp and the external magnetic field H, which is parallel to qp, is arctan(25.15/15.1)= 59 ~ The magnetic field is scaled by H0 -~ 20 mT, defined in Eq. (10) of Ref. 22; in this field the dispersion and Zeeman splittings are equal.
Comparing Fig. 18 to Fig. 17 one observes a discrepancy: Theoreti- cally the ms = - 2 mode should be stronger than the ms = +2 mode in all fields, but experimentally the highest-temperature peak with m j = +2 is the largest when H = 23.1 mT. Moreover, the m j = 0 peak is barely observable in Fig. 17c, whereas the calculation predicts that it should be almost as large as the other two peaks when H > 0.8Ho. It is difficult to explain the discrepancy by textural effects: according to the calculation, the m j = - 2
mode should be stronger than the m j = + 2 mode with all values of 7 and H, at least when qs, qp, and fl are in the same plane. It is also improbable that the small heights of the ms = - 2 and mj-~ 0 peaks would be caused by their large width: the total strength of all modes should be independent of magnetic field, and the m j = + 2 peak at H = 23mT is already as high as the dominating peak at H = 0.
I I I
4 ~ 0.4 0.6 ujE ~2 ~ -
0 -1 0.2
0 0 0.5 1.0 1.5 2.0
H/H o
--_2
-1
0 0.5 1.0 1.5 2.0 H/H o
Fig. 18. Theoretical magnetic-field dependence =,57 of (a) the posi- tions and (b) the magnitudes of the TPA-attenuation peaks caused by the five rsq submodes, when q~ _L qp and the angle between the magnetic field H and the wave vector of the mode, qs + qp, is 60 ~ H, q~, and qp are in the same plane. For further information, see text.

618 A.J . Manninen et aL
5. TWO-PHONON PAIR-BREAKING EDGE
Applications of two-phonon processes in 3He-B are not limited to studies of the rsq mode. In particular, we have observed interesting struc- ture in ultrasound attenuation near the threshold for the break-up of Cooper pairs by two phonons. Most of these experiments were performed at zero pressure in our cylindrical cell. Only one sound wave, with frequency f = 26.8 MHz, was transmitted at a time; a separate pump wave was not used. When the sound pulses were energetic enough, an anomalous behavior was observed both in the attenuation and in the phase velocity of ultrasound in the vicinity of the two-phonon pair-breaking edge at hf= A(T). Note that at this temperature the energy of two phonons is just enough to excite both members of a Cooper pair over the energy gap: 2hf=2A(T). When a magnetic field was applied parallel to the sound wave, the observed feature split to at least a triplet. Similar studies have been performed by Peters and Eska 9 in the absence of a magnetic field.
5.1. Power Dependence
The evolution of the attenuation spectra with increasing ultrasound intensity at p = 0, H = 0, f = 26.8 MHz, is presented in Fig. 19. The energies of the 12-/~s sound pulses ranged from 0.01 to 0.3 nJ, corresponding to energy densities U between 0.002Uc and 0.06Uc, where Uc = 0.077 J/m 2. This value was obtained from Eq. (15) at T/To = 0.75 and at p = 0, where m*/m = 2.80 and VF = 59.03 m/s. 2 The time interval between successive sound pulses was 2 s, and temperature was swept with a rate of about 10/~K/min.
The energy density U/Uc = 0.002 is already large enough to produce a clearly observable step in the attenuation spectrum at T/Tc ~_ 0.76. Within the accuracy of our thermometry, about +0.02T~, this temperature matches with the expected location of the two-phonon pair-breaking edge: hf= A(T) at T/T~ ~-0.74, as can be seen from the upper horizontal scale of Fig. t9. When the energy density of the sound pulses was increased, the step became higher; when U/U~ = 0.06, the attenuation level just above the step, at T/T~ ~-0.78, was about 2.5 cm -~ larger than when U/U~ =0.002. Another consequence of the higher sound intensity was that a new peak developed at the edge of the step. The origin of the peak is unknown, but the step is probably caused by two-phonon pair-breaking: when hf> A(T), ultrasound attenuation is larger than when hf < A(T) because only in the former case two phonons together have enough energy to break a Cooper pair.
The anomaly in the two-phonon pair-breaking edge was seen also by Peters and Eska. 9 They measured the attenuation of short (~<4.8 #s) but very energetic ultrasound pulses in the absence of a magnetic field, at

Experiments on Nonlinear Acoustics in 3He-B 619
0.9 12
10
8
6
I.-- ~ - 2
-2
-2
-2 0.65
hf/A(T)
1.0 1.1 1.2 1.3 1.4 i I i I ' I i I ' I
0.70 0.75 0.80 0.85
T/Tc
0.90
Fig. 19. Attenuation spectra of single f=26.8 MHz ultrasound pulses with different power levels in the vicinity of the two-phonon pair-breaking edge at zero pressure and zero magnetic field. The energies of the 12-~ts sound pulses are, from bottom to top, 0.01 nJ, 0.04nJ, 0.15nJ, and 0.30nJ, corresponding to the energy densities U/Uc=O.O02, 0.008, 0.03, and 0.06, respectively. The peak at T/Tc ~- 0.86 is caused by linear coupling of the rsq mode. The upper scale shows the energy of the phonons compared to the weak-coupling energy gap •(T). 49
pressures between 5 and 16 bar. Typically, these authors used one or two orders of magni tude larger energy densities than our maximum. At all pressures they observed a steplike feature, which was, within the accuracy of thermometry, located at h f = A(T). The shape of their spectra was some- what different from ours: no side peak was present. Instead, there often was an at tenuat ion max imum at the corner of the step, like in our spectra measured at large magnetic fields (see the topmost curve of Fig. 20a). This difference may be caused by the nonzero pressure used in the experiments of Peters and Eska. Another possible reason for the absence of the side peak is the very large energy density of the sound pulses: the step and the peak may have merged together.

620 A. 3. Manninen et aL
z O I- <
z ILl I-- I-- ,<
(b) ~ ~ I0.1
69 T
A(T)/A(O) 0.90 0.85 0.80 0,75 0.70 0.65 - f T f T - - f - - -
(a) /
,< [3_
t
m/s
l 1 0.60 0.65 0.70 0.75 0.80 0.85
T/T c
Fig. 20. Magnetic-field evolution of (a) attenuation and (b) phase velocity of ultrasound pulses with f = 26.8 MHz and U/U~ = 0.06, near the two-phonon pair- breaking edge at zero pressure. From bottom to top, H = 0, 34.8, 63.8, and 88.2 roT. The field was applied parallel to the direction of ultrasound propagation. The positions of the anomalies in the phase-velocity spectra (b) are marked by small arrows in the corresponding attenuation traces (a). For meaning of symbols ~', 0 , and O see text and Fig. 21,

Experiments on Nonlinear Acoustics in 3He-B 621
5.2. Magnetic Field Dependence
In an applied magnetic field ultrasound response displays still more structure near the two-phonon pair-breaking edge. The attenuation and phase velocity spectra of f = 26.8 MHz ultrasound in several fields between 0 and 88.2 mT are presented in Fig. 20. The field was applied parallel to the direction of propagation of the sound wave, and the energy density of ultrasound was U/Uc = 0.06. The evolution of the h f = A anomaly is best seen in the phase velocity spectra of Fig. 20b: the single feature observed at H = 0 is split into a triplet by the magnetic field. The positions of these features as a function of H are presented in Fig. 21.
Observation of the very weak anomalies in Fig. 20b was possible because of the broad maximum in the phase velocity at TIT c ~-0.67. At T/Tc > 0.67 the velocity of sound decreases smoothly owing to the linear off-resonance coupling with the J = 2 squashing mode, and at lower tem- peratures c drifts towards the velocity of the hydrodynamic first sound. Only some of the features are observable in the attenuation spectra of Fig. 20a, where the positions of the phase velocity anomalies are shown by small arrows. One notes, however, that the attenuation peak observed at H = 0 weakens with increasing magnetic field and shifts to a lower tem- perature, following the phase velocity anomaly labelled by a solid circle in Figs. 20b and 21. In addition, an attenuation maximum develops near T/Tc = 0.76 in an applied magnetic field.
The interpretation of our results is quite speculative, because there are no theoretical calculations about two-phonon processes near the pair-
O180
0.75 I
~o 0.70 I-
0.65
0.60
o 8 8 , e �9
,
I I I 1
0 20 40 60 80 100 H (mT)
Fig. 21. Locations of the anomalies in phase velocity (see Fig. 20b) as a function of magnetic field. The different symbols correspond to the three different features observable in Fig. 20b. The expected magnetic-field dependence of the effective two-phonon pair-breaking edge (see Eq. (35)) is the solid line.

622 A. ,I. Manninen et aL
breaking threshold. What can be done is to compare the magnetic-field dependence of the observed features with that of the effective pair-breaking edge, which was discussed in the end of Section 2.1. Putting hcopB = 2hf in Eq. (13) and applying Eq. (10) we get, to the second order in H,
F F 2 ) A(T)=hf I +-~fH+C 8-~HZ (35)
from which the location T of the effective two-phonon pair-breaking edge can be deduced directly, via the temperature dependence of the BCS energy gap. 49 The result is shown in Fig. 21 as a solid line. We calculated F from
a �9 Eq. (11), with 2 F o - -0.7 and neglecting F~. For the parameter C(T), defined by Eq. (12), the value C(0.70To)=0.76 was used.
From Fig. 21 we notice that the location of the weak feature labeled by a triangle has a very similar field dependence to the effective two- phonon pair-breaking edge. One of the features can be caused by the J-= 0 + "real gap mode," which should couple to ultrasound in two-phonon processes 58 and which is located near the pair-breaking edge. 1 This - and possibly the work by Peters and Eska9--would be the first experimental observation of the J = 0 + mode. One should note that none of the features that we have seen can be caused by the J = 1 - mode, which is thought to produce the peak-antipeak structure in linear experiments near the pair- breaking edge: 29'3~ the "imaginary" modes with negative parity under particle-hole transformations are not excited in two-phonon processes. 11
We detected the two-phonon pair-breaking edge also in the cubic cell, at zero pressure and with f = 2 5 . 1 5 MHz. A step in the ultrasound attenuation was observed at T/Tc = 0.77 _+ 0.02. Under these conditions the expected location of the edge is T/To---0.78. At H = 0, the phase velocity had a similar anomaly as in the lowest trace of Fig. 20b, but in the attenua- tion spectrum no peak at the edge of the step was observed. When an external magnetic field H between l0 and 90 mT was applied perpendicular to the propagation of the sound wave, the anomaly in the phase velocity disappeared; no splitting was observed.
In the cubic cell we always had q _1_ H: only a vertical magnetic field could be produced and only the horizontal pair of crystals could be used to measure sound transmission. On the other hand, in the cylindrical cell where the splitting was observed, the sound pulses propagated in the direc- tion of the field. Another possible reason why we did not see the splitting in the cubic cell is that the energy density of the sound pulses, U/Uc ~- 0.03, was not large enough to allow the observation of the nonlinearly coupling anomalies at H > 0. The absence of the side peak in the attenuation spec- trum at H = 0 suggests this possibility. However, the strongest anomalies at

Experiments on Nonlinear Acoustics in 3He-B 623
H > 0 in Fig. 20b are of the same size as in zero field. If that was also the case during the experiments performed in the cubic cell, at least one of the features should have been strong enough to be observed at H > 0 as well.
Our previous experiments in the cylindrical cell had indicated that the direction h of the effective magnetic field has an important influence on the anomalies near the two-phonon pair-breaking edge. We could not change the orientation of external magnetic field but, instead, we could rotate the cryostat. Superflow and vortices turn the [I-vector in 3He-B away from the common direction of rotation axis and external magnetic field] 3'45 Figure 22 shows two attenuation traces, one measured in the stationary state and the other when the cryostat was rotated at ~ = 0 . 5 r a d / s . A magnetic field H = 88.2 mT was applied parallel to q. The temperature interval of the traces is roughly from 0.7T~ to 0.85T~. In the lower spectrum, measured with s = 0, there is a sharp attenuation peak, which is located at T/T~ ~- 0.76 as in Fig. 20a. When the cryostat was rotated and turned off from the direction of the external magnetic field, the peak flat- tened. This means that either the source of the attenuation peak, whatever it is, couples to ultrasound most strongly when [1 H q, or that the spectrum is broadened by the uneven [Hexture in the sample. The effect of rotation on the phase-velocity spectrum is drastic as well: the anomalies disappear almost totally when ~ = 0.5 rad/s.
Z O <
Z W
<
-o.o Tc ' ' M / I
TEMPERATURE
Fig. 22. Attenuation spectra of ultrasound pulses with f = 2 6 . 8 MHz and U / U o = O . 0 3 in the stationary state and when the cryostat is rotated at ~ = 0.5 rad/s. A 88.2 mT magnetic field was applied parallel to q and f l The temperature interval is from T / T c ~_ 0.7 to T / T c ~_ 0.85. The zero-level of attenuation has been shifted upwards in the f~ = 0.5 rad/s trace,

624 A.J . Manninen et aL
5.3. Other Step Patterns
To complete our discussion, we present in Fig. 23 two types of ultrasound spectra with a step structure, whose origin is unknown. Both types could be observed only in the presence of tv)o simultaneously propagating sound waves. In Fig. 23a, the attenuation of the 26.8 MHz signal wave is presented as a function of time, when the sample first cooled from T/T c ~-0.85 to T/To ~-0.70 and then warmed up to T/Tc ~-0.85 again. The energy of the 12-ps long, 8.9 MHz pump pulses was Ep ~ - 1.0nJ. There were some day-to-day variations in the positions of the step and, especially, in their steepness.
Another staircase pattern is presented in Fig. 23b, which shows the phase of the received sound signal against time, when the sample was again first cooled from T/To > 0.85 to T/Tc ~- 0.75 and then warmed up. This time the 8.9 MHz sound was used as a signal wave and the 26.8 MHz sound with Ep "~ 0.1 nJ for pumping. Both traces were obtained in the cylindrical cell at p = 0 and H = 0. In our cubic chamber steps of this type did not appear.
The three steps in Fig. 23a are quite clearly caused by sudden changes in temperature: the same jumps also appeared in the phase velocity of ultrasound (not shown in Fig. 23), unlike the case of the two-phonon pair- breaking edge. The stairs of Fig. 23a do not appear in plots of attenuation against the phase of the received signal: only the TPA peak and the two- phonon pair-breaking edge, which is buried under the step on high-tem- perature side of the TPA peak, are left. The values of T/To on the top axes are measured directly by the platinum thermometer and show only the general behavior of temperature. The similar thermal hysteresis between the cooling and the warming traces in Figs. 23a and 23b suggests that both stairs have the same origin.
The distances between the steps in Figs. 23a and 23b suggest that they originate from the pump wave, which at some well defined temperatures can produce a standing sound wave between the quartz crystals. In Fig. 23a, there are three steps in the temperature interval over which the phase difference of the 8.9 MHz pump wave between the ends of the cell changes by about 3. 180 ~ The separations between the steps in.Fig. 23b support the idea that those jumps take place after each 180 ~ change in the phase of the 26.8 MHz pump wave as well. Note that Fig. 23b shows the phase of the 8.9 MHz signal wave. The standing wave can be produced by a finite leak voltage through the switch for the pump wave (see Fig. 6a) when the pulse is off. The nominal switching ratio was about 60 dB.
When there is a standing wave in the sample cell, i.e., the waves that reflect back and forth in the chamber interfere constructively, the sample

Exper iments on Nonl inear Acoustics in 3He-B 625
~ 6 "7,
E o v 4
I
~- 0 v
-2
T/To 0.8, 0.,71(7__~/0;7 0.8
(a) cooling warming
. . . .
TIME
T/To 0.85 0.75,, , 0 . 7 5 0.85
, , ~ - ' ~ 1 ,
(b)
TIME
Fig. 23. Two acoustic spectra at H = 0, p = 0, with a staircase pattern which is probably a technical artefact in both cases. The steps were observed only in the presence of two simultaneous sound waves. (a) Attenuation of f s = 2 6 . 8 MHz sound wave in the presence of a pump wave with fp = 8.9 MHz. The energies of the sound pulses are E s - 0 . 0 3 nJ and E p ~ 1.0 nJ. The peak at T/Tc "" 0.7 follows from two-phonon absorption by the rsq mode. (b) Phase of a fs = 8.9 MHz sound signal, when fp = 26.8 MHz; Es - Ep ~ 0.1 nJ. The sound pulses were 12 #s long in both (a) and (b). The temperature scales above the figures are only suggestive; at least in case (a) the jumps are caused by sudden changes of temperature. The possibility of standing waves as the origin of the staircases is discussed in the text. Note that (b) shows the phase of the received 8.9 M Hz signal wave, whereas the steps are suggested to correspond to 180 ~ changes in the phase of the 26.8 M Hz p u m p wave.

626 A.J . Manninen et al.
heats substantially because of sound attenuation. Otherwise the reflecting waves in the cell destroy each other and no heating takes place. Thus, when the velocity of the pump wave becomes such that a standing wave is formed in the chamber, the temperature difference between the cell and the rest of the 3He-volume across the 40-mm long support tube (see Fig. 4) changes suddenly. It is difficult, however, to understand the shape of the warming trace in Fig. 23a by such a simple model. One would think that in the resonance situation the sample would warm up abruptly and then cool down again, because the velocity of the pump wave would no more have the value required for a standing wave. Instead, the sample warms by about 50 #K within 10 s in the jumps of Fig. 23a. There is continuous heating of the 3He specimen during all this time, even though the phase of the pump wave changes by more than 90 ~ .
6. SUMMARY
This paper is the final and comprehensive report of our series of non- linear acoustic experiments on superfluid ~He-B. Two-phonon absorption (TPA), predicted by McKenzie and Sauls, 7 by the real squashing mode was discovered, and this new phenomenon was used to study the dispersion rela- tion of the rsq mode in zero magnetic field. Moreover, anomalous behavior near the threshold for pair breaking by two phonons was detected and studied as a function of the applied magnetic field. Preliminary reports on our experiments have been published earlier. 5'6'8
Two-phonon absorption with two parallel ultrasound pulses was observed under several experimental conditions, at pressures between 0 and 3.5 bar. The lower-frequency wave with a large energy density Up - 0.1 Uc was used as a pump wave, and the attenuation of the weaker signal wave with higher frequency was monitored; Uc-0.1 J/m 3 is the superfluid condensation energy density. The locations and heights of the attenuation maxima were in good agreement with theory. The size of the peak was proportional to the energy density Up of the pump wave. The power of the signal wave affected the height of the TPA peak as well: when the signal pulse was increased the attenuation maximum became lower and wider.
In a magnetic field applied perpendicular to the sound waves, five-fold Zeeman splitting of TPA was detected. In zero field a small satellite on the low-temperature side of the main TPA peak was often present. Its origin turned out to be the excitation of the rsq mode by antiparallel signal and pump waves, caused by the reflection of the latter from the receiver crystal. Two-phonon absorption and the satellite were also observed using a single high-intensity sound wave. In this case the side peak is caused by the excitation of the rsq mode with vanishing wave vector. We could not detect

Experiments on Nonlinear Acoustics in 3He-B 627
TPA when the frequency of the signal wave was lower than that of the pump wave. The stimulated Raman scattering, in which a phonon of high frequency should decay into a lower-frequency phonon and a real squashon, was not found either.
We applied two-phonon absorption to study the dispersion relation of the rsq mode. Splitting of the mode could be observed when the signal and the pump waves were perpendicular: the submodes with m = 0 and Iml = 2 did couple to ultrasound and produced attenuation peaks at different tem- peratures even in zero magnetic field, unlike the linear case. In an applied magnetic field the dispersion splitting developed to the field-induced Zeeman splitting, but the relative strengths of the observed attenuation maxima were not in agreement with theoretical predictions.
The dispersion curve of the m = 0 submode was investigated directly: the mode could be detected at a single frequency, but with three different wave numbers q, applying mutually parallel, perpendicular, or antiparallel signal and pump pulses. The result was qualitatively in good agreement with theory, but a slight deviation from the expected linear relationship between [A(T)] 2 and q2 was observed; here A(T) is the magnitude of the superfluid energy gap at each resonance. We also derived values for the parameters ca and cb in Eq. (5) for the mode velocities. The result for Cb is in agreement with theory, but the experimental value for Ca is somewhat larger than predicted. However, the error margins in experimental results are quite large owing to our nonperfect thermometry.
By employing single sound pulses with energy densities U/Uc >0.01, we detected anomalous behavior both in the attenuation and in the phase velocity spectra near the two-phonon pair-breaking edge, where hf = A(T). Peters and Eska 9 have earlier reported similar observations. When a magnetic field was applied parallel to the sound wave, the phase velocity anomaly split into a triplet. The interpretation of these results is quite speculative, because of the lack of theoretical predictions. However, the evolution of one of the features in the phase velocity as a function of the magnetic field is very similar to that of the effective pair-breaking edge, and one of the features might be caused by the J = 0 + "real gap mode."
Our results on two-phonon absorption demonstrate that parametric acoustic phenomena in 3He-B are observable and can be used to gain new information about the properties of this superfluid phase. Future directions include detection of stimulated Raman scattering by the rsq mode, and third-harmonic generation. The possibility of exotic four-wave mixing processes has been considered as well. H'41 The dispersion curve of the rsq submodes with Im I g:0 can be studied directly using TPA with suitable choices of the angle between the pump and the signal waves; in our setup only the m = 0 mode could be excited with different wave numbers (see

628 A.J. Manninen et aL
Fig. 16). A theore t ica l inves t igat ion on u l t r a sound p r o p a g a t i o n near the t w o - p h o n o n pa i r -b reak ing edge would be necessary for the in te rp re ta t ion of our da t a presented in Chap t e r 5.
A C K N O W L E D G M E N T S
W e are grateful to R. McKenz ie for his interest and theoret ica l advice dur ing all stages of this work. We also wish to thank G. Eska, V, Golo , W. Halper in , G. Kha radze , J. Kyynfir~iinen, O . V . L ouna sma a , M. Meisel, M. Sa lomaa , J. Sauls, P. Soininen, S. Stenholm, Y. Shen, E. Thuneberg , E. Varoquaux , and G. Volovik for useful comments and discussions, and M. K i r a for assist ing in some of the experiments . This work was suppor t ed by the Academy of F i n l a n d th rough project R O T A , and by the K6rbe r - Stif tung of Hamburg . Scholarships from the Emil Aa l tonen F o u n d a t i o n (A.J.M. and H.A.) and from the Vilho, Yrj6, and Kal le V~iis~il~i F o u n d a t i o n (H.A.) are gratefully acknowledged.
R E F E R E N C E S
1. D. Vollhardt and P. W61fle, The Superfluid Phases of Helium 3 (Taylor & Francis, London, 1990).
2. W. P. Halperin and E. Varoquaux, in Helium Three, edited by W. P. Halperin and L. P. Pitaevskii (North-Holland, Amsterdam, 1990), p. 353.
3. E. R. Dobbs and J. Saunders, in Progress in Low Temperature Physics, Vol. 13, edited by D. F. Brewer (North-Holland, Amsterdam, 1992), p. 91.
4. G. E. Volovik, Exotic Properties of Superfluid SHe (World Scientific, Singapore, 1992). 5. K. Torizuka, J. P. Pekola, A. J. Manninen, J. M. Kyyn~ir~iinen, and R. H. McKenzie,
Phys. Rev. Lett. 66, 3152 (1991). 6. J. P. Pekola, K. Torizuka, A. J. Manninen, H. Alles, and O. V. Lounasmaa, Physiea 178B,
238 (1992). 7. R. H. McKenzie and J. A. Sauls, Europhys. Lett. 9, 459 (1989). 8. A. J. Manninen, H. Alles, A. V. Babkin, J. P. Pekola, and R. H. McKenzie, Phys. Rev.
Lett. 68, 3725 (1992). 9. J. Peters and G. Eska, Europhys. Lett. 20, 137 (1992).
10. Z. Zhao, S. Adenwalla, B. K. Sarma, and J. B. Ketterson, Adv. Phys. 41, 147 (1992). 11. R. H. McKenzie and J. A. Sauls, in Helium Three, edited by W. P. Halperin and L. P.
Pitaevskii (North-Holland, Amsterdam, 1990), p. 255. 12. G. E. Volovik, in Helium Three, edited by W. P. Halperin and L. P. Pitaevskii (North-
Holland, Amsterdam, 1990), p. 27. 13. R. W. Giannetta, A. Ahonen, E. Polturak, J. Saunders, E. K. Zeise, R. C. Richardson, and
D. M. Lee, Phys. Rev. Lett. 45, 262 (1980); D. B. Mast, B. K. Sarma, J. R. Owers-Bradley, I. D. Calder, J. B. Ketterson, and W. P. Halperin, Phys. Rev. Lett. 45, 266 (1980).
14. V. E. Koch and P. W6fle, Phys. Rev. Lett. 46, 486 (1981). 15. L. Tewordt and N. Schopohl, J. Low Temp. Phys. 37, 421 (1979). 16. Yu. A. Vdovin, in Primennie metodov kvantovoi teorii polya k zadacham mnogikh tel
[Application of the Methods of Quantum Field Theory to Many Body Problems],

Experiments on Nonlinear Acoustics in 3He-B 629
Proceedings of the Moscow Engineering Physics Institute (Gosatomizdat, Moscow, 1963), p. 65.
17. R. S. Fishman and J. A. Sauls, Phys. Rev. Lett. 61, 2871 (1988). 18. O. Avenel, E. Varoquaux, and H. Ebisawa, Phys. Rev. Lett. 45, 1952 (1980). 19. B. S. Shivaram, M. W. Meisel, B. K. Sarma, W. P. Halperin, and J. B. Ketterson, J. Low
Temp. Phys. 63, 57 (1986). 20. B. S. Shivaram, M. W. Meisel, B. K. Sarma, W. P. Halperin, and J. B. Ketterson, Phys.
Rev. Lett. 50, 1070 (1983). 21. N. Schopohl, M. Warnke, and L. Yewordt, Phys. Rev. Lett. 50, 1066 (1983). 22. M. M. Salomaa and G. E. Volovik, J. Low Temp. Phys. 77, 17 (1989). 23. R. H. Salmelin, J. P. Pekola, A. J. Manninen, K. Torizuka, M. P. Berglund, J.M.
Kyyn~ir/iinen, O.V. Lounasmaa, G. K. Tvalashvili, O.V. Magradze, E. Varoquaux, O. Avenel, and V. P. Mineev, Phys. Rev. Lett. 63, 620 (1989).
24. R. S. Fishman and J. A. Sauls, Phys. Rev. B 33, 6068 (1986). 25. R. S. Fishman and J. A. Sauls (unpublished). 26. B. S. Shivaram, M. W. Meisel, B. K. Sarma, D. B. Mast, W. P. Halperin, and J. B.
Ketterson, Phys. Rev. Lett. 49, 1646 (1982). 27. S. Adenwalla, Z. Zhao, J. B. Ketterson, and B. K. Sarma, Phys. Rev. Lett. 63, 1811 (1989). 28. R. Movshovich, N. Kim, and D. M. Lee, Phys. Rev. Lett. 64, 431 (1990). 29. J. Saunders, M. E. Daniels, E. R. Dobbs, and P. L. Ward, in Quantum Fluids and Solids,
edited by E. D. Adams and G. G. Ihas (American Institute of Physics, New York, 1983), p. 314; R.Ling, J. Saunders, and E. R. Dobbs, Phys. Rev. Lett. 59, 461 (1987); J. Saunders, R. Ling, W. Wojtanowski, and E. R. Dobbs, J. Low Temp. Phys. 79, 75 (1990).
30. N. Schopohl and L. Tewordt, J. Low Temp. Phys. 57, 601 (1984). 31. R. H. McKenzie and J. A. Sauls, J. Low Temp. Phys. 90, 337 (1993). 32. Y. R. Shen, The Principles of Nonlinear Optics (Wiley, New York, 1984). 33. E. Polturak, P. G. N. deVegvar, E. K. Zeise, and D. M. Lee, Phys. Rev. Lett. 46, 1588
(1981). 34. O. Avenel, L. Pich6, M. Rouff, E. Varoquaux, R. Combescot, and K. Maki, Phys. Rev.
Lett. 54, 1408 (1985). 35. P. G. N. deVegvar, J. Stat. Phys. 39, 675 (1985). 36. J. A. Sauls, Phys. Rev. Lett. 47, 530 (1981). 37. H. Namaizawa, Jpn. J. AppL Phys. 26, 165 (1987). 38. M. Rouff and E. Varoquaux, Phys. Rev. Lett. 51, 1107 (1983). 39. See Ref. 2, p. 500. 40. J. P. Pekola, K. Torizuka, J. M. Kyyn~.r/iinen, A. J. Manninen, W. Wojtanowski, and
G. K. Tvalashvili, Europhys. Lett. 13, 155 (1990). 41. R. H. McKenzie and J. A. Sauls, Physica 178B, 219 (1992). 42. J. W. Serene, Phys. Rev. B 30, 5373 (1984). 43. R. H. Salmelin, J. M. Kyynariiinen, M. P. Berglund, and J. P. Pekola, J. Low Temp. Phys.
76, 83 (1989). 44. The transmitter-receiver module was kindly provided to us by O. Avenel and
E. Varoquaux. 45. J. M. Kyyn~ir~iinen, A. J. Manninen, K. Torizuka, A. V. Babkin, R. H. Salmelin, G. K.
Tvalashvili, and J. P. Pekola, Zh. Eksp. Teor. Fiz. 98, 516 (1990) [Soy. Phys. JETP 71, 287 (1990)].
46. D. S. Greywall, Phys. Rev. B 33, 7520 (1986). 47. K. Torizuka, Ph.D. Thesis, Helsinki University of Technology (1991). 48. P. N. Fraenkel, R. Keolian, and J. D. Reppy, Phys. Rev. Lett. 62, 1126 (1989). 49. B. Miihlslegel, Z. Phys. 155, 313 (1959); A(T) was calculated and tabulated for us by
M. M. Salomaa. 50. R. H. McKenzie, private communication (1991). 51. E. Varoquaux, G. A. Williams, and O. Avenel, Phys. Rev. B 34, 7617 (1986). 52. G. E. Volovik, Pis'ma Zh. Eksp. Teor. Fiz. 39, 304 (1984) [JETP Lett. 39, 365 (1984)]. 53. H. Kleinert, Phys. Lett. 78A, 155 (1980); P. N. Brusov, J. Low Temp. Phys. 58, 265 (1985).

630 A. ,J. Manninen et aL
54. G. E. Volovik, private communication (1991); Y. R. Shen, private communication (1991). 55. J. P. Pekola, R. H. Salmelin, A. J. Manninen, K. Torizuka, J. M. Kyyn/ir/iinen, and G. K.
Tvalashvili, in Quantum Fluids and Solids 1989, AIP Conf. Proc. No. 194, edited by G.G. Ihas and Y. Takano (American Institute of Physics, New York, 1989), p. 63.
56. W. P. Halperin, private communication (1992). The value b2+ -~ -(cb/vv) 2 A(O)/(12hf) = 0.025 _+ 0.006 in Ref. 2 was calculated using c o and vv tabulated by J. C. Wheatley, Rev. Mod. Phys. 47, 415 (1975). When the values of the parameters are taken from p. 510 in Ref. 2, one obtains b2+ = 0.021 + 0.005, o r ( C b / / ) F ) 2 = 0.29 _+ 0.07.
57. G. E. Volovik, private communication (1991). 58. R. H. McKenzie and J. A. Sauls, private communication (1993).


