Embed Size (px)
Citation preview
W&M ScholarWorks W&M ScholarWorks
Dissertations, Theses, and Masters Projects Theses, Dissertations, & Master Projects
1982
Adenine nucleotide levels and adenylate energy charge in Zostera Adenine nucleotide levels and adenylate energy charge in Zostera
marina (eelgrass): determination and application marina (eelgrass): determination and application
Damon A. Delistraty College of William and Mary - Virginia Institute of Marine Science
Follow this and additional works at: https://scholarworks.wm.edu/etd
Part of the Marine Biology Commons
Recommended Citation Recommended Citation Delistraty, Damon A., "Adenine nucleotide levels and adenylate energy charge in Zostera marina (eelgrass): determination and application" (1982). Dissertations, Theses, and Masters Projects. Paper 1539616629. https://dx.doi.org/doi:10.25773/v5-m32g-sp64
This Dissertation is brought to you for free and open access by the Theses, Dissertations, & Master Projects at W&M ScholarWorks. It has been accepted for inclusion in Dissertations, Theses, and Masters Projects by an authorized administrator of W&M ScholarWorks. For more information, please contact [email protected].
INFORMATION TO USERS
This reproduction was made from a copy of a document sent to us for microfilming. While the most advanced technology has been used to photograph and reproduce this document, the quality of the reproduction is heavily dependent upon the quality of the material submitted.
The following explanation of techniques is provided to help clarify markings or notations which may appear on this reproduction.
1. The sign or “target” for pages apparently lacking from the document photographed is “Missing Page(s)”. I f it was possible to obtain the missing page(s) or section, they are spliced into the film along with adjacent pages. This may have necessitated cutting through an image and duplicating adjacent pages to assure complete continuity.
2. When an image on the film is obliterated with a round black mark, it is an indication of either blurred copy because of movement during exposure, duplicate copy, or copyrighted materials that should not have been filmed. For blurred pages, a good image of the page can be found in the adjacent frame. I f copyrighted materials were deleted, a target note will appear listing the pages in the adjacent frame.
3. When a map, drawing or chart, etc., is part of the material being photographed, a definite method of “sectioning” the material has been followed. It is customary to begin filming at the upper left hand comer of a large sheet and to continue from left to right in equal sections with small overlaps. I f necessary, sectioning is continued again—beginning below the first row and continuing on until complete.
4. For illustrations that cannot be satisfactorily reproduced by xerographic means, photographic prints can be purchased at additional cost and inserted into your xerographic copy. These prints are available upon request from the Dissertations Customer Services Department.
5. Some pages in any document may have indistinct print. In all cases the best available copy has been filmed.
UniversityMicrcxilms
International300 N. Zeeb Road Ann Arbor, Ml 48106

8301456
Delistraty, Damon Andrew
ADENINE NUCLEOTIDE LEVELS AND ADENYLATE ENERGY CHARGE IN ZOSTERA MARINA (EELGRASS): DETERMINATION AND APPLICATION
The College of William and Mary in Virginia PH.D. 1982
UniversityMicrofilms
International 300 N. Zeeb Road, Ann Arbor, M I 48106
Copyright 1983
by
Delistraty, Damon Andrew
All Rights Reserved

PLEASE NOTE:
In all cases this material has been filmed in the best possible way from the available copy. Problems encountered with this document have been identified here with a check mark V .
1. Glossy photographs or pages______
2. Colored illustrations, paper or print______
3. Photographs with dark background______
4. Illustrations are poor copy______
5. Pages with black marks, not original copy_
6. Print shows through as there is text on both sides of page______
7. Indistinct, broken or small print on several pages
8. Print exceeds margin requirements______
9. Tightly bound copy with print lost in spine______
10. Computer printout pages with indistinct print_____
11. Page(s)____________lacking when material received, and not available from school orauthor.
12. Page(s)____________seem to be missing in numbering only as text follows.
13. Two pages numbered____________ . Text follows.
14. Curling and wrinkled pages______
15. Other______________________________________________________________________
UniversityMicrofilms
International

ADENINE NUCLEOTIDE LEVELS AND ADENYLATE ENERGY
CHARGE IN ZOSTERA MARINA (EELGRASS):
DETERMINATION AND APPLICATION
A Dissertation
Presented to
The Faculty o f the School o f Marine Science
The College o f W illiam and Mary in V irg in ia
In P artia l Fulfillm ent
Of the Requirements for the Degree o f
Doctor o f Philosophy
by
Damon A. D e lis tra ty
1982
APPROVAL SHEET
This d issertation is submitted in partia l fu lf illm e n t o f the
requirements for the degree of
Doctor o f Philosophy
Damon A. D e lis tra ty
Approved, August 1982
Michael E. Bender, Ph.D.
ene M. Silberhorn, Ph.D
S. Weftfh, Ph.D.Chris
Irv in ^ A '. Mendelssohn, Ph.D. Center fo r Wetland Resources Louisiana State University
n
TABLE OF CONTENTS
PAGE
ACKNOWLEDGEMENTS.................................................................................................. v i i
LIST OF TABLES...................................................................................................... v i i i
LIST OF FIGURES.................................................................................................... xiv
ABSTRACT.................................................................................................................. x v i i i
GENERAL INTRODUCTION.......................................................................................... 2
Adenylate Energy Charge......................................................................... 2Ecology o f Zostera marina..................................................................... 8Objectives....................................................................................................Overview......................................................................................................... 4
REFERENCES............................................................................................................... 6
SECTION 1. DETERMINATION................................................ 9
INTRODUCTION...................................................... 10
METHODS............................................................................... 12
Sampling S ite s .................................................................................. 12Adenine Nucleotides....................................................................... 12
Assay P rinc ip les ................................................................... 12Sample Collection and Preparation.................................. 12Extraction............................................................................... 17Conversion................................................................................ 18F ire fly Lantern Extract Preparation........................... 20Photometry............................................................................... 20Standards and Blanks........................................................... 21Data Reduction....................................................................... 24Recovery and Conversion E ffic ie n c ie s ......................... 25Reagents and Equipment....................................................... 26
Tissue Comparisons and Seasonal Survey................................ 27Environmental Data........................................... 27Morphometries......................................................................... 28
S ta tis tic a l Analysis..................................................................... 28Procedures................................................................................ 28Standard Curve....................................................................... 28Adenine Nucleotide Methodology Experiments............. 29Tissue Comparisons............................................................... 29Seasonal Survey................................. 81
i i i
PAGE
RESULTS............................................................................................................ 32
Adenine Nucleotide Methodology Experiments........................... 32Overview............................................................................. 32Sample Collection and Preparation.................................. 32Extraction.................................................................................. 39Conversion.................................................................................. 44F ire fly Lantern Extract Preparation................................ 50Photometry.................................................................................. 59Standard Curve......................................................................... 66Analytical V a r ia b il ity ......................................................... 66
Tissue Comparisons........................................................................... 74Zostera marina......................................................................... 74Other Species........................................................................... 74
Seasonal Survey................................... .......................................... 74
DISCUSSION...................................................................................................... 92
Adenine Nucleotide Methodology Experiments........................... 92Sample Collection and P re p a ra tio n .............................. 92Extraction .................................................................................. 94Conversion................................................................................. 96F ire fly Lantern Extract Preparation................................ 97Photometry................................................................................. 99Standard Curve..................................................................... 99
Tissue Comparisons.......................................................................... 100Zostera marina...................... .............................................. 100Other Species.......................................................................... 101
Seasonal Survey................................................................................ 102Conclusions......................................................................................... 104
REFERENCES..................................................................................................... 106
SECTION 2. APPLICATION.................................................................................... 112
INTRODUCTION................................................................................................. 113
Nutrient-L ight Experiment............................................................ 114Atrazine Experiments...................................................................... 115
METHODS........................................................................................................... 118
Field Collection and Transplanting......................................... 118Adenine Nucleotides........................................................................ 118Environmental Data.......................................................................... 119N utrient-L ight Experiment............................................................ 119
Design......................................................................................... 119N utrients .................................................................................. 122Morphometries.......................................................................... 125
iv
PAGE
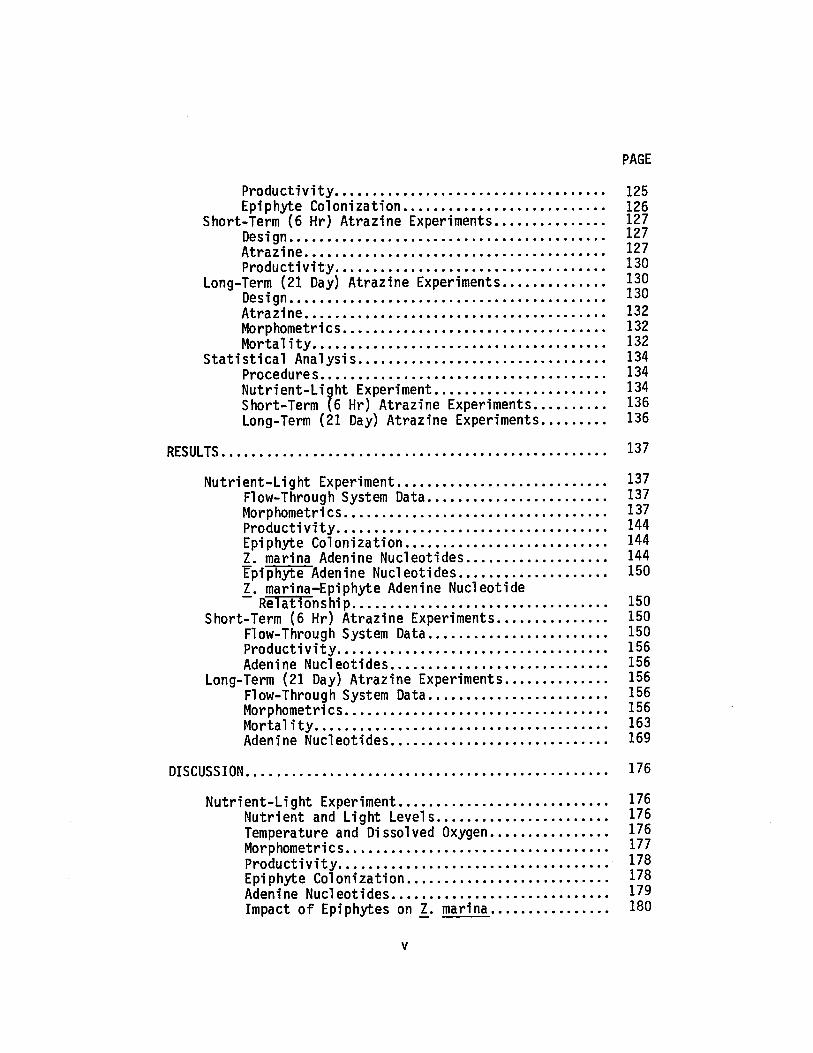
Productiv ity ......................................................................... 125Epiphyte Colonization...................................................... 126
Short-Term (6 Hr) Atrazine Experiments.............................. 127Design...................................................................................... * 27A trazine.................................................................................. | 27Productiv ity ......................................................................... * 30
Long-Term (21 Day) Atrazine Experiments........................... J30Design...................................................................................... 130A trazine.................................................................................. 132Morphometries....................................................................... 132M o rta lity ................................................................................ 132
S ta tis tic a l Analysis................................................................... 134Procedures............................................................................. 134Nutrient-L ight Experiment.............................................. 134Short-Term (6 Hr) Atrazine Experiments................... 136Long-Term (21 Day) Atrazine Experiments................. 136
RESULTS......................................................................................................... I 37
Nutrient-L ight Experiment......................................................... I 37Flow-Through System Data................................................ 137Morphometries....................................................................... 137Productiv ity ......................................................................... 144Epiphyte Colonization...................................................... 144Z. marina Adenine Nucleotides...................................... 144Epiphyte Adenine Nucleotides........................................ 1501. marina-Epiphyte Adenine Nucleotide
Relationship..................................................................... 150Short-Term (6 Hr) Atrazine Experiments.............................. 150
Flow-Through System Data................................................ 150Productiv ity ......................................................................... 156Adenine Nucleotides........................................................... 156
Long-Term (21 Day) Atrazine Experiments........................... 156Flow-Through System Data................................................ 156Morphometries....................................................................... 156M o rta lity ................................................................................ 163Adenine Nucleotides........................................................... 169
DISCUSSION.................................................................................................. 176
N utrient-L ight Experiment......................................................... I 76Nutrient and Light Levels.............................................. 176Temperature and Dissolved Oxygen................................ 176Morphometries....................................................................... I 77Productiv ity ......................................................................... * 78Epiphyte Colonization...................................................... I 78Adenine Nucleotides........................................................... I 79Impact o f Epiphytes on 1. marina................................ 180
v
PAGE
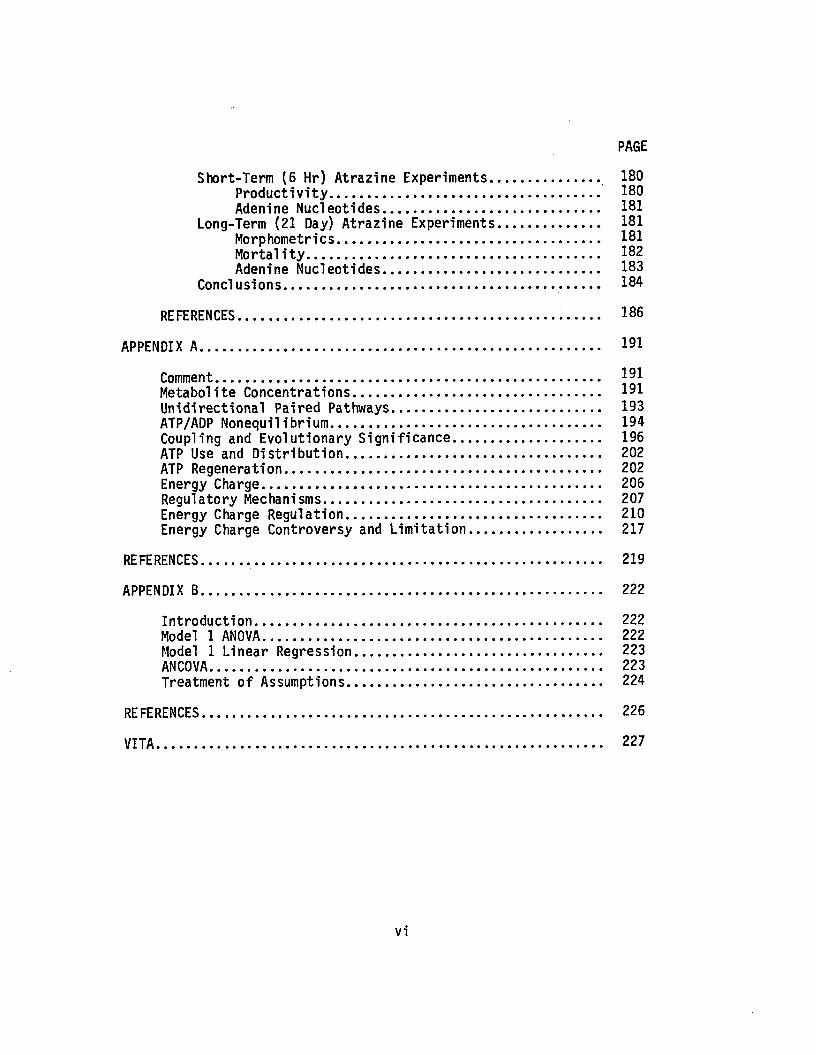
Short-Term (6 Hr) Atrazine Experiments.............................. 180P roductiv ity .......................................................................... 180Adenine Nucleotides.................................................. 181
Long-Term (21 Day) Atrazine Experiments............................ 181Morphometries........................................................................ 181M o rta lity ................................................................................ 182Adenine Nucleotides........................................................... 183
Conclusions...................................................................................... 184
REFERENCES....................................................................................... 186
APPENDIX A............................................................................................................. 191
Comment......................................................................................................... 191Metabolite Concentrations................................................................... 191Unidirectional Paired Pathways......................................................... 193ATP/ADP Nonequilibrium.......................................................................... 194Coupling and Evolutionary S ignificance........................................ 196ATP Use and D is trib u tio n ..................................................................... 202ATP Regeneration...................................................................................... 202Energy Charge............................................................................................ 206Regulatory Mechanisms............................................................................ 207Energy Charge Regulation..................................................................... 210Energy Charge Controversy and L im ita tio n .................................... 217
REFERENCES .............................................................................................. 219
APPENDIX B............................................................................................................. 222
Introduction............................................................................................... 222Model 1 ANOVA............................................................................................ 222Model 1 Linear Regression................................................................... 223ANCOVA........................................................................................................... 223Treatment o f Assumptions..................................................................... 224
REFERENCES............................................................................................................. 226
VITA ................................................................................................................. 227
v i
ACKNOWLEDGEMENTS
I wish to thank Dr. Carl Hershner, my committee chairman, fo r his
guidance and support during my studies at the V irg in ia In s titu te of
Marine Science. I g ra te fu lly acknowledge the helpful c ritic ism s ,
comments, and suggestions from Dr. Dave Karl and from committee members,
Drs. Irv Mendelssohn, Mike Bender, Chris Welch, and Gene Silberhorn.
Discussions with Dr. Howard Kator, Dr. B il l MacIntyre, Joe Boyer,
Alyce Thomson, and Ken Moore contributed appreciably to my understanding
o f biochemistry and plant physiology.
I wish to extend my gratitude to Jerry Illowsky and Laura Murray
fo r assisting with f ie ld collections and laboratory bioassays. Nancy
White, Carole Knox, and Ruth Edwards cheerfu lly and flaw lessly typed
several versions o f th is d isserta tion . Encouragement from Sargun Tont,
Jane Wingrove, Cathy Meyer, Joe Lascara, Laura Murray, and Alyce
Thomson is deeply appreciated. F in a lly , I wish to acknowledge the
unfa iling support and understanding o f my parents during my lengthy
student career.
This research was sponsored in part by grants from the U. S.
Environmental Protection Agency and the CIBA-GEIGY Corporation.
LIST OF TABLES
PAGE
TABLE
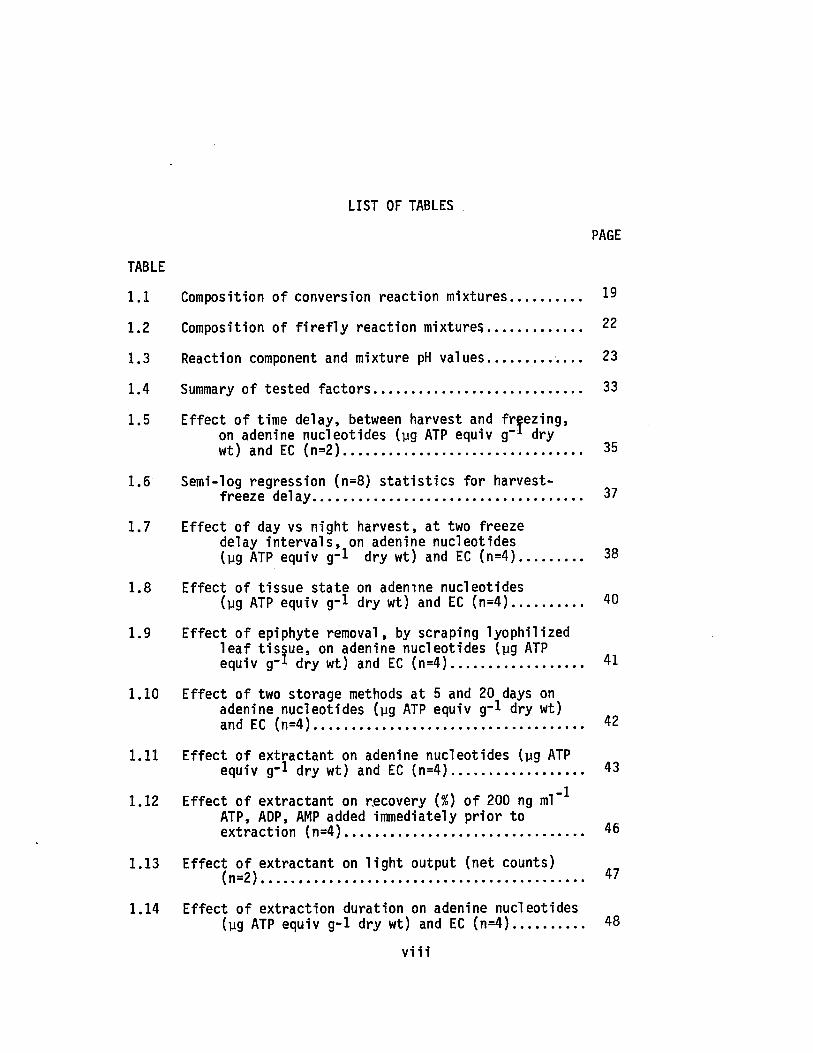
1.1 Composition o f conversion reaction mixtures.................... 19
1.2 Composition of f i r e f ly reaction mixtures........................... 22
1.3 Reaction component and mixture pH values.................... 23
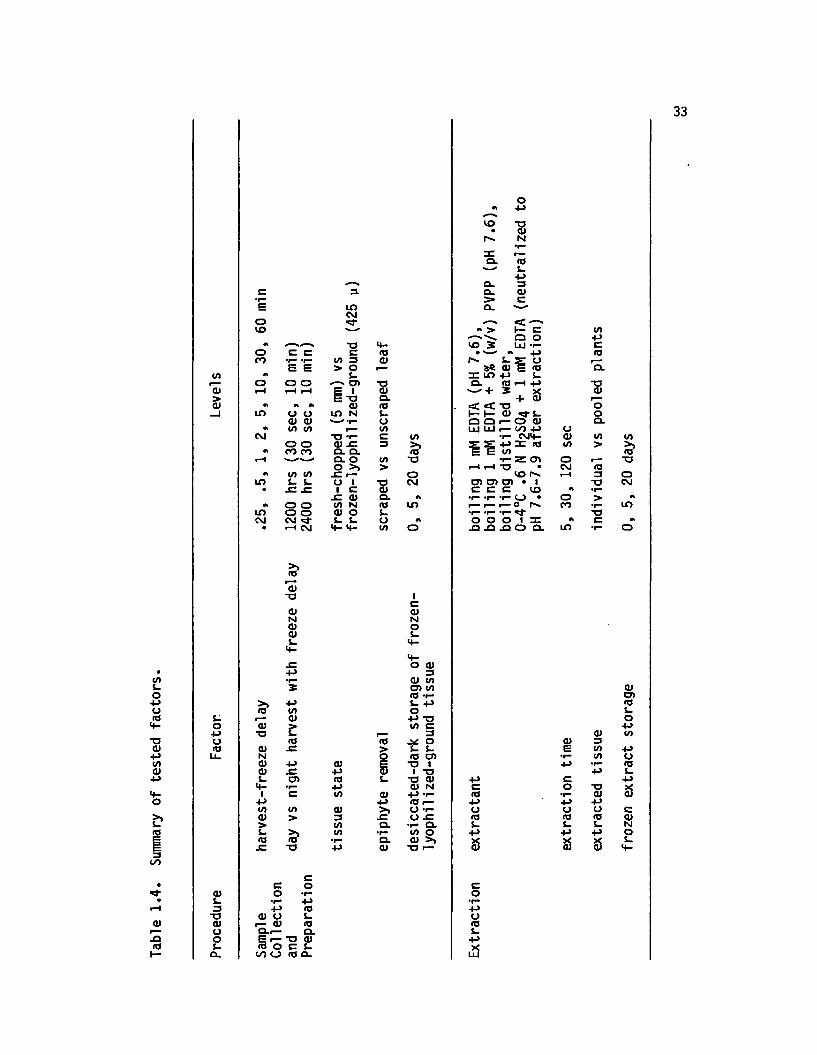
1.4 Summary of tested fac to rs ......................................................... 33
1.5 E ffect o f time delay, between harvest and freezing,on adenine nucleotides (yg ATP equiv g"1 drywt) and EC (n=2)................................................................. 35
1.6 Semi-log regression (n=8) s ta tis tic s for harvest-freeze delay......................................................................... 37
1.7 E ffect of day vs night harvest, a t two freezedelay in te rv a ls , on adenine nucleotides(yg ATP equiv g-1 dry wt) and EC (n=4)................... 38
1.8 E ffect of tissue state on adenine nucleotides(yg ATP equiv g-1 dry wt) and EC (n=4)................... 40
1.9 E ffect o f epiphyte removal, by scraping lyophilizedle a f tissue, on adenine nucleotides (yg ATP equiv g-1 dry wt) and EC (n=4).................................. 41
1.10 E ffect of two storage methods at 5 and 20 days onadenine nucleotides (yg ATP equiv g-1 dry wt)and EC (n=4)......................................................................... 42
1.11 E ffect o f extractant on adenine nucleotides (yg ATPequiv g-1 dry wt) and EC (n=4).................................. 43
1.12 E ffect o f extractant on recovery {%) o f 200 ng ml"*ATP, ADP, AMP added immediately prior toextraction (n=4)................................................................. 46
1.13 E ffect o f extractant on lig h t output (net counts)(n=2)........................................................................................ 47
1.14 E ffect o f extraction duration on adenine nucleotides(yg ATP equiv g-1 dry wt) and EC (n=4)................... 48
v i i i
PAGE
TABLE
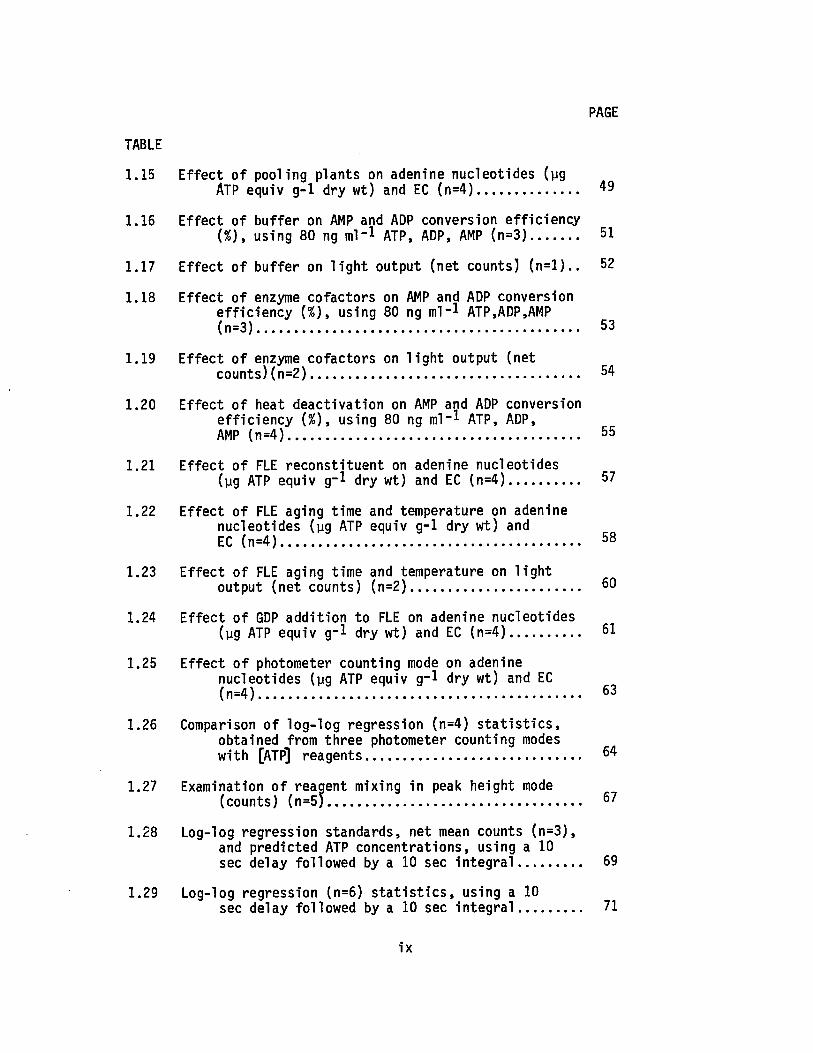
1.15 E ffect o f pooling plants on adenine nucleotides (ygATP equiv g-1 dry wt) and EC (n=4)..................... 49
1.16 E ffect of buffer on AMP and ADP conversion effic iency(%), using 80 ng ml"1 ATP, ADP, AMP (n=3).............. 51
1.17 Effect o f buffer on lig h t output (net counts) (n = l) . . 52
1.18 Effect of enzyme cofactors on AMP and ADP conversioneffic iency [%), using 80 ng ml“l ATP,ADP,AMP (n=3)........................................................................................ 53
1.19 E ffect o f enzyme cofactors on lig h t output (netcounts) (n=2)......................................................................... 54
1.20 Effect o f heat deactivation on AMP and ADP conversioneffic iency (%), using 80 ng ml~l ATP, ADP,AMP (n=4)................................................................................ 55
1.21 E ffect o f FLE reconstituent on adenine nucleotides(yg ATP equiv g-1 dry wt) and EC (n=4).................. 57
1.22 Effect of FLE aging time and temperature on adeninenucleotides (yg ATP equiv g-1 dry wt) andEC (n=4).................................................................................. 58
1.23 E ffect o f FLE aging time and temperature on lig h toutput (net counts) (n=2).............................................. 50
1.24 E ffect o f GDP addition to FLE on adenine nucleotides(yg ATP equiv g-1 dry wt) and EC (n=4).................. 51
1.25 E ffect o f photometer counting mode on adeninenucleotides (yg ATP equiv g-1 dry wt) and EC (n=4)........................................................................................ 63
1.26 Comparison o f log-log regression (n=4) s ta t is t ic s ,obtained from three photometer counting modes with [ATP] reagents.......................................................... 64
1.27 Examination o f reaaent mixing in peak height mode(counts) (n=5)..................................................................... 67
1.28 Log-log regression standards, net mean counts (n=3),and predicted ATP concentrations, using a 10sec delay followed by a 10 sec in te g ra l................. 69
1.29 Log-log regression (n=6) s ta t is t ic s , using a 10sec delay followed by a 10 sec in te g ra l................. 71
ix
PAGE
TABLE
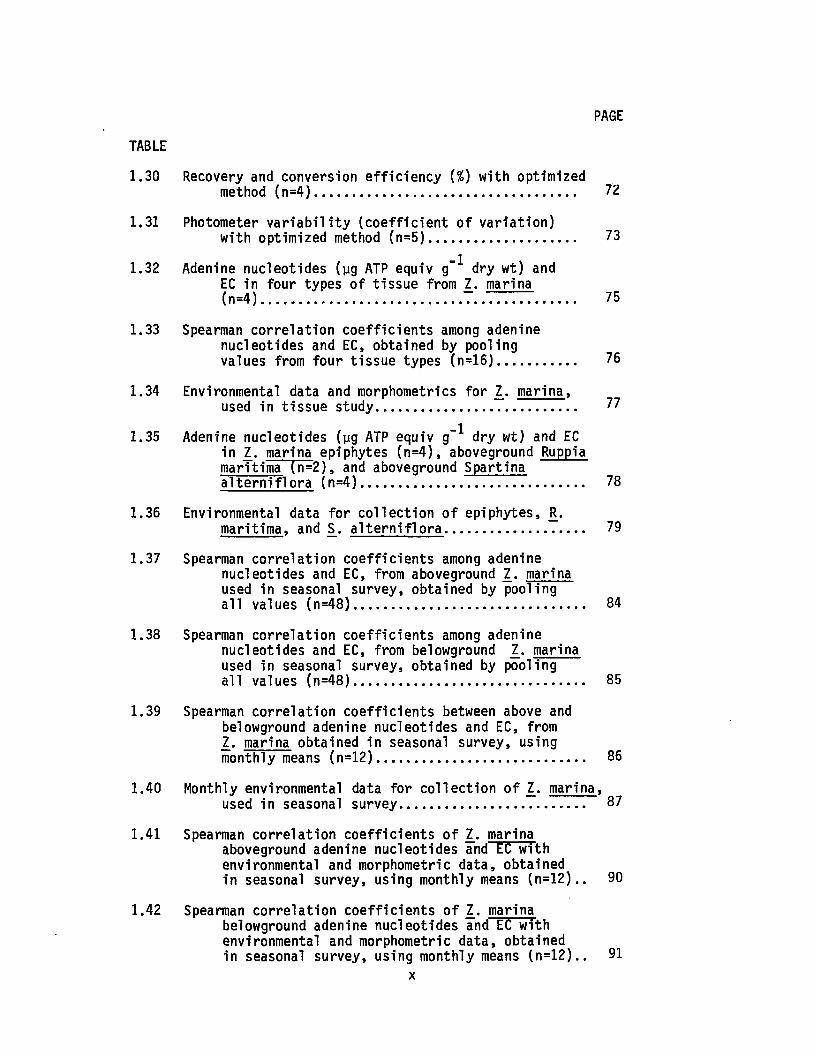
1.30 Recovery and conversion e ffic iency (%>) with optimizedmethod (n=4)....................................................................... 72
1.31 Photometer v a r ia b ili ty (co e ffic ien t o f varia tion )with optimized method (n=5)........................................ 73
1.32 Adenine nucleotides (yg ATP equiv g~* dry wt) andEC in four types o f tissue from Z. marina(n=4)...................................................... 7 . .777777........... 75
1.33 Spearman correlation coeffic ien ts among adeninenucleotides and EC, obtained by poolingvalues from four tissue types (n=16)........................ 76
1.34 Environmental data and morphometries for 1. marina,used in tissue study....................................................... 77
1.35 Adenine nucleotides (yg ATP equiv g"* dry wt) and ECin 1. marina epiphytes (n=4), aboveground Ruppiamaritima (n=2), and aboveground Spartinaa lte rn i flo ra (n=4)............................................................. 78
1.36 Environmental data fo r co llection o f epiphytes, R.maritima, and S_. a lte rn i f lo r a ...................................... 79
1.37 Spearman correlation coeffic ien ts among adeninenucleotides and EC, from aboveground 1. marinaused in seasonal survey, obtained by poolinga ll values (n=48)............................................................... 84
1.38 Spearman correlation coeffic ien ts among adeninenucleotides and EC, from belowground 1. marinaused in seasonal survey, obtained by poolinga ll values (n=48)............................................................... 85
1.39 Spearman correlation coeffic ien ts between above andbelowground adenine nucleotides and EC, from1. marina obtained in seasonal survey, using monthly means (n=12)......................................................... 86
1.40 Monthly environmental data for co llection o f 1. marina,used in seasonal survey.................................................. 87
1.41 Spearman correlation coeffic ien ts o f 1. marinaaboveground adenine nucleotides and EC with environmental and morphometric data, obtained in seasonal survey, using monthly means (n=12). . 90
1.42 Spearman correlation coeffic ien ts o f 1. marinabelowground adenine nucleotides and EC with environmental and morphometric data, obtained in seasonal survey, using monthly means (n=12).. 91
x
PAGE
TABLE
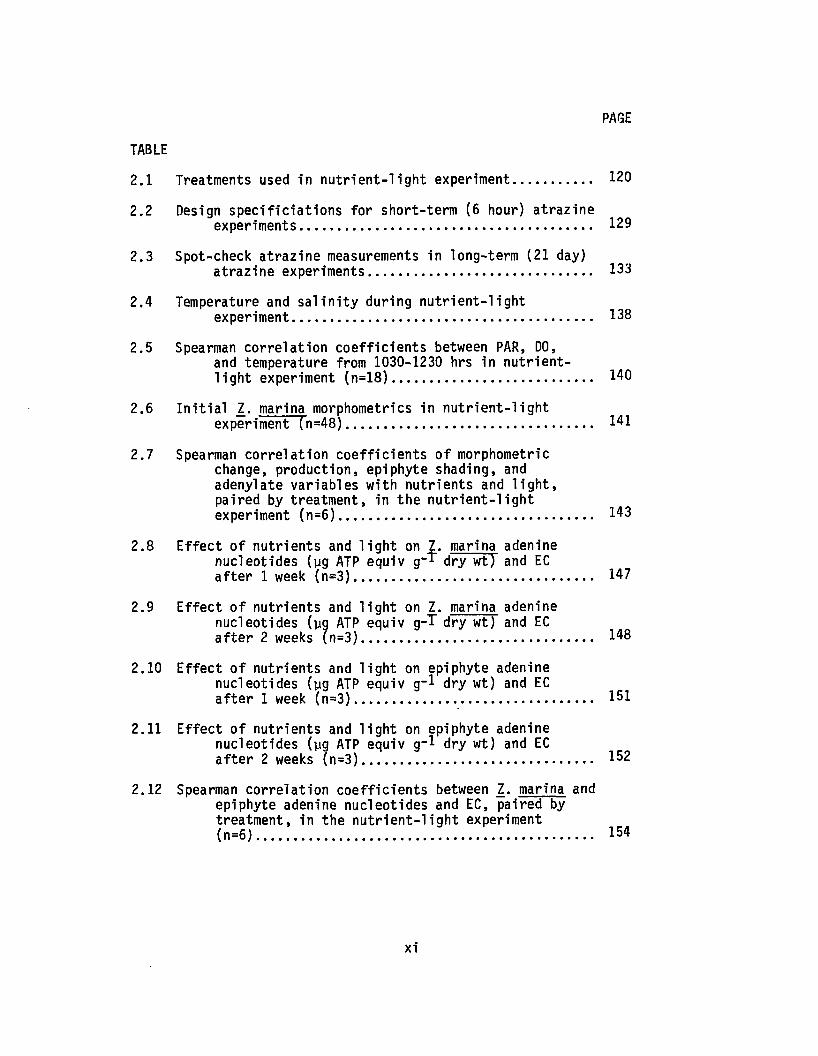
2.1 Treatments used in n u tr ie n t-lig h t experiment..................... 120
2.2 Design specific ia tions for short-term (6 hour) atrazineexperiments................................................................................ 129
2.3 Spot-check atrazine measurements in long-term (21 day)atrazine experiments............................................................. 133
2.4 Temperature and s a lin ity during n u tr ie n t-lig h texperiment.................................................................................. 138
2.5 Spearman correlation coeffic ien ts between PAR, DO,and temperature from 1030-1230 hrs in nu trien t- lig h t experiment (n=18)...................................................... 140
2.6 In i t ia l 1. marina morphometries in n u tr ie n t-lig h texperiment (n=48)................................................................... 141
2.7 Spearman correlation coeffic ien ts o f morphometricchange, production, epiphyte shading, and adenylate variables with nutrients and l ig h t , paired by treatm ent, in the n u tr ie n t-lig h t experiment (n=6)..................................................................... 143
2.8 E ffect o f nutrients and lig h t on Z. marina adeninenucleotides (pg ATP equiv g-1" dry w t) and ECa fte r 1 week (n=3)................................................................ 147
2.9 E ffect o f nutrients and lig h t on Z. marina adeninenucleotides (yg ATP equiv g-T dry wt) and ECa fte r 2 weeks (n=3).............................................................. 148
2.10 E ffect o f nutrients and lig h t on epiphyte adeninenucleotides (yg ATP equiv g-1 dry wt) and ECa fte r 1 week (n=3)................................................................ 151
2.11 E ffect o f nutrients and lig h t on epiphyte adeninenucleotides (yg ATP equiv g-1 dry wt) and ECa fte r 2 weeks (n=3).............................................................. 152
2.12 Spearman correlation coeffic ien ts between 2. marina andepiphyte adenine nucleotides and EC, paired bytreatment, in the n u tr ie n t- lig h t experiment(n=6)................................................ : ........... 154
xi
PAGE
TABLE
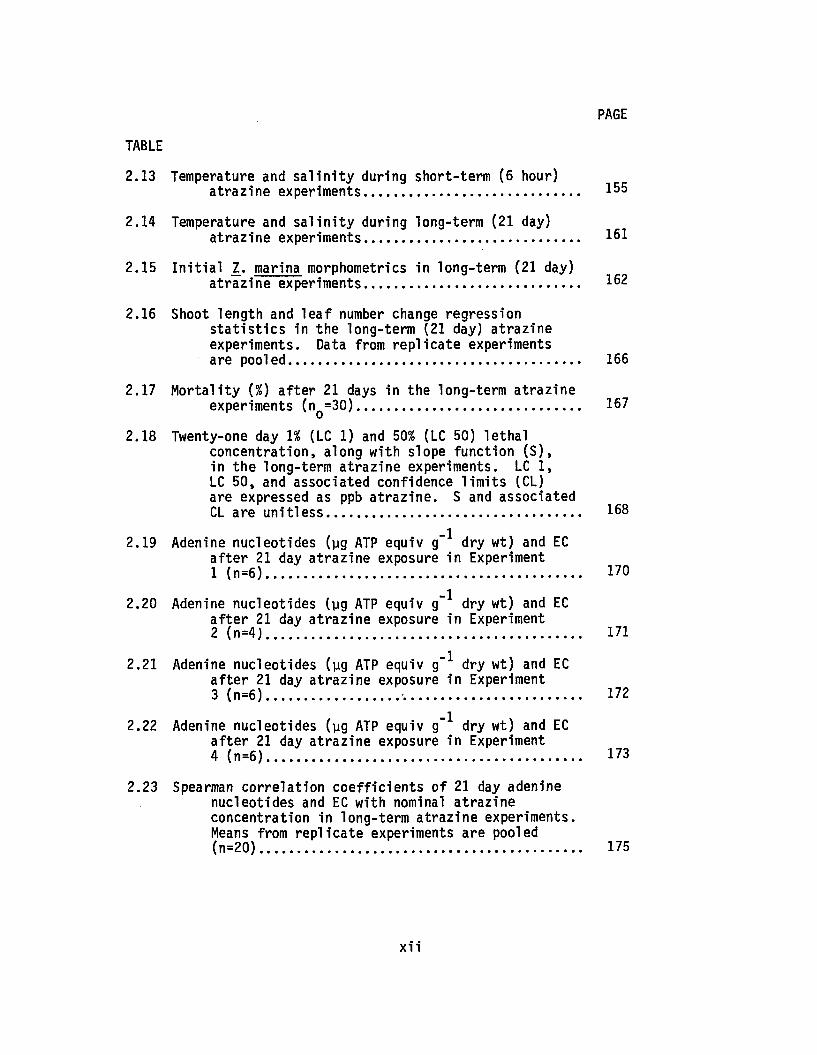
2.13 Temperature and s a lin ity during short-term (6 hour)atrazine experiments........................................................... 155
2.14 Temperature and s a lin ity during long-term (21 day)atrazine experiments........................................................... 161
2.15 In i t ia l 1. marina morphometries in long-term (21 day)atrazine experiments........................................................... i62
2.16 Shoot length and le a f number change regressions ta tis t ic s in the long-term (21 day) atrazine experiments. Data from rep lica te experiments are pooled............................................................................... 166
2.17 M o rta lity (%) a fte r 21 days in the long-term atrazineexperiments (nQ=30)............................................................. 167
2.18 Twenty-one day 1% (LC 1) and 50% (LC 50) le tha lconcentration, along with slope function (S ), in the long-term atrazine experiments. LC 1,LC 50, and associated confidence lim its (CL)are expressed as ppb a traz in e . S and associatedCL are u n itl ess..................................................................... 168
2.19 Adenine nucleotides (yg ATP equiv g”* dry wt) and ECa fte r 21 day atrazine exposure in Experiment1 (n=6)..................................................................................... 170
2.20 Adenine nucleotides (yg ATP equiv g~* dry wt) and ECa fte r 21 day atrazine exposure in Experiment2 (n=4).................................. 171
2.21 Adenine nucleotides (yg ATP equiv g~* dry wt) and ECa fte r 21 day atrazine exposure in Experiment3... (n=6).................................... 172
2.22 Adenine nucleotides (yg ATP equiv g~* dry wt) and ECa fte r 21 day atrazine exposure in Experiment4 (n=6)..................................................................................... 173
2.23 Spearman correlation coeffic ien ts of 21 day adeninenucleotides and EC with nominal atrazine concentration in long-term atrazine experiments.Means from rep lica te experiments are pooled(n=20)........................................................................................ 175
x i i
PAGE
TABLE
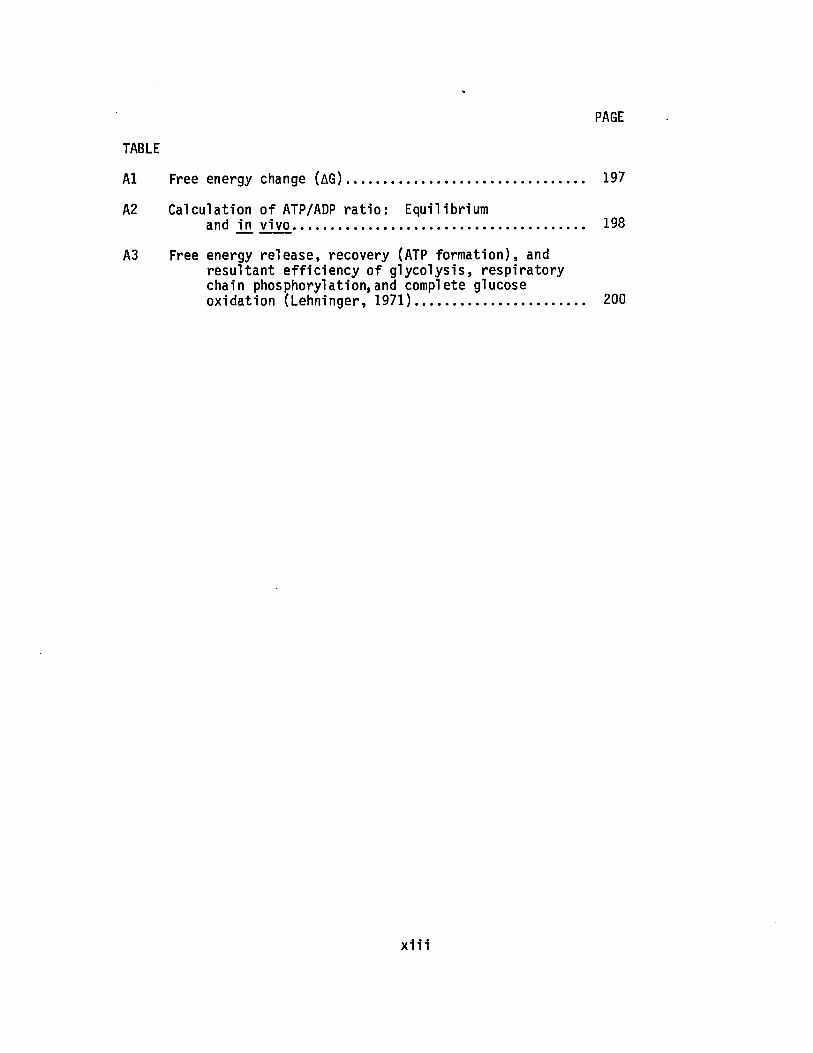
A1 Free energy change (AG)................................................................. 197
A2 Calculation o f ATP/ADP ra t io : Equilibriumand j j i v ivo ................................................................................ 198
A3 Free energy release, recovery (ATP form ation), andresultant e ffic ien cy of g lycolysis, respiratory chain phosphorylation,and complete glucose oxidation (Lehninger, 1971).............................................. 200
x i i i
LIST OF FIGURES
PAGE
FIGURE
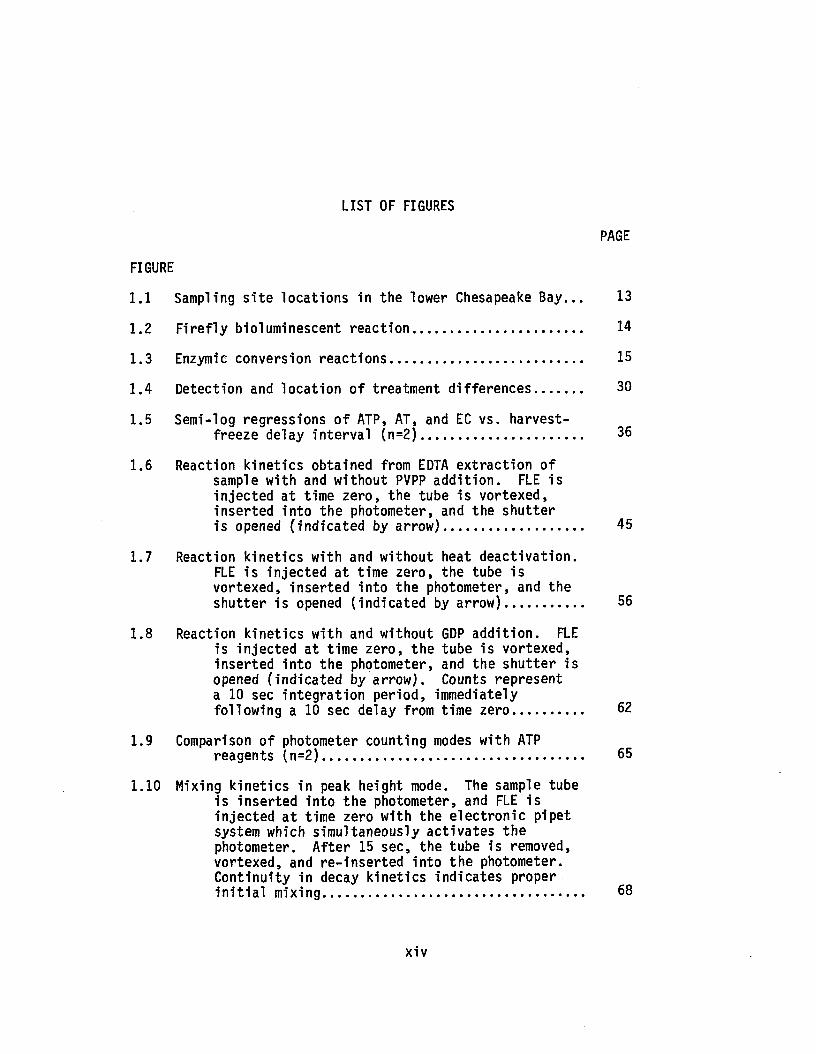
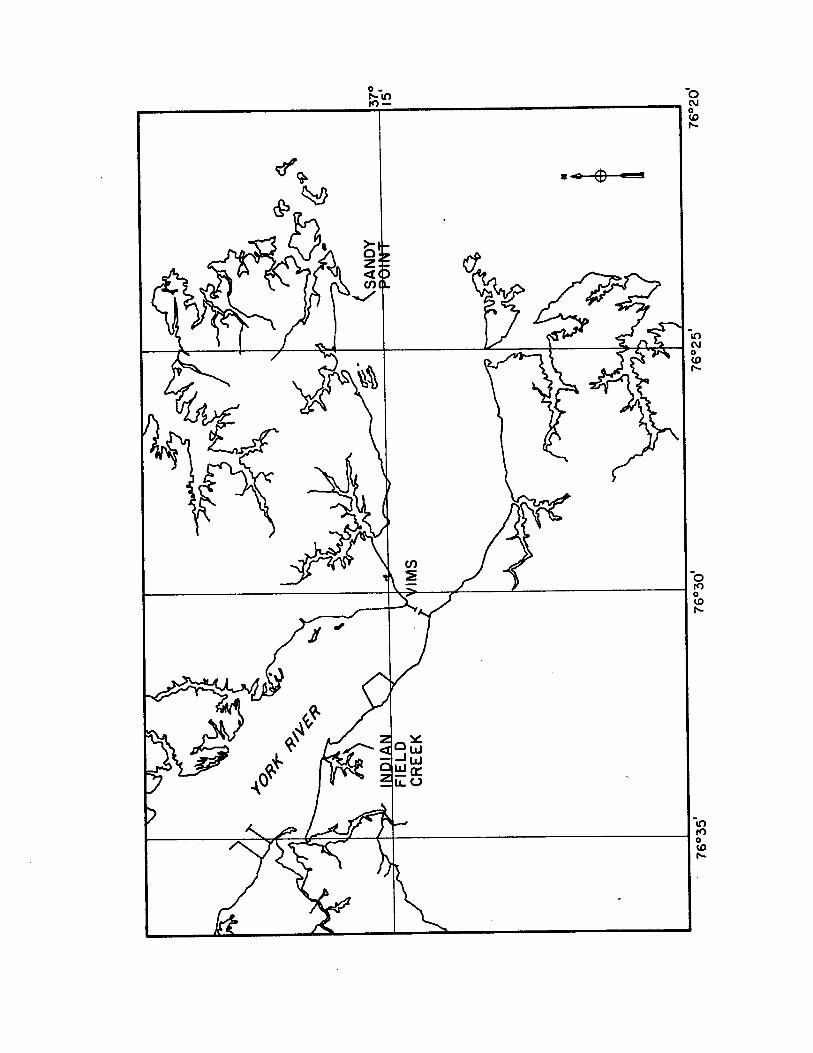
1.1 Sampling s ite locations in the lower Chesapeake B ay... 13
1.2 F ire fly bioluminescent reaction ............................................... 14
1.3 Enzymic conversion reactions..................................................... 15
1.4 Detection and location o f treatment d ifferences 30
1.5 Semi-log regressions o f ATP, AT, and EC vs. harvest-freeze delay in terval (n=2)............................................ 36
1.6 Reaction kinetics obtained from EDTA extraction ofsample with and without PVPP addition . FLE is injected at time zero, the tube is vortexed, inserted into the photometer, and the shutter is opened (indicated by arrow )...................................... 45
1.7 Reaction kinetics with and without heat deactivation.FLE is injected at time zero, the tube is vortexed, inserted into the photometer, and the shutter is opened (indicated by arrow )....................... 56
1.8 Reaction kinetics with and without GDP addition. FLEis injected at time zero, the tube is vortexed,inserted into the photometer, and the shutter isopened (indicated by arrow). Counts representa 10 sec integration period, immediatelyfollowing a 10 sec delay from time zero.................. 62
1.9 Comparison o f photometer counting modes with ATPreagents (n=2)....................................................................... 65
1.10 Mixing kinetics in peak height mode. The sample tubeis inserted into the photometer, and FLE is in jected a t time zero with the e lectronic pipet system which simultaneously activates the photometer. A fter 15 sec, the tube is removed, vortexed, and re-inserted into the photometer. Continuity in decay kinetics indicates proper in i t ia l mixing....................................................................... 68
x iv
PAGE
FIGURE
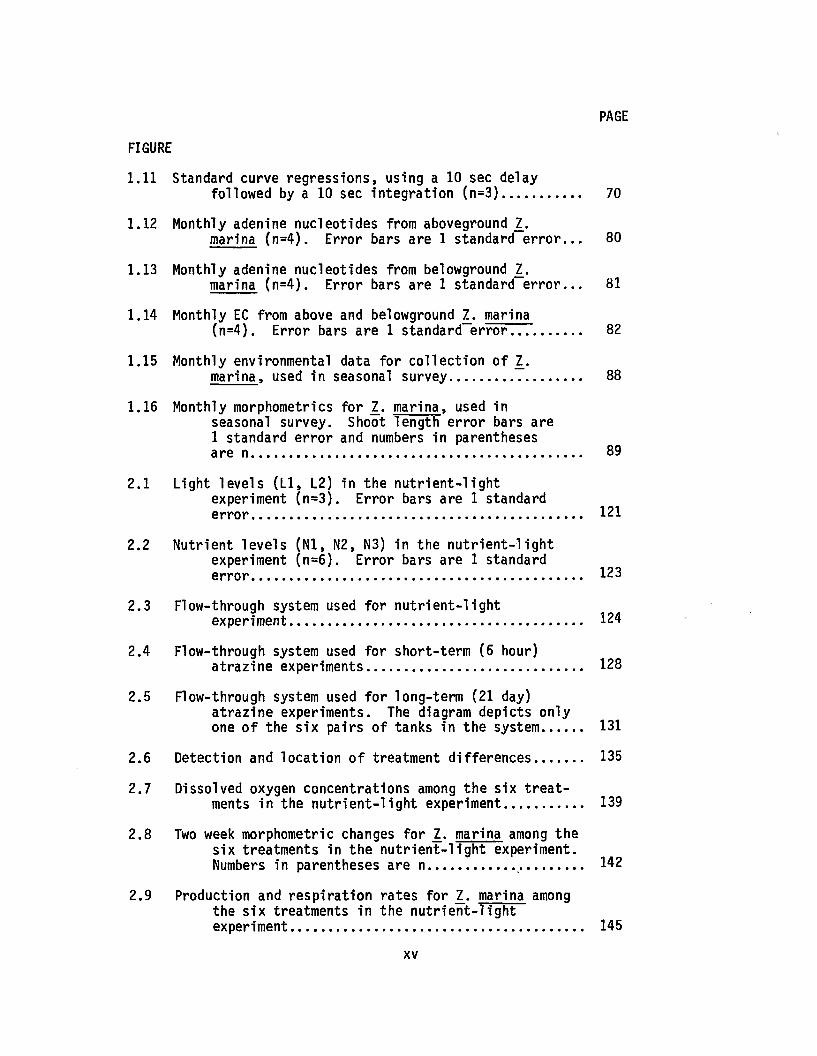
1.11 Standard curve regressions, using a 10 sec delayfollowed by a 10 sec integration (n=3)..................... 70
1.12 Monthly adenine nucleotides from aboveground 1.marina (n=4). Error bars are 1 standard e r r o r . . . 80
1.13 Monthly adenine nucleotides from belowground 1.marina (n=4). Error bars are 1 standard e r r o r . . . 81
1.14 Monthly EC from above and belowground Z. marina(n=4). Error bars are 1 standard e rro r ................... 82
1.15 Monthly environmental data for co llection o f 1.marina, used in seasonal survey.................................... 88
1.16 Monthly morphometries for 1. marina, used inseasonal survey. Shoot length error bars are1 standard error and numbers in parenthesesare n.......................................................................................... 89
2.1 Light levels (L I, L2) in the n u tr ie n t-lig h texperiment (n=3). Error bars are 1 standarde rro r .......................................................................................... 121
2.2 Nutrient levels (N l, N2, N3) in the n u tr ie n t-lig h texperiment (n=6). Error bars are 1 standarde rro r.......................................................................................... 123
2.3 Flow-through system used for n u tr ie n t-lig h texperiment................................................................................ 124
2.4 Flow-through system used for short-term (6 hour)atrazine experiments........................................................... 128
2.5 Flow-through system used fo r long-term (21 day)atrazine experiments. The diagram depicts only one o f the s ix pairs o f tanks in the system 131
2.6 Detection and location o f treatment d ifferences 135
2.7 Dissolved oxygen concentrations among the six t re a tments in the n u tr ie n t-lig h t experiment..................... 139
2.8 Two week morphometric changes fo r 1. marina among thesix treatments in the n u tr ie n t-lig h t experiment. Numbers in parentheses are n........................ 142
2.9 Production and respiration rates for 2. marina amongthe six treatments in the n u tr ie n t-lig h t experiment................................................................................ 145
xv
PAGE
FIGURE
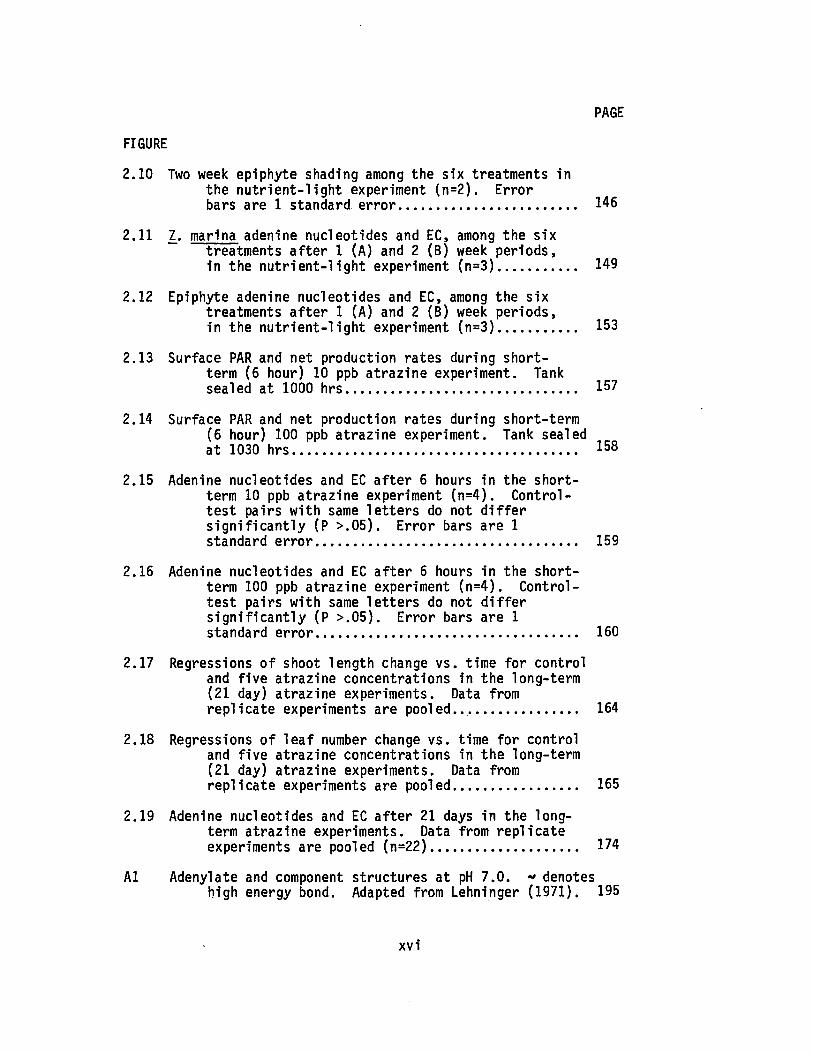
2.10 Two week epiphyte shading among the six treatments inthe n u tr ie n t-lig h t experiment (n=2). Errorbars are 1 standard e rro r ................................................ 146
2.11 Z. marina adenine nucleotides and EC, among the sixtreatments a fte r 1 (A) and 2 (B) week periods,in the n u tr ie n t-lig h t experiment (n=3)................... 149
2.12 Epiphyte adenine nucleotides and EC, among the sixtreatments a fte r 1 (A) and 2 (B) week periods,in the n u tr ie n t-lig h t experiment (n=3)................... 153
2.13 Surface PAR and net production rates during shortterm (6 hour) 10 ppb atrazine experiment. Tank sealed at 1000 hrs............................................................... 157
2.14 Surface PAR and net production rates during short-term(6 hour) 100 ppb atrazine experiment. Tank sealed at 1030 h r s . . . . ........................... 158
2.15 Adenine nucleotides and EC a fte r 6 hours in the shortterm 10 ppb atrazine experiment (n=4). Control- tes t pairs with same le tte rs do not d if fe r s ig n ific a n tly (P > .0 5 ). Error bars are 1 standard e rro r ....................................................................... 159
2.16 Adenine nucleotides and EC a fte r 6 hours in the shortterm 100 ppb atrazine experiment (n=4). Control- test pairs with same le tte rs do not d if fe r s ig n ific a n tly (P > .0 5 ). Error bars are 1 standard e rro r ....................................................................... 160
2.17 Regressions o f shoot length change vs. time for controland five atrazine concentrations in the long-term(21 day) atrazine experiments. Data fromrep lica te experiments are poo led ................................ 164
2.18 Regressions o f le a f number change vs. time for controland five atrazine concentrations in the long-term(21 day) atrazine experiments. Data fromrep lica te experiments are pooled.................................. 165
2.19 Adenine nucleotides and EC a fte r 21 days in the longterm atrazine experiments. Data from rep lica te experiments are pooled (n=22)........................................ 174
A1 Adenylate and component structures at pH 7 .0 . «* denoteshigh energy bond. Adapted from Lehninger (1971). 195
xv i
PAGE
FIGURE
A2 Metabolic design o f a photoautotrophic andheterotrophic c e l l . Adapted from Atkinson (1977a)..
A3 Electron transport in oxygen-evolving photosynthesisin plants, diagrammed in terms o f the standard redox potentials (E*) o f the in teracting redox couples. Adapted from Lehninger (1975)..........................
A4 Relative adenine nucleotide concentrations, as afunction o f energy charge. Adapted from Atkinson (1977a)..........................................................................
A5 Phosphate transfer from high energy donors to lowenergy acceptors. Adapted from Lehninger (1971)-----
A6 Channeling o f ATP phosphate bond energy into specificbiosynthetic pathways. Adapted from Lehninger (1971)..........................................................................
A7 Velocity o f reactions which regenerate (R) andu t i l iz e (U) ATP, as a function o f energy charge. Adapted from Atkinson (1977a)..............................................
A8 Regulation o f g lycolysis, TCA cycle, and electrontransport chain by positive (ADP) and negative (ATP, c itra te ) modulation. Adapted from Lehninger (1971).........................................................................
xv i i
ABSTRACT
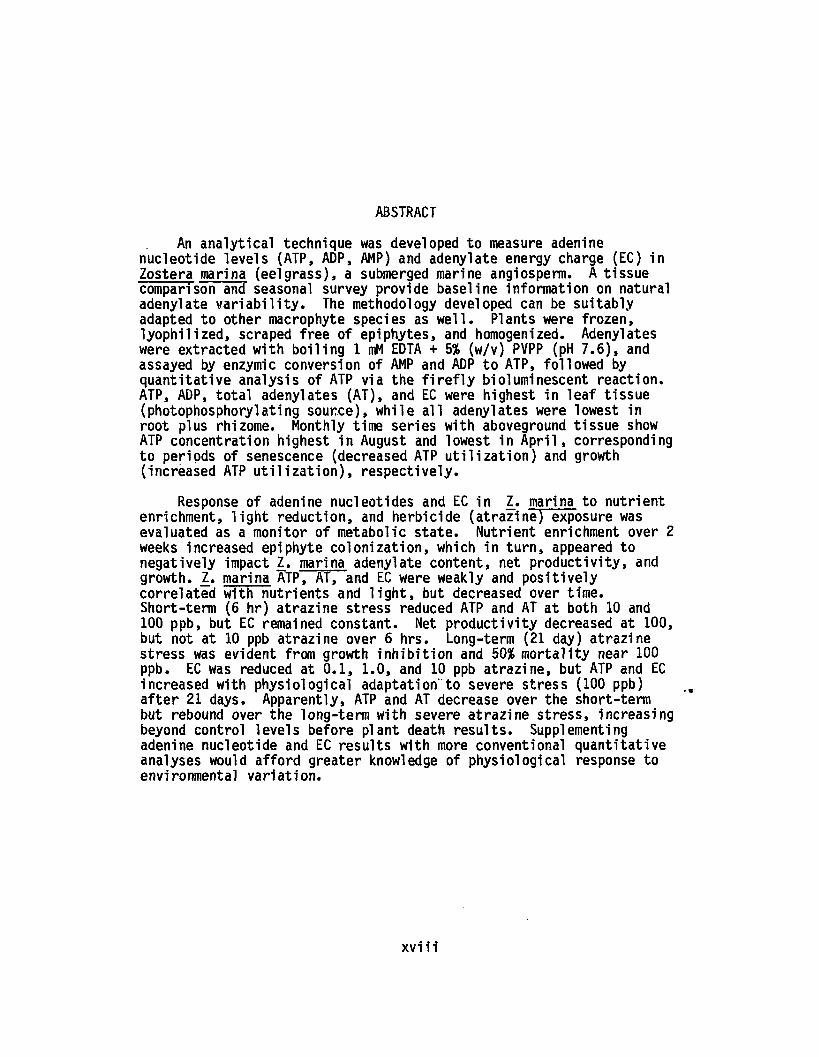
An analytical technique was developed to measure adenine nucleotide levels (ATP, ADP, AMP) and adenylate energy charge (EC) in Zostera marina (eelgrass), a submerged marine angiosperm. A tissue comparison and seasonal survey provide baseline information on natural adenylate v a r ia b ili ty . The methodology developed can be suitably adapted to other macrophyte species as w e ll. Plants were frozen, lyoph ilized , scraped free of epiphytes, and homogenized. Adenylates were extracted with boiling 1 mM EDTA + 5% (w/v) PVPP (pH 7 .6 ) , and assayed by enzymic conversion of AMP and ADP to ATP, followed by quantita tive analysis of ATP via the f i r e f ly bioluminescent reaction. ATP, ADP, to ta l adenylates (AT), and EC were highest in le a f tissue (photophosphorylating source), while a ll adenylates were lowest in root plus rhizome. Monthly time series with aboveground tissue show ATP concentration highest in August and lowest in A p r il , corresponding to periods of senescence (decreased ATP u t i l iz a t io n ) and growth (increased ATP u t i l iz a t io n ) , respectively.
Response of adenine nucleotides and EC in Z. marina to nutrient enrichment, l ig h t reduction, and herbicide (a traz in e ) exposure was evaluated as a monitor of metabolic s ta te . Nutrient enrichment over 2 weeks increased epiphyte co lonization , which in tu rn , appeared to negatively impact Z. marina adenylate content, net productiv ity , and growth. Z. marina ATP, AT, and EC were weakly and positive ly correlated with nutrients and l ig h t , but decreased over time. Short-term (6 hr) atrazine stress reduced ATP and AT a t both 10 and 100 ppb, but EC remained constant. Net productivity decreased at 100, but not at 10 ppb atrazine over 6 hrs. Long-term (21 day) atrazine stress was evident from growth in h ib itio n and 50% m orta lity near 100 ppb. EC was reduced at 0 .1 , 1 .0 , and 10 ppb a trazin e , but ATP and EC increased with physiological adaptation' to severe stress (100 ppb) a fte r 21 days. Apparently, ATP and AT decrease over the short-term but rebound over the long-term with severe atrazine stress, increasing beyond control levels before plant death resu lts . Supplementing adenine nucleotide and EC results with more conventional quantitative analyses would afford greater knowledge of physiological response to environmental varia tion .
ADENINE NUCLEOTIDE LEVELS AND ADENYLATE ENERGY CHARGE
IN ZOSTERA MARINA (EELGRASS): DETERMINATION AND APPLICATION
GENERAL INTRODUCTION
Adenylate Energy Charge
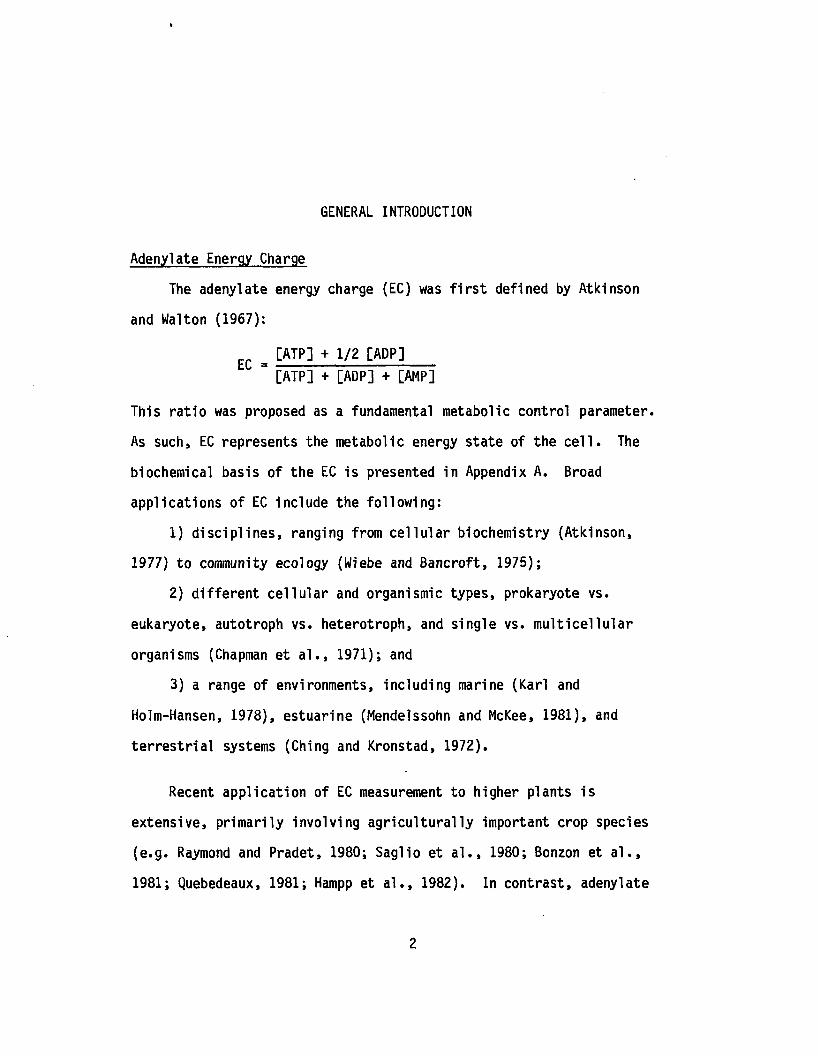
The adenylate energy charge (EC) was f i r s t defined by Atkinson
and Walton (1967):
cc _ [ATP] + 1/2 [ADP]~ [ATP] + [ADP] + [AMP]
This ra tio was proposed as a fundamental metabolic control parameter.
As such, EC represents the metabolic energy state of the c e l l . The
biochemical basis of the EC is presented in Appendix A. Broad
applications of EC include the following:
1) d isc ip lines , ranging from c e llu la r biochemistry (Atkinson,
1977) to community ecology (Wiebe and Bancroft, 1975);
2) d iffe re n t c e llu la r and organismic types, prokaryote vs.
eukaryote, autotroph vs. heterotroph, and single vs. multi c e llu la r
organisms (Chapman et a l . , 1971); and
3) a range of environments, including marine (Karl and
Holm-Hansen, 1978), estuarine (Mendelssohn and McKee, 1981), and
te r re s tr ia l systems (Ching and Kronstad, 1972).
Recent application of EC measurement to higher plants is
extensive, prim arily involving a g ric u ltu ra lly important crop species
(e .g . Raymond and Pradet, 1980; Saglio et a l . , 1980; Bonzon et a l . ,
1981; Quebedeaux, 1981; Hampp et a l . , 1982). In contrast, adenylate
2

l ite ra tu re on seagrasses (Knauer and Ayers, 1977) is extremely
lim ited . Plants respond to environmental stress in numerous ways
(L e v itt , 1972; Cottenie and Camerlynck, 1979; Rabe and Kreeb, 1979).
Since the metabolic energy state of an organism is sensitive to
environmental va ria tio n , both natural and anthropogenic, EC has been
advanced as an index of sublethal stress (Ivanovic i, 1980).
Ecology of Zostera marina
Zostera marina (eelgrass), a submerged marine angiosperm,
functions as a food source, h ab ita t, nutrient pump, and sediment
s ta b iliz e r . The basic biology (S etch e ll, 1929; Burkholder and Doheny,
1968; Harrison and Mann, 1975; Orth et a l . , 1981) and ecological value
(McRoy and H e lffe rich , 1977; Stevenson and Confer, 1978; P h illip s and
McRoy, 1980; Wetzel et a l . , 1981) of Z. marina have been well
documented.
H is to ric a lly and more recently , the d is tribu tio n and abundance of
Z. marina have undergone large fluctuations in the Chesapeake Bay
(Orth and Moore, 1981). The reduction of eel grass beds has been
attribu ted to disease (Renn, 1934), temperature increase (Orth, 1976),
herbicide input (Stevenson and Confer, 1978), cownose ray disturbance
(Orth, 1975), and to a lesser exten t, dredging and boating a c tiv it ie s
(Orth, 1976). A re lia b le method to assess the metabolic state of
eel grass is , therefore , essentia l. Application of energy charge
measurement to Z. marina is a logical choice.
Objectives
1. A major objective of th is study was development of a methodology
to q u an tita tive ly measure adenine nucleotides and adenylate energy
charge (EC) in Zostera marina (eelgrass). The remaining objectives
have incorporated these optimized techniques.
2. Adenylates and EC were compared among Z. marina tissues, including
le a f , le a f sheath, root plus rhizome, and seed pod. Comparative
measurements were made on eel grass epiphytes, aboveground Ruppia
maritima (widgeongrass), and aboveground Spartina a lte rn if lo ra
(saltmarsh cordgrass).
3. Monthly varia tion of adenylates and EC was assessed in above and
belowground Z. marina tissue over a one year period. Associated
environmental and morphometric data were collected.
4. Adenylate and EC responses to three nutrient levels and two lig h t
leve ls , over 1 and 2 week periods, were examined in 1. marina le a f
tissue and epiphytes. A d d itiona lly , morphometric, productiv ity , and
epiphyte colonization data were obtained.
5. Adenylate and EC responses to two atrazine levels over 6 hours,
and f iv e atrazine levels over 21 days, were assessed in 1. marina le a f
tissue. Hourly production rates were measured during the 6 hour
experiment. Weekly morphometric changes and m orta lity were examined
over the 21 day atrazine exposure period.
Overview
This d issertation is divided into two major sections. Section 1
(Objectives 1-3) focuses on analytical determination of adenine
nucleotides. Section 2 (Objectives 4 and 5) evaluates adenylate
response to selected environmental variab les. Appendix A reviews the
metabolic role of the adenine nucleotides. Appendix B outlines
assumptions underlying several parametric procedures, used in
s ta tis t ic a l analyses.
REFERENCES
Atkinson, D. E. 1977. C e llu lar energy metabolism and its regulation Academic Press, N. Y. 293 p.
Atkinson, D. E. and 6. M. Walton. 1967. Adenosine triphosphate conservation in metabolic regulation. J. B io l. Chem. 242:3239-3241.
Bonzon, M ., M. Hug, E. Wagner, and H. Greppin. 1981. Adeninenucleotides and energy charge evolution during the induction of flowering in spinach leaves. Planta 152:189-194.
Burkholder, P. R. and T. E. Doheny 1968. The biology of eelgrass. Lamont Geol. Obs. No. 1227. 120 p.
Chapman, A. G., L. F a l l , and D. E. Atkinson. 1971. Adenylate energy charge in Escherichia co li during growth and starvation. J. Bact. 108:1072-1086.
Ching, T. M. and W. E. Kronstad. 1972. Varietal differences in growth p o ten tia l, adenylate energy le v e l, and energy charge of wheat. Crop Sci. 12:785-789.
Cottenie, A. and R. Camerlynck. 1979. Chemical aspects of stress in plants. Meded. K. Acad. Wet. L e tt. Schone Kunsten BeTg. K. Wet. 41(4):1 -21 .
Hampp, R ., M. G o llie r , and H. Z ieg ler. 1982. Adenylate leve ls , energy charge, and phosphorylation potential during d ark -lig h t and ligh t-dark tra n s itio n in chloroplasts, mitochondria, and cytosol of mesophyll protoplasts from Avena sativa L. Plant Physiol. 69: 448-455.
Harrison, P. G. and K. H. Mann. 1975. Chemical changes duringseasonal cycle of growth and decay in eelgrass ( Zostera marina) on the A tlan tic coast of Canada. J. Fish. Res. Bd. Canada 32:615-621.
Ivanovici, A. M. 1980. Application of adenylate energy charge to problems of environmental impact assessment in aquatic organisms Helg. Meers. 33(1-4):556-565.
K arl, D. M. and 0. Holm-Hansen. 1978. Methodology and measurement of adenylate energy charge ratios in environmental samples. Mar. B io l. 48:185-197.
Knauer, G. A. and A. V. Ayers. 1977. Changes in carbon, nitrogen, adenosine triphosphate and chlorophyll a in decomposing Thalassia testudinum leaves. Limnol. Oceanogr. 22:408-414.
L e v it t , J . 1972. Responses of plants to environmental stresses. Academic Press, N.Y. 697 p.
McRoy, C. P. and C. H e lffe rich (eds). 1977. Seagrass ecosystems: As c ie n tific perspective. Marcel Dekker, In c ., N.Y. 314 p.
Mendelssohn, I . A. and K. L. McKee. 1981. Determination of adenine nucleotide levels and adenylate energy charge ra tio in two Spartina species. Aq. Bot. 11:37-55.
Orth, R. J . 1975. Destruction of eelgrass, Zostera marina, by the cownose ray, Rhinoptera bonasus, in the Chesapeake Bay.Chesapeake S c i. 16:205-208.
Orth, R. J . 1976. The demise and recovery of eelgrass, Zostera marina, in the Chesapeake Bay, V irg in ia . Aq. Bot. 2:141-159.
Orth, R. J . and K. A. Moore. 1981. D istribu tion and abundance ofsubmerged aquatic vegetation in the Chesapeake Bay: A s c ie n tific summary. Final Report, US EPA, Chesapeake Bay Program, VIMS SRAMSOE No. 259.
Orth, R. J . , K. A. Moore, M. H. Roberts, and G. M. Silberhorn. 1981. The biology and propagation of eelgrass, Zostera marina, in the Chesapeake Bay, V irg in ia . Final Report, US EPA, Chesapeake Bay Program, Grant No. R805953, VIMS.
P h illip s , R. C. and C. P. McRoy (e d s .). 1980. Handbook of seagrassbiology: An ecosystem perspective. Garland STPM Press, N. Y.353 p.
Quebedeaux, B. 1981. Adenylate and nicotinamide nucleotides in developing soybean seeds during s e e d -f i l l . Plant Physiol. 68:23-27.
Rabe, R. and K. H. Kreeb. 1979. Enzyme a c t iv it ie s and chlorophyll and protein content in plants as indicators of a ir po llu tion . Environ. P o llu t. 19:119-137.
Raymond, P. and A. Pradet. 1980. S tab iliza tio n of adenine nucleotide ratios at various values by an oxygen lim ita tio n of respiration in germinatinq le ttuce (Lactuca sativa) seeds. Biochem. J . 190:39-44.
8
Renn, C. E. 1934. Wasting disease of Zostera in American waters. Nature 134:416-417.
Saglio, P. H ., P. Raymond, and A. Pradet. 1980. Metabolic a c tiv ity and energy charge of excised maize root tip s under anoxia. Plant Physiol. 66:1053-1057.
S etch ell, W. A. 1929. Morphological and phenological notes on Zostera marina L. Univ. C a lif . Publ. Bot. 14:398-452.
Stevenson, J . C. and N. M. Confer. 1978. Summary of available information on Chesapeake Bay submerged vegetation. USFWS/OBS-78/66. 335 p.
Wetzel, R ., K. Webb, P. Penhale, R. Orth, J. van Montfrans, R. Diaz,J. M erriner, and G. Boehlert. 1981. Functional ecology of eelgrass. Final Report, US EPA, Chesapeake Bay Program, Grant No. R805974, VIMS.
Wiebe, W. J . and K. Bancroft. 1975. Use of the adenylate energy charge ra tio to measure growth state of natural microbial communities. Proc. Nat. Acad. Sci. 72:2112-2115.

SECTION 1. DETERMINATION
INTRODUCTION
Adenine nucleotides, expressed as the adenylate energy charge
(EC) r a t io , regulate c e llu la r energetics (Atkinson, 1977). Problems
associated with methodology fo r the determination o f in s itu adenine
nucleotide levels may l im it the u t i l i t y of the EC concept, in general
(Pradet and Raymond, 1978; K arl, 1980; Ivanovici, 1980). Methodology
must be ta ilo red to the specific chemical characteristics of a
p articu la r biological material in order to accurately determine in
s itu levels of in tra c e llu la r adenine nucleotides. In add ition , ease
of operation and reproducib ility are essential to any useful
analytical technique.
The most frequently employed methods fo r determination of adenine
nucleotides have involved enzymic conversion of adenosine
monophosphate (AMP) and adenosine diphosphate (ADP) to equivalent
amounts of adenosine triphosphate (ATP), followed by quantita tive
analysis of the ATP via the f i r e f ly bioluminescent reaction (Karl and
Holm-Hansen, 1978). Determination of ATP by the f i r e f ly luciferase
reaction, reviewed by Leach (1982), has been widely applied (DeLuca,
1978; DeLuca and McElroy, 1981). A fter reviewing the l ite ra tu re ,
Sofrova and Leblova (1970) concluded that the f i r e f ly reaction is the
most rapid , sensitive , and specific method fo r ATP determination in
plant tissue. Several studies, which s p e c ifica lly address methodology
10
11
fo r adenylate determination in higher plants, have u tiliz e d the
f i r e f ly reaction (Pradet, 1967; Guinn and Eidenbock, 1972; DeGreef et
a l . , 1979; Mendelssohn and McKee, 1981).
Employing the f i r e f ly assay, th is study developed a methodology
to optimize determination of adenine nucleotides in Zostera marina
(eelgrass), a submerged marine angiosperm. Z. marina is an
ecologically important macrophyte species (McRoy and H e lffe rich , 1977;
Stevenson and Confer, 1978; P h illip s and McRoy, 1980; Wetzel e t . a l . ,
1981; Orth et a l . , 1981), occurring in temperate and subarctic coastal
and estuarine waters in the Northern Hemisphere (den Hartog, 1970).
Major analytical procedures were evaluated, including sample
collection and preparation, adenylate extraction , conversion of AMP
and ADP to ATP, f i r e f ly lantern extract preparation, and photometry.
Methodology fo r adenylate determination, presented in the Methods
section, represents methodology which has been optimized from
experimental data presented in the Results section. Tissue
composition and seasonal patterns of adenine nucleotides were also
assessed in order to provide baseline information on natural adenylate
v a r ia b ili ty in Z. marina.
METHODS
Sampling sites
Zostera marina was collected at low tid e from an extensive
grassbed (37°15'40" N, 76o23'50" W) o ff Sandy Point at the mouth of
the York River in the lower Chesapeake Bay estuary. This bed is close
to the laboratory and accessible by land. Epiphytes and Ruppia
maritima were also obtained from Sandy Point. Spartina a lte rn if lo ra
was collected from nearby Indian Field Creek (37°16'5" N, 76°33'30"
W). Locations of these sites are shown in Figure 1.1 .
Adenine Nucleotides
Assay Principles
Adenylate assay reactions have been described by Pradet (1967),
Holm-Hansen and Karl (1978), and DeLuca (1976). ATP was assayed with
the f i r e f ly bioluminescent reaction (Figure 1 .2 ) . AMP and ADP were
f i r s t converted enzymically to ATP (Figure 1 .3 ) , which was then
analyzed by the f i r e f ly reaction. The equilibrium constant fo r the PK
reaction is s u ffic ie n tly large to convert most ADP, and consequently
most AMP, to ATP (Adam, 1965).
Sample Collection and Preparation
Plants were uprooted with a shovel, swirled in r iv e r water to
remove macro-algae and loose sediment, and stuffed in a 180 or 530 ml
p lastic bag (W hirl-Pak). Liquid nitrogen was poured into the bag
12
Figure 1.1. Sampling site locations in the lower Chesapeake Bay.
o - SlOcvj
1T)
CO
23
Figure 1.2. Firefly bioluminescent reaction.
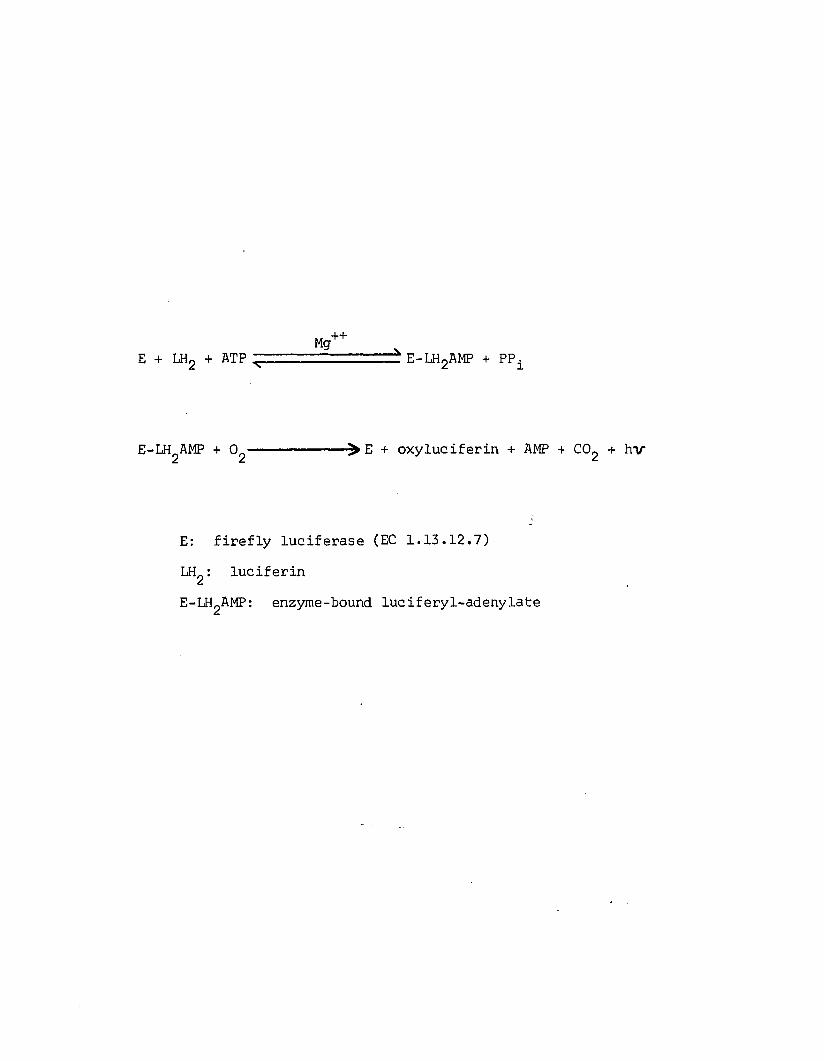
E + LH2 + ATP ~ ^ E - L H 2AMP + PP±
E-LH2AMP + 02-------------^ E + oxyluciferin + AMP + CC^ + h v
E: firefly luciferase (EC 1.13.12.7)
LH2 : luciferin
E-LHgAMP: enzyme-bound luciferyl-adenylate
Figure 1.3. Enzymic conversion reactions.
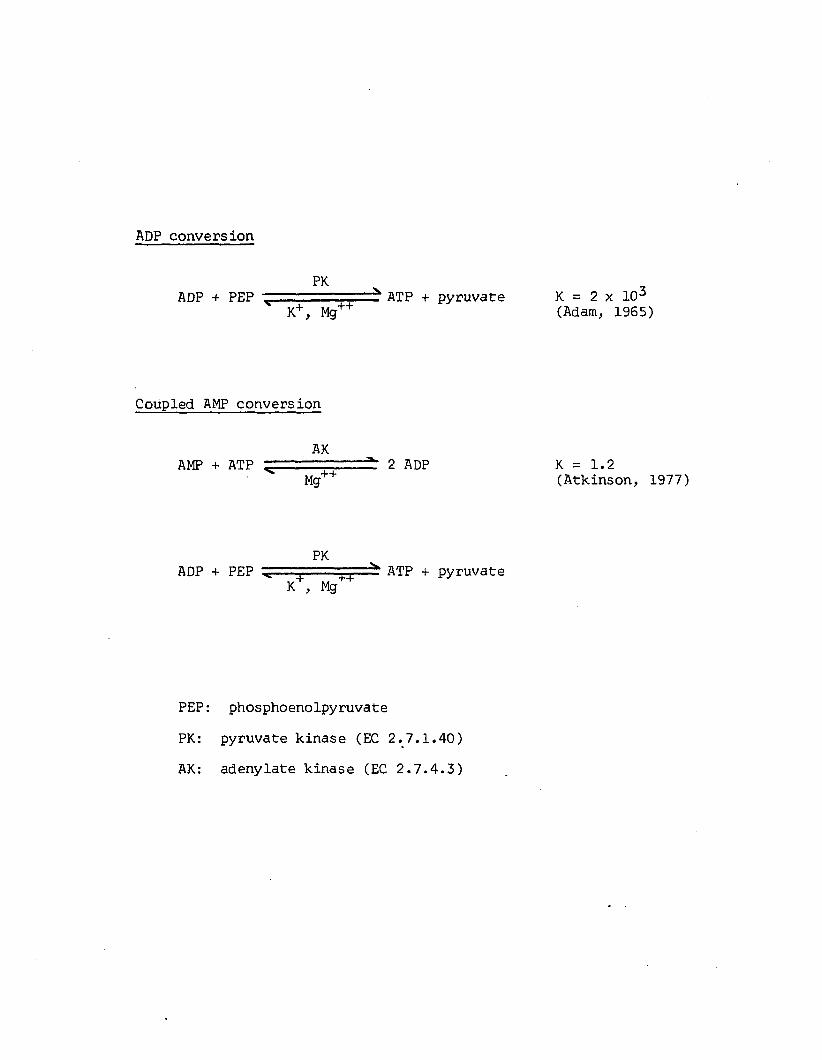
ADP c o n v e r s io n
PKADP + PEP v ATP + pyruvate
K+, Mg++
Coupled AMP conversion
AKamp + atp ■ 1 'znf* 2 adp^ ITMg
PKADP + PEP v — j . . ■— ^ ATP + pyruvate
K , Mg
PEP: phosphoenolpyruvate
PK: pyruvate kinase (EC 2.7.1.40)
AK: adenylate kinase (EC 2.7.4.3)
K = 2 x 10³ (Adam, 1965)
K = 1.2(Atkinson, 1977)
(w ith in 1 min of harvest), and the en tire bag was submerged in liqu id
nitrogen contained in a 4 1 polyethelene dewar flask (Nalgene) fo r
return to the laboratory.
Liquid nitrogen was drained from the bag which was kept opened
and placed in a ly o p h ilize r. The chamber was sealed, and vacuum was
in it ia te d , with condenser temperature allowed to reach -55°C before
sample introduction. Chamber shelves, which support the sample, were
not heated. Samples were lyophilized fo r 70-90 hrs.
A fter ly o p h iliza tio n , plant tissue was handled with forceps to
prevent hydration. Brown aboveground tissue was discarded, since th is
material was considered dead at time of harvest. Leaves were scraped
with a f la t spatula which removes 70-90% of the epiphytes (Penhale,
1977).
For methodology experiments (excluding freeze delay), plants were
pooled to provide a uniform substrate fo r experimental treatments.
For tissue comparison and seasonal survey experiments, plants w ithin a
treatment ( i . e . tissue type or monthly sample, respectively) were
pooled in order to minimize w ithin treatment varia tion and spotlight
between treatment varia tio n . In addition , pooling provides a larger
quantity of plant material fo r analysis. The pooled sample was then
divided into specific tissues to be assayed. Leaf tissue was used fo r
methodology experiments. Leaf, le a f sheath, root plus rhizome, and
seed pod tissue were examined in the tissue comparison experiment.
Aboveground (stem plus le a f) and belowground (root plus rhizome) parts
were analyzed in the seasonal survey.
Tissues were ground in a cutting m ill to pass a #40 (425 p) mesh
screen. Scrapings (epiphytes) o f f lyophilized 1. marina leaves were
ground by hand with mortar and pestle . Samples were e ith er processed
immediately or stored in a vacuum desiccator (Nalgene) in the dark fo r
up to 5 days. Tissue preparation was adapted from the method of
Mendelssohn and McKee (1981).
Extraction
Tissue was weighed into 20-80 mg aliquots and held in a
desiccator. Extractant solution was. 1 mM ethylenediaminetetraacetic
acid (EDTA) + 5% (w/v) polyvinyl polypyrrolidone (PVPP) a t pH 7 .6 .
Four to eight ml of extractant were heated to 100°C in a 50 ml beaker
on a hot plate (Corning). Tissue was added (<1% w /v ), and the beaker
swirled fo r 30 sec at 100°C. The extract was quan tita tive ly
transferred to a centrifuge tube. The beaker was rinsed with
additional 1 mM EDTA which was poured into the centrifuge tube to
bring the fin a l volume up to 5 or 10 ml. These tubes were held on ice
and centrifuged at 14000 g fo r 15 min at 4°C. The supernatant was
decanted, held on ice , and processed as soon as possible. Extraction
methodology was adapted from Mendelssohn and McKee (1981).
EDTA extractant solution was stored at 4°C in the dark and used
fo r periods up to 1 month. A working aliquot of EDTA solution was
vacuum-filtered through a 0.2 y n itroce llu lose membrane (Nalgene) fo r
each day's analyses and discarded immediately a fte r use. Reagents
were routinely f i l te re d as a precaution against microbial
contamination. PVPP was added to the f i l te re d EDTA solution
approximately 30 min prior to extraction.
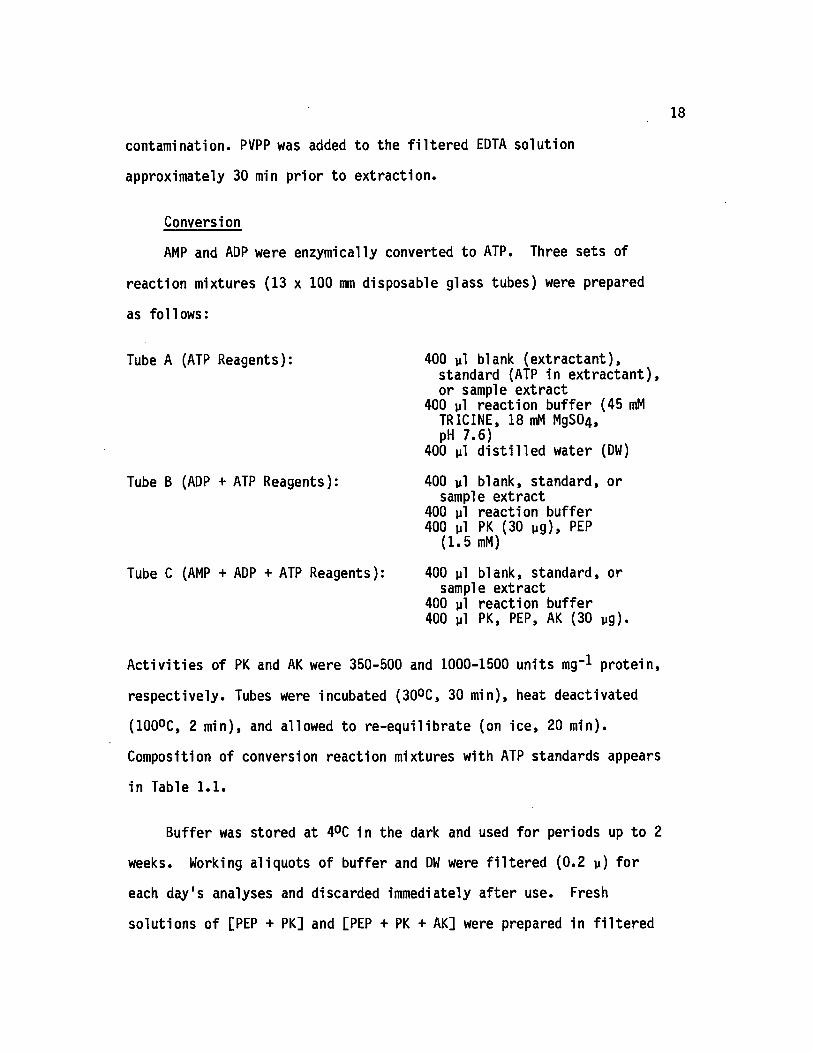
Conversion
AMP and ADP were enzymically converted to ATP. Three sets of
reaction mixtures (13 x 100 mm disposable glass tubes) were prepared
as follows:
Tube A (ATP Reagents): 400 yl blank (ex tra c tan t),standard (ATP in ex trac tan t), or sample extract
400 yl reaction buffer (45 mM TRICINE, 18 mM MgS04, pH 7.6)
400 yl d is t il le d water (DW)
Tube B (ADP + ATP Reagents): 400 yl blank, standard, orsample extract
400 yl reaction buffer 400 yl PK (30 yg), PEP
(1 .5 mM)
Tube C (AMP + ADP + ATP Reagents): 400 yl blank, standard, orsample extract
400 yl reaction buffer 400 yl PK, PEP, AK (30 yg).
A c tiv itie s of PK and AK were 350-500 and 1000-1500 units mg"l protein,
respectively. Tubes were incubated (30°C, 30 min), heat deactivated
(100°C, 2 min), and allowed to re -eq u ilib ra te (on ice , 20 min).
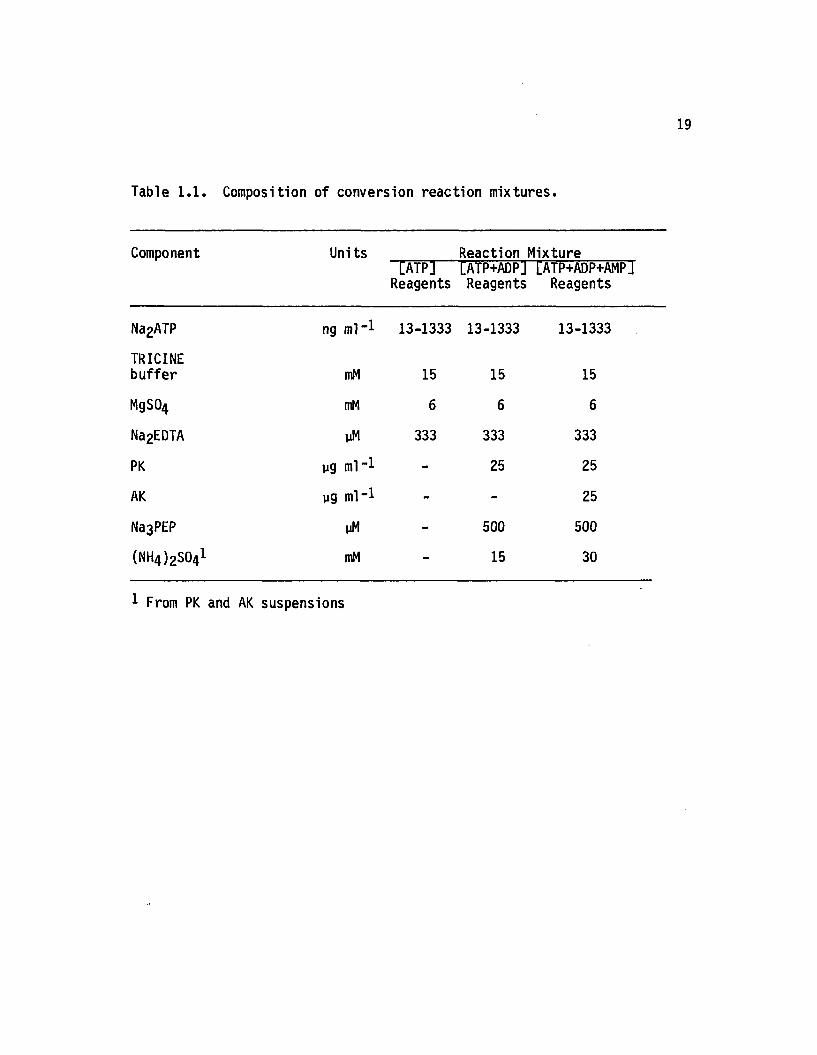
Composition of conversion reaction mixtures with ATP standards appears
in Table 1 .1 .
Buffer was stored at 4°C in the dark and used fo r periods up to 2
weeks. Working aliquots of buffer and DW were f i l te re d (0 .2 y) fo r
each day's analyses and discarded immediately a fte r use. Fresh
solutions o f [PEP + PK] and [PEP + PK + AK] were prepared in f i l te re d
19
Table 1 .1 . Composition o f conversion re a c tio n m ix tu res .
Component Units[ATP]
Reagents
Reaction Mixture [ATP+ADPj [ATP+ADP+AMPJ Reagents Reagents
Na2ATP ng ml" 1 13-1333 13-1333 13-1333
TRICINEbuffer mM 15 15 15
MgS04 mM 6 6 6
Na2EDTA yM 333 333 333
PK yg ml" 1 - 25 25
AK yg ml*-1 - - 25
Na3PEP yM - 500 500
(NH4 )2S041 mM - 15 30
1 From PK and AK suspensions
DW in glass v ia ls fo r each day's analyses, held on ice , and discarded
immediately a fte r use.
F ire fly Lantern Extract Preparation
One v ia l of lyophilized f i r e f ly lantern extract (FLE),
commercially prepared from 50 mg dried lanterns, was hydrated with 25
ml f i l te re d (0 .2 y) 45 mM TRICINE-18 mM MgS04 (pH 7 .6 ) and aged (room
temperature, 6-8 hrs) in order to degrade endogenous ATP. A fter
aging, the insoluble residue was removed by centrifugation at 3000 RPM
fo r 15 min. Whenever a large volume of FLE was required, several
via ls were pooled in order to elim inate variation between individual
v ia ls (Holm-Hansen and K arl, 1978).
Photometry
The photometer was allowed to warm up fo r at least 1 hr p rio r to
assays. A s e n s itiv ity setting of 7.00 was u t il iz e d , since best
instrument s ta b ili ty is achieved by using the lowest setting adequate
fo r analysis (SAIT, 1975). Dark current was nulled by adjusting the
zero (4.80 - 4.90 at s e n s itiv ity 7 .00 ), ju s t before each standard set
was run.
One hundred yl of solution from Tubes A, B, or C were pipetted
(Eppendorf) in to a 6 x 50 mm disposable glass tube. F ifty yl of FLE
were pipetted (Eppendorf) in to th is tube, while simultaneously
in it ia t in g the 10 sec delay mode of the photometer timing c irc u it with
the footswitch. During th is delay period, the tube was vortexed
(Vortex-Genie) to ensure thorough mixing, inserted into the
photometer, and the shutter was opened. Counts were recorded fo r the
21
following 10 sec in tegration period. A chart recorder was interfaced
with the photometer to follow reaction kinetics in order to detect
interferences or instrument malfunction.
For peak height measurements, 100 yl of solution from Tubes A, B,
or C were pipetted into a 6 x 50 mm tube. The tube was then placed
inside the photometer, the shutter opened, and 50 yl of FLE in jected
with the e lectronic pipet system which simultaneously activates the
photometer. Peak height counts were recorded. S en s itiv ity settings
from 7.00 - 10.00 were used. As a check on in i t ia l reagent mixing fo r
peak height measurements, each tube was read, removed from the
photometer, vortexed, and re-inserted into the photometer. I f the
recorder trace exhibited con tinu ity , the reading was considered valid
(Karl and Holm-Hansen, 1978). I f not, the tube was discarded, and the
process repeated u n til a continuous trace ( i . e . thorough in i t ia l
mixing) was obtained.
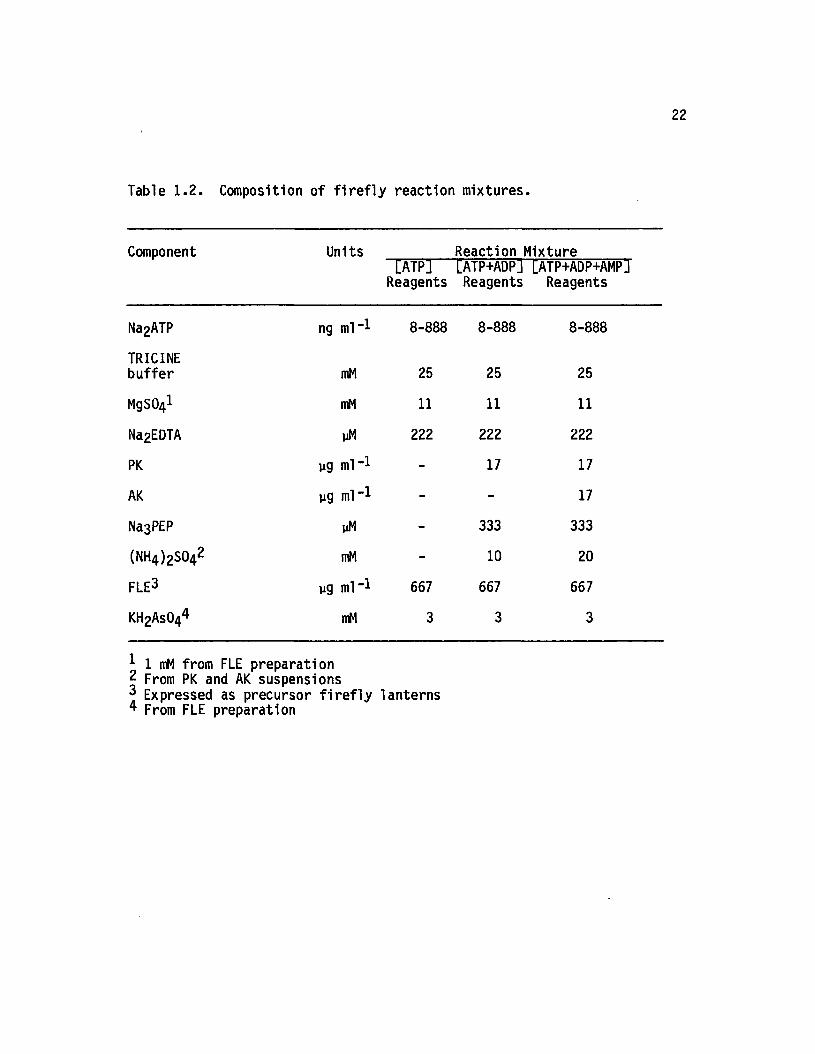
Composition of f i r e f ly reaction mixtures with ATP standards
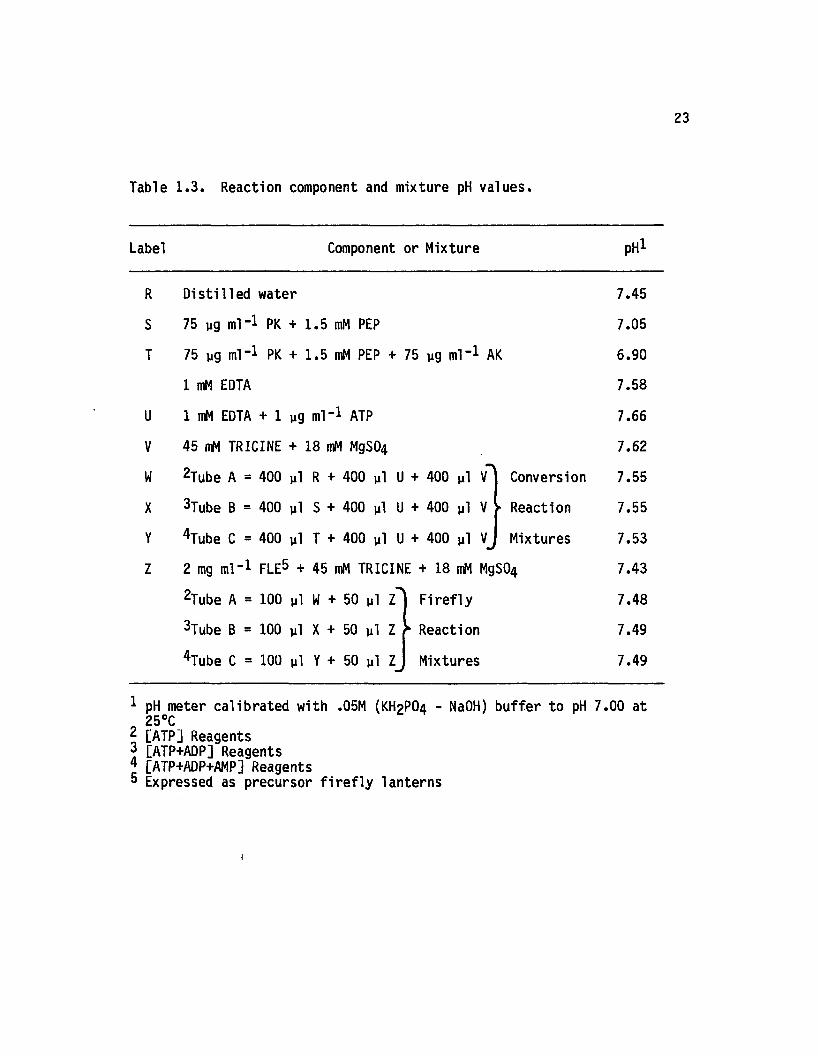
appears in Table 1 .2 . In addition, pH values fo r reaction components
and mixtures are presented in Table 1.3.
Standards and Blanks
A primary standard was prepared with a weighed amount of ATP
dissolved in f i l te re d (0 .2 y ) , d is t i l le d , deionized water. This
primary standard was divided into 1 ml aliquots and stored frozen
( -20°C ) in glass v ia ls fo r a period up to 3 months. A fresh set of
working standards was prepared in glass via ls fo r each day's analyses.
An aliquot of primary standard was thawed and s e r ia lly d ilu ted with
\
22
Table 1 .2 . Composition o f f i r e f l y re a c tio n m ix tu res .
Component Units[ATP]
Reagents
Reaction Mixture [ATP+ADP] [ATP+ADP+AMPJ Reagents Reagents
Na2ATP ng ml" 1 8-888 8-888 8-888
TRICINEbuffer mM 25 25 25
MgSCtyl mM 11 11 11
Na2EDTA yM 222 222 222
PK yg ml” 1 - 17 17
AK yg ml” 1 - - 17
Na3PEP yM - 333 333
(NH4 )2S042 mM - 10 20
FLE3 yg ml” 1 667 667 667
KH2As044 mM 3 3 3
1 1 mM from FLE preparation2 From PK and AK suspensions Expressed as precursor f i r e f ly lanterns
4 From FLE preparation
23
Table 1 .3 . Reaction component and m ixture pH v a lu e s .
Label Component or Mixture pH1
R D is tille d water 7.45
S 75 ug ml" 1 PK + 1.5 mM PEP 7.05
T 75 Mg ml" 1 PK + 1.5 mM PEP + 75 yg ml" 1 AK 6.90
1 mM EDTA 7.58
U 1 mM EDTA + 1 yg m l A T P 7.66
V 45 nW TRICINE + 18 mM MgS04 7.62
W 2Tube A = 400 yl R + 400 yl U + 400 yl vA Conversion 7.55
X 3Tube B = 400 yl S + 400 yl U + 400 yl V > Reaction 7.55
Y 4Tube C = 400 yl T + 400 yl U + 400 yl VJ Mixtures 7.53
Z 2 mg ml" 1 FLE5 + 45 mM TRICINE + 18 mM MgS04 7.43
2Tube A = 100 yl W + 50 yl z'' F ire fly 7.48
3Tube B = 100 yl X + 50 yl Z k Reaction 7.49
4Tube C = 100 yl Y + 50 yl Z Mixtures 7.49
* pH meter calibrated with .05M (KH2PO4 - NaOH) buffer to pH 7.00 at
2 [ATP] Reagents3 [ATP+ADP] Reagents4 [ATP+ADP+AMP] Reagents5 Expressed as precursor f i r e f ly lanterns
f i l te re d (0 .2 y) extractant solution (1 mM EDTA) to produce a set of
standards which bracket sample ATP leve ls . Working standards were
held on ice and discarded immediately a fte r use. Although Holm-Hansen
and Karl (1978) have reported no s ig n ifican t loss of these standard
adenylates during an 8 hr period, a standard set was run at least
every 2 hrs. Working standards and blanks were carried through
enzymic conversion and incubation steps to p ara lle l sample processing.
This results in s im ilar ionic composition and ATP re a c tiv ity ,
permitting more accurate adenylate quantification (Holm-Hansen and
K arl, 1978). Standards and blanks were each read in duplicate per
reaction Tube A, B, or C. In cases where a large discrepancy in
duplicate readings occurred, a th ird reading was taken.
Another primary standard was prepared with weighed amounts of
ATP, ADP, and AMP dissolved in f i l te re d (0 .2 y ) , d is t i l le d , deionized
water. The resultant standard, containing equal concentrations of
ATP, ADP, and AMP, was used to calculate recovery and conversion
e ffic ie n c ie s .
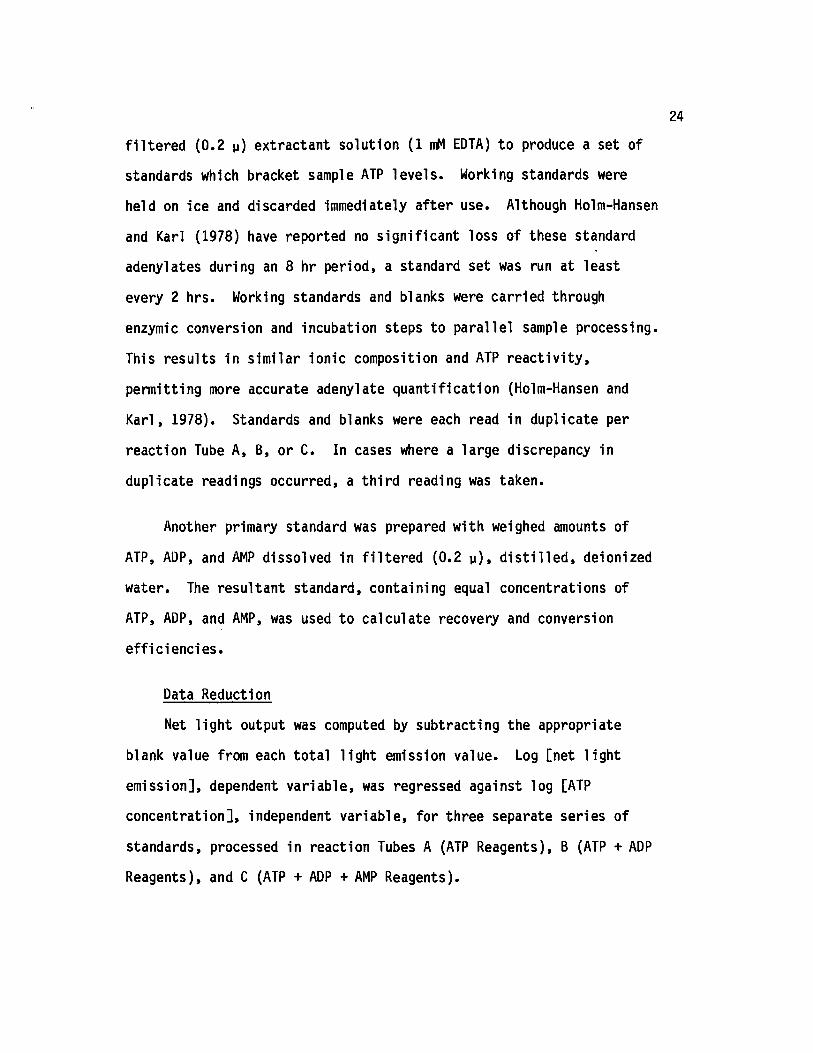
Data Reduction
Net lig h t output was computed by subtracting the appropriate
blank value from each to ta l lig h t emission value. Log [net lig h t
emission], dependent variab le , was regressed against log [ATP
concentration], independent variab le , fo r three separate series of
standards, processed in reaction Tubes A (ATP Reagents), B (ATP + ADP
Reagents), and C (ATP + ADP + AMP Reagents).
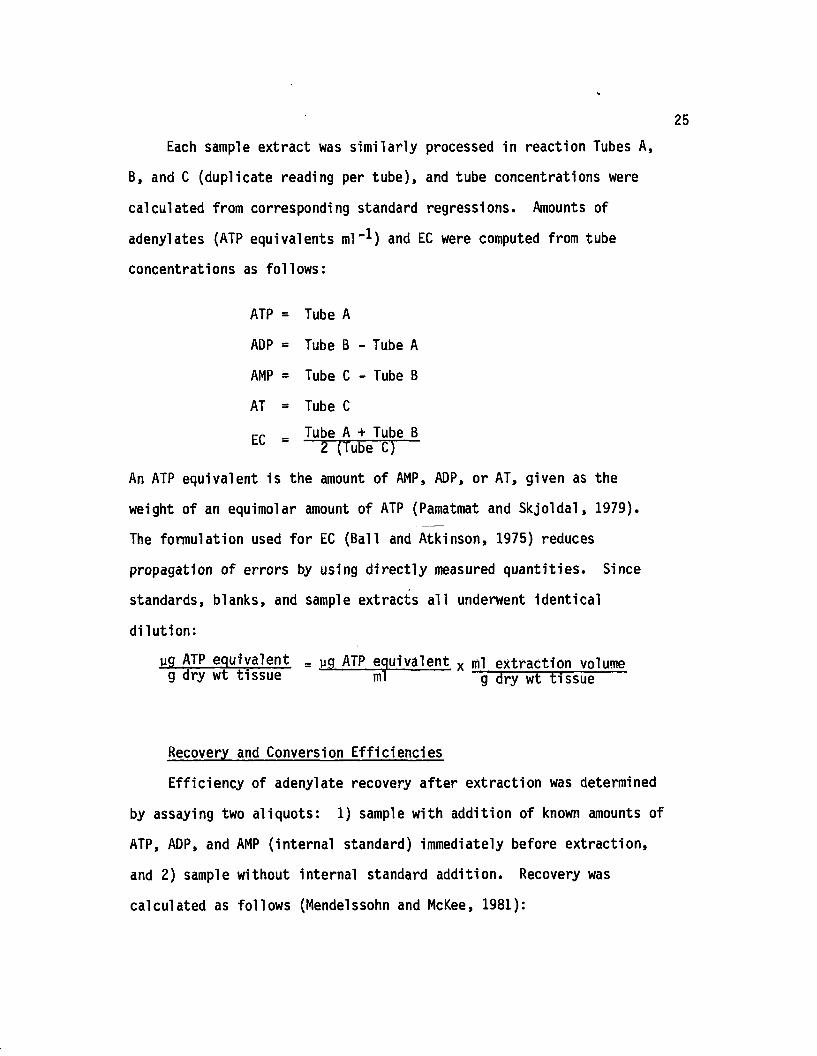
Each sample extract was s im ila rly processed in reaction Tubes A,
B, and C (duplicate reading per tube), and tube concentrations were
calculated from corresponding standard regressions. Amounts of
adenylates (ATP equivalents ml"1) and EC were computed from tube
concentrations as follows:
ATP = Tube A
ADP = Tube B - Tube A
AMP = Tube C - Tube B
AT = Tube C
cp _ Tube A + Tube BEC " 2 (tube C)
An ATP equivalent is the amount of AMP, ADP, or AT, given as the
weight of an equimolar amount of ATP (Pamatmat and S kjo ldal, 1979).
The formulation used fo r EC (Ball and Atkinson, 1975) reduces
propagation of errors by using d ire c tly measured quan tities . Since
standards, blanks, and sample extracts a ll underwent identical
d ilu tio n :
yg ATP equivalent _ yg ATP equivalent x ml extraction volume g dry wt tissue ml g dry wt tissue
Recovery and Conversion E ffic ienc ies
Efficiency of adenylate recovery a fte r extraction was determined
by assaying two aliquots: 1) sample with addition of known amounts of
ATP, ADP, and AMP (in terna l standard) immediately before extraction ,
and 2) sample without internal standard addition. Recovery was
calculated as follows (Mendelssohn and McKee, 1981):
% Recovery =
^ T is s u e + Internal Standard " ^Tissue^ Determined by Assay x iqo
^ I nternal Standard-^ Known Addition
where AN = ATP, ADP, or AMP.
S treh ler (1968) has offered two recommendations: 1) lig h t output of
sample plus added adenylate should not be more than 50% greater than
the response of sample alone, and 2) maximum ATP concentration (sample
plus internal standard) should be well below the Km value fo r ATP with
respect to luciferase ( i . e . maintenance of lin e a r ity between lig h t
output and ATP concentration). Both of these recommendations were
followed.
Efficiency of enzymic conversion ( i . e . AMP and ADP to ATP) was
evaluated by assaying a standard containing known of amounts of ATP,
ADP, and AMP (Mendelssohn and McKee, 1981):
* Conversion . ^ S ta n d a rd ] °etern,1 n e d jy fesay x m£ANStandard] Known Amount
where AN = ADP or AMP.
Reagents and Equipment
The following reagents were obtained from Sigma Chemical Co.:
f i r e f ly lantern extract (FLE-50), ATP (A 5394), ADP (A 6521), AMP (A
1877), GDP (G 6506), PEP (P 7002), PK (P 1 50 6 ),.AK (M 3003), PVPP (P
6755), TRIS-HC1 (T 3253), HEPES (H 3375), and TRICINE (T 0377). Other
chemicals used in th is study were analytical reagent grade.
Adenylates were measured with an ATP photometer (Model 3000, SAI
Technology Co.) and, in the case of peak height measurements, with the
Enzyme Kinetics K it e lectronic in jection pi pet (No. 020302, SAI
Technology Co.). A chart recorder (Model 250/MM, Linear) was modified
to accommodate an input voltage from 0.01-10 V.
Other equipment included a ly o p h ilize r (Model 10-100, V irT is ),
mechanical analytical balance (Model H31, M e ttle r), electronic
top-loading balance (Model PL 200, M e tt le r ), drying oven (Model
SW-17TA, Blue M E lec tric C o .), re frigerated centrifuge (Model PR-2,
In ternational Equipment Co.) with high capacity attachment, high speed
angle centrifuge (Model S S -l,S o rva ll) , Thomas-Wiley intermediate m ill
(Model 3383-L10, Arthur H. Thomas C o.), water bath (Model MW-1110A-1,
Blue M E lec tric C o .), vacuum pump (No. XX60000000, M illip o re ), and
d ig ita l pH meter (Model 610, Fisher S c ie n tific C o .), equipped with a
glass-body combination electrode (No. 13-639-90, Fisher S c ie n tific
C o.). Disposable tubes, v ia ls , f i l t e r s , pi pets, and pi pet tips were
routinely used. Reusable glassware was acid-washed, rinsed three
times with DW, and oven-dried to minimize contamination.
Tissue Comparisons and Seasonal Survey
Environmental Data
Environmental data included water temperature, sa lin ity , and pH.
Water samples, collected in brown bottles (Nalgene), were returned to
the laboratory fo r s a lin ity (induction salinometer, Model RS 7B,
Beckman) and pH measurements. Daylength and low tid e time and height
data were obtained from tid e tables (N0AA, 1979, 1980).
28
Morphometries
At each harvest, one 0.03 m plug of eel grass was cored down to a
depth of 10 cm with a plexiglass tube (0.10 m rad ius), placed in a
coarse mesh bag, and washed free of sediment. This sample was
returned to the laboratory and analyzed fo r to ta l number of shoots,
shoot lengths, and above and belowground biomass, according to Orth
(1977).
S ta tis tic a l Analysis
Procedures
The following procedures in the SPSS software package (Nie et
a l . , 1975; Hull and Nie, 1981) were used: ONEWAY (single factor
AN0VA, Hartley F max and Cochran C tests fo r homoscedasticity,
Student-Newman-Keuls m ultip le range te s t ) , NPAR TESTS (Kruskal-W allis
single factor AN0VA by ranks and Kolmogorov-Smirnov one sample test
fo r norm ality), and NONPAR C0RR (Spearman rank c o rre la tio n ).
Other s ta t is t ic a l procedures employed included analysis of
covariance (tes t fo r homogeneity of lin e a r regression slopes and
in tercepts) with an associated m ultip le range tes t (Zar, 1974),
nonparametric m ultiple range testing by rank sums (Zar, 1974), lin e a r
regression, and Pearson corre la tion . S ta tis tic a l assumptions are
discussed in Appendix B.
Standard Curve
In standard curve regressions, ATP net count and concentration
data were log-transformed. I t was in i t ia l l y determined that
log-transformed count data sa tis fy the assumptions of homoscedasticity
29
and norm ality. Pearson corre lation coeffic ien ts corresponding to
these lo g -1og regressions were calculated.
Adenine Nucleotide Methodology Experiments
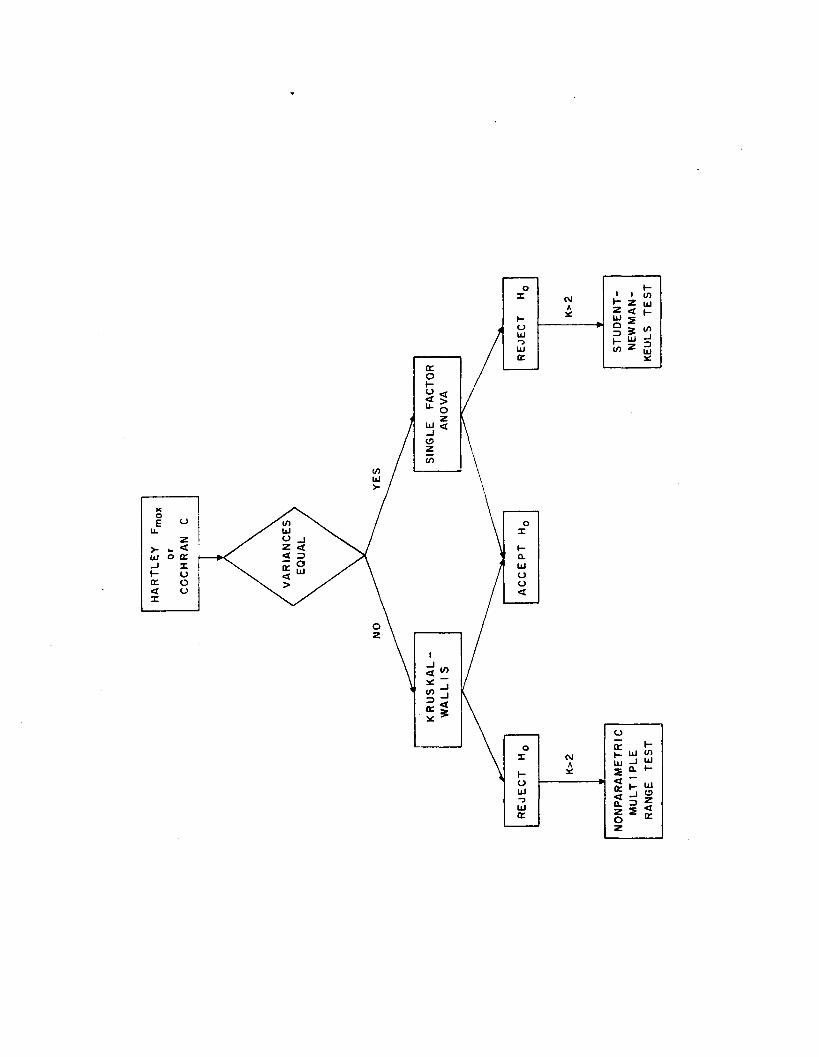
Differences between adenylates, subjected to various analytical
treatments, were detected and located by the procedure diagrammed in
Figure 1 .4 . Dependent variables are ATP, ADP, AMP, AT, and EC.
Independent variables are treatment leve ls . The null hypothesis
states no difference in adenylates between k treatments ( i . e . H0 :
PI = P2 - • • • = Pk)*
Standard curves, generated by three d iffe re n t photometer counting
modes, were compared. Homogeneity of these lin e a r regression slopes
and intercepts was tested by analysis of covariance (ANCOVA). Data
were log-transformed and sa tis fy the assumptions of homoscedasticity
and norm ality. Pearson correlation coeffic ien ts fo r log-1og
regressions used in ANCOVA were calculated. Null hypotheses state no
difference in slopes (H0 : ei = 02 = 33) or intercepts (H0 : o i =
«2 = 03) between regressions. S ign ifican t differences were located by
the Student-Newman-Keuls m ultip le range te s t.
Tissue Comparisons
Differences between adenylates in four tissue types were detected
and located by the procedure diagrammed in Figure 1 .4 . Relationships
among adenylates were evaluated by Spearman rank corre la tion .
Figure 1.4. Detection and location of treatment differences.
L>
UJ
UJ
o
H 2 2 <K 2
< >it
to
Li.
2 S
K Hi-J <2
Seasonal survey
Differences between adenylates at monthly in tervals were detected
by the procedure diagrammed in Figure 1.4. Relationships among
adenylate, environmental, and morphometric data were analyzed by
Spearman rank corre la tion .
RESULTS
Adenine Nucleotide Methodology Experiments
Overview
Table 1.4 summarizes tested factors and th e ir associated
treatment le v e ls , grouped under the appropriate analytical procedure.
Standards and blanks, used to quantify samples and internal standard
recovery and conversion, were processed in para lle l with samples and
in ternal standards ( i . e . with corresponding treatment leve ls ) fo r the
following factors: extractant, a ll conversion facto rs , a l l FLE
preparation factors , and photometer counting mode.
Sample Collection and Preparation
Eight harvest-freeze delay periods were compared (Table 1 .5 ) .
The delay period represents the time in terval between uprooting the
plants and freezing them in liq u id nitrogen. ATP, AT, and EC
generally increased as delay period lengthened. These trends are
shown graphically in Figure 1.5 . Associated regression s ta tis tic s are
presented in Table 1. 6. Results suggest that adenylate concentrations
re fle c t in s itu levels fo r a period <2 min following harvest.
Adenylate levels in plants harvested during the day or at n ight,
each at two delay in te rv a ls , appear in Table 1 .7 . Results suggest
tha t increases in ATP, AT, and EC (as delay period lengthens) are
32
Tabl
e 1.
4.
Summ
ary
of te
sted
fa
cto
rs.
33
c 0.■nE LO
CMOVO —"
"O Po c c c toCO *r- *r- 09 3 03
E E > Ot/3 ft s-r<~ o o o p-> o> ■o03 rH rH r~H p 1 03> S "o Q.a) A A A 03 <0_ i VO o o LO N t-
a> 0) " " r U* to to p~ to
CM T3 -r- c toO O 03 -C 3 >>
•* CO CO a . Q. <01 CL O to “OO >> >
« «/}«/> .£ r— oin s_ s_ a i T3 CM
• x : x : 1 c 03-C 03 Q. A
•> o o to N 03 VOin o o 03 O S-OJ CM ^ t- S- C3 A
• i—1 CM P P (/) o
>>(0
p 1 ■03“O 1
c03 03N Na Oa> &-t- Pp
P-C O 03p 3•r* 03 (O3: 03 CO
f0 »r—>> P S- P03 tO o
c r - 0) P “Oo 03 2* (O cp •o £ r— 3u <0 03 o(0 0) -c > s- s.u . N O 03 03
03 P 03 € “O 103 £ P 03 i -as- o> 0 -a 03P -r- P 03 N1 C if) 03 P -r-
P P tO i—(/) to 03 >> O T-03 > 3 .C O -C> to a . •r- Q.s- >> t/3 •r— to o03 to •r* Q. 03 >>J= “O P 03 -O •—
cc o
03 O T-S- •r- p3 P 03
-a 03 o s-03 r— 03 (0o Q-i— a .o E i- 0 a)S- 03 O C S-a . CO O 03 O.
VO
a.
oP
“O03N<0S-P30)
a or-«. $_ sr oa» & <o rc ld +j s_ a. i o h p~ + * + 25< < *0 i— i— a» «o-s- O O r— O 03 LLl UJ r— GO P •i- CMP 10
• p Z O I H H * 0 •VO Is"*o> o> o> • I c c c VO•r- * r *n O •
o r-*•f— »p- *i—O O O I 3C jQ O O O ^
<0PU<0V-p
25
o(0U4->X
aa)</)
oCM
topcto
-aa>ooQ.to>(0 3■o•n- > •r“ T3
* Cir> *r-
oCO
u<0t -P25
a)toto
■o0)po<0S-p
aS froze
n ex
trac
t st
orag
e 0,
5,
20
days
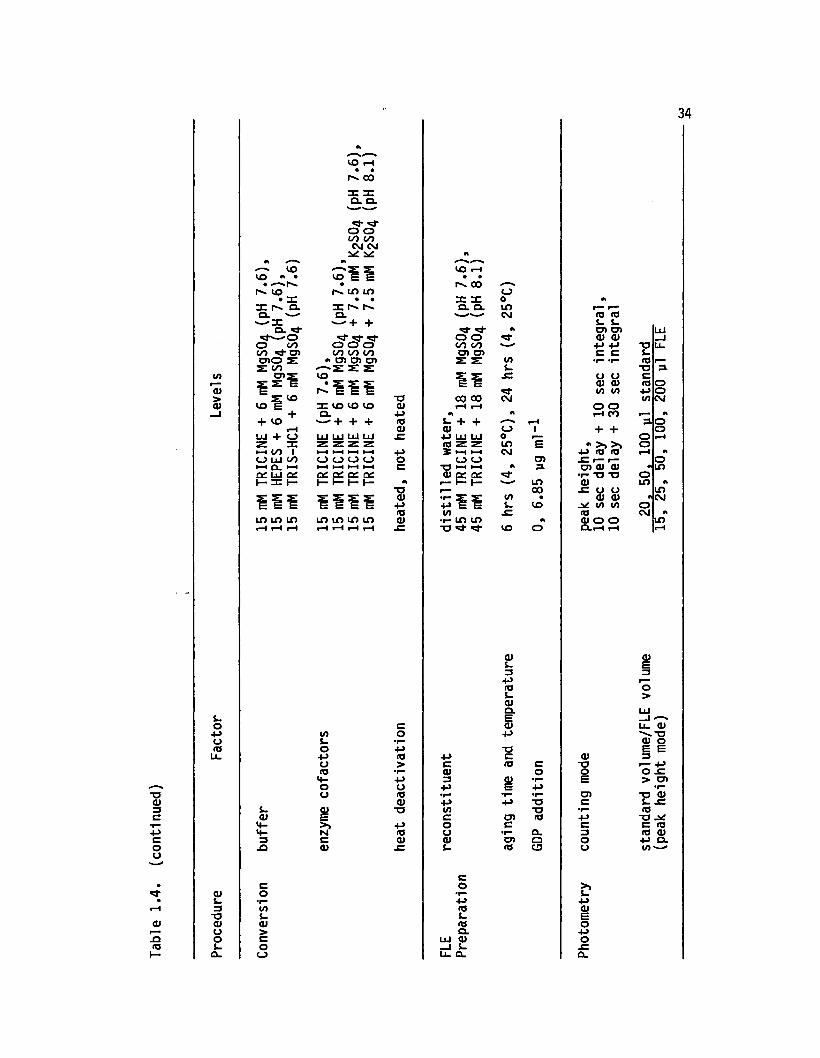
Tabl
e 1.
4.
(con
tinue
d)
34
<u><u
o-pora
<us.3-oCDoos-Qu
CO.VO .. ' '
r-« co
in r-' o. o . ^>—3=
Q.
o oo oo «3- o> c n o s : s 00 o>s
s co co e
+ CO + HUJ + O Z 3Ci—i oo i o uj ooI—I Q. Moc u j ocI— 31 1—
i~CD
c*-4 -3.a
to$-CD>coo
CO rH . .r-» ooz in Q. Q.
O O oo ooCM CM
CO E ELO LT>
• •I is r sa . +
^ o o o00 CO 00 * O) CX> D)s s
VO
r ^ I i l3= CO co CO a . + + +
o o o oH H H Hocaccc ac
in co lo in in in in
cos-o•POCO4 -oo
t fcaj
"Oat■pcoaj
+->o
T3a)■p10CD
co
4-><04->oCOCDTD■PCO(D
CO rH . .r-* 0031 3=a . a .
o o oo ooO ) O )
co oo
i- + +CD■P LO UJg z zi t —i i—i
c_> o“O '—I'—<cu accc
■p e ein■i- in in "O 'J'
CD3■P•P“4->inc;oo0)s-
co•r-«Pra S- «TJ Q. LU 0)
_J i_ Li. Q_
OOinCNJ
(/)S.x:CM
OOinCM
inu
vo
o>3.
inoovo
0)s.3■PraS-a)a .E<D4->
/TJ Co
o>ccn03
-o■oraQ.OCD
03 ra S- S- C7) O)a) a)•P «P c c
o o0) Q)cn cn
o orH CO
+ +* >» >> •p ra ra
-C r— r—o) a> <d•r-OT3 <U- C O O <D 0)
10 inraQ J O O
0)■ooE
Oo
■pCDBo-po
.cCL
stan
dard
vo
lum
e/FL
E vo
lum
e 20
, 50
. 10
0 ul
stan
dard
(p
eak
heig
ht
mod
e)
15,
25,
50,
100,
20
0 yl
FLE
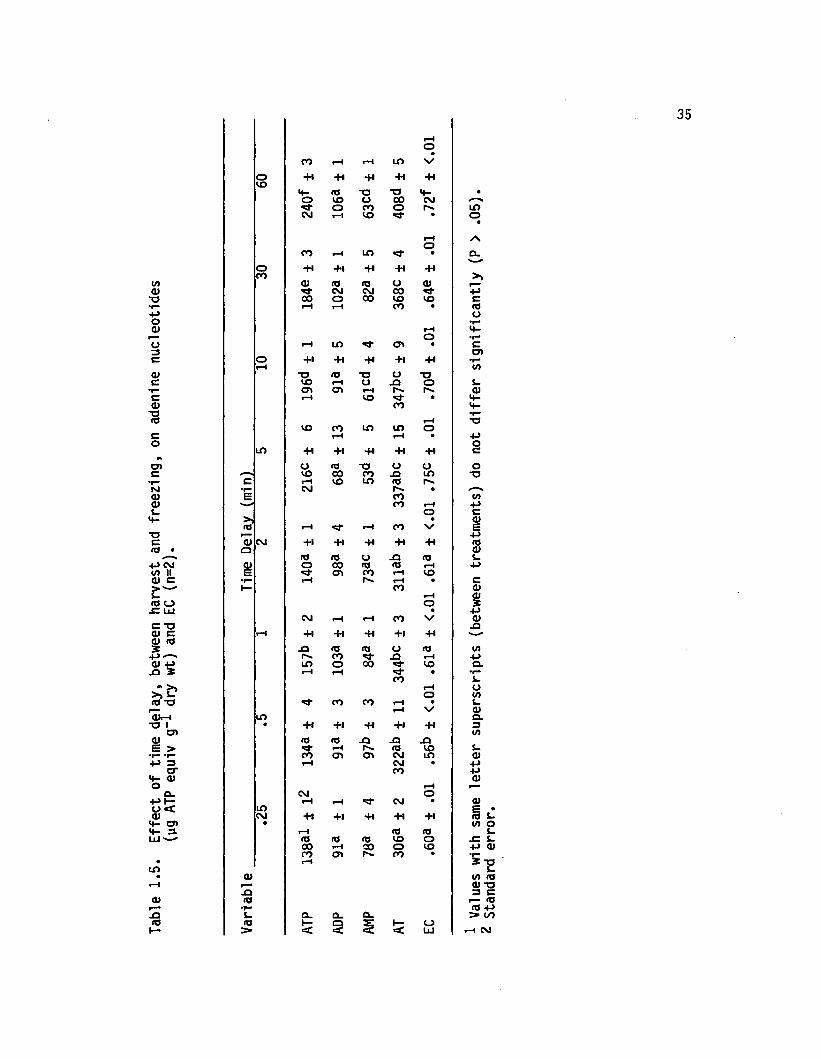
35*Ho
•CO H rH LO V/
O -H -H -H -H10
vp id ■a ■a vp •o VO o 00 CM
o co o P-N. toCM iH vo • o
•
rHo
CO rH LO • CL
O -H +1 -H ■H -Hco >>
cn 09 <d Id U 0909 CM CM 00 +J
00 o 00 VO vo C•n H rH CO • id•P uo •r“09 rH M-
r— o •r-u rH LO cn • C3 cnC o -H -H -H + i -H •r-
rH cna> ■a Id •o o “Oc LO rH o JO O s.•r— o> o> rH p". P*. 09C rH VO • Vp0) CO <P“O •r*Id rH ■a
VO CO LO LO oc rH rH • 4->o o
LO -H +1 -H -H c
o> O id “O O a oc VO 00 CO JO LO "O•r* c rH VO LO idNl •r- CM • x09 E CO cn09 CO rH •PS- o cP • 09
id i—1 rH CO V E■o r—• -Pc 09 CM +1 -H -H -H -H idid • Q 09
**—"N id id CJ JO id s-4-> CM 92 o 00 Id Id rH «Pto II E cn co rH vo09 C rH rH • c> —" 1— CO 09S-. rH 09<d o o-C LU • ■P
CM rH rH CO V 09c *o JO09 C rH ■H *H +1 ■H >Miir09 id
JO id id o id cn•P-—* Pn. CO JO rH -P09 -P LO o 00 VO CLJO 5 H rH • •r*
CO i-** >> rH O
>> *- o cnid -a co co H • s-
rH V 0909r—1 LO Q.■o 1 • +1 + i ■H +1 -H 3
o> in09 id id JO JO JO£ > rH r-* id vo s.• r •<■" CO o> cn CM LO 094-> 3 rH CM • •P
c r CO •PH- 09 09O rH
o . CM oP H rH rH <o- CM • 09C9 < LO E •09 CM +• +1 •H +1 -H id s-
vp cn • cn ovp 3. rH id id L.UJ'— <d id id vo o -C i-
00 iH 00 o vo ■P 0900 o> r^. CO • •r—•
L0rH
• 09 (/> (aH r— a» is
JO 3 cai id i— <o
<0 + j-O i- CL Q. Cl. 3» 00id id 9— Q H- o1— > < 3 <2 < UJ .-( CM
Figure 1.5. Semi-log regressions of ATP, AT, and EC vs. harvest- freeze delay interval (n = 2).
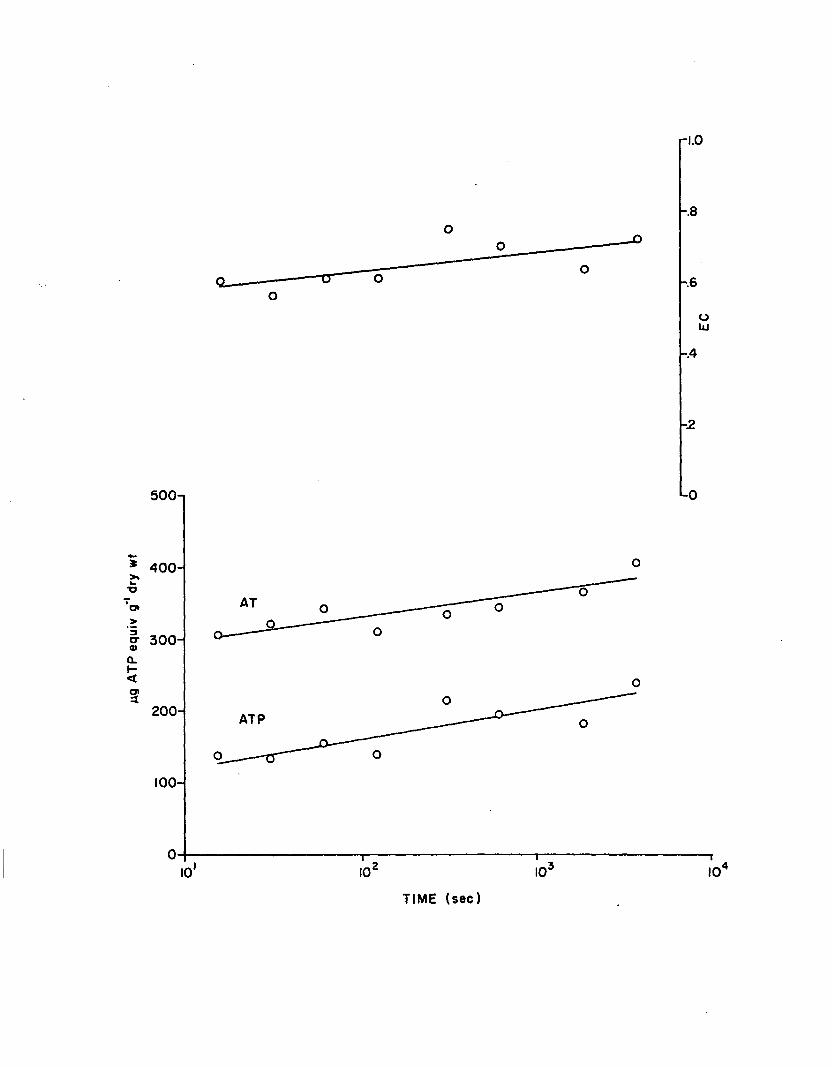
Mg
ATP
equi
v g'
1 dry
wf
-.8
-.6
-.4
500-1 L-0
400-
AT
300-
200- ATP
100-
TIME (sec)
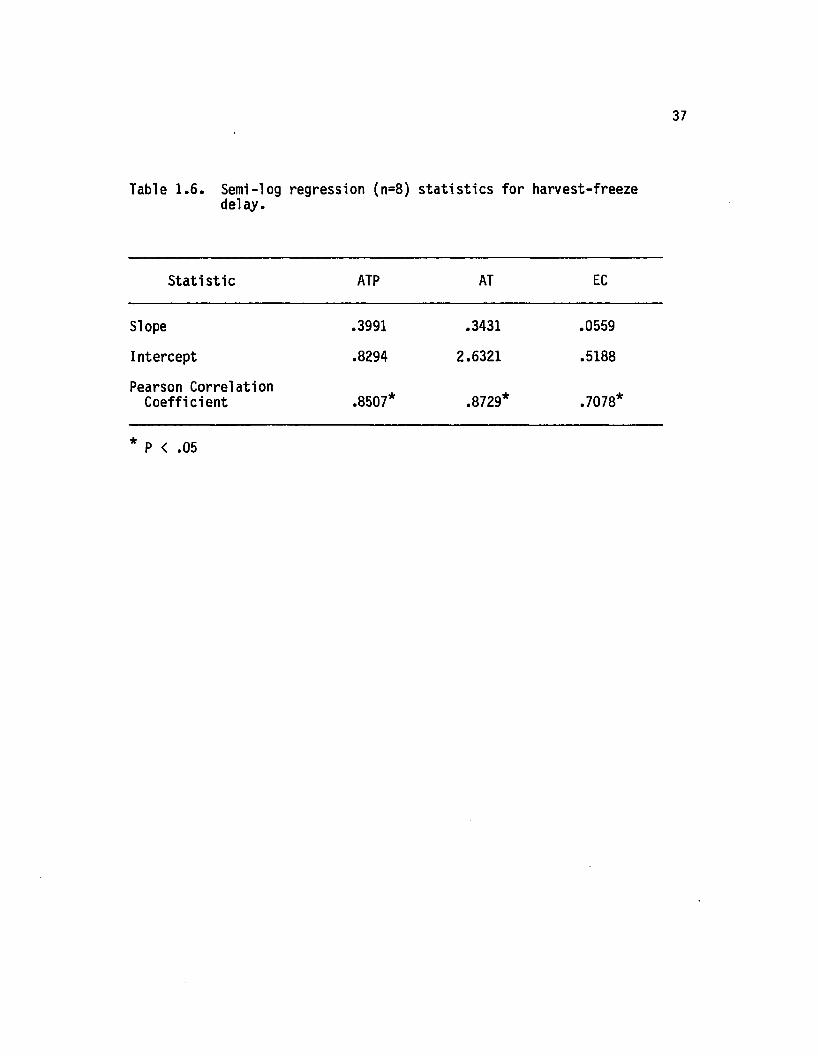
37
Table 1 .6 . Semi-log regression (n=8) s ta tis tic s fo r harvest-freeze delay.
S ta tis tic ATP AT EC
Slope .3991 .3431 .0559
Intercept .8294 2.6321 .5188
Pearson Correlation C oeffic ient .8507* .8729* .7078*
* P < .05
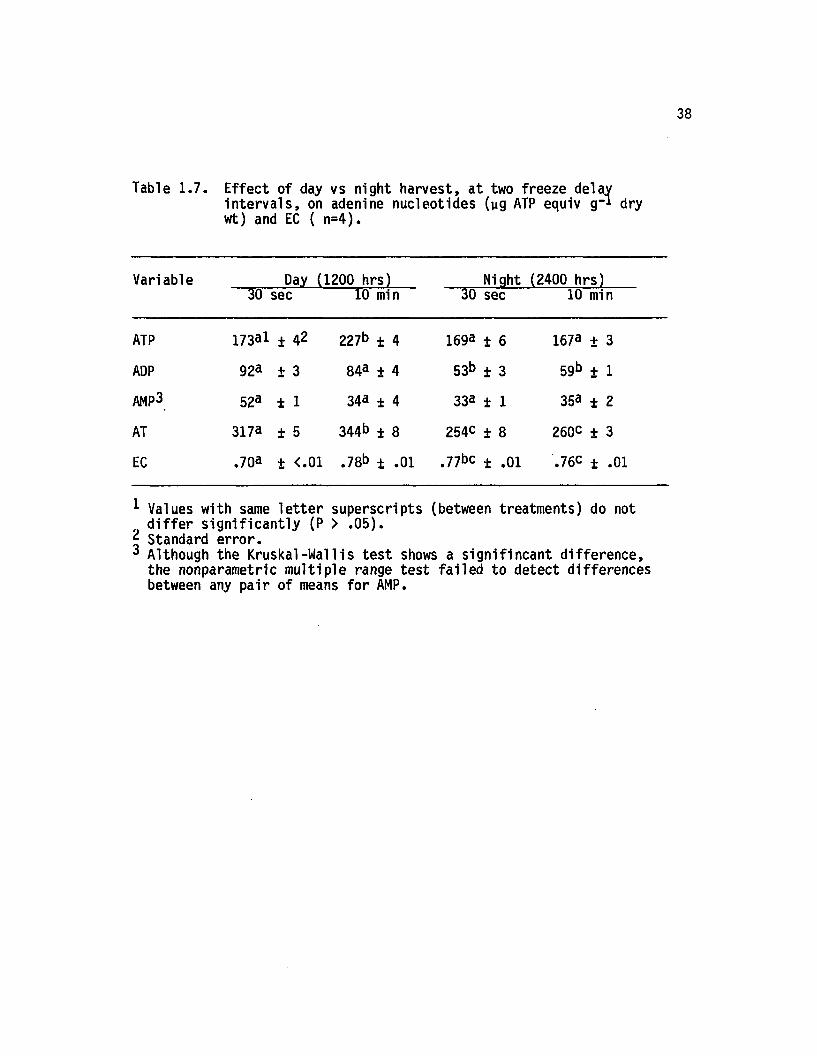
38
Table 1 .7 . E ffe c t o f day vs n ig h t h a rv e s t, a t two fre e ze delayin t e r v a ls , on adenine n u c leo tid es (yg ATP equiv g-1 dryw t) and EC ( n = 4 ).
Variable Day (1200 hrs) Night (2400 hrs)30 sec 10 min 30 sec 10 min
ATP 173a! ± 4 2 227b ± 4 169a ± 6 167a + 3
ADP 92a + 3 84a + 4 53b ± 3 59b ± 1
AMP3 52a ± 1 34a ± 4 33a ± 1 35a ± 2
AT 317a ± 5 344b ± 8 254C ± 8 260c ± 3
EC .703 ± <.01 .78b ± .01 .77bc ± .01 .76c ± .01
* Values with same le t te r superscripts (between treatments) do not d if fe r s ig n ific a n tly (P > .0 5 ).
2 Standard e rro r.3 Although the Kruskal-W allis tes t shows a s ignifincant d ifference,
the nonparametric m ultip le range test fa ile d to detect differences between any pa ir of means fo r AMP.
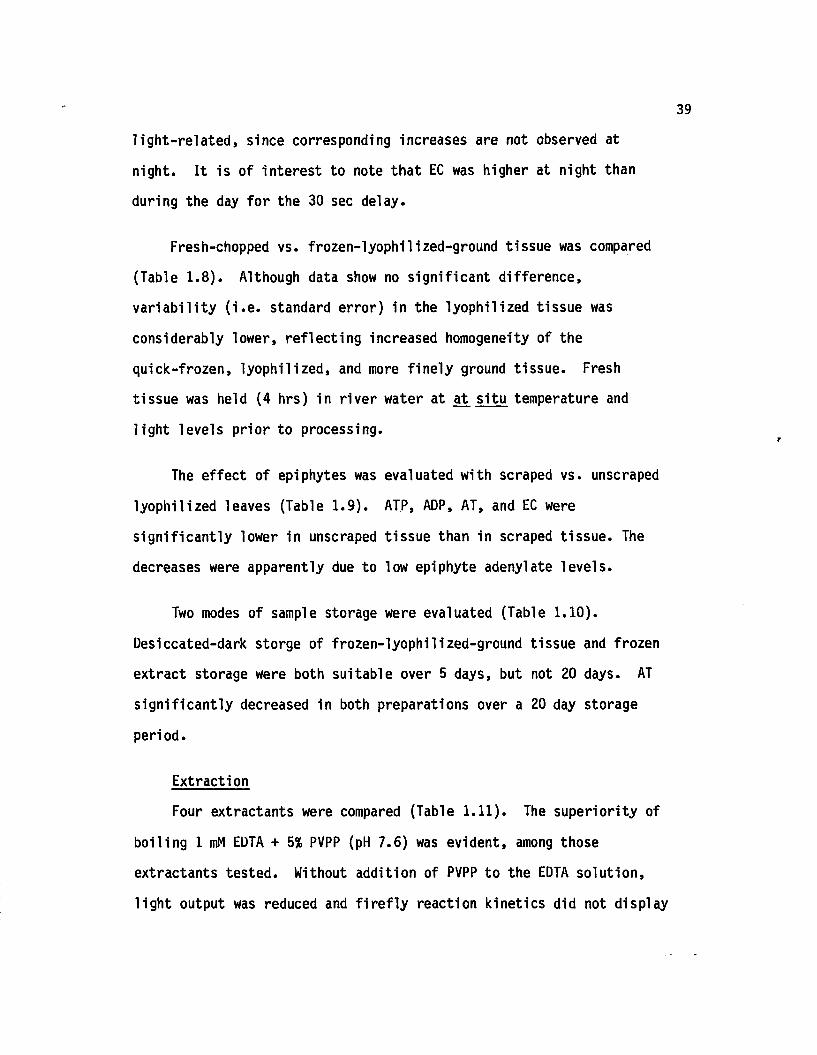
l ig h t-re la te d , since corresponding increases are not observed at
night. I t is of in te res t to note th a t EC was higher at night than
during the day fo r the 30 sec delay.
Fresh-chopped vs. frozen-lyophilized-ground tissue was compared
(Table 1 .8 ) . Although data show no s ig n ifican t d ifference,
v a r ia b ili ty ( i . e . standard erro r) in the lyophilized tissue was
considerably lower, re flec tin g increased homogeneity of the
quick-frozen, lyoph ilized , and more f in e ly ground tissue. Fresh
tissue was held (4 hrs) in r iv e r water at at s itu temperature and
l ig h t levels p rio r to processing.
The e ffe c t of epiphytes was evaluated with scraped vs. unscraped
lyophilized leaves (Table 1 .9 ) . ATP, ADP, AT, and EC were
s ig n ific a n tly lower in unscraped tissue than in scraped tissue. The
decreases were apparently due to low epiphyte adenylate leve ls .
Two modes of sample storage were evaluated (Table 1 .10 ).
Desiccated-dark storge of frozen-lyophilized-ground tissue and frozen
extract storage were both suitable over 5 days, but not 20 days. AT
s ig n ific a n tly decreased in both preparations over a 20 day storage
period.
Extraction
Four extractants were compared (Table 1 .11 ). The superiority of
boiling 1 mM EDTA + 5% PVPP (pH 7 .6 ) was evident, among those
extractants tested. Without addition of PVPP to the EDTA solution ,
l ig h t output was reduced and f i r e f ly reaction kinetics did not display
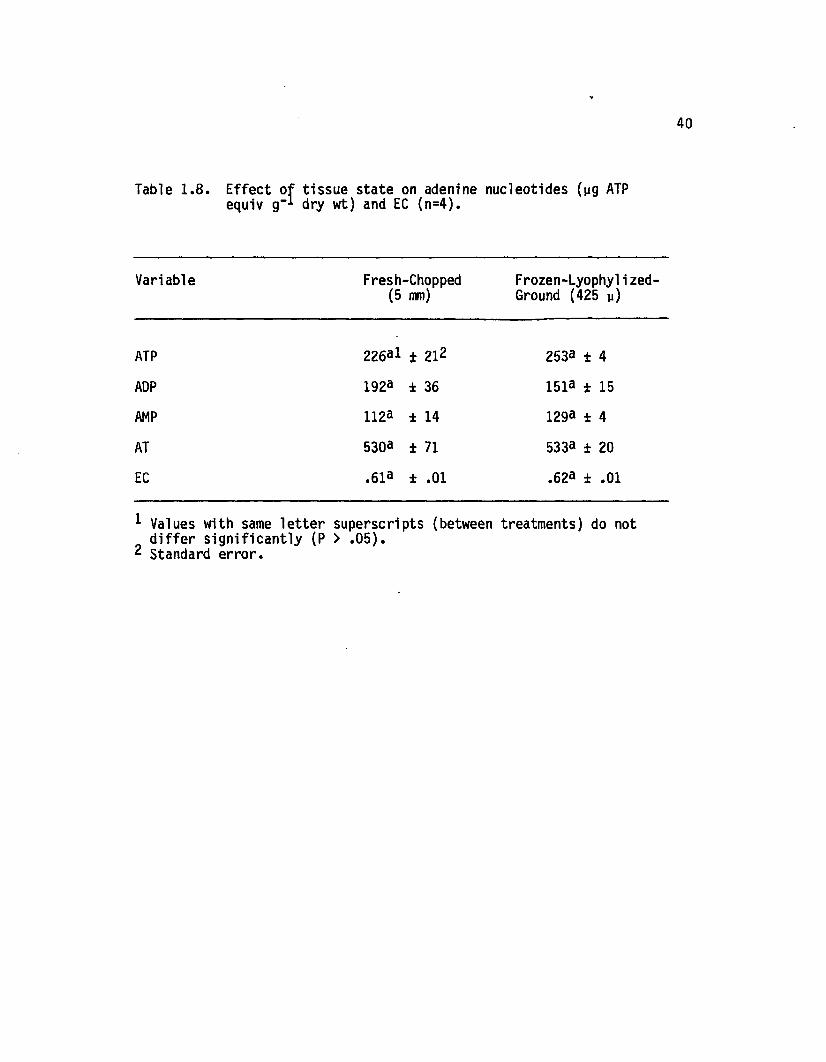
40
Table 1 .8 . E f fe c t o f t is s u e s ta te on adenine nu c leo tid es (pg ATPequiv g " l dry w t) and EC (n = 4 ).
Variable Fresh-Chopped (5 mm)
Frozen-Lyophyli zed- Ground (425 p)
ATP 226^1 * 212 253a ± 4
ADP 192a ± 36 151a ± 15
AMP 112a t 14 129a ± 4
AT 530a ± 71 533a ± 20
EC .61a ± .01 .62a ± .01
1 Values with same le t te r superscripts (between treatments) do not d if fe r s ig n ific a n tly (P > .0 5 ).
2 Standard e rro r.
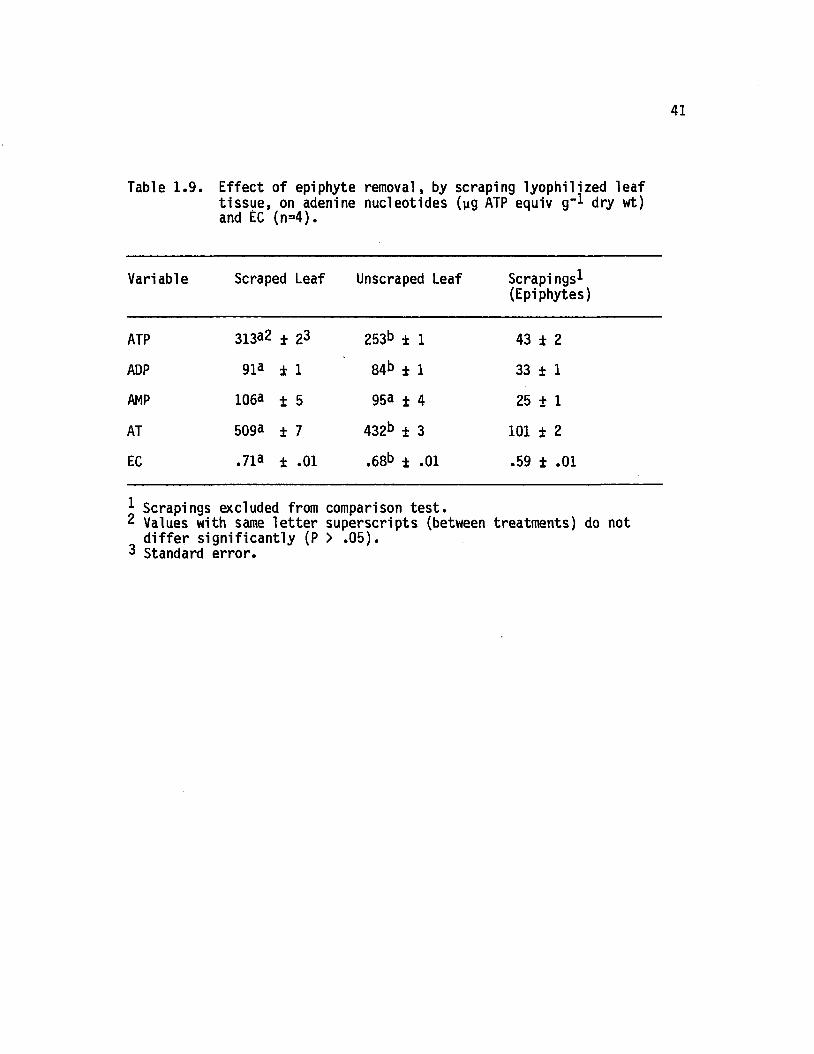
41
Table 1 .9 . E ffe c t o f ep iphyte rem oval, by scraping ly o p h iliz e d le a ft is s u e , on adenine n u c leo tid es (yg ATP equiv g"1 dry wt)and EC (n = 4 ).
Variable Scraped Leaf Unscraped Leaf Scrapings*(Epiphytes)
ATP 31332 ± 23 253b ± 1 43 ± 2
ADP 91a ± 1 84b ± 1 33 ± 1
AMP 1063 + 5 953 + 4 25 + 1
AT 5093 ± 7 432b ± 3 101 ± 2
EC .713 ± .01 .68b ± .01 .59 ± .01
* Scrapings excluded from comparison te s t.2 Values with same le t te r superscripts (between treatments) do not
d if fe r s ig n ifican tly (P > .0 5 ).3 Standard erro r.
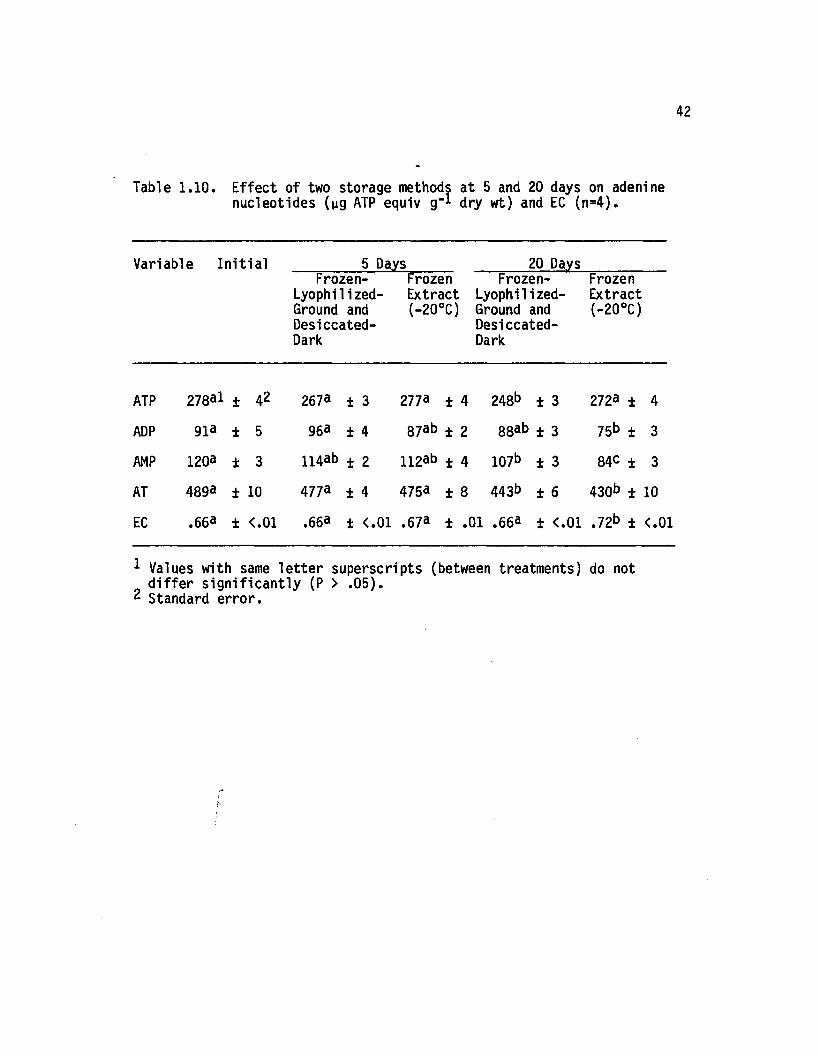
42
Tab le 1 .1 0 . E ffe c t o f two storage methods a t 5 and 20 days on adeninen u c leo tid es (yg ATP equiv g- * dry w t) and EC (n = 4 ).
Variable In i t ia l 5 DaysFrozen-
Lyophilized- Ground and Desiccated- Dark
20 DaysFrozen Frozen- Frozen Extract Lyophilized- Extract(—20°C) Ground and (-20°C)
Desiccated- Dark
ATP 278a1 ± 42 2673 ± 3 2773 ± 4 248b ± 3 2723 ± 4
ADP gia ± 5 963 ± 4 873b ± 2 883b ± 3 75b ± 3
AMP 120a ± 3 1143b ± 2 1123b ± 4 107b ± 3 84c ± 3
AT 4893 i 10 4773 ± 4 4753 ± 8 443b ± 6 430b + 10
EC .663 i <.01 .663 ± <.01 .673 ± .01 .663 ± <.01 .72b ± <J
1 Values with same le t te r superscripts (between treatments) do not d if fe r s ig n ific a n tly (P > .0 5 ).
2 Standard e rro r.
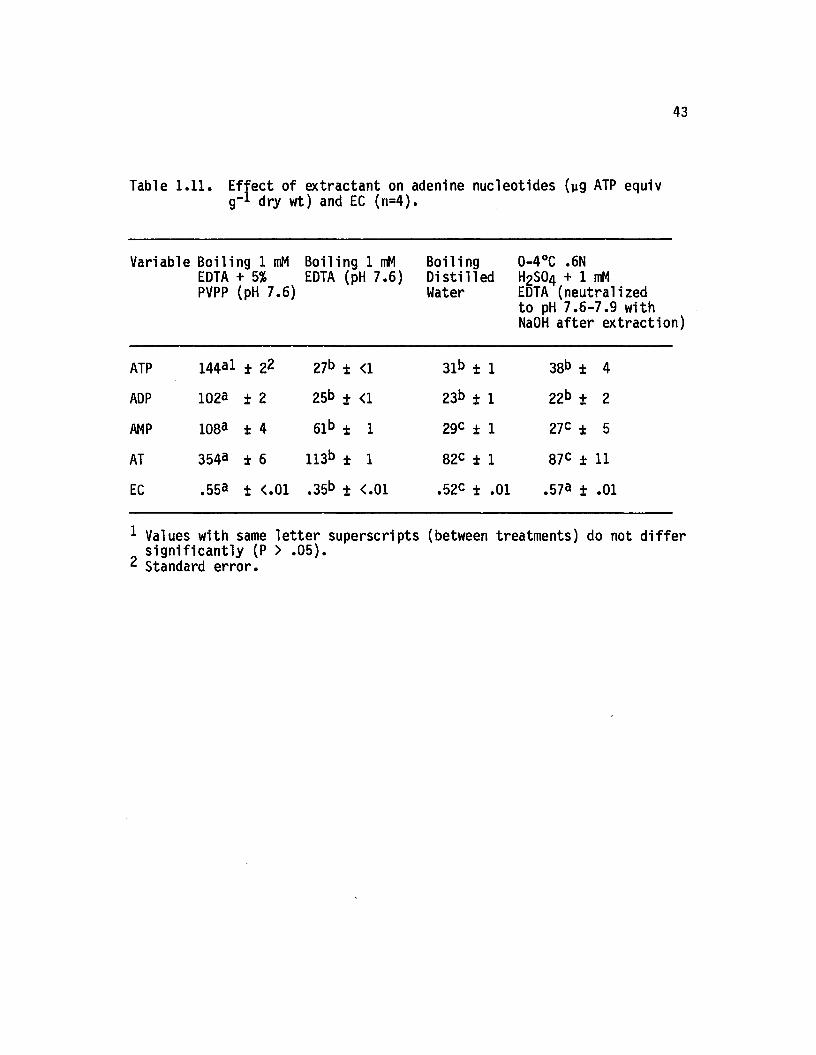
43
Tab le 1 .1 1 . E f fe c t o f e x tra c ta n t on adenine n u c leo tid es (yg ATP equivg"1 dry w t) and EC (r i= 4 ).
Variable Boiling 1 mM Boiling 1 mM Boiling 0-4°C . 6NEDTA + 5% EDTA (pH 7 .6 ) D is tille d H2SO4 + 1 mMPVPP (pH 7.6) Water EDTA (neutralized
to pH 7 .6 -7 .9 with NaOH a fte r extraction)
ATP 144a l ± 22 27b ± <1 3 1 b ± 1 38b ± 4
ADP 102 a + 2 25b + <1 2 3 b + 1 2 2 b + 2
AMP 108a ± 4 61b ± 1 29c ± 1 27C ± 5
AT 3 5 4 a i 6 113b ± 1 8 2 c ± 1
-HOp-**00
11
EC .5 5 3 ± < .0 1 . 35b ± < .0 1 . 52c + .0 1 .57 a ± .0 1
1 Values with same le t te r superscripts (between treatments) do not d if fe r s ig n ific a n tly (P > .0 5 ).
2 Standard e rro r.
44
th e ir characteris tic decay pattern (Figure 1 .6 ) . Data on recovery of
added adenylates (in ternal standard) appear in Table 1.12. Again, the
superiority of bo iling 1 mM EDTA + 5% PVPP (pH 7 .6 ) was evident.
Standards, prepared in EDTA, quenched lig h t output to a lesser extent
than those prepared in e ith er d is t il le d water or neutralized acid
(Table 1 .13 ).
Duration of three extraction times was evaluated (Table 1 .14 ).
No s ig n ifican t differences were observed fo r extraction times of 5,
30, or 120 sec.
Extraction of individual plants vs. extraction of m ultip le
aliquots from a pooled sample was compared (Table 1 .15 ). Adenylates
show no s ig n ifican t d ifference, although v a r ia b ili ty ( i . e . standard
e rro r) in the pooled plant sample was considerably lower, as would be
expected. Pooling masked natural v a r ia b ility between plants but
yielded mean adenylate leve ls , s im ilar to those obtained from
in d iv id u a lly extracted plants. Standard errors, associated with
ind iv idu a lly extracted plants, provide information on adenylate
v a r ia b ili ty between plants in the f ie ld .
Conversion
Methodology experiments in the conversion procedure were tested
by calculating conversion e ffic ien cy of AMP and ADP (in ternal
standard) to ATP. Concentrations given fo r treatment levels re fe r to
the conversion reaction mixture.
45
Figure 1.6. Reaction kinetics obtained from EDTA extraction of sample with and without PVPP addition. FLE is injected at time zero, the tube is vortexed, inserted into the photometer, and the shutter is opened (indicated by arrow).
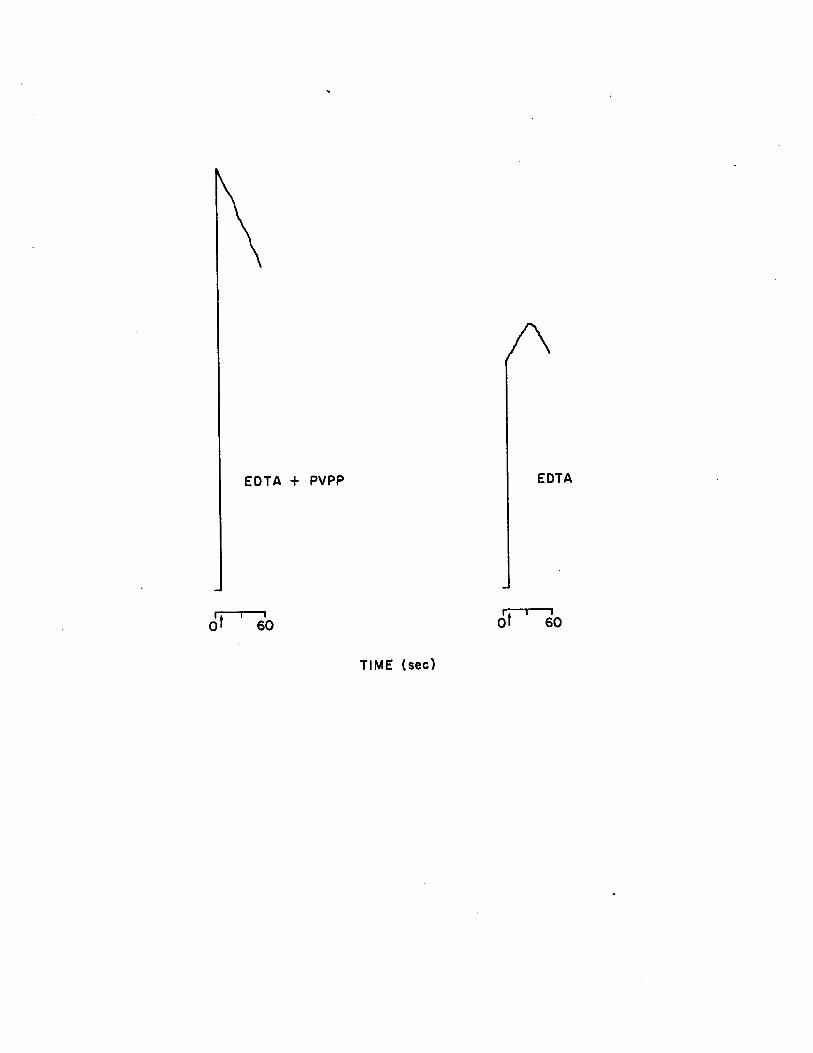
EDTA + PVPP
^ 0
A
EDTA
r —i-----101 60
TIME (sec)
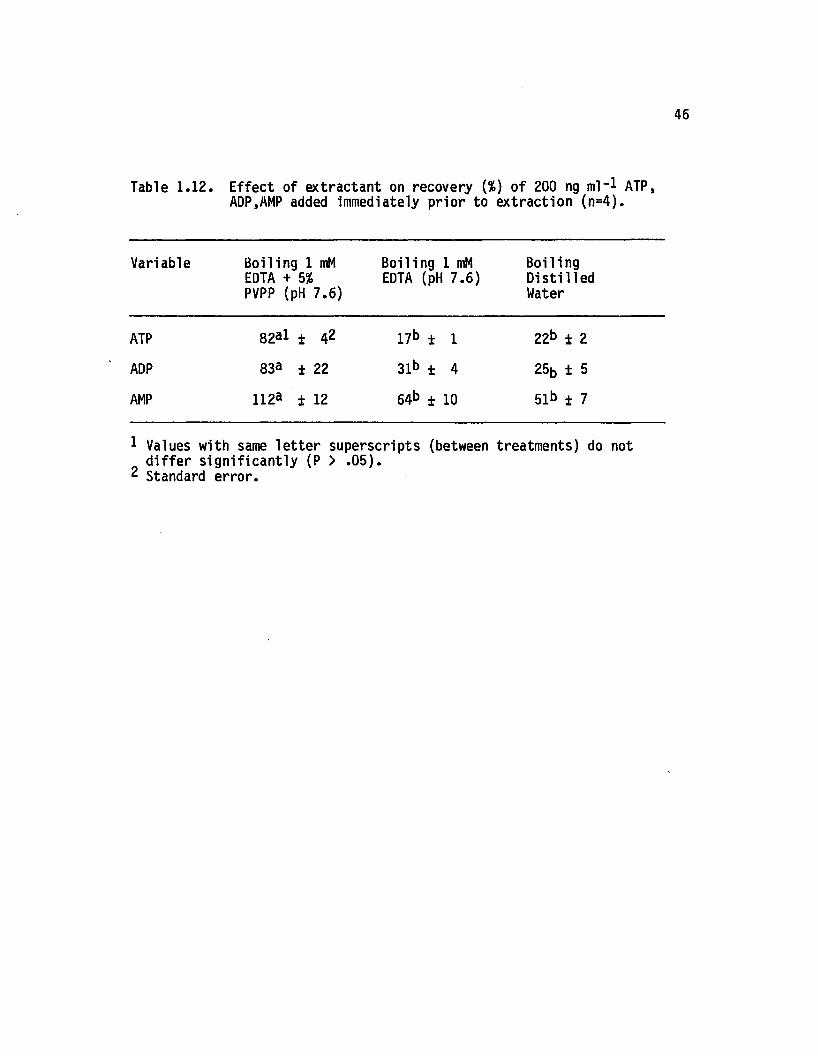
46
Table 1.12. E ffect of extractant on recovery {%) of 200 ng ml- * ATP, ADP.AMP added immediately p rio r to extraction (n=4).
Variable Boiling 1 mM EDTA + 5% PVPP (pH 7.6)
Boiling 1 mM EDTA (pH 7 .6 )
BoilingD is tille dWater
ATP 82al ± 42 17b ± 1 22b ± 2
ADP 83a ± 22 31b ± 4 25b ± 5
AMP 112a ± 12 64b ± 10 51b ± 7
1 Values with same le t te r superscripts (between treatments) do not d if fe r s ig n ific a n tly (P > .0 5 ).
2 Standard erro r.
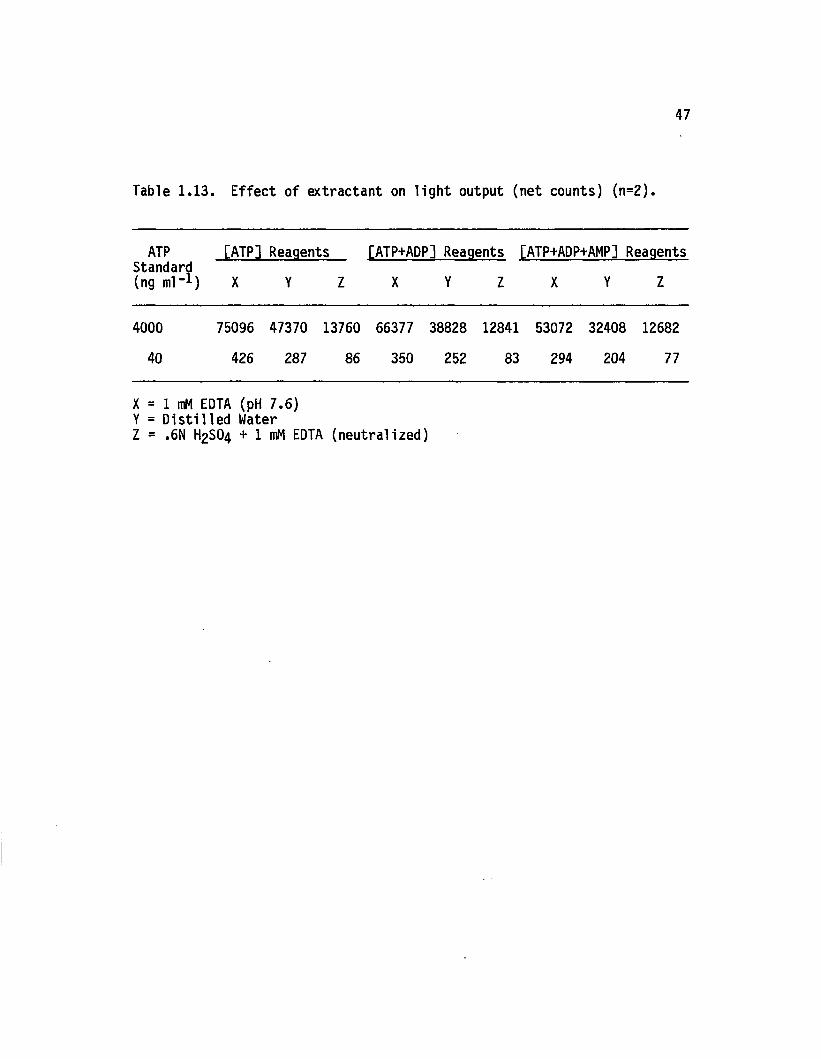
47
Table 1.13. E ffect of extractant on lig h t output (net counts) (n=2).
ATP [ATP] Reagents [ATP+ADP] Reagents [ATP+ADP+AMP] ReagentsStandard(ng ml- 1 ) X Y Z X Y Z X Y Z
4000 75096 47370 13760 66377 38828 12841 53072 32408 12682
40 426 287 86 350 252 83 294 204 77
X = 1 mM EDTA (pH 7.6)Y = D is t ille d WaterZ = ,6N H2SO4 + 1 mM EDTA (neutralized)
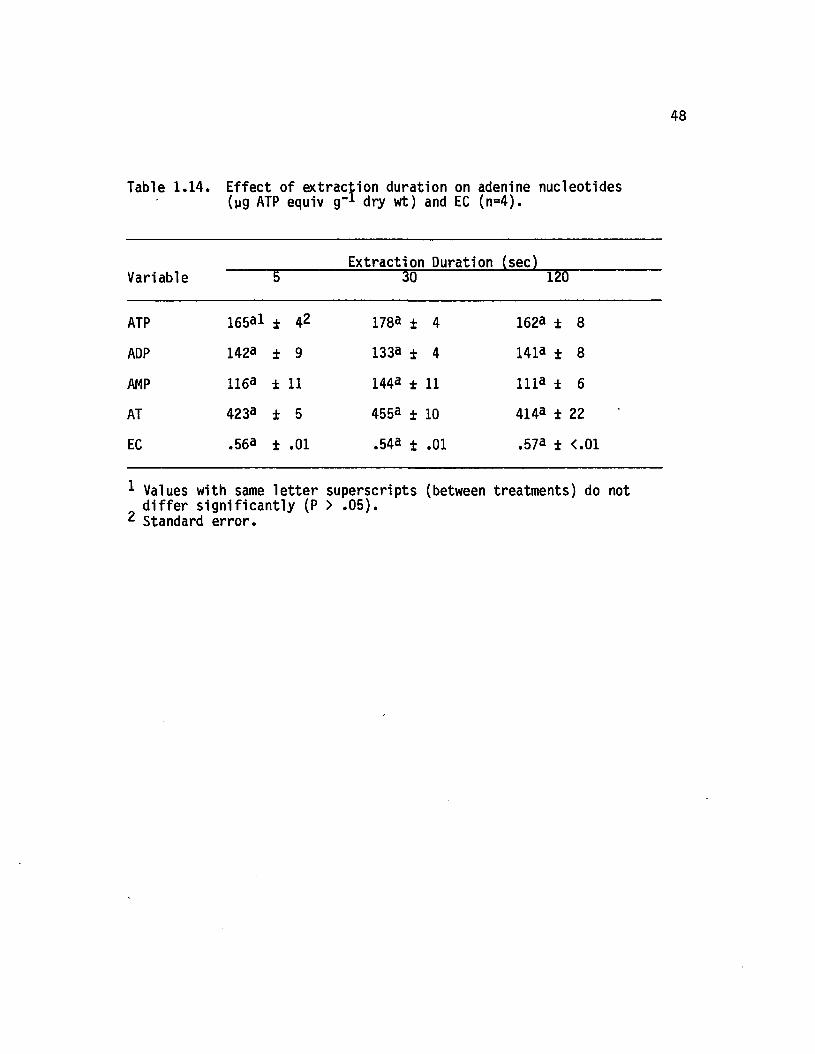
48
Table 1.14. E ffect of extraction duration on adenine nucleotides (ug ATP equiv g" 1 dry wt) and EC (n=4).
VariableExtraction Duration (sec)
5 30 120
ATP 165al ± 42 1783 ± 4 1623 ± 8
ADP 1423 ± 9 1333 ± 4 1413 ± 8
AMP 116a ± 11 1443 ± 11 1113 ± 6
AT 423a ± 5 4553 ± 10 414a ± 22
EC .563 ± .01 .543 ± .01 .5 7 3 ± < .0 1
1 Values with same le t te r superscripts (between treatments) do not d if fe r s ig n ific a n tly (P > .0 5 ).
2 Standard e rro r.
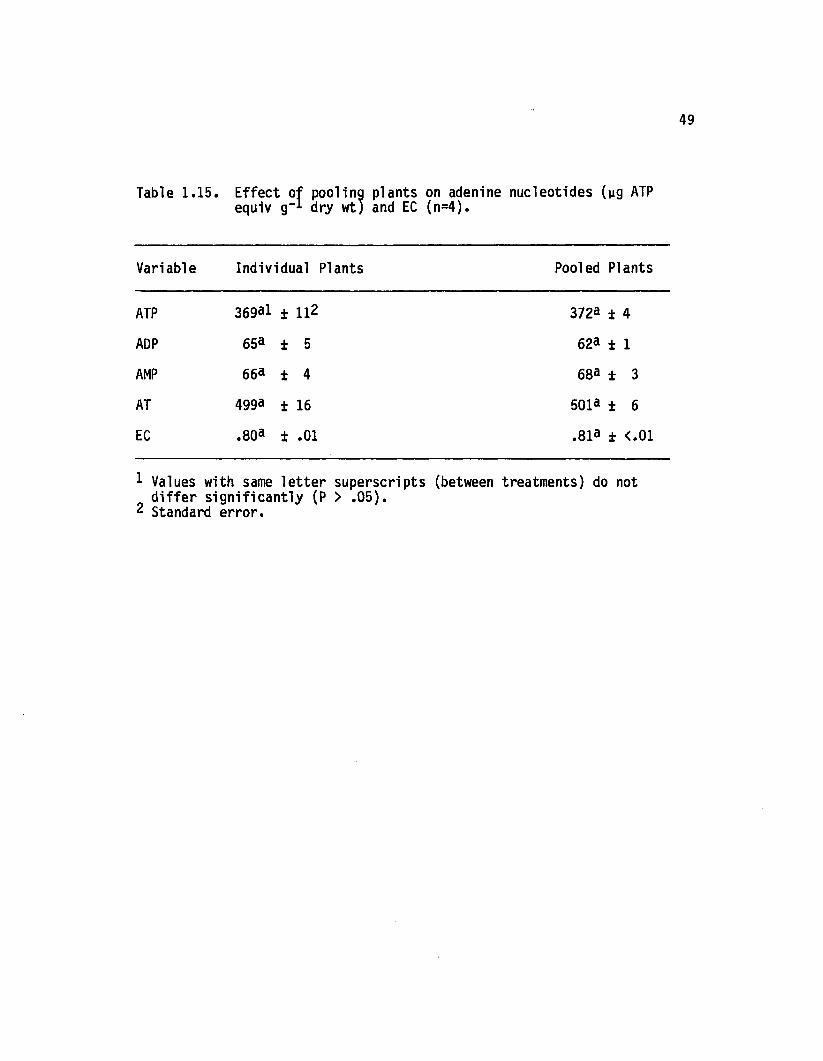
49
Table 1 .1 5 . E f fe c t o f pooling p la n ts on adenine n u c leo tid es (yg ATPequiv g " l dry w t) and EC (n = 4 ).
Variable Individual Plants Pooled Plants
ATP 369al ± 112 3723 ± 4
ADP 65a ± 5 623 ± i
AMP 663 ± 4 683 ± 3
AT 4993 ± 16 5013 ± 6
EC .80a ± .o i .813 ± < .o i
1 Values with same le t te r superscripts (between treatments) do not d if fe r s ig n ific a n tly (P > .0 5 ).
2 Standard e rro r.
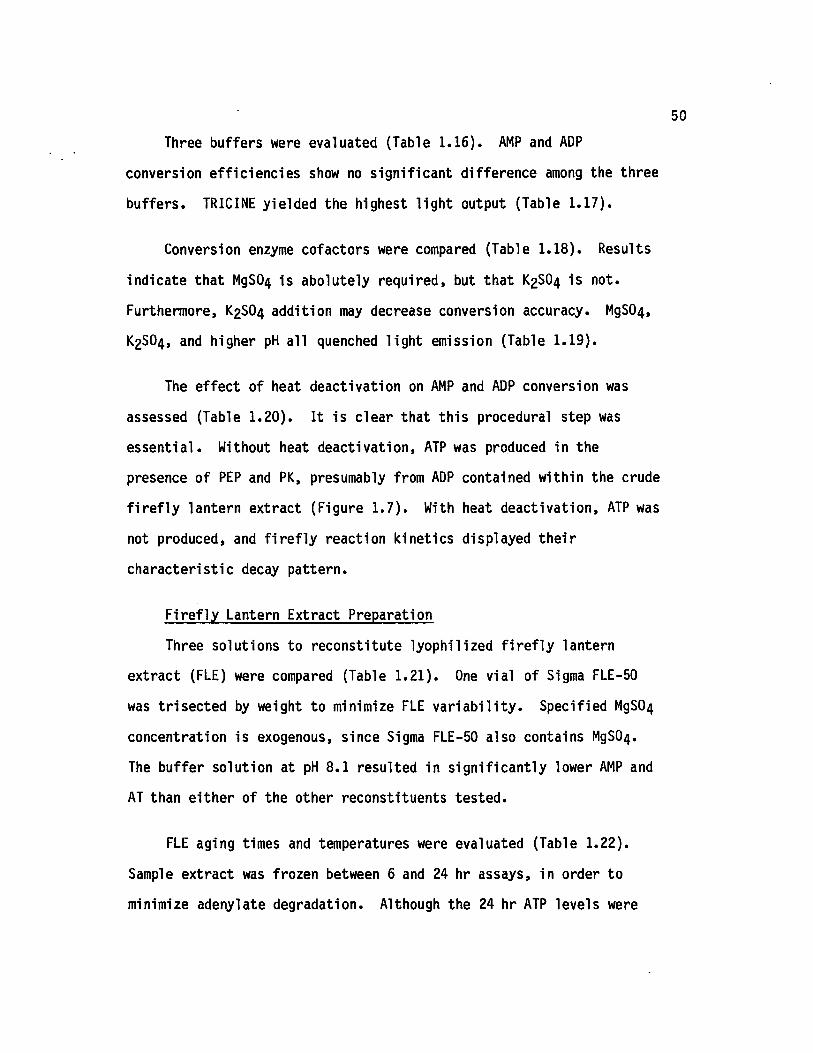
Three buffers were evaluated (Table 1 .16 ). AMP and ADP
conversion e ffic ien c ies show no s ign ifican t difference among the three
buffers. TRICINE yielded the highest lig h t output (Table 1 .17).
Conversion enzyme cofactors were compared (Table 1 .18 ). Results
indicate that MgS04 is abolutely required, but that K2SO4 is not.
Furthermore, K2SO4 addition may decrease conversion accuracy. MgS04 ,
K2SO4 , and higher pH a ll quenched lig h t emission (Table 1 .19).
The e ffe c t of heat deactivation on AMP and ADP conversion was
assessed (Table 1 .20 ). I t is clear that th is procedural step was
essen tia l. Without heat deactivation, ATP was produced in the
presence of PEP and PK, presumably from ADP contained within the crude
f i r e f ly lantern extract (Figure 1 .7 ) . With heat deactivation, ATP was
not produced, and f i r e f ly reaction kinetics displayed th e ir
characteris tic decay pattern.
F ire f ly Lantern Extract Preparation
Three solutions to reconstitute lyophilized f i r e f ly lantern
extract (FLE) were compared (Table 1 .21 ). One vial of Sigma FLE-50
was trisected by weight to minimize FLE v a r ia b ili ty . Specified MgS04
concentration is exogenous, since Sigma FLE-50 also contains MgS04 .
The buffer solution at pH 8.1 resulted in s ig n ific a n tly lower AMP and
AT than e ith e r of the other reconstituents tested.
FLE aging times and temperatures were evaluated (Table 1 .22).
Sample extract was frozen between 6 and 24 hr assays, in order to
minimize adenylate degradation. Although the 24 hr ATP levels were
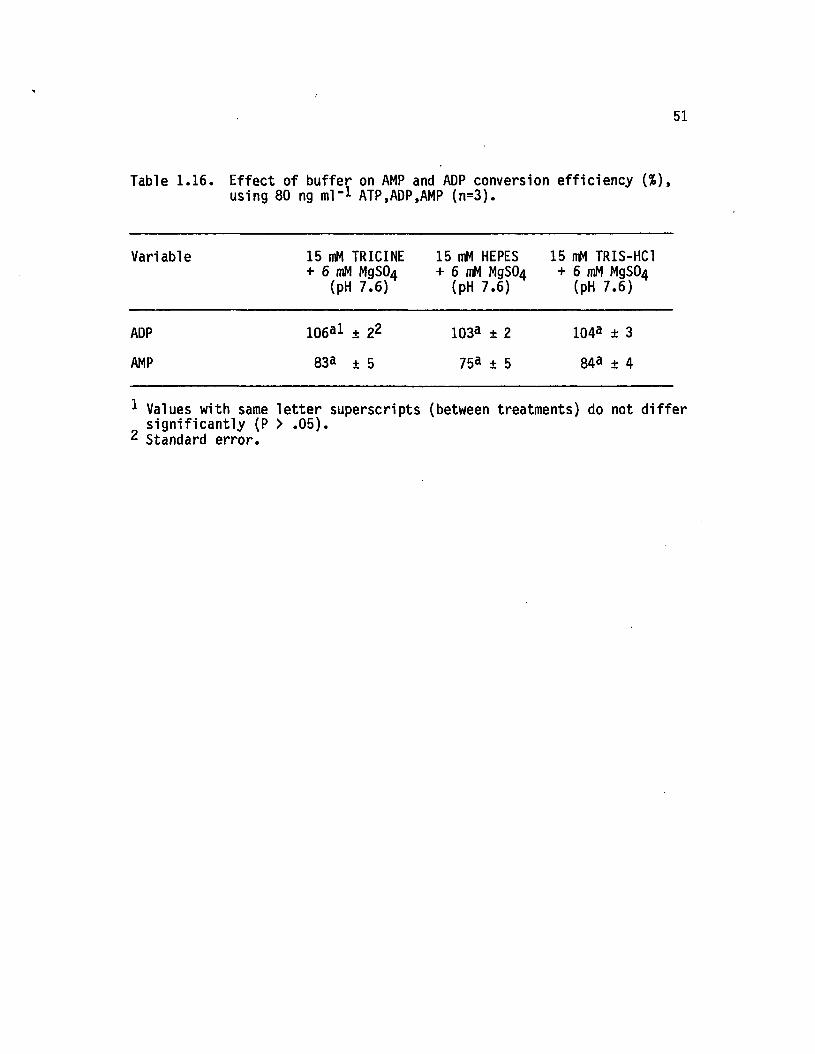
51
Table 1 .1 6 . E f fe c t o f b u ffe r on AMP and ADP conversion e f f ic ie n c y (% ),using 80 ng m l- * ATP,ADP,AMP (n = 3 ).
Variable 15 mM TRICINE + 6 mM MgS04
(pH 7.6)
15 nW HEPES + 6 mM MgS04
(pH 7.6)
15 mM TRIS-HC1 + 6 mM MgS04
(pH 7.6)
ADP 106al ± 22 103a ± 2 104a ± 3
AMP 833 ± 5 75a ± 5 84a ± 4
* Values with same le t te r superscripts (between treatments) do not d if fe r s ig n ific a n tly (P > .0 5 ).
2 Standard e rro r.
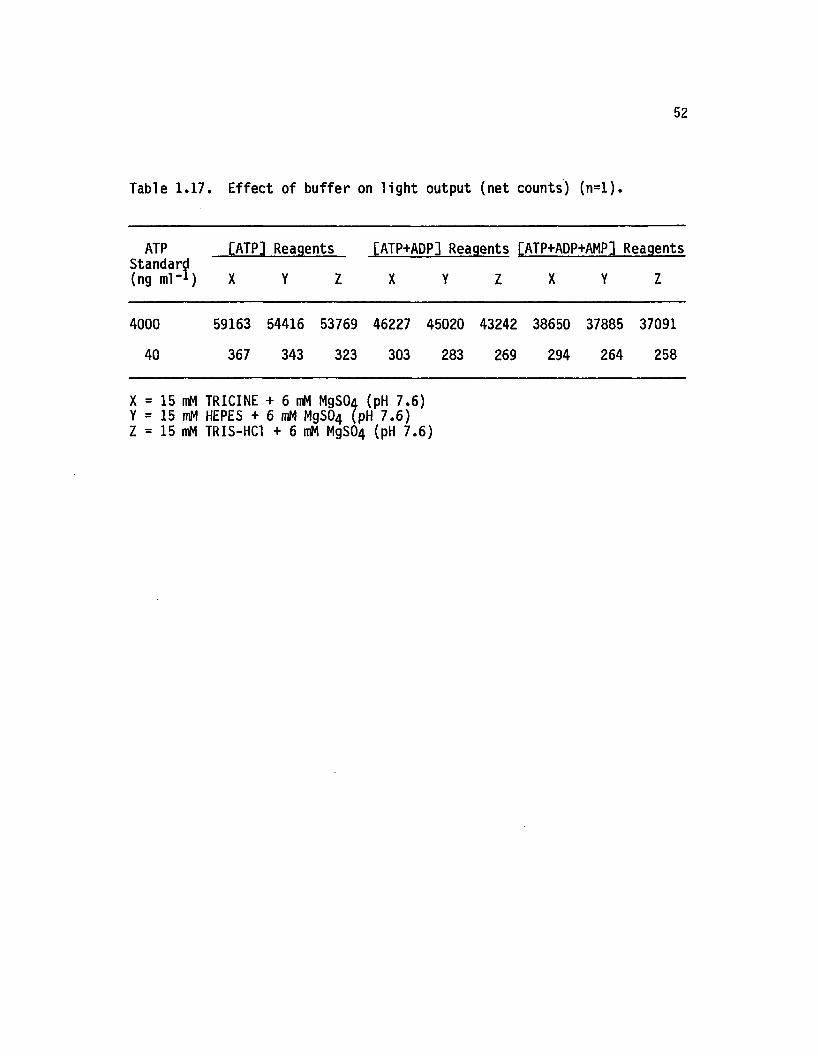
52
Table 1.17. E ffect of buffer on lig h t output (net counts) (n = l) .
ATP [ATP] Reagents [ATP+ADP] Reagents [ATP+ADP+AMP] ReagentsStandard (ng ml"1) X Y Z X Y Z X Y Z
4000 59163 54416 53769 46227 45020 43242 38650 37885 37091
40 367 343 323 303 283 269 294 264 258
X = 15 mM TRICINE + 6 mM MgSOd (pH 7.6)Y = 15 mM HEPES + 6 mM MgS04 (pH 7 .6 )Z = 15 mM TRIS-HC1 + 6 mM MgS04 (pH 7.6)
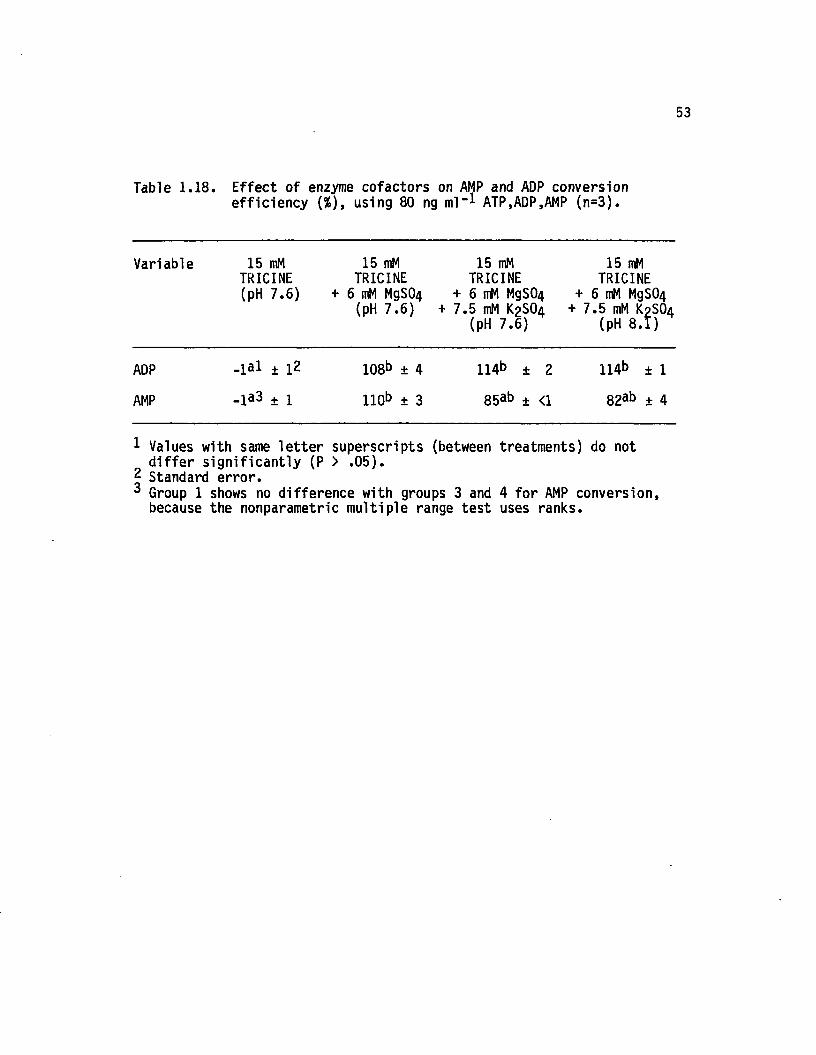
53
Table 1 .1 8 . E ffe c t o f enzyme co fac to rs on AMP and ADP conversione f f ic ie n c y (% ), using 80 ng m l-1 ATP,ADP,AMP (n = 3 ).
Variable 15 mM TRICINE (pH 7.6)
15 mM TRICINE
+ 6 mM MgS04 (pH 7 .6 )
15 mM TRICINE
+ 6 mM MgS04 + 7.5 mM K2SO4
(pH 7.6)
15 mM TRICINE
+ 6 mM MgS04 + 7.5 mM K9SO4
(pH 8 .1 )
ADP - ia l ± 12 108b + 4 114b ± 2 114b ± 1
AMP _ia3 + ! 110b ± 3 85ab ± <1 82ab ± 4
1 Values with same le t te r superscripts (between treatments) do notd if fe r s ig n ific a n tly (P > .0 5 ).
2 Standard e rro r.3 Group 1 shows no difference with groups 3 and 4 fo r AMP conversion,
because the nonparametric m ultip le range tes t uses ranks.
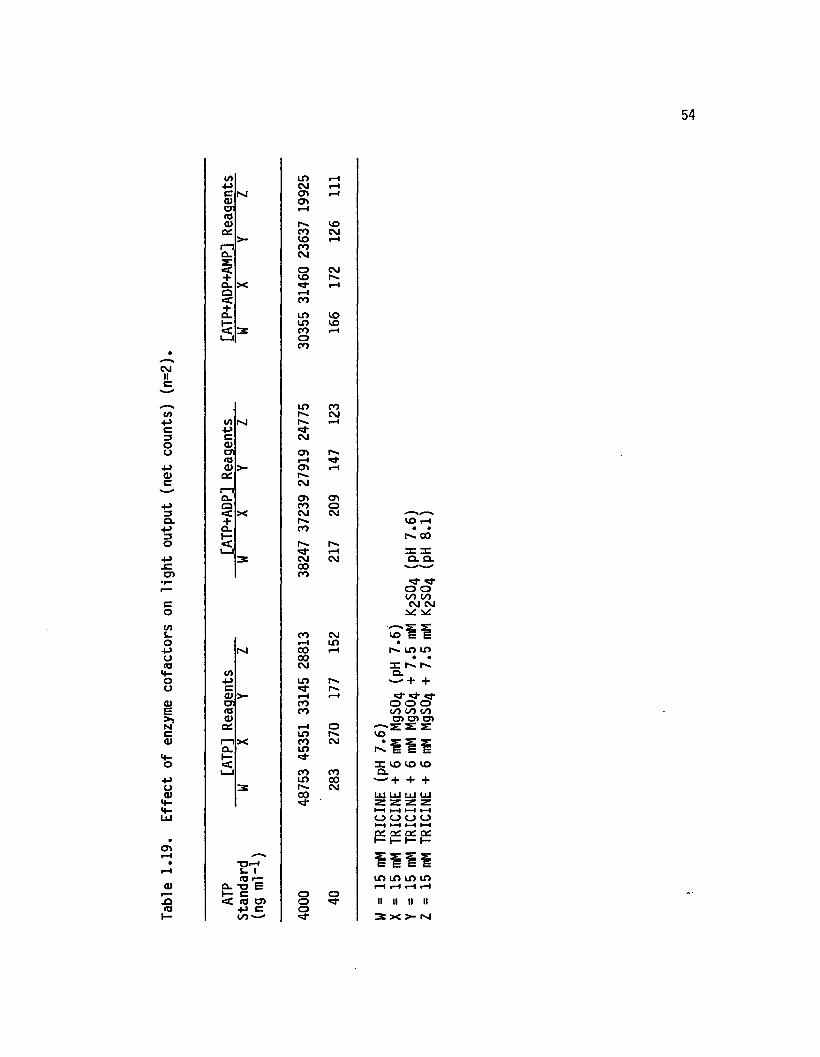
Tabl
e 1.
19.
Effe
ct
of en
zyme
co
fact
ors
on lig
ht
outp
ut
(net
co
unts
) (n
=2).
54
(/) LO »H+J CM Hc0)cr<o
M aio>i-H
i-H
01 P VO0£ CO CM1—1 a. z:
>- VOCOCM
»-H
< O CM+ to r***a.Q<+
XrHCO
i-H
Ou LO VOh— LO VO< l_12 COoCO
LO
rH
COCMt/>-Pcaj
M p-*-CM
rH
cr o> P-*<0 i-H0)Q£I—1
>- CT>p*CM
rH
cl Oi a>Q CO o<+a.1—
X CMCO
CM
<L_J i-H2 CM
COCO
COrH
CM
CMLO
(/)
M co00CM
rH
-P LO t"-C P<Ucrro0)
>- rHCOCO
i-H
0C rHLO
or-ia.I—<
X COLO
CM
L_J COLO
CO00
CL
2
-o«-hS- 1-a E
P00 CM
1— c o o< <T3 a> •P C 00 '—oo
tC rH • •
I". 003= 3= O. Q.
O O 00 00 CM CM
co E E .i-~ in in . .
I r - r-» a.—' + +^ rj- O O Oto oo oo o» o> o> £ £
cor ^ i l l3C CO CO CO Q. + + ui LU LU LUz z z zc_> o o oH-. I—I I—I Hpc o i o ; o ; r— I— I— t—
m in in inrH H i—I 1—I
II II II II 3 X >- M
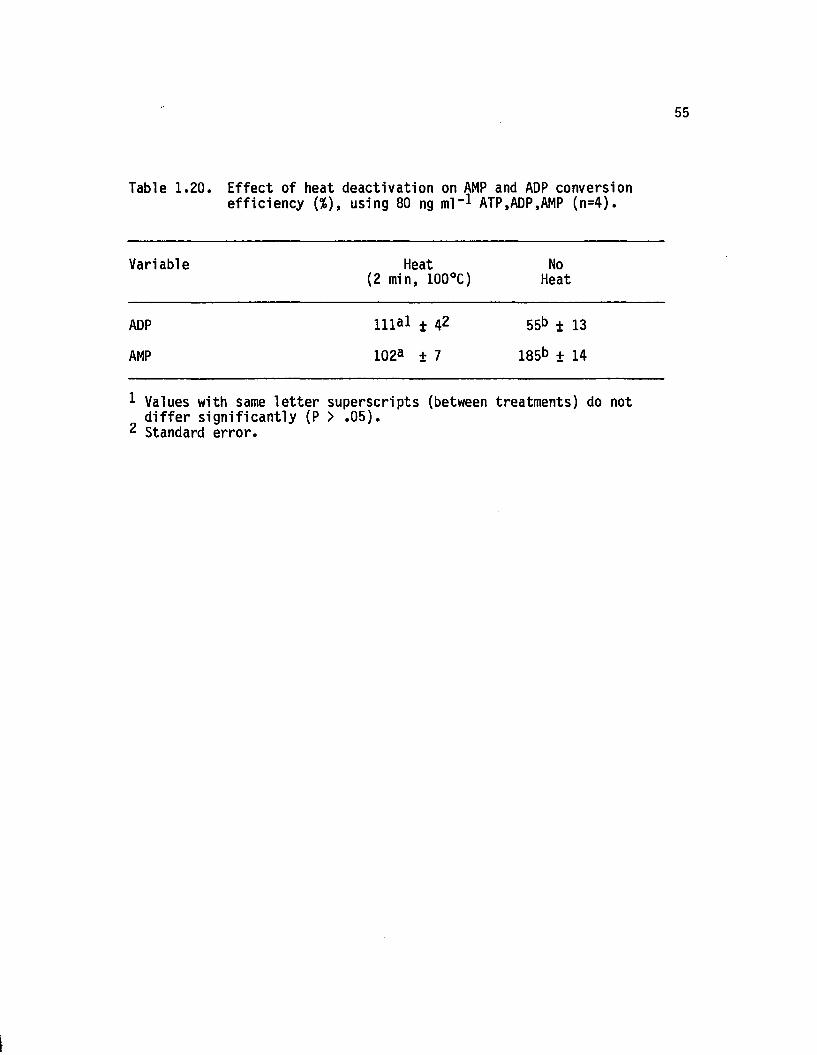
55
Table 1 .2 0 . E f fe c t o f heat d e a c tiv a tio n on AMP and ADP conversione f f ic ie n c y (% ), using 80 ng m l” * ATP,ADP,AMP (n = 4 ).
Variable Heat No(2 min, 100°C) Heat
ADP H i a l ± 42 55b ± 13
AMP 102a ± 7 185b + 14
1 Values with same le t te r superscripts (between treatments) do not d if fe r s ig n ifican tly (P > .0 5 ).
2 Standard erro r.
i
Figure 1.7. Reaction kinetics with and without heat deactivation.FLE is injected at time zero, the tube is vortexed, inserted into the photometer, and the shutter is opened (indicated by arrow).
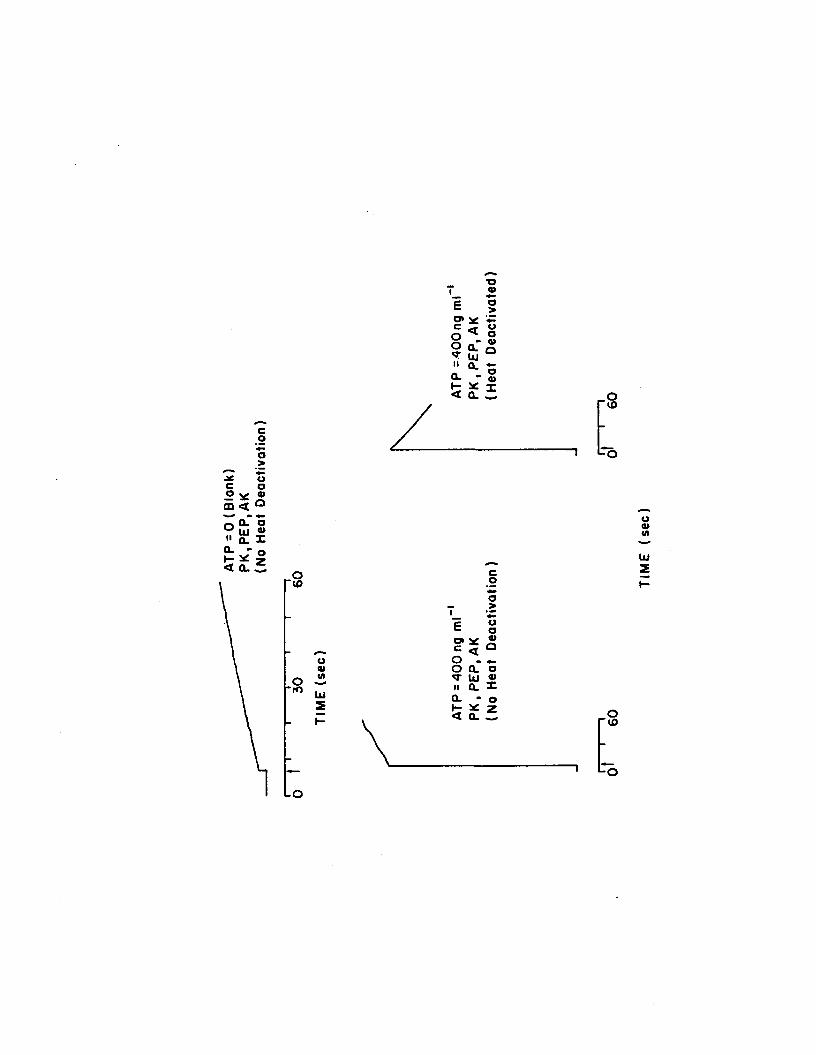
Q. a uj
e 2a> vc < a ° . sg H Q ^ uj
Q. - Sh 5C I< a. 3 _ o
co•-O
O<0
oa»O ^•fO UJ
2
Io>
p ° c 0o> * «s - . f0 0 .0
Uj «
M Q_ X C L - O& ? Z <0- _. o"<D
LoL O
TIME
(s
ec)
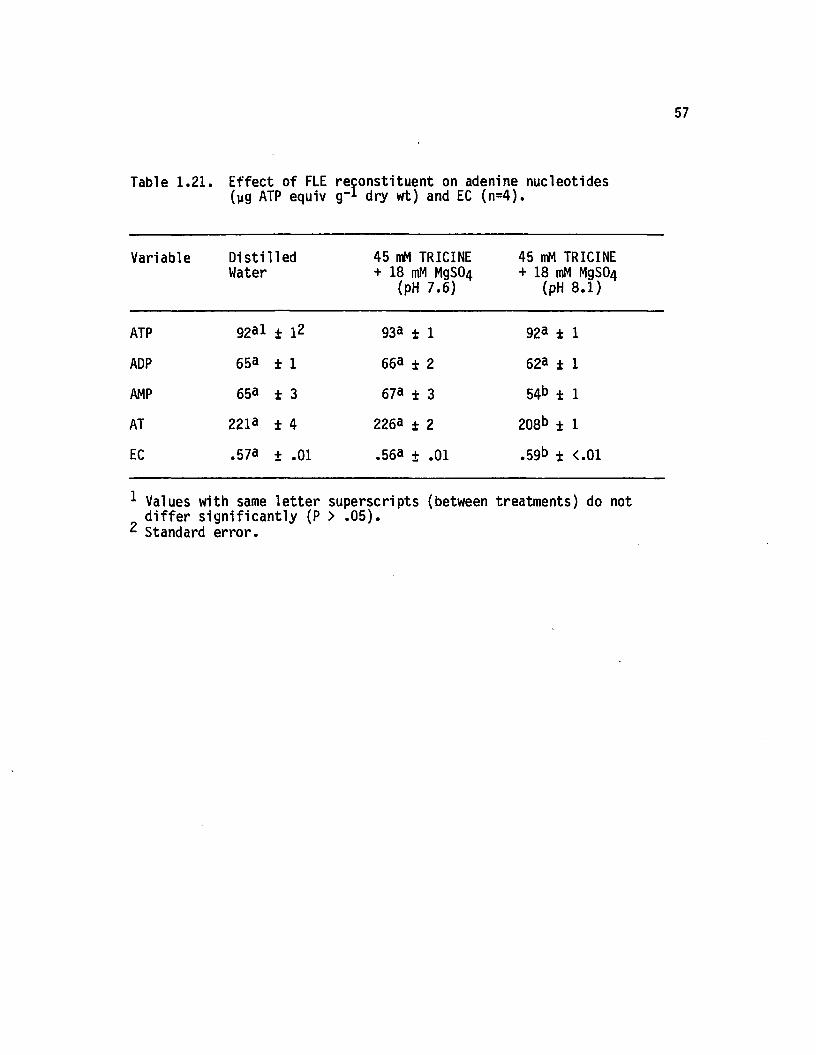
57
Table 1.21. E ffect of FLE reconstituent on adenine nucleotides (ng ATP equiv g" 1 dry wt) and EC (n=4).
Variable D is tille dWater
45 mM TRICINE + 18 mM MgS04
(pH 7.6)
45 mM TRICINE + 18 mM MgS04
(pH 8 .1 )
ATP 92a l ± ]2 933 ± 1 92a ± 1
ADP 65a ± i 663 ± 2 623 ± i
AMP 653 ± 3 673 ± 3 54b ± 1
AT 2213 ± 4 2263 ± 2 208b ± 1
EC .573 + .o i .563 + .o i .59b + <.01
1 Values with same le t te r superscripts (between treatments) do not d if fe r s ig n ific a n tly (P > .0 5 ).
Standard e rro r.
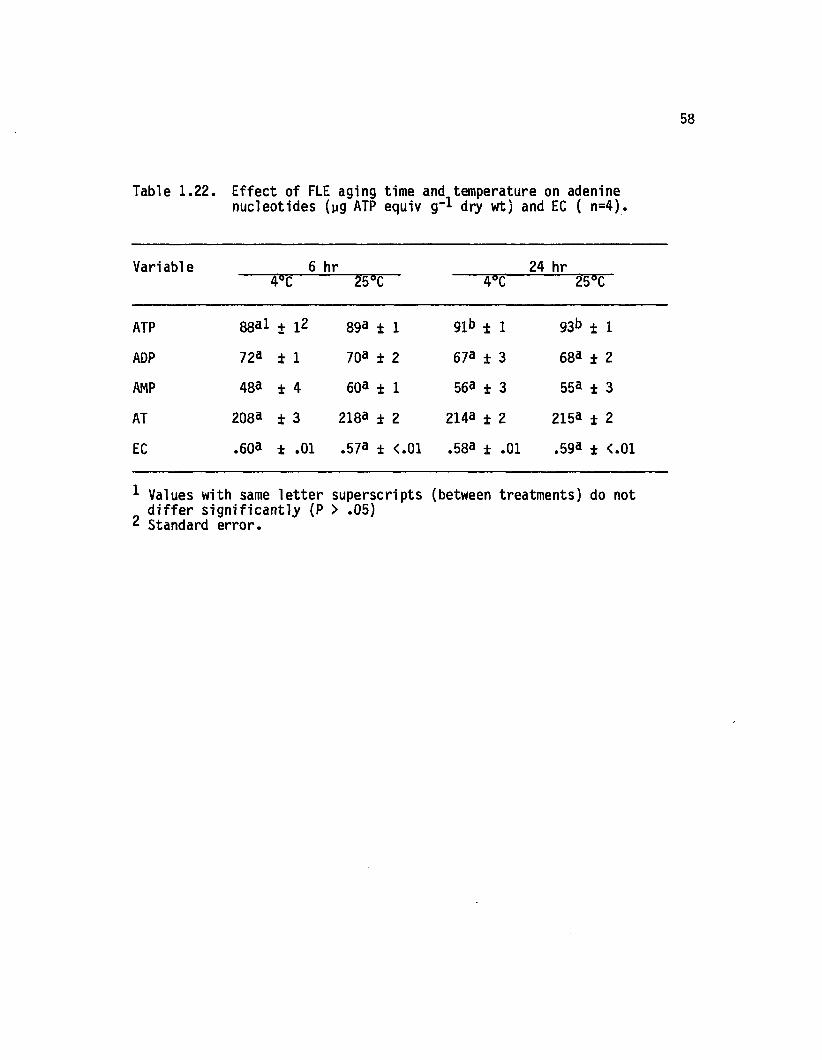
58
Table 1 .22. E ffect of FLE aging time and temperature on adenine nucleotides (ug ATP equiv g- * dry wt) and EC ( n=4).
Variable 6 hr 24 hr4°C 250C 4°C 25°C
ATP 88a l + l 2 89a ± 1 91*> ± 1 93b ± 1
ADP 72a ± 1 70a ± 2 67a ± 3 68a ± 2
AMP ■M<o00 60a ± 1 56a ± 3 55a ± 3
AT 208a ± 3 218a ± 2 214a ± 2 215a ± 2
EC .60a ± .01 .57a ± <.01 .58a ± .01 .59a ± <.01
1 Values with same le t te r superscripts (between treatments) do not d if fe r s ig n ific a n tly (P > .05)
2 Standard erro r.
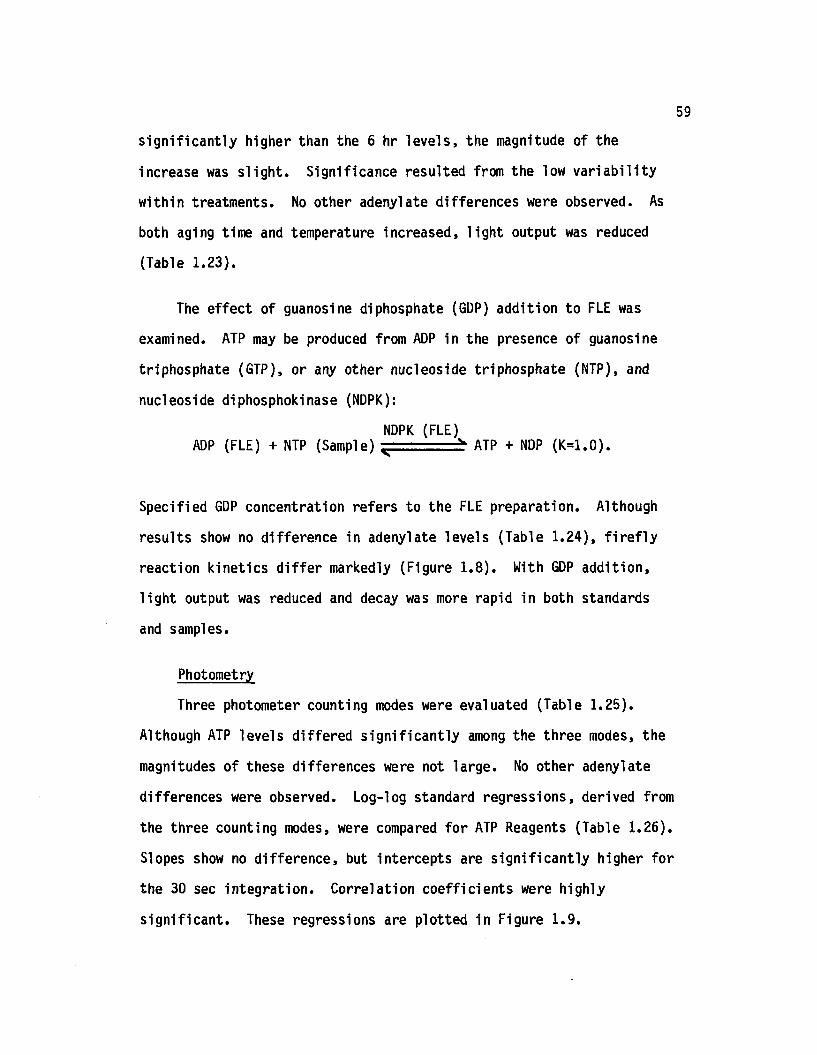
s ig n ific a n tly higher than the 6 hr le ve ls , the magnitude of the
increase was s lig h t. Significance resulted from the low v a r ia b ili ty
within treatments. No other adenylate differences were observed. As
both aging time and temperature increased, lig h t output was reduced
(Table 1 .23).
The e ffe c t of guanosine diphosphate (GDP) addition to FLE was
examined. ATP may be produced from ADP in the presence of guanosine
triphosphate (GTP), or any other nucleoside triphosphate (NTP), and
nucleoside diphosphokinase (NDPK):
NDPK (FLE)ADP (FLE) + NTP (Sample) v * ATP + NDP (K=1.0).
Specified GDP concentration refers to the FLE preparation. Although
results show no difference in adenylate levels (Table 1 .24 ), f i r e f ly
reaction kinetics d if fe r markedly (Figure 1 .8 ) . With GDP addition ,
lig h t output was reduced and decay was more rapid in both standards
and samples.
Photometry
Three photometer counting modes were evaluated (Table 1 .25).
Although ATP levels d iffe red s ig n ific a n tly among the three modes, the
magnitudes of these differences were not large. No other adenylate
differences were observed. Log-1og standard regressions, derived from
the three counting modes, were compared fo r ATP Reagents (Table 1 .26 ).
Slopes show no d ifference, but intercepts are s ig n ific a n tly higher fo r
the 30 sec in tegration . Correlation coeffic ien ts were highly
s ig n ific a n t. These regressions are plotted in Figure 1 .9 .
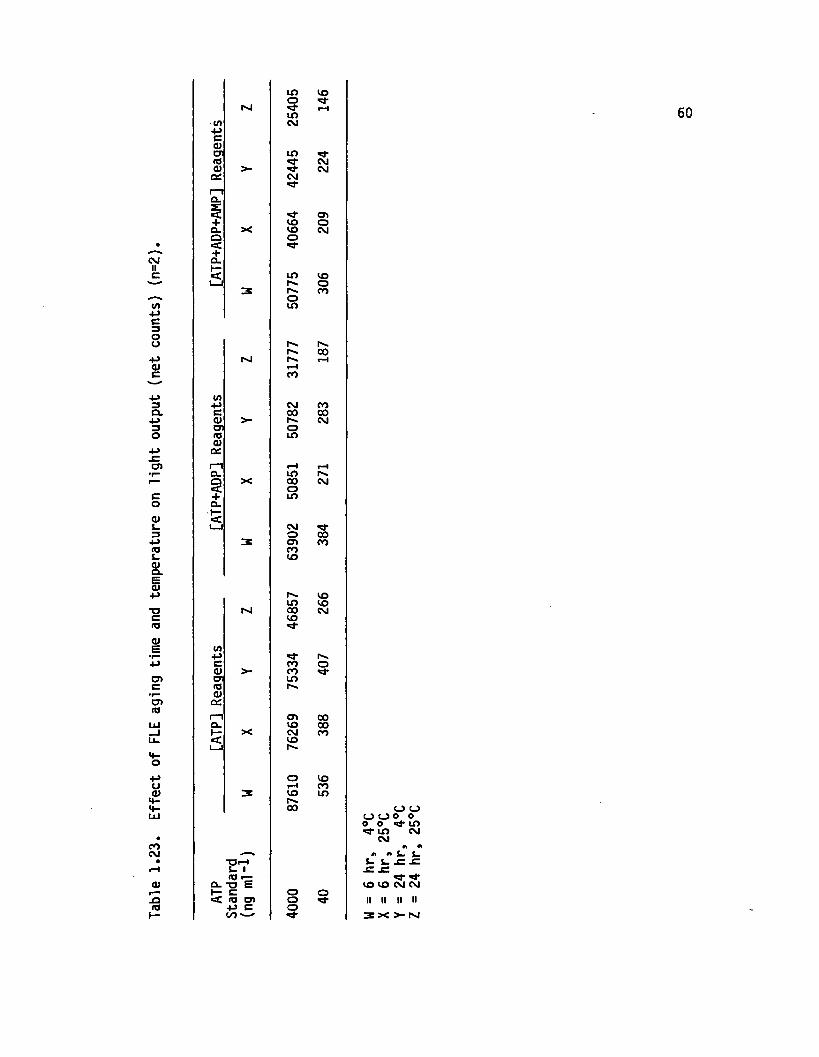
Tabl
e 1.
23.
Effe
ct
of FL
E ag
ing
time
and
tem
pera
ture
on
light
ou
tput
(n
et
coun
ts)
(n=2
).
LO VOOM *3* i-Hin</) CMpc<Dcr LO «cf«5 ^ CM0) >- CMOC CM1—1Q.
CD+ VO oa. X VO CMo O<+a.h—< in vo1_1 r-* o3: r**. cooin
r**. r .r** coN rHtHCO
</)P CM COC 00 00a> >- cmCT ofO LO01OCn H rHCL mO X 00 CM< o+ LOCL1—<1_1 CMO 003 o> COCOVO
rs. voLO VOM 00 CMvo
i/lP "Cf r**C CO o0) >- COcr LO<o0)QCn CT» 00Q. VO 001— X CM CO< voL-l I-'-
o vorH CO3 vo in00
*OrH&. 1<d *—Q.T3 Eh- C o o< fd o> OP c o00'—
60
o o o o o oO Oun cmCM A A« . L L.
S- S_ _E -C -C J=CO CO CM CM
II II II II 3 X > - M
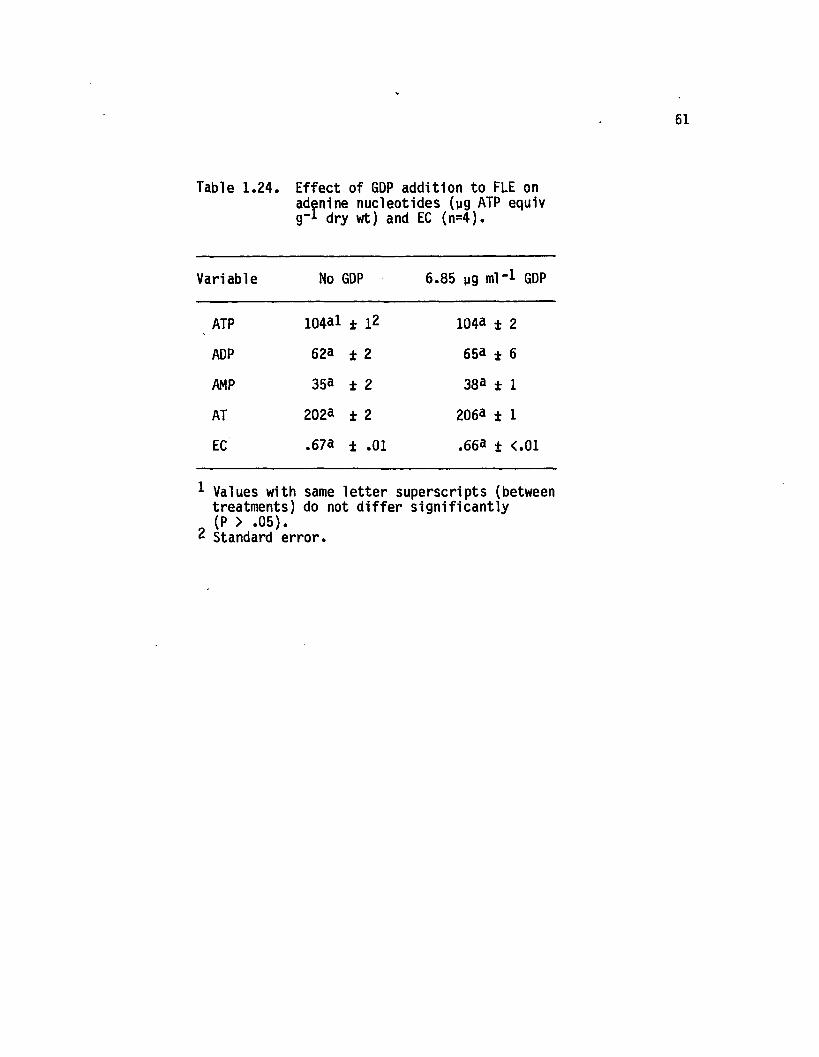
Table 1.24. E ffect of GDP addition to FLE onadenine nucleotides (ug ATP equivg" 1 dry wt) and EC (n=4).
Variable No GDP 6.85 jig ml"l GDP
ATP 104al ± l 2 1043 ± 2
ADP 62a ± 2 653 ± 6
AMP 353 ± 2 383 ± i
AT 2023 ± 2 2063 ± i
EC .673 ± .01 .66a ^ <.01
1 Values with same le t te r superscripts (between treatments) do not d if fe r s ig n ific a n tly(P > .0 5 ).
2 Standard e rro r.
62
Figure 1.8. Reaction kinetics with and without GDP addition. FLEis injected at time zero, the tube is vortexed, inserted into the photometer, and the shutter is opened (indicated by arrow). Counts represent a 10 sec integration period, immediately following a 10 sec delay from time zero.
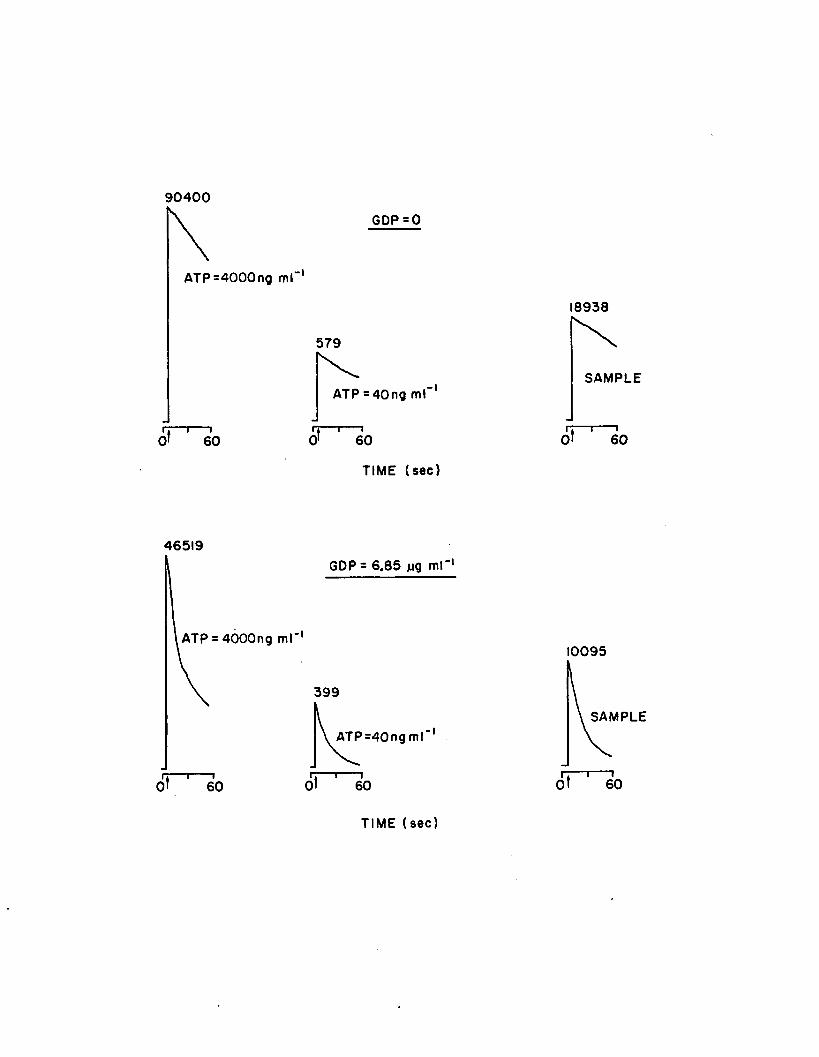
9 0 4 0 0
A TP =4000ng ml
Tr60
GDP =0
-i
579
ATP = 40ng ml
60
-I
18938
SAMPLE
T
TIM E (sec)
46519
ATP = 4000ng ml
—i60
r
GDP = 6 .85 jug ml"'
-i
399
ATP=40ngm l
T
10095
SAMPLE
“i60
r
TIM E (sec)
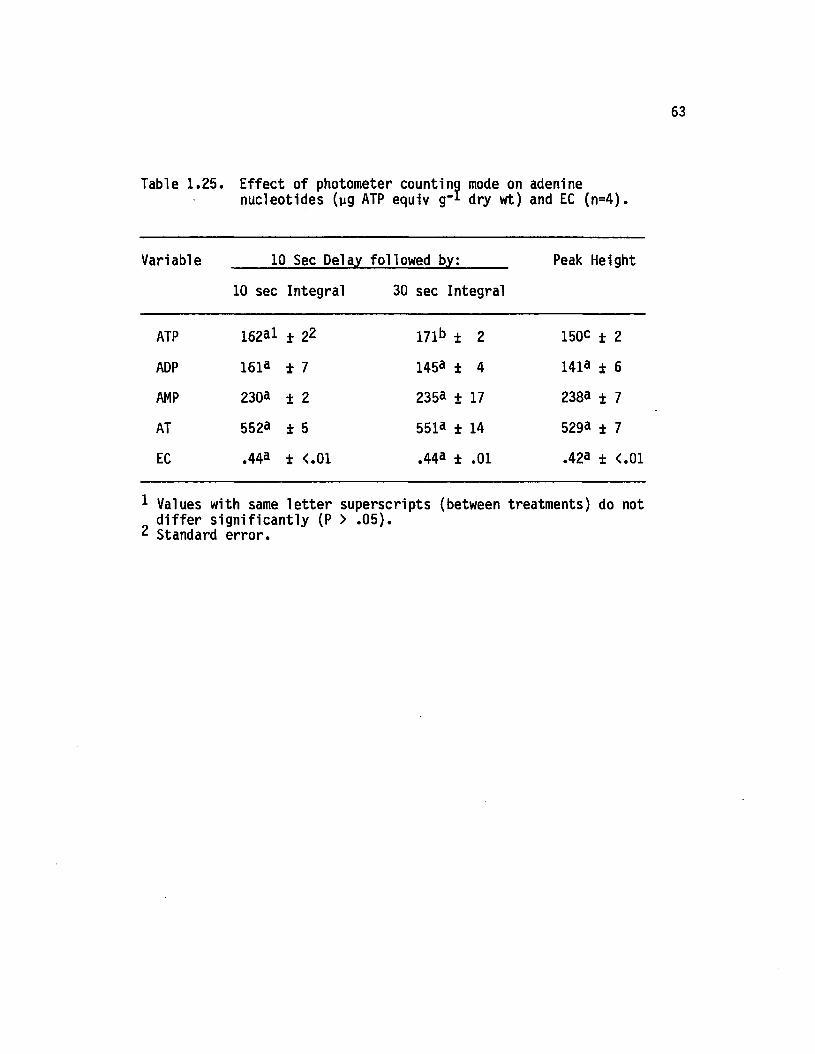
63
Table 1 .25. E ffect of photometer counting mode on adeninenucleotides (yg ATP equiv g"l dry wt) and EC (n=4).
Variable 10 Sec Delay followed by: Peak Height
10 sec Integral 30 sec Integral
ATP 16231 ± 2.2 171b ± 2 150c ± 2
ADP 1613 ± 7 1453 ± 4 1413 ± 6
AMP 2303 ± 2 2353 + 17 2383 ± 7
AT 5523 ± 5 5513 ± 14 5293 ± 7
EC .443 ± <.01 .443 ± .01 .423 ± <.01
1 Values with same le t te r superscripts (between treatments) do not d if fe r s ig n ific a n tly (P > .0 5 ).
2 Standard e rro r.
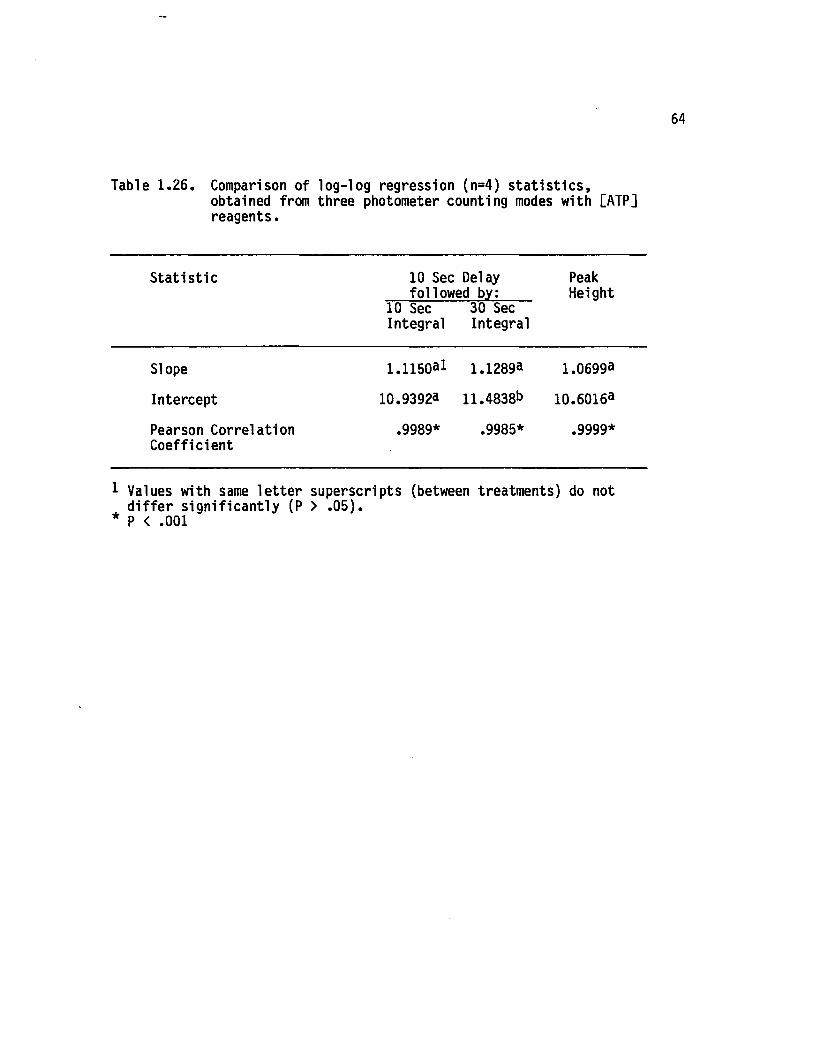
64
Table 1.26. Comparison of log-1og regression (n=4) s ta t is t ic s ,obtained from three photometer counting modes with [ATP] reagents.
S ta tis tic 10 Sec Delay followed by:
PeakHeight
10 Sec Integral
30 Sec Integral
Slope 1.1150a1 1.12893 1.06993
Intercept 10.93923 11.4838b 10.60163
Pearson Correlation C oeffic ient
.9989* .9985* .9999*
1 Values with same le t te r superscripts (between treatments) do notd if fe r s ig n ific a n tly (P > .0 5 ).
* P < .001
Figure 1.9. Comparison of photometer counting modes with ATP reagents (n = 2).
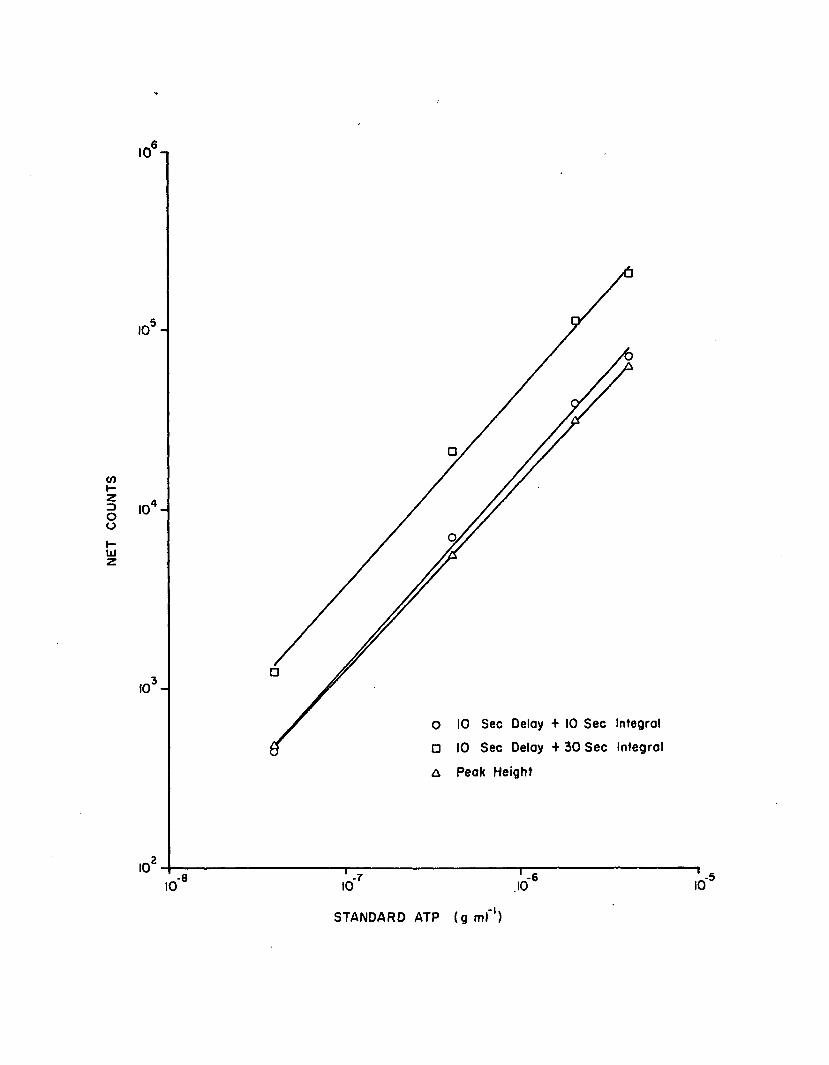
NET
CO
UN
TS
10 n
O 10 Sec Delay + 10 Sec Integral
□ 10 Sec Delay + 30 Sec Integral
A Peak Height
STANDARD ATP (g m l'1)
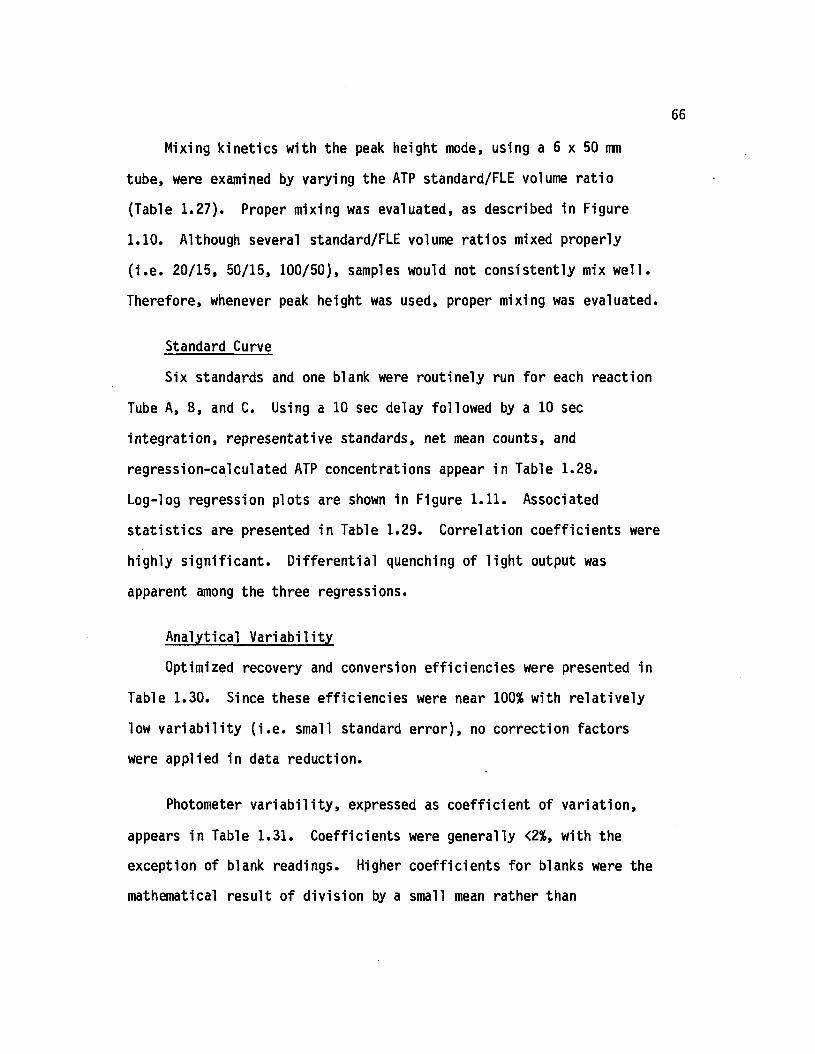
Mixing kinetics with the peak height mode, using a 6 x 50 mm
tube, were examined by varying the ATP standard/FLE volume ra tio
(Table 1 .27 ). Proper mixing was evaluated, as described in Figure
1.10. Although several standard/FLE volume ra tios mixed properly
( i . e . 20/15, 50/15, 100/50), samples would not consistently mix w e ll.
Therefore, whenever peak height was used, proper mixing was evaluated.
Standard Curve
Six standards and one blank were routinely run fo r each reaction
Tube A, B, and C. Using a 10 sec delay followed by a 10 sec
in tegration , representative standards, net mean counts, and
regression-calculated ATP concentrations appear in Table 1.28.
Log-log regression plots are shown in Figure 1.11. Associated
s ta tis tic s are presented in Table 1.29. Correlation coeffic ien ts were
highly s ig n ific a n t. D iffe re n tia l quenching of lig h t output was
apparent among the three regressions.
Analytical V a r ia b ility
Optimized recovery and conversion e ffic ien c ies were presented in
Table 1.30. Since these e ffic ien c ies were near 100% with re la tiv e ly
low v a r ia b ili ty ( i . e . small standard e rro r ) , no correction factors
were applied in data reduction.
Photometer v a r ia b ili ty , expressed as coe ffic ien t of va ria tio n ,
appears in Table 1.31. Coefficients were generally <2%, with the
exception of blank readings. Higher coe ffic ien ts fo r blanks were the
mathematical resu lt of d ivision by a small mean rather than
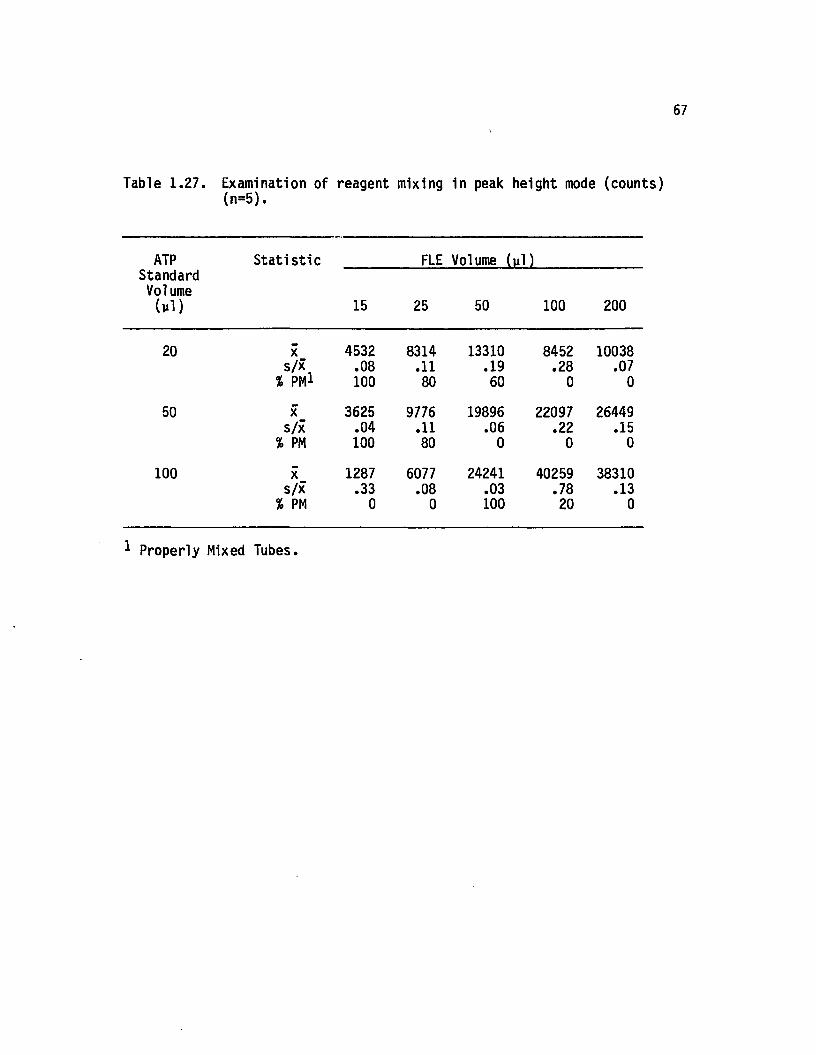
67
Table 1.27. Examination of reagent mixing in peak height mode (counts) (n=5).
ATP Standard
VolumeU l )
S ta tis tic FLE Volume (u l)
15 25 50 100 200
20 X 4532 8314 13310 8452 10038s/x .08 .11 .19 .28 .07
% PM1 100 80 60 0 0
50 X 3625 9776 19896 22097 26449s/x .04 .11 .06 .22 .15
% PM 100 80 0 0 0
100 X 1287 6077 24241 40259 38310s/x .33 .08 .03 .78 .13
% PM 0 0 100 20 0
1 Properly Mixed Tubes.
Figure 1.10. Mixing kinetics in peak height mode. The sample tube is inserted into the photometer, and FLE is injected at time zero with the electronic pipet system which simultaneously activates the photometer. After 15 sec, the tube is removed, vortexed, and re-inserted into the photometer. Continuity in decay kinetics indicates proper initial mixing.
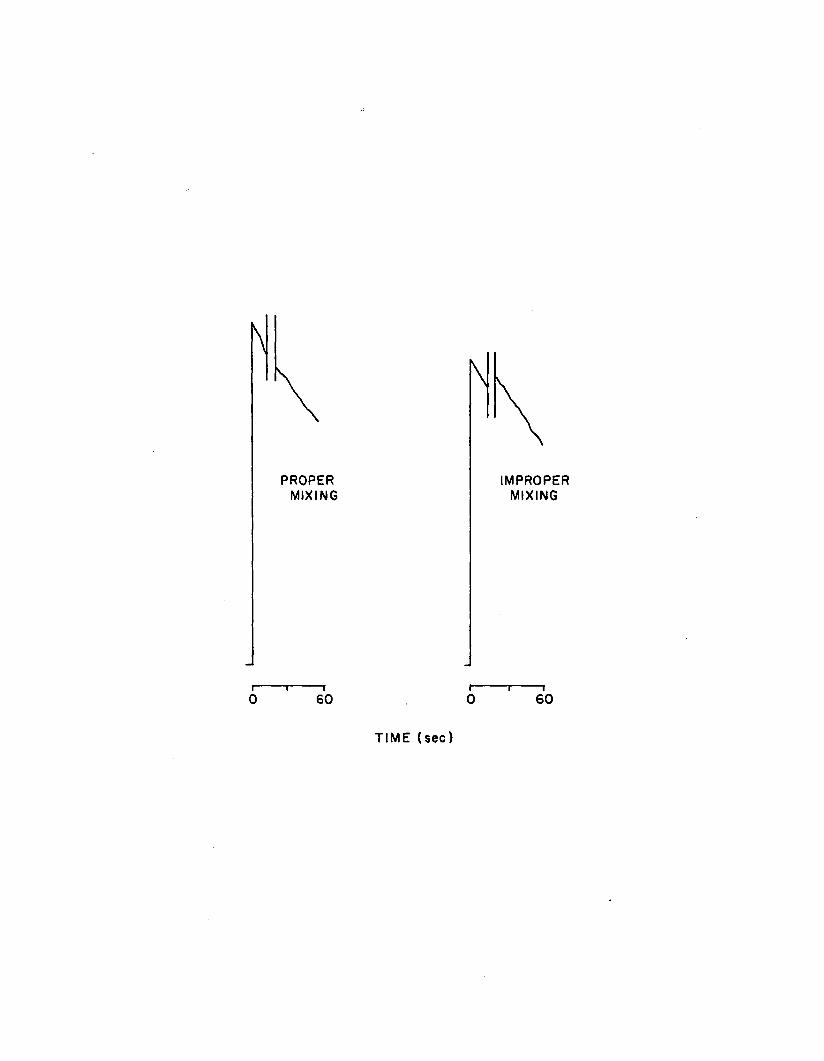
PROPERMIXING
IMPROPERMIXING
60r*0
—r 60
TIM E (sec)
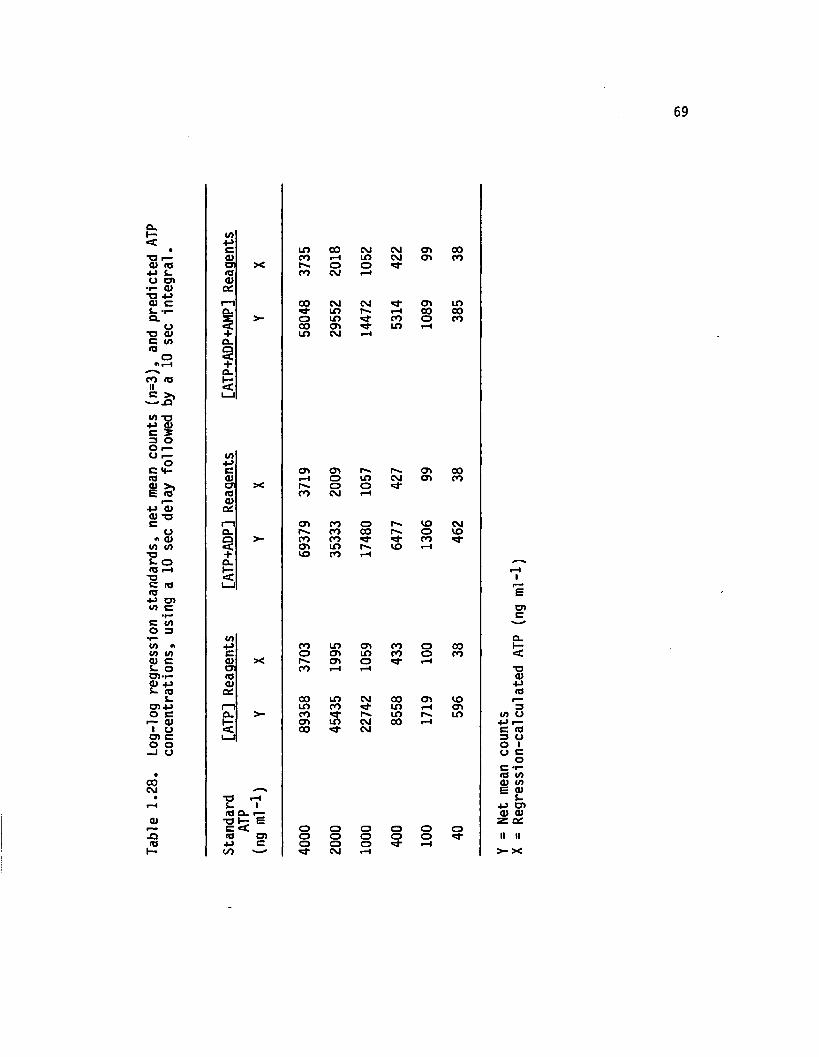
Tabl
e 1.
28.
Log-
log
regr
essi
on
stan
dard
s,
net
mean
co
unts
(n
=3),
and
pred
icte
d AT
P co
ncen
trat
ions
, us
ing
a 10
sec
dela
y fo
llow
ed
by a
10 se
c in
teg
ral.
69
i/i4->C to 00 CM CM os 000) CO rH in CM as COCT X o ord 00 CM rH<UC*r-i 00 CM CM Ol ina. in p-* rH 00 00
>- o in CO o COCO cr> in rH
+ LO CM i—<CU§+a.1—<LJ
i/i4->C Ol o> r . r . as 00a) H o in CM as COa X r . o o **■id CO CM i-H0)a:i—i cn CO o vo CMa. CO 00 r-*- o VOa >- CO CO CO< Ol in r-*. VO i-H+ VO CO Ha.H-<1__1
i/i4-> CO in <J\ CO o 00C o CT> in CO o COa) X o rHCJ CO t—1 rHid<ua;
00 in CM 00 as VOn n CO in l™< osa. >• CO P-*. in p inh- in CM 00 rH< 00 CM
*o Hs- 1(Q D. r—"O h Ec <c o o O o o oid CT> o o o o o+-> c o o o rHCO CM r-H
CT>
T3<U4-><0
W O+> i—C rtJ 3 O O I (J C O C -r-<o m <u co E <U+J C7> Qi 0) Z a£II II
>- X
70
Figure 1.11. Standard curve regressions, using a 10 sec delay followed by a 10 sec integration (n = 3).
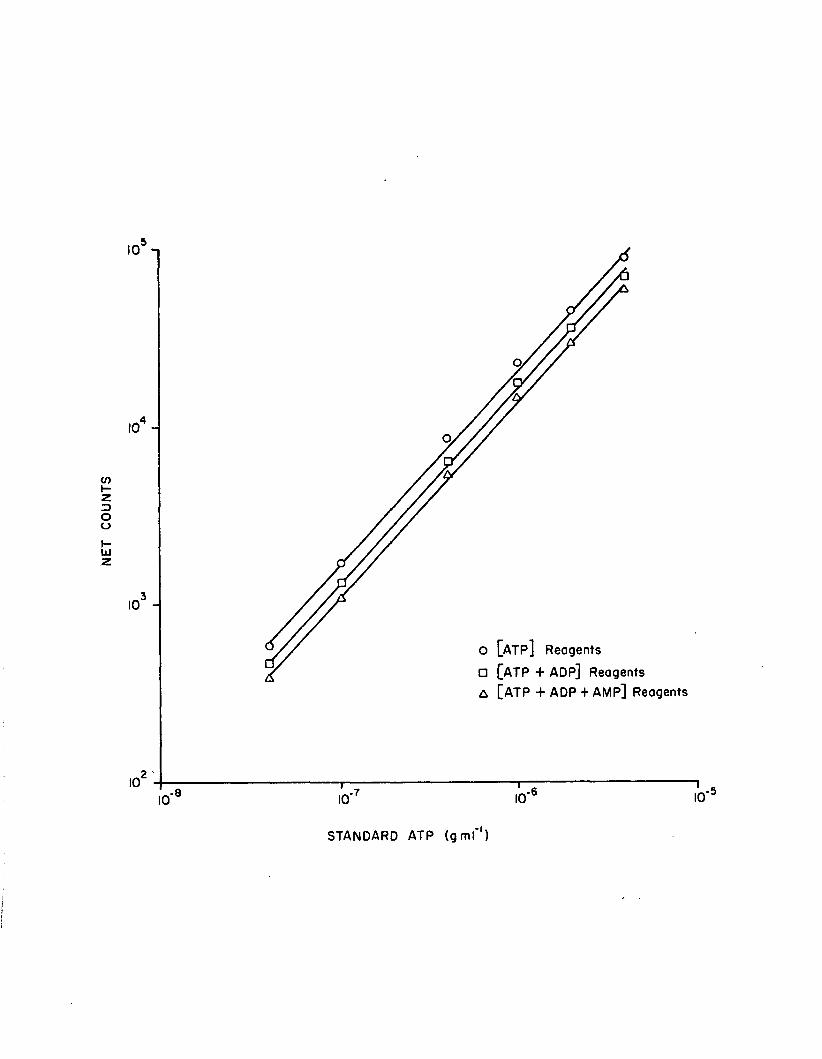
NET
COUN
TS
10
,410
310
O [ATP] Reagents □ [ATP + ADP] Reagents A [ATP + ADP + AMP] Reagents
210
STANDARD ATP (gmf‘)
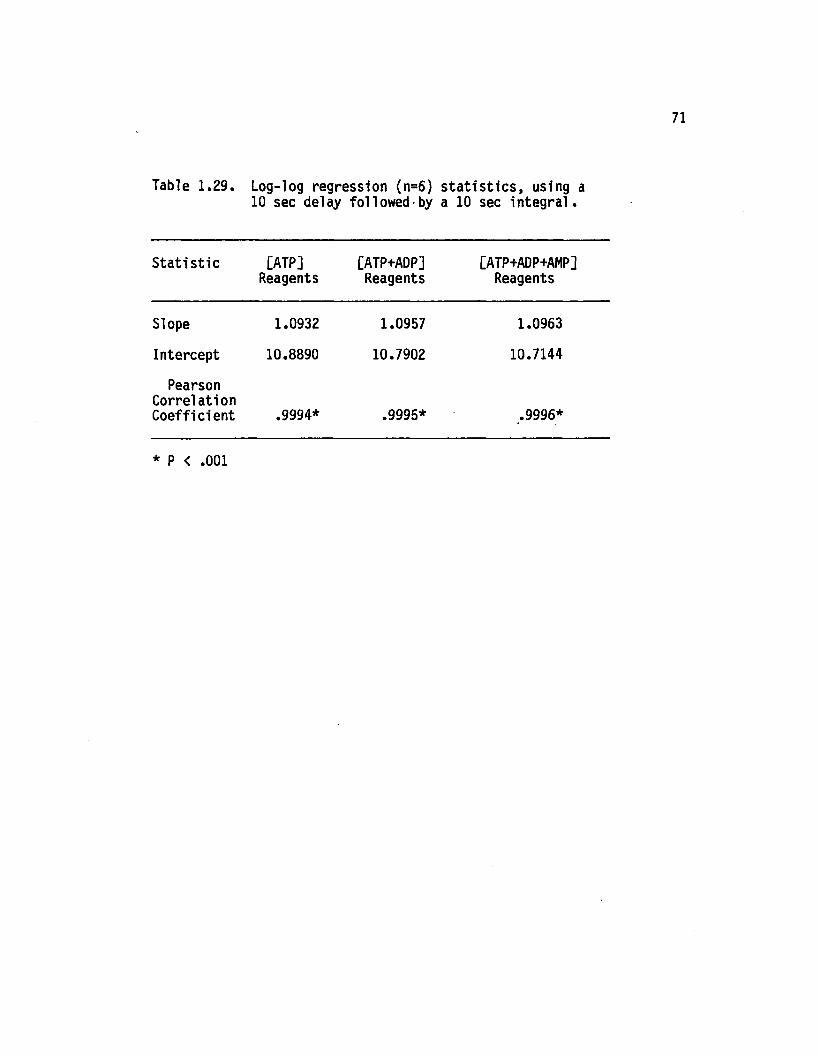
71
Table 1.29. Log-log regression (n=6 ) s ta t is t ic s , using a 10 sec delay fo i l owed by a 10 sec in te g ra l.
S ta tis tic [ATP]Reagents
[ATP+ADP]Reagents
[ATP+ADP+AMP]Reagents
Slope 1.0932 1.0957 1.0963
Intercept 10.8890 10.7902 10.7144
Pearson Correlation Coeffi ci ent .9994* .9995* .9996*
* P < .001
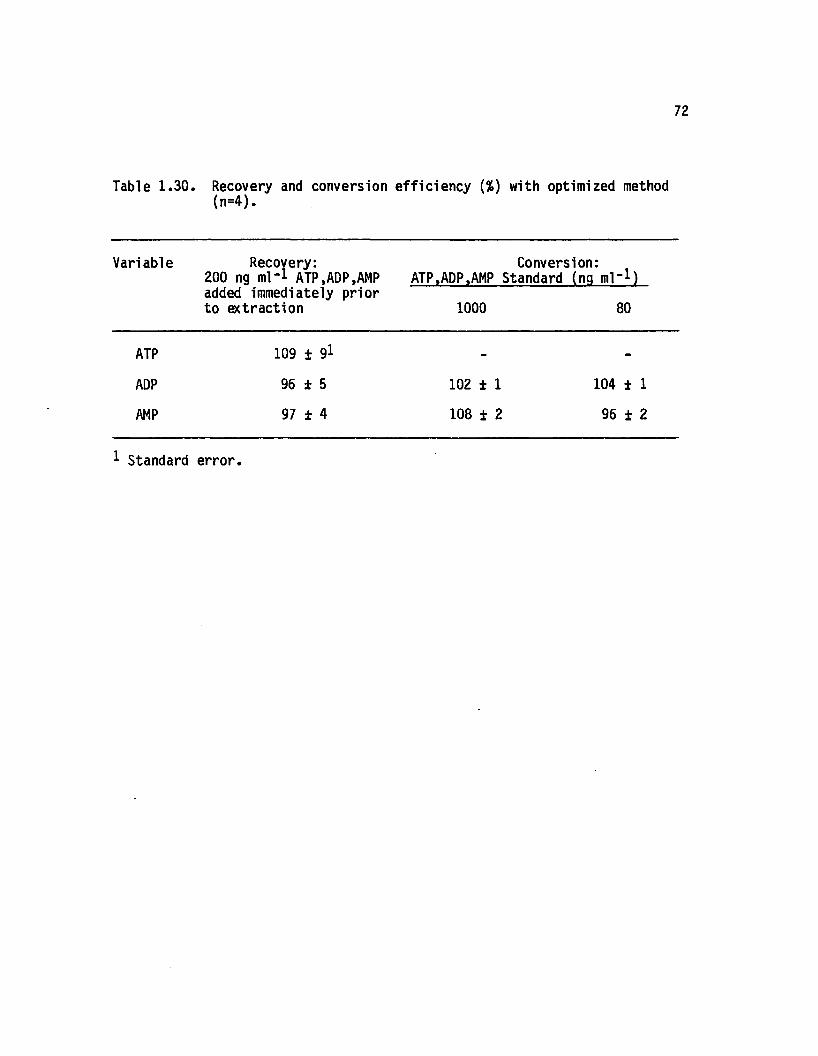
72
Table 1 .30 . Recovery and conversion e ffic ien cy (%) with optimized method (n=4).
Variable Recovery:200 ng ml" 1 ATP,ADP,AMP added immediately prior to extraction
Conversion:ATP,ADP,AMP Standard (nq ml“l )
1000 80
ATP 109 ± 9l -
ADP 96 ± 5 102 ± 1 104 ± 1
AMP 97 ± 4 108 + 2 96 ± 2
1 Standard e rro r.
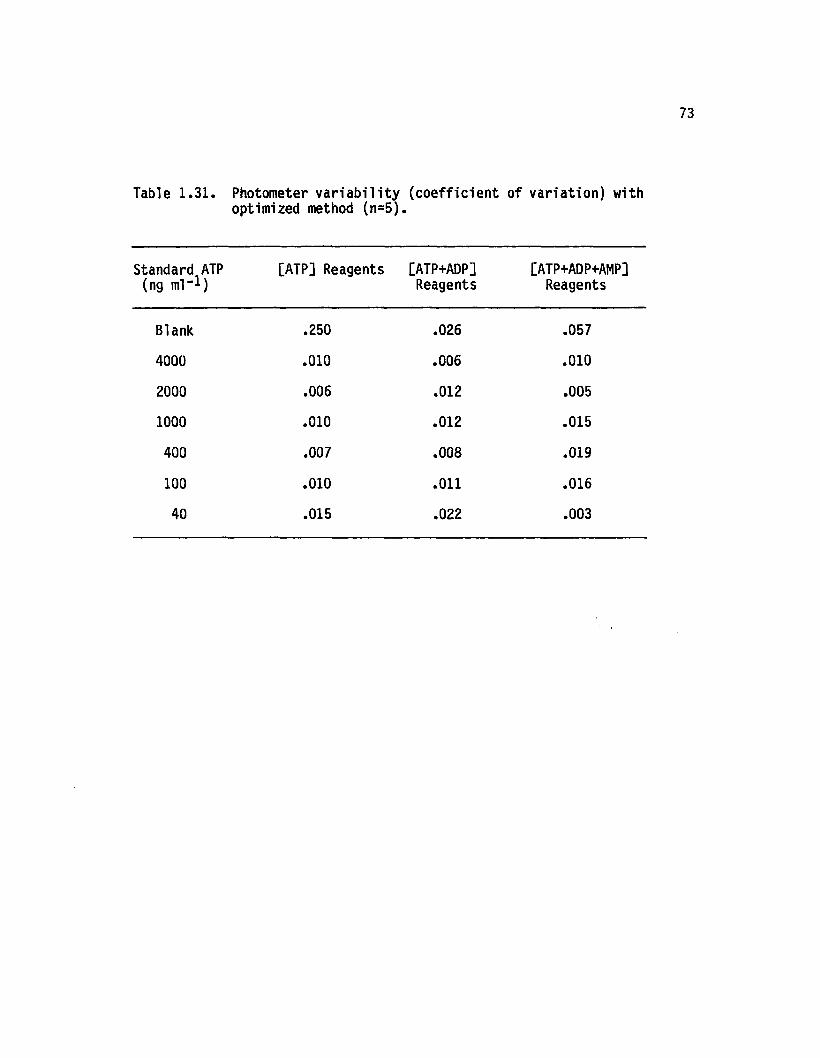
73
Table 1.31. Photometer v a r ia b ili ty (c o e ffic ien t of va ria tio n ) with optimized method (n=5).
Standard ATP [ATP] Reagents [ATP+ADP] [ATP+ADP+AMP](ng ml- 1 ) Reagents Reagents
Blank .250 .026 .057
4000 .010 .006 .010
2000 .006 .012 .005
1000 .010 .012 .015
400 .007 .008 .019
100 .010 .011 .016
40 .015 .022 .003
m ultip lication by a large standard deviation. These data were based
on a 10 sec delay, followed by a 10 sec in tegration .
Tissue Comparisons
Zostera marina
Adenylate levels in four types of tissues from Z. marina are
presented in Table 1.32. Leaf tissue c learly had the highest level of
ATP, ADP, AT, and EC, while root plus rhizome tissue showed the lowest
measured levels of ATP, ADP, AMP, and AT. An adenylate correlation
matrix was derived by pooling values from a ll four tissues (Table
1 .33 ). ATP was pos itive ly correlated with ADP, AT, and EC, while ADP
was pos itive ly correlated with AT and EC. Environmental and
morphometric data, associated with th is eelgrass sample, are presented
in Table 1.34.
Other Species
Adenylate levels in Z. marina epiphytes, aboveground Ruppia
maritima (widgeongrass), and aboveground Spartina a lte rn if lo ra
(saltmarsh cordgrass) appear in Table 1.35 fo r comparative purposes.
Z. marina le a f tissue and aboveground R. maritima had comparable
adenylate concentrations. Both were higher than e ith er the epiphytes
or aboveground S. a lte rn if lo ra tissue. Environmental data, associated
with co llection of these samples, are presented in Table 1.36.
Seasonal Survey
Monthly mean aboveground adenylates (Figure 1 .12 ), belowground
adenylates (Figure 1 .13 ), and resultant EC values (Figure 1.14) in I .
marina are p lo tted . Each of these time series contained s ign ifican t
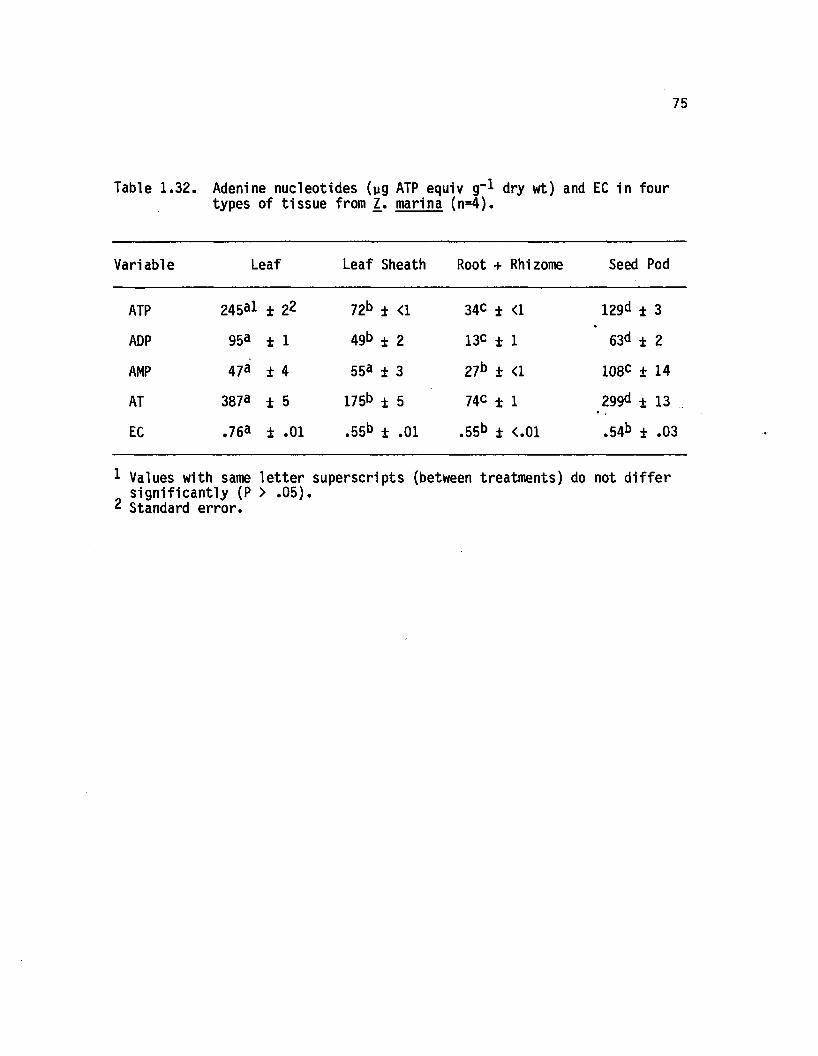
75
Table 1.32. Adenine nucleotides (jig ATP equiv g“l dry wt) and EC in four types of tissue from 1 . marina (n=4).
Variable Leaf Leaf Sheath Root + Rhizome Seed Pod
ATP 245al ± 22 72b ± <1 34C ± <1 129d ± 3
ADP 95a ± 1 49b ± 2 13C ± 1 63d ± 2
AMP 47a ± 4 553 + 3 27b ± <1 108c + 14
AT 3873 ± 5 175b ± 5 74C ± 1 299d ± 13 ..
EC .763 ± .01 .55b ± .01 •55b ± <.01 .54b ± .03
1 Values with same le t te r superscripts (between treatments) do not d if fe r s ig n ific a n tly (P > .0 5 ).
2 Standard e rro r.
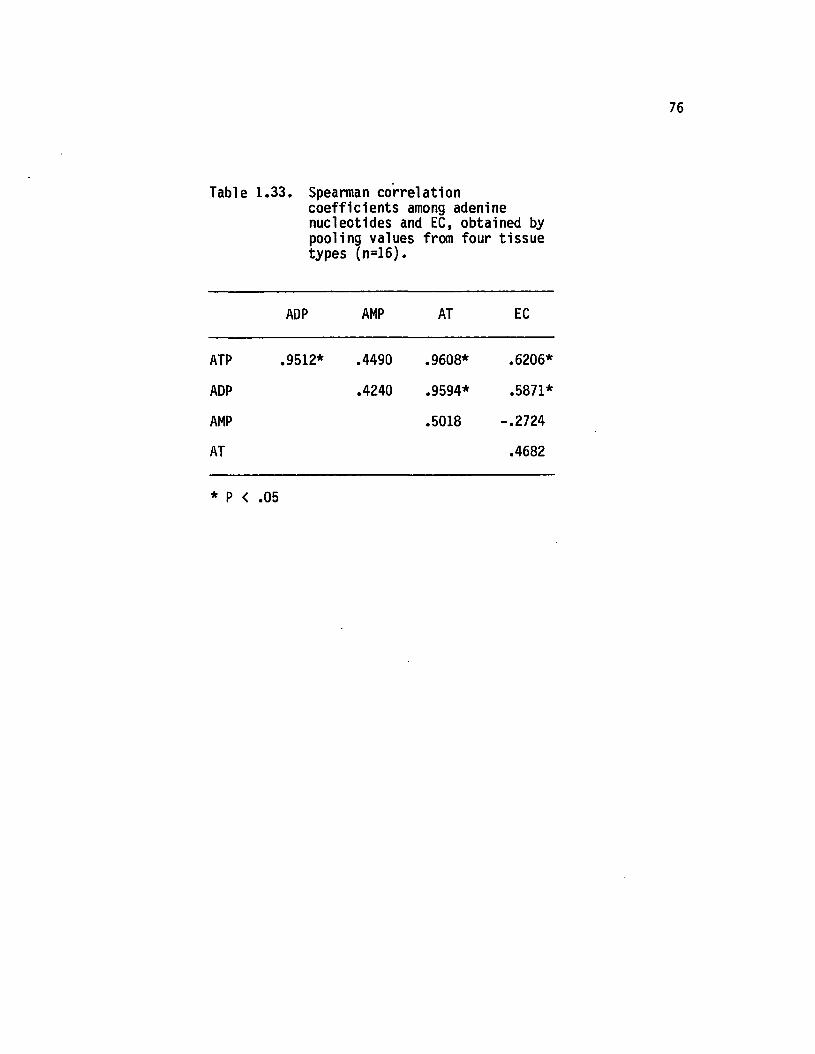
76
Table 1 .33. Spearman correlationcoeffic ien ts among adenine nucleotides and EC, obtained by pooling values from four tissue types (n=16).
ADP AMP AT EC
ATP .9512* .4490 .9608* .6206*
ADP .4240 .9594* .5871*
AMP .5018 -.2724
AT .4682
* P < .05
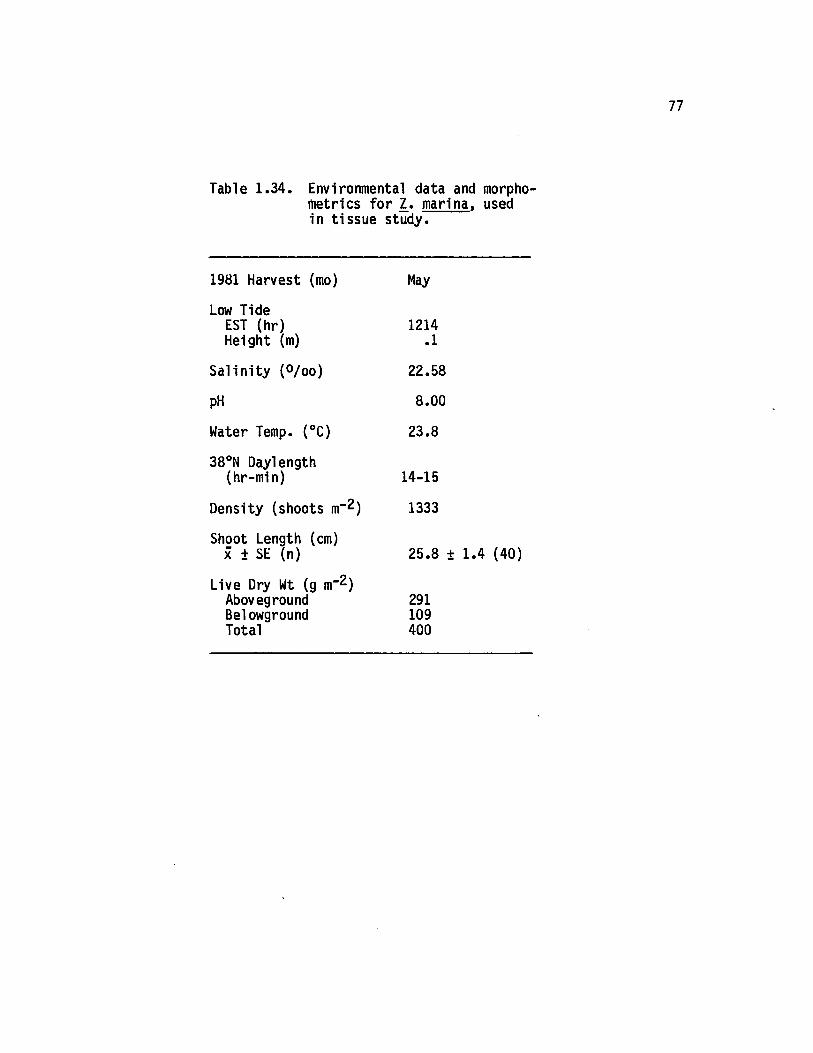
Table 1 .34. Environmental data and morphometries fo r Z. marina, used in tissue study.
1981 Harvest (mo) May
Low TideEST (hr) 1214Height (m) .1
S a lin ity (°/oo ) 22.58
pH 8.00
Water Temp. (°C) 23.8
38°N Daylength(hr-min) 14-15
Density (shoots m"2 ) 1333
Shoot Length (cm)x + SE (n) 25.8 +
Live Dry Wt (g m-2 )Aboveground 291Belowground 109Total 400
.4 (40)
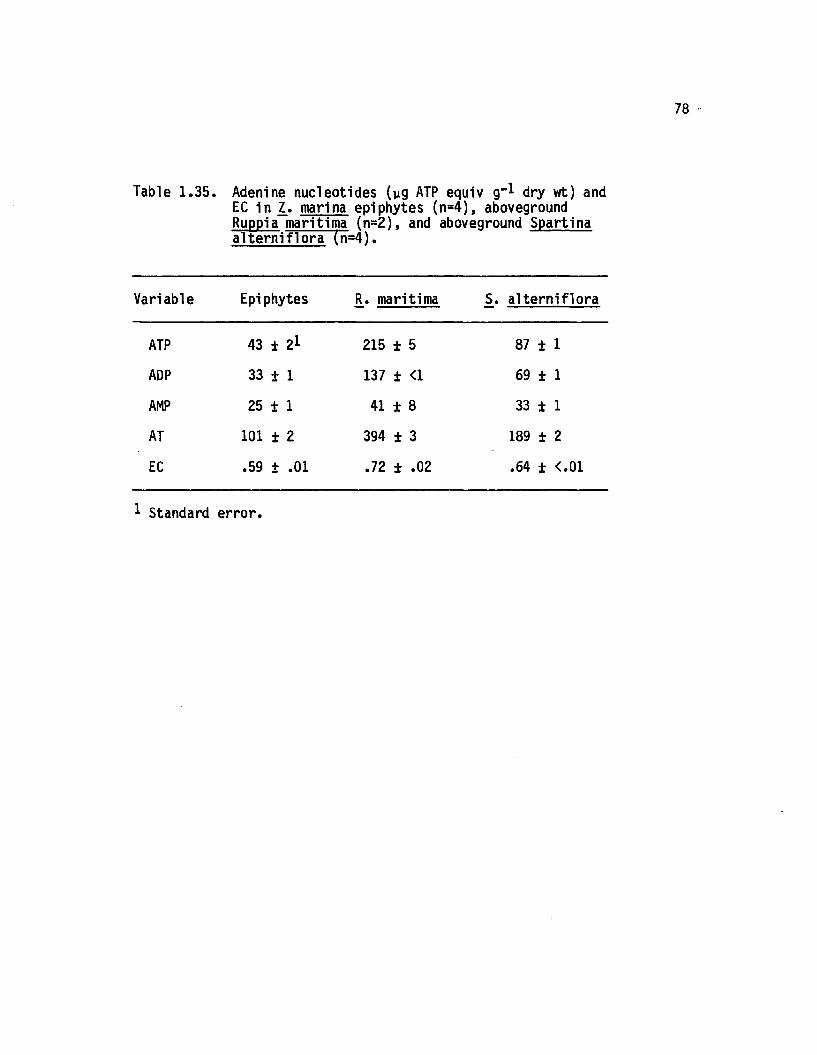
Table 1 .35 . Adenine nucleotides (yg ATP equiv g"l dry wt) and EC in I . marina epiphytes (n=4), aboveground Ruppia maritima (n=2), and aboveground Spartina a lte rn if lo ra (n=4).
Variable Epi phytes R. maritima S. a lte rn if lo ra
ATP 43 ± 21 215 ± 5 87 ± 1
ADP 33 + 1 137 ± <1 69 ± 1
AMP 25 ± 1 41 ± 8 33 ± 1
AT 101 ± 2 394 ± 3 189 ± 2
EC .59 + .01 .72 ± .02 .64 ± <.01
1 Standard e rro r.
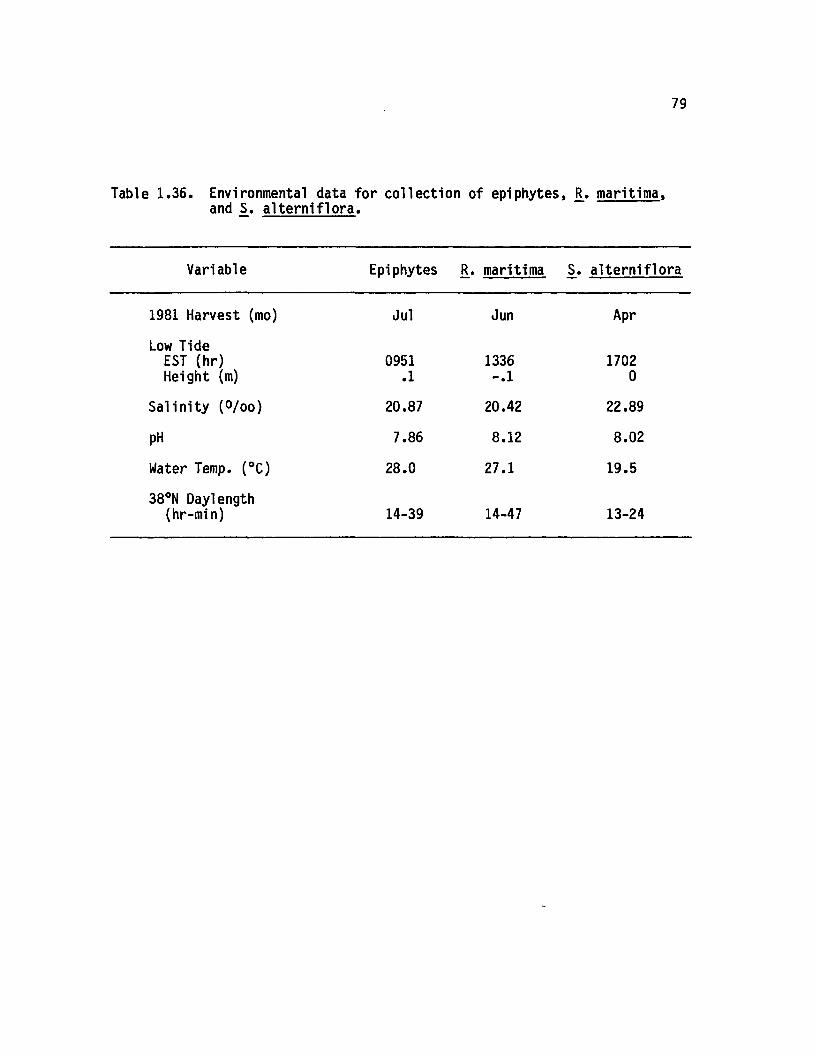
79
Table 1.36. Environmental data fo r co llection of epiphytes, j l . maritima, and S. a lte rn if lo ra .
Variable Epiphytes R. maritima S. a lte rn if lo ra
1981 Harvest (mo) Jul Jun Apr
Low Tide EST (hr) 0951 1336 1702Height (m) .1 - .1 0
S a lin ity (°/oo ) 20.87 20.42 22.89
pH 7.86 8.12 8.02
Water Temp. (°C) 28.0 27.1 19.5
38°N Daylength (hr-min) 14-39 14-47 13-24
Figure 1. 2. Monthly adenine nucleotides from aboveground.Z^. marina (n = 4). Error bars are 1 standard error.
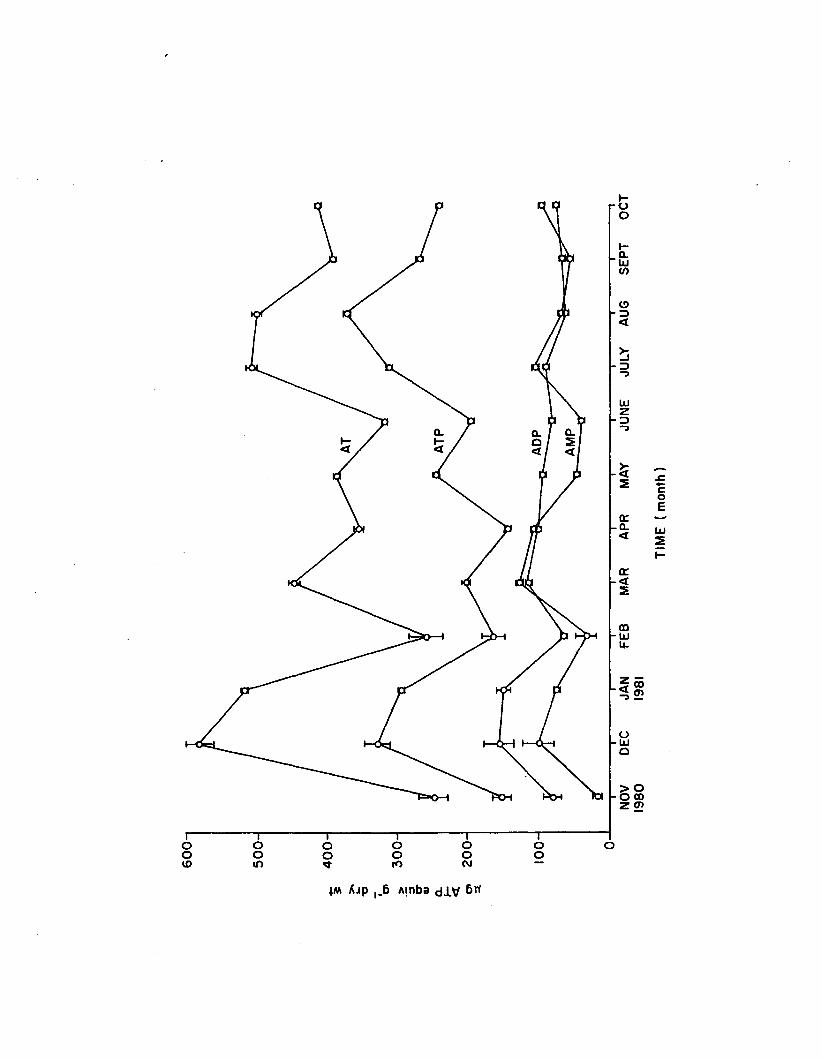
L0
09
■oo
CLUJV)
O■ z> <
■z>s
UJ
S
oc-CL<
(T■ <s
00 ■ UJ U-
•< & ^ 22
o-UJo
>0 O 00 Z <7>
“ T "OOCM
~ roooo
in
T -OO
~I-ooto
4M Ajp .6 Arnba dj.v 6rf
TIME
(mon
th)
Figure 1. Monthly adenine nucleotides from belowground Z_. marina (n = 4 ). Error bars are 1 standard error.
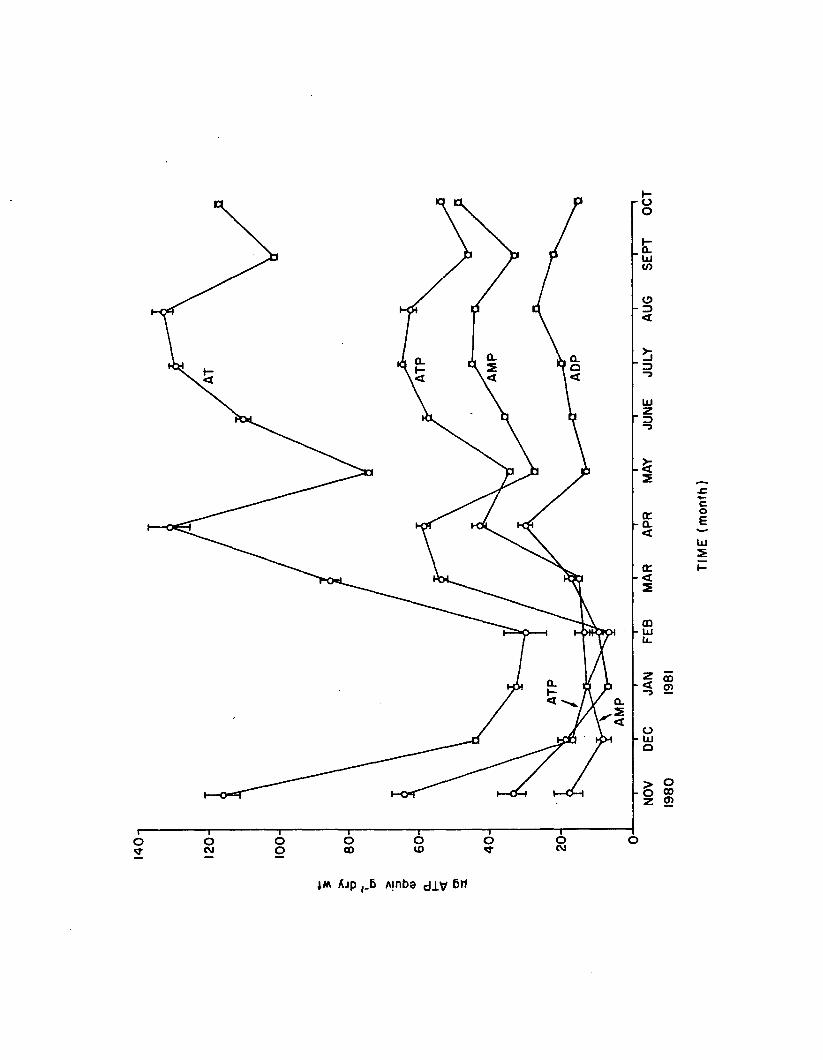
I40n
a.
■ o
O
XUJto
o ■ => <
=>~3
U Jz
a:Q.<
tr<
toI- ut u.
< m
oUJo
> 2 - o 00 z 2
— r- O CM
- r - o o- I-oCO
“ T-oto— I-o<3-
IoCM
j m Ajp ,_6 Ainba d l V M
TIME
(mon
th)
82
Figure 1. 4. Monthly EC from above and belowground Z_. marina (n = 4), Error bars are 1 standard error.
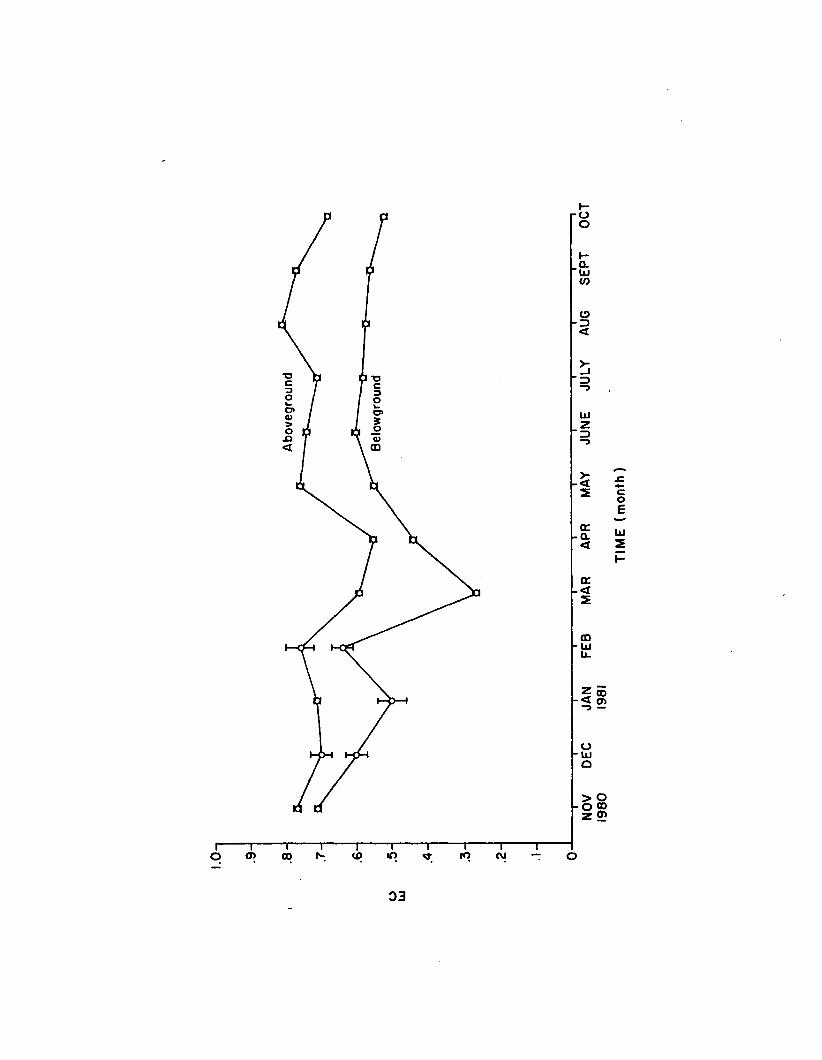
o
UJV)
O' O'
mUJu.
5 00 - < 01
oUJ
> O o oo z 2
01 in roO oOJoo
03
differences (P <.05) over the one year period. Adenylates and EC were
generally higher in aboveground tissue.
Correlation matrices fo r aboveground (Table 1.37) and belowground
(Table 1.38) adenylates were derived by pooling values from a ll 12
months. For both above and belowground adenylates, AT was positive ly
correlated with ATP, ADP, and AMP, while EC was negatively correlated
with AMP. Correlation coeffic ien ts between above and belowground
adenylates, using monthly means, are presented in Table 1.39. Above
and belowground AMP were pos itive ly correlated . Weaker positive
corre la tion (.05 < P <.10) existed between above and belowground EC.
Environmental data appear in Table 1.40 and Figure 1.15.
Morphometric data are plotted in Figure 1.16. Maxima fo r biomass,
number of shoots, and shoot length occurred in May, June, and July,
respectively.
Aboveground and belowground adenylate correlations with
environmental and morphometric data, using monthly means, are
presented in Tables 1.41 and 1.42, respectively. No s ign ifican t
correlations were observed fo r aboveground adenylates. Although
several belowground adenylate correlations were s ig n ific a n t, no clear
patterns were evident.
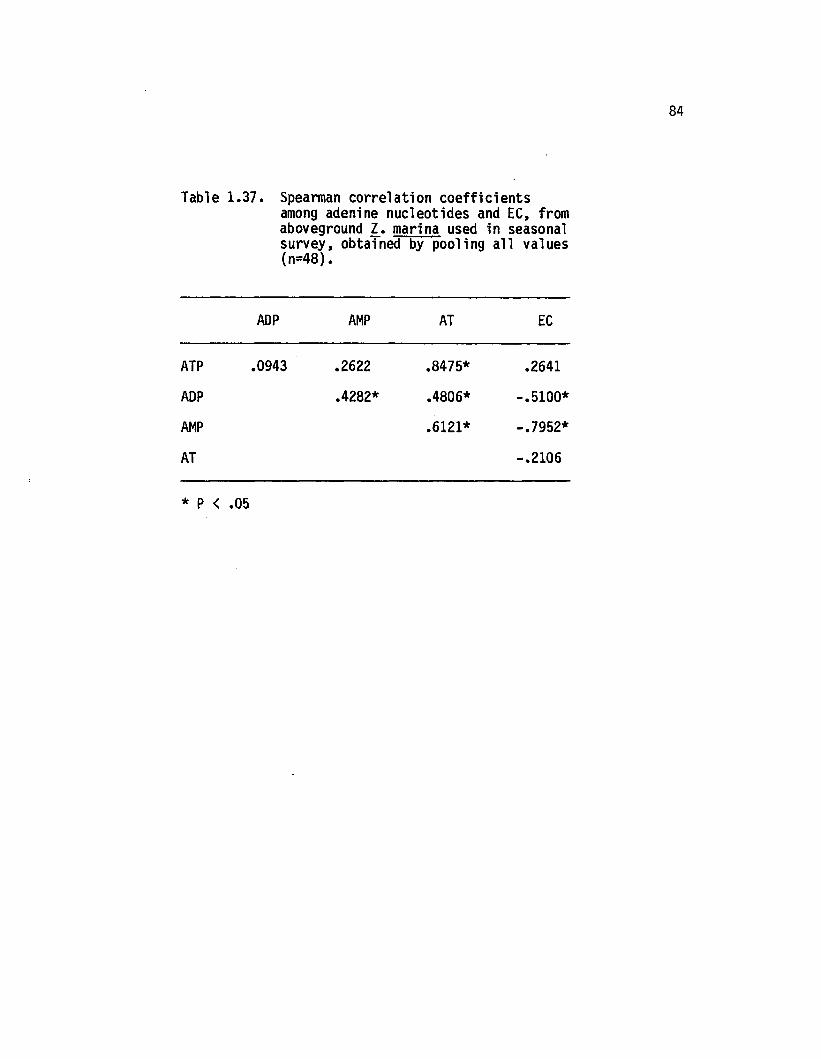
84
Table 1.37. Spearman correlation coeffic ien tsamong adenine nucleotides and EC, from aboveground 1 . marina used in seasonal survey, obtained by pooling a ll values (n=48).
ADP AMP AT EC
ATP .0943 .2622 .8475* .2641
ADP .4282* .4806* -.5100*
AMP .6121* -.7952*
AT -.2106
* P < .05
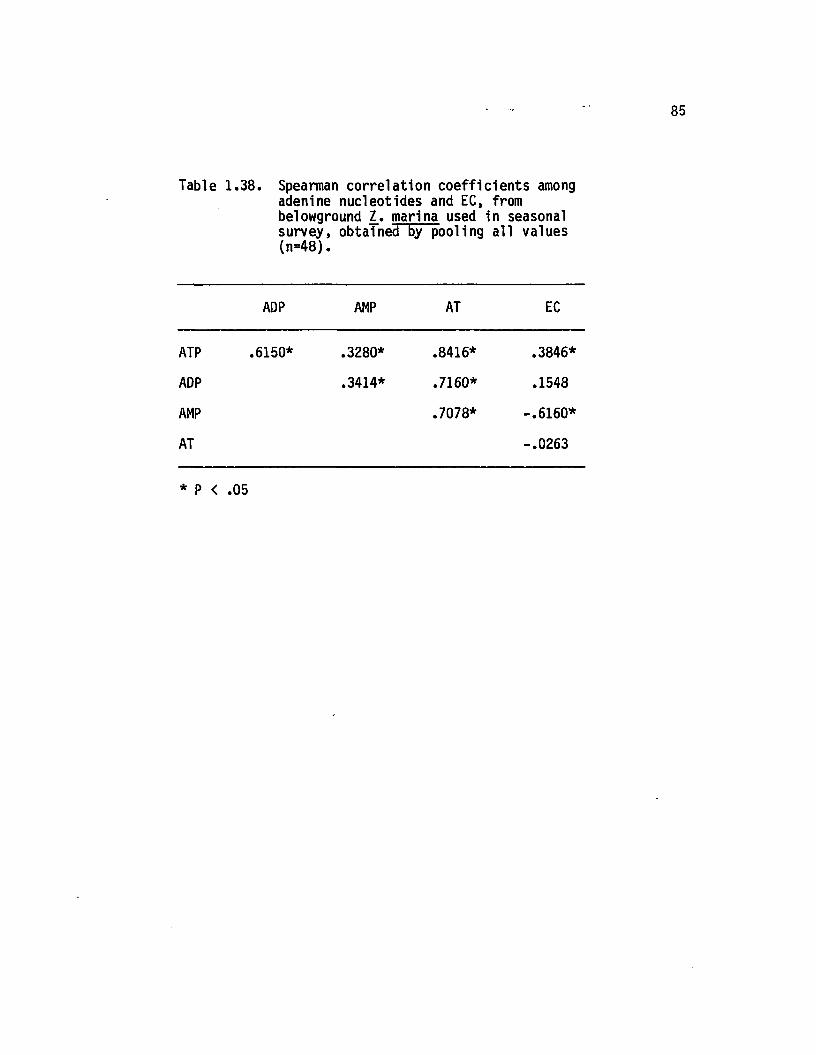
85
Table 1.38. Spearman corre lation coe ffic ien ts among adenine nucleotides and EC, from belowground 1 , marina used in seasonal survey, obtained by pooling a ll values (n=48).
ADP AMP AT EC
ATP .6150* .3280* .8416* .3846*
ADP .3414* .7160* .1548
AMP .7078* -.6160*
AT -.0263
* P < .05
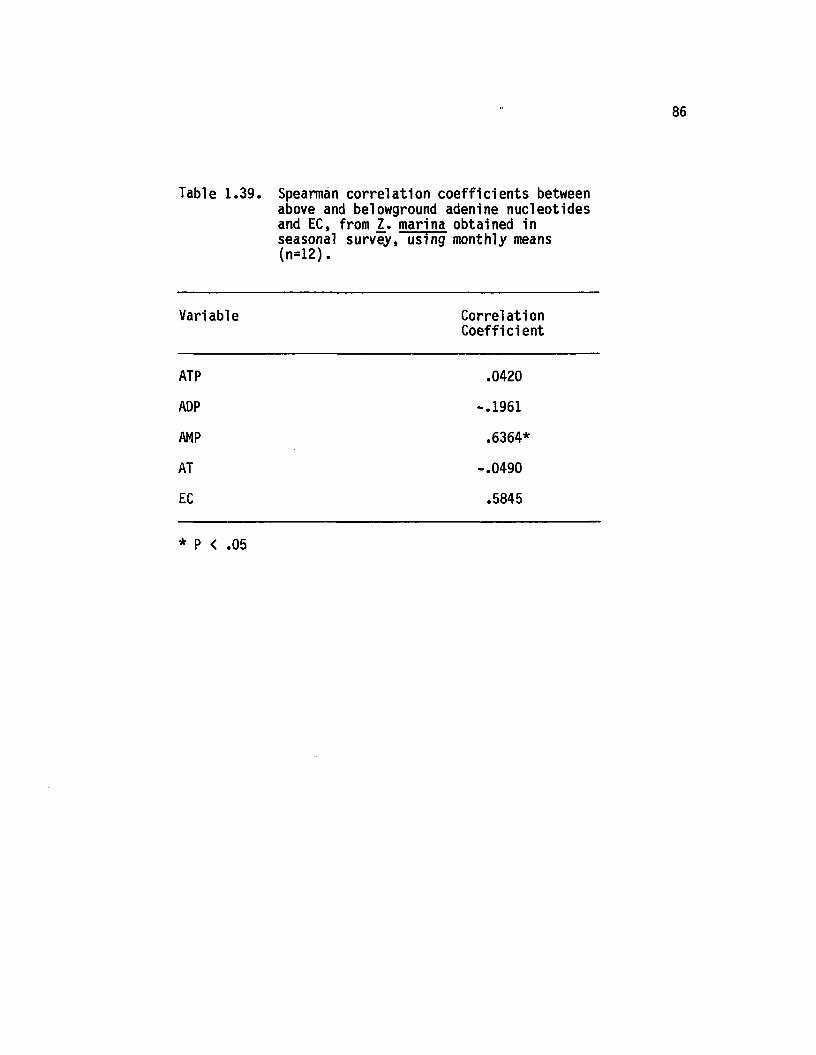
86
Table 1.39. Spearman correlation coe ffic ien ts between above and belowground adenine nucleotides and EC, from 1. marina obtained in seasonal survey, using monthly means (n -12) .
Variable CorrelationCoefficient
ATP .0420
ADP -.1961
AMP .6364*
AT -.0490
EC .5845
* P < .05
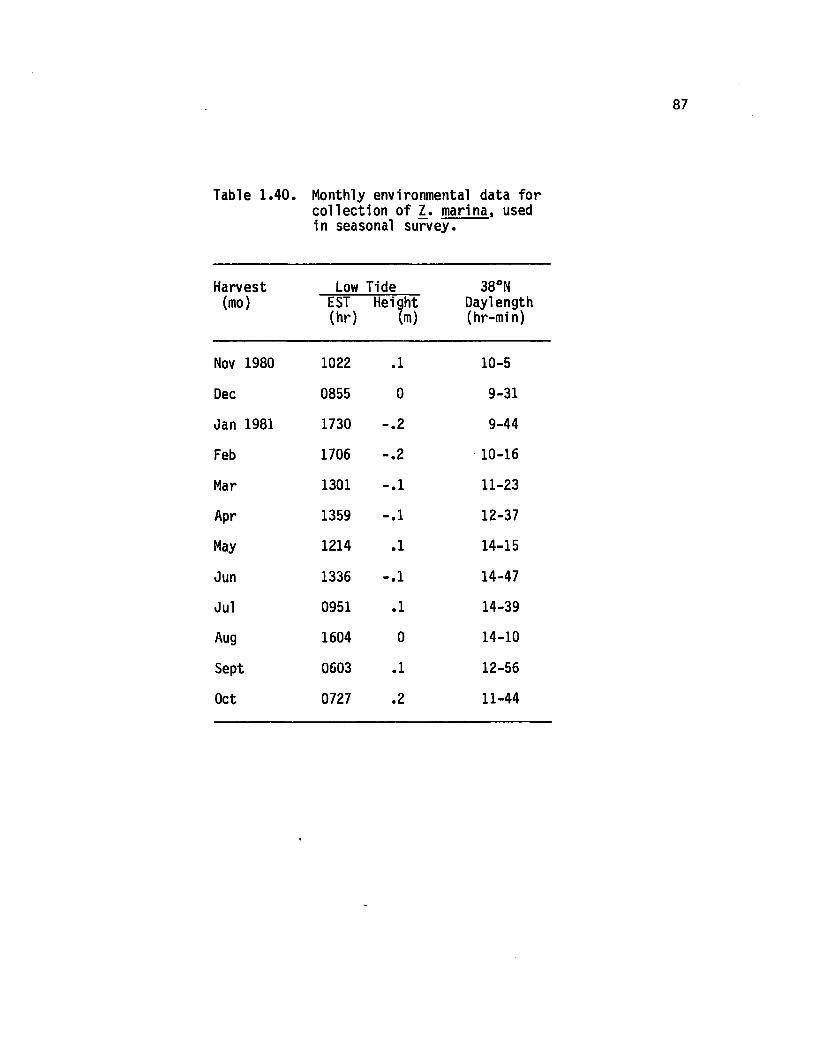
87
Table 1 .40. Monthly environmental data fo r collection of 1. marina, used in seasonal survey.
Harvest Low Tide 38°N(mo) EST Height Daylength
(hr) (m) (hr-min)
Nov 1980 1022 .1 10-5
Dec 0855 0 9-31
Jan 1981 1730 - .2 9-44
Feb 1706 - .2 10-16
Mar 1301 -•1 11-23
Apr 1359 “ •1 12-37
May 1214 • X 14-15
Jun 1336 - • 1 14-47
Jul 0951 • X 14-39
Aug 1604 0 14-10
Sept 0603 .1 12-56
Oct 0727 .2 11-44
Figure 1.15. Monthly environmental.data for collection of Z. marina, used in seasonal survey.
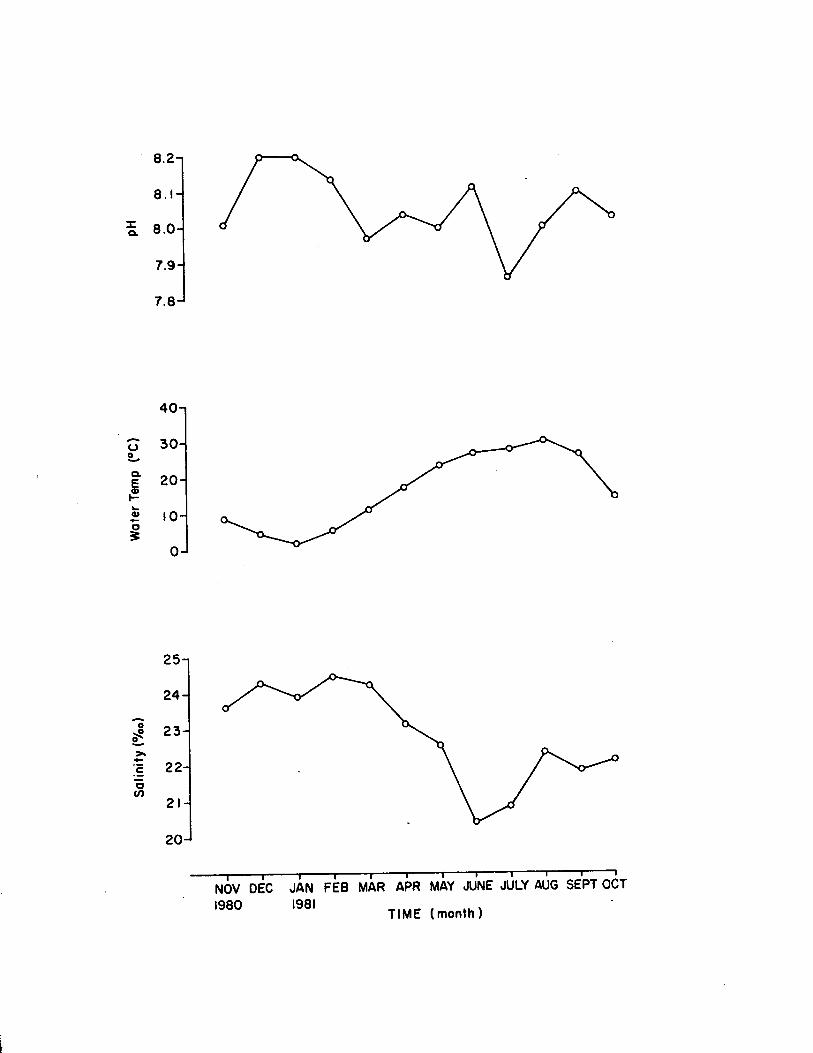
40-i
oQCLE£
30H
zo-\
2? I oHo5
0 J
NOV DEC JAN FEB MAR APR MAY JUNE JULY AUG SEPT OCT 1980 1981
TIME (month)
Figure 1.16. Monthly morphometries for Z. marina, used in seasonal survey. Shoot length error bars are 1 standard error and numbers in parentheses are n.
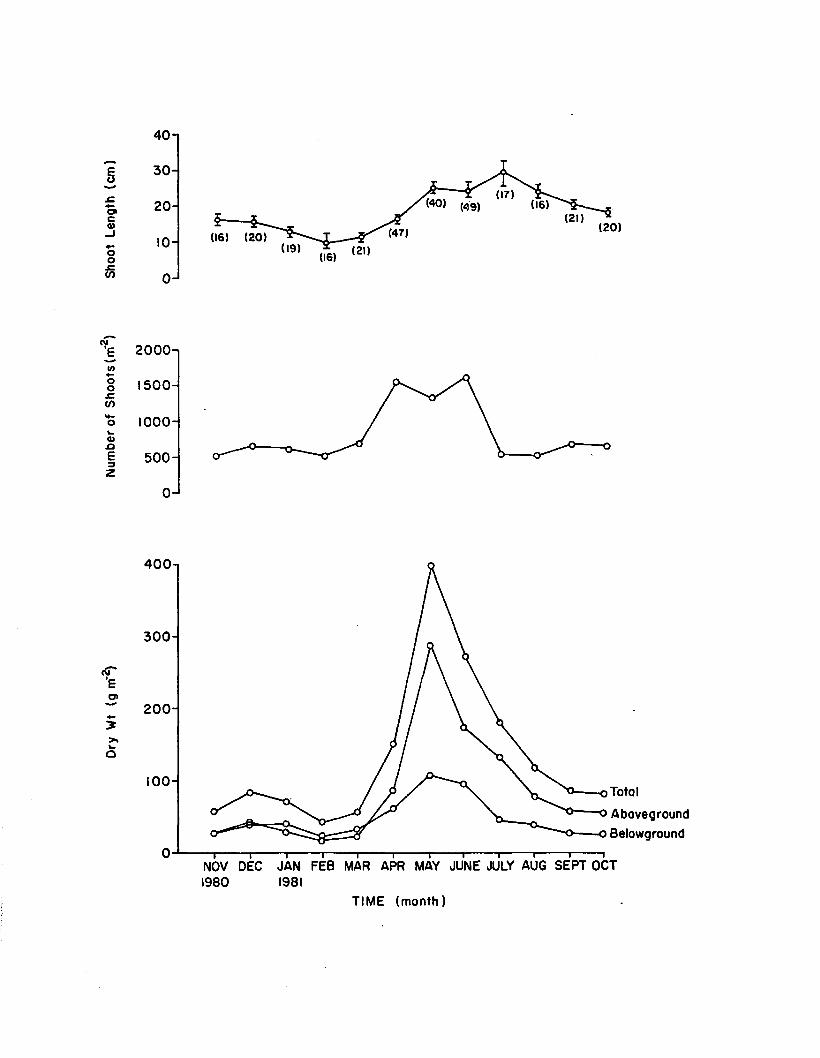
Dry
Wt
(g m
'2)
Num
ber
of S
hoot
s(m
'2)
Shoo
t Le
ngth
(c
m)
40-i
30
20
10-
0 -
(17)(16)
(2D(20 )(47)(16) (20)
(19) ( 21)(16)
2000 -
1500-
1000 -
500
0 -
400-1
300-
200 -
100 -
Total
AbovegroundBelowground
NOV DEC JAN FEB MAR APR MAY JUNE JULY AUG SEPT OCT1980 1981
TIME (month)
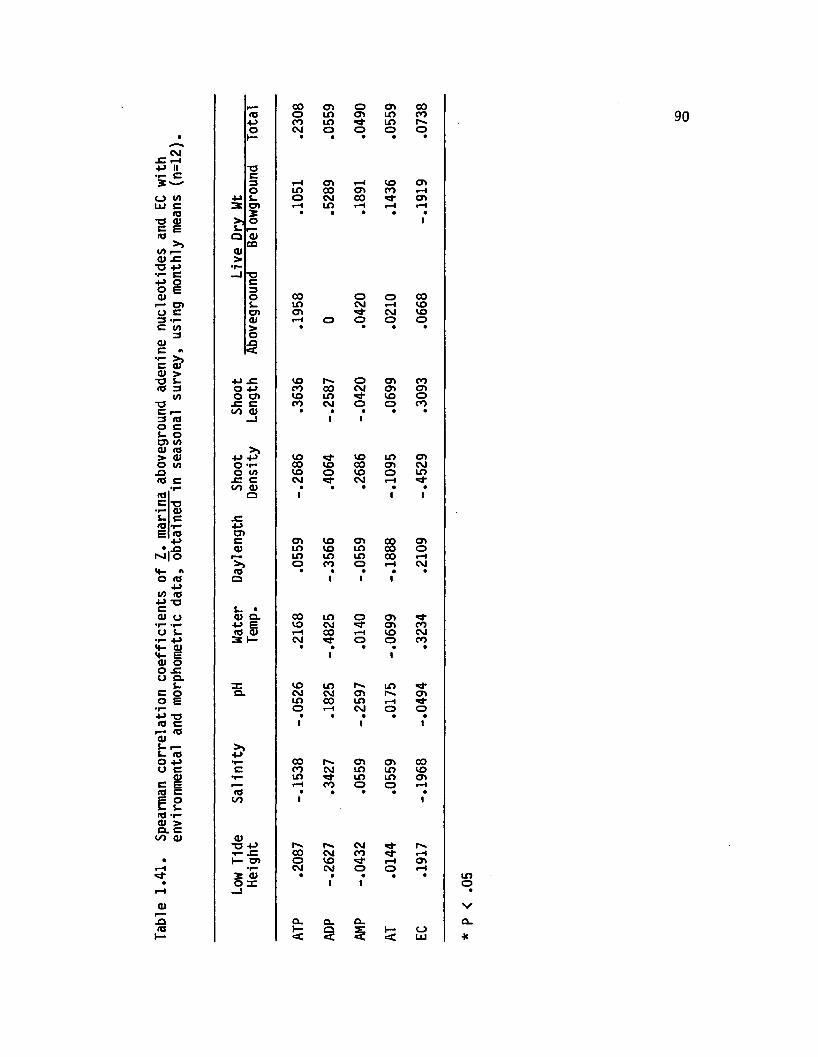
Tabl
e 1.
41.
Spea
rman
co
rrel
atio
n co
effic
ien
ts
of 1.
m
arin
a ab
oveg
roun
d ad
enin
e nu
cleo
tides
an
d EC
with
envi
ronm
enta
l an
d m
orph
omet
ric
data
, ob
tain
ed
in se
ason
al
surv
ey,
usin
g m
onth
ly
mean
s (n
=12)
.
r— 00 O* o CD 00<d o to <D LO CO4-> CO to LOo CM o O o oh- • • • • •
T3C3 rH o> rH to CDO in 00 CD CO rHi- o CM 00 CD31 o> rH LO rH rH *H2 • • • • •o 1S*.r*Q 0)COOJ>•r--J ■oc3o 00 o o 00s. o CM iH toO) o> CM to01 rH o o © o> • • • •o_Q<
4-> -C to o CD COO 4-> CO 00 CM CD CDO CD to to to o-C C CO CM o O COto 0) • • • • •-J 1 1
4-> to to LO CDO •r* 00 to 00 CD CMO </> to o to o LOJC C CM CM Hto 0) • • • • •Q 1 1 1
JC4->CDc CD to CD 00 CD0) in to LO 00 Oto LO LO 00 rH>> o 00 o H CMfO • • • • •o 1 1 1
L. •0) Q. 00 LO o CD+-> e to CM <D CO«d 0) rH 00 rH to CM3 h- CM o o CO• •1
• •1 •
3= to to r*** LOQ. CM CM CD r*- CDUO 00 LO rHo H CM o O•1 • •1 • •I
>>4->•p“ 00 r*. CD <D COC CO CM LO LO to• r “ LO LO LO <DrH CO o o rH<d • • • • •to 1 1
<u-O 4-> r . CM d*•r“ £ 00 CM CO rHH 0> o to iH CD•r» CM CM o O rH2 01 • • • • •o 3: 1 1—i
a. a. Cl.H-< 3 AT EC
90
too
Vo.*
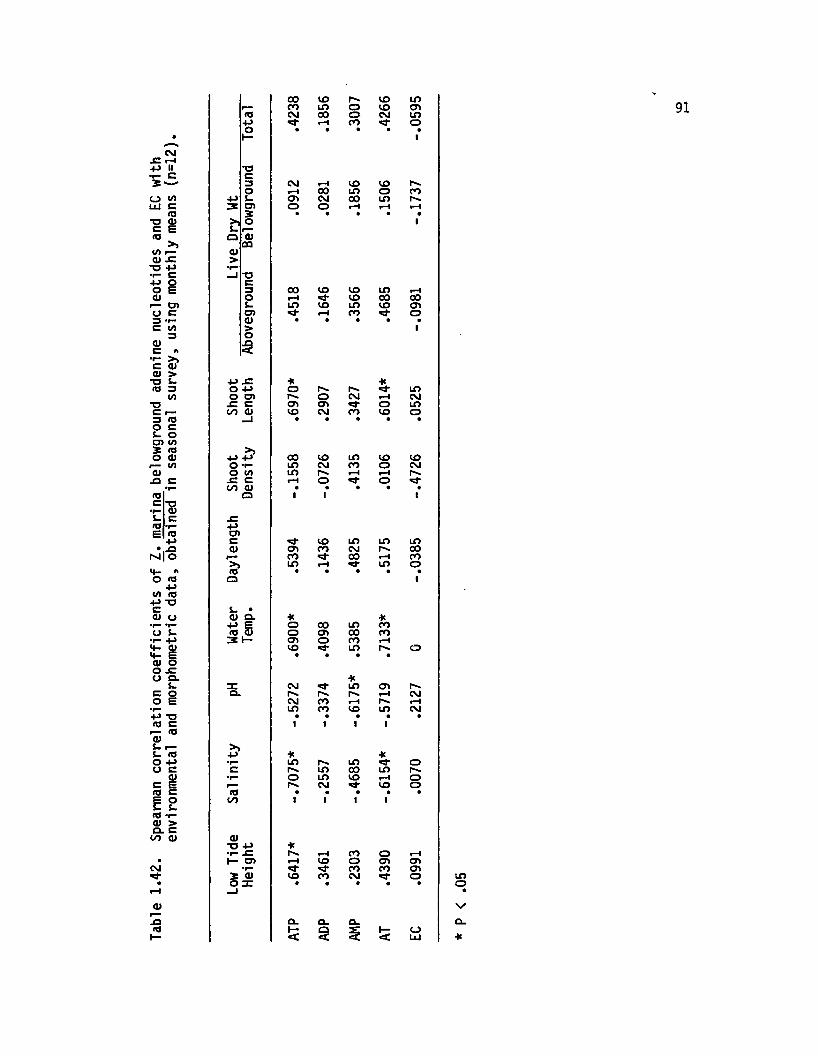
Tabl
e 1.
42.
Spea
rman
co
rrel
atio
n co
effic
ien
ts
of 1.
m
arin
a be
low
grou
nd
aden
ine
nucl
eotid
es
and
EC w
ith
envi
ronm
enta
l an
d m
orph
omet
ric
data
, ob
tain
ed
in se
ason
al
surv
ey,
usin
g m
onth
ly
mean
s (n
=12)
00 VO r-* VO tof— CO LO o VO OSas CM 00 o CM LO4-> rH CO oo • • • • •1— 1
•oc3 CM H VO VO hN.O rH 00 LO o CO4-> u cr> CM 00 LO3 CT) o o rH rH rH2 • • • • •
>1 o 1i-a a)COas>
_ i■oc3 00 VO VO LO rHo rH VO 00 00u LO VO LO VO aso> rH CO oa) • • • • •> io§
+-> -C * *O 4-> o LOO a> r** o CM rH CM■C c as Ol o LO00 <u LO CM co VO o—J • • • • •
00 VO LO VO VOo •r LO CM CO o CMo (/> LO rH rH r-*-C c rH o ooo a) • • • • •a 1 i i
.c+->o>c VO LO LO LO(U OS CO CM r-*. 00CO 00 rH CO*>) LO rH LO o(O • • • • •o 1
i- •<u a. ■JC *4-> E O 00 LO CO<0 0) O as 00 CO3 h- as o CO rHVO LO r- o• • • •
*a: CM LO as r-*a. r-* r-. r*N. rH CMCM CO rH r-* rHLO CO VO LO CM• • • • •1 I 1 1
>»+-> ■K *•r— LO r-* LO OC LO 00 LO r-«.•r— o LO VO rH or— r. CM VO oas • • • • •CO i 1 1 1
ai*o *•i— -C r. H CO o rHh- a> H VO o 0> as•r* CO CO as2 0) VO CO CM oO 3= • • • • •— I
o. a. CLh- Q h- o< < § < LU
91
LOo
VQ.
*
DISCUSSION
Adenine Nucleotide Methodology Experiments
Sample Collection and Preparation
The lo g is tica l problem of sampling a submerged aquatic
macrophyte, so that adenylates are maintained at in s itu le ve ls , was
minimized by freezing plants in liq u id nitrogen within 2 min a fte r
harvest. An increase in lig h t le v e l, associated with the harvest
procedure, appears to be responsible fo r the observed elevation in
ATP, AT, and EC. Transitions from dark to lig h t resu lt in rapid
chloroplastic ATP increase (Hampp et a l . , 1982; Cockburn, 1974;
Santarius and Heber, 1965), presumably by photophosphorylation. An
accompanying elevation in cytoplasmic ATP re flec ts in tra c e llu la r
adenylate transfer (Sellam i, 1976).
Rapid freezing with liq u id nitrogen (<3 min) is more e ffe c tive
than slow freezing with dry ice (5-15 min) a t preserving in s itu
adenylate levels in Spartina patens leaves (Mendelssohn and McKee,
1981). The longer time in terval required fo r dry ice freezing may
allow fo r more transphosphorylase and ATPase a c t iv ity . Even a fte r
plant tissue is frozen, enzymic a c tiv ity may persist (B ie lesk i, 1964).
Lyophilization of frozen tissue (e .g . Bomsel and Sellam i, 1974;
Wilson, 1978) e ffe c tiv e ly maintained in s itu adenylate leve ls , and
92
homogenization by grinding lowered v a r ia b ility in rep lica te aliquots.
Advantages of lyoph iliza tio n include adenylate s ta b iliz a tio n by enzyme
deactivation (dehydration) and d irect determination of tissue dry
weight (Mendelssohn and McKee, 1981). I t is c r it ic a l that the sample
remain frozen below its lowest eutectic point during the time interval
required by the lyo p h ilize r to reach s u ffic ie n t vacuum. Freeze-thaw
treatment increases ce ll permeability to ATP (Rhodes and Stewart,
1974) and may dislodge ATPases from thylakoid membranes (Garber and
Steponkus, 1976), reducing ATP content in plant tissue (Mendelssohn
and McKee, 1981).
Removal of epiphytes from Z. marina le a f blades was essential in
order to quantify adenine nucleotides in eelgrass tissue alone.
Epiphytes can be a s ig n ifican t proportion of an aboveground tissue
sample. For example, epiphytes comprised an average of 24% of the
to ta l eelgrass le a f plus epiphyte biomass (dry wt) in a North Carolina
estuary (Penhale, 1977). Low epiphyte adenylate le v e ls , re la tiv e to
levels in Z. marina le a f tissue, may be a ttribu ted to the inclusion of
small amounts of sediment, as well as siliceous diatom fru stu les , in
epiphyte preparations.
Storage techniques are aimed at halting enzyme a c t iv ity , which
can a lte r adenine nucleotide composition. Enzyme a c t iv ity may be
minimized by e ith er dehydration or freezing.
Frozen-lyophilized-ground-desiccated tissue (Wilson, 1978) and frozen
extract (Holm-Hansen, 1973) co n s ititu te two forms of storage. In th is
study, frozen-lyophilized-ground tissue was stored desiccated-dark fo r
periods up to 5 days.
E x tra c tio n
Extraction of adenylates at in s itu levels requires rapid
nucleotide release and enzyme deactivation by e ith e r heating or
lowering pH. Destruction of the semi permeable characteristics of cell
membranes with boiling extractants causes a ll soluble constituents
(e .g . adenylates) to rapid ly d iffuse out of the c e lls , u ltim ately
resulting in a uniform concentration of each constituent throughout
the en tire suspension (Holm-Hansen, 1973). Hydrolases are released
upon disruption of c e llu la r in te g rity (DeGreef e t a l . , 1979).
Deactivation of these enzymes re lie s on the effectiveness of heat
conduction or acid permeation through the tissue. The resultant
thermal or [H+] gradients (Karl e t a l . , 1978) are dependent on tissue
chemical and physical properties (e .g . surface to volume ra t io ,
density, chemical composition). Thermal gradients are minimized by
homogenization of tissue and by using a low tissue to extractant ra tio
(<1% w /v). Holm-Hansen and Karl (1978) recommended a sample to
extractant ra tio o f <2% (v /v ).
Optimal extraction and recovery were achieved with boiling EDTA
plus PVPP (pH 7 .6 ). Boiling EDTA extraction of plant tissue has
previously been proven e ffe c tive (Mendelssohn and McKee, 1981; Guinn
and Eidenbock, 1972). As a chelating agent, EDTA binds divalent metal
cations which generally in h ib it lig h t output in the f i r e f ly
bioluminescent reaction (Karl and LaRock, 1,' 75 ). These authors
caution against excessive EDTA addition which complexes Mg++ ions
(required by lu c ife ra s e ), decreasing lig h t output. Use of PVPP to
adsorb phenols serves to increase lig h t output. Higher plants contain
95
phenolic compounds which bind proteins (Loomis and B a tta ile , 1966) and
apparently in h ib it luciferase (Mendelssohn et a l . , 1978). Z. marina
is reported to contain several types of phenolic acids (Zapata and
McMillan, 1979). Color quenching was also reduced in extracts treated
with PVPP. Guinn and Eidenbock (1972) detected greater amounts of ATP
in cotton leaves with polyvinylpyrrolidone (PVP) treatm ent.
Re-hydration of lyophilized samples during extraction requires
that samples, along with standards, be held on ice throughout the
assay (excluding the conversion step). This minimizes adenylate
changes.
Recovery of internal standards does not assess extractant
effic ien cy per se, since added adenylates are e x tra c e llu la r . However,
in ternal standards are useful in evaluating apparent and/or real
nucleotide losses due to hydrolysis, adsorption, coprecip ita tion ,
ionic interferences, tu rb id ity , and color quenching (K arl, 1980).
A 30 sec extraction was selected for routine use, although no
s ig n ifican t differences in adenylate levels were obtained from
5-120 sec. S im ila rly , Mendelssohn and McKee (1981) found no
s ig n ifican t difference with boiling EDTA plus PVPP extraction over
5-180 sec. However, Karl et a l . (1978) caution against prolonged
extraction which may hydrolyze nucleoside triphosphates. When using a
boiling extractant, i t is essential that the temperature be maintained
at 100°C in order to deactivate ATPases (Holm-Hansen and K arl, 1978).
Leaf tissue extraction from e ith er individual plants or a pooled
plant sample masks adenylate varia tion on a c e llu la r or organellar
le v e l. When m u ltic e llu la r tissue is extracted, mass-weighted mean
adenylate values are determined. C e llu lar compartmentation and tissue
heterogeneity may actually sponsor a range of co-existing metabolic
states (Pradet and Raymond, 1978; K arl, 1980).
Conversion
TRICINE buffer (25 mM in f i r e f ly reaction) was selected fo r
routine use, since th is buffer yielded the highest lig h t output.
Webster et a l . (1980) have also reported maximum lig h t production with
25 mM TRICINE. Apparently, luciferase has the most favorable
conformation in TRICINE.
Cofactor requirements have been specified fo r conversion enzymes,
pyruvate kinase (PK) and adenylate kinase (AK), by Kayne (1973) and
Noda (1973), respectively. Both PK and AK require a divalent cation
(e .g . Mg++) . Without MgS04 add ition , essentia lly no conversion of AMP
or ADP occurs. Although the PK reaction also requires a monovalent
cation (e .g . K+) , K2SO4 addition is not necessary. NH4+ (present in
commercial PK and AK suspensions) and/or Na+ (present in commercial
EDTA and PEP s a lts ) meet th is requirement.
MgS04 , K2SO4 , and pH 8.1 quenched lig h t output in the f i r e f ly
reaction. DeLuca et a l . (1979) report tha t S04= in h ib its the
reaction. Generally, cations and anions reduce lig h t emission (Karl
and LaRock, 1975). Apparently, su ffic ien t Mg++ is contained in the
FLE preparation to meet the luciferase divalent cation requirement
(DeLuca, 1976). Additional MgS04 in h ib its lig h t output, but Mg++ is
needed in conversion reactions. The pH optimum fo r the f i r e f ly
reaction is in the range 7.4 (S tre h le r, 1968) to 7.8 (Webster and
Leach, 1980). pH 7.6 was selected fo r routine use, since i t f a l ls
within th is range and yielded higher l ig h t output than pH 8 .1 .
The heat deactivation step is essential when using integral
measurement. Heating denatures PK, preventing ATP production from
reaction of PK and PEP with ADP contained in the crude FLE
preparation. Karl and Holm-Hansen (1978) report that heat
deactivation is not required when using peak height measurement with
in s itu AT >50 ng m l"*, since PK interference is overwhelmed by the
magnitude of the ATP-dependent peak lig h t emission.
When ATP is <30 ng ml“l , AMP conversion to ATP may be incomplete,
since ATP is required to in it ia te the AK reaction (Karl and
Holm-Hansen, 1978). An increase in ATP lowers the apparent Km of AK
fo r AMP. Since a ll sample extracts in th is study contained >50 ng
ml"* ATP, addition of ATP was unnecessary.
F ire fly Lantern Extract Preparation
Reconstitution of lyophilized f i r e f ly lantern extract (FLE) with
TRICINE buffer plus MgS04 (pH 7.6) was selected fo r routine use in
order to s ta b ilize pH. This procedure results in a f in a l buffer
concentration of 25 mM ( f i r e f ly reaction m ixture), the optimum
prescribed by Webster et a l . (1980). MgS04 addition complies with the
recommendation by Karl and Holm-Hansen (1976) to add Mg++ when fin a l
FLE volume (25 ml) exceeds 5 ml, specified fo r Sigma FLE-50 by the
manufacturer.
A 6-8 hr aging period at room temperature (Mendelssohn and McKee,
1981) was chosen as the routine procedure fo r FLE preparation. FLE is
aged in order to degrade endogenous adenine nucleotides. Prolonged
aging and high temperature resu lt in loss of lu c ife r in -lu c ife ra s e
a c t iv ity . Karl and Holm-Hansen (1976) have demonstrated that loss of
Sigma FLE-50 a c t iv ity over 36 hrs at 25°C is due to lu c ife r in rather
than luciferase degradation.
Although f i r e f ly luciferase is specific fo r ATP,
transphosphorylases (e .g . NDPK) contained w ith in crude luciferase
preparations, regenerate ATP from other NTP's (DeLuca, 1976). Karl
and Holm-Hansen (1978) report that GDP addition to the FLE preparation
(400 ng ml-1 ) e ffe c tiv e ly in h ib its ATP production from GTP, uridine
triphosphate (UTP), inosine triphosphate (IT P ), and cytid ine
triphosphate (CTP). Christensen and Devol (1980) observed no
reduction in lig h t emission with GDP addition.
In the present study, a greater amount o f GDP (6.85 yg m l"*)
reduced lig h t output in both standards and samples. Since standards
contain no NTP (other than ATP), reduced lig h t output with GDP
addition re flec ts ATP consumption by mass-action adjustment via the
NDPK reaction. Apparently, NDPK does not compete with luciferase fo r
ATP (10 ng m l"*) with GDP addition under 1 yg ml"* (Karl and Neal son,
1980). Since sample adenylate levels showed no difference with or
without GDP, GDP addition to the FLE preparation (6.85 yg m l"*)
appears unnecessary.
Photometry
Since the time course of lig h t production resulting from
non-adenine NTP's is slower than in s itu ATP-dependent lig h t emission
k in e tic s , interference is minimized with peak height measurement
(Holm-Hansen and K arl, 1978). However, DeLuca et a l . (1979) have
stated that no single method of measuring lig h t production is adequate
fo r a ll conditions.
Para lle l and lin e a r log-1og standard regressions between net
l ig h t output and ATP (40-4000 ng m l"*) were obtained with peak height
(2 sec delay, 1 sec count) and in tegration (10 sec delay, 10 or 30 sec
count). Webster and Leach (1980) have demonstrated paralle lism with
peak height and in tegration (15 sec delay, 60 sec count) over
0.2-200 ng ml" 1 ATP. A 10 sec delay, followed by a 10 sec
in tegration , was selected as the routine counting method fo r two
reasons: 1) mixing problems with peak height are avoided, and 2 )
a fte r thorough mixing during a 10 sec delay, the shortest
machine-available in tegral (10 sec) minimizes time-dependent
i nterferences.
Standard Curve
Three standard curves, prepared with reagents fo r determination
of [ATP] (Tube A), [ATP+ ADP] (Tube B), and [ATP + ADP + AMP] (Tube
C), allow more accurate sample adenylate measurement than single curve
determinations (Holm-Hansen and K arl, 1978). Use of m ultiple standard
curves ensured that ionic composition and ATP re a c tiv ity were sim ilar
in both standards and samples. A ll three log-1og standard regressions
between net lig h t output and ATP (40-4000 ng ml"1) were highly lin e a r .
In th is study, separate regressions were s p e c ific a lly required,
due to (N H ^ S I^ addition and heat deactivation. Quenching was lowest
in Tube A and highest in Tube C. Commercial preparations of PK (Tubes
B and C) and AK (Tube C) contain (NH4 ) 2S04, which reduced lig h t
production. The heating step appears to e ffe c tiv e ly denature PK but
not AK. Selective PK deactivation causes the AK reaction to
re -e q u ilib ra te with backproduction of ADP from ATP in solution (Tube
C), reducing lig h t emission (Karl and Holm-Hansen, 1978). Christensen
and Devol (1980) have reported a 15% reduction in peak height due to
th is re -e q u ilib ra tio n .
Tissue Comparisons
Zostera marina
Since leaves contained the highest adenylate levels among the
four tissues examined, i t is suggested that le a f material be routinely
sampled as the tes t tissue fo r adenylate analyses in Z. marina. Low
adenylate levels in Z. marina root plus rhizome tissue are attribu ted
to the presence of structural or m etabolically in e rt material
(Pamatmat and Skjo ldal, 1979), as well as lowered aerobic respiration
in reduced sediments (Mendelssohn et a l . , 1981). Tissue adenylate
d is trib u tio n in 1. marina contrasts with that observed fo r Spartina
a lte rn if lo ra (cordgrass), where le a f sheath and roots contained higher
levels of ATP than leaves (Mendelssohn and McKee, 1981). This is
presumably due to active ly dividing meristematic tissue in le a f sheath
and roots.
Tissue ATP level re flec ts ATP generation, u t i l iz a t io n , and
translocation . Light and oxygen a v a ila b ility permit both photo- and
oxidative phosphorylation, respectively (Sellam i, 1976), in
aboveground tissue. Belowground tissue in reduced sediments must re ly
on lim ited oxidative phosphorylation, substrate phosphorylation in
glycolysis (Mendelssohn et a l . , 1981), and possibly translocation
(Thigpen, 1981) to maintain an adequate supply of ATP.
Mathematically, EC should be pos itive ly correlated with ATP and
negatively correlated with AMP. AT should corre late pos itive ly with
ATP, ADP, and AMP. A ll of these correlations were observed.
Other Species
Although adenylate analytical techniques were s p e c ifica lly
adapted to Z. marina, the methodology was applied to epiphytes of Z.
marina, Ruppia maritima (a seagrass), and Spartina a lte rn if lo ra (a
marshgrass) fo r comparative purposes. As previously suggested,
re la tiv e ly low adenylate levels in epiphytic algae may result from
m etabolically in e rt material in epiphyte preparations. Adenylate
content of R_. maritima aboveground tissue was s im ilar to that of Z.
marina le a f tissue.
Differences in methodology and environment preclude s tr ic t
comparison with the following values reported in the lite ra tu re .
Thalassia testudinum, a tropical seagrass, contained 703 ng ATP per
le a f disc dry wt (485 yg ATP g-1 dry wt) one day a fte r excision
(Knauer and Ayers, 1977). This value represents about twice the
amount observed fo r seagrasses (Z. mari na and R. maritima) in the
present study. In a tissue study with S. a lte rn if lo ra , Mendelssohn
and McKee (1981) report a compartively high le a f concentration of 980
nmol ATP g" 1 dry wt (495 yg ATP g_1 dry w t).
Seasonal Survey
Although temperature, l ig h t , s a lin ity , and nutrient regimes a ll
exert an influence on growth (S etch e ll, 1929; Biebl and McRoy, 1971;
Backman and B a r i lo t t i , 1976; Orth, 1977), temperature appears to be
dominant in regulating the seasonal growth pattern of 1. mari na in the
Chesapeake Bay (Orth et a l . , 1981). In the present study, maximal
shoot density and biomass occurred during spring. At a nearby s ite
(inshore Guinea Marsh), peak shoot density and biomass were observed
during June-July fo r the preceeding two seasons (Orth et a l . , 1981).
Aboveground tissue ATP levels were highest during w inter and
summer and lowest during spring and f a l l . Winter and summer
correspond to periods of slow growth and senescence, respectively,
with decreased rates of ATP u t liz a t io n . In contrast, spring and fa l l
correspond to periods of more rapid growth with increased rates of ATP
u t il iz a t io n . Seasonal ATP levels in aboveground Z. marina contrast
with those reported fo r Populus ge lrica (poplar) tw igs, which
contained greatest amounts of ATP during active growth and lowest
amounts during the no growth season (Sagisaka, 1981).
Sexual reproduction in Z. marina occurs during spring in the
Chesapeake Bay (Stevenson and Confer, 1978). This expenditure of
energy may reduce ATP content. Low adenylate levels are also observed
in Corbicula fiuminea (freshwater clam) during periods of reproductive
a c t iv ity (Giesy and Dickson, 1981).
Belowground tissue ATP levels were highest during summer and fa l l
and lowest during winter and spring. Belowground levels were
generally much lower than corresponding aboveground leve ls . As
previously suggested, low belowground adenylate levels may be
attrib u ted to m etabolically in e rt material (Pamatmat and Skjo ldal,
1979) or lowered aerobic respiration in reduced sediments (Mendelssohn
et a l . , 1981).
Although amounts of adenine nucleotides are routinely reported,
there is an important metabolic d is tinc tion between amount and
turnover ra te . The ATP turnover rate or energy flu x through the
adenine nucleotide pool is actually the more important quantita tive
assessment of c e llu la r energetics (W eiler and K arl, 1979).
In both above and belowground Z. marina tissue, the following
expected correlations were observed: 1) EC pos itive ly correlated with
ATP and negatively correlated with AMP, and 2) AT correlated
pos itive ly with ATP, ADP, and AMP. In aboveground tissue over the one
year survey, ATP, ADP, and AMP comprised approximately 41-74%, 12-32%,
and 7-31%, respectively, of the to ta l adenylate pool. AT fluctuation
demonstrates net synthesis and degradation of nucleotides.
Between month v a r ia b ility in EC was damped re la tiv e to individual
adenylate concentrations. This was also observed in a seasonal study
of adenine nucleotides in freshwater clams (Giesy and Dickson, 1981).
Lower EC v a r ia b ili ty has both biochemical and mathematical rationales.
EC is not only regulatory but is also regulated within narrow lim its
by enzymes, contro lling rates of reactions which are coupled to the
use and regeneration of ATP (Atkinson, 1977). I t has been suggested
that AMP removal by adenylate deaminase serves to buffer the ce ll
against a sharp transient decrease in EC (Chapman and Atkinson, 1973).
The presence of ATP and ADP in both numerator and denominator of the
EC ra tio fu rth er reduces v a r ia b ili ty .
Conclusions
Due to the la b i l i t y of adenine nucleotides, precautions must be
taken throughout the analysis in order to quantify adenylates at th e ir
in s itu le ve ls . Freezing plants w ithin 2 min a fte r harvest,
prevention of thawing, and lyo p h iliza tio n minimized adenylate change.
Prolonged desiccated or frozen storage should be avoided, and hydrated
extracts must be held on ice during the assay. High recovery rates of
in ternal standards, added immediately p rio r to extraction , indicated
minimal adenylate loss a fte r extraction during the remainder of the
assay. An additional methodological step is unique to aquatic
macrophytes. 1 . marina leaves should be scraped free of epiphytic
algae a fte r ly o p h iliza tio n , since substantial epiphytic biomass
obscures le a f nucleotide content.
The tissue comparison and seasonal survey provide baseline
information on natural adenylate v a r ia b ility in 1. marina. Since le a f
tissue contained the highest adenylate leve ls , leaves appear most
suitable as a tes t tissue fo r routine adenylate analyses. Seasonal
105
ATP levels in aboveground tissue re fle c t energy expenditures
associated with growth patterns.
The method presented fo r the determination of adenine nucleotides
in I . mari na has several lim ita tio n s . Tissue adenylate measurement
results in a mass-weighted mean value and provides no information on
in te rc e llu la r heterogeneity or in tra c e llu la r compartmentation.
Adenylate levels determined in metabolic or environmental studies with
th is technique should be interpreted in th is context. Direct
application of th is methodology to other species may be inappropriate.
With s lig h t m odification, however, the technique should prove suitable
to other important macrophyte species.
REFERENCES
Adam, H. 1965. Adenosine-5'-diphosphate and adenosine-5'-monophosphate. Pp. 573-577 In: Methods of enzymatic analysis (H. U. Bergmeyer, e d .) , Academic Press, N. Y.
Atkinson, D. E. 1977. C e llu la r energy metabolism and its regulation. Academic Press, N. Y. 293 p.
Backman, T. W. and D. C. B a r i lo t t i . 1976. Irradiance reduction: Effects on standing crops of the eelgrass Zostera marina in a coastal lagoon. Mar. B io l. 34:33-40.
B a ll, W. d. and D. E. Atkinson* 1975. Adenylate energy charge in Saccharomyces cerevisiae durinq starvation. J. Bact.121:975-982.------------------
B ieb l, R. and C. P. McRoy. 1971. Plasmatic resistance and rate of respiration and photosynthesis of Zostera marina at d iffe re n t s a lin it ie s and temperatures. Mar. B io l. 8:48-56.
B ie leski, R. L. 1964. The problem of halting enzyme action when extracting plant tissues. Anal. Biochem. 9:431-442.
Bomsel, J. L. and A. Sell ami. 1974. In vivo measurement of the rate of transfer of from adenylate tfirough the chioroplast envelope. Pp. 1363-1367 In: Proc. In t . Congr. Photosynthesis3rd, E lsevier, Amsterdam.
Chapman, A. G. and D. E. Atkinson. 1973. S tab iliza tio n of adenylate energy charge by the adenylate deaminase reaction. J. B io l.Chem. 248:8309-8312.
Christensen, J . P. and A. H. Devol. 1980. Adenosine triphosphate andadenylate energy charge in marine sediments. Mar. B io l. 56:175-182.
Cockburn, W. 1974. Simultaneous measurement of oxygen evolution and endogenous ATP levels in isolated in tac t chioroplast suspensions. J. Exp. Bot. 25:111-120.
DeGreef, J . A ., E. Moereels, E. Spruyt, and J. P. Verbelen. 1979. Problems associated with k in e tic ATP measurements in crude plant homogenates. Pp. 350-362 In: In t . Sym. on AnalyticalApplications of Bioluminescence and Chemiluminescence (E. Schram and P. Stanley, e d s .), State Printing and Publ. In c ., Westlake V illag e , CA.
106
DeLuca, M. 1976. F ire f ly luc ife rase . Adv. Enzymol. 44:37-68.
DeLuca, M. A. (e d .) . 1978. Bioluminescence and chemiluminescence.Methods in Enzymology, Vol. 57.
DeLuca, M. A. and W. D. MeElroy (e d s .). 1981. Bioluminescence andchemiluminescence. Basic chemistry and analytical applications. Academic Press, N. Y. 782 p.
DeLuca, M., J . Wannlund, and W. D. McElroy. 1979. Factors affecting the kinetics of lig h t emission from crude and purified luc iferase . Anal. Biochem. 95:194-198.
den Hartog, C. 1970. The seagrasses of the world. North Holland Pub. Co., Amsterdam. 275 p.
Garber, M. P. and P. L. Steponkus. 1976. A lterations in chlorplast thylakoids durinq an in v itro freeze-thaw cycle. Plant Physiol. 57:673-680.
Giesy, J. P. and G. W. Dickson. 1981. The e ffe c t of season andlocation on phosphoadenylate concentrations and adenylate energy charge in two species of freshwater clams. Oecologia 49:1-7.
Guinn, G. and M. P. Eidenbock. 1972. Extraction, p u rific a tio n , and estimation of ATP from leaves, f lo ra l buds, and immature fru its of cotton. Anal. Biochem. 50:89-97.
Hampp, R ., M. G o ller, and H. Z ieg ler. 1982. Adenylate leve ls , energy charge, and phosphorylation potential during d ark -lig h t and ligh t-dark tra n s itio n in chloroplasts, mitochondria, and cytosol of mesophyll protoplasts from Avena sativa L. Plant Physiol. 69:448-455.
Holm-Hansen, 0. 1973. Determination of to ta l microbial biomass bymeasurement of adenosine triphosphate. Pp. 73-89 In: EstuarineMicrobial Ecology (L. H. Stevenson and R. R. Colewell, e d s .), Univ. o f S. Carolina Press, Columbia, S. C. 536 p.
Holm-Hansen, 0. and D. M. K arl. 1978. Biomass and adenylate energy charge determination in microbial ce ll extracts and environmental samples. Methods Enzymol. 57:73-85.
H u ll, C. H. and N. H. Nie (e d s .). 1981. SPSS Update 7-9 ,McGraw-Hill, N. Y. 402 p.
Ivanovici, A. M. 1980. Adenylate energy charge: An evaluation ofa p p lic a b ility to assessment of pollution effects and directions fo r future research. Rapp. P. V. Reun. Cons. In t . Explor. Mer. 179:23-28.
108
K arl, D. M. 1980. C e llu la r nucleotide measurements and applications in microbial ecology. M icrobiol. Rev. 44:739-796.
K arl, D. M., J . A. Haugsness, L. Campbell, and 0. Holm-Hansen. 1978. Adenine nucleotide extraction from multi c e llu la r organisms and beach sand: ATP recovery, energy charge ra tio s , and determination of carbon/ATP ra tio s . J. Exp. Mar. B io l. Ecol. 34:163-181.
K arl, D. M. and 0. Holm-Hansen. 1976. Effects of lu c ife r in concentration on the quantitative assay of ATP using crude luciferase preparations. Anal. Biochem. 75:100-112.
Karl, D. M. and 0. Holm-Hansen. 1978. Methodology and measurement of adenylate energy charge ratios in environmental samples. Mar. B io l. 48:185-197.
K arl, D. M. and P. A. LaRock. 1975. Adenosine triphosphatemeasurements in soil and marine sediments. J. Fish. Res. Bd.Can. 32:599-607.
K arl, D. M. and K. H. Nealson. 1980. Regulation of c e llu la rmetabolism during synthesis and expression of luminous system in Beneckea and Photobacterium. J. Gen. M icrobiol. 117:357-368.
Kayne, F. J. 1973. Pyruvate kinase. Pp. 353-382 In: The enzymes,Vol. 8 (P. D. Boyer, e d .) , Academic Press, N.Y.
Knauer, G. A. and A. V. Ayers. 1977. Changes in carbon, nitrogen, adenosine triphosphate and chlorophyll a in decomposing Thalassia testudinum leaves. Limnol. Oceanogr. 22:408-414.
Leach, F. R. 1982. ATP determination with f i r e f ly luc ife rase . J. Appl. Biochem. In press.
Loomis, W. D. and J. B a tta ile . 1966. Plant phenolic compounds and iso la tion of plant enzymes. Phytochem. 5:423-438.
McRoy, C. P. and C. H e lffe rich (e d s .). 1977. Seagrass ecosystems: As c ie n tif ic perspective. Marcel Dekkar, In c ., N. Y. 314 p.
Mendelssohn, I . A. and K. L. McKee. 1981. Determination of adenine nucleotide levels and adenylate energy charge ra tio in two Spartina species. Aq. Bot. 11:37-55.
Mendelssohn, I . A ., K. L. McKee, and W. H. P atrick , Jr. 1981. Oxygendeficiency in Spartina a lte rn if lo ra roots: Metabolic adaptation to anoxia. Science 214:439-441.
Mendelssohn, I . A ., K. M. Mendelssohn, and W. H. P a trick , J r . 1978.A potential indicator of the cumulative impact of sublethal stress in coastal plant communities. Final report to theLouisiana Dept, of Transportation and Development, O ffice ofCoastal Zone Management. 50 p.
Nie, N. H ., C. H. H u ll, J . G. Jenkins, K. Steinbrenner, and D. H.Bent. 1975.. S ta tis tic a l Package fo r the Social Sciences (SPSS), 2nd Ed. McGraw-Hill, N. Y. 675 p.
NOAA. 1979. Tide tables 1980: East Coast of North and SouthAmerica. U. S. Dept. Commerce, NOAA, National Ocean Survey, 293 P-
NOAA. 1980. Tide tables 1981: East Coast of North and SouthAmerica. U. S. Dept. Commerce, NOAA, National Ocean survey, 285 P-
Noda, L. 1973. Adenylate kinase. Pp. 279-305 In: The Enzymes,Vol. 8 (P. D. Boyer, e d .) , Academic Press, N. Y.
Orth, R. J . 1977. E ffect of nutrient enrichment on growth of the eelqrass Zostera marina in the Chesapeake Bay, V irq in ia , USA.Mar. B io l. 44:187- 194.
Orth, R. J . , K. A. Moore, M. H. Roberts, and G. M. Silberhorn. 1981. The biology and propagation of eelgrass, Zostera marina, in the Chesapeake Bay, V irg in ia . Final Report, US EPA, Chesapeake Bay Program, Grant No. R805953, VIMS.
Pamatmat, M. M. and H. R. Skjo ldal. 1979. Metabolic a c t iv ity ,adenosine phosphates, and energy charge of belowground biomass of Juncus roemerianus Scheele and Spartina a lte rn if lo ra L o ise l.Est. Coast. Mar. Sci. 9:79-90.
Penhale, P. A. 1977. Macrophyte-epiphyte biomass and productivity in an eelqrass (Zostera marina L .) community. J. Exp. Mar. B io l. Ecol. 26:211-22?:
P h illip s , R. C. and C. P. McRoy (e d s .). 1980. Handbook of seagrasssbiology: An ecosystem perspective. Garland STPM Press, N.Y.353 p.
Pradet, A. 1967. Etude des adenosine-5'-mono, d i , et triphosphates dans les tissus vegetaux. I . Dosage enzymatique. Physiol.Veg. 5:209-221.
Pradet, A. and P. Raymond. 1978. C e llu la r energy control: Theimportance of methodology. Trends Biochem. Sci. 3:39.
Rhodes, D. and G. R. Stewart. 1974. A procedure fo r the in vivodetermination of enzyme a c tiv ity in higher plant tissue. Planta 118:133-144.
Sagisaka, S. 1981. Adenosine triphosphate levels in the poplar during one year growth. Plant Cell Physiol. 22:1287-1292.
SAIT. 1975. Model 3000 Integrating Photometer Instruction Manual. Science Application Inc. Technology Co., San Diego.
Santarius, K. A. and U. Heber. 1965. Changes in the in tra c e llu la r levels of ATP, ADP, AMP, and Pi and regulatory function of the adenylate system in le a f ce lls during photosynthesis. Biochim. Biophys. Acta 102:39-54.
Sellam i, A. 1976. Evolution des adenosine phosphates et de la charge energetique dans les compartiments chioroplastique et non-chloroplastique des fe u ille s de b le. Biochim. Biophys. Acta 423:524-539.
S etchell, W. A. 1929. Morphological and phenological notes on Zostera marina L. Univ. C a lif . Publ. Bot. 14:389-452.
Sofrova, D. and S. Leblova. 1970. Determination of ATP in plant tissue. Photosynthetica 4:162-184.
Stevenson, J. C. and N. M. Confer. 1978. Summary of available information on Chesapeake Bay submerged vegetation. USFWS/OBS-78/66. 335 p.
S treh ler, B. L. 1968. Bioluminescence assay: Principles andpractice. Pp. 99-181 In: Methods of Biochemical Analysis (D.G lick, e d .) , Interscience Pub., J . Wiley o Sons, N. Y.
Thigpen, S. P. 1981. Adenylate metabolism in re la tio n to f lo ra l induction in Pharbitis n i l . Ph.D. D issertation, Univ. C a lif . Davis. 102 p.
Webster, J. J . , J. C. Chang, E. R. Manley, H. 0. Spivey, and F. R. Leach. 1980. Buffer effects on ATP analysis by f i r e f ly luc ife rase . Anal. Biochem. 106:7-11.
Webster, J . J. and F. R. Leach. 1980. Optimization of the f i r e f ly luciferase assay fo r ATP. J. Appl. Biochem. 2:469-479.
W eiler, C. S. and D. M. Karl. 1979. Diel changes in phased-dividing cultures of Ceratium furca (Dinophyceae): Nucleotide triphosphates, adenylate energy charge, ce ll carbon, and patterns of vertic a l m igration. J. Phycol. 15:384-391.
Wetzel, R ., K. Webb, P. Penhale, R. Orth, J . van Montfrans, R. Diaz,J. M erriner, and G. Boehlert. 1981. Functional ecology of eelgrass. Final Report, US EPA, Chesapeake Bay Program, Grant No. R805974, VIMS.
Wilson, J . M. 1978. Leaf respiration and ATP levels at c h illin g temperatures. NewPhytol. 80:325-334.

Zapata, 0. and C. McMillan. 1979. Phenolic acids in seagrasses Bot. 7:307-317.
Zar, J. H. 1974. B io s ta tis tica l analysis. P ren tice -H a ll, Inc. Englewood C l i f fs , N. 0. 620 p.

SECTION 2. APPLICATION
INTRODUCTION
The role of adenine nucleotides in c e llu la r bioenergetics,
including adenylate energy charge (EC) theory, has been presented by
Atkinson (1977). Adenine nucleotides are s tra te g ic a lly adapted to
metabolic regulation, since they are operationally linked with nearly
a ll metabolic sequences. The EC ra t io , ([ATP] + 1/2 [ADP])/([ATP]+
[ADP]+[AMP]), represents a lin ear measure of the metabolic energy
stored in the adenylate pool, ranging from 0 (a l l AMP) to 1.0 (a ll
ATP). EC regulates metabolic sequences by contro lling enzymic rates
of reactions which are coupled to the use and regeneration of ATP.
Since the metabolic energy state of an organism is sensitive to
environmental va ria tio n , EC has been proposed as an index of sublethal
stress (Ivan o v ic i, 1980) and has been widely applied in th is context
(e .g . Romano and Daumas, 1981; Giesy et a l . , 1981; Mendelssohn and
McKee, 1981). The present study has evaluated effects of nutrient
enrichment, lig h t reduction, and herbicide exposure on adenylate
response patterns in Zostera marina (eelgrass), a submerged marine
angiosperm. 1. marina is an ecologically important macrophyte species
(McRoy and H e lffe rich , 1977; Stevenson and Confer, 1978; P h illip s and
McRoy, 1980; Wetzel e t a l . , 1981; Orth et a l . , 1981), occurring in
temperate and subarctic coastal and estuarine waters in the Northern
Hemisphere (den Hartog, 1970).
113
N utrient-L ight Experiment
Since nutrients and lig h t a ffe c t rates of photosynthesis and
associated photophosphorylation, adenylates are expected to respond to
changes in nutrient or lig h t regimes. Several studies have
investigated adenylate response in higher plants to nutrient
enrichment or lig h t reduction. Ching et a l . (1975) have reported
increases in ATP, AT, and EC in Triticum aestivum (wheat) leaves with
addition of NH4NO3 f e r t i l i z e r over a 2-3 month period. Levels of ATP
and AT, but not EC, decreased in Spartina a lte rn if lo ra (cordgrass)
leaves with lig h t reduction (5% of fu l l sunlight) over one week
(Mendelssohn and McKee, 1981). Kondo and Nakashima (1979) observed
increases in ATP and AT, but not EC, with sucrose enrichment and
higher lig h t level over several days in an aquatic macrophyte, Lemna
gibba (duckweed). These studies indicate that ATP and AT
concentrations are generally more sensitive than EC and consistently
increase with nutrient enrichment and higher lig h t in te n s ity .
Apparently, EC is s tab ilized within narrow lim its by mechanisms,
outlined by Atkinson (1977).
I t has been reported that epiphytic growth, stimulated by
nutrient enrichment, can adversely a ffe c t rooted aquatic macrophytes
(P h illip s et a l . , 1978; Sand-Jensen and Sondergaard, 1981). Epiphytes
presumably reduce macrophyte growth by shading and by depleting
inorganic carbon and nutrients at the le a f surface. In some cases,
epiphytic colonization may promote host le a f senescence (Rogers and
Breen, 1981). With l i t t l e or no epiphytic colonization , strong and
positive correlations of Z. marina ATP and AT with nutrients and lig h t
115
are expected, since growth correlates pos itive ly with adenylates
(Ching, 1975), nutrients (Orth, 1977), and l ig h t (Backman and
B a r i lo t t i , 1976). With heavy epiphytic colonization, these
correlations should weaken. Although several studies have addressed
adenylate response in algae to nutrient lim ita tio n (Holm-Hansen, 1970;
Falkowski, 1977; Riemann and Wium-Anderson, 1981) or lig h t lim ita tio n
(Holm-Hansen, 1970; W eiler and Karl, 1979), few studies have
investigated effects of nutrient enrichment (Stephens and Shultz,
1982) or reduced lig h t levels on epiphyte adenylates.
This stuc(y has investigated adenylate response patterns in Z.
marina and its epiphytes to nutrient enrichment and lig h t reduction.
Z. marina morphometric and production data were co llected, along with
an assessment of epiphytic colonization, in order to fa c i l i ta te
evaluation of physiological response.
Atrazine Experiments
Atrazine, a tr ia z in e herbicide, is widely used fo r selective
control of broadleaf and grassy weeds in to le ran t crop species,
including corn, sorghum, and sugarcane (WSSA, 1974). As an in h ib ito r
of the H ill reaction in photosynthesis (Ebert and Dumford, 1976;
Gardner, 1981), atrazine is expected to impair photoevolution of
oxygen, net photoreduction, and noncyclic photophosphorylation in the
chloroplast and may adversely a ffec t the adenylate pool. Several
facto rs , which may elim inate or o ffse t atrazine to x ic ity , are reduced
herbicide uptake and translocation (Ebert and Dumford, 1976),
detoxication (Shimabukuro et a l . , 1971), or compensatory
116
phosphorylation p o ten tia l. Since neither cyclic photophosphorylation
(Thompson et a l . , 1974) nor oxidative phosphorylation (Davis, 1968)
are appreciably altered by atrazine, these processes along with
substrate phosphorylation may regenerate adequate amounts of ATP.
Several studies have investigated ATP response to atrazine
exposure in higher plants. Atrazine, administered through leaves (500
ppm) or through roots (0 .5 ppm), generally decreased ATP content in
Cucumis sativus (cucumber) leaves and roots over 1-3 days (Decleire
and Decat, 1981). In contrast, Gruenhagen and Moreland (1971) have
reported s lig h tly elevated levels of ATP in Glycine max (soybean)
hypocotyls with atrazine exposure (43 ppm) over 6 hrs. These
inconsistent results may re fle c t differences in exposure time or
differences between species in atrazine metabolism or phosphorylation
potenti a l .
Nontarget effects of atrazine have been implicated in recent
declines of submerged aquatic macrophytes in the Chesapeake Bay
(Stevenson and Confer, 1978). Agricultural runoff, leaching, and
aeria l transport processes introduce atrazine into the Bay (Wu, 1981).
Forney and Davis (1981) have reported 3-6 week I i values (the
concentration in h ib itin g growth 1%) of a few ppb atrazine fo r several
submerged aquatic macrophyte species. Although atrazine levels in the
Chesapeake Bay are generally below 1 ppb (Correll et a l . , 1978; Wu et
a l . , 1980; Hershner e t a l . , 1981), Hershner et a l . (1981) have
suggested th a t Z. marina beds in the lower Bay may experience atrazine
concentrations, ranging from 1-10 ppb, fo r several days over the
growing season.
Assuming Z. marina is susceptible to atrazine to x ic ity , decreased
ATP and EC levels with atrazine exposure are expected. This study has
investigated adenylate response patterns in Z. marina over short-term
(6 h r) and long-term (21 day) atrazine exposure. Production,
morphometric, and m orta lity data were collected in order to f a c i l i ta te
in terp re ta tion of adenylate response to a trazine .
METHODS
F ie ld C o lle c tio n and T ransp lan ting
Location of the Zostera marina sampling s ite in the lower
Chesapeake Bay was described in Methods of Section 1. Clumps of
eel grass were uprooted with a shovel, swirled in r iv e r water to remove
macro-algae and loose sediment, transported in a bucket of r iv e r water
to the laboratory, and acclimated in a flow-through system. Clumps
were then divided in to "individual" plants ( i . e . single shoot with the
attached le a f c luster and a 2-5 cm rhizome segment) fo r transplanting.
Transplants, used in the n u tr ie n t-lig h t study, were planted in clean
white sand in partitioned p las tic trays . Transplants, used in
atrazine experiments, were planted in natural sediment (obtained from
the VIMS beach) in J i f fy Pots. All transplants were submerged in a
flow-through system.
Adenine Nucleotides
Samples were processed, as described in Methods of Section 1,
with the following specifications:
1 ) transplants were uprooted by hand,
2 ) fo r each treatm ent, plants were pooled in order to minimize
within treatment varia tion and spotlight between treatment
varia tio n ,
3) le a f tissue and epiphytes were assayed a fte r 1 and 2 week
exposures in the n u tr ie n t-lig h t experiment,
118
119
4) le a f tissue was asseyed at the end of short-term (6 hr) and
long-term (21 day) atrazine experiments, and
5) photometry was performed e n tire ly in the integration mode.
Environmental Data
Environmental data included water temperature, s a lin ity ,
dissolved oxygen (DO), and photosynthetically active rad iation (PAR).
Minimum and maximum temperatures were recorded with a min-max
thermometer (Taylor Instruments). S a lin ity was measured with a
temperature-compensated refractometer (Model 10419, American Optical
Corp.) or an induction salinometer (Model RS 7B Beckman). DO was
monitored polarographically (Hitchman, 1978) with an oxygen meter
(Models 2504 and 2607, Orbisphere Lab). This meter was calibrated in
water-saturated a ir at specified temperature and pressure. Because i t
was not sa lin ity -co rrec ted , DO values are re la tiv e and not absolute.
PAR was measured with a lig h t meter (Model LI-185B, Lambda Instruments
C orp.), equipped with deck (a ir ) and sea (water) quantum sensors.
Underwater readings were taken at a depth of approximately 5 cm ( i . e .
plant le v e l) . PAR includes those wavelengths from 400-720 nm (Parsons
et a l . , 1977).
Nutrient-Light Experiment
Design
Effects of three nutrient and two lig h t levels over 2 weeks were
tested with the resultant six treatments, presented in Table 2 .1 . LI
and N1 represent ambient leve ls . Hourly mean lig h t levels over a
typ ical day are plotted in Figure 2.1 Mean nutrient levels and
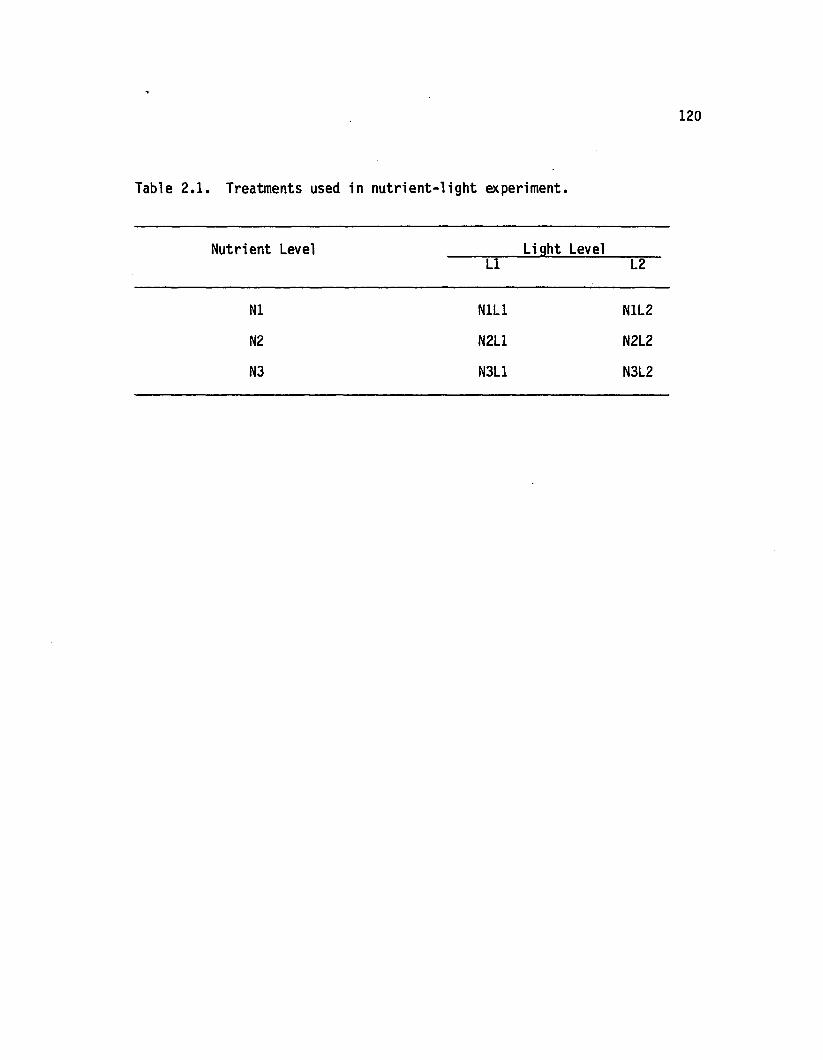
120
Table 2 .1 . Treatments used in n u tr ie n t-lig h t experiment.
Nutrient Level Light Level______LI L2
N1 N1L1 N1L2
N2 N2L1 N2L2
N3 N3L1 N3L2
Figure 2. Light levels (Ll, L2) in the nutrient-light experiment (n = 3). Error bars are 1 standard error.
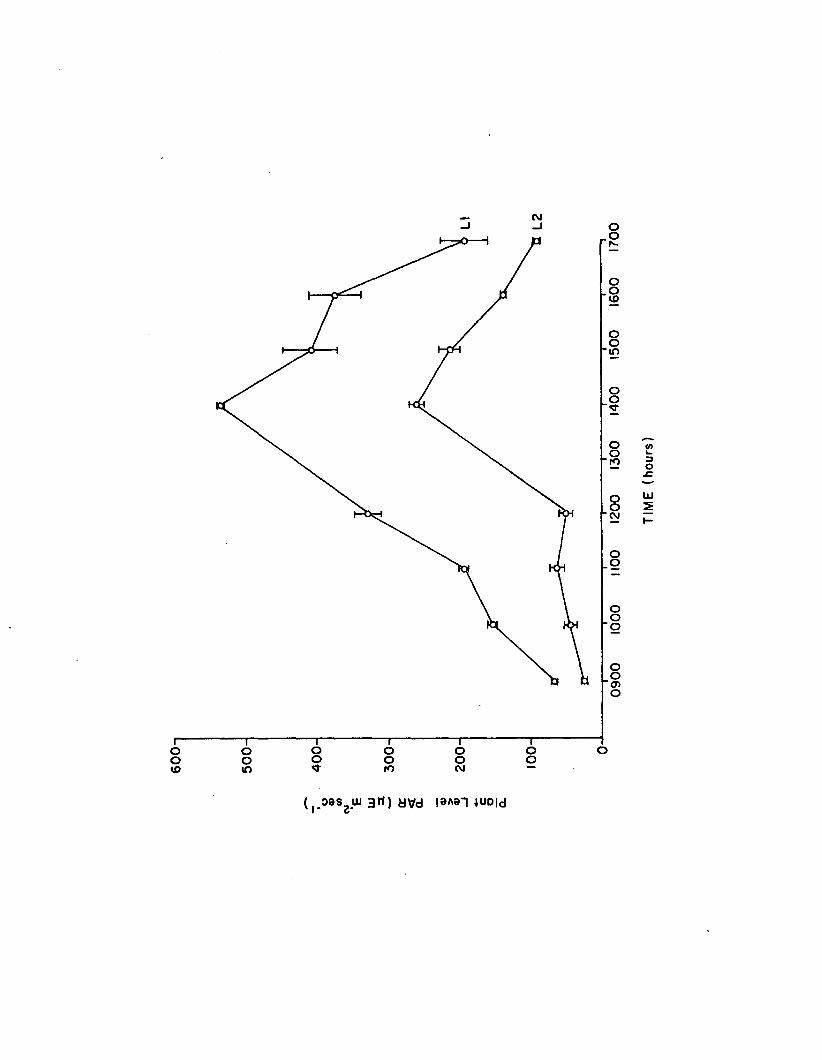
1-009
( , . 0 8 S 2JJU 3 t l ) a v d I3A9-1 JUDId
TIM
E (h
ours
)
resultant N/P ra tios were calculated from i n i t i a l , mid, and fin a l
measurements over the course of the experiment (Figure 2 .2 ) .
The flow-through system, located on the VIMS p ie r , is diagrammed
schematically in Figure 2 .3 . Six 38 1 glass tanks each held 24
plants. Tank turnover times ranged between 1 .7 -2 .0 hrs.
Nutrient stock solutions were prepared with American Chemical
Society (ACS) grade NH4NO3 and Na2HP04 (Fisher S c ie n tific C o .),
dissolved in deionized water. These solutions were metered in with a
p e r is ta lt ic pump (Model 600-1200, Harvard Apparatus Co., In c .) , so
that d ilu tio n yielded the desired tank concentrations. Flow rates
were monitored d a ily . Tanks were covered with black polypropylene
shade cloths to reach desired lig h t leve ls . In addition , tanks were
equipped with submersible rec ircu la ting pumps.
Nutrients
At i n i t i a l , mid, and fin a l times, water samples from each tank
were injected through 0.3 y glass f ib e r f i l t e r s (Type A/E, Gelman)
in to p lastic tubes and stored frozen p rio r to analysis. Dissolved
[orthophosphate]-phosphorus, [ammonia]-nitrogen, and [ n i t r i t e plus
n itra te ]-n itro g en were measured co lo rim e trica lly , as described in EPA
methods 365.2, 350.1, and 353.2, respectively (U.S. EPA, 1979).
Dissolved [P04-3 ]-P was measured manually (Model Spectronic 20 with
extended spectral range, Bausch and Lomb), while dissolved [NH3]-N and
[NOg" + N03~]-N were determined by an automated procedure (Model
AutoAnalyzer I I , Technicon Instruments Corp.).
Figure 2. 2 Nutrient levels (Nl, N2, N3) in the nutrient-light experiment (n = 6). Error bars are 1 standard error.
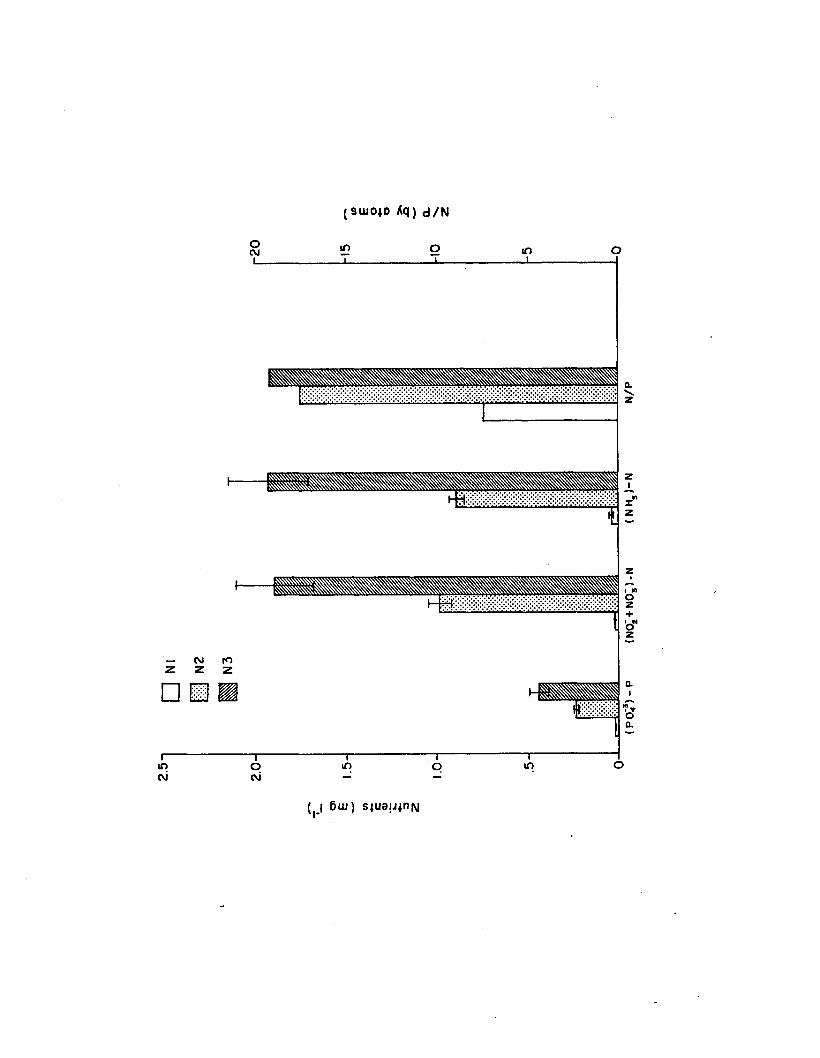
(Siuo*D Aq) d /N
( I 6 uj ) s ju a u jn N
(PO
jVP
(N
O: +
NO;)-
N (N
H )-N
N
/P
Figure 2.3. Flow-through system used for nutrient-light experiment.
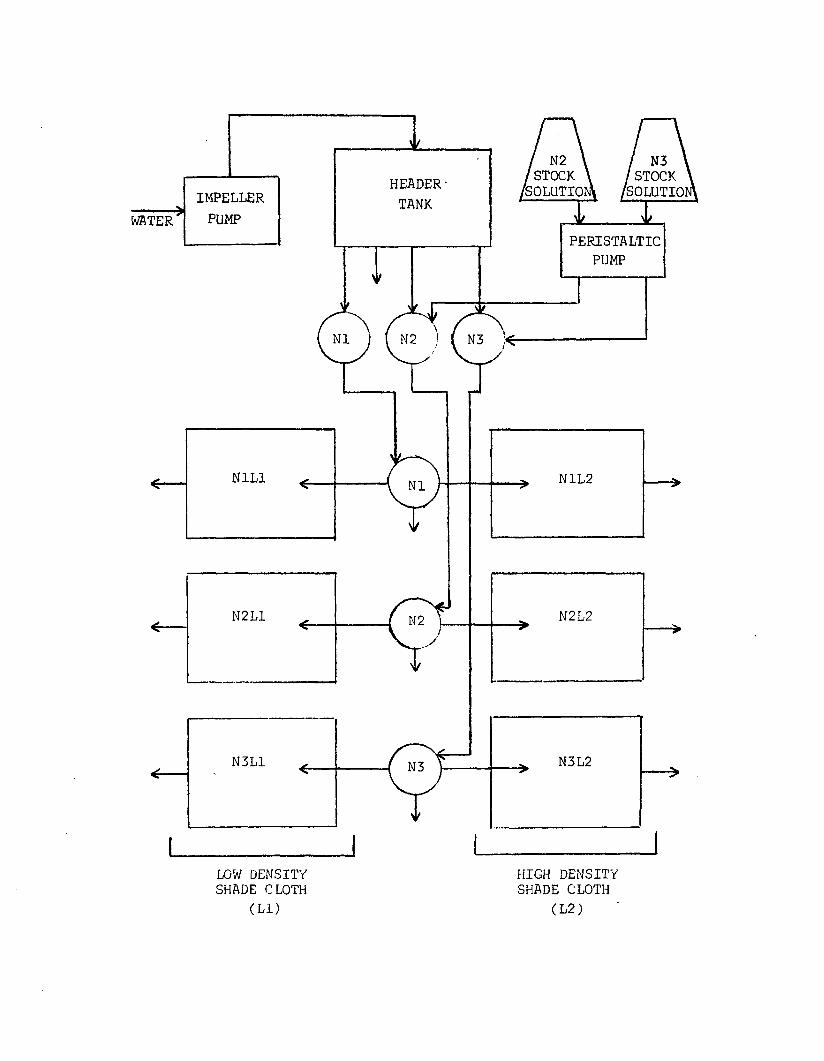
/ N2 \ /STOCK 'SOLUTIOI
/ N3 \/ STOCK SOLUTIOI
WATER
N1 N2
Ml
N2
N3
PERISTALTICPUMP
IMPELLERPUMP
HEADER• TANK
N3L1
N2L1
N1L1
N2L2
N1L2
N3L2
LOW DENSITY SHADE CLOTH
(LI)
HIGH DENSITY SHADE CLOTH
( L 2 )
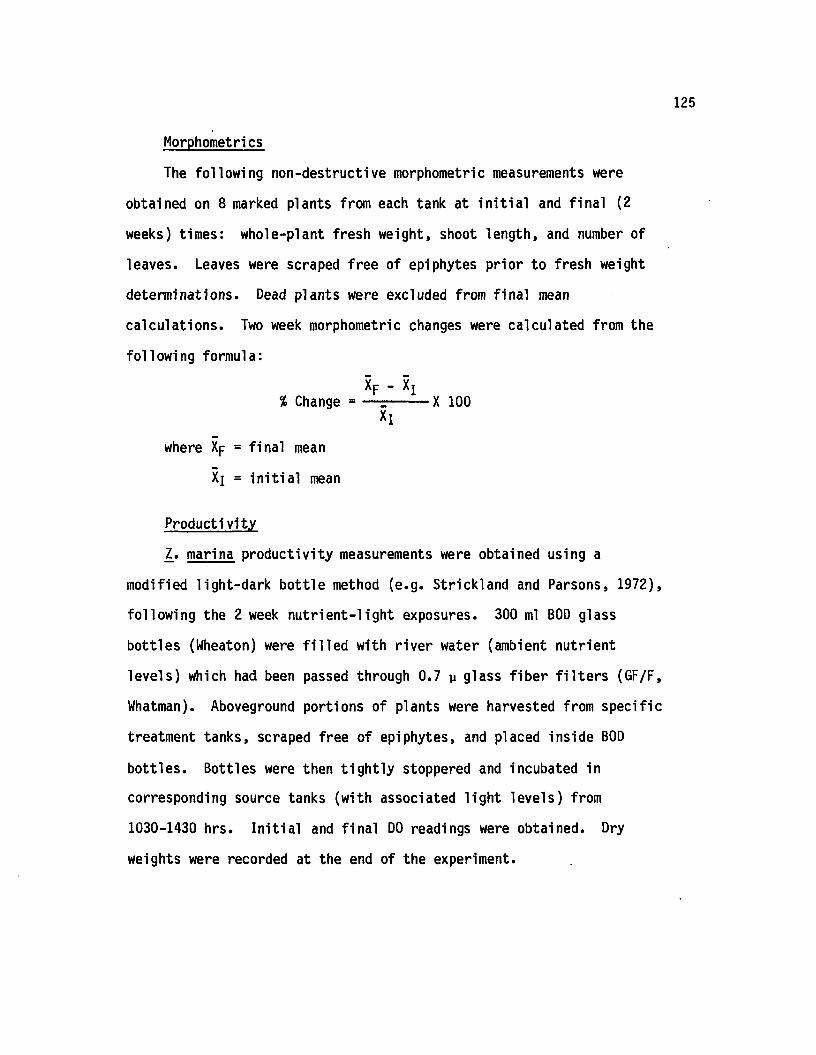
125
Morphometri cs
The following non-destructive morphometric measurements were
obtained on 8 marked plants from each tank at in i t ia l and f in a l (2
weeks) times: whole-plant fresh weight, shoot length, and number of
leaves. Leaves were scraped free of epiphytes p rio r to fresh weight
determinations. Dead plants were excluded from fin a l mean
calculations. Two week morphometric changes were calculated from the
following formula:
XF - Xj% Change = — = X 100
* 1
where Xp = fin a l mean
Xj = in i t ia l mean
Productivity
1. marina productivity measurements were obtained using a
modified ligh t-dark b o ttle method (e .g . Strickland and Parsons, 1972),
following the 2 week n u tr ie n t-lig h t exposures. 300 ml BOD glass
bottles (Wheaton) were f i l le d with r iv e r water (ambient nutrient
leve ls ) which had been passed through 0.7 u glass f ib e r f i l t e r s ( GF/F,
Whatman). Aboveground portions of plants were harvested from specific
treatment tanks, scraped free of epiphytes, and placed inside BOD
bottles . Bottles were then t ig h tly stoppered and incubated in
corresponding source tanks (w ith associated lig h t leve ls ) from
1030-1430 hrs. In i t ia l and f in a l DO readings were obtained. Dry
weights were recorded at the end of the experiment.
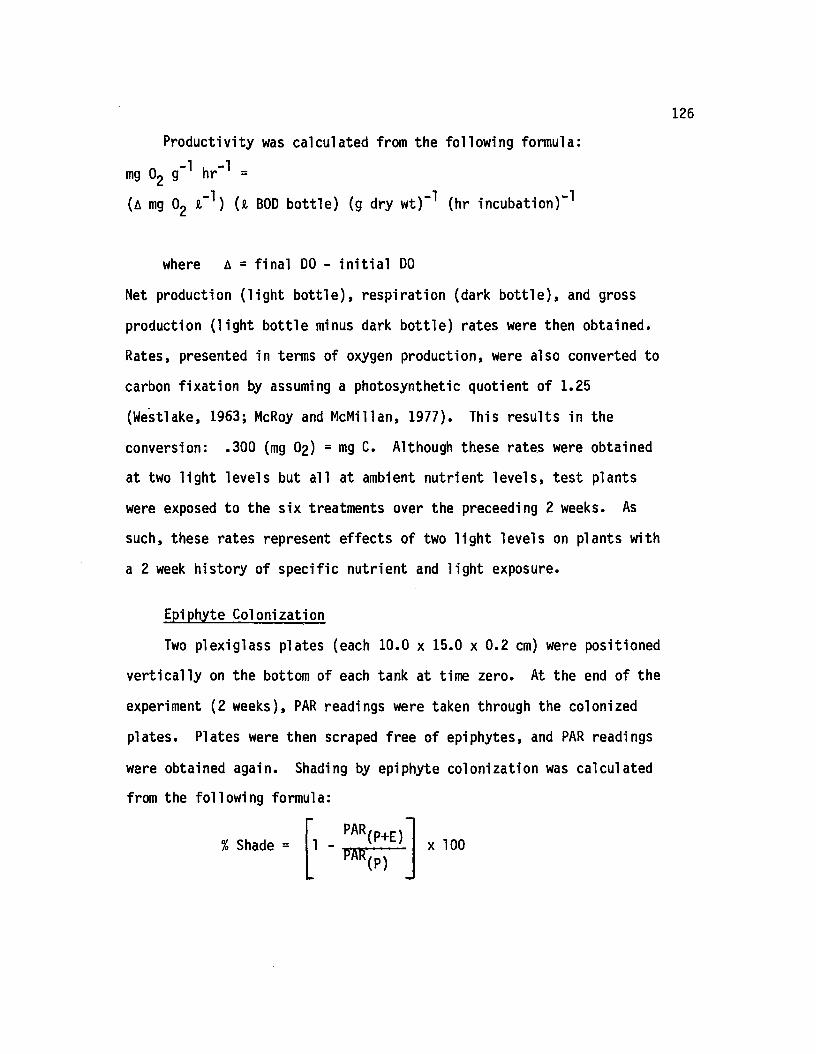
Productivity was calculated from the following formula:
mg 02 g" 1 hr” 1 =
(a mg 02 a.- 1 ) (a, BOD b o ttle ) (g dry w t) ” 1 (hr incubation) ” 1
where A = f in a l DO - in i t ia l DO
Net production ( lig h t b o tt le ) , respiration (dark b o tt le ) , and gross
production ( lig h t b o ttle minus dark b o ttle ) rates were then obtained.
Rates, presented in terms of oxygen production, were also converted to
carbon fix a tio n by assuming a photosynthetic quotient of 1.25
(Westlake, 1963; McRoy and McMillan, 1977). This results in the
conversion: .300 (mg O2 ) = mg C. Although these rates were obtained
at two lig h t levels but a ll at ambient nutrient leve ls , te s t plants
were exposed to the six treatments over the preceeding 2 weeks. As
such, these rates represent effects of two lig h t levels on plants with
a 2 week history of specific nutrient and lig h t exposure.
Epiphyte Colonization
Two plexiglass plates (each 10.0 x 15.0 x 0 .2 cm) were positioned
v e rtic a lly on the bottom of each tank at time zero. At the end of the
experiment (2 weeks), PAR readings were taken through the colonized
plates. Plates were then scraped free of epiphytes, and PAR readings
were obtained again. Shading by epiphyte colonization was calculated
from the following formula:
PAR/% Shade = n (P+E)
^ rx 100
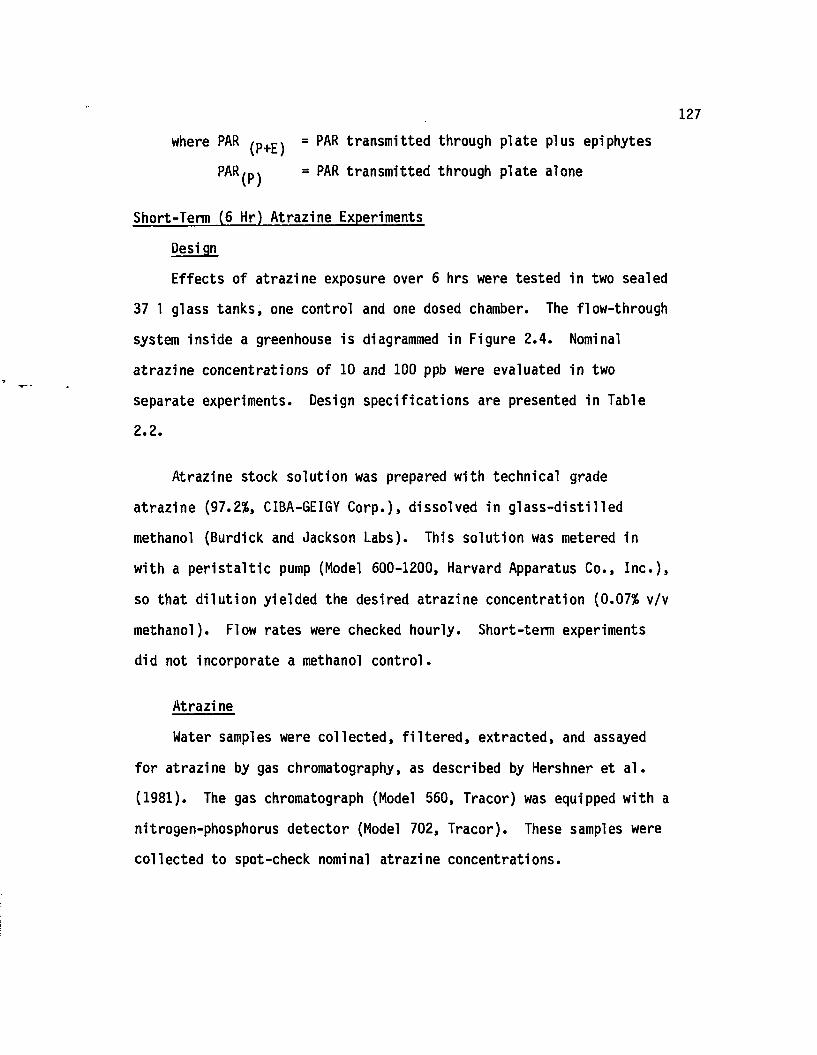
where PAR p+Ej = PAR transm itted through plate plus epiphytes
PAR^pj = PAR transmitted through plate alone
Short-Term (6 Hr) Atrazine Experiments
Design
Effects of atrazine exposure over 6 hrs were tested in two sealed
37 1 glass tanks, one control and one dosed chamber. The flow-through
system inside a greenhouse is diagrammed in Figure 2 .4 . Nominal
atrazine concentrations of 10 and 100 ppb were evaluated in two
separate experiments. Design specifications are presented in Table
2.2.
Atrazine stock solution was prepared with technical grade
atrazin e (97.2%, CIBA-GEIGY C orp .), dissolved in g la s s -d is tille d
methanol (Burdick and Jackson Labs). This solution was metered in
with a p e r is ta lt ic pump (Model 600-1200, Harvard Apparatus Co., In c .) ,
so that d ilu tio n yielded the desired atrazine concentration (0.07% v/v
methanol). Flow rates were checked hourly. Short-term experiments
did not incorporate a methanol control.
Atrazine
Water samples were co llected , f i l te r e d , extracted, and assayed
fo r atrazine by gas chromatography, as described by Hershner et a l .
(1981). The gas chromatograph (Model 560, Tracor) was equipped with a
nitrogen-phosphorus detector (Model 702, Tracor). These samples were
collected to spot-check nominal atrazine concentrations.
128
Figure 2.4. Flow-through system used for short-term (6 hour) atrazine experiments.
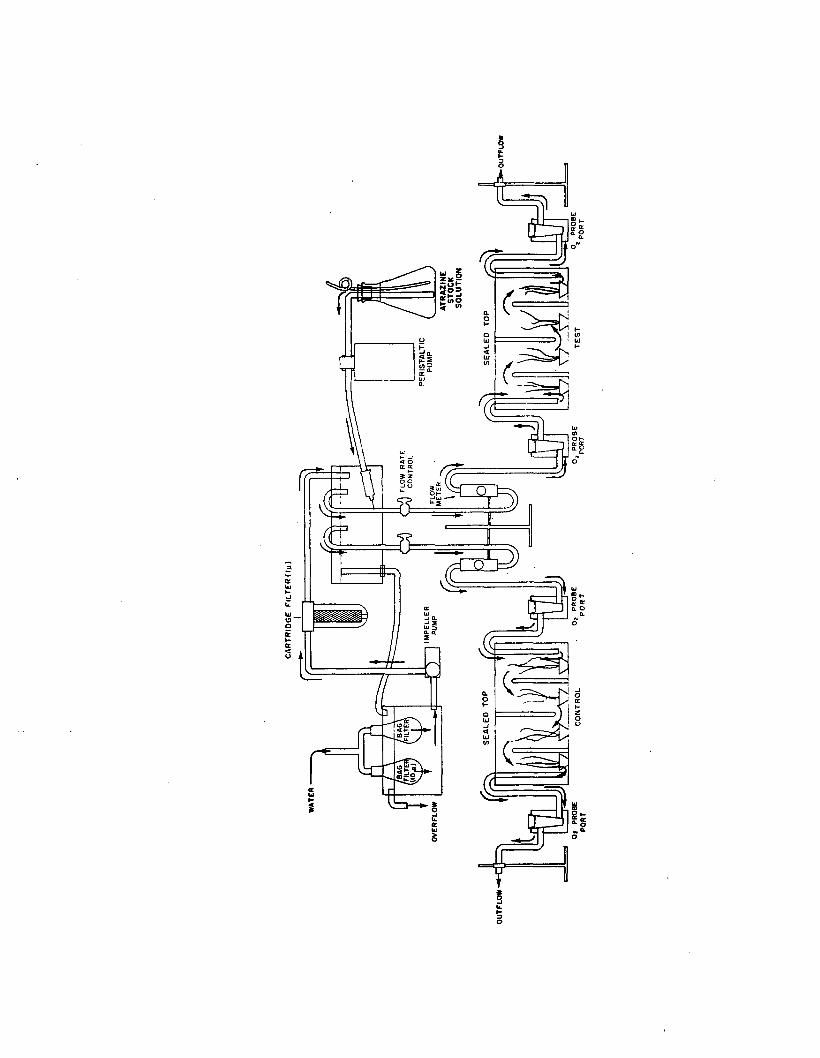
'Si?
p§<2?
0.0
aa.uJ »-u.uioo£t-a<o
o. o
I
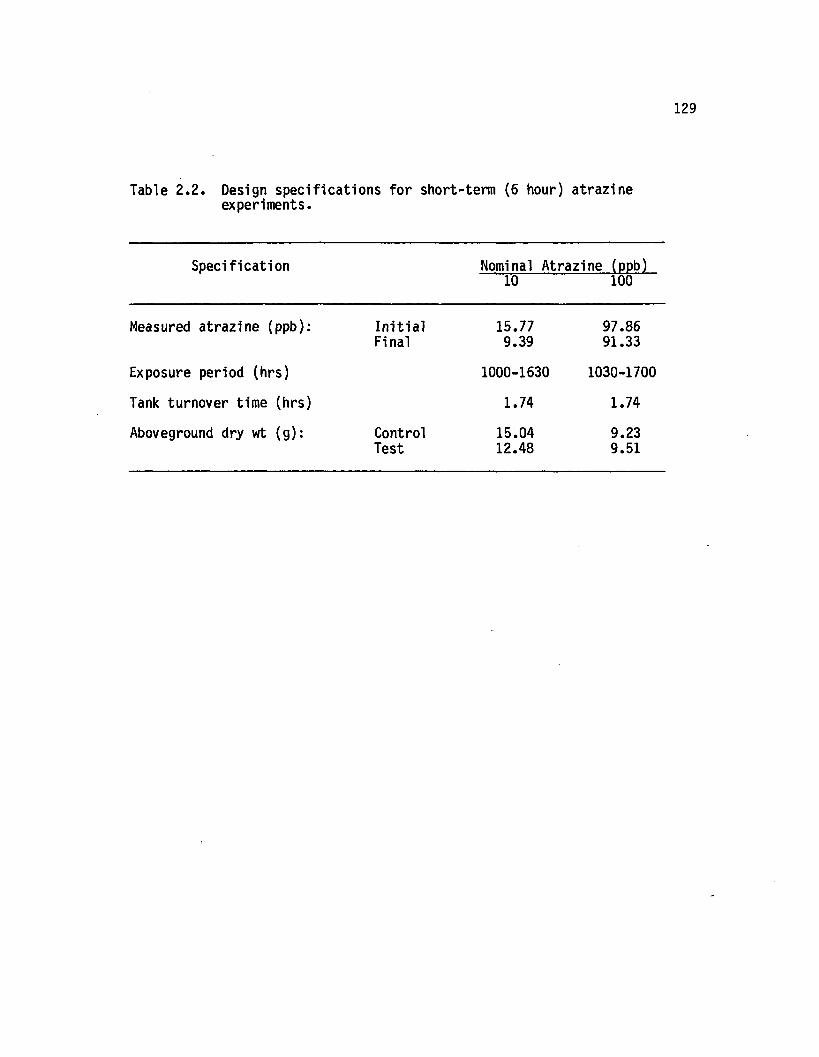
129
Table 2 .2 . Design specifications fo r short-term (6 hour) atrazineexperiments.
Specification Nominal Atrazine (ppb)10 100
Measured atrazine (ppb): In i t ia l 15.77 97.86Final 9.39 91.33
Exposure period (hrs) 1000-1630 1030-1700
Tank turnover time (hrs) 1.74 1.74
Aboveground dry wt (g ): Control 15.04 9.23Test 12.48 9.51
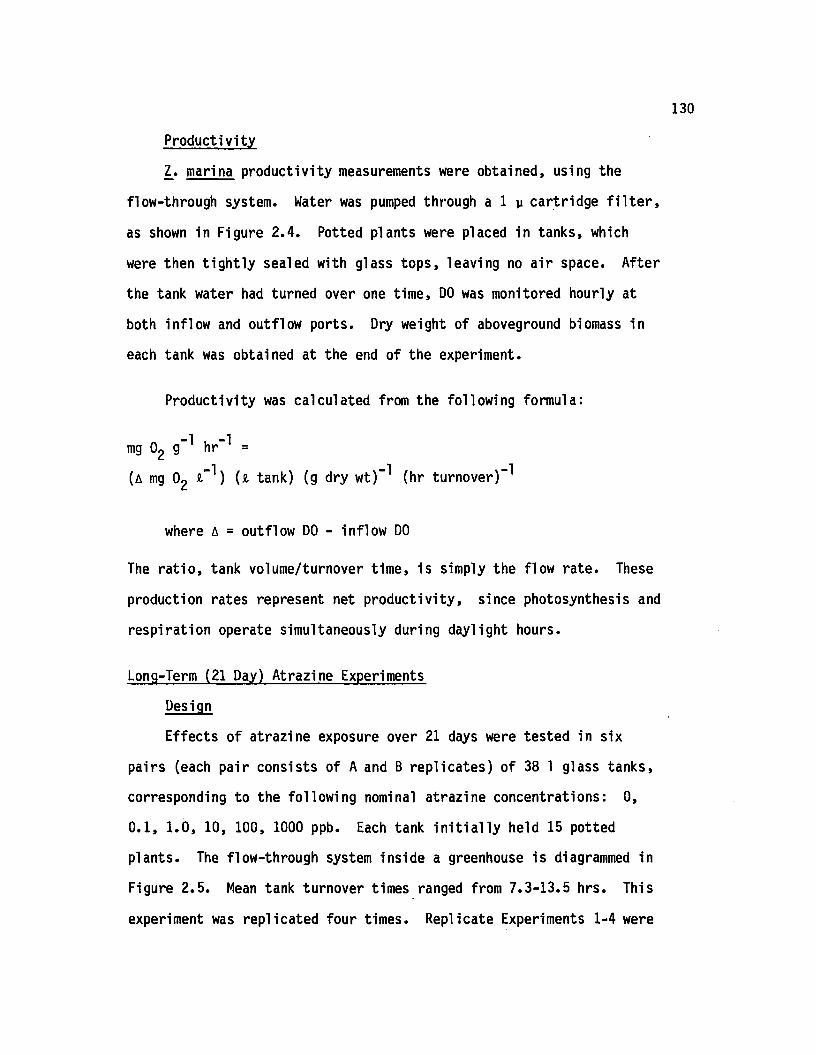
Productivity
Z. marina productivity measurements were obtained, using the
flow-through system. Water was pumped through a 1 y cartridge f i l t e r ,
as shown in Figure 2 .4 . Potted plants were placed in tanks, which
were then t ig h tly sealed with glass tops, leaving no a ir space. A fter
the tank water had turned over one tim e, DO was monitored hourly at
both inflow and outflow ports. Dry weight of aboveground biomass in
each tank was obtained at the end of the experiment.
Productivity was calculated from the following formula:
mg 02 g” 1 hr" 1 =-1 -1 -1
( a mg 02 5- ) U tank) (g dry wt) (hr turnover)
where A = outflow DO - inflow DO
The ra t io , tank volume/turnover tim e, is simply the flow ra te . These
production rates represent net p roductiv ity , since photosynthesis and
respiration operate simultaneously during daylight hours.
Long-Term (21 Day) Atrazine Experiments
Design
Effects of atrazine exposure over 21 days were tested in six
pairs (each pair consists of A and B rep licates) of 38 1 glass tanks,
corresponding to the following nominal atrazine concentrations: 0 ,
0 .1 , 1 .0 , 10, 100, 1000 ppb. Each tank in i t ia l l y held 15 potted
plants. The flow-through system inside a greenhouse is diagrammed in
Figure 2 .5 . Mean tank turnover times ranged from 7 .3 -13 .5 hrs. This
experiment was replicated four times. Replicate Experiments 1-4 were

131
Figure 2.5. Flow-through system used for long-term (21 day) atrazine experiments. The diagram depicts only one of the six pairs of tanks in the system.
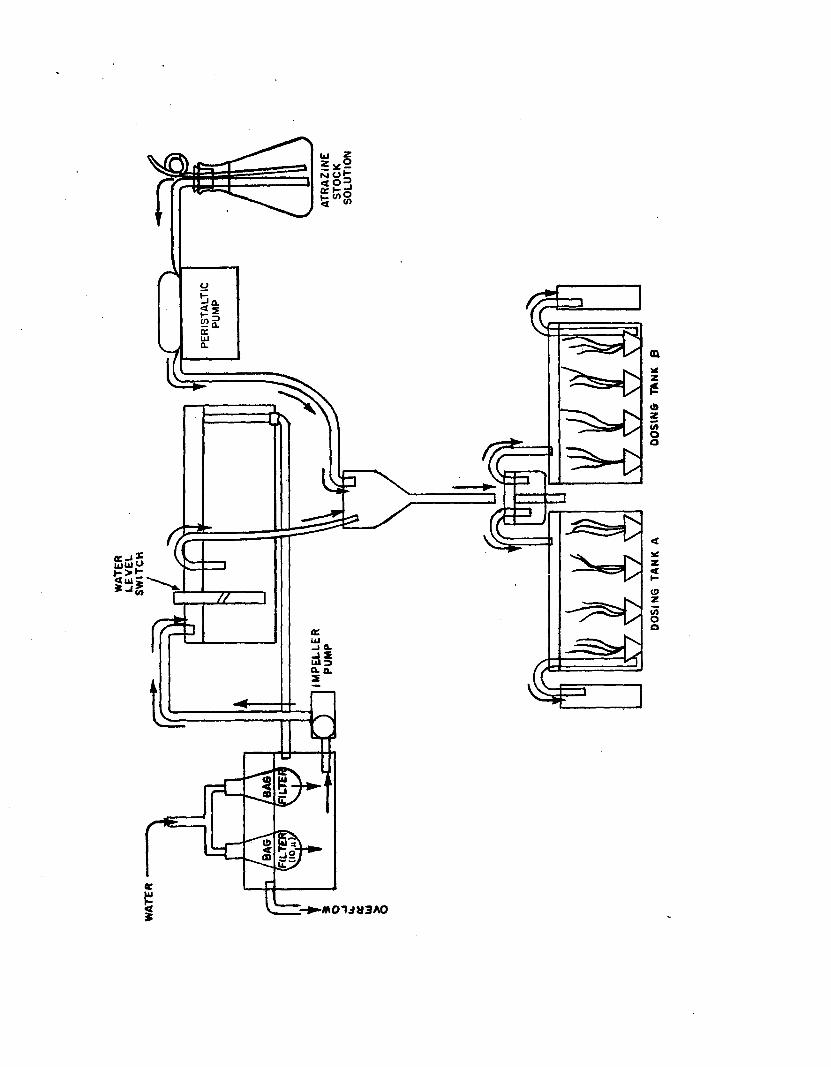
WAT
ERLE
VEL
SWIT
CH
-M 0 T J H 3 A 0
DOSIN
G TA
NK
A DO
SING
TANK
132
analyzed separately, as well as together, in some cases. Spot-check
atrazine measurements are lis te d in Table 2 .3 .
Atrazine stock solutions were metered in with a p e r is ta lt ic pump,
so that d ilu tio n yielded the desired atrazine concentrations (0.07%
v/v methanol). Flow rates were monitored d a ily . Long-term
experiments incorporated a methanol contro l.
Atrazine
Atrazine measurement was performed according to the procedure
described fo r short-term experiments.
Morphometries
Shoot length and number of leaves were obtained on a ll liv in g
plants from each tank at 0, 7, 14, and 21 days. Measurements from
rep lica te tanks A and B were combined to calculate means. Weekly
morphometric changes were calculated from the following formula:
Xt - X0 % Change = — = X 100
x0where Xt = mean at time t
X0 = mean at time zero
M ortality
M orta lity was recorded in each tank at 7, 14, and 21 days. Dead
plants were removed from the system. Visual c r ite r ia fo r plant death
were loss of green pigmentation ( i . e . chlorophyll degradation) and
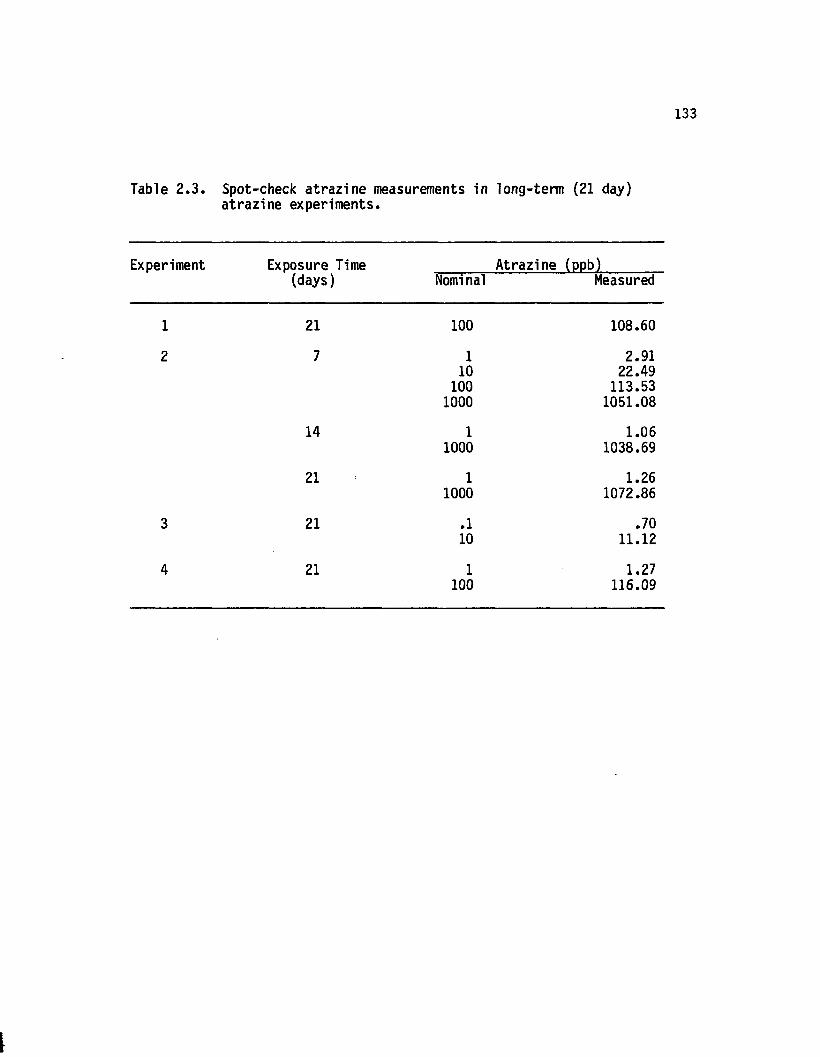
133
Table 2 .3 . Spot-check atrazine measurements in long-term (21 day) atrazine experiments.
Experiment Exposure Time Atrazine (ppb)_______(days) Nominal Measured
1 21 100 108.60
2 7 1 2.9110 22.49
100 113.531000 1051.08
14 1 1.061000 1038.69
21 1 1.261000 1072.86
3 21 .1 .7010 11.12
4 21 1 1.27100 116.09
134
loss of structural in te g r ity . M orta lity observations from rep licate
tanks A and B were combined in tabulations.
S ta tis tic a l Analysis
Procedures
The following procedures in the SPSS software package (Nie et
a l . , 1975; Hull and Nie, 1981) were used: ONEWAY (single factor
ANOVA, Hartley Fmax test fo r homoscedasticity, Student-Newman-Keuls
m ultiple range te s t ) , SCATTERGRAM (lin e a r regression and Pearson
c o rre la tio n ), NPAR TESTS (Kruskal-W allis single factor ANOVA by ranks
and Kolmogorov-Smirnov one sample tes t fo r norm ality), and NONPAR CORR
(Spearman rank c o rre la tio n ).
Other s ta t is t ic a l procedures employed included nonparametric
m ultiple range testing by rank sums (Zar, 1974) and dose-effect
analysis with log-probit transformation (L itc h fie ld and Wilcoxon,
1949). S ta tis tic a l assumptions are discussed in Appendix B.
Nutrient-L ight Experiment
Differences between adenylates in response to three nutrient
levels and two lig h t levels over time were examined. Data were
organized into single factor designs with six treatments a fte r 1 and 2
week periods. Differences between adenylates, subjected to these
treatments, were detected and located by the procedure diagrammed in
Figure 2 .6 . Dependent variables are ATP, ADP, AMP, AT, and EC.
Independent variables are n u tr ie n t-lig h t treatments. The null
hypothesis states no difference in adenylates between k treatments
( i . e . H0 : m ^ = . . . = u|<). Relationships among adenylate,
Figure 2.6. Detection and location of treatment differences.
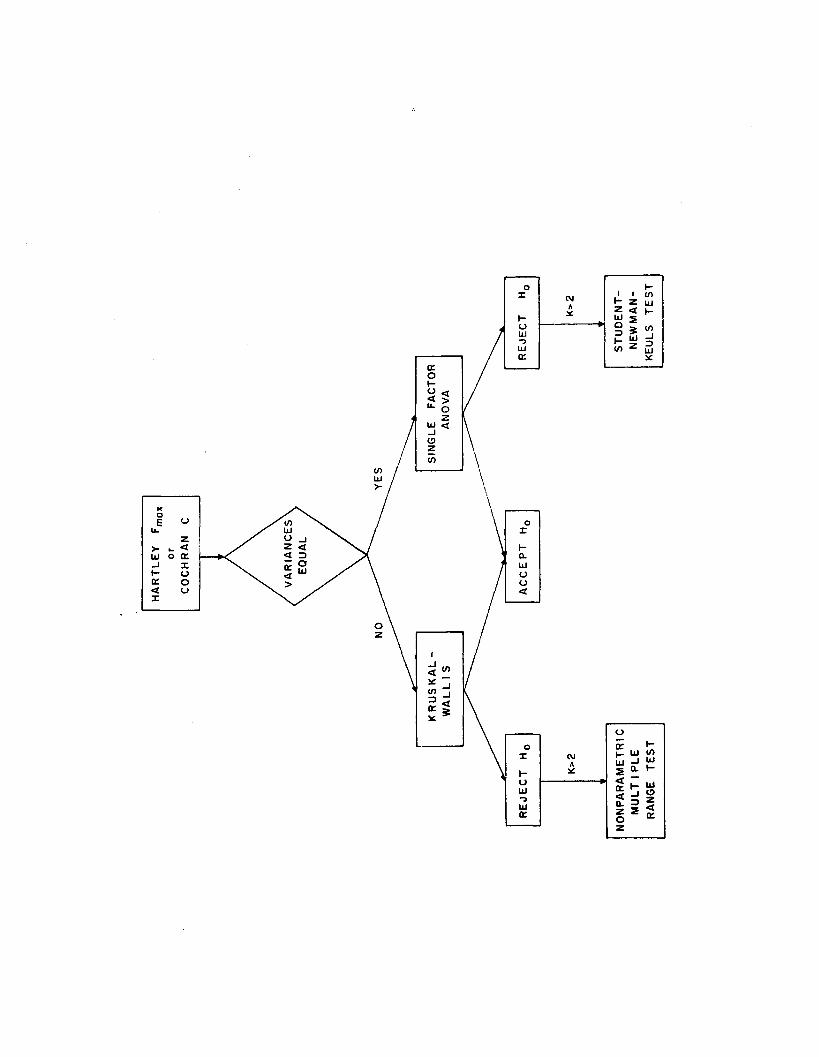
(/)
Z UJ
UJ <
2 <
ol_ UJ v>w s' £s CL H
z s
I- w _| o
136
environmental, morphometric, productiv ity , and epiphyte data were
evaluated by Spearman rank corre la tion .
Short-Term (6 Hr) Atrazine Experiments
Differences between adenylates, resulting from exposure to
a traz in e , were detected by the procedure diagrammed in Figure 2 .6 .
Long-Term (21 Day) Atrazine Experiments
Differences between adenylates, resulting from exposure to
atrazin e , were detected and located by the procedure diagrammed in
Figure 2 .6 . Morphometric change was regressed against time fo r a
control and fiv e atrazine concentrations. Relationships between
adenylate and atrazine data were evaluated by Spearman rank
corre la tion . Median and 1% lethal atrazine concentrations (LC 50 and
LC 1, respectively) and slope function (S ), together with th e ir 95%
confidence lim its , were estimated by log-probit analysis.
Differences between these m orta lity s ta tis tic s from rep licate
experiments were evaluated.
RESULTS
N utrient-L ight Experiment
Flow-Through System Data
Mean temperature and s a lin ity , over the course of the experiment,
are presented in Table 2 .4 . R elative ly small standard errors indicate
s ta b il i ty in these variables.
Hourly DO concentrations in each treatment, over a typical
morning, are plotted in Figure 2 .7 . These values represent a
saturation range from 119-303%. By 1230 hrs, DO's had diverged
considerably. At th is tim e, DO was consistently higher with both
increased lig h t levels (a t a given nutrient le v e l) and nutrient levels
(a t a given lig h t le v e l) . PAR (surface and plant le v e l) , DO, and
temperature were a ll pos itive ly and s ig n ific a n tly correlated (Table
2 .5 ) .
Morphometries
Mean fresh weight, shoot length, and number of leaves fo r Z.
marina, obtained at the s ta rt of the experiment, are presented in
Table 2 .6 . Most 2 week morphometric changes were negative (Figure
2 .8 ) . Change in le a f number was consistently lower with increased
nutrient levels (a t a given lig h t le v e l) . This observation is
reflected in the s ig n ifican t negative correlation between le a f number
change and nutrients (Table 2 .7 ) .
137
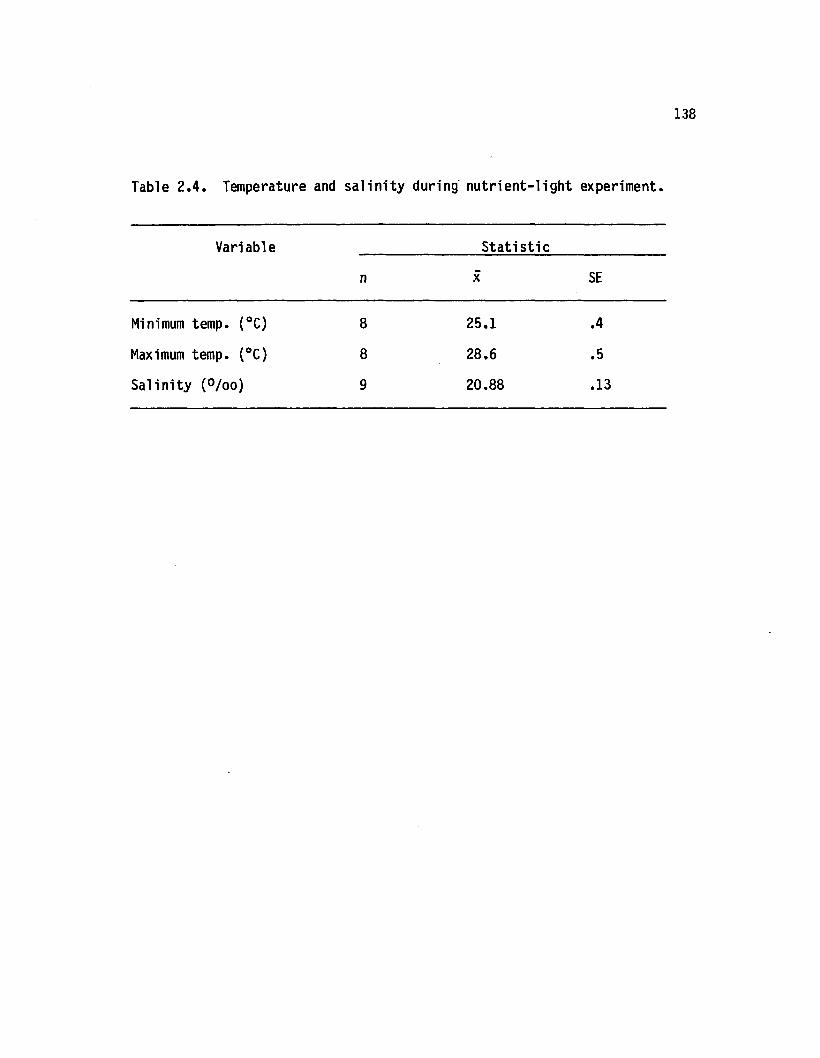
138
Table 2 .4 . Temperature and s a lin ity during n u tr ie n t-lig h t experiment.
Variable S ta tis tic
n X SE
Minimum temp. (°C) 8 25.1 .4
Maximum temp. (°C) 8 28.6 .5
S a lin ity (°/oo) 9 20.88 .13
139
Figure 2.7. Dissolved oxygen concentrations among the six treatments in the nutrient-light experiment.
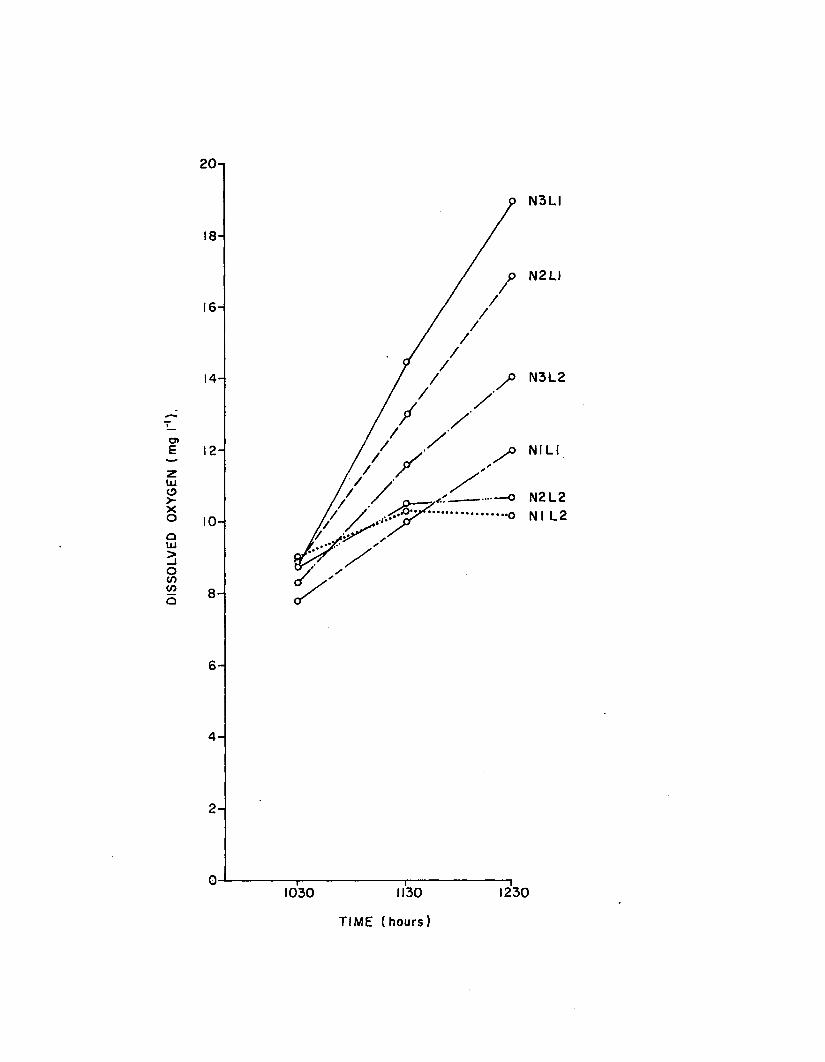
DISS
OLV
ED
OXYG
EN
(mg
I*1).
2 0 - ,
N 3LI
18-
N 2LI
16-
N 3L214-
NI LI12-
—o N 2L2 - • o NI L210-
8 -
6 -
4 -
2 -
1130 12301030
TIM E (hours)
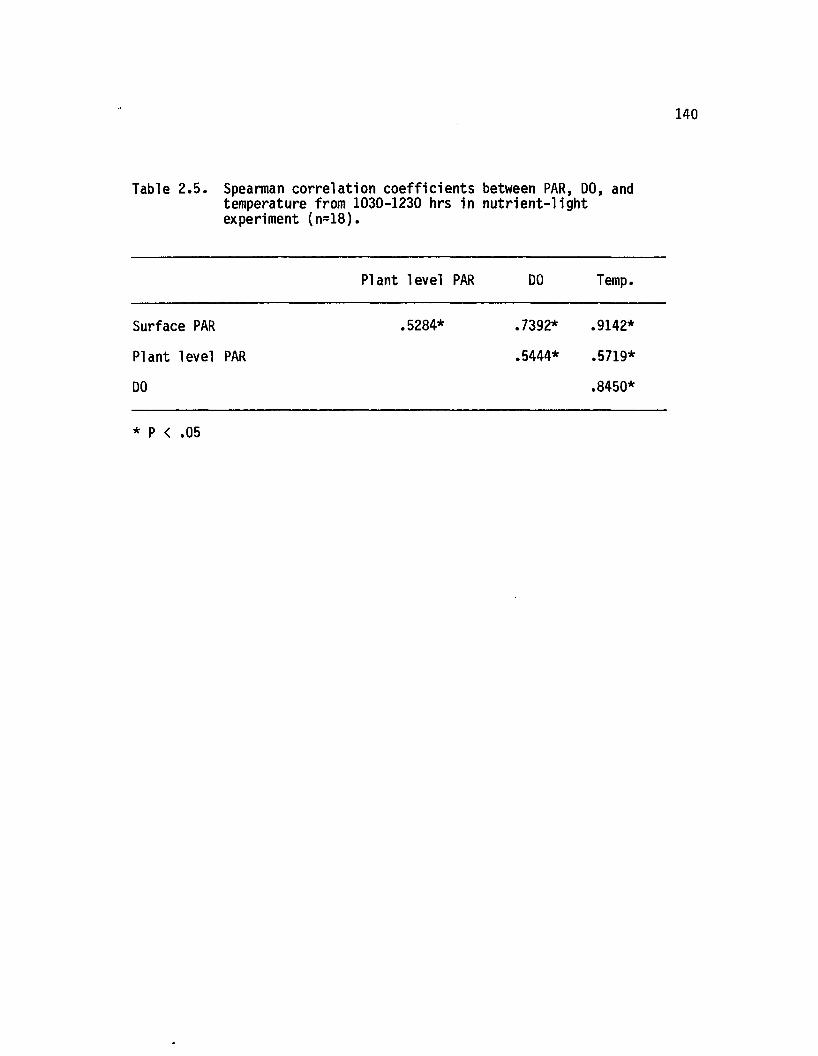
140
Table 2 .5 . Spearman corre lation coe ffic ien ts between PAR, DO, and temperature from 1030-1230 hrs in n u tr ie n t-lig h t experiment (n=18).
Plant level PAR DO Temp.
Surface PAR .5284* .7392* .9142*
Plant level PAR .5444* .5719*
DO .8450*
* P < .05
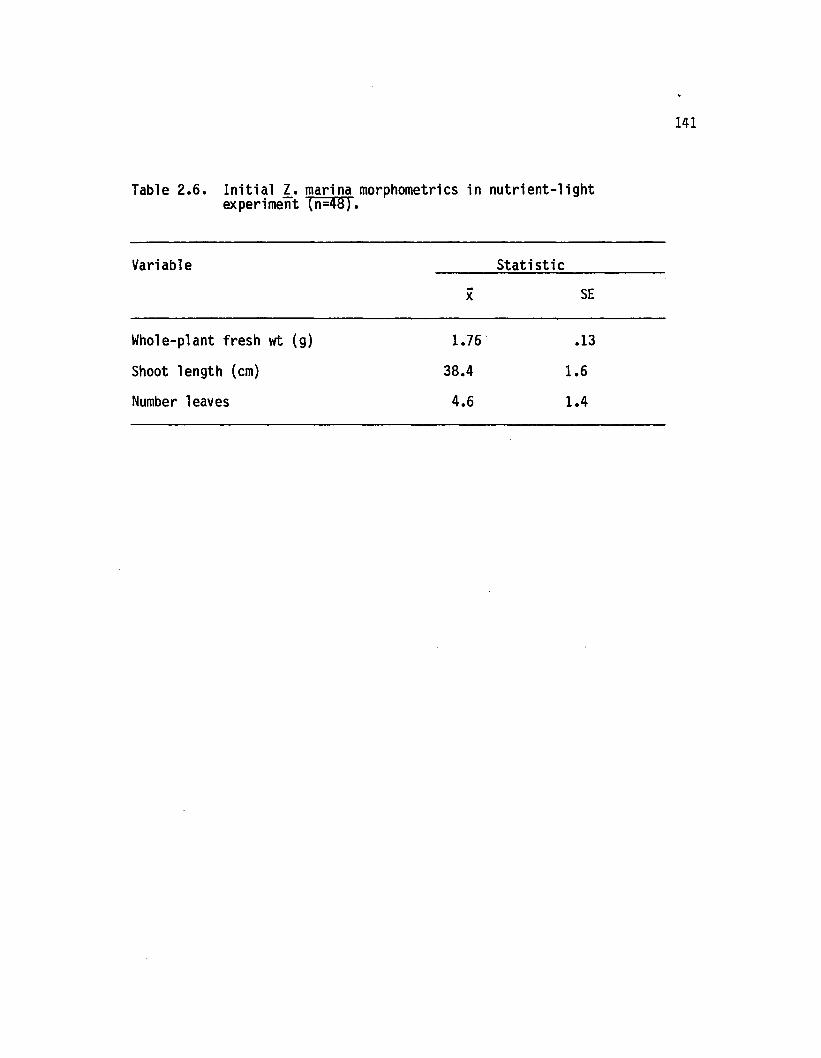
141
Table 2 .6 . In i t ia l I . marina morphometries in n u tr ie n t-lig h t experiment (n=48).
Variable
X
S ta tis tic
SE
Whole-plant fresh wt (g) 1.76 .13
Shoot length (cm) 38.4 1.6
Number leaves 4.6 1.4
142
Figure 2.8. Two week morphometric changes for Z. marina among thesix treatments In the nutrient-light experiment. Numbers in parentheses are n.
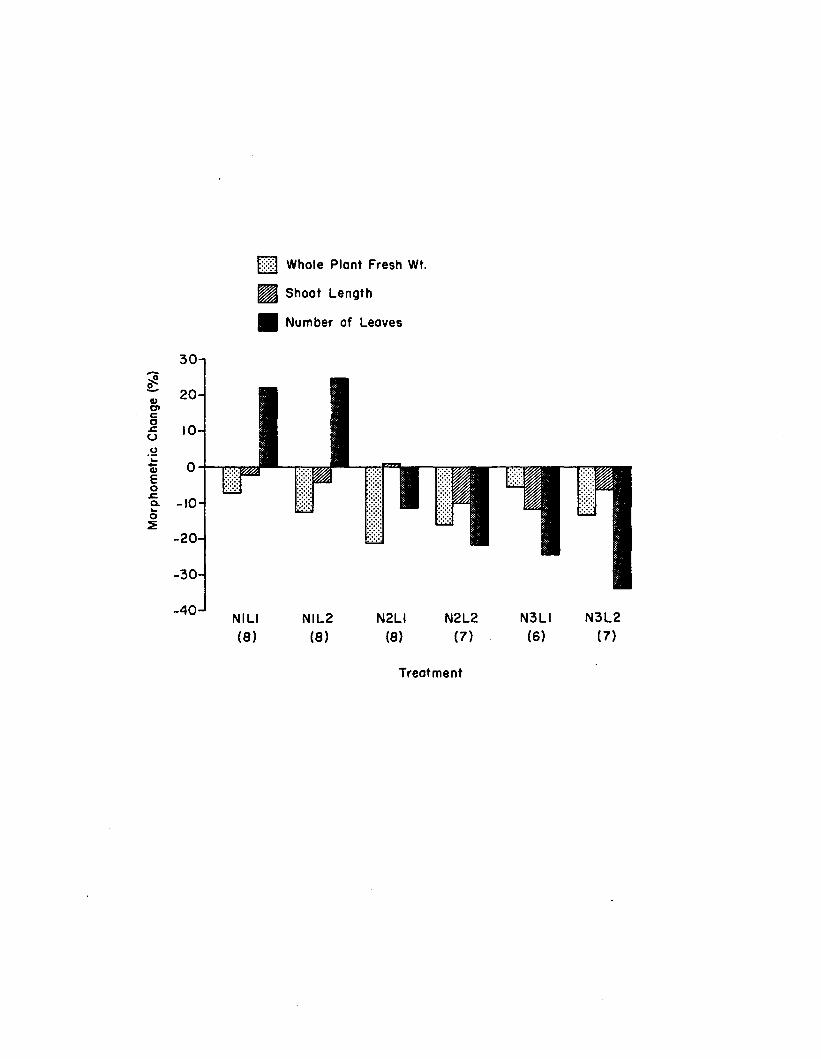
Mor
phom
etric
Ch
ange
(%
)
m Whole Plant Fresh Wt.
Shoot Length
Number of Leaves
NIL2 N2LI(8 )
N2L2(7 )
N3LI(6)
N3L2(7)
Treatment
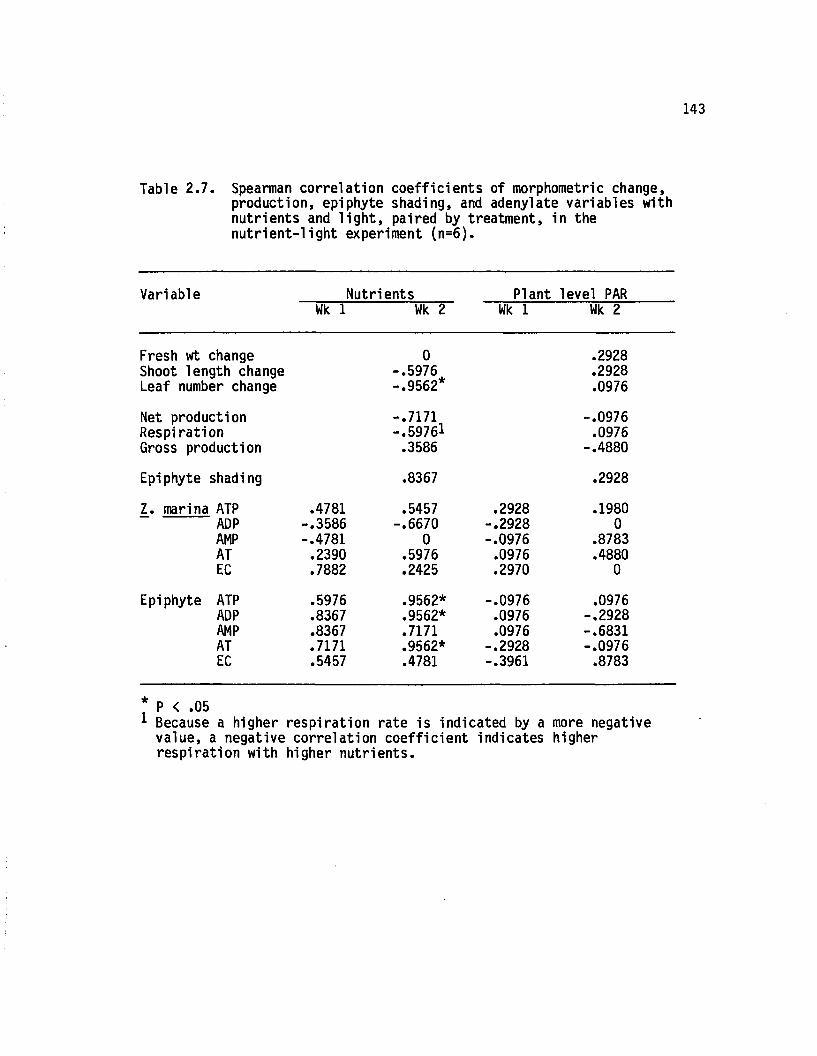
143
Table 2 .7 . Spearman correlation coeffic ien ts of morphometric change, production, epiphyte shading, and adenylate variables with nutrients and l ig h t , paired by treatment, in the n u tr ie n t-lig h t experiment (n=6 ) .
Variable Nutrients Plant level PARWk 1 Wk 2 Wk 1 Wk 2
Fresh wt change 0 .2928Shoot length change -.5976 .2928Leaf number change -.9562* .0976
Net production -.7171 -.0976Respiration -.59761 .0976Gross production .3586 -.4880
Epiphyte shading .8367 .2928
Z. marina ATP .4781 .5457 .2928 .1980ADP -.3586 -.6670 -.2928 0AMP -.4781 0 -.0976 .8783AT .2390 .5976 .0976 .4880EC .7882 .2425 .2970 0
Epiphyte ATP .5976 .9562* -.0976 .0976ADP .8367 .9562* .0976 -.2928AMP .8367 .7171 .0976 -.6831AT .7171 .9562* -.2928 -.0976EC .5457 .4781 -.3961 .8783
* P < .051 Because a higher respiration rate is indicated by a more negative
value, a negative correlation co e ffic ien t indicates higher respiration with higher nu trients .
Productivity
Net production, resp ira tion , and gross production rates fo r 2.
marina appear in Figure 2 .9 . Net productivity was positive fo r a l l
treatments, as would be expected during daylight hours. Net
productivity generally decreased and respiration rate generally
increased ( i . e . values became more negative) with higher nutrient
levels (a t a given lig h t le v e l) , administered over the preceeding 2
weeks. Although these correlations were not s ig n ific a n t, they were
re la tiv e ly strong (Table 2 .7 ) .
Epiphyte Colonization
Two week epiphyte colonization , expressed as a shading index, is
shown in Figure 2.10. Shading was consistently higher with higher
nutrient levels (a t a given lig h t le v e l) . This observation is
reflected in the re la tiv e ly strong and positive correlation
(.05< P <.10) between epiphyte shading and nutrients (Table 2 .7 ) .
Z. marina Adenine Nucleotides
Adenylate and EC values in Z. marina, a fte r 1 and 2 week exposure
periods, are presented in Tables 2.8 and 2 .9 , respectively. These
same results are displayed in Figure 2.11. ATP and AT were highest at
nutrient level N2 (at a given lig h t le v e l) a fte r both 1 and 2 week
periods. 1. marina ATP, AT, and EC were positive ly but weakly
correlated with nutrients and PAR (Table 2 .7 ) . Considering a ll
treatments, temporal trends from Week 1 to Week 2 were the following:
1) ATP, AT, and EC generally decreased, and 2) AMP generally
increased.
145
Figure 2.9. Production and respiration rates for Z. marina among the six treatments in the nutrient-light experiment.
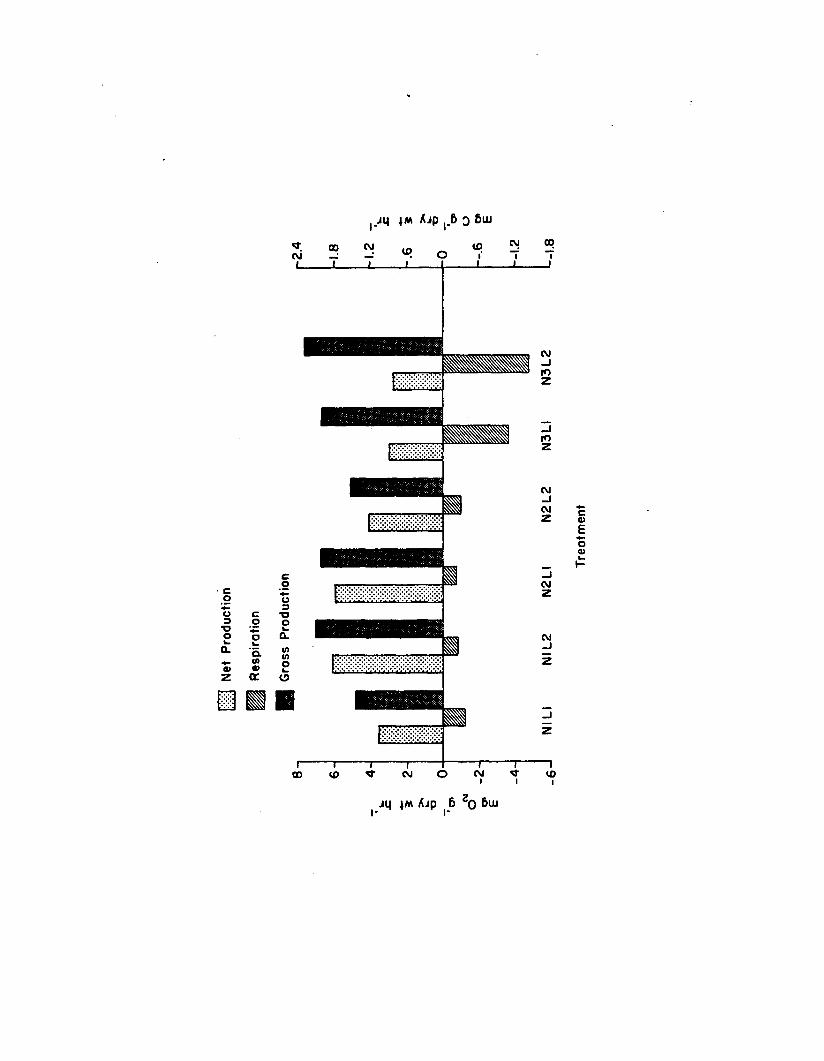
j m A j p 6 o B u j

Figure 2.10. Two week epiphyte shading among, the six treatments in the nutrient-light experiment (n = 2). Error bars are 1 standard error.

Epiph
yte
Shad
ing
(%)
lOOn
90-
80-
70-
60-
50-
40-
30-
20 -
10-
6 I
0-NILI NIL2 N2LI N2L2 N3LI
Treatment
0
N3L2
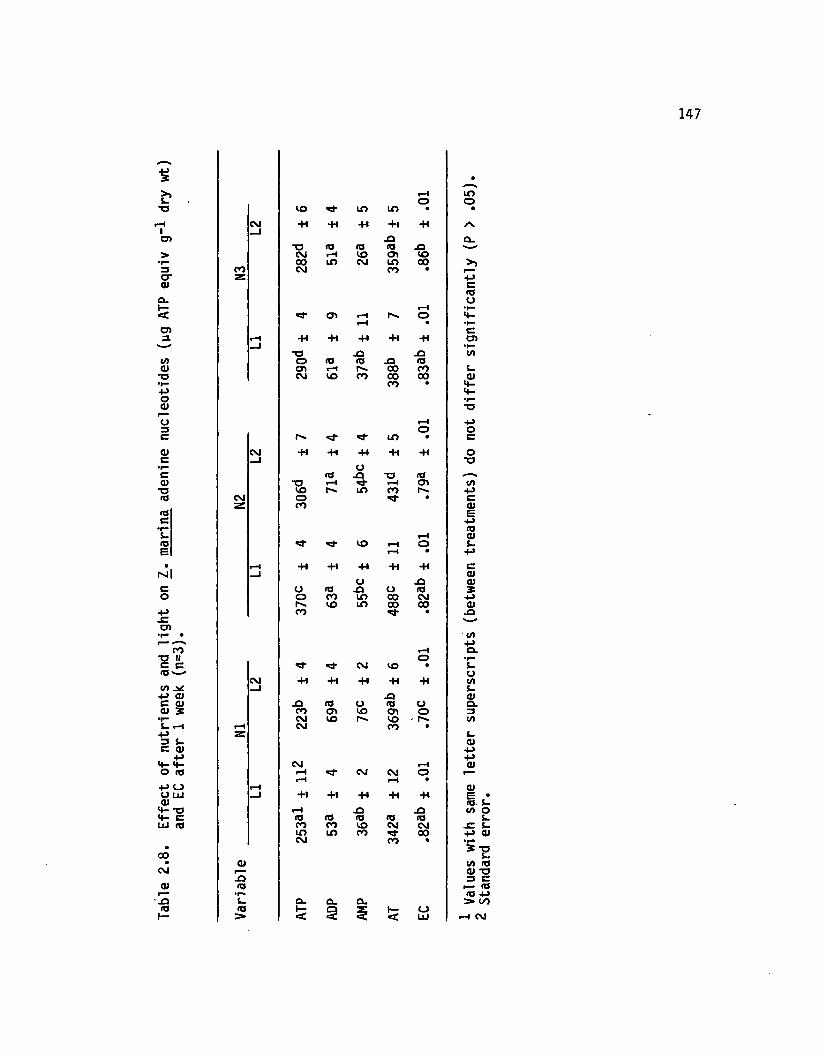
Tabl
e 2.
8.
Effe
ct
of nu
trie
nts
and
light
on
1.
mar
ina
aden
ine
nucl
eotid
es
(yg
ATP
equi
v g"
l dry
w
t)
and
EC af
ter
1 we
ek
(n=3
).
147
rHo
CO LO to •
CM -H *H •H + i -H—1
joT5 to <d rd .OCM H co Oi CO00 LT) CM LO 00
CO CM CO •z
rHCTi rH r-* o
rH •
rH •H ■M -H +» -H-J
“O -Q -QO rd rd JO rdCT> rH r*. 00 COCM CO CO 00 00
co •
rHo
LO •
CM -H •H -H -H -H-J
Ord JO ■a rd
“O rH rH o>CO LO CO r^.
C\J o •z CO
rH'O’ CO rH o
rH •
H ■H -H -H -H -H—1
u JOa rd o rdo CO LO 00 CM1-N. CO LO 00 00CO •
rHo
CM co •
CM -H -H -H •H -HJO
JO rd U rd OCO o> CO cr» oCM CO COH CM co •
z
CM rHi—1 CM CM orH rH •
H-J + i +1 -H +1 -H
rH JO JOrd rd <d rd rdCO CO CO CM CMir> lO CO 00CM co •
01.ord• rfc. a . Q . a .rd
>1—< 3 § AT EC
ino
Aa.
«oo
a>•i—</>s_aiM-TJ
oT3
ca>e+ja*s_
a>a>2+J(UjQ
S_o</)S-<UQ.
1.<u4->+-><Da>M C(/) o•C i- +-> 0)
(/) rd 0) -o3 C »— res<0 4->> oorH CM
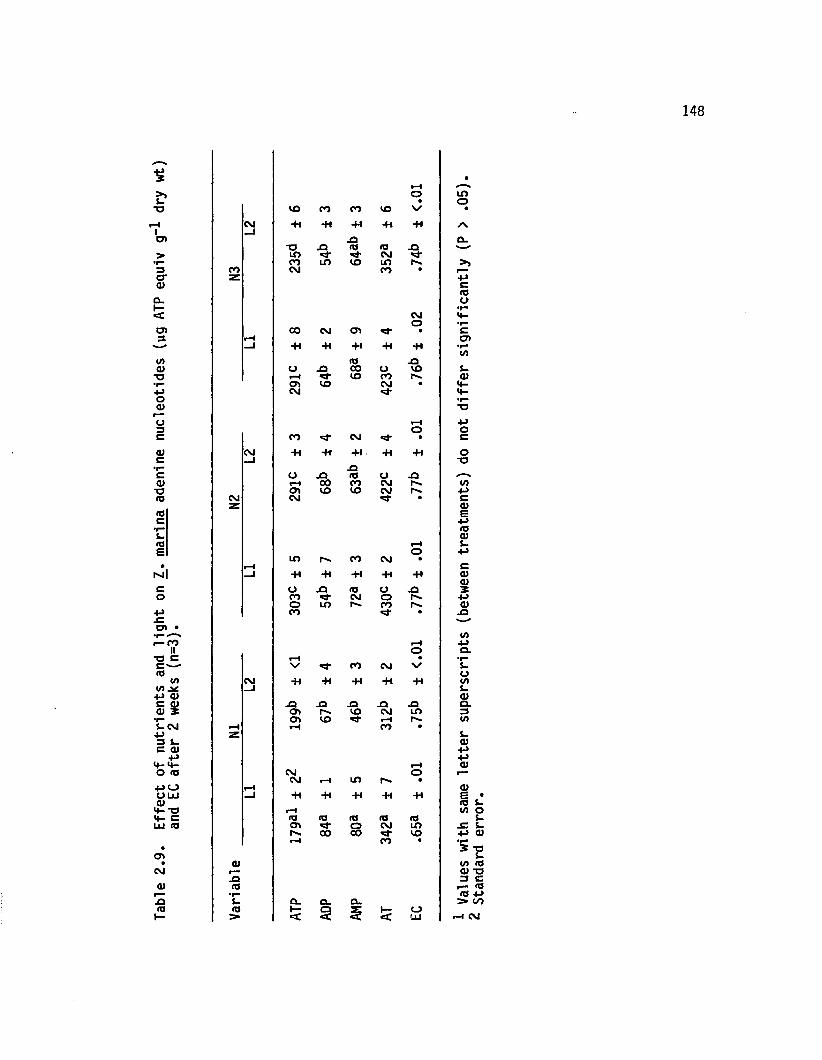
Tabl
e 2.
9.
Effe
ct
of nu
trie
nts
and
light
on
1_.
mar
ina
aden
ine
nucl
eotid
es
(yg
ATP
equi
v g-
* dry
w
t)
and
EC af
ter
2 we
eks
(n=3
).
148
•rH r—so to
• oCO CO CO CO V •
CM -H 41 41 44 44 /s.—1
jQ a .“O XX fO fd -QlO *4 CMCO LO CO to >>
CO CM CO •z c
fdu»r
CM 4-O •r*
00 CM <n <4 • CrW a>—1 +1 41 44 41 41 • r
i/i<U -Q
o JO 00 O CO S-H CO 00 03
CO CM • 4-CM *4 4-
•r*T3
rH 4>o OCO CM «5j" • c
CM -H 41 44 44 41 o—1 -o
XXU XX <d O JO r—>H 00 CO CM COo> CO CO CM p . 4>
CM CM *4* • cz <D
E4>fd03
rH s-o 4>to CO CM •
i—1 C—1 44 41 44 41 44 <D03
O X* f0 O JO 5co CM o P-* 4->O LO CO P-* 0)CO • XX
'—■"
(/)r-H 4>© Q.
H « •r*V *4 CO CM N/ L.
CM 44 41 41 41 41Oi/i—1 ua>
XX XX JO -Q -Q aCh CO CM to 3<Tt CO rH r-* i/i
H t—1 CO •Z S-
<u4>4->
rH 03CM o r—CM rH LO •
H <u—1 41 41 41 41 4« E •rd fc.
rH (/) otvs fd fd fd fd s.o\ "4 O CM LO X S-
00 00 CO 4-> 03rH CO • •r
*■ 203 <✓> fd
03 -as 3 c03 i— fd•r fd 4>S- CL CL CL > 00fd>
h-< 3 1 AT o
LU r H CM
149
Figure 2.11. Z. marina adenine nucleotides and EC, among the sixtreatments after 1 (A) and 2 (B) week periods, in the nutrient-light experiment (n = 3).
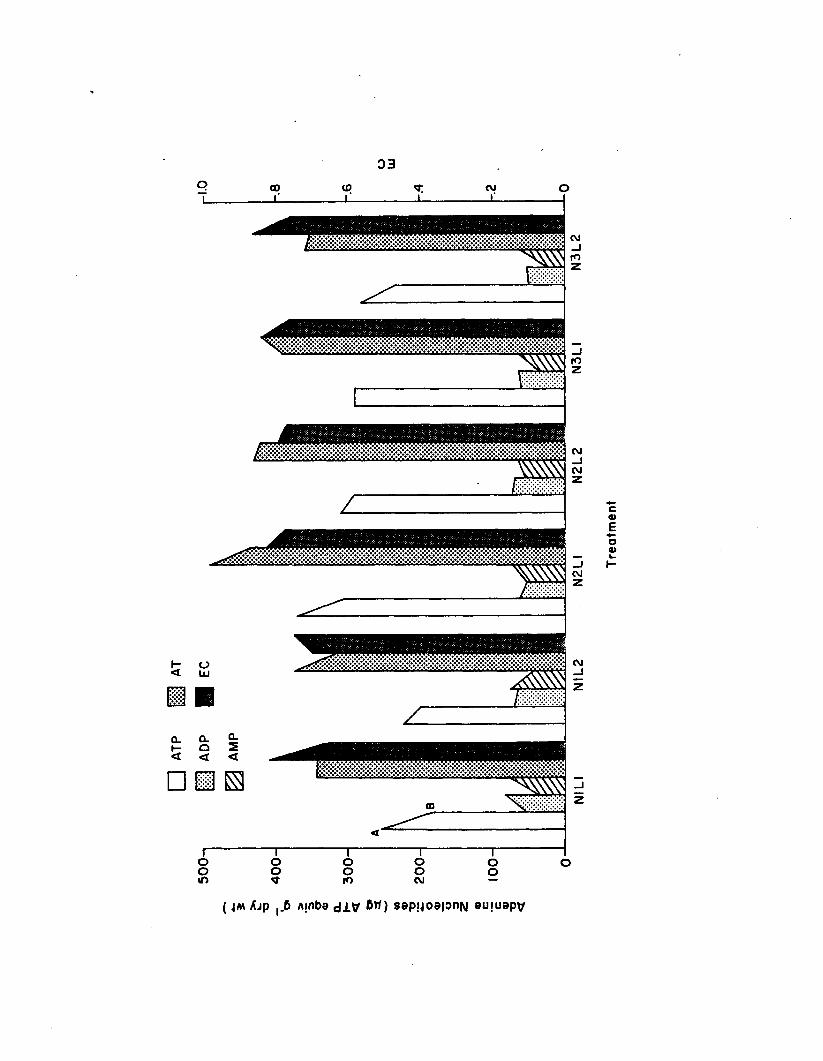
03
7S:i*S:i:S:S:•I^X'XvlvXW 'Xi!XrXx.x«x»x.x*x*x
....................n
vXvX*.v«v.v.v«v«v»x.*«X«*«*.*»X»XvX*I*IvX*XvXv!vXvX*«*XvXv'*X*«
iEL
•X ^ X 'X ^ X 'X ^ X 'X ^ X ^ X 'X ^ 'X ’X^XjXjX^XrXxVX'X'X
{- o< IU
ZZH H
Q_ CL ^
5 § 3□ U S
rOom" T "Oo<3-
oolO
~ rooCM
Ioo
CM
c0)Eoo>
( 4M Ajp 6 Ainbe j i v 6ff) sap.uoapnw auiuapv
Epiphyte Adenine Nucleotides
Adenylate and EC values in epiphytes a fte r 1 and 2 week exposure
periods are presented in Tables 2.10 and 2.11, respectively. These
same results are displayed in Figure 2.12. ATP, ADP, AMP, and AT were
generally higher with increasing nutrient levels (a t a given lig h t
le v e l) a fte r both 1 and 2 week periods. This is reflected in strong
and positive correlation between epiphyte adenylates and nutrients
(Table 2 .7 ) . Considering a ll treatments, temporal trends from Week 1
to Week 2 included the follow ing: 1) ADP, AMP, and AT generally
increased, and 2) EC consistently decreased.
Z. marina-Epiphyte Adenine Nucleotide Relationship
Correlations between corresponding adenylates and EC values in
marina and its epiphytes, fo r Weeks 1 and 2, are presented in Table
2.12. Comparatively strong correlation ( . 10< P <.20) fo r Week 1 ATP
indicates that re la tiv e ATP levels among the treatments were somewhat
sim ilar in Z. marina and its epiphytes. By week 2, th is correlation
had weakened. The overall lack of strong correlation indicates that
treatment response patterns in Z_. marina and epiphyte adenylates were
not re la ted .
Short-Term (6 Hr) Atrazine Experiments
Flow-Through System Data
Mean temperature and s a lin ity are presented in Table 2.13.
S im ilar and stable temperature and s a lin ity prevailed over the course
of the two experiments.
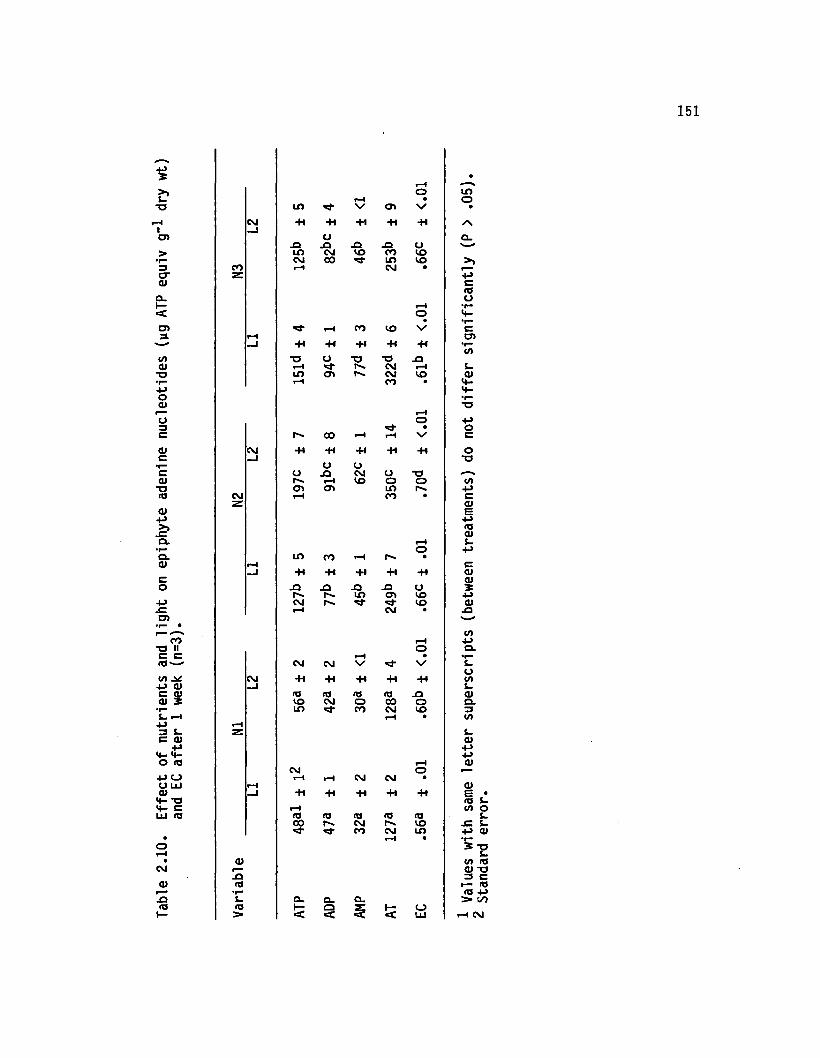
Tabl
e 2.
10.
Effe
ct
of nu
trie
nts
and
light
on
epip
hyte
ad
enin
e nu
cleo
tides
(yg
AT
P eq
uiv
g"*
dry
wt)
an
d EC
afte
r 1
week
(n
=3).
•rH r so LO
H • Oir> V CT> V •
CM -H 41 4-1 -H 41 A—I
U a .XI X JO JO o wLO CM CO CO COCM 0 0 "O' LO CO >>
CO r-H CM •2E
Ctoo
rH •r*o 4 -• •r—
*4 H CO LO V CpH cn—1 -H -H 4-1 41 41 •r*
CO■o O “O "O JOrH CM rH t-LO o> CM CO a>rH CO • 4-
4 -<r•o
rHo 1->"O' • o
r-* 0 0 rH rH \s c
CM -H 41 4-1 41 41 o—1 “O
O OO JO CM O “O r—sr-. rH CO O O C/5o* o> LO r*- 4>
CM rH CO • CZ ai
£+->to0)
rH &-o 4->LO CO rH •
rH c—1 -H ■H 4-1 41 41 a>
0)JO -O JO a *r-. LO o> CO 4->
CM r*** CO 0)rH CM • JO
(/)rH +■>o O.
rH • *r—CM CM V *4 V S.
CM 41 41 4-1 41 41oi/i
—1 Uto <0 to to J3 VCO CM O 0 0 O CLLO CO CM CO 3
rH • i/iHZ U0)
4>4J
rH 0)CM o r—rH t-H CM CM •
rH 0)_1 41 41 41 41 41 £ •
to S-rH i/i oto to to to to s.0 0 r-* CM r-* CO JC S-.
«0 - CO CM LO 4-> Q)rH • *r“
5 -oi-
0) (/) tor- 0) -oJO 3 Cto 1— to•r to 4->i- Q_ Q. a. > CO<0> 5 3 AT EC rH CM

Tabl
e 2.
11.
Effe
ct
of nu
trie
nts
and
light
on
epip
hyte
ad
enin
e nu
cleo
tides
(ug
AT
P eq
uiv
g-1
dry
wt)
an
d EC
afte
r 2
week
s (n
=3).
152
iHoO cn •LO rH LO rHCVJ-J +1 •H •H ■H -H•o U <u TO <UrH LO Oo CMCO iH CM rH LO •
rHoH CO co fH •rH-H -H -H +1 -H-a jQ -o o oiH CO 'S' 00 CMCO CM CT> LOrH iH i— 1 CO •
- rHoi—l in co LO •CM +i -H -H -H-J O<0 O jQ -aLO LO oCM «d- *3"rH rH CO •
CMziHoLO •
LO LO r-H V1—1 +i +| -H +» -Ho <0 >a (0 OP^ o LO <000 o \ 00 LO rHCM LO•
iHorH CM co CO •CM-J -H •H •H +*
<0 JO (0 JQLO rH rH LO *0*CO <n rH co COrH CM •t—Hz iHoCM •rH «d- CM LOrH-J ■H +i •H -H -H
rH10 (0 *0 <o (000 LO 00 O00 r**. co inCM •
a-Q•rS- Q. Q. o.<0> H*< 3 AT EC
LOo
AO.
<0O
o>* r "(/)S-0)
«o-Po
o■o(/>4->c<uE
+■><00)s.4->ca>i.Oc/>«PQ.ULOS-0)CL
0)0)0)i i!CO o t-_c u
(/> IQa> -a s cI— <0<o 4->> oorH CM
Figure 2.12. Epiphyte adenine nucleotides and EC, among the sixtreatments after 1 (A) and 2 (B) week periods, in the nutrient-light experiment (n = 3).
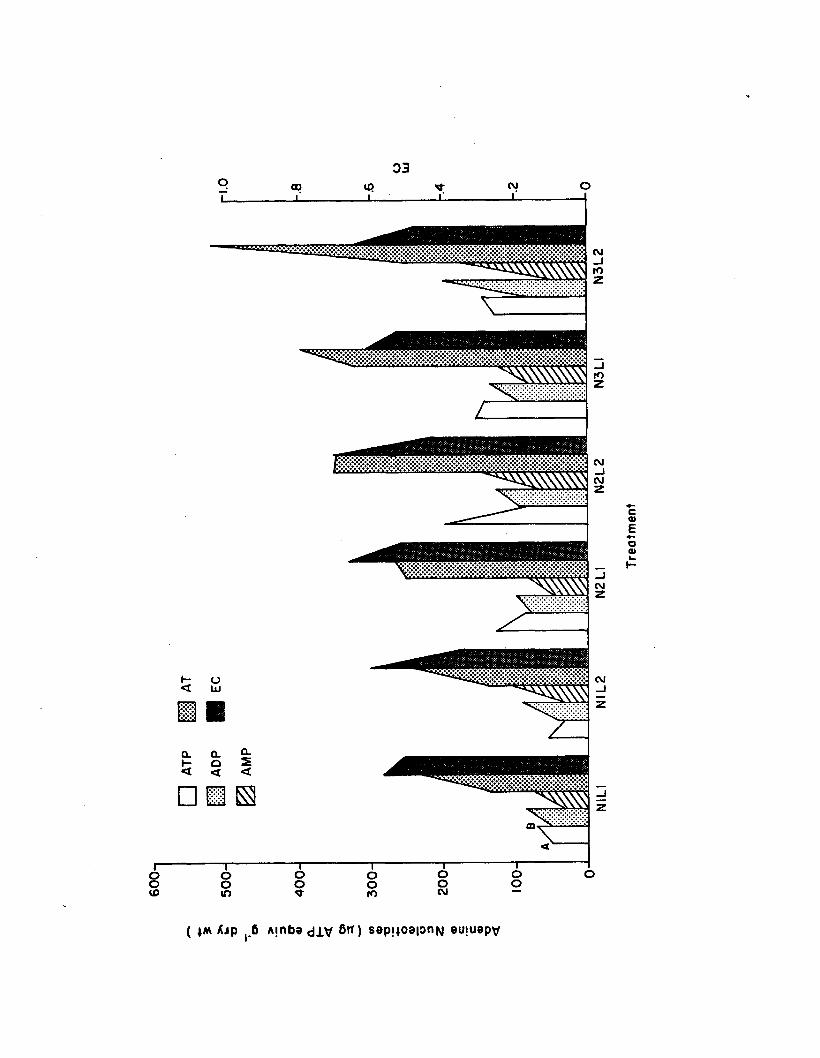
L009•••:«* ■*..................
2!•X^X*Iv^X*XvX\vX*XvX
□ U S
( |M Ajp 6 Ajnbs d iv 6rf) S9pj408|0n|g auiuapv
Treo
tme
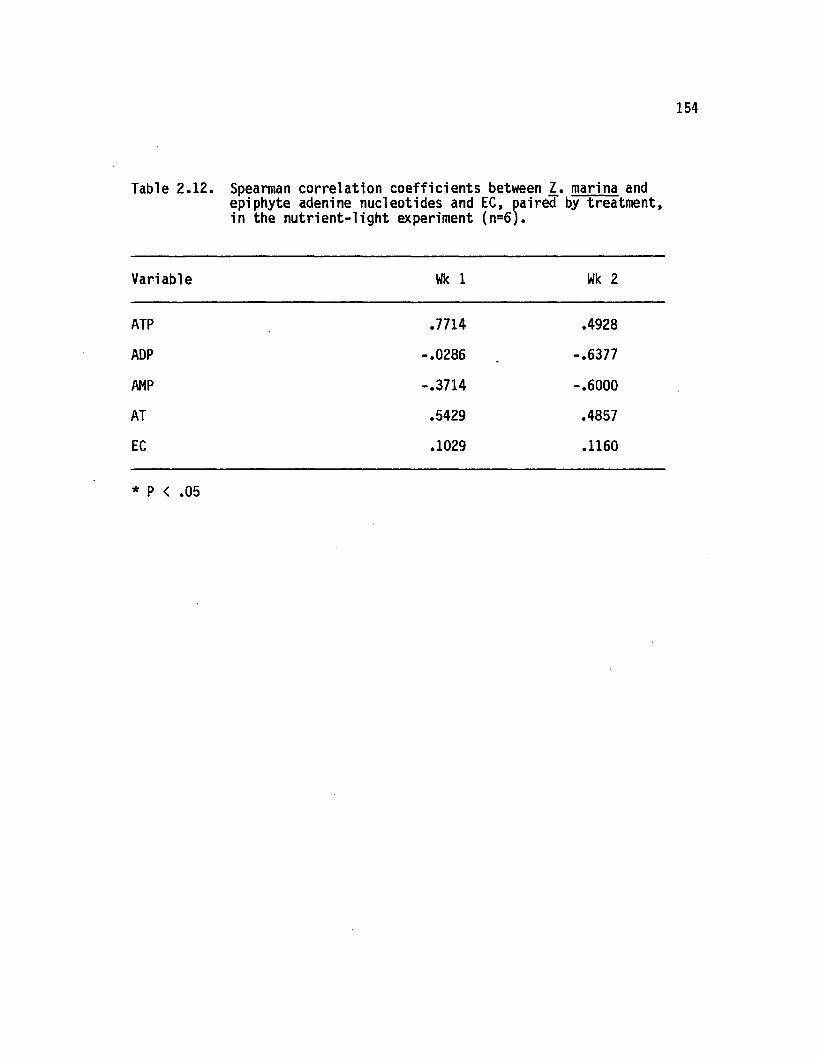
154
Table 2 .12 . Spearman correlation coeffic ien ts between 1 . marina and epiphyte adenine nucleotides and EC, paired by treatm ent, in the n u tr ie n t-lig h t experiment (n=6 ) .
Variable Wk 1 Wk 2
ATP .7714 .4928
ADP -.0286 -.6377
AMP -.3714 -.6000
AT .5429 .4857
EC .1029 .1160
* P < .05
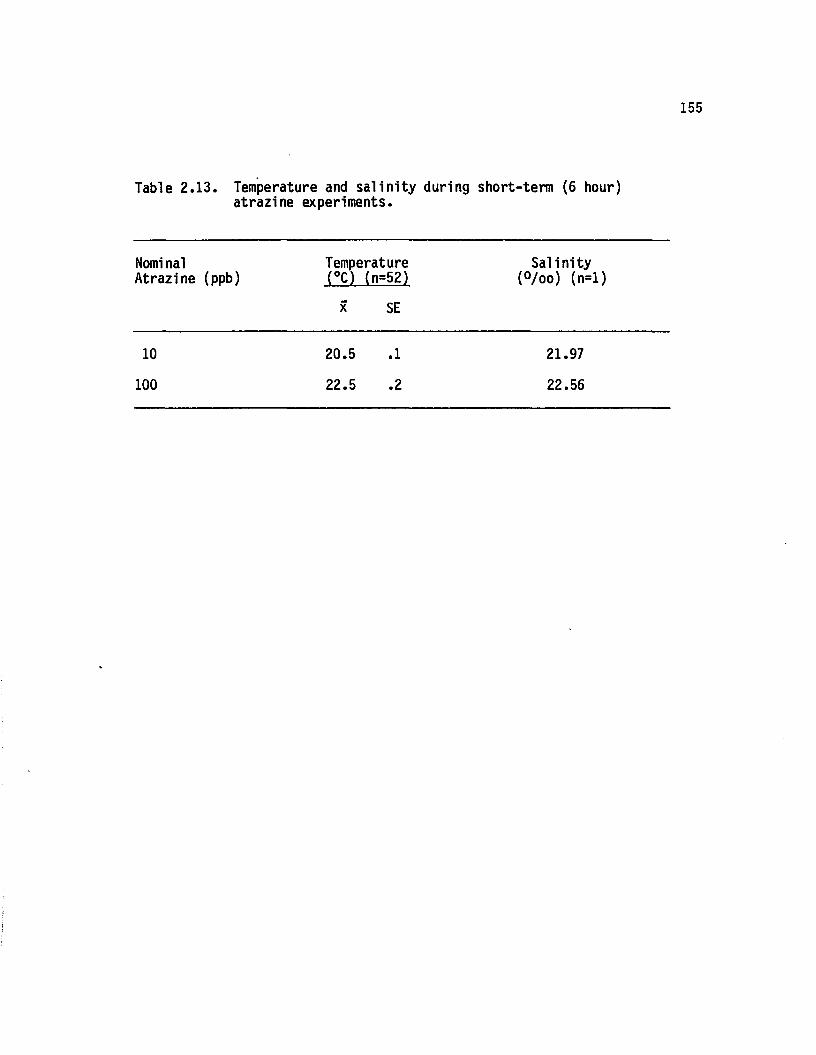
155
Table 2 .13 . Temperature and s a lin ity during short-term (6 hour) atrazine experiments.
Nominal Temperature S a lin ityAtrazine (ppb) (°C) (n=52) (°/oo) (n=l)
x SE
10
100
20.5 .1
22.5 .2
21.97
22.56
Productivity
Hourly net production rates in both control and tes t tanks, along
with surface PAR readings, are plotted in Figures 2.13 and 2.14 fo r 10
and 100 ppb atrazine experiments, respectively. At 10 ppb a trazin e ,
net productivity was positive and re la tiv e ly sim ilar in both control
and tes t tanks. At 100 ppb atrazin e , net productivity was positive in
the control but generally negative in the tes t tank. These results
indicate that 10 ppb atrazine had l i t t l e e ffe c t on net productivity
over 6 hrs, whereas 100 ppb exerted a marked negative e ffe c t.
Adenine Nucleotides
Adenylate and EC values in both control and tes t tanks are shown
in Figures 2.15 and 2.16 fo r 10 and 100 ppb atrazine experiments,
respectively. Results at both 10 and 100 ppb were the same. EC
values in control and tes t tanks show no s ig n ifican t d ifference,
whereas ATP, ADP, AMP and AT in tes t tanks were a ll s ig n ific a n tly
lower than th e ir controls at both 10 and 100 ppb atrazine over 6 hrs.
Long-Term (21 Day) Atrazine Experiments
Flow-Through System Data
Mean temperature and s a lin ity , in four rep licate experiments, are
presented in Table 2.14. Mean minimum and maximum temperatures in
Experiment 1 were considerably lower than corresponding temperatures
in Experiments 2-4. S a lin ity was sim ilar in a ll rep lica te
experiments.
Morphometries
Mean shoot length and number of leaves, obtained at the s ta rt of
each experiment, appear in Table 2.15. Mean changes in shoot length
Figure 2.13. Surface PAR and net production rates during short-term (6 hour) 10 ppb atrazine experiment. Tank sealed at 1000 hrs.
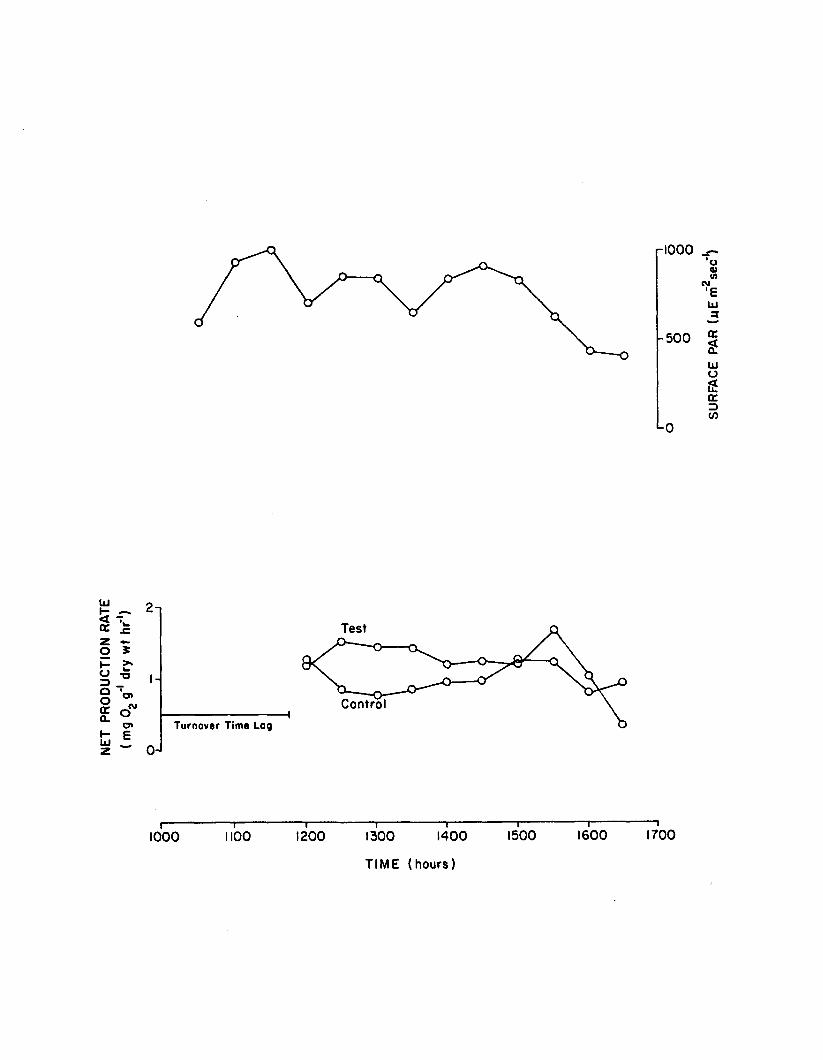
NET
PRO
DUCT
ION
RA
TE
Test
ControlTurnover Time Lag
I----------------1----------------1--------------- 1--------------- 1--------------- 1--------------- 1IOOO 1100 1200 1300 1400 1500 1600
HOOO
-500
L0
1700
TIME (hours)
SURF
ACE
PAR
(«Em
se
c )
Figure 2.14. Surface PAR and net production rates during short-term (6 hour) 100 ppb atrazine experiment. Tank sealed at 1030 hrs.
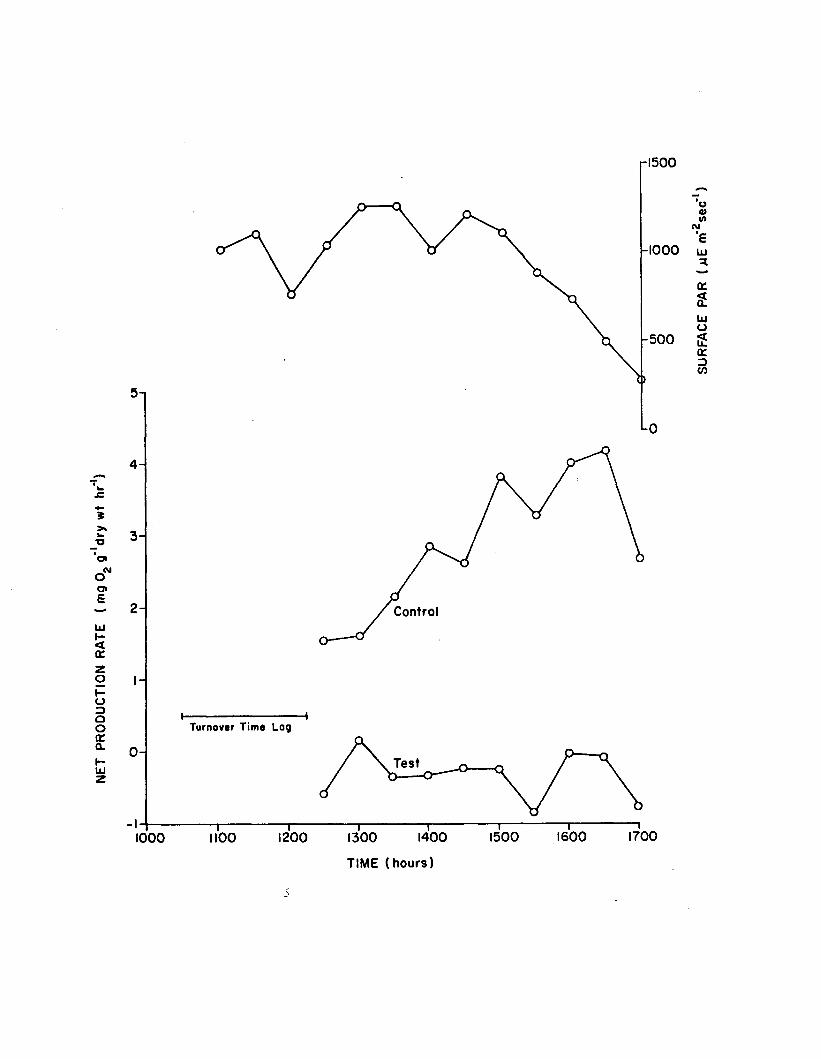
NET
PRO
DUCT
ION
RATE
(
mg
02 g'
'dry
wt
hr
*1)
r-1500
-IOOO
-500
L0
4-
Control
Turnover Tim e Lag
0 -Test
1700160015001300 140012001100IOOO
TIME (hours)
SURF
ACE
PAR
(juE
mrs
ec
Figure 2.15. Adenine nucleotides and EC after 6 hours in the shortterm 10 ppb atrazine experiment (n = 4). Control-test pairs with same letters do not differ significantly (P >.05). Error bars are 1 standard error.
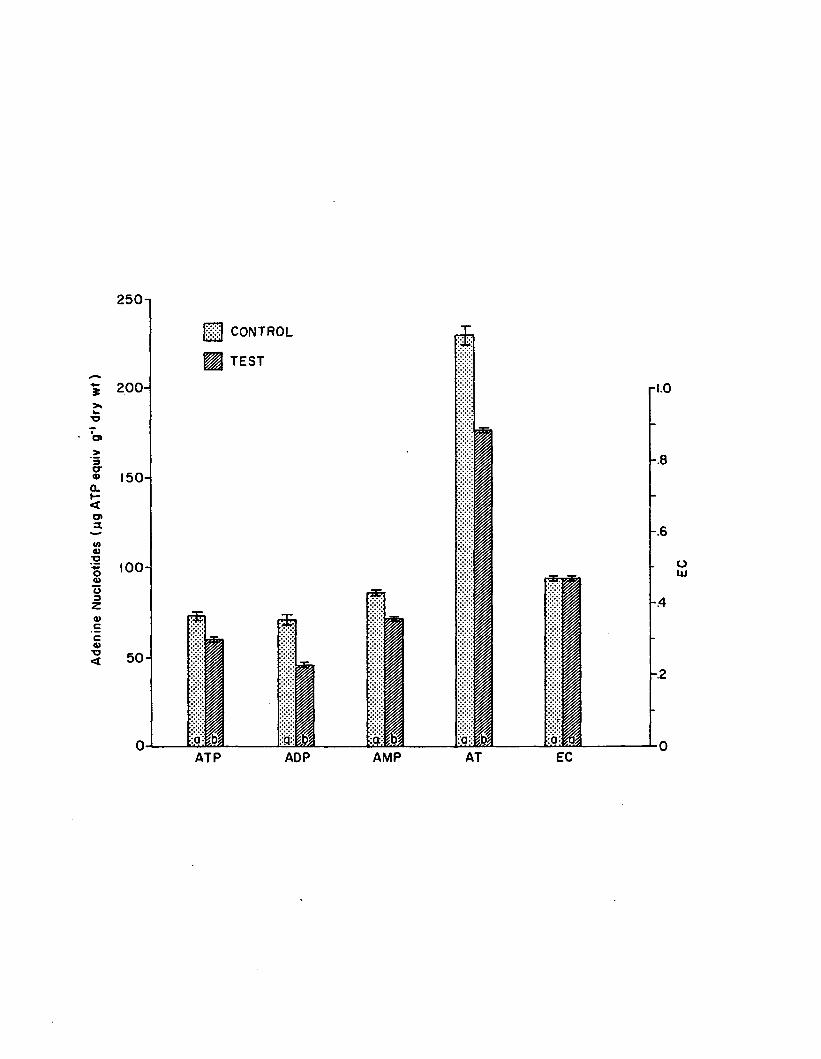
Aden
ine
Nucl
eotid
es
(ug
ATP
equiv
g
'1 dr
y w
t)
250-1
CONTROL
TEST
200- rl.O
-.8150-
-.6
100 -
- .4
50--.2
ECADP AMP ATATP
160
Figure 2.16. Adenine nucleotides and EC after 6 hours in the shortterm 100 ppb atrazine experiment (n = 4). Control-test pairs with same letters do not differ significantly (P>.05). Error bars are 1 standard error.
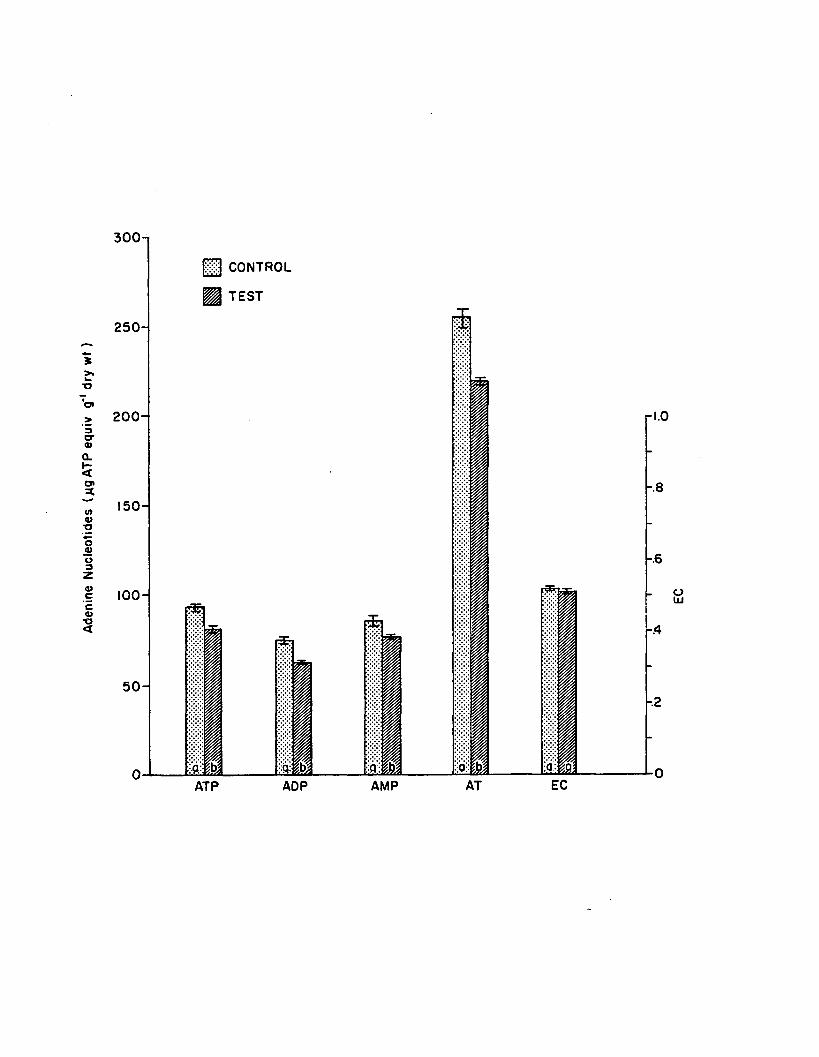
Aden
ine
Nucl
eotid
es
(m9
ATP
equi
v g'
1 dry
wt)
300-i
( H CONTROL
H TEST
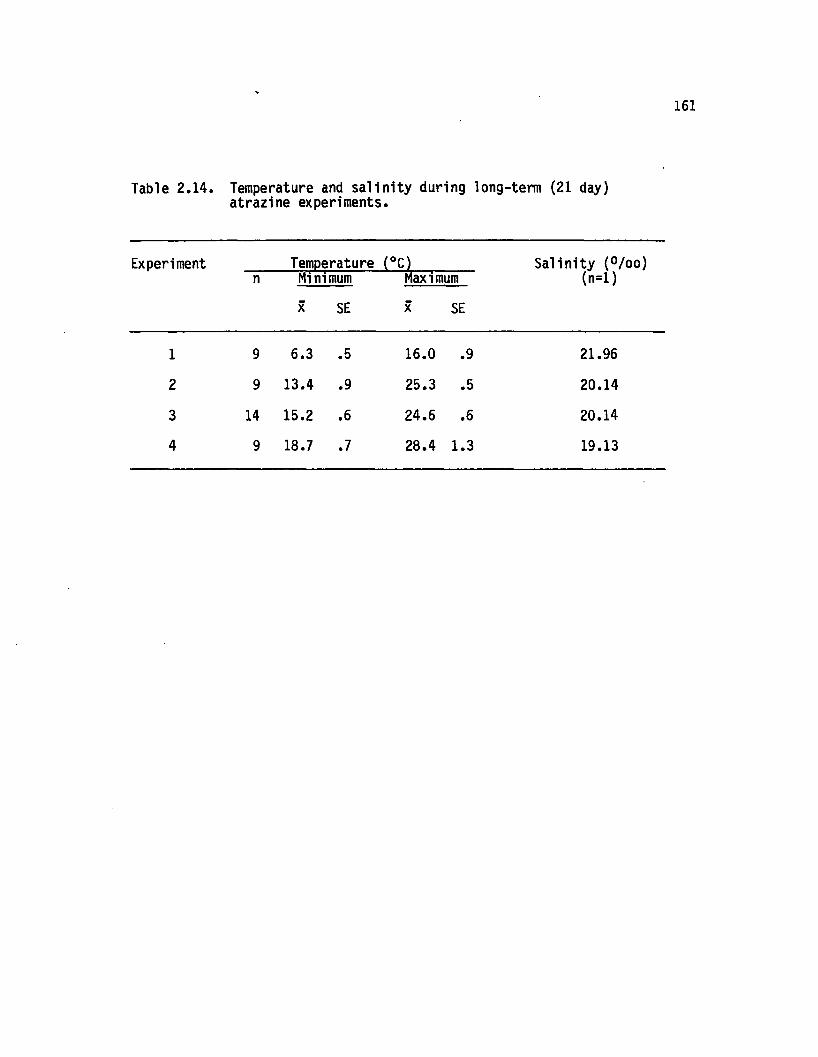
161
Table 2.14. Temperature and s a lin ity during long-term (21 day) atrazine experiments.
Experiment Temperature (°C) S a lin ity (°/oo )n Minimum Maximum (n=l)
x SE x SE
1 9 6.3 .5 16.0 .9 21.96
2 9 13.4 .9 25.3 .5 20.14
3 14 15.2 .6 24.6 .6 20.14
4 9 18.7 .7 28.4 1.3 19.13
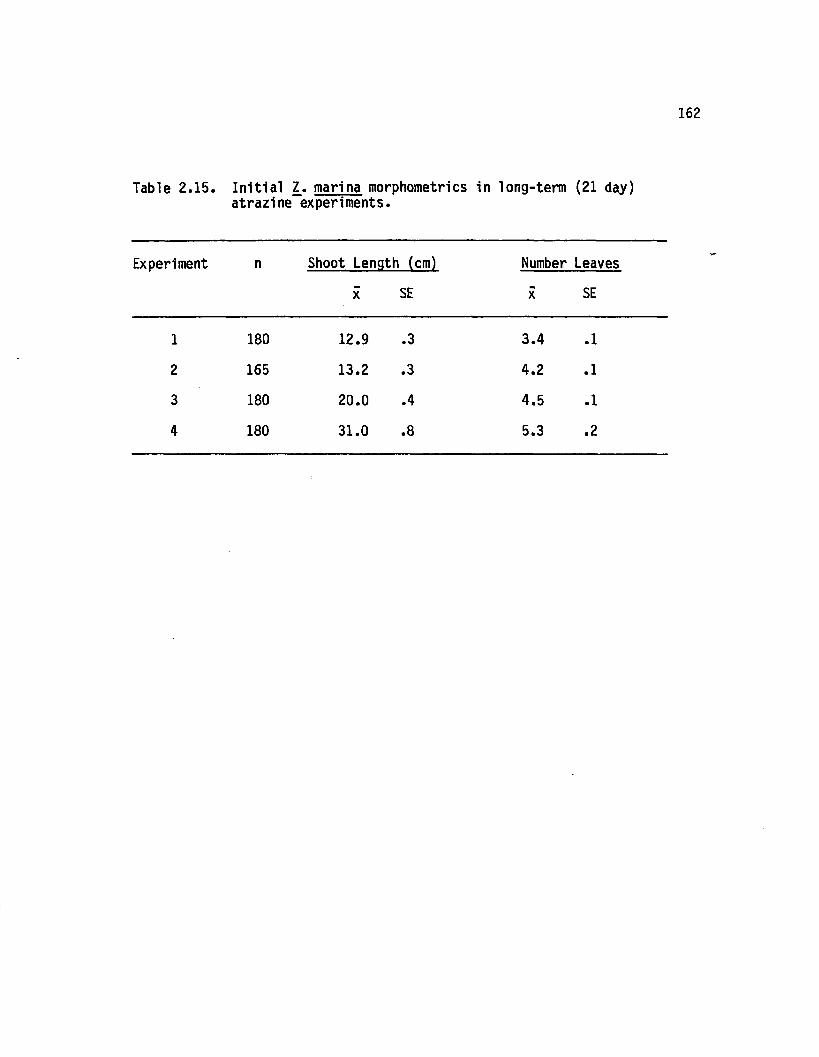
162
Table 2 .15 . In i t ia l Z. marina morphometries in long-term (21 day) atrazine experiments.
Experiment n Shoot Length (cm) Number Leaves
x SE x SE
1
2
3
4
180
165
180
180
12.9
13.2
20.0
31.0
.3
.3
.4
.8
3.4
4.2
4.5
5.3
.1
.1
.1
.2
163
and le a f number at 7, 14, and 21 days, fo r each atrazine
concentration, were pooled from rep licate experiments and regressed
against time (Figures 2.17 and 2.18, respective ly). S ta tis tics
associated with these regressions are presented in Table 2.16.
Negative slopes and correlation coeffic ien ts fo r shoot length change
at 1000 ppb atrazine and fo r le a f number change at both 100 and 1000
ppb have c lea rly demonstrated a negative e ffe c t of atrazine on growth
over 21 days.
M orta lity
Twenty-one day m o rta lity , expressed as percent dead, is presented
in Table 2.17 fo r rep lica te Experiments 1-4. M orta lity in controls
was <7%, which is acceptable in acute bioassays (Sprague, 1973).
M o rta lity was 100% at 1000 ppb atrazine over 21 days in a ll
rep lica tes , with the exception of Experiment 1.
Results, derived from log-prob it analysis of 21 day m orta lity
data, appear in Table 2.18. Estimates of m orta lity s ta tis tic s in
Experiments 3 and 4 were very s im ila r. The re la tiv e ly large slope
function (S) in Experiment 1, due to incomplete m orta lity at 1000 ppb,
was s ig n ific a n tly higher than that obtained in e ith e r Experiment 3 or
4 and was reflected in the wide confidence lim its , associated with LC
1 and LC 50 values in Experiment 1. The LC 50 estimate fo r Experiment
2 was s ig n ific a n tly lower than those obtained fo r other experiments,
due to higher m orta lity at 100 ppb in Experiment 2. O verall, results
conservatively estimate the 21 day LC 1 and LC 50 at 1 and 100 ppb
a traz in e , respectively.
164
Figure 2.17. Regressions of shoot length change vs. time for control and five atrazine concentrations in the long-term (21 day) atrazine experiments. Data from replicate experiments are pooled.
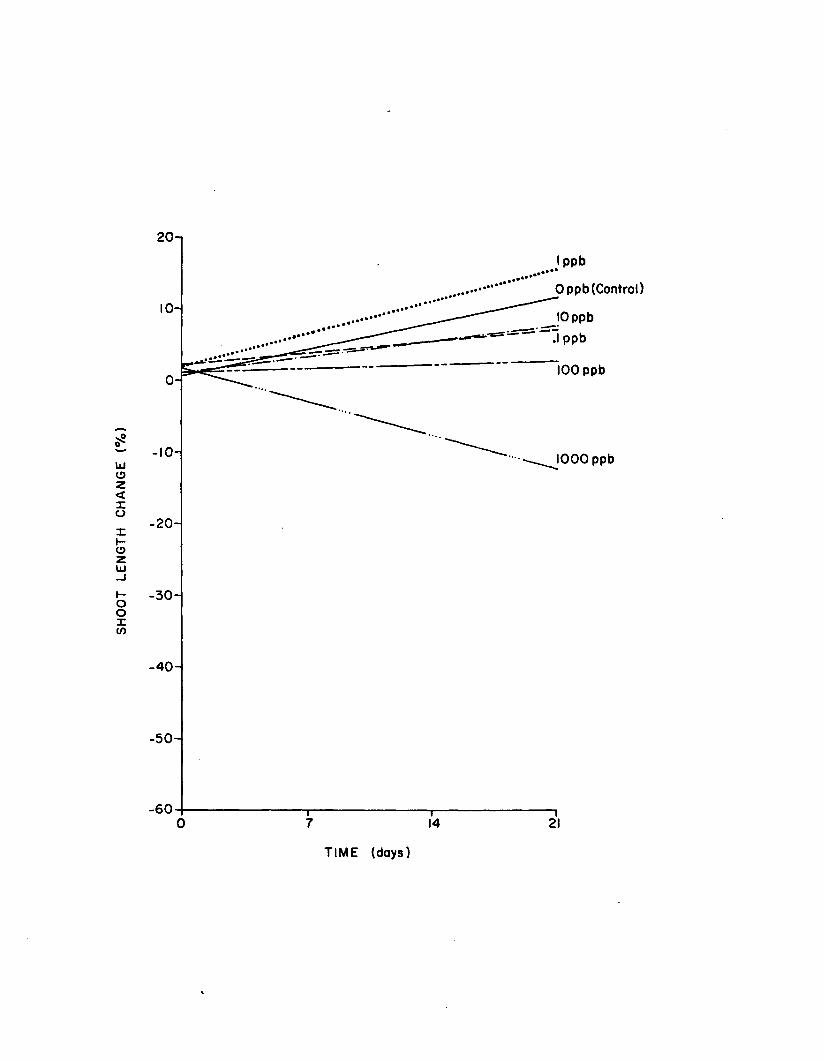
SHOO
T LE
NGTH
CH
ANGE
(%
)
Jppb
0 ppb (Control)
10 ppb j ppb
100 ppb
IOOO ppb
20
30
40
50
600 7 2114
TIME (days)
165
Figure 2.18. Regressions of leaf number change vs. time for control and five atrazine concentrations in the long-term (21 day) atrazine experiments. Data from replicate experiments are pooled.
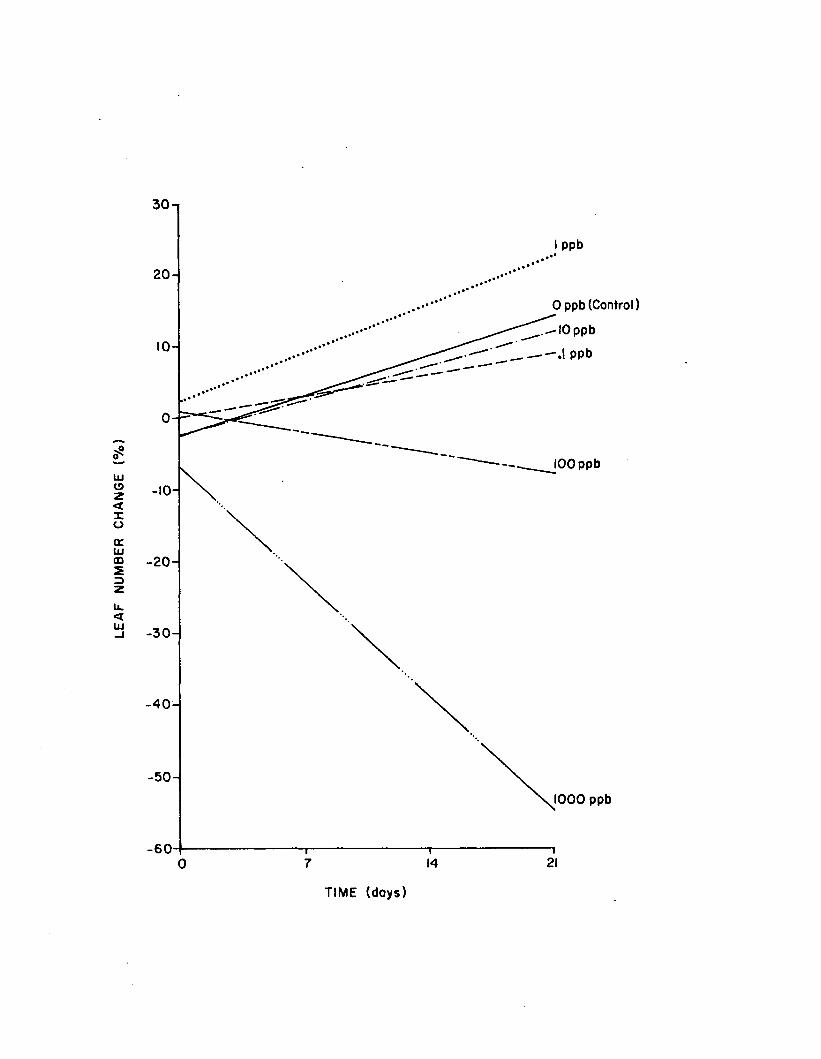
LEAF
NU
MBER
CH
ANGE
(%
)
I ppb
0 ppb (Control)
-10 ppb
-.1 ppb
100 ppb
IOOO ppb
210 7 14
TIME (days)
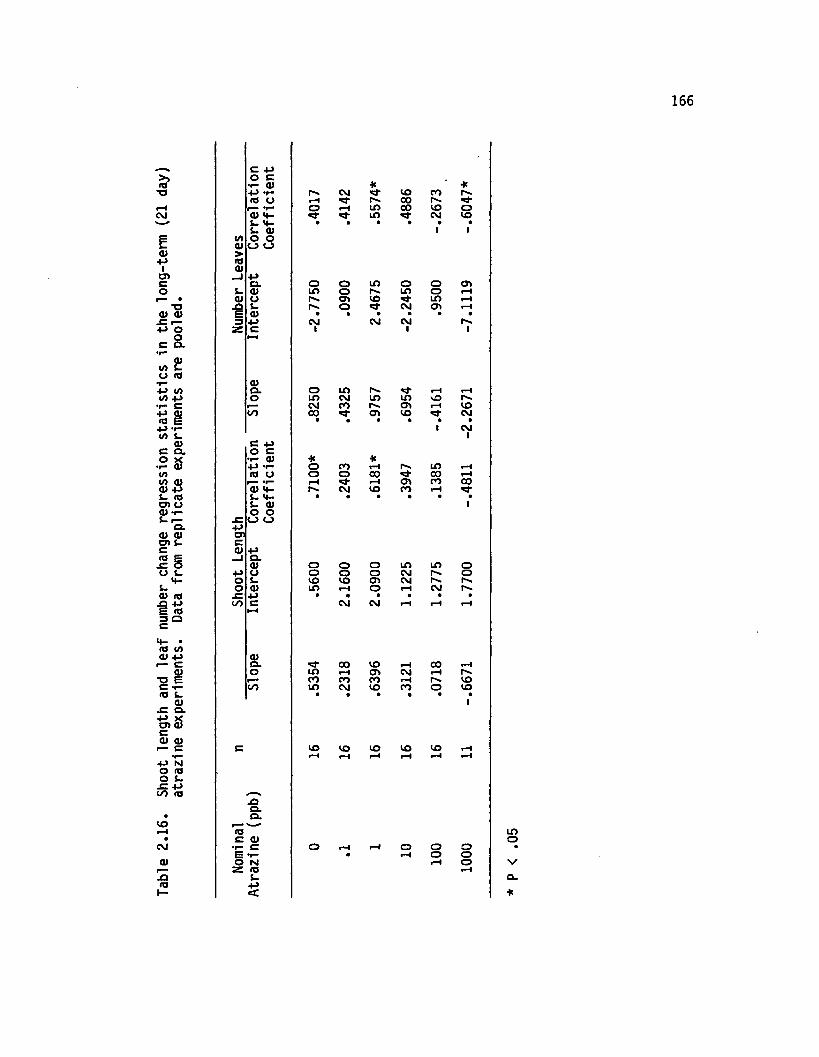
Tabl
e 2.
16.
Shoo
t le
ngth
an
d le
af
num
ber
chan
ge
regr
essi
on
stat
isti
cs
in th
e lo
ng-te
rm
(21
day)
at
razi
ne
expe
rimen
ts.
Data
from
repl
icat
e ex
perim
ents
are
po
oled
.
166
C Po c•r- 0) * ¥P T- p*% CM CO 00 P>*(0 O rH r-% 00 r**r “ *r“ o rH in 00 CO o<U P in CM coU P • • • • • •U 0) 1 1
to o oQ) o o>fOQ)
_J pQ. o o in o o a>
L. 0) in o r**. in o rH0) O o\ co in rH-Q s- o CM a> rHe 0) • • • • • •3 p CM CM CM r**Z c 1 1 i
M
o>o . O in rH rHo in CM in in vO p**
r— CM CO r* o> rH co00 00 o> co CM
• • • • • •1 CM1c Po c•1- 0) * ¥P -r- o co rH P**s in rH
O o o 00 00 rHr» ■»“ rH rH o\ CO CO<D 4- r*«. CM CD CO rHU 4- • • • • • •S- 0) 1o o
-C o o•P31Co p
CLa> o o O in in o
■P u o o o CM p** oO S- CO CO CT> CM p*- P-No a> in rH O rH CM r***
s z p • • • • • •UO c CM CM rH rH rH
l-H
a>Q. 00 CO rH 00 rHO in rH a> CM rH
CO co CO rH CO00 in CM CO CO o CO• • • • • •
i
c CO CO CO CO CO rHrH rH rH rH rH rH
.oQ.a.
«0c <u•r- c O rH rH o o oE • rH o oo N »H o
z <o rHS-P<
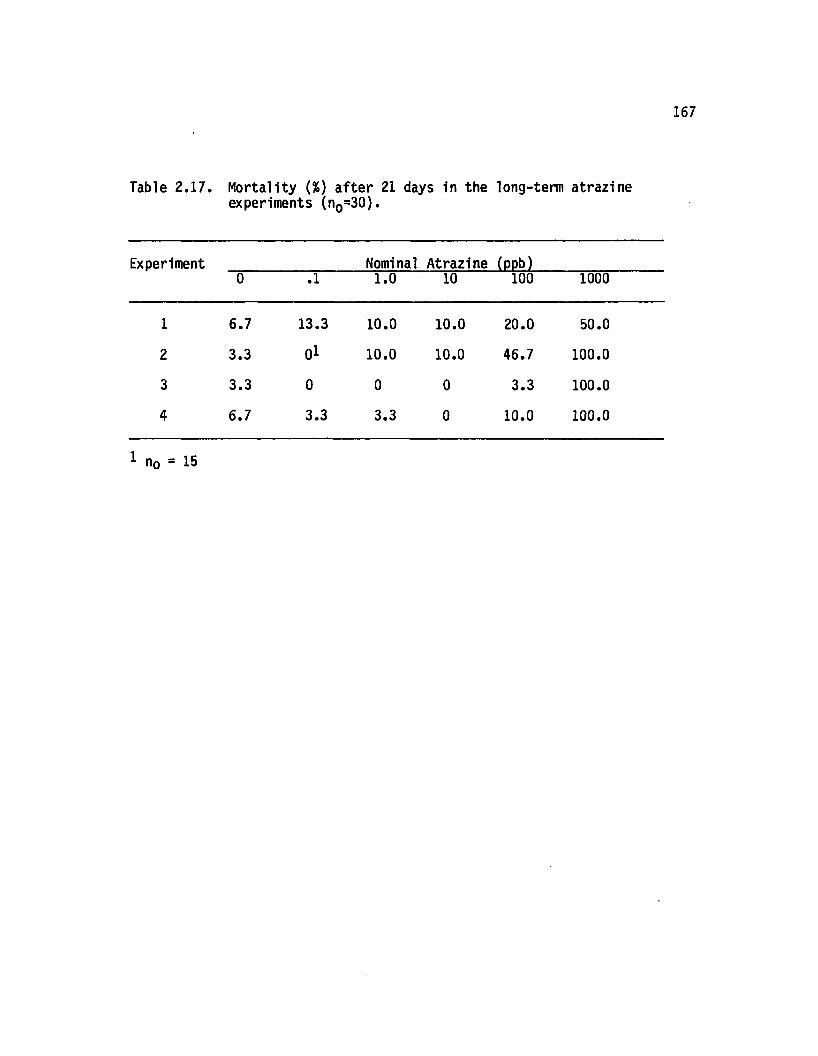
167
Table 2 .17 . M orta lity {%) a f te r 21 days in the long-term atrazine experiments (no=30).
Experiment Nominal Atrazi ne (ppb)0 .1 1.0 10 100 1000
1 6.7 13.3 10.0 10.0 20.0 50.0
2 3.3 O1 10.0 10.0 46.7 100.0
3 3.3 0 0 0 3.3 100.0
4 6.7 3.3 3.3 0 10.0 100.0
1 n0 = 15
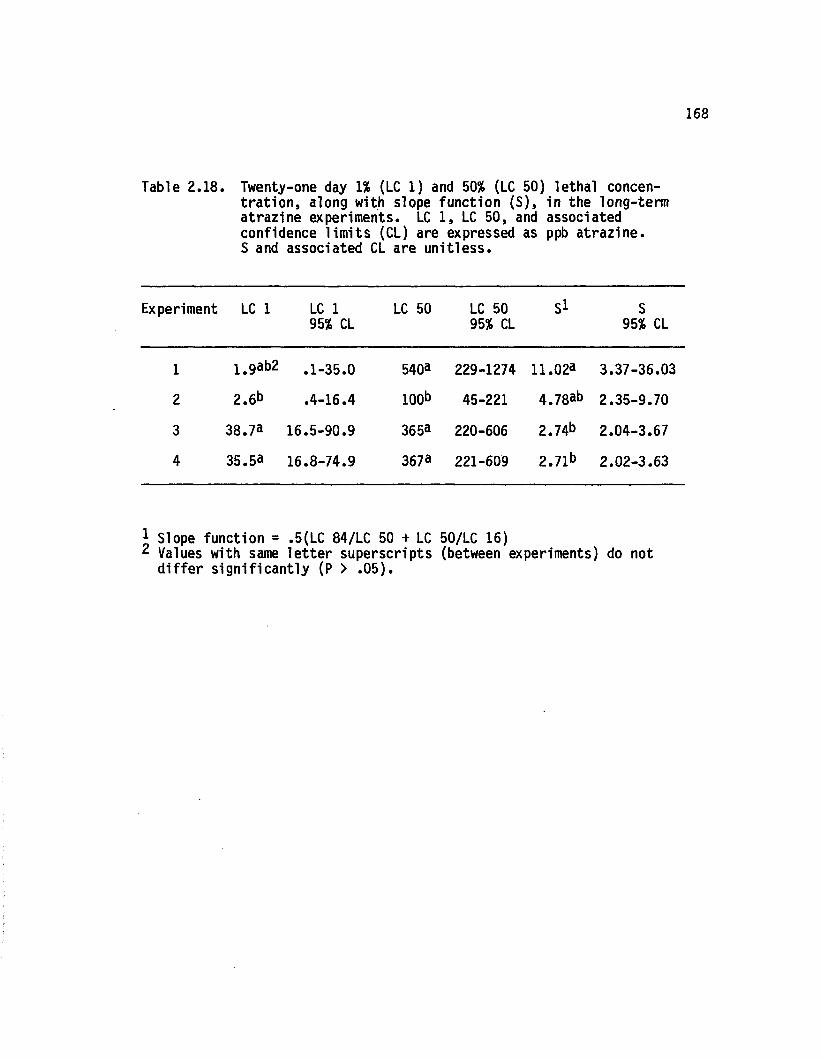
168
Table 2 .18 . Twenty-one day 1% (LC 1) and 50% (LC 50) lethal concentra tio n , along with slope function (S ), in the long-term atrazine experiments. LC 1, LC 50, and associated confidence lim its (CL) are expressed as ppb a traz in e .S and associated CL are un itless .
Experiment LC 1 LC 1 95% CLLC 50 LC 50 95% CL
S1 S95% CL
1 l.gab2 .1-35.0 540a 229-1274 11.023 3.37-36.032 2 . 6b .4-16.4 100b 45-221 4.78ab 2.35-9.703 38.7a 16.5-90.9 365a 220-606 2.74b 2.04-3.674 35.5a 16.8-74.9 367a 221-609 2.71b 2.02-3.63
1 Slope function = .5(LC 84/LC 50 + LC 50/LC 16)2 Values with same le t te r superscripts (between experiments) do not
d if fe r s ig n ifican tly (P > .0 5 ).
Adenine Nucleotides
Adenylate and EC values, in rep licate Experiments 1-4, are
presented in Tables 2 .19 -2 .22 , respectively. These data were pooled,
and mean values are displayed in Figure 2.19. In th is f ig u re , each
experiment was weighted equally and adenylates at 1000 ppb atrazine
were excluded, since data at th is concentration were obtained in
Experiment 1 only.
In th is pooled analysis, EC was reduced at 0 .1 , 1 .0 , and 10 ppb
atrazine over 21 days, but higher ATP at 100 ppb elevated EC to the
control le v e l. ADP and AT generally increased with higher atrazine
leve ls . These observations were reflected in re la tiv e ly strong and
positive correlation of ATP, ADP, and AT with atrazine (Table 2 .23 ).
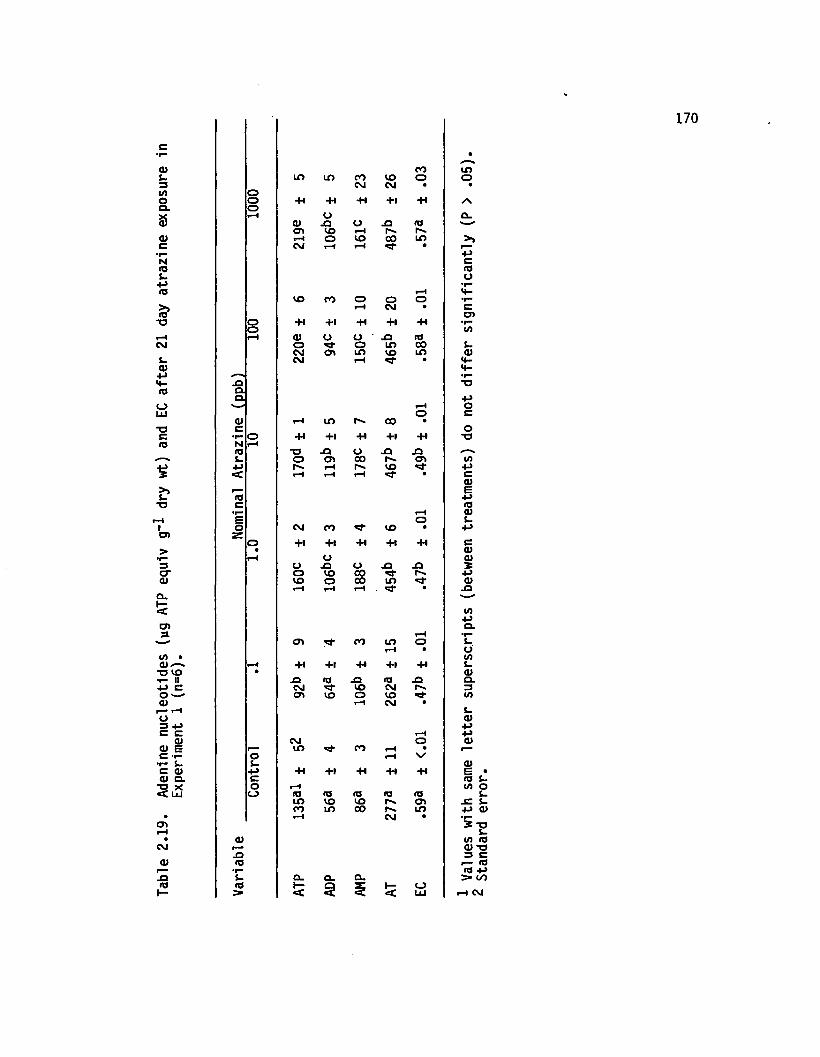
Tabl
e 2.
19.
Aden
ine
nucl
eotid
es
(yg
ATP
equi
v g”
1 dry
w
t) an
d EC
afte
r 21
day
atra
zine
ex
posu
re
in
Expe
rimen
t 1
(n=6
).
170
<Tt CO in
TO
•H + i +1
rH
+1
•
+•
fd jQ <0 -QCM lO CMo> 1 0 O 10
rH CM •
•r»—>sino•A0 -
>>4->C(QO•r“l*-•rCo>•r</)t-0)
<4-M--a+joco-a,—,i/)c(UE4->ia<uL.4->C(U0)2+->0)
X»'—'«/>+JCL■r-J-o(/)s_<uQ .3</>S_<u+J+-><U1—O)E .<0 t -I/) o
s-•C s-■M a>■i—2 -a
s-</> <0a» -a3 c
(a«a +j> 00rH CM

Tabl
e 2.
20.
Aden
ine
nucl
eotid
es
(yg
ATP
equi
v g"
1 dry
wt
) an
d EC
afte
r 21
day
atra
zine
ex
posu
re
in Ex
perim
ent
2 (n
=4).
171
iHLO o 00 o
rH •
o -H +1 -H -H -HorH -o JO to ■o to
VO 00 vo O CO s-vo o LA vo QJrH rH CO • q-
H-•r-*o•P
CO O00 LO <y> o> o C
o.o o -H -H -H ■H -H *oQ. rHQ. JO to to U JO r*"N
00 00 o» LO 00 </>r*. VO 00 CO •P
<U CM • Cc 0)
EN P<0 toS- a>4-> rH i.< LA vo o o 4->
rH •r— o Cto • +1 -H -H -H -H (Uc rH 0)♦r“ o to to X) JOE rH LO LO o o po o P . o 00 LO CDz rH rH CM • JO
V/)rH Po Q.
rH CO rH • »r*V V i-
O«H -H *H -H to
t-H S-• XI 0)
JO to JO to X) Q.O rH CO 3o> CO CO
rH CM • •
01 LAP OP •
CM rH <DVO LO CO vo o i— A
o •S- 0) o .•P *H -H -H ■H -H E ^ •c to t-o rH c/) >> Oo (0 to to to to r— fc.
rH CO o 00 JZ P S-00 o> rH LO p C <D
rH CO • •r- tOS u -o
•r* L>0) (/> q - to
0) .r- tos 3 C Cto i— CT> tO• r to •!“ +■>S- O. Q_ Q. > to 00
>*—< § AT EC rH CM
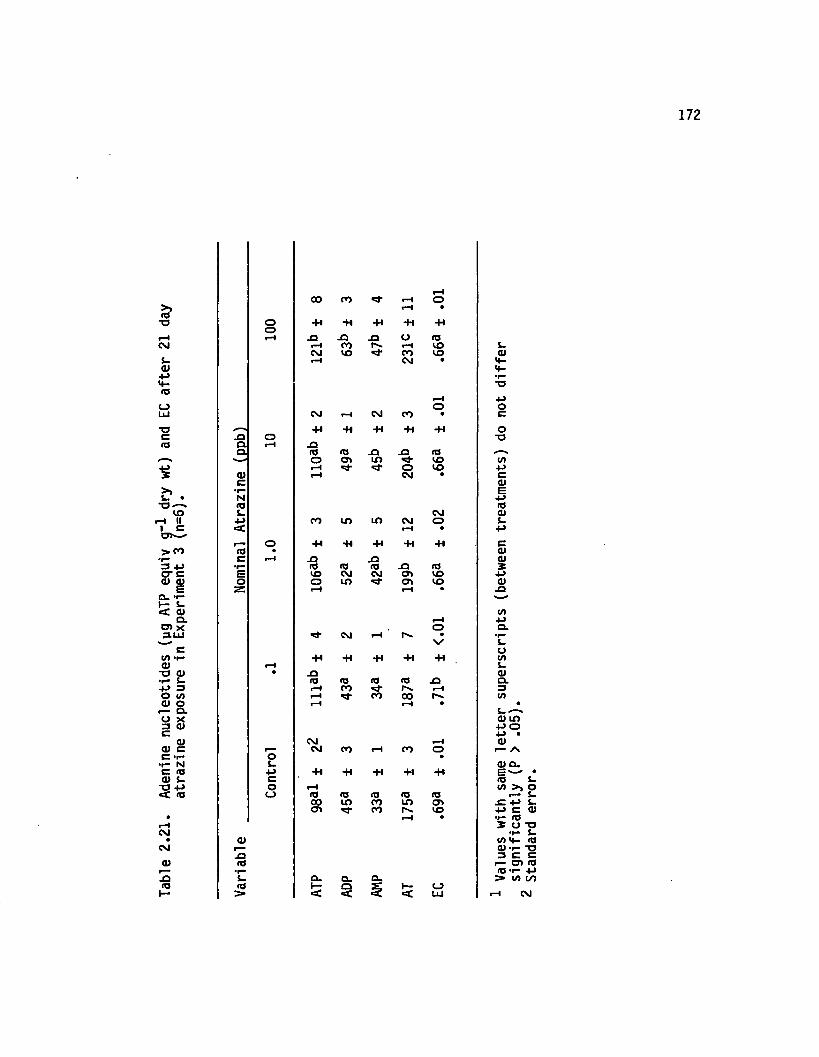
Tabl
e 2.
21.
Aden
ine
nucl
eotid
es
(pg
ATP
equi
v g-
1 dry
wt
) an
d EC
afte
r 21
day
atra
zine
ex
posu
re
in Ex
perim
ent
3 (n
=6).
172
fH00 co rH o
rH •
o +1 •H +1 -HorH jQ -Q J3 o 03
iH CO r-* rH VO L.evi vo co VO 03rH CM • P
<♦-• r•o
rH Po o
c m rH CM CO • c
+ i +• +1 -H -H oJ3 o -oQ rH J3O (0 03 JO X i rd -—X
o Ol LO vo (/)rH o vo p
03 iH CM • cc 03•r* EN Pto fdS- CM 03P CO LO LO CM O i-< tH • p
,_ o +1 +• -H -H -H c03 • 03c fH . a JO 03•f— fd 03 <d -O 03 5e to CM CM o> VO Po o ir> o> VO 03
zs rH iH • JOs—</>
rH Po a.
CM iH • ' rS.
-H -H +* *H -Hoto
rH t-• .Q 0303 03 <d os X ) OLrH co r-s. rH 3rH *0- CO 00 r-** COrH fH • •
03 LOP OP •
CM rH 03r“ CM co tH co o r— Ao •u 03 a .p -H +1 •H •H -H •c 03 t-o tH </> > * Oo 03 03 03 03 03 r— i-
00 LO CO LO CT> -C P t-a * *3* CO rs. vo P C 03
fH • •r- 03J u * o
•r“ L<u </)<+_ 03p— ■ 03*r- “OJ3 3 C Cto r— O ) 03•P“ 03 P&- a . a . a . > tO C/><o> 5 3 AT EC H CM
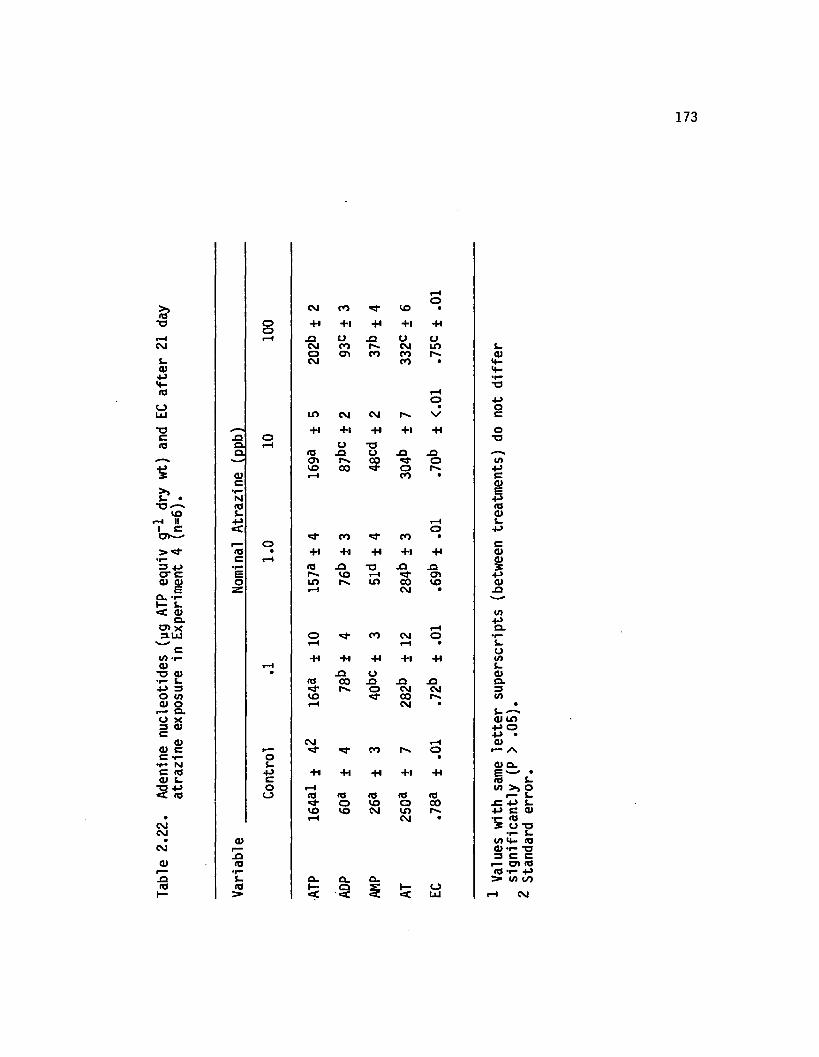
Tabl
e 2.
22.
Aden
ine
nucl
eotid
es
(ug
ATP
equi
v g-
1 dry
wt
) an
d EC
afte
r 21
day
atra
zine
ex
posu
re
in Ex
perim
ent
4 (n
=6).
173
rHO
cm CO LO •
OQ +1 + i -H +1 -H«H -Q u U U
CVJ CO CM in t-o O) CO CO <DCM CO • 4 -
4-•r“■ a
rHo +j• o
LO CM CM V c
+1 +1 -H + i -H oja o T3o. rH o •oa to JO U -Q .O —
o> r*v 00 *d* o (/)LO 00 o r^. +■>
<D rH CO • CC <u•r" EN +Jto (0U a)+> iH i-<c o -*->
Cj- CO •d- CO •o C
(0 • +1 +1 +1 -H (Uc rH a t• r to . a “O . a _Q XE LO H +->O LO ps* LO 00 LO a tsz rH CM • -O
■—"<A+J
rH a .o *d- CO CM o •r“rH rH • s_
•H + ! -H +1 ■HoC/1
rH t.• JQ o <u
<TJ 00 -O -Q . a a .rs. o CM CM 3
LO oo (/>rH CM • .
S-—»a t m
+ i o+ 3 •
CM rH t ur— CO p-% o r— Ao 0S- a t a .4-> -H •H «H + i -H E ' •c IB i-o rH </> >> oo to to fd to to r— L>
o LO o 00 £ P i .to LO CM LO P^ + j c a trH CM • ■r— IQ
5 c j - a•r-» i-
a> </> M - t0r— Q) T - “On 3 C C<0 r - O) <d
•»— tO t - H->S- a . a . a . > w o o
> < ■9 § AT EC rH CM
Figure 2. Adenine nucleotides and EC after term atrazine experiments. Data experiments are pooled (n = 22).
21 days in the long- from replicate
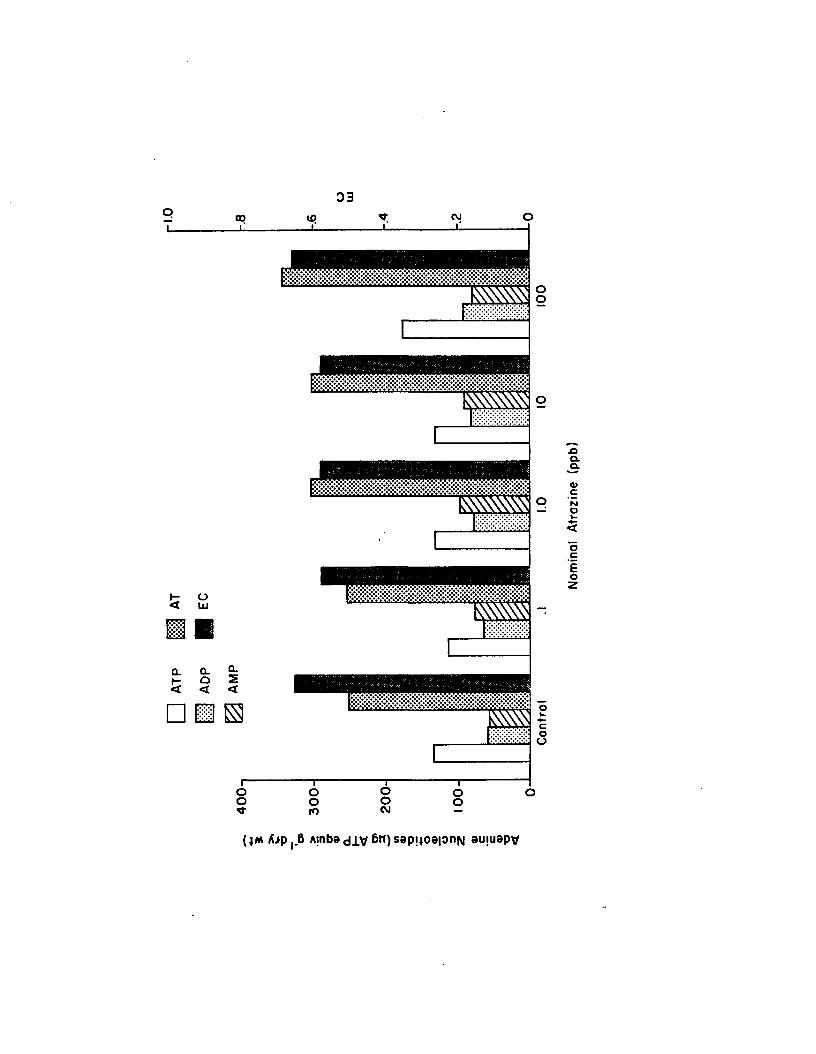
mm
V A v « « i V » V r t V i V * ¥ c t i V o V o V i V i ! M A M A i A M . » . * . ' . * . ,. V A
.m .o j .m .m A * A V A V * V A V / * V A V » V * • • « • • • •
□ m s
(|M AiPj.6 Ainbadiv 6n)S3pi*oe|onN auiuapv
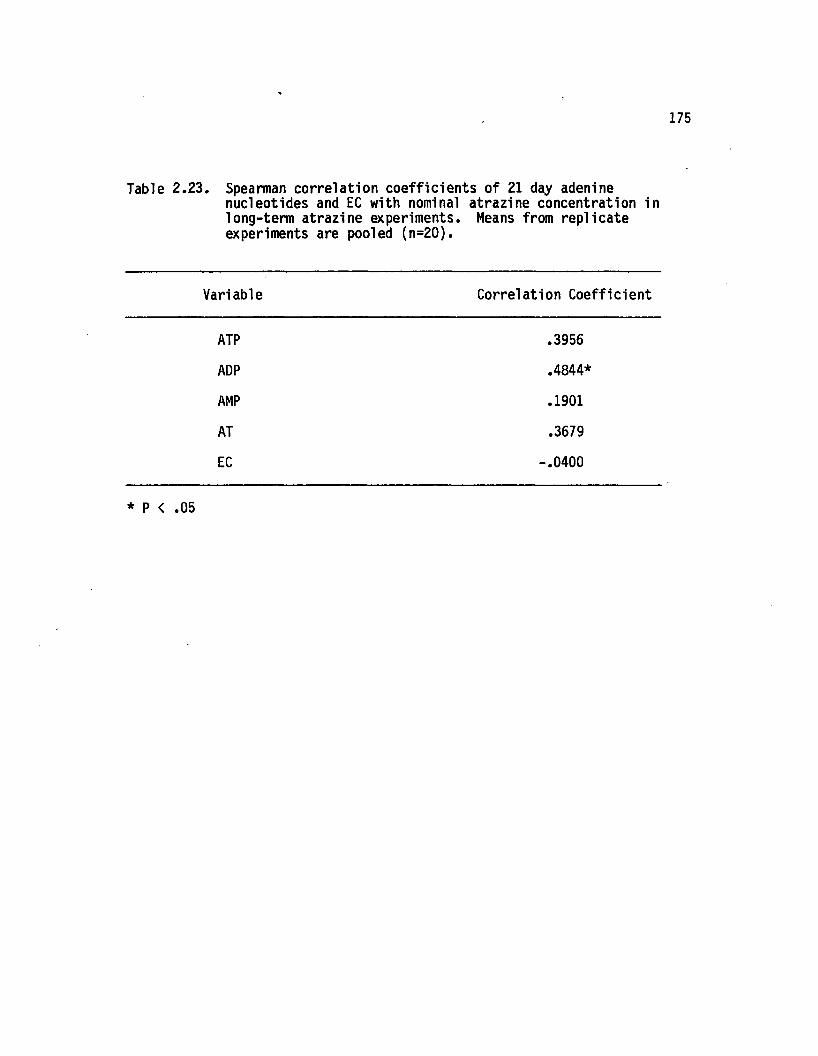
175
Table 2 .23 . Spearman corre lation coeffic ien ts of 21 day adeninenucleotides and EC with nominal atrazine concentration in long-term atrazine experiments. Means from rep licate experiments are pooled (n=20) .
Variable Correlation Coefficient
ATP .3956
ADP .4844*
AMP .1901
AT .3679
EC -.0400
* P < .05
DISCUSSION
Nutrient-Light Experiment
Nutrient and Light Levels
I t is un likely that natural eelgrass beds in the Chesapeake Bay
encounter nutrient levels as high as the enriched levels used in th is
study. Since the main stem of the Chesapeake Bay has a high flushing
rate and good vertica l mixing, i t is re la tiv e ly re s ilie n t to
f e r t i l i z e r and sewage loadings (Stevenson and Confer, 1978).
Nevertheless, selected nutrient levels function as a diagnostic agent
to e l ic i t a measurable response in Z. marina and its epiphytes.
Natural eelgrass beds in the Chesapeake Bay receive lig h t levels
comparable to those used in th is study. Drew (1979) has estimated the
compensation lig h t in tensity ( I c ) and the saturation lig h t in tensity
( I^ ) as 0.6 and 5.0 mW cm"2, respectively, fo r 1. marina at 15°C.
Employing 52 kcal as the average amount of energy per einstein over
PAR wavelengths, I c and I|< are 28 and 230 pE m"2 sec"*, respectively,
at 150C. With temperatures of 25-30°C during the present study.
marina continues to lig h t-sa tu ra te between 200-300 pE m"2 sec"*
(Wetzel, pers. comm.).
Temperature and Dissolved Oxygen
Although Setchell (1929) proposed that above 20°C Z. marina
undergoes heat rigor and growth ceases, Orth et a l . (1981) have
176
177
observed pronounced vegetative growth in Chesapeake Bay eelgrass
seedlings with nutrient enrichment at mean temperatures ranging from
24-27°C. Apparently, 1. marina in the Chesapeake Bay region is
re la tiv e ly eurythermal. Furthermore, Biebl and McRoy (1971) have
reported that gross photosynthesis in 1. marina increases up to
30-35°C. Thus, temperatures of 25-30OC during the present study
should support growth in Z. marina.
Divergence o f DO concentrations, among treatments over morning
hours, re flec ts d iffe re n tia l rates of community photosynthesis.
Higher nutrient and lig h t levels apparently increase community
photosynthesis. Since DO concentrations were re la tiv e ly high,
community photorespiration (To lbert, 1980) may have reduced
photosynthetic e ffic ien cy (Warburg e f fe c t) . Positive correlation
among PAR, temperature, and DO was expected. Increased PAR raises
water temperature and elevates DO, presumably through stim ulation of
community photosynthetic a c t iv ity .
Morphometries
Increased growth of Z. mari na with nutrient enrichment has been
observed in f ie ld (Orth, 1977; Harlin and Thorne-M iller, 1981) and
laboratory studies (Orth et a l . , 1981), conducted over 2-3 months.
Decreased shoot density (Backman and B a r i lo t t i , 1976) and shoot length
(Burkholder and Doheny, 1968) in I . marina have been reported with
l ig h t reduction in f ie ld studies. Epiphytic growth, in the present
study, may have obscured these effects of nutrient enrichment and
lig h t reduction. Two week changes in fresh weight and shoot length
were negative in a ll treatments.
Productivity
Higher respiration rates, a resu lt of nutrient enrichment over
the preceeding 2 weeks, decreased net productivity . Increased
resp iration may re fle c t residual stress in response to increased
epiphytic colonization , associated with higher nutrient leve ls .
During afternoon hours, the higher lig h t level predominantly exceeded
saturation fo r Z. marina, while the lower lig h t level was
predominantly subsaturating. Decreased net production is , therefore,
expected with the lower lig h t level (at a given nutrient le v e l) . This
was observed only at the intermediate nutrient le v e l.
Internal cycling of gases w ithin lacunar spaces of leaves may
have introduced error into production measurements, which were based
on changes in dissolved oxygen. Nevertheless, observed net production
rates f e l l w ith in the range reported fo r 1. marina in the lite ra tu re
(McRoy and McMillan, 1977).
Epiphyte Colonization
Epiphytic growth has generally increased with nutrient loading
(P h illip s et a l . , 1978; Sand-Jensen and Sondergaard, 1981). In a
f ie ld study, Harlin and Thorne-M iller (1981) observed only small
increases in epiphytic algae with nutrient enrichment. Dense epiphyte
colonization , in the present study, may have been attribu ted to higher
levels of nutrient supplementation and e ffec ts of tank containment.
In general, algae are extremely e f f ic ie n t at exp lo iting available
nutrien ts . Recirculating pumps in experimental tanks generate
currents, which decrease the boundary layer around leaves (Wheeler,
1980; Conover, 1968), fa c i l i ta t in g nutrient uptake in epiphytes via
the water column (H arlin , 1975). I t has also been demonstrated tha t
epiphytes obtain nutrients d ire c tly from host macrophytes (McRoy and
Goering, 1974; H a rlin , 1973). F in a lly , i t should be noted that the
use of plexiglass plates to quantify epiphytic growth excludes the
influence of le a f surface chemistry, including exudation of
antifou ling metabolites (Harrison and Chan, 1980; Harrison, 1982).
Adenine Nucleotides
Positive but weak correlations of 1. marina ATP, AT, and EC with
nutrients and l ig h t , along with decreased ATP, AT, and EC levels over
tim e, are in lin e with observed Z. marina morphometric and production
data. Weiler and Karl (1979) have suggested that a net decrease in
ATP and AT may represent e ith er of the following: 1) uniform ATP
production, but net removal ( i . e . u t il iz a t io n > de novo biosynthesis),
or 2) an imbalance in c e llu la r energetics ( i . e . ATP hydrolysis > ADP
phosphorylation). Adenylate response patterns, observed in Z.. marina,
may have resulted from epiphyte in tervention .
Epiphyte adenylates were correlated strongly and positive ly with
nutrien ts , and AT increased over tim e. These observations para lle l
positive correlation between epiphyte growth and nutrien ts . Overall
lack of correlation between corresponding adenylates in 1. marina and
epiphytes is compatible with th e ir generally negative and positive
growth, respective ly , over the course of the experiment. Low epiphyte
ATP, AT, and EC, re la tiv e to Z. mari na le a f tissue le v e ls , may have
been attribu ted to the presence of m etabolically in e rt material in
epiphyte preparations, including small amounts of sediment, as well as
siliceous diatom fru stu les .
Impact of Epiphytes on Z. marina
Morphom:tric, production, and adenylate data suggest that
epiphytes negatively impact Z. marina. Epiphyte growth increased with
nutrient enrichment, whereas 1. marina le a f growth and net
productivity decreased with higher nutrients . Furthermore, two week
morphometric changes in Z. marina were generally negative. F in a lly ,
epiphyte AT increased, while I . marina AT decreased over tim e. The
size of the AT pool may re fle c t metabolic a c tiv ity and associated
growth p o ten tia l. Mechanisms by which epiphytes can reduce the
photosynthetic rate o f eelgrass leaves include shading and in te rfe rin g
with carbon uptake (Sand-Jensen, 1977).
Short-Term (6 Hr) Atrazine Experiments
Productivity
Z_. mari na net productivity was inh ib ited at 100, but not 10 ppb
a traz in e , over 6 hrs. Net productivity of the 1. marina community,
iso lated under large plexiglass domes in the f ie ld , was s im ila rly
depressed at 100 ppb atrazine during daylight hrs (Hershner et a l . ,
1981). Using laboratory microcosms, Correll et a l . (1978) have
reported a reduction of net productivity with 100 ppb atrazine in
another submerged aquatic macrophyte, Zanichellia palustris (horned
pondweed), a fte r 1 and 2 week exposures.
Depression of oxygen evolution is expected, since atrazine
in h ib its the H ill reaction in'photosynthesis (Ebert and Dumford,
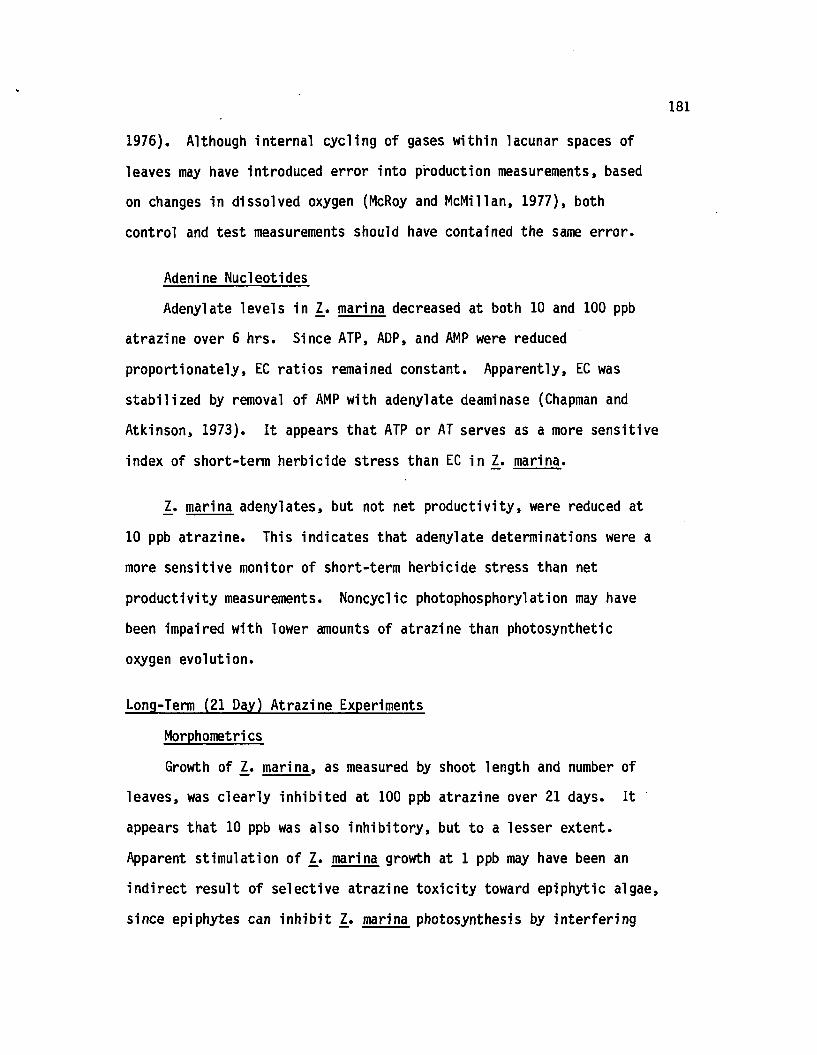
181
1976). Although internal cycling of gases w ithin lacunar spaces of
leaves may have introduced error into production measurements, based
on changes in dissolved oxygen (McRoy and McMillan, 1977), both
control and tes t measurements should have contained the same e rro r.
Adenine Nucleotides
Adenylate levels in Z. marina decreased at both 10 and 100 ppb
atrazine over 6 hrs. Since ATP, ADP, and AMP were reduced
proportionately, EC ra tios remained constant. Apparently, EC was
stab ilized by removal of AMP with adenylate deaminase (Chapman and
Atkinson, 1973). I t appears that ATP or AT serves as a more sensitive
index of short-term herbicide stress than EC in 1. marina.
Z. marina adenylates, but not net productiv ity , were reduced at
10 ppb atrazine. This indicates that adenylate determinations were a
more sensitive monitor of short-term herbicide stress than net
productivity measurements. Noncyclic photophosphorylation may have
been impaired with lower amounts of atrazine than photosynthetic
oxygen evolution.
Long-Term (21 Day) Atrazine Experiments
Morphometri cs
Growth of Z. marina, as measured by shoot length and number of
leaves, was c learly inh ib ited at 100 ppb atrazine over 21 days. I t
appears that 10 ppb was also in h ib ito ry , but to a lesser extent.
Apparent stim ulation of 1» mari na growth at 1 ppb may have been an
in d irec t result of selective atrazine to x ic ity toward epiphytic algae,
since epiphytes can in h ib it Z. marina photosynthesis by in te rfe rin g
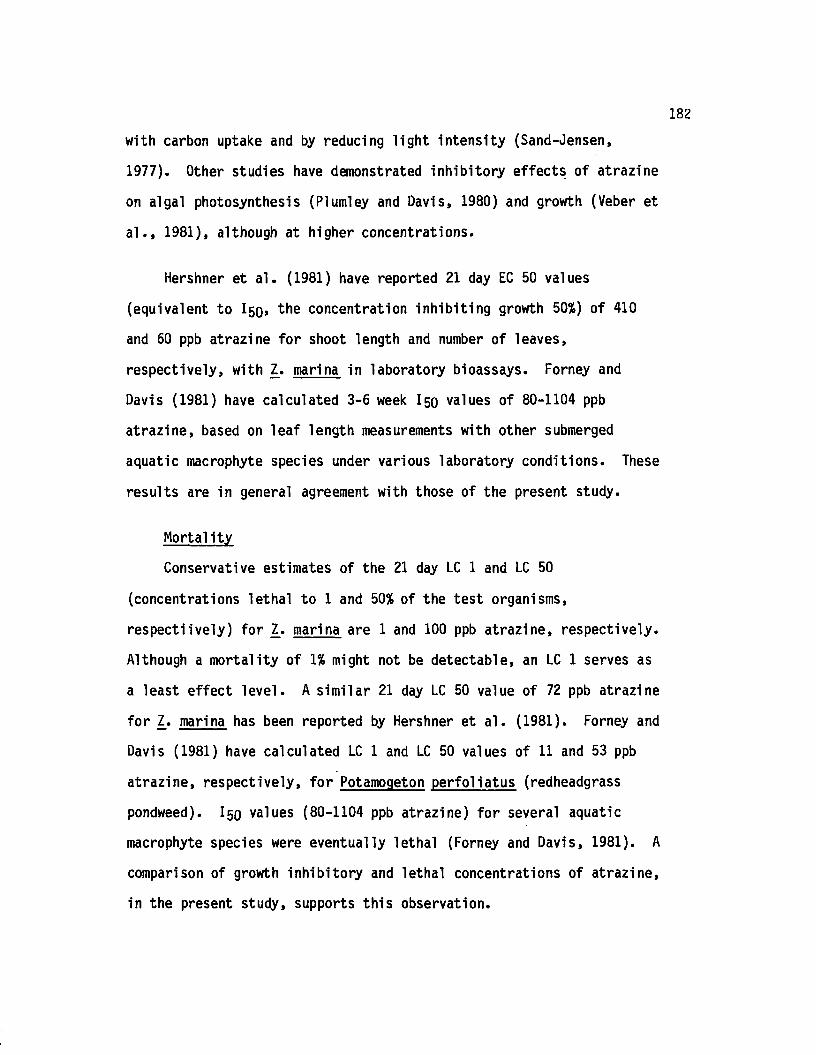
with carbon uptake and by reducing lig h t in tens ity (Sand-Jensen,
1977). Other studies have demonstrated inh ib ito ry effects of atrazine
on algal photosynthesis (Plumley and Davis, 1980) and growth (Veber et
a l . , 1981), although at higher concentrations.
Hershner et a l . (1981) have reported 21 day EC 50 values
(equivalent to l 5o> the concentration in h ib itin g growth 50%) of 410
and 60 ppb atrazine fo r shoot length and number of leaves,
respectively, with 1. marina in laboratory bioassays. Forney and
Davis (1981) have calculated 3-6 week 150 values of 80-1104 ppb
a traz in e , based on le a f length measurements with other submerged
aquatic macrophyte species under various laboratory conditions. These
results are in general agreement with those of the present study.
M orta lity
Conservative estimates of the 21 day LC 1 and LC 50
(concentrations le tha l to 1 and 50% of the tes t organisms,
re s p e c tiv e ly ) fo r 1. marina are 1 and 100 ppb a traz in e , respectively.
Although a m orta lity of 1% might not be detectable, an LC 1 serves as
a least e ffe c t le v e l. A s im ila r 21 day LC 50 value of 72 ppb atrazine
fo r Z. mari na has been reported by Hershner et a l . (1981). Forney and
Davis (1981) have calculated LC 1 and LC 50 values of 11 and 53 ppb
atrazin e , respectively, fo r Potamogeton perfo liatus (redheadgrass
pondweed). 150 values (80-1104 ppb atrazine) fo r several aquatic
macrophyte species were eventually le thal (Forney and Davis, 1981). A
comparison of growth inh ib ito ry and lethal concentrations of a trazin e ,
in the present study, supports th is observation.
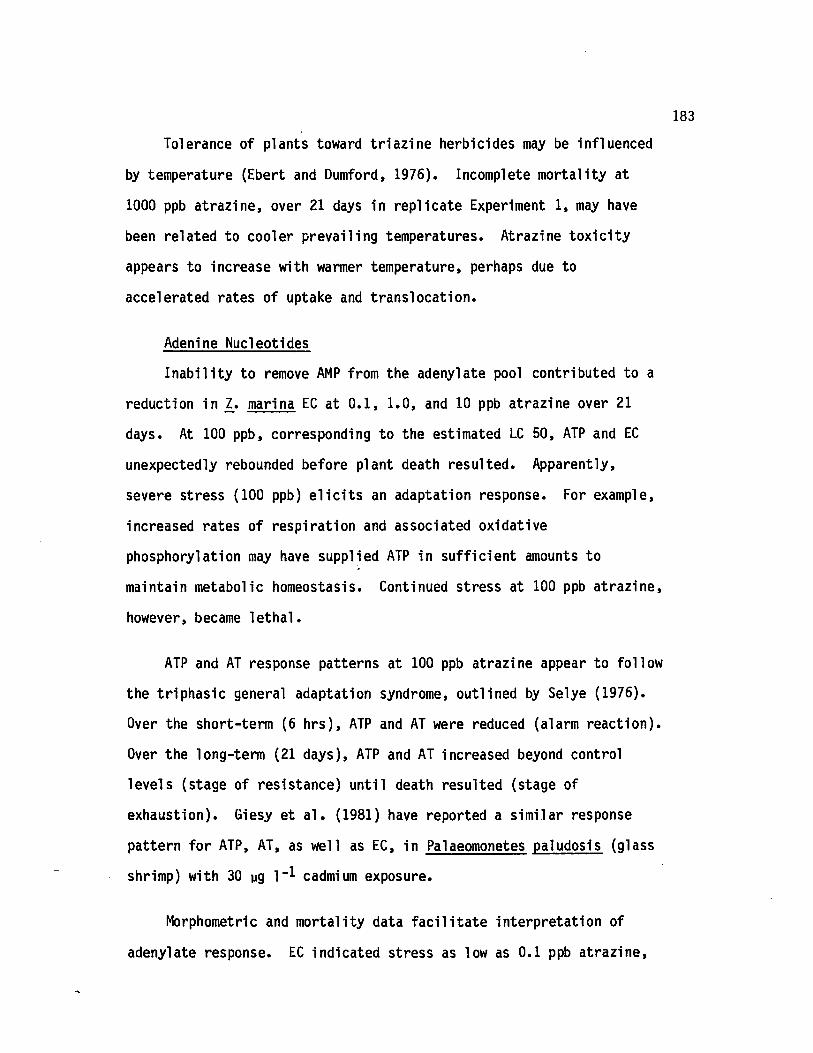
Tolerance of plants toward tr ia z in e herbicides may be influenced
by temperature (Ebert and Dumford, 1976). Incomplete m orta lity at
1000 ppb a traz in e , over 21 days in rep lica te Experiment 1, may have
been related to cooler prevailing temperatures. Atrazine to x ic ity
appears to increase with warmer temperature, perhaps due to
accelerated rates of uptake and translocation .
Adenine Nucleotides
In a b ility to remove AMP from the adenylate pool contributed to a
reduction in Z. marina EC at 0 .1 , 1 .0 , and 10 ppb atrazine over 21
days. At 100 ppb, corresponding to the estimated LC 50, ATP and EC
unexpectedly rebounded before plant death resulted. Apparently,
severe stress (100 ppb) e l ic i t s an adaptation response. For example,
increased rates of respiration and associated oxidative
phosphorylation may have supplied ATP in s u ffic ie n t amounts to
maintain metabolic homeostasis. Continued stress at 100 ppb a traz in e ,
however, became le th a l.
ATP and AT response patterns at 100 ppb atrazine appear to follow
the trip h as ic general adaptation syndrome, outlined by Selye (1976).
Over the short-term (6 h rs ), ATP and AT were reduced (alarm reaction ).
Over the long-term (21 days), ATP and AT increased beyond control
levels (stage of resistance) u n til death resulted (stage of
exhaustion). Giesy et a l . (1981) have reported a s im ilar response
pattern fo r ATP, AT, as well as EC, in Palaeomonetes paludosis (glass
shrimp) with 30 ug I -1 cadmium exposure.
Morphometric and m orta lity data f a c i l i ta te in terp re ta tion of
adenylate response. EC indicated stress as low as 0.1 ppb a traz in e ,
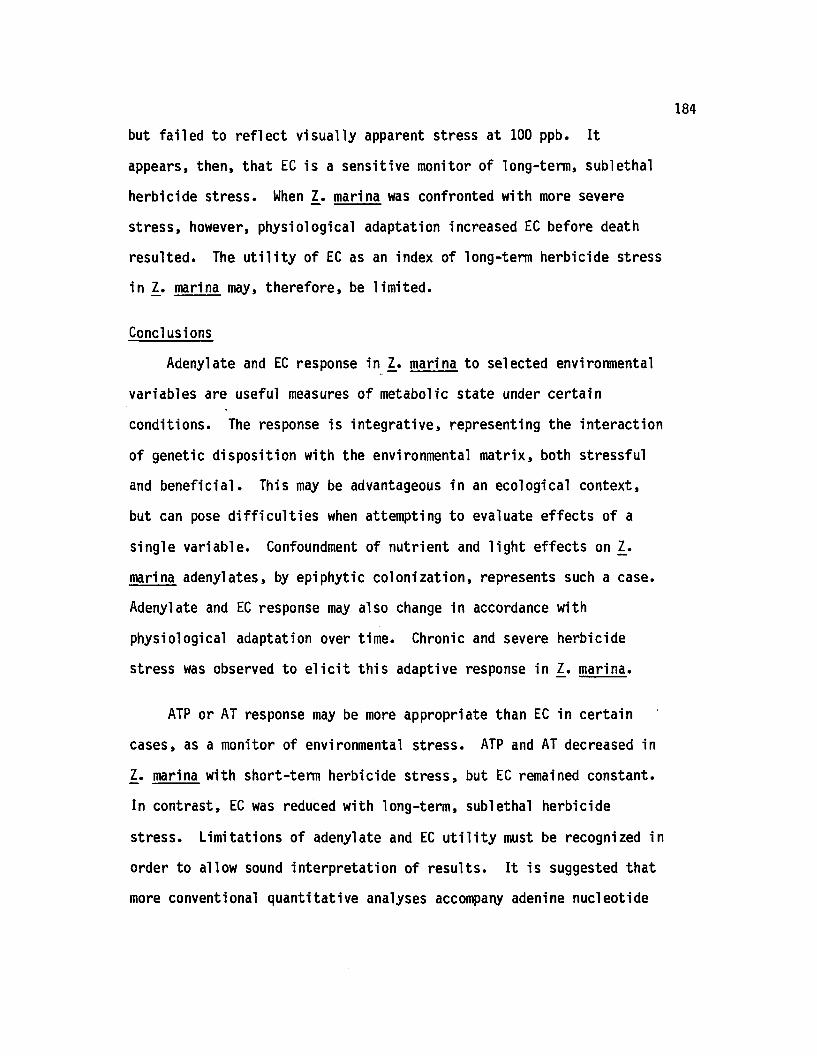
but fa ile d to re fle c t v isua lly apparent stress at 100 ppb. I t
appears, then, that EC is a sensitive monitor of long-term, sublethal
herbicide stress. When 1. marina was confronted with more severe
stress, however, physiological adaptation increased EC before death
resulted. The u t i l i t y of EC as an index of long-term herbicide stress
in Z. marina may, therefo re , be lim ited .
Conclusions
Adenylate and EC response in 1. marina to selected environmental
variables are useful measures o f metabolic state under certa in
conditions. The response is in te g ra tive , representing the in teraction
of genetic disposition with the environmental m atrix, both stressful
and b en efic ia l. This may be advantageous in an ecological context,
but can pose d if f ic u lt ie s when attempting to evaluate effects of a
single variab le . Confoundment of nutrient and lig h t e ffects on Z.
mari na adenylates, by epiphytic co lonization , represents such a case.
Adenylate and EC response may also change in accordance with
physiological adaptation over time. Chronic and severe herbicide
stress was observed to e l ic i t th is adaptive response in Z. marina.
ATP or AT response may be more appropriate than EC in certain
cases, as a monitor of environmental stress. ATP and AT decreased in
Z. marina with short-term herbicide stress , but EC remained constant.
In contrast, EC was reduced with long-term, sublethal herbicide
stress. Limitations of adenylate and EC u t i l i t y must be recognized in
order to allow sound in terp re ta tion of resu lts . I t is suggested that
more conventional quantita tive analyses accompany adenine nucleotide

measurements in any e ffo r t to evaluate physiological response to
environmental va ria tio n .
REFERENCES
Atkinson, D. E. 1977. C e llu lar energy metabolism and its regulation. Academic Press, N. Y. 293 p.
Backman, T. W. and D. C. B a r i lo t t i . 1976. Irradiance reduction: Effects on standing crops of the eelgrass Zostera marina in a coastal lagoon. Mar. B io l. 34:33-40.
B iebl, R. and C. P. McRoy. 1971. Plasmatic resistance and rate of respiration and photosynthesis of Zostera marina at d iffe ren t s a lin it ie s and temperatures. Mar. B io l. 8:48-56.
Burkholder, P. R. and T. E. Doheny. 1968. The biology of eelgrass.Lamont Geol. Obs. No. 1227. 120 p.
Chapman, A. G. and D. E. Atkinson. 1973. S tab iliza tio n of adenylate energy charge by the adenylate deaminase reaction. J. B io l.Chem. 248:8309-8312.
Ching, T. M. 1975. Application of ATP analysis to plants. Pp.284-315 In: Proc. ATP Methodology Seminor, SAI Technology Co.,San Diego.
Ching, T. M., S. Hedtke, and A. E. Garay. 1975. Energy state of wheat leaves in ammonium n itra te treated plants. L ife Sciences 16:603-610.
Conover, J. T. 1968. The importance of natural d iffusion gradientsand transport of substances related to benthic marine plantmetabolism. Bot. Mar. 11:1-9.
C o rre ll, D. L ., J . W. Pierce, and T. L. Wu. 1978. Herbicides and submerged plants in Chesapeake Bay. Pp. 858-877 In: Proc.Symp. on Technical, Environmental, Socioeconomic, and Regulatory Aspects of Coastal Zone Management, ASCE, San Francisco.
Davis, D. E. 1968. Atrazine e ffec ts on mitochondrial resp iration . Proc. So. Weed Conf. 21:346.
D ecle ire, M. and W. Decat. 1981. Modification des teneurs en ATP, glucose, fructose, et saccharose dans des plantules de concombre (Cucumis sativus) sous l'a c tio n de divers herbicides. Weed Res. 21:93-97.
den Hartog, C. 1970. The seagrasses of the world. North Holland Pub. Co., Amsterdam. 275 p.
186
Drew, E. A. 1979. Physiological aspects of primary production in seagrasses. Aq. Bot. 7:139-150.
Ebert, E. and S. W. Dumford. 1976. Effects of tr ia z in e herbicides on the physiology of plants. Residue Rev. 65:1-103.
Falkowski, P. G. 1977. The adenylate energy charge in marinephytoplankton: The e ffe c t of temperature on the physiologicalstate of Skeletonema costatum (Grev.) Cleve. J. Exp. Mar. B io l. Ecol. 27:37-45.
Forney, D. R. and D. E. Davis. 1981. Effects of low concentrations of herbicides on submersed aquatic plants. Weed Sci. 29:677-685.
Gardner, G. 1981. Azidoatrazine photoaffin ity label fo r the s ite of tr ia z in e herbicide action in chloroplasts. Science 211:937-940.
Giesy, J. P ., S. R. Denzer, C. S. Duke, and G. W. Dickson. 1981. Phosphoadenylate concentrations and energy charge in two freshwater crustaceans: Responses to physical and chemical stressors. Vehr. In te rn a t. Verein. Limnol. 21:205-220.
Gruenhagen, R. D. and D. E. Moreland. 1971. Effects of herbicides on ATP levels in excised soybean hypocotyls. Weed Sci. 19:319-323.
H arlin , M. M. 1973. Transfer of products between epiphytic marine algae and host plants. J. Phycol. 9:243-248.
H arlin , M. M. 1975. Epiphyte-host re lations in seagrass communities. Aq. Bot. 1:125-131.
H arlin , M. M. and B. Thorne-M iller. 1981. Nutrient enrichment of seagrass beds in a Rhode Island coastal lagoon. Mar. B io l. 65:221-229.
Harrison, P. G. 1982. Control of microbial growth and of amphipod qrazinq by water-soluble compounds from leaves o f Zostera marina. Mar. B io l. 67:225-230.
Harrison, P. G. and A. T. Chan. 1980. Inh ib itio n of the growth of micro-algae and bacteria by extracts of eelgrass ( Zostera marina) leaves. Mar. B io l. 61:21-26.
Hershner, C ., K. Ward, and J. Illowsky. 1981. The effects of atrazine on Zostera marina in the Chesapeake Bay, V irg in ia . Interim Report, US EPA, Chesapeake Bay Program, Grant No.R805953, VIMS.
Hitchman, M. L. 1978. Measurement of dissolved oxygen. Vol. 49. Chemical analysis: A series o f monographs on analyticalchemistry and its applications (P. J . Elving, J . D. Winefordner, and I . M. K o lthoff, ed s .). John Wiley and Sons, N. Y. 225 p.
Holm-Hansen, 0. 1970. ATP levels in algal ce lls as influenced byenvironmental conditions. Plant and Cell Physiol. 11:689-700.
H u ll, C. H. and N. H. Nie (e d s .). 1981. SPSS Update 7-9.McGraw-Hill, N. Y. 402 p.
Ivanovici, A. M. 1980. Application of adenylate energy charge toproblems of environmental impact assessment in aquatic organisms. Helg. Meers. 33(1-4):556-565.
Kondo, T. and H. Nakashima. 1979. Contents of adenosine phosphate compounds in a long day duckweed Lemna gibba G3, under d iffe re n t l ig h t and nu tritiona l conditions. Physiol. P lant. 45:357-362.
L itc h fie ld , J. T. and F. Wilcoxon. 1949. A s im plified method of evaluating dose e ffe c t experiments. J. Pharmacol. Exp. Ther. 96:99-113.
McRoy, C. P. and J. J. Goering. 1974. Nutrient transfer between the seagrass Zostera marina and its epiphytes. Nature 248:173-174.
McRoy, C. P. and C. H e lfferich (e d s .). 1977. Seagrass ecosystems: As c ie n tific perspective. Marcel Dekkar, In c ., N. Y. 314 p.
McRoy, C. P. and C. McMillan. 1977. Production and physiology of seagrasses. Pp. 53-87 In: Seagrass ecosystems: A s c ie n tificperspective (C. P. McRoy and C. H e lffe rich , e d s .), Marcel Dekkar, In c ., N. Y.
Mendelssohn, I . A. and K. L. McKee. 1981. Determination of adeninenucleotide levels and adenylate energy charge ra tio in twoSpartina species. Aq. Bot. 11:37-55.
Nie, N. H ., C. H. H u ll, J. G. Jenkins, K. Steinbrenner, and D. H.Bent. 1975. S ta tis tic a l Package fo r the Social Sciences (SPSS), 2nd Ed. McGraw-Hill, N. Y. 675 p.
Orth, R. J. 1977. Effect of nutrient enrichment on growth of the eelgrass Zostera marina in the Chesapeake Bay, V irg in ia , USA.Mar. B io l. 44:187-194.
Orth, R. J . , K. A. Moore, M. H. Roberts, and G. M. Silberhorn. 1981. The biology and propagation of eelgrass, Zostera marina, in the Chesapeake Bay, V irg in ia . Final Report, US EPA, Chesapeake Bay Program, Grant No. R805953, VIMS.
Parsons, T. R ., M. Takahashi, and B. Hargrave. 1977. Biologicaloceanographic processes, 2nd Ed. Pergamon Press, N. Y. 332 p.
P h illip s , G. L . , D. Eminson, and B. Moss. 1978. A mechanism to account fo r macrophyte decline in progressively eutrophicated freshwaters. Aq. Bot. 4:103-126.
189
P h illip s , R. C. and C. P. McRoy (ed s .)* 1980. Handbook of seagrassbiology: An ecosystem perspective. Garland STPM Press, N. Y.353 p.
Plumley, F. G. and D. E. Davis. 1980. The effects of aphotosynthesis in h ib ito r a traz in e , on sa lt marsh edaphic algae, in cu lture , microecosystems, and in the f ie ld . Estuaries 3:271-277.
Riemann, B. and S. Wium-Anderson. 1981. The ATP and to ta l adenine nucleotide content of four u n ice llu la r and colonial green algae. Oikos 36:368-373.
Rogers, K. H. and C. M. Breen. 1981. Effects of epiphyton on Potamogeton crispus L. Leaves. Microb. Ecol. 7:351-363.
Romano, J. C. and R. Daumas. 1981. Adenosine nucleotide "energy charge" ratios as an ecophysiological index fo r microplankton communities. Mar. B io l. 62:281-296.
Sand-Jensen, K. 1977. Effect o f epiphytes on eelgrass photosynthesis. Aq. Bot. 3:55-63.
Sand-Jensen, K. and M. Sondergaard. 1981. Phytoplankton and epiphyte development and th e ir shading e ffe c t on submerged macrophytes in lakes of d iffe re n t nutrient status. In t . Revue ges. Hydrobiol. 66:529-552.
Selye, H. 1976. Stress in health and disease. Butterworth, In c ., Boston. 334 p.
S etch ell, W. A. 1929. Morphological and phenological notes on Zostera marina L. Univ. C a lif . Publ. Bot. 14:389-452.
Shimabukuro, R. H ., D. S. Frear, H. R. Swanson, and W. C. Walsh.1971. Gluthathione conjugation: An enzymatic basis fo r atrazineresistance in corn. Plant Physiol. 47:10-14.
Sprague, J. B. 1973. The ABC's of pollu tant bioassay using f is h .Pp. 6-30 In: Biological methods fo r the assessment of water q u a lity (J. Cairns, J r. and K. L. Dickson, e d s .), Amer. Soc.Test. Mat. STP 528, Philadelphia.
Stephens, D. W. and D. J. Shultz. 1982. Extraction of periphyton adenosine triphosphate and evaluation of i ts use as a rapid response bioassay parameter. Arch. Hydrobiol. 93:327-340.
Stevenson, J. C. and N. M. Confer. 1978. Summary of available information on Chesapeake Bay submerged vegetation. USFWS/OBS-78/66. 335 p.
Strickland , J. D. H. and T. R. Parsons. 1972. A practical handbook of seawater analysis. Fish. Res. Bd. Canada. B u lle tin 167, 2nd Ed. 310 p.
Thompson, 0. C. B ., B. Truelove, and D. E. Davis. 1974. Effects of triaz in es on energy re lations o f mitochondria and chloroplasts. Weed Sci. 22:164-166.
To lbert, N. E. 1980. Photorespiration. Pp. 487-523 In: Thebiochemistry of plants. Vol. 2, Metabolism and respiration (D.D. Davies, e d .) , Academic Press, N.Y.
U. S. EPA. 1979. Methods fo r chemical analysis of water and wastes. EPA-600/4-79-020, Environmental Monitoring and Support Lab, ORD, US EPA, C incinnati.
Veber, K ., J . Zahradnik, I . B reyl, and F. Kredl. 1981. Toxic e ffec t and accumulation of atrazine in algae. B u ll. Environ. Contam. Toxicol. 27:872-876.
W eiler, C. S. and D. M. K arl. 1979. Diel changes in phased-dividing cultures o f Ceratium furca (Dinophyceae): Nucleotidetriphosphates, adenylate energy charge, ce ll carbon, and patterns of vertica l migration. J. Phycol. 15:384-391.
Westlake, D. F. 1963. Comparisons of plant productivity . B io l. Rev. 38:385-425.
Wetzel, R. L. Personal communication. V irg in ia In s t, of Marine Science.
Wetzel, R ., K. Webb, P. Penhale, R. Orth, J. van Montfrans, R. Diaz,J. M erriner, and G. Boehlert. 1981. Functional ecology of eelgrass. Final Report, US EPA, Chesapeake Bay Program, Grant No. R805974, VIMS.
Wheeler, W. N. 1980. E ffect of boundary layer transport on thefixa tio n of carbon by the qiant kelp Macrocystis p yrife ra . Mar. B io l. 56:103-110.
WSSA. 1974. Herbicide Handbook of the Weed Science Soc. of America,3rd Ed. Champaign, 111. 430 p.
Wu, T. L. 1981. Atrazine residues in estuarine water and the aerial deposition of atrazine in to Rhode R iver, Maryland. Water, A ir , and Soil P o llu t. 15(2):173-184.
Wu, T. L ., L. Lambert, D. Hastings, and D. Banning. 1980. Enrichmentof the agricu ltu ra l herbicide atrazine in the microsurface water of an estuary. B u ll. Environ. Contam. Toxicol. 24:411-414.
Zar, J. H. 1974. B io s ta tis tica l analysis. P ren tice -H a ll, In c ., Englewood C l i f fs , N. J. 620 p.
APPENDIX A
METABOLIC REGULATION
Comment
This appendix presents the biochemical framework underlying the
use of the adenylate energy charge in environmental studies. The
metabolic role of the adenine nucleotides is reviewed. Most of the
information was summarized from Atkinson (1977a) and Lehninger (1971,
1975).
M etabolite Concentrations
Many c e llu la r metabolites are held at low concentrations (10"®
to 10"9 M) in order to accommodate several thousand compounds and to
minimize nonenzymic side reactions (Atkinson, 1977a). This permits
integration and regulation by enzyme-controlled reactions. Low
concentrations are realized with k in e tic (enzymes) and thermodynamic
(activation and coupling) adaptations.
Enzymes which accelerate corresponding nonenzymic reaction rates
by a factor of 10^ to 10*® enable much lower metabolite
concentrations to function e ffe c tiv e ly . Enzymes lower activation
energy barriers and d irec t metabolic sequences along routes that avoid
thermodynamically stable intermediates.
191
Activation of intermediates by cofactors (c a rrie rs ) provides a
thermodynamically favorable pathway, so that metabolic sequences can
proceed smoothly to completion. To generate a useful concentration of
product, by way of a metabolic sequence with a re la tiv e ly small
equilibrium constant (K ), would require a much higher concentration of
reactants than a sequence with a large overall K. By avoiding
thermodynamically unfavorable pathways, activating groups hold down
metabolite concentrations.
Activated intermediates are held by weak bonds with a large and
negative free energy of hydrolysis (Lipmann, 1941). Considered as an
activated phosphate and coupling agent, ATP serves to hold down
metabolite concentrations. Phosphorylation of simple sugars by ATP
provides an example. Free sugar levels are held down, since the
e q u ilib r ia of reactions catalyzed by hexokinase and
phosphofructokinase l ie fa r toward the sugar phosphates. An
additional selective advantage to th is phosphorylation is that sugar
phosphates are not permeable to the c e ll membrane and are thus trapped
in the c e l l , fa c i l i ta t in g the g lyco ly tic sequence.
C e llu la r substrate concentrations are generally near th e ir
enzymic Km (hyperbolic curve) or S. 5 (sigmoidal curve) values with two
notable exceptions: adenine and pyridine nucleotides fa r exceed th e ir
!<„, or S#5 values, so that corresponding enzymes (e .g . kinases,
dehydrogenases) are substrate-saturated. In these cases, reaction
velocity is determined, not by the concentration of one single
nucleotide, but by nucleotide ratios ( i . e . ATP/ADP or ATP/AMP,
NAD/NADH or NADP/NADPH).
Undirectional Paired Pathways
Metabolic sequences are organized into paired,
oppositely-directed pathways which are essentia lly unidirectional
(large K) and largely independent. I f an interconversion proceeded by
the same reversible reaction sequence ( K = 1 ) under simple
thermodynamic (mass-action or equilibrium ) con tro l, response to
metabolic need would be slow and in e ff ic ie n t . C learly , the evolution
of paired, unidirectional pathways is more functional to metabolic
demand. Both d irection and rates can be determined by the
concentration of regulatory compounds that need not be d ire c tly
involved.
Atkinson (1977a) provides an example of the most important paired
pathway: resp iration (K = 10170) and photosynthesis (K = 1060) .
These K's represent physiological concentrations of ATP, ADP, and Pi
with other reactants and products at th e ir standard states (1 M
glucose, 1 atm p artia l pressure O2 and CO2 ) and pH 7. The magnitude
of these constants ensures thermodynamic u n id ire c tio n a lity and
fa c il i ta te s conversion of very low substrate concentrations to
product. The term, "ATP equivalent," has been introduced by Atkinson
(1977a) to standardize energy conversions involving coupling agents,
including ATP, NADH, NADPH, and FADH2. Using th is system, respiration
regenerates 38 ATP equivalents, whereas photosynthesis consumes 66 ATP
equivalents. Thermodynamically, these two major sequences d if fe r by
104 (= 3 8 -[-6 6 ]) ATP equivalents, a situation which allows them to be
simultaneously poised at a ll times in th e ir opposite physiological
directions. Oneway, oppositely-directed, paired pathways are thus
atta inable through differences in evolved coupling of ATP equivalents.
ATP/ADP Nonequilibrium
Living ce lls are open, steady-state systems, fa r from
thermodynamic equilibrium . C e llu la r homeostasis re flec ts th is dynamic
steady-state, where average rates of component formation and
degradation are equal but resultant concentrations are not in true
thermodynamic equilibrium . Although the steady-state increases
entropy (irre v e rs ib le process), the rate of entropy production is
minimized (Lehninger, 1975). Nonequilibrium enables the ce ll to
perform useful work and establish an e f f ic ie n t regulatory system.
The term, "high energy bond," denotes a large and negative free
energy change between products and reactants (Lipmann, 1941). That
is , product formation is heavily favored. Activated intermediates,
held by these re la tiv e ly weak bonds, are thermodynamically highly
ava ilab le . Lehninger (1971) outlines two features which are
responsible fo r the large and negative value fo r the standard free
energy of hydrolysis of ATP: 1) strong e le c tric a l repulsion w ithin
the polyphosphate portion of the ATP molecule, which at pH 7.0 , has
four negative charges very near to each other (Figure A l) , and 2)
resonance s ta b iliza tio n between ADP and Pj upon formation.
The observed standard ( i . e . equilibrium ) free energy of
hydrolysis of ATP under approximate physiological conditions (pH 7 .0 ,
ionic strength .25 , 38°C, water at unit a c t iv ity , 1 mM Mg++) is -7.60
kcal mole"! (Guynn and Veech, 1973). In tra c e llu la r Mg++ concentration
must be specified, since much of the ATP and ADP is complexed with
Mg++ at physiological pH (P h illip s et a l . , 1969). The nonstandard
195
Figure Al. Adenylate and component structures at pH 7.0.** denotes high energy bond. Adapted from Lehninger (1971).
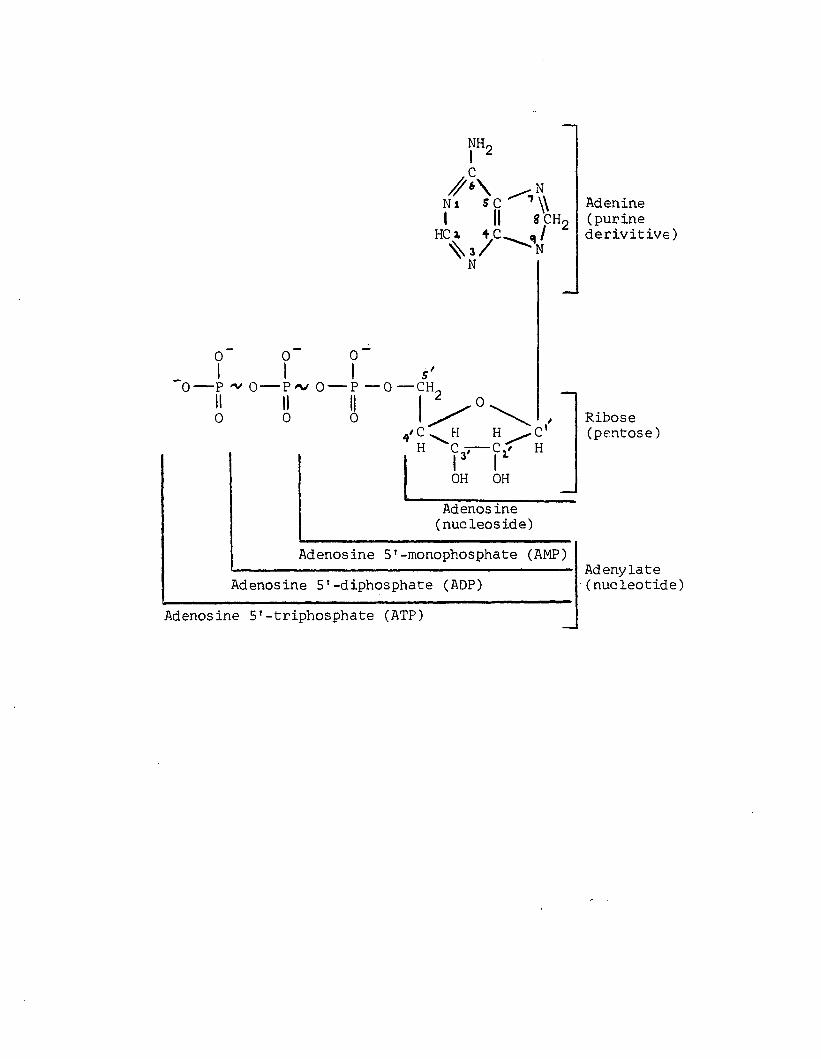
o-
0I-P 'V 0-I!o
m 0 I 2
yc
N l SCI II
HC X 4C. ^ 3 /
N
0 0I I-Pa / 0 — PII II0 0
s■0 — CH,
* 'c :
0
HH
* 9 3~
7WS CH,
j 1 ‘N
HH
OH OHAdenosine (nucleoside)
Adenosine 5'-monophosphate (AMP)
Adenosine 5'-diphosphate (ADP)
Adenine(purinederivitive)
Ribose (pentose)
Adenylate(nucleotide)
Adenosine 5'-triphosphate (ATP)
( i . e . non-equilibrium) free energy of hydrolysis of ATP, in v ivo, is
near -11.5 kcal mole-1 (Atkinson, 1977a), re flec tin g the
nonequilibrium ATP/ADP ra t io . The ATP/ADP ra tio under equilibrium and
nonequilibrium conditions can be compared, using these free energy
change values. Tables Al and A2 summarize free energy relationships
and relevant calcu lations, respectively.
I t is c lear that the ATP/ADP ra t io , in v ivo, is maintained at
about 108 times greater than the equilibrium ra tio by e ff ic ie n t
k in etic controls (Atkinson, 1977a). This large nonequilibrium ATP/ADP
ra tio provides the driving force fo r nearly a ll metabolic reactions
through ATP coupling. Energy conserved in ATP (by ADP
phosphorylation) functions to maintain the ATP/ADP ra tio fa r from
equilibrium .
Coupling and Evolutionary Significance
The large and negative free energy of ATP hydrolysis can be
coupled to unfavorable thermodynamic reactions to e ffe c t a useful
conversion. The overall K is the product of individual reaction K
values. Equivalently, the overall standard free energy change (aG°)
is the sum of individual reaction aG° values. Whenever 1 mole of ATP
is coupled to another reaction, the e ffec tive equilibrium ra tio is
increased (ATP hydrolyzed) or decreased (ADP phosphorylated) by a
factor of about 108 (Atkinson, 1977a). Coupled ATP reactions promote
u n id ire c tio n a lity of metabolic pathways, avoid thermodynamically
unfavorable pathways, and exp lo it low substrate leve ls .
As an e ffe c tive coupling agent, the ATP/ADP system must be
thermodynamically unstable but k in e tic a lly stable. Both of these
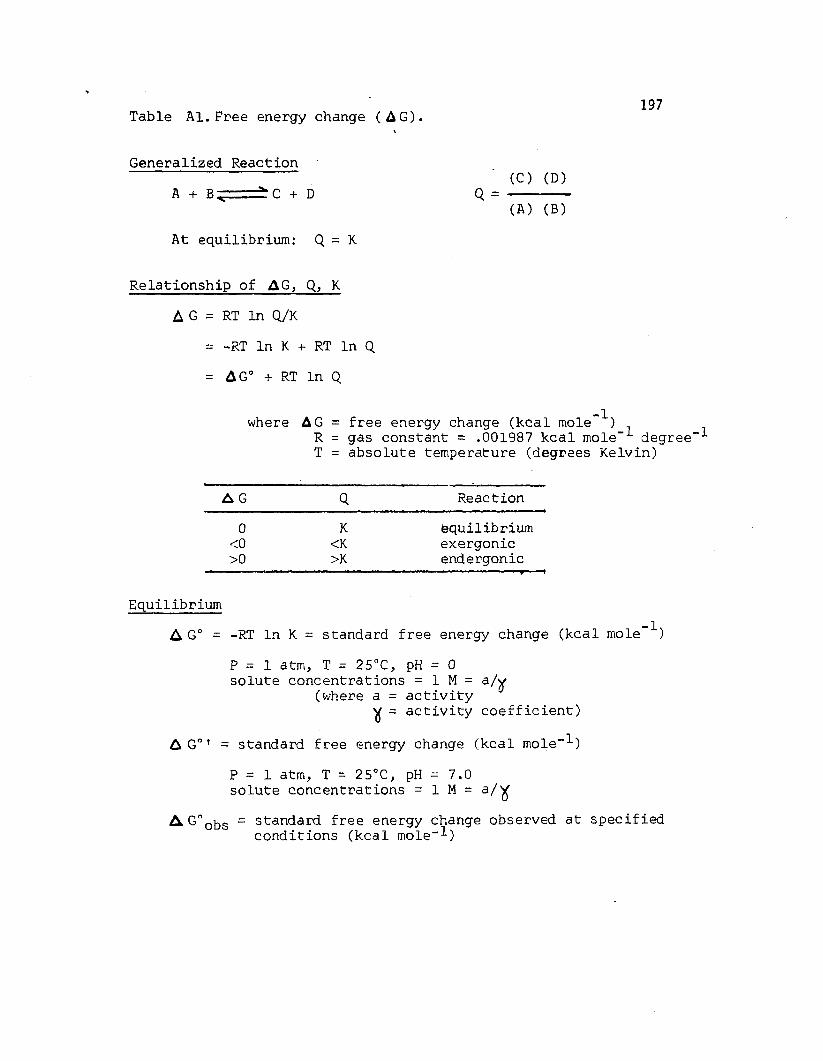
Table Al. Free energy change (AG).
Generalized Reaction' (C) (D)
A + B . C + D Q =
197
(A) (B)
At equilibrium: Q = K
Relationship of AG, Q, X
A G = RT In Q/K= -RT In K + RT In Q
= AG° + RT In Q
where A G = free energy change (kcal mole" )R = gas constant = .001987 kcal mole" degree T = absolute temperature (degrees Kelvin)
A G Q Reaction
0 X equilibrium<0 <K exergonic>0 >K endergonic
EquilibriumA G° = -RT In K = standard free energy change (kcal mole "'')
P = 1 atm, T = 2 5°C, pH = 0 solute concentrations = 1 M = a/y
(where a = activity^ = activity coefficient)
A G° ' = standard free energy change (kcal mole--'-)
P = 1 atm, T = 25°C, pH = 7.0 solute concentrations = 1 M = a/y
A G°0bs ~ standard free energy change observed at specified conditions (kcal mole--'-)
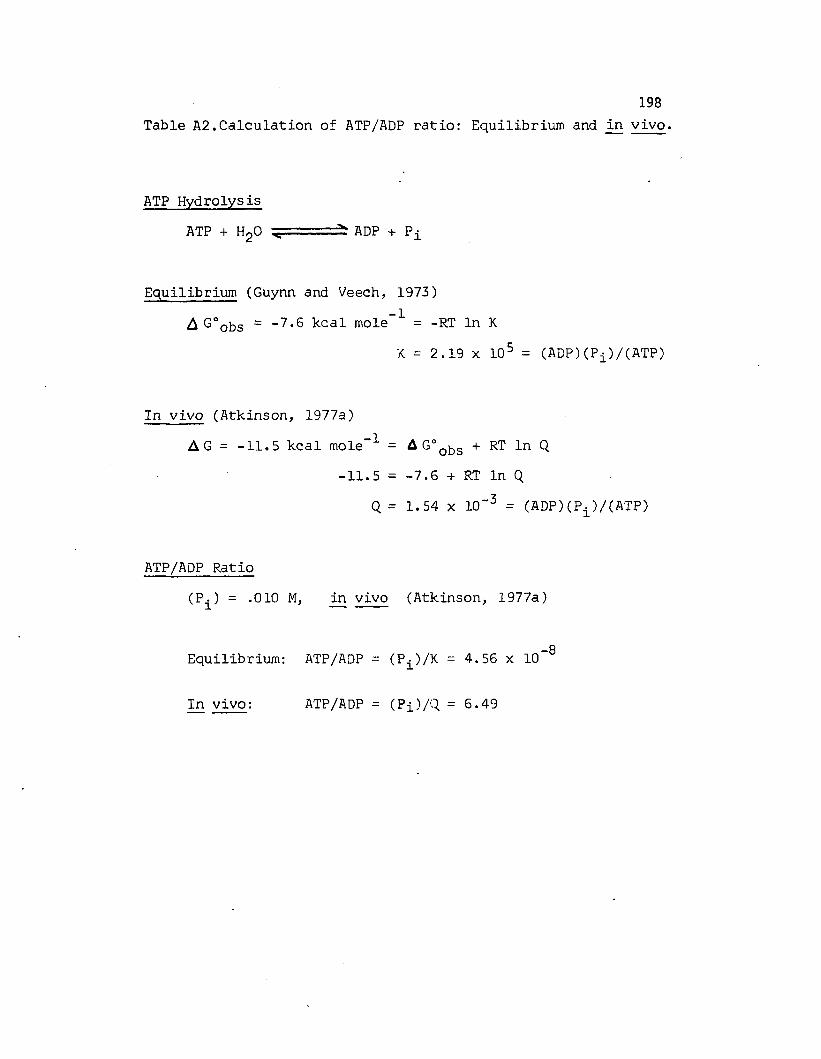
198T a b le A2 . C a lc u la t i o n o f ATP/ADP r a t i o : E q u i l ib r iu m and i n v i v o .
ATP Hydrolysis
ATP + H20 v ADP + Pi
Equilibrium (Guynn and Veech, 1973)
A G°obs = -7.6 kcal m o le ^ = -RT In KK - 2.19 X 105 = (ADP) (Pj^)/(ATP)
In vivo (Atkinson, 1977a)A G = -11.5 kcal mole-1 = A G ° obs +
-11.5 = -7.6 + RT
Q = 1.54 x 10
ATP/ADP Ratio
(P^) = .010 M, in vivo (Atkinson, 1977a)
RT In Q In Q
“3 = (ADP)(P.)/(ATP)
Equilibrium: ATP/ADP = (P^/K = 4.56 x 10⁻⁸
In vivo: ATP/ADP = (Pi)/Q = 6.49
requirements are met. The ATP/ADP ra tio is fa r from equilibrium
(thermodynamic in s ta b i l i ty ) , and enzymic catalysis is required to
hydrolyze ATP or phosphorylate ADP (k in e tic s ta b i l i t y ) .
I f aG0 ' fo r the terminal phosphate group of ATP is taken as -7 .3
kcal mole" 1 (Lehninger, 1971), e ffic ien cy of free energy recovery can
be calculated:
% Effic iency = (Number of ATP's formed) (aG0 ' ATP) x iqo(AG6 * Reaction)
E ffic ienc ies of g lycolysis, respiratory chain phosphorylation, and the
complete oxidation of glucose are lis te d in Table A3. The in vivo
e ffic iency of glucose oxidation may approach 60% (Lehninger, 1971).
The functional design of metabolic regulation is a resu lt of
evolutionary selection . This design (Figure A2) incorporates coupling
and correlation between catabolism and anabolism. Catabolic sequences
regenerate ATP and other energized couplers (e .g . NADPH, NADH, FADH2 ) ,
whereas anabolic processes require these couplers. Catabolic
sequences which supply the starting materials fo r biosynthesis (e .g .
glycolysis, TCA cycle, pentose shunt) are sometimes termed,
"amphibolic," to indicate th e ir dual catabolic and anabolic functions.
Evolved coupling stoichiom etries, l ik e a ll phenotypic characters,
re fle c t compromise. This compromise is apparent from examination of
catabolic pathways. Glycolysis, fo r example, would proceed with an
even larger overall K, without ATP coupling. Since glycolysis does
involve ATP coupling, the evolutionary significance ( i . e . functional
value of ATP regeneration) is evident. Evolutionary design is
sensitive to overall metabolic need.
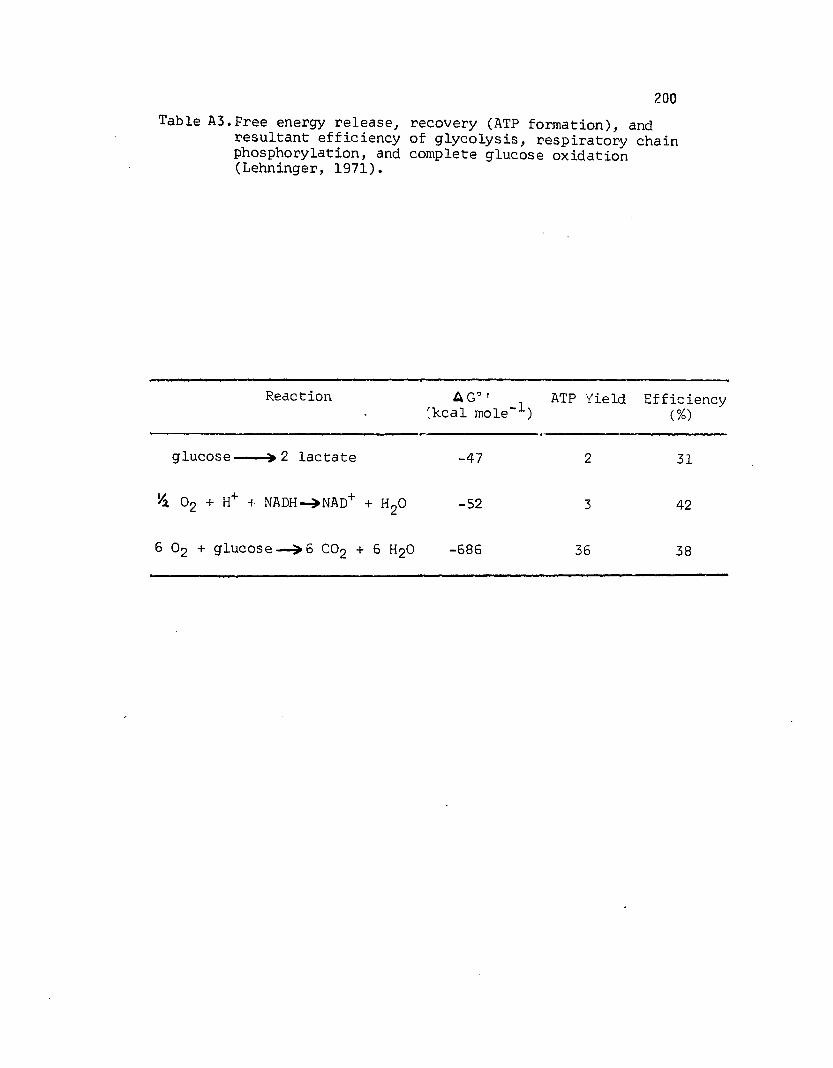
Table A3.Free energy release, recovery (ATP formation), andresultant efficiency of glycolysis, respiratory chain phosphorylation, and complete glucose oxidation (Lehninger, 1971).
Reaction A G ”(kcal mole )
ATP Yield Efficiency(%)
glucose----> 2 lactate -47 2 31
Yx 0 2 + H+ + NADH->NAD+ + H20 -52 3 42
6 02 + glucose— > 6 C02 + 6 H20 -686 36 38
201
Figure A2. Metabolic design of a photoautotrophic and heterotrophic cell. Adapted from Atkinson (1977a).
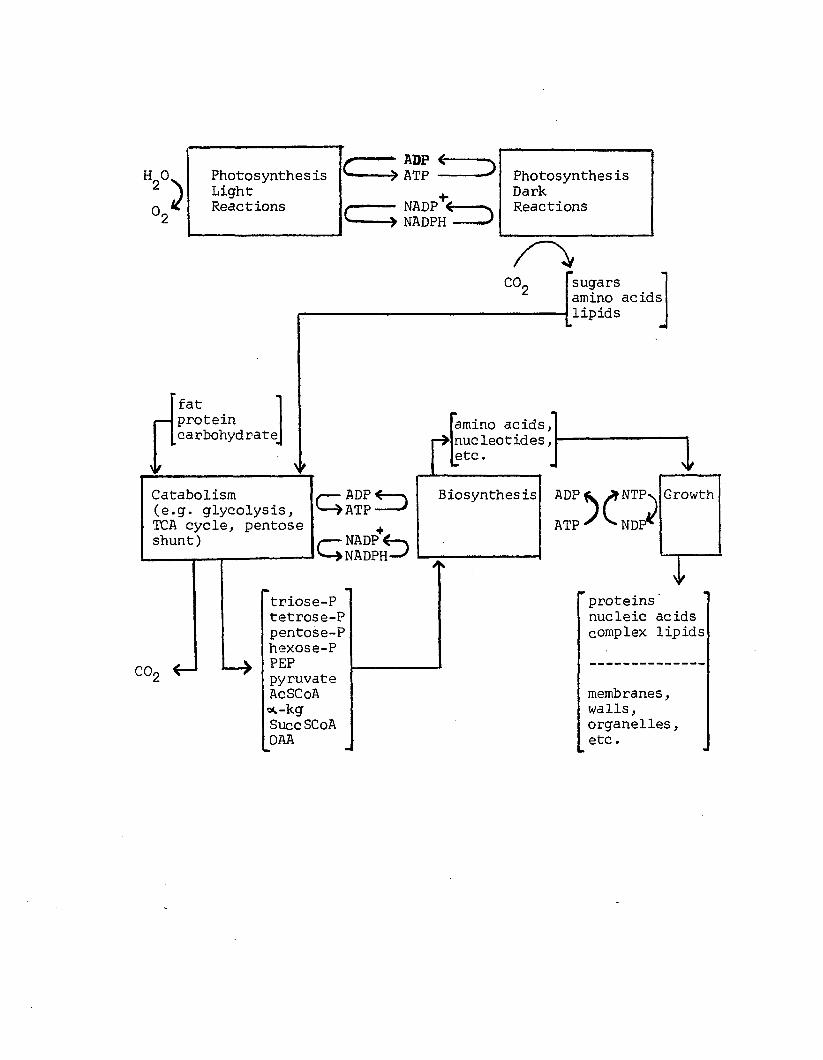
h 2 °
0 ,
“ ADP <:» ATP -
- NADP <- » NADPH ■
Photosynthes is DarkReactions
PhotosynthesisLightReactions
CO, sugars amino acids lipids
fatprotein amino acids,carbohydrate^
r > nucleotides,etc.
>' 1 _ 1* •
Catabolism (e.g. glycolysis, TCA cycle, pentose shunt)
COr
f— ADP < v1— > AT P--- *
•NADP
triose-Ptetrose-Ppentose-Phexose-P
— ^ PEPpyruvateAcSCoAoc-kgSuccSCoAOAA
Biosynthesis ADPfV. > N T P
ATP *
Growth
proteins' nucleic acids complex lipids
membranes, walls, organelles, etc.
202
ATP Use and D istribu tion
The adenine nucleotides partic ipa te d ire c tly or in d ire c tly in
nearly a ll metabolic energy transductions. Some of these conversions
include catabolism (e .g . g lyco lysis , TCA cycle, pentose shunt),
anabolism (chemical and photosynthesis), mechanical work (e .g . muscle
contraction, ce ll d iv is io n ), osmotic work (e .g . active transport of
Na+, K+) , and several specialized reactions (e .g . bioluminescence).
The adenylate pool is necessarily d istributed throughout the c e l l .
Depending on ce ll type ( i . e . prokaryote vs. eukaryote, autotroph vs.
heterotroph) and its associated structures, the adenine nucleotides
are located in the cytosol (e .g . g lycolysis , pentose shunt),
mitochondria (TCA cycle, electron transport chain), chloroplast grana
( lig h t reactions of photosynthesis) and stroma (dark reactions of
photosynthesis), nucleus (nucleic acid synthesis), and associated with
membranes (active transport) and ribosomes (protein synthesis).
ATP Regeneration
The half-tim e of turnover of ATP is on the order of seconds fo r
rapidly respiring bacteria and 1-2 minutes fo r slowly respiring
eukaryotic ce lls (Lehninger, 1975). That is , the amount of ATP
regenerated (or consumed) per second by bacteria is about equal to the
steady-state amount of ATP in the c e ll (Atkinson, 1977a), which ranges
from .001-.01 M or about .5 -5 .0 mg m l"l (Lehninger, 1971). Erecinska
and Wilson (1978) have calculated that a resting human consumes about
40 kg ATP/24 hrs. During strenuous exercise, the ATP u t il iz a t io n rate
is approximately .6 kg ATP min"*.
Enzymic phosphorylation of ADP to regenerate ATP proceeds by
substrate, oxidative, and/or photophosphorylation. These three modes
of phosphorylation are b r ie f ly reviewed.
Phosphorylation by organic substrates occurs mainly in the
cytosol. Phosphate compounds with a large and negative free energy of
hydrolysis (e .g . phosphoenolpyruvate, 1-3 diphosphoglycerate,
phosphocreatine, acetyl phosphate) donate phosphate to ADP. Both
phosphoenolpyruvate and 1-3-diphosphoglycerate partic ipa te in
glycolysis. Phosphocreatine functions as a "high energy" phosphate
reservoir, p a rtic u la rly in muscle and nerve c e lls (Lehninger, 1971).
Nucleoside triphosphates (NTP), including GTP, CTP, UTP, dATP, dTTP,
dGTP, and dCTP, can phosphorylate ADP in reversible reactions. A ll
NTP's have the same standard free energy of hydrolysis as ATP.
Oxidative phosphorylation (respiratory chain phosphorylation)
occurs within the cris tae of the inner membrane of the mitochondrion
under aerobic conditions. In a highly exergonic reaction, ATP is
formed as electrons flow from NADH or FADH2 to O2 along a series of
cytochromes (S tryer, 1975). Three ATP's are regenerated per NADH
oxidized (P/0 = 3 ), whereas two are regenerated per FADH2 oxidized
(P/0 = 2 ) . Normally, "state 3" respiration occurs in which electron
transport (oxidation of NADH and FADH2 ) is t ig h tly coupled to ADP
phosphorylation. In contrast, "state 4" respiration is not coupled to
ATP generation. The respiratory control rate (s ta te 3 /s ta te 4)
characterizes the tightness of coupling between substrate oxidation
and phosphorylation.
Photophosphorylation, cyc lic and noncyclic, occurs in the
chloroplast grana during the lig h t reactions of photosynthesis.
Theoretical electron flow patterns (Z scheme) and the formation of
ATP, NADPH, and O2 are diagrammed in Figure A3. In cyclic electron
flow (involving Photosystem I ) , l ig h t energy excites chlorophyll
electrons, causing them to leave the molecule. As the electrons pass
along a c ircu la r chain of carriers back to chlorophyll, they lose
energy, some of which is coupled to ADP phosphorylation. In noncyclic
electron flow (involving Photosystems I and I I ) , lig h t-exc ited
electrons flow from chlorophyll along a series of ca rrie rs to NADP+ ,
resu lting in NADPH and ATP formation. Noncyclic photophosphorylation
requires both an external electron donor (H2O) and acceptor (NADP+) ,
whereas cyclic photophosphorylation requires neither of these. The
function of cyclic electron flow may be to generate ATP, without the
necessity of concomitant generation of NADPH and O2 (Lehninger, 1971).
Recently, Arnon et a l . (1981) have proposed an a lte rn a tive to the Z
scheme, viewing the two photosystems as basically autonomous.
Three hypotheses fo r the mechanism of oxidative and
photophosphorylation d if fe r with respect to the intermediate which
transfers energy from the redox reactions of electron transport to ATP
synthesis: 1 ) chemical coupling involves a high energy, covalently
bonded interm ediate, 2 ) conformational coupling suggests a high energy
conformational s ta te , and 3) chemiosmotic coupling proposes an
electrochemical trans-membrane pH gradient, as the coupling veh icle .
The chemiosmotic hypothesis (M itc h e ll, 1976) has received the most
support. In th is hypothesis, electron transport pumps protons outward
across the inner membrane of the mitochondrion (oxidative
205
Figure A3. Electron transport in oxygen-evolving photosynthesis in plants, diagrammed in terms of the standard redox potentials (E0 ) of the interacting redox couples. Adapted from Lehninger (1975).
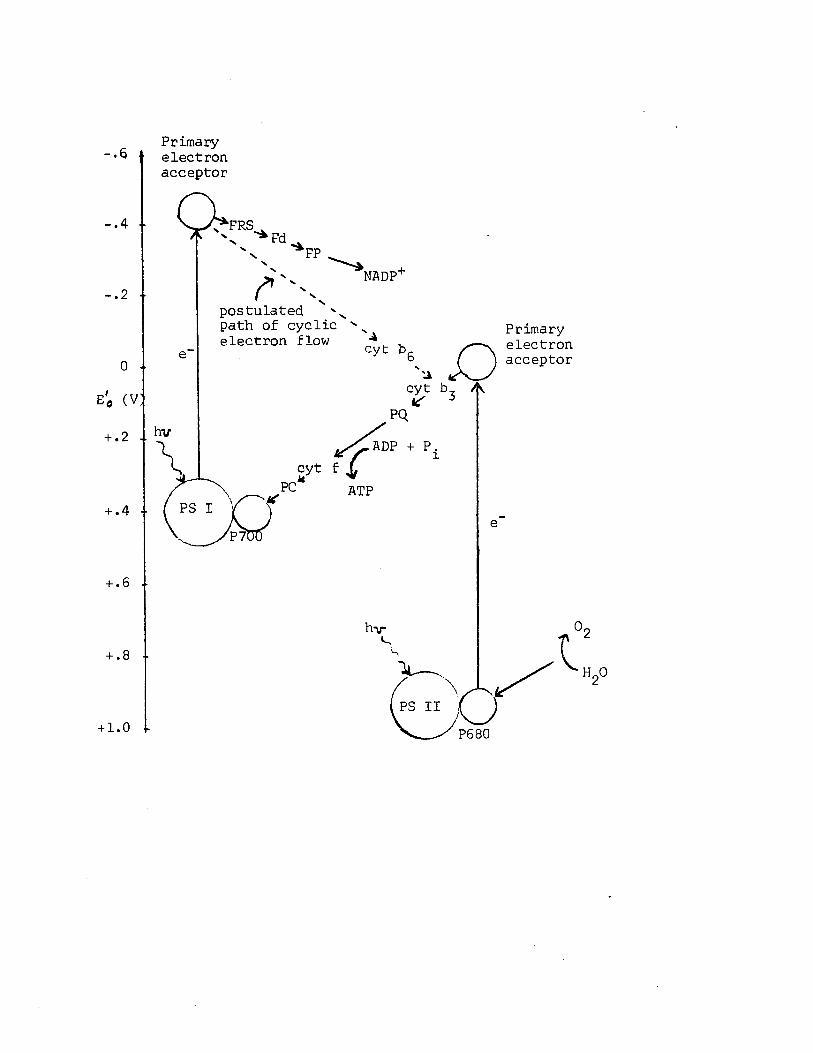
- . 4
- . 2
0
E'o (V
+ .2
+ • 4
+ • 6
+ . 8
+ 1.0
Primaryelectronacceptor
'FRSFd
FPNADP'
postulated ' path of cyclic electron flow Primary
electronacceptorcyt b
hvADP + P.
cyt fPC ATP
PS IP7i
P680
phosphorylation) or inward across the thylakoid membrane of the
chloroplast (photophosphorylation). The resultant proton motive force
(pmf) is comprised of two components: a membrane potential and a
proton gradient (Jensen, 1980). Collapse of the pmf provides the
driving force fo r ATP synthesis.
Energy Charge
The adenine nucleotide pool (AMP + ADP + ATP) can be considered
as a chemical energy storage system with the following
interconversions (Atkinson, 1977a):
2 ADP + 2 Pi v ------ ^ 2 ATP + H20
adenylate kinase AMP + ATP ^ 2 ADP
The system is fu lly charged when a ll adenylate is converted to ATP and
fu lly discharged when only AMP is present. From the adenylate kinase
reaction, 2 moles of ADP are required to produce 1 mole of ATP. On a
molar basis, ADP contributes h a lf the amount of energy as ATP, since
ATP contains two phosphoanhydride ("high energy") bonds and ADP
contains only one.
The adenylate energy charge (EC) has been defined by Atkinson and
Walton (1967):
EC - CATP] + 1/2 [ADP][ATP] + [ADP] + [AMP]
As the "effective" mole frac tio n of ATP ( i . e . the actual mole fraction
of ATP plus h a lf the mole frac tion of ADP), EC represents a lin ear
measure of the metabolic energy stored in the adenylate pool.
Numerically, the charge ranges from 0 (a ll AMP) to 1 (a ll ATP) and is
equal to h a lf the average number of anhydride-bound phosphate groups
per adenosine moiety.
I f the adenylate kinase reaction is assumed to be at equilibrium ,
the re la tiv e amounts of AMP, ADP, and ATP are fixed as a function of
EC (Kremen, 1976). The apparent K fo r the adenylate kinase reaction
varies with Mg++ concentration, since ATP binds Mg++ to a greater
extent than e ith er ADP or AMP. The value of K, in v ivo, is uncertain,
although i t is probably near 1.0 (Atkinson, 1977a). The re la tiv e
concentrations of AMP, ADP, and ATP, as a function of EC, are graphed
in Figure A4. The adenylate kinase reaction is assumed to be at
equilibrium , and a value of 1.2 is used as the e ffe c tive K, in the
direction shown.
Regulatory Mechanisms
Metabolic regulatory mechanisms are reviewed by Pradet and Bomsel
(1978). Regulation can be partitioned into coarse (e .g . enzyme
amount) and fin e (e .g . enzyme a c t iv ity ) control mechanisms. EC,
phosphorylation sta te ([A TP ]/[A D P ][P j]), redox charge ([NADH +
NADPH]/[NAD + NADH + NADP + NADPH], i . e . degree of saturation in
electrons of pyridine nucleotides), pH, mono- and divalent cations,
and inorganic phosphate (P-j) exert regulatory influence. In addition,
c e llu la r compartmentation (eukaryotes) and d is tin c t paired reaction
pathways fo r biosynthesis and degradation f a c i l i ta te regulation
(S tryer, 1975).
208
Figure A4. Relative adenine nucleotide concentrations, as a function of energy charge. Adapted from Atkinson (1977a).
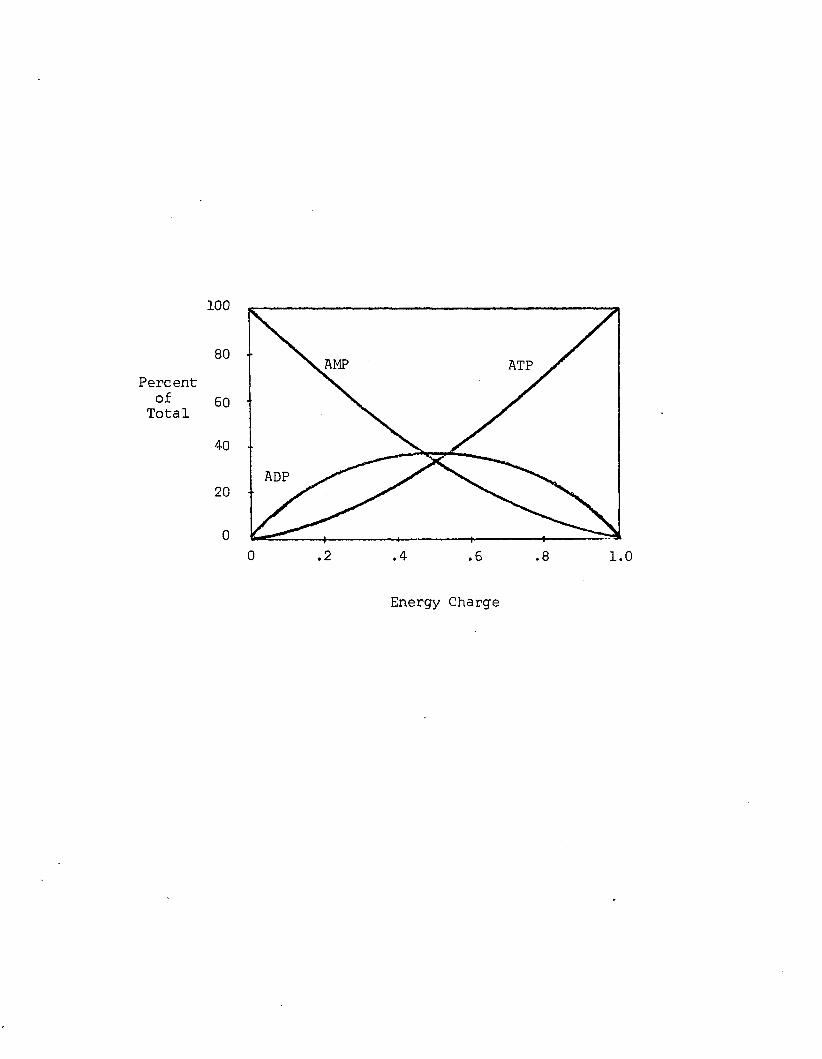
Percentof
Total
100
80 AMP ATP
60
40
ADP20
00 .2 .4 .6 .8 1.0
Energy Charge
Since nearly a ll c e llu la r reactions are enzyme-catalyzed,
metabolic regulation is achieved by contro lling type and rate of
enzyme function (Hochachka and Somero, 1973). Rates of catalysis are
regulated by amount and/or a c t iv ity of enzymes. Regulation by
changing enzyme amount results in slower, less sen sitive , but more
v ers a tile response, re la tiv e to a change in enzyme a c t iv ity . The
amount or concentration of enzyme can be controlled at four leve ls :
1) transcrip tion (operon model), 2 ) tran s la tio n (primary protein
stru c tu re ), 3) protein assembly (secondary through quintinary protein
s tru c tu re ), or 4) degradation. Enzyme a c tiv ity is dependent on
substrate concentration and physical variables (e .g . temperature,
pressure). Other factors which may influence a c tiv ity are cofactor
a v a ila b il i ty , covalent m odification, p ro teo lytic ac tiva tio n , hormonal
le v e ls , and enzyme modulators. Modulators (both positive and
negative) provide rapid , accurate, and sensitive regulation.
Regulatory or a llo s te ric enzymes are s tra te g ic a lly positioned in
multi-enzyme sequences at metabolic branch points and have both a
c a ta ly tic ( i . e . substrate) and regulatory ( i . e . modulator) s ite . In
most cases, modulators exert th e ir e ffec t by a lte ring the
enzyme-substrate (E-S) a f f in i ty , and not the Vmax potential of the
enzyme (Hochachka and Somero, 1973). Since physiological substrate
concentrations usually sub-saturate enzymes (near the region o f the Km
or S. 5 value), enzymic rates are highly sensitive to changes in th is
E-S a f f in i ty , and thus highly sensitive to modulation.
Modulators include adenine and pyridine nucleotides, as well as
specific metabolites (e .g . pathway end product in h ib ito rs ). Hochachka
210
and Somero (1973) suggest that EC modulation is a re la tiv e ly coarse
metabolic control which is f in e ly tuned by specific product
modulation. For example, a high EC stimulates A TP-utilizing pathways
in general, and a specific metabolite designates which energy
requiring process is needed in p a rtic u la r.
Energy Charge Regulation
Since they are operationally linked with nearly a ll metabolic
sequences, i t is apparent that adenine nucleotides are s tra te g ic a lly
adapted to metabolic regulation (Atkinson, 1977a). This statement is
supported by the following two observations.
F irs t, nearly a ll enzymic phosphate transfers involve ATP and ADP
( i . e . common interm ediate). The ATP/ADP couple occupies an
intermediate position among activated phosphate compounds (Figure A5).
Phosphate transfer from high energy donors (e .g . PEP) to low energy
acceptors (e .g . G-6-P) must funnel through the ATP/ADP system. This
fa c il i ta te s regulation.
Secondly, four ribonucleoside triphosphates (ATP, GTP, CTP, UTP)
and four deoxyribonucleoside triphosphates (dATP, dGTP, dCTP, dTTP)
channel ATP energy into d iffe re n t biosynthetic pathways (Figure A6 ) .
Among nucleoside diphosphates (NDP), only ADP accepts phosphate groups
during g lycolysis, and oxidative and photophosphorylation. Thus, ATP
is required to phosphorylate a l l NDP's by reversible reactions,
catalyzed by nucleoside diphosphokinase (NDPK):
NDPKATP + NDP^zr±ADP-+ NTP (K = 1 .0 ) .
211
Figure A5. Phosphate transfer from high energy donors to low energy acceptors. Adapted from Lehninger (1971).
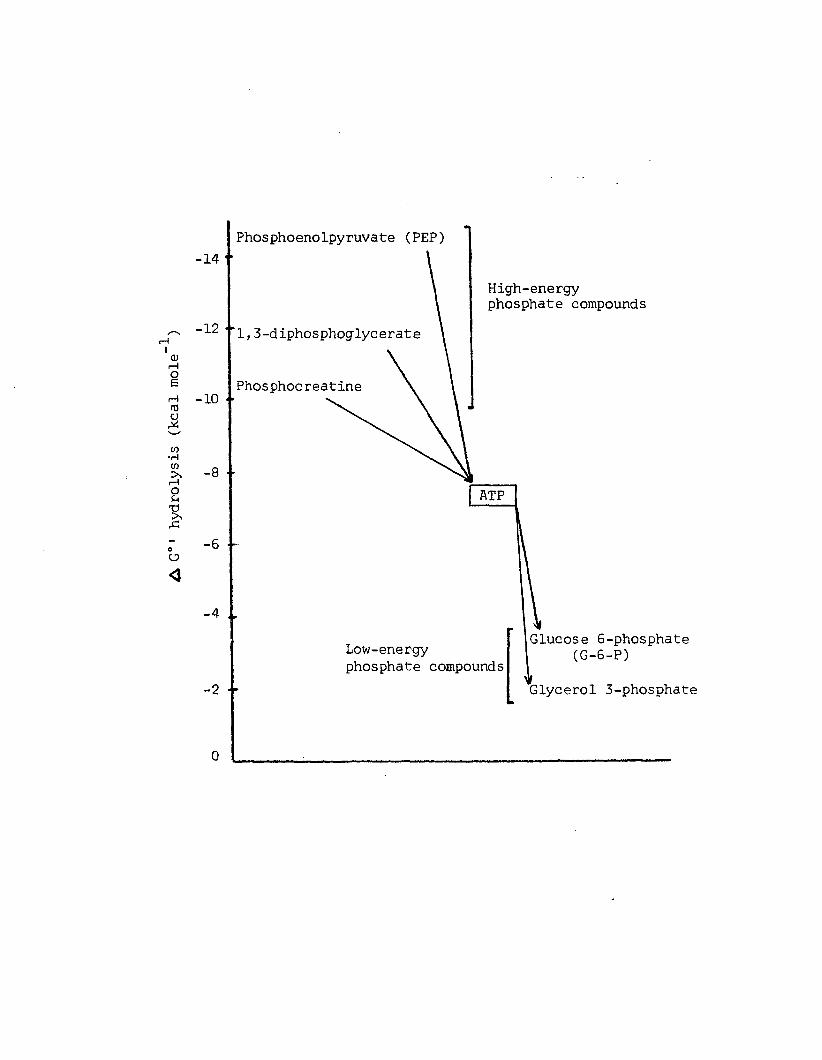
& G°
’ hy
drol
ysis
(kcal
mole
Phosphoenolpyruvate (PEP)-14 "
High-energy phosphate compounds
“12 ‘’1,3-diphosphoglycerate
Phosphocreatine-10 ••
-8
ATP
-6
-4Glucose 6-phosphate
(G-6-P)Low-energy phosphate compounds
Glycerol 3-phosphate
212
Figure A6. Channeling of ATP phosphate bond energy into specific biosynthetic pathways. Adapted from Lehninger (1971).
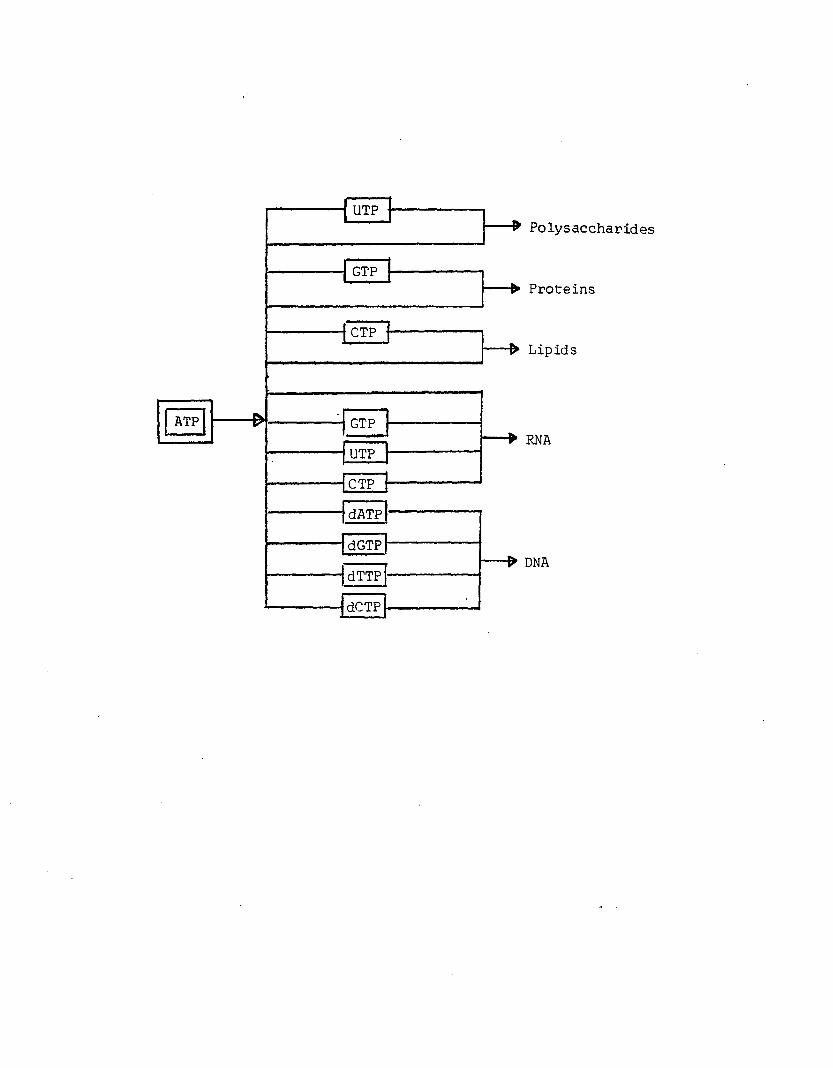
{UTP& Polysaccharides
> Proteins
■> Lipids
RNA
dATP
^ DNA
CTPUTP
dGTP
dTTP
CTP
dCTP
GTP
GTPATP
213
This adaptation may have evolved, so that macromolecular
syntheses could be regulated by the adenylate system. As a logical
extension, Atkinson (1977a) suggests that NDPK is a key control enzyme
which partitions the use of ATP between macromolecular syntheses and
other A TP-utiliz ing processes.
EC regulates metabolic sequences by contro lling enzymic rates of
reactions which are coupled to the use (U) and regeneration (R) of
ATP, as shown in Figure A7. Only key enzymes at metabolic branch
points need be contro lled , since these enzymes catalyze the " f ir s t
committed reaction" in a sequence (Atkinson, 1977b). Reciprocally, EC
is s tab ilized by corresponding regulatory enzymes, in the range where
the curves intersect in Figure A7, near a value of 0.85 (e .g . Chapman
et a l . , 1971). This general pattern (Figure A7), considered a
weighted average of R and U sequences, is derived from in v itro
studies but lends strong support to the contention that EC functions
as a regulatory parameter in v ivo .
Regulation of g lycolysis, the TCA cycle, and the electron
transport chain (Lehninger, 1971) provides an example of enzyme
response to EC or more s p e c ific a lly , the ATP/ADP ra t io . In
glycolysis, phosphofructokinase (PFK) a c t iv ity is increased with high
ADP concentration (positive modulation) and decreased with high ATP
concentration (negative modulation):
ADP, AMP
PFK > , PFK(in a c tive ) ATP, c itra te (active )
214
Figure A7. Velocity of reactions which regenerate (R) and utilize (U) ATP, as a function of energy charge. Adapted from Atkinson (1977a).
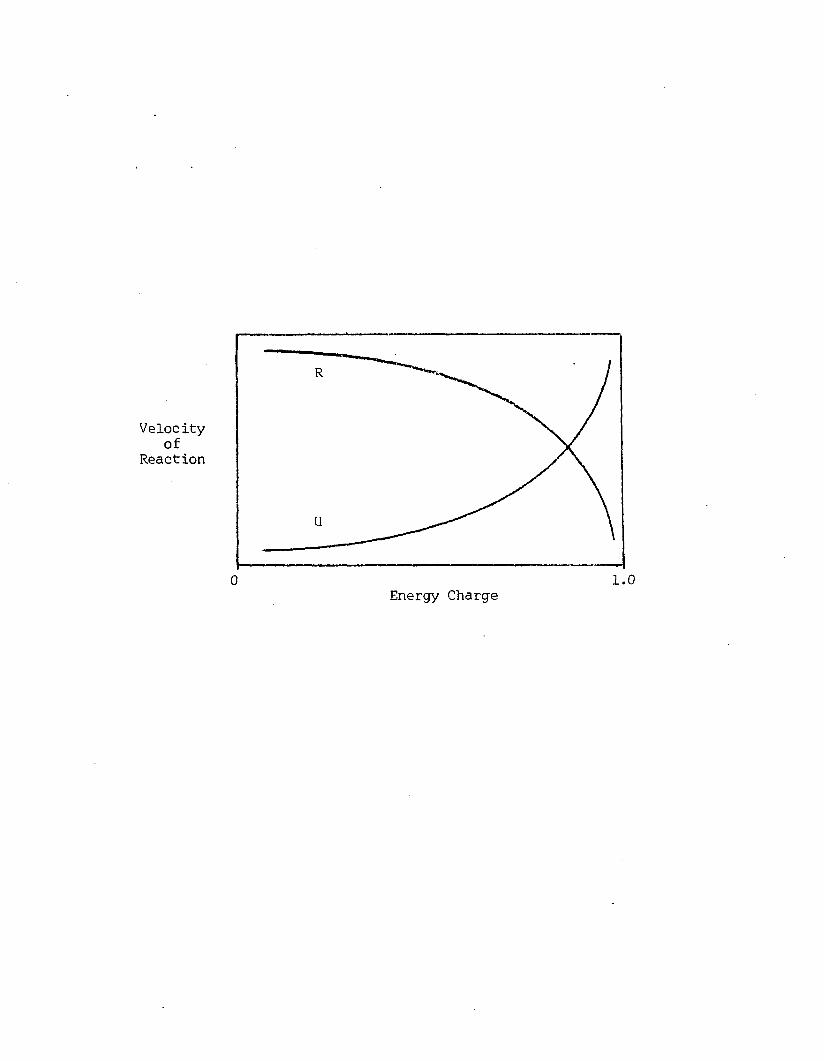
Velocity of
Reaction
0Energy Charge
1.0
215
I f ATP concentration is greater than is required fo r saturation of
PFK, c a ta ly tic a c t iv ity is.depressed. As an end product of
resp ira tion , ATP serves as a feedback in h ib ito r . In the TCA cycle,
is o c itra te dehydrogenase (IDH) a c t iv ity is modulated in a sim ilar
I t follows that whenever the ATP/ADP ra tio is larger than its
steady-state value, both the rates of glycolysis and the TCA cycle are
decreased. The rates of glycolysis and the TCA cycle are integrated
through negative modulation o f PFK by c it r a te ( i . e . i f c itra te is
being overproduced, PFK a c t iv ity is th ro ttle d down). Within the
respiratory chain, the rate of electron transport decreases and the
carrie rs become more reduced when the ATP/ADP ra tio is high.
Regulation of glycolysis and respiration is diagrammed in Figure A8 .
Glycolysis and respiration have se lf-regu la tory features,
involving the adenine nucleotides. G lycolytic and respiratory rates
are adjusted to s ta b iliz e the large nonequilibrium ATP/ADP ra t io . In
th is way, glycolysis and respiration are geared to metabolic demand
The central thermodynamic feature of metabolic organization ( i . e .
unidirectional paired pathways with evolved ATP coupling
stoichiom etries) and the k inetic feature ( i . e . correlated control
between these pathways) are functionally interdependent. K inetic
manner:
IDH “ (in a c tive )
, , . - IDHATP, NADH (active )
fo r ATP
216
Figure A8. Regulation of glycolysis, TCA cycle, and electron transport chain by positive (ADP) and negative (ATP, citrate) modulation. Adapted from Lehninger (1971).
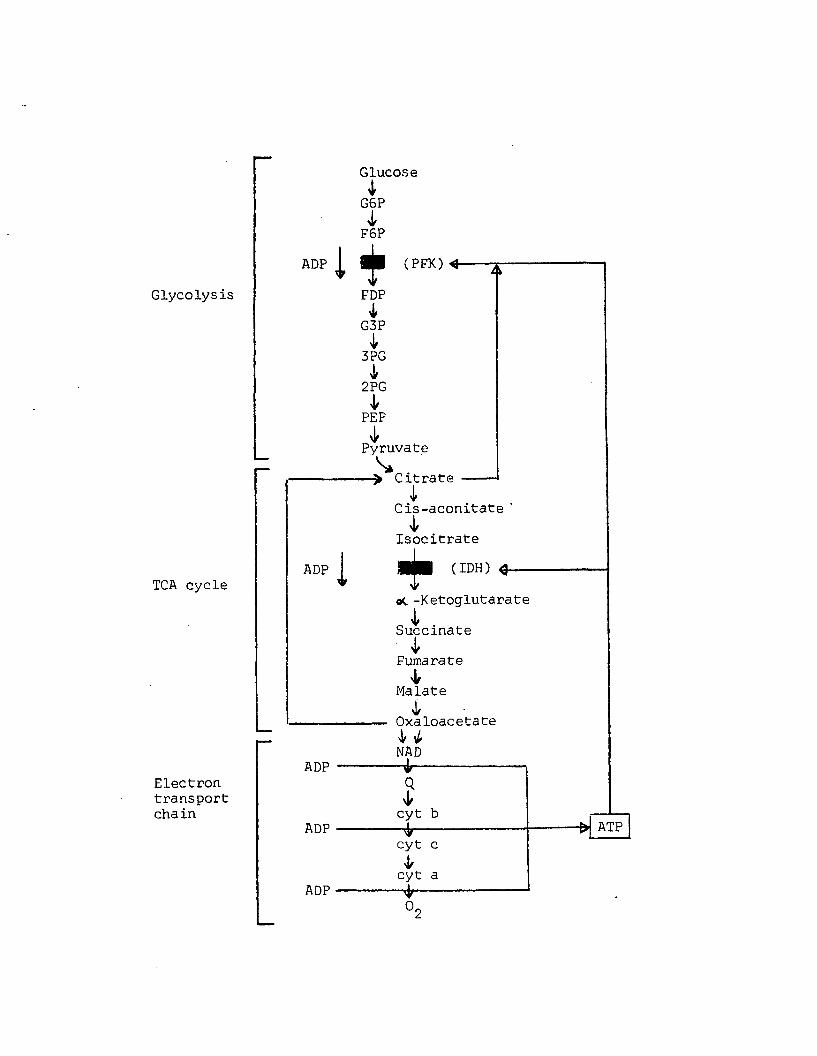
Glycolysis
TCA cycle
Electrontransportchain
Glucose4G6P4F6P
ADP (PFK) < -
FDP4G3P43PG42PG4PEP4PyruvateVCitrate --
4Cis-aconitate4Isocitrate
ADP i + (IDH) 4-
<*. -Ketoglutarate4Succinate4Fumarate4Malate4Oxaloacetate
4 4NAD
ADP
ADP
ADP
£cyt bcyt c4cyt a
~ 4 — 0 „
ATP
217
control is mandatory, in v ivo , where c e llu la r component concentrations
are fa r from equilibrium . The adenine nucleotides, most conveniently
expressd in terms of EC, regulate the rates of A TP-utiliz ing and
ATP-regenerating sequences (k in e tic featu re) to maintain an ATP/ADP
ra tio fa r from equilibrium (thermodynamic fe a tu re ). I t is , therefore ,
evident that thermodynamic and k in etic roles of the adenylates are
functionally interdependent.
Energy Charge Controversy and Lim itation
C e llu la r regulation by EC has not received universal acceptance.
Atkinson (1977a) has refuted c ritic ism s , presented by Banks and Vernon
(1970) on the role of ATP, in v ivo. Atkinson (1977b) and Fromm (1977)
have recently debated the theory of EC regulation. Using computer
simulations, Purich and Fromm (1972, 1973) have shown that to ta l
adenylate pool s ize , pH, free Mg++, k in e tic reaction mechanisms, and
adenylate kinase mass-action ra tio a lte r enzyme response to EC. These
simulations suggest that EC does not regulate enzyme response
e ffe c tiv e ly .
Some experimental evidence is inconsistent with EC theory. Two
examples are c ited which involve higher plants. F irs t , Pradet (1969)
and Raymond and Pradet (1980) have demonstrated s ta b iliza tio n of very
low EC values (near 0 .3 ) , using le ttuce seeds under reduced oxygen
tension. Since modification of EC a t low values is not accompanied by
large changes in the ATP/ADP or ATP/AMP ra tio s , Pradet and Raymond
(1978) suggest th a t low EC values are regulated by mechanisms other
than those described by Atkinson's theory. Second, the regulatory
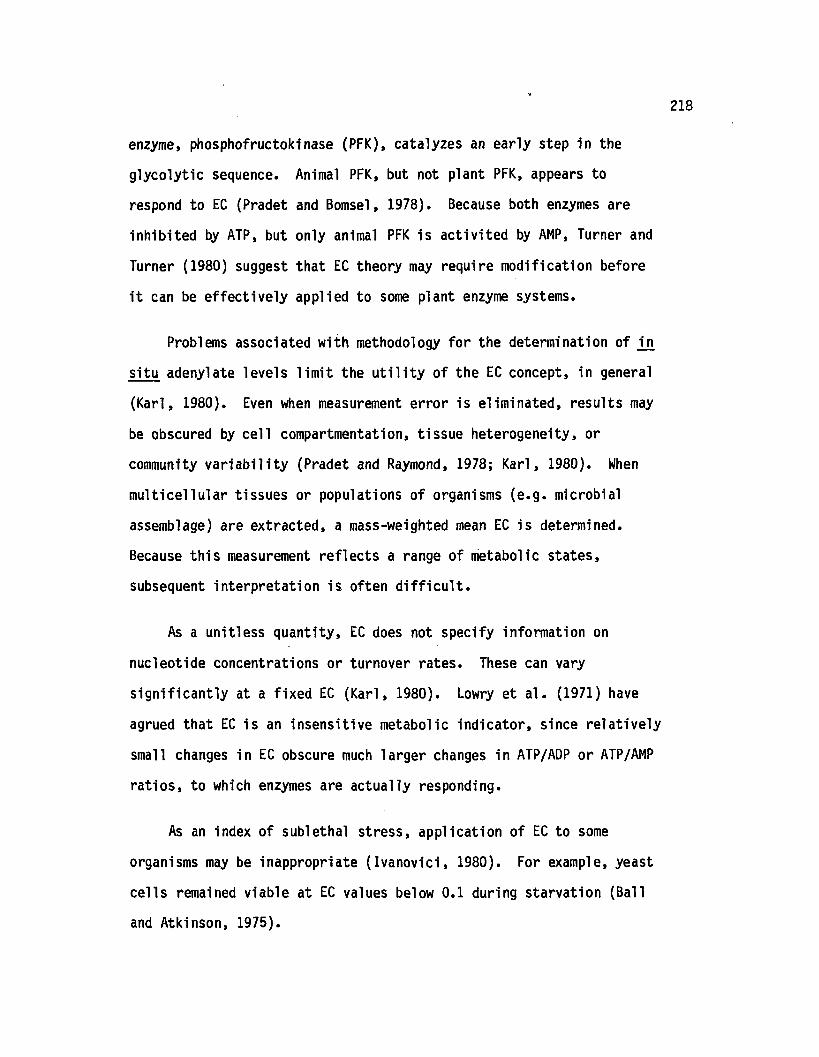
218
enzyme, phosphofructokinase (PFK), catalyzes an early step in the
glycolytic sequence. Animal PFK, but not plant PFK, appears to
respond to EC (Pradet and Bomsel, 1978). Because both enzymes are
inhib ited by ATP, but only animal PFK is ac tiv ited by AMP, Turner and
Turner (1980) suggest that EC theory may require modification before
i t can be e ffe c tiv e ly applied to some plant enzyme systems.
Problems associated with methodology fo r the determination of in
situ adenylate levels lim it the u t i l i t y of the EC concept, in general
(K arl, 1980). Even when measurement e rror is elim inated, results may
be obscured by ce ll compartmentation, tissue heterogeneity, or
community v a r ia b ili ty (Pradet and Raymond, 1978; K arl, 1980). When
multi c e llu la r tissues or populations of organisms (e .g . microbial
assemblage) are extracted, a mass-weighted mean EC is determined.
Because th is measurement re flec ts a range of metabolic states,
subsequent in terp re ta tion is often d i f f ic u l t .
As a unitless quantity, EC does not specify information on
nucleotide concentrations or turnover rates. These can vary
s ig n ifican tly at a fixed EC (K arl, 1980). Lowry et a l . (1971) have
agrued that EC is an insensitive metabolic ind icator, since re la tiv e ly
small changes in EC obscure much larger changes in ATP/ADP or ATP/AMP
ra tio s , to which enzymes are actually responding.
As an index of sublethal stress, application of EC to some
organisms may be inappropriate (Ivan o v ic i, 1980). For example, yeast
ce lls remained viable at EC values below 0.1 during starvation (Ball
and Atkinson, 1975).
REFERENCES
Arnon, D. I . , H. Y. Tsujimoto, and 6. M. S. Tang. 1981. Proton transport in photooxidation of water: A new perspective on photosynthesis. Proc. N atl. Acad. Sci. 78:2942-2946.
Atkinson, D. E. 1977a. C e llu la r energy metabolism and itsregulation. Academic Press, N. Y. 293 p.
Atkinson, D. E. 1977b.' C e llu la r energy contro l. Trends Biochem.Sci. 2:N198-200.
Atkinson, D. E. and G. M. Walton. 1967. Adenosine triphosphateconservation in metabolic regulation. J. B io l. Chem. 242:3239-3241.
B a ll, W. J. and D. E. Atkinson. 1975. Adenylate energy charge in Saccharomyces cerevisiae durinq starvation. J. Bact. 121:975^982.
Banks, B. E. C. and C. A. Vernon. 1970. Reassessment of the role ofATP in vivo. J. Theor. B io l. 29:301-326.
Chapman, A. G ., L. F a ll, and D. E. Atkinson. 1971. Adenylate energy charge in Escherichia coli during growth and starvation . J. Bact. 108:1072-1086.
Erecinska, M. and D. F. Wilson. 1978. Homeostatic regulation of c e llu la r energy metabolism. Trends Biochem. S c i. 3:219-223.
Fromm, H. J . 1977. C e llu la r energy control. Trends Biochem. Sci.2:N198-2Q0.
Guynn, R. and R. L. Veech. 1973. Equilibrium constants of the adenosine triphosphate hydrolysis and the adenosine triphosphate-c itrate lyase reactions. 0. B io l. Chem. 248:6966-6972.
Hochachka, P. W. and G. N. Somero. 1973. Strategies of biochemicaladaptation. WB Saunders Co., Philadelphia. 358 p.
Ivanovici, A. M. 1980. Adenylate energy charge: An evaluation ofa p p lic a b ility to assessment of pollution effects and directions fo r future research. Rapp. P. V. Reun. Cons. in t . Explor. Mer. 179:23-28.
219
220
Jensen, R. G. 1980. Biochemistry of the chloroplast. Pp. 273-313 In: The biochemistry of p lants. Vol. 1, The plant ce ll (N. E.To lbert, e d .) , Academic Press, N. Y.
K arl, D. M. 1980. C e llu la r nucleotide measurements and applications in microbial ecology. M icrobiol. Rev. 44:739-796.
Kremen, A. 1976. Adenylate kinase reaction and energy charge.Application of s ta t is t ic a l thermodynamic formalism to nucleotide pools. Stud. Biophys. 59:29-36.
Lehninger, A. L. 1971. Bioenergetics: The molecular basis ofbiological energy transformations, 2nd Ed. Benjamin-Cummings Pub. Co., Menlo Park, Ca. 245 p.
Lehninger, A. L. 1975. Biochemistry: The molecular basis of ce llstructure and function, 2nd Ed. Worth Pub., In c ., N. Y. 1104 p.
Lipmann, F. 1941. Metabolic generation and u t il iz a t io n of phosphate bond energy. Adv. Enzymol. 1:99-162.
Lowry, 0. H ., J. C arter, J. B. Ward, and L. Glaser. 1971. The e ffe c t of carbon and nitrogen sources on the level of metabolic intermediates in Escherichia c o l i . J. B io l. Chem. 246:6511-6521.
M itc h e ll, P. 1976. Vectorial chemistry and the molecular mechanics of chemiosmotic coupling: Power transmission by p ro tic ity .Trans. Biochem. Soc. 4:399-430.
P h illip s , R. C ., P. George, and R. J . Rutman. 1969. Thermodynamic data fo r the hydrolysis of adenosine triphosphate as a function of pH, Mg++ ion concentration, and ionic strength. J. B io l.Chem. 244:3330-3342.
Pradet, A. 1969. Etude des adenosine-5'-mono, d i , e t triphosphates dans les tissue vegetaux. V. E ffect in v ivo, sur le niveau de la charge energetique, d'un desequilibre indu it entre fourniture et u t il iz a t io n de 1 'energie dans les semences de la itu e .Physiol. Veg. 7:261-275.
Pradet, A. and J. L. Bomsel. 1978. Energy metabolism in plants underhypoxia and anoxia. Pp. 89-118 In: Plant l i f e in anaerobic environments (D. D. Hook and R. M. M. Crawford, ed s .), Ann Arbor Science Pub., Ann Arbor, Mich.
Pradet, A. and P. Raymond. 1978. C e llu la r energy control: Theimportance of methodology. Trends Biochem. Sci. 3 (2 ):39 .
Purich, D. L. and H. J . Fromm. 1972. Studies on factors influencing enzyme responses to adenylate energy charge. J. B io l. Chem. 247:249-255.
Purich, D. L. and H. J . Fromm. 1973. Additional factors influencing enzyme responses to the adenylate energy charge. J. B io l. Chem. 248:461-466.
Raymond, P. and A. Pradet. 1980. S tab iliza tio n of adenine nucleotide ratios at various values by an oxygen lim ita tio n of respiration in qerminatinq lettuce (Lactuca sativa) seeds. Biochem. J. 190:39-44.
S tryer, L. 1981. Biochemistry, 2nd Ed. W. H. Freeman, San Francisco. 949 p.
Turner, J. F. and D. H. Turner. 1980. The regulation of glycolysisand the pentose phosphate pathway. Pp. 279-316 In: Thebiochemistry of plants. Vol. 2, Metabolism and respiration (D.D. Davies, e d .) , Academic Press, N. Y.
APPENDIX B
STATISTICAL ASSUMPTIONS
Introduction
Nonparametric and parametric s ta tis t ic a l tests have been
contrasted by Siegel (1956). Every s ta tis t ic a l test is associated
with a model and measurement requirement. The parametric model
specifies conditions about population parameters from which the sample
is drawn. Interval or ra tio level measurement is required. The
nonparametric model does not specify conditions about population
parameters. Nominal, o rd in a l, in te rv a l, or ra tio level measurement
may apply. Assumptions are lis te d fo r the following parametric
procedures, used herein: single factor Model 1 Analysis of Variance
(ANOVA), Model 1 Linear Regression, and single facto r Analysis of
Covariance (ANCOVA).
Model 1 ANOVA
Assumptions fo r Model 1 ANOVA have been outlined by Steel and
Torrie (1960), mathematically presented by Guenther (1964), and
discussed in deta il by Sokal and Rohlf (1981):
1) treatment ( i . e . facto r le v e l) and environmental ( i . e . block)
effects are add itive ,
222
223
2) fo r each treatment, varia te error components (and hence,
varia te values, assuming an additive relationship between
variates and th e ir associated errors) are random,
independently and normally d istributed with mean zero (or
equal to the treatment mean, in the case of varia te values)
and a common variance which estimates the population
variance, and
3) treatments are fixed ( i . e . Model 1 ).
These assumptions are referred to as a d d itiv ity (or l in e a r ity ) ,
randomness, independence, norm ality, homoscedasticity, and fixed
e ffe c ts , respectively.
Model 1 Linear Regression
Assumptions underlying Model 1 Linear Regression have been
outlined by Zar (1974) and Sokal and Rohlf (1981):
1) fo r any value of X (independent va ria b le ), the Y values
(dependent variab le) are random, independently and normally
distributed with a common variance which estimates the
population variance, accounting for the dependence o f Y on X,
2) expected Y values are a lin e a r function of X and l ie on a
stra ight l in e , and
3) X values are fixed and measured without e rror ( i . e . Model 1 ).
ANCOVA
The assumptions fo r ANCOVA are a combination of those fo r ANOVA
and lin e a r regression (Steel and T o rrie , 1960; Guenther, 1964):
1) fo r each X w ithin a given treatm ent, Y value error components
(and hence, Y values, assuming an additive relationship
between Y values and th e ir associated errors) are random,
independently and normally d istributed with mean zero (or
equal to the treatment mean fo r a p articu la r X, in the case
of Y values) and a common variance which estimates the
population variance,
2) fo r each treatment, expected Y values are a lin ear function
of X and l ie on a s tra ight l in e ,
3) slopes of these lines are equal among treatments, and
4) X values are fixed and measured without e rro r.
Treatment of Assumptions
Assumptions fo r these parametric tests were e ith e r presumed or
evaluated. A d d itiv ity was not d ire c tly evaluated, although
homoscedasticity implies a certain degree of a d d itiv ity (Schefler,
1969). Homoscedasticity was tested fo r in ANOVA, lin e a r regression,
and ANCOVA. Random assignment of experimental units to treatment
levels ( i . e . completely randomized design) sa tis fied the randomness
assumption and may have overcome any lack of independence. In most
cases, normality was not evaluated due to small sample sizes.
Treatment sample sizes were equal in experiments subjected to ANOVA
tes tin g . Consequences of nonnormality and heteroscedasticity are not
severe, as long as these sample sizes are equal (Snedecor and Cochran,
1967; Zar, 1974). Because treatments were s p e c ific a lly chosen, Model
1 ANOVA was appropriate. Linear correlation between X and Y values
225
was tested fo r in lin e a r regression and ANCOVA. Homogeneity of slopes
was evaluated in ANCOVA.
REFERENCES
Guenther, W. C. 1964. Analysis of variance. P ren tice-H a ll, In c ., Englewood C l i f f s , N. J. 199 p.
Schefler, W. C. 1969. S ta tis tics fo r the biological sciences.Addison-Wesley Pub. Co., Reading, Mass. 231 p.
Siegel, S. 1956. Nonparametric s ta tis tic s fo r the behavioral sciences. McGraw-Hill, N. Y. 312 p.
Snedecor, G. W. and W. G. Cochran. 1967. S ta tis tic a l Methods, 6th Ed. Iowa State Univ. Press, Ames, Iowa. 593 p.
Sokal, R. R. and F. J. Rholf. 1981. Biometry: The principles andpractice of s ta tis t ic s in biological research, 2nd Ed. W. H. Freeman, San Francisco. 859 p.
S tee l, R. G. D. and J. H. Torrie . 1960. Principles and procedures of s ta t is t ic s . McGraw-Hill, N. Y. 481 p.
Zar, J. H. 1974. B io s ta tis tica l analysis. P ren tice-H a ll, In c ., Englewood C l i f fs , N. J. 620 p.
226
VITA
DAMON A. DELISTRATY
Personal
Born 13 July 1952, Fort Knox, KY
Education
BA Biology, Univ. C a l i f . , San Diego, 1974 MS Biology, C a lif . State U n iv ., San Diego, 1976 PhD Marine Science, College o f W illiam & Mary, 1982
Experience
1974. Research Assistant, Deep Sea D r illin g Pro ject, Scripps In s t. Oceanography.
1975. Teaching Assistant, Geology D ept., C a lif . State Univ., San Diego.
1975. Research Assistant, North P acific Experiment (NORPAX), Scripps In s t. Oceanography.
1975-1976. Trainee, Sea Grant College Program, C a lif . State U n iv ., San Diego.
1977-1978. S ta ff Research Associate, In s t. Marine Resources, Scripps In s t. Oceanography.
1978-Present. Research Assistant, V irg in ia In s t. Marine Science, College o f W illiam & Mary.
227


![Amidate Prodrugs of 9-[2-(Phosphonomethoxy)Ethyl]Adenine as Inhibitors of Adenylate Cyclase Toxin from Bordetella pertussis](https://img.pdfslide.net/doc/110x75/6350aac9d2282bdce30f465c/amidate-prodrugs-of-9-2-phosphonomethoxyethyladenine-as-inhibitors-of-adenylate.jpg)


