Embed Size (px)
Citation preview
AdhyayanA Journal of Management Sciences
ISSN: 2249-1066 (Print)
ISSN: 2455–8656 (Online)
Vol 9, Issue 2, December 2019

ADHYAYAN A Journal of Management Sciences
EDITORIAL BOARD
Editor-in-Chief
Prof. (Dr.) M. MehrotraDirector, School of Management Sciences, Lucknow
Managing Editor
Dr. Rekha SinghAssistant Professor, School of Management Sciences, Lucknow
Consulting Editors
Member Editorial Team
International Peer Review Board
Mr. Ashok Sen GuptaAssistant Professor
School of Management Sciences, Lucknow
Dr. Alok KumarDirector, Narayan Academy of Managerial Excellence,
Founder Dean, Faculty of Management StudiesGNS University, Rohtas, Bihar
Dr. Urooj Ahmad SiddiquiAssistant Professor, SMS Lucknow
Ms. Suchita VishwakarmaAssistant Professor, SMS Lucknow
Mr.Asad RazaAssistant Professor, SMS Lucknow
Mr. Satyajeet AsthanaAssistant Professor, SMS Lucknow
Prof. Azhar KazmiProfessor at King Fahd University
Dhahran Saudi Arabia
Prof. Meenakshi RishiDirector, International
Development Intership PrograamAlbers School of Business and Economics, Seattle University,
USA
Dr. Syed Ahsan JamilDean-CCBA, Dhofar University,
Salalah, Oman
Dr. Dharmendra SinghAssistant Professor (Finance)
Department of Business and EconomicsModern College of Business and Science
Muscat, Sultanate of Oman
Dr. Anand BaipaiAdjunct Faculty at Saint Tomas
University, USA
Advisory Board
Circulation Manager
Prof. B. P. SinghFormer Professor,
Delhi School of Economics, New Delhi
Prof. S. K. SinghVice-Chancellor, LNMU, Darbhanga, Bihar
Prof. Arunabh ChatterjeeProfessor & Ex HOD-Dept. of Commerce
University of Lucknow, Lucknow
Dr. Saumya SinghAssociate Professor
Dept. of Management StudiesIndian School of Mines, Dhanbad
Prof. (Dr.) H. J. GhoshroyFormer Director & Dean, IMSAR
MD University, Rohtak
Mr. A. T. RamanChairman SEAA Trust &
Accreditation Consultant, New Delhi
Prof. Rana SinghVice Chancellor
Sanskriti University, Mathura, UP, India
Dr. Rong ZhangAssociate Professor
Nishinippon Institute of Technology 1-2-11, Muro-machi, Kokura-kita,
Kitakyushu, Fukuoka, Japan
Mr. Najid Ahmad School of Economics,
Dongbei University of Finance and Economics,Dalian, China
Prof. Chris BrooksProfessor in Finance,
Deputy Head of School,Henley Business School
University of Reading, UK
Prof.(Dr.) Prabal K. Sen Professor-Economics Area ,
XLRI: Xavier School of Management, Circuit House Area (East), Jamshedpur
Shamit Srivastava Librarian, SMS Lucknow
EditorialIt is a matter of pride and honour to introduce this special volume of ADHYAYAN − The Journal
of Management Sciences, Lucknow. This peer-reviewed issue of the Journal incorporates a congregation of various research papers on the theme of the conference on Management. The journal is indexed with EBSCO, Ulrichs-Web, J-Gate and Cross-ref. Now the journal is also available online with individual DOIs of all articles & research papers. The Journal ‘Adhyayan’ is also listed in Journal Association of India.
This issue includes Nine quality research papers.
The authors are a mix from various well-known institutes and universities of the country. I am sure the journal will serve as a valuable addition to the management literature and will also prove to be a valuable reference material. I would also like to place on record my sincere thanks to all the members of the editorial and advisory board for their unrelenting support to Adhyayan. I also sincerely thank the appreciable efforts of the members of the editorial team for helping to bring out this issue of the journal.
I am also grateful to reviewers for providing their comments and suggestions. Our sincere appreciation goes to all the authors for their contribution and to the readers for their incessant support.
We look forward to your comments on this issue and suggestions on matters concerning the Journal.
Prof. (Dr.) M. MehrotraEditor-in-Chief
School of Management Sciences, Lucknow

Contents
1. A Study of the Challenges in Sanitation and Hygiene that have Affected the Rural Areas of South Gujarat
Indrani Sengupta1, Nishita Kumar2, Krishna Makwana
2. Econometric Analysis of Influences of Trade Openness, Economic Growth and Urbanization on Greenhouse Gas Emission in INDIA (1961-2017)
Abhay Pratap Raghuvanshi
3. Cashless Economy and Sustainable Development in India Pooja Saxena Singh
4. The Insight of Content Marketing at Social Media Platforms Akanchha Singh, Smriti Mathur
5. A Study on Various Schemes for Msmes: With Special Reference to SIDBI Shipra Shukla*, Divya Prajapti
6. SWOT Analysis: A Powerful Tool of Strategic Competitive Management Effectiveness Preeti Pant
7. An Extensive Analysis of Goods and Services Tax (GST) in India Nitika Kewalani
8. Impact of Cashless Society on Banking Sector Vijay Laxmi Sharma1, Stuti Tripathi2
9. Indian Joint Family the Indian Social Security System Sujata Sinha

Ab s t r Ac tSanitation and Hygiene has been an on-going crisis for the majority of the rural areas in India. This research study aims at understanding the various factors that may influence the decisions of rural civilians to adopt the changes in sanitation and hygiene. This study inculcates both primary and secondary research, specifically in the rural areas of Gujarat. The following research will provide valuable insights into the current situation in the area and will be able to deliver possible steps that can be taken in the near future for a better livelihood. Keywords: Hygiene, Rural, Sanitation.Adhyayan: A Journal of Management Sciences (2019); DOI: 10.21567/adhyayan.v9i2.1
A Study of the Challenges in Sanitation and Hygiene that have Affected the Rural Areas of South GujaratIndrani Sengupta1*, Nishita Kumar2, Krishna Makwana2
1Assistant Professor, AURO University, Surat, Gujarat, India2MBA Final Year Students, AURO University, Surat, Gujarat, India
Corresponding Author: Indrani Sengupta, Assistant Professor, AURO University, Surat, Gujarat, India, e-mail: [email protected] to cite his article: Sengupta, I., Kumar, N. and Makwana, K. (2019). A Study of the Challenges in Sanitation and Hygiene that have Affected the Rural Areas of South Gujarat. Adhyayan: A Journal of Management Sciences, 9(2):1-11.Source of support: NilConflict of interest: None
© The Author(s). 2019 Open Access This article is distributed under the terms of the Creative Commons Attribution 4.0 International License (http://creativecommons.org/licenses/by/4.0/), which permits unrestricted use, distribution, and non-commercial reproduction in any medium, provided you give appropriate credit to the original author(s) and the source, provide a link to the Creative Commons license, and indicate if changes were made. The Creative Commons Public Domain Dedication waiver (http://creativecommons.org/publicdomain/zero/1.0/) applies to the data made available in this article, unless otherwise stated.
In t r o d u c t I o n
Sanitation, hygiene, and cleanliness are the trademark of a society. Various initiatives are taken each year, in
distinct geographical regions. Sanitation is vital for a sustainable environment.
There is an expanding propensity for groups in rustic hinterlands to waste in the open much to the disturbance of authorities who are working additional time to manage diverse parts of sanitation with people, families, and the country on the loose. NGOs and the staff and line officers in the administration consider this to be an essential perspective for advancement, as this is by all accounts the most significant test for the administration of improvement in the 21st century (UNICEF, 2012).
The plan set for giving clean water and better sanitation applies all the more to developed nations. For the underprivileged groups, the absence of clean water and satisfactory sanitation goes about as a hindrance to human development in people over the world. A multidisciplinary subject, sanitation has the characteristic potential to saddle solid living among the general population on the loose (Sansui, 2010).
India has been one of the emerging economies, which has shown development over the years. However, there are certain areas where the changes have been progressing at a slow pace, specifically in the rural
areas of Gujarat. According to Vikaspedia (2019), various states, including Gujarat, have been facing problems related to sanitation and hygiene. From the consultations, it was found that schools and public areas are poorly maintained, where they rarely have soaps and availability of water. In addition, women are not being provided the facilities that is needed while their menstruation period, such as disposing and changing sanitary napkins.
From the above situation depicted, it can be seen that there could be many factors that are the reason behind these inadequate supplies of resources and facilities for the people belonging to the bottom of the pyramid. Over the years, there has been practitioners, who have attempted to find ways to reduce not only the huge number who remain without access to a toilet but also to those who do not use these facilities hygienically even when they are available.
RESEARCH ARTICLE
ADHYAYAN Volume 9, Issue 2, 2019 Print ISSN: 2249-1066 Online ISSN: 2455–8656
A Study of the Challenges in Sanitation and Hygiene that have Affected the Rural Areas of South Gujarat
Adhyayan: A Journal of Management Sciences, Volume 9, Issue 2 (2019)2
Pu r P o s e o f t h e s t u dyThis study has been conducted to understand the problems and challenges that rural areas are facing, specifically in Gujarat, regarding sanitation and hygiene. The research paper aims at picking out the major limitations that the people are facing or going through, which is restricting them to adopt the habits, which are not only beneficial for their health, but also for the generations to come.
Due to the lack of basic sanitation and hygiene practices or facilities, it has impacted millions of lives at risk. It is responsible for various infectious diseases each year, which eventually affects on the:
1. Health 2. Education 3. Rural development 4. Long-term riskThis cause and effect relationship need to have an
outlook as to the reasons it is occurring; hence the study attempts to understand why there is a gap between the awareness being created and the people adapting to the change being provided. It also aims at associating their personal belief upon sanitation and hygiene with their daily practices.
This study not only finds ways to address this crisis but also strives to understand the behavioral approach to the concept of adapting as well as maintaining the sanitation and hygiene for the betterment of the society and one’s health.
re s e A r c h ob j e c t I v e• To understand how rural areas in Surat have different
acceptance levels for hygiene and sanitation in their daily routine.
• To know whether certain parameters of cleanliness are being adapted.
• To find out whether there are any associations between their demographical aspect to different levels of hygiene and sanitation.
• To gather information from women about their routines during their menstrual duration.
• To understand the difficulties that the civilians of rural areas are facing in their surroundings (associated with hygiene and sanitation).
LI t e r At u r e re v I e wSanitation and hygiene have been coming a long way in India, as with increasing population, health issues have been igniting year by year. A study done by Singh (2017) studied the issues and challenges of the health
sector in India. This paper showed that health plays an important role in a person’s life and also discussed the health programs implemented by the government. The results showed that underdeveloped country could improve their health sector by investing more in the health sector. (Storrier, 2017) Along with investing it is necessary to know human rights about sanitation facilities, in which the government has various legal laws made for the proper sanitation facilities.
Virendra Kumar (2016), had a study done on health planning through Village Health Sanitation and Nutrition Committees (VHSNC). The study shows that VHSNCs are playing a significant role in health and sanitation planning. The rural area in India needs much attention than the Urban area in India. Various planning and strategy need to be implemented to create the possible awareness that people need to have about sanitation.
(Wankhade, 2015) There are also some challenges of VHSNCs that not every one of them was taking an interest and not giving significant attention. Not only was the rural area taken care of, but as well as the urban sanitation in India, which puts its focus on access to water and proper sanitation toilets for urban poor.
The various facilities provided towards sanitation and hygiene help the people having access to the resources, but due to a few factors, it is difficult. For instance, Moazzem Hossain(2014) found out that income inequality is directly linked to the lack of sanitation facilities which an individual should get. The study also found that even after having money, people are not willing to use toilets. So along with their accessibility, it is their behavior that resists in adapting to the changes being made. Due to less exposure, they find it hard to accept the various facilities that are being provided for their health.
Singh M. K. (2014) explored sanitation in rural India, in which he brought about that in rural India, there is a major problem of defecation outside, and even if they are aware of the sanitation facilities, they are not availing the benefits given by the government. It is difficult for them to understand government policies.
Worley (2014), states that open defecation is everyone’s problem in India. The government has provided huge funds and facilities for sanitation, but the toilets built in India have still remained unused and used for some other purposes. To contribute, in this situation, initiation has been developed by the government, Swachh Bharat Abhiyan, which has come about for the improvement of the country (Bhagat, 2014).
A Study of the Challenges in Sanitation and Hygiene that have Affected the Rural Areas of South Gujarat
Adhyayan: A Journal of Management Sciences, Volume 9, Issue 2 (2019) 3
Nath (2013) suggests that improvement is a much-needed factor in India, specifically the rural area. There is a huge scope of development, which can prevent cross-infection. This not only helps the country’s health but also has an impact on the social and economic development of India (Duncan Mara, 2012).
As stated correctly by Ganesh S Kumar (2011), all the development is all about various intervention strategies related to environmental sanitation in India. The change needs to be quickly made as the increase in population will mean the need to educate the people more; hence the urgent need for sanitation in India is necessary (Kaul, 2011). Kaul also found that 55% of the population has no access to toilets in rural areas, hence to become the superpower in a holistic sense, India needs to overcome the problem of sanitation and health issues related to sanitation.
Rai (2011) explored an evaluation of the sustained impact of a sanitation campaign in rural India. The key findings of this study show that 90% of the household in the rural area say that they practice open defecation, suggesting that household which owns latrines are not used by them.
Ramani (2006) observed that from various improvements and health systems provided in India with the opportunities and challenges, it was noticed that as a whole, there had been many initiatives taken by the government, which as a result, ranks the health system 118 among 191 WHO member countries. The main key development advantage is the women of the country, as the women of the house mostly do the household work. The treat due to the unavailability of water is although a problem for them working in homes. It has also has proven that women use water productively, hence having an increase in their income-earning potential (Upadhyay, 2005). This possible way solution through government and the people themselves can work hand in hand to create a sustainable environment in India.
Both government and non-governmental practices can help suppress this crisis; a study done by (Kaane, 1997) suggested that libraries can contribute to the valuable information needed for the transformation of rural people. Bridging the gap between the people and the ongoing crisis of sanitation is a challenge for the community. The growing population is estimated to reach more than china by 2045, which will have an impact on the literacy rate as well; hence urbanization can provide another door to economic development (Aspalter, 2002).
Buam (2005), focuses on India to which there are also various areas in which the initiatives could be focused
upon. Technology is one of the main factors which can bring about change rapidly. The concept of connecting rural India into the digital era is a big challenge, but the results are effective in terms of their response. The information technology (IT) revolution has come a long way in transforming into a global society in a short span of time. Knowing that India’s population is increasing, it is the most efficient way to reach a vast population quickly.
In addition to the research above, another study conducted by (Dangwal, 2005), it was figured out that children who were provided with unlimited access to computers had an impact on their ability to educate themselves as they would play outdoors. Hence, since children are the next generation of lives, it is equally important to provide them with the knowledge so that in their growing process, they can explain to their parents how certain things should be done.
In terms of the business sector, they can also contribute highly to the initiation as it is part of their corporate social responsibility, which makes them have a road-map in helping the needful, for instance, the Sacro-civic Society, where human development is the priority (Gupta, 2005).
All parameters are equally vital when considering the health system in India (rural and urban). It consists of all the aspects of behavioral changes with the changes in infrastructure as well. Without any of them, it is difficult to proceed further. However, due to government policies and reforms, India is becoming fewer in number with the sanitation problems as promotions done by known people and celebrities are taking steps to eradicate the problem.
re s e A r c h Me t h o d o Lo g y Type of studyTo make sure that the right type of research will be used, the very first step in the research is to know the type of study, so that you can later categorize the type of research you will use to gather information. In this particular study, descriptive research has been approached, for a reason being that this particular census is an on-going crisis that many people across the globe face and has been researched upon by various researchers as well.
Type of research and data collectionThe primary focus of this research is to understand the various challenges and problems that occur in the three
A Study of the Challenges in Sanitation and Hygiene that have Affected the Rural Areas of South Gujarat
Adhyayan: A Journal of Management Sciences, Volume 9, Issue 2 (2019)4
rural areas (Gam: Bhatpore, Baben, and Ena) of Surat City; hence gathering information from various sources is mandatory to validate and make the research a reliable source. The nature of this study revolves around both primary and secondary research.
Data collection• Primary research, in this case, has been done by an
interview taken in the specific rural areas to gain rich data as to what the villagers go through in the whole process of keeping themselves hygienic, government facilities provided to them, and educating their children about hygiene and sanitation. The data for this was Interview and Schedule (See Appendix B)1that was prepared in Gujarati, which was later translated in English for comprehension purposes. There were 11 questions, which formulated around the idea of sanitation and hygiene as well as their mindset as to how it is being done at their own home and whether or not they would accept the change when brought about. The last question was a composite of 8 parts which focused on women hygiene during their Menstrual Cycle (See Appendix B) 2. A total of 50 respondents were collected across the villages, with 23 being female and 27 being from the male category.
• The next type of tool that we used was secondary research, which opens up to the various journals, articles, books, etc., which consist of valuable information about sanitation and hygiene. The topmost data that was collected was through WHO and UNICEF, which contribute highly to this area of research. From these various case studies provided useful information as to how the people adapt to the change and how their situation has become with this on-going issue.
SamplingThe sample size for the primary data was 50 respondents (households) across the villages mentioned above, hence falling under simple random sampling.
For the further analysis of the information gathered, through primary (interview) and secondary research (journals and articles), different analytical approaches were used. For primary research, One- Way ANOVA was utilized using the Jamovi – SPSS tool. This analysis has provided valuable inputs into the research and resulted in providing a substantial report.
1. See Appendix B 2 See Appendix B
te c h n I q u e An A Lys e d
One-Way ANOVA This was used for our data because the hypothesis formed from the various dependent and independent variables was takin into consideration their association between the two. One-Way ANOVA considers one independent variable against another categorical variable, which is to be compared, and whether or not it is associated with the independent variable alone. Basically, to be more specific, this test’s assumption is known as the assumption of independence because the null hypothesis concludes that: The value of one of the observations mentioned is not related to any other observation.
fI n d I n g s
Categories from open-ended questions and the coding references.There was a total of 12 categories (See Appendix C) 3made, but 8 main categories were used in associating variables in the hypothesis. The categories used for hypothesis are mentioned below:
Family Members• 1-3:(Coding reference: 1)• 4-6: (Coding reference 2)• 7-9: (Coding reference 3)• 10-12:(Coding reference 4)
Occupation• Service (Coding reference: 1)• Business (Coding reference: 2)• Self-professional (Coding reference: 3)• Agriculture (Coding reference: 4)• Other (Coding reference: 5)
What is sanitation and hygiene for you?• No insects/flies (Coding reference: 1)• No garbage outside the house (Coding reference: 2) • Clean house (Coding reference: 3)• Clean body (Coding reference: 4)
Access to toilets• Govt. toilets (Coding reference: 1)• Private toilet inside house (Coding reference: 2)• Private Toilet outside house (Coding reference: 3)• Go to field despite of having toilet in house (Coding
reference: 4)• Field only (Coding reference: 5)3 See Appendix C.
A Study of the Challenges in Sanitation and Hygiene that have Affected the Rural Areas of South Gujarat
Adhyayan: A Journal of Management Sciences, Volume 9, Issue 2 (2019) 5
Regular Cleaning of surroundings• Surroundings not cleaned at all (Coding reference: 1)• Surroundings cleaned by SMC (Coding reference: 2)• Surroundings cleaned by Panchayat (Coding
reference: 3)• Surroundings cleaned by self (Coding reference: 4)
Source of drinking and cooking water • Panchayat (Coding reference: 1)• RO Water installed at home (Coding reference: 2)• Packed mineral water (Coding reference: 3)
Reason for health issues• Mosquitos due to dirty surroundings (Coding
reference: 1)• Skin disease due to contaminated food (Coding
reference: 2)• Weather (Coding reference: 3)• Cleaning Home (Coding reference: 4)
As per the government policy Rs.20, 000 was to be allotted for the washroom in a home. Have they been provided? If yes, is there a change? • Yes (Coding reference: 1)• No (Coding reference: 2)
Hypothesis FormulationFor the analysis to take place, several hypotheses have to be made in order to come to a conclusion with variables identifies in the primary research. From the variables found above, there were four hypothesis statements that were formulated:
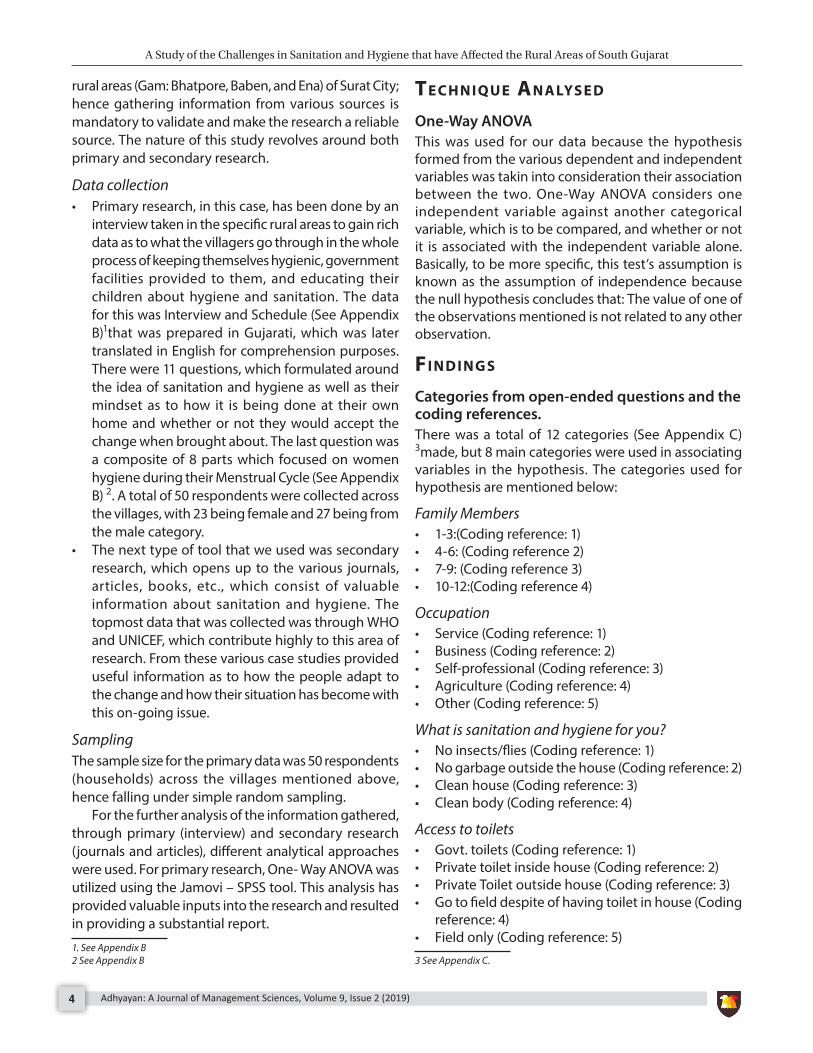
Figure 1: Glimpse of coding done from categories.
Hypothesis 1H0: There is no significant association between the ideologies of hygiene/sanitation and the occupation.H1.: There is a significant association between the ideologies of hygiene/sanitation and the occupations.Independent variable = OccupationDependent variable = Ideologies of hygiene/sanitation
Hypothesis 2H0: There is no significant association between the cleanliness of the surroundings and their health problems.H1: There is a significant association between keeping the surroundings clean and their health problems.Independent variable = Cleanliness of the surrounding.Dependent variable = Health problems
Hypothesis 3H0: There is no significant association between the occupation and source of waterH1: There is a significant association between the occupation and the source of water utilized.Independent variable = OccupationDependent variable = Source of water.
Hypothesis 4H0: There is no significant association between health problems and access to toilets H1: There is a significant association between health problems and access to toilets. Independent variable = Access to toilets.Dependent variable = Health Problems
A Study of the Challenges in Sanitation and Hygiene that have Affected the Rural Areas of South Gujarat
Adhyayan: A Journal of Management Sciences, Volume 9, Issue 2 (2019)6
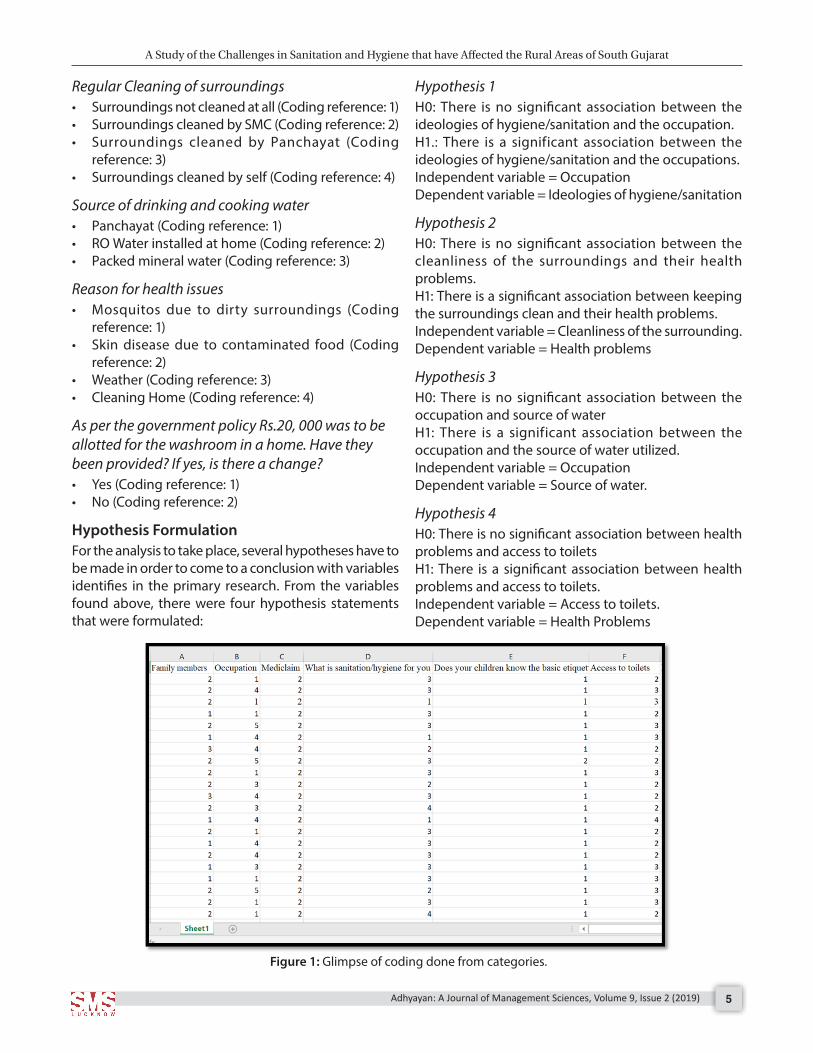
Statistical Tool Jamovi -SPSS: One-Way ANOVA Test The tool used to conduct the ANOVA test was a software known as Jamovi. This software allows one to input the data and coding material and generate the tables of the values needed to interpret the associations.
The first step to generate the values was to code the responses according to their answers given, which was done in excel, a glimpse of the codes can be seen below from MS.Excel:
The next step for applying the statistical tool was to test the hypothesis one by one by inserting the coding material for the same in the software.
Hypothesis 1: Statistical Tool Applied (One-Way ANOVA)• The ideology of Sanitation and Hygiene: Dependent • Occupation: Independent
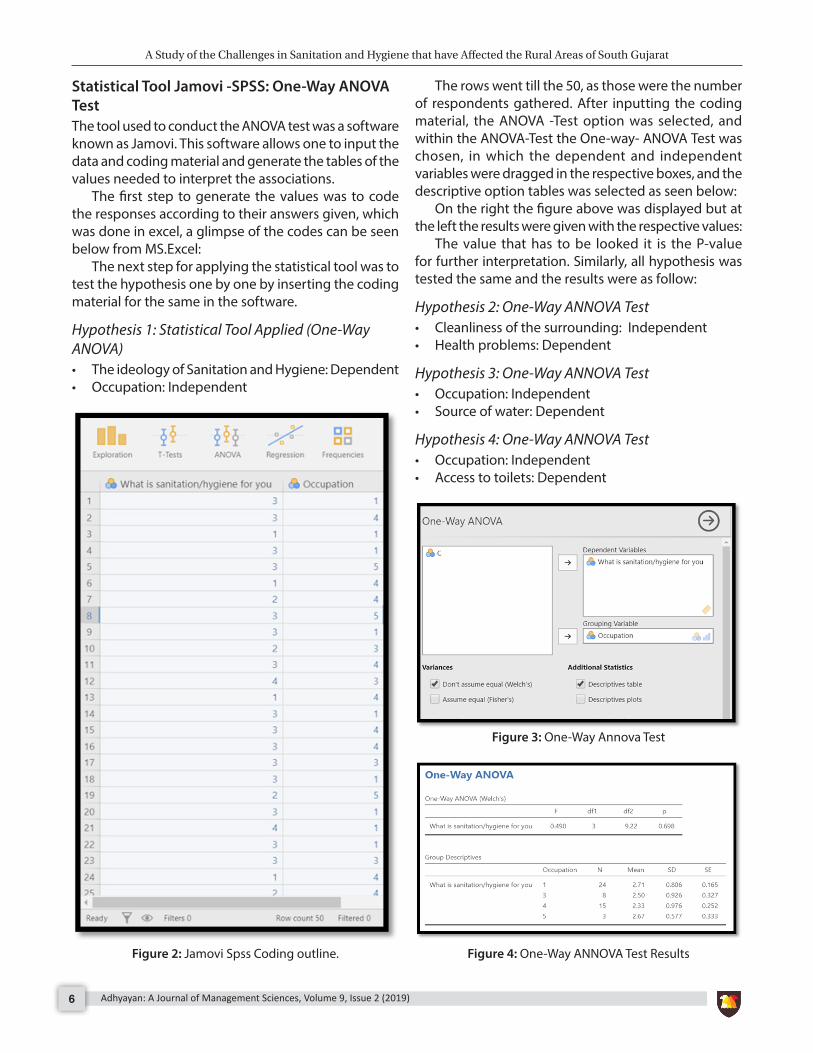
The rows went till the 50, as those were the number of respondents gathered. After inputting the coding material, the ANOVA -Test option was selected, and within the ANOVA-Test the One-way- ANOVA Test was chosen, in which the dependent and independent variables were dragged in the respective boxes, and the descriptive option tables was selected as seen below:
On the right the figure above was displayed but at the left the results were given with the respective values:
The value that has to be looked it is the P-value for further interpretation. Similarly, all hypothesis was tested the same and the results were as follow:
Hypothesis 2: One-Way ANNOVA Test• Cleanliness of the surrounding: Independent • Health problems: Dependent
Hypothesis 3: One-Way ANNOVA Test• Occupation: Independent • Source of water: Dependent
Hypothesis 4: One-Way ANNOVA Test• Occupation: Independent • Access to toilets: Dependent
Figure 2: Jamovi Spss Coding outline.
Figure 3: One-Way Annova Test
Figure 4: One-Way ANNOVA Test Results
A Study of the Challenges in Sanitation and Hygiene that have Affected the Rural Areas of South Gujarat
Adhyayan: A Journal of Management Sciences, Volume 9, Issue 2 (2019) 7
Primary Data InterpretationSince the P-value is more than our significant level (95% / 0.05) we have fail to reject H0, which means that there is no association between the ideologies of sanitation and hygiene and their occupation.
There level of understanding of cleanliness has nothing to do with the occupation, hence there could be other factors that may have led them to have certain ideologies about cleanliness which could include factors like:
• Passing on of generational teaching• Through word-of-mouth of peers• Something that they have seen others doing.• From endorsements who spread the word through
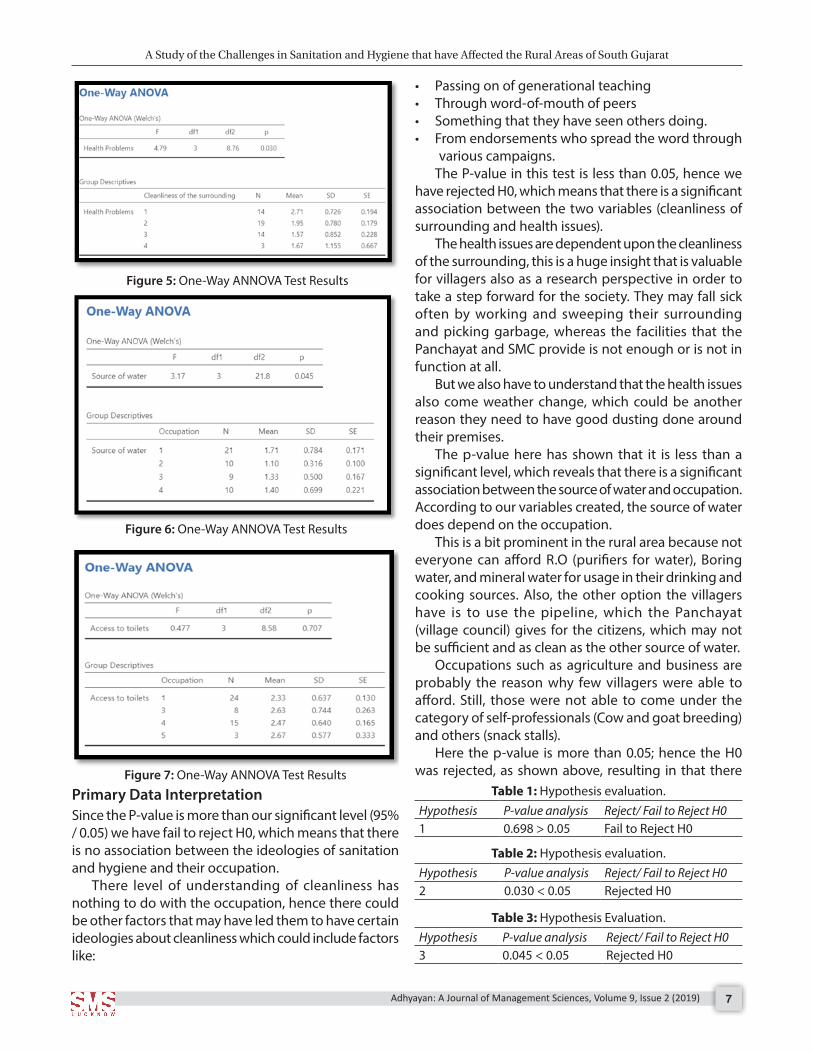
various campaigns.The P-value in this test is less than 0.05, hence we
have rejected H0, which means that there is a significant association between the two variables (cleanliness of surrounding and health issues).
The health issues are dependent upon the cleanliness of the surrounding, this is a huge insight that is valuable for villagers also as a research perspective in order to take a step forward for the society. They may fall sick often by working and sweeping their surrounding and picking garbage, whereas the facilities that the Panchayat and SMC provide is not enough or is not in function at all.
But we also have to understand that the health issues also come weather change, which could be another reason they need to have good dusting done around their premises.
The p-value here has shown that it is less than a significant level, which reveals that there is a significant association between the source of water and occupation. According to our variables created, the source of water does depend on the occupation.
This is a bit prominent in the rural area because not everyone can afford R.O (purifiers for water), Boring water, and mineral water for usage in their drinking and cooking sources. Also, the other option the villagers have is to use the pipeline, which the Panchayat (village council) gives for the citizens, which may not be sufficient and as clean as the other source of water.
Occupations such as agriculture and business are probably the reason why few villagers were able to afford. Still, those were not able to come under the category of self-professionals (Cow and goat breeding) and others (snack stalls).
Here the p-value is more than 0.05; hence the H0 was rejected, as shown above, resulting in that there Figure 7: One-Way ANNOVA Test Results
Table 1: Hypothesis evaluation.Hypothesis P-value analysis Reject/ Fail to Reject H01 0.698 > 0.05 Fail to Reject H0
Table 2: Hypothesis evaluation.Hypothesis P-value analysis Reject/ Fail to Reject H02 0.030 < 0.05 Rejected H0
Table 3: Hypothesis Evaluation.Hypothesis P-value analysis Reject/ Fail to Reject H03 0.045 < 0.05 Rejected H0
Figure 5: One-Way ANNOVA Test Results
Figure 6: One-Way ANNOVA Test Results
A Study of the Challenges in Sanitation and Hygiene that have Affected the Rural Areas of South Gujarat
Adhyayan: A Journal of Management Sciences, Volume 9, Issue 2 (2019)8
is no significant difference between access to toilets and occupation. This was a interesting finding that was analyzed in the research because villagers do not keep much space for toilets, but if they do it is of a small area that is outside their home.
From this, it was prominent to observe that their houses were built in the past with the in-built and out-built toilets to utilize. But within that occupation did was not the major factor of whether or not they had access to toilets, probably for a reason being that : • Having women in the house for the usage of toilets. • Other social norms that have to be followed.• Religion purpose• Resistant to change of defecating inside and not
outside.Apart from this interpretation through ANOVA
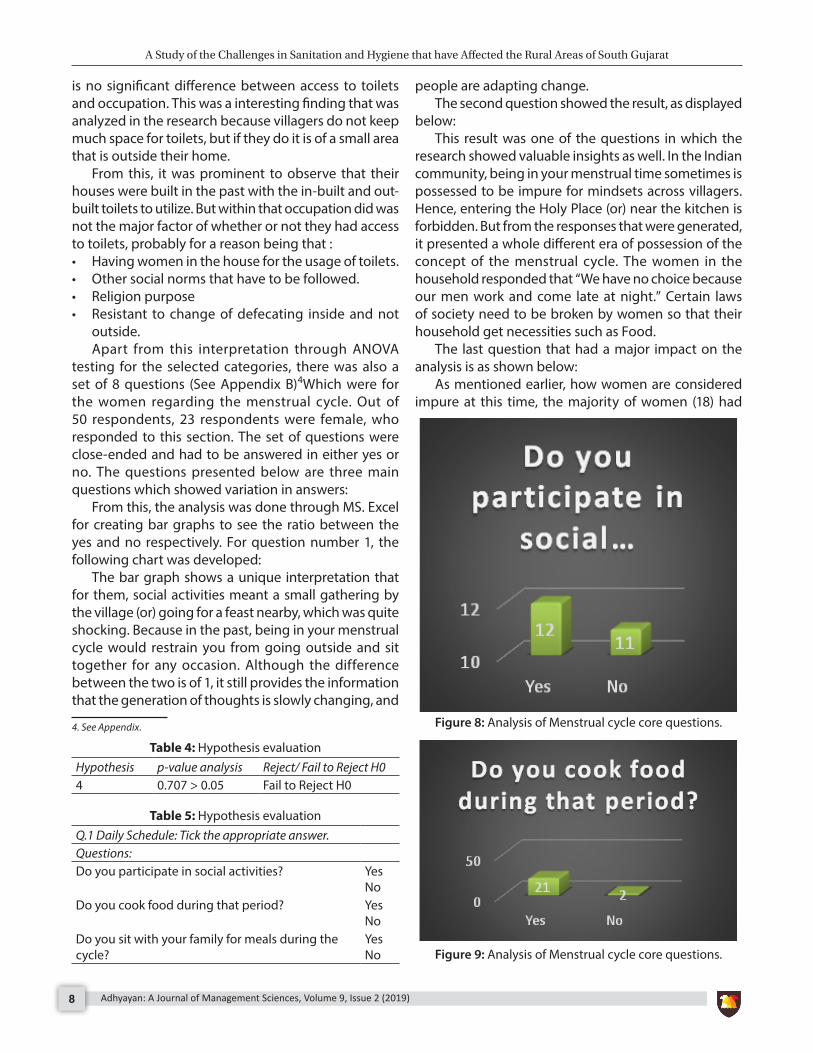
testing for the selected categories, there was also a set of 8 questions (See Appendix B)4Which were for the women regarding the menstrual cycle. Out of 50 respondents, 23 respondents were female, who responded to this section. The set of questions were close-ended and had to be answered in either yes or no. The questions presented below are three main questions which showed variation in answers:
From this, the analysis was done through MS. Excel for creating bar graphs to see the ratio between the yes and no respectively. For question number 1, the following chart was developed:
The bar graph shows a unique interpretation that for them, social activities meant a small gathering by the village (or) going for a feast nearby, which was quite shocking. Because in the past, being in your menstrual cycle would restrain you from going outside and sit together for any occasion. Although the difference between the two is of 1, it still provides the information that the generation of thoughts is slowly changing, and
4. See Appendix.
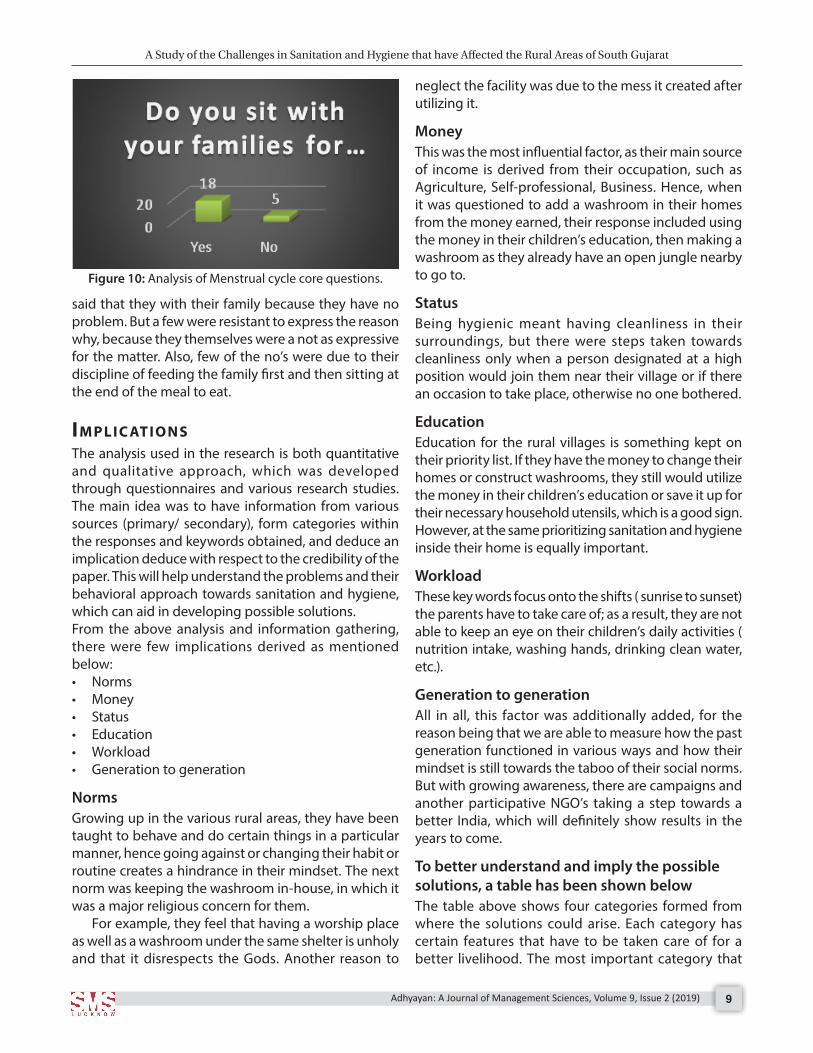
people are adapting change. The second question showed the result, as displayed
below: This result was one of the questions in which the
research showed valuable insights as well. In the Indian community, being in your menstrual time sometimes is possessed to be impure for mindsets across villagers. Hence, entering the Holy Place (or) near the kitchen is forbidden. But from the responses that were generated, it presented a whole different era of possession of the concept of the menstrual cycle. The women in the household responded that “We have no choice because our men work and come late at night.” Certain laws of society need to be broken by women so that their household get necessities such as Food.
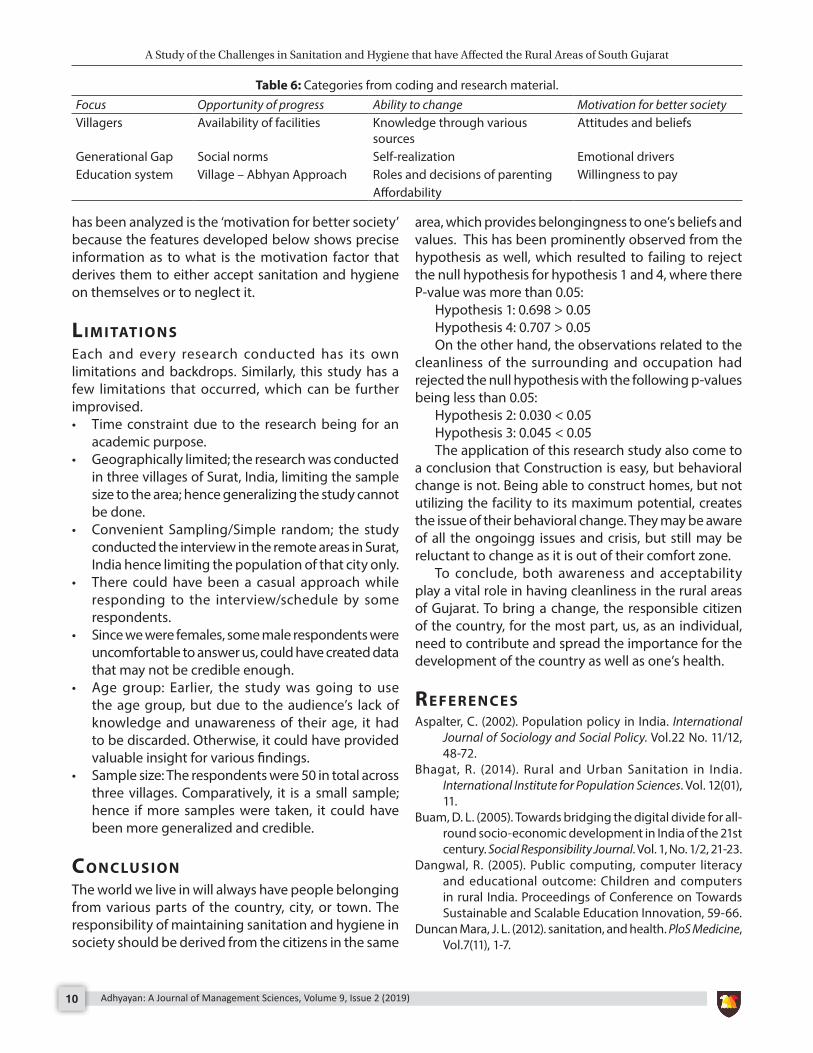
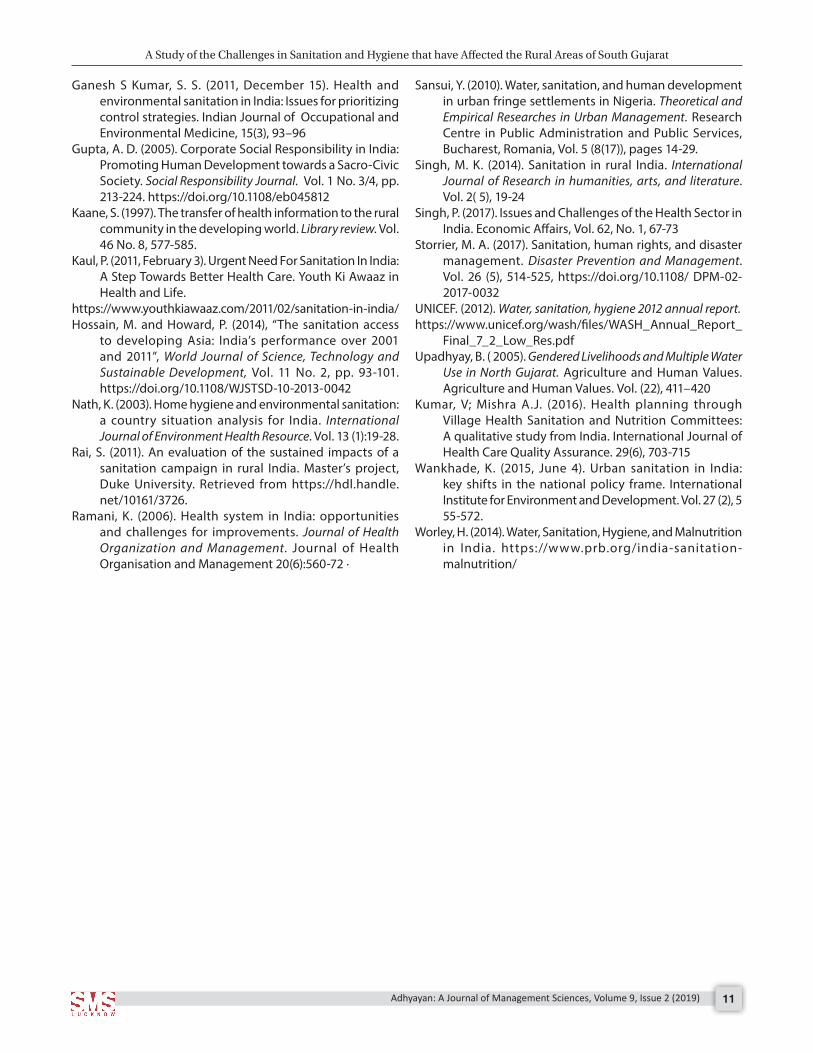
The last question that had a major impact on the analysis is as shown below:
As mentioned earlier, how women are considered impure at this time, the majority of women (18) had
Figure 8: Analysis of Menstrual cycle core questions.
Figure 9: Analysis of Menstrual cycle core questions.
Table 4: Hypothesis evaluationHypothesis p-value analysis Reject/ Fail to Reject H04 0.707 > 0.05 Fail to Reject H0
Table 5: Hypothesis evaluationQ.1 Daily Schedule: Tick the appropriate answer.Questions:Do you participate in social activities? Yes
NoDo you cook food during that period? Yes
NoDo you sit with your family for meals during the cycle?
Yes No
A Study of the Challenges in Sanitation and Hygiene that have Affected the Rural Areas of South Gujarat
Adhyayan: A Journal of Management Sciences, Volume 9, Issue 2 (2019) 9
said that they with their family because they have no problem. But a few were resistant to express the reason why, because they themselves were a not as expressive for the matter. Also, few of the no’s were due to their discipline of feeding the family first and then sitting at the end of the meal to eat.
IM P L I c At I o n sThe analysis used in the research is both quantitative and qualitative approach, which was developed through questionnaires and various research studies. The main idea was to have information from various sources (primary/ secondary), form categories within the responses and keywords obtained, and deduce an implication deduce with respect to the credibility of the paper. This will help understand the problems and their behavioral approach towards sanitation and hygiene, which can aid in developing possible solutions. From the above analysis and information gathering, there were few implications derived as mentioned below:• Norms• Money• Status• Education• Workload • Generation to generation
NormsGrowing up in the various rural areas, they have been taught to behave and do certain things in a particular manner, hence going against or changing their habit or routine creates a hindrance in their mindset. The next norm was keeping the washroom in-house, in which it was a major religious concern for them.
For example, they feel that having a worship place as well as a washroom under the same shelter is unholy and that it disrespects the Gods. Another reason to
neglect the facility was due to the mess it created after utilizing it.
MoneyThis was the most influential factor, as their main source of income is derived from their occupation, such as Agriculture, Self-professional, Business. Hence, when it was questioned to add a washroom in their homes from the money earned, their response included using the money in their children’s education, then making a washroom as they already have an open jungle nearby to go to.
StatusBeing hygienic meant having cleanliness in their surroundings, but there were steps taken towards cleanliness only when a person designated at a high position would join them near their village or if there an occasion to take place, otherwise no one bothered.
EducationEducation for the rural villages is something kept on their priority list. If they have the money to change their homes or construct washrooms, they still would utilize the money in their children’s education or save it up for their necessary household utensils, which is a good sign. However, at the same prioritizing sanitation and hygiene inside their home is equally important.
WorkloadThese key words focus onto the shifts ( sunrise to sunset) the parents have to take care of; as a result, they are not able to keep an eye on their children’s daily activities ( nutrition intake, washing hands, drinking clean water, etc.).
Generation to generationAll in all, this factor was additionally added, for the reason being that we are able to measure how the past generation functioned in various ways and how their mindset is still towards the taboo of their social norms. But with growing awareness, there are campaigns and another participative NGO’s taking a step towards a better India, which will definitely show results in the years to come.
To better understand and imply the possible solutions, a table has been shown belowThe table above shows four categories formed from where the solutions could arise. Each category has certain features that have to be taken care of for a better livelihood. The most important category that
Figure 10: Analysis of Menstrual cycle core questions.
A Study of the Challenges in Sanitation and Hygiene that have Affected the Rural Areas of South Gujarat
Adhyayan: A Journal of Management Sciences, Volume 9, Issue 2 (2019)10
Table 6: Categories from coding and research material.Focus Opportunity of progress Ability to change Motivation for better societyVillagers Availability of facilities Knowledge through various
sourcesAttitudes and beliefs
Generational Gap Social norms Self-realization Emotional driversEducation system Village – Abhyan Approach Roles and decisions of parenting Willingness to pay
Affordability
has been analyzed is the ‘motivation for better society’ because the features developed below shows precise information as to what is the motivation factor that derives them to either accept sanitation and hygiene on themselves or to neglect it.
LI M I tAt I o n sEach and every research conducted has its own limitations and backdrops. Similarly, this study has a few limitations that occurred, which can be further improvised. • Time constraint due to the research being for an
academic purpose.• Geographically limited; the research was conducted
in three villages of Surat, India, limiting the sample size to the area; hence generalizing the study cannot be done.
• Convenient Sampling/Simple random; the study conducted the interview in the remote areas in Surat, India hence limiting the population of that city only.
• There could have been a casual approach while responding to the interview/schedule by some respondents.
• Since we were females, some male respondents were uncomfortable to answer us, could have created data that may not be credible enough.
• Age group: Earlier, the study was going to use the age group, but due to the audience’s lack of knowledge and unawareness of their age, it had to be discarded. Otherwise, it could have provided valuable insight for various findings.
• Sample size: The respondents were 50 in total across three villages. Comparatively, it is a small sample; hence if more samples were taken, it could have been more generalized and credible.
co n c Lu s I o nThe world we live in will always have people belonging from various parts of the country, city, or town. The responsibility of maintaining sanitation and hygiene in society should be derived from the citizens in the same
area, which provides belongingness to one’s beliefs and values. This has been prominently observed from the hypothesis as well, which resulted to failing to reject the null hypothesis for hypothesis 1 and 4, where there P-value was more than 0.05:
Hypothesis 1: 0.698 > 0.05 Hypothesis 4: 0.707 > 0.05On the other hand, the observations related to the
cleanliness of the surrounding and occupation had rejected the null hypothesis with the following p-values being less than 0.05:
Hypothesis 2: 0.030 < 0.05Hypothesis 3: 0.045 < 0.05The application of this research study also come to
a conclusion that Construction is easy, but behavioral change is not. Being able to construct homes, but not utilizing the facility to its maximum potential, creates the issue of their behavioral change. They may be aware of all the ongoingg issues and crisis, but still may be reluctant to change as it is out of their comfort zone.
To conclude, both awareness and acceptability play a vital role in having cleanliness in the rural areas of Gujarat. To bring a change, the responsible citizen of the country, for the most part, us, as an individual, need to contribute and spread the importance for the development of the country as well as one’s health.
re f e r e n c e sAspalter, C. (2002). Population policy in India. International
Journal of Sociology and Social Policy. Vol.22 No. 11/12, 48-72.
Bhagat, R. (2014). Rural and Urban Sanitation in India. International Institute for Population Sciences. Vol. 12(01), 11.
Buam, D. L. (2005). Towards bridging the digital divide for all‐round socio‐economic development in India of the 21st century. Social Responsibility Journal. Vol. 1, No. 1/2, 21-23.
Dangwal, R. (2005). Public computing, computer literacy and educational outcome: Children and computers in rural India. Proceedings of Conference on Towards Sustainable and Scalable Education Innovation, 59-66.
Duncan Mara, J. L. (2012). sanitation, and health. PloS Medicine, Vol.7(11), 1-7.
A Study of the Challenges in Sanitation and Hygiene that have Affected the Rural Areas of South Gujarat
Adhyayan: A Journal of Management Sciences, Volume 9, Issue 2 (2019) 11
Ganesh S Kumar, S. S. (2011, December 15). Health and environmental sanitation in India: Issues for prioritizing control strategies. Indian Journal of Occupational and Environmental Medicine, 15(3), 93–96
Gupta, A. D. (2005). Corporate Social Responsibility in India: Promoting Human Development towards a Sacro‐Civic Society. Social Responsibility Journal. Vol. 1 No. 3/4, pp. 213-224. https://doi.org/10.1108/eb045812
Kaane, S. (1997). The transfer of health information to the rural community in the developing world. Library review. Vol. 46 No. 8, 577-585.
Kaul, P. (2011, February 3). Urgent Need For Sanitation In India: A Step Towards Better Health Care. Youth Ki Awaaz in Health and Life.
https://www.youthkiawaaz.com/2011/02/sanitation-in-india/Hossain, M. and Howard, P. (2014), “The sanitation access
to developing Asia: India’s performance over 2001 and 2011”, World Journal of Science, Technology and Sustainable Development, Vol. 11 No. 2, pp. 93-101. https://doi.org/10.1108/WJSTSD-10-2013-0042
Nath, K. (2003). Home hygiene and environmental sanitation: a country situation analysis for India. International Journal of Environment Health Resource. Vol. 13 (1):19-28.
Rai, S. (2011). An evaluation of the sustained impacts of a sanitation campaign in rural India. Master’s project, Duke University. Retrieved from https://hdl.handle.net/10161/3726.
Ramani, K. (2006). Health system in India: opportunities and challenges for improvements. Journal of Health Organization and Management. Journal of Health Organisation and Management 20(6):560-72 ·
Sansui, Y. (2010). Water, sanitation, and human development in urban fringe settlements in Nigeria. Theoretical and Empirical Researches in Urban Management. Research Centre in Public Administration and Public Services, Bucharest, Romania, Vol. 5 (8(17)), pages 14-29.
Singh, M. K. (2014). Sanitation in rural India. International Journal of Research in humanities, arts, and literature. Vol. 2( 5), 19-24
Singh, P. (2017). Issues and Challenges of the Health Sector in India. Economic Affairs, Vol. 62, No. 1, 67-73
Storrier, M. A. (2017). Sanitation, human rights, and disaster management. Disaster Prevention and Management. Vol. 26 (5), 514-525, https://doi.org/10.1108/ DPM-02-2017-0032
UNICEF. (2012). Water, sanitation, hygiene 2012 annual report. https://www.unicef.org/wash/files/WASH_Annual_Report_
Final_7_2_Low_Res.pdfUpadhyay, B. ( 2005). Gendered Livelihoods and Multiple Water
Use in North Gujarat. Agriculture and Human Values. Agriculture and Human Values. Vol. (22), 411–420
Kumar, V; Mishra A.J. (2016). Health planning through Village Health Sanitation and Nutrition Committees: A qualitative study from India. International Journal of Health Care Quality Assurance. 29(6), 703-715
Wankhade, K. (2015, June 4). Urban sanitation in India: key shifts in the national policy frame. International Institute for Environment and Development. Vol. 27 (2), 5 55-572.
Worley, H. (2014). Water, Sanitation, Hygiene, and Malnutrition in India. https://www.prb.org/india-sanitation-malnutrition/
Ab s t r Ac tThis paper examines the impacts of trade openness, GDP per capita, and urbanization air pollution. It takes into consideration data on India during the period 1961-2017 to see how trade openness, GDP per capita growth, urbanization have impacted CO2 emissions. To test for the existence of an inverted U shaped hypothesis, U-test is used in this paper. The data is subjected to various econometric tests, including unit root test, optimal lag test before applying the Johansen test for co-integration to understand the long-run relationship between the above variable. Then the unrestricted VAR model and Wald test are used to find the short-run causality between the variables under analysis. Further, to observe variation in an endogenous variable into the component shocks to the VAR, variance decomposition of the CO2emission is observed.Keywords: Carbon-dioxide emission per capita, Economic growth, Johansen test of co-integration, Trade openness, Urbanization, U-test, Vector autoregressive model.Adhyayan: A Journal of Management Sciences (2019); DOI: 10.21567/adhyayan.v9i2.2
Econometric Analysis of Influences of Trade Openness, Economic Growth and Urbanization on Greenhouse Gas Emission in INDIA (1961-2017)Abhay Pratap Raghuvanshi*Assistant Professor Economics
Corresponding Author: Abhay Pratap Raghuvanshi, Assistant Professor Economics, e-mail: [email protected] to cite his article: Raghuvanshi, A.P. (2019). Econometric Analysis of Influences of Trade Openness, Economic Growth and Urbanization on Greenhouse Gas Emission in INDIA (1961-2017). Adhyayan: A Journal of Management Sciences, 9(2):12-17.Source of support: NilConflict of interest: None
© The Author(s). 2019 Open Access This article is distributed under the terms of the Creative Commons Attribution 4.0 International License (http://creativecommons.org/licenses/by/4.0/), which permits unrestricted use, distribution, and non-commercial reproduction in any medium, provided you give appropriate credit to the original author(s) and the source, provide a link to the Creative Commons license, and indicate if changes were made. The Creative Commons Public Domain Dedication waiver (http://creativecommons.org/publicdomain/zero/1.0/) applies to the data made available in this article, unless otherwise stated.
In t r o d u c t I o n
The study of the relationship between pollution and income has mainly focused on investigating the
Environmental Kuznets curve (EKC) ( Stern, 2004). This so-called environmental Kuznets curve originated from Kuznets (1955), who hypothesized in 1954 that income inequality first rises in early years of economic growth and then falls in the curse of economic development. Kuznets’s view that the early stages of income growth distribution of income become more unequal but that the distribution eventually moves back toward greater equality as economic growth continues. Grossman and Krueger’s (1991) are those who set up the actual EKC concept. They point out that the level of environmental degradation and per capita income follows the same inverted U-shaped relationship, as does income inequality and per capita income in the original Kuznets curve.
This inverted U-shape curve suggests that at the early stages of economic development, pollution intensity rises with per capita income and falls as per capita income rises beyond some threshold level that could be determined from the estimated coefficients of the following equation.
lnEt = α + β1 lnYt + β2lnYt2 + εt
Where Et denotes per capita pollution, Yt, denotes per capita income, Yt
2 indicates square income per capita,εt is an error term.
The threshold point could be calculated as the exponential of the ratio β1 over 2β2. A negative value for the coefficient β2along with U-test confirms the inverted U-shape of the curve. Empirically the growth-pollution literature studying the relationship between per capita income and pollution per capita ( Millimet and Stengos, 2003 and Azomahou, Lasney and Van 2006) for individual countries and groups of countries has found that: (i) at the early stages of economic development pollution intensity rises with per capita
RESEARCH ARTICLE
ADHYAYAN Volume 9, Issue 2, 2019 Print ISSN: 2249-1066 Online ISSN: 2455–8656
Econometric Analysis of Influences of Trade Openness, Economic Growth and Urbanization...
Adhyayan: A Journal of Management Sciences, Volume 9, Issue 2 (2019) 13
income; (ii) but pollution intensity falls as per capita income rises beyond some threshold level ( Grossman and Krueger, 1995 and List and Gallet, 1999, among others)
Although several pollutants have been considered in the study of the EKC (Managi, 2006) in this paper CO2 is used as a variable for pollution. In effect, the debate concerning the reduction of CO2 emissions is still active both in developed nations and developing countries.
LI t e r At u r e r e v I e w
Environment Kuznets curve At the initial stage of development, the level of CO2 increases with income. After some threshold level of income, this relationship may change from positive to negative as more efficient infrastructure and energy-efficient technology are implemented during the development of the country.
UrbanizationMost cities are growing at a faster rate than the national average, as the endurance workers are migrating from rural to urban areas for better jobs, better life, better education, better treatment, etc. Thus urban populations pressure on urban resources and the environment, as a result, the environment is polluted. Although urbanization is often discussed in the context of economic modernization, it is a demographic indicator that increases urban density and transforms the organization of human behavior, thereby influencing household energy use patterns. However, the extent to which urbanization affects national energy use and CO2 emissions has not been fully and clearly explained in a single theory. The relationship between urbanization and various environmental issues, including energy use and emissions, has been studied extensively in recent years. Some researchers show that urbanization increases energy demand, generating more emissions. Conversely, other scholars argue that urbanization and urban density improve the efficient use of public infrastructure (e.g., public transport and other utilities), lowering energy use and emissions. Previous research has shown conflicting results, suggesting that the relationship between urbanization, energy use, and emissions is complicated.
Effect of international trade on environmentEnvironmentalists have raised the topic of free trade as being the cause of environmental pollution. Their argument that the scale of economic activities increases
the level of pollution, and in addition, it is possible that the production of pollution causing goods be taken over from northern countries, which have higher standards of protection by southern countries whose regulations are looser in this respect. Conversely, free trade advocates argue that the income gained through trade brings about a stricter adherence to environment protection regulations. Thus, the negative effects of free trade are compensated for. Many studies have been carried out concerning the issue, of which the empirical work of Grossman and Krueger (1993) and the theoretical work of Copeland and Taylor (1994), Yues (1996), and Dean (2000) can be mentioned.
The increasing amount of CO2, the dominant contributor to the greenhouse effect, seems to be aggravating environmental problems. India is an emerging economy and one of the important countries which has a high carbon emission in the world. India has experienced a significant rise in energy consumption and carbon emissions in recent decades.
ModeL sPecIfIcAtIonFor examining the Environment Kuznets Curve with data on India during 1961-2017 following regression equation is estimated:
lnEt = α + βlnY + γlnY2 (1)Depending on the parameters and equation (1) may
be inverse U-shaped or not. A U shape is then implied by the conditions
β + γf’ (xl) > 0 > β + γf’ (xh)If either of these inequalities is violated the curve is
not inverse U-shaped but U-shaped or monotone. The individual significance
of both βands γis necessary but not sufficient. First, it is checked whether the estimated minimum point (xmin=β/(2 γ)) itself is within the date range. Most works use the criterion that if both βand γare significant and if the implied extreme point is within the data range, they have found an inverted U shape. This is a sensible criterion, but it is neither sufficient nor necessary. As the noted significance of γalone is always a necessary condition in the test of a U shape. So this sufficiency condition is checked using U-test.
To study the relationship between income, trade openness and urbanization following equation is estimated.
lnEt = α + β1lnYt + β3Tt + β4lnUt + ζt (2)Where Et denotes per capita emissions of carbon
dioxide (CO2), Yt denotes per capita GDP, Tt indicates trade openness as measured by the share of exports and
Econometric Analysis of Influences of Trade Openness, Economic Growth and Urbanization...
Adhyayan: A Journal of Management Sciences, Volume 9, Issue 2 (2019)14
imports in GDP, Ut is the share of the urban population in total population, ζt is a stochastic error term, and t is a year index.
The assumptions concerning the preceding equation 2 are that while the GDP per capita is supposed to impact the emissions of CO2 i.e., negatively the environment positively, the trade openness variable will impact pollution, thus positively the environment and urbanization is supposed to impact emission of CO2thus negatively to the environment.
To observe the long-run relationship between income, pollution(emission CO2), urbanization, and trade openness, The Johansen Maximum Likelihood Procedure is applied. Based on a VAR approach to cointegration. The test relies on the relationship between the rank of a matrix and its eigenvalues or characteristic roots. In the absence of cointegation relation between the variables, the unrestricted VAR model is used. Vector auto-regression (VAR) is an econometric model used to capture the evolution and the interdependencies between multiple time series, generalizing the univariate AR models. A VAR is an equation, n variable model in which each variable is, in turn, explained by its own lagged values, plus (current) and past values of the remaining n -1 variables.Following the VAR model is estimated in the study
Et = C1 + 1iEt-i + γ1i Yt-i + α1i Tt-i + µ1i DUt-i ) + ε1 (3)Yt = C2 + 2iEt-i + γ2i Yt-i + α2i Tt-i + µ2i DUt-i ) + ε2 (4)Tt = C3 + 3iEt-i + γ3i Yt-i + α3i Tt-i + µ3i DUt-i ) + ε3 (5)DUt = C4 + 4iEt-i + γ4i Yt-i + α4i Tt-i + µ4i DUt-i ) + ε4 (6)Here urbanization is represented by the first
difference of the urbanization variable(DU); all other variables are as previous.
In the end, variance decomposition and the impulse response function is shown for emission in the above unrestricted VAR model.
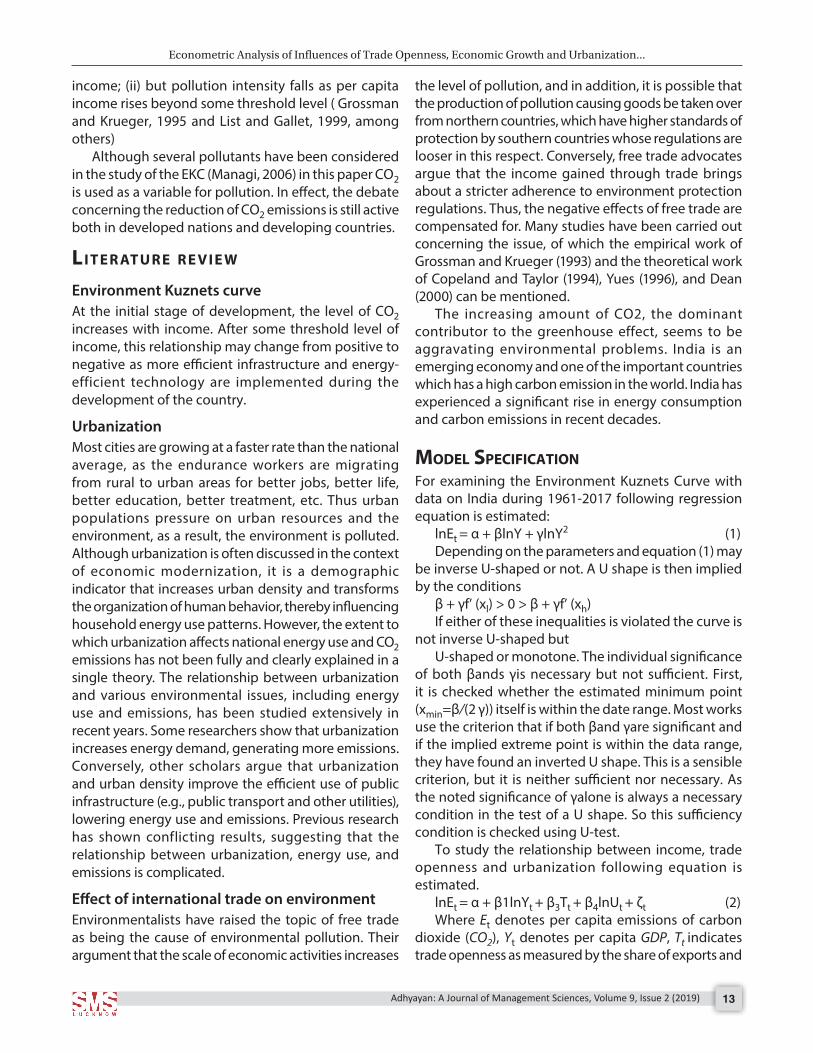
Figure 2Figure 1
dAtA A n d re s u LtsThe model is estimated using data from World Development Indicators (WDI) and covering the period 1961-2017. Figure 1 shows the series in natural logarithm (Top panel) and in first difference (Bottom panel).
The variable LNE indicates pollution measured as CO2 emission (metric ton per capita), LNY indicates Gross domestic product per capita and LNT indicates trade openness as measured by the share of exports plus imports in GDP.
Environmental Kuznets Curve (INDIA)Results of Estimated equation 1 is given in table below
Coefficients Std. Error t-value
lny 10.07086 .6730526 14.96
LnY2 -.7236865 .0547595 -13.22
constant -34.61599 2.058044 -16.82
R2Root MSE = .06931Number of observation = 51 F(2,48) = 1531.48
In effect from the estimated coefficients of the following Eq1
lnEt=-34.61599 +10.07086 lnYt- .7236865lnY2 (7)From the table above it is observed that both β
and γ coefficients are significant also the coefficient of lnYt is positive and coefficient of lnY2 is negative and, in addition, the estimated extremum point - (β/ 2γ) = 6.958026 is within the data range, it is common to conclude that there is an inverse U-shaped relationship. This criteria is too weak. To test properly for the presence of a U shape on some interval of values, we need to test whether the relationship is decreasing at low values within this interval and increasing at high values within the interval, to check this we perform
Econometric Analysis of Influences of Trade Openness, Economic Growth and Urbanization...
Adhyayan: A Journal of Management Sciences, Volume 9, Issue 2 (2019) 15
The Johansen Maximum Likelihood ProcedureThe variables Et, Yt, Tt, Du are non-stationary at level, but after first difference variables become stationary. These all 4 variables are integrated of order one i.e., I(1) as suggested by the ADF test.
Step 1 The result of test can be quite sensitive to the lag length. The most common procedure is to estimate a vector autoregression. Then use the same lag length test as in traditional VAR.
Both the Trace test and Max-eigenvalue test indicates no cointegration at the 0.05 level, which means at a 5% level of significance, the null hypothesis that many cointegration equations are 0 can be rejected. When the number of cointegrating equations are zero then unrestricted VAR is used rather than a vector error correction model.
TableOPTIMAL LAG TESTAIC 3LR 3FPE 3HQC 1SC 1
Note: AIC= Akaike information criterion, SC= Schwarz information criterion, HQC= Hannan-Quinn information criterion, LR= sequential modified LR test statisticOut of five selection criteria three indicate lag of 3, so 3 lag is used in the Johansen test of cointegration. Result of the test given in the table below.
Johansen Test of Cointegration Series: E, Y, T, DU
Hypothesized No of Cointegration equations None At most 1
Trace Statistic 43.31234(0.1251*) 22.26832(0.2839*)
Max-eigenvalue statistic
21.04402(0.2736*) 13.78736(0.3828*)
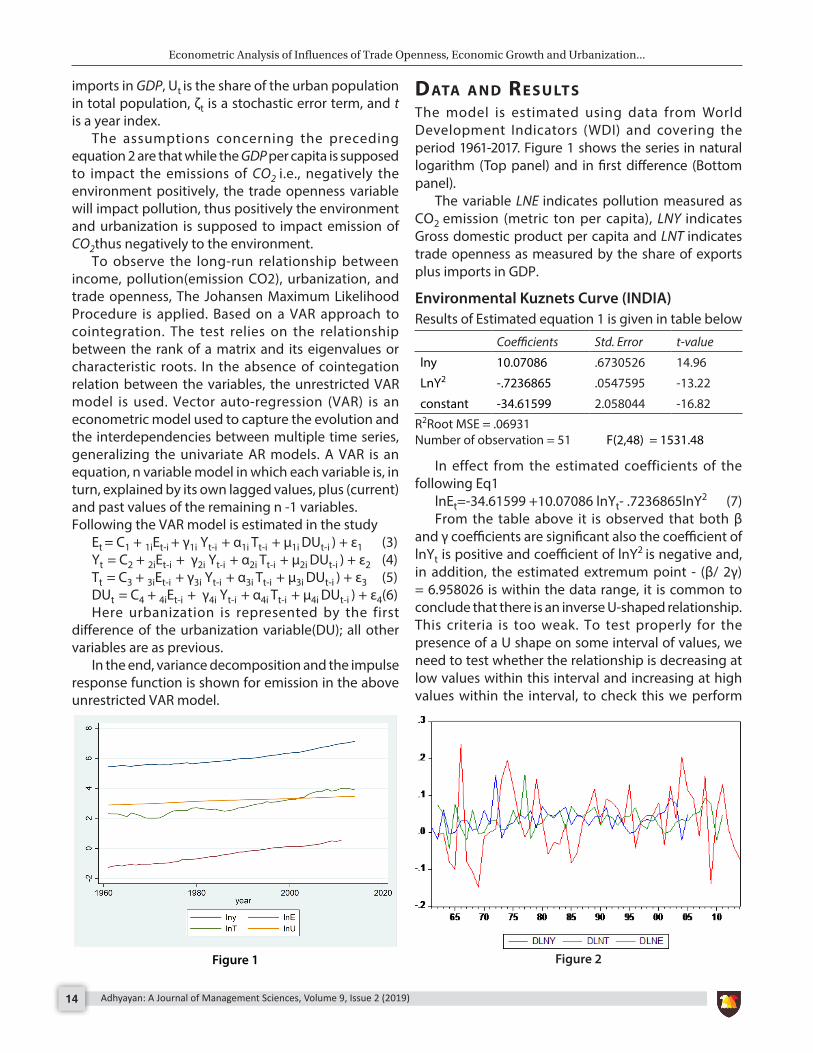
Note: (*) is the MacKinnon-Haug-Michelis (1999) p-values. Lags interval (in first differences): 1 to 3Figure 3: Environment Kuznets Curve (India)
The results of estimate equation 2
lnE Coefficients t value
lnY .7682724 7.65
lnU 1.971352 13.65
T -.0955 -4.23
Constant -11.08425 -37.63
Number of observations = 51 Adj R-squared = 0.9916F( 3, 47)= 1970.44
Note *indicate significant at 1% level of significance
the U-test. The result of the U-test is given in the table below.
Lower bound Upper boundInterval 5.447491 7.140957Slope 2.186309 -.2647684t-value 27.60546 -2.373303Overall test of presence of a Inverse U shape:t-value = 2.37p>|t| = .010895% Fieller interval for extreme point: [6.8466065; 7.1081067]
From the above test, it is observed that the hypothesis of lower bound slope β+γf’(xl)>o and at the upper bound slope is β+γf’(xl)<0 can be rejected. Also, the p-value for the overall test of the presence of inverse U shape is less than 5%, so the null hypothesis of inverse U shape is rejected.
Result suggests that using the U-test, the relation between the emission of CO2 and income is not inverted U shape in case of India during (1961-2017). As only the necessary condition, such as the statistically significant negative value of β=-.7236865 and computed extreme point (β/ 2γ)= 6.958026, predicted turning point computed by e-(β/2γ)= 1051.55574 to be present within the data set are satisfied but not the sufficiency condition. The relation between income and emission of CO2 in the case of India is plotted in Figure 3.
Trade variable (T) has a negative coefficient indicating that with an openness of trade emission has gone down, the positive coefficient on the GDP per capita variable(lnY) indicates that with an increase in income emission increase, thus increasing the environmental degradation. The positive coefficient of urbanization variable indicates an increase in emission that is urbanization negatively impacting the environment.
Econometric Analysis of Influences of Trade Openness, Economic Growth and Urbanization...
Adhyayan: A Journal of Management Sciences, Volume 9, Issue 2 (2019)16
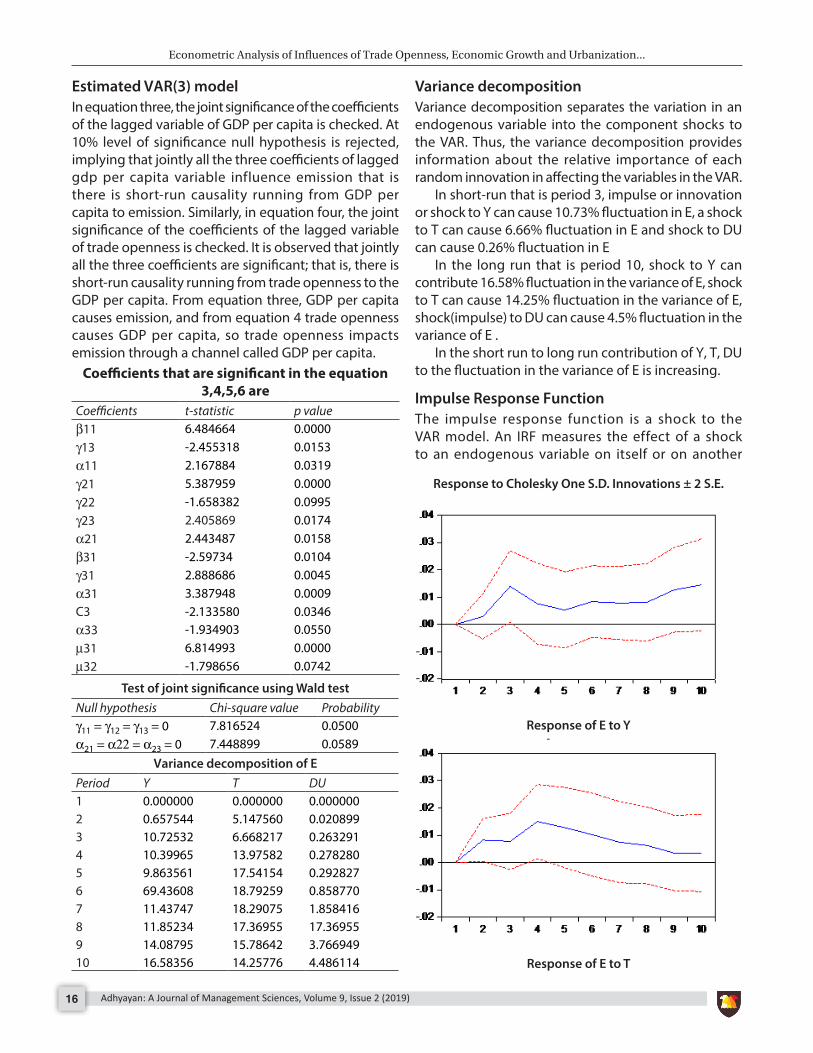
Estimated VAR(3) modelIn equation three, the joint significance of the coefficients of the lagged variable of GDP per capita is checked. At 10% level of significance null hypothesis is rejected, implying that jointly all the three coefficients of lagged gdp per capita variable influence emission that is there is short-run causality running from GDP per capita to emission. Similarly, in equation four, the joint significance of the coefficients of the lagged variable of trade openness is checked. It is observed that jointly all the three coefficients are significant; that is, there is short-run causality running from trade openness to the GDP per capita. From equation three, GDP per capita causes emission, and from equation 4 trade openness causes GDP per capita, so trade openness impacts emission through a channel called GDP per capita.
Variance decompositionVariance decomposition separates the variation in an endogenous variable into the component shocks to the VAR. Thus, the variance decomposition provides information about the relative importance of each random innovation in affecting the variables in the VAR.
In short-run that is period 3, impulse or innovation or shock to Y can cause 10.73% fluctuation in E, a shock to T can cause 6.66% fluctuation in E and shock to DU can cause 0.26% fluctuation in E
In the long run that is period 10, shock to Y can contribute 16.58% fluctuation in the variance of E, shock to T can cause 14.25% fluctuation in the variance of E, shock(impulse) to DU can cause 4.5% fluctuation in the variance of E .
In the short run to long run contribution of Y, T, DU to the fluctuation in the variance of E is increasing.
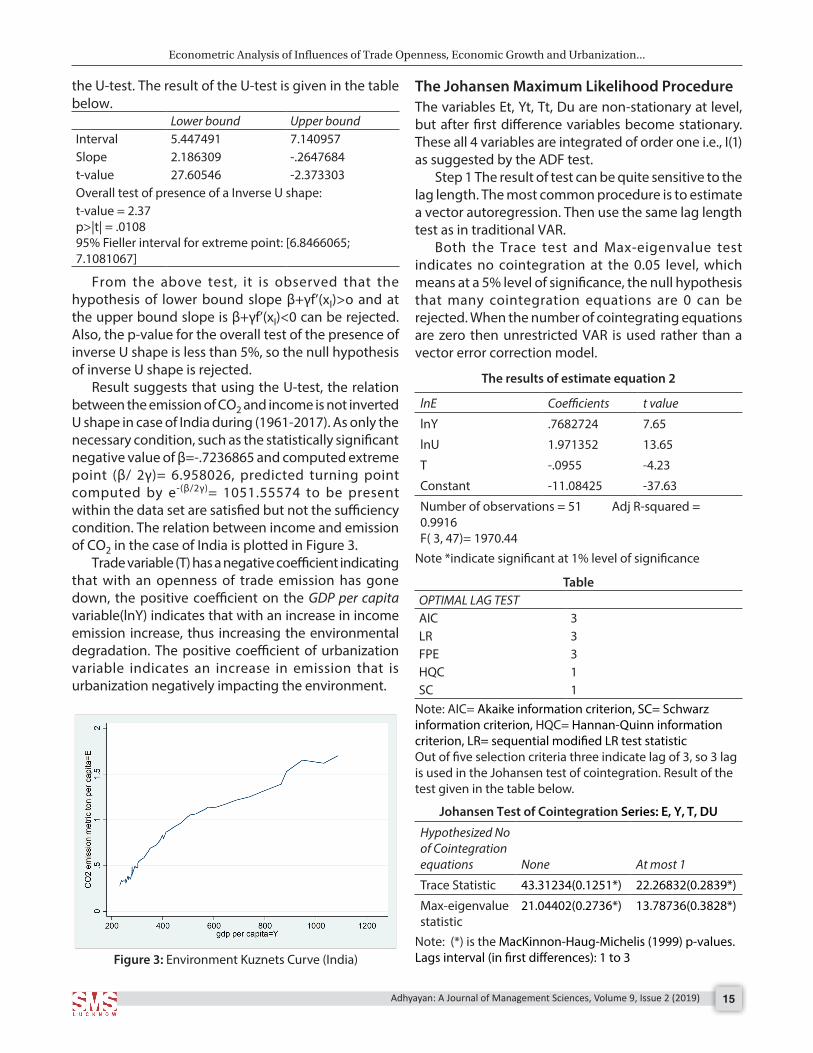
Impulse Response FunctionThe impulse response function is a shock to the VAR model. An IRF measures the effect of a shock to an endogenous variable on itself or on another
Variance decomposition of EPeriod Y T DU1 0.000000 0.000000 0.0000002 0.657544 5.147560 0.0208993 10.72532 6.668217 0.2632914 10.39965 13.97582 0.2782805 9.863561 17.54154 0.2928276 69.43608 18.79259 0.8587707 11.43747 18.29075 1.8584168 11.85234 17.36955 17.369559 14.08795 15.78642 3.76694910 16.58356 14.25776 4.486114
Test of joint significance using Wald testNull hypothesis Chi-square value Probabilityγ11 = γ12 = γ13 = 0 7.816524 0.0500α21 = α22 = α23 = 0 7.448899 0.0589
Coefficients that are significant in the equation 3,4,5,6 are
Coefficients t-statistic p valueβ11 6.484664 0.0000γ13 -2.455318 0.0153α11 2.167884 0.0319γ21 5.387959 0.0000γ22 -1.658382 0.0995γ23 2.405869 0.0174α21 2.443487 0.0158β31 -2.59734 0.0104γ31 2.888686 0.0045α31 3.387948 0.0009C3 -2.133580 0.0346α33 -1.934903 0.0550µ31 6.814993 0.0000µ32 -1.798656 0.0742
Response to Cholesky One S.D. Innovations ± 2 S.E.
Response of E to Y
Response of E to T
Econometric Analysis of Influences of Trade Openness, Economic Growth and Urbanization...
Adhyayan: A Journal of Management Sciences, Volume 9, Issue 2 (2019) 17
Residual diagnostic testEquation 3 Equation 4
Heteroskedasticity Test: Breusch-Pagan-Godfrey Prob. Chi-Square 0.7444 0.8178 Breusch-Godfrey Serial CorrelationLM Test: Prob. Chi-Square 0.8616 0.1795Jarque –Bera test probability 0.55864 0.604512 Required 0.997327 0.998281
Note: Since all the probability value more than 5%, so the null hypothesis of homoscedasticity can be rejected, no autocorrelation and errors are normally distributed in eq 3 and 4. Also regression equation 3 and 4 have high R square value
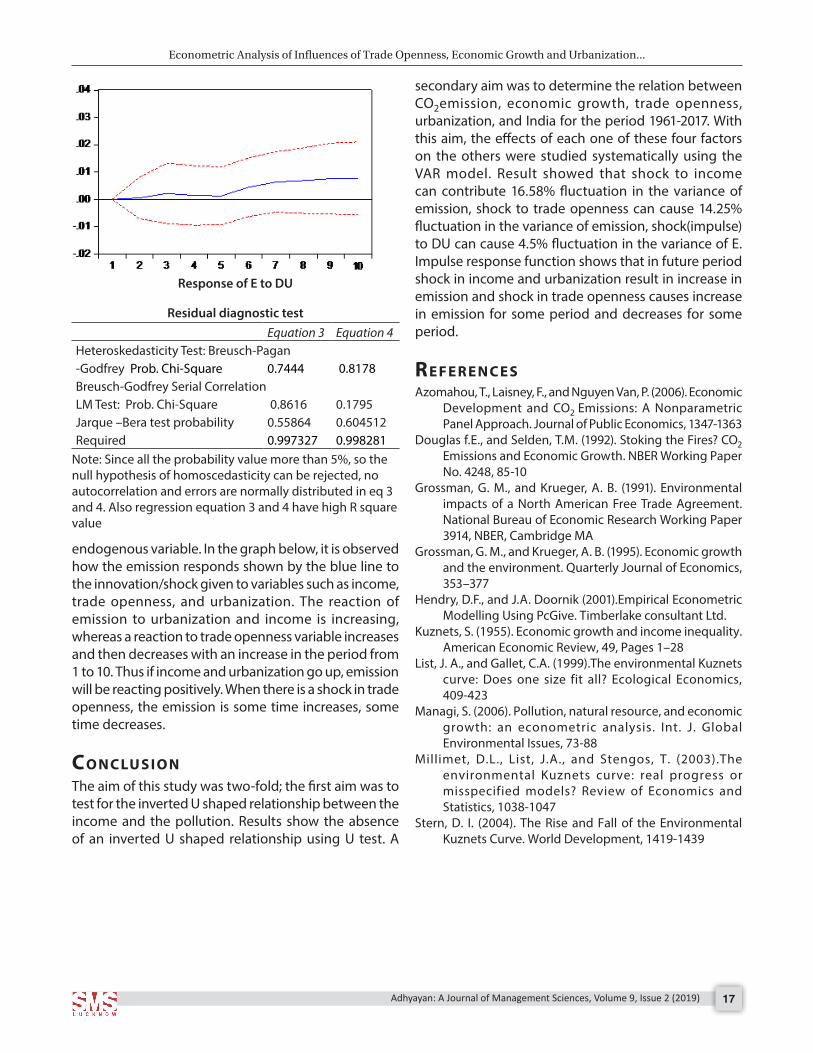
Response of E to DU
endogenous variable. In the graph below, it is observed how the emission responds shown by the blue line to the innovation/shock given to variables such as income, trade openness, and urbanization. The reaction of emission to urbanization and income is increasing, whereas a reaction to trade openness variable increases and then decreases with an increase in the period from 1 to 10. Thus if income and urbanization go up, emission will be reacting positively. When there is a shock in trade openness, the emission is some time increases, some time decreases.
co n c Lu s I o nThe aim of this study was two-fold; the first aim was to test for the inverted U shaped relationship between the income and the pollution. Results show the absence of an inverted U shaped relationship using U test. A
secondary aim was to determine the relation between CO2emission, economic growth, trade openness, urbanization, and India for the period 1961-2017. With this aim, the effects of each one of these four factors on the others were studied systematically using the VAR model. Result showed that shock to income can contribute 16.58% fluctuation in the variance of emission, shock to trade openness can cause 14.25% fluctuation in the variance of emission, shock(impulse) to DU can cause 4.5% fluctuation in the variance of E. Impulse response function shows that in future period shock in income and urbanization result in increase in emission and shock in trade openness causes increase in emission for some period and decreases for some period.
re f e r e n c e sAzomahou, T., Laisney, F., and Nguyen Van, P. (2006). Economic
Development and CO2 Emissions: A Nonparametric Panel Approach. Journal of Public Economics, 1347-1363
Douglas f.E., and Selden, T.M. (1992). Stoking the Fires? CO2 Emissions and Economic Growth. NBER Working Paper No. 4248, 85-10
Grossman, G. M., and Krueger, A. B. (1991). Environmental impacts of a North American Free Trade Agreement. National Bureau of Economic Research Working Paper 3914, NBER, Cambridge MA
Grossman, G. M., and Krueger, A. B. (1995). Economic growth and the environment. Quarterly Journal of Economics, 353–377
Hendry, D.F., and J.A. Doornik (2001).Empirical Econometric Modelling Using PcGive. Timberlake consultant Ltd.
Kuznets, S. (1955). Economic growth and income inequality.American Economic Review, 49, Pages 1–28
List, J. A., and Gallet, C.A. (1999).The environmental Kuznets curve: Does one size fit all? Ecological Economics, 409-423
Managi, S. (2006). Pollution, natural resource, and economic growth: an econometric analysis. Int. J. Global Environmental Issues, 73-88
Millimet, D.L., List, J.A., and Stengos, T. (2003).The environmental Kuznets curve: real progress or misspecified models? Review of Economics and Statistics, 1038-1047
Stern, D. I. (2004). The Rise and Fall of the Environmental Kuznets Curve. World Development, 1419-1439
Ab s t r Ac tThis study shows that the introduction of a cashless economy in India can be seen as a step in the right direction. It helps in the growth and development of the Indian economy. The digital India program is a flagship program of the Government of India with the vision to transform India into a digitally empowered society and knowledge economy.“Faceless, paperless, cashless” is one of the professed roles of digital India. The cashless economy will help in curbing black money, counter feit’s fake currency, fighting against terrorism, reduce cash related robbery helps in improving growth of our country. The demonetisation announcement in 2016 is a revolutionary move towards the cashless economy and Sustainable development. The study also helps in determining the factors which influence the people to switch from cash towards cashless payments and what are the challenges and benefits people avail while using any digital mode of payment.Keywords: Black money, Cashless Economy, Digital India, Faceless, Paperless, Terrorism.Adhyayan: A Journal of Management Sciences (2019); DOI: 10.21567/adhyayan.v9i2.3
Cashless Economy and Sustainable Development in IndiaPooja Saxena Singh*Assistant Professor, Basudev Memorial Girls Degree College, Lucknow, (U.P.), India
Corresponding Author: Dr. Pooja Saxena Singh, Assistant Professor, Basudev Memorial Girls Degree College, Lucknow, (U.P.), India, e-mail: [email protected], tel.: +91-9455007500How to cite his article: Singh, P.S. (2019). Cashless Economy and Sustainable Development in India. Adhyayan: A Journal of Management Sciences, 9(2):18-20.Source of support: NilConflict of interest: None
© The Author(s). 2019 Open Access This article is distributed under the terms of the Creative Commons Attribution 4.0 International License (http://creativecommons.org/licenses/by/4.0/), which permits unrestricted use, distribution, and non-commercial reproduction in any medium, provided you give appropriate credit to the original author(s) and the source, provide a link to the Creative Commons license, and indicate if changes were made. The Creative Commons Public Domain Dedication waiver (http://creativecommons.org/publicdomain/zero/1.0/) applies to the data made available in this article, unless otherwise stated.
In t r o d u c t I o n
A cashless society is not a newly found phenomenon. Decades back India great for it with plastic cards
the world wide Trend is to relegate cash transaction and India is not an island Indian government has been facilitating this trend with many schemes and retro measures. To weed out black money and corruption from public life government has been leveraging the digital transaction ecosystem. By December 2017, all government Agencies would adopt a digital way of transacting to ensure inclusive growth.
Digital India consists of three core components of the creation of digital infrastructure delivery of services digitally, and digital literacy. Digital India is not only transforming India but also helping to achieve the United Nations sustainable development goals agenda 2030 government’s priority in 2017 is three-pronged. The first priority is to address poverty; the second is to bring in partnerships, and the third stands over industry innovation and infrastructure. The Government of India admission for digital and financial inclusion is being supported by business organization associations like the Federation of India Chambers of Commerce and Industry FICCI.
Digital India is giving first to affordable devices internet access and digital literacy Minister of State Ministry Law and Justice Electronics and Information
Technology points out at the last two years showing a three-fold increase in the number of transactions and government is aiming to connect 90% of India with Internet Services the combination of Aadhaar with Jan-Dhan and access to finance is providing people-friendly. This increases the number of Aadhar cards from 1.8 times since 2014 to 1110 million now.
Digital-first budget of 10,000 crores have been declared as investment outlay for Bharat Net Program to ensure that the backend network is transaction-ready Government of India emphasizes that digital economy is critical for India to make government services and welfare benefits accessible to remote areas of the country seamlessly and to provide last-mile connectivity Infra-flung areas.
‘Digital Saksharta Abhiyan’ initiated with the vision to make at least one person in every family digitally literate with digital literacy skills by 2020 and provide
RESEARCH ARTICLE
ADHYAYAN Volume 9, Issue 2, 2019 Print ISSN: 2249-1066 Online ISSN: 2455–8656
Cashless Economy and Sustainable Development in India
Adhyayan: A Journal of Management Sciences, Volume 9, Issue 2 (2019) 19
digital literacy to 6 crore rural households, including Anganwadi and ASHA workers and authorized ration dealers across the country. To take the benefit of digital India to every corner of country Avast network of more than 25 lakh common service centers have been created, this has developed digital entrepreneurs among poor, marginalized Dalits and women of India.
Reducing the Indian economy’s dependence on cash is desirable for a variety of reasons. India has one of the highest cash to gross domestic product (GDP) ratios and lubricating economic activities with the paper cost. The government on its path is working at various levels to reduce the dependence on cash opening bank accounts for the unbanked under the adoption of direct benefit transfer is part of the overall idea to reduce the usage of cash and increase transparency. The shortage of cash has also significantly increased the use of digital modes of payments; the actual shift will only be visible after the cash crunch eases. Reserve Bank of India (RBI) has also issued a license to open new-age small finance banks and payment banks, which are expected to give a push to financial inclusions and bring innovative banking solutions interface by National Payments Corporation of India makes digital transactions as simple as sending a text message.
ObjectivesThe objective of this study is:-• To identify the various challenges faced by Indians
while moving towards cashless.• To analyze the status of ‘cashless layout’ in rural and
urban areas.
MethodsTo find out the effects of the cashless transactions and its impact on Indian economy primary and secondary methods are used.
re s e A r c h Me t h o d o Lo g yThis study is based on qualitative research method because, qualitative research is characterized by its names, which relates to understanding some aspect of social life and its methods, which generate words rather than numbers as data for analysis additional. It seeks to understand a given research problem or topic from the perspective of the local population qualitative research, especially effective in obtaining cultural-specific information about the values opinions behavior and social context of particular populations. Some sort of secondary data has been used in this research that was
extracted from various sources journal books, e-books, report, etc.
The data for this study was collected through an interview session research population for this study was all the resident of city Lucknow with the sample size of 42 respondents. Convenience sampling was used to determine a respondent from both Urban and Rural regions, which include all sections of the society that a student, businessmen, academicians, and service class. Open-ended questions were asked regarding the challenges they face while going cashless.
fI n d I n g sMany benefits are related directly to the Indian economy these are
The cost of printing money printing notes is a costly affair, and it is the direct cost that affects the bank (RBI). It can be reduced by using cashless transactions more.
Maintenance cost another important aspect is the maintenance in the form of storage of notes and devices for the detection of counterfeit notes. The other major aspect of the maintenance is that the distribution of money through ATM machines at different locations.
Eradication of corruption going cashless is going to eradicate the corruption to some extent. The direct transaction will be simple, easy, and transparent, which in turn will show in the accounts of the senders and the receivers. This is again going to save enough money in the economy of the country.
Wipe away the black money from the market; it has been observed that many business people start evading the real money. This practice has created a very big problem of loss of tax to the exchequer.
Installation of a formal and pure form of economy has been observed that a cashless economy leads to the start of the proper formal and functional economy in the country. When all the transactions are made properly clear, clean, and taxed, it maybe leads the country towards the development.
Stop leakages cashless economy is the best and one of the few ways in the system to stop leakages of the money by the officials of the government while distribution money to the beneficiary.
Decrease the cost of cashless commodity economy aims at reducing the cost of the commodities by setting aside the black market and the proper deposit of the tax all this leads to the development of the system where one can find the cost of the commodity going down in the market.
Cashless Economy and Sustainable Development in India
Adhyayan: A Journal of Management Sciences, Volume 9, Issue 2 (2019)20
ch A L L e n g e s It is very important to see the fact that most of the situations and circumstances have posed bit challenges to the government the major challenges that are there to establish the cashless economy:-
Financial inclusion if we see the present situation of the people having bank accounts, we can see that only sixty percent of the country’s population has bank accounts.
Lack of infrastructure In India, there are many areas where the bank is still a distant dream. The remote areas are still not having the banks at their doorstep. People have to move to distant places to have their money transactions in the banks.
Lack of education people living in remote villages and areas of the country has still not educated and half an hour not able to operate the banking services effectively. Illiterate people with bank accounts in the country are not even good enough to fill in the blank forms to deposit and withdrawal money.
Consumer awareness is missing consumers who are not aware of the different aspects of cashless transactions.
co n c Lu s I o nIf a look at the overall summary of establishing the cashless economy, its benefits, and the uses in the present system, it can be said that the cashless economy is the need of the hour. It has become not only important but necessary for the country to go cashless for the systematic development in the economy. This is to be
done in a very systematic way. Some of the initiatives that should be taken are:• People should be educated adequately. The use of
cards in the ATM should be described to the people so that they can easily use the card.
• Proper infrastructure should be developed in remote areas so that this facility should be taken to the rural and remote India.
• People should be made aware so that they can utilize their money effectively through cashless means buyers and sellers; both should be made aware of the benefits of the cashless transactions.
By following some of the points, it can send what we can effectively implement the cashless transactions in the country. It will be better to say that India, at this point, has to go for less cash easy economy rather than the cashless economy; the continuous March towards less-cash economy will lead to a cashless economy in the country.
re f e r e n c e“Faceless, Paperless, Cashless” (online) Available: http://www.
cashlessindia.gov.in Roth, B.L (2010)”The Future of Money- The CashlessEconomy
Part 1. (Online) Available: http://www.x.com/…/future-money-cashless-economy_part -i.
Dr. Asha Sharma, Indian Journal of Accounting (IJA) (Online) Vol.1, June 2017, “Potential for Cashless Economy in India.”
Garg and Panchal, Journal of Business and Management (IOSR- JBM) (Online) Vol. 19, Issue 4. Ver.II, April 2017, “Study on introduction of Cashless Economy in India.Benefits and challenges”.
Ab s t r Ac tThe marketing scenario is drastically changing, with the focus shifting from traditional marketing towards digital or electronic marketing. Enterprises must recognize the new paradigm which focuses on customer relationship and which ultimately helps in creating and retaining loyal customers. A recent tool of creating a loyal trustworthy customer relationship is by using content marketing, meaning providing customers with valuable information in the form of content and enabling two–way communication. For the creation of successful content marketing, it is very crucial for an enterprise to know how consumers perceive contents, what does attract them about the contents, what do they expect from contents, etc.Social media platforms are now providing common platforms for exchanging ideas and knowledge and for building social networks. Enterprises can make use of different social media platforms like blogs, videos, infographics, photo sharing on posts, etc. to reach targeted customers. Content marketing and social media both are complementary for each other because good content has no value until and unless it is not promoted on social media and in the same way social media marketing will fail without a good content strategy.This research paper is concerned with a deep understanding of content marketing and how social media platforms help in carrying out the value contents from producers to potential buyers. The present study is a review of books, research papers, thesis, and various articles. The study is based on secondary data.Keywords: Blogs, Content marketing, Insight, Social media, etc.Adhyayan: A Journal of Management Sciences (2019); DOI: 10.21567/adhyayan.v9i2.4
The Insight of Content Marketing at Social Media PlatformsAkanchha Singh,1* Smriti Mathur2
1Assistant Professor, School of Management Sciences, Lucknow (U.P.), India2Assistant Professor, Babu Banarasi Das University, Lucknow (U.P.), India
Corresponding Author: Akanchha Singh, Assistant Professor, School of Management Sciences, Lucknow (U.P.), India, e-mail: [email protected], tel.: +91-9971714028How to cite his article: Singh, P.S. (2019). The Insight of Content Marketing at Social Media Platforms. Adhyayan: A Journal of Management Sciences, 9(2):17-21. Source of support: NilConflict of interest: None
© The Author(s). 2019 Open Access This article is distributed under the terms of the Creative Commons Attribution 4.0 International License (http://creativecommons.org/licenses/by/4.0/), which permits unrestricted use, distribution, and non-commercial reproduction in any medium, provided you give appropriate credit to the original author(s) and the source, provide a link to the Creative Commons license, and indicate if changes were made. The Creative Commons Public Domain Dedication waiver (http://creativecommons.org/publicdomain/zero/1.0/) applies to the data made available in this article, unless otherwise stated.
In t r o d u c t I o n
With traditional ads, companies design ad content that interrupts customers in the forms of bill
boarding, magazine ads, Tv ads, radio ads, etc. Each of these advertisements does not provide any value to customers because their emphasis is on what they want a customer to know rather what customers exactly want to know. Traditional ads mainly rely on the usage of smart wordings, exceptional creativity, etc. to gain customer’s attention. The only objective of these ads is to capture the attention of the customers for at least a few seconds so that the brand message could be communicated with the target audience. But it does not work in reality in the long run.
In today’s highly competitive era, if an enterprise wants to sustain in the long run, then it has to win the trust of consumers. With content marketing, instead of developing ads that irritate customers, companies create content such as blogs, value providing youtube videos,
etc. Social media platforms give entrepreneurs voice and a path to communicate with peers, customers, and potential customers. It personalizes the brand and helps in delivering a message in a relevant and conversational way. Abundant no. of success stories are enough to justify the importance of social media. So if a value content would be provided to the target customers, it would eventually help marketers in terms of building a sustainable relationship with the customers.
RESEARCH ARTICLE
ADHYAYAN Volume 9, Issue 2, 2019 Print ISSN: 2249-1066 Online ISSN: 2455–8656
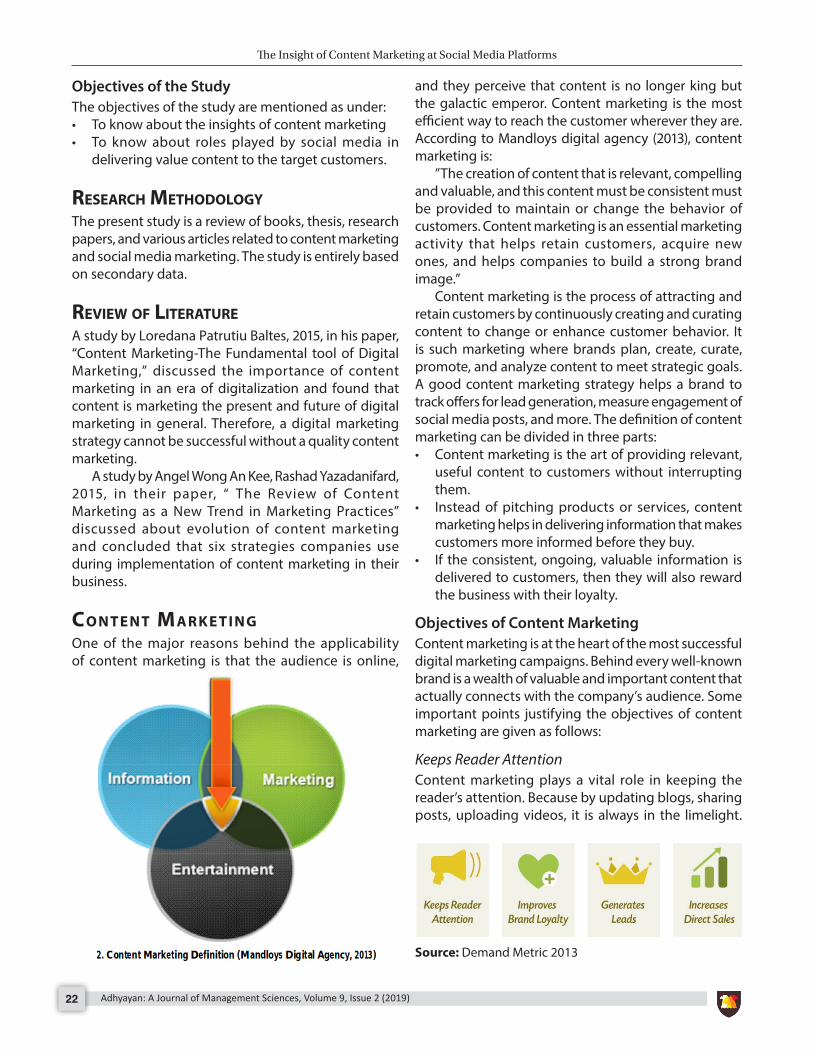
The Insight of Content Marketing at Social Media Platforms
Adhyayan: A Journal of Management Sciences, Volume 9, Issue 2 (2019)22
Objectives of the Study The objectives of the study are mentioned as under:• To know about the insights of content marketing• To know about roles played by social media in
delivering value content to the target customers.
reseArch MethodoLogyThe present study is a review of books, thesis, research papers, and various articles related to content marketing and social media marketing. The study is entirely based on secondary data.
revIew of LIterAtureA study by Loredana Patrutiu Baltes, 2015, in his paper, “Content Marketing-The Fundamental tool of Digital Marketing,” discussed the importance of content marketing in an era of digitalization and found that content is marketing the present and future of digital marketing in general. Therefore, a digital marketing strategy cannot be successful without a quality content marketing.
A study by Angel Wong An Kee, Rashad Yazadanifard, 2015, in their paper, “ The Review of Content Marketing as a New Trend in Marketing Practices” discussed about evolution of content marketing and concluded that six strategies companies use during implementation of content marketing in their business.
co n t e n t MA r k e t I n gOne of the major reasons behind the applicability of content marketing is that the audience is online,
and they perceive that content is no longer king but the galactic emperor. Content marketing is the most efficient way to reach the customer wherever they are. According to Mandloys digital agency (2013), content marketing is:
”The creation of content that is relevant, compelling and valuable, and this content must be consistent must be provided to maintain or change the behavior of customers. Content marketing is an essential marketing activity that helps retain customers, acquire new ones, and helps companies to build a strong brand image.”
Content marketing is the process of attracting and retain customers by continuously creating and curating content to change or enhance customer behavior. It is such marketing where brands plan, create, curate, promote, and analyze content to meet strategic goals. A good content marketing strategy helps a brand to track offers for lead generation, measure engagement of social media posts, and more. The definition of content marketing can be divided in three parts:• Content marketing is the art of providing relevant,
useful content to customers without interrupting them.
• Instead of pitching products or services, content marketing helps in delivering information that makes customers more informed before they buy.
• If the consistent, ongoing, valuable information is delivered to customers, then they will also reward the business with their loyalty.
Objectives of Content Marketing Content marketing is at the heart of the most successful digital marketing campaigns. Behind every well-known brand is a wealth of valuable and important content that actually connects with the company’s audience. Some important points justifying the objectives of content marketing are given as follows:
Keeps Reader AttentionContent marketing plays a vital role in keeping the reader’s attention. Because by updating blogs, sharing posts, uploading videos, it is always in the limelight.
Source: Demand Metric 2013
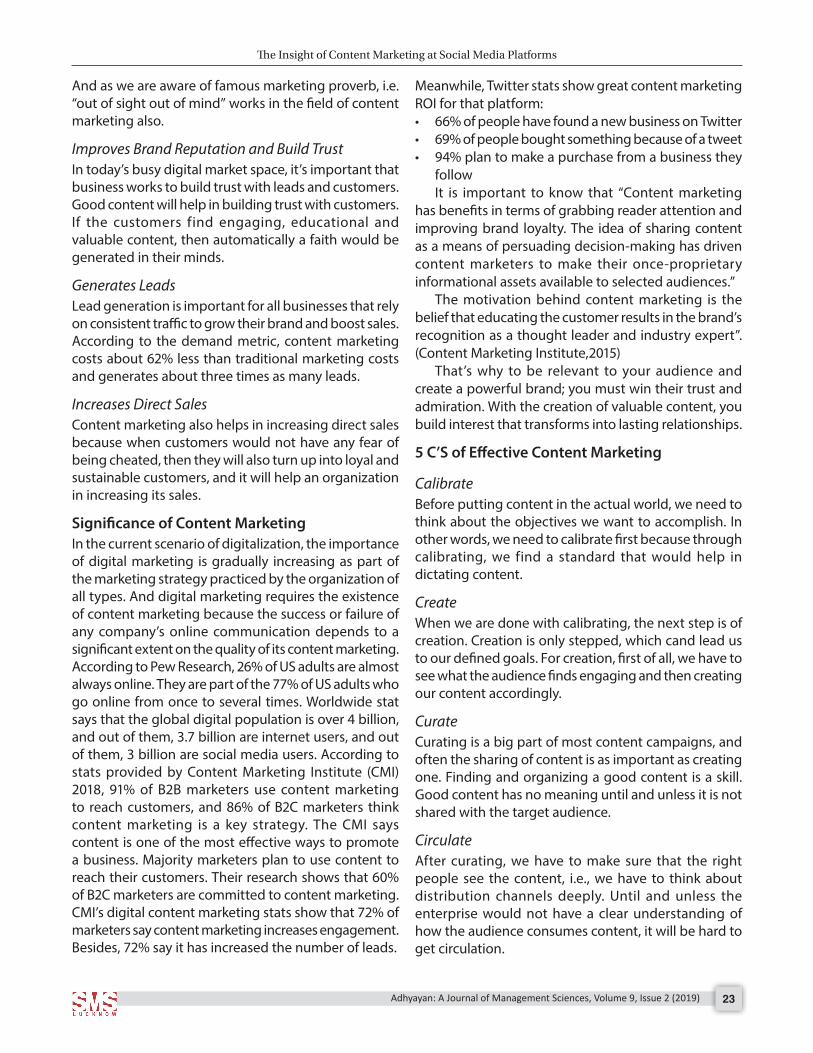
The Insight of Content Marketing at Social Media Platforms
Adhyayan: A Journal of Management Sciences, Volume 9, Issue 2 (2019) 23
And as we are aware of famous marketing proverb, i.e. “out of sight out of mind” works in the field of content marketing also.
Improves Brand Reputation and Build Trust In today’s busy digital market space, it’s important that business works to build trust with leads and customers. Good content will help in building trust with customers. If the customers find engaging, educational and valuable content, then automatically a faith would be generated in their minds.
Generates Leads Lead generation is important for all businesses that rely on consistent traffic to grow their brand and boost sales. According to the demand metric, content marketing costs about 62% less than traditional marketing costs and generates about three times as many leads.
Increases Direct SalesContent marketing also helps in increasing direct sales because when customers would not have any fear of being cheated, then they will also turn up into loyal and sustainable customers, and it will help an organization in increasing its sales.
Significance of Content MarketingIn the current scenario of digitalization, the importance of digital marketing is gradually increasing as part of the marketing strategy practiced by the organization of all types. And digital marketing requires the existence of content marketing because the success or failure of any company’s online communication depends to a significant extent on the quality of its content marketing. According to Pew Research, 26% of US adults are almost always online. They are part of the 77% of US adults who go online from once to several times. Worldwide stat says that the global digital population is over 4 billion, and out of them, 3.7 billion are internet users, and out of them, 3 billion are social media users. According to stats provided by Content Marketing Institute (CMI) 2018, 91% of B2B marketers use content marketing to reach customers, and 86% of B2C marketers think content marketing is a key strategy. The CMI says content is one of the most effective ways to promote a business. Majority marketers plan to use content to reach their customers. Their research shows that 60% of B2C marketers are committed to content marketing. CMI’s digital content marketing stats show that 72% of marketers say content marketing increases engagement. Besides, 72% say it has increased the number of leads.
Meanwhile, Twitter stats show great content marketing ROI for that platform:• 66% of people have found a new business on Twitter• 69% of people bought something because of a tweet• 94% plan to make a purchase from a business they
followIt is important to know that “Content marketing
has benefits in terms of grabbing reader attention and improving brand loyalty. The idea of sharing content as a means of persuading decision-making has driven content marketers to make their once-proprietary informational assets available to selected audiences.”
The motivation behind content marketing is the belief that educating the customer results in the brand’s recognition as a thought leader and industry expert”.(Content Marketing Institute,2015)
That’s why to be relevant to your audience and create a powerful brand; you must win their trust and admiration. With the creation of valuable content, you build interest that transforms into lasting relationships.
5 C’S of Effective Content Marketing
Calibrate Before putting content in the actual world, we need to think about the objectives we want to accomplish. In other words, we need to calibrate first because through calibrating, we find a standard that would help in dictating content.
CreateWhen we are done with calibrating, the next step is of creation. Creation is only stepped, which cand lead us to our defined goals. For creation, first of all, we have to see what the audience finds engaging and then creating our content accordingly.
Curate Curating is a big part of most content campaigns, and often the sharing of content is as important as creating one. Finding and organizing a good content is a skill. Good content has no meaning until and unless it is not shared with the target audience.
Circulate After curating, we have to make sure that the right people see the content, i.e., we have to think about distribution channels deeply. Until and unless the enterprise would not have a clear understanding of how the audience consumes content, it will be hard to get circulation.
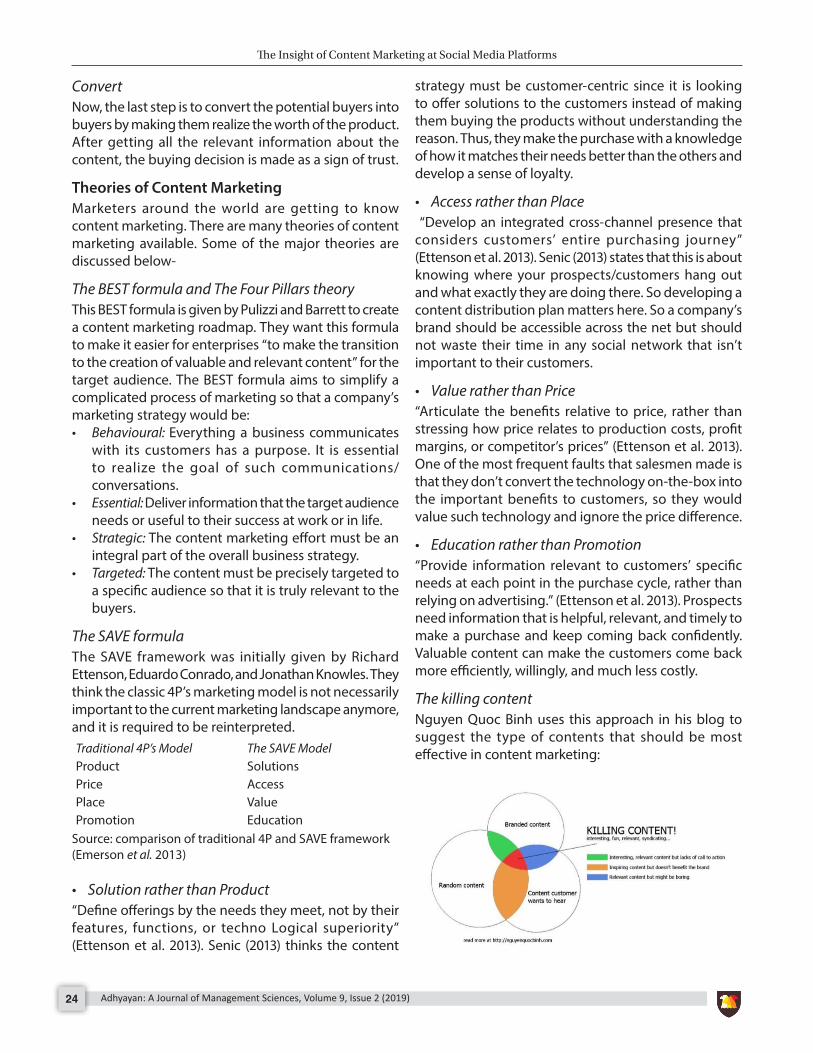
The Insight of Content Marketing at Social Media Platforms
Adhyayan: A Journal of Management Sciences, Volume 9, Issue 2 (2019)24
ConvertNow, the last step is to convert the potential buyers into buyers by making them realize the worth of the product. After getting all the relevant information about the content, the buying decision is made as a sign of trust.
Theories of Content MarketingMarketers around the world are getting to know content marketing. There are many theories of content marketing available. Some of the major theories are discussed below-
The BEST formula and The Four Pillars theory This BEST formula is given by Pulizzi and Barrett to create a content marketing roadmap. They want this formula to make it easier for enterprises “to make the transition to the creation of valuable and relevant content” for the target audience. The BEST formula aims to simplify a complicated process of marketing so that a company’s marketing strategy would be:• Behavioural: Everything a business communicates
with its customers has a purpose. It is essential to realize the goal of such communications/conversations.
• Essential: Deliver information that the target audience needs or useful to their success at work or in life.
• Strategic: The content marketing effort must be an integral part of the overall business strategy.
• Targeted: The content must be precisely targeted to a specific audience so that it is truly relevant to the buyers.
The SAVE formula The SAVE framework was initially given by Richard Ettenson, Eduardo Conrado, and Jonathan Knowles. They think the classic 4P’s marketing model is not necessarily important to the current marketing landscape anymore, and it is required to be reinterpreted. Traditional 4P’s Model The SAVE ModelProduct SolutionsPrice AccessPlace ValuePromotion Education
Source: comparison of traditional 4P and SAVE framework (Emerson et al. 2013)
• Solution rather than Product“Define offerings by the needs they meet, not by their features, functions, or techno Logical superiority” (Ettenson et al. 2013). Senic (2013) thinks the content
strategy must be customer-centric since it is looking to offer solutions to the customers instead of making them buying the products without understanding the reason. Thus, they make the purchase with a knowledge of how it matches their needs better than the others and develop a sense of loyalty.
• Access rather than Place “Develop an integrated cross-channel presence that considers customers’ entire purchasing journey” (Ettenson et al. 2013). Senic (2013) states that this is about knowing where your prospects/customers hang out and what exactly they are doing there. So developing a content distribution plan matters here. So a company’s brand should be accessible across the net but should not waste their time in any social network that isn’t important to their customers.
• Value rather than Price“Articulate the benefits relative to price, rather than stressing how price relates to production costs, profit margins, or competitor’s prices” (Ettenson et al. 2013). One of the most frequent faults that salesmen made is that they don’t convert the technology on-the-box into the important benefits to customers, so they would value such technology and ignore the price difference.
• Education rather than Promotion “Provide information relevant to customers’ specific needs at each point in the purchase cycle, rather than relying on advertising.” (Ettenson et al. 2013). Prospects need information that is helpful, relevant, and timely to make a purchase and keep coming back confidently. Valuable content can make the customers come back more efficiently, willingly, and much less costly.
The killing content Nguyen Quoc Binh uses this approach in his blog to suggest the type of contents that should be most effective in content marketing:
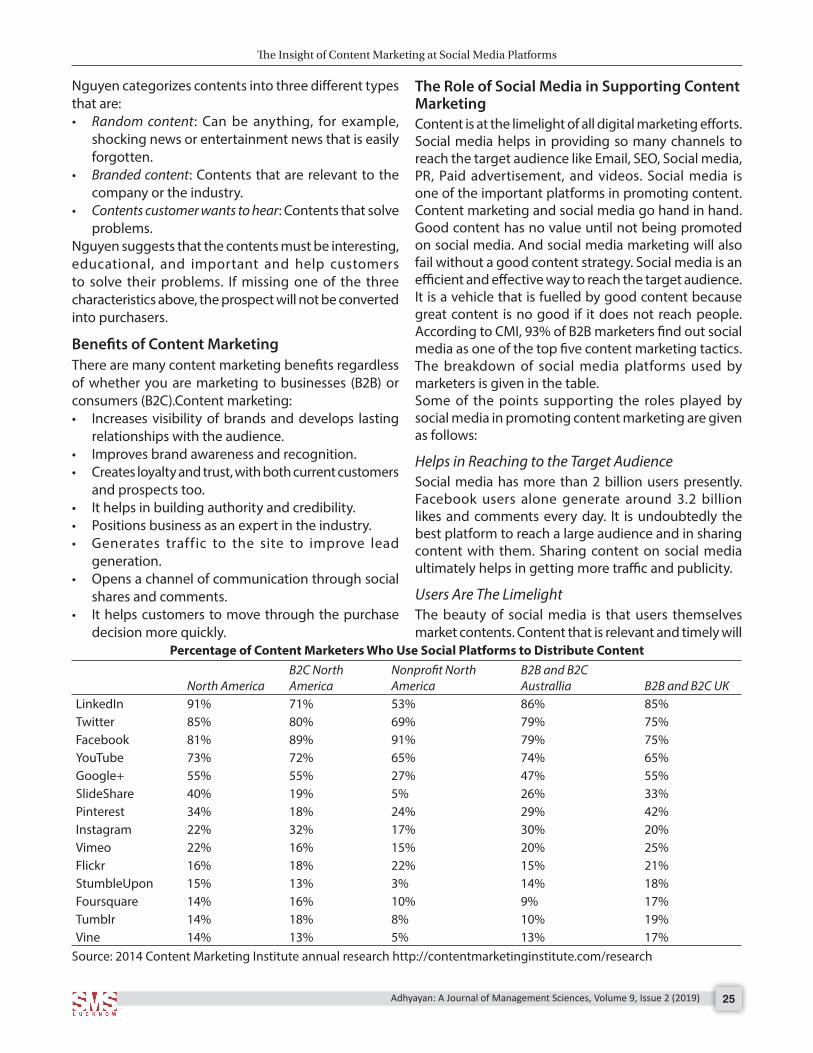
The Insight of Content Marketing at Social Media Platforms
Adhyayan: A Journal of Management Sciences, Volume 9, Issue 2 (2019) 25
Nguyen categorizes contents into three different types that are: • Random content: Can be anything, for example,
shocking news or entertainment news that is easily forgotten.
• Branded content: Contents that are relevant to the company or the industry.
• Contents customer wants to hear: Contents that solve problems.
Nguyen suggests that the contents must be interesting, educational, and important and help customers to solve their problems. If missing one of the three characteristics above, the prospect will not be converted into purchasers.
Benefits of Content Marketing There are many content marketing benefits regardless of whether you are marketing to businesses (B2B) or consumers (B2C).Content marketing:• Increases visibility of brands and develops lasting
relationships with the audience.• Improves brand awareness and recognition.• Creates loyalty and trust, with both current customers
and prospects too.• It helps in building authority and credibility.• Positions business as an expert in the industry.• Generates traffic to the site to improve lead
generation.• Opens a channel of communication through social
shares and comments.• It helps customers to move through the purchase
decision more quickly.
The Role of Social Media in Supporting Content Marketing Content is at the limelight of all digital marketing efforts. Social media helps in providing so many channels to reach the target audience like Email, SEO, Social media, PR, Paid advertisement, and videos. Social media is one of the important platforms in promoting content. Content marketing and social media go hand in hand. Good content has no value until not being promoted on social media. And social media marketing will also fail without a good content strategy. Social media is an efficient and effective way to reach the target audience. It is a vehicle that is fuelled by good content because great content is no good if it does not reach people. According to CMI, 93% of B2B marketers find out social media as one of the top five content marketing tactics. The breakdown of social media platforms used by marketers is given in the table.Some of the points supporting the roles played by social media in promoting content marketing are given as follows:
Helps in Reaching to the Target AudienceSocial media has more than 2 billion users presently. Facebook users alone generate around 3.2 billion likes and comments every day. It is undoubtedly the best platform to reach a large audience and in sharing content with them. Sharing content on social media ultimately helps in getting more traffic and publicity.
Users Are The LimelightThe beauty of social media is that users themselves market contents. Content that is relevant and timely will
Percentage of Content Marketers Who Use Social Platforms to Distribute Content
North AmericaB2C North America
Nonprofit North America
B2B and B2C Australlia B2B and B2C UK
LinkedIn 91% 71% 53% 86% 85%Twitter 85% 80% 69% 79% 75%Facebook 81% 89% 91% 79% 75%YouTube 73% 72% 65% 74% 65%Google+ 55% 55% 27% 47% 55%SlideShare 40% 19% 5% 26% 33%Pinterest 34% 18% 24% 29% 42%Instagram 22% 32% 17% 30% 20%Vimeo 22% 16% 15% 20% 25%Flickr 16% 18% 22% 15% 21%StumbleUpon 15% 13% 3% 14% 18%Foursquare 14% 16% 10% 9% 17%Tumblr 14% 18% 8% 10% 19%Vine 14% 13% 5% 13% 17%
Source: 2014 Content Marketing Institute annual research http://contentmarketinginstitute.com/research
The Insight of Content Marketing at Social Media Platforms
Adhyayan: A Journal of Management Sciences, Volume 9, Issue 2 (2019)26
be shared so many times by users. A positive E – Word- of the mouth of brands can help in building the trust of the targeted audience .ex- High ratings, positive feedbacks positively influence the consumers.
Helps In Getting Real-Timeme Feedback Social media is a good way to listen to the audience. It opens a two – way communication between business and its users. Many companies use Facebook, Twitter, etc. for customer support, feedback, and online community of customers, which helps them in keeping content relevant and responsive.
Helps In Building A Loyal Community Social media allows in building a loyal online community that is invested in the business. These community members recognize a brand and share a common purpose with business (which is why they follow business). It can build a sense of community among these users with the right kind of engagement.
Helps In Driving TrafficFacebook shares, retweets, and Instagram impressions can get huge business traffic. Customers’ shares and posts act as baits to lead website and lead pages. Social media drives more than 35% of traffic and is the top driver of website referral traffic. The company’s shares and posts can act as baits to lead websites and lead pages. So ultimately, it helps a company in driving traffic.
Distribution of Content Through Social Media Platforms The trick is not only in the content generation but also in its distribution. And to distribute its content, a company has to think about the best mix of available modes. It should never rely on a single mode because the availability of customers on social media platforms is spread about. Some of the modes are given as follows-• Writing Articles • Posting on Blogs, Facebook, Twitter• Blog syndication• Sharing in PDF forms• Sharing in the form of figures.• Use of Infographics• Uploading videos, etc.
co n c Lu s I o nContent marketing and social media go hand by hand. Content marketing and social media both are complementary for each other because good content has no value until and unless it is not promoted on social media and in the same way. Social media marketing will fail without a good content strategy.
Social media platforms give entrepreneurs voice and a path to communicate with peers, customers, and potential customers. It personalizes the brand and helps in delivering a message in a relevant and conversational way. Now, content marketing became a leading marketing technique in digital marketing communication and used the point of view of consumers to build relationships by creating and sharing engaging content in social media that enhance their daily lives. The research paper has shown that if a company would have a good content strategy, it would never face failure in terms of retention of customers. If the relevant content would be shared with users, the users also revert back to the company in terms of their long-lasting loyalty and faith, which would provide an edge over the other competitors.
re f e r e n c e shttp://www.diva-portal.org/smash/get/diva2:1143416/
FULLTEXT01.pdfhttps://core.ac.uk/download/pdf/38092806.pdfhttps://www.slideshare.net/mobile/SteveRaybould/
an-introduction-to-content-marketing-56602217https://w w w.slideshare.net/mobile/RM83/content-
marketing-ppthttps://www.impactbnd.com/blog/what-is-content-
marketinghttps://optinmonster.com/content-marketing-statistics/https://contentmarketinginstitute.com/what-is-content-
marketing/https://marketinginsidergroup.com/content-marketing/top-
10-content-marketing-articles-2017/https://www.lyfemarketing.com/blog/why-is-content-
marketing-important/https://masterful-marketing.com/content-marketing-
benefits-challenges-tips/ https://contentmarketinginstitute.com/2016/08/content-
marketing-stats/https://www.i-scoop.eu/content-marketing/https://onlinelibrary.wiley.com/doi/abs/10.1002/mar.20761https://credible-content.com/blog/3-important-objectives-
content-marketing/http://www.curata.com/blog/the-content-marketing-
pyramid-how-to-generate-more-with-less/https://w w w.singlegrain.com/blog-posts/content-
marketing/25-brands-made-big-content-marketing/https://socialmediaexplorer.com/content-marketing-2/the-
role-of-social-media-in-a-content-marketing-strategy/https://www.linkedin.com/pulse/role-social-media-content-
marketing-success-stefan-heldhttps://www.jointviews.com/blog/social-media-support-
content-marketing/https://www.i-scoop.eu/content-marketing/social-content/https://www.theleverageway.com/blog/introduction-to-
content-marketing/
Ab s t r Ac tThe Micro, Small, and Medium Enterprises (MSME) sector is the base of the Indian economy as this sector has created employment for more than 120 million persons through 63.4 million units. MSMEs contribute around 6.11% of the manufacturing GDP and 24.63% of the GDP from service activities as well as 33.4% of India’s manufacturing output and contribute around 45% of the overall exports from India. This sector has consistently maintained a growth rate of over 10%. About 20% of the MSMEs based in rural areas indicate the deployment of significant rural workforce in the MSME sector; this shows the importance of these enterprises in promoting sustainable and inclusive development as well as generating large scale employment, especially in rural areas. SIDBI is the principal financial institution for promoting, financing, and developing of the Micro Small and Medium Enterprises (MSME). It supports the MSME sector to gain the needed strength and has introduced various schemes and initiatives to meet the various requirements of the sector. Hence in the present paper various schemes of SIDBI are discussed for the development of MSMEs.Keywords: Inclusive, MSME, Sustainable.Adhyayan: A Journal of Management Sciences (2019); DOI: 10.21567/adhyayan.v9i2.5
A Study on Various Schemes for Msmes: With Special Reference to SIDBIShipra Shukla1*, Divya Prajapti2
1Research Scholar, Khwaja Moinuddin Chishti Urdu, Arabi-Farsi University, Lucknow, (U.P.), India2Shri Guru Nanak Girls Degree College, Lucknow, (U.P.), India
Corresponding Author: Shipra Shukla, Research Scholar, Khwaja Moinuddin Chishti Urdu, Arabi-Farsi University, Lucknow, (U.P.), India, e-mail: [email protected], tel.: +91-9795283806How to cite his article: Shukla, S. and Prajapti, D. (2019). A Study on Various Schemes for Msmes: With Special Reference to SIDBI. Adhyayan: A Journal of Management Sciences, 9(2): 27-30.Source of support: NilConflict of interest: None
© The Author(s). 2019 Open Access This article is distributed under the terms of the Creative Commons Attribution 4.0 International License (http://creativecommons.org/licenses/by/4.0/), which permits unrestricted use, distribution, and non-commercial reproduction in any medium, provided you give appropriate credit to the original author(s) and the source, provide a link to the Creative Commons license, and indicate if changes were made. The Creative Commons Public Domain Dedication waiver (http://creativecommons.org/publicdomain/zero/1.0/) applies to the data made available in this article, unless otherwise stated.
In t r o d u c t I o n
The Micro, Small and Medium Enterprises (MSME) sector is the base of Indian economy as this sector
has created employment for more than 120 million persons through 63.4 million units. MSMEs contribute around 6.11% of the manufacturing GDP and 24.63% of GDP from service activities as well as 33.4% of India’s manufacturing output and contribute around 45% of the overall exports from India. The Micro, Small and Medium Enterprises Development Act was enacted in 2006 by Government of India for promotion and development of Small and Medium Enterprises sector. Under this act, enterprises are classified as micro. Small and medium enterprises. This classification has been done as per the capital invested in such enterprises. The investment of capital is divided as per the manufacturing sector and service sector enterprises. In manufacturing sector enterprises having capital up to 25 lakhs is classified as micro-enterprises, enterprises having a capital of 25 lakhs but not more than 5 crore is small enterprises and enterprises having a capital of 5 crore but not more than 10-crore is medium enterprises. In the context of service sector enterprises having a capital of 10 lakhs are micro-
enterprises, those having a capital of more than 10 lakhs but limited to 2 crores has been classified as small enterprises, and those having capital of 2 crores, but limited to 5 crores are medium enterprises. As it is clear investment limit is more in the manufacturing sector as compared to the service sector. The Small Industries Development Bank of India is the principal financial institution for promoting, financing, and developing of the micro, small and medium enterprises (MSME). It supports the MSME sector to gain the needed strength and has introduced various schemes and initiatives to meet the various requirements of the sector.
RESEARCH ARTICLE
ADHYAYAN Volume 9, Issue 2, 2019 Print ISSN: 2249-1066 Online ISSN: 2455–8656
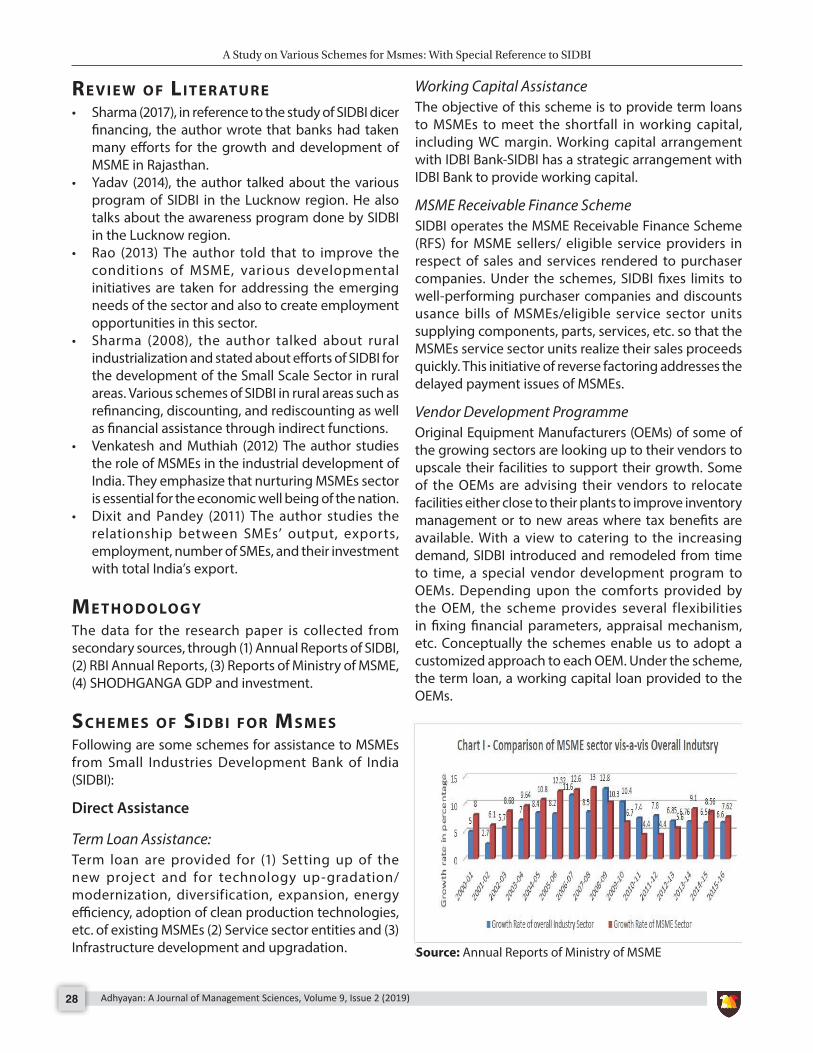
A Study on Various Schemes for Msmes: With Special Reference to SIDBI
Adhyayan: A Journal of Management Sciences, Volume 9, Issue 2 (2019)28
re v I e w o f LI t e r At u r e• Sharma (2017), in reference to the study of SIDBI dicer
financing, the author wrote that banks had taken many efforts for the growth and development of MSME in Rajasthan.
• Yadav (2014), the author talked about the various program of SIDBI in the Lucknow region. He also talks about the awareness program done by SIDBI in the Lucknow region.
• Rao (2013) The author told that to improve the conditions of MSME, various developmental initiatives are taken for addressing the emerging needs of the sector and also to create employment opportunities in this sector.
• Sharma (2008), the author talked about rural industrialization and stated about efforts of SIDBI for the development of the Small Scale Sector in rural areas. Various schemes of SIDBI in rural areas such as refinancing, discounting, and rediscounting as well as financial assistance through indirect functions.
• Venkatesh and Muthiah (2012) The author studies the role of MSMEs in the industrial development of India. They emphasize that nurturing MSMEs sector is essential for the economic well being of the nation.
• Dixit and Pandey (2011) The author studies the relationship between SMEs’ output, exports, employment, number of SMEs, and their investment with total India’s export.
Me t h o d o Lo g yThe data for the research paper is collected from secondary sources, through (1) Annual Reports of SIDBI, (2) RBI Annual Reports, (3) Reports of Ministry of MSME, (4) SHODHGANGA GDP and investment.
sc h e M e s o f sI d b I f o r Ms M e s Following are some schemes for assistance to MSMEs from Small Industries Development Bank of India (SIDBI):
Direct Assistance
Term Loan Assistance:Term loan are provided for (1) Setting up of the new project and for technology up-gradation/ modernization, diversification, expansion, energy efficiency, adoption of clean production technologies, etc. of existing MSMEs (2) Service sector entities and (3) Infrastructure development and upgradation.
Working Capital AssistanceThe objective of this scheme is to provide term loans to MSMEs to meet the shortfall in working capital, including WC margin. Working capital arrangement with IDBI Bank-SIDBI has a strategic arrangement with IDBI Bank to provide working capital.
MSME Receivable Finance SchemeSIDBI operates the MSME Receivable Finance Scheme (RFS) for MSME sellers/ eligible service providers in respect of sales and services rendered to purchaser companies. Under the schemes, SIDBI fixes limits to well-performing purchaser companies and discounts usance bills of MSMEs/eligible service sector units supplying components, parts, services, etc. so that the MSMEs service sector units realize their sales proceeds quickly. This initiative of reverse factoring addresses the delayed payment issues of MSMEs.
Vendor Development ProgrammeOriginal Equipment Manufacturers (OEMs) of some of the growing sectors are looking up to their vendors to upscale their facilities to support their growth. Some of the OEMs are advising their vendors to relocate facilities either close to their plants to improve inventory management or to new areas where tax benefits are available. With a view to catering to the increasing demand, SIDBI introduced and remodeled from time to time, a special vendor development program to OEMs. Depending upon the comforts provided by the OEM, the scheme provides several flexibilities in fixing financial parameters, appraisal mechanism, etc. Conceptually the schemes enable us to adopt a customized approach to each OEM. Under the scheme, the term loan, a working capital loan provided to the OEMs.
Source: Annual Reports of Ministry of MSME
A Study on Various Schemes for Msmes: With Special Reference to SIDBI
Adhyayan: A Journal of Management Sciences, Volume 9, Issue 2 (2019) 29
Foreign Currency LoansAssistance and Line of Credit in Foreign currency to institutions/banks for extending foreign currency assistance to MSME units/ Exports Houses and Trading Houses etc. SIDBI offers forex assistance to its MSME customers in various forms, including foreign currency term loans, booking of forwarding contracts, etc.
Equity SupportPursuant to the announcement of setting up of MSME risk Capital Fund of 2000crore by Hon’ble Finance Minister in the Budget Speech for FY 2008-09, a Risk Capital Fund for MSMEs has been set up in SIDBI to provide equity support to MSMEs. The bank has set up the “SIDBI Foundation for Risk Capital (SFRC)” to manage the fund. SFRC has developed a more standardized and appropriate risk capital products for quick and effective utilization of the fund to benefit a large spectrum of MSMEs.
Scheme for Energy Saving and Clean Production Technology Projects in MSME SectorThe SIDBI has negotiated a Line of Credit from Japan International Cooperation Agency to encourage MSMEs to invest in energy-saving projects and introduced Scheme for Energy Saving Lending in the MSME sector. Under the scheme, assistance is provided to MSMEs at the concessional interest rate for energy-saving investments in plant and machinery/production processes, clean and renewable energy sources, reduction in CO2 emission, etc. The scheme, apart from offering the concessional rate of interest, also provides the benefits of Govt subsidy schemes. Till December 2009 more than 1200 MSMEs has been provided direct assistance under the scheme with aggregate assistance of 563 crore. The bank has also organized awareness campaign at 15 MSMEs clusters for information dissemination and promoting energy savings potentials in the cluster.
Auto Rickshaw Financing600 CNG Fitted Auto Rickshaws were provided assistance in Chandigarh by Delhi Finance Corporation (DFC). SIDBI provided refinance to DFC for these clean energy initiatives.
Solar LanternsFriend’s of Women World Banking (FWWB), an MFI was sanctioned of 10 crore for providing assistance to micro entrepreneurs for Solar lanterns of 2 watts each 50000 micro entrepreneurs are proposed to be covered under the assistance.
Privileged Customer SchemeIn view of the persistent Demand from the existing customers for an open ended credit product which could be delivered quickly for meeting their unforeseen /emergent business expenditure, etc a new scheme viz Privileged Customer Scheme (PCS) was introduced to provide annual credit limits to the Existing well-performing customers of SIDBI for their annual non-project-specific investment plans.
Non-fund Based SchemeSIDBI offers guarantee and Letter of Credit facilities in foreign currency and rupee to its customers to meet their non-fund based credit requirements. In contemporary international commercial dealings, many transactions are required to be backed up with a guarantee. SIDBI provides an ordinary guarantee and deferred payment guarantee to MSMEs. SIDBI has been opening a foreign Letter of Credits for its customers both for the purchase of capital equipment and raw materials. However, several customers are required to open inland LCs for domestic suppliers of capital equipment and raw materials. Given this, SIDBI has commenced opening Inland LCs for MSMEs.
Indirect Assistance
Resource SupportSIDBI provides resource supports to institutions/Non-Banking Financial Companies (NBFCs) engaged in the promotion and development of the MSME sector to facilitate channelizing of assistance to a large number of MSMEs and infrastructure projects having linkages to MSMEs.
Lines of Credit (Refinance) in FavorsBanks, State Financial Corporation’s (SFCs), State Industrial Development Corporations (SIDCs) and State Small Industries Development Corporations (SSIDCs).
Micro Credit SchemesTerm loan assistance to MFIs for onward lending, Transformation Loans, Privileged Partner Scheme, a Term Loan to Market Service Providers, Partnership Assistance, Micro Enterprises Loans, and Equity Support.
co n c Lu s I o n The Small Industries Development Bank of India (SIDBI) is the principal financial institution for promoting, financing, and developing of the Micro, Small and Medium Enterprises (MSMEs). SIDBI also provides
A Study on Various Schemes for Msmes: With Special Reference to SIDBI
Adhyayan: A Journal of Management Sciences, Volume 9, Issue 2 (2019)30
financial assistance to various institutions engaged in the promotion and development of the MSME sector. The SIDBI provides financial support through intermediaries like SFCs, SIDCs, SSIDCs, NBFCs, IDBI. The Small Industries Development Bank of India provides various Direct Financial Assistance and Non-Financial Assistance MSME Receivable Finance Scheme, Vendor Development Programme, Equity Support, Privileged Customer Scheme, etc.
re f e r e n c e sBasant, R.& Morris Sebastine (2006),” Small- Scale Industries
in the Age of Liberalisation” INRM.
Kamala Kannan K. and Namasivayam N(2006), “SIDBI and Small Scale Industries: A Study”, Southern Economist, Vol. 40, no 10 may page (29-31).
K.R. Vijayarani (2011), “Small-Scale Industries in India- Problems and Policy Initiatives” New Century Publications, New Delhi.
P.T., Dinesha, Jayasheela : and Basil hans, V .(2008) “ Micro, Small and Medium Enterprises in India: Trends and Challenges”, Small Enterprises Development, Management and Extension journal, vol 35, No2, pp 35-48.
Rani, B. Shobha: and Rao, D. Koteswara (2008),” Financing Small Enterprises: Recent
Trends, ICFAI Journal of Entrepreneurship Development, Vol.V, No 1, pp 6-22.
Ab s t r Ac t‘Britain is one of the world’s most open economies. Most dependent on trade than any other major country. Our success depends on our competitiveness and our competitiveness depends on raising our productivity, as our competitors are raising theirs.’
-Philip Hammond (British Conservative Party Politician)Globalization has sharpened the level of competition, i.e., domestic and international both. In this cut-throat competitive era, a company must have to acquire the ability to provide products and services as or more effectively and efficiently than their relevant competitors. The main challenge is how to take advantage of new resources and markets while dealing with intense and growing global competition. The need of the hour is to design and implement supportive policies and strategies to compete with the competitors. In this context, SWOT (Strengths, Weaknesses, Opportunities, and Threats) analysis has been a useful tool to face the competition and to achieve future growth. It identifies the strengths and weaknesses of the organization along with the opportunities and threats present in the market in which it operates in SWOT analysis requires an internal survey for strengths and weaknesses and external survey for opportunities and threats. This analysis can be used as a strategic planning approach to face the competition and as well as to enhance the managerial effectiveness of the organization.This article proposes the application of the SWOT tool for making strategies to enhance competitive organizational potential. The researcher has attempted to get insight into the wide range of potential applications of SWOT analysis. A brief discussion has been made about the limitations of SWOT analysis.‘The essential element of a successful strategy is that it derives its success from the differences between competitors with a consequent difference in their behavior.’
-Bruce HendersonKeywords: Competitiveness, Cut-throat competition, Globalisation, Strategic Planning, SWOT analysis. Adhyayan: A Journal of Management Sciences (2019); DOI: 10.21567/adhyayan.v9i2.6
SWOT Analysis: A Powerful Tool of Strategic Competitive Management EffectivenessPreeti Pant*Assistant Professor, Department of Commerce, B.S.N.V.P.G. College, Lucknow, (U.P.), India
Corresponding Author: Preeti Pant, Assistant Professor, Department of Commerce, B.S.N.V.P.G. College, Lucknow, (U.P.), India, e-mail: [email protected] to cite his article: Pant, P. (2019). SWOT Analysis: A Powerful Tool of Strategic Competitive Management Effectiveness. Adhyayan: A Journal of Management Sciences, 9(2): 31-37.Source of support: NilConflict of interest: None
© The Author(s). 2019 Open Access This article is distributed under the terms of the Creative Commons Attribution 4.0 International License (http://creativecommons.org/licenses/by/4.0/), which permits unrestricted use, distribution, and non-commercial reproduction in any medium, provided you give appropriate credit to the original author(s) and the source, provide a link to the Creative Commons license, and indicate if changes were made. The Creative Commons Public Domain Dedication waiver (http://creativecommons.org/publicdomain/zero/1.0/) applies to the data made available in this article, unless otherwise stated.
In t r o d u c t I o n
“T he Four Keys of Great Managers: (1) When selecting someone, they select for talent… not simply
experience, intelligence, or determination. (2) When setting expectations, they define the right outcomes, not the right steps. (3) When motivating someone, they focus on strengths, not on weaknesses, and (4) When developing someone, they help him find the right fit, not simply the next rung on the ladder.”
-Marcus Buckingham Effective management is important to all the
organizations because it involves planning and goal setting, along with the motivation of workers to execute these plans. Effective management creates a direction for the organization and communicates its blueprint internally and its vision externally. In this cut-throat
competitive era the concept of ‘managerial effectiveness’ is gaining momentum because of excessive pressure on organizations to maintain its ability to survive and to earn profit constantly. The level of managerial effectiveness should be reflected in each and every decision making process.
RESEARCH ARTICLE
ADHYAYAN Volume 9, Issue 2, 2019 Print ISSN: 2249-1066 Online ISSN: 2455–8656
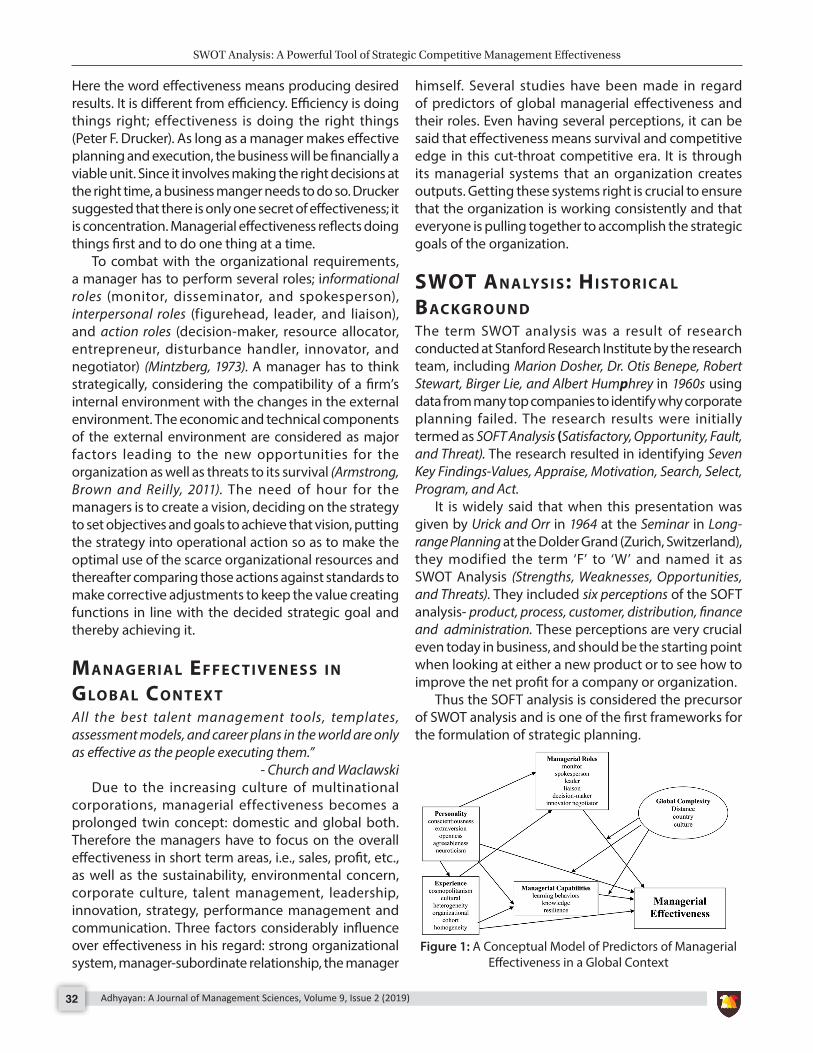
SWOT Analysis: A Powerful Tool of Strategic Competitive Management Effectiveness
Adhyayan: A Journal of Management Sciences, Volume 9, Issue 2 (2019)32
Here the word effectiveness means producing desired results. It is different from efficiency. Efficiency is doing things right; effectiveness is doing the right things (Peter F. Drucker). As long as a manager makes effective planning and execution, the business will be financially a viable unit. Since it involves making the right decisions at the right time, a business manger needs to do so. Drucker suggested that there is only one secret of effectiveness; it is concentration. Managerial effectiveness reflects doing things first and to do one thing at a time.
To combat with the organizational requirements, a manager has to perform several roles; informational roles (monitor, disseminator, and spokesperson), interpersonal roles (figurehead, leader, and liaison), and action roles (decision-maker, resource allocator, entrepreneur, disturbance handler, innovator, and negotiator) (Mintzberg, 1973). A manager has to think strategically, considering the compatibility of a firm’s internal environment with the changes in the external environment. The economic and technical components of the external environment are considered as major factors leading to the new opportunities for the organization as well as threats to its survival (Armstrong, Brown and Reilly, 2011). The need of hour for the managers is to create a vision, deciding on the strategy to set objectives and goals to achieve that vision, putting the strategy into operational action so as to make the optimal use of the scarce organizational resources and thereafter comparing those actions against standards to make corrective adjustments to keep the value creating functions in line with the decided strategic goal and thereby achieving it.
MA n Ag e r I A L ef f e c t I v e n e s s I n gLo b A L co n t e x tAll the best talent management tools, templates, assessment models, and career plans in the world are only as effective as the people executing them.”
- Church and WaclawskiDue to the increasing culture of multinational
corporations, managerial effectiveness becomes a prolonged twin concept: domestic and global both. Therefore the managers have to focus on the overall effectiveness in short term areas, i.e., sales, profit, etc., as well as the sustainability, environmental concern, corporate culture, talent management, leadership, innovation, strategy, performance management and communication. Three factors considerably influence over effectiveness in his regard: strong organizational system, manager-subordinate relationship, the manager
himself. Several studies have been made in regard of predictors of global managerial effectiveness and their roles. Even having several perceptions, it can be said that effectiveness means survival and competitive edge in this cut-throat competitive era. It is through its managerial systems that an organization creates outputs. Getting these systems right is crucial to ensure that the organization is working consistently and that everyone is pulling together to accomplish the strategic goals of the organization.
swot An A Lys I s: hI s to r I c A L bAc kg r o u n dThe term SWOT analysis was a result of research conducted at Stanford Research Institute by the research team, including Marion Dosher, Dr. Otis Benepe, Robert Stewart, Birger Lie, and Albert Humphrey in 1960s using data from many top companies to identify why corporate planning failed. The research results were initially termed as SOFT Analysis (Satisfactory, Opportunity, Fault, and Threat). The research resulted in identifying Seven Key Findings-Values, Appraise, Motivation, Search, Select, Program, and Act.
It is widely said that when this presentation was given by Urick and Orr in 1964 at the Seminar in Long-range Planning at the Dolder Grand (Zurich, Switzerland), they modified the term ‘F’ to ‘W’ and named it as SWOT Analysis (Strengths, Weaknesses, Opportunities, and Threats). They included six perceptions of the SOFT analysis- product, process, customer, distribution, finance and administration. These perceptions are very crucial even today in business, and should be the starting point when looking at either a new product or to see how to improve the net profit for a company or organization.
Thus the SOFT analysis is considered the precursor of SWOT analysis and is one of the first frameworks for the formulation of strategic planning.
Figure 1: A Conceptual Model of Predictors of Managerial Effectiveness in a Global Context
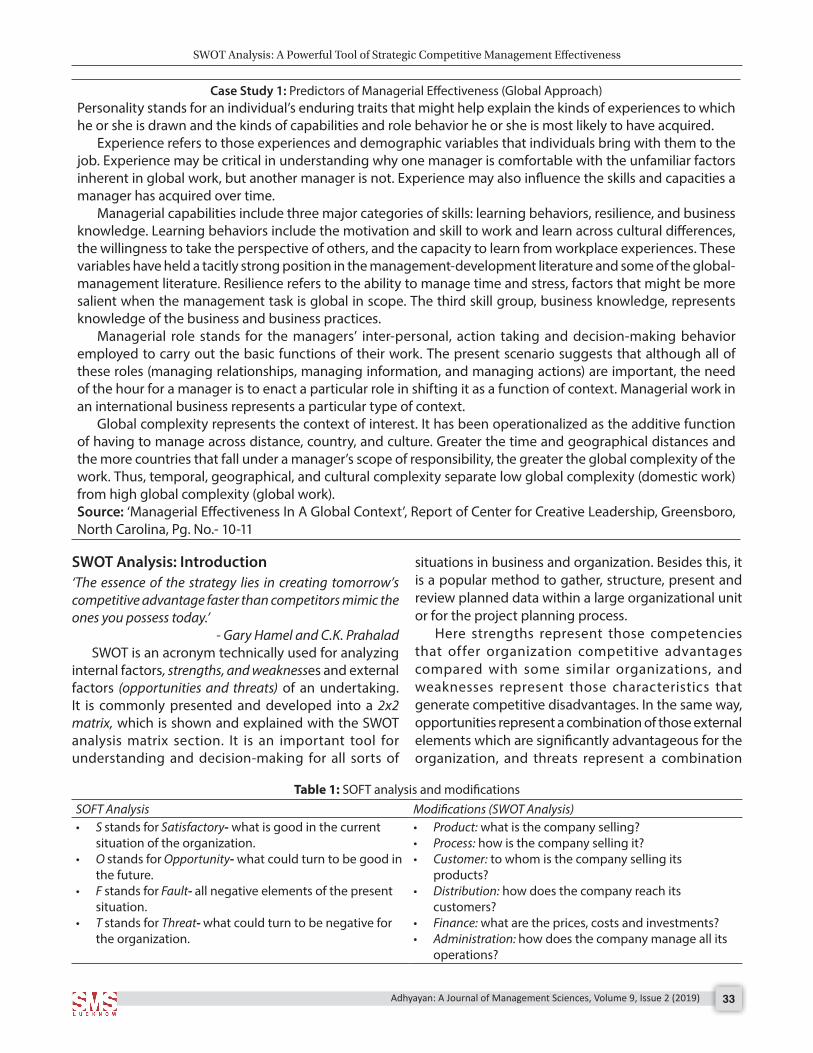
SWOT Analysis: A Powerful Tool of Strategic Competitive Management Effectiveness
Adhyayan: A Journal of Management Sciences, Volume 9, Issue 2 (2019) 33
SWOT Analysis: Introduction ‘The essence of the strategy lies in creating tomorrow’s competitive advantage faster than competitors mimic the ones you possess today.’
- Gary Hamel and C.K. PrahaladSWOT is an acronym technically used for analyzing
internal factors, strengths, and weaknesses and external factors (opportunities and threats) of an undertaking. It is commonly presented and developed into a 2x2 matrix, which is shown and explained with the SWOT analysis matrix section. It is an important tool for understanding and decision-making for all sorts of
situations in business and organization. Besides this, it is a popular method to gather, structure, present and review planned data within a large organizational unit or for the project planning process.
Here strengths represent those competencies that offer organization competitive advantages compared with some similar organizations, and weaknesses represent those characteristics that generate competitive disadvantages. In the same way, opportunities represent a combination of those external elements which are significantly advantageous for the organization, and threats represent a combination
Table 1: SOFT analysis and modificationsSOFT Analysis Modifications (SWOT Analysis)• S stands for Satisfactory- what is good in the current
situation of the organization.• O stands for Opportunity- what could turn to be good in
the future.• F stands for Fault- all negative elements of the present
situation.• T stands for Threat- what could turn to be negative for
the organization.
• Product: what is the company selling?• Process: how is the company selling it?• Customer: to whom is the company selling its
products?• Distribution: how does the company reach its
customers?• Finance: what are the prices, costs and investments?• Administration: how does the company manage all its
operations?
Case Study 1: Predictors of Managerial Effectiveness (Global Approach)Personality stands for an individual’s enduring traits that might help explain the kinds of experiences to which he or she is drawn and the kinds of capabilities and role behavior he or she is most likely to have acquired.
Experience refers to those experiences and demographic variables that individuals bring with them to the job. Experience may be critical in understanding why one manager is comfortable with the unfamiliar factors inherent in global work, but another manager is not. Experience may also influence the skills and capacities a manager has acquired over time.
Managerial capabilities include three major categories of skills: learning behaviors, resilience, and business knowledge. Learning behaviors include the motivation and skill to work and learn across cultural differences, the willingness to take the perspective of others, and the capacity to learn from workplace experiences. These variables have held a tacitly strong position in the management-development literature and some of the global-management literature. Resilience refers to the ability to manage time and stress, factors that might be more salient when the management task is global in scope. The third skill group, business knowledge, represents knowledge of the business and business practices.
Managerial role stands for the managers’ inter-personal, action taking and decision-making behavior employed to carry out the basic functions of their work. The present scenario suggests that although all of these roles (managing relationships, managing information, and managing actions) are important, the need of the hour for a manager is to enact a particular role in shifting it as a function of context. Managerial work in an international business represents a particular type of context.
Global complexity represents the context of interest. It has been operationalized as the additive function of having to manage across distance, country, and culture. Greater the time and geographical distances and the more countries that fall under a manager’s scope of responsibility, the greater the global complexity of the work. Thus, temporal, geographical, and cultural complexity separate low global complexity (domestic work) from high global complexity (global work).Source: ‘Managerial Effectiveness In A Global Context’, Report of Center for Creative Leadership, Greensboro, North Carolina, Pg. No.- 10-11
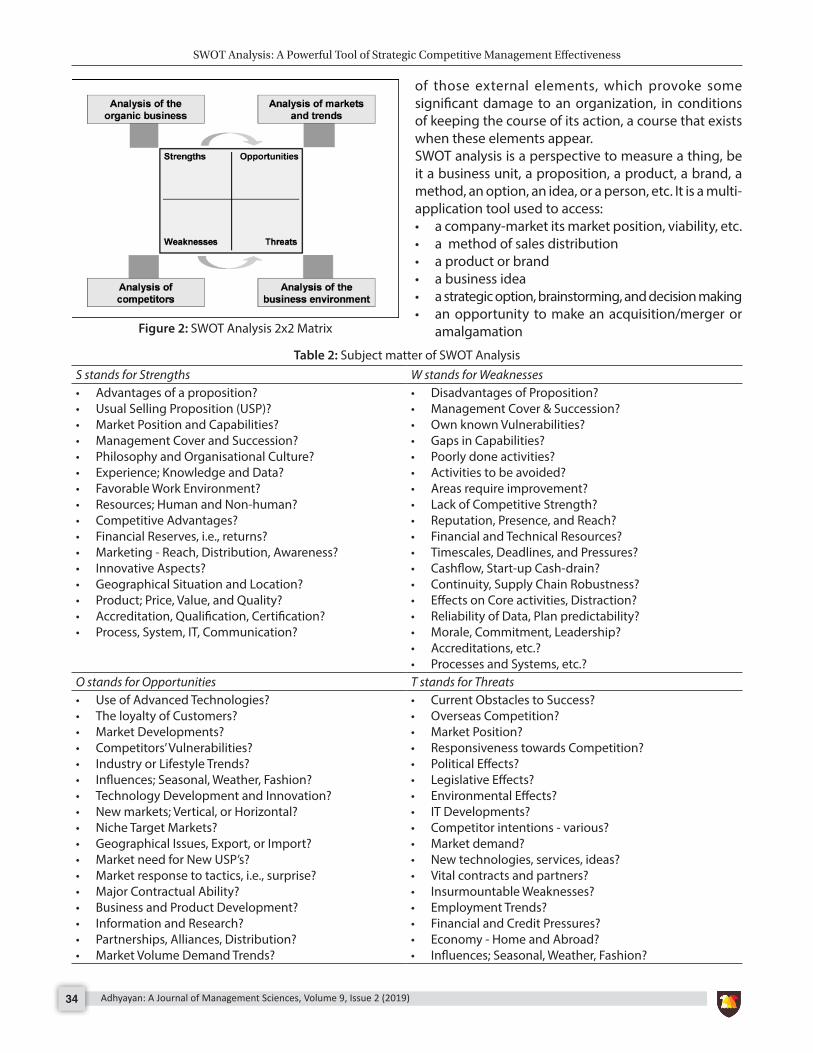
SWOT Analysis: A Powerful Tool of Strategic Competitive Management Effectiveness
Adhyayan: A Journal of Management Sciences, Volume 9, Issue 2 (2019)34
of those external elements, which provoke some significant damage to an organization, in conditions of keeping the course of its action, a course that exists when these elements appear.SWOT analysis is a perspective to measure a thing, be it a business unit, a proposition, a product, a brand, a method, an option, an idea, or a person, etc. It is a multi-application tool used to access:• a company-market its market position, viability, etc.• a method of sales distribution• a product or brand• a business idea• a strategic option, brainstorming, and decision making• an opportunity to make an acquisition/merger or
amalgamation
Table 2: Subject matter of SWOT AnalysisS stands for Strengths W stands for Weaknesses• Advantages of a proposition?• Usual Selling Proposition (USP)?• Market Position and Capabilities?• Management Cover and Succession? • Philosophy and Organisational Culture?• Experience; Knowledge and Data?• Favorable Work Environment?• Resources; Human and Non-human?• Competitive Advantages?• Financial Reserves, i.e., returns?• Marketing - Reach, Distribution, Awareness?• Innovative Aspects?• Geographical Situation and Location?• Product; Price, Value, and Quality?• Accreditation, Qualification, Certification?• Process, System, IT, Communication?
• Disadvantages of Proposition?• Management Cover & Succession?• Own known Vulnerabilities?• Gaps in Capabilities?• Poorly done activities?• Activities to be avoided?• Areas require improvement?• Lack of Competitive Strength?• Reputation, Presence, and Reach?• Financial and Technical Resources?• Timescales, Deadlines, and Pressures?• Cashflow, Start-up Cash-drain?• Continuity, Supply Chain Robustness?• Effects on Core activities, Distraction?• Reliability of Data, Plan predictability?• Morale, Commitment, Leadership?• Accreditations, etc.?• Processes and Systems, etc.?
O stands for Opportunities T stands for Threats• Use of Advanced Technologies?• The loyalty of Customers?• Market Developments?• Competitors’ Vulnerabilities?• Industry or Lifestyle Trends?• Influences; Seasonal, Weather, Fashion?• Technology Development and Innovation?• New markets; Vertical, or Horizontal?• Niche Target Markets?• Geographical Issues, Export, or Import?• Market need for New USP’s?• Market response to tactics, i.e., surprise?• Major Contractual Ability?• Business and Product Development?• Information and Research?• Partnerships, Alliances, Distribution?• Market Volume Demand Trends?
• Current Obstacles to Success?• Overseas Competition?• Market Position?• Responsiveness towards Competition?• Political Effects?• Legislative Effects?• Environmental Effects?• IT Developments?• Competitor intentions - various?• Market demand?• New technologies, services, ideas?• Vital contracts and partners?• Insurmountable Weaknesses?• Employment Trends?• Financial and Credit Pressures?• Economy - Home and Abroad?• Influences; Seasonal, Weather, Fashion?
Figure 2: SWOT Analysis 2x2 Matrix
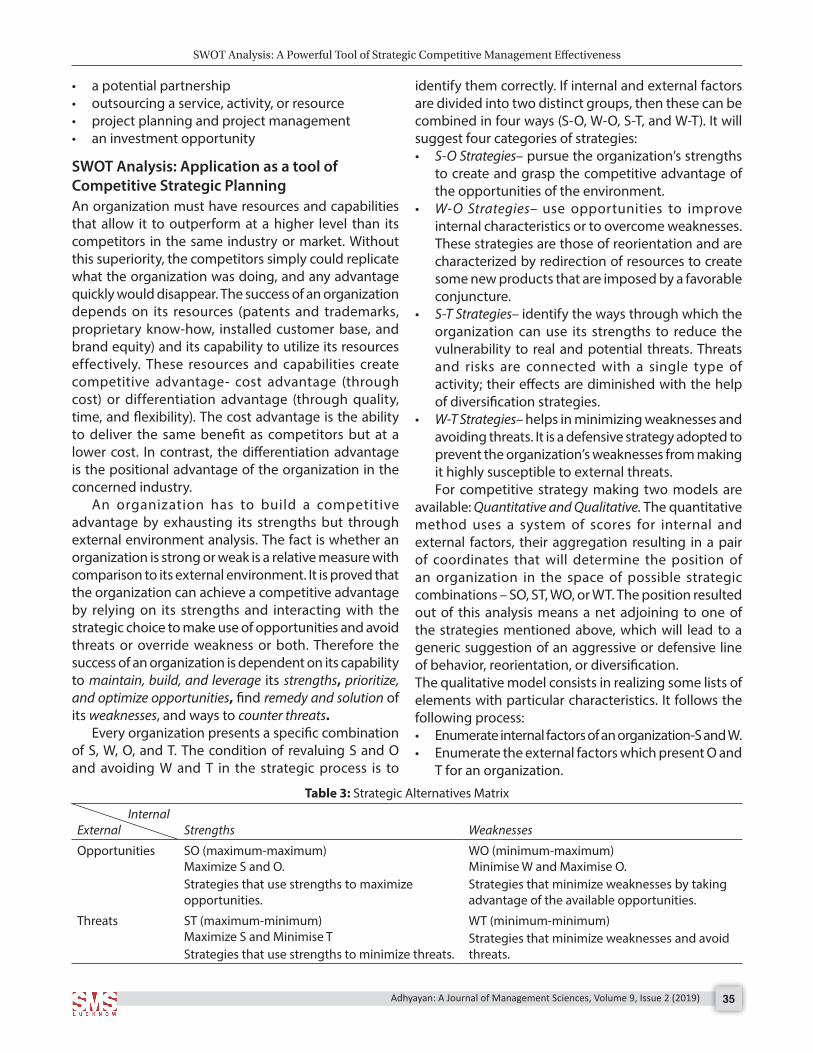
SWOT Analysis: A Powerful Tool of Strategic Competitive Management Effectiveness
Adhyayan: A Journal of Management Sciences, Volume 9, Issue 2 (2019) 35
• a potential partnership• outsourcing a service, activity, or resource• project planning and project management• an investment opportunity
SWOT Analysis: Application as a tool of Competitive Strategic PlanningAn organization must have resources and capabilities that allow it to outperform at a higher level than its competitors in the same industry or market. Without this superiority, the competitors simply could replicate what the organization was doing, and any advantage quickly would disappear. The success of an organization depends on its resources (patents and trademarks, proprietary know-how, installed customer base, and brand equity) and its capability to utilize its resources effectively. These resources and capabilities create competitive advantage- cost advantage (through cost) or differentiation advantage (through quality, time, and flexibility). The cost advantage is the ability to deliver the same benefit as competitors but at a lower cost. In contrast, the differentiation advantage is the positional advantage of the organization in the concerned industry.
An organization has to build a competitive advantage by exhausting its strengths but through external environment analysis. The fact is whether an organization is strong or weak is a relative measure with comparison to its external environment. It is proved that the organization can achieve a competitive advantage by relying on its strengths and interacting with the strategic choice to make use of opportunities and avoid threats or override weakness or both. Therefore the success of an organization is dependent on its capability to maintain, build, and leverage its strengths, prioritize, and optimize opportunities, find remedy and solution of its weaknesses, and ways to counter threats.
Every organization presents a specific combination of S, W, O, and T. The condition of revaluing S and O and avoiding W and T in the strategic process is to
identify them correctly. If internal and external factors are divided into two distinct groups, then these can be combined in four ways (S-O, W-O, S-T, and W-T). It will suggest four categories of strategies: • S-O Strategies– pursue the organization’s strengths
to create and grasp the competitive advantage of the opportunities of the environment.
• W-O Strategies– use opportunities to improve internal characteristics or to overcome weaknesses. These strategies are those of reorientation and are characterized by redirection of resources to create some new products that are imposed by a favorable conjuncture.
• S-T Strategies– identify the ways through which the organization can use its strengths to reduce the vulnerability to real and potential threats. Threats and risks are connected with a single type of activity; their effects are diminished with the help of diversification strategies.
• W-T Strategies– helps in minimizing weaknesses and avoiding threats. It is a defensive strategy adopted to prevent the organization’s weaknesses from making it highly susceptible to external threats. For competitive strategy making two models are
available: Quantitative and Qualitative. The quantitative method uses a system of scores for internal and external factors, their aggregation resulting in a pair of coordinates that will determine the position of an organization in the space of possible strategic combinations – SO, ST, WO, or WT. The position resulted out of this analysis means a net adjoining to one of the strategies mentioned above, which will lead to a generic suggestion of an aggressive or defensive line of behavior, reorientation, or diversification.The qualitative model consists in realizing some lists of elements with particular characteristics. It follows the following process: • Enumerate internal factors of an organization-S and W. • Enumerate the external factors which present O and
T for an organization.
Table 3: Strategic Alternatives Matrix
InternalExternal Strengths Weaknesses
Opportunities SO (maximum-maximum)Maximize S and O. Strategies that use strengths to maximize opportunities.
WO (minimum-maximum)Minimise W and Maximise O. Strategies that minimize weaknesses by taking advantage of the available opportunities.
Threats ST (maximum-minimum)Maximize S and Minimise TStrategies that use strengths to minimize threats.
WT (minimum-minimum)Strategies that minimize weaknesses and avoid threats.
SWOT Analysis: A Powerful Tool of Strategic Competitive Management Effectiveness
Adhyayan: A Journal of Management Sciences, Volume 9, Issue 2 (2019)36
• Now combine strengths with opportunities and threats of external factors, and elaborating some S-O and S-T strategies
• and combine weaknesses with opportunities and threats of external factors, and elaborating some W-O and W-T strategies.
• Synthesis of a restricted number of earlier strategies of an aggregate strategy, an operation, which implies the realization of a hierarchy of strategies depending on their importance.
Process of SWOT AnalysisIn the business arena, the grouping of internal and external issues is a frequent starting point for strategic planning. It is most important to start the SWOT analysis. If you fail to categorize or identify S, W, O, and T it, then the whole analysis becomes failed. Therefore, the planner or top management has to identify the internal and external factors very carefully to serve the objective of doing analysis. To gain a stronghold in the market, the process of SWOT analysis has to be completed.
Step-1: Identify S, W, O, and T To identify strengths and weaknesses, managers’ have to look in an organization’s resources, core competencies, capabilities, functional areas, organizational culture, and value chain activities. In the same way, PESTEL analysis (Political, Economic, Socio-cultural, Technological, Environment, and Legal) can be used to identify opportunities and threats. It measures a business’s market and potential according to the external macro-environment in which an organization exists. Besides this, Porter’s Five Forces Model, analysis of competitors and market changes can also be used to know the competitive position of the organization.
Step-2: Prioritize S, W, O, and T After identifying S, W, O, and T prioritize strengths and weaknesses based on its importance, rating, and score, and opportunities and threats based on its importance, probability, and score. As opportunities and threats are the external and uncertain probability of their occurrence should be checked.
Step-3: Know about your competitorsTo perform an advanced SWOT analysis, do the same analysis on the organization’s competitors. It will make the organization able to grasp the opportunities and to compete in the market with the competitors. Firstly judge your competitors from the customer’s point of view, identify their strengths and weaknesses, and
finally, determine the opportunities left by competitors and pinpoint the threats posed by them.
Conducting a SWOT analysis can of fer the organization the ways to refresh its marketing tactics and product development while ensuring that it must rise above the competitors.
co n c Lu s I o n A n d su g g e s t I o n s‘You cannot look at the competition and say you are going to do it better. You have to look at the competition and say you are going to do it differently.’
- Steve Jobs‘What business strategy is all about?’ in a word,
it is a competitive advantage. The sole purpose of organizational strategic planning is to gain, as efficiently as possible, an advantageous sustainable edge over their competitors. SWOT analysis provides strategic insight on recommendations and opportunities for businesses to map out a strategic plan. As an actionable management tool, it helps an organization to leverage its unique characteristics. By turning threats into strengths and matching strengths with opportunities, the organization can hold and improve its power in the current marketplace and can maximize the chances of success.While implementing the SWOT analysis, a few factors must be considered:• Keep in mind the organization’s resources and its
capabilities. Do SWOT based on an organization’s competitive advantage.
• Monitor key issues (S and W) and scan for the unexpected (O and T). Make the right use of the foresightedness and predictability about opportunities and threats to take advantage.
• Get multiple perspectives of SWOT analysis for the organization. Try to collect input from employees, suppliers, customers and partners.
• The whole process of analysis should be action-oriented.
• The presentation of SWOT should be based on facts, not on opinion.
• The items included must be limited, specific, and clearly defined. Strengths and weaknesses have to be identified relative to the competitors.
• Clarify and maintain a proper balance between exploitation (strategically playing the current hand of cards) and exploration (creating new hands of cards through innovation).
• There is no recognized method to identify strengths and weaknesses.
SWOT Analysis: A Powerful Tool of Strategic Competitive Management Effectiveness
Adhyayan: A Journal of Management Sciences, Volume 9, Issue 2 (2019) 37
• Conduct SWOT analysis to a specific issue, such as a goal like to be achieved or a problem to be solved rather than to an entire organization. A separate SWOT analysis may be conducted for separate issues.
• Encourage leadership in all directions, not just top-down. Streamline other managerial personnel also in the process of analysis.
• After the SWOT analysis, prioritize the results by listing them in order of the most significant factors that affect an organization to the least.
re f e r e n c e sRobert G. Dyson (Feb. 2004), ‘Strategic development and SWOT
analysis at the University of Warwick,’ European Journal of Operational Research, Vol. 152, Issue 3, Pages 631–640
Moshe Farjoun (July 2002), ‘Towards an organic perspective on strategy,’ Strategic Management Journal, Vol. 23, Issue 7, Pg. No. 561–594.
Lawrence G Fine (2009), ‘The SWOT Analysis: Using Your Strength to Overcome Weaknesses, Using Opportunities to Overcome Threats’ Retrieved from http://www.lawrencefine.com/
Kotler, P., (1991), ‘Marketing Management,’ Seventh Edition, Prentice-Hall.
Leslie, Dalton, Ernst, and Jennifer Deal (2002), ‘Managerial Effectiveness in A Global Context,’ Center for Creative Leadership.
https://en.wikipedia.org/wiki/Competitive_advantagehttps://en.wikipedia.org/wiki/Strategic_managementhttps://en.wikipedia.org/wiki/SWOT_analysishttps://en.wikipedia.org/wiki/Strategic_planning
Ab s t r Ac tThe Goods and Services Tax(GST) implemented on July 1, 2017, is regarded as the most significant tax reform in India. It is levied on manufacture, sale, and consumption of goods, services, or both at a national level. Previous taxes like- excise duty, VAT, Service tax, Central sales tax, import duty, etc., is replaced by GST. The GST based taxation system brings more transparency and also reduces tax evasion and tax avoidance in the country. This paper highlighted the background of the previous taxation system, the GST concept along with its working, comparison of previous tax structure v/s GST and also highlighted the advantages of GST to the Indian economy and other sectors.Keywords: Goods and Services Tax (GST), Indian Economy, Indian Taxation System, Indirect Tax, Tax, Taxation Reforms.Adhyayan: A Journal of Management Sciences (2019); DOI: 10.21567/adhyayan.v9i2.7
An Extensive Analysis of Goods and Services Tax (GST) in IndiaNitika Kewalani*Research Scholar, ABST Department, University of Rajasthan, Jaipur, India
Corresponding Author: Nitika Kewalani, An Extensive Analysis of Goods and Services Tax (GST) in India, e-mail: [email protected], tel.: +91-8858112112How to cite article: Kewalani, N. (2019). An Extensive Analysis of Goods and Services Tax (GST) in India. Adhyayan: A Journal of Management Sciences, 9(2):38-43.Source of support: NilConflict of interest: None
© The Author(s). 2019 Open Access This article is distributed under the terms of the Creative Commons Attribution 4.0 International License (http://creativecommons.org/licenses/by/4.0/), which permits unrestricted use, distribution, and non-commercial reproduction in any medium, provided you give appropriate credit to the original author(s) and the source, provide a link to the Creative Commons license, and indicate if changes were made. The Creative Commons Public Domain Dedication waiver (http://creativecommons.org/publicdomain/zero/1.0/) applies to the data made available in this article, unless otherwise stated.
In t r o d u c t I o n
A tax is not a voluntary donation or payment, but it is a contribution by society so that the government
ensures the development of a country. It is imposed by the government, whether under the name of toll, custom, excise, wealth, or any other name.
Taxes collected from society are a fund for the government, which he utilizes to develop the economy. It is highly important that the taxation system is designed in such a way that it doesn’t lead to any sort of market distortions and failure in the economy. Revenue can be collected in an efficient and effective manner.
In India, the taxation system was started in ancient times, which can be seen in Arthsastra. During the British Empire, the entire system was changed due to modern and scientific changes in taxation laws. Another remarkable transformation came in the year 1992, in which Britishers established entirely new reforms by categorized the taxation system in two categories:- Direct taxes and Indirect Taxes. A direct tax is imposed directly on the taxpayer or paid directly to the government, while Indirect tax is a tax that can be shifted to another person. Taxes are the prominent and most significant source of revenue of the government. The government needs money to ensure proper law and order; to safeguard the country from foreign powers and to promote the welfare of people in the country.
th e In d I A n tAxAt I o n sys t e M s c e n A r I o b e f o r e gstTax policies play a significant role in any country’s economy. A good taxation policy is that which ensures proper distribution of income and also generates revenue for the government, which can lead to overall benefit in the nation’s infrastructure, social security, public facilities, etc.
Taxes were being levied and collected exclusively by the government under constitutional provisions of India- Article 246, 7 Schedule. The Figure 1 shows tabulates the classification of taxes imposed by Central and State government of India-
But there were several issues with this taxation system. Below are the points which highlight the issues related to Indirect tax structure before GST in India:-• Existence of Multiple taxes like- Excise duty,
Customs duty, Service tax, State VAT, etc., resulted in
RESEARCH ARTICLE
ADHYAYAN Volume 9, Issue 2, 2019 Print ISSN: 2249-1066 Online ISSN: 2455–8656
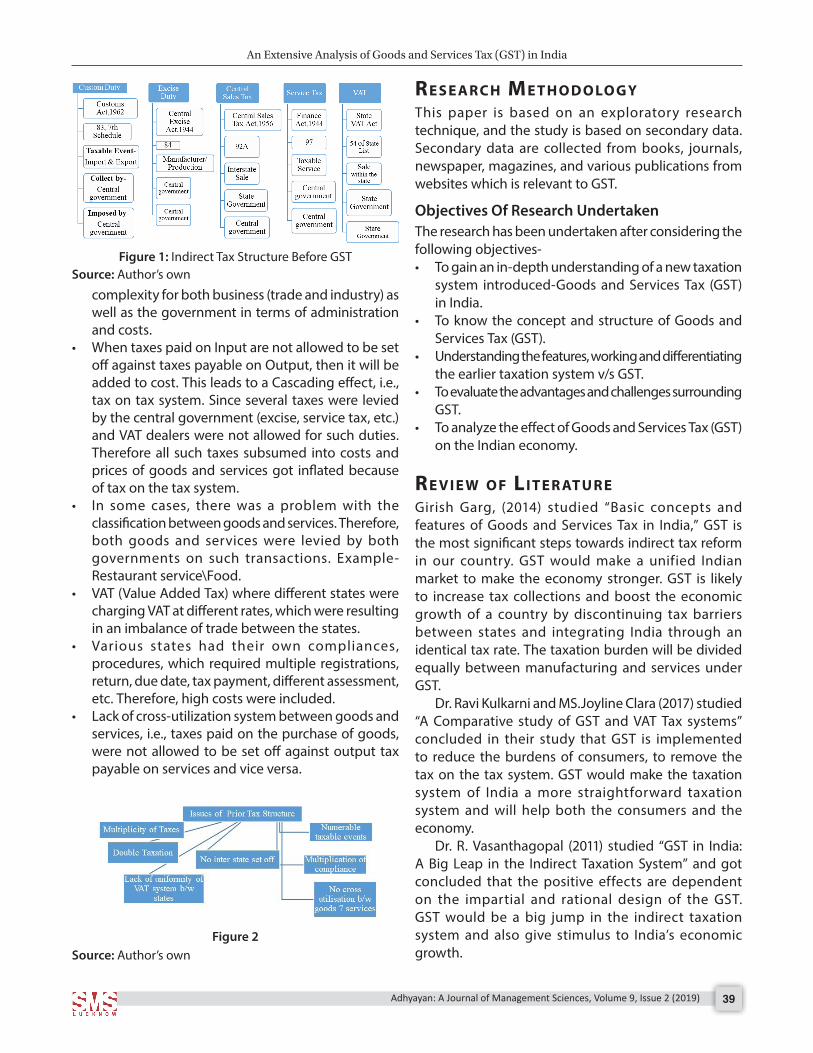
An Extensive Analysis of Goods and Services Tax (GST) in India
Adhyayan: A Journal of Management Sciences, Volume 9, Issue 2 (2019) 39
Figure 1: Indirect Tax Structure Before GSTSource: Author’s own
complexity for both business (trade and industry) as well as the government in terms of administration and costs.
• When taxes paid on Input are not allowed to be set off against taxes payable on Output, then it will be added to cost. This leads to a Cascading effect, i.e., tax on tax system. Since several taxes were levied by the central government (excise, service tax, etc.) and VAT dealers were not allowed for such duties. Therefore all such taxes subsumed into costs and prices of goods and services got inflated because of tax on the tax system.
• In some cases, there was a problem with the classification between goods and services. Therefore, both goods and services were levied by both governments on such transactions. Example- Restaurant service\Food.
• VAT (Value Added Tax) where different states were charging VAT at different rates, which were resulting in an imbalance of trade between the states.
• Various states had their own compliances, procedures, which required multiple registrations, return, due date, tax payment, different assessment, etc. Therefore, high costs were included.
• Lack of cross-utilization system between goods and services, i.e., taxes paid on the purchase of goods, were not allowed to be set off against output tax payable on services and vice versa.
re s e A r c h Me t h o d o Lo g yThis paper is based on an exploratory research technique, and the study is based on secondary data. Secondary data are collected from books, journals, newspaper, magazines, and various publications from websites which is relevant to GST.
Objectives Of Research UndertakenThe research has been undertaken after considering the following objectives-• To gain an in-depth understanding of a new taxation
system introduced-Goods and Services Tax (GST) in India.
• To know the concept and structure of Goods and Services Tax (GST).
• Understanding the features, working and differentiating the earlier taxation system v/s GST.
• To evaluate the advantages and challenges surrounding GST.
• To analyze the effect of Goods and Services Tax (GST) on the Indian economy.
re v I e w o f LI t e r At u r eGirish Garg, (2014) studied “Basic concepts and features of Goods and Services Tax in India,” GST is the most significant steps towards indirect tax reform in our country. GST would make a unified Indian market to make the economy stronger. GST is likely to increase tax collections and boost the economic growth of a country by discontinuing tax barriers between states and integrating India through an identical tax rate. The taxation burden will be divided equally between manufacturing and services under GST.
Dr. Ravi Kulkarni and MS.Joyline Clara (2017) studied “A Comparative study of GST and VAT Tax systems” concluded in their study that GST is implemented to reduce the burdens of consumers, to remove the tax on the tax system. GST would make the taxation system of India a more straightforward taxation system and will help both the consumers and the economy.
Dr. R. Vasanthagopal (2011) studied “GST in India: A Big Leap in the Indirect Taxation System” and got concluded that the positive effects are dependent on the impartial and rational design of the GST. GST would be a big jump in the indirect taxation system and also give stimulus to India’s economic growth.Source: Author’s own
Figure 2
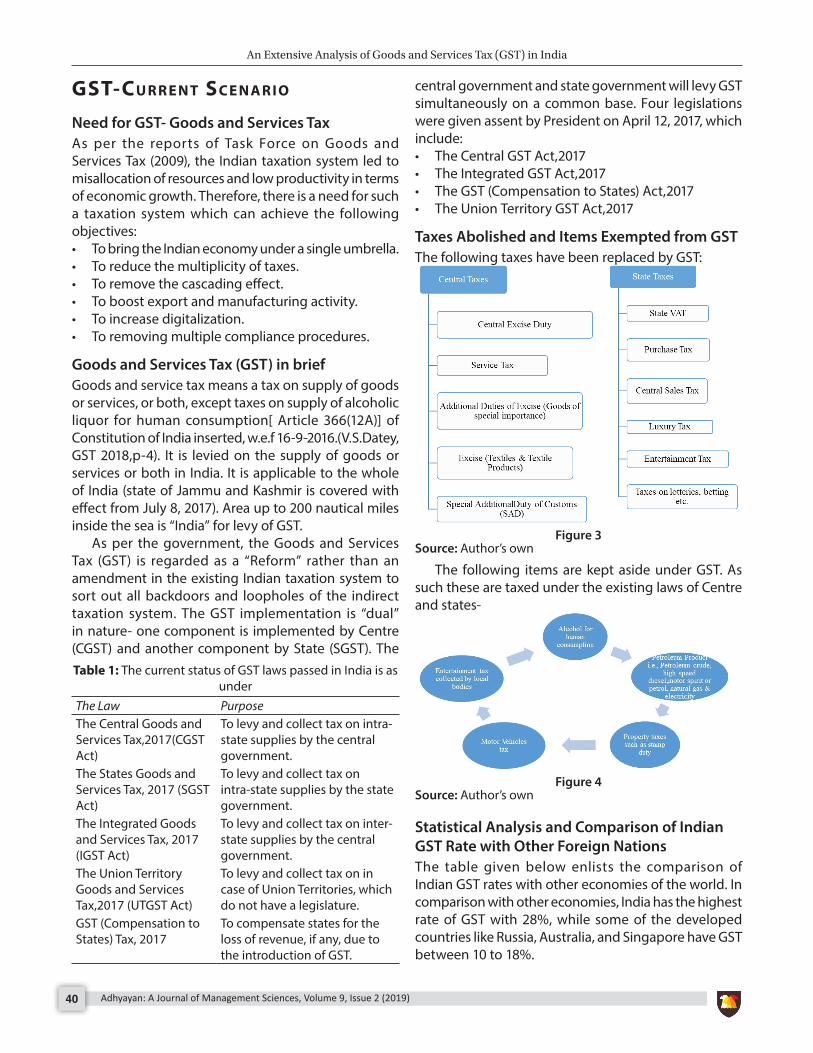
An Extensive Analysis of Goods and Services Tax (GST) in India
Adhyayan: A Journal of Management Sciences, Volume 9, Issue 2 (2019)40
gst-cu r r e n t sc e n A r I o
Need for GST- Goods and Services Tax As per the reports of Task Force on Goods and Services Tax (2009), the Indian taxation system led to misallocation of resources and low productivity in terms of economic growth. Therefore, there is a need for such a taxation system which can achieve the following objectives:• To bring the Indian economy under a single umbrella.• To reduce the multiplicity of taxes.• To remove the cascading effect.• To boost export and manufacturing activity.• To increase digitalization.• To removing multiple compliance procedures.
Goods and Services Tax (GST) in briefGoods and service tax means a tax on supply of goods or services, or both, except taxes on supply of alcoholic liquor for human consumption[ Article 366(12A)] of Constitution of India inserted, w.e.f 16-9-2016.(V.S.Datey, GST 2018,p-4). It is levied on the supply of goods or services or both in India. It is applicable to the whole of India (state of Jammu and Kashmir is covered with effect from July 8, 2017). Area up to 200 nautical miles inside the sea is “India” for levy of GST.
As per the government, the Goods and Services Tax (GST) is regarded as a “Reform” rather than an amendment in the existing Indian taxation system to sort out all backdoors and loopholes of the indirect taxation system. The GST implementation is “dual” in nature- one component is implemented by Centre (CGST) and another component by State (SGST). The
central government and state government will levy GST simultaneously on a common base. Four legislations were given assent by President on April 12, 2017, which include:• The Central GST Act,2017• The Integrated GST Act,2017• The GST (Compensation to States) Act,2017• The Union Territory GST Act,2017
Taxes Abolished and Items Exempted from GSTThe following taxes have been replaced by GST:
Figure 3Source: Author’s own
The following items are kept aside under GST. As such these are taxed under the existing laws of Centre and states-
Figure 4Source: Author’s own
Statistical Analysis and Comparison of Indian GST Rate with Other Foreign NationsThe table given below enlists the comparison of Indian GST rates with other economies of the world. In comparison with other economies, India has the highest rate of GST with 28%, while some of the developed countries like Russia, Australia, and Singapore have GST between 10 to 18%.
Table 1: The current status of GST laws passed in India is as under
The Law PurposeThe Central Goods and Services Tax,2017(CGST Act)
To levy and collect tax on intra-state supplies by the central government.
The States Goods and Services Tax, 2017 (SGST Act)
To levy and collect tax on intra-state supplies by the state government.
The Integrated Goods and Services Tax, 2017 (IGST Act)
To levy and collect tax on inter-state supplies by the central government.
The Union Territory Goods and Services Tax,2017 (UTGST Act)
To levy and collect tax on in case of Union Territories, which do not have a legislature.
GST (Compensation to States) Tax, 2017
To compensate states for the loss of revenue, if any, due to the introduction of GST.
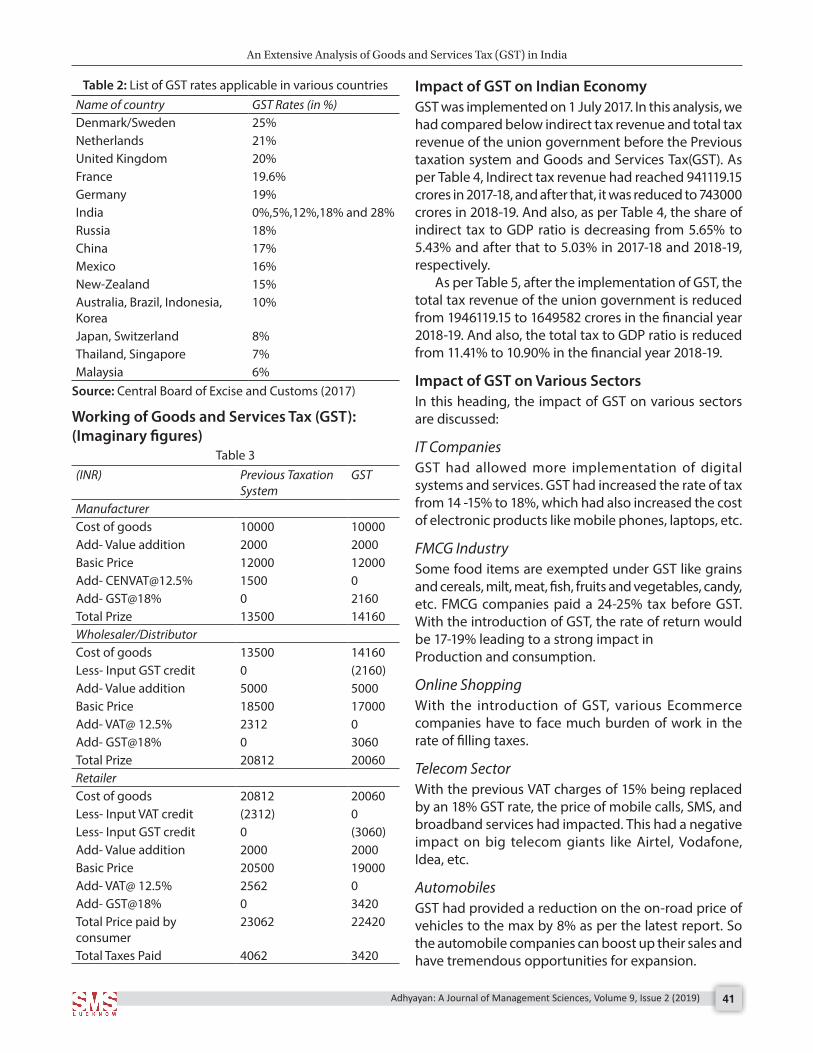
An Extensive Analysis of Goods and Services Tax (GST) in India
Adhyayan: A Journal of Management Sciences, Volume 9, Issue 2 (2019) 41
Working of Goods and Services Tax (GST): (Imaginary figures)
Table 3(INR) Previous Taxation
SystemGST
ManufacturerCost of goods 10000 10000Add- Value addition 2000 2000Basic Price 12000 12000Add- [email protected]% 1500 0Add- GST@18% 0 2160Total Prize 13500 14160Wholesaler/DistributorCost of goods 13500 14160Less- Input GST credit 0 (2160)Add- Value addition 5000 5000Basic Price 18500 17000Add- VAT@ 12.5% 2312 0Add- GST@18% 0 3060Total Prize 20812 20060RetailerCost of goods 20812 20060Less- Input VAT credit (2312) 0Less- Input GST credit 0 (3060)Add- Value addition 2000 2000Basic Price 20500 19000Add- VAT@ 12.5% 2562 0Add- GST@18% 0 3420Total Price paid by consumer
23062 22420
Total Taxes Paid 4062 3420
Table 2: List of GST rates applicable in various countriesName of country GST Rates (in %)Denmark/Sweden 25%Netherlands 21%United Kingdom 20%France 19.6%Germany 19%India 0%,5%,12%,18% and 28%Russia 18%China 17%Mexico 16%New-Zealand 15%Australia, Brazil, Indonesia, Korea
10%
Japan, Switzerland 8%Thailand, Singapore 7%Malaysia 6%
Source: Central Board of Excise and Customs (2017)
Impact of GST on Indian EconomyGST was implemented on 1 July 2017. In this analysis, we had compared below indirect tax revenue and total tax revenue of the union government before the Previous taxation system and Goods and Services Tax(GST). As per Table 4, Indirect tax revenue had reached 941119.15 crores in 2017-18, and after that, it was reduced to 743000 crores in 2018-19. And also, as per Table 4, the share of indirect tax to GDP ratio is decreasing from 5.65% to 5.43% and after that to 5.03% in 2017-18 and 2018-19, respectively.
As per Table 5, after the implementation of GST, the total tax revenue of the union government is reduced from 1946119.15 to 1649582 crores in the financial year 2018-19. And also, the total tax to GDP ratio is reduced from 11.41% to 10.90% in the financial year 2018-19.
Impact of GST on Various SectorsIn this heading, the impact of GST on various sectors are discussed:
IT CompaniesGST had allowed more implementation of digital systems and services. GST had increased the rate of tax from 14 -15% to 18%, which had also increased the cost of electronic products like mobile phones, laptops, etc.
FMCG IndustrySome food items are exempted under GST like grains and cereals, milt, meat, fish, fruits and vegetables, candy, etc. FMCG companies paid a 24-25% tax before GST. With the introduction of GST, the rate of return would be 17-19% leading to a strong impact inProduction and consumption.
Online ShoppingWith the introduction of GST, various Ecommerce companies have to face much burden of work in the rate of filling taxes.
Telecom SectorWith the previous VAT charges of 15% being replaced by an 18% GST rate, the price of mobile calls, SMS, and broadband services had impacted. This had a negative impact on big telecom giants like Airtel, Vodafone, Idea, etc.
AutomobilesGST had provided a reduction on the on-road price of vehicles to the max by 8% as per the latest report. So the automobile companies can boost up their sales and have tremendous opportunities for expansion.
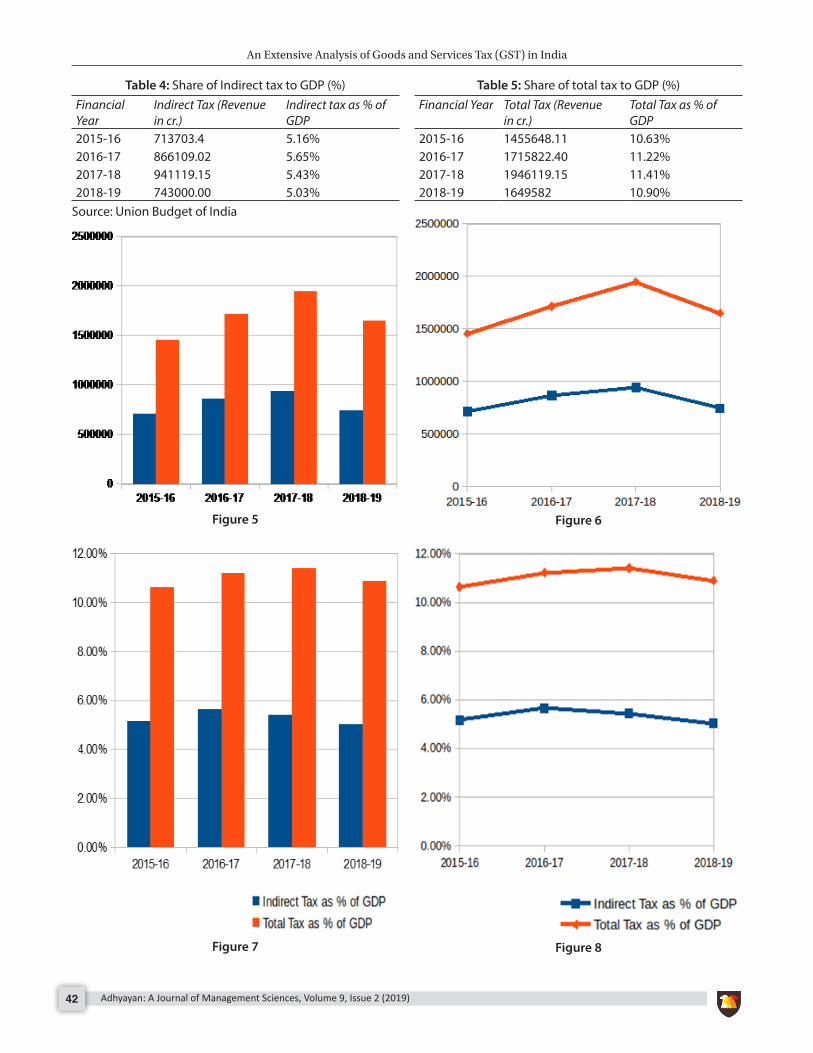
An Extensive Analysis of Goods and Services Tax (GST) in India
Adhyayan: A Journal of Management Sciences, Volume 9, Issue 2 (2019)42
Table 5: Share of total tax to GDP (%)Financial Year Total Tax (Revenue
in cr.)Total Tax as % of GDP
2015-16 1455648.11 10.63%2016-17 1715822.40 11.22%2017-18 1946119.15 11.41%2018-19 1649582 10.90%
Figure 6
Figure 8
Table 4: Share of Indirect tax to GDP (%)Financial Year
Indirect Tax (Revenue in cr.)
Indirect tax as % of GDP
2015-16 713703.4 5.16%2016-17 866109.02 5.65%2017-18 941119.15 5.43%2018-19 743000.00 5.03%
Source: Union Budget of India
Figure 5
Figure 7
An Extensive Analysis of Goods and Services Tax (GST) in India
Adhyayan: A Journal of Management Sciences, Volume 9, Issue 2 (2019) 43
Small Scale IndustriesManufacturers and traders are paying less tax after GST Implementation.
co n c Lu s I o nGoods and services tax(GST) is an indirect tax levied on manufacture, sale and consumption of goods and services at a national level. It is the most significant tax reform in India. It is implemented parallel by the central and state governments at CGST and SGST, respectively. It will improve India’s position in “Ease of doing business index” at a global level. It will increase tax compliance, which in turn had reduced tax evasion that leads to increment in tax revenue. One of the biggest advantages of GST is to bind the entire nation under a single taxation system. The implementation of GST ends the biasness between the manufacturing and service sectors. GST has assisted in removing inefficiencies created by the previous indirect taxation system in India. It had also put its impact on various sectors together with the Indian economy. More specifically, there is a need to do the following:• Create awareness to go for tax compliance.• Much more simplification of tax rates.• Handling grievances and managing resistance of
traders and tax professionals.• Meeting implementation challenges.• Strengthening of IT framework.• Effective coordination between centre and tax
administrators.
re f e r e n c e sCA Rajkumar and S Adukia (2017). A study on proposed Goods
and Services Tax (GST) Framework in India, Retrieved from https://taxclubindia.com/simple/rajkumar.pdf, 1-82.
Clara J, Meghana.M.R, Kulkrani R., A comparative analysis of GST in India, Journal of Business and Management, ISSN:2278-487X,p-ISSN:2319-7668,pp-04-05.
Datey V.S.(2018). Taxation Indirect Taxes,Taxmann Publications,1-21.
Dr. R. Vasanthagopal (2011). GST in India: A Big Leap in the Indirect Taxation System, International Journal of Trade, Economics and Finance, Vol. 2(2),144-146.
Garg G,(2014). Basic Concepts and Features of Goods and Service Tax in India, International Journal of Scientific Research and Management, Vol.2(2),542-49.
Jain, A. (2013). An empirical analysis of goods and service tax in India: Possible impacts, implications, and policies, International Journal of Reviews, Surveys, and Research (IJRSR), 2 (1), Retrieved from https://www.ijrsr.com/January2013/5.pdf
Nayyar, A, Singh I (2018). A Comprehensive Analysis of Goods and Services Tax(GST) in India, Indian Journal of Finance, Vol.12(2), 55-69, DOI: 10.17010/ijf/2018/v12i2/121377.
Roychowdhury, P. (2012). Vat and GST in India - A note. Paradigm, 16 (1), 80 – 87.
Shokeen, S., Banwari, V., and Singh, P. (2017). Impact of goods and services tax bill on the Indian economy, Indian Journal of Finance, Vol.11(7),65-78, DOI: 10.17010/ijf/2017/v11i7/116568.
Union Budget of India, (2015-19).
Ab s t r Ac tIn 21era, banks in India are moving from conventional to convenience banking approach. The topmost agenda in banks is digitization. Going cashless has many positive aspects, but at the same time, it has been confronted with several challenges. The use of plastic money in an economy is addressed to a cashless economy. The circulation of physical currency is minimal. India uses too much cash for transactions. Cashless societies are free from the curse of corruption, have a considerably less amount of black money in circulation. It also paves the way for employment opportunities, high living standards, and equal growth in the economy. The present paper aims to study the impact of focuses on the term “cashless society” in the sense of a move towards and implications of a society where cash is not the only medium of exchange rather uses digital mode. Keywords: Banks performance, Cashless, Digitalization, Information and Communication Technology. Adhyayan: A Journal of Management Sciences (2019); DOI: 10.21567/adhyayan.v9i2.8
Impact of Cashless Society on Banking SectorVijay Laxmi Sharma1, Stuti Tripathi2*1Assistant Professor, Bora Institute of Management Sciences, Lucknow, Uttar Pradesh-226201, India 2Director (MBA), Bora Institute of Management Sciences, Lucknow, Uttar Pradesh-226201, India
Corresponding Author: Stuti Tripathi, Director (MBA), Bora Institute of Management Sciences, Lucknow, Uttar Pradesh-226201, India, e-mail: [email protected] to cite his article: Sharma, V.L. and Tripathi, S. (2019). Impact of Cashless Society on Banking Sector. Adhyayan: A Journal of Management Sciences, 9(2):44-45.Source of support: NilConflict of interest: None
© The Author(s). 2019 Open Access This article is distributed under the terms of the Creative Commons Attribution 4.0 International License (http://creativecommons.org/licenses/by/4.0/), which permits unrestricted use, distribution, and non-commercial reproduction in any medium, provided you give appropriate credit to the original author(s) and the source, provide a link to the Creative Commons license, and indicate if changes were made. The Creative Commons Public Domain Dedication waiver (http://creativecommons.org/publicdomain/zero/1.0/) applies to the data made available in this article, unless otherwise stated.
In t r o d u c t I o n
For a developing economy like India, cash is a fundamental need, likewise water. Without which
survival is a challenge. Around 85%of global payments are still made in cash as people are habitual of using cash; it is easily available and flexible also, and it carries many other benefits also. Of course, the digital era is something to embrace, and new methods of payment will continue to be introduced. But Indians need to identify the risks and advantages of numerous payment tools; the risks related to electronic payment tools square measure much more various and severe.
India continues to be driven by the employment of cash, but five-hitter of all payments happen electronically, but the government minister, in 2016 budget speech, talked concerning the concept of constructing the Asian nation a cashless society, with the aim of edge the flow of black cash. Even the run batted in has conjointly recently disclosed a document — “Payments and Settlement Systems in the Asian nation.
Objective • To know how Cashless Transaction impact on
Economic growth. • To know the impact of cashless society on the
banking sector. • To find out solutions to be adopted against
challenges associated with the implementation of the cashless policies in India.
re v I e w o f L I t e r At u r e Ashish Das and Rakhi Agarwal (2010), in their article “Cashless Payment System in India- A Roadmap, ” Cash as a mode of payment is an expensive proposition for the Government. The country needs to move away from cash-based towards a cashless (electronic) payment system. This will help reduce currency management cost, track transactions, check tax avoidance/fraud, etc., enhance financial inclusion, and integrate the parallel economy with the mainstream.
Alvares, Cliford (2009), in their reports, “The problem regarding fake currency in India.” It is said that the country’s battle against fake currency is not getting easier, and many fakes go undetected. It is also stated that counterfeiters hitherto had restricted printing facilities, which made it easier to discover fakes.
Jain, P.M (2006) in the article, E-payments and e-banking opined that e-payments would be able to check black An Analysis of Growth Pattern of Cashless Transaction System. Taking the fullest advantage of
RESEARCH ARTICLE
ADHYAYAN Volume 9, Issue 2, 2019 Print ISSN: 2249-1066 Online ISSN: 2455–8656
Impact of Cashless Society on Banking Sector
Adhyayan: A Journal of Management Sciences, Volume 9, Issue 2 (2019) 45
technology, quick payments, and remittances will ensure optimal use of available funds for banks, financial institutions, business houses, and common citizens of India. He also pointed out the need for e-payments and modes of e-payments and communication networks.
re s e A r c h M e t h o d o Lo g y The present study is theoretical and analytical and is mainly based on Secondary Data. In-depth interactions/discussions with various Government agencies/representative agencies concerned with digital transactions have also been undertaken. An extensive review of reports by various committees has also been made. Public and documented data, pertinent literature, and other information have been critically analyzed. Reports and publications of the Government of India and banking sectors have been considered. The secondary data is taken from selected government websites and RBI reports, literature from earlier published studies. The study attempts to examine the Impact of Cashless society on the banking sector.
Impact of Cashless Society The new policy of demonetization and the stress of the government on a cashless transaction is a clear message towards the good economic growth in the country. It has not only reduced the threat and loss of money on the one side but also facilities the risk-free transactions. When digital payment-whether on mobile phones, cards, or online-become available to everyone, everyone in the economy can benefit from the outcomes. These include: • Cost-saving through increased efficiency and speed. • Transparenc y and securit y by increasing
accountability and tracking, reducing corruption, and theft as a result.
• Financial inclusion by advancing access to a range of financial services includes savings accounts and insurance products.
• Inclusive growth through building the institutions that form the bedrock of an economy and the
cumulative effect of cost savings, transparency has been increased, financial inclusion took placed, and greater women’s economic empowerment.
co n c Lu s I o n At present, there is a blend of cash and cashless business happening across the nation, while various enablers are functioning towards turning the cashless economy vision into a reality. In the long run, this would provide a significant boost to the economy, and more informal methods of business transactions migrate to the formal sector paving the way for cashless economy and greater transparency, financial inclusion (both on deposits and credit side), better tax compliance and a sustainable growth and progress of the country and economy.
Seemingly the largest advantage of a cashless economy is accrued potency for each merchant and customers. Gone square measure the times of significant pockets filled with mussy bills and unwieldy coins. The number of shoppers World Health Organization use their mobile devices to pay mistreatment contactless payment solutions like Apple Pay, and Google Pay is predicted to grow to 450 million individuals worldwide by 2020. This can be one of the explanations why the edifice trade has been driving the cash-free speech. Tap-and-go and postpaid digital payment ways square measure additional economical as a result of cashiers don’t waste time enumeration bills, that races wait times for purchasers. It conjointly eliminates the requirement for money registers that, at the same time, lowers the danger of thievery. Going cash-free is additionally nice for the economy.
re f e r e n c e s Business standard Economic Times Bappaditya Mukhopadhyay, Understanding cashless
payments in India, Mukhopadhyay Financial Innovation (2016) India.gov.in national portal of India
National Scholarship Portal, Ministry Of Electronics & Information Technology, Government of India
Ab s t r Ac tIndian society was collectivist in its structure where people stayed in joint or extended families, these joint families were large sets of people living together under one roof being governed by the family elder whether a male or a female. The Indian joint family promoted socio-economic interdependence. These families were driven by a similar set of values, norms, or mores, and they were guided by shared beliefs, traditions, and customs which, has proved to be a remarkable resource for the care of children, aged, terminally ill or even unemployed of the family.With the rapidly changing socio-political, economic scene: globalization, rapid urbanization, and rise in the numbers of female workers, fragmentation of large joint families has taken place giving rise to nuclear families in India, which has led to erosion of earlier family values, there appears to be an urgent need to reexamine the values which were propounded by family structures.The western world has been able to develop a social security system wherein its old, ailing, feeble and marginalized are taken care of, by state-owned and run, Health care systems i.e. NHS ( National Health Service) in England or Universal Health Coverage in France. Many other countries have their own systems to take care of their less fortunate members of the society.In the absence of any such system in India, the paper proposes to examine the role of joint family in looking after the older people, maternity issues and child care, as existed in the earlier framework of Joint family system.Keywords: Joint Family, Collectivist Society, Social Security.Adhyayan: A Journal of Management Sciences (2019); DOI: 10.21567/adhyayan.v9i2.9
Indian Joint Family the Indian Social Security SystemSujata Sinha*Assistant Professor, School of Manegment Sciences, Lucknow, U.P., India
Corresponding Author: Sujata Sinha, Assistant Professor, School of Manegment Sciences, Lucknow, U.P., India, e-mail: [email protected], +91 9335088750 How to cite his article: Sinha, S. (2019). Indian Joint Family the Indian Social Security System. Adhyayan: A Journal of Management Sciences, 9(2):46-49.Source of support: NilConflict of interest: None
© The Author(s). 2019 Open Access This article is distributed under the terms of the Creative Commons Attribution 4.0 International License (http://creativecommons.org/licenses/by/4.0/), which permits unrestricted use, distribution, and non-commercial reproduction in any medium, provided you give appropriate credit to the original author(s) and the source, provide a link to the Creative Commons license, and indicate if changes were made. The Creative Commons Public Domain Dedication waiver (http://creativecommons.org/publicdomain/zero/1.0/) applies to the data made available in this article, unless otherwise stated.
In t r o d u c t I o n
A transformation has swept over in almost all walks of man’s life since the last century. There have been
widespread changes in social, political, and economic spheres of people’s lives, in virtually all the societies of the world. The influence of globalization, increasing urbanization, and fast-spreading digitization have all created a vastly altered social reality, resulting in tremendous chaos and confusion in a belief system, values, and human relationships, in Indian society. The expansion of education, the search for employment avenues, and a shift away from home base have all greatly altered Indian social structures drastically. Amongst the various shifting trends witnessed over the last 50/60 years, one of the most significant one, has been a move away from the joint family towards a nuclear family. With higher levels of education and increasing awareness regarding family planning issues, people are often opting for a nuclear family instead of a joint or extended family. It may also be suitably put forth that nuclear families can have better access to education, finances, and a better lifestyle for individual family members; however, this transition towards
nuclear has also thrown up its challenges in the social system. The care and respect of the old was an integral part of the Indian Social Fabric, but in the newer social reality, the plight of an increasing population of elderly in India needs to be re-examined.
There have been growing concerns regarding the treatment and care of India’s aging population. ‘The neglect and abuse’ [1] are definitely forcing us all towards a rethink of our underlying social structures to act as a solution to the emerging crisis regarding the care of old people in India.
India has traditionally been a collectivist society in its structure, where the family was considered the unit of society; people mostly stayed in joint or extended
RESEARCH ARTICLE
ADHYAYAN Volume 9, Issue 2, 2019 Print ISSN: 2249-1066 Online ISSN: 2455–8656
Indian Joint Family the Indian Social Security System
Adhyayan: A Journal of Management Sciences, Volume 9, Issue 2 (2019) 47
families, living together under one roof. Child care, maternity, and care of the old were embedded into family values in India. With the disintegration of joint families, the element of looking after the old, the weak and the feeble members of the family has surfaced as a potent social challenge, specifically with the ever-growing older population.
The western societies, which are individualistic in nature, have developed the Social Security System to act as a safety net for the less able and marginalized sections of their society. In the absence of any such provision in India, it is important to search for alternative means of providing at least a basic minimum care to such people.
Family The family was regarded as the basic unit of society in the time-honored traditions of Indian society. The term family has been derived from the Latin word ‘familia’ denoting servants of the household. Presently the term is used to denote a social unit of people related by blood or marriage living together. Family ‘fulfils needs and performs functions, which are indispensable for the continuity, integration, and change in the social system.[2] A family plays a pivotal role in the development of an individual while fulfilling the emotional and societal needs of a person.
Joint Family Joint families are multi-generational, with more than two generations residing under the same roof. In sociological terms, ‘Indian joint family is composed of male descendants of a common male ancestor by three or four generations and their wives and unmarried daughters.’[3] These families were driven by a similar set of values, beliefs, and norms. The members of a family upheld their own community’s customs and traditions. These joint families have proved to be an excellent resource for the care of children, aged, terminally ill, or even unemployed of the family. Since the Indian society was collectivist, care for others was intrinsic to the shared values of traditional Indian families; this purported ‘putting the needs of others above one’s own. Respect for the elders and their kind treatment was ingrained into the psyche of the younger generation. Values like respect, consideration, and care were the threads upholding the families together in times of need.
so c I A L se c u r I t y “Social Security” has acquired a global currency today. The government’s responsibility for fixing a minimum
standard of living for all its citizens is inherent in the basic framework of Social Security. The stipulations of Social Security intend to provide for less able and marginalized members of society. Fighting the critical issues of ‘poverty, unemployment and disease,’ [4] are pre-requisites of Social Security Systems the world over. The genesis of this concept can be traced back to Germany under Chancellor Otto Von Bismarck, who introduced ‘the old-age social insurance scheme in the year 1889’ [5]. The country also introduced a social insurance scheme to keep the motivation level of its workers high, and simultaneously improve their efficiency.
However, the current history of Social Security measures dates back to 1935, when president F D Roosevelt signed the Social Security Act, thus creating Social Security, a federal safety net for elderly, unemployed, and disadvantaged Americans. The main provision of the original Social Security Act was to pay financial benefits to retirees over age 65 based on lifetime payroll tax contributions. Prior to Social Security Act there had been some vague attempts after the American Civil war to provide for ‘disabled veterans, widows and children of the deceased.[6] The French Revolution had given shape to the Rights of Man, and in the post World War One phase, the International Labour Organization was set up as per the provisions of the Treaty of Versailles in 1919. This treaty provided for the right to social security of the working class. [7]…..
Social Security Provisions mostly entail old age pension, care of the aging, unemployment benefits, state health services, Childcare, and maternity, etc. This paper focuses on the aspect of care for the aging.
Social Security in India The concept of Social Security was associated with the Hindu Joint Families, which was the Original Cell of Security and First Line of Defense “against any misfortune.[8] Currently, the social security provisions include both social insurance and social assistance, the government of India grants protection to its employees through state or central governments. The emphasis on social security measures is becoming central to the formulation of social policy in India. Historically the modern shape of social security can be divided into two phases: a) colonial India, b) independent India.
In colonial India, the whole idea of any kind of protection against adversity was broached for regulating the inhuman working condition of the factory workers of cotton and jute mills in the 1850s. But after
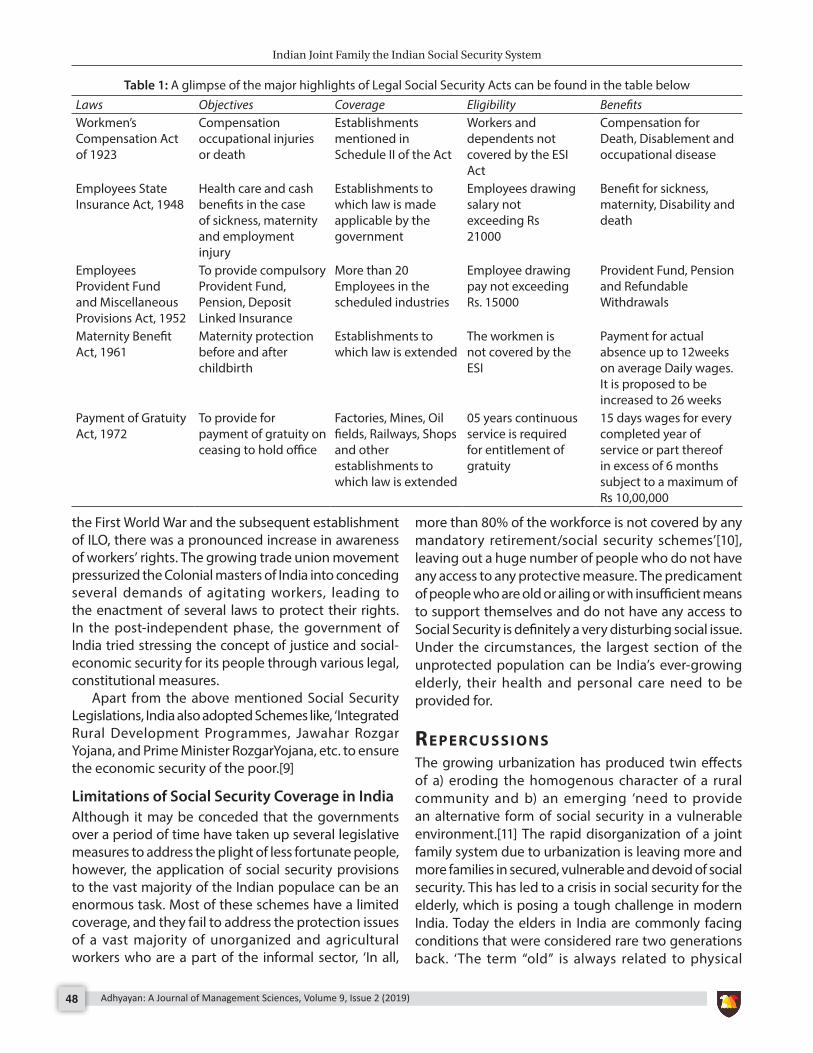
Indian Joint Family the Indian Social Security System
Adhyayan: A Journal of Management Sciences, Volume 9, Issue 2 (2019)48
the First World War and the subsequent establishment of ILO, there was a pronounced increase in awareness of workers’ rights. The growing trade union movement pressurized the Colonial masters of India into conceding several demands of agitating workers, leading to the enactment of several laws to protect their rights. In the post-independent phase, the government of India tried stressing the concept of justice and social-economic security for its people through various legal, constitutional measures.
Apart from the above mentioned Social Security Legislations, India also adopted Schemes like, ‘Integrated Rural Development Programmes, Jawahar Rozgar Yojana, and Prime Minister RozgarYojana, etc. to ensure the economic security of the poor.[9]
Limitations of Social Security Coverage in India Although it may be conceded that the governments over a period of time have taken up several legislative measures to address the plight of less fortunate people, however, the application of social security provisions to the vast majority of the Indian populace can be an enormous task. Most of these schemes have a limited coverage, and they fail to address the protection issues of a vast majority of unorganized and agricultural workers who are a part of the informal sector, ‘In all,
more than 80% of the workforce is not covered by any mandatory retirement/social security schemes’[10], leaving out a huge number of people who do not have any access to any protective measure. The predicament of people who are old or ailing or with insufficient means to support themselves and do not have any access to Social Security is definitely a very disturbing social issue. Under the circumstances, the largest section of the unprotected population can be India’s ever-growing elderly, their health and personal care need to be provided for.
re P e r c u s s I o n s The growing urbanization has produced twin effects of a) eroding the homogenous character of a rural community and b) an emerging ‘need to provide an alternative form of social security in a vulnerable environment.[11] The rapid disorganization of a joint family system due to urbanization is leaving more and more families in secured, vulnerable and devoid of social security. This has led to a crisis in social security for the elderly, which is posing a tough challenge in modern India. Today the elders in India are commonly facing conditions that were considered rare two generations back. ‘The term “old” is always related to physical
Table 1: A glimpse of the major highlights of Legal Social Security Acts can be found in the table below Laws Objectives Coverage Eligibility BenefitsWorkmen’s Compensation Act of 1923
Compensation occupational injuries or death
Establishments mentioned in Schedule II of the Act
Workers and dependents not covered by the ESI Act
Compensation for Death, Disablement and occupational disease
Employees State Insurance Act, 1948
Health care and cash benefits in the case of sickness, maternity and employment injury
Establishments to which law is made applicable by the government
Employees drawing salary not exceeding Rs 21000
Benefit for sickness, maternity, Disability and death
Employees Provident Fund and Miscellaneous Provisions Act, 1952
To provide compulsory Provident Fund, Pension, Deposit Linked Insurance
More than 20 Employees in the scheduled industries
Employee drawing pay not exceeding Rs. 15000
Provident Fund, Pension and Refundable Withdrawals
Maternity Benefit Act, 1961
Maternity protection before and after childbirth
Establishments to which law is extended
The workmen is not covered by the ESI
Payment for actual absence up to 12weeks on average Daily wages. It is proposed to be increased to 26 weeks
Payment of Gratuity Act, 1972
To provide for payment of gratuity on ceasing to hold office
Factories, Mines, Oil fields, Railways, Shops and other establishments to which law is extended
05 years continuous service is required for entitlement of gratuity
15 days wages for every completed year of service or part thereof in excess of 6 months subject to a maximum of Rs 10,00,000
Indian Joint Family the Indian Social Security System
Adhyayan: A Journal of Management Sciences, Volume 9, Issue 2 (2019) 49
incapacity, biological deterioration and disabilities, and psychological failures, although it is not a disease.[12] Naturally, such health conditions require personal attention and care either from the state or from other related social entities. At times like these, the planners with their limited resources have barely been able to cope with the ever-increasing demands to provide for its aging populace
co n c Lu s I o nThe current social condition with India’s growing aging population is creating a strain on the social fabric of India. In the absence of a suitable Social Security Provision, there is an urgent need to look at alternative solutions to this problem. A more considerable probing of our older value system and social structure may provide us with some of the answers.
su g g e s t I o n sIt can be ascertained that the disintegration of the joint family has thrown up a major challenge of care of the elders of Indian society. It may prove difficult to turn the clock back; however, the solutions for the geriatric care are embedded in a move towards greater acceptance of the joint family by the younger generation. Joint family structure was the socio-economic backbone of the average Indian,[13] in times of disease or emergency, members of the family pooled in resources to help each other out. The family also looked after it’s elders in their old age by giving them socio-economic and emotional support. It may be important to revisit the Indian family values and inculcate it in the younger generation to face the long-term consequence of this emerging crisis.
re f e r e n c e sVice President’s Address at Valedictory of AISCCON National
Conference 29-November-2018 https://vicepresidentofindia.nic.in/pressrelease/india-
traditionally-has-robust-joint-family-system-says-vice-president Extracted on 7/1/2020
Bahadur A. and Dhawan N.(2008). Social Value of Parents and Children in Joint and Nuclear Families. Journal of the Indian Academy of Applied Psychology, Vol. 34, Special Issue, 74-80
Shah A. M (1989). Parameters of Family Policy in India Economic and Political Weekly Vol. 24(10), 513-516.
Dr. Sujit Kar History of Social Security of Unorganized Workers -- With Special Reference to India,. https://papers.ssrn.com/ Extracted on 7/1/2020
Pradeep M D & Kalicharan M. L. (2016), “Social Security Measures for Indian Workforce A Legal Intervention, “International Journal of Computational Research and Development, Vol. 1 (1), 47-57.
R. Vaidyanathan, Declining joint family and emerging crisis in old age security, https://doi.org/10.1504/IJICBM.2007.014476 Extracted on 7/1/2020
Mahajan A and Ray A(2013). The Indian elder: factors affecting geriatric care in India Global Journal of Medicine and Public Health. Vol. 2,( 4) ISSN#- 2277-9604 www.gjmedph.org Vol. 2, No. 4 2013 ISSN#- 2277- 9604
Amit K; Rai, Ambarish K. et al. (eds.) (2015). A Study of Ageing and Disability in Uttar Pradesh: A District-Level Analysis Population, Economic Growth, and Environmental Pollution; Abhijeet Publications. ISBN- 978-93-5074-159-7
Shah. A. M. (1998).The Family in India: Critical Essay Pub. Orient Longman.
Table 1: Dr. Sujit Kar History of Social Security of Unorganized Workers With Special Reference to India. https://papers.ssrn.com/ Extracted on 7/1/2020
Guidelines for Submission• Journal follows a peer review procedure. The manuscript submitted by authors should include their names
and affiliations.• Apart from manuscript, authors are required to send a separate page mentioning the name, affiliation and
contact details of authors. Information regarding corresponding author should also be mentioned in this page.• While submitting the manuscript, corresponding author should give undertaking that the work is original and
it has not been published anywhere else and also it has not been submitted anywhere else for consideration. It is the responsibility of author to obtain permission to reprint previously published matter with copyright restrictions.
• Publisher would not be responsible for any plagiarism issue and it would be sole responsibility of authors.• Authors wishing to include figures, tables, or text passages that have already been published elsewhere are
required to obtain permission from the copyright owner(s) for both the print and online format and to include evidence that such permission has been granted while submitting their papers. Any material received without such evidence will be assumed to originate from the authors.
• Table content must in excel object formate. (https://support.office.com/en-us/article/paste-special-e03db6c7-8295-4529-957d-16ac8a778719)
• Manuscript should include an abstract of about 150-200 words and 3-5 keywords for indexing purpose.• Manuscript should be in MS-Word written in Times New Roman font of 12 size with 1.15 line spacing.• References should be cited at the end of the paper only. Authors are required to follow APA style of referencing.
Reference list should contain all the sources which are mentioned in the main text of the manuscript. Reference list should not contain any entry which is not mentioned in the main text. Reference list entries should be alphabetized by the last names of the first author of each work. Journal names and book titles should be italicized. Given below is the illustration for referencing:
Referencing an ideaDantzer (2003), Pinquart and Shen (2011) all state that anxiety and depression has been identified as more commonly in children and adolescents with long-term physical conditions.
Referencing a quotationIndeed, one researcher commented that “technological innovations have saved or extended the lives of many patients” (Lumby, 2001, p. 44).
Citing a source within a sourceWhere your source quotes or refers to another source, for example Unsworth refers to previous work by Halliday on linguistics, the citation might read thus: (Halliday, as cited in Unsworth, 2004, p. 15)
Referencing style for citing a Journal paper:heung, J. M. Y., Bartlett, D. J., Armour, C. L., Laba, T. L., & Saini, B. (2018). To drug or not to drug: A qualitative study of patients’ decision-making processes for managing insomnia. Behavioral Sleep Medicine, 16(1), 1-26. doi:10.1080/15402002.2016.1163702
Referencing style for citing a book:De Vaus, D. A. (2014). Surveys in social research. Sydney, Australia: Allen & Unwin.
Referencing style for citing a book chapter:McKenzie, H., Boughton, M., Hayes, L., & Forsyth, S. (2008). Explaining the complexities and value of nursing practice and knowledge. In I. Morley & M. Crouch (Eds.), Knowledge as value: Illumination through critical prisms (pp. 209-224). Amsterdam, Netherlands: Rodopi.
Referencing style for online document:Webpage with an authorHealthTimes. (2015). The future of aged care nursing in Australia. Retrieved from https://healthtimes.com.au/hub/aged-care/2/news/nc1/the-future-of-aged-care-nursing-in-australia/495/
Webpage with no authorRs 20000cr funding for Nawami Gange proejct. (2014). Retrieved from https://www.abc.net.au/news/2003-09-22/250m-funding-boost-for-malaria-vaccine/1482220
Newspaper articleFellner, C. (2019, April 7). Time bomb: Two new cases as NSW faces worst measles outbreak in years. The Sydney Morning Herald. Retrieved from https://www.smh.com.au
Government publicationAustralian Institute of Health and Welfare. (2018). Physical activity across the life stages. Canberra, Australia: Author.
Company and Industry ReportsVuong, B. (2018, November). IBISWorld industry report OD5381. Coffee shops in Australia. Retrieved from IBISWorld database.
Conferences Proceedings Blakey, N., Guinea, S., & Saghafi, F. (2017). Transforming undergraduate nursing curriculum by aligning models of clinical reasoning through simulation. In R. Walker, & S. Bedford (Eds.), HERDSA 2017 Conference: Research and Development in Higher Education: Curriculum Transformation (pp. 25-37). Hammondville, NSW: Higher Education Research and Development Society of Australasia. Retrieved from http://www.herdsa.org.au/research-and-development-higher-education-vol-40-25
Note:• All tables and figures should be properly numbered and labeled. Source should be cited wherever necessary.• Correspondence and proofs for correction will be sent to corresponding author.• Manuscript and page containing author details should be sent through e-mail only at adhyayan@smslucknow.
com
All correspondence should be addressed to: Editor-in-Chief (Adhayan)School of Management Sciences, 19th Kilometer Sultanpur Road, Near Gosaiganj, Lucknow, UP-226501+91 9792633331, 9506033170https://adhyayan.smslucknow.com
Invitation for Research Papers
Adhyayan Journal of Management Sciences bearing ISSN: 2249-1066 (Print), 2455–8656 (Online), EBSCO, Ulrich’s, Crossref, J-Gate indexed, Member of Journal Association of India is published by School of Management Sciences, Lucknow as a biannual journal.
Vision of the journal is to present a pedagogic platform to scholars all over the world to publish their novel, original, empirical and high quality research work. We intend to make ‘Adhyayan’ a landmark for quality research publication in discipline of business administration, management and allied disciplines of study which can broaden the knowledge of business professionals and academicians by providing valuable insights to business-related information, research and ideas. It provides a platform for research which advances our understanding of management, in all its varied aspects.
Editorial team invites valuable contribution of research paradigms including quantitative and qualitative analysis, case studies, conceptual, book reviews and empirical research from researchers, scholars, academicians and management.
Subjects covered by the journal include, (but not limited to):Accounting and Financial Management, IT and Systems Management, Operations Management, Rural Management, Project Management, Sales Management, Brand Management, Strategic Management, Supply Chain Management, Marketing Management, Procurement and Materials Management, Knowledge Management, Quality Management, Human Resource Management, Cost Management, Event Management, Change Management, Communication, Customer Relationship Management, Disaster Management and other allied areas.
It will be our pleasure to receive your valuable contribution for our Journal for further issues of the journal.
Please send your manuscripts to: [email protected]: 2 issues per yearISSN: 2249-1066 (Print)ISSN: 2455–8656 (Online)Subject Category: Management and Allied FieldsIndexing: EBSCO, Ulrich’s, J-Gate, Crossref with DOI Published by: School of Management Sciences, Lucknow-226501, UP, IndiaPh: +91 9792633331, 9506033170
Subscription: ADHYAYAN – A Journal of Management Sciences
su b s c r I P t I o n rAt e s
INDIA (in INR) One Year Two YearCompanies 1500 2500Academic Institutions 1000 1500Individuals 500 700SMS Alumni 400 600Students I Research Scholars 300 500FOREIGN (in US $) One Year Two YearCompanies 60 100Academic Institutions 50 80Individuals 30 50Students / Research Scholars 25 40
su b s c r I P t I o n fo r MI I We wish to subscribe ADHYAYAN-A Journal of Management Sciences for .............................................. year(s) for which a Demand Draft vide ..................... Dated .............................. for Rs. I US $ ......................... issued from .............................................. (Name of the bank) favoring School of Management Sciences, Lucknow, payable at Lucknow is enclosed.
NAME .................................................................................................................................................................................................................................................DESIGNATION .................................................................................................................................................................................................................................POSTAL ADDRESS .......................................................................................................................................................................................................................................................................................................................................................................................... PIN I ZIP .....................................................................EMAIL .................................................................................................................. FAX ................................................................................................................TELEPHONE NUMBER .................................................................................... MOBILE .........................................................................................................Subscriber ID (for renewal only) ...............................................................................................................................................................................................
.................................. .............................
Date Signature
Note: Please do not send cheques. Attach attested copy of identity card for research scholar and student categories. Foreign Subscribers may pay through US dollar pay order favoring School of Management Sciences, Lucknow. Add US $ 5 if the same is not payable at Lucknow.


