Embed Size (px)
Citation preview

Gerontologija 2008; 9(1): 7–14 GERONTOLOGIJA
Abstract
Background: The aim of our study was to evaluate adi-ponectin level in subjects with pre-diabetes and to compare it with the levels in newly diagnosed type 2 diabetes and healt-hy subjects. We also studied associations of adiponectin level with other metabolic indices.
Methods and methods: study included 48 individuals with pre-diabetes (IGT), 33 newly diagnosed type 2 diabetes mellitus (DM) subjects, and 68 healthy subjects. Blood sam-
ples were analysed for fasting blood glucose, insulin, HbA1C
and adiponectin. According to BMI control subjects were separated into obese (BMI ≥ 27) and non-obese (BMI < 27) groups, and according to HOMA-IR they were divided into insulin-sensitive (HOMA-IR < 3), and insulin-resistant (HO-
MA-IR > 3) subsets.Results: median serum adiponectin levels were not statisti-
cally signiicantly different in IGT and DM groups (7.56 (4.18;
13.57) vs. 7.63 (5.04; 11.73), p = 0.858). Serum adiponectin was signiicantly lower in IGT group as compared to obe-
se-control group (7.56 (4.18; 13.57) vs. 14.37 (7.68; 19.24), p = 0.004). Comparison of obese and non-obese control groups showed that serum adiponectin level was lower in obese su-
bjects, but the difference was not statistically signiicant (14.37 (7.68; 19.24) vs. 17.41 (9.95; 24.57) µg/ml p = 0.181), whereas insulin-resistant controls had signiicantly lower adiponectin levels when compared to insulin-sensitive ones (11.85 (8.31; 16.72) vs. 18.69 (10.72; 28.32) µg/ml p = 0.04). Adiponectin showed inverse correlation with HOMA-IR.
Conclusions: adiponectin level was similar in IGT and type 2 diabetes groups and was signiicantly lower than in con-
trol subjects.
Keywords:adiponectin, insulin resistance, prediabetes, type 2 diabetes
Introduction
Obesity is a well-known risk factor for type 2 diabe-
tes, and about 90% of the humans affected by this disease are overweight or obese [1]. The pathophysiology linking obesity to type 2 diabetes is not completely understood,
Original article
ADIPONECTIN AND INSULIN RESISTANCE IN PRE-DIABETES AND EARLY TYPE 2 DIABETES MELLITUS
V. Urbanavičius1,2, A. Abraitienė1,2, D. Vitkus1,3, R. Borovkienė3, Z. A. Kučinskienė1,3
1Vilnius University Faculty of Medicine2Vilnius University Hospital “Santariškių Klinikos” Center of Endocrinology3Vilnius University Hospital “Santariškių Klinikos” Center of Laboratory Diagnostics
Adresas: V. UrbanavičiusSantariškių g. 2Endokrinologijos centrasVilniaus universiteto ligoninės Santariškių klinikosLT-08661 VilniusTel. (8-5) 236 5189Faks. (8-5) 236 5079El.paštas: [email protected]

8 V. Urbanavičius, A. Abraitienė, D. Vitkus, R. Borovkienė, Z. A. Kučinskienė
but adipokines are thought to be involved [2]. Adiponec-
tin is a recently discovered protein that seems to be exclu-
sively secreted by adipocytes and is the most abundant adipose tissue–derived protein [3, 4]. In contrast to other
adipokines (such as leptin, interleukin-6 and others) that are often elevated in obese subjects, adiponectin is re-
duced [5–7].In animal studies, adiponectin has been shown to
have insulin-sensitizing properties. Administration of adiponectin reversed insulin resistance in various mouse
models of obesity and diabetes [8]. Injections of recom-
binant adiponectin protein into mice acutely lowered plasma fatty acids and glucose, as well as improved insu-
lin sensitivity [9]. Chronic administration of the recom-
binant adiponectin in mice also reduced body weight [10]. In animal studies adiponectin increased insulin action via effects on hepatic glucose production [8] and by increas-
ing fat oxidation and lowering circulating free fatty acids [10–12].
Lower plasma levels of adiponectin relative to the normal controls were documented in human subjects with obesity [4], insulin resistance [5, 13] and type 2 dia-
betes [6] in several cross-sectional studies. Results from a few prospective studies suggest that low adiponec-
tin level is predictive of insulin resistance or diabetes [14–17]. Although the association of low adiponectin concentration and type 2 diabetes is rather well studied, only few studies investigated adiponectin level in pre-diabetes (e.g. impaired glucose tolerance and impaired fasting glucose) [18, 19]. The results of these studies are rather conlicting, one group showing similar levels of adiponectin in pre-diabetes and type 2 diabetes [19] and the other one reporting signiicantly higher levels of adi-ponectin in pre-diabetes as compared to type 2 diabetes [18]. It seems that association of adiponectin with insulin resistance occurs early in obesity development, however it remains unclear if this association is of further impor-tance in prediabetes and early stages of type 2 diabetes and remains the same through all glucose intolerance de-
velopment stages.The objective of our study was to evaluate adiponectin
level in subjects with pre-diabetes and to compare it with the levels in newly diagnosed type 2 diabetes and healthy (normal glucose tolerance) subjects. We also studied as-
sociations of adiponectin level with insulin resistance in all study subjects and in separate groups.
Research design and methods
The present study included 48 individuals with pre-diabetes (impaired glucose tolerance or impaired fasting glucose (IGT)), 33 newly diagnosed type 2 diabetes mel-litus subjects (DM), and 68 healthy subjects.
Lithuanian Bioethics Committee approved study pro-
tocol, and all subjects signed an informed consent form after being informed on the purpose and procedures of the study.
Subjects were evaluated at Vilnius University Faculty of Medicine, Vilnius University Hospital “Santariskiu Klinikos” Endocrinology centre and Laboratory Medi-cine centre from September 2005 until May 2007. The evaluation involved a full medical history and physical examination, including anthropometric measurements (weight, height, waist and hip circumferences, total body fat mass and percentage measured by bioelectrical im-
pedance (OMRON BF 302 body fat monitor), arterial blood pressure and pulse rate. Subjects were excluded if they had a known history of cardiovascular disease, stroke or transient ischemic attack, uncontrolled hyper-tension, or any other serious chronic disease requiring active treatment.
Metabolic studiesVenous blood sample were taken in the morning after
12 hours of fasting. With the subject in the sitting posi-tion, an intravenous needle was inserted into a forearm
vein. Blood samples were drawn for fasting blood glu-
cose, insulin and adiponectin. Standard OGTT was per-formed for all study subjects: 75 grams of oral glucose load over a 2-minute period was given, and blood sam-
ples were obtained again 2 hours after for plasma glu-
cose measurement. Based on the fasting serum glucose and OGTT, categories of glucose tolerance status were
deined by WHO 1998 recommendations, and study sub-
jects were divided into impaired glucose tolerance or impaired fasting glucose (IGT), type 2 diabetes mellitus (DM) and control (C) groups. According to BMI control subjects were separated into obese (BMI ≥ 27) (Obese-C) and non-obese (BMI < 27) (Non-obese-C) groups.
Glucose and insulin were determined using standard laboratory methods. Serum adiponectin was measured with the radioimmunoassay (RIA) kits following the manufacturer’s protocols (Linco Research Inc., St. Louis, MO).
9Adiponectin and insulin resistance in pre-diabetes and early type 2 diabetes mellitus
Calculations and Statistical analysesThe body mass index (BMI) was calculated as weight
(kilograms) divided by height squared (meters). The homeostasis model assessment of insulin resistance (HO-
MA-IR), an index of insulin resistance, was calculated using an equation as described [21].
Data were summarized using standard procedures. Descriptive statistics are presented as mean ± SD or me-
dian (quartiles) for normally and non-normally distrib-
uted parameters respectively. Student’s t test was used to analyse data with normal distribution, whereas Mann and Whitney U-test was applied to compare non-parametric parameters. Spearman’s correlation coeficient was cal-culated to explore correlation between adiponectin and other variables. SPSS 15.0 for Windows software (SPSS, Chicago, IL) was used for statistical analysis. A P value < 0.05 was considered statistically signiicant.
Results
Demographic and clinical characteristics of all study groups are presented in Table 1.
As shown in the Table 1, the subjects from IGT and DM groups were older, more often suffered from arterial hypertension whereas more controls, particularly non-obese ones, were smoking.
Effects of glucose metabolism on serum adiponectin
levels
In our study we have compared anthropometric and biochemical parameters in IGT and DM groups. As shown in Table 2, anthropometric parameters (BMI, waist, hip, waist to hip ratio (W/H), body fat mass and fat percentage) did not statistically signiicantly differed in IGT and DM groups, whereas systolic and diastolic blood pressure and heart rate were signiicantly higher in DM subjects. Despite the fact that fasting blood glucose and HOMA-IR were signiicantly higher in DM group,
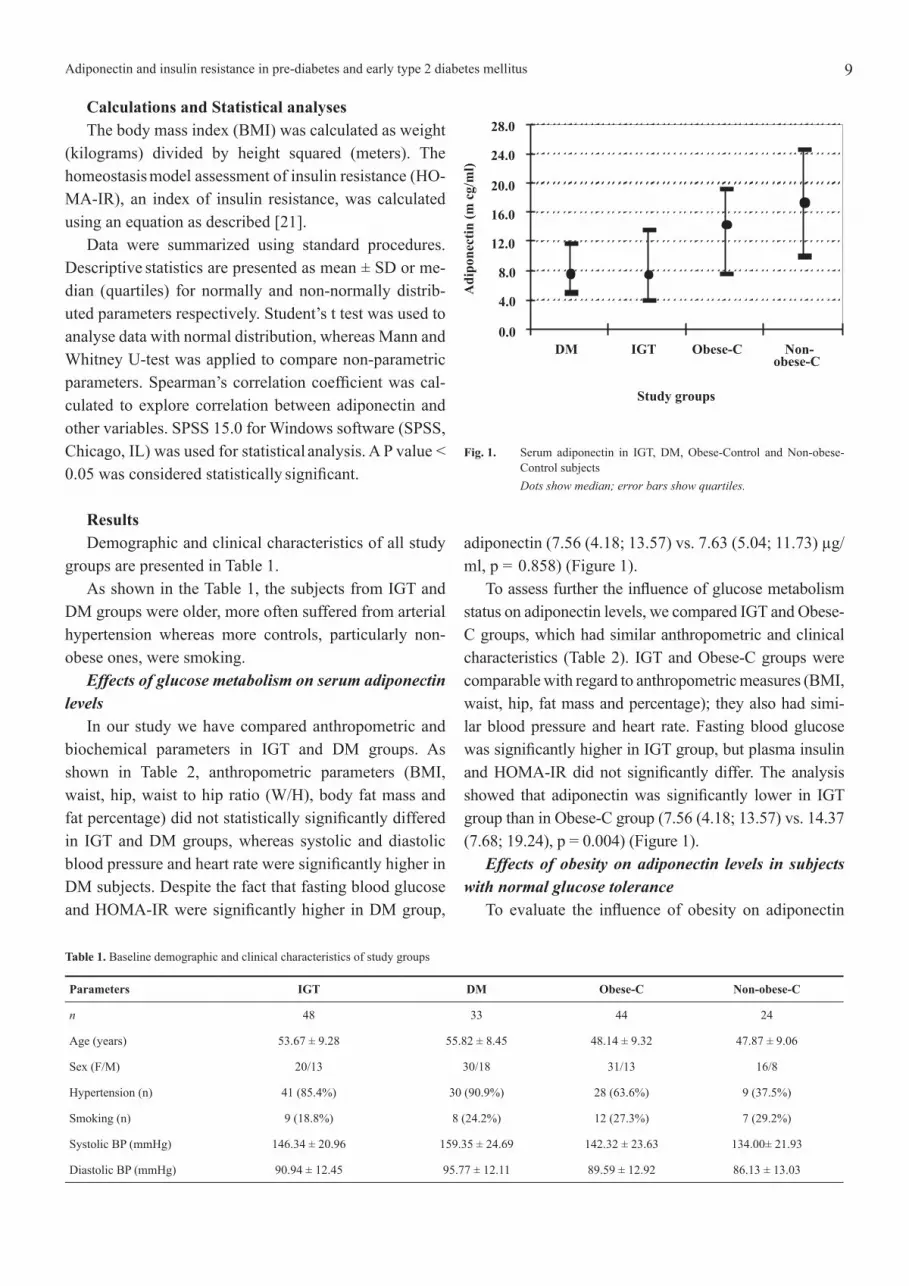
adiponectin (7.56 (4.18; 13.57) vs. 7.63 (5.04; 11.73) µg/ml, p = 0.858) (Figure 1).
To assess further the inluence of glucose metabolism status on adiponectin levels, we compared IGT and Obese-C groups, which had similar anthropometric and clinical characteristics (Table 2). IGT and Obese-C groups were comparable with regard to anthropometric measures (BMI, waist, hip, fat mass and percentage); they also had simi-lar blood pressure and heart rate. Fasting blood glucose was signiicantly higher in IGT group, but plasma insulin and HOMA-IR did not signiicantly differ. The analysis showed that adiponectin was signiicantly lower in IGT group than in Obese-C group (7.56 (4.18; 13.57) vs. 14.37 (7.68; 19.24), p = 0.004) (Figure 1).
Effects of obesity on adiponectin levels in subjects
with normal glucose tolerance
To evaluate the inluence of obesity on adiponectin
Table 1. Baseline demographic and clinical characteristics of study groups
Parameters IGT DM Obese-C Non-obese-C
n 48 33 44 24
Age (years) 53.67 ± 9.28 55.82 ± 8.45 48.14 ± 9.32 47.87 ± 9.06
Sex (F/M) 20/13 30/18 31/13 16/8
Hypertension (n) 41 (85.4%) 30 (90.9%) 28 (63.6%) 9 (37.5%)
Smoking (n) 9 (18.8%) 8 (24.2%) 12 (27.3%) 7 (29.2%)
Systolic BP (mmHg) 146.34 ± 20.96 159.35 ± 24.69 142.32 ± 23.63 134.00± 21.93
Diastolic BP (mmHg) 90.94 ± 12.45 95.77 ± 12.11 89.59 ± 12.92 86.13 ± 13.03
0.0
4.0
8.0
12.0
16.0
20.0
24.0
28.0
DM IGT Obese-C Non-obese-C
Study groups
Ad
ipo
nec
tin
(mcg
/ml)
Fig. 1. Serum adiponectin in IGT, DM, Obese-Control and Non-obese-Control subjects
Dots show median; error bars show quartiles.

10 V. Urbanavičius, A. Abraitienė, D. Vitkus, R. Borovkienė, Z. A. Kučinskienė
Table 2. Anthropometric and biochemical variables of IGT, DM and Obese-C groups.
Parameters IGT DM P1 Obese-C P2
BMI (kg/m2) 33.31 ± 5.38 35.28 ± 6.71 0.150 32.34 ± 4.62 0.360
Waist (cm) 105.31 ± 12.08 110.38 ± 12.83 0.077 100.74 ± 11.72 0.071
Hip (cm) 113.74 ± 10.00 117.38 ± 12.91 0.236 113.95 ± 9.03 0.857
W/H 0.93 ± 0.06 0.94 ± 0.08 0.498 0.88 ± 0.07 0.003
Fat mass (kg) 34.68 ± 10.02 35.41 ± 9.53 0.755 33.81 ± 9.57 0.678
Fat mass (%) 36.61 ± 7.15 37.13 ± 7.56 0.764 36.2 ± 7.10 0.789
Systolic BP (mmHg) 146.34 ± 20.96 159.35 ± 24.69 0.013 142.32 ± 23.63 0.311
Diastolic BP (mmHg) 90.94 ± 12.45 95.77 ± 12.11 0.038 89.59 ± 12.92 0.419
Heart rate (beats/min) 69.94 ± 8.04 76.35 ± 8.12 0.001 69.89 ± 7.92 0.879
Fasting blood glucose (mmol/l) 6.29 (6.05; 6.57) 8.00 (7.3; 11.4) <0.0001 5.30 (5.11; 5.70) <0.0001
Insulin (µU/ml) 12.05 (8.24; 20.53) 15.30 (10.55; 21.65) 0.226 12.30 (7.65; 18.81) 0.525
HOMA-IR 3.48 (2.25; 5.84) 5.80 (3.75; 9.11) <0.0001 3.17 (1.86; 4.20) 0.093
Adiponectin (µg/ml) 7.56 (4.18; 13.57) 7.63 (5.04; 11.73) 0.858 14.37 (7.68; 19.24) 0.004
P1 for pairwise comparisons, IGT versus DM;
P2 for pairwise comparisons, IGT versus Obese-C.
Table 3. Anthropometric and biochemical characteristics of Obese-Control and Non-obese-Control groups
Parameters Obese-Control Non-obese-Control p
BMI (kg/m2) 32.34 ± 4.62 23.55 ± 1.93 <0.0001
Waist (cm) 100.74 ± 11.72 83.17 ± 7.85 <0.0001
Hip (cm) 113.95 ± 9.03 98.90 ± 3.90 <0.0001
W/H 0.88 ± 0.07 0.84 ± 0.06 0.004
Fat mass (kg) 33.81 ± 9.57 18.26 ± 5.30 <0.0001
Fat mass (%) 36.2 ± 7.10 26.64 ± 7.44 <0.0001
Systolic BP (mmHg) 142.32 ± 23.63 134.00± 21.93 0.210
Diastolic BP (mmHg) 89.59 ± 12.92 86.13 ± 13.03 0.406
Fasting blood glucose (mmol/l) 5.30 (5.11; 5.70) 5.18 (4.81; 5.54) 0.333
Insulin (µU/ml) 12.30 (7.65; 18.81) 6.45 (5.15; 9.58) <0.0001
HOMA-IR 3.17 (1.86; 4.20) 1.53 (1.14; 2.23) <0.0001
Adiponectin (µg/ml) 14.37 (7.68; 19.24) 17.41 (9.95; 24.57) 0.181
concentration we compared Obese-C and Non-obese-C subjects. As shown in Table 3, Obese-C subjects had signiicantly higher BMI, waist and hip circumferences, larger amount of body fat mass and percentage; they also had higher systolic and diastolic blood pressure. Com-
parison of the metabolic parameters showed that fasting blood glucose was quite similar in these study groups, whereas insulin and HOMA-IR were signiicantly higher in Obese-C subjects. Serum adiponectin concentration was lower in Obese-C than in Non-obese-C group (14.37
(7.68; 19.24) vs. 17.41 (9.95; 24.57) µg/ml), but the dif-ference was not statistically signiicant (p = 0.181) (Figu-re 1).
To asses adiponectin levels in whole group of investi-gated subjects and the inluence of insulin resistance, we have empirically divided subjects into 3 groups: insulin-sensitive group (HOMA-IR ≤ 3), intermediate insulin-sensitivity group (HOMA-IR 3–6) and insulin resistant group (HOMA-IR ≥ 6). The analysis of two extremes (HOMA-IR ≤ 3 and HOMA-IR ≥ 6) showed that there is
11Adiponectin and insulin resistance in pre-diabetes and early type 2 diabetes mellitus
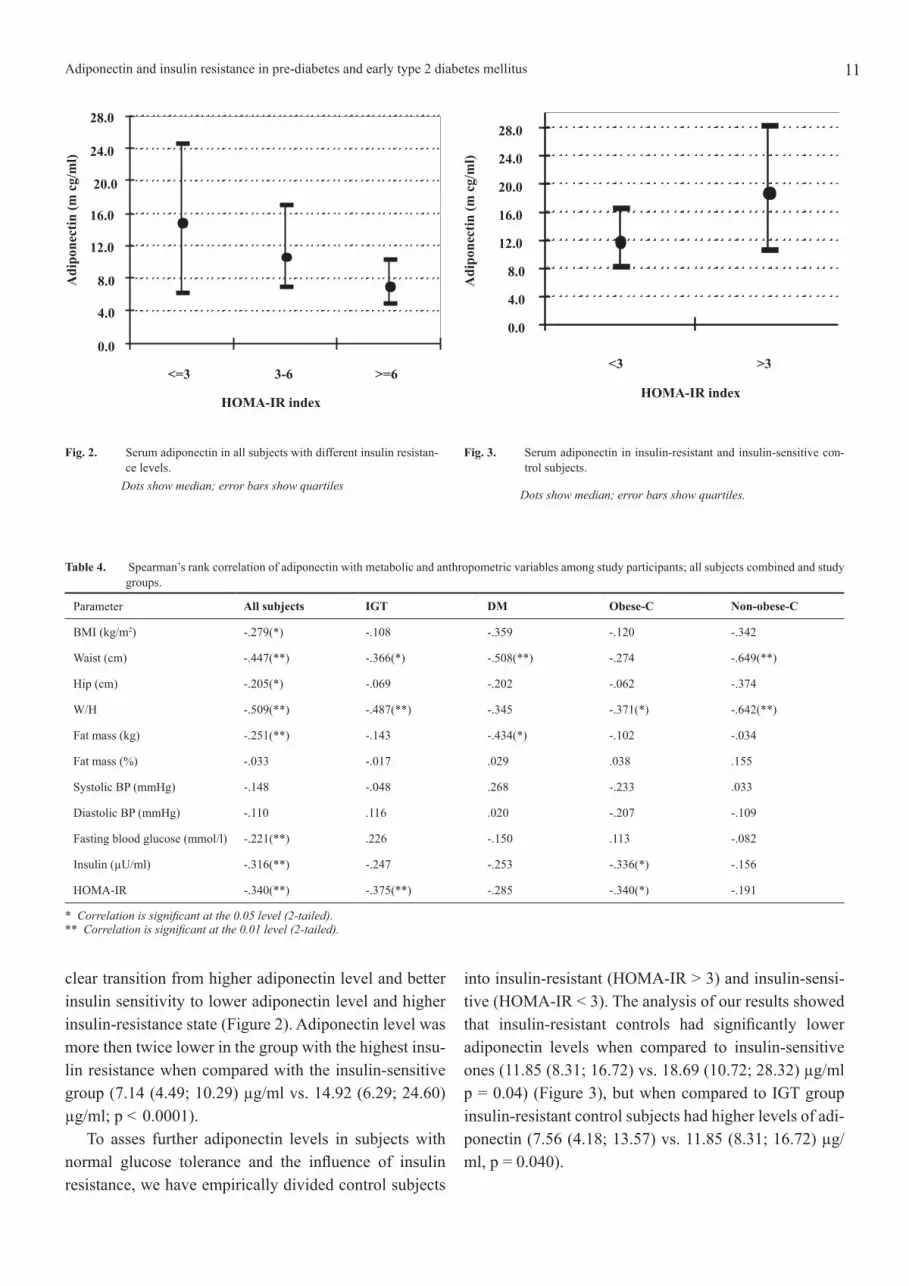
Fig. 2. Serum adiponectin in all subjects with different insulin resistan-
ce levels. Dots show median; error bars show quartiles
Fig. 3. Serum adiponectin in insulin-resistant and insulin-sensitive con-
trol subjects.
Dots show median; error bars show quartiles.
clear transition from higher adiponectin level and better insulin sensitivity to lower adiponectin level and higher insulin-resistance state (Figure 2). Adiponectin level was more then twice lower in the group with the highest insu-
lin resistance when compared with the insulin-sensitive group (7.14 (4.49; 10.29) µg/ml vs. 14.92 (6.29; 24.60) µg/ml; p < 0.0001).
To asses further adiponectin levels in subjects with normal glucose tolerance and the inluence of insulin resistance, we have empirically divided control subjects
into insulin-resistant (HOMA-IR > 3) and insulin-sensi-tive (HOMA-IR < 3). The analysis of our results showed that insulin-resistant controls had signiicantly lower adiponectin levels when compared to insulin-sensitive ones (11.85 (8.31; 16.72) vs. 18.69 (10.72; 28.32) µg/ml p = 0.04) (Figure 3), but when compared to IGT group insulin-resistant control subjects had higher levels of adi-ponectin (7.56 (4.18; 13.57) vs. 11.85 (8.31; 16.72) µg/ml, p = 0.040).
Table 4. Spearman’s rank correlation of adiponectin with metabolic and anthropometric variables among study participants; all subjects combined and study groups.
Parameter All subjects IGT DM Obese-C Non-obese-C
BMI (kg/m2) -.279(*) -.108 -.359 -.120 -.342
Waist (cm) -.447(**) -.366(*) -.508(**) -.274 -.649(**)
Hip (cm) -.205(*) -.069 -.202 -.062 -.374
W/H -.509(**) -.487(**) -.345 -.371(*) -.642(**)
Fat mass (kg) -.251(**) -.143 -.434(*) -.102 -.034
Fat mass (%) -.033 -.017 .029 .038 .155
Systolic BP (mmHg) -.148 -.048 .268 -.233 .033
Diastolic BP (mmHg) -.110 .116 .020 -.207 -.109
Fasting blood glucose (mmol/l) -.221(**) .226 -.150 .113 -.082
Insulin (µU/ml) -.316(**) -.247 -.253 -.336(*) -.156
HOMA-IR -.340(**) -.375(**) -.285 -.340(*) -.191
* Correlation is signiicant at the 0.05 level (2-tailed). ** Correlation is signiicant at the 0.01 level (2-tailed).
0.0
4.0
8.0
12.0
16.0
20.0
24.0
28.0
<=3 3-6 >=6
HOMA-IR index
Ad
ipon
ecti
n(m
cg/m
l)
0.0
4.0
8.0
12.0
16.0
20.0
24.0
28.0
<3 >3
HOMA-IR index
Ad
ipon
ecti
n(m
cg/m
l)

12 V. Urbanavičius, A. Abraitienė, D. Vitkus, R. Borovkienė, Z. A. Kučinskienė
Relationship of adiponectin levels with metabolic and obesity parameters
Among all study subjects, adiponectin showed strong-
est inverse correlations with waist circumference, W/H, and HOMA-IR, whereas more modest, but statistically signiicant negative correlations were observed between adiponectin and BMI, hip circumference, body fat mass, fasting glucose and insulin (Table 4.).
Correlation analysis in study groups (Table 4.) showed that adiponectin did not signiicantly correlate with indices of overall obesity (BMI and body fat mass or percentage body fat), but negative associations with indices of visceral obesity (waist circumference and W/H) were rather strong in all study groups. Adiponectin signiicantly correlated with W/H (r = -.487, p < 0.0001) in IGT group and with waist circumference (r = -.508, p = 0.004) in DM subjects. Inverse correlation was ob-
served between adiponectin and HOMA-IR in all sub-
jects combined, although individual variations probably had some inluence on inal data in different study groups (Figure 4). In Obese-C group adiponectin showed the in-
verse correlations with HOMA-IR, insulin and W/H. In Non-obese-C subjects adiponectin signiicantly inversely correlated with waist (r = -.649, p < 0.0001) and W/H (r = -.642, p < 0.0001).
Discussion
In this study we demonstrated that adiponectin level was similar in IGT and type 2 diabetes groups and in both these groups it was signiicantly lower when compared with obese control group. On the other hand, adiponectin
was not statistically signiicantly different in obese con-
trol when compared with non-obese control subjects.Previous studies have found that plasma adiponectin
levels in IGT were both lower [18] and similar [19] when compared with type 2 diabetes subjects. Osei K. et al. [18] studied irst degree relatives of African-American patients and showed that adiponectin levels were signii-
cantly lower in the type 2 diabetes group, whereas in IGT and normal glucose tolerance subjects adiponectin levels were signiicantly higher. Although it was not the prima-
ry endpoint of the study, Bluher M et al. [19] reported similar levels of total plasma adiponectin in IGT and type 2 diabetes Caucasian subjects, and in both groups adi-ponectin levels were lower than in subjects with normal glucose tolerance. Possibly due to the same racial group studied and similar study groups characteristics the re-
sults of our study conirmed the indings of Bluher et al. [19]. The results of our study suggest that adiponectin secretion is already altered in pre-diabetic conditions, and as the majority of subjects with IGT eventually will develop type 2 diabetes, based on the results of our study we speculate that transition from pre-diabetes to type 2 diabetes is not associated with further alterations in adi-ponectin metabolism. Our data also suggest that meta-
bolic alterations seen in IGT state are strong enough to further lead to diabetes development.
Adiponectin level was found to be decreased in obese subjects in several previous studies [4, 22]. In our inves-
tigation obese subjects with normal glucose tolerance had lower adiponectin levels than non-obese ones, but the difference did not reach statistical signiicance, prob-
ably due to rather small number of non-obese control subjects studied.
The results of our study conirm that adiponectin lev-
els are strongly associated with visceral obesity and in-
sulin resistance [5, 13, 22]. Indeed, we demonstrated that adiponectin signiicantly inversely correlated with waist circumference and waist-to-hip ratio, but not with indices of overall obesity: BMI and body fat mass.
We also found that insulin-resistant glucose tolerant subjects had signiicantly lower adiponectin level than insulin-sensitive ones, but statistically signiicantly high-
er than in IGT and DM subjects. In summary, our study demonstrated that adiponectin
levels are reduced in pre-diabetic conditions to the same extend as in early type 2 diabetes, therefore we suggest that adiponectin secretion is more closely related to insu-
lin resistance than to simply transition from pre-diabetes
-2 0 2 4 6 8 10 12 14 16
HOMA -IR
-10000
0
10000
20000
30000
40000
50000
60000
Ad
ip
on
ectin
(m
cg/m
l)
Fig. 4. Correlation of adiponectin with HOMA-IR in all subjects combi-ned.

13Adiponectin and insulin resistance in pre-diabetes and early type 2 diabetes mellitus
to diabetes which was not associated with further altera-
tion in adiponectin secretion. We conclude that insulin sensitivity and visceral obesity rather than obesity per se appears to be the major determinants of serum adiponec-
tin levels.
References
1. Ardern CI, Janssen I, Ross R, Katzmarzyk PT. Deve-
lopment of health-related waist circumference thresholds within BMI categories. Obes Res. 2004; 12: 1094–103.2. Jazet IM, Pijl H, Meinders AE. Adipose tissue as an endocrine organ: impact on insulin resistance. Neth J Med. 2003; 61: 194–212.3. Trujillo ME, Scherer PE. Adiponectin: journey from an adipocyte secretory protein to biomarker of the meta-
bolic syndrome. J Intern Med. 2005; 257: 167–75.4. Arita Y, Kihara S, Ouchi N et al. Paradoxical decrea-
se of an adipose-speciic protein, adiponectin, in obesity. Biochem Biophys Res Commun. 1999; 257: 79–83.5. Weyer C, Funahashi T, Tanaka S, et al. Hypoadiponec-
tinemia in obesity and type 2 diabetes: close association with insulin resistance and hyperinsulinemia. J Clin En-
docrinol Metab. 2001; 86: 1930–5.6. Hotta K, Funahashi T, Arita Y et al. Plasma concentra-
tions of a novel, adipose-speciic protein, adiponectin, in type 2 diabetic patients. Arterioscler Thromb Vasc Biol. 2000; 20: 1595–9.7. Cnop M, Havel PJ, Utzschneider KM et al. Relations-
hip of adiponectin to body fat distribution, insulin sensi-tivity and plasma lipoproteins: evidence for independent roles of age and sex. Diabetologia. 2003; 46: 459–69.8. Berg AH, Combs TP, Du X, Brownlee M, Scherer PE. The adipocyte-secreted protein Acrp30 enhances hepatic insulin action. Nat Med. 2001; 7: 947–53.9. Yamauchi, T, Kamon, J, Waki, H, et al. The fat-derived hormone adiponectin reverses insulin resistance associ-ated with both lipoatrophy and obesity. Nat Med. 2001; 7: 941–6.10. Fruebis, J, Tsao, TS, Javorschi, S et al. Proteolytic cleavage product of 30-kDa adipocyte complement-re-
lated protein increases fatty acid oxidation in muscle and causes weight loss in mice Proc Natl Acad Sci USA. 2001; 98: 2005–10.11. Combs TP, Berg AH, Obici S, Scherer PE, Rossetti L. Endogenous glucose production is inhibited by the adi-pose-derived protein Acrp30. J Clin Invest. 2001; 108: 1875–81.12. Yamauchi T, Kamon J, Minokoshi Y at al. Adiponec-
tin stimulates glucose utilization and fatty-acid oxidation by activating AMP-activated protein kinase. Nat Med. 2002; 8: 1288–95.13. Yamamoto Y, Hirose H, Saito I et al. Correlation of the adipocyte-derived protein adiponectin with insulin resistance index and serum high-density lipoprotein-cho-
lesterol, independent of body mass index, in the Japanese population. Clin Sci. 2002; 103: 137–42.14. Lindsay RS, Funahashi T, Hanson RL et al. Adipo-
nectin and development of type 2 diabetes in the Pima Indian population. Lancet. 2002; 360: 57–8.15. Snehalatha C, Mukesh B, Simon M, Viswanathan V, Haffner SM, Ramachandran A. Plasma adiponectin is an independent predictor of type 2 diabetes in Asian Indians. Diabetes Care. 2003; 26: 3226–9.16. Daimon M, Oizumi T, Saitoh T et al. Decreased se-
rum levels of adiponectin are a risk factor for the pro-
gression to type 2 diabetes in the Japanese population: the Funagata Study. Diabetes Care. 2003; 26: 2015–20.17. Snijder MB, Heine RJ, Seidell JC et al. Associations of adiponectin levels with incident impaired glucose me-
tabolism and type 2 diabetes in older men and women: the Hoorn Study. Diabetes Care. 2006; 29: 2498–503.18. Osei K, Gaillard T, Schuster D. Plasma adiponectin levels in high risk African-Americans with normal glu-
cose tolerance, impaired glucose tolerance, and type 2 diabetes. Obesity Research. 2005; 13: 179–85.19. Bluher M, Brennan AM, Kelesidis T et al. Total and high-molecular weight adiponectin in relation to meta-
bolic variables at baseline and in response to an exercise treatment programm. Diabetes Care. 2007; 30: 280–5.20. Alberti KG, Zimmet PZ. Deinition, diagnosis and classiication of diabetes mellitus and its complications. Part 1: diagnosis and classiication of diabetes mellitus provisional report of a WHO consultation. Diabet Med. 1998; 15(7): 539–53.21. Matthews DR, Hosker JP, Rudenski AS, Naylor BA, Treacher DF, Turner RC. Homeostasis model asses-
sment: insulin resistance and beta-cell function from fas-
ting plasma glucose and insulin concentrations in man. Diabetologia. 1985; 28: 412–9.22. Wei-Siung Y, Wei-Jei L, Funahashi T et al. Plasma adiponectin levels in overweight and obese Asians. Obes Res. 2002; 10: 1104–10.
Received 3 October, 2007,Accepted 18 December, 2007

14 V. Urbanavičius, A. Abraitienė, D. Vitkus, R. Borovkienė, Z. A. Kučinskienė
ADIPONEKTINAS IR REZISTENTIŠKUMAS INSULINUI
PREDIABETO IR ANKSTYVAIS 2 TIPO CUKRINIO
DIABETO FORMŲ ATVEjAIS
V. Urbanavičius1,2, A. Abraitienė1,2, D. Vitkus1,3, R. Borovkienė3,
Z. A. Kučinskienė1,3
1Vilniaus universiteto Medicinos fakultetas2Vilniaus universiteto ligoninės Santariškių klinikos Endokrinologijos
centras3Vilniaus universiteto ligoninės Santariškių klinikos Laboratorinės
diagnostikos centras
SantraukaĮvadas. Buvo tiriama adiponektino koncentracija ir adipo-
nektino ryšys su gliukozės apykaita ir rezistentiškumu insuli-nui asmenims esant prediabetui bei pradinėms 2 tipo cukrinio diabeto stadijoms.
Tiriamieji asmenys ir metodai. Buvo ištirti 48 asmenys, kuriems buvo diagnozuotas prediabetas (gliukozės tolerancijos sutrikimas), 33 asmenys, kuriems buvo naujai diagnozuotas 2 tipo cukrinis diabetas ir 68 sveiki asmenys. Priklausomai nuo kūno masės indekso (KMI) sveikų asmenų grupė buvo padalinta į nutukusių (KMI ≥ 27) ir nenutukusių (KMI < 27) bei priklausomai nuo insulino rezistentiškumo indekso į
jautrių insulinui (HOMA-IR < 3) ir rezistentiškų insulinui (HOMA-IR > 3) grupes.
Rezultatai. Adiponektino koncentracijos prediabeto ir dia-
beto grupėse statistiškai nesiskyrė (7,56 (4,18; 13,57) ir 7,63 (5,04; 11,73) µg/ml, p = 0,858). Serumo adiponektino koncen-
tracija, nežiūrint antropometrinių ir kitų klinikinių panašumų, buvo statistiškai patikimai mažesnė asmenims su gliukozės tolerancijos sutrikimu, palyginus su sveikų nutukusių asmenų grupe (7,56 (4,18; 13,57) ir 14,37 (7,68; 19,24), p = 0,004). Nutukusių sveikų asmenų adiponektino koncentracija buvo mažesnė palyginus nenutukusių sveikų asmenų grupe, tačiau šis skirtumas nebuvo statistiškai patikimas (14,37 (7,68; 19,24) ir 17,41 (9,95; 24,57) µg/ml p = 0,181), kai tuo tarpu insulinui rezistentiški sveiki asmenys turėjo statistiškai patiki-mai mažesnę adiponektino koncentraciją palyginus su jautrių insulinui asmenų grupe (11,85 (8,31; 16,72) ir 18,69 (10,72; 28,32) µg/ml p = 0,04). Adiponektino koncentracija koreliavo neigiamai su rezistentiškumo insulinui HOMA-IR indeksu.
Išvados. Adiponektino koncentracijos buvo panašios GTS ir 2 tipo cukrinio diabeto grupėse, tačiau buvo statistiš-
kai patikimai mažesnės palyginus su sveikų asmenų grupe.Raktažodžiai:
adiponektinas, rezistentiškumas insulinui, prediabetas, 2 tipo cukrinis diabetas


