Embed Size (px)
Citation preview

Journal of Colloid and Interface Science 425 (2014) 159–167
Contents lists available at ScienceDirect
Journal of Colloid and Interface Science
www.elsevier .com/locate / jc is
Adsorption of b-amyloid oligomers on octadecanethiol monolayers
http://dx.doi.org/10.1016/j.jcis.2014.03.0420021-9797/� 2014 Elsevier Inc. All rights reserved.
⇑ Corresponding author. Fax: +370 527 29196.E-mail addresses: [email protected] (T. Ragaliauskas),
[email protected] (M. Mickevicius), [email protected](R. Budvytyte), [email protected] (G. Niaura), [email protected](B. Carbonnier), [email protected] (G. Valincius).
1 Present address: Niels Bohr Institute, Copenhagen University, Blegdamsvej 17,Copenhagen DK 2100, Denmark.
Tadas Ragaliauskas a, Mindaugas Mickevicius a, Rima Budvytyte a,1, Gediminas Niaura a,Benjamin Carbonnier b, Gintaras Valincius a,⇑a Institute of Biochemistry, Vilnius University, Mokslininku 12, LT-08662 Vilnius, Lithuaniab Institut de Chimie et des Matériaux Paris-Est, Université Paris-Est, 2 rue Henri Dunant, 94320 Thiais, France
a r t i c l e i n f o
Article history:Received 27 December 2013Accepted 15 March 2014Available online 25 March 2014
Keywords:AmyloidOligomersAlzheimer’sAdsorptionHydrophobic surfacesSelf-assembledRAIRSAtomic force microscopySurface plasmon resonance spectroscopyQuartz microbalance
a b s t r a c t
Hypothesis: b-Amyloid oligomers of different aggregation and physiological functions exhibit distinctadsorption behavior allowing them to be discriminated in preparations.Experiments: Two forms of amyloid oligomers, small 1–4 nm and large 5–10 nm were formulated usingsynthetic 42 amino acids b-amyloid peptide. Forms differ in their size and physiological function. A sys-tematic study of adsorption of these amyloid species on self-assembled monolayers of octadecanethiol ongold was performed. Structural changes upon adsorption of oligomers were interrogated by the reflectionabsorption infrared spectroscopy.Findings: The amount of adsorbed peptide material, as detected by surface plasmon resonance spectros-copy, is similar in case of both small and large oligomers. However, adsorption of small oligomers leads toa transformation from beta sheet rich to beta sheet depleted secondary structure. These changes wereaccompanied by the unique morphology patterns detectable by atomic force microscopy (AFM), whilethe quartz microbalance with dissipation indicated a formation of a compact adsorbate layer in case ofsmall oligomers. These effects may be integrated and utilized in bioanalytical systems for sensing anddetection of Alzheimer’s disease related peptide forms in artificial, and possibly, real preparations.
� 2014 Elsevier Inc. All rights reserved.
1. Introduction
Interaction of amyloid-b (Ab) peptides and their oligomer formswith surfaces of various hydrophobicity/hydrophylicity attractedconsiderable attention of different research groups. Interest inadsorption properties of amyloidogenic proteins stems from thepresumed role of interfaces in the formation of various Ab speciesimplicated in Alzheimer’s pathogenesis. Some of those species mayexert adverse physiological effects both in cell cultures and tissues,and, consequently, trigger pathological changes. Interfaces may al-ter oligomerization pathways both in vivo and in vitro conditions.In case of interaction of artificial biocompatible materials withplasma and/or cerebral spinal fluid containing amyloidogenic pro-teins may affect oligomerization and result in unwanted long termeffects in organisms [1]. On the other hand, as recently reported
[2], the affinity of amyloid species towards the hydrophobicsurfaces may provide a therapeutic platform for the removal oftoxic amyloid species from blood.
According to various research groups, surface-induced nucle-ation and oligomerization, though being different at the molecularlevel, seems to be a general property of proteins and peptidesprone to forming supramolecular species associated with variousphysiological processes and pathologies in organisms [1,3–7].Amyloid peptides and, in particular, its fragment Ab(10–35) wasshown to adsorb and oligomerize upon contact with surfaces ofthe self-assembled monolayers (SAMs) [8]. Adsorption of amyloidspecies were observed for both hydroxyl- and methyl-terminatedas well as charged SAMs [9,10]. Ab(1–42) peptide was found toform spherical amorphous clusters on hydrophobic SAMs, whilecharged surfaces promoted the formation of protofibril entities[9]. It was pointed out that most of the surfaces exhibit accelerat-ing effect on b-sheet rich structure and amyloid fibril formation[10].
Adsorption and interaction of Ab(1–42) with surfaces werestudied using methods of molecular dynamic (MD) simulations[11–13]. Theoretical analysis of the energy of interaction of lowmolecular weight oligomers (dimers through hexamers) withmethyl-terminated self-assembled monolayers revealed domi-

160 T. Ragaliauskas et al. / Journal of Colloid and Interface Science 425 (2014) 159–167
nance of hydrophobic interaction as a driving force of adsorption[13]. Interestingly, MD simulations indicate extensive secondarystructure changes when dimers of a fragment Ab(17–42) adsorbson methyl-terminated SAMs, while the higher oligomerization de-gree species retained their predominantly b-strand-loop-b-strandstructural motif [13].
So far, in most Ab(1–42) adsorption studies, a comparison ofadsorption properties on different surfaces (hydrophilic/hydropho-bic, charges/uncharged) were carried out [8,9,14]. In this work, welook at the Ab(1–42) adsorption phenomenon from the differentperspective. Our objective was to compare the adsorption behaviorof different size and morphology Ab(1–42) oligomers, which, assome of our group demonstrated earlier [15], exhibit quite differ-ent physiological activities. Small, 1–4 nm z-height (as measuredby an AFM) spherical oligomers trigger necrosis in cell cultures,while larger 5–10 nm Ab(1–42) species does not exhibit cytotoxiceffect [15]. In this study, we investigated an interaction of thosetwo different biological activity Ab(1–42) oligomer forms withthe hydrophobic octadecanethiol SAMs on gold. Different physicalsignatures of interaction of Ab(1–42) oligomers with the hydro-phobic surfaces may be utilized in the bioanalytical detectionand separation systems that utilize the adsorption phenomenon.The detailed mechanism of the adsorption of these species alsomay contribute to understanding of complex mechanisms of olig-omerization, which is believed being involved in the Alzheimer’spathogenesis.
2. Experimental
2.1. Atomic force microscopy
The morphology of Ab(1–42) oligomer preparations were char-acterized using the atomic force microscope (AFM) Dimension Icon(Bruker, Germany) scanning probe work station, operating in thetapping mode. Model FESP (Veeco, Plainview, NY) (f = 75–100 kHz,k = 2.8–5 N/m) micro cantilevers were used in this work. 20 lL of1 lM Ab(1–42) sample solution was spotted on octadecanethiol(ODT) – modified gold surface incubated at room temperature for10 min, rinsed with deionized water, Milli-Q system (EMD Millipore,USA) and blown dry with filtered (<0.2 lm) nitrogen stream. Imagesdata were acquired at scan rates between 0.5 and 1 Hz at 512 � 512pixel resolution. The morphology of the surfaces was estimated bymeasuring the profile of the sample along the x–y plane of the AFMimages. The mean z-height was estimated by using the planecorrection module of the Gwyddion software and determining bythe step-height graphs.
2.2. Reflection absorption IR spectroscopy (RAIRS) measurements
RAIRS spectra were recorded on FTIR spectrometer Vertex 80v(Bruker, Germany) equipped with the liquid nitrogen cooled MCTnarrow band detector and the horizontal reflection accessory.The spectral resolution was set at 2 cm�1. Spectra were acquiredby 400 scans at a grazing angle of 80� by using p-polarized light.The sample chamber and the spectrometer were evacuated duringthe measurements. The spectrum of ODT SAM on Au was used as areference. Parameters of the bands were determined by fitting theexperimental contour to Gaussian–Lorentzian form componentsusing the GRAMS/AI 8.0 (Thermo Scientific, USA) software.
2.3. Preparation of Ab(1–42) oligomers
Preparation of oligomers was carried out according to protocolsdescribed in detail earlier [15]. Briefly, according to protocol I, sol-uble oligomers were prepared by dissolving 1 mg of peptide
(American Peptide, Inc., USA) in 400 lL of hexafluoroisopropanol(HFIP) (Sigma–Aldrich, Germany) for 30–60 min at room tempera-ture under sonication. About 100 lL of the resulting solution wasadded to 900 lL of H2O in a siliconized Eppendorf tube. After10–20 min incubation at room temperature, the samples were cen-trifuged for 15 min at 12,000 rpm, the supernatant was transferredto a new siliconized tube and HFIP was evaporated on the 25 �Cwater bath until no FTIR spectra line at 1192 cm�1 of the asymmet-ric CF3 stretching vibration was visible. Then, sample was incu-bated in closed vial for 24 h at 20 �C. Protocol I yields particleswith predominantly 1–2 nm z-height as measured by the AFM.Occasionally this preparation contained some (typically below20%) fraction of oligomer particles up to 4 nm. Hereinafter, suchpreparation (1–4 nm) is referred to as ‘‘small oligomers’’. Thesepreparations exhibited strong cytotoxic effect [15]. Large oligo-mers with the 5–10 nm z-height were obtained by transferringthe supernatant after the centrifugation to a non-siliconizedEppendorf tube and then, gently purging the solution with nitro-gen for 7 min. The solution was then stirred in the same vial at�500 rpm for 24 h using a magnetic Teflon-coated stirring bar.Such a protocol will be further referred to as protocol II. Theseoligomers are further referred to as ‘‘large oligomers’’. Morphologyof oligomers prepared according to described protocols can befound in Ref. [15]. Concentration of Ab(1–42) material is presentedas peptide monomer concentration.
2.4. Gold substrates and formation of self-assembled monolayers
Gold substrates for AFM were prepared on V-4 quality mica (SPISupplies, USA). For RAIRS, as well as for an electrochemical imped-ance spectroscopy (EIS) 25 by 75 mm glass slides from ThermoFi-scher Scientific (UK) were used. For quartz crystal microbalancewith dissipation (QCM-D) 14 mm diameter quartz plates with5 MHz fundamental resonance frequency were used. BK7 glassslides for SPR (25 mm diameter, 1 mm thickness) were from Auto-lab (Methorm, The Netherlands). Gold layers were deposited by themagnetron sputtering using PVD75 (Kurt J. Lesker Company, USA)vacuum deposition system. Cr adhesion and gold film layers were2 ± 0.5 nm and 50 ± 2 nm respectively. For RAIRS and QCM mea-surements gold thickness was 100 ± 10 nm. Sputtering parametersfor 2 in. diameter metal targets were the flowing: Cr – power200 W, sputtering current 0.50 A at 4.5 mTorr argon pressure; Au– power 120 W, sputtering current 0.26 A at 4.2 mTorr argon pres-sure. Prior to coating the deposition chamber was evacuated to<10�7 mbar the residual pressure. Ultrahigh purity, scientific gradeargon (AGA, Sweden) was used for sputtering. Self-assembledmonolayer were formed by incubation of freshly coated gold filmsin an ethanolic 0.2 mM solution of ODT. Incubations was carriedout for 12–18 h with a subsequent hand-washing in pure ethanolfollowed by a brief 8–12 sonication in ethanol.
2.5. Electrochemical impedance spectroscopy
Electrochemical impedance (EI) spectroscopy measurementswere carried out using Zennium electrochemical workstation(Zahner GmbH, Germany). The EI spectra were recorded in apotentiostatic mode with an 10 mV ac perturbation voltage at0 V vs. Ag|AgCl|NaCl(sat), with the potential +197 mV respectiveto the standard hydrogen electrode. Measurements were carriedout in a 6-vial measurement block-cell described earlier (for detailssee Supporting information section of Ref. [16]). Each cell had32 mm2 working electrode surface at the bottom exposed to asolution. All measurements were carried out in the frequencyrange from 0.1 to 50,000 Hz.

Fig. 1. Surface plasmon resonance traces of an adsorption of Ab(1–42) oligomers onODT surface. Ab(1–42) concentration is 1 lM. Black curve – large oligomers, redcurve – small oligomers. Horizontal arrow indicates point at which adsorbatesolutions was reinjected into the cell. Vertical arrow indicates the moment, atwhich an amyloid containing solution was replaced with the amyloid-free buffer.(For interpretation of the references to colour in this figure legend, the reader isreferred to the web version of this article.)
T. Ragaliauskas et al. / Journal of Colloid and Interface Science 425 (2014) 159–167 161
2.6. Quartz crystal microbalance
QCM-D measurements were carried out on a Q-Sense E1 systemequipped with a flow chamber (BiolinScientific/Q-Sense, Sweden).The variations of the resonance frequency (Df) and energy dissipa-tion factor (DD) were monitored simultaneously. The excitationand measurements were done on the fundamental resonance fre-quency of the quartz plate and its odd overtones (n = 3, 5, 7, 9).Measurements were performed under a computer control periodi-cally disconnecting the oscillating crystal from the circuit. The de-cay time (s0) of the exponentially decaying oscillations of thequartz sensor was measured. The Q-Sense software was used tocalculate the dissipation factor (Dn) using the relation:
Dn ¼ 1=pfns0 ¼ 2=xns0 ð1Þ
where fn is the resonance frequency at the fundamental (n = 1) andhigher overtones, and s0 is the relaxation time constant. Theseparameters provide information on the adsorption process as wellas on viscoelastic properties of the adsorbed film. In the case ofhomogeneous quasi-rigid films, the frequency shift is proportionalto the mass uptake per unit area (Dm), which can be deduced fromthe Sauerbrey relationship [17]:
Dm ¼ CDfn=n ð2Þ
where the mass sensitivity coefficient C equals �17.7 ng cm�2 Hz �1
at f1 = 5 MHz. However, for non-rigid films, which can be modeledas homogeneous and isotropic viscoelastic layers, the mass uptakeis calculated by the analysis of the experimental Dfn and Dn values,as described in Ref. [18].
QCM sensor (fundamental frequency 4.95 ± 0.05 MHz) was con-nected to the flow cell system equipped with a peristaltic pump.After the stabilization of the frequency and dissipation readingsin pure buffer solution, it was exchanged with the 1 lM Ab(1–42)oligomer solution dissolved in the same buffer. Throughout theexperiment the peristaltic pump was continuously pumpingAb(1–42) solution (total volume �18 mL) at 200 lL/min rate.Working volume of the QCM–D cell was 140 lL, and it was keptconstant at 20 ± 0.02 �C temperature.
2.7. Surface plasmon resonance (SPR)
The SPR measurements were conducted on Autolab Twinglesystem (Eco Chemie B.V., The Netherlands) equipped with a dual-channel flow-through cell. Model F34 refrigerating/heating circula-tor (Julabo, Germany) was used to stabilize temperature at20 ± 0.5 �C. The in-house prepared ODT SAM-coated gold(50 ± 2 nm thick) on BK-7 glass (1 mm thick) chip was used forthe measurements. A 0.5 mL sample containing Ab(1–42) oligo-mers was injected into one channel, while another channel (refer-ence) was filled with the blank solution prepared in a same way asa working solution but without Ab(1–42) added. Both measure-ment cells were filled up or flushed with solutions at a flow rateof 50 lL/s. Measurements were carried out at stopped-flow condi-tions. Protein adsorption was quantified by measuring SPR curveminimum shift between both channels. According to manufac-turer’s manual minimum shift by 122 millidegrees (m�) corre-sponds to a surface coverage of 100 ng/cm2 of an adsorbedprotein. So, in this work, we used the relation 1.22 m� = 1 ng/cm2
to recalculate the amount of adsorbed protein per surface areafrom the SPR data.
3. Results
Fig. 1 displays representative SPR traces obtained on ODT SAMexposed to the solutions of small (red curve) and large (black
curve) Ab(1–42) oligomers. Surface densities close to 150 ng/cm2
are reached within 1 h of exposure. At lower peptide concentration(50 nM), the amount of adsorbed material is about 15–20 timessmaller (data not shown), which indicates the concentrationdependent fashion of adsorption. Typical time pattern in Fig. 1 isconsistent with the non-steady state diffusion conditions, i.e., theSPR shift follows the square root time dependence law. The de-crease of the material accumulation rate with time is clearly visiblein Fig. 1, however, the remixing of the solution (horizontal arrow inFig. 1) restores the accumulation profile. In addition, flushing of themeasurement cell with a pure buffer does not trigger desorption(vertical arrow). SPR shows that in both cases the amount of pro-tein material adsorbed onto the surface of the ODT SAM is approx-imately the same.
Quartz microbalance, a technique sensitive to the amount andviscoelastic properties of adlayers, displays slightly differentAb(1–42) adsorption-related patterns. As seen in Fig. 2, QCM sen-sor frequency shift displays downward trend, which is consistent,according to Eq. (2), with the accumulation of material on the sur-face. Frequency decrease in case of small oligomers is significantlyless than that of large oligomers. However, in both cases a signifi-cant increase in dissipation was observed. Noteworthy the dissipa-tion change was 3–4 times larger for large oligomers. Flushing thesystem with amyloid-free buffer (at time = 5000 s) resulted in rel-atively small changes in parameters.
The adsorption of Ab(1–42) onto ODT SAM changes a contactangle of the initially highly hydrophobic surface. Mean value ofthe contact angle of freshly deposited ODM monolayer was 110�.Incubation in 1 lM solution of Ab(1–42) resulted in a gradual de-crease of the contact angle. Within 60 min, the contact angle incase of large oligomers decreased by 5�, while, small oligomers de-creased it by 15�. The decrease of the contact angle was consis-tently more pronounced in case of small oligomers.
AFM microscopy revealed significant differences upon adsorp-tion of different amyloid species. Fig. 4 displays representativeAFM images of ODT coated gold films before (Fig. 4A) and after(Fig. 4B and C) 60 min incubation in Ab(1–42) oligomer solutions.As seen, small oligomers form network-like structures with elon-gated protofibrilar formations. In the course of adsorption thelength of some of these formations reaches 500–600 nm, whilesmall, up to 10–20 nm, particles are present on the surface as well.

Fig. 2. Quartz crystal microbalance (third harmonics) traces of Ab(1–42) oligomer adsorption on ODT surface. Ab(1–42) concentration is 1 lM. Black curves – large oligomers,red curves– small oligomers. Continuous lines are variations of the resonance frequency; dotted lines indicate variations of the dissipation parameter D. Adsorbate solutionwas replaced with amyloid-free buffer Ab(1–42) at the moment t = 5000 s. (For interpretation of the references to colour in this figure legend, the reader is referred to the webversion of this article.)
Fig. 3. Contact angle variation with ODT SAM exposure time: 1 lM solution ofAb(1–42) oligomers: small (circles) and large (squares). Standard errors from 5independent measurements are approximately the size of the symbols.
162 T. Ragaliauskas et al. / Journal of Colloid and Interface Science 425 (2014) 159–167
The z-height of the structural elements of the adsorbate networkseen in Fig. 4B is on average 2–6 nm while the elements of the sur-face of pristine SAM has z-height below 2 nm (Fig. 4A). Large olig-omers form quite different morphology surface species. They arelarge, round shaped structures relatively sparsely populatingSAM surface (Fig. 4C). On average, the z-height of these structuresis 10–15 nm. In control experiments (data not shown) no changeswere observed.
Electrochemical impedance spectroscopy was used to charac-terize the effects of Ab(1–42) on electrical parameters of the ODTSAM. The effects can be monitored by changes of the interfacialcapacitance, which is sensitive to both thickness and dielectricconstant of the organic layer. Fig. 5 displays the EIS data in theform of a complex capacitance plots (Cole–Cole plots), in whichC0 denotes real and C0 0 – complex component of capacitance. Smalloligomers affect the capacitance spectra in the following manner.Upon injection of the oligomer solution, an instant increase of a
diameter of the semicircular capacitance plot is observed(Fig. 5A, red compared vs. black curves). Then, slow return to aninitial complex capacitance curve is followed. Large oligomers af-fect the capacitance differently. Upon an injection of an aliquotof the Ab(1–42), small capacitance dip is observed, which tend todisappear within �60 min on observation.
Infrared spectroscopy provides possibility to identify the ad-sorbed biomolecules and characterize the secondary structure ofpeptides and proteins by analysis of the amide group vibrations[19,20]. RAIRS is particularly useful for sensing of biomoleculesat the metal surfaces [8]. In addition, analysis of characteristic pep-tide and SAM bands enable to evaluate the adsorption induced per-turbations of the structure of both peptide and monolayer [8,21].
Fig. 6 compares RAIRS spectra of Au electrode modifiedwith fully deuterated ODT (Au/ODT-d37) before and after adsorp-tion of small Ab(1–42) oligomers in extended spectral region(900–3600 cm�1). ODT-d37 was chosen to form the hydrophobicself-assembled monolayer because the C–D vibrations of hydrocar-bon chains fall into the spectra region (2050–2200 cm�1) free fromthe peptide modes enabling analysis of subtle perturbations in-duced by the adsorbed peptides on the structure of the monolayer.Negative peaks corresponding to vibrations of ODT monolayer ongold substrate used as a reference spectrum. To obtain spectrumof adsorbed peptides, difference spectrum was constructed(Fig. 6). Adsorption of peptides after incubation of Au/ODT-d37
monolayer for the 1 h in solution containing small Ab(1–42) oligo-mers is clearly evidenced by the appearance of intense Amide-I(1634 cm�1), Amide-II (1541 cm�1), and Amide-A (3286 cm�1)vibrational bands in the difference spectrum [22]. The lowerintensity Amide-III and CAH stretching modes are visible at1228–1395 cm�1, and 2875–2966 cm�1, respectively [22].
Fig. 7 shows the effects different size Ab(1–42) oligomers on theRAIRS spectra in the wavenumber region from 1200 to 1800 cm�1.Small oligomers give rise to considerably higher intensity RAIRSspectrum; the intensity of Amide-I and Amide-II bands increaseby a factor of 7.0 and 9.2, respectively, compared to largeoligomers. Intensities in RAIRS spectrum depends on the numberof adsorbed molecules and orientation of transition dipole moment

Fig. 4. Representative 2 � 2 lm AFM images of ODT-modified gold surfaces (left) and z-height (right) profiles before (A) and after incubation for 60 min in the solutions of: B– small (1–4 nm z-height) and C – large (5–10 nm z-height) Ab oligomers. Concentration of amyloid in solution was 1 lM (calculated with respect to a monomer) in bothexperiments.
T. Ragaliauskas et al. / Journal of Colloid and Interface Science 425 (2014) 159–167 163
of particular vibrational mode with respect to the surface normal[23]. Only vibrational modes having their transition dipole mo-ments aligned normally to the surface are visible in the spectra.This finding will be discussed in more details in Section 4.
Fig. 8 compares RAIRS spectrum of small Ab(1–42) oligomersadsorbed on Au/ODT-d37 surface and transmission FTIR spectrumof the same morphology peptides deposited on the CaF2 substrate.Experimental spectra were fitted with Gaussian–Lorentzian formcomponents. These components can be assigned to different sec-ondary structure elements of peptides. The Amide-I mode corre-sponds primary to C@O stretching vibration (83%) with some
contribution from out-of-phase CAN stretching, CACAN deforma-tion, and NAH in-plane bending vibrations [24,25]. Frequency ofAmide-I band depends on the strength of hydrogen bonding inter-action involving the amide group and dipole–dipole interaction be-tween the C@O groups. Weakening of hydrogen bondinginteraction of C@O� � �H type results in higher Amide-I frequencies.Table 1 summarizes the assignments of Amide-I components forsmall Ab(1–42) peptides adsorbed at Au/ODT-d37 surface anddeposited at CaF2 substrate. The b-sheet secondary structure ele-ments are recognized by two characteristic bands, intense featurelocated at 1625–1640 cm�1 and less intensity high-frequency band
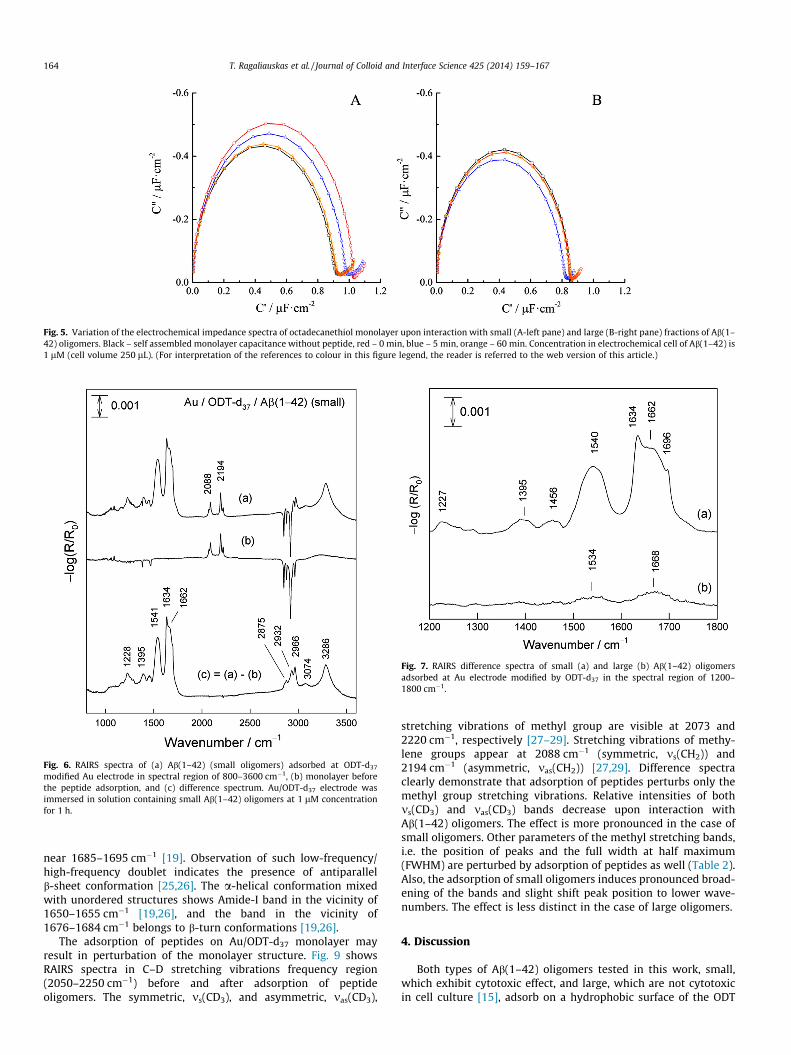
Fig. 5. Variation of the electrochemical impedance spectra of octadecanethiol monolayer upon interaction with small (A-left pane) and large (B-right pane) fractions of Ab(1–42) oligomers. Black – self assembled monolayer capacitance without peptide, red – 0 min, blue – 5 min, orange – 60 min. Concentration in electrochemical cell of Ab(1–42) is1 lM (cell volume 250 lL). (For interpretation of the references to colour in this figure legend, the reader is referred to the web version of this article.)
Fig. 6. RAIRS spectra of (a) Ab(1–42) (small oligomers) adsorbed at ODT-d37
modified Au electrode in spectral region of 800–3600 cm�1, (b) monolayer beforethe peptide adsorption, and (c) difference spectrum. Au/ODT-d37 electrode wasimmersed in solution containing small Ab(1–42) oligomers at 1 lM concentrationfor 1 h.
Fig. 7. RAIRS difference spectra of small (a) and large (b) Ab(1–42) oligomersadsorbed at Au electrode modified by ODT-d37 in the spectral region of 1200–1800 cm�1.
164 T. Ragaliauskas et al. / Journal of Colloid and Interface Science 425 (2014) 159–167
near 1685–1695 cm�1 [19]. Observation of such low-frequency/high-frequency doublet indicates the presence of antiparallelb-sheet conformation [25,26]. The a-helical conformation mixedwith unordered structures shows Amide-I band in the vicinity of1650–1655 cm�1 [19,26], and the band in the vicinity of1676–1684 cm�1 belongs to b-turn conformations [19,26].
The adsorption of peptides on Au/ODT-d37 monolayer mayresult in perturbation of the monolayer structure. Fig. 9 showsRAIRS spectra in C–D stretching vibrations frequency region(2050–2250 cm�1) before and after adsorption of peptideoligomers. The symmetric, ms(CD3), and asymmetric, mas(CD3),
stretching vibrations of methyl group are visible at 2073 and2220 cm�1, respectively [27–29]. Stretching vibrations of methy-lene groups appear at 2088 cm�1 (symmetric, ms(CH2)) and2194 cm�1 (asymmetric, mas(CH2)) [27,29]. Difference spectraclearly demonstrate that adsorption of peptides perturbs only themethyl group stretching vibrations. Relative intensities of bothms(CD3) and mas(CD3) bands decrease upon interaction withAb(1–42) oligomers. The effect is more pronounced in the case ofsmall oligomers. Other parameters of the methyl stretching bands,i.e. the position of peaks and the full width at half maximum(FWHM) are perturbed by adsorption of peptides as well (Table 2).Also, the adsorption of small oligomers induces pronounced broad-ening of the bands and slight shift peak position to lower wave-numbers. The effect is less distinct in the case of large oligomers.
4. Discussion
Both types of Ab(1–42) oligomers tested in this work, small,which exhibit cytotoxic effect, and large, which are not cytotoxicin cell culture [15], adsorb on a hydrophobic surface of the ODT
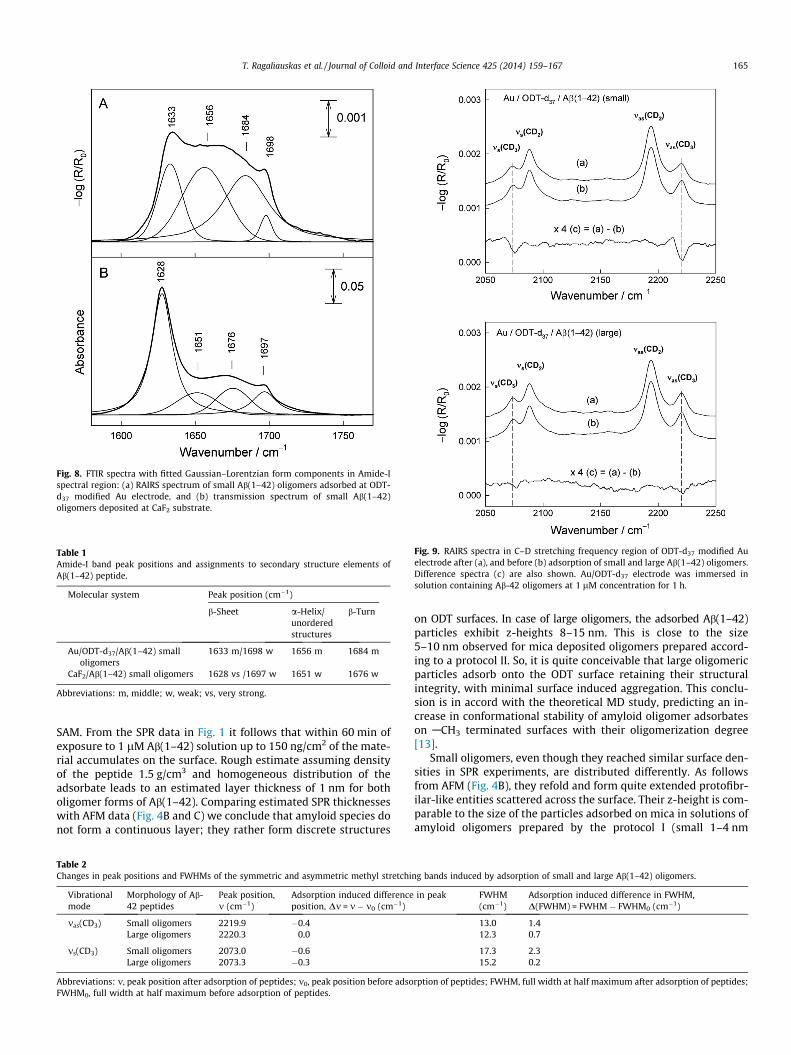
Fig. 8. FTIR spectra with fitted Gaussian–Lorentzian form components in Amide-Ispectral region: (a) RAIRS spectrum of small Ab(1–42) oligomers adsorbed at ODT-d37 modified Au electrode, and (b) transmission spectrum of small Ab(1–42)oligomers deposited at CaF2 substrate.
Table 1Amide-I band peak positions and assignments to secondary structure elements ofAb(1–42) peptide.
Molecular system Peak position (cm�1)
b-Sheet a-Helix/unorderedstructures
b-Turn
Au/ODT-d37/Ab(1–42) smalloligomers
1633 m/1698 w 1656 m 1684 m
CaF2/Ab(1–42) small oligomers 1628 vs /1697 w 1651 w 1676 w
Abbreviations: m, middle; w, weak; vs, very strong.
Fig. 9. RAIRS spectra in C–D stretching frequency region of ODT-d37 modified Auelectrode after (a), and before (b) adsorption of small and large Ab(1–42) oligomers.Difference spectra (c) are also shown. Au/ODT-d37 electrode was immersed insolution containing Ab-42 oligomers at 1 lM concentration for 1 h.
T. Ragaliauskas et al. / Journal of Colloid and Interface Science 425 (2014) 159–167 165
SAM. From the SPR data in Fig. 1 it follows that within 60 min ofexposure to 1 lM Ab(1–42) solution up to 150 ng/cm2 of the mate-rial accumulates on the surface. Rough estimate assuming densityof the peptide 1.5 g/cm3 and homogeneous distribution of theadsorbate leads to an estimated layer thickness of 1 nm for botholigomer forms of Ab(1–42). Comparing estimated SPR thicknesseswith AFM data (Fig. 4B and C) we conclude that amyloid species donot form a continuous layer; they rather form discrete structures
Table 2Changes in peak positions and FWHMs of the symmetric and asymmetric methyl stretchi
Vibrationalmode
Morphology of Ab-42 peptides
Peak position,m (cm�1)
Adsorption induced differenceposition, Dm = m � m0 (cm�1)
mas(CD3) Small oligomers 2219.9 �0.4Large oligomers 2220.3 0.0
ms(CD3) Small oligomers 2073.0 �0.6Large oligomers 2073.3 �0.3
Abbreviations: m, peak position after adsorption of peptides; m0, peak position before adsoFWHM0, full width at half maximum before adsorption of peptides.
on ODT surfaces. In case of large oligomers, the adsorbed Ab(1–42)particles exhibit z-heights 8–15 nm. This is close to the size5–10 nm observed for mica deposited oligomers prepared accord-ing to a protocol II. So, it is quite conceivable that large oligomericparticles adsorb onto the ODT surface retaining their structuralintegrity, with minimal surface induced aggregation. This conclu-sion is in accord with the theoretical MD study, predicting an in-crease in conformational stability of amyloid oligomer adsorbateson ACH3 terminated surfaces with their oligomerization degree[13].
Small oligomers, even though they reached similar surface den-sities in SPR experiments, are distributed differently. As followsfrom AFM (Fig. 4B), they refold and form quite extended protofibr-ilar-like entities scattered across the surface. Their z-height is com-parable to the size of the particles adsorbed on mica in solutions ofamyloid oligomers prepared by the protocol I (small 1–4 nm
ng bands induced by adsorption of small and large Ab(1–42) oligomers.
in peak FWHM(cm�1)
Adsorption induced difference in FWHM,D(FWHM) = FWHM � FWHM0 (cm�1)
13.0 1.412.3 0.7
17.3 2.315.2 0.2
rption of peptides; FWHM, full width at half maximum after adsorption of peptides;

166 T. Ragaliauskas et al. / Journal of Colloid and Interface Science 425 (2014) 159–167
round-shaped particles) [15]. However, while adsorbed on ODTsmall oligomers produce protofibrils with lateral size 200–300 nmsignificantly exceeding their z-height (Fig. 4B). Because the solu-tion of oligomers prepared by the protocol I (small oligomers) doesnot contain fibrilar or protofibrilar species one may conclude thatstructures displayed by AFM (Fig. 4B) were formed on the surfacein the course of interaction between the amyloid preparation andODT SAM.
The QCM data also indicate structural differences in adsorbatesformed by small and large oligomer species. Because SPR datashows accumulation of amyloid material up to 80 ng/cm2 (at1 lM Ab(1–42) in solution) within 2000 s from the injection, onemay expect, according to Eq. (2), QCM resonance frequency (thirdharmonic) decrease by �12.5 Hz. The experiment demonstrates anexpected �12.5 Hz frequency (third harmonic) variation for smalloligomers, however, large oligomers exhibited consistently higherchanges of the frequency reaching �23 Hz. Such large difference inDfn suggests QCM sensor is subject to different viscoelastic proper-ties of an interface in case of adsorption of small and large oligo-mers, which should manifest itself in different dissipationparameters of quartz resonator. In particular, as seen from Fig. 2,the dissipation D was at least by a factor or 2.5 higher in case oflarge oligomers pointing to an increased viscoelastic damping.According to a QCM theory, in liquid media damping occurs whenconsiderable amount of solvent is trapped by an adsorbate [18].This can occur when surface is populated by the pillar-like struc-tures protruding into the solution [30]. According to AFM(Fig. 4C) large oligomer particles exhibit z-heights reaching15 nm, while small oligomers (Fig. 4B) produce entities of4–5 nm z-height. Taking into account that the z-height roughness,in case of pristine ODT SAM comprise 1–2 nm one may concludethat the size of the large amyloid species exceeds the size of smalloligomers by a factor of 4. In other words, small oligomers producemore compact surface bound layer of adsorbate than the largeones.
If this is the case, the surface fractional coverage by small amy-loid oligomers should be higher as well. A contact angle is a prop-erty that is sensitive to the composition of the surface. If relativelymore hydrophilic species like proteins adsorb onto a hydrophobicsubstrate, then the contact angle variation (a decrease) should beproportional to a fraction of the surface covered by a protein. Be-cause small oligomers form denser (AFM, Fig. 4) and more closelyassociated layer (QCM data, Fig. 2) on the ODT surface one wouldexpect more pronounced effect on a contact angle. Such statementis confirmed by the contact angle traces presented in Fig. 3. As seenfrom Fig. 3, both species decrease hydrophobicity of ODT SAM.However, small in contrast to large Ab(1–42) oligomers cause lar-ger decrease of a contact angle. Notably, the difference manifestsitself only if sufficient time (>30 min) of adsorption is allowed,Fig. 3 suggesting the unfolding of small oligomers is time-dependent.
The electrochemical impedance spectroscopy reveals subtle dif-ferences in the electrochemical response of an ODT SAM to theadsorption of the amyloids. Upon injection amyloid preparationsinto the solution, small oligomers instantly trigger the capacitanceincrease (Fig. 5A). Within next 60 min the capacitance restores toapproximately the initial value of the SAM. Because the adsorptionstarts immediately after the injection, rapid increase in capacitancecannot occur due to a thinning of the dielectric sheet formed by themonolayer of ODT. The reason for the observed increase, then,must be an increase of the dielectric constant of an insulating layer.This may happen in the course of a strong hydrophobic interactionbetween the adsorbing peptide and ODT SAM, which is followed bythe distortion of a well-organized structure of an ODT SAM. It iswell-established that a decrease of order is followed by an increaseof a dielectric constant and the capacitance of the alkylthiol SAMs
[31,32]. So, a rapid initial increase attests for the order disruptionin ODT SAM by the small oligomeric particles. On a later stage, asmore of the peptide material accumulates on the surface, theincreasing effective thickness factor takes over, so the capacitancestarts decreasing. Similar factors influence the capacitance of ODTSAM in case of large oligomers, however, there is essentially notinitial capacitance jump observed, which attest for the much weak-er interaction or/and smaller surface fraction subject to an interac-tion with large amyloid particles.
RAIRS data confirms strong interaction of small Ab(1–42) oligo-mers with ODT-d37 monolayer (Table 2). Perturbation in intensity,frequency and FWHM of the methyl stretching bands indicates thatpeptides interact preferentially with the terminal monolayergroup, CD3 (Fig. 9). Changes in intensities of CD3 stretching bandsmight be associated with orientational changes of methyl groups.The increase in bandwidth of methyl stretching bands indicateson increase in dynamics of a contact region between the mono-layer and adsorbed peptide [25]. This may be associated with de-creased interaction strength between neighboring molecules inthe monolayer and increase in torsional motion of methyl groupsbecause of interaction with protein hydrophobic residues. Somecontribution to bandwidth of mas(CD3) mode might take placechanges in relative intensities of in-plane and out-of-plane asym-metric stretching modes. Frequency of in-plane asymmetric CD3
mode is slightly lower than out-of-plane component [29]. In agree-ment with our observation, slight decrease in frequency of CD3
stretching bands was detected for partially deuterated phospholip-ids upon interaction with peripheral protein cytochrome c [28].Thus, the downshift of ms(CD3) frequency is consistent with inter-action of terminal methyl groups with hydrophobic residues ofpeptide side chains.
The fact that upon adsorption on the hydrophobic surface smallAb(1–42) oligomers undergo structural transformations, whilelarge Ab(1–42) oligomers do not, can be explained, as suggestedby the theoretical analysis [13], by the enhanced stabilization ofintermolecular hydrogen bonds between adjacent Ab peptides.The absence of such interactions in small oligomers, such as di-mers, leads to a surface induced refolding of the Ab(1–42) particles.RAIRS data obtained in current work confirms such a scenario.
Both small and large oligomers adopt preferential b-sheet sec-ondary structure in aqueous solution used for adsorption studieson hydrophobic surface in this work [13]. Similar spectrum wasobserved for deposited small Ab(1–42) oligomers on CaF2 substrate(Fig. 8). However, increase in unordered and/or a-helix structuresupon adsorption on Au/ODT-d37 surface was detected in RAIRSspectrum (Fig. 8 and Table 1). Note, that quantitative evaluationof secondary structures based on analysis of Amide-I band is notpossible because of sensitivity of the technique to the orientationof amide groups. The transition dipole moment of intenseAmide-I mode components is oriented along to the C@O bond,i.e. perpendicularly to the peptide chain, while for the low inten-sity component near 1697 cm�1 its orientation is along the peptidechain. Similarly, the transition dipole moment for the Amide-IImode, which is composed predominantly from the CAN stretchingand NAH bending vibrations, is aligned to the peptide chain [26].We have observed slightly different relative intensities of Amide-I and Amide-II modes for adsorbed small and large oligomers(Fig. 7); the intensity ratio I(Amide-I)/I(Amide-II) was found to be1.3 for small and 1.7 for large oligomers, respectively. Thus, pre-sented data indicates that average orientation of amide groups isdifferent for adsorbed small and large oligomers. The lower amidebands intensity in the case of large oligomers (Fig. 7) might be ex-plained due to the preferential near parallel alignment of theamide groups with respect to the surface plane, because onlyvibrational modes having their dipole derivative normal to thesurface are visible in the RAIRS spectra [23]. Such explanation is

T. Ragaliauskas et al. / Journal of Colloid and Interface Science 425 (2014) 159–167 167
in accord with the molecular dynamics data predicting nearparallel with respect to the surface alignment of amide groups inthe case of adsorbed larger Ab(1–42) polypeptides [11], and ourQCM data presented above.
5. Conclusions
Our study demonstrates different adsorption properties of amy-loid oligomers prepared via two protocols that yield, in one case,small (1–4 nm) and, in another case, large (>5 nm) oligomer parti-cles of different cytotoxicity [15]. While the amount of the amyloidmaterial adsorbed onto a hydrophobic ODT surface is similar inboth cases, small oligomers exhibited much stronger associationwith the surface. Interaction with the ODT surface triggers bothstructural and morphological transformations of small oligomerparticles, which to a large extent, loose their original secondarystructure, and surface-oligomerize into a dense network of a proto-fibrilar species. The QCM data indicates that adsorbate, in case ofsmall oligomers, forms a compact layer of a relatively low viscosity,while the RAIRS data attests for the amyloid particles losing theiroriginal b-sheet rich secondary structure upon binding to an ODTlayer. The b-sheet rich secondary structure is a hallmark of the fibr-ilization of Ab(1–42) peptide into oligomeric forms [15], and it isknown that b-sheet structured Ab(1–42) derivatives form sponta-neously in aqueous media [7]. In this work we describe the reverseprocess, in which small toxic amyloid oligomers exhibiting b-sheetrich secondary structure transition into b-sheet depleted formsupon adsorption onto the hydrophobic surface. This finding is inaccord with recent theoretical works predicting the refolding oflow oligomerization degree amyloid particles into unordered stateon CH3 terminated surfaces [11,13]. In contrast, we found thatlarge oligomers retain their b-sheet rich secondary structure uponadsorption, as was observed earlier by others [11]. Importantly, ourfindings demonstrate the necessity of a precise evaluation of theoligomerization degree of peptides when comparing adsorptiondata obtained in different laboratories. In general, size-dependentinteractions of oligomers and hydrophobic surfaces must be takeninto account when studying physiologically important oligomeri-zation processes that take place in organisms in the presence ofother proteins exhibiting hydrophobic cavities and surfaces [33]as well as in the development of the adsorption-based therapeuticprotocols for the removal of toxic amyloid species from blood [2].
Both electrochemical and optical techniques are frequently sug-gested for label free detection of amyloid species in various bioan-alytical applications. In our study, the electrochemical, contactangle and RAIRS methods indicate different levels of perturbationof the surface structure of ODT SAM by the amyloid adsorbents.Electric capacitance and contact angle changes upon adsorptionof large oligomers is significantly smaller than changes inducedby small oligomers. On the other hand, a significant adsorption in-duced dissipation parameter changes distinguish large Ab(1–42)oligomers from the small ones. These effects allowing discrimina-tion between amyloid particles of different size and cytotoxicity
may be integrated into the bioanalytical systems for sensing anddetection of Alzheimer’s related peptides in artificial and possiblyreal media.
Acknowledgment
This work has been supported by the Research Council of Lith-uania (Grant LIG-04/2013 for research project MALPALMA).
References
[1] Y.P. Yu, S. Zhang, Q. Liu, Y.M. Li, C. Wang, F. Besenbacher, M.D. Dong, SoftMatter 8 (2012) 1616.
[2] K. Kawaguchi, M. Takeuchi, H. Yamagawa, K. Murakami, S. Nakai, H. Hori, A.Ohashi, Y. Hiki, N. Suzuki, S. Sugiyama, Y. Yuzawa, N. Kitaguchi, J. Artif. Organs16 (2013) 211.
[3] L. Nault, P. Guo, B. Jain, Y. Brechet, F. Bruckert, M. Weidenhaupt, Acta Biomater.9 (2013) 5070.
[4] M. Rabe, A. Soragni, N.P. Reynolds, D. Verdes, E. Liverani, R. Riek, S. Seeger, ACSChem. Neurosci. 4 (2013) 408.
[5] M. Zhu, P.O. Souillac, C. Ionescu-Zanetti, S.A. Carter, A.L. Fink, J. Biol. Chem. 277(2002) 50914.
[6] D. Pellenc, H. Berry, O. Gallet, J. Colloid Interface Sci. 298 (2006) 132.[7] C. Hilbich, B. Kisterswoike, J. Reed, C.L. Masters, K. Beyreuther, J. Mol. Biol. 218
(1991) 149.[8] M.J. McMasters, R.P. Hammer, R.L. McCarley, Langmuir 21 (2005) 4464.[9] B. Moores, E. Drolle, S.J. Attwood, J. Simons, Z. Leonenko, PLoS One 6 (2011)
e25954.[10] Q.M. Wang, N. Shah, J. Zhao, C.S. Wang, C. Zhao, L.Y. Liu, L.Y. Li, F.M. Zhou, J.
Zheng, Phys. Chem. Chem. Phys. 13 (2011) 15200.[11] X. Yu, Q.M. Wang, Q.F. Pan, F.M. Zhou, J. Zheng, Phys. Chem. Chem. Phys. 15
(2013) 8878.[12] X. Yu, J. Zheng, J. Mol. Biol. 421 (2012) 561.[13] J. Zhao, Q. Wang, G. Liang, J. Zheng, Langmuir 27 (2011) 14876.[14] V. Voiciuk, G. Valincius, R. Budvytyte, A. Matijoska, I. Matulaitiene, G. Niaura,
Spectrochim. Acta Part A-Mol. Biomol. Spectrosc. 95 (2012) 526.[15] P. Cizas, R. Budvytyte, R. Morkuniene, R. Moldovan, M. Broccio, M. Losche, G.
Niaura, G. Valincius, V. Borutaite, Arch. Biochem. Biophys. 496 (2010) 84.[16] R. Budvytyte, M. Mickevicius, D.J. Vanderah, F. Heinrich, G. Valincius, Langmuir
29 (2013) 4320.[17] G. Sauerbrey, Z. Phys. 155 (1959) 206.[18] B.Y. Du, D. Johannsmann, Langmuir 20 (2004) 2809.[19] M. Jackson, H.H. Mantsch, Crit. Rev. Biochem. Mol. Biol. 30 (1995) 95.[20] J.L. Kirsch, J.L. Koenig, Appl. Spectrosc. 43 (1989) 445.[21] C.W. Meuse, G. Niaura, M.L. Lewis, A.L. Plant, Langmuir 14 (1998) 1604.[22] A. Misi�unas, Z. Talaikyte, G. Niaura, V. Razumas, T. Nylander, Biophys. Chem.
134 (2008) 144.[23] M.D. Porter, Anal. Chem. 60 (1988) 1143A.[24] S. Krimm, J. Bandekar, Adv. Protein Chem. 38 (1986) 181.[25] W.K. Surewicz, H.H. Mantsch, D. Chapman, Biochemistry 32 (1993) 389.[26] E. Maltseva, A. Kerth, A. Blume, H. Möhwald, G. Brezesinski, ChemBioChem 6
(2005) 1817.[27] D.C. Lee, A.A. Durrani, D. Chapman, Biochim. Biophys. Acta 769 (1984) 49.[28] J. Castresana, J.M. Valpuesta, J.L.R. Arrondo, F.M. Goni, Biochim. Biophys. Acta
1065 (1991) 29.[29] H.H. Lee, Z. Ruzele, L. Malysheva, A. Onipko, A. Gutes, BjöreforsF, R. Valiokas, B.
Liedberg, Langmuir 25 (2009) 13959.[30] A.A. Feiler, A. Sahlholm, T. Sandberg, K.D. Caldwell, J. Colloid Interface Sci. 315
(2007) 475.[31] D.J. Vanderah, T. Parr, V. Silin, C.W. Meuse, R.S. Gates, H.Y. La, G. Valincius,
Langmuir 20 (2004) 1311.[32] M.D. Porter, T.B. Bright, D.L. Allara, C.E.D. Chidsey, J. Am. Chem. Soc. 109 (1987)
3559.[33] J. Milojevic, V. Esposito, R. Das, G. Melacini, J. Am. Chem. Soc. 129 (2007) 4282.


