Embed Size (px)
Citation preview

Collective cell motion in endothelial monolayers
A. Szabó1, R. Ünnep1, E. Méhes1, W. O. Twal2, S. W. Argraves2, Y. Cao3, and A.Czirók1,4,‡1Department of Biological Physics, Eotvos University, Budapest, Hungary2Department of Cell Biology & Anatomy, Medical Univ. of South Carolina, Charleston, SC, USA3Karolinska Institute, Stockholm, Sweden4Department of Anatomy & Cell Biology, University of Kansas Medical Center, Kansas City, KS,USA
AbstractCollective cell motility is an important aspect of several developmental and pathophysiologicalprocesses. Despite its importance, the mechanisms that allow cells to be both motile and adhere toone another are poorly understood. In this study we establish statistical properties of the randomstreaming behavior of endothelial monolayer cultures. To understand the reported empiricalfindings, we expand the widely used cellular Potts model to include active cell motility. Forspontaneous directed motility we assume a positive feedback between cell displacements and cellpolarity. The resulting model is studied with computer simulations, and is shown to exhibitbehavior compatible with experimental findings. In particular, in monolayer cultures both thespeed and persistence of cell motion decreases, transient cell chains move together as groups, andvelocity correlations extend over several cell diameters. As active cell motility is ubiquitous bothin vitro and in vivo, our model is expected to be a generally applicable representation of cellularbehavior.
Keywordscell motility; cell polarization; Cellular Potts Model
1. IntroductionCell motility is instrumental both in development and certain pathophysiologies [1,2].Collective motility of interacting cells is a poorly understood, but fundamental aspect ofthese phenomena [3]. Such movements are required for important morphogenetic andpathological processes, for example, gastrulation, vasculogenesis, tumor growth, woundhealing and revascularization of damaged tissues.
Arguably, cell sorting is the best studied process involving simultaneous displacement ofclosely packed cells [4,5]. The differential adhesion hypothesis and its computationalrepresentations – based on the Potts model [6] or analogous lattice-free variants [7,8] –successfully explain the outcome as well as the time-course of cell sorting experiments. Thecell types used in sorting experiments move diffusively within bulk uniform environmentsfar from cell type boundaries [4], although some temporal and spatial correlations aredetectable [5].
‡corresponding author [email protected].
NIH Public AccessAuthor ManuscriptPhys Biol. Author manuscript; available in PMC 2011 February 24.
Published in final edited form as:Phys Biol. ; 7(4): 046007. doi:10.1088/1478-3975/7/4/046007.
NIH
-PA Author Manuscript
NIH
-PA Author Manuscript
NIH
-PA Author Manuscript
Less is known how polarized cells, which maintain their migratory direction in time, movein high density cultures. Most studies addressing this problem have investigated theexpansion of epithelial cell sheets or other monolayers into an empty area or `wound'.During the expansion, cells at the monolayer boundary [9] or within a broader layer [10]exert substantial traction forces and are thought to pull the passive bulk of the sheet forward[4,11].
Recent studies on the motion of kidney epithelial (MDCK, [12]) or endothelial (HUVEC,[13]) cells within monolayers, as well as immune cells in explanted lymph nodes [14] haveindicated an intriguing motion pattern. These cells exhibit an apparently undirected, albeitcorrelated, streaming behavior even in the absence of directed expansion of the wholemonolayer. This type of motion is clearly different from both the uncorrelated diffusiveactivity of cell sorting experiments as well as from the external chemotactic gradient-drivenmotility.
In this study we establish statistical properties of the collective streaming motion withinendothelial cell monolayers and introduce a suitable generalization of the widely-appliedPotts model to describe a dense population of actively moving cells.
2. Empirical ResultsTo analyze movement patterns within endothelial cell monolayers, we studied cultures ofthree different kinds of endothelial cells – bovine capillary (BCE), bovine aortic (BAEC)and human umbilical cord vein (HUVEC) – on Matrigel- or fibronectin-coated tissue cultureplastic (see Table I for details). Confluent cultures, under conditions favorable for cellmotility were recorded for 24 hours using an automatized optical microscopy apparatus. Arepresentative set of the resulting image sequences were analyzed by an automatic celltracking procedure. As trajectories in Fig. 1 and supplementary Movie 1 demonstrate,endothelial cells form streams in monolayers: 5–20 cells move together in narrow, chain-likegroups. The monolayers contain vortices, and adjacent streams moving in oppositedirections. The resulting shear lines separate cells with substantial velocity differences.
To better understand this collective cell flow characteristic for endothelial monolayers,below we calculate widely used and new statistical measures of individual and group cellmotion. These measures facilitate the comparison of various experimental systemsexhibiting streaming behavior, and are also needed to test computational models aiming toexplain the phenomenon.
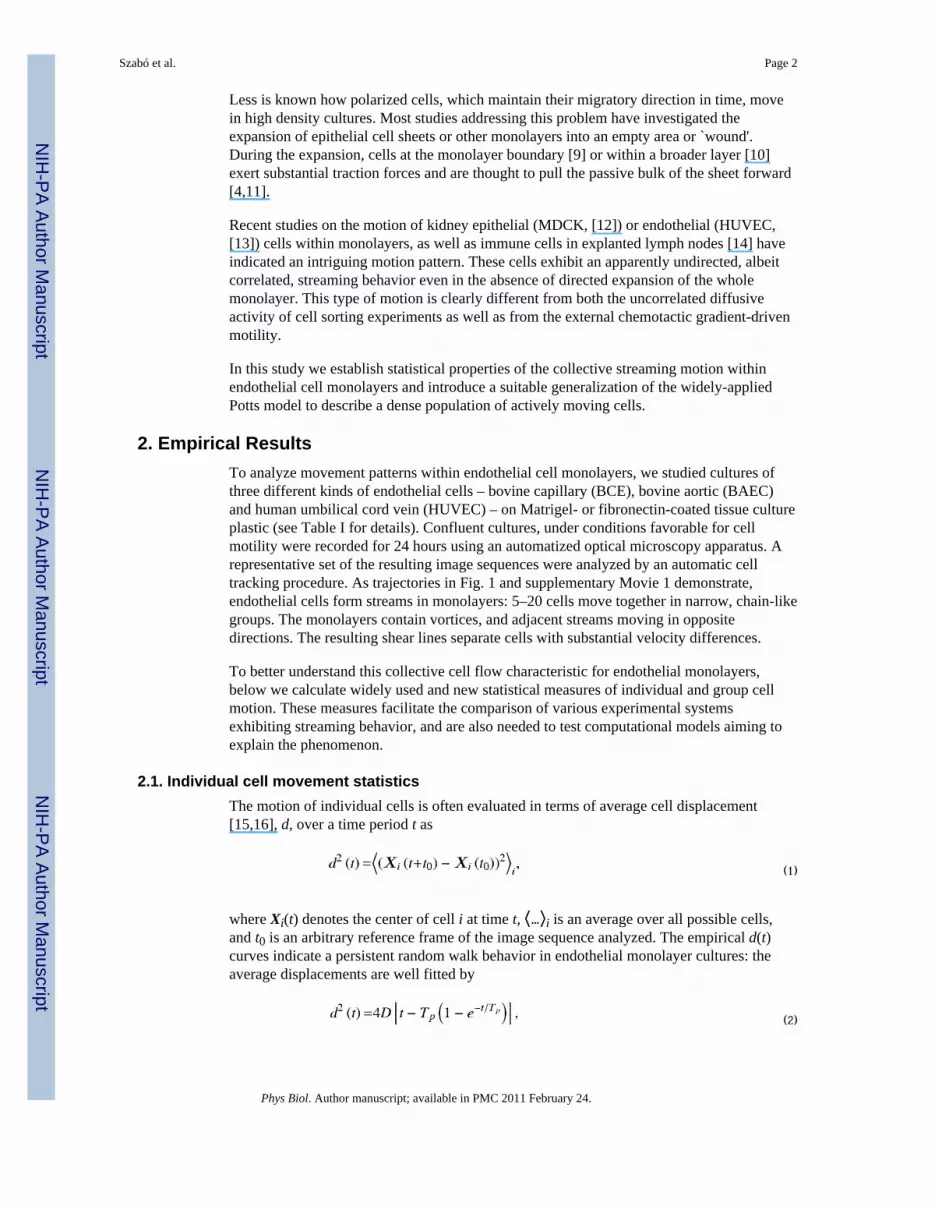
2.1. Individual cell movement statisticsThe motion of individual cells is often evaluated in terms of average cell displacement[15,16], d, over a time period t as
(1)
where Xi(t) denotes the center of cell i at time t, ⟨…⟩i is an average over all possible cells,and t0 is an arbitrary reference frame of the image sequence analyzed. The empirical d(t)curves indicate a persistent random walk behavior in endothelial monolayer cultures: theaverage displacements are well fitted by
(2)
Szabó et al. Page 2
Phys Biol. Author manuscript; available in PMC 2011 February 24.
NIH
-PA Author Manuscript
NIH
-PA Author Manuscript
NIH
-PA Author Manuscript
where Tp is the persistence time and D is the diffusion coefficient of the long-term randombehavior (Table I). Thus, for short time periods cells move at a constant speed, S, as thedistance is proportional with the time elapsed, while the motion is diffusive wheninvestigated over a long time frame:
The fitted parameter values, summarized in Table I, scatter considerably: by a factor of two(S) and five (Tp) depending on the cell line and substrate combination used.
2.2. Average flow fieldsAs cells of a monolayer constrain the possible movements in their vicinity, correlation isexpected in the motion of adjacent cells. In particular, immediately in front of a moving cellmovement in the opposite direction (i.e., towards the cell) is unsustainable and thereforeexpected to be rare. Unfortunately, there are no established statistical descriptions ofstreaming cell motility. The co-moving domains are local and randomly oriented within thewhole cell culture. Therefore, the large-scale rotational symmetry of the system is retainedand spatial autocorrelation functions (see, e.g., Eq. 3 in [12]) depend only on the magnitudeand not on the direction of their argument. Thus, such functions are ill-suited to describe thewitdh and length of streams.
We suggest here V (x), the average flow field around moving cells, as a measure sensitive tothe local cell movement pattern. For a given configuration of cell positions and velocitiesthis procedure assigns reference systems co-aligned with the movement of each cell, andaverages the velocity vectors observed at similar locations x (e.g., immediately in front,behind, left and right). The vectors of V (x) diminish in a hypothetical ensemble ofstatistically independent cells, as they are averages of independent random vectors.
To calculate V (x), for each cell i at time t the whole configuration is rotated around Xi sothat ΔXi, the displacement of cell i, is aligned to a reference direction φ = 0 (Fig. 2). Therotated displacement vectors are then binned according to a two-dimensional lattice B. Theprocedure is repeated for every cell i and multiple time points, and the bins are averagedresulting in a population- and time-averaged displacement field V (x). The procedure isfurther detailed in the Methods section.
The averages were calculated from at least 30 independent data values per grid point, andwe represent the estimated SEM values by a color code. The robustness of this statisticalmeasure is demonstrated by comparing the flow fields of two consecutive time segments ofculture recordings exhibiting similar behavior (Supplementary Fig. 1).
In Fig. 3 we plotted representative flow fields obtained from cultures with various cell-ECMcombinations and cell densities (see Table I for culture parameters). Thus, Fig. 3 includesdata from both high density monolayer cultures (panels a–d) and a subconfluent, lowerdensity culture as a comparison (panel e). For a better comparison of the flow fields, in Fig.4 we present the parallel component of V (x) along two orthogonal lines, one parallel (xaxis) and one perpendicular (y axis) to the direction of motion.
Flow fields derived from monolayer cultures reveal the presence of velocity correlationsexceeding a spatial range of 200 μm, much larger than the typical cell diameter (meandistance between adjacent cell centers) of 30–40 μm. Streaming behavior is indicated by thesimilarity of average velocity vectors obtained within an elongated area surrounding the
Szabó et al. Page 3
Phys Biol. Author manuscript; available in PMC 2011 February 24.
NIH
-PA Author Manuscript
NIH
-PA Author Manuscript
NIH
-PA Author Manuscript

origin. In the lateral direction, the average velocity drops quickly and in some cases reversesdirection (Fig. 4) – an indication that streams are narrow and adjacent streams move inopposite directions. Remarkably, very similar correlation structures are seen in all threetypes of endothelial cell monolayer cultures investigated, irrespective of the underlyingextracellular matrix substratum used. In subconfluent cultures, where fewer constraints areimposed by the behavior of adjacent cells, the correlated (co-moving) area shrinks (Fig. 3e).
2.3. Separation of adjacent cellsAnother, longer-term property of collective flow is its ability to maintain adjacency of cells.The amount of mixing within the monolayer is indicated by how quickly initially adjacentcells separate from each other. Thus, we calculated d2, the average distance between cellpairs that are adjacent in a reference frame t0:
(3)
where ⟨…⟩ denotes average over all cell pairs i and j that are neighbors at the reference framet0 (the set Q).
As the average distances of 100 independent cell pairs reveal (Fig. 5a), cells approach andseparate in a symmetric process, and the duration of their adhesion (if any) is not resolvedwell in our analysis. The di erences seen in Fig. 5a originate primarily from differences incell speeds: when neighbor separation is plotted against the path length (time scaled byaverage velocity S), the three data sets collapse around the origin (Fig. 5b).
It is natural to compare changes in cell-cell distance d2 to the mean cell displacements d(Fig. 5c). When the separation is large compared to the initial distance of the cell pair, (3)can be approximated as
(4)
where the averages are calculated over the cell pairs (i, j) ε Q. For independent cellmovements the last term in (4) vanishes, thus
(5)
holds asymptotically. Therefore, in Fig. 5c the asymptotic linear relation between averagecell displacement and neighbor separation with a slope of indicates a substantial mixingand an uncorrelated long-term behavior within the monolayer.
Our statistical characterization thus revealed that endothelial monolayers move in locallyanisotropic, 50–100 μm wide and 200–300 μm long streams, which form and disappear atrandom positions. In low density cell cultures cells in front of a moving cell tend to move insimilar direction, but cell movements in lateral directions are uncorrelated. Despite thepresence of streams, cell mixing is substantial in the monolayers: with a goodapproximation, movement of adjacent cells can be considered as independent persistentrandom walks.
Szabó et al. Page 4
Phys Biol. Author manuscript; available in PMC 2011 February 24.
NIH
-PA Author Manuscript
NIH
-PA Author Manuscript
NIH
-PA Author Manuscript

3. Model definition3.1. Cellular Potts model
To explain and model the emergence of collective flow patterns in cell monolayers, weadopted the two dimensional cellular Potts model (CPM) approach. In theoretical studies theCPM is a frequently used method to represent the movement of closely packed cells[6,17,18,14,19,20]. The main advantage of the CPM approach is that cell shape is explicitlyrepresented; thus, the simulation has the potential to describe dynamics in which controlledcell shape plays an important role [17,21]. To obtain a biologically plausible, yet simple,model we consider below a positive feedback loop between cell polarity and cell movementin addition to the surface tension-like intercellular adhesion and cell compressibility. As weexplain in detail below, the model assumptions are the following:
A1 Cells form a monolayer and each cell is simply connected.
A2 Each cell has an approximately constant, pre-set size.
A3 Cells adhere to their neighbors.
A4 Each cell is capable of autonomous biased random motion. The direction bias(in a homogeneous environment) is set by an internal polarity vector.
A5 The polarity vector has a finite lifetime, but it is reinforced by co-directionaldisplacements of the cell.
In the CPM a non-negative integer value σ is assigned to each lattice site x of a two-dimensional grid. Two lattice sites are considered neighbors if they share a side (primaryneighbors) or connect via a corner (secondary neighbors). Cells are represented as simplyconnected domains, i.e., a set of adjacent lattice sites sharing the same label σ. The label isequal to the cell index i (0 < i ≤ N, where N is the number of cells in the simulation). Sitesthat belong to the irregularly shaped area devoid of cells are marked by the special value σ =0.
Cell movement is the result of a series of elementary steps. Each step is an attempt to copythe spin value onto a random lattice site b from a randomly chosen adjacent site a, whereσ(a) ≠ σ(b). This elementary step is executed with a probability p(a → b). If the domainsremain simply connected (A1), and thus cells do not break apart or form voids, theprobability assignment rule ensures the maintenance of a target cell size (A2), adhesion ofcells (A3) and active cell motion (A4, A5). For convenience and historical reasons p is givenas
(6)
where, as specified below in detail, w represents a bias responsible for the cell-specificactive behavior considered, u represents a goal function to be minimized, and Δ(a → b)represents its change during the elementary step considered.
Since updating each lattice position takes more steps in a larger system, the elementary stepcannot be chosen as the measure of time. The usual choice for time unit is the Monte Carlostep (MCS), defined as L2 elementary steps, where L is the linear system size [21].
3.2. Evaluating configurationsIn the CPM approach, a goal function (`energy') is assigned [6] to each configuration. Thegoal function guides cell behavior by distinguishing between favorable (low u) andunfavorable (high u) configurations as
Szabó et al. Page 5
Phys Biol. Author manuscript; available in PMC 2011 February 24.
NIH
-PA Author Manuscript
NIH
-PA Author Manuscript
NIH
-PA Author Manuscript

(7)
The first term in (7) enumerates cell boundary lengths. The summation goes over adjacentlattice sites. For a homogeneous cell population the Ji,j interaction matrix (0 ≤ i, j ≤ N) isgiven as
(8)
The surface energy-like parameters α and β characterize both intercellular adhesiveness andcell surface fluctuations in the model. The magnitude of these values determines theroughness of cell boundaries: small magnitudes allow dynamic, long and hence curvyboundaries, while large magnitudes restrict boundaries to straight lines and thus freeze thedynamics. In addition to cell boundary roughness, the parameters α and β also specify thepreference of intercellular connections over free cell surfaces (A3). If two adhering cells areseparated by inserting a layer of empty sites between them, then the change in u isproportional to 2β – α at each site along the boundary line affected. Therefore, for 2β > αfree cell boundaries are penalized and the cells are adhesive [22].
The second term in expression (7) is responsible for maintaining a preferred cell area (A2).For each cell i, the deviation of its area from a pre-set value is denoted by δAi. Parameter λadjusts the tolerance for deviation. Thus, λ is related to the compressibility of cells in the 2Dplane, and also determines the magnitude of cell area fluctuations.
3.3. Cell polarity and active motilityWhile u evaluates configurations, w is assigned directly to the elementary steps andtherefore allows the specification of a broader spectrum of cellular behavior [23]. Active cellmotility involves cell polarity, a morphological, dynamical and biochemical differencebetween the cell's leading edge and tail [24,25]. In this study we model active cell motilityby first assigning a cell polarity vector pk to each cell k (A4). We then increase theprobability of those elementary conversion steps that advance the cell center in the directionparallel to pk (Fig. 1), as
(9)
Parameter P sets the magnitude of the bias and ΔXk represents the displacement of the centerof cell k during the elementary step considered.
The cell polarity vector is an attempt to represent the localization and magnitude of thebiochemical changes characterizing the leading edge of a migratory cell. It is not yet clearwhat is the molecular polarization mechanism in endothelial cells. The best documentedfront/rear polarization mechanisms involve either the mutual inhibition of Rac and Rho, keyGTPase `switches' of cell motility [1,26], and/or the accumulation of the phosphatidyl-inositol membrane component PIP3 [27,28]. The accumulation of active Rac1 (and PIP3) atthe leading edge is thought to activate a biochemical cascade that involves the Arp2/3
Szabó et al. Page 6
Phys Biol. Author manuscript; available in PMC 2011 February 24.
NIH
-PA Author Manuscript
NIH
-PA Author Manuscript
NIH
-PA Author Manuscript

complex providing new actin nucleation sites. The Rac1-Arp2/3 cascade eventually resultsin a local increase in actin polymerization, pushing the plasma membrane forward [27,1].Through positive feedback loops, both the Rac/Rho and PIP2/PIP3 systems are thought to beable to amplify slight spatial differences in upstream inputs and even develop a spontaneouspolarity [27,28]. This amplification of presumably random receptor activity and the relatedspontaneous symmetry breaking could explain the onset of spontaneous cell motility in ahomogeneous environment, and motivates the use of a unit vector in rule (9).
Even less molecular details are known about what drives changes in cell polarity in theabsence of external cues such as chemoattractant gradients. However, in a motile cell thepolarization direction must change eventually. For instance, when the advance of the leadingprocess is impaired and the process collapses, a new migration direction is selected and cellpolarity is altered. We propose to update the cell polarity vectors by considering aspontaneous decay and a reinforcement from cell displacements (A5). In each MCS thechange in pk is
(10)
where r is the rate of spontaneous decay and ΔXk is the displacement of the center of cell kduring the MCS considered. A characteristic memory length T of the polarization vector isdefined as T = 1/r.
Rules (9) and (10) together constitute a positive feedback loop. In this model, stericconstraints may result in co-migration of adjacent cells as the retraction of one cell allowsfor the expansion of the other. The resulting expansion of cell bodies (like the actinpolymerization process in real cells) therefore can alter and synchronize cell polarity. Themolecular mechanism for cell polarity reinforcement by cell motility may involve either thestabilization of PIP3 accumulation by actin polymerization [29,30,31], or the activation ofRac1 by microtubule dynamics [32,33].
4. Simulation ResultsWe have chosen the open source Tissue Simulation Toolkit ([34,21]) as our CPMframework, in which we implemented our extensions as C++ codes. We refrain from using atemperature-like parameter, as rule (3) of [6], analogous to our rule (6), simply scales eachCPM parameter α, β and λ by the temperature, a constant. Thus, when comparing our studieswith those that include a temperature in the simulations, our parameter values are to becompared with the corresponding values divided by the temperature.
Model simulations with N = 1000 cells were performed in a 200 × 200 lattice, withparameters α = 2, λ = 1 and P = 2, T=5 MCS (see Table II for a summary of the parametervalues used). After scaling by temperature, our parameters are within the same range asthose in previous studies [6,21,35,20]. We applied closed boundary conditions (immutableempty sites at the border) in the simulations.
The spatial scale of the model is easily determined by comparing the empirical andsimulated cell sizes. The target cell area was set to 50 lattice sites, yielding a distance ofabout 7 sites between cell centers in the monolayer. This compares to the experimentallyobserved 35 μm, calibrating a distance of one lattice site to 5 μm. The duration of a MCS iscalibrated by comparing empirical and simulated cell speeds (see below) resulting in oneMCS to correspond to one minute, a value similar to the ones used in other CPM studies[21,20].
Szabó et al. Page 7
Phys Biol. Author manuscript; available in PMC 2011 February 24.
NIH
-PA Author Manuscript
NIH
-PA Author Manuscript
NIH
-PA Author Manuscript

4.1. Individual cells perform a persistent random walkModel simulations of single cells were performed with Potts parameters β = 1 and γ = 1 (theparameter α is irrelevant under these conditions). Fig. 6a reveals that in the absence of activemotility (P = 0) the average displacement d(t) grows with time t as
(11)
Thus, as in the original CPM [4,5], cell movement is diffusive for P = 0. Large values of Presult in unrealistic cell shapes and behavior as the effect of the other constraining terms inexpression (7) diminish. The active motility rules (9) and (10) with 0 < P < 4 result inindividual cells performing a persistent random walk: as Fig. 6a and c demonstrate, theaverage displacements are well fitted by Eq. (2) for d(t, P) > 1.
As Fig. 6b reveals, the speed of active motion, S, is proportional to P in the 0 < P < 4 range(parameter P is bounded by the connectivity constrains of the model). Because of thepositive feedback between directed cell motion and maintenance of cell polarity in ourmodel, the persistence time Tp increases strongly both with P and the duration of thememory, T (Fig. 6d).
4.2. Streaming behavior in monolayer simulationsMonolayer simulations result in behavior similar to the experimentally observed streamingmotion, with shear lines and vortices present (Fig. 7a and Movie 2). Motion within themonolayer is somewhat hindered when compared with individual cells, as the speed andpersistence time decrease by 20% (Fig. 7b). In addition to qualitative similarity, thecalculation of flow fields allows a more rigorous comparison of model simulations toempirical data (Fig. 8, to be compared with Figs. 3 and 4). Lateral correlations and back-flow are reduced when non-adherent cells are simulated at lower cell densities (Fig. 8b). Atsubconfluent densities the average flow field still reveals the `steric' repulsion of cells in thepath of an actively moving cell.
4.3. ParametersWe introduced two new parameters, P and T, in addition to the usual CPM parametersdescribing free and intercellular boundaries (α and β) and compressibility λ. In monolayersimulations there are no free cell boundaries, therefore the parameter β is irrelevant.Parameter sensitivity analysis revealed that the model can also exhibit an ordered phase. Inthis phase, responding to the closed boundary conditions, all cells participate in a single,system-wide rotational movement. This state is reached by increasing the memory durationT. For increasing T (but still below the threshold needed for the formation of a singlevortex), the streams become wider (Fig. 9a and Movie 3). Conversely, by decreasing eitherT or P, a diffusive state is recovered, where the persistence length is smaller than the size ofa cell (Movie 4). In this limit V (x) is well approximated by the flow field of anincompressible fluid around a moving disk: Vx decays as x−2 and −y−2 along the x and yaxes, respectively. Increasing P or T results in wider and longer streams (Fig. 9e–h).
The d2 separation of adjacent cell pairs, when plotted against the mean cell displacement d(Fig. 9b and d), reveals the system-wide ordered flow, when cells can cover largediplacements without changing their neighbors ( ). In the streaming regime theasymptotic relation (5) holds indicating uncorrelated motion within the monolayer.
Depending on the values of P and T, increasing α can result in a multitude of changes.Reflecting its definition, a simulation with higher α values yields cells with smoother
Szabó et al. Page 8
Phys Biol. Author manuscript; available in PMC 2011 February 24.
NIH
-PA Author Manuscript
NIH
-PA Author Manuscript
NIH
-PA Author Manuscript

boundaries (Figs. 10b and d). In general, reducing the freedom of cell boundary movementhinders cell intercalation, and thus movement within a monolayer. This is indicated bydecreasing speeds with increasing α (data not shown). However, if self-propulsion is strongenough, the reduced intercalation can also yield wider streams as demonstrated by Figs.10c,e and f.
Our model for actively moving cells in a monolayer culture is thus capable of explainingmost experimental observations presented in Section 2. Furthermore, the simple modelstructure allows a thorough mapping of the parameter space. We find it remarkable that agiven pair of (P, T) parameters yield individual cell speeds, persistence times in the correctrange as well as a collective behavior comparable with the observed streaming. In particular,T = 5 minutes is a plausible value for the time needed to alter cell polarity. With this value, itis possible to obtain cell speeds in the range of 20–40 μm/h within monolayers and 50 μm/hfor individual cells. Our empirical data show cell speeds between 10 and 30 μm/h formonolayers. A similarly close, and independent agreement is obtained for the persistencetimes, at approximately one hour both in the model and in the experiments. The spatialstructure of streams is strongly anisotropic, being approximately 200–300 μm long and 100μm wide in both the experiments and in the simulations.
5. DiscussionWhile correlated cell velocities and streams in MDCK and HUVEC monolayers wererecently reported [12,13], their dynamics remained largely unexplained. To obtain furtherempirical data to test our model, we systematically investigated monolayer cultures of threedifferent endothelial cell lines. Our finding, that 5–20 cells move together in narrow, chain-like groups, is in accord with previous reports. Because our cultures were grown in amonolayer, our measured cell speeds and persistence times (S ≈ 10 − 30μm/h, T ≈ 1h)somewhat differ from the values previously reported for individual endothelial cells (S ≈40μm/h, T ≈ 3h, [36]; S ≈ 50μm/h, T ≈ 0.6h, [37]).
5.1. Models for collective cell movementsPrevious theoretical studies on cell movement include a multi-particle model that wasproposed to explain the collective migration of fish keratocytes [38]. In that study long-range ordered and disordered states were reported, but no streaming behavior. The modelincluded short range repulsion and long-range attraction between the particles within acertain range (not necessarily between neighbors), as well as self-propulsion and thealignment of the propulsion direction towards the actual displacement of the particles.
Another theoretical study, which did not have the aim to describe cells, investigated a 2Dsystem of self-propelled particles with short range repulsive and intermediate rangeattractive interactions, as well as an alignment of the motion direction to the local average[39]. In this model, the interaction was restricted to Voronoi neighbors, but the velocityalignment rule probably prevented the development of narrow streams. Although this studydid not predict the particular streaming modes of collective cell sheet motility, it showed thatsuch systems can exhibit six phases: gas, fluid and solid phases both with and without long-range ordered movement.
In our study we propose a model for streaming cell monolayers that is based on the CPM, awidely used representation of individual cells and their adhesion [6]. However, we arecurrently undertaking further studies to show that the CPM representation of cells is notcrucial in our approach. We expect similar results with the subcellular element model [7,40],or a particle model with Voronoi tesellation [39,41]. We argue that our model includes a
Szabó et al. Page 9
Phys Biol. Author manuscript; available in PMC 2011 February 24.
NIH
-PA Author Manuscript
NIH
-PA Author Manuscript
NIH
-PA Author Manuscript

more plausible representation of cell polarity and active cell motility than the rule variantsinvolving direction alignment to the local average direction of motion [42,39,8].
Beltman et al [14] studied a very similar problem in a three dimensional lymph node, whereT cells were shown to organize into streams. The presented model of a lymph node containsextracellular matrix fibers and more complicated assumptions about cell motility – thus theresulting model complexity prohibited an exhaustive analysis of model assumptions andparameters. In this study, we narrowly focus on the collective cell behavior in a simple twodimensional environment, and represent the feedback between polarity and cell motion by asimpler and more transparent model. These simplifications allow us to map the resultingmodel parameter space systematically, explain most of the observed behavior and comparethe model with experimental data using a variety of quantitative and qualitative measures. Avery similar model was also proposed recently by Kabla et al [43], in a work which focuseson the large-scale collective migration of a monolayer.
5.2. Positive feedback between polarity and cell motilityThe positive feedback between cell polarity and cell displacement is also supported bycareful analysis of individual cell migration paths [44]. That study proposed a number ofstochastic models for cell center speeds, the simplest of these models being a generalizationof the Ornstein-Uhlenbeck process,
(12)
and
(13)
where v is the cell speed, v* represents self-propulsion, η is an uncorrelated noise with avelocity-dependent variance σ(v), and a, b, c are parameters. In this stochastic particlemodel, the update of the self-propulsion term (13) is analogous to our rule (10).
We also investigated a model version in which the actual elementary step, and not thedisplacement of the center of mass, is compared with the polarity vector as
(14)
Simulations using (14) instead of (9) also resulted in similar overall behavior. Thus, modelbehavior does not depend on the details how the feedback between cell polarity and motilityis represented.
A recent high-throughput study of the genes involved in endothelial sheet migration [13]identified clusters of genes that effect mostly either the active motile activity of cells (thus,our parameter P), or a directional migration response into an area stripped from cells (notincluded in the present model), or cell-cell coordination. Unfortunately, the PI3K/PTENmechanism we considered here as a possible molecular feedback system capable ofproviding both persistent motility and cell-cell coordination, was not tested directly in thatstudy. Si-RNA knockdown of the PTEN protein resulted in somewhat reduced cell velocities
Szabó et al. Page 10
Phys Biol. Author manuscript; available in PMC 2011 February 24.
NIH
-PA Author Manuscript
NIH
-PA Author Manuscript
NIH
-PA Author Manuscript

and cell-cell coordination within the confluent sheet. This change is compatible with PTENplaying a role in determining cell polarity in this experimental setting. However, unpredictedby single cell studies performed in non-endothelial systems, loss of the PTEN protein alsoresulted in a marked increased sensitivity (enhanced directional migration) towards thedenuded area. Thus, while a modular structure of cell motility regulation, including cellpolarity, was empirically supported, the molecular machinery underlying coordinated cellmovement remains an intriguing problem to study.
5.3. Surface tension and intercellular adhesionThe surface energy (β) of a three-dimensional cell aggregate has been shown to beproportional to the cadherin density at the cell-matrix surface [45,46]. Despite this evidence,it is still surprising that the analogy between liquid droplets and cell aggregates is goodenough to describe the surface roughness of individual cells. Such a relation wasdemonstrated, at least for the surface cells of tumor spheroids [46]: the membrane of theoutermost cells were found to be smoother when the cadherin expression was higher. It isless clear if a similar relation holds in two dimensions between cadherin density and thesurface `energy' associated with intercellular contacts (α). If it does, then our results (Fig.10) are also consistent with recent findings indicating reduced correlation in cell movementswhen VE-Cadherin, mediating intercellular adhesion between endothelial cells, was silenced[13].
6. Materials and Methods6.1. ECM substrates
Fibronectin (Sigma) was incubated on TC plastic for 24 h at room temperature at 10 μg/mlconcentration. EHS mouse sarcoma basement membrane extract (Matrigel) was obtainedfrom multiple sources: Becton Dickinson (Franklin Lakes, NJ, USA), R&D Systems(Minneapolis, MN, USA; sold as Cultrex Basement Membrane Extract) and Cell BiolabsInc. (San Diego, CA, USA; sold as ECM gel, CBA200). The solutions allowed to gel at 37°C for 30 minutes yielding gels between 40 and 120 μm thickness.
6.2. Cell CultureBovine capillary endothelial (BCE, [47]) cells, primary bovine aortic endothelial cells(BAEC's) and human umbilical vein endothelial cells (HUVEC's; Lonza, Basel,Switzerland) were propagated on TC substrates and then transferred into a microscope-mounted incubator to record their motility on a variety of ECM substrates.
BAEC's were isolated from bovine aorta as described in [48] and cultured in M199 mediumsupplemented with 10% fetal bovine serum and 10 ng/ml of bFGF. For cell trackingexperiments, BAEC's were cultured in serum-free, CO2-independent medium (LeibovitzL15, Mediatech, VA, USA) supplemented with 1% Nutridoma (Becton Dickinson). Disheswere coated with Matrigel (Becton Dickinson) by mixing 1 volume of Matrigel with 3volumes of ice-cold serum-free L-15 medium. 50 μl/cm2 was dispensed into each well of a24 well culture dish (Corning) and allowed to gel. Cells were added to each well at a densityof 105/cm2 and allowed to attach for 2 hrs.
BCE cells were cultured in DMEM (Sigma) with 10% FCS (GIBCO) and imaged in thesame medium supplemented with 40 ng/ml bFGF (Chemicon, USA), 80 nM (50 ng/ml)PMA (Sigma), and 50 μg/ml ascobic acid (Sigma). 35 mm culture dishes were coated withundiluted Matrigel (Cultrex) at 12.5 μl/cm2 density. Cells were added to each dish at 7 ×10⁴/cm2 density and allowed to attach for 2 hrs.
Szabó et al. Page 11
Phys Biol. Author manuscript; available in PMC 2011 February 24.
NIH
-PA Author Manuscript
NIH
-PA Author Manuscript
NIH
-PA Author Manuscript

HUVEC's were grown in EGM-2 growth medium (Lonza) with 5% FCS for up to 3passages. For cell tracking experiments, HUVEC's were cultured in the same mediumsupplemented with 40 ng/ml bFGF, 40 ng/ml VEGF (Pierce, Rockford, IL, USA), 80 nMPMA, and 50 μg/ml ascorbic acid. 35mm culture dishes were coated with Matrigel (CellBiolabs) by mixing 1 volume of Matrigel with 1 volume of ice-cold PBS. 40 μl/cm2 of themixture was dispensed in the dishes and allowed to gel. Cells were added to each dish at 7 ×10⁴/cm2 density and allowed to attach for 2 hrs.
Cells were observed in multiple fields for at least 15 hours with automated phase-contrasttime-lapse microscopy [49]. Images were obtained in every 3–10 minutes at resolutionsbetween 0.87 and 1.3 μm/pixel.
6.3. Cell trackingUsing ImageJ plugins, the uneven illumination of the microscopic images were corrected bysubtracting from each image the average of the whole stack. Camera noise was reduced byapplying 3 × 3 median filter.
Cells were identified and tracked through image sequences by an automatic, two-stepprocedure. In phase contrast images cell nuclei are darker than the surrounding cell body.Thus, the algorithm loop consisted of a PIV displacement prediction [50] followed by agradient search for local brightness minima. For the cell lines investigated, the estimatederror rate of the procedure (mistraced cells per trajectory segments obtained) is less than 1%.As initial positions, we used centers of clusters obtained by a suitably chosen brightnessthreshold.
6.4. Calculation of flow fieldsThe local spatial correlations of cell movements is characterized by the average flow field, V(x), that surrounds moving cells. If the position of cell i at timepoint t is denoted by Xi(t), itsdisplacement is
(15)
where the time lag for displacement calculations is t′ = 1h. The time lag is chosen as a valueclose to the persistence time. During one hour the motion is still persistent, but the large celldisplacements reduce the relative error of tracking procedures. The direction of cell i at timet, φi(t), is the direction of the ΔXi(t) vector relative to an arbitrarily chosen referencedirection. Flow field V (x) is calculated as
(16)
where Rφ is the oprator for a 2D rotation with an angle φ as
(17)
The ⟨…⟩i,j,t average is calculated over all possible time points t and cell pairs i, j that satisfy
Szabó et al. Page 12
Phys Biol. Author manuscript; available in PMC 2011 February 24.
NIH
-PA Author Manuscript
NIH
-PA Author Manuscript
NIH
-PA Author Manuscript

(18)
where B(x) represents a two-dimensional, square bin with a fixed size, centered at positionx. The computational codes for this calculation are freely available from the correspondingauthor upon request.
Statistical errors are estimated as the standard error of the mean (SEM). SEM values arecalculated from data points which we consider statistically independent. To eliminate knowncorrelations in the velocity field we subdivide the original 2+1 dimensional velocity fielddata (2 spatial and 1 temporal dimension) into non-overlapping blocks. The size of theblocks is chosen to be equal to the spatial and temporal correlation lengths. From each blockk a flow field is calculated, and the resulting Vk(x) fields are then considered as independent.The presented V (x) fields are point-by-point averages of the corresponding Vk(x) fields, andthe number of blocks is used as sample size in SEM calculations. SEM values are presentedby a color code assigned to the SEM(x)/|V (x)| ratio: the zero value is mapped to black, theunit value is mapped to yellow.
Supplementary MaterialRefer to Web version on PubMed Central for supplementary material.
AcknowledgmentsWe are grateful to Roeland M H Merks for generously sharing his simulation code with us, to Charles D Little andTamás Vicsek for stimulating discussions. This work was supported by the NIH (R01 HL87136) and the HungarianScience Fund (OTKA K72664).
References[1]. Ridley, Anne J.; Schwartz, Martin A.; Burridge, Keith; Firtel, Richard A.; Ginsberg, Mark H.;
Borisy, Gary; Parsons, J. Thomas; Horwitz, Alan Rick. Cell migration: integrating signals fromfront to back. Science 2003;302(5651):1704–1709. [PubMed: 14657486]
[2]. Friedl, Peter; Wolf, Katarina. Tube travel: the role of proteases in individual and collective cancercell invasion. Cancer Res 2008;68(18):7247–7249. [PubMed: 18794108]
[3]. Montell, Denise J. Morphogenetic cell movements: diversity from modular mechanical properties.Science 2008;322(5907):1502–1505. [PubMed: 19056976]
[4]. Rieu JP, Upadhyaya A, Glazier JA, Ouchi NB, Sawada Y. Diffusion and deformations of singlehydra cells in cellular aggregates. Biophys J 2000;79:1903–14. [PubMed: 11023896]
[5]. Upadhyaya A, Rieu J-P, Glazier JA, Sawada Y. Anomalous diffusion and non-gaussian velocitydistribution of hydra cells in cellular aggregates. Physica A 2001;293:549–558.
[6]. Glazier JA, Graner F. Simulation of the differential adhesion driven rearrangement of biologicalcells. Phys Rev E Stat Phys Plasmas Fluids Relat Interdiscip Topics 1993;47(3):2128–2154.[PubMed: 9960234]
[7]. Newman TJ. Modeling multicellular systems using subcellular elements. Math. Biosci. Eng2005;2:611–622.
[8]. Belmonte, Julio M.; Thomas, Gilberto L.; Brunnet, Leonardo G.; de Almeida, Rita M C.; Chat,Hugues. Self-propelled particle model for cell-sorting phenomena. Phys Rev Lett 2008;100(24):248702. [PubMed: 18643634]
[9]. Olivia, du Roure; Saez, Alexandre; Buguin, Axel; Austin, Robert H.; Chavrier, Philippe;Silberzan, Pascal; Siberzan, Pascal; Ladoux, Benoit. Force mapping in epithelial cell migration.Proc Natl Acad Sci U S A 2005;102(7):2390–2395. [PubMed: 15695588]
Szabó et al. Page 13
Phys Biol. Author manuscript; available in PMC 2011 February 24.
NIH
-PA Author Manuscript
NIH
-PA Author Manuscript
NIH
-PA Author Manuscript

[10]. Trepat X, Wasserman MR, Angelini TE, Millet E, Weitz DA, Butler JP, Fredberg JJ. Physicalforces during collective cell migration. Nature Physics 2009;5:426–430.
[11]. Dipasquale A. Locomotion of epithelial cells. factors involved in extension of the leading edge.Exp Cell Res 1975;95(2):425–439. [PubMed: 1238279]
[12]. Haga, Hisashi; Irahara, Chikako; Kobayashi, Ryo; Nakagaki, Toshiyuki; Kawabata, Kazushige.Collective movement of epithelial cells on a collagen gel substrate. Biophysical Journal2005;88(3):2250–6. PMID: 15596493. [PubMed: 15596493]
[13]. Vitorino, Philip; Meyer, Tobias. Modular control of endothelial sheet migration. Genes Dev2008;22(23):3268–3281. [PubMed: 19056882]
[14]. Beltman JB, Maree AFM, Lynch JN, Miller MJ, de Boer RJ. Lymph node topology dictates t cellmigration behavior. J Exp Medicine 2007;204:771–780.
[15]. Dunn GA, Brown AF. A unified approach to analysing cell motility. J Cell Sci Suppl 1987:81–102. 0269-3518 (Print). [PubMed: 3503898]
[16]. Maheshwari G, Lauffenburger DA. Deconstructing (and reconstructing) cell migration.Microscopy Research and Technique 1998;43:358–368. [PubMed: 9858333]
[17]. Zajac, Mark; Jones, Gerald L.; Glazier, James A. Simulating convergent extension by way ofanisotropic differential adhesion. J Theor Biol 2003;222(2):247–259. [PubMed: 12727459]
[18]. Izaguirre JA, Chaturvedi R, Huang C, Cickovski T, Coffland J, Thomas G, Forgacs G, Alber M,Hentschel G, Newman SA, Glazier JA. Compucell, a multi-model framework for simulation ofmorphogenesis. Bioinformatics 2004;20(7):1129–1137. [PubMed: 14764549]
[19]. Merks MHM, Koolwijk P. Modeling morphogenesis in silico and in vitro : Towards quantitative,predictive, cell-based modeling. Math. Model. Nat. Phenom 2009;3:1–3.
[20]. Bauer, Amy L.; Jackson, Trachette L.; Jiang, Yi. Topography of extracellular matrix mediatesvascular morphogenesis and migration speeds in angiogenesis. PLOS Comp. Biol2009;5:e1000445.
[21]. Merks RM, Brodsky SV, Goligorksy MS, Newman SA, Glazier JA. Cell elongation is key to insilico replication of in vitro vasculogenesis and subsequent remodeling. Dev Biol 2006;289:44–54. [PubMed: 16325173]
[22]. Glazier, Graner. Simulation of biological cell sorting using a two-dimensional extended pottsmodel. Phys Rev Lett 1992;69(13):2013–2016. [PubMed: 10046374]
[23]. Szabo, Andras; Mehes, Elod; Kosa, Edina; Czirok, Andras. Multicellular sprouting in vitro.Biophys J 2008;95(6):2702–2710. [PubMed: 18567632]
[24]. Lauffenburger DA, Horwitz AF. Cell migration: a physically integrated molecular process. Cell1996;84(3):359–369. [PubMed: 8608589]
[25]. Libotte T, Kaiser HW, Alt W, Bretschneider T. Polarity, protrusion-retraction dynamics and theirinterplay during keratinocyte cell migration. Exp Cell Res 2001;270(2):129–137. [PubMed:11640877]
[26]. Mori Y, Jilkine A, Edelstein-Keshet L. Wave-pinning and cell polarity from a bistable reaction-diffusion system. Biophysical Journal 2008;94:3684–3697. [PubMed: 18212014]
[27]. Manahan, Carol L.; Iglesias, Pablo A.; Long, Yu; Devreotes, Peter N. Chemoattractant signalingin dictyostelium discoideum. Annu Rev Cell Dev Biol 2004;20:223–253. [PubMed: 15473840]
[28]. Gamba, Andrea; de Candia, Antonio; Di Talia, Stefano; Coniglio, Antonio; Bussolino, Federico;Serini, Guido. Diffusion-limited phase separation in eukaryotic chemotaxis. Proc Natl Acad SciU S A 2005;102(47):16927–16932. [PubMed: 16291809]
[29]. Wang, Fei; Herzmark, Paul; Weiner, Orion D.; Srinivasan, Supriya; Servant, Guy; Bourne, HenryR. Lipid products of pi(3)ks maintain persistent cell polarity and directed motility in neutrophils.Nat Cell Biol 2002;4(7):513–518. [PubMed: 12080345]
[30]. Srinivasan, Supriya; Wang, Fei; Glavas, Suzana; Ott, Alexander; Hofmann, Fred; Aktories,Klaus; Kalman, Daniel; Bourne, Henry R. Rac and cdc42 play distinct roles in regulatingpi(3,4,5)p3 and polarity during neutrophil chemotaxis. J Cell Biol 2003;160(3):375–385.[PubMed: 12551955]
[31]. Dawes, Adriana T.; Edelstein-Keshet, Leah. Phosphoinositides and rho proteins spatially regulateactin polymerization to initiate and maintain directed movement in a one-dimensional model of amotile cell. Biophys J 2007;92(3):744–768. [PubMed: 17098793]
Szabó et al. Page 14
Phys Biol. Author manuscript; available in PMC 2011 February 24.
NIH
-PA Author Manuscript
NIH
-PA Author Manuscript
NIH
-PA Author Manuscript

[32]. Wittmann T, Waterman-Storer CM. Cell motility: can rho gtpases and microtubules point theway? J Cell Sci 2001;114(Pt 21):3795–3803. [PubMed: 11719546]
[33]. Siegrist, Sarah E.; Doe, Chris Q. Microtubule-induced cortical cell polarity. Genes Dev2007;21(5):483–496. [PubMed: 17344411]
[34]. http://sourceforge.net/projects/tst[35]. Ouchi NB, Glazier JA, Rieu J-P, Upadhyaya A, Sawada Y. Improving the realism of the cellular
potts model in simulations of biological cells. Physica A 2003;329:451–458.[36]. Stokes CL, Lauffenburger DA, Williams SK. Migration of individual microvessel endothelial
cells: stochastic model and parameter measurement. J Cell Sci 1991;99:419–30. [PubMed:1885678]
[37]. Kouvroukoglou S, Dee KC, Bizios R, McIntire LV, Zygourakis K. Endothelial cell migration onsurfaces modified with immobilized adhesive peptides. Biomaterials 2000;21:1725–1733.[PubMed: 10905454]
[38]. Szabo B, Szollosi GJ, Gonci B, Juranyi Zs, Selmeczi D, Vicsek T. Phase transition in thecollective migration of tissue cells: Experiment and model. Phys. Rev. E 2006;74:061908.
[39]. Gregoire G, Chate H, Tu Y. Moving and staying together without a leader. Physica D2003;181:157–170.
[40]. Sandersius, Sebastian A.; Newman, Timothy J. Modeling cell rheology with the subcellularelement model. Phys Biol 2008;5(1):15002.
[41]. Szabo, Andras; Perryn, Erica D.; Czirok, Andras. Network formation of tissue cells viapreferential attraction to elongated structures. Phys Rev Lett 2007;98(3):038102. [PubMed:17358734]
[42]. Vicsek, Tamás; Czirók, András; Ben-Jacob, Eshel; Cohen, Inon; Shochet, Ofer. Novel type ofphase transition in a system of self-driven particles. Phys. Rev. Lett 1995;75:1226–1229.[PubMed: 10060237]
[43]. Kabla, A. preprint[44]. Selmeczi D, Mosler S, Hagedorn PH, Larsen NB, Flyvbjerg H. Cell motility as persistent random
motion: theories from experiments. Biophys J 2005;89:912–31. [PubMed: 15951372][45]. Foty, Ramsey A.; Steinberg, Malcolm S. The differential adhesion hypothesis: a direct
evaluation. Dev Biol 2005;278(1):255–263. [PubMed: 15649477][46]. Hegedüs, Balázs; Marga, Francoise; Jakab, Károly; Sharpe-Timms, Kathy L.; Forgacs, Gabor.
The interplay of cell-cell and cell-matrix interactions in the invasive properties of brain tumors.Biophysical Journal 2006;91(7):2708–16. PMID: 16829558. [PubMed: 16829558]
[47]. Veitonmaki, Niina; Fuxe, Jonas; Hultdin, Magnus; Roos, Geran; Pettersson, Ralf F.; Cao, Yihai.Immortalization of bovine capillary endothelial cells by htert alone involves inactivation ofendogenous p16ink4a/prb. FASEB J 2003;17(6):764–766. [PubMed: 12586745]
[48]. Twal WO, Czirok A, Hegedus B, Knaak C, Chintalapudi MR, Okagawa H, Sugi Y, ArgravesWS. Fibulin-1 suppression of fibronectin-regulated cell adhesion and motility. J Cell Sci2001;114(Pt 24):4587–4598. [PubMed: 11792823]
[49]. Czirók A, Schlett K, Madarász E, Vicsek T. Exponential distribution of locomotion activity incell cultures. Phys. Rev. Lett 1998;81:3038–3041.
[50]. Zamir, Evan A.; Czirok, Andras; Rongish, Brenda J.; Little, Charles D. A digital image-basedmethod for computational tissue fate mapping during early avian morphogenesis. Ann BiomedEng 2005;33:854–65. [PubMed: 16078625]
Szabó et al. Page 15
Phys Biol. Author manuscript; available in PMC 2011 February 24.
NIH
-PA Author Manuscript
NIH
-PA Author Manuscript
NIH
-PA Author Manuscript

Figure 1.Cell movement within a BAEC monolayer is visualized through cell trajectories. (a): Avelocity field snapshot is indicated by short trajectories, obtained during 30 minutes. Cellcenters are designated by black dots. Blue arrows show groups of cells moving together instreams. (b): A phase-contrast image detail with superimposed cell trajectories depictingmovements during one hour. The average cell speed is 35 μm/h. Red-to-green colorsindicate progressively later trajectory segments. Adjacent BAEC streams moving in oppositedirections are separated by white lines, vortices are denoted by asterisks.
Szabó et al. Page 16
Phys Biol. Author manuscript; available in PMC 2011 February 24.
NIH
-PA Author Manuscript
NIH
-PA Author Manuscript
NIH
-PA Author Manuscript

Figure 2.Calculation of the flow field V (x). The image depicts the process for two cells, i and j. Theoriginal configuration is drawn with blue color. Positions Xi and Xj denote cell centers, thevectors ΔXi and ΔXj are cell displacements. Cell i is heading in the direction φ, relative to anarbitrarily selected reference direction n. To calculate the flow field around cell i, first theconfiguration is rotated around Xi by –φ. In the rotated configuration (drawn in black) cell i
is heading towards the reference direction (n). The center of cell j, , now falls in thevicinity of lattice point x and therefore is taken into account for the average of V (x). Thevicinity, B(x) is defined as a two dimensional bin (shaded area) centered at lattice site x. Theprocedure is then repeated for each cell and V (x) is calculated as an average over all cells i
and j for which holds. Finally, the bins are also averaged over differenttime frames.
Szabó et al. Page 17
Phys Biol. Author manuscript; available in PMC 2011 February 24.
NIH
-PA Author Manuscript
NIH
-PA Author Manuscript
NIH
-PA Author Manuscript

Figure 3.Monolayers of various endothelial cells exhibit similar flow fields on both Matrigel andfibronectin substrates. The local spatial correlation of cell movements were characterized byV (x), the average flow field that surrounds moving cells. Arrows indicate velocities as one-hour-displacements, the green arrow in the origin represents the average velocity of cells.For better visibility, vector lengths are scaled by a factor of five. Cultures with sufficientdensity (a–d) show streaming behavior, indicated by the similarity of average velocityvectors obtained in front of and behind the moving cells. The co-movement drops rapidly inthe lateral direction, an indication of the local asymmetry of the streams. In a subconfluentculture (e) the correlation structure is less pronounced. The color code indicates theestimated relative SEM of the vectors: black corresponds to zero, yellow indicates 1, i.e., aSEM equal to the norm of the vector. A corresponding phase-contrast image of the culturesare shown in the right.
Szabó et al. Page 18
Phys Biol. Author manuscript; available in PMC 2011 February 24.
NIH
-PA Author Manuscript
NIH
-PA Author Manuscript
NIH
-PA Author Manuscript

Figure 4.Empirical flow field profiles along two orthogonal axes. To compare data presented in Fig.3, we plotted the parallel (Vx) component of the average velocity vectors along the axesparallel (x, panel a) and perpendicular (y, panel b) to the direction of motion. To reducesymbol overlap, individual data sets are slightly shifted horizontally.
Szabó et al. Page 19
Phys Biol. Author manuscript; available in PMC 2011 February 24.
NIH
-PA Author Manuscript
NIH
-PA Author Manuscript
NIH
-PA Author Manuscript

Figure 5.Cell separation within the monolayers. (a): Average separation, d2(t), of cells adjacent attime zero. (b): Increase in separation from the average cell size value d2(t0) versus the pathlength (time scaled by mean velocity). (c): Separation, d2(t), versus the averagedisplacement of cells, d(t). The blue line of slope indicates an uncorrelated movement ofcell pairs as derived in (5). Error bars indicate SEM.
Szabó et al. Page 20
Phys Biol. Author manuscript; available in PMC 2011 February 24.
NIH
-PA Author Manuscript
NIH
-PA Author Manuscript
NIH
-PA Author Manuscript

Figure 6.Motion statistics of individual, non-interacting cells in model simulations. (a): Averagedisplacement, d(t) vs time, t. Values of P are shown in the key, β = 1, λ = 1, T = 5min. Graysolid lines are fits by the persistent random walk formula (2) and a square-root function incase of P = 0. (b): The speed S of directed motion is set by parameter P. (c): Averagedisplacement vs time curves and the corresponding fits, obtained from simulations withvarious polarization memory lengths. Values of T are shown in the key, β = 1, λ = 1, P = 2.(d): The persistence time of the random walk behavior, Tp, mostly depends on T through anon-linear relation, and to a lesser extent also on the active motion parameter P.
Szabó et al. Page 21
Phys Biol. Author manuscript; available in PMC 2011 February 24.
NIH
-PA Author Manuscript
NIH
-PA Author Manuscript
NIH
-PA Author Manuscript

Figure 7.Motion characteristics in monolayer simulations. A representative parameter setting waschosen as P = 2, T = 5min, α = 2, β = 1 and λ = 1. (a): Model cell trajectories, from a 40 minlong time interval, reveal streams formed by several cells (blue arrows). The inset showstrajectories from a 90 min long interval, color-coded progressively from older to newer asred to green to blue. A shear-line separating streams moving in opposite directions (blackline) and two vortices (asterisks) are indicated. (b): Average displacements of single,unconstrained cells are greater than those in a monolayer. Persistence time and cell speed ina monolayer fall from 40 to 30 minutes and from 55μm/h to 40μm/h, respectively.
Szabó et al. Page 22
Phys Biol. Author manuscript; available in PMC 2011 February 24.
NIH
-PA Author Manuscript
NIH
-PA Author Manuscript
NIH
-PA Author Manuscript

Figure 8.Flow fields V (x) around a moving cell within a monolayer (a) and a subconfluent culture(b) simulation. The corresponding parallel and perpendicular velocity profiles are shown inpanels (c) and (d), respectively. Cell density values specified in the keys are normalized toconfluent culture density (π = 1). In low density cultures correlations are reduced in thelateral direction. Velocity vectors represent one-hour-displacements, the green arrowindicates the average velocity of the cells. As in Fig. 3, the color code in panels a and bindicates the estimated relative SEM, and the color scale represents the interval [0 : 1].
Szabó et al. Page 23
Phys Biol. Author manuscript; available in PMC 2011 February 24.
NIH
-PA Author Manuscript
NIH
-PA Author Manuscript
NIH
-PA Author Manuscript

Figure 9.The self propulsion parameters, P and T , play a crucial role in defining the collectivebehavior of the monolayer. Flow fields V (x) are shown for long (a: T = 50min) and short (c:T = 1.25min) memory duration of cell polarity. The remaining parameters are the same as inFig. 7. Flow fields are presented as in Fig. 8. The corresponding parallel and perpendicularvelocity profiles are shown in panels (e) and (f), respectively. Increasing T results in wider,longer and faster streams. Similar, but less dramatic tendencies are seen when changing P(panels g and h). For large enough T, the system organizes into a phase where the correlationlength is comparable to the system size. Movement within the monolayer is diffusive in thestreaming regime as the average neighbor separation vs cell displacement curves (panels band d) are consistent with the asymptotic behavior of Eq. (5), shown as the solid line. In theglobally ordered (rotating) regime cells move further without separating. The asterisk marksthe parameter values used in Fig. 7.
Szabó et al. Page 24
Phys Biol. Author manuscript; available in PMC 2011 February 24.
NIH
-PA Author Manuscript
NIH
-PA Author Manuscript
NIH
-PA Author Manuscript

Figure 10.Role of cell adhesion parameter α. Simulation results are compared for α = 1 (panels a, b)and α = 4 (panels c, d). Self-propulsion is strong (P = 3), while the remaining parameters arethe same as in Fig. 7. As the configurations demonstrate (panels b, d), parameter α controlscell shape and cell boundary smoothness. The V (x) flow fields (panels a, c) and theirprofiles along the parallel (e) and perpendicular (f) axes reveal, the streams get wider withincreasing α as cells cannot easily intercalate. Flow fields are presented as in Fig. 8. Theinsets in panels (b) and (d) demonstrate cell trajectories, comparable with similar plots inFigs. 1 and 7. The asterisk marks the parameter values used in Fig. 7.
Szabó et al. Page 25
Phys Biol. Author manuscript; available in PMC 2011 February 24.
NIH
-PA Author Manuscript
NIH
-PA Author Manuscript
NIH
-PA Author Manuscript

NIH
-PA Author Manuscript
NIH
-PA Author Manuscript
NIH
-PA Author Manuscript
Szabó et al. Page 26
Tabl
e 1
Expe
rimen
tal d
ata
Cel
l typ
eSu
bstr
ate
Fiel
ds r
ecor
ded/
ana
lyse
dS
[μm
/h]
Tp [
min
]ce
ll de
nsity
[100
0/cm
2 ]V(
x) sa
mpl
e si
ze [c
ell]
BA
ECM
atrig
el36
/ 9
33 ±
233
±3
8011
00
BC
EM
atrig
el10
/ 4
13 ±
340
± 1
040
500
HU
VEC
Mat
rigel
10 /
314
±2
112
± 48
4060
0
HU
VEC
Mat
rigel
10 /
214
±2
110
± 50
2050
0
HU
VEC
Fibr
onec
tin10
/ 2
14 ±
222
0 ±
170
7010
00
HU
VEC
T.C
. pla
te10
/ 2
18.3
± 0
.349
± 7
40N
.A.
Phys Biol. Author manuscript; available in PMC 2011 February 24.

NIH
-PA Author Manuscript
NIH
-PA Author Manuscript
NIH
-PA Author Manuscript
Szabó et al. Page 27
Table 2
Parameters used in the model
Parameter name Symbol Value Range Main, experimentally detectable effect (s)
Cell-cell boundary cost α 2 1–4 cell boundary flexibility, cell shape
Free cell boundary cost (relevant only in single-cell simulations) β 1 - cell boundary flexibility, cell shape, surface tension
of aggregates.
Target cell area A 50 - cell-cell distance
Area constraint coefficient λ 1 0.5–2 cell size fluctuations
Self propulsion coefficient P 2 0.5–4 average cell speed
Decay rate of cell polarity r 0.2 0.8 – 0.02 persistence time of cell motion
Phys Biol. Author manuscript; available in PMC 2011 February 24.


![[Collective] Grammaire. 350 exercices,](https://img.pdfslide.net/doc/110x75/631609f7c32ab5e46f0d988f/collective-grammaire-350-exercices.jpg)


