Embed Size (px)
Citation preview
Adult Type 3 Adenylyl Cyclase–Deficient Mice Are ObeseZhenshan Wang, Vicky Li, Guy C. K. Chan, Trongha Phan, Aaron S. Nudelman, Zhengui Xia, Daniel R.
Storm*
Department of Pharmacology, University of Washington, Seattle, Washington, United States of America
Abstract
Background: A recent study of obesity in Swedish men found that polymorphisms in the type 3 adenylyl cyclase (AC3) areassociated with obesity, suggesting the interesting possibility that AC3 may play a role in weight control. Therefore, weexamined the weight of AC3 mice over an extended period of time.
Methodology/Principal Findings: We discovered that AC32/2 mice become obese as they age. Adult male AC32/2 miceare about 40% heavier than wild type male mice while female AC32/2 are 70% heavier. The additional weight of AC32/2
mice is due to increased fat mass and larger adipocytes. Before the onset of obesity, young AC32/2 mice exhibit reducedphysical activity, increased food consumption, and leptin insensitivity. Surprisingly, the obesity of AC32/2 mice is not due toa loss of AC3 from white adipose and a decrease in lipolysis.
Conclusions/Significance: We conclude that mice lacking AC3 exhibit obesity that is apparently caused by low locomotoractivity, hyperphagia, and leptin insensitivity. The presence of AC3 in primary cilia of neurons of the hypothalamus suggeststhat cAMP signals generated by AC3 in the hypothalamus may play a critical role in regulation of body weight.
Citation: Wang Z, Li V, Chan GCK, Phan T, Nudelman AS, et al. (2009) Adult Type 3 Adenylyl Cyclase–Deficient Mice Are Obese. PLoS ONE 4(9): e6979. doi:10.1371/journal.pone.0006979
Editor: Joe Z. Tsien, Medical College of Georgia, United States of America
Received July 21, 2009; Accepted August 13, 2009; Published September 11, 2009
Copyright: � 2009 Wang et al. This is an open-access article distributed under the terms of the Creative Commons Attribution License, which permitsunrestricted use, distribution, and reproduction in any medium, provided the original author and source are credited.
Funding: This work was supported by National Institutes of Health grant #DC04158. The funders had no role in study design, data collection and analysis,decision to publish,or preparation of the manuscript.
Competing Interests: The authors have declared that no competing interests exist.
* E-mail: [email protected]
Introduction
Based on the definition of obesity, about 65% of the U.S.
population is overweight (Body Mass Index .25), and over 30% is
obese (Body Mass Index .30) [1]. Obese individual have a higher
risk for a number of diseases including type 2 diabetes,
cardiovascular disease, metabolic syndrome, hypertension, certain
forms of cancer, and sleep-breathing disorders [1]. Furthermore,
obesity decreases longevity [2,3,4] and lowers the general quality
of life [5]. Although intensive effort has been devoted to anti-
obesity therapy, the percentage of obese individuals in industri-
alized countries continues to increase.
Obesity is a disorder of energy balance and it occurs when
energy intake persistently exceeds energy expenditure. Although it
has been generally accepted that reduced physical activity with a
sedentary lifestyle contributes to the increasing prevalence of
obesity, the underlying molecular mechanisms are largely
unknown. In humans, twin studies show that 78% of the variance
in physical activity can be explained by genetic factors [6] and a
study with over 4,000 twin individuals showed that physical
inactivity in adolescence strongly predicts the risk for obesity in
adults [7]. Moreover, studies with monozygotic twin pairs indicate
that physical activity, or lack thereof, is both causative and
secondary to the development of obesity [7].
Recently it was reported that AC3 gene polymorphisms are
associated with obesity in a group of Swedish men [8]. This
suggests the interesting possibility that AC3, which is expressed in
adipose tissue and the hypothalamus, may play an important role
in the regulation of body weight. To test this hypothesis, we
monitored the weight of AC32/2 mice over an extended period of
time. Here, we report that mice lacking AC3 exhibit obesity which
is apparently caused by low locomotor activity, hyperphagia, and
leptin resistance.
Materials and Methods
AnimalsAC32/2 mice and wild type littermates were bred from
heterozygotes and genotyped as previously reported [9]. Wild
type littermates were used as controls. Mice were maintained on a
12 hr light/dark cycle and had access to water and food ad libitum.
Except as indicated, all animals were 6 to 12 months old. Animals
were housed individually and allowed to habituate in the new
cages for at least one week before recording food consumption.
Food consumption was measured daily for at least two weeks.
During fasting, the animals were without food for 18 hrs. All
animal procedures were approved by the Institutional Animal
Care and Use Committee at the University of Washington.
Adenylyl cyclase activity assayAdenylyl cyclase activity was measured as previously described
[10]. Briefly, epididymal white or brown adipose tissue was
homogenized in cold buffer containing 25 mM Tris/HCl (ph 7.4),
250 mM sucrose, 1 mM MgCl2, and protease inhibitor cocktail
tablets (1 tablet/10 ml; Roche, Indianapolis, IN). The homoge-
nate was centrifuged at 1,1006g for 15 min at 4uC, and the
PLoS ONE | www.plosone.org 1 September 2009 | Volume 4 | Issue 9 | e6979
supernatant was centrifuged at 48,0006g for one hr to obtain a
membrane preparation. Protein concentrations were determined
by BCA assay kit (Pierce, Rockford, IL). Adenylyl cyclase activity
was measured in a buffer consisting of 1 mM cyclic AMP, 10 mM
phosphocreatine, 0.5 unit of creatine phosphokinase, 5 mM GTP,
5 mM MgCl2, 0.2 mM EDTA, 50 mM Tris/HCl (pH 7.5), with
[a-32P] ATP to 56106 cpm/reaction at 30uC for 15 min.
Western blot analysisWestern blot analysis was performed as previously described
[9]. Isolated brown adipose tissue and white adipocytes were
homogenized on ice in homogenization buffer. Protein concen-
trations were measured with a BCA assay kit (Pierce, Rockford, IL)
according to the manufacturer’s instructions. Samples (40 mg to
60 mg) were boiled at 95uC for more than 5 min, then placed on
ice and loaded onto 7.5% polyacrylamide gels. The gels were
transferred to a PVDF membrane (Mllipore), and blocked with
5% milk in phosphate-buffered saline (PBS) with 0.05% Tween 20
for 1,2 hr. Blots were incubated with polyclonal AC3 antibody
(1:1000; Santa Cruz Biotechnology, Inc.) over night at 4uC,
followed by horseradish peroxidase-conjugated goat anti-rabbit
lgG for 1 hr at room temperature. Blots were developed with an
ECL detection reagent kit (Amersham Biosciences) according to
the manufacturer’s instructions.
HistologySegments of epididymal white adipose tissue from 6- to 8-
month old of AC32/2 and AC3+/+ mice (each genotype consisted
of 2 male and 2 female) were fixed in Bouin’s solution (Sigma-
Aldrich, St. Louis, MO), dehydrated in ethanol, embedded in
paraffin, and cut at a thickness of 5 mm. Sections were
deparaffinized, rehydrated, and stained with hematoxylin/eosin.
ImmunofluoresceneImmunofluorescene procedures were performed as described
previously [9] with a few modifications. Mice were perfused with a
mixture consisting of half 4% paraformaldehyde (PFA) and half
HistoChoice (Amresco). The brains were then dissected and post
fixed with the same fixing solution overnight at 4uC. Then the
brains were cryoprotected with 30% sucrose for 48 hr at 4uC.
Brains were cut into 30 mm sections with a cryostat freezing
microtome. Floating sections were blocked and then first
incubated with the Somatostatin receptor subtype 3 (Sstr3)
antibody (1:5000, Santa Cruz Biotechnology, Inc.) overnight at
4uC and processed with a TSATM Cyanine 3 system (Perkin Elmer
LAS, Inc.) according to the manufacturer’s instructions. The
sections were incubated with AC3 antibody (1:500, Santa Cruz
Biotechnology, Inc.) overnight at 4uC followed by the secondary
antibody, Alexa Fluor 488-conjugated donkey anti-rabbit IgG
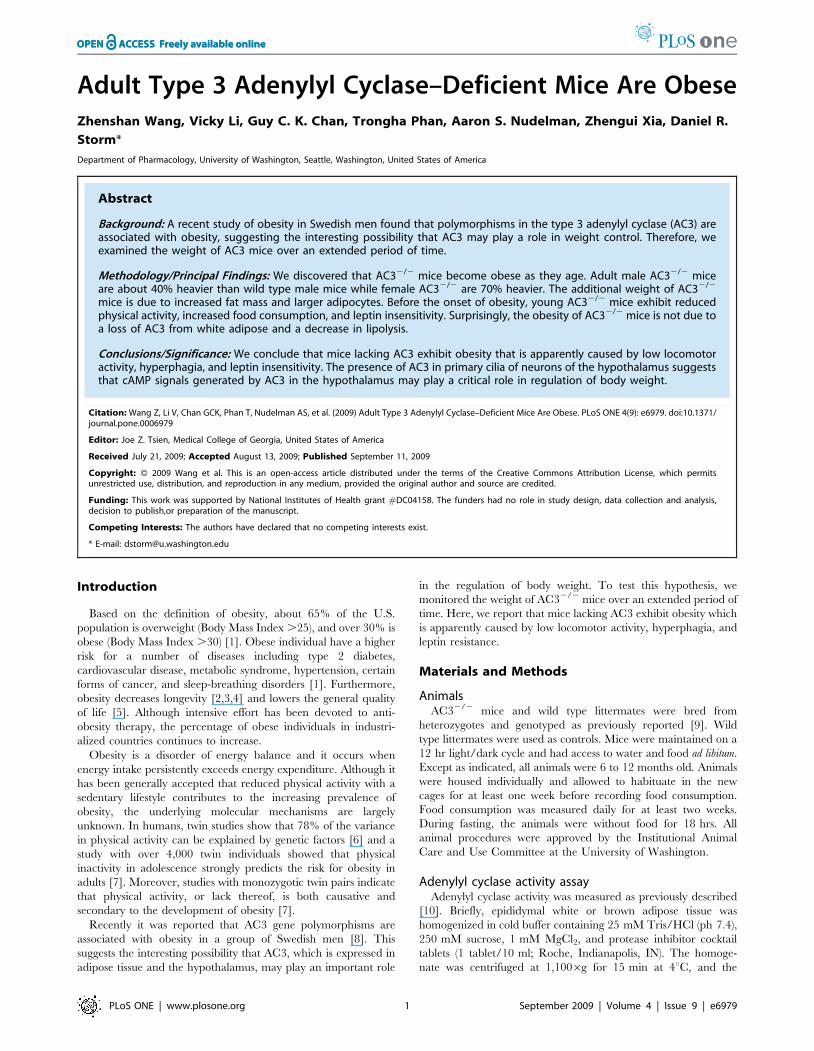
Figure 1. AC32/2 mice exhibit adult onset obesity. (A) Representative eight-month-old AC3+/+ and AC32/2 male mice. (B) The growth curve ofAC32/2 male mice compared to AC3+/+ male mice. (C) The growth curve of AC32/2 female mice compared to AC3+/+ female mice. At each time point,the data are the average of 16 mice. Data are represented as means6SEM. *, p,0.05; **, p,0.01.doi:10.1371/journal.pone.0006979.g001
AC3 and Obesity
PLoS ONE | www.plosone.org 2 September 2009 | Volume 4 | Issue 9 | e6979
(Invitrogen, La Jolla, CA), for 2 hr at room temperature. Stained
sections were mounted onto microscopy slides and visualized by
confocal microscopy (Zeiss 510 META).
Metabolic parametersBody composition and locomotor activity of ten- to twelve-
month old of AC32/2 and AC3+/+ mice were measured as
previously described [11]. Body composition was determined in
conscious mice by quantitative magnetic resonance (QMR)
(EchoMRI 3-in-machine Whole Body Composition Analyzer;
Echo Medical Systems, Houston, TX). We measured locomotor
activity in mice for 36 hrs. Locomotor activity was measured by
the infrared beam break method using an Opto-Varimetrix-3
sensor system (Columbus Instruments). Locomotor activities of
young animals were measured as previously described [12]. Mice
were individually housed in rat cages for 3 days to allow them to
adjust to the environment before recording voluntary activity.
Movement episodes were recorded as infrared beam breaking.
The recording was collected with the use of QA-4 input modules
coupled with infrared motion detectors. Data was collected by
VitalView Data Acquisition System (Mini Mitter, version 4.1) and
transferred to the ActiView Biological Rhythm Analysis program
(Mini Mitter, version 1.2) for actogram generation.
Measurement of serum parametersBlood was collected from mouse-tail veins and serum FFA levels
were determined by a NEFA kit (Wako Diagnostics, Richmond, VA)
according to the instructions of the manufacturer. We assayed serum
triglyceride and glycerol by a serum triglyceride determination kit
(Sigma, St. Louis, MO). Leptin and insulin levels were assayed with
an ELISA kit (Crystal Chem Inc., Downers Grove, IL) according to
the manufacturer’s instructions. For in vivo study of b-AR agonists,
CL316,243 (CL) (1 mg/kg), isoproterenol (0.1 mg/kg), or saline
were injected intraperitoneally into AC3+/+ or AC32/2 mice. Blood
was collected 15 min later.
Effects of leptin treatment on food intake and bodyweight
Mice were housed individually for at least one week to allow
them to adjust to the new environment before starting the
experiments. The food intake and body weight were measured
daily for one week before vehicle injection. Vehicle (10 ml 0.9%
NaCl/g body weight) was injected intraperitoneally twice (6:00 pm
and 12:00 am) daily for two consecutive days. After one day of
vehicle treatment, leptin (2 mg/g body weight) was injected
intraperitoneally twice (6:00 pm and 12:00 am) daily for two
consecutive days. Food intake and body weight were measured
daily during the study and continued for one week thereafter. The
average food intake and body weight for each animal before
vehicle treatment taken over five consecutive days was taken as the
basal value. We used the averages of food intake and body weight
during vehicle treatment as the control for leptin effects.
Statistical analysisAll data are expressed as means6SEM, unless otherwise
indicated. We performed statistical analysis using the unpaired
Student’s t test. P,0.05 was considered to be statistically
significant. For growth curves, the data were analyzed with two-
way ANOVA (PRISM Version 4.0b).
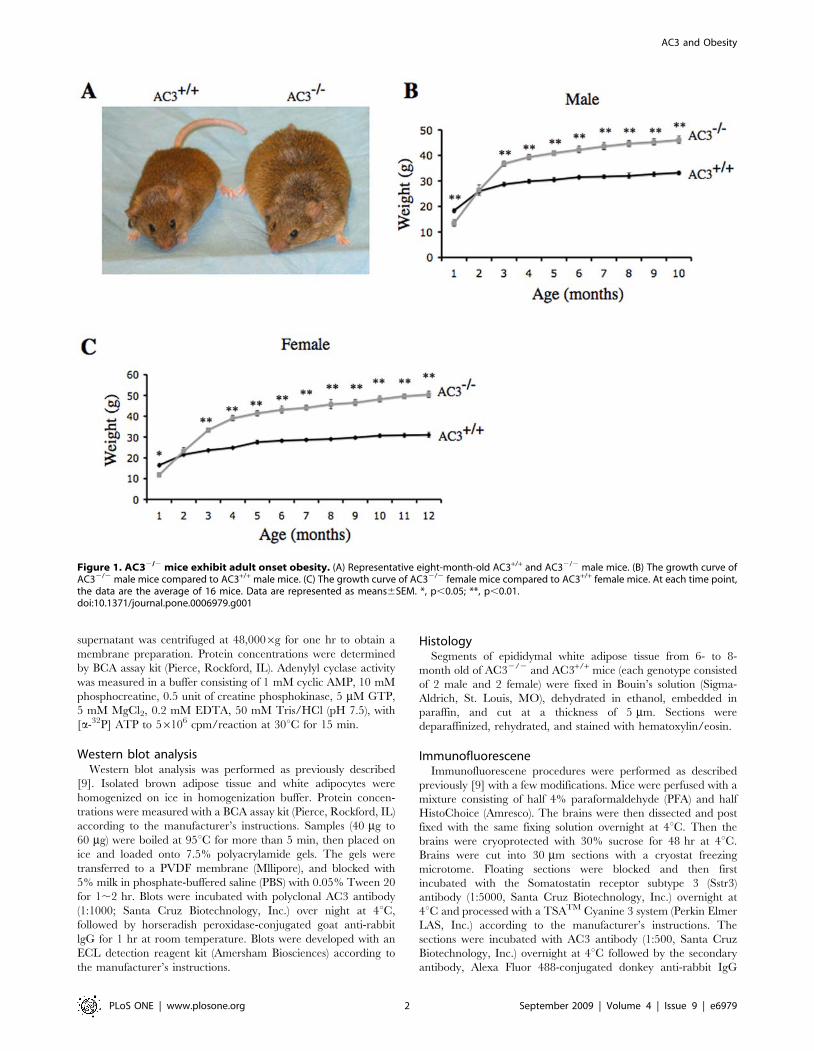
Figure 2. AC32/2 mice weight gain is due to an increase in fat mass. The body compositions of AC3+/+ and AC32/2 mice were determined inconscious mice by quantitative magnetic resonance (QMR). (A) Body composition of male AC3+/+ and AC32/2 mice at 10 months. (B) Bodycomposition of female AC3+/+ and AC32/2 mice at 10 months. (C) Percentage of fat mass and lean mass of male AC3+/+ and AC32/2 mice at 10months. (D) Percentage of fat mass and lean mass of female AC3+/+ and AC32/2 mice at 10 months. N = 8 mice for each group. Data are representedas means6SEM. **, p,0.01.doi:10.1371/journal.pone.0006979.g002
AC3 and Obesity
PLoS ONE | www.plosone.org 3 September 2009 | Volume 4 | Issue 9 | e6979
Results
AC32/2 mice are obeseTo investigate the importance of AC3 for regulation of body
weight, we monitored the weight of AC32/2 mice and wild type
littermates over 12 months (Figure 1). During this period, mice were
fed ad libitum on laboratory mouse chow. Although AC32/2 mice
are about half the size of their wild type littermates right after birth,
they achieve normal size and weight after two months [9]. This
smaller size during the first couple of months is attributable to their
lack of olfaction and pheromone responses which impair suckling
[9,13]. As the mice age, however, they become obese and are
significantly heavier than wild type littermates (Figure 1A). Adult
male AC32/2 mice are about 40% heavier than wild type male
mice (Figure 1B) while female AC32/2 are 70% heavier (Figure 1C).
AC32/2 mice were analyzed by quantitative magnetic
resonance to determine body composition. A comparison of
AC32/2 male mice and wild type littermates indicates that the
weight gain is exclusively in fat mass with no change in lean mass
(Figure 2A). Fat mass comprised 41% of the weight of AC32/2
male mice compared to 19% of the weight of AC3+/+ male mice
(Figure 2C). Similarly, the weight difference between female
AC32/2 and AC3+/+ mice was attributable to a large increase in
fat mass (Figure 2B). Fat accounted for 50% of the weight of
female AC32/2 mice and 23% for AC3+/+ females (Figure 2D).
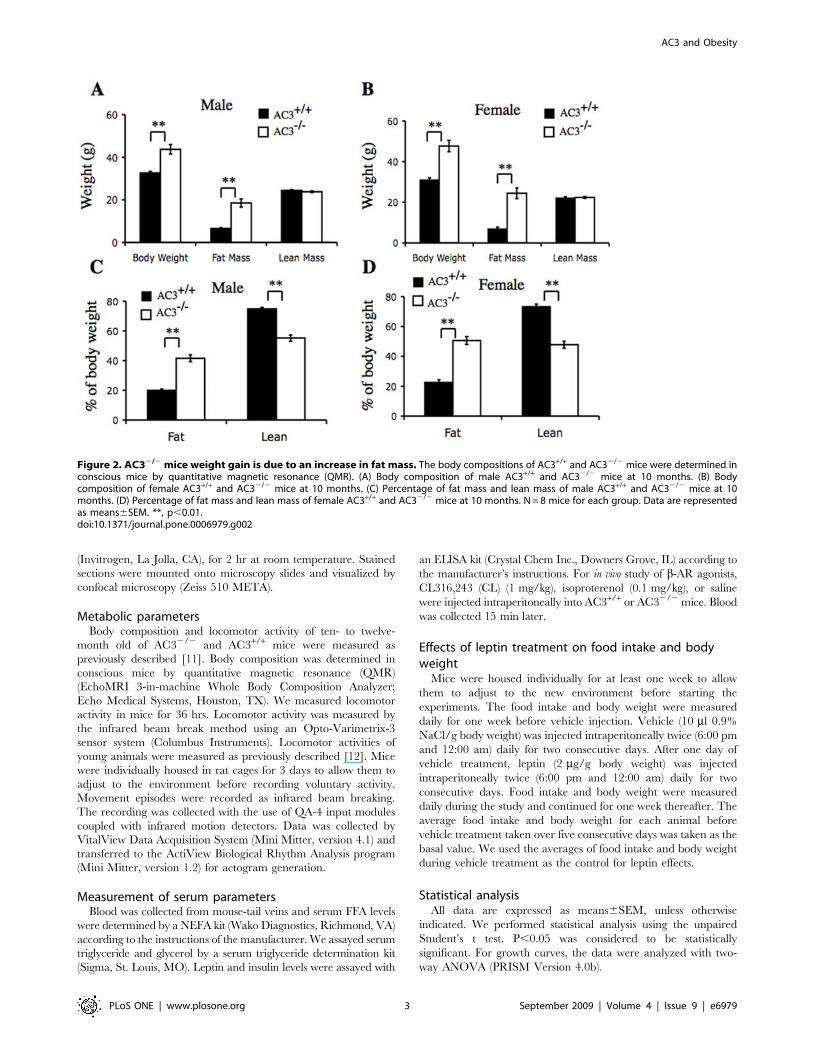
Since obesity is often associated with adipocyte enlargement
[14,15], sections from epididymal adipose tissue of AC32/2 and
AC3+/+ mice were compared (Figure 3). The adipocytes from
AC32/2 mice were considerably larger than those from AC3+/+
mice (Figure 3A and 3B). This difference is reflected in the cell
diameter (Figure 3C and 3D) as well as the cell volume which is
approximately 3.5 times larger in AC32/2 mice (Figure 3E). These
data are consistent with the increased fat mass of AC32/2 mice.
A key feature of obesity is increased production of triglycerides.
Therefore, we monitored triacylglycerol levels to determine if
AC32/2 mice synthesize more triglyceride than wild type mice.
Serum triglyceride levels in AC32/2 mice and AC3+/+ mice were
4.260.1 mg/ml and 1.160.06 mg/ml, respectively (Figure 4A).
Leptin is an adipokine synthesized in adipose that is thought to be
a hormonal indicator of fat accumulation. Since the expression and
release of leptin depends on adipocyte size [16] and are often higher
in obese patients [17], we compared serum leptin levels between
AC32/2 and AC3+/+ mice. Serum leptin is approximately 10 fold
higher in AC32/2 mice compared to AC3+/+ mice (Figure 4B). The
difference in serum leptin between AC32/2 and AC3+/+ was even
greater when mice were treated with CL, a ß-3 adrenergic agonist or
in fasting mice (data not shown). Leptin increases in adult AC32/2
mice may reflect increased adipocyte size and obesity.
Insulin is another adiposity signal that is secreted in proportion
to adipocyte size and positively correlates with body weight
Figure 3. AC32/2 mice have larger adipocytes. Representative hematoxylin sections of epididymal adipose tissue from (A) AC3+/+ and (B) AC32/2
mice. Scale bar, 50 mm. (C) The distribution of adipocyte cell diameter of AC3+/+ and AC32/2 mice. (D) The average adipocyte cell diameter of AC3+/+ andAC32/2 mice. (E) The adipocyte cell volume of AC3+/+ and AC32/2 mice. Data is the average from four AC32/2 and four AC3+/+ mice at 8 months. A totalof 400 cells from each genotype were counted. Data are represented as means6SEM. **, p,0.01.doi:10.1371/journal.pone.0006979.g003
AC3 and Obesity
PLoS ONE | www.plosone.org 4 September 2009 | Volume 4 | Issue 9 | e6979
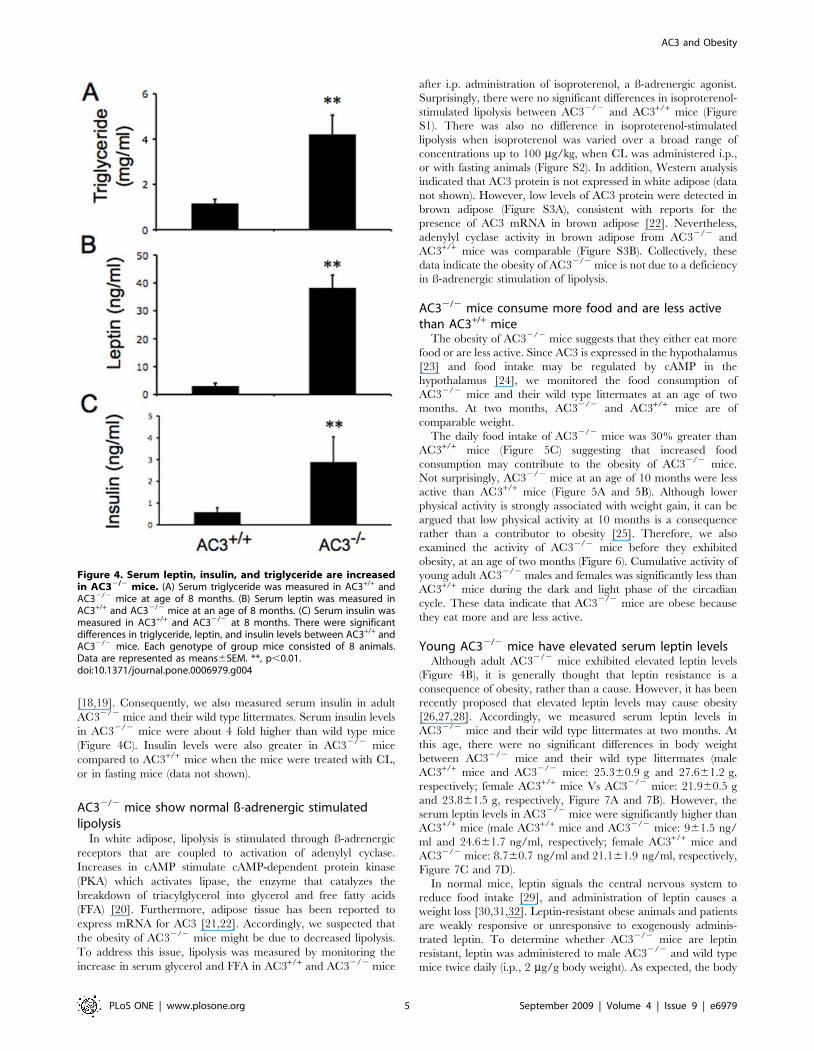
[18,19]. Consequently, we also measured serum insulin in adult
AC32/2 mice and their wild type littermates. Serum insulin levels
in AC32/2 mice were about 4 fold higher than wild type mice
(Figure 4C). Insulin levels were also greater in AC32/2 mice
compared to AC3+/+ mice when the mice were treated with CL,
or in fasting mice (data not shown).
AC32/2 mice show normal ß-adrenergic stimulatedlipolysis
In white adipose, lipolysis is stimulated through ß-adrenergic
receptors that are coupled to activation of adenylyl cyclase.
Increases in cAMP stimulate cAMP-dependent protein kinase
(PKA) which activates lipase, the enzyme that catalyzes the
breakdown of triacylglycerol into glycerol and free fatty acids
(FFA) [20]. Furthermore, adipose tissue has been reported to
express mRNA for AC3 [21,22]. Accordingly, we suspected that
the obesity of AC32/2 mice might be due to decreased lipolysis.
To address this issue, lipolysis was measured by monitoring the
increase in serum glycerol and FFA in AC3+/+ and AC32/2 mice
after i.p. administration of isoproterenol, a ß-adrenergic agonist.
Surprisingly, there were no significant differences in isoproterenol-
stimulated lipolysis between AC32/2 and AC3+/+ mice (Figure
S1). There was also no difference in isoproterenol-stimulated
lipolysis when isoproterenol was varied over a broad range of
concentrations up to 100 mg/kg, when CL was administered i.p.,
or with fasting animals (Figure S2). In addition, Western analysis
indicated that AC3 protein is not expressed in white adipose (data
not shown). However, low levels of AC3 protein were detected in
brown adipose (Figure S3A), consistent with reports for the
presence of AC3 mRNA in brown adipose [22]. Nevertheless,
adenylyl cyclase activity in brown adipose from AC32/2 and
AC3+/+ mice was comparable (Figure S3B). Collectively, these
data indicate the obesity of AC32/2 mice is not due to a deficiency
in ß-adrenergic stimulation of lipolysis.
AC32/2 mice consume more food and are less activethan AC3+/+ mice
The obesity of AC32/2 mice suggests that they either eat more
food or are less active. Since AC3 is expressed in the hypothalamus
[23] and food intake may be regulated by cAMP in the
hypothalamus [24], we monitored the food consumption of
AC32/2 mice and their wild type littermates at an age of two
months. At two months, AC32/2 and AC3+/+ mice are of
comparable weight.
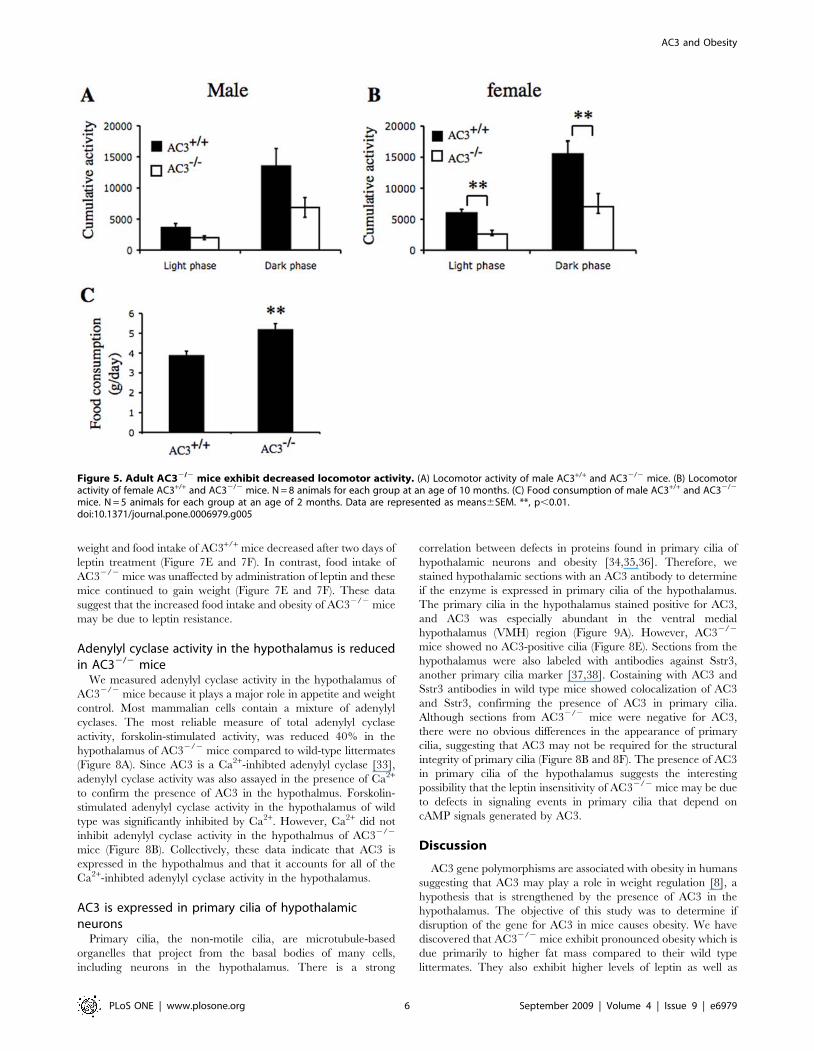
The daily food intake of AC32/2 mice was 30% greater than
AC3+/+ mice (Figure 5C) suggesting that increased food
consumption may contribute to the obesity of AC32/2 mice.
Not surprisingly, AC32/2 mice at an age of 10 months were less
active than AC3+/+ mice (Figure 5A and 5B). Although lower
physical activity is strongly associated with weight gain, it can be
argued that low physical activity at 10 months is a consequence
rather than a contributor to obesity [25]. Therefore, we also
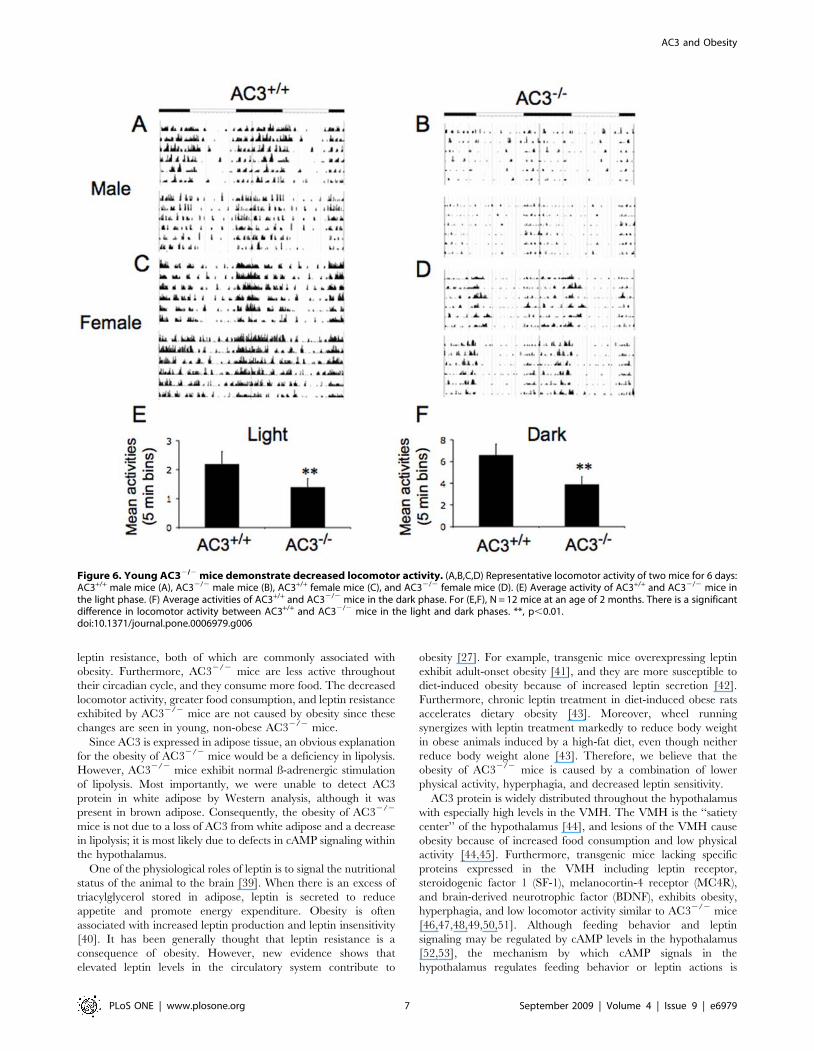
examined the activity of AC32/2 mice before they exhibited
obesity, at an age of two months (Figure 6). Cumulative activity of
young adult AC32/2 males and females was significantly less than
AC3+/+ mice during the dark and light phase of the circadian
cycle. These data indicate that AC32/2 mice are obese because
they eat more and are less active.
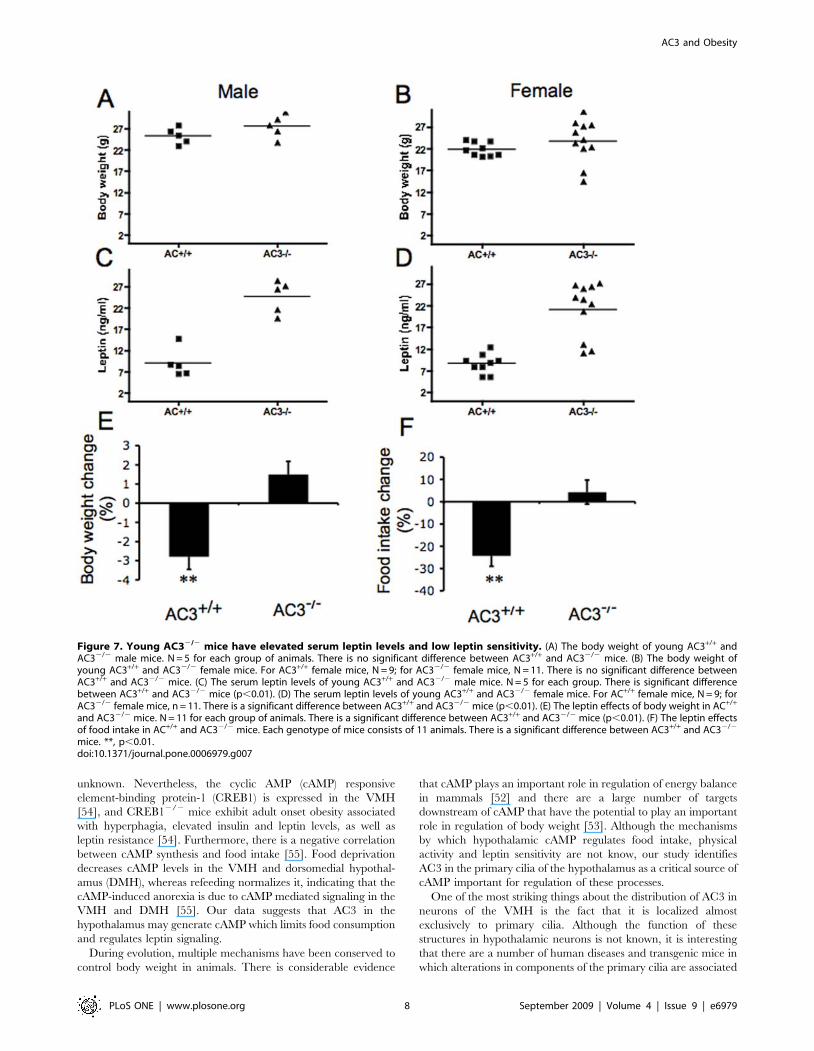
Young AC32/2 mice have elevated serum leptin levelsAlthough adult AC32/2 mice exhibited elevated leptin levels
(Figure 4B), it is generally thought that leptin resistance is a
consequence of obesity, rather than a cause. However, it has been
recently proposed that elevated leptin levels may cause obesity
[26,27,28]. Accordingly, we measured serum leptin levels in
AC32/2 mice and their wild type littermates at two months. At
this age, there were no significant differences in body weight
between AC32/2 mice and their wild type littermates (male
AC3+/+ mice and AC32/2 mice: 25.360.9 g and 27.661.2 g,
respectively; female AC3+/+ mice Vs AC32/2 mice: 21.960.5 g
and 23.861.5 g, respectively, Figure 7A and 7B). However, the
serum leptin levels in AC32/2 mice were significantly higher than
AC3+/+ mice (male AC3+/+ mice and AC32/2 mice: 961.5 ng/
ml and 24.661.7 ng/ml, respectively; female AC3+/+ mice and
AC32/2 mice: 8.760.7 ng/ml and 21.161.9 ng/ml, respectively,
Figure 7C and 7D).
In normal mice, leptin signals the central nervous system to
reduce food intake [29], and administration of leptin causes a
weight loss [30,31,32]. Leptin-resistant obese animals and patients
are weakly responsive or unresponsive to exogenously adminis-
trated leptin. To determine whether AC32/2 mice are leptin
resistant, leptin was administered to male AC32/2 and wild type
mice twice daily (i.p., 2 mg/g body weight). As expected, the body
Figure 4. Serum leptin, insulin, and triglyceride are increasedin AC32/2 mice. (A) Serum triglyceride was measured in AC3+/+ andAC32/2 mice at age of 8 months. (B) Serum leptin was measured inAC3+/+ and AC32/2 mice at an age of 8 months. (C) Serum insulin wasmeasured in AC3+/+ and AC32/2 at 8 months. There were significantdifferences in triglyceride, leptin, and insulin levels between AC3+/+ andAC32/2 mice. Each genotype of group mice consisted of 8 animals.Data are represented as means6SEM. **, p,0.01.doi:10.1371/journal.pone.0006979.g004
AC3 and Obesity
PLoS ONE | www.plosone.org 5 September 2009 | Volume 4 | Issue 9 | e6979
weight and food intake of AC3+/+ mice decreased after two days of
leptin treatment (Figure 7E and 7F). In contrast, food intake of
AC32/2 mice was unaffected by administration of leptin and these
mice continued to gain weight (Figure 7E and 7F). These data
suggest that the increased food intake and obesity of AC32/2 mice
may be due to leptin resistance.
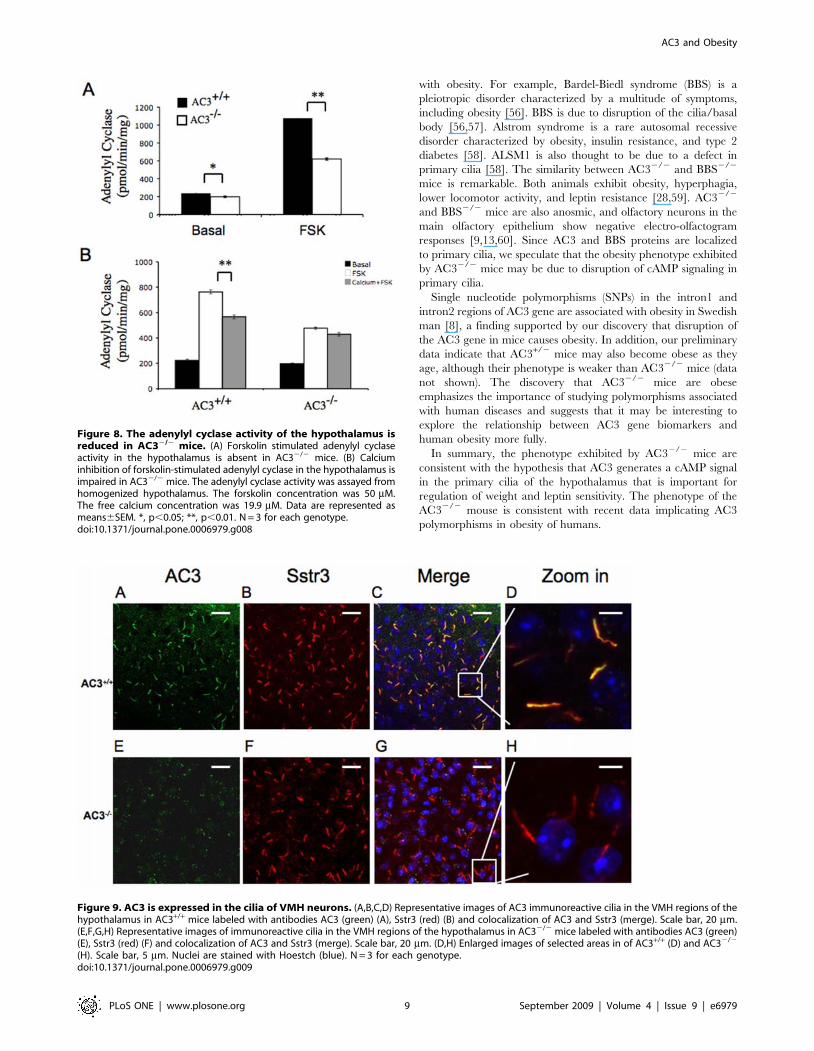
Adenylyl cyclase activity in the hypothalamus is reducedin AC32/2 mice
We measured adenylyl cyclase activity in the hypothalamus of
AC32/2 mice because it plays a major role in appetite and weight
control. Most mammalian cells contain a mixture of adenylyl
cyclases. The most reliable measure of total adenylyl cyclase
activity, forskolin-stimulated activity, was reduced 40% in the
hypothalamus of AC32/2 mice compared to wild-type littermates
(Figure 8A). Since AC3 is a Ca2+-inhibted adenylyl cyclase [33],
adenylyl cyclase activity was also assayed in the presence of Ca2+
to confirm the presence of AC3 in the hypothalmus. Forskolin-
stimulated adenylyl cyclase activity in the hypothalamus of wild
type was significantly inhibited by Ca2+. However, Ca2+ did not
inhibit adenylyl cyclase activity in the hypothalmus of AC32/2
mice (Figure 8B). Collectively, these data indicate that AC3 is
expressed in the hypothalmus and that it accounts for all of the
Ca2+-inhibted adenylyl cyclase activity in the hypothalamus.
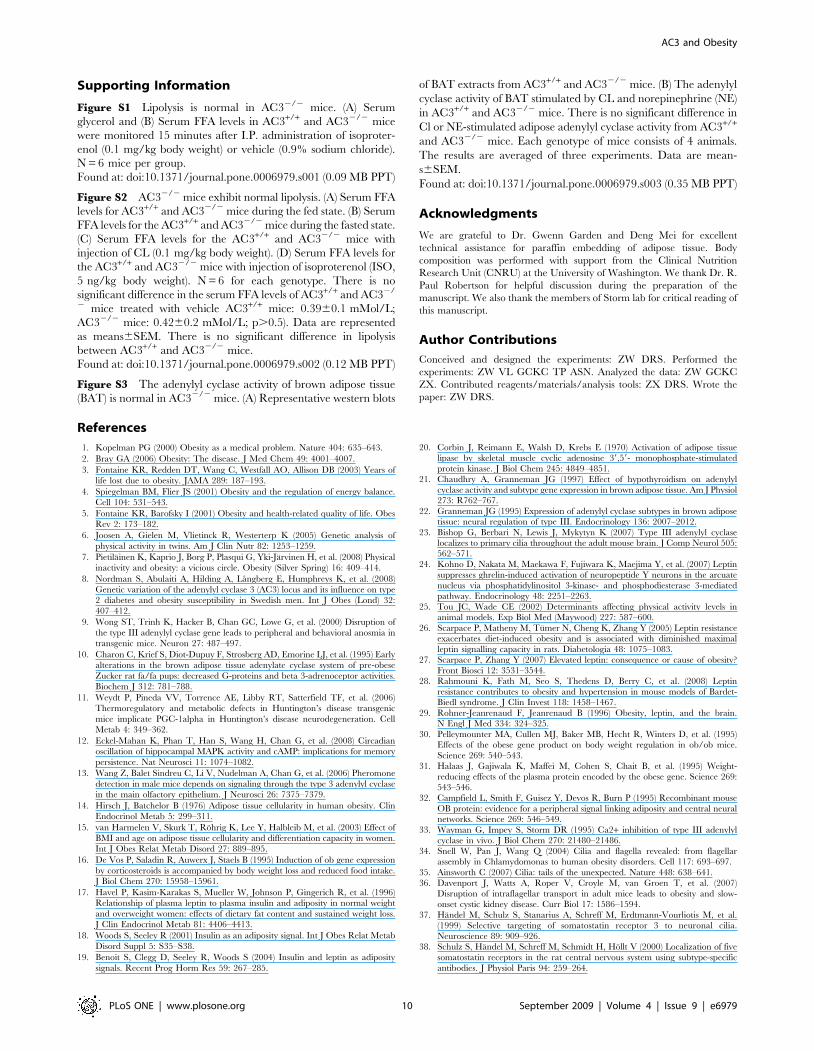
AC3 is expressed in primary cilia of hypothalamicneurons
Primary cilia, the non-motile cilia, are microtubule-based
organelles that project from the basal bodies of many cells,
including neurons in the hypothalamus. There is a strong
correlation between defects in proteins found in primary cilia of
hypothalamic neurons and obesity [34,35,36]. Therefore, we
stained hypothalamic sections with an AC3 antibody to determine
if the enzyme is expressed in primary cilia of the hypothalamus.
The primary cilia in the hypothalamus stained positive for AC3,
and AC3 was especially abundant in the ventral medial
hypothalamus (VMH) region (Figure 9A). However, AC32/2
mice showed no AC3-positive cilia (Figure 8E). Sections from the
hypothalamus were also labeled with antibodies against Sstr3,
another primary cilia marker [37,38]. Costaining with AC3 and
Sstr3 antibodies in wild type mice showed colocalization of AC3
and Sstr3, confirming the presence of AC3 in primary cilia.
Although sections from AC32/2 mice were negative for AC3,
there were no obvious differences in the appearance of primary
cilia, suggesting that AC3 may not be required for the structural
integrity of primary cilia (Figure 8B and 8F). The presence of AC3
in primary cilia of the hypothalamus suggests the interesting
possibility that the leptin insensitivity of AC32/2 mice may be due
to defects in signaling events in primary cilia that depend on
cAMP signals generated by AC3.
Discussion
AC3 gene polymorphisms are associated with obesity in humans
suggesting that AC3 may play a role in weight regulation [8], a
hypothesis that is strengthened by the presence of AC3 in the
hypothalamus. The objective of this study was to determine if
disruption of the gene for AC3 in mice causes obesity. We have
discovered that AC32/2 mice exhibit pronounced obesity which is
due primarily to higher fat mass compared to their wild type
littermates. They also exhibit higher levels of leptin as well as
Figure 5. Adult AC32/2 mice exhibit decreased locomotor activity. (A) Locomotor activity of male AC3+/+ and AC32/2 mice. (B) Locomotoractivity of female AC3+/+ and AC32/2 mice. N = 8 animals for each group at an age of 10 months. (C) Food consumption of male AC3+/+ and AC32/2
mice. N = 5 animals for each group at an age of 2 months. Data are represented as means6SEM. **, p,0.01.doi:10.1371/journal.pone.0006979.g005
AC3 and Obesity
PLoS ONE | www.plosone.org 6 September 2009 | Volume 4 | Issue 9 | e6979
leptin resistance, both of which are commonly associated with
obesity. Furthermore, AC32/2 mice are less active throughout
their circadian cycle, and they consume more food. The decreased
locomotor activity, greater food consumption, and leptin resistance
exhibited by AC32/2 mice are not caused by obesity since these
changes are seen in young, non-obese AC32/2 mice.
Since AC3 is expressed in adipose tissue, an obvious explanation
for the obesity of AC32/2 mice would be a deficiency in lipolysis.
However, AC32/2 mice exhibit normal ß-adrenergic stimulation
of lipolysis. Most importantly, we were unable to detect AC3
protein in white adipose by Western analysis, although it was
present in brown adipose. Consequently, the obesity of AC32/2
mice is not due to a loss of AC3 from white adipose and a decrease
in lipolysis; it is most likely due to defects in cAMP signaling within
the hypothalamus.
One of the physiological roles of leptin is to signal the nutritional
status of the animal to the brain [39]. When there is an excess of
triacylglycerol stored in adipose, leptin is secreted to reduce
appetite and promote energy expenditure. Obesity is often
associated with increased leptin production and leptin insensitivity
[40]. It has been generally thought that leptin resistance is a
consequence of obesity. However, new evidence shows that
elevated leptin levels in the circulatory system contribute to
obesity [27]. For example, transgenic mice overexpressing leptin
exhibit adult-onset obesity [41], and they are more susceptible to
diet-induced obesity because of increased leptin secretion [42].
Furthermore, chronic leptin treatment in diet-induced obese rats
accelerates dietary obesity [43]. Moreover, wheel running
synergizes with leptin treatment markedly to reduce body weight
in obese animals induced by a high-fat diet, even though neither
reduce body weight alone [43]. Therefore, we believe that the
obesity of AC32/2 mice is caused by a combination of lower
physical activity, hyperphagia, and decreased leptin sensitivity.
AC3 protein is widely distributed throughout the hypothalamus
with especially high levels in the VMH. The VMH is the ‘‘satiety
center’’ of the hypothalamus [44], and lesions of the VMH cause
obesity because of increased food consumption and low physical
activity [44,45]. Furthermore, transgenic mice lacking specific
proteins expressed in the VMH including leptin receptor,
steroidogenic factor 1 (SF-1), melanocortin-4 receptor (MC4R),
and brain-derived neurotrophic factor (BDNF), exhibits obesity,
hyperphagia, and low locomotor activity similar to AC32/2 mice
[46,47,48,49,50,51]. Although feeding behavior and leptin
signaling may be regulated by cAMP levels in the hypothalamus
[52,53], the mechanism by which cAMP signals in the
hypothalamus regulates feeding behavior or leptin actions is
Figure 6. Young AC32/2 mice demonstrate decreased locomotor activity. (A,B,C,D) Representative locomotor activity of two mice for 6 days:AC3+/+ male mice (A), AC32/2 male mice (B), AC3+/+ female mice (C), and AC32/2 female mice (D). (E) Average activity of AC3+/+ and AC32/2 mice inthe light phase. (F) Average activities of AC3+/+ and AC32/2 mice in the dark phase. For (E,F), N = 12 mice at an age of 2 months. There is a significantdifference in locomotor activity between AC3+/+ and AC32/2 mice in the light and dark phases. **, p,0.01.doi:10.1371/journal.pone.0006979.g006
AC3 and Obesity
PLoS ONE | www.plosone.org 7 September 2009 | Volume 4 | Issue 9 | e6979
unknown. Nevertheless, the cyclic AMP (cAMP) responsive
element-binding protein-1 (CREB1) is expressed in the VMH
[54], and CREB12/2 mice exhibit adult onset obesity associated
with hyperphagia, elevated insulin and leptin levels, as well as
leptin resistance [54]. Furthermore, there is a negative correlation
between cAMP synthesis and food intake [55]. Food deprivation
decreases cAMP levels in the VMH and dorsomedial hypothal-
amus (DMH), whereas refeeding normalizes it, indicating that the
cAMP-induced anorexia is due to cAMP mediated signaling in the
VMH and DMH [55]. Our data suggests that AC3 in the
hypothalamus may generate cAMP which limits food consumption
and regulates leptin signaling.
During evolution, multiple mechanisms have been conserved to
control body weight in animals. There is considerable evidence
that cAMP plays an important role in regulation of energy balance
in mammals [52] and there are a large number of targets
downstream of cAMP that have the potential to play an important
role in regulation of body weight [53]. Although the mechanisms
by which hypothalamic cAMP regulates food intake, physical
activity and leptin sensitivity are not know, our study identifies
AC3 in the primary cilia of the hypothalamus as a critical source of
cAMP important for regulation of these processes.
One of the most striking things about the distribution of AC3 in
neurons of the VMH is the fact that it is localized almost
exclusively to primary cilia. Although the function of these
structures in hypothalamic neurons is not known, it is interesting
that there are a number of human diseases and transgenic mice in
which alterations in components of the primary cilia are associated
Figure 7. Young AC32/2 mice have elevated serum leptin levels and low leptin sensitivity. (A) The body weight of young AC3+/+ andAC32/2 male mice. N = 5 for each group of animals. There is no significant difference between AC3+/+ and AC32/2 mice. (B) The body weight ofyoung AC3+/+ and AC32/2 female mice. For AC3+/+ female mice, N = 9; for AC32/2 female mice, N = 11. There is no significant difference betweenAC3+/+ and AC32/2 mice. (C) The serum leptin levels of young AC3+/+ and AC32/2 male mice. N = 5 for each group. There is significant differencebetween AC3+/+ and AC32/2 mice (p,0.01). (D) The serum leptin levels of young AC3+/+ and AC32/2 female mice. For AC+/+ female mice, N = 9; forAC32/2 female mice, n = 11. There is a significant difference between AC3+/+ and AC32/2 mice (p,0.01). (E) The leptin effects of body weight in AC+/+
and AC32/2 mice. N = 11 for each group of animals. There is a significant difference between AC3+/+ and AC32/2 mice (p,0.01). (F) The leptin effectsof food intake in AC+/+ and AC32/2 mice. Each genotype of mice consists of 11 animals. There is a significant difference between AC3+/+ and AC32/2
mice. **, p,0.01.doi:10.1371/journal.pone.0006979.g007
AC3 and Obesity
PLoS ONE | www.plosone.org 8 September 2009 | Volume 4 | Issue 9 | e6979
with obesity. For example, Bardel-Biedl syndrome (BBS) is a
pleiotropic disorder characterized by a multitude of symptoms,
including obesity [56]. BBS is due to disruption of the cilia/basal
body [56,57]. Alstrom syndrome is a rare autosomal recessive
disorder characterized by obesity, insulin resistance, and type 2
diabetes [58]. ALSM1 is also thought to be due to a defect in
primary cilia [58]. The similarity between AC32/2 and BBS2/2
mice is remarkable. Both animals exhibit obesity, hyperphagia,
lower locomotor activity, and leptin resistance [28,59]. AC32/2
and BBS2/2 mice are also anosmic, and olfactory neurons in the
main olfactory epithelium show negative electro-olfactogram
responses [9,13,60]. Since AC3 and BBS proteins are localized
to primary cilia, we speculate that the obesity phenotype exhibited
by AC32/2 mice may be due to disruption of cAMP signaling in
primary cilia.
Single nucleotide polymorphisms (SNPs) in the intron1 and
intron2 regions of AC3 gene are associated with obesity in Swedish
man [8], a finding supported by our discovery that disruption of
the AC3 gene in mice causes obesity. In addition, our preliminary
data indicate that AC3+/2 mice may also become obese as they
age, although their phenotype is weaker than AC32/2 mice (data
not shown). The discovery that AC32/2 mice are obese
emphasizes the importance of studying polymorphisms associated
with human diseases and suggests that it may be interesting to
explore the relationship between AC3 gene biomarkers and
human obesity more fully.
In summary, the phenotype exhibited by AC32/2 mice are
consistent with the hypothesis that AC3 generates a cAMP signal
in the primary cilia of the hypothalamus that is important for
regulation of weight and leptin sensitivity. The phenotype of the
AC32/2 mouse is consistent with recent data implicating AC3
polymorphisms in obesity of humans.
Figure 8. The adenylyl cyclase activity of the hypothalamus isreduced in AC32/2 mice. (A) Forskolin stimulated adenylyl cyclaseactivity in the hypothalamus is absent in AC32/2 mice. (B) Calciuminhibition of forskolin-stimulated adenylyl cyclase in the hypothalamus isimpaired in AC32/2 mice. The adenylyl cyclase activity was assayed fromhomogenized hypothalamus. The forskolin concentration was 50 mM.The free calcium concentration was 19.9 mM. Data are represented asmeans6SEM. *, p,0.05; **, p,0.01. N = 3 for each genotype.doi:10.1371/journal.pone.0006979.g008
Figure 9. AC3 is expressed in the cilia of VMH neurons. (A,B,C,D) Representative images of AC3 immunoreactive cilia in the VMH regions of thehypothalamus in AC3+/+ mice labeled with antibodies AC3 (green) (A), Sstr3 (red) (B) and colocalization of AC3 and Sstr3 (merge). Scale bar, 20 mm.(E,F,G,H) Representative images of immunoreactive cilia in the VMH regions of the hypothalamus in AC32/2 mice labeled with antibodies AC3 (green)(E), Sstr3 (red) (F) and colocalization of AC3 and Sstr3 (merge). Scale bar, 20 mm. (D,H) Enlarged images of selected areas in of AC3+/+ (D) and AC32/2
(H). Scale bar, 5 mm. Nuclei are stained with Hoestch (blue). N = 3 for each genotype.doi:10.1371/journal.pone.0006979.g009
AC3 and Obesity
PLoS ONE | www.plosone.org 9 September 2009 | Volume 4 | Issue 9 | e6979
Supporting Information
Figure S1 Lipolysis is normal in AC32/2 mice. (A) Serum
glycerol and (B) Serum FFA levels in AC3+/+ and AC32/2 mice
were monitored 15 minutes after I.P. administration of isoproter-
enol (0.1 mg/kg body weight) or vehicle (0.9% sodium chloride).
N = 6 mice per group.
Found at: doi:10.1371/journal.pone.0006979.s001 (0.09 MB PPT)
Figure S2 AC32/2 mice exhibit normal lipolysis. (A) Serum FFA
levels for AC3+/+ and AC32/2 mice during the fed state. (B) Serum
FFA levels for the AC3+/+ and AC32/2 mice during the fasted state.
(C) Serum FFA levels for the AC3+/+ and AC32/2 mice with
injection of CL (0.1 mg/kg body weight). (D) Serum FFA levels for
the AC3+/+ and AC32/2 mice with injection of isoproterenol (ISO,
5 ng/kg body weight). N = 6 for each genotype. There is no
significant difference in the serum FFA levels of AC3+/+ and AC32/
2 mice treated with vehicle AC3+/+ mice: 0.3960.1 mMol/L;
AC32/2 mice: 0.4260.2 mMol/L; p.0.5). Data are represented
as means6SEM. There is no significant difference in lipolysis
between AC3+/+ and AC32/2 mice.
Found at: doi:10.1371/journal.pone.0006979.s002 (0.12 MB PPT)
Figure S3 The adenylyl cyclase activity of brown adipose tissue
(BAT) is normal in AC32/2 mice. (A) Representative western blots
of BAT extracts from AC3+/+ and AC32/2 mice. (B) The adenylyl
cyclase activity of BAT stimulated by CL and norepinephrine (NE)
in AC3+/+ and AC32/2 mice. There is no significant difference in
Cl or NE-stimulated adipose adenylyl cyclase activity from AC3+/+
and AC32/2 mice. Each genotype of mice consists of 4 animals.
The results are averaged of three experiments. Data are mean-
s6SEM.
Found at: doi:10.1371/journal.pone.0006979.s003 (0.35 MB PPT)
Acknowledgments
We are grateful to Dr. Gwenn Garden and Deng Mei for excellent
technical assistance for paraffin embedding of adipose tissue. Body
composition was performed with support from the Clinical Nutrition
Research Unit (CNRU) at the University of Washington. We thank Dr. R.
Paul Robertson for helpful discussion during the preparation of the
manuscript. We also thank the members of Storm lab for critical reading of
this manuscript.
Author Contributions
Conceived and designed the experiments: ZW DRS. Performed the
experiments: ZW VL GCKC TP ASN. Analyzed the data: ZW GCKC
ZX. Contributed reagents/materials/analysis tools: ZX DRS. Wrote the
paper: ZW DRS.
References
1. Kopelman PG (2000) Obesity as a medical problem. Nature 404: 635–643.
2. Bray GA (2006) Obesity: The disease. J Med Chem 49: 4001–4007.
3. Fontaine KR, Redden DT, Wang C, Westfall AO, Allison DB (2003) Years of
life lost due to obesity. JAMA 289: 187–193.
4. Spiegelman BM, Flier JS (2001) Obesity and the regulation of energy balance.
Cell 104: 531–543.
5. Fontaine KR, Barofsky I (2001) Obesity and health-related quality of life. Obes
Rev 2: 173–182.
6. Joosen A, Gielen M, Vlietinck R, Westerterp K (2005) Genetic analysis of
physical activity in twins. Am J Clin Nutr 82: 1253–1259.
7. Pietilainen K, Kaprio J, Borg P, Plasqui G, Yki-Jarvinen H, et al. (2008) Physical
inactivity and obesity: a vicious circle. Obesity (Silver Spring) 16: 409–414.
8. Nordman S, Abulaiti A, Hilding A, Langberg E, Humphreys K, et al. (2008)
Genetic variation of the adenylyl cyclase 3 (AC3) locus and its influence on type
2 diabetes and obesity susceptibility in Swedish men. Int J Obes (Lond) 32:
407–412.
9. Wong ST, Trinh K, Hacker B, Chan GC, Lowe G, et al. (2000) Disruption of
the type III adenylyl cyclase gene leads to peripheral and behavioral anosmia in
transgenic mice. Neuron 27: 487–497.
10. Charon C, Krief S, Diot-Dupuy F, Strosberg AD, Emorine LJ, et al. (1995) Early
alterations in the brown adipose tissue adenylate cyclase system of pre-obese
Zucker rat fa/fa pups: decreased G-proteins and beta 3-adrenoceptor activities.
Biochem J 312: 781–788.
11. Weydt P, Pineda VV, Torrence AE, Libby RT, Satterfield TF, et al. (2006)
Thermoregulatory and metabolic defects in Huntington’s disease transgenic
mice implicate PGC-1alpha in Huntington’s disease neurodegeneration. Cell
Metab 4: 349–362.
12. Eckel-Mahan K, Phan T, Han S, Wang H, Chan G, et al. (2008) Circadian
oscillation of hippocampal MAPK activity and cAMP: implications for memory
persistence. Nat Neurosci 11: 1074–1082.
13. Wang Z, Balet Sindreu C, Li V, Nudelman A, Chan G, et al. (2006) Pheromone
detection in male mice depends on signaling through the type 3 adenylyl cyclase
in the main olfactory epithelium. J Neurosci 26: 7375–7379.
14. Hirsch J, Batchelor B (1976) Adipose tissue cellularity in human obesity. Clin
Endocrinol Metab 5: 299–311.
15. van Harmelen V, Skurk T, Rohrig K, Lee Y, Halbleib M, et al. (2003) Effect of
BMI and age on adipose tissue cellularity and differentiation capacity in women.
Int J Obes Relat Metab Disord 27: 889–895.
16. De Vos P, Saladin R, Auwerx J, Staels B (1995) Induction of ob gene expression
by corticosteroids is accompanied by body weight loss and reduced food intake.
J Biol Chem 270: 15958–15961.
17. Havel P, Kasim-Karakas S, Mueller W, Johnson P, Gingerich R, et al. (1996)
Relationship of plasma leptin to plasma insulin and adiposity in normal weight
and overweight women: effects of dietary fat content and sustained weight loss.
J Clin Endocrinol Metab 81: 4406–4413.
18. Woods S, Seeley R (2001) Insulin as an adiposity signal. Int J Obes Relat Metab
Disord Suppl 5: S35–S38.
19. Benoit S, Clegg D, Seeley R, Woods S (2004) Insulin and leptin as adiposity
signals. Recent Prog Horm Res 59: 267–285.
20. Corbin J, Reimann E, Walsh D, Krebs E (1970) Activation of adipose tissuelipase by skeletal muscle cyclic adenosine 39,59- monophosphate-stimulated
protein kinase. J Biol Chem 245: 4849–4851.
21. Chaudhry A, Granneman JG (1997) Effect of hypothyroidism on adenylyl
cyclase activity and subtype gene expression in brown adipose tissue. Am J Physiol273: R762–767.
22. Granneman JG (1995) Expression of adenylyl cyclase subtypes in brown adiposetissue: neural regulation of type III. Endocrinology 136: 2007–2012.
23. Bishop G, Berbari N, Lewis J, Mykytyn K (2007) Type III adenylyl cyclaselocalizes to primary cilia throughout the adult mouse brain. J Comp Neurol 505:
562–571.
24. Kohno D, Nakata M, Maekawa F, Fujiwara K, Maejima Y, et al. (2007) Leptin
suppresses ghrelin-induced activation of neuropeptide Y neurons in the arcuate
nucleus via phosphatidylinositol 3-kinase- and phosphodiesterase 3-mediatedpathway. Endocrinology 48: 2251–2263.
25. Tou JC, Wade CE (2002) Determinants affecting physical activity levels inanimal models. Exp Biol Med (Maywood) 227: 587–600.
26. Scarpace P, Matheny M, Tumer N, Cheng K, Zhang Y (2005) Leptin resistanceexacerbates diet-induced obesity and is associated with diminished maximal
leptin signalling capacity in rats. Diabetologia 48: 1075–1083.
27. Scarpace P, Zhang Y (2007) Elevated leptin: consequence or cause of obesity?
Front Biosci 12: 3531–3544.
28. Rahmouni K, Fath M, Seo S, Thedens D, Berry C, et al. (2008) Leptin
resistance contributes to obesity and hypertension in mouse models of Bardet-Biedl syndrome. J Clin Invest 118: 1458–1467.
29. Rohner-Jeanrenaud F, Jeanrenaud B (1996) Obesity, leptin, and the brain.N Engl J Med 334: 324–325.
30. Pelleymounter MA, Cullen MJ, Baker MB, Hecht R, Winters D, et al. (1995)Effects of the obese gene product on body weight regulation in ob/ob mice.
Science 269: 540–543.
31. Halaas J, Gajiwala K, Maffei M, Cohen S, Chait B, et al. (1995) Weight-
reducing effects of the plasma protein encoded by the obese gene. Science 269:
543–546.
32. Campfield L, Smith F, Guisez Y, Devos R, Burn P (1995) Recombinant mouse
OB protein: evidence for a peripheral signal linking adiposity and central neuralnetworks. Science 269: 546–549.
33. Wayman G, Impey S, Storm DR (1995) Ca2+ inhibition of type III adenylylcyclase in vivo. J Biol Chem 270: 21480–21486.
34. Snell W, Pan J, Wang Q (2004) Cilia and flagella revealed: from flagellarassembly in Chlamydomonas to human obesity disorders. Cell 117: 693–697.
35. Ainsworth C (2007) Cilia: tails of the unexpected. Nature 448: 638–641.
36. Davenport J, Watts A, Roper V, Croyle M, van Groen T, et al. (2007)
Disruption of intraflagellar transport in adult mice leads to obesity and slow-onset cystic kidney disease. Curr Biol 17: 1586–1594.
37. Handel M, Schulz S, Stanarius A, Schreff M, Erdtmann-Vourliotis M, et al.(1999) Selective targeting of somatostatin receptor 3 to neuronal cilia.
Neuroscience 89: 909–926.
38. Schulz S, Handel M, Schreff M, Schmidt H, Hollt V (2000) Localization of five
somatostatin receptors in the rat central nervous system using subtype-specific
antibodies. J Physiol Paris 94: 259–264.
AC3 and Obesity
PLoS ONE | www.plosone.org 10 September 2009 | Volume 4 | Issue 9 | e6979
39. Spiegelman B, Flier J (1996) Adipogenesis and obesity: rounding out the big
picture. Cell 87: 377–389.
40. Maffei M, Halaas J, Ravussin E, Pratley R, Lee G, et al. (1995) Leptin levels in
human and rodent: measurement of plasma leptin and ob RNA in obese and
weight-reduced subjects. Nat Med 1: 1155–1161.
41. Qiu J, Ogus S, Lu R, Chehab F (2001) Transgenic mice overexpressing leptin
accumulate adipose mass at an older, but not younger, age. Endocrinology 142:
348–358.
42. Ogus S, Ke Y, Qiu J, Wang B, Chehab F (2003) Hyperleptinemia precipitates
diet-induced obesity in transgenic mice overexpressing leptin. Endocrinology
144: 2865–2869.
43. Shapiro A, Matheny M, Zhang Y, Tumer N, Cheng K, et al. (2008) Synergy
between leptin therapy and a seemingly negligible amount of voluntary wheel
running prevents progression of dietary obesity in leptin-resistant rats. Diabetes
57: 614–622.
44. King B (2006) The rise, fall, and resurrection of the ventromedial hypothalamus
in the regulation of feeding behavior and body weight. Physiol Behav 87:
221–244.
45. Challet E, Le Maho Y, Malan A (1995) Locomotor activity and utilization of
energy reserves during fasting after ventromedial hypothalamic lesions. Physiol
Behav 58: 257–264.
46. Majdic G, Young M, Gomez-Sanchez E, Anderson P, Szczepaniak L, et al.
(2002) Knockout mice lacking steroidogenic factor 1 are a novel genetic model of
hypothalamic obesity. Endocrinology 143: 607–614.
47. Dhillon H, Zigman J, Ye C, Lee C, McGovern R, et al. (2006) Leptin directly
activates SF1 neurons in the VMH, and this action by leptin is required for
normal body-weight homeostasis. Neuron 49: 191–203.
48. Bingham N, Anderson K, Reuter A, Stallings N, Parker K (2008) Selective loss
of leptin receptors in the ventromedial hypothalamic nucleus results in increased
adiposity and a metabolic syndrome. Endocrinology 149: 2138–2148.
49. Kernie S, Liebl D, Parada L (2000) BDNF regulates eating behavior and
locomotor activity in mice. EMBO J 19: 1290–1300.
50. Rios M, Fan G, Fekete C, Kelly J, Bates B, et al. (2001) Conditional deletion of
brain-derived neurotrophic factor in the postnatal brain leads to obesity andhyperactivity. Mol Endocrinol 15: 1748–1757.
51. Huszar D, Lynch C, Fairchild-Huntress V, Dunmore J, Fang Q, et al. (1997)
Targeted disruption of the melanocortin-4 receptor results in obesity in mice.Cell 88: 131–141.
52. Zhao A (2005) Control of food intake through regulation of cAMP. Curr TopDev Biol 67: 207–224.
53. Zhao A, Huan J, Gupta S, Pal R, Sahu A (2002) A phosphatidylinositol 3-kinase
phosphodiesterase 3B-cyclic AMP pathway in hypothalamic action of leptin onfeeding. Nat Neurosci 5: 727–728.
54. Altarejos J, Goebel N, Conkright M, Inoue H, Xie J, et al. (2008) The Creb1coactivator Crtc1 is required for energy balance and fertility. Nat Med 14:
1112–1117.55. Sheriff S, Chance W, Iqbal S, Rizvi T, Xiao C, et al. (2003) Hypothalamic
administration of cAMP agonist/PKA activator inhibits both schedule feeding
and NPY-induced feeding in rats. Peptides 24: 245–254.56. Blacque O, Leroux M (2006) Bardet-Biedl syndrome: an emerging pathome-
chanism of intracellular transport. Cell Mol Life Sci 63: 2145–2161.57. Ansley S, Badano J, Blacque O, Hill J, Hoskins B, et al. (2003) Basal body
dysfunction is a likely cause of pleiotropic Bardet-Biedl syndrome. Nature 425:
628–633.58. Hearn T, Spalluto C, Phillips V, Renforth G, Copin N, et al. (2005) Subcellular
localization of ALMS1 supports involvement of centrosome and basal bodydysfunction in the pathogenesis of obesity, insulin resistance, and type 2 diabetes.
Diabetes 54: 1581–1587.59. Davis R, Swiderski R, Rahmouni K, Nishimura D, Mullins R, et al. (2007) A
knockin mouse model of the Bardet-Biedl syndrome 1 M390R mutation has cilia
defects, ventriculomegaly, retinopathy, and obesity. Proc Natl Acad Sci U S A104: 19422–19427.
60. Kulaga H, Leitch C, Eichers E, Badano J, Lesemann A, et al. (2004) Loss of BBSproteins causes anosmia in humans and defects in olfactory cilia structure and
function in the mouse. Nat Genet 36: 994–998.
AC3 and Obesity
PLoS ONE | www.plosone.org 11 September 2009 | Volume 4 | Issue 9 | e6979


